Physiological and Molecular Plant Pathology (1998) 52, 223–243 Article No. : pp980148 Phenylalanine ammonia-lyase inhibition, autofluorescence, and localized accumulation of silicon, calcium and manganese in oat epidermis attacked by the powdery mildew fungus Blumeria graminis (DC) Speer. T. L. W. C", B. J. T", M. P. R" and R. J. Z*# " Institute of Grasslands and Environmental Research, Plas Gogerddan, Aberystwyth, Dyfed, SY23 3EB, UK # Department of Plant Pathology, 495 Borlaug Hall, University of Minnesota, St. Paul, MN 55108, USA (Accepted for publication February 1998) Phenolic-based autofluorogens accumulate locally in haloes and papillae formed in cereal epidermal cells responding to attack by germ tubes of Blumeria graminis (the powdery mildew fungus). The chemical elements silicon, calcium and manganese have been reported to accumulate in spatial coincidence with autofluorogens. We tested the hypothesis that chemical element accumulations are dependent upon the presence of autofluorogens. Light and fluorescence microscopy showed that treating seedling leaves of Selma oat (Aena satia L.) with α-amino-β-phenylpropionic acid (AOPP) to inhibit phenylalanine ammonia lyase (PAL) greatly suppressed the frequency and intensity of localized autofluorescence. Energy dispersive X-ray microanalysis was used to identify and quantify levels of Si, Ca and Mn at 12, 16, 18, 24 and 30 h after inoculation. Leaf specimens were cryopreserved in the frozen-hydrated state allowing elemental analysis of halo and upper papilla regions, and then freeze-dried for analysis from deeper within cells. Although autofluorescence was detected at 12 h, no accumulation of any element was detected until 18 h. Results strongly indicated that Si accumulation is a process independent from autofluorogen accumulation. At attack sites, Mn levels were generally elevated in association with AOPP treatment, while Ca levels deep within epidermal cells decreased. Further comparisons were made between successful and failed B. graminis penetration sites and detailed results are presented and discussed. # 1998 Academic Press INTRODUCTION Conidia of Blumeria graminis (DC.) Speer (syn. Erysiphe graminis DC.) germinate on host cereal leaves, first producing a primary germ tube (PGT) and then a second germ tube destined to elongate and differentiate an appressorium. Haustoria are never produced by the PGT, but it forms a short penetration peg that enters the host epidermal cell wall and stimulates host responses. Successful infection depends upon * To whom correspondence should be addressed. Abbreviations used in the text : AOPP, α-amino-β-phenylpropionic acid ; EDX, energy dispersive X-ray microanalysis ; PAL, phenylalanine ammonia lyase ; PGT, primary germ tube ; SEM, scanning electron microscope. 0885-5765}98}040223›21 $30.00}0 # 1998 Academic Press

Welcome message from author
This document is posted to help you gain knowledge. Please leave a comment to let me know what you think about it! Share it to your friends and learn new things together.
Transcript
Physiological and Molecular Plant Pathology (1998) 52, 223–243Article No. : pp980148
Phenylalanine ammonia-lyase inhibition,
autofluorescence, and localized accumulation of silicon,
calcium and manganese in oat epidermis attacked by
the powdery mildew fungus Blumeria graminis (DC)
Speer.
T. L. W. C", B. J. T", M. P. R" and R. J. Z*#
" Institute of Grasslands and Environmental Research, Plas Gogerddan, Aberystwyth, Dyfed, SY23 3EB, UK#Department of Plant Pathology, 495 Borlaug Hall, University of Minnesota, St. Paul, MN 55108, USA
(Accepted for publication February 1998)
Phenolic-based autofluorogens accumulate locally in haloes and papillae formed in cerealepidermal cells responding to attack by germ tubes of Blumeria graminis (the powdery mildewfungus). The chemical elements silicon, calcium and manganese have been reportedto accumulate in spatial coincidence with autofluorogens. We tested the hypothesis thatchemical element accumulations are dependent upon the presence of autofluorogens. Light andfluorescence microscopy showed that treating seedling leaves of Selma oat (A�ena sati�a L.) withα-amino-β-phenylpropionic acid (AOPP) to inhibit phenylalanine ammonia lyase (PAL) greatlysuppressed the frequency and intensity of localized autofluorescence. Energy dispersive X-raymicroanalysis was used to identify and quantify levels of Si, Ca and Mn at 12, 16, 18, 24 and 30 hafter inoculation. Leaf specimens were cryopreserved in the frozen-hydrated state allowingelemental analysis of halo and upper papilla regions, and then freeze-dried for analysis fromdeeper within cells. Although autofluorescence was detected at 12 h, no accumulation of anyelement was detected until 18 h. Results strongly indicated that Si accumulation is a processindependent from autofluorogen accumulation. At attack sites, Mn levels were generally elevatedin association with AOPP treatment, while Ca levels deep within epidermal cells decreased.Further comparisons were made between successful and failed B. graminis penetration sites anddetailed results are presented and discussed. # 1998 Academic Press
INTRODUCTION
Conidia of Blumeria graminis (DC.) Speer (syn. Erysiphe graminis DC.) germinate on
host cereal leaves, first producing a primary germ tube (PGT) and then a second germ
tube destined to elongate and differentiate an appressorium. Haustoria are never
produced by the PGT, but it forms a short penetration peg that enters the host
epidermal cell wall and stimulates host responses. Successful infection depends upon
*To whom correspondence should be addressed.Abbreviations used in the text : AOPP, α-amino-β-phenylpropionic acid; EDX, energy dispersive X-ray
microanalysis ; PAL, phenylalanine ammonia lyase ; PGT, primary germ tube; SEM, scanning electronmicroscope.
0885-5765}98}04022321 $30.00}0 # 1998 Academic Press

224 T. L. W. Carver et al.
the appressorium from which a penetration peg passes through the host epidermal cell
wall and forms a haustorium. Defensive barriers are produced in response to attempted
penetration.
Recent reviews describe the details of germling development [6] and host response
[1, 9]. The first visible response to appressorium contact is the appearance of
autofluorescent material in the underlying host plasmalemma or cell wall [23, 30].
Within minutes an actively moving aggregation of host cell cytoplasm gathers directly
beneath the appressorium [30] and a halo region develops as the host cell wall is
modified in the area surrounding appressorial contact [2]. The cytoplasmic aggregate
is coincident with vesicle-mediated deposition of papilla materials [40]. The papilla is
a heterogeneous mass deposited between the epidermal cell plasma membrane and the
cell wall, directly beneath the site of attempted penetration. Considerable evidence
indicates that papillae provide a barrier to infection [1].
Papillae are chemically complex structures [1]. They have a callous matrix infused
with phenolic substances, proteins, hydrolytic enzymes and altered levels of specific
chemical elements including Si. Si is commonly localized in papillae and epidermal cell
wall halo regions [8, 26, 27, 28, 41, 42]. In our experience, these same host cell regions
exhibit strong localized autofluorescence (Fig. 1). This suggests that Si accumulation
depends upon the accumulation of autofluorogens. The primary objective of the
current experiments was to test this hypothesis.
Mayama & Shishyama [33] first described localized autofluorescence in barley
epidermal cells attacked by B. graminis appressoria. It is now clear that localized
autofluorescence is a normal expression of epidermal cell response to B. graminis attack
in oat, barley and wheat [2, 7, 9–14, 23, 24, 29–31, 33, 43]. Considerable physical and
biochemical evidence indicates that these autofluorogens are phenolic compounds, and
that they are probably products related to lignin biosynthesis [11, 12, 14, 43].
In a series of investigations, we examined the effects of treating cereal leaves with α-
amino-β-phenylpropionic acid (AOPP), a potent competitive inhibitor of phenyl-
alanine ammonia-lyase (PAL), which catalyses the first committed step in phenolic
compound synthesis. In oat, barley and wheat, PAL inhibition dramatically suppresses
localized autofluorescence associated with response to appressorial attack and increases
the proportion of appressoria successfully penetrating to form haustoria [7, 10–14, 43].
Kunoh and his co-workers [26–28] led early investigations of the accumulation of
inorganic chemical elements at attempted penetration sites. High levels of Si, Mn and
Ca were reported. Kunoh [25] and Zeyen et al. [41] reviewed these and other studies
and described possible roles for these inorganic ions that accumulate in the same
localized regions that exhibit autofluorescence (Fig. 1).
Mn is an essential trace element in plants. Adding Mn to barley and wheat plantings
to prevent deficiency decreased powdery mildew disease [20]. Zeyen et al. [40] pointed
out that Mn is one of the many known inducers of PAL activity in plants, and suggested
that this and its capacity to act in promoting nonenzymic polymerization of phenolic
compounds [5] may be important in resistance to attempted penetration. Conversely,
Kunoh [25] noted that Mn can promote chitin synthetase activity in fungi, and thus
it may be sequestered and used by the attacking fungus.
Ca is involved in many metabolic processes [22], and its role in resistance}susceptibility to infection is complex and not well understood. In certain situations, Ca
Oat epidermis attacked by Blumeria graminis 225
is associated with increased effectiveness of papilla-based resistance to B. graminis
[4, 16], while in other cases Ca enhances infection [19, 36, 37].
There is a consistent correlation between Si accumulation and disease resistance in
several host}pathogen systems [41]. Carver, Zeyen & Ahlstrand [8] demonstrated by
sequential use of light microscopy, scanning electron microscopy (SEM) and energy
dispersive X-ray microanalysis (EDX) [41] that the rate of Si accumulation in papillae
formed in barley may influence the outcome of attempted penetration from appressoria.
Thus, when Si accumulated to high levels relatively early in the attack, penetration
tended to fail, whereas where penetration succeeded the accumulation was delayed.
Despite this correlation, the function of Si remains a matter of speculation. For
example, in the non-host French bean}cowpea rust interaction, it was suggested that
Si may present a physical barrier to penetration and}or restrict the flow of materials
to an attacking fungus that prevents its premature senescence [17].
An important question is whether the accumulation of inorganic elements is
dependent upon the accumulation of the autofluorogenic compounds. For Si, at least,
there is reason to suppose this might be so from evidence by Heath [18], who found
insoluble silicon in necrotic cowpea cells that died as a result of infection with
incompatible cowpea rust. Further, in the French bean}cowpea rust fungus system,
Perumalla and Heath [36] found that PAL inhibition (AOPP treatment), reduced the
incidence of autofluorescence in mesophyll cell walls and this was associated with
reduced incidence of Si deposition as judged by cell wall refractivity using light
microscopy. It was argued that this is not surprising, since Si is taken up and
transported in plants in the form of monosilicic acid [see 8], and monosilicic acid can
form strong complexes with organic hydroxy compounds [21]. The formation of such
complexes was also used to explain Si accumulation in barley cells that died and
accumulated autofluorescent phenolics as a result of hypersensitivity to avirulent B.
graminis attack [24].
The present study used X-ray microanalysis to compare Si accumulation in time-
course studies where susceptible oat (A�ena sati�a L.) leaves attacked by B. graminis were
treated with AOPP to inhibit PAL and suppress localized autofluorescent host cell
responses [7]. We also studied the effects of the treatment on accumulation of Mn and
Ca. Analyses were performed using both frozen-hydrated and freeze-dried samples. In
frozen-hydrated material, electron beam penetration, which generates element-specific
X-ray emission, is restricted [3, 41]. Thus, X-ray analysis from frozen-hydrated
material reflects the composition of the epidermal wall halo regions and papillae at
appressorial attack sites. Freeze-drying allows greater beam penetration into epidermal
cells and thus provides information on elements present within attacked cells.
MATERIALS AND METHODS
Host and pathogen material
Seedling leaves of the powdery mildew susceptible spring oat cv. Selma were used
throughout. Seeds were sown in John Innes No. 3 potting compost and grown in a
spore-proof glasshouse under natural lighting conditions and a minimum temperature
of 12 °C. Seedlings were grown until the second leaf was fully expanded, then first-
formed leaves were excised for experimentation. Blumeria graminis f. sp. a�enae (Marchal)

226 T. L. W. Carver et al.
race 5 was maintained on young plants of Selma. One day before experimentation,
Selma leaves bearing conidia were shaken to displace older spores, ensuring that freshly
formed conidia were available for inoculation.
The PAL inhibitor and its application to lea�es, inoculation and incubation procedures
The PAL inhibitor α-aminooxy-β-phenylpropionic acid (AOPP) (Cambridge Research
Biochemicals Ltd., Northwich, Cheshire, U.K.) was used as a 1±0 m aqueous solution.
At this concentration, AOPP treatment effectively inhibits localized autofluorescent
host cell responses to B. graminis in oat [7]. Sterile distilled water was the control
treatment.
Twenty-four hours before inoculation, first-formed leaves of Selma were cut through
the sheath at soil level, the second leaf was discarded, and the cut ends of the first leaves
were submerged either in AOPP solution or in water. The submerged cut ends were
trimmed to remove air embolisms from the vascular tissue. Leaves were allowed test
solution uptake for 24 h in a growth cabinet at 20°³0±5 °C, with a 12 h light}dark
cycle. Light was supplied by white fluorescent tubes supplemented with incandescent
bulbs to give 150 µmol m−# s−" photon flux density. The RH was approximately 48%
during the light and 54% during the dark periods. After 24 h, the leaves were removed
from test solutions and their adaxial surfaces were inoculated in a spore settling tower
to give approximately 20 conidia mm−#. Leaves were then replaced in the appropriate
test solution, their cut ends trimmed to remove air embolisms, and returned to the
growth cabinet for incubation.
At the end of the experimental incubation periods, 30 mm segments were cut from
the centre of the leaf blades. The acropetal 20 mm portions were prepared for light
microscopy and the 10 mm basipetal portions were used for SEM and EDX.
Tissue fixation and preparation for light and incident fluorescence microscopy
The 20 mm acropetal leaf segments were fixed and cleared as previously described [9]
to avoid displacement of fungal germlings. The unstained leaves were mounted on glass
slides without coverslips. Differential interference contrast microscopy, with a 40X ‘no-
coverslip ’ objective, allowed resolution of fungal PGTs, appressoria, haustoria and
secondary hyphae. Localized autofluorescent host responses associated with PGT and
appressorial contact sites were observed by incident fluorescence microscopy (blue
exciter filter, max. transmittance 400 nm; dichroic mirror and barrier filter
transmittance range 500–800 nm).
Tissue fixation and preparation for scanning electron microscopy and energy dispersi�e X-ray
microanalysis
The 10 mm basipetal leaf segments were mounted inoculated (adaxial) surface up on
individual copper SEM stubs using colloidal carbon. Stubs were immediately immersed
and held in liquid nitrogen to cryofix tissues until viewed and analysed as frozen-
hydrated specimens.
For observation of frozen-hydrated specimens, stubs were mounted in a pre-cooled
(®196 °C) copper stub holder and transferred immediately to the cold stage
(®160 °C) of a JEOL 840A SEM, and observed without coating. To remove ice
crystals formed on the specimen and stub holder during transfer, the cold stage was
Oat epidermis attacked by Blumeria graminis 227
warmed to ®70 °C until ice sublimed (1–3 min) and then re-cooled to ®160 °C before
observations were made.
The SEM was fitted with a Kevex EDX microanalysis system using a Quantum
light-element detector. To standardize X-ray collection conditions, an electron
accelerating voltage of 10 kV was selected and the electron beam current was adjusted
to a fixed value by stopping the scanning raster and positioning the beam on the copper
stub holder at 3000¬ magnification. Copper K-α X-rays were collected and the beam
current adjusted using the probe current control (beam spot size ; condenser lens) to
give an X-ray emission rate of 3000 counts s−", equivalent to a specimen current of
558 pA when measured with a carbon Faraday cup. With these instrument conditions
held constant, and with proper detector location, sufficient X-rays were produced over
100 s collection from leaf tissues to allow reliable comparisons between sites of analysis
[42, 43].
To collect X-ray data from host tissues associated with fungal appressoria, the
magnification was adjusted to 7000¬ and a raster area of 1±15¬0±8 µm was positioned
on the host cell at the tip of the first appressorial lobe (Fig. 1) and X-rays were collected
for 100 s. X-ray data were also collected from unattacked epidermal cells by
positioning the raster on the wall of a cell which was not in contact with any fungal
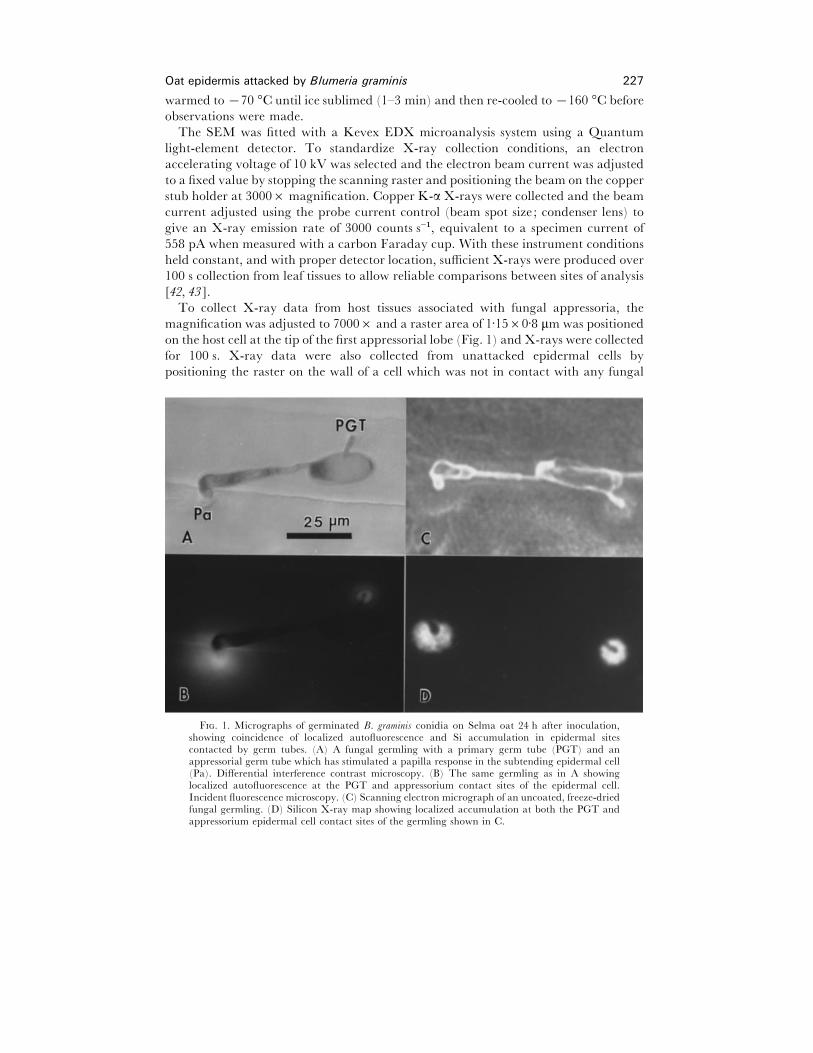
F. 1. Micrographs of germinated B. graminis conidia on Selma oat 24 h after inoculation,showing coincidence of localized autofluorescence and Si accumulation in epidermal sitescontacted by germ tubes. (A) A fungal germling with a primary germ tube (PGT) and anappressorial germ tube which has stimulated a papilla response in the subtending epidermal cell(Pa). Differential interference contrast microscopy. (B) The same germling as in A showinglocalized autofluorescence at the PGT and appressorium contact sites of the epidermal cell.Incident fluorescence microscopy. (C) Scanning electron micrograph of an uncoated, freeze-driedfungal germling. (D) Silicon X-ray map showing localized accumulation at both the PGT andappressorium epidermal cell contact sites of the germling shown in C.
228 T. L. W. Carver et al.
structure. X-ray data were processed using Kevex software for automatic background
(Bremsstrahlung X-rays) subtraction for bulk specimens, and calculations of Si, Ca,
and Mn peak intensities in counts s−" was by Gaussian deconvolution.
To freeze-dry specimens previously analysed in a frozen-hydrated state, the
specimens were left on the microscope stage under vacuum, and the stage temperature
was allowed to rise to ambient (ca. 20 °C) overnight. Resultant freeze-dried specimens
were examined either the next day or were stored over anhydrous silica gel until
analysed. All freeze-dried specimens were examined uncoated, using the identical X-
ray collection conditions used for frozen-hydrated specimens.
X-ray analysis of the frozen-hydrated material caused some beam damage and loss
of mass at the appressorial contact sites under examination. Therefore, these germlings
were avoided in the subsequent analyses of the same specimens following freeze-drying.
Experimental details
Experiment 1. Fungal development, autofluorescent host cell responses to fungal germ tube contact and
EDX microanalysis of material sampled 12 and 16 h after inoculation. Experiment 1 was a
preliminary, exploratory experiment designed to determine when autofluorescence and
haustorial formation began, and to determine the earliest time of appearance of Si, Ca
and Mn at appressorial contact sites.
First-formed leaves of 12 phenotypically similar Selma plants were excised; six were
treated with 1±0 m AOPP, and six with sterile distilled water as controls. Three
replicate leaves from both treatments were selected 12 and 16 h after inoculation, and
segments from each were prepared for light microscopy and SEM}EDX microanalysis
of frozen-hydrated specimens.
On each leaf segment prepared for light microscopy, 100 germlings with a mature
appressorium were examined. Germlings were accepted for examination only if the
host cell subtending the appressorium was either adjacent to a stomatal complex or no
more than two cells distant from a stomatal complex, and then only if the host cell had
contact with only one germ tube. These selection criteria were necessary because the
oat epidermis contains several types of epidermal cell, whose responses to attack vary,
and we wished to avoid confounding effects by having only one germling attack per cell
so that an epidermal cell was only responding to that single attack and not multiple
attacks. Differential interference contrast microscopy was used to determine whether
appressoria had penetrated the host cell successfully to form a haustorium. Each
germling was also examined by incident fluorescence microscopy to determine whether
the PGT and appressorium were associated with a localized autofluorescent host cell
response. Replicate mean data for each character were calculated in percentages and
transformed to arcsines to normalize data prior to analysis of variance [7].
The intensity of localized autofluorescence associated with appressoria was classified
visually using a 0–3 scale where: 0¯no fluorescence, 1¯ faint, 2¯moderate and
3¯ intense fluorescence [7]. Fluorescence intensity data were not analysed statistically.
When SEM was used to examine the fungus at these early stages of development (12
and 16 h), it was impossible to determine whether appressoria had formed haustoria
because they would be concealed within epidermal cells and no hyphae were formed.
For each specimen taken 12 h after inoculation, X-ray data were collected from five
unattacked cells and from sites adjacent to the tips of five different appressorial germ
Oat epidermis attacked by Blumeria graminis 229
tubes. For specimens taken 16 h after inoculation, X-ray data were gathered from a
raster positioned at the tip of 20 appressoria on each leaf segment and from five
unattacked epidermal cells.
Experiment 2. Pathogen development, autofluorescent host cell responses to fungal germ tube contact
and EDX microanalysis of material sampled 18, 24 and 30 h after inoculation. Nine first-formed
leaves were treated with 1±0 m AOPP to inhibit PAL, and nine with water as controls.
Three replicate leaves from both treatments were selected 18, 24 and 30 h after
inoculation, and segments from each were prepared for light microscopy and
SEM}EDX microanalysis as in Experiment 1. Light and fluorescence microscope
observations were made in the same way as for Experiment 1.
When the SEM was used to examine material sampled 18 h after inoculation, it was
again impossible to determine whether appressoria had formed haustoria since no
hyphae had developed at this early stage. Therefore, at this time, X-ray data were
gathered from a raster positioned at the tip of 20 appressoria on each leaf segment.
When the SEM was used to examine 24 and 30 h samples, it was possible to
discriminate between appressoria which had penetrated host cells to form functional
haustoria (because hyphae are formed by these times), and appressoria which failed to
do so (hyphae absent). From each leaf segment cryo-fixed at 24 and 30 h, X-ray data
were collected from a raster positioned at the tip of 10 appressoria which had
successfully formed a haustorium (hyphae present) and 10 appressoria which had failed
to form a haustorium (hyphae absent). X-ray data were collected from five unattacked
epidermal cells on each leaf.
Statistical analyses of X-ray data
X-ray count data in counts s−" for each element of interest (Si, Ca, and Mn) collected at
each sample time (18, 24 and 30 h) were subjected to statistical analysis of variance,
and weighted orthogonal comparisons were made to compare data between treatments
(water control vs. AOPP treatment), between sample sites (unattacked cells vs.
appressorial lobe sites), and between sites associated with successful (hyphae present)
and unsuccessful appressoria (hyphae absent) (24 and 30 h samples only). Residuals
from analyses of raw data were inspected to determine whether the data conformed to
normal distributions and whether the variances were constant over the data range;
where they were not, the raw data were transformed to logarithms and the statistical
analysis was performed on this log data. Because of these complexities, no attempt was
made to compare data between specimens from different sample times by statistical
analysis.
RESULTS
Differential interference microscopy: fungal development
In Experiment 1, appressoria had formed a distinct lobe by 12 h after inoculation, but
no haustoria were evident at 12 or 16 h in either AOPP-treated or control leaves
showing that the outcome of penetration attempts had not been determined by 16 h.
In Experiment 2, a proportion of appressorial penetration pegs had penetrated
successfully to produce haustoria in leaves from both treatments at 18 h. However, at
230 T. L. W. Carver et al.
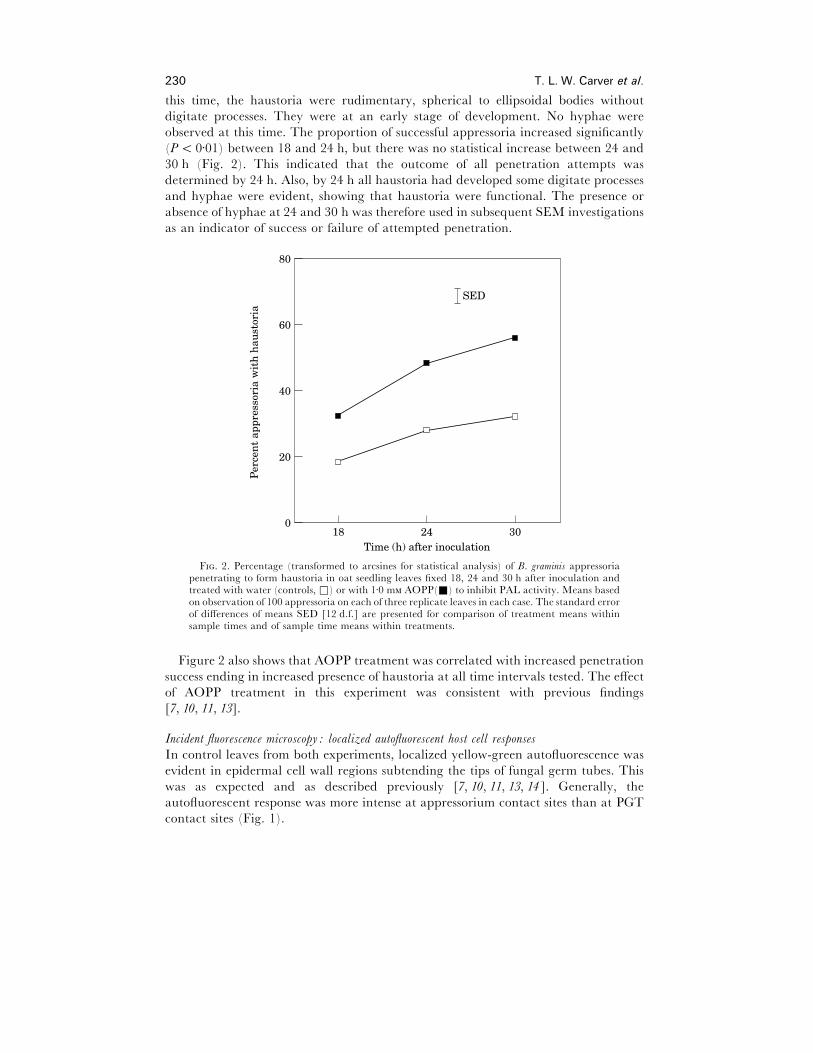
this time, the haustoria were rudimentary, spherical to ellipsoidal bodies without
digitate processes. They were at an early stage of development. No hyphae were
observed at this time. The proportion of successful appressoria increased significantly
(P! 0±01) between 18 and 24 h, but there was no statistical increase between 24 and
30 h (Fig. 2). This indicated that the outcome of all penetration attempts was
determined by 24 h. Also, by 24 h all haustoria had developed some digitate processes
and hyphae were evident, showing that haustoria were functional. The presence or
absence of hyphae at 24 and 30 h was therefore used in subsequent SEM investigations
as an indicator of success or failure of attempted penetration.
30
80
018
Time (h) after inoculation
Per
cen
t ap
pres
sori
a w
ith
hau
stor
ia
60
40
20
24
SED
F. 2. Percentage (transformed to arcsines for statistical analysis) of B. graminis appressoriapenetrating to form haustoria in oat seedling leaves fixed 18, 24 and 30 h after inoculation andtreated with water (controls, *) or with 1±0 m AOPP(+) to inhibit PAL activity. Means basedon observation of 100 appressoria on each of three replicate leaves in each case. The standard errorof differences of means SED [12 d.f.] are presented for comparison of treatment means withinsample times and of sample time means within treatments.
Figure 2 also shows that AOPP treatment was correlated with increased penetration
success ending in increased presence of haustoria at all time intervals tested. The effect
of AOPP treatment in this experiment was consistent with previous findings
[7, 10, 11, 13].
Incident fluorescence microscopy: localized autofluorescent host cell responses
In control leaves from both experiments, localized yellow-green autofluorescence was
evident in epidermal cell wall regions subtending the tips of fungal germ tubes. This
was as expected and as described previously [7, 10, 11, 13, 14]. Generally, the
autofluorescent response was more intense at appressorium contact sites than at PGT
contact sites (Fig. 1).
Oat epidermis attacked by Blumeria graminis 231
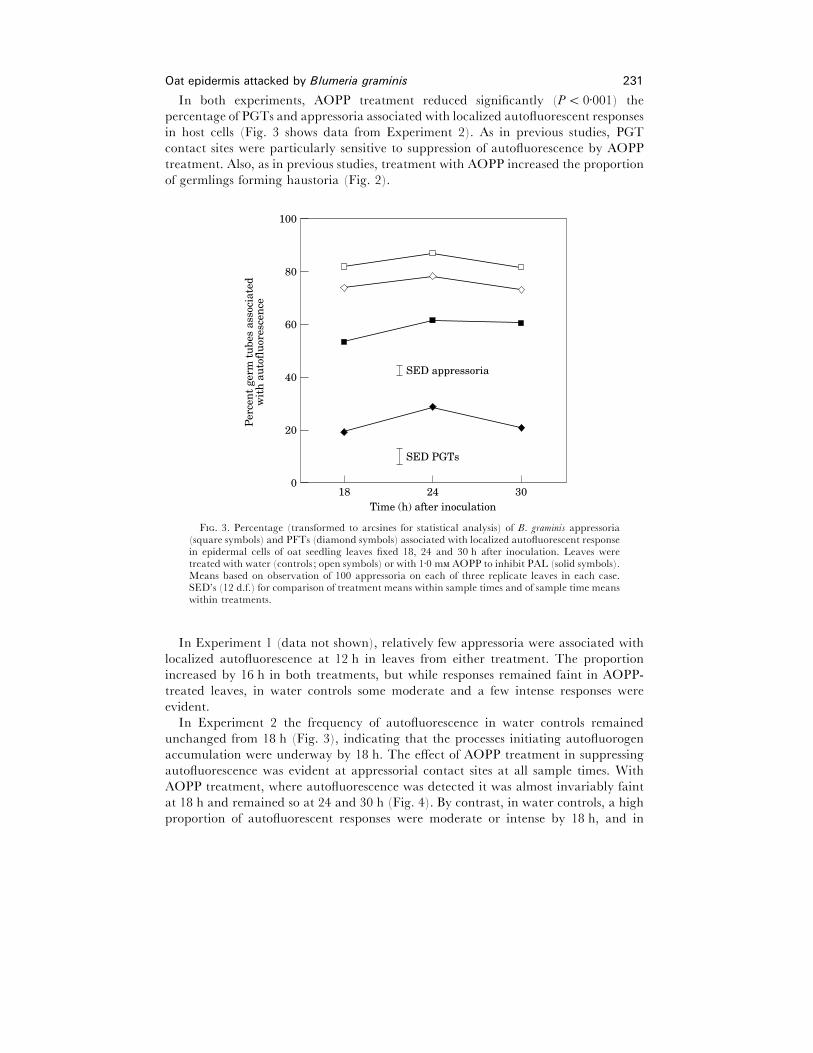
In both experiments, AOPP treatment reduced significantly (P! 0±001) the
percentage of PGTs and appressoria associated with localized autofluorescent responses
in host cells (Fig. 3 shows data from Experiment 2). As in previous studies, PGT
contact sites were particularly sensitive to suppression of autofluorescence by AOPP
treatment. Also, as in previous studies, treatment with AOPP increased the proportion
of germlings forming haustoria (Fig. 2).
30
100
018
Time (h) after inoculation
Per
cen
t ge
rm t
ube
s as
soci
ated
wit
h a
uto
flu
ores
cen
ce
60
40
20
24
SED PGTs
80
SED appressoria
F. 3. Percentage (transformed to arcsines for statistical analysis) of B. graminis appressoria(square symbols) and PFTs (diamond symbols) associated with localized autofluorescent responsein epidermal cells of oat seedling leaves fixed 18, 24 and 30 h after inoculation. Leaves weretreated with water (controls ; open symbols) or with 1±0 m AOPP to inhibit PAL (solid symbols).Means based on observation of 100 appressoria on each of three replicate leaves in each case.SED’s (12 d.f.) for comparison of treatment means within sample times and of sample time meanswithin treatments.
In Experiment 1 (data not shown), relatively few appressoria were associated with
localized autofluorescence at 12 h in leaves from either treatment. The proportion
increased by 16 h in both treatments, but while responses remained faint in AOPP-
treated leaves, in water controls some moderate and a few intense responses were
evident.
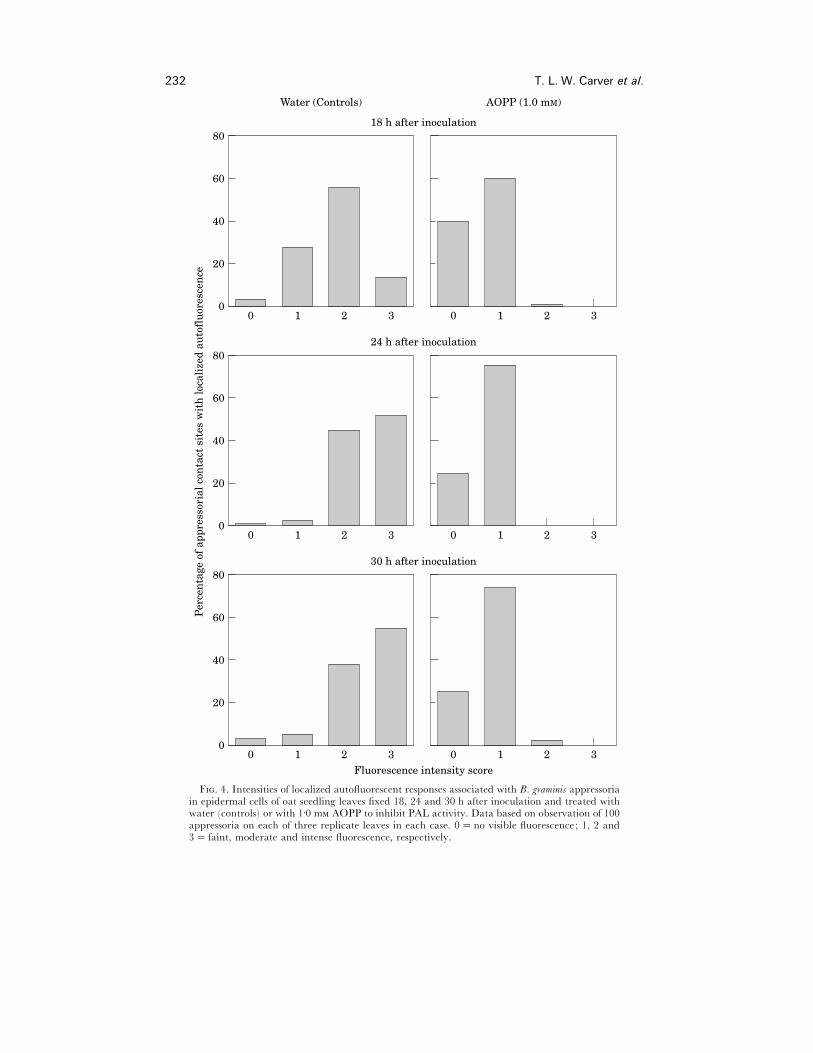
In Experiment 2 the frequency of autofluorescence in water controls remained
unchanged from 18 h (Fig. 3), indicating that the processes initiating autofluorogen
accumulation were underway by 18 h. The effect of AOPP treatment in suppressing
autofluorescence was evident at appressorial contact sites at all sample times. With
AOPP treatment, where autofluorescence was detected it was almost invariably faint
at 18 h and remained so at 24 and 30 h (Fig. 4). By contrast, in water controls, a high
proportion of autofluorescent responses were moderate or intense by 18 h, and in
232 T. L. W. Carver et al.
80
00
Fluorescence intensity score
60
40
20
321 0
30 h after inoculation
321
80
00
Per
cen
tage
of
appr
esso
rial
con
tact
sit
es w
ith
loca
lize
d au
tofl
uor
esce
nce
60
40
20
321 0
24 h after inoculation
321
80
00
60
40
20
321 0
18 h after inoculation
321
Water (Controls) AOPP (1.0 mM)
F. 4. Intensities of localized autofluorescent responses associated with B. graminis appressoriain epidermal cells of oat seedling leaves fixed 18, 24 and 30 h after inoculation and treated withwater (controls) or with 1±0 m AOPP to inhibit PAL activity. Data based on observation of 100appressoria on each of three replicate leaves in each case. 0¯no visible fluorescence; 1, 2 and3¯ faint, moderate and intense fluorescence, respectively.
Oat epidermis attacked by Blumeria graminis 233
subsequent samples the majority of appressoria were associated with an intense
response (Fig. 4).
In summary, AOPP treatment suppressed the frequency and intensity of localized
autofluorescent host cell responses, and this effect was correlated with increased
successful penetration (approximately doubled, Fig. 2). Light microscopy further
revealed that the processes of attempted penetration were underway by 18 h after
inoculation, and the outcome of penetration attempts was fully determined by 24 h.
EDX microanalysis of elements present in lea�es attacked by B. graminis
Analyses from Experiment 1 showed that at 12 and at 16 h the X-ray count rates
obtained for all elements at appressorial lobe contact sites were similar to unattacked
cells which had no contact with the fungus. Therefore, for brevity, X-ray data from
Experiment 1 are omitted and only data from Experiment 2 are given for Si, Ca, and
Mn.
P < 0.05†
P < 0.01†
NS
P < 0.05
NS
300
0
Unattacked cells
Si X
-ray
cou
nts
s–1
18
200
10
24 30
NS NS
Appressorium contact sites
18 24 30
NS
Freeze-dried
Time after inoculation (h)
300
0
Si X
-ray
cou
nts
s–1
18
200
100
24 30
NS NS NS
18 24 30
NS
Frozen-hydrated
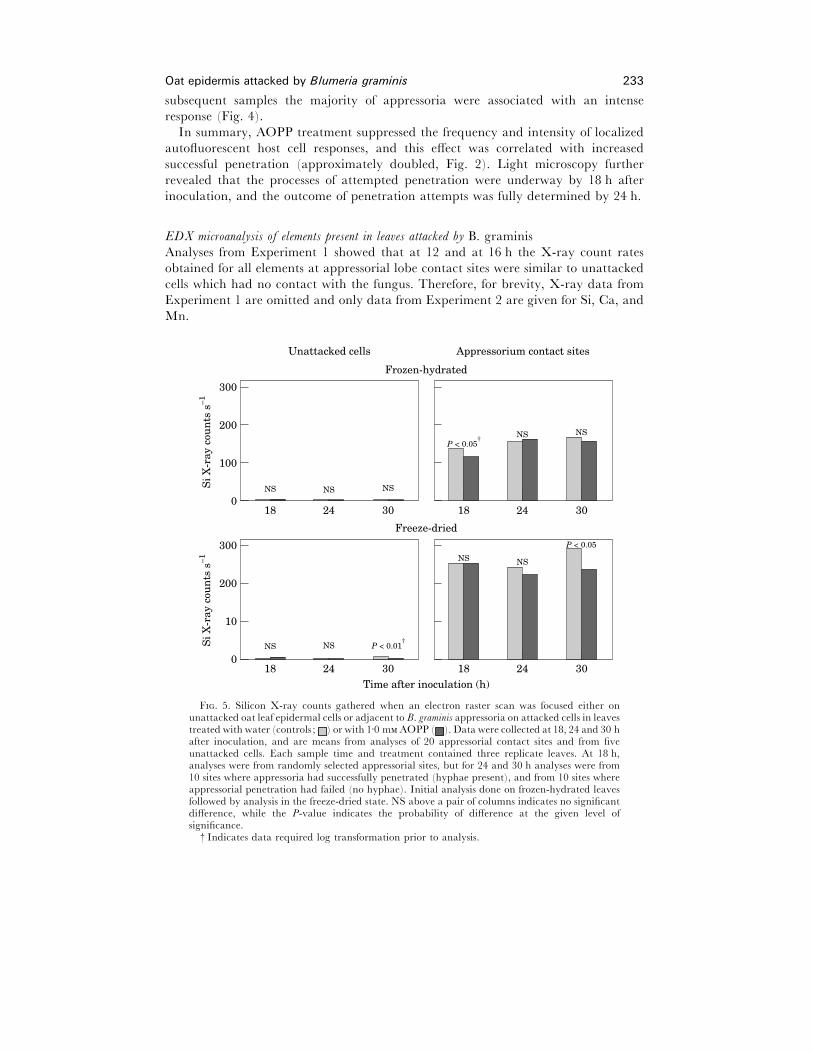
F. 5. Silicon X-ray counts gathered when an electron raster scan was focused either onunattacked oat leaf epidermal cells or adjacent to B. graminis appressoria on attacked cells in leavestreated with water (controls ; ) or with 1±0 m AOPP ( ). Data were collected at 18, 24 and 30 hafter inoculation, and are means from analyses of 20 appressorial contact sites and from fiveunattacked cells. Each sample time and treatment contained three replicate leaves. At 18 h,analyses were from randomly selected appressorial sites, but for 24 and 30 h analyses were from10 sites where appressoria had successfully penetrated (hyphae present), and from 10 sites whereappressorial penetration had failed (no hyphae). Initial analysis done on frozen-hydrated leavesfollowed by analysis in the freeze-dried state. NS above a pair of columns indicates no significantdifference, while the P-value indicates the probability of difference at the given level ofsignificance.
† Indicates data required log transformation prior to analysis.
234 T. L. W. Carver et al.
Silicon. Figure 5 shows the average Si X-ray counts s−" from raster scans at the different
localities (appressorial contact sites and unattacked cells) and times (18, 24 and 30 h
post-inoculation).
In frozen-hydrated leaves, unattacked cells that had no contact with B. graminis
always gave less than 4 counts s−" When freeze-dried, the count rate for unattacked
cells was always less than 7 counts s−" There was no difference in the Si count rate
obtained from unattacked cells in water-treated (control) leaves and AOPP-treated
leaves, except in freeze-dried leaves fixed at 30 h after inoculation when the Si count
rate was marginally higher (P! 0±01) in water-treated (6±04 counts s−") than in
AOPP-treated leaves (2±47 counts s−").
The difference between unattacked cells and appressorial contact sites was marked
beginning at 18 h after inoculation (P! 0±001), and this difference was maintained at
subsequent sample times. No direct statistical comparison was made between
preparation procedures, but higher count rates for Si were consistently obtained in
freeze-dried, where electron beam penetration was greater, compared to frozen-
hydrated material where electron beam penetration was less [41].
Figure 5 also shows that there was very rarely any difference between water-treated
controls and AOPP-treated leaves in Si count rates at appressorial contact sites. In
frozen-hydrated material sampled at 18 h slightly higher count rates (P! 0±05) were
associated with appressorial contact sites in water controls when compared with
AOPP-treated leaves. However, this difference was not seen when the same tissue was
freeze-dried. Also, in freeze-dried material from 30 h samples, slightly higher count
rates (P! 0±05) were associated with appressorial contact sites in water controls when
compared with AOPP-treated leaves. It is questionable whether these small statistical
differences were of biological significance.
Si count rates were also compared from sites adjacent to appressoria where
penetration had succeeded (hyphae present) and sites where penetration had failed
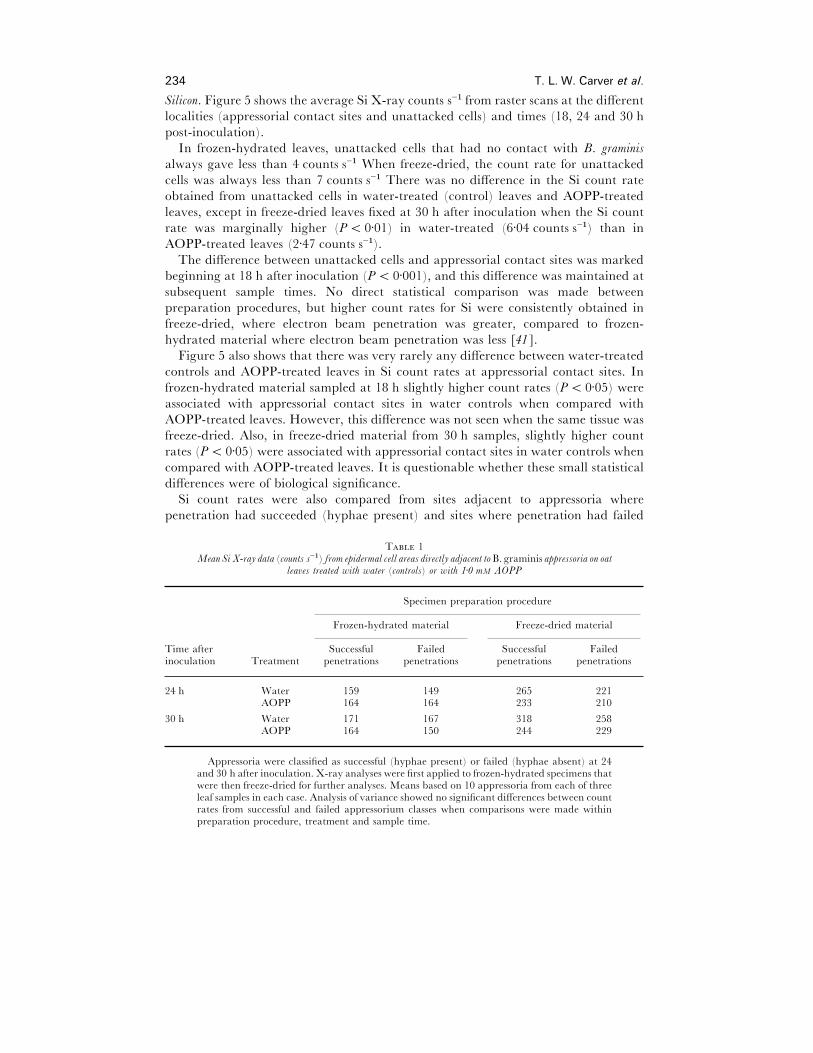
T 1Mean Si X-ray data (counts s−") from epidermal cell areas directly adjacent to B. graminis appressoria on oat
lea�es treated with water (controls) or with 1±0 mM AOPP
Specimen preparation procedure
Frozen-hydrated material Freeze-dried material
Time after Successful Failed Successful Failedinoculation Treatment penetrations penetrations penetrations penetrations
24 h Water 159 149 265 221AOPP 164 164 233 210
30 h Water 171 167 318 258AOPP 164 150 244 229
Appressoria were classified as successful (hyphae present) or failed (hyphae absent) at 24and 30 h after inoculation. X-ray analyses were first applied to frozen-hydrated specimens thatwere then freeze-dried for further analyses. Means based on 10 appressoria from each of threeleaf samples in each case. Analysis of variance showed no significant differences between countrates from successful and failed appressorium classes when comparisons were made withinpreparation procedure, treatment and sample time.
Oat epidermis attacked by Blumeria graminis 235
(hyphae absent) in samples from 24 h and 30 h after inoculation (Table 1). Analyses
of variances showed that there were no differences in Si count rates between successful
and failed penetration sites.
Taken together with Experiment 1, the data suggest that Si accumulated rapidly in
appressorial contact sites between 16 and 18 h, when light microscopy revealed that the
most advanced fungal germlings were penetrating epidermal cells to form haustoria.
While treatment with AOPP greatly reduced the frequency and intensity of
autofluorescence, it had almost no effect on the accumulation of Si. This was true
regardless of the success or failure of penetration.
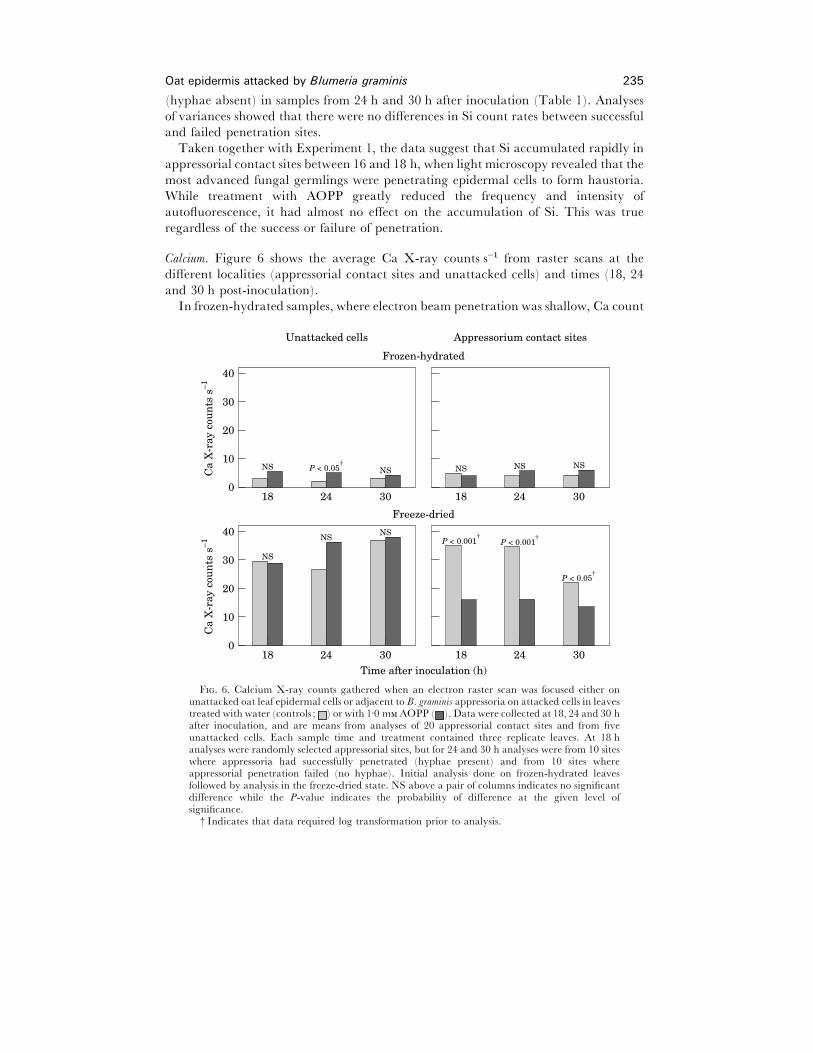
Calcium. Figure 6 shows the average Ca X-ray counts s−" from raster scans at the
different localities (appressorial contact sites and unattacked cells) and times (18, 24
and 30 h post-inoculation).
In frozen-hydrated samples, where electron beam penetration was shallow, Ca count
P < 0.05†
P < 0.001†
40
0
Unattacked cells
Ca
X-r
ay c
oun
ts s
–1
18
30
20
10
24 30
NS
NSNS
Appressorium contact sites
18 24 30
P < 0.001†
Freeze-dried
Time after inoculation (h)
40
0
Ca
X-r
ay c
oun
ts s
–1
18
30
20
10
24 30
NS P < 0.05†
NS
18 24 30
NS NS NS
Frozen-hydrated
F. 6. Calcium X-ray counts gathered when an electron raster scan was focused either onunattacked oat leaf epidermal cells or adjacent to B. graminis appressoria on attacked cells in leavestreated with water (controls ; ) or with 1±0 m AOPP ( ). Data were collected at 18, 24 and 30 hafter inoculation, and are means from analyses of 20 appressorial contact sites and from fiveunattacked cells. Each sample time and treatment contained three replicate leaves. At 18 hanalyses were randomly selected appressorial sites, but for 24 and 30 h analyses were from 10 siteswhere appressoria had successfully penetrated (hyphae present) and from 10 sites whereappressorial penetration failed (no hyphae). Initial analysis done on frozen-hydrated leavesfollowed by analysis in the freeze-dried state. NS above a pair of columns indicates no significantdifference while the P-value indicates the probability of difference at the given level ofsignificance.
† Indicates that data required log transformation prior to analysis.

236 T. L. W. Carver et al.
rates were relatively low. In frozen-hydrated specimens there was no difference
between Ca count rates obtained from unattacked cells and from sites of appressorial
contact, or between water- and AOPP-treated leaves except for unattacked cells at
24 h after inoculation when slightly higher count rates were obtained from AOPP-
treated leaves (Fig. 6).
In freeze-dried material, where beam penetration occurred to a greater depth than
in frozen-hydrated material, substantially higher Ca count rates were obtained.
However, as in frozen-hydrated material, count rates from unattacked cells were
similar in water- and AOPP-treated leaves. By contrast, at appressorial contact sites in
freeze-dried specimens, consistently lower Ca count rates were obtained from AOPP-
treated leaves than from water controls (Fig. 6). Further, at 30 h the Ca count rate
from appressorial contact sites was lower than from unattacked cells in both the water-
and AOPP-treated leaves (P! 0±05).
Ca count rates were also compared from sites adjacent to appressoria where
penetration had succeeded (hyphae present) and sites where penetration had failed
(hyphae absent) in samples from 24 h and 30 h after inoculation (Table 2). In frozen-
hydrated material, at 24 h there was no difference between sites adjacent to successful
and failed penetration sites. However, in 30 h frozen-hydrated samples higher Ca
count rates were obtained from sites adjacent to failed than successful penetrations in
both water controls and AOPP-treated leaves. In freeze-dried material, data were
variable, and there were no significant differences between successful and failed sites of
penetration.
T 2MeanCaX-ray data (counts s−") from epidermal cell areas directly adjacent toB. graminis appressoria on oat
lea�es treated with water (controls) or with 1±0 mM AOPP
Specimen preparation procedure
Frozen-hydrated material Freeze-dried material
Time after Successful Failed Successful Failedinoculation Treatment penetrations penetrations penetrations penetrations
24 h Water 3±4 4±7 35±1 33±5AOPP 5±2 6±1 14±3 18±0
30 h Water 2±3 a 6±7 b 16±8 26±9AOPP 4±9 a 7±3 b 13±5 14±0
Appressoria were classified as successful (hyphae present) or failed (hyphae absent) at 24and 30 h after inoculation. X-ray analyses were first applied to frozen-hydrated specimens thatwere then freeze-dried for further analyses. Means based on 10 appressoria from each of threeleaf samples in each case. Within preparation procedure, treatment and sample time, valuesfollowed by different letters differed significantly (P! 0±01) as determined from analysis ofvariance of log transformed data; in other cases, values did not differ statistically.
Manganese. Figure 7 shows the average Mn X-ray counts s−" from raster scans at the
different localities (appressorial contact sites and unattacked cells) and times (18, 24
and 30 h post-inoculation).
Overall count rates for Mn were relatively low in unattacked cells in frozen-hydrated
and freeze-dried samples. There was no difference in Mn count rates between

Oat epidermis attacked by Blumeria graminis 237
P < 0.001†
P < 0.001†
P < 0.01†
15
0
Unattacked cells
Mn
X-r
ay c
oun
ts s
–1
18
10
5
24 30
NS NS NS
Appressorium contact sites
18 24 30
P < 0.05†
Freeze-dried
Time after inoculation (h)
15
0
Mn
X-r
ay c
oun
ts s
–1
18
10
5
24 30
NS P < 0.05 NS
18 24 30
NSP < 0.01
Frozen-hydrated
F. 7. Manganese X-ray counts gathered when an electron raster scan was focused either onunattacked oat leaf epidermal cells or adjacent to B. graminis appressoria on attacked cells in leavestreated with water (controls ; ) or with 1±0 m AOPP) ). Data were collected at 18, 24 and 30 hafter inoculation, and are means from analyses of 20 appressorial contact sites and from fiveunattacked cells. Each sample time and treatment contained three replicate leaves. At 18 h,analyses were from randomly selected appressorial sites, but for 24 and 30 h analyses were from10 sites where appressoria had successfully penetrated (hyphae present) and from 10 sites whereappressorial penetration had failed (no hyphae). Initial analysis done on frozen-hydrated leavesfollowed by analysis in the freeze-dried state. NS above a pair of columns indicates no significantdifference, while the P-value indicates the probability of difference at the given level ofsignificance.
† Indicates data required log transformation prior to analysis.
unattacked cells from water- and AOPP-treated leaves, with the exception of frozen-
hydrated samples at 24 h when slightly greater (P! 0±05) count rates were obtained
from AOPP- than water treated leaves (Fig. 7).
When X-ray analyses were applied to sites adjacent to appressoria, in all but one
case significantly higher Mn count rates were obtained from AOPP-treated than from
water-treated leaves. The exception was in 18 h samples from AOPP-treated, frozen-
hydrated leaves, where no difference was detected.
Mn count rates were also compared from sites adjacent to appressoria which had
succeeded in penetration (hyphae present) and sites of failed penetration (hyphae
absent) in 24 and 30 h samples (Table 3). In frozen-hydrated preparations, sites
adjacent to appressoria which had failed to penetrate had Mn count rates significantly
higher than those where penetration had succeeded. This was true in both AOPP- and
water-treated leaves. In freeze-dried preparations a similar trend was evident in most
cases, but the data were variable and no statistical differences were detected.
238 T. L. W. Carver et al.
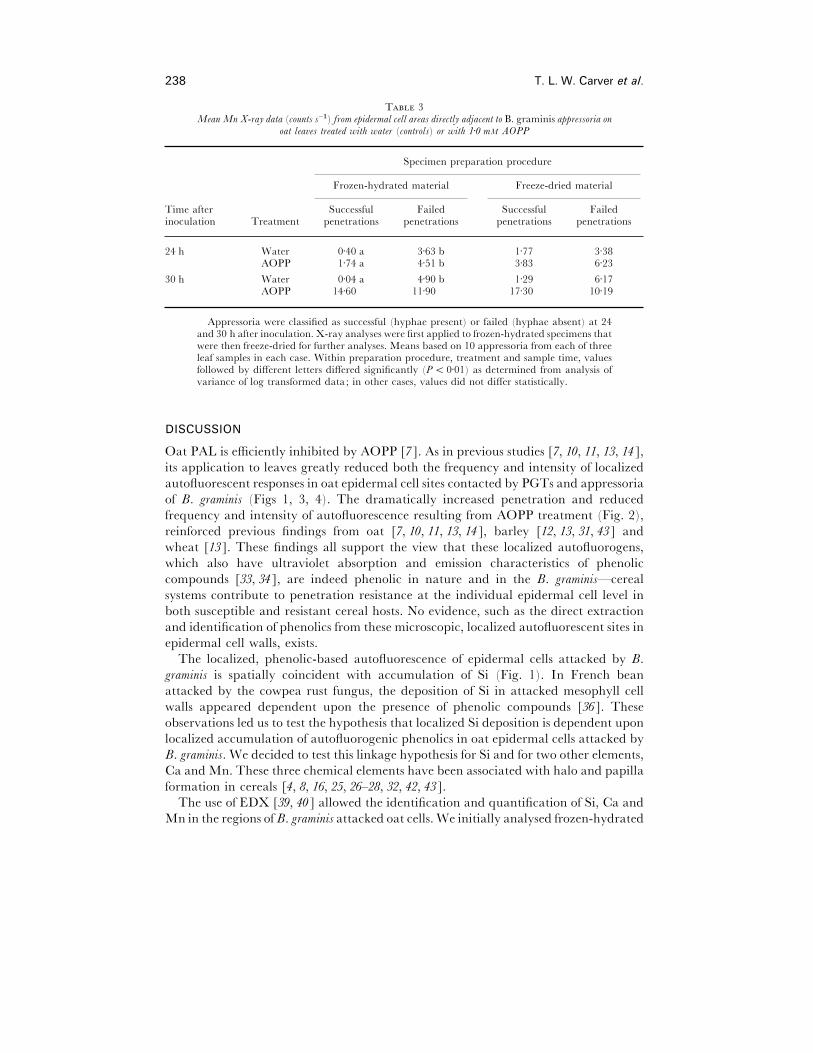
T 3Mean Mn X-ray data (counts s−") from epidermal cell areas directly adjacent to B. graminis appressoria on
oat lea�es treated with water (controls) or with 1±0 mM AOPP
Specimen preparation procedure
Frozen-hydrated material Freeze-dried material
Time after Successful Failed Successful Failedinoculation Treatment penetrations penetrations penetrations penetrations
24 h Water 0±40 a 3±63 b 1±77 3±38AOPP 1±74 a 4±51 b 3±83 6±23
30 h Water 0±04 a 4±90 b 1±29 6±17AOPP 14±60 11±90 17±30 10±19
Appressoria were classified as successful (hyphae present) or failed (hyphae absent) at 24and 30 h after inoculation. X-ray analyses were first applied to frozen-hydrated specimens thatwere then freeze-dried for further analyses. Means based on 10 appressoria from each of threeleaf samples in each case. Within preparation procedure, treatment and sample time, valuesfollowed by different letters differed significantly (P! 0±01) as determined from analysis ofvariance of log transformed data; in other cases, values did not differ statistically.
DISCUSSION
Oat PAL is efficiently inhibited by AOPP [7]. As in previous studies [7, 10, 11, 13, 14],
its application to leaves greatly reduced both the frequency and intensity of localized
autofluorescent responses in oat epidermal cell sites contacted by PGTs and appressoria
of B. graminis (Figs 1, 3, 4). The dramatically increased penetration and reduced
frequency and intensity of autofluorescence resulting from AOPP treatment (Fig. 2),
reinforced previous findings from oat [7, 10, 11, 13, 14], barley [12, 13, 31, 43] and
wheat [13]. These findings all support the view that these localized autofluorogens,
which also have ultraviolet absorption and emission characteristics of phenolic
compounds [33, 34], are indeed phenolic in nature and in the B. graminis—cereal
systems contribute to penetration resistance at the individual epidermal cell level in
both susceptible and resistant cereal hosts. No evidence, such as the direct extraction
and identification of phenolics from these microscopic, localized autofluorescent sites in
epidermal cell walls, exists.
The localized, phenolic-based autofluorescence of epidermal cells attacked by B.
graminis is spatially coincident with accumulation of Si (Fig. 1). In French bean
attacked by the cowpea rust fungus, the deposition of Si in attacked mesophyll cell
walls appeared dependent upon the presence of phenolic compounds [36]. These
observations led us to test the hypothesis that localized Si deposition is dependent upon
localized accumulation of autofluorogenic phenolics in oat epidermal cells attacked by
B. graminis. We decided to test this linkage hypothesis for Si and for two other elements,
Ca and Mn. These three chemical elements have been associated with halo and papilla
formation in cereals [4, 8, 16, 25, 26–28, 32, 42, 43].
The use of EDX [39, 40] allowed the identification and quantification of Si, Ca and
Mn in the regions of B. graminis attacked oat cells. We initially analysed frozen-hydrated
Oat epidermis attacked by Blumeria graminis 239
epidermal cells, and then freeze-dried the same specimens for further analysis. Since
electron beam penetration at 10 kV accelerating voltage in frozen-hydrated plant cells
is expected to be ! 3±5 µm [42], EDX analysis was confined to the epidermal cell wall
apoplast and upper portions of the subtending papillae. Freeze-drying results in far
greater electron beam penetration, " 50 µm at a 10 kV accelerating voltage. Thus,
characteristic X-rays of elements from the leaf specimens when freeze-dried came from
within the epidermal cells [42].
Despite the marked effects of AOPP on suppressing the incidence and intensity of
localized autofluorescence, AOPP treatment had little or no effect on the spatially
coincident accumulation of Si. This was true when specimens were frozen-hydrated or
freeze-dried (Fig. 5). Simply put, Si accumulation appears independent of auto-
fluorgenic phenolic accumulation, even though they are spatially coincident.
Our findings with Si contrast somewhat with the situation in French bean (Phaseolus
�ulgaris L.) attacked by the cowpea rust fungus (Uromyces �ignae), which is an
inappropriate formae specialis of rust for French bean. Here, Perumalla and Heath [36]
showed that AOPP treatment, which prevented mesophyll cell wall autofluorescence,
apparently prevented silica deposition as assessed by the refractivity of light passing
through attacked mesophyll cell wall areas. While Perumalla & Heath’s data [36]
suggested that silica deposition in French bean was linked to phenolic-based
autofluorescence in mesophyll cells of bean, they also suggested that Si accumulation
may not be solely dependent on the presence of phenolic compounds. They suggested
roles for other factors, including the presence of hydroxyproline-rich glycoproteins in
accumulating Si in attacked mesophyll cells.
We do not know what factor(s) control localized Si accumulation in oat epidermal
cells attacked by B. graminis, but Si may well complex with various organic constituents
in the halo}papilla regions. Si with its four active valences (Si%+) is almost as adept at
forming chemical bonds as is carbon. Si can be covalently combined with alginic and
pectic acids and some polysaccharides as well as with proteins [15]. Alternatively, Si
may require only minute quantities of phenolics or other organic constituents leading
to insoluble, localized deposits in epidermal cell walls and papillae [42]. If only minute
quantities of organic compounds were needed to stimulate Si accumulation, then it
would be very difficult to prove or disprove any phenolic linkage hypothesis by the
cytological means we employed.
At 24 and 30 h it is too late to determine whether Si accumulation had influenced
attempted penetration, since penetration commenced between 16 and 18 h after
inoculation. Thus, the present study did not allow us to determine whether Si
accumulation contributed to penetration resistance in oat. We were first able (by
SEM) to discriminate successful penetrations (hyphae present) from failed penetrations
(hyphae absent) at 24 h after inoculation. Our Si X-ray count data showed no
significant differences between success and failure at either 24 or 30 h post inoculation
(Table 1). With barley it has been shown that Si in successful penetrations continues
to accumulate in papillae which now become haustorial neck collars [8]. In view of
this, it is not surprising that comparisons between count rates associated with successful
and failed penetration sites showed little difference (Table 1).
In barley leaves and coleoptiles, various studies have found that Ca is present in
papillae and haloes during B. graminis attack [2, 28, 32]. The probable role of Ca in
240 T. L. W. Carver et al.
papilla formation and effectiveness of papillae was reviewed recently [1, 25]. Ca is not
always found at elevated levels in halo}papillae regions. Zeyen et al. [42] found Ca
levels at appressorial contact sites of resistant and susceptible barley were, if anything,
slightly lower than in unattacked cells. In our current study of oat, Ca count rates at
halo}papilla regions did not increase above the level seen in unattacked cells, nor were
Ca levels reduced by AOPP treatment in unattacked cells (Fig. 6).
When Ca levels were compared at sites of successful and failed penetration, the only
statistically significant differences noted were in frozen-hydrated samples at 30 h after
inoculation, long after success or failure of penetration was determined. Perhaps, as
Zeyen et al. [42] suggested from barley studies, the low levels of Ca found in contact
sites are sufficient to support its role in papilla formation.
In freeze-dried material (where the electron beam penetrated deeply into cells) Ca
count rates from water-treated leaves were similar in attacked and unattacked cells at
18 and 24 h after inoculation. However, at 30 h they were lower in attacked cells. In
freeze-dried, AOPP-treated, leaves Ca count rates were always substantially lower
within attacked when compared with unattacked cells (Fig. 6). Although this effect
clearly relates to pathogen attack, its relevance, if any, to success or failure of
penetration is unclear.
As reported by others working with barley [25, 42], we found that Mn accumulated
in oat at appressorial contact sites. Mn had already accumulated above levels seen in
unattacked cells by 18 h when light microscopy showed that fungal penetration was
underway. Figure 7 shows that similar count rates were obtained in both frozen-
hydrated and freeze-dried samples from the same times after inoculation. This
contrasts with the situation for both Si and Ca where there were substantially higher
count rates from freeze-dried cells. This indicates that the majority of Mn was located
in the upper portions of halo}papilla regions rather than deeper within the cells.
Zeyen et al. [42] speculated that Mn may be involved in phenolic compound
synthesis related to plant defence. Mn is one of many known inducers of PAL, and it
also stimulates the production of hydrogen peroxide required for the polymerization of
monophenols during lignin formation [5]. In both AOPP- and water-treated leaves,
higher Mn count rates were generally obtained from sites adjacent to failed appressoria
(Table 3). This supports the idea that Mn accumulation plays a role in resistance.
The composition of the halo}papilla response site is clearly complex. The
physiological processes governing the accumulation of elemental and organic
components is the focus of continuing research. To understand the complicated
relationship between localized accumulation of phenolic autofluorogens and of Ca and
Mn will require further investigation. However, the current results indicate that
localized Si accumulation occurs independently of the localized accumulation of
phenolic autofluorogens. This suggests that it may prove possible to enhance the
accumulation of each of these components to increase the efficacy of host cell responses
that prevent successful pathogen attack.
A co-operative investigation of the Institute of Grassland and Environmental Research,
Plas Gogerddan, Aberystwyth, U.K.; and the Department of Plant Pathology,
University of Minnesota, St. Paul, MN, U.S.A. Research supported by MAFF (UK),
NATO Collaborative Research Grant 900441, by the Lieberman-Okinow Chair for
Oat epidermis attacked by Blumeria graminis 241
Disease Resistance in Cereals, and by Projects 22-70 and 22-62 of the Minnesota
Agricultural Experiment Station. Published as Paper 191220022 of the scientific
journal series of the Minnesota Agricultural Experiment Station. Mention of a
trademark name or proprietary product does not constitute a guarantee by the
University of Minnesota or by IGER.
REFERENCES
1. Aist JR, Bushnell WR. 1991. Invasion of plants by powdery mildew fungi, and cellular mechanismsof resistance. In: Cole GT, Hoch HC, eds. The Fungal Spore and Disease Initiation in Plants and Animals.New York: Plenum Press, 321–345.
2. Aist JR, Israel HW. 1986. Autofluorescent and ultraviolet absorbing components in cell walls andpapillae of barley coleoptiles and their relationship to disease resistance. Canadian Journal of Botany 64 :266–272.
3. Ahlstrand GG, Zeyen RJ, Carver TLW. 1991. Preparation of barley epidermis for X-raymicroanalysis. In: Microbeam Analysis—1990. San Francisco: San Francisco Press, 463–466.
4. Bayles CJ, Aist JR. 1987. Apparent calcium mediation of resistance of an ml-o mutant to powderymildew. Physiological and Molecular Plant Pathology 30 : 337–345.
5. Burnell JN. 1988. The biochemistry of manganese in plants. In: Graham RD, Hannam RJ, Uren NC,eds. Manganese in Soils and Plants. Dordrecht, The Netherlands : Kluwer Academic Publishers,pp 125–137.
6. Carver TLW, Ingerson SM, Thomas BJ. 1996. Influences of host surface features on developmentof Erysiphe graminis and Erysiphe pisi. In: Kerstiens G., ed. Plant Cuticles–an integrated functional approach.Oxford: Bios Scientific Publishers, 255–266.
7. Carver TLW, Robbins MP, Zeyen RJ. 1991. Effects of two PAL inhibitors on the susceptibility andlocalized autofluorescent host cell responses of oat leaves attacked by Erysiphe graminis DC. Physiologicaland Molecular Plant Pathology 39 : 269–287.
8. Carver TLW, Zeyen RJ, Ahlstrand GG. 1987. The relationship between insoluble silicon and successor failure of attempted primary penetration by powdery mildew (Erysiphe graminis) germlings onbarley. Physiological and Molecular Plant Pathology 31 : 133–148.
9. Carver TLW, Zeyen RJ, Lyngkjaer MF. 1995. Plant cell defences to powdery mildew of Gramineae.In: Walters DR, Scholes JD, Bryson RJ, Paul ND, McRoberts N, eds. Aspects of Applied Biology, Vol.42. Physiological Responses of Plants to Pathogens. Warwick: Association of Applied Biologists, 257–266.
10. Carver TLW, Robbins MP, Zeyen RJ, Dearne GA. 1992. Effects of PAL-specific inhibition onsuppression of activated defence, and on quantitative susceptibility of oats to Erysiphe graminis.Physiological and Molecular Plant Pathology 41 : 149–163.
11. Carver TLW, Zhang L, Zeyen RJ, Robbins MP. 1996. Phenolic biosynthesis inhibitors suppressadult plant resistance to Erysiphe graminis in oat at 20° and 10 °C. Physiological and Molecular PlantPathology 49 : 121–142.
12. Carver TLW, Zeyen RJ, Bushnell WR, Robbins MP. 1994. Inhibition of phenylalanine ammonialyase and cinnamyl-alcohol dehydrogenase increases quantitative susceptibility of barley to powderymildew (Erysiphe graminis DC). Physiological and Molecular Plant Pathology 44 : 261–272.
13. Carver TLW, Zeyen RJ, Robbins MP, Dearne GA. 1992. Effects of PAL inhibition on oat, barley,and wheat cell responses to appropriate and inappropriate formae specialis of Erysiphe graminis DC.Physiological and Molecular Plant Pathology 41 : 397–409.
14. Carver TLW, Zeyen RJ, Robbins MP, Vance CP, Boyles DA. 1994. Suppression of host cinnamyl-alcohol dehydrogenase and phenylalanine ammonia lyase increases oat epidermal cell susceptibilityto powdery mildew penetration. Physiological and Molecular Plant Pathology 44 : 243–259.
15. Epstein E. 1994. The anomaly of silicon in plant biology. Proceedings of the National Academy of Science USA91 : 11–17.
16. Gold RE, Aist JR, Hazen BE, Stolzenburg MR. 1986. Effects of calcium nitrate and chlortetracyclineon papilla formation, ml-o resistance and susceptibility of barley to powdery mildew. Physiological andMolecular Plant Pathology 29 : 115–129.
17. Heath MC, Stumpf MA. 1986. Ultrastructural observations of penetration sites of the cowpea rustfungus in untreated and silicon-depleted French bean cells. Physiological and Molecular Plant Pathology29 : 27–39.
18. Heath MC. 1981. Insoluble silicon in necrotic cowpea cells following infection with an incompatibleisolate of the cowpea rust fungus. Physiological and Molecular Plant Pathology 19 : 273–276.
19. Hirata K. 1971. Calcium in relation to the susceptibility of primary barley leaves to powdery mildew.

242 T. L. W. Carver et al.
In: Ouchi S, ed. Morphological and Biochemical E�ents in Plant–Parasite Interactions. PhytopathologicalSociety of Japan, Tokyo, 207–228.
20. Huber DM, Wilhelm NS. 1988. The role of manganese in resistance to plant diseases. In: Graham RD,Hannam RJ, Uren NC, (eds.). Manganese in Soils and Plants. Dordrecht, The Netherlands : KluwerAcademic Publishers, 155–173.
21. Ingri N. 1978. Aqueous silicic acid, silicates and silicate complexes. In: Bendz G, Lindquist I, eds.Biochemistry of Silicon and Related Problems. New York: Plenum, 3–50.
22. Kauss H. 1987. Some aspects of calcium-dependent regulation in plant metabolism. Annual Re�iew ofPlant Physiology 38 : 47–72.
23. Kidger AL, Carver TLW. 1981. Autofluorescence in oats infected by powdery mildew. Transactions ofthe British Mycological Society 76 : 405–409.
24. Koga H, Zeyen RJ, Bushnell WR, Ahlstrand GG. 1988. Hypersensitive cell death, autofluorescence,and insoluble silicon accumulation in barley leaf epidermal cells under attack by Erysiphe graminis f.sp.hordei. Physiological and Molecular Plant Pathology 32 : 395–409.
25. Kunoh H. 1990. Ultrastructure and mobilization of ions near infection sites. Annual Re�iew ofPhytopathology 28 : 93–111.
26. Kunoh H, Ishizaki H. 1976. Accumulation of chemical elements around the penetration sites ofErysiphe graminis hordei on barley leaf epidermis II. Level of silicon in papilla around the haustorialneck. Annals of the Phytopathological Society of Japan 42 : 30–34.
27. Kunoh H, Ishizaki H. 1976. Accumulation of chemical elements around the penetration sites ofErysiphe graminis hordei on barley leaf epidermis (III). Micromanipulation and X-ray microanalysis ofsilicon. Physiological Plant Pathology 8 : 91–96.
28. Kunoh H, Ishizaki H, Kondo F. 1975. Composition analysis of ‘halo ’ area of barley leaf epidermisinduced by powdery mildew infection. Annals of the Phytopathological Society of Japan 41 : 33–39.
29. Kunoh H, Kuno K, Ishizaki H. 1985. Cytological studies of the early stages of powdery mildew inbarley and wheat. XI. Auto-fluorescence and haloes at penetration sites of appressoria of Erysiphegraminis and Erysiphe pisi on barley coleoptiles. Canadian Journal of Botany 63 : 1535–1539.
30. Kunoh H, Yamamori K, Ishizaki H. 1982. Cytological studies of early stages of powdery mildew inbarley and wheat. VIII. Auto-fluorescence at penetration sites of Erysiphe graminis hordei on livingbarley coleoptiles. Physiological Plant Pathology 21 : 373–379.
31. Lyngkjaer MF, Carver TLW, Zeyen RJ. 1996. Suppression of mlo5 powdery mildew resistance inbarley. Physiological and Molecular Plant Pathology 50 : 17–36.
32. Marshall MR, Smart MG, Aist JR, Israel HW. 1985. Chlortetracycline and barley papillaformation: localization of calcium and alteration of the response induced by Erysiphe graminis. CanadianJournal of Botany 63 : 876–880.
33. Mayama S, Shishiyama J. 1978. Localized accumulation of fluorescent and U.V.-absorbingcompounds at penetration sites in barley leaves infected with Erysiphe graminis hordei. Physiological PlantPathology 13 : 347–354.
34. Nicholson RL, Hammerschmidt R. 1992. Phenolic compounds and their role in disease resistance.Annual Re�iew of Phytopathology 30 : 369–389.
35. Perumalla CJ, Heath MC. 1991. The effect of inhibitors of various cellular processes on the wallmodifications induced in bean leaves by the cowpea rust fungus. Physiological and Molecular PlantPathology 38 : 293–300.
36. Takamatsu S, Ishizaki H, Kunoh H. 1978. Cytological studies of early stages of powdery mildew inbarley and wheat. (V). Effects of calcium on the infection of coleoptiles of barley by Erysiphe graminishordei. Canadian Journal of Botany 56 : 2544–2549.
37. Takamatsu S, Ishizaki H, Kunoh H. 1979. Cytological studies of early stages of powdery mildew inbarley and wheat. (VI). Antagonistic effects of calcium and lithium on the infection of coleoptiles ofbarley by Erysiphe graminis hordei. Canadian Journal of Botany 57 : 408–412.
38. Zeyen RJ. 1982. Applications of in situ microanalysis in understanding disease : X-ray microanalysis.Annual Re�iew of Phytopathology 20 : 119–142.
39. Zeyen RJ. 1991. Analytical electron microscopy in plant pathology: X-ray microanalysis and energy lossspectrometry. In: Mendgen K, Lesemann DE, eds. Electron Microscopy of Plant Pathogens. Berlin:Springer-Verlag Press, 59–71.
40. Zeyen RJ, Bushnell WR. 1979. Papilla response of barley epidermal cells caused by Erysiphe graminis :rate and method of deposition determined by microcinematography and transmission electronmicroscopy. Canadian Journal of Botany 57 : 898–913.
41. Zeyen RJ, Ahlstrand GG, Carver TLW. 1993. X-ray microanalysis of frozen-hydrated, freeze-dried,and critical point dried leaf specimens: determination of soluble and insoluble chemical elements atErysiphe graminis epidermal cell papilla sites in barley isolines containing Ml-o and ml-o alleles. CanadianJournal of Botany 71 : 284–296.
Oat epidermis attacked by Blumeria graminis 243
42. Zeyen RJ, Carver TLW, Ahlstrand GG. 1983. Relating cytoplasmic detail of powdery mildewinfection to presence of insoluble silicon by sequential use of light microscopy, SEM, and X-raymicroanalysis. Physiological Plant Pathology 22 : 101–108.
43. Zeyen RJ, Bushnell WR, Carver TLW, Robbins MP, Clark TA, Boyles DA, Vance CP. 1995.Inhibiting phenylalanine ammonia lyase and cinnamyl-alcohol dehydrogenase suppresses Mla1 (HR)but not mlo5 (non-HR) barley powdery mildew resistance. Physiological and Molecular Plant Pathology47 : 119–140.
Related Documents