BioMed Central Page 1 of 11 (page number not for citation purposes) BMC Cancer Open Access Research article Phenotypic alterations in breast cancer cells overexpressing the nuclear receptor co-activator AIB1 Sarah L Anzick 1,2 , David O Azorsa 3 , S Stoney Simons Jr 4 and Paul S Meltzer* 1 Address: 1 Cancer Genetics Branch, NHGRI, National Institutes of Health, Bethesda, MD, 20892, USA, 2 Columbia School of Arts and Sciences, Program in Molecular and Cellular Oncology, George Washington University, Washington, D.C., 20037, USA, 3 Translational Genomics Research Institute, Pheonix, AZ 85004, USA and 4 Steroid Hormones Section, NIDDK, National Institutes of Health, Bethesda, MD 20892, USA Email: Sarah L Anzick - [email protected]; David O Azorsa - [email protected]; S Stoney Simons - [email protected]; Paul S Meltzer* - [email protected] * Corresponding author Abstract Background: Estrogen signaling plays a critical role in a number of normal physiological processes and has important implications in the treatment of breast cancer. The p160 nuclear receptor coactivator, AIB1 (amplified in breast cancer 1), is frequently amplified and overexpressed in human breast cancer and has been shown to enhance estrogen-dependent transactivation. Methods: To better understand the molecular and physiological consequences of AIB1 overexpression in breast cancer cells, an AIB1 cDNA was transfected into the low AIB1 expressing, estrogen-receptor (ER) negative breast cancer cell line, MDA-MB-436. The features of a derivative cell line, designated 436.1, which expresses high levels of AIB1, are described and compared with the parental cell line. Results: A significant increase in the levels of CREB binding protein (CBP) was observed in 436.1 cells and immunofluorescent staining revealed altered AIB1 and CBP staining patterns compared to the parental cells. Further, transient transfection assays demonstrated that the overall estrogen- dependent transactivation in 436.1 cells is approximately 20-fold higher than the parental cells and the estrogen dose-response curve is repositioned to the right. Finally, cDNA microarray analysis of approximately 7,100 cDNAs identified a number of differentially expressed genes in the 436.1 cells. Conclusion: These observations lend insight into downstream signaling pathways that are influenced by AIB1. Background Estrogen hormone action is an essential regulator of phys- iologic responses ranging from reproductive development and function to bone formation and fat metabolism. Estrogens have also been considered one of the major adverse factors in the pathogenesis of breast cancer, the second leading cause of cancer-related deaths in American women [1,2]. Estrogen action is mediated through the estrogen recep- tors, ER-α and ER-β, members of the nuclear hormone receptor superfamily [3,4]. Also critical to estrogen signal- ing are the interactions of ER-α with transcriptional coac- tivators including p/CAF, CREB binding protein (CBP), p300, and the p160 family members (reviewed in [5]). It isthought that the coactivators activate transcription through the modification of histonesand the bridging of Published: 10 September 2003 BMC Cancer 2003, 3:22 Received: 17 March 2003 Accepted: 10 September 2003 This article is available from: http://www.biomedcentral.com/1471-2407/3/22 © 2003 Anzick et al; licensee BioMed Central Ltd. This is an Open Access article: verbatim copying and redistribution of this article are permitted in all media for any purpose, provided this notice is preserved along with the article's original URL.

Welcome message from author
This document is posted to help you gain knowledge. Please leave a comment to let me know what you think about it! Share it to your friends and learn new things together.
Transcript

BioMed CentralBMC Cancer
ss
Open AcceResearch articlePhenotypic alterations in breast cancer cells overexpressing the nuclear receptor co-activator AIB1Sarah L Anzick1,2, David O Azorsa3, S Stoney Simons Jr4 and Paul S Meltzer*1Address: 1Cancer Genetics Branch, NHGRI, National Institutes of Health, Bethesda, MD, 20892, USA, 2Columbia School of Arts and Sciences, Program in Molecular and Cellular Oncology, George Washington University, Washington, D.C., 20037, USA, 3Translational Genomics Research Institute, Pheonix, AZ 85004, USA and 4Steroid Hormones Section, NIDDK, National Institutes of Health, Bethesda, MD 20892, USA
Email: Sarah L Anzick - [email protected]; David O Azorsa - [email protected]; S Stoney Simons - [email protected]; Paul S Meltzer* - [email protected]
* Corresponding author
AbstractBackground: Estrogen signaling plays a critical role in a number of normal physiological processesand has important implications in the treatment of breast cancer. The p160 nuclear receptorcoactivator, AIB1 (amplified in breast cancer 1), is frequently amplified and overexpressed in humanbreast cancer and has been shown to enhance estrogen-dependent transactivation.
Methods: To better understand the molecular and physiological consequences of AIB1overexpression in breast cancer cells, an AIB1 cDNA was transfected into the low AIB1 expressing,estrogen-receptor (ER) negative breast cancer cell line, MDA-MB-436. The features of a derivativecell line, designated 436.1, which expresses high levels of AIB1, are described and compared withthe parental cell line.
Results: A significant increase in the levels of CREB binding protein (CBP) was observed in 436.1cells and immunofluorescent staining revealed altered AIB1 and CBP staining patterns compared tothe parental cells. Further, transient transfection assays demonstrated that the overall estrogen-dependent transactivation in 436.1 cells is approximately 20-fold higher than the parental cells andthe estrogen dose-response curve is repositioned to the right. Finally, cDNA microarray analysisof approximately 7,100 cDNAs identified a number of differentially expressed genes in the 436.1cells.
Conclusion: These observations lend insight into downstream signaling pathways that areinfluenced by AIB1.
BackgroundEstrogen hormone action is an essential regulator of phys-iologic responses ranging from reproductive developmentand function to bone formation and fat metabolism.Estrogens have also been considered one of the majoradverse factors in the pathogenesis of breast cancer, thesecond leading cause of cancer-related deaths in Americanwomen [1,2].
Estrogen action is mediated through the estrogen recep-tors, ER-α and ER-β, members of the nuclear hormonereceptor superfamily [3,4]. Also critical to estrogen signal-ing are the interactions of ER-α with transcriptional coac-tivators including p/CAF, CREB binding protein (CBP),p300, and the p160 family members (reviewed in [5]). Itisthought that the coactivators activate transcriptionthrough the modification of histonesand the bridging of
Published: 10 September 2003
BMC Cancer 2003, 3:22
Received: 17 March 2003Accepted: 10 September 2003
This article is available from: http://www.biomedcentral.com/1471-2407/3/22
© 2003 Anzick et al; licensee BioMed Central Ltd. This is an Open Access article: verbatim copying and redistribution of this article are permitted in all media for any purpose, provided this notice is preserved along with the article's original URL.
Page 1 of 11(page number not for citation purposes)

BMC Cancer 2003, 3 http://www.biomedcentral.com/1471-2407/3/22
sequence specific transcription factors, including nuclearreceptors, to the pre-initiation complex. Moreover, tran-scriptional activation through ER-α depends upon anordered assembly of coactivator proteins on and off thepromoter of the targetgene in a cyclic fashion [6,7]. Thisselective modulation of cofactor assembly potentiallycontributes to the tightly regulated pattern of tissue-spe-cific estrogen response.
The p160 coactivator, AIB1, was identified during a searchfor genes that are frequently amplified in human breastcancer [8]. The frequent gene amplification and overex-pression of AIB1 in ER-positive human breast cancers ishypothesized to confer a selective growth advantagethrough increased hormone signaling [8,9]. While it islikely that overexpression of AIB1 contributes to tumori-genesis through this mechanism, overexpression of AIB1has also been observed in breast tumors that are ER-nega-tive, suggesting increased expression of AIB1 perturbsadditional signaling pathways which may have importantimplications in the absence of ER [10].
In the present study, low AIB1 expressing, ER-negativebreast cancer cells, MDA-MB-436, were transfected withthe human AIB1 cDNA and selected for stable expressionof AIB1. One of the clones expresses high levels of AIB1message and protein and is referred to as 436.1. Thesecells were used to investigate estrogen receptor activity intransient transfection assays and cDNA microarray analy-sis was performed to identify differentially expressedgenes. Here, we report the characterization of the 436.1cell line and suggest that it may be a useful tool for exam-ining the effects of AIB1 overexpression on a variety of sig-naling pathways.
MethodsThe breast cancer cell line, MDA-MB-436, was obtainedfrom the American Type Culture Collection (ATCC) andcultured in RPMI 1640 medium (Life Technologies) con-taining 10% fetal bovine serum. Stable transfections wereperformed using the standard calcium-phosphate tech-nique using the CalPhos Maximizer System (Clontech)according to the manufacturer's recommended proce-dures. To generate stablytransfected lines, MDA-MB-436cells were seeded at 1.5 × 10⁵ cells per well into 6-well cul-ture dishes (20 mm2) and grown overnight. Cells weretransfected with 2.0 µg pcDNA3.1-AIB1 (described in [8])or empty pcDNA3.1 vector (Invitrogen) and refed thefol-lowing day. After 48 hours, cells were transferred to 100mm2 dishes and selected in culture medium supple-mented with 500 µg/ml neomycin (G418) (Life Technol-ogies). After approximately three weeks, neomycin-resistant colonies were isolated usingcloning rings andtransferred to 12-well dishes for expansion.
RNA was extracted from exponentially growing cells usingthe RNeasy kit (Qiagen). Following extraction, 10–15 µgof total RNA was electrophoresed in a 1.0 % formamide/formaldehyde agarose gel and transferred by standardmethods [11]. An RNA ladder, 0.24–9.5 kb (Life Technol-ogies), was used as a molecular size marker. Hybridiza-tion was performed using a 32P-dCTP random-primed 2.2kb Not/SacI fragment of pCMVSPORT-B11 as probe(described in [8]).
For Western blot analyses, cells were harvested and lysedin RIPA buffer (1X PBS, 1% NP40, 0.5% sodium deoxy-cholate, 0.1% SDS) containing complete protease inhibi-tor cocktail (Boehringer Mannheim). Cellular lysates werecollected after centrifugation at 10,000 × g for 15 minutes.Approximately 100 µg of total protein was denatured byboiling for three minutes in sample loading buffer(Novex) and separated by SDS-polyacrylamide gel electro-phoresis. To examine proteins from transient transfectionassays, a total of 3 × 10 µl of cell extract from each tripli-cate was pooled for Western analysis. Resolved proteinswere transferred onto nylon membranes and blockedo-vernight at 4°C in 5% milk/PBS. AIB1 protein wasdetected by chemiluminescenceusing a mouse mono-clonal antibody, AX15.2 [12]. Estrogen receptor and CBPwere detected using the anti-ER-α polyclonal antibodyHC-20 and the anti-CBP antibody A-11 (Santa Cruz Bio-technology), respectively. Secondary antibodies used wereHRP-goatanti-mouse IgG Fc specific and HRP goat anti-rabbit IgG (Jackson Immunoresearch) and detection wasdone using the ECL chemiluminescent substrate (Amer-sham) and exposing to autoradiography film (Hyperfilm-ECL, Amersham).
For fluorescent microscopy, adherent cells were grown onFalcon culture slides (Becton Dickenson) to 70% conflu-ency. Cells were fixed with 2% paraformaldehyde, perme-abolized with 1:1 methanol/acetone and blocked with 5%normal goat serum/1% casein/0.5% BSA/0.2% Triton X-100. Cells were incubated with 1:5 dilution of anti-AIB1mAb AAP.1 hybridoma culture supernatant [13] and anti-CBP for 1 hour at room temperature. After washing withPBS, the cells were incubated with 2 µg/ml Rhodamine-conjugated goat anti-mouse IgG and 2 µg/ml FITC-conju-gated goat anti-rabbit IgG (Jackson Immunoresearch) for1 hour at room temperature. Following a finalwash, DAPImounting media and coverslips were added and slideswere analyzed using a fluorescent microscope (ZeissAxiophot).
To examine the effects of estrogen, cells were transientlytransfected using Lipofectamine transfection reagent (LifeTechnologies). The transfections were performed with 1.0µg pGL3. luc.3ERE or pTK. luc. ERE reporter vectors, 0.4 or10 ng of pHEGO-hyg (wild type estrogen receptor coding
Page 2 of 11(page number not for citation purposes)

BMC Cancer 2003, 3 http://www.biomedcentral.com/1471-2407/3/22
sequence plus hygromycin resistance, ATCC), and 5.0 ngofpRL-tk (Renilla null luciferase reporter; Promega). Theday following transfection, cells were incubated in theabsence or presence of varying concentrations of 17β-estradiol or 100 nM 4-hydroxytamoxifen. Cell lysateswere harvested 48 hours post transfection and reporteractivities were determined using the Dual LuciferaseReporter Assay system (Promega) and the supplier's rec-ommended methods. The pGL3. luc.3ERE, which con-tains three tandem copies of the ERE upstream the SimianVirus 40 promoter driving the luciferase gene, was thekind gift of Fern Merdoch (University of Wisconsin). Thetk. ERE. luc, which contains three ERE upstream the thy-midine kinase promoter, was giftfrom Susan Fuqua (Bay-lor University). The activity for subsaturatingconcentrations of 17β-estradiol was expressed as percentof maximal activity with saturating concentrations of 17β-estradiol (10 nM). In cases in which saturation wasreached at concentrations below 10 nM 17β-estradiol, anaverage of the maximal activities was utilized to deter-mine percent of maximal activity. The results areexpressed in relative luciferaseactivity (Luciferase/Renilla.).
cDNA microarray preparation and analyses were per-formed according to standard NHGRI protocol http://www.nhgri.nih.gov/DIR/Microarray/main.html. Microar-rays consisted of 7,088 known human genes. Briefly, RNAwas extracted from cells using TRIzol purification (LifeTechnologies) followed by purification with the RNeasykit (Qiagen). Sixty to 80 µg total RNA was fluorescentlylabeled with Cy5-dUTP or Cy3-dUTP (Amersham) usingoligo-(dT)-primed reverse transcriptase (Superscript II,Life Technologies) and hybridized to PCR productsimmobilized on glass slides. Fluorescent images wereacquired using a custom-designed confocal scannerequipped for dual laser excitation at the appropriate wave-lengths. Pseudo-colored images were obtained by placingone fluorescent image into the green channel and theother into the red channel. A detection method was thenemployed to determine the actual target region based onthe information from both red and green pixel values[14]. The ratios of the red intensity to the green intensity(R/G) for all targets were determined and normalizedwith 88 preselected internal control genes. The hybridiza-tion quality of each target area was based on fluorescenceintensity background and signal to noise ratio, asdescribed in detail at http://www.nhgri.nih.gov/DIR/Microarray/main.html.
ResultsMDA-MB-436 cells were transfected with an expressionvector containing the full-length human AIB1 cDNA andcultured in the presence of neomycin for the selection ofstable transfectants. While numerous resistant colonies
were selected for expansion, the majority gradually diedfollowing culture passage. The viable colonies wereexpanded and characterized. Additionally, five independ-ently transfected populations were selected en masse andexpanded for characterization.
To determine if the transfected cells expressed the exoge-nous AIB1 cDNA, RNAs from viable clonal populationswere analyzed by Northern blot. One of the clones, desig-nated 436.1, showed significant expression of the pre-dicted 5.7 kb transcript (Fig. 1A). This transcript was notdetected in other transfected clones (e.g., 436.5) or in fiveen masse selected populations (data not shown), suggest-ing the exogenous AIB1 cDNA was not highly expressed inthese cell populations. Next, Western blot analysis ofwhole cell lysates from the parental MDA-MB-436 and the436.1 cells was performed to ascertain if 436.1 cells dis-played increased AIB1 protein. Figure 1B shows high lev-els of AIB1 protein in the 436.1 cells compared to theparental cells. Taken together, these results illustrate thatthe 436.1 cells integrated and significantly expressed thetransfected AIB1 cDNA.
Previous reports have demonstrated compensatory effectsof p160 coactivator expression levels with the loss of oneof the p160 coactivators [15,16]. In SRC-1 knockout mice,for example, the expression of TIF2 is increased in certaintissues. To examine if the increase in AIB1 mRNA expres-sion in 436.1 cells was paralleled by changes in SRC-1 orTIF2 coactivator levels, the Northern blot was strippedand hybridized with cDNAs of SRC-1 and TIF2. Densito-metric measurements indicated approximately 10% and15% reduction in the expression levels of SRC-1 and TIF2,respectively, in the 436.1 cells compared to the MDA-MB-436 parental cells or the AIB1 transfected cell line, 436.5,which failed to express the 5.7 kb transcript (Fig. 1C).
To determine if the levels of the general co-integrator pro-teins, CBP or p300, had changed in the 436.1 cells, theWestern blot from Figure 1B was stripped and probedwith either anti-CBP or anti-p300 antibodies. Interest-ingly, a significant increase in the levels of CBP proteinwas observed in the 436.1 cells compared to the parentalcells, whereas levels of p300 appeared slightly reduced(Fig. 1D).
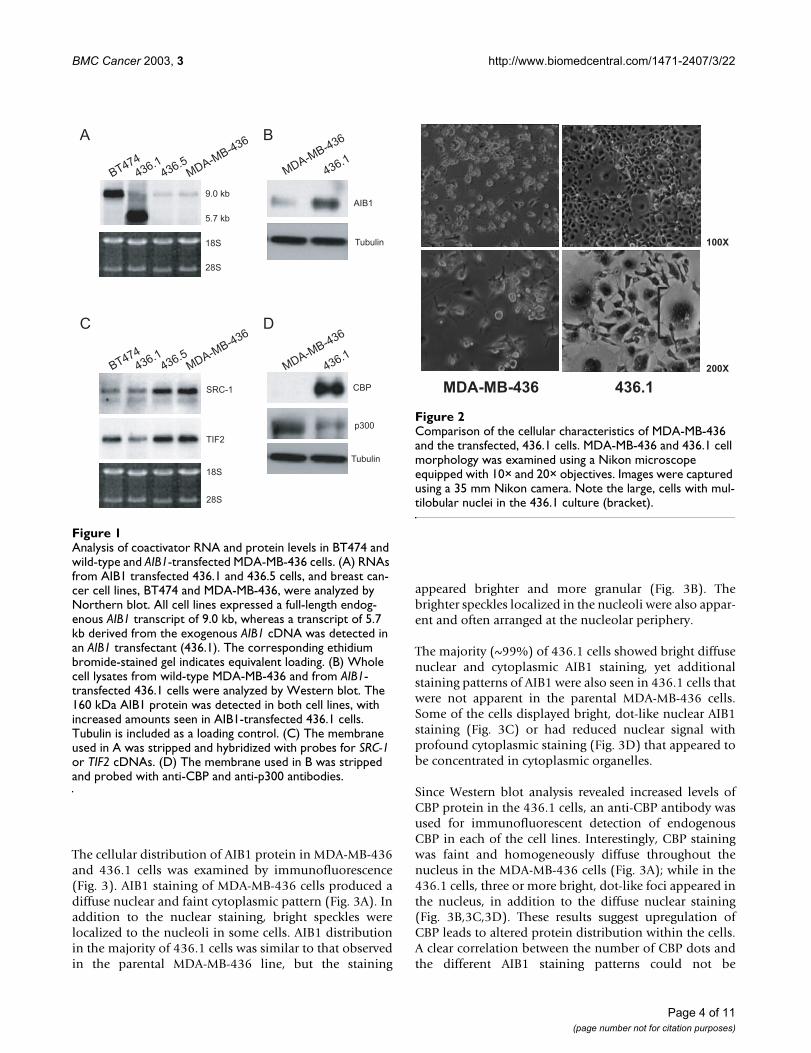
The 436.1 cells are morphologically distinct from theparental MDA-MB-436 cells. While the MDA-MB-436cells display a typical epithelial morphology, the mostconspicuous feature of the 436.1 population was theappearance of giant cells with abundant cytoplasm, oftenexhibiting multiple nuclei or a multilobular nucleus (Fig.2).
Page 3 of 11(page number not for citation purposes)
BMC Cancer 2003, 3 http://www.biomedcentral.com/1471-2407/3/22
The cellular distribution of AIB1 protein in MDA-MB-436and 436.1 cells was examined by immunofluorescence(Fig. 3). AIB1 staining of MDA-MB-436 cells produced adiffuse nuclear and faint cytoplasmic pattern (Fig. 3A). Inaddition to the nuclear staining, bright speckles werelocalized to the nucleoli in some cells. AIB1 distributionin the majority of 436.1 cells was similar to that observedin the parental MDA-MB-436 line, but the staining
appeared brighter and more granular (Fig. 3B). Thebrighter speckles localized in the nucleoli were also appar-ent and often arranged at the nucleolar periphery.
The majority (~99%) of 436.1 cells showed bright diffusenuclear and cytoplasmic AIB1 staining, yet additionalstaining patterns of AIB1 were also seen in 436.1 cells thatwere not apparent in the parental MDA-MB-436 cells.Some of the cells displayed bright, dot-like nuclear AIB1staining (Fig. 3C) or had reduced nuclear signal withprofound cytoplasmic staining (Fig. 3D) that appeared tobe concentrated in cytoplasmic organelles.
Since Western blot analysis revealed increased levels ofCBP protein in the 436.1 cells, an anti-CBP antibody wasused for immunofluorescent detection of endogenousCBP in each of the cell lines. Interestingly, CBP stainingwas faint and homogeneously diffuse throughout thenucleus in the MDA-MB-436 cells (Fig. 3A); while in the436.1 cells, three or more bright, dot-like foci appeared inthe nucleus, in addition to the diffuse nuclear staining(Fig. 3B,3C,3D). These results suggest upregulation ofCBP leads to altered protein distribution within the cells.A clear correlation between the number of CBP dots andthe different AIB1 staining patterns could not be
Analysis of coactivator RNA and protein levels in BT474 and wild-type and AIB1-transfected MDA-MB-436 cellsFigure 1Analysis of coactivator RNA and protein levels in BT474 and wild-type and AIB1-transfected MDA-MB-436 cells. (A) RNAs from AIB1 transfected 436.1 and 436.5 cells, and breast can-cer cell lines, BT474 and MDA-MB-436, were analyzed by Northern blot. All cell lines expressed a full-length endog-enous AIB1 transcript of 9.0 kb, whereas a transcript of 5.7 kb derived from the exogenous AIB1 cDNA was detected in an AIB1 transfectant (436.1). The corresponding ethidium bromide-stained gel indicates equivalent loading. (B) Whole cell lysates from wild-type MDA-MB-436 and from AIB1-transfected 436.1 cells were analyzed by Western blot. The 160 kDa AIB1 protein was detected in both cell lines, with increased amounts seen in AIB1-transfected 436.1 cells. Tubulin is included as a loading control. (C) The membrane used in A was stripped and hybridized with probes for SRC-1 or TIF2 cDNAs. (D) The membrane used in B was stripped and probed with anti-CBP and anti-p300 antibodies.
BT474
436.1436.5
MDA-MB-436
9.0 kb
5.7 kb
18S
28S
SRC-1
TIF2
18S
28S
BT474
436.1436.5
MDA-MB-436
MDA-MB-436
436.1
MDA-MB-436
436.1
AIB1
Tubulin
CBP
p300
Tubulin
A B
C D
Comparison of the cellular characteristics of MDA-MB-436 and the transfected, 436.1 cell morphology was examined using a Nikon microscope equipped with 10× and 20× objectivesFigure 2Comparison of the cellular characteristics of MDA-MB-436 and the transfected, 436.1 cells. MDA-MB-436 and 436.1 cell morphology was examined using a Nikon microscope equipped with 10× and 20× objectives. Images were captured using a 35 mm Nikon camera. Note the large, cells with mul-tilobular nuclei in the 436.1 culture (bracket).
MDA-MB-436 436.1
100X
200X
Page 4 of 11(page number not for citation purposes)

BMC Cancer 2003, 3 http://www.biomedcentral.com/1471-2407/3/22
established, though in a few cells some CBP dots co-local-ized with AIB1 dots (data not shown).
The results described above demonstrate that the 436.1cells have integrated andexpressed exogenous AIB1, withsmall reductions in the expression of TIF2 and SRC-1, anda large increase in CBP levels. The effects of these altera-tions on estrogen receptor-α dependent transactivation in436.1 cells were examined in transient transfection assaysusing an ER reporter and varying concentrations of anestrogen receptor-α expression plasmid. An estrogen-induced response was seen in both cell lines, but the436.1 cellsdisplayed a dramatic increase (approximately20-fold) in the overall luciferase reporter gene activitycompared with the parental line (Fig. 4). The increase inluciferase activity in 436.1 cells was observed in both theabsence and presence of added ligand. Moreover, anincrease in reporter activity was also observed with
increasing amounts of transfected receptor (50 ng to 500ng). These results suggest increased expression of AIB1and CBP augments the capacity of 436.1 cells to assemblefunctional ER/ERE coregulator complexes.
The dose-response curve for a particular steroid predictsthe biological response of the exposed cell to a given con-centration of ligand. Since the levels of transactivationwere profoundly higher in 436.1 cells compared to MDA-MB-436 cells, we asked if the estrogen dose-responsecurve was modified in the 436.1 line compared to MDA-MB-436 cells. For these studies, different concentrationsof ER were used to ascertain that the receptor was limitingand that increased response is obtained over a range ofsteroidconcentrations. Thus, transient transfections wereperformed in which 0.4 ng and 10 ng of ER-α plasmidwere transfected into MDA-MB-436 and 436.1 cells andincubated with increasing concentrations of 17β-estra-diol. In 436.1 cells, increasing amounts of ER-α from 0.4ng to 10 ng increased reporter gene expression at eachconcentration of steroid (Fig. 5A). To determine if thedose-response curve of estradiol has been altered by theaddition of ER-α, the data from Figure 5A is replotted as apercent of the maximal activity induced by a saturatingconcentration of 17β-estradiol (Fig. 5B). Significantly,concentrations. The the dose-response curve is shifted to a
Immunofluorescence of AIB1 and CBP in MDA-MB-436 (top row) and 436.1 (bracket) cellsFigure 3Immunofluorescence of AIB1 and CBP in MDA-MB-436 (top row) and 436.1 (bracket) cells. Primary antibodies are as indi-cated. The cells were fixed at approximately 70% confluency and counterstained with DAPI (first panel). Red corresponds to AIB1 staining revealed with the Cy3-conjugated secondary goat anti-mouse antibody (second panel) and green corre-sponds to CBP staining with fluorescein isothiocyanate-con-jugated goat anti-rabbit secondary antibody (third panel). The DAPI, AIB1, and CBP images from the same field of cells are merged in the last panel.
DAPI Anti-AIB1 Anti-CBP MergedA
B
C
D
MDA-MB-436
436.1
AIB1 transfected 436.1 cells display increased reporter gene activityFigure 4AIB1 transfected 436.1 cells display increased reporter gene activity. Cells weretransiently transfected with increasing amounts of estrogen receptor expression plasmidand 1.5 ug of pGL3. ERE. luc reporter vector and incubated in the pres-ence or absence of ethanol (EtOH), 10 nM 17β-estradiol (E2), or 100 nM 4-hydroxytamoxifen (Tam). Results are rep-resentative of three experiments. Relative luciferase activity = Luciferase/Renilla.
10
20
30
40
50
60
00 050 50500 500
Estrogen Receptor (ng)
Rel
ativ
e L
uci
fera
se A
ctiv
ity
436.1 MDA-MB-436
EtOH
10 nM E2
100 nM Tam
Page 5 of 11(page number not for citation purposes)

BMC Cancer 2003, 3 http://www.biomedcentral.com/1471-2407/3/22
lower EC50 with higher ER-α average left shift in the dose-response curve was 2.2 ± 0.33 fold (SEM, n = 8, P =0.0085) with increasing ER-α plasmid. This effect was alsoseen in the MDA-MB-436 cells, but total gene expressionreached maximal activity at a much lower ligand concen-tration. Figure 5C illustrates the dose-response curves ofboth MDA-MB-436 and 436.1 cellstransfected with 0.4 ngER-α. The EC50 of 13 ± 4 pM (SEM, n = 5) in MDA-MB-436cells was significantly right shifted in 436.1 cells to118 ± 20 pM (SEM, n = 8, P = 0.0016 by Mann-Whitneytest) 17β-estradiol.
Next, we determined if the increased levels of AIB1 andCBP coactivators in 436.1 cells modified the levels oftransfected ER-α. Cellular lysates from MDA-MB-436 and436.1 cells transfected with 10 ng and 100 ng of ER-α wereanalyzed by Western blot. The levels of full length ER-αprotein were not significantly increased in the 436.1 cellsrelative to the parental cells, indicating the observedincrease in ER-dependenttransactivation in these cells isnot the result of increased receptor levels (Fig. 5D).
Finally, cDNA microarray analysis was performed toexamine endogenous gene expression [8] in the 436.1cells compared to MDA-MB-436, and to identify potentialdownstream effects of AIB1 overexpression. Total RNAsfrom MDA-MB-436 and 436.1 cells were reverse-tran-scribed and labeled with fluorescent Cy3 and Cy5 dyes.Replicate experiments were also performed in which thefluorescent labels were reversed. Labeled RNAs werehybridized to a cDNA microarray containing 7,088cDNAs arrayed on a glass slide. Out of 3,658 genes whichmet hybridization quality criteria (see methods), a total of94 and 87 genes were upregulated and downregulated,respectively, by a factor of 3 or more in 436.1 cells com-pared to MDA-MB-436 cells. The 30 most significant out-liers in each category are listed in Table 1 [see additionalfile 1].
DiscussionVast epidemiological data supports a causative role forestrogens in the development of human breast cancer.Though significant progress has been made in the identi-fication and characterization of a large number of proteinsthat participate in estrogen signaling, the precise molecu-lar mechanisms that control specific cellular responses toendogenous and exogenous ligands of the ER signalingpathway are complex and not completely understood.However, increased understanding of hormone actionsuggests that the cell type and/or co-regulator levels dic-tate the ultimate response to ligand. The present study wasinitiated to examine the cellular and molecular conse-quences of AIB1 overexpression.
Our previous report demonstrated that the majority of ER-positive breast cancer cell lines have correspondingly highlevels of endogenous AIB1 expression (four out of five celllines analyzed); therefore, the number of suitable celllines in which to generate stable overexpression of AIB1are limiting [8]. Of interest, transfection of the AIB1 cDNAinto the ER-positive, low AIB1-expressing cell line, T47-D,demonstrated a cell-lethal phenotype and no subcloneswith high levels of AIB1 expression were generated (datanot shown).
Likewise, transfection of AIB1 into MDA-MB-436 breastcancer cells appears to be lethal since all but one of thesurviving subclones failed to demonstrate expression ofthe transfected AIB1. The 436.1 line discussed in thisstudy, however, has integrated the exogenous AIB1 cDNAand maintained high levels of AIB1 mRNA and proteinexpression. Most likely, 436.1 cells have acquired addi-tional alterations which support its survival.
Though the parental MDA-MB-436 cells are ER-α nega-tive, transient transfection of ERα was capable of inducingexpression of an ERE-regulated reporter gene in the pres-ence of estrogen, indicating these cells contain sufficientamounts of co-regulatory factors required for estrogeninducibility. Furthermore, since the levels of ER-α couldbe experimentally modulated in transient tranfectionstudies, this derivative cell line provided a useful model tocompare the effects of low-level, constitutive versus high-level expression of AIB1 in the presence or absence of var-ying concentrations of ER-α.
Immunostaining patterns of AIB1 and CBP included dif-fuse fluorescent staining as well as large, bright, dot-likefoci (Fig. 3). Although the punctate-staining pattern ofAIB1 in 436.1 cells resembled CBP containing PML (pro-myelocytic leukemia protein) oncogenic domain (POD)-like structures [17,18], the AIB1 dots appeared in only asmall percentage of the population (< 2%) and typicallydid not overlap with CBP. Analyses of populationsderived from single cell isolates revealed that the punctatestaining was not a clonal variant. Similarly, Baumann et alused GFP-fused to GRIP1 to investigate its intracellulardistribution in HeLa cells and observed both diffuse andfocal accumulation of GRIP1 [19]. CBP staining, on theother hand, was consistently diffuse throughout thenucleus in MDA-MB-436 cells but appeared to accumulatein PML-like bodies in the AIB1-transfected 436.1 cells.These results are consistent with observations maderecently by Boisvert et al [20]; several cell lines do notaccumulate CBP into PML bodies, but transfection of aGFP-CBP fusion protein into these cells leads to accumu-lation of CBP into distinct PML nuclear bodies. Takentogether, these observations imply that increasedamounts of AIB1 and CBP have caused the redistribution
Page 6 of 11(page number not for citation purposes)

BMC Cancer 2003, 3 http://www.biomedcentral.com/1471-2407/3/22
Dose-dependent stimulation of luciferase activity by 17β-estradiolFigure 5Dose-dependent stimulation of luciferase activity by 17β-estradiol. MDA-MB-436 and 436.1 cells were transiently transfected with 0.4 or 10 ng of estrogen receptor plasmid (pHEGO-hyg) and incubated in the presence of ethanol or increasing amounts of 17β-estradiol. The total levels of luciferase seen with ethanol and varying levels 17β-estradiol in 436.1 cells are plotted in (A). The data from (A) was replotted in (B) as a percentage of the maximal activity with 10 nM 17β-estradiol, as described in the Materials and Methods section. To facilitate direct comparison of the position of the dose-response curves for the two cell lines, the data from (A) and that obtained with MDA-MB-436 cells with 0.4 ng ER (data not shown) is illustrated in panel (C). The data are representative of eight (436.1) and five (MDA-MB-436) experiments. (D) Whole cell lysates from ER-positive BT474 and MCF-7 breast cancer cells and transiently transfected MDA-MB-436 and 436.1 cells were analyzed by Western blot. The 58 kDa ER protein (arrow) was detected in ER-positive BT474 and MCF-7 cells, as well as both cell lines that were trans-fected with 10 and 100 ng of ER.
A B
D
0 10 100
BT 474
ER (ng)
MCF 7MDA-MB-436
66
45
kDa MDA-MB-436
436.1436.1
436.1MDA-MB-436
Lu
cife
rase
Act
ivit
y as
Per
cen
t o
f M
axim
al R
esp
on
se w
ith
10
nM
Est
adio
l
17b-estradiol (pM)
0
25
50
75
1000.4 ng ER
10 ng ER
101 100 1000 10000
Rel
ativ
e L
uci
fera
se A
ctiv
ity
17b-estradiol (pM)
100 100 1000 100000
25
50
75
1000.4 ng ER
10 ng ER
17b-estradiol (pM)
100.01 100 1000 100000.1 1
Lu
cife
rase
Act
ivit
y as
Per
cen
t o
f M
axim
al R
esp
on
se w
ith
10
nM
Est
adio
l
0
25
50
75
100
125
150
C
436.1
MDA-MB-436
Page 7 of 11(page number not for citation purposes)

BMC Cancer 2003, 3 http://www.biomedcentral.com/1471-2407/3/22
of these proteins into nuclear foci in 436.1 cells. Perhapsthe levels of CBP and AIB1 are below the level required forrecruitment to nuclear bodies in the non-transfectedMDA-MB-436 cells. The mechanisms for upregulation ofCBP in 436.1 cells remain elusive, but it will be interestingto determine if overexpression of AIB1 plays a direct rolein the transcriptional regulation of CBP, or if levels of CBPare sensitized to and somehow adjusted with levels ofAIB1, or vise versa.
While the overall level of reporter gene activity was dra-matically increased in 436.1 cells, perhaps the most strik-ing observation is in the right in the shift of the estrogendose-response curve in 436.1 cells. The repositioning ofthe E2 dose-response curve to the right in 436.1 cells wassomewhat unexpected since several studies with otherreceptors have demonstrated a left shift in the dose-response curve with the addition of p160 proteins, includ-ing TIF2 and SRC-1 [21–24]. However, there is no evi-dence that the total levels of transactivation and theposition of the dose-response curve are linked. Studieswith glucocorticoid [21,25–28] and progesterone [22,28]receptors show that the two phenomena can be totallydisconnected. Increased total transactivation might beexpected if the concentrations of two coactivators (AIB1and CBP) are increased, but this does not predict theeffects of these changes on the dose-response curve andEC50.
One explanation for these observations is squelching,where increased levels of AIB1 compete for some limitingfactor that is crucial for nuclear receptor transactivation,such as CBP. Because we have also demonstrated that thelevels of CBP are significantly elevated in the 436.1 cells itis unlikely that the level of CBP is limiting. However, AIB1and CBP could be competing for a common factor that isnow limiting due to AIB1 and CBP abundance [24]. Also,cell specific differences, which have caused somecoactivators and corepressors to be apparently inactive[21,22] or to have opposite activities [22,28], may beimportant.
We propose a hypothetical model to explain the increasein total transactivation and the overall right-shift in thedose-response curve, as schematized in Figure 6. In thismodel, the dose-response curve depends on the presenceof a ternary complex composed of AIB1, CBP, and a third,unknown nuclear receptor complex participant, depictedas X. In MDA-MB-436 cells, the levels of AIB1, CBP, andfactor X, are at concentrations sufficient to form ternaryAIB1/CBP/X complexes that support the observed dose-response curve. The absence or dramatic reduction of sucha ternary AIB1/CBP/X complex in 436.1 cells (due toincreased levels of AIB1 and CBP and limiting levels of X)might result in a very different EC50. In fact, by the law of
mass action, elevated levels of AIB1 and CBP would beexpected to cause increased levels of the dimeric com-plexes (i.e., AIB1/X, AIB1/CBP, and CBP/X). Each of thesemay cause increased transactivation but not permit thesame positioning of the dose-response curve as in MDA-MB-436 cells, resulting in a relative increase in the EC50and a right shift in the dose-response curve. The greatlydecreased levels in 436.1 cells of the ternary AIB1/CBP/Xcomplex, which has no effect on the level of total transac-tivation, would now have only minimal effects of thepositioning of the dose-response curve.
Additional support for this model comes from severallines of evidence. First, convincing evidence for a limitingfactor other than p160 coactivators has been demon-strated by Lopez et al. [23]. These investigators haveshown that squelching between different receptors cannotbe relieved by supplying excess amounts of CBP or p160coactivator and suggest there is an unknown factor that isnecessary for receptor coactivation. Similarly, Kino et alreported that the amount of CBP that is required to see adecrease in glucocorticoid receptor (GR) transactivation iscell dependent [29]. The presence of a limiting complexcomponent that participates in the positioning of thedose-response curve has been established by Chen et al[24]. Here, the effects of modulators (GR, TIF2, or a cis-acting element in the reporter gene) were additive whenall components were limiting, but no further effect wasobtained if saturating amounts of any one modulator waspresent. Second, there is a well established physical inter-action between CBP/p300 and p160 coactivators [13,30–32], and several groups have proposed that CBP and othercoregulators, e.g., p160s, exist in the cytoplasm in pre-formed complexes [33,34].
Candidate genes whose altered expression might contrib-ute to the phenotypic features of the 436.1 cells, such ascell survival, multinucleated morphology, and transcrip-tional properties were identified by cDNA microarraytechnology. Comparison of RNAs from MDA-MB-436 ver-sus 436.1 revealed a number of profound changes in theexpression of genes with a variety of functions, includingcell adhesion, communication, maintenance of cellshape, apoptosis, and cell cycle control. For example, cyc-lin D3, an important regulator of endomitosis and poly-ploidization in megakaryocytes [35], was upregulated3.75-fold in 436.1 cells, suggesting upregulation of cyclinD3 contributed to the altered morphological featuresobserved in these cells. An 8.2-fold upregulation of theapoptosisinhibitor 2 gene may have facilitated the sur-vival of these cells. Downregulation of NFkB and C/EBPβcDNAs (ratios of 0.3 and 0.5, respectively) and a numberof interleukins whose gene expression are regulated bythese transcription factors (Table 1) possibly indicates ashift away from NFkB and C/EBPβ signaling to
Page 8 of 11(page number not for citation purposes)

BMC Cancer 2003, 3 http://www.biomedcentral.com/1471-2407/3/22
transcriptional activities mediated by other transcriptionfactors. Finally, none of the general transcription factors,including TFIIA (ratio = 1.1), TFIIB (ratio = 1.0), TFIID(ratio=.53), TFIIE (ratio = 1.25), TFIIF polypeptides 1 and2 (ratio = 0.63, 0.94), and TFIIH (ratio = 1.16) showedincreased expression in 436.1 cells, supporting the ideathat AIB1 and CBP overexpression play a significant rolein the observed increase in basal and E2-induced reportergene activity in 436.1 cells. Future studies are necessary toconfirm these observations and to determine which aregenes regulated by transcriptional complexes containingAIB1.
In summary, we have characterized an AIB1-transfectedcell line that displays high levels of AIB1 expression. The
data presented here support a role for AIB1 in the estro-gen-dose response and also suggest that, apart from ER-mediated pathways, AIB1 contributes to a number of sig-naling events which influence cell cycle, morphology, andsurvival. Future efforts directed at determining howoverexpression of AIB1 affects cell behavior in the pres-ence or absence of specific hormone receptors shouldshed light onto specific signaling pathways that are alteredas a consequence of AIB1 amplification in breast cancer.
Competing interestNone declared.
A proposed model of how increased concentrations of AIB1 and CBP in 436.1 cells compete for a factor that is necessary for estrogen-induced transcriptionFigure 6A proposed model of how increased concentrations of AIB1 and CBP in 436.1 cells compete for a factor that is necessary for estrogen-induced transcription. As schematized on the left, transcriptional activation through the estrogen receptor relies on interaction with AIB1, CBP, and an unknown factor X. In MDA-MB-436 cells, none of these components are limiting. The 436.1 cells have limited amounts of factor X and excess quantities of AIB1 and CBP, which compete for binding to factor X. The absence or presence of a ternary complex of AIB1/CBP/X in 436.1 cells affects the EC50 and transactivation, as schematized.
ER ER
CBP
ERE
AIB1
X
X
X
436.1MDA-MB-436
XAIB1
CBP CBP
CBP
X
AIB1
low AIB1low CBP
AIB1
EC50 -
high AIB1 high CBP
ERE
CBP
AIB1
Ternary complex
+
ERE
ERER
ERE
ERER
ERE
ERER
CBP
X
ER
AIB1
ER
Total transactivation +
limiting
EC50 -Total transactivation +
EC50 -Total transactivation +
EC50 +Total transactivation -
not
limiting
Page 9 of 11(page number not for citation purposes)

BMC Cancer 2003, 3 http://www.biomedcentral.com/1471-2407/3/22
Additional material
AcknowledgementsThis work was done in partial fulfillment of the Ph.D. requirements of the Molecular and Cellular Oncology Program for S. L. Anzick. The authors wish to thank J. Lueders, B. Walker, K. Gayton, and H. Cunliffe for technical assistance and helpful discussions.
References1. McGuire WL, Chamness GC and Fuqua SA: Estrogen receptor
variants in clinical breast cancer. Mol Endocrinol 1991,5:1571-1577.
2. Dickson RB and Lippman ME: Control of human breast cancer byestrogen, growth factors, and oncogenes. Cancer Treat Res1988, 40:119-165.
3. Evans RM: The steroid and thyroid hormone receptorsuperfamily. Science 1988, 240:889-895.
4. Dechering K, Boersma C and Mosselman S: Estrogen receptorsalpha and beta: two receptors of a kind? Curr Med Chem 2000,7:561-576.
5. Robyr D, Wolffe AP and Wahli W: Nuclear hormone receptorcoregulators in action: diversity for shared tasks. MolEndocrinol 2000, 14:329-347.
6. Kraus WL and Kadonaga JT: p300 and estrogen receptor coop-eratively activate transcription via differential enhancementof initiation and reinitiation. Genes Dev 1998, 12:331-342.
7. Shang Y, Hu X, DiRenzo J, Lazar MA and Brown M: Cofactordynamics and sufficiency in estrogen receptor-regulatedtranscription. Cell 2000, 103:843-852.
8. Anzick SL, Kononen J, Walker RL, Azorsa DO, Tanner MM, Guan XY,Sauter G, Kallioniemi OP, Trent JM and Meltzer PS: AIB1, a steroidreceptor coactivator amplified in breast and ovarian cancer.Science 1997, 277:965-968.
9. Murphy LC, Simon SL, Parkes A, Leygue E, Dotzlaw H, Snell L, TroupS, Adeyinka A and Watson PH: Altered expression of estrogenreceptor coregulators during human breast tumorigenesis.Cancer Res 2000, 60:6266-6271.
10. Bouras T, Southey MC and Venter DJ: Overexpression of thesteroid receptor coactivator AIB1 in breast cancer corre-lates with the absence of estrogen and progesterone recep-tors and positivity for p53 and HER2/neu. Cancer Res 2001,61:903-907.
11. Sambrook J, Fritsch EF and Maniatis T: Molecular cloning: A labo-ratory manual. Cold Spring Harbor Laboratory Press, Cold Spring Har-bor, N 1989.
12. Azorsa DO and Meltzer PS: Production and characterization ofmonoclonal antibodies to the steroid receptor coactivatorAIB1. Hybridoma 1999, 18:281-287.
13. Azorsa DO, Cunliffe HE and Meltzer PS: Association of steroidreceptor coactivator AIB1 with estrogen receptor-alpha inbreast cancer cells. Breast Cancer Res Treat 2001, 70:89-101.
14. Chen Y, Dougherty ER and Bittner ML: Ratio-based decisions andthe quantitative analysis of cDNA microarray images. JBiomed Optics 1997, 2:364-374.
15. Wang Z, Rose DW, Hermanson O, Liu F, Herman T, Wu W, SzetoD, Gleiberman A, Krones A, Pratt K, Rosenfeld R, Glass CK andRosenfeld MG: Regulation of somatic growth by the p160 coac-tivator p/CIP. Proc Natl Acad Sci U S A 2000, 97:13549-13554.
16. Xu J, Qiu Y, DeMayo FJ, Tsai SY, Tsai MJ and O'Malley BW: Partialhormone resistance in mice with disruption of the steroidreceptor coactivator-1 (SRC-1) gene. Science 1998,279:1922-1925.
17. Doucas V, Tini M, Egan DA and Evans RM: Modulation of CREBbinding protein function by the promyelocytic (PML) onco-protein suggests a role for nuclear bodies in hormonesignaling. Proc Natl Acad Sci U S A 1999, 96:2627-2632.
18. LaMorte VJ, Dyck JA, Ochs RL and Evans RM: Localization of nas-cent RNA and CREB binding protein with the PML-contain-ing nuclear body. Proc Natl Acad Sci U S A 1998, 95:4991-4996.
19. Baumann CT, Ma H, Wolford R, Reyes JC, Maruvada P, Lim C, YenPM, Stallcup MR and Hager GL: The glucocorticoid receptorinteracting protein 1 (GRIP1) localizes in discrete nuclearfoci that associate with ND10 bodies and are enriched incomponents of the 26S proteasome. Mol Endocrinol 2001,15:485-500.
20. Boisvert FM, Kruhlak MJ, Box AK, Hendzel MJ and Bazett-Jones DP:The transcription coactivator CBP is a dynamic componentof the promyelocytic leukemia nuclear body. J Cell Biol 2001,152:1099-1106.
21. Szapary D, Huang Y and Simons SS Jr: Opposing effects of core-pressor and coactivators in determining the dose-responsecurve of agonists, and residual agonist activity of antagonists,for glucocorticoid receptor-regulated gene expression. MolEndocrinol 1999, 13:2108-2121.
22. Giannoukos G, Szapary D, Smith CL, Meeker JE and Simons SS Jr:New antiprogestins with partial agonist activity: potentialselective progesterone receptor modulators (SPRMs) andprobes for receptor- and coregulator-induced changes inprogesterone receptor induction properties. Mol Endocrinol2001, 15:255-270.
23. Lopez GN, Webb P, Shinsako JH, Baxter JD, Greene GL and KushnerPJ: Titration by estrogen receptor activation function-2 oftargets that are downstream from coactivators. Mol Endocrinol1999, 13:897-909.
24. Chen S, Sarlis NJ and Simons SS Jr: Evidence for a common stepin three different processes for modulating the kinetic prop-erties of glucocorticoid receptor-induced gene transcription.J Biol Chem 2000, 275:30106-30117.
25. Oshima H and Simons SS Jr: Sequence-selective interactions oftranscription factor elements with tandem glucocorticoid-responsive elements at physiological steroid concentrations.J Biol Chem 1993, 268:26858-26865.
26. Szapary D, Xu M and Simons SS Jr: Induction properties of a tran-siently transfected glucocorticoid-responsive gene vary withglucocorticoid receptor concentration. J Biol Chem 1996,271:30576-30582.
27. Zeng H, Plisov SY and Simons SS Jr: Ability of the glucocorticoidmodulatory element to modify glucocorticoid receptortransactivation indicates parallel pathways for the expres-sion of glucocorticoid modulatory element and glucocorti-coid response element activities. Mol Cell Endocrinol 2000,162:221-234.
28. Song LN, Huse B, Rusconi S and Simons SS Jr: Transactivation spe-cificity of glucocorticoid versus progesterone receptors.Role of functionally different interactions of transcriptionfactors with amino- and carboxyl-terminal receptordomains. J Biol Chem 2001, 276:24806-24816.
29. Kino T, Nordeen SK and Chrousos GP: Conditional modulationof glucocorticoid receptor activities by CREB-binding pro-tein (CBP) and p300. J Steroid Biochem Mol Biol 1999, 70:15-25.
30. Torchia J, Rose DW, Inostroza J, Kamei Y, Westin S, Glass CK andRosenfeld MG: The transcriptional co-activator p/CIP bindsCBP and mediates nuclear-receptor function. Nature 1997,387:677-684.
31. Chen H, Lin RJ, Schiltz RL, Chakravarti D, Nash A, Nagy L, PrivalskyML, Nakatani Y and Evans RM: Nuclear receptor coactivatorACTR is a novel histone acetyltransferase and forms a mul-timeric activation complex with P/CAF and CBP/p300. Cell1997, 90:569-580.
32. Kamei Y, Xu L, Heinzel T, Torchia J, Kurokawa R, Gloss B, Lin SC,Heyman RA, Rose DW, Glass CK and Rosenfeld MG: A CBP inte-grator complex mediates transcriptional activation and AP-1 inhibition by nuclear receptors. Cell 1996, 85:403-414.
33. McKenna NJ, Nawaz Z, Tsai SY, Tsai MJ and O'Malley BW: Distinctsteady-state nuclear receptor coregulator complexes existin vivo. Proc Natl Acad Sci U S A 1998, 95:11697-11702.
Additional File 1The 30 most up- (ratio >3.0) or down- (ratio < 0.3) regulated genes in 436.1 cellscompared to MDA-MB-436.Click here for file[http://www.biomedcentral.com/content/supplementary/1471-2407-3-22-S1.pdf]
Page 10 of 11(page number not for citation purposes)
http://www.ncbi.nlm.nih.gov/entrez/query.fcgi?cmd=Retrieve&db=PubMed&dopt=Abstract&list_uids=1779964
http://www.ncbi.nlm.nih.gov/entrez/query.fcgi?cmd=Retrieve&db=PubMed&dopt=Abstract&list_uids=1779964
http://www.ncbi.nlm.nih.gov/entrez/query.fcgi?cmd=Retrieve&db=PubMed&dopt=Abstract&list_uids=2908648
http://www.ncbi.nlm.nih.gov/entrez/query.fcgi?cmd=Retrieve&db=PubMed&dopt=Abstract&list_uids=2908648
http://www.ncbi.nlm.nih.gov/entrez/query.fcgi?cmd=Retrieve&db=PubMed&dopt=Abstract&list_uids=3283939
http://www.ncbi.nlm.nih.gov/entrez/query.fcgi?cmd=Retrieve&db=PubMed&dopt=Abstract&list_uids=3283939
http://www.ncbi.nlm.nih.gov/entrez/query.fcgi?cmd=Retrieve&db=PubMed&dopt=Abstract&list_uids=9450928
http://www.ncbi.nlm.nih.gov/entrez/query.fcgi?cmd=Retrieve&db=PubMed&dopt=Abstract&list_uids=9450928
http://www.ncbi.nlm.nih.gov/entrez/query.fcgi?cmd=Retrieve&db=PubMed&dopt=Abstract&list_uids=9450928
http://www.ncbi.nlm.nih.gov/entrez/query.fcgi?cmd=Retrieve&db=PubMed&dopt=Abstract&list_uids=9252329
http://www.ncbi.nlm.nih.gov/entrez/query.fcgi?cmd=Retrieve&db=PubMed&dopt=Abstract&list_uids=9252329
http://www.ncbi.nlm.nih.gov/entrez/query.fcgi?cmd=Retrieve&db=PubMed&dopt=Abstract&list_uids=9506940
http://www.ncbi.nlm.nih.gov/entrez/query.fcgi?cmd=Retrieve&db=PubMed&dopt=Abstract&list_uids=9506940
http://www.ncbi.nlm.nih.gov/entrez/query.fcgi?cmd=Retrieve&db=PubMed&dopt=Abstract&list_uids=9506940
http://www.ncbi.nlm.nih.gov/entrez/query.fcgi?cmd=Retrieve&db=PubMed&dopt=Abstract&list_uids=9560216
http://www.ncbi.nlm.nih.gov/entrez/query.fcgi?cmd=Retrieve&db=PubMed&dopt=Abstract&list_uids=9560216
http://www.ncbi.nlm.nih.gov/entrez/query.fcgi?cmd=Retrieve&db=PubMed&dopt=Abstract&list_uids=9560216
http://www.ncbi.nlm.nih.gov/entrez/query.fcgi?cmd=Retrieve&db=PubMed&dopt=Abstract&list_uids=7903299
http://www.ncbi.nlm.nih.gov/entrez/query.fcgi?cmd=Retrieve&db=PubMed&dopt=Abstract&list_uids=7903299
http://www.ncbi.nlm.nih.gov/entrez/query.fcgi?cmd=Retrieve&db=PubMed&dopt=Abstract&list_uids=8940029
http://www.ncbi.nlm.nih.gov/entrez/query.fcgi?cmd=Retrieve&db=PubMed&dopt=Abstract&list_uids=8940029
http://www.ncbi.nlm.nih.gov/entrez/query.fcgi?cmd=Retrieve&db=PubMed&dopt=Abstract&list_uids=8940029
http://www.ncbi.nlm.nih.gov/entrez/query.fcgi?cmd=Retrieve&db=PubMed&dopt=Abstract&list_uids=9192892
http://www.ncbi.nlm.nih.gov/entrez/query.fcgi?cmd=Retrieve&db=PubMed&dopt=Abstract&list_uids=9192892
http://www.ncbi.nlm.nih.gov/entrez/query.fcgi?cmd=Retrieve&db=PubMed&dopt=Abstract&list_uids=9267036
http://www.ncbi.nlm.nih.gov/entrez/query.fcgi?cmd=Retrieve&db=PubMed&dopt=Abstract&list_uids=9267036
http://www.ncbi.nlm.nih.gov/entrez/query.fcgi?cmd=Retrieve&db=PubMed&dopt=Abstract&list_uids=9267036
http://www.ncbi.nlm.nih.gov/entrez/query.fcgi?cmd=Retrieve&db=PubMed&dopt=Abstract&list_uids=8616895
http://www.ncbi.nlm.nih.gov/entrez/query.fcgi?cmd=Retrieve&db=PubMed&dopt=Abstract&list_uids=8616895
http://www.ncbi.nlm.nih.gov/entrez/query.fcgi?cmd=Retrieve&db=PubMed&dopt=Abstract&list_uids=8616895
http://www.ncbi.nlm.nih.gov/entrez/query.fcgi?cmd=Retrieve&db=PubMed&dopt=Abstract&list_uids=9751728

BMC Cancer 2003, 3 http://www.biomedcentral.com/1471-2407/3/22
Publish with BioMed Central and every scientist can read your work free of charge
"BioMed Central will be the most significant development for disseminating the results of biomedical research in our lifetime."
Sir Paul Nurse, Cancer Research UK
Your research papers will be:
available free of charge to the entire biomedical community
peer reviewed and published immediately upon acceptance
cited in PubMed and archived on PubMed Central
yours — you keep the copyright
Submit your manuscript here:http://www.biomedcentral.com/info/publishing_adv.asp
BioMedcentral
34. Yao TP, Ku G, Zhou N, Scully R and Livingston DM: The nuclearhormone receptor coactivator SRC-1 is a specific target ofp300. Proc Natl Acad Sci U S A 1996, 93:10626-10631.
35. Zimmet JM, Ladd D, Jackson CW, Stenberg PE and Ravid K: A rolefor cyclin D3 in the endomitotic cell cycle. Mol Cell Biol 1997,17:7248-7259.
Pre-publication historyThe pre-publication history for this paper can be accessedhere:
http://www.biomedcentral.com/1471-2407/3/22/prepub
Page 11 of 11(page number not for citation purposes)
http://www.ncbi.nlm.nih.gov/entrez/query.fcgi?cmd=Retrieve&db=PubMed&dopt=Abstract&list_uids=8855229
http://www.ncbi.nlm.nih.gov/entrez/query.fcgi?cmd=Retrieve&db=PubMed&dopt=Abstract&list_uids=8855229
http://www.ncbi.nlm.nih.gov/entrez/query.fcgi?cmd=Retrieve&db=PubMed&dopt=Abstract&list_uids=8855229
http://www.ncbi.nlm.nih.gov/entrez/query.fcgi?cmd=Retrieve&db=PubMed&dopt=Abstract&list_uids=9372957
Related Documents