Phasing out plastics The construction sector Sam Pickard and Samuel Sharp September 2020 Report

Welcome message from author
This document is posted to help you gain knowledge. Please leave a comment to let me know what you think about it! Share it to your friends and learn new things together.
Transcript
Phasing out plasticsThe construction sectorSam Pickard and Samuel Sharp
September 2020
Report

Readers are encouraged to reproduce material for their own publications, as long as they are not being sold commercially. ODI requests due acknowledgement and a copy of the publication. For online use, we ask readers to link to the original resource on the ODI website. The views presented in this paper are those of the author(s) and do not necessarily represent the views of ODI or our partners.
This work is licensed under CC BY-NC-ND 4.0.
Cover photo: Building bricks. © Iker Urteaga/Unsplash

3
Acknowledgements
The authors are grateful to Simon Corbey, Katherine Adams, Jannik Giesekam, Craig White, Fiona McGarvey, Dan Sharp, Natalie Brighty, Renilde Becqué, Helen Picot, Dan Plechaty, and Kingsmill Bond for their insights and comments on drafts of this paper. They also gratefully acknowledge guidance and data from Arnulf Grübler. The support and assistance of Natalie Brighty, Elizabeth Tribone, Emma Carter, Jessica Rennoldson, Poilin Breathnach, Deborah Eade and Garth Stewart with its editing and production are gratefully acknowledged.
The paper was prepared with support from ClimateWorks Foundation and the 11th Hour Project. The views expressed in this document are entirely those of the authors and do not necessarily represent the views or policies of ODI, ClimateWorks Foundation or the 11th Hour Project.

4
Contents
Acknowledgements 3
List of tables and figures 6
Acronyms and abbreviations 7
Executive summary 9
1 Introduction 13
1.1 Background 13
1.2 Context 13
1.3 Methodology 14
1.4 Structure of the report 15
2 Plastics in the construction sector 16
2.1 Sector overview – main types, uses and trends 16
2.2 The lifespan of plastics in construction 17
2.3 End-of-life treatment 18
2.4 Regions and markets 19
3 Uses of plastics in construction 20
3.1 By plastic type 20
3.2 Profiles 21
3.3 Pipes, tubes, gutters and fittings 22
3.4 Flooring 22
3.5 Cables 23
3.6 Insulation 23
3.7 Liners 23
4 Plastics in the construction sector in 2050 24
4.1 Vision 2050 – sustainable living in compact cities 24
4.2 Alternative ways to meet construction demand for plastic materials in 2050 29
5
5 Pathways to 2050 33
5.1 Technical possibilities for change 33
5.2 Directions and trends 34
5.3 High-level political-economy analysis 36
6 Outcomes in 2050 40
6.1 Material forecasts 40
6.2 GHG emissions and sustainability considerations 40
6.3 Waste 41
7 Conclusions 43
References 44

6
List of tables and figures
Tables
Table 1 Total global consumption of different plastic types by the construction sector in 2015 20
Table 2 Changes in built area under the LED and the IEA’s buildings analysis scenarios 25
Table 3 Plastic uses and alternatives for different pipe requirements 31
Table 4 Indicated timescales for technical advances to achieve the low-plastic-demand scenario 33
Table 5 Estimated change in fossil-fuel plastic demand in 2050 41
Figures
Figure 1 Potential to reduce plastics demand in the construction sector in 2050 11
Figure 2 How to cut demand for fossil-fuel plastics by 2050 14
Figure 3 Global construction-sector consumption of polymer resins 16
Figure 4 Indicative lifetimes of plastic-containing products used in the construction industry 17
Figure 5 End-of-life fate of construction-sector plastic waste in Europe in 2018 19
Figure 6 PVC applications in the EU 21
Figure 7 Examples of PVC flooring-market estimates 22
Figure 8 Total floorspace projections under various scenarios 25
Figure 9 Illustration of housing footprints (m2 per capita) for new houses built in different countries 26
Figure 10 Construction activity in the residential and commercial sectors 2020–2050 for
longer-lived buildings 27
Figure 11 Material efficiency strategies across the building construction value chain 29
Figure 12 Whole-life cost (net present value) of installing different window frames 30
Figure 13 Service life of window types, as reported in industry literature 30
7
Acronyms and abbreviations
ASBP Alliance for Sustainable Building Products
BAU business as usual
BEIS UK Department for Business, Energy & Industrial Strategy
BIM building information modelling
BREEAM building Research Establishment Environmental Assessment Method
CCC Committee on Climate Change
CDC US Centers for Disease Control and Prevention
DCLG UK Department for Communities and Local Government
ECB ethylene copolymer bitumen
EIT European Institute of Innovation and Technology
ERFMI European Resilient Flooring Manufacturers’ Institute
ESWA European Single ply Waterproofing Association
EU European Union
EVA ethylene vinyl acetate
GABC Global Alliance for Buildings and Construction
GAIA Global Alliance for Incinerator Alternatives
GHG greenhouse gas
HDPE high-density polyethylene
IEA International Energy Agency
IPA UK Infrastructure and Projects Authority
LDPE low-density polyethylene
LED low energy demand
LEED Leadership in Energy and Environmental Design
NBS National Building Specification
OECD Organisation for Economic Co-operation and Development
PE polyethylene
PIR polyisocyanurate
PP polypropylene
PS polystyrene
PTFE polytetrafluoroethylene
PUR polyurethane
PVC polyvinyl chloride
RICS Royal Institution of Chartered Surveyors
SDG Sustainable Development Goals

8
TEPPFA European Plastic Pipe and Fittings Association
UK United Kingdom
UKCES UK Commission for Employment and Skills
UNDESA United Nations Department of Economic and Social Affairs
UN-Habitat United Nations Human Settlement Programme
US United States
USCB United States Census Bureau
WEF World Economic Forum
WGBC World Green Building Council

9
Executive summary
1 Polyvinyl chloride (PVC), polyethylene (PE), polyurethane (PUR), polystyrene (PS), polypropylene (PP), and polyethylene terephthalate (PET).
Background
Today, almost all plastics are made from fossil-fuel raw materials (oil, gas and coal) and use fossil-fuel energy in their manufacture. Globally, they were the source of about 4% of greenhouse gas (GHG) emissions in 2015 (Zheng and Suh, 2019) – more than the whole continent of Africa. By 2050, on current trends, emissions from plastics will be three times present levels. Simply put, current trends in plastic production and use are incompatible with averting catastrophic climate change.
Analyses and campaigns on the negative aspects of plastics have focused predominantly on plastic waste, ocean pollution and threats to human health. The climate impacts of plastics must be filtered into this discourse to inform solutions to the various challenges posed by current plastic consumption. Tackling these challenges separately will not suffice. Better materials handling and waste management may help with pollution and waste, but will not address plastic’s climate footprint. Similarly, the substitution of plastics derived from fossil fuels with ones from carbon-neutral sources will still cause waste and pollution. To have any chance of managing these challenges, we must scale down the problem. It is imperative from a climate and broader environmental perspective that we curtail the consumption of new plastic materials.
Context
This technical analysis serves part of a broader research project investigating the technical potential for phasing out virgin plastic materials produced from fossil fuels by 2050. Unlike
most top-down and circular-economy analyses, we take a bottom-up approach to assess the use of six main (‘bulk’) plastics1 in four sectors – packaging, construction, automotive, and electrical and electronic appliances. These sectors together accounted for around 60% of plastics consumption in 2015, while the six bulk plastics accounted for 80% of all plastics production (Geyer et al., 2017).
These sector studies illustrate both the technical and high-level political feasibility of phasing out fossil plastics production and use in these sectors. They do not assess the likelihood of it being achieved, nor explore in detail the economic, political and behavioural dimensions of these changes.
Method
Our analysis uses current trends to forecast business-as-usual (BAU) demand for plastics in the sector in 2050. We then investigate the different uses of each bulk plastic type in the sector today to provide a basis for reducing future consumption in a low-plastics-consumption scenario. We estimate the technical potential to reduce the use of new plastic materials compared with BAU in 2050 by considering the potential for dematerialisation and reuse (avoiding the need for new plastic demand) and substitution (shifting the demand for new plastics to demand for other materials). The implications of this reduction and the opportunities to manage residual plastic production (for example, by using recycled plastics) are covered holistically in the companion synthesis report.

10
Plastics in construction todayThe construction sector is the second-largest consumer of plastic resins globally (65 million tonnes (Mt) in 2015) and its consumption has been growing at a rate of 4.3% per year for the past two decades (Geyer et al., 2017). Few applications involve products that are entirely made from plastic. Rather, plastics tend to be used as subcomponents or additives in more complicated products for a broad range of uses. Most plastics are consumed in building construction, which is the focus of this report, rather than in infrastructure construction (such as roads, railways or utility mains).
In terms of sheer mass, the six bulk plastic types account for around 90% of the plastics used by the sector. The construction industry dominates the polyvinyl chloride (PVC) market, in particular, and PVC is the largest single plastic consumed by the construction sector. Leading applications for plastics include: tubing, piping, ducting and guttering (PVC, polypropylene (PP) and high-density polyethylene (HDPE)); thermal and acoustic insulation (polyurethane (PUR) and polystyrene (PS)); door and window frames and other external profiling, such as cladding, soffits and fascia boards, flooring and cabling (PVC); and waterproofing and linings (low-density polyethylene (LDPE) and PVC).
In-use lifespans vary significantly depending on the application but, at an average of 35 years (Geyer et al., 2017), are considerably longer than those of plastics used in other sectors. It is possible to recycle some construction-sector plastics, but it occurs rarely. Even in the most advanced circular economies, where industries are actively pursuing plastic recycling, fewer than one-sixth of new products are made from recycled materials. Elsewhere, the figure is much lower. In many cases, reclaimed plastic is of lower grade than virgin plastic, and ‘recycling’ actually means that plastics are downcycled to uses with less stringent specifications. In some cases, recycling is further constrained by additives in plastics from previous decades, which are now known to be toxic.
Although the consumption of plastics by the construction sector has grown in recent years, most plastic-containing products used in modern
2 See the accompanying automotive-sector report, entitled ‘Phasing out plastic: the automotive sector’.
construction are optional or substitutable. In many cases, plastics have been used to replace previous materials, rather than to create entirely new products. Plastics use is not primarily based on consumer demand or taste, but on producer or supplier choice.
At a general level, plastic-containing products tend to be manufactured in domestic and regional markets rather than transported globally. Although relatively few companies produce the bulk materials used in construction products, significantly more firms turn those bulk materials into plastic components and incorporate them into products. Indeed, thousands of companies use bulk plastics to produce components or products used in the construction sector in the UK alone, while thousands more act as intermediaries that sell the plastic products to end users.
Opportunities to reduce demand in 2050
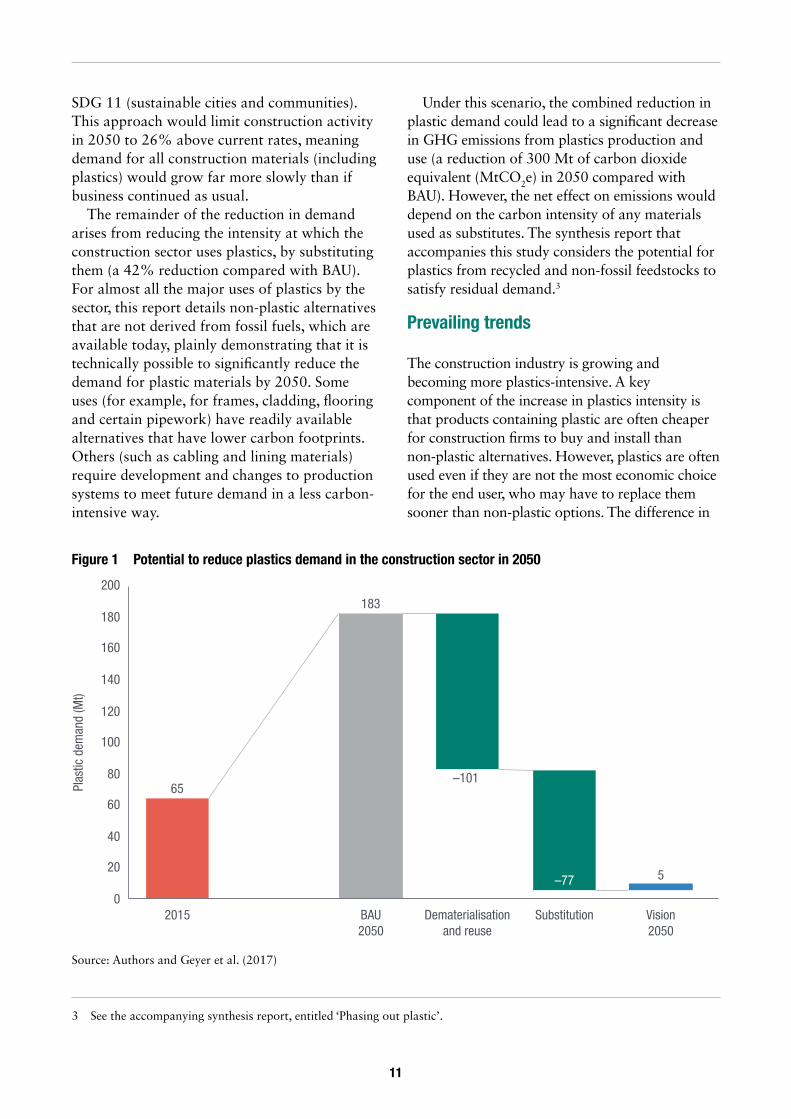
Our low-plastics-consumption scenario illustrates how the construction sector presents an enormous opportunity to reduce the use of plastic materials in 2050 compared with BAU (Figure 1). Our scenario builds on projections set out in Grubler et al.’s (2018) low energy demand (LED) scenario, which makes substantial progress towards achieving the Sustainable Development Goals (SDGs) – especially those related to poverty (SDG 1), hunger (SDG 2), health (SDG 3), clean energy (SDG 7), responsible consumption and production (SDG 12), and climate change (SDG 13).
About half the reduction in demand (55% compared with BAU) comes from a model of urbanisation that pivots away from large, single-occupancy buildings that are demolished before the end of their useful life towards compact cities that prioritise renovation and refurbishment. The average physical size of houses envisaged in 2050 is similar to that being built today in the UK, Spain and Italy – larger than the average dwelling built in China or Russia, but far smaller than that in the United States or Australia. Urban densification creates synergies that are also essential to constraining plastic demand in the automotive sector2 and is key to achieving
11
SDG 11 (sustainable cities and communities). This approach would limit construction activity in 2050 to 26% above current rates, meaning demand for all construction materials (including plastics) would grow far more slowly than if business continued as usual.
The remainder of the reduction in demand arises from reducing the intensity at which the construction sector uses plastics, by substituting them (a 42% reduction compared with BAU). For almost all the major uses of plastics by the sector, this report details non-plastic alternatives that are not derived from fossil fuels, which are available today, plainly demonstrating that it is technically possible to significantly reduce the demand for plastic materials by 2050. Some uses (for example, for frames, cladding, flooring and certain pipework) have readily available alternatives that have lower carbon footprints. Others (such as cabling and lining materials) require development and changes to production systems to meet future demand in a less carbon-intensive way.
3 See the accompanying synthesis report, entitled ‘Phasing out plastic’.
Under this scenario, the combined reduction in plastic demand could lead to a significant decrease in GHG emissions from plastics production and use (a reduction of 300 Mt of carbon dioxide equivalent (MtCO2e) in 2050 compared with BAU). However, the net effect on emissions would depend on the carbon intensity of any materials used as substitutes. The synthesis report that accompanies this study considers the potential for plastics from recycled and non-fossil feedstocks to satisfy residual demand.3
Prevailing trends
The construction industry is growing and becoming more plastics-intensive. A key component of the increase in plastics intensity is that products containing plastic are often cheaper for construction firms to buy and install than non-plastic alternatives. However, plastics are often used even if they are not the most economic choice for the end user, who may have to replace them sooner than non-plastic options. The difference in
Figure 1 Potential to reduce plastics demand in the construction sector in 2050
65
183
–101
–77 5
2015 BAU2050
Dematerialisationand reuse
Substitution Vision2050
Plas
tic d
eman
d (M
t)
0
20
40
60
80
100
120
140
160
180
200
Source: Authors and Geyer et al. (2017)

12
economic incentive between users and construction companies is an obvious market failure, similar to that involving other low-carbon building materials.
There are other compelling reasons to reduce the use of some plastics in the construction sector, irrespective of their climate impact. Recent tragedies such as the fire in London’s Grenfell Tower block have reopened the debate on the combustibility of plastic and the toxic smoke they release when they burn. Elsewhere, the leeching of toxic compounds and the contamination of indoor air by plastics and their additives are prompting ever tighter regulations that are narrowing the market for plastics in construction applications.
The construction industry’s growing recognition of the need to act on climate change may soon affect plastics, too. A systemic focus on the carbon footprint and whole-life costs of longer-lived buildings, and the ongoing transition to offsite construction could combine to speed up the industry’s shift away from choosing plastic components.
Pathways to reducing demand
Policies that disincentivise urban sprawl and promote more densely populated, compact cities would contribute to a low-plastic-consumption scenario in both the construction and automotive
sectors. Equally, the emergence of a wider sustainability agenda within the construction industry and growing awareness of the true costs of using plastics across a building’s lifetime could reduce the sector’s plastic demand.
The combination of powerful vested interests, the misaligned incentives of consumers (the industry) and users (occupants) and a perceived sectoral reluctance to change all present considerable barriers to disrupting the projected growth of plastics in the construction sector. However, much can be learned from the regulatory experience of developing low-energy buildings and other low-carbon building materials.
Public procurement policies, voluntary and mandatory standards for the private sector, better quality and more comparable full life-cycle data, shorter supply chains and increased offsite construction could focus attention on more sustainable construction choices and reduce plastic demand. Key challenges include making the environmental impact of plastic elements used in construction more tangible to the general public and remedying plastics’ cheapness compared with alternatives.
Various actors in the sector are already promoting action on each of these themes; the challenge is to coordinate and scale up these efforts to move them from the fringes to the new status quo.
13
1 Introduction
4 See the accompanying synthesis report, entitled ‘Phasing out plastic’.
1.1 Background
Almost all modern plastics are made from fossil-fuel raw materials (oil, gas and coal) and use fossil-fuel energy in their manufacture. They account for 9% of total demand for oil and 3% of total demand for gas and, by 2050, could account for 20% of all oil demand (World Economic Forum et al., 2016). Plastics are also problematic for the global climate emergency. They were the source of about 4% of global GHG emissions in 2015 (Zheng and Suh, 2019) – more than those emitted by all of Africa. We calculate that by 2050, emissions from plastics will be three times greater on current trends. But global GHG emissions need to reach net zero by 2050 if the world is to have a chance of averting catastrophic climate change (IPCC, 2018).
Recently, plastic waste and pollution have dominated the negative narrative on plastics. Along with the effects of plastic pollution on sea life, concerns have arisen about toxicity and health problems related to plastic microfibres found in the air, water and food. Better materials handling and waste management will not be enough to address these challenges. Nor will they be resolved by substituting plastics derived from fossil fuels with those made from biomass – these will also lead to waste and pollution. It is imperative from a climate and broader environmental perspective that the demand for new plastic materials is curtailed.
1.2 Context
This technical analysis is part of a broader research project investigating the technical potential for phasing out virgin plastic materials produced from fossil fuels by 2050. It complements existing forecasting and circular-economy analysis, but our method is different. We take a bottom-up approach to assessing the use of plastics in four sectors (packaging, construction, automotive, and electrical and electronic appliances), which together account for around 60% of total plastics consumption (Geyer et al., 2017). Our analysis focuses on the six main types of plastic (polyethylene, polypropylene, polystyrene, polyvinyl chloride, polyethylene terephthalate and polyurethane). These ‘bulk plastics’ accounted for about 80% of total plastics production in 2015 (Geyer et al., 2017).
We consider the upstream and downstream aspects of the plastic value chain to operate outside the individual sectors, in other words, the production of plastic pellets and the collection of waste plastic materials to be largely separate to – and cut across – the sectors in which plastic products are used. We, therefore, discuss opportunities to reduce the environmental impacts of plastics demand through changes to the production, recycling and disposal processes in the accompanying synthesis report.4 The technical reports in this study series focus on minimising the demand for plastic materials, because any reductions in aggregate demand facilitate easier management of the associated processes.
14
The purpose of these detailed sector studies is to illustrate both the technical and high-level political feasibility of phasing out fossil plastics production and use in these sectors. The target audience for the synthesis report is broad, including policymakers, advocacy groups, the private sector and other researchers. The audience for the technical reports is narrower, primarily researchers and those working directly in the sector.
1.3 Methodology
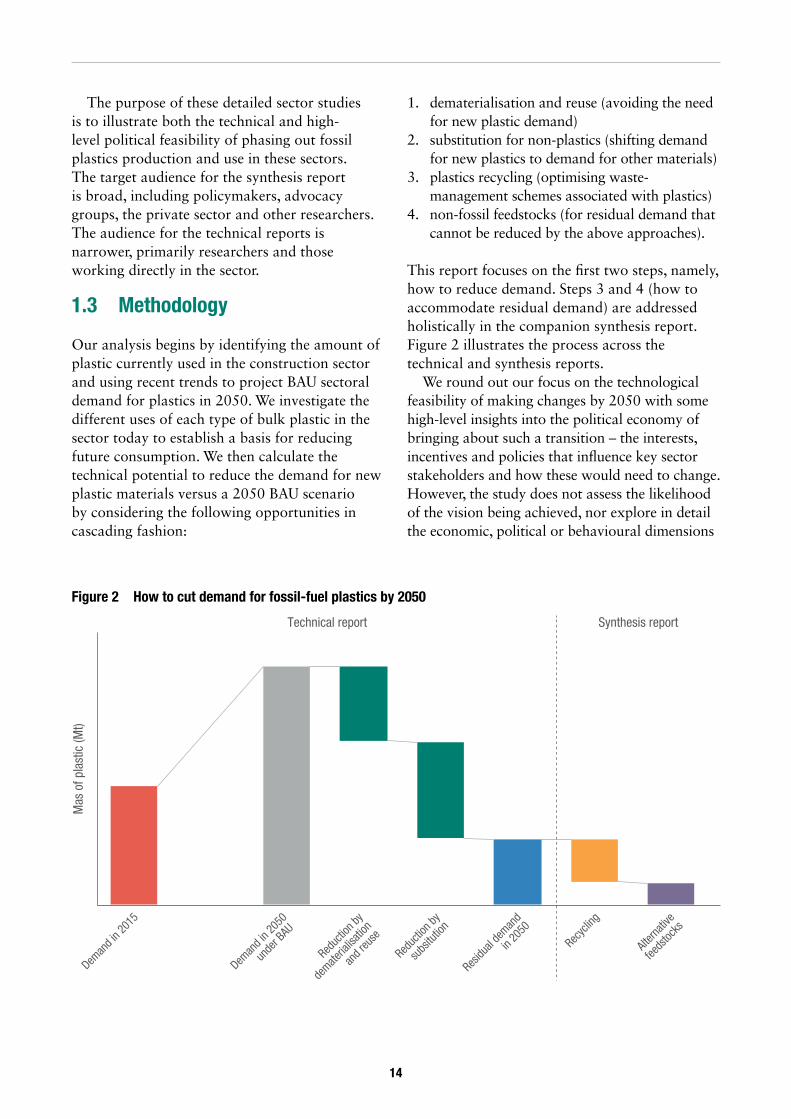
Our analysis begins by identifying the amount of plastic currently used in the construction sector and using recent trends to project BAU sectoral demand for plastics in 2050. We investigate the different uses of each type of bulk plastic in the sector today to establish a basis for reducing future consumption. We then calculate the technical potential to reduce the demand for new plastic materials versus a 2050 BAU scenario by considering the following opportunities in cascading fashion:
1. dematerialisation and reuse (avoiding the need for new plastic demand)
2. substitution for non-plastics (shifting demand for new plastics to demand for other materials)
3. plastics recycling (optimising waste-management schemes associated with plastics)
4. non-fossil feedstocks (for residual demand that cannot be reduced by the above approaches).
This report focuses on the first two steps, namely, how to reduce demand. Steps 3 and 4 (how to accommodate residual demand) are addressed holistically in the companion synthesis report. Figure 2 illustrates the process across the technical and synthesis reports.
We round out our focus on the technological feasibility of making changes by 2050 with some high-level insights into the political economy of bringing about such a transition – the interests, incentives and policies that influence key sector stakeholders and how these would need to change. However, the study does not assess the likelihood of the vision being achieved, nor explore in detail the economic, political or behavioural dimensions
Figure 2 How to cut demand for fossil-fuel plastics by 2050
Mas
of p
last
ic (M
t)
Technical report Synthesis report
Deman
d in 2
015
Deman
d in 2
050
unde
r BAU
Reduc
tion b
y
subs
itutio
n
Reduc
tion b
y
demate
rialis
ation
and r
euse
Residu
al de
mand
in 20
50
Recyc
ling
Altern
ative
feeds
tocks
15
of these changes. Rather, we aim to present one possible outcome and illustrate how it might come about, rather than to predict the future.
1.4 Structure of the report
The remainder of the report is structured as follows:
• Chapter 2 provides an overview of plastic consumption by the sector.
• Chapter 3 details the uses of plastics in the sector.
• Chapter 4 sets out our 2050 vision for reducing the demand for virgin fossil plastics.
• Chapter 5 provides a high-level analysis of steps to achieve this vision.
• Chapter 6 illustrates the potential outcomes in 2050, illustrating total demand for plastics in the sector under the low-plastics-demand scenario, the associated impact on CO2 emissions, and the amount of waste generated.
• Chapter 7 provides an overall conclusion to our analysis of the sector.

16
2 Plastics in the construction sector
5 No further data were available to disaggregate this figure by geography.
6 We assume this also includes polyisocyanurate (PIR), which is made from the same plastic monomers as PUR.
2.1 Sector overview: main types, uses and trends
Few products used in the construction sector are made entirely from plastic. Rather, plastics are generally used as subcomponents or additives in more complicated products. The construction sector is the second-largest consumer of plastic resins globally and demand has been growing at a rate of 4.3% per year for the past two decades, marginally slower than demand for plastics overall (Geyer et al., 2017). In 2015, the construction sector consumed 65 Mt of plastic resins (Geyer et al., 2017).5
Plastics are used in a broad range of applications, but we do not know what fraction of the tens of thousands of products used by the construction industry contain plastic (Corbey, 2018). Most plastics are consumed in the construction of buildings, which is the focus of this report, rather than in the construction of infrastructure, such as roads or railways. In part, this is because current infrastructure uses of plastic usually involve the downcycling of waste plastic rather than the use of virgin plastic materials (see, for example, Arora, 2015; Booth 2019). The major exception is plastic for pipes and conduits in large-scale transmission, distribution and collection networks (such as water and sewer mains and underground cables), which we also cover insofar as information is available.
On the whole, six bulk plastics account for around 90% of plastics used by the construction sector (see Figure 3): polyvinyl chloride (PVC),
high-density polyethylene (HDPE), polyurethane (PUR),6 polystyrene (PS), polypropylene (PP) and low-density/linear-low-density polyethylene (LDPE/LLDPE). The leading applications for products that use plastic as a major component and account for the greatest mass usage include: tubing, piping, ducting and guttering (PVC, PP, HDPE); thermal and acoustic insulation (PUR, PS); door and window frames and other external profiling, such as cladding, soffits and fascia boards, flooring and cabling (PVC); and waterproofing and linings (LDPE, PVC). Many
Figure 3 Global construction-sector consumption of polymer resins
Other plasticsAdditives
PVC
LDPE, LLDPE
PP
PS
PUR
HDPE
2015 (Mt)
Source: Geyer et al. (2017)

17
other products used in the construction industry contain plastics (both the bulk ones examined here and those based on other polymers).
The use of plastics in the construction sector has grown for numerous reasons depending on application. A recent think piece by the global engineering services company WSP illustrates how most of the plastic-containing products used in modern construction are optional or substitutable (McGarvey et al., 2019). However, for some uses, there are currently few alternatives. There is growing interest in using recycled plastics for some applications. Although the degree to which recyclate is used varies from region to region (see, for example, CalRecycle, 2019) and company to company (see, for example, Voltimum, 2018), across the industry as a whole, recycling is expanding from a very small base and can involve downcycling to lower-grade products rather than a circular flow. For non-visible components (such as linings and pipework), in particular, material decisions for construction projects are often specified during the design stage and rarely taken by the end
user (Zoran, 2016). Alternatives to plastics are likely to face similar barriers to other low-carbon building materials (for a summary, see Giesekam et al., 2016). Combined with plastic products’ low upfront costs and ease of installation, this suggests current growth trends are likely to continue without major interventions (see Market Research Gazette, 2019).
2.2 The lifespan of plastics in construction
Geyer et al. (2017) model plastic products used in the construction industry as having an average lifetime of 35 years (with a standard deviation of 7 years). However, it is not clear how these values have been derived, whether they reflect weighted design or in-use lifetimes, how they have changed, or how they might continue to change over time. Looking deeper into the construction sector, lifetimes vary considerably between different plastic-containing components. Figure 4 illustrates expected lifetimes for the various products discussed in this report. The broad ranges for
Figure 4 Indicative lifetimes of plastic-containing products used in the construction industry
0 10 20 30 40 50 60 70 80 90 100
Typical lifetime (years)
Pipes Windows Flooring Cables Insulation Construction average
Note: The construction average is a weighted approximation for all products used in the sector (Geyer et al., 2017), while the individual component lifetimes are intended to be indicative and show the range of in-use (measured – solid lines) and design (manufacturer-envisaged – dashed lines) lifetimes.Source: Biatz et al. (2004); ETool Global (2015); Geyer et al. (2017); TEPPFA (2019); InterNACHI (n.d.)
18
some illustrate the differences between design lifetimes and in-use lifetimes, where, for example, renovation replaces functional plastic-containing components before the end of their useful life.
2.3 End-of-life treatment
The fate of construction-sector plastic products at the end of their useful life also varies. Large-diameter plastic pipes that are buried underground, such those used for water mains or sewage, can often be filled and abandoned in place (see, for example, City of Milpitas, 2016). The plastic industry claims that some products are easily (for example, window frames) or economically (for example, cables, owing to the high value of other co-recycled components such as copper) disassembled to yield near-pure plastic components that can be recycled into other products – and this is borne out to some extent in certain jurisdictions.
No global data were available for plastics recycling in the construction sector. However, limited data are available for some plastics in some regions. In 2017, the European Union (EU) construction industry’s voluntary VinylPlus programme, for example, resulted in more than 600 kilotonnes (kt) of PVC being recycled. Almost half of this (300 kt) came from window and door profiles. PVC from cables yielded around 135 kt, as did PVC from membranes and flexible products, while about 75 kt came from pipes (VinylPlus, 2018). The target for 2020 is 800 kt, corresponding to around 14% of total PVC produced in Europe (PVC4Pipes, n.d.a).7
Much of the plastic that is designated ‘recycled’ is perhaps more accurately ‘downcycled’, as reclaimed plastic is often unable to meet the same aesthetic or safety requirements as that from virgin sources. This is an issue for the construction sector, in particular, owing to the relatively long lifespans involved (compared to, say, packaging or electronics end uses) and the changes in permissible additives over these periods. PVC recycled from window frames or flooring products that were installed 25 years ago, for instance, is unlikely to attain the
7 In an attempt to reconcile these numbers with the 309 kt of PVC reported as recycled by Plastics Europe (Plastics Europe, 2018), it appears that VinylPlus considers incineration and recovery of the non-carbonaceous parts of PVC to be recycling (VinylPlus, n.d.).
same level of coloration as that produced from virgin material and may contain higher levels of additives than are permitted today (particularly heavy metals like lead or cadmium) (see Hahladakis et al., 2018 for a full discussion).
Similarly, Calton et al. (2016) report that almost half of PVC recyclate used in pipe manufacture, which has relatively low aesthetic requirements, comes from PVC windows. The use of recycled PVC is also constrained legally: the same study details six EU product standards that limit or forbid the use of PVC recycled from other uses. As a result, a survey of European Plastic Pipe Producers found that slightly over 80 kt of ‘recycled’ PVC was used as an input in creating new pipes in 2014, including factory waste that was directly recycled. This equates to roughly 7% of the total PVC consumed in Europe to make new pipes and fittings (PVC4Pipes, n.d.a).
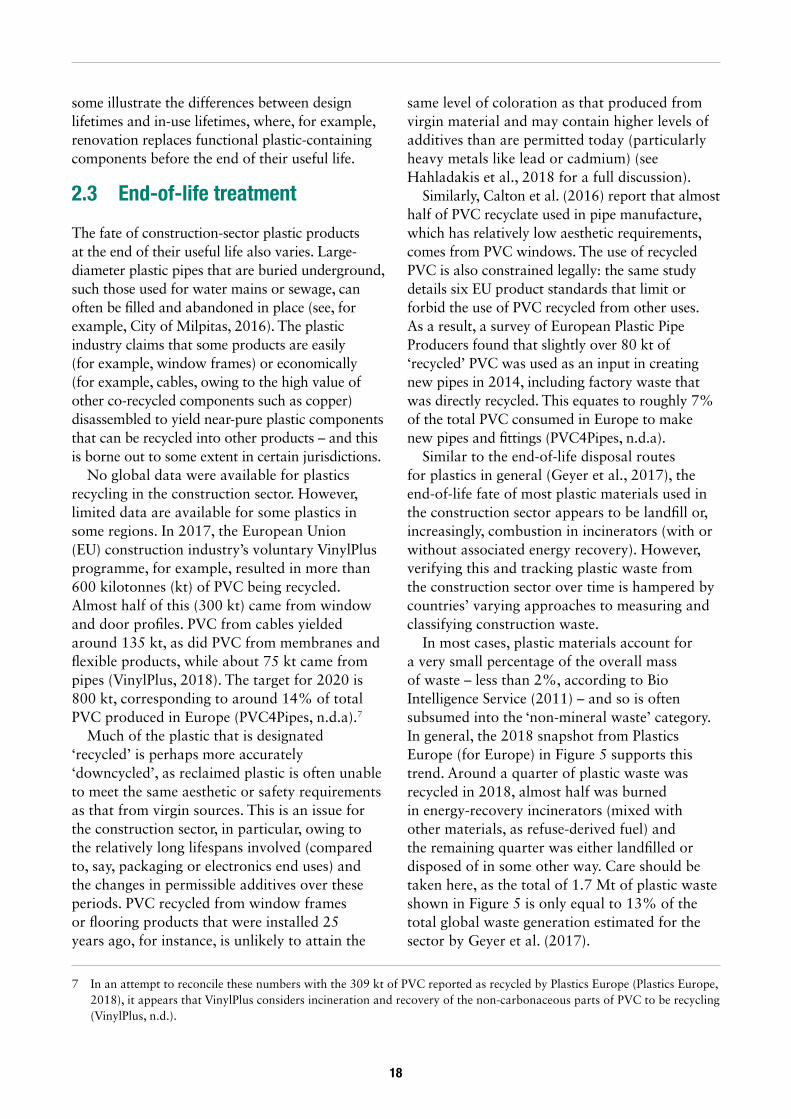
Similar to the end-of-life disposal routes for plastics in general (Geyer et al., 2017), the end-of-life fate of most plastic materials used in the construction sector appears to be landfill or, increasingly, combustion in incinerators (with or without associated energy recovery). However, verifying this and tracking plastic waste from the construction sector over time is hampered by countries’ varying approaches to measuring and classifying construction waste.
In most cases, plastic materials account for a very small percentage of the overall mass of waste – less than 2%, according to Bio Intelligence Service (2011) – and so is often subsumed into the ‘non-mineral waste’ category. In general, the 2018 snapshot from Plastics Europe (for Europe) in Figure 5 supports this trend. Around a quarter of plastic waste was recycled in 2018, almost half was burned in energy-recovery incinerators (mixed with other materials, as refuse-derived fuel) and the remaining quarter was either landfilled or disposed of in some other way. Care should be taken here, as the total of 1.7 Mt of plastic waste shown in Figure 5 is only equal to 13% of the total global waste generation estimated for the sector by Geyer et al. (2017).

19
2.4 Regions and markets
The value chains for plastic products used in the construction sector vary by region and by market. Comprehensive data are not available. Rather, the following discussion reflects the limited data that are publicly available. In general, production seems to be for domestic or, on occasion, well-connected regional markets (such as western Europe or the United States/Canada). Although relatively few companies produce the bulk materials used in construction products, far more turn those bulk materials into plastic components and incorporate them into products used in the sector, sometimes alongside products used in other sectors. There are thousands of companies
8 See, for example, Modern Building Alliance (n.d.); Plastics Europe (n.d.); PVC4Pipes (n.d.a); Vinyl Council Australia (n.d.b); European Plastics Converters (n.d.); ERMFI (n.d.); TEPPFA (n.d.); ESWA (n.d.)
in the UK alone using bulk plastics to produce construction-sector components or products and thousands more acting as intermediaries, selling the plastic products to end users (for UK examples, see InsightData, n.d.). Similar large numbers are found elsewhere. For example, despite some consolidation in prior years, there were reportedly more than 5,000 companies producing some type of plastic pipe in China in 2014 (Zhanjie, 2014). Mature markets may have fewer actors, however; a 2008 paper reported that there were just 200 companies producing HDPE pipes in all of Europe (Škarka, 2008). More developed markets also have strong trade groups, some of which cover plastics across the sector, while others focus on specific product groups.8
Figure 5 End-of-life fate of construction-sector plastic waste in Europe in 2018
0
100
200
300
400
500
600
700
800
900
1,000
LDPE HDPE PP PS PVC Other
Mas
s (k
t)
Recycled Incinerated (energy recovery) Land�ll/other disposal
Source: Plastics Europe (2018)
20
3 Uses of plastics in construction
3.1 By plastic type
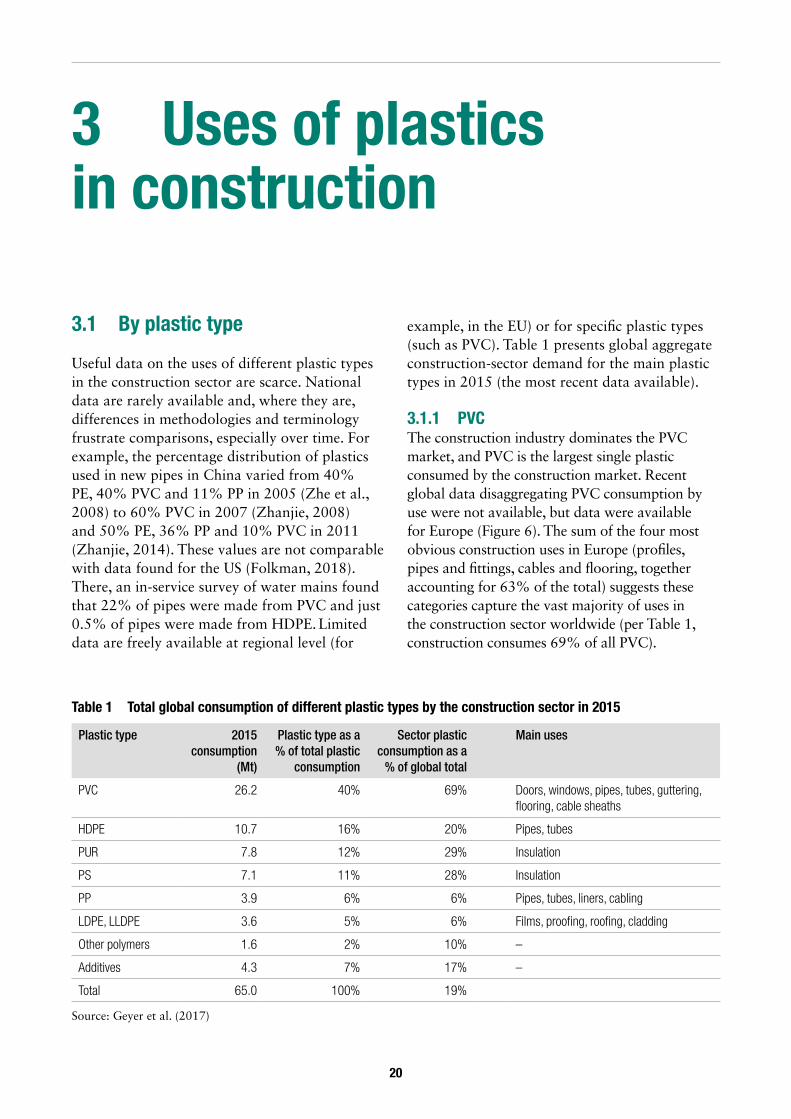
Useful data on the uses of different plastic types in the construction sector are scarce. National data are rarely available and, where they are, differences in methodologies and terminology frustrate comparisons, especially over time. For example, the percentage distribution of plastics used in new pipes in China varied from 40% PE, 40% PVC and 11% PP in 2005 (Zhe et al., 2008) to 60% PVC in 2007 (Zhanjie, 2008) and 50% PE, 36% PP and 10% PVC in 2011 (Zhanjie, 2014). These values are not comparable with data found for the US (Folkman, 2018). There, an in-service survey of water mains found that 22% of pipes were made from PVC and just 0.5% of pipes were made from HDPE. Limited data are freely available at regional level (for
example, in the EU) or for specific plastic types (such as PVC). Table 1 presents global aggregate construction-sector demand for the main plastic types in 2015 (the most recent data available).
3.1.1 PVCThe construction industry dominates the PVC market, and PVC is the largest single plastic consumed by the construction market. Recent global data disaggregating PVC consumption by use were not available, but data were available for Europe (Figure 6). The sum of the four most obvious construction uses in Europe (profiles, pipes and fittings, cables and flooring, together accounting for 63% of the total) suggests these categories capture the vast majority of uses in the construction sector worldwide (per Table 1, construction consumes 69% of all PVC).
Table 1 Total global consumption of different plastic types by the construction sector in 2015
Plastic type 2015 consumption
(Mt)
Plastic type as a % of total plastic
consumption
Sector plastic consumption as a
% of global total
Main uses
PVC 26.2 40% 69% Doors, windows, pipes, tubes, guttering, flooring, cable sheaths
HDPE 10.7 16% 20% Pipes, tubes
PUR 7.8 12% 29% Insulation
PS 7.1 11% 28% Insulation
PP 3.9 6% 6% Pipes, tubes, liners, cabling
LDPE, LLDPE 3.6 5% 6% Films, proofing, roofing, cladding
Other polymers 1.6 2% 10% –
Additives 4.3 7% 17% –
Total 65.0 100% 19%
Source: Geyer et al. (2017)

21
Other uses (such as rigid films and flexible piping) may include some construction end uses, but are believed to be mainly used in other sectors (such as packaging and consumer goods, respectively). We note, however, that the recent growth of plastics consumption in China suggests caution is warranted in extrapolating these values.9 Also, while European profile consumption may be higher than the global average, that of PVC flooring may be lower than the global average, given the dominance of PVC flooring in the Chinese market (Grand View Research, 2019). Overall these factors should act to balance each other out in terms of impact on PVC consumption by the construction sector, so for this high-level analysis, we assume that the data are broadly representative and focus on these four uses of PVC.
3.1.2 Other bulk plasticsHDPE is mainly used for the large-scale transport of water (for example, in water mains, sewers and agriculture), but is also used to a lesser extent for cable ducting and the transport of industrial gases and fossil fuels. PUR and PS are mainly used for thermal and acoustic insulation. For simplicity, we assume that PUR’s contribution to flooring
9 For example, consider the growth in plastic pipe production in China: 1.8 Mt in 2005 (Zhe et al., 2008), 3.5 Mt in 2007 (Zhanjie, 2008) and 12.1 Mt in 2013 (Zhanjie, 2014) – almost a fifth of all plastic used by the sector in 2015, according to Geyer et al. (2017).
10 However, the styrene monomer is extensively used in poly(styrene-butadiene-styrene), or SBS, as a flexible and waterproof roofing material (van der Berg, 2018).
and cabling is negligible in comparison, and that insulation accounts for all of the PUR and PS used by the construction sector.10
No data were found to quantify the use of PP or LDPE/LLDPE. There is some evidence to suggest PP has a wide range of uses that are similar to those of other plastics in the construction sector, including piping and cabling applications, and as fibres for direct use (for example, in carpets) or to stabilise other materials, such as concrete (Designing Buildings, 2019). PP can also be used for waterproof sheeting and liners (see, for example, Dupont, 2017), which are considered to be the sector’s dominant uses of LDPE/LLDPE.
3.2 Profiles
Unplasticised PVC (uPVC) is a common material used in window and door frames and is particularly common in wealthier and colder climates, where double-glazed glass panes are increasingly used to improve thermal insulation. uPVC can also be used for weatherproofing or aesthetic elements, such as soffits, fascia boards or cladding. No further data were available on the number of PVC profile applications, or on how they vary geographically.
Figure 6 PVC applications in the EU
Flexible tubes and pro�les, 2%
Coated fabrics, 3%
Rigid plates, 2%
Others, 9%
Rigid �lm, 8%
Flexible �lm and sheets, 8%
Pro�les, 27%
Pipes and �ttings, 22%
Flooring, 7%
Cables, 7%
ConstructionApplications63%
Miscellaneous rigid, 6%
Source: Reproduced using 2017 European Council of Vinyl Manufacturers data via PVC4Pipes (n.d.a)

22
3.3 Pipes, tubes, gutters and fittings
Many plastics are used for pipes, tubes and fittings – for instance, in connectors or elbow joints – in part because the use of push-fit or solvent cement means they are relatively quick to install. PVC appears to be the most common plastic used, but types vary according to requirements. uPVC is mainly used for cold-water pipes of relatively small diameter, for example, while chlorinated PVC (c-PVC) and PP are more often used for warm- and hot-water applications. Various types of PVC are also used for guttering, drainpipes and soil/waste pipes (PVC4Pipes, n.d.b; n.d.c).
Plastics are also used for larger-scale pipes, such as for municipal or industrial infrastructure. For example, molecularly-oriented PVC (PVC-O) and HDPE are used in large-scale water transit and non-drinking-water situations (for irrigation or sewage, for instance). High-impact PVC (HI-PVC) pipes are also used for the low-pressure transport of gases (including natural gas) and HDPE is used for natural gas and oil transport (PVC4Pipes, n.d.b; n.d.c; Plastic Pipe Institute, n.d.).
The degree to which various plastics are employed for these uses differs around the world. For example, a survey of US water mains showed that around 22% of pipes were made from PVC, and almost none made from HDPE (Folkman,
2018), yet in China, HDPE accounted for half of all plastic pipes installed by municipal water authorities, equivalent to almost a quarter of all of the piping they installed (Zhanjie, 2014). Approximately 20% of the EU’s consumption of HDPE was for pipes in the 2000s, suggesting that the situation in the EU lies somewhere between that of China and the US (Škarka, 2008).
3.4 Flooring
Vinyl Council Australia (n.d.a) says PVC is the most commonly used polymer in flooring there. It is not clear whether this is also globally representative, but PVC is widely used in many countries for flooring alongside PUR coatings, PE felt and PP fibres (Plastics in Construction, 2015; Designing Buildings, 2019). In residential buildings, PVC is commonly found in synthetic linoleum or laminate floor tiles. Building areas with higher footfall (such as atria in shopping centres) or more stringent cleaning requirements (for example, in hospitals) tend to use thicker and heavier variants. Some of these come in tiles that can be melted together to form a waterproof seal, while others are produced as rolled sheets.
Estimating the mass of PVC used by this sector globally is difficult, because freely available data on the size of the market are inconsistent (Figure 7) and different types of PVC flooring
Figure 7 Examples of PVC flooring-market estimates
0
0.5
1
1.5
2
2.5
3
3.5
2014 2016 2018 2020 2022 2024 2026 2028 2030
Floo
ring
area
(bill
ion
m2 )
FMI [CAGR: 6.3%] Technavio [4.0%] IMARC [5.3%]
Sources: Future Market Insights (2018); Business Insider (2017); Research and Markets (2019)

23
contain different amounts of PVC per square metre (thickness varies and they also contain other materials, such as adhesives, plasticisers, additives and backing layers).
3.5 Cables
PVC is used extensively in electrical cables to create cable insulation, sheathing and the flexible tubing that surrounds the cables. PVC is usually plasticised (often using phthalates) to make it softer and more flexible, though different additives can be selected to change the properties of the covering to best suit the end use. Other plastics (notably PE and PP and PUR) are also used in relatively niche cabling applications (Galaxy Wire, n.d.; Gannon, 2014; BASF, n.d.).
3.6 Insulation
PS and PUR are commonly used to provide thermal and acoustic insulation in residential and commercial buildings.11 Both PUR and PS can be used to create insulation boards or rolls that can then be installed as the building structure is erected. PUR can also be sprayed into a void where it can expand to yield the thermoset plastic.
11 Within these bulk material categories, there are a number of other options, such as PIR and expanded and extruded polystyrene (EPS and XPS, respectively).
Analogous to the growth in uPVC windows and doors, plastic-based insulation has tended to be installed in cooler regions in richer countries to improve the building envelope’s thermal efficiency. The impact of climate and geography on demand vary between and within countries. For example, the United States is divided into seven zones with different thermal-barrier requirements for windows, doors and insulation (US Department of Energy, 2012).
3.7 Liners
Based on its material characteristics, we attribute LDPE/LLDPE use in the construction sector entirely to the plastic sheeting and films used for waterproofing or sealing non-waterproof components. Many of the other uses of LDPE appear to be in infrastructure construction, for example, to line earthworks, water courses or transport channels. PVC is also used for sheeting, especially for roof lining. In some cases, the ethylene monomer appears to be bound with other plastic monomers; for example, copolymers such as ethylene vinyl acetate (EVA) and ethylene copolymer bitumen (ECB) may be used with other plastics (see, for example, Dacheng Building Material, n.d.).
24
4 Plastics in the construction sector in 2050
12 Specifically, in terms of shelter, consumer goods, mobility and nutrition. See Supplementary Note 12 in Grubler et al. (2018) for more detail.
As outlined in chapter 1, our approach is to compare two possible 2050 scenarios: BAU and low plastic demand. We approximate BAU as 3% growth per year. The low-plastic-consumption scenario is based on the 1.5°C-compatible LED scenario published by Grubler et al. (2018). As the LED scenario is mainly focused on energy demand, it does not relate to all of the SDGs. However, energy use under this scenario translates into living standards that surpass the relevant Decent Living Standards (Rao and Min, 2017).12
The amount of plastic used by the construction sector can be approximated by the sector’s activity (the number of new building projects and the renovation/replacement of existing buildings) and its plastic intensity (the amount of new plastic in each new building).The LED scenario provides a framework to investigate changes in activity – the demand for the services that plastic materials provide compared with the BAU scenario – through dematerialisation and reuse. We then augment this with an analysis of reducing the sector’s plastic intensity – the potential to fulfil residual demand for plastic materials with other materials – through substitution.
4.1 Vision 2050: sustainable living in compact cities
4.1.1 The area covered by the built environmentThe LED scenario projects the global population to reach 9.2 billion by 2050. Residential floorspace is assumed to grow from 180 billion m2 in 2020 to 260 billion m2 in 2050, with almost all
of this growth in the Global South. In the Global North, floorspace demand remains relatively constant, at around 30 m2 per capita; the 7% increase from 44 million m2 to 47 billion m2 is mainly driven by a similar percentage increase in population (of around 100 million) over the period. In the Global South in 2050, there is 63% more residential floorspace than in 2020, driven by an increase in demand per capita (from 22 m2 to 29 m2) and a population increase of about 800 million over the period. This increase in per capita floorspace in the Global South is key to the LED scenario’s progress towards the SDGs, in particular, SDG 1 on the reduction of poverty (Grubler et al., 2018).
Under the LED scenario, commercial floorspace in the Global North grows 46% to 35 billion m2 (an average of 23 m2 per capita). Unlike the residential sector, per capita floorspace in the commercial sector in the Global South does not equal that in the Global North, growing to just 9 m2. This lower figure is offset by (and may be a result of) the larger population, as total commercial floorspace in the Global South reaches 68 billion m2 in 2050, double that of the Global North. Total global floorspace for the residential and commercial sectors in 2050 is 264 billion m2 and 104 billion m2, respectively, corresponding to compound average growth rates of 1.3% and 1.7%.
4.1.2 Comparison with other scenariosFor context, Table 2 provides floorspace estimates from the IEA’s Transition to sustainable buildings report (IEA, 2013). The regional

25
figures are not directly comparable because of definitional differences (the Organisation for Economic Co-operation and Development (OECD) used by the IEA does not equate to the Global North used by Grubler et al., for example). At a global level, the lower residential floorspace requirements projected under the LED scenario reflect a lower population estimate and more compact housing. Conversely, the increase in prosperity in the Global South envisaged under the LED scenario leads to far greater commercial floorspace requirements than projected by the IEA. As Figure 8 shows, overall, the total floorspace estimate under the LED scenario is between 80% and 103% of that projected under other scenarios for which data were available. Of note is that all these projections show a considerable reduction in the annual growth rate of 3% observed between 2000 and 2017 (IEA, 2019b). We found no comparable data estimating infrastructure activity in 2050, so we assume that its growth is proportional to that of buildings.13
13 As we calculate activity in percentage terms relative to a BAU scenario, this does not affect our results. Indeed, we would argue that the increase in densification under the LED scenario would fuel a decline in infrastructure-related activity compared with BAU, owing to the economies of scale possible with greater urbanisation.
Table 2 Changes in built area under the LED and the IEA’s buildings analysis scenarios
Scenario Region Year Population (billion)
Residential floorspace Commercial floorspace
Total (billion m2)
Per capita (m2/person)
Total (billion m2)
Per capita (m2/person)
LED Global North 2020 1.5 44 30 24 16
Global South 2020 6.2 134 22 39 6
World 2020 7.6 178 23 62 8
Global North 2050 1.6 47 30 35 23
Global South 2050 7.6 218 29 68 9
World 2050 9.2 264 29 104 11
IEA OECD 2050 1.4 82 134 31 22
Non-OECD 2050 8.1 212 83 32 4
World 2050 9.5 294 31 63 7
Note: Totals may not sum due to rounding.Source: Grubler et al. (2018); International Energy Agency (IEA) (2013)
Figure 8 Total floorspace projections under various scenarios
0
100
200
300
400
500
2020(Grubleret al.,2018)
2050 LED(Grubleret al.,2018)
2050(IEA,2013)
2050(IEA,
2019b)
2050(Statista,
2016)
Tota
l �oo
rspa
ce (b
illio
n m
2 )
Sources: IEA (2013; 2019b); Grubler et al. (2018); Statista (2016)

26
In Figure 9, we illustrate the variation between the space allocated per person for new houses built in different countries by dividing the average size of new housing by the average household size in each country. Figure 9 also shows that the average residential footprint in the LED scenario equates to something similar to the average new home built in Spain, Italy or the UK. This is considerably more space than in Russia, China and Hong Kong, but far less than in North America, Germany and Australia. The LED average is also notably higher than the minimum level set by the UK’s building standards for four-person households (19–23 m2 per person) and similar to that for two-person households (26–30 m2 per person) (DCLG, 2015).
The constraints on space requirements in the LED scenario stem from its emphasis on ‘living in the city’ in the Global North owing to substantial improvements in urban air quality and mobility resulting from progressive planning decisions already being trialled today (such as Barcelona’s superblocks; see Bausells, 2016). Urbanisation in the Global South continues, but urban sprawl is contained, leading to greater densification and a continued shift towards multi-occupant dwellings (flats and apartments) in the compact,
connected and clean cities outlined in the recent report by the Coalition for Urban Transitions (2019). This also aligns the LED scenario with SDG 11 on sustainable cities and communities. As an example of the potential within countries, in the US in 2018, an average single-family unit was 240 m2, but the average for a new home in a multiple-occupancy building was 108 m2 (USCB, 2019).
4.1.3 Longer-lived buildings Under the LED scenario, demolition and replacement rates decrease from current levels in both the residential and commercial sectors. This is in part driven by the fact that decision-making during the construction and renovation of buildings is being rebalanced away from its current focus on capital costs to take better account of lifetime costs (Menzies, 2013). This is similar to the trend seen in the automotive sector and the growth of electric vehicles (see, for example, Palmer et al., 2018).
Another contributor to longer building lifespans is an increased focus on far higher levels of energy efficiency (which can be more capital intensive than alternative, less efficient construction choices) and global recognition of
Figure 9 Illustration of housing footprints (m2 per capita) for new houses built in different countries
Japan
Russia
UK
GreeceFrance
Canada
Germany
China
Hong Kong
Italy
SpainUSA
Australia
LED Average
Note: Data limitations mean this graphic should be considered illustrative only. Source: Shrinkthatfootprint.com (n.d.); UNDESA (2019).

27
the need to reduce embodied emissions in order to meet the Paris climate-change goals. Policy that supports renovation over demolition and new construction is already beginning to emerge: the city of Stockholm recently introduced legislation requiring developers who want to demolish a building to carry out a life-cycle assessment to demonstrate that the new building will result in a lower carbon footprint than could be achieved through renovation (J. Jarvinen, pers. comm., 2020).
Average building lifespans are assumed to increase in line with those set out in the IEA’s recent report on material efficiency (IEA, 2019a). This projects average lifespans of 80 years for the residential sector and 50 years for the commercial sector (up from 50 and 30 years, respectively, today), with the global average essentially converging on values observed today in western Europe (IEA, 2019a; 2019b; Johansson et al., 2012). This marks a considerable deviation from current practices in rapidly growing construction sectors: average lifespans in China, India and Brazil are currently less than 35 years (IEA, 2019a).
14 We neither provide activity comparisons to other projections nor disaggregate beyond the global data, as we could not find replacement rates for the alternative scenarios and only have a global aggregate for the construction sector’s consumption of plastic.
4.1.4 Impact on construction activityWe have so far discussed the impact of the above factors on the total floor area of residential and commercial buildings, but to understand the impact on demand for construction in 2050, we need to calculate the construction activity this will entail. This is a combination of net additions (to satisfy the global increase in floorspace) and replacement buildings, which have no impact on total global floorspace. Under the scenario modelled here, using the assumptions detailed above, net construction activity in the residential and commercial sectors in 2050 is 48% and 66% higher, respectively, than in 2020. As noted, infrastructure activity, which is largely beyond the scope of this analysis, is considered to grow proportionally with building construction activity. Figure 10 shows how we interpret construction activity to grow under the LED scenario, with the above-mentioned replacement (demolition + new construction) rates.14 In both the residential and commercial sectors, replacements form a smaller part of total activity in 2050 than in 2020, reflecting the increase in average building lifespans over the period.
Figure 10 Construction activity in the residential and commercial sectors 2020–2050 for longer-lived buildings
Com
mer
cial
bui
ldin
g ar
ea (b
illio
n m
2 )
2020 2030 2040 20500
1
2
3
4
5
6
7
Net additions Refurbishments
2020 2030 2040 20500
1
2
3
4
5
6
7
Resi
dent
ial b
uild
ing
area
(bill
ion
m2 )
A B
Source: Authors’ calculations based on Grubler et al. (2017)

28
4.1.5 High-level impacts on demand for plasticsThe consumption of plastics by the construction sector is a function of construction activity (m2 added or replaced) and the plastic intensity of that activity (the amount of plastics used per m2 added or replaced). Recent growth in plastics consumption by the construction sector has been driven by growth in both factors.
The LED scenario implies that annual residential construction activity in 2050 will be 22% higher than in 2015 and 34% higher in the commercial sector. This would correspond to an increase of 26% for the sector overall compared with 2015 (the latest data available on sectoral plastics consumption). Crudely, if the intensity at which plastic was used in 2015 continued to 2050, this would result in a construction sector that consumed 82 Mt of plastic in 2050. For comparison, annual growth of 3%, as assumed under the BAU scenario (which combines growth in construction activity and plastics intensity), would result in plastics consumption of 183 Mt in 2050. Thus, the decrease in construction activity in the low-plastic consumption scenario presented here, compared with BAU, would reduce construction-sector demand for plastics by 55% if intensity remained unchanged.15 For comparison, the growth assumed under the BAU scenario is considerably lower than many short-term market forecasts, which project annual growth of 5.4% (Market Insight Reports, 2019) to 6.9% (SBWire, 2019) for plastics in the construction industry – itself slated to grow by anything from 4.2% (Research and Markets, 2018) to 7.1% (Damodaran, 2019) a year over the next five years.
These figures only capture new construction activity, but plastics are also used today in building refurbishments, including retrofitting to
15 The LED scenario assumes a uniform dematerialisation factor (-50%) for all plastics derived from fossil fuels (see supplementary material to Grubler et al., 2018: 62). We do not include this top-down factor here, as our focus is on looking at sectoral opportunities for reducing plastic demand from the bottom up.
improve energy efficiency, which play a key role in extending building lifespans under the LED scenario. Other things being equal, an increase in renovation could be interpreted as leading to an increase in plastic use. However, as we will see in the following sections, most plastic use is for building aspects that are unlikely to be replaced during renovation (insulation, for example) or for which there are readily available non-plastic substitutes (for example, uPVC windows). This leads us to discount the potential increase in plastic demand caused by an increase in renovation rates.
In addition to these changes in activity, the LED scenario also proposes various ways in which the intensity of use by the construction sector may be decreased, by reducing the demand for the services plastics provide (further dematerialisation) and through substitution with other products (covered in the following section).
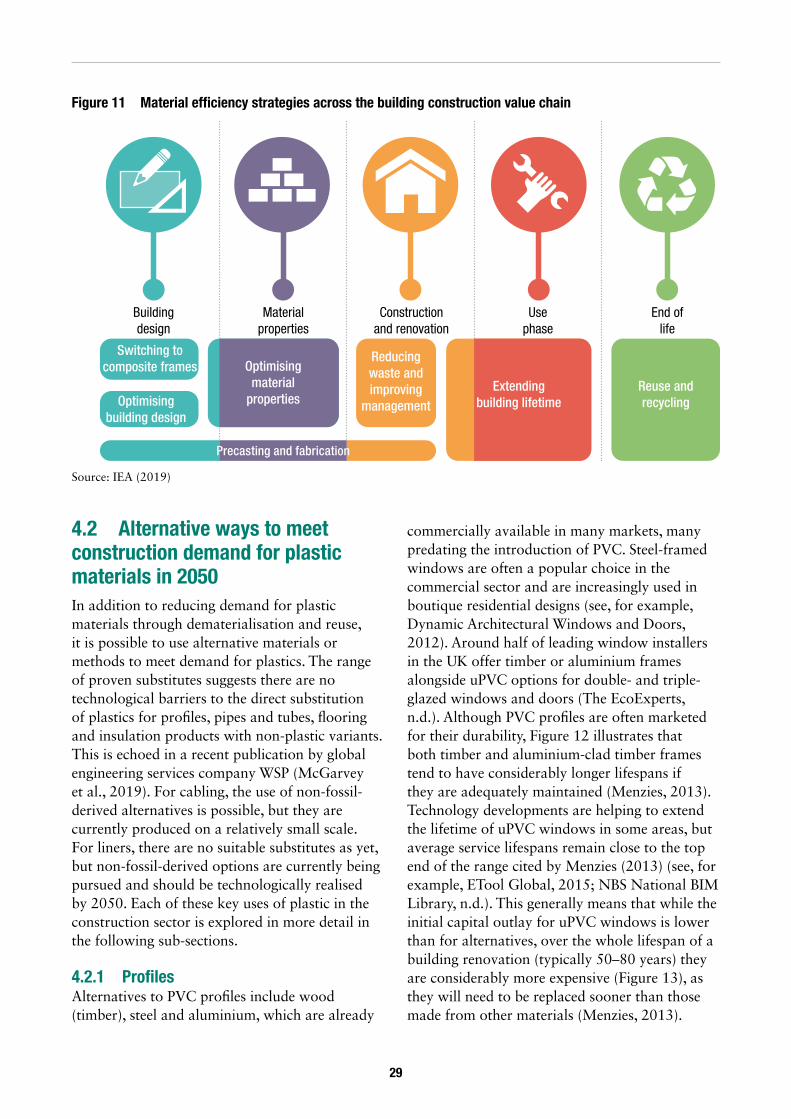
One suggestion relates to densification. A shift from single-family homes to multiple-occupancy buildings significantly decreases the number of roofs and exterior walls per dwelling. This could reduce per-home demand for insulation, roofing materials and external door and window profiles compared with continued building of single-family homes. Similar approaches could be taken to reduce per-home or per-business requirements for piping and cabling as part of the strategies to optimise building design to improve material efficiency set out in Figure 11. There are also clear opportunities for the direct reuse of serviceable plastic materials that can be harvested from demolition and renovation projects (insulation, for instance). Despite their obvious potential to reduce the demand for plastic materials, we have been unable to quantify their impact.
29
4.2 Alternative ways to meet construction demand for plastic materials in 2050 In addition to reducing demand for plastic materials through dematerialisation and reuse, it is possible to use alternative materials or methods to meet demand for plastics. The range of proven substitutes suggests there are no technological barriers to the direct substitution of plastics for profiles, pipes and tubes, flooring and insulation products with non-plastic variants. This is echoed in a recent publication by global engineering services company WSP (McGarvey et al., 2019). For cabling, the use of non-fossil-derived alternatives is possible, but they are currently produced on a relatively small scale. For liners, there are no suitable substitutes as yet, but non-fossil-derived options are currently being pursued and should be technologically realised by 2050. Each of these key uses of plastic in the construction sector is explored in more detail in the following sub-sections.
4.2.1 ProfilesAlternatives to PVC profiles include wood (timber), steel and aluminium, which are already
commercially available in many markets, many predating the introduction of PVC. Steel-framed windows are often a popular choice in the commercial sector and are increasingly used in boutique residential designs (see, for example, Dynamic Architectural Windows and Doors, 2012). Around half of leading window installers in the UK offer timber or aluminium frames alongside uPVC options for double- and triple-glazed windows and doors (The EcoExperts, n.d.). Although PVC profiles are often marketed for their durability, Figure 12 illustrates that both timber and aluminium-clad timber frames tend to have considerably longer lifespans if they are adequately maintained (Menzies, 2013). Technology developments are helping to extend the lifetime of uPVC windows in some areas, but average service lifespans remain close to the top end of the range cited by Menzies (2013) (see, for example, ETool Global, 2015; NBS National BIM Library, n.d.). This generally means that while the initial capital outlay for uPVC windows is lower than for alternatives, over the whole lifespan of a building renovation (typically 50–80 years) they are considerably more expensive (Figure 13), as they will need to be replaced sooner than those made from other materials (Menzies, 2013).
Figure 11 Material efficiency strategies across the building construction value chain
Normal body fontBolder body font
Key box
Normal body fontBolder body font
Key box
Precasting and fabrication
Buildingdesign
Materialproperties
Constructionand renovation
Use phase
End oflife
Switching to composite frames
Optimisingbuilding design
Optimisingmaterial
properties
Reducingwaste andimproving
managementExtending
building lifetimeReuse andrecycling
Source: IEA (2019)

30
For non-frame uses (such as fascias, soffits and cladding), wood, fibre, cement, steel and aluminium are already used in place of PVC profiles (Biatz et al., 2004).
4.2.2 Pipes, tubes, gutters and fittingsAlternatives to plastics for piping, tubing and guttering vary by application. Table 3 illustrates the main uses of plastic in these sectors and where
alternatives are available. We note that acceptance and use of different materials for piping applications varies significantly from country to country. A review of US water mains found very little HDPE (0.5%) in use there (Folkman, 2018), while it was the most common option in China (Zhanjie, 2014). Elsewhere, another report found there was little interest in plastic pipes for water mains overall in the UK, Germany and France (Zoran, 2016).
Figure 12 Whole-life cost (net present value) of installing different window frames
20 30 40 50 60 70 80 90
Aluminium
PVC-U
Timber
Al-clad timber
Window service life (years)
Source: Menzies (2013)
Figure 13 Service life of window types, as reported in industry literature
550
600
650
700
750
800
Timber Modified timber Al-clad timber PVC-U
NPV
, inc
ludi
ng in
flatio
n (£
)
Source: Menzies (2013)

31
4.2.3 FlooringThere is a wide range of alternatives to PVC flooring, depending on the application. Examples include (Biatz et al., 2004; Green Building Supply, n.d.):
• marmoleum (bio-linoleum) • wood and wood panels (non-plastic composites) • cork • concrete • ceramic tiles • stone • rubber • carpet (non-plastic).
4.2.4 InsulationA large number of non-plastic insulation materials are already available. Stone and glass wool are the main competitors in the insulation market; combined, they have a larger market share than EPS and PUR. The last decade has also seen a substantial increase in the number of biomass-based materials being reported as useful insulation products (Asdrubali et al., 2015; Liu et al., 2017; ASBP, n.d.). Some involve using locally sourced, non-edible agricultural waste, while others use bio-based materials recycled from other sectors – such as fibres, which are the focus of the EU-funded Sustainable Bio & Waste Resources for Construction industrial–academic collaboration (Construction21 International, n.d). Many of these resources are globally available and a recent paper cites various
research into the potential of creating insulation from wheat, rice, maize, sawdust, date palm, cotton, sunflower, hemp, sugarcane, bark and bamboo residue (Muthuraj et al., 2019).
4.2.5 CablingAlmost all cable insulation and sheathing is made from plastic. Historically, bitumen-impregnated paper and natural rubber were used, but both have been superseded by synthetic materials (OElectrical, n.d.). Most cables are protected with the plastics discussed here (particularly PVC and PE), but many others can also be used, including silicones, synthetic rubber and plastic materials such as polytetrafluoroethylene (PTFE), nylon and fibreglass (plastic materials reinforced with glass fibres) (Webro, 2016; Grainger, n.d.). All of these alternatives are partially or wholly derived from fossil fuels, so not considered suitable substitutes.
The polyamide biopolymer Rilsan PA 11 is 100% renewable and derived from castor oil, however, and has reportedly been used for cable sheathing for 50 years, offering benefits over conventional plastic types, such as resistance to termites (Arkema, n.d.). It is likely that other non-fossil-fuel options exist, albeit in niche markets.
4.2.6 LinersThe chemical composition of most liners (LDPE and PVC) make them hydrophobic and intrinsically useful as waterproofing agents. With low demand for alternatives until now,
Table 3 Plastic uses and alternatives for different pipe requirements
Use Current use Non-plastic alternatives already in use
Reference
Small-diameter water pipes, including hot/cold/potable (domestic, commercial, light industrial) (up to 3 inches diameter)
Common (PVC and PP) Copper, stainless steel Biatz et al., 2004
Medium- and large-diameter pipes (3–12 inch and 12+ inch) for cold water, sewage and other fluids (such as natural gas) at low to moderate pressure, electrical and communication cables
Common (PVC, HDPE) Asbestos cement, cast iron, ductile iron, steel, vitrified clay, concrete
Folkman, 2018; Zoran, 2016; Muñoz, 2016
Guttering/downpipes, soil pipes Common (PVC) Aluminium, steel, copper, wood, non-guttering water-dispersal systems
Citywide Gutters and Exteriors, 2015; Rainhandler, n.d., Wood Gutters, n.d.

32
there has been relatively little interest in creating non-fossil plastic materials. For roofing, a major use of polymer sheeting, the most common alternative is roofing felt. However, a major constituent of this material is bitumen, which is derived from crude oil. Although this is not a plastic, it is not deemed a useful substitute, as the aim is to remove fossil-fuel-based materials from the supply chain. The sustainability agenda is accelerating research in this area and some companies already offer lining materials mainly constituted from recycled non-fossil materials, with a much lower plastic content (for example, the pro clima DB+ range; see Ecological Building Systems, 2015). In addition, BMI, the world’s largest roofing and waterproofing business, is
currently undertaking research with a view to create ‘a 100% bio-based roofing membrane … that is a true ‘drop-in’ alternative to existing roofing materials’ (van der Berg, 2018).
If a direct substitute cannot be created from biomass-derived products, it will be necessary to create a similar product to today’s sheeting liners, but based on recycled or non-fossil hydrocarbon feedstock. To reduce the amount of virgin materials used in these applications, most of the material requirements would need to come from recycled sources. One benefit of this is that plastics used in liners generally have lower technical and aesthetic requirements than those used in other applications, potentially opening up a wider range of materials that could be ‘downcycled’.
33
5 Pathways to 2050
Achieving the 2050 vision would require action in various parts of the sector over the next 30 years. This section is set out in three stages. The first outlines some of the most important changes the sector would need to make to achieve the 2050 vision and when these will be technically possible. The second provides a brief analysis of current trends in the sector and whether these are moving towards or away from the low-plastic-demand scenario. The third builds on these trends to provide a high-level political-economy analysis that investigates what might be done, and by whom, to shift the sector away from BAU towards achieving the low-plastic-demand scenario in 2050. This includes outlining the interests and incentives of various key stakeholders that sustain BAU within the sector and how these would need to change.
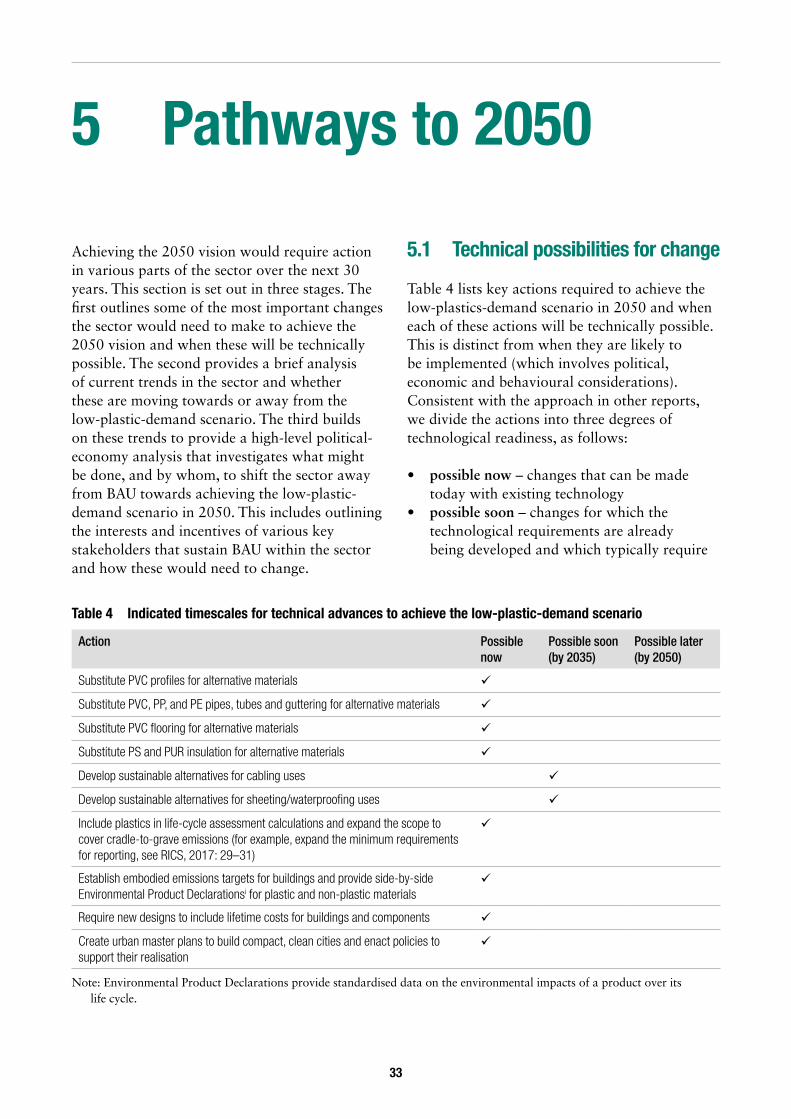
5.1 Technical possibilities for change
Table 4 lists key actions required to achieve the low-plastics-demand scenario in 2050 and when each of these actions will be technically possible. This is distinct from when they are likely to be implemented (which involves political, economic and behavioural considerations). Consistent with the approach in other reports, we divide the actions into three degrees of technological readiness, as follows:
• possible now – changes that can be made today with existing technology
• possible soon – changes for which the technological requirements are already being developed and which typically require
Table 4 Indicated timescales for technical advances to achieve the low-plastic-demand scenario
Action Possible now
Possible soon (by 2035)
Possible later (by 2050)
Substitute PVC profiles for alternative materials
Substitute PVC, PP, and PE pipes, tubes and guttering for alternative materials
Substitute PVC flooring for alternative materials
Substitute PS and PUR insulation for alternative materials
Develop sustainable alternatives for cabling uses
Develop sustainable alternatives for sheeting/waterproofing uses
Include plastics in life-cycle assessment calculations and expand the scope to cover cradle-to-grave emissions (for example, expand the minimum requirements for reporting, see RICS, 2017: 29–31)
Establish embodied emissions targets for buildings and provide side-by-side Environmental Product Declarationsi for plastic and non-plastic materials
Require new designs to include lifetime costs for buildings and components
Create urban master plans to build compact, clean cities and enact policies to support their realisation
Note: Environmental Product Declarations provide standardised data on the environmental impacts of a product over its life cycle.

34
incremental advances in or repurposing of existing technologies
• possible later – changes that require fundamental technological advances, which may be at the concept stage of technological development or require a plausible but unrealised technological breakthrough.
These actions are specific to plastics used in the construction sector and complement those set out in the synthesis report for plastics in general (for example, to develop wide-scale chemical recycling). These plastics-focused technical actions also complement the broader societal changes that would lead to the outcomes envisaged in the LED scenario (clean, compact cities) and the policy and sectoral trends described in the following sub-section.
5.2 Directions and trends
5.2.1 Increasing intensity of plastic use in new buildingsThe construction industry is becoming more plastics-intensive; its demand for plastic materials has increased faster than construction-sector activity overall. On average, a new 100 m2 building today will contain more plastic than a 100 m2 building completed in the past. This is not universal, however. The IEA (2019a) notes stark geographic differences in the building materials used: local materials that are not derived from fossil fuels are much more common in Africa, the Nordic countries and parts of North America and Japan than on new developments in China, for example.
Much of this growth comes down to upfront costs. Although their useful lives may be shorter than those of non-plastic alternatives, plastics are considered fit for purpose in most applications, especially by construction firms. Yet, some plastics may not be the most economic choice for the end user. For example, while cheaper initially, plastic components may need to be replaced more often than non-plastic alternatives. This difference in economic incentives between users and suppliers is an obvious market failure. Construction firms’ preference for plastics over non-plastic alternatives is further compounded by the fact that plastics’ uniformity makes them
easier to manufacture and install (requiring less specialist knowledge). This latter takes on added significance in view of the construction sector’s chronic lack of investment in training (McKinsey & Co., 2017). Plastic use may also have increased because of regulation. In China, official mandates to minimise the use of wood shifted demand to uPVC profiles (Markets Insider, 2017).
Arresting this trend towards higher plastic intensity is likely to encounter similar barriers to other low-carbon building materials (Giesekam et al., 2016). The construction industry is known to be highly fragmented, conservative and slow to adapt (McKinsey & Co., 2017; WEF, 2016). The spread of new technologies is hampered by a lack of knowledge transfer (WEF, 2016). Economic incentives are often confounded by persistent market failures (McKinsey et al., 2017) and, in many countries, promoting change through regulation often sees poor levels of compliance (see, for example, CCC, 2019).
5.2.2 Composite materials A subsidiary of the major plastics trade body in the US notes that all of the main plastic types analysed in this study are routinely used in composite materials (Green Building Solutions, n.d.). The range of polymer binder and substrate materials yields a very large number of potential materials, each with different potential uses. Current use of these bulk plastics in composite materials is thought to be relatively small compared with the uses discussed previously. However, new composite products continue to be launched and this area has substantial political and commercial backing (see, for instance, Composites Leadership Forum, 2016), suggesting it could be a much more prominent consumer of plastic materials in years to come. One notable impact of growth of this area would be on plastic waste, as the close integration of materials in composites may prevent mechanical recycling and complicate chemical recycling.
5.2.3 Fire safety regulationsThe combustibility of plastic and the toxic smoke released upon combustion has gained considerable attention in recent years after several tall-building fires linked to plastic-based cladding (see, for example, BBC, 2017). An

35
investigation into causes of death in the Grenfell Tower fire in London in 2017 pointed to PE droplets from a composite fascia board, which set light to PIR insulation boards, releasing a toxic cocktail of gases that overwhelmed many of the residents (McKenna et al., 2019). Recent research has shown that the addition of flame retardants, such as those used in plastic products, may not prevent fire-related deaths – and may even contribute to them. While fire retardants delay ignition, they usually do not prevent it and, instead, create far more toxic fumes – the leading cause of fire-related deaths (Stec and Hull, 2011). The same research showed that alternatives to the plastic-based insulation materials, such as glass wool or stone wool, did not catch fire or release toxic materials when exposed to fire. There is precedent for related policy: plastic-filled cladding has been banned in tall buildings in Germany since the 1980s (Davies et al., 2017).
5.2.4 Embodied emissions and whole-life costs National and international groups are beginning to advocate reductions in buildings’ embodied carbon emissions – those involved in the production and disposal of building components – in addition to emissions released through use (such as from heating and power). A recent report by The World Green Building Council (WGBC) (an international network of around 70 national green building councils) proposes targets for new buildings to have 40% less embodied carbon by 2030 and net zero embodied carbon by 2050 (WGBC, 2019). The IEA has called for a life-cycle approach to improve the design, reuse and recycling of building components and for ‘increasing material use data collection and benchmarking’ and for ‘life-cycle CO2 emissions per m2 targets to promote low-carbon buildings construction’ (IEA, 2019a: 1, 64). The Embodied Carbon Review found more than 100 regulations and certification systems in place across 26 countries that specifically address embodied carbon, more than double the number of regulations and certification systems five years previously (Bionova, 2018). Even so, sustainable building standards and their enforcement vary from country to country and most people still live in countries without any such standards.
Reducing embodied carbon by choosing less-carbon-intensive materials has been facilitated by the increased availability of comparable Environmental Product Declarations and whole-life costs for construction projects (WEF, 2016). Whole-life costing is now routinely carried out in many countries, driven by developments in building information modelling (BIM) tools (see, for example, Bentley, 2015), the integration of tools that assess environmental and financial costs (such as OneClickLCA, n.d.) and national standards like those issued in the US by the National Institute of Standards and Technology (Fuller, 2016).
Greater focus on the carbon footprint of buildings, longer-lived buildings and whole-life costs could promote a shift towards specification of components with a lower carbon footprint. The decarbonisation of the energy sector envisaged under the LED scenario would make most alternatives to fossil-derived plastic produced in 2050 less carbon intensive, even for those materials with more carbon-intensive production routes at present. As seen in the energy-efficiency sector (Morrissey and Horne, 2011), such approaches could reduce the importance of upfront costs, helping to overcome the higher capital costs faced by many plastic alternatives. To date, this trend has overwhelmingly concentrated on the emissions embodied in steel and concrete, which are mainly employed for structural purposes (such as foundations, walls and load-bearing supports), with many plastic components not considered in minimum embodied emission analyses (RICS, 2017). This may be because the embodied emissions in plastics are a small proportion of a building’s total mass and, hence, its overall embodied emissions. However, the recent WGBC (2019) report explicitly mentions plastics, suggesting a more holistic view that includes plastics may soon emerge.
5.2.5 Indoor air quality and toxicityThere is a growing awareness of the potential impact of plastic additives and the materials used to install them. Some types of laminate flooring that contain the thermosetting plastic melamine have been shown to release formaldehyde at levels well in excess of indoor

36
air-quality standards (CDC, 2016). Other studies on newborn children report that phthalates (suspected endocrine-disrupting chemicals) added as a plasticiser to PVC flooring can be absorbed by humans (Carlstedt et al., 2012).
Although such research findings are contested (Blakey et al., 2012), the trend appears to be towards phasing out plastics with toxic potential. A recent review of the extent to which the various health impacts of PVC could be mitigated concluded that, ‘The totality of issues revealed in relation to PVC presents a compelling case for a call for complete elimination of use of this material in sustainable construction’ (Petrovic and Hamer, 2018: 1). The EU has already banned the use of the most common phthalates and, as Pecht et al. (2018: 6233) notes: ‘It is likely that all phthalates will eventually be found to be harmful and banned, since they all have the same foundational composition.’ It is possible to use more benign additives, yet it seems equally possible that public opinion may turn away from plastic materials altogether where alternatives exist.
5.2.6 Offsite constructionThere are increasing signs that the construction industry is beginning to transition towards projects where building components are prefabricated offsite and then installed, rather than manufactured in situ. In the UK, the technique became popular as a way to rapidly building housing estates during the 1950s (London Assembly, 2017), but it has expanded more recently into the creation of bespoke build with high sustainability levels and now accounts for 7% of the industry’s value (Southern, 2016).
Prefabricated projects can yield considerable benefits over traditional projects, both in terms of cost and speed. Offsite construction of a 50-storey office building in London saved £36 million (7% of total costs) compared with an on-site construction model (Southern, 2016), while in China, in 2011, Broad Sustainable Buildings famously constructed 93% of a 30-storey hotel offsite and then assembled it in 15 days (Peiffer, 2016).
Offsite construction has received support from international, national and subnational agencies for many years (see UKCES, 2015;
EIT, 2012). In the UK, it features in three of the ten recommendations of the government-commissioned Farmer Review into how to modernise the construction industry (Farmer, 2016) and is part of the Construction Sector Deal with government to boost industry productivity through innovation and training (BEIS, 2019). Recent public procurement drives have prioritised offsite manufacturing for housing and government departments, partly in recognition of offsite manufacturing’s potential to reduce buildings’ embodied carbon (London Assembly, 2017; IPA, 2018). Europe and North America are already mature markets for offsite construction, and the Chinese construction industry is accelerating its spread throughout the industry (Dou et al., 2019).
Sector experience of the offsite construction of timber building products could also apply to plastic products and suggests there are three main areas that could affect plastics in construction:
1. Offsite manufacture drastically reduces wastage compared with on-site construction, by eliminating off-cuts and precise designs avoiding overspecification (House of Lords, 2019).
2. Offsite and modular construction can also be combined with design for deconstruction, increasing the reuse of any plastic materials used (BRE, 2015).
3. Offsite construction also reduces the number of decision-makers involved in any given construction project and could give designers much more control over the materials procured for projects (as opposed to current models, which often rely on individual contractors to make these decisions) (Taylor, 2009).
5.3 High-level political-economy analysis
5.3.1 The current situationPlastics are used for a variety of construction purposes, largely based on producer or supplier choice rather than consumer demand or taste. In many cases, plastics have been employed to replace previously used materials rather than to create entirely new products. Plastics’ relatively low cost and acceptable performance in a wide range of contexts explain their
37
continued prominence. Their diverse uses have spawned thousands of supply-chain companies that transform bulk plastic materials into usable products for the construction industry. Government policy on building materials primarily targets building safety, while environmental policies are overwhelmingly aimed at incentivising energy efficiency to reduce in-use carbon emissions, rather than regulating the embodied carbon in building materials. Even where embodied carbon is a focus, the contribution of plastic materials is usually overshadowed by that of steel and cement used in features such as walls, foundations and load-bearing supports.
5.3.2 Pathways to changeA fundamental route to change in the construction sector is to adjust the relative cost of plastics and, in particular, make current alternatives to PVC (such as wood, steel or aluminium) relatively more economic. Some of the pathways to these changes may come from upstream changes, such as increasing the price of fossil fuels as a feedstock for plastics through national and international policies. Policies to make plastics relatively more expensive may be insufficient, however, and would need to be supplemented with regulation that restricts producer choice of building materials.
Over the past two decades, there has been greater policy attention on the sustainability of construction and building design. This has resulted in a proliferation of policies aimed at energy efficiency and reducing the environmental impact of buildings (Harrison, 2017; Matisoff et al., 2016). One of the more common types of policy is a certification scheme to accredit buildings – such as the UK’s Building Research Establishment Environmental Assessment Method (BREEAM) certification – for meeting environmental standards, aimed at spurring demand from environmentally conscious consumers.
All EU countries now have some form of environmental performance certificate for buildings (Arcipowska et al., 2014; European Commission, 2014). One initial step towards the 2050 vision is to expand these policies to disincentivise the use of virgin plastic materials. According to Matisoff et al. (2016: 343),
alternative policies could include ‘construction permitting fees, impact fees, and targeting subsidies to buildings that provide positive externalities’. These could be informed by detailed case studies of actions taken by EU countries to progress towards the bloc’s Near-Zero-Energy Buildings standard (Toleikyte et al., 2016) and be enmeshed with building codes, such as those that already exist in at least 111 countries (FM Global, 2016). Public procurement policies could lead the way and encourage industries to provide alternatives to plastic, for example, by regulating the use of plastics in new public housing or office developments. Here, governments could draw on existing initiatives, for example, the UN-led One Planet Network (n.d.), which includes workstreams for both Sustainable Buildings and Construction, and Sustainable Public Procurement.
As mentioned, there are growing calls on the construction industry to account for embodied emissions, not just energy efficiency, in reducing the carbon footprint of buildings. Achieving the 2050 vision requires complementing the visibility of a building’s carbon footprint with consideration of its whole-life costs. Combined, these approaches favour the construction of buildings that are designed to last longer and be renovated, rather than demolished and replaced. The recent WGBC (2019) report provides a number of suggestions about how this may be achieved.
There are other trends that could inspire a move away from plastics, including concerns over the fire safety of plastic building materials and indoor air quality being affected by volatile organic compounds used with some plastic products (such as flooring). As with the automotive sector, the low-plastic-consumption scenario relies on the creation of densely populated compact cities (and, thus, fewer external walls/roofs per capita), so advocacy for policies to disincentivise urban sprawl (as discussed in the accompanying automotive sector report) would be mutually supportive. To this end, as a first step, the Coalition for Urban Transitions (2019) suggests focusing on the different tiers of government responsible for policies on minimum lot areas, maximum building heights, plot coverage ratios and land-use restrictions.
38
5.3.3 ObstaclesConstruction itself is clearly visible and, as a result, the construction industry has often been a target for activism, including on the perceived environmental impact of construction. The challenge, however, is to make the environmental impact of plastics used in construction more publicly tangible. This is difficult, as the benefits of more sustainable building materials in homes do not accrue directly to consumers, even after occupation (in contrast to other ‘green’ measures, such as energy efficiency, which can be marketed as saving direct costs). In addition, the environmental impacts of many plastic construction elements are doubly overlooked – their ‘invisibility’ limits their green signalling effect for end users while, even for climate-conscious construction firms, their carbon footprint tends to be overshadowed by those of cement and steel.
In addition, growth in demand for new construction may be difficult to slow. Expected growth in building floor area is concentrated in the Global South, where construction is forecast to continue apace (in China and India, in particular) (GABC, 2016). The key, then, must be to alter the incentives behind plastics usage in new construction in emerging economies. This is likely to face resistance from industry trade bodies that often lobby for the use of plastic products. This lobbying includes arguing for plastics on environmental grounds, citing their ability to reduce buildings’ energy demand, or their lower carbon footprint than some alternatives (see for example, Plastics Europe, n.d.), narratives that will need to be countered to achieve the low-plastic-consumption scenario.
In the United States, Harrison and Seiler (2011) found that a greater rental premium accrued to environmentally certified buildings in liberal areas.16 As Harrison (2017: 91) describes, ‘To the extent the adoption of environmentally friendly, energy-efficient building design and construction processes are driven by ideological values rather than inherent cost savings or productivity advantages, the
16 Democratic and Republican voting results from the 2008 Presidential election were used as a proxy for political ideology.
economic viability and sustainability of such reforms is dramatically weakened.’ Adding to this challenge is the fact that the costs of environmentally unsustainable construction are currently borne more by users (and society at large) than the construction industry, an issue that public policy will need to address (CCC, 2019b).
5.3.4 Building a coalition for changeA first step would be to push the green, environmentally friendly and energy-efficient building movement to take account of the embodied emissions in plastic building materials, for example, by including the limited use of plastics in the criteria for the ‘green certification’ of buildings. Certification policies also need to be expanded to and institutionalised in those emerging economies where new building construction is likely to grow most rapidly. Chinese Green Building certification systems, for example, are relatively new compared with the Green Mark ratings in Singapore, or the Energy Star or Leadership in Energy and Environmental Design (LEED) rating in the United States (Keitsch et al., 2012; Zheng et al., 2012). Getting a commitment to reduce embodied emissions into these certification schemes provides an opportunity to create visibility for the hidden environmental benefits of reducing plastic use. ‘Green building’ advocates are, at least in theory, natural allies of a plastics phase-out. While there are many producers of plastic building materials, they are relatively diffuse and dispersed, which may limit their political resistance.
There is some evidence (Arcipowska et al., 2014; Chegut et al., 2014; Deng and Wu, 2014; Eichholtz et al., 2012) that green-certified buildings offer economic value to their owners, as the certification generates demand. Campaigners could, therefore, build on expanded certification policies, to make a growing economic case to developers for the use of fewer plastics in building construction. They could also engage in public campaigns to increase environmental consciousness

39
on construction and, thus, signal the value of a ‘green building’ to buyers, tenants and occupants.
Longer term, however, the broad use of non-plastic building materials is likely to require more than certification schemes that influence consumer demand. Rather, policies will be needed
to influence the decisions of the construction industry. This could include making non-plastic alternatives more affordable than equivalent plastic products, potentially through upstream policy measures, or through direct regulation that gradually limits the use of plastic materials in construction.

40
6 Outcomes in 2050
17 The long lifespan of products in the construction sector may limit opportunities for direct reuse, so we do not consider it explicitly here (we include it in our estimate of reduced demand). Examples of direct reuse include insulation removed from deconstructed buildings or sheeting used for temporary industrial purposes (such as lining or covering earthworks).
6.1 Material forecasts
Our projections for the reduction in consumption of virgin plastic products in 2050 compared with BAU are based on several steps. The first is the reduction in activity compared with BAU (55%), as set out in chapter 4. As chapter 5 shows, the intensity of plastics use in the remaining 45% may be decreased by substitution. The extent will vary, depending on use and the availability of alternative materials.
Most plastic uses in construction have readily available non-plastic substitutes, which can be substituted entirely from a technical point of view. Two major uses of plastic in the sector do not yet have ‘drop-in’ substitutes: waterproofing and sheeting materials, and cables. For simplicity, in our material forecast, we include all cables under PVC and all sheeting under PE. Technically, therefore, the demand for most plastic types (PS, PP, PUR, HDPE) could be avoided completely, as could most of the demand for PVC and LDPE. Absent any other data, in cases where alternatives are not already commercial competitors, we conservatively assume that the existence of some non-fossil-fuel plastic alternatives (cabling) and active research by market leaders into substitutes (liners) could enable half of demand to be met by non-plastic sources in 2050. The remainder would need to be met by plastic material that was (in order of preference) reused,17 mechanically recycled, chemically recycled or derived from non-fossil sources. We carried out no analysis on additives or ‘other’ plastics used by the sector, which account for 6.5% and 2.5% of total
consumption, respectively (Geyer et al., 2017). Rather, we assume that the reduction in other plastic types and additives is proportional to the average reduction in bulk plastics. Table 5 details the changes in consumption by plastic type. For aggregated data, see Figure 1.
6.2 GHG emissions and sustainability considerations
Reducing the consumption of virgin plastics in this way could reduce GHG emissions by as much as 300 Mt CO2e in 2050, equivalent to a 97% absolute reduction. The scale of any reduction will depend on the effectiveness of controls to limit the GHG intensity of substitute materials (for example, to avoid creating emissions through land-use changes) and decarbonisation efforts throughout the value chain (in transportation and end-of-life disposal, for instance). Estimating net changes will require comparisons based on service requirements, rather than other metrics (for example, GHG emissions per unit of service rather than per kilogram of material). Where using alternative (including recycled) materials also creates GHG emissions, the net reduction in GHG emissions from avoiding virgin plastic use will be smaller. Conversely, alternative materials that act as carbon stores, such as products derived from timber and agricultural residue, could yield larger net reductions in GHG emissions.
Five of the six substitutes considered by McGarvey et al. (2019) for plastic construction products using today’s technologies resulted

41
in net reductions in GHG emissions.18 However, assessing the GHG impacts in detail is beyond the scope of this study, not least because much of the data required for our purposes (in 2050) does not exist. Our focus on 2050 also cautions against making comparisons using current life-cycle data, as production systems in 2050 – especially energy-production systems, which are a key driver of life-cycle GHG emissions for manufactured products – under the LED scenario are vastly different to those today. Our primary focus on virgin (rather than recycled) plastics relates specifically to their embodiment of fossil carbon in the truest sense of the word, which is not a feature of many other building materials.
In addition to any impacts on GHG emissions, any substitution consideration would also need to include a full range of sustainability elements such as other environmental pollutants and social impacts.
18 Non-plastic alternatives considered for windows, hard flooring, carpet, cladding and guttering had smaller carbon footprints, based on production processes today. The only non-plastic alternative that had a larger carbon footprint, based on today’s production processes, was a cork-based insulation product, though the calculation did not account for carbon sequestered within the cork during the growing process.
6.3 Waste
Geyer et al. (2017) model plastics use in construction based on an average lifespan of 35 years and estimate current (2015) plastic waste production by the construction sector at 13 Mt (20% of consumption). As Figure 4 in chapter 2 indicates, this average lifespan includes a broad range of plastic types and uses. We assume that, in 2050, plastics recycling is carried out holistically across all sectors. Geographically, we assume waste is produced in proportion to demand for new (mainly recycled) plastic materials. Without data on what plastics are used for what purposes in what regions today, we are unable to project disaggregated waste-generation profiles for 2050. The long lifespan of plastics in the sector suggests that legacy plastics will play an important role in waste-generation rates. Thus, we do not assume a constant turnover factor for the construction
Table 5 Estimated change in fossil-fuel plastic demand in 2050
Use Plastic type
Mass under BAU (Mt)
Reduction due to 55% decrease in
activity vs. BAU (Mt)
Reduction due to substitution
Change vs. BAU (Mt)
Residual plastic
demand (Mt)% Mt
Profiles PVC 31.6 –17.4 –100 –14.2 –31.6 0.0
Pipes, tubes, fittings PVC 25.7 –14.1 –100 –11.6 –25.7 0.0
HDPE 30.0 –16.5 –100 –13.5 –30.0 0.0
PP 10.9 –6.0 –100 –4.9 –10.9 0.0
Flooring Insulation
PVC 8.2 –4.5 –100 –3.7 –8.2 0.0
PS 20.0 –11.0 –100 –9.0 –20.0 0.0
PUR 21.8 –12.0 –100 –9.8 –21.8 0.0
Cabling PVC 8.2 –4.5 –50 –1.8 –6.4 1.9
Waterproof liners LDPE 10.0 –5.5 –50 –2.3 –7.8 2.3
Additives 12.0 –6.6 –87 –4.7 –11.3 0.7
Other 4.5 –2.5 –87 –1.8 –4.3 0.3
Total 183.0 –100.6 –87 –77.3 –177.9 5.1
Note: Totals may not sum due to rounding. Sources: Authors and Geyer et al. (2017)

42
sector as we do with other sectors. Rather, noting the 35-year average lifespan, we assume that the amount of waste for each plastic type
generated by the construction sector in 2050 will be equal to the amount consumed in 2015 (in other words, a total of 65 Mt).

43
7 Conclusions
The construction sector is the second-largest consumer of virgin plastic materials. This report illustrates how and where plastics are used by the sector and shows how more than 90% of demand can be attributed to just six bulk plastics, primarily PVC. Sectoral growth in the use of plastics has stemmed mainly from plastic substitution of other materials, born more out of choice than necessity. For the construction industry, plastic materials are typically cheaper, lighter and easier to install than non-plastic alternatives. End users (namely, the building’s occupants) are rarely responsible for the specification of plastic products, many of which are invisible. This allows the industry to choose plastics over alternatives that might be preferable from an end user’s point of view. The relatively long lifespan of plastics in construction compared with other sectors limits the amount of demand that can be met from recycled plastic waste. Where recycling infrastructure exists, downcycling or the substitution of other materials appears to occur.
Our low-plastics-demand scenario illustrates how the consumption of plastic construction materials could be drastically reduced in 2050 compared with a BAU scenario, while making substantial progress towards other SDGs. About half the reduction in consumption would come from a model of urbanisation that pivots away from large single-occupancy buildings that are demolished before the end of their useful life, towards compact cities that prioritise renovation and refurbishment. This would limit construction activity in 2050 to 26% above current rates, slowing growth in demand for all construction
materials (including plastics) compared with a BAU scenario. The remaining reduction in demand considered in this report would stem from reducing the intensity of plastics use by substituting plastic materials. For almost all of the major sector uses of plastics, our analysis has found non-plastic alternatives that are not derived from fossil fuels and are available today. This clearly demonstrates that it is technically possible to significantly reduce the consumption of plastic construction materials in 2050. Under the 2050 low-plastics-consumption scenario, the combined reduction in plastic demand could lead to a significant reduction in GHG emissions.
The emergence of a broader sustainability agenda within the construction industry and growing awareness of the true costs of using plastics across a building’s lifetime suggest the potential to realise this reduction in plastic demand. However, the combination of powerful vested interests, the misalignment of producer/builder and consumer incentives and a perceived sectoral reluctance to change present significant barriers to disrupting the forecast growth of plastics in construction. Voluntary and mandatory standards, better quality and more comparable life-cycle data, as well as shorter supply chains through a shift to pre-fabrication, could focus attention on making more sustainable construction choices and reduce plastic demand. Various players within the sector are already promoting action on each of these issues. The challenge will be to coordinate and scale up these efforts to move them from the fringes to the new status quo.

44
References
Arcipowska, A., Anagnostopoulos, F., Mariottini, F. and Kunkel, S. (2014) Energy performance certificates across the EU: a mapping of national approaches. Brussels: Buildings Performance Institute Europe (http://bpie.eu/wp-content/uploads/2015/10/Energy-Performance-Certificates-EPC-across-the-EU.-A-mapping-of-national-approaches-2014.pdf).
Arkema (n.d.) ‘Rilsan Polyamide 11 Resin’. Paris: Arkema (www.arkema.com/en/products/product-finder/product-viewer/Rilsan-Polyamide-11-Resin/).
Arora, R. (2015) ‘Government makes use of plastic waste in road construction mandatory’. Economic Times of India, 26 November (https://economictimes.indiatimes.com/news/economy/infrastructure/government-makes-use-of-plastic-waste-in-road-construction-mandatory/articleshow/49919167.cms).
ASBP – Alliance for Sustainable Building Products (n.d.) ‘Natural fibre insulation’. London: ASBP (https://asbp.org.uk/natural-fibre-insulation).
Asdrubali, F., D’Alessandro, F. and Schiavoni, S. (2015) ‘A review of unconventional sustainable building insulation materials’ Sustainable Materials and Technologies 4: 1–17 (www.sciencedirect.com/science/article/pii/S2214993715000068?via%3Dihub).
BASF (n.d.) ‘Cable sheathing’. Webpage. BASF (https://plastics-rubber.basf.com/in/en/PP-Electronics-Electric/Wire-Cable.html).
Bausells, M. (2016) ‘Superblocks to the rescue: Barcelona’s plan to give streets back to residents’. The Guardian, 17 May (www.theguardian.com/cities/2016/may/17/superblocks-rescue-barcelona- spain-plan-give-streets-back-residents).
BBC (2017) ‘London fire: Grenfell Tower cladding “linked to other fires”’. BBC News, 17 June (www.bbc.co.uk/news/uk-40283980).
BEIS – UK Department for Business, Energy & Industrial Strategy (2019) ‘Construction sector deal’. Policy Paper. London: BEIS (www.gov.uk/government/publications/construction-sector-deal/construction-sector-deal).
Bentley (2015) ‘Totex approach to asset management key to driving performance’. Infrastructure Intelligence, 13 April (www.infrastructure-intelligence.com/article/apr-2015/totex-approach-asset- management-key-driving-performance).
Biatz, M., Kreissig, J., Byrne, E. et al. (2004) Life cycle assessment of PVC and of principal competing materials. Final Report. Brussels: European Commission (https://ec.europa.eu/environment/waste/studies/pdf/pvc-final_report_lca.pdf).
Bio Intelligence Service (2011) Service contract on management of construction and demolition waste – SR1. Final Report Task 2. Brussels: European Commission (DG Environment) (https://ec.europa.eu/environment/waste/pdf/2011_CDW_Report.pdf).
Bionova (2018) The embodied carbon review: embodied carbon reduction in 100+ regulations and rating systems globally. Helsinki and London: Bionova Ltd (www.oneclicklca.com/wp-content/uploads/2018/12/Embodied_Carbon_Review_2018.pdf).
Blakey, A., Ott, K., Peters, T. and Risotto, S. (2012) ‘Anti-PVC advocacy disguised as science (Response to Carlstedt et al., PVC flooring is related to human uptake of phthalates in infants)’ Indoor Air 23(1): 85–86 (www.ncbi.nlm.nih.gov/pubmed/23013111).
Booth, E. (2019) ‘Recycling plastic and glass into road materials’. Infrastructure Magazine, 17 June (https://infrastructuremagazine.com.au/2019/06/17/recycling-plastic-and-glass-into-road-materials/).
BRE (2015) ‘Design for deconstruction: case study – modular show house construction.’ Blog. Watford, UK: BRE Group. (www.bregroup.com/buzz/design-for-deconstruction-case-study- modular-show-house-construction/).
45
Business Insider (2017) ‘Global vinyl flooring market trends & feasibility report 2017–2022’. Press release. PR Newswire, 30 August (https://markets.businessinsider.com/news/stocks/global-vinyl-flooring-market-trends-feasibility-report-2017-2022-1002295437).
Calton, T., van’t Veer, R. and Meerman, H. (2016) ‘The European plastic pipes industry – recycling commitment’. Proceedings of the 18th Plastic Pipes Conference, 12–14 September 2016, Berlin (www.plasticpipesconference.com/content/263/295/5c86661cc30e3.pdf).
CalRecycle (2019) ‘Matrix: overview of recycled content levels and product availability’. Webpage. Sacramento CA: California Department of Resources Recycling and Recovery (CalRecycle) (www.calrecycle.ca.gov/greenbuilding/materials/matrix/).
Carlstedt, F., Jönsson, B.A.G. and Bornehag, C.-G. (2012) ‘PVC flooring is related to human uptake of phthalates in infants’. Indoor Air 23(1): 32–39 (https://onlinelibrary.wiley.com/doi/abs/10.1111/ j.1600-0668.2012.00788.x).
CCC – Committee on Climate Change (2019a) Net zero – technical report. London: CCC (www.theccc.org.uk/publication/net-zero-technical-report/).
CCC (2019b) UK housing: fit for the future? London: CCC (www.theccc.org.uk/wp-content/uploads/2019/02/UK-housing-Fit-for-the-future-CCC-2019.pdf).
CDC – Centers for Disease Control and Prevention (2016) Possible health implications from exposure to formaldehyde emitted from laminate flooring samples tested by the Consumer Product Safety Commission. Atlanta GA: CDC National Center for Environmental Health and the Agency for Toxic Substances and Disease Registry (www.cdc.gov/nceh/laminateflooring/docs/laminate-flooring-report-3-22-2016_508.pdf).
Chegut, A., Eichholtz, P. and Kok, N. (2014) ‘Supply, demand and the value of green buildings’ Urban Studies 51(1): 22–43 (https://doi.org/10.1177/0042098013484526).
City of Milpitas (2016) ‘Abandonment notes’. Milpitas CA: City of Milpitas Engineering Department (www.ci.milpitas.ca.gov/wp-content/uploads/2016/06/Sewer-Water-Abandonment-Notes.pdf).
Citywide Gutters and Exteriors (2015) ‘Average life expectancy for your gutters’. Webpage (www.citywidegutters.com/average-life-expectancy-gutters/).
Coalition for Urban Transitions (2019) Climate emergency, urban opportunity: how national governments can secure economic prosperity and avert climate catastrophe by transforming cities. Washington DC and London: Coalition for Urban Transitions (https://urbantransitions.global/wp-content/uploads/2019/09/Climate-Emergency-Urban-Opportunity-report.pdf).
Composites Leadership Forum (2016) Lightening the load: delivering UK growth through the multi-sector application of composites. The 2016 UK Composites Strategy. Berkhamsted, UK: Composites UK (https://compositesuk.co.uk/about/industry/uk-composites-strategy).
Construction21 International (n.d.) ‘SB&WRC Project: fostering a circular economy in the construction sector’. Webpage (www.construction21.org/static/sbwrc-project.html).
Corbey, S. (2018) ‘Delivering healthy buildings: plastics and construction’. Presentation to the Delivering Healthy Buildings: Plastics, POE & Embodied Carbon conference, 1 November 2018, Bristol, UK (https://asbp.org.uk/wp-content/uploads/2018/07/ASBP-TGR-01.11.18-Simon-Corbey.pdf).
Dacheng Building Material (n.d.) ‘Product list of waterproof series products’. Webpage (www.geotextile-fabrics.com/products).
Damodaran, A. (2019) ‘Historical (compounded annual) growth rates by sector’ (as of January 2019’. Data file. New York: NYU Stern School of Business (http://pages.stern.nyu.edu/~adamodar/New_Home_Page/datafile/histgr.html).
Davies, R., Connolly, K. and Sample, I. (2017) ‘Cladding for Grenfell Tower was cheaper, more flammable option’. The Guardian, 16 June (www.theguardian.com/uk-news/2017/jun/16/manufacturer-of-cladding-on-grenfell-tower-identified-as-omnis-exteriors).

46
DCLG – Department for Communities and Local Government (UK) (2015) ‘Technical housing standards – nationally described space standard’. London: DCLG (https://assets.publishing.service.gov.uk/government/uploads/system/uploads/attachment_data/file/524531/160519_Nationally_Described_Space_Standard____Final_Web_version.pdf).
Deng, Y. and Wu, J. (2014) ‘Economic returns to residential green building investment: the developers’ perspective’ Regional Science and Urban Economics 47: 35–44 (https://doi.org/10.1016/ j.regsciurbeco.2013.09.015).
Department of Energy (US) (2012) ‘IECC climate zone map’. Washington DC: Department of Energy (https://basc.pnnl.gov/images/iecc-climate-zone-map).
Designing Buildings (2019) ‘Polypropylene’. Designing Buildings Wiki webpage, 15 April (www.designingbuildings.co.uk/wiki/Polypropylene).
Dou, Y., Xue, X., Zhao, Z. and Jiang, Y. (2019) ‘Measuring the factors that influence the diffusion of prefabricated construction technology innovation’. KSCE Journal of Civil Engineering 23: 3737–3752 (https://link.springer.com/article/10.1007/s12205-019-2029-3).
Dupont (2017) ‘Dupont roof protector’. Webpage. Dupont (www.dupont.com/products/tyvek-roof-protector.html).
Dynamic Architectural Windows and Doors (2012) ‘Steel Arte: architecture in steel’. Catalogue. Abbotsford, BC, Canada: Dynamic Architectural Windows and Doors, Inc. (www.dynamicwindows.com/wp-content/uploads/2014/09/Steel-ArteCatalog2012.pdf).
Ecological Building Systems (2015) ‘Pro clima intelligent airtight and windtight building systems’. Product Portfolio. 4th Edition (www.ribaproductselector.com/Docs/4/25264/external/COL147098.pdf).
Eichholtz, P., Kok, N. and Yonder, E. (2012) ‘Portfolio greenness and the financial performance of REITs’. Journal of International Money and Finance 31(7): 1911–1929 (https://doi.org/10.1016/ j.jimonfin.2012.05.014).
EIT – European Institute of Innovation and Technology (2012) ‘NOEM: the no-emission house – EIT Awards 2012 Winner (KIC InnoEnergy)’. Budapest: European Institute of Innovation and Technology (https://eit.europa.eu/news-events/media/noem-no-emission-house-eit-awards-2012- winner-kic-innoenergy).
ESWA – European Single ply Waterproofing Association (n.d.) ‘ESWA’. Website (www.eswa.be/ index.cfm).
ETool Global (2015) ‘Typical life expectancy of building components’. Perth and Melbourne, Australia: ETool Global (https://etoolglobal.com/wp-content/uploads/2015/10/BuildingComponentLifeExpectancy.pdf).
European Commission (2014). ‘Certificates and inspections’. Webpage. Brussels: European Commission (https://ec.europa.eu/energy/en/topics/energy-efficiency/energy-performance-of-buildings/certificates-and-inspections).
European Plastics Converters (n.d.) ‘Plastics products and solutions in construction’. Website (www.plasticsinconstruction.com/).
ERFMI – European Resilient Flooring Manufacturers’ Institute (n.d.) ‘European Resilient Flooring Manufacturers’ Institute’. Website (https://erfmi.com/).
Farmer, M. (2016) Modernise or die: time to decide the industry’s future. The Farmer review of the UK construction labour model. London: The Construction Leadership Council (www.constructionleadershipcouncil.co.uk/wp-content/uploads/2016/10/Farmer-Review.pdf).
FM Global (2016) ‘Country Building Codes Index’. Webpage (www.fmglobal.com/~/media/Files/FMGlobal/Resilience%20Index/P15105.pdf).
Folkman, S. (2018) Water main break rates in the USA and Canada: a comprehensive study. An asset management tool for water utilities. Logan UT: Buried Structures Laboratory, Utah State University (https://digitalcommons.usu.edu/cgi/viewcontent.cgi?article=1173&context=mae_facpub).
Fuller, S. (2016) Life-cycle cost analysis (LCCA). Washington DC: National Institute of Building Sciences, Whole Building Design Guide (www.wbdg.org/resources/life-cycle-cost-analysis-lcca).
https://eit.europa.eu/news-events/media/noem-no-emission-house-eit-awards-2012-winner-kic-innoenergy

47
Future Market Insights (2018) Vinyl flooring market: deployment in commercial spaces to register significant increase over the forecast period: global industry analysis 2013–2017 and opportunity assessment 2018–2028. London and Valley Cottage NY: Future Market Insights (www.futuremarketinsights.com/reports/vinyl-flooring-market).
GABC – Global Alliance for Buildings and Construction (2016) Towards zero-emission efficient and resilient buildings: Global Status Report 2016. Paris: GABC (www.buildup.eu/en/practices/publications/towards-zero-emission-efficient-and-resilient-buildings-global-status-repor-0).
Galaxy Wire (n.d.) ‘Polyvinyl chloride, pvc insulated/jacketed wire & cable’. Webpage (www.galaxywire.com/custom-wire-cable/jacket-insulation/pvc-polyvinyl-chloride/).
Gannon, M. (2014) ‘What are benefits of PVC in cable designs?’. Wire and Cable Tips, 13 March (www.wireandcabletips.com/benefits-pvc-cable-designs/).
Geyer, R., Jambeck, J. and Law, K.L. (2017) ‘Production, use, and fate of all plastics ever made’ Science Advances 3(7): e1700782 (www.researchgate.net/publication/318567844_Production_use_ and_fate_of_all_plastics_ever_made).
Giesekam, J., Barrett, J.R. and Taylor, P. (2016) ‘Construction sector views on low carbon building materials’. Building Research & Information 44(4): 423–444 (www.tandfonline.com/doi/full/ 10.1080/09613218.2016.1086872).
Grainger (n.d.) ‘Wire and cable sleeving’. Webpage (www.grainger.com/category/electrical/electrical-supplies/wire-management-cable-organization/wire-and-cable-sleeving).
Grand View Research (2019) Vinyl flooring market size, share & trends analysis report by product (vinyl sheets, vinyl tiles, luxury vinyl tiles), by application (residential, commercial), by region, and segment forecasts, 2019–2025. San Francisco CA: Grand View Research (www.grandviewresearch.com/industry-analysis/vinyl-flooring-market).
Green Building Supply (n.d.) ‘Sustainable flooring’. Webpage (www.greenbuildingsupply.com/All-Products/Sustainable-Flooring).
Green Building Solutions (n.d.) ‘Composites as high performance building solutions’. Webpage (www.greenbuildingsolutions.org/blog/composites-high-performance-building-solutions/).
Grubler, A., Wilson, C., Bento, N. et al. (2018) ‘A low energy demand scenario for meeting the 1.5 °C target and sustainable development goals without negative emission technologies’ Nature Energy 3: 515–527 (www.nature.com/articles/s41560-018-0172-6).
Hahladakis, J.N., Velis, C.A., Weber, R., et al. (2018) ‘An overview of chemical additives present in plastics: migration, release, fate and environmental impact during their use, disposal and recycling’. Journal of Hazardous Materials 344: 179–199 (www.sciencedirect.com/science/article/pii/S030438941730763X).
Harrison, D.M. (2017) ‘The political economy of energy efficiency’ in N.E. Coulson, Y. Wang and C.A. Lipscomb (eds) Energy efficiency and the future of real estate. New York: Palgrave Macmillan US.
Harrison, D. and Seiler, M. (2011) ‘The political economy of green office buildings’ Journal of Property Investment & Finance 29(4/5): 551–565 (https://doi.org/10.1108/14635781111150394).
House of Lords (2019) Off-site manufacture for construction: building for change. Second report of Session 2017–19 of the Science and Technology Select Committee. HL Paper 169. London: House of Lords (https://publications.parliament.uk/pa/ld201719/ldselect/ldsctech/169/169.pdf).
IEA – International Energy Agency (2013) Transition to sustainable buildings strategies and opportunities to 2050. Paris: IEA (https://webstore.iea.org/transition-to-sustainable-buildings).
IEA (2019a) Material efficiency in clean energy transitions. Paris: IEA (www.iea.org/reports/material-efficiency-in-clean-energy-transitions).
IEA (2019b) Perspectives for the clean energy transition: The critical role of buildings. Paris: IEA (https://webstore.iea.org/download/direct/2496).
InsightData (n.d.) ‘Glazing industry explained’. Webpage (www.insightdata.co.uk/double-glazing-window-conservatory-industry/).
https://www.researchgate.net/publication/318567844_Production_use_and_fate_of_all_plastics_ever_made

48
InterNACHI (n.d.) ‘InterNACHI’s standard estimated life expectancy chart for homes, International Association of Certified Home Inspectors (InterNACHI)’. Webpage (www.nachi.org/life-expectancy.htm).
IPA – Infrastructure and Projects Authority (UK) (2018) Proposal for a new approach to building: call for evidence. London: IPA (https://assets.publishing.service.gov.uk/government/uploads/system/uploads/attachment_data/file/758996/CCS207_CCS1118988908-001_New_Approach_to_Building_WEB_ACCESSIBLE.pdf).
IPCC – Intergovernmental Panel on Climate Change (2018) ‘Summary for policymakers’ in V. Masson-Delmotte, P. Zhai, H.-O. Pörtner et al. Global warming of 1.5°C. Geneva: IPCC (www.ipcc.ch/sr15/).
Johansson, T., Patwardhan, A., Nakicenovic, N. and Gomez-Echeverri, L. (eds) (2012) Global energy assessment – toward a sustainable future. Cambridge University Press (www.researchgate.net/publication/258260552_Global_Energy_Assessment_Toward_a_Sustainable_Future).
Keitsch, M., Geng, Y., Dong, et al. (2012) ‘An overview of chinese green building standards’ Sustainable Development 20: 211–221 (https://doi.org/10.1002/sd.1537).
Liu, L.F., Li, H.Q., Lazzaretto, A. et al. (2017) ‘The development history and prospects of biomass-based insulation materials for buildings’ Renewable and Sustainable Energy Reviews 69: 912–932 (www.sciencedirect.com/science/article/pii/S1364032116308887?via%3Dihub).
London Assembly (2017) Designed, sealed, delivered: the contribution of offsite manufactured homes to solving London’s housing crisis. London: Planning Committee, London Assembly (www.london.gov.uk/sites/default/files/london_assembly_osm_report_0817.pdf).
Market Insight Reports (2019) ‘Building and construction plastics market size growing at 5.4% CAGR to hit USD 112600 million by 2024’. Press release, 16 May (www.marketwatch.com/press-release/building-and-construction-plastics-market-size-growing-at-54-cagr-to-hit-usd-112600-million-by-2024-2019-05-16).
Market Research Gazette (2019) ‘Construction plastics market: expected to generate huge profits by 2026’. Press release, 3 June (https://amarketresearchgazette.com/construction-plastics-market-expected-to-generate-huge-profits-by-2026/).
Markets Insider (2017) ‘uPVC doors & windows market to exceed $47 billion by 2024’. Press release. PR Newswire, 29 August (https://markets.businessinsider.com/news/stocks/upvc-doors-windows- market-to-exceed-47-billion-by-2024-1001959130).
Matisoff, D.C., Noonan, D.S. and Flowers, M.E. (2016) ‘Policy monitor – green buildings: economics and policies’ Review of Environmental Economics and Policy 10(2): 329–346 (https://doi.org/10.1093/reep/rew009).
McGarvey (2019) Working towards a plastic free house. London: WSP (www.linkedin.com/pulse/towards-plastic-free-house-fiona-mcgarvey/)
McKenna, S.T., Jones, N., Peck, G. et al. (2019) ‘Fire behaviour of modern façade materials – understanding the Grenfell Tower fire’. Journal of Hazardous Materials 368: 115–123 (www.sciencedirect.com/science/article/pii/S0304389418312275).
McKinsey & Co. (2017) Reinventing construction: a route to higher productivity. New York: McKinsey Global Institute (www.mckinsey.com/~/media/McKinsey/Industries/Capital%20Projects%20and%20Infrastructure/Our%20Insights/Reinventing%20construction%20through%20a%20productivity%20revolution/MGI-Reinventing-construction-A-route-to-higher-productivity-Full-report.ashx).
Menzies, G.F. (2013) Whole life analysis of timber, modified timber and aluminium-clad timber windows: service life planning (SLP), whole life costing (WLC) and life cycle assessment (LCA). Report for the Wood Window Alliance. Edinburgh: Institute for Building and Urban Design, Heriot Watt University (https://pureapps2.hw.ac.uk/ws/portalfiles/portal/4378394/Final_report_SLP_WLC_and_LCA.pdf).
Modern Building Alliance (n.d.) ‘About us’. Webpage (www.modernbuildingalliance.eu/).Morrissey, J. and Horne, R.E. (2011) ‘Life cycle cost implications of energy efficiency measures in new
residential buildings’ Energy and Buildings, 43(4): 915–924 (www.sciencedirect.com/science/article/abs/pii/S0378778810004330).

49
Muñoz, I.M. (2016) ‘What’s new on PVC?’ Proceedings of the 18th Plastic Pipes Conference, 12–14 September 2016, Berlin (www.plasticpipesconference.com/content/263/295/5c86661e5b5b8.pdf).
Muthuraj, R., Lacoste, C., Lacroix, P. and Bergeret, A. (2019) ‘Sustainable thermal insulation biocomposites from rice husk, wheat husk, wood fibers and textile waste fibers: Elaboration and performances evaluation’. Industrial Crops & Products 135: 238–245 (www.sciencedirect.com/science/article/abs/pii/S0926669019303024).
NBS National BIM Library (n.d.) ‘Traditional 2500 Casement – c10 opener/opener’. Webpage. National Building Specification (NBS) National Building Information Modelling (BIM) Library (www.nationalbimlibrary.com/en-gb/Deceuninck-ltd/traditional-2500-casement-c10-opener- opener?lo=en-GB).
OElectrical (n.d.) ‘Paper-insulated cables with its construction’. Webpage (https://oelectrical.com/paper-insulated-cables/).
One Planet Network (n.d.) ‘A window into sustainable consumption and production across the globe’. Webpage. One Planet Network (www.oneplanetnetwork.org/).
OneClickLCA (n.d.) ‘Life cycle costing – add-on feature: automate building lifetime cost calculations’. Webpage (www.oneclicklca.com/construction/life-cycle-costing-software/).
Palmer, K., Tate, J.E., Wadud, Z. and Nellthorp, J. (2018) ‘Total cost of ownership and market share for hybrid and electric vehicles in the UK, US and Japan’. Applied Energy 209(1): 108–119 (www.sciencedirect.com/science/article/abs/pii/S030626191731526X?via%3Dihub).
Pecht, M.G., Ali, I. and Carlson, A. (2018) ‘Phthalates in electronics: the risks and the alternatives’ IEEE 6: 6232–6242 (https://ieeexplore.ieee.org/stamp/stamp.jsp?arnumber=8126250).
Peiffer, E. (2016) ‘The state of modular construction — and where it’s headed’. Construction Dive, 26 September (www.constructiondive.com/news/modular-construction-state-offsite/426948/).
Petrovic, E.K. and Hamer, L.K. (2018) ‘Improving the healthiness of sustainable construction: example of polyvinyl chloride (PVC)’ Buildings 8(2): 28 (www.mdpi.com/2075-5309/8/2/28).
Plastic Pipe Institute (n.d.) ‘Energy piping systems division’. Webpage (https://plasticpipe.org/energy/).Plastics Europe (n.d.) ‘Plastics in building and construction’. Webpage (www.plasticseurope.org/en/
about-plastics/building-construction).Plastics Europe (2018) ‘Overview plastic waste from building & construction by polymer type and
by recycling, energy recovery and disposal – 1’. Webpage (www.plasticseurope.org/application/files/6315/5730/5565/BC_Table.pdf).
Plastics in Construction (2015) ‘Plastic floor coverings’. Webpage (www.plasticsinconstruction.com/floor-coverings).
PVC4Pipes (n.d.a) ‘PVC – the building plastic’. Webpage (https://pvc4pipes.com/pvc-pipes/pvc-the-building-plastic/).
PVC4Pipes (n.d.b) ‘PVC piping applications’. Webpage (https://pvc4pipes.com/pvc-pipes/pvc-piping-applications/).
PVC4Pipes (n.d.c) ‘PVC pipe atandards’. Webpage (https://pvc4pipes.com/pvc-pipes/pvc-pipe-standards/).Rainhandler (n.d.) ‘About rainhandler’. Webpage (www.rainhandler.com/about-rainhandler/).Rao, N. and Min, J. (2017) ‘Decent living standards: material prerequisites for human wellbeing’ Social
Indicators Research 138: 225–244 (https://link.springer.com/article/10.1007/s11205-017-1650-0).Research and Markets (2018) ‘Growth opportunities for the global construction industry 2018–2023 –
a potential $10.5 trillion market’. Press release. PR Newswire, 5 January (www.prnewswire.com/news-releases/growth-opportunities-for-the-global-construction-industry-2018-2023---a-potential-105-trillion-market-300578103.html).
Research and Markets (2019) Vinyl flooring market: global industry trends, share, size, growth, opportunity and forecast 2019–2024. IMARC Group report (www.researchandmarkets.com/reports/4775734/vinyl-flooring-market-global-industry-trends#rela0-4380142).

50
RICS – Royal Institution of Chartered Surveyors (2017) Whole life carbon assessment for the built environment. RICS professional standards and guidance, UK. First edition. London: RICS (www.rics.org/globalassets/rics-website/media/news/whole-life-carbon-assessment-for-the--built-environment-november-2017.pdf).
SBWire (2019) ‘Construction plastics market worth $105.7 billion by 2023: at a CAGR of 6.9%’. SBWire, 12 May (www.sbwire.com/press-releases/construction-plastics-market-worth-1057-billion-by-2023-at-a-cagr-of-69-1267312.htm).
Shrinkthatfootprint.com (n.d.) ‘How big is a house? Average house size by country’. Webpage (http://shrinkthatfootprint.com/how-big-is-a-house).
Škarka, R. (2008) ‘Pipe market in the CEE’. Plastic pipes conference XIV paper, September 22–24, Budapest, Hungary (www.plasticpipesconference.com/content/1/80/86/5c8666028754a.pdf).
Southern, J. (2016) Smart construction: how offsite manufacturing can transform our industry. London: KPMG (www.buildoffsite.com/content/uploads/2016/08/KPMG-Smart-Construction.pdf).
Statista (2016) ‘Projected growth of building floor area worldwide from 2015 to 2050, by region’. Statistics database (www.statista.com/statistics/731858/projected-global-building-floor-area-growth-by-region/).
Stec, A.A. and Hull, T.R. (2011) ‘Assessment of the fire toxicity of building insulation materials’. Energy and Buildings 43(2–3): 498–506 (https://doi.org/10.1016/j.enbuild.2010.10.015).
Taylor, S. (2009) Offsite production in the UK construction industry. Bootle, UK: Health and Safety Executive (www.buildoffsite.com/content/uploads/2015/04/HSE-off-site_production_june09.pdf).
TEPPFA – European Plastic Pipe and Fittings Association (n.d.) ‘TEPPFA – plastic pipes & fittings voice in Europe’. Website (www.teppfa.eu/).
TEPPFA (2019) ‘100 years lifetime of polyethylene pressure pipe systems buried in the ground for water and natural gas supply’. Brussels: TEPPFA (www.teppfa.eu/wp-content/uploads/TEPPFA-PE100-Position-on-100years-lifetime-of-PE-Pipes-2.pdf).
The EcoExperts (n.d.) ‘Wooden double glazed windows’. Webpage (www.theecoexperts.co.uk/wooden-windows).
Toleikyte, A., Kranzl, L., Bointner, R. et al. (2016) ZEBRA 2020 – nearly zero-energy building strategy 2020: strategies for a nearly zero-energy building market transition in the European Union. Vienna: ZEBRA 2020 (www.zebra2020.eu/website/wp-content/uploads/2014/08/ZEBRA2020_Strategies-for-nZEB_07_LQ_single-pages-1.pdf).
UKCES – UK Commission for Employment and Skills (2015) A 10 year change programme. Developing offsite construction skills for the challenges ahead. London: UKCES (https://assets.publishing.service.gov.uk/government/uploads/system/uploads/attachment_data/file/469805/151021_OSCS_brochure_for_web_reduced.pdf).
UNDESA – United Nations Department of Economic and Social Affairs (2019) ‘Household size and composition, 2019’. Data table. New York: UNDESA (https://population.un.org/Household/index.html#/countries/840).
USCB – United States Census Bureau (2019) ‘New residential construction tables, Table Q6’. Statistics database. Washington DC: USCB (www.census.gov/construction/nrc/index.html).
van der Berg, W.J. (2018) ‘Innovative, sustainable materials for roofing – biobased roofing membranes’. Presentation. Biobased Performance Materials Symposium, 14 June 2018, Wageningen, The Netherlands (https://biobasedperformancematerials.nl/upload_mm/7/8/0/36609b87-56f0-4f23-98d1-b168021f283a_BPM%202018%20-%20Speaker%2008%20-%20Wouter%20Jan%20van%20den%20Berg%20-%20Innovative%20sustainable%20materials%20for%20roofing.pdf).
Vinyl Council Australia (n.d.a) ‘PVC floor and wall coverings’. Webpage (www.vinyl.org.au/pvc-building-solutions/floor-and-wall-coverings).
Vinyl Council Australia (n.d.b) ‘In construction’. Webpage (www.vinyl.org.au/using-vinyl/in-construction). VinylPlus (n.d.) ‘Incineration with energy recovery and material recovery’. Webpage (https://vinylplus.eu/
recycling/recycling-options/incineration-with-energy-recovery-and-material-recovery).

51
VinylPlus (2018) Progress Report 2018: reporting on 2017 activities. Brussels: VinylPlus (https://vinylplus.eu/uploads/Modules/Documents/vinylplus-progress-report-2018.pdf).
Voltimum (2018) ‘Driving the switch to 50% recycled content in PVC cable management’. Blog, 29 October (www.voltimum.co.uk/articles/driving-switch-50-recycled-content-pvc).
Webro (2016) ‘Cable sheath types’. Webpage (www.webro.com/cable-sheath-types/).WEF – World Economic Forum (2016) Shaping the future of construction: a breakthrough in mindset
and technology. Geneva, Switzerland: WEF (www3.weforum.org/docs/WEF_Shaping_the_Future_of_Construction_full_report__.pdf).
WGBC – World Green Building Council (2019) Bringing embodied carbon upfront: coordinated action for the building and construction sector to tackle embodied carbon. London, UK and Toronto, Canada (www.worldgbc.org/sites/default/files/WorldGBC_Bringing_Embodied_Carbon_Upfront.pdf).
Wood Gutters (n.d.) ‘Wood gutters’. Website (http://woodgutters.net/index.html).World Economic Forum, Ellen MacArthur Foundation and McKinsey & Co. (2016). The new plastics
economy: rethinking the future of plastics. Cowes, UK: Ellen MacArthur Foundation (www.ellenmacarthurfoundation.org/publications/the-new-plastics-economy-rethinking-the- future-of-plastics).
Zhanjie, W. (2008) ‘China plastics pipe, status, development, trend’. Proceedings of the 14th Plastic Pipes Conference, 23 September 2008, Budapest (www.plasticpipesconference.com/content/183/275/ 5c866610191fe.pdf).
Zhanjie, W. (2014) ‘The current situation of China plastic pipe industry and market opportunities for further economic development in the future’. Proceedings of the 17th Plastic Pipes Conference, 22–24 September 2014, Chicago IL (www.plasticpipesconference.com/content/208/265/ 5c86661c2c8c2.pdf).
Zhe , D., Wei, R., Liu, C. et al. (2008) ‘Study on the consumption of polyethylene pipe materials in China’. Proceedings of the 14th Plastic Pipes Conference, 23 September 2008, Budapest (www.plasticpipesconference.com/content/1/80/86/5c866602896c3.pdf).
Zheng, J. and Suh, S. (2019) ‘Strategies to reduce the global carbon footprint of plastics’ Nature Climate Change 9: 374–378 (www.nature.com/articles/s41558-019-0459-z).
Zheng, S., Wu, J., Kahn, M.E. and Deng, Y. (2012) ‘The nascent market for “green” real estate in Beijing’ European Economic Review 56(5): 974–984 (https://doi.org/10.1016/j.euroecorev.2012.02.012).
Zoran, D. (2016) ‘Main drivers and barriers for plastic pipes in Europe’. Proceedings of the 18th Plastic Pipes Conference, 12–14 September 2016, Berlin (www.plasticpipesconference.com/content/263/295/5c86661cbc293.pdf).

Evidence.Ideas.Change.
ODI203 Blackfriars RoadLondon SE1 8NJ
+44 (0)20 7922 [email protected]
odi.orgodi.org/facebookodi.org/twitter
ODI is an independent, global think tank, working for a sustainable and peaceful world in which every person thrives. We harness the power of evidence and ideas through research and partnership to confront challenges, develop solutions, and create change.
Related Documents