J. Phys. Chem. Solids, 1972,Vol.33, pp. 2053-2062. Pergamon Press. Printed in Great Britain PHASE RELATIONS AND TRANSFORMATIONS IN THE SYSTEM PbTe-GeTe D. K. HOHNKE, H. HOLLOWAY and S. KAISER Scientific Research Staff, Ford Motor Company, Dearborn, Mich. 48121, U.S.A. (Received29 December 1971) Abstract--Results of a study of the pseudobinary system PbTe-GeTe are reported and discussed. A new phase diagram, the dependence of the lattice constants on alloy composition, and measurements of a phase transformation in Pb,_~GexTe are presented. Complete solid solubility is found above 570°C. An exsolution dome extends from a maximum at 570°C (near 60 mole % GeTe) to about 5 and 96 mole % GeTe at 300°C. For alloys with compositions near GeTe the unit cell parameters depend markedly on the concentration of cation vacancies. The temperature for the cubic to trigonal phase transformation depends on alloy composition, decreasing from about 670°K for x = l to 0°K for x ~ 0.01. The variation of lattice parameters at the transition temperature is continuous within experimental precision. 1. INTRODUCTION SOLID solutions of the IV-VI semiconductors have been the subject of much recent atten- tion, generated by the discovery that Pbl-: Sn~Te and Pb,_~Sn~Se exhibit a band cross- ing [1,2]. However, little is known about the phase relationships in the closely related system PbTe-GeTe. Mazelsky et al.[3] found very limited solubility of GeTe in PbTe at temperatures up to 500°C and Shelimova et al.[4] reported that mutual solubility increased with increasing temperature, but was limited to the composition ranges PbTe-Pb0.gsGe0.3: Te and Pb0.0sGe0.9~Te-GeTe by the occur- rence of a eutectic point at 695°C. Later, work by Woolley and Nikolic[5] showed complete solid solubility between PbTe and GeTe in samples quenched from 600°C. Because of the difference in annealing temperature these last results need not be inconsistent with those of Mazelsky et al.[3] but they are cIearly in- compatible with the phase diagram given by Shelimova et al.[4]. Phase relationships in the system PbTe- GeTe are complicated by the different crystal structures of the binary components. PbTe has a cubic NaCl-type structure, but GeTe attains this structure only above approxi- mately 400°C (the exact temperature depends on the concentration of native defects). At lower temperatures, GeTe transforms into a slightly distorted NaCl-structure with trigonal symmetry[6-9]. Disagreement exists as to whether this process is discontinuous[8] or continuous [9] and therefore about the possi- bility that it is of second order. Woolley and Nikolic [5] reported that the room temperature lattice constants of Pb,_xGexTe show a gradual change with composition from the trigonal structure of GeTe to a cubic structure near Pb0.TGe0.3Te. These results suggest the existence of a phase transformation in Pb,_~GexTe. The present paper describes the composi- tion dependence of the lattice constants in Pbx_~Ge~Te, the reinvestigated phase dia- gram, the composition dependence of the transformation temperature, and the change of the lattice parameters in the region of the phase transformation. 2. EXPERIMENTAL PbTe and GeTe were synthesized from Pb and Te (nominally 99.9999 per cent pure) and semiconductor grade Ge. For bulk specimens of Pb,_~GexTe, PbTe and GeTe in the correct 2053

Welcome message from author
This document is posted to help you gain knowledge. Please leave a comment to let me know what you think about it! Share it to your friends and learn new things together.
Transcript

J. Phys. Chem. Solids, 1972, Vol. 33, pp. 2053-2062. Pergamon Press. Printed in Great Britain
PHASE RELATIONS AND TRANSFORMATIONS IN THE SYSTEM PbTe-GeTe
D. K. HOHNKE, H. HOLLOWAY and S. KAISER
Scientific Research Staff, Ford Motor Company, Dearborn, Mich. 48121, U.S.A.
(Rece ived29 December 1971)
Abstract--Resul ts of a study of the pseudobinary system P b T e - G e T e are reported and discussed. A new phase diagram, the dependence of the lattice constants on alloy composition, and measurements of a phase transformation in Pb,_~GexTe are presented. Complete solid solubility is found above 570°C. An exsolution dome extends from a maximum at 570°C (near 60 mole % GeTe) to about 5 and 96 mole % GeTe at 300°C. For alloys with compositions near GeTe the unit cell parameters depend markedly on the concentration of cation vacancies. The temperature for the cubic to trigonal phase transformation depends on alloy composition, decreasing from about 670°K for x = l to 0°K for x ~ 0.01. The variation of lattice parameters at the transition temperature is continuous within experimental precision.
1. INTRODUCTION
SOLID solutions of the IV-VI semiconductors have been the subject of much recent atten- tion, generated by the discovery that P b l - : Sn~Te and Pb,_~Sn~Se exhibit a band cross- ing [1,2]. However, little is known about the phase relationships in the closely related system PbTe-GeTe. Mazelsky e t al.[3] found very limited solubility of GeTe in PbTe at temperatures up to 500°C and Shelimova e t
al.[4] reported that mutual solubility increased with increasing temperature, but was limited to the composition ranges PbTe-Pb0.gsGe0.3: Te and Pb0.0sGe0.9~Te-GeTe by the occur- rence of a eutectic point at 695°C. Later, work by Woolley and Nikolic[5] showed complete solid solubility between PbTe and GeTe in samples quenched from 600°C. Because of the difference in annealing temperature these last results need not be inconsistent with those of Mazelsky e t al.[3] but they are cIearly in- compatible with the phase diagram given by Shelimova e t al.[4].
Phase relationships in the system PbTe- GeTe are complicated by the different crystal structures of the binary components. PbTe has a cubic NaCl-type structure, but GeTe attains this structure only above approxi-
mately 400°C (the exact temperature depends on the concentration of native defects). At lower temperatures, GeTe transforms into a slightly distorted NaCl-structure with trigonal symmetry[6-9]. Disagreement exists as to whether this process is discontinuous[8] or continuous [9] and therefore about the possi- bility that it is of second order. Woolley and Nikolic [5] reported that the room temperature lattice constants of Pb,_xGexTe show a gradual change with composition from the trigonal structure of GeTe to a cubic structure near Pb0.TGe0.3Te. These results suggest the existence of a phase transformation in Pb,_~GexTe.
The present paper describes the composi- tion dependence of the lattice constants in Pbx_~Ge~Te, the reinvestigated phase dia- gram, the composition dependence of the transformation temperature, and the change of the lattice parameters in the region of the phase transformation.
2. EXPERIMENTAL
PbTe and GeTe were synthesized from Pb and Te (nominally 99.9999 per cent pure) and semiconductor grade Ge. For bulk specimens of Pb,_~GexTe, PbTe and GeTe in the correct
2053

2054 D . K . H O H N K E , H. H O L L O W A Y and S. K A I S E R
proportions were sealed in evacuated silica tubes at about 10-rtorr, melted, shaken to insure complete mixing, and then quenched in ice water. Subsequently, the resulting ingots were crushed to powder (< 74/zm) and re- sealed in ampoules for annealing.
Vacuum deposited thin films of Pb~_~GexTe were used for equilibration annealing between 300 and 460°C and for phase transformation studies. Layers with thicknesses of 1-4/zm were deposited by evaporation of PbTe and GeTe from two isothermal Knudsen cells in a single rod of spectroscopically pure graphite, This double cell was operated at 700---0.5°C by heating with a coaxial tantalum cylinder. The composition of the flux incident on the substrate was selected by appropriate choice of the orifice sizes. Descriptions of isothermal multiple sources and their application to the vacuum deposition of epitaxial films of IV-VI alloys have been given previously[10, 11]. The substrates were single crystals of BaF~ and KC1 cleaved in air immediately before use. Substrate temperatures were 150-325°C.
The large difference between the vapor pressures of PbTe[12] and GeTe[13-15] imposed the need for reduction of tempera- ture gradients during annealing to avoid preferential sublimation of GeTe that would cause a change in alloy composition. With closely controlled furnaces (÷ 0-5°C) and with the specimens inside thick-walled graphite liners, conditions were sufficiently isothermal that no GeTe sublimate was observed. Each anneal was terminated by immersing the sealed tube in ice water, with quench times of about one second. To facilitate rapid quench- ing the bulk specimens were sealed in small diameter vycor tubes (2-3 mm). Annealing periods ranged from 50 hr for thin film speci- mens to 500 hr for bulk material. In contrast to previous experiments [5], it was found that annealing periods of approximately 100 hr at 600°C were sufficient to establish equilibrium in bulk material at all compositions. X-ray diffraction was used to determine
(i) the variation of lattice parameters with
composition in samples quenched from 600°C,
(ii) the number and composition of phases present in samples quenched from temperatures below 600°C,
(iii) the temperature for transformation from trigonal to cubic symmetry as a function of alloy composition.
Diffraction patterns were obtained with Cu- radiation (X (CuKai) = 1.54051 ,~) on a Sfemens diffractometer. BaF2 (a z98= 6.2001 .~) or KCI (a298=6.2929.~) were used as internal standards. Annealed powder speci- mens with grain sizes less than 44/xm gave diffraction peaks that were usually sharp enough to allow the value of 20 to be read to --- 0.02 ° or better. With epitaxial films on BaF2 or KC1, the high intensity and small width of the peaks enables 20 to be read to +_ 0.002 °.
The phase transformation in Pbl-xGexTe was observed by measuring the temperature dependence of its lattice parameters. Low- temperature trigonal Pb~_~Ge~Te, described with rhombohedral lattice parameters, can be visualized as a slight distortion of the high- temperature cubic phase. The change from trigonal to cubic symmetry was observed by measuring the angular separation of appro- priate pairs of reflections, e.g. (hkO) and (hk0), that merge to a single line in the cubic phase. Such pairs were scanned at 4.2 or 77°K and then at 10-20°K intervals. The tempera- ture depencence of the unit cell edge (a) was determined from large-angle reflections.
For low-temperature X-ray diffraction experiments a cryostat with a resistance heater was used to control the temperature of the specimen holder to -----l°K in the range 4.2-300°K. Temperatures above 40°K were measured with a copper-constantan thermo- couple; a calibrated carbon resistance thermo- meter was used at low temperatures.
3. LATTICE PARAMETERS
The composition dependence of the room- temperature lattice constants in Pbl-xGexTe is complicated by the effects of nonstoichio-

T H E SYSTEM P b T e - G e T e 2055
metry and also by the varying proximity of the cubic to trigonal phase transformation. It is helpful to discuss these factors in terms of their influence on the lattice constants of the binary components.
1. GeTe. According to Shelimova et al.[7] and Brebrick[15], GeTe has a homogeneity range of 1-1.5at.% which lies entirely,, or almost entirely, o n the Ge-deficient side of the equiatomic composition. This variability of composition is reflected in the change of the lattice parameters across the single-phase field.
Table 1 shows the lattice parameters of GeTe that were obtained after equilibration with germanium or tellurium at 420 and at
In contrast to the unit cell edge (a) the literature values of the rhombohedral angle (a) in GeTe(Ge) are widely divergent[5-9, 16-21]. However, scrutiny of the different experimental conditions reveals a pronounced dependence of a on the thermal history of the specimen. Figure 1 shows that a, measured at room temperature, decreases with increasing equilibration temperature from 88 ° 33' -+ 1' for electrolytically prepared GeTe(Ge)[21] to 88°10.2'--+0.1 ' for GeTe(Ge) annealed at 650°C (this work). This correlation with the thermal history probably arises from the temperature dependence of the stoichiometry at the metal-rich phase boundary.
Due to the dominant point defects in GeTe,
Table 1. Lattice parameters for Ge-saturated and Te-saturated GeTe annealed at 420°C and650°C
T~ = 650°C Ta = 420°C
GeTe(Ge) a (/~) 5.984 ± 0"001 5.988 ± 0.002 ot 88010.2 , ±0 .1 ' 88~20 ' ±0"5 '
GeTe(Te) ° a(/~) 5.966+__0.001 5.956±0"002 ot 88010.0 , ± 0.5' 88o43-5 ' ± 0.5'
650°C. The unit cell edge for GeTe in equi- librium with germanium is in good agreement with most earlier determinations [5-9, 16-20] of a for GeTe synthesized from equiatomic mixtures of Ge and Te. (From the homogene- ity range, such specimens would be expected to be at the germanium-rich phase boundary.) The previous results and the present data in Table 1 show that there is little dependence of the unit cell edge of GeTe(Ge)* on annealing temperature between 315°C (5.986 A,[6]) and close to the melting point. Considering the extent of the GeTe phase at 420°C, approxi- mately 1.3at.%[7, 15], and the variation of the unit cell edge across this range (Table 1) we estimate that the composition at the germanium-rich boundary changes less than 0.2 at.% between 315 and 650°C.
*GeTe(Ge) and GeTe(Te) denote germanium-saturated GeTe and tellurium-saturated GeTe, respectively.
Ge vacanciest [7], the unit cell of GeTe(Te) is considerably smaller than that of GeTe(Ge). However, while a seems to be directly pro- portional to the vacancy concentration, the rhombohedral angle is not, in contrast to a previous interpretation[5]. The angles are nearly identical in GeTe(Ge) and GeTe(Te) specimens when quenched from 650°C, des- pite a difference in their Ge-vacancy concen- trations of about an order of magnitude. Since both a and the transition temperature depend on the vacancy concentration[6, 7], (similar
t A t 420°C, the compositions GeTe(Ge) and GeTe(Te) correspond to Gea.497Te0.so3 and Ge0.4asTe0.51z with experi- mental densities of 6.193 -----0.005 gem -a and 6.203 ___0.005 gem -a, respectively [7]. Assuming Ge-vaeancies and using the lattice constants in Table 1, the calculated densities are 6-197±0.01 gem -a and 6 .190±0"01gem -a, in good agreement with the experimental values. With a Te- interstitial model the calculated densities are much larger, 6-272 gem -a and 6"493 gem -a, respectively. Thus, the predominant native defects are Ge-vaeancies.

2056 D . K . HOHNKE, H. HOLLOWAY and S. KAISER
8 8 " 3 ~
a 88 ° 20
8 8 = 1 0 '
I
I I I I l
<3D
o I" 0 0
0 .,,--0 " - 0 0
I t I I I I 0 I 0 0 2 0 0 3 0 0 4 0 0 5 0 0 6 0 0
T e m p e r a t u r e , °C
MP
t 700
Fig. 1. Rhombohedral angle in Ge-saturated GeTe, measured at room temperature, as a function of annealing temperature. This work: 0 ; Refs. [5-9], [16-21]: ©. Arrows indicate a possible shift from the annealing tem- perature because of unspecified quenching procedures or because of a subsequent anneal at a different temperature
(indicated by a limiting bar).
behavior of SnTe was recently reported [22]) the measured values for a at room tempera- ture depend in a more complex fashion on composition than the unit cell edge. With GeTe(Te), we found no evidence for the more complicated structure mentioned by Schubert and Fricke [6].
2. PbTe. The lattice parameters for PbT.e- (Pb) and PbTe(Te) are the same within experi- mental precision, 6.460___ 0.0005 ~, according to Miller et al.[23]. Their results, obtained from specimens equilibrated at 450°C and at 874°C (50°C below the PbTe solidus), have recently been confirmed by Brebrick [24] who found 6.4600 __+ 0.0002 ~, for PbTe equilibrated with Pb or Te at 400°C.
3. Pb~_=Ge~Te. X-ray analysis of a series of single-phase Pbl_=Ge=Te alloys showed that the unit cell edge varies nearly linearly with composition between cubic PbTe and trigonal GeTe (Table 2). This continuous change in unit cell edge, shown in Fig. 2, is accompanied by a gradual variation of the rhombohedral angle from 90 ° at x = 0.18 to almost 88 ° for x = 1-0, i.e. GeTe.
The present data for the lattice parameter a of Pb~_=GeTe at room temperature are in satisfactory agreement with those given by
6 - 5 0 X - - ? - - ~ - N \ ~ ~ ~ ' ~ ' 9 0 " 0
6-4C ~ \\~\\\\ 8 9 - 5
6.30 '~,, 89-0 ~
~; 6.2c
6.0c ~ e-r-5
I I ! I r I I I I T
0"1 0 " 2 0 " 3 0 " 4 0 ' 5 0 " 6 0 "7 0 " 8 0"9 P b T e G e T e
M o l e f r o c t i o n G e T e
Fig. 2. Lattice constants of Pb,_~Ge~Te. Open circles: Metal-saturated alloys; filled circles: Tellurium-saturated alloys. The dashed line shows the dependence of c~ in
Sn~_~Ge~Te (Ref. [9]).
Woolley and Nikolic[5]. For compositions 0.7 < x ~< 1.0, the measured rhombohedral angles also agree well, but, at smaller values of x, the present values of o~ diverge consider- ably from those reported earlier. Instead of following a sigmoid curve, ~ shows a linear dependence on composition which is striking- ly similar to that found previously for Snl-x- GexTe [9]. In view of the excellent agreement for x > 0.7 it was thought that different preparative conditions might be responsible. As shown above, this accounts for the widely divergent values of a in GeTe(Ge).
Figure 3 shows the lattice parameters of Pbl_=Ge=Te obtained from samples annealed at 600°C and lower temperatures. The dashed curve shows the results of Woolley and Nikolic [5], obtained from specimens annealed at 600°(3. By plotting a against a the explicit dependence on mole fraction GeTe, a possible source of discrepancies, is eliminated. As in GeTe(Ge), the rhombohedral angle for alloys near GeTe depends on the annealing tempera- ture. However, with increasing values of a

THE SYSTEM PbTe-GeTe 2057
Table 2. Lattice parameters o f Pbl-xGe~Te. All specimens, except those with x = 0 and 1-0, were
annealed at (and rapidly quenched from) 600°C
x J a(.~) o~
0.000 6-4600___ 0-0002 90 (a) 0-090 _ 0-005 6.422 ± 0.001 90 0.185---0-005 6.382___0.002 90 0-275 - 0.005 6.338 - 0.002 89'45' ___ 0-5' 0-375 - 0.005 6.293 - 0.003 89028 ' - 1-0' 0.475---0.010 6-245---0.005 89011'___3-0 , 0.700+-0.005 6.144___0-002 88038'___0-5 ' 0.800 _+ 0.005 6-095 +- 0-002 88027' +- 0-5' 0.900---0.005 [6.040--- 0-003 88o16 ' ---0-5' (b)
[6.018±0.003 88013'±2-0 ' (c) ~5-984 ± 0 .001 88"10.2'___0.1' (d)
1 .000 [5.966___0.001 88o10'---0-5 ' (e)
(a): Ref. [24]. (b), (c): Specimen equilibrated
respectively. (d), (e): Specimen equilibrated
respectively.
at 600°C with Ge and Te,
at 650°C with Ge and Te,
ff
9 0 - 0
89"5
89-0
88-5
88.0
GeTe
/ ' / / /
Ao o 6_OO*C ./ • 5 6 0 o c
t I I I i I i I i I 600 6" I 0 6"20 6-30 6'40
PbTe
Fig. 3. Rhombohedral angle in metal-saturated Pbl-~Gex- Te as a function of lattice constant a for several anneal- ing temperatures. The dashed line shows the dependence for samples annealed at 600°C as given in Ref. [5]. The
bar shows the range of values reported for GeTe.
(i.e. with larger mole fract ions o f PbTe) this dependence becomes less p ronounced , prob- ably as a result o f a decreasing homogene i ty range. Beyond a = 6.14 A (corresponding to P b l - x G e ~ T e with x <~ 0.7) variat ions o f o~ with annealing t empera tu re were not detected. Thus , different thermal histories do not re-
solve the discrepancies be tween the present and the previous data for the composi t ion dependence o f the rhombohedra l angle.
4. PHASE RELATIONS IN THE SYSTEM PbTe-GeTe
T h e results o f the present investigation are shown in Fig. 4. X-ray analyses o f samples annealed at and quenched f rom 600°C showed single-phase alloys at all composi t ions be- tween P b T e and G e T e , excep t at 60 mole % G e T e where the quenching rate was ap- parent ly insufficient. With lower annealing tempera tures some samples, depending on composi t ion and annealing tempera ture , showed two sets of diffraction peaks with posit ions intermediate be tween those o f P b T e and G e T e . This implied the exis tence of a miscibility gap. T o determine the limits of the two-phase region samples of overall composi- t ions indicated by crosses in Fig. 4 were annealed at the indicated tempera tures and then rapidly quenched. T h e equilibrium com- posit ions of the two phases present were then de termined f rom the known relat ionship be- tween unit cell edge and composit ion.
JPCS Vc~. 33, No. 1 ! -- E

2058 D . K . H O H N K E , H. H O L L O W A Y and S. KAISER
2
Q)
E
9 0 0
8 0 0
7 0 0
6 0 0
500
4 0 0
300
I ' I ' I ' I ' I
! !
u , , i i i i , ~ , " 0 - 1 0 - 2 0 - 3 0 4 0 . 5 0 - 6 0 - 7 0.8 0-9
Mole fracl"ion GeTe
Fig. 4. Phase diagram for the system PbTe-GeTe. Quenched to one solid: @. Quenched to two solids: +. Two-phase boundary: ©. Single phase solids, Ref. [3]: • (quenched from 500°C), • (heated from room tempera-
ture). Liquidus and solidus, Ref. [4]; n .
Data for 460°C and below were obtained by annealing vacuum deposited thin films. In contrast to the PbTe-rich phase, which was highly oriented (< 100> on KC1, < 111 ) on BaF2) and gave intense diffraction peaks, the GeTe- rich phase was randomly oriented, with dif- fraction peaks that were too weak to serve for accurate lattice parameter determinations. Data for the GeTe-rich side of the miscibility gap are, therefore, limited to temperatures above 460°C.
The present results show a broad asym- metric exsolution dome with a maximum at about 570°C for Pb0.~sGeo.35Te. X-ray diffrac- tion patterns from specimens quenched from near the dome maximum were considerably more diffuse than patterns obtained from samples quenched from above the steeper slopes at the sides. The poor crystallinity of
those specimens is attributed to inadequate quenching although the quench times were about one second. Despite several attempts, the composition at 60 mole % GeTe was not quenched fast enough to retain a single phase. Rapid dissociation of Pbo.4Geo.6Te was con- firmed when two samples were quenched at slightly different rates because of different wall thicknesses of their vycor ampoules. Exsolution had progressed appreciably further in the thick walled ampoule as indicated by the extent of the splitting of the difflaction peaks into two sets that corresponded to slightly different compositions. However, from the shape of the two-phase region, it seems evi- dent that it closes smoothly between Pb0.5- Ge0.sTe and Pb0.3Ge0.TTe to give complete solid solubility above 570°C.
The existence of a miscibility gap in the system PbTe-GeTe and the rapid dissociation reconcile or explain-the observations of earlier workers. The limited solid solubility at 500°C [3] as well as the complete solubility at 600°C[5] are consistent with the phase diagram in Fig. 4. Diffuse X-ray diffraction was previously observed [5] for alloys near the center of the composition range, but attri- buted to insufficient annealing rather than to phase separation, although annealing periods of up to four weeks were used. In the present study 100-200 hr were found to be adequate and even the 18-24hr periods, used by Mazelsky e t al.[3] were apparently enough considering our agreement with their data.
Shelimova e t al.[4] quenched a series of samples of Pbl_=Ge=Te from 650°C. Their observation of limited solubility at this tem- perature appears to be a consequence of phase separation due to insufficient quenching rates. This interpretation is supported by inspection of their table which gives the results of anneal- ing specimens with overall compositions between PbTe and Pb0.sGe0.sTe. The compo- sitions Pb0.sGe0.2Te and Pb0.TGe0.3Te were reported to be single phase alloys. However, their values of a are considerably larger than those reported here. Such results would be

THE SYSTEM PbTe-GeTe 2059
expected for a phase separation where the second phase, the alloy with the larger GeTe mole fraction, remained unobserved. Using their lattice parameters togethe~ with the data in Figs. 2 and 4, we calculate that the GeTe- rich phase would have given about one tenth the diffracted intensity due to the PbTe-rich phase. From this, it seems likely that there was an undetected, GeTe-rich, phase in some of these specimens.
Apparently limited solid solubility at 650°C and the shape of the liquidus and solidus lines, measured by thermal analysis, led Shelimova et al. to propose a simple eutectic phase diagram with a eutectic point at Pb0.2Ge0.sTe. However, with complete miscibility at tem- peratures above 570°C established by the present investigation and by Woolley and Nikolic [5], it is evident that the liquidus and solidus have a common minimum at that composition rather than a eutectic point. As shown in Fig. 4, the thermal analysis data of Shelimova e t al. are consistent with this reinterpretation. Similar behavior of the liquid- us and solidus has been found with several other IV-VI alloys[25] (for example in the system PbS-PbTe, which also shows an exsolution dome [26].
5. PHASE TRANSFORMATIONS
With increasing temperature the rhombo- hedral angle in GeTe gradually increases, reaching 90 ° at about 400°C [6-9]. Above this temperature GeTe is cubic. Studies of Snl-~- Ge~Te have shown a reduction of the trans- formation temperature with increasing SnTe content [9] and the possibility of an analogous dependence in Pbl_~Ge=Te has been sugges- ted [25].
The present study shows that a similar phase transformation does exist in Pbl-=Ge~- Te. The transformation occurs at room tem- perature when x=0-18 (Fig. 2). Figure 5 shows the temperature dependence of o~ and the extrapolated transition temperatures for several other values of x. The rhombohedral angles at different temperatures were calcul-
90"00'
58'
56'
54'
a 52'
50'
48'
46'
8 9 " 4 #
~ l / ' - ' ~ , f - ' ° r - - / ' < / / /
. / / / ' x = 0 - 0 5 ~ ' /
x-O.070
x=0-093
= I I I = I = I 5 0 I 0 0 1 5 0 2 0 0
Temperofure, * K
Fig. 5. Temperature dependence of the rhombohedral angle in Pbl-=Ge=Te.
ated from the separation of the (420) and (420) diffraction peaks, except for x = 0.02 where the (642)-(642) separation was used. The pre- cision of the transformation temperatures is limited to ___ 5-10°K by the gradual approach to the cubic structure. This is shown in more detail for Pb0.asGe0.02Te in Fig. 6. For this composition the (420)-(420) separation is too small, even at 4.2°K, to give useful informa- tion. Although the (642)-(642) separation was not resolved either, it was possible to follow the gradual merger of the two peaks with increasing temperature by measuring the decreasing width of the peak that results from
0,50
0 - 4 5
"o 0 - 4 0
<3 0.35
0 - 3 0
I I I I I I
I I I I I I 2 5 5 0 7 5 I 0 0 125 150
Temperofure, OK
Fig. 6. Width of CuKal diffraction peak at half height from overlapping (642) and (642) in Pbo.aaGeo.o2Te.
Sample A: ©; sample B: O.

2060 D . K . H O H N K E , H. H O L L O W A Y and S. K A I S E R
their partial overlap. Points for x = 0.02 in Fig. 5 were obtained by adjusting the super- position of two identical peaks (with profiles that had been measured at 156°1{) to fit the observed peak widths.* Above 60--+5°K the width remained essentially constant, indicat- ing that the alloy is cubic in this region.
The trigonal to cubic transition tempera- tures for two other alloys, with compositions Pbo.ss3Geo.04rTe and Pbo.s25Geo.o~sTe, were ob- tained by measuring the temperature depen- dence of the unit cell edge. Figure 7 shows the results for these alloys as well as the data for Pbo.ssGeo.o2Te and PbTe/r
"n-r 1-r "r 6 - 4 3 0 6 4 4 5 , , , , , , ~ , , , 6 ~160
- 6 " 4 7 0
6 - 2 4 5 6 4 4 0 1 " 6455
- 6 - 4 6 5
6 - ' 4 2 0 6"435~- 6.45o
- 6 . 4 6 0
6 .415 6-4301" 6~45
=¢1 ~t - 6 " 4 5 5
6 .41C 6 - 4 2 5 ~ 6.440 ¢~
- 6 - 4 5 0 o
6 - 4 0 5 6"420~- e435
- 6 " 4 4 5
6 " 4 0 ' C 6"415~ 8-43o
- 6 ' 4 4 0
6 " 3 9 5 6 " 4 1 0 l 64z5
I i I , I , I i I i 6 " 4 5 5
5 0 I 0 0 150 2 0 0 2 5 0 3 0 0
T e m p e r o F u r e ~ OK
Fig. 7. Lattice constants of Pbl_~GexTe as a function of temperature. Arrows indicate the trigonal to cubic trans- formation. Internal standards: BaF2 (I and IV), KCI (III),
none (I 1).
*The cubic (642) reflection splits into four rhombo- hedral reflections. In the peak width analysis only the widely separated (642) and (642) peaks were considered. The error in neglecting the contribution of the two other peaks is small.
?The lattice constant of PbTe at 298"K in Fig. 7, measured on a single crystal film on BaF~, is 6.462 A and thus considerably larger than the value of 6.4600 [24] for bulk specimens. Repeated measurements on other films, careful alignment of the diffractometer, use of BaF2 and KCI as internal standards and extrapolation to 20 = 180 ° gave 6-4622 ± 0.0005 A.
Lattice constants for PbTe and Pb0.ss3- Ge0.o4~Te were obtained from the (800) diffrac- tion angle of epitaxial layers on KCI sub- strates and that for Pbo.92sGe0.o75Te from the (600) diffraction angle of a layer with a (100) fiber orientation on BaF~. All measurements were corrected by using the substrates as internal standards. (Coefficients of thermal expansion for BaF~[27] and KC1128] were used to calculate the temperature dependence of their lattice constants.) The estimated relative precision of the alloy lattice constants from these measurements is _ 0-0002 .~. The data for Pb0.asGeo.o2Te are from a powder specimen; no internal standard was used.
The unit cell edge, like the rhombohedral angle, shows no discontinuity at the transition temperature, only a change of the coefficient of thermal expansion. This is indicated by the changing slopes of curves III and IV in Fig. 7. The change becomes particularly evident when the difference of the lattice constants of Pb0.925Geo.o75Te and its BaFz substrate (Aa) is plotted as a function of temperature (Fig. 8). In this case the thermal expansion coefficients of the high and low temperature modifications of the alloy are, respectively, slightly larger and smaller than those for BaF2, as indicated by the sudden reversal of the slope at the transition temperature of 190+10°K. The magnitude of this change, 7 × 10⁻⁶deg -1, is
<3
0 . 2 2 9
0 " 2 2 8
0 " 2 2 " /
0 ' 2 2 6
I I I I i I
t I i I i I i I , I
I 0 0 1 5 0 2 0 0 2 5 0 3 0 0
T e m p e r o f u r e , * K
Fig. 8. Difference of the lattice constants of a Pb0.9~ Ge0.oTsTe layer and its BaF2 substrate as a function of
temperature.
T H E SYSTEM PbTe-GeTe 2061
comparable to that of 8 × 10 -6 deg -1 observed at the transformation point of GeTe[7]. A transition temperature of 130+-10°K was obtained for Pb0.a~aGe0.047Te on a KCI sub- strate (III in Fig. 7).
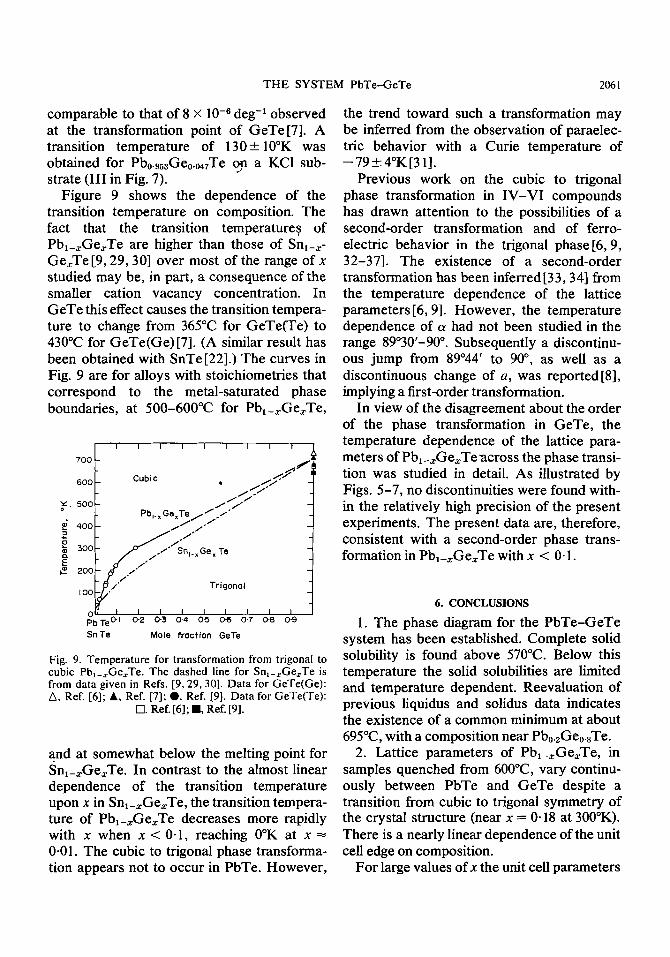
Figure 9 shows the dependence of the transition temperature on composition. The fact that the transition temperatures of Pb~_~GexTe are higher than those of Sn~_~- Ge~Te[9, 29, 30] over most of the range o f x studied may be, in part, a consequence of the smaller cation vacancy concentration. In GeTe this effect causes the transition tempera- ture to change from 365°C for GeTe(Te) to 430°C for GeTe(Ge)[7] . (A similar result has been obtained with SnTe [22].) The curves in Fig. 9 are for alloys with stoichiometries that correspond to the metal-saturated phase boundaries, at 500-600°C for Pba_~Ge~Te,
700
600
~ . 500
400
P 30O
~ 200
I00
o PbTe TM
Sn Te
I I I I I I I I I
Cubic ~, ~ .I//"'~ f i
Pb=. x G e x T e / / / "
j ° Snr_,, Ge x Te
/ " ~. i / Trigonol ~,.
I I I I I I I I I 0 - 2 0 " 3 0 " 4 0 " 5 0 6 0 . 7 0 " 8 0 " 9
Mole frocfion GeTe
Fig. 9. Temperature for transformation from trigonal to cubic Pb,_=Ge~Te. The dashed line for Sn,_~Ge=Te is from data given in Refs. [9, 29, 30]. Data for GeTe(Ge): A, Ref. [6]; &, Ref. [7]; O, Ref. [9]. Data for GeTe(Te):
I--I. Ref. [6]; i , Ref. [9].
and at somewhat below the melting point for Snl_~Ge~Te. In contrast to the almost linear dependence of the transition temperature upon x in Snl_xGe~Te, the transition tempera- ture of Pb~_~Ge~Te decreases more rapidly with x when x < 0.1, reaching 0°K at x 0.01. The cubic to trigonal phase transforma- tion appears not to occur in PbTe. However ,
the trend toward such a transformation may be inferred from the observation of paraelec- tric behavior with a Curie temperature of --79_+ 4°K[31].
Previous work on the cubic to trigonal phase transformation in I V - V I compounds has drawn attention to the possibilities of a second-order transformation and of ferro- electric behavior in the trigonal phase[6, 9, 32-37]. The existence of a second-order transformation has been inferred [33, 34] from the temperature dependence of the lattice parameters [6, 9]. However , the temperature dependence of a had not been studied in the range 89o30'-90 °. Subsequently a discontinu- ous jump from 89o44 ' to 90 ° , as well as a discontinuous change of a, was reported[8], implying a first-order transformation.
In view of the disagreement about the order of the phase transformation in GeTe, the temperature dependence of the lattice para- meters of Pbl_xGe~Teacross the phase transi- tion was studied in detail. As illustrated by Figs. 5-7, no discontinuities were found with- in the relatively high precision of the present experiments. The present data are, therefore, consistent with a second-order phase trans- formation in Pbl_=GexTe with x < 0-1.
6. CONCLUSIONS
1. The phase diagram for the P b T e - G e T e system has been established. Complete solid solubility is found above 570°C. Below this temperature the solid solubilities are limited and temperature dependent. Reevaluation of previous liquidus and solidus data indicates the existence of a common minimum at about 695°(2, with a composition near Pb0.zGe0.aTe.
2. Lattice parameters of Pbl _xGexTe, in samples quenched from 6000(2, vary continu- ously between PbTe and GeTe despite a transition from cubic to trigonal symmetry of the crystal structure (near x = 0.18 at 300°K). There is a nearly linear dependence of the unit cell edge on composition.
For large values o fx the unit cell parameters

2062 D . K . HOHNKE, H. HOLLOWAY and S. KAISER
depend significantly on vacancy concentra- tion. The large range of the values that has been reported for the rhombohedral angle in Ge-saturated GeTe is correlated with the thermal histories of the specimens and probab- ly arises from the temperature-dependence of the stoichiometry at the phase boundary.
3. On cooling, the crystal structure of Pbl-xGexTe transforms from cubic to trigonal symmetry. This transformation is continuous within experimental uncertainty. The transi- tion temperature depends on alloy composi- tion and reaches 0°K near x = 0-01. The present data are consistent with a second order phase transformation, although a first order transition cannot be definitely excluded.
REFERENCES
1. D I M M O C K J. O., MELNGAILIS I. and STRAUSS A. J., Phys. Rev. Lett. 16, 1193 (1966).
2. STRAUSS A. J., Phys. Rev. 157, 608 (1967). 3. MAZELSKY R., LUBELL M. S. and KRAMER
W. E.,J. chem. Phys. 37, 45 (1962). 4. SHELIMOVA L. E., ABRIKOSOV N. Kh. and
BESSONOV V. L, lzv. akad. nauk. SSSR, Metal. i. Gornoe Delo 1, 180 (1964).
5. WOOLLEY J. C. and NIKOLIC P., J. electro- chem. Soc. 112, 82 (1965) and 112, 906 (1965).
6. SCHUBERT K. and FRICKE H., Z. Metallkunde 44, 457 (1953).
7. SHELIMOVA L. E., ABRIKOSOV N. Kh. and ZHDANOVA V. V., Russ. J. lnorg. Chem. 10, 650 (1965).
8. ZHUKOVA T. B. and ZASLAVSKII A. I., Soviet Phys. Crystallogr. 12, 28 (1967).
9. BIERLY J. N., MULDAWER L. and BECKMAN O.,Acta Metall. 11, 447 (1963).
10. HOLLOWAY H., HOHNKE D. K., CRAWLEY R. L. and WILKES E., J. Vae. Sci. Technol. 7, 586 (1970).
11. HOLLOWAY H., LOGOTHETIS E. M. and WILKES E., J. appl. Phys. 41, 3543 (1970).
12. BREBRICK R. F. and STRAUSS A. J., J. chem. Phys. 40, 3230 (1964).
13. LIU CH'LJN-HUA, PASHINKIN A. S. and NOVOSELOVA A. V., Russ. J. Inorg. Chem. 7, 496 (1962).
14. COLIN R. and DROWART J., J. Phys. Chem. 68, 428 (1964).
15. BREBRICK R. F., J. Phys. Chem. Solids 27, 1495 (1966).
16. ABRIKOSOV N. Kh., VASSERMAN A. M. and PORETSKAYA L. V., Dokl akad. nauk. SSSR 123, 297 (1958).
17. KREBS H., GR(JN K. and KALLEN D., Z. anorg. allg. Chem. 312, 307 (1961).
18. JOHNSTON W. D. and SESTRICH D. E.,J. lnorg. Nucl. Chem. 19, 229 (1961).
19. KREBS H. and LANGNER D., Z. anorg, allg. Chem. 334, 37 (1964).
20. GOLDAK J., BARRETT C. S., INNES D. and YOUDELIS W.,J. chem. Phys. 44, 3323 (1966).
21. PANSON A.,J. Inorg. Chem. 3, 940 (1964). 22. MULDAWER L., Bull. Am. Phys. Soc. 16, 85
(1971). 23. MILLER E., KOMAREK K. and CADOFF I.,
Trans. AIME 218, 382 (1960). 24. BREBRICK R. F., J. Phys. Chem. Solids 32, 551
(1971). 25. STRAUSS A. J., Trans. Met. Soc. AIME 242, 354
(1968). 26. DARROW M. S., WHITE W. B. and ROY R.,
Trans. A IME 236, 654 (1966). 27. BAILEY A. C. and YATES B., Proc. Phys. Soc.
Lond. 91, 390 (1967). 28. MEINCKE P. P. M. and GRAHAM G. M., Can. J:
Phys. 43, 1853 (1965). 29. ABRIKOSOV N. Kh., NOVIKOVA S. I.,
SHELIMOVA L. E. and ZHDANOVA V. V., lnorg. Mater. 5, I615 (I969).
30. RIGAMONTI A. and PETRINI G., Phys. Status Solidi41, 591 (1970).
31. BATE R. T., CARTER D. L. and WROBEL J. S., Phys. Rev. Left. 25, 159 (1970).
32. COCHRAN R. A., Phys. Rev. 134, A981 (1964). 33. PAWLEY G. S.,J. de Phys. 29 (suppl.), t45 (1968). 34. BIRMAN J. L.,J. de Phys. 29 (suppl.), 151 (1968). 35. PAWLEY G. S., COCHRAN W., COWLEY R. A.
and DOLLING G., Phys. Rev. Lett. 17, 753 (1966). 36. BIRMAN J. L., Ferroelectricity (Edited by E. F.
Weller), p. 20. Elsevier, N e w York (1967). 37. LEFKOWITZ I., SHIELDS M., DOLLING G.,
BUYERS W. J. L. and COWLEY R. A., J. phys. Soc. Japan 28 (suppl.), 249 (1970).
Related Documents


