Phase reddening on near-Earth asteroids: Implications for mineralogical analysis, space weathering and taxonomic classification Juan A. Sanchez a,b,⇑ , Vishnu Reddy a,c,1 , Andreas Nathues a,1 , Edward A. Cloutis d , Paul Mann d , Harald Hiesinger b a Max Planck Institut für Sonnensystemforschung, Max Planck Str. 2, 37191 Katlenburg-Lindau, Germany b Institut für Planetologie, 48149 Münster, Germany c Department of Space Studies, University of North Dakota, Grand Forks, ND 58202, USA d Department of Geography, University of Winnipeg, Winnipeg, Manitoba, Canada article info Article history: Received 22 February 2012 Revised 2 April 2012 Accepted 2 April 2012 Available online 25 April 2012 Keywords: Asteroids Near-Earth objects Spectroscopy Infrared observations Meteorites abstract Phase reddening is an effect that produces an increase of the spectral slope and variations in the strength of the absorption bands as the phase angle increases. In order to understand its effect on spectroscopic observations of asteroids, we have analyzed the visible and near-infrared spectra (0.45–2.5 lm) of 12 near-Earth asteroids observed at different phase angles. All these asteroids are classified as either S-complex or Q-type asteroids. In addition, we have acquired laboratory spectra of three different types of ordinary chondrites at phase angles ranging from 13° to 120°. We have found that both, asteroid and meteorite spectra show an increase in band depths with increasing phase angle. In the case of the aster- oids the Band I depth increases in the range of 2° < g < 70° and the Band II depth increases in the range of 2° < g < 55°. Using this information we have derived equations that can be used to correct the effect of phase reddening in the band depths. Of the three meteorite samples, the (olivine-rich) LL6 ordinary chon- drite is the most affected by phase reddening. The studied ordinary chondrites have their maximum spec- tral contrast of Band I depths at a phase angle of 60°, followed by a decrease between 60° and 120° phase angle. The Band II depths of these samples have their maximum spectral contrast at phase angles of 30–60° which then gradually decreases to 120° phase angle. The spectral slope of the ordinary chon- drites spectra shows a significant increase with increasing phase angle for g > 30°. Variations in band cen- ters and band area ratio (BAR) values were also found, however they seems to have no significant impact on the mineralogical analysis. Our study showed that the increase in spectral slope caused by phase red- dening is comparable to certain degree of space weathering. In particular, an increase in phase angle in the range of 30–120° will produce a reddening of the reflectance spectra equivalent to exposure times of 0.1 10 6 –1.3 10 6 years at about 1 AU from the Sun. This increase in spectral slope due to phase red- dening is also comparable to the effects caused by the addition of different fractions of SMFe. Further- more, we found that under some circumstances phase reddening could lead to an ambiguous taxonomic classification of asteroids. Ó 2012 Elsevier Inc. All rights reserved. 1. Introduction Near-infrared (NIR) spectroscopy is a powerful technique to de- rive information about the surface mineralogy of asteroids. This mineralogical characterization relies primarily on the identifica- tion and analysis of diagnostic features present in the spectra of some asteroids. Olivine and pyroxene are two common mafic min- erals found on asteroids (Gaffey et al., 2002), and their spectral properties dominate the reflectance spectra of some particular classes. Asteroids belonging to the S-complex and Q-types (DeMeo et al., 2009, Bus–DeMeo taxonomy hereafter) are examples of these objects. In the case of olivine, the absorption feature is composed of three overlapping bands and is centered near 1.04–1.1 lm, while pyroxenes show to major absorption bands, centered near 0.9–1 lm and 1.9–2 lm, all of them caused by the presence of Fe 2+ cations (e.g., Adams, 1974, 1975; Burns, 1993). In the spectra of olivine–pyroxene mixtures the wavelength position (band centers) of the combined absorption features near 1 lm (Band I) is a function of relative abundance and composition of olivine and pyroxene, while the position of the feature near 2 lm (Band 0019-1035/$ - see front matter Ó 2012 Elsevier Inc. All rights reserved. http://dx.doi.org/10.1016/j.icarus.2012.04.008 ⇑ Corresponding author at: Max Planck Institut für Sonnensystemforschung, Max Planck Str. 2, 37191 Katlenburg-Lindau, Germany. E-mail address: [email protected] (J.A. Sanchez). 1 Visiting Astronomer at the Infrared Telescope Facility, which is operated by the University of Hawaii under Cooperative Agreement No. NNX-08AE38A with the National Aeronautics and Space Administration, Science Mission Directorate, Planetary Astronomy Program. Icarus 220 (2012) 36–50 Contents lists available at SciVerse ScienceDirect Icarus journal homepage: www.elsevier.com/locate/icarus

Welcome message from author
This document is posted to help you gain knowledge. Please leave a comment to let me know what you think about it! Share it to your friends and learn new things together.
Transcript
Icarus 220 (2012) 36–50
Contents lists available at SciVerse ScienceDirect
Icarus
journal homepage: www.elsevier .com/ locate/ icarus
Phase reddening on near-Earth asteroids: Implications for mineralogicalanalysis, space weathering and taxonomic classification
Juan A. Sanchez a,b,⇑, Vishnu Reddy a,c,1, Andreas Nathues a,1, Edward A. Cloutis d, Paul Mann d,Harald Hiesinger b
a Max Planck Institut für Sonnensystemforschung, Max Planck Str. 2, 37191 Katlenburg-Lindau, Germanyb Institut für Planetologie, 48149 Münster, Germanyc Department of Space Studies, University of North Dakota, Grand Forks, ND 58202, USAd Department of Geography, University of Winnipeg, Winnipeg, Manitoba, Canada
a r t i c l e i n f o a b s t r a c t
Article history:Received 22 February 2012Revised 2 April 2012Accepted 2 April 2012Available online 25 April 2012
Keywords:AsteroidsNear-Earth objectsSpectroscopyInfrared observationsMeteorites
0019-1035/$ - see front matter � 2012 Elsevier Inc. Ahttp://dx.doi.org/10.1016/j.icarus.2012.04.008
⇑ Corresponding author at: Max Planck Institut für SPlanck Str. 2, 37191 Katlenburg-Lindau, Germany.
E-mail address: [email protected] (J.A. Sanche1 Visiting Astronomer at the Infrared Telescope Faci
University of Hawaii under Cooperative Agreemethe National Aeronautics and Space Administration,Planetary Astronomy Program.
Phase reddening is an effect that produces an increase of the spectral slope and variations in the strengthof the absorption bands as the phase angle increases. In order to understand its effect on spectroscopicobservations of asteroids, we have analyzed the visible and near-infrared spectra (0.45–2.5 lm) of 12near-Earth asteroids observed at different phase angles. All these asteroids are classified as eitherS-complex or Q-type asteroids. In addition, we have acquired laboratory spectra of three different typesof ordinary chondrites at phase angles ranging from 13� to 120�. We have found that both, asteroid andmeteorite spectra show an increase in band depths with increasing phase angle. In the case of the aster-oids the Band I depth increases in the range of �2� < g < 70� and the Band II depth increases in the rangeof �2� < g < 55�. Using this information we have derived equations that can be used to correct the effect ofphase reddening in the band depths. Of the three meteorite samples, the (olivine-rich) LL6 ordinary chon-drite is the most affected by phase reddening. The studied ordinary chondrites have their maximum spec-tral contrast of Band I depths at a phase angle of �60�, followed by a decrease between 60� and 120�phase angle. The Band II depths of these samples have their maximum spectral contrast at phase anglesof 30–60� which then gradually decreases to 120� phase angle. The spectral slope of the ordinary chon-drites spectra shows a significant increase with increasing phase angle for g > 30�. Variations in band cen-ters and band area ratio (BAR) values were also found, however they seems to have no significant impacton the mineralogical analysis. Our study showed that the increase in spectral slope caused by phase red-dening is comparable to certain degree of space weathering. In particular, an increase in phase angle inthe range of 30–120� will produce a reddening of the reflectance spectra equivalent to exposure times of�0.1 � 106–1.3 � 106 years at about 1 AU from the Sun. This increase in spectral slope due to phase red-dening is also comparable to the effects caused by the addition of different fractions of SMFe. Further-more, we found that under some circumstances phase reddening could lead to an ambiguoustaxonomic classification of asteroids.
� 2012 Elsevier Inc. All rights reserved.
1. Introduction
Near-infrared (NIR) spectroscopy is a powerful technique to de-rive information about the surface mineralogy of asteroids. Thismineralogical characterization relies primarily on the identifica-tion and analysis of diagnostic features present in the spectra of
ll rights reserved.
onnensystemforschung, Max
z).lity, which is operated by thent No. NNX-08AE38A withScience Mission Directorate,
some asteroids. Olivine and pyroxene are two common mafic min-erals found on asteroids (Gaffey et al., 2002), and their spectralproperties dominate the reflectance spectra of some particularclasses. Asteroids belonging to the S-complex and Q-types (DeMeoet al., 2009, Bus–DeMeo taxonomy hereafter) are examples of theseobjects. In the case of olivine, the absorption feature is composed ofthree overlapping bands and is centered near 1.04–1.1 lm, whilepyroxenes show to major absorption bands, centered near0.9–1 lm and 1.9–2 lm, all of them caused by the presence ofFe2+ cations (e.g., Adams, 1974, 1975; Burns, 1993). In the spectraof olivine–pyroxene mixtures the wavelength position (bandcenters) of the combined absorption features near 1 lm (Band I)is a function of relative abundance and composition of olivineand pyroxene, while the position of the feature near 2 lm (Band

J.A. Sanchez et al. / Icarus 220 (2012) 36–50 37
II) is a function of the pyroxene composition (Cloutis et al., 1986;Gaffey et al., 1993). In addition to the absorption band centers,the ratio of the area of Band II to that of Band I, known as band arearatio (BAR), is used to estimate olivine and pyroxene abundances inasteroids and meteorites (Cloutis et al., 1986; Burbine et al., 2003;Dunn et al., 2010). Together, these spectral band parameters con-stitute a useful tool to obtain information about the surface miner-alogy and composition of asteroids. However, band parameters canalso be affected by other factors not related to compositional vari-ations. One of these factors is the phase angle at the moment of theobservation. The phase angle (g), is defined as the angular separa-tion between the Sun and the observer as seen from the target.Phase angle induced effects can manifest themselves as phase red-dening, which produces an artificial increase (reddening) of thespectral slope and variations in the strength of the absorptionbands with increasing phase angle. This effect is explained as theresult of the wavelength dependence of the single-scattering albe-do (Gradie et al., 1980; Gradie and Veverka, 1986; Clark et al.,2002b). Traditionally, the term phase reddening was used to de-scribe only the increase of the spectral slope or continuum, how-ever as will be shown later, as the phase angle increasesvariations in the absorption bands are also seen. Therefore, in thepresent work the term phase reddening is extended to refer notonly to the increase of the spectral slope, but also to the variationsin the strength of the absorption bands.
Phase reddening effect among Solar System objects was first no-ticed in asteroid broad band colors. Gehrels (1970) reported aphase reddening in the B-V and U-B colors of 4 Vesta to be0.0018 and 0.0027 mag/degree, respectively. Additional studiesusing photometric observations include the works of Millis et al.(1976) and Lumme and Bowell (1981). The effects of phase redden-ing have been also observed among NEAs. Luu and Jewitt (1990)found that the spectral slopes of NEAs in general are higher thanthose measured for 3:1 resonance asteroids. Since NEAs are oftenobserved at high phase angles this increase in the spectral slopeswas interpreted as phase reddening.
Nathues (2000, 2010) carried out a spectroscopic and spectro-photometric survey of the Eunomia asteroid family, obtainingspectra in visible (VIS) and NIR wavelengths of 97 of its members.The analysis of the spectral slopes of these asteroids revealed anaverage increase of 0.067%/100 nm per degree with increasingphase angle in the range of 2� < g < 24�. Apart from the increaseof the spectral slope he also observed an increase of the 1 lmabsorption band (depth) with increasing phase angle.
Reddy et al. (2012) conducted an extensive study of Asteroid (4)Vesta in order to quantify phase angle-induced spectral effects onthis asteroid prior to the arrival of the Dawn spacecraft. Rotation-ally resolved NIR spectral observations (0.7–2.5 lm) were obtainedfor this purpose. They found that in the phase angle range of 0� < g6 25� for every 10� increase in phase angle, Vesta’s Band I and BandII depths increase 2.35% and 1.5%, respectively, and the BAR valueincreases by 0.30.
Phase reddening effect has been also detected and quantifiedfrom spacecraft observations of asteroids. The NEAR Shoemakerspacecraft obtained NIR spectroscopic observations (0.8–2.4 lm)of Asteroid (433) Eros at phase angles ranging from 0� to 100�.These observations showed the most intense phase reddening forwavelengths inside of the 1.0 lm band, occurring at the level of10% across this phase angle range (Clark et al., 2002b; Bell et al.,2002). Similar results were observed from NIR reflectance spectraof Asteroid (25143) Itokawa acquired by the Hayabusa spacecraft(Kitazato et al., 2008).
Laboratory measurements of different materials have con-firmed the existence of the phase reddening effect. Gradie et al.(1980) investigated phase angle induced effects on the spectro-photometric properties of powdered materials. They obtained
reflectance spectra at phase angles of 4� 6 g 6 120�, in the wave-length range 0.4 6 k 6 1.2 lm. All the samples studied by themshowed a significant reddening as the phase angle increases from4� to 120�. Furthermore, some of the spectra showed variations inthe spectral contrast of the absorption bands with increasingphase angle. More recent laboratory studies related to phase red-dening include the works of Mann et al. (2011) and Shepard andCloutis (2011).
Despite the fact that phase reddening has been known for a longtime, its effect on the analysis of asteroid spectra has not been fullyassessed. In the present work we study the phase reddening onNEAs and its implications for mineralogical analysis, space weath-ering and taxonomic classification. Due to their proximity, NEAscan exhibit a wide range of phase angles, often much higher thanthose observed for main belt asteroids, which make them the log-ical choice for this study. Our investigation focuses on the analysisof 27 VIS–NIR spectra of 12 NEAs previously classified as eitherS-complex or Q-types (Bus–DeMeo), which have been observedat different phase angles. In addition to the ground-based observa-tions, laboratory spectra of ordinary chondrites are also analyzedand the results compared to those obtained from the asteroid spec-tral data.
2. Phase reddening from ground-based observations of NEAs
2.1. The data
One of the drawbacks of this kind of study is the necessity to ob-tain multiple observations of the same asteroids at different phaseangles, which in terms of allocated observation time can be verydifficult to do. For this reason we have decided to combine datafrom Reddy (2009), DeMeo et al. (2009), Abell et al. (2007), Binzelet al. (2001) and the MIT-UH-IRTF Joint Campaign for NEO SpectralReconnaissance (NEOSR). All of these observations were conductedwith the SpeX instrument (Rayner et al., 2003) on the NASA Infra-red Telescope Facility (IRTF). The NIR spectra (0.7–2.5 lm) wereobtained using Spex in its low resolution (R � 150) prism modewith a 0.800 slit width. Typical observations consist of acquiringframes employing a nodding sequence in which the object is alter-nated between two different slit positions (A and B) following thesequence ABBA. Since the object and the sky are observed simulta-neously in each exposure, by subtracting A from B and B from A, ispossible to remove the sky background during the data reductionprocess. In order to minimize the effects of differential atmosphericrefraction the slit is oriented along the parallactic angle during theobservations. To correct for telluric water vapor features, and toobtain the relative reflectance, local standard and solar analog starsare observed at airmasses as similar as possible as the asteroids.Flat fields and arc line spectra for each night are also obtained dur-ing the observations. The data reduction is performed using differ-ent packages, including IRAF and Spextool (Cushing et al., 2004).For more details about the observing protocols and reduction ofthese data sets see Reddy (2009), DeMeo et al. (2009), Abell et al.(2007) and Binzel et al. (2001). The spectra of the NEAs at visiblewavelengths used in the present work were taken from Binzelet al. (2001, 2004) and DeMeo et al. (2009). All the spectra werenormalized to unity at 0.55 lm. Observational circumstances forthe studied objects are presented in Table 1.
2.2. Spectral band analysis of NEAs
As mentioned earlier, increasing the phase angle will producean increase in the spectral slope and changes in the strength ofthe absorption bands. Spectral slope variations can be interpretedas surface heterogeneities caused by different factors such as metal
Table 1NEAs observational circumstances. The columns in this table are: object number anddesignation, UT date of observation, the phase angle (g) and the heliocentric distanceat the time of observation.
Object UT date g (�) Heliocentricdistance (AU)
1036 Ganymeda 09–March–2005 5.9 4.091036 Ganymedb 01–June–2006 15.2 3.011620 Geographosb 10–March–2008 38.3 1.091620 Geographosc 27–February–2008 12.0 1.161620 Geographosa 29–January–2001 16.7 1.391627 Ivarb 02–October–2008 31.0 1.581627 Ivarb 03–December–2008 16.0 1.901862 Apollob 13–November–2005 51.7 1.051862 Apollob 22–November–2005 15.4 1.201980 Tezcatlipocab 25–October–2006 54.6 1.171980 Tezcatlipocac 05–January–2007 25.0 1.484179 Toutatisb 15–September–2004 27.0 1.094179 Toutatisb 02–October–2008 68.0 1.064179 Toutatisc 13–August–2008 6.1 1.454954 Ericb 20–July–2007 28.3 1.674954 Ericc 26–November–2007 62.0 1.106239 Minosa 26–January–2004 47.3 1.036239 Minosb 06–September–2010 2.4 1.2011398b 10–March–2008 33.0 1.1611398c 28–February–2008 19.0 1.2125143 Itokawad 12–March–2001 25.6 1.0725143 Itokawae 28–March–2001 69.0 1.0135107c 26–July–2008 87.0 1.0835107a 27–December–2002 45.0 1.2066146b 02–October–2008 70.3 1.0666146b 13–October–2010 32.1 1.1566146b 06–September–2010 55.3 1.16
a Data from DeMeo et al. (2009).b Data from NEOSR, http://smass.mit.edu/minus.html.c Data from Reddy (2009).d Data from Abell et al. (2007).e Data from Binzel et al. (2001).
38 J.A. Sanchez et al. / Icarus 220 (2012) 36–50
content, particle size and space weathering (Gaffey et al., 1993;Clark et al., 2002a; Gaffey, 2010). However, this parameter is alsoknown to be very sensitive to other factors. Apart from the viewing
Table 2NEAs spectral band parameters and their errors. The columns in this table correspond to: obthe Band I center (BI ± 0.01), the Band I depth (BIdep ± 0.3), the Band II center (BII ± 0.03), thetemperature corrected Band II depth (DBIIdep ± 0.5), the band area ratio (BAR ± 0.04) and
Object g (�) T (K) BI (lm) BIdep (%) BII (l
1036 Ganymed 5.9 129.6 0.909 18.79 1.8671036 Ganymed 15.2 150.9 0.917 18.22 1.8831620 Geographos 12.0 240.4 0.995 16.34 1.9701620 Geographos 16.7 219.6 0.997 16.77 1.9671620 Geographos 38.3 247.7 1.001 18.03 2.0131627 Ivar 16.0 198.9 0.948 19.14 1.9551627 Ivar 31.0 218.4 0.959 20.28 1.9641862 Apollo 15.4 243.3 0.986 25.00 1.9971862 Apollo 51.7 260.0 0.988 27.54 1.9891980 Tezcatlipoca 25.0 218.6 0.947 16.05 1.9321980 Tezcatlipoca 54.6 246.2 0.950 20.45 1.9464179 Toutatis 6.1 222.3 0.943 14.91 1.9714179 Toutatis 27.0 256.9 0.951 17.44 1.9734179 Toutatis 68.0 260.5 0.952 18.04 1.9624954 Eric 28.3 207.1 0.929 18.74 1.9254954 Eric 62.0 255.2 0.923 16.69 1.9466239 Minos 2.4 244.1 0.994 16.56 2.0306239 Minos 47.3 263.2 0.993 19.02 2.01011398 19.0 243.3 0.913 19.04 1.93511398 33.0 248.3 0.925 19.81 1.94525143 Itokawa 25.6 229.2 0.988 17.02 2.01725143 Itokawa 69.0 235.2 0.982 19.85 2.01735107 45.0 244.1 0.984 19.57 2.01935107 87.0 257.6 0.997 18.90 1.99666146 32.1 250.1 0.992 22.17 1.98366146 55.3 249.1 0.987 22.99 1.98466146 70.3 260.2 0.986 22.57 1.992
geometry, atmospheric differential refraction (Filippenko, 1982),airmass differences between the standard star and the asteroid atthe time of the observations (DeMeo et al., 2011), incorrect center-ing of the object in the slit (Cushing et al., 2004), poor weather con-ditions (Bus et al., 2002) and the use of different solar analogs(Sunshine et al., 2004) are often the cause of fluctuations in theasteroid’s spectral slope. In some cases the origin of these errorsources is difficult to determine since they are seen as nonsystem-atic variations in the final asteroid reflectance spectrum(Hardersen et al., 2006). Therefore, in order to better quantify theeffect of phase reddening on the spectral slope we will leave thatpart of the study to the laboratory spectra (see Section 3), and willfocus our attention on the analysis of the absorption bands of theasteroid spectra.
The spectral band parameters for each VIS–NIR spectrum weremeasured using the Spectral Processing Routine (SpecPR) programbased on the protocols discussed by Cloutis et al. (1986), Gaffeyet al. (2002), and Gaffey (2003). Band centers are calculated bydividing out the linear continuum and fitting an n-order polyno-mial over the bottom third of each band. In the case of Band II,we defined the unresolved red edge as 2.44 lm. After ratioingthe absorption features to the straight-line continuum, a subrou-tine in SpecPR was used to calculate the band areas (areas betweenthe linear continuum and the data curve) and band depths (mea-sured from the continuum to the band center and given as percent-age depths). The band areas were then used to calculate the BARvalues. Each band parameter was measured 10 times using differ-ent order polynomial fits (typically third and fourth order) andsampling different ranges of points within the corresponding inter-vals. Averages of these measurements were taken as the final val-ues. The uncertainties are given by the average 1 � r (standarddeviation of the mean) calculated from the multiple measurementsof each band parameter. The olivine–pyroxene abundance ratio ofthe asteroids was estimated using the relationship between ol/(ol + px) and BAR derived by Dunn et al. (2010) from the analysisof 48 ordinary chondrite samples. This linear regression is ex-pressed as
ject number and designation, the phase angle (g), the average surface temperature (T),temperature corrected Band II center (DBII ± 0.03), the Band II depth (BIIdep ± 0.5), the
the temperature corrected band area ratio (DBAR ± 0.04).
m) DBII (lm) BIIdep (%) DBIIdep (%) BAR DBAR
1.901 8.05 5.49 0.901 0.7681.913 9.29 7.05 1.101 0.9841.982 5.68 4.79 0.497 0.4471.984 6.56 5.35 0.490 0.4252.023 4.19 3.40 0.278 0.2341.975 6.26 4.74 0.407 0.3261.980 5.04 3.82 0.253 0.1862.008 4.81 3.96 0.188 0.1411.997 6.53 5.93 0.260 0.2251.949 6.62 5.40 0.526 0.4601.956 4.37 3.56 0.228 0.1831.987 4.89 3.72 0.551 0.4871.981 7.29 6.64 0.524 0.4871.970 6.90 6.31 0.487 0.4521.944 9.78 8.39 1.073 0.9981.955 8.81 8.14 0.917 0.8782.041 4.03 3.19 0.239 0.1922.017 6.10 5.55 0.348 0.3151.946 6.89 6.04 0.622 0.5751.955 8.33 7.55 0.653 0.6102.030 6.07 5.01 0.448 0.3902.030 5.45 4.48 0.395 0.3412.030 7.40 6.56 0.452 0.4052.004 6.92 6.28 0.444 0.4071.993 6.20 5.45 0.339 0.2961.994 6.35 5.59 0.290 0.2462.000 5.75 5.15 0.306 0.272
Table 3Olivine abundance with its error and taxonomy for the NEAs. The columns in this table are: object number and designation, the phase angle (g), the olivine–pyroxene abundanceratio (ol/(ol + px) ± 0.03), the temperature corrected olivine–pyroxene ratio (Dol/(ol + px) ± 0.03), taxonomic classification (Bus–DeMeo) and principal components PC10 and PC20
for each asteroid.
Object g (�) ol/(ol + px) Dol/(ol + px) Taxonomy PC10 PC20
1036 Ganymed 5.9 0.51 0.54 S 0.2400 0.04161036 Ganymed 15.2 0.46 0.49 Sr 0.3957 0.03811620 Geographos 12.0 0.61 0.62 Sq �0.1096 0.00381620 Geographos 16.7 0.61 0.63 S �0.0169 0.02061620 Geographos 38.3 0.66 0.67 Sqw �0.2337 0.05031627 Ivar 16.0 0.63 0.65 S �0.0151 0.05171627 Ivar 31.0 0.67 0.68 Sw �0.0591 0.06891862 Apollo 15.4 0.68 0.69 Q �0.5926 0.19961862 Apollo 51.7 0.66 0.67 Q �0.6011 0.23871980 Tezcatlipoca 25.0 0.60 0.62 Sw 0.1132 0.05081980 Tezcatlipoca 54.6 0.67 0.68 Sw �0.0238 0.05884179 Toutatis 6.1 0.59 0.61 Sqw �0.2825 0.09724179 Toutatis 27.0 0.60 0.61 Sq �0.3115 0.16224179 Toutatis 68.0 0.61 0.62 Sq �0.3278 0.12824954 Eric 28.3 0.47 0.49 Sw 0.1552 0.04334954 Eric 62.0 0.51 0.52 Sr 0.4719 �0.03696239 Minos 2.4 0.67 0.68 Sq �0.2907 0.05576239 Minos 47.3 0.64 0.65 Sqw �0.3090 0.123111398 19.0 0.58 0.59 Sr 0.0631 0.097811398 33.0 0.57 0.58 Sr 0.1312 0.091225143 Itokawa 25.6 0.62 0.63 Sq �0.3425 0.094625143 Itokawa 69.0 0.63 0.65 Sqw �0.3283 0.157935107 45.0 0.62 0.63 Sq �0.2848 0.128135107 87.0 0.62 0.63 Sq �0.3077 0.118266146 32.1 0.65 0.66 Q �0.5262 0.199466146 55.3 0.66 0.67 Q �0.5737 0.182466146 70.3 0.65 0.66 Q �0.4978 0.1938
J.A. Sanchez et al. / Icarus 220 (2012) 36–50 39
ol=ðolþ pxÞ ¼ �0:242� BAR þ 0:728 ð1Þ
where the ol/(ol + px) is expressed as a decimal. The band parame-ters and ol/(ol + px) ratios with their corresponding errors obtainedfor each asteroid at different phase angles are presented in Tables 2and 3 respectively.
2.3. Temperature correction to band parameters
Temperature-induced effects on the spectra of mafic mineralsare characterized by shifting the band centers and broadening ornarrowing the absorption features (Singer and Roush, 1985; Sch-ade and Wäsch, 1999; Moroz et al., 2000; Hinrichs and Lucey,2002). While surface temperature variations are considered ofminor importance for main-belt asteroids, they may be significantfor objects with higher eccentric orbits like NEAs (Moroz et al.,2000; Shestopalov and Golubeva, 2000). Furthermore, the spectraof laboratory samples are commonly obtained at room tempera-ture (�300 K). Thus, in order to compare the band parameters withthose measured for laboratory samples temperature correctionsshould be applied.
For each asteroid we have determined the average surface tem-perature (T) in the same way as (e.g., Burbine et al., 2009), wherethe temperature of the asteroid is approximated by the equationfor energy conservation. The calculated temperatures of the NEAsare given in Table 2.
Since all the asteroids studied in this work are S-complex orQ-types, i.e., olivine–orthopyroxene assemblages, we have derivedtemperature corrections based on the analysis of ordinary chon-drites. These meteorites are the most common type of meteoriteto fall on Earth (�85% of all), and they have been generally linkedto either S-complex or Q-type asteroids (e.g., Gaffey et al., 1993;Vernazza et al., 2008; Nakamura et al., 2011).
We have reanalyzed spectra of two H5 ordinary chondrites fromHinrichs and Lucey (2002) acquired in the temperature range be-tween 80 and 400 K. Spectral band parameters (band centers, banddepths and BAR) and their uncertainties were measured using the
same methods applied to the asteroid spectra. These data werecombined with the results obtained by Moroz et al. (2000) for aL5 and a LL4 ordinary chondrite acquired at temperatures between293 and 80 K.
We found that Band II is the most affected by temperature vari-ations. A correlation between Band II centers and temperature isobserved for all samples, i.e., Band II centers shift to longer wave-lengths as the temperature increases. Therefore, to each data set alinear fit was performed and the equations that represent thoselinear fits were averaged, obtaining the following expression:
BIIðTÞ ¼ 0:0002� T ðKÞ þ 1:87 ð2Þ
where the Band II center (BII) is given in lm. From this equation wederived a wavelength correction for the Band II center
DBII ðlmÞ ¼ 0:06� 0:0002� T ðKÞ ð3Þ
This correction is derived with respect to room temperature(300 K) and must be added to the calculated Band II center of eachasteroid. The temperature corrected Band II centers are presentedin Table 2. For the Band I center we found that the wavelength shiftis in general very small (�0.003 lm), so no temperature correctionwas derived.
A decrease in Band II depth with increasing temperature wasfound for the three groups of ordinary chondrites. No obvioustrend was observed for the Band I depth. Applying a similar proce-dure to the Band II center, we can estimate the approximate rate ofchange of the Band II depth for a range of temperatures
BIIdepðTÞ ¼ 20:89� 0:015� T ðKÞ ð4Þ
where the Band II depth (BIIdep) is given in %. From this equation wederived a temperature correction for the Band II depth
DBIIdep ð%Þ ¼ 0:015� T ðKÞ � 4:5 ð5Þ
This correction is derived with respect to the room temperatureand must be added to the calculated Band II depth of each asteroid.
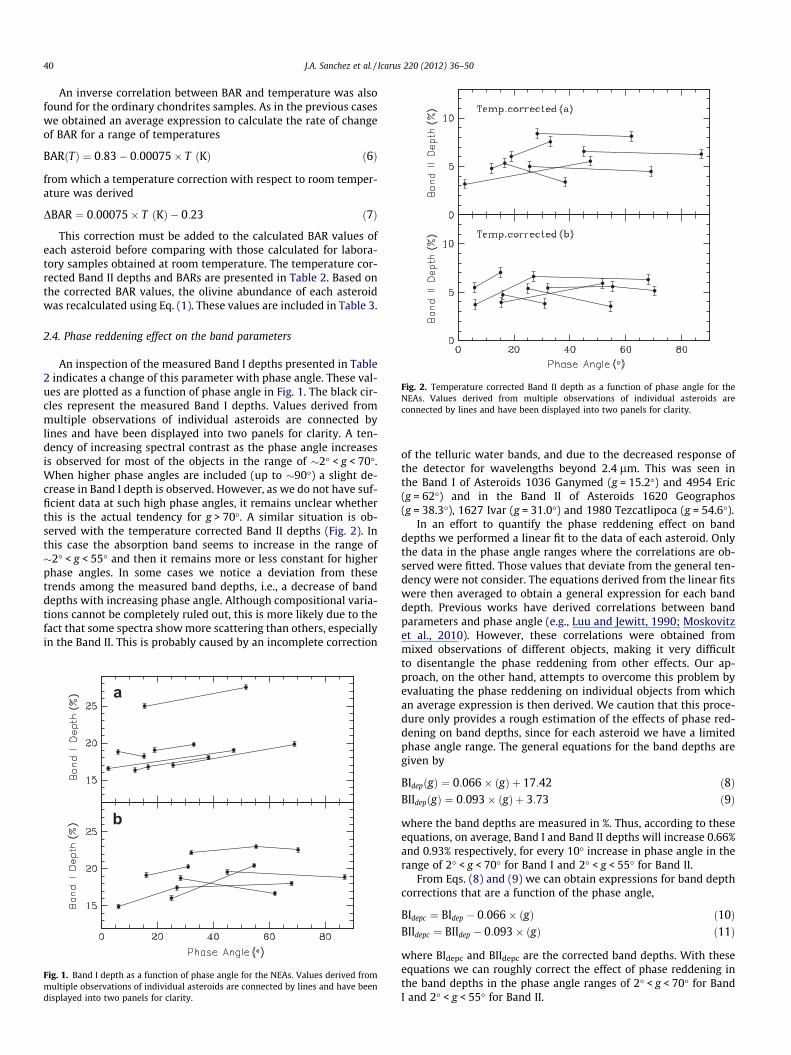
Fig. 2. Temperature corrected Band II depth as a function of phase angle for theNEAs. Values derived from multiple observations of individual asteroids areconnected by lines and have been displayed into two panels for clarity.
40 J.A. Sanchez et al. / Icarus 220 (2012) 36–50
An inverse correlation between BAR and temperature was alsofound for the ordinary chondrites samples. As in the previous caseswe obtained an average expression to calculate the rate of changeof BAR for a range of temperatures
BARðTÞ ¼ 0:83� 0:00075� T ðKÞ ð6Þ
from which a temperature correction with respect to room temper-ature was derived
DBAR ¼ 0:00075� T ðKÞ � 0:23 ð7Þ
This correction must be added to the calculated BAR values ofeach asteroid before comparing with those calculated for labora-tory samples obtained at room temperature. The temperature cor-rected Band II depths and BARs are presented in Table 2. Based onthe corrected BAR values, the olivine abundance of each asteroidwas recalculated using Eq. (1). These values are included in Table 3.
2.4. Phase reddening effect on the band parameters
An inspection of the measured Band I depths presented in Table2 indicates a change of this parameter with phase angle. These val-ues are plotted as a function of phase angle in Fig. 1. The black cir-cles represent the measured Band I depths. Values derived frommultiple observations of individual asteroids are connected bylines and have been displayed into two panels for clarity. A ten-dency of increasing spectral contrast as the phase angle increasesis observed for most of the objects in the range of �2� < g < 70�.When higher phase angles are included (up to �90�) a slight de-crease in Band I depth is observed. However, as we do not have suf-ficient data at such high phase angles, it remains unclear whetherthis is the actual tendency for g > 70�. A similar situation is ob-served with the temperature corrected Band II depths (Fig. 2). Inthis case the absorption band seems to increase in the range of�2� < g < 55� and then it remains more or less constant for higherphase angles. In some cases we notice a deviation from thesetrends among the measured band depths, i.e., a decrease of banddepths with increasing phase angle. Although compositional varia-tions cannot be completely ruled out, this is more likely due to thefact that some spectra show more scattering than others, especiallyin the Band II. This is probably caused by an incomplete correction
b
a
Fig. 1. Band I depth as a function of phase angle for the NEAs. Values derived frommultiple observations of individual asteroids are connected by lines and have beendisplayed into two panels for clarity.
of the telluric water bands, and due to the decreased response ofthe detector for wavelengths beyond 2.4 lm. This was seen inthe Band I of Asteroids 1036 Ganymed (g = 15.2�) and 4954 Eric(g = 62�) and in the Band II of Asteroids 1620 Geographos(g = 38.3�), 1627 Ivar (g = 31.0�) and 1980 Tezcatlipoca (g = 54.6�).
In an effort to quantify the phase reddening effect on banddepths we performed a linear fit to the data of each asteroid. Onlythe data in the phase angle ranges where the correlations are ob-served were fitted. Those values that deviate from the general ten-dency were not consider. The equations derived from the linear fitswere then averaged to obtain a general expression for each banddepth. Previous works have derived correlations between bandparameters and phase angle (e.g., Luu and Jewitt, 1990; Moskovitzet al., 2010). However, these correlations were obtained frommixed observations of different objects, making it very difficultto disentangle the phase reddening from other effects. Our ap-proach, on the other hand, attempts to overcome this problem byevaluating the phase reddening on individual objects from whichan average expression is then derived. We caution that this proce-dure only provides a rough estimation of the effects of phase red-dening on band depths, since for each asteroid we have a limitedphase angle range. The general equations for the band depths aregiven by
BIdepðgÞ ¼ 0:066� ðgÞ þ 17:42 ð8ÞBIIdepðgÞ ¼ 0:093� ðgÞ þ 3:73 ð9Þ
where the band depths are measured in %. Thus, according to theseequations, on average, Band I and Band II depths will increase 0.66%and 0.93% respectively, for every 10� increase in phase angle in therange of 2� < g < 70� for Band I and 2� < g < 55� for Band II.
From Eqs. (8) and (9) we can obtain expressions for band depthcorrections that are a function of the phase angle,
BIdepc ¼ BIdep � 0:066� ðgÞ ð10ÞBIIdepc ¼ BIIdep � 0:093� ðgÞ ð11Þ
where BIdepc and BIIdepc are the corrected band depths. With theseequations we can roughly correct the effect of phase reddening inthe band depths in the phase angle ranges of 2� < g < 70� for BandI and 2� < g < 55� for Band II.

J.A. Sanchez et al. / Icarus 220 (2012) 36–50 41
The temperature corrected BAR values presented in Table 2 andplotted in Fig. 3 indicate variations with increasing phase angle,however no obvious trend can be seen. The most significant changein BAR is observed for the same objects whose absorption bandsshow more scattering.
Small variations on band centers with increasing phase anglewere found, however they are within the uncertainties associatedto these band parameters. This can be seen in Fig. 4 where we plot-ted Band I center as a function of phase angle for the NEAs. Theblack circles represent the measured Band I centers. Values derivedfrom multiple observations of the same asteroids are connected bylines.
Fig. 3. Temperature corrected BAR values as a function of phase angle for the NEAs.Values derived from multiple observations of individual asteroids are connected bylines and have been displayed into two panels for clarity.
a
b
Fig. 4. Band I center as a function of phase angle for the NEAs. Values derived frommultiple observations of individual asteroids are connected by lines and have beendisplayed into two panels for clarity.
3. Phase reddening from laboratory measurements of ordinarychondrites
3.1. Data and spectral band analysis
As it was stated before, ordinary chondrites are considered to bethe meteorite analogs of S-complex and Q-type asteroids. There-fore, in order to complement our study we have analyzed the spec-tra of a group of ordinary chondrites obtained at a wide range ofphase angles.
Diffuse reflectance spectra were collected at the University ofWinnipeg Planetary Spectrophotometer Facility (UWPSF) usingan ASD FieldSpec Pro HR spectrometer over the wavelength rangeof 0.35–2.5 lm. The three samples that have been analyzed areDhurmsala (LL6, fell 1860), Pavlograd (L6, fell 1826), and Lancon(H6, fell 1897). They were all crushed and sieved to a grain sizeof <150 lm. The samples were gently poured into aluminum sam-ple cups and the edge of a glass slide was drawn across the sampleto provide a flat surface for the spectral measurements. Reflectancespectra were acquired relative to a 100% Labsphere Spectralon diskmeasured at an incident angle i = 13� and emission angle e = 0�(13� phase angle). Ten sets of measurements were acquired foreach sample resulting in three emission angles (e = 0�, 30�, 60�),five incidence angles (i = 0�, 13�, 30�, �30�, 60�) and five differentphase angles ranging from 13� to 120�. Positive angles (i and e)are measured when the light source and the detector are on eitherside of the normal, while negative incidence angles are measuredwhen both light source and detector are on the same side of thenormal. For each measurement, a total of 250 scans were collectedand averaged to improve the signal to noise ratio.
Spectral band parameters and their uncertainties were mea-sured for each VIS–NIR spectrum using the same methods appliedto the asteroid spectra. In addition to the band parameters we havealso measured the spectral slope, which was determined from thefitted continuum across Band I, i.e., a straight line tangent to thereflectance peaks from �0.7 to �1.55 lm. The uncertainty of thespectral slope is given by the average 1 � r, estimated from sam-pling different ranges of points near to the reflectance peaks oneither side of the absorption band. The olivine–pyroxene abun-dance ratio of the samples was estimated using Eq. (1). The bandparameters, spectral slopes and ol/(ol + px) ratios with their corre-sponding errors obtained for each sample are presented in Table 4.
3.2. Phase reddening effect on the band parameters
The analysis of the laboratory spectra shows that variations inthe band parameters can arise not only by changing the phase an-gle, but also for the same phase angle using different configura-tions of the incidence and emission angle. As can be seen inTable 4 phase angles of 30�, 60� and 90� were obtained using differ-ent combinations of i and e, and these different combinations pro-duced, in some cases, very different band parameter values. Sincewe want to quantify the effects of phase reddening on the spectralband parameters, for those phase angles where more than onecombination of i and e was used the average value for each bandparameter was taken. These average values are presented in Table4.
Fig. 5 shows the reflectance spectra of the LL6 ordinary chon-drite at five different phase angles. From the bottom to the topthe phase angles are 13�, 30�, 60�, 90� and 120�. The spectra corre-sponding to g = 30�, 60� and 90� are the average spectra obtainedfrom different combinations of the incidence and emission angles.All the spectra are normalized to unity at 0.55 lm. An increase inthe spectral slope with increasing phase angle is evident, beingmore significant for phase angles higher than 30�. A similar

Table 4Spectral band parameters of the ordinary chondrites. The columns in this table correspond to: sample type, the incidence angle (i), the emission angle (e), the phase angle (g), thespectral slope ±0.004, the Band I center (BI ± 0.003), the Band I depth (BIdep ± 0.1), the Band II center (BII ± 0.005), the Band II depth (BIIdep ± 0.2), the band area ratio (BAR ± 0.01)and the olivine–pyroxene abundance ratio (ol/(ol + px) ± 0.03).
Sample i (�) e (�) g (�) Slope (%l�1) BI (lm) BIdep (%) BII (lm) BIIdep (%) BAR ol/(ol + px)
LL6 13 0 13 �0.127 0.984 36.81 1.963 17.27 0.58 0.59LL6 30 0 30 �0.094 0.982 38.41 1.959 18.35 0.58 0.59LL6 0 30 30 �0.083 0.978 38.47 1.961 18.73 0.61 0.58LL6 �30 60 30 �0.179 0.978 36.69 1.964 18.36 0.63 0.58LL6 30,0,�30 0, 30,60 30 �0.119 0.979 37.86 1.961 18.48 0.61 0.58LL6 60 0 60 0.002 0.981 40.28 1.957 18.55 0.55 0.59LL6 0 60 60 �0.097 0.969 37.30 1.965 18.89 0.68 0.56LL6 30 30 60 �0.043 0.982 39.61 1.960 18.22 0.56 0.59LL6 60,0,30 0, 60,30 60 �0.046 0.977 39.06 1.961 18.55 0.60 0.58LL6 60 30 90 0.099 0.973 37.91 1.963 18.75 0.62 0.58LL6 30 60 90 0.184 0.980 36.84 1.961 16.46 0.53 0.60LL6 60,30 30,60 90 0.141 0.976 37.38 1.962 17.61 0.57 0.59LL6 60 60 120 0.212 0.972 34.18 1.959 17.50 0.67 0.57L6 13 0 13 �0.102 0.949 42.37 1.944 18.70 0.57 0.59L6 30 0 30 �0.090 0.951 42.71 1.943 18.92 0.56 0.59L6 0 30 30 �0.089 0.950 42.39 1.945 19.03 0.58 0.59L6 �30 60 30 �0.192 0.950 41.58 1.947 18.00 0.57 0.59L6 30,0,�30 0, 30,60 30 �0.124 0.951 42.23 1.945 18.65 0.57 0.59L6 60 0 60 �0.084 0.954 43.16 1.945 18.21 0.51 0.60L6 0 60 60 �0.085 0.949 43.36 1.948 18.73 0.59 0.59L6 30 30 60 0.004 0.947 44.68 1.939 20.86 0.62 0.58L6 60,0,30 0, 60,30 60 �0.055 0.950 43.73 1.944 19.26 0.57 0.59L6 60 30 90 0.097 0.945 42.53 1.941 17.21 0.51 0.61L6 30 60 90 0.177 0.944 41.69 1.948 17.24 0.56 0.59L6 60,30 30,60 90 0.137 0.944 42.11 1.945 17.23 0.54 0.60L6 60 60 120 0.191 0.944 39.84 1.943 16.15 0.51 0.61H6 13 0 13 �0.141 0.934 35.45 1.930 18.41 0.88 0.52H6 30 0 30 �0.151 0.935 36.20 1.929 19.12 0.89 0.51H6 0 30 30 �0.115 0.933 35.33 1.934 18.33 0.88 0.52H6 �30 60 30 �0.177 0.931 34.80 1.931 18.26 0.93 0.50H6 30,0,�30 0, 30,60 30 �0.148 0.933 35.44 1.932 18.57 0.90 0.51H6 60 0 60 �0.149 0.935 36.48 1.926 18.91 0.83 0.53H6 0 60 60 �0.096 0.929 34.54 1.935 16.93 0.84 0.52H6 30 30 60 �0.096 0.933 36.93 1.931 17.85 0.76 0.55H6 60,0,30 0, 60,30 60 �0.114 0.933 35.98 1.931 17.90 0.81 0.53H6 60 30 90 �0.058 0.932 34.77 1.928 17.65 0.83 0.53H6 30 60 90 �0.012 0.926 31.69 1.934 14.77 0.84 0.53H6 60,30 30,60 90 �0.035 0.929 33.23 1.931 16.21 0.83 0.53H6 60 60 120 0.020 0.932 31.77 1.932 15.55 0.80 0.54
Fig. 5. Reflectance spectra of the LL6 chondrite Dhurmsala obtained at five differentphase angles. From the bottom to the top g = 13� (solid line), g = 30� (short dashedline), g = 60� (long dashed line), g = 90� (dot-short dashed line) and g = 120� (dot-long dashed line). All the spectra are normalized to unity at 0.55 lm.
42 J.A. Sanchez et al. / Icarus 220 (2012) 36–50
behavior was observed for the other two samples. For phase anglesbetween 13� and 30� a slight reddening is observed in the LL6 spec-tra, while a slight blueing (i.e decreasing of the spectral slope withincreasing phase angle) is seen in the L6 and H6 spectra. Variationsin the strengths of the absorption bands are also seen for the threesamples.
In Fig. 6 we plotted the spectral slopes (panel a), the BAR values(panel b), the Band I depths (panel c), the Band II depths (panel d)and the band centers (panels e and f) as functions of the phase an-gle for the LL6 ordinary chondrite. The dashed lines are polynomialfits.
From the ‘‘a’’ panel we can see that the measured spectralslopes remain more or less constant for phase angles between13� and 30�, and then they increase as the phase angle increasesup to 120�. A similar trend was observed for the L6 and H6 ordinarychondrites. The largest difference in spectral slope between thelowest (13�) and the highest (120�) phase angle was found forthe LL6 ordinary chondrite, which increased 0.34%l�1, followedby the L6 ordinary chondrite with an increase of 0.29%l�1 andthe H6 ordinary chondrite with an increase of 0.16%l�1.
The Band I depth of the three samples has its maximum spectralcontrast near g = 60�. The LL6 spectra show a progressive increaseof Band I depth from g = 13� to 60� (Fig. 6 panel c), however the L6and H6 spectra show almost no change in Band I depth for phaseangles between 13� and 30�, and then an increase in Band I depth
a b
c d
e f
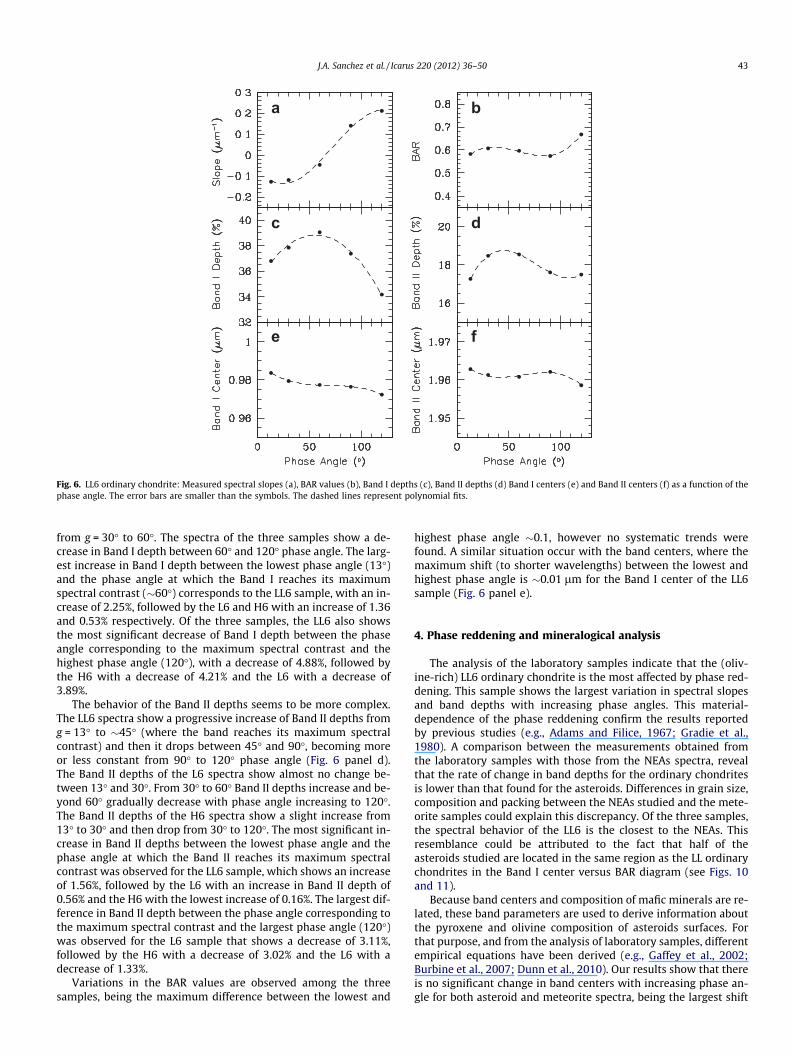
Fig. 6. LL6 ordinary chondrite: Measured spectral slopes (a), BAR values (b), Band I depths (c), Band II depths (d) Band I centers (e) and Band II centers (f) as a function of thephase angle. The error bars are smaller than the symbols. The dashed lines represent polynomial fits.
J.A. Sanchez et al. / Icarus 220 (2012) 36–50 43
from g = 30� to 60�. The spectra of the three samples show a de-crease in Band I depth between 60� and 120� phase angle. The larg-est increase in Band I depth between the lowest phase angle (13�)and the phase angle at which the Band I reaches its maximumspectral contrast (�60�) corresponds to the LL6 sample, with an in-crease of 2.25%, followed by the L6 and H6 with an increase of 1.36and 0.53% respectively. Of the three samples, the LL6 also showsthe most significant decrease of Band I depth between the phaseangle corresponding to the maximum spectral contrast and thehighest phase angle (120�), with a decrease of 4.88%, followed bythe H6 with a decrease of 4.21% and the L6 with a decrease of3.89%.
The behavior of the Band II depths seems to be more complex.The LL6 spectra show a progressive increase of Band II depths fromg = 13� to �45� (where the band reaches its maximum spectralcontrast) and then it drops between 45� and 90�, becoming moreor less constant from 90� to 120� phase angle (Fig. 6 panel d).The Band II depths of the L6 spectra show almost no change be-tween 13� and 30�. From 30� to 60� Band II depths increase and be-yond 60� gradually decrease with phase angle increasing to 120�.The Band II depths of the H6 spectra show a slight increase from13� to 30� and then drop from 30� to 120�. The most significant in-crease in Band II depths between the lowest phase angle and thephase angle at which the Band II reaches its maximum spectralcontrast was observed for the LL6 sample, which shows an increaseof 1.56%, followed by the L6 with an increase in Band II depth of0.56% and the H6 with the lowest increase of 0.16%. The largest dif-ference in Band II depth between the phase angle corresponding tothe maximum spectral contrast and the largest phase angle (120�)was observed for the L6 sample that shows a decrease of 3.11%,followed by the H6 with a decrease of 3.02% and the L6 with adecrease of 1.33%.
Variations in the BAR values are observed among the threesamples, being the maximum difference between the lowest and
highest phase angle �0.1, however no systematic trends werefound. A similar situation occur with the band centers, where themaximum shift (to shorter wavelengths) between the lowest andhighest phase angle is �0.01 lm for the Band I center of the LL6sample (Fig. 6 panel e).
4. Phase reddening and mineralogical analysis
The analysis of the laboratory samples indicate that the (oliv-ine-rich) LL6 ordinary chondrite is the most affected by phase red-dening. This sample shows the largest variation in spectral slopesand band depths with increasing phase angles. This material-dependence of the phase reddening confirm the results reportedby previous studies (e.g., Adams and Filice, 1967; Gradie et al.,1980). A comparison between the measurements obtained fromthe laboratory samples with those from the NEAs spectra, revealthat the rate of change in band depths for the ordinary chondritesis lower than that found for the asteroids. Differences in grain size,composition and packing between the NEAs studied and the mete-orite samples could explain this discrepancy. Of the three samples,the spectral behavior of the LL6 is the closest to the NEAs. Thisresemblance could be attributed to the fact that half of theasteroids studied are located in the same region as the LL ordinarychondrites in the Band I center versus BAR diagram (see Figs. 10and 11).
Because band centers and composition of mafic minerals are re-lated, these band parameters are used to derive information aboutthe pyroxene and olivine composition of asteroids surfaces. Forthat purpose, and from the analysis of laboratory samples, differentempirical equations have been derived (e.g., Gaffey et al., 2002;Burbine et al., 2007; Dunn et al., 2010). Our results show that thereis no significant change in band centers with increasing phase an-gle for both asteroid and meteorite spectra, being the largest shift
44 J.A. Sanchez et al. / Icarus 220 (2012) 36–50
of �0.01 lm (for the meteorite spectra), which is on the order ofthe uncertainty associated with this parameter for the asteroidspectra. Based on this, it seems to be unlikely that phase reddeningcould lead to a misinterpretation of the minerals composition inasteroids.
In addition to the band centers, we used the BAR values and Eq.(1) to estimate olivine and pyroxene abundances for both NEAs andthe laboratory samples. The results obtained (Tables 3 and 4) showthat the largest variation in the ol/(ol + px) ratio with increasingphase angles for NEAs is �0.02 (not taken into account the valuesobtained from the noisy spectra), and for the ordinary chondritesbetween 0.03 and 0.05. Since these variations are on the order ofthe errors, effects of phase reddening on the estimation of theolivine–pyroxene abundance ratio seems to be negligible.
Fig. 7. Ratio plots (solid lines) between the spectra of the LL6 obtained at g = 60�and g = 30� (bottom), at g = 90� and g = 30� (middle) and at g = 120� and g = 30� (toppanel). Dashed curves are the best fit curves obtained using Eq. (13). For each ratioplot the resultant A, CP and R2 values are given.
5. Phase reddening and space weathering
Space weathering is the term commonly used to refer to anyprocess that modifies the surfaces of airless bodies. The effects ofspace weathering on the spectra can be seen as reddening of thespectral slopes and suppression of the absorption bands, (Pieterset al., 2000; Hapke, 2001; Gaffey, 2010). The analysis of returnedsamples from the Moon and Asteroid (25143) Itokawa have shownthat the cause of the spectral changes is the presence of submicro-scopic metallic iron (SMFe) incorporated into the soil grains (Piet-ers et al., 2000; Taylor et al., 2001; Noguchi et al., 2011). This SMFeis produced by condensation of vapors created by micrometeoriteimpacts and/or deposition of atoms sputtered off from silicatesby solar wind ions (Taylor et al., 2001; Hapke, 2001; Clark et al.,2002a). Ion irradiation experiments conducted by Brunetto andStrazzulla (2005) showed that solar wind irradiation can also red-den reflectance spectra by creation of displacements (the sum ofthe vacancies and the replacements) caused by elastic collisionsbetween ions and target nuclei.
Brunetto et al. (2006) determined that the effects of spaceweathering due to ion irradiation can be described by an exponen-tial continuum. They computed the ratio between the reflectancespectra of irradiated and unirradiated samples and then modeledit with an exponential curve given by
Ratio ¼WðkÞ ¼ K expðCS=kÞ ð12Þ
where k is the wavelength, K is a scale factor and the parameter CS isa measure of the effects of space weathering. They called W(k) theweathering function. Since both effects, phase reddening and spaceweathering, are manifested in a similar way, we investigatedwhether the red slopes exhibited by spectra obtained at high phaseangles could be misinterpreted as space weathering. In order to dothis we carried out two different experiments.
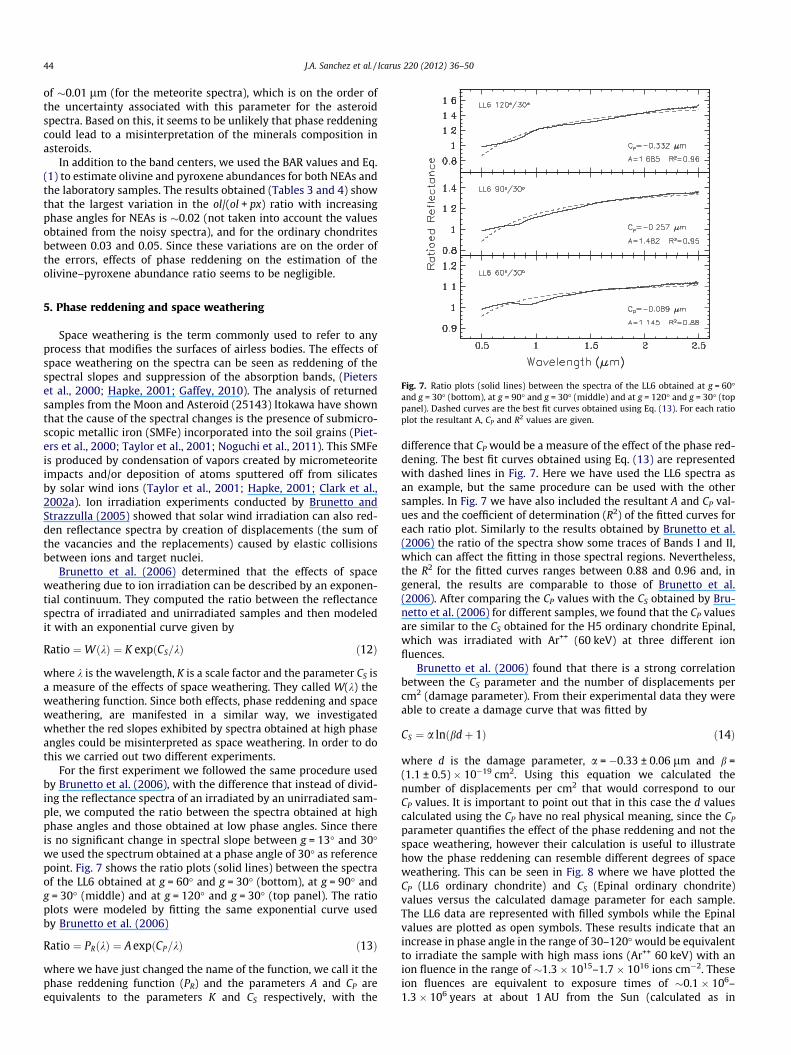
For the first experiment we followed the same procedure usedby Brunetto et al. (2006), with the difference that instead of divid-ing the reflectance spectra of an irradiated by an unirradiated sam-ple, we computed the ratio between the spectra obtained at highphase angles and those obtained at low phase angles. Since thereis no significant change in spectral slope between g = 13� and 30�we used the spectrum obtained at a phase angle of 30� as referencepoint. Fig. 7 shows the ratio plots (solid lines) between the spectraof the LL6 obtained at g = 60� and g = 30� (bottom), at g = 90� andg = 30� (middle) and at g = 120� and g = 30� (top panel). The ratioplots were modeled by fitting the same exponential curve usedby Brunetto et al. (2006)
Ratio ¼ PRðkÞ ¼ A expðCP=kÞ ð13Þ
where we have just changed the name of the function, we call it thephase reddening function (PR) and the parameters A and CP areequivalents to the parameters K and CS respectively, with the
difference that CP would be a measure of the effect of the phase red-dening. The best fit curves obtained using Eq. (13) are representedwith dashed lines in Fig. 7. Here we have used the LL6 spectra asan example, but the same procedure can be used with the othersamples. In Fig. 7 we have also included the resultant A and CP val-ues and the coefficient of determination (R2) of the fitted curves foreach ratio plot. Similarly to the results obtained by Brunetto et al.(2006) the ratio of the spectra show some traces of Bands I and II,which can affect the fitting in those spectral regions. Nevertheless,the R2 for the fitted curves ranges between 0.88 and 0.96 and, ingeneral, the results are comparable to those of Brunetto et al.(2006). After comparing the CP values with the CS obtained by Bru-netto et al. (2006) for different samples, we found that the CP valuesare similar to the CS obtained for the H5 ordinary chondrite Epinal,which was irradiated with Ar++ (60 keV) at three different ionfluences.
Brunetto et al. (2006) found that there is a strong correlationbetween the CS parameter and the number of displacements percm2 (damage parameter). From their experimental data they wereable to create a damage curve that was fitted by
CS ¼ a lnðbdþ 1Þ ð14Þ
where d is the damage parameter, a = �0.33 ± 0.06 lm and b =(1.1 ± 0.5) � 10�19 cm2. Using this equation we calculated thenumber of displacements per cm2 that would correspond to ourCP values. It is important to point out that in this case the d valuescalculated using the CP have no real physical meaning, since the CP
parameter quantifies the effect of the phase reddening and not thespace weathering, however their calculation is useful to illustratehow the phase reddening can resemble different degrees of spaceweathering. This can be seen in Fig. 8 where we have plotted theCP (LL6 ordinary chondrite) and CS (Epinal ordinary chondrite)values versus the calculated damage parameter for each sample.The LL6 data are represented with filled symbols while the Epinalvalues are plotted as open symbols. These results indicate that anincrease in phase angle in the range of 30–120� would be equivalentto irradiate the sample with high mass ions (Ar++ 60 keV) with anion fluence in the range of �1.3 � 1015–1.7 � 1016 ions cm�2. Theseion fluences are equivalent to exposure times of �0.1 � 106–1.3 � 106 years at about 1 AU from the Sun (calculated as in

Fig. 8. The CP (LL6 ordinary chondrite) and CS (Epinal ordinary chondrite)parameters as a function of the number of displacements per cm2 (damageparameter). The data corresponding to the Epinal meteorite were obtained fromBrunetto et al. (2006). The LL6 and the Epinal data are plotted as filled and opensymbols respectively. For the LL6 each symbol represents the value obtained fromthe ratioed spectra of different phase angles. The symbols corresponding to theEpinal meteorite represent different ions fluences. Approximate exposure times (at1 AU) corresponding to each ion fluence are also shown. The solid line representsthe experimental damage curve from Brunetto et al. (2006). The error bars of theLL6 data are on the order of the size of symbols.
J.A. Sanchez et al. / Icarus 220 (2012) 36–50 45
Strazzulla et al. (2005)). Laboratory experiments (e.g., Strazzullaet al., 2005) have shown that the timescale for the weathering ofNEAs surfaces due to ion irradiation is on the order of 104–106 years. Thus, observing NEAs at high phase angles could producespectral slopes that resemble those exhibited by weatheredsurfaces.
For the second experiment we modeled the optical effects of theSMFe on the laboratory spectra by using Hapke’s radiative transfermodel (Hapke, 1981, 1993, 2001), and then we compared thesespectra with those obtained at different phase angles.
From Hapke (2001) the bidirectional reflectance of a medium ofisotropic scatterers ignoring the opposition effect is given by
rði; e; gÞ ¼ w4p
l0
l0 þ lHðc;l0ÞHðc;lÞ ð15Þ
where i, e and g are the incidence, emission and phase angle respec-tively, l0 = cos(i), l = cos(e), w is the single scattering albedo,c = (1 �w)1/2, and H(c,l) is an analytic approximation to theAmbartsumian–Chandrasekhar H functions. Since most reflectancesare relative to a standard, Hapke (2001) represented this relativereflectance as
CðcÞ ¼ 1� c2
ð1þ 2cl0Þð1þ 2clÞ ð16Þ
from which c can be determined, and the single scattering albedo ofthe sample can be calculated as
w ¼ 1� c2 ð17Þ
The single scattering albedo can be also written as a function of theproperties of the particles of the medium by
w ¼ Se þ ð1� SeÞ1� Si
1� SiHH ð18Þ
where Se is the Fresnel reflection coefficient for externally incidentlight, Si is the Fresnel reflection coefficient for internally scatteredlight (see Hapke, 2001), and H is the single-pass transmission ofthe particle. If there is no internal scattering, then
H ¼ e�ahDi ð19Þ
where hDi is the mean ray path length (Hapke, 1993) and a is theabsorption coefficient given by
a ¼ 4pnkk
ð20Þ
where n and k are the real and imaginary part of the refractive indexrespectively and k is the wavelength. From Eqs. (18) and (19) theabsorption coefficient can be also calculated as
a ¼ 1hDi ln Si þ
ð1� SeÞð1� Si
w� Se
� �ð21Þ
To model the effects of the SMFe, the absorption coefficient of thehost material (ah) is increased by adding to it the absorption coeffi-cient of the SMFe (aFe). Using the Maxwell–Garnett effective med-ium theory, Hapke (2001) derived an expression to calculate aFe,
aFe ¼36pzfqh
kqFeð22Þ
where f is the mass fraction of the Fe particles, qh is the density ofthe host material, qFe is the density of iron and z is given by
z ¼ n3hnFekFe
n2Fe � k2
Fe þ 2n2h
� �2þ ð2nFekFeÞ2
ð23Þ
where nh and nFe are the real part of the refractive indices of thehost material and iron respectively, and kFe is the imaginary partof the refractive index of iron. Thus, if we use Eq. (21) to calculatethe absorption coefficient of the host material (ah), then the absorp-tion coefficient of the material containing SMFe is given by
aw ¼ ah þ aFe ð24Þ
Looking at Eqs. (15) and (18)–(20) we can understand whyphase reddening and space weathering are manifested in similarways. Reflectance spectra are controlled by the single scattering al-bedo (w), which is a function of the absorption coefficient (a). Theabsorption coefficient is a parameter that characterizes how deepinto a material light of a particular wavelength can penetrate be-fore being absorbed. As the phase angle increases, light is less ableto escape from the medium, meaning that photons are more ab-sorbed, resulting in a decrease of reflectance throughout the entirespectrum. However, because the absorption coefficient is inverselyproportional to the wavelength (the shorter the wavelength thehigher the absorption coefficient) the reflectance in the blue partof the spectrum will decrease faster than in the red part, producingthe increase in spectral slope (reddening). Similarly, the addition ofthe SMFe (Eq. (24)) will decrease the blue part of the spectrummore than the red part due to the stronger absorption at shortwavelengths, increasing the spectral slope (Hapke, 2001).
For our experiment we used the spectrum of the LL6 ordinarychondrite obtained at a phase angle of 13� as reference point. Usingthese data we first calculated ah with Eqs. (16)–(21), where wehave assumed nh = 1.7, which is a typical value for mafic minerals(Hapke, 2001). Then using Eqs. (22) and (23) we estimated aFe. Forthis calculation we have assumed qh = 3.48, which is the averagegrain density for LL chondrites (Britt and Consolmagno, 2003)and qFe = 7.87. The optical constants of iron, nFe and kFe, were takenfrom Johnson and Christy (1974). Since these values were mea-sured only for k � 1.9 lm, we did a polynomial fit to the data in or-der to extrapolate them to 2.5 lm. The aFe was calculated fordifferent mass fractions of Fe and then the resulting values were

Fig. 9. Reflectance spectra of the LL6 chondrite Dhurmsala after adding differentamounts of SMFe (dot-short dashed lines) to the spectrum obtained at g = 13�. Forcomparison the spectra of the LL6 obtained at g = 13� (solid lines) and g = 60�, 90�and 120� (long dashed lines from the bottom to the top) have been included. All thespectra are normalized to unity at 0.55 lm.
46 J.A. Sanchez et al. / Icarus 220 (2012) 36–50
added to the calculated ah in order to obtain aw. These aw valueswere then inserted into Eq. (19), which combined with Eq. (18) al-lowed us to determine the new single scattering albedos. Finally,we calculated c from Eq. (17) and using Eq. (16) we obtained the‘‘weathered spectra’’ for the different % of SMFe. In Fig. 9 we plotthe reflectance spectra of the LL6 after adding different amountsof SMFe. We found that the spectrum obtained at g = 60� shows aspectral slope comparable to the spectrum obtained at g = 13� afteradding 0.0015% SMFe. For phase angles of 90� and 120� the spectralslopes are equivalent to adding 0.0048 and 0.0062% SMFe respec-tively, to the spectrum obtained at g = 13�. If we consider that anamount of �0.02% of SMFe is required to explain the red slopesof some S-complex asteroids (e.g., Hapke, 2001; Rivkin et al.,2004), this means that the spectral slope for the highest phase an-gle (g = 120�) would be equivalent to �30% of that SMFe.
Fig. 10. Plot of the Band I center versus BAR for the NEAs. The polygonal regionrepresents the mafic silicate components of ordinary chondrites and S(IV) asteroids(Gaffey et al., 1993). The gray oval region represents the mineralogical zonecorresponding to the calcic pyroxene-bearing where the S(III) subtypes are located(Gaffey et al., 1993). The dashed curve indicates the location of the olivine–orthopyroxene mixing line (Cloutis et al., 1986). The top panel shows the measuredvalues for Asteroids 1620 Geographos (filled circles), 1036 Ganymed (open circles),1862 Apollo (filled triangles), 1980 Tezcatiploca (crosses), 11398 (open squares)and 6239 Minos (filled squares). The bottom panel shows the measured values forAsteroids 4954 Eric (open circles), 66146 (filled squares), 1627 Ivar (crosses), 35107(open squares), 25143 Itokawa (filled circles) and 4179 Toutatis (filled triangles).Measured values from multiple observations of individual asteroids are connectedby lines. The average 1 � r error bars are shown in the upper right corner.
6. Phase reddening and taxonomic classification
The taxonomic classification of asteroids is based on sharedobservational parameters like spectral slope, color, albedo andband depth. Most of the current classification systems are basedon visible data (e.g., Tholen, 1984; Bus and Binzel, 2002b,a), in partbecause only during the last decade sufficient high-quality NIRspectral data became available to extend the classification to thenear-infrared wavelengths. Two of the most common systems usedto classify asteroids using VIS–NIR data are those introduced byGaffey et al. (1993) and more recently by DeMeo et al. (2009). Gaf-fey et al. (1993) developed their classification system from theanalysis of 39 asteroids classified as S-type by Tholen (1984). Theydivided the S-population into seven main compositional subgroupsdesignated S(I)–S(VII). These subgroups range from pure olivinethrough olivine–pyroxene mixtures to pure pyroxene mixtures,and were derived on the basis of two band parameters, the BandI center and the BAR. The Bus–DeMeo taxonomy, on the otherhand, is based on Principal Component Analysis and is comprisedof 24 classes that include three major complexes (S-, C- and X-complex) and the end members O, Q, R, V, D, K, L, T. The S-complexis subdivided into S, Sa, Sq, Sr and Sv. Since both taxonomic
systems use band depths as one of the primary criteria to classifythe objects, multiple observations of the same asteroid obtainedat different phase angles could lead to ambiguous classifications.In order to test the influence of phase reddening on the taxonomicclassification, we have applied the two classification systems de-scribed above to each of the observed asteroids.
Fig. 10 shows the measured Band I center versus BAR for theNEAs. Within the uncertainties all the NEAs studied are classifiedeither as S(III) or S(IV). There are four cases (1620 Geographos,1627 Ivar, 1980 Tezcatlipoca and 1036 Ganymed) that show largevariations of the BAR from one phase angle to another, but this islikely attributed to noisy spectra rather than phase reddening.The rest of the asteroids show variations in Band I centers andBAR that are on the order of the error bars. The results obtainedfrom the laboratory samples (Fig. 11) indicate that the largest var-iation in the BAR (�0.1) is larger than the typical uncertainty asso-ciated with the BAR values measured from asteroids (representedby the 1 � r error bars in the upper corner of this figure). Thismeans that in certain cases phase reddening could contribute toan ambiguous classification, particularly if the measured bandparameters of the object are located close to the boundaries thatdefine each class.
The classification into the Bus–DeMeo system was done usingthe online taxonomy calculator (http://smass.mit.edu/busdemeo-class.html). The class assigned to each spectrum and the calculatedprincipal components PC10 and PC20 are given in Table 3. Only inthree cases asteroids were ambiguously classified. Asteroid(1036) Ganymed was classified as S and Sr, (1620) Geographoswas classified as S and Sq and (4954) Eric was classified as Swand Sr. The letter ‘‘w’’ was introduced by DeMeo et al. (2009) toindicate an object exhibiting a high slope, but does not representa different class, thus an object designated as ‘‘Sw’’ is an asteroid
J.A. Sanchez et al. / Icarus 220 (2012) 36–50 47
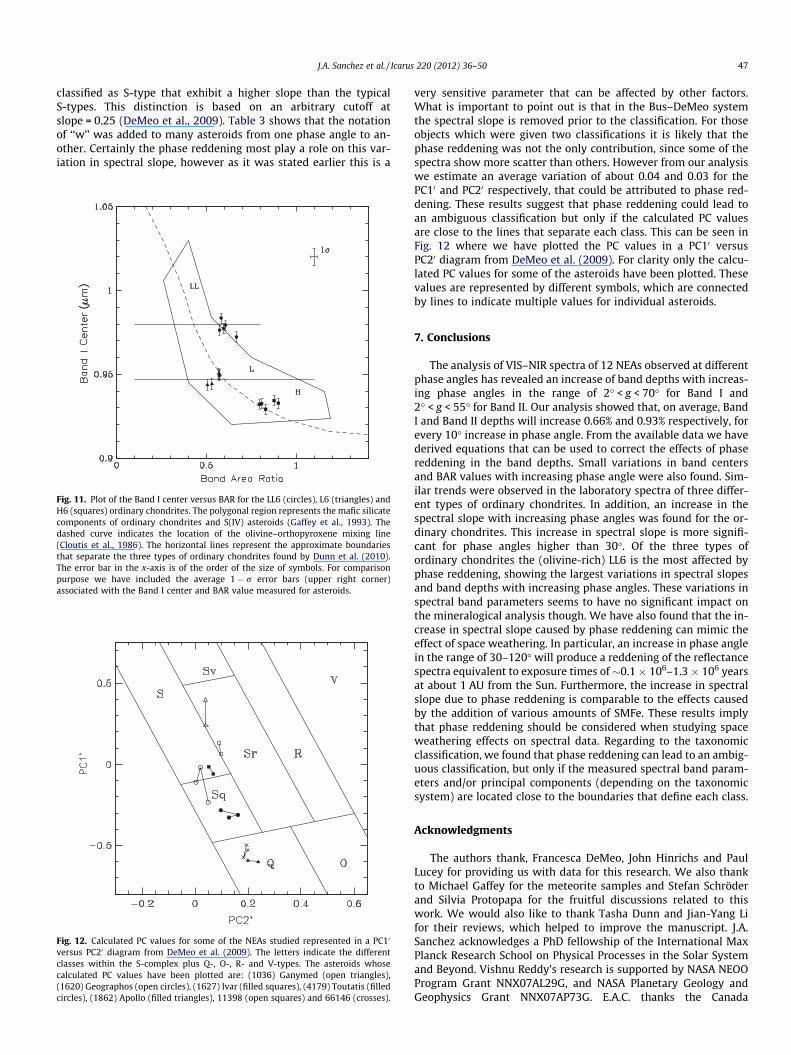
classified as S-type that exhibit a higher slope than the typicalS-types. This distinction is based on an arbitrary cutoff atslope = 0.25 (DeMeo et al., 2009). Table 3 shows that the notationof ‘‘w’’ was added to many asteroids from one phase angle to an-other. Certainly the phase reddening most play a role on this var-iation in spectral slope, however as it was stated earlier this is a
Fig. 11. Plot of the Band I center versus BAR for the LL6 (circles), L6 (triangles) andH6 (squares) ordinary chondrites. The polygonal region represents the mafic silicatecomponents of ordinary chondrites and S(IV) asteroids (Gaffey et al., 1993). Thedashed curve indicates the location of the olivine–orthopyroxene mixing line(Cloutis et al., 1986). The horizontal lines represent the approximate boundariesthat separate the three types of ordinary chondrites found by Dunn et al. (2010).The error bar in the x-axis is of the order of the size of symbols. For comparisonpurpose we have included the average 1 � r error bars (upper right corner)associated with the Band I center and BAR value measured for asteroids.
Fig. 12. Calculated PC values for some of the NEAs studied represented in a PC10
versus PC20 diagram from DeMeo et al. (2009). The letters indicate the differentclasses within the S-complex plus Q-, O-, R- and V-types. The asteroids whosecalculated PC values have been plotted are: (1036) Ganymed (open triangles),(1620) Geographos (open circles), (1627) Ivar (filled squares), (4179) Toutatis (filledcircles), (1862) Apollo (filled triangles), 11398 (open squares) and 66146 (crosses).
very sensitive parameter that can be affected by other factors.What is important to point out is that in the Bus–DeMeo systemthe spectral slope is removed prior to the classification. For thoseobjects which were given two classifications it is likely that thephase reddening was not the only contribution, since some of thespectra show more scatter than others. However from our analysiswe estimate an average variation of about 0.04 and 0.03 for thePC10 and PC20 respectively, that could be attributed to phase red-dening. These results suggest that phase reddening could lead toan ambiguous classification but only if the calculated PC valuesare close to the lines that separate each class. This can be seen inFig. 12 where we have plotted the PC values in a PC10 versusPC20 diagram from DeMeo et al. (2009). For clarity only the calcu-lated PC values for some of the asteroids have been plotted. Thesevalues are represented by different symbols, which are connectedby lines to indicate multiple values for individual asteroids.
7. Conclusions
The analysis of VIS–NIR spectra of 12 NEAs observed at differentphase angles has revealed an increase of band depths with increas-ing phase angles in the range of 2� < g < 70� for Band I and2� < g < 55� for Band II. Our analysis showed that, on average, BandI and Band II depths will increase 0.66% and 0.93% respectively, forevery 10� increase in phase angle. From the available data we havederived equations that can be used to correct the effects of phasereddening in the band depths. Small variations in band centersand BAR values with increasing phase angle were also found. Sim-ilar trends were observed in the laboratory spectra of three differ-ent types of ordinary chondrites. In addition, an increase in thespectral slope with increasing phase angles was found for the or-dinary chondrites. This increase in spectral slope is more signifi-cant for phase angles higher than 30�. Of the three types ofordinary chondrites the (olivine-rich) LL6 is the most affected byphase reddening, showing the largest variations in spectral slopesand band depths with increasing phase angles. These variations inspectral band parameters seems to have no significant impact onthe mineralogical analysis though. We have also found that the in-crease in spectral slope caused by phase reddening can mimic theeffect of space weathering. In particular, an increase in phase anglein the range of 30–120� will produce a reddening of the reflectancespectra equivalent to exposure times of�0.1 � 106–1.3 � 106 yearsat about 1 AU from the Sun. Furthermore, the increase in spectralslope due to phase reddening is comparable to the effects causedby the addition of various amounts of SMFe. These results implythat phase reddening should be considered when studying spaceweathering effects on spectral data. Regarding to the taxonomicclassification, we found that phase reddening can lead to an ambig-uous classification, but only if the measured spectral band param-eters and/or principal components (depending on the taxonomicsystem) are located close to the boundaries that define each class.
Acknowledgments
The authors thank, Francesca DeMeo, John Hinrichs and PaulLucey for providing us with data for this research. We also thankto Michael Gaffey for the meteorite samples and Stefan Schröderand Silvia Protopapa for the fruitful discussions related to thiswork. We would also like to thank Tasha Dunn and Jian-Yang Lifor their reviews, which helped to improve the manuscript. J.A.Sanchez acknowledges a PhD fellowship of the International MaxPlanck Research School on Physical Processes in the Solar Systemand Beyond. Vishnu Reddy’s research is supported by NASA NEOOProgram Grant NNX07AL29G, and NASA Planetary Geology andGeophysics Grant NNX07AP73G. E.A.C. thanks the Canada
48 J.A. Sanchez et al. / Icarus 220 (2012) 36–50
Foundation for Innovation, the Manitoba Research InnovationsFund, and the Canadian Space Agency for their support of theestablishment of the University of Winnipeg Planetary Spectropho-tometer Facility, and NSERC for a Discovery grant, and the Univer-sity of Winnipeg for various internal grants, to support this project.
Fig. A.13. Reflectance spectra of
Fig. A.14. Reflectance spectra of
Appendix A. Asteroid spectra
This appendix contains the spectra of all NEAs analyzed in thisstudy. The numerical designation and the date of the observation(YYMMDD) for each asteroid are given (see Figs. A.13–A.15).
NEAs analyzed in this study.
NEAs analyzed in this study.

Fig. A.15. Reflectance spectra of NEAs analyzed in this study.
J.A. Sanchez et al. / Icarus 220 (2012) 36–50 49
References
Abell, P.A., Vilas, F., Jarvis, K.S., Gaffey, M.J., Kelley, M.S., 2007. Mineralogicalcomposition of (25143) Itokawa 1998 SF36 from visible and near-infraredreflectance spectroscopy: Evidence for partial melting. Meteorit. Planet. Sci. 42,2165–2177.
Adams, J.B., 1974. Visible and near-infrared diffuse reflectance spectra of pyroxenesas applied to remote sensing of solid objects in the Solar System. J. Geophys.Res. 79, 4829–4836.
Adams, J.B., 1975. Interpretation of visible and near-infrared diffuse reflectancespectra of pyroxenes and other rock-forming minerals. In: Karr, C.I. (Ed.),Infrared and Raman Spectroscopy of Lunar and Terrestrial Minerals. Academic,New York, pp. 91–116.
Adams, J.B., Filice, A.L., 1967. Spectral reflectance 0.4 to 2.0 microns of silicate rockpowders. J. Geophys. Res. 72, 5705–5715.
Bell, J.F., Izenberg, N.I., Lucey, P.G., Clark, B.E., Peterson, C., Gaffey, M.J., Joseph, J.,Carcich, B., Harch, A., Bell, M.E., Warren, J., Martin, P.D., McFadden, L.A.,Wellnitz, D., Murchie, S., Winter, M., Veverka, J., Thomas, P., Robinson, M.S.,Malin, M., Cheng, A., 2002. Near-IR reflectance spectroscopy of 433 Eros fromthe NIS instrument on the NEAR mission: I – Low phase angle observations.Icarus 155, 119–144.
Binzel, R.P., Rivkin, A.S., Bus, S.J., Sunshine, J.M., Burbine, T.H., 2001. MUSES-C targetAsteroid (25143) 1998 SF36: A reddened ordinary chondrite. Meteorit. Planet.Sci. 36, 1167–1172.
Binzel, R.P., Rivkin, A.S., Stuart, J.S., Harris, A.W., Bus, S.J., Burbine, T.H., 2004.Observed spectral properties of near-Earth objects: Results for populationdistribution, source regions, and space weathering processes. Icarus 170, 259–294.
Britt, D.T., Consolmagno, G.J., 2003. Stony meteorite porosities and densities: Areview of the data through 2001. Meteorit. Planet. Sci. 38, 1161–1180.
Brunetto, R., Strazzulla, G., 2005. Elastic collisions in ion irradiation experiments: Amechanism for space weathering of silicates. Icarus 179, 265–273.
Brunetto, R., Vernazza, P., Marchi, S., Birlan, M., Fulchignoni, M., Orofino, V.,Strazzulla, G., 2006. Modeling asteroid surfaces from observations andirradiation experiments: The case of 832 Karin. Icarus 184, 327–337.
Burbine, T.H., McCoy, T.J., Jaresowich, E., Sunshine, J.M., 2003. Deriving asteroidmineralogies from reflectance spectra: Implications for the MUSES-C targetasteroid. Antarct. Meteorite Res. 16, 185–195.
Burbine, T.H., Buchanan, P.C., Binzel, R.P., 2007. Deriving formulas from HED spectrafor determining the pyroxene mineralogy of Vesta and Vestoids. Lunar Planet.Sci. 2117 (abstract).
Burbine, T.H., Buchanan, P.C., Dolkar, T., Binzel, R.P., 2009. Pyroxene mineralogies ofnear-Earth Vestoids. Meteorit. Planet. Sci. 44, 1331–1341.
Burns, R.G., 1993. Mineralogical Applications of Crystal Field Theory. CambridgeUniversity Press, Cambridge, UK, 575pp..
Bus, S.J., Binzel, R.P., 2002a. Phase II of the small main-belt asteroid spectroscopicsurvey a feature-based taxonomy. Icarus 158, 146–177.
Bus, S.J., Binzel, R.P., 2002b. Phase II of the small main-belt asteroid spectroscopicsurvey the observations. Icarus 158, 106–145.
Bus, S.J., Vilas, F., Barucci, M.A., 2002. Visible-wavelength spectroscopy of asteroids.In: Bottke, W., Cellino, A., Paolicchi, P., Binzel, R. (Eds.), Asteroids III. Universityof Arizona Press, pp. 169–182.
Clark, B.E., Hapke, B., Pieters, C., Britt, D., 2002a. Asteroid space weathering andregolith evolution. In: Bottke, W., Cellino, A., Paolicchi, P., Binzel, R. (Eds.),Asteroids III. University of Arizona Press, pp. 585–599.
Clark, B.E., Helfenstein, P., Bell, J.F., Peterson, C., Veverka, J., Izenberg, N.I., Domingue,D., Wellnitz, D., McFadden, L., 2002b. NEAR infrared spectrometer photometryof Asteroid 433 Eros. Icarus 155, 189–204.
Cloutis, E.A., Gaffey, M.J., Jackowski, T.L., Reed, K.L., 1986. Calibrations of phaseabundance, composition, and particle size distribution for olivine–orthopyroxene mixtures from reflectance spectra. J. Geophys. Res. 91, 11641–11653.
Cushing, M.C., Vacca, W.D., Rayner, J.T., 2004. Spextool: A spectral extractionpackage for SpeX, a 0.8–5.5 micron cross-dispersed spectrograph. Publ. Astron.Soc. Pacific 116, 362–376.
DeMeo, F.E., Binzel, R.P., Slivan, S.M., Bus, S.J., 2009. An extension of the Bus asteroidtaxonomy into the near-infrared. Icarus 202, 160–180.
DeMeo, F.E., Carry, B., Marchis, F., Birlan, M., Binzel, R.P., Bus, S.J., Descamps, P.,Nedelcu, A., Busch, M., Bouy, H., 2011. A spectral comparison of (379) Huennaand its satellite. Icarus 212, 677–681.
Dunn, T.L., McCoy, T.J., Sunshine, J.M., McSween, H.Y., 2010. A coordinated spectral,mineralogical, and compositional study of ordinary chondrites. Icarus 208, 789–797.
Filippenko, A.V., 1982. The importance of atmospheric differential refraction inspectrophotometry. Publ. Astron. Soc. Pacific 94, 715–721.
Gaffey, M.J., 2003. Observational and data reduction techniques to optimizemineralogical characterizations of asteroid surface materials. In: Mackwell, S.,Stansbery, E. (Eds.), Lunar and Planetary Institute Science Conference, p. 1602(abstract).
Gaffey, M.J., 2010. Space weathering and the interpretation of asteroid reflectancespectra. Icarus 209, 564–574.
Gaffey, M.J., Burbine, T.H., Piatek, J.L., Reed, K.L., Chaky, D.A., Bell, J.F., Brown, R.H.,1993. Mineralogical variations within the S-type asteroid class. Icarus 106, 573–602.
Gaffey, M.J., Cloutis, E.A., Kelley, M.S., Reed, K.L., 2002. Mineralogy of asteroids. In:Bottke, W., Cellino, A., Paolicchi, P., Binzel, R. (Eds.), Asteroids III. University ofArizona Press, pp. 183–204.
Gehrels, T., 1970. Photometry of asteroids. In: Dollfus, A. (Ed.), Surfaces and Interiorsof Planets and Satellites. Academic Press, London, pp. 317–375.
Gradie, J., Veverka, J., 1986. The wavelength dependence of phase coefficients. Icarus66, 455–467.
50 J.A. Sanchez et al. / Icarus 220 (2012) 36–50
Gradie, J., Veverka, J., Buratti, B., 1980. The effects of scattering geometry on thespectrophotometric properties of powdered material. In: Bedini, S.A. (Ed.),Lunar and Planetary Science Conference Proceedings. Pergamon Press,Newyork, pp. 799–815.
Hapke, B., 1981. Bidirectional reflectance spectroscopy: I – Theory. J. Geophys. Res.86, 3039–3054.
Hapke, B., 1993. Theory of Reflectance and Emittance Spectroscopy. CambridgeUniversity Press, Cambridge, UK.
Hapke, B., 2001. Space weathering from Mercury to the asteroid belt. J. Geophys.Res. 106, 10039–10074.
Hardersen, P.S., Gaffey, M.J., Cloutis, E.A., Abell, P.A., Reddy, V., 2006. Near-infraredspectral observations and interpretations for S-asteroids 138 Tolosa, 306 Unitas,346 Hermentaria, and 480 Hansa. Icarus 181, 94–106.
Hinrichs, J.L., Lucey, P.G., 2002. Temperature-dependent near-infrared spectralproperties of minerals, meteorites, and lunar soil. Icarus 155, 169–180.
Johnson, P.B., Christy, R.W., 1974. Optical constants of transition metals: Ti, V, Cr,Mn, Fe, Co, Ni, and Pd. Phys. Rev. B 9, 5056–5070.
Kitazato, K., Clark, B.E., Abe, M., Abe, S., Takagi, Y., Hiroi, T., Barnouin-Jha, O.S., Abell,P.A., Lederer, S.M., Vilas, F., 2008. Near-infrared spectrophotometry of Asteroid25143 Itokawa from NIRS on the Hayabusa spacecraft. Icarus 194, 137–145.
Lumme, K., Bowell, E., 1981. Radiative transfer in the surfaces of atmospherelessbodies: I – Theory. II – Interpretation of phase curves. Astron. J. 86, 1694–1721.
Luu, J.X., Jewitt, D.C., 1990. Charge-coupled device spectra of asteroids: I – Near-Earth and 3:1 resonance asteroids. Astron. J. 99, 1985–2011.
Mann, P., Cloutis, E.A., Reddy, V., 2011. The effect of changing viewing geometry onpyroxene and eucrite reflectance spectra. Lunar Planet. Sci. 2268 (abstract).
Millis, R.L., Bowell, E., Thompson, D.T., 1976. UBV photometry of Asteroid 433 Eros.Icarus 28, 53–67.
Moroz, L., Schade, U., Wäsch, R., 2000. Reflectance spectra of olivine–orthopyroxene-bearing assemblages at decreased temperatures: Implicationsfor remote sensing of asteroids. Icarus 147, 79–93.
Moskovitz, N.A., Willman, M., Burbine, T.H., Binzel, R.P., Bus, S.J., 2010. Aspectroscopic comparison of HED meteorites and V-type asteroids in theinner main belt. Icarus 208, 773–788.
Nakamura, T. et al., 2011. Itokawa dust particles: A direct link between S-typeasteroids and ordinary chondrites. Science 333, 1113–1116.
Nathues, A., 2000. Spectroscopic Study of Eunomia Asteroid Family. Ph.D.Dissertation, University of Berlin, Germany.
Nathues, A., 2010. Spectral study of the Eunomia asteroid family. Part II: The smallbodies. Icarus 208, 252–275.
Noguchi, T. et al., 2011. Incipient space weathering observed on the surface ofItokawa dust particles. Science 333, 1121–1125.
Pieters, C.M. et al., 2000. Space weathering on airless bodies: Resolving a mysterywith lunar samples. Meteorit. Planet. Sci. 35, 1101–1107.
Rayner, J.T. et al., 2003. SpeX: A medium-resolution 0.8–5.5 micron spectrographand imager for the NASA Infrared Telescope Facility. Publ. Astron. Soc. Pacific115, 362–382.
Reddy, V., 2009. Mineralogical Survey of Near-Earth Asteroid Population:Implications for Impact Hazard Assessment and Sustainability of Life onEarth. Ph.D. Dissertation, University of North Dakota, Grand Forks.
Reddy, V., Sanchez, J.A., Nathues, A., Moskovitz, N.A., Li, J.Y., Cloutis, E.A., Archer, K.,Tucker, R.A., Gaffey, M.J., Paul Mann, J., Sierks, H., Schade, U., 2012. Photometric,spectral phase and temperature effects on 4 Vesta and HED meteorites:Implications for the Dawn mission. Icarus 217, 153–168.
Rivkin, A.S., Binzel, R.P., Sunshine, J., Bus, S.J., Burbine, T.H., Saxena, A., 2004. Infraredspectroscopic observations of 69230 Hermes (1937 UB): Possible unweatheredendmember among ordinary chondrite analogs. Icarus 172, 408–414.
Schade, U., Wäsch, R., 1999. NIR reflectance spectroscopy of mafic minerals in thetemperature range between 80 and 473 K. Adv. Space Res. 23, 1253–1256.
Shepard, M.K., Cloutis, E., 2011. Laboratory measurements of band depth variationwith observation geometry. Lunar Planet. Sci. 1043 (abstract).
Shestopalov, D.I., Golubeva, L.F., 2000. Influence of temperature on reflectancespectra of asteroids. Lunar Planet. Sci. 1003 (abstract).
Singer, R.B., Roush, T.L., 1985. Effects of temperature on remotely sensed mineralabsorption features. J. Geophys. Res. 901, 12434–12444.
Strazzulla, G., Dotto, E., Binzel, R., Brunetto, R., Barucci, M.A., Blanco, A., Orofino, V.,2005. Spectral alteration of the Meteorite Epinal (H5) induced by heavy ionirradiation: A simulation of space weathering effects on near-Earth asteroids.Icarus 174, 31–35.
Sunshine, J.M., Bus, S.J., McCoy, T.J., Burbine, T.H., Corrigan, C.M., Binzel, R.P., 2004.High-calcium pyroxene as an indicator of igneous differentiation in asteroidsand meteorites. Meteorit. Planet. Sci. 39, 1343–1357.
Taylor, L.A. et al., 2001. The effects of space weathering on Apollo 17 mare soils:Petrographic and chemical characterization. Meteorit. Planet. Sci. 36, 285–299.
Tholen, D.J., 1984. Asteroid Taxonomy from Cluster Analysis of Photometry. Ph.D.Thesis, Arizona Univ., Tucson.
Vernazza, P. et al., 2008. Compositional differences between meteorites and near-Earth asteroids. Nature 454, 858–860.
Related Documents