PHASE II INVESTIGATION REPORT AREA A: PARCEL A4 TRADEPOINT ATLANTIC SPARROWS POINT, MARYLAND Prepared For: ENVIROANALYTICS GROUP 1650 Des Peres Road, Suite 230 Saint Louis, Missouri 63131 Prepared By: ARM GROUP INC. 9175 Guilford Road Suite 310 Columbia, Maryland 20146 ARM Project No. 150298M-2 Respectfully Submitted, Eric S. Magdar T. Neil Peters, P.E. Senior Geologist Vice President Revision 1 – January 4, 2017

Welcome message from author
This document is posted to help you gain knowledge. Please leave a comment to let me know what you think about it! Share it to your friends and learn new things together.
Transcript

PHASE II
INVESTIGATION REPORT
AREA A: PARCEL A4 TRADEPOINT ATLANTIC
SPARROWS POINT, MARYLAND
Prepared For:
ENVIROANALYTICS GROUP
1650 Des Peres Road, Suite 230 Saint Louis, Missouri 63131
Prepared By:
ARM GROUP INC.
9175 Guilford Road Suite 310
Columbia, Maryland 20146
ARM Project No. 150298M-2
Respectfully Submitted,
Eric S. Magdar T. Neil Peters, P.E. Senior Geologist Vice President
Revision 1 – January 4, 2017

Tradepoint Atlantic Phase II Investigation Report – Area A: Parcel A4 EnviroAnalytics Group Revision 1 – January 4, 2017
TABLE OF CONTENTS
INTRODUCTION ............................................................................................................................ 1 1.0 Site History ....................................................................................................................... 2 1.1. Objectives ......................................................................................................................... 2 1.2.
ENVIRONMENTAL SETTING ...................................................................................................... 3 2.0 Land Use and Surface Features ........................................................................................ 3 2.1. Regional Geology ............................................................................................................. 3 2.2. Site Geology/Hydrogeology ............................................................................................. 4 2.3.
SITE INVESTIGATION .................................................................................................................. 5 3.0 Sample Target Identification ............................................................................................ 5 3.1. Soil Investigation.............................................................................................................. 6 3.2. Groundwater Investigation ............................................................................................... 7 3.3. Management of Investigation-Derived Waste (IDW) ...................................................... 8 3.4.
ANALYTICAL RESULTS............................................................................................................. 10 4.0 Soil Conditions ............................................................................................................... 10 4.1.
4.1.1. Soil Conditions: Organic Compounds .................................................................... 10
4.1.2. Soil Conditions: Inorganic Constituents ................................................................. 11
4.1.3. Soil Conditions: Results Summary ......................................................................... 11
Groundwater Conditions ................................................................................................ 11 4.2.4.2.1. Groundwater Conditions: Organic Compounds...................................................... 12
4.2.2. Groundwater Conditions: Inorganic Constituents .................................................. 12
4.2.3. Groundwater Conditions: Results Summary .......................................................... 12
4.2.4. Non-Aqueous Phase Liquid .................................................................................... 13
DATA USABILITY ASSESSMENT ............................................................................................. 14 5.0 Data Verification ............................................................................................................ 14 5.1. Data Validation .............................................................................................................. 15 5.2. Data Usability ................................................................................................................. 15 5.3.
HUMAN HEALTH SCREENING LEVEL RISK ANALYSIS (SLRA) ....................................... 18 6.0 Analysis Process ............................................................................................................. 18 6.1. Parcel A4 SLRA Results and Risk Characterization ..................................................... 20 6.2.
FINDINGS AND RECOMMENDATIONS ................................................................................... 25 7.0 Soil ................................................................................................................................. 25 7.1. Non-Aqueous Phase Liquid ........................................................................................... 25 7.2. Groundwater ................................................................................................................... 26 7.3. Human Health Screening Analysis ................................................................................ 27 7.4. Recommendations .......................................................................................................... 28 7.5.
REFERENCES ............................................................................................................................... 30 8.0
Tradepoint Atlantic Phase II Investigation Report – Area A: Parcel A4 EnviroAnalytics Group Revision 1 – January 4, 2017
TABLE OF CONTENTS
(CONT.)
ARM Project No. 150298M-2 1
FIGURES
Figure 1 Area A and Area B Parcel Map ........................................................ Following Text
Figure 2 1916 Shoreline Map .......................................................................... Following Text
Figure 3 Groundwater Sample Locations and Potentiometric Map ................ Following Text
Figure 4 Soil Boring Sample Locations .......................................................... Following Text
Figure S-1 Summary of Exceedances – SVOCs in Soil ..................................... Following Text
Figure S-2 Summary of Exceedances – TPH/Oil & Grease in Soil ................... Following Text
Figure S-3 Summary of Exceedances – Inorganics in Soil................................. Following Text
Figure GW-1 Summary of Exceedances – SVOCs in Groundwater....................... Following Text
Figure GW-2 Summary of Exceedances – TPH/Oil & Grease in Groundwater ..... Following Text
Figure GW-3 Summary of Exceedances – Inorganics in Groundwater .................. Following Text
Figure GW-4 Shallow Groundwater Vapor Intrusion Criteria Exceedances .......... Following Text
TABLES
Table 1 Groundwater Elevation Data............................................................. Following Text
Table 2 Historical Site Drawing Details ........................................................ Following Text
Table 3 Field Shifted Boring Locations ......................................................... Following Text
Table 4 TCLP Results for Solid IDW ............................................................ Following Text
Table 5 TCLP Results for Liquid IDW .......................................................... Following Text
Table 6 Summary of Organics Detected in Soil ............................................ Following Text
Table 7 Summary of Inorganics Detected in Soil .......................................... Following Text
Table 8 Summary of Soil PAL Exceedances ................................................. Following Text
Table 9 Soil PAL Exceedances for Specific Targets ..................................... Following Text
Table 10 Summary of Organics Detected in Groundwater .............................. Following Text
Table 11 Summary of Inorganics Detected in Groundwater ........................... Following Text
Table 12 Shallow Groundwater Vapor Intrusion Criteria Comparison ........... Following Text

Tradepoint Atlantic Phase II Investigation Report – Area A: Parcel A4 EnviroAnalytics Group Revision 1 – January 4, 2017
TABLE OF CONTENTS
(CONT.)
ARM Project No. 150298M-2 2
Table 13 Shallow Groundwater Cumulative Vapor Intrusion Comparison ..... Following Text
Table 14 Rejected Analytical Soil Results ....................................................... Following Text
Table 15 Rejected Analytical Groundwater Results ........................................ Following Text
Table 16 Assessment of Lead .......................................................................... Following Text
Table 17 Exposure Point Concentrations – Surface Soil ................................. Following Text
Table 18 Exposure Point Concentrations – Sub-Surface Soil .......................... Following Text
Table 19 Exposure Point Concentrations – Pooled Soil .................................. Following Text
Table 20 Risk Ratios – Composite Worker Surface Soil ................................. Following Text
Table 21 Risk Ratios – Composite Worker Sub-Surface Soil ......................... Following Text
Table 22 Risk Ratios – Composite Worker Pooled Soil .................................. Following Text
Table 23 Risk Ratios – Construction Worker Surface Soil ............................. Following Text
Table 24 Risk Ratios – Construction Worker Sub-Surface Soil ...................... Following Text
Table 25 Risk Ratios – Construction Worker Pooled Soil............................... Following Text
APPENDICES
Appendix A Building Occupancy Assessment (NCMC) ...................................... Following Text
Appendix B Final Sample Summary Table ........................................................... Following Text
Appendix C Soil Boring Logs .............................................................................. Following Text
Appendix D Groundwater Survey Data ................................................................. Following Text
Appendix E PID Calibration Log .......................................................................... Following Text
Appendix F Temporary Groundwater Sample Collection Point
Construction Logs ............................................................................. Following Text
Appendix G Groundwater Purge Logs & YSI Calibration Log ............................ Following Text
Appendix H Parcel Specific IDW Drum Log ........................................................ Following Text
Appendix I Summary of QA/QC Samples ........................................................... Following Text
Appendix J Evaluation of Data Completeness ..................................................... Following Text
Appendix K Construction Worker SSLs – Calculation Spreadsheet .................... Following Text

Tradepoint Atlantic Phase II Investigation Report – Area A: Parcel A4 EnviroAnalytics Group Revision 1 – January 4, 2017
TABLE OF CONTENTS
(CONT.)
ARM Project No. 150298M-2 3
ELECTRONIC ATTACHMENTS
Soil Laboratory Certificates of Analysis ....................................................... Electronic Attachment
Soil Data Validation Reports ........................................................................ Electronic Attachment
Groundwater Laboratory Certificates of Analysis ........................................ Electronic Attachment
Groundwater Data Validation Reports.......................................................... Electronic Attachment
Soil ProUCL Input Tables (formatted analytical data) ................................. Electronic Attachment
Soil ProUCL Output Tables .......................................................................... Electronic Attachment

Tradepoint Atlantic Phase II Investigation Report – Area A: Parcel A4 EnviroAnalytics Group Revision 1 – January 4, 2017
ARM Project No. 150298M-2 1
INTRODUCTION 1.0
ARM Group Inc. (ARM), on behalf of EnviroAnalytics Group (EAG), has completed a Phase II Investigation of a portion of the Tradepoint Atlantic property (formerly Sparrows Point Terminal, LLC) that has been designated as Area A: Parcel A4 (the Site). Parcel A4 is comprised of 61.4 acres of the approximately 3,100-acre former steel making facility (Figure 1). The Site is bounded to the south by the former Billet Building (Parcel B8) and Humphrey’s Impoundment (Parcel B14), to the north by I-695, to the west by the former Pipe Mill (Parcel A1), and to the east by the former mud reservoir (Parcel A6) and open vegetated areas (Parcel B6). Parcel A4 includes an 800,000 square foot building that was the former New Cold Mill Complex (NCMC) and 10 acres of existing pavement and laydown areas. The NCMC building interior was previously investigated by a Building Occupancy Assessment – New Cold Mill Complex dated April 13, 2015 (the BOA), and is not covered by this Phase II Investigation. The complete BOA report for the NCMC is included as Appendix A.
The Phase II Investigation was performed in accordance with procedures outlined in the approved Phase II Investigation Work Plan – Parcel A4. This Work Plan (dated October 29, 2015) was approved by the Maryland Department of the Environment and the United States Environmental Protection Agency on October 30, 2015 in compliance with requirements pursuant to the following:
Administrative Consent Order (ACO) between Tradepoint Atlantic (formerly Sparrows Point Terminal, LLC) and the Maryland Department of the Environment (effective September 12, 2014); and
Settlement Agreement and Covenant Not to Sue (SA) between Tradepoint Atlantic (formerly Sparrows Point Terminal, LLC) and the United States Environmental Protection Agency (effective November 25, 2014).
Parcel A4 is part of the acreage that was removed (Carveout Area) from inclusion in the Multimedia Consent Decree between Bethlehem Steel Corporation, the United States Environmental Protection Agency (USEPA), and the Maryland Department of the Environment (MDE) (effective October 8, 1997) as documented in correspondence received from USEPA on September 12, 2014. Based on this agreement, USEPA determined that no further investigation or corrective measures will be required under the terms of the Consent Decree for the Carveout Area. However, the SA reflects that the property within the Carveout Area will remain subject to the USEPA's RCRA Corrective Action authorities.
An application to enter the Tradepoint Atlantic property into the Maryland Department of the Environment Voluntary Cleanup Program (MDE-VCP) was submitted to MDE on September 10,

Tradepoint Atlantic Phase II Investigation Report – Area A: Parcel A4 EnviroAnalytics Group Revision 1 – January 4, 2017
ARM Project No. 150298M-2 2
2014. The property’s current and anticipated future use is Tier 3 (Industrial), and plans for the property include demolition and redevelopment over the next several years.
This revised Phase II Investigation Report is being submitted in response to comments received from the MDE and USEPA regarding the Screening Level Risk Analysis (SLRA) procedure presented in Section 6.0. The original Phase II Investigation Report (Revision 0) was previously submitted to the agencies dated October 13, 2016. A revision letter listing the recent updates made to the Phase II Investigation Report accompanies this document.
SITE HISTORY 1.1.
From the late 1800s until 2012, the production and manufacturing of steel was conducted at Sparrows Point. Iron and steel production operations and processes at Sparrows Point included raw material handling, coke production, sinter production, iron production, steel production, and semi-finished and finished product preparation. In 1970, Sparrows Point was the largest steel facility in the United States, producing hot and cold rolled sheets, coated materials, pipes, plates, and rod and wire. The steel making operations at Sparrows Point ceased in fall 2012.
The western portion of Parcel A4 historically operated as a pipe production facility (Pipe Mill) beginning in the 1940s. In May 1984, the Pipe Mill was closed under a Closure Plan approved by the MDE on December 12, 1983. Closure activities occurred on the Site and surrounding area through the 1980s and 1990s. In 1998, the Pipe Mill was demolished. The NCMC was constructed in 2000. Operations at the NCMC included steel semi-finishing and finishing processes at the NCMC that delivered cold flat-rolled sheeting for either sale or further coating operations conducted elsewhere on the Sparrows Point land. The NCMC, housed an in-line continuous pickler, which cleaned steel prior to rolling. The pickler was linked to a sheet steel cold reduction section that consisted of a five-stand Tandem Mill. Additionally, the NCMC contained a hydrogen batch annealing facility, a combination Skin Pass Mill and tension leveling line, a coil build-up and inspection line, a packaging line, cranes, storage areas and offices. All steel finishing equipment has been removed and the building is currently in use for warehousing of materials.
OBJECTIVES 1.2.
The objective of this Phase II Investigation was to fully characterize the nature and extent of contamination at the Site. This report includes a summary of the work performed, including the environmental setting, site investigation methods, analytical results and data usability assessment, and findings and recommendations. A summary table of the site investigation locations including the boring identification number, if applicable, and the analyses performed is provided as Appendix B. A human health screening level risk analysis was prepared to identify constituents and pathways of potential concern and to evaluate the significance of any observed impacts or elevated concentrations with respect to the potential future use of the Site.

Tradepoint Atlantic Phase II Investigation Report – Area A: Parcel A4 EnviroAnalytics Group Revision 1 – January 4, 2017
ARM Project No. 150298M-2 3
ENVIRONMENTAL SETTING 2.0
LAND USE AND SURFACE FEATURES 2.1.
The Tradepoint Atlantic property consists of the former Sparrows Point steel mill. According to the Phase I ESA prepared by Weaver Boos dated May 19, 2014, the property is zoned Manufacturing Heavy-Industrial Major (MH-IM). Surrounding property zoning classifications (beyond Tradepoint Atlantic) include the following: Manufacturing Light (ML); Resource Conservation (RC); Density Residential (DR); Business Roadside (BR); Business Major (BM); Business Local (BL); and Residential Office (RO). Light industrial and commercial properties are located northeast of the property and northwest of the property across Bear Creek. Residential areas of Edgemere and Fort Howard are located northeast of the property across Jones Creek and to the southeast across Old Road Bay, respectively. Residential and commercial areas of Dundalk are located northwest of the property across Bear Creek.
According to topographic maps provided by EAG, the Site is at an elevation of approximately 12 feet above mean sea level (amsl). Elevations at the Site range from 8 to 19 feet across the parcel area. In the northwestern corner of the parcel, the ground slopes sharply upward from 11 to 19 feet. Across most of the Site, elevations are fairly uniform with no clear surface discharge location for stormwater. Parcel A4 includes stormwater sewer infrastructure that directs runoff to the Humphrey Creek Wastewater Treatment Plant (HCWWTP). Surface waters which are collected and treated at the HCWWTP ultimately flow through a NPDES-permitted outfall (Outfall 014), which discharges to Bear Creek.
REGIONAL GEOLOGY 2.2.
The Site is located within the Atlantic Coastal Plain Physiographic Province (Coastal Plain). The western boundary of the Coastal Plain is the “Fall Line”, which separates the Coastal Plain from the Piedmont Plateau Province. The Fall Line runs from northeast to southwest along the western boundary of the Chesapeake Bay, passing through Elkton (MD), Havre de Grace (MD), Baltimore City (MD), and Laurel (MD). The eastern boundary of the Coastal Plain is the off-shore Continental Shelf.
The unconsolidated sediments beneath the Site belong to the Talbot Formation (Pleistocene), which is then underlain by the Cretaceous formations which comprise the Potomac Group (Patapsco Formation, Arundel Formation and the Patuxent Formation). The Potomac Group formations are comprised of unconsolidated sediments of varying thicknesses and types, which may be several hundred feet to several thousand feet thick. These unconsolidated formations may overly deeper Mesozoic and/or Precambrian bedrock.

Tradepoint Atlantic Phase II Investigation Report – Area A: Parcel A4 EnviroAnalytics Group Revision 1 – January 4, 2017
ARM Project No. 150298M-2 4
SITE GEOLOGY/HYDROGEOLOGY 2.3.
Groundcover at the Site is comprised of 74% natural soils and 26% slag fill based on the approximate shoreline of the Sparrows Point Peninsula in 1916, as shown on Figure 2 (adapted from Figure 2-20 in the Description of Current Conditions (DCC) Report prepared by Rust Environmental and Infrastructure, dated January 1998).
In general, the encountered subsurface geology included slag fill materials overlying natural soils, which included fine-grained sediments (clays and silts) and coarse grained sediments (sands). Slag fill materials were encountered at depths of up to 11 feet below the ground surface (bgs), although typical thicknesses ranged from 1.5 to 4 feet bgs (often underlying paved cover). In several cases a perched water table was indicated by the observation of two wet intervals with a dry (or moist) clay zone between the water bearing units. Shallow groundwater was observed in soil cores from 2 to 23 feet bgs across the Site. Soil boring logs are provided in Appendix C.
Temporary groundwater sample collection points were installed at seven locations across the Site to investigate shallow groundwater conditions. The locations of the groundwater sampling points are indicated on Figure 3. Piezometer A4-002-PZ was initially proposed in the Work Plan; however, this groundwater sample point was relocated to soil boring location A4-001-PZ due to refusal at 12.5 feet below ground surface (bgs). The original A4-002-PZ was abandoned. SW04-PZM001 was initially proposed to be sampled, but it could not be located in the field. In accordance with the approved Work Plan, this groundwater sample location was replaced with an additional piezometer (A4-019-PZ) at a nearby soil boring location. The temporary groundwater sample collection points were surveyed by a Maryland-licensed surveyor. Supporting documentation from the surveys is included in Appendix D.
A synoptic round of groundwater level measurements was collected on April 8, 2016 from each of the groundwater points included in the parcel-specific sampling plan. Surveyed top of casing (TOC) and ground surface elevations for all applicable locations can be found in Table 1, along with the depth to water (DTW) measurements from this date.
A groundwater potentiometric surface map was constructed for the shallow hydrogeologic zone based on the field measurements. The potentiometric map for shallow groundwater has been included on Figure 3. As seen on Figure 3, groundwater flows from the northeast corner of the Site (groundwater elevation of 10 feet amsl) diagonally to the south west corner of the Site (groundwater elevation of 4 feet amsl). Flow direction appears to be uniform across the Site.

Tradepoint Atlantic Phase II Investigation Report – Area A: Parcel A4 EnviroAnalytics Group Revision 1 – January 4, 2017
ARM Project No. 150298M-2 5
SITE INVESTIGATION 3.0
A total of 76 soil samples (from 28 boring locations) and 8 groundwater samples were collected for analysis between November 2, 2015 and April 12, 2016 as part of the Parcel A4 Phase II Investigation. The Phase II Investigation utilized methods and protocols that followed the procedures included in the Quality Assurance Project Plan (QAPP) dated October 2, 2015 approved by the agencies to support the investigation and remediation of the Tradepoint Atlantic property. Information regarding the project organization, field activities and sampling methods, sampling equipment, sample handling and management procedures, the selected laboratory and analytical methods, quality control and quality assurance procedures, investigation-derived waste (IDW) management methods, and reporting requirements are described in detail in the approved Parcel A4 Work Plan dated October 29, 2015, and the QAPP.
All site characterization activities were conducted under the site-specific health and safety plan (HASP) provided as Appendix D of the approved Work Plan.
SAMPLE TARGET IDENTIFICATION 3.1.
Previous activities within and around the buildings and facilities located on the Tradepoint Atlantic property may have been historical sources of environmental contamination. If present, source areas were identified as targets for sampling through a careful review of historical documents. When a sampling target was identified, a boring was placed at or next to its location using GIS software (ArcMap Version 10.2.2).
Sampling targets included, as applicable, 1) Recognized Environmental Conditions (RECs) shown on the REC Location Map provided in Weaver Boos’ Phase I ESA, 2) additional findings (non-RECs) from the Phase I ESA which were identified as potential environmental concerns, and 3) Solid Waste Management Units (SWMUs) and Areas of Concern (AOCs) identified from the DCC Report prepared by Rust Environmental and Infrastructure. There were no RECs (or non-REC findings) identified at the Site based on the Phase I report. The following SWMUs and AOCs were identified in the DCC in the Parcel A4 Work Plan but were not listed as RECs or non-REC findings in the Phase I report: Pipe Mill Trenches/Sump (SWMU 49) and a Hydraulic Oil Storage Area (AOC O). The location of AOC O is now occupied by the NCMC building.
Four (4) sets of historical drawings were also reviewed to identify potential sampling targets for the Site. These drawings included the 5000 Set (Plant Arrangement), the 5100 Set (Plant Index), the 5500 Set (Plant Sewer Lines), and a set of drawings indicating coke oven gas distribution drip leg locations. Drip legs are points throughout the distribution system where coke oven gas condensate was removed from the gas pipelines. The condensate from the drip legs was typically discharged to drums, although it is possible some spilled out of the drums and on to the ground. There were no drip legs identified inside the boundary of Parcel A4. A summary of the
Tradepoint Atlantic Phase II Investigation Report – Area A: Parcel A4 EnviroAnalytics Group Revision 1 – January 4, 2017
ARM Project No. 150298M-2 6
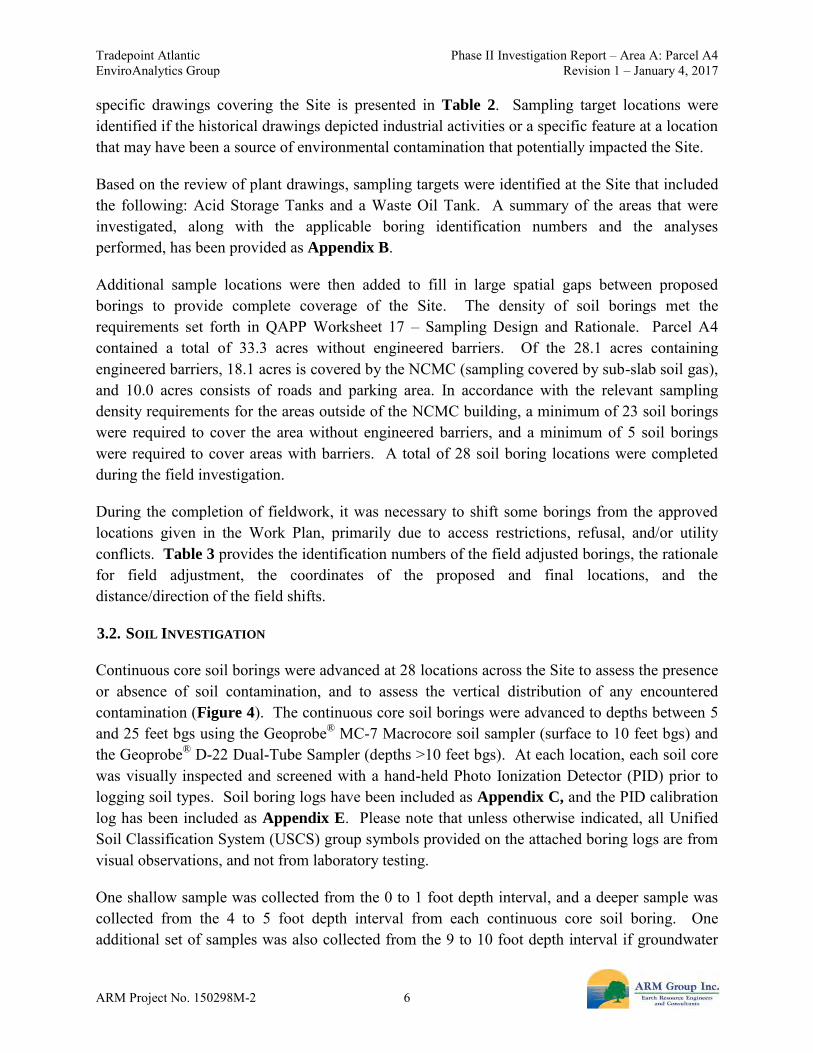
specific drawings covering the Site is presented in Table 2. Sampling target locations were identified if the historical drawings depicted industrial activities or a specific feature at a location that may have been a source of environmental contamination that potentially impacted the Site.
Based on the review of plant drawings, sampling targets were identified at the Site that included the following: Acid Storage Tanks and a Waste Oil Tank. A summary of the areas that were investigated, along with the applicable boring identification numbers and the analyses performed, has been provided as Appendix B.
Additional sample locations were then added to fill in large spatial gaps between proposed borings to provide complete coverage of the Site. The density of soil borings met the requirements set forth in QAPP Worksheet 17 – Sampling Design and Rationale. Parcel A4 contained a total of 33.3 acres without engineered barriers. Of the 28.1 acres containing engineered barriers, 18.1 acres is covered by the NCMC (sampling covered by sub-slab soil gas), and 10.0 acres consists of roads and parking area. In accordance with the relevant sampling density requirements for the areas outside of the NCMC building, a minimum of 23 soil borings were required to cover the area without engineered barriers, and a minimum of 5 soil borings were required to cover areas with barriers. A total of 28 soil boring locations were completed during the field investigation.
During the completion of fieldwork, it was necessary to shift some borings from the approved locations given in the Work Plan, primarily due to access restrictions, refusal, and/or utility conflicts. Table 3 provides the identification numbers of the field adjusted borings, the rationale for field adjustment, the coordinates of the proposed and final locations, and the distance/direction of the field shifts.
SOIL INVESTIGATION 3.2.
Continuous core soil borings were advanced at 28 locations across the Site to assess the presence or absence of soil contamination, and to assess the vertical distribution of any encountered contamination (Figure 4). The continuous core soil borings were advanced to depths between 5 and 25 feet bgs using the Geoprobe® MC-7 Macrocore soil sampler (surface to 10 feet bgs) and the Geoprobe® D-22 Dual-Tube Sampler (depths >10 feet bgs). At each location, each soil core was visually inspected and screened with a hand-held Photo Ionization Detector (PID) prior to logging soil types. Soil boring logs have been included as Appendix C, and the PID calibration log has been included as Appendix E. Please note that unless otherwise indicated, all Unified Soil Classification System (USCS) group symbols provided on the attached boring logs are from visual observations, and not from laboratory testing.
One shallow sample was collected from the 0 to 1 foot depth interval, and a deeper sample was collected from the 4 to 5 foot depth interval from each continuous core soil boring. One additional set of samples was also collected from the 9 to 10 foot depth interval if groundwater

Tradepoint Atlantic Phase II Investigation Report – Area A: Parcel A4 EnviroAnalytics Group Revision 1 – January 4, 2017
ARM Project No. 150298M-2 7
had not been encountered; however, these samples were held by the laboratory pending the analysis of the 0 to 1 and 4 to 5 foot depth interval samples. If clean surface cover materials (such as paving or gravel) were present, the first 1 foot of soil material beneath this layer was collected as the surface sample. If the PID or other field observations indicated contamination to exist at a depth greater than 5 feet bgs but less than 9 feet bgs, and was above the water table, the sample from the deeper 4 to 5 foot interval was shifted to the alternate depth interval. It should be noted that soil samples were not collected from a depth that was below the water table. Soil sampling activities were conducted in accordance with the procedures and methods referenced in Field SOP Numbers 009, 012, and 013 provided in Appendix A of the QAPP.
Down-hole soil sampling equipment was decontaminated after soil sampling had been concluded at a location, according to the procedures and methods referenced in Field SOP Number 016
provided in Appendix A of the QAPP.
Soil samples were submitted to Pace Analytical Services, Inc. (PACE), and analyzed for Target Compound List (TCL) volatile organic compounds (VOCs) via USEPA Method 8260B, TCL semi-volatile organic compounds (SVOCs) via USEPA Methods 8270D and 8270D SIM, Oil & Grease via USEPA Method 9071, Target Analyte List (TAL) Metals via 6010C and 7471C, hexavalent chromium via USEPA Method 7196A, and cyanide via USEPA Method 9012. Based on the specific sampling plan targets, select locations were analyzed for total petroleum hydrocarbon (TPH) diesel range organics (DRO) and gasoline range organics (GRO) via USEPA Methods 8015B and 8015D. Additionally, the shallow soil samples collected across the Site from the 0 to 1 foot bgs interval were also analyzed for polychlorinated biphenyls (PCBs) via USEPA Method 8082. Sample containers, preservatives, and holding times for the sample analyses are listed in the QAPP Worksheet 19 & 30 – Sample Containers, Preservation, and Holding Times.
GROUNDWATER INVESTIGATION 3.3.
Eight shallow temporary groundwater sample collection points were installed to facilitate the collection of groundwater samples, and to support the definition of the potentiometric surface. Temporary piezometer A4-019-PZ was installed to replace SW04-PZM001. The soil boring locations where shallow temporary groundwater sample collection points were installed during the investigation included A4-001-PZ, A4-005-PZ, A4-007-PZ, A4-010-PZ, A4-012-PZ, A4-013-PZ, A4-014-PZ, and A4-019-PZ (Figure 3). The temporary groundwater sample collection point construction logs have been included as Appendix F.
At each location the Geoprobe® DT22 Dual Tube sampling system was advanced to a depth
approximately 10 feet below where groundwater was identified in the associated soil cores, the 1.25-inch inner rod string was removed, and the temporary, 1-inch PVC groundwater sample collection point was installed through the outer casing. Following the installation of each sample collection point, the 0-hour depth to water was documented and the collection point was checked
Tradepoint Atlantic Phase II Investigation Report – Area A: Parcel A4 EnviroAnalytics Group Revision 1 – January 4, 2017
ARM Project No. 150298M-2 8
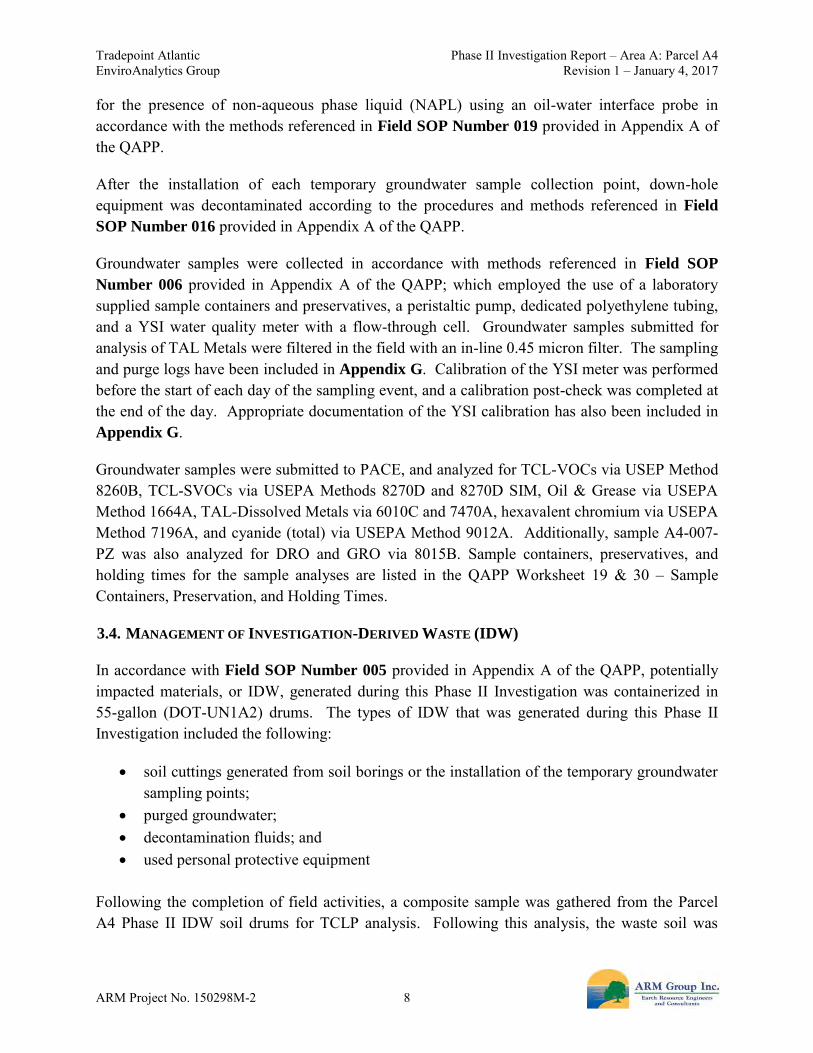
for the presence of non-aqueous phase liquid (NAPL) using an oil-water interface probe in accordance with the methods referenced in Field SOP Number 019 provided in Appendix A of the QAPP.
After the installation of each temporary groundwater sample collection point, down-hole equipment was decontaminated according to the procedures and methods referenced in Field
SOP Number 016 provided in Appendix A of the QAPP.
Groundwater samples were collected in accordance with methods referenced in Field SOP
Number 006 provided in Appendix A of the QAPP; which employed the use of a laboratory supplied sample containers and preservatives, a peristaltic pump, dedicated polyethylene tubing, and a YSI water quality meter with a flow-through cell. Groundwater samples submitted for analysis of TAL Metals were filtered in the field with an in-line 0.45 micron filter. The sampling and purge logs have been included in Appendix G. Calibration of the YSI meter was performed before the start of each day of the sampling event, and a calibration post-check was completed at the end of the day. Appropriate documentation of the YSI calibration has also been included in Appendix G.
Groundwater samples were submitted to PACE, and analyzed for TCL-VOCs via USEP Method 8260B, TCL-SVOCs via USEPA Methods 8270D and 8270D SIM, Oil & Grease via USEPA Method 1664A, TAL-Dissolved Metals via 6010C and 7470A, hexavalent chromium via USEPA Method 7196A, and cyanide (total) via USEPA Method 9012A. Additionally, sample A4-007-PZ was also analyzed for DRO and GRO via 8015B. Sample containers, preservatives, and holding times for the sample analyses are listed in the QAPP Worksheet 19 & 30 – Sample Containers, Preservation, and Holding Times.
MANAGEMENT OF INVESTIGATION-DERIVED WASTE (IDW) 3.4.
In accordance with Field SOP Number 005 provided in Appendix A of the QAPP, potentially impacted materials, or IDW, generated during this Phase II Investigation was containerized in 55-gallon (DOT-UN1A2) drums. The types of IDW that was generated during this Phase II Investigation included the following:
soil cuttings generated from soil borings or the installation of the temporary groundwater sampling points;
purged groundwater; decontamination fluids; and used personal protective equipment
Following the completion of field activities, a composite sample was gathered from the Parcel A4 Phase II IDW soil drums for TCLP analysis. Following this analysis, the waste soil was

Tradepoint Atlantic Phase II Investigation Report – Area A: Parcel A4 EnviroAnalytics Group Revision 1 – January 4, 2017
ARM Project No. 150298M-2 9
characterized as non-hazardous. A list of all results from the soil TCLP procedure can be found in Table 4, which indicates no exceedances of TCLP criteria.
IDW drums containing aqueous materials were characterized by preparing composite samples from randomly selected drums. Each composite sample included aliquots from three individual drums that were chosen from a set of 30 drums being staged on-site at the date of collection. A total of eight aqueous composite samples were collected for TCLP analysis. A list of all results from the aqueous TCLP procedure can be found in Table 5, which indicates no exceedances of TCLP criteria. The parcel specific IDW drum log from the Phase II investigation is included as Appendix H. All IDW procedures were carried out in accordance with methods referenced in the QAPP Worksheet 21 – Field SOPs and Appendix A of the QAPP.

Tradepoint Atlantic Phase II Investigation Report – Area A: Parcel A4 EnviroAnalytics Group Revision 1 – January 4, 2017
ARM Project No. 150298M-2 10
ANALYTICAL RESULTS 4.0
SOIL CONDITIONS 4.1.
Soil analytical results were screened against Project Action Limits (PALs) established in the site-wide Quality Assurance Project Plan (QAPP) to determine PAL exceedances. The analytical results for the detected parameters are summarized and compared to the PALs in the attached Table 6 (Organics) and Table 7 (Inorganics). The laboratory Certificates of Analysis (including Chains of Custody) and Data Validation Reports have been included as electronic attachments. The data validation reports contain a glossary of qualifiers for the final flags assigned to individual results in the attached summary tables.
4.1.1. Soil Conditions: Organic Compounds
As provided on Table 6, several VOCs were identified above the laboratory’s limits of detection (LODs) in the soil samples collected from across the Site. There were no VOCs detected above their respective PALs.
Table 6 provides a summary of SVOCs detected above the laboratory’s LODs in the soil samples collected from across the Site. Six SVOCs, all polynuclear aromatic hydrocarbons (PAHs), were detected above their respective PALs. These SVOCs were benzo[a]anthracene, benzo[a]pyrene, benzo[b]fluoranthene, dibenz[a,h]anthracene, indeno[1,2,3-c,d]pyrene, and naphthalene. Exceedances were noted at over half the boring locations distributed throughout the parcel. A summary of the PAL exceedance locations and results has been provided on Figure S-1.
Shallow soil samples collected across the Site from the 0-1 foot bgs interval were analyzed for PCBs. Table 6 provides a summary of the PCBs detected above the laboratory’s LODs. No individual PCB mixtures (or total PCBs) were detected above the specified PALs.
Table 6 provides a summary of the Oil & Grease detections in the parcel. There were detections of Oil & Grease at numerous locations across the Site; two locations exceeded the PAL (6,200 mg/kg). The highest detection of Oil & Grease (17,600 mg/kg) was identified in boring A4-002-SB; which targeted the Pipe Mill Trenches/Sump. The table also provides a summary of TPH-DRO/GRO detections. Four locations were selected for TPH-DRO/GRO analysis, due to the specific sampling targets at the boring locations (Hydraulic Oil Storage Area and Waste Oil Tank). Neither DRO nor GRO were detected above their respective PALs in Parcel A4. A summary of the TPH/Oil & Grease PAL exceedance locations and results has been provided on Figure S-2.

Tradepoint Atlantic Phase II Investigation Report – Area A: Parcel A4 EnviroAnalytics Group Revision 1 – January 4, 2017
ARM Project No. 150298M-2 11
4.1.2. Soil Conditions: Inorganic Constituents
Table 7 provides a summary of inorganic constituents detected above the laboratory’s LODs in the soil samples collected from across the Site. Six inorganic compounds (arsenic, manganese, lead, thallium, cadmium, and hexavalent chromium) were detected above their respective PALs. Arsenic was by far the most common inorganic exceedance, and was detected above the PAL in 47 (approximately 70%) of the soil samples analyzed for this compound. In comparison, manganese, lead, hexavalent chromium, thallium, and cadmium accounted for only 16 total exceedances. A summary of the inorganic PAL exceedance locations and results has been provided on Figure S-3.
4.1.3. Soil Conditions: Results Summary
Table 6 and Table 7 provide a summary of the detected organic compounds and inorganics in the soil samples submitted for laboratory analysis, and Figures S-1 through S-3 present a summary of the soil sample results that exceeded the PALs. Table 8 provides a summary of results for all PAL exceedances in soil, including detection frequencies and maximum results. Table 9 indicates which soil impacts (PAL exceedances) were associated with the specific targets listed in the Parcel A4 Work Plan. There were no detections of VOCs or PCBs above the applicable PALs. PAL exceedances in soil within Parcel A4 consisted of six inorganics (arsenic, manganese, lead, thallium, cadmium, and hexavalent chromium), six SVOCs (benzo[a]anthracene, benzo[a]pyrene, benzo[b]fluoranthene, dibenz[a,h]anthracene, indeno[1,2,3-c,d]pyrene, and naphthalene), and Oil & Grease. Arsenic was detected above the PAL in most soil samples, although only one sample had a concentration greater than 11.8 mg/kg (A4-015-SB-5 at 85.5J mg/kg). Manganese and hexavalent chromium were detected above the PALs in a few samples each, all located in the outdoor storage yard areas in the southwestern portion of the Site. Cadmium was only detected above the PAL in one sample (A4-013-SB-4). Thallium was also only detected above the PAL in one sample (A4-005-SB-5) which targeted the Acid Storage Tanks. The maximum detections for each of the PAH compounds were associated with a single sample (A4-021-SB-1). Four locations were selected for TPH-DRO/GRO analysis, due to the specific sampling targets at the boring locations (Hydraulic Oil Storage Area and Waste Oil Tank) and the standard sampling protocol at the time of Work Plan approval. The highest detection of Oil & Grease (17,600 mg/kg) in soil was in sample A4-002-SB-5, which targeted the Pipe Mill Trenches/Sump (AOC O).
GROUNDWATER CONDITIONS 4.2.
The analytical results for the detected parameters in groundwater are summarized and compared to the site-specific PALs in attached Table 10 (Organics) and Table 11 (Inorganics). The laboratory Certificates of Analysis (including Chains of Custody) and Data Validation Reports have been included as electronic attachments. The data validation reports contain a glossary of qualifiers for the final flags assigned to individual results in the attached summary tables.

Tradepoint Atlantic Phase II Investigation Report – Area A: Parcel A4 EnviroAnalytics Group Revision 1 – January 4, 2017
ARM Project No. 150298M-2 12
4.2.1. Groundwater Conditions: Organic Compounds
There were few VOCs identified above the laboratory’s LODs in groundwater samples collected from across the Site, and no individual sample results exceeded the specified PALs.
Table 10 provides a summary of SVOCs reported in groundwater above the laboratory’s LODs. Four SVOCs (1,4-dioxane, benzo[a]anthracene, naphthalene, and pentachlorophenol) were detected above their respective PALs. Pentachlorophenol was only detected above its PAL at one location, A4-012-PZ, with a detection of 2.6 μg/L. The other three SVOCs were identified above their respective PALs in at least two locations each. A summary of the PAL exceedance locations and results has been provided as Figure GW-1.
Table 10 provides a summary of the TPH/Oil & Grease detections in groundwater at the Site. One location (A4-007-PZ) was selected for TPH-DRO/GRO analysis, due to the specific sampling target at the piezometer location (Waste Oil Tank). The maximum detection of Oil & Grease was 1,500 μg/L (“J” flagged) at A4-007-PZ, which exceeded the PAL of 47 μg/L specified by the agencies. GRO was also detected above its PAL at groundwater location A4-007-PZ, with the result (1,560 μg/L) flagged with the “J” qualifier. DRO was not detected at this sample location. A summary of the TPH/Oil & Grease PAL exceedance locations and results has been provided on Figure GW-2.
4.2.2. Groundwater Conditions: Inorganic Constituents
Table 11 provides a summary of inorganic constituents detected above the LODs in the groundwater samples collected from across the Site. A total of four inorganic compounds (cobalt, iron, manganese, and vanadium) were detected above their respective PALs. Vanadium was only detected above its PAL at one location, A4-012-PZ, with a detection of 630 μg/L. The other three inorganic compounds were identified above their respective PALs in at least two locations each. A summary of the PAL exceedance locations and results has been provided as Figure GW-3.
4.2.3. Groundwater Conditions: Results Summary
Groundwater data were screened to determine whether individual sample results may exceed the USEPA Vapor Intrusion (VI) Screening Levels (Target Cancer Risk (TCR) of 1E-5 and Target Hazard Quotient (THQ) of 1) as determined by the Vapor Intrusion Screening Level (VISL) Calculator version 3.5.1 (https://www.epa.gov/vaporintrusion/vapor-intrusion-screening-levels-visls). The PALs specified in the QAPP are based upon drinking water use, which is not a potential exposure pathway for groundwater at the Site. The results of the sample screening against the VI criteria are summarized in Table 12.

Tradepoint Atlantic Phase II Investigation Report – Area A: Parcel A4 EnviroAnalytics Group Revision 1 – January 4, 2017
ARM Project No. 150298M-2 13
The only parameter which exceeded the individual VI THQ criteria was total cyanide, which was detected above the acceptable VI limit (3.5 μg/L) at two of the eight applicable shallow groundwater locations, with the highest detection (20.6 μg/L) observed at sample location A4-012-PZ. The piezometer locations which exceeded the individual VI criteria due to elevated total cyanide are shown in Figure GW-4. None of the sample results exceeded the VI TCR criteria for individual compounds, and none of the cumulative VI cancer risks were greater than or equal to 1E-5 when the results were summed by sample location. There was one location where the screening level estimate of cumulative VI non-cancer hazard exceeded 1 (rounded to one significant digit), caused by the maximum individual detection of total cyanide. The results of the cumulative VI comparisons are provided in Table 13, with the exceedance highlighted.
Naphthalene was also reported at elevated levels in groundwater sample A4-012-PZ (below the VI screening criterion of 200 ug/L). This location had a detection (63.9 μg/L) in excess of 100 times the applicable PAL specified in the QAPP (0.17 μg/L). In addition to naphthalene, pentachlorophenol was also detected in A4-012-PZ at a low level, with no detections of this compound at other locations in the parcel. Based on the lack of elevated detections of naphthalene at surrounding sample locations, and the apparent insignificant risk for vapor intrusion, a continuing source of naphthalene is not suspected within the Study Area.
The presence and absence of groundwater impacts within the Site boundaries have been adequately described. Groundwater is not used on the Tradepoint Atlantic property (and is not proposed to be utilized) and there is no direct discharge of groundwater to surface water on Parcel A4. VI risks were evaluated and identified two locations which may be impacted by elevated cyanide. However, the detected levels of cyanide did not suggest that sources of continuing releases of contaminant mass to the groundwater are present. The VI risks were conservatively screened using total cyanide rather than free cyanide or cyanide amenable to chlorination. The concentrations of free cyanide that could contribute to VI risks would be expected to be significantly lower than the total cyanide. Based on the sporadic and relatively low-level results identified during this effort, significant ongoing sources of groundwater contamination have not been identified within the Site boundaries.
4.2.4. Non-Aqueous Phase Liquid
Immediately after the installation of each temporary groundwater sampling point (A4-001-PZ, A4-005-PZ, A4-007-PZ, A4-010-PZ, A4-012-PZ, A4-013-PZ, A4-014-PZ and A4-019-PZ), an oil-water interface probe was used to check for the presence of NAPL in accordance with the methods referenced in Field SOP Number 019 provided in Appendix A of the QAPP. During the initial check, NAPL was not detected in any temporary groundwater sampling point. Additional NAPL checks were completed 24 hours after installation, and again prior to groundwater sampling (November 9 to November 11, 2016). NAPL was not detected in any temporary groundwater point during these checks, and no delineation activities were warranted.

Tradepoint Atlantic Phase II Investigation Report – Area A: Parcel A4 EnviroAnalytics Group Revision 1 – January 4, 2017
ARM Project No. 150298M-2 14
DATA USABILITY ASSESSMENT 5.0
The approved site-wide QAPP specified a process for evaluating data usability in the context of meeting project goals. Specifically, the goal of the Phase II Investigation is to determine if potentially hazardous substances or petroleum products (VOCs, SVOCs, PCBs, TAL Metals, cyanide, or TPH-DRO/GRO) are present in Site media (soil and groundwater) at concentrations that could pose an unacceptable risk to Site receptors. Individual results are compared to the Project Action Limits established in the QAPP (i.e., the most current USEPA RSLs) to identify the presence of exceedances in each environmental medium.
Quality control (QC) samples were collected during field studies to evaluate field/laboratory variability. A summary of QA/QC samples associated with this investigation has been included as Appendix I. The following QC samples were submitted for analysis to support the data validation:
Trip Blank – at a rate of one per day o Soil – VOCs only o Water – VOCs only
Blind Field Duplicate – at a rate of one per twenty samples o Soil – VOCs, SVOCs, Metals, TPH-DRO, TPH-GRO, Oil & Grease, PCBs,
Hexavalent Chromium, and Cyanide o Water – VOCs, SVOCs, Metals, TPH-DRO, TPH-GRO, Oil & Grease,
Hexavalent Chromium, and Cyanide Matrix Spike/Matrix Spike Duplicate – at a rate of one per twenty samples
o Soil – VOCs, SVOCs, Metals, TPH-DRO, TPH-GRO, Oil & Grease, PCBs, and Hexavalent Chromium
o Water – VOCs, SVOCs, Metals, TPH-DRO, TPH-GRO, Oil & Grease, and Hexavalent Chromium
Field Blank and Equipment Blank – at a rate of one per twenty samples o Soil – VOCs, SVOCs, Metals, TPH-DRO, TPH-GRO, Oil & Grease, Hexavalent
Chromium, and Cyanide o Water – VOCs, SVOCs, Metals, TPH-DRO, TPH-GRO, Oil & Grease,
Hexavalent Chromium, and Cyanide
The QC samples were collected and analyzed in accordance with the QAPP Worksheet 12 – Measurement Performance Criteria, QAPP Worksheet 20 – Field Quality Control and QAPP Worksheet 28 – Analytical Quality Control and Corrective Action.
DATA VERIFICATION 5.1.
A verification review was performed on documentation generated during sample collection and analysis. The verification included a review of field log books, field data sheets, and chain-of-custody (COC) forms to ensure that all planned samples were collected, and to ensure

Tradepoint Atlantic Phase II Investigation Report – Area A: Parcel A4 EnviroAnalytics Group Revision 1 – January 4, 2017
ARM Project No. 150298M-2 15
consistency with the field methods and decontamination procedures specified in the QAPP Worksheet 21 – Field SOPs and Appendix A of the QAPP. In addition, calibration logs were reviewed to ensure that field equipment was calibrated and/or checked once per day. The logs have been provided in Appendix E (PID calibration log) and Appendix G (YSI calibration log). The laboratory deliverables were reviewed to ensure that all records specified in the QAPP as well as necessary signatures and dates are present. Sample receipt records were reviewed to ensure that the sample condition upon receipt was noted, and any missing/broken sample containers (if any) were noted and reported according to plan. The data packages were compared to the COCs to verify that results were provided for all collected samples. The data package case narratives were reviewed to ensure that all exceptions (if any) are described.
DATA VALIDATION 5.2.
USEPA Stage 2B data validation was completed for the environmental sample analyses performed by PACE and supporting Level IV Data Package information by Environmental Data Quality Inc. (EDQI).
Sample analyses have undergone an analytical quality assurance review to ensure adherence to the required protocols. The Stage 2B review was performed as outlined in “Guide for Labeling Externally Validated Laboratory Analytical Data for Superfund Use”, EPA-540-R-08-005. Results have been validated or qualified according to general guidance provided in “USEPA National Functional Guidelines for Inorganic Superfund Data Review (ISM02.1)”, USEPA October 2013. Region III references this guidance for validation requirements. This document specifies procedures for validating data generated for Contract Laboratory Program (CLP) analyses. The approved QAPP dated October 2, 2015 and the quality control requirements specified in the methods and associated acceptance criteria were also used to evaluate the non-CLP data.
Data Validation has been completed for the Parcel A4 data. The Data Validation Reports (DVRs) provided by EDQI have been included as electronic attachments.
DATA USABILITY 5.3.
The data were evaluated with respect to the quality control elements of precision, bias, representativeness, comparability, completeness and sensitivity relative to data quality indicators and performance measurement criteria outlined in QAPP Worksheet 12 – Measurement Performance Criteria. The following discussion details deviation from the performance measurement criteria, and the impact on data quality and usability.
The measurement performance criteria of precision and bias were evaluated in the data validation process as described in the Data Validation Reports provided as electronic

Tradepoint Atlantic Phase II Investigation Report – Area A: Parcel A4 EnviroAnalytics Group Revision 1 – January 4, 2017
ARM Project No. 150298M-2 16
attachments. Where appropriate, potential limitations in the results have been indicated through final data flags. These flags indicate whether particular data points were quantitative estimates, biased high/low, associated with blank contamination, etc. Individual data flags are provided with the results in the detection summary tables. A qualifier code glossary is included with each data validation report provided by EDQI. Particular results may have been marked with the “R” flag if the result was deemed to be unreliable and was not included in any further data evaluation. A summary of the results that were rejected during data validation has been provided on Table
14 (soil) and Table 15 (groundwater). A discussion of data completeness (the proportion of valid data) is included below.
Representativeness is a measure of how accurately and precisely the data describe the Site conditions. Representativeness of the samples submitted for analysis was ensured by adherence to standard sampling techniques and protocols, as well as appropriate sample preservation prior to analysis. Sampling was conducted in accordance with the QAPP Worksheet 21 – Field SOPs and Appendix A of the QAPP. Specific Field SOPs applicable to the assessment of representativeness include Field SOP Numbers 006, 007, 009, 010, 011, 017, and 024. Review of the field notes and laboratory sample receipt records indicated that collection of soil and groundwater at the Site was representative, with no significant deviations from the SOPs.
Comparability describes the degree of confidence in comparing two sets of data. Comparability is maintained across multiple datasets by the use of consistent sampling and analytical methods across multiple project phases. Comparability of sample results was ensured through the use of approved standard sampling and analysis methods outlined in the QAPP. QA/QC protocols help to maintain the comparability of datasets, and in this case were assessed via blind duplicates, blank samples, and spiked samples, where applicable. No deviations from the QAPP were noted in the data set.
Sensitivity is a determination of whether the analytical methods and quantitation limits will satisfy the requirements of the project. The laboratory reports were reviewed to verify that reporting limits met the quantitation limits for specific analytes provided in QAPP Worksheet #15 – Project Action Limits and Laboratory-Specific Detection/Quantitation Limits. In general the laboratory reporting limits met the detection and quantitation limits specified in the QAPP.
Completeness is expressed as a ratio of the number of valid data points to the total number of analytical data results. Non-usable (“R” flagged) data results were determined through the data validation process. The approved QAPP specifies that the completeness of data is assessed by professional judgement, but should be greater than or equal to 90%. Data completeness for each compound is provided in Appendix J. As a result of dilutions due to matrix interferences, some of the initial soil samples had limited value for characterization of SVOCs. As a corrective measure, and to improve the accuracy and precision of the dataset, an additional round of soil

Tradepoint Atlantic Phase II Investigation Report – Area A: Parcel A4 EnviroAnalytics Group Revision 1 – January 4, 2017
ARM Project No. 150298M-2 17
samples were collected and analyzed for SVOCs at each of the affected boring locations and the results of the second round of samples was used in lieu of the original results for SVOCs.
A total of 11 acid extractable SVOCs had completeness values of 89.4% in soil analyses. These compounds (2,4-dinitrophenol, 2,3,4,6-tetrachlorophenol, 2,4,5-trichlorophenol, 2,4,6-trichlorophenol, 2,4-dichlorophenol, 2,4-dimethylphenol, 2-chlorophenol, 2-methylphenol, 3&4-methylphenol (m&p Cresol), pentachlorophenol, and phenol) were rejected due to poor recoveries, which is believed to be due to the highly alkaline conditions typical of slag fill. These compounds are generally not expected to be site-related contaminants. Since each of these compounds had completeness ratios very close to the 90% goal, and are unlikely to be site-related contaminants, these are not considered to be significant data gaps.
Additional limitations identified in the soil data were the number of rejected sample results for methyl acetate, acetone, benzaldehyde, 1,4-dioxane, bromomethane, and chloroethane. The limited soil data for methyl acetate (75%) is not considered to be a significant data gap as this compound had only one low soil detection and is not expected to be a site-related contaminant. Since acetone had a completeness ratio of 87.5% in soil and all detections were very low (0.17 mg/kg maximum) in comparison to the PAL (670,000 mg/kg), the lack of soil data for acetone is not considered to be a data gap. Of the remaining four compounds with reduced completeness percentages in soil (benzaldehyde, 1,4-dioxane, bromomethane, and chloroethane), only benzaldehyde had any detections in soil, and the maximum benzaldehyde detection (0.15 mg/kg) was well below the PAL (120,000 mg/kg). Of these compounds, 1,4-dioxane is the only analyte that was detected in groundwater. The groundwater data for 1,4-dioxane should allow for an adequate evaluation of this compound. The limited soil data for methyl acetate, acetone, benzaldehyde, 1,4-dioxane, bromomethane, and chloroethane are not considered to be significant data gaps.
In the groundwater samples, only methyl acetate, 3,3’-dichlorobenzidine, and acetone were below the goal of 90% completeness. Adequate soil data was available to determine that methyl acetate does not appear to be a significant concern at the Site. The groundwater completeness ratio for 3,3’-dichlorobenzidine was 87.5%, with only one rejected analytical result, and adequate data for soil was available to determine that 3,3’-dichlorobenzidine is not a significant concern at the Site. The only additional limitation in the groundwater data was the number of rejected sample results for acetone. Since none of the rejected groundwater results were detections, and all soil detections were very low “J” flagged values, the limited acetone data in groundwater is not a significant data gap.

Tradepoint Atlantic Phase II Investigation Report – Area A: Parcel A4 EnviroAnalytics Group Revision 1 – January 4, 2017
ARM Project No. 150298M-2 18
HUMAN HEALTH SCREENING LEVEL RISK ANALYSIS (SLRA) 6.0
ANALYSIS PROCESS 6.1.
A human health Screening Level Risk Analysis (SLRA) has been conducted for soils to further evaluate the Site conditions in support of the design of necessary response measures. The SLRA included the following evaluation process:
Identification of Constituents of Potential Concern (COPCs): Compounds that are present at concentrations at or above the USEPA Regional Screening Levels (RSLs) set at a target cancer risk of 1E-6 or target non-cancer Hazard Quotient (HQ) of 0.1 were identified as COPCs to be included in the SLRA. Identification of Exposure Units (EUs): A single exposure unit including the entire parcel exclusive of the NCMC building footprint was identified for Parcel A4. The site-wide exposure unit is comprised of 43.3 acres, with the remaining 18.1 acres occupied by the building. Conditions under the building were addressed by a separate BOA completed prior to the Phase II Investigation (with results presented in Appendix A). Exposure Point Concentrations (EPCs): The COPC soil data for the exposure unit was divided into surface (0-1 ft) and subsurface (>1 ft) depths for estimation of potential exposure point concentrations. An evaluation of pooled surface and subsurface soil data was also performed. Thus, for Parcel A4 there are three soil datasets. A statistical analysis was performed for each COPC dataset using the ProUCL software (version 5.0) developed by the USEPA to determine representative reasonable maximum exposure (RME) values for the EPC for each constituent. The RME value is typically the 95% Upper Confidence Limit (UCL) of the mean. For lead, the arithmetic mean for each depth category was calculated for comparison to the Adult Lead Model-based values, and any individual results exceeding 10,000 would be delineated for possible excavation and removal (if applicable). For PCBs, all results equaling or exceeding 50 mg/kg would be delineated for excavation and removal (if applicable). All PCB results less than 50 mg/kg are included in the EPCs and risk ratio calculations. Risk Ratios: The surface soil EPCs, subsurface soil EPCs, and pooled soil EPCs were compared to the USEPA RSLs for the Composite Industrial Worker and to site-specific Soil Screening Levels (SSLs) for the Construction Worker based on equations derived in the USEPA Supplemental Guidance for Developing Soil Screening Levels for Superfund Sites (OSWER 9355.4-24, December 2002). For the Construction Worker scenario, a baseline scenario was evaluated using the default exposure frequency of 250 work days (1 year construction period) for future potential risk. The risk ratios were calculated with a cancer risk of 1E-6 and a non-cancer Hazard Quotient (HQ) of 1. The risk ratios for the

Tradepoint Atlantic Phase II Investigation Report – Area A: Parcel A4 EnviroAnalytics Group Revision 1 – January 4, 2017
ARM Project No. 150298M-2 19
carcinogens were summed to develop a screening level estimate of the baseline cumulative cancer risk. The risk ratios for the non-carcinogens were segregated and summed by target organ to develop a screening level estimate of the baseline cumulative non-cancer hazard. There is no potential for human exposure to groundwater for a Composite Worker since groundwater is not used on the Tradepoint Atlantic property (and is not proposed to be utilized). In the event that future construction/excavation leads to a potential Construction Worker exposure to groundwater, health and safety plans and procedures shall be followed to limit exposure risk. Assessment of Lead: For lead, the arithmetic mean concentrations for surface soils, subsurface soils, and pooled soils for the site-wide EU were compared to the applicable RSL (800 mg/kg) as an initial screening. If the mean concentrations for the EU were below the applicable RSL, the EU was identified as requiring no further action for lead. If a mean concentration exceeded the RSL, the mean values were compared to calculated Adult Lead Model values (ALM Version dated 6/21/2009 updated with the August 2, 2016 OLEM Directive) with inputs of 1.7 for the geometric standard deviation and a blood baseline lead level of 0.7 ug/dL. The ALM calculation generates a soil lead concentration of 2,737 mg/kg, which is the most conservative (i.e., lowest) concentration which would yield a probability of 5% of a blood lead concentration of 10 ug/dL. If the arithmetic mean concentrations for the EU were below 2,737 mg/kg, the EU was identified as requiring no further action for lead. The lead averages and screening levels are presented for surface, subsurface, and pooled soils in Table 16. For lead, any results equaling or exceeding 10,000 mg/kg were identified to be delineated for possible excavation and removal (if applicable). Assessment of TPH-DRO/GRO and Oil & Grease: EPCs were not calculated for TPH-DRO/GRO or Oil & Grease. Instead, the individual results were compared to the PAL set to a HQ of 1 (6,200 mg/kg). Of the four locations sampled for DRO/GRO, the highest detection was 2,310 mg/kg for DRO in sample A4-004-SB-5, which did not exceed the PAL. Oil & Grease was detected above 6,200 mg/kg in two analytical samples: A4-002-SB-5 (17,600 mg/kg) and A4-008-SB-1 (12,400 mg/kg). An evaluation of the potential for product mobility based on these detections and response actions is presented following the SLRA in Section 7.2.
Risk Characterization Approach: For the site-wide EU, if the baseline risk ratio for each non-carcinogenic COPC or cumulative target organ does not exceed 1 (with the exception of lead), and the sum of the risk ratios for the carcinogenic COPCs does not exceed a cumulative cancer risk of 1E-5, then a no further action determination will be

Tradepoint Atlantic Phase II Investigation Report – Area A: Parcel A4 EnviroAnalytics Group Revision 1 – January 4, 2017
ARM Project No. 150298M-2 20
recommended. The primary EPC comparisons to determine the need for possible remedial action will be the Construction Worker scenario comparisons to the surface and subsurface soil EPCs, as well as the Composite Worker comparison to the surface soil EPCs. However, no further action will only be approvable if subsurface soil EPCs are compared to the Composite Worker RSLs in addition to the Construction Worker SSLs, and the cancer and non-cancer risk estimates are equal to or less than 1E-5 and 1, respectively. Pooled soil data has also been evaluated and included for discussion.
If the baseline estimate of cumulative cancer risk exceeds 1E-5, but is less than or equal to 1E-4, then capping of the EU will be considered to be an acceptable remedy for the Composite Worker. For the Construction Worker, cumulative cancer risks exceeding 1E-5, but less than or equal to 1E-4, will be mitigated via site-specific health and safety requirements. The efficacy of capping for elevated non-cancer hazard will be evaluated in terms of the magnitude of the exceedance and other factors such as bioavailability of the COPC. Similarly, for lead, if the ALM results indicate that the mean concentrations would present a 5% to 10% probability of a blood concentration of 10 ug/dL for the EU, then capping of the EU would be an acceptable presumptive remedy. The mean soil lead concentrations corresponding to ALM probabilities of 5% and 10% are 2,737 mg/kg, and 3,417 mg/kg, respectively. If capping of the identified area is not proposed, additional more detailed quantitative risk evaluation will be required for the EU. This supplemental risk evaluation may include a selective removal (excavation) remedy to reduce site-wide cancer and/or non-cancer risks to acceptable levels.
The USEPA’s acceptable risk range is between 1E-6 and 1E-4. If the sum of the risk ratios for carcinogens exceeds a cumulative cancer risk of 1E-4, further analysis of site conditions will be required including the consideration of toxicity reduction in any proposal for a remedy. The magnitude of non-carcinogen hazard exceedances and bioavailability of the COPC will also dictate further analysis of site conditions including consideration of toxicity reduction in any proposal for a remedy. In addition, if the ALM indicates that the mean lead concentrations would present a >10% probability of a blood concentration of 10 ug/dL for the EU, further analysis of site conditions including toxicity reduction will be completed such that the probability would be reduced to less than 10% after toxicity reduction, but before capping.
PARCEL A4 SLRA RESULTS AND RISK CHARACTERIZATION 6.2.
Soil data were divided into three datasets (surface, subsurface, and pooled) for the Parcel A4 exposure unit to evaluate potential current and future exposure scenarios. The pooled data may be applicable for future development plans that involve disturbances of the surface soil, since workers would likely not be exposed solely to the subsurface soil.

Tradepoint Atlantic Phase II Investigation Report – Area A: Parcel A4 EnviroAnalytics Group Revision 1 – January 4, 2017
ARM Project No. 150298M-2 21
EPCs were calculated for each soil dataset (i.e., surface, subsurface, and pooled surface/subsurface). The EPCs for lead are the average (i.e., arithmetic mean) values for each dataset. The average lead concentrations are presented for each dataset in Table 16. ProUCL output tables (with computed UCLs) derived from the data for each COPC in soils are provided as electronic attachments, with computations presented and EPCs calculated for COPCs within each of the three datasets (surface, subsurface, and pooled) for the exposure unit. The ProUCL input tables are also included as electronic attachments. The calculated EPCs are shown in Table 17 (surface soils) and Table 18 (subsurface soils). Table 19 presents the supplemental EPCs generated from the pooled surface and subsurface soils for the site-wide EU.
As indicated on Table 16, neither surface, subsurface, nor pooled soils exceeded an average lead value of 800 mg/kg. The screening criterion for lead was set at an exposure unit arithmetic mean of 800 mg/kg based on the RSL, with a secondary limit of 2,737 mg/kg based on the Adult Lead Model developed by the USEPA (corresponding to a 5% probability of a blood lead level of 10 ug/dL).
None of the detections of PCBs exceeded the mandatory excavation criterion of 50 mg/kg. Composite Worker Assessment:
Risk ratios for the estimates of potential EPCs for the Composite Worker scenario are shown in Table 20 (surface), Table 21 (subsurface), and Table 22 (pooled surface and subsurface soils). The results are summarized as follows:
Worker Scenario Medium Hazard Index (>1) Total Cancer
Risk
Composite Worker Surface Soil none 4E-5
Composite Worker Subsurface Soil Urinary System = 14 2E-5
Composite Worker Surface & Subsurface Soil Urinary System = 4 2E-5
The current Composite Worker will be exposed only to surface soils. The risk ratios indicated that the cumulative cancer risk for a potential Composite Worker exposure to surface soils was equal to 4E-5. The main contributors to cumulative cancer risk in surface soils were several SVOCs (benzo[a]anthracene, benzo[a]pyrene, benzo[b]fluoranthene, dibenz[a,h]anthracene, indeno[1,2,3-c,d]pyrene) and arsenic. The maximum detections in shallow soil for each listed SVOC were identified in sample A4-021-SB-1. When the non-cancer risks were segregated and summed by target organ for cumulative Hazard Index (HI), no target organ exceeded a cumulative HI of 1 in surface soils.

Tradepoint Atlantic Phase II Investigation Report – Area A: Parcel A4 EnviroAnalytics Group Revision 1 – January 4, 2017
ARM Project No. 150298M-2 22
Future construction activities were assumed to result in the placement of subsurface material over existing surface soils exposing a future Composite Worker to a mixture of surface and subsurface soils. This exposure scenario is dependent on any future development proposed for the parcel. The risk ratios indicated that the cumulative cancer risks for the Composite Worker scenario were equal to 2E-5 for both the subsurface soils and pooled soils in the parcel. An elevated hazard above the HI of 1 was calculated for the urinary system (HI=14) due to elevated cadmium (HQ=14) identified in sample A4-013-SB-4. No other target organs exceeded a cumulative HI of 1 in subsurface soils. The analysis evaluating the Composite Worker exposure to pooled soils (which may be applicable depending on any proposed development) again resulted in an elevated hazard above the HI of 1 for the urinary system (HI=4) due to elevated cadmium (HQ=4). No other target organs exceeded a cumulative HI of 1 in pooled surface and subsurface soils.
Based on this assessment, unacceptable risk to a future Composite Worker may be encountered if soil disturbances occur which relocate subsurface soils at the surface. Potential risks resulting from such a scenario should be addressed in a Response and Development Work Plan associated with any proposed future construction activities. Regardless of future development planning, institutional controls should be implemented to ensure proper oversight and management of any future construction activity that includes disturbances of the existing surface soil. These controls will be protective of future Composite Workers by limiting potential exposures to subsurface soil which may be impacted above the acceptable risk criteria.
Construction Worker Assessment:
Risk ratios for the estimates of potential EPCs for the Construction Worker scenario (250-day baseline exposure frequency) are shown in Table 23 (surface), Table 24 (subsurface), and Table
25 (pooled surface and subsurface soils). The variables entered for calculation of site-specific SSLs (EU area, input assumptions, and exposure frequency) are indicated as notes on the tables. The spreadsheet used for computation of the site-specific 250-day Construction Worker SSLs is included as Appendix K. The results are summarized as follows:
Worker Scenario Medium Hazard Index (>1) Total Cancer
Risk
Construction Worker (250 work day schedule) Surface Soil Nervous System = 7 5E-6
Construction Worker (250 work day schedule) Subsurface Soil Nervous System = 2
Urinary System = 86 3E-6
Construction Worker (250 work day schedule) Surface & Subsurface Soil Nervous System = 3
Urinary System = 28 3E-6

Tradepoint Atlantic Phase II Investigation Report – Area A: Parcel A4 EnviroAnalytics Group Revision 1 – January 4, 2017
ARM Project No. 150298M-2 23
The Construction Worker may be exposed to only surface soils or a combination of surface and subsurface soils (i.e. pooled) during future excavation or other earth moving activities. The screening level estimates of Construction Worker cancer risk for exposure to surface soils, subsurface soils, and pooled soils in the parcel-wide exposure unit were all less than the regulatory risk level of 1E-5. Using the baseline 250-day exposure, an elevated non-cancer hazard in surface soils was identified above the HI of 1 for the nervous system (HI=7). The impacts for the nervous system were caused primarily by elevated manganese (HQ=7). For subsurface soils evaluated for the baseline 250-day exposure, non-cancer hazards were noted for the nervous system (HI=2) and the urinary system (HI=86) due to elevated manganese (HQ=2) and cadmium (HQ=86), respectively. For the pooled soils evaluated for the 250-day exposure, elevated non-cancer hazards were noted for the nervous system (HI=3) and the urinary system (HI=28) due to elevated manganese (HQ=2) and cadmium (HQ=28), respectively.
The cancer and non-cancer risks may be re-evaluated based on any future proposed schedule of construction, which may be less than the 250 work day exposure presented herein.
Soil Removal Assessment:
The baseline risk ratio analysis indicated an elevated non-cancer HI for exposure to subsurface soil (and pooled soil) for both future Composite and future Construction Worker scenarios. In both cases the high HI for the urinary system was related to an elevated cadmium detection in one subsurface soil sample (A4-013-SB-4). Therefore, a supplemental exposure scenario was evaluated to assess the non-cancer hazard if elevated cadmium impacts were removed via excavation. The assessment was completed by replacing the maximum detection (33,600 mg/kg) with a soil concentration representing the proposed maximum concentration of the material to remain in place. The cadmium EPC for the subsurface soil dataset (representing the exposure scenario with the highest non-cancer HI) was then recalculated to evaluate the remaining risk. This process was repeated until a non-cancer HI of 1 was calculated for the urinary system.
The assessment indicated that the removal of cadmium above 550 mg/kg would be sufficient to reduce the future Construction Workers HI to 1 when evaluated for a potential 250-day exposure frequency. This threshold was selected specifically to be protective of the most conservative exposure scenario, the potential future Construction Worker. This threshold would also ensure that the HQ associated with cadmium is less than 1 for the Composite Worker scenario.
An additional analysis was performed to determine whether selective removal of localized soil impacts could reduce the carcinogenic risks associated with the potential Composite Worker exposures to surface soils to 1E-5. Surface carcinogenic risk is driven by elevated SVOC impacts for which the maximum concentrations of each SVOC with significant contributions to the cancer risk were co-located in the surface sample A4-021-SB-1, which is along the southeastern edge of the NCMC building. The SVOC concentrations at A4-021-SB-1 were replaced in the surface dataset with proposed maximum concentrations of the material to remain

Tradepoint Atlantic Phase II Investigation Report – Area A: Parcel A4 EnviroAnalytics Group Revision 1 – January 4, 2017
ARM Project No. 150298M-2 24
in place (assumed as the second highest value for each SVOC in the surface dataset; benzo[a]anthracene = 3.0 mg/kg, benzo[a]pyrene = 3.0 mg/kg, benzo[b]fluoranthene = 4.6 mg/kg, dibenz[a,h]anthracene = 0.46 mg/kg, and indeno[1,2,3-c,d]pyrene = 1.3 mg/kg). The EPCs for each SVOC were then recomputed and the revised risk ratios resulted in a cumulative carcinogenic risk of 1E-5. Thus, the carcinogenic risk in surface soils could be adequately addressed by removing SVOC impacts associated with the surface sample A4-021-SB-1, and no additional remedy (i.e., capping) would be required.

Tradepoint Atlantic Phase II Investigation Report – Area A: Parcel A4 EnviroAnalytics Group Revision 1 – January 4, 2017
ARM Project No. 150298M-2 25
FINDINGS AND RECOMMENDATIONS 7.0
The objective of this Phase II Investigation was to fully characterize the nature and extent of contamination at the Site. During the Phase II Investigation, a total of 8 groundwater samples and 76 soil samples (all locations/depths) were collected and analyzed to define the nature and extent of contamination in Parcel A4. The sampling and analysis plan for the parcel was developed to target specific features which represented a potential release of hazardous substances and/or petroleum products to the environment. Groundwater samples were analyzed for TCL-VOCs, TCL-SVOCs, Oil & Grease, TAL-Dissolved Metals, hexavalent chromium, and cyanide. Soil samples were analyzed for TCL-VOCs, TCL-SVOCs, Oil & Grease, TAL-Metals, hexavalent chromium, and cyanide. Shallow soil samples (0-1 foot bgs) were analyzed for PCBs. Select soil and groundwater samples were also analyzed for TPH-DRO/GRO.
SOIL 7.1.
The concentrations of constituents in the soil have been characterized by the Phase II Investigation to provide estimates of exposure point concentrations to support risk assessment.
SVOCs and inorganics in soil were responsible for the majority of PAL exceedances at the Site. There were no PAL exceedances for PCBs or VOCs, indicating that these compound groups are not significant contaminants at the Site. The maximum detections for each of the six PAHs with PAL exceedances were associated with a single sample (A4-021-SB-1) which provided general site coverage. Manganese, lead, hexavalent chromium, thallium, and cadmium contributed a relatively low number of PAL exceedances across the parcel (16 total), and the thallium and cadmium exceedances were limited to single locations. Arsenic exceeded its PAL in the largest proportion of the samples analyzed site-wide; however, all results were relatively low (less than ten times the PAL) with the exception of one sample (A4-015-SB-5).
NON-AQUEOUS PHASE LIQUID 7.2.
Elevated Oil & Grease was identified above the PAL (6,200 mg/kg) in two soil samples collected from Parcel A4 (A4-002-SB-5 at 17,600 mg/kg and A4-008-SB-1 at 12,400 mg/kg). TPH-DRO and GRO were analyzed at four soil boring locations including A4-008-SB, with no detections above the action limit of 6,200 mg/kg. The potential mobility of NAPL to groundwater was investigated via the installation of two temporary screening piezometers at location A4-002-SB (the most heavily impacted boring with a detection of 17,600 mg/kg) with screen intervals from 18 to 28 and 5 to 20 feet bgs. During the 0-hour, 48-hour, and 30-day measurements, NAPL was not identified and it was determined that free petroleum product (NAPL) is not present at quantities that are likely to migrate.
No additional investigation is recommended with regard to elevated detections of Oil & Grease. A4-002-SB was identified as the most likely source area where NAPL could potentially be

Tradepoint Atlantic Phase II Investigation Report – Area A: Parcel A4 EnviroAnalytics Group Revision 1 – January 4, 2017
ARM Project No. 150298M-2 26
present at quantities that could migrate. Soils potentially impacted by Oil & Grease have been present for many years and migration pathways associated with existing utilities that may cause off-site migration or surface discharges should be apparent by now. None of the piezometers installed in Parcel A4 for groundwater sampling showed any evidence of NAPL. However, the proximity of potential future utilities to both A4-008-SB and A4-002-SB should be evaluated in any future development planning for Parcel A4. Appropriate protocols should be documented in a Response and Development Work Plan (as necessary) to prevent the mobilization of any product if future utilities are proposed in the vicinity of these borings.
GROUNDWATER 7.3.
The concentrations of constituents in the groundwater have also been characterized by the Phase II Investigation to provide estimates of exposure point concentrations to support risk assessment. There were no VOCs or PCBs that exceeded their respective PALs, and these contaminant groups were determined to not be significant groundwater contaminants at the Site. None of the temporary groundwater sample collection points showed any detections of NAPL. The single groundwater sample selected for TPH-DRO/GRO analysis (based on the specific target) contained a PAL exceedance for GRO. The elevated detection was at sample location A4-007-PZ, which targeted Waste Oil Tanks. The detection (1,560 μg/L) was flagged with a “J” qualifier, indicating that it is an estimated value. The highest Oil & Grease concentration (1,500 μg/L) was identified in the same groundwater sample (A4-007-PZ) flagged with the “J” qualifier. Based on the lack of elevated Oil & Grease elsewhere on the Site, DRO and GRO are not suspected to be significant contaminants in Site groundwater.
Analysis of the groundwater samples identified concentrations of four inorganic compounds that exceeded their PALs. There was only one PAL exceedance of vanadium in groundwater (A4-012-PZ), and only two exceedances of cobalt (A4-010-PZ and A4-014-PZ). Iron and manganese were responsible for four and six PAL exceedances, respectively. Cobalt was the only compound which exceeded its applicable PAL in groundwater by greater than a factor of 10. This detection (243 μg/L) in A4-014-PZ exceeded the PAL by approximately a factor of 40.
Four SVOC compounds were identified with exceedances, with individual exceedances noted in six groundwater sample locations. Benzo[a]anthracene had PAL exceedances in half of the samples collected at the Site, all located towards the southern end of the parcel. The highest detection of benzo[a]anthracene was 0.067 μg/L (A4-012-PZ), and all exceedances of this compound were flagged with “J” qualifiers. There was only one PAL exceedance of pentachlorophenol (A4-012-PZ), and the exceedance was less than three times the PAL. There were only two exceedances each of 1,4-dioxane (A4-005-PZ and A4-010-PZ) and naphthalene (A4-012-PZ and A4-013-PZ). These compounds exceeded PALs by the greatest ratios of any SVOCs, with maximum detections of 19.2 ug/L and 63.9 ug/L observed for 1,4-dioxane and naphthalene, respectively.

Tradepoint Atlantic Phase II Investigation Report – Area A: Parcel A4 EnviroAnalytics Group Revision 1 – January 4, 2017
ARM Project No. 150298M-2 27
HUMAN HEALTH SCREENING ANALYSIS 7.4.
Groundwater is not used on the Tradepoint Atlantic property (and is not proposed to be utilized), therefore there is no potential for direct human exposure for a Composite Worker. In the event that future construction/excavation leads to a potential Construction Worker exposure to groundwater, health and safety plans should be implemented to limit exposure risk. The groundwater data were screened to determine whether any cumulative (or individual) sample results exceeded the USEPA VI TCR (carcinogen) or THQ (non-carcinogen) Screening Levels. None of the individual sample results exceeded the VI TCR criteria, and none of the cumulative VI cancer risks were greater than or equal to 1E-5 when the results were summed by sample location. There was one location where the screening level estimate of cumulative VI non-cancer hazard exceeded 1 (rounded to one significant digit), caused by the individual detection of total cyanide. However, detected levels of cyanide across the parcel did not suggest that sources of continuing releases of contaminant mass to the groundwater are present. The VI risks were conservatively screened using total cyanide rather than free cyanide or cyanide amenable to chlorination, and the fraction of free cyanide that could contribute to VI risks would be expected to be significantly lower than the total cyanide.
The current Composite Worker will be exposed to surface soils. The risk ratios indicated that the cumulative cancer risk for the Composite Worker scenario was equal to 4E-5 for surface soils which exceeded the target benchmark of 1E-5. The main contributions to cancer risk in surface soils were due to several SVOCs (benzo[a]anthracene, benzo[a]pyrene, benzo[b]fluoranthene, dibenz[a,h]anthracene, indeno[1,2,3-c,d]pyrene) and arsenic. A non-cancer risk cumulative HI of 1 was not exceeded for any organ system evaluated for Composite Worker exposure to surface soils. Since the cumulative HI did not exceed 1 for any target organ and the estimate of cumulative cancer risk was less than 1E-4, capping of impacted areas would be an appropriate remedy to address potential Composite Worker exposures to surface soil. Alternatively, the excavation and removal of SVOC impacts in the vicinity of soil sample A4-021-SB-1 would be adequate to reduce the site-wide cumulative carcinogenic risk estimate for exposure to the shallow soils to the acceptable level of 1E-5. If a response measure (capping or excavation) is not planned, further analysis including a more detailed risk assessment may be warranted.
An elevated hazard above the HI of 1 was calculated for the urinary system (HI=14) due to elevated cadmium (HQ=14) for a potential future Composite Worker exposure to subsurface soils. Based on this assessment, unacceptable risk to a future Composite Worker may be encountered if soil disturbances occur that relocate cadmium impacted soils to the surface. The removal of cadmium impacted soil above 550 mg/kg (via excavation and off-site disposal) would be sufficient to protect future Composite Workers by reducing the urinary system HI to an acceptable level. The cumulative carcinogenic risk for the potential Composite Worker exposure to subsurface soils was equal to 2E-5 (slightly above the target benchmark), caused primarily by elevated subsurface arsenic. Institutional controls should be implemented for the protection of

Tradepoint Atlantic Phase II Investigation Report – Area A: Parcel A4 EnviroAnalytics Group Revision 1 – January 4, 2017
ARM Project No. 150298M-2 28
Composite Workers to ensure proper oversight and management of any future construction activity that includes disturbances of the existing surface soil. If future development of Parcel A4 would relocate subsurface materials to the surface, the carcinogenic risks may require further evaluation in a Response and Development Work Plan. If surface soils may be disturbed, a more detailed risk assessment may be warranted to evaluate the subsurface arsenic contribution.
The Construction Worker risk analysis for a potential baseline exposure (250 work days) indicated that the cumulative cancer risks were equal to 5E-6 (surface soils) and 3E-6 (subsurface soils) in the parcel. Based on these values, the cancer risk to the future Construction Worker is in the acceptable range with no further action.
An elevated non-cancer hazard above the HI of 1 was calculated for surface soils associated with the nervous system (HI=7) due to elevated manganese (HQ=7). Elevated non-cancer hazards were also noted in subsurface soils for the nervous system (HI=2) and the urinary system (HI=86) due to elevated manganese (HQ=2) and cadmium (HQ=86), respectively. The removal of cadmium impacted soils above 550 mg/kg would be sufficient to reduce the urinary system HI to 1 for the protection of future Construction Workers evaluated for a 250-day exposure frequency. While not quantified, the mineralized manganese in the Parcel A4 soils is likely less bioavailable than the source materials from which the manganese toxicity criteria (and basis of the SSLs) were derived. Therefore, the non-cancer hazard is likely overstated for manganese. The total HI associated with manganese for the future Construction Worker may indicate the need for protective controls (dust mask, etc.) if a long term construction project is proposed for the property in the future. The risks may be re-evaluated based on the proposed schedule of construction, which may be less than the baseline 250 work day exposure presented herein. Unacceptable risks due to elevated metals remaining in place can be addressed by the implementation of health and safety protocols.
RECOMMENDATIONS 7.5.
Sufficient remedial investigation data has been collected to evaluate the nature and extent of possible constituents of concern in Parcel A4. The presence and absence of soil and groundwater impacts within Parcel A4 have been adequately described and further investigation is not warranted. The entire Site is not currently suitable for industrial use; remedial and/or further action is recommended to support use of the parcel via the following:
Future use of the parcel should include the following deed restrictions:
o Deed restriction for industrial Site use only, no portion of the Site should be used for agricultural, recreational or residential purposes.
o Deed restriction on groundwater use, no subsurface water or groundwater should be extracted from aquifers for any purpose.

Tradepoint Atlantic Phase II Investigation Report – Area A: Parcel A4 EnviroAnalytics Group Revision 1 – January 4, 2017
ARM Project No. 150298M-2 29
Elevated cadmium impacts in the vicinity of A4-013-SB-4 above 550 mg/kg (determined via a preliminary risk ratio analysis to provide protection for both the site-wide Composite Worker and 250-day Construction Worker scenarios) should be delineated for excavation and removal.
Elevated SVOCs in surface soils in the vicinity of A4-021-SB-1 should be remediated either by capping or a selective removal remedy via excavation to provide Composite Worker protection.
Institutional controls should be implemented for the protection of workers to ensure proper oversight and management of any future construction activity that includes disturbances of the existing soil. These institution controls will necessarily need to include a written notice to the MDE of any future soil disturbance activities, and may require health and safety requirements for any excavations of substantial time periods, and proper management and characterization of any material removed from the Site.
If future development proposes disturbance of the surface soil, then a detailed risk analysis should be completed and presented in a Response and Development Work Plan to further assess potential elevated carcinogenic exposures to future Composite Workers due to the subsurface arsenic contribution.
Soil boring locations with elevated detections of Oil & Grease (A4-002-SB and A4-008-SB) should be considered for proximity to proposed utilities in any future development planning. If future utilities are proposed in the vicinity of these borings, appropriate protocols for the mitigation of potential product mobility should be addressed in a Response and Development Work Plan.

Tradepoint Atlantic Phase II Investigation Report – Area A: Parcel A4 EnviroAnalytics Group Revision 1 – January 4, 2017
ARM Project No. 150298M-2 30
REFERENCES 8.0
ARM Group, Inc. (2015). Building Occupancy Assessment – New Cold Mill Complex. April 13, 2015
ARM Group, Inc. (2015). Phase II Investigation Work Plan: Parcel A4. Revision 2. October 29, 2015.
ARM Group, Inc. (2015). Quality Assurance Project Plan: Sparrows Point Terminal Site. Revision 2. October 2, 2015.
Rust Environmental & Infrastructure (1998). Description of Current Conditions: Bethlehem Steel Corporation. Final Draft. January, 1998.
USEPA (2002). Supplemental Guidance for Developing Soil Screening Levels for Superfund Sites. OSWER 9355.4-24. December, 2002.
USEPA (2016). Vapor Intrusion Screening Level (VISL) Calculator version 3.5.1. (https://www.epa.gov/vaporintrusion/vapor-intrusion-screening-levels-visls).
Weaver Boos Consultants (2014). Phase I Environmental Site Assessment: Former RG Steel Facility. Final Draft. May 19, 2014.

FIGURES

August 1, 20160 750 1,500375Feetq 1Figure
Baltimore County, MD
Tradepoint AtlanticEnviroAnalytics Group
Area A: Project 150298M
Site BoundaryPrivate PropertyArea A BoundariesArea B Boundaries Area B: Project 150300M
Tradepoint AtlanticArea A and Area B Parcels

Adapted from Figure 2-5 of the Description of Current Conditions Report prepared byRust Environmental and Infrastructure, dated January 1998
August 1, 20160 750 1,500375
Feetq 2Figure
Baltimore County, MD
Tradepoint AtlanticEnviroAnalytics Group
Area A: Project 150298M
Site BoundaryArea A BoundariesArea B Boundaries
LandMarshWater Area B: Project 150300M
Approximate Shoreline 1916

@A
@A
@A
@A
@A
@A
@A
@A
Parcel A1 Parcel A4
Parcel A6
Parcel B8
Parcel B14
Parcel B6
10
4
9
5
8
7
6
A4-012-PZ
A4-001-PZ3.87
A4-005-PZ5.11
A4-007-PZ7.99
A4-010-PZ10.11
A4-013-PZ4.22
A4-014-PZ5.72
A4-019-PZ9.29
q0 150 30075
Feet
May 2016
Groundwater Sample Locationsand Potentiometric Surface
EnviroAnalytics GroupARM Project 150298M-2
Tradepoint AtlanticBaltimore County, MD 3Figure
@A Piezometer@A Piezometer (destroyed)
Piezometer IDGroundwater Elevation (ft amsl)Potentiometric Surface Contour (ft amsl)Parcel Boundary
Groundwater MeasurementsCollected 4/8/2016
A4-014-PZ5.72

@A
@A
@A
@A
@A
@A
@A
@A
@A
@A
@A
@A
@A
@A
@A
@A
@A
@A
@A
@A
@A
@A
@A
@A
@A
@A
@A
@A
Parcel A1 Parcel A4
Parcel A6
Parcel B8
Parcel B14
Parcel B6
A4-001-SB
A4-005-SB
A4-007-SB
A4-009-SBA4-010-SB
A4-011-SB
A4-013-SB
A4-014-SB
A4-017-SB
A4-018-SB
A4-008-SB
A4-021-SB
A4-022-SB
A4-024-SB
A4-002-SB
A4-003-SB
A4-006-SB
A4-025-SB
A4-026-SB
A4-028-SB
A4-004-SB
A4-012-SB
A4-015-SB
A4-016-SB
A4-019-SB
A4-020-SB
A4-023-SB
A4-027-SB
q0 150 30075
Feet
May 2016
Parcel A4Final Boring Locations
EnviroAnalytics GroupARM Project 150298M-2
Tradepoint AtlanticBaltimore County, MD 4Figure
@A Boring LocationParcel Boundary
Groundwater MeasurementsCollected 4/8/2016

@A
@A
@A
@A@A
@A
@A
@A
@A
@A
@A
@A
@A
@A
@A
@A
@A
@A
@A
@A
@A
@A
@A
@A
@A
@A
@A
@A
Parcel B8
Parcel B14
Parcel B6
Parcel A1
Parcel A4
Parcel A6
A4-001-SB-1A4-001-SB-5
A4-005-SB-1A4-005-SB-5Benzo(a)anthracene: 4.4Benzo(a)pyrene: 3.6Benzo(b)fluoranthene: 6.1Dibenz(a,h)anthracene: 0.81A4-005-SB-10
A4-007-SB-1A4-007-SB-5
A4-009-SB-1A4-009-SB-5
A4-010-SB-1A4-010-SB-5Benzo(a)anthracene: 3.0Benzo(a)pyrene: 6.4Benzo(b)fluoranthene: 8.2Dibenz(a,h)anthracene: 1.8Indeno(1,2,3-cd)pyrene: 5.4A4-010-SB-10Benzo(a)pyrene: 0.32
A4-011-SB-1A4-011-SB-5
A4-013-SB-1A4-013-SB-4Benzo(a)pyrene: 0.48
A4-014-SB-1Benzo(a)pyrene: 2.1Benzo(b)fluoranthene: 3.1Dibenz(a,h)anthracene: 0.46A4-014-SB-7
A4-017-SB-1Benzo(a)pyrene: 0.81A4-017-SB-5 A4-018-SB-1
A4-018-SB-5
A4-008-SB-1A4-008-SB-5
A4-021-SB-1Benzo(a)anthracene: 27.8Benzo(a)pyrene: 16.1Benzo(b)fluoranthene: 24.9Dibenz(a,h)anthracene: 2.9Indeno(1,2,3-cd)pyrene: 8.1Naphthalene: 19.4A4-021-SB-5
A4-022-SB-1A4-022-SB-8Benzo(a)pyrene: 0.67A4-022-SB-10
A4-024-SB-1A4-024-SB-5Benzo(a)pyrene: 1.1Dibenz(a,h)anthracene: 0.31
A4-002-SB-1A4-002-SB-5A4-002-SB-10
A4-003-SB-1A4-003-SB-7.5A4-003-SB-10
A4-006-SB-1Benzo(a)pyrene: 1.7Dibenz(a,h)anthracene: 0.31A4-006-SB-6
A4-025-SB-1A4-025-SB-7Benzo(a)pyrene: 1.7Dibenz(a,h)anthracene: 0.32A4-025-SB-10
A4-026-SB-1Benzo(a)anthracene: 3.0Benzo(a)pyrene: 3.0Benzo(b)fluoranthene: 4.6Dibenz(a,h)anthracene: 0.45A4-026-SB-5A4-026-SB-10
A4-028-SB-1A4-028-SB-5
A4-004-SB-1A4-004-SB-5
A4-012-SB-1A4-012-SB-5Benzo(a)pyrene: 1.5Dibenz(a,h)anthracene: 0.39A4-012-SB-10
A4-015-SB-1Benzo(a)pyrene: 0.52A4-015-SB-5
A4-016-SB-1Benzo(a)pyrene: 1.6Benzo(b)fluoranthene: 3.7Dibenz(a,h)anthracene: 0.31A4-016-SB-5Benzo(a)pyrene: 0.95A4-016-SB-10
A4-019-SB-1Benzo(a)pyrene: 0.81A4-019-SB-5
A4-020-SB-1A4-020-SB-5
A4-023-SB-1A4-023-SB-5A4-023-SB-10
A4-027-SB-1A4-027-SB-5Benzo(a)anthracene: 3.1Benzo(a)pyrene: 2.8Benzo(b)fluoranthene: 4.7Dibenz(a,h)anthracene: 0.47A4-027-SB-10
July 7, 20160 100 20050Feetq
Parcel A4 Soil BoringsPhase II SVOC Exceedances (mg/kg) S-1
Figure
Tradepoint AtlanticBaltimore County, MD
EnviroAnalytics GroupARM Project 150298M-2@A Soil Boring
Parcel Boundary

@A
@A
@A
@A@A
@A
@A
@A
@A
@A
@A
@A
@A
@A
@A
@A
@A
@A
@A
@A
@A
@A
@A
@A
@A
@A
@A
@A
A4-001-SB-1A4-001-SB-5
A4-005-SB-1A4-005-SB-5
A4-007-SB-1A4-007-SB-5
A4-009-SB-1A4-009-SB-5
A4-010-SB-1A4-010-SB-5
A4-011-SB-1A4-011-SB-5
A4-013-SB-1A4-013-SB-4
A4-014-SB-1A4-014-SB-7
A4-017-SB-1A4-017-SB-5
A4-018-SB-1A4-018-SB-5
A4-008-SB-1OG: 12,400A4-008-SB-5
A4-021-SB-1A4-021-SB-5
A4-022-SB-1A4-022-SB-8
A4-024-SB-1A4-024-SB-5
A4-002-SB-1A4-002-SB-5OG: 17,600
A4-003-SB-1A4-003-SB-7.5
A4-006-SB-1A4-006-SB-6
A4-025-SB-1A4-025-SB-7
A4-026-SB-1A4-026-SB-5
A4-028-SB-1A4-028-SB-5
A4-004-SB-1A4-004-SB-5
A4-012-SB-1A4-012-SB-5
A4-015-SB-1A4-015-SB-5
A4-016-SB-1A4-016-SB-5
A4-019-SB-1A4-019-SB-5
A4-020-SB-1A4-020-SB-5
A4-023-SB-1A4-023-SB-5
A4-027-SB-1A4-027-SB-5
December 16, 20160 100 20050Feetq
Parcel A4 Soil BoringsPhase II TPH/O&G Exceedances (mg/kg) S-2
Figure
Tradepoint AtlanticBaltimore County, MD
EnviroAnalytics GroupARM Project 150298M-2@A Soil Boring (O&G)
@A Soil Boring (TPH/O&G)Parcel Boundary
Parcel B14
Parcel B6
Parcel A1
Parcel A4
Parcel A6

@A
@A
@A
@A@A
@A
@A
@A
@A
@A
@A
@A
@A
@A
@A
@A
@A
@A
@A
@A
@A
@A
@A
@A
@A
@A
@A
@A
Parcel B8
Parcel B14
Parcel B6
Parcel A1
Parcel A4
Parcel A6
A4-001-SB-1A4-001-SB-5
A4-005-SB-1Manganese: 30,000 JA4-005-SB-5Arsenic: 8.1 JManganese: 26,500 JThallium: 13.8A4-005-SB-10Arsenic: 5.9
A4-007-SB-1A4-007-SB-5Arsenic: 5.0A4-007-SB-10Arsenic: 3.9
A4-009-SB-1Arsenic: 4.3A4-009-SB-5
A4-010-SB-1Arsenic: 5.7A4-010-SB-5
A4-011-SB-1Arsenic: 5.9Chromium, Hexavalent: 15.1Manganese: 35,800A4-011-SB-5 A4-013-SB-1
Arsenic: 6.2A4-013-SB-4Arsenic: 29.4Cadmium: 33,600Lead: 2,780
A4-014-SB-1Arsenic: 5.2A4-014-SB-7Arsenic: 5.3A4-014-SB-10Arsenic: 7.1
A4-017-SB-1Arsenic: 5.2 JA4-017-SB-5Arsenic: 6.4 JA4-017-SB-10Arsenic: 11.8
A4-018-SB-1Arsenic: 16.5A4-018-SB-5Arsenic: 3.4A4-018-SB-10Arsenic: 10.5
A4-008-SB-1A4-008-SB-5Arsenic: 3.8A4-008-SB-10Arsenic: 12.3
A4-021-SB-1Arsenic: 7.2 JA4-021-SB-5Arsenic: 4.0 JA4-021-SB-10Arsenic: 11.8
A4-022-SB-1A4-022-SB-8Arsenic: 8.5Manganese: 31,300 J
A4-024-SB-1Chromium, Hexavalent: 9.6Manganese: 30,600A4-024-SB-5Arsenic: 10.1
A4-002-SB-1A4-002-SB-5Lead: 817
A4-003-SB-1A4-003-SB-7.5Arsenic: 11.7
A4-006-SB-1Arsenic: 4.3 JA4-006-SB-6Arsenic: 4.5 JA4-006-SB-10Arsenic: 10.5
A4-025-SB-1A4-025-SB-7
A4-026-SB-1A4-026-SB-5Arsenic: 4.3 JA4-026-SB-10Arsenic: 4.7
A4-028-SB-1A4-028-SB-5
A4-004-SB-1Arsenic: 5.1Chromium, Hexavalent: 10.3Manganese: 31,900A4-004-SB-5Arsenic: 3.6
A4-012-SB-1Arsenic: 3.7A4-012-SB-5Arsenic: 9.4
A4-015-SB-1Arsenic: 6.1 JA4-015-SB-5Arsenic: 85.5 JA4-015-SB-10Arsenic: 6.7
A4-016-SB-1Arsenic: 9.5A4-016-SB-5Arsenic: 9.5A4-016-SB-10Arsenic: 8.3
A4-019-SB-1Arsenic: 6.5 JLead: 1,010 JA4-019-SB-5
A4-020-SB-1Arsenic: 5.7A4-020-SB-5Arsenic: 3.1A4-020-SB-10Arsenic: 8.4
A4-023-SB-1Manganese: 33,700 JA4-023-SB-5Arsenic: 3.3
A4-027-SB-1A4-027-SB-5Arsenic: 25.5Lead: 1,500
July 7, 20160 100 20050Feetq
Parcel A4 Soil BoringsPhase II Inorganic Exceedances (mg/kg) S-3
Figure
Tradepoint AtlanticBaltimore County, MD
EnviroAnalytics GroupARM Project 150298M-2@A Soil Boring
Parcel Boundary

@A
@A
@A
@A
@A
@A
@A
@A
Parcel B8
Parcel B14
Parcel B6
Parcel A1
Parcel A4
Parcel A6
A4-001-PZBenzo[a]anthracene: 0.021 J
A4-005-PZ1,4-Dioxane: 2.1
A4-007-PZ
A4-010-PZ1,4-Dioxane: 19.2
A4-013-PZBenzo[a]anthracene: 0.024 JNaphthalene: 0.28
A4-014-PZBenzo[a]anthracene: 0.024 J
A4-012-PZBenzo[a]anthracene: 0.067 JNaphthalene: 63.9Pentachlorophenol: 2.6
A4-019-PZ
July 7, 20160 100 20050Feetq
Parcel A4 Groundwater SamplesPhase II SVOC Exceedances (ug/L) GW-1
Figure
Tradepoint AtlanticBaltimore County, MD
EnviroAnalytics GroupARM Project 150298M-2
@A Piezometer (Shallow)Parcel Boundary
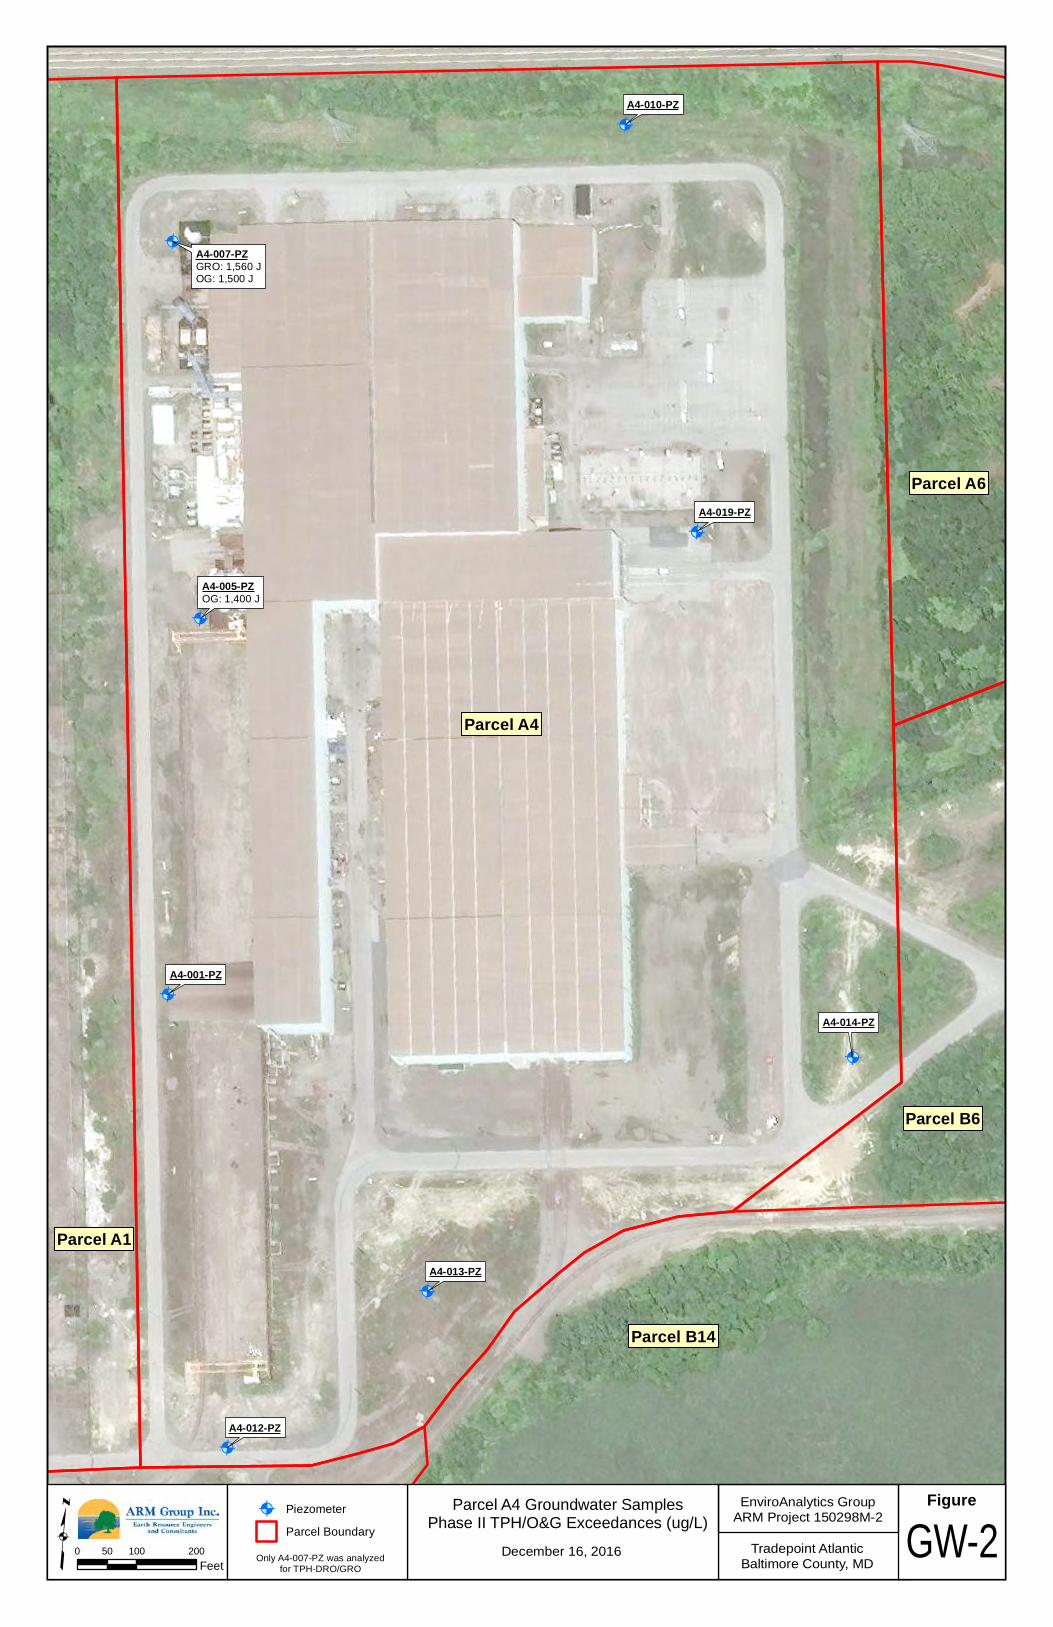
@A
@A
@A
@A
@A
@A
@A
@A
A4-001-PZ
A4-005-PZOG: 1,400 J
A4-007-PZGRO: 1,560 JOG: 1,500 J
A4-010-PZ
A4-013-PZ
A4-014-PZ
A4-012-PZ
A4-019-PZ
December 16, 20160 100 20050Feetq
Parcel A4 Groundwater SamplesPhase II TPH/O&G Exceedances (ug/L) GW-2
Figure
Tradepoint AtlanticBaltimore County, MD
EnviroAnalytics GroupARM Project 150298M-2
Only A4-007-PZ was analyzedfor TPH-DRO/GRO
@A PiezometerParcel Boundary
Parcel B14
Parcel B6
Parcel A1
Parcel A4
Parcel A6

@A
@A
@A
@A
@A
@A
@A
@A
Parcel B8
Parcel B14
Parcel B6
Parcel A1
Parcel A4
Parcel A6
A4-001-PZManganese: 458
A4-005-PZIron: 66,200Manganese: 2,930
A4-007-PZIron: 61,200Manganese: 3,270
A4-010-PZCobalt: 41.8Iron: 72,000Manganese: 3,060
A4-013-PZ
A4-014-PZCobalt: 243Manganese: 4,050
A4-012-PZVanadium: 630
A4-019-PZIron: 57,800Manganese: 2,040
July 7, 20160 100 20050Feetq
Parcel A4 Groundwater SamplesPhase II Inorganic Exceedances (ug/L) GW-3
Figure
Tradepoint AtlanticBaltimore County, MD
EnviroAnalytics GroupARM Project 150298M-2
@A Piezometer (Shallow)Parcel Boundary
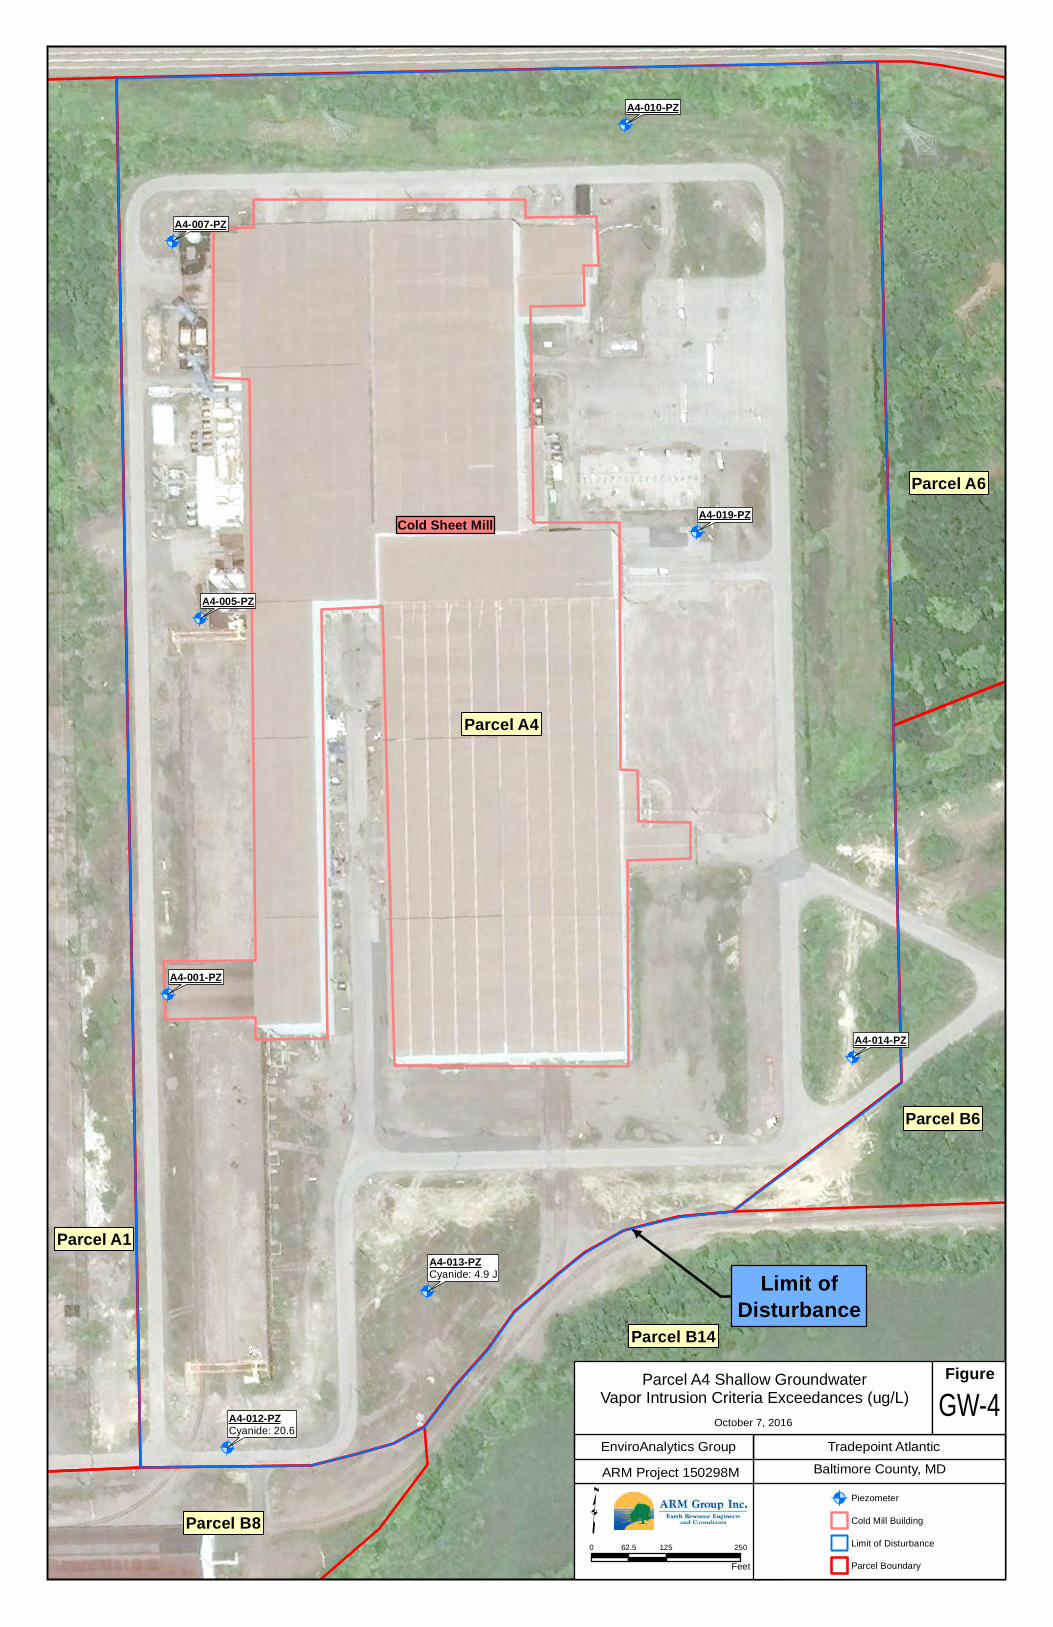
@A
@A
@A
@A
@A
@A
@A
@A
Parcel B8
Parcel B14
Parcel B6
Parcel A1
Parcel A4
Parcel A6
Limit ofDisturbance
A4-001-PZ
A4-005-PZ
A4-007-PZ
A4-010-PZ
A4-013-PZCyanide: 4.9 J
A4-014-PZ
A4-012-PZCyanide: 20.6
A4-019-PZCold Sheet Mill
Tradepoint AtlanticBaltimore County, MD
EnviroAnalytics GroupARM Project 150298M
Parcel A4 Shallow GroundwaterVapor Intrusion Criteria Exceedances (ug/L)
October 7, 2016
Figure
0 125 25062.5
Feet
q
GW-4
@A Piezometer
Cold Mill Building
Limit of Disturbance
Parcel Boundary

TABLES
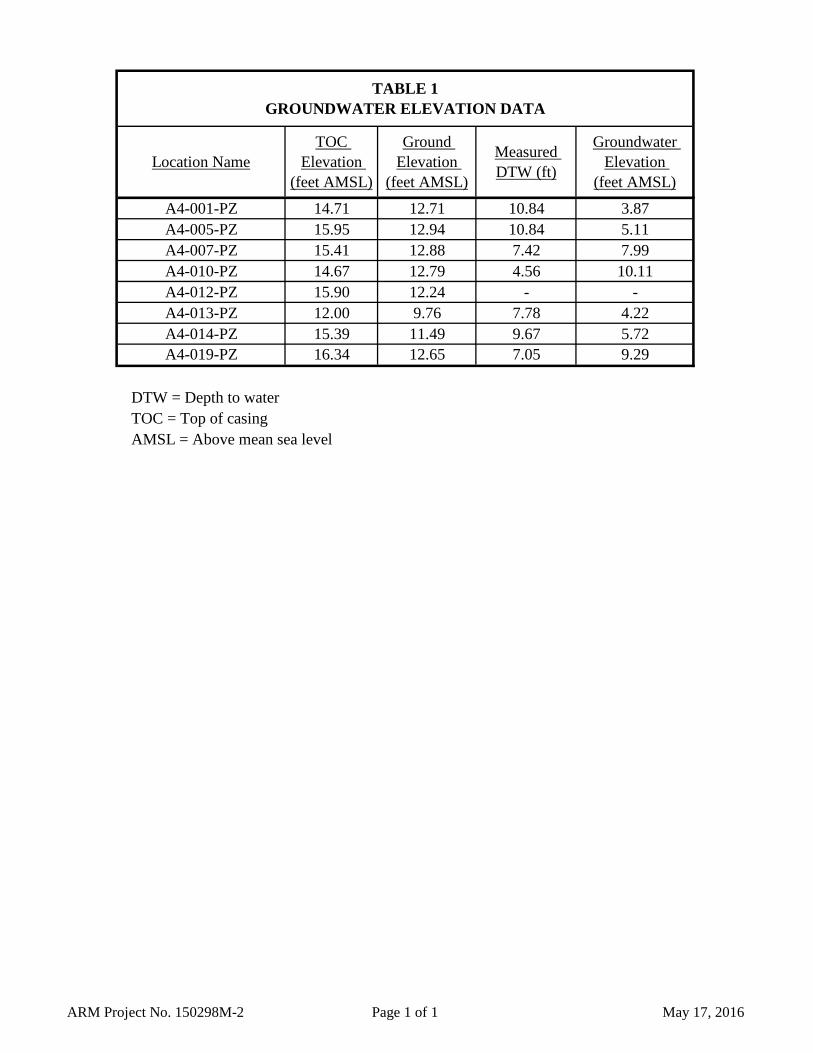
ARM Project No. 150298M-2 Page 1 of 1 May 17, 2016
A4-001-PZ 14.71 12.71 10.84 3.87A4-005-PZ 15.95 12.94 10.84 5.11A4-007-PZ 15.41 12.88 7.42 7.99A4-010-PZ 14.67 12.79 4.56 10.11A4-012-PZ 15.90 12.24 - -A4-013-PZ 12.00 9.76 7.78 4.22A4-014-PZ 15.39 11.49 9.67 5.72A4-019-PZ 16.34 12.65 7.05 9.29
DTW = Depth to water TOC = Top of casing AMSL = Above mean sea level
TABLE 1GROUNDWATER ELEVATION DATA
Location NameTOC
Elevation (feet AMSL)
Ground Elevation
(feet AMSL)
Measured DTW (ft)
Groundwater Elevation
(feet AMSL)

ARM Project No. 150298M-2 Page 1 of 1 May 17, 2016
5044 8/3/1959 3/11/19825049 6/4/1968 3/11/19825050 Unknown 3/18/19825054 4/27/1959 3/11/19825055 1/27/1959 3/11/19825144 Unknown 8/5/20085149 Unknown 3/28/20085150 Unknown 8/18/20085154 Unknown 3/26/20085155 Unknown 3/3/20085544 9/16/1959 2/27/19765549 10/15/1959 3/3/19765550 9/16/1959 3/5/19765554 2/10/1976 2/10/19765555 2/10/1976 2/10/19765888 Unknown Sept. 19885887 Unknown Sept. 1988
TABLE 2HISTORICAL SITE DRAWING DETAILS
Set Name
Plant Arrangement
Typical Features Shown
Roads, water bodies, building/structure footprints, electric lines, above-ground pipelines (e.g.:
steam, nitrogen, etc.)
Drawing Number
Original Date Drawn
Latest Revision Date
Drip Legs Coke Oven Gas Drip Legs Locations
Plant Index
Plant Sewer Lines
Roads, water bodies, demolished buildings/structures, electric lines,
above-ground pipelines
Same as above plus trenches, sumps, underground piping (includes pipe
materials)

ARM Project No. 150298M-2 Page 1 of 1 May 19, 2016
Northing Easting Northing Easting
A4-004-SB AOC O - Hydraulic Oil Storage Area 571,164 1,458,158 571,175 1,458,160 9 NE RefusalA4-012-SB Parcel Coverage 570,399 1,458,228 570,368 1,458,231 26 S UtilitiesA4-015-SB Parcel Coverage 571,608 1,459,155 571,628 1,459,137 23 NW UtilitiesA4-016-SB Parcel Coverage 570,993 1,458,898 570,994 1,458,908 10 E RefusalA4-019-SB Parcel Coverage 571,933 1,458,896 571,969 1,458,880 36 NW UtilitiesA4-020-SB Parcel Coverage 572,070 1,458,006 572,134 1,457,992 61 N UtilitiesA4-023-SB Parcel Coverage 571,671 1,458,331 571,626 1,458,374 60 SE UtilitiesA4-027-SB Parcel Coverage 571,312 1,458,367 571,260 1,458,372 49 S Refusal/Utilities
¥Reported northings and eastings are not survey accurate. Coordinates are reported in NAD 1983 Maryland State Plane (US feet).
RationaleProposed Location¥ Final Location¥
TABLE 3FIELD SHIFTED BORING LOCATIONS
Relocation Distance & Direction
Location ID Sample Target
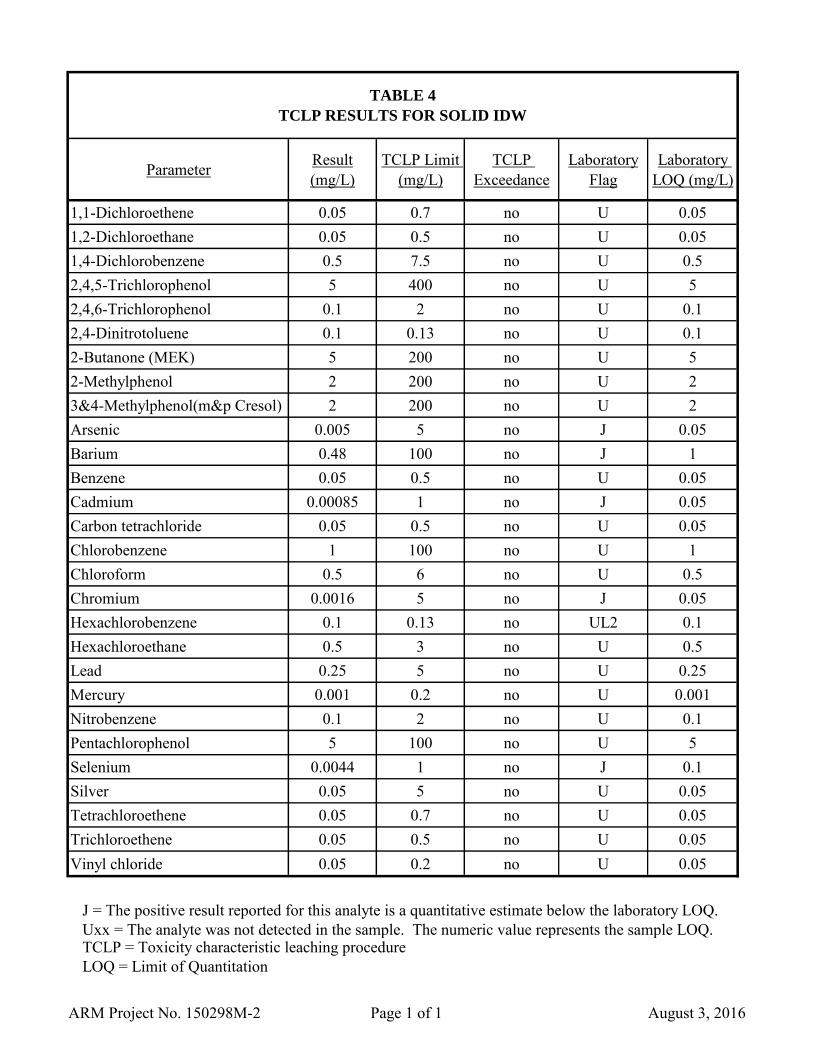
Parameter Result(mg/L)
TCLP Limit (mg/L)
TCLP Exceedance
LaboratoryFlag
Laboratory LOQ (mg/L)
1,1-Dichloroethene 0.05 0.7 no U 0.051,2-Dichloroethane 0.05 0.5 no U 0.051,4-Dichlorobenzene 0.5 7.5 no U 0.52,4,5-Trichlorophenol 5 400 no U 52,4,6-Trichlorophenol 0.1 2 no U 0.12,4-Dinitrotoluene 0.1 0.13 no U 0.12-Butanone (MEK) 5 200 no U 52-Methylphenol 2 200 no U 23&4-Methylphenol(m&p Cresol) 2 200 no U 2Arsenic 0.005 5 no J 0.05Barium 0.48 100 no J 1Benzene 0.05 0.5 no U 0.05Cadmium 0.00085 1 no J 0.05Carbon tetrachloride 0.05 0.5 no U 0.05Chlorobenzene 1 100 no U 1Chloroform 0.5 6 no U 0.5Chromium 0.0016 5 no J 0.05Hexachlorobenzene 0.1 0.13 no UL2 0.1Hexachloroethane 0.5 3 no U 0.5Lead 0.25 5 no U 0.25Mercury 0.001 0.2 no U 0.001Nitrobenzene 0.1 2 no U 0.1Pentachlorophenol 5 100 no U 5Selenium 0.0044 1 no J 0.1Silver 0.05 5 no U 0.05Tetrachloroethene 0.05 0.7 no U 0.05Trichloroethene 0.05 0.5 no U 0.05Vinyl chloride 0.05 0.2 no U 0.05
J = The positive result reported for this analyte is a quantitative estimate below the laboratory LOQ. Uxx = The analyte was not detected in the sample. The numeric value represents the sample LOQ. TCLP = Toxicity characteristic leaching procedure LOQ = Limit of Quantitation
TABLE 4
TCLP RESULTS FOR SOLID IDW
ARM Project No. 150298M-2 Page 1 of 1 August 3, 2016

ARM Project No. 150298M-3 Page 1 of 4 August 2, 2016
Water Disposal 1 1,1-Dichloroethene 0.001 0.7 no U 0.001Water Disposal 1 1,2-Dichloroethane 0.001 0.5 no U 0.001Water Disposal 1 1,4-Dichlorobenzene 0.001 7.5 no U 0.001Water Disposal 1 2-Butanone (MEK) 0.01 200 no U 0.01Water Disposal 1 Arsenic 0.005 5 no U 0.005Water Disposal 1 Barium 0.0338 100 no 0.01Water Disposal 1 Benzene 0.001 0.5 no U 0.001Water Disposal 1 Cadmium 0.0006 1 no J 0.003Water Disposal 1 Carbon tetrachloride 0.001 0.5 no U 0.001Water Disposal 1 Chlorobenzene 0.001 100 no U 0.001Water Disposal 1 Chloroform 0.001 6 no U 0.001Water Disposal 1 Chromium 0.0016 5 no J 0.005Water Disposal 1 Lead 0.005 5 no U 0.005Water Disposal 1 Mercury 0.0002 0.2 no U 0.0002Water Disposal 1 Selenium 0.008 1 no U 0.008Water Disposal 1 Silver 0.006 5 no U 0.006Water Disposal 1 Tetrachloroethene 0.001 0.7 no U 0.001Water Disposal 1 Trichloroethene 0.001 0.5 no U 0.001Water Disposal 1 Vinyl chloride 0.001 0.2 no U 0.001Water Disposal 2 1,1-Dichloroethene 0.001 0.7 no U 0.001Water Disposal 2 1,2-Dichloroethane 0.001 0.5 no U 0.001Water Disposal 2 1,4-Dichlorobenzene 0.001 7.5 no U 0.001Water Disposal 2 2-Butanone (MEK) 0.01 200 no U 0.01Water Disposal 2 Arsenic 0.005 5 no U 0.005Water Disposal 2 Barium 0.0811 100 no 0.01Water Disposal 2 Benzene 0.001 0.5 no U 0.001Water Disposal 2 Cadmium 0.003 1 no U 0.003Water Disposal 2 Carbon tetrachloride 0.001 0.5 no U 0.001Water Disposal 2 Chlorobenzene 0.001 100 no U 0.001Water Disposal 2 Chloroform 0.0029 6 no 0.001Water Disposal 2 Chromium 0.0012 5 no J 0.005Water Disposal 2 Lead 0.005 5 no U 0.005Water Disposal 2 Mercury 0.0002 0.2 no U 0.0002Water Disposal 2 Selenium 0.008 1 no U 0.008Water Disposal 2 Silver 0.006 5 no U 0.006Water Disposal 2 Tetrachloroethene 0.001 0.7 no U 0.001Water Disposal 2 Trichloroethene 0.001 0.5 no U 0.001Water Disposal 2 Vinyl chloride 0.001 0.2 no U 0.001
TABLE 5TCLP RESULTS FOR LIQUID IDW
Location IDLaboratory
FlagLaboratory
LOQ (mg/L)Parameter
Result (mg/L)
TCLP Limit (mg/L)
TCLP Exceedance

ARM Project No. 150298M-3 Page 2 of 4 August 2, 2016
TABLE 5TCLP RESULTS FOR LIQUID IDW
Location IDLaboratory
FlagLaboratory
LOQ (mg/L)Parameter
Result (mg/L)
TCLP Limit (mg/L)
TCLP Exceedance
Water Disposal 3 1,1-Dichloroethene 0.001 0.7 no U 0.001Water Disposal 3 1,2-Dichloroethane 0.001 0.5 no U 0.001Water Disposal 3 1,4-Dichlorobenzene 0.001 7.5 no U 0.001Water Disposal 3 2-Butanone (MEK) 0.01 200 no U 0.01Water Disposal 3 Arsenic 0.005 5 no U 0.005Water Disposal 3 Barium 0.0051 100 no J 0.01Water Disposal 3 Benzene 0.001 0.5 no U 0.001Water Disposal 3 Cadmium 0.003 1 no U 0.003Water Disposal 3 Carbon tetrachloride 0.001 0.5 no U 0.001Water Disposal 3 Chlorobenzene 0.001 100 no U 0.001Water Disposal 3 Chloroform 0.0016 6 no 0.001Water Disposal 3 Chromium 0.00085 5 no J 0.005Water Disposal 3 Lead 0.005 5 no U 0.005Water Disposal 3 Mercury 0.0002 0.2 no U 0.0002Water Disposal 3 Selenium 0.008 1 no U 0.008Water Disposal 3 Silver 0.006 5 no U 0.006Water Disposal 3 Tetrachloroethene 0.001 0.7 no U 0.001Water Disposal 3 Trichloroethene 0.001 0.5 no U 0.001Water Disposal 3 Vinyl chloride 0.001 0.2 no U 0.001Water Disposal 4 1,1-Dichloroethene 0.001 0.7 no U 0.001Water Disposal 4 1,2-Dichloroethane 0.001 0.5 no U 0.001Water Disposal 4 1,4-Dichlorobenzene 0.001 7.5 no U 0.001Water Disposal 4 2-Butanone (MEK) 0.01 200 no U 0.01Water Disposal 4 Arsenic 0.0094 5 no 0.005Water Disposal 4 Barium 0.101 100 no 0.01Water Disposal 4 Benzene 0.001 0.5 no U 0.001Water Disposal 4 Cadmium 0.003 1 no U 0.003Water Disposal 4 Carbon tetrachloride 0.001 0.5 no U 0.001Water Disposal 4 Chlorobenzene 0.001 100 no U 0.001Water Disposal 4 Chloroform 0.0024 6 no 0.001Water Disposal 4 Chromium 0.0012 5 no J 0.005Water Disposal 4 Lead 0.005 5 no U 0.005Water Disposal 4 Mercury 0.0002 0.2 no U 0.0002Water Disposal 4 Selenium 0.008 1 no U 0.008Water Disposal 4 Silver 0.006 5 no U 0.006Water Disposal 4 Tetrachloroethene 0.001 0.7 no U 0.001Water Disposal 4 Trichloroethene 0.001 0.5 no U 0.001Water Disposal 4 Vinyl chloride 0.001 0.2 no U 0.001

ARM Project No. 150298M-3 Page 3 of 4 August 2, 2016
TABLE 5TCLP RESULTS FOR LIQUID IDW
Location IDLaboratory
FlagLaboratory
LOQ (mg/L)Parameter
Result (mg/L)
TCLP Limit (mg/L)
TCLP Exceedance
Water Disposal 5 1,1-Dichloroethene 0.001 0.7 no U 0.001Water Disposal 5 1,2-Dichloroethane 0.001 0.5 no U 0.001Water Disposal 5 1,4-Dichlorobenzene 0.001 7.5 no U 0.001Water Disposal 5 2-Butanone (MEK) 0.01 200 no U 0.01Water Disposal 5 Arsenic 0.005 5 no U 0.005Water Disposal 5 Barium 0.398 100 no 0.01Water Disposal 5 Benzene 0.001 0.5 no U 0.001Water Disposal 5 Cadmium 0.00058 1 no J 0.003Water Disposal 5 Carbon tetrachloride 0.001 0.5 no U 0.001Water Disposal 5 Chlorobenzene 0.001 100 no U 0.001Water Disposal 5 Chloroform 0.0039 6 no 0.001Water Disposal 5 Chromium 0.0012 5 no J 0.005Water Disposal 5 Lead 0.005 5 no U 0.005Water Disposal 5 Mercury 0.0002 0.2 no U 0.0002Water Disposal 5 Selenium 0.008 1 no U 0.008Water Disposal 5 Silver 0.006 5 no U 0.006Water Disposal 5 Tetrachloroethene 0.001 0.7 no U 0.001Water Disposal 5 Trichloroethene 0.001 0.5 no U 0.001Water Disposal 5 Vinyl chloride 0.001 0.2 no U 0.001Water Disposal 6 1,1-Dichloroethene 0.001 0.7 no U 0.001Water Disposal 6 1,2-Dichloroethane 0.001 0.5 no U 0.001Water Disposal 6 1,4-Dichlorobenzene 0.001 7.5 no U 0.001Water Disposal 6 2-Butanone (MEK) 0.01 200 no U 0.01Water Disposal 6 Arsenic 0.005 5 no U 0.005Water Disposal 6 Barium 2.14 100 no 0.01Water Disposal 6 Benzene 0.001 0.5 no U 0.001Water Disposal 6 Cadmium 0.001 1 no J 0.003Water Disposal 6 Carbon tetrachloride 0.001 0.5 no U 0.001Water Disposal 6 Chlorobenzene 0.001 100 no U 0.001Water Disposal 6 Chloroform 0.00058 6 no J 0.001Water Disposal 6 Chromium 0.005 5 no U 0.005Water Disposal 6 Lead 0.005 5 no U 0.005Water Disposal 6 Mercury 0.0002 0.2 no U 0.0002Water Disposal 6 Selenium 0.008 1 no U 0.008Water Disposal 6 Silver 0.006 5 no U 0.006Water Disposal 6 Tetrachloroethene 0.001 0.7 no U 0.001Water Disposal 6 Trichloroethene 0.001 0.5 no U 0.001Water Disposal 6 Vinyl chloride 0.001 0.2 no U 0.001

ARM Project No. 150298M-3 Page 4 of 4 August 2, 2016
TABLE 5TCLP RESULTS FOR LIQUID IDW
Location IDLaboratory
FlagLaboratory
LOQ (mg/L)Parameter
Result (mg/L)
TCLP Limit (mg/L)
TCLP Exceedance
Water Disposal 7 1,1-Dichloroethene 0.001 0.7 no U 0.001Water Disposal 7 1,2-Dichloroethane 0.001 0.5 no U 0.001Water Disposal 7 1,4-Dichlorobenzene 0.001 7.5 no U 0.001Water Disposal 7 2-Butanone (MEK) 0.01 200 no U 0.01Water Disposal 7 Arsenic 0.005 5 no U 0.005Water Disposal 7 Barium 0.0889 100 no 0.01Water Disposal 7 Benzene 0.001 0.5 no U 0.001Water Disposal 7 Cadmium 0.00067 1 no J 0.003Water Disposal 7 Carbon tetrachloride 0.001 0.5 no U 0.001Water Disposal 7 Chlorobenzene 0.001 100 no U 0.001Water Disposal 7 Chloroform 0.00075 6 no J 0.001Water Disposal 7 Chromium 0.005 5 no U 0.005Water Disposal 7 Lead 0.005 5 no U 0.005Water Disposal 7 Mercury 0.0002 0.2 no U 0.0002Water Disposal 7 Selenium 0.008 1 no U 0.008Water Disposal 7 Silver 0.006 5 no U 0.006Water Disposal 7 Tetrachloroethene 0.001 0.7 no U 0.001Water Disposal 7 Trichloroethene 0.00065 0.5 no J 0.001Water Disposal 7 Vinyl chloride 0.001 0.2 no U 0.001Water Disposal 8 1,1-Dichloroethene 0.001 0.7 no U 0.001Water Disposal 8 1,2-Dichloroethane 0.001 0.5 no U 0.001Water Disposal 8 1,4-Dichlorobenzene 0.001 7.5 no U 0.001Water Disposal 8 2-Butanone (MEK) 0.01 200 no U 0.01Water Disposal 8 Arsenic 0.005 5 no U 0.005Water Disposal 8 Barium 0.01 100 no J 0.01Water Disposal 8 Benzene 0.001 0.5 no U 0.001Water Disposal 8 Cadmium 0.003 1 no U 0.003Water Disposal 8 Carbon tetrachloride 0.001 0.5 no U 0.001Water Disposal 8 Chlorobenzene 0.001 100 no U 0.001Water Disposal 8 Chloroform 0.001 6 no U 0.001Water Disposal 8 Chromium 0.005 5 no U 0.005Water Disposal 8 Lead 0.005 5 no U 0.005Water Disposal 8 Mercury 0.0002 0.2 no U 0.0002Water Disposal 8 Selenium 0.008 1 no U 0.008Water Disposal 8 Silver 0.006 5 no U 0.006Water Disposal 8 Tetrachloroethene 0.001 0.7 no U 0.001Water Disposal 8 Trichloroethene 0.001 0.5 no U 0.001Water Disposal 8 Vinyl chloride 0.001 0.2 no U 0.001
J = The positive result reported for this analyte is a quantitative estimate below the laboratory PQL. U = The analyte was not detected in the sample. The numeric value represents the sample LOQ. TCLP = Toxicity characteristic leaching procedure LOQ = Limit of Quantitation

Table 6Summary of Organics Detected in Soil
Parcel A4Tradepoint Atlantic
Sparrows Point, Maryland
ARM Project No. 150298M-2 Page 1 of 4 December, 16 2016
Parameter Units PAL A4-001-SB-1 A4-001-SB-5 A4-002-SB-1 A4-002-SB-10 A4-002-SB-5 A4-003-SB-1 A4-003-SB-10 A4-003-SB-7.5 A4-004-SB-1 A4-004-SB-5 A4-005-SB-1 A4-005-SB-10 A4-005-SB-5 A4-006-SB-1 A4-006-SB-6 A4-007-SB-1 A4-007-SB-5
Volatile Organic Compounds
1,2-Dichlorobenzene mg/kg 9,300 0.0055 U 0.0046 U 0.0052 U N/A 0.0046 U 0.0045 U N/A 0.0048 U 0.0044 U 0.0051 U 0.0048 U N/A 0.0051 U 0.0048 U 0.0047 U 0.0046 U 0.0055 U2-Butanone (MEK) mg/kg 190,000 0.0035 J 0.0091 U 0.0045 J N/A 0.0092 J 0.0028 J N/A 0.059 0.0088 U 0.01 U 0.012 N/A 0.016 0.0042 J 0.0083 J 0.0091 U 0.011 U2-Hexanone mg/kg 1,300 0.011 U 0.0091 U 0.01 U N/A 0.0092 U 0.0089 U N/A 0.0096 U 0.0088 U 0.01 U 0.0096 U N/A 0.01 U 0.0097 U 0.0093 U 0.0091 U 0.011 UAcetone mg/kg 670,000 0.028 J 0.023 J 0.039 J N/A 0.057 J 0.037 J N/A 0.065 J 0.013 J 0.072 J 0.074 J N/A 0.11 J 0.042 J 0.061 J 0.0091 R 0.055 JBenzene mg/kg 5.1 0.002 J 0.0046 U 0.0052 U N/A 0.0013 J 0.0045 U N/A 0.027 0.0044 U 0.012 0.0048 U N/A 0.0036 J 0.0048 U 0.0047 U 0.0046 U 0.0094Cyclohexane mg/kg 27,000 0.011 U 0.0091 U 0.01 U N/A 0.0092 U 0.0089 U N/A 0.052 0.0088 U 0.0026 J 0.0096 U N/A 0.01 U 0.0097 U 0.0093 U 0.0091 U 0.011 UEthylbenzene mg/kg 25 0.0055 U 0.0046 U 0.0052 U N/A 0.00051 J 0.0045 U N/A 0.0065 0.0044 U 0.012 0.0048 U N/A 0.0051 U 0.0048 U 0.0047 U 0.0046 U 0.0055 UIsopropylbenzene mg/kg 9,900 0.0055 U 0.0046 U 0.0052 U N/A 0.0046 U 0.0045 U N/A 0.0012 J 0.0044 U 0.067 0.0048 U N/A 0.0051 U 0.0048 U 0.0047 U 0.0046 U 0.0055 UMethyl Acetate mg/kg 1,200,000 0.055 U 0.046 U 0.052 U N/A 0.046 U 0.045 U N/A 0.048 U 0.044 U 0.051 U 0.048 U N/A 0.051 U 0.048 U 0.047 U 0.046 R 0.055 RMethylene Chloride mg/kg 1,000 0.0036 J 0.0057 0.0031 J N/A 0.0046 U 0.0024 J N/A 0.0021 J 0.0034 J 0.0032 J 0.0048 U N/A 0.0051 U 0.0023 J 0.0036 J 0.0046 U 0.0055 UToluene mg/kg 47,000 0.0015 J 0.0046 U 0.00049 J N/A 0.0023 J 0.00049 J N/A 0.02 0.00057 J 0.0089 0.0048 U N/A 0.0018 J 0.0007 J 0.00082 J 0.0046 U 0.0038 JTrichloroethene mg/kg 6 0.0055 U 0.0046 U 0.0052 U N/A 0.0046 U 0.0045 U N/A 0.0048 U 0.0044 U 0.0051 U 0.0048 U N/A 0.0051 U 0.0048 U 0.0047 U 0.0046 U 0.0055 U
Xylenes mg/kg 2,800 0.016 U 0.014 U 0.016 U N/A 0.0025 J 0.013 U N/A 0.0066 J 0.013 U 0.012 J 0.014 U N/A 0.015 U 0.015 U 0.014 U 0.014 U 0.016 U
1,1-Biphenyl mg/kg 200 0.073 U 0.071 U 0.075 U 0.08 U 0.072 U 0.072 U 0.51 1.5 0.075 U 0.077 U 0.083 0.08 U 0.21 0.075 U 0.075 U 0.075 U 0.083 U2,4-Dimethylphenol mg/kg 16,000 0.073 U 0.071 U 0.075 U 0.08 U 0.072 U 0.072 UJ 0.024 J 0.095 0.075 R 0.077 U 0.074 R 0.08 U 0.035 J 0.075 U 0.075 U 0.075 U 0.083 U2,6-Dinitrotoluene mg/kg 1.5 0.073 U 0.071 U 0.075 U 0.08 U 0.072 U 0.043 J 0.081 U 0.08 U 0.075 U 0.077 U 0.074 U 0.08 U 0.075 U 0.075 U 0.075 U 0.075 U 0.083 U2-Chloronaphthalene mg/kg 60,000 0.073 U 0.071 U 0.075 U 0.08 U 0.072 U 0.072 U 0.081 U 0.08 U 0.075 U 0.077 U 0.074 U 0.08 U 0.075 U 0.075 U 0.075 U 0.075 U 0.083 U2-Methylnaphthalene mg/kg 3,000 0.017 0.0064 J 0.015 N/A 0.15 U 0.0046 J N/A 0.011 0.0072 U 0.19 0.0037 J 0.008 U 0.17 0.041 0.056 J 0.071 U 0.0093 U2-Methylphenol mg/kg 41,000 0.073 U 0.071 U 0.075 U 0.08 U 0.072 U 0.072 UJ 0.025 J 0.11 0.075 R 0.077 U 0.074 R 0.08 U 0.023 J 0.075 U 0.075 U 0.075 U 0.083 U3&4-Methylphenol(m&p Cresol) mg/kg 41,000 0.15 U 0.14 U 0.15 U 0.16 U 0.14 U 0.14 UJ 0.13 J 0.55 0.15 R 0.15 U 0.15 R 0.16 U 0.021 J 0.15 U 0.15 U 0.15 U 0.17 UAcenaphthene mg/kg 45,000 0.01 0.0043 J 0.0067 J N/A 0.15 U 0.0073 U N/A 0.0073 U 0.0072 U 0.052 0.0074 U 0.008 U 0.16 0.1 0.14 U 0.071 U 0.0093 UAcenaphthylene mg/kg 45,000 0.0061 J 0.0029 J 0.011 N/A 0.15 U 0.0073 U N/A 0.026 0.0072 U 0.0056 J 0.0074 U 0.008 U 0.22 0.077 0.14 U 0.071 U 0.0093 UAcetophenone mg/kg 120,000 0.073 U 0.071 U 0.075 U 0.08 U 0.038 J 0.11 0.03 J 0.076 J 0.075 U 0.077 U 0.028 J 0.08 U 0.075 U 0.075 U 0.075 U 0.075 U 0.083 UAnthracene mg/kg 230,000 0.024 0.021 0.023 N/A 0.15 U 0.0052 J N/A 0.053 0.0072 U 0.074 0.0031 J 0.008 U 1.1 0.39 0.063 J 0.071 U 0.0093 UBenzaldehyde mg/kg 120,000 0.073 R 0.071 R 0.075 R 0.15 J 0.045 J 0.064 J 0.1 J 0.08 R 0.075 R 0.077 R 0.074 R 0.08 UJ 0.1 J 0.075 R 0.075 R 0.075 R 0.083 RBenzo[a]anthracene mg/kg 2.9 0.15 0.056 0.097 N/A 0.14 J 0.038 N/A 0.25 0.0029 J 0.13 0.0089 0.0036 J 4.4 1.7 0.27 0.06 J 0.0093 UBenzo[a]pyrene mg/kg 0.29 0.21 0.049 0.1 N/A 0.15 J 0.029 N/A 0.24 0.0072 U 0.077 U 0.0058 J 0.0028 J 3.6 1.7 0.25 0.071 U 0.0093 UBenzo[b]fluoranthene mg/kg 2.9 0.38 0.073 0.16 N/A 0.32 0.16 N/A 0.49 0.0068 J 0.18 0.023 0.0061 J 6.1 2.2 0.43 0.098 0.0093 UBenzo[g,h,i]perylene mg/kg 0.098 0.033 0.097 N/A 0.074 J 0.048 N/A 0.2 0.0027 J 0.097 0.0095 0.0021 J 1.8 0.68 0.19 0.033 J 0.0093 UJBenzo[k]fluoranthene mg/kg 29 0.12 0.042 0.094 N/A 0.13 J 0.13 N/A 0.16 0.0058 J 0.08 0.0071 J 0.002 J 2.4 0.81 0.18 0.045 J 0.0093 Ubis(2-Ethylhexyl)phthalate mg/kg 160 0.073 UJ 0.071 U 0.075 U 0.08 UJ 0.24 J 0.072 U 0.081 UJ 0.8 U 0.075 U 0.077 U 0.074 UJ 0.08 U 0.075 U 0.075 U 0.075 U 0.075 U 0.083 UCarbazole mg/kg 0.046 J 0.071 U 0.018 J 0.08 U 0.031 J 0.072 U 3 16 0.075 U 0.077 U 0.078 0.08 U 0.35 0.11 0.021 J 0.075 U 0.083 UChrysene mg/kg 290 0.18 0.062 0.12 N/A 0.2 0.088 N/A 0.28 0.003 J 0.24 0.019 0.0026 J 4.3 1.8 0.32 0.05 J 0.0093 UDibenz[a,h]anthracene mg/kg 0.29 0.041 0.012 0.033 N/A 0.15 U 0.017 N/A 0.086 0.0072 U 0.077 U 0.0074 U 0.008 U 0.81 0.31 0.072 J 0.071 U 0.0093 UDiethylphthalate mg/kg 660,000 0.073 U 0.071 U 0.075 U 0.08 U 0.072 U 0.072 U 0.081 U 0.08 U 0.075 U 0.077 U 0.074 U 0.08 U 0.075 U 0.075 U 0.075 U 0.075 U 0.083 UDi-n-butylphthalate mg/kg 82,000 0.073 U 0.071 U 0.075 U 0.12 0.072 U 0.017 B 0.081 U 0.8 U 0.075 U 0.077 U 0.029 B 0.08 U 0.075 U 0.075 U 0.075 U 0.075 U 0.083 UDi-n-ocytlphthalate mg/kg 8,200 0.073 UJ 0.071 U 0.075 U 0.027 J 0.072 UJ 0.072 U 0.081 UJ 0.8 U 0.075 U 0.077 U 0.074 UJ 0.08 U 0.075 U 0.075 U 0.075 U 0.075 U 0.083 UFluoranthene mg/kg 30,000 0.19 0.1 0.14 N/A 0.3 0.1 N/A 0.55 0.0075 0.47 0.021 0.0051 J 7.9 3 0.47 0.071 U 0.0093 UFluorene mg/kg 30,000 0.0061 J 0.0047 J 0.0041 J N/A 0.017 J 0.00082 J N/A 0.0069 J 0.0072 U 0.063 0.0074 U 0.008 U 0.19 0.079 0.031 J 0.071 U 0.0093 UIndeno[1,2,3-c,d]pyrene mg/kg 2.9 0.11 0.032 0.094 N/A 0.15 U 0.047 N/A 0.22 0.0072 U 0.077 U 0.0069 J 0.0019 J 2.1 0.73 0.16 0.071 U 0.0093 UNaphthalene mg/kg 17 0.012 0.0087 0.024 N/A 0.15 U 0.0098 N/A 0.033 0.0027 B 0.18 0.0085 0.0015 J 0.34 0.067 0.14 U 0.071 U 0.0015 BN-Nitrosodiphenylamine mg/kg 470 0.073 U 0.071 U 0.075 U 0.08 U 0.072 U 0.072 U 0.081 U 0.8 U 0.075 U 0.077 U 0.074 U 0.08 U 0.075 U 0.075 U 0.075 U 0.075 U 0.083 UPhenanthrene mg/kg 0.091 0.059 0.069 N/A 0.15 U 0.047 N/A 0.22 0.0072 U 0.3 0.016 0.0035 J 3.5 1.3 0.23 0.071 U 0.0093 UPhenol mg/kg 250,000 0.073 U 0.071 U 0.075 U 0.08 U 0.072 U 0.072 UJ 0.23 0.99 0.075 R 0.077 U 0.074 R 0.08 U 0.075 U 0.075 U 0.075 U 0.075 U 0.083 U
Pyrene mg/kg 23,000 0.16 0.085 0.11 N/A 0.31 0.084 N/A 0.36 0.0047 J 0.44 0.018 0.0044 J 6.3 2.6 0.47 0.06 J 0.0093 U
PCBsAroclor 1254 mg/kg 0.97 0.019 U N/A 0.018 U N/A N/A 0.018 U N/A N/A 0.018 U N/A 0.018 U N/A N/A 0.088 U N/A 0.018 U N/AAroclor 1260 mg/kg 0.99 0.0089 J N/A 0.018 U N/A N/A 0.018 U N/A N/A 0.018 U N/A 0.018 U N/A N/A 0.088 U N/A 0.018 U N/A
PCBs (total) mg/kg 0.97 0.13 U N/A 0.12 U N/A N/A 0.13 U N/A N/A 0.13 U N/A 0.13 U N/A N/A 0.62 U N/A 0.12 U N/A
TPH/Oil and GreaseDiesel Range Organics mg/kg 6,200 N/A N/A N/A N/A N/A 33.4 N/A 22.1 13.1 2,310 N/A N/A N/A N/A N/A 24.1 9.1 UGasoline Range Organics mg/kg 6,200 N/A N/A N/A N/A N/A 9.6 U N/A 7.1 J 9.2 U 162 N/A N/A N/A N/A N/A 9.2 U 11.2 U
Oil and Grease mg/kg 6,200 541 557 787 N/A 17,600 355 N/A 718 734 5,590 303 N/A 613 547 2,300 614 1,720
Detections in boldN/A indicates that the parameter was not analyzed for this sample
Values in red indicate an exceedance of the Project Action Limit (PAL)A glossary of laboratory flags can be viewed in the attached laboratory reports*PAH compounds were analyzed via sim
Semi-Volatile Organic Compounds*

Table 6Summary of Organics Detected in Soil
Parcel A4Tradepoint Atlantic
Sparrows Point, Maryland
ARM Project No. 150298M-2 Page 2 of 4 December, 16 2016
Parameter Units PAL
Volatile Organic Compounds
1,2-Dichlorobenzene mg/kg 9,3002-Butanone (MEK) mg/kg 190,0002-Hexanone mg/kg 1,300Acetone mg/kg 670,000Benzene mg/kg 5.1Cyclohexane mg/kg 27,000Ethylbenzene mg/kg 25Isopropylbenzene mg/kg 9,900Methyl Acetate mg/kg 1,200,000Methylene Chloride mg/kg 1,000Toluene mg/kg 47,000Trichloroethene mg/kg 6
Xylenes mg/kg 2,800
1,1-Biphenyl mg/kg 2002,4-Dimethylphenol mg/kg 16,0002,6-Dinitrotoluene mg/kg 1.52-Chloronaphthalene mg/kg 60,0002-Methylnaphthalene mg/kg 3,0002-Methylphenol mg/kg 41,0003&4-Methylphenol(m&p Cresol) mg/kg 41,000Acenaphthene mg/kg 45,000Acenaphthylene mg/kg 45,000Acetophenone mg/kg 120,000Anthracene mg/kg 230,000Benzaldehyde mg/kg 120,000Benzo[a]anthracene mg/kg 2.9Benzo[a]pyrene mg/kg 0.29Benzo[b]fluoranthene mg/kg 2.9Benzo[g,h,i]perylene mg/kgBenzo[k]fluoranthene mg/kg 29bis(2-Ethylhexyl)phthalate mg/kg 160Carbazole mg/kgChrysene mg/kg 290Dibenz[a,h]anthracene mg/kg 0.29Diethylphthalate mg/kg 660,000Di-n-butylphthalate mg/kg 82,000Di-n-ocytlphthalate mg/kg 8,200Fluoranthene mg/kg 30,000Fluorene mg/kg 30,000Indeno[1,2,3-c,d]pyrene mg/kg 2.9Naphthalene mg/kg 17N-Nitrosodiphenylamine mg/kg 470Phenanthrene mg/kgPhenol mg/kg 250,000
Pyrene mg/kg 23,000
PCBsAroclor 1254 mg/kg 0.97Aroclor 1260 mg/kg 0.99
PCBs (total) mg/kg 0.97
TPH/Oil and GreaseDiesel Range Organics mg/kg 6,200Gasoline Range Organics mg/kg 6,200
Oil and Grease mg/kg 6,200
Detections in boldN/A indicates that the parameter was not analyzed for this sample
Values in red indicate an exceedance of the Project Action Limit (PAL)A glossary of laboratory flags can be viewed in the attached laboratory reports*PAH compounds were analyzed via sim
Semi-Volatile Organic Compounds*
A4-008-SB-1 A4-008-SB-5 A4-009-SB-1 A4-009-SB-5 A4-010-SB-1 A4-010-SB-10 A4-010-SB-5 A4-011-SB-1 A4-011-SB-5 A4-012-SB-1 A4-012-SB-10 A4-012-SB-5 A4-013-SB-1 A4-013-SB-4 A4-014-SB-1 A4-014-SB-7 A4-015-SB-1
0.0048 U 0.0048 U 0.0048 U 0.0046 U 0.0048 U N/A 0.0048 U 0.0044 U 0.0059 U 0.0021 J N/A 0.0052 U 0.0087 UJ 0.007 U 0.0044 U 0.005 U 0.0063 U0.0097 U 0.0096 U 0.022 0.0093 U 0.0096 U N/A 0.0096 U 0.0043 J 0.0037 J 0.0041 J N/A 0.0058 J 0.017 U 0.011 J 0.0082 J 0.0092 J 0.0075 J0.0097 U 0.0096 U 0.0096 U 0.0093 U 0.0096 U N/A 0.0096 U 0.0087 U 0.012 U 0.01 U N/A 0.01 U 0.017 U 0.014 U 0.0088 U 0.01 U 0.013 U0.0097 R 0.0096 R 0.48 U 0.07 J 0.17 J N/A 0.0096 R 0.029 J 0.046 J 0.036 J N/A 0.046 J 0.081 J 0.069 J 0.085 J 0.059 J 0.051 J0.0048 U 0.0048 U 0.0048 U 0.0046 U 0.0048 U N/A 0.0048 U 0.0044 U 0.0059 U 0.005 U N/A 0.0052 U 0.0087 U 0.002 J 0.0044 U 0.005 U 0.0063 U0.0097 U 0.0096 U 0.0096 U 0.0093 U 0.0096 U N/A 0.0096 U 0.0087 U 0.00072 J 0.01 UJ N/A 0.0017 J 0.017 UJ 0.002 J 0.0088 UJ 0.01 UJ 0.013 U0.0048 U 0.0048 U 0.0048 U 0.0046 U 0.0048 U N/A 0.0048 U 0.005 J 0.0059 U 0.005 U N/A 0.0052 U 0.0087 U 0.007 U 0.0044 U 0.005 U 0.0063 U0.0048 U 0.0048 U 0.0048 U 0.0046 U 0.0048 U N/A 0.0048 U 0.0044 U 0.0059 U 0.005 U N/A 0.0052 U 0.0087 U 0.007 U 0.0044 U 0.005 U 0.0063 U0.048 R 0.048 R 0.048 R 0.046 R 0.048 R N/A 0.048 R 0.044 U 0.059 U 0.05 U N/A 0.052 U 0.087 U 0.07 U 0.044 U 0.058 0.063 U
0.0048 U 0.0048 U 0.0048 U 0.0046 U 0.0037 J N/A 0.0048 U 0.0044 U 0.0059 U 0.005 U N/A 0.0052 U 0.0087 U 0.007 U 0.0044 U 0.005 U 0.003 J0.0048 U 0.0048 U 0.0048 U 0.0046 U 0.0048 U N/A 0.0048 U 0.08 0.0059 U 0.005 U N/A 0.0052 U 0.0087 U 0.0015 B 0.00075 B 0.0014 B 0.0063 U0.0048 U 0.0048 U 0.0048 U 0.0046 U 0.0048 U N/A 0.0048 U 0.0044 U 0.0059 U 0.005 U N/A 0.0052 U 0.0087 U 0.007 U 0.0044 U 0.005 U 0.0018 J0.015 U 0.014 U 0.014 U 0.014 U 0.014 U N/A 0.014 U 0.028 J 0.018 U 0.015 U N/A 0.016 U 0.026 U 0.021 U 0.013 U 0.015 U 0.019 U
0.072 U 0.073 U 0.074 U 0.074 U 0.074 U 0.087 U 0.026 J 0.071 U 0.019 J 0.14 U 0.039 J 0.079 J 0.075 U 0.073 U 0.034 J 0.08 U 0.073 U0.072 U 0.073 U 0.074 U 0.074 U 0.074 U 0.087 U 0.073 J 0.071 R 0.079 U 0.14 UJ 0.078 UJ 0.079 U 0.075 U 0.073 U 0.074 U 0.08 U 0.073 U0.072 U 0.073 U 0.074 U 0.074 U 0.074 U 0.087 U 0.074 U 0.071 U 0.079 U 0.14 U 0.078 U 0.079 U 0.075 U 0.073 U 0.074 U 0.08 U 0.073 U0.072 U 0.073 U 0.074 U 0.074 U 0.074 U 0.087 U 0.074 U 0.071 U 0.079 U 0.14 U 0.078 U 0.079 U 0.075 U 0.024 J 0.074 U 0.08 U 0.073 U
0.076 J 0.0079 U 0.0074 J 0.0072 U 0.0078 U 0.0036 J 0.084 0.007 U 0.051 0.14 U N/A 0.11 0.027 0.14 0.38 U 0.014 0.0260.072 U 0.073 U 0.074 U 0.074 U 0.074 U 0.087 U 0.016 J 0.071 R 0.079 U 0.14 UJ 0.078 UJ 0.079 U 0.075 U 0.073 U 0.074 U 0.08 U 0.073 U0.14 U 0.15 U 0.15 U 0.15 U 0.15 U 0.17 U 0.13 J 0.14 R 0.16 U 0.29 UJ 0.16 UJ 0.036 J 0.15 U 0.15 U 0.022 J 0.16 U 0.15 U0.14 U 0.0079 U 0.0081 U 0.0072 U 0.011 0.048 1 0.007 U 0.0072 U 0.14 U N/A 0.092 0.033 0.011 0.049 J 0.0032 J 0.0140.14 U 0.0079 U 0.014 0.0072 U 0.0078 U 0.0086 U 0.071 U 0.007 U 0.0096 0.14 U N/A 0.2 0.023 0.092 0.18 J 0.0062 J 0.045
0.072 U 0.073 U 0.074 U 0.074 U 0.074 U 0.087 U 0.019 J 0.071 U 0.031 J 0.14 U 0.078 U 0.037 J 0.075 U 0.073 U 0.074 U 0.08 U 0.073 U0.14 U 0.0079 U 0.0078 J 0.0072 U 0.0084 0.021 0.44 0.007 U 0.016 0.14 U N/A 0.5 0.024 0.14 0.49 0.013 0.130.072 R 0.073 R 0.074 R 0.074 R 0.074 R 0.087 UJ 0.074 R 0.071 R 0.057 J 0.14 R 0.018 J 0.054 J 0.075 R 0.073 R 0.074 R 0.08 R 0.073 R
0.063 J 0.0079 U 0.047 0.0072 U 0.059 0.13 3 0.0026 J 0.043 0.31 N/A 1.5 0.094 0.63 2.2 0.038 0.630.068 J 0.0079 U 0.059 0.0072 U 0.098 0.32 6.4 0.007 U 0.059 0.23 N/A 1.5 0.12 0.48 2.1 0.041 0.52
0.18 0.0079 U 0.12 0.0072 U 0.12 0.39 8.2 0.011 0.12 0.45 N/A 2.5 0.3 1.1 3.1 0.11 1.10.04 J 0.0079 UJ 0.024 J 0.0072 UJ 0.085 J 0.24 5.2 J 0.0039 J 0.068 0.16 N/A 0.85 0.077 0.21 1.2 0.011 0.12
0.082 J 0.0079 U 0.059 0.0072 U 0.052 0.13 3.2 0.009 0.042 0.17 N/A 1.3 0.083 1.4 1.3 0.099 0.470.072 UJ 0.073 U 0.074 U 0.074 U 0.074 U 0.087 U 0.074 U 0.071 U 0.079 U 0.14 UJ 0.078 U 0.079 UJ 0.075 U 0.073 U 0.074 U 0.08 U 0.073 U0.072 U 0.073 U 0.074 U 0.074 U 0.074 U 0.087 U 0.43 0.071 U 0.079 U 0.14 U 0.16 0.27 J 0.027 J 0.073 U 0.47 0.08 U 0.073 U
0.15 0.0079 U 0.059 0.0072 U 0.063 0.13 3.1 0.0072 0.07 0.28 N/A 1.5 0.12 0.69 2.1 0.056 0.630.14 U 0.0079 U 0.01 0.0072 U 0.029 0.07 1.8 0.007 U 0.026 0.14 U N/A 0.39 0.033 0.095 0.46 0.004 J 0.065
0.072 U 0.073 U 0.074 U 0.074 U 0.074 U 0.087 U 0.074 U 0.071 U 0.079 U 0.14 U 0.078 U 0.079 U 0.075 U 0.073 U 0.074 U 0.08 U 0.073 U0.072 U 0.073 U 0.074 U 0.074 U 0.074 U 0.087 U 0.074 U 0.071 U 0.079 U 0.14 U 0.078 U 0.079 U 0.075 U 0.021 B 0.074 U 0.08 U 0.073 U0.072 UJ 0.073 U 0.074 U 0.074 U 0.074 U 0.087 U 0.074 U 0.071 U 0.079 U 0.14 UJ 0.078 U 0.079 UJ 0.075 U 0.073 U 0.074 U 0.08 U 0.073 U
0.07 J 0.0079 U 0.072 0.0072 U 0.071 0.15 3.1 0.012 0.071 0.46 N/A 2.1 0.15 1.2 3.1 0.061 10.14 U 0.0079 U 0.0021 J 0.0072 U 0.0025 J 0.0096 0.17 0.007 U 0.0024 J 0.14 U N/A 0.12 0.0066 J 0.016 0.06 J 0.011 0.0120.14 U 0.0079 U 0.028 0.0072 UJ 0.081 0.23 5.4 0.007 U 0.06 0.14 U N/A 1 0.078 0.23 1.3 0.011 0.160.14 U 0.0079 U 0.014 0.0072 U 0.0047 B 0.014 0.21 0.0023 B 0.036 0.14 U N/A 0.19 0.044 0.46 0.083 J 0.017 0.04
0.072 U 0.073 U 0.074 U 0.074 U 0.074 U 0.087 U 0.074 U 0.071 U 0.079 U 0.14 U 0.078 U 0.079 U 0.075 U 0.073 U 0.074 U 0.08 U 0.073 U0.14 U 0.0079 U 0.028 0.0072 U 0.024 0.069 1.3 0.007 U 0.071 0.14 U N/A 1.3 0.072 0.69 1.2 0.037 0.36
0.072 U 0.073 U 0.074 U 0.074 U 0.074 U 0.087 U 0.046 J 0.071 R 0.079 U 0.14 UJ 0.078 UJ 0.031 J 0.075 U 0.073 U 0.074 U 0.08 U 0.073 U
0.09 J 0.0079 U 0.063 0.0072 U 0.07 0.14 2.9 0.0065 J 0.06 0.43 N/A 1.9 0.14 0.95 2.5 0.052 0.84
0.18 U N/A 0.02 U N/A 0.019 U N/A N/A 0.018 U N/A 0.018 U N/A N/A 0.019 U N/A 0.093 U N/A 0.018 U0.18 U N/A 0.02 U N/A 0.019 U N/A N/A 0.018 U N/A 0.018 U N/A N/A 0.044 N/A 0.093 U N/A 0.0551.3 U N/A 0.14 U N/A 0.13 U N/A N/A 0.12 U N/A 0.12 U N/A N/A 0.044 J N/A 0.65 U N/A 0.055 J
428 7.8 U N/A N/A N/A N/A N/A N/A N/A N/A N/A N/A N/A N/A N/A N/A N/A9.5 U 9.1 U N/A N/A N/A N/A N/A N/A N/A N/A N/A N/A N/A N/A N/A N/A N/A
12,400 348 501 317 404 N/A 239 549 598 1,290 N/A 567 469 1,240 663 1,760 417

Table 6Summary of Organics Detected in Soil
Parcel A4Tradepoint Atlantic
Sparrows Point, Maryland
ARM Project No. 150298M-2 Page 3 of 4 December, 16 2016
Parameter Units PAL
Volatile Organic Compounds
1,2-Dichlorobenzene mg/kg 9,3002-Butanone (MEK) mg/kg 190,0002-Hexanone mg/kg 1,300Acetone mg/kg 670,000Benzene mg/kg 5.1Cyclohexane mg/kg 27,000Ethylbenzene mg/kg 25Isopropylbenzene mg/kg 9,900Methyl Acetate mg/kg 1,200,000Methylene Chloride mg/kg 1,000Toluene mg/kg 47,000Trichloroethene mg/kg 6
Xylenes mg/kg 2,800
1,1-Biphenyl mg/kg 2002,4-Dimethylphenol mg/kg 16,0002,6-Dinitrotoluene mg/kg 1.52-Chloronaphthalene mg/kg 60,0002-Methylnaphthalene mg/kg 3,0002-Methylphenol mg/kg 41,0003&4-Methylphenol(m&p Cresol) mg/kg 41,000Acenaphthene mg/kg 45,000Acenaphthylene mg/kg 45,000Acetophenone mg/kg 120,000Anthracene mg/kg 230,000Benzaldehyde mg/kg 120,000Benzo[a]anthracene mg/kg 2.9Benzo[a]pyrene mg/kg 0.29Benzo[b]fluoranthene mg/kg 2.9Benzo[g,h,i]perylene mg/kgBenzo[k]fluoranthene mg/kg 29bis(2-Ethylhexyl)phthalate mg/kg 160Carbazole mg/kgChrysene mg/kg 290Dibenz[a,h]anthracene mg/kg 0.29Diethylphthalate mg/kg 660,000Di-n-butylphthalate mg/kg 82,000Di-n-ocytlphthalate mg/kg 8,200Fluoranthene mg/kg 30,000Fluorene mg/kg 30,000Indeno[1,2,3-c,d]pyrene mg/kg 2.9Naphthalene mg/kg 17N-Nitrosodiphenylamine mg/kg 470Phenanthrene mg/kgPhenol mg/kg 250,000
Pyrene mg/kg 23,000
PCBsAroclor 1254 mg/kg 0.97Aroclor 1260 mg/kg 0.99
PCBs (total) mg/kg 0.97
TPH/Oil and GreaseDiesel Range Organics mg/kg 6,200Gasoline Range Organics mg/kg 6,200
Oil and Grease mg/kg 6,200
Detections in boldN/A indicates that the parameter was not analyzed for this sample
Values in red indicate an exceedance of the Project Action Limit (PAL)A glossary of laboratory flags can be viewed in the attached laboratory reports*PAH compounds were analyzed via sim
Semi-Volatile Organic Compounds*
A4-015-SB-5 A4-016-SB-1 A4-016-SB-10 A4-016-SB-5 A4-017-SB-1 A4-017-SB-5 A4-018-SB-1 A4-018-SB-5 A4-019-SB-1 A4-019-SB-5 A4-020-SB-1 A4-020-SB-5 A4-021-SB-1 A4-021-SB-5 A4-022-SB-1 A4-022-SB-10 A4-022-SB-8
0.0052 U 0.0054 U N/A 0.0057 U 0.0047 U 0.0051 U 0.0049 U 0.005 U 0.0039 U 0.0049 U 0.0044 U 0.0048 U 0.0055 U 0.0051 U 0.0051 U N/A 0.0059 UJ0.01 U 0.0061 J N/A 0.011 U 0.014 0.01 U 0.0098 U 0.0099 U 0.0029 J 0.0097 U 0.0087 U 0.0095 U 0.0046 J 0.0035 J 0.0037 J N/A 0.0120.01 U 0.011 U N/A 0.011 U 0.0095 U 0.01 U 0.0098 U 0.0099 U 0.0079 U 0.0097 U 0.0087 U 0.0095 U 0.011 U 0.01 U 0.01 U N/A 0.012 U
0.01 J 0.044 J N/A 0.029 J 0.076 J 0.011 J 0.044 J 0.0099 R 0.024 J 0.0079 J 0.037 J 0.0095 R 0.059 J 0.052 J 0.03 J N/A 0.095 J0.0052 U 0.0054 U N/A 0.0057 U 0.0075 0.0051 U 0.0049 U 0.005 U 0.0039 U 0.0049 U 0.0044 U 0.0048 U 0.0016 J 0.0051 U 0.0051 U N/A 0.0059 U
0.01 U 0.011 UJ N/A 0.011 UJ 0.0006 J 0.01 U 0.0098 U 0.0099 U 0.0079 U 0.0097 U 0.0087 U 0.0095 U 0.011 U 0.01 U 0.01 UJ N/A 0.012 UJ0.0052 U 0.0054 U N/A 0.0057 U 0.0047 U 0.0051 U 0.0049 U 0.005 U 0.0039 U 0.0049 U 0.0044 U 0.0048 U 0.0055 U 0.0051 U 0.0051 U N/A 0.0059 U0.0052 U 0.0054 U N/A 0.0057 U 0.0047 U 0.0051 U 0.0049 U 0.005 U 0.0039 U 0.0049 U 0.0044 U 0.0048 U 0.0055 U 0.0051 U 0.0051 U N/A 0.0059 U0.052 U 0.054 U N/A 0.057 U 0.047 U 0.051 U 0.049 R 0.05 R 0.039 U 0.049 U 0.044 R 0.048 R 0.055 U 0.051 U 0.051 U N/A 0.059 U0.0052 U 0.0054 U N/A 0.0057 U 0.003 J 0.0051 U 0.0049 U 0.005 U 0.0028 J 0.0043 J 0.0044 U 0.0038 J 0.0032 J 0.0041 J 0.0051 U N/A 0.0059 U0.0052 U 0.00074 B N/A 0.0057 U 0.0046 J 0.0051 U 0.0049 U 0.005 U 0.00043 J 0.0049 U 0.0044 U 0.0048 U 0.0055 U 0.00055 J 0.0011 B N/A 0.0013 B0.0052 U 0.0054 U N/A 0.0057 U 0.0047 U 0.0051 U 0.0049 U 0.005 U 0.0039 U 0.0049 U 0.0044 U 0.0048 U 0.0055 U 0.0051 U 0.0051 U N/A 0.0059 U
0.016 U 0.016 U N/A 0.017 U 0.014 U 0.015 U 0.015 U 0.015 U 0.012 U 0.015 U 0.013 U 0.014 U 0.016 U 0.015 U 0.015 U N/A 0.018 U
0.079 U 0.073 U 0.083 U 0.074 U 0.075 U 0.081 U 0.074 U 0.081 U 0.022 J 0.075 U 0.071 U 0.085 U 0.075 U 0.076 U 0.073 U 0.42 0.2 J0.079 U 0.073 U 0.083 U 0.074 U 0.075 U 0.081 U 0.074 U 0.081 U 0.074 U 0.075 U 0.071 U 0.085 U 0.075 U 0.076 U 0.073 U 0.087 UJ 0.077 UJ0.079 U 0.073 U 0.083 U 0.074 U 0.075 U 0.081 U 0.074 U 0.081 U 0.074 U 0.075 U 0.071 U 0.085 U 0.075 U 0.076 U 0.073 U 0.087 U 0.077 U0.079 U 0.073 U 0.083 U 0.074 U 0.075 U 0.081 U 0.074 U 0.081 U 0.074 U 0.075 U 0.071 U 0.085 U 0.075 U 0.076 U 0.073 U 0.087 U 0.077 U0.0083 U 0.089 N/A 0.054 0.03 0.0013 J 0.042 0.0082 U 0.086 0.0078 U 0.0035 J 0.008 U 9.7 0.0077 U 0.01 N/A 0.0290.079 U 0.073 U 0.083 U 0.074 U 0.075 U 0.081 U 0.074 U 0.081 U 0.074 U 0.075 U 0.071 U 0.085 U 0.075 U 0.076 U 0.073 U 0.087 UJ 0.077 UJ0.16 U 0.15 U 0.17 U 0.022 J 0.15 U 0.16 U 0.15 U 0.16 U 0.15 U 0.15 U 0.14 U 0.17 U 0.15 U 0.15 U 0.15 U 0.025 J 0.15 UJ
0.0083 U 0.052 N/A 0.26 0.11 0.0079 U 0.0086 0.0082 U 0.056 0.0078 U 0.0072 U 0.008 U 3.5 0.0077 U 0.0077 N/A 0.0280.0083 U 0.053 N/A 0.051 0.013 0.0079 U 0.016 0.0082 U 0.14 0.0078 U 0.0072 U 0.008 U 6.1 0.02 0.042 N/A 0.0150.079 U 0.073 U 0.083 U 0.074 U 0.075 U 0.081 U 0.074 U 0.081 U 0.074 U 0.075 U 0.071 U 0.085 U 0.075 U 0.076 U 0.073 U 0.057 J 0.025 J0.0083 U 0.45 N/A 0.083 0.076 0.0021 J 0.021 0.0082 U 0.15 0.0078 U 0.011 0.008 U 69.5 0.016 0.082 N/A 0.170.079 R 0.073 R 0.083 UJ 0.074 R 0.075 R 0.081 R 0.074 R 0.081 R 0.074 R 0.075 R 0.071 R 0.085 R 0.075 R 0.076 R 0.073 R 0.11 J 0.018 J
0.0083 U 1.9 N/A 0.57 0.48 0.0043 J 0.1 0.0082 U 0.56 0.0022 J 0.041 0.008 U 27.8 0.053 0.32 N/A 0.710.0083 U 1.6 0.11 J 0.95 0.81 0.0026 J 0.14 0.0082 U 0.81 0.001 J 0.047 0.008 U 16.1 0.049 0.28 N/A 0.670.0009 J 3.7 N/A 1.5 1.2 0.0038 J 0.23 0.0082 U 2 0.0023 J 0.075 0.008 U 24.9 0.08 0.61 N/A 1.2
0.0083 UJ 0.48 N/A 0.35 0.28 0.0079 U 0.12 J 0.0082 UJ 0.22 0.0078 U 0.023 J 0.008 UJ 6.8 0.041 0.14 N/A 0.260.0083 U 0.96 N/A 0.49 0.49 0.0023 J 0.083 0.0082 U 0.53 0.00093 J 0.041 0.008 U 8.6 0.03 0.19 N/A 0.370.079 U 0.073 U 0.083 U 0.074 U 0.075 U 0.081 U 0.074 U 0.081 U 0.13 J 0.075 U 0.071 U 0.085 U 0.075 U 0.076 U 0.073 UJ 0.087 U 0.077 UJ0.079 U 0.024 J 0.083 U 0.058 J 0.032 J 0.081 U 0.074 U 0.081 U 0.028 J 0.075 U 0.071 U 0.085 U 0.054 J 0.076 U 0.062 J 0.21 0.34 J
0.00064 J 2.2 N/A 0.57 0.46 0.0041 J 0.15 0.0082 U 0.57 0.0015 J 0.049 0.008 U 23.8 0.055 0.34 N/A 0.710.0083 UJ 0.31 N/A 0.2 0.13 0.0079 U 0.041 0.0082 U 0.092 0.0078 U 0.01 0.008 U 2.9 0.013 0.057 N/A 0.130.079 U 0.073 U 0.083 U 0.074 U 0.044 J 0.081 U 0.074 U 0.081 U 0.074 U 0.075 U 0.071 U 0.085 U 0.075 U 0.076 U 0.073 U 0.087 U 0.077 U0.079 U 0.073 U 0.083 U 0.074 U 0.075 U 0.081 U 0.074 U 0.081 U 0.074 U 0.075 U 0.071 U 0.085 U 0.075 U 0.076 U 0.073 U 0.087 U 0.041 B0.079 U 0.073 U 0.083 U 0.074 U 0.075 U 0.081 U 0.074 U 0.081 U 0.074 UJ 0.075 U 0.071 U 0.085 U 0.075 U 0.076 U 0.073 UJ 0.087 U 0.021 J0.0017 J 2.9 N/A 0.66 0.51 0.0087 0.16 0.0082 U 0.69 0.0027 J 0.063 0.008 U 147 0.1 0.56 N/A 1.30.0083 U 0.052 N/A 0.038 0.023 0.0019 J 0.0071 J 0.0082 U 0.031 0.0078 U 0.0017 J 0.008 U 79.1 0.0065 J 0.013 N/A 0.0270.0083 UJ 0.69 N/A 0.45 0.32 0.0079 U 0.1 0.0082 U 0.28 0.0078 U 0.026 0.008 U 8.1 0.04 0.15 N/A 0.320.0083 U 0.22 N/A 0.14 0.057 0.003 J 0.028 0.0082 U 0.25 0.0016 J 0.0073 0.008 U 19.4 0.018 0.03 N/A 0.080.079 U 0.073 U 0.083 U 0.074 U 0.075 U 0.081 U 0.074 U 0.081 U 0.074 U 0.075 U 0.071 U 0.085 U 0.075 U 0.076 U 0.073 U 0.087 U 0.077 U
0.0012 J 1.6 N/A 0.27 0.24 0.0091 0.067 0.0082 U 0.36 0.0019 J 0.028 0.008 U 287 0.06 0.23 N/A 0.530.079 U 0.073 U 0.083 U 0.074 U 0.075 U 0.081 U 0.074 U 0.081 U 0.074 U 0.075 U 0.071 U 0.085 U 0.075 U 0.076 U 0.073 U 0.03 J 0.077 UJ
0.0015 J 2.5 N/A 0.68 0.48 0.0067 J 0.16 0.0082 U 0.62 0.0022 J 0.058 0.008 U 104 0.075 0.47 N/A 1.2
N/A 0.19 U N/A N/A 0.018 U N/A 0.018 U N/A 0.018 U N/A 0.018 U N/A 0.12 J N/A 0.018 U N/A N/AN/A 0.19 U N/A N/A 0.027 N/A 0.036 N/A 0.13 N/A 0.01 J N/A 0.019 U N/A 0.018 U N/A N/A
N/A 1.3 U N/A N/A 0.13 U N/A 0.036 J N/A 0.13 N/A 0.13 U N/A 0.12 J N/A 0.12 U N/A N/A
N/A N/A N/A N/A N/A N/A N/A N/A N/A N/A N/A N/A N/A N/A N/A N/A N/AN/A N/A N/A N/A N/A N/A N/A N/A N/A N/A N/A N/A N/A N/A N/A N/A N/A
252 595 N/A 472 773 285 645 573 1,440 516 336 425 840 67.2 J 366 N/A 630
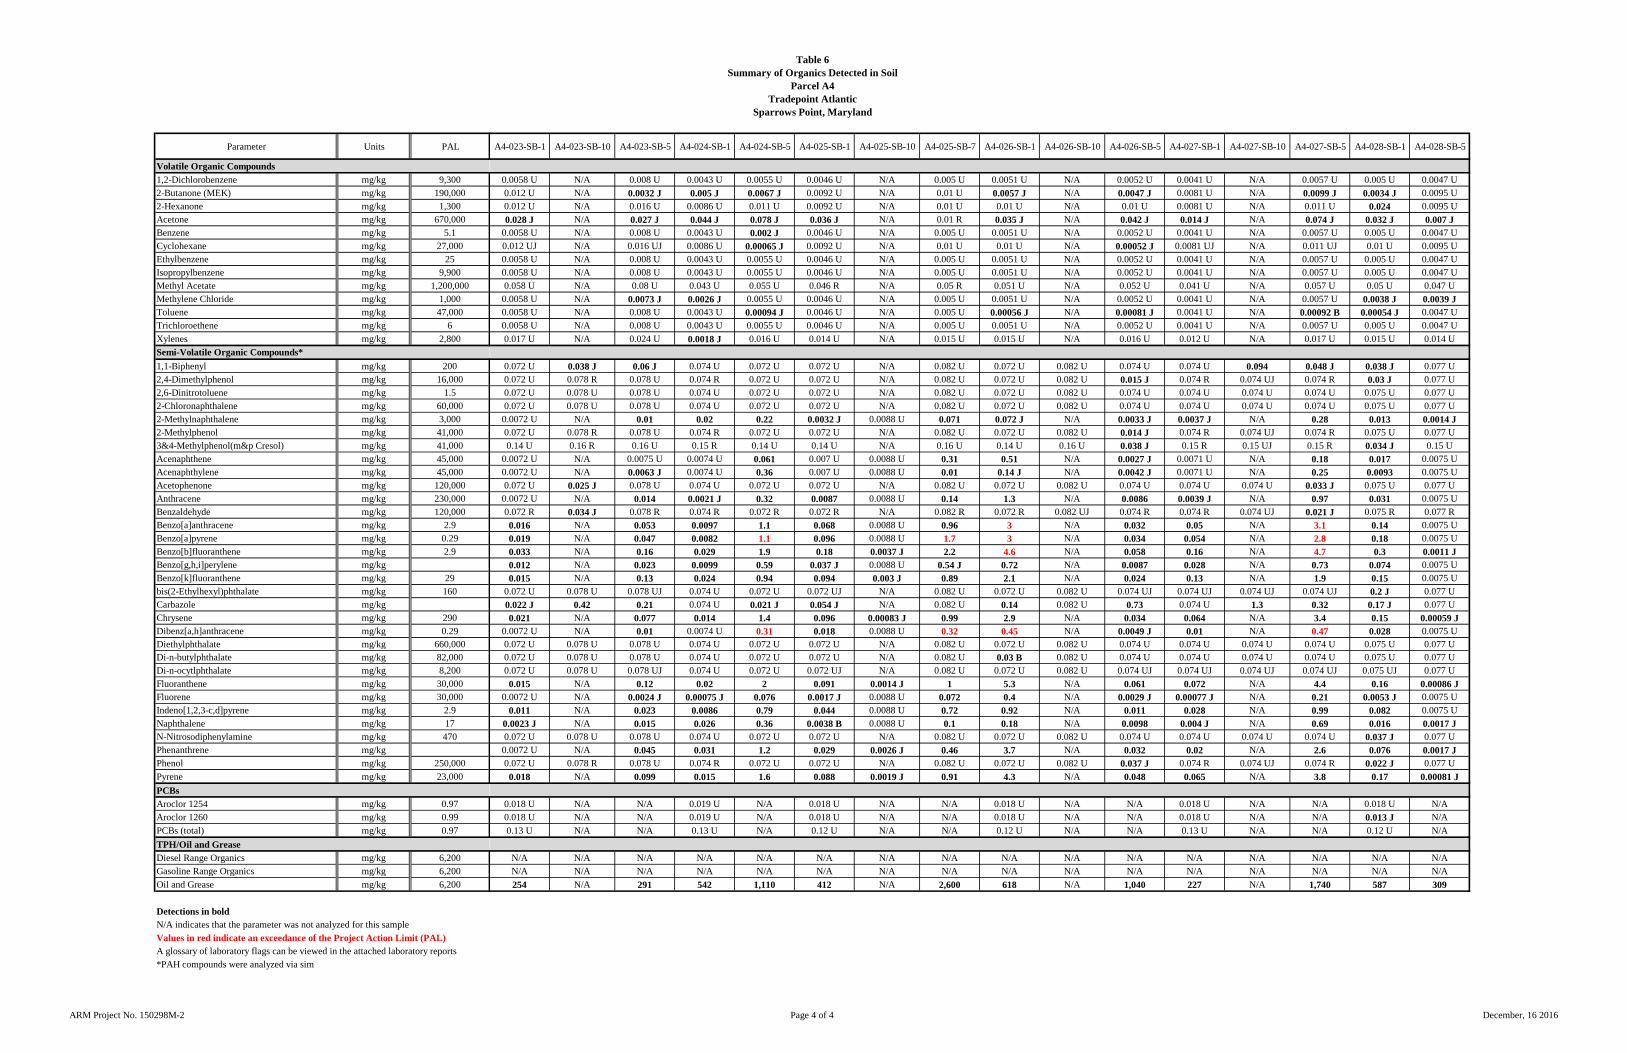
Table 6Summary of Organics Detected in Soil
Parcel A4Tradepoint Atlantic
Sparrows Point, Maryland
ARM Project No. 150298M-2 Page 4 of 4 December, 16 2016
Parameter Units PAL
Volatile Organic Compounds
1,2-Dichlorobenzene mg/kg 9,3002-Butanone (MEK) mg/kg 190,0002-Hexanone mg/kg 1,300Acetone mg/kg 670,000Benzene mg/kg 5.1Cyclohexane mg/kg 27,000Ethylbenzene mg/kg 25Isopropylbenzene mg/kg 9,900Methyl Acetate mg/kg 1,200,000Methylene Chloride mg/kg 1,000Toluene mg/kg 47,000Trichloroethene mg/kg 6
Xylenes mg/kg 2,800
1,1-Biphenyl mg/kg 2002,4-Dimethylphenol mg/kg 16,0002,6-Dinitrotoluene mg/kg 1.52-Chloronaphthalene mg/kg 60,0002-Methylnaphthalene mg/kg 3,0002-Methylphenol mg/kg 41,0003&4-Methylphenol(m&p Cresol) mg/kg 41,000Acenaphthene mg/kg 45,000Acenaphthylene mg/kg 45,000Acetophenone mg/kg 120,000Anthracene mg/kg 230,000Benzaldehyde mg/kg 120,000Benzo[a]anthracene mg/kg 2.9Benzo[a]pyrene mg/kg 0.29Benzo[b]fluoranthene mg/kg 2.9Benzo[g,h,i]perylene mg/kgBenzo[k]fluoranthene mg/kg 29bis(2-Ethylhexyl)phthalate mg/kg 160Carbazole mg/kgChrysene mg/kg 290Dibenz[a,h]anthracene mg/kg 0.29Diethylphthalate mg/kg 660,000Di-n-butylphthalate mg/kg 82,000Di-n-ocytlphthalate mg/kg 8,200Fluoranthene mg/kg 30,000Fluorene mg/kg 30,000Indeno[1,2,3-c,d]pyrene mg/kg 2.9Naphthalene mg/kg 17N-Nitrosodiphenylamine mg/kg 470Phenanthrene mg/kgPhenol mg/kg 250,000
Pyrene mg/kg 23,000
PCBsAroclor 1254 mg/kg 0.97Aroclor 1260 mg/kg 0.99
PCBs (total) mg/kg 0.97
TPH/Oil and GreaseDiesel Range Organics mg/kg 6,200Gasoline Range Organics mg/kg 6,200
Oil and Grease mg/kg 6,200
Detections in boldN/A indicates that the parameter was not analyzed for this sample
Values in red indicate an exceedance of the Project Action Limit (PAL)A glossary of laboratory flags can be viewed in the attached laboratory reports*PAH compounds were analyzed via sim
Semi-Volatile Organic Compounds*
A4-023-SB-1 A4-023-SB-10 A4-023-SB-5 A4-024-SB-1 A4-024-SB-5 A4-025-SB-1 A4-025-SB-10 A4-025-SB-7 A4-026-SB-1 A4-026-SB-10 A4-026-SB-5 A4-027-SB-1 A4-027-SB-10 A4-027-SB-5 A4-028-SB-1 A4-028-SB-5
0.0058 U N/A 0.008 U 0.0043 U 0.0055 U 0.0046 U N/A 0.005 U 0.0051 U N/A 0.0052 U 0.0041 U N/A 0.0057 U 0.005 U 0.0047 U0.012 U N/A 0.0032 J 0.005 J 0.0067 J 0.0092 U N/A 0.01 U 0.0057 J N/A 0.0047 J 0.0081 U N/A 0.0099 J 0.0034 J 0.0095 U0.012 U N/A 0.016 U 0.0086 U 0.011 U 0.0092 U N/A 0.01 U 0.01 U N/A 0.01 U 0.0081 U N/A 0.011 U 0.024 0.0095 U
0.028 J N/A 0.027 J 0.044 J 0.078 J 0.036 J N/A 0.01 R 0.035 J N/A 0.042 J 0.014 J N/A 0.074 J 0.032 J 0.007 J0.0058 U N/A 0.008 U 0.0043 U 0.002 J 0.0046 U N/A 0.005 U 0.0051 U N/A 0.0052 U 0.0041 U N/A 0.0057 U 0.005 U 0.0047 U0.012 UJ N/A 0.016 UJ 0.0086 U 0.00065 J 0.0092 U N/A 0.01 U 0.01 U N/A 0.00052 J 0.0081 UJ N/A 0.011 UJ 0.01 U 0.0095 U0.0058 U N/A 0.008 U 0.0043 U 0.0055 U 0.0046 U N/A 0.005 U 0.0051 U N/A 0.0052 U 0.0041 U N/A 0.0057 U 0.005 U 0.0047 U0.0058 U N/A 0.008 U 0.0043 U 0.0055 U 0.0046 U N/A 0.005 U 0.0051 U N/A 0.0052 U 0.0041 U N/A 0.0057 U 0.005 U 0.0047 U0.058 U N/A 0.08 U 0.043 U 0.055 U 0.046 R N/A 0.05 R 0.051 U N/A 0.052 U 0.041 U N/A 0.057 U 0.05 U 0.047 U
0.0058 U N/A 0.0073 J 0.0026 J 0.0055 U 0.0046 U N/A 0.005 U 0.0051 U N/A 0.0052 U 0.0041 U N/A 0.0057 U 0.0038 J 0.0039 J0.0058 U N/A 0.008 U 0.0043 U 0.00094 J 0.0046 U N/A 0.005 U 0.00056 J N/A 0.00081 J 0.0041 U N/A 0.00092 B 0.00054 J 0.0047 U0.0058 U N/A 0.008 U 0.0043 U 0.0055 U 0.0046 U N/A 0.005 U 0.0051 U N/A 0.0052 U 0.0041 U N/A 0.0057 U 0.005 U 0.0047 U
0.017 U N/A 0.024 U 0.0018 J 0.016 U 0.014 U N/A 0.015 U 0.015 U N/A 0.016 U 0.012 U N/A 0.017 U 0.015 U 0.014 U
0.072 U 0.038 J 0.06 J 0.074 U 0.072 U 0.072 U N/A 0.082 U 0.072 U 0.082 U 0.074 U 0.074 U 0.094 0.048 J 0.038 J 0.077 U0.072 U 0.078 R 0.078 U 0.074 R 0.072 U 0.072 U N/A 0.082 U 0.072 U 0.082 U 0.015 J 0.074 R 0.074 UJ 0.074 R 0.03 J 0.077 U0.072 U 0.078 U 0.078 U 0.074 U 0.072 U 0.072 U N/A 0.082 U 0.072 U 0.082 U 0.074 U 0.074 U 0.074 U 0.074 U 0.075 U 0.077 U0.072 U 0.078 U 0.078 U 0.074 U 0.072 U 0.072 U N/A 0.082 U 0.072 U 0.082 U 0.074 U 0.074 U 0.074 U 0.074 U 0.075 U 0.077 U
0.0072 U N/A 0.01 0.02 0.22 0.0032 J 0.0088 U 0.071 0.072 J N/A 0.0033 J 0.0037 J N/A 0.28 0.013 0.0014 J0.072 U 0.078 R 0.078 U 0.074 R 0.072 U 0.072 U N/A 0.082 U 0.072 U 0.082 U 0.014 J 0.074 R 0.074 UJ 0.074 R 0.075 U 0.077 U0.14 U 0.16 R 0.16 U 0.15 R 0.14 U 0.14 U N/A 0.16 U 0.14 U 0.16 U 0.038 J 0.15 R 0.15 UJ 0.15 R 0.034 J 0.15 U
0.0072 U N/A 0.0075 U 0.0074 U 0.061 0.007 U 0.0088 U 0.31 0.51 N/A 0.0027 J 0.0071 U N/A 0.18 0.017 0.0075 U0.0072 U N/A 0.0063 J 0.0074 U 0.36 0.007 U 0.0088 U 0.01 0.14 J N/A 0.0042 J 0.0071 U N/A 0.25 0.0093 0.0075 U0.072 U 0.025 J 0.078 U 0.074 U 0.072 U 0.072 U N/A 0.082 U 0.072 U 0.082 U 0.074 U 0.074 U 0.074 U 0.033 J 0.075 U 0.077 U
0.0072 U N/A 0.014 0.0021 J 0.32 0.0087 0.0088 U 0.14 1.3 N/A 0.0086 0.0039 J N/A 0.97 0.031 0.0075 U0.072 R 0.034 J 0.078 R 0.074 R 0.072 R 0.072 R N/A 0.082 R 0.072 R 0.082 UJ 0.074 R 0.074 R 0.074 UJ 0.021 J 0.075 R 0.077 R
0.016 N/A 0.053 0.0097 1.1 0.068 0.0088 U 0.96 3 N/A 0.032 0.05 N/A 3.1 0.14 0.0075 U
0.019 N/A 0.047 0.0082 1.1 0.096 0.0088 U 1.7 3 N/A 0.034 0.054 N/A 2.8 0.18 0.0075 U
0.033 N/A 0.16 0.029 1.9 0.18 0.0037 J 2.2 4.6 N/A 0.058 0.16 N/A 4.7 0.3 0.0011 J0.012 N/A 0.023 0.0099 0.59 0.037 J 0.0088 U 0.54 J 0.72 N/A 0.0087 0.028 N/A 0.73 0.074 0.0075 U
0.015 N/A 0.13 0.024 0.94 0.094 0.003 J 0.89 2.1 N/A 0.024 0.13 N/A 1.9 0.15 0.0075 U0.072 U 0.078 U 0.078 UJ 0.074 U 0.072 U 0.072 UJ N/A 0.082 U 0.072 U 0.082 U 0.074 UJ 0.074 UJ 0.074 UJ 0.074 UJ 0.2 J 0.077 U
0.022 J 0.42 0.21 0.074 U 0.021 J 0.054 J N/A 0.082 U 0.14 0.082 U 0.73 0.074 U 1.3 0.32 0.17 J 0.077 U
0.021 N/A 0.077 0.014 1.4 0.096 0.00083 J 0.99 2.9 N/A 0.034 0.064 N/A 3.4 0.15 0.00059 J0.0072 U N/A 0.01 0.0074 U 0.31 0.018 0.0088 U 0.32 0.45 N/A 0.0049 J 0.01 N/A 0.47 0.028 0.0075 U0.072 U 0.078 U 0.078 U 0.074 U 0.072 U 0.072 U N/A 0.082 U 0.072 U 0.082 U 0.074 U 0.074 U 0.074 U 0.074 U 0.075 U 0.077 U0.072 U 0.078 U 0.078 U 0.074 U 0.072 U 0.072 U N/A 0.082 U 0.03 B 0.082 U 0.074 U 0.074 U 0.074 U 0.074 U 0.075 U 0.077 U0.072 U 0.078 U 0.078 UJ 0.074 U 0.072 U 0.072 UJ N/A 0.082 U 0.072 U 0.082 U 0.074 UJ 0.074 UJ 0.074 UJ 0.074 UJ 0.075 UJ 0.077 U
0.015 N/A 0.12 0.02 2 0.091 0.0014 J 1 5.3 N/A 0.061 0.072 N/A 4.4 0.16 0.00086 J0.0072 U N/A 0.0024 J 0.00075 J 0.076 0.0017 J 0.0088 U 0.072 0.4 N/A 0.0029 J 0.00077 J N/A 0.21 0.0053 J 0.0075 U
0.011 N/A 0.023 0.0086 0.79 0.044 0.0088 U 0.72 0.92 N/A 0.011 0.028 N/A 0.99 0.082 0.0075 U
0.0023 J N/A 0.015 0.026 0.36 0.0038 B 0.0088 U 0.1 0.18 N/A 0.0098 0.004 J N/A 0.69 0.016 0.0017 J0.072 U 0.078 U 0.078 U 0.074 U 0.072 U 0.072 U N/A 0.082 U 0.072 U 0.082 U 0.074 U 0.074 U 0.074 U 0.074 U 0.037 J 0.077 U
0.0072 U N/A 0.045 0.031 1.2 0.029 0.0026 J 0.46 3.7 N/A 0.032 0.02 N/A 2.6 0.076 0.0017 J0.072 U 0.078 R 0.078 U 0.074 R 0.072 U 0.072 U N/A 0.082 U 0.072 U 0.082 U 0.037 J 0.074 R 0.074 UJ 0.074 R 0.022 J 0.077 U
0.018 N/A 0.099 0.015 1.6 0.088 0.0019 J 0.91 4.3 N/A 0.048 0.065 N/A 3.8 0.17 0.00081 J
0.018 U N/A N/A 0.019 U N/A 0.018 U N/A N/A 0.018 U N/A N/A 0.018 U N/A N/A 0.018 U N/A0.018 U N/A N/A 0.019 U N/A 0.018 U N/A N/A 0.018 U N/A N/A 0.018 U N/A N/A 0.013 J N/A
0.13 U N/A N/A 0.13 U N/A 0.12 U N/A N/A 0.12 U N/A N/A 0.13 U N/A N/A 0.12 U N/A
N/A N/A N/A N/A N/A N/A N/A N/A N/A N/A N/A N/A N/A N/A N/A N/AN/A N/A N/A N/A N/A N/A N/A N/A N/A N/A N/A N/A N/A N/A N/A N/A
254 N/A 291 542 1,110 412 N/A 2,600 618 N/A 1,040 227 N/A 1,740 587 309

Table 7Summary of Inorganics Detected in Soil
Parcel A4Tradepoint Atlantic
Sparrows Point, Maryland
ARM Project No. 150298M-2 Page 1 of 7 December 16, 2016
Parameter Units PAL A4-001-SB-1 A4-001-SB-5 A4-002-SB-1 A4-002-SB-5 A4-003-SB-1 A4-003-SB-7.5 A4-004-SB-1 A4-004-SB-5 A4-005-SB-1 A4-005-SB-10
Metals
Aluminum mg/kg 1,100,000 41,000 15,600 27,200 36,600 9,490 6,080 9,450 13,900 11,400 N/AAntimony mg/kg 470 2.5 UJ 2.2 UJ 1.8 UJ 3.4 UJ 2 UJ 5.4 J 2.2 UJ 3.5 UJ 2.4 UJ N/AArsenic mg/kg 3 1.8 B 1.8 U 1.2 B 2.7 B 2.7 11.7 5.1 3.6 2.6 J 5.9Barium mg/kg 220,000 417 J 108 J 277 J 689 J 50.8 J 83.8 J 31.3 J 95.6 J 75.8 J N/ABeryllium mg/kg 2,300 7.3 1.7 4.7 2.8 0.17 J 0.96 U 0.73 U 0.7 B 0.38 B N/ACadmium mg/kg 980 0.34 J 0.3 J 0.34 J 6.3 0.44 J 0.36 J 0.41 J 0.43 J 1.2 N/AChromium mg/kg 120,000 32.5 17.3 27.8 73.3 913 472 1,320 25.3 1,390 N/AChromium VI mg/kg 6.3 1.1 U 1.1 U 1.1 U 1.1 U 1.1 1.1 U 10.3 1.2 U 4.2 J- N/ACobalt mg/kg 350 1.4 B 2.9 B 1.3 B 30.5 1.9 J 17.9 1.2 B 11.2 3.9 B N/ACopper mg/kg 47,000 7.2 J 34.4 J 5.9 J 30 J 34.5 J 224 J 21.2 J 18.2 J 35.5 N/AIron mg/kg 820,000 20,900 10,700 9,960 20,700 105,000 140,000 160,000 18,200 158,000 J N/ALead mg/kg 800 11.8 14.7 17.3 817 13.7 84.8 1.9 92 105 J N/AManganese mg/kg 26,000 2,940 679 2,140 9,360 22,500 9,290 31,900 432 30,000 J 46.3Mercury mg/kg 350 0.11 UJ 0.11 UJ 0.1 UJ 0.11 UJ 0.0082 J 0.0061 J 0.11 UJ 0.19 J 0.085 J N/ANickel mg/kg 22,000 6 J 6.1 J 4 J 14.4 J 15.1 J 36.4 J 22 J 12.8 J 23.9 N/ASelenium mg/kg 5,800 2.6 J 3 U 2.1 J 4.5 U 2.3 J 3.8 U 2.9 U 4.6 U 3.2 U N/ASilver mg/kg 5,800 2.5 U 2.2 U 1.8 U 3.4 U 1.6 J 2.9 U 3.1 3.5 U 2.7 N/AThallium mg/kg 12 8.2 UJ 7.4 UJ 5.9 UJ 11.2 UJ 6.6 UJ 9.6 UJ 7.3 UJ 11.5 UJ 7.9 U 10.2 UVanadium mg/kg 5,800 36.2 33 30.2 301 400 2,140 563 41.2 629 J N/A
Zinc mg/kg 350,000 96 76 69.5 8,500 94.3 71.6 21 223 350 N/A
Other
Cyanide mg/kg 150 0.28 J+ 0.6 U 0.22 J+ 0.23 J+ 0.12 J+ 0.06 J+ 0.052 J+ 0.67 U 1.3 N/A
Detections in boldN/A indicates that the parameter was not analyzed for this sampleValues in red indicate an exceedance of the Project Action Limit (PAL)A glossary of laboratory flags can be viewed in the attached laboratory reports

Table 7Summary of Inorganics Detected in Soil
Parcel A4Tradepoint Atlantic
Sparrows Point, Maryland
ARM Project No. 150298M-2 Page 2 of 7 December 16, 2016
Parameter Units PAL
Metals
Aluminum mg/kg 1,100,000Antimony mg/kg 470Arsenic mg/kg 3Barium mg/kg 220,000Beryllium mg/kg 2,300Cadmium mg/kg 980Chromium mg/kg 120,000Chromium VI mg/kg 6.3Cobalt mg/kg 350Copper mg/kg 47,000Iron mg/kg 820,000Lead mg/kg 800Manganese mg/kg 26,000Mercury mg/kg 350Nickel mg/kg 22,000Selenium mg/kg 5,800Silver mg/kg 5,800Thallium mg/kg 12Vanadium mg/kg 5,800
Zinc mg/kg 350,000
Other
Cyanide mg/kg 150
Detections in boldN/A indicates that the parameter was not analyzed for this sampleValues in red indicate an exceedance of the Project Action Limit (PAL)A glossary of laboratory flags can be viewed in the attached laboratory reports
A4-005-SB-5 A4-006-SB-1 A4-006-SB-10 A4-006-SB-6 A4-007-SB-1 A4-007-SB-10 A4-007-SB-5 A4-008-SB-1 A4-008-SB-10 A4-008-SB-5
10,900 13,800 N/A 17,800 19,200 N/A 17,400 15,100 N/A 16,0002.4 J 2.6 UJ N/A 3.1 UJ 2 UJ N/A 2.2 UJ 2.1 UJ N/A 3.3 UJ
8.1 J 4.3 J 10.5 4.5 J 1.7 U 3.9 5 1.8 U 12.3 3.8159 J 107 J N/A 139 J 163 N/A 47.5 98.9 N/A 72.70.21 B 1.4 N/A 2.3 2.9 N/A 1.1 1.6 N/A 0.82 B
4 1.1 B N/A 0.6 B 0.39 B N/A 1.1 U 0.36 B N/A 1.7 U
1,580 94.5 N/A 40.5 36.9 N/A 34.8 55 N/A 17.41.1 UJ 1.1 UJ N/A 1.1 UJ 1 U N/A 0.87 J 1.1 U N/A 1.2 U
24.1 4.7 N/A 4.1 B 2 B N/A 3.8 4.1 N/A 5.1 B155 42.3 N/A 23.3 7.9 N/A 9.6 9.1 N/A 10.3
123,000 J 31,100 J N/A 23,600 J 16,000 N/A 37,200 19,900 N/A 6,150693 J 187 J N/A 42.9 J 26.5 N/A 27.3 10.1 N/A 12.7
26,500 J 2,050 J N/A 1,330 J 2,230 N/A 48.9 1,170 N/A 15.60.14 0.078 J N/A 0.0025 J 0.012 J N/A 0.055 J 0.0057 J N/A 0.025 J33 14.2 N/A 12.8 5.9 B N/A 7.7 11.5 N/A 13.7
2.2 U 3.4 U N/A 4.1 U 2.7 U N/A 2.9 U 2.8 U N/A 4.5 U1.6 U 2.6 U N/A 3.1 U 2 U N/A 2.2 U 2.1 U N/A 3.3 U
13.8 8.5 U N/A 1.6 B 6.8 U N/A 7.3 U 7.1 U N/A 11.2 U
5,460 J 162 J N/A 46.7 J 39.4 N/A 97.5 72.9 N/A 18.3
1,720 346 N/A 171 71.2 N/A 29.8 97.8 N/A 23.6
1.6 0.3 J N/A 0.6 J 0.075 J N/A 0.73 U 0.084 J N/A 0.65 U

Table 7Summary of Inorganics Detected in Soil
Parcel A4Tradepoint Atlantic
Sparrows Point, Maryland
ARM Project No. 150298M-2 Page 3 of 7 December 16, 2016
Parameter Units PAL
Metals
Aluminum mg/kg 1,100,000Antimony mg/kg 470Arsenic mg/kg 3Barium mg/kg 220,000Beryllium mg/kg 2,300Cadmium mg/kg 980Chromium mg/kg 120,000Chromium VI mg/kg 6.3Cobalt mg/kg 350Copper mg/kg 47,000Iron mg/kg 820,000Lead mg/kg 800Manganese mg/kg 26,000Mercury mg/kg 350Nickel mg/kg 22,000Selenium mg/kg 5,800Silver mg/kg 5,800Thallium mg/kg 12Vanadium mg/kg 5,800
Zinc mg/kg 350,000
Other
Cyanide mg/kg 150
Detections in boldN/A indicates that the parameter was not analyzed for this sampleValues in red indicate an exceedance of the Project Action Limit (PAL)A glossary of laboratory flags can be viewed in the attached laboratory reports
A4-009-SB-1 A4-009-SB-5 A4-010-SB-1 A4-010-SB-5 A4-011-SB-1 A4-011-SB-5 A4-012-SB-1 A4-012-SB-5 A4-013-SB-1 A4-013-SB-4
11,800 5,220 12,800 29,400 8,040 20,600 15,600 11,800 12,100 4,8403.6 UJ 2.8 UJ 3.4 UJ 2.8 UJ 3.1 UJ 2.4 UJ 3.1 UJ 2 UJ 3.3 UJ 7.8 J
4.3 2.4 U 5.7 2.6 5.9 2.8 3.7 9.4 6.2 29.469.3 16.2 62 250 41.5 J 214 J 124 173 157 90.8
0.62 B 0.23 B 0.71 B 3.9 1 U 1.2 B 1.1 1 1.6 0.28 J0.82 B 1.4 U 0.28 B 0.34 B 0.7 J 0.65 J 0.76 B 11.7 1.4 B 33,60029.8 7.6 30.5 46.3 1,810 31.3 687 399 89 1261.2 U 1.1 U 1.1 U 1.1 U 15.1 1.1 U 1 UJ 1.1 UJ 1.1 UJ 1.3 UJ
4.5 B 0.76 B 6.2 3.1 B 5.2 U 9.1 4.7 B 14.2 9.5 70.919 3.9 J 10.4 15.7 17.5 J 72.4 J 23.5 J 70.7 J 49.4 J 10,700 J
16,900 3,690 20,100 30,900 177,000 25,700 79,600 73,100 38,700 255,00053.2 2.4 U 15.2 10.7 3.4 235 68 228 115 2,780613 5.9 517 2,580 35,800 1,370 16,100 J 9,020 J 3,060 J 3,580 J0.12 0.1 U 0.067 J 0.0053 J 0.1 UJ 0.017 J 0.031 J 0.054 J 0.027 J 0.89 J13.4 2.7 B 14.7 18.6 13.8 J 14.9 J 13 35.8 24.4 2134.7 U 3.8 U 4.6 U 3.7 U 4.1 U 3.1 U 2.8 B 2.6 U 4.4 U 3.9 U3.6 U 2.8 U 3.4 U 2.8 U 2.9 J 2.4 U 3.1 U 2 U 3.3 U 14.3
11.9 U 9.5 U 11.4 U 9.3 U 10.4 UJ 7.8 UJ 10.2 UJ 6.6 UJ 11 UJ 9.7 UJ
60.5 9.5 35 101 630 121 324 J 1,060 J 228 J 106 J
192 7.3 75.6 20.8 29.8 236 208 1,250 308 62,400
0.59 U 0.59 U 0.66 U 2.4 0.65 U 0.59 U 0.18 J 0.49 J 0.28 J 0.72 U

Table 7Summary of Inorganics Detected in Soil
Parcel A4Tradepoint Atlantic
Sparrows Point, Maryland
ARM Project No. 150298M-2 Page 4 of 7 December 16, 2016
Parameter Units PAL
Metals
Aluminum mg/kg 1,100,000Antimony mg/kg 470Arsenic mg/kg 3Barium mg/kg 220,000Beryllium mg/kg 2,300Cadmium mg/kg 980Chromium mg/kg 120,000Chromium VI mg/kg 6.3Cobalt mg/kg 350Copper mg/kg 47,000Iron mg/kg 820,000Lead mg/kg 800Manganese mg/kg 26,000Mercury mg/kg 350Nickel mg/kg 22,000Selenium mg/kg 5,800Silver mg/kg 5,800Thallium mg/kg 12Vanadium mg/kg 5,800
Zinc mg/kg 350,000
Other
Cyanide mg/kg 150
Detections in boldN/A indicates that the parameter was not analyzed for this sampleValues in red indicate an exceedance of the Project Action Limit (PAL)A glossary of laboratory flags can be viewed in the attached laboratory reports
A4-014-SB-1 A4-014-SB-10 A4-014-SB-7 A4-015-SB-1 A4-015-SB-10 A4-015-SB-5 A4-016-SB-1 A4-016-SB-10 A4-016-SB-5 A4-017-SB-1
11,200 N/A 17,300 34,000 N/A 16,300 21,000 N/A 24,000 14,6003.1 UJ N/A 3.5 UJ 2.5 UJ N/A 3 UJ 3 UJ N/A 2.1 UJ 2.5 UJ
5.2 7.1 5.3 6.1 J 6.7 85.5 J 9.5 8.3 9.5 5.2 J113 N/A 74.5 314 J N/A 20.6 J 210 N/A 308 137 J
0.69 J N/A 0.82 J 3.1 N/A 1.2 2.6 N/A 3 1.32.4 N/A 1.7 U 1.2 B N/A 0.23 B 3.7 N/A 1.6 0.71 B219 N/A 35.3 303 N/A 43 570 N/A 487 567
1.1 UJ N/A 1.3 UJ 1.1 U N/A 1.2 UJ 1.1 UJ N/A 1.1 UJ 1.1 U
12.7 N/A 7.2 8.6 N/A 4.1 B 7.3 N/A 6.1 7.350.3 J N/A 18.8 J 73.5 N/A 9.1 59.9 J N/A 54.5 J 71.143,200 N/A 19,100 102,000 J N/A 73,000 J 96,300 N/A 118,000 150,000 J
214 N/A 19.3 101 J N/A 17.1 J 776 N/A 272 135 J3,470 J N/A 238 J 17,300 J N/A 51.1 J 13,600 J N/A 14,100 J 16,700 J0.082 J N/A 0.036 J 0.042 J N/A 0.0079 J 0.11 UJ N/A 0.11 UJ 0.042 J
22.9 N/A 15.4 46.1 N/A 9.6 B 21.7 N/A 17.7 54.64.1 U N/A 4.6 U 2.9 B N/A 4 U 3 B N/A 3.5 3.3 U3.1 U N/A 3.5 U 2.5 U N/A 0.39 J 3 U N/A 2.1 U 2.5 U
10.2 UJ N/A 11.6 UJ 8.4 U N/A 2.2 B 9.9 UJ N/A 7.1 UJ 8.4 U
558 J N/A 38 J 430 J N/A 72.8 J 663 J N/A 1,360 J 935 J
721 N/A 80 332 N/A 39.8 1,180 N/A 274 211
0.2 J N/A 0.63 U 0.86 N/A 0.71 U 3.1 N/A 0.77 0.2 J

Table 7Summary of Inorganics Detected in Soil
Parcel A4Tradepoint Atlantic
Sparrows Point, Maryland
ARM Project No. 150298M-2 Page 5 of 7 December 16, 2016
Parameter Units PAL
Metals
Aluminum mg/kg 1,100,000Antimony mg/kg 470Arsenic mg/kg 3Barium mg/kg 220,000Beryllium mg/kg 2,300Cadmium mg/kg 980Chromium mg/kg 120,000Chromium VI mg/kg 6.3Cobalt mg/kg 350Copper mg/kg 47,000Iron mg/kg 820,000Lead mg/kg 800Manganese mg/kg 26,000Mercury mg/kg 350Nickel mg/kg 22,000Selenium mg/kg 5,800Silver mg/kg 5,800Thallium mg/kg 12Vanadium mg/kg 5,800
Zinc mg/kg 350,000
Other
Cyanide mg/kg 150
Detections in boldN/A indicates that the parameter was not analyzed for this sampleValues in red indicate an exceedance of the Project Action Limit (PAL)A glossary of laboratory flags can be viewed in the attached laboratory reports
A4-017-SB-10 A4-017-SB-5 A4-018-SB-1 A4-018-SB-10 A4-018-SB-5 A4-019-SB-1 A4-019-SB-5 A4-020-SB-1 A4-020-SB-10 A4-020-SB-5
N/A 14,100 11,400 N/A 17,100 6,190 10,900 7,740 N/A 13,300N/A 2.6 UJ 0.97 B N/A 2.3 UJ 2 UJ 2.4 UJ 1.7 UJ N/A 2.7 UJ
11.8 6.4 J 16.5 10.5 3.4 6.5 J 1.8 J 5.7 8.4 3.1N/A 32.5 J 110 N/A 53.1 62.5 J 40.2 J 53.9 N/A 35.4N/A 0.87 B 2.5 N/A 0.8 0.61 B 0.63 B 0.27 B N/A 0.3 BN/A 1.3 U 1.4 N/A 0.14 B 3 1.2 U 0.29 B N/A 1.3 UN/A 25.4 117 N/A 36.1 219 15.3 25.3 N/A 18.7N/A 1.2 U 1.1 U N/A 1.2 U 1.1 U 1.2 U 1.1 U N/A 1.2 UN/A 4.6 17.6 N/A 5.7 12.3 3 B 8.4 N/A 2.6 BN/A 4 B 138 N/A 13.5 119 6.8 8.1 N/A 6.4N/A 48,700 J 259,000 N/A 20,000 152,000 J 14,300 J 12,700 N/A 12,800N/A 15.4 J 182 N/A 17.7 1,010 J 13.9 J 8.8 N/A 7.5N/A 47.5 J 3,910 N/A 37.5 5,460 J 27.8 J 452 N/A 44.3N/A 0.013 J 0.12 N/A 0.0045 J 0.84 0.0069 J 0.0074 J N/A 0.04 JN/A 9.5 B 94.2 N/A 14.5 49.9 7.1 B 9.1 N/A 8 BN/A 3.5 U 2.7 U N/A 3 U 2.6 U 3.2 U 2.3 U N/A 3.5 UN/A 0.29 B 3.1 N/A 2.3 U 1.1 B 2.4 U 1.7 U N/A 2.7 UN/A 8.7 U 6.9 U N/A 7.6 U 6.5 U 8 U 5.8 U N/A 8.9 UN/A 62.2 J 178 N/A 43.6 441 J 18.5 J 26.9 N/A 27.5
N/A 35 509 N/A 42.8 462 18.6 29.1 N/A 19.1
N/A 0.68 U 0.29 J N/A 0.65 U 0.75 0.89 0.54 U N/A 0.73 U
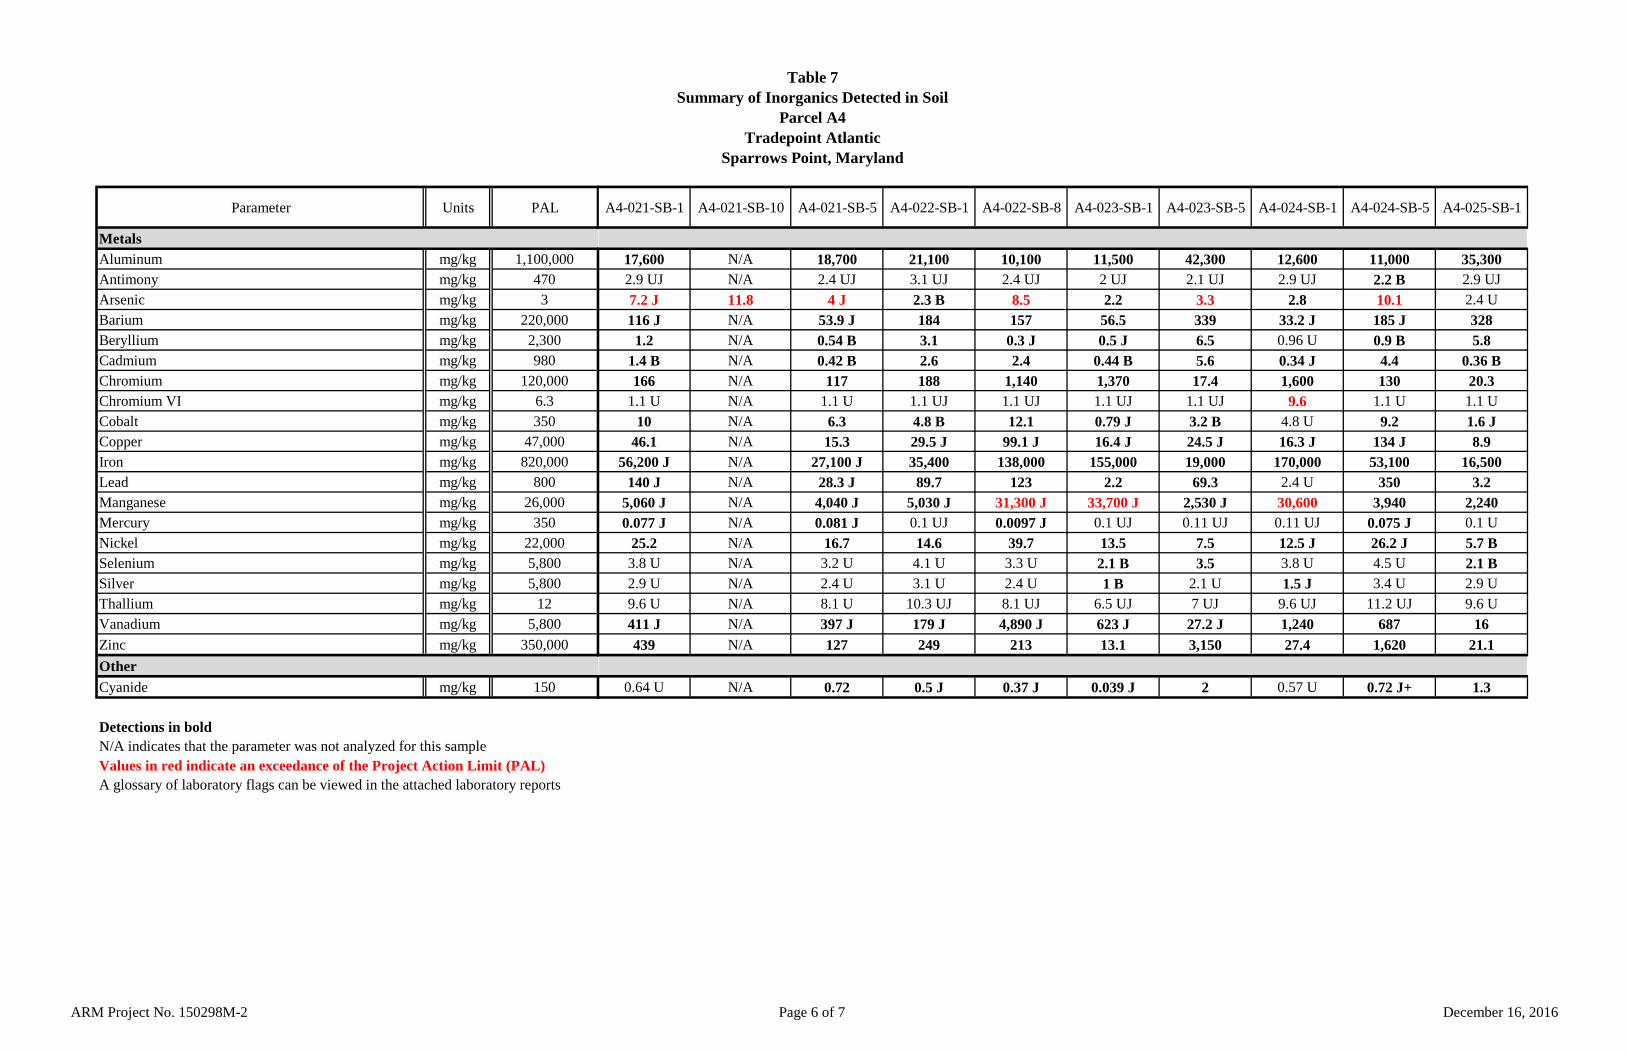
Table 7Summary of Inorganics Detected in Soil
Parcel A4Tradepoint Atlantic
Sparrows Point, Maryland
ARM Project No. 150298M-2 Page 6 of 7 December 16, 2016
Parameter Units PAL
Metals
Aluminum mg/kg 1,100,000Antimony mg/kg 470Arsenic mg/kg 3Barium mg/kg 220,000Beryllium mg/kg 2,300Cadmium mg/kg 980Chromium mg/kg 120,000Chromium VI mg/kg 6.3Cobalt mg/kg 350Copper mg/kg 47,000Iron mg/kg 820,000Lead mg/kg 800Manganese mg/kg 26,000Mercury mg/kg 350Nickel mg/kg 22,000Selenium mg/kg 5,800Silver mg/kg 5,800Thallium mg/kg 12Vanadium mg/kg 5,800
Zinc mg/kg 350,000
Other
Cyanide mg/kg 150
Detections in boldN/A indicates that the parameter was not analyzed for this sampleValues in red indicate an exceedance of the Project Action Limit (PAL)A glossary of laboratory flags can be viewed in the attached laboratory reports
A4-021-SB-1 A4-021-SB-10 A4-021-SB-5 A4-022-SB-1 A4-022-SB-8 A4-023-SB-1 A4-023-SB-5 A4-024-SB-1 A4-024-SB-5 A4-025-SB-1
17,600 N/A 18,700 21,100 10,100 11,500 42,300 12,600 11,000 35,3002.9 UJ N/A 2.4 UJ 3.1 UJ 2.4 UJ 2 UJ 2.1 UJ 2.9 UJ 2.2 B 2.9 UJ
7.2 J 11.8 4 J 2.3 B 8.5 2.2 3.3 2.8 10.1 2.4 U
116 J N/A 53.9 J 184 157 56.5 339 33.2 J 185 J 3281.2 N/A 0.54 B 3.1 0.3 J 0.5 J 6.5 0.96 U 0.9 B 5.8
1.4 B N/A 0.42 B 2.6 2.4 0.44 B 5.6 0.34 J 4.4 0.36 B166 N/A 117 188 1,140 1,370 17.4 1,600 130 20.3
1.1 U N/A 1.1 U 1.1 UJ 1.1 UJ 1.1 UJ 1.1 UJ 9.6 1.1 U 1.1 U
10 N/A 6.3 4.8 B 12.1 0.79 J 3.2 B 4.8 U 9.2 1.6 J46.1 N/A 15.3 29.5 J 99.1 J 16.4 J 24.5 J 16.3 J 134 J 8.9
56,200 J N/A 27,100 J 35,400 138,000 155,000 19,000 170,000 53,100 16,500140 J N/A 28.3 J 89.7 123 2.2 69.3 2.4 U 350 3.2
5,060 J N/A 4,040 J 5,030 J 31,300 J 33,700 J 2,530 J 30,600 3,940 2,2400.077 J N/A 0.081 J 0.1 UJ 0.0097 J 0.1 UJ 0.11 UJ 0.11 UJ 0.075 J 0.1 U
25.2 N/A 16.7 14.6 39.7 13.5 7.5 12.5 J 26.2 J 5.7 B3.8 U N/A 3.2 U 4.1 U 3.3 U 2.1 B 3.5 3.8 U 4.5 U 2.1 B2.9 U N/A 2.4 U 3.1 U 2.4 U 1 B 2.1 U 1.5 J 3.4 U 2.9 U9.6 U N/A 8.1 U 10.3 UJ 8.1 UJ 6.5 UJ 7 UJ 9.6 UJ 11.2 UJ 9.6 U
411 J N/A 397 J 179 J 4,890 J 623 J 27.2 J 1,240 687 16
439 N/A 127 249 213 13.1 3,150 27.4 1,620 21.1
0.64 U N/A 0.72 0.5 J 0.37 J 0.039 J 2 0.57 U 0.72 J+ 1.3

Table 7Summary of Inorganics Detected in Soil
Parcel A4Tradepoint Atlantic
Sparrows Point, Maryland
ARM Project No. 150298M-2 Page 7 of 7 December 16, 2016
Parameter Units PAL
Metals
Aluminum mg/kg 1,100,000Antimony mg/kg 470Arsenic mg/kg 3Barium mg/kg 220,000Beryllium mg/kg 2,300Cadmium mg/kg 980Chromium mg/kg 120,000Chromium VI mg/kg 6.3Cobalt mg/kg 350Copper mg/kg 47,000Iron mg/kg 820,000Lead mg/kg 800Manganese mg/kg 26,000Mercury mg/kg 350Nickel mg/kg 22,000Selenium mg/kg 5,800Silver mg/kg 5,800Thallium mg/kg 12Vanadium mg/kg 5,800
Zinc mg/kg 350,000
Other
Cyanide mg/kg 150
Detections in boldN/A indicates that the parameter was not analyzed for this sampleValues in red indicate an exceedance of the Project Action Limit (PAL)A glossary of laboratory flags can be viewed in the attached laboratory reports
A4-025-SB-7 A4-026-SB-1 A4-026-SB-10 A4-026-SB-5 A4-027-SB-1 A4-027-SB-5 A4-028-SB-1 A4-028-SB-5
14,300 16,700 N/A 19,500 16,200 10,000 28,600 14,1002.5 UJ 2.7 UJ N/A 2.1 UJ 2 UJ 2.8 UJ 2.7 UJ 2.9 UJ
2.7 2.9 J 4.7 4.3 J 1.4 J 25.5 2.2 UJ 2.4 J129 154 J N/A 98.2 J 125 202 348 J 40.6 J1.8 2 N/A 1 1.9 0.73 J 5.6 0.64 B
0.35 B 1.1 B N/A 0.46 B 0.26 B 8.9 0.54 B 1.5 U
511 184 N/A 25.4 1,070 603 79.8 45.71.1 U 1.1 U N/A 1.2 U 1.1 UJ 1.1 UJ 1.1 U 1.1 U
3.9 J 3.9 B N/A 6.7 0.93 B 26.9 2.9 B 3.7 B46.7 27 N/A 14.8 17 J 182 J 25.4 6.5
71,100 44,600 J N/A 20,700 J 145,000 153,000 34,300 J 26,900 J188 121 J N/A 32.8 J 2 1,500 79 J 12.7 J
6,580 5,740 J N/A 862 J 25,800 J 20,700 J 4,780 J 446 J0.027 J 0.099 U N/A 0.18 0.1 UJ 0.61 J 0.1 U 0.0065 J
27.1 15.5 N/A 12.7 12.6 73.2 11.1 8.5 B3.4 U 3.6 U N/A 2.8 U 1.9 J 3.7 U 3.5 U 3.9 U2.5 U 2.7 U N/A 2.1 U 0.81 B 2.4 B 2.7 U 2.9 U8.4 U 9.1 U N/A 7.1 U 6.6 UJ 9.4 UJ 8.9 U 9.8 U
357 460 J N/A 42.6 J 500 J 1,650 J 127 J 81.5 J
109 298 N/A 184 25.1 3,720 83.1 26.7
0.91 0.54 J N/A 0.66 U 0.52 U 4.7 0.24 J 0.62 U
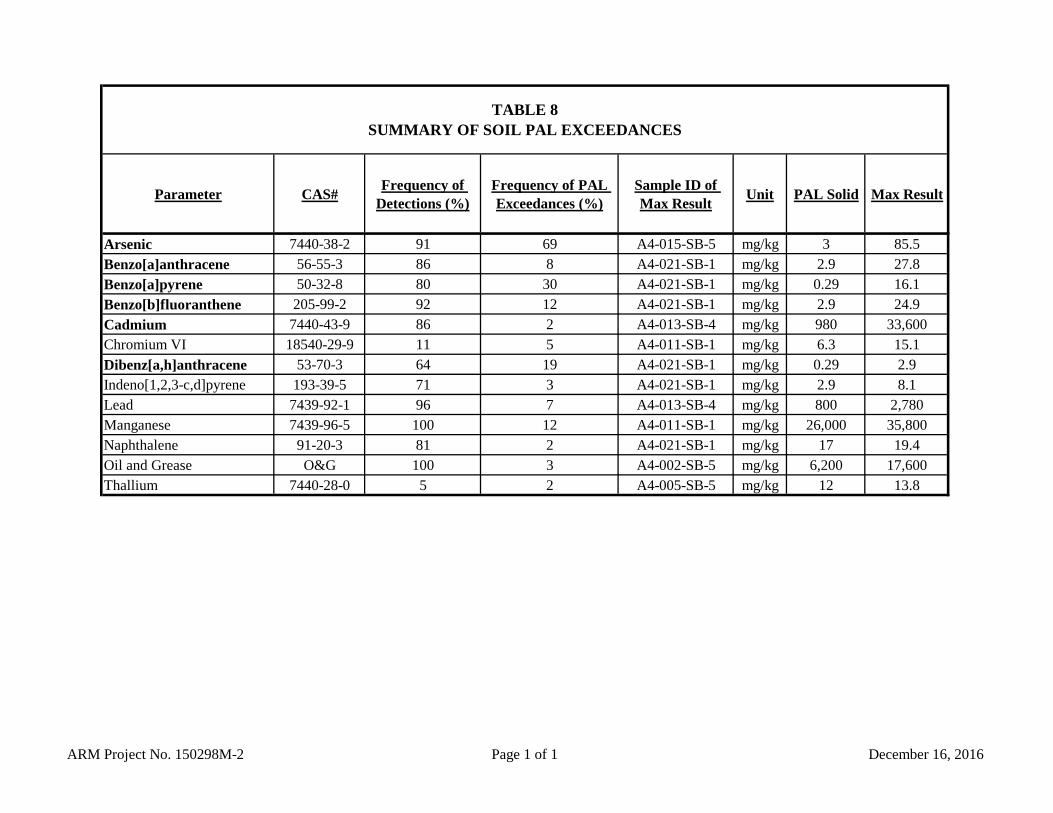
ARM Project No. 150298M-2 Page 1 of 1 December 16, 2016
Parameter CAS#Frequency of
Detections (%)Frequency of PAL Exceedances (%)
Sample ID of Max Result
Unit PAL Solid Max Result
Arsenic 7440-38-2 91 69 A4-015-SB-5 mg/kg 3 85.5
Benzo[a]anthracene 56-55-3 86 8 A4-021-SB-1 mg/kg 2.9 27.8
Benzo[a]pyrene 50-32-8 80 30 A4-021-SB-1 mg/kg 0.29 16.1
Benzo[b]fluoranthene 205-99-2 92 12 A4-021-SB-1 mg/kg 2.9 24.9
Cadmium 7440-43-9 86 2 A4-013-SB-4 mg/kg 980 33,600Chromium VI 18540-29-9 11 5 A4-011-SB-1 mg/kg 6.3 15.1
Dibenz[a,h]anthracene 53-70-3 64 19 A4-021-SB-1 mg/kg 0.29 2.9Indeno[1,2,3-c,d]pyrene 193-39-5 71 3 A4-021-SB-1 mg/kg 2.9 8.1Lead 7439-92-1 96 7 A4-013-SB-4 mg/kg 800 2,780Manganese 7439-96-5 100 12 A4-011-SB-1 mg/kg 26,000 35,800Naphthalene 91-20-3 81 2 A4-021-SB-1 mg/kg 17 19.4Oil and Grease O&G 100 3 A4-002-SB-5 mg/kg 6,200 17,600Thallium 7440-28-0 5 2 A4-005-SB-5 mg/kg 12 13.8
TABLE 8SUMMARY OF SOIL PAL EXCEEDANCES

ARM Project No. 150298M-2 Page 1 of 1 December 16, 2016
Target Feature Boring IDSample
Depth (ft)Parameter
PAL(mg/kg)
Result(mg/kg)
Final Flag
A4-002-SB 5 Lead 800 817
A4-002-SB 5 Oil and Grease 6,200 17,600
A4-003-SB 7.5 Arsenic 3 11.7
A4-004-SB 1 Arsenic 3 5.1
A4-004-SB 1 Chromium, Hexavalent 6.3 10.3
A4-004-SB 1 Manganese 26,000 31,900
A4-004-SB 5 Arsenic 3 3.6
A4-005-SB 1 Manganese 26,000 30,000 J
A4-005-SB 5 Arsenic 3 8.1 J
A4-005-SB 5 Benzo(a)anthracene 2.9 4.4
A4-005-SB 5 Benzo(a)pyrene 0.29 3.6
A4-005-SB 5 Benzo(b)fluoranthene 2.9 6.1
A4-005-SB 5 Dibenz(a,h)anthracene 0.29 0.81
A4-005-SB 5 Manganese 26,000 26,500 J
A4-005-SB 5 Thallium 12 13.8
A4-005-SB 10 Arsenic 3 5.9
A4-006-SB 1 Arsenic 3 4.3 J
A4-006-SB 1 Benzo(a)pyrene 0.29 1.7
A4-006-SB 1 Dibenz(a,h)anthracene 0.29 0.31
A4-006-SB 6 Arsenic 3 4.5 J
A4-006-SB 10 Arsenic 3 10.5
A4-007-SB 5 Arsenic 3 5
A4-007-SB 10 Arsenic 3 3.9
A4-008-SB 1 Oil and Grease 6,200 12,400
A4-008-SB 5 Arsenic 3 3.8
A4-008-SB 10 Arsenic 3 12.3
J = The positive result reported for this analyte is a quantitative estimate.
Hydraulic Oil Storage Area
Acid Storage Tanks
Waste Oil Tank
TABLE 9SOIL PAL EXCEEDANCES FOR SPECIFIC TARGETS
Pipe Mill Trenches/Sump

Table 10Summary of Organics Detected in Groundwater
Parcel A4Tradepoint Atlantic
Sparrows Point, Maryland
ARM Project No. 150298M-2 Page 1 of 1 December 16, 2016
Parameter Units PAL A4-001-PZ A4-005-PZ A4-007-PZ A4-010-PZ A4-012-PZ A4-013-PZ A4-014-PZ A4-019-PZ
Volatile Organic Compounds
Benzene µg/L 5 1 U 1 U 1 U 1 U 2.1 1 U 1 U 1 U
Ethhlbenzene µg/L 700 1 U 1 U 1 U 1 U 0.56 J 1 U 1 U 1 U
Toulene µg/L 1,000 1 U 1 U 1 U 1 U 1.6 0.31 J 1 U 1 U
Xylene µg/L 10,000 3 U 3 U 3 U 3 U 3.6 3 U 3 U 3 U
Semi-Volatile Organic Compounds *
1,1-Biphenyl µg/L 0.83 1 U 1 U 1 U 1 U 0.39 J 1 U 1 U 1 U
1,4-Dioxane µg/L 0.46 0.1 UJ 2.1 0.025 B 19.2 0.1 U 0.1 U 0.069 B 0.1 U
2,3,4,6-Tetrachlorophenol µg/L 240 1 U 1 U 1 U 1 U 0.33 J 1 U 1 U 1 U
2,4-Dimethylphenol µg/L 360 1 U 1 U 1 U 1 U 1.2 1 U 1 U 1 U
2-Methylnaphthalene µg/L 36 0.1 U 0.1 U 0.1 U 0.1 U 2.9 0.064 J 0.1 U 0.1 U
2-Methylphenol µg/L 930 1 U 1 U 1 U 1 U 0.3 J 1 U 1 U 1 U
3&4-Methylphenol(m&p Cresol) µg/L 930 2.1 U 2 U 2 U 2 U 1.4 J 2 U 2 U 2 U
Acenaphthene µg/L 530 0.1 U 0.1 U 0.1 U 0.1 U 2.3 0.056 J 0.1 U 0.1 U
Acenaphthylene µg/L 530 0.1 U 0.1 U 0.1 U 0.1 U 0.41 0.02 J 0.1 U 0.1 U
Anthracene µg/L 1,800 0.018 J 0.1 U 0.1 U 0.1 U 0.6 0.057 J 0.1 U 0.1 U
Benzo[a]anthracene µg/L 0.012 0.021 J 0.1 U 0.1 U 0.1 U 0.067 J 0.024 J 0.024 J 0.1 U
Benzo[a]pyrene µg/L 0.2 0.1 U 0.1 U 0.1 U 0.1 U 0.0082 J 0.0097 J 0.0098 J 0.1 U
Benzo[b]fluoranthene µg/L 0.034 0.1 U 0.1 U 0.1 U 0.1 U 0.026 J 0.1 U 0.016 J 0.1 U
Benzo[k]fluoranthene µg/L 0.34 0.1 U 0.1 U 0.1 U 0.1 U 0.023 J 0.1 U 0.1 U 0.1 U
bis(2-Ethylhexyl)phthalate µg/L 6 0.22 J 1 U 1 U 1 U 0.26 J 1 U 1 U 1 U
Carbazole µg/L 1 U 1 U 1 U 1 U 4.7 1 U 1 U 1 U
Chrysene µg/L 3.4 0.01 J 0.1 U 0.1 U 0.1 U 0.067 J 0.011 J 0.016 J 0.1 U
Fluoranthene µg/L 800 0.024 J 0.1 U 0.1 U 0.1 U 0.77 0.054 J 0.029 J 0.1 U
Fluorene µg/L 290 0.018 J 0.1 U 0.1 U 0.1 U 2.3 0.085 J 0.1 U 0.1 U
Naphthalene µg/L 0.17 0.063 J 0.038 B 0.064 B 0.061 B 63.9 0.28 0.034 B 0.028 BPentachlorophenol µg/L 1 2.6 U 2.5 U 2.5 U 2.5 U 2.6 2.5 U 2.5 U 2.5 U
Phenanthrene µg/L 0.044 J 0.1 U 0.1 U 0.1 U 4.4 0.17 0.032 J 0.1 U
Pyrene µg/L 120 0.018 J 0.1 U 0.1 U 0.1 U 0.51 0.047 J 0.024 J 0.1 U
TPH/Oil and Grease
Gasoline Range Organics µg/L 47 N/A N/A 1,560 J N/A N/A N/A N/A N/A
Oil and Grease µg/L 47 4,850 U 1,400 J 1,500 J 4,870 U 4,820 U 4,820 U 4,850 U 4,850 U
Detections in boldN/A indicates that the parameter was not analyzed for this sample
Values in red indicate an exceedance of the Project Action Limit (PAL)A glossary of laboratory flags can be viewed in the attached laboratory reports*PAH compounds were analyzed via sim

Table 11Summary of Inorganics Detected in Groundwater
Parcel A4Tradepoint Atlantic
Sparrows Point, Maryland
ARM Project No. 150298M-2 Page 1 of 1 December 16, 2016
Parameter Units PAL A4-001-PZ A4-005-PZ A4-007-PZ A4-010-PZ A4-012-PZ A4-013-PZ A4-014-PZ A4-019-PZ
MetalsAluminum, Dissolved µg/L 20,000 38.6 B 50 U 50 U 17.9 B 677 31.3 J 178 50 UArsenic, Dissolved µg/L 10 5 U 5 U 5 U 5 U 5 5 U 5 U 5 UBarium, Dissolved µg/L 2,000 37.8 91 89 146 38.1 29.2 19.4 107Beryllium, Dissolved µg/L 4 1 U 1 U 1 U 1 U 1 U 1 U 0.98 J 1 UCadmium, Dissolved µg/L 5 3 U 3 U 3 U 3 U 3 U 3 U 2.5 J 3 UChromium, Dissolved µg/L 100 2.4 B 1 B 0.81 B 1.2 B 1 B 0.91 B 1.9 B 5 UCobalt, Dissolved µg/L 6 5 U 5 U 5 U 41.8 5 U 5 U 243 5 UCopper, Dissolved µg/L 1,300 4.7 B 2.2 B 1.8 B 2 B 1.5 B 5 U 5 U 5 UIron, Dissolved µg/L 14,000 3,870 66,200 61,200 72,000 22.3 B 326 9,570 57,800Manganese, Dissolved µg/L 430 458 2,930 3,270 3,060 0.88 B 282 4,050 2,040Nickel, Dissolved µg/L 390 0.89 J 1.3 J 10 U 41.4 10 U 10 U 278 1 BSelenium, Dissolved µg/L 50 8 U 8 U 8 U 8 U 7.2 B 8 U 8 U 8 USilver, Dissolved µg/L 94 6 U 0.59 J 0.78 J 6 U 6 U 6 U 6 U 0.99 JVanadium, Dissolved µg/L 86 45.2 5 U 5 U 1.2 B 630 63.7 1.6 B 0.81 BZinc, Dissolved µg/L 6,000 8.3 B 11.2 0.89 B 59.8 10 U 10 U 307 0.96 JOtherCyanide µg/L 200 10 U 10 U 10 U 10 U 20.6 4.9 J 10 U 10 U
Detections in boldValues in red indicate an exceedance of the Project Action Limit (PAL)A glossary of laboratory flags can be viewed in the attached laboratory reports

Table 12Vapor Intrusion Criteria Comparison
ARM Project No. 150298-2 Page 1 of 1 December 16, 2016
Sample Location
ParameterResult (ug/L)
Final Flag
Target Groundwater Concentration (ug/L)
TCR=1E-05 or THQ=1
Exceeds Criteria
Comparison= Result Target
Toxicity Type
A4-012-PZ Cyanide 20.6 3.5 YES 5.89 NCA4-013-PZ Cyanide 4.9 J 3.5 YES 1.40 NC
NC indicates non-carcinogenicA glossary of laboratory flags can be viewed in the attached laboratory reports

Table 13Cumulative Vapor Intrusion Criteria Comparison
ARM Project No. 150298M-2 Page 1 of 1 December 19, 2016
Parameter Type Organ Systems A4-001-PZ A4-005-PZ A4-007-PZ A4-010-PZ A4-012-PZ A4-013-PZ A4-014-PZ A4-019-PZ
1,4-Dioxane SVOCHepatic; Nervous;
Respiratory; Urinary0 1.6E-10 1.9E-12 1.5E-09 0 0 5.3E-12 0
Naphthalene SVOC Nervous; Respiratory 3.2E-09 1.9E-09 3.2E-09 3.05E-09 3.2E-06 1.4E-08 1.7E-09 1.4E-09Benzene VOC Immune 0 0 0 0 3.0E-07 0 0 0
Ethylbenzene VOCDevelopmental; Hepatic; Urinary
0 0 0 0 3.7E-08 0 0 0
3E-09 2E-09 3E-09 5E-09 4E-06 1E-08 2E-09 1E-09
Cyanide Other None Specified 0 0 0 0 6 1 0 00 0 0 0 6 1 0 0
Values highlights in red indicate exceedances of the cumulative vapor intrusion criteria TCR > 1 E-05 THI > 1
Non-Cancerous Risk
Cancerous Risk
Cumulative Vapor Intrusion - Target Cancer Risk =
Cumulative Vapor Intrusion - Target Hazard Index =

Rejected Results for Soil
ARM Project No. 150298M
Parameter Result Units PAL Exceeds PAL? Flag
Parcel A4 - Table 14
A4-001-SB-1Sample:
1,4-Dioxane 0.11 mg/kg 24 no R
Benzaldehyde 0.073 mg/kg 120,000 no R
Bromomethane 0.0055 mg/kg 30 no R
Chloroethane 0.0055 mg/kg 57,000 no R
A4-001-SB-5Sample:
1,4-Dioxane 0.091 mg/kg 24 no R
Benzaldehyde 0.071 mg/kg 120,000 no R
Bromomethane 0.0046 mg/kg 30 no R
Chloroethane 0.0046 mg/kg 57,000 no R
A4-002-SB-1Sample:
1,4-Dioxane 0.1 mg/kg 24 no R
Benzaldehyde 0.075 mg/kg 120,000 no R
Bromomethane 0.0052 mg/kg 30 no R
Chloroethane 0.0052 mg/kg 57,000 no R
A4-002-SB-5Sample:
1,4-Dioxane 0.092 mg/kg 24 no R
Bromomethane 0.0046 mg/kg 30 no R
Chloroethane 0.0046 mg/kg 57,000 no R
A4-003-SB-1Sample:
1,4-Dioxane 0.089 mg/kg 24 no R
Bromomethane 0.0045 mg/kg 30 no R
Chloroethane 0.0045 mg/kg 57,000 no R
A4-003-SB-7.5Sample:
1,4-Dioxane 0.096 mg/kg 24 no R
Benzaldehyde 0.08 mg/kg 120,000 no R
5/17/2016 Page 1 of 11

Parameter Result Units PAL Exceeds PAL? Flag
Rejected Results for Soil
A4-003-SB-7.5Sample:
Bromomethane 0.0048 mg/kg 30 no R
Chloroethane 0.0048 mg/kg 57,000 no R
A4-004-SB-1Sample:
1,4-Dioxane 0.088 mg/kg 24 no R
2,3,4,6-Tetrachlorophenol 0.075 mg/kg 25,000 no R
2,4,5-Trichlorophenol 0.19 mg/kg 82,000 no R
2,4,6-Trichlorophenol 0.075 mg/kg 210 no R
2,4-Dichlorophenol 0.075 mg/kg 2,500 no R
2,4-Dimethylphenol 0.075 mg/kg 16,000 no R
2,4-Dinitrophenol 0.19 mg/kg 1,600 no R
2-Chlorophenol 0.075 mg/kg 5,800 no R
2-Methylphenol 0.075 mg/kg 41,000 no R
3&4-Methylphenol(m&p Cresol) 0.15 mg/kg 41,000 no R
Benzaldehyde 0.075 mg/kg 120,000 no R
Bromomethane 0.0044 mg/kg 30 no R
Chloroethane 0.0044 mg/kg 57,000 no R
Pentachlorophenol 0.19 mg/kg 4 no R
Phenol 0.075 mg/kg 250,000 no R
A4-004-SB-5Sample:
1,4-Dioxane 0.1 mg/kg 24 no R
Benzaldehyde 0.077 mg/kg 120,000 no R
Bromomethane 0.0051 mg/kg 30 no R
Chloroethane 0.0051 mg/kg 57,000 no R
A4-005-SB-1Sample:
1,4-Dioxane 0.096 mg/kg 24 no R
2,3,4,6-Tetrachlorophenol 0.074 mg/kg 25,000 no R
2,4,5-Trichlorophenol 0.19 mg/kg 82,000 no R
2,4,6-Trichlorophenol 0.074 mg/kg 210 no R
2,4-Dichlorophenol 0.074 mg/kg 2,500 no R
2,4-Dimethylphenol 0.074 mg/kg 16,000 no R
2,4-Dinitrophenol 0.19 mg/kg 1,600 no R
5/17/2016 Page 2 of 11

Parameter Result Units PAL Exceeds PAL? Flag
Rejected Results for Soil
A4-005-SB-1Sample:
2-Chlorophenol 0.074 mg/kg 5,800 no R
2-Methylphenol 0.074 mg/kg 41,000 no R
3&4-Methylphenol(m&p Cresol) 0.15 mg/kg 41,000 no R
Benzaldehyde 0.074 mg/kg 120,000 no R
Bromomethane 0.0048 mg/kg 30 no R
Pentachlorophenol 0.19 mg/kg 4 no R
Phenol 0.074 mg/kg 250,000 no R
A4-005-SB-5Sample:
1,4-Dioxane 0.1 mg/kg 24 no R
Bromomethane 0.0051 mg/kg 30 no R
A4-006-SB-1Sample:
1,4-Dioxane 0.097 mg/kg 24 no R
Benzaldehyde 0.075 mg/kg 120,000 no R
Bromomethane 0.0048 mg/kg 30 no R
A4-006-SB-6Sample:
1,4-Dioxane 0.093 mg/kg 24 no R
Benzaldehyde 0.075 mg/kg 120,000 no R
Bromomethane 0.0047 mg/kg 30 no R
A4-007-SB-1Sample:
Acetone 0.0091 mg/kg 670,000 no R
Benzaldehyde 0.075 mg/kg 120,000 no R
Methyl Acetate 0.046 mg/kg 1,200,000 no R
A4-007-SB-5Sample:
Benzaldehyde 0.083 mg/kg 120,000 no R
Methyl Acetate 0.055 mg/kg 1,200,000 no R
A4-008-SB-1Sample:
Acetone 0.0097 mg/kg 670,000 no R
Benzaldehyde 0.072 mg/kg 120,000 no R
5/17/2016 Page 3 of 11

Parameter Result Units PAL Exceeds PAL? Flag
Rejected Results for Soil
A4-008-SB-1Sample:
Methyl Acetate 0.048 mg/kg 1,200,000 no R
A4-008-SB-5Sample:
Acetone 0.0096 mg/kg 670,000 no R
Benzaldehyde 0.073 mg/kg 120,000 no R
Methyl Acetate 0.048 mg/kg 1,200,000 no R
A4-009-SB-1Sample:
Benzaldehyde 0.074 mg/kg 120,000 no R
Methyl Acetate 0.048 mg/kg 1,200,000 no R
A4-009-SB-5Sample:
Benzaldehyde 0.074 mg/kg 120,000 no R
Methyl Acetate 0.046 mg/kg 1,200,000 no R
A4-010-SB-1Sample:
Benzaldehyde 0.074 mg/kg 120,000 no R
Methyl Acetate 0.048 mg/kg 1,200,000 no R
A4-010-SB-5Sample:
Acetone 0.0096 mg/kg 670,000 no R
Benzaldehyde 0.074 mg/kg 120,000 no R
Methyl Acetate 0.048 mg/kg 1,200,000 no R
A4-011-SB-1Sample:
1,4-Dioxane 0.087 mg/kg 24 no R
2,3,4,6-Tetrachlorophenol 0.071 mg/kg 25,000 no R
2,4,5-Trichlorophenol 0.18 mg/kg 82,000 no R
2,4,6-Trichlorophenol 0.071 mg/kg 210 no R
2,4-Dichlorophenol 0.071 mg/kg 2,500 no R
2,4-Dimethylphenol 0.071 mg/kg 16,000 no R
2,4-Dinitrophenol 0.18 mg/kg 1,600 no R
2-Chlorophenol 0.071 mg/kg 5,800 no R
2-Methylphenol 0.071 mg/kg 41,000 no R
5/17/2016 Page 4 of 11

Parameter Result Units PAL Exceeds PAL? Flag
Rejected Results for Soil
A4-011-SB-1Sample:
3&4-Methylphenol(m&p Cresol) 0.14 mg/kg 41,000 no R
Benzaldehyde 0.071 mg/kg 120,000 no R
Bromomethane 0.0044 mg/kg 30 no R
Chloroethane 0.0044 mg/kg 57,000 no R
Pentachlorophenol 0.18 mg/kg 4 no R
Phenol 0.071 mg/kg 250,000 no R
A4-011-SB-5Sample:
1,4-Dioxane 0.12 mg/kg 24 no R
Bromomethane 0.0059 mg/kg 30 no R
Chloroethane 0.0059 mg/kg 57,000 no R
A4-012-SB-1Sample:
1,4-Dioxane 0.1 mg/kg 24 no R
Benzaldehyde 0.14 mg/kg 120,000 no R
Bromomethane 0.005 mg/kg 30 no R
A4-012-SB-5Sample:
1,4-Dioxane 0.1 mg/kg 24 no R
Bromomethane 0.0052 mg/kg 30 no R
A4-013-SB-1Sample:
1,4-Dioxane 0.17 mg/kg 24 no R
Benzaldehyde 0.075 mg/kg 120,000 no R
Bromomethane 0.0087 mg/kg 30 no R
A4-013-SB-4Sample:
1,4-Dioxane 0.14 mg/kg 24 no R
Benzaldehyde 0.073 mg/kg 120,000 no R
Bromomethane 0.007 mg/kg 30 no R
A4-014-SB-1Sample:
1,4-Dioxane 0.088 mg/kg 24 no R
Benzaldehyde 0.074 mg/kg 120,000 no R
5/17/2016 Page 5 of 11

Parameter Result Units PAL Exceeds PAL? Flag
Rejected Results for Soil
A4-014-SB-1Sample:
Bromomethane 0.0044 mg/kg 30 no R
A4-014-SB-7Sample:
1,4-Dioxane 0.1 mg/kg 24 no R
Benzaldehyde 0.08 mg/kg 120,000 no R
Bromomethane 0.005 mg/kg 30 no R
A4-015-SB-1Sample:
1,4-Dioxane 0.13 mg/kg 24 no R
Benzaldehyde 0.073 mg/kg 120,000 no R
Bromomethane 0.0063 mg/kg 30 no R
A4-015-SB-5Sample:
1,4-Dioxane 0.1 mg/kg 24 no R
Benzaldehyde 0.079 mg/kg 120,000 no R
Bromomethane 0.0052 mg/kg 30 no R
A4-016-SB-1Sample:
1,4-Dioxane 0.11 mg/kg 24 no R
Benzaldehyde 0.073 mg/kg 120,000 no R
Bromomethane 0.0054 mg/kg 30 no R
A4-016-SB-5Sample:
1,4-Dioxane 0.11 mg/kg 24 no R
Benzaldehyde 0.074 mg/kg 120,000 no R
Bromomethane 0.0057 mg/kg 30 no R
A4-017-SB-1Sample:
1,4-Dioxane 0.095 mg/kg 24 no R
Benzaldehyde 0.075 mg/kg 120,000 no R
Bromomethane 0.0047 mg/kg 30 no R
A4-017-SB-5Sample:
1,4-Dioxane 0.1 mg/kg 24 no R
5/17/2016 Page 6 of 11

Parameter Result Units PAL Exceeds PAL? Flag
Rejected Results for Soil
A4-017-SB-5Sample:
Benzaldehyde 0.081 mg/kg 120,000 no R
Bromomethane 0.0051 mg/kg 30 no R
A4-018-SB-1Sample:
Benzaldehyde 0.074 mg/kg 120,000 no R
Methyl Acetate 0.049 mg/kg 1,200,000 no R
A4-018-SB-5Sample:
Acetone 0.0099 mg/kg 670,000 no R
Benzaldehyde 0.081 mg/kg 120,000 no R
Methyl Acetate 0.05 mg/kg 1,200,000 no R
A4-019-SB-1Sample:
1,4-Dioxane 0.079 mg/kg 24 no R
Benzaldehyde 0.074 mg/kg 120,000 no R
Bromomethane 0.0039 mg/kg 30 no R
A4-019-SB-5Sample:
1,4-Dioxane 0.097 mg/kg 24 no R
Benzaldehyde 0.075 mg/kg 120,000 no R
Bromomethane 0.0049 mg/kg 30 no R
A4-020-SB-1Sample:
Benzaldehyde 0.071 mg/kg 120,000 no R
Methyl Acetate 0.044 mg/kg 1,200,000 no R
A4-020-SB-5Sample:
Acetone 0.0095 mg/kg 670,000 no R
Benzaldehyde 0.085 mg/kg 120,000 no R
Methyl Acetate 0.048 mg/kg 1,200,000 no R
A4-021-SB-1Sample:
1,4-Dioxane 0.11 mg/kg 24 no R
Benzaldehyde 0.075 mg/kg 120,000 no R
5/17/2016 Page 7 of 11

Parameter Result Units PAL Exceeds PAL? Flag
Rejected Results for Soil
A4-021-SB-1Sample:
Bromomethane 0.0055 mg/kg 30 no R
A4-021-SB-5Sample:
1,4-Dioxane 0.1 mg/kg 24 no R
Benzaldehyde 0.076 mg/kg 120,000 no R
Bromomethane 0.0051 mg/kg 30 no R
A4-022-SB-1Sample:
1,4-Dioxane 0.1 mg/kg 24 no R
Benzaldehyde 0.073 mg/kg 120,000 no R
Bromomethane 0.0051 mg/kg 30 no R
A4-022-SB-8Sample:
1,4-Dioxane 0.12 mg/kg 24 no R
Bromomethane 0.0059 mg/kg 30 no R
A4-023-SB-1Sample:
1,4-Dioxane 0.12 mg/kg 24 no R
Benzaldehyde 0.072 mg/kg 120,000 no R
Bromomethane 0.0058 mg/kg 30 no R
A4-023-SB-10Sample:
2,3,4,6-Tetrachlorophenol 0.078 mg/kg 25,000 no R
2,4,5-Trichlorophenol 0.2 mg/kg 82,000 no R
2,4,6-Trichlorophenol 0.078 mg/kg 210 no R
2,4-Dichlorophenol 0.078 mg/kg 2,500 no R
2,4-Dimethylphenol 0.078 mg/kg 16,000 no R
2,4-Dinitrophenol 0.2 mg/kg 1,600 no R
2-Chlorophenol 0.078 mg/kg 5,800 no R
2-Methylphenol 0.078 mg/kg 41,000 no R
3&4-Methylphenol(m&p Cresol) 0.16 mg/kg 41,000 no R
Pentachlorophenol 0.2 mg/kg 4 no R
Phenol 0.078 mg/kg 250,000 no R
5/17/2016 Page 8 of 11

Parameter Result Units PAL Exceeds PAL? Flag
Rejected Results for Soil
A4-023-SB-5Sample:
1,4-Dioxane 0.16 mg/kg 24 no R
Benzaldehyde 0.078 mg/kg 120,000 no R
Bromomethane 0.008 mg/kg 30 no R
A4-024-SB-1Sample:
1,4-Dioxane 0.086 mg/kg 24 no R
2,3,4,6-Tetrachlorophenol 0.074 mg/kg 25,000 no R
2,4,5-Trichlorophenol 0.18 mg/kg 82,000 no R
2,4,6-Trichlorophenol 0.074 mg/kg 210 no R
2,4-Dichlorophenol 0.074 mg/kg 2,500 no R
2,4-Dimethylphenol 0.074 mg/kg 16,000 no R
2,4-Dinitrophenol 0.18 mg/kg 1,600 no R
2-Chlorophenol 0.074 mg/kg 5,800 no R
2-Methylphenol 0.074 mg/kg 41,000 no R
3&4-Methylphenol(m&p Cresol) 0.15 mg/kg 41,000 no R
Benzaldehyde 0.074 mg/kg 120,000 no R
Bromomethane 0.0043 mg/kg 30 no R
Chloroethane 0.0043 mg/kg 57,000 no R
Pentachlorophenol 0.18 mg/kg 4 no R
Phenol 0.074 mg/kg 250,000 no R
A4-024-SB-5Sample:
1,4-Dioxane 0.11 mg/kg 24 no R
Benzaldehyde 0.072 mg/kg 120,000 no R
Bromomethane 0.0055 mg/kg 30 no R
Chloroethane 0.0055 mg/kg 57,000 no R
A4-025-SB-1Sample:
Benzaldehyde 0.072 mg/kg 120,000 no R
Methyl Acetate 0.046 mg/kg 1,200,000 no R
A4-025-SB-7Sample:
Acetone 0.01 mg/kg 670,000 no R
Benzaldehyde 0.082 mg/kg 120,000 no R
5/17/2016 Page 9 of 11

Parameter Result Units PAL Exceeds PAL? Flag
Rejected Results for Soil
A4-025-SB-7Sample:
Methyl Acetate 0.05 mg/kg 1,200,000 no R
A4-026-SB-1Sample:
1,4-Dioxane 0.1 mg/kg 24 no R
Benzaldehyde 0.072 mg/kg 120,000 no R
Bromomethane 0.0051 mg/kg 30 no R
A4-026-SB-5Sample:
1,4-Dioxane 0.1 mg/kg 24 no R
Benzaldehyde 0.074 mg/kg 120,000 no R
Bromomethane 0.0052 mg/kg 30 no R
A4-027-SB-1Sample:
1,4-Dioxane 0.081 mg/kg 24 no R
2,3,4,6-Tetrachlorophenol 0.074 mg/kg 25,000 no R
2,4,5-Trichlorophenol 0.18 mg/kg 82,000 no R
2,4,6-Trichlorophenol 0.074 mg/kg 210 no R
2,4-Dichlorophenol 0.074 mg/kg 2,500 no R
2,4-Dimethylphenol 0.074 mg/kg 16,000 no R
2,4-Dinitrophenol 0.18 mg/kg 1,600 no R
2-Chlorophenol 0.074 mg/kg 5,800 no R
2-Methylphenol 0.074 mg/kg 41,000 no R
3&4-Methylphenol(m&p Cresol) 0.15 mg/kg 41,000 no R
Benzaldehyde 0.074 mg/kg 120,000 no R
Bromomethane 0.0041 mg/kg 30 no R
Pentachlorophenol 0.18 mg/kg 4 no R
Phenol 0.074 mg/kg 250,000 no R
A4-027-SB-5Sample:
1,4-Dioxane 0.11 mg/kg 24 no R
2,3,4,6-Tetrachlorophenol 0.074 mg/kg 25,000 no R
2,4,5-Trichlorophenol 0.19 mg/kg 82,000 no R
2,4,6-Trichlorophenol 0.074 mg/kg 210 no R
2,4-Dichlorophenol 0.074 mg/kg 2,500 no R
5/17/2016 Page 10 of 11

Parameter Result Units PAL Exceeds PAL? Flag
Rejected Results for Soil
A4-027-SB-5Sample:
2,4-Dimethylphenol 0.074 mg/kg 16,000 no R
2,4-Dinitrophenol 0.19 mg/kg 1,600 no R
2-Chlorophenol 0.074 mg/kg 5,800 no R
2-Methylphenol 0.074 mg/kg 41,000 no R
3&4-Methylphenol(m&p Cresol) 0.15 mg/kg 41,000 no R
Bromomethane 0.0057 mg/kg 30 no R
Pentachlorophenol 0.19 mg/kg 4 no R
Phenol 0.074 mg/kg 250,000 no R
A4-028-SB-1Sample:
1,4-Dioxane 0.1 mg/kg 24 no R
Benzaldehyde 0.075 mg/kg 120,000 no R
Bromomethane 0.005 mg/kg 30 no R
A4-028-SB-5Sample:
1,4-Dioxane 0.095 mg/kg 24 no R
Benzaldehyde 0.077 mg/kg 120,000 no R
Bromomethane 0.0047 mg/kg 30 no R
5/17/2016 Page 11 of 11

Rejected Results for Groundwater
ARM Project No. 150298M
Parameter Result Units PAL Exceeds PAL? Flag
Parcel A4 - Table 15
A4-001-PZSample:
3,3'-Dichlorobenzidine 1 µg/L 0.12 YES R
A4-005-PZSample:
Acetone 10 µg/L 14,000 no R
Methyl Acetate 5 µg/L 20,000 no R
A4-007-PZSample:
Acetone 10 µg/L 14,000 no R
Methyl Acetate 5 µg/L 20,000 no R
A4-010-PZSample:
Acetone 10 µg/L 14,000 no R
Methyl Acetate 5 µg/L 20,000 no R
A4-012-PZSample:
Acetone 10 µg/L 14,000 no R
Methyl Acetate 5 µg/L 20,000 no R
A4-013-PZSample:
Acetone 10 µg/L 14,000 no R
Methyl Acetate 5 µg/L 20,000 no R
A4-014-PZSample:
Acetone 10 µg/L 14,000 no R
Methyl Acetate 5 µg/L 20,000 no R
A4-019-PZSample:
Acetone 10 µg/L 14,000 no R
Methyl Acetate 5 µg/L 20,000 no R
5/17/2016 Page 1 of 1

Table 16 - Parcel A4Development AreaAssessment of Lead
ARM Project No 150298-2 Page 1 of 1 December 16, 2016
Exposure Unit Surface/Sub-SurfaceArithmetic Mean
(mg/kg)
Surface 124.80Sub-Surface 275.27
Pooled 200.03
Soil Concentration (mg/kg)
Probability of Blood Concentration of 10 ug/dL
2,737 mg/kg 5%3,417 mg/kg 10%
Adult Lead Model (ALM) Risk Levels
Site-Wide (43.30 ac.)

ARM Project No. 150298M-2 Page 1 of 1 December 21, 2016
ParameterPAL
(mg/kg)EPC Type Site-Wide Exposure
Unit
EPC Site-Wide Exposure Unit
(mg/kg)
Arsenic 3.0095% GROS Adjusted Gamma
UCL5.66
Cadmium 98095% Chebyshev (Mean, Sd)
UCL1.75
Chromium VI 6.30 95% KM (t) UCL 3.49Cobalt 350 95% KM (Chebyshev) UCL 8.84Copper 47,000 95% Adjusted Gamma UCL 47.8Iron 820,000 95% Adjusted Gamma UCL 114,500Manganese 26,000 95% H-UCL 29,715Vanadium 5,800 95% Student's-t UCL 456Zinc 350,000 95% Adjusted Gamma UCL 347
Benzo[a]anthracene 2.9097.5% Chebyshev (Mean, Sd)
UCL7.59
Benzo[a]pyrene 0.29 99% KM (Chebyshev) UCL 6.76
Benzo[b]fluoranthene 2.9095% Chebyshev (Mean, Sd)
UCL5.54
Dibenz[a,h]anthracene 0.29 99% KM (Chebyshev) UCL 1.22Indeno[1,2,3-c,d]pyrene 2.90 99% KM (Chebyshev) UCL 3.37Naphthalene 17.0 99% KM (Chebyshev) UCL 7.63
Bold indicates UCL higher than PAL
Table 17 - Parcel A4 EPCs - Surface Soils

ARM Project No. 150298M-2 Page 1 of 1 December 21, 2016
ParameterPAL
(mg/kg)EPC Type Site-Wide Exposure
Unit
EPC Site-Wide Exposure Unit
(mg/kg)Arsenic 3.00 95% KM (Chebyshev) UCL 18.5Cadmium 980 99% KM (Chebyshev) UCL 13,230Chromium VI 6.30 Maximum Result 0.87Cobalt 350 95% H-UCL 16.0
Copper 47,000 95% Chebyshev (Mean, Sd) UCL 2,088
Iron 820,000 95% H-UCL 96,561Manganese 26,000 95% Adjusted Gamma UCL 9,901Thallium 12.0 95% KM (t) UCL 3.25
Vanadium 5,800 95% Chebyshev (Mean, Sd) UCL 1,828
Zinc 350,00097.5% Chebyshev (Mean, Sd)
UCL16,909
Benzo[a]anthracene 2.90 95% KM (Chebyshev) UCL 1.40Benzo[a]pyrene 0.29 95% KM (Chebyshev) UCL 1.69Benzo[b]fluoranthene 2.90 95% KM (Chebyshev) UCL 2.56
Dibenz[a,h]anthracene 0.2995% GROS Adjusted Gamma
UCL0.40
Indeno[1,2,3-c,d]pyrene 2.9095% GROS Adjusted Gamma
UCL1.09
Naphthalene 17.0 95% KM (Chebyshev) UCL 0.22
Bold indicates UCL higher than PAL
Table 18 - Parcel A4 EPCs - Sub-Surface Soils

ARM Project No. 150298M-2 Page 1 of 1 December 21, 2016
ParameterPAL
(mg/kg)EPC Type Site-Wide Exposure
Unit
EPC Site-Wide Exposure Unit
(mg/kg)Arsenic 3.00 95% KM (Chebyshev) UCL 12.9Cadmium 980 97.5% KM (Chebyshev) UCL 4,354
Chromium VI 6.3095% KM (Percentile Bootstrap)
UCL2.20
Cobalt 350 95% KM (Chebyshev) UCL 14.3
Copper 47,000 95% Chebyshev (Mean, Sd) UCL 1,062
Iron 820,000 95% Chebyshev (Mean, Sd) UCL 107,600
Manganese 26,000 95% Adjusted Gamma UCL 12,011Thallium 12.0 95% KM (t) UCL 3.25Vanadium 5,800 95% H-UCL 1,062
Zinc 350,000 95% Chebyshev (Mean, Sd) UCL 6,499
Benzo[a]anthracene 2.90 99% KM (Chebyshev) UCL 5.73Benzo[a]pyrene 0.29 97.5% KM (Chebyshev) UCL 2.67Benzo[b]fluoranthene 2.90 99% KM (Chebyshev) UCL 5.90Dibenz[a,h]anthracene 0.29 97.5% KM (Chebyshev) UCL 0.54
Indeno[1,2,3-c,d]pyrene 2.90 97.5% KM (Chebyshev) UCL 1.49
Naphthalene 17.0 97.5% KM (Chebyshev) UCL 2.45
Bold indicates UCL higher than PAL
Table 19 - Parcel A4 EPCs - Pooled Soils

Table 20 - Parcel A4Surface Soils
Composite Worker Risk Ratios
ARM Project No. 150298M-2 Page 1 of 1 December 16, 2016
Parameter Target Organs Cancer Non-Cancer Risk HQ
Arsenic Cardiovascular; Dermal 5.66 3.0 480 1.9E-06 0.01Cadmium Urinary 1.75 9,300 980 1.9E-10 0.002Chromium VI Respiratory 3.49 6.3 3,500 5.5E-07 0.001Cobalt None Specified 8.84 1,900 350 4.7E-09 0.03Copper None Specified 47.78 47,000 0.001Iron None Specified 114,500 820,000 0.1
Manganese Nervous 29,715 26,000 1
Vanadium Dermal 456 5,800 0.08
Zinc Hematologic; Immune 347 350,000 0.001
Benzo(a)anthracene 7.59 2.9 2.6E-06
Benzo(a)pyrene 6.76 0.29 2.3E-05
Benzo(b)fluoranthene 5.54 2.9 1.9E-06
Dibenz(a,h)anthracene 1.22 0.29 4.2E-06
Indeno(1,2,3-cd)pyrene 3.37 2.9 1.2E-06
Naphthalene Nervous; Respiratory 7.63 17 590 4.5E-07 0.01
4E-05 ↓
Cardiovascular 0Dermal 0Urinary 0Respiratory 0Nervous 1Hematologic 0Immune 0None Specified 0
Site-Wide Exposure Unit (43.30 ac.)Composite Worker
EPC (mg/kg)
Total HI
RSLs (mg/kg) Risk Ratios
RSLs were obtained from the EPA Regional Screening Levels at https://www.epa.gov/risk/regional-screening-levels-rsls-generic-tables-may-2016

Table 21 - Parcel A4Sub-Surface Soils
Composite Worker Risk Ratios
ARM Project No. 150298M-2 Page 1 of 1 December 16, 2016
Parameter Target Organs Cancer Non-Cancer Risk HQ
Arsenic Cardiovascular; Dermal 18.5 3.0 480 6.2E-06 0.04Cadmium Urinary 13,230 9,300 980 1.4E-06 14Chromium VI Respiratory 0.87 6.3 3,500 1.4E-07 0.0002Cobalt None Specified 16.0 1,900 350 8.4E-09 0.05Copper None Specified 2,088 47,000 0.04Iron None Specified 96,561 820,000 0.1
Manganese Nervous 9,901 26,000 0.4
Thallium None Specified 3.25 12 0.3
Vanadium Dermal 1,828 5,800 0.3
Zinc Hematologic; Immune 16,909 350,000 0.05
Benzo(a)anthracene 1.40 2.9 4.8E-07
Benzo(a)pyrene 1.69 0.29 5.8E-06
Benzo(b)fluoranthene 2.56 2.9 8.8E-07
Dibenz(a,h)anthracene 0.40 0.29 1.4E-06
Indeno(1,2,3-cd)pyrene 1.09 2.9 3.7E-07
Naphthalene Nervous; Respiratory 0.22 17 590 1.3E-08 0.0004
2E-05 ↓
Bold indicates maximum result Cardiovascular 0Dermal 0Urinary 14Respiratory 0Nervous 0Hematologic 0Immune 0None Specified 0
Site-Wide Exposure Unit (43.30 ac.)Composite Worker
RSLs were obtained from the EPA Regional Screening Levels at https://www.epa.gov/risk/regional-screening-levels-rsls-generic-tables-may-2016
EPC (mg/kg)
Total HI
RSLs (mg/kg) Risk Ratios

Table 22 - Parcel A4Pooled Soils
Composite Worker Risk Ratios
ARM Project No. 150298M-2 Page 1 of 1 December 16, 2016
Parameter Target Organs Cancer Non-Cancer Risk HQ
Arsenic Cardiovascular; Dermal 12.9 3.0 480 4.3E-06 0.03Cadmium Urinary 4,354 9,300 980 4.7E-07 4Chromium VI Respiratory 2.20 6.3 3,500 3.5E-07 0.001Cobalt None Specified 14.3 1,900 350 7.5E-09 0.04Copper None Specified 1,062 47,000 0.02Iron None Specified 107,600 820,000 0.1
Manganese Nervous 12,011 26,000 0.5
Thallium None Specified 3.25 12 0.3
Vanadium Dermal 1,062 5,800 0.2
Zinc Hematologic; Immune 6,499 350,000 0.02
Benzo(a)anthracene 5.73 2.9 2.0E-06
Benzo(a)pyrene 2.67 0.29 9.2E-06
Benzo(b)fluoranthene 5.90 2.9 2.0E-06
Dibenz(a,h)anthracene 0.54 0.29 1.9E-06
Indeno(1,2,3-cd)pyrene 1.49 2.9 5.1E-07
Naphthalene Nervous; Respiratory 2.45 17 590 1.4E-07 0.004
2E-05 ↓
Cardiovascular 0Dermal 0Urinary 4Respiratory 0Nervous 0Hematologic 0Immune 0None Specified 0
Site-Wide Exposure Unit (43.30 ac.)Composite Worker
RSLs were obtained from the EPA Regional Screening Levels at https://www.epa.gov/risk/regional-screening-levels-rsls-generic-tables-may-2016
EPC (mg/kg)
Total HI
RSLs (mg/kg) Risk Ratios
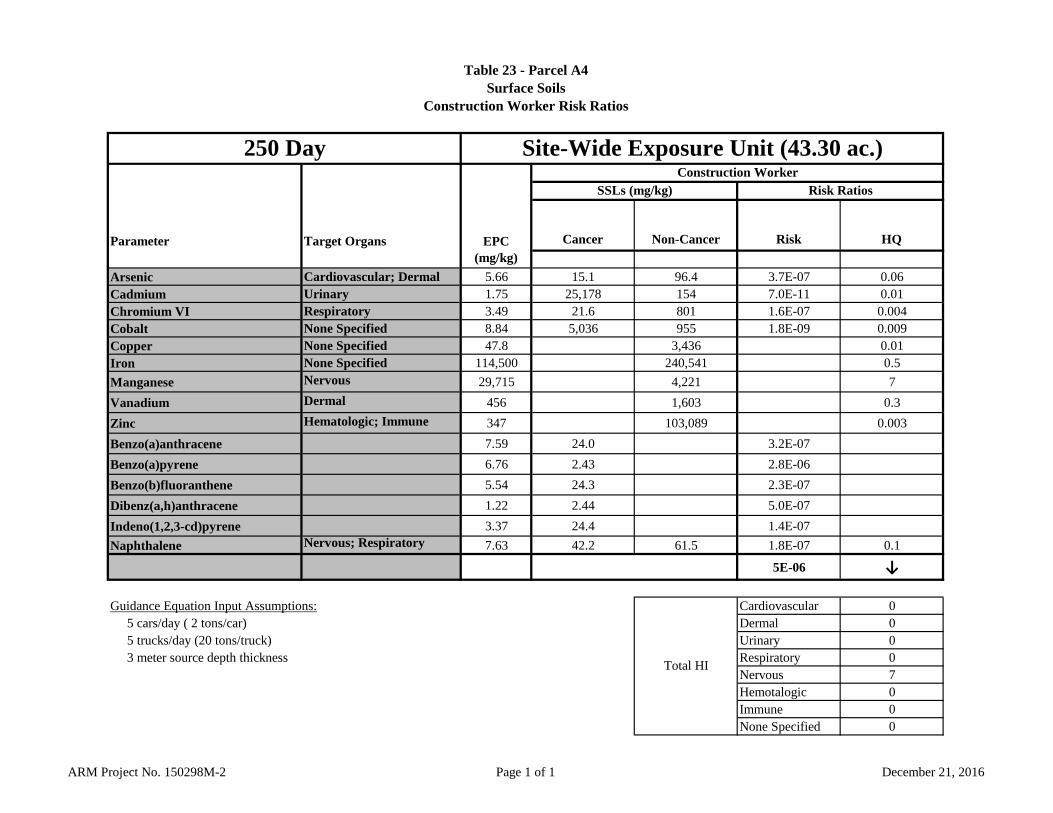
Table 23 - Parcel A4Surface Soils
Construction Worker Risk Ratios
ARM Project No. 150298M-2 Page 1 of 1 December 21, 2016
Parameter Target Organs Cancer Non-Cancer Risk HQ
Arsenic Cardiovascular; Dermal 5.66 15.1 96.4 3.7E-07 0.06Cadmium Urinary 1.75 25,178 154 7.0E-11 0.01Chromium VI Respiratory 3.49 21.6 801 1.6E-07 0.004Cobalt None Specified 8.84 5,036 955 1.8E-09 0.009Copper None Specified 47.8 3,436 0.01Iron None Specified 114,500 240,541 0.5
Manganese Nervous 29,715 4,221 7
Vanadium Dermal 456 1,603 0.3
Zinc Hematologic; Immune 347 103,089 0.003
Benzo(a)anthracene 7.59 24.0 3.2E-07
Benzo(a)pyrene 6.76 2.43 2.8E-06
Benzo(b)fluoranthene 5.54 24.3 2.3E-07
Dibenz(a,h)anthracene 1.22 2.44 5.0E-07
Indeno(1,2,3-cd)pyrene 3.37 24.4 1.4E-07
Naphthalene Nervous; Respiratory 7.63 42.2 61.5 1.8E-07 0.1
5E-06 ↓
Guidance Equation Input Assumptions: Cardiovascular 0 5 cars/day ( 2 tons/car) Dermal 0 5 trucks/day (20 tons/truck) Urinary 0 3 meter source depth thickness Respiratory 0
Nervous 7Hemotalogic 0Immune 0None Specified 0
250 Day Site-Wide Exposure Unit (43.30 ac.)
EPC (mg/kg)
Total HI
Construction WorkerSSLs (mg/kg) Risk Ratios

Table 24 - Parcel A4Sub-Surface Soils
Construction Worker Risk Ratios
ARM Project No. 150298M-2 Page 1 of 1 December 21, 2016
Parameter Target Organs Cancer Non-Cancer Risk HQ
Arsenic Cardiovascular; Dermal 18.5 15.1 96.4 1.2E-06 0.2Cadmium Urinary 13,230 25,178 154 5.3E-07 86Chromium VI Respiratory 0.87 21.6 801 4.0E-08 0.001Cobalt None Specified 16.0 5,036 955 3.2E-09 0.02Copper None Specified 2,088 3,436 0.6Iron None Specified 96,561 240,541 0.4
Manganese Nervous 9,901 4,221 2
Thallium None Specified 3.25 13.7 0.2
Vanadium Dermal 1,828 1,603 1
Zinc Hematologic; Immune 16,909 103,089 0.2
Benzo(a)anthracene 1.40 24.0 5.8E-08
Benzo(a)pyrene 1.69 2.43 7.0E-07
Benzo(b)fluoranthene 2.56 24.3 1.1E-07
Dibenz(a,h)anthracene 0.40 2.44 1.6E-07
Indeno(1,2,3-cd)pyrene 1.09 24.4 4.5E-08
Naphthalene Nervous; Respiratory 0.22 42.2 61.5 5.3E-09 0.004
3E-06 ↓
Bold indicates max value Cardiovascular 0Guidance Equation Input Assumptions: Dermal 1 5 cars/day ( 2 tons/car) Urinary 86 5 trucks/day (20 tons/truck) Respiratory 0 3 meter source depth thickness Nervous 2
Hemotalogic 0Immune 0None Specified 1
250 Day Site-Wide Exposure Unit (43.30 ac.)
EPC (mg/kg)
Total HI
Construction WorkerSSLs (mg/kg) Risk Ratios

Table 25 - Parcel A4Pooled Soils
Construction Worker Risk Ratios
ARM Project No. 150298M-2 Page 1 of 1 December 21, 2016
Parameter Target Organs Cancer Non-Cancer Risk HQ
Arsenic Cardiovascular; Dermal 12.9 15.1 96.4 8.6E-07 0.1Cadmium Urinary 4,354 25,178 154 1.7E-07 28Chromium VI Respiratory 2.20 21.6 801 1.0E-07 0.003Cobalt None Specified 14.3 5,036 955 2.8E-09 0.01Copper None Specified 1,062 3,436 0.3Iron None Specified 107,600 240,541 0.4
Manganese Nervous 12,011 4,221 3
Thallium None Specified 3.25 13.7 0.2
Vanadium Dermal 1,062 1,603 0.7
Zinc Hematologic; Immune 6,499 103,089 0.06
Benzo(a)anthracene 5.73 24.0 2.4E-07
Benzo(a)pyrene 2.67 2.43 1.1E-06
Benzo(b)fluoranthene 5.90 24.3 2.4E-07
Dibenz(a,h)anthracene 0.54 2.44 2.2E-07
Indeno(1,2,3-cd)pyrene 1.49 24.4 6.1E-08
Naphthalene Nervous; Respiratory 2.45 42.2 61.5 5.8E-08 0.04
3E-06 ↓
Guidance Equation Input Assumptions: Cardiovascular 0 5 cars/day ( 2 tons/car) Dermal 1 5 trucks/day (20 tons/truck) Urinary 28 3 meter source depth thickness Respiratory 0
Nervous 3Hemotalogic 0Immune 0None Specified 1
250 Day Site-Wide Exposure Unit (43.30 ac.)
EPC (mg/kg)
Total HI
Construction WorkerSSLs (mg/kg) Risk Ratios

APPENDIX A

9 1 7 5 G u i l f o r d R o a d • S u i t e 3 1 0 • C o l u m b i a , M D • 2 1 0 4 6 v o i c e: (4 1 0) 2 9 0 - 7 7 7 5 • f a x : (4 1 0) 2 9 0 - 7 7 7 6 • e - m a i l : i n f o @ a r m g r o u p . n e t
April 13, 2015
Ms. Barbara Brown Project Coordinator Maryland Department of the Environment 1800 Washington Boulevard. Baltimore, Maryland 21230-1719
Re: Building Occupancy Assessment New Cold Mill Complex Sparrows Point Terminal Property Sparrows Point, Maryland ARM Project M14152
Dear Ms. Brown: ARM Group, Inc. (ARM), on behalf of EnviroAnalytics Group (EAG), recently completed a Building Occupancy Assessment (BOA) of the New Cold Mill Complex (NCMC) located on the Sparrows Point Terminal, LLC (SPT) property, in Sparrows Point, Maryland. The BOA was completed in accordance with the MDE-approved Work Plan dated March 10, 2015. As SPT is seeking to put the NCMC back into commercial use, the BOA was performed to verify that the current conditions within and below the NCMC would not pose a potential unacceptable risk to commercial workers occupying the NCMC. The NCMC is located south of Bethlehem Boulevard on the northwest portion of the Sparrows Point Terminal property (the Site). The southeastern portion of the building consists of primarily warehouse space, while the remainder of the building, aside from a small area used as office space, was used for the production of light, flat-rolled sheet steel. The area immediately surrounding the building is paved with asphalt or concrete. The anticipated use of the NCMC would be warehouse/manufacturing/logistics with workers utilizing the warehouse and office space. The exterior of the building would be used only for worker parking and truck traffic. Background The fully-automated NCMC produced light, flat-rolled sheet steel from hot-rolled steel; which was supplied from Sparrows Point's hot strip mill. The cold-rolled products from Sparrows Point were used in containers, tubing, machinery, storage tanks, automotive parts, metal furniture, electrical lighting equipment and hardware.

Building Occupancy Assessment 2 April 13, 2015 New Cold Mill Complex ARM Project: M14152
The NCMC, which replaced the old cold mill, housed an in-line continuous pickler, which cleaned steel prior to rolling. The pickler was linked to a sheet steel cold reduction section that consisted of a five-stand tandem mill. Additionally, the NCMC contained a hydrogen batch annealing facility, a combination skin pass mill and tension leveling line, a coil build-up and inspection line, a packaging line, cranes, storage areas and offices. According to the Phase I Environmental Site Assessment (ESA) prepared by Weaver Boos Consultants, dated May 19, 2014, no recognized environmental conditions were identified directly associated with the NCMC. Based on conversations with Weaver Boos consultants, while petroleum products in metal secondary containment and petroleum/chemical storage containers were observed, they and their secondary containment appeared to be in good condition during their site visit and were therefore not identified as recognized environmental conditions. As part of the Work Plan development process, ARM and EAG conducted a walkthrough inspection of the NCMC on February 13, 2015. During the walk through inspection ARM observed the NCMC to be inactive, and the equipment within the NCMC being decommissioned and prepared for removal from the property. The following observations of petroleum use were made during the inspection:
An oil skimmer associated with the cooling water sumps was present along the northern wall of the complex;
an air compressor room was present in the northwest corner of the building with oil stained floors and floor drains;
a bulk oil storage room, located south of the compressor room, contained two large tanks surrounded by concrete containment; and
multiple collection trenches and depressed floor areas throughout the NCMC were noted to contain what appeared to be oil or hydraulic fluid.
Areas of interest observed during the walkthrough and subsequently targeted by the sub-slab soil gas sampling, are provided on Figure 1 (attached), and the sub-slab soil gas sample locations are provided on Figure 2 (attached). Soil Gas Investigation To determine if historical on-site activities have negatively impacted the soil or groundwater beneath the NCMC, and to determine if there is a potentially unacceptable risk associated with the vapor intrusion to indoor air risk pathway, a total of 19 sub-slab soil gas samples were

Building Occupancy Assessment 3 April 13, 2015 New Cold Mill Complex ARM Project: M14152
collected utilizing temporary soil gas monitoring probes at each of the following locations (which are also provided on Figure 2):
one sample from within the Oil Compressor Room;
one sample from within the Bulk Oil Storage Room;
one sample adjacent to the oil skimmer associated with the cooling water sumps along the northern wall of the complex;
multiple samples associated with the collection trenches and depressed floor areas observed throughout the NCMC where oil or hydraulic fluid were noted; and
multiple samples throughout the remainder of the building; which were collected to provide an overall sample density of one sample per 40,000 square feet.
To facilitate the collection of each sub-slab soil gas sample, a core-drill was used to create a pilot-hole approximately three-inches in diameter that extended through the concrete floor. The borehole was then extended through the subgrade and into the soil to a final depth of at least eight inches below the bottom of the concrete floor slab. A six inch soil gas implant, constructed of double woven stainless steel wire screen, was then attached to an appropriate length of polyethylene tubing and lowered to the bottom of the borehole. Once the implant and tubing were installed, the tubing was capped with a three-way valve, and clean sand was added around the implant to create a permeable layer that extended at least two inches above the implant. Bentonite was then added and hydrated to create a seal above the sand pack that extended to the surface. Once installed, each sub-slab soil gas monitoring probe was allowed to equilibrate for at least 24 hours. Prior to sampling, a syringe was attached to the three-way valve and three purge volumes of air were removed. After the probe had been purged of any ambient air, an evacuated stainless steel canister (summa canisters) with a flow restrictor set for a 24-hour intake time was attached to the tubing. The soil gas sample was then collected over a period of twenty-four (24) hours. At the completion of the sampling period, the valve of the summa canister was closed, and an identification tag was attached to the canister. The probes were then removed, the borehole filled, and the surface repaired. Laboratory Analysis EAG contracted Pace Analytical Services, Inc. (PACE) of Greensburg, Pennsylvania to perform the laboratory analysis for this project. The sub-slab soil gas samples were analyzed for Volatile Organic Compounds (VOCs) via USEPA Method TO-15. All sub-slab soil gas samples that were submitted to the laboratory were accompanied by a Chain of Custody (CoC) form.

Building Occupancy Assessment 4 April 13, 2015 New Cold Mill Complex ARM Project: M14152
The laboratory results for the detected compounds have been summarized on Table 1 (attached), and compared to the MDE Tier 1 and Tier 2 Commercial Target Soil Gas Levels provided on “Table 2 – Commercial Ambient Air” from the MDE’s Vapor Intrusion Fact Sheet (September 2012). The laboratory reports showing results for all analyses have been included as Attachment 1. Data Validation The data provided in this report has not undergone a full EPA level 2B verification/validation review. Once the Data Validation Report (DVR) is provided to ARM, this report will be appended. Summary of Results As provided on Table 1:
there were no exceedances of the MDE’s Tier 1 or Tier 2 Commercial Target Soil Gas Levels identified in any of the sub-slab soil gas samples submitted for analysis;
detectable but insignificant levels of petroleum hydrocarbon vapors (e.g. BTEX) were identified in each sample submitted for analysis; and
detectable but insignificant levels of acetone, 2-butanone (MEK), carbon disulfide and chloroform, which are all common laboratory contaminants, were identified in each sample submitted for analysis.
Conclusions The objective of this Building Occupancy Assessment (BOA) was to evaluate the potential for current conditions within and below the New Cold Mill Complex (NCMC) to cause an unacceptable risk to commercial workers occupying the NCMC. The anticipated use of the NCMC would be warehouse/manufacturing/logistics with workers utilizing the warehouse space and office space. The exterior of the building would be used only for worker parking and truck traffic. Areas outside of the building to be used by commercial workers for parking, and ingress and egress to the building are paved with asphalt and concrete. Therefore, direct contact with the soil outside of the building, and potential exposure by dermal contact or incidental ingestion or by inhalation of vapors in an excavation, are not pathways of concern. The building is served by public water and there is no groundwater use on site. Therefore, exposure to groundwater is not a potential concern.

Building Occupancy Assessment 5 April 13, 2015 New Cold Mill Complex ARM Project: M14152
Compounds identified in the sub-slab soil gas samples collected from the locations identified on Figure 1 were all below the MDE’s Tier 1 and Tier 2 Commercial Target Soil Gas Levels; therefore, there is not an unacceptable risk to the health of a commercial worker. As no unacceptable risk to human health was identified during this BOA, the current conditions within and below the NCMC would not pose a potential unacceptable risk to commercial workers. We therefore believe the building is suitable for immediate occupancy. If you have any questions or require additional information please do not hesitate to contact the undersigned at 410-290-7775. Thank you very much.
Respectfully Submitted,
ARM Group Inc.
Eric S. Magdar Senior Geologist
Attachments: Figure 1 Figure 2 Table 1 Attachment 1 cc: Andrew Fan, EPA Region III

FIGURES

ASTAST
Trenches
Oil Skimmer
Compressor Room
Depressed floor area
Depressed floor area
Depressed floor area with AST
q
0 100 20050Feet

Legend
@ASub-Slab Soil GasSample Location
q
0 100 20050Feet

TABLES

Building Occupancy Assessment -New Cold Mill ComplexSub-Slab Soil Gas - Detection and Exceedance Report
Samples Collected - March 20, 2015
ARM Project No. M14152
Parameter Result Unit MDE Tier I Exceeds Tier I? MDE Tier II Exceeds Tier II?
Sample: AA100-SG
2‐Butanone (MEK) 3.80 µg/m3 2,200,000 No 11,000,000 No
Acetone 33.00 µg/m3 14,000,000 No 70,000,000 No
Benzene 3.70 µg/m3 1,600 No 8,000 No
Bromodichloromethane 1.80 µg/m3 340 No 1,700 No
Carbon disulfide 31.80 µg/m3 310,000 No 1,550,000 No
Chloroform 13.30 µg/m3 540 No 2,700 No
Ethylbenzene 1.60 µg/m3 5,000 No 25,000 No
m&p‐xylene 5.60 µg/m3 44,000 No 220,000 No
o‐xylene 2.30 µg/m3 44,000 No 220,000 No
Styrene 1.10 µg/m3 440,000 No 2,200,000 No
Toluene 8.40 µg/m3 2,200,000 No 11,000,000 No
Page 1 of 13April 09, 2015
Sub‐Slab Soil Gas Detection and Exceedance Report

Parameter Result Unit MDE Tier I Exceeds Tier I? MDE Tier II Exceeds Tier II?
Sample: AA101-SG
2‐Butanone (MEK) 4.10 µg/m3 2,200,000 No 11,000,000 No
Acetone 52.30 µg/m3 14,000,000 No 70,000,000 No
Benzene 3.60 µg/m3 1,600 No 8,000 No
Bromodichloromethane 1.90 µg/m3 340 No 1,700 No
Carbon disulfide 28.40 µg/m3 310,000 No 1,550,000 No
Chloroform 23.30 µg/m3 540 No 2,700 No
m&p‐xylene 3.80 µg/m3 44,000 No 220,000 No
o‐xylene 1.60 µg/m3 44,000 No 220,000 No
Toluene 6.00 µg/m3 2,200,000 No 11,000,000 No
Sample: AA102-SG
2‐Butanone (MEK) 3.30 µg/m3 2,200,000 No 11,000,000 No
Acetone 33.00 µg/m3 14,000,000 No 70,000,000 No
Benzene 1.60 µg/m3 1,600 No 8,000 No
Carbon disulfide 4.60 µg/m3 310,000 No 1,550,000 No
Chloroform 15.30 µg/m3 540 No 2,700 No
m&p‐xylene 4.30 µg/m3 44,000 No 220,000 No
o‐xylene 1.80 µg/m3 44,000 No 220,000 No
Toluene 5.20 µg/m3 2,200,000 No 11,000,000 No
Page 2 of 13April 09, 2015
Sub‐Slab Soil Gas Detection and Exceedance Report

Parameter Result Unit MDE Tier I Exceeds Tier I? MDE Tier II Exceeds Tier II?
Sample: AA103-SG
2‐Butanone (MEK) 3.00 µg/m3 2,200,000 No 11,000,000 No
Acetone 38.60 µg/m3 14,000,000 No 70,000,000 No
Benzene 1.00 µg/m3 1,600 No 8,000 No
Carbon disulfide 8.50 µg/m3 310,000 No 1,550,000 No
Chloroform 3.60 µg/m3 540 No 2,700 No
m&p‐xylene 3.50 µg/m3 44,000 No 220,000 No
o‐xylene 1.60 µg/m3 44,000 No 220,000 No
Toluene 3.70 µg/m3 2,200,000 No 11,000,000 No
Page 3 of 13April 09, 2015
Sub‐Slab Soil Gas Detection and Exceedance Report

Parameter Result Unit MDE Tier I Exceeds Tier I? MDE Tier II Exceeds Tier II?
Sample: AA104-SG
1,1‐Dichloroethane 5.40 µg/m3 7,700 No 38,500 No
2‐Butanone (MEK) 4.30 µg/m3 2,200,000 No 11,000,000 No
Acetone 33.70 µg/m3 14,000,000 No 70,000,000 No
Benzene 8.90 µg/m3 1,600 No 8,000 No
Carbon disulfide 174.00 µg/m3 310,000 No 1,550,000 No
Chloroethane 1.50 µg/m3 4,400,000 No 22,000,000 No
Chloroform 54.70 µg/m3 540 No 2,700 No
Chloromethane 10.90 µg/m3 40,000 No 200,000 No
Ethylbenzene 2.60 µg/m3 5,000 No 25,000 No
m&p‐xylene 9.20 µg/m3 44,000 No 220,000 No
o‐xylene 3.50 µg/m3 44,000 No 220,000 No
Toluene 9.30 µg/m3 2,200,000 No 11,000,000 No
Page 4 of 13April 09, 2015
Sub‐Slab Soil Gas Detection and Exceedance Report

Parameter Result Unit MDE Tier I Exceeds Tier I? MDE Tier II Exceeds Tier II?
Sample: AA105-SG
2‐Butanone (MEK) 4.20 µg/m3 2,200,000 No 11,000,000 No
Acetone 91.50 µg/m3 14,000,000 No 70,000,000 No
Benzene 7.10 µg/m3 1,600 No 8,000 No
Bromodichloromethane 3.50 µg/m3 340 No 1,700 No
Carbon disulfide 21.20 µg/m3 310,000 No 1,550,000 No
Chloroform 49.10 µg/m3 540 No 2,700 No
Ethylbenzene 1.70 µg/m3 5,000 No 25,000 No
m&p‐xylene 7.00 µg/m3 44,000 No 220,000 No
o‐xylene 2.70 µg/m3 44,000 No 220,000 No
Toluene 14.20 µg/m3 2,200,000 No 11,000,000 No
Page 5 of 13April 09, 2015
Sub‐Slab Soil Gas Detection and Exceedance Report

Parameter Result Unit MDE Tier I Exceeds Tier I? MDE Tier II Exceeds Tier II?
Sample: AA106-SG
2‐Butanone (MEK) 3.30 µg/m3 2,200,000 No 11,000,000 No
Acetone 25.40 µg/m3 14,000,000 No 70,000,000 No
Benzene 1.80 µg/m3 1,600 No 8,000 No
Bromodichloromethane 2.50 µg/m3 340 No 1,700 No
Carbon disulfide 16.20 µg/m3 310,000 No 1,550,000 No
Chloroform 24.90 µg/m3 540 No 2,700 No
Ethylbenzene 1.70 µg/m3 5,000 No 25,000 No
m&p‐xylene 6.50 µg/m3 44,000 No 220,000 No
o‐xylene 2.60 µg/m3 44,000 No 220,000 No
Toluene 6.90 µg/m3 2,200,000 No 11,000,000 No
Page 6 of 13April 09, 2015
Sub‐Slab Soil Gas Detection and Exceedance Report

Parameter Result Unit MDE Tier I Exceeds Tier I? MDE Tier II Exceeds Tier II?
Sample: AA107-SG
2‐Butanone (MEK) 2.10 µg/m3 2,200,000 No 11,000,000 No
Acetone 40.70 µg/m3 14,000,000 No 70,000,000 No
Benzene 1.70 µg/m3 1,600 No 8,000 No
Carbon disulfide 20.30 µg/m3 310,000 No 1,550,000 No
Chloroform 21.50 µg/m3 540 No 2,700 No
Ethylbenzene 1.40 µg/m3 5,000 No 25,000 No
m&p‐xylene 5.50 µg/m3 44,000 No 220,000 No
o‐xylene 2.30 µg/m3 44,000 No 220,000 No
Toluene 7.20 µg/m3 2,200,000 No 11,000,000 No
Sample: AA108-SG
2‐Butanone (MEK) 3.70 µg/m3 2,200,000 No 11,000,000 No
Acetone 44.20 µg/m3 14,000,000 No 70,000,000 No
Benzene 1.40 µg/m3 1,600 No 8,000 No
Carbon disulfide 8.60 µg/m3 310,000 No 1,550,000 No
Chloroform 13.00 µg/m3 540 No 2,700 No
Ethylbenzene 1.60 µg/m3 5,000 No 25,000 No
m&p‐xylene 6.90 µg/m3 44,000 No 220,000 No
o‐xylene 2.90 µg/m3 44,000 No 220,000 No
Toluene 5.50 µg/m3 2,200,000 No 11,000,000 No
Page 7 of 13April 09, 2015
Sub‐Slab Soil Gas Detection and Exceedance Report

Parameter Result Unit MDE Tier I Exceeds Tier I? MDE Tier II Exceeds Tier II?
Sample: AA90-SG
2‐Butanone (MEK) 8.30 µg/m3 2,200,000 No 11,000,000 No
Acetone 72.50 µg/m3 14,000,000 No 70,000,000 No
Benzene 1.70 µg/m3 1,600 No 8,000 No
Carbon disulfide 7.20 µg/m3 310,000 No 1,550,000 No
Chloroform 15.80 µg/m3 540 No 2,700 No
Toluene 5.90 µg/m3 2,200,000 No 11,000,000 No
Sample: AA91-SG
2‐Butanone (MEK) 5.50 µg/m3 2,200,000 No 11,000,000 No
Acetone 58.70 µg/m3 14,000,000 No 70,000,000 No
Benzene 5.80 µg/m3 1,600 No 8,000 No
Bromodichloromethane 6.00 µg/m3 340 No 1,700 No
Bromomethane 1.20 µg/m3 2,200 No 11,000 No
Carbon disulfide 138.00 µg/m3 310,000 No 1,550,000 No
Chloroform 143.00 µg/m3 540 No 2,700 No
Chloromethane 1.60 µg/m3 40,000 No 200,000 No
Ethylbenzene 1.20 µg/m3 5,000 No 25,000 No
m&p‐xylene 4.50 µg/m3 44,000 No 220,000 No
o‐xylene 1.90 µg/m3 44,000 No 220,000 No
Toluene 6.60 µg/m3 2,200,000 No 11,000,000 No
Page 8 of 13April 09, 2015
Sub‐Slab Soil Gas Detection and Exceedance Report

Parameter Result Unit MDE Tier I Exceeds Tier I? MDE Tier II Exceeds Tier II?
Sample: AA92-SG
2‐Butanone (MEK) 5.10 µg/m3 2,200,000 No 11,000,000 No
Acetone 48.20 µg/m3 14,000,000 No 70,000,000 No
Benzene 2.60 µg/m3 1,600 No 8,000 No
Bromodichloromethane 6.80 µg/m3 340 No 1,700 No
Carbon disulfide 19.60 µg/m3 310,000 No 1,550,000 No
Chloroform 124.00 µg/m3 540 No 2,700 No
Ethylbenzene 1.30 µg/m3 5,000 No 25,000 No
m&p‐xylene 4.80 µg/m3 44,000 No 220,000 No
o‐xylene 2.10 µg/m3 44,000 No 220,000 No
Toluene 6.10 µg/m3 2,200,000 No 11,000,000 No
Sample: AA93-SG
2‐Butanone (MEK) 2.20 µg/m3 2,200,000 No 11,000,000 No
Acetone 17.50 µg/m3 14,000,000 No 70,000,000 No
Benzene 0.52 µg/m3 1,600 No 8,000 No
Carbon disulfide 9.40 µg/m3 310,000 No 1,550,000 No
Chloroform 2.90 µg/m3 540 No 2,700 No
Toluene 1.40 µg/m3 2,200,000 No 11,000,000 No
Page 9 of 13April 09, 2015
Sub‐Slab Soil Gas Detection and Exceedance Report

Parameter Result Unit MDE Tier I Exceeds Tier I? MDE Tier II Exceeds Tier II?
Sample: AA94-SG
2‐Butanone (MEK) 5.60 µg/m3 2,200,000 No 11,000,000 No
Acetone 55.60 µg/m3 14,000,000 No 70,000,000 No
Benzene 4.80 µg/m3 1,600 No 8,000 No
Bromodichloromethane 5.00 µg/m3 340 No 1,700 No
Carbon disulfide 197.00 µg/m3 310,000 No 1,550,000 No
Chloroform 139.00 µg/m3 540 No 2,700 No
Chloromethane 1.90 µg/m3 40,000 No 200,000 No
Ethylbenzene 1.30 µg/m3 5,000 No 25,000 No
m&p‐xylene 4.90 µg/m3 44,000 No 220,000 No
o‐xylene 2.20 µg/m3 44,000 No 220,000 No
Toluene 6.10 µg/m3 2,200,000 No 11,000,000 No
Page 10 of 13April 09, 2015
Sub‐Slab Soil Gas Detection and Exceedance Report

Parameter Result Unit MDE Tier I Exceeds Tier I? MDE Tier II Exceeds Tier II?
Sample: AA95-SG
2‐Butanone (MEK) 9.10 µg/m3 2,200,000 No 11,000,000 No
Acetone 117.00 µg/m3 14,000,000 No 70,000,000 No
Benzene 2.00 µg/m3 1,600 No 8,000 No
Bromodichloromethane 4.40 µg/m3 340 No 1,700 No
Carbon disulfide 52.00 µg/m3 310,000 No 1,550,000 No
Chloroform 99.30 µg/m3 540 No 2,700 No
Ethylbenzene 1.20 µg/m3 5,000 No 25,000 No
m&p‐xylene 4.20 µg/m3 44,000 No 220,000 No
o‐xylene 1.20 µg/m3 44,000 No 220,000 No
Toluene 4.60 µg/m3 2,200,000 No 11,000,000 No
Page 11 of 13April 09, 2015
Sub‐Slab Soil Gas Detection and Exceedance Report

Parameter Result Unit MDE Tier I Exceeds Tier I? MDE Tier II Exceeds Tier II?
Sample: AA96-SG
2‐Butanone (MEK) 4.10 µg/m3 2,200,000 No 11,000,000 No
Acetone 44.80 µg/m3 14,000,000 No 70,000,000 No
Benzene 3.20 µg/m3 1,600 No 8,000 No
Bromodichloromethane 2.20 µg/m3 340 No 1,700 No
Carbon disulfide 22.80 µg/m3 310,000 No 1,550,000 No
Chloroform 40.80 µg/m3 540 No 2,700 No
m&p‐xylene 4.20 µg/m3 44,000 No 220,000 No
o‐xylene 1.70 µg/m3 44,000 No 220,000 No
Toluene 8.60 µg/m3 2,200,000 No 11,000,000 No
Sample: AA97-SG
2‐Butanone (MEK) 5.80 µg/m3 2,200,000 No 11,000,000 No
Acetone 49.60 µg/m3 14,000,000 No 70,000,000 No
Benzene 3.50 µg/m3 1,600 No 8,000 No
Carbon disulfide 157.00 µg/m3 310,000 No 1,550,000 No
Chloroform 97.20 µg/m3 540 No 2,700 No
Ethylbenzene 1.40 µg/m3 5,000 No 25,000 No
m&p‐xylene 4.80 µg/m3 44,000 No 220,000 No
o‐xylene 2.00 µg/m3 44,000 No 220,000 No
Toluene 6.40 µg/m3 2,200,000 No 11,000,000 No
Page 12 of 13April 09, 2015
Sub‐Slab Soil Gas Detection and Exceedance Report

Parameter Result Unit MDE Tier I Exceeds Tier I? MDE Tier II Exceeds Tier II?
Sample: AA98-SG
2‐Butanone (MEK) 56.20 µg/m3 2,200,000 No 11,000,000 No
Acetone 188.00 µg/m3 14,000,000 No 70,000,000 No
Benzene 2.50 µg/m3 1,600 No 8,000 No
Carbon disulfide 9.40 µg/m3 310,000 No 1,550,000 No
Chloroform 23.60 µg/m3 540 No 2,700 No
Toluene 55.70 µg/m3 2,200,000 No 11,000,000 No
Sample: AA99-SG
2‐Butanone (MEK) 5.00 µg/m3 2,200,000 No 11,000,000 No
Acetone 39.40 µg/m3 14,000,000 No 70,000,000 No
Benzene 3.60 µg/m3 1,600 No 8,000 No
Bromodichloromethane 3.00 µg/m3 340 No 1,700 No
Carbon disulfide 4.60 µg/m3 310,000 No 1,550,000 No
Chloroform 66.00 µg/m3 540 No 2,700 No
m&p‐xylene 4.30 µg/m3 44,000 No 220,000 No
o‐xylene 1.90 µg/m3 44,000 No 220,000 No
Toluene 5.30 µg/m3 2,200,000 No 11,000,000 No
Page 13 of 13April 09, 2015
Sub‐Slab Soil Gas Detection and Exceedance Report

ATTACHMENT 1

#=CL#
April 10, 2015
LIMS USE: FR - JAMES CALENDALIMS OBJECT ID: 10300341
10300341Project:Pace Project No.:
RE:
James CalendaEnvironmental Liability Transfer1430 Sparrows Point BlvdSparrows Point, MD 21219
NCM BOA
Dear James Calenda:Enclosed are the analytical results for sample(s) received by the laboratory on March 23, 2015. Theresults relate only to the samples included in this report. Results reported herein conform to themost current TNI standards and the laboratory's Quality Assurance Manual, where applicable, unlessotherwise noted in the body of the report.
This project was revised to match desired VOC list, per client's request. -NB3 4/1/15
This project was revised to include EDB to the final report
If you have any questions concerning this report, please feel free to contact me.
Sincerely,
Nathan [email protected] Manager
Enclosures
REPORT OF LABORATORY ANALYSISThis report shall not be reproduced, except in full,
without the written consent of Pace Analytical Services, Inc..
Pace Analytical Services, Inc.1700 Elm Street - Suite 200
Minneapolis, MN 55414(612)607-1700
Page 1 of 34

#=CP#
CERTIFICATIONS
Pace Project No.:Project:
10300341NCM BOA
Minnesota Certification IDs1700 Elm Street SE Suite 200, Minneapolis, MN 55414A2LA Certification #: 2926.01Alaska Certification #: UST-078Alaska Certification #MN00064Alabama Certification #40770Arizona Certification #: AZ-0014Arkansas Certification #: 88-0680California Certification #: 01155CAColorado Certification #PaceConnecticut Certification #: PH-0256EPA Region 8 Certification #: 8TMS-LFlorida/NELAP Certification #: E87605Guam Certification #:14-008rGeorgia Certification #: 959Georgia EPD #: PaceIdaho Certification #: MN00064Hawaii Certification #MN00064Illinois Certification #: 200011Indiana Certification#C-MN-01Iowa Certification #: 368Kansas Certification #: E-10167Kentucky Dept of Envi. Protection - DW #90062Kentucky Dept of Envi. Protection - WW #:90062Louisiana DEQ Certification #: 3086Louisiana DHH #: LA140001Maine Certification #: 2013011Maryland Certification #: 322Michigan DEPH Certification #: 9909
Minnesota Certification #: 027-053-137Mississippi Certification #: PaceMontana Certification #: MT0092Nevada Certification #: MN_00064Nebraska Certification #: PaceNew Jersey Certification #: MN-002New York Certification #: 11647North Carolina Certification #: 530North Carolina State Public Health #: 27700North Dakota Certification #: R-036Ohio EPA #: 4150Ohio VAP Certification #: CL101Oklahoma Certification #: 9507Oregon Certification #: MN200001Oregon Certification #: MN300001Pennsylvania Certification #: 68-00563Puerto Rico CertificationSaipan (CNMI) #:MP0003South Carolina #:74003001Texas Certification #: T104704192Tennessee Certification #: 02818Utah Certification #: MN000642013-4Virginia DGS Certification #: 251Virginia/VELAP Certification #: PaceWashington Certification #: C486West Virginia Certification #: 382West Virginia DHHR #:9952CWisconsin Certification #: 999407970
REPORT OF LABORATORY ANALYSISThis report shall not be reproduced, except in full,
without the written consent of Pace Analytical Services, Inc..
Pace Analytical Services, Inc.1700 Elm Street - Suite 200
Minneapolis, MN 55414(612)607-1700
Page 2 of 34

#=SS#
SAMPLE SUMMARY
Pace Project No.:Project:
10300341NCM BOA
Lab ID Sample ID Matrix Date Collected Date Received
10300341001 AA108-SG Air 03/20/15 09:35 03/23/15 08:50
10300341002 AA106-SG Air 03/20/15 09:37 03/23/15 08:50
10300341003 AA107-SG Air 03/20/15 09:38 03/23/15 08:50
10300341004 AA105-SG Air 03/20/15 09:39 03/23/15 08:50
10300341005 AA104-SG Air 03/20/15 09:41 03/23/15 08:50
10300341006 AA100-SG Air 03/20/15 09:43 03/23/15 08:50
10300341007 AA97-SG Air 03/20/15 09:45 03/23/15 08:50
10300341008 AA98-SG Air 03/20/15 09:46 03/23/15 08:50
10300341009 AA92-SG Air 03/20/15 09:47 03/23/15 08:50
10300341010 AA91-SG Air 03/20/15 09:49 03/23/15 08:50
10300341011 AA90-SG Air 03/20/15 09:50 03/23/15 08:50
10300341012 AA93-SG Air 03/20/15 09:51 03/23/15 08:50
10300341013 AA94-SG Air 03/20/15 09:51 03/23/15 08:50
10300341014 AA96-SG Air 03/20/15 09:52 03/23/15 08:50
10300341015 AA99-SG Air 03/20/15 09:53 03/23/15 08:50
10300341016 AA101-SG Air 03/20/15 09:54 03/23/15 08:50
10300341017 AA102-SG Air 03/20/15 09:56 03/23/15 08:50
10300341018 AA103-SG Air 03/20/15 09:57 03/23/15 08:50
10300341019 AA95-SG Air 03/21/15 11:30 03/23/15 08:50
REPORT OF LABORATORY ANALYSISThis report shall not be reproduced, except in full,
without the written consent of Pace Analytical Services, Inc..
Pace Analytical Services, Inc.1700 Elm Street - Suite 200
Minneapolis, MN 55414(612)607-1700
Page 3 of 34

#=SA#
SAMPLE ANALYTE COUNT
Pace Project No.:Project:
10300341NCM BOA
Lab ID Sample ID MethodAnalytesReported LaboratoryAnalysts
10300341001 AA108-SG TO-15 37 PASI-MMLS
10300341002 AA106-SG TO-15 37 PASI-MMLS
10300341003 AA107-SG TO-15 37 PASI-MMLS
10300341004 AA105-SG TO-15 37 PASI-MMLS
10300341005 AA104-SG TO-15 37 PASI-MMLS
10300341006 AA100-SG TO-15 37 PASI-MMLS
10300341007 AA97-SG TO-15 37 PASI-MMLS
10300341008 AA98-SG TO-15 37 PASI-MMLS
10300341009 AA92-SG TO-15 37 PASI-MMLS
10300341010 AA91-SG TO-15 37 PASI-MMLS
10300341011 AA90-SG TO-15 37 PASI-MMLS
10300341012 AA93-SG TO-15 37 PASI-MMLS
10300341013 AA94-SG TO-15 37 PASI-MMLS
10300341014 AA96-SG TO-15 37 PASI-MMLS
10300341015 AA99-SG TO-15 37 PASI-MMLS
10300341016 AA101-SG TO-15 37 PASI-MMLS
10300341017 AA102-SG TO-15 37 PASI-MMLS
10300341018 AA103-SG TO-15 37 PASI-MMLS
10300341019 AA95-SG TO-15 37 PASI-MMLS
REPORT OF LABORATORY ANALYSISThis report shall not be reproduced, except in full,
without the written consent of Pace Analytical Services, Inc..
Pace Analytical Services, Inc.1700 Elm Street - Suite 200
Minneapolis, MN 55414(612)607-1700
Page 4 of 34

#=NA#
PROJECT NARRATIVE
Pace Project No.:Project:
10300341NCM BOA
Method:
Client: Enviro Analytics Group
TO-15
Date: April 10, 2015
Description: TO15 MSV AIR
General Information:19 samples were analyzed for TO-15. All samples were received in acceptable condition with any exceptions noted below.
Hold Time:The samples were analyzed within the method required hold times with any exceptions noted below.
Initial Calibrations (including MS Tune as applicable):All criteria were within method requirements with any exceptions noted below.
Continuing Calibration:All criteria were within method requirements with any exceptions noted below.
Internal Standards:All internal standards were within QC limits with any exceptions noted below.
QC Batch: AIR/22835IQ: The internal standard recoveries associated with this sample exceed the lower control limit. The reported results should beconsidered estimated values.
• AA108-SG (Lab ID: 10300341001)• AA93-SG (Lab ID: 10300341012)
Method Blank:All analytes were below the report limit in the method blank, where applicable, with any exceptions noted below.
Laboratory Control Spike:All laboratory control spike compounds were within QC limits with any exceptions noted below.
Duplicate Sample:All duplicate sample results were within method acceptance criteria with any exceptions noted below.
QC Batch: AIR/22835R1: RPD value was outside control limits.
• DUP (Lab ID: 1926218)• Acetone
Additional Comments:Analyte Comments:
QC Batch: AIR/22835E: Analyte concentration exceeded the calibration range. The reported result is estimated.
• AA105-SG (Lab ID: 10300341004)• Acetone
• AA95-SG (Lab ID: 10300341019)• Acetone
REPORT OF LABORATORY ANALYSISThis report shall not be reproduced, except in full,
without the written consent of Pace Analytical Services, Inc..
Pace Analytical Services, Inc.1700 Elm Street - Suite 200
Minneapolis, MN 55414(612)607-1700
Page 5 of 34

#=NA#
PROJECT NARRATIVE
Pace Project No.:Project:
10300341NCM BOA
Method:
Client: Enviro Analytics Group
TO-15
Date: April 10, 2015
Description: TO15 MSV AIR
Analyte Comments:
QC Batch: AIR/22835E: Analyte concentration exceeded the calibration range. The reported result is estimated.
• DUP (Lab ID: 1926218)• Carbon disulfide• Acetone
This data package has been reviewed for quality and completeness and is approved for release.
REPORT OF LABORATORY ANALYSISThis report shall not be reproduced, except in full,
without the written consent of Pace Analytical Services, Inc..
Pace Analytical Services, Inc.1700 Elm Street - Suite 200
Minneapolis, MN 55414(612)607-1700
Page 6 of 34

#=AR#
ANALYTICAL RESULTS
Pace Project No.:Project:
10300341NCM BOA
Sample: AA108-SG Lab ID: 10300341001 Collected: 03/20/15 09:35 Received: 03/23/15 08:50 Matrix: Air
Parameters Results Units DF Prepared Analyzed CAS No. QualPQL
Analytical Method: TO-15TO15 MSV AIR
Acetone 44.2 ug/m3 03/25/15 15:34 67-64-13.5 1.44Benzene 1.4 ug/m3 03/25/15 15:34 71-43-20.47 1.44Bromodichloromethane 1.2J ug/m3 03/25/15 15:34 75-27-42.0 1.44Bromoform <0.47 ug/m3 03/25/15 15:34 75-25-27.6 1.44Bromomethane <0.39 ug/m3 03/25/15 15:34 74-83-91.1 1.442-Butanone (MEK) 3.7 ug/m3 03/25/15 15:34 78-93-30.86 1.44Carbon disulfide 8.6 ug/m3 03/25/15 15:34 75-15-00.91 1.44Carbon tetrachloride <0.46 ug/m3 03/25/15 15:34 56-23-50.92 1.44Chlorobenzene <0.15 ug/m3 03/25/15 15:34 108-90-71.4 1.44Chloroethane <0.23 ug/m3 03/25/15 15:34 75-00-30.78 1.44Chloroform 13.0 ug/m3 03/25/15 15:34 67-66-30.71 1.44Chloromethane <0.28 ug/m3 03/25/15 15:34 74-87-30.60 1.44Dibromochloromethane <1.2 ug/m3 03/25/15 15:34 124-48-12.5 1.441,2-Dibromoethane (EDB) <0.34 ug/m3 03/25/15 15:34 106-93-42.2 1.441,1-Dichloroethane <0.20 ug/m3 03/25/15 15:34 75-34-31.2 1.441,2-Dichloroethane <0.17 ug/m3 03/25/15 15:34 107-06-20.59 1.441,1-Dichloroethene <0.15 ug/m3 03/25/15 15:34 75-35-41.2 1.44cis-1,2-Dichloroethene <0.28 ug/m3 03/25/15 15:34 156-59-22.9 1.44trans-1,2-Dichloroethene <0.23 ug/m3 03/25/15 15:34 156-60-51.2 1.441,2-Dichloropropane <0.22 ug/m3 03/25/15 15:34 78-87-51.4 1.44cis-1,3-Dichloropropene <0.20 ug/m3 03/25/15 15:34 10061-01-51.3 1.44trans-1,3-Dichloropropene <0.22 ug/m3 03/25/15 15:34 10061-02-61.3 1.44Ethylbenzene 1.6 ug/m3 03/25/15 15:34 100-41-41.3 1.44Isopropylbenzene (Cumene) <0.72 ug/m3 03/25/15 15:34 98-82-83.6 1.44Methylene Chloride <0.33 ug/m3 03/25/15 15:34 75-09-25.1 1.444-Methyl-2-pentanone (MIBK) <0.25 ug/m3 03/25/15 15:34 108-10-13.0 1.44Methyl-tert-butyl ether <0.13 ug/m3 03/25/15 15:34 1634-04-41.1 1.44Styrene 0.95J ug/m3 03/25/15 15:34 100-42-51.3 1.441,1,2,2-Tetrachloroethane <0.34 ug/m3 03/25/15 15:34 79-34-51.0 1.44Tetrachloroethene <0.27 ug/m3 03/25/15 15:34 127-18-40.99 1.44Toluene 5.5 ug/m3 03/25/15 15:34 108-88-31.1 1.441,1,1-Trichloroethane <0.20 ug/m3 03/25/15 15:34 71-55-61.0 1.441,1,2-Trichloroethane <0.35 ug/m3 03/25/15 15:34 79-00-50.80 1.44Trichloroethene <0.26 ug/m3 03/25/15 15:34 79-01-60.79 1.44Vinyl chloride <0.13 ug/m3 03/25/15 15:34 75-01-40.37 1.44m&p-Xylene 6.9 ug/m3 03/25/15 15:34 179601-23-12.5 1.44o-Xylene 2.9 ug/m3 03/25/15 15:34 95-47-61.3 1.44
REPORT OF LABORATORY ANALYSISThis report shall not be reproduced, except in full,
without the written consent of Pace Analytical Services, Inc..Date: 04/10/2015 02:09 PM
Pace Analytical Services, Inc.1700 Elm Street - Suite 200
Minneapolis, MN 55414(612)607-1700
Page 7 of 34

#=AR#
ANALYTICAL RESULTS
Pace Project No.:Project:
10300341NCM BOA
Sample: AA106-SG Lab ID: 10300341002 Collected: 03/20/15 09:37 Received: 03/23/15 08:50 Matrix: Air
Parameters Results Units DF Prepared Analyzed CAS No. QualPQL
Analytical Method: TO-15TO15 MSV AIR
Acetone 25.4 ug/m3 03/25/15 16:02 67-64-13.4 1.39Benzene 1.8 ug/m3 03/25/15 16:02 71-43-20.45 1.39Bromodichloromethane 2.5 ug/m3 03/25/15 16:02 75-27-41.9 1.39Bromoform <0.45 ug/m3 03/25/15 16:02 75-25-27.3 1.39Bromomethane <0.38 ug/m3 03/25/15 16:02 74-83-91.1 1.392-Butanone (MEK) 3.3 ug/m3 03/25/15 16:02 78-93-30.83 1.39Carbon disulfide 16.2 ug/m3 03/25/15 16:02 75-15-00.88 1.39Carbon tetrachloride <0.44 ug/m3 03/25/15 16:02 56-23-50.89 1.39Chlorobenzene <0.15 ug/m3 03/25/15 16:02 108-90-71.3 1.39Chloroethane <0.22 ug/m3 03/25/15 16:02 75-00-30.75 1.39Chloroform 24.9 ug/m3 03/25/15 16:02 67-66-30.69 1.39Chloromethane <0.27 ug/m3 03/25/15 16:02 74-87-30.58 1.39Dibromochloromethane <1.2 ug/m3 03/25/15 16:02 124-48-12.4 1.391,2-Dibromoethane (EDB) <0.33 ug/m3 03/25/15 16:02 106-93-42.2 1.391,1-Dichloroethane <0.19 ug/m3 03/25/15 16:02 75-34-31.1 1.391,2-Dichloroethane <0.17 ug/m3 03/25/15 16:02 107-06-20.57 1.391,1-Dichloroethene <0.14 ug/m3 03/25/15 16:02 75-35-41.1 1.39cis-1,2-Dichloroethene <0.27 ug/m3 03/25/15 16:02 156-59-22.8 1.39trans-1,2-Dichloroethene <0.23 ug/m3 03/25/15 16:02 156-60-51.1 1.391,2-Dichloropropane <0.21 ug/m3 03/25/15 16:02 78-87-51.3 1.39cis-1,3-Dichloropropene <0.19 ug/m3 03/25/15 16:02 10061-01-51.3 1.39trans-1,3-Dichloropropene <0.21 ug/m3 03/25/15 16:02 10061-02-61.3 1.39Ethylbenzene 1.7 ug/m3 03/25/15 16:02 100-41-41.2 1.39Isopropylbenzene (Cumene) <0.70 ug/m3 03/25/15 16:02 98-82-83.5 1.39Methylene Chloride 1.8J ug/m3 03/25/15 16:02 75-09-24.9 1.394-Methyl-2-pentanone (MIBK) <0.24 ug/m3 03/25/15 16:02 108-10-12.9 1.39Methyl-tert-butyl ether <0.12 ug/m3 03/25/15 16:02 1634-04-41.0 1.39Styrene <0.19 ug/m3 03/25/15 16:02 100-42-51.2 1.391,1,2,2-Tetrachloroethane <0.32 ug/m3 03/25/15 16:02 79-34-50.97 1.39Tetrachloroethene <0.26 ug/m3 03/25/15 16:02 127-18-40.96 1.39Toluene 6.9 ug/m3 03/25/15 16:02 108-88-31.1 1.391,1,1-Trichloroethane <0.19 ug/m3 03/25/15 16:02 71-55-60.97 1.391,1,2-Trichloroethane <0.34 ug/m3 03/25/15 16:02 79-00-50.77 1.39Trichloroethene <0.25 ug/m3 03/25/15 16:02 79-01-60.76 1.39Vinyl chloride <0.13 ug/m3 03/25/15 16:02 75-01-40.36 1.39m&p-Xylene 6.5 ug/m3 03/25/15 16:02 179601-23-12.4 1.39o-Xylene 2.6 ug/m3 03/25/15 16:02 95-47-61.2 1.39
REPORT OF LABORATORY ANALYSISThis report shall not be reproduced, except in full,
without the written consent of Pace Analytical Services, Inc..Date: 04/10/2015 02:09 PM
Pace Analytical Services, Inc.1700 Elm Street - Suite 200
Minneapolis, MN 55414(612)607-1700
Page 8 of 34
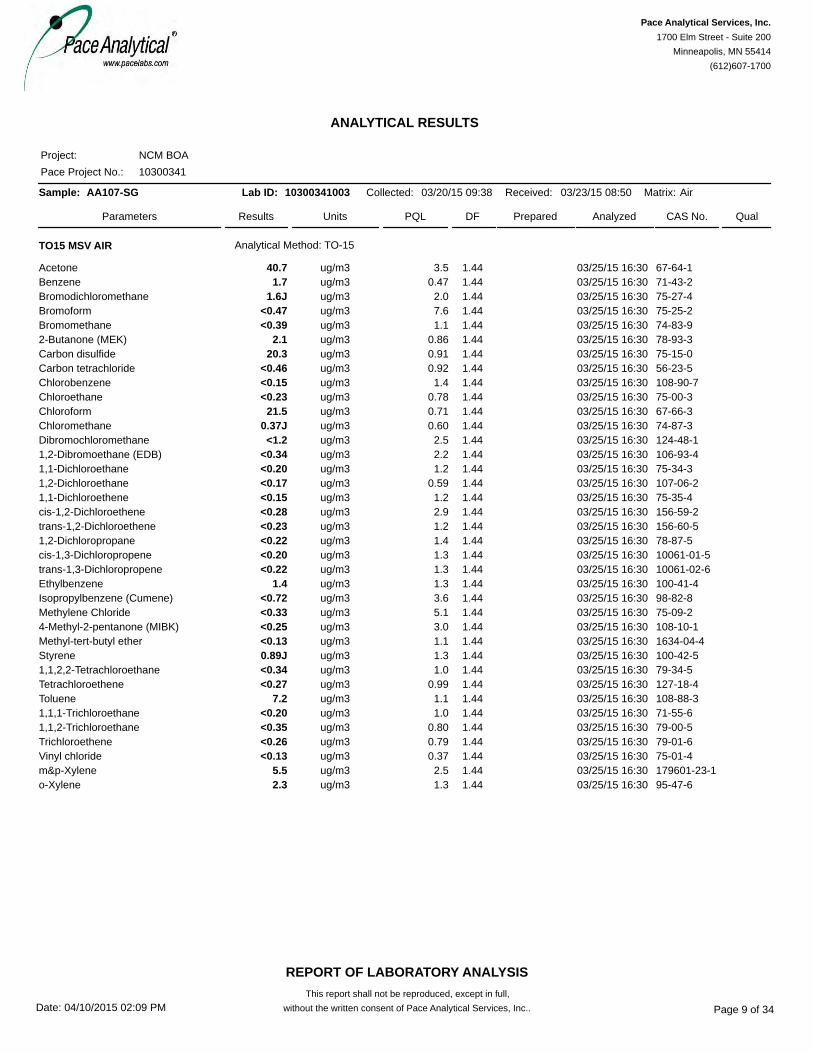
#=AR#
ANALYTICAL RESULTS
Pace Project No.:Project:
10300341NCM BOA
Sample: AA107-SG Lab ID: 10300341003 Collected: 03/20/15 09:38 Received: 03/23/15 08:50 Matrix: Air
Parameters Results Units DF Prepared Analyzed CAS No. QualPQL
Analytical Method: TO-15TO15 MSV AIR
Acetone 40.7 ug/m3 03/25/15 16:30 67-64-13.5 1.44Benzene 1.7 ug/m3 03/25/15 16:30 71-43-20.47 1.44Bromodichloromethane 1.6J ug/m3 03/25/15 16:30 75-27-42.0 1.44Bromoform <0.47 ug/m3 03/25/15 16:30 75-25-27.6 1.44Bromomethane <0.39 ug/m3 03/25/15 16:30 74-83-91.1 1.442-Butanone (MEK) 2.1 ug/m3 03/25/15 16:30 78-93-30.86 1.44Carbon disulfide 20.3 ug/m3 03/25/15 16:30 75-15-00.91 1.44Carbon tetrachloride <0.46 ug/m3 03/25/15 16:30 56-23-50.92 1.44Chlorobenzene <0.15 ug/m3 03/25/15 16:30 108-90-71.4 1.44Chloroethane <0.23 ug/m3 03/25/15 16:30 75-00-30.78 1.44Chloroform 21.5 ug/m3 03/25/15 16:30 67-66-30.71 1.44Chloromethane 0.37J ug/m3 03/25/15 16:30 74-87-30.60 1.44Dibromochloromethane <1.2 ug/m3 03/25/15 16:30 124-48-12.5 1.441,2-Dibromoethane (EDB) <0.34 ug/m3 03/25/15 16:30 106-93-42.2 1.441,1-Dichloroethane <0.20 ug/m3 03/25/15 16:30 75-34-31.2 1.441,2-Dichloroethane <0.17 ug/m3 03/25/15 16:30 107-06-20.59 1.441,1-Dichloroethene <0.15 ug/m3 03/25/15 16:30 75-35-41.2 1.44cis-1,2-Dichloroethene <0.28 ug/m3 03/25/15 16:30 156-59-22.9 1.44trans-1,2-Dichloroethene <0.23 ug/m3 03/25/15 16:30 156-60-51.2 1.441,2-Dichloropropane <0.22 ug/m3 03/25/15 16:30 78-87-51.4 1.44cis-1,3-Dichloropropene <0.20 ug/m3 03/25/15 16:30 10061-01-51.3 1.44trans-1,3-Dichloropropene <0.22 ug/m3 03/25/15 16:30 10061-02-61.3 1.44Ethylbenzene 1.4 ug/m3 03/25/15 16:30 100-41-41.3 1.44Isopropylbenzene (Cumene) <0.72 ug/m3 03/25/15 16:30 98-82-83.6 1.44Methylene Chloride <0.33 ug/m3 03/25/15 16:30 75-09-25.1 1.444-Methyl-2-pentanone (MIBK) <0.25 ug/m3 03/25/15 16:30 108-10-13.0 1.44Methyl-tert-butyl ether <0.13 ug/m3 03/25/15 16:30 1634-04-41.1 1.44Styrene 0.89J ug/m3 03/25/15 16:30 100-42-51.3 1.441,1,2,2-Tetrachloroethane <0.34 ug/m3 03/25/15 16:30 79-34-51.0 1.44Tetrachloroethene <0.27 ug/m3 03/25/15 16:30 127-18-40.99 1.44Toluene 7.2 ug/m3 03/25/15 16:30 108-88-31.1 1.441,1,1-Trichloroethane <0.20 ug/m3 03/25/15 16:30 71-55-61.0 1.441,1,2-Trichloroethane <0.35 ug/m3 03/25/15 16:30 79-00-50.80 1.44Trichloroethene <0.26 ug/m3 03/25/15 16:30 79-01-60.79 1.44Vinyl chloride <0.13 ug/m3 03/25/15 16:30 75-01-40.37 1.44m&p-Xylene 5.5 ug/m3 03/25/15 16:30 179601-23-12.5 1.44o-Xylene 2.3 ug/m3 03/25/15 16:30 95-47-61.3 1.44
REPORT OF LABORATORY ANALYSISThis report shall not be reproduced, except in full,
without the written consent of Pace Analytical Services, Inc..Date: 04/10/2015 02:09 PM
Pace Analytical Services, Inc.1700 Elm Street - Suite 200
Minneapolis, MN 55414(612)607-1700
Page 9 of 34

#=AR#
ANALYTICAL RESULTS
Pace Project No.:Project:
10300341NCM BOA
Sample: AA105-SG Lab ID: 10300341004 Collected: 03/20/15 09:39 Received: 03/23/15 08:50 Matrix: Air
Parameters Results Units DF Prepared Analyzed CAS No. QualPQL
Analytical Method: TO-15TO15 MSV AIR
Acetone 91.5 ug/m3 03/25/15 16:57 67-64-1 E3.2 1.34Benzene 7.1 ug/m3 03/25/15 16:57 71-43-20.44 1.34Bromodichloromethane 3.5 ug/m3 03/25/15 16:57 75-27-41.8 1.34Bromoform <0.43 ug/m3 03/25/15 16:57 75-25-27.0 1.34Bromomethane <0.36 ug/m3 03/25/15 16:57 74-83-91.1 1.342-Butanone (MEK) 4.2 ug/m3 03/25/15 16:57 78-93-30.80 1.34Carbon disulfide 21.2 ug/m3 03/25/15 16:57 75-15-00.84 1.34Carbon tetrachloride <0.43 ug/m3 03/25/15 16:57 56-23-50.86 1.34Chlorobenzene <0.14 ug/m3 03/25/15 16:57 108-90-71.3 1.34Chloroethane <0.22 ug/m3 03/25/15 16:57 75-00-30.72 1.34Chloroform 49.1 ug/m3 03/25/15 16:57 67-66-30.66 1.34Chloromethane 0.36J ug/m3 03/25/15 16:57 74-87-30.56 1.34Dibromochloromethane <1.2 ug/m3 03/25/15 16:57 124-48-12.3 1.341,2-Dibromoethane (EDB) <0.31 ug/m3 03/25/15 16:57 106-93-42.1 1.341,1-Dichloroethane <0.19 ug/m3 03/25/15 16:57 75-34-31.1 1.341,2-Dichloroethane <0.16 ug/m3 03/25/15 16:57 107-06-20.55 1.341,1-Dichloroethene <0.14 ug/m3 03/25/15 16:57 75-35-41.1 1.34cis-1,2-Dichloroethene <0.26 ug/m3 03/25/15 16:57 156-59-22.7 1.34trans-1,2-Dichloroethene <0.22 ug/m3 03/25/15 16:57 156-60-51.1 1.341,2-Dichloropropane <0.20 ug/m3 03/25/15 16:57 78-87-51.3 1.34cis-1,3-Dichloropropene <0.18 ug/m3 03/25/15 16:57 10061-01-51.2 1.34trans-1,3-Dichloropropene <0.20 ug/m3 03/25/15 16:57 10061-02-61.2 1.34Ethylbenzene 1.7 ug/m3 03/25/15 16:57 100-41-41.2 1.34Isopropylbenzene (Cumene) <0.67 ug/m3 03/25/15 16:57 98-82-83.4 1.34Methylene Chloride 1.1J ug/m3 03/25/15 16:57 75-09-24.7 1.344-Methyl-2-pentanone (MIBK) <0.23 ug/m3 03/25/15 16:57 108-10-12.8 1.34Methyl-tert-butyl ether <0.12 ug/m3 03/25/15 16:57 1634-04-40.98 1.34Styrene 0.85J ug/m3 03/25/15 16:57 100-42-51.2 1.341,1,2,2-Tetrachloroethane <0.31 ug/m3 03/25/15 16:57 79-34-50.94 1.34Tetrachloroethene <0.25 ug/m3 03/25/15 16:57 127-18-40.92 1.34Toluene 14.2 ug/m3 03/25/15 16:57 108-88-31.0 1.341,1,1-Trichloroethane <0.19 ug/m3 03/25/15 16:57 71-55-60.94 1.341,1,2-Trichloroethane <0.33 ug/m3 03/25/15 16:57 79-00-50.74 1.34Trichloroethene <0.24 ug/m3 03/25/15 16:57 79-01-60.73 1.34Vinyl chloride <0.12 ug/m3 03/25/15 16:57 75-01-40.35 1.34m&p-Xylene 7.0 ug/m3 03/25/15 16:57 179601-23-12.4 1.34o-Xylene 2.7 ug/m3 03/25/15 16:57 95-47-61.2 1.34
REPORT OF LABORATORY ANALYSISThis report shall not be reproduced, except in full,
without the written consent of Pace Analytical Services, Inc..Date: 04/10/2015 02:09 PM
Pace Analytical Services, Inc.1700 Elm Street - Suite 200
Minneapolis, MN 55414(612)607-1700
Page 10 of 34
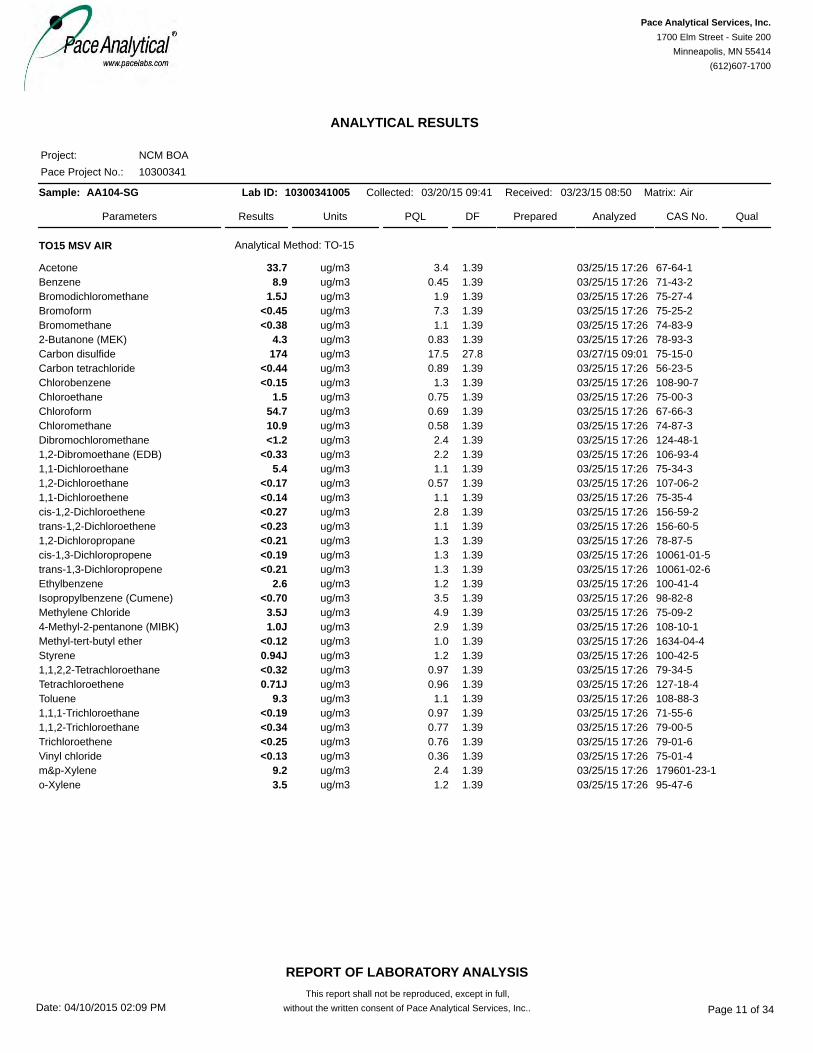
#=AR#
ANALYTICAL RESULTS
Pace Project No.:Project:
10300341NCM BOA
Sample: AA104-SG Lab ID: 10300341005 Collected: 03/20/15 09:41 Received: 03/23/15 08:50 Matrix: Air
Parameters Results Units DF Prepared Analyzed CAS No. QualPQL
Analytical Method: TO-15TO15 MSV AIR
Acetone 33.7 ug/m3 03/25/15 17:26 67-64-13.4 1.39Benzene 8.9 ug/m3 03/25/15 17:26 71-43-20.45 1.39Bromodichloromethane 1.5J ug/m3 03/25/15 17:26 75-27-41.9 1.39Bromoform <0.45 ug/m3 03/25/15 17:26 75-25-27.3 1.39Bromomethane <0.38 ug/m3 03/25/15 17:26 74-83-91.1 1.392-Butanone (MEK) 4.3 ug/m3 03/25/15 17:26 78-93-30.83 1.39Carbon disulfide 174 ug/m3 03/27/15 09:01 75-15-017.5 27.8Carbon tetrachloride <0.44 ug/m3 03/25/15 17:26 56-23-50.89 1.39Chlorobenzene <0.15 ug/m3 03/25/15 17:26 108-90-71.3 1.39Chloroethane 1.5 ug/m3 03/25/15 17:26 75-00-30.75 1.39Chloroform 54.7 ug/m3 03/25/15 17:26 67-66-30.69 1.39Chloromethane 10.9 ug/m3 03/25/15 17:26 74-87-30.58 1.39Dibromochloromethane <1.2 ug/m3 03/25/15 17:26 124-48-12.4 1.391,2-Dibromoethane (EDB) <0.33 ug/m3 03/25/15 17:26 106-93-42.2 1.391,1-Dichloroethane 5.4 ug/m3 03/25/15 17:26 75-34-31.1 1.391,2-Dichloroethane <0.17 ug/m3 03/25/15 17:26 107-06-20.57 1.391,1-Dichloroethene <0.14 ug/m3 03/25/15 17:26 75-35-41.1 1.39cis-1,2-Dichloroethene <0.27 ug/m3 03/25/15 17:26 156-59-22.8 1.39trans-1,2-Dichloroethene <0.23 ug/m3 03/25/15 17:26 156-60-51.1 1.391,2-Dichloropropane <0.21 ug/m3 03/25/15 17:26 78-87-51.3 1.39cis-1,3-Dichloropropene <0.19 ug/m3 03/25/15 17:26 10061-01-51.3 1.39trans-1,3-Dichloropropene <0.21 ug/m3 03/25/15 17:26 10061-02-61.3 1.39Ethylbenzene 2.6 ug/m3 03/25/15 17:26 100-41-41.2 1.39Isopropylbenzene (Cumene) <0.70 ug/m3 03/25/15 17:26 98-82-83.5 1.39Methylene Chloride 3.5J ug/m3 03/25/15 17:26 75-09-24.9 1.394-Methyl-2-pentanone (MIBK) 1.0J ug/m3 03/25/15 17:26 108-10-12.9 1.39Methyl-tert-butyl ether <0.12 ug/m3 03/25/15 17:26 1634-04-41.0 1.39Styrene 0.94J ug/m3 03/25/15 17:26 100-42-51.2 1.391,1,2,2-Tetrachloroethane <0.32 ug/m3 03/25/15 17:26 79-34-50.97 1.39Tetrachloroethene 0.71J ug/m3 03/25/15 17:26 127-18-40.96 1.39Toluene 9.3 ug/m3 03/25/15 17:26 108-88-31.1 1.391,1,1-Trichloroethane <0.19 ug/m3 03/25/15 17:26 71-55-60.97 1.391,1,2-Trichloroethane <0.34 ug/m3 03/25/15 17:26 79-00-50.77 1.39Trichloroethene <0.25 ug/m3 03/25/15 17:26 79-01-60.76 1.39Vinyl chloride <0.13 ug/m3 03/25/15 17:26 75-01-40.36 1.39m&p-Xylene 9.2 ug/m3 03/25/15 17:26 179601-23-12.4 1.39o-Xylene 3.5 ug/m3 03/25/15 17:26 95-47-61.2 1.39
REPORT OF LABORATORY ANALYSISThis report shall not be reproduced, except in full,
without the written consent of Pace Analytical Services, Inc..Date: 04/10/2015 02:09 PM
Pace Analytical Services, Inc.1700 Elm Street - Suite 200
Minneapolis, MN 55414(612)607-1700
Page 11 of 34

#=AR#
ANALYTICAL RESULTS
Pace Project No.:Project:
10300341NCM BOA
Sample: AA100-SG Lab ID: 10300341006 Collected: 03/20/15 09:43 Received: 03/23/15 08:50 Matrix: Air
Parameters Results Units DF Prepared Analyzed CAS No. QualPQL
Analytical Method: TO-15TO15 MSV AIR
Acetone 33.0 ug/m3 03/25/15 17:53 67-64-13.0 1.26Benzene 3.7 ug/m3 03/25/15 17:53 71-43-20.41 1.26Bromodichloromethane 1.8 ug/m3 03/25/15 17:53 75-27-41.7 1.26Bromoform <0.41 ug/m3 03/25/15 17:53 75-25-26.6 1.26Bromomethane <0.34 ug/m3 03/25/15 17:53 74-83-91.0 1.262-Butanone (MEK) 3.8 ug/m3 03/25/15 17:53 78-93-30.76 1.26Carbon disulfide 31.8 ug/m3 03/25/15 17:53 75-15-00.79 1.26Carbon tetrachloride <0.40 ug/m3 03/25/15 17:53 56-23-50.81 1.26Chlorobenzene <0.13 ug/m3 03/25/15 17:53 108-90-71.2 1.26Chloroethane <0.20 ug/m3 03/25/15 17:53 75-00-30.68 1.26Chloroform 13.3 ug/m3 03/25/15 17:53 67-66-30.62 1.26Chloromethane <0.24 ug/m3 03/25/15 17:53 74-87-30.53 1.26Dibromochloromethane <1.1 ug/m3 03/25/15 17:53 124-48-12.2 1.261,2-Dibromoethane (EDB) <0.29 ug/m3 03/25/15 17:53 106-93-42.0 1.261,1-Dichloroethane <0.18 ug/m3 03/25/15 17:53 75-34-31.0 1.261,2-Dichloroethane <0.15 ug/m3 03/25/15 17:53 107-06-20.52 1.261,1-Dichloroethene <0.13 ug/m3 03/25/15 17:53 75-35-41.0 1.26cis-1,2-Dichloroethene <0.25 ug/m3 03/25/15 17:53 156-59-22.5 1.26trans-1,2-Dichloroethene <0.21 ug/m3 03/25/15 17:53 156-60-51.0 1.261,2-Dichloropropane <0.19 ug/m3 03/25/15 17:53 78-87-51.2 1.26cis-1,3-Dichloropropene <0.17 ug/m3 03/25/15 17:53 10061-01-51.2 1.26trans-1,3-Dichloropropene <0.19 ug/m3 03/25/15 17:53 10061-02-61.2 1.26Ethylbenzene 1.6 ug/m3 03/25/15 17:53 100-41-41.1 1.26Isopropylbenzene (Cumene) <0.63 ug/m3 03/25/15 17:53 98-82-83.2 1.26Methylene Chloride 1.7J ug/m3 03/25/15 17:53 75-09-24.4 1.264-Methyl-2-pentanone (MIBK) 0.52J ug/m3 03/25/15 17:53 108-10-12.6 1.26Methyl-tert-butyl ether <0.11 ug/m3 03/25/15 17:53 1634-04-40.92 1.26Styrene 1.1 ug/m3 03/25/15 17:53 100-42-51.1 1.261,1,2,2-Tetrachloroethane <0.29 ug/m3 03/25/15 17:53 79-34-50.88 1.26Tetrachloroethene <0.24 ug/m3 03/25/15 17:53 127-18-40.87 1.26Toluene 8.4 ug/m3 03/25/15 17:53 108-88-30.97 1.261,1,1-Trichloroethane <0.18 ug/m3 03/25/15 17:53 71-55-60.88 1.261,1,2-Trichloroethane <0.31 ug/m3 03/25/15 17:53 79-00-50.70 1.26Trichloroethene <0.22 ug/m3 03/25/15 17:53 79-01-60.69 1.26Vinyl chloride <0.12 ug/m3 03/25/15 17:53 75-01-40.33 1.26m&p-Xylene 5.6 ug/m3 03/25/15 17:53 179601-23-12.2 1.26o-Xylene 2.3 ug/m3 03/25/15 17:53 95-47-61.1 1.26
REPORT OF LABORATORY ANALYSISThis report shall not be reproduced, except in full,
without the written consent of Pace Analytical Services, Inc..Date: 04/10/2015 02:09 PM
Pace Analytical Services, Inc.1700 Elm Street - Suite 200
Minneapolis, MN 55414(612)607-1700
Page 12 of 34

#=AR#
ANALYTICAL RESULTS
Pace Project No.:Project:
10300341NCM BOA
Sample: AA97-SG Lab ID: 10300341007 Collected: 03/20/15 09:45 Received: 03/23/15 08:50 Matrix: Air
Parameters Results Units DF Prepared Analyzed CAS No. QualPQL
Analytical Method: TO-15TO15 MSV AIR
Acetone 49.6 ug/m3 03/27/15 10:11 67-64-133.6 13.9Benzene 3.5 ug/m3 03/25/15 18:21 71-43-20.45 1.39Bromodichloromethane 1.9J ug/m3 03/25/15 18:21 75-27-41.9 1.39Bromoform <0.45 ug/m3 03/25/15 18:21 75-25-27.3 1.39Bromomethane 0.58J ug/m3 03/25/15 18:21 74-83-91.1 1.392-Butanone (MEK) 5.8 ug/m3 03/25/15 18:21 78-93-30.83 1.39Carbon disulfide 157 ug/m3 03/27/15 10:11 75-15-08.8 13.9Carbon tetrachloride <0.44 ug/m3 03/25/15 18:21 56-23-50.89 1.39Chlorobenzene <0.15 ug/m3 03/25/15 18:21 108-90-71.3 1.39Chloroethane <0.22 ug/m3 03/25/15 18:21 75-00-30.75 1.39Chloroform 97.2 ug/m3 03/25/15 18:21 67-66-30.69 1.39Chloromethane <0.27 ug/m3 03/25/15 18:21 74-87-30.58 1.39Dibromochloromethane <1.2 ug/m3 03/25/15 18:21 124-48-12.4 1.391,2-Dibromoethane (EDB) <0.33 ug/m3 03/25/15 18:21 106-93-42.2 1.391,1-Dichloroethane <0.19 ug/m3 03/25/15 18:21 75-34-31.1 1.391,2-Dichloroethane <0.17 ug/m3 03/25/15 18:21 107-06-20.57 1.391,1-Dichloroethene <0.14 ug/m3 03/25/15 18:21 75-35-41.1 1.39cis-1,2-Dichloroethene <0.27 ug/m3 03/25/15 18:21 156-59-22.8 1.39trans-1,2-Dichloroethene <0.23 ug/m3 03/25/15 18:21 156-60-51.1 1.391,2-Dichloropropane <0.21 ug/m3 03/25/15 18:21 78-87-51.3 1.39cis-1,3-Dichloropropene <0.19 ug/m3 03/25/15 18:21 10061-01-51.3 1.39trans-1,3-Dichloropropene <0.21 ug/m3 03/25/15 18:21 10061-02-61.3 1.39Ethylbenzene 1.4 ug/m3 03/25/15 18:21 100-41-41.2 1.39Isopropylbenzene (Cumene) <0.70 ug/m3 03/25/15 18:21 98-82-83.5 1.39Methylene Chloride 1.8J ug/m3 03/25/15 18:21 75-09-24.9 1.394-Methyl-2-pentanone (MIBK) <0.24 ug/m3 03/25/15 18:21 108-10-12.9 1.39Methyl-tert-butyl ether <0.12 ug/m3 03/25/15 18:21 1634-04-41.0 1.39Styrene 0.84J ug/m3 03/25/15 18:21 100-42-51.2 1.391,1,2,2-Tetrachloroethane <0.32 ug/m3 03/25/15 18:21 79-34-50.97 1.39Tetrachloroethene <0.26 ug/m3 03/25/15 18:21 127-18-40.96 1.39Toluene 6.4 ug/m3 03/25/15 18:21 108-88-31.1 1.391,1,1-Trichloroethane <0.19 ug/m3 03/25/15 18:21 71-55-60.97 1.391,1,2-Trichloroethane <0.34 ug/m3 03/25/15 18:21 79-00-50.77 1.39Trichloroethene <0.25 ug/m3 03/25/15 18:21 79-01-60.76 1.39Vinyl chloride <0.13 ug/m3 03/25/15 18:21 75-01-40.36 1.39m&p-Xylene 4.8 ug/m3 03/25/15 18:21 179601-23-12.4 1.39o-Xylene 2.0 ug/m3 03/25/15 18:21 95-47-61.2 1.39
REPORT OF LABORATORY ANALYSISThis report shall not be reproduced, except in full,
without the written consent of Pace Analytical Services, Inc..Date: 04/10/2015 02:09 PM
Pace Analytical Services, Inc.1700 Elm Street - Suite 200
Minneapolis, MN 55414(612)607-1700
Page 13 of 34

#=AR#
ANALYTICAL RESULTS
Pace Project No.:Project:
10300341NCM BOA
Sample: AA98-SG Lab ID: 10300341008 Collected: 03/20/15 09:46 Received: 03/23/15 08:50 Matrix: Air
Parameters Results Units DF Prepared Analyzed CAS No. QualPQL
Analytical Method: TO-15TO15 MSV AIR
Acetone 188 ug/m3 03/25/15 19:20 67-64-18.9 3.67Benzene 2.5 ug/m3 03/25/15 19:20 71-43-21.2 3.67Bromodichloromethane <0.67 ug/m3 03/25/15 19:20 75-27-45.0 3.67Bromoform <1.2 ug/m3 03/25/15 19:20 75-25-219.3 3.67Bromomethane <0.99 ug/m3 03/25/15 19:20 74-83-92.9 3.672-Butanone (MEK) 56.2 ug/m3 03/25/15 19:20 78-93-32.2 3.67Carbon disulfide 9.4 ug/m3 03/25/15 19:20 75-15-02.3 3.67Carbon tetrachloride <1.2 ug/m3 03/25/15 19:20 56-23-52.3 3.67Chlorobenzene <0.39 ug/m3 03/25/15 19:20 108-90-73.4 3.67Chloroethane <0.59 ug/m3 03/25/15 19:20 75-00-32.0 3.67Chloroform 23.6 ug/m3 03/25/15 19:20 67-66-31.8 3.67Chloromethane <0.70 ug/m3 03/25/15 19:20 74-87-31.5 3.67Dibromochloromethane <3.2 ug/m3 03/25/15 19:20 124-48-16.3 3.671,2-Dibromoethane (EDB) <0.86 ug/m3 03/25/15 19:20 106-93-45.7 3.671,1-Dichloroethane <0.51 ug/m3 03/25/15 19:20 75-34-33.0 3.671,2-Dichloroethane <0.44 ug/m3 03/25/15 19:20 107-06-21.5 3.671,1-Dichloroethene <0.38 ug/m3 03/25/15 19:20 75-35-43.0 3.67cis-1,2-Dichloroethene <0.72 ug/m3 03/25/15 19:20 156-59-27.4 3.67trans-1,2-Dichloroethene <0.60 ug/m3 03/25/15 19:20 156-60-53.0 3.671,2-Dichloropropane <0.56 ug/m3 03/25/15 19:20 78-87-53.4 3.67cis-1,3-Dichloropropene <0.50 ug/m3 03/25/15 19:20 10061-01-53.4 3.67trans-1,3-Dichloropropene <0.55 ug/m3 03/25/15 19:20 10061-02-63.4 3.67Ethylbenzene 1.8J ug/m3 03/25/15 19:20 100-41-43.2 3.67Isopropylbenzene (Cumene) <1.8 ug/m3 03/25/15 19:20 98-82-89.2 3.67Methylene Chloride 6.6J ug/m3 03/25/15 19:20 75-09-213.0 3.674-Methyl-2-pentanone (MIBK) 4.5J ug/m3 03/25/15 19:20 108-10-17.6 3.67Methyl-tert-butyl ether <0.33 ug/m3 03/25/15 19:20 1634-04-42.7 3.67Styrene <0.50 ug/m3 03/25/15 19:20 100-42-53.2 3.671,1,2,2-Tetrachloroethane <0.86 ug/m3 03/25/15 19:20 79-34-52.6 3.67Tetrachloroethene <0.69 ug/m3 03/25/15 19:20 127-18-42.5 3.67Toluene 55.7 ug/m3 03/25/15 19:20 108-88-32.8 3.671,1,1-Trichloroethane <0.51 ug/m3 03/25/15 19:20 71-55-62.6 3.671,1,2-Trichloroethane <0.89 ug/m3 03/25/15 19:20 79-00-52.0 3.67Trichloroethene <0.65 ug/m3 03/25/15 19:20 79-01-62.0 3.67Vinyl chloride <0.34 ug/m3 03/25/15 19:20 75-01-40.95 3.67m&p-Xylene 6.4J ug/m3 03/25/15 19:20 179601-23-16.5 3.67o-Xylene 2.6J ug/m3 03/25/15 19:20 95-47-63.2 3.67
REPORT OF LABORATORY ANALYSISThis report shall not be reproduced, except in full,
without the written consent of Pace Analytical Services, Inc..Date: 04/10/2015 02:09 PM
Pace Analytical Services, Inc.1700 Elm Street - Suite 200
Minneapolis, MN 55414(612)607-1700
Page 14 of 34

#=AR#
ANALYTICAL RESULTS
Pace Project No.:Project:
10300341NCM BOA
Sample: AA92-SG Lab ID: 10300341009 Collected: 03/20/15 09:47 Received: 03/23/15 08:50 Matrix: Air
Parameters Results Units DF Prepared Analyzed CAS No. QualPQL
Analytical Method: TO-15TO15 MSV AIR
Acetone 48.2 ug/m3 03/25/15 20:21 67-64-13.0 1.26Benzene 2.6 ug/m3 03/25/15 20:21 71-43-20.41 1.26Bromodichloromethane 6.8 ug/m3 03/25/15 20:21 75-27-41.7 1.26Bromoform <0.41 ug/m3 03/25/15 20:21 75-25-26.6 1.26Bromomethane <0.34 ug/m3 03/25/15 20:21 74-83-91.0 1.262-Butanone (MEK) 5.1 ug/m3 03/25/15 20:21 78-93-30.76 1.26Carbon disulfide 19.6 ug/m3 03/25/15 20:21 75-15-00.79 1.26Carbon tetrachloride <0.40 ug/m3 03/25/15 20:21 56-23-50.81 1.26Chlorobenzene <0.13 ug/m3 03/25/15 20:21 108-90-71.2 1.26Chloroethane <0.20 ug/m3 03/25/15 20:21 75-00-30.68 1.26Chloroform 124 ug/m3 03/25/15 20:21 67-66-30.62 1.26Chloromethane 0.42J ug/m3 03/25/15 20:21 74-87-30.53 1.26Dibromochloromethane <1.1 ug/m3 03/25/15 20:21 124-48-12.2 1.261,2-Dibromoethane (EDB) <0.29 ug/m3 03/25/15 20:21 106-93-42.0 1.261,1-Dichloroethane <0.18 ug/m3 03/25/15 20:21 75-34-31.0 1.261,2-Dichloroethane <0.15 ug/m3 03/25/15 20:21 107-06-20.52 1.261,1-Dichloroethene <0.13 ug/m3 03/25/15 20:21 75-35-41.0 1.26cis-1,2-Dichloroethene <0.25 ug/m3 03/25/15 20:21 156-59-22.5 1.26trans-1,2-Dichloroethene <0.21 ug/m3 03/25/15 20:21 156-60-51.0 1.261,2-Dichloropropane <0.19 ug/m3 03/25/15 20:21 78-87-51.2 1.26cis-1,3-Dichloropropene <0.17 ug/m3 03/25/15 20:21 10061-01-51.2 1.26trans-1,3-Dichloropropene <0.19 ug/m3 03/25/15 20:21 10061-02-61.2 1.26Ethylbenzene 1.3 ug/m3 03/25/15 20:21 100-41-41.1 1.26Isopropylbenzene (Cumene) <0.63 ug/m3 03/25/15 20:21 98-82-83.2 1.26Methylene Chloride 1.7J ug/m3 03/25/15 20:21 75-09-24.4 1.264-Methyl-2-pentanone (MIBK) <0.22 ug/m3 03/25/15 20:21 108-10-12.6 1.26Methyl-tert-butyl ether <0.11 ug/m3 03/25/15 20:21 1634-04-40.92 1.26Styrene 0.80J ug/m3 03/25/15 20:21 100-42-51.1 1.261,1,2,2-Tetrachloroethane <0.29 ug/m3 03/25/15 20:21 79-34-50.88 1.26Tetrachloroethene <0.24 ug/m3 03/25/15 20:21 127-18-40.87 1.26Toluene 6.1 ug/m3 03/25/15 20:21 108-88-30.97 1.261,1,1-Trichloroethane <0.18 ug/m3 03/25/15 20:21 71-55-60.88 1.261,1,2-Trichloroethane <0.31 ug/m3 03/25/15 20:21 79-00-50.70 1.26Trichloroethene <0.22 ug/m3 03/25/15 20:21 79-01-60.69 1.26Vinyl chloride <0.12 ug/m3 03/25/15 20:21 75-01-40.33 1.26m&p-Xylene 4.8 ug/m3 03/25/15 20:21 179601-23-12.2 1.26o-Xylene 2.1 ug/m3 03/25/15 20:21 95-47-61.1 1.26
REPORT OF LABORATORY ANALYSISThis report shall not be reproduced, except in full,
without the written consent of Pace Analytical Services, Inc..Date: 04/10/2015 02:09 PM
Pace Analytical Services, Inc.1700 Elm Street - Suite 200
Minneapolis, MN 55414(612)607-1700
Page 15 of 34

#=AR#
ANALYTICAL RESULTS
Pace Project No.:Project:
10300341NCM BOA
Sample: AA91-SG Lab ID: 10300341010 Collected: 03/20/15 09:49 Received: 03/23/15 08:50 Matrix: Air
Parameters Results Units DF Prepared Analyzed CAS No. QualPQL
Analytical Method: TO-15TO15 MSV AIR
Acetone 58.7 ug/m3 03/25/15 20:54 67-64-13.0 1.26Benzene 5.8 ug/m3 03/25/15 20:54 71-43-20.41 1.26Bromodichloromethane 6.0 ug/m3 03/25/15 20:54 75-27-41.7 1.26Bromoform <0.41 ug/m3 03/25/15 20:54 75-25-26.6 1.26Bromomethane 1.2 ug/m3 03/25/15 20:54 74-83-91.0 1.262-Butanone (MEK) 5.5 ug/m3 03/25/15 20:54 78-93-30.76 1.26Carbon disulfide 138 ug/m3 03/27/15 09:48 75-15-07.9 12.61Carbon tetrachloride 0.73J ug/m3 03/25/15 20:54 56-23-50.81 1.26Chlorobenzene <0.13 ug/m3 03/25/15 20:54 108-90-71.2 1.26Chloroethane <0.20 ug/m3 03/25/15 20:54 75-00-30.68 1.26Chloroform 143 ug/m3 03/27/15 09:48 67-66-36.3 12.61Chloromethane 1.6 ug/m3 03/25/15 20:54 74-87-30.53 1.26Dibromochloromethane <1.1 ug/m3 03/25/15 20:54 124-48-12.2 1.261,2-Dibromoethane (EDB) <0.29 ug/m3 03/25/15 20:54 106-93-42.0 1.261,1-Dichloroethane <0.18 ug/m3 03/25/15 20:54 75-34-31.0 1.261,2-Dichloroethane <0.15 ug/m3 03/25/15 20:54 107-06-20.52 1.261,1-Dichloroethene <0.13 ug/m3 03/25/15 20:54 75-35-41.0 1.26cis-1,2-Dichloroethene <0.25 ug/m3 03/25/15 20:54 156-59-22.5 1.26trans-1,2-Dichloroethene <0.21 ug/m3 03/25/15 20:54 156-60-51.0 1.261,2-Dichloropropane <0.19 ug/m3 03/25/15 20:54 78-87-51.2 1.26cis-1,3-Dichloropropene <0.17 ug/m3 03/25/15 20:54 10061-01-51.2 1.26trans-1,3-Dichloropropene <0.19 ug/m3 03/25/15 20:54 10061-02-61.2 1.26Ethylbenzene 1.2 ug/m3 03/25/15 20:54 100-41-41.1 1.26Isopropylbenzene (Cumene) <0.63 ug/m3 03/25/15 20:54 98-82-83.2 1.26Methylene Chloride 1.6J ug/m3 03/25/15 20:54 75-09-24.4 1.264-Methyl-2-pentanone (MIBK) <0.22 ug/m3 03/25/15 20:54 108-10-12.6 1.26Methyl-tert-butyl ether <0.11 ug/m3 03/25/15 20:54 1634-04-40.92 1.26Styrene 0.82J ug/m3 03/25/15 20:54 100-42-51.1 1.261,1,2,2-Tetrachloroethane <0.29 ug/m3 03/25/15 20:54 79-34-50.88 1.26Tetrachloroethene <0.24 ug/m3 03/25/15 20:54 127-18-40.87 1.26Toluene 6.6 ug/m3 03/25/15 20:54 108-88-30.97 1.261,1,1-Trichloroethane <0.18 ug/m3 03/25/15 20:54 71-55-60.88 1.261,1,2-Trichloroethane <0.31 ug/m3 03/25/15 20:54 79-00-50.70 1.26Trichloroethene <0.22 ug/m3 03/25/15 20:54 79-01-60.69 1.26Vinyl chloride <0.12 ug/m3 03/25/15 20:54 75-01-40.33 1.26m&p-Xylene 4.5 ug/m3 03/25/15 20:54 179601-23-12.2 1.26o-Xylene 1.9 ug/m3 03/25/15 20:54 95-47-61.1 1.26
REPORT OF LABORATORY ANALYSISThis report shall not be reproduced, except in full,
without the written consent of Pace Analytical Services, Inc..Date: 04/10/2015 02:09 PM
Pace Analytical Services, Inc.1700 Elm Street - Suite 200
Minneapolis, MN 55414(612)607-1700
Page 16 of 34

#=AR#
ANALYTICAL RESULTS
Pace Project No.:Project:
10300341NCM BOA
Sample: AA90-SG Lab ID: 10300341011 Collected: 03/20/15 09:50 Received: 03/23/15 08:50 Matrix: Air
Parameters Results Units DF Prepared Analyzed CAS No. QualPQL
Analytical Method: TO-15TO15 MSV AIR
Acetone 72.5 ug/m3 03/25/15 21:26 67-64-19.8 4.04Benzene 1.7 ug/m3 03/25/15 21:26 71-43-21.3 4.04Bromodichloromethane <0.74 ug/m3 03/25/15 21:26 75-27-45.5 4.04Bromoform <1.3 ug/m3 03/25/15 21:26 75-25-221.2 4.04Bromomethane <1.1 ug/m3 03/25/15 21:26 74-83-93.2 4.042-Butanone (MEK) 8.3 ug/m3 03/25/15 21:26 78-93-32.4 4.04Carbon disulfide 7.2 ug/m3 03/25/15 21:26 75-15-02.5 4.04Carbon tetrachloride <1.3 ug/m3 03/25/15 21:26 56-23-52.6 4.04Chlorobenzene <0.43 ug/m3 03/25/15 21:26 108-90-73.8 4.04Chloroethane <0.65 ug/m3 03/25/15 21:26 75-00-32.2 4.04Chloroform 15.8 ug/m3 03/25/15 21:26 67-66-32.0 4.04Chloromethane <0.78 ug/m3 03/25/15 21:26 74-87-31.7 4.04Dibromochloromethane <3.5 ug/m3 03/25/15 21:26 124-48-17.0 4.041,2-Dibromoethane (EDB) <0.95 ug/m3 03/25/15 21:26 106-93-46.3 4.041,1-Dichloroethane <0.57 ug/m3 03/25/15 21:26 75-34-33.3 4.041,2-Dichloroethane <0.48 ug/m3 03/25/15 21:26 107-06-21.7 4.041,1-Dichloroethene <0.42 ug/m3 03/25/15 21:26 75-35-43.3 4.04cis-1,2-Dichloroethene <0.79 ug/m3 03/25/15 21:26 156-59-28.1 4.04trans-1,2-Dichloroethene <0.66 ug/m3 03/25/15 21:26 156-60-53.3 4.041,2-Dichloropropane <0.61 ug/m3 03/25/15 21:26 78-87-53.8 4.04cis-1,3-Dichloropropene <0.55 ug/m3 03/25/15 21:26 10061-01-53.7 4.04trans-1,3-Dichloropropene <0.61 ug/m3 03/25/15 21:26 10061-02-63.7 4.04Ethylbenzene <0.72 ug/m3 03/25/15 21:26 100-41-43.6 4.04Isopropylbenzene (Cumene) <2.0 ug/m3 03/25/15 21:26 98-82-810.1 4.04Methylene Chloride 4.3J ug/m3 03/25/15 21:26 75-09-214.3 4.044-Methyl-2-pentanone (MIBK) <0.69 ug/m3 03/25/15 21:26 108-10-18.4 4.04Methyl-tert-butyl ether <0.36 ug/m3 03/25/15 21:26 1634-04-42.9 4.04Styrene <0.55 ug/m3 03/25/15 21:26 100-42-53.5 4.041,1,2,2-Tetrachloroethane <0.94 ug/m3 03/25/15 21:26 79-34-52.8 4.04Tetrachloroethene <0.76 ug/m3 03/25/15 21:26 127-18-42.8 4.04Toluene 5.9 ug/m3 03/25/15 21:26 108-88-33.1 4.041,1,1-Trichloroethane <0.56 ug/m3 03/25/15 21:26 71-55-62.8 4.041,1,2-Trichloroethane <0.98 ug/m3 03/25/15 21:26 79-00-52.2 4.04Trichloroethene <0.72 ug/m3 03/25/15 21:26 79-01-62.2 4.04Vinyl chloride <0.38 ug/m3 03/25/15 21:26 75-01-41.1 4.04m&p-Xylene 3.9J ug/m3 03/25/15 21:26 179601-23-17.1 4.04o-Xylene 1.9J ug/m3 03/25/15 21:26 95-47-63.6 4.04
REPORT OF LABORATORY ANALYSISThis report shall not be reproduced, except in full,
without the written consent of Pace Analytical Services, Inc..Date: 04/10/2015 02:09 PM
Pace Analytical Services, Inc.1700 Elm Street - Suite 200
Minneapolis, MN 55414(612)607-1700
Page 17 of 34

#=AR#
ANALYTICAL RESULTS
Pace Project No.:Project:
10300341NCM BOA
Sample: AA93-SG Lab ID: 10300341012 Collected: 03/20/15 09:51 Received: 03/23/15 08:50 Matrix: Air
Parameters Results Units DF Prepared Analyzed CAS No. QualPQL
Analytical Method: TO-15TO15 MSV AIR
Acetone 17.5 ug/m3 03/25/15 21:59 67-64-13.4 1.39Benzene 0.52 ug/m3 03/25/15 21:59 71-43-20.45 1.39Bromodichloromethane <0.25 ug/m3 03/25/15 21:59 75-27-41.9 1.39Bromoform <0.45 ug/m3 03/25/15 21:59 75-25-27.3 1.39Bromomethane <0.38 ug/m3 03/25/15 21:59 74-83-91.1 1.392-Butanone (MEK) 2.2 ug/m3 03/25/15 21:59 78-93-30.83 1.39Carbon disulfide 9.4 ug/m3 03/25/15 21:59 75-15-00.88 1.39Carbon tetrachloride <0.44 ug/m3 03/25/15 21:59 56-23-50.89 1.39Chlorobenzene <0.15 ug/m3 03/25/15 21:59 108-90-71.3 1.39Chloroethane <0.22 ug/m3 03/25/15 21:59 75-00-30.75 1.39Chloroform 2.9 ug/m3 03/25/15 21:59 67-66-30.69 1.39Chloromethane <0.27 ug/m3 03/25/15 21:59 74-87-30.58 1.39Dibromochloromethane <1.2 ug/m3 03/25/15 21:59 124-48-12.4 1.391,2-Dibromoethane (EDB) <0.33 ug/m3 03/25/15 21:59 106-93-42.2 1.391,1-Dichloroethane <0.19 ug/m3 03/25/15 21:59 75-34-31.1 1.391,2-Dichloroethane <0.17 ug/m3 03/25/15 21:59 107-06-20.57 1.391,1-Dichloroethene <0.14 ug/m3 03/25/15 21:59 75-35-41.1 1.39cis-1,2-Dichloroethene <0.27 ug/m3 03/25/15 21:59 156-59-22.8 1.39trans-1,2-Dichloroethene <0.23 ug/m3 03/25/15 21:59 156-60-51.1 1.391,2-Dichloropropane <0.21 ug/m3 03/25/15 21:59 78-87-51.3 1.39cis-1,3-Dichloropropene <0.19 ug/m3 03/25/15 21:59 10061-01-51.3 1.39trans-1,3-Dichloropropene <0.21 ug/m3 03/25/15 21:59 10061-02-61.3 1.39Ethylbenzene <0.25 ug/m3 03/25/15 21:59 100-41-41.2 1.39Isopropylbenzene (Cumene) <0.70 ug/m3 03/25/15 21:59 98-82-83.5 1.39Methylene Chloride <0.32 ug/m3 03/25/15 21:59 75-09-24.9 1.394-Methyl-2-pentanone (MIBK) <0.24 ug/m3 03/25/15 21:59 108-10-12.9 1.39Methyl-tert-butyl ether <0.12 ug/m3 03/25/15 21:59 1634-04-41.0 1.39Styrene <0.19 ug/m3 03/25/15 21:59 100-42-51.2 1.391,1,2,2-Tetrachloroethane <0.32 ug/m3 03/25/15 21:59 79-34-50.97 1.39Tetrachloroethene <0.26 ug/m3 03/25/15 21:59 127-18-40.96 1.39Toluene 1.4 ug/m3 03/25/15 21:59 108-88-31.1 1.391,1,1-Trichloroethane <0.19 ug/m3 03/25/15 21:59 71-55-60.97 1.391,1,2-Trichloroethane <0.34 ug/m3 03/25/15 21:59 79-00-50.77 1.39Trichloroethene <0.25 ug/m3 03/25/15 21:59 79-01-60.76 1.39Vinyl chloride <0.13 ug/m3 03/25/15 21:59 75-01-40.36 1.39m&p-Xylene 0.87J ug/m3 03/25/15 21:59 179601-23-12.4 1.39o-Xylene <0.61 ug/m3 03/25/15 21:59 95-47-61.2 1.39
REPORT OF LABORATORY ANALYSISThis report shall not be reproduced, except in full,
without the written consent of Pace Analytical Services, Inc..Date: 04/10/2015 02:09 PM
Pace Analytical Services, Inc.1700 Elm Street - Suite 200
Minneapolis, MN 55414(612)607-1700
Page 18 of 34

#=AR#
ANALYTICAL RESULTS
Pace Project No.:Project:
10300341NCM BOA
Sample: AA94-SG Lab ID: 10300341013 Collected: 03/20/15 09:51 Received: 03/23/15 08:50 Matrix: Air
Parameters Results Units DF Prepared Analyzed CAS No. QualPQL
Analytical Method: TO-15TO15 MSV AIR
Acetone 55.6 ug/m3 03/25/15 22:29 67-64-13.4 1.39Benzene 4.8 ug/m3 03/25/15 22:29 71-43-20.45 1.39Bromodichloromethane 5.0 ug/m3 03/25/15 22:29 75-27-41.9 1.39Bromoform <0.45 ug/m3 03/25/15 22:29 75-25-27.3 1.39Bromomethane <0.38 ug/m3 03/25/15 22:29 74-83-91.1 1.392-Butanone (MEK) 5.6 ug/m3 03/25/15 22:29 78-93-30.83 1.39Carbon disulfide 197 ug/m3 03/27/15 09:24 75-15-08.8 13.9Carbon tetrachloride 0.56J ug/m3 03/25/15 22:29 56-23-50.89 1.39Chlorobenzene <0.15 ug/m3 03/25/15 22:29 108-90-71.3 1.39Chloroethane <0.22 ug/m3 03/25/15 22:29 75-00-30.75 1.39Chloroform 139 ug/m3 03/27/15 09:24 67-66-36.9 13.9Chloromethane 1.9 ug/m3 03/25/15 22:29 74-87-30.58 1.39Dibromochloromethane <1.2 ug/m3 03/25/15 22:29 124-48-12.4 1.391,2-Dibromoethane (EDB) <0.33 ug/m3 03/25/15 22:29 106-93-42.2 1.391,1-Dichloroethane <0.19 ug/m3 03/25/15 22:29 75-34-31.1 1.391,2-Dichloroethane <0.17 ug/m3 03/25/15 22:29 107-06-20.57 1.391,1-Dichloroethene <0.14 ug/m3 03/25/15 22:29 75-35-41.1 1.39cis-1,2-Dichloroethene <0.27 ug/m3 03/25/15 22:29 156-59-22.8 1.39trans-1,2-Dichloroethene <0.23 ug/m3 03/25/15 22:29 156-60-51.1 1.391,2-Dichloropropane <0.21 ug/m3 03/25/15 22:29 78-87-51.3 1.39cis-1,3-Dichloropropene <0.19 ug/m3 03/25/15 22:29 10061-01-51.3 1.39trans-1,3-Dichloropropene <0.21 ug/m3 03/25/15 22:29 10061-02-61.3 1.39Ethylbenzene 1.3 ug/m3 03/25/15 22:29 100-41-41.2 1.39Isopropylbenzene (Cumene) <0.70 ug/m3 03/25/15 22:29 98-82-83.5 1.39Methylene Chloride 1.7J ug/m3 03/25/15 22:29 75-09-24.9 1.394-Methyl-2-pentanone (MIBK) <0.24 ug/m3 03/25/15 22:29 108-10-12.9 1.39Methyl-tert-butyl ether <0.12 ug/m3 03/25/15 22:29 1634-04-41.0 1.39Styrene 0.90J ug/m3 03/25/15 22:29 100-42-51.2 1.391,1,2,2-Tetrachloroethane <0.32 ug/m3 03/25/15 22:29 79-34-50.97 1.39Tetrachloroethene <0.26 ug/m3 03/25/15 22:29 127-18-40.96 1.39Toluene 6.1 ug/m3 03/25/15 22:29 108-88-31.1 1.391,1,1-Trichloroethane <0.19 ug/m3 03/25/15 22:29 71-55-60.97 1.391,1,2-Trichloroethane <0.34 ug/m3 03/25/15 22:29 79-00-50.77 1.39Trichloroethene <0.25 ug/m3 03/25/15 22:29 79-01-60.76 1.39Vinyl chloride <0.13 ug/m3 03/25/15 22:29 75-01-40.36 1.39m&p-Xylene 4.9 ug/m3 03/25/15 22:29 179601-23-12.4 1.39o-Xylene 2.2 ug/m3 03/25/15 22:29 95-47-61.2 1.39
REPORT OF LABORATORY ANALYSISThis report shall not be reproduced, except in full,
without the written consent of Pace Analytical Services, Inc..Date: 04/10/2015 02:09 PM
Pace Analytical Services, Inc.1700 Elm Street - Suite 200
Minneapolis, MN 55414(612)607-1700
Page 19 of 34

#=AR#
ANALYTICAL RESULTS
Pace Project No.:Project:
10300341NCM BOA
Sample: AA96-SG Lab ID: 10300341014 Collected: 03/20/15 09:52 Received: 03/23/15 08:50 Matrix: Air
Parameters Results Units DF Prepared Analyzed CAS No. QualPQL
Analytical Method: TO-15TO15 MSV AIR
Acetone 44.8 ug/m3 03/25/15 23:01 67-64-13.6 1.49Benzene 3.2 ug/m3 03/25/15 23:01 71-43-20.48 1.49Bromodichloromethane 2.2 ug/m3 03/25/15 23:01 75-27-42.0 1.49Bromoform <0.48 ug/m3 03/25/15 23:01 75-25-27.8 1.49Bromomethane <0.40 ug/m3 03/25/15 23:01 74-83-91.2 1.492-Butanone (MEK) 4.1 ug/m3 03/25/15 23:01 78-93-30.89 1.49Carbon disulfide 22.8 ug/m3 03/25/15 23:01 75-15-00.94 1.49Carbon tetrachloride <0.48 ug/m3 03/25/15 23:01 56-23-50.95 1.49Chlorobenzene <0.16 ug/m3 03/25/15 23:01 108-90-71.4 1.49Chloroethane <0.24 ug/m3 03/25/15 23:01 75-00-30.80 1.49Chloroform 40.8 ug/m3 03/25/15 23:01 67-66-30.74 1.49Chloromethane <0.29 ug/m3 03/25/15 23:01 74-87-30.63 1.49Dibromochloromethane <1.3 ug/m3 03/25/15 23:01 124-48-12.6 1.491,2-Dibromoethane (EDB) <0.35 ug/m3 03/25/15 23:01 106-93-42.3 1.491,1-Dichloroethane <0.21 ug/m3 03/25/15 23:01 75-34-31.2 1.491,2-Dichloroethane <0.18 ug/m3 03/25/15 23:01 107-06-20.61 1.491,1-Dichloroethene <0.15 ug/m3 03/25/15 23:01 75-35-41.2 1.49cis-1,2-Dichloroethene <0.29 ug/m3 03/25/15 23:01 156-59-23.0 1.49trans-1,2-Dichloroethene <0.24 ug/m3 03/25/15 23:01 156-60-51.2 1.491,2-Dichloropropane <0.23 ug/m3 03/25/15 23:01 78-87-51.4 1.49cis-1,3-Dichloropropene <0.20 ug/m3 03/25/15 23:01 10061-01-51.4 1.49trans-1,3-Dichloropropene <0.22 ug/m3 03/25/15 23:01 10061-02-61.4 1.49Ethylbenzene 1.2J ug/m3 03/25/15 23:01 100-41-41.3 1.49Isopropylbenzene (Cumene) <0.74 ug/m3 03/25/15 23:01 98-82-83.7 1.49Methylene Chloride 2.8J ug/m3 03/25/15 23:01 75-09-25.3 1.494-Methyl-2-pentanone (MIBK) <0.25 ug/m3 03/25/15 23:01 108-10-13.1 1.49Methyl-tert-butyl ether <0.13 ug/m3 03/25/15 23:01 1634-04-41.1 1.49Styrene 0.91J ug/m3 03/25/15 23:01 100-42-51.3 1.491,1,2,2-Tetrachloroethane <0.35 ug/m3 03/25/15 23:01 79-34-51.0 1.49Tetrachloroethene <0.28 ug/m3 03/25/15 23:01 127-18-41.0 1.49Toluene 8.6 ug/m3 03/25/15 23:01 108-88-31.1 1.491,1,1-Trichloroethane <0.21 ug/m3 03/25/15 23:01 71-55-61.0 1.491,1,2-Trichloroethane <0.36 ug/m3 03/25/15 23:01 79-00-50.83 1.49Trichloroethene <0.27 ug/m3 03/25/15 23:01 79-01-60.81 1.49Vinyl chloride <0.14 ug/m3 03/25/15 23:01 75-01-40.39 1.49m&p-Xylene 4.2 ug/m3 03/25/15 23:01 179601-23-12.6 1.49o-Xylene 1.7 ug/m3 03/25/15 23:01 95-47-61.3 1.49
REPORT OF LABORATORY ANALYSISThis report shall not be reproduced, except in full,
without the written consent of Pace Analytical Services, Inc..Date: 04/10/2015 02:09 PM
Pace Analytical Services, Inc.1700 Elm Street - Suite 200
Minneapolis, MN 55414(612)607-1700
Page 20 of 34

#=AR#
ANALYTICAL RESULTS
Pace Project No.:Project:
10300341NCM BOA
Sample: AA99-SG Lab ID: 10300341015 Collected: 03/20/15 09:53 Received: 03/23/15 08:50 Matrix: Air
Parameters Results Units DF Prepared Analyzed CAS No. QualPQL
Analytical Method: TO-15TO15 MSV AIR
Acetone 39.4 ug/m3 03/25/15 23:29 67-64-13.4 1.39Benzene 3.6 ug/m3 03/25/15 23:29 71-43-20.45 1.39Bromodichloromethane 3.0 ug/m3 03/25/15 23:29 75-27-41.9 1.39Bromoform <0.45 ug/m3 03/25/15 23:29 75-25-27.3 1.39Bromomethane <0.38 ug/m3 03/25/15 23:29 74-83-91.1 1.392-Butanone (MEK) 5.0 ug/m3 03/25/15 23:29 78-93-30.83 1.39Carbon disulfide 4.6 ug/m3 03/25/15 23:29 75-15-00.88 1.39Carbon tetrachloride <0.44 ug/m3 03/25/15 23:29 56-23-50.89 1.39Chlorobenzene <0.15 ug/m3 03/25/15 23:29 108-90-71.3 1.39Chloroethane <0.22 ug/m3 03/25/15 23:29 75-00-30.75 1.39Chloroform 66.0 ug/m3 03/25/15 23:29 67-66-30.69 1.39Chloromethane <0.27 ug/m3 03/25/15 23:29 74-87-30.58 1.39Dibromochloromethane <1.2 ug/m3 03/25/15 23:29 124-48-12.4 1.391,2-Dibromoethane (EDB) <0.33 ug/m3 03/25/15 23:29 106-93-42.2 1.391,1-Dichloroethane <0.19 ug/m3 03/25/15 23:29 75-34-31.1 1.391,2-Dichloroethane <0.17 ug/m3 03/25/15 23:29 107-06-20.57 1.391,1-Dichloroethene <0.14 ug/m3 03/25/15 23:29 75-35-41.1 1.39cis-1,2-Dichloroethene <0.27 ug/m3 03/25/15 23:29 156-59-22.8 1.39trans-1,2-Dichloroethene <0.23 ug/m3 03/25/15 23:29 156-60-51.1 1.391,2-Dichloropropane <0.21 ug/m3 03/25/15 23:29 78-87-51.3 1.39cis-1,3-Dichloropropene <0.19 ug/m3 03/25/15 23:29 10061-01-51.3 1.39trans-1,3-Dichloropropene <0.21 ug/m3 03/25/15 23:29 10061-02-61.3 1.39Ethylbenzene 1.1J ug/m3 03/25/15 23:29 100-41-41.2 1.39Isopropylbenzene (Cumene) <0.70 ug/m3 03/25/15 23:29 98-82-83.5 1.39Methylene Chloride <0.32 ug/m3 03/25/15 23:29 75-09-24.9 1.394-Methyl-2-pentanone (MIBK) <0.24 ug/m3 03/25/15 23:29 108-10-12.9 1.39Methyl-tert-butyl ether <0.12 ug/m3 03/25/15 23:29 1634-04-41.0 1.39Styrene 0.82J ug/m3 03/25/15 23:29 100-42-51.2 1.391,1,2,2-Tetrachloroethane <0.32 ug/m3 03/25/15 23:29 79-34-50.97 1.39Tetrachloroethene <0.26 ug/m3 03/25/15 23:29 127-18-40.96 1.39Toluene 5.3 ug/m3 03/25/15 23:29 108-88-31.1 1.391,1,1-Trichloroethane <0.19 ug/m3 03/25/15 23:29 71-55-60.97 1.391,1,2-Trichloroethane <0.34 ug/m3 03/25/15 23:29 79-00-50.77 1.39Trichloroethene <0.25 ug/m3 03/25/15 23:29 79-01-60.76 1.39Vinyl chloride <0.13 ug/m3 03/25/15 23:29 75-01-40.36 1.39m&p-Xylene 4.3 ug/m3 03/25/15 23:29 179601-23-12.4 1.39o-Xylene 1.9 ug/m3 03/25/15 23:29 95-47-61.2 1.39
REPORT OF LABORATORY ANALYSISThis report shall not be reproduced, except in full,
without the written consent of Pace Analytical Services, Inc..Date: 04/10/2015 02:09 PM
Pace Analytical Services, Inc.1700 Elm Street - Suite 200
Minneapolis, MN 55414(612)607-1700
Page 21 of 34

#=AR#
ANALYTICAL RESULTS
Pace Project No.:Project:
10300341NCM BOA
Sample: AA101-SG Lab ID: 10300341016 Collected: 03/20/15 09:54 Received: 03/23/15 08:50 Matrix: Air
Parameters Results Units DF Prepared Analyzed CAS No. QualPQL
Analytical Method: TO-15TO15 MSV AIR
Acetone 52.3 ug/m3 03/25/15 23:57 67-64-13.2 1.34Benzene 3.6 ug/m3 03/25/15 23:57 71-43-20.44 1.34Bromodichloromethane 1.9 ug/m3 03/25/15 23:57 75-27-41.8 1.34Bromoform <0.43 ug/m3 03/25/15 23:57 75-25-27.0 1.34Bromomethane <0.36 ug/m3 03/25/15 23:57 74-83-91.1 1.342-Butanone (MEK) 4.1 ug/m3 03/25/15 23:57 78-93-30.80 1.34Carbon disulfide 28.4 ug/m3 03/25/15 23:57 75-15-00.84 1.34Carbon tetrachloride <0.43 ug/m3 03/25/15 23:57 56-23-50.86 1.34Chlorobenzene <0.14 ug/m3 03/25/15 23:57 108-90-71.3 1.34Chloroethane <0.22 ug/m3 03/25/15 23:57 75-00-30.72 1.34Chloroform 23.3 ug/m3 03/25/15 23:57 67-66-30.66 1.34Chloromethane <0.26 ug/m3 03/25/15 23:57 74-87-30.56 1.34Dibromochloromethane <1.2 ug/m3 03/25/15 23:57 124-48-12.3 1.341,2-Dibromoethane (EDB) <0.31 ug/m3 03/25/15 23:57 106-93-42.1 1.341,1-Dichloroethane <0.19 ug/m3 03/25/15 23:57 75-34-31.1 1.341,2-Dichloroethane <0.16 ug/m3 03/25/15 23:57 107-06-20.55 1.341,1-Dichloroethene <0.14 ug/m3 03/25/15 23:57 75-35-41.1 1.34cis-1,2-Dichloroethene <0.26 ug/m3 03/25/15 23:57 156-59-22.7 1.34trans-1,2-Dichloroethene <0.22 ug/m3 03/25/15 23:57 156-60-51.1 1.341,2-Dichloropropane <0.20 ug/m3 03/25/15 23:57 78-87-51.3 1.34cis-1,3-Dichloropropene <0.18 ug/m3 03/25/15 23:57 10061-01-51.2 1.34trans-1,3-Dichloropropene <0.20 ug/m3 03/25/15 23:57 10061-02-61.2 1.34Ethylbenzene 1.0J ug/m3 03/25/15 23:57 100-41-41.2 1.34Isopropylbenzene (Cumene) <0.67 ug/m3 03/25/15 23:57 98-82-83.4 1.34Methylene Chloride <0.31 ug/m3 03/25/15 23:57 75-09-24.7 1.344-Methyl-2-pentanone (MIBK) <0.23 ug/m3 03/25/15 23:57 108-10-12.8 1.34Methyl-tert-butyl ether <0.12 ug/m3 03/25/15 23:57 1634-04-40.98 1.34Styrene 0.77J ug/m3 03/25/15 23:57 100-42-51.2 1.341,1,2,2-Tetrachloroethane <0.31 ug/m3 03/25/15 23:57 79-34-50.94 1.34Tetrachloroethene <0.25 ug/m3 03/25/15 23:57 127-18-40.92 1.34Toluene 6.0 ug/m3 03/25/15 23:57 108-88-31.0 1.341,1,1-Trichloroethane <0.19 ug/m3 03/25/15 23:57 71-55-60.94 1.341,1,2-Trichloroethane <0.33 ug/m3 03/25/15 23:57 79-00-50.74 1.34Trichloroethene <0.24 ug/m3 03/25/15 23:57 79-01-60.73 1.34Vinyl chloride <0.12 ug/m3 03/25/15 23:57 75-01-40.35 1.34m&p-Xylene 3.8 ug/m3 03/25/15 23:57 179601-23-12.4 1.34o-Xylene 1.6 ug/m3 03/25/15 23:57 95-47-61.2 1.34
REPORT OF LABORATORY ANALYSISThis report shall not be reproduced, except in full,
without the written consent of Pace Analytical Services, Inc..Date: 04/10/2015 02:09 PM
Pace Analytical Services, Inc.1700 Elm Street - Suite 200
Minneapolis, MN 55414(612)607-1700
Page 22 of 34

#=AR#
ANALYTICAL RESULTS
Pace Project No.:Project:
10300341NCM BOA
Sample: AA102-SG Lab ID: 10300341017 Collected: 03/20/15 09:56 Received: 03/23/15 08:50 Matrix: Air
Parameters Results Units DF Prepared Analyzed CAS No. QualPQL
Analytical Method: TO-15TO15 MSV AIR
Acetone 33.0 ug/m3 03/26/15 00:25 67-64-13.4 1.39Benzene 1.6 ug/m3 03/26/15 00:25 71-43-20.45 1.39Bromodichloromethane 0.96J ug/m3 03/26/15 00:25 75-27-41.9 1.39Bromoform <0.45 ug/m3 03/26/15 00:25 75-25-27.3 1.39Bromomethane <0.38 ug/m3 03/26/15 00:25 74-83-91.1 1.392-Butanone (MEK) 3.3 ug/m3 03/26/15 00:25 78-93-30.83 1.39Carbon disulfide 4.6 ug/m3 03/26/15 00:25 75-15-00.88 1.39Carbon tetrachloride <0.44 ug/m3 03/26/15 00:25 56-23-50.89 1.39Chlorobenzene <0.15 ug/m3 03/26/15 00:25 108-90-71.3 1.39Chloroethane <0.22 ug/m3 03/26/15 00:25 75-00-30.75 1.39Chloroform 15.3 ug/m3 03/26/15 00:25 67-66-30.69 1.39Chloromethane <0.27 ug/m3 03/26/15 00:25 74-87-30.58 1.39Dibromochloromethane <1.2 ug/m3 03/26/15 00:25 124-48-12.4 1.391,2-Dibromoethane (EDB) <0.33 ug/m3 03/26/15 00:25 106-93-42.2 1.391,1-Dichloroethane <0.19 ug/m3 03/26/15 00:25 75-34-31.1 1.391,2-Dichloroethane <0.17 ug/m3 03/26/15 00:25 107-06-20.57 1.391,1-Dichloroethene <0.14 ug/m3 03/26/15 00:25 75-35-41.1 1.39cis-1,2-Dichloroethene <0.27 ug/m3 03/26/15 00:25 156-59-22.8 1.39trans-1,2-Dichloroethene <0.23 ug/m3 03/26/15 00:25 156-60-51.1 1.391,2-Dichloropropane <0.21 ug/m3 03/26/15 00:25 78-87-51.3 1.39cis-1,3-Dichloropropene <0.19 ug/m3 03/26/15 00:25 10061-01-51.3 1.39trans-1,3-Dichloropropene <0.21 ug/m3 03/26/15 00:25 10061-02-61.3 1.39Ethylbenzene 1.1J ug/m3 03/26/15 00:25 100-41-41.2 1.39Isopropylbenzene (Cumene) <0.70 ug/m3 03/26/15 00:25 98-82-83.5 1.39Methylene Chloride <0.32 ug/m3 03/26/15 00:25 75-09-24.9 1.394-Methyl-2-pentanone (MIBK) <0.24 ug/m3 03/26/15 00:25 108-10-12.9 1.39Methyl-tert-butyl ether <0.12 ug/m3 03/26/15 00:25 1634-04-41.0 1.39Styrene 0.82J ug/m3 03/26/15 00:25 100-42-51.2 1.391,1,2,2-Tetrachloroethane <0.32 ug/m3 03/26/15 00:25 79-34-50.97 1.39Tetrachloroethene <0.26 ug/m3 03/26/15 00:25 127-18-40.96 1.39Toluene 5.2 ug/m3 03/26/15 00:25 108-88-31.1 1.391,1,1-Trichloroethane <0.19 ug/m3 03/26/15 00:25 71-55-60.97 1.391,1,2-Trichloroethane <0.34 ug/m3 03/26/15 00:25 79-00-50.77 1.39Trichloroethene <0.25 ug/m3 03/26/15 00:25 79-01-60.76 1.39Vinyl chloride <0.13 ug/m3 03/26/15 00:25 75-01-40.36 1.39m&p-Xylene 4.3 ug/m3 03/26/15 00:25 179601-23-12.4 1.39o-Xylene 1.8 ug/m3 03/26/15 00:25 95-47-61.2 1.39
REPORT OF LABORATORY ANALYSISThis report shall not be reproduced, except in full,
without the written consent of Pace Analytical Services, Inc..Date: 04/10/2015 02:09 PM
Pace Analytical Services, Inc.1700 Elm Street - Suite 200
Minneapolis, MN 55414(612)607-1700
Page 23 of 34

#=AR#
ANALYTICAL RESULTS
Pace Project No.:Project:
10300341NCM BOA
Sample: AA103-SG Lab ID: 10300341018 Collected: 03/20/15 09:57 Received: 03/23/15 08:50 Matrix: Air
Parameters Results Units DF Prepared Analyzed CAS No. QualPQL
Analytical Method: TO-15TO15 MSV AIR
Acetone 38.6 ug/m3 03/26/15 00:53 67-64-13.0 1.26Benzene 1.0 ug/m3 03/26/15 00:53 71-43-20.41 1.26Bromodichloromethane <0.23 ug/m3 03/26/15 00:53 75-27-41.7 1.26Bromoform <0.41 ug/m3 03/26/15 00:53 75-25-26.6 1.26Bromomethane <0.34 ug/m3 03/26/15 00:53 74-83-91.0 1.262-Butanone (MEK) 3.0 ug/m3 03/26/15 00:53 78-93-30.76 1.26Carbon disulfide 8.5 ug/m3 03/26/15 00:53 75-15-00.79 1.26Carbon tetrachloride <0.40 ug/m3 03/26/15 00:53 56-23-50.81 1.26Chlorobenzene <0.13 ug/m3 03/26/15 00:53 108-90-71.2 1.26Chloroethane <0.20 ug/m3 03/26/15 00:53 75-00-30.68 1.26Chloroform 3.6 ug/m3 03/26/15 00:53 67-66-30.62 1.26Chloromethane <0.24 ug/m3 03/26/15 00:53 74-87-30.53 1.26Dibromochloromethane <1.1 ug/m3 03/26/15 00:53 124-48-12.2 1.261,2-Dibromoethane (EDB) <0.29 ug/m3 03/26/15 00:53 106-93-42.0 1.261,1-Dichloroethane <0.18 ug/m3 03/26/15 00:53 75-34-31.0 1.261,2-Dichloroethane <0.15 ug/m3 03/26/15 00:53 107-06-20.52 1.261,1-Dichloroethene <0.13 ug/m3 03/26/15 00:53 75-35-41.0 1.26cis-1,2-Dichloroethene <0.25 ug/m3 03/26/15 00:53 156-59-22.5 1.26trans-1,2-Dichloroethene <0.21 ug/m3 03/26/15 00:53 156-60-51.0 1.261,2-Dichloropropane <0.19 ug/m3 03/26/15 00:53 78-87-51.2 1.26cis-1,3-Dichloropropene <0.17 ug/m3 03/26/15 00:53 10061-01-51.2 1.26trans-1,3-Dichloropropene <0.19 ug/m3 03/26/15 00:53 10061-02-61.2 1.26Ethylbenzene 0.99J ug/m3 03/26/15 00:53 100-41-41.1 1.26Isopropylbenzene (Cumene) <0.63 ug/m3 03/26/15 00:53 98-82-83.2 1.26Methylene Chloride <0.29 ug/m3 03/26/15 00:53 75-09-24.4 1.264-Methyl-2-pentanone (MIBK) <0.22 ug/m3 03/26/15 00:53 108-10-12.6 1.26Methyl-tert-butyl ether <0.11 ug/m3 03/26/15 00:53 1634-04-40.92 1.26Styrene 0.75J ug/m3 03/26/15 00:53 100-42-51.1 1.261,1,2,2-Tetrachloroethane <0.29 ug/m3 03/26/15 00:53 79-34-50.88 1.26Tetrachloroethene <0.24 ug/m3 03/26/15 00:53 127-18-40.87 1.26Toluene 3.7 ug/m3 03/26/15 00:53 108-88-30.97 1.261,1,1-Trichloroethane <0.18 ug/m3 03/26/15 00:53 71-55-60.88 1.261,1,2-Trichloroethane <0.31 ug/m3 03/26/15 00:53 79-00-50.70 1.26Trichloroethene <0.22 ug/m3 03/26/15 00:53 79-01-60.69 1.26Vinyl chloride <0.12 ug/m3 03/26/15 00:53 75-01-40.33 1.26m&p-Xylene 3.5 ug/m3 03/26/15 00:53 179601-23-12.2 1.26o-Xylene 1.6 ug/m3 03/26/15 00:53 95-47-61.1 1.26
REPORT OF LABORATORY ANALYSISThis report shall not be reproduced, except in full,
without the written consent of Pace Analytical Services, Inc..Date: 04/10/2015 02:09 PM
Pace Analytical Services, Inc.1700 Elm Street - Suite 200
Minneapolis, MN 55414(612)607-1700
Page 24 of 34

#=AR#
ANALYTICAL RESULTS
Pace Project No.:Project:
10300341NCM BOA
Sample: AA95-SG Lab ID: 10300341019 Collected: 03/21/15 11:30 Received: 03/23/15 08:50 Matrix: Air
Parameters Results Units DF Prepared Analyzed CAS No. QualPQL
Analytical Method: TO-15TO15 MSV AIR
Acetone 117 ug/m3 03/26/15 01:20 67-64-1 E3.0 1.26Benzene 2.0 ug/m3 03/26/15 01:20 71-43-20.41 1.26Bromodichloromethane 4.4 ug/m3 03/26/15 01:20 75-27-41.7 1.26Bromoform <0.41 ug/m3 03/26/15 01:20 75-25-26.6 1.26Bromomethane <0.34 ug/m3 03/26/15 01:20 74-83-91.0 1.262-Butanone (MEK) 9.1 ug/m3 03/26/15 01:20 78-93-30.76 1.26Carbon disulfide 52.0 ug/m3 03/26/15 01:20 75-15-00.79 1.26Carbon tetrachloride <0.40 ug/m3 03/26/15 01:20 56-23-50.81 1.26Chlorobenzene <0.13 ug/m3 03/26/15 01:20 108-90-71.2 1.26Chloroethane <0.20 ug/m3 03/26/15 01:20 75-00-30.68 1.26Chloroform 99.3 ug/m3 03/26/15 01:20 67-66-30.62 1.26Chloromethane <0.24 ug/m3 03/26/15 01:20 74-87-30.53 1.26Dibromochloromethane <1.1 ug/m3 03/26/15 01:20 124-48-12.2 1.261,2-Dibromoethane (EDB) <0.29 ug/m3 03/26/15 01:20 106-93-42.0 1.261,1-Dichloroethane <0.18 ug/m3 03/26/15 01:20 75-34-31.0 1.261,2-Dichloroethane <0.15 ug/m3 03/26/15 01:20 107-06-20.52 1.261,1-Dichloroethene <0.13 ug/m3 03/26/15 01:20 75-35-41.0 1.26cis-1,2-Dichloroethene <0.25 ug/m3 03/26/15 01:20 156-59-22.5 1.26trans-1,2-Dichloroethene <0.21 ug/m3 03/26/15 01:20 156-60-51.0 1.261,2-Dichloropropane <0.19 ug/m3 03/26/15 01:20 78-87-51.2 1.26cis-1,3-Dichloropropene <0.17 ug/m3 03/26/15 01:20 10061-01-51.2 1.26trans-1,3-Dichloropropene <0.19 ug/m3 03/26/15 01:20 10061-02-61.2 1.26Ethylbenzene 1.2 ug/m3 03/26/15 01:20 100-41-41.1 1.26Isopropylbenzene (Cumene) <0.63 ug/m3 03/26/15 01:20 98-82-83.2 1.26Methylene Chloride 1.0J ug/m3 03/26/15 01:20 75-09-24.4 1.264-Methyl-2-pentanone (MIBK) <0.22 ug/m3 03/26/15 01:20 108-10-12.6 1.26Methyl-tert-butyl ether <0.11 ug/m3 03/26/15 01:20 1634-04-40.92 1.26Styrene 0.71J ug/m3 03/26/15 01:20 100-42-51.1 1.261,1,2,2-Tetrachloroethane <0.29 ug/m3 03/26/15 01:20 79-34-50.88 1.26Tetrachloroethene <0.24 ug/m3 03/26/15 01:20 127-18-40.87 1.26Toluene 4.6 ug/m3 03/26/15 01:20 108-88-30.97 1.261,1,1-Trichloroethane <0.18 ug/m3 03/26/15 01:20 71-55-60.88 1.261,1,2-Trichloroethane <0.31 ug/m3 03/26/15 01:20 79-00-50.70 1.26Trichloroethene <0.22 ug/m3 03/26/15 01:20 79-01-60.69 1.26Vinyl chloride <0.12 ug/m3 03/26/15 01:20 75-01-40.33 1.26m&p-Xylene 4.2 ug/m3 03/26/15 01:20 179601-23-12.2 1.26o-Xylene 1.2 ug/m3 03/26/15 01:20 95-47-61.1 1.26
REPORT OF LABORATORY ANALYSISThis report shall not be reproduced, except in full,
without the written consent of Pace Analytical Services, Inc..Date: 04/10/2015 02:09 PM
Pace Analytical Services, Inc.1700 Elm Street - Suite 200
Minneapolis, MN 55414(612)607-1700
Page 25 of 34

#=QC#
QUALITY CONTROL DATA
Pace Project No.:Project:
10300341NCM BOA
Results presented on this page are in the units indicated by the "Units" column except where an alternate unit is presented to the right of the result.
QC Batch:QC Batch Method:
Analysis Method:Analysis Description:
AIR/22835TO-15
TO-15TO15 MSV AIR Low Level
Associated Lab Samples: 10300341001, 10300341002, 10300341003, 10300341004, 10300341005, 10300341006, 10300341007,10300341008, 10300341009, 10300341010, 10300341011, 10300341012, 10300341013, 10300341014,10300341015, 10300341016, 10300341017, 10300341018, 10300341019
Parameter UnitsBlankResult
ReportingLimit Qualifiers
METHOD BLANK: 1925412Associated Lab Samples: 10300341001, 10300341002, 10300341003, 10300341004, 10300341005, 10300341006, 10300341007,
10300341008, 10300341009, 10300341010, 10300341011, 10300341012, 10300341013, 10300341014,10300341015, 10300341016, 10300341017, 10300341018, 10300341019
Matrix: Air
Analyzed
1,1,1-Trichloroethane ug/m3 <0.14 0.70 03/25/15 15:001,1,2,2-Tetrachloroethane ug/m3 <0.23 0.70 03/25/15 15:001,1,2-Trichloroethane ug/m3 <0.24 0.56 03/25/15 15:001,1-Dichloroethane ug/m3 <0.14 0.82 03/25/15 15:001,1-Dichloroethene ug/m3 <0.10 0.81 03/25/15 15:001,2-Dibromoethane (EDB) ug/m3 <0.23 1.6 03/25/15 15:001,2-Dichloroethane ug/m3 <0.12 0.41 03/25/15 15:001,2-Dichloropropane ug/m3 <0.15 0.94 03/25/15 15:002-Butanone (MEK) ug/m3 <0.27 0.60 03/25/15 15:004-Methyl-2-pentanone (MIBK) ug/m3 <0.17 2.1 03/25/15 15:00Acetone ug/m3 <1.2 2.4 03/25/15 15:00Benzene ug/m3 <0.12 0.32 03/25/15 15:00Bromodichloromethane ug/m3 <0.18 1.4 03/25/15 15:00Bromoform ug/m3 <0.32 5.3 03/25/15 15:00Bromomethane ug/m3 <0.27 0.79 03/25/15 15:00Carbon disulfide ug/m3 <0.072 0.63 03/25/15 15:00Carbon tetrachloride ug/m3 <0.32 0.64 03/25/15 15:00Chlorobenzene ug/m3 <0.11 0.94 03/25/15 15:00Chloroethane ug/m3 <0.16 0.54 03/25/15 15:00Chloroform ug/m3 <0.18 0.50 03/25/15 15:00Chloromethane ug/m3 <0.19 0.42 03/25/15 15:00cis-1,2-Dichloroethene ug/m3 <0.20 2.0 03/25/15 15:00cis-1,3-Dichloropropene ug/m3 <0.14 0.92 03/25/15 15:00Dibromochloromethane ug/m3 <0.87 1.7 03/25/15 15:00Ethylbenzene ug/m3 <0.18 0.88 03/25/15 15:00Isopropylbenzene (Cumene) ug/m3 <0.50 2.5 03/25/15 15:00m&p-Xylene ug/m3 <0.14 1.8 03/25/15 15:00Methyl-tert-butyl ether ug/m3 <0.089 0.73 03/25/15 15:00Methylene Chloride ug/m3 <0.23 3.5 03/25/15 15:00o-Xylene ug/m3 <0.44 0.88 03/25/15 15:00Styrene ug/m3 <0.14 0.87 03/25/15 15:00Tetrachloroethene ug/m3 <0.19 0.69 03/25/15 15:00Toluene ug/m3 <0.14 0.77 03/25/15 15:00trans-1,2-Dichloroethene ug/m3 <0.16 0.81 03/25/15 15:00trans-1,3-Dichloropropene ug/m3 <0.15 0.92 03/25/15 15:00Trichloroethene ug/m3 <0.18 0.55 03/25/15 15:00Vinyl chloride ug/m3 <0.093 0.26 03/25/15 15:00
REPORT OF LABORATORY ANALYSISThis report shall not be reproduced, except in full,
without the written consent of Pace Analytical Services, Inc..Date: 04/10/2015 02:09 PM
Pace Analytical Services, Inc.1700 Elm Street - Suite 200
Minneapolis, MN 55414(612)607-1700
Page 26 of 34

#=QC#
QUALITY CONTROL DATA
Pace Project No.:Project:
10300341NCM BOA
Results presented on this page are in the units indicated by the "Units" column except where an alternate unit is presented to the right of the result.
Parameter UnitsLCS
Result% RecLimits Qualifiers% RecConc.
1925413LABORATORY CONTROL SAMPLE:LCSSpike
1,1,1-Trichloroethane ug/m3 57.655.5 104 72-1401,1,2,2-Tetrachloroethane ug/m3 78.369.8 112 68-1371,1,2-Trichloroethane ug/m3 54.755.5 98 66-1381,1-Dichloroethane ug/m3 34.041.2 83 68-1371,1-Dichloroethene ug/m3 33.540.3 83 73-1381,2-Dibromoethane (EDB) ug/m3 10178.1 129 75-1321,2-Dichloroethane ug/m3 37.641.2 91 73-1391,2-Dichloropropane ug/m3 52.147 111 70-1302-Butanone (MEK) ug/m3 24.530 82 67-1314-Methyl-2-pentanone (MIBK) ug/m3 51.141.7 123 68-134Acetone ug/m3 21.924.2 90 63-144Benzene ug/m3 30.232.5 93 64-139Bromodichloromethane ug/m3 79.168.2 116 75-134Bromoform ug/m3 117105 112 72-130Bromomethane ug/m3 30.839.5 78 71-132Carbon disulfide ug/m3 26.231.7 83 56-139Carbon tetrachloride ug/m3 73.864 115 75-150Chlorobenzene ug/m3 45.946.8 98 71-132Chloroethane ug/m3 21.526.8 80 71-129Chloroform ug/m3 46.949.7 94 73-136Chloromethane ug/m3 16.221 77 52-143cis-1,2-Dichloroethene ug/m3 37.040.3 92 64-137cis-1,3-Dichloropropene ug/m3 46.546.2 101 75-128Dibromochloromethane ug/m3 99.186.6 114 75-136Ethylbenzene ug/m3 52.644.2 119 71-136Isopropylbenzene (Cumene) ug/m3 59.050 118 72-139m&p-Xylene ug/m3 10488.3 118 71-134Methyl-tert-butyl ether ug/m3 34.236.7 93 73-134Methylene Chloride ug/m3 27.435.3 78 64-130o-Xylene ug/m3 51.544.2 117 75-134Styrene ug/m3 45.243.3 104 75-133Tetrachloroethene ug/m3 73.769 107 66-137Toluene ug/m3 36.838.3 96 70-129trans-1,2-Dichloroethene ug/m3 33.240.3 82 61-140trans-1,3-Dichloropropene ug/m3 46.646.2 101 75-134Trichloroethene ug/m3 49.554.6 91 70-134Vinyl chloride ug/m3 19.926 77 72-129
Parameter UnitsDup
ResultMaxRPD QualifiersRPDResult
103003410071926218SAMPLE DUPLICATE:
1,1,1-Trichloroethane ug/m3 <0.19 25<0.191,1,2,2-Tetrachloroethane ug/m3 <0.32 25<0.321,1,2-Trichloroethane ug/m3 <0.34 25<0.341,1-Dichloroethane ug/m3 <0.19 25<0.19
REPORT OF LABORATORY ANALYSISThis report shall not be reproduced, except in full,
without the written consent of Pace Analytical Services, Inc..Date: 04/10/2015 02:09 PM
Pace Analytical Services, Inc.1700 Elm Street - Suite 200
Minneapolis, MN 55414(612)607-1700
Page 27 of 34

#=QC#
QUALITY CONTROL DATA
Pace Project No.:Project:
10300341NCM BOA
Results presented on this page are in the units indicated by the "Units" column except where an alternate unit is presented to the right of the result.
Parameter UnitsDup
ResultMaxRPD QualifiersRPDResult
103003410071926218SAMPLE DUPLICATE:
1,1-Dichloroethene ug/m3 <0.14 25<0.141,2-Dibromoethane (EDB) ug/m3 <0.33 25<0.331,2-Dichloroethane ug/m3 <0.17 25<0.171,2-Dichloropropane ug/m3 <0.21 25<0.212-Butanone (MEK) ug/m3 5.3 9 255.84-Methyl-2-pentanone (MIBK) ug/m3 <0.24 25<0.24Acetone ug/m3 88.7 E,R157 2549.6Benzene ug/m3 3.4 4 253.5Bromodichloromethane ug/m3 1.8J 251.9JBromoform ug/m3 <0.45 25<0.45Bromomethane ug/m3 0.56J 250.58JCarbon disulfide ug/m3 170 E8 25157Carbon tetrachloride ug/m3 <0.44 25<0.44Chlorobenzene ug/m3 <0.15 25<0.15Chloroethane ug/m3 <0.22 25<0.22Chloroform ug/m3 93.5 4 2597.2Chloromethane ug/m3 <0.27 25<0.27cis-1,2-Dichloroethene ug/m3 <0.27 25<0.27cis-1,3-Dichloropropene ug/m3 <0.19 25<0.19Dibromochloromethane ug/m3 <1.2 25<1.2Ethylbenzene ug/m3 1.4 3 251.4Isopropylbenzene (Cumene) ug/m3 <0.70 25<0.70m&p-Xylene ug/m3 5.0 4 254.8Methyl-tert-butyl ether ug/m3 <0.12 25<0.12Methylene Chloride ug/m3 1.8J 251.8Jo-Xylene ug/m3 2.2 7 252.0Styrene ug/m3 0.86J 250.84JTetrachloroethene ug/m3 <0.26 25<0.26Toluene ug/m3 6.2 3 256.4trans-1,2-Dichloroethene ug/m3 <0.23 25<0.23trans-1,3-Dichloropropene ug/m3 <0.21 25<0.21Trichloroethene ug/m3 <0.25 25<0.25Vinyl chloride ug/m3 <0.13 25<0.13
REPORT OF LABORATORY ANALYSISThis report shall not be reproduced, except in full,
without the written consent of Pace Analytical Services, Inc..Date: 04/10/2015 02:09 PM
Pace Analytical Services, Inc.1700 Elm Street - Suite 200
Minneapolis, MN 55414(612)607-1700
Page 28 of 34

#=QL#
QUALIFIERS
Pace Project No.:Project:
10300341NCM BOA
DEFINITIONS
DF - Dilution Factor, if reported, represents the factor applied to the reported data due to dilution of the sample aliquot.ND - Not Detected at or above adjusted reporting limit.J - Estimated concentration above the adjusted method detection limit and below the adjusted reporting limit.MDL - Adjusted Method Detection Limit.PQL - Practical Quantitation Limit.RL - Reporting Limit.S - Surrogate1,2-Diphenylhydrazine decomposes to and cannot be separated from Azobenzene using Method 8270. The result for each analyte isa combined concentration.Consistent with EPA guidelines, unrounded data are displayed and have been used to calculate % recovery and RPD values.LCS(D) - Laboratory Control Sample (Duplicate)MS(D) - Matrix Spike (Duplicate)DUP - Sample DuplicateRPD - Relative Percent DifferenceNC - Not Calculable.SG - Silica Gel - Clean-UpU - Indicates the compound was analyzed for, but not detected.N-Nitrosodiphenylamine decomposes and cannot be separated from Diphenylamine using Method 8270. The result reported foreach analyte is a combined concentration.Pace Analytical is TNI accredited. Contact your Pace PM for the current list of accredited analytes.TNI - The NELAC Institute.
LABORATORIES
Pace Analytical Services - MinneapolisPASI-M
SAMPLE QUALIFIERS
Sample: 10300341001The internal standard recoveries associated with this sample exceed the lower control limit. The reported results shouldbe considered estimated values.
[1]
Sample: 10300341012The internal standard recoveries associated with this sample exceed the lower control limit. The reported results shouldbe considered estimated values.
[1]
ANALYTE QUALIFIERS
Analyte concentration exceeded the calibration range. The reported result is estimated.ERPD value was outside control limits.R1
REPORT OF LABORATORY ANALYSISThis report shall not be reproduced, except in full,
without the written consent of Pace Analytical Services, Inc..Date: 04/10/2015 02:09 PM
Pace Analytical Services, Inc.1700 Elm Street - Suite 200
Minneapolis, MN 55414(612)607-1700
Page 29 of 34
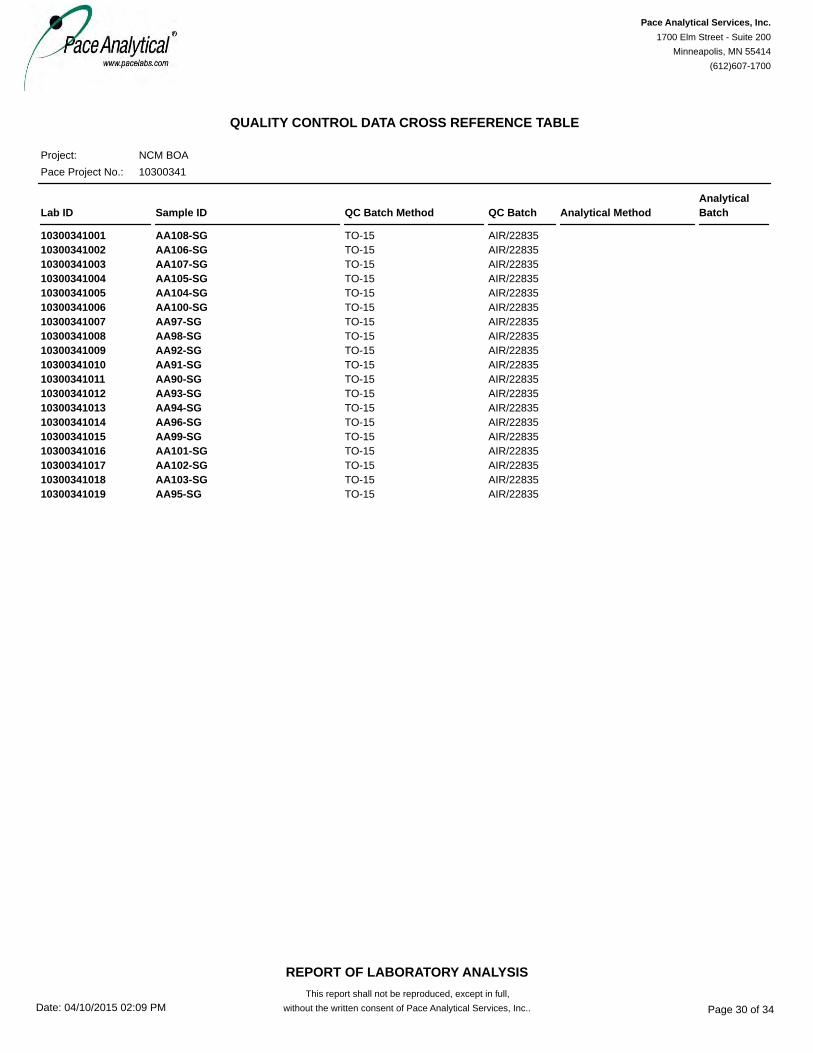
#=CR#
QUALITY CONTROL DATA CROSS REFERENCE TABLE
Pace Project No.:Project:
10300341NCM BOA
Lab ID Sample ID QC Batch Method QC Batch Analytical MethodAnalyticalBatch
10300341001 AIR/22835AA108-SG TO-1510300341002 AIR/22835AA106-SG TO-1510300341003 AIR/22835AA107-SG TO-1510300341004 AIR/22835AA105-SG TO-1510300341005 AIR/22835AA104-SG TO-1510300341006 AIR/22835AA100-SG TO-1510300341007 AIR/22835AA97-SG TO-1510300341008 AIR/22835AA98-SG TO-1510300341009 AIR/22835AA92-SG TO-1510300341010 AIR/22835AA91-SG TO-1510300341011 AIR/22835AA90-SG TO-1510300341012 AIR/22835AA93-SG TO-1510300341013 AIR/22835AA94-SG TO-1510300341014 AIR/22835AA96-SG TO-1510300341015 AIR/22835AA99-SG TO-1510300341016 AIR/22835AA101-SG TO-1510300341017 AIR/22835AA102-SG TO-1510300341018 AIR/22835AA103-SG TO-1510300341019 AIR/22835AA95-SG TO-15
REPORT OF LABORATORY ANALYSISThis report shall not be reproduced, except in full,
without the written consent of Pace Analytical Services, Inc..Date: 04/10/2015 02:09 PM
Pace Analytical Services, Inc.1700 Elm Street - Suite 200
Minneapolis, MN 55414(612)607-1700
Page 30 of 34

Page 31 of 34

Page 32 of 34

Page 33 of 34

Page 34 of 34

APPENDIX B

Parcel A4 Sampling Plan SummaryFormer Sparrows Point Steel Mill
Sparrows Point, Maryland
Source Area/ Description
REC & Finding/
SWMU/AOC
Figure or Drawing
of Reference
RationaleNumber of Locations
Sample Locations
Boring Depth Sample DepthAnalytical
Parameters: Soil Samples
Pipe Mill Trenches/Sump SWMU 49 DCC
Figure 3-1
The Pipe Mill Trenches/Sumps were identified as a unit associated with piping designed to transport process wastewater from the Pipe Mill to the Tin Mill Canal
Discharge Pipes and ultimately to the TMC. This unit was dismantled in 1983
and no longer discharges to the TMC.
2 A4-001 and A4-002
Total depth of 20 feet or groundwater.
0-1', 4-5', 9-10' bgs. 4-5' interval may be
adjusted in the field based on observations
or field screening.
VOC, SVOC, Metals, O&G, PCBs
(0-1')
Hydraulic Oil Storage Area AOC O DCC
Figure 3-1
AOC O was described as containing approximately 30 drums containing non-
hazardous, water-based hydraulic oil stored outside on soil and gravel. During a 1997
site inspection, the area contained no drums and was overgrown with vegetation and
general debris.
2 A4-003 and A4-004
Total depth of 20 feet or groundwater.
0-1', 4-5', 9-10' bgs. 4-5' interval may be
adjusted in the field based on observations
or field screening.
VOC, SVOC, Metals, O&G, PCBs
(0-1'), DRO/GRO
Acid Storage Tanks
Drawing 5149
Investigate potential impacts related to acid storage tanks. 2 A4-005 and
A4-006Total depth of 20
feet or groundwater.
0-1', 4-5', 9-10' bgs. 4-5' interval may be
adjusted in the field based on observations
or field screening.
VOC, SVOC, Metals, O&G, PCBs
(0-1')
Waste Oil Tank Drawing 5154
Investigate potential impacts from waste oil tank. 2 A4-007 and
A4-008Total depth of 20
feet or groundwater.
0-1', 4-5', 9-10' bgs. 4-5' interval may be
adjusted in the field based on observations
or field screening.
VOC, SVOC, Metals, O&G, PCBs
(0-1'), DRO/GRO
Parcel A4 Coverage
Investigate potential impacts related to historical activities. 20 A4-009 through
A4-028Total depth of 20
feet or groundwater.
0-1', 4-5', 9-10' bgs. 4-5' interval may be
adjusted in the field based on observations
or field screening.
VOC, SVOC, Metals, O&G, PCBs
(0-1')
Total: 28Soil Borings Sampling Density Requirements (from Worksheet 17 - Sampling Design and Rationale) VOCs - Volatile Organic Compounds (Target Compound List)No Engineered Barrier (16-40 acres): 1 boring per 1.5 acres with no less than 15 borings SVOCs - Semivolatile Organic Compounds (Target Compound List)Engineered Barrier (1-15 acres): 1 boring per 2 acres with no less than 2 Metals - (Target Analyte List plus Hexavalent Chromium and Cyanide) No Engineered Barrier (33.3 acres) = 23 Samples O&G - Oil and Grease Engineered Barrier - Paving/Buildings (28.1 acres) PCBs - Polychlorinated Biphenyls Roads/Parking (10.0 acres) = 5 Samples DRO/GRO - Diesel Range Organics/Gasoline Range Organics Building Footprints (18.1 acres) = N/A (Covered by Soil Gas, see Appendix B) bgs - Below Ground Surface
Table 1 - Soil Sampling Summary
Page 1 of 2 July 7, 2016

Parcel A4 Sampling Plan SummaryFormer Sparrows Point Steel Mill
Sparrows Point, Maryland
Source Area/ Description
REC & Finding/
SWMU/AOC
Figure or Drawing
of Reference
Condition of Existing WellNumber of Locations
Sample Locations
Boring Depth Screen Interval
Analytical Parameters:
Groundwater Samples†
Pipe Mill Trenches/Sump SWMU 49 DCC
Figure 3-1N/A 1 A4-001 Total depth of 7 feet
below water table.
7 feet below water table to 3 feet above
water table.
VOC, SVOC, O&G, Dissolved Metals
Waste Oil Tank Drawing 5154
N/A 1 A4-007 Total depth of 7 feet below water table.
7 feet below water table to 3 feet above
water table.
VOC, SVOC, O&G, Dissolved Metals,
DRO/GRO
Acid Storage Tanks
Drawing 5149
N/A 1 A4-005 Total depth of 7 feet below water table.
8 feet below water table to 3 feet above
water table.
VOC, SVOC, O&G, Dissolved Metals
Parcel A4 Coverage
N/A 4A4-010,
A4-012 through A4-014
Total depth of 7 feet below water table.
7 feet below water table to 3 feet above
water table.
VOC, SVOC, O&G, Dissolved Metals
Existing Groundwater
Well
To be inspected prior to the start of parcel work. 1 SW04-PZM001* Total depth of 13
feet bgs. 13 feet to 3 feet bgs. VOC, SVOC, O&G, Dissolved Metals
Total: 8†Field measurements
include pH, DO, ORP, conductivity, temperature.
Table 2 - Groundwater Sampling Summary
Page 2 of 2 July 7, 2016
*SW04-PZM001 could not be located in the field and was replaced with shallow piezometer A4-019-PZ

APPENDIX C
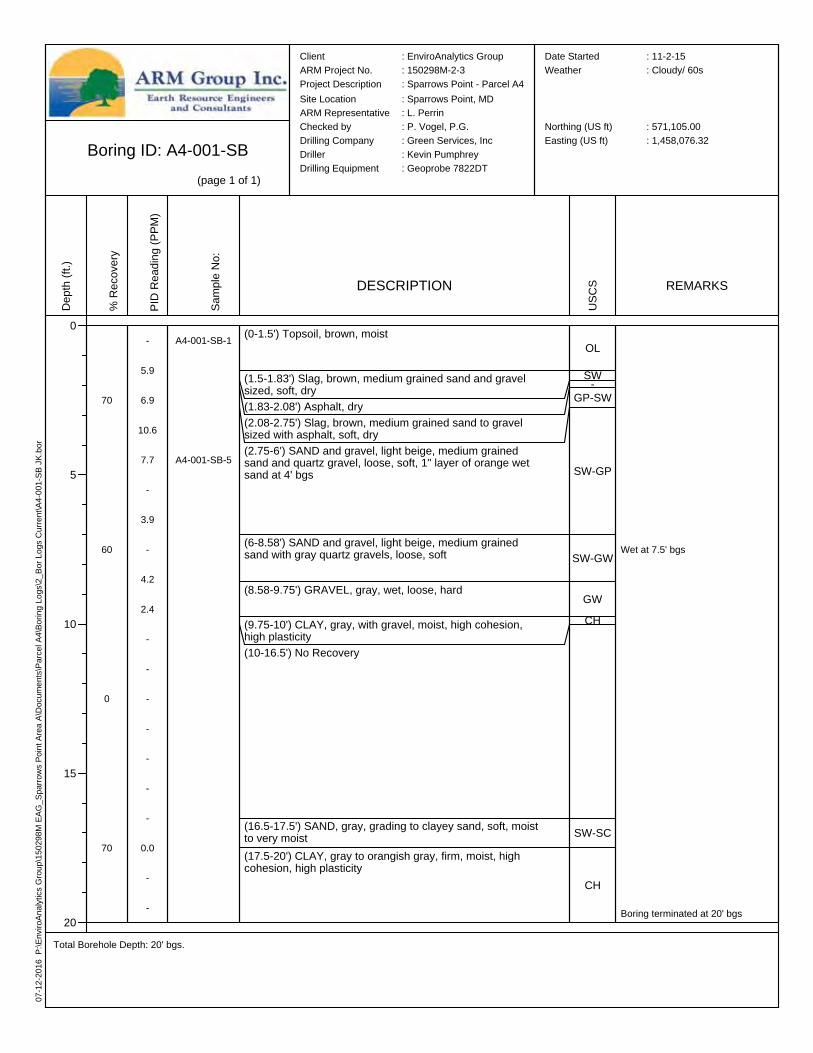
07-12
-2016
P:\E
nviro
Analy
tics G
roup\1
5029
8M EA
G_Sp
arrow
s Poin
t Area
A\Do
cume
nts\Pa
rcel A
4\Bori
ng Lo
gs\2_
Bor L
ogs C
urren
t\A4-0
01-S
B JK.b
or
Boring ID: A4-001-SB(page 1 of 1)
Total Borehole Depth: 20' bgs.
Depth
(ft.)
0
5
10
15
20
% Re
cove
ry
70
60
0
70
PID R
eadin
g (PP
M)
-
5.9
6.9
10.6
7.7
-
3.9
-
4.2
2.4
-
-
-
-
-
-
-
0.0
-
-
Samp
le No
:
A4-001-SB-1
A4-001-SB-5
DESCRIPTION
(0-1.5') Topsoil, brown, moist
(1.5-1.83') Slag, brown, medium grained sand and gravel sized, soft, dry(1.83-2.08') Asphalt, dry(2.08-2.75') Slag, brown, medium grained sand to gravel sized with asphalt, soft, dry(2.75-6') SAND and gravel, light beige, medium grained sand and quartz gravel, loose, soft, 1" layer of orange wet sand at 4' bgs
(6-8.58') SAND and gravel, light beige, medium grained sand with gray quartz gravels, loose, soft
(8.58-9.75') GRAVEL, gray, wet, loose, hard
(9.75-10') CLAY, gray, with gravel, moist, high cohesion, high plasticity(10-16.5') No Recovery
(16.5-17.5') SAND, gray, grading to clayey sand, soft, moist to very moist(17.5-20') CLAY, gray to orangish gray, firm, moist, high cohesion, high plasticity
USCS
OL
SW-GP-SW
SW-GP
SW-GW
GWCH
SW-SC
CH
REMARKS
Wet at 7.5' bgs
Boring terminated at 20' bgs
Client : EnviroAnalytics GroupARM Project No. : 150298M-2-3Project Description : Sparrows Point - Parcel A4Site Location : Sparrows Point, MDARM Representative : L. PerrinChecked by : P. Vogel, P.G.Drilling Company : Green Services, IncDriller : Kevin PumphreyDrilling Equipment : Geoprobe 7822DT
Date Started : 11-2-15Weather : Cloudy/ 60s
Northing (US ft) : 571,105.00Easting (US ft) : 1,458,076.32

07-12
-2016
P:\E
nviro
Analy
tics G
roup\1
5029
8M EA
G_Sp
arrow
s Poin
t Area
A\Do
cume
nts\Pa
rcel A
4\Bori
ng Lo
gs\2_
Bor L
ogs C
urren
t\A4-0
02-S
B JK.b
or
Boring ID: A4-002-SB(page 1 of 1)
Total Borehole Depth: 10' bgs.
Depth
(ft.)
0
5
10
15
20
% Re
cove
ry
76
40
PID R
eadin
g (PP
M)
-
0.9
5.7
32.0
80.1
-
-
-
-
-
Samp
le No
:
A4-002-SB-1
A4-002-SB-5
A4-002-SB-10
DESCRIPTION
(0-2') Slag with gravelly sand, loose, brown, dry
(2.0-2.42') SAND, firm, orange, dry, medium grained,(2.42-4.58') Slag, brown to dark brown, medium grained to gravel sized
(4.58-6') CLAY with SAND, light brown, soft, moist, high cohesion, very high plasticity
(6-10') GRAVEL with SAND, gray, black oily water with shean, fill
USCS
SW
SW
SW
CH
GW
REMARKS
Wet at 8' bgsPetroleum odor
Boring terminated at 10' bgs
Client : EnviroAnalytics GroupARM Project No. : 150298M-2-3Project Description : Sparrows Point - Parcel A4Site Location : Sparrows Point, MDARM Representative : L. PerrinChecked by : P. Vogel, P.G.Drilling Company : Green Services, IncDriller : Kevin PumphreyDrilling Equipment : Geoprobe 7822DT
Date Started : 11-2-15Weather : Cloudy/ 60s
Northing (US ft) : 571,102.640Easting (US ft) : 1,458,051.366

07-12
-2016
P:\E
nviro
Analy
tics G
roup\1
5029
8M EA
G_Sp
arrow
s Poin
t Area
A\Do
cume
nts\Pa
rcel A
4\Bori
ng Lo
gs\2_
Bor L
ogs C
urren
t\A4-0
03-S
B JK.b
or
Boring ID: A4-003-SB(page 1 of 1)
Total Borehole Depth: 15' bgs.
Depth
(ft.)
0
5
10
15
% Re
cove
ry
80
80
50
PID R
eadin
g (PP
M)
0.4
3.0
3.8
2.4
3.5
-
58.5
316.6
110.3
50.5
-
-
-
-
-
Samp
le No
:
A4-003-SB-1
A4-003-SB-7.5
DESCRIPTION
(0-3') SAND fine to medium grained, loose, brown, dry,
(3-3.33') Concrete, light gray, sand to gravel sized, moist, loose(3.33-3.58') Asphalt, black, sand to gravel sized, moist, loose, soft(3.58-5') Slag, loose, gray to black, moist, gravel sized(5-8.5') Slag, loose, black, slightly moist, fine to coarse grained, rust coated
(8.5-9.5') SAND and GRAVEL, loose, orangish red to black and white, moist, coarse grained sand
(9.5-11') Slag, loose, black, wet, coarse grained to gravel sized, with clay
(11-14') Sandy CLAY, dark brown to black, with slag gravels, wet, medium cohesion, low plasticity
(14-15') CLAY, beige, rust stained, wet, high cohesion, high plasticity
USCS
SW
SWSW
GP
SW-GP
SW-GP
SW-SC
CL
CH
REMARKS
Wet at 7.5' bgs
Boring terminated at 15' bgs
Client : EnviroAnalytics GroupARM Project No. : 150298M-2-3Project Description : Sparrows Point - Parcel A4Site Location : Sparrows Point, MDARM Representative : L. PerrinChecked by : P. Vogel, P.G.Drilling Company : Green Services, IncDriller : Kevin PumphreyDrilling Equipment : Geoprobe 7822DT
Date Started : 11-2-15Weather : Cloudy/ 60s
Northing (US ft) : 571,058.994Easting (US ft) : 1,458,171.019
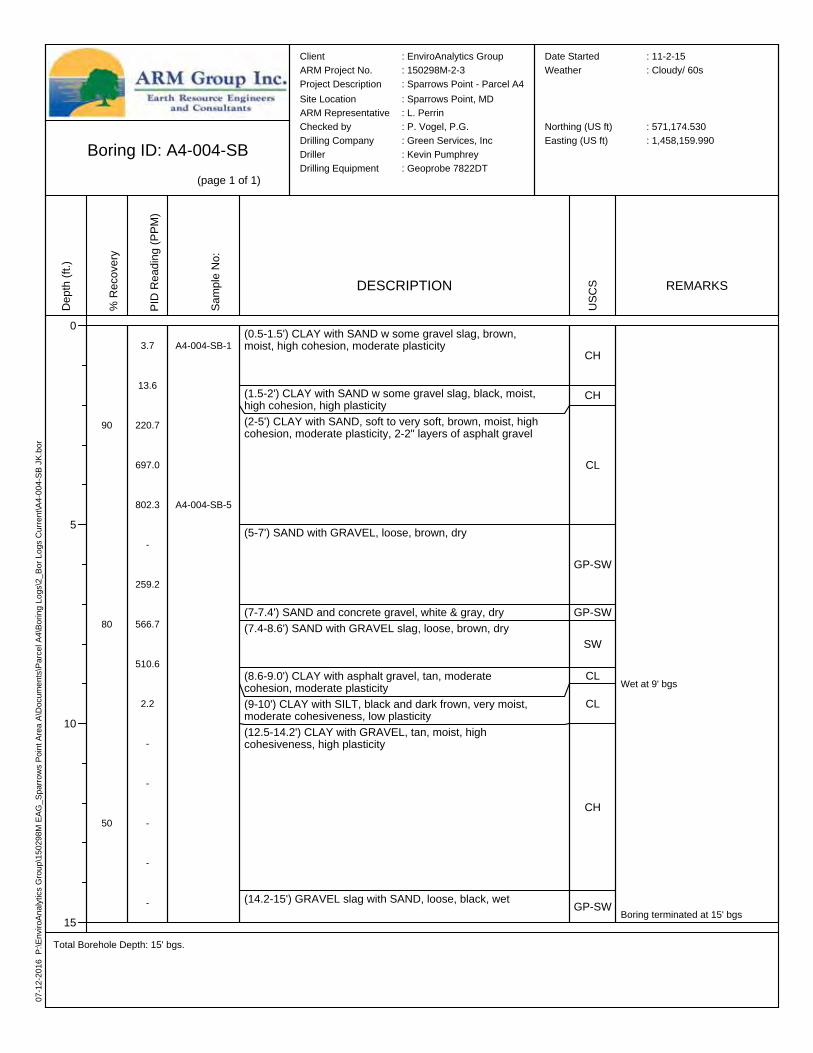
07-12
-2016
P:\E
nviro
Analy
tics G
roup\1
5029
8M EA
G_Sp
arrow
s Poin
t Area
A\Do
cume
nts\Pa
rcel A
4\Bori
ng Lo
gs\2_
Bor L
ogs C
urren
t\A4-0
04-S
B JK.b
or
Boring ID: A4-004-SB(page 1 of 1)
Total Borehole Depth: 15' bgs.
Depth
(ft.)
0
5
10
15
% Re
cove
ry
90
80
50
PID R
eadin
g (PP
M)
3.7
13.6
220.7
697.0
802.3
-
259.2
566.7
510.6
2.2
-
-
-
-
-
Samp
le No
:
A4-004-SB-1
A4-004-SB-5
DESCRIPTION
(0.5-1.5') CLAY with SAND w some gravel slag, brown, moist, high cohesion, moderate plasticity
(1.5-2') CLAY with SAND w some gravel slag, black, moist, high cohesion, high plasticity(2-5') CLAY with SAND, soft to very soft, brown, moist, high cohesion, moderate plasticity, 2-2" layers of asphalt gravel
(5-7') SAND with GRAVEL, loose, brown, dry
(7-7.4') SAND and concrete gravel, white & gray, dry(7.4-8.6') SAND with GRAVEL slag, loose, brown, dry
(8.6-9.0') CLAY with asphalt gravel, tan, moderate cohesion, moderate plasticity(9-10') CLAY with SILT, black and dark frown, very moist, moderate cohesiveness, low plasticity(12.5-14.2') CLAY with GRAVEL, tan, moist, high cohesiveness, high plasticity
(14.2-15') GRAVEL slag with SAND, loose, black, wet
USCS
CH
CH
CL
GP-SW
GP-SW
SW
CL
CL
CH
GP-SW
REMARKS
Wet at 9' bgs
Boring terminated at 15' bgs
Client : EnviroAnalytics GroupARM Project No. : 150298M-2-3Project Description : Sparrows Point - Parcel A4Site Location : Sparrows Point, MDARM Representative : L. PerrinChecked by : P. Vogel, P.G.Drilling Company : Green Services, IncDriller : Kevin PumphreyDrilling Equipment : Geoprobe 7822DT
Date Started : 11-2-15Weather : Cloudy/ 60s
Northing (US ft) : 571,174.530Easting (US ft) : 1,458,159.990

07-12
-2016
P:\E
nviro
Analy
tics G
roup\1
5029
8M EA
G_Sp
arrow
s Poin
t Area
A\Do
cume
nts\Pa
rcel A
4\Bori
ng Lo
gs\2_
Bor L
ogs C
urren
t\A4-0
05-S
B JK.b
or
Boring ID: A4-005-SB(page 1 of 1)
Total Borehole Depth: 25' bgs.
Depth
(ft.)
0
5
10
15
20
25
% Re
cove
ry
100
70
100
100
100
PID R
eadin
g (PP
M)
0.6
0.5
8.1
21.3
141.8
-
5.2
0.1
0.2
0.1
0.0
0.0
0.0
0.0
-
0.0
0.0
0.0
0.0
-
-
-
-
-
-
Samp
le No
:
A4-005-SB-1
A4-005-SB-5
A4-005-SB-10
DESCRIPTION
(0-0.25') Topsoil, brown, soft, loose, trace fines, dry(0.25-4.75') Slag, brown and black, medium grained to gravel sized, loose, dry
(4.75-5') GRAVEL, gray, with sand, dry(5-7.5') Slag, black, coarse grained to gravel sized, wet, loose
(7.5-10') CLAY, light brown, very soft, very moist, very high cohesion, very high plasticity Soft and high cohesion and plasticity at 8.83' bgs(10-10.33') Slag, black, coarse grained, wet(10.33-15') CLAY, light gray to beige, hard, high cohesion, high plasticity
(15-19') CLAY, light gray, trace sand, with orange mottling
(19-20') CLAY, dark gray, trace sand, with orange mottling(20-20.42') CLAY, dark gray, very moist, very soft, very high cohesion, very high plasticity(20.42-22.5') SAND, dark gray, wet, soft
(22.5-25') CLAY, dark gray, very moist, very soft, very high cohesion, very high plasticity
USCS
OL
GP
GP
SW-GP
CH
SW
CH
CH
CHCH
SW
CH
REMARKS
Wet at 6.5' bgs(perched)
Wet at 23' bgs
Boring terminated at 25' bgs
Client : EnviroAnalytics GroupARM Project No. : 150298M-2-3Project Description : Sparrows Point - Parcel A4Site Location : Sparrows Point, MDARM Representative : L. PerrinChecked by : P. Vogel, P.G.Drilling Company : Green Services, IncDriller : Kevin PumphreyDrilling Equipment : Geoprobe 7822DT
Date Started : 11-4-15Weather : Sunny, 70s
Northing (US ft) : 571,744.657Easting (US ft) : 1,458,067.106

07-12
-2016
P:\E
nviro
Analy
tics G
roup\1
5029
8M EA
G_Sp
arrow
s Poin
t Area
A\Do
cume
nts\Pa
rcel A
4\Bori
ng Lo
gs\2_
Bor L
ogs C
urren
t\A4-0
06-S
B JK.b
or
Boring ID: A4-006-SB(page 1 of 1)
Total Borehole Depth: 20' bgs.
Depth
(ft.)
0
5
10
15
20
% Re
cove
ry
60
63
60
80
PID R
eadin
g (PP
M)
-
-
4.5
5.0
11.9
-
-
57.9
0.4
1.9
-
-
0.0
0.0
-
-
-
0.0
0.0
-
Samp
le No
:
A4-006-SB-1
A4-006-SB-6
A4-006-SB-10
DESCRIPTION
(0-2.5') SAND and quartz gravel, brown, medium to coarse grained, soft, loose, dry
(2.5-4.33') Sandy SILT to sand, brown, dry to wet at 3.5' bgs, low cohesion, no plasticity
(4.33-5') Concrete, light gray, hard(5-7.58') GRAVEL and sand, brown to light gray, dry, loose
(7.58-8.25') GRAVEL and sand, gray to black, wet, loose(8.25-9.25') Sandy CLAY, black ,very moist, very soft, high cohesion, high plasticity(9.25-9.66') SILT, light gray, trace sand, hard, low cohesion, no plasticity(9.66-10') Clayey SAND, gray, very soft, wet, low cohesion, low plasticity(10-12.42') SAND, brown, wet
(12.42-15') CLAY, beige to gray, trace sand, firm, moist, high cohesion, medium plasticity
(15-20') CLAY, light gray, hard, with orange mottling, moist, high cohesion, high plasticity
USCS
SW
SW-SM
-
GP-SW
GP-SWCHMLSC
SW
CH
CH
REMARKS
Wet at 3.5' (perched)
Wet at 8' bgs (perched)
Wet at 10' bgs (perched)
Boring terminated at 20' bgs
Client : EnviroAnalytics GroupARM Project No. : 150298M-2-3Project Description : Sparrows Point - Parcel A4Site Location : Sparrows Point, MDARM Representative : L. PerrinChecked by : P. Vogel, P.G.Drilling Company : Green Services, IncDriller : Kevin PumphreyDrilling Equipment : Geoprobe 7822DT
Date Started : 11-4-15Weather : Cloudy/ 60s
Northing (US ft) : 571,824.945Easting (US ft) : 1,458,064.94

07-12
-2016
P:\E
nviro
Analy
tics G
roup\1
5029
8M EA
G_Sp
arrow
s Poin
t Area
A\Do
cume
nts\Pa
rcel A
4\Bori
ng Lo
gs\2_
Bor L
ogs C
urren
t\A4-0
07-S
B JK.b
or
Boring ID: A4-007-SB(page 1 of 1)
Total Borehole Depth: 20' bgs.
Depth
(ft.)
0
5
10
15
20
% Re
cove
ry
80
70
60
80
PID R
eadin
g (PP
M)
-
0.8
26.2
11.4
7.9
-
1.5
5.1
2.7
0.4
-
-
0.0
0.0
0.0
-
0.0
-
-
-
Samp
le No
:
A4-007-SB-1
A4-007-SB-5
A4-007-SB-10
DESCRIPTION
(0-1.25') Topsoil, brown, dry
(1.25-3.25') SAND, light beige, medium grained with quartz gravels, silt lens at 2' bgs
(3.25-3.50') Slag, glassy, black, hard(3.50-4.66') Sandy CLAY, brown, soft, dry, high cohesion, high plasticity(4.66-5') CLAY, light gray with orange mottling, dry, medium cohesion, medium plasticity(5-6.83') Clayey SAND, orangish brown, soft, moist, medium cohesion, medium plasticity(6.83-7.33') Sandy CLAY, dark beige, firm, moist, high cohesion, high plasticity(7.33-7.66') SAND, brown, moist, soft(7.66-10') CLAY, light gray, moist, soft, high cohesion, high plasticity
(10-13.5') CLAY, gray with orange mottling, slighty soft, trace sand, high cohesion, high plasticity
(13.5-15') CLAY, dark gray, very moist, very soft, very high cohesion, very high plasticity
(15-19.33') CLAY, dark gray, very moist, very soft, very high cohesion, very high plasticity
(19.33-20') SAND, gray, soft, trace clay, wet
USCS
OL
SW
GMCHCL
SW-SC
CHSW
CH
CH
CH
CH
SW
REMARKS
Wet at 19.4' bgsBoring terminated at 20' bgs
Client : EnviroAnalytics GroupARM Project No. : 150298M-2-3Project Description : Sparrows Point - Parcel A4Site Location : Sparrows Point, MDARM Representative : L. PerrinChecked by : P. Vogel, P.G.Drilling Company : Green Services, IncDriller : Kevin PumphreyDrilling Equipment : Geoprobe 7822DT
Date Started : 11-3-15Weather : Cloudy/ 60s
Northing (US ft) : 572,372.75Easting (US ft) : 1,457,964.554

07-12
-2016
P:\E
nviro
Analy
tics G
roup\1
5029
8M EA
G_Sp
arrow
s Poin
t Area
A\Do
cume
nts\Pa
rcel A
4\Bori
ng Lo
gs\2_
Bor L
ogs C
urren
t\A4-0
08-S
B JK.b
or
Boring ID: A4-008-SB(page 1 of 1)
Total Borehole Depth: 20' bgs.
Depth
(ft.)
0
5
10
15
20
% Re
cove
ry
60
100
13
80
PID R
eadin
g (PP
M)
-
-
7.6
6.8
5.2
1.2
0.7
0.0
0.0
0.0
-
-
-
-
-
-
-
0.0
0.0
-
Samp
le No
:
A4-008-SB-1
A4-008-SB-5
A4-008-SB-10
DESCRIPTION
(0-2.5') SAND, light beige, medium grained with quartz gravel, soft, dry
(2.5-3') Concrete, gray to black, hard, dry(3-4') SAND, light beige with orange mottling, very dry, firm
(4-5') SILT, light gray with orange mottling, very dry, very firm, low cohesion, no plasticity(5-7') Clayey SAND, light gray to beige with orange mottling with depth
(7-12') CLAY, light gray with orange mottling, soft to very soft, moist, trace sand, very high cohesion, very high plasticity
(12.33-15') Sandy CLAY, grayish brown, wet, very soft, visible water present, very high plasticity, very high cohesion
(15-19.66') CLAY, dark gray, very soft, very moist, very high cohesion, very high plasticity, grading to sandy clay with depth
(19.66-20') SAND, dark gray, soft, wet
USCS
SW
-SW
ML
SW-SC
CH
CH
CH
SW
REMARKS
Wet at 19.5' bgsBoring terminated at 20' bgs
Client : EnviroAnalytics GroupARM Project No. : 150298M-2-3Project Description : Sparrows Point - Parcel A4Site Location : Sparrows Point, MDARM Representative : L. PerrinChecked by : P. Vogel, P.G.Drilling Company : Green Services, IncDriller : Kevin PumphreyDrilling Equipment : Geoprobe 7822DT
Date Started : 11-3-15Weather : Sunny 60s
Northing (US ft) : 572411.15Easting (US ft) : 1,457,999.03

07-12
-2016
P:\E
nviro
Analy
tics G
roup\1
5029
8M EA
G_Sp
arrow
s Poin
t Area
A\Do
cume
nts\Pa
rcel A
4\Bori
ng Lo
gs\2_
Bor L
ogs C
urren
t\A4-0
09-S
B JK.b
or
Boring ID: A4-009-SB(page 1 of 1)
Total Borehole Depth: 20' bgs.
Depth
(ft.)
0
5
10
15
20
% Re
cove
ry
100
90
60
80
PID R
eadin
g (PP
M)
0.2
0.3
0.3
0.3
0.4
0.3
1.2
2.2
3.1
2.9
-
-
0.0
0.0
-
-
-
0.0
0.0
-
Samp
le No
:
A4-009-SB-1
A4-009-SB-5
DESCRIPTION
(0-3') SILT, brown grading to light gray, hard, bits of clay sand and roots throughout, medium cohesion, no plasticity
(3-4.83') SAND, light gray, trace silt, moist, soft, 2" of beige-orange sand at 4.5' bgs
(4.83-5') Clayey SAND, light gray, soft, slightly moist, slight cohesion, slight plasticity(5-5.66') SAND, orange, soft, moist(5.66-7.58') CLAY, light gray with orange mottling, trace sand, moist, high cohesion, high plasticity(7.58-8.58') CLAY, dark brown with orange mottling, trace sand, moist, high cohesion, high plasticity(8.58-9.66') Clayey SAND, light brown, very moist, soft, low cohesion, medium plasticity(9.66-10') CLAY, light gray, trace sand, firm, moist, high cohesion, high plasticity(10-15') CLAY, beige grading to dark gray, soft, high cohesion, high plasticity
(15-20') CLAY, dark gray, very moist, very soft, very high cohesion, very high plasticity
USCS
ML
SW
SCSW
CH
CH
SCCH
CH
CH
REMARKS
Boring terminated at 20' bgs
Client : EnviroAnalytics GroupARM Project No. : 150298M-2-3Project Description : Sparrows Point - Parcel A4Site Location : Sparrows Point, MDARM Representative : L. PerrinChecked by : P. Vogel, P.G.Drilling Company : Green Services, IncDriller : Kevin PumphreyDrilling Equipment : Geoprobe 7822DT
Date Started : 11-3-15Weather : Sunny 60s
Northing (US ft) : 572,598.976Easting (US ft) : 1,458,099.535

07-12
-2016
P:\E
nviro
Analy
tics G
roup\1
5029
8M EA
G_Sp
arrow
s Poin
t Area
A\Do
cume
nts\Pa
rcel A
4\Bori
ng Lo
gs\2_
Bor L
ogs C
urren
t\A4-0
10-S
B JK.b
or
Boring ID: A4-010-SB(page 1 of 1)
Total Borehole Depth: 20' bgs.
Depth
(ft.)
0
5
10
15
20
% Re
cove
ry
90
100
70
60
PID R
eadin
g (PP
M)
1.2
4.9
8.7
33.9
97.7
0.1
0.2
0.3
0.3
0.2
-
-
-
-
-
-
-
-
-
-
Samp
le No
:
A4-010-SB-1
A4-010-SB-5
A4-010-SB-10
DESCRIPTION
(0-1.66') Topsoil, brown, dry
(1.66-2.5') Clayey SAND, tan, moist, soft, 3" quartz gravel layer(2.5-2.83') Asphalt, black, dry, loose, gravel sized(2.83-3.5') SAND, light beige, medium to coarse grained with gravel slag, wet(3.5-5') Slag, black, cinder ballast, soft, loose, dry, fine to coarse grained with gravel(5-9.66') CLAY, light gray with orange mottling, moist, soft, high cohesion, high plasticity, sand mixed in at 9' bgs
(9.66-10') Cinder ballast, black, fine grained, rust colored sand, very moist, soft(10-15') CLAY, beige grading to dark gray, soft, high cohesion, very high plasticity
(15-19.66') CLAY, dark gray, very moist, very soft, very high cohesion, very high plasticity
(19.66-20') SAND, dark gray, wet, soft
USCS
OL
SC-
SW/GP
SW/GP
CH
SW
CH
CH
SW
REMARKS
Wet at 3' bgs(perched)
Wet at 19.5' bgsBoring terminated at 20' bgs
Client : EnviroAnalytics GroupARM Project No. : 150298M-2-3Project Description : Sparrows Point - Parcel A4Site Location : Sparrows Point, MDARM Representative : L. PerrinChecked by : P. Vogel, P.G.Drilling Company : Green Services, IncDriller : Kevin PumphreyDrilling Equipment : Geoprobe 7822DT
Date Started : 11-3-15Weather : Sunny 70s
Northing (US ft) : 572,638.796Easting (US ft) : 1,458,700.221

07-12
-2016
P:\E
nviro
Analy
tics G
roup\1
5029
8M EA
G_Sp
arrow
s Poin
t Area
A\Do
cume
nts\Pa
rcel A
4\Bori
ng Lo
gs\2_
Bor L
ogs C
urren
t\A4-0
11-S
B JK.b
or
Boring ID: A4-011-SB(page 1 of 1)
Total Borehole Depth: 20' bgs.
Depth
(ft.)
0
5
10
15
20
% Re
cove
ry
92
40
0
43
PID R
eadin
g (PP
M)
411.3
400.6
213.3
46.6
6.8
-
-
-
7.2
-
-
-
-
-
-
-
-
-
-
-
Samp
le No
:
A4-011-SB-1 MS/MSD
A4-011-SB-5
DESCRIPTION
(0-3.42') SAND, brown, soft, loose, very fine to medium grained, trace silt,clay, and gravel slag, dry, moist at 2.92'
(3.42-3.75') Asphalt, black(3.75-4.25') SAND, brown, soft, loose, very fine to medium grained, moist, trace silt,clay, and gravel slag(4.25-4.5') Cinder ballast, black, sand sized, moist(4.5-4.83') Slag, beige, sand to gravel sized, moist, soft(4.83-5') Cinder ballast, black, moist(5-8.33') Cinder ballast, black, coarse grained with slag gravels, dry, loose
(8.33-9.83') Slag, black, sand and gravel sized, dry
(9.83-10') Slag, black, gravel sized with brown clay, soft, moist, low plasticity, low cohesion(10-17.83) No Recovery
(17.83-20') Slag, gray, with fine to coarse grained sand, wet, black water
USCS
SW
-SWSWSWSW
GP
SW/GPGC
-
GP
REMARKS
Solvent odor
Wet at 18' bgs
Boring terminated at 20' bgs
Client : EnviroAnalytics GroupARM Project No. : 150298M-2-3Project Description : Sparrows Point - Parcel A4Site Location : Sparrows Point, MDARM Representative : L. PerrinChecked by : P. Vogel, P.G.Drilling Company : Green Services, IncDriller : Kevin PumphreyDrilling Equipment : Geoprobe 7822DT
Date Started : 11-2-15Weather : Cloudy 60s
Northing (US ft) : 570,753.379Easting (US ft) : 1,458,168.971

07-12
-2016
P:\E
nviro
Analy
tics G
roup\1
5029
8M EA
G_Sp
arrow
s Poin
t Area
A\Do
cume
nts\Pa
rcel A
4\Bori
ng Lo
gs\2_
Bor L
ogs C
urren
t\A4-0
12-S
B JK.b
or
Boring ID: A4-012-SB(page 1 of 1)
Total Borehole Depth: 25' bgs.
Depth
(ft.)
0
5
10
15
20
25
% Re
cove
ry
90
90
50
60
87
PID R
eadin
g (PP
M)
1.0
24.6
52.5
47.4
18.3
15.2
30.6
21.9
15.6
14.1
-
-
0.0
0.0
0.0
-
-
-
0.0
0.0
-
-
0.0
0.0
-
Samp
le No
:
A4-012-SB-1
A4-012-SB-5
A4-012-SB-10
DESCRIPTION
(0-5') SAND, brown grading to black, medium to coarse grained with gravel slag, dry, loose, soft, no cohesion, no plasticity, moist at 4' bgs
(5-8') SAND, brown, medium to coarse grained with gravel slag and trace clay, dry, loose, soft, no cohesion, no plasticity
(8-9') Sandy CLAY, brown, very soft, very moist, medium cohesion, medium plasticity(9-9.5') Slag, brown to black, gravel sized with coarse sand, wet(9.5-10') Sandy CLAY, brown with black mottling, very moist, soft, medium cohesion, medium plasticity(10-12.66') Clayey SAND with gravel slag, greenish brown, wet(12.66-13.16') CLAY, mint green, with trace sand, soft, moist, high cohesion, high plasticity(13.16-13.66') SAND, grading to Sandy CLAY, beige, soft, wet, clay exhibits medium cohesion, medium plasticity(13.66-15') SAND, dark beige, soft, wet(15-17.83') Clayey SAND with gravel slag, greenish brown, wet
(17.83-18.5') CLAY, green with black streaks, slight odor, very soft, very moist, high cohesion, high plasticity(18.5-20') CLAY, light gray with orange mottling, moist(20-21.16') Clayey SAND, greenish gray, wet
(21.16-21.5') CLAY, brown, soft, moist, high cohesion, high plasticity(21.5-25') SAND, orange, medium to coarse grained, soft, wet
USCS
SW/GP
GW/GP
CL/SCGP
CL/SC
GP
CHSW-SC
SW
SP-SC
CHCH
SW-SCCH
SW
REMARKS
Wet at 9' bgs
Odor
Boring terminated at 25' bgs
Client : EnviroAnalytics GroupARM Project No. : 150298M-2-3Project Description : Sparrows Point - Parcel A4Site Location : Sparrows Point, MDARM Representative : L. PerrinChecked by : P. Vogel, P.G.Drilling Company : Green Services, IncDriller : Don MarcheseDrilling Equipment : Geoprobe 7822DT
Date Started : 11-5-15Weather : Rainy
Northing (US ft) : 570,367.940Easting (US ft) : 1,458,231.260

07-12
-2016
P:\E
nviro
Analy
tics G
roup\1
5029
8M EA
G_Sp
arrow
s Poin
t Area
A\Do
cume
nts\Pa
rcel A
4\Bori
ng Lo
gs\2_
Bor L
ogs C
urren
t\A4-0
13-S
B JK.b
or
Boring ID: A4-013-SB(page 1 of 1)
Total Borehole Depth: 15' bgs.
Depth
(ft.)
0
5
10
15
% Re
cove
ry
70
70
40
PID R
eadin
g (PP
M)
-
4.0
18.3
240.0
112.9
-
-
65.4
248.5
136.3
-
-
-
-
-
Samp
le No
:
A4-013-SB-1
A4-013-SB-4
DESCRIPTION
(0-2') Topsoil, brown, soft, with fines, dry
(2-5') Slag, black to beige, coarse sand to gravel sized, loose, salmon colored fat clay at 4' bgs, dry
(5-6') Slag, brown to black, with medium to coarse grained sand, dry
(6-10') Slag, brown to black, wet, strong petroleum odor, loose, soft
(10-15') Sandy CLAY, greenish black, with gravels, very wet, soft
USCS
OH
SW/GP
GP/SW
GP/SW
GP/SC
REMARKS
Wet at 6' bgs
Petroleum odor
Petroleum odor
Client : EnviroAnalytics GroupARM Project No. : 150298M-2-3Project Description : Sparrows Point - Parcel A4Site Location : Sparrows Point, MDARM Representative : L. PerrinChecked by : P. Vogel, P.G.Drilling Company : Green Services, IncDriller : Don MarcheseDrilling Equipment : Geoprobe 7822DT
Date Started : 11-5-15Weather : Cloudy/ 60s
Northing (US ft) : 570,659.629Easting (US ft) : 1,458,543.971

07-12
-2016
P:\E
nviro
Analy
tics G
roup\1
5029
8M EA
G_Sp
arrow
s Poin
t Area
A\Do
cume
nts\Pa
rcel A
4\Bori
ng Lo
gs\2_
Bor L
ogs C
urren
t\A4-0
14-S
B JK.b
or
Boring ID: A4-014-SB(page 1 of 1)
Total Borehole Depth: 25' bgs.
Depth
(ft.)
0
5
10
15
20
25
% Re
cove
ry
60
100
100
100
100
PID R
eadin
g (PP
M)
1.7
1.9
4.4
3.9
1.4
0.4
6.1
1.4
0.0
0.0
0.0
0.0
0.0
0.0
0.0
Samp
le No
:
A4-014-SB-1
A4-014-SB-7
A4-014-SB-10
DESCRIPTION
(0-5') Slag, brown to beige, sand to gravel sized up to 3", 3" lenses of Silty CLAY throughout, dry, loose
(5-6.5') CLAY, olive green, trace silt and gravel slag, moist, soft, medium cohesion, high plasticity(6.5-7.5') CLAY, gray with black streaks, organics, strong petroleum odor, trace sand, very high cohesion, very high plasticity(7.5-10') CLAY, light gray with orange mottling, hard, trace sand, medium cohesion, medium plasticity
(10-15') CLAY, light gray to beige with orange mottling, firm, moist, high cohesion, high plasticity
(15-22.5') CLAY, light gray to beige with orange mottling, very soft, moist, very high cohesion, very high plasticity
(22.5-24') SAND, orange, soft, wet
(24-25') CLAY, light brown, very moist, very soft, very high cohesion, very high plasticity
USCS
SW/GP
CH
CH
CH
CH
CH
SW
CH
REMARKS
Strong petroleum odor at 7' bgs
Wet at 22.5' bgs
Boring terminated at 25' bgs
Client : EnviroAnalytics GroupARM Project No. : 150298M-2-3Project Description : Sparrows Point - Parcel A4Site Location : Sparrows Point, MDARM Representative : L. PerrinChecked by : P. Vogel, P.G.Drilling Company : Green Services, IncDriller : Don MarcheseDrilling Equipment : Geoprobe 7822DT
Date Started : 11-5-15Weather : Cloudy 60s
Northing (US ft) : 571,114.490Easting (US ft) : 1,459,217.582

07-12
-2016
P:\E
nviro
Analy
tics G
roup\1
5029
8M EA
G_Sp
arrow
s Poin
t Area
A\Do
cume
nts\Pa
rcel A
4\Bori
ng Lo
gs\2_
Bor L
ogs C
urren
t\A4-0
15-S
B JK.b
or
Boring ID: A4-015-SB(page 1 of 1)
Total Borehole Depth: 20' bgs.
Depth
(ft.)
0
5
10
15
20
% Re
cove
ry
100
100
100
90
PID R
eadin
g (PP
M)
6.1
1.9
19.5
5.4
0.1
1.7
1.5
1.5
1.6
1.3
-
0.0
0.0
0.0
0.0
-
-
0.0
0.0
-
Samp
le No
:
A4-015-SB-1
A4-015-SB-5 MS/MSD
A4-015-SB-10
DESCRIPTION
(0-0.16') Topsoil, brown, loose, soft, dry(0.16-2.16') Slag, black to brown, wtih medium to coarse sand, loose, dry to moist
(2.16-2.5') Slag, black, gravel sized with coarse sand, wet(2.5-3.16') Clayey SAND, light brown, medium cohesion, medium plasticity(3.16-4') CLAY, brown, medium cohesion, medium plasticity(4-5') Clayey SAND, beige, moist(5-10') CLAY, light gray to beige with orange mottling, firm, high cohesion, high plasticity
(10-15') CLAY, brownish gray with orange mottling, soft, moist, very high cohesion, very high plasticity
(15-19.16') CLAY, brown to dark gray, trace sand, very moist, very soft, very high cohesion, very high plasticity
(19.16-20') SAND, dark gray, wet, soft
USCS
OL
GP/SW
GPSW-SC
CH
SW-SC
CH
CH
CL
SW
REMARKS
Wet at 2' bgs(perched)
Wet at 19.2' bgsBoring terminated at 20' bgs
Client : EnviroAnalytics GroupARM Project No. : 150298M-2-3Project Description : Sparrows Point - Parcel A4Site Location : Sparrows Point, MDARM Representative : L. PerrinChecked by : P. Vogel, P.G.Drilling Company : Green Services, IncDriller : Kevin PumphreyDrilling Equipment : Geoprobe 7822DT
Date Started : 11-4-15Weather : Sunny 70s
Northing (US ft) : 571,628.380Easting (US ft) : 1,459,137.350

07-12
-2016
P:\E
nviro
Analy
tics G
roup\1
5029
8M EA
G_Sp
arrow
s Poin
t Area
A\Do
cume
nts\Pa
rcel A
4\Bori
ng Lo
gs\2_
Bor L
ogs C
urren
t\A4-0
16-S
B JK.b
or
Boring ID: A4-016-SB(page 1 of 1)
Total Borehole Depth: 20' bgs.
Depth
(ft.)
0
5
10
15
20
% Re
cove
ry
90
60
93
100
PID R
eadin
g (PP
M)
0.2
1.0
1.2
11.4
11.7
-
-
1.5
2.0
2.1
-
-
-
-
-
-
-
-
-
-
Samp
le No
:
A4-016-SB-1
A4-016-SB-5
A4-016-SB-10
DESCRIPTION
(0-2') SAND with slag gravel, dark brown to beige, loose, dry, soft
(2-2.5') Sandy SILT, beige, moist, soft, low cohesion, no plasticity(2.5-3.5') SAND with slag gravel, dark brown to beige, loose, dry, soft(3.5-4') Sandy SILT, beige, moist, soft, low cohesion, no plasticity(4-5') SAND with slag gravel, dark brown to beige, loose, dry, soft(5-8') Slag, gray, gravel sized, hard, loose
(8-10') Sandy CLAY, greenish brown, soft, moist, low cohesion, low plasticity
(10-20') CLAY, light beige to gray, trace sand, moist
USCS
SW
MLSWMLSW
GP
CL/SC
CH
REMARKS
Boring terminated at 20' bgs
Client : EnviroAnalytics GroupARM Project No. : 150298M-2-3Project Description : Sparrows Point - Parcel A4Site Location : Sparrows Point, MDARM Representative : L. PerrinChecked by : P. Vogel, P.G.Drilling Company : Green Services, IncDriller : Don MarcheseDrilling Equipment : Geoprobe 7822DT
Date Started : 11-5-15Weather : Cloudy 60s
Northing (US ft) : 570,993.990Easting (US ft) : 1,458,908.440

07-12
-2016
P:\E
nviro
Analy
tics G
roup\1
5029
8M EA
G_Sp
arrow
s Poin
t Area
A\Do
cume
nts\Pa
rcel A
4\Bori
ng Lo
gs\2_
Bor L
ogs C
urren
t\A4-0
17-S
B JK.b
or
Boring ID: A4-017-SB(page 1 of 1)
Total Borehole Depth: 20' bgs.
Depth
(ft.)
0
5
10
15
20
% Re
cove
ry
100
100
100
100
PID R
eadin
g (PP
M)
0.8
2.0
14.0
1.5
1.4
0.6
0.3
0.2
0.1
0.1
-
-
-
-
-
-
-
-
-
-
Samp
le No
:
A4-017-SB-1
A4-017-SB-5
A4-017-SB-10
DESCRIPTION
(0-2.5') Slag, brown, alternating with brown silt and medium to coarse grained sand, sand is loose, silt is dry, medium cohesion and no plasticity
(2.5-3.5') Slag, gravel sized with coarse sand, loose, wet
(3.5-5') Clayey SAND, brown with orange mottling, moist, medium cohesion, low plasticity
(5-6') Sandy CLAY, light gray with orange mottling, firm, high cohesion, medium plasticity(6-10') CLAY, light gray with orange mottling, firm, coarse orange sand in parts, high cohesion, high plasticity
(10-13.5') CLAY, gray with beige streaking, coarse orange sand in parts, moist, very soft, high cohesion, high plasticity
(13.5-19.33') CLAY, dark gray, very soft, moist, very high cohesion, very high plasticity
(19.33-20') SAND, dark gray, soft, wet
USCS
GM/GW
GP/SW
SW-SC
CH/SC
CH
CH
CH
SW
REMARKS
Wet at 2.5' bgs - perched
Wet at 19.4' bgsBoring terminated at 20' bgs
Client : EnviroAnalytics GroupARM Project No. : 150298M-2-3Project Description : Sparrows Point - Parcel A4Site Location : Sparrows Point, MDARM Representative : L. PerrinChecked by : P. Vogel, P.G.Drilling Company : Green Services, IncDriller : Don MarcheseDrilling Equipment : Geoprobe 7822DT
Date Started : 11-4-15Weather : Sunny 60s
Northing (US ft) : 572,320.219Easting (US ft) : 1,458,706.080

07-12
-2016
P:\E
nviro
Analy
tics G
roup\1
5029
8M EA
G_Sp
arrow
s Poin
t Area
A\Do
cume
nts\Pa
rcel A
4\Bori
ng Lo
gs\2_
Bor L
ogs C
urren
t\A4-0
18-S
B JK.b
or
Boring ID: A4-018-SB(page 1 of 1)
Total Borehole Depth: 20' bgs.
Depth
(ft.)
0
5
10
15
20
% Re
cove
ry
90
100
70
80
PID R
eadin
g (PP
M)
5.7
4.9
19.8
0.3
0.0
0.0
0.0
0.0
0.0
0.0
-
-
0.0
0.0
0.0
-
-
0.0
0.0
-
Samp
le No
:
A4-018-SB-1
A4-018-SB-5
DESCRIPTION
(0-0.66') Topsoil, brown, soft(0.66-2.83') Slag, gray, gravel sized with coarse gray sand, wet, loose
(2.83-3.5') Sandy CLAY, beige and orange, moist, firm, high cohesion, high plasticity(3.5-5') CLAY, light gray with orange mottling, firm, moist, high cohesion, high plasticity(5-10') CLAY, light gray with orange streaks, very moist to wet near bottom, soft, very high cohesion, very high plasticity
(10-15') CLAY, gray to dark gray, very soft, very moist, very high cohesion, very high plasticity
(15-19') CLAY, dark gray, very soft, very moist, very high cohesion, very high plasticity
(19-20') SAND, dark gray, medium grained, soft, wet
USCS
OL
GP/SW
CH
CH
CH
CH
CH
SW
REMARKS
Wet at 19' bgsBoring terminated at 20' bgs
Client : EnviroAnalytics GroupARM Project No. : 150298M-2-3Project Description : Sparrows Point - Parcel A4Site Location : Sparrows Point, MDARM Representative : L. PerrinChecked by : P. Vogel, P.G.Drilling Company : Green Services, IncDriller : Kevin PumphreyDrilling Equipment : Geoprobe 7822DT
Date Started : 11-3-15Weather : Sunny 70s
Northing (US ft) : 572,447.824Easting (US ft) : 1,459,102.998

07-12
-2016
P:\E
nviro
Analy
tics G
roup\1
5029
8M EA
G_Sp
arrow
s Poin
t Area
A\Do
cume
nts\Pa
rcel A
4\Bori
ng Lo
gs\2_
Bor L
ogs C
urren
t\A4-0
19-S
B JK.b
or
Boring ID: A4-019-SB(page 1 of 1)
Total Borehole Depth: 20' bgs.
Depth
(ft.)
0
5
10
15
20
% Re
cove
ry
100
80
100
100
PID R
eadin
g (PP
M)
0.8
11.6
11.5
10.1
16.2
-
0.0
0.0
0.0
0.0
0.0
0.0
0.0
0.0
0.0
-
-
0.0
0.0
-
Samp
le No
:
A4-019-SB-1
A4-019-SB-5
DESCRIPTION
(0-2.66') Slag, brown to black, with fine to coarse grained sand, soft, dry, loose
(2.66-4') Slag, gray, gravel sized with little sand, wet, loose
(4-5') CLAY, light brown, with trace sand, high cohesion, high plasticity(5-10') CLAY, light gray, moist, firm, high cohesion, high plasticity, weathered coarse rock fragments at 7-8' bgs
(10-15') CLAY, light gray to beige with orange mottling, soft to very soft, moist, very high cohesion, very high plasticity
(15--19.84') CLAY, dark gray, very soft, very moist, very high cohesion, very high plasticity
(19.84-20') Dark gray sand, wet, soft at 19.96' bgs
USCS
GP/SW
GW
CH
CH
CH
CH
SP
REMARKS
Wet at 3' bgs(perched)
Wet at 19.8' bgsBoring terminated at 20' bgs
Client : EnviroAnalytics GroupARM Project No. : 150298M-2-3Project Description : Sparrows Point - Parcel A4Site Location : Sparrows Point, MDARM Representative : L. PerrinChecked by : P. Vogel, P.G.Drilling Company : Green Services, IncDriller : Kevin PumphreyDrilling Equipment : Geoprobe 7822DT
Date Started : 11-4-15Weather : Sunny 70s
Northing (US ft) : 571,969.200Easting (US ft) : 1,458,880.080

07-12
-2016
P:\E
nviro
Analy
tics G
roup\1
5029
8M EA
G_Sp
arrow
s Poin
t Area
A\Do
cume
nts\Pa
rcel A
4\Bori
ng Lo
gs\2_
Bor L
ogs C
urren
t\A4-0
20-S
B JK.b
or
Boring ID: A4-020-SB(page 1 of 1)
Total Borehole Depth: 20' bgs.
Depth
(ft.)
0
5
10
15
20
% Re
cove
ry
100
100
60
60
PID R
eadin
g (PP
M)
1.7
2.0
1.9
1.7
0.2
0.2
0.8
0.8
0.8
0.7
-
-
0.0
0.0
0.0
-
-
0.0
0.0
0.0
Samp
le No
:
A4-020-SB-1
A4-020-SB-5
A4-020-SB-10
DESCRIPTION
(0-1.16') SAND, with quartz gravel, brown, medium to coarse grained, loose, dry(1.16-3.5') Sandy SILT, dark beige, firm, dry, low cohesion, no plasticity
(3.5-5') Sandy CLAY, dark beige with orange streaks, very soft, moist, high cohesion, high plasticity
(5-5.25') SAND, dark beige, moist, soft(5.25-6.5') Sandy CLAY, grayish beige, very soft, moist, high cohesion, high plasticity(6.5-10') CLAY, beige, hard, moist, high cohesion, high plasticity
(10-15') CLAY, beige, soft, moist, high cohesion, high plasticity
(15-20') CLAY, beige grading to gray, soft, trace sand, moist, high cohesion, high plasticity
USCS
SW
ML
CHSWCH
CH
CL
CH
REMARKS
Boring terminated at 20' bgs
Client : EnviroAnalytics GroupARM Project No. : 150298M-2-3Project Description : Sparrows Point - Parcel A4Site Location : Sparrows Point, MDARM Representative : L. PerrinChecked by : P. Vogel, P.G.Drilling Company : Green Services, IncDriller : Kevin PumphreyDrilling Equipment : Geoprobe 7822DT
Date Started : 11-3-15Weather : Sunny 60s
Northing (US ft) : 572,134.260Easting (US ft) : 1,457,992.040

07-12
-2016
P:\E
nviro
Analy
tics G
roup\1
5029
8M EA
G_Sp
arrow
s Poin
t Area
A\Do
cume
nts\Pa
rcel A
4\Bori
ng Lo
gs\2_
Bor L
ogs C
urren
t\A4-0
21-S
B JK.b
or
Boring ID: A4-021-SB(page 1 of 1)
Total Borehole Depth: 20' bgs.
Depth
(ft.)
0
5
10
15
20
% Re
cove
ry
100
100
100
100
PID R
eadin
g (PP
M)
1.7
1.5
3.0
3.4
1.6
0.1
0.1
0.1
0.1
0.4
0.0
0.0
0.0
0.0
0.0
0.0
0.0
0.0
0.0
0.0
Samp
le No
:
A4-021-SB-1
A4-021-SB-5
A4-021-SB-10
DESCRIPTION
(0-2') SILT, brown, with some slag gravel, dry, low cohesion, no plasticity
(2-3') Sandy SILT, dark brown, with slag gravels, dry
(3-5') SILT, brown, with some slag gravels, hard, dry, low cohesion, no plasticity
(5-6.5') Sandy SILT, brown, with some slag gravels, hard, dry, low cohesion, no plasticity
(6.5-10') Silty CLAY, gray to light gray with orange mottling, very firm, dry, medium cohesion, medium plasticity
(10-15') CLAY, light gray with orange mottling, slightly firm, moist, high cohesion, high plasticity, orange weathered coarse sand sized fragments throughout
(15-20') CLAY, light gray to dark gray, very soft, very moist, trace sand, very high cohesion, very high plasticity
USCS
ML
ML/SM
ML
ML/SM
CL
CH
CH
REMARKS
Boring terminated at 20' bgs
Client : EnviroAnalytics GroupARM Project No. : 150298M-2-3Project Description : Sparrows Point - Parcel A4Site Location : Sparrows Point, MDARM Representative : L. PerrinChecked by : P. Vogel, P.G.Drilling Company : Green Services, IncDriller : Kevin PumphreyDrilling Equipment : Geoprobe 7822DT
Date Started : 11-4-15Weather : Sunny 70s
Northing (US ft) : 571,351.11Easting (US ft) : 1,458,858.60

07-12
-2016
P:\E
nviro
Analy
tics G
roup\1
5029
8M EA
G_Sp
arrow
s Poin
t Area
A\Do
cume
nts\Pa
rcel A
4\Bori
ng Lo
gs\2_
Bor L
ogs C
urren
t\A4-0
22-S
B JK.b
or
Boring ID: A4-022-SB(page 1 of 1)
Total Borehole Depth: 10' bgs.
Depth
(ft.)
0
5
10
% Re
cove
ry
90
80
PID R
eadin
g (PP
M)
1.0
3.6
8.5
6.4
1.3
-
3.9
14.9
8.4
5.4
Samp
le No
:
A4-022-SB-1
A4-022-SB-8
A4-022-SB-10
DESCRIPTION
(0-5') SAND, brown, medium grained, with gravel slag, dry, black and moist with depth, loose, soft
(5-10') SAND and slag, dark brown to black, moist to dry, soft, loose
USCS
GP/SW
GP/SW
REMARKS
Wet at 9' bgs
Boring terminated at 10' bgs
Client : EnviroAnalytics GroupARM Project No. : 150298M-2-3Project Description : Sparrows Point - Parcel A4Site Location : Sparrows Point, MDARM Representative : L. PerrinChecked by : P. Vogel, P.G.Drilling Company : Green Services, IncDriller : Don MarcheseDrilling Equipment : Geoprobe 7822DT
Date Started : 11-5-15Weather : Cloudy/ 60s
Northing (US ft) : 570,958.752Easting (US ft) : 1,458,511.373

07-12
-2016
P:\E
nviro
Analy
tics G
roup\1
5029
8M EA
G_Sp
arrow
s Poin
t Area
A\Do
cume
nts\Pa
rcel A
4\Bori
ng Lo
gs\2_
Bor L
ogs C
urren
t\A4-0
23-S
B JK.b
or
Boring ID: A4-023-SB(page 1 of 1)
Total Borehole Depth: 10' bgs.
Depth
(ft.)
0
5
10
% Re
cove
ry
83
90
PID R
eadin
g (PP
M)
-
2.7
31.1
2.5
36.5
-
-
3.3
13.9
24.6
Samp
le No
:
A4-023-SB-1 MS/MSD
A4-023-SB-5
A4-023-SB-10
DESCRIPTION
(0-5') SAND, brown to gray, medium to coarse grained, with gravel slag, black at depth, moist, quartz gravel at 4' bgs, loose, soft
(5-6') SILT, black, moist, petroleum odor, low cohesion, no plasticity
(6-10') Slag, black, sand to gravel sized, dry, loose, patch of beige-yellow sand at 7' bgs
USCS
SW/GP
ML
SW/GP
REMARKS
Petroleum odor
Wet at 9' bgs
Boring terminated at 10' bgs
Client : EnviroAnalytics GroupARM Project No. : 150298M-2-3Project Description : Sparrows Point - Parcel A4Site Location : Sparrows Point, MDARM Representative : L. PerrinChecked by : P. Vogel, P.G.Drilling Company : Green Services, IncDriller : Don MarcheseDrilling Equipment : Geoprobe 7822DT
Date Started : 11-5-15Weather : Cloudy/ 60s
Northing (US ft) : 571,626.176Easting (US ft) : 1,458,373.664

07-12
-2016
P:\E
nviro
Analy
tics G
roup\1
5029
8M EA
G_Sp
arrow
s Poin
t Area
A\Do
cume
nts\Pa
rcel A
4\Bori
ng Lo
gs\2_
Bor L
ogs C
urren
t\A4-0
24-S
B JK.b
or
Boring ID: A4-024-SB(page 1 of 1)
Total Borehole Depth: 10' bgs.
Depth
(ft.)
0
5
10
% Re
cove
ry
90
60
PID R
eadin
g (PP
M)
1.4
3.3
21.7
9.3
13.9
-
13.3
15.6
18.6
177.8
Samp
le No
:
A4-024-SB-1
A4-024-SB-5
DESCRIPTION
(0-3') SAND and gravel, brown, dry, fine to coarse grained
(3-3.75') Sandy CLAY, brown with orange streaks, firm, moist, medium cohesion, low plasticity
(3.75-3.92') Asphalt, gravel sized, moist(3.92-4.25') SAND, medium to coarse grained with gravel slag, brown to dark brown(4.25-4.42') CLAY, gray, moist, high cohesion, high plasticity(4.42-4.75') SAND and gravel, dark brown, dry(4.75-5') SAND, orange, medium to coarse grained, moist, loose(5-8') SAND, dark brown to black, fine to medium grained with slag gravel, loose, dry, moist at 7.66' bgs
(8-9') SAND, black, fine to coarse grained, wet, soft
(9-10') Slag, black, with coarse sand, wet, loose, with railroad tie debris
USCS
SW
CL
-SWCHSWSW
SW/GP
SW
GP
REMARKS
Wet at 8' bgs
Boring terminated at 10' bgs
Client : EnviroAnalytics GroupARM Project No. : 150298M-2-3Project Description : Sparrows Point - Parcel A4Site Location : Sparrows Point, MDARM Representative : L. PerrinChecked by : P. Vogel, P.G.Drilling Company : Green Services, IncDriller : Kevin PumphreyDrilling Equipment : Geoprobe 7822DT
Date Started : 11-2-15Weather : Cloudy/ 60s
Northing (US ft) : 571,462.224Easting (US ft) : 1,458,087.762

07-12
-2016
P:\E
nviro
Analy
tics G
roup\1
5029
8M EA
G_Sp
arrow
s Poin
t Area
A\Do
cume
nts\Pa
rcel A
4\Bori
ng Lo
gs\2_
Bor L
ogs C
urren
t\A4-0
25-S
B JK.b
or
Boring ID: A4-025-SB(page 1 of 1)
Total Borehole Depth: 20' bgs.
Depth
(ft.)
0
5
10
15
20
% Re
cove
ry
100
70
50
87
PID R
eadin
g (PP
M)
1.7
4.2
4.4
5.8
9.0
-
14.9
10.4
4.1
0.0
-
-
0.0
0.0
-
-
-
0.0
0.0
-
Samp
le No
:
A4-025-SB-1
A4-025-SB-7
A4-027-SB-10
DESCRIPTION
(0-0.25') Topsoil, dark brown, dry(0.25-2.92') SAND, light brown to dark brown, slightly moist, fine to coarse grained, 2" seam of white sand at 1.5' bgs
(2.92-3.42') GRAVEL, quartz, with sand(3.42-4.33') Slag, coarse grained to gravel sized, gray, loose, soft, wet(4.33-5') Cinder ballast, black, dry, loose, with gravel slag, no cohesion, no plasticity(5-7.5') Cinder ballast, black, dry, loose, with brown medium to coarse grained sand and gravel slag, no cohesion, no plasticity
(7.5-8') Sandy CLAY, black, very soft, moist, blue-green streaks throughout, slight odor, high cohesion, high plasticity(8-10') CLAY, brown, moist, soft, high cohesion, high plasticity(10-15') CLAY, light brown with black streaks, very soft, moist, very high cohesion, very high plasticity
(15-19.58') CLAY, dark gray, very moist, very soft, very high cohesion, very high plasticity
(19.58-20') SAND, dark gray, soft, wet
USCS
OL
SW
GPGPSW
SW
CH
CH
CH
CH
SW
REMARKS
Wet at 4' bgs(perched)
Wet at 19.5' bgsBoring terminated at 20' bgs
Client : EnviroAnalytics GroupARM Project No. : 150298M-2-3Project Description : Sparrows Point - Parcel A4Site Location : Sparrows Point, MDARM Representative : L. PerrinChecked by : P. Vogel, P.G.Drilling Company : Green Services, IncDriller : Kevin PumphreyDrilling Equipment : Geoprobe 7822DT
Date Started : 11-3-15Weather : Cloudy/ 60s
Northing (US ft) : 572,455.267Easting (US ft) : 1,458,435.373

07-12
-2016
P:\E
nviro
Analy
tics G
roup\1
5029
8M EA
G_Sp
arrow
s Poin
t Area
A\Do
cume
nts\Pa
rcel A
4\Bori
ng Lo
gs\2_
Bor L
ogs C
urren
t\A4-0
26-S
B JK.b
or
Boring ID: A4-026-SB(page 1 of 1)
Total Borehole Depth: 20' bgs.
Depth
(ft.)
0
5
10
15
20
% Re
cove
ry
100
90
100
100
PID R
eadin
g (PP
M)
0.5
6.1
67.8
10.9
6.0
0.5
0.4
0.3
0.0
0.0
0.0
0.0
0.0
0.0
0.0
0.0
0.0
0.0
Samp
le No
:
A4-026-SB-1
A4-026-SB-5
A4-026-SB-10
DESCRIPTION
(0-4') Slag, brown, coarse grained sand to gravel sized, clay lenses present, loose, dry
(4-5') SILT, greenish gray, dry, firm, medium cohesion, no plasticity(5-6.5') Silty CLAY, greenish gray, moist, soft, medium cohesion, medium plasticity
(6.5-8') Sandy CLAY, light beige with orange mottling, firm, dry, medium cohesion, low plasticity
(8-10') CLAY, light beige, moist, firm, high cohesion, high plasticity
(10-13') CLAY, light gray with orange mottling, coarse sand sized orange rock fragments throughout, firm to soft
(13-15') CLAY, light gray, very soft, moist, very high cohesion, very high plasticity
(15-20') CLAY, gray, very soft, very moist to wet, very high cohesion, very high plasticity
USCS
SW/GP
ML
CL
CL
CH
CH
CH
CH
REMARKS
Boring terminated at 20' bgs
Client : EnviroAnalytics GroupARM Project No. : 150298M-2-3Project Description : Sparrows Point - Parcel A4Site Location : Sparrows Point, MDARM Representative : L. PerrinChecked by : P. Vogel, P.G.Drilling Company : Green Services, IncDriller : Kevin PumphreyDrilling Equipment : Geoprobe 7822DT
Date Started : 11-4-15Weather : Sunny 70s
Northing (US ft) : 571,587.914Easting (US ft) : 1,458,828.682

07-12
-2016
P:\E
nviro
Analy
tics G
roup\1
5029
8M EA
G_Sp
arrow
s Poin
t Area
A\Do
cume
nts\Pa
rcel A
4\Bori
ng Lo
gs\2_
Bor L
ogs C
urren
t\A4-0
27-S
B JK.b
or
Boring ID: A4-027-SB(page 1 of 1)
Total Borehole Depth: 5' bgs.
Depth
(ft.)
0
5
10
% Re
cove
ry
95
PID R
eadin
g (PP
M)
0.7
2.8
12.9
15.7
41.3
Samp
le No
:
A4-027-SB-1
A4-027-SB-5
A4-027-SB-10
DESCRIPTION
0-0.25' No Recovery(0-1') SAND, dark brown, fine to medium grained, soft, moist, loose
(1-2.5') SAND, dark brown, fine to medium grained, soft, dry, loose
(2.5-2.83') SAND, and quartz gravels, tan(2.83-5') SAND, dark brown, fine to medium grained, soft, dry, loose
USCS
SW
SW
SW
SW
REMARKS
No water encountered at 5' bgs
Sample at 9.5' bgs collected as part of resample event.Boring terminated at 10' bgs due to barrel stuck in ground
Client : EnviroAnalytics GroupARM Project No. : 150298M-2-3Project Description : Sparrows Point - Parcel A4Site Location : Sparrows Point, MDARM Representative : L. PerrinChecked by : P. Vogel, P.G.Drilling Company : Green Services, IncDriller : Don MarcheseDrilling Equipment : Geoprobe 7822DT
Date Started : 11-5-15Weather : Cloudy/ 60s
Northing (US ft) : 571,259.804Easting (US ft) : 1,458,372.205

07-12
-2016
P:\E
nviro
Analy
tics G
roup\1
5029
8M EA
G_Sp
arrow
s Poin
t Area
A\Do
cume
nts\Pa
rcel A
4\Bori
ng Lo
gs\2_
Bor L
ogs C
urren
t\A4-0
28-S
B JK.b
or
Boring ID: A4-028-SB(page 1 of 1)
Total Borehole Depth: 20' bgs.
Depth
(ft.)
0
5
10
15
20
% Re
cove
ry
100
100
100
90
PID R
eadin
g (PP
M)
0.6
9.1
8.4
10.7
16.8
0.7
0.9
0.8
0.6
0.3
0.0
0.0
0.0
0.0
-
-
0.0
0.0
-
Samp
le No
:
A4-028-SB-1
A4-028-SB-5
DESCRIPTION
(0-0.66') Slag, light beige, medium grained sand to gravel sized, moist, loose(0.66-1.33') Slag, medium grained to gravel sized, dark brown, loose(1.33-1.83') Slag, medium grained to gravel sized, light gray, loose(1.83-2.83') Slag, medium grained to gravel sized, black, loose, wet(2.83-4.75') SILT, light brown with orange mottling, hard, very dry, low cohesion, no plasticity(4.75-5') Silty CLAY, light brown, very firm, medium cohesion, medium plasticity(5-6') CLAY, light brown, firm, dry, medium cohesion, medium to high plasticity(6-7') Sandy CLAY, light gray with orange mottling, firm, medium cohesion, medium plasticity(7-10') CLAY, light gray with orange mottling, trace sand, high cohesion, high plasticity
(10-15') CLAY, light brown, very soft, moist, high cohesion, high plasticity
(15-19.66') CLAY, dark gray, very moist, very soft, very high cohesion, very high plasticity
(19.66-20') SAND, dark gray, wet, soft
USCS
GP/SWGP/SWGP/SWGP/SW
ML
CLCH
CL
CH
CH
CH
SW
REMARKS
Wet at 1.9' bgs(perched)
Wet at 19.7' bgsBoring terminated at 20' bgs
Client : EnviroAnalytics GroupARM Project No. : 150298M-2-3Project Description : Sparrows Point - Parcel A4Site Location : Sparrows Point, MDARM Representative : L. PerrinChecked by : P. Vogel, P.G.Drilling Company : Green Services, IncDriller : Kevin PumphreyDrilling Equipment : Geoprobe 7822DT
Date Started : 11-4-15Weather : Sunny 60s
Northing (US ft) : 572,142.544Easting (US ft) : 1,458,607.467

APPENDIX D

December 4, 2015
Mr. James CalendaEnviroAnalytis Group, LLC1650 Des Peres Road, Suite 303St. Louis, MO 63131
Re: Sparrows Point Piezometer SurveySparrows Point, MDTriad Engineering Job No. 03-15-0343
Mr. Calenda:Below are the specified surveyed piezometers, date of last field work completed onNovember 24, 2015. The coordinate values shown were derived from G.P.S.observations based on National Geodetic Surveys stations “GIS 1”, PID AC7684 and“GIS 2”, PID AC7685 which purport to be on NAD83(2011) Maryland Grid coordinatesystem and NAVD88 elevations.
DESCRIPTION NORTHING EASTINGTOP
CASINGELEVATION
GROUND ATPIEZOMETERELEVATION
A2-013-PZ 574018.74 1463788.08 16.17 12.38
A2-022-PZ 572911.38 1463476.53 12.58 9.68
A2-025-PZ 573614.75 1464570.56 11.23 8.51
A2-031-PZ 574485.04 1464939.09 22.88 20.78
A4-001-PZ 571114.57 1458067.91 14.71 12.71
A4-005-PZ 571746.11 1458066.66 15.95 12.94
A4-005a-PZ 571748.15 1458062.51 15.55 12.99
A4-007-PZ 572370.58 1457965.85 15.41 12.88
A4-010-PZ 572631.43 1458703.03 14.67 12.79
A4-012-PZ 570367.73 1458232.61 15.90 12.24
A4-013-PZ 570657.51 1458543.60 12.00 9.76
A4-014-PZ 571109.86 1459218.50 15.39 11.49
A4-019-PZ 571962.55 1458881.91 16.34 12.65
A8-002-PZ 573593.69 1461765.45 16.14 13.21
A8-004-PZ 573652.14 1462090.63 16.73 12.85
A8-007-PZ 573458.80 1462039.43 15.86 12.60
A8-009-PZ 573912.57 1461846.67 16.73 12.81
A8-013-PZ 574444.07 1462162.14 20.01 16.10
A8-015-PZ 574293.04 1461458.35 16.18 11.91
A8-017-PZ 572956.53 1461959.46 16.59 13.26
A8-017a-PZ 572957.82 1461960.12 15.44 13.26

APPENDIX E

SAMPLER INITIALS PID SERIAL #
LLP 592-913262LLP 592-913262LLP 592-913262LLP 592-913262
PROJECT NUMBER: 150298M-2-4 DATE: November 2, 2015 PAGE 1 of 1
PID CALIBRATION LOG
SAMPLER NAME: L. PerrinPROJECT NAME: Area A, Parcel A4 Phase II
Isobutylene 100 ppm
-
STANDARD CONCENTRATION METER READING COMMENTS
11/2/2015 8:2911/3/2015 8:0011/4/2015 7:45
---
DATE/TIME STANDARDIsobutyleneIsobutyleneIsobutyleneIsobutyleneIsobutyleneIsobutylene
100.0 ppm100.0 ppm100.0 ppm100.0 ppm11/5/2015 8:15
IsobutyleneIsobutyleneIsobutyleneIsobutyleneIsobutylene
IsobutyleneIsobutyleneIsobutylene
100 ppm100 ppm100 ppm100 ppm100 ppm100 ppm
IsobutyleneIsobutyleneIsobutyleneIsobutyleneIsobutyleneIsobutylene 100 ppm
100 ppm100 ppm100 ppm
100 ppm100 ppm100 ppm100 ppm100 ppm100 ppm
Isobutylene 100 ppm100 ppm100 ppm100 ppm100 ppm

APPENDIX F

Client: EnviroAnalytics GroupSite: Sparrows Point - Area A Parcel A4
Sparrows Point, MDARM Project No.: 150298M-2-3
Page 1 of 1
Total Depth: 18'
LOG OF TEMPORARY GROUNDWATER SAMPLE COLLECTION POINT: A4-001-PZ
Depth
in Fe
et
0
1
2
3
4
5
6
7
8
9
10
11
12
13
14
15
16
17
18
19
20
Surf.Elev.12.71
12
11
10
9
8
7
6
5
4
3
2
1
0
-1
-2
-3
-4
-5
-6
-7
DESCRIPTION
Riser Type: PVCRiser Diameter: 1 inchRiser Stickup: 24.5"
Screen Type: PVCScreen Diameter: 1 inchScreen Amount: 15 feetSlot Size: 0.010"
Filter Pack: Top: 2' bgs Bottom: 18' bgs Grain Size: WG #1
Bentonite Seal: Top: 0 (surface) Bottom: 2' bgs Grain Size: 3/8" chips/ granular 30-50 mesh
End of Boring
PZM Name: A4-001-PZ
Bentonite seal
Sand Pack
1" PVC Riser
1" PVC Screen
REMARKS
Northing (US ft): 571,105.00Easting (US ft): 1,458,076.32
Date Installed : 11-3-15Casing/Riser Type : PVCBorehole Diameter : 2.25"Drilling Method : 7822DT GeoprobeDriller : Kevin Pumphrey
Drilling Company : Green Services, IncTOC Elevation : 14.710-Hr DTW : 8.15' bgs24-Hr DTW : 10.65' TOCARM Representative : L. Perrin

Client: EnviroAnalytics GroupSite: Sparrows Point - Area A Parcel A4
Sparrows Point, MDARM Project No.: 150298M-2-3
Page 1 of 1
Total Depth: 25'
LOG OF TEMPORARY GROUNDWATER SAMPLE COLLECTION POINT: A4-005-PZ
Depth
in Fe
et
0123456789
10111213141516171819202122232425
Surf.Elev.12.94
1211
1098
765
432
10-1
-2-3-4
-5-6-7
-8-9-10
-11-12
DESCRIPTION
Riser Type: PVCRiser Diameter: 1 inchRiser Stickup: 34"
Screen Type: PVCScreen Diameter: 1 inchScreen Amount: 5 feetSlot Size: 0.010"
Filter Pack: Top: 19' bgs Bottom: 25' bgs Grain Size: WG #1
Bentonite Seal: Top: 0 (surface) Bottom: 19' bgs Grain Size: 3/8" chips/ granular 30-50 mesh
End of Boring
PZM Name: A4-005-PZ
Bentonite seal
Sand Pack
1" PVC Riser
1" PVC Screen
REMARKS
Date Installed : 11-4-15Casing/Riser Type : PVCBorehole Diameter : 2.25"Drilling Method : 7822DT GeoprobeDriller : Kevin Pumphrey
Drilling Company : Green Services, IncTOC Elevation : 15.950-Hr DTW : 9.00' bgs24-Hr DTW : 10.01' TOCARM Representative : L. Perrin

Client: EnviroAnalytics GroupSite: Sparrows Point - Area A Parcel A4
Sparrows Point, MDARM Project No.: 150298M-2-3
Page 1 of 1
Total Depth: 27'
LOG OF TEMPORARY GROUNDWATER SAMPLE COLLECTION POINT: A4-007-PZ
Depth
in Fe
et
0123456789
101112131415161718192021222324252627282930
Surf.Elev.12.88
1211109876543210-1-2-3-4-5-6-7-8-9-10-11-12-13-14-15-16-17
DESCRIPTION
Riser Type: PVCRiser Diameter: 1 inchRiser Stickup: 30"
Screen Type: PVCScreen Diameter: 1 inchScreen Amount: 10 feetSlot Size: 0.010"
Filter Pack: Top: 16' bgs Bottom: 27' bgs Grain Size: WG #1
Bentonite Seal: Top: 0 (surface) Bottom: 16' bgs Grain Size: 3/8" chips/ granular 30-50 mesh
End of Boring
PZM Name: A4-007-PZ
Bentonite seal
Sand Pack
1" PVC Riser
1" PVC Screen
REMARKS
Northing (US ft): 572,372.75Easting (US ft): 1,457,964.55
Date Installed : 11-3-15Casing/Riser Type : PVCBorehole Diameter : 2.25"Drilling Method : 7822DT GeoprobeDriller : Kevin Pumphrey
Drilling Company : Green Services, IncTOC Elevation : 15.410-Hr DTW : 7.45' TOC24-Hr DTW : 7.22' TOCARM Representative : L. Perrin

Client: EnviroAnalytics GroupSite: Sparrows Point - Area A Parcel A4
Sparrows Point, MDARM Project No.: 150298M-2-3
Page 1 of 1
Total Depth: 28'
LOG OF TEMPORARY GROUNDWATER SAMPLE COLLECTION POINT: A4-010-PZ
Depth
in Fe
et
0123456789
101112131415161718192021222324252627282930
Surf.Elev.12.79
1211109876543210-1-2-3-4-5-6-7-8-9-10-11-12-13-14-15-16-17
DESCRIPTION
Riser Type: PVCRiser Diameter: 1 inchRiser Stickup: 19"
Screen Type: PVCScreen Diameter: 1 inchScreen Amount: 10 feetSlot Size: 0.010"
Filter Pack: Top: 17' bgs Bottom: 28' bgs Grain Size: WG #1
Bentonite Seal: Top: 0 (surface) Bottom: 17' bgs Grain Size: 3/8" chips/ granular 30-50 mesh
End of Boring
PZM Name: A4-010-PZ
Bentonite seal
Sand Pack
1" PVC Riser
1" PVC Screen
REMARKS
Northing (US ft): 572,638.80Easting (US ft): 1,458,700.22
Date Installed : 11-3-15Casing/Riser Type : PVCBorehole Diameter : 2.25"Drilling Method : 7822DT GeoprobeDriller : Kevin Pumphrey
Drilling Company : Green Services, IncTOC Elevation : 14.670-Hr DTW : 5.71' TOC24-Hr DTW : 5.10' TOCARM Representative : L. Perrin
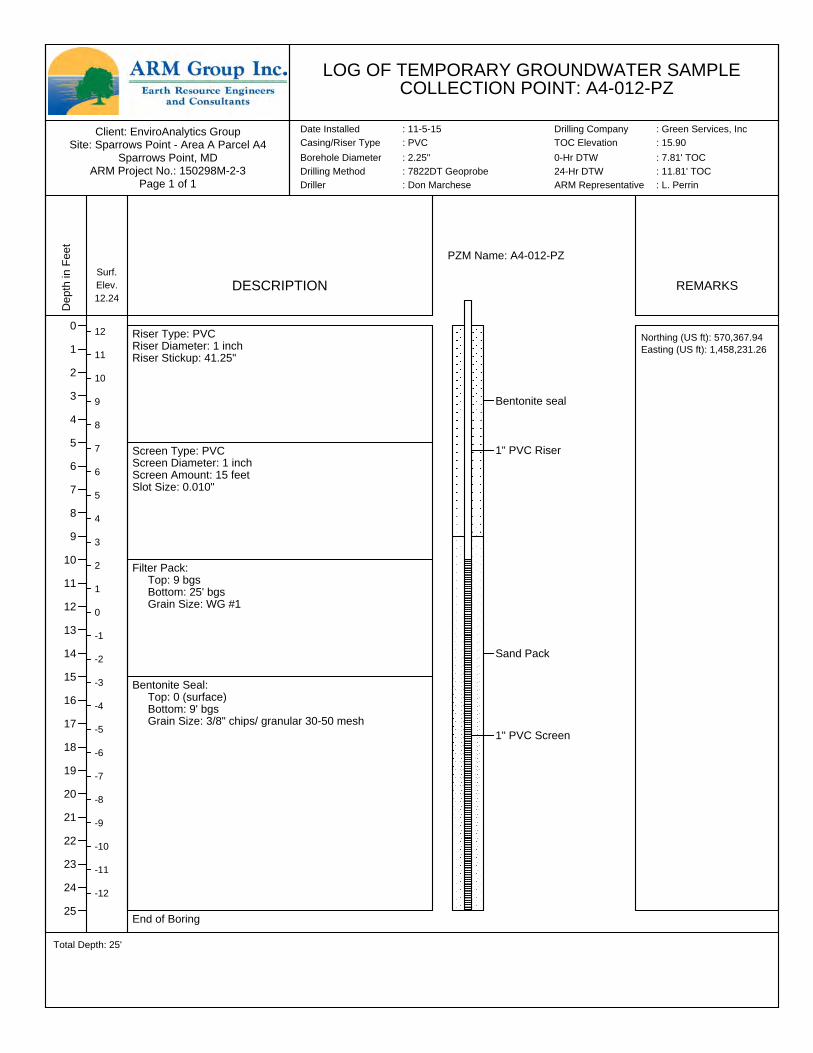
Client: EnviroAnalytics GroupSite: Sparrows Point - Area A Parcel A4
Sparrows Point, MDARM Project No.: 150298M-2-3
Page 1 of 1
Total Depth: 25'
LOG OF TEMPORARY GROUNDWATER SAMPLE COLLECTION POINT: A4-012-PZ
Depth
in Fe
et
0123456789
10111213141516171819202122232425
Surf.Elev.12.24
121110
987
654
321
0-1-2
-3-4-5
-6-7-8
-9-10-11
-12
DESCRIPTION
Riser Type: PVCRiser Diameter: 1 inchRiser Stickup: 41.25"
Screen Type: PVCScreen Diameter: 1 inchScreen Amount: 15 feetSlot Size: 0.010"
Filter Pack: Top: 9 bgs Bottom: 25' bgs Grain Size: WG #1
Bentonite Seal: Top: 0 (surface) Bottom: 9' bgs Grain Size: 3/8" chips/ granular 30-50 mesh
End of Boring
PZM Name: A4-012-PZ
Bentonite seal
Sand Pack
1" PVC Riser
1" PVC Screen
REMARKS
Northing (US ft): 570,367.94Easting (US ft): 1,458,231.26
Date Installed : 11-5-15Casing/Riser Type : PVCBorehole Diameter : 2.25"Drilling Method : 7822DT GeoprobeDriller : Don Marchese
Drilling Company : Green Services, IncTOC Elevation : 15.900-Hr DTW : 7.81' TOC24-Hr DTW : 11.81' TOCARM Representative : L. Perrin

Client: EnviroAnalytics GroupSite: Sparrows Point - Area A Parcel A4
Sparrows Point, MDARM Project No.: 150298M-2-3
Page 1 of 1
Total Depth: 13'
LOG OF TEMPORARY GROUNDWATER SAMPLE COLLECTION POINT: A4-013-PZ
Depth
in Fe
et
0
1
2
3
4
5
6
7
8
9
10
11
12
13
14
15
Surf.Elev.9.76
9
8
7
6
5
4
3
2
1
0
-1
-2
-3
-4
-5
DESCRIPTION
Riser Type: PVCRiser Diameter: 1 inchRiser Stickup: 23.75"
Screen Type: PVCScreen Diameter: 1 inchScreen Amount: 10 feetSlot Size: 0.010"
Filter Pack: Top: 2 bgs Bottom: 13' bgs Grain Size: WG #1
Bentonite Seal: Top: 0 (surface) Bottom: 2' bgs Grain Size: 3/8" chips/ granular 30-50 mesh
End of Boring
PZM Name: A4-013-PZ
Bentonite seal
Sand Pack
1" PVC Riser
1" PVC Screen
REMARKS
Northing (US ft): 570,659.63Easting (US ft): 1,458,543.97
Date Installed : 11-5-15Casing/Riser Type : PVCBorehole Diameter : 2.25"Drilling Method : 7822DT GeoprobeDriller : Don Marchese
Drilling Company : Green Services, IncTOC Elevation : 12.000-Hr DTW : 7.82' TOC24-Hr DTW : 7.83' TOCARM Representative : L. Perrin

Client: EnviroAnalytics GroupSite: Sparrows Point - Area A Parcel A4
Sparrows Point, MDARM Project No.: 150298M-2-3
Page 1 of 1
Total Depth: 25'
LOG OF TEMPORARY GROUNDWATER SAMPLE COLLECTION POINT: A4-014-PZ
Depth
in Fe
et
0123456789
10111213141516171819202122232425
Surf.Elev.11.49
1110
987
654
321
0-1-2
-3-4-5
-6-7-8
-9-10-11
-12-13
DESCRIPTION
Riser Type: PVCRiser Diameter: 1 inchRiser Stickup: 43.5"
Screen Type: PVCScreen Diameter: 1 inchScreen Amount: 10 feetSlot Size: 0.010"
Filter Pack: Top: 14 bgs Bottom: 25' bgs Grain Size: WG #1
Bentonite Seal: Top: 0 (surface) Bottom: 14' bgs Grain Size: 3/8" chips/ granular 30-50 mesh
End of Boring
PZM Name: A4-014-PZ
Bentonite seal
Sand Pack
1" PVC Riser
1" PVC Screen
REMARKS
Northing (US ft): 571,114.49Easting (US ft): 1,459,217.58
Date Installed : 11-5-15Casing/Riser Type : PVCBorehole Diameter : 2.25"Drilling Method : 7822DT GeoprobeDriller : Don Marchese
Drilling Company : Green Services, IncTOC Elevation : 15.390-Hr DTW : 10.31 TOC24-Hr DTW : 10.03' TOCARM Representative : L. Perrin

Client: EnviroAnalytics GroupSite: Sparrows Point - Area A Parcel A4
Sparrows Point, MDARM Project No.: 150298M-2-3
Page 1 of 1
Total Depth: 25'
LOG OF TEMPORARY GROUNDWATER SAMPLE COLLECTION POINT: A4-019-PZ
Depth
in Fe
et
0123456789
10111213141516171819202122232425
Surf.Elev.12.65
12
11109
876
543
210
-1-2-3
-4-5-6
-7-8-9
-10-11-12
DESCRIPTION
Riser Type: PVCRiser Diameter: 1 inchRiser Stickup: ??
Screen Type: PVCScreen Diameter: 1 inchScreen Amount: 10 feetSlot Size: 0.010"
Filter Pack: Top: 14 bgs Bottom: 25' bgs Grain Size: WG #1
Bentonite Seal: Top: 0 (surface) Bottom: 14' bgs Grain Size: 3/8" chips/ granular 30-50 mesh
End of Boring
PZM Name: A4-019-PZ
Bentonite seal
Sand Pack
1" PVC Riser
1" PVC Screen
REMARKS
Northing (US ft): 571,969.20Easting (US ft): 1,458,880.08
Date Installed : 11-5-15Casing/Riser Type : PVCBorehole Diameter : 2.25"Drilling Method : 7822DT GeoprobeDriller : Don Marchese
Drilling Company : Green Services, IncTOC Elevation : 16.340-Hr DTW : 8.02' TOC24-Hr DTW : 7.96' TOCARM Representative : L. Perrin

APPENDIX G

Graduated Bucket

Graduated Bucket

Graduated Bucket

Graduated Bucket
9

Graduated Bucket

Graduated Bucket

Graduated Bucket

Graduated Bucket

SOP No. 017 Calibration of Field Instruments
Quality Assurance Project Plan Sparrows Point Terminal Site EnviroAnalytics Group
TABLE 1 MULTIPARAMETER CALIBRATION LOG
Project Name Parcel A4 Date 11/9/15 Weather Partly Cloudy 50s-60s Calibrated by N. Kurtz & L. Perrin Instrument YSI Meter Serial Number NA Parameters Morning
Calibration Morning Temperature
End of Day Calibration Check
End of Day Temperature
Specific Conductance Standard #1
1.412 40 ̊F (est.) NA¥ NA
Specific Conductance Standard #2
NA NA NA NA
pH (7) 6.98 40 ̊F (est.) NA¥ NA pH (4) 3.97 40 ̊F (est.) NA¥ NA
pH(10) 9.96 40 ̊F (est.) NA¥ NA
ORP Zobel Solution
240.1 40 ̊F (est.) NA¥ NA
Dissolved Oxygen 100% water saturated air mg/L
13.30¥ 40 ̊F (est.) NA¥ NA
Dissolved Oxygen Zero Dissolved Oxygen Solution mg/L
NA 40 ̊F (est.) NA NA
Barometric Pressure mm Hg
775.2 NA NA¥ NA
Turbidity #1 (10 NTU)
9.24 NA NA¥ NA
Turbidity #2 (0.0 NTU)
0.04 NA NA¥ NA
Turbidity Standard #3
NA NA NA NA ¥The post-calibration check was not performed on this date. DO is outside of the calibration acceptance criteria. Values displayed on field purge logs may be inaccurate.

SOP No. 017 Calibration of Field Instruments
Quality Assurance Project Plan Sparrows Point Terminal Site EnviroAnalytics Group
TABLE 1 MULTIPARAMETER CALIBRATION LOG
Project Name Parcel A4 Date 11/10/15 Weather Rain 50s Calibrated by L. Perrin Instrument YSI Meter Serial Number NA Parameters Morning
Calibration Morning Temperature
End of Day Calibration Check
End of Day Temperature
Specific Conductance Standard #1
NA¥ 56 ̊F (est.) NA¥ 60 ̊F (est.)
Specific Conductance Standard #2
NA NA NA NA
pH (7) 7.00 56 ̊F (est.) 7.22 60 ̊F (est.) pH (4) 4.00 56 ̊F (est.) 3.92 60 ̊F (est.)
pH(10) 10.40 56 ̊F (est.) 10.22 60 ̊F (est.)
ORP Zobel Solution
234.4 56 ̊F (est.) 236.2 60 ̊F (est.)
Dissolved Oxygen 100% water saturated air mg/L
NA¥ 56 ̊F (est.) NA¥ 60 ̊F (est.)
Dissolved Oxygen Zero Dissolved Oxygen Solution mg/L
NA NA NA NA
Barometric Pressure mm Hg
762.51 NA 760.10 NA
Turbidity #1 (10 NTU)
calibrated before each sample
NA NA NA
Turbidity #2 (0.0 NTU)
calibrated before each sample
NA NA NA
Turbidity Standard #3
NA NA NA NA ¥No calibration and check values were recorded for Specific Conductance and DO. Values displayed on field purge logs may be inaccurate.

SOP No. 017 Calibration of Field Instruments
Quality Assurance Project Plan Sparrows Point Terminal Site EnviroAnalytics Group
TABLE 1 MULTIPARAMETER CALIBRATION LOG
Project Name Parcel A4 Date 11/11/15 Weather Sunny 50s & 60s Calibrated by L. Perrin & N. Kurtz Instrument YSI Meter Serial Number NA Parameters Morning
Calibration Morning Temperature
End of Day Calibration Check
End of Day Temperature
Specific Conductance Standard #1
1.412 53 ̊F (est.) 1.446 62 ̊F (est.)
Specific Conductance Standard #2
NA NA NA NA
pH (7) 7.04 53 ̊F (est.) 7.00 62 ̊F (est.) pH (4) 4.00 53 ̊F (est.) 3.80 62 ̊F (est.)
pH(10) 10.06 53 ̊F (est.) 10.00 62 ̊F (est.)
ORP Zobel Solution
240.0 53 ̊F (est.) 240.0 62 ̊F (est.)
Dissolved Oxygen 100% water saturated air mg/L
10.41 53 ̊F (est.) 10.21 62 ̊F (est.)
Dissolved Oxygen Zero Dissolved Oxygen Solution mg/L
NA 53 ̊F (est.) NA 62 ̊F (est.)
Barometric Pressure mm Hg
NA¥ NA NA¥ NA
Turbidity #1 (10 NTU)
calibrated before each sample
NA NA NA
Turbidity #2 (0.0 NTU)
calibrated before each sample
NA NA NA
Turbidity Standard #3
NA NA NA NA ¥Barometric pressure values were not recorded. Values displayed on field purge logs may be inaccurate.
APPENDIX H

ARM Project No. 150298M
Parcel A4 - IDW Drum Log
Drum ID Designation Activity/Phase Contents Open Date
352-Soil-3/16/16-A4 Non-haz. Parcel A4 Soil 3/16/2016
55-Soil-11/2/15-A4 Non-haz. Parcel A4 Soil 11/2/2015
56-Liners-11/2/15-A4 Non-haz. Parcel A4 Liners 11/2/2015
57-Decon Water-11/2/15-A4 Non-haz. Parcel A4 Decon water 11/2/2015
58-PPE-11/2/15-A4 Non-haz. Parcel A4 PPE 11/2/2015
59-Soil-11/4/15-A4 Non-haz. Parcel A4 Soil 11/4/2015
60-PPE-11/4/15-A4 Non-haz. Parcel A4 PPE 11/4/2015
61-Purge Water-11/4/15-A3 Hazardous Parcel A3 Purge water 11/4/2015
5/18/2016 Page 1 of 1

APPENDIX I

QA/QC Tracking Log
Date: Date:
1) A4-011-SB-1 1) A4-019-SB-1
2) A4-011-SB-5 2) A4-019-SB-5
3) A4-011-SB-10 3) A4-019-SB-10
4) A4-003-SB-1 4) A4-026-SB-1
5) A4-003-SB-7.5 5) A4-026-SB-5
6) A4-004-SB-1 6) A4-026-SB-10
7) A4-004-SB-5 Duplicate: A4-004-SB-5 7) A4-015-SB-1 Duplicate: A4-019-SB-1
8) A4-024-SB-1 Date: 11/2/2015 8) A4-015-SB-5 Date: 11/4/2015
9) A4-024-SB-5 MS/MSD: A4-011-SB-1 9) A4-015-SB-10 MS/MSD: A4-015-SB-5
10) A4-001-SB-1 Date: 11/2/2015 10) A4-021-SB-1 Date: 11/4/2015
11) A4-001-SB-5 Field Blank: 11) A4-021-SB-5 Field Blank:
12) A4-002-SB-1 Date: 11/2/2015 12) A4-021-SB-10 Date: 11/4/2015
13) A4-002-SB-5 Eq. Blank: 13) A4-006-SB-1 Eq. Blank:
14) A4-020-SB-1 Date: 11/2/2015 14) A4-006-SB-6 Date: 11/4/2015
15) A4-020-SB-5 15) A4-006-SB-10
16) A4-020-SB-10 16) A4-005-SB-1
17) A4-007-SB-1 17) A4-005-SB-5
18) A4-007-SB-5 18) A4-005-SB-10
19) A4-007-SB-10 19) A4-012-SB-1
20) A4-008-SB-1 20) A4-012-SB-5
1) A4-008-SB-5 1) A4-013-SB-1
2) A4-008-SB-10 2) A4-013-SB-4
3) A4-009-SB-1 3) A4-023-SB-1
4) A4-009-SB-5 4) A4-023-SB-5
5) A4-009-SB-10 5) A4-022-SB-1
6) A4-025-SB-1 6) A4-022-SB-8
7) A4-025-SB-7 Duplicate: A4-010-SB-5 7) A4-027-SB-1 Duplicate: A4-027-SB-1
8) A4-025-SB-10 Date: 11/3/2015 8) A4-027-SB-5 Date: 11/5/2015
9) A4-010-SB-1 MS/MSD: A4-009-SB-5 9) A4-016-SB-1 MS/MSD: A4-023-SB-1
10) A4-010-SB-5 Date: 11/3/2015 10) A4-016-SB-5 Date: 11/5/2015
11) A4-010-SB-10 Field Blank: 11) A4-016-SB-10 Field Blank:
12) A4-018-SB-1 Date: 11/3/2015 12) A4-014-SB-1 Date: 11/5/2015
13) A4-018-SB-5 Eq. Blank: 13) A4-014-SB-7 Eq. Blank:
14) A4-018-SB-10 Date: 11/3/2015 14) A4-014-SB-10 Date: 11/5/2015
15) A4-017-SB-1 15) A4-016-SB-1 Notes: *SVOC only
16) A4-017-SB-5 16) A4-016-SB-5 and no trip blank
17) A4-017-SB-10 17) A4-014-SB-1
18) A4-028-SB-1 18) A4-014-SB-7
19) A4-028-SB-5 19) A4-021-SB-1
20) A4-028-SB-10 20) A4-021-SB-5
Trip Blanks: 11/2/2015, 11/3/2015, 11/4/2015, 11/5/2015
Sample IDs Sample IDs
11/2/2015
11/3/2015
11/3/2015
11/4/2015
11/4/2015
11/5/2015
11/5/2015
*3/16/2016

QA/QC Tracking Log
Date: Date:
1) A4-026-SB-1 1) A4-001-SB-1
2) A4-026-SB-5 2) A4-001-SB-5
3) A4-019-SB-1 3) A4-013-SB-1
4) A4-019-SB-5 4) A4-013-SB-4
5) A4-015-SB-1 5) A4-027-SB-1
6) A4-015-SB-5 6) A4-027-SB-5
7) A4-028-SB-1 Duplicate: A4-019-SB-1 7) A4-023-SB-1 Duplicate: A4-027-SB-1
8) A4-028-SB-5 Date: 3/16/2016 8) A4-023-SB-5 Date: 3/17/2016
9) A4-017-SB-1 MS/MSD: A4-015-SB-5 9) MS/MSD: A4-023-SB-1
10) A4-017-SB-5 Date: 3/16/2016 10) Date: 3/17/2016
11) A4-018-SB-1 Field Blank: 11) Field Blank:
12) A4-018-SB-5 Date: 3/16/2016 12) Date: 3/17/2016
13) A4-010-SB-1 Eq. Blank: 13) Eq. Blank:
14) A4-010-SB-5 Date: 3/16/2016 14) Date: 3/17/2016
15) A4-009-SB-1 Notes: *SVOC only 15)
16) A4-009-SB-5 and no trip blank 16)
17) A4-025-SB-1 17)
18) A4-025-SB-7 18)
19) A4-008-SB-1 19)
20) A4-008-SB-5 20)
1) A4-007-SB-1 1)
2) A4-007-SB-5 2)
3) A4-020-SB-1 3)
4) A4-020-SB-5 4)
5) A4-006-SB-1 5)
6) A4-006-SB-6 6)
7) A4-005-SB-1 Duplicate: A4-004-SB-5 7) Duplicate:
8) A4-005-SB-5 Date: 3/17/2016 8) Date:
9) A4-024-SB-1 MS/MSD: A4-011-SB-1 9) MS/MSD:
10) A4-024-SB-5 Date: 3/17/2016 10) Date:
11) A4-004-SB-1 Field Blank: 11) Field Blank:
12) A4-004-SB-5 Date: 3/17/2016 12) Date:
13) A4-003-SB-1 Eq. Blank: 13) Eq. Blank:
14) A4-003-SB-7.5 Date: 3/17/2016 14) Date:
15) A4-011-SB-1 Notes: *SVOC only 15)
16) A4-011-SB-5 and no trip blank 16)
17) A4-012-SB-1 17)
18) A4-012-SB-5 18)
19) A4-002-SB-1 19)
20) A4-002-SB-5 20)
Sample IDs Sample IDs
Trip Blanks:
*3/16/2016
*3/16/2016
*3/17/2016
*3/17/2016

APPENDIX J
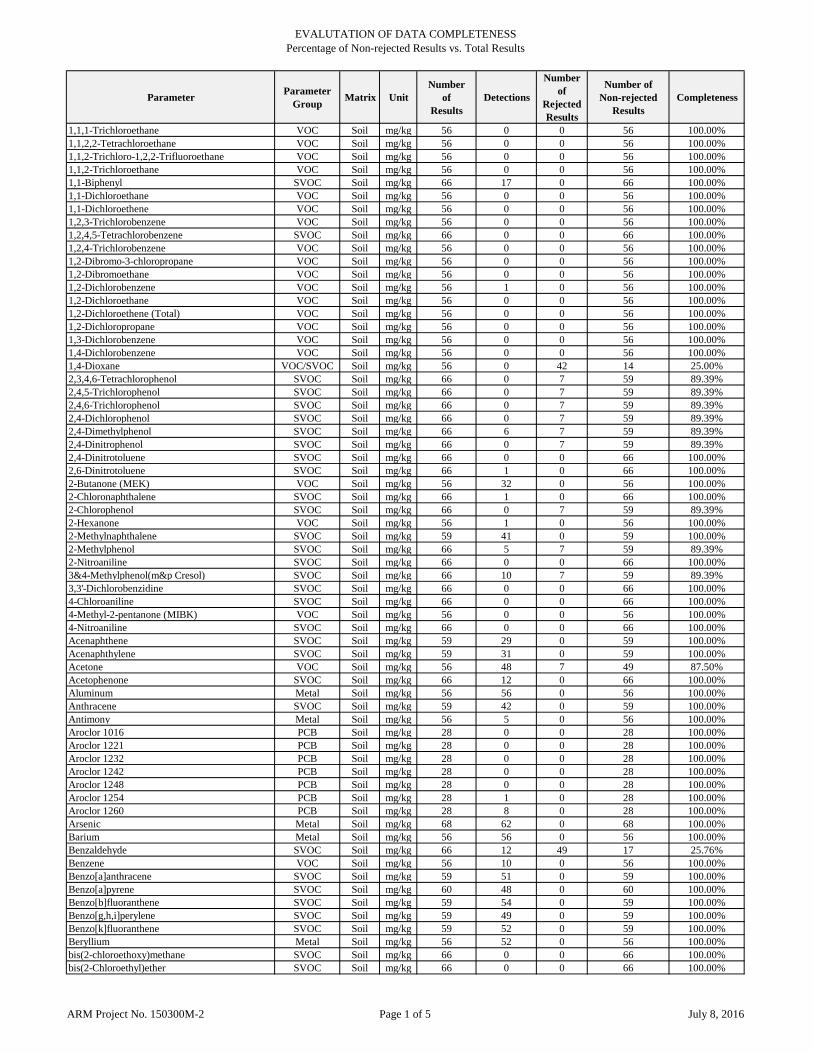
EVALUTATION OF DATA COMPLETENESSPercentage of Non-rejected Results vs. Total Results
ARM Project No. 150300M-2 Page 1 of 5 July 8, 2016
ParameterParameter
GroupMatrix Unit
Numberof
ResultsDetections
Number of
Rejected Results
Number of Non-rejected
ResultsCompleteness
1,1,1-Trichloroethane VOC Soil mg/kg 56 0 0 56 100.00%1,1,2,2-Tetrachloroethane VOC Soil mg/kg 56 0 0 56 100.00%1,1,2-Trichloro-1,2,2-Trifluoroethane VOC Soil mg/kg 56 0 0 56 100.00%1,1,2-Trichloroethane VOC Soil mg/kg 56 0 0 56 100.00%1,1-Biphenyl SVOC Soil mg/kg 66 17 0 66 100.00%1,1-Dichloroethane VOC Soil mg/kg 56 0 0 56 100.00%1,1-Dichloroethene VOC Soil mg/kg 56 0 0 56 100.00%1,2,3-Trichlorobenzene VOC Soil mg/kg 56 0 0 56 100.00%1,2,4,5-Tetrachlorobenzene SVOC Soil mg/kg 66 0 0 66 100.00%1,2,4-Trichlorobenzene VOC Soil mg/kg 56 0 0 56 100.00%1,2-Dibromo-3-chloropropane VOC Soil mg/kg 56 0 0 56 100.00%1,2-Dibromoethane VOC Soil mg/kg 56 0 0 56 100.00%1,2-Dichlorobenzene VOC Soil mg/kg 56 1 0 56 100.00%1,2-Dichloroethane VOC Soil mg/kg 56 0 0 56 100.00%1,2-Dichloroethene (Total) VOC Soil mg/kg 56 0 0 56 100.00%1,2-Dichloropropane VOC Soil mg/kg 56 0 0 56 100.00%1,3-Dichlorobenzene VOC Soil mg/kg 56 0 0 56 100.00%1,4-Dichlorobenzene VOC Soil mg/kg 56 0 0 56 100.00%1,4-Dioxane VOC/SVOC Soil mg/kg 56 0 42 14 25.00%2,3,4,6-Tetrachlorophenol SVOC Soil mg/kg 66 0 7 59 89.39%2,4,5-Trichlorophenol SVOC Soil mg/kg 66 0 7 59 89.39%2,4,6-Trichlorophenol SVOC Soil mg/kg 66 0 7 59 89.39%2,4-Dichlorophenol SVOC Soil mg/kg 66 0 7 59 89.39%2,4-Dimethylphenol SVOC Soil mg/kg 66 6 7 59 89.39%2,4-Dinitrophenol SVOC Soil mg/kg 66 0 7 59 89.39%2,4-Dinitrotoluene SVOC Soil mg/kg 66 0 0 66 100.00%2,6-Dinitrotoluene SVOC Soil mg/kg 66 1 0 66 100.00%2-Butanone (MEK) VOC Soil mg/kg 56 32 0 56 100.00%2-Chloronaphthalene SVOC Soil mg/kg 66 1 0 66 100.00%2-Chlorophenol SVOC Soil mg/kg 66 0 7 59 89.39%2-Hexanone VOC Soil mg/kg 56 1 0 56 100.00%2-Methylnaphthalene SVOC Soil mg/kg 59 41 0 59 100.00%2-Methylphenol SVOC Soil mg/kg 66 5 7 59 89.39%2-Nitroaniline SVOC Soil mg/kg 66 0 0 66 100.00%3&4-Methylphenol(m&p Cresol) SVOC Soil mg/kg 66 10 7 59 89.39%3,3'-Dichlorobenzidine SVOC Soil mg/kg 66 0 0 66 100.00%4-Chloroaniline SVOC Soil mg/kg 66 0 0 66 100.00%4-Methyl-2-pentanone (MIBK) VOC Soil mg/kg 56 0 0 56 100.00%4-Nitroaniline SVOC Soil mg/kg 66 0 0 66 100.00%Acenaphthene SVOC Soil mg/kg 59 29 0 59 100.00%Acenaphthylene SVOC Soil mg/kg 59 31 0 59 100.00%Acetone VOC Soil mg/kg 56 48 7 49 87.50%Acetophenone SVOC Soil mg/kg 66 12 0 66 100.00%Aluminum Metal Soil mg/kg 56 56 0 56 100.00%Anthracene SVOC Soil mg/kg 59 42 0 59 100.00%Antimony Metal Soil mg/kg 56 5 0 56 100.00%Aroclor 1016 PCB Soil mg/kg 28 0 0 28 100.00%Aroclor 1221 PCB Soil mg/kg 28 0 0 28 100.00%Aroclor 1232 PCB Soil mg/kg 28 0 0 28 100.00%Aroclor 1242 PCB Soil mg/kg 28 0 0 28 100.00%Aroclor 1248 PCB Soil mg/kg 28 0 0 28 100.00%Aroclor 1254 PCB Soil mg/kg 28 1 0 28 100.00%Aroclor 1260 PCB Soil mg/kg 28 8 0 28 100.00%Arsenic Metal Soil mg/kg 68 62 0 68 100.00%Barium Metal Soil mg/kg 56 56 0 56 100.00%Benzaldehyde SVOC Soil mg/kg 66 12 49 17 25.76%Benzene VOC Soil mg/kg 56 10 0 56 100.00%Benzo[a]anthracene SVOC Soil mg/kg 59 51 0 59 100.00%Benzo[a]pyrene SVOC Soil mg/kg 60 48 0 60 100.00%Benzo[b]fluoranthene SVOC Soil mg/kg 59 54 0 59 100.00%Benzo[g,h,i]perylene SVOC Soil mg/kg 59 49 0 59 100.00%Benzo[k]fluoranthene SVOC Soil mg/kg 59 52 0 59 100.00%Beryllium Metal Soil mg/kg 56 52 0 56 100.00%bis(2-chloroethoxy)methane SVOC Soil mg/kg 66 0 0 66 100.00%bis(2-Chloroethyl)ether SVOC Soil mg/kg 66 0 0 66 100.00%

EVALUTATION OF DATA COMPLETENESSPercentage of Non-rejected Results vs. Total Results
ARM Project No. 150300M-2 Page 2 of 5 July 8, 2016
ParameterParameter
GroupMatrix Unit
Numberof
ResultsDetections
Number of
Rejected Results
Number of Non-rejected
ResultsCompleteness
bis(2-Chloroisopropyl)ether SVOC Soil mg/kg 66 0 0 66 100.00%bis(2-Ethylhexyl)phthalate SVOC Soil mg/kg 66 3 0 66 100.00%Bromodichloromethane VOC Soil mg/kg 56 0 0 56 100.00%Bromoform VOC Soil mg/kg 56 0 0 56 100.00%Bromomethane VOC Soil mg/kg 56 0 42 14 25.00%Cadmium Metal Soil mg/kg 56 48 0 56 100.00%Caprolactam SVOC Soil mg/kg 66 0 0 66 100.00%Carbazole SVOC Soil mg/kg 66 32 0 66 100.00%Carbon disulfide VOC Soil mg/kg 56 0 0 56 100.00%Carbon tetrachloride VOC Soil mg/kg 56 0 0 56 100.00%Chlorobenzene VOC Soil mg/kg 56 0 0 56 100.00%Chloroethane VOC Soil mg/kg 56 0 12 44 78.57%Chloroform VOC Soil mg/kg 56 0 0 56 100.00%Chloromethane VOC Soil mg/kg 56 0 0 56 100.00%Chromium Metal Soil mg/kg 56 56 0 56 100.00%Chromium VI Metal Soil mg/kg 56 6 0 56 100.00%Chrysene SVOC Soil mg/kg 59 54 0 59 100.00%cis-1,2-Dichloroethene VOC Soil mg/kg 56 0 0 56 100.00%cis-1,3-Dichloropropene VOC Soil mg/kg 56 0 0 56 100.00%Cobalt Metal Soil mg/kg 56 54 0 56 100.00%Copper Metal Soil mg/kg 56 56 0 56 100.00%Cyanide CN Soil mg/kg 56 35 0 56 100.00%Cyclohexane VOC Soil mg/kg 56 8 0 56 100.00%Dibenz[a,h]anthracene SVOC Soil mg/kg 59 38 0 59 100.00%Dibromochloromethane VOC Soil mg/kg 56 0 0 56 100.00%Dichlorodifluoromethane VOC Soil mg/kg 56 0 0 56 100.00%Diesel Range Organics TPH Soil mg/kg 8 6 0 8 100.00%Diethylphthalate SVOC Soil mg/kg 66 1 0 66 100.00%Di-n-butylphthalate SVOC Soil mg/kg 66 6 0 66 100.00%Di-n-ocytlphthalate SVOC Soil mg/kg 66 2 0 66 100.00%Ethylbenzene VOC Soil mg/kg 56 4 0 56 100.00%Fluoranthene SVOC Soil mg/kg 59 53 0 59 100.00%Fluorene SVOC Soil mg/kg 59 42 0 59 100.00%Gasoline Range Organics TPH Soil mg/kg 16 4 0 16 100.00%Hexachlorobenzene SVOC Soil mg/kg 66 0 0 66 100.00%Hexachlorobutadiene SVOC Soil mg/kg 66 0 0 66 100.00%Hexachlorocyclopentadiene SVOC Soil mg/kg 66 0 0 66 100.00%Hexachloroethane SVOC Soil mg/kg 66 0 0 66 100.00%Indeno[1,2,3-c,d]pyrene SVOC Soil mg/kg 59 42 0 59 100.00%Iron Metal Soil mg/kg 56 56 0 56 100.00%Isophorone SVOC Soil mg/kg 66 0 0 66 100.00%Isopropylbenzene VOC Soil mg/kg 56 2 0 56 100.00%Lead Metal Soil mg/kg 56 54 0 56 100.00%Manganese Metal Soil mg/kg 57 57 0 57 100.00%Mercury Metal Soil mg/kg 56 39 0 56 100.00%Methyl Acetate VOC Soil mg/kg 56 1 14 42 75.00%Methyl tert-butyl ether (MTBE) VOC Soil mg/kg 56 0 0 56 100.00%Methylene Chloride VOC Soil mg/kg 56 21 0 56 100.00%Naphthalene SVOC Soil mg/kg 59 48 0 59 100.00%Nickel Metal Soil mg/kg 56 56 0 56 100.00%Nitrobenzene SVOC Soil mg/kg 66 0 0 66 100.00%N-Nitroso-di-n-propylamine SVOC Soil mg/kg 66 0 0 66 100.00%N-Nitrosodiphenylamine SVOC Soil mg/kg 66 1 0 66 100.00%Oil and Grease TPH Soil mg/kg 56 56 0 56 100.00%PCBs (total) PCB Soil mg/kg 28 5 0 28 100.00%Pentachlorophenol SVOC Soil mg/kg 66 0 7 59 89.39%Phenanthrene SVOC Soil mg/kg 59 47 0 59 100.00%Phenol SVOC Soil mg/kg 66 7 7 59 89.39%Pyrene SVOC Soil mg/kg 59 54 0 59 100.00%Selenium Metal Soil mg/kg 56 11 0 56 100.00%Silver Metal Soil mg/kg 56 13 0 56 100.00%Styrene VOC Soil mg/kg 56 0 0 56 100.00%Tetrachloroethene VOC Soil mg/kg 56 0 0 56 100.00%Thallium Metal Soil mg/kg 57 3 0 57 100.00%Toluene VOC Soil mg/kg 56 26 0 56 100.00%

EVALUTATION OF DATA COMPLETENESSPercentage of Non-rejected Results vs. Total Results
ARM Project No. 150300M-2 Page 3 of 5 July 8, 2016
ParameterParameter
GroupMatrix Unit
Numberof
ResultsDetections
Number of
Rejected Results
Number of Non-rejected
ResultsCompleteness
trans-1,2-Dichloroethene VOC Soil mg/kg 56 0 0 56 100.00%trans-1,3-Dichloropropene VOC Soil mg/kg 56 0 0 56 100.00%Trichloroethene VOC Soil mg/kg 56 1 0 56 100.00%Trichlorofluoromethane VOC Soil mg/kg 56 0 0 56 100.00%Vanadium Metal Soil mg/kg 56 56 0 56 100.00%Vinyl chloride VOC Soil mg/kg 56 0 0 56 100.00%Xylenes VOC Soil mg/kg 56 5 0 56 100.00%Zinc Metal Soil mg/kg 56 56 0 56 100.00%1,1,1-Trichloroethane VOC Water ug/L 8 0 0 8 100.00%1,1,2,2-Tetrachloroethane VOC Water ug/L 8 0 0 8 100.00%1,1,2-Trichloro-1,2,2-Trifluoroethane VOC Water ug/L 8 0 0 8 100.00%1,1,2-Trichloroethane VOC Water ug/L 8 0 0 8 100.00%1,1-Biphenyl SVOC Water ug/L 8 1 0 8 100.00%1,1-Dichloroethane VOC Water ug/L 8 0 0 8 100.00%1,1-Dichloroethene VOC Water ug/L 8 0 0 8 100.00%1,2,3-Trichlorobenzene VOC Water ug/L 8 0 0 8 100.00%1,2,4,5-Tetrachlorobenzene SVOC Water ug/L 8 0 0 8 100.00%1,2,4-Trichlorobenzene VOC Water ug/L 8 0 0 8 100.00%1,2-Dibromo-3-chloropropane VOC Water ug/L 8 0 0 8 100.00%1,2-Dibromoethane VOC Water ug/L 8 0 0 8 100.00%1,2-Dichlorobenzene VOC Water ug/L 8 0 0 8 100.00%1,2-Dichloroethane VOC Water ug/L 8 0 0 8 100.00%1,2-Dichloroethene (Total) VOC Water ug/L 8 0 0 8 100.00%1,2-Dichloropropane VOC Water ug/L 8 0 0 8 100.00%1,3-Dichlorobenzene VOC Water ug/L 8 0 0 8 100.00%1,4-Dichlorobenzene VOC Water ug/L 8 0 0 8 100.00%1,4-Dioxane VOC/SVOC Water ug/L 8 4 0 8 100.00%2,3,4,6-Tetrachlorophenol SVOC Water ug/L 8 1 0 8 100.00%2,4,5-Trichlorophenol SVOC Water ug/L 8 0 0 8 100.00%2,4,6-Trichlorophenol SVOC Water ug/L 8 0 0 8 100.00%2,4-Dichlorophenol SVOC Water ug/L 8 0 0 8 100.00%2,4-Dimethylphenol SVOC Water ug/L 8 1 0 8 100.00%2,4-Dinitrophenol SVOC Water ug/L 8 0 0 8 100.00%2,4-Dinitrotoluene SVOC Water ug/L 8 0 0 8 100.00%2,6-Dinitrotoluene SVOC Water ug/L 8 0 0 8 100.00%2-Butanone (MEK) VOC Water ug/L 8 0 0 8 100.00%2-Chloronaphthalene SVOC Water ug/L 8 0 0 8 100.00%2-Chlorophenol SVOC Water ug/L 8 0 0 8 100.00%2-Hexanone VOC Water ug/L 8 0 0 8 100.00%2-Methylnaphthalene SVOC Water ug/L 8 2 0 8 100.00%2-Methylphenol SVOC Water ug/L 8 1 0 8 100.00%2-Nitroaniline SVOC Water ug/L 8 0 0 8 100.00%3&4-Methylphenol(m&p Cresol) SVOC Water ug/L 8 1 0 8 100.00%3,3'-Dichlorobenzidine SVOC Water ug/L 8 0 1 7 87.50%4-Chloroaniline SVOC Water ug/L 8 0 0 8 100.00%4-Methyl-2-pentanone (MIBK) VOC Water ug/L 8 0 0 8 100.00%4-Nitroaniline SVOC Water ug/L 8 0 0 8 100.00%Acenaphthene SVOC Water ug/L 8 2 0 8 100.00%Acenaphthylene SVOC Water ug/L 8 2 0 8 100.00%Acetone VOC Water ug/L 8 0 7 1 12.50%Acetophenone SVOC Water ug/L 8 0 0 8 100.00%Aluminum Metal Water ug/L 8 5 0 8 100.00%Anthracene SVOC Water ug/L 8 3 0 8 100.00%Antimony Metal Water ug/L 8 0 0 8 100.00%Arsenic Metal Water ug/L 8 1 0 8 100.00%Barium Metal Water ug/L 8 8 0 8 100.00%Benzaldehyde SVOC Water ug/L 8 0 0 8 100.00%Benzene VOC Water ug/L 8 1 0 8 100.00%Benzo[a]anthracene SVOC Water ug/L 8 4 0 8 100.00%Benzo[a]pyrene SVOC Water ug/L 8 3 0 8 100.00%Benzo[b]fluoranthene SVOC Water ug/L 8 2 0 8 100.00%Benzo[g,h,i]perylene SVOC Water ug/L 8 0 0 8 100.00%Benzo[k]fluoranthene SVOC Water ug/L 8 1 0 8 100.00%Beryllium Metal Water ug/L 8 1 0 8 100.00%bis(2-chloroethoxy)methane SVOC Water ug/L 8 0 0 8 100.00%

EVALUTATION OF DATA COMPLETENESSPercentage of Non-rejected Results vs. Total Results
ARM Project No. 150300M-2 Page 4 of 5 July 8, 2016
ParameterParameter
GroupMatrix Unit
Numberof
ResultsDetections
Number of
Rejected Results
Number of Non-rejected
ResultsCompleteness
bis(2-Chloroethyl)ether SVOC Water ug/L 8 0 0 8 100.00%bis(2-Chloroisopropyl)ether SVOC Water ug/L 8 0 0 8 100.00%bis(2-Ethylhexyl)phthalate SVOC Water ug/L 8 2 0 8 100.00%Bromodichloromethane VOC Water ug/L 8 0 0 8 100.00%Bromoform VOC Water ug/L 8 0 0 8 100.00%Bromomethane VOC Water ug/L 8 0 0 8 100.00%Cadmium Metal Water ug/L 8 1 0 8 100.00%Caprolactam SVOC Water ug/L 8 0 0 8 100.00%Carbazole SVOC Water ug/L 8 1 0 8 100.00%Carbon disulfide VOC Water ug/L 8 0 0 8 100.00%Carbon tetrachloride VOC Water ug/L 8 0 0 8 100.00%Chlorobenzene VOC Water ug/L 8 0 0 8 100.00%Chloroethane VOC Water ug/L 8 0 0 8 100.00%Chloroform VOC Water ug/L 8 0 0 8 100.00%Chloromethane VOC Water ug/L 8 0 0 8 100.00%Chromium Metal Water ug/L 8 7 0 8 100.00%Chromium VI Metal Water ug/L 8 0 0 8 100.00%Chrysene SVOC Water ug/L 8 4 0 8 100.00%cis-1,2-Dichloroethene VOC Water ug/L 8 0 0 8 100.00%cis-1,3-Dichloropropene VOC Water ug/L 8 0 0 8 100.00%Cobalt Metal Water ug/L 8 2 0 8 100.00%Copper Metal Water ug/L 8 5 0 8 100.00%Cyanide CN Water ug/L 8 2 0 8 100.00%Cyclohexane VOC Water ug/L 8 0 0 8 100.00%Dibenz[a,h]anthracene SVOC Water ug/L 8 0 0 8 100.00%Dibromochloromethane VOC Water ug/L 8 0 0 8 100.00%Dichlorodifluoromethane VOC Water ug/L 8 0 0 8 100.00%Diesel Range Organics TPH Water ug/L 1 0 0 1 100.00%Diethylphthalate SVOC Water ug/L 8 0 0 8 100.00%Di-n-butylphthalate SVOC Water ug/L 8 0 0 8 100.00%Di-n-ocytlphthalate SVOC Water ug/L 8 0 0 8 100.00%Ethylbenzene VOC Water ug/L 8 1 0 8 100.00%Fluoranthene SVOC Water ug/L 8 4 0 8 100.00%Fluorene SVOC Water ug/L 8 3 0 8 100.00%Gasoline Range Organics TPH Water ug/L 1 1 0 1 100.00%Hexachlorobenzene SVOC Water ug/L 8 0 0 8 100.00%Hexachlorobutadiene SVOC Water ug/L 8 0 0 8 100.00%Hexachlorocyclopentadiene SVOC Water ug/L 8 0 0 8 100.00%Hexachloroethane SVOC Water ug/L 8 0 0 8 100.00%Indeno[1,2,3-c,d]pyrene SVOC Water ug/L 8 0 0 8 100.00%Iron Metal Water ug/L 8 8 0 8 100.00%Isophorone SVOC Water ug/L 8 0 0 8 100.00%Isopropylbenzene VOC Water ug/L 8 0 0 8 100.00%Lead Metal Water ug/L 8 0 0 8 100.00%Manganese Metal Water ug/L 8 8 0 8 100.00%Mercury Metal Water ug/L 8 0 0 8 100.00%Methyl Acetate VOC Water ug/L 8 0 7 1 12.50%Methyl tert-butyl ether (MTBE) VOC Water ug/L 8 0 0 8 100.00%Methylene Chloride VOC Water ug/L 8 0 0 8 100.00%Naphthalene SVOC Water ug/L 8 3 0 8 100.00%Nickel Metal Water ug/L 8 5 0 8 100.00%Nitrobenzene SVOC Water ug/L 8 0 0 8 100.00%N-Nitroso-di-n-propylamine SVOC Water ug/L 8 0 0 8 100.00%N-Nitrosodiphenylamine SVOC Water ug/L 8 0 0 8 100.00%Oil and Grease TPH Water ug/L 8 2 0 8 100.00%Pentachlorophenol SVOC Water ug/L 8 1 0 8 100.00%Phenanthrene SVOC Water ug/L 8 4 0 8 100.00%Phenol SVOC Water ug/L 8 0 0 8 100.00%Pyrene SVOC Water ug/L 8 4 0 8 100.00%Selenium Metal Water ug/L 8 1 0 8 100.00%Silver Metal Water ug/L 8 3 0 8 100.00%Styrene VOC Water ug/L 8 0 0 8 100.00%Tetrachloroethene VOC Water ug/L 8 0 0 8 100.00%Thallium Metal Water ug/L 8 0 0 8 100.00%Toluene VOC Water ug/L 8 2 0 8 100.00%
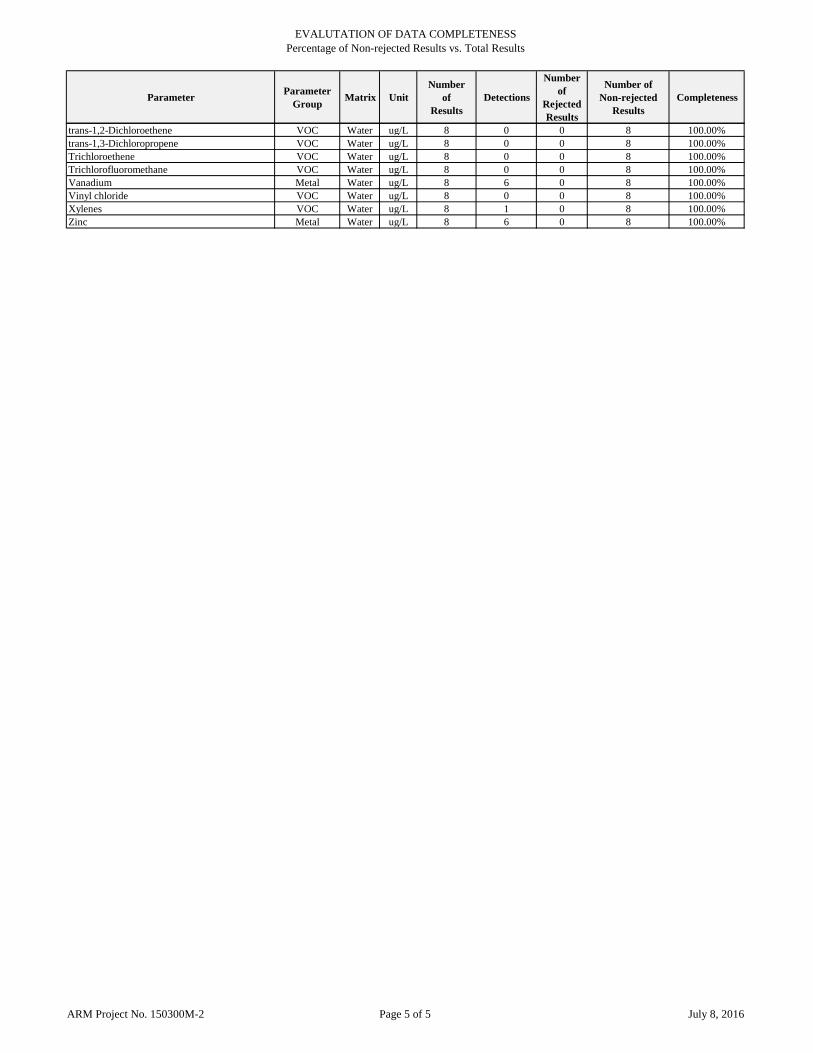
EVALUTATION OF DATA COMPLETENESSPercentage of Non-rejected Results vs. Total Results
ARM Project No. 150300M-2 Page 5 of 5 July 8, 2016
ParameterParameter
GroupMatrix Unit
Numberof
ResultsDetections
Number of
Rejected Results
Number of Non-rejected
ResultsCompleteness
trans-1,2-Dichloroethene VOC Water ug/L 8 0 0 8 100.00%trans-1,3-Dichloropropene VOC Water ug/L 8 0 0 8 100.00%Trichloroethene VOC Water ug/L 8 0 0 8 100.00%Trichlorofluoromethane VOC Water ug/L 8 0 0 8 100.00%Vanadium Metal Water ug/L 8 6 0 8 100.00%Vinyl chloride VOC Water ug/L 8 0 0 8 100.00%Xylenes VOC Water ug/L 8 1 0 8 100.00%Zinc Metal Water ug/L 8 6 0 8 100.00%

APPENDIX K

Construction Worker Soil Screening Levels250 Work Day Exposure
Calculation Spreadsheet - Parcel A4
ARM Project No. 150298M-2 Page 1 of 2 December 29, 2016
Description Variable Value
Days worked per week DW 5Exposure duration (yr) ED 1Hours worked per day ET 8A/constant (unitless) - particulate emission factor Aconst 12.9351B/constant (unitless) - particulate emission factor Bconst 5.7383C/constant (unitless) - particulate emission factor Cconst 71.7711Dispersion correction factor (unitless) FD 0.185Days per year with at least .01" precipitation P 130Target hazard quotient (unitless) THQ 1Body weight (kg) BW 80Averaging time - noncancer (yr) ATnc 1Soil ingestion rate (mg/d) IR 330Skin-soil adherence factor (mg/cm2) AF 0.3Skin surface exposed (cm2) SA 3300Event frequency (ev/day) EV 1Target cancer risk (unitless) TR 01E-06Averaging time - cancer (yr) ATc 70A/constant (unitless) - volatilization Aconstv 2.4538B/constant (unitless) - volatilization Bconstv 17.566C/constant (unitless) - volatilization Cconstv 189.0426Dry soil bulk density (kg/L) Pb 1.5Average source depth (m) ds 3Soil particle density (g/cm3) Ps 2.65Total soil porosity Lpore/Lsoil 0.43Air-filled soil porosity Lair/Lsoil 0.28

Construction Worker Soil Screening Levels250 Work Day Exposure
Calculation Spreadsheet - Parcel A4
ARM Project No. 150298M-2 Page 2 of 2 December 29, 2016
Ac 43.3 InputEW 50 CalculationEF 250Ca 5CaT 2Tru 5TrT 20w 11
Q/Csr 13.7
tc 8,400Tt 7,200,000AR 175,229LR 419ΣVKT 1,047PEFsc 147,816,350
Q/Csa 6.72
Tcv 30,240,000
Chemical^Ingestion
SF (mg/kg-day)-1
^InhalationUnit Risk (ug/m3)-1
^SubchronicRfD
(mg/kg-day)
^SubchronicRfC
(mg/m3)^GIABS
Dermally Adjusted RfD (mg/kg-day)
^ABS ^RBA *Dia *Diw*Henry's Law
Constant(atm-m3/mol)
*Kd *Koc DA
VolatilizationFactor - Unlimited
Reservoir (m3/kg)
Carcinogenic Ingestion/ Dermal SL (SLing/der)
Carcinogenic Inhalation SL
(SLinh)
Carcinogenic SL (mg/kg)
Non-Carcinogenic
Ingestion/ Dermal SL (SLing/der)
Non-Carcinogenic Inhalation SL
(SLinh)
Non-Carcinogenic
SL (mg/kg)
Arsenic, Inorganic 1.50E+00 4.30E-03 3.00E-04 1.50E-05 1 3.00E-04 0.03 0.6 - 2.90E+01 15.15 10,540 15.1 97.4 9,712 96.4Cadmium - 1.80E-03 5.00E-04 1.00E-05 0.025 1.25E-05 0.001 1 - 7.50E+01 25,178 25,178 158 6,474 154Chromium(VI) 5.00E-01 8.40E-02 5.00E-03 3.00E-04 0.025 1.25E-04 0.01 1 - 1.90E+01 22.5 540 21.6 804 194,231 801Cobalt - 9.00E-03 3.00E-03 2.00E-05 1 3.00E-03 0.01 1 - 4.50E+01 5,036 5,036 1,031 12,949 955Copper - - 1.00E-02 - 1 1.00E-02 0.01 1 - 3.50E+01 3,436 3,436Iron - - 7.00E-01 - 1 7.00E-01 0.01 1 - 2.50E+01 240,541 240,541Manganese (Non-diet) - - 2.40E-02 5.00E-05 0.04 9.60E-04 0.01 1 - 6.50E+01 4,854 32,372 4,221Thallium (Soluble Salts) - - 4.00E-05 - 1 4.00E-05 0.01 1 - 7.10E+01 13.7 13.7Vanadium and Compounds - - 1.00E-02 1.00E-04 0.026 2.60E-04 0.01 1 - 1.00E+03 1,643 64,744 1,603Zinc - - 3.00E-01 - 1 3.00E-01 0.01 1 - 6.20E+01 103,089 103,089Benz[a]anthracene 7.30E-01 1.10E-04 - - 1 0.13 1 2.60E-02 6.70E-06 4.91E-04 1.08E+03 1.80E+05 6.71E-10 4.55E+5 24.4 1,265 24.0Benzo[a]pyrene 7.30E+00 1.10E-03 - - 1 0.13 1 4.80E-02 5.60E-06 1.87E-05 3.54E+03 5.90E+05 2.37E-11 2.42E+6 2.44 665 2.43Benzo[b]fluoranthene 7.30E-01 1.10E-04 - - 1 0.13 1 4.80E-02 5.60E-06 2.69E-05 3.60E+03 6.00E+05 2.91E-11 2.19E+6 24.4 6,003 24.3Dibenz[a,h]anthracene 7.30E+00 1.20E-03 - - 1 0.13 1 4.50E-02 5.20E-06 5.76E-06 1.14E+04 1.90E+06 4.13E-12 5.80E+6 2.44 1,427 2.44Indeno[1,2,3-cd]pyrene 7.30E-01 1.10E-04 - - 1 0.13 1 4.50E-02 5.20E-06 1.42E-05 1.20E+04 2.00E+06 5.62E-12 4.98E+6 24.4 13,419 24.4Naphthalene - 3.40E-05 6.00E-01 3.00E-03 1 6.00E-01 0.13 1 6.00E-02 8.40E-06 1.80E-02 9.00E+00 1.50E+03 6.35E-06 4.68E+3 42.2 42.2 152,780 61.5 61.5
*chemical specific parameters found in Chemical Specific Parameters Spreadsheet at https://www.epa.gov/risk/regional-screening-levels-rsls-generic-tables-may-2016^chemical specific parameters found in Unpaved Road Traffic calculator at https://epa-prgs.ornl.gov/cgi-bin/chemicals/csl_search
Length (km)Distance traveled (km)Particulate emission factor (m3/kg)Derivation of dispersion factor - volatilization (g/m2-s per kg/m3)Total time of construction (s)
Area of site (ac)Overall duration of construction (wk/yr)Exposure frequency (day/yr)Cars per dayTons per car
Overall duration of traffic (s)Surface area (m2)
Trucks per day Tons per truckMean vehicle weight (tons)Derivation of dispersion factor - particulate emission factor (g/m2-s per kg/m3)Overall duration of construction (hr)
Related Documents