Phase Diagram of Hard Tetrahedra Amir Haji-Akbari, 1 Michael Engel, 1 and Sharon C. Glotzer 2, * 1 Department of Chemical Engineering, University of Michigan, Ann Arbor, Michigan 48109, USA 2 Department of Chemical Engineering & Department of Materials Science and Engineering, University of Michigan, Ann Arbor, Michigan 48109, USA (Dated: October 9, 2018) Advancements in the synthesis of faceted nanoparticles and colloids have spurred interest in the phase behavior of polyhedral shapes. Regular tetrahedra have attracted particular attention because they prefer local symmetries that are incompatible with periodicity. Two dense phases of regular tetrahedra have been reported recently. The densest known tetrahedron packing is achieved in a crystal of triangular bipyramids (dimers) with packing density 4000/4671 ≈ 85.63%. In simulation a dodecagonal quasicrystal is observed; its approximant, with periodic tiling (3.4.3 2 .4), can be compressed to a packing fraction of 85.03%. Here, we show that the quasicrystal approximant is more stable than the dimer crystal for packing densities below 84% using Monte Carlo computer simulations and free energy calculations. To carry out the free energy calculations, we use a variation of the Frenkel-Ladd method for anisotropic shapes and thermodynamic integration. The enhanced stability of the approximant can be attributed to a network substructure, which maximizes the free volume (and hence the wiggle room) available to the particles and facilitates correlated motion of particles, which further contributes to entropy and leads to diffusion for packing densities below 65%. The existence of a solid-solid transition between structurally distinct phases not related by symmetry breaking – the approximant and the dimer crystal– is unusual for hard particle systems. I. INTRODUCTION The self-assembly of nanoparticles into ordered struc- tures is governed by interaction and shape anisotropy [1]. Anisotropic particles are capable of stabilizing complex phases by entropy alone. Such structures can have poten- tially interesting optical and electrical properties yet to be fully investigated [2–6]. Among anisotropic particles, tetrahedra are promising for assembling unusual struc- tures because of their simplicity as well as their lack of inversion symmetry. When arranged face-to-face, tetra- hedra form configurations with five-fold or icosahedral symmetries that are incompatible with periodicity. This results in geometric frustration and renders the assem- bly of tetrahedra more challenging than assembling other shapes. Various types of nano-tetrahedra have recently been synthesized from noble metals [7, 8] and crystalline silicon [9, 10]. Micron-size colloidal tetrahedra made of colloidal spheres have also been reported [11]. In certain cases, these tetrahedra may be treated as hard particles. Particles whose interactions are dominated by repul- sion can be modeled to first approximation as hard parti- cles. Since all permissible configurations of such systems are of identical energy, entropic effects govern their phase behavior. Classic examples of entropy-driven phase tran- sitions are the isotropic-to-nematic transition for hard thin rods [12] and the crystallization of hard spheres into close-packed structures upon compression [13]. Entropy drives these particles to order, because doing so will in- crease the number of configurations accessible to the sys- tem. In other words, the increase in macroscopic (visible) * Electronic address: [email protected] order is accompanied by an increase in microscopic disor- der (the number of microstates) [14]. The origin of order- ing can also be explained by considering the underlying thermodynamics of hard particle systems. In the limit of infinite pressure, the Gibbs free energy G = PV - ST is dominated by the PV term, which means that the dens- est packing will be ultimately stable at sufficiently high pressures. To date, all known maximally dense packings of hard shapes are ordered [15]. Although the phase behavior of hard spheres has been investigated extensively [16], many fewer studies have been done on other hard shapes [17–25]. A key fea- ture of the reported phase diagrams is the occurrence of symmetry-breaking phase transitions (first and second order) in which the symmetry group of the high-density phase is a subgroup of the symmetry group of the low- density phase (see for example the phase transitions in [25]). This means that the compression of the isotropic fluid results in an increase of structural complexity by breaking at least one symmetry per transformation. For instance, hard cubes form a cubatic liquid crystal before crystallizing into a simple cubic lattice. In both the liquid crystal and the cubic crystal the rotational symmetry is broken while the translational symmetry is only broken in the crystal and is present in the cubatic phase [23]. The problem of assembling and packing hard tetra- hedra has drawn significant attention over the last few years [26–36] and two competing phases have been re- ported in the high-density regime. The densest known packing of regular tetrahedra is a structurally simple double-triangular bipyramid crystal with packing density φ = 4000/4671 ≈ 85.63% obtained from analytical con- struction and supported by numerical simulation [32, 34]. It is obtained through optimizing an earlier monoclinic crystal discovered by Kallus et al [30, 33]. We refer to arXiv:1106.4765v3 [cond-mat.soft] 22 Nov 2011

Welcome message from author
This document is posted to help you gain knowledge. Please leave a comment to let me know what you think about it! Share it to your friends and learn new things together.
Transcript
Phase Diagram of Hard Tetrahedra
Amir Haji-Akbari,1 Michael Engel,1 and Sharon C. Glotzer2, ∗
1Department of Chemical Engineering, University of Michigan, Ann Arbor, Michigan 48109, USA2Department of Chemical Engineering & Department of Materials Science and Engineering,
University of Michigan, Ann Arbor, Michigan 48109, USA(Dated: October 9, 2018)
Advancements in the synthesis of faceted nanoparticles and colloids have spurred interest in thephase behavior of polyhedral shapes. Regular tetrahedra have attracted particular attention becausethey prefer local symmetries that are incompatible with periodicity. Two dense phases of regulartetrahedra have been reported recently. The densest known tetrahedron packing is achieved in acrystal of triangular bipyramids (dimers) with packing density 4000/4671 ≈ 85.63%. In simulationa dodecagonal quasicrystal is observed; its approximant, with periodic tiling (3.4.32.4), can becompressed to a packing fraction of 85.03%. Here, we show that the quasicrystal approximantis more stable than the dimer crystal for packing densities below 84% using Monte Carlo computersimulations and free energy calculations. To carry out the free energy calculations, we use a variationof the Frenkel-Ladd method for anisotropic shapes and thermodynamic integration. The enhancedstability of the approximant can be attributed to a network substructure, which maximizes the freevolume (and hence the wiggle room) available to the particles and facilitates correlated motion ofparticles, which further contributes to entropy and leads to diffusion for packing densities below65%. The existence of a solid-solid transition between structurally distinct phases not related bysymmetry breaking – the approximant and the dimer crystal– is unusual for hard particle systems.
I. INTRODUCTION
The self-assembly of nanoparticles into ordered struc-tures is governed by interaction and shape anisotropy [1].Anisotropic particles are capable of stabilizing complexphases by entropy alone. Such structures can have poten-tially interesting optical and electrical properties yet tobe fully investigated [2–6]. Among anisotropic particles,tetrahedra are promising for assembling unusual struc-tures because of their simplicity as well as their lack ofinversion symmetry. When arranged face-to-face, tetra-hedra form configurations with five-fold or icosahedralsymmetries that are incompatible with periodicity. Thisresults in geometric frustration and renders the assem-bly of tetrahedra more challenging than assembling othershapes. Various types of nano-tetrahedra have recentlybeen synthesized from noble metals [7, 8] and crystallinesilicon [9, 10]. Micron-size colloidal tetrahedra made ofcolloidal spheres have also been reported [11]. In certaincases, these tetrahedra may be treated as hard particles.
Particles whose interactions are dominated by repul-sion can be modeled to first approximation as hard parti-cles. Since all permissible configurations of such systemsare of identical energy, entropic effects govern their phasebehavior. Classic examples of entropy-driven phase tran-sitions are the isotropic-to-nematic transition for hardthin rods [12] and the crystallization of hard spheres intoclose-packed structures upon compression [13]. Entropydrives these particles to order, because doing so will in-crease the number of configurations accessible to the sys-tem. In other words, the increase in macroscopic (visible)
∗Electronic address: [email protected]
order is accompanied by an increase in microscopic disor-der (the number of microstates) [14]. The origin of order-ing can also be explained by considering the underlyingthermodynamics of hard particle systems. In the limit ofinfinite pressure, the Gibbs free energy G = PV − ST isdominated by the PV term, which means that the dens-est packing will be ultimately stable at sufficiently highpressures. To date, all known maximally dense packingsof hard shapes are ordered [15].
Although the phase behavior of hard spheres has beeninvestigated extensively [16], many fewer studies havebeen done on other hard shapes [17–25]. A key fea-ture of the reported phase diagrams is the occurrenceof symmetry-breaking phase transitions (first and secondorder) in which the symmetry group of the high-densityphase is a subgroup of the symmetry group of the low-density phase (see for example the phase transitions in[25]). This means that the compression of the isotropicfluid results in an increase of structural complexity bybreaking at least one symmetry per transformation. Forinstance, hard cubes form a cubatic liquid crystal beforecrystallizing into a simple cubic lattice. In both the liquidcrystal and the cubic crystal the rotational symmetry isbroken while the translational symmetry is only brokenin the crystal and is present in the cubatic phase [23].
The problem of assembling and packing hard tetra-hedra has drawn significant attention over the last fewyears [26–36] and two competing phases have been re-ported in the high-density regime. The densest knownpacking of regular tetrahedra is a structurally simpledouble-triangular bipyramid crystal with packing densityφ = 4000/4671 ≈ 85.63% obtained from analytical con-struction and supported by numerical simulation [32, 34].It is obtained through optimizing an earlier monocliniccrystal discovered by Kallus et al [30, 33]. We refer to
arX
iv:1
106.
4765
v3 [
cond
-mat
.sof
t] 2
2 N
ov 2
011
2
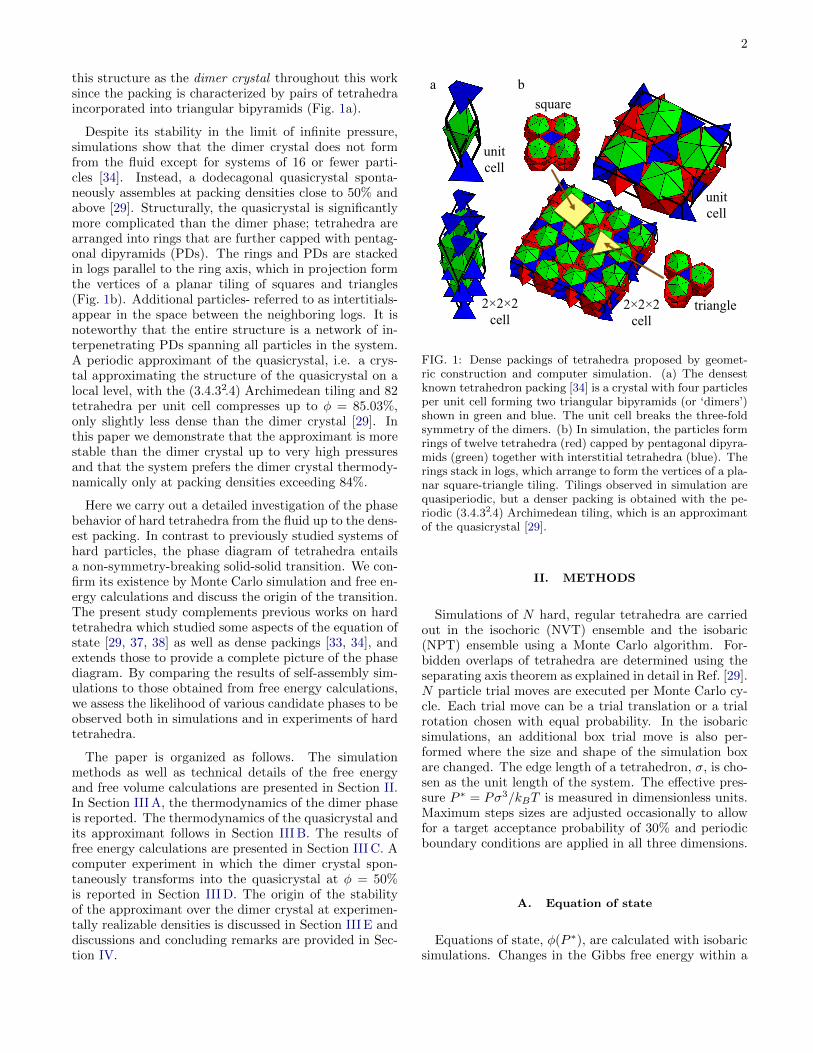
this structure as the dimer crystal throughout this worksince the packing is characterized by pairs of tetrahedraincorporated into triangular bipyramids (Fig. 1a).
Despite its stability in the limit of infinite pressure,simulations show that the dimer crystal does not formfrom the fluid except for systems of 16 or fewer parti-cles [34]. Instead, a dodecagonal quasicrystal sponta-neously assembles at packing densities close to 50% andabove [29]. Structurally, the quasicrystal is significantlymore complicated than the dimer phase; tetrahedra arearranged into rings that are further capped with pentag-onal dipyramids (PDs). The rings and PDs are stackedin logs parallel to the ring axis, which in projection formthe vertices of a planar tiling of squares and triangles(Fig. 1b). Additional particles- referred to as intertitials-appear in the space between the neighboring logs. It isnoteworthy that the entire structure is a network of in-terpenetrating PDs spanning all particles in the system.A periodic approximant of the quasicrystal, i.e. a crys-tal approximating the structure of the quasicrystal on alocal level, with the (3.4.32.4) Archimedean tiling and 82tetrahedra per unit cell compresses up to φ = 85.03%,only slightly less dense than the dimer crystal [29]. Inthis paper we demonstrate that the approximant is morestable than the dimer crystal up to very high pressuresand that the system prefers the dimer crystal thermody-namically only at packing densities exceeding 84%.
Here we carry out a detailed investigation of the phasebehavior of hard tetrahedra from the fluid up to the dens-est packing. In contrast to previously studied systems ofhard particles, the phase diagram of tetrahedra entailsa non-symmetry-breaking solid-solid transition. We con-firm its existence by Monte Carlo simulation and free en-ergy calculations and discuss the origin of the transition.The present study complements previous works on hardtetrahedra which studied some aspects of the equation ofstate [29, 37, 38] as well as dense packings [33, 34], andextends those to provide a complete picture of the phasediagram. By comparing the results of self-assembly sim-ulations to those obtained from free energy calculations,we assess the likelihood of various candidate phases to beobserved both in simulations and in experiments of hardtetrahedra.
The paper is organized as follows. The simulationmethods as well as technical details of the free energyand free volume calculations are presented in Section II.In Section III A, the thermodynamics of the dimer phaseis reported. The thermodynamics of the quasicrystal andits approximant follows in Section III B. The results offree energy calculations are presented in Section III C. Acomputer experiment in which the dimer crystal spon-taneously transforms into the quasicrystal at φ = 50%is reported in Section III D. The origin of the stabilityof the approximant over the dimer crystal at experimen-tally realizable densities is discussed in Section III E anddiscussions and concluding remarks are provided in Sec-tion IV.
a b
unitcell
unitcell
2!2!2cell
2!2!2cell
triangle
square
FIG. 1: Dense packings of tetrahedra proposed by geomet-ric construction and computer simulation. (a) The densestknown tetrahedron packing [34] is a crystal with four particlesper unit cell forming two triangular bipyramids (or ‘dimers’)shown in green and blue. The unit cell breaks the three-foldsymmetry of the dimers. (b) In simulation, the particles formrings of twelve tetrahedra (red) capped by pentagonal dipyra-mids (green) together with interstitial tetrahedra (blue). Therings stack in logs, which arrange to form the vertices of a pla-nar square-triangle tiling. Tilings observed in simulation arequasiperiodic, but a denser packing is obtained with the pe-riodic (3.4.32.4) Archimedean tiling, which is an approximantof the quasicrystal [29].
II. METHODS
Simulations of N hard, regular tetrahedra are carriedout in the isochoric (NVT) ensemble and the isobaric(NPT) ensemble using a Monte Carlo algorithm. For-bidden overlaps of tetrahedra are determined using theseparating axis theorem as explained in detail in Ref. [29].N particle trial moves are executed per Monte Carlo cy-cle. Each trial move can be a trial translation or a trialrotation chosen with equal probability. In the isobaricsimulations, an additional box trial move is also per-formed where the size and shape of the simulation boxare changed. The edge length of a tetrahedron, σ, is cho-sen as the unit length of the system. The effective pres-sure P ∗ = Pσ3/kBT is measured in dimensionless units.Maximum steps sizes are adjusted occasionally to allowfor a target acceptance probability of 30% and periodicboundary conditions are applied in all three dimensions.
A. Equation of state
Equations of state, φ(P ∗), are calculated with isobaricsimulations. Changes in the Gibbs free energy within a
3
single phase are obtained via thermodynamic integration:
G2 −G1
NkBT=
VTσ3
∫ P∗2
P∗1
dp
φ(p), (1)
where VT = σ3√
2/12 is the volume of a tetrahedron.Simulations are carried out in the pressure range 50 ≤
P ∗ ≤ 4000 for the dimer crystal (4 × 6 × 6 × 6 = 864tetrahedra), quasicrystal (8,000 tetrahedra) assembledfrom the fluid and compressed to a packing density upto 83.36%, and the approximant (82 × 2 × 2 × 3 = 984tetrahedra).
B. Pressure estimation
The acceptance probability of trial volume changesis an estimator of the pressure in Monte Carlo simula-tions [39]. Consider a trial expansion that increases thevolume from V to V + ∆V . To fulfill detailed balance,the acceptance probability of the volume change is givenby the Boltzmann factor,
PB = exp
{−P
∗∆V
σ3+N ln
(1 +
∆V
V
)}. (2)
On the other hand, a trial compression that decreasesthe volume from V to V − ∆V is accepted if and onlyif no overlap is generated by the trial volume change.Let PNO be the probability to generate an overlap in thetrial compression. For small ∆V and in equilibrium theprobabilities are equal, PNO = PB, and we can solve forthe pressure:
P ∗ = lim∆V→0
⟨Nσ3
∆V
[ln
(1 +
∆V
V
)− 1
2ln pNO
]⟩. (3)
Here, pNO = P2/NNO is the probability of a single particle
not having any overlap with any other particle after thetrial compression that decreases the volume by ∆V .
C. Free energy calculations
1. Frenkel-Ladd method for anisotropic hard particles
The free energy of a (quasi-)crystal is calculated us-ing the Frenkel-Ladd method [39, 40] by transforming itreversibly into an Einstein crystal, which serves as a ref-erence structure with known free energy. In the Einsteincrystal, each particle is tethered to its average lattice po-sition via harmonic springs. Although originally devel-oped for spherical particles, this method can be extendedto particles with rotational degrees of freedom, such astetrahedra. Additional springs are needed to tether theorientations of the particles to their average orientationsin the lattice. Alternative extensions of the Frenkel-Laddmethod to systems of particles with rotational degrees offreedom can be found in the literature [41].
We describe the configuration of a tetrahedron by(r,q), with r being its center of mass position and q theunit quaternion describing its orientation. The potentialenergy of of the corresponding Einstein crystal can thenbe expressed as:
U(rN ,qN )
kBT=
N∑i=1
||ri − ri,0||2
σ2+ c
N∑i=1
||qi − qi,0||2 (4)
where ri,0 and qi,0 are the reference position and the ref-erence orientation of the i-th particle in the crystal. Theconstant c allows us to adjust the relative strength ofthe rotational springs and does not affect the computedfree energy differences. All the results in this study areobtained using a value of c = 1/2; we tested that us-ing other values of c does not affect the outcome of thecalculations.
Each system is transformed to the Einstein crystalalong a reversible path parameterized by γ ∈ [0, γmax]using the isochoric-isothermal (NVT) ensemble and theHamiltonian
H(rN ,qN ; γ) = Hhard(rN ,qN ) + γU(rN ,qN ). (5)
The hard particle system with Hamiltonian Hhard cor-responds to γ = 0, while in the limit γ → ∞ the Ein-stein crystal is obtained. In practice, we can stop ata sufficiently large value of γmax when the springs arestrong enough to suppress any particle collisions. TheHelmholtz free energy difference ∆A = AEin −Ahard be-tween the reference Einstein crystal and the hard particlesystem is given by:
∆A =
∫ γmax
0
⟨∂H(γ)
∂γ
⟩γ
dγ =
∫ γmax
0
〈U〉γdγ (6)
Note that the Frenkel-Ladd method can only be usedif there is no translational or rotational diffusion in thesystem; otherwise the ensemble average 〈U〉γ will not bewell-defined for small values of γ.
In our simulations, the system is held for 2×10⁵ MonteCarlo cycles at each γ value during which 〈U〉γ is eval-uated. The integral in equation (6) is then computednumerically. This allows us to determine the Gibbs freeenergy G = A + PV of the dimer (D) and the approxi-mant (A) in the range 250 ≤ P ∗ ≤ 600 where no config-urational rearrangements are observed. The free energydifference ∆G = GD − GA is extrapolated to pressuresoutside this range using thermodynamic integration inaddition to the Frenkel-Ladd method [42]:
∆G(P ∗)
NkBT=
∆G(P ∗0 )
NkBT+VTσ3
∫ P∗
P∗0
[1
φD(p)− 1
φA(p)
]dp
(7)
2. Fluid-solid transition
We determine the melting pressure P ∗M by calculatingthe absolute free energies of the solid and fluid. For suf-
4
ficiently large values of γ, the Helmholtz free energy ofthe Einstein crystal is given by [39]:
AEin
NkBT= −3
2
N − 1
Nlnπ
γ− 3
2ln
π
cγ− lnNsym
+3N − 1
Nln
Λ
σ, (8)
where Λ = h/(2πmkBT )1/2 is the de Broglie wavelength.Nsym is the number of quaternions corresponding to ori-entations that are symmetry-equivalent, which is twicethe order of the rotation group of the particle. Thefactor 2 arises from the fact that quaternions are inher-ently degenerate in describing the orientation i.e. q and−q correspond to the same rotation matrix. For a non-symmetric particle, the rotation group will have one ele-ment (identity) only and Nsym = 2. Here, for tetrahedra,the rotation group has twelve elements, so Nsym = 24.The first and the second terms are configurational con-tributions resulting from the translational and rotationalsprings. The last term corresponds to momentum contri-butions due to translational degrees of freedom. Momen-tum contributions due to rotational degrees of freedomare identical for the fluid and the solid and are thereforenot included here.
The Gibbs free energy of an ideal gas, which approxi-mates a real gas in the limit of infinite dilution, is
Gid
NkBT= ln
P ∗
2π2+
ln(2πN)
2N+ 3 ln
Λ
σ. (9)
The free energy of the fluid phase is then obtained fromthermodynamic integration [43]:
Gfluid(P ∗)
NkBT=Gid(P ∗)
NkBT+
∫ P∗
0
[VT /σ
3
φ(p)− 1
p
]dp. (10)
We calculate Gfluid(P ∗) using the equation of state for asystem of N = 4,096 tetrahedra for 0.01 ≤ P ∗ ≤ 60.
3. Finite size effects
To ensure the system sizes we use are free of finitesize effects, we calculate the Gibbs free energy differencebetween the dimer crystal and the approximant ∆G =GD −GA, using equation (8):
∆G(N)−∆G
NkBT=
3
2
[1
ND− 1
NA
]ln
πσ2
γmaxΛ2(11)
For the particle numbers used in the free energy cal-culations, ND = 864, NA = 984, γmax = 4 × 10⁶ andσ/Λ =
√2π, the error in ∆G is on the order of 10−3kBT ,
which is negligible for the present purposes.
D. Free volume calculations
The free volume of a hard sphere is the volume of theregion of space in which the sphere can be moved continu-
ously without overlapping with its neighbors while keep-ing all the other particles fixed [44]. The definition gen-eralizes to anisotropic particles with rotational degrees offreedom where free volume vf is now the volume of thelargest subset of configurational space connected to theorigin that can be accessed by a given particle while fixingthe positions and orientations of all other particles [45]:
vf =
∫I(r,q)d3rd3q. (12)
Here, I(r,q) is the indicator function of motions (r,q)consisting of a translation by r and a rotation by q andconnected to the origin. I is unity if the particle does notoverlap with any other particle and zero otherwise. Dueto the inherent periodicity of rotational motion, the freevolume of an anisotropic particle has generally a morecomplicated topology compared to the free volume of asphere. Here we calculate free volumes at high densitieswhere the free volume is simply connected.
1. Shooting method
We calculate the free volume of a particle using amethod we call the shooting method. Let (u,v) corre-spond to a unit vector in the six dimensional configura-tion space and suppose that particle i is ‘shot’ in thisdirection until it hits another particle. The ‘shootingdistance’ is the smallest value of α for which the particlefirst overlaps with its neighbors if translated by αu andoriented according to the quaternion (qi+αv)/||qi+αv||.
A lower bound for the free volume can be obtainedby averaging over a sufficiently large number Ns of shotswith shot distances αj along randomly chosen directions:
vf ' limNs→∞
1
Ns
Ns∑j=1
π3
6α6j . (13)
Here π3/6 is the volume of the six-dimensional unitsphere. Note that the periodic topology and the cur-vature of the six-dimensional configuration space are ig-nored, which is acceptable at high packing densities be-cause ||∆q|| � 1.
Eq. (13) is a lower bound for concave free volumes,because shooting only allows access to the parts of thefree volume connected to the origin by a straight line.Non-convex free volumes can arise from sliding collisionswhich, however, become increasingly rare at high packingdensities. In fact, as we will show now for tetrahedra,the shooting method is accurate for high enough packingdensities.
2. Binning method
To estimate the amount of error in the shootingmethod introduced by non-convexity, we using the al-ternative binning method which corresponds to a Monte
5
Carlo integration of the free volume. The configurationspace of a given particle is partitioned into Nbins smallradial bins of volume V bin. We perform Nt random ghosttrial moves per bin to average out the orientational de-grees of freedom and determine the number NNO of trialmoves not leading to an overlap. Free volume can thenbe estimated from:
vf /1
Nt
Nbins∑j=1
V binj NNO
j . (14)
Binning is much slower than shooting and might overesti-mate the free volume, if a trial move discovers an area ofconfiguration space without overlap, but not connectedto the original particle position. We find that the averageof the logarithms of the free volumes calculated from theshooting method and the binning method agree within arelative error of 10−2 for all densities φ ≥ 70%.
3. Mean-field approximation
The distribution of free volumes is related to the en-tropy of a hard particle system in the mean-field approx-imation. If we assume that free volumes of neighbor-ing particles are uncorrelated, then the partition func-
tion of the system is expressed as Qmf =∏Ni=1 vf,i and
the Helmholtz free energy as Amf/NkBT = −〈ln vf 〉.The thermodynamically relevant quantity is therefore themean-log average of free volumes:
vf,ML := exp〈ln vf 〉 (15)
which will be used in the rest of this study instead of thesimple average 〈vf 〉.
III. RESULTS
A. Symmetrization of the dimer packing ondecreasing pressure
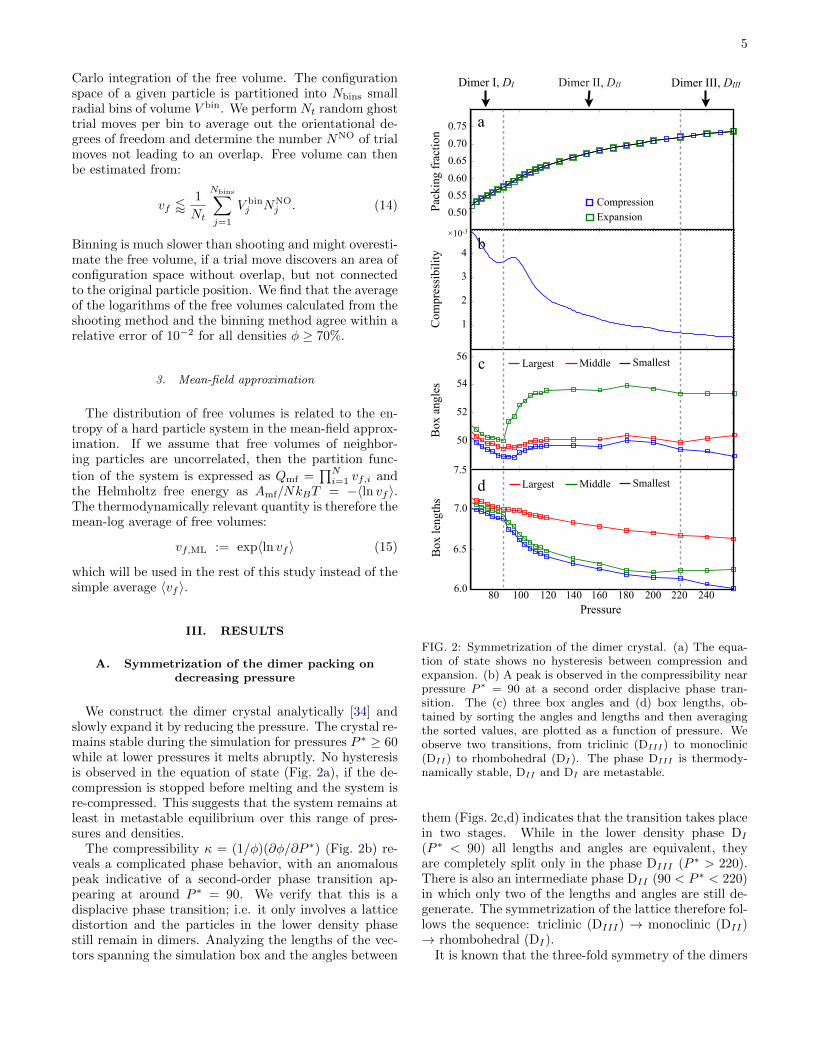
We construct the dimer crystal analytically [34] andslowly expand it by reducing the pressure. The crystal re-mains stable during the simulation for pressures P ∗ ≥ 60while at lower pressures it melts abruptly. No hysteresisis observed in the equation of state (Fig. 2a), if the de-compression is stopped before melting and the system isre-compressed. This suggests that the system remains atleast in metastable equilibrium over this range of pres-sures and densities.
The compressibility κ = (1/φ)(∂φ/∂P ∗) (Fig. 2b) re-veals a complicated phase behavior, with an anomalouspeak indicative of a second-order phase transition ap-pearing at around P ∗ = 90. We verify that this is adisplacive phase transition; i.e. it only involves a latticedistortion and the particles in the lower density phasestill remain in dimers. Analyzing the lengths of the vec-tors spanning the simulation box and the angles between
80 100 120 140 160 180 200 220 240 26048
50
52
54
56
80 100 120 140 160 180 200 220 240 2606
6.5
7
7.5
Pressure
Length
80 100 120 140 160 180 200 220 240 2600.45
0.5
0.55
0.6
0.65
0.7
0.75
0.8
!" #"" #$" #%" #&" #!" $"" $$" $%" $&""
#
$
'
%
()*#"
!'
Pack
ing
frac
tion
4
3
2
1Com
pres
sibi
lity
56
54
50
52
6.0
6.5
7.0
a
b
c
d
0.50
0.55
0.60
0.65
0.70
0.75
!10-3
7.5
80 100 120 140 160 180 200 220 240Pressure
Box
leng
ths
Box
ang
les
Compression
Dimer I, DI Dimer II, DII Dimer III, DIII
Expansion
Largest Middle Smallest
Largest Middle Smallest
FIG. 2: Symmetrization of the dimer crystal. (a) The equa-tion of state shows no hysteresis between compression andexpansion. (b) A peak is observed in the compressibility nearpressure P ∗ = 90 at a second order displacive phase tran-sition. The (c) three box angles and (d) box lengths, ob-tained by sorting the angles and lengths and then averagingthe sorted values, are plotted as a function of pressure. Weobserve two transitions, from triclinic (DIII) to monoclinic(DII) to rhombohedral (DI). The phase DIII is thermody-namically stable, DII and DI are metastable.
them (Figs. 2c,d) indicates that the transition takes placein two stages. While in the lower density phase DI
(P ∗ < 90) all lengths and angles are equivalent, theyare completely split only in the phase DIII (P ∗ > 220).There is also an intermediate phase DII (90 < P ∗ < 220)in which only two of the lengths and angles are still de-generate. The symmetrization of the lattice therefore fol-lows the sequence: triclinic (DIII) → monoclinic (DII)→ rhombohedral (DI).
It is known that the three-fold symmetry of the dimers
6
must be broken to achieve optimal bulk packing [33, 34],and we observe this in the sequence of transitions. Wenote that DII was initially reported by Kallus et al. asa candidate for the densest packing of tetrahedra [33].Its maximum packing density is only 0.2% lower thanthe maximum packing density of DIII , the structure pre-dicted by Chen et al. [34]. Note also that the integratedarea under the peak is a measure of the difference inpacking densities. This explains the missing peak in thecompressibility for the transition DIII → DII . In con-trast, the difference in maximum packing densities forthe transition DII → DI is much larger, and of the orderof a few percent.
B. Comparison of the quasicrystal and its (3.4.32.4)approximant
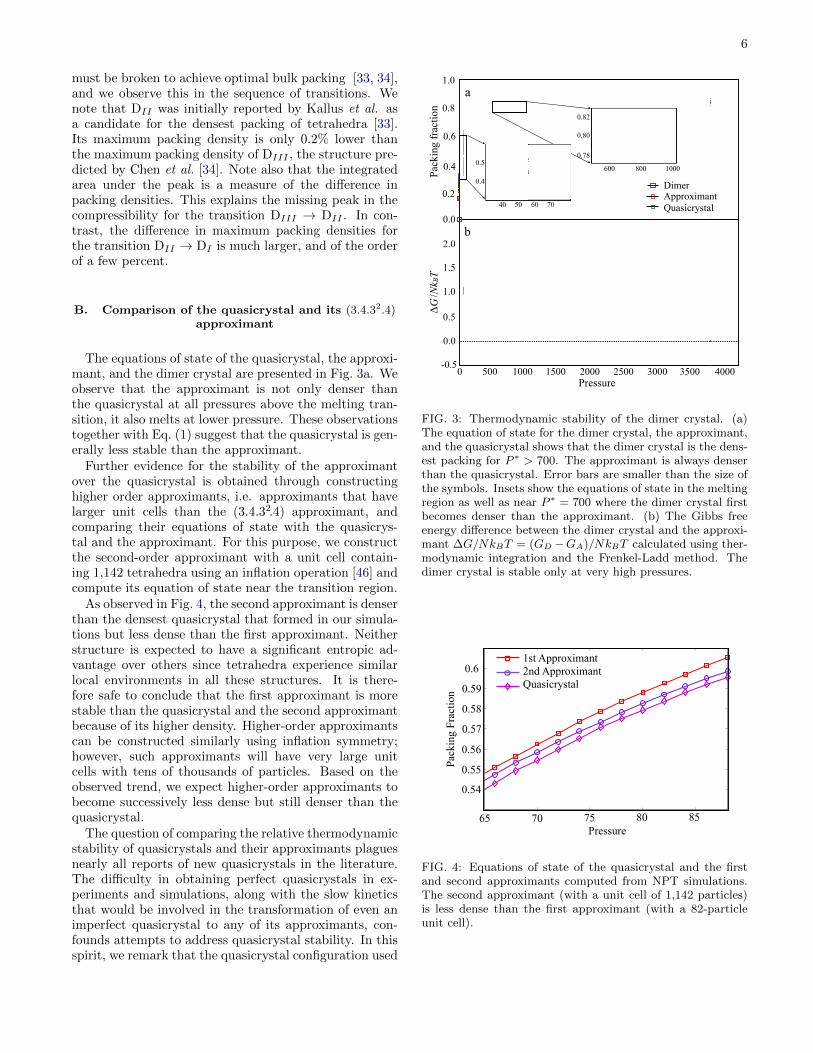
The equations of state of the quasicrystal, the approxi-mant, and the dimer crystal are presented in Fig. 3a. Weobserve that the approximant is not only denser thanthe quasicrystal at all pressures above the melting tran-sition, it also melts at lower pressure. These observationstogether with Eq. (1) suggest that the quasicrystal is gen-erally less stable than the approximant.
Further evidence for the stability of the approximantover the quasicrystal is obtained through constructinghigher order approximants, i.e. approximants that havelarger unit cells than the (3.4.32.4) approximant, andcomparing their equations of state with the quasicrys-tal and the approximant. For this purpose, we constructthe second-order approximant with a unit cell contain-ing 1,142 tetrahedra using an inflation operation [46] andcompute its equation of state near the transition region.
As observed in Fig. 4, the second approximant is denserthan the densest quasicrystal that formed in our simula-tions but less dense than the first approximant. Neitherstructure is expected to have a significant entropic ad-vantage over others since tetrahedra experience similarlocal environments in all these structures. It is there-fore safe to conclude that the first approximant is morestable than the quasicrystal and the second approximantbecause of its higher density. Higher-order approximantscan be constructed similarly using inflation symmetry;however, such approximants will have very large unitcells with tens of thousands of particles. Based on theobserved trend, we expect higher-order approximants tobecome successively less dense but still denser than thequasicrystal.
The question of comparing the relative thermodynamicstability of quasicrystals and their approximants plaguesnearly all reports of new quasicrystals in the literature.The difficulty in obtaining perfect quasicrystals in ex-periments and simulations, along with the slow kineticsthat would be involved in the transformation of even animperfect quasicrystal to any of its approximants, con-founds attempts to address quasicrystal stability. In thisspirit, we remark that the quasicrystal configuration used
0 500 1000 1500 2000 2500 3000 3500 40000
0.2
0.4
0.6
0.8
1
Dimer Crystal
Approximant
Quasicrystal
! "!! #!!! #"!! $!!! $"!! %!!! %"!! &!!!!!'"
!
!'"
#
#'"
$
$'"
Pack
ing
frac
tion
!G /N
k BT
0 500 1000 1500 2000 2500 3000 3500 4000Pressure
-0.5
0.0
0.5
1.0
1.5
2.0
0.0
0.2
0.6
0.8
1.0
b
a
500 600 700 800 900 10000.77
0.78
0.79
0.8
0.81
0.82
0.4
DimerApproximantQuasicrystal
600 800 1000
0.80
0.82
30 40 50 60 70 800.3
0.4
0.5
0.6
40 50 60 70
0.4
0.50.78
FIG. 3: Thermodynamic stability of the dimer crystal. (a)The equation of state for the dimer crystal, the approximant,and the quasicrystal shows that the dimer crystal is the dens-est packing for P ∗ > 700. The approximant is always denserthan the quasicrystal. Error bars are smaller than the size ofthe symbols. Insets show the equations of state in the meltingregion as well as near P ∗ = 700 where the dimer crystal firstbecomes denser than the approximant. (b) The Gibbs freeenergy difference between the dimer crystal and the approxi-mant ∆G/NkBT = (GD −GA)/NkBT calculated using ther-modynamic integration and the Frenkel-Ladd method. Thedimer crystal is stable only at very high pressures.
65 70 75 80 850.53
0.54
0.55
0.56
0.57
0.58
0.59
0.6
0.6
0.59
0.58
0.57
0.56
0.55
0.54
Pack
ing
Frac
tion
65 70 75 80 85Pressure
1st Approximant2nd ApproximantQuasicrystal
FIG. 4: Equations of state of the quasicrystal and the firstand second approximants computed from NPT simulations.The second approximant (with a unit cell of 1,142 particles)is less dense than the first approximant (with a 82-particleunit cell).
7
0.83 0.832 0.834 0.836 0.838 0.84 0.842 0.844 0.846 0.8482
3
4
5
6
7
8
9
10
11
!
A/NkT
0.832 0.836 0.840 0.844 0.848Packing Fraction
4
6
8
10H
elm
holtz
Fre
e En
ergy
, A /Nk BT
!c,app !c,dimer
ApproximantDimer crystal
2
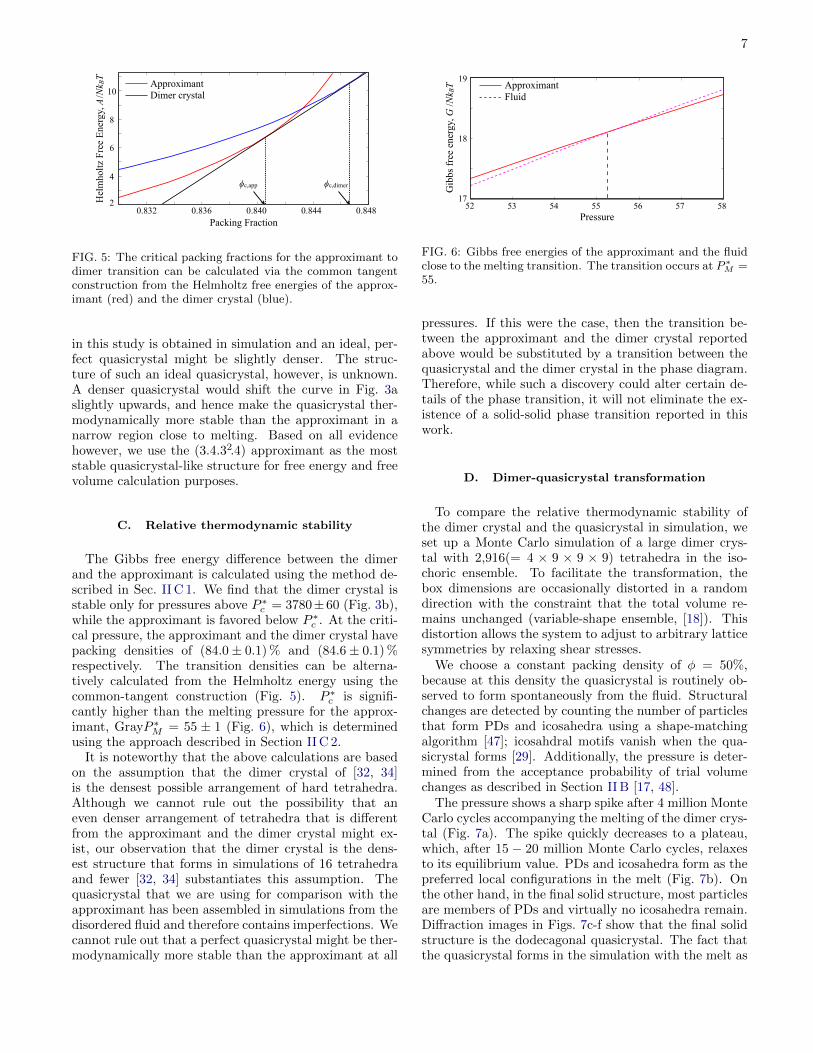
FIG. 5: The critical packing fractions for the approximant todimer transition can be calculated via the common tangentconstruction from the Helmholtz free energies of the approx-imant (red) and the dimer crystal (blue).
in this study is obtained in simulation and an ideal, per-fect quasicrystal might be slightly denser. The struc-ture of such an ideal quasicrystal, however, is unknown.A denser quasicrystal would shift the curve in Fig. 3aslightly upwards, and hence make the quasicrystal ther-modynamically more stable than the approximant in anarrow region close to melting. Based on all evidencehowever, we use the (3.4.32.4) approximant as the moststable quasicrystal-like structure for free energy and freevolume calculation purposes.
C. Relative thermodynamic stability
The Gibbs free energy difference between the dimerand the approximant is calculated using the method de-scribed in Sec. II C 1. We find that the dimer crystal isstable only for pressures above P ∗c = 3780±60 (Fig. 3b),while the approximant is favored below P ∗c . At the criti-cal pressure, the approximant and the dimer crystal havepacking densities of (84.0± 0.1) % and (84.6± 0.1) %respectively. The transition densities can be alterna-tively calculated from the Helmholtz energy using thecommon-tangent construction (Fig. 5). P ∗c is signifi-cantly higher than the melting pressure for the approx-imant, GrayP ∗M = 55 ± 1 (Fig. 6), which is determinedusing the approach described in Section II C 2.
It is noteworthy that the above calculations are basedon the assumption that the dimer crystal of [32, 34]is the densest possible arrangement of hard tetrahedra.Although we cannot rule out the possibility that aneven denser arrangement of tetrahedra that is differentfrom the approximant and the dimer crystal might ex-ist, our observation that the dimer crystal is the dens-est structure that forms in simulations of 16 tetrahedraand fewer [32, 34] substantiates this assumption. Thequasicrystal that we are using for comparison with theapproximant has been assembled in simulations from thedisordered fluid and therefore contains imperfections. Wecannot rule out that a perfect quasicrystal might be ther-modynamically more stable than the approximant at all
52 53 54 55 56 57 5817
17.5
18
18.5
19
52 53 54 55 56 57 5817
18
19
Pressure
Gib
bs fr
ee e
nerg
y, G
/Nk B
T ApproximantFluid
FIG. 6: Gibbs free energies of the approximant and the fluidclose to the melting transition. The transition occurs at P ∗
M =55.
pressures. If this were the case, then the transition be-tween the approximant and the dimer crystal reportedabove would be substituted by a transition between thequasicrystal and the dimer crystal in the phase diagram.Therefore, while such a discovery could alter certain de-tails of the phase transition, it will not eliminate the ex-istence of a solid-solid phase transition reported in thiswork.
D. Dimer-quasicrystal transformation
To compare the relative thermodynamic stability ofthe dimer crystal and the quasicrystal in simulation, weset up a Monte Carlo simulation of a large dimer crys-tal with 2,916(= 4 × 9 × 9 × 9) tetrahedra in the iso-choric ensemble. To facilitate the transformation, thebox dimensions are occasionally distorted in a randomdirection with the constraint that the total volume re-mains unchanged (variable-shape ensemble, [18]). Thisdistortion allows the system to adjust to arbitrary latticesymmetries by relaxing shear stresses.
We choose a constant packing density of φ = 50%,because at this density the quasicrystal is routinely ob-served to form spontaneously from the fluid. Structuralchanges are detected by counting the number of particlesthat form PDs and icosahedra using a shape-matchingalgorithm [47]; icosahdral motifs vanish when the qua-sicrystal forms [29]. Additionally, the pressure is deter-mined from the acceptance probability of trial volumechanges as described in Section II B [17, 48].
The pressure shows a sharp spike after 4 million MonteCarlo cycles accompanying the melting of the dimer crys-tal (Fig. 7a). The spike quickly decreases to a plateau,which, after 15 − 20 million Monte Carlo cycles, relaxesto its equilibrium value. PDs and icosahedra form as thepreferred local configurations in the melt (Fig. 7b). Onthe other hand, in the final solid structure, most particlesare members of PDs and virtually no icosahedra remain.Diffraction images in Figs. 7c-f show that the final solidstructure is the dodecagonal quasicrystal. The fact thatthe quasicrystal forms in the simulation with the melt as
8
0 0.5 1 1.5 2 2.5 3
x 107
50
55
60
65
70
75
MC Cycle
Pre
ss
ure
0 0.5 1 1.5 2 2.5 3
x 107
0
0.2
0.4
0.6
0.8
11.0
0.8
0.6
0.4
0.2
0
70
65
60
55
Pres
sure
0 5 10 15 20 25 30!106Monte Carlo Cycles
c
e
f
d
Parti
cle
Frac
tion
a
Melt Quasicrystal
c
d
e
f
PDico
b
Dimer
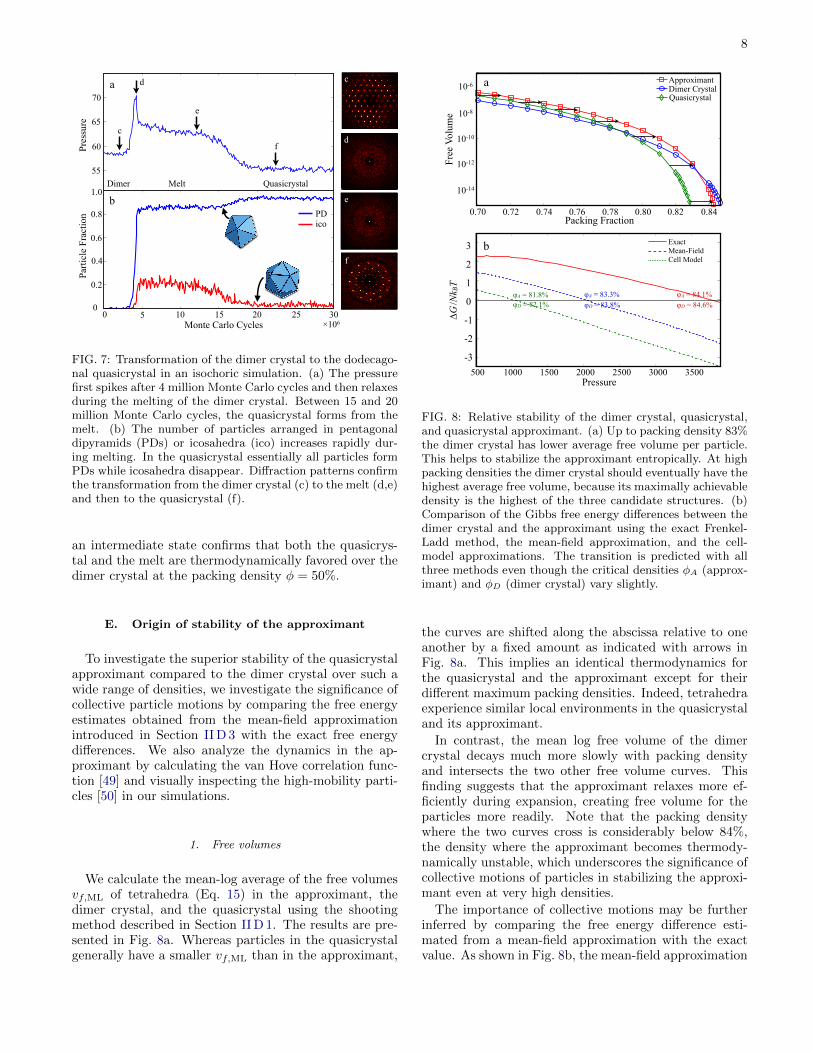
FIG. 7: Transformation of the dimer crystal to the dodecago-nal quasicrystal in an isochoric simulation. (a) The pressurefirst spikes after 4 million Monte Carlo cycles and then relaxesduring the melting of the dimer crystal. Between 15 and 20million Monte Carlo cycles, the quasicrystal forms from themelt. (b) The number of particles arranged in pentagonaldipyramids (PDs) or icosahedra (ico) increases rapidly dur-ing melting. In the quasicrystal essentially all particles formPDs while icosahedra disappear. Diffraction patterns confirmthe transformation from the dimer crystal (c) to the melt (d,e)and then to the quasicrystal (f).
an intermediate state confirms that both the quasicrys-tal and the melt are thermodynamically favored over thedimer crystal at the packing density φ = 50%.
E. Origin of stability of the approximant
To investigate the superior stability of the quasicrystalapproximant compared to the dimer crystal over such awide range of densities, we investigate the significance ofcollective particle motions by comparing the free energyestimates obtained from the mean-field approximationintroduced in Section II D 3 with the exact free energydifferences. We also analyze the dynamics in the ap-proximant by calculating the van Hove correlation func-tion [49] and visually inspecting the high-mobility parti-cles [50] in our simulations.
1. Free volumes
We calculate the mean-log average of the free volumesvf,ML of tetrahedra (Eq. 15) in the approximant, thedimer crystal, and the quasicrystal using the shootingmethod described in Section II D 1. The results are pre-sented in Fig. 8a. Whereas particles in the quasicrystalgenerally have a smaller vf,ML than in the approximant,
!"# !"#$ !"#% !"#& !"#' !"' !"'$ !"'%(!
!()
(!!(!
(!!)
!
*+,,-./012,
344+/562789
:62,+-;+<=970
>17=6?+<=970
!"" #""" #!"" $""" $!"" %""" %!""
!%
!$
!#
"
#
$
%
&'())*'(
!+,-./
-3
-2
-1
0
1
2
3
500 1000 1500 2000 2500 3000 3500Pressure
!G /N
k BT
b
0.70 0.72 0.74 0.76 0.78 0.80 0.82 0.84
10-10
Free
Vol
ume
Packing Fraction
a
10-8
10-6
10-12
10-14
ExactMean-FieldCell Model
"A = 84.1%"A = 83.3%"A = 81.8%"D = 84.6%"D = 83.8%"D = 82.1%
Dimer CrystalApproximant
Quasicrystal
FIG. 8: Relative stability of the dimer crystal, quasicrystal,and quasicrystal approximant. (a) Up to packing density 83%the dimer crystal has lower average free volume per particle.This helps to stabilize the approximant entropically. At highpacking densities the dimer crystal should eventually have thehighest average free volume, because its maximally achievabledensity is the highest of the three candidate structures. (b)Comparison of the Gibbs free energy differences between thedimer crystal and the approximant using the exact Frenkel-Ladd method, the mean-field approximation, and the cell-model approximations. The transition is predicted with allthree methods even though the critical densities φA (approx-imant) and φD (dimer crystal) vary slightly.
the curves are shifted along the abscissa relative to oneanother by a fixed amount as indicated with arrows inFig. 8a. This implies an identical thermodynamics forthe quasicrystal and the approximant except for theirdifferent maximum packing densities. Indeed, tetrahedraexperience similar local environments in the quasicrystaland its approximant.
In contrast, the mean log free volume of the dimercrystal decays much more slowly with packing densityand intersects the two other free volume curves. Thisfinding suggests that the approximant relaxes more ef-ficiently during expansion, creating free volume for theparticles more readily. Note that the packing densitywhere the two curves cross is considerably below 84%,the density where the approximant becomes thermody-namically unstable, which underscores the significance ofcollective motions of particles in stabilizing the approxi-mant even at very high densities.
The importance of collective motions may be furtherinferred by comparing the free energy difference esti-mated from a mean-field approximation with the exactvalue. As shown in Fig. 8b, the mean-field approximation
9
underestimates the stability of the approximant, whichindicates that entropic contributions from collective mo-tions are significant. We suspect that slight rearrange-ments of particles in the approximant during expansionalso increase its stability at lower packing densities. Thisis confirmed by estimating ∆G from a cell model ap-proximation. The cell model is similar to the mean-fieldapproximation except that free volumes are calculatedfor a non-equilibrated structure obtained by isotropicallyexpanding the densest packing to a given packing den-sity [45]. As shown in Fig. 8b, the cell-model approxima-tion underestimates the stability of the approximant evenmore than the mean-field approximation, which suggeststhe significance of small local rearrangements that occurwhile the structure is equilibrated after expansion.
2. Dynamics in the approximant
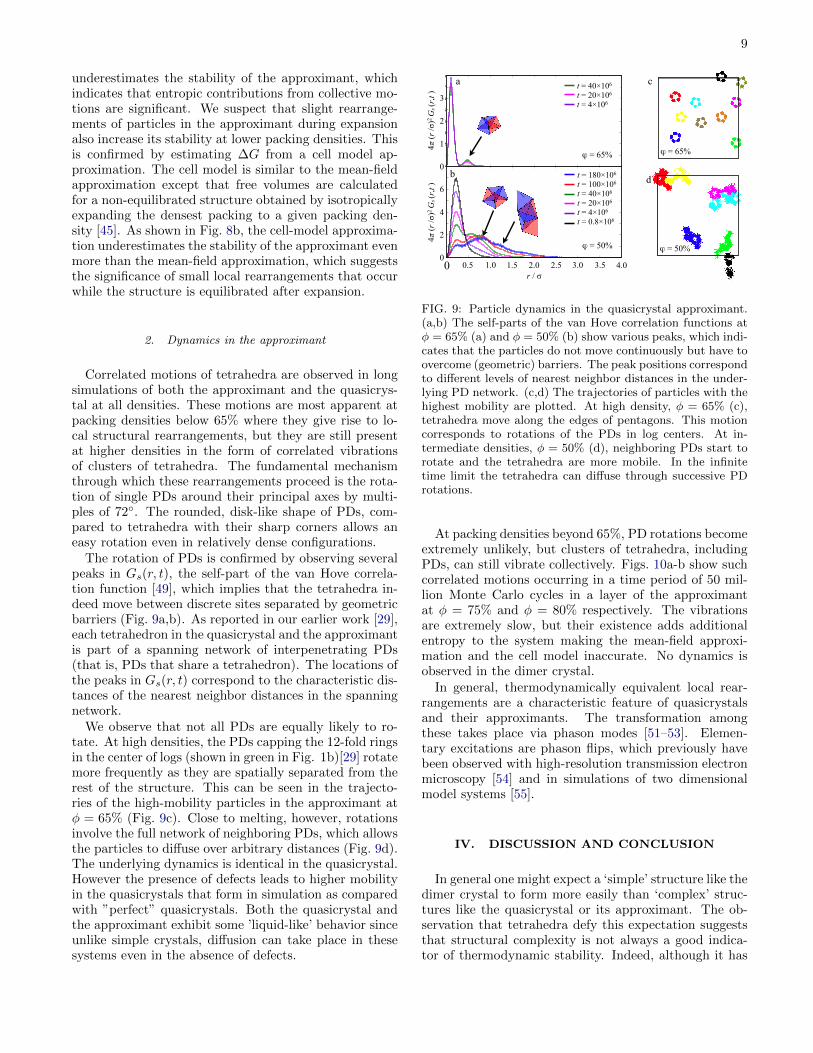
Correlated motions of tetrahedra are observed in longsimulations of both the approximant and the quasicrys-tal at all densities. These motions are most apparent atpacking densities below 65% where they give rise to lo-cal structural rearrangements, but they are still presentat higher densities in the form of correlated vibrationsof clusters of tetrahedra. The fundamental mechanismthrough which these rearrangements proceed is the rota-tion of single PDs around their principal axes by multi-ples of 72◦. The rounded, disk-like shape of PDs, com-pared to tetrahedra with their sharp corners allows aneasy rotation even in relatively dense configurations.
The rotation of PDs is confirmed by observing severalpeaks in Gs(r, t), the self-part of the van Hove correla-tion function [49], which implies that the tetrahedra in-deed move between discrete sites separated by geometricbarriers (Fig. 9a,b). As reported in our earlier work [29],each tetrahedron in the quasicrystal and the approximantis part of a spanning network of interpenetrating PDs(that is, PDs that share a tetrahedron). The locations ofthe peaks in Gs(r, t) correspond to the characteristic dis-tances of the nearest neighbor distances in the spanningnetwork.
We observe that not all PDs are equally likely to ro-tate. At high densities, the PDs capping the 12-fold ringsin the center of logs (shown in green in Fig. 1b)[29] rotatemore frequently as they are spatially separated from therest of the structure. This can be seen in the trajecto-ries of the high-mobility particles in the approximant atφ = 65% (Fig. 9c). Close to melting, however, rotationsinvolve the full network of neighboring PDs, which allowsthe particles to diffuse over arbitrary distances (Fig. 9d).The underlying dynamics is identical in the quasicrystal.However the presence of defects leads to higher mobilityin the quasicrystals that form in simulation as comparedwith ”perfect” quasicrystals. Both the quasicrystal andthe approximant exhibit some ’liquid-like’ behavior sinceunlike simple crystals, diffusion can take place in thesesystems even in the absence of defects.
! = 65%
! = 50%
0 0.5 1 1.5 2 2.5 3 3.5 40
1
2
3
4
5
6
7
8
Approximant, !=0.65
r
4"r2
Gs(r
,t)
t=40!106
t=20!106
t=4!106
! = 65%
0 0.5 1.0 1.5 2.0 2.5 3.0 3.5 4.00
2
4
6
0
r / !
1
2
3
0 0.5 1 1.5 2 2.5 3 3.5 40
0.5
1
1.5
2
2.5
3
3.5
4
Approximant, !=0.5
r
4"r2
Gs(r
,t)
t=180!106
t=100!106
t=40!106
t=20!106
t=4!106
t=8!105
4! (r
/!)2
Gs (
r,t )
! = 50%
4! (r
/!)2
Gs (
r,t )
t = 40"106
t = 20"106
t = 4"106
t = 180"106
t = 100"106
t = 40"106
t = 20"106
t = 4"106
t = 0.8"106
a
b
c
d
FIG. 9: Particle dynamics in the quasicrystal approximant.(a,b) The self-parts of the van Hove correlation functions atφ = 65% (a) and φ = 50% (b) show various peaks, which indi-cates that the particles do not move continuously but have toovercome (geometric) barriers. The peak positions correspondto different levels of nearest neighbor distances in the under-lying PD network. (c,d) The trajectories of particles with thehighest mobility are plotted. At high density, φ = 65% (c),tetrahedra move along the edges of pentagons. This motioncorresponds to rotations of the PDs in log centers. At in-termediate densities, φ = 50% (d), neighboring PDs start torotate and the tetrahedra are more mobile. In the infinitetime limit the tetrahedra can diffuse through successive PDrotations.
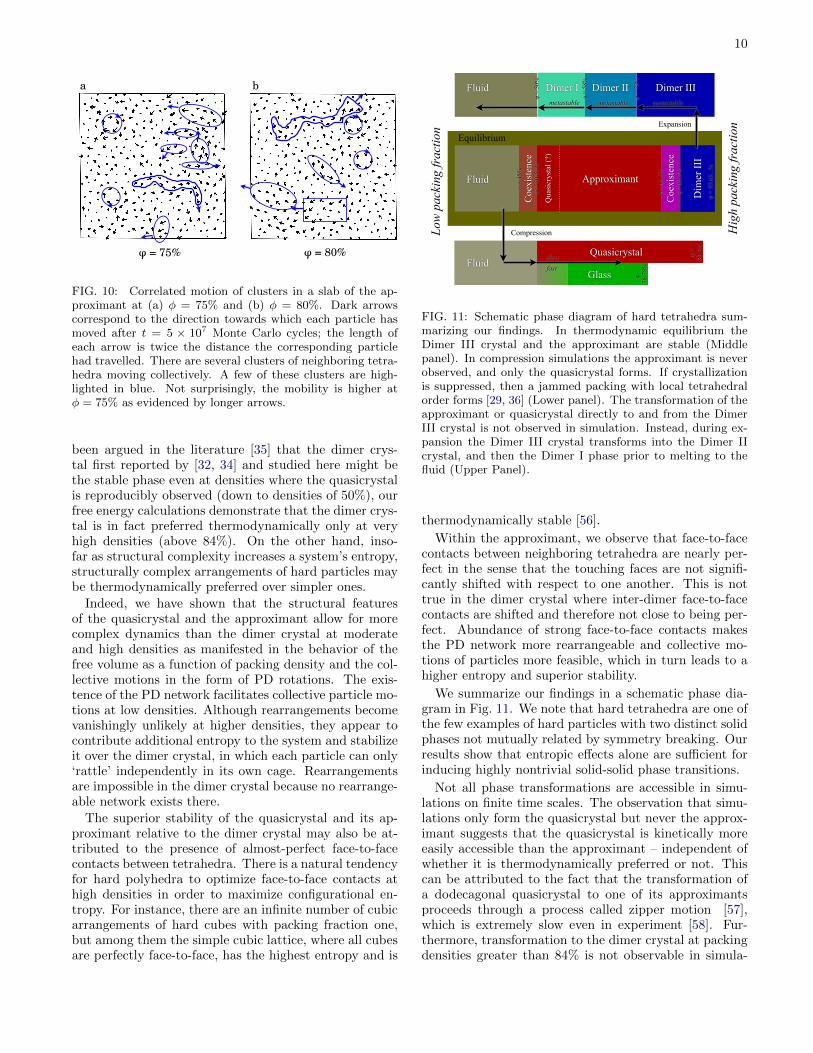
At packing densities beyond 65%, PD rotations becomeextremely unlikely, but clusters of tetrahedra, includingPDs, can still vibrate collectively. Figs. 10a-b show suchcorrelated motions occurring in a time period of 50 mil-lion Monte Carlo cycles in a layer of the approximantat φ = 75% and φ = 80% respectively. The vibrationsare extremely slow, but their existence adds additionalentropy to the system making the mean-field approxi-mation and the cell model inaccurate. No dynamics isobserved in the dimer crystal.
In general, thermodynamically equivalent local rear-rangements are a characteristic feature of quasicrystalsand their approximants. The transformation amongthese takes place via phason modes [51–53]. Elemen-tary excitations are phason flips, which previously havebeen observed with high-resolution transmission electronmicroscopy [54] and in simulations of two dimensionalmodel systems [55].
IV. DISCUSSION AND CONCLUSION
In general one might expect a ‘simple’ structure like thedimer crystal to form more easily than ‘complex’ struc-tures like the quasicrystal or its approximant. The ob-servation that tetrahedra defy this expectation suggeststhat structural complexity is not always a good indica-tor of thermodynamic stability. Indeed, although it has
10
! = 75% ! = 80%
a b
FIG. 10: Correlated motion of clusters in a slab of the ap-proximant at (a) φ = 75% and (b) φ = 80%. Dark arrowscorrespond to the direction towards which each particle hasmoved after t = 5 × 10⁷ Monte Carlo cycles; the length ofeach arrow is twice the distance the corresponding particlehad travelled. There are several clusters of neighboring tetra-hedra moving collectively. A few of these clusters are high-lighted in blue. Not surprisingly, the mobility is higher atφ = 75% as evidenced by longer arrows.
been argued in the literature [35] that the dimer crys-tal first reported by [32, 34] and studied here might bethe stable phase even at densities where the quasicrystalis reproducibly observed (down to densities of 50%), ourfree energy calculations demonstrate that the dimer crys-tal is in fact preferred thermodynamically only at veryhigh densities (above 84%). On the other hand, inso-far as structural complexity increases a system’s entropy,structurally complex arrangements of hard particles maybe thermodynamically preferred over simpler ones.
Indeed, we have shown that the structural featuresof the quasicrystal and the approximant allow for morecomplex dynamics than the dimer crystal at moderateand high densities as manifested in the behavior of thefree volume as a function of packing density and the col-lective motions in the form of PD rotations. The exis-tence of the PD network facilitates collective particle mo-tions at low densities. Although rearrangements becomevanishingly unlikely at higher densities, they appear tocontribute additional entropy to the system and stabilizeit over the dimer crystal, in which each particle can only‘rattle’ independently in its own cage. Rearrangementsare impossible in the dimer crystal because no rearrange-able network exists there.
The superior stability of the quasicrystal and its ap-proximant relative to the dimer crystal may also be at-tributed to the presence of almost-perfect face-to-facecontacts between tetrahedra. There is a natural tendencyfor hard polyhedra to optimize face-to-face contacts athigh densities in order to maximize configurational en-tropy. For instance, there are an infinite number of cubicarrangements of hard cubes with packing fraction one,but among them the simple cubic lattice, where all cubesare perfectly face-to-face, has the highest entropy and is
Fluid Approximant
Dim
er II
I
Glass
Dimer IIIDimer IIFluid
Expansion
Compression
Fluid
Coe
xist
ence
Coe
xist
ence
Low
pac
king
frac
tion
Hig
h pa
ckin
g fr
actio
n
! =
45%
! ~
50-5
1%
! =
84.1
%
! =
84.7
%
! =
85.6
3...%
! =
72%
! ~
76-7
8%
Dimer I
! =
58%
! ~
50%
slow
metastablemetastablemetastable
Equilibrium
Quasicrystal ! >
83.2
%
fast
Qua
sicr
ysta
l (?)
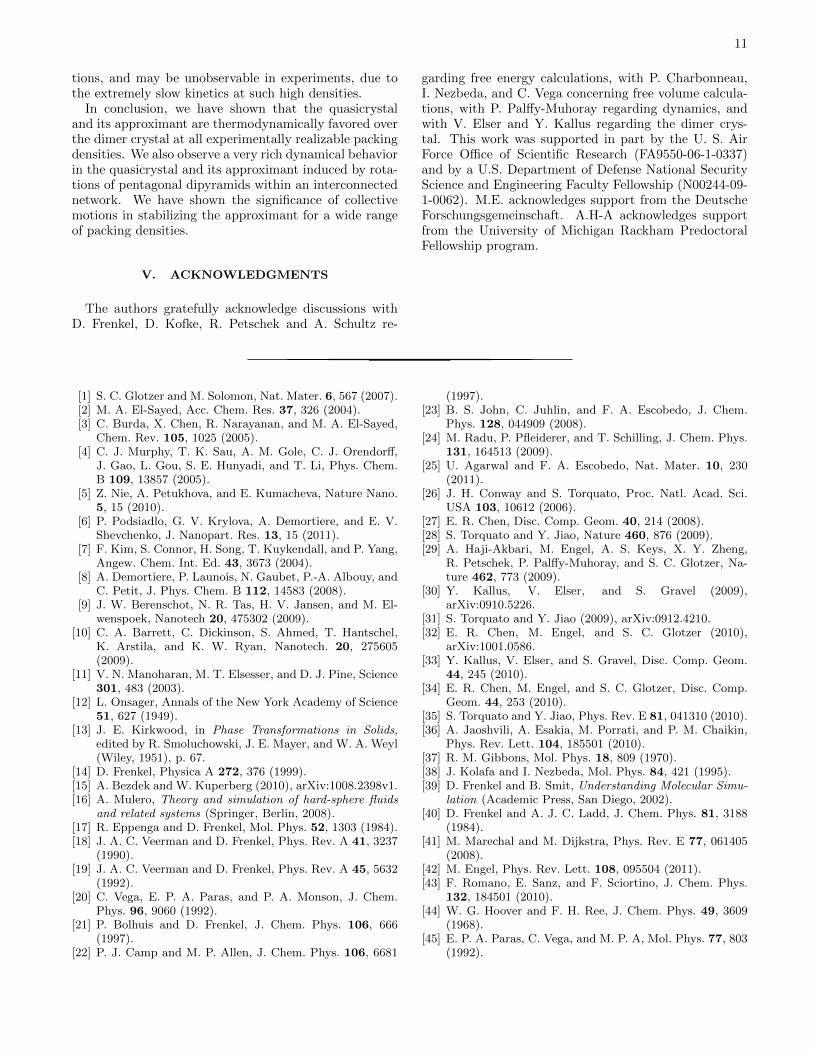
FIG. 11: Schematic phase diagram of hard tetrahedra sum-marizing our findings. In thermodynamic equilibrium theDimer III crystal and the approximant are stable (Middlepanel). In compression simulations the approximant is neverobserved, and only the quasicrystal forms. If crystallizationis suppressed, then a jammed packing with local tetrahedralorder forms [29, 36] (Lower panel). The transformation of theapproximant or quasicrystal directly to and from the DimerIII crystal is not observed in simulation. Instead, during ex-pansion the Dimer III crystal transforms into the Dimer IIcrystal, and then the Dimer I phase prior to melting to thefluid (Upper Panel).
thermodynamically stable [56].
Within the approximant, we observe that face-to-facecontacts between neighboring tetrahedra are nearly per-fect in the sense that the touching faces are not signifi-cantly shifted with respect to one another. This is nottrue in the dimer crystal where inter-dimer face-to-facecontacts are shifted and therefore not close to being per-fect. Abundance of strong face-to-face contacts makesthe PD network more rearrangeable and collective mo-tions of particles more feasible, which in turn leads to ahigher entropy and superior stability.
We summarize our findings in a schematic phase dia-gram in Fig. 11. We note that hard tetrahedra are one ofthe few examples of hard particles with two distinct solidphases not mutually related by symmetry breaking. Ourresults show that entropic effects alone are sufficient forinducing highly nontrivial solid-solid phase transitions.
Not all phase transformations are accessible in simu-lations on finite time scales. The observation that simu-lations only form the quasicrystal but never the approx-imant suggests that the quasicrystal is kinetically moreeasily accessible than the approximant – independent ofwhether it is thermodynamically preferred or not. Thiscan be attributed to the fact that the transformation ofa dodecagonal quasicrystal to one of its approximantsproceeds through a process called zipper motion [57],which is extremely slow even in experiment [58]. Fur-thermore, transformation to the dimer crystal at packingdensities greater than 84% is not observable in simula-
11
tions, and may be unobservable in experiments, due tothe extremely slow kinetics at such high densities.
In conclusion, we have shown that the quasicrystaland its approximant are thermodynamically favored overthe dimer crystal at all experimentally realizable packingdensities. We also observe a very rich dynamical behaviorin the quasicrystal and its approximant induced by rota-tions of pentagonal dipyramids within an interconnectednetwork. We have shown the significance of collectivemotions in stabilizing the approximant for a wide rangeof packing densities.
V. ACKNOWLEDGMENTS
The authors gratefully acknowledge discussions withD. Frenkel, D. Kofke, R. Petschek and A. Schultz re-
garding free energy calculations, with P. Charbonneau,I. Nezbeda, and C. Vega concerning free volume calcula-tions, with P. Palffy-Muhoray regarding dynamics, andwith V. Elser and Y. Kallus regarding the dimer crys-tal. This work was supported in part by the U. S. AirForce Office of Scientific Research (FA9550-06-1-0337)and by a U.S. Department of Defense National SecurityScience and Engineering Faculty Fellowship (N00244-09-1-0062). M.E. acknowledges support from the DeutscheForschungsgemeinschaft. A.H-A acknowledges supportfrom the University of Michigan Rackham PredoctoralFellowship program.
[1] S. C. Glotzer and M. Solomon, Nat. Mater. 6, 567 (2007).[2] M. A. El-Sayed, Acc. Chem. Res. 37, 326 (2004).[3] C. Burda, X. Chen, R. Narayanan, and M. A. El-Sayed,
Chem. Rev. 105, 1025 (2005).[4] C. J. Murphy, T. K. Sau, A. M. Gole, C. J. Orendorff,
J. Gao, L. Gou, S. E. Hunyadi, and T. Li, Phys. Chem.B 109, 13857 (2005).
[5] Z. Nie, A. Petukhova, and E. Kumacheva, Nature Nano.5, 15 (2010).
[6] P. Podsiadlo, G. V. Krylova, A. Demortiere, and E. V.Shevchenko, J. Nanopart. Res. 13, 15 (2011).
[7] F. Kim, S. Connor, H. Song, T. Kuykendall, and P. Yang,Angew. Chem. Int. Ed. 43, 3673 (2004).
[8] A. Demortiere, P. Launois, N. Gaubet, P.-A. Albouy, andC. Petit, J. Phys. Chem. B 112, 14583 (2008).
[9] J. W. Berenschot, N. R. Tas, H. V. Jansen, and M. El-wenspoek, Nanotech 20, 475302 (2009).
[10] C. A. Barrett, C. Dickinson, S. Ahmed, T. Hantschel,K. Arstila, and K. W. Ryan, Nanotech. 20, 275605(2009).
[11] V. N. Manoharan, M. T. Elsesser, and D. J. Pine, Science301, 483 (2003).
[12] L. Onsager, Annals of the New York Academy of Science51, 627 (1949).
[13] J. E. Kirkwood, in Phase Transformations in Solids,edited by R. Smoluchowski, J. E. Mayer, and W. A. Weyl(Wiley, 1951), p. 67.
[14] D. Frenkel, Physica A 272, 376 (1999).[15] A. Bezdek and W. Kuperberg (2010), arXiv:1008.2398v1.[16] A. Mulero, Theory and simulation of hard-sphere fluids
and related systems (Springer, Berlin, 2008).[17] R. Eppenga and D. Frenkel, Mol. Phys. 52, 1303 (1984).[18] J. A. C. Veerman and D. Frenkel, Phys. Rev. A 41, 3237
(1990).[19] J. A. C. Veerman and D. Frenkel, Phys. Rev. A 45, 5632
(1992).[20] C. Vega, E. P. A. Paras, and P. A. Monson, J. Chem.
Phys. 96, 9060 (1992).[21] P. Bolhuis and D. Frenkel, J. Chem. Phys. 106, 666
(1997).[22] P. J. Camp and M. P. Allen, J. Chem. Phys. 106, 6681
(1997).[23] B. S. John, C. Juhlin, and F. A. Escobedo, J. Chem.
Phys. 128, 044909 (2008).[24] M. Radu, P. Pfleiderer, and T. Schilling, J. Chem. Phys.
131, 164513 (2009).[25] U. Agarwal and F. A. Escobedo, Nat. Mater. 10, 230
(2011).[26] J. H. Conway and S. Torquato, Proc. Natl. Acad. Sci.
USA 103, 10612 (2006).[27] E. R. Chen, Disc. Comp. Geom. 40, 214 (2008).[28] S. Torquato and Y. Jiao, Nature 460, 876 (2009).[29] A. Haji-Akbari, M. Engel, A. S. Keys, X. Y. Zheng,
R. Petschek, P. Palffy-Muhoray, and S. C. Glotzer, Na-ture 462, 773 (2009).
[30] Y. Kallus, V. Elser, and S. Gravel (2009),arXiv:0910.5226.
[31] S. Torquato and Y. Jiao (2009), arXiv:0912.4210.[32] E. R. Chen, M. Engel, and S. C. Glotzer (2010),
arXiv:1001.0586.[33] Y. Kallus, V. Elser, and S. Gravel, Disc. Comp. Geom.
44, 245 (2010).[34] E. R. Chen, M. Engel, and S. C. Glotzer, Disc. Comp.
Geom. 44, 253 (2010).[35] S. Torquato and Y. Jiao, Phys. Rev. E 81, 041310 (2010).[36] A. Jaoshvili, A. Esakia, M. Porrati, and P. M. Chaikin,
Phys. Rev. Lett. 104, 185501 (2010).[37] R. M. Gibbons, Mol. Phys. 18, 809 (1970).[38] J. Kolafa and I. Nezbeda, Mol. Phys. 84, 421 (1995).[39] D. Frenkel and B. Smit, Understanding Molecular Simu-
lation (Academic Press, San Diego, 2002).[40] D. Frenkel and A. J. C. Ladd, J. Chem. Phys. 81, 3188
(1984).[41] M. Marechal and M. Dijkstra, Phys. Rev. E 77, 061405
(2008).[42] M. Engel, Phys. Rev. Lett. 108, 095504 (2011).[43] F. Romano, E. Sanz, and F. Sciortino, J. Chem. Phys.
132, 184501 (2010).[44] W. G. Hoover and F. H. Ree, J. Chem. Phys. 49, 3609
(1968).[45] E. P. A. Paras, C. Vega, and M. P. A, Mol. Phys. 77, 803
(1992).
12
[46] P. Stampfii, Helv. Phys. Acta 59, 1260 (1986).[47] A. S. Keys, C. R. Iacovella, and S. C. Glotzer, Ann. Rev.
Cond. Mat. Phys. 2, 263 (2011).[48] V. I. Harismiadis, J. Vorholz, and A. Z. Panagiotopoulos,
J. Chem. Phys. 105, 8469 (1996).[49] L. van Hove, Phys. Rev. 95, 249 (1954).[50] W. Kob, C. Donati, S. J. Plimpton, P. H. Poole, and
S. C. Glotzer, Phys. Rev. Lett. 79, 2827 (1997).[51] P. Bak, Phys. Rev. B 32, 5764 (1985).[52] T. C. Lubensky and S. Ramaswamy, Phys. Rev. B 32,
7444 (1985).[53] D. Levine and P. J. Steinhardt, Phys. Rev. B 34, 596
(1986).[54] K. Edagawa, K. Suzuki, and S. Takeuchi, Phys. Rev.
Lett. 85, 1674 (2000).[55] M. Engel, M. Umezaki, H.-R. Trebin, and T. Odagaki,
Phys. Rev. B 82, 134206 (2010).[56] B. Groh and B. Mulder, J. Chem. Phys. 114, 3653 (2001).[57] M. Oxborrow and C. L. Henley, Phys. Rev. B. 48, 6966
(1993).[58] D. V. Talapin, E. V. Shevchenko, M. I. Bodnarchuk,
X. Ye, J. Chen, and C. B. Murray, Nature 461, 964(2009).
Related Documents


