Phase development of the ZrO 2 –ZnO system during the thermal treatments of amorphous precursors Goran Štefanic ´ * , Svetozar Music ´, Mile Ivanda Division of Materials Chemistry, Rugjer Boškovic ´ Institute, P.O. Box 180, HR-10002 Zagreb, Croatia article info Article history: Received 10 October 2008 Accepted 27 October 2008 Available online xxxx Keywords: ZrO 2 X-ray diffraction Raman spectroscopy Electron microscopy DSC FT-IR spectroscopy abstract Thermal behavior of the amorphous precursors of the ZrO 2 –ZnO system on the ZrO 2 -rich side of the con- centration range, co-precipitated from aqueous solutions of the corresponding salts, was monitored using X-ray powder diffraction, Raman spectroscopy, Fourier transform infrared spectroscopy, field emission scanning electron microscopy, energy dispersive X-ray spectrometry, differential scanning calorimetry and thermogravimetric analysis. The crystallization temperature of the amorphous precursors increased with an increase in the ZnO content, from 457 °C (0 mol% ZnO) to 548 °C (25 mol% ZnO). Maximum sol- ubility of Zn 2+ ions in the ZrO 2 lattice (25 mol%) occurred in the metastable products obtained upon crystallization of the amorphous precursors. Raman spectroscopy indicates that the incorporation of Zn 2+ ions can partially stabilize only the tetragonal ZrO 2 . A precise determination of unit-cell parameters of the t-ZrO 2 -type solid solutions, using both Rietveld and Le Bail refinements of the powder diffraction patterns, shows that the increase in the Zn 2+ content causes a decrease in c-ax, which in a solid solution with a Zn 2+ content above 20 mol% approaches very closely a-ax. The thermal treatment of the crystalli- zation products (up to 1000 °C) leads to a rapid decrease in the terminal solid solubility limit of Zn 2+ ions in the ZrO 2 lattice that is followed by the partial evaporation of zinc, the formation of and increase in phases structurally closely related to zincite and monoclinic ZrO 2 . The results of micro-structural analysis indicate that the presence of ZnO promotes the sintering of the ZrO 2 crystallization products. Ó 2008 Elsevier B.V. All rights reserved. 1. Introduction The strongly covalent nature of the Zr–O bond favors the 7-fold coordination of zirconium, present in the thermodynamically sta- ble monoclinic polymorph (m-ZrO 2 ) [1]. High-temperature tetrag- onal polymorph (t-ZrO 2 ), stable above 1170 °C, and cubic polymorph (c-ZrO 2 ), stable above 2370 °C, with zirconium coor- dination number 8, can be stabilized at room temperature by the introduction of oxygen vacancies that reduce the coordination number of the Zr 4+ ion. Oxygen vacancies can be introduced into ZrO 2 lattice by incorporation of aliovalent cations, but these vacan- cies will preferably associate with the Zr 4+ ion only in solid solu- tions with oversized dopants, viz. Ca 2+ , Sc 3+ ,Y 3+ , etc. [2]. The lowest amount of oxygen vacancies required for stabilization of c-ZrO 2 , in a case when all vacancies are associated with the Zr 4+ ions, was estimated at 6.5% [3]. Smaller amounts of oxygen vacan- cies could partially stabilize only the t-ZrO 2 . In our previous investigations we have examined the effect of trivalent undersized dopant cations [4–7] on the formation of the high-temperature polymorphs of ZrO 2 . In thermodynamically sta- ble systems, obtained after prolonged calcinations at temperatures above 1100 °C, the amount of the incorporated trivalent dopants was too small to stabilize high-temperature polymorphs of ZrO 2 . However, solubility became significantly higher in the metastable solid solutions, obtained after the crystallization of amorphous precursors. The obtained results show that in the metastable prod- ucts obtained upon crystallization of amorphous precursors up to 50 mol% of Fe 3+ ions can be incorporated into theZrO 2 lattice, resulting in the stabilization of the cubic polymorphs of ZrO 2 [4]. Maximum solubility of smaller Ga 3+ ion (0.63 Å, CN = 6 [8]) [5], Cr 3+ ion (0.615 Å, CN = 6 [8]) [6] or Al 3+ ion (0.54 Å, CN = 6 [8]) [7] was estimated at 43, 26 and 10 mol%, respectively, resulting in a partial stabilization of t-ZrO 2 . Theoretically, the incorporation of divalent cations should have an even stronger influence on the stabilization of the high-temper- ature polymorphs of zirconia [3]. However, due to their signifi- cantly different valency, it is much difficult to incorporate divalent cations into ZrO 2 lattice. In the case of the ZrO 2 –NiO sys- tem [9], regardless of the fact that the size of the Ni 2+ ion (0.69 Å, CN = 6 [8]) is closer to the size of the Zr 4+ ion (0.72 Å, CN = 6 [8]) in comparison with the size of the Fe 3+ ion (0.645 Å, CN = 6 [8]), only about 5 mol% of Ni 2+ ions can be incorporated into the ZrO 2 lattice. In the present investigation we examine the effect of incorporation of a slightly larger Zn 2+ ion (0.74 Å, CN = 6 [8]) on the phase development of the ZrO 2 -type solid solutions. The effects of ZnO 0022-2860/$ - see front matter Ó 2008 Elsevier B.V. All rights reserved. doi:10.1016/j.molstruc.2008.10.044 * Corresponding author. Tel.: +385 1 456 1111; fax: +385 1 46 80084. E-mail address: [email protected] (G. Štefanic ´). Journal of Molecular Structure xxx (2008) xxx–xxx Contents lists available at ScienceDirect Journal of Molecular Structure journal homepage: www.elsevier.com/locate/molstruc ARTICLE IN PRESS Please cite this article in press as: G. Štefanic ´ et al., J. Mol. Struct. (2008), doi:10.1016/j.molstruc.2008.10.044

Welcome message from author
This document is posted to help you gain knowledge. Please leave a comment to let me know what you think about it! Share it to your friends and learn new things together.
Transcript
Journal of Molecular Structure xxx (2008) xxx–xxx
ARTICLE IN PRESS
Contents lists available at ScienceDirect
Journal of Molecular Structure
journal homepage: www.elsevier .com/ locate /molst ruc
Phase development of the ZrO2–ZnO system during the thermal treatmentsof amorphous precursors
Goran Štefanic *, Svetozar Music, Mile IvandaDivision of Materials Chemistry, Rugjer Boškovic Institute, P.O. Box 180, HR-10002 Zagreb, Croatia
a r t i c l e i n f o a b s t r a c t
Article history:Received 10 October 2008Accepted 27 October 2008Available online xxxx
Keywords:ZrO2
X-ray diffractionRaman spectroscopyElectron microscopyDSCFT-IR spectroscopy
0022-2860/$ - see front matter � 2008 Elsevier B.V. Adoi:10.1016/j.molstruc.2008.10.044
* Corresponding author. Tel.: +385 1 456 1111; faxE-mail address: [email protected] (G. Štefanic)
Please cite this article in press as: G. Štefa
Thermal behavior of the amorphous precursors of the ZrO2–ZnO system on the ZrO2-rich side of the con-centration range, co-precipitated from aqueous solutions of the corresponding salts, was monitored usingX-ray powder diffraction, Raman spectroscopy, Fourier transform infrared spectroscopy, field emissionscanning electron microscopy, energy dispersive X-ray spectrometry, differential scanning calorimetryand thermogravimetric analysis. The crystallization temperature of the amorphous precursors increasedwith an increase in the ZnO content, from 457 �C (0 mol% ZnO) to 548 �C (25 mol% ZnO). Maximum sol-ubility of Zn2+ ions in the ZrO2 lattice (�25 mol%) occurred in the metastable products obtained uponcrystallization of the amorphous precursors. Raman spectroscopy indicates that the incorporation ofZn2+ ions can partially stabilize only the tetragonal ZrO2. A precise determination of unit-cell parametersof the t-ZrO2-type solid solutions, using both Rietveld and Le Bail refinements of the powder diffractionpatterns, shows that the increase in the Zn2+ content causes a decrease in c-ax, which in a solid solutionwith a Zn2+ content above 20 mol% approaches very closely a-ax. The thermal treatment of the crystalli-zation products (up to 1000 �C) leads to a rapid decrease in the terminal solid solubility limit of Zn2+ ionsin the ZrO2 lattice that is followed by the partial evaporation of zinc, the formation of and increase inphases structurally closely related to zincite and monoclinic ZrO2. The results of micro-structural analysisindicate that the presence of ZnO promotes the sintering of the ZrO2 crystallization products.
� 2008 Elsevier B.V. All rights reserved.
1. Introduction
The strongly covalent nature of the Zr–O bond favors the 7-foldcoordination of zirconium, present in the thermodynamically sta-ble monoclinic polymorph (m-ZrO2) [1]. High-temperature tetrag-onal polymorph (t-ZrO2), stable above �1170 �C, and cubicpolymorph (c-ZrO2), stable above �2370 �C, with zirconium coor-dination number 8, can be stabilized at room temperature by theintroduction of oxygen vacancies that reduce the coordinationnumber of the Zr4+ ion. Oxygen vacancies can be introduced intoZrO2 lattice by incorporation of aliovalent cations, but these vacan-cies will preferably associate with the Zr4+ ion only in solid solu-tions with oversized dopants, viz. Ca2+, Sc3+, Y3+, etc. [2]. Thelowest amount of oxygen vacancies required for stabilization ofc-ZrO2, in a case when all vacancies are associated with the Zr4+
ions, was estimated at 6.5% [3]. Smaller amounts of oxygen vacan-cies could partially stabilize only the t-ZrO2.
In our previous investigations we have examined the effect oftrivalent undersized dopant cations [4–7] on the formation of thehigh-temperature polymorphs of ZrO2. In thermodynamically sta-ble systems, obtained after prolonged calcinations at temperatures
ll rights reserved.
: +385 1 46 80084..
nic et al., J. Mol. Struct. (20
above 1100 �C, the amount of the incorporated trivalent dopantswas too small to stabilize high-temperature polymorphs of ZrO2.However, solubility became significantly higher in the metastablesolid solutions, obtained after the crystallization of amorphousprecursors. The obtained results show that in the metastable prod-ucts obtained upon crystallization of amorphous precursors up to50 mol% of Fe3+ ions can be incorporated into theZrO2 lattice,resulting in the stabilization of the cubic polymorphs of ZrO2 [4].Maximum solubility of smaller Ga3+ ion (0.63 Å, CN = 6 [8]) [5],Cr3+ ion (0.615 Å, CN = 6 [8]) [6] or Al3+ ion (0.54 Å, CN = 6 [8])[7] was estimated at 43, 26 and 10 mol%, respectively, resultingin a partial stabilization of t-ZrO2.
Theoretically, the incorporation of divalent cations should havean even stronger influence on the stabilization of the high-temper-ature polymorphs of zirconia [3]. However, due to their signifi-cantly different valency, it is much difficult to incorporatedivalent cations into ZrO2 lattice. In the case of the ZrO2–NiO sys-tem [9], regardless of the fact that the size of the Ni2+ ion (0.69 Å,CN = 6 [8]) is closer to the size of the Zr4+ ion (0.72 Å, CN = 6 [8]) incomparison with the size of the Fe3+ ion (0.645 Å, CN = 6 [8]), onlyabout 5 mol% of Ni2+ ions can be incorporated into the ZrO2 lattice.In the present investigation we examine the effect of incorporationof a slightly larger Zn2+ ion (0.74 Å, CN = 6 [8]) on the phasedevelopment of the ZrO2-type solid solutions. The effects of ZnO
08), doi:10.1016/j.molstruc.2008.10.044

Table 1The initial molar fraction and the results of phase analysis of products obtained uponcalcination and cooling of the amorphous precursors of the ZrO2–ZnO system in the
2 G. Štefanic et al. / Journal of Molecular Structure xxx (2008) xxx–xxx
ARTICLE IN PRESS
addition to zirconia were mostly investigated in connection withthe promotion of conductivity and sinterability of materials [10–12]. However, to the best of our knowledge no investigations havebeen performed concerning the effect of Zn2+ ions incorporation onthe formation and stability of the high-temperature polymorphs ofZrO2. In the present investigation we have examined the thermalbehaviour of the amorphous precursors of the ZrO2–ZnO systemcalcined at different temperatures up to 1000 �C. The aim of theinvestigation was to find answers to the questions about the max-imum solubility of Zn2+ ions in a ZrO2 lattice, the influence of Zn2+
ions incorporation on the lattice parameters of ZrO2–type solidsolutions and the capability of Zn2+ ions to stabilize the t-ZrO2
and c-ZrO2 polymorphs.
presence of air under atmospheric pressure.Sample x (ZnO) t (�C) Rietveld refinement Individualprofilefitting
Phase composition(volume fraction)
vmvmþvt
Z0 – 400 m-ZrO2 (0.77) + t-ZrO2 (0.23) 0.77500 m-ZrO2 (0.89) + t-ZrO2 (0.11) 0.91600 m-ZrO2 (0.98) + t-ZrO2 (0.02) 0.97700 m-ZrO2 1800 m-ZrO2 11000 m-ZrO2 1
Z1 0.02 400 Zt (0.81) + Zm (0.19) 0.17500 Zm (0.89) + Zt (0.11) 0.89600 Zm (0.96) + Zt (0.04) 0.96700 Zm (0.99) + Zt (0.01) 0.99800 Zm 11000 Zm (0.99) + Zn (0.01) 1
Z2 0.04 400 Zt (0.91) + Zm (0.09) 0.06500 Zt (0.83) + Zm (0.17) 0.22600 Zm (0.97) + Zt (0.03) 0.97700 Zm (0.98) + Zt (0.01) + Zn (0.01) 0.99800 Zm (0.99) + Zn (0.01) 11000 Zm (0.98) + Zn (0.02) 1
Z3 0.07 400 Zt + amorphous 0500 Zt (0.99) + Zm (0.01) 0.01600 Zm (0.89) + Zt (0.11) + Zn (0.01) 0.90700 Zm (0.97) + Zn (0.02) + Zt (0.01) 0.99800 Zm (0.95) + Zn (0.05) 11000 Zm (0.95) + Zn (0.05) 1
Z4 0.11 400 Zt + amorphous 0500 Zt (0.99) + Zm (0.01) 0.01600 Zt (0.80) + Zm (0.18) + Zn (0.02) 0.15700 Zm (0.91) + Zn (0.06) + Zt (0.03) 0.98800 Zm (0.94) + Zn (0.06) 11000 Zm (0.93) + Zn (0.07) 1
Z5 0.16 500 Zt 0600 Zt (0.90) + Zm (0.07) + Zn (0.03) 0.08700 Zm (0.86) + Zn (0.06) + Zt (0.08) 0.93800 Zm (0.89) + Zn (0.11) 11000 Zm (0.87) + Zn (0.13) 1
Z6 0.25 500 Zt 0600 Zt (0.84) + Zm (0.06) + Zn (0.10) 0.06700 Zm (0.81) + Zn (0.13) + Zt (0.06) 0.94800 Zm (0.82) + Zn (0.18) 11000 Zm (0.83) + Zn (0.17) 1
Z7 0.42 500 Zt + Zn + amorphous 0600 Zt + Zn + Zm + amorphous –700 Zm (0.69) + Zn (0.26) + Zt (0.05) 0.93800 Zm (0.71) + Zn (0.28) + Zt (0.01) 0.981000 Zm (0.71) + Zn (0.29) 1
Z8 0.60 500 Zt + Zn + amorphous 0600 Zt + Zn + Zm + amorphous –700 Zm (0.50) + Zn (0.42) + Zt (0.08) 0.85800 Zm (0.55) + Zn (0.43) + Zt (0.02) 0.981000 Zm (0.56) + Zn (0.44) 1
Description: Zm, phase structurally similar to m-ZrO2; Zt, phase structurally similarto t-ZrO2; Zn, phase structurally similar to zincite; mm, volume fraction of Zm phase;mt, volume fraction of Zt phase.
2. Experimental
Amorphous precursors of the ZrO2–ZnO system on the ZrO2-richside of the concentration range were co-precipitated from an aque-ous solution of ZrOCl2�8H2O (Aldrich) and ZnCl2 (Kemika) salts byadding NaOH� aq. up to pH 7.5. All the chemicals were of analyticalgrade. The solid phase was separated from the corresponding li-quid using an ultra-speed centrifuge, washed (5 times with bidis-tilled water), then dried at 120 �C for 24 h. Dried samples werecalcined at 400, 500, 600, 700, 800 and 1000 �C for 2 h and ana-lyzed at RT using X-ray powder diffraction (XRD), Raman spectros-copy, Fourier transform infrared spectroscopy (FT-IR), fieldemission scanning electron microscopy (FE-SEM) and energy dis-persive X-ray spectrometry (EDS).
The thermal behavior of amorphous precursors was also ana-lyzed using differential scanning calorimetry (DSC) and thermo-gravimetric (TG) analysis.
XRD measurements were taken using an ItalStructures diffrac-tometer APD2000 with monochromatized Cu Ka radiation (graph-ite monochromator).
Precise lattice parameters of t-ZrO2-type solid solutions weredetermined from the results of Le Bail [13] (program GSAS [14]with graphical user interface EXPGUI [15]) and Rietveld refine-ments [16] (program MAUD [17]) of powder diffraction patterns.Silicon (Koch-Light Lab. Ltd.) was used as an internal standard(space group m�3m, a = 5.43088 Å). Rietveld refinements of powderdiffraction patterns were also used for a quantitative crystal phaseanalysis of the ZrO2–ZnO products obtained after calcinations atdifferent temperatures. In all the cases the Rwp indexes of the re-fined patterns were less than 10%. The obtained values of the vol-ume fractions of t-ZrO2- and m-ZrO2-type solid solutions (mt andmm) were compared with the values obtained from the integralintensities of the monoclinic diffraction lines �1 1 1 and 111 andthe tetragonal diffraction line 101, following the procedure pro-posed by Toraya et al. [18]. The volume fractions are given bythe following relations:
mm ¼1:311x
1þ 0:311xð1Þ
mt ¼ 1� mm; ð2Þ
where x is
x ¼ Imð�1 1 1Þ þ Imð1 1 1ÞImð�1 1 1Þ þ Imð1 1 1Þ þ Itð1 0 1Þ
ð3Þ
Integrated intensities of the m-ZrO2 and t-ZrO2 diffraction lines(Im and It) were determined using the individual profile-fittingmethod (computer program PRO-FIT) [19].
Raman scattering experiments were carried out at room tem-perature by using the double subtractive configuration of a JobinYvon T64000 triple monochromator. The spectral resolution was1.4 cm�1. The 514.5 nm laser excitation line beam of the Coherent
Please cite this article in press as: G. Štefanic et al., J. Mol. Struct. (20
argon ion laser was focused on the diameter of 5 lm by using 100�microscope objective. The laser power on the sample was 20 mW.
FT-IR spectra were recorded using a Perkin-Elmer spectrometer,model 2000. The FT-IR spectrometer was coupled to a personalcomputer loaded with the IR Data Manager (IRDM) program. Thespecimens were pressed into the pellets using spectroscopicallypure KBr as a matrix.
FE-SEM/EDS analyses of uncoated samples were made using thefield emission scanning electron microscope JSM-7000F (Jeol)
08), doi:10.1016/j.molstruc.2008.10.044

G. Štefanic et al. / Journal of Molecular Structure xxx (2008) xxx–xxx 3
ARTICLE IN PRESS
equipped with an energy dispersive X-ray spectrometer INCA-350EDS Microanalysis System (Oxford Instruments).
The DSC analysis of the amorphous precursors of ZrO2–ZnO sys-tems was performed up to 600 �C with a scanning rate of20 K min�1 using a differential scanning calorimeter (Perkin-ElmerDSC, model 7). The instrument was connected to a personal com-puter loaded with a program for processing the obtained DSCcurves. The starting mass of the samples was adjusted to10 ± 0.5 mg.
Thermogravimetric (TG) analysis of the samples was performedin air up to 1000 �C with a scanning rate of 5 K min�1 using a DTG-60H Thermal Analyzer (Shimadzu Scientific Instruments Inc.). Theinstrument was connected to a personal computer loaded with aprogram for processing the obtained TG curves.
3. Results and discussion
3.1. Phase analysis
The initial molar compositions and the results of phase analysisobtained after calcination and cooling of the amorphous precursorsof the ZrO2–ZnO system are given in Table 1. FT-IR spectra of allcrystallization products obtained after calcination of the amor-phous precursor of pure ZrO2 (sample Z0) contain bands typicalof m-ZrO2 [20]. The intensities of those bands increase with an in-crease in the calcination temperature. Absence of m-ZrO2 bands inthe FT-IR spectra of the crystallization products of sample Z2(�4 mol% of ZnO) calcination at 400 �C and sample Z5 (�16 mol%of ZnO) calcined at 400 and 500 �C (Fig. 1) indicates a stabilizinginfluence of Zn2+ ions.
The results of phase analysis obtained using X-ray powder dif-fraction show that m-ZrO2 is a dominant phase in all crystallizationproducts of pure ZrO2 (sample Z0), while t-ZrO2 appears as a sec-ond phase in products calcined up to 600 �C (Table 1). The amor-phous precursors of the ZrO2–ZnO system with a ZnO contentbetween 2 and 25 mol% (samples Z1 to Z6) crystallized as a solidsolution structurally closely related to t- or c-ZrO2 (Zt phase). A sig-nificant line broadening prevents any clear distinguishing betweenthe tetragonal and cubic polymorphs of ZrO2. The amorphous pre-cursors of the ZrO2–ZnO system with more than 25 mol% of ZnO(samples Z7 and Z8) crystallized into products which, beside theZt phase, contain a phase structurally closely related to zincite(Zn phase). Temperature treatments of the crystallization productsof the ZrO2–ZnO system cause a transition of the Zt phase into aphase structurally closely related to m-ZrO2 (Zm phase) followed
Fig. 1. FT-IR spectra of the crystallization products of samples Z0 (
Please cite this article in press as: G. Štefanic et al., J. Mol. Struct. (20
by the appearance of and increase in the Zn phase. After calcinationat 700 �C, Zm became a dominant phase in all products, regardlessof the amount of ZnO. After calcinations at 800 �C the Zt phasecompletely disappears in the products of samples Z0 to Z6, andonly the traces of the Zt phase can be observed in the products ofsamples Z7 and Z8 (Table 1). After calcination at 1000 �C only theZm and Zn phases are present in the ZrO2–ZnO products (samplesZ1 to Z8). However, the results of the quantitative crystal phaseanalysis, obtained using Rietveld refinements of powder diffractionpatterns, indicate a smaller amount of the Zn phase than can be ex-pected from the initial Zn/Zr ration and the maximum solubility ofthe Zn2+ ions in the ZrO2 lattice (Table 1).
Volume fractions of Zt and Zm phases were determined usingthe results of both Rietveld refinements and individual profile fit-ting (Fig. 2). The obtained values appeared to be in good agreement(Table 1). Fig. 3 shows how the ratio between the volume fractionof Zt phase and the sum of the volume fractions of Zt and Zm phases,mt/(mm + mt), varies with the ZnO amount and calcination tempera-ture (up to 800 �C). The obtained curves indicate that the presenceof ZnO stabilizes the high-temperature Zt phase after calcinationsat 500 and 600 �C. However, at higher temperatures (700 and800 �C) the presence of ZnO has a very small influence on the sta-bilization of the high-temperature polymorphs of ZrO2. Such asmall thermal resistance of the metastable Zt phase can be attrib-uted to a rapid decrease in the terminal solid solubility limit ofZn2+ ions in the ZrO2 lattice (Fig. 4). Maximum solubility of Zn2+
ions in the ZrO2 lattice decreases from �25 mol% after calcinationsat 500 �C to �6 mol% after calcinations at 600 �C. These resultsindicate that the presence of ZnO can stabilize the high-tempera-ture polymorphs of ZrO2 only in a case when Zn2+ ions are incorpo-rated into the ZrO2 lattice. In most binary systems (ZrO2–MOx)with ZrO2 as a major phase, the stabilizing influence of the secondoxide phase extends beyond the maximum solubility of the dopantM2x+ cation. In a case involving ZrO2–Cr2O3 system calcined at1100 �C the stabilization of the tetragonal polymorph of ZrO2 oc-curred regardless of the negligible solubility of Cr3+ ions [21], whilein a case of the ZrO2–SnO2 system the stabilization of the tetrago-nal polymorph of zirconia increased with a decrease in the solidsolubility of Sn4+ ions [22]. Partial stabilization of metastable t-ZrO2 in these cases results from the ZrO2–MOx surface interactionthat prevents the diffusion of oxygen from the atmosphere into theZrO2 lattice and triggers the t-ZrO2 ? m-ZrO2 transition upon cool-ing. In case of ZrO2–ZnO system surface interaction between ZrO2-and ZnO-type solid solutions seems to be too small to lead to thestabilization of the high-temperature polymorphs of ZrO2.
0 mol% of ZnO), Z2 (4 mol% of ZnO) and Z5 (16 mol% of ZnO).
08), doi:10.1016/j.molstruc.2008.10.044
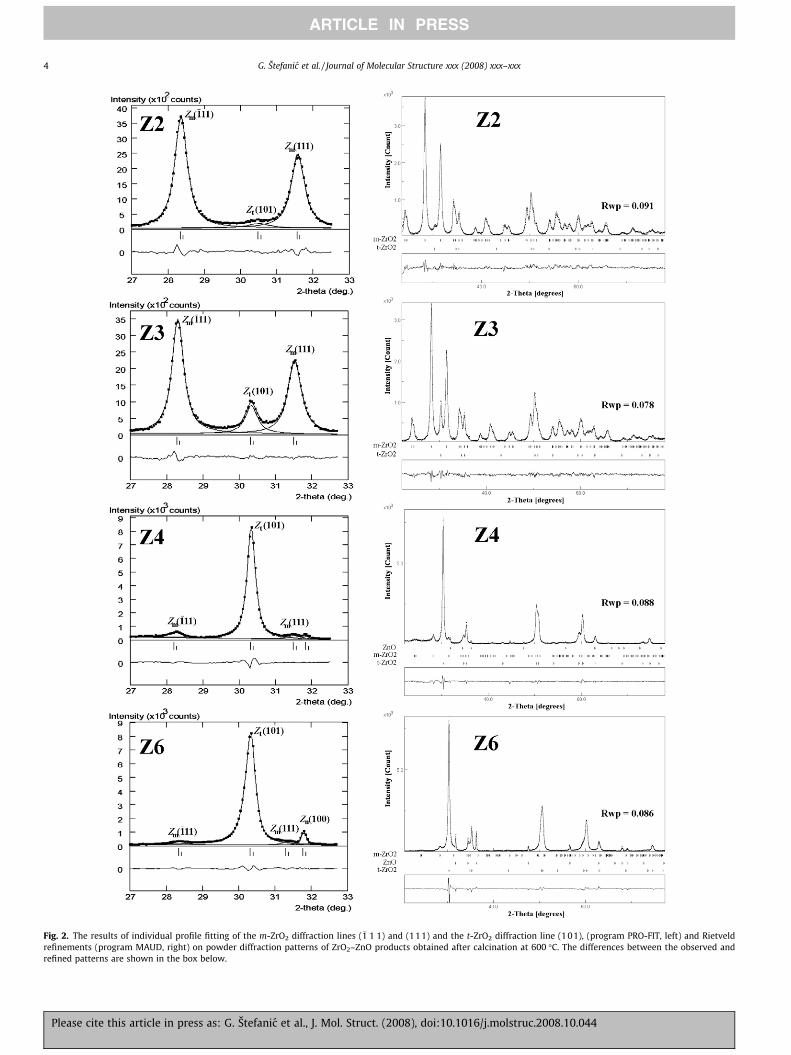
Fig. 2. The results of individual profile fitting of the m-ZrO2 diffraction lines (�1 1 1) and (111) and the t-ZrO2 diffraction line (101), (program PRO-FIT, left) and Rietveldrefinements (program MAUD, right) on powder diffraction patterns of ZrO2–ZnO products obtained after calcination at 600 �C. The differences between the observed andrefined patterns are shown in the box below.
4 G. Štefanic et al. / Journal of Molecular Structure xxx (2008) xxx–xxx
ARTICLE IN PRESS
Please cite this article in press as: G. Štefanic et al., J. Mol. Struct. (2008), doi:10.1016/j.molstruc.2008.10.044

Fig. 3. The influence of the ZnO content on the ratio between the volume fraction ofZt phase and the sum of the volume fractions of Zt and Zm phase, mt/(mm + mt), inproducts calcined at 500, 600, 700 and 800 �C.
Fig. 4. The influence of temperature treatment on the terminal solid solubility limitof Zn2+ ions in the ZrO2 lattice.
G. Štefanic et al. / Journal of Molecular Structure xxx (2008) xxx–xxx 5
ARTICLE IN PRESS
The capability of Zn2+ ions to stabilize the cubic polymorph ofZrO2 was examined using Raman spectroscopy, the most powerfultechnique in cases where the tetragonal or cubic symmetry of ZrO2
cannot be clearly distinguished from the results of X-ray diffraction[23–25]. Group theory allows six Raman active modes of vibration(A1g + 2B1g + 3Eg) for the tetragonal ZrO2 polymorph, of which theband at �265 cm�1 is usually used to determine the presence ofa tetragonal phase, and only one active mode of vibration for thecubic polymorph (F2g) at �610 cm�1. Fig. 5 shows the Raman spec-tra of crystallization products from the ZrO2–ZnO system obtainedupon calcination at 500 and 700 �C. After calcinations at 500 �C theproducts of samples Z0, Z1 and Z2 contain bands typical of m-ZrO2
and t-ZrO2. Bands typical of m-ZrO2 decrease with an increase in
Please cite this article in press as: G. Štefanic et al., J. Mol. Struct. (20
the ZnO content and finally disappear in the spectrum of sampleZ3 (�7 mol% of ZnO). The Raman spectra of the samples Z3, Z4,Z5 and Z6, calcined at 500 �C, contain only the bands typical of t-ZrO2 (Fig. 5), which indicates that the observed high-temperatureZrO2 polymorph has a tetragonal symmetry. Further increase inthe ZnO content (samples Z7 and Z8) causes the appearance ofadditional bands typical of zincite. The Raman spectra of allZrO2–ZnO products calcined at 700 �C contain bands typical of m-ZrO2. Only products of sample Z7 and Z8 contain small bands at147 and 268 cm�1, indicating the presence of a Zt phase. The firstsign of zincite bands can be observed in the products of sampleZ3, indicating a significant decrease in Zn2+ ion solubility.
3.2. Lattice parameters of t-ZrO2-type solid solutions
A closer look at the portion of the diffraction patterns of crystal-lization products of ZrO2–ZnO system calcined at 500 �C, contain-ing the diffraction lines 103, 211 and 202 of the Zt phase, showsthat an increase in the ZnO content shifts the diffraction lines ofthe Zt phase to a higher angle (Fig. 6). We can also notice thatthe shift of the diffraction line 103 is greater compared with theshift of the diffraction line 211, so that in the product of sampleZ6 these two neighbouring lines completely overlap. These resultsindicate that the incorporation of Zn2+ ions causes a decrease in thet-ZrO2-type lattice and that the rate of the decrease is higher forc-ax.
The unit-cell parameters of the t-ZrO2-type solid solutions weredetermined with precision from the results of Rietveld refinements[16] (MAUD program [17]) and Le Bail refinements [13] (GSAS pro-gram [14]) of powder diffraction patterns. Fig. 7 shows the ob-served and calculated powder patterns of crystallization productscontaining the t-ZrO2-type solid solutions with a varying zinc con-tent. The refined unit-cell parameters of the Zt phase are listed inTable 2. The obtained results (Fig. 8) show that an increase in theamount of incorporated zinc cations causes a significant decreasein parameter c and a very small decrease in parameter a. In theproduct of sample Z6 calcined at 500 �C the a/c ratio become veryclose to 1 (a is related to fluorite type lattice) (Table 2).
3.3. FE-SEM/EDS analyses
The first sign of small spherical crystallites (up to �10 nm insize) typical of zirconia appeared in the FE SEM micrographs ofproducts calcined at 500 �C. An increase in the temperature treat-ment leads to crystallite growth and porosity reduction. The FESEM micrograph of sample Z0 (pure ZrO2) calcined at 1000 �C con-tains spherical particles of �100 nm in size. However, a significantamount of pores is still present (Fig. 9). The presence of ZnO (even asmall amount) causes a significant crystal growth and the disap-pearance of pores in the products calcined at 1000 �C. The FESEM micrographs of products with a high amount of ZnO show, be-side the crystallites typical of zirconia, the crystallites typical ofzincite (Fig. 10). A significant difference in the shape and size of zir-conia and zincite particles causes heterogeneity of these samples athigher temperatures (800 and 1000 �C).
The results of EDS analysis indicate that thermal treatmenthas a significant influence on the elementary composition ofsamples. Amorphous precursors contain, beside Zr, Zn and O,up to 3% of Cl impurities that cannot be washed away com-pletely. Temperature treatment causes a decrease in the amountof chloride, which almost completely disappears after calcina-tions at 600 �C. Temperature treatment also causes a decreasein the amount of oxygen, which may be attributed to the lossof water during the treatment. The results of EDS analysis indi-cate that the Zn/Zr ratio in amorphous precursors is in goodagreement with the Zn/Zr ratio in the starting aqueous solutions
08), doi:10.1016/j.molstruc.2008.10.044

Fig. 5. Raman spectra of the crystallization products from ZrO2–ZnO system with different ZnO content obtained after calcination at 500 and 700 �C. ., 5 and s mark thepositions of bands typical of m-ZrO2, t-ZrO2 and zincite, respectively.
Fig. 6. The portion of the diffraction patterns of crystallization products of ZrO2–ZnO system calcined at 500 �C that contain the diffraction lines 103, 211 and 202of the t-ZrO2-type solid solution.
6 G. Štefanic et al. / Journal of Molecular Structure xxx (2008) xxx–xxx
ARTICLE IN PRESS
(Table 3). However, temperature treatment causes a significantdecrease in that ratio due to the partial evaporation of zinc.The onset of zinc evaporation shifts to a lower temperature withan increase in the ZnO content. Fig. 11 shows the characteristicpart of the EDS spectra of samples Z6 and Z7 as prepared andafter treatment at 500 and 800 �C. The obtained spectra showthat temperature treatment, beside a decrease in oxygen andchloride, causes a significant decrease in zinc. In the case of sam-ple Z6, calcination at 500 �C has a very small influence on theZn/Zr ratio, but further temperature treatment up to 800 �Ccauses a significant decrease in zinc. On the other hand, in thecase of sample Z7, the most significant decrease in the Zn/Zr ra-tio occurs during the calcinations up to 500 �C, while further in-crease in temperature treatment has much smaller influence onthe zinc content (Fig. 11). The results of EDS analysis (Table 3)suggest a connection between the onset of zinc evaporationand the decrease in Zn2+ ion solubility inside the ZrO2 lattice.These results are in good agreement with the results of Rietveldrefinements of the XRD patterns, which indicate a smaller in-crease in the Zn phase than could be expected from the initialZn/Zr ratio and the maximum solubility of Zn2+ ions in a ZrO2
lattice (Table 1).
Please cite this article in press as: G. Štefanic et al., J. Mol. Struct. (20
3.4. DSC/TG analyses
The DSC curves of samples from a ZrO2–ZnO system having itsZnO content between 0 and 25 mol% are characterized by the exo-thermic peak resulting from crystallization (Fig. 12). The positionof the exothermic peak shifted to higher temperatures with an in-crease in the ZnO content, from �460 �C for a sample with 0 mol%of ZnO to �550 �C for sample with 25 mol% of ZnO (Fig. 12). A com-parison with the DSC results obtained for the systems ZrO2–NiO [9]and ZrO2–CuO [26] (Fig. 13) indicates that, similar to the case of thetrivalent undersized dopants [4–7], the crystallization temperatureof the amorphous co-gels depends on the amount of the dopantcation (crystallization temperature increases with an increase inthe dopant content) and the ionic radius of the dopant cation (crys-tallization temperature increases with the decrease in the ionic ra-dius of the undersized dopant cation).
Fig. 14 shows the results of thermogravimetric (TG) analysis. Inthe temperature region between 50 and 500 �C the TG curves of allsamples show a similar decrease in sample weight associated withthe loss of water and chlorides present in the starting amorphousprecursors. However, further loss of sample weight appeared tobe strongly associated with the ZnO content. In the temperatureregion between 500 and 1000 �C, sample Z0 (0 mol% of ZnO) showsa small continuous weight loss, which finally decrease for �3%. In-crease in the ZnO content causes an increase in weight loss. Therate of weight loss shows a significant increase in the temperaturerange between 550 and 800 �C (Fig. 14). The onset of weight de-crease shifts toward lower temperatures with an increase in theZnO content (�730 �C for sample Z2 and �550 �C for sample Z6).These results are in good agreement with the results of EDS andquantitative XRD analysis. The overlapping of the temperature re-gion associated with a rapid decrease in Zn2+ ion solubility in theZrO2 lattice (XRD analysis) and the onset of a decreasing samplemass (TG analysis) and Zn/Zr ratio (EDS analysis) indicate thatthe bulk of the evaporated zinc was previously incorporated intothe ZrO2 lattice.
4. Conclusions
The obtained results show that temperature treatments of theamorphous precursors of the ZrO2–ZnO system on the ZrO2-rich
08), doi:10.1016/j.molstruc.2008.10.044
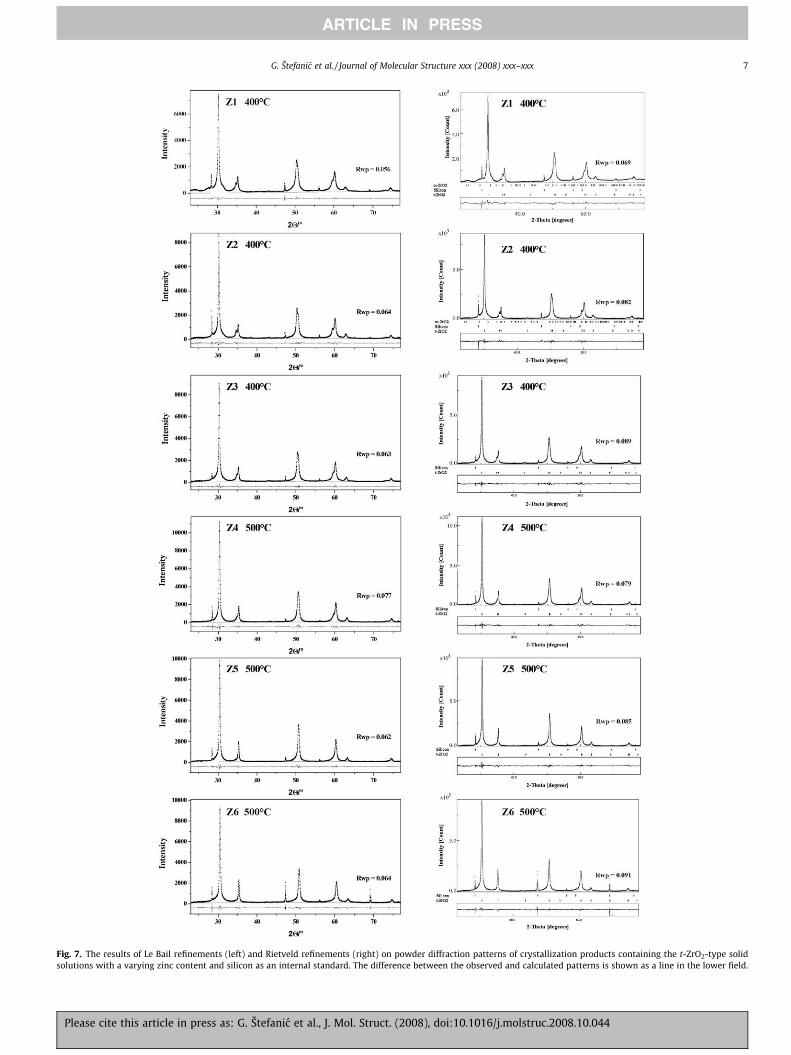
Fig. 7. The results of Le Bail refinements (left) and Rietveld refinements (right) on powder diffraction patterns of crystallization products containing the t-ZrO2-type solidsolutions with a varying zinc content and silicon as an internal standard. The difference between the observed and calculated patterns is shown as a line in the lower field.
G. Štefanic et al. / Journal of Molecular Structure xxx (2008) xxx–xxx 7
ARTICLE IN PRESS
Please cite this article in press as: G. Štefanic et al., J. Mol. Struct. (2008), doi:10.1016/j.molstruc.2008.10.044

Table 2Refined values of unit-cell parameters of the t-ZrO2-type solid solutions, obtained after crystallization of the amorphous precursors of ZrO2-ZnO systems, with varying amounts ofincorporated Zn2+ ions.
Sample Lattice parameters of t-ZrO2-type solid solutions
Le Bail refinement (GSAS program) Rietveld refinement (MAUD program)
a (Å) c (Å) V (Å3) Rwp a (Å) c (Å) V (Å3) Rwp
Z1 3.6012(1) 5.1661(3) 67.0 0.056 3.6015(4) 5.1645(4) 67.0 0.0695.0929(2)* 134.0* 5.0933(6)* 134.0*
Z2 3.5997(1) 5.1628(3) 66.9 0.064 3.6005(2) 5.1603(5) 66.9 0.0825.0907(2)* 133.8* 5.0912(3)* 133.8*
Z3 3.5998(1) 5.1549(4) 66.8 0.063 3.6005(2) 5.1510(4) 66.8 0.0895.0908(2)* 133.6* 5.0912(3)* 133.5*
Z4 3.5944(1) 5.1392(4) 66.4 0.077 3.5975(2) 5.1352(6) 66.5 0.0795.0833(2)* 132.8* 5.0876(3)* 132.9*
Z5 3.5994(6) 5.1079(6) 66.2 0.062 3.5985(2) 5.1073(8) 66.1 0.0855.0911(9)* 132.4* 5.0891(3)* 132.3*
Z6 3.5898(5) 5.0745(14) 65.4 0.064 3.5889(2) 5.0743(8) 65.4 0.0915.0767(7)* 130.8* 5.0755(3)* 130.7*
* Related to fluorite type lattice.
Fig. 8. Influence of the Zn2+ ion content on parameter a (related to fluorite typelattice) and parameter c of the t-Zr1�xZnxO2�x solid solution.
Fig. 9. The portion of the FE SEM micrographs of sample Z0, Z1 and Z5 calcined at1000 �C containing zirconia particles.
8 G. Štefanic et al. / Journal of Molecular Structure xxx (2008) xxx–xxx
ARTICLE IN PRESS
side of the concentration range cause crystallization into a meta-stable solid solution with extended capability for the incorporationof Zn2+ ions.
The crystallization temperature of the ZrO2–ZnO system in-creases with an increase in the Zn2+ content, but the rate of in-crease is significantly smaller compared with the ZrO2–NiO andZrO2–CuO systems. Maximum solubility of Zn2+ ions in the ZrO2
lattice was estimated at �25 mol%. The solubility of Zn2+ ions intothe ZrO2 lattice rapidly decreases with an increase in temperaturetreatment. The results of Raman spectroscopy indicate that theincorporation of Zn2+ ions can stabilize only the tetragonal poly-morph of ZrO2. However, a precise determination of lattice param-eters showed that the axial ratio c/a in the t-ZrO2-type solidsolutions with Zn2+ content >20 mol% approach 1 (a related to fluo-rite type lattice). The results of EDS, TG and quantitative XRD anal-ysis show that temperature treatments cause significant decreasein the Zn/Zr ratio due to the partially evaporation of zinc previouslyincorporated into ZrO2 lattice. The results of the micro-structuralanalysis indicate that the presence of ZnO promote sintering ofthe ZrO2 crystallization products.
Please cite this article in press as: G. Štefanic et al., J. Mol. Struct. (2008), doi:10.1016/j.molstruc.2008.10.044

Fig. 10. FE SEM micrograph of sample Z6 calcined at 800 �C showing very bigelongated particle of zincite surrounded with the small spherical particles ofzirconia.
Table 3The Zn/Zr ratio, determined from the results of EDS analysis, in the samples Z1 to Z8as prepared and after treatment at 500 and 800 �C.
Temperature (�C) Zn/Zr ratio
Z1 Z2 Z3 Z4 Z5 Z6 Z7 Z8
– 0.02 0.05 0.08 0.13 0.18 0.33 0.73 1.51500 0.02 0.05 0.08 0.12 0.17 0.30 0.45 1.11800 0.02 0.04 0.04 0.07 0.11 0.15 0.38 0.94
Fig. 11. The characteristic part of the EDS spectra of samples Z6 and Z7 as preparedand after treatment at 500 and 800 �C.
Fig. 12. The DSC curves of samples from a ZrO2–ZnO system having its ZnO contentbetween 0 and 25 mol%.
Fig. 13. The influence of the molar fraction of ZnO on the crystallizationtemperatures of the amorphous precursors of the ZrO2–ZnO system and thecorresponding results obtained for ZrO2–NiO and ZrO2–CuO systems.
Fig. 14. The results of thermogravimetric analysis of samples Z0, Z2, Z5 and Z6.
G. Štefanic et al. / Journal of Molecular Structure xxx (2008) xxx–xxx 9
ARTICLE IN PRESS
Please cite this article in press as: G. Štefanic et al., J. Mol. Struct. (2008), doi:10.1016/j.molstruc.2008.10.044

10 G. Štefanic et al. / Journal of Molecular Structure xxx (2008) xxx–xxx
ARTICLE IN PRESS
Acknowledgements
The authors wish to thank Dr. Pavica Planinic and Ernest Sand-ers for TG measurements.
References
[1] R. Stevens, Zirconia and Zirconia Ceramics, Magnesium Electron PublicationNo. 113, Published by Magnesium Electron Ltd., July 1986, Printed by Litko2000, Twickenham, UK.
[2] P. Li, I.-W. Chen, J.E. Penner-Hahn, J. Am. Ceram. Soc. 77 (1994) 1281.[3] S.M. Ho, Mater. Sci. Eng. 54 (1982) 23.[4] G. Štefanic, B. Grzeta, K. Nomura, R. Trojko, S. Music, J. Alloys Compd. 327
(2001) 151.[5] G. Štefanic, S. Music, J. Alloys Compd. 460 (2008) 444.[6] G. Štefanic, S. Music, A. Gajovic, J. Mol. Struct. 744–747 (2005) 541.[7] G. Štefanic, S. Music, R. Trojko, J. Alloys Compd. 388 (2005) 126.[8] R.D. Shannon, Acta Cryst. A32 (1976) 751.[9] G. Štefanic, M. Didovic, S. Music, J. Mol. Struct. 834 (2007) 435.
[10] S. Nakayama, S. Kakita, Y. Masuda, T. Suzuki, J. Mater. Sci. 41 (2006) 1631.
Please cite this article in press as: G. Štefanic et al., J. Mol. Struct. (20
[11] R.S. Nasar, M. Cerqueira, E. Longo, J.A. Varela, Ceram. Int. 25 (1999) 593.[12] Y. Nakada, T. Kimura, J. Am. Ceram. Soc. 80 (1997) 401.[13] A. Le Bail, H. Duroy, J.L. Fourquet, Mater. Res. Bull. 23 (1988) 447.[14] A.C. Larson, R.B. Von Dreele, General Structure Analysis System GSAS, Los
Alamos National Laboratory Report, 2001.[15] B.H. Toby, J. Appl. Cryst. 34 (2001) 210.[16] H.M. Rietveld, J. Appl. Cryst. 2 (1969) 65.[17] L. Lutterotti, S. Matthies, H.-R. Wenk, MAUD (Material Analysis Using
Diffraction): a User Friendly Java Program for Rietveld Texture Analysis andMore, Proceeding of the Twelfth International Conference on Textures ofMaterials (ICOTOM-12), 1999, 1, 1599.
[18] H. Toraya, M. Yoshimura, S. Somiya, J. Am. Ceram. Soc. 67 (1984) C119.[19] H. Toraya, J. Appl. Cryst. 19 (1986) 440.[20] T. Hirata, E. Asari, M. Kitajima, J. Solid State Chem. 110 (1994) 201.[21] G. Štefanic, S. Popovic, S. Music, Mater. Lett. 36 (1998) 240.[22] G. Štefanic, S. Music, A. Gajovic, Mater. Res. Bull. 43 (2008) 2855.[23] H. Fujimori, M. Yashima, S. Sasaki, M. Kakihana, T. Mori, M. Tanaka, M.
Yoshimura, Chem. Phys. Lett. 346 (2001) 217.[24] T. Merle, R. Guinebretiere, A. Mirgorodsky, P. Quintard, Phys. Rev. B65 (2002)
144302–144331.[25] G. Štefanic, S. Music, A. Gajovic, Mater. Res. Bull. 41 (2006) 764.[26] G. Štefanic, S. Music, unpublished results.
08), doi:10.1016/j.molstruc.2008.10.044
Related Documents