Page | 1 PHARMACIES IN QATAR Current State HEALTHCARE PLANNING & ASSESSMENT DEPARTMENT HEALTHCARE FACILITY PLANNING – FACT SHEET III – April 2018

Welcome message from author
This document is posted to help you gain knowledge. Please leave a comment to let me know what you think about it! Share it to your friends and learn new things together.
Transcript
Page | 1
PHARMACIES IN QATAR Current State
HEALTHCARE PLANNING & ASSESSMENT DEPARTMENT HEALTHCARE FACILITY PLANNING – FACT SHEET III – April 2018

Page | 2
LIST OF CONTENT
I. Introduction II. Executive Summary III. Findings & Analysis IV. Appendix

Page | 3
I. INTRODUCTION
Pharmacies as healthcare facilities play a vital role in the healthcare system. However there role has moved through time from solely dispense medicines into providing first levels of healthcare services to outpatients, and ensuring outpatients access to those levels of healthcare at the right time and place.
Within this context and in recognition to the importance of pharmacies role in the healthcare system FACT SHEET III “Pharmacies in Qatar – Current state” has been developed. The data and figures illustrated in this fact sheet were based on data collection activities carried out by the Health Planning and Assessment Department (HPA) within the Ministry of Public Health (MoPH).
These data and figures are consistent with MoPH license & Accreditation Department register as of September 2017. In addition, the Geographic Health Information System (GeoMed) Application developed by HPA was used to extract statistics and geographical distribution of pharmacies.
II. EXECUTIVE SUMMARY
The “Pharmacies in Qatar – Current state” fact sheet III aims to highlight the status of pharmacies in the state of Qatar as of September 2017 from a Healthcare facility planning perspective. This fact sheet can be considered as a complementary part of the “Community Pharmacy Strategy” of Qatar 2011-2016 supporting the implementation of the second goal of:
“Convenience” - Healthcare services and medications are easily accessible at Community Pharmacies for all members of society”.
Where recommendations are given to expand the number of channels available to access medications and making sure that the distribution of pharmacies – as healthcare facilities- is sufficient to meet the need of population in Qatar. All within the primary aim to mature the capabilities of Qatar private retail pharmacies to deliver quality healthcare services to patients within their respective communities and neighborhoods.

Page | 4
I. FINDINGS & ANALYSIS
Findings and analysis is based on MoPH definition of the pharmaceutical establishment. This definition includes five categories: Governmental pharmacies, Commercial Pharmacies, Private Pharmacies, Medicines stores and Pharmaceutical Industry. Table A and chart A below show the numbers and percentages of these five categories as of September 2017 (refer to Appendix for the pharmaceutical establishment full definition):
Entity Count Percentage
Governmental pharmacies 80 13.7%
Commercial Pharmacies 278 47.8%
Private Pharmacies 119 20.4%
Medicines Stores/ Pharmaceutical Co.& Factories Agents & Brokers 103 17.7%
Pharmaceutical Industry 2 0.3%
Total 582 100.0%
Chart A: Numbers of existing pharmaceutical establishments
Table A: Numbers & percentages of existing pharmaceutical establishments
Page | 5
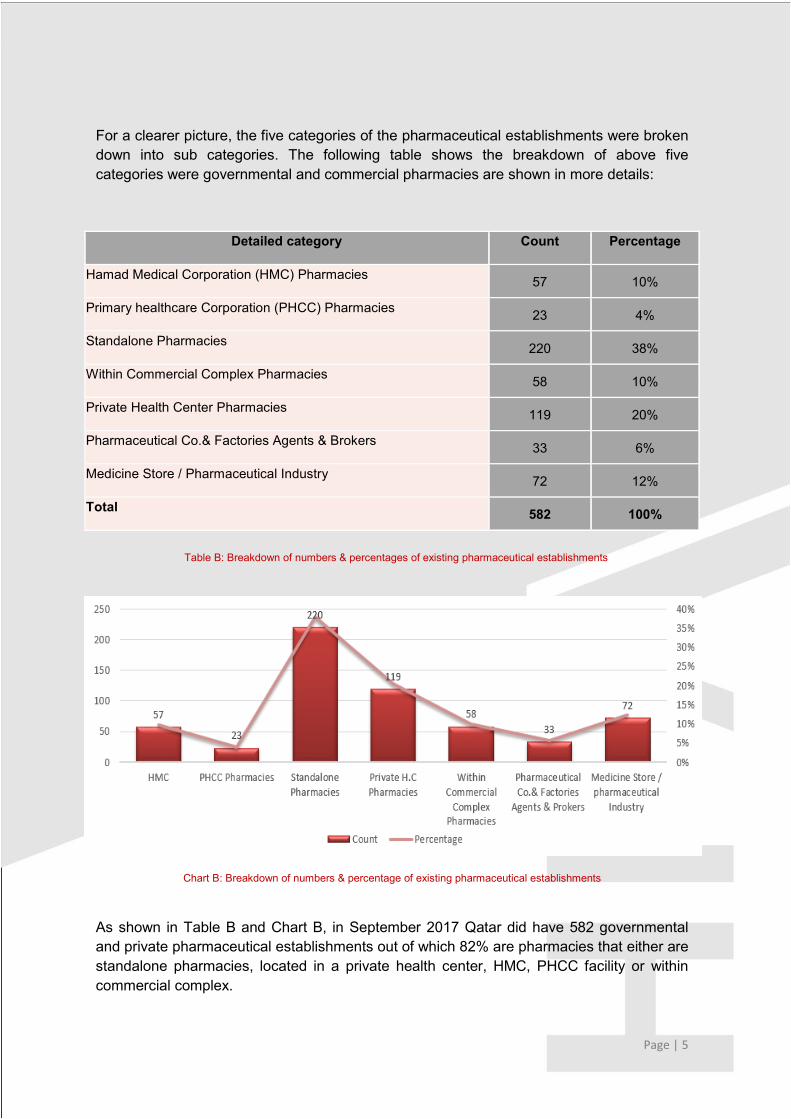
For a clearer picture, the five categories of the pharmaceutical establishments were broken down into sub categories. The following table shows the breakdown of above five categories were governmental and commercial pharmacies are shown in more details:
Detailed category Count Percentage
Hamad Medical Corporation (HMC) Pharmacies 57 10%
Primary healthcare Corporation (PHCC) Pharmacies 23 4%
Standalone Pharmacies 220 38%
Within Commercial Complex Pharmacies 58 10%
Private Health Center Pharmacies 119 20%
Pharmaceutical Co.& Factories Agents & Brokers 33 6%
Medicine Store / Pharmaceutical Industry 72 12%
Total 582 100%
Chart B: Breakdown of numbers & percentage of existing pharmaceutical establishments
As shown in Table B and Chart B, in September 2017 Qatar did have 582 governmental and private pharmaceutical establishments out of which 82% are pharmacies that either are standalone pharmacies, located in a private health center, HMC, PHCC facility or within commercial complex.
Table B: Breakdown of numbers & percentages of existing pharmaceutical establishments
Page | 6
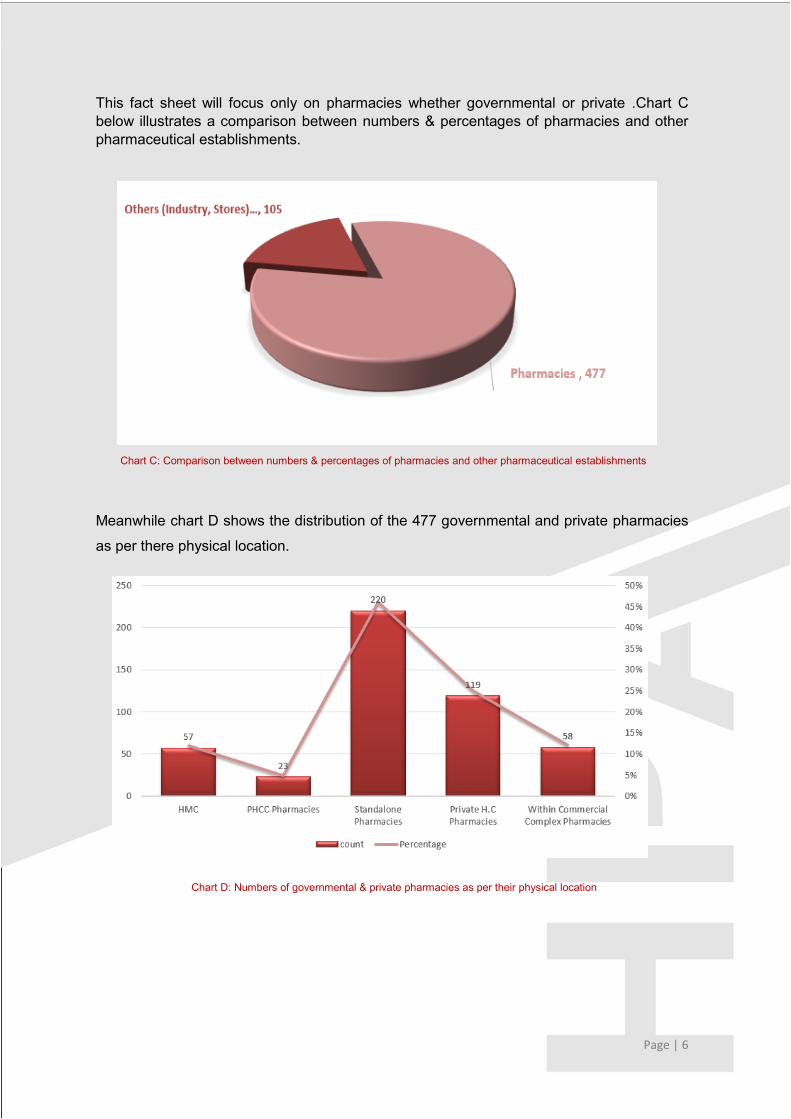
This fact sheet will focus only on pharmacies whether governmental or private .Chart C below illustrates a comparison between numbers & percentages of pharmacies and other pharmaceutical establishments.
Meanwhile chart D shows the distribution of the 477 governmental and private pharmacies
as per there physical location.
Chart C: Comparison between numbers & percentages of pharmacies and other pharmaceutical establishments
Chart D: Numbers of governmental & private pharmacies as per their physical location
Page | 7
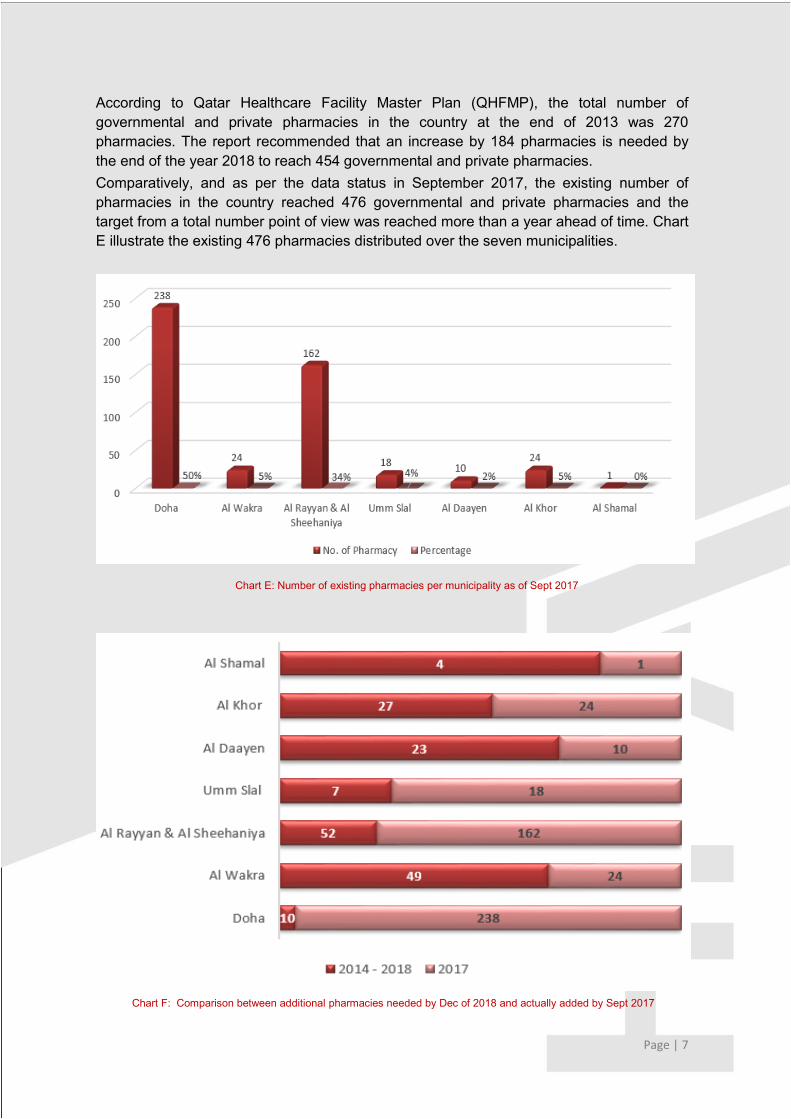
According to Qatar Healthcare Facility Master Plan (QHFMP), the total number of governmental and private pharmacies in the country at the end of 2013 was 270 pharmacies. The report recommended that an increase by 184 pharmacies is needed by the end of the year 2018 to reach 454 governmental and private pharmacies. Comparatively, and as per the data status in September 2017, the existing number of pharmacies in the country reached 476 governmental and private pharmacies and the target from a total number point of view was reached more than a year ahead of time. Chart E illustrate the existing 476 pharmacies distributed over the seven municipalities.
Chart E: Number of existing pharmacies per municipality as of Sept 2017
Chart F: Comparison between additional pharmacies needed by Dec of 2018 and actually added by Sept 2017 municipality

Page | 8
But when looking into the additional pharmacies needed by Dec of 2018 with the total of 184 pharmacies and the actually added pharmacies by Sept 2017 (Chart F above). The comparison shows not only the uneven type of this distribution over the different municipalities but also clear deviation from what was recommended by the QFHMP to these municipalities.
Furthermore and when stretching the 477 numbers of the existing pharmacies over 59 out of the 99 municipal zones the bias presence of pharmacies and unevenness looks even clearer as the concentration is not only in two municipalities but also even in specific municipal zones. Chart G above shows more than 50% of existing pharmacies concentration in 14 zones out of 59 municipal zones.
Chart G: Numbers & percentage of existing pharmaticular Establishments distributed by municipal zone

Page | 9
Figure A: Existing pharmacies distribution over municipalities as of Sept 2017
Although the total number of required pharmacies by 2018 was reached in 2017 and despite the fact that there was in Qatar and as of Sept 2017 1.8 pharmacy per 10000 population which is approximately near to international benchmarks of 1.9 in New Zealand and 2.2 in the United Kingdom. However, this total and ratio, suffer from a clear misdistribution and misallocation of pharmacies. Figure A above illustrates the current geographical distribution of pharmacies across the country and over the different municipalities.

Page | 10
Furthermore and looking from ownership perspective based on pharmacies registered license names. Governmental and private pharmacies could be grouped as shown in chart I below:
The following table C and chart J present the numbers and percentages of governmental and private pharmacies as per there registered license names in more details:
# Group Count Percentage
1 HMC 57 11.95%
2 PHCC 23 4.82%
3 KULUD Group 37 7.76%
4 Well care Group 34 7.13%
5 Aziziya Group 19 3.98%
6 Boots Group 5 1.05%
7 Afiya Group 10 2.10%
8 Med & Cure group 2 0.42%
9 Al Tafaol 8 1.68%
10 Care n Cure group 10 2.10%
Chart I: Numbers & percentage of pharmacies groups based on registered names- Big groups’ ≥ 10 pharmacies, Small Groups (0-5),

Page | 11
# Group Count Percentage
11 Sun life Group 5 1.05%
12 Family Group 10 2.10%
13 Taylos group 7 1.47%
14 Community group 10 2.10%
15 Private Health Center Pharmacies 119 24.95%
16 Al Dana Group 4 0.84%
17 Al Nahdi Group 4 0.84%
18 Individual Pharmacies 113 23.69%
Total 477 100.00%
Table C: Numbers & percentages of pharmacies grouped based on registered license names
Chart J: Numbers of pharmacies grouped based on registered license names

Page | 12
In the attempt in this fact sheet to give the widest possible picture on the status of the existing pharmacies in Qatar, the 24 hours operating private pharmacies has been covered. The distribution of these pharmacies per municipality is shown below.
Municipality Count Percentage
Al Wakra 2 6%
Al Rayyan 12 39%
Al Shamal 0 0%
Al Sheehaniya 0 0%
Al Daayen 0 0%
Umm Slal 3 10%
Doha 12 39%
Al Khor & Al Thakhira 2 6% Total 31 100%
When looking closely at the table it could be noticed that Al Shamal, Al Sheehaniya and Al Daayen municipalities do not have any 24 hours operating private pharmacy. In addition, Al Rayyan municipality has 8% of pharmacies located within its municipal boundaries that open 24 hours meanwhile Al Doha municipality percentage of 24 hours operating pharmacies is less and equal to 5%.
The following chart represents the distribution of pharmacies operating 24 hours over different municipalities in Qatar.
Chart K: Percentage of 24 hours operating pharmacies
Table D: Numbers & percentages of 24 hours operating private pharmacies per municipality

Page | 13
The initial conclusions drawn from the analysis of the status of pharmacies in Qatar in general and of private pharmacies in specific elaborated in this fact sheet convey a number of messages. These messages exhibit the contradiction between the quantity of available pharmacies that could be considered very close to international standards and the quality of this availability that experience remarkable level of concentration and poor distribution both at municipal and zones levels the thing that would have a real impact on Qatar healthcare delivery network efficiency.
Working towards healthcare services and medications that are easily accessible for all members of society. In addition to ensuring that the distribution of pharmacies is sufficient, balanced and meet the needs of the population, intel the need for an objective implementation of pharmacies planning guidelines in both levels of provision and distribution of pharmacies in their different physical location in terms of catchment area and catchment population. All in the context of proper role delineation and integration of public and private pharmacies.

Page | 14
IV. APPENDIX
A. Pharmaceutical establishments by definition as used in this fact sheet consist of commercial pharmacies, governmental pharmacies, private pharmacies, medicine stores and pharmaceutical industry. These five categories are defined as follows:
1. Commercial pharmacies: Pharmacies that sell medicines and medical products to the public.
2. Governmental pharmacies: Pharmacies dispensing medicines to patients in governmental health establishments and hospitals.
3. Private pharmacies: Pharmacies dispensing medicines to patients in private health establishments and centers.
4. Medicine stores: An establishment licensed to import, store and sell medicines in wholesale
5. Pharmaceutical industry: An industrial facility licensed to produce or manufacture pharmaceuticals by chemical composition or extraction from animal, plant or other sources for the purpose of diagnosis, prevention or treatment of human diseases or any other medical purpose.
B. The distribution of existing pharmaceutical establishments according to municipalities:
Municipality No. of Pharmacy Percentage
Doha 238 50%
Al Daayen 10 2%
Umm Slal 18 4%
Al Sheehaniya 9 2%
Al Khor & Al Thakhira 24 5%
Al Rayyan 153 32%
Al Wakra 24 5%
Al Shamal 1 0%
Total 477 100%

Page | 15
C. The distribution of Existing pharmaceutical establishments throughout the country according to zones (excluding HMC & PHCC).
Zone No. Zone Name Pharmacy
Count Percentage
1 Al Jasra 2 0.50% 4 Al Asmakh 1 0.25% 6 Al Ghanim Al Qadeem (North) 1 0.25% 7 New Markets 3 0.76% 13 Musheireb 4 1.01% 14 Fareeq Abdul Aziz 3 0.76% 16 Al Ghanim Al Qadeem (South) 4 1.01% 20 Wadi Al Sail (West) 2 0.50% 22 Bin Mahmoud (North) 3 0.76% 23 Bin Mahmoud (South) 3 0.76% 24 Al Muntazah 7 1.76% 25 Al Mansoura/ Bin Dirhem 7 1.76% 26 Najma 6 1.51% 27 Umm Ghuwailina 3 0.76% 30 Al Duhail 10 2.52% 31 Al Duhail South 13 3.27% 32 Madinat Khalifa (North) 4 1.01% 33 Al Markhiya 8 2.02% 34 Madinat Khalifa (South) 4 1.01% 35 Kulaib 4 1.01% 36 Al Messila/ AlMurour 3 0.76% 37 Bin Omran/ Al Hitmi Al Jadeed 5 1.26% 38 Al Sadd 4 1.01% 39 Al Mirqab Al Jadeed/ Al Nasr 12 3.02% 40 Al Salata Al Jadeeda / Al Asiri 2 0.50% 41 Al Hilal (West) 9 2.27% 42 Al Hilal (East) 8 2.02% 43 Al Nuaija (West) 5 1.26% 44 Al Nuaija (East) 1 0.25% 45 Al Matar Al Qadeem 14 3.53% 46 Musaimeer 1 0.25% 47 Al Matar Al Qadeem South 3 0.76% 49 Doha International Airport (East) 1 0.25% 50 Al Thumama 1 0.25% 51 Al Gharrafa/ Bani Hajer/ Al Zaghwa 23 5.79% 52 Al Luqta/ Al Rayyan Al Qadeem 7 1.76% 53 Al Rayyan Al Jadeed/ Muaither North 27 6.80% 54 Fareeq Al Amir/ Muraykh/ Al Soudan North 7 1.76% 55 Al Soudan South/ Al Aziziya/ Al Ghanim/ Al Murrah 40 10.08% 56 Al Khulaifat Al Jadeeda/ Al Maamoura/ Abu Hamur 41 10.33% 57 Industrial Area 10 2.52% 61 Diplomatic District 1 0.25%

Page | 16
Zone No. Zone Name Pharmacy
Count Percentage
63 New District Of Doha 3 0.76% 65 New District Of Doha 1 0.25% 66 New District Of Doha 7 1.76% 67 New District Of Doha 5 1.26% 68 Qatar University 2 0.50% 69 New District Of Doha 1 0.25% 70 Al Kheesa 7 1.76% 71 Umm Slal/ Al Kharaitiyat 17 4.28% 74 Al Khor 12 3.02% 75 Al Thakhira 2 0.50% 76 Al Ghuwairiya 1 0.25% 80 Al Shahhniya 2 0.50% 81 Abu Nakhla 1 0.25% 86 Dukhan 1 0.25% 90 Al Wakra 12 3.02% 91 Al Wukair 4 1.01% 92 Mesaieed (town) 2 0.50%
Related Documents