Pharmaceutical Tablet Compaction: Product and Process Design Mridula Pore B.A. Chemical Engineering Sidney Sussex College University of Cambridge, 2003 M.Eng. Chemical Engineering Sidney Sussex College University of Cambridge, 2003 SUBMITTED TO THE DEPARTMENT OF CHEMICAL ENGINEERING IN PARTIAL FULFILLMENT OF THE REQUIREMENTS FOR THE DEGREE OF DOCTOR OF PHILOSOPHY IN CHEMICAL ENGINEERING PRACTICE AT THE MASSACHUSETTS INSTITUTE OF TECHNOLOGY June, 2009 ARCHIVES © 2007 Massachusetts Institute of Technology. All Rights Reserved. Author:.................. Mridula Pore D epartment of Chemical Engineering May 27, 2009 Certified by: ......... ... .... ......................... Charles L. Cooney Robert T. Haslam Professor of Chemical Engineering Thesis supervisor Accepted by: ................ ..................... William M. Deen Carbon P. Dubbs Professor of Chemical and Biological Engineering Chairman, Committee for Graduate Students MASSACHUSETTS INSTTUTE OF TECHNOLOGY JUN 2 3 2009 LIBRARIES -1-

Welcome message from author
This document is posted to help you gain knowledge. Please leave a comment to let me know what you think about it! Share it to your friends and learn new things together.
Transcript

Pharmaceutical Tablet Compaction: Product and Process Design
Mridula Pore
B.A. Chemical Engineering
Sidney Sussex College
University of Cambridge, 2003
M.Eng. Chemical Engineering
Sidney Sussex College
University of Cambridge, 2003
SUBMITTED TO THE DEPARTMENT OF CHEMICAL ENGINEERING
IN PARTIAL FULFILLMENT OF THE REQUIREMENTS FOR THE DEGREE OF
DOCTOR OF PHILOSOPHY IN CHEMICAL ENGINEERING PRACTICE
AT THE
MASSACHUSETTS INSTITUTE OF TECHNOLOGY
June, 2009 ARCHIVES
© 2007 Massachusetts Institute of Technology. All Rights Reserved.
Author:..................
Mridula Pore
D epartment of Chemical EngineeringMay 27, 2009
Certified by: ......... ... .... .........................
Charles L. CooneyRobert T. Haslam Professor of Chemical Engineering
Thesis supervisorAccepted by: ................ .....................
William M. DeenCarbon P. Dubbs Professor of Chemical and Biological Engineering
Chairman, Committee for Graduate StudentsMASSACHUSETTS INSTTUTE
OF TECHNOLOGY
JUN 2 3 2009
LIBRARIES -1-

Pharmaceutical Tablet Compaction: Product and Process Design
Mridula Pore
B.A & M.Eng Sidney Sussex College, University of Cambridge, 2003
Submitted to the Department of Chemical Engineering on June, 2009 in PartialFulfillment of the Requirements for the Degree of Doctor of Philosophy in Chemical
Engineering PracticeABSTRACT
This thesis explores how tablet performance is affected by microstructure, and howmicrostructure can be controlled by selection of excipients and compaction parameters. Asystematic strategy for formulation and process design of pharmaceutical tablets isproposed.A modified nanoindenter method was used to test the mechanical behavior of diametrallycompressed excipient granules. X ray micro computed tomography and Terahertz pulsedspectroscopy (TPS) and imaging (TPI) were used to analyze the microstructure of thetablet core and detect internal defects.Granule failure mechanisms are found to be consistent with tablet microstructure. MCCgranules deform plastically when tested and X ray images show individual granulesundergoing increasing deformation in tablets as higher compaction forces are used. Ahighly interconnected pore-structure limited tablet hardness and led to bursting behaviorduring dissolution. No effect of compaction force or speed was observed in dissolutionprofiles. Lactose granules fracture at strains less than 5%, forming monolithic structureswith no evidence of initial granule shape or size. Pore size decreases as compaction forceis increased for DCL 11 tablets. A decreasing pore size corresponds to increasing THzrefractive index, tablet hardness and dissolution time. DCL 11 and DCL 14 tabletscompacted under the same conditions have the same pore size distributions and hardness,although DCL 14 granules are weaker than DCL 11, and DCL 14 tablets dissolve up tofour times slower than DCL 11 tablets.No difference was observed between the THz spectra of tablets made from the two gradesof lactose. Further work is needed to understand the physical significance of the THzmeasurements. TPI can detect laminated tablets and is faster than X ray micro CT.In order to develop a rational design methodology, two key areas for future research arebuilding a process model for compaction and developing quality testing methods that canbe analyzed mechanistically.The capstone project explores strategic decision making for innovator firms and genericdrug manufacturers in the period surrounding patent expiry. Statin products were used asan illustrative case of a pharmaceutical technology experiencing commoditization. Asystem dynamics model was used to simulate historic results and explore options forproducts still under patent protection. Current models of technology market dynamicsapply to statins, but regulation and legislation play a large role in controlling marketentry, leading to strong sequencing effects.
Thesis Supervisor: Charles L. CooneyTitle: Robert T. Haslam Professor of Chemical Engineering
-3-
To my teachers, past and present, with gratitude.
To my family, with love.
-4-
Acknowledgements
Over the course of working on this thesis, I have been fortunate to meet and learn from
numerous people, at MIT and beyond.
Firstly, I would like to thank my advisor, Prof Charles L. Cooney for his guidance. Not
only did I benefit from his technical expertise, but he has been an inspiration and taught
me by example how to lead, communicate, teach and mentor. I am grateful for the varied
opportunities he has provided to expand my horizons.
Dr Henry Weil supervised my capstone paper research. He has been instrumental in
guiding my thinking and helping me to consolidate material learnt in various Sloan
classes. I am grateful for his encouragement and enthusiastic support. I would also like to
thank my thesis committee, Professors George Stephanopoulos, Alan Hatton, Christine
Ortiz and Steve Eppinger, for their valuable suggestions and advice.
I am grateful to the Consortium for the Advancement of Manufacturing of
Pharmaceuticals (CAMP) for financial support and to its members for their input.
My thanks to the Cooney group: Yu Pu, Samuel Ngai, Lakshman Pernenkil, Matthew
Abel, Brian Mickus, Erin Bell, Claudia Fabian, Daniel Weber, Farzad Jalali-Yazdi and
Ben Lin for their friendship and support. Rosangela dos Santos has been an invaluable
support and a caring and friendly presence. It has been a pleasure working with them all.
I benefited greatly from interactions with the undergraduate students in the UROP
program and in classes 10.29: Cathleen Allard, Moira Kessler, Shannon Nees, Sidra
Khan, Kyle Yazzie, Deepika Singh, Jamira Cotton, Joe Roy-Mayhew and Mary
Machado. Also, thanks to Margo Servison. I am grateful to Dr Bill Dalzell for offering
me a position as teaching assistant with the class of 10.32, Spring 2008. I believe I learnt
at least as much from them, as they (maybe) did from me.
Many people have been kind enough to train and assist me in the different experimental
techniques described in this research. They are too numerous to list here and are
acknowledged in the appropriate chapters.
On a personal note, I would like to thank my beloved husband, Raj, for his unwavering
patience, good humor and affection. Finally, I could not have attempted this endeavor
without the boundless love, support and encouragement of Aai, Baba and Meenal. They
are always at the heart of my success.
-5-
Mridula Pore, 2009 Doctoral Thesis, MIT
Table of ContentsIntroduction ...................................... .............................................................. .............. 13
Part I: Physical and Mechanical Characterization of Excipient Powders ...................... 23
I.A: Physical Characterization of Powders ................... .................. 24
I.B Mechanical Characterization of Powders .................................. 32
Part II: T ablet Perform ance......................................... .......................................... 59
II.A: Tablet Hardness .................. ...................... . ................... ...................................... 60
II.B : D issolution .......................................... 66
Part III: Imaging and Spectroscopic Analysis of Tablet Structure ....................... 77
III.A: Terahertz Pulsed Transmission Spectroscopy ............................... 78
III.B: Microstructure Analysis using X ray microCT .................................. 86
III.C: Tablet Defect Detection ........................................ 102
III.D: Comparison of Analytical Techniques...................................................... 111
Part IV: Implications for Design.................................. 117
IV.A: Product and Process Design Overview ............................... 118
IV .B Form ulation D esign............................. ...... ..................... ...... ..................... 124
IV .C Process D esign ................. ....... ............. ............ ....... ...................... 130
IV.D Recommendations for Future Work ........................................ 135
Part V: Patent Expiry of Statin Products - A Study of Market Dynamics ................... 147
V.A Statin Products: the Perspective of Technology Market Dynamics ..................... 149
V.B. Regulatory and Structural Features Influencing Strategic Decision Making......... 157
V.C Modeling Statin Market Dynamics during Patent Expiry .................................... 170
V.D: Conclusions and Further Work ........................................ 186
V.E Appendices and Bibliography ........................................ 188
C onclusions ........................................................... ..... .................................. .... 209
A bbreviations ........................................................... ............................ 210
-6-

Doctoral Thesis, MIT
List of FiguresFigure 1: Dosage Form of FDA-approved Drug Products (*includes inhalation andtopical products, Source: Drugs@FDA, 2005).................................. ............ 13Figure 2: Design approach for structured products (adapted from Hill, 2005) ............. 15Figure 3: Tablet compaction cycle.................................................... 17Figure 4: Relationship between material properties and compaction behavior (Rowe andR ob erts, 1996).................................................................................................................. 17Figure 5: Feret diameter measurement ..................................... .... ................ 26Figure 6: Lognormal number distribution of particle size (dotted lines represent upper andlower 95% confidence intervals) ...................................... 27Figure 7: ESEM images of granule morphology before and after ethanol wash. No changeis observed. ................................................... 28Figure 8: Environmental scanning electron microscope images of DCL 11 (left) and DCL14 (right) granules (DMV International, 2005) ...................................... ....... 28Figure 9: Equipment geometry for single granule compression test ............................ 34Figure 10: Environmental scanning electron microscope image of MCC Celphere®granules (A sahi K asei, 2007) ............................................................ .......................... 36Figure 11: Environmental scanning electron microscope images of DCL 11 (left) andDCL 14 (right) granules (DMV International, 2005) .......................................... 36Figure 12: DEM simulation of agglomerate (Martin, 2007)................................ 38Figure 13: Comparison of DEM simulations for single granule compression testing ofdense and loose packed agglomerates, resulting in fracture (a,b) and disintegration (c,d)respectively (Thornton et al, 2004)................................................................................... 39Figure 14: Map showing the dependence of granule breakage regime on impact velocityand solid fraction (Subero and Ghadiri, 2001)..................................... ....... 41Figure 15: Schematic of Micro Materials Ltd Nanotest apparatus with detail of stub andtip ................... ............................................................................................ . ...... 4 3Figure 16: ESEM images of granule morphology before and after ethanol wash. Nochange is observed. ........................................................................................................... 44Figure 17: Feret diameter measurement ....................................................... 45Figure 18: Comparison of force-displacement profiles obtained for MCC Celphere®granules tested with a MTS Nanoindenter and a Micromaterials Ltd. Nanotest .............. 48Figure 19: Comparison of force-displacement profiles obtained for DCL 11 granulestested with a MTS Nanoindenter and a Micromaterials Ltd. Nanotest ............................. 49Figure 20: Failure modes of lactose agglomerates, characterized by force-displacementprofile, fracture planes and daughter fragment size................................... ........ 50Figure 21: DCL 11 granules tested at 2mN/s show no correlation........................ . 50Figure 22: Distributions of mechanical properties for DCL 11 and 14 tested at 10mN/s 53Figure 23: Tablet failures modes (left to right): (a) simple tensile failure, (b) triple cleft(tensile failure) (c) shear-induced failure (adapted from Davies and Newton, 1996) ..... 60Figure 24: Tensile strength of MCC and DCL 11 tablets .................................... . 63Figure 25: Comparison of tensile strength for DCL11 and DCL 14 tablets ................... 64Figure 26: Tablet erosion model (Katzenhendler et al., 1997) .................................... 68Figure 27: Dissolution profile for 5% caffeine, 95% MCC tablet compacted to 60kN at50m m /m in ............... .................................................................................................... 70
-7-
Mridula Pore, 2009

Doctoral Thesis, MIT
Figure 28: T90 for lactose DCL 11 and DCL 14 tablets compacted at a range of speeds andforces ............................................................... ....................................... 71Figure 29: Normalized dissolution profiles for 5% caffeine, 95% DCL 11 tabletscompacted to different forces (shown, in kN) ...................................... ........... 72Figure 30: Normalized dissolution profiles for 5% caffeine, 95% DCL 14 tabletscompacted to different forces (shown, in kN) ...................................... ............ 72Figure 31: The position of terahertz radiation in the electromagnetic spectrum (Source:TeraV iew , 2007) .................................................. 78Figure 32: Mean refractive index data for MCC tablets prepared under differentcom paction conditions .................................................................. .............................. 80Figure 33: Mean refractive index data for lactose compacts prepared under differentcom paction conditions .............................................................................................. 81Figure 34: Correlation between tablet hardness and THz mean refractive index (averagedover 10-50 cm -' for MCC tablets and 10-80 cm-1 for MCC tablets ............................... 82Figure 35: Spectra of DCL1 1 and DCL 14 tablets compacted at 0.5mm/min to differentfin al fo rces ........................................ ................... ............. .. ...... ........... ..................... 82Figure 36: Terahertz spectra of different lactose hydrate forms. Spectra are verticallyoffset and normalized for clarity (Source: Zeitler et al 2007) ..................................... 84Figure 37: X ray micro CT scan configuration (source: Skyscan, 2007) ...................... 86Figure 38: X ray shadow image of lactose tablet fragment ..................................... .87Figure 39: Example of reconstructed grayscale cross section of a fragment of lactoseDCL 11 tablet at a depth of 1.586mm into the sample ..................................... 87Figure 40: Intensity histogram for a set of reconstructed slices (global threshold: 46).... 88Figure 41: Pore diameter calculation for point x. The structural thickness is the volumeaverage of the spherical diameter, 2r ..................................... . ... .................. 89Figure 42: Cylindrical region selected for analysis ..................................... ....... 91Figure 43: Grayscale cross section of MCC tablets (from left to right), (a) 0.5mm/min19kN, (b) 5mm/min 40kN, (c) 50mm/min 72kN........................................................... 92Figure 44: Grayscale cross section of DCL 11 tablets (from left to right), (a) 0.5mm/min19kN, (b) 5mm/min 40kN, (c) 50mm/min 72kN........................................................... 92Figure 45: Example of binarized cross section of lactose DCL 11 tablet (white: pores,black: solid/area outside region of interest) ....................................... ............ 93Figure 46: 3D porosity of lactose DCL 11 tablets compacted under different conditions 93Figure 47: Average pore cross section area (2D analysis) of DCL 11 tablets decreases ascom paction force increases ............................................... ..... ... ..... .. .................. 94Figure 48: Volume average pore diameter of lactose DCL 11 decreases as compactionforce in creases............................... ..... ......... ... ... ...... .. ............. ....... .................... 95Figure 49: Effect of compaction conditions on volume weighted pore diameterdistribution of DCL 11 tablets ....................................... ..................... 95Figure 50: Cross sections of DCL 11 and DCL 14 tablets compacted to the same finalforce at a speed of 0.5mm/min. White: pores, Black: solid/area outside region of interest(diam eter -Im m ). ............................................... ................................. ...................... 97Figure 51: Comparison of volume-weighted pore diameter distributions of DCL 11 andDCL 14 tablets compacted to the same conditions ........................................................ 98
-8-
Mridula Pore, 2009

Doctoral Thesis, MIT
Figure 52: Effect of resolution and voxel positioning on porosity measurement. Left handimages represent real object, right hand images represent binary image. Grid sizerepresents resolution. ........................................................................................................ 99Figure 53: Common tablet defects (shown for cylindrical tablet geometry) ............... 102Figure 54: Principle of THz pulsed imaging. RI n indicates the refractive index of thedifferent layers and tn indicates the signal reflection time from the correspondinginterfaces. ............................................................... 103Figure 55: TPI images of MCC tablet compacted to 72kN at 50mm/min ........... 105Figure 56: Diametral and axial cross sections of lactose DCL 11 tablet compacted to60kN at 5mm/min (Tablet B) ...................................... 107Figure 57: Cross section of MCC tablet compacted to 60kN at 5mm/min.................. 107Figure 58: Diametral cross section of DCL 11 tablets............................. 107Figure 59: NIR spectra show a wavelength dependent shift with tablet hardness (Source:D onoso et al, 2003) ........................................ 113Figure 60: Design approach for structured products (adapted from Hill, 2005) ............ 118Figure 61: Model-based framework for systematic product-process design anddevelopment (Adapted from: Gani et al, 2007) ..................................... 119Figure 62: Tablets compacted to 19kN at 0.5mm/min (left to right) (a) MCC, (b) DCL 11,(c) D C L 14 ................................... ................................................................ .......... 12 5Figure 63: DCL 11 and DCL 14 tablets have same pore size distribution .................. 126Figure 64: Tensile strength of MCC and DCL 11 tablets .................................... 126Figure 65: Lactose DCL1 1 and DCL 14 form tablets of equal strength..................... 127Figure 66: DCL14 tablets dissolve at slower rates than DCL 11 tablets ........................ 128Figure 67: Grayscale cross-section of MCC tablets (from left to right), (a) 0.5mm/min19kN, (b) 5mm/min 40kN, (c) 50mm/min 72kN............................ 131Figure 68: Tensile strength of MCC tablets compacted under different conditions....... 132Figure 69: DCL 11 and DCL 14 tablet pore size decreases with increasing compactionfo rce ................................................................................................................................ 13 2Figure 70: Lactose DCL 11 and DCL 14 tablets show increasing strength with increasingcom paction force............................................................................................................. 133Figure 71: Dissolution times for lactose DCL 1I and DCL 14 tablets increase withcompaction force at different rates ..................................... 133Figure 72: Particle geometry is considered as a Voronoi cell (a), densification is modeledby concentric growth (b) and redistribution of the excess volume (c) (Source: Lum et al,19 9 8 ) ............................................................................................................................... 13 8Figure 73: DEM/FEM model of compaction for a binary mixture with equal componentsof soft ductile particles and hard, brittle particles. (Source: Gethin et al., 2003) ........... 140Figure 74: ESEM picture of fractured tablet of caffeine and micro-crystalline cellulose
.................................................................................................................................... 14 1Figure 75: Slice of 3D packing evolution during uniaxial compaction of 100 breakableaggregates (indicated by different colors) Source: Martin and Bouvard, 2006........... 142Figure 76: The technology 'S' curve ...................................... 149Figure 77: Lifecycles of statin products to date (Data from: FDA Orange Book, 2009;Smith 2006; Herper, 2006) ........................................ 153Figure 78: Growth in dispensed prescriptions versus sales for the lipid regulator market inthe US (Source: 2007 Top-line industry data, IMS Health, 2007) ............................. 155
-9-
Mridula Pore, 2009
Doctoral Thesis, MIT
Figure 79: Flow of physical goods and financial transactions in the pharmaceutical supplychain (Source: Kaiser, 2005)...... ................................... 163Figure 80: Intrinsic versus perceived product value index (PVI) ................................ 171Figure 81: Number of statin prescriptions January 2004- July 2007 (Source: Tooley andSteadm an, 2007) ............................................................ ........................................ 174Figure 82: Market share of statins prescriptions January 2004- July 2007 (Source:Tooleyand Steadm an, 2007). ................................................................................................ 174Figure 83: Weight on PVI for lovastatin .............................. 175Figure 84: Mevacor® (B) and generic lovastatin (G) market share ............................ 176Figure 85: Revenues for Mevacor® (B) and generic lovastatin (G)........................... 176Figure 86: Market share of Pravachol............................. 177Figure 87: Effect of promotion spend on market share of Pravachol® and genericpravastatin .............................. ...................................... 177Figure 88: Effect of promotion spend on revenues of Pravachol® and generic pravastatin........................................ .. ...................... ............................................... 178Figure 89: Effect of the generic entry price on market share of pravastatin............... 179Figure 90: Effect of the generic entry price on market share of simvastatin .................. 180Figure 91: Predicted market share for Lescol® ........................................ 181Figure 92: Weight on PVI for Lipitor ..................................... 181Figure 93: Pricing scenario analysis for Lipitor® market share .................................. 182Figure 94: Pricing scenario analysis for Lipitor® revenues ........................................ 183Figure 95: Base case market share for Crestor® ..................................... 184Figure 96: Lovastatin average wholesale prices (own analysis, based on data from RedB o o k TM )....................... ......... .......................................... ........................................... 19 1Figure 97: Pravastatin average wholesale prices (own analysis, based on data from RedB ook TM )...................... ........ ..... .......................................................................... 192Figure 98: Simvastatin average wholesale prices (own analysis, based on data from RedBookTM).................................................................................................................................... 193Figure 99: Average wholesale prices of branded single-active ingredient statin products1997-2008 (own analysis based on data from Red BookTM ) .......................................... 194Figure 100: Model View 1: Market share for the branded product and the effects ofprom otional spend ........................................................................................................... 197Figure 101: Model View 2: Market share allocation .................................... 198Figure 102: Model View 3: Market share of generics and IP investments by the brandedand generics m anufacturers................................................................................... 199
-10-
Mridula Pore, 2009
Doctoral Thesis, MIT
List of TablesTable 1: Lognormal parameters of particle size number distribution............................... 26Table 2: Pycnometric density of excipient powders ...................................................... 27Table 3: Asphericity of DCL 11 and DCL 14 granules ........................................ 29Table 4: Literature and experimental values for mechanical properties of polystyrene... 47Table 5: Effect of loading rate on failure mode of DCL 11 granule............................. 51Table 6: Effect of loading rate on mechanical properties of DCL 11 granules ................ 52Table 7: Granule failure modes for DCL 11 and DCL 14 tested at 10mN/s ................ 52Table 8: Comparison of mechanical properties of DCL 11 and DCL 14 tested at 10mN/s.............................. ............................................................................................................ 5 3Table 9: Stiffening effects are observed during cyclic loading of DCL 11 and DCL 14granules ..................................................... 54Table 10: X ray microCT scanning and reconstruction parameters for tablet fragments. 90Table 11: Average porosity of DCL 11 and DCL 14 tablets compacted to the samecon d ition s ..................................................................................................... .................... 9 6Table 12: X ray microCT scanning and reconstruction parameters for whole tablets.... 105Table 13: TPI cross section images of DCL 11 tablets (scale indicates THz signal in a.u.)show ing m ost extensive defects ...................................................................................... 106Table 14: X ray micro CT cross section images of DCL 11 tablets, showing mostextensive defects ........................................ 107Table 15: Comparison of fracture toughness of DCL 11 and DCL 14 tested at 10mN/s 125Table 16: Chemical structure of active ingredients of the statin family ..................... 151Table 17: US Sales (Source: IMS Health, 2007) ..................................... 152Table 18: US and worldwide statin sales for firms with products under patent protection.Sources: Annual reports to shareholders ............................ 152Table 19: Branded and generic stating products approved by the FDA (Source: FDAOrange Book, 2009)................................... 154
- 11 -
Mridula Pore, 2009
Doctoral Thesis, MIT
- 12-
Mridula Pore, 2009
Mridula Pore, 2009 Doctoral Thesis, MIT
Introduction
Introduction
Current state of tablet product development and manufacturing
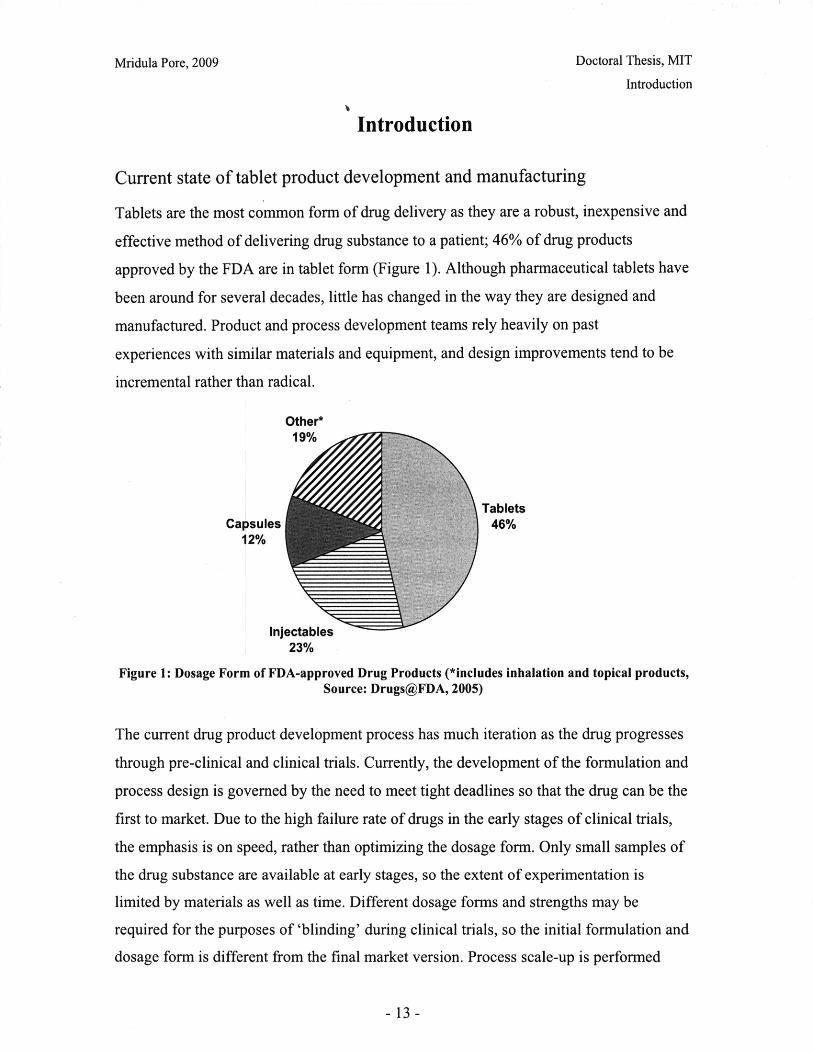
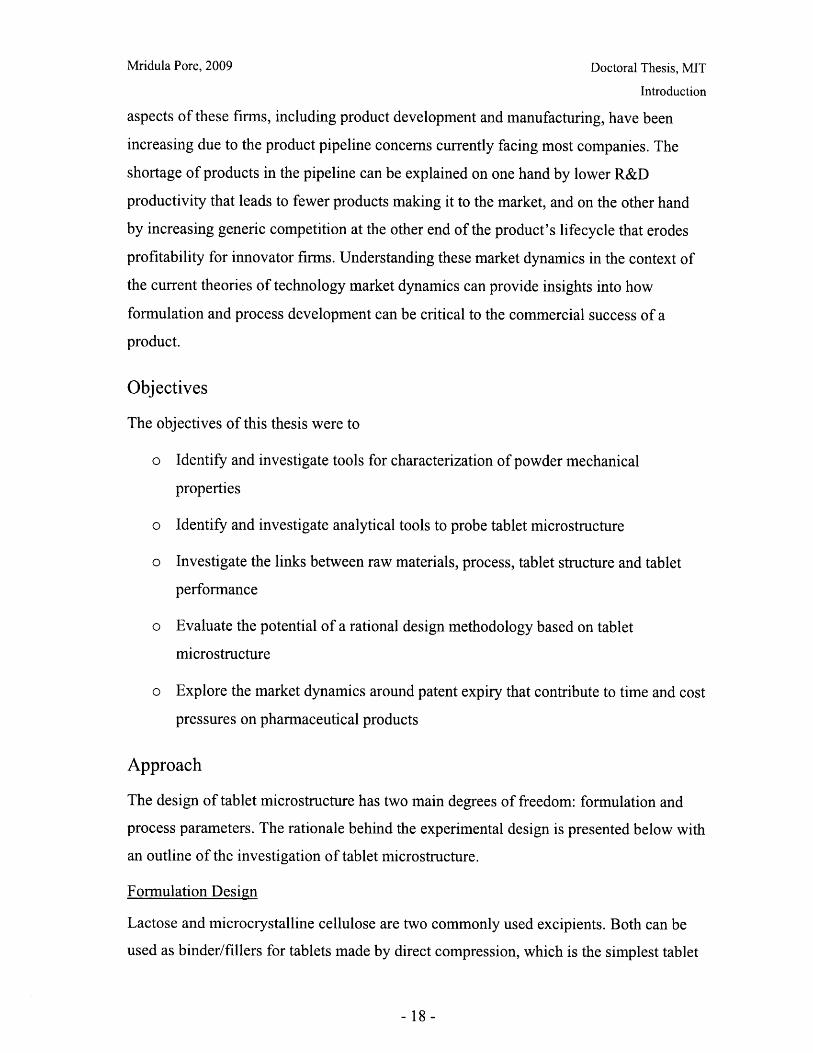
Tablets are the most common form of drug delivery as they are a robust, inexpensive and
effective method of delivering drug substance to a patient; 46% of drug products
approved by the FDA are in tablet form (Figure 1). Although pharmaceutical tablets have
been around for several decades, little has changed in the way they are designed and
manufactured. Product and process development teams rely heavily on past
experiences with similar materials and equipment, and design improvements tend to be
incremental rather than radical.
Other*19%
TabletsCapsules 46%
12%
Injectables23%
Figure 1: Dosage Form of FDA-approved Drug Products (*includes inhalation and topical products,Source: Drugs@FDA, 2005)
The current drug product development process has much iteration as the drug progresses
through pre-clinical and clinical trials. Currently, the development of the formulation and
process design is governed by the need to meet tight deadlines so that the drug can be the
first to market. Due to the high failure rate of drugs in the early stages of clinical trials,
the emphasis is on speed, rather than optimizing the dosage form. Only small samples of
the drug substance are available at early stages, so the extent of experimentation is
limited by materials as well as time. Different dosage forms and strengths may be
required for the purposes of 'blinding' during clinical trials, so the initial formulation and
dosage form is different from the final market version. Process scale-up is performed
-13-

Mridula Pore, 2009 Doctoral Thesis, MIT
Introduction
only at the later stages of clinical development, so potential manufacturing problems
cannot be identified until the formulation and dosage form specifications have been fixed
by regulatory documentation. Hence processes that are sub-optimal in terms of cost-
efficiency or raw material usage are often implemented.
Direct compression is a tablet-making process whereby active pharmaceutical ingredients
(API's) are simply blended with other ingredients (excipients) and the resulting powder
mixture is compacted. This is the simplest and most cost-effective process for
manufacturing tablets. However, the impact of material properties and process attributes
on product quality is not well understood. As a result, there is a high perceived risk
associated with the process and only a small fraction of manufacturing processes are
direct compression (McCormick, 2005). Most manufacturing processes involve
additional operations, such as wet granulation or roller compaction. More complex
processes result in additional capital, energy and material requirements and introduce
sources of variation. It is desirable to eliminate these increased costs and uncertainties by
increasing the fundamental knowledge of the direct compression process.
It has been proposed in the literature that a combined product design and process systems
engineering approach (Cussler and Moggridge, 2001, Sieder et al., 2004) could be
applied to the development of solid dosage forms to reduce the time and effort required
for the launch of a new solid dosage product (Fung and Ng, 2003, Hardy and Cook,
2003). There is also a strong regulatory driver for a rational design approach. For
example, the ICH Q8 guidelines (FDA, 2004) advocate 'designing and developing
formulations and manufacturing processes to ensure predefined product quality'. For this
to be a realistic goal, the materials and process must be thoroughly understood and there
should be capacity to predict their effects on the product quality. Better understanding of
the process and the sources of variability allows a control strategy to be implemented,
which would lead to more robust manufacturing processes.
The 'Structured Chemical Product' Design paradigm
There is a growing body of chemical engineering literature that discusses approaches for
designing products whose structure is a key part of their functionality. A pharmaceutical
tablet falls in this category. Hill (2004) describes structured products as complex,
-14-
Mridula Pore, 2009 Doctoral Thesis, MIT
Introduction
multiphase materials, with microstructures on the scale of 0.1-100 tm. Some familiar
examples include consumer products such as ice-cream and chocolate: solids whose
crystal structure affects their taste, or skin creams and margarine, whose 'spreadability'
depends on the structure of the emulsion. Their structure, more than the chemical
composition, determines the functional properties of these materials.
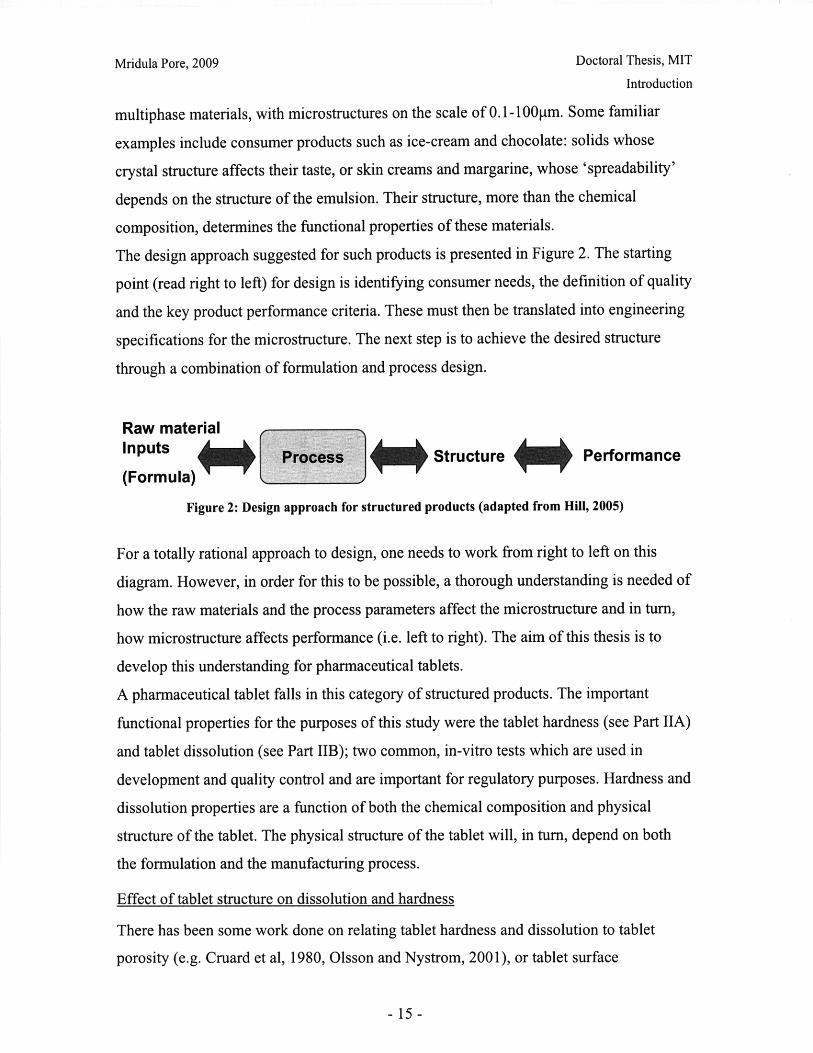
The design approach suggested for such products is presented in Figure 2. The starting
point (read right to left) for design is identifying consumer needs, the definition of quality
and the key product performance criteria. These must then be translated into engineering
specifications for the microstructure. The next step is to achieve the desired structure
through a combination of formulation and process design.
Raw materialInputs Process Structure Performance(Formula)
Figure 2: Design approach for structured products (adapted from Hill, 2005)
For a totally rational approach to design, one needs to work from right to left on this
diagram. However, in order for this to be possible, a thorough understanding is needed of
how the raw materials and the process parameters affect the microstructure and in turn,
how microstructure affects performance (i.e. left to right). The aim of this thesis is to
develop this understanding for pharmaceutical tablets.
A pharmaceutical tablet falls in this category of structured products. The important
functional properties for the purposes of this study were the tablet hardness (see Part IIA)
and tablet dissolution (see Part IIB); two common, in-vitro tests which are used in
development and quality control and are important for regulatory purposes. Hardness and
dissolution properties are a function of both the chemical composition and physical
structure of the tablet. The physical structure of the tablet will, in turn, depend on both
the formulation and the manufacturing process.
Effect of tablet structure on dissolution and hardness
There has been some work done on relating tablet hardness and dissolution to tablet
porosity (e.g. Cruard et al, 1980, Olsson and Nystrom, 2001), or tablet surface
-15-
Mridula Pore, 2009 Doctoral Thesis, MIT
Introduction
morphology (e.g.Narayan and Hancock, 2003). However, these are usually correlative
relationships and there are limitations to the structural information obtained. Porosity has
typically been measured by permeametry in these studies and an average value for the
tablet is obtained. Therefore qualitative morphological data is not available.
Surface imaging, by ESEM for example, can give us high resolution information about
the tablet. However, the surface of a tablet or a broken fragment typically does not
represent the internal structure due to wall effects during compaction or smearing effects
during breakage. Until recently it was not possible to obtain high resolution images (on
the order of microns) of the internal structure of tablets.
Effect of formulation and compaction process on tablet structure
Most commercially-produced tablets consist of a coating around a core containing the
active ingredient plus other materials (known as excipients) that act as fillers, binders,
lubricants, disintegrants etc. For the purposes of simplicity, the focus of this study is on
uncoated tablets.
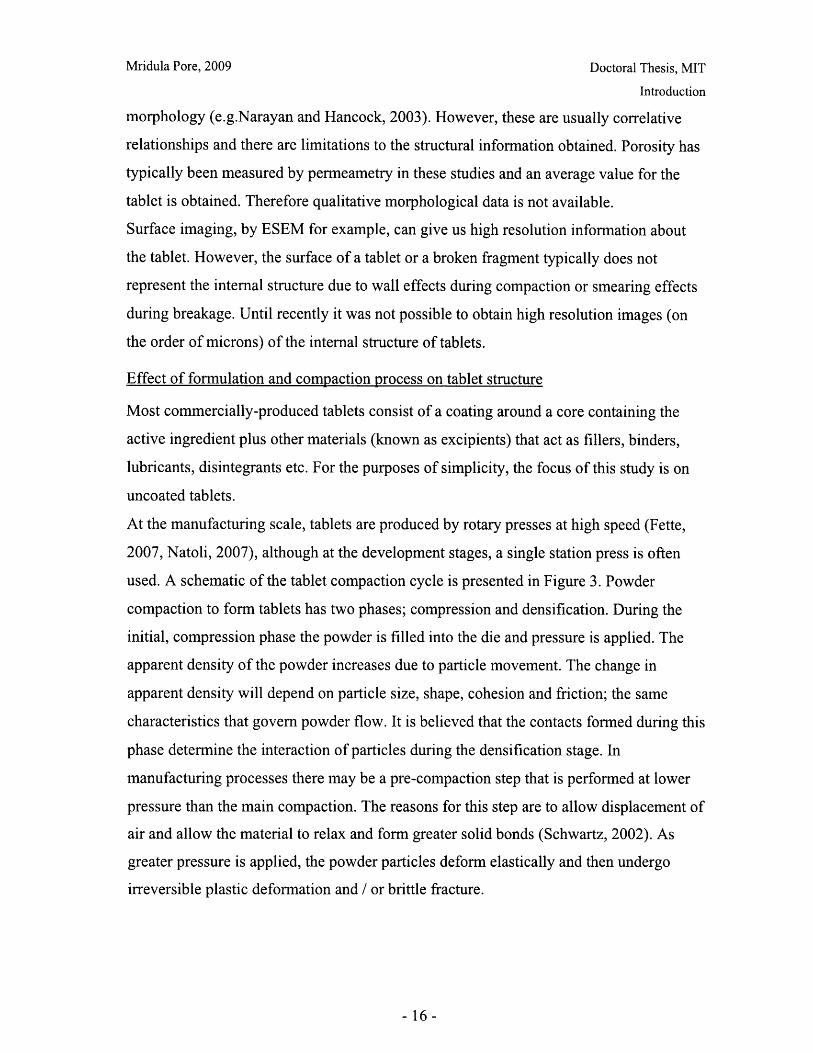
At the manufacturing scale, tablets are produced by rotary presses at high speed (Fette,
2007, Natoli, 2007), although at the development stages, a single station press is often
used. A schematic of the tablet compaction cycle is presented in Figure 3. Powder
compaction to form tablets has two phases; compression and densification. During the
initial, compression phase the powder is filled into the die and pressure is applied. The
apparent density of the powder increases due to particle movement. The change in
apparent density will depend on particle size, shape, cohesion and friction; the same
characteristics that govern powder flow. It is believed that the contacts formed during this
phase determine the interaction of particles during the densification stage. In
manufacturing processes there may be a pre-compaction step that is performed at lower
pressure than the main compaction. The reasons for this step are to allow displacement of
air and allow the material to relax and form greater solid bonds (Schwartz, 2002). As
greater pressure is applied, the powder particles deform elastically and then undergo
irreversible plastic deformation and / or brittle fracture.
-16-
Mridula Pore, 2009 Doctoral Thesis, MIT
Introduction
Die Filling Compression Pre-compaction Compaction Ejection
Figure 3: Tablet compaction cycle
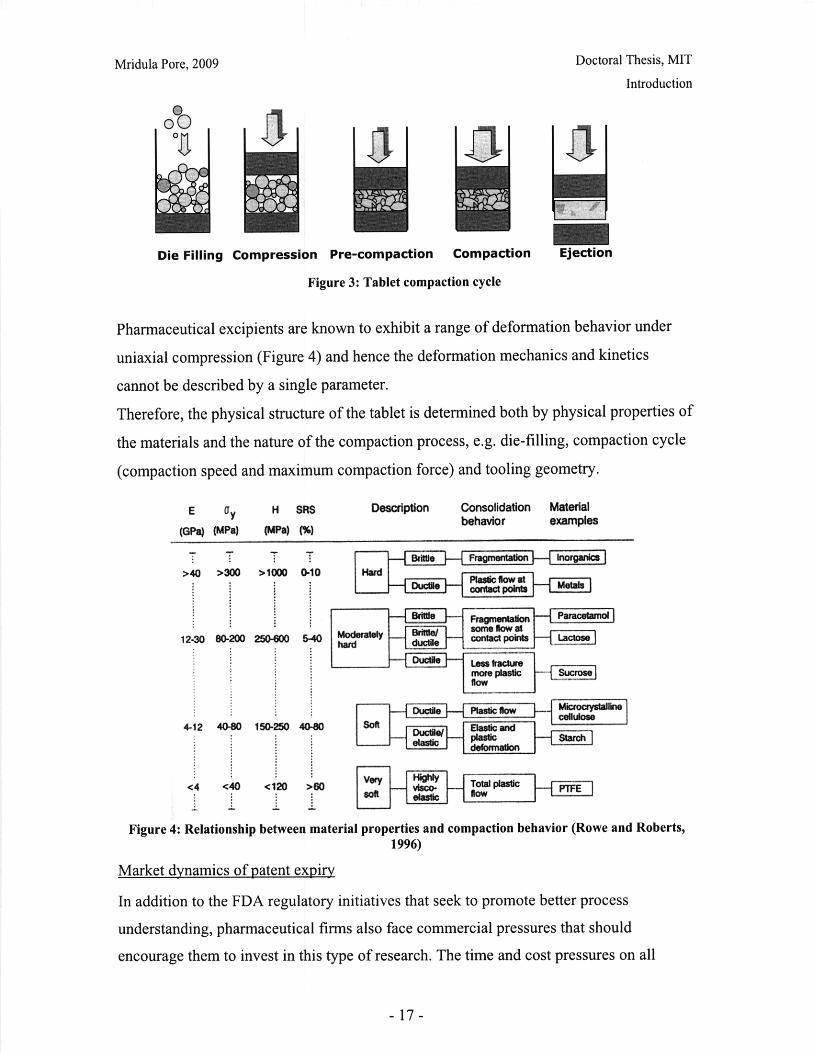
Pharmaceutical excipients are known to exhibit a range of deformation behavior under
uniaxial compression (Figure 4) and hence the deformation mechanics and kinetics
cannot be described by a single parameter.
Therefore, the physical structure of the tablet is determined both by physical properties of
the materials and the nature of the compaction process, e.g. die-filling, compaction cycle
(compaction speed and maximum compaction force) and tooling geometry.
E Iy H SRS Description Consolidation Materialbehavior examples
e T Tn Fagmntdno- Iin rganlc>40 >300 >1000 0-10 Hard
12-30 0200 95000 5-40 had duct% CxMlApoirt i
Market dynamics of patent expiryIn addition to the FDA regulatory initiatives that seek tor promote better processunderstanding, pharmaceutical firms also face commercial pressures that should4-12 4080them to invest in this type of research. The time and cost pressures on all<4 <40 <12o 80 Vuy ~ Tota plastic PTFEsoft .. low
Figure 4: Relationship between material properties and compaction behavior (Rowe and Roberts,1996)
Market dynamics of patent expiry
In addition to the FDA regulatory initiatives that seek to promote better process
understanding, pharmaceutical firms also face commercial pressures that should
encourage them to invest in this type of research. The time and cost pressures on all
-17-
Mridula Pore, 2009 Doctoral Thesis, MIT
Introduction
aspects of these firms, including product development and manufacturing, have been
increasing due to the product pipeline concerns currently facing most companies. The
shortage of products in the pipeline can be explained on one hand by lower R&D
productivity that leads to fewer products making it to the market, and on the other hand
by increasing generic competition at the other end of the product's lifecycle that erodes
profitability for innovator firms. Understanding these market dynamics in the context of
the current theories of technology market dynamics can provide insights into how
formulation and process development can be critical to the commercial success of a
product.
Objectives
The objectives of this thesis were to
o Identify and investigate tools for characterization of powder mechanical
properties
o Identify and investigate analytical tools to probe tablet microstructure
o Investigate the links between raw materials, process, tablet structure and tablet
performance
o Evaluate the potential of a rational design methodology based on tablet
microstructure
o Explore the market dynamics around patent expiry that contribute to time and cost
pressures on pharmaceutical products
Approach
The design of tablet microstructure has two main degrees of freedom: formulation and
process parameters. The rationale behind the experimental design is presented below with
an outline of the investigation of tablet microstructure.
Formulation Design
Lactose and microcrystalline cellulose are two commonly used excipients. Both can be
used as binder/fillers for tablets made by direct compression, which is the simplest tablet
- 18 -
Mridula Pore, 2009 Doctoral Thesis, MIT
Introduction
manufacturing process. A direct compression process was used in this research to
eliminate sources of variation from blending and other preliminary steps. The potency of
new drugs is increasing and hence dosages are lower. In this case, excipients will form a
large part of the tablet and the characteristics of the excipient will play a dominant role in
determining tablet physico-chemical properties. Therefore, this study focuses on tablets
made only of direct-compression excipients. The only exception is the dissolution study,
where small amounts of caffeine were added to the tablet to act as a tracer.
As shown in Figure 4, lactose and MCC are believed to have very different mechanical
characteristics. Therefore they were chosen as materials to investigate the effects of
granule mechanical properties on tablet structure and performance.
MCC Celphere CP102 lot no. 15J1 (Asahi Kasei, Japan) and Lactose DCL 11 lot number
10218008 (DMV International, The Netherlands) were used to compare the effects of
different granule failure mechanisms. Lactose DCL 14 lot number 10185935 (DMV
International) was used for a quantitative comparison with DCL 11.
The physical and mechanical characteristics of these powders were obtained
experimentally and are presented in Part I. The effects of material on tablet performance
and physical structure are presented in Parts II and III respectively.
Process Design
In this study, the effects of compaction speed and maximum compaction force were
investigated. The tooling geometry was kept constant and a uniaxial, constant-speed
compaction cycle was used for making the tablets.
The effects of speed and force on tablet hardness and dissolution are presented in Part II
and the effects on tablet structural features are presented in Part III.
Tablet structural analysis
Terahertz spectroscopy and imaging, and X ray microCT are tools that are relatively new
in the area of pharmaceutical solids analysis. Their potential for characterizing the
structure of the tablet was investigated. The tools were used to obtain information about
the microstructure of the tablet (length scale of 1-100 microns) and also to detect large
structural features (on the order of millimeters). This investigation is presented in Part III
of this thesis.
-19-
Mridula Pore, 2009 Doctoral Thesis, MIT
Introduction
In Part IV, the implications of the experimental findings on product and process design
are considered.
Market dynamics of patent expiry
Statin drug products were selected for this investigation, as there are several indicators
showing that they are illustrative of a pharmaceutical market undergoing the process of
commoditization . As this is a high-profile market, pricing and market data is available in
the public domain for analysis.
The following frameworks for the strategic analysis of technology markets were applied:
S-curve industry dynamics frameworks (Foster, 1986) and the value capture framework
by Teece (1986).
A system dynamics model was created in Vensim® and used to replicate and explain the
dynamics of products that have already seen generic entry and to explore options for
those products that still have patent protection. This work is described in Part V.
References
Cruaud O.; Duchene D.; Puisieux F.; Carstensen J. T. J. Pharm. Sci. 1980, 69 (5), 607-
608
Cussler E.L.; Moggridge G.D. Chemical Product Design, Cambridge University Press,
Cambridge (UK), 2001
Drugs@FDA Database, www.fda.gov/CDER, Accessed 19th September 2005
FDA International Conference on Harmonization (ICH) Guidelines, Q8: Pharmaceutical
Development, Food and Drug Administration, 2004
Fette GmBH, www.fette.com, accessed July 2007
Foster R. 'The S-curve: A new forecasting tool' Chapter 4 in Innovation: The attacker's
advantage' Simon and Schuster, New York (NY), 1986, 88-111
Fung K.Y.; Ng K.M AIChE J. 2003, 49 (5), 1193
Hardy I.J.; Cook W.G. J. Pharm.Pharmacol. 2003, 55 (3)
Hill M. AIChE J., 2004, 50 (8)
Hill M. Presentation at Process Systems and Engineering Consortium Meeting, Amherst,
MA, October 14, 2005
McCormick D. Pharm. Tech. 2005, 29c(4) 52
-20-
Mridula Pore, 2009 Doctoral Thesis, MIT
Introduction
Narayan P.; Hancock B.C.,Mat. Sci. Eng. 2003, A355, 24-36
Natoli, www.natoli.com, accessed July 2007, Natoli Inc.
Olsson H.; Nystrom C. Pharm. Res. 2001, 18 (2), 203-210
Rowe R.C.; Roberts R.J. Pharmaceutical Powder Compaction Technology, Marcel
Dekker, 1996
Schwartz J.B. Pharmaceutical Process Scale-Up, Marcel Dekker, Ed. Levin M. 2002
Seider W.D.; Seader J.D.; Lewin D.R. Product and Process Design Principles; Synthesis,
Analysis and Evaluation, 2nd Ed., Wiley 2004
Teece D.J. Research Policy, 15, 285-305, 1986
-21-

Mridula Pore, 2009 Doctoral Thesis, MIT
Introduction
- 22-
Mridula Pore, 2009 Doctoral Thesis, MIT
Part I
Part I: Physical and Mechanical Characterization of Excipient
Powders
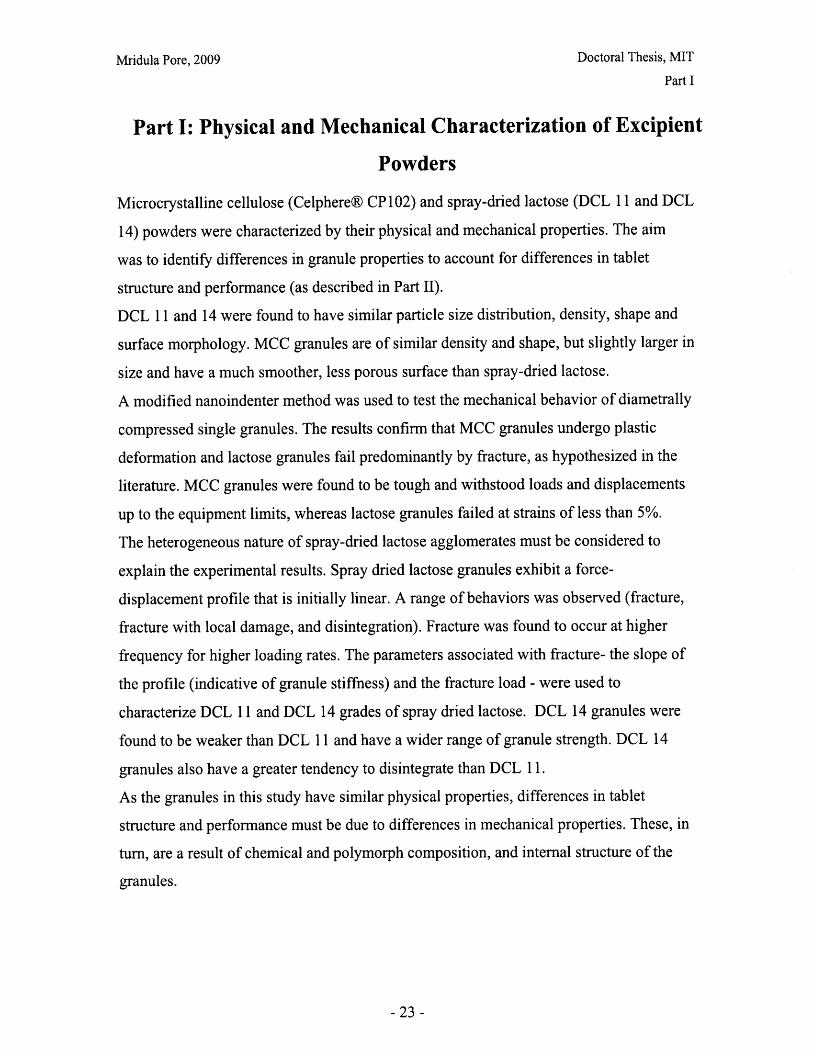
Microcrystalline cellulose (Celphere® CP 102) and spray-dried lactose (DCL 11 and DCL
14) powders were characterized by their physical and mechanical properties. The aim
was to identify differences in granule properties to account for differences in tablet
structure and performance (as described in Part II).
DCL 11 and 14 were found to have similar particle size distribution, density, shape and
surface morphology. MCC granules are of similar density and shape, but slightly larger in
size and have a much smoother, less porous surface than spray-dried lactose.
A modified nanoindenter method was used to test the mechanical behavior of diametrally
compressed single granules. The results confirm that MCC granules undergo plastic
deformation and lactose granules fail predominantly by fracture, as hypothesized in the
literature. MCC granules were found to be tough and withstood loads and displacements
up to the equipment limits, whereas lactose granules failed at strains of less than 5%.
The heterogeneous nature of spray-dried lactose agglomerates must be considered to
explain the experimental results. Spray dried lactose granules exhibit a force-
displacement profile that is initially linear. A range of behaviors was observed (fracture,
fracture with local damage, and disintegration). Fracture was found to occur at higher
frequency for higher loading rates. The parameters associated with fracture- the slope of
the profile (indicative of granule stiffness) and the fracture load - were used to
characterize DCL 11 and DCL 14 grades of spray dried lactose. DCL 14 granules were
found to be weaker than DCL 11 and have a wider range of granule strength. DCL 14
granules also have a greater tendency to disintegrate than DCL 11.
As the granules in this study have similar physical properties, differences in tablet
structure and performance must be due to differences in mechanical properties. These, in
turn, are a result of chemical and polymorph composition, and internal structure of the
granules.
-23-

Mridula Pore, 2009 Doctoral Thesis, MIT
Part I
I.A: Physical Characterization of Powders
Introduction
The size, shape and density of excipient powders used in this study were characterized
using standard methods. The purpose was to detect any differences between the raw
materials (other than their mechanical properties under loading) that might be the source
of variation in tablet structure. For example, smaller particles (Yang et al, 2000) or wider
particle size distributions (Nolan and Kavanagh, 1993) lead to denser packing structure in
a powder bed, which increases the number of particle-particle contacts and determines
force transmission pathways during compaction.
Reviews and comparisons of methods to measure and describe powder size distribution
have been presented by Rhodes (1998), Naito et al (1998), Etzler and Sanderson (1995)
and Domike (2003) and will not be covered here.
Excipient powders were prepared by a standard procedure, as described below. Only the
sieve fraction 106-212 microns was used for all experiments in this thesis. Granule size
distribution was measured using laser light diffraction (Wedd, 2003, Plantz, 2005) and
density was measured using helium pycnometry (USP 2005, ASTM, 2005, Webb, 2001
Keith, 2006, Micromeritics, 1996) . Powder granules were imaged using ESEM to study
surface morphology and optical microscopy was used to measure sphericity.
Material preparation
MCC Celphere ® CP102 lot no. 15J1 (Asahi Kasei, Japan), Lactose Pharmatose® DCL
11 lot number 10218008 (DMV International) and DCL 14 lot number 10185935 (DMV
International) were analyzed. The powders were sieved using a standard sieve tester SS-
15 (Gilson Company Inc.) and ASTM E l standard sieves.
50g of powder was sieved for five minutes on top of a stack of sieves (ASTM number
140 and 70) to obtain the sieve fraction 106-212 microns. The sieving time was kept to a
minimum to prevent damage to the powder granules (Pernenkil, 2006).
Once sieved, the powder was stored over saturated magnesium nitrate solution in a
dessicator (at 55% relative humidity) for at least 24 hours prior to testing.
-24-
Mridula Pore, 2009 Doctoral Thesis, MIT
Part I
Experimental Methods
Granule Size
A Microtrac ASVR / X100 system was used to obtain the granule size distribution by
laser light diffraction. The data was analyzed with Microtrac v9.1.15 software. 200 proof
USP grade ethyl alcohol was used as the dispersion medium, as lactose and cellulose are
both insoluble in ethanol.
Three batches of each material were sieved. One spatula of each sieve fraction was
analyzed. Each analysis consisted of three consecutive readings.
The equipment was rinsed twice with ethanol between samples to remove any powder
residue. If a bimodal distribution was observed for MCC samples, ultrasonication was
used to disperse the granules and the measurement was repeated. Ultrasonication was not
used for lactose powders to prevent damage to the granules.
Pycnometric Density
A Icc AccuPyc 1330 Helium Pycnometer (Micromeritics Inc.) was used to measure the
true volume of the powder samples (Keith, 2006). Pycnometric volume can be considered
the 'apparent particle volume' as it includes the solid volume and the volume of closed
pores, but excludes interstitial and open pore volume.
Powder was weighed into the sample cup to an accuracy of 0.1mg. The analysis consisted
of five purge runs to remove water vapor and contaminants, followed by five
measurement runs. Four samples of powder were measured for each material.
The temperature range during calibration and measurement was 25.8 - 26.1 0 C, which is
within the 2°C variation permitted by the USP standard <699> (USP, 2005a).
Environmental Scanning Electron Microscopy
A FEI/Philips XL30 FEG ESEM apparatus was used in low-vacuum mode to image
MCC and DCL11 granules before and after washing with ethanol. This was to ensure that
ethanol did not affect the morphology of the granules during particle size analysis and
sample preparation for nanoindenter experiments (see part I.B).
-25-
Mridula Pore, 2009 Doctoral Thesis, MIT
Part I
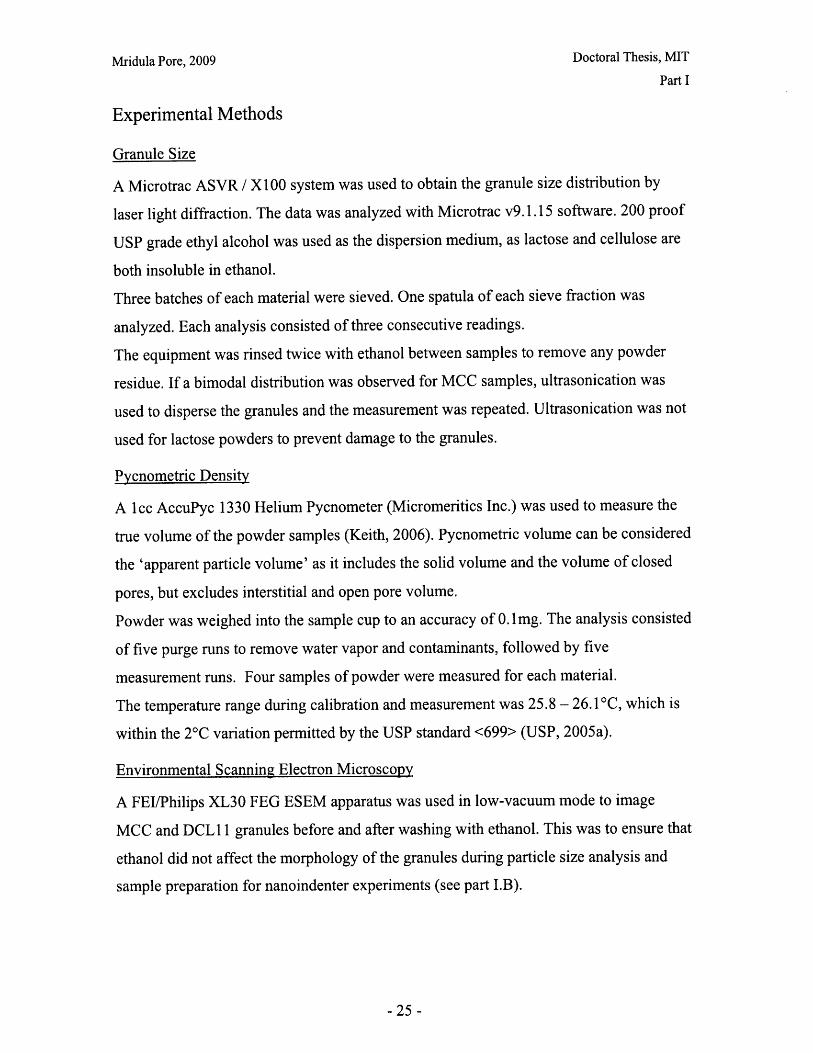
Optical Microscopy
An in-line 4X zoom optical microscope was used to image granules before mechanical
testing with a MicroMaterials Ltd Nanotest device (see Part I.B). The length scale of
images was calibrated using glass spheres of known diameter. The ratio of the Feret
diameter in two perpendicular directions (see Figure 5) was calculated as a measure of
sphericity of the granules.
Asphericity = Max ,d (I.A-1)
Y
Y X
d y
Figure 5: Feret diameter measurement
Results
Particle Size Distribution
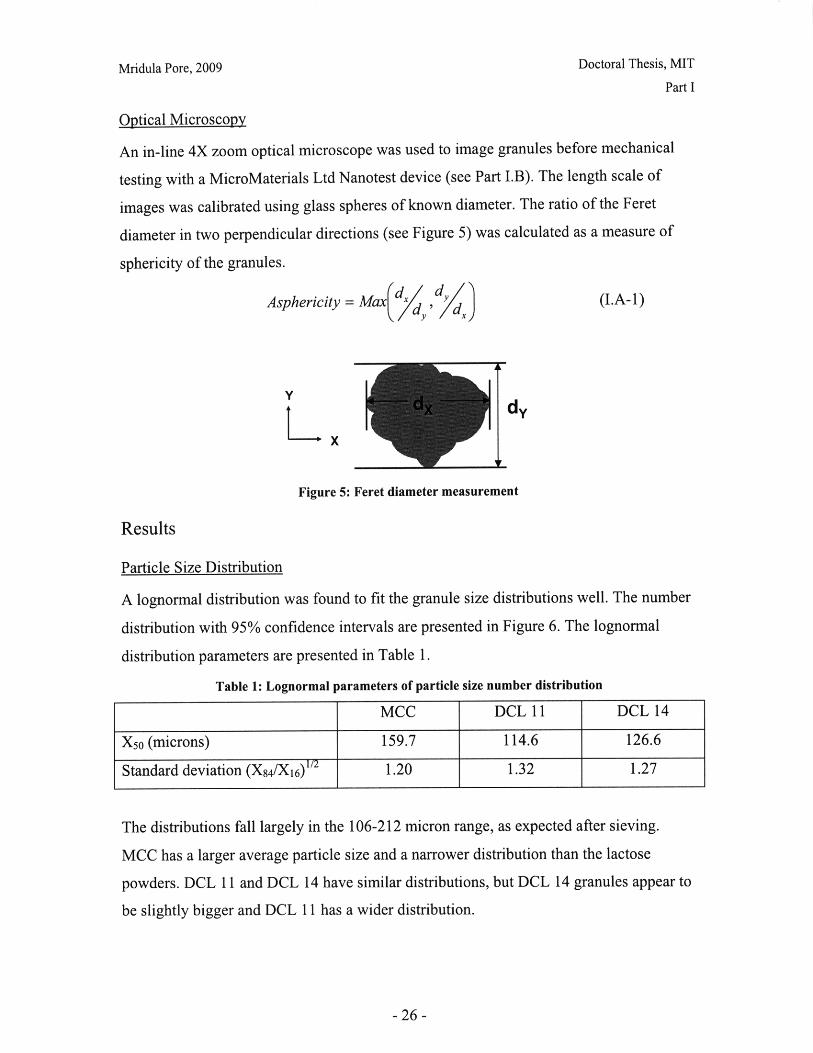
A lognormal distribution was found to fit the granule size distributions well. The number
distribution with 95% confidence intervals are presented in Figure 6. The lognormal
distribution parameters are presented in Table 1.
Table 1: Lognormal parameters of particle size number distribution
MCC DCL 11 DCL 14
Xs0o (microns) 159.7 114.6 126.6
Standard deviation (X84/X16) /2 1.20 1.32 1.27
The distributions fall largely in the 106-212 micron range, as expected after sieving.
MCC has a larger average particle size and a narrower distribution than the lactose
powders. DCL 11 and DCL 14 have similar distributions, but DCL 14 granules appear to
be slightly bigger and DCL 11 has a wider distribution.
-26-
Mridula Pore, 2009
100
90
80
70
60
50
40
30
20
10
0
Doctoral Thesis, MIT
Part I
50 100 150 200particle size (microns)
250
Figure 6: Lognormal number distribution of particle size (dotted lines represent upper and lower95% confidence intervals)
Pycnometric Density
MCC was found to have a slightly lower pycnometric density than both lactose grades
(Table 2). DCL 11 and DCL 14 do not have significantly different densities.
Table 2: Pycnometric density of excipient powders
Material (sieve fraction 106-212pgm) Pycnometric density (g/cm 3)
MCC Celphere® CP 102 1.516 + 0.004
Pharmatose® Lactose DCL 11 1.529 ± 0.004
Pharmatose® Lactose DCL 14 1.535 ± 0.003
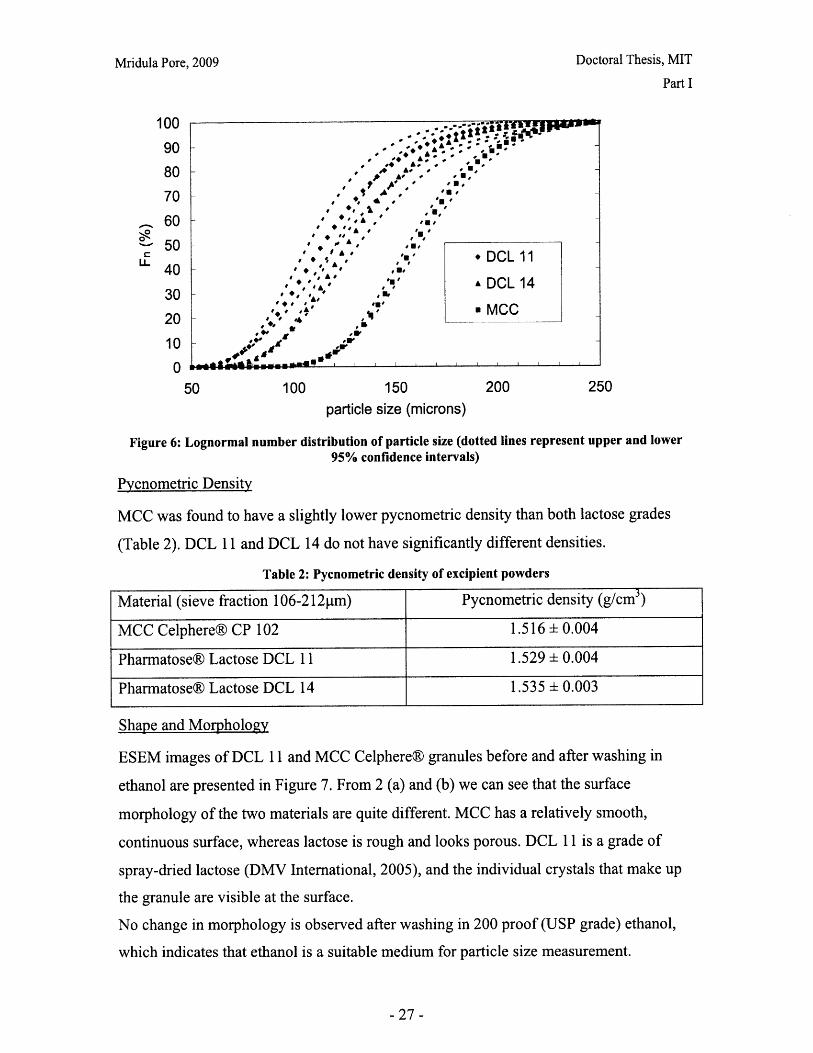
Shape and Morphology
ESEM images of DCL 11 and MCC Celphere® granules before and after washing in
ethanol are presented in Figure 7. From 2 (a) and (b) we can see that the surface
morphology of the two materials are quite different. MCC has a relatively smooth,
continuous surface, whereas lactose is rough and looks porous. DCL 11 is a grade of
spray-dried lactose (DMV International, 2005), and the individual crystals that make up
the granule are visible at the surface.
No change in morphology is observed after washing in 200 proof (USP grade) ethanol,
which indicates that ethanol is a suitable medium for particle size measurement.
-27-

Mridula Pore, 2009 Doctoral Thesis, MIT
Part I
(a) Pharmatose@ DCL 11 - as recei-
(c) Pharmatose@ DCL 11 - washed in (d) MCC Celphere@ - washed in ethanolethanol
Figure 7: ESEM images of granule morphology before and after ethanol wash. No change isobserved.
ESEM images of DCL 11 and DCL 14 (supplied by vendor) are presented in Figure 8.
No difference in surface morphology is seen.
Figure 8: Environmental scanning electron microscope images of DCL 11 (left) and DCL 14 (right)granules (DMV International, 2005)
The ratio of granule lengths was used as an indicator of asphericity for DCL 11 and DCL
14. The average and standard deviation of 25-30 samples is presented in Table 3. There is
- 28-
(h) MCC CP1nhrP(i - as received
Mridula Pore, 2009 Doctoral Thesis, MIT
Part I
no significant difference in sphericity of the granules. Both are close to a value of one,
indicating that the granules are almost spherical in shape.
Table 3: Asphericity of DCL 11 and DCL 14 granules
DCL 11 DCL 14
Average asphericity (-) 1.080 1.067
Standard deviation (-) 0.078 0.064
Discussion
Particle size distribution is known to vary with the analytical method used (Naito et al,
1998, Etzler and Sanderson, 1995). Therefore, a widely used method, laser diffraction,
was selected to analyze the powders that had already been sieved. MCC powders have a
distribution within the sieve fraction range. DCL 11 and DCL 14 contain some fines
(about 25% of particles are less than 100microns), which may be the result of attrition
during handling, as they are known to be fragile. The creation of fines leads to a wider
particle size distribution. Wider distributions are known to create denser packings of the
initial powder bed. However, the subsequent effect on the tablet structure will also
depend on the granule failure mechanism and the evolution of the powder bed structure
during the compaction process.
For the density measurement, variation in volume is within the 0.2% variation permitted
by the USP standard (USP, 2005). Pycnometric volume measurements are more accurate
if the sample is previously dried to prevent water vapor from contributing to pressure
measurements. However, in this case, the density at a given humidity was required, so the
samples were not previously dried. The density of the three powders analyzed did not
differ by more than 1%, therefore, density differences are unlikely to affect the powder
flow behavior during die filling (Ngai, 2005, Pu, 2007).
Physical characterization of MCC, DCL 11 and DCL 14 indicate that the sieved powders
have similar particle size distributions and densities. The surface morphology of the
granules varies with material, but the granules are near-spherical in shape. Therefore
although surface, and hence powder flow, properties are likely to be different, the initial
packing of the powder bed should be similar. Therefore differences in tablet structure and
-29-
Mridula Pore, 2009 Doctoral Thesis, MIT
Part I
performance must be due to differences in chemical composition and the mechanical
response of the powder bed during compaction.
Conclusions
Physical characterization of MCC, DCL 11 and DCL 14 granules indicates that they have
similar particle size distributions, densities and shape. This indicates that the pre-
compaction packing of the powders is similar and differences in tablet structure and
performance must be due to differences in chemical and mechanical properties of the
powders.
References
ASTM D5550 Test Method for Specific Gravity of Soil Solids by Gas Pycnometer
American Society for Testing Materials 2005
DMV International Product Group Overview, Pharmatose ® DC Lactose February
2005
USP Test <699> Density of Solids United States Pharmacopeia 2005, 2670
Keith, A. Micromeritics Instrument Corporation, Personal Communication 2006
Webb, P.A. Volume and Density Determinations for Particle Technologists
www.micromeritics.com 2001
Micromeritics, AccuPyc 1330 1-cm3 Samples Operation Manual, Micromeritics
Instrument Corporation 1996
Pernenkil L. Continuous Blending of Pharmaceutical Powders PhD Thesis, MIT 2006
Domike R.R. Pharmaceutical Powders in Experiment and Simulation PhD Thesis, MIT
2003
Etzler F.M.; Sanderson M.S. Part. Part. Syst. Char. 1995, 12 (5), 217-224
Naito M.; Hayakawa 0.; Nakahira K.; Mori H., Tsubaki J. Powder Technol. 1998, 100,
52-60
Nolan G.T.; Kavanagh P.E. Powder Technol. 1993, 76(3), 309-316
Ngai S.S.H. Multiscale Analysis and Simulation of Powder Blending in Pharmaceutical
Manufacturing, PhD Thesis, MIT 2005
-30-
Mridula Pore, 2009 Doctoral Thesis, MIT
Part I
Plantz, P.E. Explanation of Data Reported by Microtrac Instruments, Microtrac Inc.
Application Note 2005
Pu Y. Theoretical and Experimental Investigation of Particle Interactions in
Pharmaceutical Blending PhD Thesis, MIT 2007
Rhodes M. Introduction to Particle Technology John Wiley and Sons 1998
Wedd, M.W. Determination of Particle Size using Laser Diffraction, Educational
Resources for Particle Technologists (www.erpt. org) AIChE 2003
Yang R.Y.; Zou R.P.; Yu A-B. Phys. Rev. E. 2000, 62(3) B, 3900-3908
-31 -
Mridula Pore, 2009 Doctoral Thesis, MIT
Part I
I.B Mechanical Characterization of Powders
Introduction
The behavior of a powder bed subjected to uniaxial compaction will depend on both the
properties of the powder granules and the parameters of the compaction process.
Important material properties include the mode of deformation or failure and the granule
strength. This chapter presents work done on characterizing the failure mode of powder
particles, and qualitative and quantitative comparisons of common excipients.
Materials
The mechanical properties of microcrystalline cellulose (Celphere® CP 102 Lot 15J 1,
Asahi Kasei, Japan), and two grades of spray-dried lactose (DCL 11 Lot 10218008 and
DCL 14 Lot 10185935, DMV International, Netherlands) were investigated
experimentally.
Literature Search
A literature search was undertaken to identify a suitable method to test the mechanical
properties of powders. The single-granule diametral test was selected. The literature on
experimental and computational work on this test method was reviewed.
Methods to characterize mechanical properties of powders
Current methods to characterize materials used in pharmaceutical tablet compaction
either test the final compact e.g., beam bending (Bassam et al, 1991), Vickers indentation
(Ridgeway et al., 1969) or mimic the tablet compaction process e.g. Heckel analysis
(Heckel, 1961, Hassanpour and Ghadiri, 2004, Roberts and Rowe, 1987). These testing
methods give a single parameter value that describes the 'macroscopic' behavior of the
powder bed or compact. Therefore the values are not purely properties of the particulate
material, but include the influence of the compact preparation method. The numerical
values of the parameters depend on the testing equipment (one exception is Hiestand
indices, which use a standard testing configuration (Hiestand, 1996)) and modeling
methods indicate that values extrapolated from bulk testing are not representative of
single granule properties (Hassanpour and Ghadiri, 2004). These tests do not give insight
-32-

Mridula Pore, 2009 Doctoral Thesis, MIT
Part I
into the mechanisms of tablet compaction or enable prediction of process problems such
as tablet lamination or capping. Therefore, methods for probing the behavior of
individual granules are required.
In this study an attempt was made to characterize the mechanical properties of individual
powder granules and investigate whether these properties are predictive of tablet structure
and product performance.
Reviews of mechanical testing of powders have been published by Bemrose and
Bridgwater (1987) and Couroyer et al. (2000). There are two classes of single-granule
testing methods to predict the behavior under compression; indentation and single-
granule diametral compression tests. Impact testing was not considered for this study
because the short time-frame limits data collection.
Indentation
Indentation is a means of assessing the mechanical properties of a material (typically
hardness) by probing the surface with a sharp tip and observing the response. Indentation
of pharmaceutical materials has been performed at the micro- and the nano-scale.
Indentation hardness has been used to obtain an estimate for stiffness and yield stress of
crystals and observation of cracks has been used to obtain the fracture toughness. This
method only probes the surface of the material, therefore these values may not be
representative of the entire granule. Microindentation is performed with a Vickers
indenter (also used for standardized testing of catalysts or metals) which requires hard
particles in the size range of millimeters (Duncan-Hewitt, 1993). Hence it is unsuitable
for pharmaceutical excipients, which are small (10-100s of microns), porous and
relatively soft. Nanoindentation using a sharp tip has been used to compare the
mechanical properties of API crystals and sucrose and shown to give rank order
agreement with literature values of stiffness (Liao and Wiedmann, 2005). A brittleness
index calculated from nanoindentation methods has also been demonstrated to be
predictive of milling behavior of pharmaceutical crystals (Taylor et al., 2004).
Nanoindentation requires a flat, homogeneous surface and the technique can be highly
sensitive to the substrate that the granule is placed on. Therefore, it may better suited for
analysis of crystalline materials, such as API's, rather than soft, irregular and porous
excipient materials.
-33 -
Mridula Pore, 2009 Doctoral Thesis, MIT
Part I
Single granule diametral compression test
The single-granule diametral compression test is a standard method for testing catalyst
beads and other granular materials in the size range of millimeters (ASTM, 1982). It is
also known as the Brazilian or single-granule crushing test. The test consists of placing a
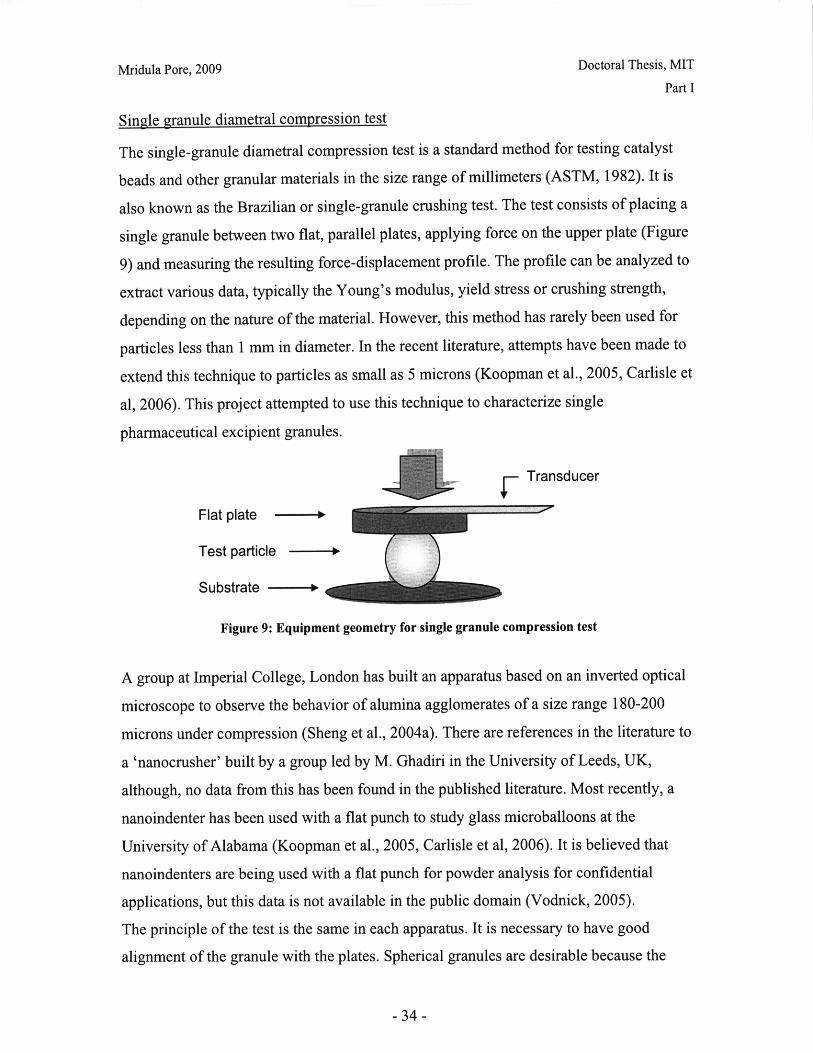
single granule between two flat, parallel plates, applying force on the upper plate (Figure
9) and measuring the resulting force-displacement profile. The profile can be analyzed to
extract various data, typically the Young's modulus, yield stress or crushing strength,
depending on the nature of the material. However, this method has rarely been used for
particles less than 1 mm in diameter. In the recent literature, attempts have been made to
extend this technique to particles as small as 5 microns (Koopman et al., 2005, Carlisle et
al, 2006). This project attempted to use this technique to characterize single
pharmaceutical excipient granules.
Transducer
Flat plate
Test particle 1
Substrate 1-
Figure 9: Equipment geometry for single granule compression test
A group at Imperial College, London has built an apparatus based on an inverted optical
microscope to observe the behavior of alumina agglomerates of a size range 180-200
microns under compression (Sheng et al., 2004a). There are references in the literature to
a 'nanocrusher' built by a group led by M. Ghadiri in the University of Leeds, UK,
although, no data from this has been found in the published literature. Most recently, a
nanoindenter has been used with a flat punch to study glass microballoons at the
University of Alabama (Koopman et al., 2005, Carlisle et al, 2006). It is believed that
nanoindenters are being used with a flat punch for powder analysis for confidential
applications, but this data is not available in the public domain (Vodnick, 2005).
The principle of the test is the same in each apparatus. It is necessary to have good
alignment of the granule with the plates. Spherical granules are desirable because the
- 34-
Mridula Pore, 2009 Doctoral Thesis, MIT
Part I
geometry lends itself to analytical equations for data analysis and granule orientation is
not an issue. For non-spherical granules, measurements for different orientations of the
granules relative to the punch will be required. The granule size, temperature and relative
humidity may determine the nature of the material failure mode.
In compaction of bulk powder, a granule will typically be subjected to forces from
multiple adjoining granules or surfaces, hence the mechanical response does not correlate
directly to that observed in a diametral test. However, this testing configuration most
closely represents the loading experienced during the compaction process.
Modeling the single granule crushing test
Various models have been developed to explain the mechanical behavior of single
powder granules. Some models treat the granule as a homogeneous continuum, whereas
some models attempt to incorporate information on internal structure to explain the
mechanisms behind the deformation of the granule. For smaller powder granules, it is not
possible to experimentally capture parameters relating to internal structure. However, the
structural models give considerable insight into the failure mechanisms and how internal
parameters affect the mechanical behavior. Both types of models and information about
the internal structure of the tested materials are presented below.
Materials structure
One pharmaceutical grade of microcrystalline cellulose (Celphere® CP102 Lot 15J1,
Asahi Kasei, Japan), and two grades of spray-dried lactose (Pharmatose® DCL 11 Lot
10218008 and DCL 14 Lot 10185935, DMV International, Netherlands) were
investigated for their mechanical properties. The materials were selected because MCC
and lactose are commonly used direct-compression excipients. The specific grades were
chosen for their spherical morphology, which eliminates the issue of granule orientation
during testing and allows for more direct comparison with published theoretical and
experimental results.
Celphere® is produced by granulation of MCC around a core (Asahi Kasei, 2007). The
manufacturer-supplied images indicate that this forms a spherical, smooth, non-porous
particle (see Figure 10). It is sold for the manufacture of larger granules for
encapsulation.
-35-

Mridula Pore, 2009 Doctoral Thesis, MIT
Part I
Figure 10: Environmental scanning electron microscope image of MCC Celphere® granules (AsahiKasei, 2007)
DCL 11 and DCL 14 are both spray-dried grades of lactose sold for direct-compression
tablets, capsules and sachet formulations. A slurry of small a-monohydrate lactose
crystals is spray dried to form spherical, porous agglomerates with an amorphous lactose
binder (DMV, 2005). DCL 11 is made of primary particles (lactose crystals)
approximately 35 microns in size, whereas DCL 14 is made of primary particles of
approximately 23 microns (DMV, 2007a and 2007b).
Figure 11: Environmental scanning electron microscope images of DCL 11 (left) and DCL 14 (right)granules (DMV International, 2005)
Bolhuis et al (2004) found that DCL 14 forms harder tablets than DCL 11 under the same
conditions and proposed that smaller primary particle size is responsible for this as there
is increased surface area for inter-particle bonding.
Continuum models
First order Hertz theory gives an analytical solution for small deformations of
homogeneous, perfectly elastic spheres against a flat plate. The following expression is
obtained for the force-displacement profile obtained using a diametral compression test if
we use Johnson's method (1973) as outlined by Sheng et al. (2004b).
-36-

Mridula Pore, 2009 Doctoral Thesis, MIT
Part I
F = 3.2 Er hy (I.B-1)
F is the force, R is the diameter of the granule and h is the displacement. The value, Er, is
not exactly the Young's modulus because it depends not only on the fundamental
properties of the material, but also on the structure of the granule. However, this is the
desired contribution if we want to understand the granule's behavior under stress.
The derivation of this expression assumes perfectly elastic deformation at frictionless
contacts. It also assumes that the deformation is localized to the contact and zones of
deformation that form at different contact points do not impinge on one another.
If the granule undergoes more severe deformation, including plastic deformation, an
analytical solution is not possible. A finite element method (FEM) model is required to
model a single granule. These can incorporate elasto-plastic behavior, but not fracture.
The parameters of constitutive equations for the model can be obtained by fitting from
experiment data and these values will characterize the material. A combined FEM/DEM
model can be used to simulate the compaction of a powder bed (e.g. Gethin et al, 2006).
DEM models for agglomerate damage
Many powders exist in the form of agglomerates. Agglomerates are clusters of primary
particles that may be formed by granulation or spray drying. Agglomerates are common
in process industries, as they have better flow properties than the primary particles alone.
Spray-dried lactose is a commonly-used material for pharmaceutical tablet direct-
compression processes and is investigated in this study.
The heterogeneous nature of agglomerates can be modeled using discrete element method
(DEM). This technique explicitly defines each single primary particle and models its
progress through a process by satisfying force and momentum equilibria at discrete time
steps. A single agglomerate can be assembled from primary particles that are assumed to
be non-breakable and non-deformable, and have a defined inter-particle bond strength
(see Figure 12).
-37-

Mridula Pore, 2009 Doctoral Thesis, MIT
Part I
Figure 12: DEM simulation of agglomerate (Martin, 2007)
Single agglomerates can be subjected to stresses imitating those used in testing
techniques such as diametral compression and impact testing (Thornton and Liu, 2004,
Thornton et al, 2004, Thornton et al, 1999, Kafui and Thornton, 2000, Martin et al, 2006)
and the intra-granular force evolution and failure can be observed. An assembly of
agglomerates can be subjected to processes such as closed die compaction, however there
are currently computational limitations on the size of the assembly that can be simulated,
so it is not possible to simulate at the process-scale (Martin et al, 2006).
Hence, DEM can be used to relate intragranular bonding and geometry of agglomerates
to their mechanical properties, which can be experimentally observed. It accounts for the
effects of heterogeneity within in the agglomerate and enhances understanding of granule
failure behavior. The source of heterogeneity is the random structure of the assembly of
primary particles in the agglomerate. This leads to non-uniform force transmission and
intra-granular microstructural changes when the agglomerate is subjected to applied
stresses. These force transmission pathways and microstructural changes determine the
observed mechanical response.
These simulations require input parameters describing intra-granule structure, such as
primary particle packing or bond strength. However, theoretical simulations with
assumed parameters can give considerable qualitative insight into failure mechanisms and
can aid in the interpretation of single-granule testing results.
-38-
Mridula Pore, 2009 Doctoral Thesis, MIT
Part I
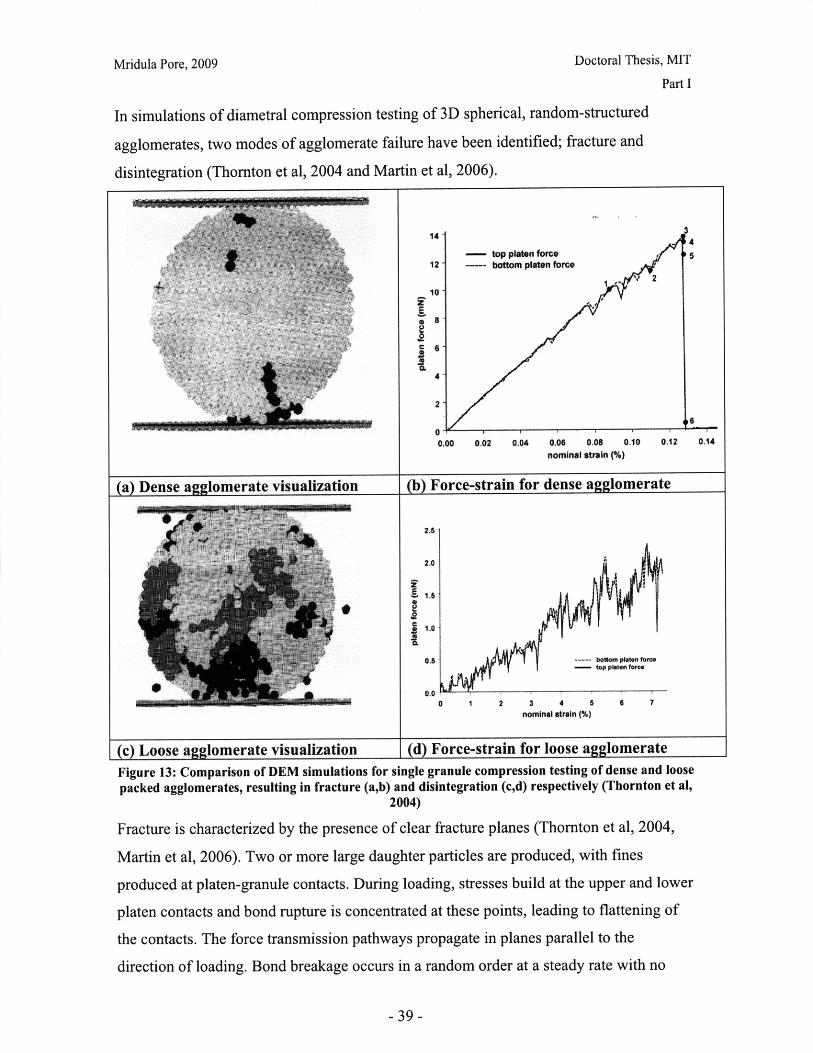
In simulations of diametral compression testing of 3D spherical, random-structured
agglomerates, two modes of agglomerate failure have been identified; fracture and
disintegration (Thornton et al, 2004 and Martin et al, 2006).
14
12
10
4
2
00.00 0.02 0.04 0.06 0.08 0.10 0.12 0,14
nominal strain (%)
(b) Force-strain for dense agglomerate(fn Dpnpe oolnmerate visualization
2.6
2.0
Z
1.0
O.S
0.00 2 3 4 5
nominal strain (%)
(c) Loose agglomerate visualization (d) Force-strain for loose agglomerate
Figure 13: Comparison of DEM simulations for single granule compression testing of dense and loose
packed agglomerates, resulting in fracture (a,b) and disintegration (c,d) respectively (Thornton et al,2004)
Fracture is characterized by the presence of clear fracture planes (Thornton et al, 2004,
Martin et al, 2006). Two or more large daughter particles are produced, with fines
produced at platen-granule contacts. During loading, stresses build at the upper and lower
platen contacts and bond rupture is concentrated at these points, leading to flattening of
the contacts. The force transmission pathways propagate in planes parallel to the
direction of loading. Bond breakage occurs in a random order at a steady rate with no
-39-
6 7
I
I Jvv .... e( Force-strai for ... o
Mridula Pore, 2009 Doctoral Thesis, MIT
Part I
clear evidence of a propagating front. Hence a linear force-strain profile of the plates is
observed. As compression proceeds, there are fluctuations in the profile due to small
jumps in bond breakage (see Figure 13b). This is followed by instantaneous fracture
along a plane slightly inclined to the direction of loading. Thornton et al (2004) also
observed other weakened radial planes where there was significant bond breakage and the
secondary fracture of one of the hemispherical daughter fragments.
Disintegration is the gradual attrition of the entire granule into small fragments. The
force-strain profile of a diametral compression test is linear with small fluctuations as
internal cracks form and fragments break off. There is no significant build up of forces at
the platen contacts as the energy is dissipated in bond breakage and microstructural
rearrangement. Hence forces do not propagate throughout the agglomerate. Eventually
the agglomerate collapses into many small fragments (Figure 13 c and d).
Thornton et al (2004) noted that the failure modes and fracture patterns for diametral
compression were the same as those observed in simulations of impact testing. For both
fracture and disintegration, the break-up of the agglomerate is a progressive process and
is shear-induced. The planes of weakness observed in fracture are believed to be a subset
of the fracture planes that occur in granules that shatter on impact. Therefore, pre-existing
flaws do not have a significant effect on granule strength or failure mode (Kafui and
Thornton, 2000).
The factors determining failure mode in impact testing include (Thornton et al, 2004):
1. Impact speed
2. Porosity or solid fraction of agglomerate
3. Bond strength between primary particles
Thornton et al (1999) demonstrated that as the impact velocity is increased, the granule
first rebounds, then undergoes fracture and at high velocities, it shatters into small
fragments.
Mishra and Thornton (2001) demonstrated that dense agglomerates tend to undergo
fracture, whereas loose agglomerates disintegrate in an impact test. Thornton et al (2004)
demonstrated that the same trend is seen in a diametral compression test (Figure 13). For
fracture to occur, strong force transmission pathways must exist. This is possible in a
dense structure as the primary particles are constrained. In the loose structure, energy is
-40-
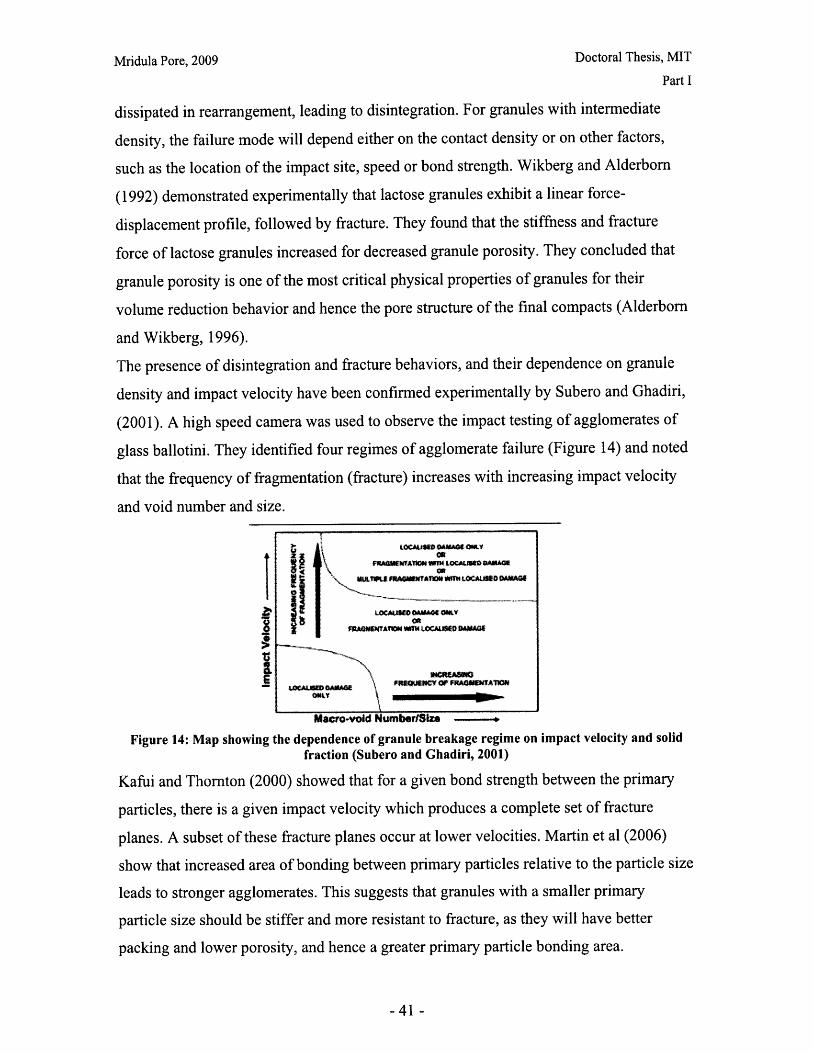
Mridula Pore, 2009 Doctoral Thesis, MIT
Part I
dissipated in rearrangement, leading to disintegration. For granules with intermediate
density, the failure mode will depend either on the contact density or on other factors,
such as the location of the impact site, speed or bond strength. Wikberg and Alderborn
(1992) demonstrated experimentally that lactose granules exhibit a linear force-
displacement profile, followed by fracture. They found that the stiffness and fracture
force of lactose granules increased for decreased granule porosity. They concluded that
granule porosity is one of the most critical physical properties of granules for their
volume reduction behavior and hence the pore structure of the final compacts (Alderborn
and Wikberg, 1996).
The presence of disintegration and fracture behaviors, and their dependence on granule
density and impact velocity have been confirmed experimentally by Subero and Ghadiri,
(2001). A high speed camera was used to observe the impact testing of agglomerates of
glass ballotini. They identified four regimes of agglomerate failure (Figure 14) and noted
that the frequency of fragmentation (fracture) increases with increasing impact velocity
and void number and size.
Macro-void NumberfISze
Figure 14: Map showing the dependence of granule breakage regime on impact velocity and solidfraction (Subero and Ghadiri, 2001)
Kafui and Thornton (2000) showed that for a given bond strength between the primary
particles, there is a given impact velocity which produces a complete set of fracture
planes. A subset of these fracture planes occur at lower velocities. Martin et al (2006)
show that increased area of bonding between primary particles relative to the particle size
leads to stronger agglomerates. This suggests that granules with a smaller primary
particle size should be stiffer and more resistant to fracture, as they will have better
packing and lower porosity, and hence a greater primary particle bonding area.
-41-

Mridula Pore, 2009 Doctoral Thesis, MIT
Part I
Experimental Investigation
Objectives
The objectives of this study were:
1. To determine whether failure modes can be identified for commercially available
pharmaceutical excipient powders using a modified nanoindenter apparatus to conduct
single granule diametral compression
2. To quantitatively compare differences in granule properties using this method
Method
Two machines were used to perform the diametral compression tests. The first was a
MTS Nanotester, which has a vertical punch configuration (see Figure 9). This apparatus
was used to test the feasibility of using a nanoindenter for the selected pharmaceutical
materials. The second rig was a Micro Materials Ltd. Nanotest, which has a pendulum
configuration (see Figure 15). This was used for the remainder of the experiments.
Preliminary test
An MTS Nanotester XP was used to test 3 granules each of lactose DCL 11 and MCC
Celphere® with sapphire flat cylindrical tip of diameter 89 micron. The calibration and
testing method is described in Koopman et al (2005). No sample preparation was
necessary. The powder sample was scattered on a horizontal plate. Individual granules
were subjected to a constant strain rate of 0.05 s-1. The force-displacement profile of the
upper punch was recorded. Top-view images of the granules were captured with an
optical microscope before and after testing.
Micro Materials Ltd. Nanotest: Equipment configuration
A Micro Materials Ltd. Nanotest instrument was used to conduct tests on lactose DCL
11, DCL 14 and MCC Celphere®. The Micro Materials Ltd. Nanotest Materials Testing
platform v 3.14 software was used to control the indenter and record data. The inbuilt 4x
Zoom Microscope with Biokinetics Digital Display software was used for particle
imaging (see also Part I.A). The apparatus has a pendulum configuration (Figure 15).
-42 -
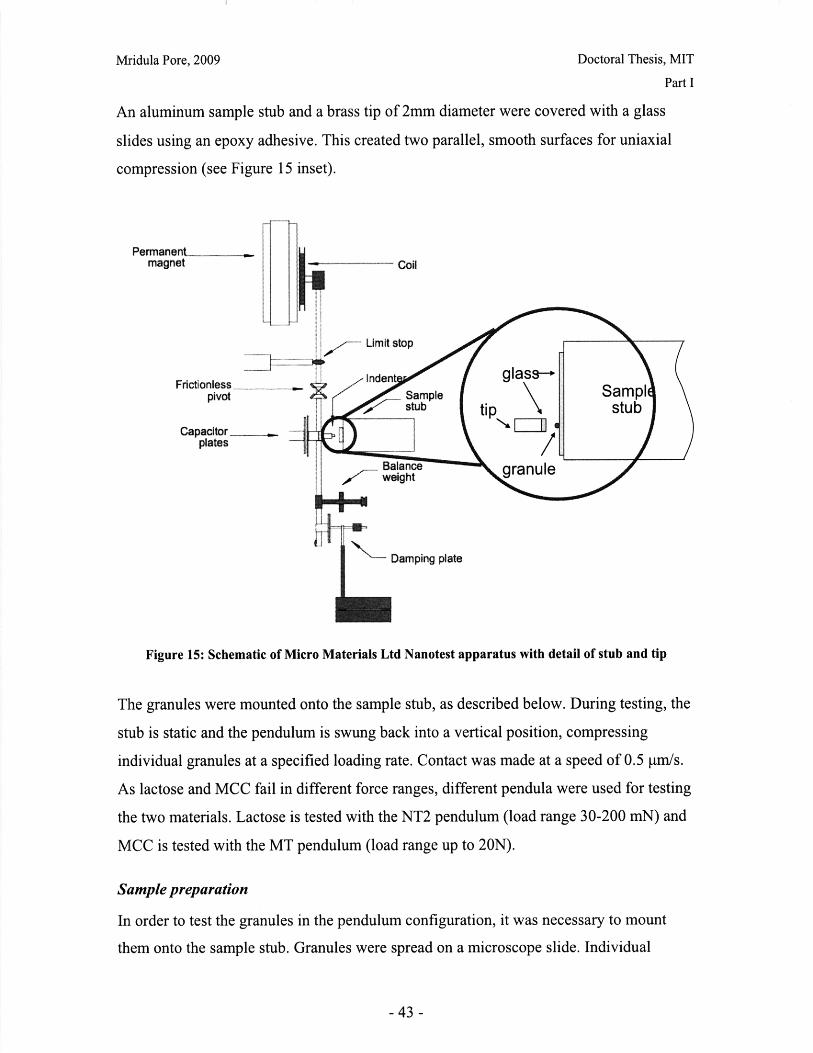
Mridula Pore, 2009 Doctoral Thesis, MIT
Part I
An aluminum sample stub and a brass tip of 2mm diameter were covered with a glass
slides using an epoxy adhesive. This created two parallel, smooth surfaces for uniaxial
compression (see Figure 15 inset).
Perm anent ...............................magnet
Frictionless ..........pivot
Capacitorplates
I -- Coil
- Limit stop
inde !W
Damping plate
Figure 15: Schematic of Micro Materials Ltd Nanotest apparatus with detail of stub and tip
The granules were mounted onto the sample stub, as described below. During testing, the
stub is static and the pendulum is swung back into a vertical position, compressing
individual granules at a specified loading rate. Contact was made at a speed of 0.5 ptm/s.
As lactose and MCC fail in different force ranges, different pendula were used for testing
the two materials. Lactose is tested with the NT2 pendulum (load range 30-200 mN) and
MCC is tested with the MT pendulum (load range up to 20N).
Sample preparation
In order to test the granules in the pendulum configuration, it was necessary to mount
them onto the sample stub. Granules were spread on a microscope slide. Individual
-43 -

Mridula Pore, 2009 Doctoral Thesis, MIT
Part I
particles were selected and transferred onto a sample stub covered with a film of 200
proof USP grade ethanol. The granules were spaced at least 2 mm apart on the sample
stub to prevent impingement on surrounding granules during testing. The stub surface
was allowed to dry under ambient conditions for at least 2 hours and then stored
overnight in a dessicator over saturated magnesium nitrate solution (at 55% relative
humidity) prior to testing. The capillary force due to ethanol residues was sufficient to
keep granules on the slide and prevent slipping during testing. MCC and lactose are both
insoluble in ethanol. In order to check that coating the granules in ethanol did not cause
changes to the morphology, environmental scanning electron microscope (ESEM) images
were taken of DCL 11 and Celphere® granules before and after washing with 200 proof
ethanol. No morphological changes were observed.
a Pharmatose@ DCL 11 - as received b MCC Cel here@- as received
(c) Pharmatose@ DCL 11 - washed in (d) MCC Celphere@ - washed in ethanolethanol
Figure 16: ESEM images of granule morphology before and after ethanol wash. No change isobserved.
Testing
Depth calibration was performed prior to each round of testing using a fused silica
sample and Berkovitch tip for the NT pendulum and a spherical tip for the MT. Frame
-44 -

Mridula Pore, 2009 Doctoral Thesis, MIT
Part I
compliance, optical calibration and thermal drift correction were found to be negligible.
The gain was set to 25% to maximize the displacement range.
Granule images were captured before and after testing using an in-built 4x microscope.
The optical microscope is mounted parallel to the tip. A glass bead of known dimensions
was used to calibrate the optics so that the size of the granules could be determined.
The chamber temperature was maintained at 270 C. Humidity could not be controlled
tightly because of the need to open and close chamber doors frequently for tip cleaning.
Testing humidity was in the range of 25-45%. The granule size is estimated by taking the
mean of the Feret diameters in the X and Y directions, dx and dy, as illustrated in Figure
17.
Y
Figure 17: Feret diameter measurement
i) Polystyrene microspheres
Polystyrene microspheres (Polystyrene DVB, Duke Scientific Corp., Cat# 434, Lot #
23218) of diameter 290-330 microns were subjected to loading and unloading (with NT1
electronics settings) to maximum loads between 5 and 30mN. The purpose of testing with
polystyrene spheres was to check if the equipment was aligned correctly and whether the
required force-displacement profile was being measured. In particular, it was necessary to
confirm that the instantaneous fracture observed for lactose granules was actually due to
breakage and not slip. Polystyrene beads were selected because they have smooth
surfaces, are spherical and behave elastically at low loads.
ii) Comparison of MTS and Nanotest indenters
Due to the horizontal geometry of the Nanotest and the sample preparation required, the
results were compared for consistency between the MTS and the Nanotest systems.
Pharmatose® DCLl 1 and MCC Celphere® granules were tested at 0.05s -' with the MTS
indenter and at 2mN/s on the Nanotest.
iii) Effect of loading rate
-45 -
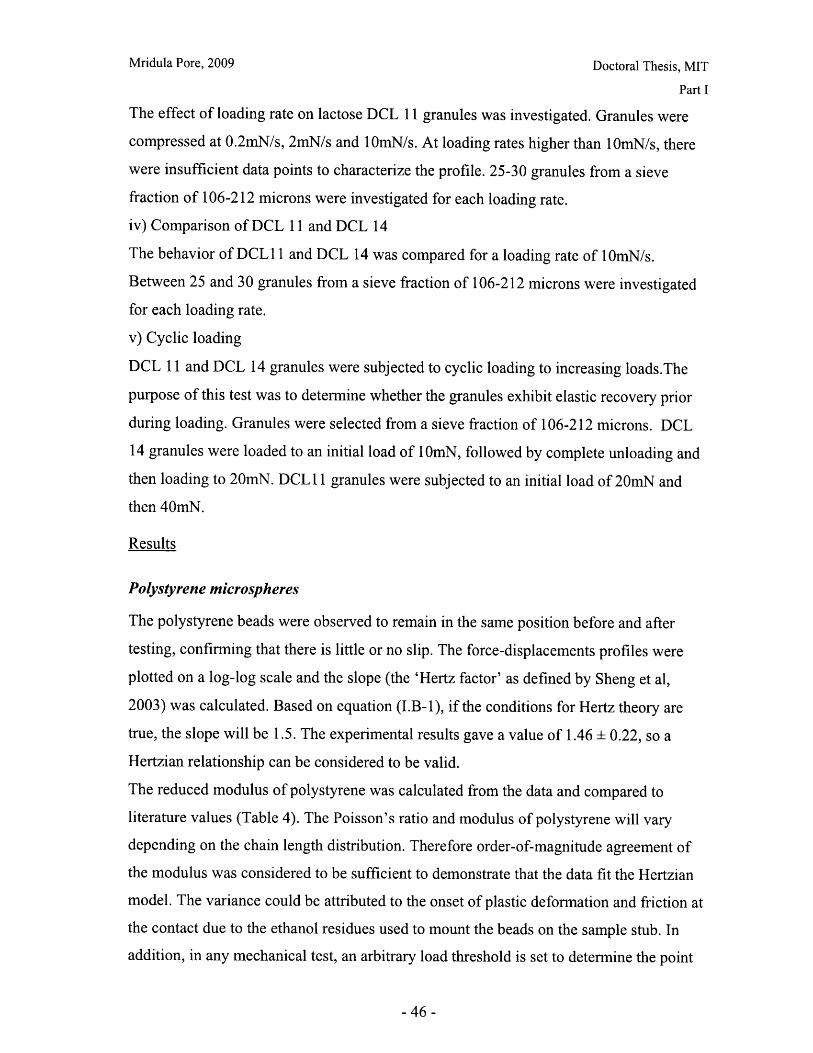
Mridula Pore, 2009 Doctoral Thesis, MIT
Part I
The effect of loading rate on lactose DCL 11 granules was investigated. Granules were
compressed at 0.2mN/s, 2mN/s and 10mN/s. At loading rates higher than 10mN/s, there
were insufficient data points to characterize the profile. 25-30 granules from a sieve
fraction of 106-212 microns were investigated for each loading rate.
iv) Comparison of DCL 11 and DCL 14
The behavior of DCL1 1 and DCL 14 was compared for a loading rate of 10mN/s.
Between 25 and 30 granules from a sieve fraction of 106-212 microns were investigated
for each loading rate.
v) Cyclic loading
DCL 11 and DCL 14 granules were subjected to cyclic loading to increasing loads.The
purpose of this test was to determine whether the granules exhibit elastic recovery prior
during loading. Granules were selected from a sieve fraction of 106-212 microns. DCL
14 granules were loaded to an initial load of 10mN, followed by complete unloading and
then loading to 20mN. DCL 1I granules were subjected to an initial load of 20mN and
then 40mN.
Results
Polystyrene microspheres
The polystyrene beads were observed to remain in the same position before and after
testing, confirming that there is little or no slip. The force-displacements profiles were
plotted on a log-log scale and the slope (the 'Hertz factor' as defined by Sheng et al,
2003) was calculated. Based on equation (I.B-1), if the conditions for Hertz theory are
true, the slope will be 1.5. The experimental results gave a value of 1.46 ± 0.22, so a
Hertzian relationship can be considered to be valid.
The reduced modulus of polystyrene was calculated from the data and compared to
literature values (Table 4). The Poisson's ratio and modulus of polystyrene will vary
depending on the chain length distribution. Therefore order-of-magnitude agreement of
the modulus was considered to be sufficient to demonstrate that the data fit the Hertzian
model. The variance could be attributed to the onset of plastic deformation and friction at
the contact due to the ethanol residues used to mount the beads on the sample stub. In
addition, in any mechanical test, an arbitrary load threshold is set to determine the point
-46 -

Mridula Pore, 2009 Doctoral Thesis, MIT
Part I
of contact between the substrate and the tip. The Hertz factor was found to be very
sensitive to the threshold load.
Table 4: Literature and experimental values for mechanical properties of polystyrene
Value Reference Experimental data
Poisson's ratio 0.325 Boundy and Boyer, 1952 Assumed to be
0.33 Nielsen, 1962 0.33
Tensile modulus (MPa) 3200 Rudd and Gurnee, 1957
3400 Dow, 1965
Compressive modulus (MPa) 3000 Dow, 1965 4850 + 2400
Comparison offorce-displacement profiles of MCC and lactose
Lactose and MCC granules exhibited distinctly different behaviors when subjected to a
uniaxial compression test. A Hertzian relationship was not valid for either material.
For MCC, initial stiffening of the granules was observed, followed by the onset of yield,
observed at loads greater than IN (Figure 18). This suggests that there is initial flattening
of the granule-platen contacts followed by plastic deformation. The granules did not fail
within the load limits of the MTS indenter (limits: 500mN load, several mm
displacement), or within the displacement limits of the Nanotest (limits: 20N load,
approximately 15 micron displacement).
Lactose granules had a linear force-displacement profile, consistent with experimental
and numerical results for single granule compression of agglomerates (Figure 19). The
granules failed at low strain (typically less than 5%), by instantaneous fracture. With the
MTS indenter data, compression of the daughter particles and debris was observed. This
was not seen in the Nanotest data due to the limited displacement range.
-47 -
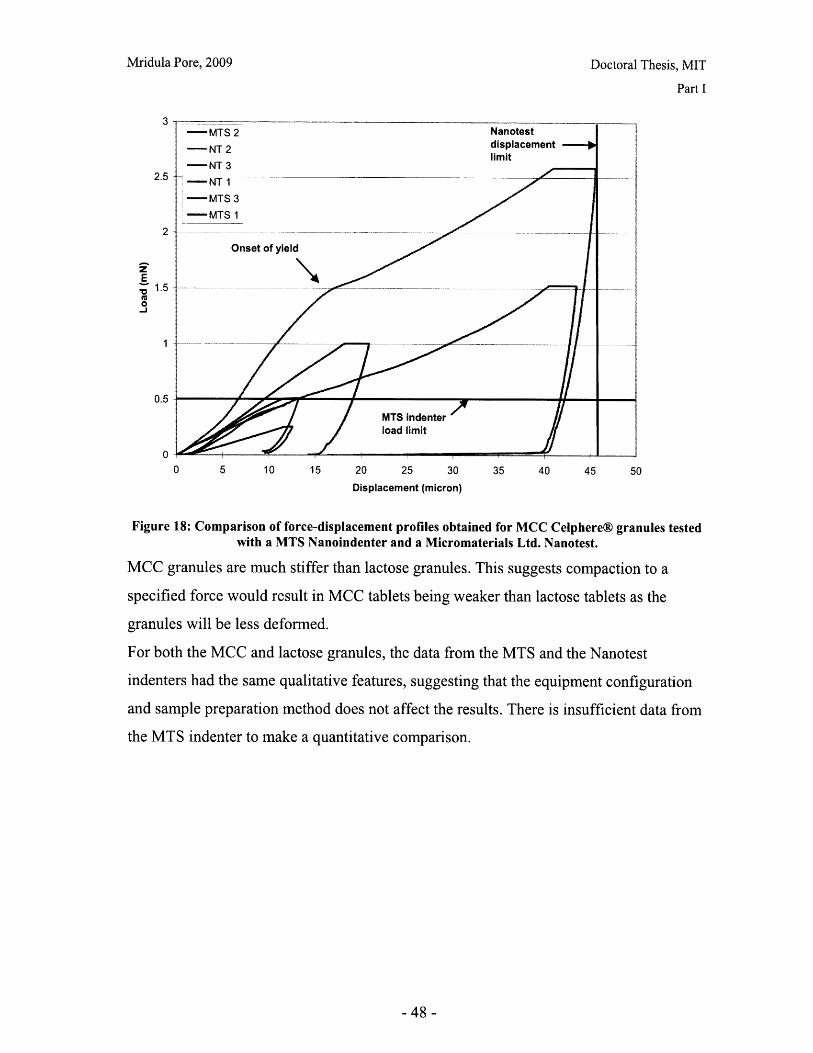
Doctoral Thesis, MIT
Part I
Nanotestdisplacementlimit
0 5 10 15 20 25 30
Displacement (micron)
35 40 45 50
Figure 18: Comparison of force-displacement profiles obtained for MCC Celphere® granules testedwith a MTS Nanoindenter and a Micromaterials Ltd. Nanotest.
MCC granules are much stiffer than lactose granules. This suggests compaction to a
specified force would result in MCC tablets being weaker than lactose tablets as the
granules will be less deformed.
For both the MCC and lactose granules, the data from the MTS and the Nanotest
indenters had the same qualitative features, suggesting that the equipment configuration
and sample preparation method does not affect the results. There is insufficient data from
the MTS indenter to make a quantitative comparison.
-48 -
3
2.5
2
E1.5
-,J
0.5
0
Mridula Pore, 2009
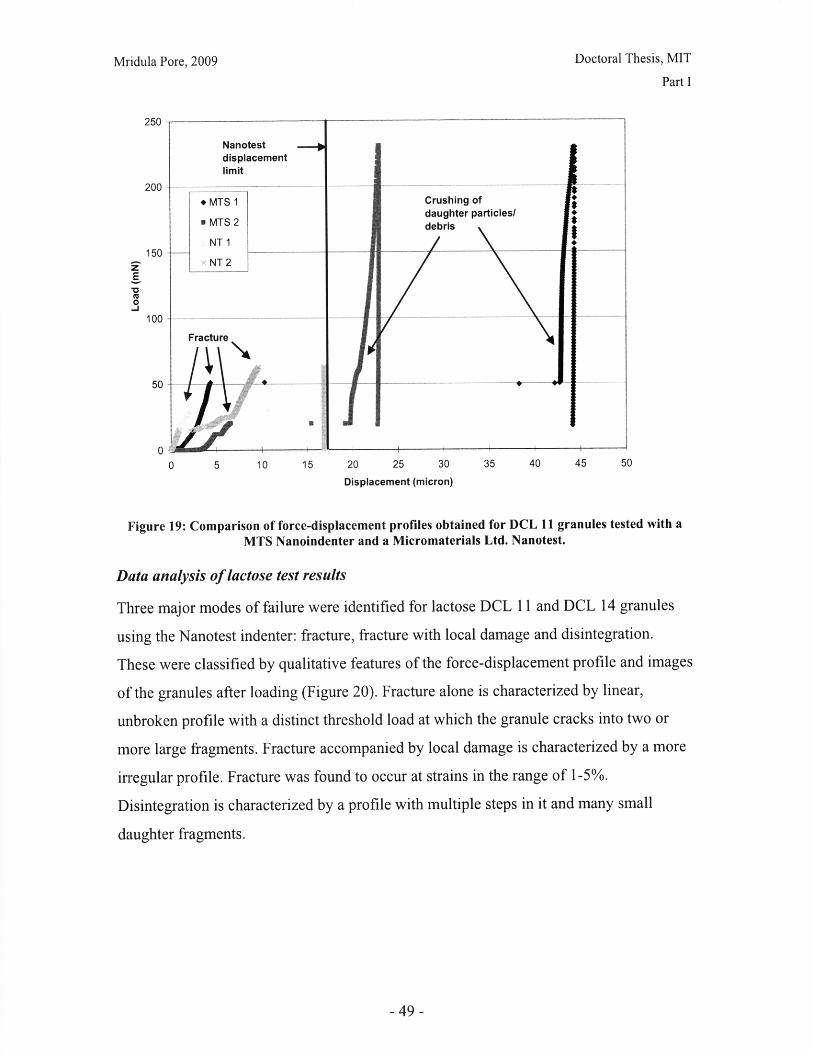
Mridula Pore, 2009
250::
200
Doctoral Thesis, MIT
Part I
0 5 10 15 20 25 30 35 40 45 50
Displacement (micron)
Figure 19: Comparison of force-displacement profiles obtained for DCL 11 granules tested with aMTS Nanoindenter and a Micromaterials Ltd. Nanotest.
Data analysis of lactose test results
Three major modes of failure were identified for lactose DCL 11 and DCL 14 granules
using the Nanotest indenter: fracture, fracture with local damage and disintegration.
These were classified by qualitative features of the force-displacement profile and images
of the granules after loading (Figure 20). Fracture alone is characterized by linear,
unbroken profile with a distinct threshold load at which the granule cracks into two or
more large fragments. Fracture accompanied by local damage is characterized by a more
irregular profile. Fracture was found to occur at strains in the range of 1-5%.
Disintegration is characterized by a profile with multiple steps in it and many small
daughter fragments.
-49 -
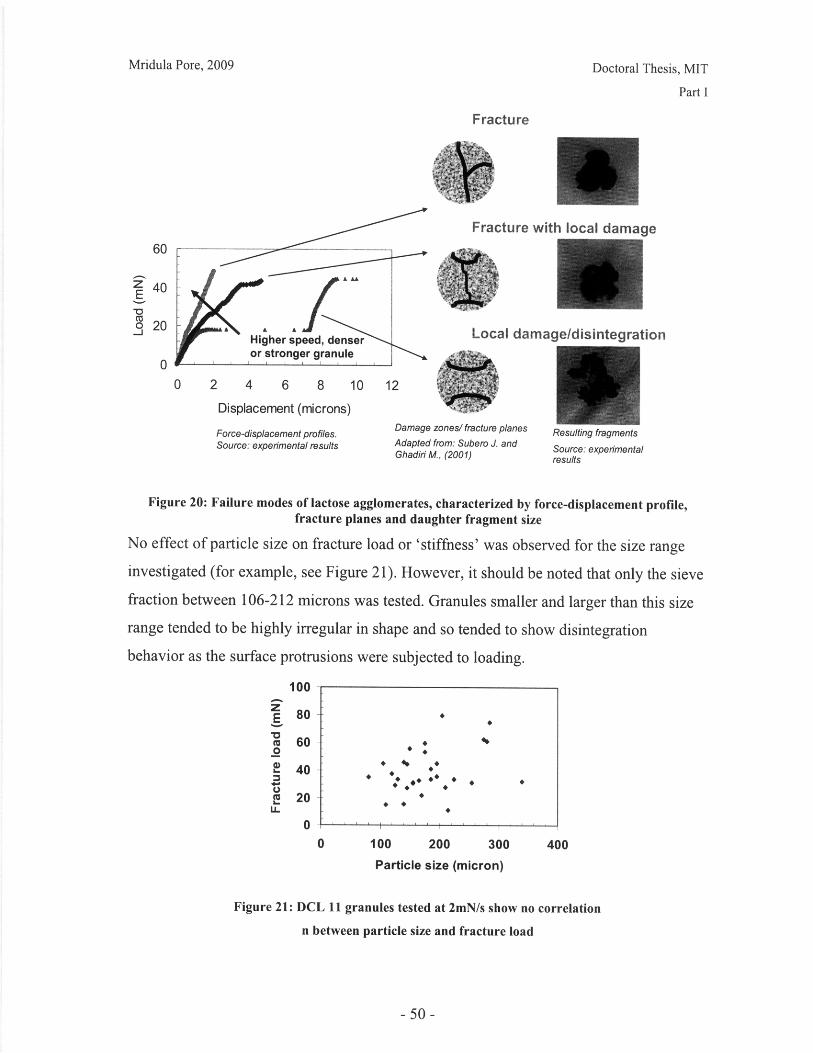
Mridula Pore, 2009 Doctoral Thesis, MIT
Part I
Fracture
A A lI
Higher speed, denseror stronger granule
Fracture with local damage
Local damage/disintegration
4 6 8
Displacement (microns)
Force-displacement profiles.Source: experimental results
10 12
Damage zones/ fracture planes Resulting fragmentsAdapted from: Subero J. and Source: experimentalGhadiri M., (2001) results
Figure 20: Failure modes of lactose agglomerates, characterized by force-displacement profile,fracture planes and daughter fragment size
No effect of particle size on fracture load or 'stiffness' was observed for the size range
investigated (for example, see Figure 21). However, it should be noted that only the sieve
fraction between 106-212 microns was tested. Granules smaller and larger than this size
range tended to be highly irregular in shape and so tended to show disintegration
behavior as the surface protrusions were subjected to loading.
100
80
60
40
20
0
100 200 300
Particle size (micron)
400
Figure 21: DCL 11 granules tested at 2mN/s show no correlation
n between particle size and fracture load
-50-
60
Z 40E
coo 20
0
*
S** * *
* ~* *: * ** *
*

Mridula Pore, 2009 Doctoral Thesis, MIT
Part I
The force-displacement data could not be converted to a stress-strain plot, as the contact
area between the platen and the granule is unknown. The linear force-displacement
profile suggests that there is considerable flattening of the contact (this is also observed in
DEM simulations, eg. Martin et al, 2006, Thornton et al, 2004).
Therefore, the slope of the profile ('stiffness') and the load at which fracture occurs were
selected as mechanical parameters to characterize the material behavior. 25-30 data
points were collected for each sample and loading conditions. A lognormal distribution
was found to give a good fit of the cumulative frequency profile for each dataset.
Effect of loading rate on DCL 11
Fracture is the dominant mechanism of granule failure for DCL 11 (Table 5). There is a
higher tendency for fracture to be accompanied by local damage at lower loading rates. It
is not possible to collect the fractured samples after testing to analyze the resulting
fragments. It was observed that the resulting fragments often stuck to the indenter tip, and
so could not always be observed with the microscope.
Table 5: Effect of loading rate on failure mode of DCL11 granule
DCL 11 granule failure mode Frequency of occurrence
0.2 mN/s 2 mN/s 10 mN/s
Fracture only 0.15 0.29 0.74
Fracture with local damage 0.73 0.71 0.19
Local damage/disintegration only 0.12 0.00 0.07
The median fracture load increases with loading rate (Table 6). The higher loading rate
will allow less time for rearrangement of primary particles within the granule. Therefore
there will be propagation of forces chains throughout the granule, released by
instantaneous fracture. There is also less variation at higher loading rates. This is likely
because as the loading rate is increased, shear forces have a larger effect on the creation
of fracture planes than pre-existing intra-granule flaws, so variability due to granule
structure is reduced. There is no discernable effect of loading rate on granule stiffness.
-51 -
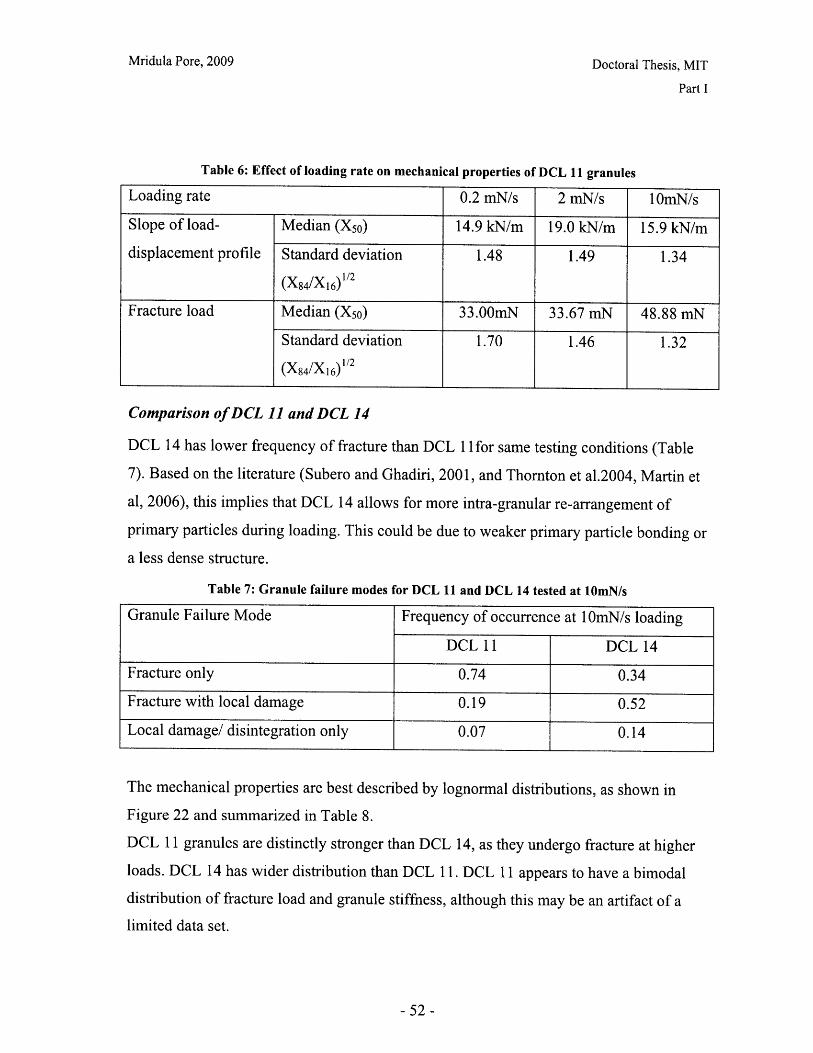
Mridula Pore, 2009 Doctoral Thesis, MIT
Part I
Table 6: Effect of loading rate on mechanical properties of DCL 11 granules
Loading rate 0.2 mN/s 2 mN/s 10mN/s
Slope of load- Median (X50) 14.9 kN/m 19.0 kN/m 15.9 kN/m
displacement profile Standard deviation 1.48 1.49 1.34
(X84/XI6)1/2
Fracture load Median (X50) 33.00mN 33.67 mN 48.88 mN
Standard deviation 1.70 1.46 1.32
(X84/XI6) 1/2
Comparison of DCL 11 and DCL 14
DCL 14 has lower frequency of fracture than DCL 11 for same testing conditions (Table
7). Based on the literature (Subero and Ghadiri, 2001, and Thornton et al.2004, Martin et
al, 2006), this implies that DCL 14 allows for more intra-granular re-arrangement of
primary particles during loading. This could be due to weaker primary particle bonding or
a less dense structure.
Table 7: Granule failure modes for DCL 11 and DCL 14 tested at 10mN/s
Granule Failure Mode Frequency of occurrence at 10mN/s loading
DCL 11 DCL 14
Fracture only 0.74 0.34
Fracture with local damage 0.19 0.52
Local damage/ disintegration only 0.07 0.14
The mechanical properties are best described by lognormal distributions, as shown in
Figure 22 and summarized in Table 8.
DCL 11 granules are distinctly stronger than DCL 14, as they undergo fracture at higher
loads. DCL 14 has wider distribution than DCL 11. DCL 11 appears to have a bimodal
distribution of fracture load and granule stiffness, although this may be an artifact of a
limited data set.
-52-
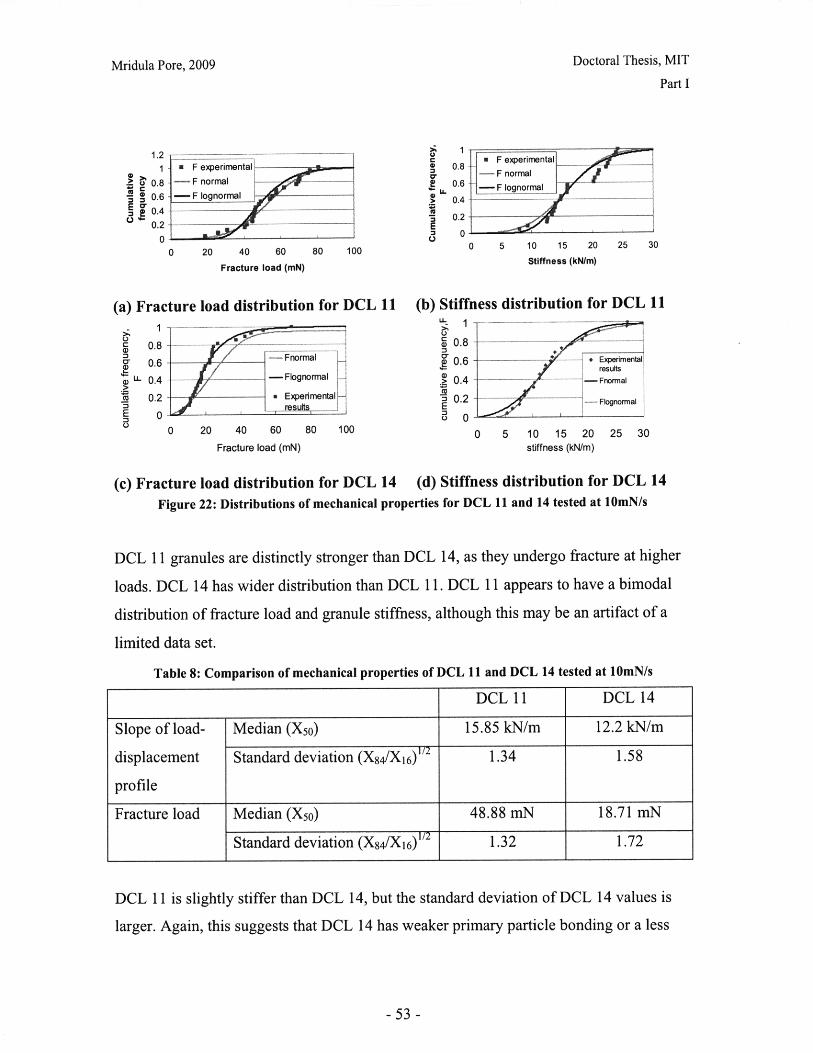
Mridula Pore, 2009
1.21
0.8i 0.6
, 0.40.2
00 20 40 60
Fracture load (rmN)
Doctoral Thesis, MIT
Part I
C3
a.
u.g5.iu
EC.
80 100
(a) Fracture load distribution for DCL 11
0.80.6 -Fnormal
>l 0.4
U 0.4 -Flognormal
0.2 u " Experimental
0 e
0 20 40 60 80 100
Fracture load (mN)
(b)
0 5 10 15 20
Stiffness (kN/m)
25 30
Stiffness distribution for DCL 11
, 0.8 .0.6 -* Experimental
results
. 0.4 - Fnormal
S0.2 -- Flognormal
S00
0 5 10 15 20 25 30stiffness (kN/m)
(c) Fracture load distribution for DCL 14 (d) Stiffness distribution for DCL 14
Figure 22: Distributions of mechanical properties for DCL 11 and 14 tested at 10mN/s
DCL 11 granules are distinctly stronger than DCL 14, as they undergo fracture at higher
loads. DCL 14 has wider distribution than DCL 11. DCL 11 appears to have a bimodal
distribution of fracture load and granule stiffness, although this may be an artifact of a
limited data set.
Table 8: Comparison of mechanical properties of DCL 11 and DCL 14 tested at 10mN/s
DCL 11 DCL 14
Slope of load- Median (Xso) 15.85 kN/m 12.2 kN/m
displacement Standard deviation (X84/XI6)1/2 1.34 1.58
profile
Fracture load Median (X50) 48.88 mN 18.71 mN
Standard deviation (X84/X1 6)1/ 1.32 1.72
DCL 11 is slightly stiffer than DCL 14, but the standard deviation of DCL 14 values is
larger. Again, this suggests that DCL 14 has weaker primary particle bonding or a less
-53 -
Mridula Pore, 2009 Doctoral Thesis, MIT
Part I
dense structure, allowing more primary particle rearrangement during compression and
hence there is a larger influence of the granule structure.
Cyclic loading
DCL 11 and DCL 14 granules both demonstrated some recovery of the granule during
unloading (Table 9). However, in each case, there was considerable stiffening, with the
unloading slope being 20-500% greater than during loading. This is consistent with
damage occurring at the granule-platen contact, resulting in local densification. DCL14
shows more variability in stiffness increase than DCL 11, which implies that local
structure is having a significant effect. This could be because the granule is less dense, or
because the initial loading is lower for DCL 14 than for DCL 11, therefore there is less
flattening of the granule.
Table 9: Stiffening effects are observed during cyclic loading of DCL 11 and DCL 14 granules
DCL 11 DCL 14
First loading limit 20mN 10mN
Second loading limit 40mN 20mN
% increase in profile slope Average 106% 124%
(granule 'stiffness') between Standard 68% 161%
consecutive loading Deviation
These results indicate that there is densification and deformation at the granule-platen
contact prior to fracture. Therefore the linear portion of the profile does not represent
elastic behavior.
Discussion
The results demonstrate that single compression testing can be used to determine
qualitative and quantitative differences between mechanical properties of pharmaceutical
powder.
The method of using a nanoindenter to perform single-granule diametral compression
tests shows agreement with the theoretical model for polystyrene microspheres. The data
is qualitatively consistent for two indenters in both the vertical and pendulum
configurations. This suggests that the test can be performed in any apparatus with a
- 54-
Mridula Pore, 2009 Doctoral Thesis, MIT
Part I
parallel plate geometry and the capability to control and record small loads and
displacements. It also suggests that our sample preparation method had little or no effect
on mechanical properties of the granules.
The compression test demonstrated that MCC granules undergo plastic deformation,
whereas lactose agglomerates tend to undergo fracture. Multiple modes of granule failure
were observed for lactose agglomerates; fracture only, fracture with local damage and
local damage/disintegration only. The relative prevalence of each mode depends on both
the loading speed and the grade of material (i.e. on the nature of the primary particles,
binder and manufacturing method).
The strain rates used for granule testing are much lower than those used in tablet
manufacturing processes. However, the purpose of the test is to detect relative differences
between the materials by subjecting the granules to loading conditions similar, but not
identical, to those in compaction. Due to the random structure of the loose powder bed,
loading conditions will vary significantly from granule to granule and as the compaction
proceeds. It is not possible, nor necessarily desirable, to replicate such multi-point
loading in a characterization technique. Fracture was found to be the dominant mode of
granule failure for the lactose grades studied. Given the constrained positions of granules
in a closed die, it is most likely that they will undergo a combination of fracture and
disintegration and unlikely that they will undergo shattering or other failure pattern.
Therefore, parameters associated with fracture have been used to characterize the
materials.
Quantitative differences between different grades (DCL 11 and DCL 14) can be
measured. DCL 14 is less stiff than DCL 11 and undergoes fracture at lower loads. This
suggests that it will undergo greater volume reduction than DCL 11 during compaction to
a given load. The product literature (DMV, 2007 (a) and (b)) suggests that DCL 14 has
smaller primary particles (23 microns) than DCL 11 (35 microns). This would suggest
that DCL 14 granules are more dense than DCL 11 and also that there is a greater contact
area between the primary particles, hence they are stronger. However, the experimental
findings do not support this. Based on the literature on DEM modeling of agglomerates,
DCL 14 should be less dense and/or have weaker inter-primary particle bonding than
DCL 11, as it more prone to disintegration and fails at lower loads. One possible
-55-

Mridula Pore, 2009 Doctoral Thesis, MIT
Part I
explanation is that there is another, non-geometric contribution to intra-granular bond
strengths. It is possible that a different manufacturing process gives rise to different
proportions of lactose crystalline forms between DCL 11 and DCL 14, which affects the
bond strength between primary particles.
Potential applications of this analytical technique are to enable specifications for vendor-
supplied materials, such as those studied here, or to determine the necessary process
settings in a granulation process that precedes compaction. The parameters can also be
used in a model to predict the behavior of the powder during uniaxial compaction.
To fully capture the multi-mode behavior of lactose granules during compaction, data is
needed on primary particle size distribution, intra-granular structure and intra-granular
bonding strength. However, information at this scale cannot be obtained for off-the shelf
excipients such as spray dried lactose. Fracture parameters, such as pre-fracture stiffness
and fracture load, may be sufficient to characterize the differences in materials and
predict their relative performance during compaction. Suitable process models are
presented in part IV.
Conclusions
A nanoindenter with a flat tip can be used in either a vertical or pendulum configuration
to measure the mechanical response of pharmaceutical powder granules to uniaxial
compression.
Pharmaceutical excipient granules are unlikely to fit the Hertzian model for elastic
deformation. Numerical methods to simulate plastic deformation or agglomerate
compression can provide insight into the intra-granule structure and bonding. The
quantitative measurements could be used as inputs for powder compaction models.
References
Alderborn G.; Wikberg M., Pharmaceutical Powder Compaction Technology, Ed.
Alderborn G. and Nystrom C. Marcel Dekker 1996
Asahi Kasei http://www.ceolus.com/eng/product/celphere/index.html, accessed January
15, 2007
ASTM, Test D41 79: Single pellet crush strength offormed catalyst shapes, American
Society for Testing Materials 1982
- 56-
Mridula Pore, 2009 Doctoral Thesis, MIT
Part I
Bassam F.; York P.; Rowe R.C.; Roberts R.J. Powder Technol. 1991, 65, 103
Bemrose C.R.; Bridgwater J. Powder Technol. 1987, 49 (2), 97-126
Bolhuis G.; Kusendrager K.; Langridge Pharm. Technol. Suppl. Excipients and Solid
Dosage Forms 2004, 26-31
Boundy R. H.; Boyer R. F. (Eds.) Styrene, Its Polymers, Copolymers and Derivatives
Reinhold, New York 1952
Carlisle K.; Chawla K.K.; Gladysz G.; Koopman M,, J. Mater. Sci. 2006, 41, 3961-3972
Couroyer, C.; Ghadiri, M.; Laval, P.; Brunard, N.; Kolenda, F. R. I. Fr. Petrol 2000, 55
(1), 67-85
Dow 'Strength and Stiffness' in Plastics Design Data, Dow Technical Chemical
Publication 1965
DMV International, Product Group Overview, Pharmatose ® DC Lactose 2005
DMV International, Directly compressible lactose.: high speed compaction, DMV
excipient guide 3.2.2, 2007(a)
DMV International, Directly compressible lactose: general considerations, DMV
excipient guide 3.2.1, 2007(b)
Duncan-Hewitt W.C. Drug Dev. Ind. Pharm. 1993, 19, 2197-2240
Gethin D.T.; Yang X.S.; Lewis R.W. Comput. Methods Appl., Mech Engrg 2006, 195
5552-5565
Hassanpour A.; Ghadiri M. Powder Technol. 2004, 141, 251-261
Heckel R.W., Trans Metal Soc, AIME, 1961, 221, 671
Hiestand E.V., Pharmaceutical Powder Compaction Technology, Ed. Alderborn G. and
Nystrom C. Marcel Dekker, 1996
Kafui K.D.; Thornton C. Powder Technol. 2000, 109, 113-132
Koopman M.; Gouadec G.; Carlisle K.; Chawla K.K.; Gladysz G., Scripta Mater. 2004,
50, 593-596
Laio X.; Wiedmann T.S., J. Pharm. Sci. 2005, 94, 79-92
Martin C.L. http://www.gpm2.inpg.fr/perso/doc_cm/crushing_aggregate.html, accessed
Jan 2007
Martin C.L.; Bouvard D.; Delette G. J. Am. Ceram. Soc 2006, 89 (11), 3379-3387
Mishra B.K.; Thornton C. Int. J. Miner. Process. 2001, 61 (4), 225-239
- 57-
Mridula Pore, 2009 Doctoral Thesis, MIT
Part I
Nielsen L. E. Mechanical Properties of Polymers, Reinhold, New York 1962
Ridgway K.; Glasby J.; Rosser P.H. J. Pharm. Pharmacol. 1969, 21:24S
Roberts R.J.; Rowe R.C. Chem Eng. Sci. 1987, 42, 903
Rudd J. F.; Gurnee, J. Appl. Phys. 1957, 28, 1096
Sheng Y.; Briscoe B.J.; Maung R.; Rovea C. Powder Technol. 2004 (a), 140, 228-239
Sheng Y.; Lawrence C.J.; Briscoe B.J.; Thornton C. Eng. Computation, 2004b, 21, 304-
317
Subero J.; Ghadiri M. Powder Technol. 2001, 120 , 232-243
Snowden M.J. Org Proces Res Dev. 2004, 8, 674-679
Taylor L.J.; Papadopoulos D.G.; Dunn P.J.; Bentham A.C.; Dawson N.J.; Mitchell J.C.;
Thornton C.; Ciomocos M.T.; Adams M.J. Powder Technol. 1999, 105, 74-82
Thornton C., Ciomocos M.T., Adams M.J., Powder Technol. 2004 (a), 140, 258- 267
Thornton C.; Liu L. Powder Technol. 2004 (b), 143-144, 110-116
Vodnick, D. Hysitron Inc. Personal Communication, 1 8th November 2005
Wikberg M.; Alderborn G. STP Pharma Sci, 1992, 2, 313
-58-
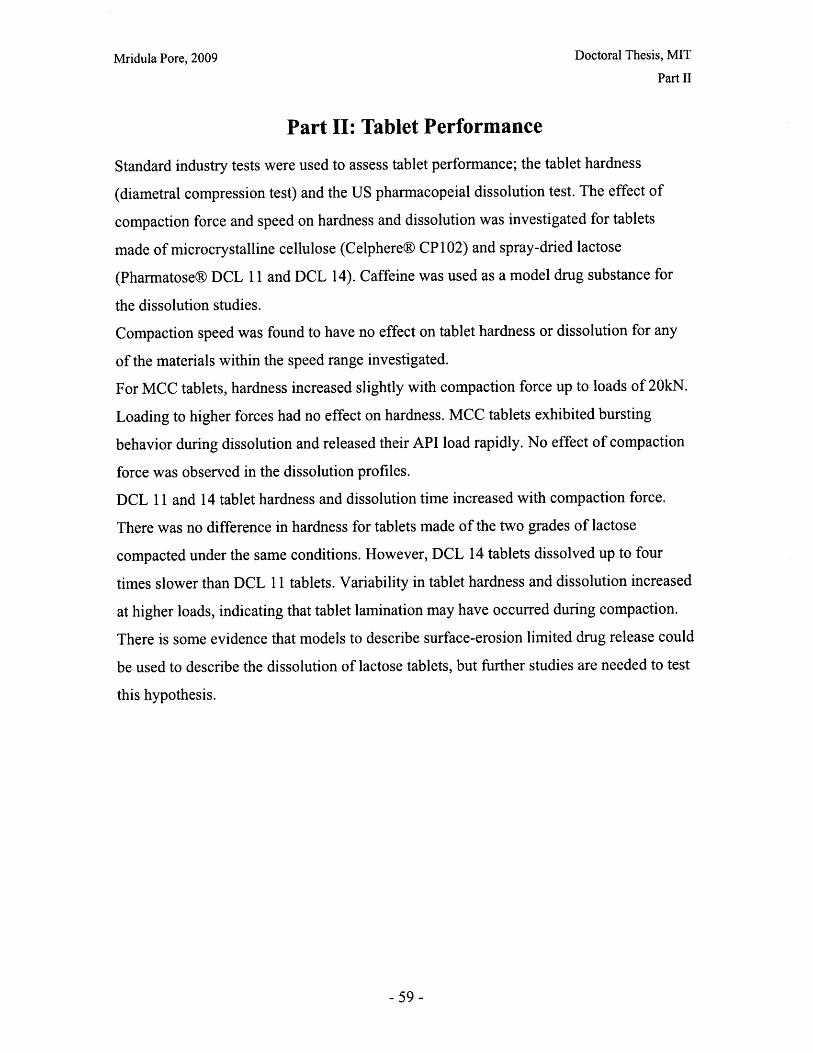
Mridula Pore, 2009 Doctoral Thesis, MIT
Part II
Part II: Tablet Performance
Standard industry tests were used to assess tablet performance; the tablet hardness
(diametral compression test) and the US pharmacopeial dissolution test. The effect of
compaction force and speed on hardness and dissolution was investigated for tablets
made of microcrystalline cellulose (Celphere® CP 102) and spray-dried lactose
(Pharmatose® DCL 11 and DCL 14). Caffeine was used as a model drug substance for
the dissolution studies.
Compaction speed was found to have no effect on tablet hardness or dissolution for any
of the materials within the speed range investigated.
For MCC tablets, hardness increased slightly with compaction force up to loads of 20kN.
Loading to higher forces had no effect on hardness. MCC tablets exhibited bursting
behavior during dissolution and released their API load rapidly. No effect of compaction
force was observed in the dissolution profiles.
DCL 11 and 14 tablet hardness and dissolution time increased with compaction force.
There was no difference in hardness for tablets made of the two grades of lactose
compacted under the same conditions. However, DCL 14 tablets dissolved up to four
times slower than DCL 11 tablets. Variability in tablet hardness and dissolution increased
at higher loads, indicating that tablet lamination may have occurred during compaction.
There is some evidence that models to describe surface-erosion limited drug release could
be used to describe the dissolution of lactose tablets, but further studies are needed to test
this hypothesis.
-59-
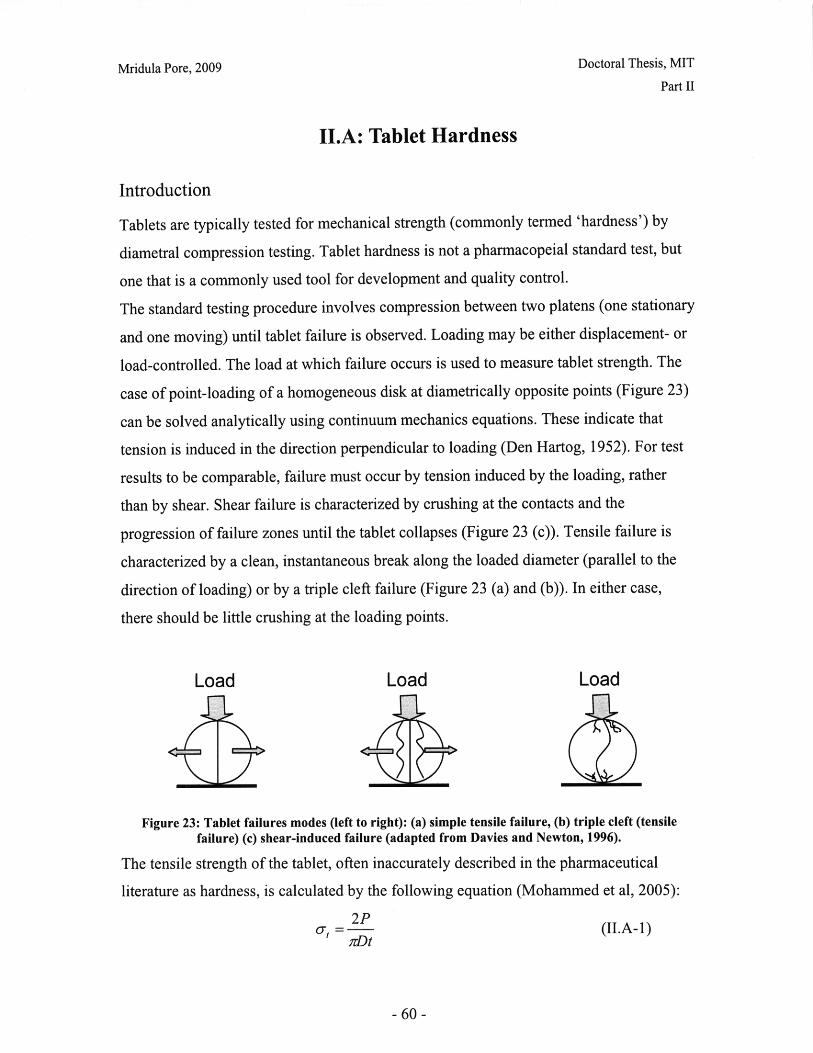
Mridula Pore, 2009 Doctoral Thesis, MIT
Part II
II.A: Tablet Hardness
Introduction
Tablets are typically tested for mechanical strength (commonly termed 'hardness') by
diametral compression testing. Tablet hardness is not a pharmacopeial standard test, but
one that is a commonly used tool for development and quality control.
The standard testing procedure involves compression between two platens (one stationary
and one moving) until tablet failure is observed. Loading may be either displacement- or
load-controlled. The load at which failure occurs is used to measure tablet strength. The
case of point-loading of a homogeneous disk at diametrically opposite points (Figure 23)
can be solved analytically using continuum mechanics equations. These indicate that
tension is induced in the direction perpendicular to loading (Den Hartog, 1952). For test
results to be comparable, failure must occur by tension induced by the loading, rather
than by shear. Shear failure is characterized by crushing at the contacts and the
progression of failure zones until the tablet collapses (Figure 23 (c)). Tensile failure is
characterized by a clean, instantaneous break along the loaded diameter (parallel to the
direction of loading) or by a triple cleft failure (Figure 23 (a) and (b)). In either case,
there should be little crushing at the loading points.
Load Load Load
Figure 23: Tablet failures modes (left to right): (a) simple tensile failure, (b) triple cleft (tensilefailure) (c) shear-induced failure (adapted from Davies and Newton, 1996).
The tensile strength of the tablet, often inaccurately described in the pharmaceutical
literature as hardness, is calculated by the following equation (Mohammed et al, 2005):
2Pr,= (II.A-1)
nrDt
- 60-
Mridula Pore, 2009 Doctoral Thesis, MIT
Part II
Where at is the tensile strength, P is the failure load, D is the tablet diameter and t is the
tablet thickness.
Factors affecting tablet hardness
Tablet hardness is an indicator of the tablet structure; a combined result of the powder
mechanical properties and the compaction process. Some attempts have been made to
relate hardness directly to structural characteristics of the tablet.
Tablet hardness is known to increase with increased solid volume fraction, as decreased
porosity is believed to reduce sources of crack propagation. Mohammed et al. (2005) note
that the extent of volume reduction can be related to the amount of energy that goes into
plastic deformation during compaction for a range of materials.
Olsson and Nystrom (2001) found that the specific surface area of the tablet (measured
by permeametry) is also a factor in determining tablet tensile strength. They attribute this
effect to greater inter-particle bonding surface area creating greater bond strength.
De Boer et al (1986) found that for different types of fragmenting lactose, tablet strength
is simply a function of specific surface area (measured by mercury porosimetry) and does
not depend on the crystalline form. They investigated a-lactose monohydrate, anhydrous
a-lactose, roller-dried P lactose and crystalline P lactose. This suggests that the same
binding mechanism applies to all forms of crystalline lactose. However, for materials that
deform plastically, tablet strength was not found to be related to surface area. For
example, increasing fractions of amorphous lactose in spray-dried lactose was found to
increase tablet strength but did not increase surface area of the tablets (Vromans et al,
1986).
Narayan and Hancock (2003) related tablet surface morphology to the consolidation
mechanism of direct compression powders, and hence to tablet strength. They found that
brittle materials produced smooth and brittle compacts, whereas plastic materials
produced rough and ductile compacts.
Various models have been proposed to predict tablet hardness. Of these, the most
commonly cited were proposed by Rumpf (1962), Hiestand (1991) and Leunberger
(1982). These models assume that the tensile strength of the tablet is equal to the sum of
the bonding strength along the failure plane and all bonds are separated instantaneously.
-61 -
Mridula Pore, 2009 Doctoral Thesis, MIT
Part II
Therefore, tablet tensile strength is dependent on bonding surface area and the inter-
particulate bond strength.
Objectives
The objective of this study was to study the effect of compaction speed and force on the
mechanical strength of tablets made of microcrystalline cellulose (Celphere CP102), and
two grades of spray-dried lactose (DCL 11 and DCL 14).
Method
MCC Celphere, DCL 11 and DCL 14 powders were sieved to obtain the sieve fraction
106-212 microns. The powders were stored over saturated magnesium nitrate solution (at
55% relative humidity) for a minimum of 10 hours before compaction.
Powder beds of depth 4mm were compacted at constant upper punch speed (0.5, 5 or 50
mm/min) and to a range of final compaction forces (5-75kN). This corresponded to
430+10 mg MCC and 350+10 mg lactose. Flat-faced punches were used with a 12.7mm
diameter punch. An Instron 4260 mechanical tester was used to compact the tablets.
Tablets were then stored at 55% relative humidity for a minimum of 72 hours before
testing.
Tablets were tested between two flat, stainless steel plates with a 2kN load cell in an
Instron 8848 MicroTester. Loading was performed at a constant upper plate speed of
5mm/min until tablet failure. The lower plate was stationary. The resulting fragments
were inspected to identify the failure mode. Data was collected only from tablets that
failed in tension.
Results
A comparison of lactose (DCL 11) and MCC tablets is presented below. For both
materials tensile strength varied with compaction force (Figure 24). Compaction speed
had no detectable effect in the range studied. The tensile strength of MCC tablets was
lower than that of lactose tablets for the same compaction conditions. Tensile strength
increases with compaction force between 5-20kN, but is not increased by applying forces
greater than 20kN.
-62-
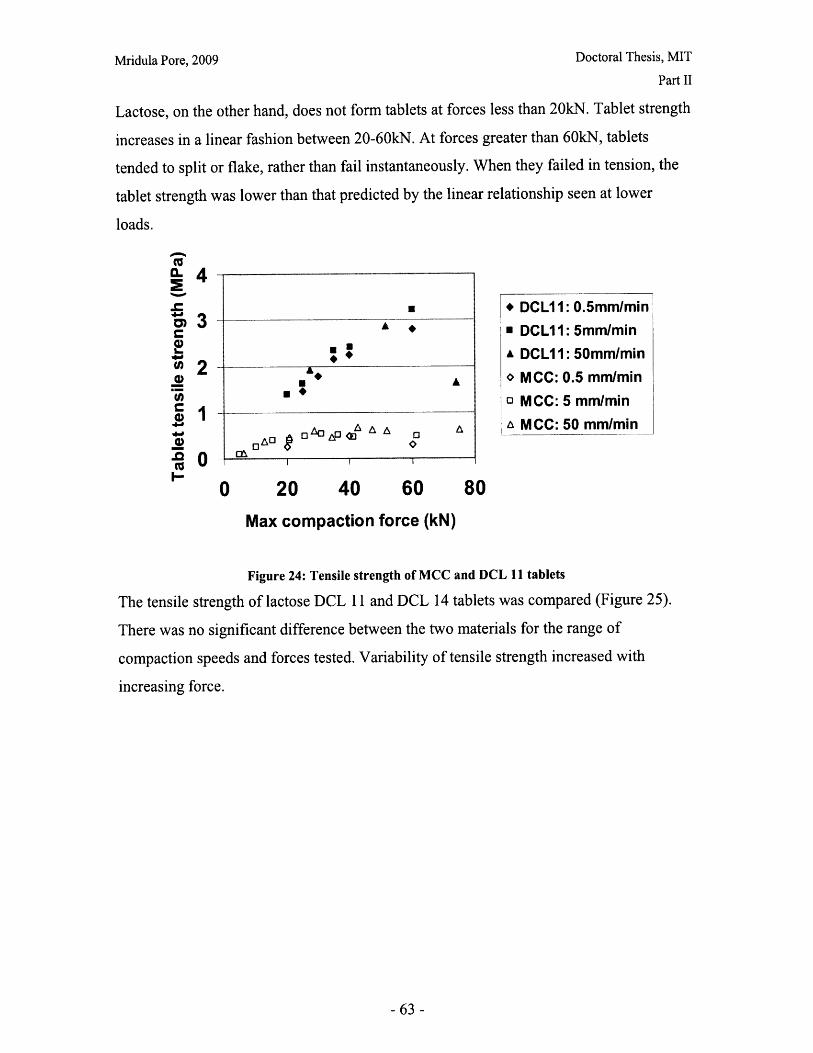
Mridula Pore, 2009 Doctoral Thesis, MIT
Part II
Lactose, on the other hand, does not form tablets at forces less than 20kN. Tablet strength
increases in a linear fashion between 20-60kN. At forces greater than 60kN, tablets
tended to split or flake, rather than fail instantaneously. When they failed in tension, the
tablet strength was lower than that predicted by the linear relationship seen at lower
loads.
" 4-
* DCL11: 0.5mm/min3A • DCL11: 5mm/min
2 " * A DCL11: 50mm/min
_ 2 - E ' MCC: 0.5 mmmin
UU a MCC: 5 mm/min
A A MCC: 50 mm/min
0 20 40 60 80
Max compaction force (kN)
Figure 24: Tensile strength of MCC and DCL 11 tablets
The tensile strength of lactose DCL 11 and DCL 14 tablets was compared (Figure 25).
There was no significant difference between the two materials for the range of
compaction speeds and forces tested. Variability of tensile strength increased with
increasing force.
-63 -
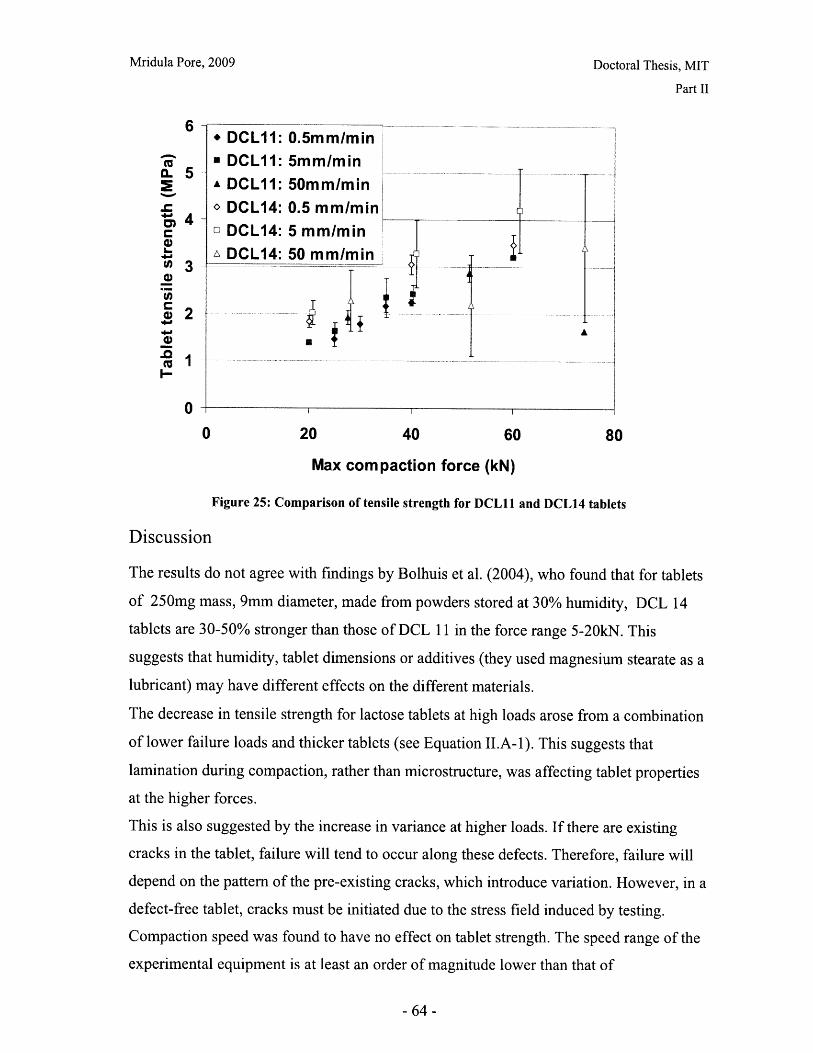
Mridula Pore, 2009 Doctoral Thesis, MIT
Part II
6-* DCL11: 0.5mm/min
cc * DCL11: Smm/min
E 5 A DCL11: 50mm/min. o DCL14: 0.5 mm/mintE)4 4 DCL14: 5 mm/min
DCL14: 50 mm/min
00 20 40 60 80
Max compaction force (kN)
Figure 25: Comparison of tensile strength for DCL11 and DCL14 tablets
Discussion
The results do not agree with findings by Bolhuis et al. (2004), who found that for tablets
of 250mg mass, 9mm diameter, made from powders stored at 30% humidity, DCL 14
tablets are 30-50% stronger than those of DCL 11 in the force range 5-20kN. This
suggests that humidity, tablet dimensions or additives (they used magnesium stearate as a
lubricant) may have different effects on the different materials.
The decrease in tensile strength for lactose tablets at high loads arose from a combination
of lower failure loads and thicker tablets (see Equation II.A-1). This suggests that
lamination during compaction, rather than microstructure, was affecting tablet properties
at the higher forces.
This is also suggested by the increase in variance at higher loads. If there are existing
cracks in the tablet, failure will tend to occur along these defects. Therefore, failure will
depend on the pattern of the pre-existing cracks, which introduce variation. However, in a
defect-free tablet, cracks must be initiated due to the stress field induced by testing.
Compaction speed was found to have no effect on tablet strength. The speed range of the
experimental equipment is at least an order of magnitude lower than that of
- 64 -

Mridula Pore, 2009 Doctoral Thesis, MIT
Part II
manufacturing equipment, so this observation may be a result of a narrow experimental
range.
Conclusions
Pharmaceutical materials show different trends in tablet hardness when subjected to a
range of compaction forces. This indicates that an understanding of the compaction
mechanism is necessary to predict tablet hardness. Compaction speed had no effect on
tablet strength for any of the materials studied.
References
Bolhuis G.; Kusendrager K.; Langridge Pharm. Technol. Suppl. Excipients and Solid
Dosage Forms 2004, 26-31
Davies P.N.; Newton J.M in Pharmaceutical Powder Compaction Technology Eds.
Alderborn G.; Nystrom C. Marcel Dekker, New York, 1996, 165
De Boer A.H.; Vromans H.; Lerk C.F.; Bolhuis G.K.; Kussendrager K.D.; Bosch H.
Pharm Weekbl. Sci. Ed. 1986, 8, 145
Den Hartog J.P. Advanced Strength of Materials, McGraw-Hill, New York, 1952
Hiestand H. Int. J. Pharm. 1991a, 67, 217-229
Hiestand H. Int. J. Pharm. 1991b, 67, 231-246
Leuenberger H. Int. J. Pharm. 1982, 12, 41-55
Olsson H.; Nystrom C. Pharmaceutical Research, 2001, 18 (2), 203-210
Mohammed H.; Briscoe B.J.; Pitt K.G. Chem. Eng. Sci. 2005, 60, 3941-3947
Narayan P.; Hancock B. Mater. Sci. Eng., 2003, A355, 24-36
Rumpf H. Agglomeration Ed. Knepper W.A., Interscience, New York, 1962, 379
Vromans H.; Bolhuis G.K.; Lerk C.F.; Kussendrager K.D.; Bosch H. Acta. Pharma.
Suec. 1986, 23, 231
-65-
Mridula Pore, 2009 Doctoral Thesis, MIT
Part II
II.B: Dissolution
Introduction
From a regulatory perspective, tablet dissolution characteristics are important at many
stages in product development, manufacturing and post-marketing activities (Dressman
and Kramer, 2005). In many cases, the dissolution properties of a tablet are used as an
indicator of bioavailability. In R&D, dissolution testing is used to guide formulation and
process development. In manufacturing, dissolution is a quality control test to check for
batch-to-batch variability and can also be a criterion for releasing a product into the
market. Once a product has been approved and gone into full-scale production,
dissolution profiles can be used to check for product similarity following changes in the
formulation or manufacturing process. When an ANDA (abbreviated new drug
application) is filed for approval of a generic product, dissolution studies form part of the
studies to establish bioequivalence of the generic and the original products (FDA, 2007).
Testing equipment and protocol
Standards for the test equipment and protocol are outlined by the United States, European
and Japanese Pharmacopeias. The USP describes four types of apparatus (paddle, basket,
reciprocating cylinder and flow-through cell (USP, 2007)) of which the paddle apparatus
is the most commonly used (Kramer et al, 2005). It consists of a vessel of specified
geometry agitated at constant speed by a flat paddle. The dissolution properties are
measured by inserting the tablet into a fixed volume of medium and sampling the solution
periodically to generate a time-profile of concentration.
Analysis of dissolution data
There are multiple ways of characterizing the dissolution profile, depending on the
requirements. In some cases it is necessary to simply compare multiple profiles for
reproducibility or to a reference profile. This can be performed by calculating a
characteristic index, such as the difference (f)), the similarity (f2) or the Rescigno indices.
A description of the different indices and their suitability under different conditions is
- 66 -
Mridula Pore, 2009 Doctoral Thesis, MIT
Part II
given by Vertzoni et al (2005). Another common indicator is the time for a given fraction
of the drug to be released, e.g. tso for 50%, or tgo for 90% of drug released.
Other analyses focus on capturing the shape of the cumulative time-concentration profile.
These models fall into two categories (Nicolaides et al, 2001, Costa and Lobo, 2001): the
empirical formulae, such as zero or first-order equations, or a Weibull model
(Langenbucher, 1976), that allow us to fit and compare parameters, and the mechanistic
models, which attempt to identify the key steps in tablet dissolution. Empirical models do
not give us insight into the physics of dissolution; therefore for the purposes of this study,
mechanistic models are of more interest. These models have been applied mainly to the
study of sustained-release formulations with polymeric matrices. Much of the literature
concerns diffusion-limited drug release from an insoluble polymer matrix, using a
stagnant film model (Higuchi, 1961 and 1963, Desai et al 1966a and b, Korsmeyer et al,
1983, Peppas, 1985). However, this is not relevant to the materials in this study, as the
MCC matrix disintegrates and the lactose matrices dissolve.
The solubility of caffeine is 21g/liter and of lactose is 170g/liter (Dean, 1999). Therefore,
it is unlikely that there is any leaching of caffeine from the lactose matrix. It is more
likely that the erosion (dissolution) of the lactose matrix is the rate determining step for
drug release.
Cooney (1972), Hopfenberg (1976) and Katzenhendler (1997) developed models where
surface erosion of the tablet is the rate-limiting step for drug release.
It should be noted that none of the models described above explicitly account for the
hydrodynamics of the testing apparatus, or how changes in testing parameters, such as
agitation speed, might affect dissolution.
Surface-erosion limited drug release
Katzenhendler et al (1997) developed a model for erosion of a disk shaped tablet of
radius, a, thickness, b (Figure 26).
-67-

Mridula Pore, 2009 Doctoral Thesis, MIT
Part II
Ib
Figure 26: Tablet erosion model (Katzenhendler et al., 1997)
Erosion in the linear dimensions was assumed to be zero order:
kata = ao (II.B-1)Co
2kbtb = bo 2kbt (II.B-2)Co
Where ka and kb are the rate constants in the radial and the vertical directions and Co is
the concentration of active ingredient (API).
Assuming that the drug is uniformly distributed throughout the matrix, the fractional
amount of drug released from the tablet at time t, M/M will be
M, /M = 1- nrr2b/2r b (II.B-3)
Substituting the rate equations gives
M, / Mm = 1-I k Coa0 a)'( Cbo (II.B-4)
Katzenhendler et al. present several limiting cases of this equation based on geometric
and kinetic extremes. For the experiments described here, the initial dimensions of the
tablet, ao and bo, were not varied (except for small differences in bo due to different
extents of compression. The thickness and the diameter are of the same order of
magnitude, but not equal (2ao/bo - 6), so it is not reasonable to reduce dimensionality and
model the tablet as a slab, an infinite cylinder or a sphere. However, it is possible that the
anisotropic compaction could lead to significantly different rates of erosion in the radial
and the vertical directions. Three possible cases are presented below.
(1) kb >> ka Tablet thickness decreases much faster than tablet radiusEquation II.B-4 reduces to a linear relationship between M/Mo and time.
M, /Mb = 2k ,bo (II.B-5)
(2) ka >> kb Tablet radius decreases much faster than tablet thickness
-68 -
Mridula Pore, 2009 Doctoral Thesis, MIT
Part II
M1 / Mo = I- 1- k pa0 2 (11.1-6)
In this case a function of Mt/M will be proportional to time.
1- ex - t (II.B-7)2 m C o a
(3) ka = kb = koIn this case, the rate of drug release can be described by a single rate constant and
MtIM is a cubic function of time.
M, /Mo = 1- 1 - kta 21- 2k' bo (II.B-8)
Method
Caffeine (Sigma Aldrich C0750, Lot no: 014K0036) was sieved through a 212 micron
sieve.
Three powder blends were made, consisting of 0.5g caffeine and 9.5g of either MCC,
DCL 11 or DCL 14. The powders were blended using a 42ml capacity V-shaped blender
rotated at 10rpm for 15 minutes. The powders were stored over saturated magnesium
nitrate solution in a dessicator overnight (at 55% relative humidity) before blending and
again before compaction.
Powder beds of depth 4mm were compacted at constant upper punch speed (0.5, 5 or 50
mm/min) and to a range of final compaction forces (5-75kN). This corresponded to 430
±10 mg MCC and 350 ±10 mg lactose. Flat-faced punches were used with a 12.7mm
diameter punch. An Instron 4260 mechanical tester was used to compact the tablets.
Tablets were then stored at 55% relative humidity for a minimum of 72 hours before
testing.
A paddle apparatus (Distek Dissolution system 2100B) was used to perform the
dissolution testing. 1 liter of Millipore-filtered water was placed in the vessel and the
paddles rotated at 225 rpm. The tablet was inserted into the vessel and Iml samples of the
solution were extracted from the top of the vessel at fixed intervals. The caffeine
concentration in the samples was measured using UV spectrophotometry (Hewlett-
Packard 8452A) at 274nm wavelength. The water temperature was not controlled but was
-69-
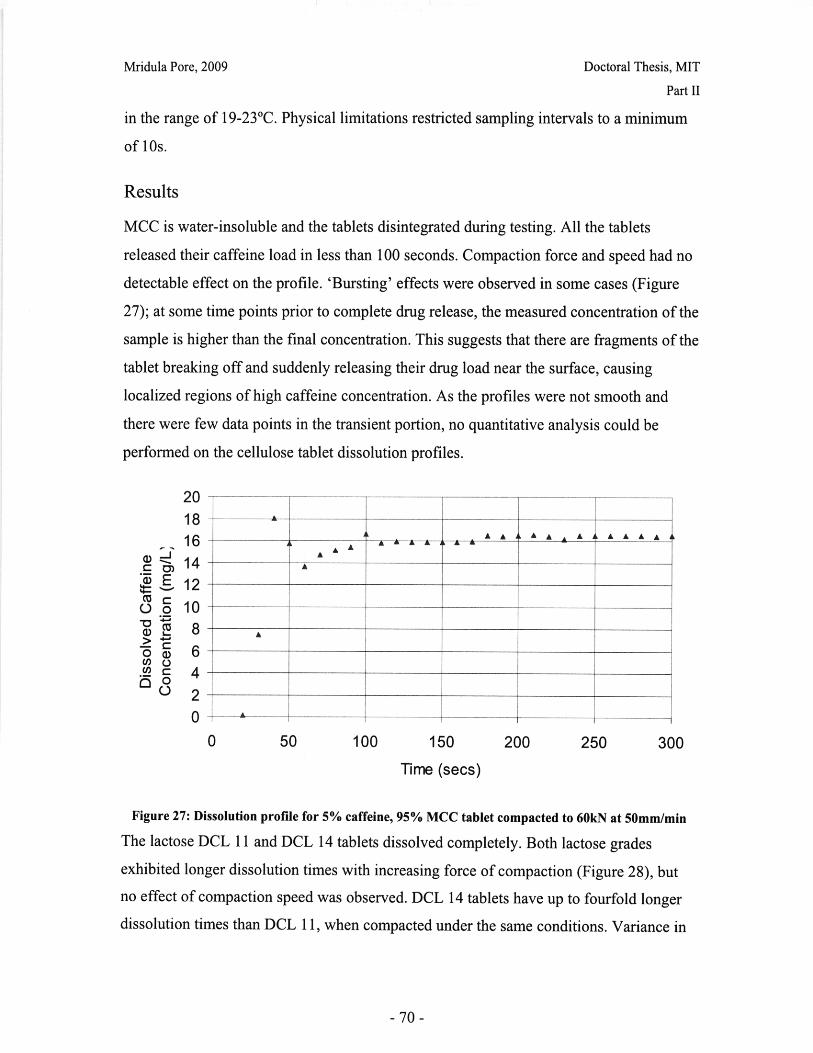
Mridula Pore, 2009 Doctoral Thesis, MIT
Part II
in the range of 19-230C. Physical limitations restricted sampling intervals to a minimum
of 10s.
Results
MCC is water-insoluble and the tablets disintegrated during testing. All the tablets
released their caffeine load in less than 100 seconds. Compaction force and speed had no
detectable effect on the profile. 'Bursting' effects were observed in some cases (Figure
27); at some time points prior to complete drug release, the measured concentration of the
sample is higher than the final concentration. This suggests that there are fragments of the
tablet breaking off and suddenly releasing their drug load near the surface, causing
localized regions of high caffeine concentration. As the profiles were not smooth and
there were few data points in the transient portion, no quantitative analysis could be
performed on the cellulose tablet dissolution profiles.
20
1816 -A LAhA A AA14 A
SE 12
0 0 10
00 6
Ci)o0 2
00 50 100 150 200 250 300
Time (secs)
Figure 27: Dissolution profile for 5% caffeine, 95% MCC tablet compacted to 60kN at 50mm/min
The lactose DCL 11 and DCL 14 tablets dissolved completely. Both lactose grades
exhibited longer dissolution times with increasing force of compaction (Figure 28), but
no effect of compaction speed was observed. DCL 14 tablets have up to fourfold longer
dissolution times than DCL 11, when compacted under the same conditions. Variance in
-70-

Mridula Pore, 2009 Doctoral Thesis, MIT
Part II
t90 increases with compaction force. Although the variance in t90 is greater, individual
profiles are smooth curves.
900 -* DCL 11 at 0.5 mm/min
800 - DCL 11 at 5 mm/minDCL 11 at 50 mm/min
7 DCL 14 at 5mm/min600 x DCL14 at 50mm/min
( 500 * DCL14 at 0.5mm/min
a 400Qo 4 oo .... ... . ... -- ......300 ----200 --
100
0 20 40 60 80
Final force of compaction (kN)
Figure 28: T90 for lactose DCL11 and DCL 14 tablets compacted at a range of speeds and forces
An attempt was made to fit the data to Katzenhendler's models. Only the data up to 90%
dissolution was considered. A cubic relationship was found to fit all the profiles of M/M
versus time (R2 values were greater than 0.96), suggesting that the rates of surface
erosion in the radial and vertical directions are comparable (ka-kb, or ka z kb = ko). The fit
parameters are not presented as values for bo are not available; therefore it is not possible
to calculate values of ko. Also, there is no data to indicate whether a single rate constant is
sufficient to describe erosion.
DCL 11 profiles all have a similar shape (Figure 29) and this is similar to DCL 14 tablets
compacted to forces less than 41kN (Figure 30). A transition was observed in DCL 14
tablets between 4lkN and 50kN. The profile shape changes from a concave to a convex
form. At forces greater than 50kN, the profile fits Equation II.B-6 well, indicating that
radial erosion may dominate drug release at higher compaction loads for DCL 14.
-71 -

Mridula Pore, 2009
1
0.8 -
0.6
0.4
0.2
0 -
Doctoral Thesis, MIT
Part II
0
I" %At2 ~oa
-.
A
CllU0
I0a0
* 20.07
* 20.72
20.57
40.12
x41.15
o 52.98
u 60.15
a 61.39
-73.48
0 200 400 600 800 1000 1200
Time (s)
Figure 29: Normalized dissolution profiles for 5% caffeine, 95% DCL 11 tablets compacted todifferent forces (shown, in kN)
1.2
1
0.8
0.6
0.4
0.2 4
0 200 400 600
Time (s)
800 1000 1200
Figure 30: Normalized dissolution profiles for 5% caffeine, 95% DCL 14 tablets compacted todifferent forces (shown, in kN)
- 72-
1 • a* 18.79A o . 18.82
A C 25.59
a a : 38.75"a) x41.16
a 4-+ 50.15
o 59.34
A 59.57
S- 73.02vW
------~m~ROIQ 1CClb~-~LI~L 21 L~-l~~YI~~Y~YI- 1 a o- 1616 a *-&- **- -** *1.2
r I I I
S-----
ap- --
1.2 -- -------- -- -- -

Mridula Pore, 2009 Doctoral Thesis, MIT
Part II
Discussion
The increasing variance in t9o as compaction force increases may be attributed to the
increased probability of lamination during compaction, leading to cracks in the tablets. If
cracks are present, the data is unlikely to fit the surface erosion model. However, the
profiles are quite smooth, which suggests that there was not much fragmentation or
bursting of tablets during dissolution. It is possible that the cracks allow more penetration
in the radial direction, and hence increase the rate of radial erosion, leading to the DCL
14 data fitting Equation II.B-6. This could be confirmed by calculating the erosion rate
constant(s) by fitting the curves to a cubic equation and measuring the dimensions of
tablets withdrawn from the apparatus at different times. The geometry of the tablets
(ao/bo) can be varied to investigate its effect on dissolution. However, it is possible that
different geometry will lead to different stresses during compaction and hence it may not
be possible to vary geometry independently of matrix solubility.
DCL 11 has shorter dissolution times, which limits the number of data points, as the
solution was sampled manually. Automatic sampling and analysis would lead to better
quality of data.
The standard paddle apparatus was used for this study as it is the most relevant to the
pharmaceutical industry. However, it is not well-suited for developing understanding
about how tablet microstructure affects dissolution. Firstly, the hydrodynamics of the
apparatus are complicated and poorly-understood, therefore mass transfer within the
medium volume cannot be modeled easily. Secondly, the tablet geometry can complicate
the analysis, as seen above. It may be possible to eliminate the effect of tablet geometry
by, for example, encasing part of the tablet in a wax, so that drug release can be
considered to be from a flat surface. A non-standard testing configuration will likely be
necessary to develop an understanding of the relationship between tablet microstructure
and dissolution behavior.
Conclusions
The USP dissolution test is not well-suited for modeling of tablet dissolution, due to
complex hydrodynamic and geometric factors. Excipient choice determines whether
compaction parameters can be used to modify dissolution behavior.
-73-
Mridula Pore, 2009 Doctoral Thesis, MIT
Part II
Increasing compaction force was found to increase dissolution times for DCL 11 and 14,but no effect of speed was observed for the range investigated.
There is some evidence that the rate-limiting step for drug release is surface erosion of
the tablet, but disintegration studies are needed to confirm this hypothesis.
References
Cooney D.O., AIChE J, 1972, 18, 446-449
Costa, P.; Lobo J.M.S. Eur. J. Pharm. Sci. 2001, 13, 123-133
Dean, J.A. Lange's Handbook of Chemistry (15th Edition). McGraw-Hill. 1999
Desai S.J.; Singh P.; Simonelli A.P.; Higuchi W.I. J. Pharm Sci., 1966a, 55, 1230-1234
Desai S.J.; Singh P.; Simonelli A.P.; Higuchi W.I. J. Pharm Sci., 1966b, 55, 1235-1239
Dressman J.; Kramer J. (Eds), Pharmaceutical Dissolution Testing, Taylor and Francis
Group, LLC 2005
FDA, ANDA Checklist for CTD or eCTD format for completeness and acceptability of an
application for filing, Office of Generic Drugs, Center for Drug Evaluation and
Research, U.S. Food and Drug Administration, 2007
Hopfenberger H.B. In Controlled Release Polymeric Formulations Eds. Paul D.R., Haris
F. W. ACS Symposium Series 33: American Chemical Society, Washington DC, 1976,26-31
Higuchi T. J. Pharm Sci. 1961, 50, 874-875
Higuchi T. J. Pharm Sci. 1963, 52, 1145-1149
Katzenhendler I.; Hofman A.; Goldberger A.; Friedman M. J. Pharm. Sci, 1997, 86, 110-
115
Korsmeyer R.W., Gurny R., Doelker E.M., Buri P., Peppas N.A., Int. J. Pharm. 1983, 15,25-35
Kramer J.; Grady, L.T.; Gajendran J. 'Historical Development of Dissolution Testing' in
Pharmaceutical Dissolution Testing, Ed. Dressman J., Kramer J., Taylor and Francis
Group, LLC 2005
Langenbucher F. 'Interpretation of in vitro-in vivo time profiles in terms of extent, rate,
and shape' in Pharmaceutical Dissolution Testing, Ed. Dressman J., Kramer J., Taylor
and Francis Group, LLC 2005
- 74 -
Mridula Pore, 2009 Doctoral Thesis, MIT
Part II
Nicolaides E.; Symillides M.; Dressman J.B.; Reppas C. Pharmaceut. Res.2001, 18 (3),
380-388
Peppas N.A. Pharm. Act. Helv. 1985, 60, 110-111
Vertzoni M.; Nicolaides E.; Symillides M.; Reppas C.; Iliadis A. 'Orally administered
drug products: Dissolution data analysis with a view to in vitro-in vivo correlation' in
Pharmaceutical Dissolution Testing, Ed. Dressman J., Kramer J., Taylor and Francis
Group, LLC 2005
USP, Chapter <711 > Dissolution, United States Pharmacopeia National Formulary,
Volume 1, 2007
- 75 -
Mridula Pore, 2009 Doctoral Thesis, MIT
Part II
- 76 -

Mridula Pore, 2009 Doctoral Thesis, MIT
Part III
Part III: Imaging and Spectroscopic Analysis of Tablet Structure
X ray micro computed tomography and Terahertz pulsed spectroscopy (TPS) and
imaging (TPI) were used to analyze the microstructure of the tablet core (III.A and III.B)
and to detect internal defects (III.C) in MCC Celphere®, and Pharmatose® DCL 11 and
DCL 14 tablets.
Using TPS, changes in refractive index spectra caused by different compaction conditions
were observed for MCC and DCL 11 tablets. No changes in spectral features were found,
but the profile is translated along the axis of refractive index. The average refractive
index was found to correlate well to tablet hardness for DCL 11, but not for MCC tablets.
DCL 11 and DCL 14 tablets compacted at the same conditions were analyzed by TPS. No
difference between the spectra of the two grades of lactose was observed.
The X ray images showed that MCC tablets formed by plastic deformation of the
granules, whereas lactose tablets were monolithic structures, that showed no evidence of
initial granule shape or size. Pore size, rather than average porosity was found to be a
better indicator of structural changes. The average 2D pore area and the volume-average
pore diameter decreased with increasing compaction force for DCL 11 tablets (and
increasing average THz refractive index). However, at higher forces, scanning resolution
may have been a limiting factor. No effect of compaction speed was observed. DCL 11
and DCL 14 tablets compacted under the same conditions had the same pore size
distributions.
TPI was found to detect internal defects in tablets. The presence or absence of defects
was confirmed by X ray micro CT.
A comparison of commercially-available imaging techniques used for analysis of
pharmaceutical tablets is presented in chapter III.D. TPS has some advantages over near
infra-red spectroscopy (the current non-destructive technique for assessing tablet
hardness). However, further work is needed to understand the physical significance of the
THz measurements. TPI is a more rapid method of tablet defect detection than X ray
micro CT. A quantitative assessment of the resolution and limit of detection of the TPI
technique will be required before it can be a reliable quality assessment tool.
-77-

Mridula Pore, 2009 Doctoral Thesis, MIT
Part III
III.A: Terahertz Pulsed Transmission Spectroscopy
An introduction to Terahertz technology
Terahertz radiation is a term used for the portion of the electromagnetic spectrum
between microwave and mid-infrared (0. 1-10THz, or 3-333cm-1). Unlike Raman and
mid-IR wavelengths which excite intramolecular covalent bonds, the THz range causes
vibration and translation of intermolecular non-covalent bonds, and hence is sensitive to
changes in crystalline structure (Day et al, 2006). A description of the technology for
generation and detection of THz pulses is presented by Ho et al (2006).
Commercial terahertz pulsed spectroscopy (TPS) devices have been on the market for
less than 10 years, and the technique has shown promise for pharmaceutical applications,
as outlined by Zeitler et al (2007). TPS has been shown to detect polymorphic differences
in solids (Upadhya et al, 2004, Taday et al, 2003) and to quantify the composition of a
mixture of polymorphs (Strachan et al., 2005).
Terahertz and the spectral fingerprint
... . . ....... .. ... ............ ......
: . wC ,,- ,U 'O 0 4O.. .. . ... ...
T h~ terartz gap 40 GH to 4 THz or 133 cm :to 3 cm e ? 5 mm to 75 rm
Figure 31: The position of terahertz radiation in the electromagnetic spectrum (Source: TeraView,2007)
Objective
This study investigated the potential of THz spectroscopy to evaluate tablet hardness and
dissolution.
Method
Sample preparation
The samples tested are single-component wafers of MCC Celphere®, lactose
Pharmatose® DCL 11 or lactose DCL 14.
- 78-

Mridula Pore, 2009 Doctoral Thesis, MIT
Part III
MCC, DCL 11 and DCL 14 powders were sieved to obtain the sieve fraction 106-212
microns. The powders were stored over saturated magnesium nitrate solution (at 55%
relative humidity) for a minimum of 10 hours before compaction.
Powder beds of depth 4mm were compacted at constant upper punch speed (0.5, 5 or 50
mm/min) and to a range of final compaction forces (5-75kN). This corresponded to
430+10 mg MCC and 350±10 mg lactose. Flat-faced punches were used with a 12.7mm
diameter punch. An Instron 4260 mechanical tester was used to compact the tablets.
Tablets were made in triplicate for each set of compaction parameters and stored in air-
tight containers for approximately 3 weeks before testing.
TPS Measurement
Samples were analyzed using a TPS Spectra 1000 transmission spectrometer (TeraView
Ltd., Cambridge, UK). No sample preparation was necessary. The sample was inserted in
a holder in the chamber. The chamber was then purged with nitrogen for 4 minutes to
remove water vapor before scanning. Each sample was measured in triplicate, each
measurement being an average of 1800 scans.
The spectrometer samples the entire thickness of the tablet at a central point, but the spot
size varies with wavenumber. A spectrum of refractive index (RI) in the THz range as a
function of wavenumber is obtained.
The sample thickness is required to calculate the refractive index and was measured with
a vernier scale (Mitutoyo Absolute Digimatic) to an accuracy of 0.01m.
Results
Spectral changes as a function of compaction conditions for MCC and DCL 11
The spectra are reproducible for each set of compaction conditions. The mean values (of
three tablets per curve) are plotted in Figure 32 and Figure 33.
For MCC tablets, the refractive index increases with increasing compaction force.
However, there is overlap between the spectra in the force range 41-62kN. As it was not
possible to ensure that tablets were compacted to the same force at different speeds, the
effect of speed is inconclusive from this plot.
-79-
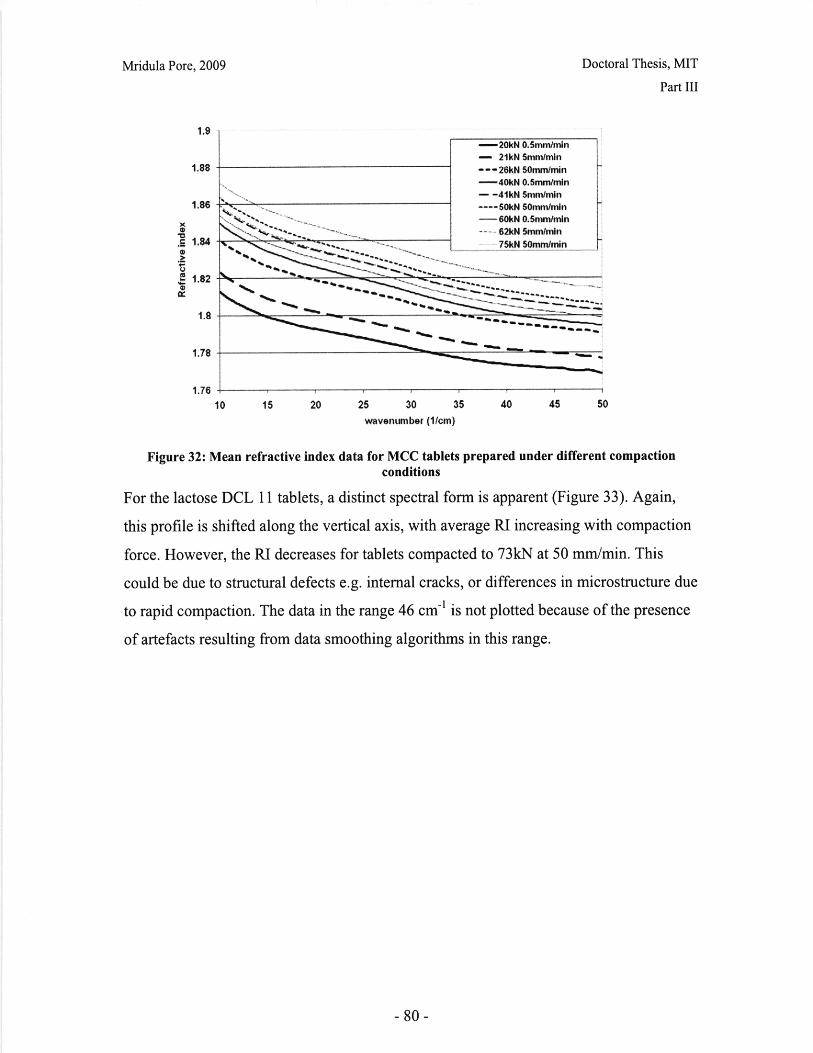
Doctoral Thesis, MIT
Part III
Mridula Pore, 2009
1.9
1.88
1.86
1.82 .
1.8
1.78
1.76
-I-s
ft
l _~._~..;C..~.1~' ""' .e.......1r _ _I
10 15 20 25 30 35 40 45 50
wavenumber (1/cm)
Figure 32: Mean refractive index data for MCC tablets prepared under different compactionconditions
For the lactose DCL 11 tablets, a distinct spectral form is apparent (Figure 33). Again,
this profile is shifted along the vertical axis, with average RI increasing with compaction
force. However, the RI decreases for tablets compacted to 73kN at 50 mm/min. This
could be due to structural defects e.g. internal cracks, or differences in microstructure due
to rapid compaction. The data in the range 46 cm-' is not plotted because of the presence
of artefacts resulting from data smoothing algorithms in this range.
- 80-

Mridula Pore, 2009
2.05
2
1.95
1.9
1.85
1.8
1.75
1.7
1.65
Doctoral Thesis, MIT
Part III
20 30 40 50 60 70 80wavenumber (1/cm)
Figure 33: Mean refractive index data for lactose compacts prepared under different compactionconditions
Correlation between tablet hardness and THz refractive index
Tablet hardness was measured for a set of identical tablets, as described in chapter IIA
and hardness was plotted against refractive index (Figure 34). A poor correlation is
observed for MCC tablets. However, the range of tablet hardness achievable was narrow.
For the lactose DCL 11 tablet data (Figure 34), an outlying data point is observed that
corresponds to tablets compacted to 73kN at 50mm/min. If this data point is excluded, a
good correlation is observed between tablet hardness and refractive index. The refractive
indices for lactose tablets were higher than for MCC tablets
-81 -
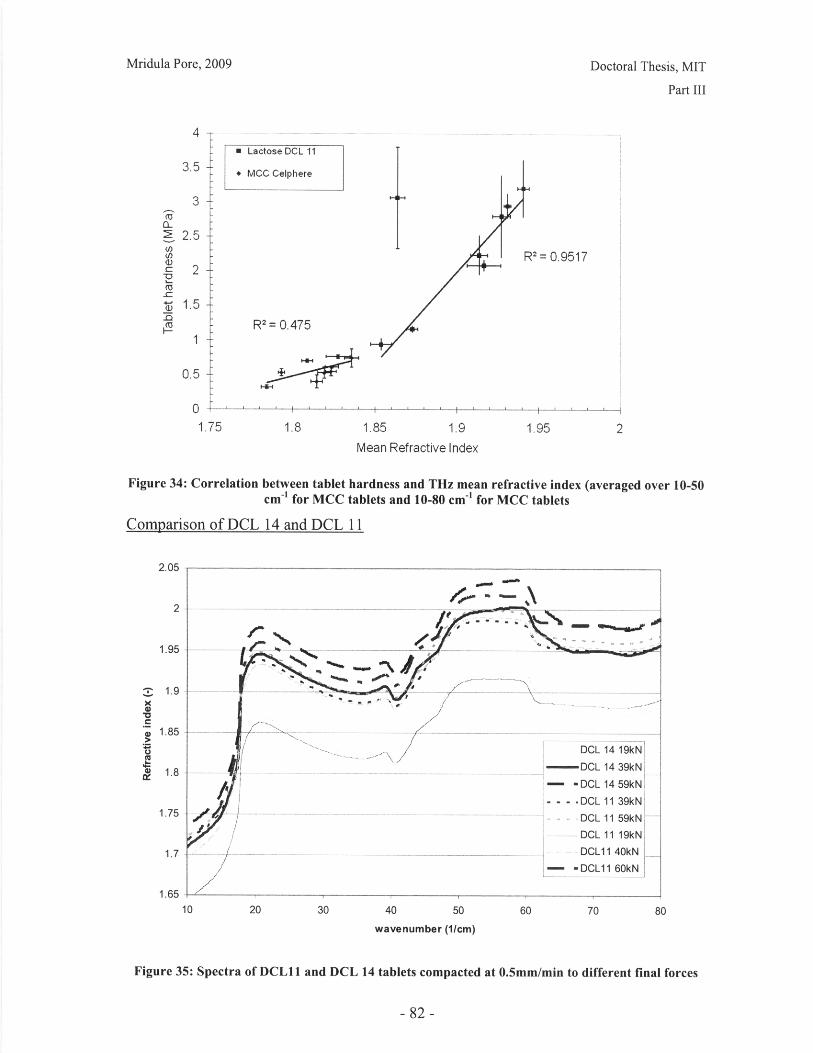
Mridula Pore, 2009
3-
2.5 -
2-
1.5-
1
n
Doctoral Thesis, MIT
Part III
I Lactose DCL 11
* MCC Celphere
R2 = 0.475
R2 = 0.9517
I- , , , ,, , , , , ,,,
1.75 1.85 1.95Mean Refractive Index
Figure 34: Correlation between tablet hardness and THz mean refractive index (averaged over 10-50cm' for MCC tablets and 10-80 cm-' for MCC tablets
Comparison of DCL 14 and DCL 11
2.05
2
1.95
1.9
1.85
1.8
1.75 DCL 1159kN
// DCL 11 19kNi
1.7 .. . . . .. . . .. D C L11 40kN
--DCL11 60kN
1.65
10 20 30 40 50 60 70 80
wavenumber (1/cm)
Figure 35: Spectra of DCL11 and DCL 14 tablets compacted at 0.5mm/min to different final forces
- 82-
Mridula Pore, 2009 Doctoral Thesis, MIT
Part III
The RI spectra of DCL 11 and DCL14 tablets compacted at 0.5mm/min are plotted in
Figure 35. The range 44 - 46 cm' is omitted, because of the presence of numerical
artefacts. No difference is observed in the spectra for DCL 11 and DCL 14 tablets
compacted under the same conditions.
Discussion
Effect of compaction conditions
The lack of peaks in the MCC profile is consistent with an unstructured molecular
organization, as observed for amorphous materials by Strachan et al (2004) and Walther
et al. (2003). DCL 11 and DCL 14 consist of a mixture of amorphous and a-monohydrate
lactose, which accounts for the more distinct features observed in the spectra.
The outlier in Figure 34 is possibly due to the presence of cracks in the tablets.
Lamination was detected by THz pulsed imaging and by X ray tomography (see chapter
III.C) and shown to increase with compaction force. It is possible that the presence of
major cracks in the tablet caused scattering of the THz beam and distortion of the data.
Comparison of DCL 11 and DCL 14
DCL 11 and DCL 14 form tablets of equivalent hardness for given compaction conditions,
as described in chapter IIA. However the dissolution times for DCL 14 tablets are much
longer than those for DCL11 tablets (chapter IIB). One hypothesis to account for the
difference in dissolution was different proportions of amorphous and a-monohydrate
lactose in the two grades. If so, the TPS spectra ought to be different, as demonstrated by
the absorption spectra for the different lactose hydrate forms (Figure 36). However, no
such difference has been observed.
-83-
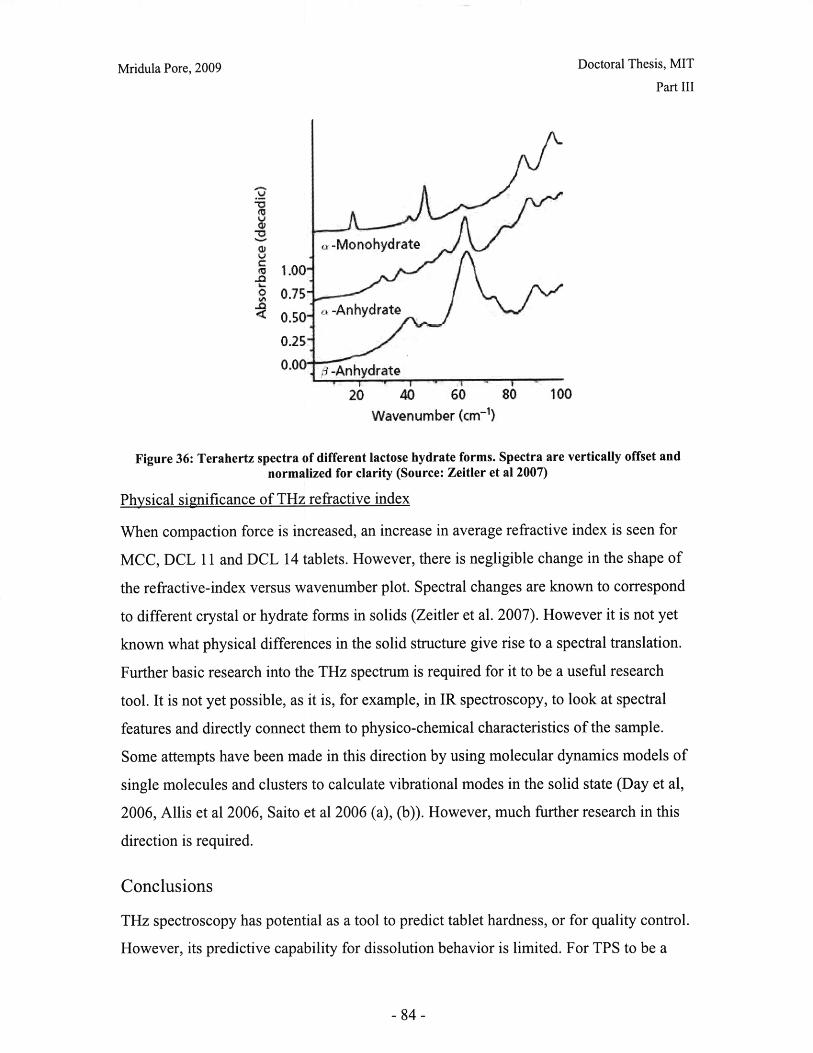
Mridula Pore, 2009 Doctoral Thesis, MIT
Part III
a -Monohydrate
0 0.75-
0.50. o-Anhydrate
0.25-
0.00 .3 -Anhydrate
20 40 60 80 100
Wavenumber (cm-1)
Figure 36: Terahertz spectra of different lactose hydrate forms. Spectra are vertically offset andnormalized for clarity (Source: Zeitler et al 2007)
Physical significance of THz refractive index
When compaction force is increased, an increase in average refractive index is seen for
MCC, DCL 11 and DCL 14 tablets. However, there is negligible change in the shape of
the refractive-index versus wavenumber plot. Spectral changes are known to correspond
to different crystal or hydrate forms in solids (Zeitler et al. 2007). However it is not yet
known what physical differences in the solid structure give rise to a spectral translation.
Further basic research into the THz spectrum is required for it to be a useful research
tool. It is not yet possible, as it is, for example, in IR spectroscopy, to look at spectral
features and directly connect them to physico-chemical characteristics of the sample.
Some attempts have been made in this direction by using molecular dynamics models of
single molecules and clusters to calculate vibrational modes in the solid state (Day et al,
2006, Allis et al 2006, Saito et al 2006 (a), (b)). However, much further research in this
direction is required.
Conclusions
THz spectroscopy has potential as a tool to predict tablet hardness, or for quality control.
However, its predictive capability for dissolution behavior is limited. For TPS to be a
- 84-

Mridula Pore, 2009 Doctoral Thesis, MIT
Part III
useful research tool, further work is required to understand the physico-chemical basis for
features and shifts in the spectra.
Acknowledgements
Axel Zeitler, Phil Taday, Alessia Porteiri (TeraView Ltd.) and Samuel Ngai (MIT) are
gratefully acknowledged for assistance in training, data collection and for many helpful
discussions.
References
Allis D.G.; Prokhorova D.A.; Korter T.M. J. Phys. Chem. A, 2006, 110, 1951-1959
Day G.M.; Zeitler J.A.; Jones W.; Rades T.; Taday P.F. J. Phys. Chem B., 2006, 110,
447-456
Ho L.; Zeitler J.A.; Rades T.; Gordon K.C.; Rantanen J.; Strachan C. Pharm. Tech. Eur.,
http://www.ptemag.com/pharmtecheurope/ November 2006
Saito S.; Inverbaev T.M.; Mizuseki H.; Igarashi N.; Kawazoe Y. JAppl. Physics Part I-
Regular Papers Brief Commun. Rev Papers, 2006a, 45, 4170-4175
Saito S.; Inverbaev T.M.; Mizuseki H.; Igarashi N.; Kawazoe Y. Chem. Phys. Lett.
2006b, 423, 439-444
Strachan C.J.; Rades T.; Newnham D.A.; Gordon K.C.; Pepper M.; Taday P.F. Chem.
Phys. Letters 2004,390 (1-3) pp20-24
Strachan C.J.; Taday P.F.; Newnham D.A.; Gordon K.C.; Zeitler J.A.; Pepper M.; Rades
T. J. Pharm. Sci. 2005, 94(4), 837-846
Taday P.; Bradley I.V.; Amone D.D.; Pepper M. J. Pharm. Sci. 2003, 92 (4), 831-838
TeraView www.teraview.co.uk, accessed April 5, 2007
Upadhya P.C.; Nguyen K.L.; Shen Y.C.; Obradovic J.; Fukushige K.; Griffiths R.;
Gladden L.; Davies A.G.; Linfield E.H. Joint 29 th Conference on Infrared and
Millimeter Waves and 12 th Int. Conf on Terahertz Electronics 2004, 429-430
Walther M.; Fischer B.M.; Jepsen P.U. Chem. Phys., 2003, 288 (2-3), 261-268
Zeitler J.A.; Taday P.F.; Newnham D.A.; Pepper M.; Gordon K.C.; Rades T. J. Pharm.
Pharmacol. 2007, 59, 209-223
-85-

Mridula Pore, 2009 Doctoral Thesis, MIT
Part III
III.B: Microstructure Analysis using X ray microCT
Introduction
X ray tomography is a method that allows high-resolution 3D mapping of density
variations in a sample. It is well suited for samples such as the tablet fragments
investigated here, which consist of two phases, solid and gas, with distinctly different
densities.
This technique has been used to study the structure and porosity of materials such as
bone, soil, ceramics and pastes. The potential of this technique within the pharmaceutical
industry is discussed by Hancock and Mullarney (2005). It is being used (in conjunction
with other experimental and modeling methods) to study powder packing and particle
movement during compaction by Xiaowei et al. (2006 (a), (b)) at the Pfizer Institute for
Pharmaceutical Material Science, Cambridge, UK.
As with any tomographic technique, the sample is first scanned in multiple
configurations and then undergoes several steps of data-processing to obtain the three-
dimensional data. The steps are outlined below.
Scan
A SkyScanT M 1172 microCT instrument was used in this study. The X ray point source
and detector are stationary and the sample is rotated to obtain multiple grayscale shadow
images (e.g. Figure 38), similar to those obtained by standard medical X ray imaging.
Figure 37: X ray micro CT scan configuration (source: Skyscan, 2007)
- 86-
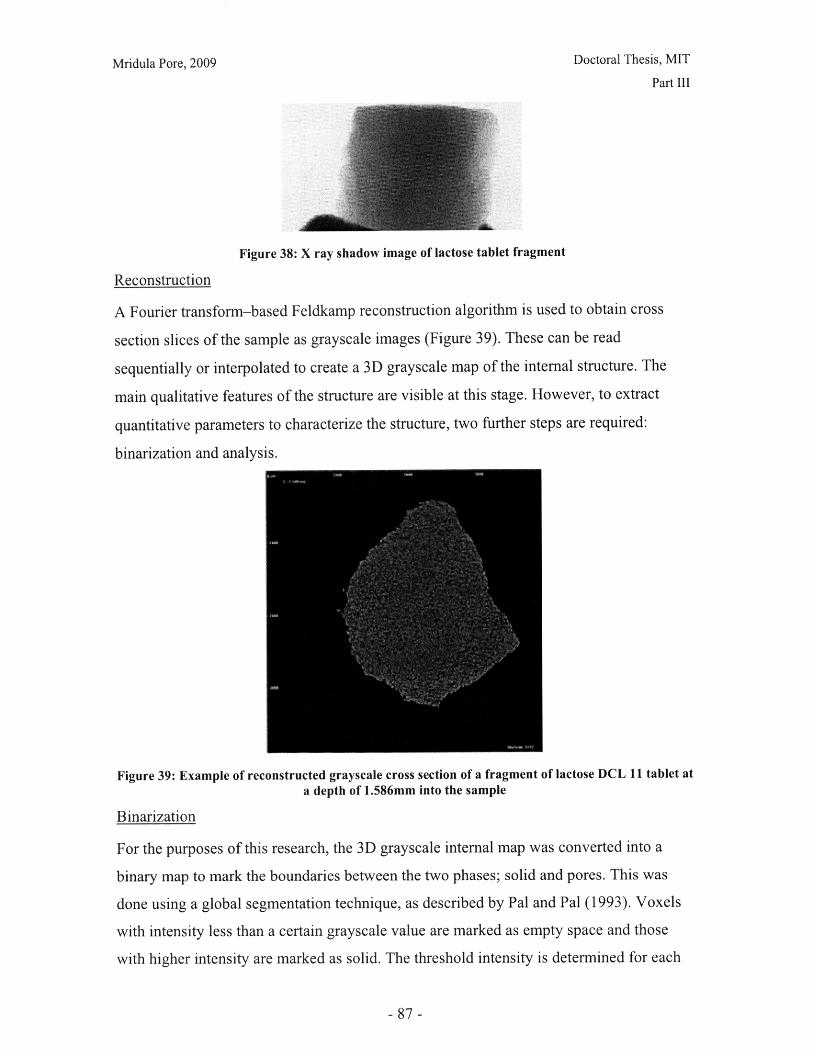
Mridula Pore, 2009 Doctoral Thesis, MIT
Part III
Figure 38: X ray shadow image of lactose tablet fragment
Reconstruction
A Fourier transform-based Feldkamp reconstruction algorithm is used to obtain cross
section slices of the sample as grayscale images (Figure 39). These can be read
sequentially or interpolated to create a 3D grayscale map of the internal structure. The
main qualitative features of the structure are visible at this stage. However, to extract
quantitative parameters to characterize the structure, two further steps are required:
binarization and analysis.
Figure 39: Example of reconstructed grayscale cross section of a fragment of lactose DCL 11 tablet ata depth of 1.586mm into the sample
Binarization
For the purposes of this research, the 3D grayscale internal map was converted into a
binary map to mark the boundaries between the two phases; solid and pores. This was
done using a global segmentation technique, as described by Pal and Pal (1993). Voxels
with intensity less than a certain grayscale value are marked as empty space and those
with higher intensity are marked as solid. The threshold intensity is determined for each
- 87 -

Mridula Pore, 2009 Doctoral Thesis, MIT
Part III
scan set to allow for drift and fluctuations of the X ray tube. An intensity histogram iscalculated for the entire dataset (e.g. Figure 40). This forms a bimodal distribution withone low-intensity mode (solid pink line) corresponding to the voxels indicating emptyspace around the sample and in the pores, and another mode (dotted blue line)representing the intensity distribution of 'solid' voxels. As there is always an overlapbetween the two distributions, the valley where they intersect is selected as the thresholdvalue.
46
20 $ 0 10 120 140 160 IS 200 2 0
Figure 40: Intensity histogram for a set of reconstructed slices (global threshold: 46)
Analysis
The dataset of binary images can be analyzed as a set of 2D images or as a 3D structure
by interpolating between the images. The average porosity can be calculated in 2D (pore
area/total area of interest) or in 3D (pore volume/total volume of interest).
A relevant 2D parameter is the average cross section area of each pore. This is calculated
for each cross section slice and averaged over the dataset. A highly interconnected
structure with large pores will result in fewer, larger discrete pores in cross section than a
homogenous structure with lower porosity (SkyScan, 2007b).
A relevant 3D parameter is the volume-weighted pore diameter (average and
distribution). This parameter is known more generally in stereology (the field of
estimating geometrical quantities of spatial objects from lower dimensional probes) as the
structure thickness. A detailed discussion on the calculation of this parameter can be
found in Hildebrand and Ruegsegger (1997). For our purposes it is sufficient to
understand that the method works by fitting maximal spheres to each voxel marked as
-88-
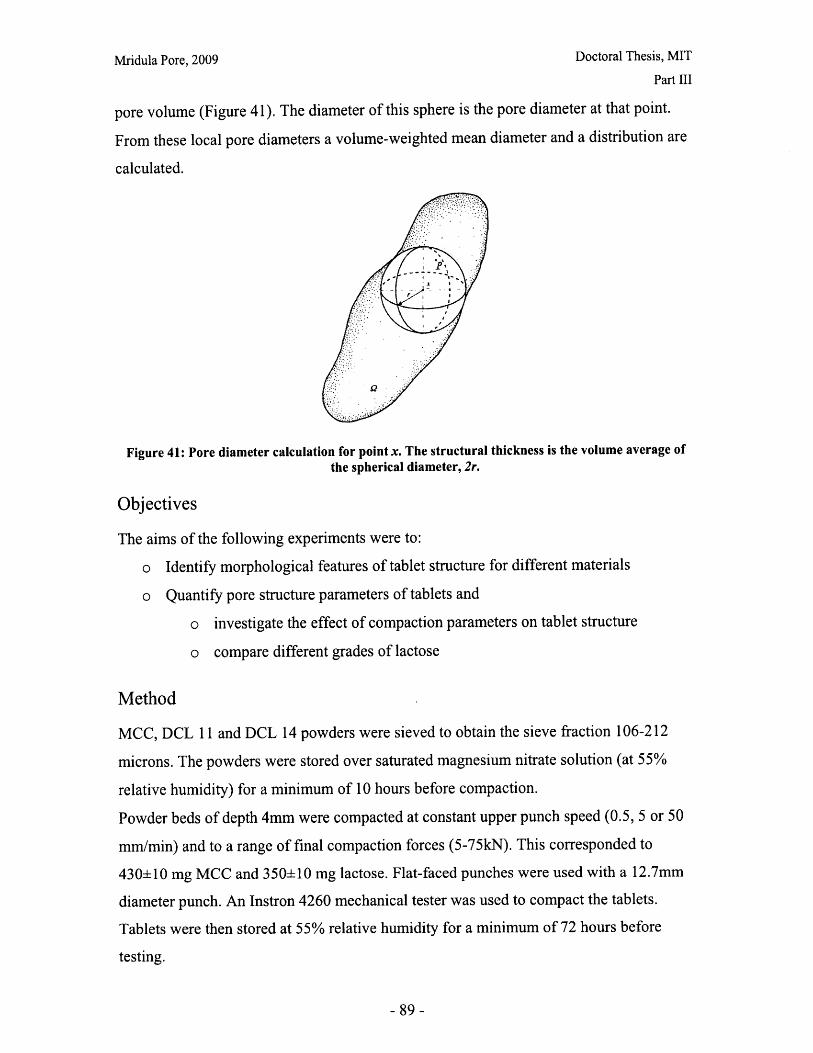
Mridula Pore, 2009 Doctoral Thesis, MIT
Part III
pore volume (Figure 41). The diameter of this sphere is the pore diameter at that point.
From these local pore diameters a volume-weighted mean diameter and a distribution are
calculated.
Figure 41: Pore diameter calculation for point x. The structural thickness is the volume average ofthe spherical diameter, 2r.
Objectives
The aims of the following experiments were to:
o Identify morphological features of tablet structure for different materials
o Quantify pore structure parameters of tablets and
o investigate the effect of compaction parameters on tablet structure
o compare different grades of lactose
Method
MCC, DCL 11 and DCL 14 powders were sieved to obtain the sieve fraction 106-212
microns. The powders were stored over saturated magnesium nitrate solution (at 55%
relative humidity) for a minimum of 10 hours before compaction.
Powder beds of depth 4mm were compacted at constant upper punch speed (0.5, 5 or 50
mm/min) and to a range of final compaction forces (5-75kN). This corresponded to
430±10 mg MCC and 350±10 mg lactose. Flat-faced punches were used with a 12.7mm
diameter punch. An Instron 4260 mechanical tester was used to compact the tablets.
Tablets were then stored at 55% relative humidity for a minimum of 72 hours before
testing.
-89-

Mridula Pore, 2009 Doctoral Thesis, MIT
Part III
A SkyScanTM 1172 microCT machine (SkyScan N.V., Artselaar, Belgium) was used to
scan tablet fragments of approximately 2 millimeters in diameter cut from the center of
the tablet.
The reconstructed cross sections were created using NRecon software and binarization
and analysis was conducted using CTAn software from SkyScanTM.
The scanning and reconstruction parameters for the lactose tablets are shown in Table 10.
A cylindrical region approximately Imm3 in volume (Figure 42) was selected for analysis
of each sample. The global threshold method for image segmentation was used to convert
the grayscale images into binary images. The effects of noise were minimized by
removing clusters of connected 'pore' voxels less than 3 voxels in size.
Table 10: X ray microCT scanning and reconstruction parameters for tablet fragments
Beam voltage 40kVBeam current 250 tASample total rotation 180"Rotation degree 0.10Exposure time 147 msFrame average 4Random movement correction 10Pixel linear dimension 1.9 tmCamera make and model Hamamatsu 10Mp cameraCamera resolution 2000 x 1048 pixelsFilter No filterFlat field Gathered prior to each scan. Frame
average for flat field = 100Median filter OFFReconstruction (NRecon v1.4.4)Image post alignment Automatic (Range: -12 to 12
pixels)Beam hardening correction factor 10Ring artifact correction factor 10Cross section intensity limits 0.001 - 0.15Voxel dimension (isotropic cube) 1.9 pm
- 90-
Scannin2 (SkyScan 1172)
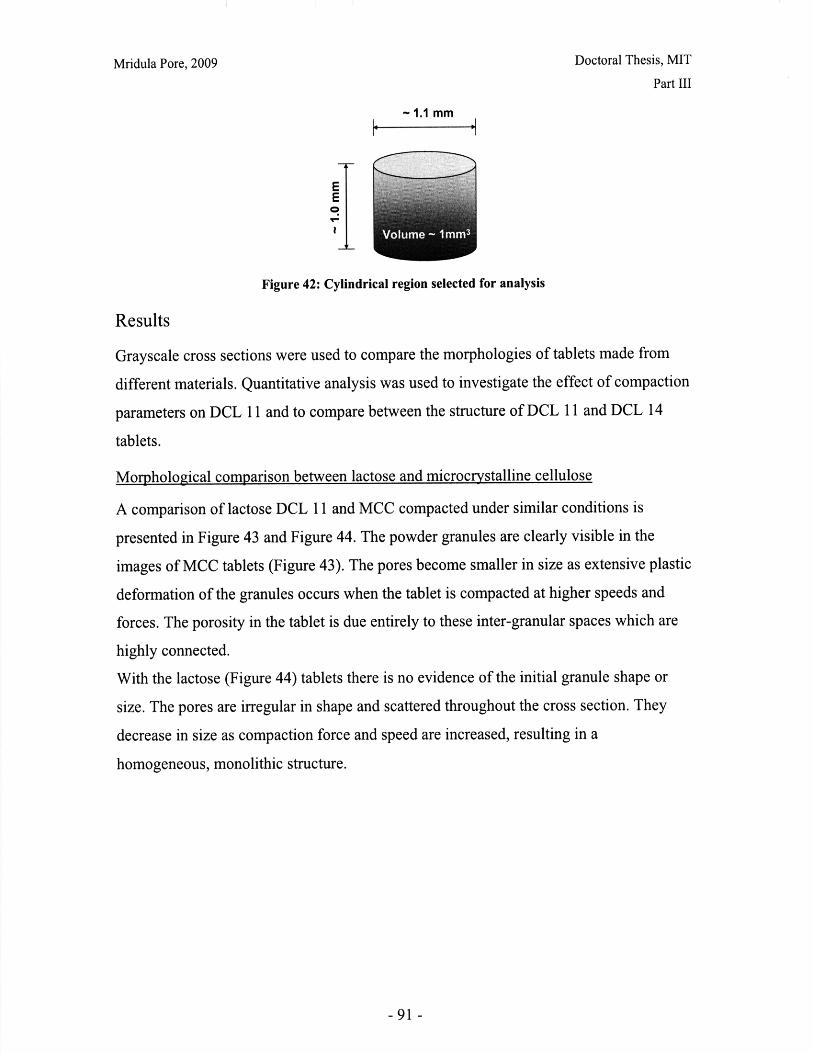
Mridula Pore, 2009 Doctoral Thesis, MIT
Part III
~ 1.1 mm
EE
JI
Figure 42: Cylindrical region selected for analysis
Results
Grayscale cross sections were used to compare the morphologies of tablets made from
different materials. Quantitative analysis was used to investigate the effect of compaction
parameters on DCL 11 and to compare between the structure of DCL 11 and DCL 14
tablets.
Morphological comparison between lactose and microcrystalline cellulose
A comparison of lactose DCL 11 and MCC compacted under similar conditions is
presented in Figure 43 and Figure 44. The powder granules are clearly visible in the
images of MCC tablets (Figure 43). The pores become smaller in size as extensive plastic
deformation of the granules occurs when the tablet is compacted at higher speeds and
forces. The porosity in the tablet is due entirely to these inter-granular spaces which are
highly connected.
With the lactose (Figure 44) tablets there is no evidence of the initial granule shape or
size. The pores are irregular in shape and scattered throughout the cross section. They
decrease in size as compaction force and speed are increased, resulting in a
homogeneous, monolithic structure.
-91-
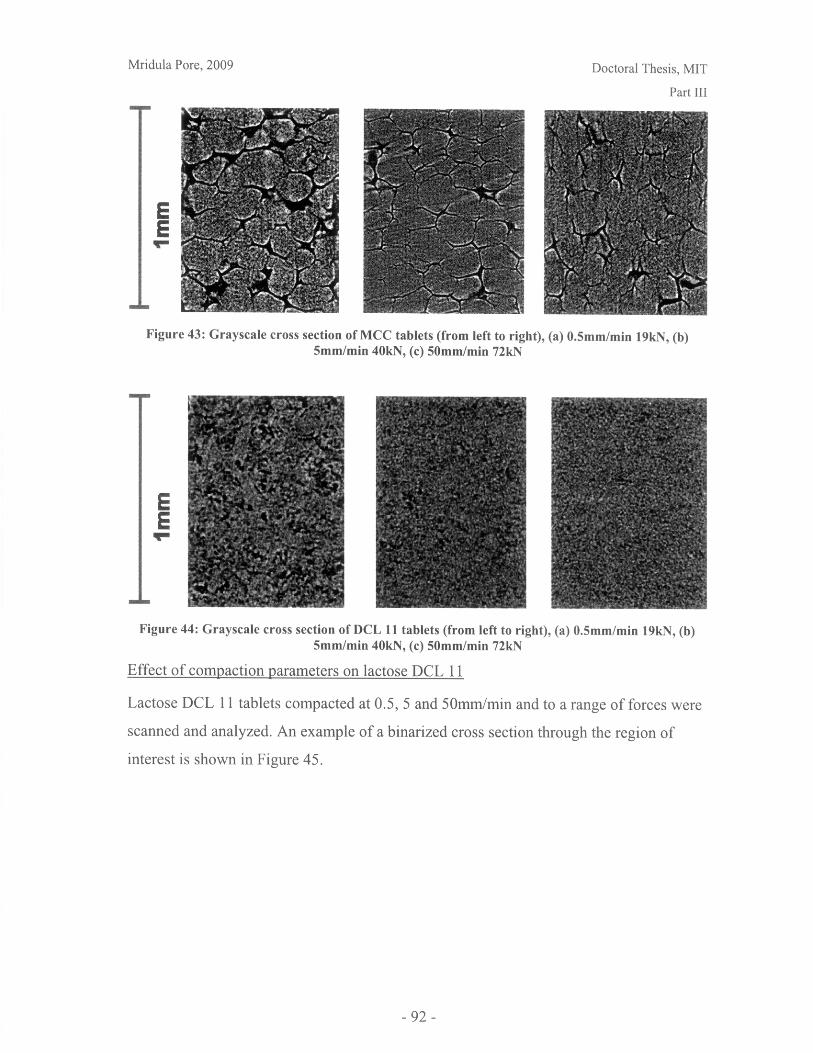
Mridula Pore, 2009 Doctoral Thesis, MIT
Part III
EE
Figure 43: Grayscale cross section of MCC tablets (from left to right), (a) 0.5mm/min 19kN, (b)5mm/min 40kN, (c) 50mm/min 72kN
E
Figure 44: Grayscale cross section of DCL 11 tablets (from left to right), (a) 0.5mm/min 19kN, (b)5mm/min 40kN, (c) 50mm/min 72kN
Effect of compaction parameters on lactose DCL 11
Lactose DCL 11 tablets compacted at 0.5, 5 and 50mm/min and to a range of forces were
scanned and analyzed. An example of a binarized cross section through the region of
interest is shown in Figure 45.
- 92-
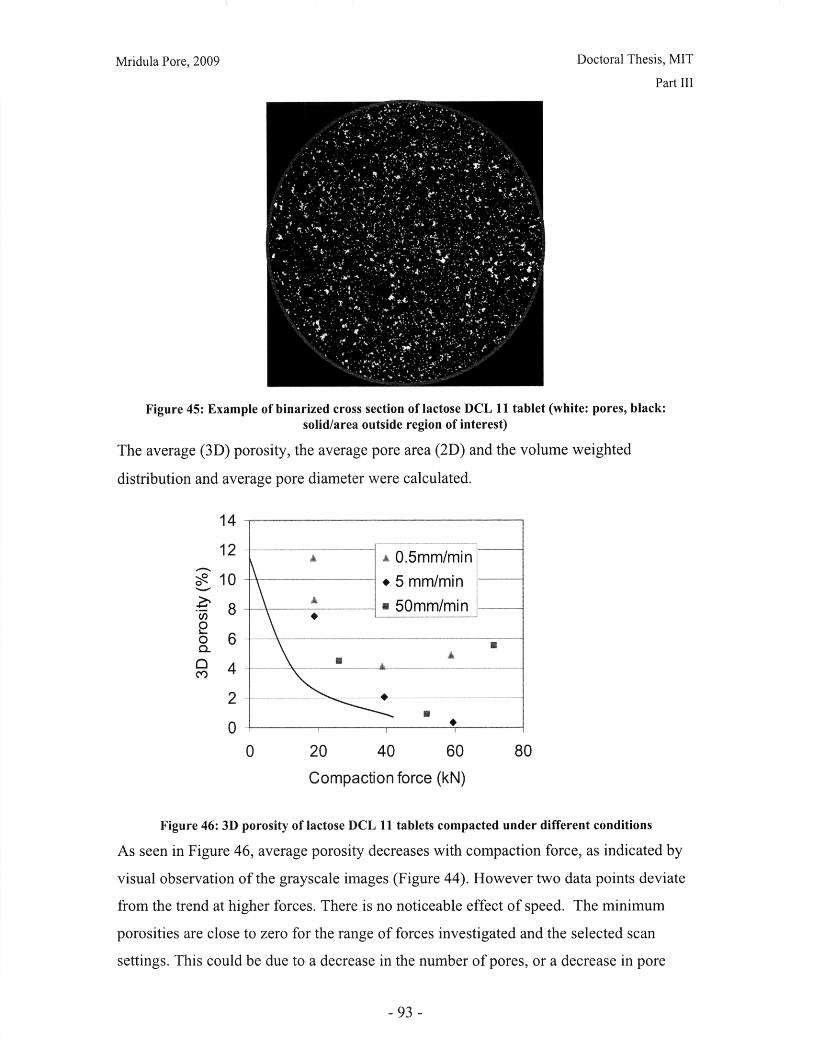
Mridula Pore, 2009 Doctoral Thesis, MIT
Part III
Figure 45: Example of binarized cross section of lactose DCL 11 tablet (white: pores, black:solid/area outside region of interest)
The average (3D) porosity, the average pore area (2D) and the volume weighted
distribution and average pore diameter were calculated.
14
12
10
8
6
4
2
020 40 60
Compaction force (kN)
80
Figure 46: 3D porosity of lactose DCL 11 tablets compacted under different conditions
As seen in Figure 46, average porosity decreases with compaction force, as indicated by
visual observation of the grayscale images (Figure 44). However two data points deviate
from the trend at higher forces. There is no noticeable effect of speed. The minimum
porosities are close to zero for the range of forces investigated and the selected scan
settings. This could be due to a decrease in the number of pores, or a decrease in pore
- 93-
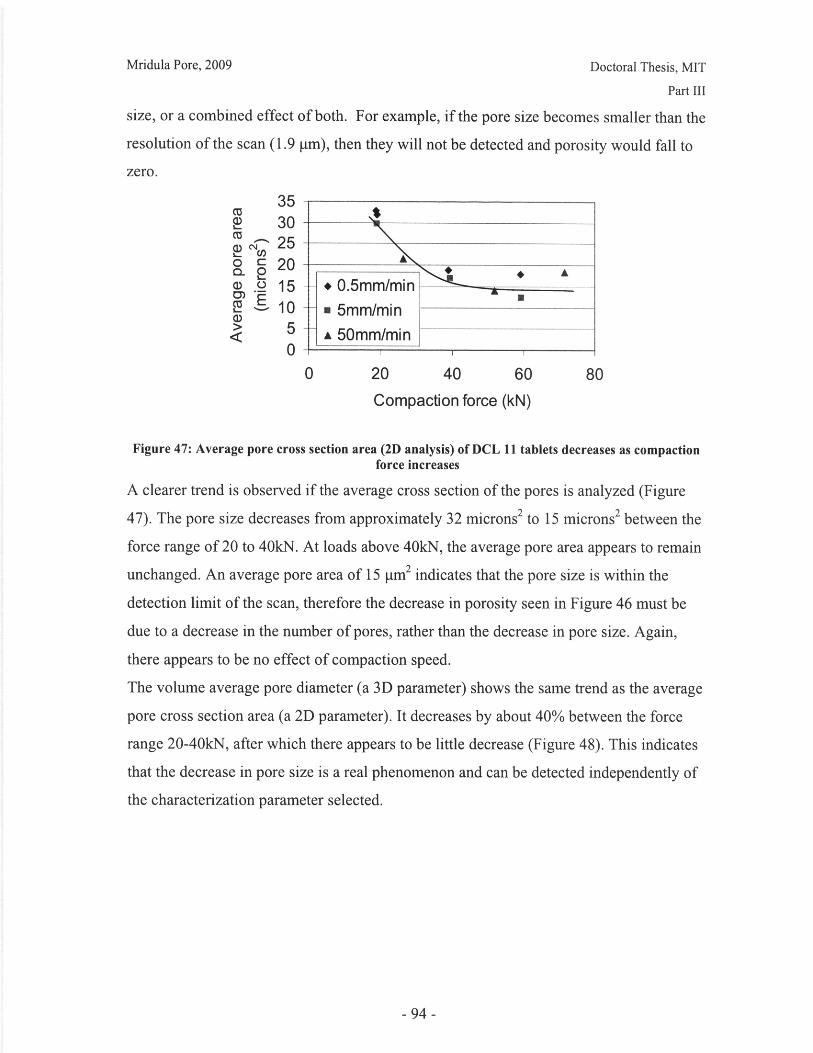
Mridula Pore, 2009 Doctoral Thesis, MIT
Part III
size, or a combined effect of both. For example, if the pore size becomes smaller than the
resolution of the scan (1.9 p~m), then they will not be detected and porosity would fall to
zero.
35CU
30m 25
0 - 20S. 15 0.5mm/min -
10 " 5mm/min> 55 -A 50mm/min0 - I
0 20 40 60 80
Compaction force (kN)
Figure 47: Average pore cross section area (2D analysis) of DCL 11 tablets decreases as compactionforce increases
A clearer trend is observed if the average cross section of the pores is analyzed (Figure
47). The pore size decreases from approximately 32 microns2 to 15 microns2 between the
force range of 20 to 40kN. At loads above 40kN, the average pore area appears to remain
unchanged. An average pore area of 15 [tm 2 indicates that the pore size is within the
detection limit of the scan, therefore the decrease in porosity seen in Figure 46 must be
due to a decrease in the number of pores, rather than the decrease in pore size. Again,
there appears to be no effect of compaction speed.
The volume average pore diameter (a 3D parameter) shows the same trend as the average
pore cross section area (a 2D parameter). It decreases by about 40% between the force
range 20-40kN, after which there appears to be little decrease (Figure 48). This indicates
that the decrease in pore size is a real phenomenon and can be detected independently of
the characterization parameter selected.
- 94-
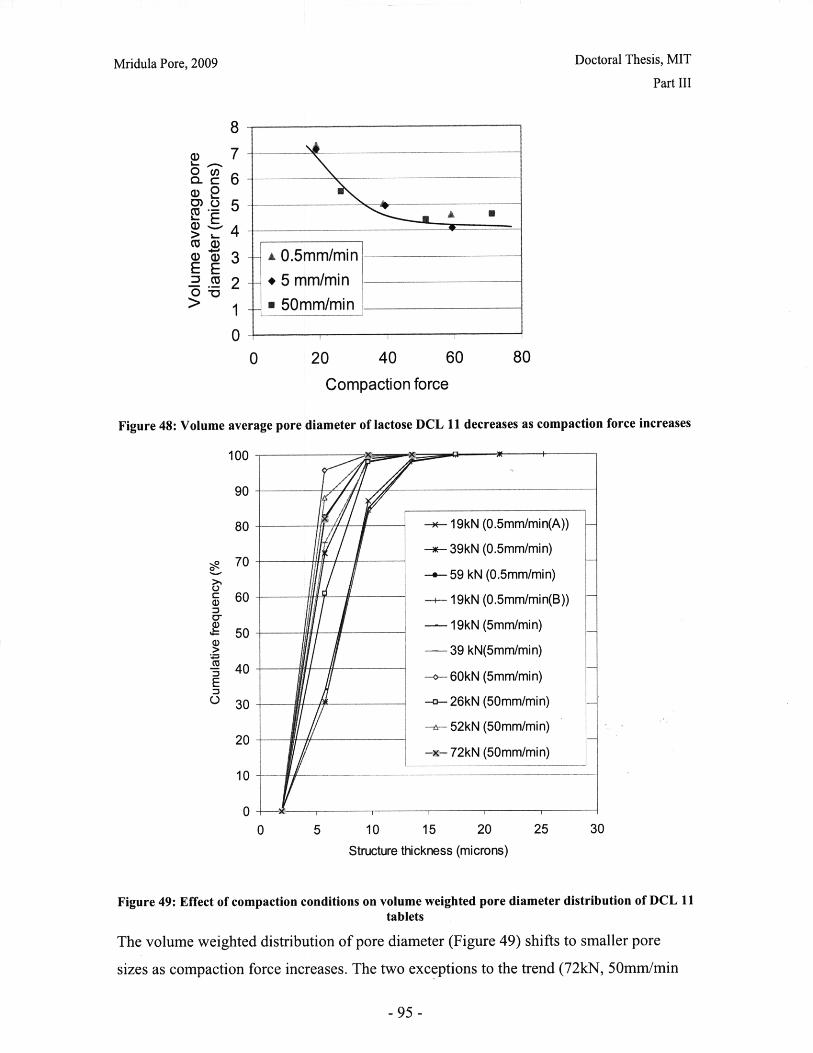
Mridula Pore, 2009 Doctoral Thesis, MIT
Part III
20 40 60 80
Compaction force
Figure 48: Volume average pore diameter of lactose DCL 11 decreases as compaction force increases
"'I//-- 19kN (0.5mm/min(A))
--- 39kN (0.5mm/min)
59 kN (0.5mm/min)
-+--19kN (0.5mm/min(B))
- 19kN (5mm/min)
39 kN(5mm/min)
-o- 60kN (5mm/min)
-o-- 26kN (50mm/min)
-+- 52kN (50mm/min)
-x- 72kN (50mm/min)
0 5 10 15 20
Structure thickness (microns)
Figure 49: Effect of compaction conditions on volume weighted pore diameter distribution of DCL 11tablets
The volume weighted distribution of pore diameter (Figure 49) shifts to smaller pore
sizes as compaction force increases. The two exceptions to the trend (72kN, 50mm/min
- 95-
100
90
80
"A
10 -
A -
i JR
r
v

Mridula Pore, 2009 Doctoral Thesis, MIT
Part III
and 59kN, 0.5mm/min) correspond to the two data points that deviate significantly from
the trend in Figure 46.
Comparison of lactose DCL 11 and DCL 14
There are no morphological differences between DCL 11 and DCL 14 tablets compacted
under the same conditions. Figure 50 contains binarized versions of cross sections
through tablets compacted at 0.5mm/min to a range of forces. For both materials, we see
no evidence of initial granule size or shape. Pores are scattered randomly across the cross
section of the tablet. There is a decrease in pore size as compaction force is increased.
Table 11: Average porosity of DCL 11 and DCL 14 tablets compacted to the same conditions
DCL 14 DCL 11
19 kN 7.4 % 11.4 %, 8.6%
39 kN 8.2 % 4.1%
59 kN 3.8 % 4.2 %
The average (3D) porosity measurements are presented in Table 11. No clear trend is
seen between compaction force and average porosity. This suggests that average porosity
is not the correct parameter to characterize microstructural changes, as differences
between tablets compacted to different forces are clearly visible in the cross section
images (Figure 50).
- 96-
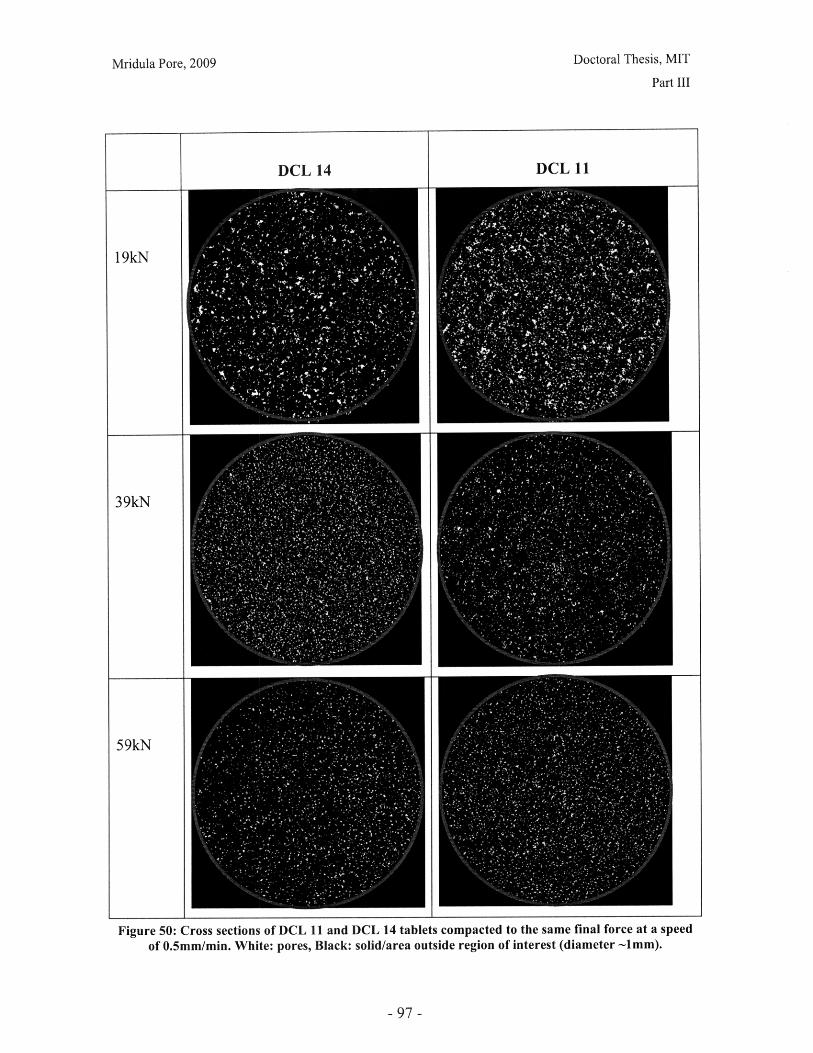
Part III
DCL 14 DCL 11
19kN
39kN
59kN
Figure 50: Cross sections of DCL 11 and DCL 14 tablets compacted to the same final force at a speed
of 0.5mm/min. White: pores, Black: solid/area outside region of interest (diameter -1mm).
- 97 -
Doctoral Thesis, MITMridula Pore, 2009

Mridula Pore, 2009 Doctoral Thesis, MIT
Part III
120
100 . -- -- -
- - DCL 14 (19kN)80- -u -DCL 14 (39kN)
60 - --- DCL 11 A(19kN)
-*--- DCL 11 (39kN)S40
-->-- DCL 11 (591kN)
5 20 - DCL 14 (59kN)S---- DCL 11B (19kN)0
0 10 20 30Volume weighted pore diameter (microns)
Figure 51: Comparison of volume-weighted pore diameter distributions of DCL 11 and DCL 14tablets compacted to the same conditions
The volume-weighted pore size distributions are almost identical for DCL 11 and DCL
14 tablets compacted at the same conditions (Figure 51). It was possible to do only one
repeat measurement (a second tablet of DCL 11 at 0.5mm/min to 19kN). This reproduced
the previous result.
Discussion
X ray micro CT allows us to visualize the internal structure of compacted tablets. The
qualitative features of the tablet morphology are clearly visible and elucidate the
compaction mechanism of the materials; MCC granules consolidate by plastic
deformation, whereas lactose DCL 11 and DCL 14 granules appear to undergo fracture or
crushing.
However, if tablet structure is to be a product specification, quantitative characterization
of the structure is necessary. The relevant parameters must be selected from a range of
two and three-dimensional parameters commonly used for image analysis.
Average porosity was not found to correlate to compaction force, although a decreasing
porosity could be observed visually from gray-scale cross-sections. There are several
possible explanations.
- 98-
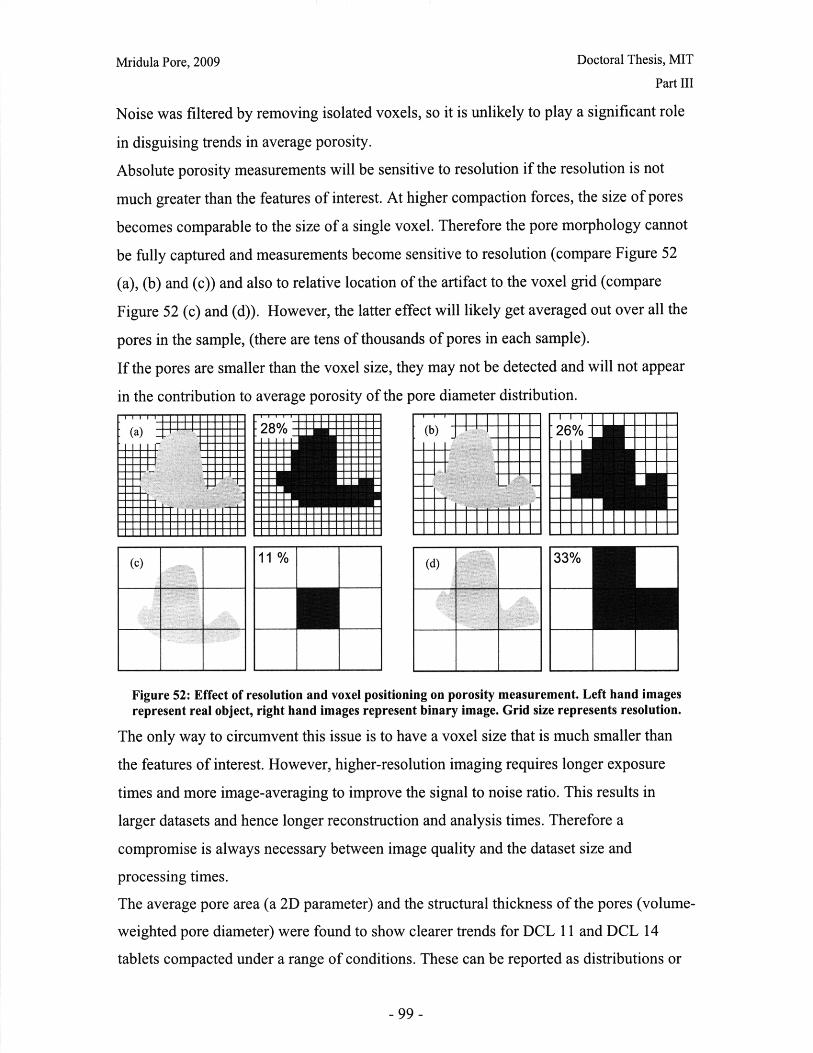
Mridula Pore, 2009 Doctoral Thesis, MIT
Part III
Noise was filtered by removing isolated voxels, so it is unlikely to play a significant role
in disguising trends in average porosity.
Absolute porosity measurements will be sensitive to resolution if the resolution is not
much greater than the features of interest. At higher compaction forces, the size of pores
becomes comparable to the size of a single voxel. Therefore the pore morphology cannot
be fully captured and measurements become sensitive to resolution (compare Figure 52
(a), (b) and (c)) and also to relative location of the artifact to the voxel grid (compare
Figure 52 (c) and (d)). However, the latter effect will likely get averaged out over all the
pores in the sample, (there are tens of thousands of pores in each sample).
If the pores are smaller than the voxel size, they may not be detected and will not appear
in the contribution to average porosity of the pore diameter distribution.
(a) 28%(b) 26%---~~i -- --- '- -- i i ., i~:!i~i iii!
(c) 11% (d)33%
Figure 52: Effect of resolution and voxel positioning on porosity measurement. Left hand imagesrepresent real object, right hand images represent binary image. Grid size represents resolution.
The only way to circumvent this issue is to have a voxel size that is much smaller than
the features of interest. However, higher-resolution imaging requires longer exposure
times and more image-averaging to improve the signal to noise ratio. This results in
larger datasets and hence longer reconstruction and analysis times. Therefore a
compromise is always necessary between image quality and the dataset size and
processing times.
The average pore area (a 2D parameter) and the structural thickness of the pores (volume-
weighted pore diameter) were found to show clearer trends for DCL 11 and DCL 14
tablets compacted under a range of conditions. These can be reported as distributions or
- 99-
Mridula Pore, 2009 Doctoral Thesis, MIT
Part III
average quantities. The visually observed decrease in pore size and pore size range can be
captured by these parameters.
One limitation with the equipment was that the point source with fan beams allows for
greater resolution imaging, by creating projections of the sample which can be moved
back and forth. However, resolution is restricted by sample size. Therefore only a
fragment of the tablets needed to be broken into fragments for analysis, so although it is a
non-invasive technique, it was destructive and it was not possible to obtain spatially
resolved data on porosity. For example, future research might consider whether the
anisotropic compaction process causes axial variation in porosity.
Conclusions
X ray micro CT is a useful tool for qualitative and quantitative investigation of the
microstructure of pharmaceutical tablets. It can be used to identify compaction
mechanisms and measure porosity parameters, such as pore size distributions.
Average porosity was found to be a poor indicator of tablet structure for DCL 11 and
DCL 14 tablets. Pore size (measured by 2D pore area and volume-weighted pore
diameter) decreased with increasing compaction force, but the range of measurement
depends on scanning resolution. No effect of compaction speed on microstructure was
observed.
Acknowledgements
J.Whitey Hagadorn and Diane Kelly (Department of Geology, Amherst College) are
gratefully acknowledged for providing training and access to the scanner. The assistance
of Arun Tatiparthi (Microphotonics Inc.) in conducting a pilot study and providing
software and training for data processing and analysis is also much appreciated.
References
Hancock B.C.; Mullarney M.P. Pharm. Tech. April 2005, 92-100
Hildebrand T.; Ruegsegger P. J. Microsc. 1997, 185, 67-75
Pal N.R.; Pal S.K. Pattern Recogn. 1993, 26(9), 1277-1294
SkyScan, www.skyscan.be, accessed June 2007(a)
- 100-
Mridula Pore, 2009 Doctoral Thesis, MIT
Part III
SkyScan, Structural Parameters measured by the SkyScanTM CT-analyzer software,
SkyScan N.V., Artselaar, Belgium 2007b
Xiaowei F.; Elliot J.A.; Bentham A.C.; Hancock B.C.; Cameron R.E. Part. Part. Syst.
Charact. 2006a, 23, 229-236
Xiaowei F.; Dutt M.; Bentham A.C.; Hancock B.C.; Cameron R.E.; Elliot J.A. Powder
Tech. 2006b, 167, 134-140
- 101-

Mridula Pore, 2009 Doctoral Thesis, MIT
Part III
III.C: Tablet Defect Detection
Introduction
Internal defects can form in tablets during the compaction process. Two of the most
common tablet defects are lamination and capping. Capping is the detachment of a
convex portion of a (usually biconvex) tablet during ejection, usually from the top face of
the tablet (Figure 53(a)). Lamination (Figure 53(b)) is defined varyingly as the splitting
of a tablet into two or more laminar layers, parallel to the punch face, with or without
detachment of fragments (Au et al, 2004). In each case, cracks are initiated at the
perimeter of the tablet and propagate radially inwards. These problems are often
encountered during scale up of tablet compaction, particularly as compaction (and de-
compression) speeds are increased.
(a) Lamination (b) CappingFigure 53: Common tablet defects (shown for cylindrical tablet geometry)
Two common explanations for these defects are (Kuppuswamy et al, 2001):
1) entrapment of air during the compaction
2) the build up of anisotropic stresses during uniaxial compaction, such that there is
considerable residual radial stress, which is released during ejection, causing
lateral cracking (Sugimori et al, 1989)
It has been observed that materials that consolidate by powder particle fracture have a
greater tendency to capping and lamination than materials that undergo plastic
deformation. This suggests that explanation (2) is the most likely cause of defects, as
plastic materials will tend to reduce the tendency for cracking. Also, consolidation by
fracture tends to cause greater stress anisotropy in the compact due to the presence of a
compact zone propagating from the moving punch face.
Little effort has been made to characterize the capping and lamination patterns, beyond a
qualitative description (capping: cracks propagate from top edge of tablet to bottom
center, creating a biconvex cap (Wu et al, 2005), lamination: cracks parallel to punch
-102-

Mridula Pore, 2009 Doctoral Thesis, MIT
Part III
(Kuppuswamy et al, 2001). This is presumably because it is the presence or absence of
defects that is the most important, in terms of quality control and process design. Even
small cracks at the tablet edge will lead to chipping and wear and are therefore
undesirable. Therefore most experimental work, such as that by Au et al (2004) present
results in a binary format- the presence or absence of detectable defects.
Terahertz pulsed imaging is a nondestructive analysis tool which generates and detects
ultra-short pulses of THz radiation (0.6-3.6THz, or 2-120cmnf). The THz electric field-
versus-time profile is obtained at a point on the sample. The time delay associated with
receiving the reflected signal is used to measure film thicknesses, or the depth of
embedded objects or defects. The intensity of the reflected signal will depend on the
difference in refractive index between the two materials at the interface (Figure 54). A
robotic arm can be used to move the sample in multiple axes for sampling and a 3D
image of the sample can be constructed from this data (TeraView, 2007). Therefore, this
technique can be used to measure film thicknesses, or detect embedded objects. It should
therefore also detect cracks in tablets.
The technique operates much the same way as ultrasound or radar is used to locate
embedded or distant objects, and the sample itself is unaffected by the measurement.
t3
t2t,
RI R12
Figure 54: Principle of THz pulsed imaging. RI, indicates the refractive index of the different layersand t. indicates the signal reflection time from the corresponding interfaces.
Objectives
The objective of this study was to test whether THz pulsed imaging could detect internal
tablet defects. The presence of defects was confirmed by X ray micro CT imaging.
- 103-
Mridula Pore, 2009 Doctoral Thesis, MIT
Part III
Method
Sample preparation
MCC Celphere® and Pharmatose® DCL 11 powders were sieved to obtain the sieve
fraction 106-212 microns. The powders were stored over saturated magnesium nitrate
solution (at 55% relative humidity) for a minimum of 10 hours before compaction.
Powder beds of depth 4mm were compacted at constant upper punch speed (0.5, 5 or 50
mm/min) and to a range of final compaction forces (5-75kN). This corresponded to
430+10 mg MCC and 350±10 mg lactose. Flat-faced punches were used with a 12.7mm
diameter punch. An Instron 4260 mechanical tester was used to compact the tablets.
Tablets were then stored at 55% relative humidity for a minimum of 72 hours before
testing. Two sets of tablets were made under the same conditions: one for the THz and
one for the Xray study.
THz Imaging
A TPI imaga 2000 machine (TeraView Ltd., Cambridge, UK) was used to scan the
tablets in triplicate. A central area of diameter 10mm was scanned point-by-point with
0.2mm spacing. Images were taken from both tablet faces to ensure that the full depth of
the tablet was probed. The tablets were scanned within 3 weeks of manufacture.
The intensity-time data was de-convoluted and a 3-D image of the tablet section was
constructed using custom TPicsView software.
X ray microCT
A SkyScanTM 1172 microCT machine (SkyScan N.V., Artselaar, Belgium) was used to
scan tablets. The reconstructed cross sections were created using NRecon software from
SkyScanTM. The scanning and reconstruction parameters are presented in Table 12.
- 104-
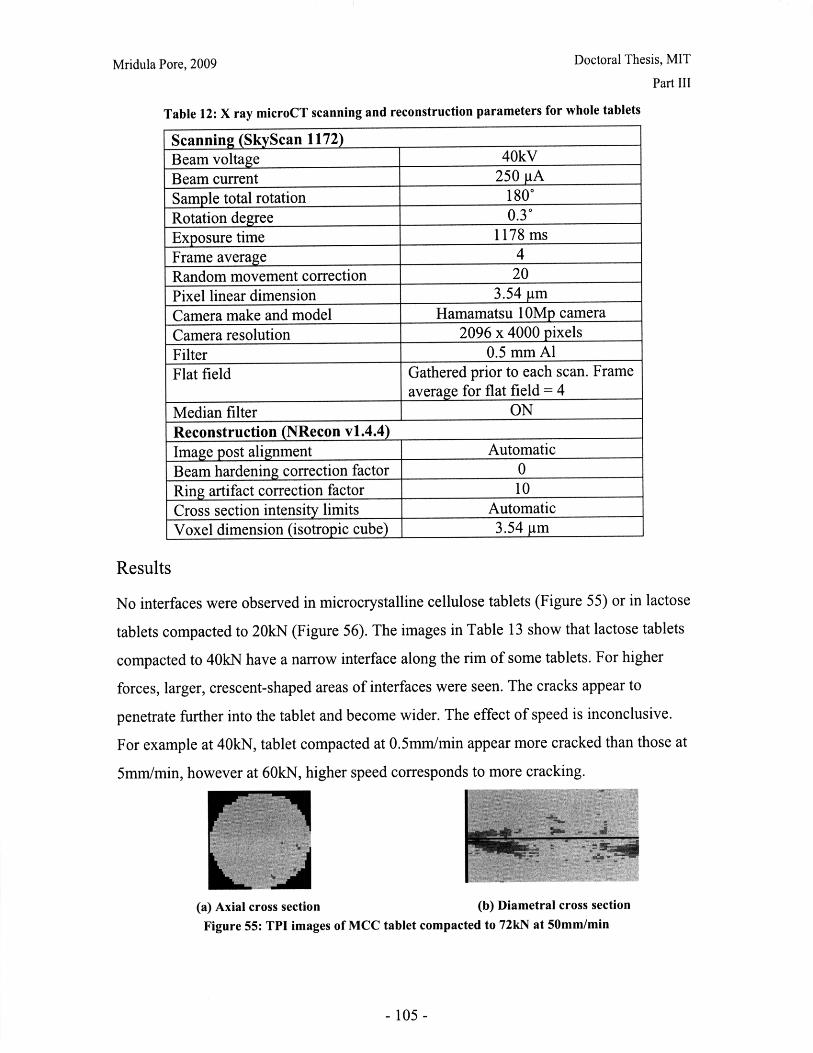
Mridula Pore, 2009 Doctoral Thesis, MIT
Part III
Table 12: X ray microCT scanning and reconstruction parameters for whole tablets
Beam voltage 40kV
Beam current 250 tA
Sample total rotation 180"
Rotation degree 0.30
Exposure time 1178 ms
Frame average 4
Random movement correction 20
Pixel linear dimension 3.54 gm
Camera make and model Hamamatsu 10Mp camera
Camera resolution 2096 x 4000 pixels
Filter 0.5 mm Al
Flat field Gathered prior to each scan. Frameaverage for flat field = 4
Median filter ON
Reconstruction (NRecon v1.4.4)Image post alignment Automatic
Beam hardening correction factor 0
Ring artifact correction factor 10
Cross section intensity limits Automatic
Voxel dimension (isotropic cube) 3.54 gm
Results
No interfaces were observed in microcrystalline cellulose tablets (Figure 55) or in lactose
tablets compacted to 20kN (Figure 56). The images in Table 13 show that lactose tablets
compacted to 40kN have a narrow interface along the rim of some tablets. For higher
forces, larger, crescent-shaped areas of interfaces were seen. The cracks appear to
penetrate further into the tablet and become wider. The effect of speed is inconclusive.
For example at 40kN, tablet compacted at 0.5mm/min appear more cracked than those at
5mm/min, however at 60kN, higher speed corresponds to more cracking.
(a) Axial cross section (b) Diametral cross section
Figure 55: TPI images of MCC tablet compacted to 72kN at 50mm/min
- 105-
Scannin (SkvScan 1172)

Part III
Table 13: TPI cross section images of DCL 11 tablets (scale indicates THz signal in a.u.) showingmost extensive defects
Compaction conditions
20kN
5mm/min
28kN
50 mm/min
40kN
0.5mm/min
40kN
5 mm/min
52 kN
50mm/min
60kN
0.5mm/min
60kN
5mm/min
72kN
50mm/min
Tablet A Tablet B Tablet C
0.040.02
0
0.04
0.02
0 02
-0.02
0.04
0
0.0200.02
004
02
-0.02
I0.04
0
-0.02
0.02
0
L -0.02
- 106-
Mridula Pore, 2009 Doctoral Thesis, MIT
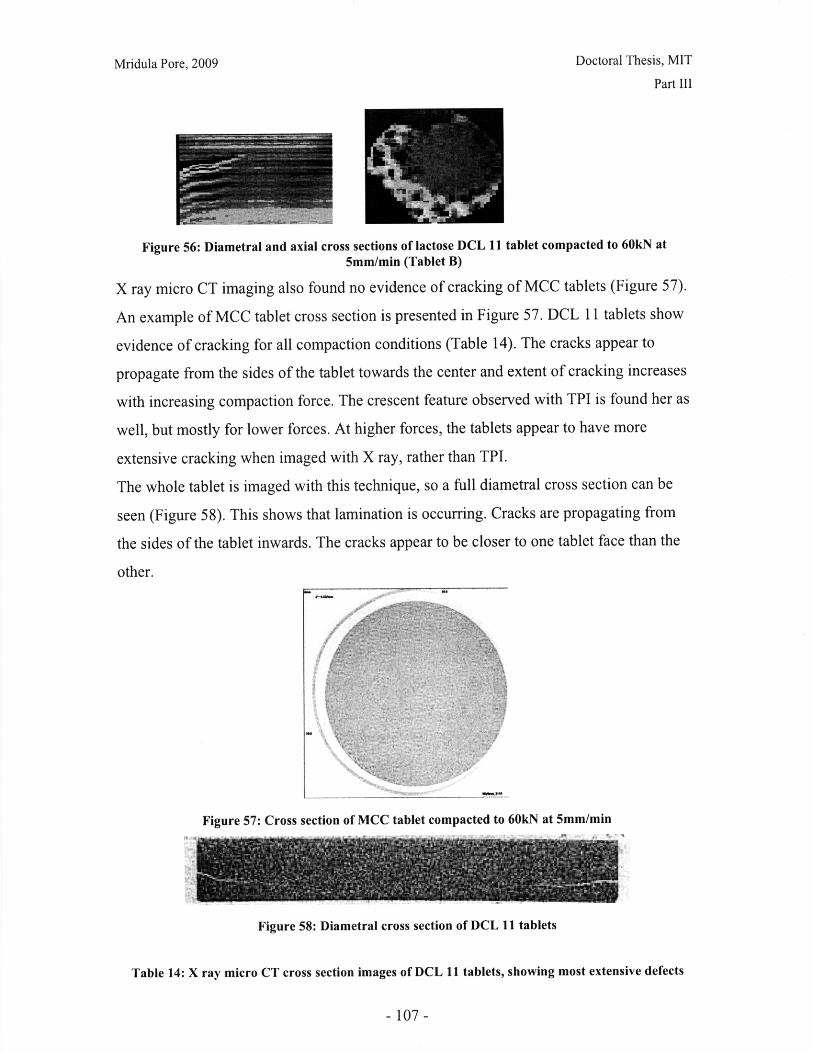
Mridula Pore, 2009 Doctoral Thesis, MIT
Part III
Figure 56: Diametral and axial cross sections of lactose DCL 11 tablet compacted to 60kN at5mm/min (Tablet B)
X ray micro CT imaging also found no evidence of cracking of MCC tablets (Figure 57).
An example of MCC tablet cross section is presented in Figure 57. DCL 11 tablets show
evidence of cracking for all compaction conditions (Table 14). The cracks appear to
propagate from the sides of the tablet towards the center and extent of cracking increases
with increasing compaction force. The crescent feature observed with TPI is found her as
well, but mostly for lower forces. At higher forces, the tablets appear to have more
extensive cracking when imaged with X ray, rather than TPI.
The whole tablet is imaged with this technique, so a full diametral cross section can be
seen (Figure 58). This shows that lamination is occurring. Cracks are propagating from
the sides of the tablet inwards. The cracks appear to be closer to one tablet face than the
other.
Figure 57: Cross section of MCC tablet compacted to 60kN at 5mm/min
Figure 58: Diametral cross section of DCL 11 tablets
Table 14: X ray micro CT cross section images of DCL 11 tablets, showing most extensive defects
- 107-
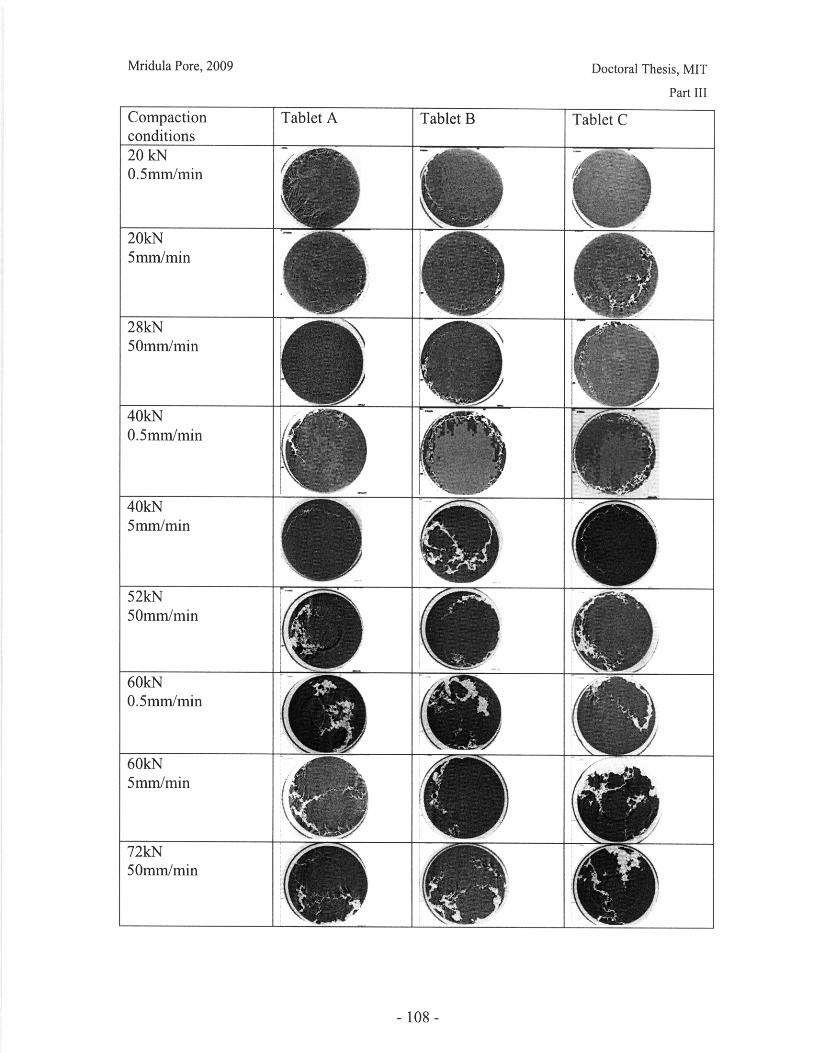
Part III
Compactionconditions
Tablet A
20 kN0.5mm/min
20kN5mm/min
28kN50mm/min
40kN0.5mm/min
40kmm/min5mm/min
52kN50mm/min
60kN0.5mm/min
60kN5mm/min
Tablet B Tablet C
- 108-
72kNm50mm./min
.Jk a. L -
Mridula Pore, 2009 Doctoral Thesis, MIT
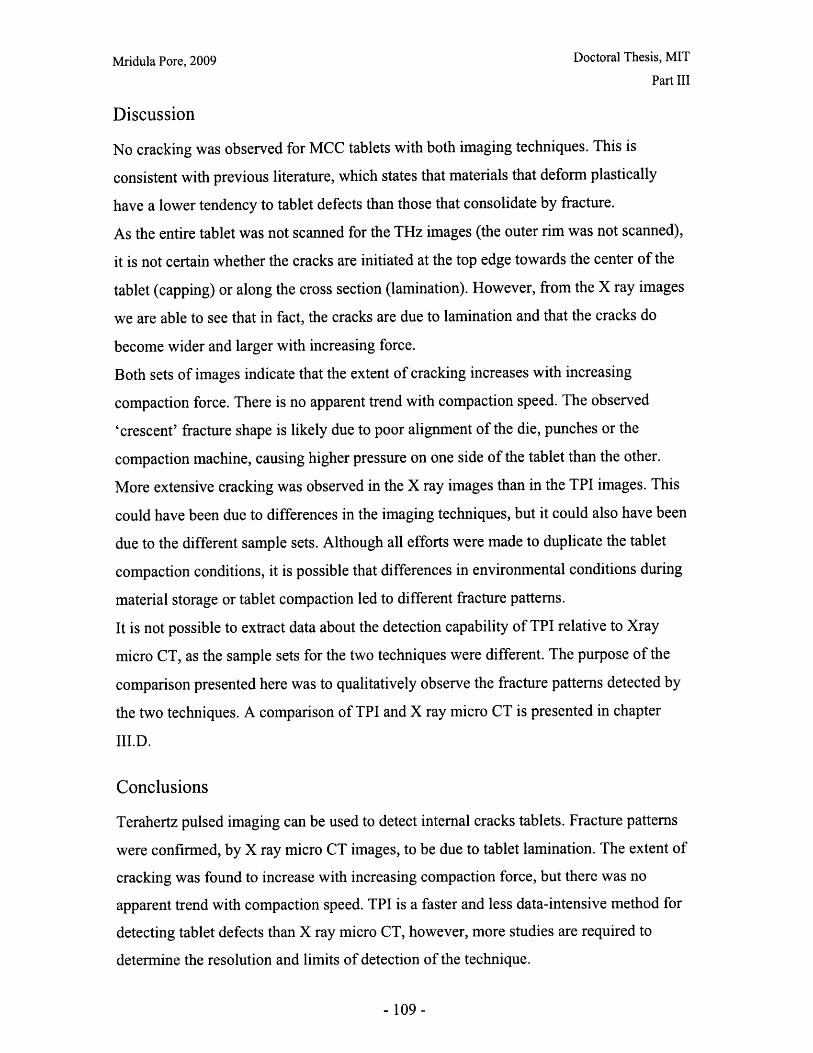
Mridula Pore, 2009 Doctoral Thesis, MIT
Part III
Discussion
No cracking was observed for MCC tablets with both imaging techniques. This is
consistent with previous literature, which states that materials that deform plastically
have a lower tendency to tablet defects than those that consolidate by fracture.
As the entire tablet was not scanned for the THz images (the outer rim was not scanned),
it is not certain whether the cracks are initiated at the top edge towards the center of the
tablet (capping) or along the cross section (lamination). However, from the X ray images
we are able to see that in fact, the cracks are due to lamination and that the cracks do
become wider and larger with increasing force.
Both sets of images indicate that the extent of cracking increases with increasing
compaction force. There is no apparent trend with compaction speed. The observed
'crescent' fracture shape is likely due to poor alignment of the die, punches or the
compaction machine, causing higher pressure on one side of the tablet than the other.
More extensive cracking was observed in the X ray images than in the TPI images. This
could have been due to differences in the imaging techniques, but it could also have been
due to the different sample sets. Although all efforts were made to duplicate the tablet
compaction conditions, it is possible that differences in environmental conditions during
material storage or tablet compaction led to different fracture patterns.
It is not possible to extract data about the detection capability of TPI relative to Xray
micro CT, as the sample sets for the two techniques were different. The purpose of the
comparison presented here was to qualitatively observe the fracture patterns detected by
the two techniques. A comparison of TPI and X ray micro CT is presented in chapter
III.D.
Conclusions
Terahertz pulsed imaging can be used to detect internal cracks tablets. Fracture patterns
were confirmed, by X ray micro CT images, to be due to tablet lamination. The extent of
cracking was found to increase with increasing compaction force, but there was no
apparent trend with compaction speed. TPI is a faster and less data-intensive method for
detecting tablet defects than X ray micro CT, however, more studies are required to
determine the resolution and limits of detection of the technique.
- 109-

Mridula Pore, 2009 Doctoral Thesis, MIT
Part III
Acknowledgements
Axel Zeitler, Phil Taday, Alessia Porteiri (TeraView Ltd.) and Samuel Ngai (MIT) are
gratefully acknowledged for assistance in training, data collection and for many helpful
discussions about the THz experiments.
J. Whitey Hagadorn and Diane Kelly from the Department of Geology at Amherst
College are gratefully acknowledged for providing training and access to the X ray
equipment.
References
Au Y.H. J.; Eissa S.; Jones B.E. Ultrasonics 2004, 42 , 149-153
Kuppuswamy R.; Anderson S.R.; Augsburger L.L.; Hoag, S.W. AAPS Pharm. Sci. 2001,
3(1)
TeraView www.teraview.co.uk, accessed April 5, 2007
Wu C.Y.; Ruddy O.M.; Bentham A.C.; Hancock B.C.; Best S.M.; Elliott J.A.
Powder Tech. 2005, 152, 107-117
SkyScan www.skyscan.be, accessed April 5, 2007
Sugimori K.; Mori S.; Kawashima Y. Powder Technol. 1989. 58 (4), 259-264
-110-

Mridula Pore, 2009 Doctoral Thesis, MIT
Part III
III.D: Comparison of Analytical Techniques
Various methods for probing the physical properties of the tablet core were presented in
chapters III.A-III.C. Terahertz pulsed spectroscopy (III.A) and X ray micro CT (III.B)
were used to analyze the microstructural characteristics of the tablet core, either directly
(X ray) or through a correlation with tablet hardness (TPS). The first part of this chapter
discusses how TPS compares to NIR spectroscopy; currently the only other non-
destructive spectroscopic technique for assessing tablet hardness. The second part
compares some of the practical issues of TPS and X ray micro CT, and the relative value
of the generated data is discussed. It must be noted that some of the practical issues may
be resolved by development of the technologies, as both THz and X ray microCT devices
have become available as lab instruments fairly recently. Therefore the technology is still
evolving at considerable speed.
In chapter III.C, a comparison was made between Terahertz pulsed imaging (TPI) and X
ray micro CT in their ability to map tablet defects. A comparison of these imaging
techniques and areas for future work are presented in the final part of this chapter.
Assessing microstructure: NIR diffuse reflectance spectroscopy and Terahertz pulsed
transmission spectroscopy
Near Infra-Red (NIR) spectroscopy is gaining in popularity as a non-destructive
analytical tool for the pharmaceutical industry. It is known to be sensitive to both the
physical structure and the chemical composition of pharmaceutical solids. Much of the
NIR literature in the pharmaceutical field discusses its capability to identify or
quantitatively characterize the chemical composition of tablets or powders. It can also be
used to produce spatially resolved maps of chemical components. Reviews of
pharmaceutical applications for NIR have been published by Kirsch and Drennen (1995),
Blanco et al (1998), Reich (2005). NIR in diffuse reflectance mode has been used to
study tablet hardness (Morrisseau and Rhodes, 1997, Ebube et al 1999, Donoso et al,
2003, Cogdill et al, 2004, Blanco and Alcala, 2006). NIR spectroscopy can also be used
in transmission mode to investigate hardness, but this technique has not been used
extensively (Reich, 2000, 2005).
-111-
Mridula Pore, 2009 Doctoral Thesis, MIT
Part III
An overview of Terahertz pulsed spectroscopy (TPS) technology and its pharmaceutical
applications has been presented in part III.A.
Both TPS and NIR methods have the advantage of being fast (a few seconds) and non-
destructive. It is likely that there is no general correlation between spectroscopic
measurement and tablet hardness for all materials, particularly as the relationship
between spectroscopic data and physico-chemical properties is poorly understood for
both methods. Therefore, both methods will require some sort of calibration for a new
formulation (Morrisseau and Rhodes, 1997). However, there are some particular
differences that indicate that TPS may have an advantage over NIR as a rapid, non-
destructive analytical technique.
1. NIR diffuse reflectance spectroscopy only probes a short distance into the tablet
whereas THz examines the entire thickness at one point. Therefore a greater volume of
the tablet is sampled and the measurement reflects properties of the core. This issue could
be resolved by using NIR in transmission mode (Reich, 2000, 2005).
2. NIR spectra show an increase in absorbance with increased tablet hardness. However,
the spectral shift is baseline-dependent (Figure 59) hence the data is usually analyzed
using multilinear and partial least squares regression on the second derivative of the
absorption spectrum.
Multivariate data analysis may not be necessary for TPS data, as the shift in RI does not
appear to depend on the wavelength, unlike NIR.
3. The measured reflected NIR signal is somewhat arbitrary and known to be affected by
surface roughness (which causes diffusion), particle size and experimental configuration
e.g. beam length. THz spectrometry is performed in transmission mode, so surface
morphology has a less pronounced effect. Also, the measured quantity is the refractive
index; an inherent property of the material, rather than a reflected beam spectrum which
depends on the equipment configuration.
-112-

Mridula Pore, 2009 Doctoral Thesis, MIT
Part III
NTR Spectra of Thophyine Tablets at Seven Hardness Levels
1,2 1,4 1,6 1,8 2,0 2.2 2,4
WAVELENGTH pm
Figure 59: NIR spectra show a wavelength dependent shift with tablet hardness (Source: Donoso etal, 2003)
Assessing microstructure: X ray micro computed tomography (micro CT) and Terahertz
pulsed transmission spectroscopy (TPS)
As described in chapter III.B, X ray micro CT can be used to obtained detailed, three-
dimensional data about the structure of tablets. Both THz and X ray micro CT are
relatively new, non-destructive techniques for probing the tablet core. Neither technique
requires any sample preparation and can be performed with commercial, off-the-shelf
instruments.
In order to obtain high-resolution images by microCT, it is not possible to scan a whole
tablet due to equipment and data constraints. In effect, it becomes a destructive technique
as a fragment of the tablet must be broken off for scanning. X ray data is able to give us
much more insight into the physical structure of the tablet. Instruments are now available
capable of resolutions on a sub-micron scale. However, this data comes at high costs in
terms of time and computation. Scans can take between 40 mins to a couple of days and
raw data sets for a single sample are typically on the order of 1-20GB. Furthermore, the
data requires multiple steps of processing before it can be analyzed, which increases the
computational and memory burden.
TPS scans, on the other hand, take a matter of seconds and the data is easily manipulated
by a standard PC. It is possible to obtain 2-D spatial information by using robotics to
-113-
Mridula Pore, 2009 Doctoral Thesis, MIT
Part III
manipulate the sample and scan it at different points. Trends have been observed in the
data, but it is, as yet, unclear what its physical significance is.
Although TPS may have a place as a development or quality control tool, the current
level of understanding is insufficient to allow any insight into the tablet physics.
Therefore, it is recommended that X ray microCT should be used for studies into the
physical structure of tablets.
Detecting tablet defects: Terahertz pulsed imaging (TPI) and X ray micro CT
In order to consider whether TPI is a useful tool for defect detection, the purpose of
detection must be determined. If the purpose is simply to determine the presence or
absence of defects, the data from this experiment suggest that TPI is sufficient and has
considerable time advantages over X ray micro CT. However, further studies are required
to determine the maximum acceptable defect size and assess whether the accuracy and
sensitivity of TPI is sufficient. The resolution of the TPI method is limited by the fact that
scanning is performed in a point-by-point fashion, whereas for X ray micro CT resolution
can be varied continuously, down to sub-micron levels.
The time required for data collection and processing varied significantly between TPI and
X ray for whole tablet scans. A single tablet scan with the THz imager took
approximately 25 minutes and de-convolution and reconstruction of the 3D image took a
few seconds on a 2.66GHz processor speed PC.
A single tablet scan with the Xray microCT took approximately 90 minutes and the
reconstruction took about 7 hours on the same PC. Lower scanning and computational
times are possible, but this will likely require considerable trial and error and may
compromise image quality.
Conclusions
While neither TPS nor NIR give detailed morphological information about the tablet
microstructure, both spectroscopic signals indicate changing tablet hardness. TPS has
some advantages over NIR in terms of the sampling and data analysis. Some of these
advantages arise because TPS was carried out in transmission mode, rather than
reflectance (the common mode for NIR).
-114-
Mridula Pore, 2009 Doctoral Thesis, MIT
Part III
As yet, the physical significance of shifts in TPS spectra is unknown. Therefore, although
TPS offers several advantages in terms of time for data collection and processing, X ray
micro CT is recommended for future studies of tablet microstructure.
TPI is a much faster and less data-intensive technique for tablet defect detection than X
ray micro CT. However, further studies are required to do a quantitative assessment of
the resolution and limits of detection of TPI systems.
References
Blanco M.; Coello J.; Itirriaga H.; Maspoch S.; De la Pezuela C. Analyst 1998, 123,
135R-150R
Blanco M.; Alcala M. Anal. Chim. Acta 2006, 557, 353-359
Clark F. Vib. Spectrosc. 2004, 34, 25-35
Cogdill R.P.; Anderson C.A.; Delgado M.; Chisholm R.; Bolton R.; Herkert T.; Afnan
A.M.; Drennen J.K. AAPS Pharm. Sci. Tech. 2005, 6(2), 38
Donoso M.; Kildsig D.O.; Ghalyn E.S.; Pharm. Dev. Tech. 2003, 8 (4), 357-366
Ebube N.K.; Thosar S.S.; Roberts R.A.; Kemper M.S.; Rubinovitz R.; Martin D.L.; Reier
G.E.; Wheatley T.A.; Shukla A.J. Pharm. Dev. Tech. 1999, 4(1), 19-26
Kirsch J.D.; Drennen J.K., Appl. Spectrosc. Rev. 1995, 38, 139-174
Morrisseau K.M.; Rhodes C.T. Pharm. Res. 1997, 14(1), 108-111
Reich G. Proc. 3rd World Meeting APV/APGI, Berlin 3/6 2000, 105-6
Reich G. Adv. Drug Deliver. Rev. 2005, 57, 1109-1143
-115-
Mridula Pore, 2009 Doctoral Thesis, MIT
Part III
-116-
Mridula Pore, 2009 Doctoral Thesis, MIT
Part IV
Part IV: Implications for Design
A systematic strategy for the design of pharmaceutical tablets is presented and the scope
of the thesis within the design framework is highlighted (IV.A). Two aspects of design
were considered for the tablet compaction step: the formulation and the process. The
results of these investigations are presented in chapters IV.B and IV.C.
The single granule compression test can be used to measure the mechanical properties of
commercial excipient powders (MCC Celphere®, Pharmatose DCL 11 and DCL 14). The
granule failure mechanisms were consistent with features of the tablets, as observed by X
ray micro CT, confirming the link between granule mechanical properties and tablet
microstructure. However, quantitative differences in fracture parameters of DCL 11 and
DCL 14 had no effect on tablet structure. The qualitative features of the X ray scans
explained trends observed in tablet hardness and dissolution. Compaction force was
found to affect tablet microstructure and hence hardness and dissolution. Hardness was
found to be linked to structural parameters, but tablet structure alone was not sufficient to
predict differences in dissolution between DCL 11 and 14. This suggests that additional
characterization methods are necessary.
Further work is recommended to
1) Study a greater range of pharmaceutical materials
2) Further develop experimental techniques for application in pharmaceutical R&D
3) Build a process model for compaction that can be used for process and product
design
4) Develop quality criteria for tablet performance
-117-
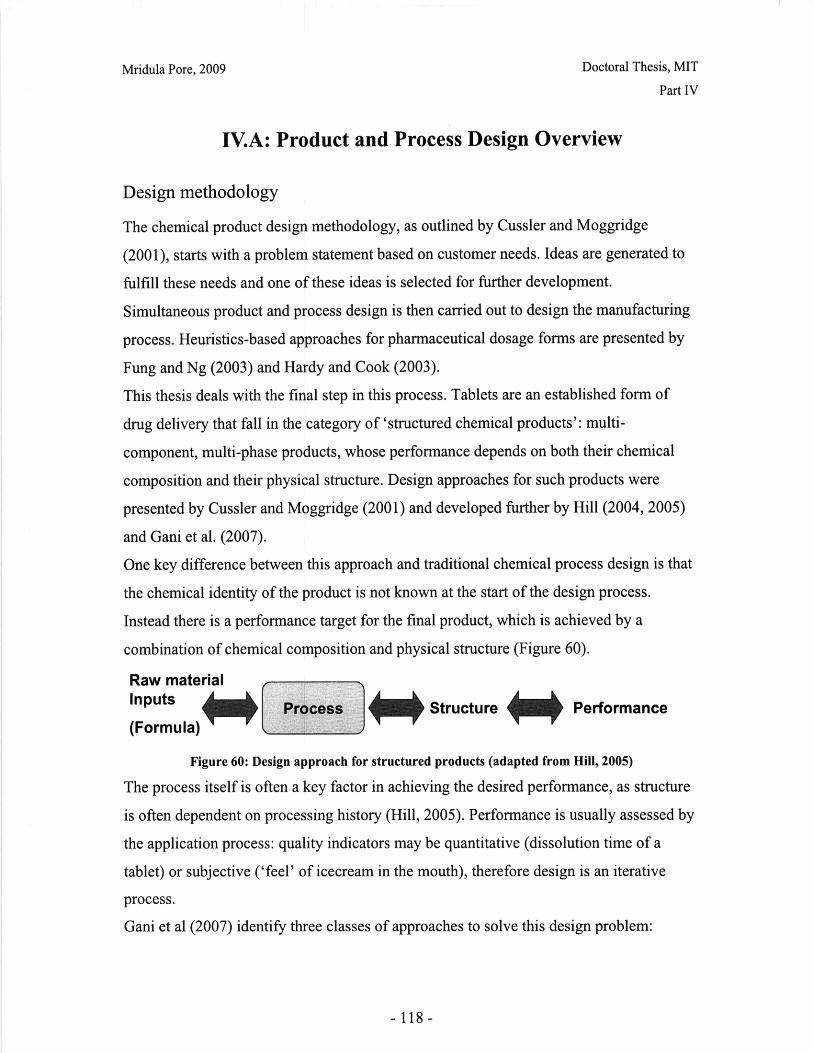
Mridula Pore, 2009 Doctoral Thesis, MIT
Part IV
IV.A: Product and Process Design Overview
Design methodology
The chemical product design methodology, as outlined by Cussler and Moggridge
(2001), starts with a problem statement based on customer needs. Ideas are generated to
fulfill these needs and one of these ideas is selected for further development.
Simultaneous product and process design is then carried out to design the manufacturing
process. Heuristics-based approaches for pharmaceutical dosage forms are presented by
Fung and Ng (2003) and Hardy and Cook (2003).
This thesis deals with the final step in this process. Tablets are an established form of
drug delivery that fall in the category of 'structured chemical products': multi-
component, multi-phase products, whose performance depends on both their chemical
composition and their physical structure. Design approaches for such products were
presented by Cussler and Moggridge (2001) and developed further by Hill (2004, 2005)
and Gani et al. (2007).
One key difference between this approach and traditional chemical process design is that
the chemical identity of the product is not known at the start of the design process.
Instead there is a performance target for the final product, which is achieved by a
combination of chemical composition and physical structure (Figure 60).
Raw materialInputs Process Structure Performance
(Formula)
Figure 60: Design approach for structured products (adapted from Hill, 2005)
The process itself is often a key factor in achieving the desired performance, as structure
is often dependent on processing history (Hill, 2005). Performance is usually assessed by
the application process: quality indicators may be quantitative (dissolution time of a
tablet) or subjective ('feel' of icecream in the mouth), therefore design is an iterative
process.
Gani et al (2007) identify three classes of approaches to solve this design problem:
-118-

Mridula Pore, 2009 Doctoral Thesis, MIT
Part IV
assessments of performance. Hardness is used as an indicator of the physical stability of
the tablet core in coating, handling and transportation. The dissolution test is an in-vitro
indicator for bioavailability, the primary performance indicator for pharmaceutical
products. Therefore, although the tests are of importance from a regulatory and industrial
perspective, developing predictive capability for hardness and dissolution was not a focus
of research for this work.
Instead, the focus was on identifying techniques for characterizing the microstructure
(length scale of 1-100microns), an area that has received little interest to date, and
investigating how microstructure is affected by the formulation and the process.
Correlative connections were made between microstructure and tablet performance.
Degrees of Freedom in Tablet Compaction Design
There are two main areas for design: the formulation and the process. For a structured
product, the two are not independent, as the structure will be a result of both the chemical
components and the history of their processing (Hill, 2005). In order to predict this
combined effect, a process model is required that allows formulation and process
parameters to be independent inputs and that gives the product structural parameters as
outputs. The development of a process model for compaction was not part of this thesis,
but is discussed in chapter IV.D.
Formulation
Tablet cores consist of a mixture of active ingredient (API) and excipients. In this study,
only the effect of filler/binder excipients was investigated. These are usually bought from
external vendors and come in powder form. Therefore, formulation parameters include
not only chemical, but physical specifications of the materials.
The requirements for the filler/binder are:
o It should be chemically compatible with the API e.g. chemically inert, moisture
content etc.
o The powder mixture should be stable and not segregate during pre-compaction
processing
o The powder mixture should create a physically stable tablet upon compaction
Only specifications relating to compactibility of the tablet are considered here.
-120-
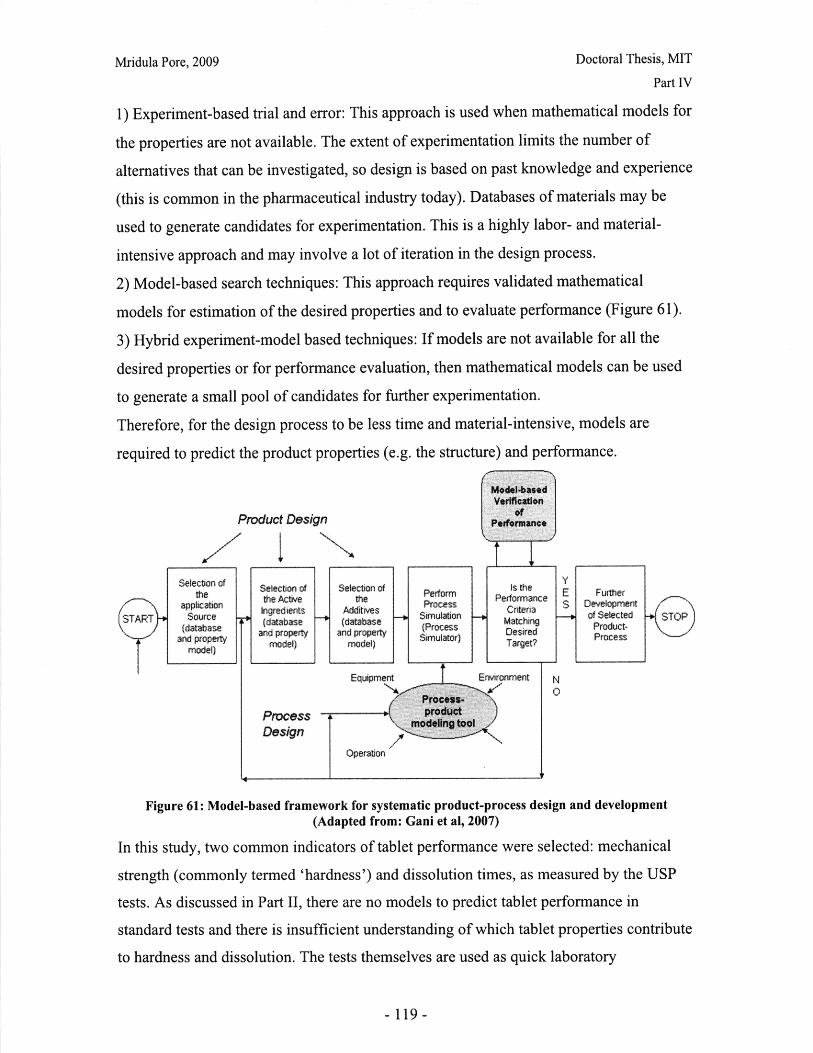
Mridula Pore, 2009 Doctoral Thesis, MIT
Part IV
1) Experiment-based trial and error: This approach is used when mathematical models for
the properties are not available. The extent of experimentation limits the number of
alternatives that can be investigated, so design is based on past knowledge and experience
(this is common in the pharmaceutical industry today). Databases of materials may be
used to generate candidates for experimentation. This is a highly labor- and material-
intensive approach and may involve a lot of iteration in the design process.
2) Model-based search techniques: This approach requires validated mathematical
models for estimation of the desired properties and to evaluate performance (Figure 61).
3) Hybrid experiment-model based techniques: If models are not available for all the
desired properties or for performance evaluation, then mathematical models can be used
to generate a small pool of candidates for further experimentation.
Therefore, for the design process to be less time and material-intensive, models are
required to predict the product properties (e.g. the structure) and performance.
Model-basedVerification
Product Design frma
Section of fmanceSelection of Selection of Selection of Performs the E Furtherthe Acte the Perform E Further
application Ingredients Additives ProcCriteria S Development
START Source (database (database Simulation Matching of Selected(database and proerty and property (Process Desired Producsst-
and property model) Simulator) Target? Processmodel)
Procss
Design
Operation
Figure 61: Model-based framework for systematic product-process design and development
(Adapted from: Gani et al, 2007)
In this study, two common indicators of tablet performance were selected: mechanical
strength (commonly termed 'hardness') and dissolution times, as measured by the USP
tests. As discussed in Part II, there are no models to predict tablet performance in
standard tests and there is insufficient understanding of which tablet properties contribute
to hardness and dissolution. The tests themselves are used as quick laboratory
-119-

Mridula Pore, 2009 Doctoral Thesis, MIT
Part IV
Currently, some of the specifications for excipient powders are:
o Chemical composition
o Polymorph (crystalline form) composition
o Particle size (usually defined as a range)
o Particle shape
These physico-chemical properties of the powder are not sufficient to predict the
mechanical behavior of the powder bed during the compaction process. Therefore, the
mechanical properties of powders were investigated and the results are linked to tablet
structure and performance (chapter IV.B).
Process Flow Sheet Design
The manufacture of tablets from its raw material powders is most commonly performed
as a wet-granulation process. This consists of multiple blending steps, as well as shear
granulation, milling and fluid-bed drying. In this study, the compaction step itself is of
interest, as it creates the tablet microstructure. Therefore a direct compression process
was selected. This is the simplest and most cost-effective process at the manufacturing
scale, so is desirable, but not often implemented. Most of the tablets in this study had
only one component and could be compacted directly. For the dissolution studies, a
blending step preceded compaction.
Tablet compaction is performed as a semi-continuous operation in the pharmaceutical
industry. The powder hopper-filling is performed in batch mode, but the rotary press
works in continuous mode. The operation is scaled by time, rather than volume, so the
learnings of this work are applicable to a batch or a continuous system.
Unit Operation Design
Degrees of freedom in process design of a unit operation include:
o Equipment geometry
o Environmental conditions for materials and process
o Operational parameters
In this study, the unit operation considered was the tablet compaction step. Equipment
geometry was kept constant; flat punches were used to obtain cylindrical tablets. The die
radius was kept constant at 12.7mm and a fixed volume of powder (4mm bed depth) was
- 121-

Mridula Pore, 2009 Doctoral Thesis, MIT
Part IV
used for all tablets. As the physical properties (size distribution, shape, density) are
similar, it was assumed that their packing properties would be similar. Therefore a given
volume would contain approximately the same number of granules.
The environmental conditions were controlled as far as possible, by storing the powders
and tablets at 55% relative humidity during sample preparation and testing, and in air-
tight containers during transportation. However, humidity was not controlled during
powder storage. This may have resulted in changes over time.
Compaction cycles in commercial manufacturing equipment may be quite complex, due
to the rotary press configuration and pre-compression steps (Fette, Natoli, MCC, 2007).
For the purposes of this study, an Instron 4206 mechanical testing apparatus was used to
create a simple compaction cycle. The powder bed was simply loaded at constant speed
(varied between 0.5, 5 and 50mm/min), to a specified force, and unloaded at constant
speed (kept constant at 0.5mm/min). Therefore, the only two operational parameters that
were varied were the compaction speed and the final force of compaction (in the range of
5-75kN). The effects of these variables are discussed in chapter IV.C.
Acknowledgements
The author would like to thank Dr San Kiang (Bristol-Myers Squibb), John Levins
(Wyeth) and Lakshman Parthiban, (Novartis) for their suggestions and helpful
discussions.
References
Cussler E.L.; Moggridge G.D. Chemical Product Design, Cambridge University Press,
2001
Fette, www.fette.com, accessed July 2007, Fette GmbH
Fung K.Y.; Ng K.M AIChE J. 2003, 49 (5), 1193
Gani R.; Dam-Johansen K.; Ng K.M. in Chemical Product Design: Toward a Perspective
through Case Studies, Elsevier, 2007
Hardy I.J.; Cook W.G. J. Pharm. Pharmacol. 2003, 55 (3)
Hill M., AIChE Journal, 2004, 50 (8)
- 122-

Mridula Pore, 2009 Doctoral Thesis, MIT
Part IV
Hill M., Presentation at Process Systems and Engineering Consortium Meeting, Amherst,
MA, October 14, 2005
Natoli, www.natoli.com, accessed July 2007, Natoli Inc.
MCC, www.mcc-online.com, Metropolitan Computing Corporation, accessed 2007
- 123-
Mridula Pore, 2009 Doctoral Thesis, MIT
Part IV
IV.B Formulation Design
Introduction
Three different excipient powders were investigated: microcrystalline cellulose (MCC)
Celphere® CP102 and two grades of spray-dried lactose: Pharmatose® DCL 11 and DCL
14. MCC and lactose are two commonly used excipients for direct compression and the
grades were selected for the similarity of their shape and size (see chapter I.A).
Part I describes physical and mechanical characterization of the powders. As described in
chapter IV.A, mechanical characteristics of powders do not currently form part of the raw
material specifications, yet are very important in tablet compaction. The aim was to test
individual granules to:
o Understand the mechanism of compaction for different materials and how it
affects tablet structure and performance
o Characterize the materials using parameters that are independent of compaction
equipment
o Obtain parameters that could be used as inputs for a compaction process model to
predict microstructure (this is discussed in chapter IV.D)
Effect of granule mechanics on tablet structure
The single granule mechanical tests indicate that MCC granules are tough and ductile,
whereas lactose granules fracture when loaded (chapter I.B). The microstructures of
MCC and lactose tablets, as viewed by X ray micro CT (chapter III.B), are consistent
with the single granule crushing results. MCC granules were found to be tough and yield,
which is consistent with the plastic deformation observed in tablets (Figure 62). DCL 11
and 14 granules were both found to collapse when a load was applied. This is consistent
with the observation that there is no evidence of granule shape or size in the monolithic
structure of the compacted tablet (Figure 62).
- 124-

Mridula Pore, 2009 Doctoral Thesis, MIT
Part IV
E
Figure 62: Tablets compacted to 19kN at 0.5mm/min (left to right) (a) MCC, (b) DCL 11, (c) DCL 14The quantitative comparison between DCL 11 and DCL 14 showed that the difference in
mechanical properties of the two grades of lactose is not reflected in the tablet structure.
DCL 11 was found to consist of stronger granules than DCL 14 (Table 15), but the pore
diameter distribution was the same for tablets made of the two materials (Figure 63). It is
likely that the observed difference in mechanical properties (when tested to a few mN)
was too small to be significant after compaction (to loads of several kN). Terahertz
pulsed spectroscopy also shows no difference between compacts made of the two
materials. This suggests that the composition of amorphous and a-monohydrate lactose is
the same for both grades (see chapter III.A for details).
Table 15: Comparison of fracture toughness of DCL 11 and DCL 14 tested at 10mN/s
DCL 11 DCL 14
Fracture load Median (X50) 48.88 mN 18.71 mN
Standard deviation (X84/X1 6) 1.32 1.72
- 125-
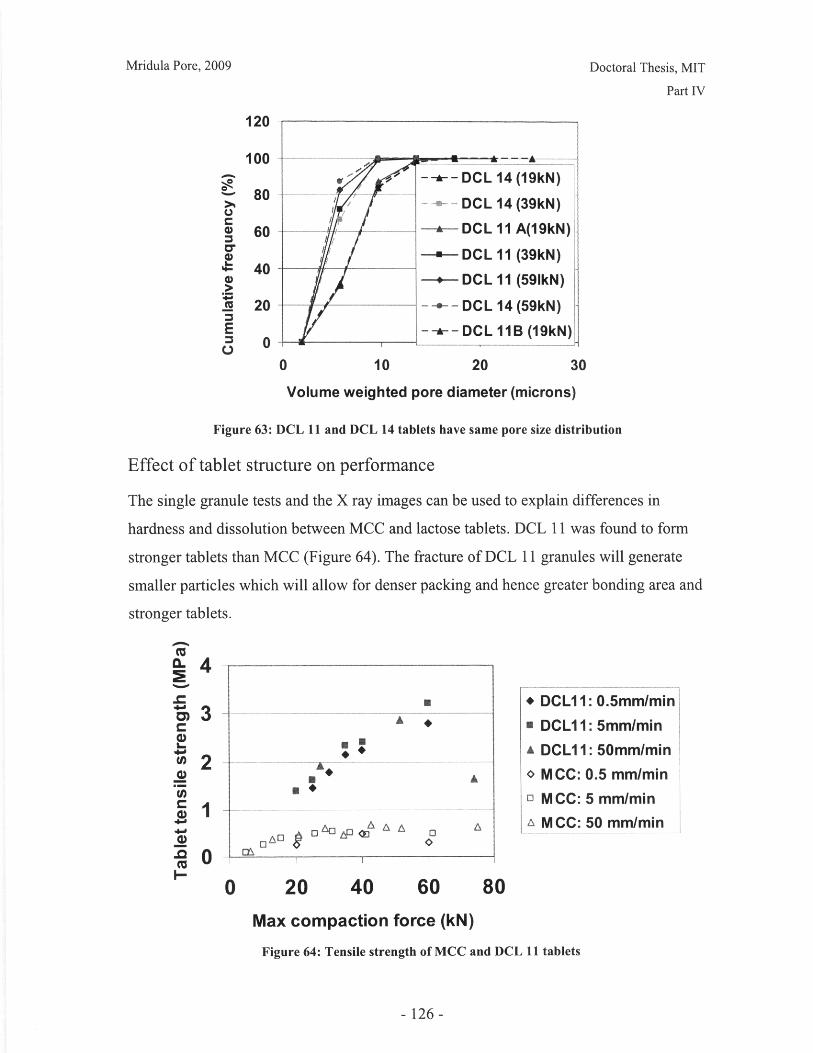
Mridula Pore, 2009 Doctoral Thesis, MIT
Part IV
120
100 - .. .S8 -- *--DCL14(19kN)
- 80 S- .- DCL 14(39kN)
S60 --- DCL 11 A(19kN)-- DCL 11 (39kN)
40S---- DCL 11 (591kN)
m 20 --- DCL 14 (59kN)E --- DCL 11B (19kN)
S 00 10 20 30
Volume weighted pore diameter (microns)
Figure 63: DCL 11 and DCL 14 tablets have same pore size distribution
Effect of tablet structure on performance
The single granule tests and the X ray images can be used to explain differences in
hardness and dissolution between MCC and lactose tablets. DCL 11 was found to form
stronger tablets than MCC (Figure 64). The fracture of DCL 11 granules will generate
smaller particles which will allow for denser packing and hence greater bonding area and
stronger tablets.
IL 4
.a * DCL11: 0.5mm/min
C 9 , DCL11: 5mm/mins, ,A DCL11: 50mm/min
SA o MCC: 0.5 mm/min
D MCC: 5 mm/min
0 20 40 60 80
Max compaction force (kN)
Figure 64: Tensile strength of MCC and DCL 11 tablets
- 126-
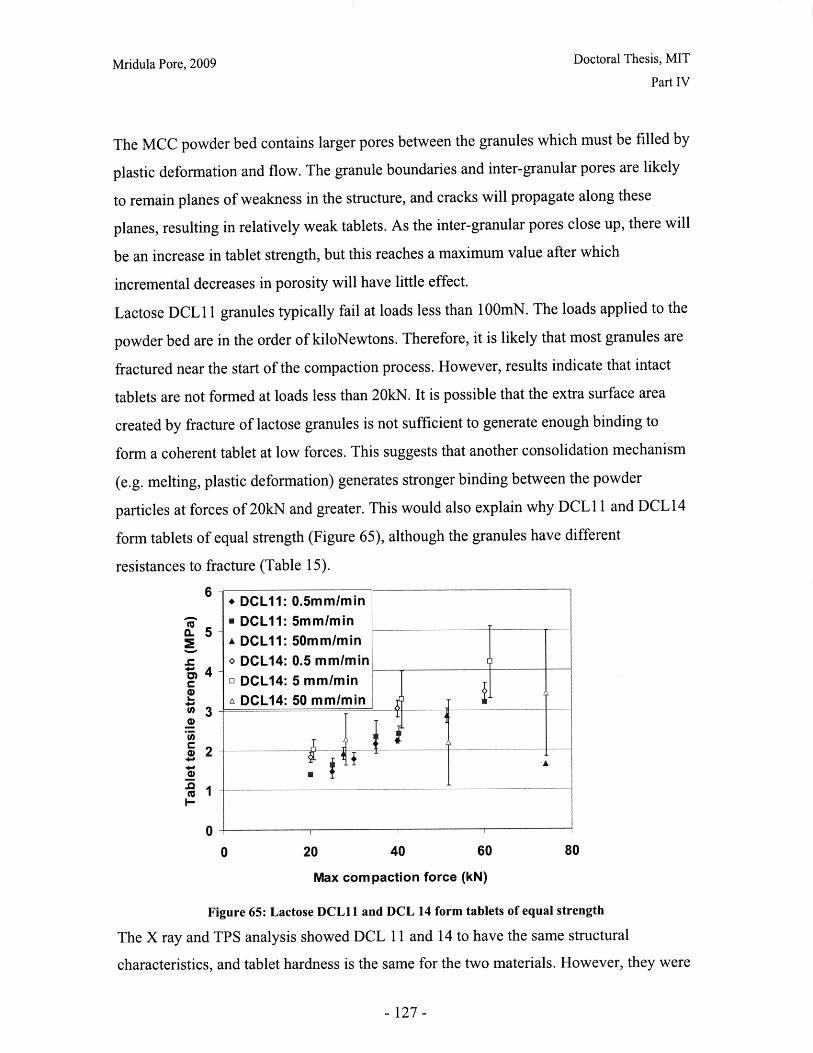
Mridula Pore, 2009 Doctoral Thesis, MIT
Part IV
The MCC powder bed contains larger pores between the granules which must be filled by
plastic deformation and flow. The granule boundaries and inter-granular pores are likely
to remain planes of weakness in the structure, and cracks will propagate along these
planes, resulting in relatively weak tablets. As the inter-granular pores close up, there will
be an increase in tablet strength, but this reaches a maximum value after which
incremental decreases in porosity will have little effect.
Lactose DCL 11 granules typically fail at loads less than 100mN. The loads applied to the
powder bed are in the order of kiloNewtons. Therefore, it is likely that most granules are
fractured near the start of the compaction process. However, results indicate that intact
tablets are not formed at loads less than 20kN. It is possible that the extra surface area
created by fracture of lactose granules is not sufficient to generate enough binding to
form a coherent tablet at low forces. This suggests that another consolidation mechanism
(e.g. melting, plastic deformation) generates stronger binding between the powder
particles at forces of 20kN and greater. This would also explain why DCL 11 and DCL14
form tablets of equal strength (Figure 65), although the granules have different
resistances to fracture (Table 15).
6 -. -- -- 1-
a. 5
4
(h3
S2
00 20 40 60 80
Max compaction force (kN)
Figure 65: Lactose DCL11 and DCL 14 form tablets of equal strength
The X ray and TPS analysis showed DCL 11 and 14 to have the same structural
characteristics, and tablet hardness is the same for the two materials. However, they were
- 127-
* DCL11: 0.5mm/min
* DCL11: 5mm/minA DCL11: 50mm/min
0 DCL14: 0.5 mmlmino DCL14: 5 mm/mina DCL14: 50 mmlmin -
I T,_

Mridula Pore, 2009 Doctoral Thesis, MIT
Part IV
found to differ in their dissolution behavior; DCL 14 tablets take up to four times as longto dissolve as DCL 11 tablets (Figure 66). Lactose tablets were found to be subject tolamination, which is believed to be the source of variation in the hardness and dissolutiondata. However, the difference in dissolution times is not believed to be due to lamination.If the tablets are cracked, they will break into fragments before dissolution. This wouldlead to discontinuities in the dissolution profile. However, all the individual dissolutionprofiles are smooth functions of time. The lactose tablets were observed to dissolve fully.Erosion of the lactose matrix is believed to be the rate-determining step in the dissolutionprocess (see chapter II.B for details). The dissolution behavior of the two grades oflactose is believed to differ because of physico-chemical differences in the two materials.Although TPS found no difference, techniques such as X ray diffraction and DSC couldbe used to analyze the polymorphic composition of the two powders.
9009 * DCL 11 at 0.5 mm/min
800 . DCL 11 at 5 mm/min700 DCL 11 at 50 mm/min
DCL 14 at 5mm/min600 x DCL14 at 50mm/min500 * DCL14 at 0.5mm/min
400
300
200
100 --
0 I
0 20 40 60 80Final force of compaction (kN)
Figure 66: DCL14 tablets dissolve at slower rates than DCL 11 tablets
In contrast to the smooth dissolution profiles for lactose tablets, MCC tablets released
their drug load in bursts. The X ray images show that MCC tablets have highly connected
pores which would allow penetration of water throughout the tablet, causing it to
disintegrate rapidly. MCC is insoluble in water, so drug release occurs by disintegration,not dissolution of the excipient matrix.
DCL 11 and 14 varied in their mechanical properties, but produced tablets with similar
pore size distributions. Structural characterization techniques (X ray and TPS) did not
- 128-
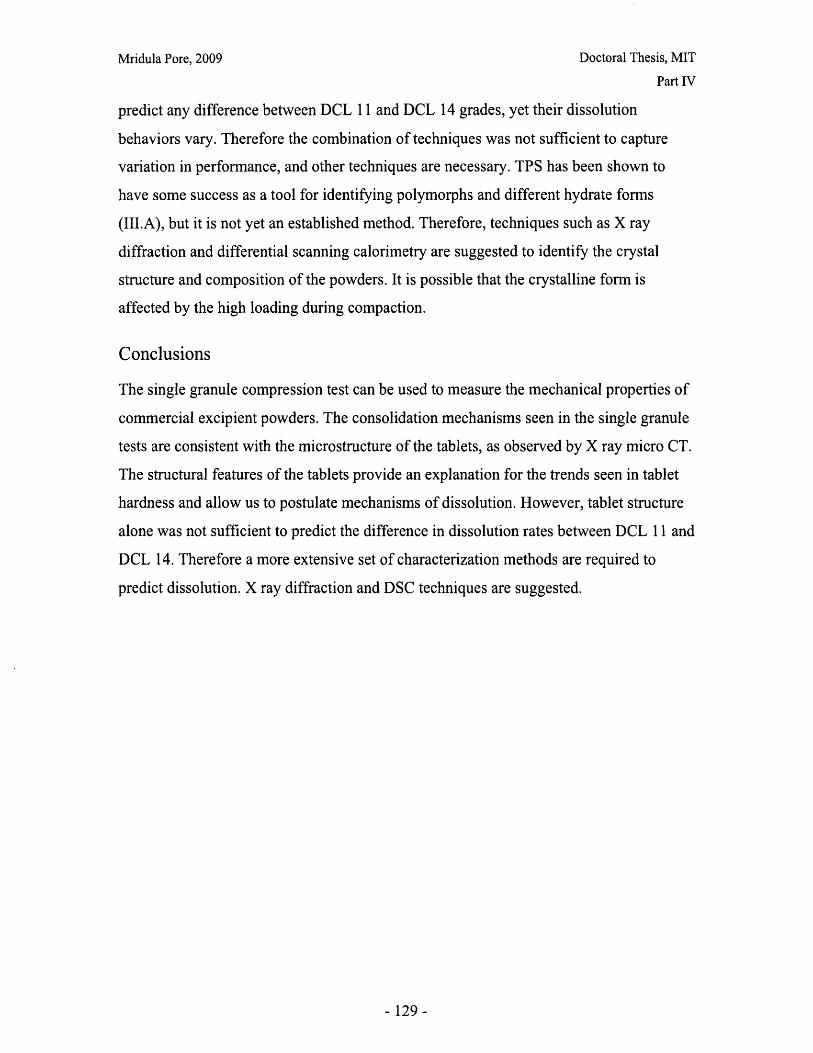
Mridula Pore, 2009 Doctoral Thesis, MIT
Part IV
predict any difference between DCL 11 and DCL 14 grades, yet their dissolution
behaviors vary. Therefore the combination of techniques was not sufficient to capture
variation in performance, and other techniques are necessary. TPS has been shown to
have some success as a tool for identifying polymorphs and different hydrate forms
(III.A), but it is not yet an established method. Therefore, techniques such as X ray
diffraction and differential scanning calorimetry are suggested to identify the crystal
structure and composition of the powders. It is possible that the crystalline form is
affected by the high loading during compaction.
Conclusions
The single granule compression test can be used to measure the mechanical properties of
commercial excipient powders. The consolidation mechanisms seen in the single granule
tests are consistent with the microstructure of the tablets, as observed by X ray micro CT.
The structural features of the tablets provide an explanation for the trends seen in tablet
hardness and allow us to postulate mechanisms of dissolution. However, tablet structure
alone was not sufficient to predict the difference in dissolution rates between DCL 11 and
DCL 14. Therefore a more extensive set of characterization methods are required to
predict dissolution. X ray diffraction and DSC techniques are suggested.
- 129-
Mridula Pore, 2009 Doctoral Thesis, MIT
Part IV
IV.C Process Design
Parts II and III presented the effects of compaction speed and force on tablet performance
and structure. Compaction force was found to be the dominant effect for the experimental
space investigated. The experimental ranges of force and speed were determined by the
range within which intact tablets could be formed.
Effect of compaction speed
No effect of speed was observed on tablet hardness, dissolution, TPS spectra, or pore size
for any of the materials investigated, and the effect of speed on tablet lamination for
lactose tablets was inconclusive.
The range of speed investigated was narrow (0.5-50mm/min), mainly due to equipment
limitations. The maximum speed for the Instron 4206 is 50mm/min, whereas rotary
presses have ranges of 400- 2400 mm/sec (MCC, 2007). To achieve these speeds, a full-
scale rotary press or a compaction simulator is needed (e.g. MCC, ESH, 2007).
The other factor that may limit the speed range is tablet lamination. This will depend on
the compaction force and the tablet geometry selected. Lamination and capping are
known to increase during scale-up, when de-compression speeds are increased (Wu,
2006), so this may be another limit on the range of speed. For this study, a cylindrical
geometry was selected, as analytical equations could be used to calculate tensile strength
and models for disintegration. However, it has been observed that punch geometry affects
the shape and extent of capping and lamination (Wu, 2006). Therefore, one way of
increasing the speed range, without creating tablet defects, would be to modify the
geometry.
As well as experimental considerations, limitations of the process model may determine
the compaction speed range for future work. For example, DEM models of powder
compaction (see chapter IV.D) often assume pseudostatic loading, where the rate of
punch movement is slow relative to the rate of particle re-arrangement (e.g. Hassanpour
et al, 2003, Sheng et al, 2004). For experimental validation of these models, compaction
must be performed at strain rates much lower than that of commercial equipment.
- 130-

Mridula Pore, 2009 Doctoral Thesis, MIT
Part IV
Effect of compaction force
For MCC tablets, the effect of force and speed was not assessed separately for tablet
structure (results from chapter III.B are reproduced below). However, it was observed
that the structure changed significantly within the range studied: there was plastic
deformation of the granules, resulting in increasing consolidation as force and speed are
increased (Figure 67). As consolidation occurs by plastic deformation and flow, it is
likely that, as porosity decreases, increasing force leads to progressively less
consolidation.
EE
Figure 67: Grayscale cross-section of MCC tablets (from left to right), (a) 0.5mm/min 19kN, (b)
5mm/min 40kN, (c) 50mm/min 72kN
In the X ray images we see clear structural differences between tablets compacted at 19,
40 and 72kN, but when tablet hardness was measured (II.A), no significant changes were
observed within the same force range (Figure 68). Similarly, there was no detectable
difference in dissolution times (II.B), as all tablets disintegrated within 100s. The
'bursting' mechanism observed during dissolution suggests that there was penetration of
water into the highly connected pores (Figure 67) which caused the rapid disintegration.
This highly-connected pore network would also lead to planes of weakness, along which
cracks could propagate during hardness testing. The X ray images indicate that even
though these pores become narrower, the networks are still extensive. This is the likely
cause for the limited strength of MCC tablets.
- 131 -
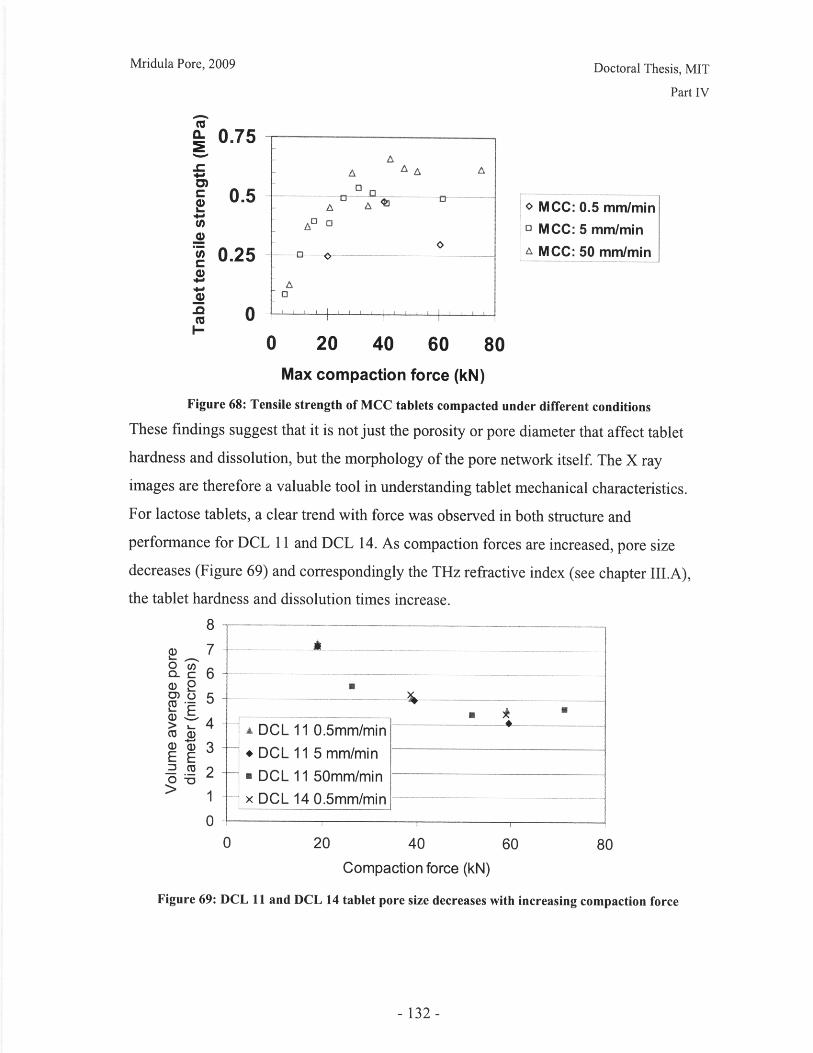
Mridula Pore, 2009 Doctoral Thesis, MIT
Part IV
S0.75
A U Co MCC: 0.5 mm/minI) A o o0 MCC: 5 mm/min" 0.25 - MCC:50 somm/min
W 0
I--
0 20 40 60 80Max compaction force (kN)
Figure 68: Tensile strength of MCC tablets compacted under different conditions
These findings suggest that it is not just the porosity or pore diameter that affect tablethardness and dissolution, but the morphology of the pore network itself. The X rayimages are therefore a valuable tool in understanding tablet mechanical characteristics.
For lactose tablets, a clear trend with force was observed in both structure and
performance for DCL 11 and DCL 14. As compaction forces are increased, pore sizedecreases (Figure 69) and correspondingly the THz refractive index (see chapter III.A),the tablet hardness and dissolution times increase.
8
u,7c. : 6
4 ADCL 11 0.5mm/mina) 3 * DCL 11 5 mm/min
c 2 a DCL 11 50mm/minS 1 x DCL 140.5mm/min - ------
0 20 40 60 80Compaction force (kN)
Figure 69: DCL 11 and DCL 14 tablet pore size decreases with increasing compaction force
- 132-
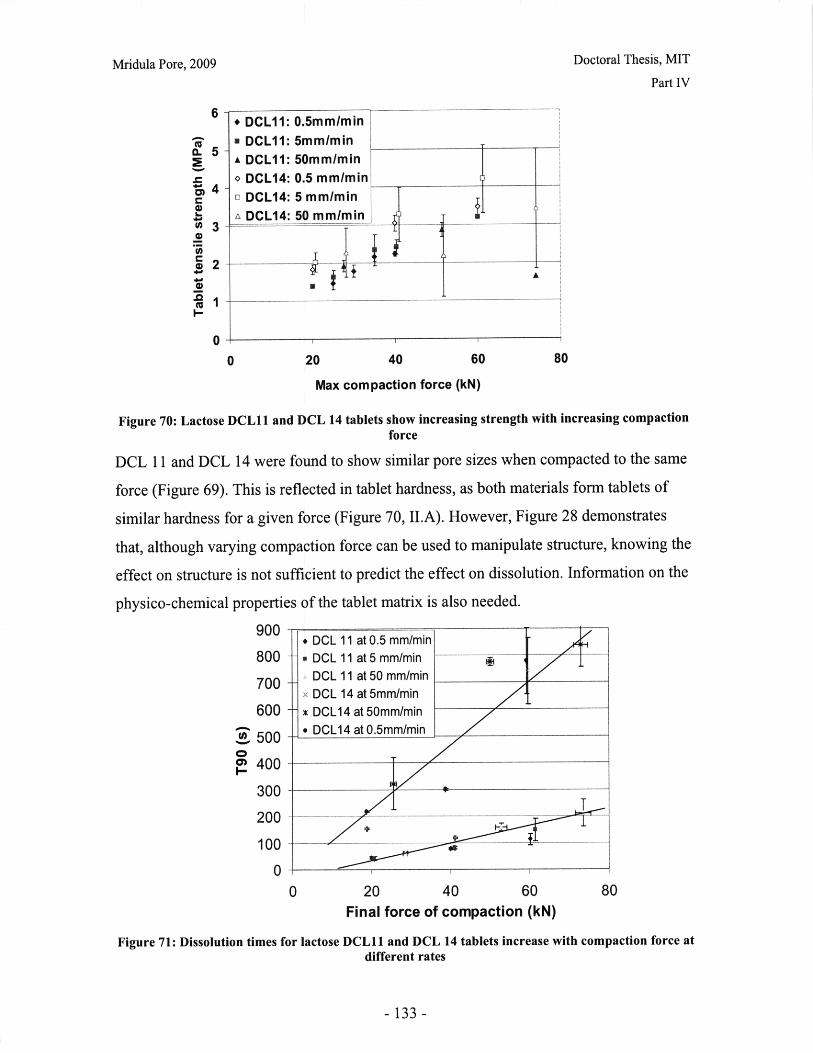
Mridula Pore, 2009 Doctoral Thesis, MIT
Part IV
S5IE
4
S3
S2
a-
• DCL11: 0.5mm/mina DCL11: 5mmlmin
• DCL11: 50mm/min
o DCL14:0.5 mmlmin
A DCL14: 50 mmlminDCL14:50 mm/minDC_ 50__ I
- ----------------
0 20 40 60 80
Max compaction force (kN)
Figure 70: Lactose DCL11 and DCL 14 tablets show increasing strength with increasing compactionforce
DCL 11 and DCL 14 were found to show similar pore sizes when compacted to the same
force (Figure 69). This is reflected in tablet hardness, as both materials form tablets of
similar hardness for a given force (Figure 70, II.A). However, Figure 28 demonstrates
that, although varying compaction force can be used to manipulate structure, knowing the
effect on structure is not sufficient to predict the effect on dissolution. Information on the
physico-chemical properties of the tablet matrix is also needed.
900 * DCL 11 at 0.5 mm/min800 .DCL 11 at 5 mm/min 4
700 DCL 11 at 50 mm/min700
DCL 14 at 5mm/min600 • DCL14 at 50mm/min500 * DCL14 at 0.5mm/min
500
a 400
300
200
100
00 20 40 60 80
Final force of compaction (kN)
Figure 71: Dissolution times for lactose DCL11 and DCL 14 tablets increase with compaction force atdifferent rates
- 133 -
61
-
-

Mridula Pore, 2009 Doctoral Thesis, MIT
Part IV
Tablet lamination was also found to increase with compaction force (III.C), therefore the
formation of defects will form an upper limit to the force range that can be used for a
given tablet composition, geometry and mass.
Conclusions
Compaction force can be used to manipulate tablet structure. X ray microCT is a useful
tool to assess these structural changes. Depending on the microstructure morphology and
the chemical properties of the binder, modifying the geometry of the structure may or
may not be an effective tuning tool for tablet hardness and dissolution. The range of force
that can be used for tuning depends on the tablet composition, geometry and mass, and is
limited at the lower end by the compactibility of the material and at the upper limit by the
formation of tablet defects, such as lamination.
References
ESH Powder Compaction Simulator, Huxley Bertram Engineering Ltd.,
www.powdercompaction.com, accessed 2007
Hassanpour A.; Ghadiri M.; Bentham A.C.; Papadopoulos D.G. Adv. Powder Technol.
2003, 14 (4), 427-434
MCC, www.mcc-online.com, Metropolitan Computing Corporation, accessed 2007
Sheng Y.; Lawrence C.J.; Briscoe B.J.; Thornton C. Eng. Computation 2004, 21, 304-317
Wu C-Y. 'Capping Mechanisms during Pharmaceutical Powder Compaction'
Proceedings of the Fifth World Congress on Particle Technology, Orlando, April 2006
- 134 -
Mridula Pore, 2009 Doctoral Thesis, MIT
Part IV
IV.D Recommendations for Future Work
Four major areas for further work are identified: expanding the range of materials
studied, developing the experimental techniques described in this thesis, process
modeling of tablet compaction and clarification and development of tablet performance
criteria.
Investigation of Pharmaceutical Materials
Only two types of binders were investigated in this study: microcrystalline cellulose and
spray-dried lactose. Many other direct compression filler/binders are available and
investigation should be extended to materials that deform by a range of mechanisms.
Only single component tablets were considered here, but studies have shown that
excipients can be mixed to obtain further tunability (Allard et al, 2006, Cotton et al,
2007).
The effect of APIs (active pharmaceutical ingredients) was not considered, as it was
assumed that excipient properties would dominate the tablet microstructure for low-
dosage tablets. However, there are many formulations where APIs (either a single API, or
a mixture) make up a significant volume of the tablet. APIs are often in crystalline form
so methods other than single granule compression may be needed to characterize their
mechanical properties, such as nanoindentation (chapter I.B).
Other constituents of commercial tablet formulations include excipients to act as
lubricants, disintegrants etc. These materials will likely have different mechanical
properties which may affect the tablet microstructure and will affect hardness and the
mechanics of dissolution.
Development of Characterization Techniques
Several of the experimental techniques used in this thesis have had limited application in
the pharmaceutical sector. Therefore, further research is recommended to investe the
potential and limitations of these techniques.
- 135-

Mridula Pore, 2009 Doctoral Thesis, MIT
Part IV
Granule mechanical properties
A modified nanoindenter apparatus was found to be a useful means of measuring the
mechanical properties of spherical excipient granules. However, the load and
displacement range of this apparatus was found to be insufficient to test tough granules
such as MCC. Instruments with a wider load and displacement range are required, such as
a MTS indenter with high load cell, or an Instron testing machine, for some materials.
The major limitations of the nanoindenter technique are:
i) Long times required for testing
ii) Data on the size, shape and number of daughter particles cannot be captured after the
test
A limited data set (25-30 granules per loading condition) was collected due to the long
times associated with indenter calibration, maneuvering and tip-cleaning. More data
would be desirable for more statistically reliable values of the granule stiffness and
strength.
Thornton et al (2004) demonstrated that impact testing and compression testing of
granules results in similar fracture patterns. The two tests could be used in parallel, as
suggested by Couroyer et al. (2000): compression testing to get quantitative data about
fracture mode and impact testing to get quantitative data on the particle size distribution
of the resulting fragments.
Only spherical, excipient powder materials have been considered in this study. To
understand the mechanical behavior of realistic multi-component blends, it is necessary
to characterize API crystals and irregular excipients. This will require a combination of
powder particle compression with different testing techniques, such as nanoindentation.
X ray micro CT
X ray micro CT was found to be a valuable tool to analyze the microstructure of tablets,both qualitatively and quantitatively. However, further investigation is required on
quantitative parameters to describe the relevant microstructural characteristics. The 2D
pore area and volume-averaged pore diameter were used to characterize pore size, but
other significant features may include pore connectivity and length. The reported pores
sizes are averaged over the whole volume tested, but it is possible that there is spatial
variation in the tablet, particularly along the axis of compaction.
- 136-

Mridula Pore, 2009 Doctoral Thesis, MIT
Part IV
Terahertz technologies
This study showed the Terahertz pulsed spectroscopy can be used to obtain the refractive
index of tablet materials and that this correlates with tablet hardness for DCL 1 1 (chapter
III.A). However, it is not yet known exactly what physical changes in the structure
correspond to changes in refractive index. X ray micro CT has shown that decreasing
pore size in lactose tablets corresponds to increasing hardness and hence correlates with
refractive index in the THz range. However, further studies are required to understand the
physical significance of the TPS spectrum.
TPS did not indicate any difference in the polymorphic composition of tablets of DCL 11
and DCL 14. Other techniques for characterizing the crystal structure in tablets should be
investigated and the effects on dissolution studied. Some techniques that have been used
to study the crystal structure of lactose are thermogravimetric analysis (Buckton et
al,2002), solution calorimetry (Harjunen et al, 2004), Raman spectroscopy (Katainen et
al., 2005) X ray diffraction (Jouppila et al, 1998) and differential scanning calorimetry
(Gabbott et al, 2003). However, these techniques require the sample to be in solution or
in powder form. TPS is worth further investigation for its potential to non-destructively
analyze the polymorphic composition in commercial tablets. However, to date, studies
have made use of binders that are not common in the pharmaceutical setting, such as
polyethylene or polytetrafluoroethane (Upadhya et al, 2004, Taday et al, 2003).
TPI was found to be a useful tool for rapid detection of tablet defects such as lamination.
However, the study presented here is not sufficient to determine the technique's limits of
detection. Further work is required to determine the maximum permissible size of defects
and investigate the technique's capabilities of differentiating faulty and good tablets.
Process Model of Tablet Compaction
For systematic design, a process model is required of the tablet compaction process. In
the ideal case, the model would have the material properties, the tooling geometry and the
operating parameters as independent inputs and the tablet microstructure as an output.
An overview of methods for modeling powder compaction is presented below. Empirical
models to predict porosity, such as the Heckel (1961) and the Kawakita-Ludde (1970)
equations have been excluded, as they are one-dimensional models that rely on
- 137-
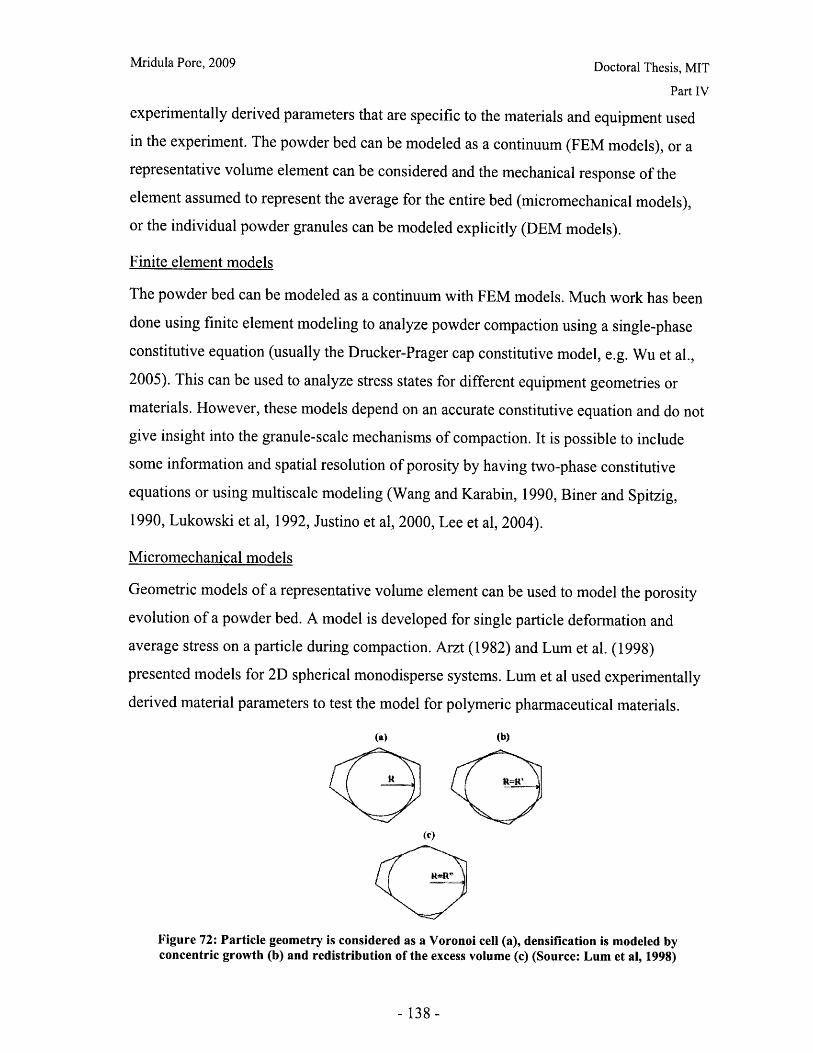
Mridula Pore, 2009 Doctoral Thesis, MIT
Part IV
experimentally derived parameters that are specific to the materials and equipment used
in the experiment. The powder bed can be modeled as a continuum (FEM models), or a
representative volume element can be considered and the mechanical response of the
element assumed to represent the average for the entire bed (micromechanical models),or the individual powder granules can be modeled explicitly (DEM models).
Finite element models
The powder bed can be modeled as a continuum with FEM models. Much work has been
done using finite element modeling to analyze powder compaction using a single-phase
constitutive equation (usually the Drucker-Prager cap constitutive model, e.g. Wu et al.,2005). This can be used to analyze stress states for different equipment geometries or
materials. However, these models depend on an accurate constitutive equation and do not
give insight into the granule-scale mechanisms of compaction. It is possible to include
some information and spatial resolution of porosity by having two-phase constitutive
equations or using multiscale modeling (Wang and Karabin, 1990, Biner and Spitzig,
1990, Lukowski et al, 1992, Justino et al, 2000, Lee et al, 2004).
Micromechanical models
Geometric models of a representative volume element can be used to model the porosity
evolution of a powder bed. A model is developed for single particle deformation and
average stress on a particle during compaction. Arzt (1982) and Lum et al. (1998)
presented models for 2D spherical monodisperse systems. Lum et al used experimentally
derived material parameters to test the model for polymeric pharmaceutical materials.
(v)
Figure 72: Particle geometry is considered as a Voronoi cell (a), densification is modeled byconcentric growth (b) and redistribution of the excess volume (c) (Source: Lum et al, 1998)
- 138-

Mridula Pore, 2009 Doctoral Thesis, MIT
Part IV
The main limitation of these models is that they do not incorporate any particle
rearrangement during compaction and can be used only for viscoelastic or plastic
deformation. Only the average porosity of the powder bed can be calculated and spatial
variation or wall effects cannot be included.
Gardiner and Torsedillas (2006) have used micromechanical models to incorporate3D
polydisperse assemblies, incorporating contact anisotropy, particle rotation and sliding
Their models can be used to study void evolution and shear bands (Torsedillas and
Walsh, 2002).
This approach has the advantage of being computationally tractable, but has limitations
when it comes to modeling a uniaxial compaction process where there is considerable
particle rearrangement and wall effects are significant.
Discrete element models of compaction
Discrete element modeling accounts for the heterogeneous nature of granular material in
processes including compaction. The method considers each granule as a discrete particle
and Newton's equations of motion are solved explicitly for each particle at each time
step. The complexity and computational requirements of the DEM model depend on the
model for the particle interactions with other particles or any bounding surfaces, the
number of particles in the system and the geometry of the system.
The advantage of DEM modeling is that it enables us to investigate the effect of
individual particle properties on the macroscopic processing behavior and thus opens up
the possibility for both process and particle optimization. Particles are usually modeled as
rods (in 2D) or spheres (in 3D) as this simplifies algorithms to determine inter-particle
contact, although algorithms have also been developed for contact of non-spherical
particles (Yang et al, 2002). Structural information of the powder bed can be obtained
and it is temporally and spatially resolved.
DEM can be used to model consolidation by plastic deformation or by fracture.
Two approaches have been taken for modeling plastic deformation of particles; either the
contact damping and deformation is modeled, or the entire particle is modeled as a
continuum in a combined discrete/finite element method to incorporate volumetric
deformation.
-139-

Mridula Pore, 2009 Doctoral Thesis, MIT
Part IV
The particle contact can be modeled to incorporate cohesion, friction and deformation of
the particle. A model of elastic-plastic contacts has been presented by Li et al. (2002),
based on the Hertzian theory for perfectly elastic spheres. In these models, the
'deformation' of the particles is incorporated by allowing the spheres to overlap and by
considering the deformed particles as truncated spheres with volume reduction. The
contact force-displacement model can be obtained by single granule compression testing
(chapter I.B) and inter-granule friction and cohesion can be measured by atomic force
microscopy (Domike, 2003, Ngai, 2005, Pu, 2007). A 3D model incorporating cohesion,
friction and elastic-plastic deformation was implemented by Sheng et al., (2004) and the
effect of friction and yield stress on a unit cell with a periodic boundary condition was
investigated.
Another approach that has been taken to model plastic deformation is to treat the particle
as a continuum using combined DEM / FEM approach (Komodromos and Williams,
2002). This method gives more insight into the mechanisms of volumetric particle
deformation, but is considerably more computationally intensive. Gethin et al (2003)
developed a code with both brittle and ductile failure criteria for a confined 2D system.
The number of particles was limited to sixteen due to computational intensity.
Models have been developed for binary composite materials where the two components
have greatly different properties by assuming one component to be hard and rigid and the
other to be perfectly plastic. This has been used with a contact (truncated Hertzian) model
by Martin and Bouvard (2003) and with a combined DEM / FEM model by Gethin et al.
(2003). It has been shown that this combination of materials leads to the plastic material
extruding around harder materials (Figure 73).
Figure 73: DEM/FEM model of compaction for a binary mixture with equal components of softductile particles and hard, brittle particles. (Source: Gethin et al., 2003)
-140-
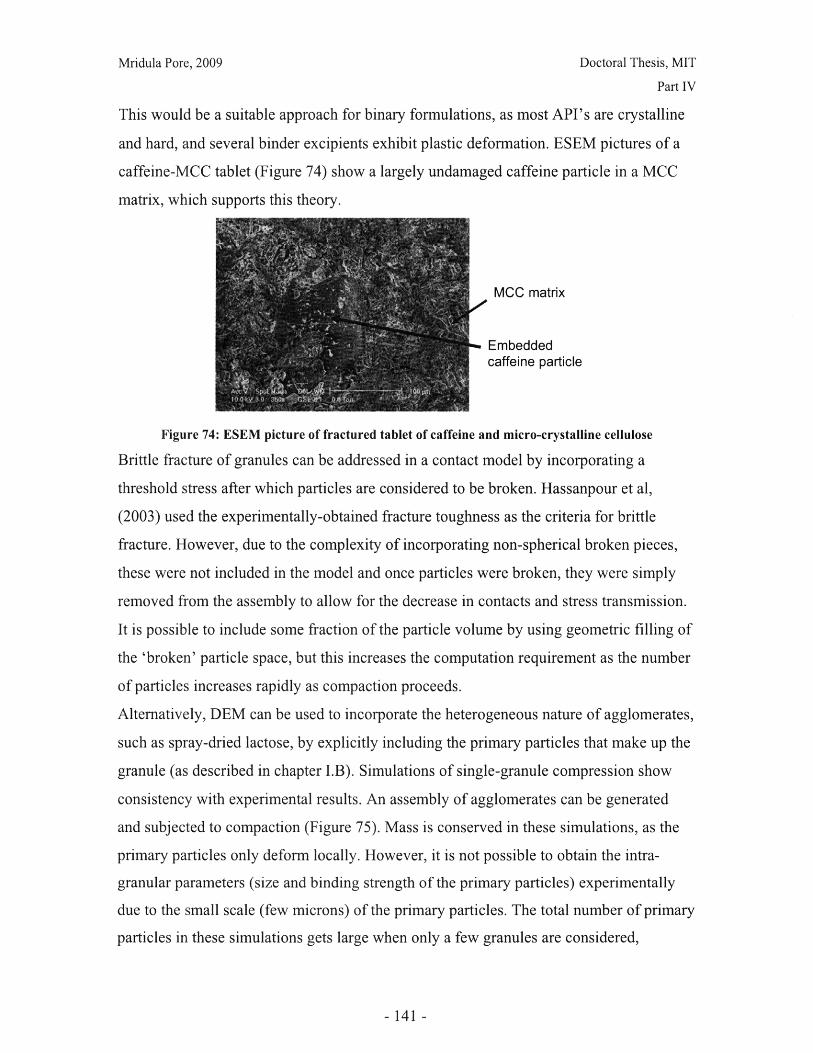
Mridula Pore, 2009 Doctoral Thesis, MIT
Part IV
This would be a suitable approach for binary formulations, as most API's are crystalline
and hard, and several binder excipients exhibit plastic deformation. ESEM pictures of a
caffeine-MCC tablet (Figure 74) show a largely undamaged caffeine particle in a MCC
matrix, which supports this theory.
MCC matrix
Embeddedcaffeine particle
Figure 74: ESEM picture of fractured tablet of caffeine and micro-crystalline cellulose
Brittle fracture of granules can be addressed in a contact model by incorporating a
threshold stress after which particles are considered to be broken. Hassanpour et al,
(2003) used the experimentally-obtained fracture toughness as the criteria for brittle
fracture. However, due to the complexity of incorporating non-spherical broken pieces,
these were not included in the model and once particles were broken, they were simply
removed from the assembly to allow for the decrease in contacts and stress transmission.
It is possible to include some fraction of the particle volume by using geometric filling of
the 'broken' particle space, but this increases the computation requirement as the number
of particles increases rapidly as compaction proceeds.
Alternatively, DEM can be used to incorporate the heterogeneous nature of agglomerates,
such as spray-dried lactose, by explicitly including the primary particles that make up the
granule (as described in chapter I.B). Simulations of single-granule compression show
consistency with experimental results. An assembly of agglomerates can be generated
and subjected to compaction (Figure 75). Mass is conserved in these simulations, as the
primary particles only deform locally. However, it is not possible to obtain the intra-
granular parameters (size and binding strength of the primary particles) experimentally
due to the small scale (few microns) of the primary particles. The total number of primary
particles in these simulations gets large when only a few granules are considered,
141 -

Mridula Pore, 2009 Doctoral Thesis, MIT
Part IV
therefore there are computational limits on the size of the assembly and it is not yet
possible to simulate at the process scale (Martin and Bouvard, 2006).
Figure 75: Slice of 3D packing evolution during uniaxial compaction of 100 breakable aggregates(indicated by different colors) Source: Martin and Bouvard, 2006
Smoothed Particle Hydrodynamics
Another potential method for modeling of powder compaction is smoothed particle
hydrodynamics. In SPH, the fluid or solid is discretized and the properties of each
element are attributed to their centres (to create 'particles'). An interpolation kernel is
used to smooth values held by the particles, giving smooth continuous interpolated fields
(eg. of density or pressure). These fields are used in the solution of the governing
equations (Cleary et al, 2007).
This method has been used for modeling of solids processing, such as fine powder flow
(Sugino and Yuu, 2002), and solid fragmentation (Libersky et al., 1997;
Parshikov et al., 2000; Rabczuk and Eibl, 2003). Although this method can be used to
generate density, pressure and velocity fields, its effectiveness at predicting
microstructural characteristics of a compacted powder bed is unclear.
- 142-
Mridula Pore, 2009 Doctoral Thesis, MIT
Part IV
Evaluating and Modeling Tablet Performance
As discussed in chapter II.A and II.B, the tablet properties affecting tablet hardness and
dissolution are not well understood. The testing conditions and equipment are
standardized, but do not enhance understanding of the physics. In the case of hardness,
the strength of the material can only be calculated analytically for cylindrical tablets,
whereas most tablets are biconvex. Also, the strength calculation assumes that the
material is homogeneous, whereas several studies have shown that it is, in fact, the
heterogeneity (porosity or pore structure) of the material that determines resistance to
crack propagation. In the case of dissolution, the geometry of the tablet and the complex
hydrodynamics of the testing apparatus do not allow for a simple model of dissolution.
In order to build predictive models of tablet performance, it is vital to understand the
physics of the performance assessment and how the properties of the tablet (chemical and
microstructural) affect the test. Therefore, further experiments should investigate non-
standard testing configurations to assess the mechanical and dissolution characteristics of
tablets.
Nanoindentation is a possible method for quantifying mechanical properties of the
compact. Mohammed et al. (2005) studied the response of tablets made from various
pharmaceutical materials, but did not investigate the effect of compaction force.
Solution sampling was used to monitor the progression of dissolution in our experiments,
but this is labor-intensive, prone to error and limits the sampling rate. Other ways to
monitor dissolution are an automated HPLC, or an in-situ FTIR system (van der Weerd et
al. 2004). The hydrodynamics of the system should be designed to allow for analytical
solution and geometric factors should be minimized, for example, by sealing faces of the
tablet, so that medium penetration and drug diffusion occurs through a single face.
For a soluble matrix, both disintegration and dissolution studies are necessary. In
addition, the evolution of the tablet structure can be inspected by X ray CT or MRI at
different steps during dissolution (Karakasota et al, 2006). This will provide insight into
the mechanism of dissolution and hence how it is affected by initial tablet structure.
- 143-
Mridula Pore, 2009 Doctoral Thesis, MIT
Part IV
Concluding Remarks
This study has identified a framework for rational design of pharmaceutical tablets and
identified some of the tools that can be used for future research. The research presented
here indicates that a more systematic design paradigm is a feasible, if long-term, goal.
Much further work is required in the areas of pharmaceutical materials, analytical
technology and process modeling. In particular, modeling of the tablet compaction
process and the tablet applications process (e.g. dissolution behavior) is necessary to
reduce the time and materials required for design.
The FDA's Process Analytical Technology (FDA, 2004) and international harmonization
(ICH, 2007) initiatives are generating much interest in the analytics sector and increasing
attention is being paid to developing applications for the pharmaceutical industry. The
pharmaceutical industry is also becoming more receptive to new technologies in
development and manufacturing as a result of changing business and regulatory
environments. It is anticipated that pharmaceutical product and process development will
be a fertile area of future research.
References
Allard C.; Kessler M.; Nees S. Tunable Formulation of Pharmaceutical Tablets 10.26
Class Project, MIT, 2006
Arzt E. Acta Metall. 1982, 30, 1883-1890
Biner, S.B.; Spitzig, W.A. Acta Metall. Mater. 1990, 38(4), 603-610
Buckton G.; Chidavaenzi O.; Koosha F. AAPS Pharm.Sci. Tech. 2002, 3(4)
Cleary P.W.; Prakash M.; Ha J.; Stokes N.; Scott C. Prog. Comput. Fluid Dy. 2007, 7(2-
4), 70-90
Cotton J.; Machado M.; Roy-Mayhew J. Tunable Formulation of Pharmaceutical Tablets
10.26 Class Project, MIT, 2007
Couroyer C.; Ghadiri M.; Laval P.; Brunard N.; Kolenda F. R. I. Fr. Petrol 2000, 55 (1),
67-85
Domike R.R. Pharmaceutical Powders in Experiment and Simulation PhD Thesis, MIT
2003
- 144-

Mridula Pore, 2009 Doctoral Thesis, MIT
Part IV
FDA, Guidance for Industry: PAT- A Framework for Innovative Pharmaceutical
Development, Manufacturing, and Quality Assurance, US Food and Drug
Administration, 2004
Gabbott P.; Clarke P.; Mann T.; Royall P.; Shergill S. A High-Sensitivity, High-Speed
DSC Technique.- Measurement of Amorphous Lactose, Technical Note, Perkin Elmer Inc.
www.perkinelmer.com, 2003
Gardiner B.S.; Torsedillas A. Powder Technol. 2006, 161, 110-121
Gethin D.T.; Lewis R.W.; Ransing R.S. Modelling Simul. Mater. Sci. Eng. 2003, 11, 101-
114
Hassanpour A.; Ghadiri M.; Bentham A.C.; Papadopoulos D.G. Adv. Powder Technol
2003, 14(4), 427-434
Harjunen P.; Lehto V.; Koivisto M.; Levonen E.1 Paronen P.; Jarvinen K. Drug Dev. Ind.
Pharm. 2004, 30(8), 809-815
Heckel R.W. Trans Metal Soc, AIME, 1961, 221, 671
ICH, International Conference on Harmonisation of Technical Requirements for
Registration of Pharmaceuticals for Human Use, www. ich. org, accessed 2007
Jouppila K.; Kansikas J.; Roos Y.H.; Biotechnol. Prog. 1998, 14, 347-350
Justino, J.G; Alves, M.K.; Klein, A.N.; Al-Qureshi, H.A. J Mater. Process. Tech. 2006,
179(1-3), 44-49
Karakasota E.; Jenneson P.M.; Sear R.P.; McDonald P.J. Phys Rev E 2006, (74), 011504
Katainen E.; Niemela P.; Harjunen P.; Suhonen J.; Jarvinen K., Talanta, 2005, 68(1), 1-5
Kawakita K.; Ludde K.H. Powder Technol. 1970, 4, 61
Komodromos P.I.; Williams J.R. Geotechnical Special Publications 2002, 17, 138 - 144
Lee, P.D.; Chirazi, A.; Atwood, R.C.; Wang, W. Mat. Sci. Eng. A, 2004, 365(1-2), 57-65
Li L.Y., Wu C.Y., Thornton C. P. I. Mech. Eng. Sci. C 2002, 216(4), 421-431
Libersky, L. D.; Randles, P. W.; Carney, T. C.; Dickinson, D. L. Int. J. Impact
Eng. 1997, 20, 525-532
Lukowski, J.; Grosman, F.; Misiolek, W.Z. Adv Powder Metall. 1992, 2, 301-311
Lum S.K.; Hoag S.W.; Duncan-Hewitt W.C. J. Pharm. Sci. 1998, 87(8), 909-916
Martin C.L.; Bouvard D. Acta Materialia, 2003, 51, 373-386
Martin C.L.; Bouvard M. J. Am. Ceram. Soc. 2006, 89(11), 3379-3387
- 145-
Mridula Pore, 2009 Doctoral Thesis, MIT
Part IV
Monaghan J.J. Annu. Rev. Astron. Astrophys. 1992, 30, 543-74
Ngai S.S.H. Multiscale Analysis and Simulation of Powder Blending in Pharmaceutical
Manufacturing, PhD Thesis, MIT 2005
Parshikov, A. N.; Medin, S. A.; Loukashenko, I. I.; Milekhin, V. A., Int. J. Impact Eng.
2000, 24, 779-796.
Pu Y. Theoretical and Experimental Investigation of Particle Interactions in
Pharmaceutical Blending PhD Thesis, MIT 2007
Rabczuk, T.; Eibl, J. Int. J. Numer. Methods Engng 2003, 56, 1421-1444.
Sheng Y.; Lawrence C.J.; Briscoe B.J.; Thornton C. Eng. Computation 2004, 21, 304-317
Sugino, T.; Yuu, S. Chem. Eng. Sci. 2002, 57, 227-237.
Taday P.; Bradley I.V.; Arnone D.D.; Pepper M. J. Pharm. Sci. 2003, 92 (4), 831-838
Thornton C., Ciomocos M.T., Adams M.J., Powder Technol. 2004 (a), 140, 258- 267
Torsedillas A.; Walsh D.C.S. Powder Technol. 2002, 124, 106-111
Upadhya P.C.; Nguyen K.L.; Shen Y.C.; Obradovic J.; Fukushige K.; Griffiths R.;
Gladden L.; Davies A.G.; Linfield E.H. Joint 2 9th Conference on Infrared and
Millimeter Waves and 12 th Int. Conf on Terahertz Electronics 2004, 429-430
Van der Weerd J.; Chan K.L.A.; Kazarian S.G.; Vib. Spectrosc. 2004, 35(1-2), 9-13
Wang, P.T.; Karabin, M.E. ASME PED, Microstructural Evolution in Metal Processing,
1990, 46, 47-58
Wu C.Y.; Ruddy O.M.; Bentham A.C.; Hancock B.C.; Best S.M.; Elliott J.A. Powder
Tech. 2005, 152, 107-117
Yang X.S.; Lewis R.W.; Gethin D.T.; Ransing R.S.; Rowe R.C. Geotechnical Special
Publications, 2002, 17, 74-78
- 146-
Mridula Pore, 2009 Doctoral Thesis, MIT
Part V
Part V: Patent Expiry of Statin Products - A Study of Market
Dynamics
This project investigates the interactions between innovators and generics manufacturers
in the US market for statin drug products. In particular it looks at the market dynamics
during the period when branded products lose their patent-protected status and generic
products emerge.
Statins comprise the largest segment of prescription drug sales by revenues and are
typical of the 'blockbuster' model employed in major multinational pharmaceutical firms.
In fact, statin products comprise of a significant percentage of revenue for several of
these firms. This project is particularly timely, as the branded product family is at a
midpoint in its lifecycle. Earlier products have gone off-patent and seen generic
substitution. Generics manufacturers are being more aggressive about attacking the
remaining market through intellectual property challenges, and the manufacturers of the
remaining on-patent products are being forced to be more creative in their strategies to
maximize profits from existing products.
This work follows that of Ngai (Ngai, 2005), who explored value creation strategies
during the early phases of the statin family lifecycle. That model captured the dynamics
of the entire statin market when the only players are the innovators. This work presents
the argument that statins have moved up the 'technology S curve', and the market is
currently in a mature phase, where the goal of value capture dominates value creation.
Rather than a market view, we look at the actions taken at a firm level, based on
historical studies of the six statin products currently in the market. A model has been
created to explore the major value-capture strategies employed at a firm level around the
period of patent expiry. The major leverage points for both branded and generic
manufacturers during this period are price and intellectual property. For branded product
manufacturers, investing in marketing and R&D for new indications and formulations is
an effective means of maintaining or gaining market share.
Part V.A of this report presents a history of the statin's trajectory along the technology S
curve. Part V.B looks at the structural and regulatory aspects of the market that influence
what strategies can be employed. Part V.C explores specific strategies that are employed
- 147-

Mridula Pore, 2009 Doctoral Thesis, MIT
Part V
in the period surrounding patent expiry, through the lens of a systems dynamics model
applied to case studies of the six statin products. Part V.D considers the future direction
for the market and presents recommendations for a continuation of this work.
- 148-
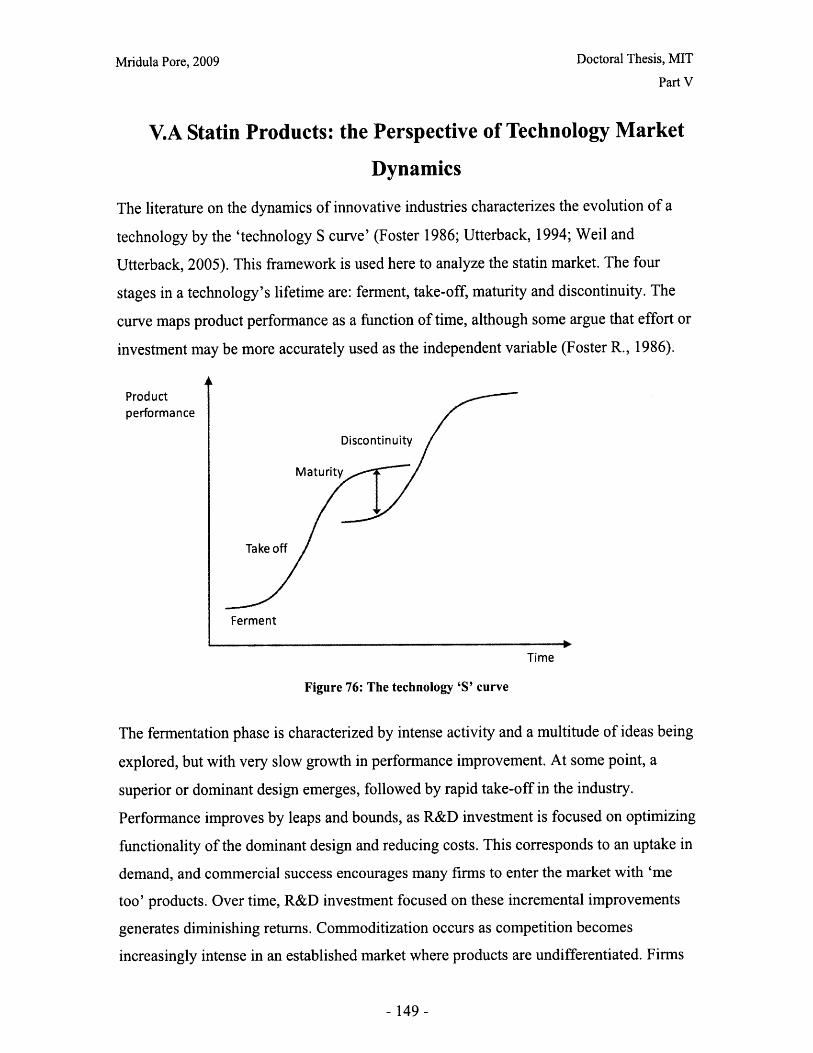
Mridula Pore, 2009 Doctoral Thesis, MIT
Part V
V.A Statin Products: the Perspective of Technology Market
Dynamics
The literature on the dynamics of innovative industries characterizes the evolution of a
technology by the 'technology S curve' (Foster 1986; Utterback, 1994; Weil and
Utterback, 2005). This framework is used here to analyze the statin market. The four
stages in a technology's lifetime are: ferment, take-off, maturity and discontinuity. The
curve maps product performance as a function of time, although some argue that effort or
investment may be more accurately used as the independent variable (Foster R., 1986).
Productperformance
Discontinuity
Maturity
Take off
Ferment
Time
Figure 76: The technology 'S' curve
The fermentation phase is characterized by intense activity and a multitude of ideas being
explored, but with very slow growth in performance improvement. At some point, a
superior or dominant design emerges, followed by rapid take-off in the industry.
Performance improves by leaps and bounds, as R&D investment is focused on optimizing
functionality of the dominant design and reducing costs. This corresponds to an uptake in
demand, and commercial success encourages many firms to enter the market with 'me
too' products. Over time, R&D investment focused on these incremental improvements
generates diminishing returns. Commoditization occurs as competition becomes
increasingly intense in an established market where products are undifferentiated. Firms
-149-

Mridula Pore, 2009 Doctoral Thesis, MIT
Part V
increasingly compete on price and focus on low-cost production as a source of
competitive advantage. Innovation now comes from process improvement, rather than
product improvement (Abernathy and Utterback, 1978). Eventually, value may get
destroyed in a 'race to the bottom' within the industry. A new technology may emerge
and completely erode the market for the established players, creating a discontinuity.
The purpose of this section is to track the statin family of products as it has moved along
this curve, and demonstrate that the dynamics in this market are consistent with what has
been observed in many other technology markets.
What are Statins?
Statins are a family of small-molecule drugs used to reduce blood cholesterol levels,
particularly low-density lipoproteins that are believed to be responsible for
atheroschlerosis (Pfizer, 2007), or the build-up of plaque on coronary arteries. They work
by inhibiting the enzyme HMG-CoA reductase that is required for cholesterol
biosynthesis (Manzoni and Rollini, 2002). High cholesterol levels are believed to be a
cause of heart disease and stroke, the first and third leading causes of death in the US
(CDC, 2009).
These drugs come in tablet form and are administered orally. They are prescribed as
prophylaxis or chronic therapy of patients at risk of primary or secondary heart disease,
i.e. those who may be at risk of a heart attack or stroke, but are asymptomatic and have
no history of cardiovascular problems, as well as patients who have already had heart
attacks/ heart surgery.
Ferment and Emergence of a Dominant Design
Statins were first discovered at Sankyo Pharmaceuticals in Japan in 1971 by a research
scientist, Akira Endo. Roy Vagelos, ex-CEO of Merck and head of research at the time,
describes the sense of competition within the industry to find a molecule that inhibited
the HMG-CoA reductase enzyme pathway, the uncertainty surrounding whether this was
going to be an effective mechanism, and the relative ineffectiveness of existing therapies
at the time (Vagelos and Galambos, 2006). Although Sankyo did develop the first drug,
mevastatin, they never commercialized it. Instead they worked with Merck to co-develop
150 -

Mridula Pore, 2009 Doctoral Thesis, MIT
Part V
lovastatin, the first commercial product. This product set the standard for the dominant
technology: all subsequent statin products work via the same metabolic pathway.
Chemical entities are based on similar structures (Table 16), although two generations are
clearly evident.
Table 16: Chemical structure of active ingredients of the statin family
HO
0t it
H3C % 0
? 3C' i
Lovastatin (C&EN, 2005) Simvastatin (Merck Sharpe and Pravastatin (NCBI, 2007)Dohme, 2007)
Bottom: Synthetic statins have a very different structure to natural statins
14
Rosuvastatin calcium (Astra Atorvastatin (Manzoni and Rollini, Fluvastatin (NCBI, 2007)Zeneca, 2007) 2002)
Take-off
Take-off in the statin market is described by Ngai's model (Ngai, 2005). It was
characterized by growing sales, and the entry of multiple players in the branded market,
with incremental improvements in product performance. It created what is still the largest
segment of the pharmaceutical market, and some of the most profitable products in the
industry.
Ngai's model captures the increasing R&D investment that led to a proliferation of statin
products in the market between 1987 and 2003. Six statin active ingredients are currently
approved by the FDA: Lovastatin (launched by Merck in 1987), Pravastatin (BMS,
1991), Simvastatin (Merck SP, 1991), Fluvastatin (Novartis, 1993), Atorvastatin (Pfizer,
- 151 -
Top: Natural statins share a polyketide portion and a hydroxy-hexahydro naphthalene ringstructure. Thev vary in their side chains.
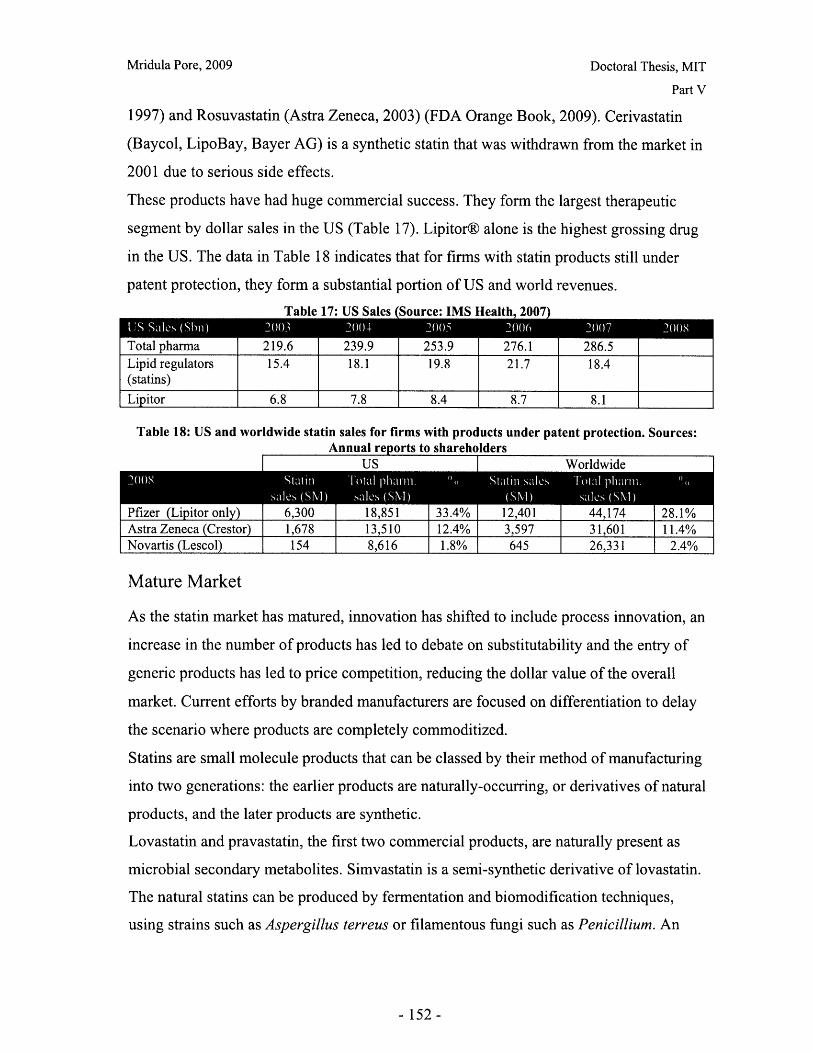
Mridula Pore, 2009 Doctoral Thesis, MIT
Part V
1997) and Rosuvastatin (Astra Zeneca, 2003) (FDA Orange Book, 2009). Cerivastatin
(Baycol, LipoBay, Bayer AG) is a synthetic statin that was withdrawn from the market in
2001 due to serious side effects.
These products have had huge commercial success. They form the largest therapeutic
segment by dollar sales in the US (Table 17). Lipitor® alone is the highest grossing drug
in the US. The data in Table 18 indicates that for firms with statin products still under
patent protection, they form a substantial portion of US and world revenues.
Table 17: US Sales (Source: IMS Health, 2007)
Total pharma 219.6 239.9 253.9 276.1 286.5Lipid regulators 15.4 18.1 19.8 21.7 18.4(statins)
Lipitor 6.8 7.8 8.4 8.7 8.1
Table 18: US and worldwide statin sales for firms with products under patent protection. Sources:Annual reports to shareholders
US Worldwide
Pfizer (Lipitor only) 6,300 18,851 33.4% 12,401 44,174 28.1%Astra Zeneca (Crestor) 1,678 13,510 12.4% 3,597 31,601 11.4%Novartis Lescol 154 8,616 1.8% 645 26,331 2.4%
Mature Market
As the statin market has matured, innovation has shifted to include process innovation, an
increase in the number of products has led to debate on substitutability and the entry of
generic products has led to price competition, reducing the dollar value of the overall
market. Current efforts by branded manufacturers are focused on differentiation to delay
the scenario where products are completely commoditized.
Statins are small molecule products that can be classed by their method of manufacturing
into two generations: the earlier products are naturally-occurring, or derivatives of natural
products, and the later products are synthetic.
Lovastatin and pravastatin, the first two commercial products, are naturally present as
microbial secondary metabolites. Simvastatin is a semi-synthetic derivative of lovastatin.
The natural statins can be produced by fermentation and biomodification techniques,
using strains such as Aspergillus terreus or filamentous fungi such as Penicillium. An
- 152-

Mridula Pore, 2009 Doctoral Thesis, MIT
Part V
example of natural statin manufacture is Biocon's solid matrix fermentation technology
to produce lovastatin (NCBI, 2007).
The later products- fluvastatin, rosuvastatin and atorvastatin- are completely synthetically
derived (Robison et al, 1994; NCBI, 2007; Astra Zeneca, 2000). Atorvastatin and
fluvastatin are synthetic derivatives of mevalonate and pyridine respectively (Manzoni
and Rollini, 2002).
The patents on natural statins (lovastatin, pravastatin and simvastatin) have expired and
generics manufacturers have entered the market aggressively. There are currently
between nine and twelve generics companies competing in the market for each product
(Figure 77, Table 19). The synthetic statins are still under patent protection, although as
they near expiry, they are being subject to patent challenges from generic companies.
However, the entry of generics has created a scenario that encourages substitutability
between products. Prescribers and health care providers now have a range of choice of
both branded and generic statins. There has been considerable discussion on the relative
effectiveness of statin products, and generics firms capturing market share not only from
the same branded statin product, but from other statin products that are still on patent.
Lovasta t in
Pravastatin
Simvastatin
Fluvastatin
Atorvastatin
Rosuvastatin
Branded product lifetime between FDA approval and patent expiryReformulated product released by patent holder e.g. extended release, combination therapyReformulated products released by other manufacturersNumber of generic product manufacturersExpected patent life
Figure 77: Lifecycles of statin products to date (Data from: FDA Orange Book, 2009; Smith 2006;Herper, 2006)
- 153-

Mridula Pore, 2009 Doctoral Thesis, MIT
Part V
The result of generic substitution has been a decrease in the dollar amount of statin sales
between 2006 and 2007, while total prescribed volumes have been increasing (Figure 78),
particularly following patent expiry of Zocor® (S&P, 2008). There is also increasing
advocation for lower prices. Consumers' Union and Consumer Reports Best Buy Drugs,
cite research claiming that up to US$8.2bn of savings could be made in 2007 alone by
prescribing generic statin drugs rather than branded alternatives (BMI, 2009).
Table 19: Branded and generic stating products approved by the FDA (Source: FDA Orange Book,
Lovastatin 10,20,40,60 mg Mevacor MerckAdvicor AbbottAltoprev Andrx Labs LLCLovastatin Actavis Elizabeth, Apotex Inc., Carlsbad,
Genpharm, Mutual Pharm, Mylan, Sandoz,Teva
Pravastatin 10,20,40,80 mg Pravachol, Bristol Myers SquibbPravigard PacPravastatin Apotex, Cobalt, Dr Reddy's Labs Inc,
Genpharm, Glenmark, LEK pharma DD,Pliva Hrvatska DOO, Ranbaxy, Teva,Watson Labs, Zydus
Simvastatin 5,10,20,40,80mg Zocor, Vytorin, MerckSimcor AbbottSimvastatin Accord Healthcare, Aurobindo Pharma,
Cobalt, Dr Reddy's Labs Inc, Ivax Pharma,Lupin, Perrigo R&D, Ranbaxy, Sandoz,Zydus Pharma
Rosuvastatin 5,10,20,40mg Crestor Astra ZenecaFluvastatin 20,40,80mg Lescol NovartisAtorvastatin 10,20,40,80 mg Lipitor, Caduet Pfizer
As competition in the market has intensified, firms have been increasingly trying to
differentiate their products. This has led to a wider range of dosages, extended release
formulations and combination therapies (two or more drugs co-packaged or in one
tablet).
- 154-

Mridula Pore, 2009 Doctoral Thesis, MIT
Part V
240 ----- ---- ---- 24
220 ----- ------ 22
o 200 - ------ 20 d
2E 160 16
S 140 14 *
120 ------- ---- - 12
100 F 102002 2003 2004 2005 2006 2007 2008
Year
Figure 78: Growth in dispensed prescriptions versus sales for the lipid regulator market in the US(Source: 2007 Top-line industry data, IMS Health, 2007)
Lovastatin was available only in 10, 20 and 40mg dosages. Merck initially got approval
for 5,10, 20 and 40mg dosages of simvastatin in 1991, and then introduced 80mg dosage
in 1998. Lescol XL®, the extended release formulation of fluvastatin was the first
extended release statin product. It was launched in 2000, seven years after the launch of
Lescol® (FDA Orange Book, 2009). It has since been followed by Altoprev® and
Simcor®. Some examples of combination therapies are Caduet (atorvastatin with
amlodipine besylate, Pfizer), Praviguard (pravistatin with aspirin, Merck-Schering
Plough), Vytorin® (simvastatin with ezetemide, Merck and SP) and Advicor (lovastatin
with niacin, Abbott).
Future Prospects
The US statin market is set to grow in volume. There is an increasing demand for
prescription drugs overall, due to an ageing population in the US. Statins are particularly
likely to see growth as they are often prescribed both for prophylactic and therapeutic
use. There is evidence to suggest that statins may also be effective against Alzheimer'sdisease, multiple schlerosis (C&EN, 2005) and several cancers, including breast, colonand esophageal cancer (FT, 2005). However, manufacturers have not shown interest inpursuing new indications, largely due to the long timelines for clinical trials in cancer that
- 155-
Mridula Pore, 2009 Doctoral Thesis, MIT
Part V
would extend beyond the patent lifetimes, and the risks of opening themselves up to the
liabilities of stricter safety requirements for cancer drugs (WSJ, 2005).
Currently the focus is still on incremental innovation, with the goal of differentiating
between the current products. There is growing belief that it is possible to control
cholesterol, not only by lowering low density lipoproteins, but increasing high density
lipoproteins. AstraZeneca's product Crestor®, claims to do both and has been seeing
growth in market share (Astra Zeneca, 2007, 2009). Pfizer had committed to spend
$800M on development of torcetrapib, a product to increase HDL levels, with a plan of
creating a combination therapy to tie-in patients to Lipitor®. Development of the drug
was cancelled following higher-than-expected mortalities in clinical trials (WSJ, 2006a).
Pfizer has since announced that it will be exiting research for cardiovascular therapies. As
yet, there are no signs of new technologies emerging for either cholesterol control, or to
seriously reduce the chances of cardiac events.
Implications for strategy
Statins are a mature technology, as characterized by the presence of multiple, similar
products and the growing price competition. Generics are rapidly capturing value created
by the innovators. Although the branded product manufacturers are continuing to attempt
value-creating strategies, such as investing in product improvements, it is becoming
increasingly important for them to switch to value capturing strategies to sustain their
revenues for as long as possible. This analysis focuses on strategies to maximize value
capture during the current phase, as opposed to the value-creation strategies explored by
Ngai.
Teece (1986) suggests that value capture strategies depend on regimes of appropriability
and access to the necessary complementary assets. Part V.B explores the role of
regulation and intellectual property law in determining what strategies firms can take to
develop or sustain uniqueness of their products, and how different complementary assets
affect commercial success of the innovator and the generics firms. These structural
dynamics affect the entire market, yet the strategies that will benefit an individual firm
depend also on its timing and competitive position in the market relative to other products
(e.g. whether it is an early versus late entrant). This is most clearly seen in pricing and
branding strategies, discussed in the context of particular case studies in Part V.C.
- 156-

Mridula Pore, 2009 Doctoral Thesis, MIT
Part V
V.B. Regulatory and Structural Features Influencing Strategic
Decision Making
Teece (1986) argues that capturing value from innovation requires an understanding of
the regimes of appropriability, the structure of the value chain, and complementary
assets. Each of these is explored with respect to the statin market. Many of the standard
models for technology industries are distorted in this case due to heavy regulation and a
complicated industry structure, where it is unclear who the actual customer is.
Appropriation of technology can be ensured through three means: intellectual property,
secrecy and speed. Secrecy is not a viable option in the pharmaceutical industry, due to
documentation requirements for health and safety. Innovator firms rely on speed of R&D
to demonstrate uniqueness and on formal intellectual property, in the form of patents, to
sustain it. For the generic entrants in the market, speed is also important if they take an
aggressive IP strategy of challenging the innovator's patents. The FDA approval process
acts to sequence entry into the innovator market (Ngai, 2005) and determines the entry of
generics players once patents expire.
Statins are currently sold only by prescription in the USA (FDA Orange Book, 2009),
although companies are applying for OTC status for low dose statins (USA Today, 2007).
This means that statin sales depend on the prescribing habits of physicians, and the
coverage provided by healthcare insurance schemes. The sales, distribution and
reimbursement systems are complicated and involve many parties, each with different
incentives. Understanding where the pricing power lies in these systems is important for
maximizing the value captured in a rapidly-changing environment, particularly for
generics firms when they consider their entry strategy.
Complementary assets are those which allow the firm to sell a non-unique product at a
reasonable return. For the period covered by this project, the relevant assets are the brand
of the innovator products, and manufacturing facilities, supply chains and regulatory and
IP expertise of the generics firms. The degree to which these assets can be used to sustain
an advantage depends on how tightly held they are. We find that each of these assets is
tightly held by the respective firms.
- 157-

Mridula Pore, 2009 Doctoral Thesis, MIT
Part V
The role of intellectual property rights and regulatory procedures in generic
entry
The primary federal agency responsible for implementing food and drug safety laws in
the US is the Food and Drug Administration. Their policies, combined with the patent
protection granted by the US Patent Office play a key factor in determining the windows
of high profitability in the drug industry.
Patent term extensions for innovators (Grabowski and Vernon, 2000)
When developing and launching a new drug, firms will apply for patents on the product,
its use, and the process. These include patents on the active ingredient, its crystalline
polymorphs, the formulation and the manufacturing process. A US patent has a life of 20
years. As product patents are issued early in the development process, this usually
translates into seven to sixteen years of market monopoly, in which to recoup their
investment and realize returns. Part of the Hatch Waxman amendments (1984) to the
Food, Drug and Cosmetics Act (officially known as the Drug Price Competition and
Patent Term Restoration Act, 1984) created provisions to extend patent life to
compensate for time lost during regulatory approval and clinical trials. This is capped at 5
years, and constrains maximum effective patent life (i.e. the period during which the
product is under patent and in the market) to fourteen years.
Other relevant legislation is the FDA modernization act of 1997 which allows six-month
extension of market exclusivity for drugs that have been shown to deliver health benefits
in children (FDA, 1997). This creates an incentive to invest in post-launch trials for
pediatric use, e.g. Merck used this strategy to get an extension for Zocor®. These clinical
trials are expensive, but the return can be highly lucrative, although there is evidence that
returns can vary widely. A study on the economic returns of pediatric clinical trials for
antihypertensive drugs found that average costs for these trials was $2.7 - $14.7 mn but
the extensions on patent life generated returns on cost anywhere in the range of 4 to 64.7
(average 17). (Baker-Smith et al, 2008).
Generic approval and 180 day exclusivity (CDER 1998, 2009)
To enter the US market, generic products must be approved by the Food and Drug
Administration and be listed in the 'Orange Book' public database. The Hatch Waxman
- 158 -

Mridula Pore, 2009 Doctoral Thesis, MIT
Part V
amendments also established the abbreviated new drug application (ANDA) process,
which requires demonstration of bioequivalence, but does not require costly clinical
trials. The intention behind this legislation was to allow consumers to benefit from the
entry of lower cost generic products, while maintaining incentives for innovators to
continue to invest in new drug development.
The timing of ANDA approval depends partially on the patent expiry timeline of the
innovator drug. An ANDA application must provide certification of each patent listed in
the innovator drug's NDA and state one of the following:
I. that the required patent information relating to such patent has not been filed;
II. that such patent has expired;
III. that the patent will expire on a particular date; or
IV. that such patent is invalid or will not be infringed by the drug, for which approval
is being sought.
Certification under paragraphs I or II permits the ANDA to be approved immediately,
and certification under paragraph III indicates that the ANDA may be approved on the
patent expiration date. There is no period of exclusivity for the generics manufacturer in
these cases.
An ANDA citing paragraph IV certification requires the generics company to give notice
to the original manufacturer of the patent challenge, and explain the basis for the
challenge. In this case, the dispute must be settled by the courts.
If the generics manufacturer intends to market their product before this patent has
expired, they can be sued for patent infringements. If the patent owner files a patent
infringement suit against the ANDA applicant within 45 days of receiving the patent
challenge notice, the FDA cannot give final approval to the ANDA for at least 30 months
from the date of the notice (unless the court reaches a decision earlier in the patent
infringement case or orders a different duration of the stay).
In the case that the generic firm is first to successfully challenge a patent under paragraph
IV, they are granted an incentive of 180 days of market exclusivity as the only competitor
to the branded product. The FDA cannot approve ANDAs from other applicants until this
180 day period is ended. However, this period can be deemed by the courts to start on the
earlier of:
- 159-

Mridula Pore, 2009 Doctoral Thesis, MIT
Part V
1. The day the generics firm begins commercial marketing of the product
2. The date of a court decision finding the patent invalid, unenforceable or not
infringed
Therefore the generics firm may not be able to take full advantage of their period of
exclusivity, unless they are ready to market their drug on the day of the court ruling. This
requires an irreversible investment in manufacturing and distribution capacity in
anticipation of approval.
This legislation creates different paths that a generics manufacturer can take to enter the
market. One option is to follow a purely low-cost, high volume strategy, relying on
efficient manufacturing and economies of scale (see the following section). They
minimize their R&D and marketing costs, enter the market when patents expire and try to
capture a share of the competitive market by competing on price. If price competition is
triggered, firms with the lowest costs will win in this scenario.
Alternatively they can invest in R&D to develop their own patentable manufacturing
processes, or formulations to circumvent the patents held by the innovator. The returns on
this investment will be rewarded if the patent challenge is successful, and they are able to
create a short-term duopoly market where they need only a small price difference to
capture significant market share. Eventually other players will enter and erode away any
price advantage associated with early entry, so investment must be in line with the returns
they can expect in the six month period. The internal capabilities that will be built up in
taking this route can create an advantage to the firm when they consider entering other
product markets with the same strategy. However, it does increase upfront costs. It
seems, therefore, that a generics firm must choose to be committed to an aggressive IP
strategy or not. An example of a firm pursuing the latter strategy is Dr Reddy's
laboratories, who have established an R&D center in the US to do process development
(Reddy, 2009) and be aggressive on ANDA filings, while relying on global
manufacturing to keep costs low.
For manufacturers of branded products, this legislation creates incentives for them to
continue to invest in defensive IP after the launch of a product to delay a successful
challenge. It also increases their expected legal costs of defending the patent life of their
- 160-

Mridula Pore, 2009 Doctoral Thesis, MIT
Part V
product. This may result in lower profitability or higher prices during the monopoly
regime.
Authorized generics
Authorized generics are products licensed by the branded manufacturer to a third party,
who then markets them. (Business Week, 2008). This allows them to pursue a market
segmentation strategy, where they continue to market the branded product at high profit
margins, as well as entering the generics market at a lower price point in a profit-sharing
model with their licensee. Within the statin products, Pravachol® was marketed as an
authorized generic by Bristol Myers Squibb, and Zocor® was licensed by Merck to Dr
Reddy's (FDA 2009a).
This strategy can soften the blow to innovators by allowing them to share some of the
generic revenue. Offering to authorize generics to the most aggressive ANDA filers may
also be an effective way to reduce direct competition and possibly sustain their patent
protection. It also reduces the incentive for other generics firms to pursue a para IV
strategy, as 180 day exclusivity period is now shared between three, not two,
manufacturers. For the licensee, this model allows them to participate in a triopolistic
market without investing in the R&D and legal fees associated with a paragraph IV filing.
They can also benefit from the brand value of the innovator's product, and may gain a
market share advantage that carries them through the period when more competitors
enter.
An example of this is in 2006, Dr Reddy's entered into an agreement with Merck in
January to act as an authorized generics distributor for Zocor®, provided another firm
gets thel 180 day exclusivity period. Ivax (FDA 2009b) got the 180 day exclusivity for
generic simvastatin, starting in June. At the same time, under the terms of the agreement,
Dr Reddy's procured product from Merck at a specified rate and sold it to their
customers, sharing profits with Merck. When the 180 day exclusivity period expired in
December 2006, Dr Reddy's maintained a 24% market share of simvastatin (Reddy,
2007).
Authorized generics have been opposed by some generics manufacturers. Mylan (FDA,
2004a), Teva (FDA, 2004b), Apotex (Apotex Corp, 2004) and Andrx (FDA, 2004c) have
all communicated their desire for authorized generics not to be allowed during the 180
- 161-
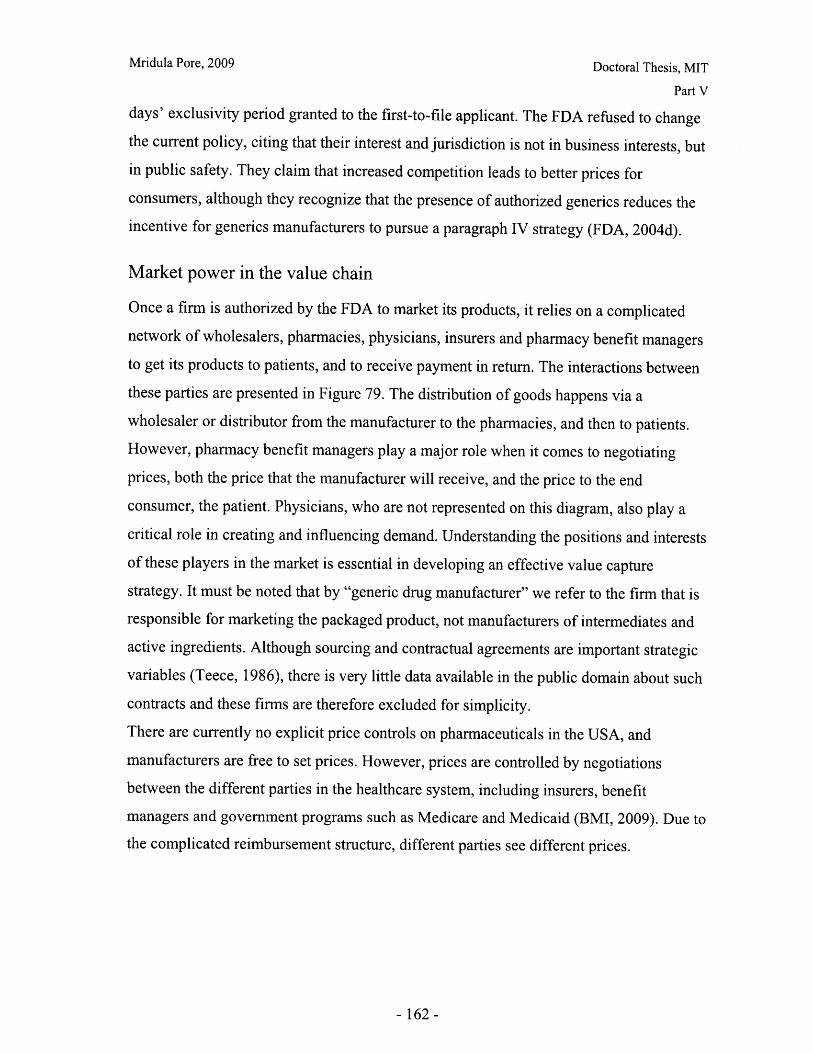
Mridula Pore, 2009 Doctoral Thesis, MIT
Part V
days' exclusivity period granted to the first-to-file applicant. The FDA refused to change
the current policy, citing that their interest and jurisdiction is not in business interests, but
in public safety. They claim that increased competition leads to better prices for
consumers, although they recognize that the presence of authorized generics reduces the
incentive for generics manufacturers to pursue a paragraph IV strategy (FDA, 2004d).
Market power in the value chain
Once a firm is authorized by the FDA to market its products, it relies on a complicated
network of wholesalers, pharmacies, physicians, insurers and pharmacy benefit managers
to get its products to patients, and to receive payment in return. The interactions between
these parties are presented in Figure 79. The distribution of goods happens via a
wholesaler or distributor from the manufacturer to the pharmacies, and then to patients.
However, pharmacy benefit managers play a major role when it comes to negotiating
prices, both the price that the manufacturer will receive, and the price to the end
consumer, the patient. Physicians, who are not represented on this diagram, also play a
critical role in creating and influencing demand. Understanding the positions and interests
of these players in the market is essential in developing an effective value capture
strategy. It must be noted that by "generic drug manufacturer" we refer to the firm that is
responsible for marketing the packaged product, not manufacturers of intermediates and
active ingredients. Although sourcing and contractual agreements are important strategic
variables (Teece, 1986), there is very little data available in the public domain about such
contracts and these firms are therefore excluded for simplicity.
There are currently no explicit price controls on pharmaceuticals in the USA, and
manufacturers are free to set prices. However, prices are controlled by negotiations
between the different parties in the healthcare system, including insurers, benefit
managers and government programs such as Medicare and Medicaid (BMI, 2009). Due to
the complicated reimbursement structure, different parties see different prices.
- 162-
Mridula Pore, 2009 Doctoral Thesis, MIT
Part V
CONSUMER
- HEALTH NSLRER
I II I
PHAKRCY - -(RetaiL .Mail-order)
-DRUG
- - Payment Flow
---- Rebate Flow
Product flow
Figure 79: Flow of physical goods and financial transactions in the pharmaceutical supply chain(Source: Kaiser, 2005)
Wholesale drug distributors
Wholesalers and distributors are a key player as they handle nearly 80% of the volume of
drugs in the US market (Booz Allen, 2007). There has been a wave of consolidation in
the US drug distribution industry, resulting in an effective triopoly between McKeeson,
Cardinal Health and AmeriSourceBergen. This would suggest that they have considerable
market power, but these firms operate at very low profit margins - in the range of 1.7 -
5.0% (BMI, 2008).
In the commercial, rather than the clinical, supply chain, availability of the drug is of
utmost priority. Distributors traditionally made margins on 'buy and hold' strategies to
benefit from price fluctuations and inflation, but have since switched to a 'fee for service'
model whereby manufacturers pay them a fee for distributing their products (Singh
2005). The distributors do not have much power when it comes to branded products and
do not get significant discounts on the average wholesale list prices (AWP) of branded
products, unlike government organizations, hospital chains and other institutional buyers
- 163-

Mridula Pore, 2009 Doctoral Thesis, MIT
Part V
(S&P 2008, Kaiser 2005). Some manufacturers have been pursuing a strategy of building
in-house distribution capabilities, although this is not necessarily cost effective (Booz
Allen, 2007).
By contrast, distributors have significantly more negotiation power with generics firms,who seek to secure low-cost access to the market. The economies of scale offered by the
distributor, their brand power and ability to drive volume makes it vital for a generics
firm to build a good relationship with a distributor. This is particularly true when they
need to rapidly introduce a product into the US market or if the generics firm is a
relatively new entrant to the US market. From the distributors' point of view, generics
dampen total sales figures, but they are generally more profitable (AmerisourceBergen,
2007), so they will secure supplies from multiple manufacturers, as ensuring low-cost
supplies is vital for their success.
Pharmacies and retailers
Pharmacies are the final point in the goods supply chain where the product reaches the
end consumer, the patient. They also generate the prescription claims data that pharmacy
benefit managers (PBMs), insurers, employers and government organizations rely on. It
is up to them to implement PBM policies, such as mandatory generic substitution for a
prescription.
A large chunk of this market is dominated by chain stores (who filled 52% of all
prescriptions and accounted for 36% of sales in 2004, according to IMS Health (2005)).
CVS/Caremark claims to be the largest purchaser of generic drugs in the USA. They
believe that although selling more generics depresses their revenues, they are more
profitable than branded drugs (CVS, 2007). Large pharmacies have pricing power for
branded products, and typically negotiate directly with manufacturers for discounts and
rebates. This can lower prices below the wholesalers cost, in which case, the wholesaler
will 'charge back' the extra cost to the manufacturer (Kaiser, 2005).
Other pharmacy segments are: independent pharmacies, specialty pharmacies, mail order,
and long-term care, and other non-specialist retailers. Independent pharmacies must pay
higher prices than the large chains to buy directly from wholesalers, or they may come to
some pooled purchasing agreement to get better prices (Kaiser, 2005). Most small
pharmacies will stock only one generic for each product, and will choose primarily on
- 164 -
Mridula Pore, 2009 Doctoral Thesis, MIT
Part V
price and conditional on availability from their wholesalers, although they typically have
two or three suppliers and may switch suppliers based on price, supply availability or
customer demand (Skendarian, 2009).
Large retailers are taking advantage of the price sensitivity of uninsured customers to
increase their sales of low-cost generics (BMI, 2009). E.g. Wal-Mart introduced 90 day
course of/generic drug prescriptions for US$10, a move that was followed by Target, K-
Mart and others. This includes some dosages of lovastatin and simvastatin. (Target,
2009).
Pharmacies and retailers have power in determining the market share of the individual
generics manufacturers , as they are the major retailers of generics products, with each
retailer typically stocking products from only one or two manufacturers. Hence they can
exert pricing pressure on the generics segment, via the distributors.
Pharmacy benefit managers
Pharmacy benefit managers have considerable negotiating power with manufacturers of
branded drugs because of their ability to keep a product in their formularies, and hence
under insurance coverage. This makes it considerably cheaper for patients, and doctors
are much more likely to prescribe it if they know that their patients have coverage. Their
negotiating power is determined by how much market share their formulary can generate.
The evidence suggests that price is the major factor influencing a PBM's coverage of a
particular product.
One example of a PBM's ability to shift between products is Express Scripts Inc's shift to
emphasizing Zocor® as the preferred statin, six months before it went off patent. This
gave rise to 2.4% increase in new prescriptions of Zocor®. 2/3 of these patients
previously took Lipitor@ then switched to Zocor®, and eventually onto generic
simvastatin, once it became available (WSJ, 2006b).
Another example of this is Lescol's entry strategy which focused on a low price (30 -
60% below the competition), while emphasizing equal efficacy to the competitors. This
strategy rapidly got the product onto 600 formularies (Liebman, 2001).
- 165-
Mridula Pore, 2009 Doctoral Thesis, MIT
Part V
Physicians
Physicians are not directly linked into the chain of product supply or payment in the US,but play a very influential role in determining demand by writing prescriptions and
advising their patients. By law, pharmacies are required to fill a prescription with a
generic product (generic substitution), unless the physician has indicated otherwise.
Promotion to physicians through detailing, advertising and research publications has been
vital to creating a market for the statin products (see following section and Part V.C).
The role of complementary assets in generating returns
Historically, the major pharmaceutical firms have relied on their monopoly and the brand
power of their company and products to realize high returns. For example, when it comes
to products, 'Lipitor', 'Prozac' and 'Claritin' are household names. They rely on this
brand value to maximize returns during the patent-protected period. In comparison,
generics firms have positioned themselves as low-cost manufacturers through their global
supply chains and in-house manufacturing in low-cost regions such as India and Eastern
Europe. An important complementary asset required for them to market their products in
the US is expertise in regulatory affairs and intellectual property legal processes.
Brand-building by innovators
Spending on promotion for branded products is a substantial portion of costs for
innovator firms. A PhRMA study found that total PhRMA member promotional spending
in 2006 was $12bn, of which $4.8bn was DTC and $7.2bn was on office promotion,
hospital promotion and journal advertising (PhRMA, 2008) - this is in comparison to an
R&D spend of $58.8bn for the same period. Pharmaceutical firms build the brand of their
products through promotional activities directed at two major groups: physicians and
patients.
Promotion to physicians includes journal advertising, office and hospital promotion
(detailing to physicians by sales representatives) and giving free samples. These tactics
have been used successfully to educate physicians and grow the total market for statin
products. As more products have entered the statin market, firms are conducting post-
launch clinical trials with the intention of demonstrating clinical superiority of a given
- 166-

Mridula Pore, 2009 Doctoral Thesis, MIT
Part V
product over its competitors. The results of these studies are published in medical
journals and are intended to influence the perceptions of the medical community.
DTC (direct-to-consumer) advertising is targeted towards existing or potential patients,
much of it taking the form of television advertising. It is used mainly as a tool to gain
market share from the competition, rather than as a means to get pricing power. A
Federal Trade commission study found that DTC advertising had little, if any effect on
prescription drug prices. A 2002 study from Harvard on the effect of DTC advertising on
demand for pharmaceuticals revealed that DTC advertising may increase demand for a
particular brand drug, but only if it has a favorable status on the insurer's formulary
(Wosinska, 2002).
Firms generally hold these assets tightly. Promotion efforts are led by large in-house
teams, which allows the firms to build up internal expertise and the teams build
relationships with doctors. However, co-promotion of products with a partner has also
been used very effectively by Merck/Smith-Kline Beecham with Zocor® and by Parke-
Davis/Pfizer with Lipitor®.
Are generic brands a potential strategy within a competitive market?
Although makers of the innovator products rely heavily on promotion and brand
management to develop a market and capture market share, there has been relatively little
investment in promotion by the generics manufacturers. There is some brand sensitivity
amongst patients and the smaller, independent pharmacies will respond to the brand
preferences of customers (Skendarian, 2009). There are also indicators that brand may be
increasingly important as a differentiator in the generics market: For example, Actavis
has started marketing their products, as well as those from recent acquisitions, under a
single 'Actavis' brand. Similarly, Teva pursues a brand-building strategy for the
wholesale market, by advertising in trade journals and exhibitions (Teva, 2008). As
competition in the generics market increases, it is likely that the generics firms increase
their spending on promotion as a means to capture market share, even though this creates
upward pressures on costs.
- 167-
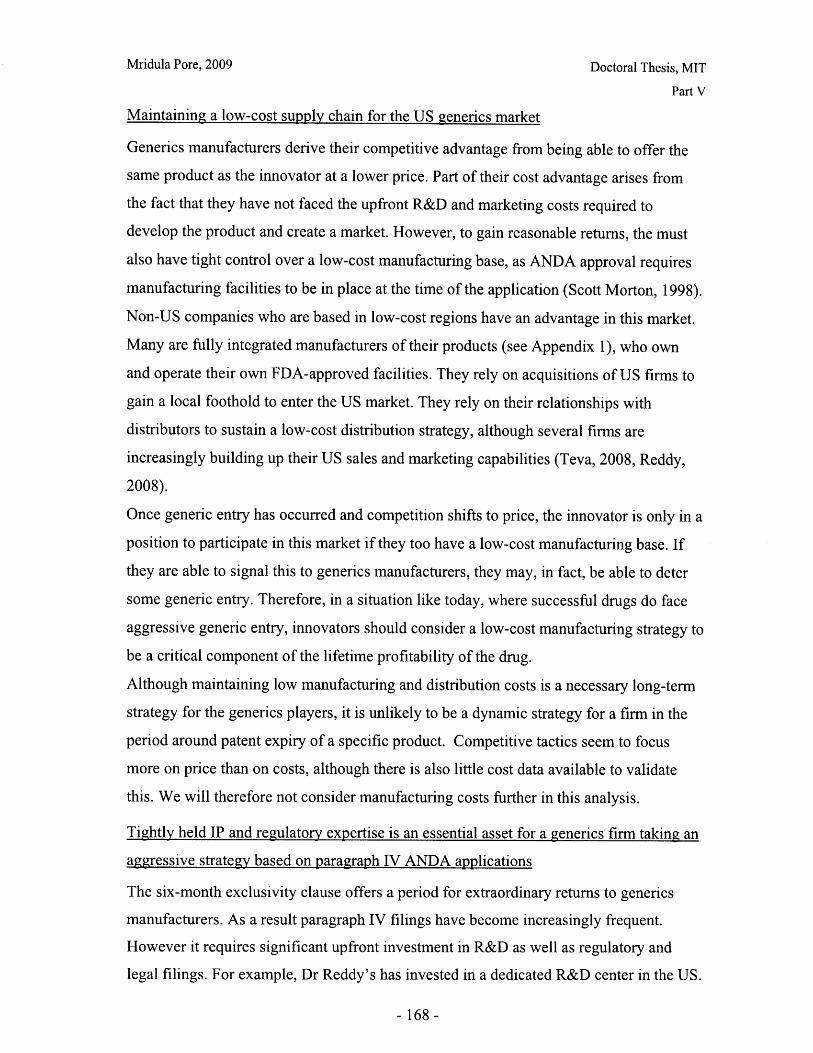
Mridula Pore, 2009 Doctoral Thesis, MIT
Part V
Maintaining a low-cost supply chain for the US generics market
Generics manufacturers derive their competitive advantage from being able to offer the
same product as the innovator at a lower price. Part of their cost advantage arises from
the fact that they have not faced the upfront R&D and marketing costs required to
develop the product and create a market. However, to gain reasonable returns, the must
also have tight control over a low-cost manufacturing base, as ANDA approval requires
manufacturing facilities to be in place at the time of the application (Scott Morton, 1998).
Non-US companies who are based in low-cost regions have an advantage in this market.
Many are fully integrated manufacturers of their products (see Appendix 1), who own
and operate their own FDA-approved facilities. They rely on acquisitions of US firms to
gain a local foothold to enter the US market. They rely on their relationships with
distributors to sustain a low-cost distribution strategy, although several firms are
increasingly building up their US sales and marketing capabilities (Teva, 2008, Reddy,
2008).
Once generic entry has occurred and competition shifts to price, the innovator is only in a
position to participate in this market if they too have a low-cost manufacturing base. If
they are able to signal this to generics manufacturers, they may, in fact, be able to deter
some generic entry. Therefore, in a situation like today, where successful drugs do face
aggressive generic entry, innovators should consider a low-cost manufacturing strategy to
be a critical component of the lifetime profitability of the drug.
Although maintaining low manufacturing and distribution costs is a necessary long-term
strategy for the generics players, it is unlikely to be a dynamic strategy for a firm in the
period around patent expiry of a specific product. Competitive tactics seem to focus
more on price than on costs, although there is also little cost data available to validate
this. We will therefore not consider manufacturing costs further in this analysis.
Tightly held IP and regulatory expertise is an essential asset for a generics firm taking an
aggressive strategy based on paragraph IV ANDA applications
The six-month exclusivity clause offers a period for extraordinary returns to generics
manufacturers. As a result paragraph IV filings have become increasingly frequent.
However it requires significant upfront investment in R&D as well as regulatory and
legal filings. For example, Dr Reddy's has invested in a dedicated R&D center in the US.
- 168-

Mridula Pore, 2009 Doctoral Thesis, MIT
Part V
These investments will create economies of learning for a firm taking this strategy, as
much of this expertise is transferable across products. Therefore as firms accumulate
expertise in process innovation, drug delivery technology, regulatory filings and IP law,
their R&D investments will become more productive, giving them an advantage relative
to their competitors. These learning effects occur over a period of time, and will create
early-mover advantages for firms who have led this trend.
Conclusions
This analysis demonstrates that FDA regulations determine the timelines for uniqueness
of a given statin product, and also create sequencing effects in market entry. Much of the
pricing power is held by the pharmacy benefit managers, although access to the supply
chain is likely to be a differentiating factor for success of a generics product. Overall,
access to complementary assets: low-cost manufacturing base, a low-cost supply chain,
strong brand, expertise in IP/regulatory procedures and the ability to innovate on process/
drug delivery technology are critical to be a successful player in this market.
Complementary assets are particularly important for generics players, but innovators
must consider the need for these assets in evaluating their competitive position and the
lifetime profitability of their products.
Given the regulation and structure of the pharmaceutical industry, the most significant
value-capture strategies available for the innovators in the period immediately
surrounding patent expiry are:
1. Competitive pricing
2. Promotion as a means to increase the size of the market, and gain market share
from competitors
3. Investment in R&D and IP to extend patent life and deter patent challenges
For the generics firms, the major opportunities to capture value can be created by
1. Competitive pricing
2. Investment in R&D and IP to take a strategy based on challenging patents on the
basis of process innovation
These dynamics are incorporated into the system dynamics model described in part V.C.
-169-
Mridula Pore, 2009 Doctoral Thesis, MIT
Part V
V.C Modeling Statin Market Dynamics during Patent Expiry
A systems dynamics model was used to capture the interactions between the innovator
and generic entrants for a single statin product. This model differs from that of Ngai
(2005) because it explores decisions and actions at the firm level, rather than behavior of
the entire market. The scope includes the effects of pricing and promotion on market
share (and hence revenues), and begins to explore the dynamics of IP investment.
The model was used to simulate the markets for each of the statin products, based on the
data in Appendix 2. The model was tested in the context of the first three products that
have already lost patent protection. The model was then used to predict market reactions
to potential strategies for the manufacturers of the three statin products that have not yet
faced generic entry.
Why System Dynamics?
The period considered in this work represents the transition from an established
monopoly, into a threatened monopoly, followed by a duo/triopoly, and then a
competitive market. A dynamic model is particularly appropriate for this situation
because of the multiple transitions and because the legislation sequences market entry of
the generics firm, allowing participants to anticipate, observe and react to market
movements. There are also different time horizons involved. Some changes, such as
pricing, can be made relatively fast and result in rapid changes in the market whereas a
marketing campaign will be associated with slower shifts.
Model Structure
The model simulates a time period of 400 weeks: approximately five years prior to expiry
and three years after. Full documentation of the model is provided in Appendix 3, but the
main features are outlined here.
The impact of 'perceived' product value index (PVI) on market share
The model assigns a market share based on the relative price of the product to the average
statin price and the relative perceived PVI of the product. The concept of a perceived PVI
is an extension of the concept of an 'intrinsic' product value index defined by Ngai
-170-

Mridula Pore, 2009 Doctoral Thesis, MIT
Part V
(2005). In the value creation model, cumulative R&D spend leads to products with
greater PVI value, where PVI is an arbitrary index with higher values indicating greater
therapeutic benefits and lower side effects. For FDA approval, a product must
demonstrate a PVI benefit relative to other products above a certain threshold. However,
this becomes more difficult to do the more products there are on the market.
The case studies (Appendix 2) highlight the importance of both promotion and price in
determining the market share that a product is able to capture. For example, Lescol® was
not able to capture the most market share, despite a low price and an intrinsic PVI equal
to the market average. Conversely, Zocor® was able to charge high prices due to its
strong brand. Therefore we define:
Perceived PVI = Intrinsic PVI + Premium generated by promotion
This definition allows us to capture the effect of promotion to boost market share. Figure
80 shows a schematic of intrinsic versus perceived PVI. The intrinsic PVI curve is based
on results from Ngai's model. The PVI premium from promotion is initially small, as
sales and marketing efforts are needed to create the market for the new products.
However, as the technology starts gaining momentum in the market, there is greater
scope to use promotion to differentiate a specific statin product versus the competition.
As more products enter the market, this becomes more difficult. Unwise or excess
promotion spend could even lead to a negative return on investment if, for example, post-
launch clinical trials give unfavorable results (see Appendix 2 for examples). This
scenario is represented in the lower of the two perceived PVI curves.
5045
35 - ---- -+-intrinsic PVI30
S2520 - --- /--- -- -perceived PV15 potential10 - . . . .... . ......
0
0 2 4 6 8
Figure 80: I ntrant number
Figure 80: Intrinsic versus perceived product value index (PVI)
- 171-

Mridula Pore, 2009 Doctoral Thesis, MIT
Part V
The weighting on perceived PVI is non-linear. The model assumes that differences in
perceived PVI become more significant when price differences are small. When price
differences become very large, they over-ride the marginal product benefits due to the
tipping effects created by pharmacy benefit managers as they channel demand through
the use of formularies.
Market share allocation
The market share algorithm described above is used to predict market share of the
following categories:
1. The branded product
2. The generic product (market share is set to zero prior to patent expiry)
3. Other branded products
4. Other generic products
These market share values are normalized so that total market share is equal to one.
Promotion spend positive feedback
Firms are assumed to chase a target market share that is always above their current
market share, allowing for lags in observation and decision-making times. In this way we
can explicitly model the management decision-making and the aggressiveness of a
management team. Based on the discrepancy between the observed and target market
share, an investment is made in promotion, as a fraction of current revenues. This creates
a positive feedback loop where products that are successful and have a significant market
share have more revenue to invest in promotion and are able to create a higher perceived
PVI. Conversely, if a product loses market share rapidly, it becomes extremely difficult
to recapture this market share, because of the reduced revenues available for promotional
spend.
IP investment 'race'
Generic entry via a paragraph IV ANDA filing becomes more attractive for products with
higher revenues. We assume that all statin products have revenues high enough to attract
strong generic competition. Therefore, the incumbent must invest in defensive IP to
protect their patent life and maintain a high barrier to entry. The generics firms will also
- 172 -
Mridula Pore, 2009 Doctoral Thesis, MIT
Part V
start to invest in IP to erode the barriers to entry, mount a patent challenge and shorten
the monopoly period.
The difference between these two parties arises from the productivity of their R&D
spend. The incumbent already has in-house expertise on the product and process, so will
have higher initial productivity than the generics firm that must first reverse-engineer the
product and process from publicly available data. The effectiveness of the generics R&D
spend will depend also on longer term dynamics, such as the overall strategy that the firm
pursues, as outlined in part V.B. Both the innovator and the generics firm see diminishing
returns on R&D spend after a certain point. Therefore the timing and the rate of
investment is critical in determining whether the generics firms are able to overcome
barriers to entry at any point and reduce the patent protected lifetime.
The model aggregates investment in process and delivery technology R&D with the costs
of legal and regulatory proceedings.
Model Calibration
Data from several sources was used in setting the parameters for this model, and in
producing the case study simulations. Average wholesale prices (AWP) were obtained
from the Red BookTM publication by Thomson Reuters. These are self-reported,
published prices that manufacturers charge distributors, and are used as an indicator of
relative pricing. They were averaged across dosages to get an average price per mg.
Market share data was obtained from analyst reports, mostly the dataset presented in
Figure 81and Figure 82. The parameters for promotion spend were estimates based on
anecdotes in PhRMA publications, media publications and trade journals. No data was
available for IP investment or productivity.
- 173-
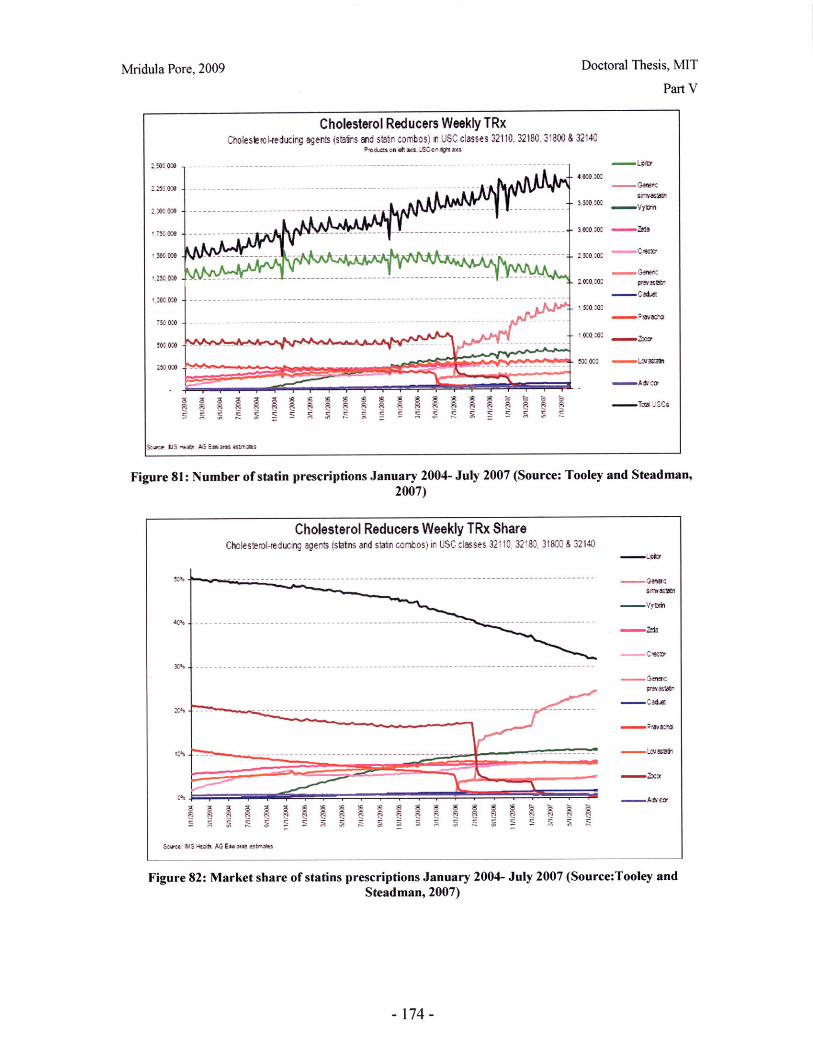
Mridula Pore, 2009 Doctoral Thesis, MIT
Part V
Cholesterol Reducers Weekly TRxCholestero-educing agents (stainrs and stain combos) i USC classes 32110, 32180, 31800 & 32140
PMuc on hsOf ads.l 'o n dcautm
2 500000 -
20000CO -
1,500000 -
750 00 -
00,OCO
250,WTA0
I I 1 1 I I;i x f W g a aa@ c a i~d d rss ib 1 I"~~~5~"~5~~2~~~~50~
- 4,000000
srivaS- 3500C,000 -Vyt
- 3000000 - ?az
- 00000 preTi
530 0CO ,-accWl5wT ioatd
Figure 81: Number of statin prescriptions January 2004- July 2007 (Source: Tooley and Steadman,2007)
Cholesterol Reducers Weekly TRx ShareCholesterol-reducing agents (satins and statin combos) in USC classes 32110 32180, 31800 & 32140
-usbr
-Cilias
- ravao3 0 % - ..- -- --- -- -- - - -- - -- -- -- -- - -- - -- --- - -- --- -- -- - - -- -- -- -- -. -- - -- - ---. - -- --- -. .. . ... . .... . . .. .
"Ar ar
Scw~e IMS eah. AG Edwares estnatES
Figure 82: Market share of statins prescriptions January 2004- July 2007 (Source:Tooley andSteadman, 2007)X% ,_ ................................................................ ---------- e10- ------ -- ------- --------- !!..._, _ . t ------ --70-,,,stiSteadman, 2007)
-174-
-~-- --~----- ----- ~ ~ ---~~-~-
------------- --------- _-- ----------....----------------------------- - -l ---------- .- ----- - -- - - - -- -
- -------- ------------------------
-- ---------------- ------------------------- --------------- -- -
I ---------------------------------- ------------------------------ ---
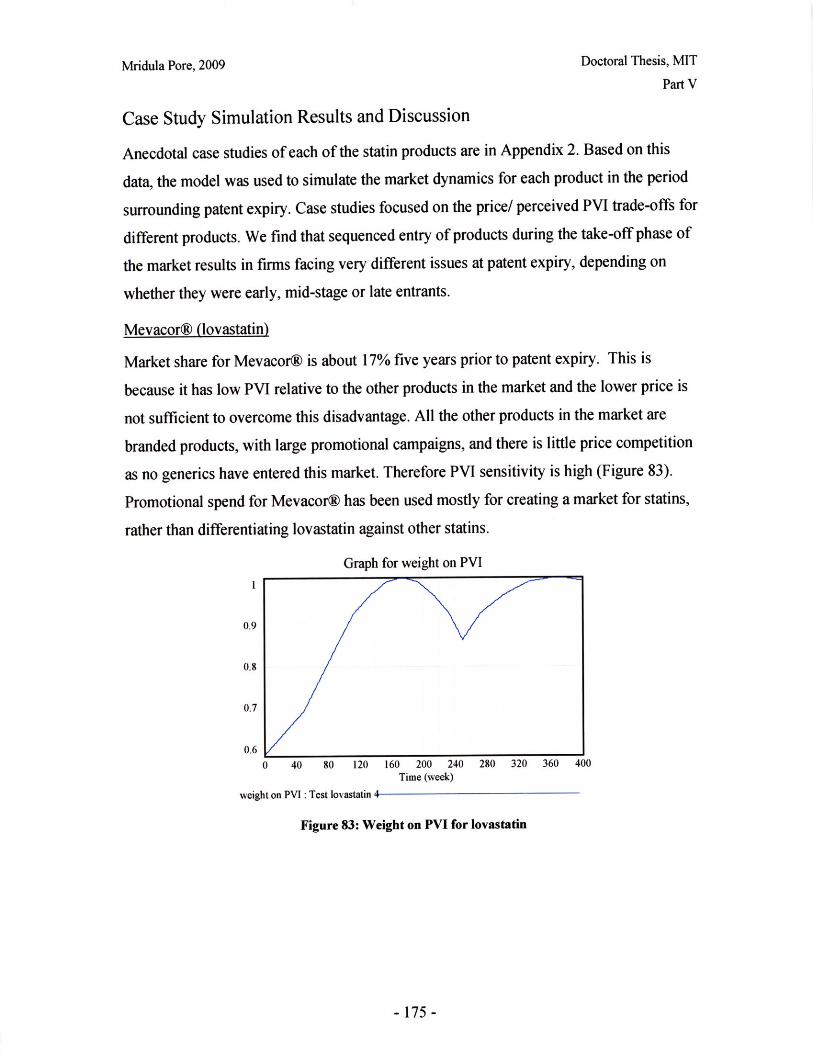
Mridula Pore, 2009 Doctoral Thesis, MIT
Part V
Case Study Simulation Results and Discussion
Anecdotal case studies of each of the statin products are in Appendix 2. Based on this
data, the model was used to simulate the market dynamics for each product in the period
surrounding patent expiry. Case studies focused on the price/ perceived PVI trade-offs for
different products. We find that sequenced entry of products during the take-off phase of
the market results in firms facing very different issues at patent expiry, depending on
whether they were early, mid-stage or late entrants.
Mevacor® (lovastatin)
Market share for Mevacor@ is about 17% five years prior to patent expiry. This is
because it has low PVI relative to the other products in the market and the lower price is
not sufficient to overcome this disadvantage. All the other products in the market are
branded products, with large promotional campaigns, and there is little price competition
as no generics have entered this market. Therefore PVI sensitivity is high (Figure 83).
Promotional spend for Mevacor® has been used mostly for creating a market for statins,
rather than differentiating lovastatin against other statins.
Graph for weight on PVI
1
0.9
0.8
0.7
0.6
0 40 80 120 160 200 240 280 320 360 400
Time (week)
weight on PVI : Test lovastatin 4
Figure 83: Weight on PVI for lovastatin
- 175 -
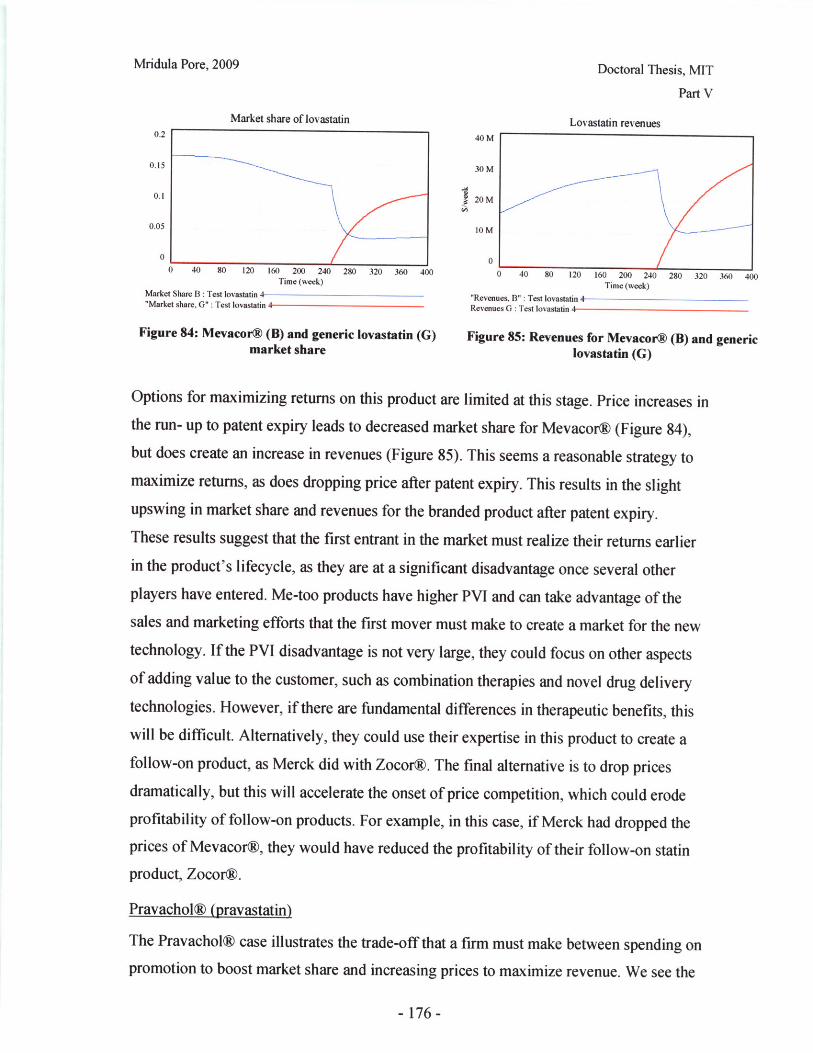
Mridula Pore, 2009 Doctoral Thesis, MIT
Part V
Market share of lovastatin Lovastatin revenues0.2 40 M
0.15 30 M
0.1 20M
0.05 10 M
0 00 40 80 120 160 200 240 280 320 360 400 0 40 80 120 160 200 240 280 320 360 400
Time (week) Time (week)Market Share B : Test lovastatin 4 "Revenues, B" : Test lovastatin 4"Market share, G" : Test lovastatin 4 Revenues G : Test lovastatin 4
Figure 84: Mevacor@ (B) and generic lovastatin (G) Figure 85: Revenues for Mevacor@ (B) and genericmarket share lovastatin (G)
Options for maximizing returns on this product are limited at this stage. Price increases inthe run- up to patent expiry leads to decreased market share for Mevacor@ (Figure 84),but does create an increase in revenues (Figure 85). This seems a reasonable strategy tomaximize returns, as does dropping price after patent expiry. This results in the slightupswing in market share and revenues for the branded product after patent expiry.
These results suggest that the first entrant in the market must realize their returns earlier
in the product's lifecycle, as they are at a significant disadvantage once several other
players have entered. Me-too products have higher PVI and can take advantage of thesales and marketing efforts that the first mover must make to create a market for the new
technology. If the PVI disadvantage is not very large, they could focus on other aspects
of adding value to the customer, such as combination therapies and novel drug delivery
technologies. However, if there are fundamental differences in therapeutic benefits, thiswill be difficult. Alternatively, they could use their expertise in this product to create a
follow-on product, as Merck did with Zocor®. The final alternative is to drop prices
dramatically, but this will accelerate the onset of price competition, which could erodeprofitability of follow-on products. For example, in this case, if Merck had dropped theprices of Mevacor®, they would have reduced the profitability of their follow-on statinproduct, Zocor®.
Pravachol® (pravastatin)
The Pravachol® case illustrates the trade-off that a firm must make between spending onpromotion to boost market share and increasing prices to maximize revenue. We see the
- 176-

Part V
initial effect of promotion, eventually being over-ridden by price increases that lead to
loss of volume (Figure 86).
Market share of Pravachol
0.2
0.15
0.1
0.05
0
0 40 80 120 160 200 240Time (week)
280 320 360 400
Market Share B : Test pravastatin 2
Figure 86: Market share of Pravachol®
Effect of promotion spend at end of lifetime
0 40 80 120 160 200 240 280 320 360 400Time (week)
Market share B, with promotionMarket share B, with no promotion spendMarket share G, with promotionMarket share G, with no promotion spend
Figure 87: Effect of promotion spend on market share of Pravachol@ and generic pravastatin
-177-
Doctoral Thesis, MITMridula Pore, 2009
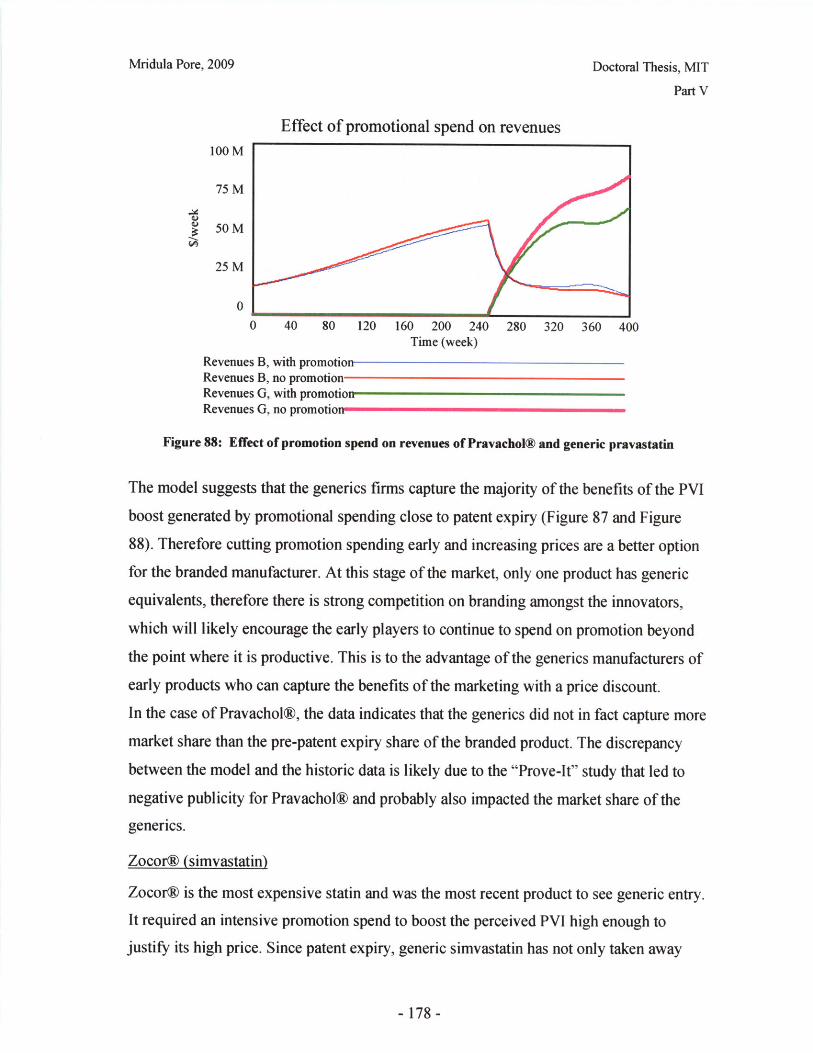
Mridula Pore, 2009 Doctoral Thesis, MIT
Part V
Effect of promotional spend on revenues100 M
75 M
g 50 M
25 M
0
0 40 80 120 160 200 240 280 320 360 400Time (week)
Revenues B, with promotio nRevenues B, no promotion-Revenues G, with promotionRevenues G, no promotion..
Figure 88: Effect of promotion spend on revenues of Pravachol@ and generic pravastatin
The model suggests that the generics firms capture the majority of the benefits of the PVI
boost generated by promotional spending close to patent expiry (Figure 87 and Figure
88). Therefore cutting promotion spending early and increasing prices are a better option
for the branded manufacturer. At this stage of the market, only one product has generic
equivalents, therefore there is strong competition on branding amongst the innovators,which will likely encourage the early players to continue to spend on promotion beyond
the point where it is productive. This is to the advantage of the generics manufacturers of
early products who can capture the benefits of the marketing with a price discount.
In the case of Pravachol®, the data indicates that the generics did not in fact capture more
market share than the pre-patent expiry share of the branded product. The discrepancy
between the model and the historic data is likely due to the "Prove-It" study that led to
negative publicity for Pravachol® and probably also impacted the market share of the
generics.
Zocor@ (simvastatin)
Zocor@ is the most expensive statin and was the most recent product to see generic entry.
It required an intensive promotion spend to boost the perceived PVI high enough to
justify its high price. Since patent expiry, generic simvastatin has not only taken away
-178-
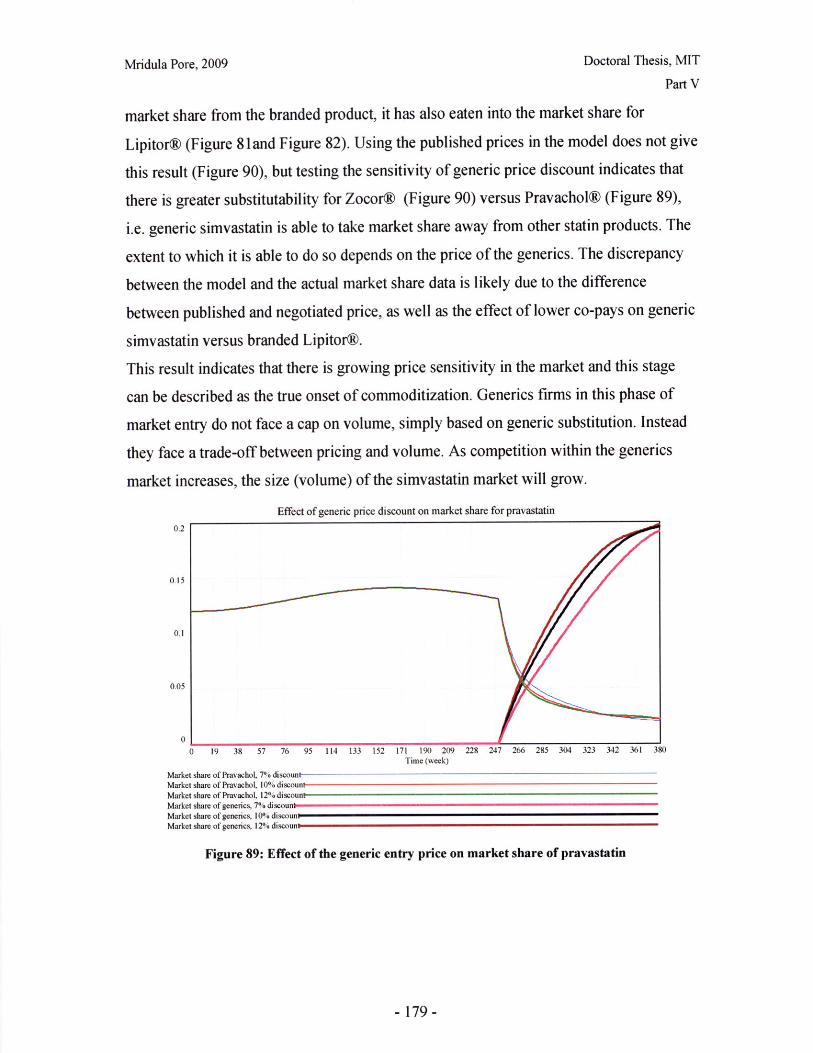
Mridula Pore, 2009 Doctoral Thesis, MIT
Part V
market share from the branded product, it has also eaten into the market share for
Lipitor® (Figure 81and Figure 82). Using the published prices in the model does not give
this result (Figure 90), but testing the sensitivity of generic price discount indicates that
there is greater substitutability for Zocor® (Figure 90) versus Pravachol® (Figure 89),
i.e. generic simvastatin is able to take market share away from other statin products. The
extent to which it is able to do so depends on the price of the generics. The discrepancy
between the model and the actual market share data is likely due to the difference
between published and negotiated price, as well as the effect of lower co-pays on generic
simvastatin versus branded Lipitor®.
This result indicates that there is growing price sensitivity in the market and this stage
can be described as the true onset of commoditization. Generics firms in this phase of
market entry do not face a cap on volume, simply based on generic substitution. Instead
they face a trade-off between pricing and volume. As competition within the generics
market increases, the size (volume) of the simvastatin market will grow.
Effect of generic price discount on market share for pravastatin
0.2
0.15
0.1
0.05
00 19 38 57 76 95 114 133 152 171 190 209 228 247 266 285 304 323 342 361 380
Time (week)
Market share of Pravachol, 7% discountMarket share of Pravachol, 10% discount
Market share of Pravachol, 12%fc discountMarket share of generics, 7% discountMarket share of generics, 10/,0 discoun.Market share of generics, 12% discount
Figure 89: Effect of the generic entry price on market share of pravastatin
-179-
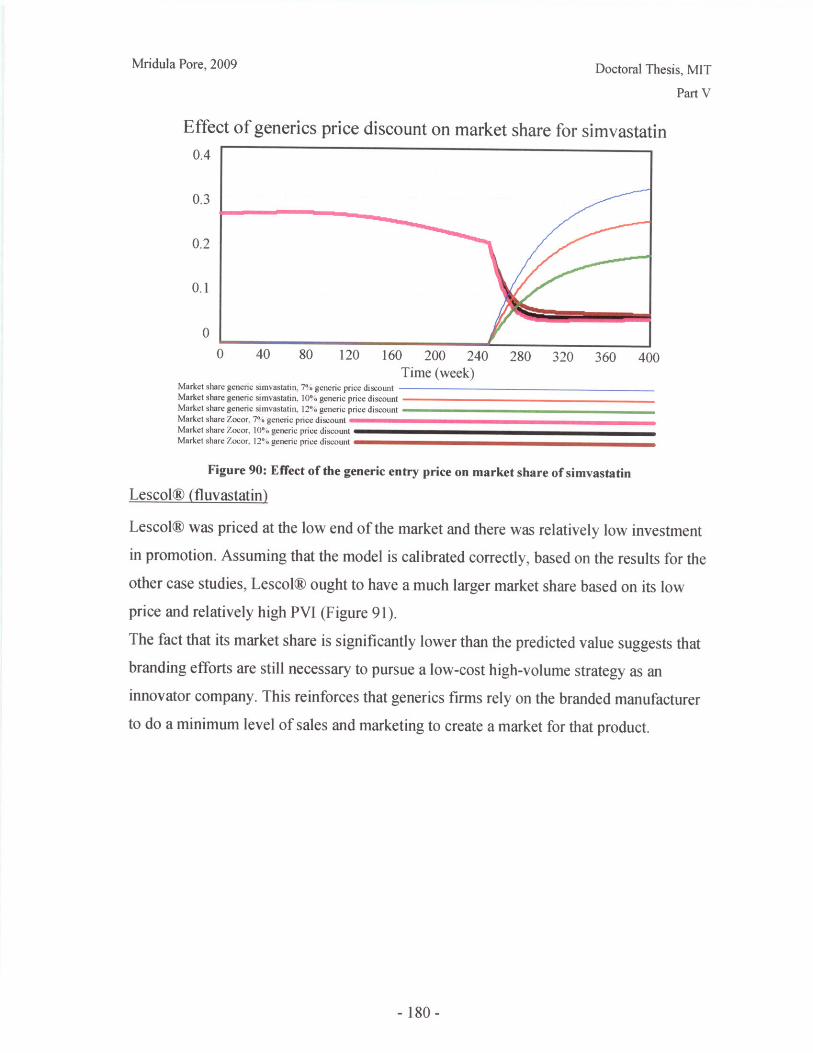
Mridula Pore, 2009 Doctoral Thesis, MIT
Part V
Effect of generics price discount on market share for simvastatin0.4
0.3
0.2
0.1
0
0 40 80 120 160 200 240 280 320 360 400Time (week)
Market share generic simvastatin, 7% generic price discountMarket share generic simvastatin. 10% generic price discountMarket share generic simvastatin, 12%o generic price discountMarket share Zocor. 7% generic price discountMarket share Zocor, 1000 generic price discountMarket share Zocor. 12%0 generic price discount
Figure 90: Effect of the generic entry price on market share of simvastatin
Lescol® (fluvastatin)
Lescol® was priced at the low end of the market and there was relatively low investmentin promotion. Assuming that the model is calibrated correctly, based on the results for theother case studies, Lescol® ought to have a much larger market share based on its lowprice and relatively high PVI (Figure 91).
The fact that its market share is significantly lower than the predicted value suggests thatbranding efforts are still necessary to pursue a low-cost high-volume strategy as aninnovator company. This reinforces that generics firms rely on the branded manufacturerto do a minimum level of sales and marketing to create a market for that product.
-180-
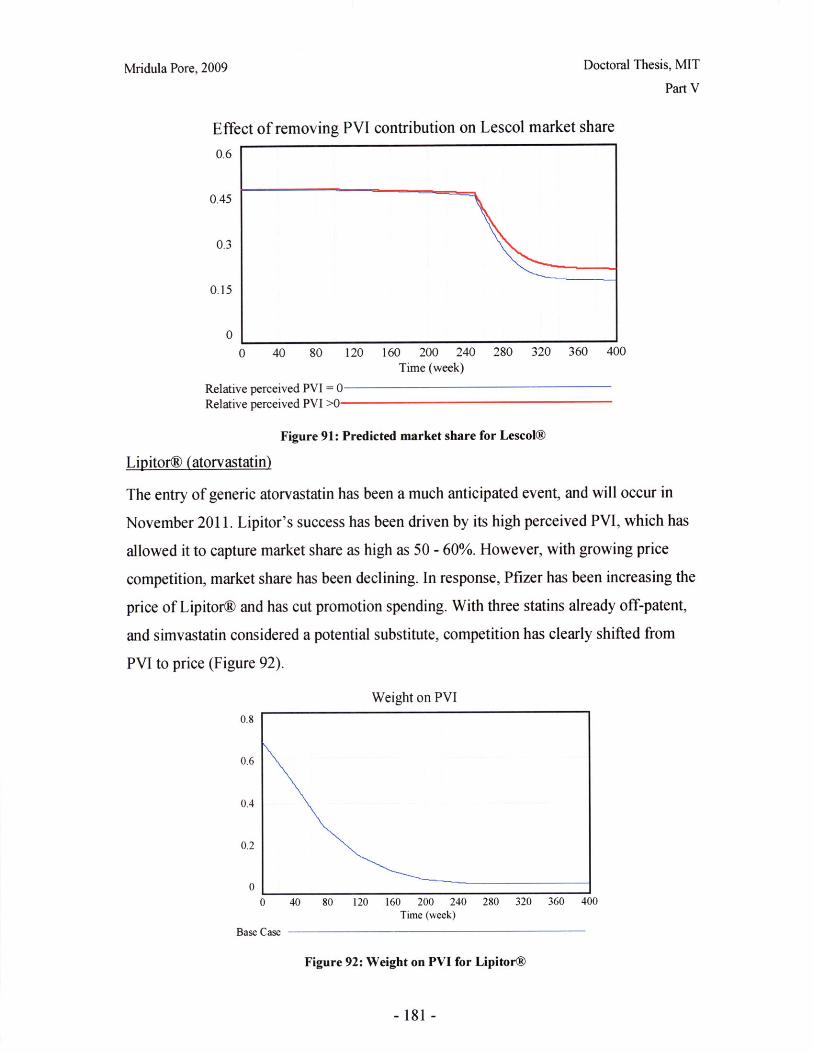
Mridula Pore, 2009 Doctoral Thesis, MIT
Part V
Effect of removing PVI contribution on Lescol market share
0.6 I
0.45
0.3
0.15
0
0 40 80 120 160 200 240 280 320 360 400Time (week)
Relative perceived PVI = 0Relative perceived PVI >0
Figure 91: Predicted market share for Lescol@
Lipitor@ (atorvastatin)
The entry of generic atorvastatin has been a much anticipated event, and will occur in
November 2011. Lipitor's success has been driven by its high perceived PVI, which has
allowed it to capture market share as high as 50 - 60%. However, with growing price
competition, market share has been declining. In response, Pfizer has been increasing the
price of Lipitor@ and has cut promotion spending. With three statins already off-patent,
and simvastatin considered a potential substitute, competition has clearly shifted from
PVI to price (Figure 92).
Weight on PVI
0 40
Base Case -
80 120 160 200 240 280 320 360 400Time (week)
Figure 92: Weight on PVI for Lipitor@
- 181 -
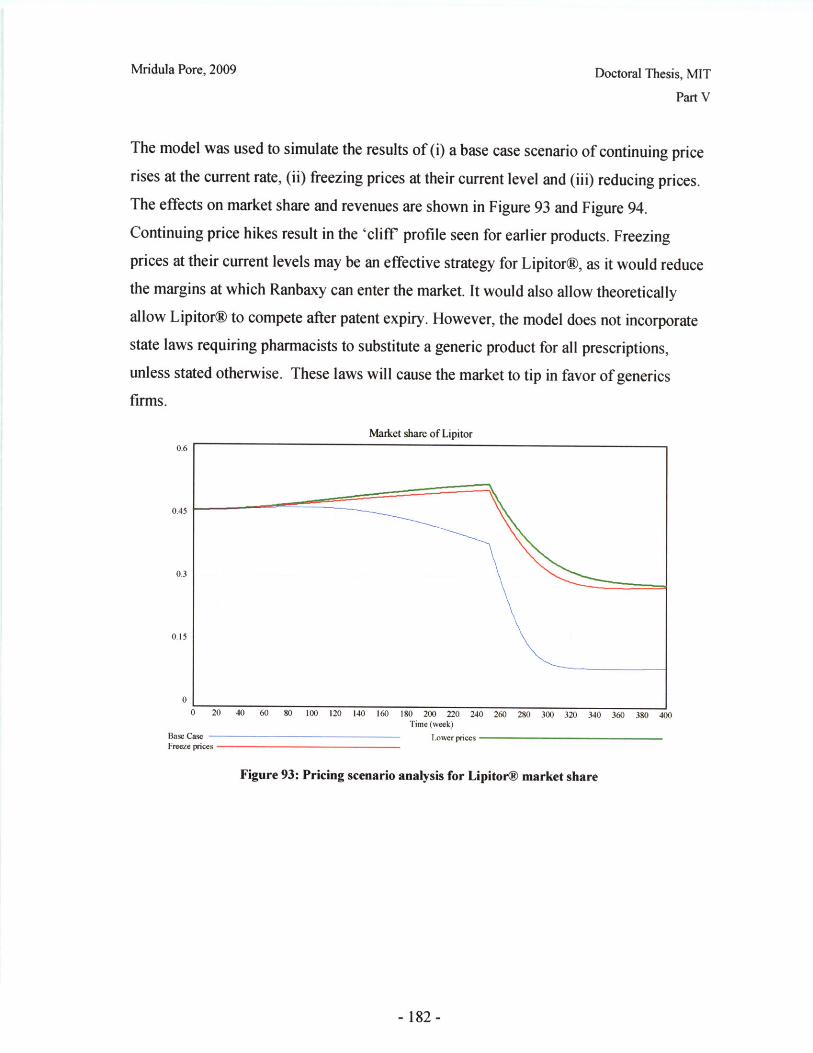
Mridula Pore, 2009 Doctoral Thesis, MIT
Part V
The model was used to simulate the results of (i) a base case scenario of continuing price
rises at the current rate, (ii) freezing prices at their current level and (iii) reducing prices.
The effects on market share and revenues are shown in Figure 93 and Figure 94.
Continuing price hikes result in the 'cliff profile seen for earlier products. Freezing
prices at their current levels may be an effective strategy for Lipitor®, as it would reduce
the margins at which Ranbaxy can enter the market. It would also allow theoretically
allow Lipitor® to compete after patent expiry. However, the model does not incorporate
state laws requiring pharmacists to substitute a generic product for all prescriptions,unless stated otherwise. These laws will cause the market to tip in favor of generics
firms.
Market share of Lipitor
Time (week)
Lower pricesBase Case -Freeze prices
Figure 93: Pricing scenario analysis for Lipitor@ market share
-182-
~
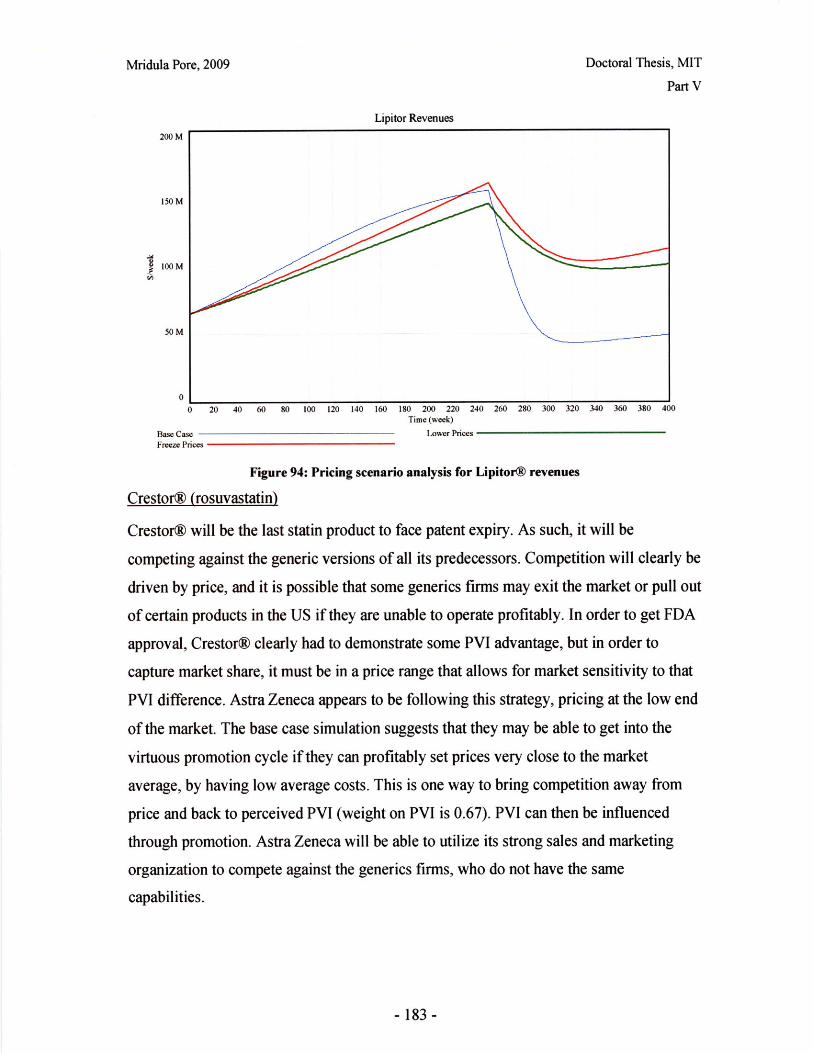
Mridula Pore, 2009 Doctoral Thesis, MIT
Part V
Lipitor Revenues
200 M
150 M
100 M
50 M
00 20 40 60 80 100 120 140 160 180 200 220 240 260 280 300 320 340 360 380 400
Time (week)
Base Case Lower PricesFreeze Prices
Figure 94: Pricing scenario analysis for Lipitor@ revenues
Crestor® (rosuvastatin)
Crestorg will be the last statin product to face patent expiry. As such, it will be
competing against the generic versions of all its predecessors. Competition will clearly be
driven by price, and it is possible that some generics firms may exit the market or pull out
of certain products in the US if they are unable to operate profitably. In order to get FDA
approval, Crestor® clearly had to demonstrate some PVI advantage, but in order to
capture market share, it must be in a price range that allows for market sensitivity to that
PVI difference. Astra Zeneca appears to be following this strategy, pricing at the low end
of the market. The base case simulation suggests that they may be able to get into the
virtuous promotion cycle if they can profitably set prices very close to the market
average, by having low average costs. This is one way to bring competition away from
price and back to perceived PVI (weight on PVI is 0.67). PVI can then be influenced
through promotion. Astra Zeneca will be able to utilize its strong sales and marketing
organization to compete against the generics firms, who do not have the same
capabilities.
- 183 -

Mridula Pore, 2009 Doctoral Thesis, MIT
Part V
Market share for Crestor0.8
0.65
0.5
0.35
0.20 20 40 60 80 100 120 140 160 180 200 220 240 260 280 300 320 340 360 380 400
Time (week)Base Case
Figure 95: Base case market share for Crestor®
The Significance of Sequenced Patent Expiry on Strategic Decisions
The model simulates the market dynamics of the branded and generic products in theperiod surrounding patent expiry. It is able to capture the effects of different marketconditions that firms face at patent expiry, based on whether they were early, mid-stage,or late entrants to the statin market. This determines whether competition is largely onbrand and perceived product value index (PVI), or on price (and eventually on low
production and distribution costs).
Early entrants face patent expiry during a period where competition is largely onperceived PVI, and their low relative PVI puts them at a disadvantage to compete in themarket. Their profit maximizing strategy during this period is to maximize revenues byincreasing prices. Promotional spending very close to patent expiry may translate intomore benefit for the generics entrant than the innovator. The early entrants may be well-positioned to create follow-on products within the same market, as Merck did withZocor®.
Mid-stage entrants see the transition from competition on perceived PVI to price, and theonset of commoditization is clearly seen at this stage. Prior to patent expiry, theseproducts can capture market share through heavy promotion to emphasize their PVI
-184-

Mridula Pore, 2009 Doctoral Thesis, MIT
Part V
differences. This allows them to charge high prices and realize large profits as they get
into a virtuous cycle. There are incentives to invest in lavish promotion campaigns while
revenues are strong, but these can breed skepticism or generate backlash amongst the
medical and payer communities and bring an end to the virtuous cycle. As more of the
earlier products lose patent protection, competition shifts to price. There is increased
substitutability between products during this period, as a result of the diminishing returns
on R&D seen in Ngai's model.
Late stage entrants must compete in a market dominated by price competition. By the
time they approach the end of their patent life, not only have all the earlier products seen
generic entry, there has been considerable competition within the generic sub-markets,
leading to price erosion. In order to be a player in the market, they must price at, or just
slightly above the average price. This may enable them to get into a virtuous cycle and
use their sales, marketing and brand management capabilities to differentiate their
product. If there is intense price competition, all product prices will converge and a small
PVI advantage may be enough to steadily gain market share. However, this strategy is
only profitable until severe price competition in a crowded market drives margins to zero.
Intellectual Property Investments
A portion of the model incorporates spending on defensive IP by the innovator firms as
well as anticipatory investment in R&D by the generics firms. Creating this model
highlighted some key issues that require further data on investment decisions to explore
this phenomenon further. First of all, the branded manufacturers face a positive feedback
loop, whereby the more successful their product, the more they need, and are willing, to
invest in defensive IP to prolong their monopoly. This results in higher barriers to entry
that will extend patent lifetime, and allow them to spend more on defensive IP. These
investments have a much longer time horizon than promotional spend, due to the
timelines for research and development.
There are longer time horizons involved in the evolution of productivity of the generics
firms (as mentioned in part V.B). Sequencing of patent expiry could also play a part here,
with learning from the IP generated by earlier statin products leading to investment rates
being a function of entry position.
- 185-
Mridula Pore, 2009 Doctoral Thesis, MIT
Part V
V.D: Conclusions and Further Work
The market for statins has evolved in a way that is largely consistent with the theory on
technology market dynamics. Pharmaceutical markets differ from the standard models
due to the presence of heavy regulation that restricts and sequences the entry of firms. A
complex supply chain and reimbursement structure means that pricing can affect market
dynamics in a highly non-linear manner. Complementary assets are vital in determining a
firm's ability to execute an effective strategy during this period. The relative importance
of the type of assets differs between innovators and generics manufacturers.
A system dynamics model has been created that simulates the competition between the
branded and generic versions of a single statin product during the period surrounding
patent expiry. Case studies of each of the statin products indicate that competition shifts
from brand and perceived product value index (PVI) to price as the market evolves.
Therefore firms must compete differently depending on whether they were early, mid-
stage or late entrants into the market. Positive feedback loops can create incentives for
over-investment in promotion and R&D, particularly for the mid-stage entrants. Late
stage entrants must price at par with generics in order to have effective promotion and
gain market share.
This model considers all generic players to be equal, and considers the generics response
of multiple firms in aggregate. However, there is considerable heterogeneity between
generic firms and generic entry is sequenced, each phase requiring different capabilities
and entry strategies. System dynamics would be an appropriate tool to explore these
sequencing effects and further work should focus on the effects of heterogeneity and
competition on the evolution of the generics market.
Firms that pursue an aggressive patent challenge strategy compete to be early entrants
and capture a brief period of market protection. A firm's ability to successfully challenge
patents will evolve over time as it builds up capabilities in R&D, international patent law
and regulatory procedures.
The number of firms that enter after the 180 day exclusivity period is likely a function of
the pre-patent expiry revenues, and the decision to enter the market will be based on their
experience in manufacturing/sourcing certain compounds and formulations (Scott-
-186-
Mridula Pore, 2009 Doctoral Thesis, MITPart V
Morton, 1998). In addition, their ability to capture market share in a competitive market
will depend on their supply chain capabilities and relationships, and ability to
differentiate themself through a brand.
There are also late entrants who apply for ANDAs after the patents have expired, and
whose profitability is less than assured in a crowded market. Some assessment of likely
profitability is required to justify investing in the manufacturing capacity required to file
an ANDA.
Although annual reports give some indication of each firm's strategy, as outlined in the
appendix, much of this information is not available in the public domain, so I recommend
an interview-based approach to data collection for the next portion of the work stream.
Acknowledgements
I would like to thank the following for helpful discussions and suggestions: Dr Stanley
Finkelstein, Dr Mahender Singh, and the librarians at Massachusetts College of
Pharmacy. Prof Jason Davis provided valuable feedback and taught the class on
technology strategy that influenced this work.
- 187-

Mridula Pore, 2009 Doctoral Thesis, MIT
Part V
V.E Appendices and Bibliography
Appendix 1: Profiles of Firms in the US Generic Statins Market
Actavis Elizabeth LLC
The Actavis group is headquartered in Iceland. They have grown through aggressive
acquisition, particularly in India, China, and Eastern Europe, and have a global network
of R&D, manufacturing and sales and marketing facilities. The firm was taken privatize
in 2007 and is currently owned by the group's chairman, Thor Bjorgolfsson. Their
strategy focuses on low-cost operations, and being fast to market through investment in
regulatory and development expertise (Actavis, 2009).
In the USA, they operate five manufacturing sites, with solid-dosage manufacturing
concentrated in New Jersey. They completed two major acquisitions (Amide and
Alpharma) in 2005 to enter the US market and create the 8th largest US generics firm.
Following these acquisitions, they launched a marketing campaign to consolidate under
the Actavis brand (Actavis, 2005). Out of the statin products they market only lovastatin
in the US, now sold under their own brand.
Apotex
Apotex is a Canadian firm focused on the generics market. They are vertically integrated
and make their own API and formulations, as well as doing their own marketing and
distribution (Apotex, 2009).
Dr Reddy's Laboratories Ltd.
Dr Reddy's is a vertically-integrated pharmaceutical firm based in Hyderabad, India. It is
a public company, cross listed on the NYSE.
The firm has had FDA approval to market generic statins in the US since 2006. They
currently market simvastatin and pravastatin in the US under their own name. They had
15% of the current simvastatin market in the US in June 2008 (Reddy, 2009). Their
strategy is to be aggressive in ANDA filings (particularly under para IV), and have an
experienced North American team in sales, marketing, regulatory, sales operation and
supply chain (Reddy, 2008).
- 188 -
Mridula Pore, 2009 Doctoral Thesis, MIT
Part V
Lupin Pharmaceuticals Inc.
Lupin Pharmaceuticals Inc. is a US subsidiary of Lupin Ltd, an Indian pharmaceuticals
manufacturer. They entered the US market in 2003 (Lupin, 2009).
Mylan Laboratories
Mylan is a US pharmaceuticals firm that started as a distributor and has moved into
generics and branded products. They have operations in 140 countries, having grown
through acquisitions, including Merck KGaA's generics business, a controlling stake in
Matrix Laboratories, Hyderabad, and UDL, the largest unit-dosage packaged product
company in the US. (Mylan, 2009)
RanbaxyLaboratories Ltd.
Ranbaxy is a publicly listed company based in India. They have an aggressive strategy of
filing ANDAs under paragraph IV, and have first-to-file rights for both pravastatin and
simvastatin (80mg). They have also been contesting Lipitor® patents worldwide, and
have come to an agreement with Pfizer that allows them to launch atorvastatin in the US
market from November 2011 (FT, 2008a). They received first to file on 80mg pravastatin
in 2007, and captured 30% of prescription market share during the 180 day exclusivity
period (Ranbaxy, 2007).
Ranbaxy Pharmaceuticals Inc. is a wholely owned US subsidiary that was established in
1994, and operates in the generic, branded and OTC space. They are aiming for growth
through organic means, in-licensing and acquisition. Their product strategy focuses on
aggressive IP challenges, ANDA submissions and developing 'niche' products (Ranbaxy,
2009).
Sandoz
Sandoz is the generics division of Novartis AG and is headquartered in Germany. They
have manufacturing sites in Latin America, Europe (Poland, Slovenia, Austria, Turkey
and Germany), India and the North America (Novartis, 2009). Their strategy is to focus
on higher-value generics that are difficult to make and have limited competition
(Novartis, 2007). They entered the statin market through the acquisition of Geneva
pharmaceuticals in 2003, and filed ANDA applications for simvastatin.
- 189-
Mridula Pore, 2009 Doctoral Thesis, MIT
Part V
Teva Pharmaceutical Industries Ltd.
Teva is a global generics firm incorporated in Israel and operating in the US through a
subsidiary, Teva Pharmaceuticals USA Inc., who market 320 generic products in more
than 1,000 dosages. They are the leading manufacturer of generics in the US. They focus
on first-to-market strategies, including through paragraph IV filings, broadening their
product portfolio, vertical integration in production, as well as investing in R&D
capabilities, and increasing market share through acquisitions and collaborations. In
2008, Teva grew their US market share through the acquisition of Barr pharmaceuticals
in 2008 (Teva, 2008) and Ivax corporation in 2006.
Watson Pharmaceuticals Inc.
Watson is a US-based pharmaceuticals firm with operations in North America and Asia.
Developing and marketing generics now makes up 60% of their revenues. Their plans for
the future include being more aggressive with para IV filings. They focus their generics
R&D on drug delivery systems in order to differentiate themselves in the generics
market. They use a manufacturing site in Goa, India for products that can benefit from
low-costs and high volumes. They have forward-integrated, creating Anda, a
pharmaceutical distribution division. They see this as a way to develop 'stickier'
relationships with pharmacies, and ensure good penetration of their products (Watson,
2008).
Zydus Pharmaceuticals (USA) Inc.
Zydus is a generics-focused subsidiary of Zydus Cadila, a vertically integrated Indian
pharmaceutical firm with a global presence. They have expressed an interest in pursuing
difficult-to-make formulations, and have built up expertise in formulation and drug
delivery methods. Zydus has 70 R&D personnel dedicated to the US market.
Their strategy focuses on supply chain excellence with low costs as well as US marketing
partnerships with Covidien and other parties. They have their own product distribution
system and source bulk chemicals and APIs from their manufacturing sites in India,
which are operated by the parent company. Their goal is to move to developing their own
products by 2015 (Zydus, 2009).
- 190-

Mridula Pore, 2009 Doctoral Thesis, MIT
Part V
Appendix 2: Case Studies of Statin Products
Mevacor® (lovastatin)
Mevacor® was the first statin product to go off patent in December 2001 (FDA Orange
Book, 2007). By the time it reached the end of its patent life, Mevacor® was priced
below the average for the market. Merck-SP raised the prices of the branded product in
anticipation of patent expiry, and kept prices constant for six years following expiry
(Figure 96). Price now appear to be converging to generics prices, which have remained
constant since 2001 when they entered the market at a 10% discount to the branded
product price. Interestingly, the extended release version, Advicor, has seen rapid price
increases.
- Merck (Mevacor)0.14 - -- Abbott (Advicor)
-*-Alpharma0.13 .-------------- ----- -4-Andrx
-4*- Eon0.12 --------------- -- Mutual
% 0 .1 2 L. ........ . . ............ .0.11 - Par.40 - Sandoz
. 0.10 -- 4-Teva-U"- UDL
0.09 - M- PurePacGeneva
0.08 -- ----------- Apotex_ _ Watson
0.07 4 Lupin
1995 2000 2005 2010
Year
Figure 96: Lovastatin average wholesale prices (own analysis, based on data from Red BookTM)
As the first statin product, a considerable part of promotion focused on educating
physicians and patients of the new technology. By the time that Mevacor® was facing
generic entry, Merck-SP had a new statin product (Zocor®, simvastatin) in the market.
Therefore, they were shifting promotional spend from Mevacor® to Zocor® (Liebman,
2001). Data from analysts reports suggests that lovastatin had a market volume share of
approximately 5% in early 2004, that was rising slowly, with approximately 8% of the
statin market in 2007 (see Figure 82).
- 191-
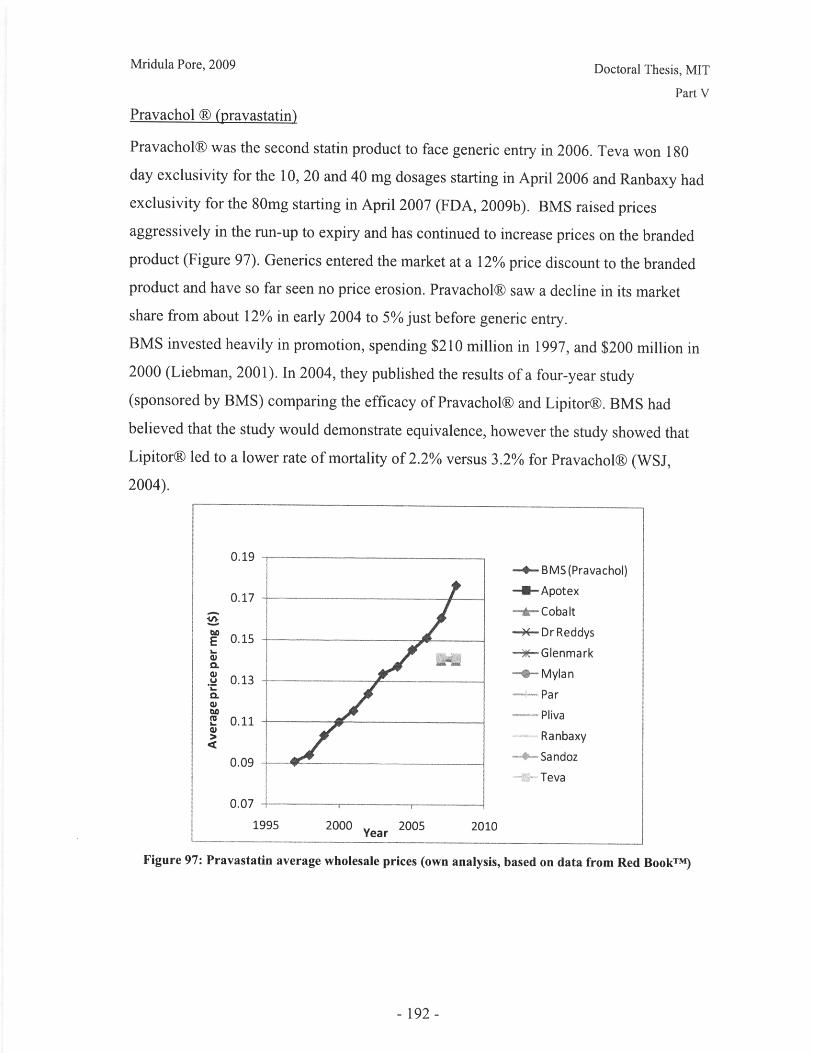
Mridula Pore, 2009 Doctoral Thesis, MIT
Part V
Pravachol 9 (pravastatin)
Pravachol® was the second statin product to face generic entry in 2006. Teva won 180
day exclusivity for the 10, 20 and 40 mg dosages starting in April 2006 and Ranbaxy had
exclusivity for the 80mg starting in April 2007 (FDA, 2009b). BMS raised prices
aggressively in the run-up to expiry and has continued to increase prices on the branded
product (Figure 97). Generics entered the market at a 12% price discount to the branded
product and have so far seen no price erosion. Pravachol® saw a decline in its market
share from about 12% in early 2004 to 5% just before generic entry.
BMS invested heavily in promotion, spending $210 million in 1997, and $200 million in
2000 (Liebman, 2001). In 2004, they published the results of a four-year study
(sponsored by BMS) comparing the efficacy of Pravachol® and Lipitor®. BMS had
believed that the study would demonstrate equivalence, however the study showed that
Lipitor® led to a lower rate of mortality of 2.2% versus 3.2% for Pravachol® (WSJ,
2004).
0.19 -+- BMS(Pravachol)
0.17 -- Apotex
- Cobalt
o -4- Dr ReddysE 0.15
- Glenmark
a - - Mylan. 0.13C -Par
.....- Pliva0.11=, ..... Ranbaxy
0.09 Sandoz0.09 - - - - -Teva
0.07 -r
1995 2000 2005 2010Yearices (own analysis, based on data from Red Book
Figure 97: Pravastatin average wholesale prices (own analysis, based on data from Red BookTM )
- 192-

Mridula Pore, 2009 Doctoral Thesis, MIT
Part V
Zocor® (simvastatin)
Zocor® lost patent protection just three months after Pravachol®, in June 2006. Ivax
pharmaceuticals won 180 days of market exclusivity for the 5, 10, 20, 40mg dosages and
Ranbaxy won exclusivity for the 80mg dosage (FDA, 2009b).
0.210.21 -- Merck (Zocor)
0.19 -~- -*-Merck(Vytorin)
+ - -Aurobindo0.17
S-*-Cobalt0.
. 0.15 ------ Dr Reddys
_ _ -4-Lupin1 0.13 --
01 - Mallinckrodt
0.11 - - - - - - - - - - -0.11 -- Perrigo
0 .0 9 - - --- ........ ....... ..................
1995 2000 2005 2010
Year
Figure 98: Simvastatin average wholesale prices (own analysis, based on data from Red BookTM)
Zocor® is the most expensive statin per mg, based on the published prices. Merck-SP
raised prices prior to expiry and has kept them constant since then. The generics firms
entered the market at a 7% discount to the branded price, and most have stuck to the same
price, although a couple of firms appear to be trying to undercut the market (Figure 98).
In 1997, Zocor® led the statin category in promotion spend, with $265 spent dominantly
on samples. In 2000, annual spend was still high, but second to Lipitor®, at $180 million.
By 2006, Merck- SP was also marketing a combination therapy, Vytorin®. As patent
expiry for Zocor® approached, marketing efforts were focused on shifting patients from
Zocor® to Vytorin®. However, these efforts were impacted by the release of the
'Enhance' study in 2008 that reported that Vytorin® delivered no benefit over Zocor® on
important dimensions (The Economist, 2008). Merck and Schering Plough received
considerable bad press for this result, particularly as the study had been completed in
2006 and release of the results had been delayed for two years.
- 193-
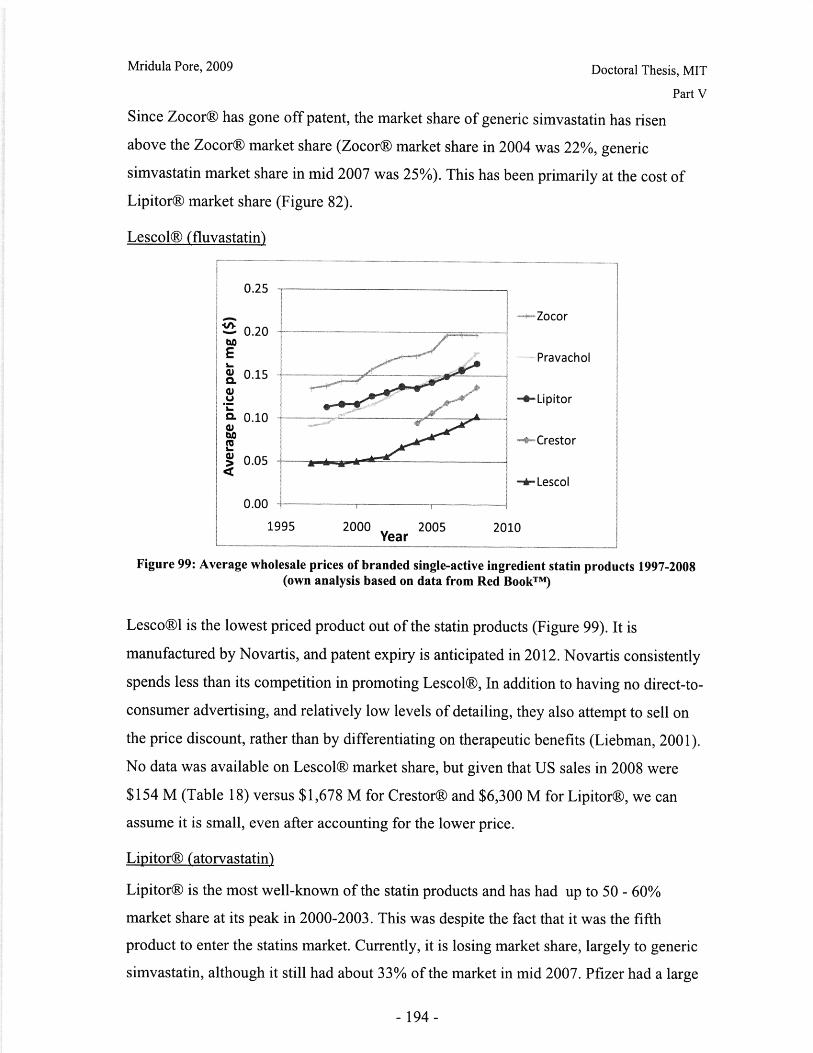
Mridula Pore, 2009 Doctoral Thesis, MIT
Part V
Since Zocor® has gone off patent, the market share of generic simvastatin has risen
above the Zocor® market share (Zocor® market share in 2004 was 22%, generic
simvastatin market share in mid 2007 was 25%). This has been primarily at the cost ofLipitor® market share (Figure 82).
Lescol® (fluvastatin)
0.25
-Zocor0.20
E Pravachol
I . 1 Q - - Lipitor. 0.10
0 .1 - C r e s t o r
-.- Lescol
0.00
1995 2000 2005 2010Year
Figure 99: Average wholesale prices of branded single-active ingredient statin products 1997-2008(own analysis based on data from Red BookT)
Lesco®l is the lowest priced product out of the statin products (Figure 99). It is
manufactured by Novartis, and patent expiry is anticipated in 2012. Novartis consistently
spends less than its competition in promoting Lescol®, In addition to having no direct-to-
consumer advertising, and relatively low levels of detailing, they also attempt to sell on
the price discount, rather than by differentiating on therapeutic benefits (Liebman, 2001).
No data was available on Lescol® market share, but given that US sales in 2008 were
$154 M (Table 18) versus $1,678 M for Crestor® and $6,300 M for Lipitor®, we can
assume it is small, even after accounting for the lower price.
Lipitor® (atorvastatin)
Lipitor® is the most well-known of the statin products and has had up to 50 - 60%
market share at its peak in 2000-2003. This was despite the fact that it was the fifth
product to enter the statins market. Currently, it is losing market share, largely to generic
simvastatin, although it still had about 33% of the market in mid 2007. Pfizer had a large
- 194-
Mridula Pore, 2009 Doctoral Thesis, MIT
Part V
branding campaign for Lipitor®, spending $285 million on promotion in 2000 (Liebman,
2001).
Lipitor® has been generally perceived to be superior to other statins. Initially it was sold
on its ability to reduce cholesterol levels more aggressively than other products, but
further studies have demonstrated its success in lower cardiac events and mortality.
Lipitor® has faced the most aggressive and public IP challenges from a variety of firms.
In June 2008 Ranbaxy won a court ruling allowing it to market generic atorvastatin in the
US from November 2011 (FT, 2008a). However, they were fielding challenges as early
as 2003.
In terms of pricing, Pfizer has been a price-leader, partly as a result of its large market
share. Lipitor® has been consistently priced slightly above the weighted market average.
Crestor® (rosuvastatin)
Astra Zeneca bought Crestor® to be the sixth entrant in the statin market. It has been
priced at the low end of the market (Figure 99) and has been consistently gaining market
share, despite being a late entrant. However, the trajectory in Figure 82 suggests that it is
unlikely to gain more than 10-15% market share. Astra Zeneca have invested in the
'Jupiter' trial which demonstrated that Crestor® reduced the likelihood of severe heart
attacks, but did not attempt to do a head-to-head comparison with other products (FT,
2008b). The patents on Crestor® are anticipated to expire in 2015 (Figure 77).
- 195-

Mridula Pore, 2009 Doctoral Thesis, MIT
Part V
Appendix 3: Model documentation
The model (Statin Patent Expiry.mdl) consists of three views. View one (Figure 100)
contains the market share allocation for the branded product manufacturer, and the
promotion feedback loop. View 2 (Figure 101) consists of the market allocation for other
players in the market. View 3 (Figure 102) is the generics firms' perspective and includes
the IP investment model.
- 196-
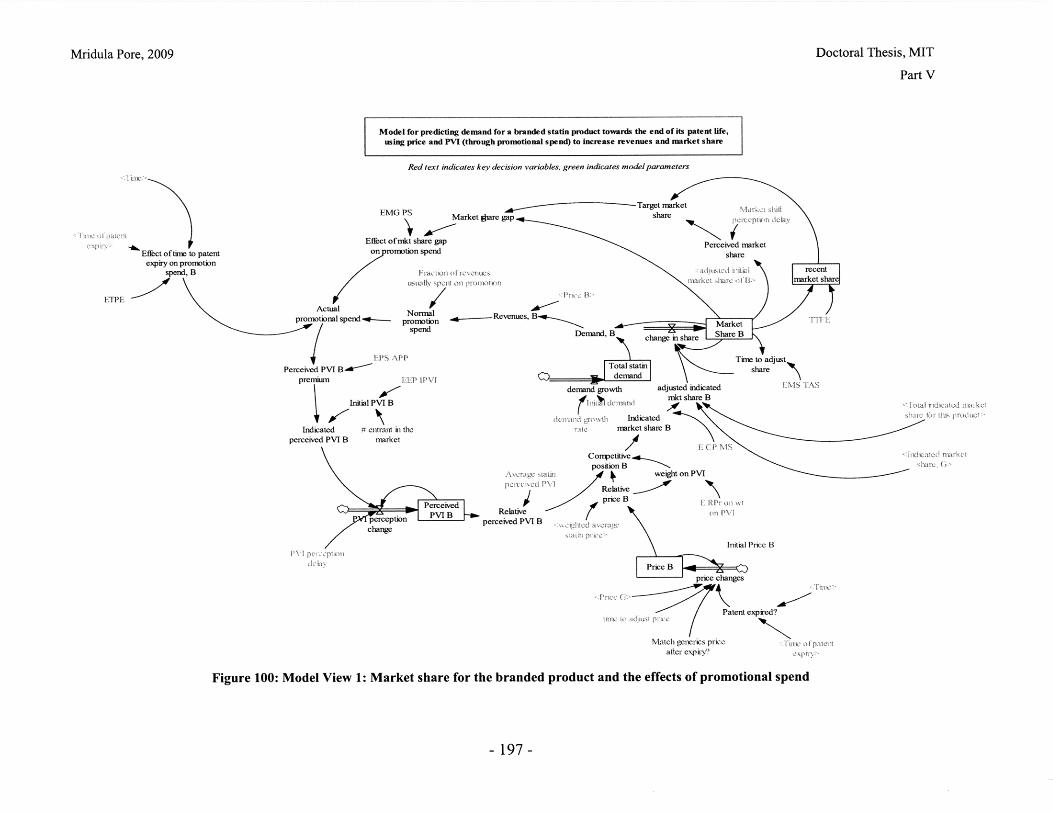
Mridula Pore, 2009 Doctoral Thesis, MIT
Part V
Model for predicting demand for a branded statin product towards the end of its patent life,using price and PVI (through promotional spend) to increase revenues and market share
Red text indicates key decision variables, green indicates model parameters
EMG PS
Effect ofmkt share gap
Effect of time to patent on romotion spend
expiry on promotionspend, B Factin o .,vcrac s
Actualpmotional spend prNonal Revenues, B."promotioalspend promotion
spend
iI PS APP
Perceived PVI B-d rpremam EEP IPVI
Initial PVI B
Indicated # entrant in theperceived PVI B rnarket
Avergew -,L
pePerceivedd
PeIB Relativeperception perceived PVI B
change
:!.-hv
oal Iid ilate i- maktshamc lir tis rodulc
1 E CP MConmetitive 4position B
ati B weight onPVI
Relativeprice B E RPr 0 wL
Initial Price B
ice: ( adut - C,tim to diUYtp'c
Match generics priceafter expiry?
Figure 100: Model View 1: Market share for the branded product and the effects of promotional spend
- 197 -
'ime oI pa-en
i i
exq.

Mridula Pore, 2009 Doctoral Thesis, MIT
Part V
Market share alocation between different product classes I
S Initial Rel PVI B initialcoppos B
. ' PVI BRel iitialprice nitialweig on Initial dicated
----- PVI B Initial inicated/ PVI B \ carket share, Baje
i 10R on i on initialmarketV i: P share ofB
products (r G) Relprie other G) ther G IdcaPVImarket
A-
ver ei ; w r on P on
prdrtts (other B) RelPVI other B
eVI other B share, other
Relprceothr ohe
Indicated market sharer other products
share fr this roduct
Total indicatedmarket share
\- o
A C e: - RP share, other B
Rel PVI G--- com p
pos G
PV G Indicated marketRel price G weigh ton PVI G share, G
adjusted indicatedmkt share, G
Figure 101: Model View 2: Market share allocation
- 198 -
Pere-d e PV-

Mridula Pore, 2009 Doctoral Thesis, MIT
Part V
Generics pricing and IP 'contest' betveen branded and generics
<Reenucsi B1-
EBE PEBarriers to entry
Indicated time
rate of IPgeneration G
rate ofIP
inwst nt IP investiment G
Marketchange in mkt share, G
share
h7--d mare kctShare, ()'
erosion factorofprice G
Figure 102: Model View 3: Market share of generics and IP investments by the branded and generics manufacturers
-199-
Initial time ofpatent expiry
Time for patentchallenge
T7-
<Total statmn

Part V
The model equations are documented below, with inputs for the Crestor® base case
simulation.
"Indicated market share, other B"= IF THEN ELSE( "# on patent products (other B)"=0, 0 ,E CP MS(comp pos other B)) - -"Indicated market share, other G"=IF THEN ELSE(("# off-patent products (other G)"=0),0,E CPMS(comp pos other G)) - IIndicated perceived PVI B=Initial PVI B+Perceived PVI B premium ~ -IActual promotional spend= Effect of mkt share gap on promotion spend*Normal promotionspend*"Effect of time to patent expiry on promotion spend, B" -$/week -1Indicated time of patent expiry= Initial time of patent expiry+(EBE PE(Barriers to entry))
-1price changes= IF THEN ELSE("Patent expired?",IF THEN ELSE("Match generics price afterexpiry?", ((\Price G-Price B)/time to adjust price), 0),Price B*-0 ) - $/mg/week -1Indicated market share for other products= SMOOTH("adjusted indicated mkt share, otherB"+"adjusted indicated mkt share, other G", 200 ) -Total indicated market share for this product=1-Indicated market share for other products -1adjusted indicated mkt share B= Indicated market share B*Total indicated market share for thisproduct/(Indicated market share B+"Indicated market share, G") - - I"adjusted indicated mkt share, G"= "Indicated market share, G"*Total indicated marketshare for this product/(Indicated market share B\ +"Indicated market share, G")- Ierosion factor of price G = 0erosion of patent protected life= MIN(0,-(Time of patent expiry-Indicated time of patentexpiry)/Time for patent challenge)Time for patent challenge= 50 week ~EBE PE( [(-25,-60)-(25,60)],(-25,-52),(-10,-52),(-7,-45),(-5,-40),(-4,-35),(-3,-30),(-2,-20),(-1,-8),(0 1, 8),(2,20),(3,30),(4,35),(5,40),(7,45),(10,52),(25,52)) -1"Indicated market share, G"= "Patent expired?"*E CP MS(comp pos G) ~ ~Normal promotion spend= Fraction of revenues usually spent on promotion*"Revenues, B"
$/week -Iprice erosion= IF THEN ELSE(Time>(Time of patent expiry+26), Price G*erosion factor ofprice G, 0 ) - I"Effect of time to patent expiry on promotion spend, B"= ETPE(Time of patent expiry-Time)
S :SUPPLEMENTARY Irate of IP investment B= ("Revenues, B"/le+006)*Fraction of revenues spent ondefensive IP*ETPE(Time of patent expiry\ -Time) $/week - $ inmillions ITime of patent expiry= INTEG (erosion of patent protected life, Initial time of patent expiry)
ETPE( [(-400,0)-(400,1)],(-400,0),(0,0),(28.1346,0.0131579),(50,0.05),(70,0.2),(100,0.5),(\120,0.8),(140,0.95),(162.691,0.991228),(400,1)) ~ |
Barriers to entry=IP output B-IP output G - |Effect of mkt share gap on promotion spend= EMG PS(Market share gap B) -
E CP MS([(-1,0)-(1,1)],(-1,0.001),(-0.9,0.005),(-0.761468,0.0175439),(-0.522936,0.0482456),(-0.425076,0.0745614),(-0.33945,0.100877),(-0.25,0.140351),(-0.217125,0.162281),(-0.168196,0.192982),(-0.119266,0.22807),(-0.058104,0.27193),(-0.00917431,0.307018),(0.1,0.4),(0.2,0.5),(0.5,0.63),(0.7,0.69),(0.8,0.72),(0.9,0.74),(1,0.75))
Effect of competitive position (range approx -1:1) on market share.Current market share for older products (low PVI and low price) is about \
200 -
Mridula Pore, 2009 Doctoral Thesis, MIT

Part V
2-3%, average products are in the range 10-20% and lipitor is in the \50-60% range
comp: b, other b, g, other g - index - |PVI[b]= 2 -- 1PVI[other b]= 3 -- 1PVI[g]= 1.5--lPVI[other g]= 1.25 :SUPPLEMENTARY IEcum inv on productivity B( [(0,0), (600,1)], (0,0.2), (12,0.18), (25,0.16), (50,0.13), (75,0.1),(100,0.08), (125,0.06), (150,0.04), (175,0.03),(200,0.02),(225,0.01),(250,0.01), (500,0.005))
patents/$ $ in millions IIP investment B= INTEG (rate of IP investment B, 0) - $ - IIP investment G= INTEG (rate of IP investment, 0) - $ -IIP output B= INTEG (rate of IP generation B,0) - patents - IIP output G= INTEG (rate of IP generation G, 0) - patents -Price G= INTEG (price increase G-price erosion, Initial Price B*(1-Initial discount on priceB))-$/mg~price increase G=IF THEN ELSE((Time<(Time of patent expiry)), Price G*0, 0) -
$/(mg*week)-l"Patent expired?"=IF THEN ELSE(Time of patent expiry<=Time , 1 , 0) - -Irate of IP generation G=Ecum inv on productivity G(IP investment G)*rate of IP investment
patents/week- IEcum inv on productivity G([(0,0)(200,0.8)],(0,0),(10,0.09),(20,0.18),(25,0.195),(30,0.2),(35,0.195),(40,0.19),(50,0.165),(60,0.13),(70,0.1 ),(80,0.07),(90,0.045),(100,0.03),(120,0.017),(150,0.01),(200,0.005))
patents/$Effect of total investment in IP on productivity. Assume that at low levels of
investment, learning is slow, but increases with investment. At some point, increased investmentis not productivelInitial discount on price B= 0.1*(1.001)A250Initial time of patent expiry= 250 - week -rate of IP generation B= Ecum inv on productivity B(IP investment B)*rate of IP investment B -
patents/week -rate of IP investment= 0.5 - $/week - in millionsFraction of revenues spent on defensive IP= 0.04- -"Market share, G"= INTEG (change in mkt share, 0)change in mkt share= ("Indicated market share, G"-"Market share, G")/TTFE --Demand G= "Market share, G"*Total statin demand - mg/week -IRevenues G= Price G*Demand G ~ $/week - -:SUPPLEMENTARY |time to adjust price= 300 - week - Takes about 5-7 years to adjust price IPrice B= INTEG ( price changes, Initial Price B) - $/mg - IMarket Share B= INTEG (change in share, adjusted initial market share of B) - -I"adjusted indicated mkt share, other B"= "Indicated market share, other B"/Total indicated marketshare - - I"adjusted indicated mkt share, other G"="Indicated market share, other G"/Total indicated marketshare - -Iweighted average statin price=0. 15 - - |Rel price G= (Price G-weighted average statin price)/weighted average statin price - Ichange in share=(adjusted indicated mkt share B-Market Share B)/Time to adjust share
-l1/week -I
-201-
Doctoral Thesis, MITMridula Pore, 2009

Part V
Total indicated market share=MAX((Indicated market share B+"Indicated market share, otherB"+"Indicated market share, other G"), (+"Indicated market share, other B"+"Indicated marketshare, other G"+"Indicated market share, G"\)) - -IRelative price B=(Price B-weighted average statin price)/weighted average statin price - -
"Match generics price after expiry?"= 0 1: want to eventually matchgenerics price. 0: want to maintain price IPerceived market share= DELAY FIXED ( Market Share B, Market shift perception delay,adjusted initial market share of B) I"Initial indicated market share, B"= E CP MS(initial comp pos B)Indicated market share B= E CP MS(Competitive position B) IRel price other G=(Average other G price-weighted average statin price)/weighted average statinprice - -Rel initial price= (Initial Price B-weighted average statin price)/weighted average statinprice --IRel price other B=(Average other B price-weighted average statin price)/weighted average statinprice - Iadjusted initial market share of B="Initial indicated market share, B"/("Indicated market share,other B"+"Indicated market share, other G"+"Initial indicated market share, B") ~
"# off-patent products (other G)"= "# entrant in the market"-1"# on patent products (other B)"= 6-"# entrant in the market" - I"EEM #OG"([(0,0)-(10,40)],(0,0),(1,8),(2,17),(3,24),(4,27),(5,28),(6,29))
- Effect of # entrant on the average PVI of generic products in the marketlRel PVI G= (PVI G-Average statin perceived PVI)/Average statin perceived PVI - -Average other B price= 0.15 - $/mg -Average other G price= 0.14 - $/mg Iinitial weight on PVI B= E RPr on wt on PVI(Rel initial price) - Iweight on PVI other G= E RPr on wt on PVI(Rel price other G) - -comp pos G=weight on PVI G*Rel PVI G-((1-weight on PVI G)*Rel price G)
comp pos other B=(weight on PVI other B*Rel PVI other B)-((l-weight on PVI other B)*Relprice other B\) - - Icomp pos other G=(weight on PVI other G*Rel PVI other G)-((1-weight on PVI other G)*Relprice other G\ ) - - IPVI other G = "EEM #OG"("# off-patent products (other G)") -Initial Rel PVI B=(Initial PVI B-Average statin perceived PVI)/Average statin perceived PVI--IRel PVI other G=(PVI other G-Average statin perceived PVI)/Average statin perceived PVI
weight on PVI G= E RPr on wt on PVI(Rel price G) - - Iweight on PVI other B= E RPr on wt on PVI(Rel price other B) ~ I"EEM #OB"([(0,0)-(10,50)],(1,33),(2,37.2),(3,41),(4,42),(5,41),(6,40)) IRel PVI other B= (PVI other B-Average statin perceived PVI)/Average statin perceived PVI -
-1initial comp pos B=initial weight on PVI B*Initial Rel PVI B-(1-initial weight on PVI B)*(Relinitial price--IPVI other B= "EEM #OB"("# on patent products (other B)") - IPVI G = Perceived PVI B - - I"Revenues, B"= "Demand, B"*Price B ~ $/week-"# entrant in the market"= 6 - -1
202 -
Mridula Pore, 2009 Doctoral Thesis, MIT
Part V
EEP IPVI( [(0,0)-(10,60)],(1,12),(2,24),(3,36),(4,32),(5,42),(6,38)) -- Effect of entryposition on intrinsic PVI (Source: Ngai, 2005). Diminishing returns of R&D lead to smallerincrements in PVI of new productslAverage statin perceived PVI= 32 - ~Initial Price B= 0.14 -Initial PVI B= EEP IPVI("# entrant in the market")-Market share gap B= MAX(0, (Target market share-Market Share B)/Target market share)-
-1recent market share= SMOOTH(Market Share B, TTFE)- -Target market share= MAX(recent market share, Perceived market share + (Perceived marketshare-recent market share\ )) ITTFE= 52- week - Time to form expectations- assume annuallylRelative perceived PVI B= (Perceived PVI B-Average statin perceived PVI)/Average statinperceived PVI~ - IPerceived PVI B premium= EPS APP(Actual promotional spend) - -- :SUPPLEMENTARYEMG PS( [(0,0)-(1,2)],(0,1),(0.01,1),(0.02,1),(0.025,1),(0.03,1),(0.04,1),(0.05, 1),(0.1,1 ),(\
0.15,1.1),(0.2,1.35),(0.25,1.4),(0.3,1.25),(0.4,0.9),(0.5,0.6),(0.8,0.15),(1,0)) -IPerceived PVI B= INTEG (PVI perception change, Initial PVI B) - IEPS APP( [(0,0),(2e+007,40)],(0,0),(500000,1),(1e+006,1.5),(1.5e+006,2.5),(2e+006,3.75),(2.5e+006,5),(3e+006,7.5),(3 .5e+006,11.5),(4e+006,14.5),(4.5e+006,17),(5e+006,19),(6e+006,21),(7e+006,23),(8e+006,23.75),(9e+006,24.5),(le+007,25),(1.2e+007,25),(2e+007,25)) - -1PVI perception change=MAX(0,(Indicated perceived PVI B-Perceived PVI B)/PVI perceptiondelay) -I1/week -IPVI perception delay= 12 - week - IMarket shift perception delay= 4 - week
Low perception delay- newspapers were printing details of drops in new prescriptionswithin two-three weeks after Zocor went off patent I"Demand, B"= Market Share B*Total statin demand -mg/week -Fraction of revenues usually spent on promotion= 0.06 - - Includes phaseIV clinical trials (13.4% of R&D spend), detailing, journal advertising and hopsital promotioin.Excludes retail value of free samples. Annual R&D spend is 17.4% of sales, or $56M total,vs $12bn promotion. i.e. = (.174*0.134)+(12/56)*.174 = 0.06 (source: PhRMA industry profile,2009)1Time to adjust share= EMS TAS(Market Share B) - week -EMS TAS( [(0,0)-(1,80)],(0,10),(0.01,10),(0.02,10),(0.05,10),(0.1,12),(0.15,15),(0.2,18),(0.3,26),(0.4,37),(0.5,45),(0.6,50),(0.7,55),(0.8,59),(0.9,59.5),(1,60)) -Initial demand= 1.5e+006*20*30 - mg/week
1.5 million prescriptions per week in Jan 2004. Assume each prescription is for 20mg, 30dayslweight on PVI=E RPr on wt on PVI(Relative price B) -Competitive position B= (weight on PVI*Relative perceived PVI B)-((1-weight onPVI)*Relative price B) - - IE RPr on wt on PVI([(-1,0)-(1,1 )],(-1 ,0),(-0.7,0.005),(-0.5,0.03),(-0.4,0.035),(-0.3,0.06),(-0.25,0.1 ),(-0.2,0.17),(-0.15,0.3),(-0.1,0.53),(-0.06,0.7),(-0.04,0.85),(-0.03,0.92),(-0.02,0.96),(-0.01,0.99),(0,1),(0.01,0.99),(0.02,0.96),(0.03,0.92),(0.04,0.85),(0.06,0.7),(0.1,0.53),(0.15,0.3),(0.2,0.17),(0.25,0.1),(0.3,0.06),(0.4,0.035),(0.5,0.03),(0.7,0.005), (1,0)) -
Effect of relative price on weight on PVI Idemand growth= demand growth rate*Initial demand - mg/week/week -Idemand growth rate=0.005 - -ITotal statin demand= INTEG (demand growth, Initial demand) - mg/week-
- 203 -
Doctoral Thesis, MITMridula Pore, 2009

Mridula Pore, 2009 Doctoral Thesis, MIT
Part V
Bibliography
Abernathy W.J. ; Utterback J.M. Technol. Rev. 1978 80(7) 40-47
Actavis Annual Report to Shareholders 2005
Actavis www.actavis.com, accessed March 14, 2009
AmerisourceBergen Annual report to shareholders 2007
Apotex Corp. 'Comment ofApotex Corp. in Support of Citizen Petition Docket No.
2004P-0075/CPl' Submitted to Division of Dockets Management, Janet Woodcock,
Gary Buehler and Daniel Troy, FDA, March 24, 2004
Apotex Inc. www.apotex.com, accessed May 2009
Astra Zeneca www.crestor.com, accessed April 25, 2007
Astra Zeneca 'Astra Zeneca's new statin shows potential to improve treatment for the
world's leading cause of death' Press Release, June 29, 2000
Astra Zeneca International Annual report to shareholders 2008
Baker-Smith C.M.; Benjamin D.K.; Grabowski H.G.; Reid E.D.; Mangum B.; Goldsmith
J.V.; Murphy M.D.; Edwards R.; Eisenstein E.L.; Sun J.; Califf R.M.; Li J.S. Am. Heart.
J. 2008 156(4), 628-688
Booz Allen and Hamilton 'The role of distributors in the US healthcare industry: a study
prepared for the center for healthcare supply chain research' 2007
BMI 'Industry Trend Analysis- Slim profit margins for drug distributors', Business
Monitor International, July 10, 2008
BMI 'United States Pharmaceuticals & Healthcare Report Q1 2009' Business Monitor
International, 2009
Bristol Myers Squibb www. bms. com, accessed on April 25, 2007
BusinessWeek 'Big Pharma 's Patent Headache' Feb 26, 2008
Chemical and Engineering News, 'Lovastatin '2005 83(25)
Center for Disease Prevention and Control, www.cdc.gov, accessed April 11, 2009
CDER 'Guidance for Industry: 180 days of Generic Drug Exclusivity Under the Hatch-
Waxman Amendments to the Federal Food, Drug, and Cosmetic Act', Center for Food
and Drug Evaluation and Research, US Food and Drug Administration, June 1998
- 204 -

Mridula Pore, 2009 Doctoral Thesis, MIT
Part V
CDER (Center for Food and Drug Evaluation and Research), US Food and Drug
Administration www.fda.gov/cder, accessed March 13, 2009
CVS/Caremark Annual report to shareholders 2007
Drug Price Competition and Patent Term Restoration Act, (Public Law 98-417) U.S.C.
1984
FDA Act, Food and Drug Administration Improvement Act of 1997, Section 111, 105th
Congress USA, 1997
FDA 'Mylan Pharmaceuticals Inc/Prohibit the marketing and distribution ofAuthorized
Generics until the expiration of the first generic applicant's exclusivity period' Citizen
Petition Docket No. 2004P-0075 February 18, 2004a
FDA 'Teva Pharmaceuticals USA, Inc./ Prevent Pfizer Inc. from marketing a generic
version ofAccupril until after the expiration of Teva's 180-day exclusivity period' Citizen
Petition Docket No. 2004P-0261 June 10, 2004b
FDA 'Andrx Pharamceuticals, Inc./Re-evaluate FDA 's policy concerning the marketing
of "Authorizied generic" versions of brand name prescription drugs' Citizen Petition
Docket No. 2004P-0563 December 27, 2004c
FDA 'FDA supports broader access to lower priced drugs' FDA Talk Paper, July 2,
2004d
FDA 'Listing ofAuthorized Generics' www.fda.gov, accessed March 16, 2009a
FDA 'FDA Generic Drug approvals' www.fda.gov, accessed March 16, 2009b
FDA Orange Book, Food and Drug Administration, Electronic Orange Book Database,
http://www.fda.gov/cder/ob/default.htm, accessed on April 13, 2009
Foster R. 'The S-curve: A new forecasting tool' Chapter 4 in 'Innovation: The attacker's
advantage' Simon and Schuster, New York (NY) 1986 88-111
FT 'Statins 'reduce risk of colon cancer', Financial Times, May 27, 2005
FT 'Pfizer agrees Lipitor sales deal', Financial Times, June 19, 2008a
FT 'Astra set to receive boost in drug sales', Financial Times, November 10, 2008b
Grabowski H.G.; Vernon J.M. Int. J. Technol. Manag. 2000 19(1/2) 98-120
Herper M. 'Storm warnings; who will come out ahead?' Forbes, June 6, 2006
IMS Health National Prescription AuditTMPlus January 2005
- 205 -
Mridula Pore, 2009 Doctoral Thesis, MIT
Part V
IMS Health '2007 Top-line US Industry data' www.imshealth.com, accessed April 12,
2009
Kaiser 'Follow the Pill: Understanding the U.S. Pharmaceutical Supply Chain' Prepared
for The Kaiser Family Foundation by The Health Strategies Consultancy LLC, March
2005
Liebman M. Med. Mark. Med. November 2001 86 - 92
Lupin Pharmaceuticals Inc. www.lupinpharmaceuticals.com, accessed May 2009
Manzoni M.; Rollini M. Appl. Microbiol. Biotechnol. 2002, 58, 555-564
Merck Sharpe and Dohme www.vytorin.com, accessed April 25, 2007
Mylan Inc. www. mylan. com, accessed May 2009
NCBI (National Center for Biotechnology Information) http://pubchem.ncbi.nlm.nih.gov,
accessed April 25, 2007
Ngai S.S.H. 'Business dynamics ofpatent expiry and commoditization in the
pharmaceutical industry: A case study on the US statins market', Chapter 15, PhD
Thesis, MIT, 2005
Novartis AG, Annual report to shareholders 2007
Novartis AG Annual report to shareholders 2008
Novartis AG 'Sandoz at a glance', www.novartis.com 2009
PhRMA 'The truth about pharmaceutical marketing and promotion', Pharmaceutical
Research and Manufacturers of America, July 2008
Pfizer Inc. Annual report to shareholders 2008
Pfizer www. lipitor. com, accessed on April 25, 2007
Ranbaxy Annual report to shareholders 2007
Ranbaxy www.ranbaxy.com, accessed March 14, 2009
Red BookTM Annual Publication by Thomson Reuters Healthcare
Reddy Annual Report to shareholders Dr Reddy's Laboratories 2007
Reddy Dr Reddy's Product Guide 2008, North America, www.drreddys.com, 2008
Reddy www.drreddys.com, accessed March 14, 2009
Robison R.L.; Suter W.; Cox R.H. Toxicol. Sci. 1994 23 (1) 9-20
Scott-Morton F. 'Entry Decisions in the Generic Pharmaceutical Industry' NBER
working paper, October 1998
- 206 -
Mridula Pore, 2009 Doctoral Thesis, MIT
Part V
Singh M. 'The Pharmaceutical Supply Chain. a Diagnosis of the State-of-the-art' MEng
thesis, Engineering Systems Division, MIT 2005
Skendarian, Conversations with Skendarian apothecary, Cambridge, MA, March 2009
S&P (Standard and Poor's) 'Industry Surveys: Healthcare and pharmaceuticals'
November 27, 2008
Smith A. 'Pfizer may lose billions in sales ofLipitor' CNN News, August 2, 2006
Target Corp. www. target.com, accessed March 25, 2009
Teece D.J. Res. Pol. 1986 15 285-305
Teva Pharmaceutical Industries Ltd. Annual report to shareholders 2008
The Economist 'Shock to the system - Pharmaceuticals' February 2, 2008
Tooley J.F.; Steadman D.D. Weekly Prescription Trends, A.G. Edwards, August 8, 2007
USA Today 'Cholesterol buster Mevacor again seeks OTC approval' December 9, 2007
Utterback J.M. 'Mastering the Dynamics ofInnovation' Harvard University Press,
Boston MA, 1994
Vagelos R.; Galambos J. 'The moral corporation - Merck experiences' Cambridge
University Press, NY, 2006
Watson, www. watson. com, accessed May 2008
Weil H.B.; Utterback J.M. 'The dynamics of innovative industries' International
conference on system dynamics, Boston, 2005
Wosinska M. 'Just What the Patient Ordered? Direct-to-Consumer Advertising and the
Demand for Pharmaceutical Products' HBS Marketing Research Paper No. 02-04,
October 2002
WSJ 'Blood Feud: For BMS, Challenging Pfizer was a big mistake', The Wall Street
Journal, March 9, 2004
WSJ 'Do statins help prevent cancer? Few tests slated.' The Wall Street Journal, May
20, 2005
WSJ, 'Pipeline problem: Demise of a blockbuster drug complicates Pfizer's revamp' The
Wall Street Journal, December 4, 2006a
WSJ 'The week ahead' The Wall Street Journal, April 15, 2006b
Zydus www.zydususa.com, accessed April 23, 2009
- 207-
Mridula Pore, 2009 Doctoral Thesis, MIT
Part V
-208-
Mridula Pore, 2009 Doctoral Thesis, MIT
Conclusions
Conclusions
o A systematic design methodology for design of pharmaceutical tablets is
presented. Models to predict tablet microstructure and performance are required.
o Nanoindentation and X ray micro CT can be used to measure mechanical
properties of powders and structural parameters of the tablet. This can be a basis
for future compaction modeling work.
o Tablet microstructure can be modified by a combination of formulation and
process variables. Microstructure influences tablet hardness and dissolution
behavior.
o The standard testing configurations for measurement of tablet performance
(hardness and dissolution) are not well-suited for developing process models.
o Terahertz pulsed spectroscopy is sensitive to microstructural changes and THz
imaging can be used to detect internal defects.
o The market for statins has evolved in a way that is largely consistent with the
theory on technology market dynamics.
o Case studies of each of the statin products show that there are strong sequencing
effects and competition shifts from brand and perceived product value index
(PVI) to price as the market evolves.
- 209 -

Doctoral Thesis, MIT
Abbreviations
AFM Atomic Force Microscopy
ANDA Abbreviated New Drug Application
API Active Pharmaceutical Ingredient (also called Drug Substance)
DEM Discrete Element Modeling
CAMP Consortium for the Advancement of the Manufacturing of Pharmaceuticals
CFD Computational Fluid Dynamics
CT Computed Tomography
ESEM Environmental Scanning Electron Microscope
FDA US Food and Drug Administration
FEM Finite Element Modeling
IP Intellectual Property
MCC Microcrystalline Cellulose
PBM Pharmacy Benefit Manager
PVI Product Value Index
TPI Terahertz Pulsed Imaging
TPS Terahertz Pulsed Spectroscopy
USP United States Pharmacopeia
-210-
Mridula Pore, 2009
Related Documents