Pharma Pharma and Biotech Industry Outlook and Biotech Industry Outlook A look at trends and opportunities in this increasingly challenging A look at trends and opportunities in this increasingly challenging environment with a focus on the generics landscape environment with a focus on the generics landscape October 2012 October 2012 [email protected] [email protected]

Pharma and Biotech Industry Outlook - A look at trends and opportunities in this increasingly challenging environment with a focus on the generics landscape
Aug 20, 2015
Welcome message from author
This document is posted to help you gain knowledge. Please leave a comment to let me know what you think about it! Share it to your friends and learn new things together.
Transcript

PharmaPharma and Biotech Industry Outlookand Biotech Industry Outlook
A look at trends and opportunities in this increasingly challenging A look at trends and opportunities in this increasingly challenging environment with a focus on the generics landscapeenvironment with a focus on the generics landscape
October 2012October 2012
[email protected]@frost.com

Market Overview
2
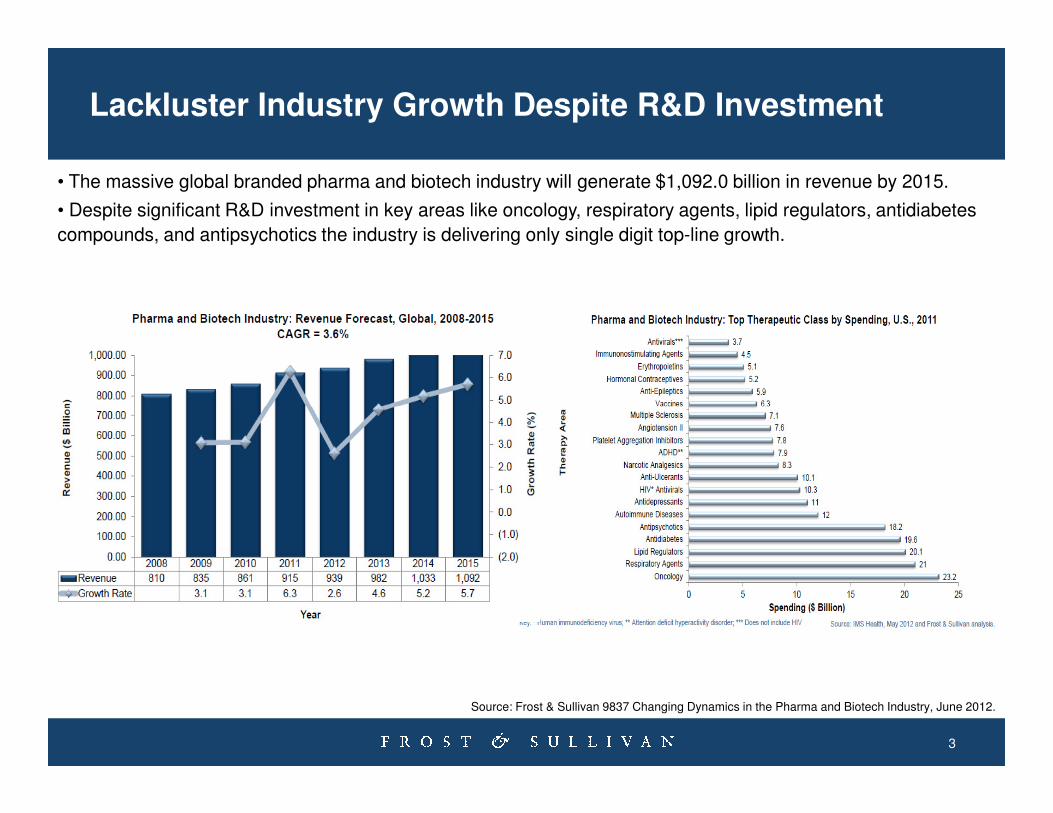
Lackluster Industry Growth Despite R&D Investment
• The massive global branded pharma and biotech industry will generate $1,092.0 billion in revenue by 2015.
• Despite significant R&D investment in key areas like oncology, respiratory agents, lipid regulators, antidiabetes
compounds, and antipsychotics the industry is delivering only single digit top-line growth.
3
Source: Frost & Sullivan 9837 Changing Dynamics in the Pharma and Biotech Industry, June 2012.
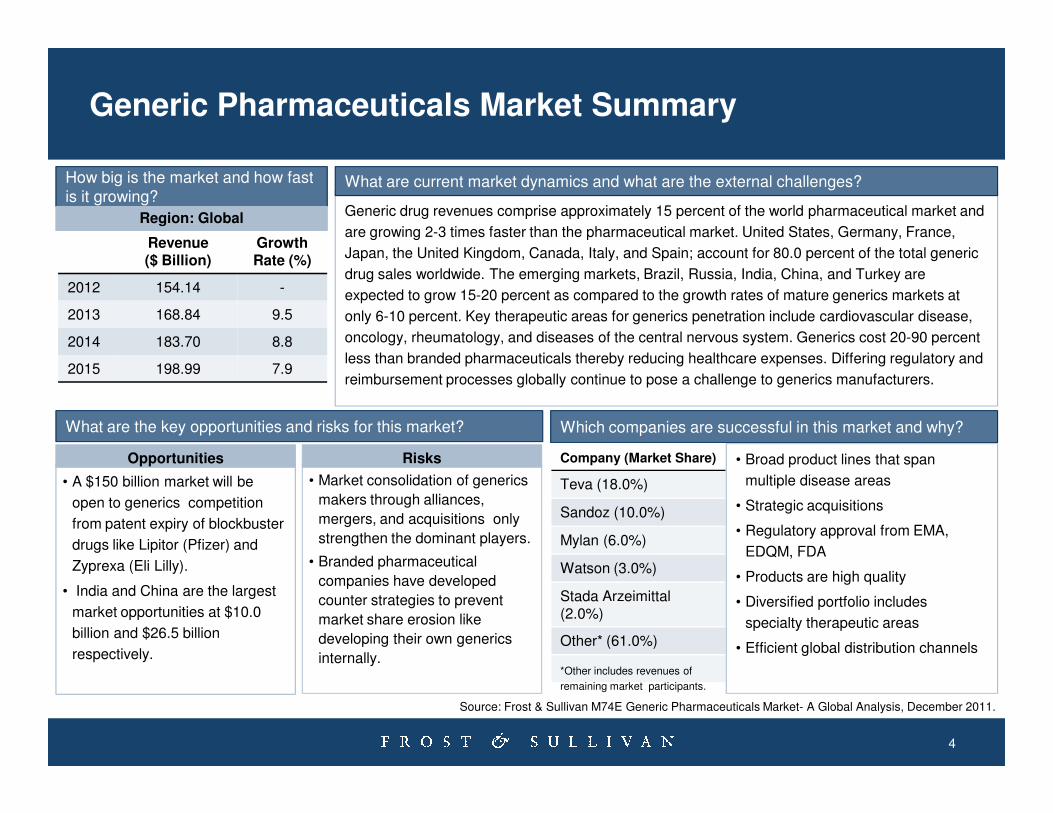
Generic Pharmaceuticals Market Summary
Generic drug revenues comprise approximately 15 percent of the world pharmaceutical market and
are growing 2-3 times faster than the pharmaceutical market. United States, Germany, France,
Japan, the United Kingdom, Canada, Italy, and Spain; account for 80.0 percent of the total generic
drug sales worldwide. The emerging markets, Brazil, Russia, India, China, and Turkey are
expected to grow 15-20 percent as compared to the growth rates of mature generics markets at
only 6-10 percent. Key therapeutic areas for generics penetration include cardiovascular disease,
oncology, rheumatology, and diseases of the central nervous system. Generics cost 20-90 percent
less than branded pharmaceuticals thereby reducing healthcare expenses. Differing regulatory and
reimbursement processes globally continue to pose a challenge to generics manufacturers.
How big is the market and how fast is it growing?
What are current market dynamics and what are the external challenges?
Revenue($ Billion)
GrowthRate (%)
2012 154.14 -
2013 168.84 9.5
2014 183.70 8.8
2015 198.99 7.9
Region: Global
4
• A $150 billion market will be
open to generics competition
from patent expiry of blockbuster
drugs like Lipitor (Pfizer) and
Zyprexa (Eli Lilly).
• India and China are the largest
market opportunities at $10.0
billion and $26.5 billion
respectively.
Company (Market Share)
Teva (18.0%)
Sandoz (10.0%)
Mylan (6.0%)
Watson (3.0%)
Stada Arzeimittal(2.0%)
Other* (61.0%)
Opportunities • Broad product lines that span
multiple disease areas
• Strategic acquisitions
• Regulatory approval from EMA,
EDQM, FDA
• Products are high quality
• Diversified portfolio includes
specialty therapeutic areas
• Efficient global distribution channels
What are the key opportunities and risks for this market? Which companies are successful in this market and why?
• Market consolidation of generics
makers through alliances,
mergers, and acquisitions only
strengthen the dominant players.
• Branded pharmaceutical
companies have developed
counter strategies to prevent
market share erosion like
developing their own generics
internally.
Risks
Source: Frost & Sullivan M74E Generic Pharmaceuticals Market- A Global Analysis, December 2011.
*Other includes revenues of
remaining market participants.
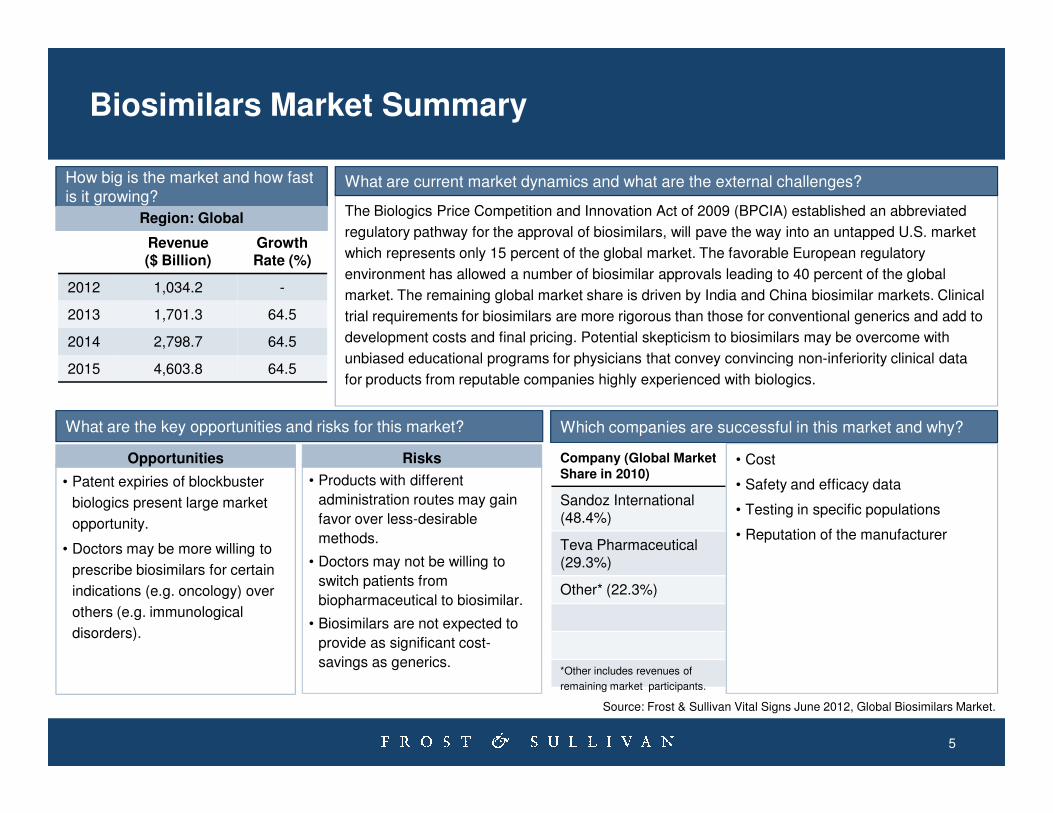
Biosimilars Market Summary
The Biologics Price Competition and Innovation Act of 2009 (BPCIA) established an abbreviated
regulatory pathway for the approval of biosimilars, will pave the way into an untapped U.S. market
which represents only 15 percent of the global market. The favorable European regulatory
environment has allowed a number of biosimilar approvals leading to 40 percent of the global
market. The remaining global market share is driven by India and China biosimilar markets. Clinical
trial requirements for biosimilars are more rigorous than those for conventional generics and add to
development costs and final pricing. Potential skepticism to biosimilars may be overcome with
unbiased educational programs for physicians that convey convincing non-inferiority clinical data
for products from reputable companies highly experienced with biologics.
How big is the market and how fast is it growing?
What are current market dynamics and what are the external challenges?
Revenue($ Billion)
GrowthRate (%)
2012 1,034.2 -
2013 1,701.3 64.5
2014 2,798.7 64.5
2015 4,603.8 64.5
Region: Global
5
• Patent expiries of blockbuster
biologics present large market
opportunity.
• Doctors may be more willing to
prescribe biosimilars for certain
indications (e.g. oncology) over
others (e.g. immunological
disorders).
Company (Global Market Share in 2010)
Sandoz International (48.4%)
Teva Pharmaceutical(29.3%)
Other* (22.3%)
Opportunities • Cost
• Safety and efficacy data
• Testing in specific populations
• Reputation of the manufacturer
What are the key opportunities and risks for this market? Which companies are successful in this market and why?
• Products with different
administration routes may gain
favor over less-desirable
methods.
• Doctors may not be willing to
switch patients from
biopharmaceutical to biosimilar.
• Biosimilars are not expected to
provide as significant cost-
savings as generics.
Risks
Source: Frost & Sullivan Vital Signs June 2012, Global Biosimilars Market.
*Other includes revenues of
remaining market participants.
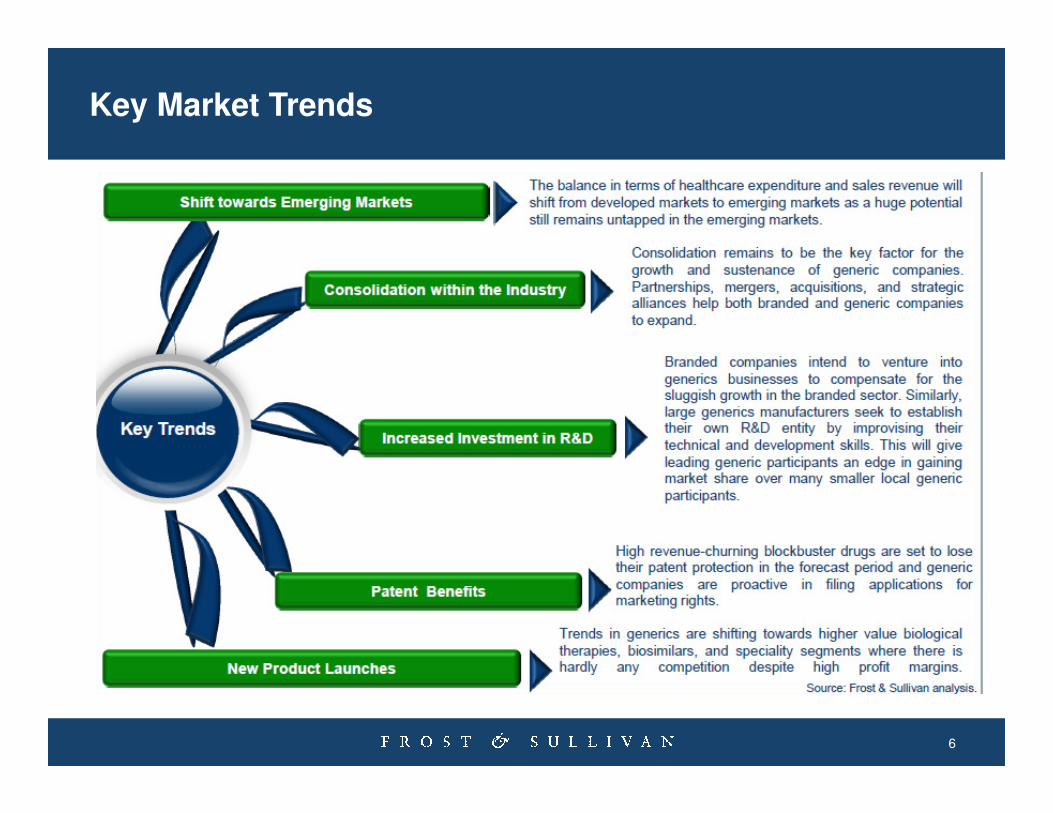
Key Market Trends
6
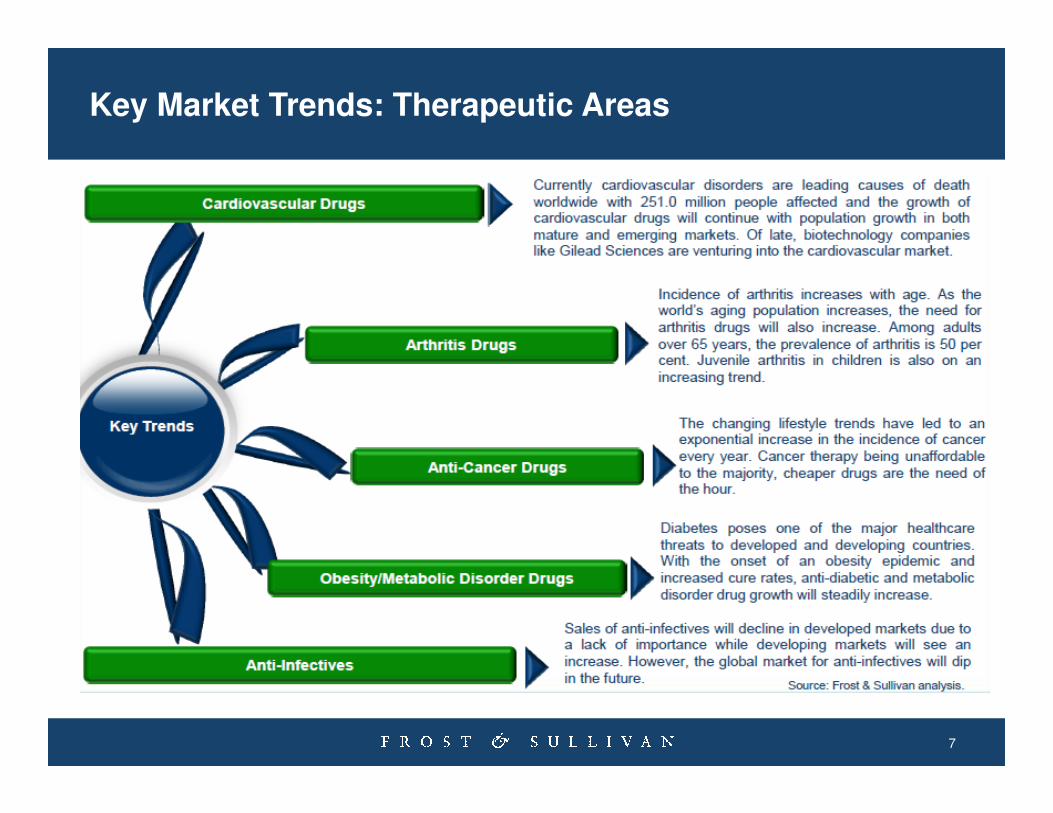
Key Market Trends: Therapeutic Areas
7
Asia outlook
8
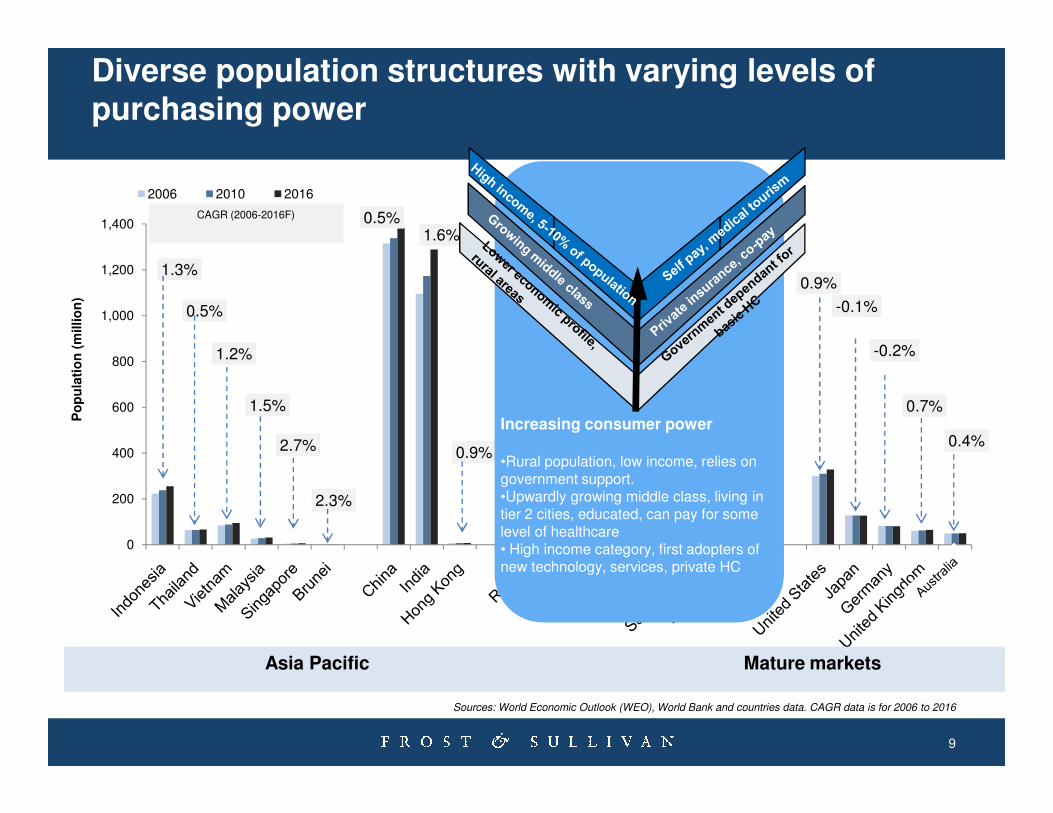
Diverse population structures with varying levels of purchasing power
1.3%
0.5%
1.2%
1.5%
0.5%1.6%
-0.5%
1.0%
2.1%-0.2%
0.9%
-0.1%
-0.2%
0.7%600
800
1,000
1,200
1,400
Po
pu
lati
on
(m
illio
n)
2006 2010 2016
CAGR (2006-2016F)
9
1.5%
2.7%
2.3%
0.9%
2.6%
0.2%
3.9%
0.7%
0.4%
0
200
400
600
Po
pu
lati
on
(m
illio
n)
Asia Pacific Mature markets
Sources: World Economic Outlook (WEO), World Bank and countries data. CAGR data is for 2006 to 2016
Increasing consumer power
•Rural population, low income, relies on government support. •Upwardly growing middle class, living in tier 2 cities, educated, can pay for some level of healthcare• High income category, first adopters of new technology, services, private HC
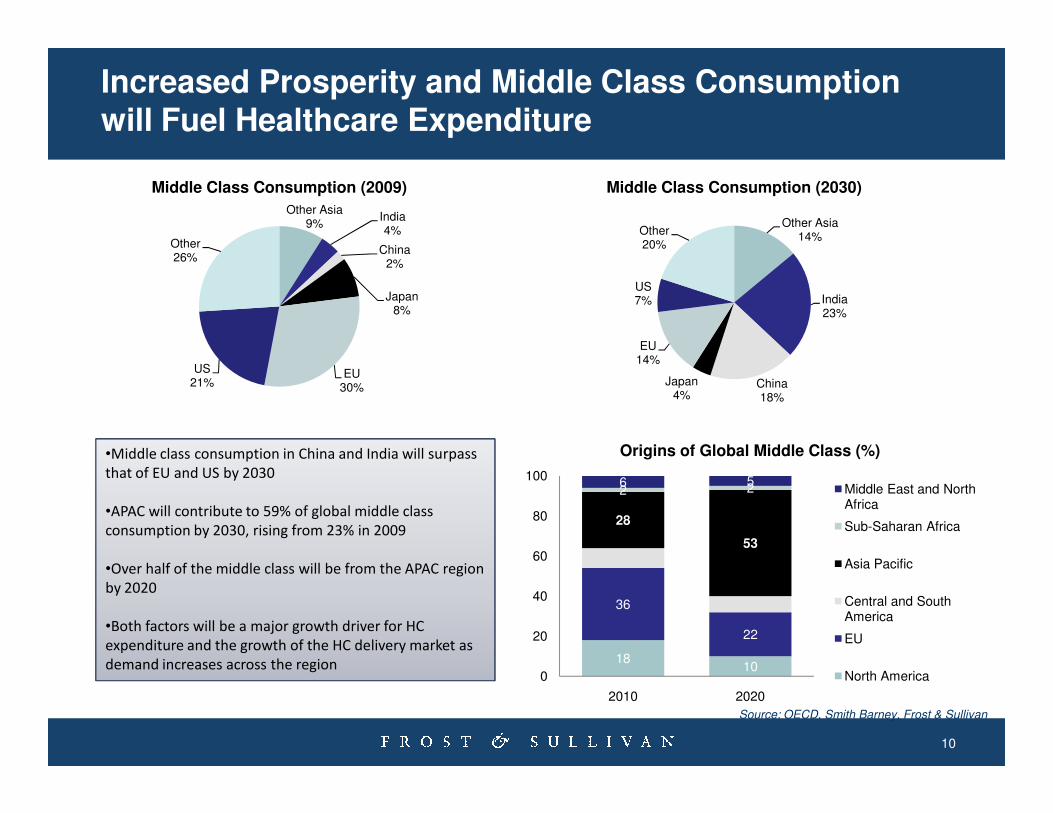
Increased Prosperity and Middle Class Consumption will Fuel Healthcare Expenditure
Other Asia9%
India4%
China2%
Japan8%
EU30%
US21%
Other26%
Middle Class Consumption (2009)
Other Asia14%
India23%
China18%
Japan4%
EU14%
US7%
Other20%
Middle Class Consumption (2030)
10
•Middle class consumption in China and India will surpass
that of EU and US by 2030
•APAC will contribute to 59% of global middle class
consumption by 2030, rising from 23% in 2009
•Over half of the middle class will be from the APAC region
by 2020
•Both factors will be a major growth driver for HC
expenditure and the growth of the HC delivery market as
demand increases across the region 1810
36
22
28
53
2 26 5
0
20
40
60
80
100
2010 2020
Origins of Global Middle Class (%)
Middle East and North Africa
Sub-Saharan Africa
Asia Pacific
Central and South America
EU
North America
Source: OECD, Smith Barney, Frost & Sullivan
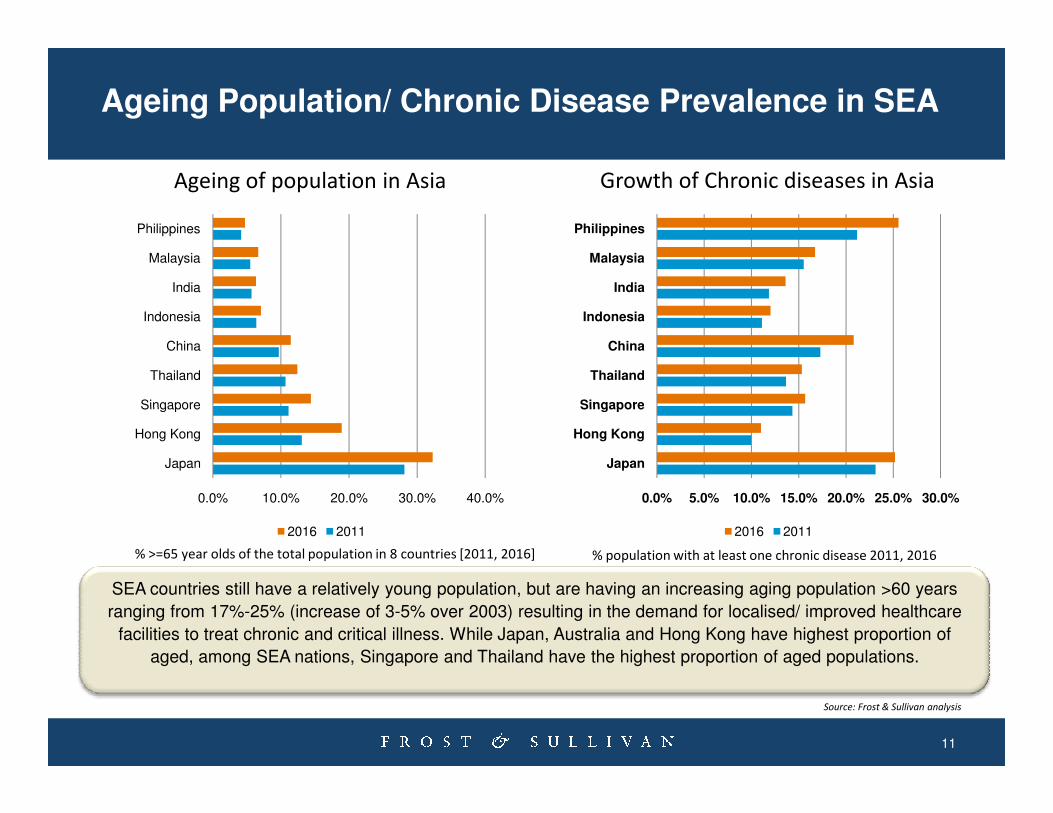
Ageing Population/ Chronic Disease Prevalence in SEA
Ageing of population in Asia Growth of Chronic diseases in Asia
Singapore
Thailand
China
Indonesia
India
Malaysia
Philippines
Singapore
Thailand
China
Indonesia
India
Malaysia
Philippines
11
SEA countries still have a relatively young population, but are having an increasing aging population >60 years
ranging from 17%-25% (increase of 3-5% over 2003) resulting in the demand for localised/ improved healthcare
facilities to treat chronic and critical illness. While Japan, Australia and Hong Kong have highest proportion of
aged, among SEA nations, Singapore and Thailand have the highest proportion of aged populations.
% population with at least one chronic disease 2011, 2016% >=65 year olds of the total population in 8 countries [2011, 2016]
0.0% 5.0% 10.0% 15.0% 20.0% 25.0% 30.0%
Japan
Hong Kong
Singapore
2016 2011
0.0% 10.0% 20.0% 30.0% 40.0%
Japan
Hong Kong
Singapore
2016 2011
Source: Frost & Sullivan analysis

The Last Word
12
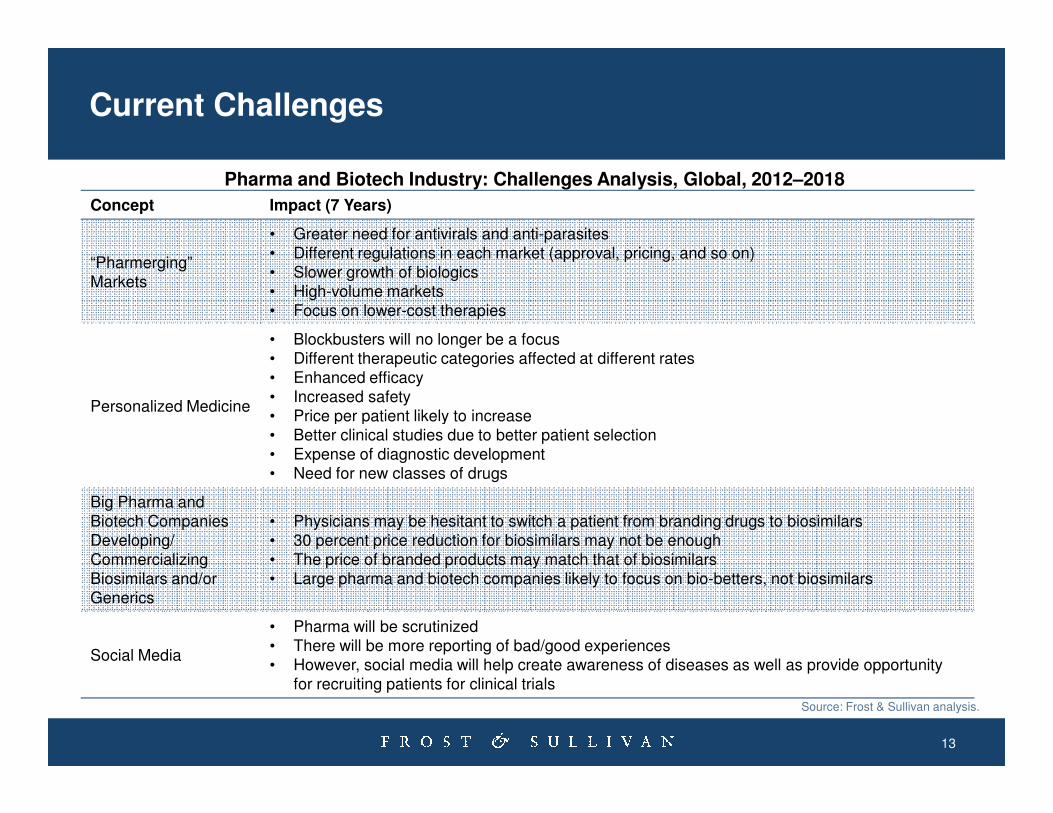
Current Challenges
Concept Impact (7 Years)
“Pharmerging” Markets
• Greater need for antivirals and anti-parasites• Different regulations in each market (approval, pricing, and so on)• Slower growth of biologics• High-volume markets• Focus on lower-cost therapies
Personalized Medicine
• Blockbusters will no longer be a focus• Different therapeutic categories affected at different rates• Enhanced efficacy• Increased safety• Price per patient likely to increase
Pharma and Biotech Industry: Challenges Analysis, Global, 2012–2018
13
Personalized Medicine• Price per patient likely to increase• Better clinical studies due to better patient selection• Expense of diagnostic development• Need for new classes of drugs
Big Pharma and Biotech Companies Developing/CommercializingBiosimilars and/orGenerics
• Physicians may be hesitant to switch a patient from branding drugs to biosimilars• 30 percent price reduction for biosimilars may not be enough • The price of branded products may match that of biosimilars• Large pharma and biotech companies likely to focus on bio-betters, not biosimilars
Social Media
• Pharma will be scrutinized• There will be more reporting of bad/good experiences• However, social media will help create awareness of diseases as well as provide opportunity
for recruiting patients for clinical trials
Source: Frost & Sullivan analysis.

The Last Word
14
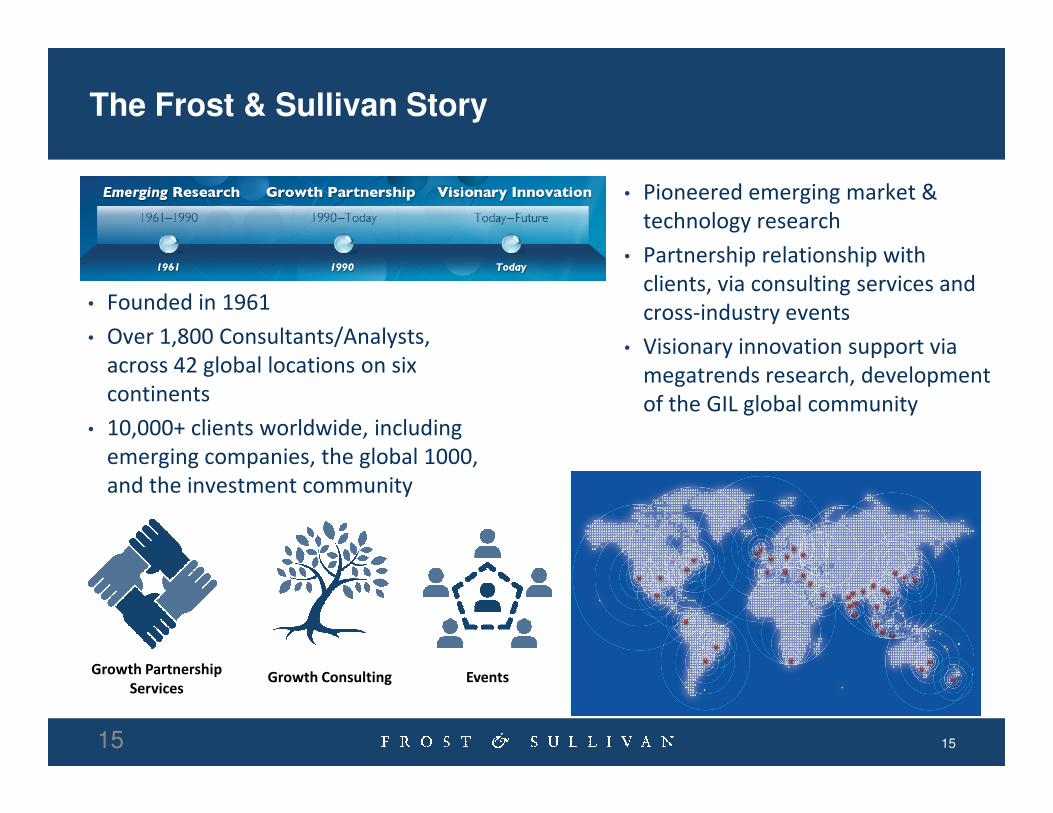
The Frost & Sullivan Story
• Founded in 1961
• Over 1,800 Consultants/Analysts,
across 42 global locations on six
continents
• Pioneered emerging market &
technology research
• Partnership relationship with
clients, via consulting services and
cross-industry events
• Visionary innovation support via
megatrends research, development
of the GIL global community
15
continents
• 10,000+ clients worldwide, including
emerging companies, the global 1000,
and the investment community
Growth Partnership
ServicesGrowth Consulting Events
15
of the GIL global community
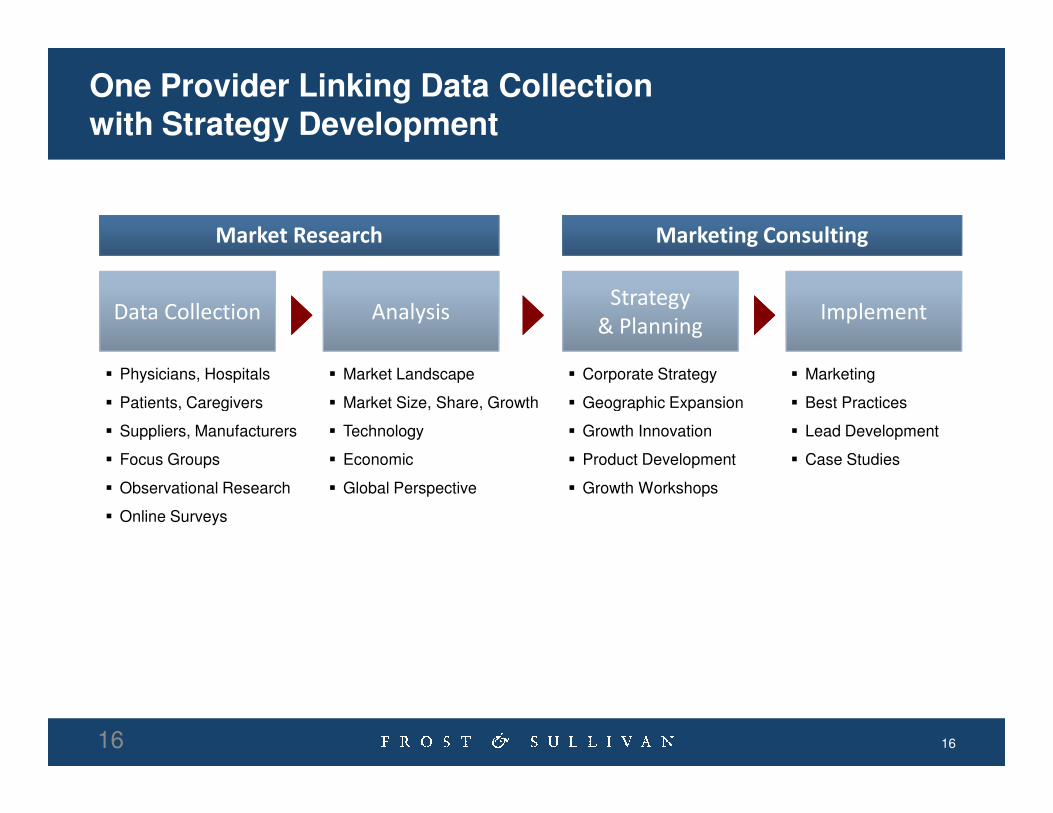
One Provider Linking Data Collection with Strategy Development
Market Research Marketing Consulting
Data Collection AnalysisStrategy
& PlanningImplement
� Physicians, Hospitals
� Patients, Caregivers
� Market Landscape
� Market Size, Share, Growth
� Corporate Strategy
� Geographic Expansion
� Marketing
� Best Practices
1616
� Patients, Caregivers
� Suppliers, Manufacturers
� Focus Groups
� Observational Research
� Online Surveys
� Market Size, Share, Growth
� Technology
� Economic
� Global Perspective
� Geographic Expansion
� Growth Innovation
� Product Development
� Growth Workshops
� Best Practices
� Lead Development
� Case Studies
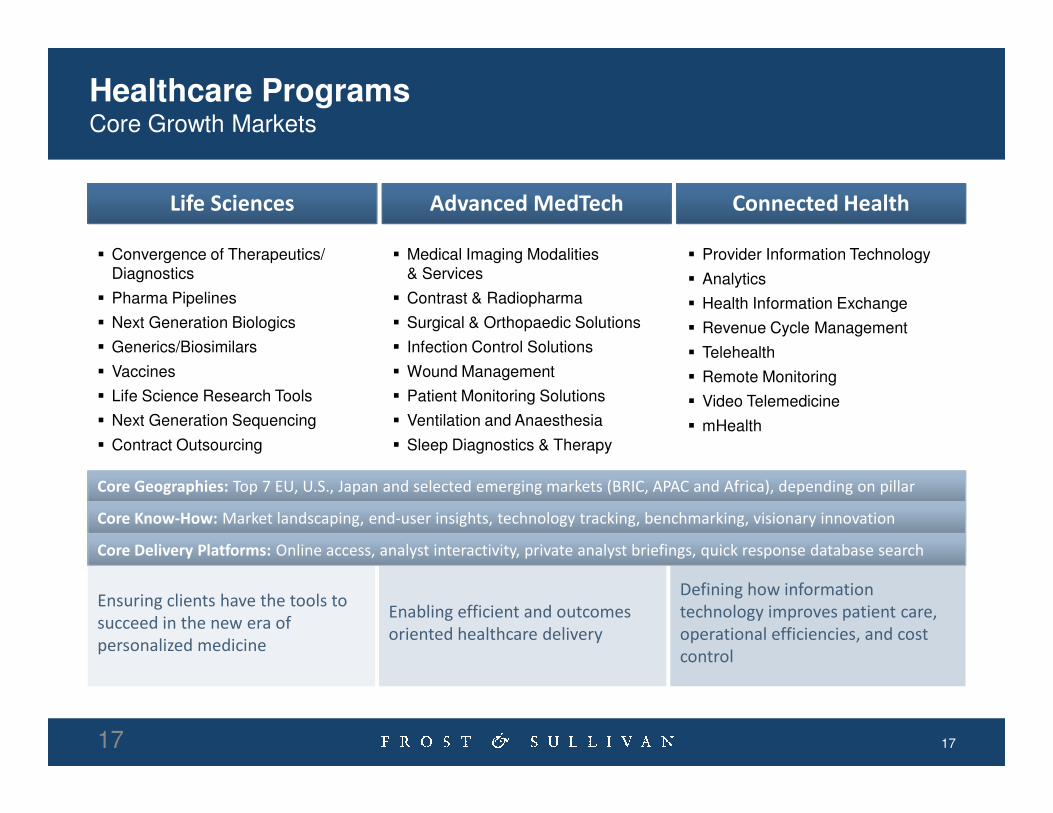
Healthcare ProgramsCore Growth Markets
� Convergence of Therapeutics/Diagnostics
� Pharma Pipelines
� Next Generation Biologics
� Generics/Biosimilars
� Vaccines
� Life Science Research Tools
Life Sciences Advanced MedTech Connected Health
� Medical Imaging Modalities& Services
� Contrast & Radiopharma
� Surgical & Orthopaedic Solutions
� Infection Control Solutions
� Wound Management
� Patient Monitoring Solutions
� Provider Information Technology
� Analytics
� Health Information Exchange
� Revenue Cycle Management
� Telehealth
� Remote Monitoring
� Video Telemedicine
17
Enabling efficient and outcomes
oriented healthcare delivery
Defining how information
technology improves patient care,
operational efficiencies, and cost
control
Ensuring clients have the tools to
succeed in the new era of
personalized medicine
17
� Next Generation Sequencing
� Contract Outsourcing
� Ventilation and Anaesthesia
� Sleep Diagnostics & Therapy
� Video Telemedicine
� mHealth
Core Geographies: Top 7 EU, U.S., Japan and selected emerging markets (BRIC, APAC and Africa), depending on pillar
Core Know-How: Market landscaping, end-user insights, technology tracking, benchmarking, visionary innovation
Core Delivery Platforms: Online access, analyst interactivity, private analyst briefings, quick response database search
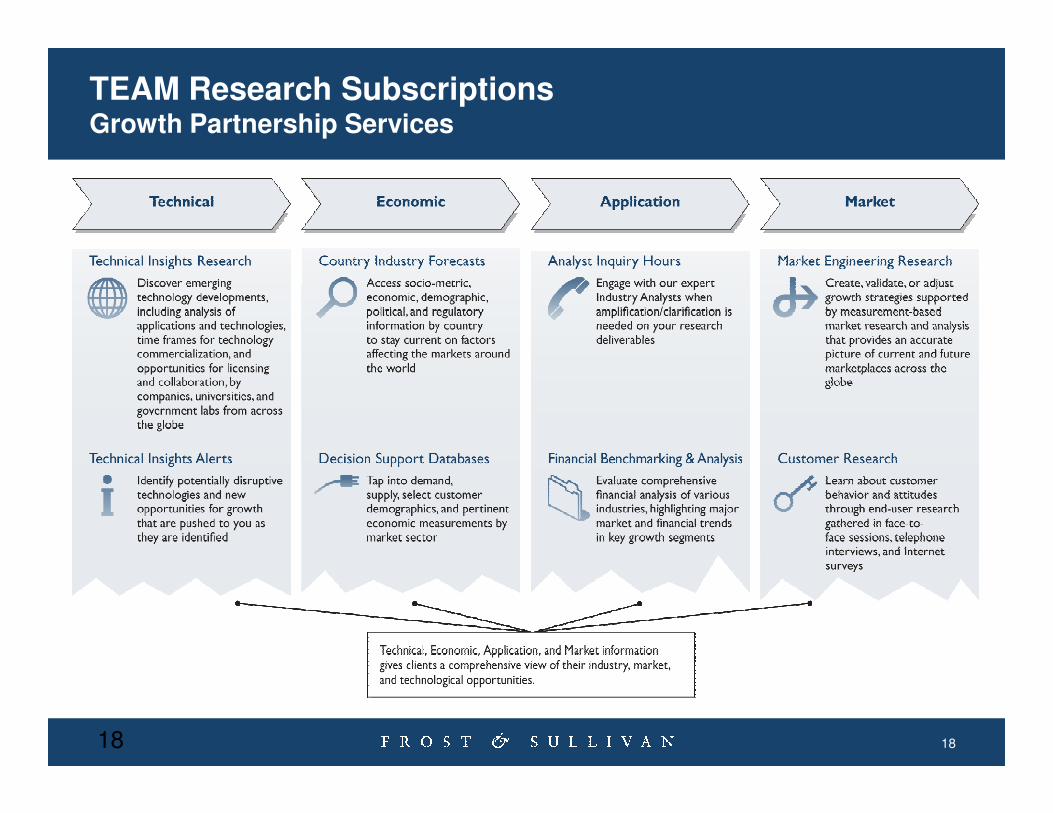
TEAM Research SubscriptionsGrowth Partnership Services
1818
Follow Frost & Sullivan on Facebook, LinkedIn, SlideShare, and Twitter
http://www.facebook.com/FrostandSullivan
http://www.linkedin.com/companies/4506
19
http://twitter.com/frost_sullivan
http://www.linkedin.com/companies/4506
http://www.slideshare.net/FrostandSullivan
Additional Information
Donna Jeremiah
Director Corporate Communications, Asia [email protected]: +61 (02) 8247 8927
20
Jessie Loh
ManagerCorporate Communications, Asia [email protected]. (65) 6890 0942
Carrie Low
ExecutiveCorporate Communications, Asia [email protected]. (603) 6204 5910
Contact Your Life Sciences Team
Jennifer BriceGlobal Program Manager – Life Sciences
+1 (650) 475 4560
Reenita DasGlobal Leader, Growth Partnership ServicesHealthcare
(+1) 408 8579 386
21
Geeta DhanoaAssociate Director, Growth Partnership Services – APAC, Healthcare
(+60) 03 62045828
Rhenu BhullerVice President, Healthcare GVP, Pharmaceuticals
(+65) 6890 0986
Related Documents