Prof. Claude Farrugia Vice‐President Communications, EIPG

Pharma 2014: Rework, Renaissance or Ragnarök?
Jul 17, 2015
Welcome message from author
This document is posted to help you gain knowledge. Please leave a comment to let me know what you think about it! Share it to your friends and learn new things together.
Transcript
Prof. Claude FarrugiaVice‐President Communications, EIPG
Is the storm over?
Malta, 2008

Is the storm over?
Malta, 2008
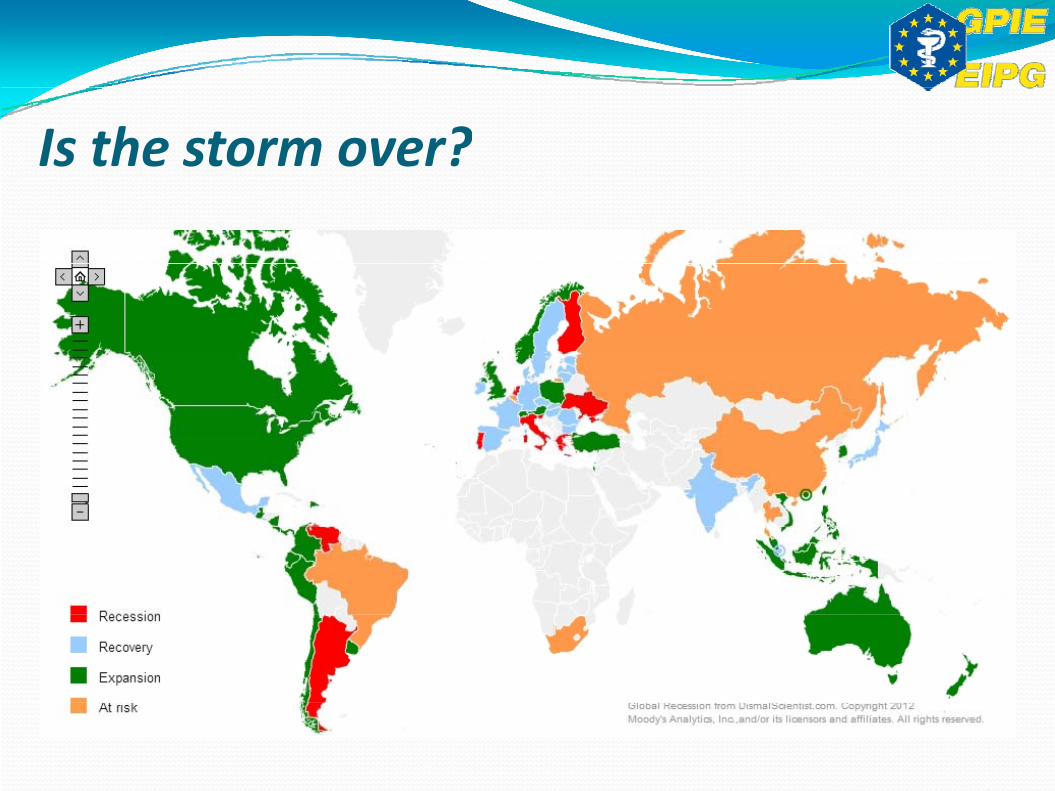
Is the storm over?
Malta, 2008

Drug Development is Riskyg p y

Drug Development is a Costly Businessg p y
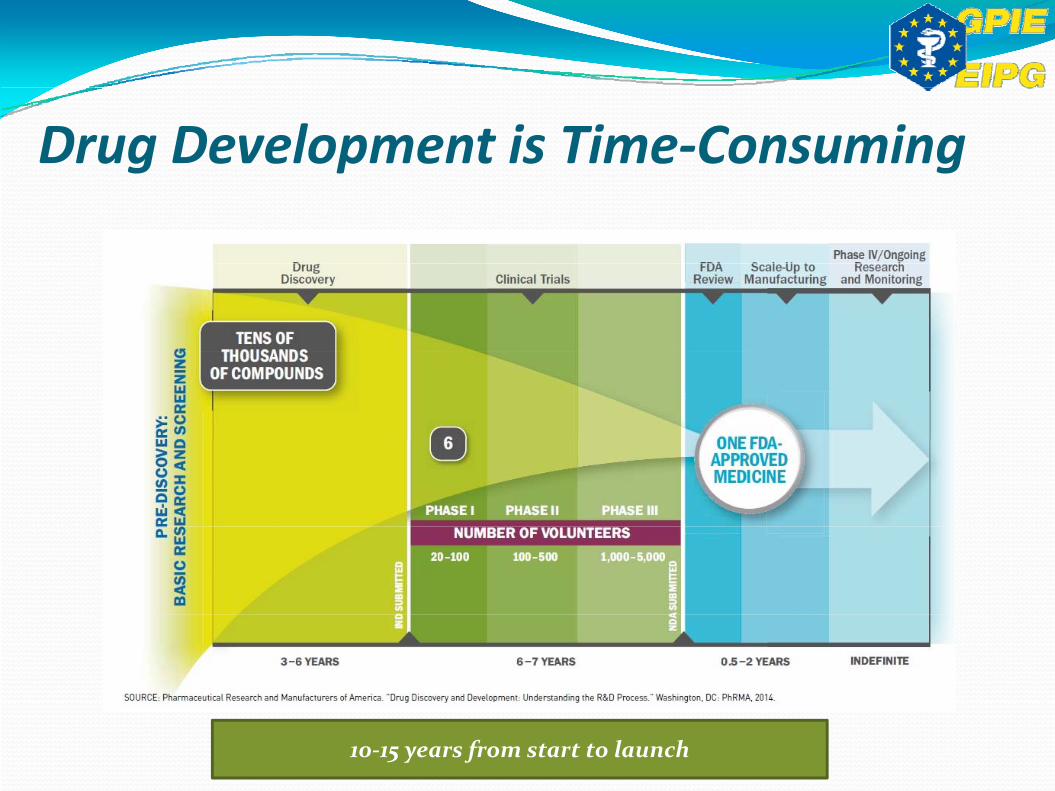
Drug Development is Time‐Consuming
10‐15 years from start to launch
Just to put things in perspective…p g p p

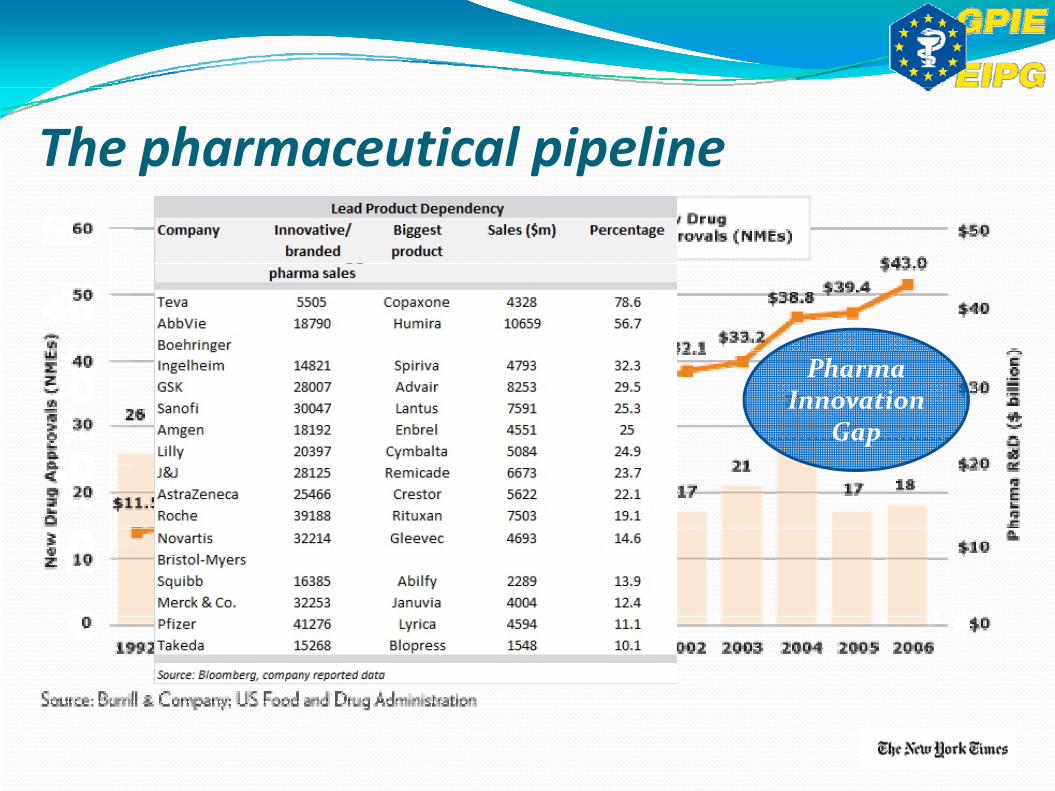
The pharmaceutical pipelinep p p
PharmaInnovation
GapGap

The pharmaceutical pipelinep p p
Source: Evaluate Pharma, 2014
The pharmaceutical pipelinep p p
PharmaInnovation
GapGap

Is there still a patent cliff?p ff
Source: Accenture Research, August 2012, based on Evaluate Pharma
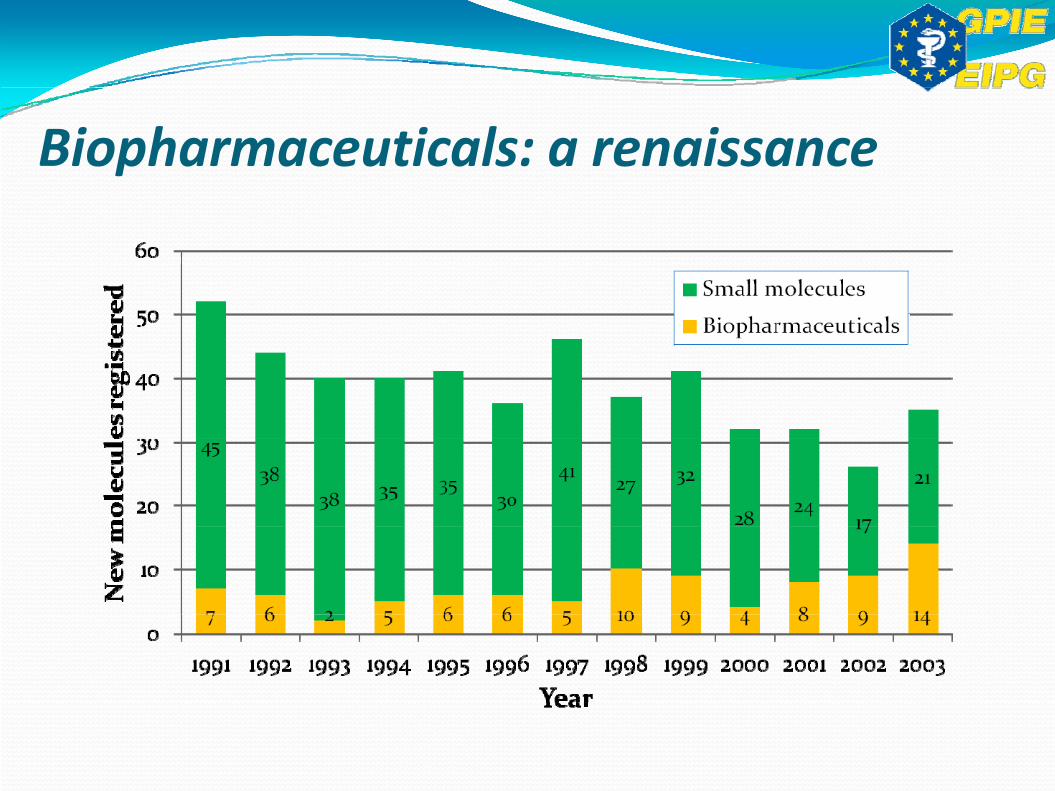
Biopharmaceuticals: a renaissancep

Biopharmaceuticals: a renaissancep

From pipeline to marketp p
Is Europe prepared to pay?The European Union constantly considers cost‐
p p p p y
containment policies in public pharmaceutical spending. External reference pricing as a tool to control prices and set a parameter of expenditures.p ces a d se a pa a e e o e pe d u es.
Rebates, clawback and payback policies.I t l f i i Internal reference pricing.
The inclusion of the most recent medicinal products in reimbursement lists or government p gformularies is sometimes inexplicably delayed.
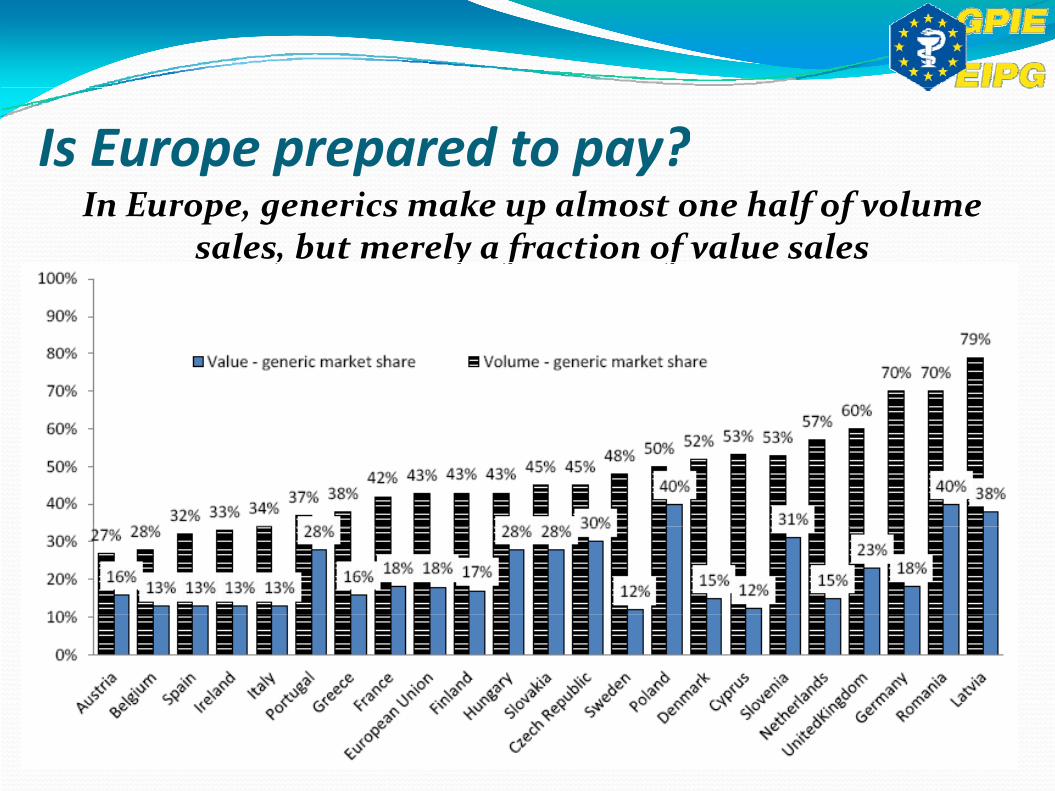
Is Europe prepared to pay?In Europe, generics make up almost one half of volume
sales, but merely a fraction of value sales
p p p p y
, y f f
Is Europe prepared to pay?p p p p y
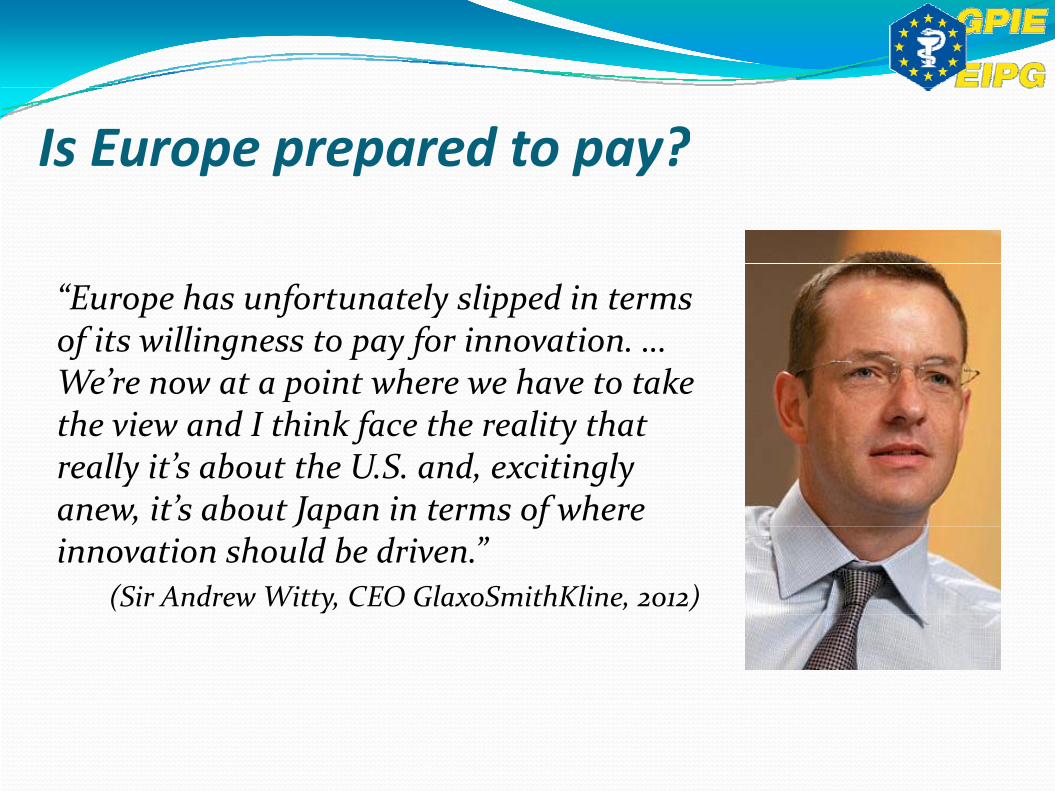
“Europe has unfortunately slipped in terms of its willingness to pay for innovation. … of its willingness to pay for innovation. … We’re now at a point where we have to take the view and I think face the reality that f yreally it’s about the U.S. and, excitingly anew, it’s about Japan in terms of where J p finnovation should be driven.”
(Sir Andrew Witty, CEO GlaxoSmithKline, 2012)
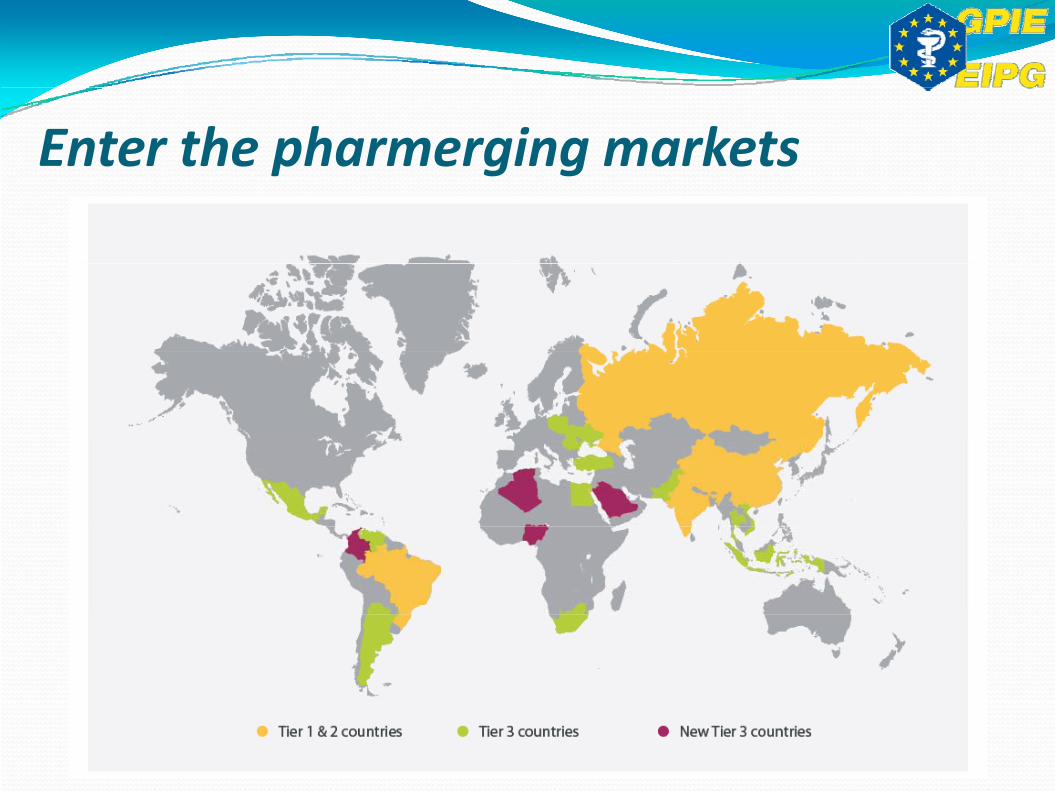
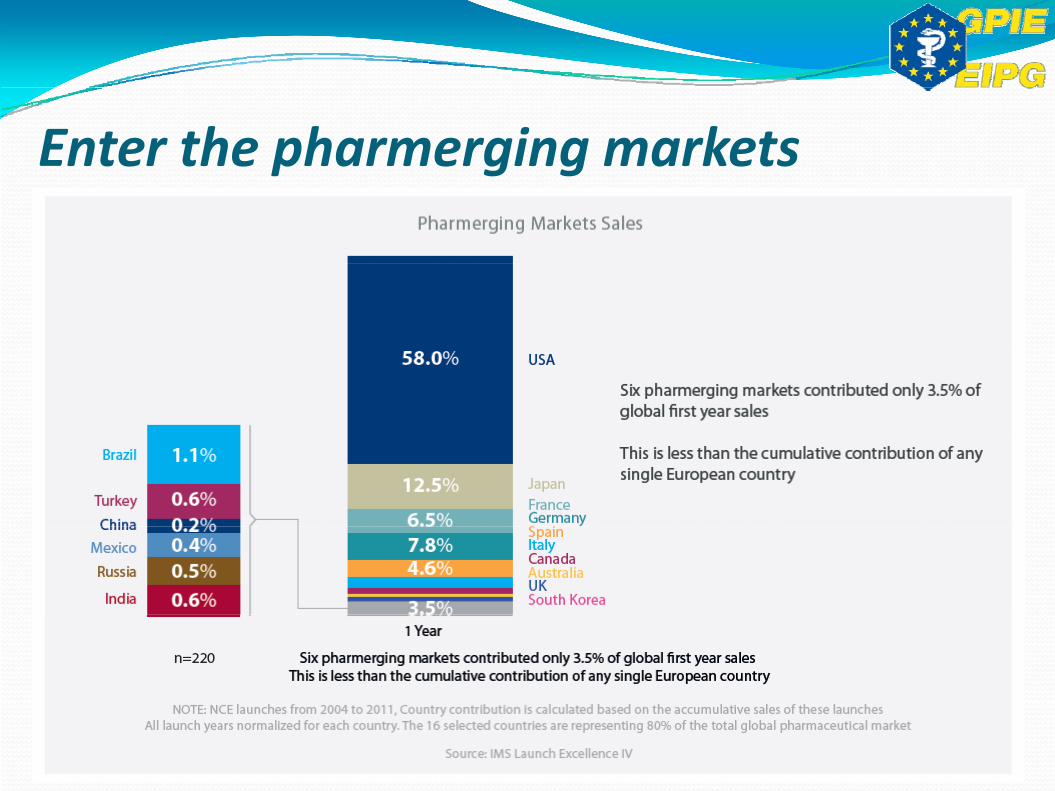
Enter the pharmerging marketsp g g

Enter the pharmerging marketsp g g

Enter the pharmerging marketsp g g
Enter the pharmerging marketsp g g
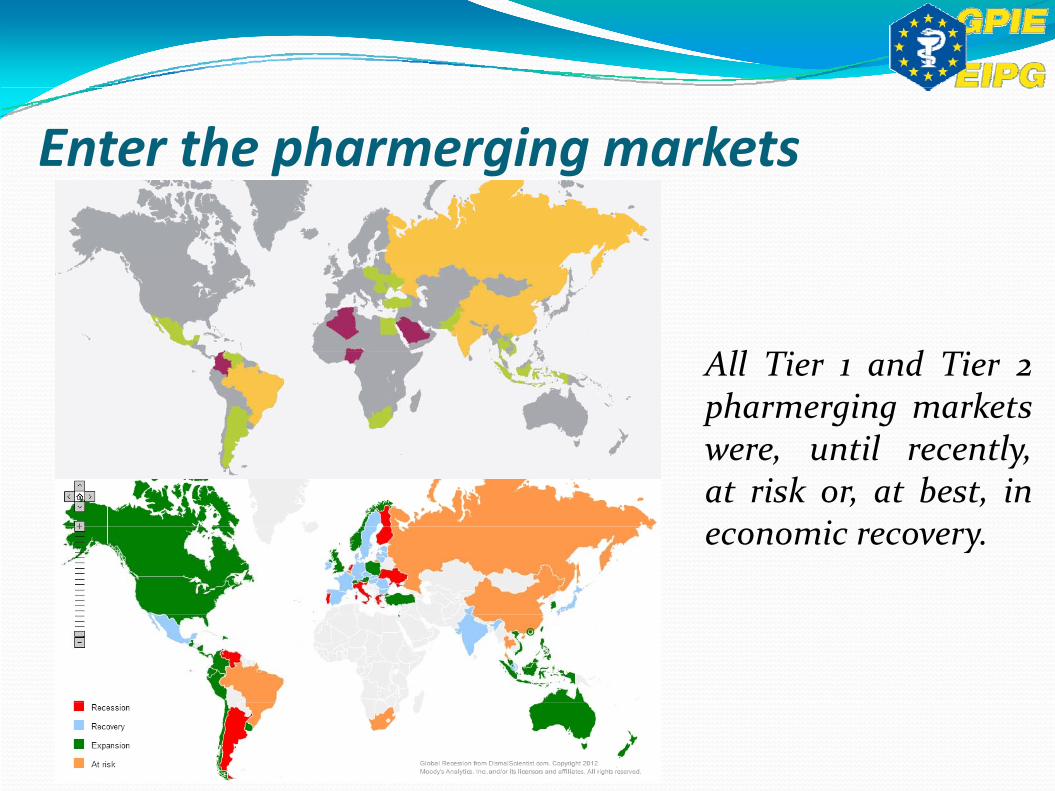
All dAll Tier 1 and Tier 2pharmerging markets
il lwere, until recently,at risk or, at best, in
ieconomic recovery.
Enter the pharmerging marketsp g g
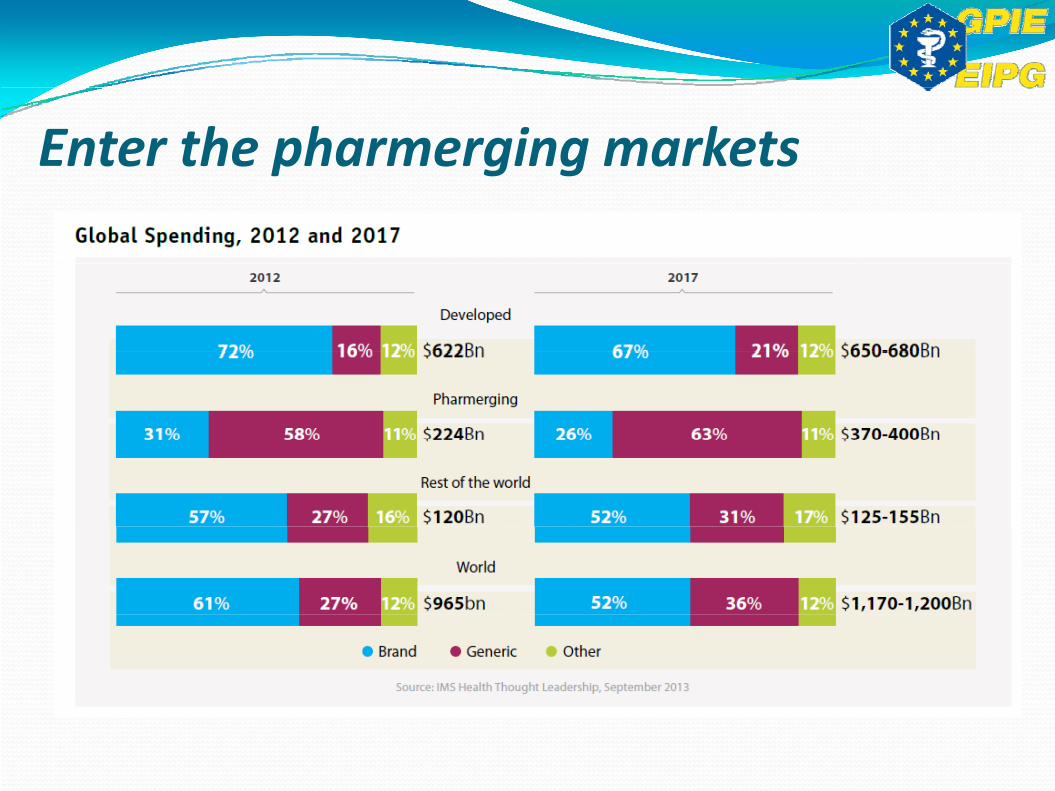
Enter the pharmerging marketsp g g
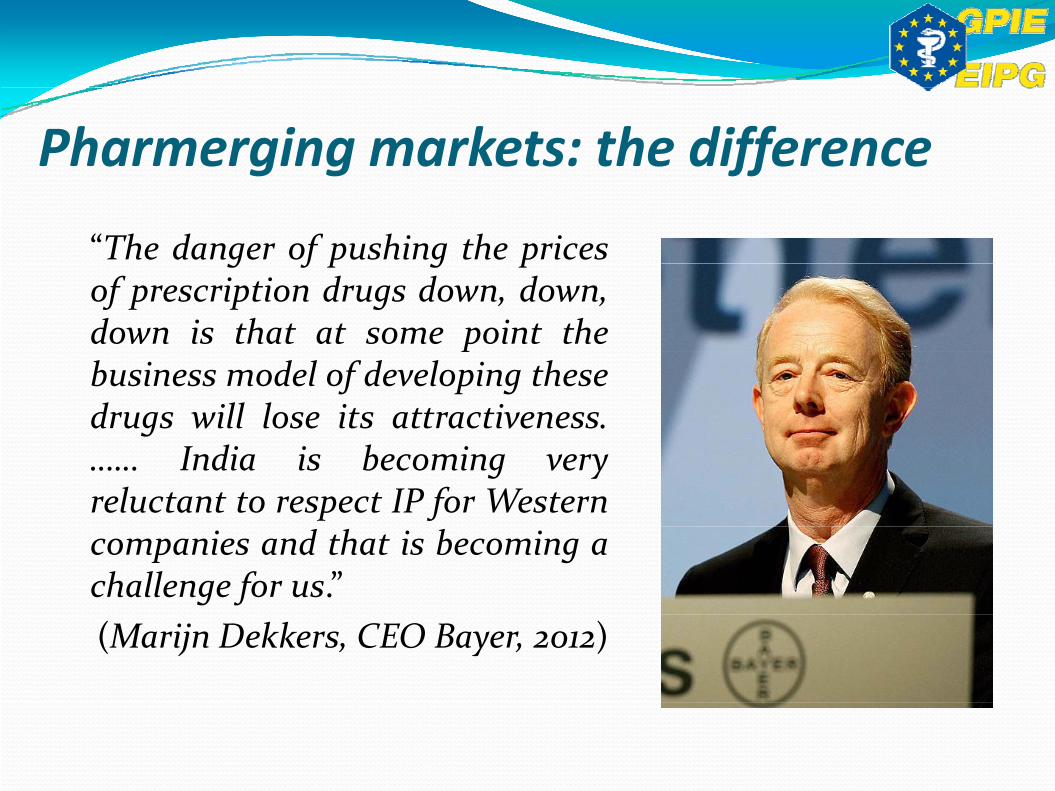
Pharmerging markets: the difference
“The danger of pushing the prices
g g ff
g f p g pof prescription drugs down, down,down is that at some point thepbusiness model of developing thesedrugs will lose its attractiveness.…… India is becoming veryreluctant to respect IP for Westerncompanies and that is becoming achallenge for us.”(Marijn Dekkers, CEO Bayer, 2012)
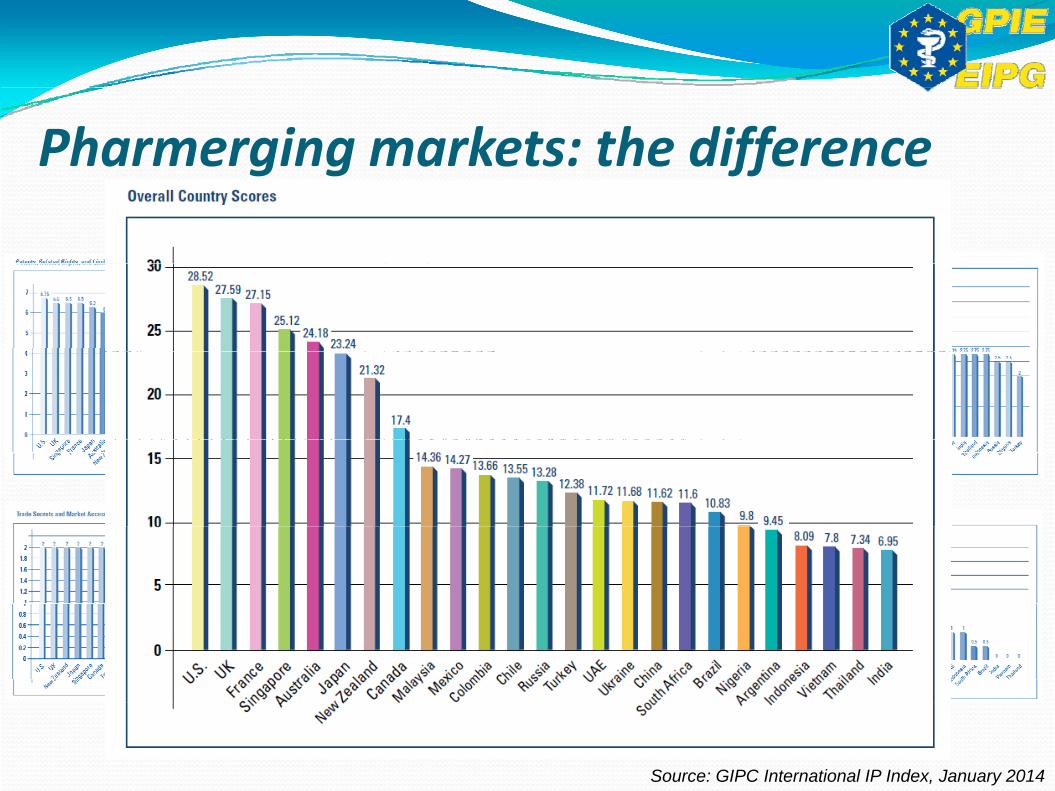
Pharmerging markets: the differenceg g ff
Source: GIPC International IP Index, January 2014

Pharmerging markets: the differenceg g ff

Pharmerging markets or players?g g p yGlobal share of pharma exports
95
100
85
90
utical produ
cts
75
80
re of pharm
aceu
65
70
ort m
arket shar
Other Japan
55
60Expo Switzerland India
China USA
EU‐25
Source: Blanc, 2014
502002 2003 2004 2005 2006 2007 2008 2009 2010 2011 2012 2013
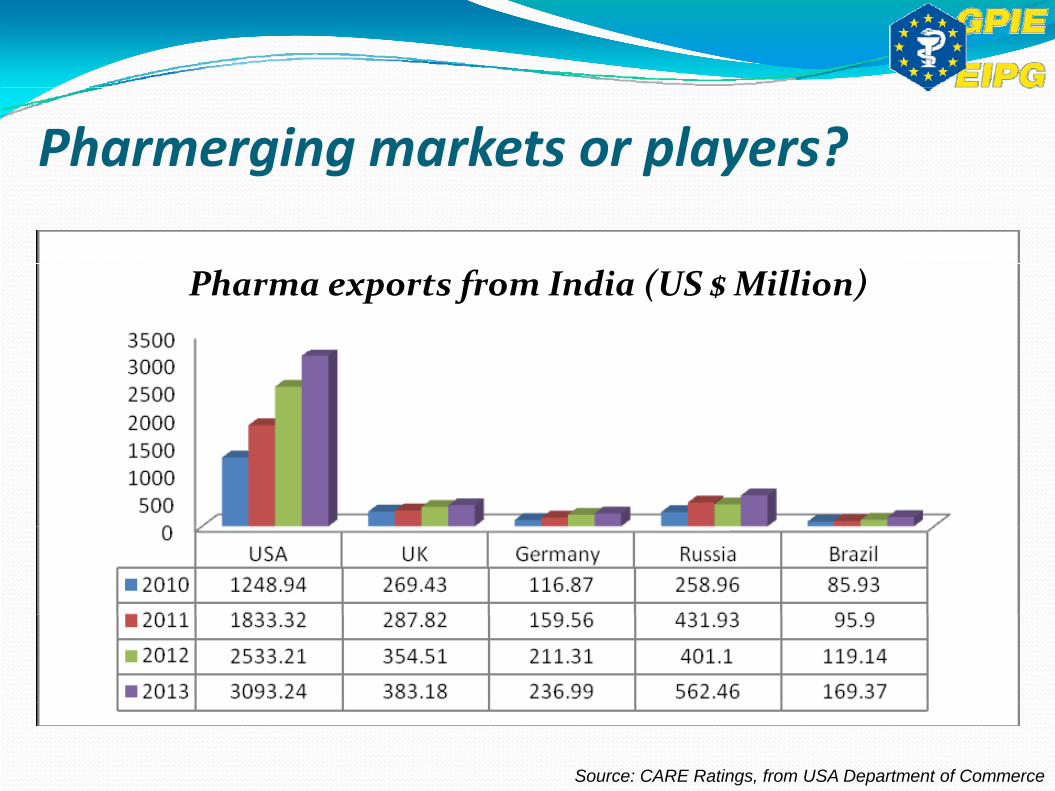
Pharmerging markets or players?g g p y
Pharma exports from India (US $ Million)
Source: CARE Ratings, from USA Department of Commerce
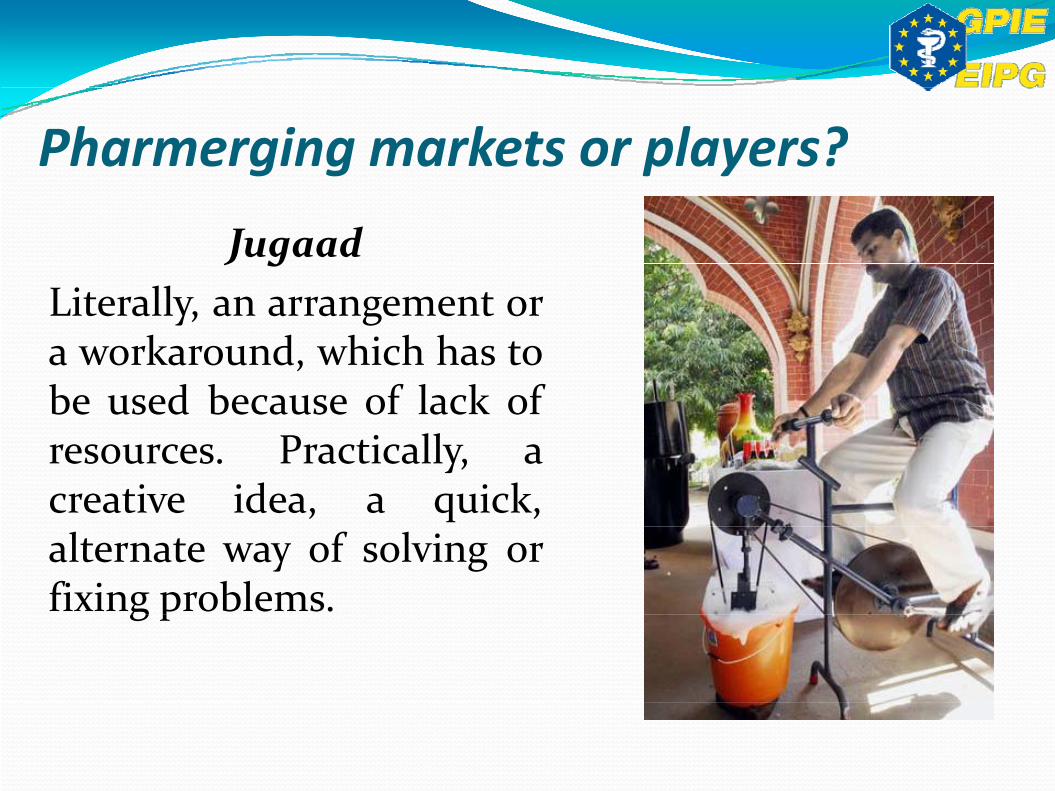
Pharmerging markets or players?Jugaad
g g p yJ g
Literally, an arrangement ora workaround which has toa workaround, which has tobe used because of lack of
P i llresources. Practically, acreative idea, a quick,alternate way of solving orfixing problems.g p

Pharmerging markets or players?g g p y
I th li it t j d?Is there a limit to jugaad?
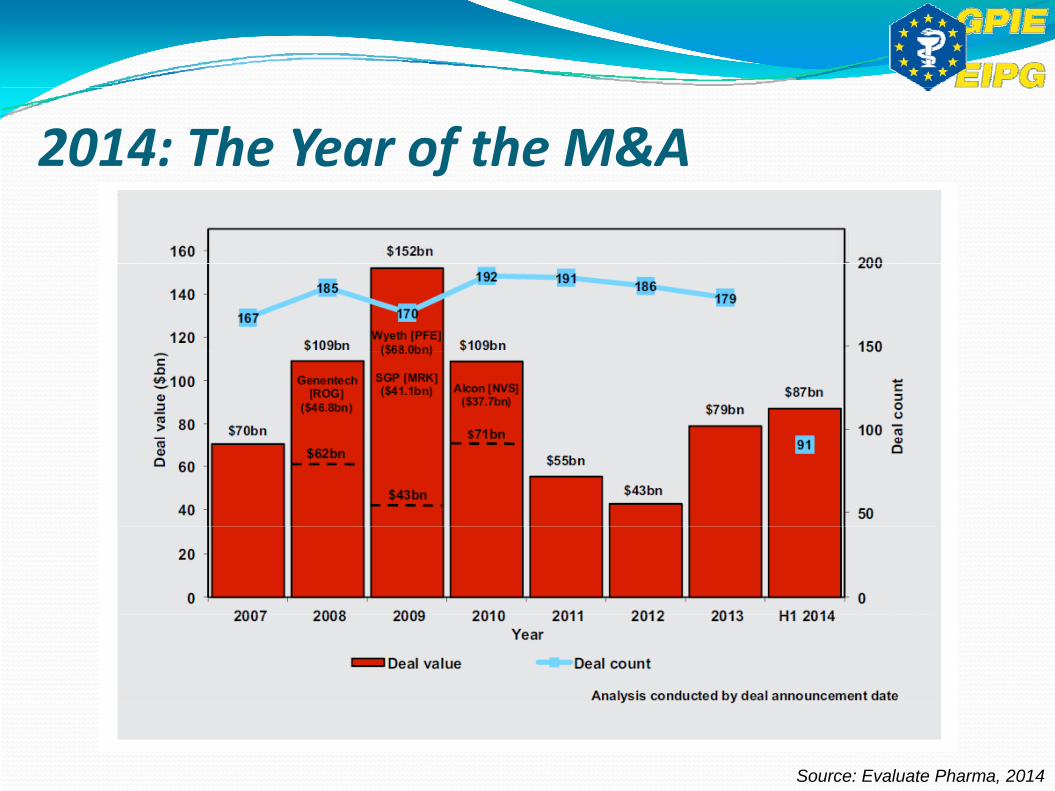
2014: The Year of the M&Af
Source: Evaluate Pharma, 2014
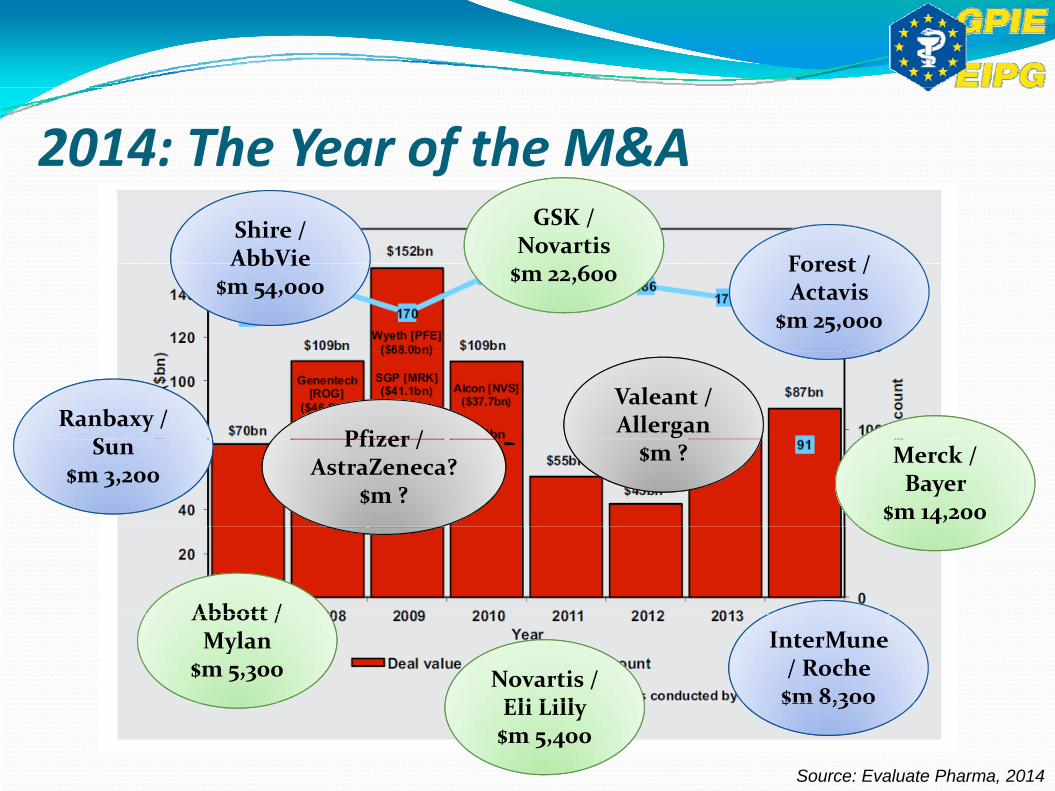
2014: The Year of the M&AfShire / AbbVie Forest /
GSK / NovartisAbbVie
$m 54,000Forest / Actavis
$m 25,000
$m 22,600
Ranbaxy / S
Valeant / AllerganPfizer /
Merck / Bayer
$m 14,200
Sun$m 3,200
$m ?Pfizer / AstraZeneca?
$m ?
Abbott / InterMune/ Roche $m 8,300
Novartis / Eli Lill
Abbott / Mylan
$m 5,300
Source: Evaluate Pharma, 2014
$m 8,300Eli Lilly$m 5,400
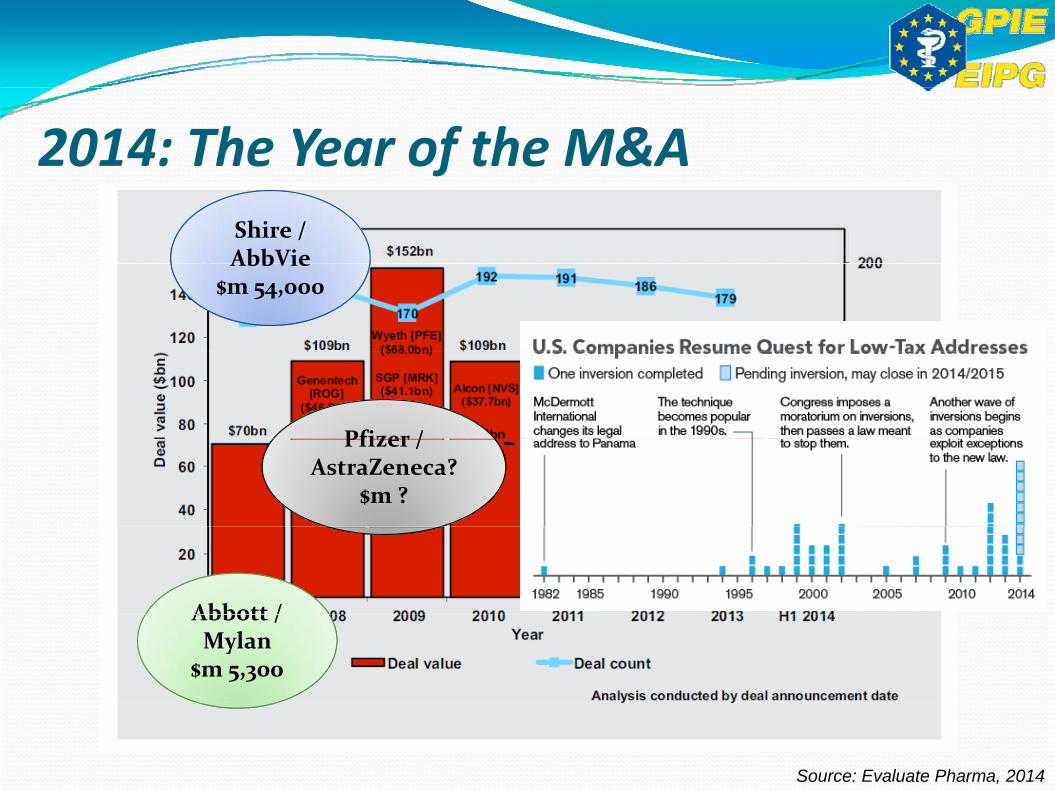
2014: The Year of the M&AfShire / AbbVieAbbVie
$m 54,000
Valeant / AllerganPfizer /
Merck / Bayer
$m 14,200
$m ?Pfizer / AstraZeneca?
$m ?
Abbott / Abbott / Mylan
$m 5,300
Source: Evaluate Pharma, 2014

2014: The Year of the M&AEnterprise
value Enterprise value to Gross
iProfit M i
Sales to Return on A
Return on invested GSA to
l
f
value growth
value to sales margin Margin assets Assets invested
capital sales
Shire 45.2% 4.84 81.50% 40.09% 66% 26.46% 29.02% 47.07%
Abbvie 47.9% 4.72 75.77% 38.25% 67% 25.63% 22.45% 42.30%
Actavis 116.3% 4.38 45.46% 20.90% 47% 9.28% ‐5.33% 25.79%
F % % % % % % %Forest 216.1% 7.12 79.14% 16.59% 37% 6.14% 7.12% 71.07%
Valeant 101.8% 9.70 44.79% 40.59% 29% 10.15% ‐4.71% 26.03%
All % 8 6 % 6% 6 % % % 6%Allergan 49.2% 5.02 85.64% 34.76% 64% 22.25% 15.95% 55.06%
Pfizer 6.7% 3.90 72.90% 45.17% 25% 13.10% 10.39% 40.21%
AstraZeneca 18 7% 2 74 75 06% 34 39% 49% 16 85% 8 26% 51 03%AstraZeneca 18.7% 2.74 75.06% 34.39% 49% 16.85% 8.26% 51.03%
GSK 12.9% 3.46 69.07% 32.33% 63% 20.37% 25.32% 42.08%
Source: Pharm Exec Industry Audit

2014: The Year of the M&AEnterprise
value Enterprise value to Gross
iProfit M i
Sales to Return on A
Return on invested GSA to
l
f
value growth
value to sales margin Margin assets Assets invested
capital sales
Shire 45.2% 4.84 81.50% 40.09% 66% 26.46% 29.02% 47.07%
Abbvie 47.9% 4.72 75.77% 38.25% 67% 25.63% 22.45% 42.30%
Actavis 116.3% 4.38 45.46% 20.90% 47% 9.28% ‐5.33% 25.79%
F % % % % % % %
Indicators of present d f t th
Operational metricsForest 216.1% 7.12 79.14% 16.59% 37% 6.14% 7.12% 71.07%
Valeant 101.8% 9.70 44.79% 40.59% 29% 10.15% ‐4.71% 26.03%
All % 8 6 % 6% 6 % % % 6%
and future growth
Allergan 49.2% 5.02 85.64% 34.76% 64% 22.25% 15.95% 55.06%
Pfizer 6.7% 3.90 72.90% 45.17% 25% 13.10% 10.39% 40.21%
AstraZeneca 18 7% 2 74 75 06% 34 39% 49% 16 85% 8 26% 51 03%AstraZeneca 18.7% 2.74 75.06% 34.39% 49% 16.85% 8.26% 51.03%
GSK 12.9% 3.46 69.07% 32.33% 63% 20.37% 25.32% 42.08%
Source: Pharm Exec Industry Audit
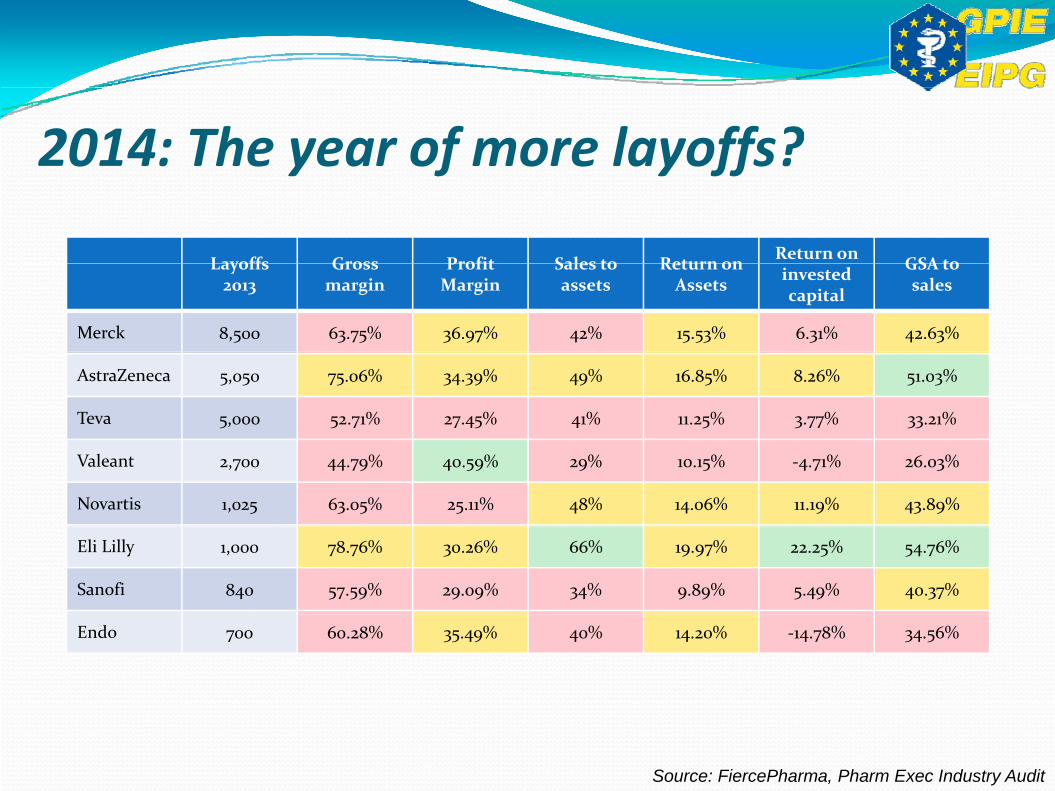
2014: The year of more layoffs?
Layoffs Gross Profit Sales to Return on Return on GSA to
y f y ff
Layoffs2013
Gross margin
Profit Margin
Sales to assets
Return on Assets invested
capital
GSA to sales
Merck 8,500 63.75% 36.97% 42% 15.53% 6.31% 42.63%
AstraZeneca 5,050 75.06% 34.39% 49% 16.85% 8.26% 51.03%
Teva 5,000 52.71% 27.45% 41% 11.25% 3.77% 33.21%
Valeant 2,700 44.79% 40.59% 29% 10.15% ‐4.71% 26.03%
Novartis 1,025 63.05% 25.11% 48% 14.06% 11.19% 43.89%
Eli Lilly 1,000 78.76% 30.26% 66% 19.97% 22.25% 54.76%
Sanofi 840 57.59% 29.09% 34% 9.89% 5.49% 40.37%
Endo 700 60.28% 35.49% 40% 14.20% ‐14.78% 34.56%
Source: FiercePharma, Pharm Exec Industry Audit
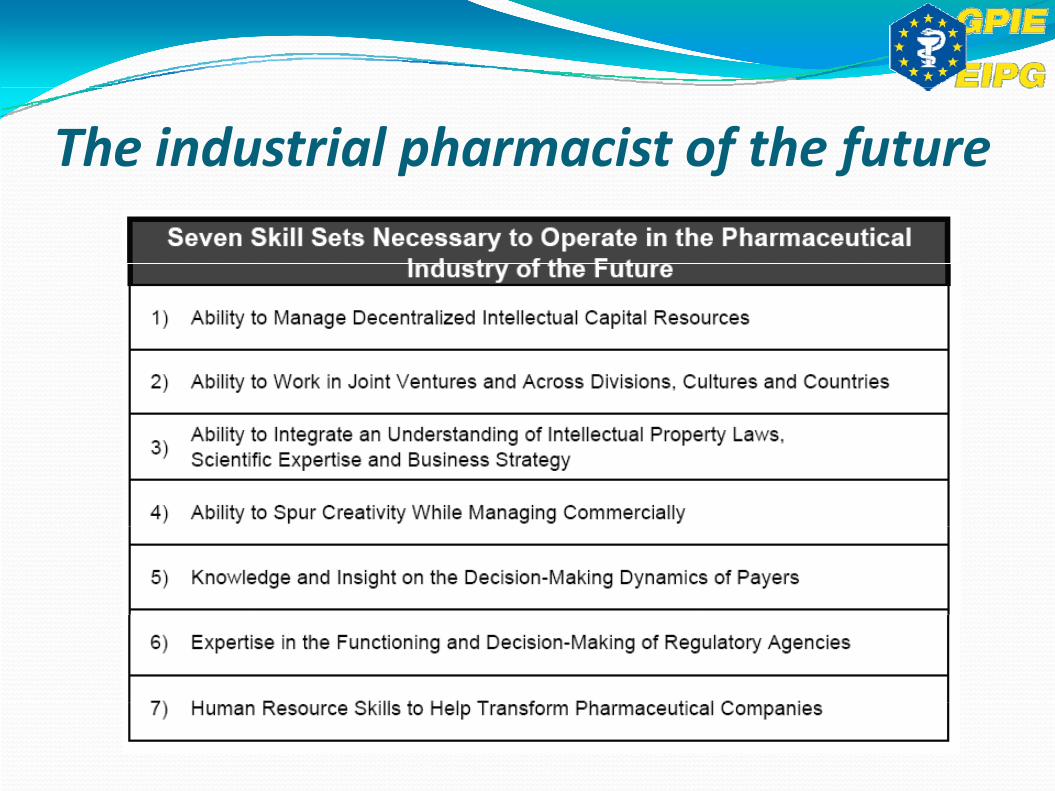
The industrial pharmacist of the futurep f f

RenaissanceRework Ragnarökg

European Industrial Pharmacists Group
Related Documents