The Integration between Knowledge Management and Total Quality Management and its Impact on Educational Performance Mohammad Mehdi Berrish Ph. D. Thesis 2016

Welcome message from author
This document is posted to help you gain knowledge. Please leave a comment to let me know what you think about it! Share it to your friends and learn new things together.
Transcript
The Integration between Knowledge Management
and Total Quality Management and its Impact on
Educational Performance
Mohammad Mehdi Berrish
Ph. D. Thesis 2016
II
The Integration between Knowledge Management
and Total Quality Management and its Impact on
Educational Performance.
Mohammad Mehdi Berrish
School of the Built Environment, University of Salford, Salford, UK
Submitted in Partial Fulfillment of the Requirements
of the Degree of Doctor of Philosophy, Feb 2016
I
TABLE OF CONTANETS
TABLE OF CONTANETS ..........................................................................................................I LIST OF TABLES ..................................................................................................................... V
GLOSSARY OF TERMS AND ABBREVIATIONS ............................................................... X ABSTRACT.............................................................................................................................. XI CHAPTER ONE ......................................................................................................................... 1
INTRODUCTION ...................................................................................................................... 1 1.1 Introduction ..................................................................................................................... 1
1.2 Jordan: General Overview............................................................................................... 2 1.2.1 The Education System in Jordan ..................................................................................... 2 1.2.2 Higher Education............................................................................................................. 3
1.2.3 Universities in Jordan ...................................................................................................... 3 1.2.4 Background of the Study................................................................................................. 4
1.2.5 The Quality of Higher Education in Jordan .................................................................... 5 1.2.6 The Dearth of Research on KM and TQM in Jordan ...................................................... 6 1.3 The Research Problem .................................................................................................... 7
1.4 Importance of the Study .................................................................................................. 8 1.5 Study Aim and Objectives............................................................................................... 9
1.6 Research Conceptual Framework.................................................................................. 10 1.6.1 Research Framework ..................................................................................................... 10 1.6.2 Theoretical Framework ................................................................................................. 11
1.7 Research Variables ........................................................................................................ 11 1.8 Research Hypotheses..................................................................................................... 12
1.8.1 The First Hypothesis: .................................................................................................... 12 1.8.2 The Second Hypothesis ................................................................................................. 13 1.9 Thesis Structure. ............................................................................................................ 14
1.10 Summary ....................................................................................................................... 16 CHAPTER TWO ...................................................................................................................... 17
KNOWLEDGE MANAGEMENT ........................................................................................... 17 2.1 Introduction ................................................................................................................... 17 2.2 Knowledge .................................................................................................................... 17
2.2.1 The Historical Background of Knowledge.................................................................... 18 2.2.2 The Concept of Knowledge........................................................................................... 18
2.2.3 Organisational Knowledge ............................................................................................ 21 2.2.4 The Importance of Knowledge...................................................................................... 23 2.2.5 Knowledge and Related Terminologies ........................................................................ 24
2.2.6 Knowledge Resources ................................................................................................... 27 2.2.7 Knowledge Types.......................................................................................................... 27
2.3 Knowledge Management (KM) .................................................................................... 29 2.3.1 Emergence of Knowledge Management ....................................................................... 30 2.3.2 The Concept of KM....................................................................................................... 31
2.3.3 Models of KM ............................................................................................................... 33 2.3.4 Elements of KM ............................................................................................................ 36
2.3.4.1 KM Processes ................................................................................................................ 37 2.3.4.2 KM Technology ............................................................................................................ 44 2.3.4.3 Knowledge Team .......................................................................................................... 50
2.3.5 KM in Higher Education Institutions ............................................................................ 56 2.3.5.1 Concept of KM in Educational Institutions................................................................... 56
2.3.5.2 Justifications for the Application of KM in Educational Institutions ........................... 59 2.3.6 Previous Studies Related to KM ................................................................................... 60
II
2.4 Summary ....................................................................................................................... 61 CHAPTER THREE .................................................................................................................. 62 TOTAL QUALITY MANAGEMENT ..................................................................................... 62
3.1 Introduction ................................................................................................................... 62 3.2 Quality ........................................................................................................................... 62
3.2.1 The Concept of Quality ................................................................................................. 63 3.2.2 Quality in Education...................................................................................................... 64 3.2.3 Inspection ...................................................................................................................... 66
3.2.4 Quality control............................................................................................................... 66 3.2.5 Quality Assurance ......................................................................................................... 66
3.3 Total Quality Management (TQM) ............................................................................... 67 3.3.1 The Concept of TQM .................................................................................................... 67 3.3.2 Total quality management (TQM) Definition ............................................................... 69
3.3.3 TQM as a Comprehensive System ................................................................................ 72 3.3.4 TQM as an Approach .................................................................................................... 72
3.3.5 TQM as a Philosophy .................................................................................................... 73 3.3.6 The Components of TQM ............................................................................................. 75 3.3.7 Quality Experts and their Contributions........................................................................ 77
3.3.7.1 Edwards W. Deming ..................................................................................................... 77 3.3.7.2 Joseph M. Juran ............................................................................................................. 79
3.3.7.3 Philip Crosby................................................................................................................. 81 3.3.7.4 Armand V. Feigenbaum ................................................................................................ 83 3.3.7.5 Kaoru Ishikawa ............................................................................................................. 83
3.3.7.6 Genichi Taguchi ............................................................................................................ 84 3.3.7.7 Shigeo Shingo ............................................................................................................... 85
3.3. 8 Quality Awards ............................................................................................................. 86 3.3.8.1 The Deming Prize.......................................................................................................... 86 3.3.8.2 Malcolm Baldrige National Quality Award (MBNQA) ............................................... 87
3.3.9 Models of TQM............................................................................................................. 93 3.3.10 TQM in Higher Education............................................................................................. 95
3.3.11 Elements of TQM ........................................................................................................ 100 3.3.11.1Effective Leadership .................................................................................................. 101 3.3.11.2Continuous Improvement........................................................................................... 103
3.3.11.3Employee Involvement .............................................................................................. 105 3.3.11.4Strategic Planning ...................................................................................................... 106
3.3.11.5Customer Focus.......................................................................................................... 108 3.3.12 Requirements for TQM Application in Institutes of Higher Education:..................... 112 3.3.13 Indications of TQM in HEIs........................................................................................ 113
3.3.14 The implementation of TQM in Higher Education Institutions .................................. 115 3.3.15 The Benefits of the Application of Quality Systems in Universities .......................... 116
3.4 KM Integration with Total Quality Management ....................................................... 117 3.5 Previous Studies Related to KM and TQM................................................................. 119 3.5.1 What Distinguishes the Current Study from Previous Studies? .................................. 121
3.6 Summary ..................................................................................................................... 121 CHAPTER FOUR................................................................................................................... 122
EDUCATIONAL PERFORMANCE ..................................................................................... 122 4.1 Introduction ................................................................................................................. 122 4.2 Performance ................................................................................................................ 123
4.2.1 Areas and Measures of Performance........................................................................... 124 4.2.2 Balanced Score Card (BSC) Model ............................................................................ 125
4.2.2.1 Identification of the BSC Model ................................................................................. 126 4.2.2.2 What is balanced score card? ...................................................................................... 127
III
4.2.2.3 The Basic Components of the BSC Model ................................................................. 130 4.2.2.4 The basic Rules for the Implementation of the BSC Model ....................................... 130 4.2.2.5 Advantages of Balanced Performance BSC Model: ................................................... 131
4.2.3 How Does Higher Education Measure Performance?................................................. 134 4.2.4 Educational Performance Indicators ........................................................................... 135
4.2.5 Research Performance Indicators ................................................................................ 135 4.2.6 Management Performance Indicators.......................................................................... 135 4.2.7 Applying the BSC to a Higher Education Institute (HEI)........................................... 136
4.2.8 The BSC in the Education Criteria for Performance Excellence ................................ 136 4.2.9 Institutional Performance ............................................................................................ 137
4.3 BSC, Four perspectives ............................................................................................... 138 4.4 Summary ..................................................................................................................... 142 CHAPTER FIVE .................................................................................................................... 143
RESEARCH METHODOLOGY............................................................................................ 143 5.1 Introduction ................................................................................................................. 143
5.2 Philosophical Assumption and Concept of Social Research....................................... 143 5.3 Research Design and Methodology............................................................................. 146 5.3.1 Research Approach ..................................................................................................... 146
5.3.2 Rationale of the Research Technique .......................................................................... 147 5.4 The Questionnaire ....................................................................................................... 148
5.4.1 Development of Questionnaire.................................................................................... 148 5.4.2 Structure of the Questionnaire..................................................................................... 150 5.4.3 Piloting the Questionnaire ........................................................................................... 152
5.5 Sample population ....................................................................................................... 153 5.6 Data Collection............................................................................................................ 154
5.7 Survey Research .......................................................................................................... 154 5.8 Reliability and Validity of the Questionnaire ............................................................. 155 5.8.1 Reliability .................................................................................................................... 155
5.8.2 Testing Reliability ....................................................................................................... 155 5.8.2.1 Reliability Analysis: .................................................................................................... 156
5.8.3 Testing Acceptability .................................................................................................. 156 5.9 Self-Administered Questionnaire ................................................................................ 157 5.10 Conducting the Case Study ......................................................................................... 158
5.11 Data Analysis .............................................................................................................. 159 5.11.1 Descriptive Analysis ................................................................................................... 159
5.11.2 Correlation Analysis.................................................................................................... 160 5.11.3 Multiple Regression Analysis ..................................................................................... 161 5.11.4 Structural Equation Modeling ..................................................................................... 161
5.12 Summary ..................................................................................................................... 162 CHAPTER SIX ....................................................................................................................... 163
DATA ANALYSES AND RESPONDENT CHARACTERISTICS ..................................... 163 6.1 Introduction ................................................................................................................. 163 6.2 The Demographic Characteristics of Respondents ..................................................... 163
6.2.1 Responses by Gender and Age Group......................................................................... 163 6.2.2 Responses by Academic Degree Level ....................................................................... 164
6.2.3 Responses by Academic Degree, Experience, and Position ....................................... 165 6.2.4 Responses by Sample Degree, Population Group, and Affiliation ............................. 166 6.3 Summary ..................................................................................................................... 167
CHAPTER SEVEN ................................................................................................................ 168 RESEARCH FINDINGS FROM PUBLIC UNIVERSITIES ................................................ 168
7.1 Introduction ................................................................................................................. 168
IV
7.2 The Quantitative Data Analysis of Respondent Perceptions in Public Universities. ............................................................................................................................ 169 7.3 The Perception Towards KM ...................................................................................... 169
7.4 The Perception Towards TQM.................................................................................... 174 7.5 Perception Towards Performance ............................................................................... 177
7.6 Correlation Coefficient of KM Process with Management-related Variables in Public Universities .................................................................................................................. 181 7.7 The Effect of KM and TQM on Internal Process Perspectives................................... 183
7.8 Summary ..................................................................................................................... 186 CHAPTER EIGHT ................................................................................................................. 187
RESEARCH FINDINGS FROM PRIVATE UNIVERSITIES .............................................. 187 8.1 Introduction ................................................................................................................. 187 8.2 The Quantitative Data Analysis of Responses Perception in Private
Universities. ............................................................................................................................ 188 8.3 The Perception Towards KM ...................................................................................... 188
8.3.1 The Perception Towards KM Process ......................................................................... 188 8.3.2 The Perception Towards KM Technology .................................................................. 190 8.3.3 The Perception Towards KM Knowledge Team......................................................... 191
8.4 The Perception Towards TQM.................................................................................... 193 8.4.1 Effective Leadership ................................................................................................... 193
8.4.2 Continuous Improvements .......................................................................................... 194 8.4.3 Employees Involvement .............................................................................................. 195 8.5 Perception towards performance ................................................................................. 196
8.6 Correlation coefficient of KM process with management-related variables in private universities .................................................................................................................. 201
8.7 The effect of KM and TQM on internal process perspective...................................... 203 8.8 Summary ..................................................................................................................... 206 CHAPTER NINE .................................................................................................................... 207
GENERAL DISCUSSION AND RECOMMENDATIONS .................................................. 207 9.1 Overview of the Current Research .............................................................................. 207
9.2 General Discussion...................................................................................................... 207 9.3 Framework .................................................................................................................. 213 9.4 The Revised Framework ............................................................................................. 213
9.5 Achieving the Aim and Objectives of the Study......................................................... 215 9.6 Contribution Knowledge ............................................................................................. 216
9.7 Limitations of the Research......................................................................................... 219 9.8 Suggestions and Recommendations ............................................................................ 220 9.9 Conclusion................................................................................................................... 222
REFERENCES ....................................................................................................................... 224 APPENDIX ............................................................................................................................. 261
Appendix.A: Questionnaire .................................................................................................... 261 Appendix.B: Invitation Letter ................................................................................................. 267 Appendix.C: Copy of samples of online survey steps ............................................................ 268
Appendix.D: SPSS Outputs Public University ....................................................................... 270
V
LIST OF TABLES Table 1. 1 Progress of the establishment of public and private universities by year ..................................... 4
Table 1. 2 Higher education and training quality in Jordan (Schwab, 2012) .................................................. 6
Table 3. 1 Juran’s Six Steps to Problem Solv ing Source: James (1996, p. 65). ............................................ 81
Table 3. 2 Comparative statements of MBNQA, and EQA, and Deming Prize adapted from (Sharma &
Talwar, 2007).................................................................................................................................................. 89
Table 3. 3 The elements in TQM ......................................................................................................................... 110
Table 3. 4 Similarities and Differences: KM and TQM................................................................................... 117
Table 4. 1 A list of universities that currently apply the Balanced Scorecard [Rompho, N. (2008). ....... 133
Table 5 1 Variab les and Measurement Items. .................................................................................................... 148
Table 5 2 The Likert rating scale used in this study. ........................................................................................ 150
Table 5 3 The general structure of the questionnaire........................................................................................ 151
Table 5 4 Jordanian universities that were involved in the current study.. ................................................... 152
Table 5 5 measured correlat ions between the answers of a five repentants at two period time. ........... 156
Table 5 6 Questionnaire groups from the two parts of case study organisations......................................... 159
Table 5 7 Presents the details of those participants. ......................................................................................... 159
Table 6. 1 The distribution of respondents by sample population group and gender. 164
Table 6. 2 The distribution of respondents by sample population group and age groups. ......................... 164
Table 6. 3 The distribution of respondents by sample population group and academic degree. ............... 165
Table 6. 4 The distribution of respondents by sample population group and academic rank. ................... 165
Table 6. 5 The distribution of respondents by sample population group and work experience. ............... 166
Table 6. 6 The distribution of respondents by sample population group and current position. ................ 166
Table 6. 7 The distribution of respondents by sample population group and affiliation. ........................... 167
Table 7 1 Ranking order for statements related to knowledge creation: university administration depends
on the following to create knowledge (N= 200). .................................................................................... 169
Table 7 2 Rank order for statements related to storage of knowledge: University administration depends
on the following to store knowledge: (N= 200). ..................................................................................... 170
Table 7 3 Rank order for statements related to knowledge distribution: University administration
depends on the following to distribute knowledge: (N= 200). ............................................................. 170
Table 7 4 Rank order for statements related to knowledge application: to apply knowledge, the
university admin istration should: (N= 200). ............................................................................................ 171
Table 7 5 Statistics of the overall ranks for KM process (statements 1-20, Tab les 7.1-7.4) ..................... 171
Table 7 6 Rank order for statements related to variable of KM technology (N= 200). .............................. 172
Table 7 7 Statistics of the overall ranks for KM technology (statements 21-28, Tab le 7.6). .................... 172
Table 7 8 Rank order for statements related to Knowledge-makers: (N= 200). .......................................... 173
Table 7 9 Rank order for statements related to knowledge managers: University knowledge managers
carry out the follo wing: (N= 200). ............................................................................................................ 173
Table 7 10 Rank order for statements related to students' KM: student’s KM at the university is keen on:
(N= 200). ....................................................................................................................................................... 174
Table 7 11 Statistics of the overall ranks for team knowledge (statements 29-40, Tables: 7.8-7.10). ... 174
Table 7 12 Statistics of the overall ranks for KM (statements 1-40, Tables 7.1-7.4, 7.6-7.10). ............... 174
Table 7 13 Rank order for statements related to variable of effective leadership (TQM Processes) (N=
200)................................................................................................................................................................. 175
Table 7 14 Statistics of the overall ranks for effect ive leadership (statements 41-47, Tables 7.13). ....... 175
Table 7 15 Rank order for statements related to variable of continuous improvemen t (N= 200). ........... 176
Table 7 16 Statistics of the overall ranks for continuous improvement (statements 48 -52, Table 7.13). 176
Table 7 17 Rank order for statements related to variable of staff involved: (N= 200). .............................. 177
Table 7 18 Statistics of the overall ranks for employee involvement (statements 53 -60, Tables 7.1)..... 177
Table 7 19 Statistics of the overall ranks for TQM (statements 41-60, Tab les 7.13, 7.15, 7.17). ............ 177
Table 7 20 Rank order for statements related to variable internal processes perspective: (n= 200). ....... 178
Table 7 21 Statistics of the overall ranks for perspective of internal processes (statements 61-65, Table
7.20)................................................................................................................................................................ 178
Table 7 22 Rank order for statements related to variable of customers (stakeholder) perspective: (N=
200)................................................................................................................................................................. 179
Table 7 23 Rank order for statements related to external stakeholders (marketplace). (N= 200). ........... 179
Table 7 24 Statistics of the overall ranks for customer (stakeholder) perspectives (statements 66-75,
Tables 7.22-7.23). ........................................................................................................................................ 179
Table 7 25 Rank order for statements related to technological innovation. (N= 200). ............................... 180
Table 7 26 Rank order for statements related to administrative innovation. (N= 200). ............................. 180
Table 7 27 Rank order for statements related to additional creat ivity (N= 200). ........................................ 181
VI
Table 7 28 Statistics of the overall ranks for learning and growth perspective (statements 76-83, Tables
7.25-7.27). ..................................................................................................................................................... 181
Table 7 29 Statistics of the overall ranks for overall performance (statements 61-83, Tables 7.20-7.23,
7.25-7.27 ). .................................................................................................................................................... 181
Table 7 30 Correlation coefficient of KM processes with TQM effective leadership, continuous
improvement, or employee involvement in public universities (N=200). .......................................... 182
Table 7 31 Correlation coefficient of KM technology with TQM effective leadership, employee
involvement, and continuous improvement in the public universit ies (N=200). .............................. 182
Table 7 32 Correlation coefficient KM team of knowledge with TQM effective leadership, continuous
improvement, and employee involvement in public universities (N=200). ....................................... 183
Table 7 33 Correlat ion coefficient of KM with TQM in public universities................................................ 183
Table 7 34 Multiple linear regressions of KM and TQM with internal processes perspective. ................ 184
Table 7 35 Rank order for statement related to knowledge distribution: University administration
depends on following to distribute knowledge: (N= 200). ................................................................... 184
Table 7 36 The results of multiple linear regressions of the independent variables of KM and TQM with
the learning and growth perspective. ........................................................................................................ 185
Table 7 37 The results of multiple linear regressions of the independent variables, KM and TQM with
adopted variable EP. .................................................................................................................................... 185
Table 8. 1 Rank order for Statements Related to Knowledge Creating: University Administration
Depends on the Following to Create Knowledge (N= 151). 188
Table 8. 2 Rank order for statements related to storage of knowledge: University administration depends
on the following to store knowledge: (N= 151). ..................................................................................... 189
Table 8. 3 Rank order for statements related to knowledge distribution: University administ ration
depends on the following to distribute knowledge: (N= 151). ............................................................. 189
Table 8. 4 Rank order for statements related to knowledge applying: to apply knowledge, the University
administration should: (N= 151). .............................................................................................................. 190
Table 8. 5 Stat istics of the overall ranksfor KM process (statements 1-20, Tab les 8.1-8.4). .................... 190
Table 8. 6 Rank order for statement related to knowledge distribution: University administration
depends on following to distribute knowledge: (N= 151). ................................................................... 191
Table 8. 7 Stat istics of the overall ranksfor KM technology (statements 21-28, Tab les 8.6).................... 191
Table 8. 8 Rank Order fo r Statements Related to Knowledge-Makers: (N= 151). ..................................... 192
Table 8. 9 Rank Order for statements related to knowledge managers: University knowledge managers
carry out the following: (N= 151). ............................................................................................................ 192
Table 8. 10 Rank order for statements related to Studen ts' KM: student’s knowledge management at the
University is keen on: (N= 151). ............................................................................................................... 193
Table 8. 11 Statistics of the overall ranksfor Team knowledge (statements 29-40, Tables 8.8-2.10). .... 193
Table 8. 12 Statistics of the overall ranksfor KM (statements 1-40, Tables 8.1-8.4, 8.6-8.10). ............... 193
Table 8. 13 Rank order for statements related to variable of effective leadership (TQM Processes) (N=
151)................................................................................................................................................................. 194
Table 8. 14 Statistics of the overall ranksfor effect ive leadership (statements 41-47, Tables 8.13). ....... 194
Table 8. 15 Rank order for statements related to variable of continuous improvement (N= 151). .......... 195
Table 8. 16 Statistics of the overall ranksfor continuous improvement (statements 48-52, Tables 8.13).
......................................................................................................................................................................... 195
Table 8. 17 Rank order for statements related to Variab le of Staff Involved: (N= 151). ........................... 196
Table 8. 18 Statistics of the overall ranksfor employee involvement (statements 53 -60, Table 8.1). ..... 196
Table 8. 19 Statistics of the overall ranksfor TQM (statements 41-60, Tab les 8.13, 8.15, 8.17). ............ 196
Table 8. 20 Rank order for statements related to variable internal processes perspective: (n= 151). ...... 197
Table 8. 21 Statistics of the overall ranksfor perspective of internal processes (statements 61-65, Table
8.20)................................................................................................................................................................ 197
Table 8. 22 Rank order for statements related to variable of customers (stakeholder)’ perspective: (N=
151)................................................................................................................................................................. 198
Table 8. 23 Rank order for statements related to external stakeholders (marketplace). (N= 151). .......... 199
Table 8. 24 Statistics of the overall ranksfor customers’ (stakeholder) perspective (statements 66-75,
Tables 8.22-8.23). ........................................................................................................................................ 199
Table 8. 25 Rank order for statements related to technological innovation. (N= 151). .............................. 199
Table 8. 26 Rank order for statements related to admin istrative innovation. (N= 151). ............................ 200
Table 8. 27 Rank order for statements related to additional creativity (N= 151). ....................................... 200
Table 8. 28 Statistics of the overall ranksfor learning and growth perspective (statements 76-83, Tables
8.25-8.27). ..................................................................................................................................................... 200
Table 8. 29 Statistics of the overall ranksfor overall performance (statements 61-83, Tables 8.20-8.23,
8.25-8.27). ..................................................................................................................................................... 200
VII
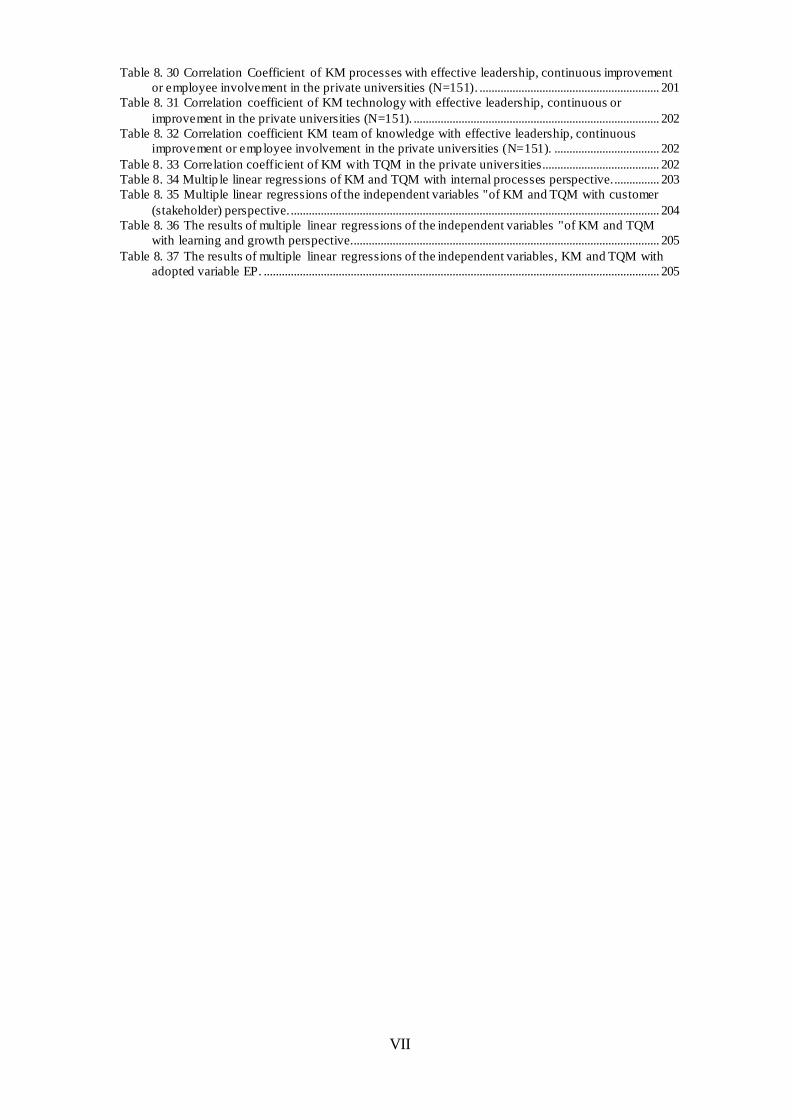
Table 8. 30 Correlation Coefficient of KM processes with effective leadership, continuous improvement
or employee involvement in the private universities (N=151). ............................................................ 201
Table 8. 31 Correlation coefficient of KM technology with effective leadership, continuous or
improvement in the private universities (N=151). .................................................................................. 202
Table 8. 32 Correlation coefficient KM team of knowledge with effective leadership, continuous
improvement or employee involvement in the private universities (N=151). ................................... 202
Table 8. 33 Correlation coefficient of KM with TQM in the private universities....................................... 202
Table 8. 34 Multip le linear regressions of KM and TQM with internal processes perspective................ 203
Table 8. 35 Multiple linear regressions of the independent variables "of KM and TQM with customer
(stakeholder) perspective. ........................................................................................................................... 204
Table 8. 36 The results of multiple linear regressions of the independent variables "of KM and TQM
with learning and growth perspective....................................................................................................... 205
Table 8. 37 The results of multiple linear regressions of the independent variables, KM and TQM with
adopted variable EP. .................................................................................................................................... 205
VIII
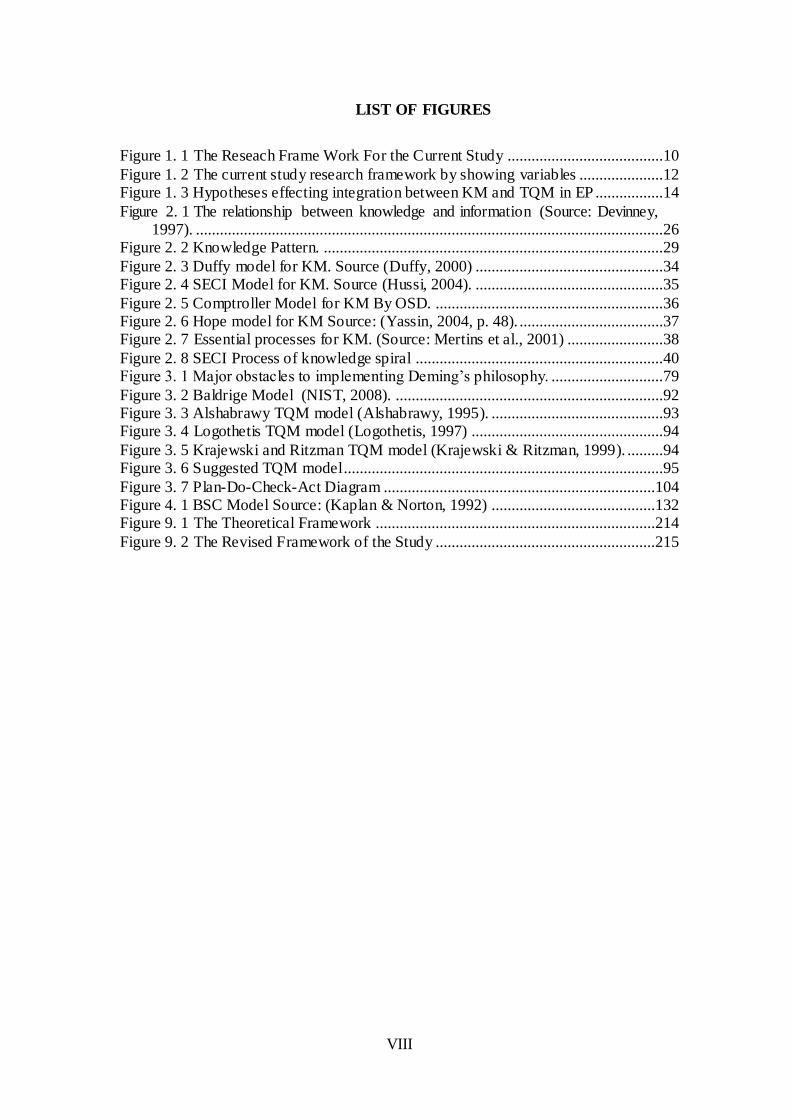
LIST OF FIGURES
Figure 1. 1 The Reseach Frame Work For the Current Study .......................................10
Figure 1. 2 The current study research framework by showing variables .....................12 Figure 1. 3 Hypotheses effecting integration between KM and TQM in EP .................14
Figure 2. 1 The relationship between knowledge and information (Source: Devinney, 1997). .....................................................................................................................26
Figure 2. 2 Knowledge Pattern. .....................................................................................29
Figure 2. 3 Duffy model for KM. Source (Duffy, 2000) ...............................................34 Figure 2. 4 SECI Model for KM. Source (Hussi, 2004). ...............................................35
Figure 2. 5 Comptroller Model for KM By OSD. .........................................................36 Figure 2. 6 Hope model for KM Source: (Yassin, 2004, p. 48). ....................................37 Figure 2. 7 Essential processes for KM. (Source: Mertins et al., 2001) ........................38
Figure 2. 8 SECI Process of knowledge spiral ..............................................................40 Figure 3. 1 Major obstacles to implementing Deming’s philosophy. ............................79
Figure 3. 2 Baldrige Model (NIST, 2008). ...................................................................92 Figure 3. 3 Alshabrawy TQM model (Alshabrawy, 1995). ...........................................93 Figure 3. 4 Logothetis TQM model (Logothetis, 1997) ................................................94
Figure 3. 5 Krajewski and Ritzman TQM model (Krajewski & Ritzman, 1999). .........94 Figure 3. 6 Suggested TQM model ................................................................................95
Figure 3. 7 Plan-Do-Check-Act Diagram ....................................................................104 Figure 4. 1 BSC Model Source: (Kaplan & Norton, 1992) .........................................132 Figure 9. 1 The Theoretical Framework ......................................................................214
Figure 9. 2 The Revised Framework of the Study .......................................................215

IX
ACKNOWLEDGEMENTS
This research is the culmination of the efforts and contributions of the many
people who made this thesis possible and who gave me their continuous,
untiring, and unconditional devotion, time, support, and love to achieve this
important goal.
I sincerely thank my supervisor Professor Les Ruddock for his continuous
support, encouragement, and follow up. I also would like to express the deepest
appreciation to my volunteer advisor Dr Jassem G. Mahdi (Cardiff University,
UK), who gave me valuable ideas, superb support and encouragement to pursue
this journey and to strengthen my thesis. I also would like to express the deepest
appreciation to Dr Abdulbaset Khashkosha who helped me to complete this
work.
I would also like to express my thanks and appreciation to the academic staff and
administrative employees in the Salford School of the Built Environment for
their help and encouragement, especially Mrs Moira Mort (Research Officer) for
her help.
This acknowledgement would be incomplete without thanking my father,
mother, wife, brothers, sisters, sons, daughters and my friends, peer learners, and
colleagues for their interest in my pursuit of this degree and for their continuous
support and encouragement.
X
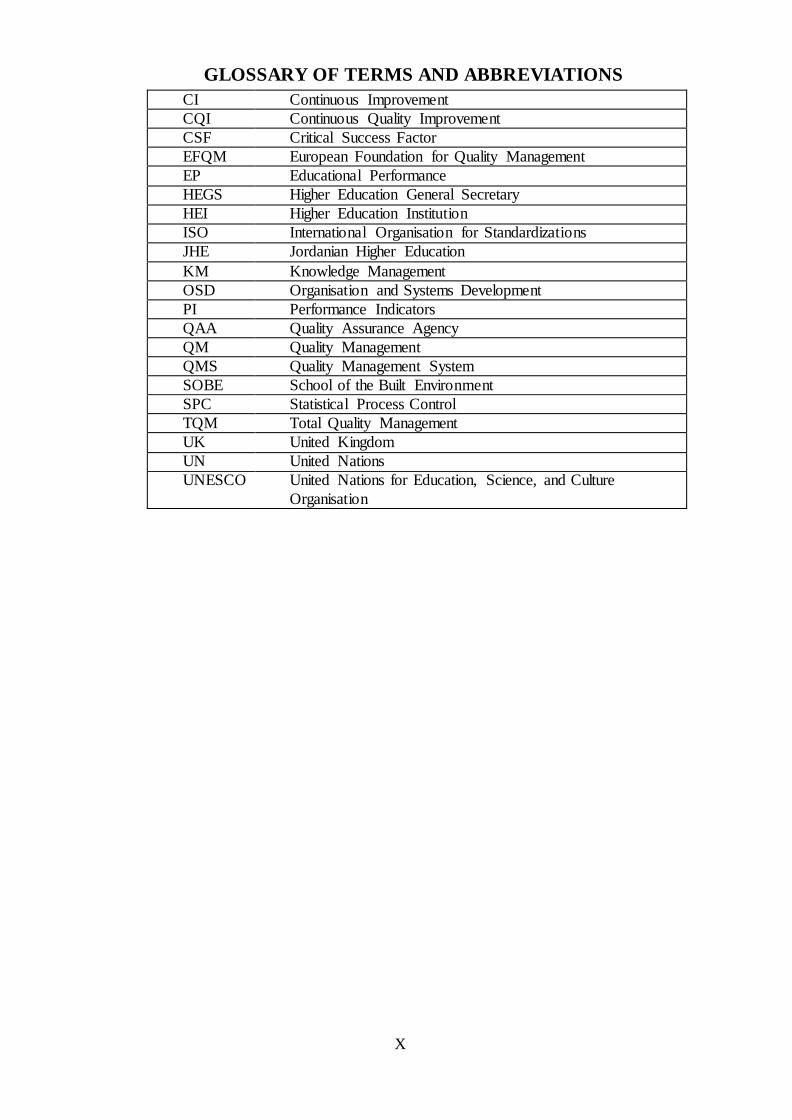
GLOSSARY OF TERMS AND ABBREVIATIONS
CI Continuous Improvement
CQI Continuous Quality Improvement
CSF Critical Success Factor
EFQM European Foundation for Quality Management
EP Educational Performance
HEGS Higher Education General Secretary
HEI Higher Education Institution
ISO International Organisation for Standardizations
JHE Jordanian Higher Education
KM Knowledge Management
OSD Organisation and Systems Development
PI Performance Indicators
QAA Quality Assurance Agency
QM Quality Management
QMS Quality Management System
SOBE School of the Built Environment
SPC Statistical Process Control
TQM Total Quality Management
UK United Kingdom
UN United Nations
UNESCO United Nations for Education, Science, and Culture
Organisation
XI
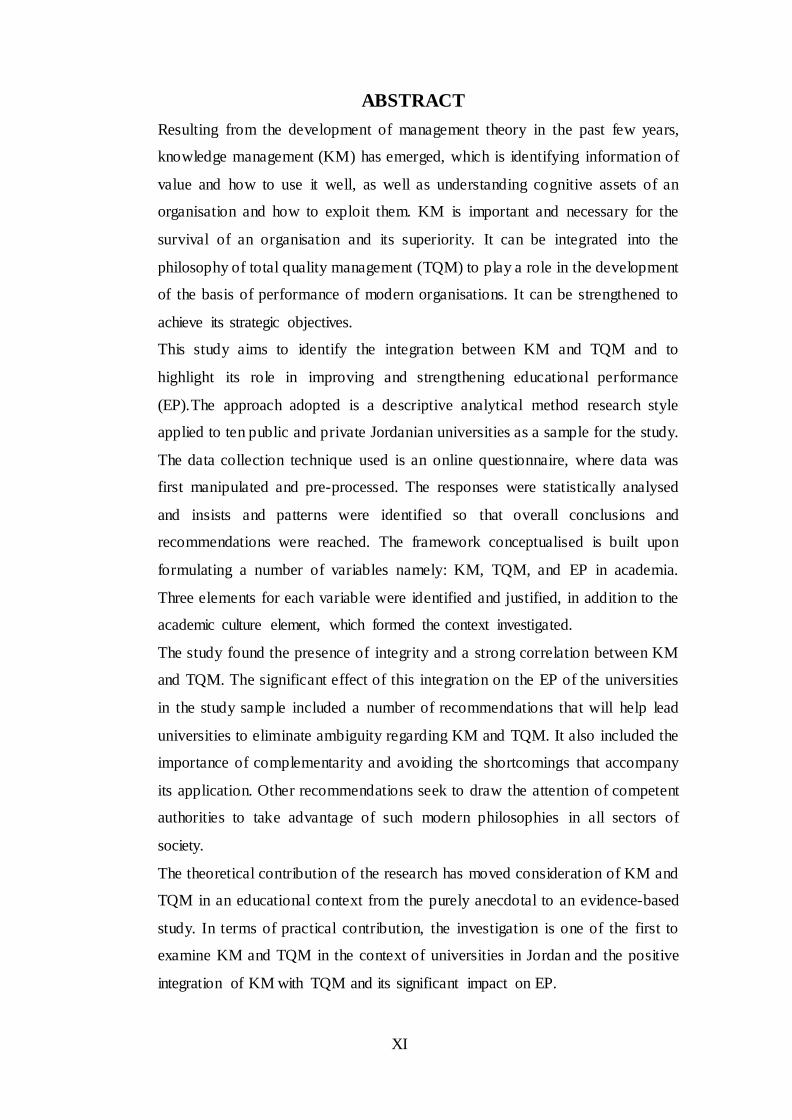
ABSTRACT
Resulting from the development of management theory in the past few years,
knowledge management (KM) has emerged, which is identifying information of
value and how to use it well, as well as understanding cognitive assets of an
organisation and how to exploit them. KM is important and necessary for the
survival of an organisation and its superiority. It can be integrated into the
philosophy of total quality management (TQM) to play a role in the development
of the basis of performance of modern organisations. It can be strengthened to
achieve its strategic objectives.
This study aims to identify the integration between KM and TQM and to
highlight its role in improving and strengthening educational performance
(EP).The approach adopted is a descriptive analytical method research style
applied to ten public and private Jordanian universities as a sample for the study.
The data collection technique used is an online questionnaire, where data was
first manipulated and pre-processed. The responses were statistically analysed
and insists and patterns were identified so that overall conclusions and
recommendations were reached. The framework conceptualised is built upon
formulating a number of variables namely: KM, TQM, and EP in academia.
Three elements for each variable were identified and justified, in addition to the
academic culture element, which formed the context investigated.
The study found the presence of integrity and a strong correlation between KM
and TQM. The significant effect of this integration on the EP of the universities
in the study sample included a number of recommendations that will help lead
universities to eliminate ambiguity regarding KM and TQM. It also included the
importance of complementarity and avoiding the shortcomings that accompany
its application. Other recommendations seek to draw the attention of competent
authorities to take advantage of such modern philosophies in all sectors of
society.
The theoretical contribution of the research has moved consideration of KM and
TQM in an educational context from the purely anecdotal to an evidence-based
study. In terms of practical contribution, the investigation is one of the first to
examine KM and TQM in the context of universities in Jordan and the positive
integration of KM with TQM and its significant impact on EP.
1
CHAPTER ONE
INTRODUCTION
1. 1 Introduction
This research is related to knowledge management (KM) and total quality
management (TQM) in higher educational institutions (HEIs) in Jordan. These
two issues have attracted the attention of many researchers and writers in higher
education (HE). The significance of these issues is that they are both associated
with the effectiveness of the academic process. Therefore, the growing
worldwide interest in KM among organisations has increased because it is related
to the quality of education and learning as an alternative managerial action
(Harvey, 1995). This is due to the competiveness among innovative firms in their
fields of interest. When TQM became more defined, it was successfully applied
by many organisations in HE. However, as KM was more defined, it was
extensively applied in developed countries, and good results were obtained. At
the same time, some organisations still lack the proper use and benefits of KM in
achieving distinction through the use of TQM. This is especially evident from the
inefficient integration of KM and TQM.
The quality of education is vital for promoting society and contributes to the
enduring wealth and security of a country (Babbar, 1995). Therefore, this
research project focuses on the integration of KM and TQM and its impact on
educational performance (EP) in HE in Jordan. The purpose of this research is to
learn about KM and TQM and to identify the integration that affects the use of it.
Thus, this chapter gives an overview of the concept in the research problem and
its rationale that underlines the main issues, including the research aim,
objectives, and hypotheses.
The next section of this chapter aims to provide the reader with an overview of
the country in which this study was conducted. It consists of two parts; the first
one is a brief review of Jordan consisting of the following sections. The first part
is about the educational system while the second part is related to a brief review
of the population of the study, the two types of universities in Jordan, pub lic and
private, were chosen as two parts of case study. A summary of the chapter is
presented as a conclusion.
2
1. 2 Jordan: General Overview
1.2. 1 The Education System in Jordan
The development of the educational system in Jordan can only be described as
dramatic. Starting from almost nothing in the early 1920s, Jordan has forged a
comprehensive, high-quality system in order to develop the human capital of its
population. All villages and communities with ten or more school children are
provided with a school so that the population who live in poor and remote areas
have access to education. For all Jordanian primary and secondary school students
up to the age of fifteen, education is free and compulsory. Jordan has achieved
over 95% enrolment for its school-age children. Jordan’s policy of prioritising
spending on basic education over HE has enabled the country’s aim to
increase universal enrolment and has boosted literacy levels throughout the
general population. Jordan’s education record has proven remarkable by
international standards and results from the foresight of the country’s leadership
who saw and continue to see the need to focus on building the country’s human
capital to meet the challenges of the future (A Higher Education Cooperation
Scheme between EU Member States Partner Countries, 2007).
The educational system in Jordan encompasses a 12-year comprehensive
programme divided into four parts: nursery, kindergarten, basic, and secondary.
The basic portion extends from grades one to ten. At the end of grade ten, the
grades of each student for the previous three years (eighth, ninth, and tenth) are
calculated to determine which secondary stream (academic or vocational) that
students can enter. Often, the student’s wishes are taken into consideration, but
the Ministry of Education makes the final decision. The two-year secondary
portion is divided into two main streams. The first stream is the comprehensive
secondary educational stream that ends with a general secondary education
examination, the Tawjihi, and consists of a common principal curriculum and
optional specialised academic or vocational courses. The second stream is the
applied secondary educational stream, which consists of specialised vocational
courses; skilled labour is prepared through apprenticeship programmes run by the
Vocational Training Corporation or the Ministry of Education (Department of
Statistics, 2006).
3
1.2. 2 Higher Education
Holders of the general secondary education certificate have access to HE and can
choose between community colleges (private or public) or universities (private or
public). Higher education in Jordan started in the second half of the twentieth
century (1960s) when many teachers’ colleges were established throughout the
country. Their establishment provided the important teaching work force needed
to meet the high demand on school education characterising that period (A
Higher Education Cooperation Scheme between EU Member States Partner
Countries, 2007).
Jordan’s community colleges offer specialised two or three-year programmes in
various areas of study. All students who attend community colleges must pass a
comprehensive government exam at the end of their study. Community colleges
tend to offer practical education targeted at professions such as education,
commerce, computer studies, medicine, pharmacology, hotel management,
interior design, social work, nursing, and midwifery (A Higher Education
Cooperation Scheme between EU Member States Partner Countries, 2007).
1.2. 3 Universities in Jordan
Higher education in Jordan has expanded dramatically since 1951. It started with a
one-year postsecondary teacher training college. Later, in 1962 the first public
university was established, the University of Jordan. Fourteen years later, the
University of Yarmouk was established, which was followed by the establishment
of six universities (Abu-El-Haija, 2014). Table 1.1 demonstrates the progress o f
the establishment of public and private universities in Jordan since 1962. Nine
universities, or approximately 43%, were established between 1990 and 1992.
The progress of the establishment of private universities was due the government
policy to ease the pressure in providing HE to the increased number of students
who wanted to continue their HE. Because Jordan’s resources are limited, the
government struggled to subsidise the increased number of enrolled students.
Therefore, many private universities were set up to ease the pressure on public
universities (Kanaan et al., 2009). The Ministry of Higher Education and Scientific
Research (MoHESR) has emphasised quality education as one of the important
public sectors that can benefit society. Therefore, the establishment of the Higher

4
Education Council in 1982 aimed to maintain the quality and efficiency o f
education in Jordan (MoHESR, 2014).
Table 1. 1 Progress of the establishment of public and private universities by year
Year Number of public universities Number of private universities
1962 1 0
1976 1 0
1981 1 0
1986 1 0
1990 0 2
1991 0 5
1992 1 2
1993 1 1
1994 0 1
1995 0 1
1997 1 1
Total 7 13
The establishment of the Jordanian Council of Higher Education was in response
to the need for the regulation and planning of HE policies and coordination among
Jordanian public policies at the post-secondary level and the need for legislating
up-to-date laws on HE.
1.2. 4 Background of the Study
The last few decades have witnessed a widespread acceptance of KM and TQM as
a means of acquiring and maintaining competitiveness in the global marketplace.
Globalisation issues have triggered the move to improve performance, and HE
institutions have been quick to adopt quality and knowledge models in order to
survive in the increasingly globalized market. Indeed, worldwide HE institutions
have made steady progress in adopting KM and TQM models and institutiona l
self-assessment approaches. The Malcolm Baldrige National Quality Award
(MBNQA) in the United States and the European Foundation for Quality
Management Excellence Model (EFQM) in the United Kingdom have been
adapted for the HE sector, and institutions within the sector are recognising their
benefits. The HE sector in Jordan has tried to adapt the model as well, and Jordan
is as susceptible to globalisation as any other country.

5
According to Borhan and Ziarati (2002), a strong relationship exists between a
country’s competitiveness and the quality of HE. Hence, countries need to assure
themselves of the quality of their HE institutions. In Jordan, where the number o f
HE institutions has expanded substantially, this has become an important issue.
The growth in Jordan’s HE sector began with a large investment in state
universities, which correspondingly attracted a large number of students. With an
increase in the student market and the resulting pressure on the public budget to
continually provide more HE locations, Jordan’s HE policy allowed the loca l
public administration and private sector to establish universities, colleges, and
technical HE institutions. Now, with the increasing number of private universities,
the need to establish and maintain a competitive advantage is becoming
increasingly significant. In this respect, the University of Jordan has adopted TQM
and information technology systems (Abu-El-Haija, 2014). However, research has
reported poor implementation of TQM principles in Jordanian colleges of physica l
education (Altahayneh, 2014). In addition, in view of the increased demand on
Jordanian universities, the King of Jordan and his prime minister encourage
adopting a clear plan for improving quality in HE that enables universities to
compete with the global market (Schwab, 2012).
Knowledge Management and TQM play vital roles in the modern management
progress where KM contributes to innovation by creating, storing, transferring,
and applying knowledge. The implementation of TQM practices is considered one
of the important factors that influenced innovation in a positive way (Honarpour et
al., 2012). Despite the vast growth in the implementation of TQM in HE
institutions worldwide, there is no universal model for adopting TQM within a
higher education context (Sarvan & Anafarta, 2005, p. 12). Indeed, it is
documented (Hides et al., 2004) that the implementation of TQM in the public
sector, particularly the HE sector, has lagged behind that of the private sector,
essentially because the private sector is under pressure to respond to customer
calls for continual improvement.
1.2. 5 The Quality of Higher Education in Jordan
The HE institutions in Jordan have witnessed an increase in demand for enrolment
in educational programmes in universities and colleges. The Jordanian government
has stressed that it is important to have a clear plan for HE quality improvement as
well as improved quality for the coming years to ensure the right of young people

6
at universities to have a high quality education and to enable both students and
universities to compete in the global market.
The graduates of the Jordanian educational system in all disciplines are not
sufficiently knowledgeable or trained to be productive, and graduates usually need
extensive retraining. As such, the quality of HE in Jordan is illustrated in Table 1.2
Table 1.2. Higher education and training quality in Jordan (Schwab, 2012)
Country
Ranking/144
Quality of the educational system 31
University/industry research collaboration in research and development
93
Quality of math and science education 28
Quality of scientific research institutions 77
Quality of primary education 43
Availability of scientists and engineers 11
Quality of management schools 55
Internet access in schools 44
Availability of specialised research and training services 47
Extent staff training 88
The global rank of the quality of HE in Jordan was highest in the availability o f
scientists and engineers (11 out of 144). However, the rank for university/industry
research collaboration in research and development, extent of staff training, and
quality of scientific research institutions were, respectively, 93, 88, and 77 out o f
144 (Schwab, 2012). Furthermore, the quality of the educational system was
ranked 31 out of 144. The overall assessment of HE in Jordan is more likely to
indicate that the quality of the educational process supports business in Jordan.
1.2. 6 The Dearth of Research on KM and TQM in Jordan
The primary motive for conducting this study is the lack of empirical research on
the implementation of KM and TQM within Jordanian HE institutions. While
there has been much attention devoted to the integration between KM and TQM
and its impact on EP, the vast majority of literature has been focused on its
association with economies (McAdam & McCreed, 1999; Thiagarajan et al., 2001;
Aboyassin et al., 2011). The growing awareness of the importance of KM and
7
TQM in developing the economy has attracted the interest of many researchers.
This has encouraged empirical research to study TQM for improving the quality
system of an organisation (Soltani & Lai, 2007). They found that the major
discrepancy between the rhetoric of these systems and the reality of their practice
is where organisations tend to develop a more strategic approach to managing soft
aspects of quality management. However, literature indicated that the number o f
organisations that implemented TQM successfully is comparatively small (Huq,
2005; Gibbs, 2009). In particular, the number of studies on quality in HE is
relatively few (Lagrosen et al., 2004). Furthermore, KM processes including
diagnosing, acquiring, generating, sharing, storing, and applying have been found
to influence TQM (Aboyassin et al., 2011). Therefore, KM could be considered a
key tool to higher educational long-term success. Thus, change initiatives in
organisations, including educational institutions, can improve shareholder value
(i.e., economic value theory) and develop organisational capabilities (i.e.,
organisational capability theory) (Soltani et al., 2007). Like any organisation,
educational institutions (mainly private ones) are confronted by competition due to
the presence of many universities and colleges in Jordan and other countries in the
region. In addition, globalisation, the advancements in communications and
information technologies, economic recession, and a simultaneous search for
excellence are also encouraging competition; therefore, the desire to take up
change initiatives has interested the majority of leading organisations (Soltani et
al., 2007). The current study will explore the correlation between public and
private universities in Jordan in terms of KM and TQM.
1. 3 The Research Problem
Many organisations seek to keep abreast of modern administrative developments
and implement them in their various activities—not only to thrive and survive but
also to achieve and maintain high levels of leadership. In addition, due to the
development of Quality Management (QM), many educational organisations
moved to implement this concept in many countries. In this respect, the
development of KM contributes to better achievement in the global competitive
market. There is a close relationship between KM and TQM in achieving a
competitive edge through distinctive EP. Therefore, the emergence of KM has
helped many educational institutions achieve a high educational standard and
increase their rank. Therefore, research stands as a vital tool for investigating what
8
is required to develop the effectiveness of the educational process in terms of QM
and TQM. Initially, research in QM and TQM attracted the interest of many
universities in Jordan. Nonetheless, it is still necessary to continue the research to
gain an insight into the real nature of what is required to achieve high standards
using KM and implementing TQM. Therefore, it is possible to summarise the
main issues that are related to KM and TQM in the following questions:
How deficient is the lack of personal knowledge of KM and TQM in Jordanian
universities?
What benefits are gained from KM in the development of quality in Jordanian
universities?
How clear is the vision with regard to the integration of KM and TQM?
What impact is caused by this integration in EP to achieve excellence and
leadership in universities?
Yet, the main question is what distinguishes the current study from previous
studies? By reviewing past studies, it appears that some have examined the
attitudes of managers towards the application of KM and other studies have
examined the performance of KM, creativity, and decision-making as well as
discovering the competitive advantage. The current study is distinguished from
past studies and research by focusing on a vital aspect, which is the integration o f
KM and TQM and its impact on EP in institutions of HE in Jordan and its role in
achieving TQM in these institutions, where most efforts and research have been
directed towards KM. In addition, the researcher has benefited from previous
studies, and the benefit is reflected in two points. The first is the formulation of the
theoretical framework for the study, and the second is the formulation o f
hypotheses.
1. 4 Importance of the Study
The significance of adopting KM and the proper implementation of TQM are
increasing globally in educational organisations. The main reasons behind the
focus on KM and TKM are to secure the market share amongst competitors and to
maintain a competitive advantage. Therefore, the importance of the current study
is to investigate the integration between KM and TQM and to what extent the

9
universities in Jordan are adopting KM, implementing TQM, and measuring EP.
Thus, the main objectives of the current study are to:
- Investigate what is required to develop the effectiveness of the educationa l
process in terms of QM and TQM, and
- develop a deep understanding into the real nature of the requirements to achieve
high standards using KM and implementing TQM.
On the surface, there are a growing number of anecdotal accounts of the
“successes” of TQM and KM in education. Nevertheless, there has been almost no
theory-building and methodologically rigorous research to validate these
evidences (Chen & Burstein, 2006; Venkatraman, 2007). In addition, the
researches which linked TQM and KM were conducted in the manufacturing
industry and do not reflect the service sector (such as Daud & Yusoff, 2011; Ju
et al., 2006; Ooi, 2009; Ooi et l., 2012), particularly the educational sector, which
is of interest in this study. Thus, methodologically rigorous empirical studies that
examine the link between institutional outcomes and institutional manageme nt
initiatives are needed to fill these gaps.
1. 5 Study Aim and Objectives
The study aim is to establish a framework that represents the integration of KM
and TQM to measure the performance of HE based on improvement of teaching
and learning. Therefore, the research was set up according to the following
objectives:
To review relevant literature on the concepts of KM and TQM and their
significance for educational organisations and to contribute to the conceptua l
framing of them.
To contextualise a framework for the integration of KM and TQM.
To identify integration and correlation between KM and TQM and its impact
on EP.
To identify the impact of the integration of KM and TQM in the EP of
organisations.
To refine the framework scientific methods and techniques to be followed in
order to take advantage of the integration of KM and TQM in enhancing the
competitive advantage through improved EP.
10
1. 6 Research Conceptual Framework
A research conceptual framework is a useful set-up tool for organising socia l
research (Rodman, 1980). According to Labaree (2013), the theoretica l
assumption connects the researcher to existing knowledge and gives a basis for
hypotheses and research methods. In other words, the concept of the research
framework can be extended to involve the integration of concepts and methods. In
this respect, the description of background information and research driving KM
and TQM are associated with literature and the design of the current research.
Literature helps develop research focus and its approach for deriving the required
data for analysis and discussion (Labaree, 2013).
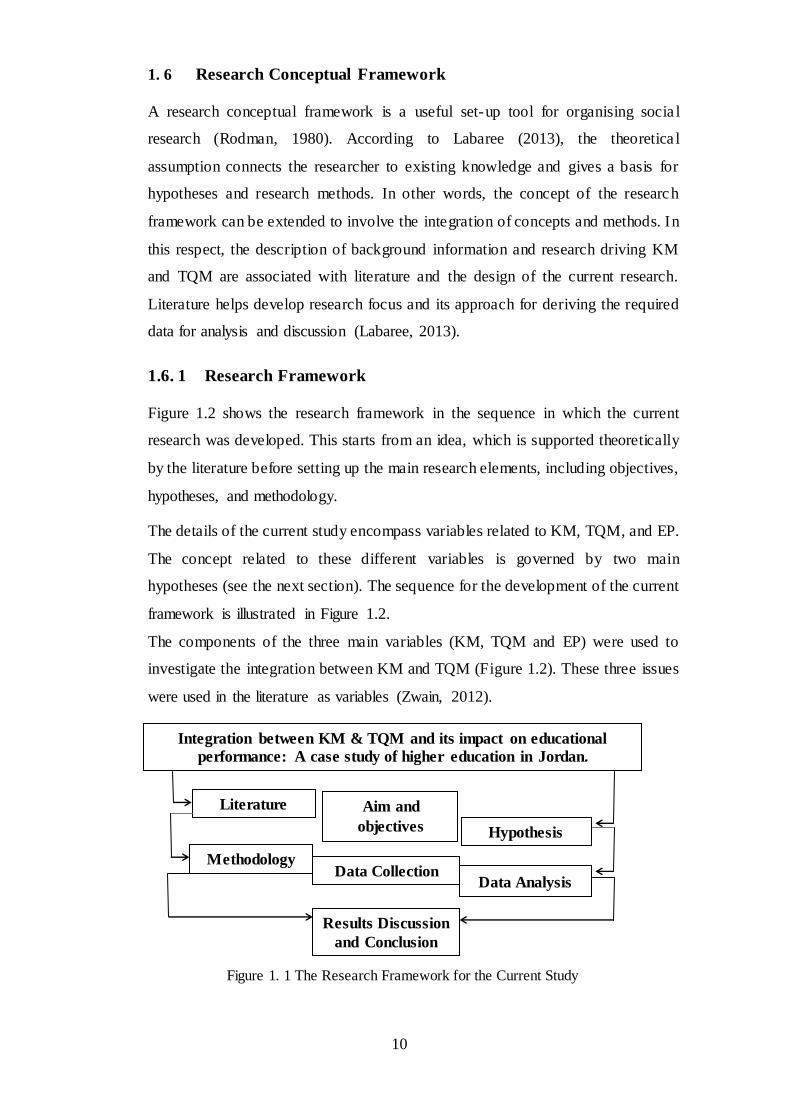
1.6. 1 Research Framework
Figure 1.2 shows the research framework in the sequence in which the current
research was developed. This starts from an idea, which is supported theoretically
by the literature before setting up the main research elements, including objectives,
hypotheses, and methodology.
The details of the current study encompass variables related to KM, TQM, and EP.
The concept related to these different variables is governed by two main
hypotheses (see the next section). The sequence for the development of the current
framework is illustrated in Figure 1.2.
The components of the three main variables (KM, TQM and EP) were used to
investigate the integration between KM and TQM (Figure 1.2). These three issues
were used in the literature as variables (Zwain, 2012).
Figure 1. 1 The Research Framework for the Current Study
Integration between KM & TQM and its impact on educational
performance: A case study of higher education in Jordan.
Literature Aim and
objectives Hypothesis
Methodology Data Collection
Data Analysis
Results Discussion
and Conclusion
11
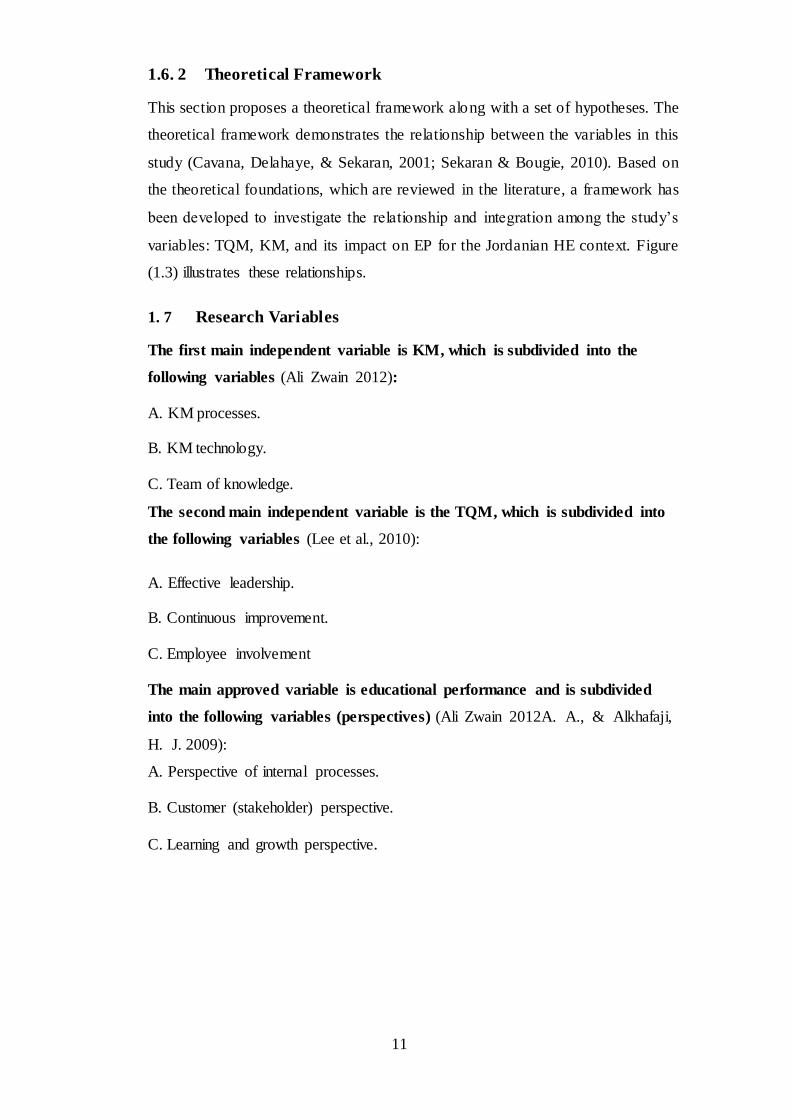
1.6. 2 Theoretical Framework
This section proposes a theoretical framework along with a set of hypotheses. The
theoretical framework demonstrates the relationship between the variables in this
study (Cavana, Delahaye, & Sekaran, 2001; Sekaran & Bougie, 2010). Based on
the theoretical foundations, which are reviewed in the literature, a framework has
been developed to investigate the relationship and integration among the study’s
variables: TQM, KM, and its impact on EP for the Jordanian HE context. Figure
(1.3) illustrates these relationships.
1. 7 Research Variables
The first main independent variable is KM, which is subdivided into the
following variables (Ali Zwain 2012):
A. KM processes.
B. KM technology.
C. Team of knowledge.
The second main independent variable is the TQM, which is subdivided into
the following variables (Lee et al., 2010):
A. Effective leadership.
B. Continuous improvement.
C. Employee involvement
The main approved variable is educational performance and is subdivided
into the following variables (perspectives) (Ali Zwain 2012A. A., & Alkhafaji,
H. J. 2009):
A. Perspective of internal processes.
B. Customer (stakeholder) perspective.
C. Learning and growth perspective.

12
Figure 1. 2 The current study research framework by showing variables
1. 8 Research Hypotheses
The current study considers two main hypotheses. Each of these hypotheses is
subdivided into different sub-hypotheses. Generally, the hypothesis is an important
element of research for scientific studies as it is one way to assist the researcher to
focus on the main subject. It is also an alternative assumption made in order to
draw out and test its logical or empirical consequences (Kenya, 2013). Therefore,
the hypothesis is one of the fundamental tools for research. Merriam (2014) and
others (Bogdan & Biklen, 1992) maintained that the hypothesis serves to guide the
researcher in seeking answers to tentatively adopted generalisations (Punch, 2013).
Here, the focus is on KM and TQM. These two contemporary terms are vital for
the educational management process and its outcomes.
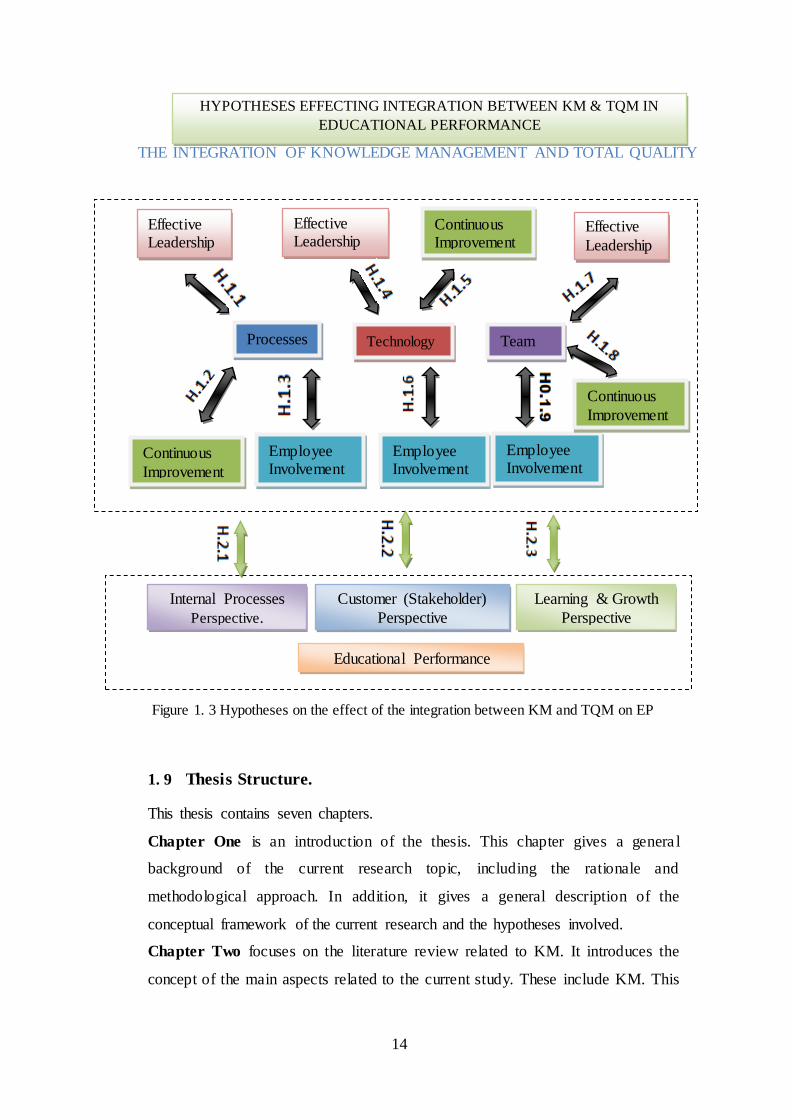
Two hypotheses to be justified are proposed in this study. The structure and their
connection with the main variables of the current study are depicted in Figure 1.3.
1.8.1 The First Hypothesis:
H.1 There is significant relationship between KM and TQM. This hypothesis is
subdivided into the following sub-hypotheses.

13
H.1.1 There is significant relationship between the processes of KM and effective
leadership.
H.1.2 There is significant relationship between the processes of KM and
continuous improvement.
H.1.3 There is significant relationship between KM processes and employee
involvement.
H.1.4 There is significant relationship between technology of KM and effective
leadership.
H.1.5 There is significant relationship between technology of KM and continuous
improvement.
H.1.6 There is significant relationship between technology of KM and employee
involvement.
H.1.7 There is significant relationship between team knowledge and effective
leadership.
H.1.8 There is significant relationship between team knowledge and continuous
improvement.
H.1.9 There is significant relationship between the team and employee
involvement.
1.8.2 The Second Hypothesis
H.2 There is a significant effect of the integration of KM and TQM on EP.
Subdivided into the following sub-hypotheses:
H.2.1 There is a significant effect of the integration of KM and TQM on the
perspective of internal processes.
H.2.2 There is a significant effect of the integration of KM and TQM on the
customer (stakeholder) perspective.
H.2.3 There is a significant effect of the integration of KM and TQM on the
learning and growth perspective.
14
Figure 1. 3 Hypotheses on the effect of the integration between KM and TQM on EP
1. 9 Thesis Structure.
This thesis contains seven chapters.
Chapter One is an introduction of the thesis. This chapter gives a genera l
background of the current research topic, including the rationale and
methodological approach. In addition, it gives a general description of the
conceptual framework of the current research and the hypotheses involved.
Chapter Two focuses on the literature review related to KM. It introduces the
concept of the main aspects related to the current study. These include KM. This
THE INTEGRATION OF KNOWLEDGE MANAGEMENT AND TOTAL QUALITY
HYPOTHESES EFFECTING INTEGRATION BETWEEN KM & TQM IN
EDUCATIONAL PERFORMANCE
Continuous Improvement
Processes Technology Team
Effective Leadership
Continuous Improvement
Employee Involvement
Continuous
Improvement
Effective
Leadership
Effective Leadership
Employee Involvement
Employee Involvement
Learning & Growth
Perspective
Customer (Stakeholder)
Perspective
Internal Processes
Perspective.
Educational Performance
Continuous
Improvement

15
chapter focuses on the explanation of the main related issues, including resources
and models.
Chapter Three focuses on the literature review related to TQM. It introduces the
concept of the main aspects related to the current study. These include TQM, the
perspectives of quality. In all these aspects, this chapter focuses on the explanation
of the main related issues, for example leadership.
Chapter Four focuses on the literature review related to EP. It introduces the
concept of the main aspects related to the current study. These include EP
elements. This chapter focuses on the explanation of the main related issues,
including BSC.
Chapter Five focuses on methodology and its concept. This includes the
philosophical assumption of social research, its methodology, and design. In
addition, this chapter discusses the rationale of the current research and its
methodological approach to collecting data, including the design, structure, and
development of the questionnaire and the statistical analysis of the obtained data.
Chapter Six focuses on the demographic characteristics of respondents in both
public and private universities in Jordan. It also describes the overall data analysis
using other tests.
Chapter Seven deals with the first part of the study, which is related to the
analysis of data that reflect the perceptions of respondents in Jordanian public
universities towards different issues related to KM, TQM, and EP. Various
statistical analyses were used to analyse the data.
Chapter Eight deals with the second part of the study, which is related to the
analysis of data obtained from respondents in Jordanian private universities. The
same format and statistical analysis as in the previous chapter was used in the
current chapter. Chapters seven and eight also focus on testing the hypotheses.
Chapter Nine deals with the general discussion on the data related to both parts o f
case study. It summarises and discusses the current research findings related to
how respondents in public and private universities perceived KM and TQM in
their academic institutions. In addition, this chapter discusses achieving the aim
and objectives in the current study. It also gives some suggestions and
recommendations related to KM and TQM.
16
1. 10 Summary
This chapter focused on an overview of the thesis. This included a genera l
background regarding HE in Jordan and its relation to the current study. In
addition, this chapter described the research problem, the conceptual framework o f
the research, its objectives, and hypotheses. The next following three chapters dea l
with the literature review and are related to the main three issues: KM, TQM and
EP.
17
CHAPTER TWO
KNOWLEDGE MANAGEMENT
2.1 Introduction
This chapter focuses on the first part of the literature review related to the concept
of knowledge and knowledge management (KM). It aims to discuss the main
issues related to knowledge and KM. The state of knowledge represents the
continuous interaction between the tacit components of knowledge, such as
experiences, skills, and mental abilities in the minds of individuals as well as the
information and presented acknowledged strategies to achieve value. It is one o f
the most important assets of an organisation and cannot be overlooked.
Knowledge is endemic in an organisation with intellectual capital that seeks to
retain it. In this respect, the sources of knowledge represent of all the sources of
present information that individuals can convert into knowledge, in addition to the
mental abilities, experience, and skills of these individuals. The term that
expresses the ability of the team of knowledge in the organisation is associated
with KM. The aspect of managing knowledge in modern organisations utilises KM
technology to carry out knowledge generation, storage, and distribution and is
applied to achieve excellence and leadership. Adding to the importance of KM is
its ability to handle many of the changes and challenges that are encountered by
organisations, as well as its assistance to staff to achieve value for organisations
that apply KM. Furthermore, the target of KM is to allow the sharing o f
knowledge among employees and with customers and business partners to achieve
and maximise returns. Therefore, KM ensures the work of an organisation is
moving towards intellectual viability and achievement of the best value in the
assets of the organisation. The structure of the current chapter involves the related
issues on knowledge and KM, including definition, concept, and background.
2.2 Knowledge
Knowledge is associated with knowing something which could be gained through
experience or association. Knowing something leads to a better understanding o f
an entity process that is used to take effective action to achieve the entity’s goal(s)
(Galbraith et al., 2001). In this respect, developing and exploiting knowledge helps
organisation and its members to achieve a better chance of success. Thus, this

18
section focuses on the historical background of knowledge, its concept, and its
types and resources.
2.2.1 The Historical Background of Knowledge
While seeking to acquire knowledge is ancient, interest in it becomes rejuvenated
and more complicated with the complexity of life and with the development that
occurs in educational methods. Hammurabi from Iraq is considered the first ruler
in history to have grasped the importance of education, establishing the first schoo l
in the country two thousand years BCE. The Chinese philosopher Confucius (479-
551 B.C.E.) renewed the call to spread knowledge when he said, “Knowledge is
the only way to improvement and success on earth.” The Greek philosopher Plato
(347-427 B.C.E.) gave a new and strong push to the importance of knowledge
throughout his call to establish Utopia, as he is the one who said, “Without
knowledge the human being will not be able to understand his identity, only he
who carries the knowledge will be able to understand his surroundings represented
by the existence itself” (Hassan, 2003).
It is only natural for the interest in knowledge to continue in our present time after
informatics and communication revolutions have paved the way and reduced
distances, making it easier to exchange and rejuvenate knowledge. It is not strange
that in light of these evolutions for the volume and quantity of knowledge to
multiply every few years after it took a century to achieve (Kubaisi, 2004, p. 46).
Therefore, understanding the term knowledge and its organisation and application
helps the development of an effective educational organisation and strengthens its
reputation
2.2.2 The Concept of Knowledge
Different types of contemporary organisations are facing a surge of transitions and
accelerating changes sweeping today’s world, on top of informatics and technica l
evolution. This evolution relies on advanced scientific knowledge and the best use
of information flow resulting from big developments in computer technology and
world communication (Internet). As a result of those transitions, knowledge has
become the most significant strategic source; moreover, it has become the
strongest, most influential, and dominating factor in an organisation’s success or
failure (Schwandt & Marqurdt, 2000).

19
By looking at this subject in literature, it has been demonstrated that trend
researchers classified the concept of knowledge as following two main streams:
looking at a partial perspective of knowledge constructed only through implicit
acquired knowledge of information and the causal links that assist in making sense
of this information (Sarvary, 1999, p. 96). Knowledge is described by Daft (2001,
p. 258) as “the basis for the sense to measure the personal experience of intuition
(intuition) or special view.” Knowledge, according to this definition, is the
fundamental basis of the experience of an individual in judging things. Hislop et
al. (2000, p. 1) add that the status of knowledge is defined as “a continuous
process for the restructuring of ideas during exercise or ongoing experience. ”
While to Drucker (1999) knowledge is “the ability to translate information into the
performance to achieve a specific task, and this ability can only be done in humans
with brains and intellectual skills” (Ibrahim, 1998, p. 4). This definition refers to
performance as the director of knowledge to achieve specific targets, which was
not mentioned in any of the above definitions.
Knowledge, in accordance with this route, reflects a changing state of mind. Its
interactive and connected processes are considered natural in the human mind and
in individual experiences, and this knowledge can be defined as the brain’s
thoughts, which can be converted into performance and thus reach set goals.
However, this definition is restricted to the implied aspect of knowledge, whereas
there is another aspect that is focused on by many researchers.
The other concept of knowledge is a holistic view. Through the components
underlying the phenomenon, this context is defined by Sowa as “the possession
and inventory determinants implicit and tacit (explicit) on the subject or specific
operations, and the relationships to their own procedures for positions that are
dealt with” (Turban & Aronson, 1998, p. 202). With any knowledge that reflects
the experience and underlying expertise (implicit) of ideas, selves, values, and
estimates associated with people, the dynamics can be achieved by the completion
of interdependence and communication systems and relationships with the
explicit. In Probst et al.’s view (Probst et al., 2001, p. 7), the concept of knowledge
“includes in addition to the reports and memoranda the experiences of workers,
their skills and the result outcomes from assembled in groups and teams
integrated” and that knowledge, according to this concept, is a mix of tangible
objects, such as reports and memos, and other intangibles that lie in the
20
individual’s skills and experiences; and perhaps the most important characteristic
of this concept is referring to the added value that represents knowled ge, which
produces a compilation of individuals in groups and integrated teams. More
comprehensively, (Kubaisi, 2002, p. 48) knowledge is defined as “every piece o f
information, tacit or explicit, that can be recalled by individuals to accomplish
their tasks perfectly or make right decisions”. However, there are many other
objectives that seek achievement through knowledge, such as providing advisory
services to others, for example.
Knowledge is now considered the real core of today’s organisations, including
educational organisations, and a successful contemporary administrative too l
enabling them to adapt to the requirements of this era. This is because knowledge
is the most important resource in creating fortune and achieving excellence and
creativity in light of the intellectual facts ascending in its path, such as severa l
intellectual concepts like globalisation and privatisation. Information evolution
and the extended various types of society’s most important approaches for
development of KM, which manages knowledge and change in our present time,
have achieved a quantum leap in the level of performance in different
organisations, especially educational institutions (Hamoud, 2010, p. 54). There is a
type of harmony and synergy between KM and the activities of educationa l
institutions. There is a certain level of consistency between the operational concept
of knowledge and the mechanisms, activities, and events of educationa l
institutions as cognitive institutions (Almahgob, 2004, p. 18). Many studies, such
as the study by Almalak and Alathary (2002, p. 19) and Alamry (2004, p. 12),
confirm that adopting KM in organisations results in several benefits, such as
enhancing efficiency and effectiveness, improving decision-making processes,
enhancing performance, increasing productivity and creativity, achieving a
competitive advantage, and swift response to environmental changes.
The study of Kidwell and Johnson (2000) referred to adopting KM techniques and
strategies in HE organisations, which are seen to be as important and essential as
organizations in the business sector and, if implemented effectively, will lead to
those educational institutions excelling in their ability to make decisions. It will
also lead to the shortening of the product development cycle, such as curricula,
scientific research and will provide better academic and administrative and reduce
cost. Intermediate vocational colleges are one type of educational institution
21
undertaking an important role in society due to the nature of its functions, where it
provides a collection of scientific and vocational disciplines not existing in other
universities. This type of institution has proven its merit in several ways, in
particular regarding the way it has adapted to the periodic increase in numbers o f
youth who sought to register and has met their needs (Hamdan, 2004).
2.2.3 Organisational Knowledge
Currently, knowledge assets are very important in most organisations; these
organisations hire brains, not hands. Knowledge is seen as one of the assets of the
organisation, while information technology is seen as a factor in creating and
sharing knowledge, and linking knowledge contributes to the strategic objectives
of the organisation creating a clearly defined increase in the enthusiasm of the
work force.
Organisational knowledge is used to understand the relationship between interna l
structures, processes and procedures, laws and standards, cultures, products,
systems, and the basic elements which are owned by individuals, or it can be taken
advantage of to carry out activities related to work (Hislop et al., 2000, p. 15). The
activities of organisational knowledge are indeed dedicated to the higher menta l
processes in the brains of managers and members of the organisation, who realise
that education and ideas contribute to the formation of opinions, attitudes, and
expectations to provide an accurate view from the periphery of the organisation,
strategic enhanced survival, and durability (Al-Khafaji, 1996, p. 5). Knowledge is
a crucial item that cannot be ignored by any organisation and is often called
intellectual capital. After the trade name, trademark, and the physical assets of the
organisation, knowledge is acquired from years of experience in the fields o f
different production and marketing. This accumulated knowledge in combination
with information gathered from external sources is one of the most important
resources of the organisation. The accumulation and utilisation of knowledge can
contribute to the intellectual capital of the organisation (Davenpart and Prusak,
1998). Intellectual capital refers to the knowledge that can be converted into profit
which enables an organisation to achieve its goal and compete with other
organisations. Indeed, knowledge is a main source of competitive advantage and
intellectual capital of an organisation and is the sum of human capital, structura l
capital, and customer capital. (McShane and Glinow, 2000, p. 20). Furthermore,
22
human capital is the knowledge possessed by individuals who generate it, and
includes skills, experience, and creativity. Structural capital is the knowledge that
is captured and kept in the systems and organisational structures. The customer’s
capital represents the amount derived from satisfied customers, appointed
exporters, and external resources, which provide an added value to the
organisation. Building intellectual capital requires the organisation to follow the
following steps (Linder & Jennifer, 1998, pp. 2-4):
1. To set high performance standards for all, while continuing to improve to arrive
at the possible best method.
2. Staff development through new, difficult, and challenging assigned tasks.
3. Modification of each point of the interfaces of work (organisational culture,
structure, and strategy).
4. Provide each level of the organisation new talent and recruitment of suitable
individuals to solve problems.
5. Ensure the workers in the organisation are collectively involved in the process
of change.
If intellectual capital disappears and its ideas and results become worthless, this
affects the market value of the organisation because intellectual capital is essentia l
for an existing organisation (Koenigi, 2000, p. 1). Intellectual capital may go to
other organisations and countries because the organisation was unable to convert
their experience and skills to the practice of executive functioning (Enzi, 2001, p.
17). The seriousness of this issue lies in the possibility of transferring these people,
ideas, and experiences (that they personally own) as well as data and information
pertaining to the previous organisation to the new organisation, thus giving the
new organisation a strategic opportunity and additional advantage against the
threat and vulnerability of the previous organisation.
The question that arises is how organisations can maintain intellectual capital. In
order to keep and preserve the organisation’s intellectual capital, it is important to
maintain qualified staff with good knowledge, but arguably it is more important to
convert their knowledge into a structural capital where inculcated knowledge can
be organised and sorted out in a manner that can be accessible to
others. Considerably, the skills and expertise of Japanese companies brought out
organisational knowledge that distinguished them from American
23
companies. While the latter focused on generating and converting explicit
knowledge, the former focused on generating and converting the implicit
knowledge embedded in the minds of individuals. In this context, Saleh (2001, p.
83) has identified the most important factors that help organisations maintain
intellectual capital, namely:
Activating material and moral stimulation,
Intercepting organisational traditionalism,
Facing organisational frustration,
Reducing the chances of organisational alienation, and
Enhancing organisational discrimination.
Since capital is a term of the industrial age, and the world is moving towards the
era of knowledge, it is preferable (Sveiby, 1998; Barroso & Gomes, 1998, p. 5) to
use the term intangible assets, rather than intellectual capital; the term externa l
construction, instead of the customer’s capital; internal construction, rather than
structural capital; and competitive individuals rather than human capital. The
reason that knowledge, in some cases, can become reverse capital is because
knowledge grows by sharing (participation) and usage, and knowledge can be used
to damage capital.
The new term knowledge capital refers to the settlement of knowledge in
organisations and has appeared in recent years in writings and research on this
subject that attempted to explain and highlight it as a subject worthy of attention in
the foreseeable future.
2.2.4 The Importance of Knowledge
The 1990s saw a genuine interest in the subject of knowledge in organisations, and
this was largely the result of the emergence of reality, an inevitable topic
deserving focus on a number of areas simultaneously.
In the present information economy, knowledge is one of the most important
assets of an organisation. Production of goods and services of high quality and low
cost depends heavily on strong knowledge in the design process. The success of a
business in an increasingly competitive market is based on the quality of the
knowledge applied by organisations in their main industries, and this fact becomes
more visible when it is noted that innovation in products is a reflection perhaps o f
24
knowing the status of the market, or the potential of a new technology, or through
the participation of customers with the knowledge to guide the organisation in
their work, and how their service would best benefit (Barroso & Gomes, 1998, p.
1). This is the reason organisational managers focus on knowledge for monitoring,
implementation, and completeness of tasks (especially routine ones) so the
manager must direct the interaction of the workers. Personal interaction arises in
order to transfer knowledge (which is the basis of solving work problems). In
addition, knowledge is an important and decisive lead to creativity and success in
an organisation and in directing its work. This internal interaction between people
can benefit the organisation by obtaining new ideas and integrating them, which is
called brainstorming (Hansen & Oetinger, 2001, p. 108).
In the view of certain management theories, the most important aspects of the
knowledge of physical and financial assets is when the knowledge becomes centra l
and strategically located, then the organisation’s success will depend on its ability
to collect, produce, and sustain the continuation of the information that represents
the anchor of knowledge.
Accordingly, the main advantage of knowledge is its ability to assist management
to overcome all the difficulties they face and to overcome constraints. In addition,
an advantage is its substantial role in the proper functioning of the organisation.
A number of administrative theories state that cognitive assets are more valuable
than financial and material assets. It also holds to the fact that when knowledge is
situated centrally and strategically, the success of the organisation depends on its
ability to collect, produce, manage and the continuously improving information
that represents an anchor of knowledge.
Accordingly, in terms of knowledge for management purposes, knowledge is
central to allowing the proper functioning of an organisation, as well as reducing
and mitigating any difficulties management may face.
2.2.5 Knowledge and Related Terminologies
For many individuals, the term knowledge gets confused with another two terms,
data and information. An explanation is needed to understand the difference
between the three terms. Primarily, the term data refers to the descriptions for
objects, events, or activities which are kept and categorised but not organised to
produce any meaningful result (Subai'i, 2008, p. 3). Almtiran (2007) defined data
25
as raw material and abstract facts unorganised and independent from each other in
the form of numbers or words. In contrast, the term information represents the data
attached to other subjects, like the target or other connections (Leesr, 2000, p. 3).
In addition, Guendhilji (2005, p. 36) defined information as a group of organised,
coordinated data collected in a suitable way in order to give a specific meaning. In
this respect, the combination of homogeneous ideas and concepts can enable the
individual to use the term information in order to reach and discover knowledge.
Laudon and Laudon (2007, p. 33) described the main difference between data and
information to be related to the degree of dependence on it while making
decisions. Information could be very important when making a decision for a
certain department, but for another department it may not be considered important
and needs treatment before depending on it while making decisions.
Furthermore, knowledge and information are closely associated with each other. In
this respect, knowledge can be expressed by language and graphics, while
information can be part of a database and a strategic plan (Devinney, 1997).
However, information does not afford a significant perspective for strategic action
without the involvement of individual experience. Therefore, he considers
information a commodity that can contribute to the production of knowledge. As
illustrated in Figure 2.1, the association of information and knowledge play an
important role for organisations to achieve success.
Devinney (1997) sees information as a commodity capable of producing
knowledge, and with prolonged information, the indication is that we can learn
from it, but knowledge is a belief of information productivity.
It is clear from figure 2.1 that information regarding the two-dimensional meaning
can be interpreted only in the light of knowledge and with a volume o f
information. In knowledge, there are two types of contexts that can be independent
of the existing information, or that could increase or be affected by new
information, but there are no reasons based on the information except knowledge.

26
Figure 2. 1 The relationship between knowledge and information (Source: Devinney, 1997).
Knowledge leads to the formation of beliefs and commitment to principles, gives
meaning to living and non-living things, and serves as the basis for each
performance. It follows (Blumentritt & Johnston, 1999: 10) that knowledge is
different from information in such a manner that the former needs a medium (o f
intelligence) where it is produced through a connection between the ongoing
information to give a clear view of the fundamentals being used. Still, the
difference between knowledge and information emerges through the limits made
up by the existent intelligence system. Such limits may include the communication
tools used in the process of knowledge acquisition. Yet the same means cannot be
used because a greater capacity will be needed for managing such knowledge.
Important still, Daft (2001, p. 258) has pointed out that the main difference
between them is the human role in building knowledge. Accordingly, in light o f
the difference between knowledge and information shown (Zamel, 2003, p. 1), the
difference between “knowledge management” and “information management” is
that information management indicates dealing with objects (data and information)
related to management information, and dealing with human beings is KM. To
clarify further, the management of information concerns documentation and
design drawings by computers, tables, electronic symbols, and programs, which
deal exclusively with representation of data that is clear and obvious. While KM,
Information
Knowledge affected by of the
new information
Knowledge is
unaffected by the new information
Activity
27
on the other hand, characterises value in originality, innovation, agility,
adaptability, intelligence, and learning, and it seeks to activate the potential of the
organisation in these aspects. Overall, we can say that knowledge comes in the
advanced stage and the subsequent information comes in the data series (data,
information, knowledge, wisdom). It is also knowledge, especially knowledge of
explicit and useful information, which can be documented, coded, and restored.
The essence of the difference between knowledge and information in the
interpretation of humanitarian needs is that tacit knowledge requires high skills in
management and means.
2.2.6 Knowledge Resources
Knowledge resources are known to be the objects from where knowledge emerges
or where knowledge is contained or gathered. Intelligence, learning, and
experience define the knowledge limits of individuals (Saffady, 2000). It can be
obtained from books, movies, databases, images, maps, flow charts, novels, or
even observation of behaviour. These resources could be divided into two types,
documented and undocumented; the last one is thoughts in the minds o f
individuals. There are several methods in which knowledge is acquired, including
extensive team work, phone and other communication means, e-mails, publishing
legal documents, or communication through the Internet (Hislop et al., 2000, p. 6).
In general, sources of knowledge are embodied in all sources of clear information
that individuals (heads and subordinates) can convert into knowledge, in addition
to the capabilities of these individuals’ minds in terms o f latent capacity of
intelligence, experience, intuition, and skill.
2.2.7 Knowledge Types
Knowledge is classified according to its human perspective into two main types :
tacit knowledge and explicit knowledge. It is generally accepted that literature
supports both types (Nonaka & Takeuchi, 1995; Duffy, 2000; Daft, 2001; Heisig,
2001; Alkobaissy, 2002).
Explicit knowledge is the knowledge individuals can share. It includes all the data
and information that could be obtained and stored. Examples include stored data
and information related to policies, procedures, programs, budgets, and documents
related to the system, in addition to the basis of correction, operation, and
28
communication and its standards and various functional operations (Hijazi, 2005,
p. 66). This type of knowledge is also known as documented and encoded
information, which is often found in documents, reference books, blogs, reports,
and digital storage devices. This is why this knowledge is easy to describe and
identify and could be transformed from one language to another and from one
form to another. It can be read and produced consistently and thus be stored and
restored (Alziyadat, 2008, p. 40). Thus, explicit knowledge is an important issue ,
as it can be expressed in simple forms, including words, symbols, or graphics, and
it is transferable. It is accessible and can be stored electronically (Alziyadat, 2008,
p. 41).
The second type of knowledge, tacit knowledge, is often stored in the minds o f
individuals. It is obtained from accumulated past experiences; in most cases it will
have a personal impression, which makes it difficult to acquire as it is stored inside
the mind of the knowledge owner.
Alian (2008, p. 81) indicated that tacit knowledge is hidden knowledge indicating
the skills existing in the mind of each individual, which is difficult to transfer to
others or to transport. This knowledge could be artistic or perceptive. However, he
indicated that it is not easy to understand tacit knowledge as a process or express it
in words. Although it can be invested through some practices and some of it
transformed into explicit knowledge, tacit knowledge can also be transformed into
another tacit knowledge when the individual shares his artistic knowledge with
others in order to transfer and exchange skills, experiences, situations, directions,
capabilities, events, and practices (Alian, 2008, p. 81). Abufara and Hamad (2010,
p. 5) confirm that tacit knowledge is related to artistic, perceptive, and behaviour
knowledge lying within the individual, which is not easy to share with others or
transfer to them. In addition, tacit knowledge is difficult to transmit to others at a
workstation. It is also a very precious and unique commodity that is difficult for an
organisation to copy or clone. All of that makes it a foundation for distinction and
excellency. One crucial matter for an organisation is to reveal the tacit knowledge
kept within its employees, thus collecting it in order to manage its intellectua l
capital (Economic and Social Commission for Western Asia, 2004, p. 5). This is
why any organisation that wishes to manage the knowledge kept in its employees ’
minds has to seek transformation of tacit knowledge into declared knowledge
through motivating individuals to reveal the knowledge they own and through
publishing it in order for its personnel to develop and benefit from it. Despite the

29
apparent difference in features between the two types of knowledge (explicit and
tacit), each is considered complementary to the other with a high level o f
importance for any organisation. This calls for finding the proper means to transfer
and transform tacit knowledge to explicit knowledge. Figure 2.2 shows the most
common knowledge patterns (Al-Ali, et al., 2009).
Figure 2. 2 Knowledge Pattern.
2.3 Knowledge Management (KM)
The above sections focussed on the ‘knowledge’ which requires
Figure 2. 3 Knowledge Pattern.
KM has played a significant role in improving management practices by setting
the guiding principles of knowledge acquisition, knowledge application, and
knowledge dissemination (Ooi, 2009). KM is an interesting discipline that reflects
the renewable ideas inherent in the human mind. It represents the most important
assets of an organisation, and it is a manageable commodity. It has only been
recognised as a discipline in the past few years, when there appeared to be some
serious attempts to standardise it and apply it in a number of internationa l
organisations. In addition, it has become the most important competitive
advantage for organisations seeking to acquire and exploit it. This resource is an
important asset for organisations in light of the developments in high technology
information and communication, and the rapid changes and fluctuations in the
economic, social, and political fields at a global level. In this context, this section
reviews the literature related to KM.
30
In terms of information in a data series (data, information, knowledge, wisdom), it
is apparent that knowledge comes towards the end of the range, illustrat ing the
greater sophistication.
Information can be documented, coded and restored. The essence of the difference
between knowledge and information lies in the human interpretation required by
tacit knowledge and skills in management.
2.3. 1 Emergence of Knowledge Management
The field of KM is relatively new, particularly at the applied level. It has been
recognised only in the past few years, and afterwards some standards as well as a
growing awareness of the benefits have been realised from its application. At the
end of the twentieth century, attention was drawn to this subject because at the
time the components involved in the management of knowledge needed to re-
adjust the value that would be utilised in the market to meet the needs of the
customer in the face of rapid changes taking place. The need to manage
knowledge emerged because of the increasing growth and necessity to diagnose
the flexibility of organisational structures, which could not cope with rapid change
in the market (Soo et al., 2001, p. 1). Perhaps the increasing use of information
technology and communications that led to the evolution of available information,
which impressed users, is one of the reasons that stimulated the emergence of KM.
It was not a challenge limited to finding information on an order or a specific
project, but how to search through the information available to find the most
useful information for a particular purpose. Another method is the ability of the
growing information and communications technology that have assisted additiona l
processing and retrieval methods to obtain the information on storage, which is
necessary to the user.
Don Marchand first used the term knowledge management (KM) at the beginning
of the 1980s as the final stage of hypotheses concerning the development o f
information systems, but he did not refer to it as an independent process (Kubaisi,
2002, p. 57). At that time, a series of early pioneers of KM were credited with
putting KM on the map. Featured organisations like Beckman Labs and the
International Bank, by their creation of jobs in the field of KM, have led Japanese
companies to play an important role in the emergence of KM and its applications.
31
The emergence of KM and its development were the collections of outcomes of a
set of elements, assets, and the roots of the relationship. The most important
include the following (Abu Fara, 2004, pp. 9-10):
Philosophical theoretical thinking.
Consideration of realism in the requirements of experience in the labour
market.
The views of educators.
The views of entrepreneurs and business leaders.
The role of economic forces in the formation of knowledge.
The efforts of business organisations during the twentieth century to increase
effectiveness.
In this context, the accumulation of knowledge and the rapid changes and
developments that have been seen by the world during the end of the last century
contributed greatly to the creation of the term KM. During that period, a series o f
writings and research on the development of this term determined the concept,
models, and development as well as the development of applied standards. Many
organisations attempted to apply KM in their work, some of which succeeded and
achieved good results in performance; however others failed due to the vagueness
of the term, which was in the process of evolution.
2.3. 2 The Concept of KM
The concept of KM is considered a modern concept in management science. It has
gained increased interest in the last two decades that has led to the emergence o f
many definitions of the concept, which vary depending on the specialties of the
researchers and various perspectives. To understand and define KM, there are
three basic portals, as follows (Malhotra, 2000, p. 83):
The Informational Portal includes data processing and the management o f
information flow activities, database development, and documenting business
activities in an organisation.
The Technical Portal is concerned with building and developing KM systems
based on information technology systems, such as data mining, data warehousing,
expert systems, analytical processing systems, instant information systems based
on the Web, and others.
32
The Cultural Portal is concerned with behavioural or intellectual dimensions o f
KM through handling the fields of collective learning, lifelong learning, and
building learning-oriented organisations.
In all these portals, KM seeks to provide administrative solutions through
investing in knowledge resources, building memory for knowledge, and focusing
on knowledge exchange and participation through a systematic methodologica l
portal. Therefore, different definitions appear in literature. As such, the researcher
was concerned with providing a range of definitions that serve the purpose of the
study. Thus, Chou (2005, p. 26) maintains that KM is the process whereby an
organisation extracts and invests intellectual capital in order to reach decisions
efficiently, effectively, and innovatively, to give an it a competitive advantage, and
to obtain the loyalty and commitment of customers. Delong (2004, p. 6) sees KM
as an administrative system activity based on containment, collection, and
formulation of all matters related to the important critical activities of an
institution in order to enhance performance and ensure the continuity of the
evolution of an institution in the face of the surrounding variables. In other words,
it is the process aimed at institutional coordination and integration of data
processing, information technology, the utilization of human resources, and the
factors surrounding the institution (Delong, 2004, p. 6). Alokalpi (2008, p. 26)
concluded a definition for KM as an administration that is working to identify the
complete knowledge (in their minds) individuals have (whether employees,
consultants, or beneficiaries), or to collect and create knowledge that appears in
records and documents and organise it in a manner that facilitates its use, or the
participation between employees of the institution in order to achieve higher
performance and work success with the best methods at the lowest possible cost.
In addition, Al-Zamel (2003) defined KM as a set of activities and processes that
help the organisation generate knowledge, access it, select it, use it, organise it,
and disseminate it, and work on transforming the knowledge (along with what it
includes in terms of data, information, experiences, directives, and capabilities) to
products (goods or services) and using KM outputs in decision-making, solving
problems, drawing learning processes, and building an integrated system for
strategic planning.
Based on the above, the researcher defines KM as a continuous dynamic process
that includes a set of activities and practices designed to identify, find, develop,
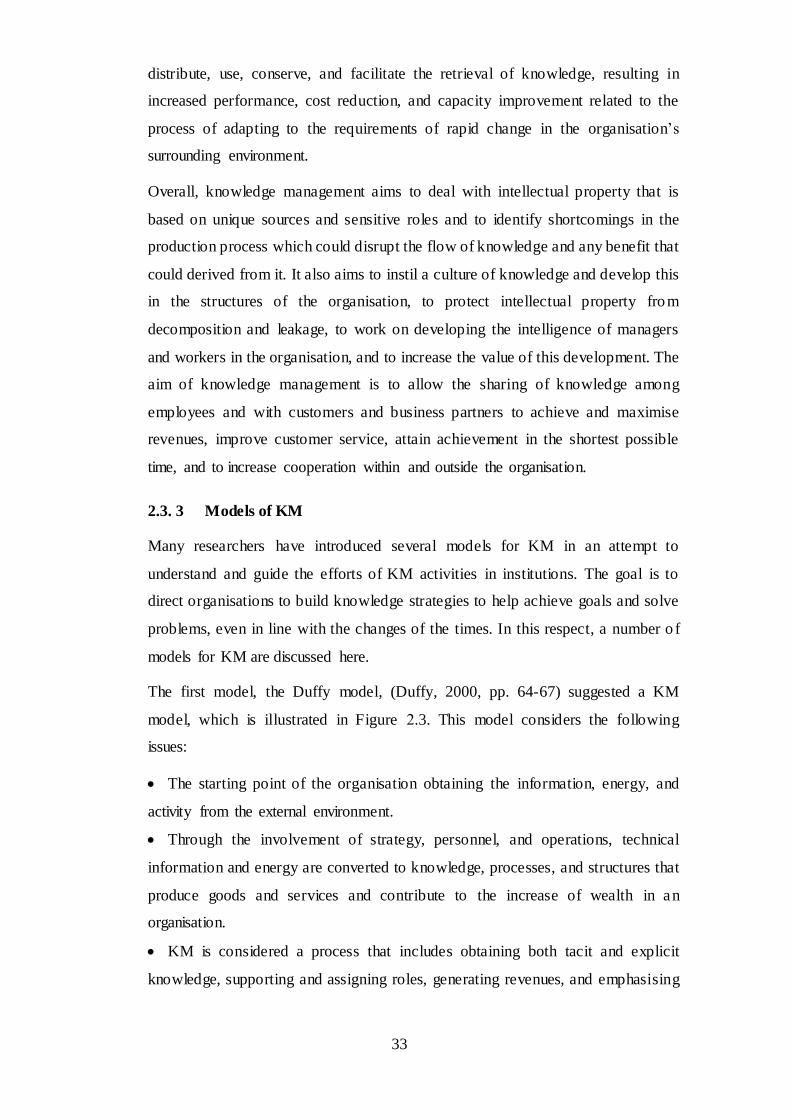
33
distribute, use, conserve, and facilitate the retrieval of knowledge, resulting in
increased performance, cost reduction, and capacity improvement related to the
process of adapting to the requirements of rapid change in the organisation’s
surrounding environment.
Overall, knowledge management aims to deal with intellectual property that is
based on unique sources and sensitive roles and to identify shortcomings in the
production process which could disrupt the flow of knowledge and any benefit that
could derived from it. It also aims to instil a culture of knowledge and develop this
in the structures of the organisation, to protect intellectual property from
decomposition and leakage, to work on developing the intelligence of managers
and workers in the organisation, and to increase the value of this development. The
aim of knowledge management is to allow the sharing of knowledge among
employees and with customers and business partners to achieve and maximise
revenues, improve customer service, attain achievement in the shortest possible
time, and to increase cooperation within and outside the organisation.
2.3. 3 Models of KM
Many researchers have introduced several models for KM in an attempt to
understand and guide the efforts of KM activities in institutions. The goal is to
direct organisations to build knowledge strategies to help achieve goals and solve
problems, even in line with the changes of the times. In this respect, a number o f
models for KM are discussed here.
The first model, the Duffy model, (Duffy, 2000, pp. 64-67) suggested a KM
model, which is illustrated in Figure 2.3. This model considers the following
issues:
The starting point of the organisation obtaining the information, energy, and
activity from the external environment.
Through the involvement of strategy, personnel, and operations, technical
information and energy are converted to knowledge, processes, and structures that
produce goods and services and contribute to the increase of wealth in an
organisation.
KM is considered a process that includes obtaining both tacit and explicit
knowledge, supporting and assigning roles, generating revenues, and emphasising
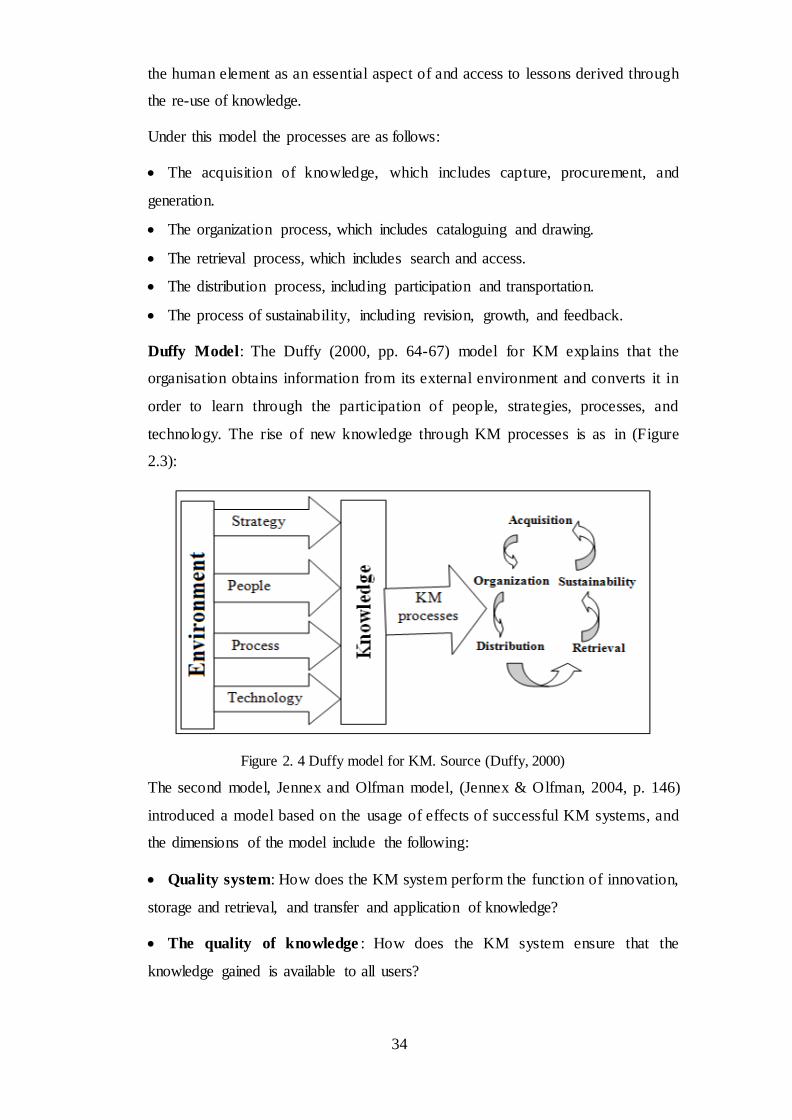
34
the human element as an essential aspect of and access to lessons derived through
the re-use of knowledge.
Under this model the processes are as follows:
The acquisition of knowledge, which includes capture, procurement, and
generation.
The organization process, which includes cataloguing and drawing.
The retrieval process, which includes search and access.
The distribution process, including participation and transportation.
The process of sustainability, including revision, growth, and feedback.
Duffy Model: The Duffy (2000, pp. 64-67) model for KM explains that the
organisation obtains information from its external environment and converts it in
order to learn through the participation of people, strategies, processes, and
technology. The rise of new knowledge through KM processes is as in (Figure
2.3):
Figure 2. 4 Duffy model for KM. Source (Duffy, 2000)
The second model, Jennex and Olfman model, (Jennex & Olfman, 2004, p. 146)
introduced a model based on the usage of effects of successful KM systems, and
the dimensions of the model include the following:
Quality system: How does the KM system perform the function of innovation,
storage and retrieval, and transfer and application of knowledge?
The quality of knowledge : How does the KM system ensure that the
knowledge gained is available to all users?
35
User satisfaction: Describes the level at which a KM system achieves high
levels of user satisfaction.
Possible returns : Measuring the benefits and impacts of a KM system for both
the user and management of the institution (university or college) as a whole.
The collective impact: The use of an individual’s KM system to improve the
quality of performance in the workplace and that, in turn, is reflected on the
performance of the institution (university or college) as a whole.
The SECI model is the model developed by Nonaka and Takeuchi (1995), and it
was abbreviated as SECI to shorten the four processes of KM. The full terms for
this abbreviation represent, respectively, the following: socialisation,
externalisation, combination, and internalisation, which are illustrated in Figure
2.4 below
Figure 2. 5 SECI Model for KM. Source (Hussi, 2004).
As indicated in Figure 2.4, KM is aimed at creating new knowledge based on
current knowledge. It is through the construction of a field of interaction between
individuals and extending tacit knowledge between individuals, which is
confirmed by conversation and extracted as explicit and understandable
knowledge. By correlation between explicit knowledge, transition occurs to wards
a more standard knowledge that is more likely to be used in the organisation’s
work. Finally, by learning by action standard systemic knowledge is dissolved and
converted into new operational (implied) knowledge in individuals’ minds.
Therefore, rising new knowledge expands the scope through the four SECI
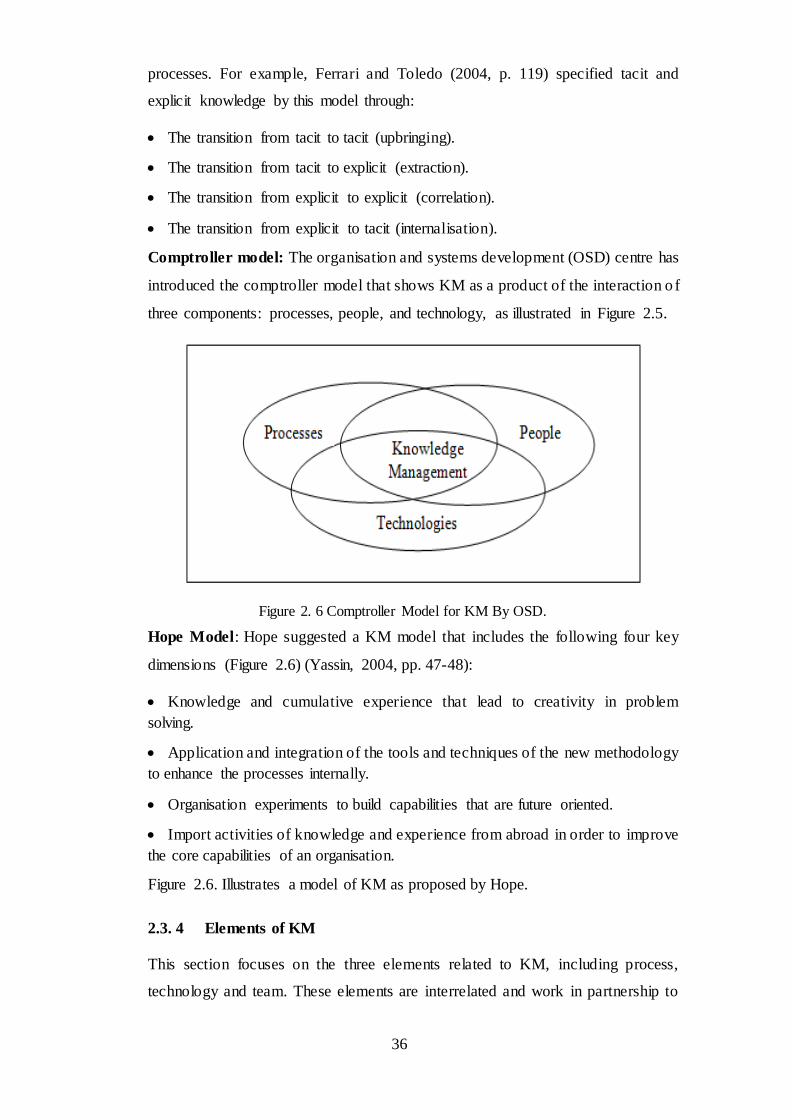
36
processes. For example, Ferrari and Toledo (2004, p. 119) specified tacit and
explicit knowledge by this model through:
The transition from tacit to tacit (upbringing).
The transition from tacit to explicit (extraction).
The transition from explicit to explicit (correlation).
The transition from explicit to tacit (internalisation).
Comptroller model: The organisation and systems development (OSD) centre has
introduced the comptroller model that shows KM as a product of the interaction o f
three components: processes, people, and technology, as illustrated in Figure 2.5.
Figure 2. 6 Comptroller Model for KM By OSD.
Hope Model: Hope suggested a KM model that includes the following four key
dimensions (Figure 2.6) (Yassin, 2004, pp. 47-48):
Knowledge and cumulative experience that lead to creativity in problem
solving.
Application and integration of the tools and techniques of the new methodology
to enhance the processes internally.
Organisation experiments to build capabilities that are future oriented.
Import activities of knowledge and experience from abroad in order to improve
the core capabilities of an organisation.
Figure 2.6. Illustrates a model of KM as proposed by Hope.
2.3. 4 Elements of KM
This section focuses on the three elements related to KM, including process,
technology and team. These elements are interrelated and work in partnership to

37
play a key supporting role during the implementation of KM. As KM process is
driven by team workers physically and virtually, technology and team worker
collaborations enable the organisation to learn and implement KM more efficiently
and effectively. The following sub-sections provide an overview information what
are related to the three elements of KM.
Figure 2. 7 Hope model for KM Source: (Yassin, 2004, p. 48).
2.3.4.1 KM Processes
Institutions realised that knowledge is the most important intangible asset. Most
institutions have adopted the concept of knowledge in one way or another.
However, some have not used it in an appropriate manner. The improper
adaptation of KM could be due to the lack of employee experience. So many
institutions have sought to work on the causes of the possession and management
of asset elements, and KM began to occupy a priority as a sophisticated,
intellectually important role in today's business world. Generally, KM is formed
due to a number of processes that provide the key that leads to the understanding
of KM and how best to implement it within an organisation. Various researchers
indicated that KM is influenced by internal and external sources. Thus, dividing
KM into its sub-elements is vital to success. Alavi (1997, p. 63) divided KM
processes into the following five elements: composing and acquiring knowledge,
knowledge organisation, knowledge storage, distribution and dissemination o f
knowledge, and the implementation of knowledge. Marquardt (2002, p. 26)
suggested six stages for processing knowledge, namely: acquisition, generation,
storage, extraction, and analysis of information, transportation, and publishing
application, and approval. Other researchers (Badr, 2010; Awdah, 2010; Dacey,
2007) identified KM processes involving the following phases: organising
knowledge, generating knowledge, sharing knowledge, and implementing
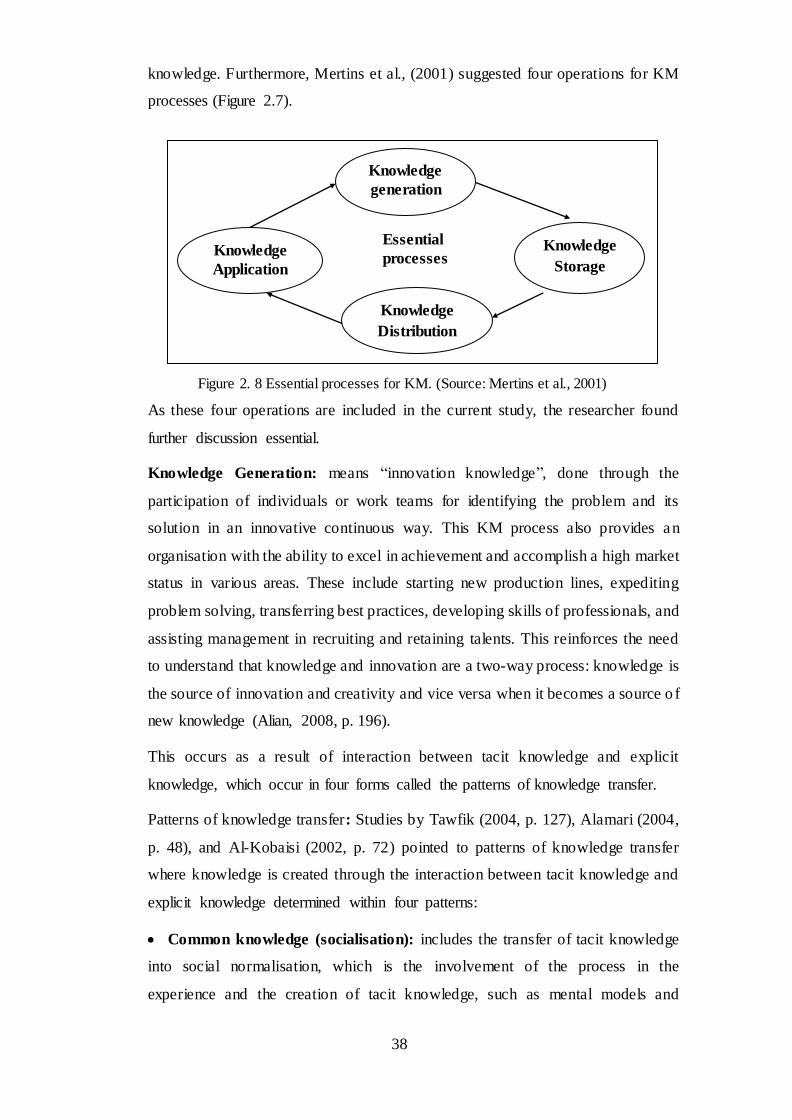
38
knowledge. Furthermore, Mertins et al., (2001) suggested four operations for KM
processes (Figure 2.7).
Figure 2. 8 Essential processes for KM. (Source: Mertins et al., 2001)
As these four operations are included in the current study, the researcher found
further discussion essential.
Knowledge Generation: means “innovation knowledge”, done through the
participation of individuals or work teams for identifying the problem and its
solution in an innovative continuous way. This KM process also provides an
organisation with the ability to excel in achievement and accomplish a high market
status in various areas. These include starting new production lines, expediting
problem solving, transferring best practices, developing skills of professionals, and
assisting management in recruiting and retaining talents. This reinforces the need
to understand that knowledge and innovation are a two-way process: knowledge is
the source of innovation and creativity and vice versa when it becomes a source o f
new knowledge (Alian, 2008, p. 196).
This occurs as a result of interaction between tacit knowledge and explicit
knowledge, which occur in four forms called the patterns of knowledge transfer.
Patterns of knowledge transfer: Studies by Tawfik (2004, p. 127), Alamari (2004,
p. 48), and Al-Kobaisi (2002, p. 72) pointed to patterns of knowledge transfer
where knowledge is created through the interaction between tacit knowledge and
explicit knowledge determined within four patterns:
Common knowledge (socialisation): includes the transfer of tacit knowledge
into social normalisation, which is the involvement of the process in the
experience and the creation of tacit knowledge, such as mental models and
Knowledge
generation
Knowledge
Application
Knowledge
Storage
Knowledge
Distribution
Essential
processes

39
common technical skills. The individual can acquire tacit knowledge directly from
others with the use of language. This is done though observation, simulation, or
practice. In the context of business, practical training is applied on the same
principal of job performance, as the key to acquiring tacit knowledge is
experience, and without the presence of some form of shared experience, it
becomes difficult for an individual to identify with the process when thinking o f
another individual. Indeed, the transfer of information is barely feasible if it is
stripped from its emotions related to special contexts or shared experiences
(Tawfik, 2004, p. 127).
External knowledge (externalisation): includes the transfer of tacit
knowledge to explicit knowledge called “Manifesting or Output”, a process o f
phonetic identification of tacit knowledge from which it transforms into tacit
concepts, which is a process of finding essential knowledge that takes the form o f
metaphors, concepts, hypotheses, or models that express the essence through
language or writing; however, the changes are often inadequate and inconsistent as
a result of the differences and gaps between mental images and expressions that
assist in the revitalisation of reflection and interaction between individuals, which
include the transfer of explicit knowledge.
Aggregate knowledge (combination): includes a transfer of explicit
knowledge into a specific explicit knowledge called integration, a process o f
systematisation of the concepts that turn it into a knowledge system. This pattern
of knowledge transfer includes the integration of different sets of explicit
knowledge, the exchange of knowledge between individuals, and merging it
through media, such as documents, meetings, telephone conversations, or
computer networks. This could result in the restructuring of the existing
information through classification, addition, and integration of explicit knowledge
to the emergence of new knowledge. Usually the creation of knowledge is
undertaken through education and training (Alamari, 2004, p. 48).
Internal knowledge (internalisation): includes a transfer of explicit
knowledge into tacit knowledge, and this is linked closely to learning by working.
When the experience related to common knowledge is being introduced, output,
and integrated within the rules of tacit knowledge to individuals in the form o f
common mental models or technical knowledge, knowledge becomes a valuable
asset.
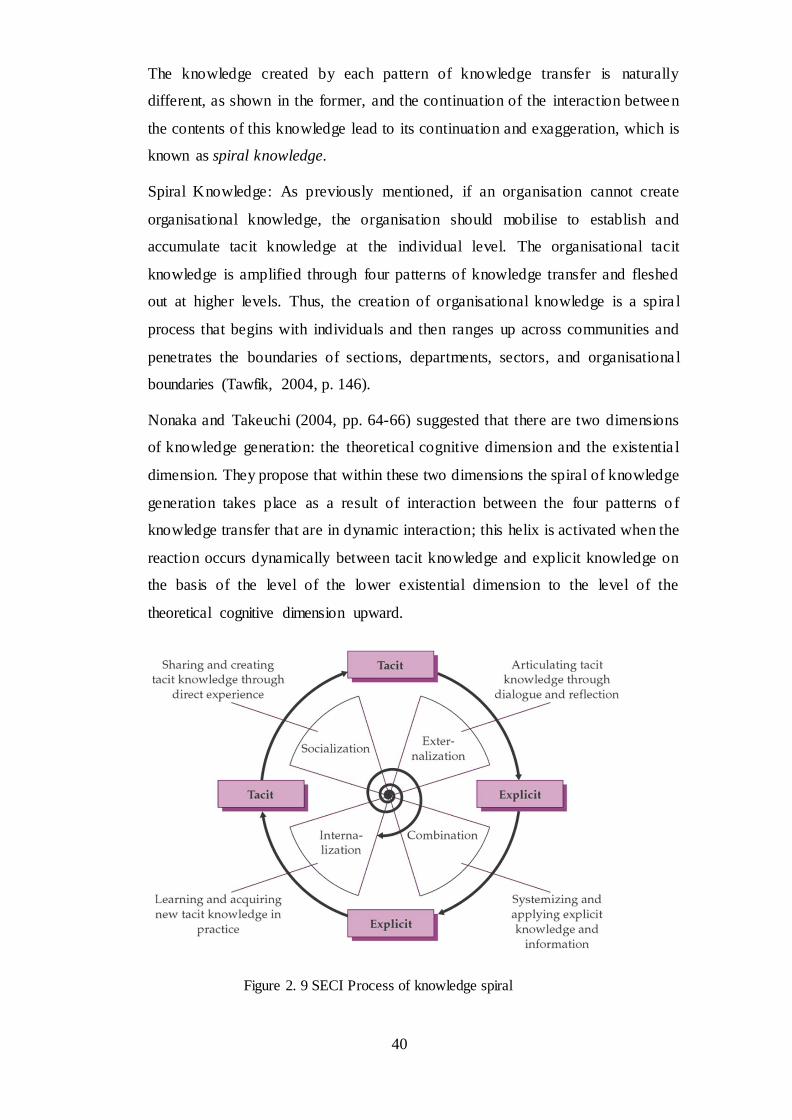
40
The knowledge created by each pattern of knowledge transfer is naturally
different, as shown in the former, and the continuation of the interaction between
the contents of this knowledge lead to its continuation and exaggeration, which is
known as spiral knowledge.
Spiral Knowledge: As previously mentioned, if an organisation cannot create
organisational knowledge, the organisation should mobilise to establish and
accumulate tacit knowledge at the individual level. The organisational tacit
knowledge is amplified through four patterns of knowledge transfer and fleshed
out at higher levels. Thus, the creation of organisational knowledge is a spira l
process that begins with individuals and then ranges up across communities and
penetrates the boundaries of sections, departments, sectors, and organisationa l
boundaries (Tawfik, 2004, p. 146).
Nonaka and Takeuchi (2004, pp. 64-66) suggested that there are two dimensions
of knowledge generation: the theoretical cognitive dimension and the existentia l
dimension. They propose that within these two dimensions the spiral of knowledge
generation takes place as a result of interaction between the four patterns o f
knowledge transfer that are in dynamic interaction; this helix is activated when the
reaction occurs dynamically between tacit knowledge and explicit knowledge on
the basis of the level of the lower existential dimension to the level of the
theoretical cognitive dimension upward.
Figure 2. 9 SECI Process of knowledge spiral

41
Figure 2.8 illustrates that knowledge generation does not only happen within an
organisation, but could also happen between a range of organisations through a
network of relationships that exist between these organisations. Therefore,
knowledge and the ability to be generated and used is one of the most important
sources to achieve sustainable competitive advantage for an organisation (Warner
&, 2004 p. 91).
In this sense, the generation of knowledge is the first and most important process
of knowledge operations underlying the other operations management. It is
through knowledge management that the organisation ensures the possession of
knowledge, which means possessing power and melting it down in its various
activities to achieve the desired goals. Knowledge is generated from interna l
sources, such as documents, records, personnel and various databases, or is
captured from external sources, such as the internet, customers, suppliers and
business partners.
Knowledge Storage: means those operations that include retention, sustainability,
search, access, retrieval, and location. The process of knowledge storage refers to
the importance of organisational memory as organisations are facing significant
risk as a result of the loss of much knowledge held by individuals who are
departing an organisation for one reason or another. Hence, knowledge storing and
retention became very important, especially for organisations that suffer from high
rates of labour turnover, which can result from the recruitment of temporary
employees and/or consulting contracts, in order to generate knowledge because
these individuals take their tacit, undocumented knowledge with them, and
documented knowledge can remain stored within its databases (Alziyadat, 2008, p.
99). Alwani (2006, p. 318) has pointed out that knowledge retention shall be done
on a selective basis and should be based on a same sort of organisationa l
knowledge, which requires special KM by taking into account the availability o f
standards that ensure the selection of knowledge has a future value for the
organisation and that knowledge retention comes after the ensured selection o f
knowledge in two basic forms. The first form is individuals, which who are the
keepers of expertise and must provide the administrative procedures that ensure
the preservation of their experience through encouragement, incentive systems,
and procedures of an orderly transition of expertise up the career ladder. The
second form is computers, which are a common means of knowledge storage
42
because of their efficiency, accuracy, and expandable massive storage. In addition,
computers have a high capacity to deal with document storage in digital form with
the ability to process it in various ways, ensure the most appropriate methods to
provide answers to employees of an organisation, and respond to their queries.
Within this context, Alian (2008, p. 197) confirms that knowledge storage
represents a bridge between knowledge capture and its retrieval process. Thus,
much of the known acquired value of KM is a result of the various elements o f
knowledge, its subjects, and the need to link to each other as well as be maintained
and updated.
Knowledge distribution: is considered the first step in the process of knowledge
use. It means the delivery of appropriate knowledge to the right person at the
appropriate time and should be in the right context and cost effective (Coakes,
2003, p. 42). Within this context, Dalkir (2005) indicated that knowledge
distribution is the process of knowledge interchange and transference to
employees, who need it in a timely manner in order to complete significant tasks.
This means the exchange of ideas, experiences, and practise among employees,
necessitating the connection of workers with each other and the use of knowledge
to solve problems creatively. Knowledge is an element that flourishes when it is
shared and used. Therefore, knowledge distribution depends on the existence o f
effective mechanisms. These mechanisms could be formal, such as reports,
manuals, training, planned official meetings, and learning on the job, or could be
informal, such as meetings, symposia, and seminars that take a formalised codified
manner and usually take place in non-working hours. These informal mechanisms
could be an effective mechanism in small groups. However, informal mechanisms
could lead to the partial loss of knowledge, where there is no guarantee that
knowledge is transferred correctly from one person to another, as well as the
ability of the receiver to operate, purify, and interpret the knowledge according to
the individual’s terms of reference. On the other hand, formal mechanisms could
be more effective and ensure a greater transfer of knowledge; however, they may
impede the process of innovation. Therefore, combining both mechanisms, formal
and informal, would lead to greater proficiency in the transference and distribution
of knowledge (Alwani, 2006, p. 315).
Knowledge application: The third essential KM process involves knowledge
application to new circumstances in which users can learn and produce new
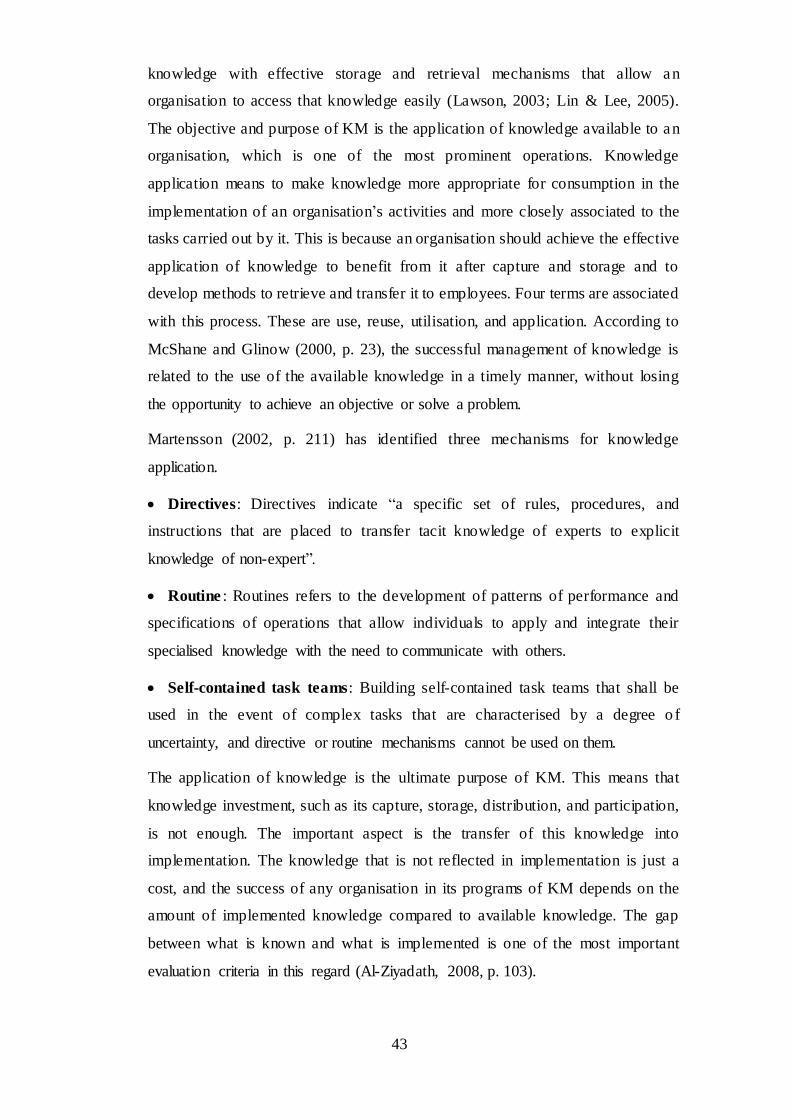
43
knowledge with effective storage and retrieval mechanisms that allow an
organisation to access that knowledge easily (Lawson, 2003; Lin & Lee, 2005).
The objective and purpose of KM is the application of knowledge available to an
organisation, which is one of the most prominent operations. Knowledge
application means to make knowledge more appropriate for consumption in the
implementation of an organisation’s activities and more closely associated to the
tasks carried out by it. This is because an organisation should achieve the effective
application of knowledge to benefit from it after capture and storage and to
develop methods to retrieve and transfer it to employees. Four terms are associated
with this process. These are use, reuse, utilisation, and application. According to
McShane and Glinow (2000, p. 23), the successful management of knowledge is
related to the use of the available knowledge in a timely manner, without losing
the opportunity to achieve an objective or solve a problem.
Martensson (2002, p. 211) has identified three mechanisms for knowledge
application.
Directives: Directives indicate “a specific set of rules, procedures, and
instructions that are placed to transfer tacit knowledge of experts to explicit
knowledge of non-expert”.
Routine : Routines refers to the development of patterns of performance and
specifications of operations that allow individuals to apply and integrate their
specialised knowledge with the need to communicate with others.
Self-contained task teams: Building self-contained task teams that shall be
used in the event of complex tasks that are characterised by a degree o f
uncertainty, and directive or routine mechanisms cannot be used on them.
The application of knowledge is the ultimate purpose of KM. This means that
knowledge investment, such as its capture, storage, distribution, and participation,
is not enough. The important aspect is the transfer of this knowledge into
implementation. The knowledge that is not reflected in implementation is just a
cost, and the success of any organisation in its programs of KM depends on the
amount of implemented knowledge compared to available knowledge. The gap
between what is known and what is implemented is one of the most important
evaluation criteria in this regard (Al-Ziyadath, 2008, p. 103).

44
2.3.4.2 KM Technology
The technology means, methods, and actions used to transform organisationa l
inputs into outputs (Daft, 2001, p. 240) represent the massive amounts of ideas and
information that are in constant motion. This is a contemporary challenge for
managers in creating awareness and ensuring accurate beneficial usage o f
technology. Not all technologies provide progress or add value, but they can have
an influence on how and where to perform work.
Information technology and computer systems are associated with KM
developments. The process of access to knowledge, attraction, and coding as well
as participation, distribution, and even creation and composition is necessary to
secure its structures and the basic infrastructure of information technology (Al-
Saba’a, 1997, pp. 18-19). On this basis, the use of information technology
applications is considered the newest tool of KM. Technology specialists consider
KM to be the analysis, design, and implementation process of systems. As such,
they focus on one of the following areas: knowledge storage and access methods,
use methods, information networks, customer satisfaction, organisational culture,
and applied software packages that cover the cost (Baserda, 2006, p. 63).
It may also be noted here that although commonly available communication and
collaboration technologies (telephones, electronic mail, message/messenger
services, etc.) as well as traditional information distribution media (newspapers,
printing and publishing, radio, television, audio and video records, etc.) enable
sharing of knowledge, they do not qualify as KM technologies since they do not
manage knowledge attributes adequately to meet the knowledge needs of large
organizations (Kavi Mahesh and J. K. Suresh 2004) . It could be contended that
most of these technological advances emerged in the 1980s and the first half of the
1990s, which were characterised by shared competition among organisations to
accommodate all the outputs of the technology. The perception was that the most
important competitive advantage that may be obtained by an organisation was new
technology that the other competitive organisations did not have yet, which was
reflected in the attributes of this period, such as re-engineering of business
processes, size reduction, and others. Many organisations have proceeded to lay
off large numbers of workers in order to reduce costs and replace their work with
technological means to lower cost and increase performance, resulting in the
drainage of the knowledge base of those organisations.
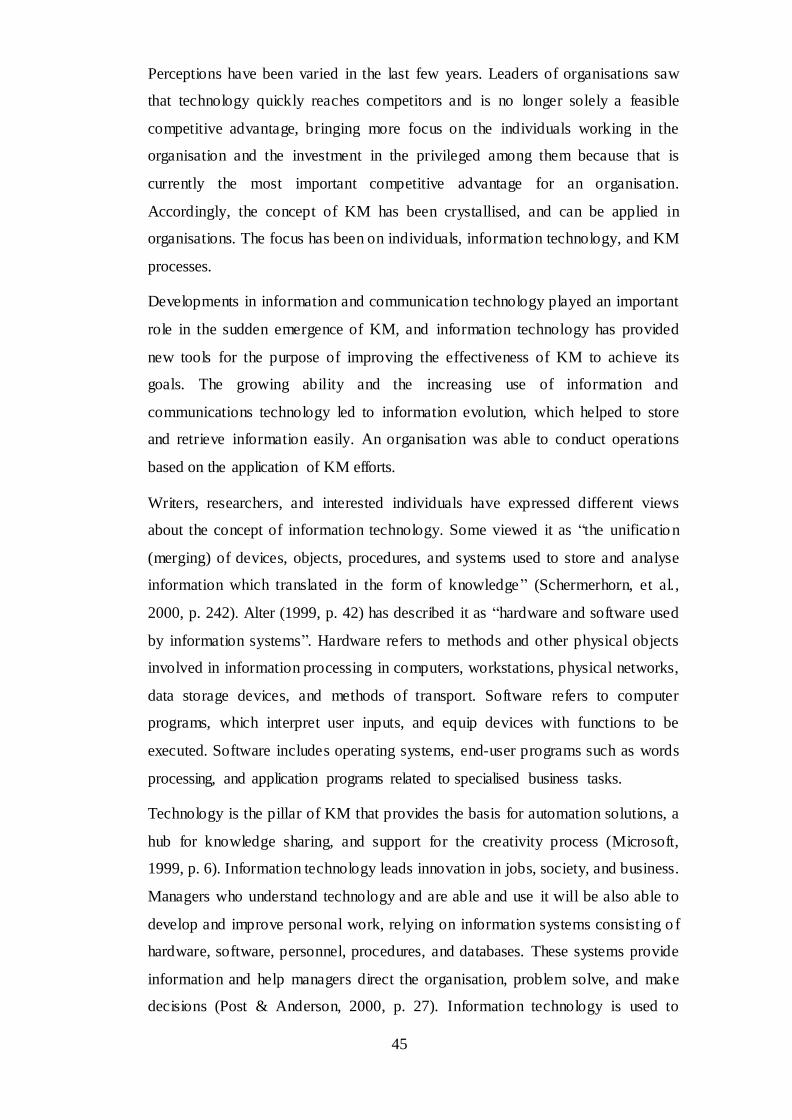
45
Perceptions have been varied in the last few years. Leaders of organisations saw
that technology quickly reaches competitors and is no longer solely a feasible
competitive advantage, bringing more focus on the individuals working in the
organisation and the investment in the privileged among them because that is
currently the most important competitive advantage for an organisation.
Accordingly, the concept of KM has been crystallised, and can be applied in
organisations. The focus has been on individuals, information technology, and KM
processes.
Developments in information and communication technology played an important
role in the sudden emergence of KM, and information technology has provided
new tools for the purpose of improving the effectiveness of KM to achieve its
goals. The growing ability and the increasing use of information and
communications technology led to information evolution, which helped to store
and retrieve information easily. An organisation was able to conduct operations
based on the application of KM efforts.
Writers, researchers, and interested individuals have expressed different views
about the concept of information technology. Some viewed it as “the unification
(merging) of devices, objects, procedures, and systems used to store and analyse
information which translated in the form of knowledge” (Schermerhorn, et al.,
2000, p. 242). Alter (1999, p. 42) has described it as “hardware and software used
by information systems”. Hardware refers to methods and other physical objects
involved in information processing in computers, workstations, physical networks,
data storage devices, and methods of transport. Software refers to computer
programs, which interpret user inputs, and equip devices with functions to be
executed. Software includes operating systems, end-user programs such as words
processing, and application programs related to specialised business tasks.
Technology is the pillar of KM that provides the basis for automation solutions, a
hub for knowledge sharing, and support for the creativity process (Microsoft,
1999, p. 6). Information technology leads innovation in jobs, society, and business.
Managers who understand technology and are able and use it will be also able to
develop and improve personal work, relying on information systems consist ing o f
hardware, software, personnel, procedures, and databases. These systems provide
information and help managers direct the organisation, problem solve, and make
decisions (Post & Anderson, 2000, p. 27). Information technology is used to
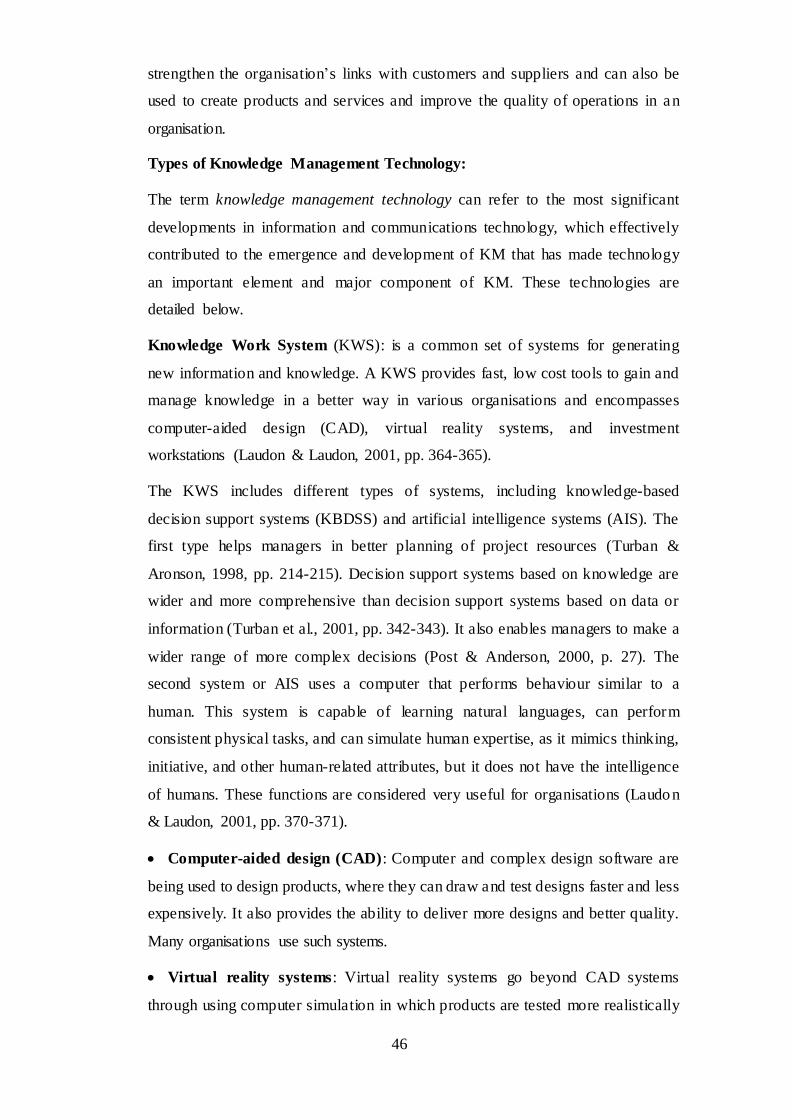
46
strengthen the organisation’s links with customers and suppliers and can also be
used to create products and services and improve the quality of operations in an
organisation.
Types of Knowledge Management Technology:
The term knowledge management technology can refer to the most significant
developments in information and communications technology, which effectively
contributed to the emergence and development of KM that has made technology
an important element and major component of KM. These technologies are
detailed below.
Knowledge Work System (KWS): is a common set of systems for generating
new information and knowledge. A KWS provides fast, low cost tools to gain and
manage knowledge in a better way in various organisations and encompasses
computer-aided design (CAD), virtual reality systems, and investment
workstations (Laudon & Laudon, 2001, pp. 364-365).
The KWS includes different types of systems, including knowledge-based
decision support systems (KBDSS) and artificial intelligence systems (AIS). The
first type helps managers in better planning of project resources (Turban &
Aronson, 1998, pp. 214-215). Decision support systems based on knowledge are
wider and more comprehensive than decision support systems based on data or
information (Turban et al., 2001, pp. 342-343). It also enables managers to make a
wider range of more complex decisions (Post & Anderson, 2000, p. 27). The
second system or AIS uses a computer that performs behaviour similar to a
human. This system is capable of learning natural languages, can perform
consistent physical tasks, and can simulate human expertise, as it mimics thinking,
initiative, and other human-related attributes, but it does not have the intelligence
of humans. These functions are considered very useful for organisations (Laudon
& Laudon, 2001, pp. 370-371).
Computer-aided design (CAD): Computer and complex design software are
being used to design products, where they can draw and test designs faster and less
expensively. It also provides the ability to deliver more designs and better quality.
Many organisations use such systems.
Virtual reality systems: Virtual reality systems go beyond CAD systems
through using computer simulation in which products are tested more realistically
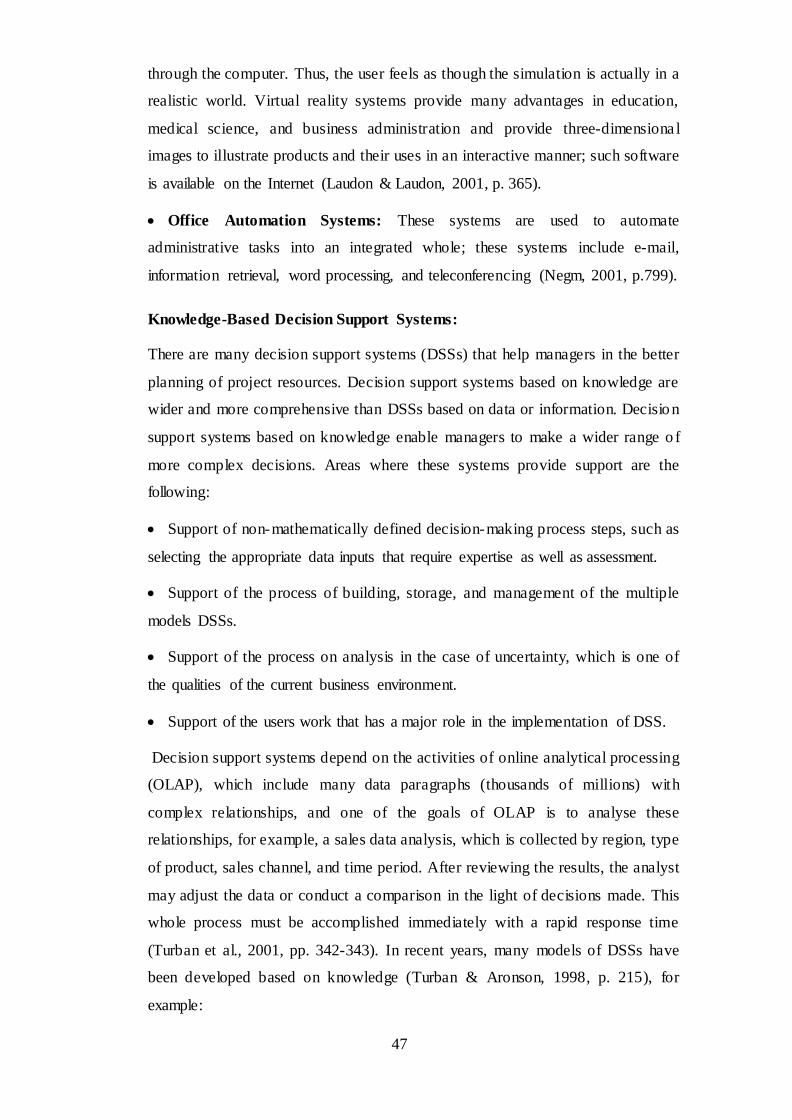
47
through the computer. Thus, the user feels as though the simulation is actually in a
realistic world. Virtual reality systems provide many advantages in education,
medical science, and business administration and provide three-dimensiona l
images to illustrate products and their uses in an interactive manner; such software
is available on the Internet (Laudon & Laudon, 2001, p. 365).
Office Automation Systems: These systems are used to automate
administrative tasks into an integrated whole; these systems include e-mail,
information retrieval, word processing, and teleconferencing (Negm, 2001, p.799).
Knowledge-Based Decision Support Systems:
There are many decision support systems (DSSs) that help managers in the better
planning of project resources. Decision support systems based on knowledge are
wider and more comprehensive than DSSs based on data or information. Decision
support systems based on knowledge enable managers to make a wider range o f
more complex decisions. Areas where these systems provide support are the
following:
Support of non-mathematically defined decision-making process steps, such as
selecting the appropriate data inputs that require expertise as well as assessment.
Support of the process of building, storage, and management of the multiple
models DSSs.
Support of the process on analysis in the case of uncertainty, which is one of
the qualities of the current business environment.
Support of the users work that has a major role in the implementation of DSS.
Decision support systems depend on the activities of online analytical processing
(OLAP), which include many data paragraphs (thousands of millions) with
complex relationships, and one of the goals of OLAP is to analyse these
relationships, for example, a sales data analysis, which is collected by region, type
of product, sales channel, and time period. After reviewing the results, the analyst
may adjust the data or conduct a comparison in the light of decisions made. This
whole process must be accomplished immediately with a rapid response time
(Turban et al., 2001, pp. 342-343). In recent years, many models of DSSs have
been developed based on knowledge (Turban & Aronson, 1998, p. 215), for
example:

48
Effective DSSs: these systems exert a significant role in the process of
interaction between man and machine and implement calculations to provide data
and respond to standard commands that help in solving mysterious and complex
problems.
Self-managed DSSs: It is one of design enhancements of DSSs, since they are
able to provide information on how to use these systems. Thus, it will be able to
self-adjust with user status.
Artificial Intelligence Systems: Artificial intelligence (AI) is an effort to develop
systems based on a computer that performs behaviour similar to a human, and
such systems will be able to learn natural languages, perform consistent physica l
tasks, and simulate human expertise, as they mimic thinking, initiative, and other
human-related attributes, but they do not have the intelligence of human. These
systems are very useful for an organisation for the following reasons (Laudon &
Laudon, 2001, pp. 370-371):
They can take advantage of the expertise that can be lost by the organisation
due to retirement, leaving work, or death of experts.
They can store information effectively to generate a knowledge base can be
used by many workers or employees who could learn from it.
Artificial intelligence systems use a number of tools and techniques, and the most
famous are calculation machines, Intelligence Quotient (IQ) agents, and
correlation analysis. These tools and techniques can be clarified briefly as follows
(Turban et al., 2001, p. 344; Laudon & Laudon, 2001, p. 382):
Calculation Machines: Learning machines through which historical data of
patterns can be tested. The users will be equipped with these machines to engage
in huge databases and to identify potential customers for a new product, or search
for organisations that are on the brink of bankruptcy.
IQ agents: Software that works in the backend to find specific applications and
functions that a user cannot predict. This customer (agent) could be programmed
to make decisions depending on a user’s preference and can be linked to a PC to
help the user perform applications easily.

49
Correlation Analysis: It is an approach that uses a special series of algorithms
that arise through chains of large databases reflecting the differences between
paragraphs.
Artificial intelligence systems are as follows:
Expert Systems:
Expert systems are based on knowledge and are defined as computer intelligence
systems that have the ability to solve difficult problems using knowledge and
methods of reasoning. Knowledge or information sets are expressed by computer
codes and usually bases (if/then). The codes modelled in these systems are based
on facts, data, assumptions, and definitions that rely on the combined experience
and knowledge of human experts (Negm, 2001, p. 794). Landon and Laudon
(2001, p. 373) have pointed out that the structure of expert systems is similar to the
structure of other information systems. Expert systems rely on one or more
knowledge engineers similar to the analyst of a normal system, but having
specialised expertise in information and knowledge.
Natural Language:
Natural language programs allow the user to connect with the computer through
the user’s language, and the program works as an ear for the computer. It is now in
different stages of development, where the user will be able to access information
from the database by entering commands in normal language (for example,
English) in a simple form. It should be noted that expert systems use many
symbolic languages, including the two main languages, LISP and PROLOG,
detailed briefly below.
The LIST processor language, denoted as LISP, is the oldest symbolic
processing language of artificial intelligence in the US.
Programing- in- logic language, denoted as PROLOG, was developed in Europe
and had extensive use in Japan. It was chosen for the fifth generation of Japanese
computers. Development has taken place in order for natural language to mediate
between the system and the ordinary language user (Negm, 2001, p. 796).
Neural Networks/Machine Vision: Neural Networks are designed to work in a
similar manner to the neural network of the human body, where the electrical key
works as the cell in the centre and the electrical wiring resembles nerves. Thus, the

50
network of synthetic nerves includes computers with software that are trying to
mimic the actions of neurons in the human body. Artificial neural networks can
learn from errors, where if the learning process continued for thousands of cycles,
the machine could learn the correct response. This network is interconnected and
parallel (Laudon & Laudon, 2001, p. 377). Similarly, Negm (2001, p. 796)
indicated that machine vision represents visual sensing by the cameras that
improve the appearance and shape of an object, which act as the eyes of a
computer. There are two basic mechanisms of vision: the first is a linear system
that is sensitive to only one dimension, and the second system is the matrix system
that senses objects in three dimensions (3D).
Hybrid IT Systems: Many IT systems can be integrated together to create specific
applications to gain the benefits of each of the individual applications. Such as
systems are called hybrid IT systems (Laudon & Laudon, 2001, pp. 381-382) and
are increasingly used in many Japanese companies, as the applications of these
systems have expanded to include office equipment, industrial machinery, and
household appliances.
Overall, applications in the field of technology (IT in particular) have contributed
significantly to the crystallisation and development of the concept of KM and have
become a fundamental pillar, important component, and integral part of KM. It is
what might be called “KM Technology” to distinguish it from other information
technology. Knowledge management technology is the advanced means used by a
knowledge team to facilitate knowledge generation, storage, distributio n, and
application in various systems, structures, and activities of an organisation to
achieve the goal of acquiring such technologies.
2.3.4.3 Knowledge Team
In the early years of KM, many organisations lacked in the development o f
significant conformation of technological solutions before understanding the
human factors of KM, but these organisations realised that when individua l
capabilities and technology are brought together effectively, KM may provide rea l
value to an organisation (Baserda, 2006, p. 72). Knowledge management is partly
a reaction and sequel to the patterns of the last decade, as downsizing and
rearranging of business processes has led to the withdrawal of a lot of talented
employees in organisations, after which the organisations realised the transfer o f
51
technology-based advantages to competitive organisations meant the only
remaining advantage was their work force (Baserda, 2006, p. 72). Theorists of KM
realised the importance of individuals and their value to the success of an
organisation; therefore, they are now trying harder to reduce the number o f
individuals in the organisations and to increase the value of those remaining (Zorn,
2001, p. 5).
Knowledge has become a directly competitive advantage for organisations to sell
ideas and relationships (service performance, software, and technology of
organisational leadership) and an indirect competitive advantage for all
organisations that are trying to differentiate themselves in how they serve
customers. Successful organisations are those that tend to attract the most
expertise. The development and retention of the individuals who can lead the
organisation to lead the market through responsiveness to customers and
opportunities deployed in technology is a challenge for organisations, requiring the
capacity to recruit, choose, assimilate, develop, and retain such talented
individuals (Ulrich, 1998, pp. 126-127). Furthermore, knowledge makers as well
as directors and managers of customer knowledge are those representing a
knowledge team of an organisation, which represents tacit knowledge possessed
by human resources, which, in turn, achieves a competitive advantage for
organisations in the era of knowledge and technology. This resource is considered
a key component, if not the most important element of KM. In this context,
components of a knowledge team are clarified as follows (Baserda, 2006, p. 73).
Knowledge workers: are different from data makers, who are responsible for the
processing that is conducted by secretaries, salespersons, and record holders, and
are capable of generating information and knowledge. They are more informed
and cultured than data makers, and they may be organisational consultants. Other
knowledge makers include researchers, designers, writers, and judges who can
generate knowledge (Laudon and Lauson, 2001, p. 359). Kubaisi (2002, p. 6)
believes that knowledge makers are generally university graduates and are often
members of a recognised profession, such as engineers, scientists, financia l
analysts, marketing partners, and production planners. They are responsible for
generation, development, and integration of new knowledge into existing
knowledge and should have the ability to judge. They have a thorough
understanding and independence to act. Laudon and Lauson (2001, p. 363)

52
indicated that knowledge makers are essential for an organisation and managers.
They can maintain a currency of knowledge in the organisation and communicate
its development to the external environment in the fields of technology, science,
social thought, and the arts. They can also serve as advisors in the field of interna l
knowledge and act as agents of change (i.e., perform and evaluate the process o f
organisational change).
In spite of the difficulty of measuring the productivity of knowledge makers due to
the difficulty of defining output units, there are six major factors that determine
the productivity of knowledge makers (Drucker, 1999, pp. 83-84).
The productivity of knowledge makers requires defining the mission. A basic
requirement of the process of knowledge makers is to reveal the mission or what
should be the mission for the purpose of focussing on the task.
The productivity of knowledge makers requires an imposition of the burden of
their responsibility on themselves (i.e., knowledge makers themselves).
Knowledge makers must manage themselves and must have independence.
Continuous innovation and creativity must be an integral part of the task or
responsibility that should be performed by knowledge makers.
Knowledge work requires on-going learning and teaching by knowledge
makers.
The productivity of knowledge makers does not focus on the quantity of
products but rather the quality.
The productivity of knowledge makers requires their treatment to be as an asset
and not a cost. This leads to increased productivity at work and the organisation’s
preference to all other opportunities.
Knowledge Managers: The introduction of the post of Chief Knowledge Officer
(CKO), termed by Rastogi (2000, p. 41) as Chief Knowledge Manager (CKM), is
the first step in helping organisations manage their own knowledge. The manager
should have the basic task of the collection of various aspects of knowledge,
especially with regards to personnel, the classification and transfer of the
knowledge base to derive results, standards, and formulas necessary to improve
work (Kuhn, 2001, p. 1). Organisations seeking to create the post of CKO must
provide a measure of technical and regulatory infrastructures and must focus on
critical initiatives to ensure the achievement of KM. There are three roles that can
be performed by a CKO (Herschel, 2000, p. 37).
53
Responsible for the development and execution of KM programs.
Development of the strategy that guides the organisation on how to maintain
and process their intellectual assets.
Adoption of an organisational culture that focuses on permanent learning and
growth. Turban et al. (2001, p. 40) indicated that the role of CKO represented the
briefing of knowledge using the method of information technology and has three
responsibilities, including generating infrastructure for KM, building a knowledge
culture, and dissemination of the knowledge culture.
The job of KM director is not one position, but it is a management concept o f
various aspects, positions, and multiple sites, including (Probst et al., 2001, p. 38)
those detailed next.
A Knowledge Officer’s mission is to create and install a knowledge base and
oversee development operations. An Excellence Fields Specialist’s mission is to
encourage the establishment of individual excellence fields and oversee
development operations. A Communications Expert’s mission is to ensure
networking inside and outside the organisation and to ensure the easy flow o f
knowledge and distribution through the network. Asllani and Luthans (2003, pp.
55-56) have classified knowledge managers into two main groups.
Explicit Knowledge Managers include all employees in an organisation who are
carrying out knowledge generation, transfer, classif ication, and connection.
Managers of information technology are considered a prime model for explicit
knowledge managers.
Tacit Knowledge Managers often focus on the process that facilitates the
interaction between knowledge makers and experts, and they are also concerned
with finding new experiences and achieving the benefits in time and place. Tacit
knowledge requires that the basic formula for the transfer of knowledge is direct
contact between individuals. Human resources managers are an example of tacit
knowledge managers.
Effective knowledge managers find likely methods to access knowledge
representation for others and adapt the process of re-drafting that knowledge to
different users, different contexts, and applications, as they should be informed o f
the advance impact of the change on users (OSD Comptro ller, 2002, pp.3-4). A
54
good knowledge director will find ways to ensure that adaptation to changes is less
threatening. Based on the above, a knowledge manager in an organisation should
have a high degree of professionalism and should have the qualities that qualify
the manager to carry out KM efficiently, as the manager should possess a vision o f
what the organisation should be and should give this vision a high level o f
commitment. This vision must address the creative capacities of workers and
encourage them to think about the future in innovative, renewable, and constantly
evolving ways. The manager must also work toward developing a sense o f
awareness among workers of the importance of interaction and integration with
modern technologies and toward generating valuable knowledge with beneficia l
applications.
Customer KM (CKM): represents the management of an external structure
(capital of the customer), which reflects the knowledge of external customers of an
organisation. Most organisations that are geared toward the customer have
managers that know their customers and mostly succeed in KM “about” the
customer, but few could appropriately manage their knowledge of the customers
(Baserda, 2006, p. 76). The CKM is a retrospective process, through which
organisations liberate their customers from only the receiving of products and
services by admitting them as partners in knowledge and aiming to acquire
customer knowledge in order to share and expand among them to achieve benefits
to both the customer and the organisation (Gibbet et al., 2002, p. 2). There are two
types of this knowledge (Rowley, 2002, p. 501).
Knowledge about the customer, which may include knowledge about potential
customers and their respective divisions.
Acquisition (possession) knowledge through customers, regarding harmony
between product lines (for example) or effective treatment of the complaints
regarding a certain commodity, the wider environment of the organisation, and the
marketplace where products and services are being delivered.
Organisations geared toward customers need to enhance their ability to manage the
knowledge of those buying their products. To apply, there are five ways through
them (or some of them) the organisation could manage the knowledge of its
customers; these methods follow (Gibbert et al., 2002, pp. 8-11):

55
Production consumption (prosumerism): This is a term that refers to the
possibility of a consumer that performs dual roles of the product and the customer.
This joint role generates options and prior tendencies within the customer to
provide something in the future, depending on the proposal of new ideas and
benefits in an innovative way. Thus, through the stimulation o f the pattern of idea
generation, the customer becomes a generator of the joint value in the
organisation.
Joint learning team: Joint learning teams focus on the total change and re-
configuration of organisations and value systems, where internal links in the
organisation become consistent with the customer knowledge base, and
participation in the activation of the joint EP with the customer.
Mutual innovation: Most product innovations do not come from within the
organisation, but come from the end customers of the product. The questioning o f
customers regarding what they need in the future may not necessarily lead to the
emergence of new products, but may lead to continuous improvement of the
product. Close cooperation between an organisation and the customer leads to
innovative, mutually inclusive solutions for many work problems.
Knowledge generation group: is one the methods of customer KM reflected in
linking groups of customers with knowledge experts. Knowledge generation
groups are groups of individuals who work together over a long period of time,
have a common interest in the subject, and are interested in generating and sharing
knowledge. The dialogue process is conducted between the customers themselves
and among production managers and development engineers with the presence o f
observers to obtain knowledge from such dialogue.
Joint intellectual property: This method may cause more and more powerful
participation of knowledge between the customers and an organisation, and here,
the organisation believes that its ownership belongs to the customers, and it works
for them; therefore, the intellectual property that exists in the organisation is
owned partly by the customers. This contributes to the generation of joint future
work between an organisation and the customers, which encourages customers to
provide strategic plans and structural proposals for the development of the
organisation and its outputs and relationships.
56
Overall, customer KM focuses on strengthening the relationship with the customer
and linking those interests with that of the organisation, as the customer is the
provider of information and knowledge regarding the customer, customer needs,
and the development of the organisation and its needs and outputs. Customer KM
is directed basically to gain knowledge from the customer. In addition, there
should be caution in dealing with customer knowledge in order to prevent
unstudied pandering to a customer’s wishes or reliance on misleading knowledge
that may be issued from certain customers.
Overall, we can say that the knowledge of customer management focuses on
strengthening the relationship with the customer and linking his interests with the
interests of the organisation. This is because the customer is considered to be the
provider of information and knowledge of himself and his needs and of the
development of the organisation and its outputs. Knowledge of customer
management is largely to acquire greater knowledge of the customer. Customer
knowledge should also be treated with caution so that it does not result in
following the customer’s wishes, or relying on misleading knowledge that may be
given by some customers.
In this respect KM can be considered a dynamic combination of specific
processes, which include the identification of knowledge and its acquisition.
Knowledge gained from customers must be learnt, which aids in the application o f
sharing and the exploitation of knowledge application and knowledge technology.
The understanding of the concepts of these elements can contribute to the
optimisation of the EP.
2.3. 5 KM in Higher Education Institutions
2.3. 5. 1 Concept of KM in Educational Institutions
The concept of KM is a recent concept in educational institutions, especially in
practice, and there is no agreed upon definition for KM in universities and
colleges. A Petrides and Nodine (2003, p. 10) study has defined KM in
educational institutions as “a framework or a way that enables individuals working
in the educational institutions to develop a set of practices to share information and
to share what they know, resulting in behaviours or actions that will improve the
level of service and products offered by the educational institution”. In this
definition, it is clear that KM is working on the linkage between the three primary

57
sources in an organisation, which are individuals, processes, and techniques to
enable an organisation to invest and share its available information more
effectively. Otaibi (2007, p. 21) has defined it as regular operations, which help
educational organizations to generate, capture, organise, use and disseminate
knowledge and make it available to all members of the organisation and outside
beneficiaries
In addition, Abu Khudair (2009, p. 13) related KM in education to the technica l
human activities and practices that aim to link individuals from different
administrative levels and sections of educational institutions. He maintains that in
the form of teams or working groups where mutual trust relationships should be
established among group teams, this can result in the automatic sharing and
exchanging of what these individuals possessed of their own resources
(information, knowledge, skills, expertise, and capabilities), which support the
learning of individual and collective processes and improve and develop the
performance of individuals and organisations.
Based on above, KM in education can be defined as a tool that gives guidance to
managers and staff of educational organisations in the emerging world of KM to
meet the challenges of the knowledge age. Knowledge management helps
educational organisations realise the merits of knowledge creation and sharing as a
means of enhancing the teaching and learning process.
There are some authors who have agreed on KM and its effectiveness on
organisational performance (Choy, 2006; Kiessling, Richey, Meng & Dabic, 2009;
McKeen et al., 2006; Ngah & Jusoff, 2009; Safa et al., 2006). However, there are
quite a number of studies applied to determine the impact of KM in educationa l
organisations (Daud & Abdul Hamid, 2006; Mohammad et al., 2010). Bose (2004)
asserted that the managers of organizations have played a key role in ensuring KM
effectiveness. Therefore, it is very important for them to effectively understand the
nature of knowledge and knowledge development activities ranging from
managing, measuring, and extending KM values to provide tangible additiona l
value to their organisations.
It has been proposed that effective implementation of reliable KM strategy and
ensuring that an organisation is knowledge-driven are necessary in the emerging
knowledge economy (Bose, 2004). Kiessling et al. (2009) argued that the success
58
of an organisation depends on its ability to accumulate and process knowledge in a
way that ensures organisational learning.
Ngah and Jusoff (2009) also say that knowledge sharing leads to better
organisational performance. The researcher considered knowledge sharing to be
one of the measures of KM in this study. Similarly, KM has been considered to
have a positive impact on EP, and KM has assisted limited organisations in
gaining a competitive advantage (Liao & Wu, 2009). The authors equate KM to
the factors of production in any business. This demonstrates how relevant KM is
to organisational performance. In line with the view of the researcher, KM
processes (creation, conversion, and sharing) are identified as the necessary
organisation preconditions of an effective KM system (Liao & Wu, 2009).
In general, knowledge environments are made up of the people who are affiliated
with colleges and universities. As their organisational activities (such as teaching,
research, and community service) revolve around knowledge, this notion has been
supported by many authors. For example, Kidwell et al. (2000) mentioned that if
knowledge is the heart of any higher institution of learning, then educationa l
organisations should take the advantage of the emerging field of KM to enhance
innovation, promote good customer service, and gain competitive advantage. The
authors buttressed this by the statement, “colleges and universities have significant
opportunities to apply KM processes to support every part of their mission”.
Moreover, Kidwell et al. (2000) say that KM is can be applied to the teaching and
learning process, research process, student and alumni services, and administrative
activities as well as strategic planning in any educational organisation. Therefore,
applying KM in a higher-education environment can reap benefits which include
improved, result-oriented decision-making, shorter time required to deliver an
educational product, more effective teaching and learning processes, higher quality
and volume of research, and better academic and administrative services at a
reasonable cost. More about applying knowledge in educational organisations can
be found in the next section, which presents justifications for the application o f
KM in educational institutions.
The KM process is also recognised and implemented in Jordanian HEIs (Al-
Shamary, 2006). It has a positive association with the effective performance of
59
HEIs. In the current study, the researcher is entrusted to invest igate the impact o f
KM on the EP of Jordanian HEIs.
2.3. 5. 2 Justifications for the Application of KM in Educational Institutions
The regulatory environment of educational institutions such as universities and
colleges is one of most suitable environments for the application of the concept of
KM, but it may be the most suitable environment to apply this concept compared
to other organisations due to their role in the community. As universities and
colleges of various kinds are responsible for the preparation and the creation of a
qualified and trained workforce, which is a vital element for all comprehensive
social development, thus necessitating the adoption of the concepts, methods, and
practices of modern management that contribute to raising levels of performance
(teaching, research, innovation) that leads to upgrading the quality of its outputs
(Abu Khudair, 2009, p. 14). A study by Kidwell et al. (2000) has shown that
knowledge creation, innovation, discovery, dissemination, and circulation are the
main reasons for the existence and establishment of universities and colleges, and
they emphasise the importance of the inevitable adoption of KM as the entrance to
the improvement and development that will contribute effectively in achieving its
goals and mission. Mikulecka and Mikulecky (2000) have defined severa l
justifications for considering the environment of universities and colleges and the
role assigned to them as the most appropriate environment for the application o f
the principles and methods of KM, which are as follows:
Universities and colleges usually own infrastructure and modern information.
Knowledge sharing with others is normal between faculty members, lecturers,
and students in general.
Students seek access to knowledge sources that are accessible through joining
universities and colleges.
These institutions usually provide an organisational climate characterised by
confidence; thus, no member would hesitate in the publication and distribution o f
knowledge.
In light of the great similarity between universities and colleges and modern
business organisations and in terms of the orientation of these institutions toward
providing many activities and educational services, research, and advisory

60
meetings in return for money, any style or method that may give the university a
competitive advantage and the ability to perform better may be of interest to those
institutions, and KM is one of the modern management techniques leading in this
direction.
Jordanian universities are one of that developing country’s educational institutions
that are not less popular than international universities in terms of the desire to
attend, and perhaps the most important justification for their popularity and
increasing demand is because they contain comprehensive, flexible courses that
meet the needs of individuals and society and the needs of the development plans
of human resources and the labour market (Amer, 2008). Jordanian universities
provide a greater opportunity for those wishing to join the labour market and those
who want to continue their advanced higher university education (Amer, 2008).
The programme aims to provide students with the skills needed by the labour
market, in addition to a broad base of information with multi-purpose use, such as
basic science, language, communication skills, and the use of computers. Most
Jordanian universities give a final certificate that qualifies the student for a
specific career and emphasises proficiency for specialisation and familiarity with
skills that can be refined by appropriate expertise from the corresponding
profession (Amer, 2008).
Based on many researchers (Dacey, 2007; Mertins et al., 2001; Badr, 2010;
Awdah, 2010; Alavi, 1997; Kiessling et al., 2009; al-Kobaisi, 2004; Alziyadat,
2008 Coakes, 2003; Alwani, 2006; Marquardt 2002; Alian, 2008; and others), the
researcher considers knowledge identification and knowledge discovery as a single
dimension referred to as knowledge identification. Other main processes of KM,
which are storage, sharing, and application, make up the remainder of the
processes (dimensions) of KM and, along with technology and KM teams, are
considered in this study. A discussion of the three dimensions of KM fo llows in
subsequent subsections.
2.3. 6 Previous Studies Related to KM
1. Study of Laszlo and Laszlo, (2002, pp. 400-412) “The Role of Knowledge
Management in a Changing World” The study aimed to show the three different
generations that KM passed through. The first generation focused on what KM is
through the acquisition of intelligence represented by technology of intellectua l
61
capital. The second generation focused on existing KM to propose what it could be
through learning and innovation; this generation led literate organisations and
enabled workers and groups to be creative, which directed them towards the third
generation. The third generation focused on exploring the future by focusing on
what KM should be. It is this generation that required from tasks what has become
known as strong organisational citizenship and democracy-oriented knowledge
through employee involvement toward more know-how. Per se, such changes in
KM have clearly changed the modern world which is characterised by higher
effectiveness and performance compared to earlier eras.
2.4 Summary
This chapter focussed on reviewing the literature on knowledge and KM. The
above sections represent the first part of the literature review which aimed to
understand the research related to knowledge and KM. Therefore, the above
information in this chapter not only consolidates understanding of various
published issues related to knowledge and KM but also helped to set up the
required variables for the current research project. Therefore, this chapter focused
on the main elements, including the background, the concept, related terminology,
models and other related issues. The next chapter will be on the second part of the
literature review under title Total Quality Management (TQM).The target of KM
is to allow the sharing of knowledge among employees and with customers and
business partners to achieve and maximise returns. Therefore, KM ensures the
work of an organisation is moving towards intellectual viability and achievement
of the best value in the assets of the organisation.
62
CHAPTER THREE
TOTAL QUALITY MANAGEMENT
3.1 Introduction
The previous chapter reviewed literature related to knowledge and knowledge
management (KM). This chapter focuses on quality and total quality management
(TQM). Generally, quality characterises the outcome of the product or service that
is provided by an organisation. The term quality has evolved from other similar
concepts and represents continuous processes related to perfecting products,
services, operations, and the quality environment that do not just satisfy but
exceed customer expectations. Many concepts and terms have appeared that reflect
the accelerated development in quality. Inspection, quality control, total quality
control, and quality assurance are stages the development of quality undergoes
until TQM is reached. Generally, many concepts of TQM have evolved and are
varied depending on the different viewpoints of researchers and interested parties.
Taken as a whole, it can be defined as a management philosophy that seeks
perfection in all aspects of the organisation, internally and externally, through
leadership encouragement of workers to participate in continuous improvement
and control customer satisfaction. The importance of TQM is represented in
private and public benefits earned by organisations that have applied TQM. The
most important distinction of TQM is the focus on internal and external customers
of the organisation. In order to be successful, there is a set of conditions, factors,
and statistical tools that help to achieve this. These two terms are associated with
stakeholder satisfaction and the reputation of the organisation. The structure of this
chapter will involve the literature related to the main elements of both quality and
TQM. These include definitions, concepts and the related terminology.
3.2 Quality
Quality is crucial aspect for all types of organisations. This is due to a number o f
factors that influence customers to choose a product or a service. In this respect,
the level of customer satisfaction plays a key role in selecting a product or service.
Thus, customer satisfaction is one of the major factors that contribute to build up
the reputation of an organisation. In education, quality education involves building
knowledge, attitudes, values, and skills that depend upon the quality of the

63
curricula and human and physical resources, mainly the teaching staff which
contribute to inspire knowledge and skills. This section focuses on five points ,
including the concept of quality and quality in education, quality inspection,
quality control and quality assurance.
3.2. 1 The Concept of Quality
Regarding the concept, it means the suitability for usage as defined by Juran
(1995), as quality is defined by some as matching features and characteristics.
Others refer to it as a decrease in customer complaints. Others propose that it is the
decrease in defects, damage, or losses during operation. Others say that it is the
improvement of performance efficiency and achievement or cost reduction
(Hamoud, 2010, p. 16). The American Oxford Dictionary defines quality as “leve l
or degree of excellence” (Russell & Taylor, 1995, p. 88). From the point of view
of management, science quality is “adequacy of the product or service for its
designated purpose” or “doing the right things using a correct way in order to
achieve the wanted goal, decreasing customer complaints, decreasing percentage
of defects, continuously improving performance” (Alshaar, 2001, p. 38). The
American association for quality control (ASQC) defined quality as “group o f
characteristics and features of a product or service depending on its ability to fulfil
specific needs” (Evans, 1997, p. 45). The International standards organisation
(ISO) described it as a “group of characteristics and features in a product or
service resulting in the ability to fulfil declared or implied desires” (Heizer &
Render, 2001, p. 171).
We can conclude from the above that the mentioned definitions focused on quality
as the product or service matching its pre-specified requirements, although the
concept of quality continued to develop later on, and the focus became the
customer as the main factor in quality. In this context, Goetsch and Davis (1997,
pp. 2-3) referred to a number of definitions stated by some individuals and
organisations interested in the subject. For example the definition of quality by
Smith (1973) was “achievement of the standard expected by the customer”, and
the definition of quality by the Boeing corporation was “providing our customers
with products and services which always fulfil their needs and expectations”. In
addition, the American department of quality protection defines it as “doing the
right thing in the right way from the first time, always striving to improve and
64
satisfy the customer”. In a wider perspective (Gerosa, 1998, p. 40) defines it as
“everything valuable to the customer”. The definition of Goetsch and Davis (1997,
p. 3), who sees quality as “a motion state related to products, services, individuals,
operation and environment which fulfills or exceeds expectations”, is considered
one of the most accepted and comprehensive definitions from the researcher’s
point of view.
Based on that, the researcher proposes a definition of quality as being a continuous
process concerned by the individuals mastering the products, services, operations ,
and environment that satisfies and exceeds customer expectations. According to
this definition, we can emphasise the most important features of quality as follows.
Quality is a continuous process. This means it is an evolving and uninterrupted
process, and that which qualifies as quality today might not be considered quality
tomorrow.
Mastering is a feature that means it is considered top notch and the highest
level of quality.
Quality applies to individuals, products, services, operations, and even the
internal and external environment of the organisation. It is not limited to products
and services only. This requires extraction of the tacit knowledge from the
individuals’ minds and even customers in order to classify the knowledge and
merge it with explicit knowledge in the organisation and manage it well to
enhance the mastering of it.
Quality does not only seek to fulfil customer expectations, but also to exceed
those expectations.
3.2. 2 Quality in Education
Haworth and Conrad (1997) wrote that in the context of the ever-changing
dynamics of the norms that we adhere to, it is only consistent that the definition o f
the quality of education also changes with time. Thus, it can be character ised as
what society deems necessary to standardise as the minimum level of education
within a certain factor, the ethics, and monetary pledge to achieve it (Davok,
2007). Therefore, it can be put forward as the accomplishment of the implied and
explicit objectives of society that it expects from the educational system, while
assuring strategic requirements (Tikly & Barrett, 2011). All of the process,
65
including its elements, inputs, and outputs, while justifying the expectations of the
society, determines the direction of education, and the character of each of the
mentioned elements determines the quality of education (Gidley et al., 2010).
The ultimate objective for a student within an educational institution is to
successfully attain a certain noteworthy educational accolade that would enable
the student to be a valuable contributor to society (Haworth & Conrad, 1997).
Therefore, quality in education is the extent to which any educational institution is
able to maintain the same educational quality. This was also put forward as being
the definition of the quality of education by yet another school of thought (Jones,
2011). While considering the fact that (like the health sector) education is also a
service sector, we can define the quality of education as the extent to which the
educational needs and expectations of the individual in general, and society as
whole, are met (Davok, 2007).
We can easily reach an ambiguous conclusion when trying to comprehend the
definitions of the quality of education as put forward by different schools o f
thought in which there is no single factor or aspect that we can tag as the quality o f
education (Ediger, 2010). There are many different areas, and every school o f
thought addresses and focuses on the specific area that they have found to be
important in order to gauge the quality of education (Tikly & Barrett, 2011).
However, all schools of thought were consistent in implying that (regardless of the
standards to determine the quality in education) customer satisfaction remains the
core value (Gidley et al., 2010). It is also significant to understand that due to its
characteristics and nature, it is almost impossible to accurately explain the qua lity
of education in specific terms (Jones, 2011).
In general, it can be said that no universal definition of the term quality has yet to
appear and that different authors place different emphasis on certain aspects of this
concept according to their experience. However, while quality experts define the
concept differently, they do all agree that customer satisfaction is the core element.
But in acknowledging this, it must also be recognised that due to the nature and
characteristics of the service sector, and especially the Higher Education sector,
the term is more difficult to define in a very precise way and is expected to change
over time.

66
3.2. 3 Inspection
Quality inspection was modified in order to separate non-conforming parts;
therefore, the term “quality” can be a synonym for inspection. In the period o f
mass production, an examination for the purposes of quality assurance for all
finished products was conducted. Inspection of quality was developed during the
First World War. During the Second World War, the manufacturing systems were
more complex and huge numbers of labourers were reporting to each foreman,
who could easily have lost control of the quality of the work. Consequently, it was
essential to employ full-time quality inspectors (Feigenbaum, 1991).
3.2. 4 Quality control
During the late 1940s and early 1950s, production was made a main concern,
which was due to the shortage of civilian goods in the United States. In many
organisations, quality remained the area of experts. During that time, both Juran
and Deming introduced statistical quality control techniques to the Japanese to
help them in their rebuilding efforts. They concentrated on upper management,
rather than quality experts alone. With the support of top managers, the Japanese
applied quality throughout their organisations and developed a culture o f
continuous improvement. In 1951, the Union of Japanese Scientists and Engineers
launched the Deming Prize to reward individuals and organisations who met the
strict criteria for quality management practice. Under a system of quality control,
paperwork, and procedure control systems raw material and intermediate stage
product testing, logging of elementary process performance data, and feedback o f
process information to suitable personnel are expected to be in place. In quality
control there will be some development of basic inspection activities, in terms o f
the sophistication of methods and systems and the tools and techniques that are
employed, while the main mechanism for preventing off-specification products
and services from being delivered to a customer is screening inspection. Quality
control measures lead to greater process control and lower incidences of non-
conformances (Dale, 1994).
3.2. 5 Quality Assurance
Finding and solving a problem after a non-conformance has been discovered is not
an effective method for eradicating the root cause of a problem. Under quality
assurance, continuous development can only be achieved by directing

67
organisational efforts towards planning for and preventing problems from
occurring at the source. This concept leads to the third stage of quality
management development, which is quality assurance (Dale, 1994).
Overall, the concept of quality is widely defined in the literature. In order to
achieve a high level quality, it is essential to consider the product or service that
satisfies customer requirements. These requirements should be clear to the
customers, whether they are specified in the purchase contract, identified under the
declared specifications by law or otherwise.
3.3 Total Quality Management (TQM)
As indicated in the previous section, quality is an important feature or
characteristic that is given to the product or service and is subject to competition
by customers. TQM involves the overall management of all efforts to ensure long-
term loyalty and customer satisfaction. Therefore, both quality and TQM are
interrelated with each other, involving structured effort by employees (Oakland,
2003). It is a universal fact that quality is an attribute that cannot be measured in
absolute terms, as it is not quantifiable, and there are numerous meanings to
different schools of thought (Ediger, 2010). The issue is still the same; when we
focus on TQM, a common concept in management style emerges, which was put
forward in 1961 as Total Quality Control (TQC) by Feigenbaum (Black & Porter,
1996). This section focuses on the definition and the concept of TQM.
3.3. 1 The Concept of TQM
The concept of TQM has played a significant role in improving management
practices by setting the guiding principles. Therefore, the current research
undertakes the conceptual framework that investigates total quality TQM. This
term is associated with the effectiveness of an organisation, and it is a manageable
commodity. It has only been recognised as a discipline in the past few years, when
there appeared to be some attempts to standardise it and apply it in a number o f
international organisations. In addition, it has become the most important
competitive advantage for organisations seeking to acquire and exploit it. This
resource is an important issue for organisations in light of the developments in
high quality outcomes, and the rapid changes and fluctuations in the economic,
social, and political fields at a global level.

68
Many considered TQM to be one of the most controversial topics within the
management field; thus, this concept and its importance has been interpreted
differently by many schools of thought over time (Lee et al., 2010). Regardless o f
all the differences, TQM is regarded by all schools of thought as a concept that is
significant in constantly improving upon production and processes to improve and
exceed customer satisfaction and expectations (Zakuan et al., 2010). TQM ensures
that every employee of the organisation is involved in the process of developing a
complete picture of the effectiveness of the business (Fotopoulos & Psomas,
2010). This ensures that the customer’s needs and satisfaction, which may be
internal or external to the business, are met by the organisation. (Tanninen et al.,
2010). Thus, in the short and long term, TQM acts as a direction for businesses,
providing advantages to all stakeholders (Perera & Kuruppuarachchi, 2010). By
directing the energies and abilities of those on board, TQM tends to continuously
meet customer needs and requirements at a feasible price (Black & Porter, 1996).
It has been certified many times that those organisations that adhere to TQM in
their management processes tend to benefit from augmented performance and
benefits (Lee et al., 2010). It is believed to enhance and improve the management
of the organisation to its optimal best, ensuring more productivity (Fotopoulos &
Psomas, 2010).
The ultimate goal when focusing on continuous improvement of the overall
business with the application of TQM is to acquire a competitive advantage for the
organisation (Tanninen et al., 2010). It is also significant to understand the
importance of this advantage when TQM tends to incorporate all aspects of the
organisation and take every factor into account while directing energy in one
direction to augment the effectiveness, competitiveness, and efficiency of the
business for the sake of stakeholders (Zakuan et al., 2010).
Although many organisations consider TQM to be a fundamental key to
management practice that necessitates adoption and implementation within their
organisation, TQM is still in its early days when it comes to empirically proving
the impact of its implementation with the application of certain variables
(Fotopoulos & Psomas, 2010). Many variables have been considered to discover
an acceptable relationship that would prove the effectiveness of implementing the
TQM processes within an organisation since it is currently in the theoretical stage
(Lee et al., 2010). This is followed by validation and subsequent improvement to
69
the validated theory once the variables and their relationship to gauging TQM
have been identified (Perera & Kuruppuarachchi, 2010).
3.3. 2 Total quality management (TQM) Definition
It is a universal fact that quality is an attribute that cannot be measured in absolute
terms, as it is not quantifiable, and there are numerous meanings to different
schools of thought (Ediger, 2010). The issue is still the same; when we focus on
TQM, a common concept in management style emerges, which was put forward in
1961 as TQC or Total Quality Control by Feigenbaum (Black & Porter, 1996).
Many considered TQM to be one of the most controversial topics within the
management field; thus, this concept and its importance has been interpreted by
many schools of thought differently over a period of time (Lee et al., 2010).
Regardless of all the differences, TQM is regarded by all schools of thought as a
concept that is significant in constantly improving upon production and processes
to improve and exceed customer satisfaction and expectations (Zakuan et al.,
2010).
Some authors consider that total quality management ensures that every employee
of the organisation is involved in the process of developing a complete picture o f
the effectiveness of the business (Fotopoulos & Psomas, 2010). This ensures the
end customer’s needs and satisfaction, which may be internal or external to the
business, are met by the organisation. (Tanninen et al., 2010).
Thus, in the short and long term, TQM acts as a direction for businesses, providing
advantages to all stakeholders (Perera & Kuruppuarachchi, 2010). By directing the
energies and abilities of those on board, TQM tends to continuously meet
customer needs and requirements at a feasible price (Black & Porter, 1996).
It has been certified many times that those organisations that adhere to TQM in
their management processes tend to benefit from augmented performance and
benefits (Lee et al., 2010). It is believed to enhance and improve the management
of the organisation to its optimal best, ensuring more productivity (Fotopoulos &
Psomas, 2010).
The ultimate goal when focusing on continuous improvement of the overall
business with the application of TQM is to acquire a competitive advantage for the
organisation (Tanninen et al., 2010). It is also significant to understand the
70
importance of this advantage when TQM tends to incorporate all aspects of the
organisation and take every factor in account while directing energy in one
direction to augment the effectiveness, competitiveness, and efficiency of the
business for the sake of stakeholders (Zakuan et al., 2010).
Although many organisations consider TQM to be a fundamental key to
management practice that necessitates adoption and implementation within their
organisation, TQM still is in the early days when it comes to empirically proving
the impact of its implementation with the application of certain variables
(Fotopoulos & Psomas, 2010). Many variables have been considered to discover
an acceptable relationship that would prove the effectiveness of implementing the
TQM processes within an organisation, since it is currently in the theoretical stage
(Lee et al., 2010). This is followed by validation and subsequent improvement to
the validated theory once the variables and their relationship to gauging TQM
have been identified (Perera & Kuruppuarachchi, 2010).
Total quality management has been defined as the constant application of a
management technique to ensure improvement in the final production and product
of an organisation with the overall goal of satisfying customer needs and meeting
expectations. It can be acknowledged as the first real step taken by management to
ensure that they achieve excellence (Black & Porter, 1996). It not only benefits the
customers and the organisation itself but also proves to be of key significance to
all stakeholders involved at different levels as it tends to make decisions that not
only cater to financial growth, stability, and long-term strategies but also the
human values and other resources that may cater to soft issues simultaneously
(Lee et al., 2010).
Understanding TQM plays a major role in the constant, augmented improvement
within the ranks, effectiveness and customer satisfaction of all stakeholders in an
organisation, who must simultaneously be productive and result-oriented (Perera
& Kuruppuarachchi, 2010). It is also integral to all organisational members that
they realise the necessity and importance of TQM as a management practice to be
implemented (Fotopoulos & Psomas, 2010).
Therefore, the overall impact that TQM carries over the organisational structure is
very essential. This is because the process envelops the entire organisation, with
each stakeholder at different levels (Zakuan et al., 2010). The influence of TQM is
not limited; instead, it tends to determine the dynamics and direction of the overall
71
culture of the company, which may leave a mark on its end product and services to
the delight of their customers (Tanninen et al., 2010). Thus, it also impacts the
organisation in the long-term, as it can improve upon the processes, practices, and
overall business aspects of the entire organisation.
Customer satisfaction has always remained the key objective for the
implementation of TQM (Lam et al., 2012). It is because even from the goal-
achievement aspect, customer satisfaction drives sales and generates profits for
any organisation, be it in the product or service sector (Tanninen et al., 2011).
While considering the end customer’s satisfaction in perspective, we can explain
TQM as the constant improvement in overall efficiency and effectiveness of a
company to ensure that customer needs are met over and above both the
competitors’ ability and the customer’s expectations, which results in a long-term
relationship (Lee et al., 2010). It also enables the organisation to take all the
stakeholders aboard on their journey of augmenting performance improvement and
be a key participant to the process (Fotopoulos & Psomas, 2010).
When it comes to meeting customer needs and expectations, all schools of thought
are unanimous in endorsing the practice of implementing TQM as the key to
ensuring organisational performance that is reflected in end products and services
(Zakuan et al., 2010).
Total Quality Management can be broken down into three terms that represent a
world of meanings (Black & Porter, 1996). The first word total indicates that
every member, department, and level of the organisation must be involved and has
significance over the overall process of TQM (Perera & Kuruppuarachchi, 2010).
The second word quality points to the fact that expectations of the end customers
are not only met but also exceeded. Finally, the third word management indicates
that management must be dedicated to implementing and ensuring that the TQM
processes are followed (Lam et al., 2012).
In this respect, one common aspect that generalises TQM is related to continuous
improvement, which is necessary for achieving the effective management o f
TQM. In this element, TQM processes are required for an effective method o f
maintaining organisational performance and competitiveness. Therefore, in the
current study, the researcher has proposed the following operational definition o f
TQM in the HEI context, which captures the above-mentioned definitions.
72
Most authors agree that TQM is an integrated management philosophy aimed at
continually improving an organisation’s performance of products, processes and
services to achieve and exceed customer expectations.
Generally, TQM can be considered a systematic approach for managing HEI in
order to achieve high performance, which is mainly in academic achievement.
These two elements of management require leadership commitment to achieve
effective core quality elements, including effective planning and continuous
improvement. Training and progress focus are other aspects that are required to
develop a cohesive environment for academic institutions to enhance their
continuous improvement for all education-related processes and activities.
3.3. 3 TQM as a Comprehensive System
This aims to achieve customer satisfaction (Khadra, 1998, pp. 6-7). Hammoud
(2010, p. 75) defined TQM as a management system that puts customer
satisfaction on its top priorities list instead of focusing on short-term profits.
Orientation to customer satisfaction achieves long-term profits that are more stable
and consistent compared to short-term profits.
3.3. 4 TQM as an Approach
The International Trade Center (ITC, 1996, p. 100) focused on quality to achieve
long-term success through customer satisfaction and benefits for individuals, the
organisation, and society (Goetsch & Davis, 1997, p. 5). Thus, the organisationa l
approach for TQM is related to work performance to maximise competitive
management. Research in this area refers to TQM as an administrative policy with
philosophy concerning the necessity of meeting the requirements and expectations
of the people (Lozi, 2009). Furthermore, Helal (2000, p. 16) related TQM to
management of the organisation that relies on quality built on the contributions o f
all organisational members that aim to achieve long-term success through
customer satisfaction and benefits to the working members in the organisation.
From previous definitions, the thoughts of the pioneers of this trend have revolved
around the concept of TQM as an approach to manage the organisation focusing
on quality as a management science that achieves long-term success through
investment in all organisational aspects as well as its internal and externa l
activities.
73
3.3. 5 TQM as a Philosophy
Some institutions, such as the British Quality Institution, address TQM as an
administrative philosophy for managing business. This takes customer needs and
business targets as a base that enables its implementation inside both industry and
society (Rogerson, 1994, p. 45). In addition, Spenley (1995, p. 3) described TQM
as a philosophy of management that strives for the best usage of all resources and
precious opportunities of continuous improvement. Dilworth (1996, p. 91)
recognised the concept of TQM as a philosophy and a good way of managing an
organisation. While the customer views this as a basic general value, through the
organisation each section works on achieving excellent quality. Helga (1997, p.
19) maintains that TQM is a philosophy of management based on customer
satisfaction.
Furthermore, Williams (1999, p. 5) stated that an organisation’s philosophy for
each of its individuals, who are also working on achieving continuous customer
satisfaction through blending tools, technology, and training, including continuous
improvement of internal operations in the organisation, will result in high quality
products and services. According to Halawi (2000, p. 23), TQM is a philosophy
and administrative tool focusing on continuous improvement in activities inside
and outside an organisation with the purpose of achieving customer satisfaction
and guaranteed consistency of an organisation in a competitive environment.
Dagher (2001, p. 21) described it as an administrative philosophy, strategic
approach, and management method to manage change in order to alter the thinking
patterns and policies made for past requirements and environments. The
development of managerial intellect in previous definitions is noticeable, although
all the definitions in this paragraph consider TQM as an administrative
philosophy. However, the most important distinction regarding the last definition
is the strategic approach and means to manage change, which enable it to keep
pace with future disturbances and changes over time.
The second perspective of the concept of TQM is its consideration for
organisational culture. In this context, Logothetis (1997, p. 1) considered TQM as
a culture requiring complete commitment to customer satisfaction through
continuous improvement and innovation in all work fields. While Vasu et al.
(1998, p. 235) described it as a specified organisational culture seeking to delegate
all organisation members to undertake continuous improvement of work

74
performance, the main target of the process of continuous improvement is
achieving customer satisfaction. Furthermore, Barwari (2000, p. 92) considered
TQM a cultural uprising in the way management thinks and acts regarding quality
improvement. It is an approach expressing a more mutual sense of practicing
management, which confirms communication in both directions, as well as the
importance of statistical measures of management practices and analytical means
leading to continuous improvement, which lead to cost reduction. Thus, TQM is
concerned about changing work traditions, values, and beliefs in a way that will
establish an organisational culture that makes quality a behaviour practiced by all
employees and administration in an organisation.
The third perspective of the concept of TQM is related to the strategic procedure
that organisations seek to achieve in the long term. In this context, Spenley (1995,
p. 3) defined TQM as a strategy of improving the main business; it is considered
the main future concern of management because it is the base of efficiency and
competitiveness. Bundagji (1996, p. 133) added that TQM as strategy is dependent
on the synergy of efforts of all employees in the organisation, whether workers or
administrative employees, in order to improve quality. In addition, Staggs (1999,
p. 5) indicated that TQM as strategy is concerned about changing the core beliefs,
values, and culture of an organisation while increasing the contribution and
enthusiasm of everyone. In summary, it may be possible to indicate that TQM is a
long-term vision that needs to build momentum, employ potentials and
capabilities, prepare plans, and define proper policies that are necessary to achieve
the strategic target from applying this concept.
Specifically, TQM can be defined as a systematic approach of managing quality
aimed at achieving high performance in terms of academic achievement, which
requires commitment from the academic leadership by adopting effective core
quality elements (leadership commitment; strategic planning, continuous
improvement, customer focus, process focus, employee involvement, training and
learning, rewards and recognition, and management by fact) to develop a cohesive
academic environment, which infuses and enhances the continuous improvement
for all educational related processes and activities.
75
3.3. 6 The Components of TQM
Research on TQM describes it according to its components. As such, Dobbin and
Fowler (1997, pp. 20-21) indicated that the meaning of management is the direct
concentration on the employees’ application of activities that allow them to
provide the necessary quality for the customer. Managers help the workers to
understand procedures and how to achieve interaction with others in order to
achieve complete success. Thus, quality means to identify customer satisfaction
and the level of fulfilment the product or service provides compared to the
measures of general and specific requirements, which represent the engine leading
an organisation to acquire a competitive advantage. Total means it includes all
individuals and departments in an organisation that require some adaptation to
achieve continuous improvement of operations guaranteeing good delivery to the
customer. Staggs (1999, p. 5) further indicated that the word total means the
possibility of applying the subject on all work aspects beginning from identifying
customer needs to measuring satisfaction. The word quality means fulfilling and
exceeding customer expectations while management means developing
organisational capabilities and consistency to continuously improve quality.
Therefore, we may pose the following question, is the TQM a process, technique,
management method, target, or tool? To answer this question, Williams (1999, p.
2) stated that TQM expresses all those things and more. In all cases, TQM
expresses the leadership model creating an organisational philosophy that helps to
achieve the highest possible level of product and service quality.
Despite several definitions and the variety of concepts for TQM, it is noted that a
certain agreement exists among different researchers on the fact that TQM is based
on achieving customer satisfaction. It relies mainly on two principles (Al_Batal,
1994, p. 291). The first is that its endless focus is on achieving customer
satisfaction in the best way possible. The second principle is related to the
continuous intention to achieve excellence through building competitive
advantages, that is, leading in development and continuous anticipation of change
in the customer’s desires (Daradeka, 2005, pp. 20-21). The basic features of TQM
can be described in the following points (Daradeka, 2005, pp. 20-21):
Excellence: Organisations take the desires, needs, and expectations of
customers in the form of feedback; this in order to provide the products and
76
services that meet those desires and expectations to enable it to prepare its plans
and strategies in a way that serves it best.
Focusing on quality in its broad sense: this requires knowledge of the
measurable characteristics of products and services the organisation could offer
and the way the customer perceives those products and services.
Continuous improvement: this requires the organisation to avoid delaying
improvement to distant periods of time and requires focusing on continuous
improvement in all operations of the organisation.
Cooperation between employees and the organisation and convincing those
employees that their success on the individual level will lead to the success of the
organisation.
Making decisions based upon evidence and data.
Adaptation of the concept of team work.
Giving the employees more authority and power in the field of designing job
descriptions and the related organisational policies.
Attention to training and appreciating the efforts of the working individuals.
Shared vision for employees and managers must be clear, expressing a specific
trend of the organisation.
Effective leadership must be the model to follow for employees and must
feature objectivity and accomplishments more than slogans.
The researcher concludes from the above that TQM is an administrative system
based on several foundations and requirements, including awareness of the
philosophy and concept of total quality, and the commitment and persuasion of the
leadership to apply it. This will be through sharing and strategic planning,
focusing on internal and external customers, continuous improvement of products
and services, defining standards of measure and task analysis, preventing mistakes
before they happen, and giving necessary motivation for workers as well as proper
training.
Accordingly, we can define TQM as an administrative philosophy seeking to
achieve excellence in all aspects of the organisation–internal and external–
through management that encourages employees to share and through continuous
77
improvement; it can be integrated with KM in order to achieve customer
satisfaction and control it. Furthermore, Bakri (2002, p. 40) indicated that the
foundations of TQM could be presented by three main indicators, which are
achieving customer satisfaction, contribution of all individuals of the organisation,
and continuity of improvement and development of quality.
3.3. 7 Quality Experts and their Contributions
The conceptual root of TQM can be traced to Walter Shewhart’s work in
Statistical Process Control (SPC) at the Bell Laboratories in the United States
during the 1920s. Shewhart had a concern about developing a system to measure
variables in production. Moreover, he designed the plan-do-check-act (PDCA)
cycle, which applied the scientific method in order to improve the work process
(Evans & Lindsay, 2001).
Shewhart’s early work on the statistical control of processes and the control chart
founded the quality of management movement. He concentrated on the need for
statistical analysis to create enough understanding of work processes that was
clearly influential for grasping the essence and causes of variation, both controlled
and uncontrolled (Bank, 1992). Following Shewhart’s innovations, the three gurus
in the quality movement emerged. They are all Americans: Edward W. Deming,
Joseph M. Juran, and Philip B. Crosby (Evans & Lindsay, 2001).
Experts have contributed to the thinking and practice of the quality improvement
movement in two ways. Some of them focused on the philosophical aspects of
quality improvement and others concentrated on the tools of quality management.
However, Crosby, Deming, Feigenbaum, Ishikawa, and Juran can be considered
the most important leaders of the quality management movement (Martinez-
Lorente et al., 1998). The following section discusses the work of these pioneers
as well as the work of Taguchi, Shingo, Oakland, and Moller.
3.3.7. 1 Edwards W. Deming
It is regarded by many researchers that Deming is the founder of the quality
movement as cited by Beckford (2002). Inspired by Shewhart (the statistician from
Bell Laboratories that contributed to the development of control charts), Deming
endeavoured to achieve quality in 1940 when he focused on statistical sampling
techniques (Flood, 1993) as explained in (Bank, 2000). Bank (2000) revealed that
Deming’s approach to quality was essentially based on Shewhart’s contributions,

78
and the approach mainly aims at investigating the causes of the following two
types of variations:
Uncontrolled variation caused by an assignable cause.
Controlled variation caused by an unassignable cause.
It was presented by Flood (1993) that efforts made by Deming are documented in
the “Economic Control of Quality of Manufactured Product” published by Van
Nostrand in 1931. Deming’s contributions were beyond developing statistical
methods and conducting surveys, rather he developed a systemic approach to
problem solving represented in a four-step cycle; these are plan, do, check, act
(PDCA). This cycle is iteratively completed with additional feedback based on
each of its components.
The philosophy behind Deming’s quality management review comprises the
following areas.
Application for a system: This implies the need for all members of an
organisation to realise their integrated roles within the organisation’s system,
where a failure in one of those roles consequently affects the remainder.
Knowledge of statistical theory: This calls for the need for all organisational
staff to be aware of the general statistical methods followed and be able to use
them appropriately.
Knowledge of psychology: Quality development entails different changes in
personalities in terms of attitudes, values, and behaviours. As a result, staff at both
levels (managerial and worker levels) must realise individual drivers and how
these drivers can be customised for the progressive development of quality
(James, 1996).
Bank (2000) pinpointed four major issues that are obstacles for the
implementation of Deming’s philosophy. These are the lack of constancy,
preoccupation with short-term profit, different forms of performance appraisals,
and the mobility of management and their dependence on visible figures as a
success evaluation criterion.
Lack of constancy is Deming’s phrase for this. It is argued by other researchers
that management has been undergoing a great changeability and is being shifted
from one theory to another, where management ideas become invalidated, as they
are gradually applied with frequent moves from one idea to another. Manager
failure to perform the required organisational changes demanded by new ideas
gives rise to a lack of management constancy. Lack of management constancy
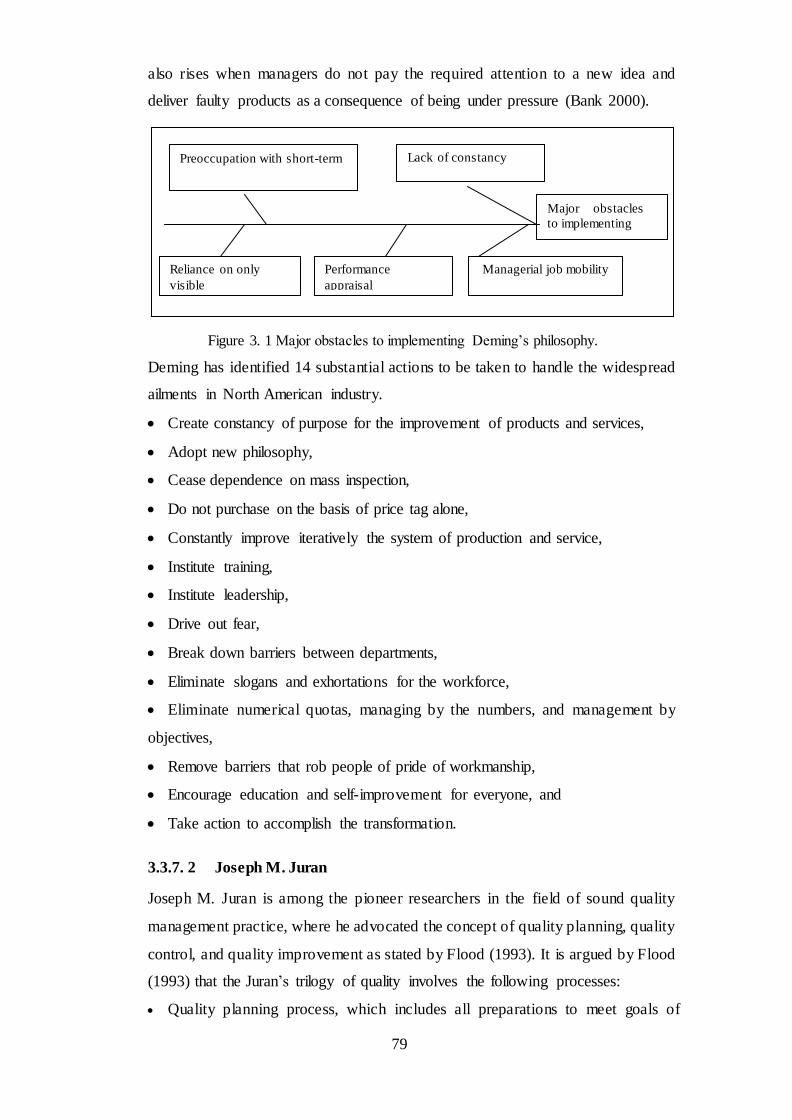
79
also rises when managers do not pay the required attention to a new idea and
deliver faulty products as a consequence of being under pressure (Bank 2000).
Figure 3. 1 Major obstacles to implementing Deming’s philosophy.
Deming has identified 14 substantial actions to be taken to handle the widespread
ailments in North American industry.
Create constancy of purpose for the improvement of products and services,
Adopt new philosophy,
Cease dependence on mass inspection,
Do not purchase on the basis of price tag alone,
Constantly improve iteratively the system of production and service,
Institute training,
Institute leadership,
Drive out fear,
Break down barriers between departments,
Eliminate slogans and exhortations for the workforce,
Eliminate numerical quotas, managing by the numbers, and management by
objectives,
Remove barriers that rob people of pride of workmanship,
Encourage education and self-improvement for everyone, and
Take action to accomplish the transformation.
3.3.7. 2 Joseph M. Juran
Joseph M. Juran is among the pioneer researchers in the field of sound quality
management practice, where he advocated the concept of quality planning, quality
control, and quality improvement as stated by Flood (1993). It is argued by Flood
(1993) that the Juran’s trilogy of quality involves the following processes:
Quality planning process, which includes all preparations to meet goals of
Preoccupation with short-term Lack of constancy
Major obstacles
to implementing
Reliance on only
visible
Performance
appraisal
Managerial job mobility
80
quality.
Quality control process, which demands taking corrective actions based on
evaluations conducted during operation.
Quality improvement process, which aims at achieving unprecedented
performance by means of waste reduction, delivery enhancement, and employee
and customer satisfaction.
In the 1920s, Juran joined the Western Electrical Company, as it is among the
firms that explored statistical methods for quality control. He founded and taught
the principles of quality to the Japanese in the 1950s, where he played a central
role in Japanese quality reorganisation. Juran set a definition for quality
management, and he emphasised that quality is fitness for use. He argues that
80% of quality defects are consequences of avoidable factors by management
(Flood, 1993). The definite set by Juran is induced from five quality
characteristics.
technological (e.g., strength),
psychological (e.g., beauty),
time-oriented (e.g., reliability),
contractual (e.g., guarantees), and
ethical (e.g., sales staff courtesy).
It is reported by James (1996) that Juran mainly focused on contributing towards
quality improvement. He set goals to increase performance in order to achieve
targets with unprecedented performance levels. Striving to achieve these goals, he
emphasised that organisations have to radically change attitudes, organisational
structure, knowledge, culture patterns, and results. He proposed a six-stage
framework to solve problems. These are listed here and summarised in Table 3.1:
identifying the project, establishing the project, diagnosing the cause, mitigating
the cause, holding the gains, and replicating and nominating.
Juran’s philosophy towards quality management can be briefly described in five
key concepts.
Quality is largely dependent on and effected by management.
Planning is the central player behind quality improvement.
Targets and plans must specified and iteratively evaluated.
Training has an essential role in achieving quality goals.
The three-step process of planning, controlling, and action is essential.
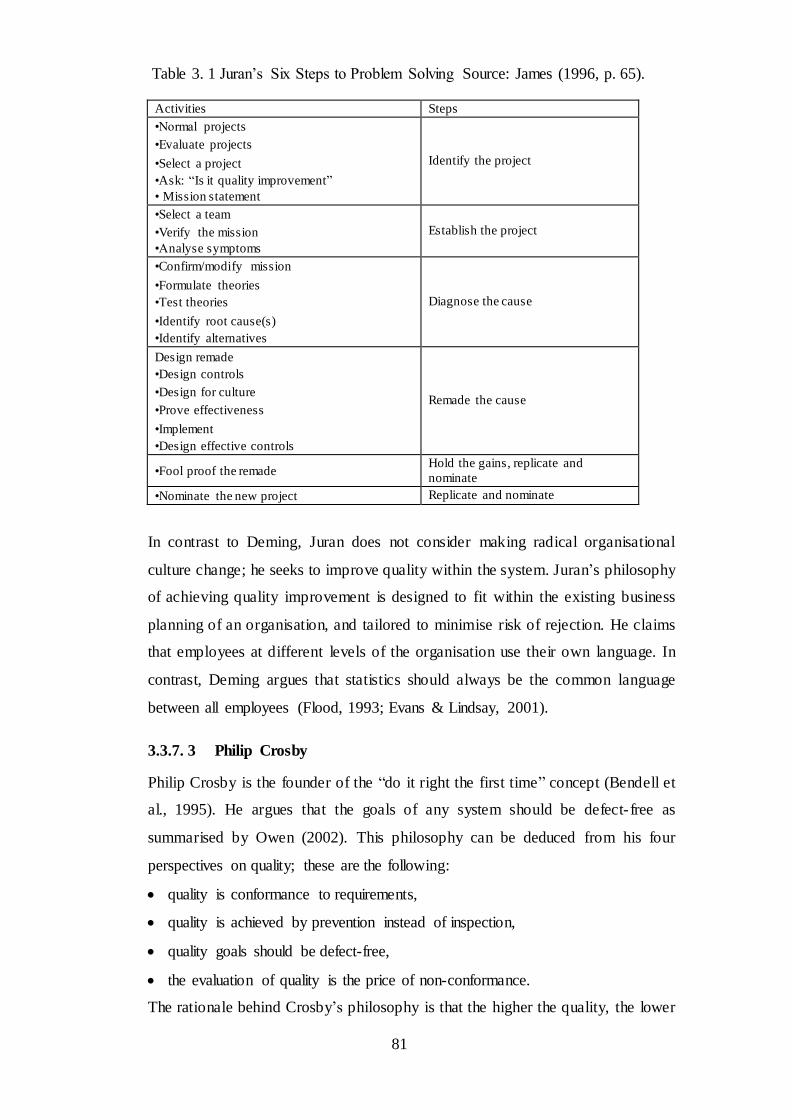
81
Table 3. 1 Juran’s Six Steps to Problem Solving Source: James (1996, p. 65).
Activities Steps •Normal projects
•Evaluate projects
•Select a project
•Ask: “Is it quality improvement”
• Mission statement
Identify the project
•Select a team
•Verify the mission
•Analyse symptoms Establish the project
•Confirm/modify mission
•Formulate theories
•Test theories
•Identify root cause(s)
•Identify alternatives
Diagnose the cause
Design remade
•Design controls
•Design for culture
•Prove effectiveness
•Implement
•Design effective controls
Remade the cause
•Fool proof the remade Hold the gains, replicate and
nominate
•Nominate the new project Replicate and nominate
In contrast to Deming, Juran does not consider making radical organisational
culture change; he seeks to improve quality within the system. Juran’s philosophy
of achieving quality improvement is designed to fit within the existing business
planning of an organisation, and tailored to minimise risk of rejection. He claims
that employees at different levels of the organisation use their own language. In
contrast, Deming argues that statistics should always be the common language
between all employees (Flood, 1993; Evans & Lindsay, 2001).
3.3.7. 3 Philip Crosby
Philip Crosby is the founder of the “do it right the first time” concept (Bendell et
al., 1995). He argues that the goals of any system should be defect- free as
summarised by Owen (2002). This philosophy can be deduced from his four
perspectives on quality; these are the following:
quality is conformance to requirements,
quality is achieved by prevention instead of inspection,
quality goals should be defect-free,
the evaluation of quality is the price of non-conformance.
The rationale behind Crosby’s philosophy is that the higher the quality, the lower
82
the cost and the higher the profit. Thus, he argues that quality improvement does
not cost money, and for this reason, he advocates that the way to achieve quality
is defect-free programs and continuous improvement (Crosby, 1979).
Aiming to build a total quality culture, Crosby has developed fourteen principles
of continuous quality improvement (Zairi, 1991; Flood, 1993). Dale (2003) listed
the fourteen steps, which include:
Management commitment: this aids managerial level staff to be aware of the
importance of participating in a quality improvement program.
Quality improvement teams: to build up quality teams from different
departments.
Quality measurement: to evaluate the current quality status throughout the
company.
Cost of quality evaluation: conducting such an evaluation aids assessment of
the need to take corrective actions and evaluate their profitability.
Quality awareness: this involves sharing awareness among all employees of
the cost of non-quality by communication.
Corrective action: it implies clarifying problems, diagnosing their causes, and
resolving them on a regular basis.
Establish an ad hoc committee for a defect- free program: this inspires and
affirms that everyone should do things right the first time through management
commitment to the reach zero defects.
Supervisors train: prior to implementing the zero defects program, a formal
orientation is to be carried out with all levels of management.
Zero defect in a day: establishing zero defects as a company standard of
performance in one day helps to create a long-lasting impression.
Goal-setting: regular supervisory meetings help achieve specific goals and
carry out particular tasks in a team-oriented way.
Removal of task and error causes: identifying causes that prevent zero-defect
work, and address these problems appropriately and functionally.
Recognition: this aims to recognise individuals who perform outstandingly
through a recognition program; however, rewards are not encouraged to be
financial.
Quality councils: quality professionals and specialists are advised to arrange
regular meetings and to communicate effectively in order to update and improve

83
the company quality improvement program.
Repeat: in order to implement a typical quality improvement program, setting
up new representatives helps overcoming periodical (12-18 month) turnover
problems and unplanned situation changes.
3.3.7. 4 Armand V. Feigenbaum
Feigenbaum’s contributions in TQM built up an approach to TQM. His approach
builds upon the idea of identifying socio-technical aspects in an organisation and
controlling and coordinating all management and operational functions in a way
that assists management company-wide. According to Feigenbaum, this can be
achieved simultaneously by targeting consumer satisfaction and focusing on both
suppliers and supplies (Flood, 1993).
Feigenbaum identified ten benchmarks to achieve competitive success in TQM
(as cited in Dale 2003). These are listed here.
Quality is a company-wide process.
Quality is judged by the customer.
Quality and cost are sums, not a difference.
Quality calls for both individual and teamwork.
Quality is a way of managing.
Quality and innovation are mutually dependent.
Quality is an ethic.
Quality requires continuous improvement.
Quality is the most cost-effective, least capital- intensive way to enhance
productivity.
Quality is integrated within a whole system connected with customers and
suppliers.
Feigenbaum emphasises that managers should be committed to strengthening the
quality improvement process with a company, such that it becomes the culture in
an organisation. He adds that quality and cost should be targeted complementarily
(Dale, 2003). This implies commitment to a systemic total approach that
emphasises designing for quality in a team-oriented manner. However, this should
be dependent on the human aspects of the organisation (Beckford 2002).
3.3.7. 5 Kaoru Ishikawa
Due to his role in launching Japan’s quality movement in the 1960s, Kaoru
84
Ishikawa is known as the founding father for quality control circles (QCCs)
(Bank, 2000). The rationale behind developing QCCs is to help establish the
philosophy of participation. The idea behind the circles is that a quality circle is
formed from a small number of volunteers in an organisation and is led by one of
its members. The circle members meet regularly in order to perform their tasks
effectively and efficiently (Flood, 1993).
Ishikawa’s theories, as stated by Owen (2002), are based on the concept that
quality improvement is a continuous process. He proposed a seven-tool system
that can help achieve this continuous improvement. These tools require training,
as they are basically cause and effect diagrams, flowcharts, Pareto diagrams,
check sheets, histograms, scatter diagrams, and control charts.
Ishikawa’s control chart philosophy is summarised by Evans and Lindsay (2001)
in the following key elements:
Quality begins and ends with education.
The first step towards quality is to know customer requirements.
The ideal state of quality control occurs when inspection is no longer necessary.
Remove the root cause, not the symptoms.
All workers and all divisions should contribute to quality control.
Means and objectives are not to be confused with each other.
Put quality first and set your targets on long-term profits.
Markets are the entrance and exit of quality.
Top management must not demonstrate anger when facts are presented by
subordinates.
Ninety-five per cent of problems in a company can be solved with simple tools
for analysis and problem solving.
Data without dispersion information (i.e., variability) is false data.
3.3.7. 6 Genichi Taguchi
Taguchi criticises the traditional approach to the design of an experiment as being
impractical in industrial situations, and due to this, he made use of a method to
develop his own approach, which he calls the Taguchi approach. This approach
has been implemented in Japan for over 30 years, and the main ideas can be
categorised into two principals. These are ‘the loss function’ and ‘off- line quality
control’. He proposed three unique stages to design for quality: system design,
85
parameter design, and tolerance design, as per Dale (2003). Owen (2002)
proposed that Taguchi’s ideas put quality on pre-production and services forward.
He argues that quality and reliability are not a result of a quality inspection; rather
they are directly linked with the design of services and products. The whole
theory is summarised in the following eight stages: define the problem, determine
the objective, conduct a brainstorming session, design the experiment, conduct the
experiment, analyse the data, interpret the results, and run a confirmatory
experiment (Beckford, 2002).
3.3.7. 7 Shigeo Shingo
Despite the fact that the impact of Shingo’s contributions is immense, particularly
in Japan, he is not as well known as the rest of the Japanese pioneers in this area.
Shingo developed Poka-Yoke systems in 1961. The system simply means
mistake proofing that involves devices or other methods to prevent introducing
defects. The basic application of Poka-Yoke has been manufacturing systems;
however, it is also applicable to administrative, customer-service, and other non-
manufacturing systems. The rationale behind the method is to stop the process
whenever a defect is identified and diagnose the cause to prevent it from
reoccurring. The Poka-Yoke approach has 100% inspection during the process but
not after the event. It is argued by Bendell et al. (1995) that using Shingo’s
concept of zero quality control can lead to achieving zero defects.
Quality awards have been developed by many nations to achieve different and
numerous targets that include the promotion of awareness of productivity and
quality, the fostering of information exchange, encouragement of organisations to
adopt strategies that assist obtaining improved productivity and quality, the
recognition of firms that have successfully applied strategies, and the provision of
models for other businesses in the country (Evans & Lindsay, 2001).
It is pinpointed by Tan ( 2002) that awards are to be made annually for the most
worthy and well-run firms. These awards are for well-run quality management
practices. The awards include the following:
different award categories depending on organisational sizes,
awards for the manufacturing and service sectors,
awards for non-profit organisations, and
awards for different levels of quality management excellence attainment.
86
Tan (2002) states that generally, awards are managed and awarded by
governmental bodies in collaboration with judges and examiners from private and
public sectors.
In contrast, it is advised in (Vokurka et al., 2000) that using these models cannot
be generalisable to all problems. Precisely, it is argued by Ghobadian and Woo
(1996) that the use of models underpinning awards suffers from different
limitations.
3.3. 8 Quality Awards
3.3.8. 1 The Deming Prize
The idea of self-assessment was established in Japan as the Japanese Union of
Scientists and Engineers (JUSE) was first founded in 1946, while in the west it is
relatively new. In 1950, Deming was invited by JUSE to give lectures and
seminars to present his work in SPC, where the latter contribution created a
devotion to quality control, which became ingrained in the Japanese industria l
culture (Kathawala & Elmuti, 1991).
In Deming’s honour, JUSE has instituted the first quality award for his work that
effectively contributed towards improving Japanese industry through the emphasis
on SPC (Zairi,1996). The wide acceptance of the Deming prize caused great
improvement in manufacturing quality that placed Japan on the world map
(Kathawala & Elmuti, 1991).
Deming’s award is divided into two annual prizes. These are the Deming
Application Prize and the Deming Prize. The former is awarded to organisations,
divisions, and small enterprises, which through the application of company-wide
quality control, have achieved distinctive performance improvement. The latter is
awarded to outstanding contributors in the area of research and education (Evans
& Lindsay, 2000).
It was indicated by Ghobadian and Woo (1996) that the Deming Application Prize
checks for ten primary factors. These are policies, future plans, effects, quality
assurance, control/management, standardisation, analysis, information gathering
communication and its utilisation, education and dissemination, and the
organisation and its operations.
It is expected from organisations applying for the prize to submit 30 copies of the
documents that detail the quality control practices of the organisation, its business
87
units, business activities, and its prospectus. The submitted application is checked
by the Deming Application Prize sub-committee, which in turn identifies whether
quality control/management is applied systematically and effectively throughout
the organisation. The shortlisted companies are then visited on-site for an
examination (Ghobadian & Woo, 1996).
Since first created, Deming’s prize has undergone various changes. Since JUSE
manages the award, organisations applying for the award must first be approved
by their consultants to undergo the review process. This is why Florida Power and
Light (the first company from outside Japan to win the award in 1989) took such a
long time to be accepted as an award applicant. It was stated by Porter and Tanner
(1996) that the process is extremely thorough.
The Deming Prize is managed by JUSE and is awarded to private and public
organisations that have successfully implemented or developed quality contro l
activities/strategies. Unlike the above-mentioned quality awards, the Deming Prize
does not provide a model framework for organising and prioritising criteria, rather
it uses ten equally weighted checkpoints to assess a company’s quality
performance. These are policies; organisation; information; standardisation;
human resources; quality assurance; maintenance; improvement, effects, and
future plans.
Despite the fact that DP does not follow or adopt a model, the ten weighted
checkpoints it considers emphasise values which are pointed out in the other above
award models (Stading & Vokurka, 2003).
3.3.8. 2 Malcolm Baldrige National Quality Award (MBNQA)
While the growth of productivity in the American manufacturing sector
significantly decreased between the 1970s and the 1980s, the Japanese industry
has experienced a noticeably increasing growth accompanied with high quality
products (Arvinder et al., 1997).
In the 1980s, several industrial and governmental leaders had the view that
renewed stresses on quality were no longer an option for American organisations.
They, however, stressed on the necessity of doing business and occupying a niche
in a growing, demanding, and competitive international market. This attitude
might be explained by the possibility that those leaders did not recognise the
importance of quality or they did not know where and how to start. For this
88
reason, the United States Department of Commerce created the Baldrige Award in
1987 as a standard of excellence. The aim was to help US organisations achieve
world-standard quality (Kathawala & Elmuti, 1991).
The goal of MBQNA is to raise quality awareness, to recognise achievements
made by U.S. organisations, and most importantly to publicise successful
performance strategies. Its evaluation criterion of an organization’s performance
is based on seven categories. These categories include: leadership, strategic
planning, customer and market focus, information and analysis, human resource
focus, process management, and business results. The MBQNA is awarded to
manufacturing, service, small business, education, healthcare, and non-profit
organisations (NIST, 2008).
The European Foundation for Quality Management (EFQM) has developed the
European Quality Award EQA to develop a comprehensive and contemporary
body of quality principles and best practices. It also aims to recognise top quality
performance in terms of people and performance. Unlike other awards, the EQA
is a regional award, and its model is a set of ‘enabler criteria’ and ‘results
criteria’. The former includes leadership, including people management, policy
and strategy, and resource processes, while the latter is based on people
satisfaction, including customer satisfaction, impact on society, and business
results (Stading & Vokurka, 2003).
Despite the role that national quality awards play in providing a solid foundation
to an organisation by assessing its performance, winning the award is not a
remedy. It is still necessary to achieve and create a competitive advantage. This
remains the basis for a particular organisation’s infrastructure and its excellence
efforts. It is reported in Tan, Wong et al. (2003) that organisations applying for
the awards report that customer orientation, process orientation, and improvement
orientation are all improved. Process and content must be connected and tightly
related, as copying the process from an award model is not sufficient.
Table 3.2 compares MBNQA, EQA, and the Deming Prize. Generally, they all
share virtually the same aims in terms of promoting quality awareness and
recognising the requirements for quality excellence. However, they differ in their
focus in terms of the framework criteria.
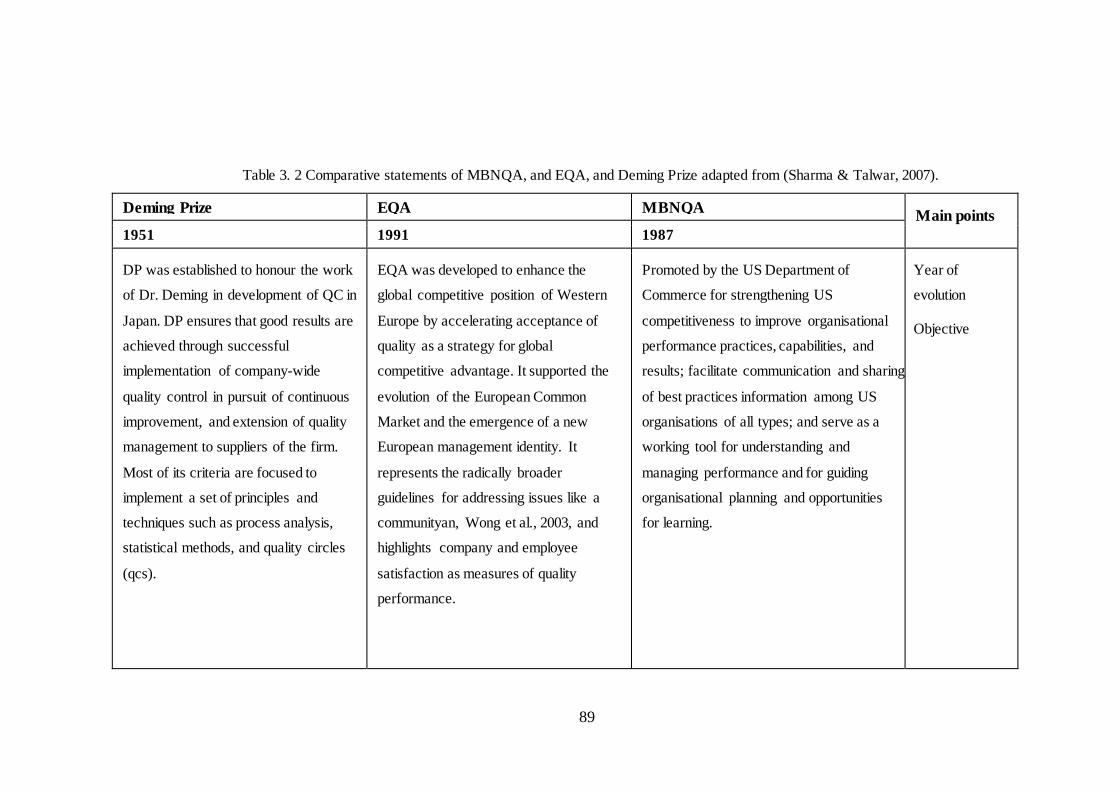
89
Table 3. 2 Comparative statements of MBNQA, and EQA, and Deming Prize adapted from (Sharma & Talwar, 2007).
Deming Prize EQA MBNQA Main points
1951 1991 1987
DP was established to honour the work
of Dr. Deming in development of QC in
Japan. DP ensures that good results are
achieved through successful
implementation of company-wide
quality control in pursuit of continuous
improvement, and extension of quality
management to suppliers of the firm.
Most of its criteria are focused to
implement a set of principles and
techniques such as process analysis,
statistical methods, and quality circles
(qcs).
EQA was developed to enhance the
global competitive position of Western
Europe by accelerating acceptance of
quality as a strategy for global
competitive advantage. It supported the
evolution of the European Common
Market and the emergence of a new
European management identity. It
represents the radically broader
guidelines for addressing issues like a
communityan, Wong et al., 2003, and
highlights company and employee
satisfaction as measures of quality
performance.
Promoted by the US Department of
Commerce for strengthening US
competitiveness to improve organisational
performance practices, capabilities, and
results; facilitate communication and sharing
of best practices information among US
organisations of all types; and serve as a
working tool for understanding and
managing performance and for guiding
organisational planning and opportunities
for learning.
Year of
evolution
Objective

90
Responsible organisation
NIST EFQM JUSE
International influence award.
North and South America, Asia, Oceania, and EQA
Europe, Central Asia, Middle East, and Africa
MBNQA reference at enactment, Asia
Criteria and relative score.
1. Leadership 120. 1. Leadership 100. A. Basic categories 100.
2. Strategic planning 85. 2. Policy and strategy 80. 1. Management policies and their deployment 20.
3. Customer and market focus 85.
3. People 90. 2. New product development, work process innovation 20.
4. Measurement, analysis and KM 90.
4. Partnership and resources 90. 4. Maintenance and improvement 20.
5. HR focus 85. 5. Processes 140. 5. Management system 10.
6. Process management 85. 6. Customer results 200. 6. Information analysis and utilization of IT 15.
7. Results 450. 7. People results 90. 7. HR development 15.
8. Society results 60. B. Unique activities 100. C. Role of top management 100.
9. Key performance results 150.
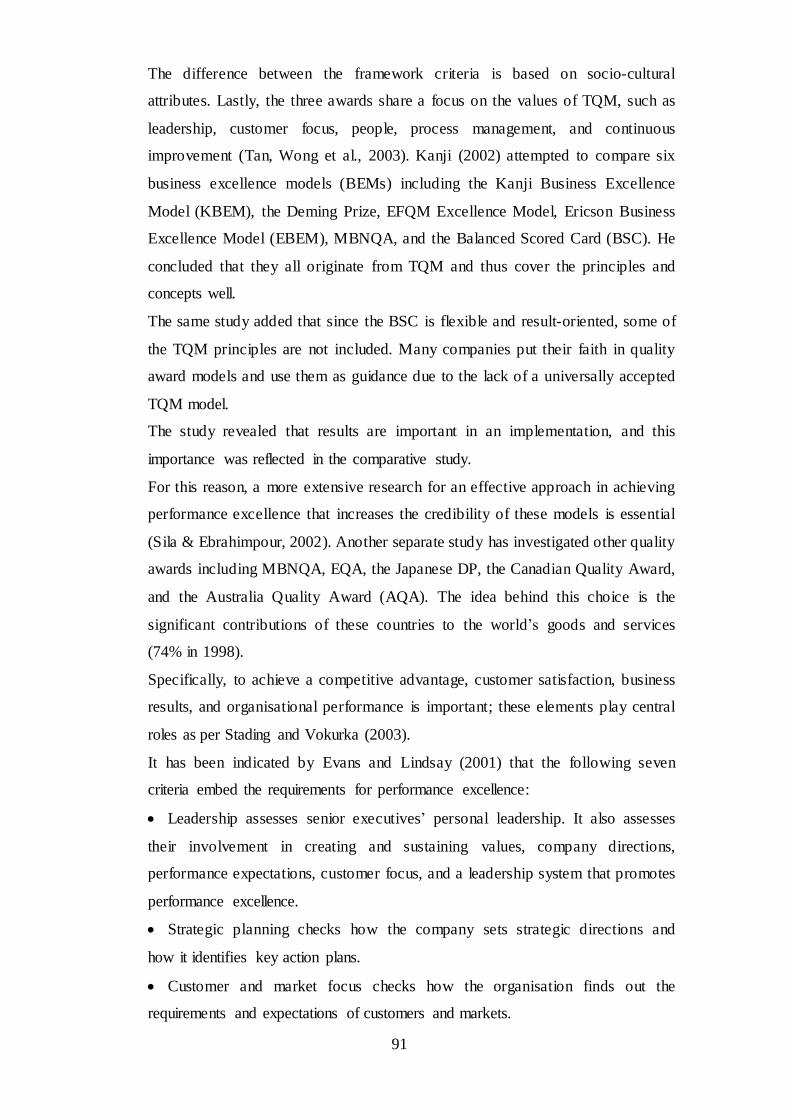
91
The difference between the framework criteria is based on socio-cultural
attributes. Lastly, the three awards share a focus on the values of TQM, such as
leadership, customer focus, people, process management, and continuous
improvement (Tan, Wong et al., 2003). Kanji (2002) attempted to compare six
business excellence models (BEMs) including the Kanji Business Excellence
Model (KBEM), the Deming Prize, EFQM Excellence Model, Ericson Business
Excellence Model (EBEM), MBNQA, and the Balanced Scored Card (BSC). He
concluded that they all originate from TQM and thus cover the principles and
concepts well.
The same study added that since the BSC is flexible and result-oriented, some of
the TQM principles are not included. Many companies put their faith in quality
award models and use them as guidance due to the lack of a universally accepted
TQM model.
The study revealed that results are important in an implementation, and this
importance was reflected in the comparative study.
For this reason, a more extensive research for an effective approach in achieving
performance excellence that increases the credibility of these models is essential
(Sila & Ebrahimpour, 2002). Another separate study has investigated other quality
awards including MBNQA, EQA, the Japanese DP, the Canadian Quality Award,
and the Australia Quality Award (AQA). The idea behind this choice is the
significant contributions of these countries to the world’s goods and services
(74% in 1998).
Specifically, to achieve a competitive advantage, customer satisfaction, business
results, and organisational performance is important; these elements play central
roles as per Stading and Vokurka (2003).
It has been indicated by Evans and Lindsay (2001) that the following seven
criteria embed the requirements for performance excellence:
Leadership assesses senior executives’ personal leadership. It also assesses
their involvement in creating and sustaining values, company directions,
performance expectations, customer focus, and a leadership system that promotes
performance excellence.
Strategic planning checks how the company sets strategic directions and
how it identifies key action plans.
Customer and market focus checks how the organisation finds out the
requirements and expectations of customers and markets.

92
Information and analysis examine the management and effectiveness of
utilising data and information in order to support key company processes and the
company performance management system.
Human resources management focuses on how the workforce is enabled to
ensure the development and utilisation of its full potential, which is tailored and
customised to the company objectives.
Process management checks process management key aspects, including
customer-focused design, product and service delivery processes, supplier
processes, and supplier and partnering processes involving all work units.
Business results check the company performance and improvement in terms
of its key business areas and performance levels and how it evaluates its position
among the relative competitors.
Figure 3. 2 Baldrige Model (NIST, 2008).
Evans and Lindsay (2001) analysed the above seven categories and assert that
each category consists of several items, each of which focuses on major
requirements on which the business should concentrate. It has also been
highlighted by Prybutok and Cutshall (2004) that these seven categories can form
one framework composed of four basic elements: driver, system, measures o f
progress, and the goal.
Baldrige Criteria for Performance Excellence Framework: A Systems Perspective
Organisational Profile: Environment, Relationships, and
Challenges
2 Strategic Planning
5 Workforce Focus
7 Results
6 Process Management 3
Customer Market Focus
1 Leadership
4 Measurement, Analysis, and Knowledge
Management

93
3.3. 9 Models of TQM
Several TQM models have been reported in literature, including Alshabrawy
(Figure 3.3), Logothetis (Figure 3.4), and Krajewski and Ritzman (Figure 3.5)
models. After these, the most common awards are the Deming Prize (1951), the
Malcolm Baldrige National Quality Award (1987), and the European Quality
Award (EQA) (1988).
These models are different in their main elements and aspects. The main elements
for the first model involve achieving higher profitability and customer satisfaction.
It also deals with setting up a better competitive position through several activities
in an organisation. In contrast, the second TQM model is the Logothetis model or
“Axioms of total quality management” also called the “TQM trilogy”. This mode l
involves three elements: commitment, scientific knowledge, and participation. The
philosophy of the third model, the Krajewski and Ritzman model, focuses on
customer satisfaction. It relies on continuous improvement and employee
involvement as the two main elements. In addition, this model also considers
various other issues, including the design of the operation, product, or service,
purchasing and problem solving tools, and the basis of comparison representing
other elements of TQM. Table 3.1 shows the core elements in TQM that include
four elements that are associated with these TQM pioneers, (Deming, 1950;
Williams, 1999; Juran, 1995).
Figure 3. 3 Alshabrawy TQM model (Alshabrawy, 1995).
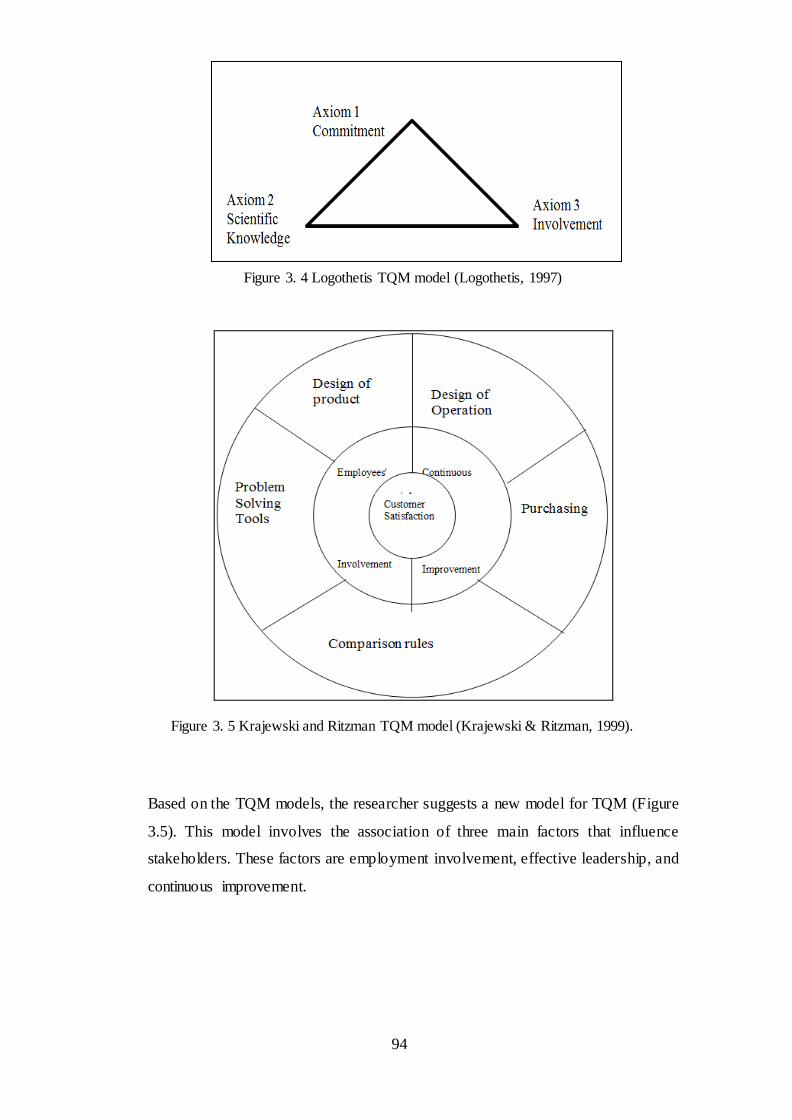
94
Figure 3. 4 Logothetis TQM model (Logothetis, 1997)
Figure 3. 5 Krajewski and Ritzman TQM model (Krajewski & Ritzman, 1999).
Based on the TQM models, the researcher suggests a new model for TQM (Figure
3.5). This model involves the association of three main factors that influence
stakeholders. These factors are employment involvement, effective leadership, and
continuous improvement.
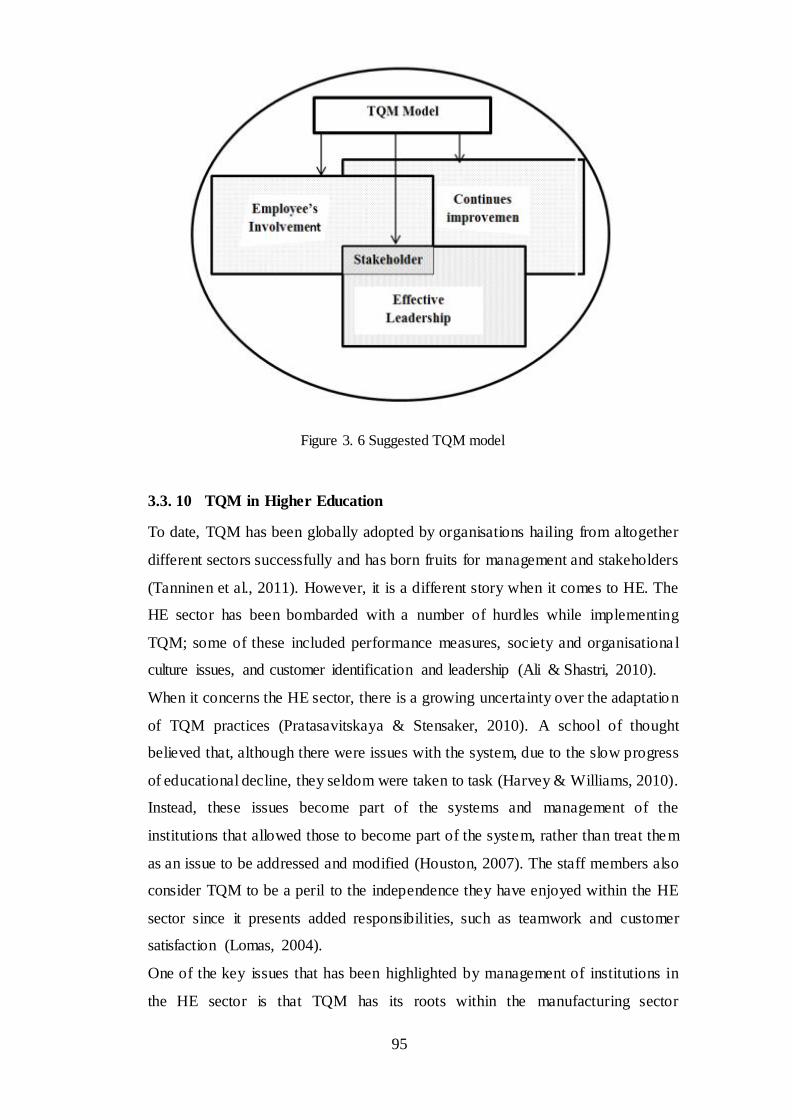
95
Figure 3. 6 Suggested TQM model
3.3. 10 TQM in Higher Education
To date, TQM has been globally adopted by organisations hailing from altogether
different sectors successfully and has born fruits for management and stakeholders
(Tanninen et al., 2011). However, it is a different story when it comes to HE. The
HE sector has been bombarded with a number of hurdles while implementing
TQM; some of these included performance measures, society and organisationa l
culture issues, and customer identification and leadership (Ali & Shastri, 2010).
When it concerns the HE sector, there is a growing uncertainty over the adaptation
of TQM practices (Pratasavitskaya & Stensaker, 2010). A school of thought
believed that, although there were issues with the system, due to the slow progress
of educational decline, they seldom were taken to task (Harvey & Williams, 2010).
Instead, these issues become part of the systems and management of the
institutions that allowed those to become part of the system, rather than treat them
as an issue to be addressed and modified (Houston, 2007). The staff members also
consider TQM to be a peril to the independence they have enjoyed within the HE
sector since it presents added responsibilities, such as teamwork and customer
satisfaction (Lomas, 2004).
One of the key issues that has been highlighted by management of institutions in
the HE sector is that TQM has its roots within the manufacturing sector
96
(Pratasavitskaya & Stensaker, 2010). As TQM developed from the manufacturing
sector, its utility and implementation in the service sector seems pointless to them
and poses a grave threat (Harvey & Williams, 2010). Therefore, in this situation,
without any precedent, it is hard for supporters of TQM to persuade institutions to
adapt to TQM practices and implement this within the HE sector (Houston, 2007).
It is a fact that adhering to TQM practices, especially in different scenarios,
sectors, and different situations may pose a number of hurdles, but even then it is
not impossible to adapt to it (Ali & Shastri, 2010). A school of thought is adamant
that educational institutions may even be directed to continuous improvement with
the application of TQM (Lomas, 2004). Although they may face a few issues
while adhering to TQM, even then it is likely to boost the quality of education
within these institutions (Harvey & Williams, 2010).
With reference to the HE sector, other schools of thought, however, refrain from
suggesting the associated benefits of adapting to TQM (Houston, 2007). Instead,
they propose doubts and uncertainty in adapting. This is because education
belongs to a service sector that has no tangible end product, rather a satisfied
customer, which would vary by individual (Pratasavitskaya & Stensaker, 2010).
They suggest alterations to TQM in a manner that it is on the same lines that
would be deemed feasible for the HE sector (Harvey & Williams, 2010).
As discussed earlier, these distinct attributes do pose a range of boundaries and
limitations especially when considering TQM from the educational institution and
HE perspective (Lomas, 2004). However, it is also evident that within the
education industry there are very few quality performance indicators present, if
any (Houston, 2007). Therefore, rather than focusing on the education itself, TQM
should be used as an indicator of the service that educational institutions provide
(Ali & Shastri, 2010). This is even more suggestive since the customers in the HE
sector are relatively unknown compared to the manufacturing sector where the end
customer is identified and the end product is tangible (Houston, 2007).
However, there are a number of institutions within the HE sector that, in the span
of last decade or two, began implementing facets of, if not the complete, TQM
processes within their models (Lomas, 2004). The adherence was prompted in the
development of the institutional cultures that were more prone to TQM principles
and allowed the institutions to work more efficiently and effectively (Ali &
Shastri, 2010).
97
However, the lack of a quantifiable tangibility of the end product and the lack o f
homogeneity for the customer pose a grave threat to TQM practice and somewhat
segregates the manufacturing sector from the service sector, which encompasses
the HE sector (Harvey & Williams, 2010).
Since TQM paves the way for quantifying and is suggestive of empirically
calculating quality, it causes a point of concern for those who are employed by the
HE sector (Houston, 2007). The quality management philosophy is beyond their
comfort level (Pratasavitskaya & Stensaker, 2010). This is primarily because not
only is education an on-going, long-term process, but also it is rather beyond the
education sector to quantify and analyse the progress on the basis of goa l
achievement (Lomas, 2004). The education sector is more comfortable with
dispersing knowledge, enabling the students to understand and comprehend,
imparting wisdom to tackle issues, and developing the characters of the students to
ensure that they become contributing member of society (Ali & Shastri, 2010).
From their perspective, it is unfair to be subjected to analysis and measurement on
specific goal achievements as a part of a TQM system for the education sector
(Harvey & Williams, 2010).
Due to this culture in place within the education sector, it was suggested that a
modified version of TQM can be implemented within the HE sector (Houston,
2007). An excellence model was put forward with a suggestion that strong leaders
were required to apply and ensure its implementation within the institution while
modifying the institutional culture (Lomas, 2004). There was a mutual agreement
by different schools of thought that application of TQM within the HE sector was
not impossibility. Instead, the management of the institution should focus on
determining the modifications that are required within TQM to make it more
adaptable from the HE perspective (Ali & Shastri, 2010).
There was a suggestion to modify the terms used in the context of TQM while
applying it in the HE setting (Pratasavitskaya & Stensaker, 2010). However, it is
significant to understand that each and every element of HE cannot be brought
under the folds of TQM (Harvey & Williams, 2010). This notion is truer in the
case of education, academics, teaching, and research where the tangibility of the
effort poses a obstacle (Houston, 2007). Therefore, TQM is more applicable in the
service sector if the independent nature of the professionals is taken into account
or modifications are made in TQM to adhere to their liking within HE sector
(Lomas, 2004).
98
Regardless of the fact that the manufacturing sector stimulated the creation o f
TQM philosophy, there is a belief that the approach would also help the education
service sector (Ali & Shastri, 2010). The HE sector and the institutions within it
need to identify the issues and tackle them with modifications that are more suited
to their industry (Harvey & Williams, 2010). The issues faced by HE pertaining to
TQM should be addressed and the barriers identified to ensure that TQM is
implemented within institutions, and the education sector is able to make full use
of the philosophy while ensuring organisational successes (Houston, 2007).
In the 1980s, TQM started gaining acceptance in US colleges and universities
(Harvey & Williams, 2010). Although TQM made its way into the educationa l
sector at that time, it was not able to cement its position within HE culture
comprehensively as compared to other industries in the country (Lomas, 2004).
This was because there were a number of impediments that were almost contrary
to the culture and traditional characteristics of institutions within the HE fold in
the US (Houston, 2007). Within HE sector, there were also a number of variations
within the culture being adopted by different institutions that are discussed here
(Ali & Shastri, 2010).
Universities that were relatively older were found to be engaging in longer-range
plans. There was status quo in the top management, and they would not readily
agree to any change or introduction of any new ways, culture, or any measures that
would gauge their performance (Pratasavitskaya & Stensaker, 2010). They would
resist any such implementations, as they considered TQM a threat to their
independence and method of working (Houston, 2007). However, the newer
universities and colleges were more apprehensive of their image and status and
were found to be very eager regarding various aspects of TQM implementation
within the HE sector (Lomas, 2004). Since the 1990s there has been an increase in
pressure from various sectors and businesses to enforce TQM practices within the
HE sectors and all institutions to adhere to TQM philosophy (Ali & Shastri, 2010).
As the global application and success of TQM started to become evident, the HE
sector also started to implement the same within its institutions in the 1980s
(Harvey & Williams, 2010). The importance of TQM was soon realised, as it
started playing a major role in national developmental programs and globa l
economies (Pratasavitskaya & Stensaker, 2010).
With the ever-changing dynamics of the global stage, there was a need to revise
the curriculum to maintain it with the changes (Houston, 2007). This would be

99
applicable within an institution in the field of HE that would endorse consistent
quality and performance improvement within the educational system (Lomas,
2004). Therefore curriculum, administrative units, non-academic units, and the
core learning process were deemed to be four areas where the application of TQM
could obtain better results for educational institutions (Ali & Shastri, 2010).
The issues that cropped up for the institutions in the HE sector during the
application and adaptation to TQM practices were very common and suggestive
ones (Harvey & Williams, 2010). These included issues such as the variation and
character of the end customer of their services, the traditional management style o f
the educational institute, and the research and academic nature of the work done
within the HE sector (Houston, 2007). The compartmentalisation, conformance to
traditional style, lack of competition, and adherence to the status quo were
identified as the four main obstacles to the continuous improvement cycle of TQM
(Lomas, 2004). There was a sense among the employees that they had already
worked enough to attain whatever excellence they may have already achieved
(Pratasavitskaya & Stensaker, 2010). Since TQM was considered to be the brain
child of the manufacturing industry, it was hard to assure those within the HE
sector that it would have the same impact on the improvement in the education
sector, which proved to be a major impediment as well (Harvey & Williams,
2010).
There was an understanding that instead of the academic itself, TQM was
beneficial for employee and process performance within the HE sector, which in
the long run on a continuous basis would be advantageous for teachers, students,
and all stakeholders with the education sector (Houston, 2007). It would help in
addressing the issues and problems of students, teachers, and other stakeholders,
while assisting them in meeting the needs and expectations of those concerned
(Lomas, 2004). Continuous improvement would analyse the effectiveness of the
academic programs, identify areas of improvement, and work on how to resolve
these (Harvey & Williams, 2010). An important aspect for continuous
improvement in HE is to allocate resources to tackle the same areas and issues on
priority (Ali & Shastri, 2010).
It is important for management to fully understand the importance of TQM and the
benefit of the application of continuous improvement (Pratasavitskaya &
Stensaker, 2010). Management posed serious impediments to its application due to
100
their misinformation and lack of relevant awareness (Houston, 2007). Even in the
case of a willingness to continue with TQM, management failed to implement
basic guidelines like teamwork, skill provision, agreed upon goals, and resource
allocation (Lomas, 2004).
Literature indicated that the evidence in favour of the use of TQM in the
educational context relates primarily to administrative tasks (Koch & Fisher, 1998;
Koch, 2003; Venkatraman, 2007). The non-academic focus of TQM dramatically
reduces its significance and impact in the world of higher education (Ahmed,
2008; Koch, 2003; Venkatraman, 2007). Hence, research is needed to test the
position that TQM initiatives do, indeed, have a relationship with academic related
improvements. In light of this, the present study will focus on the educationa l
process as a core academic activity in HEIs. Moreover, the researcher aims to
contribute in this direction by examining the TQM effect on performance through
KM to further enhance the fitness of TQM in the higher-education context.
From the principles of TQM and other quality management theories, it is obvious
that these are all highly structured towards one philosophy, which is continuous
improvement in order to achieve a common goal—customer satisfaction (Adair,
2004). Therefore, it is necessary to identify the customers (stakeholders) of higher
education. Kanji and Tambi (1999) classified the customers of higher education
from two perspectives, primary and secondary customers, based on their position
(i.e., internal or external) and the interactions the institution has with them. While
the academic educator (as an employee) is defined as the primary interna l
customer, the students (as educational partners) are secondary internal customers.
Similarly, the student is also the primary external customer, and the government,
business companies, and parents are secondary external customers.
Therefore, quality in higher education has become a public issue in Arab
countries. Since Jordan is one of these Arab countries, the case is not different in
the institutions of higher education in Jordan.
3.3. 11 Elements of TQM
Success in applying the philosophy of TQM is not easy to manage, but it is still
possible. It is considered the biggest challenge faced by management. A lot o f
organisations attempted to implement this philosophy and failed, either because o f
poor understanding of the targets and tools of this philosophy, a lack of persuasion
101
regarding the necessary steps to achieve those targets, or a lack of interaction from
the managers and individuals with the spirit of this philosophy. On the other hand,
other organisations succeeded in achieving their goals by applying this philosophy.
In general, there is a group of elements on which the philosophy of TQM relies on,
and if committed to, will lead to success in applying this philosophy and achieving
its targets, despite the multiplicity and divergence of those elements as a result o f
the divergence of visions related to the intellectuals, theorists, and quality
researchers regarding the TQM concept. There are still some core elements already
concluded from the contributions of the pioneers of this philosophy (Deming,
Juran, Crosby, and Feigenbaum) that could be looked at as essential components
of the philosophy of TQM, which includes all other elements of this philosophy.
Those core elements are effective leadership, continuous improvement, employee
involvement, and customer satisfaction (Baserda, 2006, p. 109).
Based on the main concepts related to TQM, the current study will identify the
important elements of TQM in both private and public universities in Jordan in
line with the requirements of this study and with customer satisfaction as the goa l
to achieve through the TQM philosophy. Therefore, in the current study the
researcher has focused on three elements namely, effective leadership, continuous
improvement, and employee involvement. These three variables have been
adopted in the current research. Generally, achieving customer satisfaction is
considered a performance indicator for TQM. In the following section, the core
elements of TQM are discussed.
3.3.11. 1 Effective Leadership
Despite the overabundance of literature available on leadership, there is no
consistent definition of this concept (Mello, 1999). Not surprisingly, Davies et al.
(2001) observed that there are different definitions of leadership provided by
different authors, including the following:
The leader has the ability to influence a group of individuals towards the
achievement of a particular goal.
Leadership is about coping with complexity.
Leadership is about coping with change.
“Leadership means visions, cheerleading, enthusiasm, love, trust, verve, passion,
obsession, consistency, the use of symbols, paying attention as illustrated by one’s
calendar, out-and-out drama (and the management thereof) creating heroes at all
102
levels, coaching effectively, wandering around, and numerous other things”
(Peters & Austin, 1985; see Zairi, 1994 b, p. 10).
Effective leadership in the organisation represents an important factor and the
main requirement in order to guarantee the success of TQM philosophy.
Commitment to apply this philosophy requires the organisational leaders to adopt
a strategic plan with specific targets and means focusing on long-term profits.
Management must also (a) build the momentum, (b) provide the requirements and
potential necessary for the implementation to succeed, (c) perform an effective and
continuous change process in the structure and culture of the organisation, (d)
accurately predict problems and ensure a readiness to confront them, (e) make
decisions based on facts, (f) build teamwork and coordination, and (g) encourage
individual and group innovation in improving the quality of products as well as the
method of productivity. All of the previous are considered the essence of effective
management tasks, which seek to adopt TQM philosophy and succeed in its
application.
Successful management models confirmed by this philosophy for the leaders o f
organisations are managed by circulating within an organisation (Logothetis, 1997,
p. 94). This model depends on the leader circulating around all aspects of the work
in the organisation, knowing the course of business, and listening to the employee
complaints, in addition to training them in the latest technology in their work field.
This is to enable the leader to know what is going on in the organisation and to
discover the strengths and weaknesses, urging the employees to handle and solve
issues in order to avoid repetition.
Gerosa (1998, p. 42) states that TQM focuses on the administrative process “the
effort done” more than the achieved results, despite the importance of the fina l
results, but instead of starting with the results, management must take the correct
course in order to reach them. The real reason behind many failures is the lack o f
leadership in organisations more than anything else. Leadership alone can
compensate for the gap between personal and organisational values, and only
leadership can generate a common vision leading to a profound sense o f
responsibility. Leadership alone can delegate to the employees.
Based on that, and in order for the TQM philosophy to succeed, it must be directed
to individuals. This means to focus on management orientation more than results.

103
This requires specific identification for a quality message, effectively building and
executing strategies, and coordinating other elements of TQM. Effective
leadership is the only qualified element to do this role, meaning that effective
leadership is the most important element in TQM.
Effective leadership is the most important element in TQM. For HEIs, it is
important to consider the leadership traits and the relation to constructing and
maintaining a customer focus and leadership system. In addition, clear objectives
and higher expectations are essential elements for leadership in HEIs (Michael et
al., 1997; Venkatraman, 2007). The literature clearly emphasises the importance o f
leadership commitment as one of most important elements for TQM in HEIs.
3.3.11. 2 Continuous Improvement
The idea of continuous improvement arises from one main principle: everything is
capable of being continuously improved. This is not limited to products and
services offered by an organisation, but it includes the entire organisation and what
relates to it.
The philosophy of continuous improvement, which represents the essence o f
TQM, is focused on improving every aspect of product and service provisions
accurately, and as one of the daily tasks for responsible employees, it seeks to
achieve two goals, which are (Al-Azzawi, 2002, p. 16) the following:
Putting forth all efforts in order for the improvement to be easy in all parts of
the organisation.
Great focus on the operations that make the offered products and services as
perfect as possible.
Organisations seek to achieve the targets of total quality in increasing productivity
from applying the philosophy of continuous improvement—adopted from the first
to successfully apply it (Japanese)—while retaining the quality of performance
and achieving customer satisfaction.
In order to apply the philosophy of continuous improvement, several statistica l
means were used. The most significant is the “Schwart” circle also known as the
“Deming” circle. It is a circle consisting of the four phases (PDCA) that assures its
consistent nature, used mainly a base for activities of continuous improvement,
and those phases are (Mustafa, 1999, p. 2) plan, do, check, act.
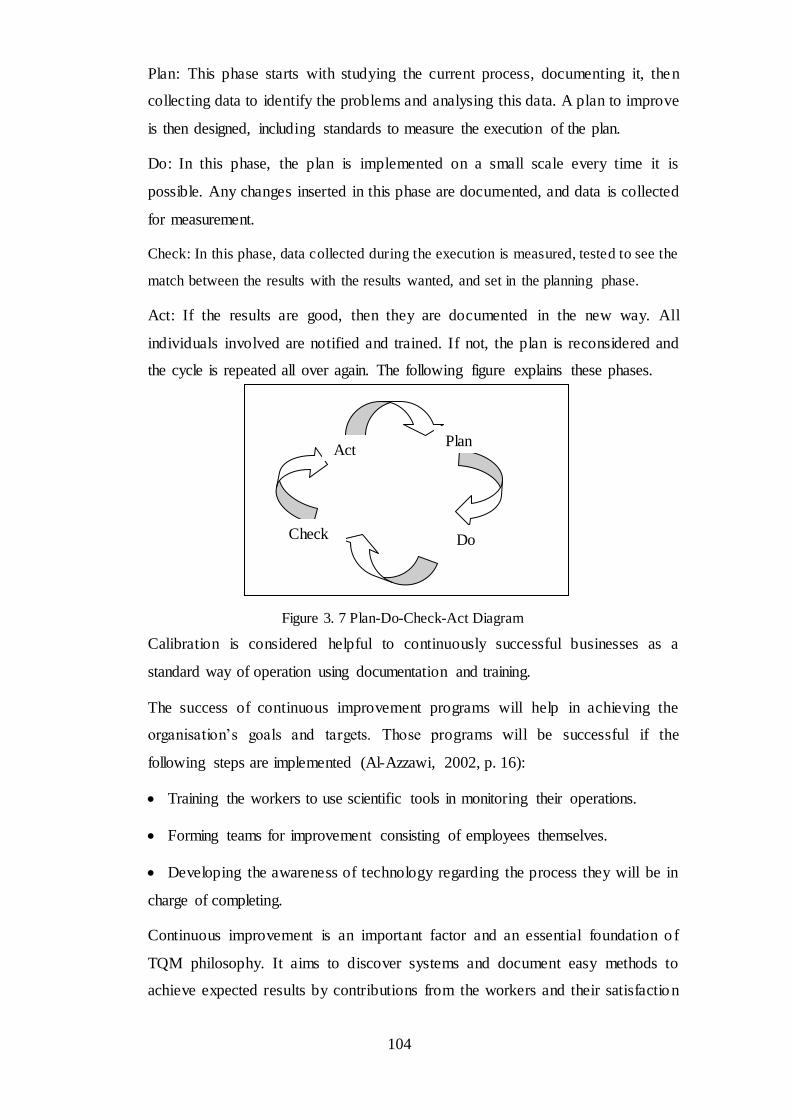
104
Plan: This phase starts with studying the current process, documenting it, then
collecting data to identify the problems and analysing this data. A plan to improve
is then designed, including standards to measure the execution of the plan.
Do: In this phase, the plan is implemented on a small scale every time it is
possible. Any changes inserted in this phase are documented, and data is collected
for measurement.
Check: In this phase, data collected during the execution is measured, tested to see the
match between the results with the results wanted, and set in the planning phase.
Act: If the results are good, then they are documented in the new way. All
individuals involved are notified and trained. If not, the plan is reconsidered and
the cycle is repeated all over again. The following figure explains these phases.
Figure 3. 7 Plan-Do-Check-Act Diagram
Calibration is considered helpful to continuously successful businesses as a
standard way of operation using documentation and training.
The success of continuous improvement programs will help in achieving the
organisation’s goals and targets. Those programs will be successful if the
following steps are implemented (Al-Azzawi, 2002, p. 16):
Training the workers to use scientific tools in monitoring their operations.
Forming teams for improvement consisting of employees themselves.
Developing the awareness of technology regarding the process they will be in
charge of completing.
Continuous improvement is an important factor and an essential foundation o f
TQM philosophy. It aims to discover systems and document easy methods to
achieve expected results by contributions from the workers and their satisfaction
Plan
Do Check
Act

105
regarding their jobs as internal customers of the organisation. Developing the spirit
of cooperation, innovation, and creativity and extracting tacit knowledge from
their minds to use in the production process, it also aims to provide continuously
improved products and services for external customers. Targets of TQM
philosophy are achieved when they are satisfied and loyal in addition to the
productivity increase while keeping the quality of performance, yet improving
continuously through inventing ways to decrease, if not prevent, negative
deviations during the production process and the stages of providing the product or
service to customers.
Regarding this, the emphasis on continuous improvement is one of the important
elements of TQM that is associated with the improvement of the management
process. Generally, the concept of TQM is closely associated with the continuous
improvement which is considered in the current study.
3.3.11. 3 Employee Involvement
Employee involvement as one of the foundations of TQM requires clarity of plans,
policies, and goals to enable the worker to understand their individual role in
successfully achieving this philosophy. The involvement of every individual in the
organisation in teamwork and problem solving, decision-making, and quality
improvement gives an impression to those individuals that the work they are doing
is important and effective in achieving the organisation’s targets; it also helps
develop their loyalty and affiliation (Baserda 2006).
Management of the organisation seeks to increase the participation of the workers
in different activities in order to achieve the targets of TQM and avoid the
problems resulting from keeping the workers away from the decision-making
process. The risk in keeping the workers away from practicing decision-making
lies in the following (Williams 1999, pp. 57-58):
Low quality decisions due to individuals who represent different organisational
levels with a lack of involvement in this process. This also sends a message that
the workers’ ideas are not of any worth to the organisation. This results in barriers
and hostility between management and the workers.
Workers’ feelings of non- importance as a result of constant elimination in
important activities and decision-making only enhances the idea “it is not my
business” which contradicts with the philosophy of TQM.

106
To achieve the participation and involvement of workers in the organisation
seeking to apply the TQM philosophy, it requires a change in the role of top
management represented in delegating and empowering the workers to enable
important decision-making that helps to improve the quality of products and
production process and to build, enhance, and integrate teams to express the
teamwork principle in the organisation and to benefit from intellectual minds close
to work problems.
Delegation and empowering techniques include the following (Heizer & Render,
2001, p. 175):
Formation of communication networks consisting of workers.
Developing and supporting supervisors.
Delegating responsibility from managers to production workers.
Innovation in official organisation structure and formation of quality teams
among them.
Training for communication, interpersonal skills in conversations, and open
discussions lead to successful advanced teamwork; it also urges the individuals to
effectively participate in group activities, which allows them the opportunity to be
effectively involved in product and operation improvement continuously (Bin
Saeed, 1997, pp. 97-98).
3.3.11. 4 Strategic Planning
Strategic planning is the one of elements that determines successful TQM which
precedes the actual implementation of TQM to provide an enabling environment
for the TQM execution and deployment throughout the organisation (Cascella,
2002; Hung & Lien, 2004).
The criteria for the AACSB, EFQM, EQUIS, and MBNQ demonstrate how
important strategic planning is as a principal element in quality improvement
activities. From the principles of TQM through the ideas of the three pioneering
quality experts, Crosby (1979), Deming (1986), and Juran (1988), it is obvious
that strategic planning is another basic element of TQM. Landon (2003)
investigated the strategic planning concept and concluded that the success of any
modern organisation mainly relies on its strategic planning. It is emphasised

107
further that organisational strategic planning has a positive direct relationship on
the achievement of organisational goals.
Strategic planning can be defined as the process that involves the top management
of an organisation in planning its future by designing a number of required
procedures and operations to achieve the organisational objectives (Evans & Dean,
2003). For that reason, it can be inferred from this definition that strategic
planning delineates the course and direction of any organisation in fulfilling its
long-term goals and objectives.
George and Weimerskirch (1998) gave a description of strategic planning as a
planned and understood element of organisational supervision and the
development of structure and management practices that are targeted at realising
total customer satisfaction. The authors mentioned that strategic planning defines
who we are and where we are trying to go, and quality is a strategic issue, rather
than a technical aspect. Therefore, TQM as a strategic issue must be carefully
incorporated into the overall strategic planning practices of an organisation
(Santos-Vijande & Alivarez-Gonzalez, 2007). By integration, this implies that the
decision-makers within the organisation must institutionalise TQM within the
organisational strategic plan.
Strategic planning should be considered a crucial concern of top management in
supporting an organisation in establishing action plans that relate to incessant
improvement of consequences and customer satisfaction to gain a competitive
advantage (Swift, Ross, & Omachonu, 1998; Hung & Lien, 2004; Lim et al., 2004;
Santos-Vijande & Alivarez-Gonzalez, 2007).
Learning-centred education and operational performance are key strategic issues
that are vital as parts of an organisation’s general planning in HEIs. In particular,
learner-centred education is considered a strategic view of education. The
concentration is on the drivers of student learning, such as determination of the
student, student and investor satisfaction, new markets, and market share, all o f
which are significant features in educational success (AACSB, 2012; EQUIS,
2012; MBNQA, 2011,2012). This means that strategic planning in HEIs should be
concentrated on the real needs of students, including those related to market
requirements and national responsibilities (AACSB, 2012; Hung & Lien, 2004;
MBNQA, 2011,2012).
108
Briefly, strategic planning is conceptualised in light of designing a clear mission
statement for educational objectives as well as a clear description of the learning-
centred process, prioritising the learning-process, emphasising student
requirements, monitoring staff performance, and designing clear quality goals
(AACSB, 2012; Bayraktar et al., 2008; EQUIS, 2012; Evans & Dean, 2003; Hung
& Lien, 2004; Lim et al., 2004; MBNQA, 2011,2012; Santos-Vijande & Alivarez-
Gonzalez, 2007; Swift et al., 1998).
3.3.11. 5 Customer Focus
In the TQM context, the concept of customer focus has another interpretation,
sometimes in literature it is referred to as “delight the customer”. According to
Lynne and Ross (2007), delight the customer means being the best at issues that
are considered the most essential to customers; these change continually.
Customer focus is a key element of TQM that emphasises the importance o f
knowing and understanding customers’ needs and requirements, and such
understanding will ensure customer satisfaction and consistently boost
organisational performance (Lagrosen, 2001; Samson & Terziovski, 1999;
Venkatraman, 2007; Zairi, 2000).
There were many reasons that the customer, as the market of any organisation,
cannot be treated with levity especially when effective organisational performance
is desired. This supports Taylor and Wright’s (2003) point of view where the focus
is on the need to understand customer needs as a key factor of TQM success.
Rampersad (2001) emphasised the need to understand customer requirements and
that everyone within the organisation should take customer focus into
consideration as a common issue and support the storage of a customer database
for benchmarking to obtain what the customer needs.
For other conventional industries, it is very easy to identify customer needs.
Regarding HEIs, many researchers have pointed out that there are varied customer
focuses (Lawrence & Robert, 1997; Owlia & Aspinwall, 1998; Venkatraman,
2007). Therefore, it is necessary to identify the customers of HEIs. According to
Lewis and Smith (1994), four categories of customers are identified vis-à-vis the
internal-academic (students, faculty, and programs/departments), the internal-
administrative (students, employees, and units/departments), the external-direct
(employees, other colleges), and the external- indirect (legislature, community,
109
accrediting agencies, alumni, and donors). All these categories have specific needs
(see Table 3.3). As a result, customer focus is important in order to understand
customer needs.
Since the adoption of TQM in HEIs, there has been much debate on the identity o f
the main customer of HEIs (Sirvanci, 2004). Many researchers have clearly shown
that the primary customer in an education system is the student (Bayraktar et al.,
2008; Kanji & Tambi, 1999; Lim et al., 2004; Sallis, 1993; Sakthivel et al., 2005;
Sirvanci, 2004). An investigation is being conducted in order to answer the
question of whether the main customer depends on which aspect of the educationa l
process is the focus. When focusing on the teaching process, the student is the
primary customer for the delivery of the teaching process. In addition, MBNQA
criteria for education, which were adopted from MBNQA criteria for business,
translated the term “customer” into “student”.
The MBNQA (2011, 2012) also revealed that the student focus in HEIs explains
the ways in which the universities perceive current and future needs of their
students and stakeholders. This is achieved with access to important information
regarding necessary student requirements.
In this study, the focus is mainly on learning and teaching aspects of HEIs. Hence,
the researcher’s focus is on the student as the primary customer of HEIs. In brief,
customer focus is conceptualised in terms of attending to the demands of students,
understanding student requirements, consideration of suggestions from students,
effective resolution of student complaints, using student complaints for improving
the teaching/learning process, and regular assessment of student satisfaction
(AACSB, 2012; EQUIS, 2012; Bayraktar et al., 2008; ISO 9000, 2008; Lagrosen,
2001; Lim et al., 2004; MBNQA, 2011, 2012; Samson & Terziovski, 1999;
Venkatraman, 2007; Zairi, 2000).
It is clearly indicated in the literature that the emphasis on the quality gurus,
empirical studies, and models of quality are vital issues that are related to TQM
(Peters & Austin, 1985; Zairi, 1994; Al-Azzawi, 2002; Crosby, 1979; Deming,
1986; Williams, 1999; ISO 9000, 2008; Juran, 1988; Kanji, 1999; Lim et al., 2004;
Oakland, 2000; and others). The researcher has identified three initial important
elements of TQM. Table 3.3 summarises the core elements as variables of TQM.
A discussion of the three important elements follows.

110
Table 3. 3 The elements in TQM
Core elements
Contributions of TQM pioneers
Deming (Williams, 1999)
Juran (Russell & Taylor, 1998) Crosby (Logothetis, 1997) Faginbaum (Dale et al.,
1997)
Continuous improvement
- Permanent target, which is
improving production.
- New philosophy.
- Continuous development in
testing methods for product
quality.
- Finding good program for
education and improvement.
- Achieving improvement based on a
continuous foundation.
- Establishing the purposes of
improvement.
- Increasing awareness of
improvement chances.
- Reporting the progress of work
improvement.
- Integrating the improvement
process in the organisation systems
and processes.
- Developing infrastructure to
execute the improvements.
- Defining the area for improvement.
- Building a team for improvement
projects.
- Providing the improvement team
with necessary requirements.
- Formation of a team for
quality improvement
throughout the departments.
- Problem solving once
occurred.
- Planning zero defects and
committing to its program.
- Emphasising the importance
of defect elimination from
the beginning because it is a
new approach.
- Encouraging individuals and
teams to establish
improvement purposes.
- Continue to repeat
everything.
- Management
commitment to the
quality improvement
process.
- Making sure quality
improvement becomes a
tradition of the
organisation.
Employee involvement
- Establishing effective
training centres.
- Elimination of fear from the
workers while working.
- Elimination of obstacles
between departments.
- Establishing an intensive training
program.
- Availability of training.
- Formation of an improvement team
and designating the responsibility
of its members.
- Providing the team with necessary
tools to do their work.
- Formation of a quality
improvement team.
- Increasing the awareness of
all employees to commit to
quality.
- Training supervisors to
undertake their
responsibilities in the
program.
- Surpassing the individual
organisational and
functional limits.

111
- Preparing a strong program
for education and
improvement.
- Encouraging individuals and
teams to set goals for
improvement.
- Encourage the workers to
notify the administration
about the obstacles that
withhold quality objectives .
- Motivating individuals for
participating and granting
them the proper
appreciation.
- Establishing quality boards
to enhance the continuous
communication.
Effective leadership: All
the contributions of the
TQM pioneers are
considered missions done
by the organisation’s
leadership, since the total
quality is everyone’s
responsibility, there are
missions that are related
to the leadership which
are:
- The presence of an effective
leadership.
- Ensuring strategic thinking
and long term revenue.
- Not focused on the personal
perspective.
- Doesn’t follow the method
of bypassing (jumping) jobs .
- Making decisions based on
facts.
- The foundation of improvement
discipline and leadership is the
higher administration
responsibility.
- Adherence of the higher
management to long-term
quality.
- Adherence of higher
management to the
quality improvement
process.
- Higher management
ensures that quality
became a tradition in the
organisation.
- Monitoring all the higher
levels of the organisation
and determining all sorts
of imminent issues.
Achieving customer
satisfaction:
- Removing the obstacles that
interfere with the craft’s
pride.
- Identifying the customer.
- Determining customer needs.
- Developing products in a way that
meets the customer needs.
- Developing systems and procedures
that allow the response of the
organisation.
- Organisation’s customers
must be contacted
directly.
112
3.3. 12 Requirements for TQM Application in Institutes of Higher Education:
In order to apply the philosophy of TQM in institutes of HE, some requirements should
precede this process. Saqqaf, (2007) indicated that the main requirements requested for
TQM application include reshaping the culture of the university’s institution, promoting
and marketing the new concept, learning, training, consulting advisors, forming work
teams, encouraging, motivating, monitoring, supervising, and evaluating.
One of the requirements for the introduction of any new principle for an organisation
requires reshaping of its culture, and employee acceptance or refusal depends on their
culture and beliefs. As such, adopting the TQM principle requires a culture that differs
radically from the traditional culture, thus a proper organisational culture needs to be
found to implement this management philosophy within it. It also needs the emphasis of
TQM among workers in the institutions before making any decisions on its
implementation. Marketing this management philosophy to the organisation’s audience,
whether inside or outside, helps to reduce the objection to change. Also, expected risks
can be determined when the implementation starts, and management can prepare the
proper actions.
In order to implement the TQM philosophy correctly, all participants should be trained
on the implementation process and educated with the proper required methods and tools
for this philosophy to be implemented on a solid grounding, which leads to the desired
results and avoidance of errors, confusion, and randomness in implementation. This
cannot be achieved without effective training programs. Furthermore, the purpose of
consulting experts and advisors that specialise in implementing the quality management
philosophy in institutions of HE from outside the institution on implementation start-up
is to support and assist the internal experience and assist in discovering solutions for the
problems that arise on the actual implementation.
Work teams are formed that each contain between five and eight members from the
directly related departments or from those who assume the work in need of
development. Those members should be trusted individuals and have a readiness to
work, develop, and sacrifice as well as have loyalty to the organisation and the
necessary powers to review, evaluate, and propose suggestions for improvement.
Therefore, workers must be credited for performing distinctive jobs and trusted to
support effective performance. This encouragement and motivation plays a role in
developing the TQM philosophy in the institution and its continuity. This is done

113
through establishment of an incentive system that demonstrates care for astounding
performance. Supervising work teams is considered one of the necessities to the
implementation of TQM, as it works on adjusting any deviation from the proper course
and monitoring achievements of these teams and adjusting them when needed through
monitoring and supervision. Coordination can be achieved between workers on their
different administrative levels and between all of the institution’s departments to
overcome difficulties that hinder those teams.
The development of a TQM strategy in a HE institution can involve three main stages:
preparation, planning, and progress analysis. The first stage involves knowledge
exchange, promoting experiences, identifying goals, identifying the need for
improvement, and reviews of other institutions’ experiments. In the second stage, the
setting plan is devised on how to implement and identify the necessary funding
resources. Finally, different statistical methods can be used to monitor continuous
development and measure performance levels. Al-Banna (2007) proposed that the
implementation of a TQM system in HE institutes requires a full understanding of the
organisational culture and learning environment as well as commitment to its principles.
The implementation of TQM also requires coordination between the management of the
different departments and faculties to activate the participation of all administrative
levels and workers in the efforts of total quality improvement communication.
3.3. 13 Indications of TQM in HEIs
Total quality management systems consist of ten criteria that describe the
characteristics of TQM of institutions in general (Al-Banna, 2007), and they include the
following:
Strategic management is concerned with designing general institution policies and
setting plans that determine the institution’s path. The plan includes the institution’s
mission, vision, and objectives that must be achieved as well as performance indicators,
priorities, the required resources to execute the plan, the learner’s needs, and the quality
management system indicators, which are set on the start of each college year.
Quality management is concerned with the institutional ability to provide a service
that meets the expectations of the beneficiaries (learners, academic and administrative
workers, and the employment market).

114
Marketing and customer care requires that the employment market and learners
needs must be determined in order provide an effective training and education that
achieves the beneficiary’s satisfaction.
The human resources development includes continuous training and education for
workers in order to be able to perform their tasks effectively and with high productivity
and to have the complete competence to perform their work properly.
Equal opportunity guarantees should be provided for all the learners and workers in
educational institutions and the employment market in a way that promotes a feeling of
satisfaction, which is reflected on productivity.
Health and safety ensures the presence of a safe, healthy environment for the
learners and workers in these institutions.
Communication and administration require that the administrations of these
institutions seek to meet the needs of workers and learners; information must transition
flawlessly through all levels.
Guidance services focus on the learner’s psychological, academic, and social needs
(and work on achieving them).
Program design and delivery are concerned with building teaching programs
according to the requirements of the employment market and applying them, choosing
proper teaching methods and focusing on the learner’s needs and activities that they are
interested in.
Assessment design and delivery ensures that the learner achieving the requirements
and indicators obtains the degree.
These indicators are used to explain and determine the degree of achieving a certain
objective, (i.e., they must be standard or benchmarked), and they monitor the changes in
the educational system, help build credible and stable characteristics for the educational
system, and clarify the extent of similarity or differences in the education field.
Thus, TQM seeks to prepare learning outcomes with certain features to assist with
assimilating the wealth of information, continuous change procedures, and huge
technological advancements as the HE role will not be limited to knowledge transition
and listening, but will include the process of handling information and using it
sufficiently to serve the learning process. This stage requires a person with certain
characteristics to assimilate, accelerate, and deal with the new information effectively
115
(Abo Mlouh, 2001). This requires a major role from the institutions of HE and from the
teaching staff in these institutions. Work is done to provide an educational climate that
allows free expression, discussion, and assisting students in cooperative and self-
learning.
3.3. 14 The implementation of TQM in Higher Education Institutions
In order to activate TQM and its role in HEIs, several issues must be considered for
implementation. Dotchin and Oakland (1992) focused on six issues for activating and
implementing TQM. These are (a) identifying the stakeholders and discovering their
needs, (b) determining the standards that are consistent with customer requirements
(stakeholder), (c) calibrating procedures and improving their efficiency, (d) establishing
quality systems, (e) management’s responsibility to identify the quality policy for the
institution, and (f) providing workers on all organisational levels with the energy to
work on quality improvement. Doherty (1993) reported different elements for the
implementation of educational TQM. These include providing methods to identify the
customer needs and demands and ensure that quality is maintained throughout the
educational process. This also requires a strategy in which workers at all levels adopt an
effective quality improvement method that is acceptable to external institutions. In
addition, the quality system should contain mechanisms that lead to clear improvements
in quality and give attention to human service, care, compassion, and leadership. Such
systems should encourage teamwork and provide the means that allow the teams to
assume their responsibilities towards quality of HE.
Mustafa (1998) and others (Zidan, 1997, Mahyawi, 2007) indicated that the quality
system of education should include the quality of student, technical staff, courses, the
educational programme, and teaching methods. It should also include the material
capabilities, the quality of senior management, legislation, and the quality of
performance evaluation.
The student is the core of the learning process. Therefore, various issues should be
taken into consideration during the educational process, including a student’s selection
and preparation. In addition, teaching staff and the quality of the educational
programme are other important factors that affect TQM. Teaching is generally
associated with the size and adequacy of the staff quality. The efficiency of the teaching
staff is also determined by the quality of scientific and cultural training, teaching
methods, academic performance, curriculum, and skills. In addition, several material
116
capabilities affect the educational quality in a university. These include buildings,
libraries, books, periodicals, laboratories, and workshops. The building must have the
ability to provide the required flexibility that is appropriate for the interaction between
all the elements of the educational process and be able to accommodate the number of
students.
The TQM of an academic institution is influenced by senior management and
legislation. Senior management at the university can shape and direct the policy of the
academic institution. The success of quality depends on the commitment and initiative
of senior leadership regarding the quality management programs. There must be quality
in the strategic planning and relations between leadership, workers, methods of
communication, and the selection, preparation, and activity follow-up of personnel that
lead to the creation of a culture that believes in the philosophy of TQM. In regards to
legislation and university systems, instructions and decisions shall be at the level that
ensure sufficient and effective conduct of work required by TQM and be clear, flexible,
specific, and keep up with changes and developments in the surrounding environment.
Furthermore, the evaluation factor is another factor that guides TQM and quality
management. This requires the presence of criteria for evaluating all elements in order
to be clear, specific, and easy to use for measurement. This requires the training of staff
in TQM and the restructuring of functions and activities according to these standards
and levels of performance.
3.3. 15 The Benefits of the Application of Quality Systems in Universities
The benefits of the application of quality systems in universities can summarised by the
following: (a) improving the efficiency of university management, (b) improving
curriculum development, (c) improving the development of measurement and
evaluation methods, (d) improving the use of education technology, (e) raising the level
of academic and administrative staff, (f) encouraging teamwork, (g) developing
administrative capacity, (h) improving educational outcomes, (i) increasing student
satisfaction, and (j) increasing production of scientific research at the university. Higher
education quality in Jordanian universities can be measured (in addition to the study
tool—a survey) through other measurements, such as graduate quality, access to jobs in
the labour market, scientific awards obtained by the university, scientific contributions
of faculty members at the university in international forums, creativity and excellence
prizes awarded by the university.

117
Many researchers have incorporated the elements of TQM into different aspects of the
educational field as a step towards achieving better management of higher education
(Bayraktar et al., 2008; Koch & Fisher, 1998; Lim et al., 2004; Peat, Taylor & Franklin,
2005). The authors believed that the elements of TQM could positively contribute to the
improvement of higher-educational performance.
3.4 KM Integration with Total Quality Management
The integration of KM with TQM can enhance and develop the organisation’s
performance as well as achieve its goals of excellence and leadership. These two issues
are closely related to each other. Table 3.4 shows the similarity and differences between
KM and TQM.
Table 3. 4 Similarities and Differences: KM and TQM.
Similarities
KM TQM
Continuous improvement and learning from
others
Valuing employees/intellectual capital
People/competence development
Empowerment/ involvement
Teambuilding/collaboration
Acquiring knowledge of competitors,
customers, suppliers and partners
Facilitating/improving access to knowledge
Improving quality and efficiency of
decision-making
Continuous improvement and measuring to achieve
customer satisfaction
Valuing employees/intellectual capital
Employee training/education/development
Empowerment/involvement
Teambuilding/collaboration
Acquiring customer and market knowledge
Selection and use of information and data
Open channel of communication
Improving quality and efficiency of decision-
making
Differences (Focus/Strategies)
KM TQM
Embedding knowledge in staff, customer,
products, process, and services
Regarding knowledge as the source of
competitive advantage
Achieving greater productivity through the
use of knowledge
Creating/disseminating new knowledge and
embedding it in new technologies
Searching for new source of information
Adapting knowledge to market needs
Better use of resources, to achieve effectiveness and
efficiency
Striving for excellence through benchmarking, etc.
Consistent and precise performance to high
standards in all areas of the organisation
Effective leadership and team commitment
throughout
Customer focus
Results focus
Measurement of quality using data and tools
118
To clarify, the relationship between the elements of KM and elements of TQM is
exposure of the interrelationship between each element of the KM (knowledge
management processes, its technology and team knowledge) on the unit, with all the
elements of Total Quality Management (effective leadership continuous improvement
and participation of workers (Ali Zwain 2012).
Relationship Between Knowledge Management Elements and Total Quality
Management Elements
The knowledge management processes are represented as knowledge generation
storage, distribution, and application and are determined by the relationship between
each process of the four operations, with the elements of Total Quality Management
(Ali Zwain 2012).
Relationship of knowledge generation elements of Total Quality Management : This
relationship is reflected through mutual roles and contributes to the reactants between
the process of generating knowledge with every element of the basic TQM (effective
leadership, continuous improvement and participation of workers (Ali Zwain 2012).) as
follows:
Relationship of generating knowledge with effective leadership.
Relationship of generating knowledge with continuous improvement.
Relationship of generating knowledge with the participation of workers.
Relationship of knowledge storage with elements of Total Quality Management:
This represents storage which is the second process of knowledge management
processes. To determine its relationship with the basic elements of TQM, the exposure
of the relationship to this process with each of these elements separately (Ali Zwain
2012) is as follows:
Relationship of storing knowledge with effective leadership.
Relationship of storing knowledge with continuous improvement.
Relationship of storing knowledge with knowledge workers.
Relationship of knowledge distribution elements with Total Quality Management:
In this Section, the relationship is based on the distribution of knowledge as one of the
knowledge management processes with each element of the core of TQM as follows:
Relationship of knowledge distribution with effective leadership.
Relationship of knowledge distribution with continuous improvement.
Relationship of knowledge distribution with knowledge workers.
119
Relationship of the elements of knowledge application with Total Quality
Management:
Senior management in institutes of HE must lead the efficient application of knowledge
in the organisation to achieve the objectives of total quality management and help
pursue the philosophy of Total Quality Management to apply different types of
knowledge in the work of the organisation. In this context, the nature of the relationship
between the process of applying knowledge and core elements of TQM, is as follows:
Relationship of the application of knowledge and effective leadership.
Relationship of the application of knowledge and continuous improvement.
Relationship of the application of knowledge and knowledge workers.
It could be observed from the numerous elements given by notable scholars in the area
of KM and TQM, that they placed TQM (Effective leadership, Employee involvement
Continuous improvement) as the mediator variable as well as placing KM (comprised of
knowledge processes, technology and Team of knowledge ) as a variable (Ali Zwain
2012).
3.5 Previous Studies Related to KM and TQM
1. Study of Waddell and Stewart (2006) “The Interdependency between
Knowledge Management and Quality” This study aimed to test the relationship
between KM and quality. The sample of the study consisted of 1000 questionnaires
distributed to Australian companies; 25 per cent of the total number of distributed
questionnaires were retrieved. The study found that of the many results, the most
prominent one represents that there is a relationship between KM and quality and that
there is a kind of support for KM as a key component for the transfer of culture of
quality in these companies.
2. Study of Chua and Lam (2007) “Quality assurance in online education: The
Universities 21 Global approach” This study aimed to describe the quality assurance
processes in a global university. The study found that the quality assurance processes in
the study sample of universities worked to achieve student satisfaction and to attract
additional students. In addition, the adoption of quality assurance processes facilitated
the enrolment of students in these universities through e-learning and the transfer of
knowledge possessed by these universities.
120
3. Study of Zhao and Bryar (2006) “Integrating Knowledge Management and
Total A Complementary Process: Quality” This study aimed to describe the quality
assurance processes. The study provided a brief theoretical presentation on KM and
TQM, and it compared both of them in terms of goals, strategies, and focus. Also, it
attempted to integrate both philosophies in order to develop and provide continuous
improvement in business organisations. The study found that knowledge that is based
on TQM facilitates and guides the process of learning and provides continuous
improvement in business activities. In addition to that, the integration between these
two management systems leads to change in customer needs and expectations.
4. Study of Baserda (2006) “The integration of knowledge management and total
quality and its impact on performance” Performance is a measure of efficiency,
effectiveness, and learning for human resources, which is also the fundamental measure
for success as well as the index upon which many administrative decisions are built.
The study determined the effects of each element of KM and TQM on performance as a
whole and on each of its components. There were large effects on performance (positive
relations) when the activities and events of KM were integrated with TQM. Therefore,
the study came to the conclusion that the model of balanced scorecards of parallel
relations is the most important model that can be used to measure the performance of
the organisation.
5. Study of William Gang Dzekashu (2009) “Integration of Quality Management
into the Tacit Knowledge Capture Process” The study confirmed that adoption of
QM in the process of documenting critical knowledge could lead to greatly improved
knowledge quality as well as to operational excellence and better organisational
performance. Organisations are encouraged to implement quality standards that best fit
their culture.
6. Juozas Ruþevièius (2006) “Integration of Total Quality Management and
Knowledge Management” The main field of KM is the use and development of an
organisation’s knowledge resources in order to meet its goals. Explicit documented
knowledge needs to be managed as much as tacit subjective knowledge. An
organisation’s managers need to establish and determine all the processes related to the
identification, creation, storage, and dispersal of knowledge. For this to occur,
organisations must implement a system that trains employees on how to create, store,
maintain, safeguard, and share knowledge. Although the concepts of TQM and KM are
markedly different, there are four fields of commonality: goals, areas receiving
particular attention, the position they hold in the organisation in terms of its general
121
management, and issues regarding the financial benefits of implementing these systems.
The author has devised a model that integrates KM into TQM, which could be used in
TQM training and when implementing TQM and KM in an organisation.
3.5. 1 What Distinguishes the Current Study from Previous Studies?
By reviewing the past studies, it appears that some of them examined the attitudes of
managers towards the application of KM, and other studies examined the performance,
creativity, and decision-making of KM as well as discovering the competitive
advantage. The current study and what distinguishes it from past studies and research is
that it reviews an important and vital aspect; that is, the integration of KM and TQM
and its impact on EP in institutions of HE in Jordan and its role in achieving TQM in
this institution, where most efforts and research were directed towards KM. Also, the
researcher has benefited from previous studies, and this benefit is reflected in two
important points. The first point is the formulation of the theoretical framework for the
study, and the second is the formulation of the hypotheses.
3.6 Summary
This chapter focused on reviewing the relevant literature on quality and TQM. A large
amount of literature focused on the attributes of quality and TQM. This literature
reported various information related to the concept, its application and elements of both
‘quality’ and ‘TQM’. As a result of the various studies, and global concern regarding
quality, a large number of TQM pioneers have participated in its illustration,
development, and ease of application. The appearance of many models has also
contributed to the illustration, understanding, and interpretation of TQM. In the light of
these models, various elements of TQM have emerged. Effective leadership, continuous
improvement, and personnel participation are the significant elements of TQM.
Furthermore, customer satisfaction is a pivotal goal that this philosophy seeks to
achieve. In order to understand the concept of quality and TQM, it is necessary to
comprehend the relevant issues that are interrelated with each other. Therefore, this
chapter along with Chapter 2 has provided a background on TQM and KM, which are
both essential issues for modern educational performance that will be reviewed in the
next chapter.
122
CHAPTER FOUR
EDUCATIONAL PERFORMANCE
4.1 Introduction
The processes of KM and TQM are closely associated with the performance of higher
education (HE). A number of elements are considered for KM and TQM. For KM,
identification, acquisition, storage, sharing, and application of knowledge elements are
considered. Whilst for TQM, elements include leadership commitment, strategic
planning, continuous improvement, customer focus, process focus, employee
involvement, training and learning, and rewards and recognition (Zwain, 2012). In
addition, the measurement of performance plays an important role in the overall
organisational process. Therefore, it is considered an integral part of managing
educational performance. Literature reported that the importance of ensuring TQM
directs the organisation for sustainable improvements (Armitage and Atkinson 1990,
Vollmann 1990). TQM allows for the potential for an organisation to be competitive
when it is suitably organised and performance is managed effectively. Human resources
and strategic planning influence this.
This chapter represents the third part of the literature review and focuses on educational
performance. The previous two chapters reviewed the literature related to knowledge
and knowledge management (KM) (Chapter 2), and quality and total quality
management (TQM) (Chapter 3). In this respect, the quality practices are an essential
factor for managing the organisation system to achieve effective performance. This is
associated with success and leads to many administrative decisions that benefit the
organisation to sustain its performance in the market. Consequently, performance is the
basis that reflects the organisation’s ability to achieve efficiency, effectiveness, and the
appropriate uses of its available human and material resources to achieve its goals. It is
a measure for success and an indicator upon which many administrative decisions have
been made. Furthermore, in light of the many complex and individual standards, there
are many areas of performance. The BSC model, adopted by this study, is one of the
most important complex standards to measure the performance of an organisation.
The structure of this chapter includes reviewing and discussing the main issues that
contribute to a better understanding of educational performance. This chapter will
concentrate on different aspects of performance in education, including concepts,
mainly of BSC models and their application and implementation.
123
4.2 Performance
Performance is an important indicator based upon many important decisions. It
identifies negative and positive trends of the organisation’s activity and identifies
approaching or receding from the achievement of the objectives and implementation of
set plans. Thus, it reflects the extent of an organisation’s success or failure.
Researchers differ in defining the concept of performance because of the multiplicity
and divergence of indicators measured that depend on the different nature of the work of
organisations, their goals, and those who measure it. Some believed that performance is
the final result of the activity of the organisation, which was adopted by Wright (1996,
p. 259) when he defined performance as “those results the organization is trying to
achieve”. Wheelen and Hunger (2000, p. 231) proposed that it is “the final result of the
activities of the organization”. Others believed that the performance is a reflection of an
organisation’s ability to achieve its goals and to measure these goals, which was
expressed by Eccles (1991, p. 31) when he described performance as the “reflection of
the ability of the organization and its ability achieve its goals”.
Robins and Wiersema (1995, p. 278) explained that performance is the standard of the
long-term goals of the organisation represented by goals of survival, adaptation, and
growth. Others argued that performance is a reflection of how the organisation exploits
its resources, and in this regard, performance is known as “a reflection of how the
organization uses and exploits its material and human resources in a way that makes it
capable of reaching its goals” (Miller & Bromiley, 1990, p. 757). Daft (1992, p. 120)
agreed with both of them when he described organisational performance as “the ability
of the organisation to achieve its goals through the use of available resources
effectively”.
Consequently, performance can be defined as a reflection of an organisation’s ability to
achieve efficiency, effectiveness, and learning in the use of its available material and
human resources to achieve its goals. This means that performance is the mirror of an
organisation’s achievement of high productivity by attaining effectiveness and
efficiency in the use of available material resources, knowledge generation, sharing, and
application through human resources, in addition to achieving other goals represented in
accomplishing customer satisfaction, high market share, and success in taking
responsibility towards society. It also assists in the detection of the suitability of plans,
goals, policies, and programs for available human and material resources as well as in
124
detecting the level of coordination between various functions and activities and in the
ability of human resources to carry their mandate. In the light of this comparison,
management can make the right motivational decisions that flow into the strategic goals
of the organisation.
It should be noted here that performance management should not be confused with
performance appraisal, as the latter is a component of performance management, which
is concerned with the continued communication and planning that must occur between
the worker and manager. When an organisation adopts the model of performance
management, it moves from the model where individuals are in control to the model of
direction and guidance. To reach successful performance management, the director
should (Schwartz, 2001, pp. 4, 113):
understand the functions of the worker,
work with the worker to develop standards and expectations,
ensure that every worker has obtained the proper appraisal by the co-workers,
customers, and supervisors in an honest and continuous manner, and
prepare and implement an appropriate writing process for the performance appraisal.
Consequently, the importance of performance lies in that it is the real detector of an
organisation’s position in the market and the extent of its success in achieving its
internal and external goals. In addition, it is the basis upon which many important
decisions in organisation are made. In other words, an organisation cannot know the
direction of its activity or the extent of nearing achievement of its goals, unless it is
guided by the compass of performance.
4.2.1 Areas and Measures of Performance
Areas of performance measurement differ according to the organisation’s goals, the
nature of its activities, and its strategic direction. Some researchers attempted to identify
key areas of organisational performance (Miller & Dess, 1996, pp. 12-13) setting five
key areas of performance, which include profitability, market share, productivity,
individual development, staff satisfaction, and general liability.
As a result of the multiplicity of organisations and areas of performance, there are
numerous indicators of performance measurement. Individual indicators that measure
specific objectives for an organisation represent one type of these indicators. These can
be represented by financial standards such as liquidity, profitability ratios, and others, or
125
by operational standards such as productivity, or by marketing standards such as the
growth of market share. However, as result of seeking to achieve more than one goal
simultaneously (financial and non-financial goals, long-term and short-term goals,
internal and external goals), a complex standard has been epitomised that reflects a
clearer picture of organisational performance.
We have a growing interest in using complex standards to measure organisational
performance for the following reasons (Kaplan and Norton, 1992, p. 71):
Individual standards express an individual goal. As organisations create a set of
goals rather than one goal, it is appropriate to adopt a complex standard that fits the set
of goals.
Organisations deal with a group of parties that include administration, workers,
shareholders, customers, and the local community. Each of these parties has a particular
goal. Workers look for compensation and better work conditions. Shareholders seek to
maximise profits. Customers desire high quality products at a reasonable price.
Administration wants to adopt work methods that achieve higher productivity. The local
community desires a clean environment. Thus, complex standards can help determine
the extent to which these parties can achieve their goals, while individual standards are
unable to do so.
The current environment of various organisations is complicated and dynamic, which
requires that these organisations should adopt performance measurements that
determine the extent of its control over its activities. This fits exactly with the adoption
of complex standards for measuring organisational performance.
The researcher believes that the Kaplan and Norton model (Figure 4.1), which is known
as a balanced score card, is one of the most important complex standards in the
measurement of organisational performance, which is based on financial and
operational standards to measure performance (which are adopted in this study as a
measure of performance). These standards include four main perspectives, financial,
internal business process, customer, and learning and growth perspectives.
4.2.2 Balanced Score Card (BSC) Model
The BSC model is considered one of the most important performance measurement
systems that has been developed recently. It is the most prevalent, which indicates this
model provides effective and strong methods to translate BSC vision. Supporters of the
BSC model and strategy have confirmed that it is an effective tool that transfers the

126
strategic goal and motivates performance compared to established strategic goals (Abu-
Fada, 2006). The BSC model plays an important role as a tool of strategic management
in an organisation. Kaplan and Norton (1996) explained that this model helps managers
in performing four new management operations, working independently or integrating
to connect between long-term goals and short-term actions. These operations are
translation of vision, connection and linkage, work planning, and feedback and learning
(Abu-Fada, 2006).
The strategy is a general framework that the organisation is guided by in defining its
direction and future view in order to make its decisions (Idris & Morsi, 2006). Also,
strategy management is an initiative and action process more than just work planning. It
is a management process that is targeted to achieve the vision of the organisation
through management and direction of the relationship between the organisation and its
environment (Plant, 2007). Strategy management is defined as a continuous and
repetitive process that passes through the different functions of the organization and
aims to maintain the condition of the whole organization that is suited to its
environment (Porter, 1996). As for Strickland and Thompson, they defined strategy
management as “establishment of the future direction of the organization, revealing its
goals on the long-term and choosing of the appropriate strategic manner of achievement
in the light of internal, external and environmental factors and changes, then the
application, follow-up and evaluation of the strategy” (Idris & Morsi, 2006).
The BSC model can be described as giving an organisation’s managers the position of a
pilot who needs information from several sources in the current environment, which
assists the pilot in flying the plane, as the level of complexity in the business
environment requires management to be responsible for monitoring performance in
different sites inside and outside the organisation simultaneously.
4.2.2. 1 Identification of the BSC Model
The BSC model is a tool used to transfer the strategy of the organisation to various
management units and levels, as well as for the measurement of implementation models
in these units. It is used in a way that ensures the achievement of targeted goals, which
support the strength of the organisation and its competitive position through providing a
tool to execute the strategy and accountability of its target goals (Gering & Keith,
2000).
127
Kaplan and Norton (1992) maintained that the BSC is a comprehensive system that
could be used for measuring the performance strategic perspective, and in this respect,
the strategy of business administration can be translated to strategic goals, targeted
values, and clear procedural steps.
4.2.2. 2 What is balanced score card?
With the four perspectives of organisational strategy in sight, the role of the BSC
becomes significant when it comes to the application, execution, and implementation of
the same (Rodriguez Bolivar et al., 2010). Balanced score cards assist in impartial and
unbiased decision-making, while simultaneously helping to secure non-financial and
feasible measures for the organisation (Holmes et al., 2006).
The BSC is helpful in associating tactical operations and daily achievements with the
strategic long-term objectives of an organisation, while focusing on the future outlook
(Tseng, 2010). In this way, the BSC tends to improve the working of the organisation in
terms of current and future perspectives. Every moment, capability, and resource
invested today is likely to impact the organisation of tomorrow with growth and
development (Banchieri et al., 2011). The BSC helps in identifying leading and lagging
indicators (Klassen et al., 2010). The former shows the direction for the performance
indicators, while providing for methods to achieve performance goals, and the latter are
the performance goals and objectives that are set for management and generally result
from the outcome of earlier actions (Holmes et al., 2006).
The BSC tends to help an organisation with the factors that may impact the business
both internally and externally (Tseng, 2010). This helps management and the business
to understand the prospect of internal processes that may be critical to eventual goal
achievement and the external impact that may be created from customer feedback and
positioning of the product or service (Rodriguez Bolivar et al., 2010).
It is understood that strategy helps direct a company toward its specified goals for
unknown positive consequences and results. In this regard, the application of the BSC
helps management in associating tactics, cause and effect assumptions, and strategies
(Klassen et al., 2010). The BSC works on the assumptions and postulates that would
encourage management in achieving the already determined goals and objectives
(Tseng, 2010). It also helps management in testing possible strategies for their
organisation (Rodriguez Bolivar et al., 2010). The techniques and measures put together
128
in the BSC help management in attaining the objectives and goals, especially with
reference to the financial outlook (Holmes et al., 2006).
The concept of a strategy map was put forward with input from all the departments
concerning all organisational units and allocated resources (D'Antoni et al., 2010). The
strategy map is a tool that is employed by management to describe the association
between cause and effect relationships (Ni et al., 2010).
The financial perspective tends to inform management with the end result that they
sought. Like every other business, they seek improved numbers for the organisation and
stakeholders to earn substantial profits (Gapenski & Pink, 2003). It explains to them
whether the strategy implementation for the business has proven to be successful or not
(Shapiro, 2008). Financial perspective leads the company in assessing financial returns
for the shareholders, who may have invested in the company (Brigham & Houston,
2011). Different aspects and terminologies of financial management, in this case, have
made their way into the BSC as standards for performance indicators (Holmes et al.,
2006). Yet, another method is to investigate customer satisfaction and product quality
rather than financial growth to understand the performance indicators of a company
(Rodriguez Bolivar et al., 2010).
Thus, in a way, the BSC provides an opportunity for management to associate their day-
to-day, short-term, and tactical actions with their long-term strategy (Banchieri et al.,
2011). Furthermore, the technique also facilitates management in establishing
performance measures at all levels of an organisation to gauge performance and
evaluate improvement (Holmes et al., 2006).
When managers put forth an effort to organise and accurately implement management
processes, techniques, and decisions, customer satisfaction and need fulfilment are
ensured (Shapiro, 2008). Another perspective of the internal process focuses on
customer satisfaction, ensuring improved results that augment shareholder value. In this
way, not only financial objectives are attained, but also customer satisfaction ensures
long-term relationships (Gapenski & Pink, 2003). Business aspects that are crucial for
customer satisfaction are taken into account, and the focus is more on factors like
quality and the skills of the workers (Brigham & Houston, 2011).
Aspects like inventory turnover, productivity, development expenses, and delivery help
management single out and tackle issues and identify core competencies, while
ascertaining market leadership within the sector in this process (Shapiro, 2008).

129
Another perspective that details the infrastructure provided to sustain the other three
perspectives crucial to organisational success is the learning and growth perspective
(Chen et al., 2009). Considered to provide the basis for the BSC, the learning and
growth perspective allows the other three perspectives to blossom (Rodriguez Bolivar et
al., 2010). The former ensures that the continued improvement process continues with
new innovations, expands into new territories globally, and increases the shareholder’s
assets and the value of the organisation (Shapiro, 2008). This perspective is generally
gauged and evaluated by different aspects of learning and growth within the
organisation, which include worker skills and knowledge, satisfaction, information
flow, and other relevant tools (Gapenski & Pink, 2003).
This perspective also enables the institution to expand and structure their internal
processes to ascertain the skill levels of their employees (Chen et al., 2009). With the
help of this learning and growth perspective, the area of internal processes is also
improved, which further enhances the stakeholder’s confidence and end customer
satisfaction that also translates into financial perspectives and outcomes (Brigham &
Ehrhardt, 2013).
Many academic researchers used the BSC in their researches to quantify and empirically
evaluate their research (Rodriguez Bolivar et al., 2010). It has paved way for the BSC to
be used and implemented and as an evaluation tool by institutions and universities to
gauge performance indicators for the HE sector (Holmes et al., 2006). The growing
acceptance has enabled educational organisations and institutions to apply the BSC
within their organisational settings (Banchieri et al., 2011).
More than seventy per cent of the universities that were being interviewed in the United
States were found to be employing the BSC for most of their organisational
performance aspects, indicator monitoring, and evaluation (Klassen et al., 2010).
However, a significant aspect was that most of the referenced universities have not
completely utilised the BSC in all aspects of their business (Rodriguez Bolivar et al.,
2010). Most universities were using the BSC within the confinements of a certain
department or an individual division (Gapenski & Pink, 2003). The only other
universities and institutions that adhere to the BSC belong to the United Kingdom,
Canada, and Australia. However, there were a few universities identified that still apply
the BSC within their institutions (Klassen et al., 2010).

130
Research performance, educational performance, and management performance were
therefore identified as three very important indicators of performance that can be used
to evaluate the application of the BSC within the institutions (Tseng, 2010).
4.2.2. 3 The Basic Components of the BSC Model
For the success of the application of the BSC model, the following basic requirements
should be available (Abdul-Aziz, 2003):
A clear determination of strategic goals is considered the basic perspective in using
the BSC model.
The success of the use of the BSC model depends on the adoption of system input;
however, this standard uses the strategic management system, but not a
measurement system (i.e., integration of the four perspectives of the model in the
form of an integrated system).
Presence of motivation to choose the balanced performance standards is required
(i.e., there should be a response for environmental changes and pressure on
facilities, such as intensity of the competition, focusing on the customer and
industrial integration, etc.).
4.2.2. 4 The basic Rules for the Implementation of the BSC Model
Pim (1997) demonstrated that there are number of basic rules (golden rules) for the
implementation of the BSC model, and they can be presented as follows (Btanony,
2004):
The need to support senior management in applying the standards of the BSC model
with the necessity that this support must be clear to staff of the organisation.
It must be realised that there are no standard solutions that fit all organisations, due
to the differences between internal and external environmental factors that affect
these organisations.
It must be realised that the determination and understanding of the organisational
strategy is the starting point in the project of the BSC model. When the strategic
requirements for organisational success have been determined and understood,
standards are selected that are consistent with the strategy and reflect the extent of
the implementation of the specified goals.
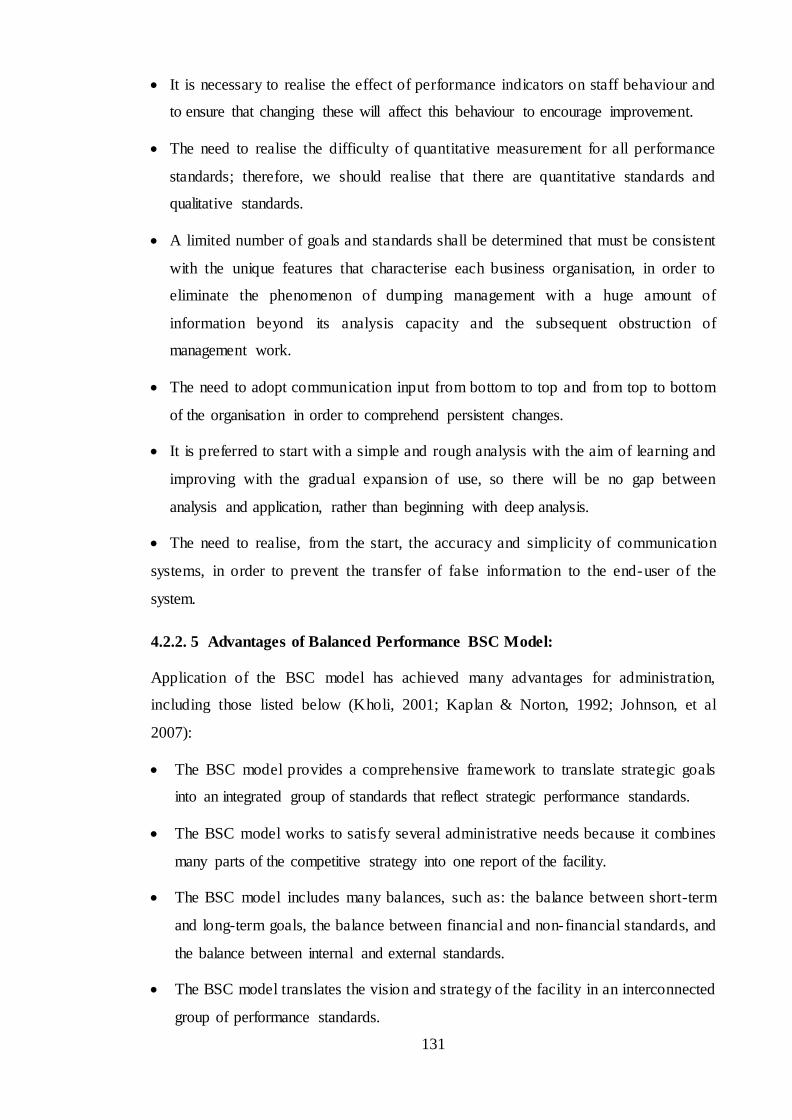
131
It is necessary to realise the effect of performance indicators on staff behaviour and
to ensure that changing these will affect this behaviour to encourage improvement.
The need to realise the difficulty of quantitative measurement for all performance
standards; therefore, we should realise that there are quantitative standards and
qualitative standards.
A limited number of goals and standards shall be determined that must be consistent
with the unique features that characterise each business organisation, in order to
eliminate the phenomenon of dumping management with a huge amount of
information beyond its analysis capacity and the subsequent obstruction of
management work.
The need to adopt communication input from bottom to top and from top to bottom
of the organisation in order to comprehend persistent changes.
It is preferred to start with a simple and rough analysis with the aim of learning and
improving with the gradual expansion of use, so there will be no gap between
analysis and application, rather than beginning with deep analysis.
The need to realise, from the start, the accuracy and simplicity of communication
systems, in order to prevent the transfer of false information to the end-user of the
system.
4.2.2. 5 Advantages of Balanced Performance BSC Model:
Application of the BSC model has achieved many advantages for administration,
including those listed below (Kholi, 2001; Kaplan & Norton, 1992; Johnson, et al
2007):
The BSC model provides a comprehensive framework to translate strategic goals
into an integrated group of standards that reflect strategic performance standards.
The BSC model works to satisfy several administrative needs because it combines
many parts of the competitive strategy into one report of the facility.
The BSC model includes many balances, such as: the balance between short-term
and long-term goals, the balance between financial and non-financial standards, and
the balance between internal and external standards.
The BSC model translates the vision and strategy of the facility in an interconnected
group of performance standards.

132
The BSC model helps in the effective management of human resources through
performance-based staff motivation.
The BSC model provides administration with a comprehensive picture of the
facility’s operations.
The BSC model enables the facility to manage the requirements of related parties,
such as shareholders, customers, employees, as well as operational processes.
The BSC improves traditional systems of oversight and accountability by including
non-financial facts.
The BSC model leads to reduction of the problems of profit in a sub-organisation,
where managers at senior management levels are forced to consider all important
operational standards together.
Figure 4. 1 BSC Model Source: (Kaplan & Norton, 1992)
4.3. 1 Application of the BSC among Universities
The concept of BSC principles has been widely adopted among researchers. Many
research studies have related the concept of implementation of the BSC to university
management (Stewart & Carpenter-Hubin, 2000), academic departments (Lawrence &
Sharma, 2002), university research (Pursglove & Simpson, 2000), university teaching

133
(Southern, 2002), and internal service providers within a university (Pursglove &
Simpson, 2000). These prove that the BSC concept has not only been used among
academic researchers, but the BSC will be more and more applied in various
universities as well.
According to a survey study (Rompho, 2008), which interviewed universities regarding
their implementation of the BSC, the researcher found that there were 22 universities
out of 29, which had been using the BSC. In fact, most of these particular universities
were located in the United States, while two were in the United Kingdom, another two
were in Australia, and only one was in Canada. Yet, not all the universities applied the
BSC to the entire university, as some implemented it for only a specific division. In
addition, from literature, the researcher also provides a list of those universities that
currently apply the BSC regarding the table below.
Table 4. 1 A list of universities that currently apply the Balanced Scorecard [Rompho, N. (2008).
University Country Unit that implements the
Balanced Scorecard
1. University of California at San Diego US Business Affairs 2. University of California at Davis US Division of Administration
3. University of California at Berkeley US Business and Administration Services Division
4. University of California at Los Angeles US Administrative Information System, Business v Administration Service
5. University of California at Irvine US Division of Business and administration Services
6. University of California at Santa Cruz US Business and Administration Service
7. University of California at San Francisco US Campus Auxiliary Services
8. California State University at Northridge US Administration and Finance 9. California State University at San Marcos US Finance and Administrative
Service
10.California State University at San Bernardino
US Administration and Finance
11. Florida International University US Entire university 12. University of Louisville US Entire university
13. University of Vermont US Entire university
14. University of Akron US Entire university 15. University of Virginia US Library
16. Fort Heys State University US Entire university 17. University of Florida US Library
18. University of Edinburgh UK Entire university 19. Glasgow Caledonian University UK Entire university
20. Deakin University Australia Library 21. Bond University Australia Entire university
22. Carleton University Canada Finance and Administration

134
Wang (2010) also came up with three significant performance indicators that focused on
the measurement of EP, research performance, and management performance, which
will be addressed accordingly.
4.3. 2 Application Impact of the KM Approach to Performance Excellence in
Universities
According to Kidwell and Johnson (2000), areas that enable institutions of HE to
achieve excellence in their performance through KM, can be classified into six areas:
scientific research, curricula and program development, student and graduate services,
strategic planning, administrative services, and functions of a faculty member. Here are
the most important benefits obtained in each of the above-mentioned areas of activity.
4.2.3 How Does Higher Education Measure Performance?
The impact of the BSC and the implementation of performance evaluation systems was
also appreciated by the Australian government (Tseng, 2010). Australia, therefore,
enabled performance management and evaluation systems within institutions and a few
of its universities (Rodriguez Bolivar et al., 2010).
To apply the BSC within universities and institutions, ten evaluating performance
indicators were identified that had a major role to play within the continuous
improvement implementation in the HE sector (Holmes et al., 2006). These included
aspects such as wherewithal, academic standing of the institution within the sector,
learner experiences, imparting of knowledge and education, finances, leadership, and
human resources and its development and grooming (Brigham & Ehrhardt, 2013). The
highlighted factors and indicators mentioned above had a significant impact on the
overall performance of an institution and were important indicators to gauge
management performance (Gapenski & Pink, 2003).
Indicators including performance progress, graduate full-time employment, salary,
student study time period, satisfaction, teaching, and other skills were highlighted by the
Australian government (Chen et al., 2009). They suggested that these aspects have a
massive impact when it comes to the performance indicators in the HE sector (Ferreira
& Otley, 2009).
135
4.2.4 Educational Performance Indicators
To establish an institute’s standing, performance on academic and educational grounds
is considered the classical and usual method of understanding and evaluating
performance measurements for education (Gaither, 1994). Educational performance
tends to encompass all the processes from the beginning to the process considered the
final yield (Harvey & Williams, 2010). The three indicators that are required to further
understand educational performance include the input, output, and performance
indicators (Houston, 2007). Input indicators evaluate the admission process as well as
the onboarding process of students for different degrees and graduate programs in all
disciplines and the required student- instructor ratio and other relevant facilities (Beard,
2009). The efficiency of knowledge communication, student satisfaction, contact hours,
and the drop-out and retention rates of students and even teachers can be used as the
measuring criteria for process indicators (Ali & Shastri, 2010). Finally, the extent of
employment and number of graduations measure the outcome indicators (Harvey &
Williams, 2010).
4.2.5 Research Performance Indicators
Ranking and rating an academic institute or university is carried out in comparison to
others in the education sector, and the research studies that are undertaken by
universities in the past and present improve the possibility of the institution attaining
better points (Beard, 2009). The research performance indicators that help gauge and
evaluate the system include research input, output, and outcome indicators (Secundo et
al., 2010).
Research input indicators help evaluate sponsor-based research, successful grants for
research, and partnerships to conduct research (Hazelkorn, 2011). On the other hand, the
large number of publications, doctorates being conferred, thriving entrepreneurs, as well
as the utilisation of academic property can be determined to be the output indicators of
research (Gaither, 1994). Finally, research outcome indicators are those that calculate
the research citation, membership of the research councils, ranking, and awards
(Secundo et al., 2010).
4.2.6 Management Performance Indicators
It is necessary that managers running any facet of universities and institutes within the
educational sector are on the same page as senior management regarding the goals and
achievements that are expected of the institute in the longer term strategically (Chen et
136
al., 2009). They should be well aware of the university’s future outlook, plans, and
development processes that they might be implementing (Gaither, 1994). This will
ensure that the managers on board would not take any wrong steps or incorrect
decisions at this level that would become and obstacle in the long-term planning and
future aspirations of the university (Ferreira & Otley, 2009). We broadly divide
management performance indicators into major divisions (i.e., finance performance and
human resources).
4.2.7 Applying the BSC to a Higher Education Institute (HEI)
The HE sector is one area of the public sector where the introduction of performance
measurements (PMs) poses dilemmas (Ulrich, 1998). Even though human resources are
the most valuable assets of HE institutions, many universities and colleges have
established procedures and rules for the administration of personnel; however, they do
not ‘manage’ their human resources (Shelley, 1999). There are various reasons for the
restricted presence of human resources management (HRM) in HE institutions. Higher
education institutions are described as loosely coupled systems (Weick, et al, 1976) or
organised anarchies (Cohen & March, 1974) with weak regulation and control
mechanisms; these are indicators that predict low PM impact. On the other hand, over
the last decade, we have seen a rising institutional autonomy, and HE institutions are
given more and more responsibility for managing their employees. Moreover, PM
principles in HE institutions encounter important implications for the management of
these organisations and have certainly altered the internal management of the HE
institutions and the character and everyday existence of the academic manager in far-
reaching ways (Deem, 2004).
Internal operational measures focus inward into the internal workings of universities on
those processes and activities that deliver critical services to both internal and external
customers. Internal business process measures address such items as productivity,
accuracy, cycle time, core competencies, and the effective use of people and
information resources. At the university level, quality of teaching, learning processes,
other facilities, and management information are key activities. In their simplest form,
these indicators characterise productivity in terms of ratios of resources to outputs.
4.2.8 The BSC in the Education Criteria for Performance Excellence
Although the concept of the BSC has been widely adopted in the business sector, the
education sector has not embraced the BSC concept widely, as indicated by the dearth
137
of published research on this topic. A thorough review of the literature yielded few
significant publications. For example, Cullen, Joyce, Hassall, and Broadbent (2003)
proposed that a BSC could be used in educational institutions for reinforcement of the
importance of managing rather than just monitoring performance. Sutherland (2000)
reported that the Rossier School of Education at the University of Southern California
adopted the BSC approach to assess its academic program and planning processes.
Also, Chang and Chow (1999) reported that responses in a survey of 69 accounting
department heads were generally supportive of the BSC’s applicability and benefits to
accounting programs.
4.2.9 Institutional Performance
Institutional performance is the common denominator for all the efforts exerted by
management and workers in the framework of institutions, so performance is an
essential concept for organisations in general. It is an almost totalitarian phenomenon
for all branches and fields of management knowledge. In spite of the large number of
research studies that dealt with the concept of performance, no consensus was reached
on a specific concept for this title due to the different standards and criter ia upon which
organisations and managers depend in the study of performance. Such standards are
closely linked to the objectives and directions that the organisation seeks to achieve
(Baserda, 2006, p. 123).
4.2. 9. 1 The nature of institutional performance
In accordance with Sinclair (Zairi, 1995), performance is “the achievement of
organizational goals by using resources efficiently and effectively.” Efficiency means
“to maximize results using less resource”. The effectiveness relates to the “achievement
of the desired objectives.”
Meer (1995, p. 21) defines institutional performance as the “accomplishment of
organizational goals by using resources efficiently and effectively, so it requires
focusing on the unique elements of the establishment on which it shall be assessed.
Unique elements include financial indicators, non-financial assets, and measuring the
tangible and intangible, including the broad-based institutional strategies and
operations, human resources and systems aspects of the performance.”
138
4.3 BSC, Four perspectives
4.3.1 Financial Perspective:
The first perspective in the BSC model for the measurement of strategic performance
includes a number of strategic standards, such as the standard of achieving fair profit,
which represents a strategic goal most organisations are seeking to achieve, the standard
of balanced growth of revenue and mix of investment activities, the standard of cost
minimisation (in order to achieve maximum efficiency), standard of maximising the
profit of shareholders and depositors through the achievement of real revenue on the
investment, and the standard of achieving added economic value (Kaplan & Norton,
1996). This perspective includes the tangible outcomes in conventional financial terms.
4.3. 1.1 Finance Performance
One of the major needs of any university is the constant supply of capital investment
(Gapenski & Pink, 2003). Thus, the amount of financial resources tends to propel the
university’s academic and research performance (Brigham & Ehrhardt, 2013). In this
regard, financial position indicators and financial resource indicators become absolutely
crucial.
Financial position indicators tend to focus more on financial operations. For instance,
the focus is on financial ratios, percentages, deficits or surpluses, and the nature and
duration of the financing employed (Gapenski & Pink, 2003). Managers tend to
appreciate long-term financing and the annual number of investments in infrastructure
(Cornett & Saunders, 2003).
Financial resource indicators, on the other hand, evaluate cost recovery and income
from research, tuition fees, service charges, and shares in third party funded research
(Brigham & Ehrhardt, 2013).
The amount of financial resources can significantly supply the capital investment in a
university to increase the university’s academic performance. The two critical financial
indicators are financial resource indicators and financial position indicators (Kaplan &
Norton, 1996).
Financial resource indicators measure beyond the amount of research income, research
indirect cost recovery, share in third-party funding, share in governmental funding, and
income from tuition fees and others services (Cornett & Saunders, 2003).
139
The measurement of these financial indicators is based upon a number of factors,
including the operation of cost recovery, surplus or deficit as per cent of income, current
ratio, and debt ratio as a short-term financial position. Long-term financial positions are
an indication of a manager’s satisfaction and an indication of whether the manager has
satisfied the financial strategies and the annual amount of investment in infrastructures.
Based on the above, the financial position indicators measure the operation of cost
recovery, surplus or deficit as a percentage of income, current ratio, and debt ratio as a
short-term financial position. Long-term financial positions are an indication of a
manager’s satisfaction of financial strategies and the annual amount of investment in
infrastructures.
4.3.2 Human Resources
The main purpose of these indicators is to pay heed to the staff, teachers, instructors,
lecturers, and all those that are involved in performance measurement. Human resources
are gauged by the human capital indicators and human resources policies and practices
indicators (Storey, 2001).
Human capital indicators, such as staff recruitment and the percentage of successfully
carried out processes, determine the human capital indicator along with the employee’s
age distribution and diversity among the employees on board (Gatewood et al., 2010).
Human resource policy and practice indicators are more related to the operation of the
human resource department for employee motivation and training that help employees
develop and become more productive from the university’s perspective (Wright &
McMahan, 1992).
Based on the above, the employees in an institution, such as administrative staff or
lecturers, drive university performance. There are two significant terms in measuring
human resource performance. Human capital indicators measure performance using the
percentage of success in recruitment, staff skill, staff diversity, and employee age
distribution. Human resources policy and practice indicators Measure performance
based upon on training and development and employee motivation.
4.3.3 Customer Perspective
The second perspective in the BSC model includes the standard of the fair market share
and consists of elements that balance between available organisational capacity and
targeted market share and the acquisition of new customers, considering the goal of
achieving a fair profit. As for retaining exiting customers, it aims to apply standards that
140
meet the physical and psychological needs of the partners. Regarding customers' profit,
it contains the standards of fair profit and customer satisfaction through the achievement
of psychological satisfaction and fair material profit (Kaplan & Norton, 1996).
4.3.3. 1 Customers in HE
In fact, there is no specific definition of the HE customer (Michael et al., 1997;
Motwani & Kumar, 1997; Davies et al., 2001; Sirvanci, 2004), although Michael et al.
(1997, p. 109) put forward their ideas as follows:
“the customer of Higher Education is the student as a customer of knowledge and
service, the future employer or graduate school as customer of the student product, and
society as a whole as taxpayers and beneficiaries of the education operations of the
institutions”.
Some authors (Claver et al., 2003) use the term customer management, which includes
activities aimed at enhancing customer satisfaction. Others use the term customer-
centric (Siddiqui & Rahman, 2006). Essential to the concept of TQM is a customer-
oriented culture (Motwani & Kumar, 1997) in which the customer him/herself is
involved in designing and assessing products and services (Siddiqui & Rahman, 2006).
4.3.4 Internal Operation Processes Perspective
The third perspective in the BSC model includes a standard of achieving production
efficiency aiming to achieve a target amount for less time or less cost and quality. It
calculates the optimal ratio of acceptable quality in the units and services produced or
the lowest percentage of allowed defects (Kaplan & Norton, 1996, 2001).
The BSC has proven effective in resolving the inability of traditional management
systems to link long-term strategy to short-term actions. Most importantly, performance
measures assist the establishment and support of a continuous process of self-evaluation
and correction at all levels of an organisation.
Great customer performance is the result of processes, decisions, and actions that
managers must focus on in order to satisfy customer needs (Kaplan & Norton,1992).
According to Kaplan and Norton (2000), in the internal process perspective the
organisation determines how it will achieve the value proposition for its customers and
the productivity improvements to reach its financial objectives in order to satisfy its
shareholders. This perspective measures the business processes that have the greatest
impact on customer satisfaction. It measures factors like quality and employee skills.
141
Here, companies should identify and measure their core competencies and technologies
critical to ensuring market leadership (Kaplan & Norton, 1992). Measures that can
represent this perspective are inventory turnover, delivery, productivity, cycle times,
and research and development expenses (Niven, 2006).
4.3.5 Growth and Learning Perspective:
The fourth perspective in the BSC model includes the following criteria: level of
individual ability, provision of appropriate academic skills for individuals, individual
creativity applied in administration, which requires the availability of superior mental
abilities to devise solutions, employee satisfaction, employee profitability based on the
ability to deliver added economic value, and employee retention, which emphas ises the
standards of individual efficiency and effectiveness (Davis, 1996).
The learning and growth perspective identifies the needed infrastructure to support the
other three perspectives. Niven (2006) argued that measures of the learning and growth
perspective are the enablers of the other perspectives and represent the foundation of the
BSC. According to Kaplan and Norton (1992), continual improvements and the ability
to learn and introduce new products and services are the preconditions to survival,
expansion in the global marketplace, and the increase in the company’s value.
Knowledge, employee skills and satisfaction, and the availability of information and
adequate tools are frequently the source of growth; therefore, they are the most common
measures of this perspective (Niven, 2006).
The learning and growth perspective determines the skills and processes that can drive a
university to develop significant internal processes. This perspective area can feed into
internal processes to motivate stakeholder satisfaction and eventually, financial
outcomes (Pingle & Natashaa, 2011).
4.3.6 Application Impact of TQM Approach to Performance Excellence in
Universities
Measures in HEIs are vital to their development and serve as indicators of performance
(Tai et al., 2008, pp. 325-326). The quality of academic performance, such as teaching,
can be measured by student perceptions and satisfaction (Owlia & Aspinwall, 1996;
Petruzzellis et al., 2006). In this respect, TQM is a useful tool to achieve continuous
improvement in educational institutions (Kanji & Tambi, 1999). Thus, the quality of the
142
academic process should be complemented with the needs of industry and the
evaluation of the academic programme (Hussein & Aboud 2008, p. 260).
Although the researcher has adopted the Kaplan and Norton model for measuring
organisational performance, it was difficult to obtain the financial data from the relevant
universities; therefore, this was collected indirectly from respondents via the
questionnaire. Accoding to Alhakem, L. A., Zwain, A. A., & Alkhafaji, H. J.
(2009) perspective of internal processes, customer (stakeholder) perspective, and
learning and growth perspective were the endogenous variables.
4.4 Summary
The current chapter focused on highlighting the main issues related to educational
performance. It provides a general background to the concept of performance and its
measurements. Generally, performance is one of the main issues that reflect the
organisation’s ability to achieve efficiency and effectiveness and the appropriate uses of
its available human and material resources to achieve its goals. Performance measures
success and is an indicator upon which many administrative decisions can be made.
Furthermore, this chapter has reviewed different areas of performance in light of the
many complex and unique standards related to higher education. In this respect,
educational performance provides justification for the suitability and sustainability of an
organisation. However, educational organisations differ in their performance as each
one has its own strategic goal. Nonetheless, the most common model for measuring
performance is the BSC model. This model was reviewed in this chapter in order to
identify the most common perspectives that are associated with the assessment of
performance. The next chapter will deal with the research methodology.

143
CHAPTER FIVE
RESEARCH METHODOLOGY
5. 1 Introduction
The previous chapters focused on the general introduction and background related to the
framework of the current project. This chapter focuses on the research methodology
adopted in the current research. It includes discussion on the concept of research
methodology, its design, and the analysis of data. It also involves setting up the
questionnaire, selecting a sample population, and collecting the data related to KM and
TQM in both public and private universities in Jordan. Both KM and TQM issues play
significant roles in directing the educational process and subsequently quality
educational outcomes. The general framework of the current chapter includes the
following sections:
Philosophical Assumption on Methodology and Methods.
Research Design and Methodology.
Population and Sample
Measurement and Instrumentation
Data Analysis
5. 2 Philosophical Assumption and Concept of Social Research
Research philosophy is considered a vital element for setting up the perspectives of
research, developing new knowledge, and investigating the nature of that knowledge
(Holden and Lynch, 2004). In addition, research philosophy refers to scientific practices
based on presumptions about the cosmos and the nature of knowledge (Collis &
Hussey, 2009).The presumptions of the current research were associated with the KM
and TQM in relation to educational performance in Jordanian public and private
universities. Therefore, it is necessary to understand the concept of the research choice
to fill a gap or generate new knowledge that can contribute to the KM and TQM field.
Specifically, the new knowledge is related to investigate the integration between KM
and TQM and to answer the question about how private educational organisations
consider KM and TQM and if public universities are different from private universities.
Although both public and private universities are under the Ministry of Higher
Education rules and regulations, it is still important to understand the nature of KM and
TQM in both types of universities. So a number of theoretical assumptions were
144
adopted to grasp the nature of the current research problem as well as the
methodological strategy. As indicated in Chapter 1, the research background on KM
and TQM is associated with literature and the design of the current research. Literature
helps develop research focus and its approach for deriving the required data for analysis
and discussion (Labaree, 2013). Literature has highlighted two research philosophies or
paradigms to include positivism and phenomethalogy (Collis and Hussey, 2003). These
depend on the assumptions made related to the research. In this respect, Hughes (1994)
listed the main character of research assumption to include matter, aspects as mind,
reason, truth, nature, and proof of knowledge.
The research in this study is mainly descriptive and interpretive and focuses on different
perspectives related to KM and TQM and how respondents in the two types of
universities perceive KM and TQM-related issues. The interpretation of the results is
analysed by statistical methods to evaluate respondent perceptions quantitatively.
Therefore, the research philosophy of this study was not lead methodologically but was
conducted by the methodological choice that is suitable for the current study.
Philosophically, social science research is associated with two concepts: the positivist
and phenomenological. Social research is directly associated with the social context,
reflecting the interaction between ideas regarding the social paradigm and the collected
data on it (Bryman, 2012). Other methodologists indicated that social research involves
a dialogue between ideas and evidence (Ragin, 1994). According to Ragin (1994), ideas
help social researchers to make sense of evidence, and researchers use evidence to
extend, revise, and test ideas. The end result of this dialogue is a representation of social
life-evidence that has been shaped and reshaped by ideas presented along with the
thinking that guided the construction of the representation (Ragin, 1994, p. 55). In
addition, social research can be influenced by various researcher perspectives, including
ability, assumption, aim, interest, values, and ambitions (Collins & Hussey 2009). The
concept of social studies involves various interrelated perceptions, including ontology,
epistemology, and theory. Thus, method cannot be separated when conducting research
(Hesse-Biber & Leavy, 2006).
In addition, the philosophical suppositions of social research are associated with
positivist, interpretive, and critical approaches. In this respect, identifying, measuring,
evaluating, and providing rational explanations for phenomena are classified as
positivist approaches (Lather, 2006). The concept of a positivist approach assumes that
social phenomena are like objects in natural science. The purpose of a positivist

145
approach is to test theory and encourage better understanding of phenomena (Myers,
1997). In addition, Hammersley (2007) indicated that causes determine effects. Thus,
this approach aims to contribute to directly observing, quantitatively measuring, and
objectively predicting relationships between variables. As such, the positivist approach
can be applied to the current research to quantitatively measure the perceptions of
academic staff on EP in relation to the integration of KM and TQM. Thus, the
positivism approach should involve a defined methodology for ensuring reliability and
internal and external validity (Parr & Shanks, 2000). The concept of interpretive
research places emphasis on the element of social constructions. These elements involve
the awareness, shared meaning, and language needed to understand the phenomenon of
social research. This critical concept in social research highlights the desire for
improving human conditions. Therefore, the third concept focuses on human behaviour
and assumes individuals are different from each other (Parr & Shanks, 2000).
The research philosophy that governs the current research is associated with the
positivist paradigm since it refers to the subjective aspects of human activity by
focusing on the substance rather than the measurement of the social phenomena
(Johnston, 1986). This notion is managed by the quantitative approach for collecting
data. In addition, this school of thought also believes that a commitment to quantitative
precision and accumulation of facts is the only method to gain a closer estimation of a
reality that exists independent of human discernment (Rubin et al., 1996). The research
value of undertaking this research is primarily associated with the originality of this
research and an obvious lack of previous research on this subject (Creswell, 2013).
Practically, it is important to differentiate between methodology and method. Although
both terms are interrelated, the research methodology is the utilisation of approaches to
inquiring into specific matters, while methods are techniques used to gather data (Grix,
2002). According to Blaxter et al. (2010), methodology refers to the philosophical
meaning of collecting the data, while method denotes the technique of collecting the
data. In addition, other researchers have expanded the concept of research methodology
to include five issues: where, why, what the collected data is, and how data are collected
and analysed (Collis & Hussey, 2009). These issues reflect the notion related to
identifying something unidentified and making it known through collecting and
analysing data (Gall et al., 2007). In order to find the unknown, a research approach that
is most suitable for the study must be specified. In the current research, the quantitative
approach was used. This approach is more suitable to this study as it involves an online

146
questionnaire. Therefore, the method for collecting data was through an online
questionnaire that was sent to participants’ email addresses. In this respect, online
Survey Creator Software was used. In contrast, the other approach (qualitative) was
thought to avoid biased opinions. These two approaches are commonly used in social
research, either individually or combined (Bell, 2005; Blaxter et al., 2010).
The rest of this chapter provides the design, approach, concept and methodology that
involves looking for and collecting data that helps to translate the philosophy into actual
practice.
5. 3 Research Design and Methodology
Research design is an important part of how research components are planned and
integrated in a coherent perspective and logical method (Kirshenblatt-Gimblett, 2006).
It involves making various decisions regarding conducting the research problem and the
level of analysis that is required to effectively answer the research question and justify
the hypotheses (Sekaran & Bougie 2003; McDaniel & Gates, 1999). The previous
chapters discussed the main issues related to stipulating the main research problems and
justified their choice. Subsequently, different hypotheses were explicitly specified. In
addition, the background to the research problem was supported by various literature.
These initial steps in designing the current research are followed by other steps, which
are related to the selection and design techniques for data collection and statistical
analysis. Therefore, the following sections address the steps that were adopted in the
design of the current research.
5. 3. 1 Research Approach
This research adopts the quantitative approach using the questionnaire technique. The
objective of the quantitative research is closely related to the concept of positivism, as
the research requires the hypotheses to be tested statistically. Therefore, the quantitative
data can be obtained by the questionnaire technique. As such, the different components
of the questionnaire should be examined to observe how respondents perceived various
issues related to the current research problem. The questionnaire is based on numerical
data collection. The choice for the questionnaire is described and discussed in the next
sections.
147
5. 3. 2 Rationale of the Research Technique
Social methodologists have devised different techniques for collecting data in social
research. They identified these techniques according to two research approaches, the
quantitative and qualitative (Bell, 2005; Blaxter et al., 2010; Collins & Hussey, 2009).
The main difference between these two approaches is the measurements employed in
collecting and analysing the data. The quantitative research emphasises quantification in
the collection and analysis of data. In contrast, the qualitative approach emphasises
words rather than numerical data in data collection and analysis. In this context, the
quantitative research involves a deductive approach and the qualitative research entails
an inductive approach in which the accent is placed on testing or generation of theories,
respectively. As indicated above, the quantitative approach was adopted in the current
research. The purpose of this technique is to collect data for investigating the integration
between KM and TQM and how they affect the EP in HE.
Generally, the questionnaire technique is an effective means of gathering information
and is frequently used by many researchers for quantitative data collection (Blaxter,
2010). Therefore, it has various advantages, including reliability and anonymity, which
encourage participants to respond and answer questions. In addition, the questionnaire
technique is more economical in terms of time and money in obtaining information
(Bell, 2005; Blaxter, 2010). Furthermore, it is faster and generates high-retained rates of
data compared to the interview technique. Another advantage in using the questionnaire
is that it can reach large numbers of respondents regardless of the distance. Thus, the
administration of the questionnaire is much easier to approach compared to other social
research techniques, including interviews.
With the fast expansion of software, it is efficient to convey the questionnaire digitally
to a large number of targeted contributors. In this respect, a number of online
questionnaire software and online survey services have been developed to aid
researchers in administering their questionnaire to the sample population. Thus, the
Internet-based survey can save time and reduce research costs despite being separated
by geographic distances (Wright, 2005). There are different methods to invite
participants of a community of interest, including email or posting the questionnaire
directly online through different survey providers, including Smart Survey, Web Survey
Creator, Research Online, and eSurvey Creator Software (Andrews et al., 2003). These
incentive means of collecting data can provide access to samples beyond the
researcher’s reach and access a database of participants for full analysis.
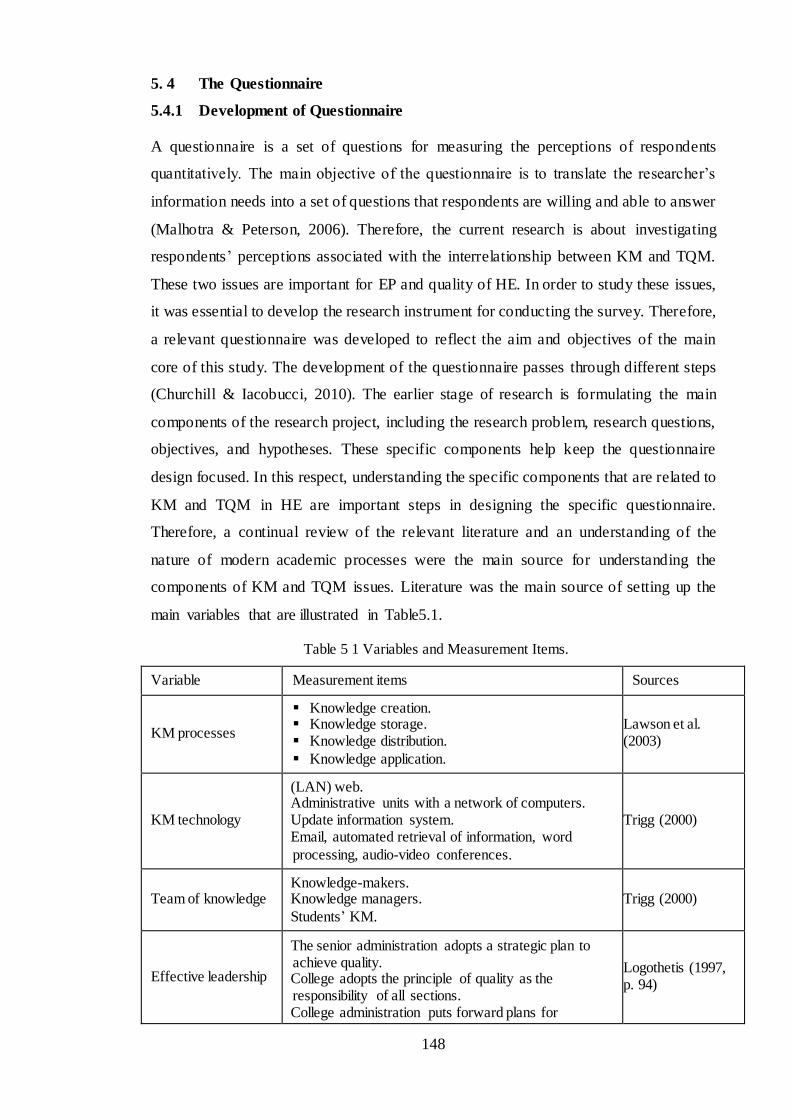
148
5. 4 The Questionnaire
5.4.1 Development of Questionnaire
A questionnaire is a set of questions for measuring the perceptions of respondents
quantitatively. The main objective of the questionnaire is to translate the researcher’s
information needs into a set of questions that respondents are willing and able to answer
(Malhotra & Peterson, 2006). Therefore, the current research is about investigating
respondents’ perceptions associated with the interrelationship between KM and TQM.
These two issues are important for EP and quality of HE. In order to study these issues,
it was essential to develop the research instrument for conducting the survey. Therefore,
a relevant questionnaire was developed to reflect the aim and objectives of the main
core of this study. The development of the questionnaire passes through different steps
(Churchill & Iacobucci, 2010). The earlier stage of research is formulating the main
components of the research project, including the research problem, research questions,
objectives, and hypotheses. These specific components help keep the questionnaire
design focused. In this respect, understanding the specific components that are related to
KM and TQM in HE are important steps in designing the specific questionnaire.
Therefore, a continual review of the relevant literature and an understanding of the
nature of modern academic processes were the main source for understanding the
components of KM and TQM issues. Literature was the main source of setting up the
main variables that are illustrated in Table5.1.
Table 5 1 Variables and Measurement Items.
Variable Measurement items Sources
KM processes
Knowledge creation. Knowledge storage. Knowledge distribution.
Knowledge application.
Lawson et al. (2003)
KM technology
(LAN) web. Administrative units with a network of computers. Update information system. Email, automated retrieval of information, word
processing, audio-video conferences.
Trigg (2000)
Team of knowledge Knowledge-makers. Knowledge managers.
Students’ KM.
Trigg (2000)
Effective leadership
The senior administration adopts a strategic plan to achieve quality.
College adopts the principle of quality as the responsibility of all sections.
College administration puts forward plans for
Logothetis (1997, p. 94)

149
Variable Measurement items Sources
continuous improvement and encouragement of employees.
Communication channels to the market place should be available.
The college has competent research and development units to determine the needs and desires of the market place.
Higher administrative decisions are made on the basis of facts.
Higher administration makes a radical change to make
the quality a part of the organisation’s system.
Continuous Improvement
There are teams equipped with the necessary supplies to improve quality.
There is a specific and a clear-cut program to
avoid mistakes.
There are statistical methods and tools to test and measure the quality of graduates.
Devise ways and means continuously to help improve the quality of EP.
Workers receive training to be aware of the opportunities and improvement targets.
Dahlgaard et al. (1998) and Seddon (1997)
Staff Involved
Faculty members partake in making strategic decisions regarding quality.
Faculty and staff are entitled to resolve major problems related to graduates.
Efficient system to motivate individuals. The system rewards persons showing creativity. Facilitate communication. Efficient programs that help faculty members get
acquainted with the objectives and mechanism.
Partlow (1996)
Internal Processes Perspective:
Continuous increase in the productivity of faculty members.
Continuous increase in the rate of the production capacity of the administration.
Continuous increase in the rate of use of the educational technology.
Continuous increase in the rate of development curriculum and educational programs.
Continuous increase in the rate of development
for educational environment.
Kaplan and Norton (1992)
Customer (stakeholder) Perspective
Internal stakeholders. External stakeholders (marketplace).
Kaplan and Norton (1992), Williams (1999), Dobbin and Fowler (1997)
Learn and grow Perspective
Technological innovation. Administrative innovation.
Additional creativity.
Kaplan and Norton (1992) Hill and Jones (2001)
Total number of statements = 90
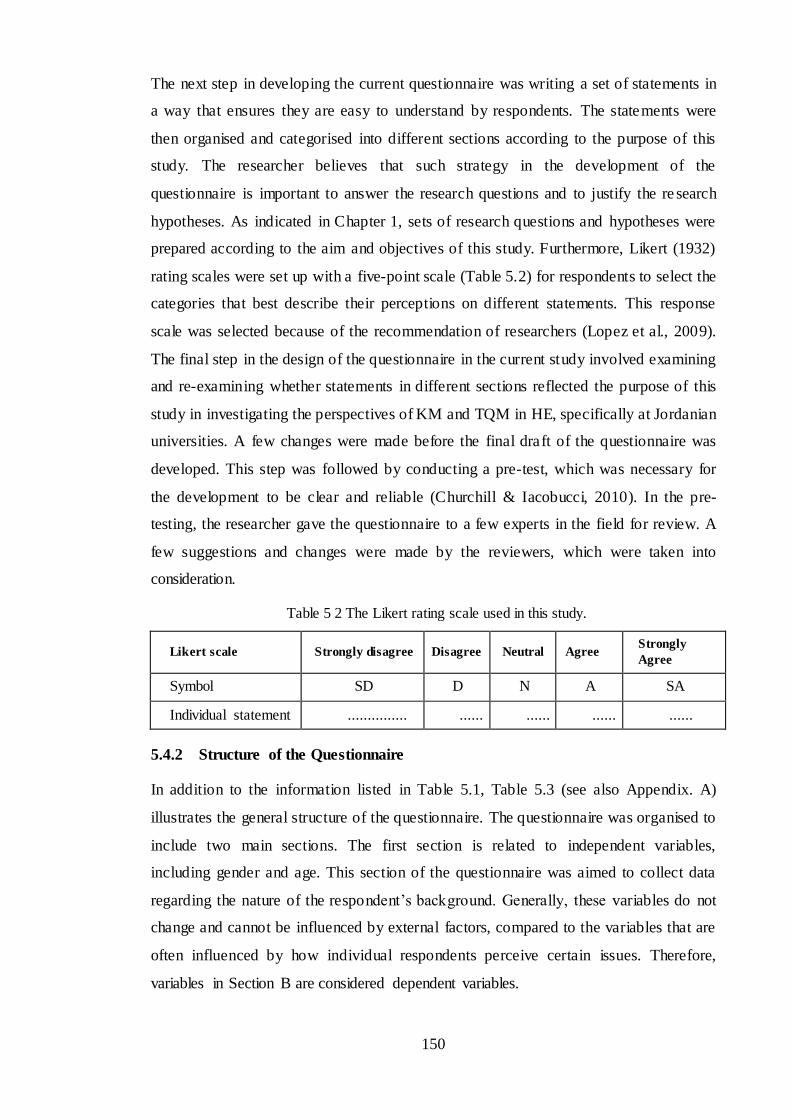
150
The next step in developing the current questionnaire was writing a set of statements in
a way that ensures they are easy to understand by respondents. The statements were
then organised and categorised into different sections according to the purpose of this
study. The researcher believes that such strategy in the development of the
questionnaire is important to answer the research questions and to justify the re search
hypotheses. As indicated in Chapter 1, sets of research questions and hypotheses were
prepared according to the aim and objectives of this study. Furthermore, Likert (1932)
rating scales were set up with a five-point scale (Table 5.2) for respondents to select the
categories that best describe their perceptions on different statements. This response
scale was selected because of the recommendation of researchers (Lopez et al., 2009).
The final step in the design of the questionnaire in the current study involved examining
and re-examining whether statements in different sections reflected the purpose of this
study in investigating the perspectives of KM and TQM in HE, specifically at Jordanian
universities. A few changes were made before the final draft of the questionnaire was
developed. This step was followed by conducting a pre-test, which was necessary for
the development to be clear and reliable (Churchill & Iacobucci, 2010). In the pre-
testing, the researcher gave the questionnaire to a few experts in the field for review. A
few suggestions and changes were made by the reviewers, which were taken into
consideration.
Table 5 2 The Likert rating scale used in this study.
Likert scale Strongly disagree Disagree Neutral Agree Strongly
Agree
Symbol SD D N A SA
Individual statement ............... ...... ...... ...... ......
5.4.2 Structure of the Questionnaire
In addition to the information listed in Table 5.1, Table 5.3 (see also Appendix. A)
illustrates the general structure of the questionnaire. The questionnaire was organised to
include two main sections. The first section is related to independent variables,
including gender and age. This section of the questionnaire was aimed to collect data
regarding the nature of the respondent’s background. Generally, these variables do not
change and cannot be influenced by external factors, compared to the variables that are
often influenced by how individual respondents perceive certain issues. Therefore,
variables in Section B are considered dependent variables.

151
The structure of Section B includes nine sub-sections (B-1 to B-9). Each subsection
deals with certain issues related to both KM and TQM. In addition, each sub-section
contains a different number of statements, which form the main core for collecting the
data. The analysis of the collected data gives an insight into how respondents perceive
KM and TQM–related issues and how the perception of respondents can impact the
higher educational process at Jordanian universities.
Table 5 3 The general structure of the questionnaire
Category Content Section A: Demographic information
Gender, age group, degree, academic ranking, how long you have been working in this field, current position, university affiliation
Section B: Independent variables or the categorised statements related to the integration of KM and TQM and their impact on EP
Dependent variables Number of statements
B-1. KM processes
I Knowledge Creation: university administration depends on the following to create knowledge.
5
II Storing Knowledge: university administration depends on the following to store knowledge.
4
III Knowledge Distribution: university administration depends on the following to distribute the knowledge.
6
IV Application of knowledge: to apply the knowledge, the university administration should
5
B-2. KM Technology 8
B-3. Knowledge-related variables
I Knowledge Team 3
II. Knowledge managers: university knowledge managers carry out the following
4
III. Students' KM 5
B-4. Effective Leadership (TQM Processes) 7 B-5. Continuous Improvement 5
B-6. Staff Involvement 8 B-7. Internal Processes Perspective 5
B-8. Stakeholder related variables
I Stakeholder Perspective 6
II. External Stakeholders 4
B-9. Learn and grow perspective
I. Technological Innovation 3
II. Administrative Innovation 3 III. Additional Creativity 2
Total 90
Therefore, the structure and flow of topics are an essential part of the questionnaire
structure to make it friendlier to the respondents. Well-mannered structure contributes to
making the questionnaire easy for respondents to give the necessary information and for

152
the researcher to collect accurate and efficient data. In this respect, both the logical
nature and clarity of the statements often encourage respondents to complete the
questionnaire.
5.4.3 Piloting the Questionnaire
Piloting the questionnaire is an important step, which comes after the first draft. It is
often suggested to have other opinions about how to design a sound questionnaire. The
purpose of presenting the questionnaire to be pre-assessed is to check the wording, the
order of statements, whether they are understood by respondents, whether some
statements require elimination, and whether the questionnaire is adequate. Therefore, a
copy of the first draft was distributed to ten academic staff for review to identify any
mistakes that needed correction. They were asked to give comments and make changes
to the first draft of the questionnaire. The researcher emphasised the clearness of the
statements, the structure of the questionnaire, and that the content should be closely
related to the main subject. Responses from the proofreading of the questionnaire
resulted in a few comments that were mainly related to the statements it contained. The
comments recommended changing the concept of a few statements. However, as the
content of the questionnaire was derived from literature (Table 5.4), comments related
to the concepts were not considered. However, some contextual changes were made,
especially those that improved the statements to make them clearer.
The next step in the development of the current questionnaire was to send it to the
supervisor for proofreading to achieve the desired results. Professor Les Ruddock
suggested some changes related to the soundness of the questionnaire and eliminated
some statements. Thus, the final draft of the questionnaire was downloaded online and
emails were sent to the sample population.
Table 5 4 Jordanian universities that were involved in the current study..
Public Universities Websites
1. The University of Jordan www.ju.edu.jo
2. Yarmouk University www.yu.edu.jo
3. Mutah University www.mutah.edu.jo
4. Jordan University of Science & Technology www.just.edu.jo
5. The Hashemite University www.hu.edu.jo
6. AL al-Bayt University www.aabu.edu.jo
7. AL-Balqa Applied University www.bau.edu.jo
8. AL-Hussein Bin Talal University www.ahu.edu.jo
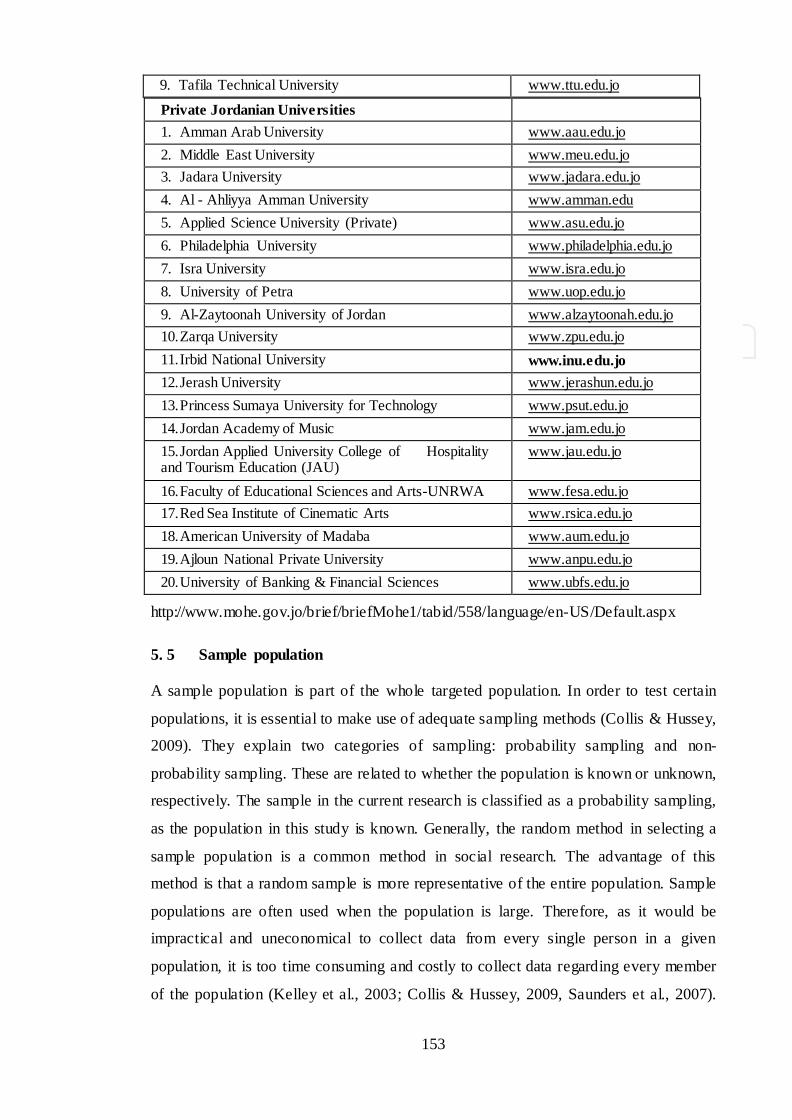
153
9. Tafila Technical University www.ttu.edu.jo
Private Jordanian Universities
1. Amman Arab University www.aau.edu.jo
2. Middle East University www.meu.edu.jo
3. Jadara University www.jadara.edu.jo
4. Al - Ahliyya Amman University www.amman.edu
5. Applied Science University (Private) www.asu.edu.jo
6. Philadelphia University www.philadelphia.edu.jo
7. Isra University www.isra.edu.jo
8. University of Petra www.uop.edu.jo
9. Al-Zaytoonah University of Jordan www.alzaytoonah.edu.jo
10. Zarqa University www.zpu.edu.jo
11. Irbid National University www.inu.edu.jo
12. Jerash University www.jerashun.edu.jo
13. Princess Sumaya University for Technology www.psut.edu.jo
14. Jordan Academy of Music www.jam.edu.jo
15. Jordan Applied University College of Hospitality and Tourism Education (JAU)
www.jau.edu.jo
16. Faculty of Educational Sciences and Arts-UNRWA www.fesa.edu.jo
17. Red Sea Institute of Cinematic Arts www.rsica.edu.jo
18. American University of Madaba www.aum.edu.jo
19. Ajloun National Private University www.anpu.edu.jo
20. University of Banking & Financial Sciences www.ubfs.edu.jo
http://www.mohe.gov.jo/brief/briefMohe1/tabid/558/language/en-US/Default.aspx
5. 5 Sample population
A sample population is part of the whole targeted population. In order to test certain
populations, it is essential to make use of adequate sampling methods (Collis & Hussey,
2009). They explain two categories of sampling: probability sampling and non-
probability sampling. These are related to whether the population is known or unknown,
respectively. The sample in the current research is classified as a probability sampling,
as the population in this study is known. Generally, the random method in selecting a
sample population is a common method in social research. The advantage of this
method is that a random sample is more representative of the entire population. Sample
populations are often used when the population is large. Therefore, as it would be
impractical and uneconomical to collect data from every single person in a given
population, it is too time consuming and costly to collect data regarding every member
of the population (Kelley et al., 2003; Collis & Hussey, 2009, Saunders et al., 2007).
154
However, when the total population is small, it is normal to collect data regarding each
member of the population.
In the current research, the population size of this research was 500 members (academic
staff, deans, and heads of departments) at both public and private universities in Jordan
(Table 5.1). The list of the population members to be surveyed (sampling frame) was
up-to-date and was obtained from a reliable source to enhance the external validity of
the survey. The method by which the sample was selected from a sampling frame is
integral to the external validity of the survey. The sample must be representative of the
larger population to obtain a composite profile of the population (Kelley et al., 2003).
Response rates are a potential source of bias. The results from a survey with large non-
responses could be misleading and only representative of those that replied. It is unwise
to define a level above which a response rate is acceptable as this depends on many
local factors; however, an achievable and acceptable rate is 65% for self-completion
postal questionnaires (Gilbert, 2008). The survey method was considered suitable for
this study and the justification was elaborated in Section 3.7. The survey was targeted at
the key players in staff in HE universities of Jordan. In general, every survey is involved
in the issue of sampling. This is to use a range of techniques, either probability sampling
or non-probability sampling, which enables the researcher to collect data from a sub-
group, rather than a whole target population (Saunders et al., 2007). This research is
concerned with the integration of KM and TQM and its impact on the EP in Jordanian
HE, although the target sample must be as representative as possible of the key players
in Jordanian HE. More importantly, with respect to the survey methodology, a small
sample size is suitable for this research to be as generalizable and representative as
possible.
5. 6 Data Collection
The research problems of the study should be constructed in order to choose a good data
collection method (Tull & Hawkins, 1987). As such, in this section the choices made
will be discussed considering the particular problems inspected and consequently
examined at each level.
5. 7 Survey Research
As indicated above, the quantitative survey method is widely used in social research,
which was adopted here for descriptive and causal research designs. According to Hair
et al. (2010), survey research is distinctive from other types of methods because data
155
can be collected in a large quantity from the specified sample of Jordanian university
employees using a questionnaire. Moreover, two other situations attest to the
importance and appropriateness of this design. The first is when the variable(s) of
interest cannot be controlled by the researchers, and the second is when the respondents
of the study cannot be allocated, assigned, and controlled in the way that it can be done
in experimental studies.
Furthermore, the questionnaire method is considered appropriate for the present study
because through this method responses can be acquired from the respondents more
accurately and completely (Malhotra, and Krosnick 2007). Therefore, survey research is
considered best suitable for the present study in order to effectively examine the
research hypotheses and questions.
5. 8 Reliability and Validity of the Questionnaire
To avoid the possibility of obtaining misleading results and to increase the accuracy of
the result findings, close attention is needed in selecting valid and reliable research
instruments (Saunders et al., 2007).
5. 8. 1 Reliability
Consistent and similar results obtained by different researchers would be an important
indicator of reliability (Saunders et al., 2007). In addition to rapid change in the area of
the integration of KM and TQM and its impact on EP, time and cost constraints might
cause some difficulty in assessing the reliability of the same criteria. In order to avoid
that, adequate effort and attention at each stage of planning, designing, conducting, and
analysis would ensure the reliability of the research. Saunders et al. (2007) have
indicated that it is likely the validity and reliability of collected data will be increased by
a pre-test. Therefore, a pre-test has been conducted for this research.
5. 8. 2 Testing Reliability
Reliability is defined as an assessment of the reproducibility and consistency of an
instrument. For self-completion questionnaires, two aspects of reliability should be
examined.
Test-retest reliability was completed by requesting individuals to complete the
questionnaire on two separate occasions approximately two to three weeks apart,
assuming that their circumstances will not have changed in the interim. The two sets of
responses can then be compared statistically using weighted Kappa (Altman, 1991) for
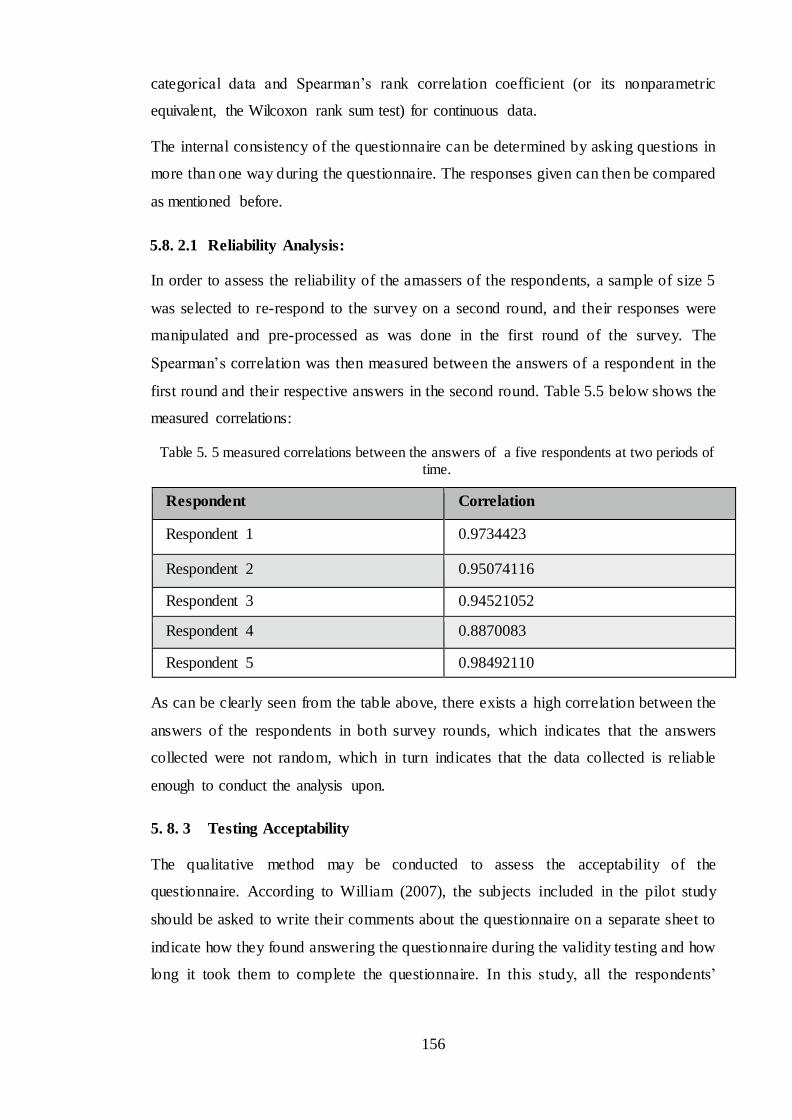
156
categorical data and Spearman’s rank correlation coefficient (or its nonparametric
equivalent, the Wilcoxon rank sum test) for continuous data.
The internal consistency of the questionnaire can be determined by asking questions in
more than one way during the questionnaire. The responses given can then be compared
as mentioned before.
5.8. 2.1 Reliability Analysis:
In order to assess the reliability of the amassers of the respondents, a sample of size 5
was selected to re-respond to the survey on a second round, and their responses were
manipulated and pre-processed as was done in the first round of the survey. The
Spearman’s correlation was then measured between the answers of a respondent in the
first round and their respective answers in the second round. Table 5.5 below shows the
measured correlations:
Table 5. 5 measured correlations between the answers of a five respondents at two periods of time.
Respondent Correlation
Respondent 1 0.9734423
Respondent 2 0.95074116
Respondent 3 0.94521052
Respondent 4 0.8870083
Respondent 5 0.98492110
As can be clearly seen from the table above, there exists a high correlation between the
answers of the respondents in both survey rounds, which indicates that the answers
collected were not random, which in turn indicates that the data collected is reliable
enough to conduct the analysis upon.
5. 8. 3 Testing Acceptability
The qualitative method may be conducted to assess the acceptability of the
questionnaire. According to William (2007), the subjects included in the pilot study
should be asked to write their comments about the questionnaire on a separate sheet to
indicate how they found answering the questionnaire during the validity testing and how
long it took them to complete the questionnaire. In this study, all the respondents’

157
information was included in the cover letter that was used to accompany the
questionnaire survey.
In order to measure the validity of the questionnaire used in this study, a number of
procedures were followed in this research:
The goal of this was to validate the questionnaire and to avoid the possible confusion of
each individual question, which might lead to misinterpretation of the data. The
translated version was then pre-tested with selected relevant informants. Pre-testing is
an important step in which the researcher can discover problems of comprehension or
connotation that were not identified previously (Douglas & Craig, 2007).
A draft version of the questionnaire was presented to experts similar to the target
population for comments as addressed by (Al-Awwad, 1991). The pilot questionnaire
was designed and distributed to a number of researchers within the University of
Salford who have experience in questionnaire design, including Prof. Les Ruddock, the
supervisor of this thesis.
5. 9 Self-Administered Questionnaire
To administer the questionnaire form to a sample population, the researcher used the
online eSurvey Creator (https://www.esurveycreator.com/s/dbd9332). This application,
eSurvey Creator, offers a quick and easy way to create and automatically evaluate web
surveys on any possible topic. In addition, it facilitates intuitive support in designing
the web survey and linking the online survey by email, thereby members of the sample
population were directly invited to participate in the current survey. Although SPSS
was used in the analysis of the collected data, this online software provided descriptive
analysis, including graphs, and organised data in an Excel sheet. A period of about two
months was given to participants to receive the completed questionnaire. Each
questionnaire administered was accompanied by a cover letter, an introductory page
that contained the objectives of the study, research definitions, and the benefits of the
study to respondents. The total responses to the questionnaire after two months were
351, or 70.2% of the questionnaires. Twenty questionnaires (5.7%) were incomplete
and were excluded from the study.
This study employed a response rate calculation that removed partially completed
questionnaires and non-responding participants, based on the response rate calculation
as suggested by Bryman (2012), where only the number of usable questionnaires is
considered.
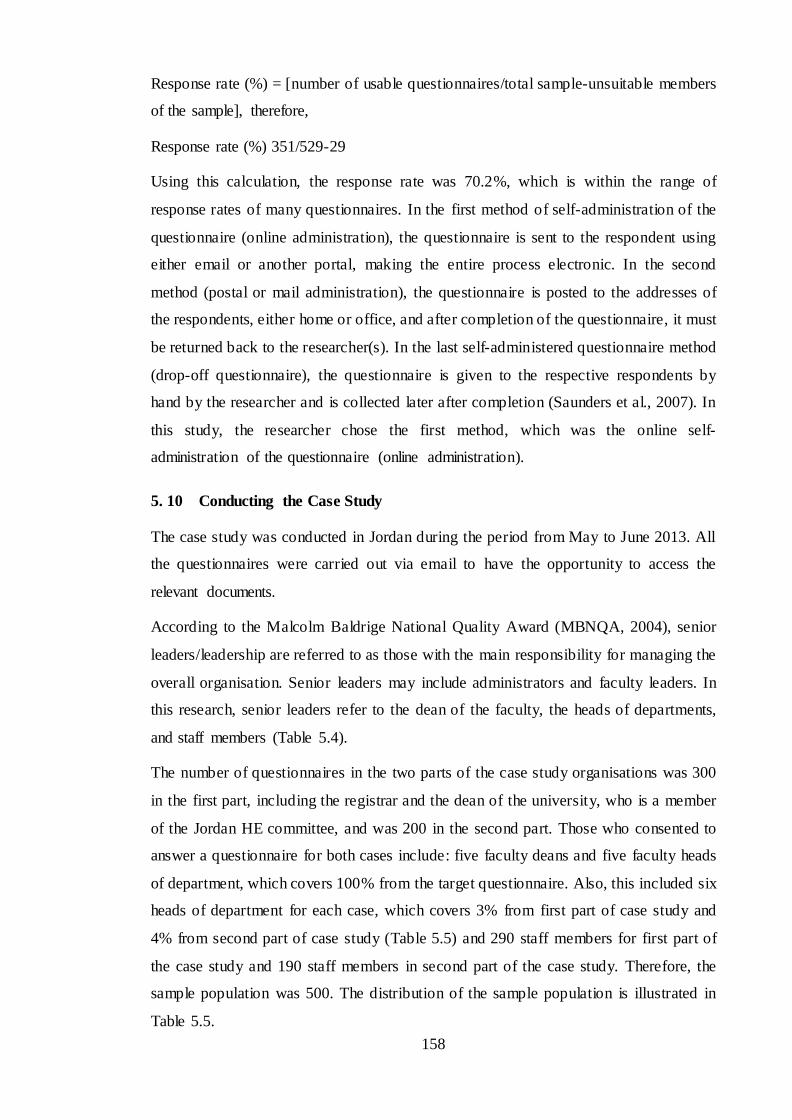
158
Response rate (%) = [number of usable questionnaires/total sample-unsuitable members
of the sample], therefore,
Response rate (%) 351/529-29
Using this calculation, the response rate was 70.2%, which is within the range of
response rates of many questionnaires. In the first method of self-administration of the
questionnaire (online administration), the questionnaire is sent to the respondent using
either email or another portal, making the entire process electronic. In the second
method (postal or mail administration), the questionnaire is posted to the addresses of
the respondents, either home or office, and after completion of the questionnaire, it must
be returned back to the researcher(s). In the last self-administered questionnaire method
(drop-off questionnaire), the questionnaire is given to the respective respondents by
hand by the researcher and is collected later after completion (Saunders et al., 2007). In
this study, the researcher chose the first method, which was the online self-
administration of the questionnaire (online administration).
5. 10 Conducting the Case Study
The case study was conducted in Jordan during the period from May to June 2013. All
the questionnaires were carried out via email to have the opportunity to access the
relevant documents.
According to the Malcolm Baldrige National Quality Award (MBNQA, 2004), senior
leaders/leadership are referred to as those with the main responsibility for managing the
overall organisation. Senior leaders may include administrators and faculty leaders. In
this research, senior leaders refer to the dean of the faculty, the heads of departments,
and staff members (Table 5.4).
The number of questionnaires in the two parts of the case study organisations was 300
in the first part, including the registrar and the dean of the university, who is a member
of the Jordan HE committee, and was 200 in the second part. Those who consented to
answer a questionnaire for both cases include: five faculty deans and five faculty heads
of department, which covers 100% from the target questionnaire. Also, this included six
heads of department for each case, which covers 3% from first part of case study and
4% from second part of case study (Table 5.5) and 290 staff members for first part of
the case study and 190 staff members in second part of the case study. Therefore, the
sample population was 500. The distribution of the sample population is illustrated in
Table 5.5.
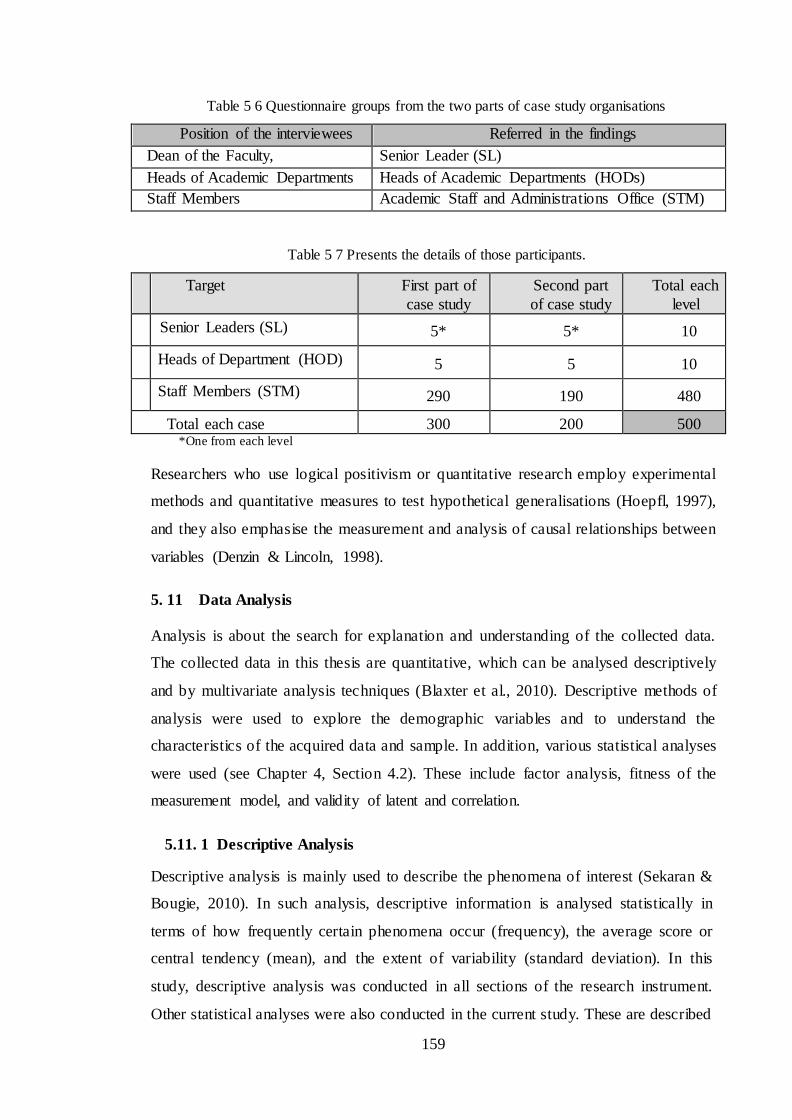
159
Table 5 6 Questionnaire groups from the two parts of case study organisations
Position of the interviewees Referred in the findings
Dean of the Faculty, Senior Leader (SL)
Heads of Academic Departments Heads of Academic Departments (HODs)
Staff Members Academic Staff and Administrations Office (STM)
Table 5 7 Presents the details of those participants.
Target First part of
case study
Second part
of case study
Total each
level
1 Senior Leaders (SL) 5* 5* 10
2 Heads of Department (HOD) 5 5 10
3 Staff Members (STM) 290 190 480
Total each case 300 200 500 *One from each level
Researchers who use logical positivism or quantitative research employ experimental
methods and quantitative measures to test hypothetical generalisations (Hoepfl, 1997),
and they also emphasise the measurement and analysis of causal relationships between
variables (Denzin & Lincoln, 1998).
5. 11 Data Analysis
Analysis is about the search for explanation and understanding of the collected data.
The collected data in this thesis are quantitative, which can be analysed descriptively
and by multivariate analysis techniques (Blaxter et al., 2010). Descriptive methods of
analysis were used to explore the demographic variables and to understand the
characteristics of the acquired data and sample. In addition, various statistical analyses
were used (see Chapter 4, Section 4.2). These include factor analysis, fitness of the
measurement model, and validity of latent and correlation.
5.11. 1 Descriptive Analysis
Descriptive analysis is mainly used to describe the phenomena of interest (Sekaran &
Bougie, 2010). In such analysis, descriptive information is analysed statistically in
terms of how frequently certain phenomena occur (frequency), the average score or
central tendency (mean), and the extent of variability (standard deviation). In this
study, descriptive analysis was conducted in all sections of the research instrument.
Other statistical analyses were also conducted in the current study. These are described
160
in the following sections.
5.11. 2 Correlation Analysis
Understanding the relations between variables is usually is interesting subject for
empirical researchers, managers, and also decision makers. Sekaran (2003) proposes
that to measure the relationship between two variables, researchers need to compute the
correlation coefficients of observed variables. Therefore, this study employed the
Pearson Correlation method to determine the numeric linear relationship among
variables and sub-variables of the study (see Figure 1.2). In this respect, Spearman’s
correlation is not suitable for measurement of the relationship between different
variables, as it is applied to the measurement of non-parametric ranges and monotonic
relationships (Fujita et al., 2009; Hanke and Kossowski, 2011). The magnitude of
coefficients shows the strength of a relationship and the value closer to +1 or -1
indicates the strength. The direction of relationship is determined by the sign of
correlation coefficients. Results of paired correlation among the latent constructs of the
study are presented in Table 4.18 in the next chapter.
Correlation analysis is primarily designed for measuring the association between two
variables. In other words, correlation analysis measures how a variable relates to
another variable (Hair et al., 2007; Sekaran & Bougie, 2010). Correlation analyses in
this study consist of Pearson's correlation and canonical correlation.
Pearson’s correlation is used to assess the linear association between variables of a
continuous data, and as participants’ responses are actually the averages of Likert
scores across a set of statements (detailed in the case study in chapter 7 and in chapter
8) and are not the raw Likert scores, Pearson’s correlation was used. In contrast to
this, canonical correlation was used in the above reported reliability analysis as the
analysis was conducted directly on the raw ordinal data (Murray, 2011 & Norman,
2010).
The number representing the Pearson correlation is referred to as a correlation
coefficient. By using Pearson's correlation analysis, the researcher was able to
understand the nature, direction, and significance of the bivariate relationship of the
variables used in the study (Sekaran & Bougie, 2010). In addition, canonical correlation
was also employed to examine the relationship between two sets of variables (Hair et
al., 2010). In this study, canonical correlation analysis was employed to predict the
relationships between the set of TQM elements and the set of KM elements, between

161
the set of TQM elements and the set of EP perspectives, and between the set of KM
elements and the set of EP perspectives
5.11. 3 Multiple Regression Analysis
There is always a deficiency in the result of the correlation coefficient as it only gives
the degree of relationships between the variables under test without necessarily giving
an idea of how much the variance in the dependent variables or criterion variable will
be explained when several independent variables are theorized to simultaneously
influence it (Sekaran & Bougie, 2010). The correlation may exist not only in the
relationship between independent variables and dependent variables but also among
themselves or inter-correlations. Thus, multiple regression analysis was used to
measure the concurrent effects of several independent variables on a dependent
variable (Cavana et al., 2001; Sekaran & Bougie, 2010).
Adjusted R2 is the statistic that can be used to measure how well the dependent
variables can be predicted by the independent variables. Sample size has a direct
impact on the statistical power of multiple regression. It is suggested that the
minimum ratio is (5 to 1), meaning that there must be five observations for each
independent variable (Hair, et al., 2010). Four assumptions that must be met under
regression analysis are linearity, heteroscedasticity, normality and no serious
multicollinearity problem (Coakes & Steed, 2007; Hair et al., 2010).
In the present study, regression analysis was applied to measure the significance of
the relationship between TQM elements and KM elements, between TQM elements
and EP perspectives, and between KM elements and EP perspectives. This analysis also
provided information regarding the linear relationship between TQM elements with
both KM elements and EP, and the linear relationship between KM elements with EP
perspectives.
To investigate the linear relationship between TQM core elements with KM elements
and EP, separate regression models were developed for each dependent variable so
that two general models were posited. The first model was aimed to measure the
linear relationship between TQM elements and KM elements, while the second model
was developed to find out the linear relationship between TQM elements and EP
perspectives.
5.11. 4 Structural Equation Modeling
Structural Equation Modeling (SEM) is a statistical methodology used by behavioural,
162
social, and educational scientists (Raykov & Marcoulides, 2006; Byrne, 2010). SPSS
is also a family of statistical models and multivariate techniques, with mixing
characteristics of factor analysis and multiple regressions that enables the researcher
to test simultaneously a series of interrelated dependence relationships among the
measured variables and latent constructs (Hair et al., 2010). In this study, the Statistical
Package for the Social Sciences SPSS was applied for assessing the role of the
relationship between KM and TQM.
Many researchers and statisticians (e.g., Bollen, 1989; Hair et al., 2010; Iacobucci,
Saldanha, & Deng, 2007; James, Mulaik, & Brett, 2006; Kline, 2011) have revealed
that SPSS performed better than regression while assessing the mediating role of a
research variable. Hence, suggesting that SPSS was a superior statistical technique
over the regression. According to Hair et al. (2010), the standard errors in the SPSS
model are minimized due to the simultaneous estimation of all parameters in the SPSS
model.
5. 12 Summary
This chapter focused on the methodology that was adopted in the current research. It
highlighted the main issues related to the philosophical assumption of the research
design, sample population, and setting up the quantitative approach for collecting the
necessary data. The next three chapters will deal with the statistical analyses of the
quantitative data that were obtained by the questionnaire.

163
CHAPTER SIX
DATA ANALYSES AND RESPONDENT CHARACTERISTICS
6. 1 Introduction
The previous chapter focused on the concept of methodology that was adopted in the
current research. The outcomes of the previous chapter are discussed and analysed here
and in the next chapters. The current chapter deals with analysing the characteristics of
the academic staff or demographic data of the responses to the online questionnaire.
Generally, the main characteristics of respondents were included in the questionnaire.
These included gender, age group, degree, academic ranking, time worked in the field,
current position, and university affiliation.
The Statistical Package for the Social Sciences (SPSS) was used to analyse data that
were obtained from the questionnaire. The total number of respondents was 351 or
70.2%. These respondents belonged to two groups: academic staff in Jordanian public
universities (200, 66.7% out of 300 academic staff) and academic staff in Jordanian
private universities (151, 75.5% out of 260).
The demographic data that were obtained from the questionnaire were analysed
statistically by SPSS. These included mainly descriptive statistics, which summarise
and describe data related to the demography of respondents, the mean, and standard
deviation. This chapter includes the characteristics of respondents.
6. 2 The Demographic Characteristics of Respondents
The demographic portion of the questionnaire was designed to get a clear picture
concerning the characteristics of respondents. These demographic variables were
analysed quantitatively by mainly frequencies and percentages (Tables 6.1 to 6.7), using
SPSS. The data in these tables were organised by two main variables, sample group
(respondents in public and private universities) and the individual demographic
variables, such as gender and age.
6. 2.1 Responses by Gender and Age Group
Tables 6.1 reveal the results of the respondent distribution in public and private
universities according to gender. The majority of respondents were male 81% and
77.5% in public and private universities, respectively (Table 6.1). Female respondents
were 19% and 34% in public and private universities, respectively. In both types of
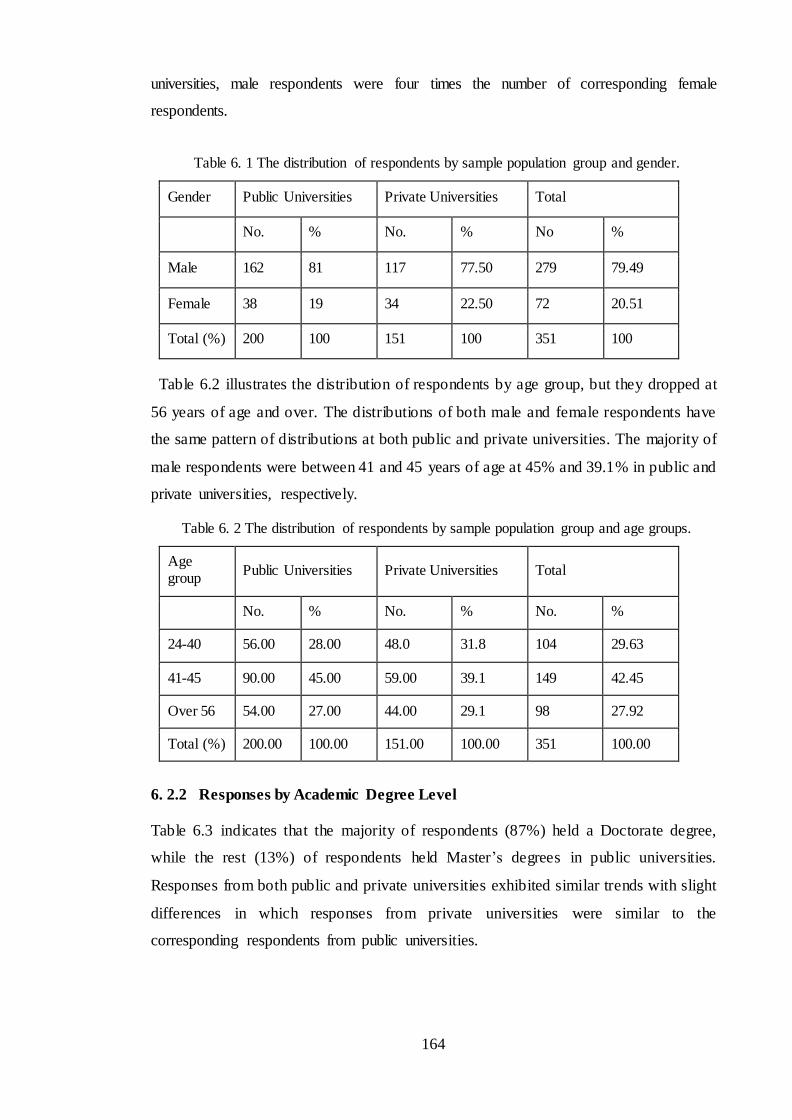
164
universities, male respondents were four times the number of corresponding female
respondents.
Table 6. 1 The distribution of respondents by sample population group and gender.
Gender Public Universities Private Universities Total
No. % No. % No %
Male 162 81 117 77.50 279 79.49
Female 38 19 34 22.50 72 20.51
Total (%) 200 100 151 100 351 100
Table 6.2 illustrates the distribution of respondents by age group, but they dropped at
56 years of age and over. The distributions of both male and female respondents have
the same pattern of distributions at both public and private universities. The majority of
male respondents were between 41 and 45 years of age at 45% and 39.1% in public and
private universities, respectively.
Table 6. 2 The distribution of respondents by sample population group and age groups.
Age group
Public Universities Private Universities Total
No. % No. % No. %
24-40 56.00 28.00 48.0 31.8 104 29.63
41-45 90.00 45.00 59.00 39.1 149 42.45
Over 56 54.00 27.00 44.00 29.1 98 27.92
Total (%) 200.00 100.00 151.00 100.00 351 100.00
6. 2.2 Responses by Academic Degree Level
Table 6.3 indicates that the majority of respondents (87%) held a Doctorate degree,
while the rest (13%) of respondents held Master’s degrees in public universities.
Responses from both public and private universities exhibited similar trends with slight
differences in which responses from private universities were similar to the
corresponding respondents from public universities.

165
Table 6. 3 The distribution of respondents by sample population group and academic degree.
Academic Degree Public Universities Private Universities Total
No. % No. % No. %
Bachelor 01.00 0.50 - - 1 0.28
Master 26.00 13.00 18.00 11.9 44 12.54
Doctorate 173.00 87.00 133.00 88.1 306 87.18
Total 200.00 100.00 151.00 100.00 351 100.00
6. 2.3 Responses by Academic Degree, Experience, and Position
Table 6.4 shows respondent’s distribution by academic rank in which lecturers showed
the lowest distributions among other academic ranks. The respondents with higher ranks
increased proportionally in public universities. However, in the private universities, the
differences among academic ranks were slightly lower than the corresponding public
universities.
Table 6. 4 The distribution of respondents by sample population group and academic rank.
Academic Rank Public
Universities Private
Universities Total
No. % No. % No. %
Lecturer 27.00 13.50 18 11.9 12.82 12.82
Assistant professor 51.00 25.50 44.00 29.1 27.07 27.07
Associated professor 58.00 29.00 40 26.5 27.92 27.92
Professor 64.00 32.50 49 32.5 32.19 32.19
Total 200.00 100.00 151.00 100.0 100 100
Table 6.5 shows responses by work experience in which the results are in agreement
with the previous results in Tables 6.6 through 4.8. The majority (42%) of responses in
public universities were from academics with work experience of eleven or more years.
However, the highest (56.29%) responses in private universities belonged to academic
groups with eleven or more years of experience. The other two groups (one to five years
and six to ten years) were between 21.19% and 22.52%, respectively.
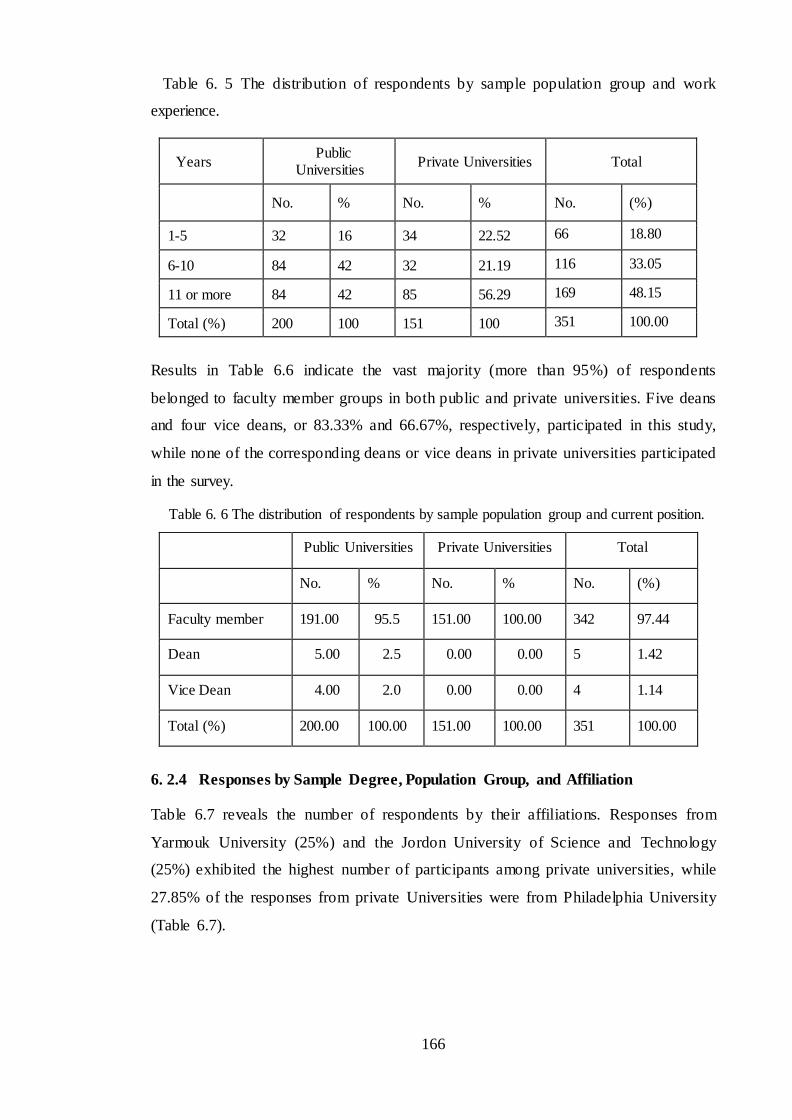
166
Table 6. 5 The distribution of respondents by sample population group and work
experience.
Years Public
Universities Private Universities Total
No. % No. % No. (%)
1-5 32 16 34 22.52 66 18.80
6-10 84 42 32 21.19 116 33.05
11 or more 84 42 85 56.29 169 48.15
Total (%) 200 100 151 100 351 100.00
Results in Table 6.6 indicate the vast majority (more than 95%) of respondents
belonged to faculty member groups in both public and private universities. Five deans
and four vice deans, or 83.33% and 66.67%, respectively, participated in this study,
while none of the corresponding deans or vice deans in private universities participated
in the survey.
Table 6. 6 The distribution of respondents by sample population group and current position.
Public Universities Private Universities Total
No. % No. % No. (%)
Faculty member 191.00 95.5 151.00 100.00 342 97.44
Dean 5.00 2.5 0.00 0.00 5 1.42
Vice Dean 4.00 2.0 0.00 0.00 4 1.14
Total (%) 200.00 100.00 151.00 100.00 351 100.00
6. 2.4 Responses by Sample Degree, Population Group, and Affiliation
Table 6.7 reveals the number of respondents by their affiliations. Responses from
Yarmouk University (25%) and the Jordon University of Science and Technology
(25%) exhibited the highest number of participants among private universities, while
27.85% of the responses from private Universities were from Philadelphia University
(Table 6.7).

167
6. 3 Summary
This chapter described the distribution of respondents in both public and private
universities. The results indicated that there is close similarity between the two types of
the universities in relation to different demographic characteristics of respondents,
including gender, age, work experience, and other related academic ranks. The next two
chapters will focus on the data analyses from the public and private universities.
Table 6. 7 The distribution of respondents by sample population group and affiliation.
Affiliation Public Universities Private Universities
No. % No. %
Yarmouk 50 25.64 - -
Jadarah 35 17.95 - -
Jordon University of science and
Technology 50 25.64 - -
Mutah 37 18.97 - -
Balaqa 13 6.67 - -
Al-Hussein Bin Talal University 10 5.13 - -
Jerash - - 21 13.91
Zarqa - - 36 23.84
Applied Science Private University - - 33 21.85
Philadelphia - - 42 27.81
Jadara - - 19 12.58
Total (%) 195 100.00 151 100.00
168
CHAPTER SEVEN
RESEARCH FINDINGS FROM PUBLIC UNIVERSITIES
7. 1 Introduction
As indicated in chapter one, the overall objective of this study is to investigate KM and
TQM in Jordanian universities. These issues have received much attention by various
researchers to establish the quality of education (Chapter 2). This chapter focuses on the
empirical data analysis generated by the online questionnaires (Appendix C, Chapter 5).
It also focuses on the presentation and interpretation of the data to investigate how
respondents in public universities perceived KM and TQM.
The Statistical Package for the Social Sciences (SPSS) was used to analyse the
perceptions of 200 respondents, aiming to answer the current research questions
(Chapter 1). The correlation between variables was mainly used to investigate the
relationship between variables. Therefore, the data were analyzed statistically using
diverse methods, including frequency, mean, Pearson correlation, T-test, and F-test
methods for determining the relationship between different variables related to KM and
TQM. The magnitude of coefficients represents the level of the strength of relationship
between computed variables. The optimum value of the correlation coefficient is +1 or -
1, which represents, respectively, the positive and negative correlation (Cohen et al.,
2003). Regardless of the direction, values of the correlation coefficient r range between
1 (the strongest) and zero (no correlation). Thus, r = + 0.95 and r = -95 represent a high
association, and both values are equal in the degree of association of the measured
variables.
The structure of this chapter includes the following sections:
• The Quantitative Data Analysis of Respondent Perceptions in Public Universities.
• The Perception Towards KM.
• The Perception Towards TQM.
• Perception Towards Performance.
• Correlation Coefficient of the KM Process with Management-related Variables in
Public Universities.
• The Effect of KM and TQM on Internal Process Perspectives.
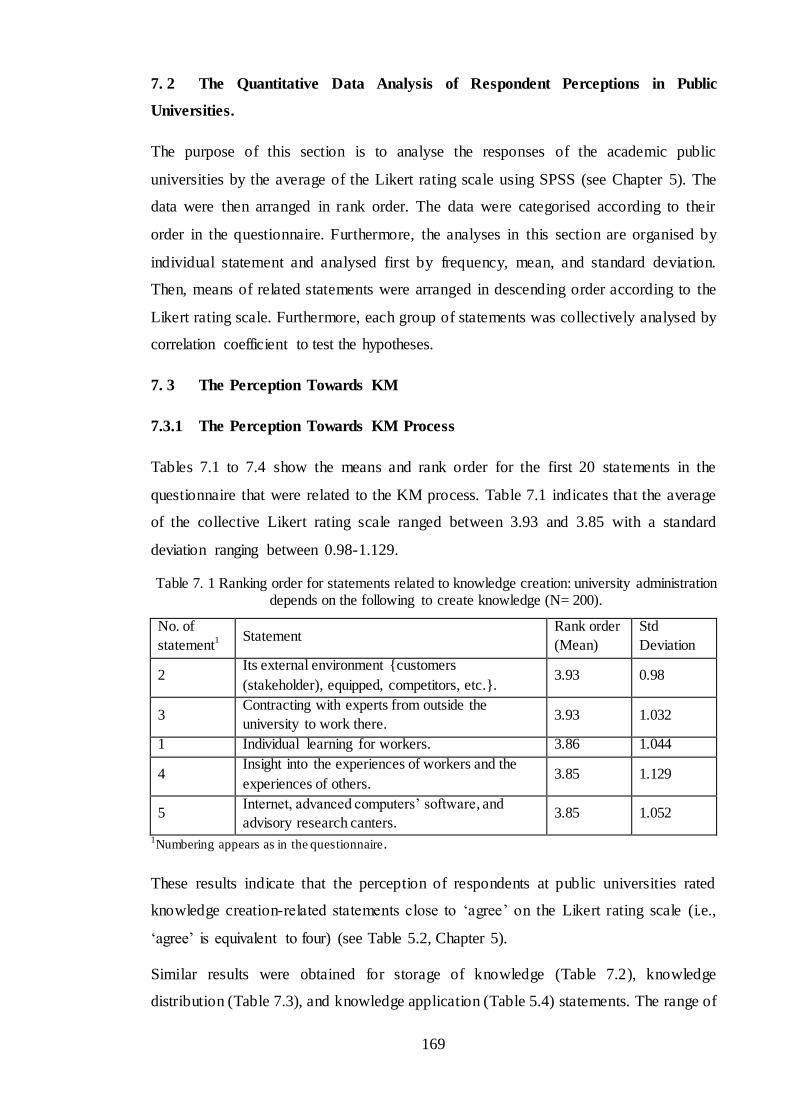
169
7. 2 The Quantitative Data Analysis of Respondent Perceptions in Public
Universities.
The purpose of this section is to analyse the responses of the academic public
universities by the average of the Likert rating scale using SPSS (see Chapter 5). The
data were then arranged in rank order. The data were categorised according to their
order in the questionnaire. Furthermore, the analyses in this section are organised by
individual statement and analysed first by frequency, mean, and standard deviation.
Then, means of related statements were arranged in descending order according to the
Likert rating scale. Furthermore, each group of statements was collectively analysed by
correlation coefficient to test the hypotheses.
7. 3 The Perception Towards KM
7.3.1 The Perception Towards KM Process
Tables 7.1 to 7.4 show the means and rank order for the first 20 statements in the
questionnaire that were related to the KM process. Table 7.1 indicates that the average
of the collective Likert rating scale ranged between 3.93 and 3.85 with a standard
deviation ranging between 0.98-1.129.
Table 7. 1 Ranking order for statements related to knowledge creation: university administration depends on the following to create knowledge (N= 200).
No. of
statement1 Statement
Rank order
(Mean)
Std
Deviation
2 Its external environment {customers
(stakeholder), equipped, competitors, etc.}. 3.93 0.98
3 Contracting with experts from outside the
university to work there. 3.93 1.032
1 Individual learning for workers. 3.86 1.044
4 Insight into the experiences of workers and the
experiences of others. 3.85 1.129
5 Internet, advanced computers’ software, and
advisory research canters. 3.85 1.052
1Numbering appears as in the questionnaire.
These results indicate that the perception of respondents at public universities rated
knowledge creation-related statements close to ‘agree’ on the Likert rating scale (i.e.,
‘agree’ is equivalent to four) (see Table 5.2, Chapter 5).
Similar results were obtained for storage of knowledge (Table 7.2), knowledge
distribution (Table 7.3), and knowledge application (Table 5.4) statements. The range of

170
the mean and standard deviation (SD) were, respectively, 3.91 to 3.87 (SD 1.03 to
1.088), 3.98 to 3.78 (SD 0.908 to 1.135) and 3.96 to 3.72 (SD 0.876 to 0.926).
Table 7. 2 Rank order for statements related to storage of knowledge: University administration depends on the following to store knowledge: (N= 200).
No. of statement
1 Statement Rank order (Mean)
Std Deviation
7 Computer and other digital information media storage.
3.91 1.03
6 Records and written documents. 3.89 1.038
8 Activated incentives (financial and moral) to maintain individuals of high knowledge and talents.
3.87 1.059
9 System to control the tangible knowledge assets. 3.87 1.088 1Numbering appears as in the questionnaire.
Table 7. 3 Rank order for statements related to knowledge distribution: University administration depends on the following to distribute knowledge: (N= 200).
No. of statement
1 Statement Rank order (Mean)
Std Deviation
15 Metaphorical representation and imaging of knowledge.
3.98 0.908
11 Documents, publications, and internal information network.
3.96 0.968
10 Work Teams and regular meetings. 3.95 0.983
13 Relations and informal contacts. 3.92 0.948
14 The transfer of knowledge to others through lectures and services.
3.86 0.993
12 Training and openness in the exchange of thought and dialogue.
3.78 1.135
1Numbering appears as in the questionnaire.
Table 7.5 illustrates the overall mean for statements 1 to 20 (Tables 1 to 4). The mean
(3.879) perception of respondents at public universities agrees with the individual
statement means (Tables 7.1 to 7.4), which also indicates that respondents agreed with
the KM process at Jordanian public universities.
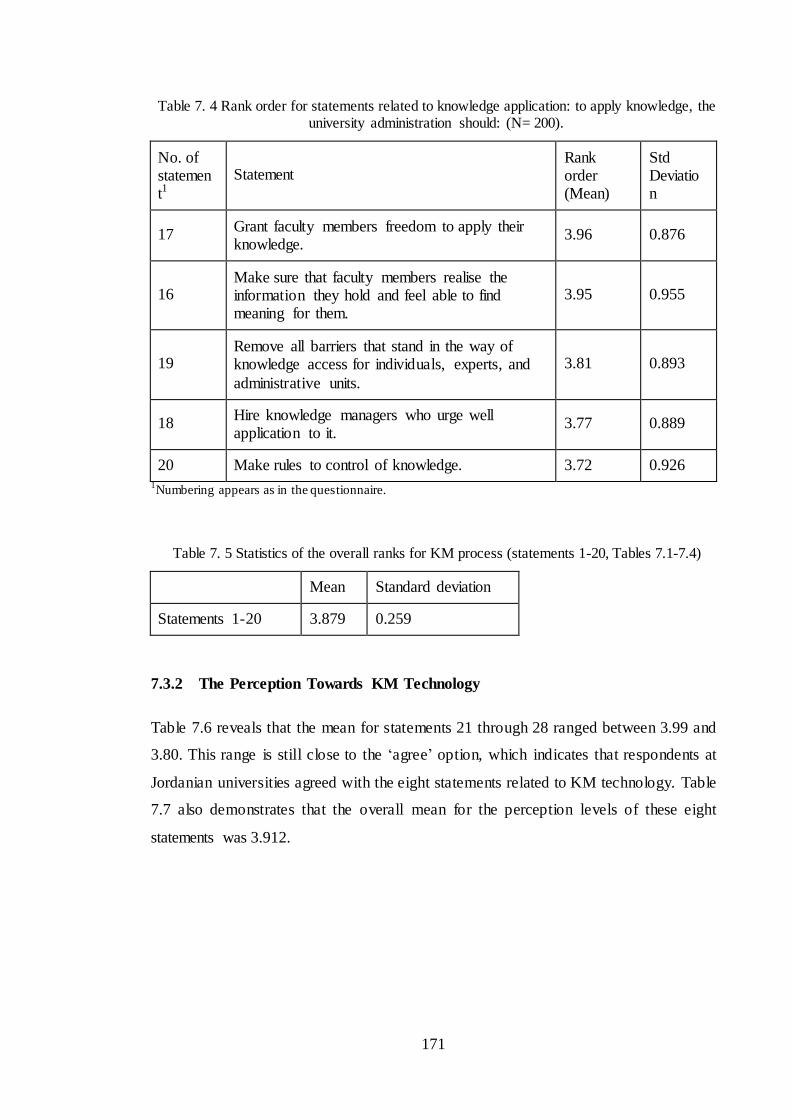
171
Table 7. 4 Rank order for statements related to knowledge application: to apply knowledge, the university administration should: (N= 200).
No. of statement1
Statement Rank order (Mean)
Std Deviation
17 Grant faculty members freedom to apply their knowledge.
3.96 0.876
16 Make sure that faculty members realise the information they hold and feel able to find meaning for them.
3.95 0.955
19 Remove all barriers that stand in the way of knowledge access for individuals, experts, and
administrative units.
3.81 0.893
18 Hire knowledge managers who urge well application to it.
3.77 0.889
20 Make rules to control of knowledge. 3.72 0.926 1Numbering appears as in the questionnaire.
Table 7. 5 Statistics of the overall ranks for KM process (statements 1-20, Tables 7.1-7.4)
Mean Standard deviation
Statements 1-20 3.879 0.259
7.3.2 The Perception Towards KM Technology
Table 7.6 reveals that the mean for statements 21 through 28 ranged between 3.99 and
3.80. This range is still close to the ‘agree’ option, which indicates that respondents at
Jordanian universities agreed with the eight statements related to KM technology. Table
7.7 also demonstrates that the overall mean for the perception levels of these eight
statements was 3.912.
172
Table 7. 6 Rank order for statements related to variable of KM technology (N= 200).
No. of
statement1 Statement
Rank
order (Mean)
Std
Deviation
24 Keep pace quickly with changes of technology. 3.99 0.830
27
Use of office automation systems (email,
automated retrieval of information, word processing, audio-video conferences) to carry out
administrative tasks.
3.99 0.899
25 Use virtual reality systems in the work of the
college. 3.97 0.918
28 Use university artificial intelligence systems. 3.97 0.832
26 Make crucial decisions with the help of decision
support systems-based knowledge. 3.92 0.979
22 Connect faculty and administrative units in the
university with a network of computers. 3.84 0.837
23 Update Information system in the university
constantly. 3.84 0.794
21 The university has intranet (LAN) web 3.80 0.846 1Numbering appears as in the questionnaire.
Table 7. 7 Statistics of the overall ranks for KM technology (statements 21-28, Table 7.6).
Mean Standard deviation
Statements 21-28 3.912 0.350
7.3.3 The Perception Towards KM Knowledge Teams
Tables 7.8 to 7.10 summarise the average responses to the knowledge team-related
statements 29 to 40. Table 7.8 shows the mean range to be between 3.99 and 3.97 for
knowledge maker statements, indicated by responses from public universities.
Similarly, the other two groups of statements that are related to knowledge managers
(Table 7.9) and students’ KM (Table 7.10) show mean values of four or slightly below
or above on the Likert rating scale, which is equivalent to the ‘agree’ option. The mean
responses for knowledge manager statements were all four with a standard deviation of
0.742 to 0.877 (Table 7.9).
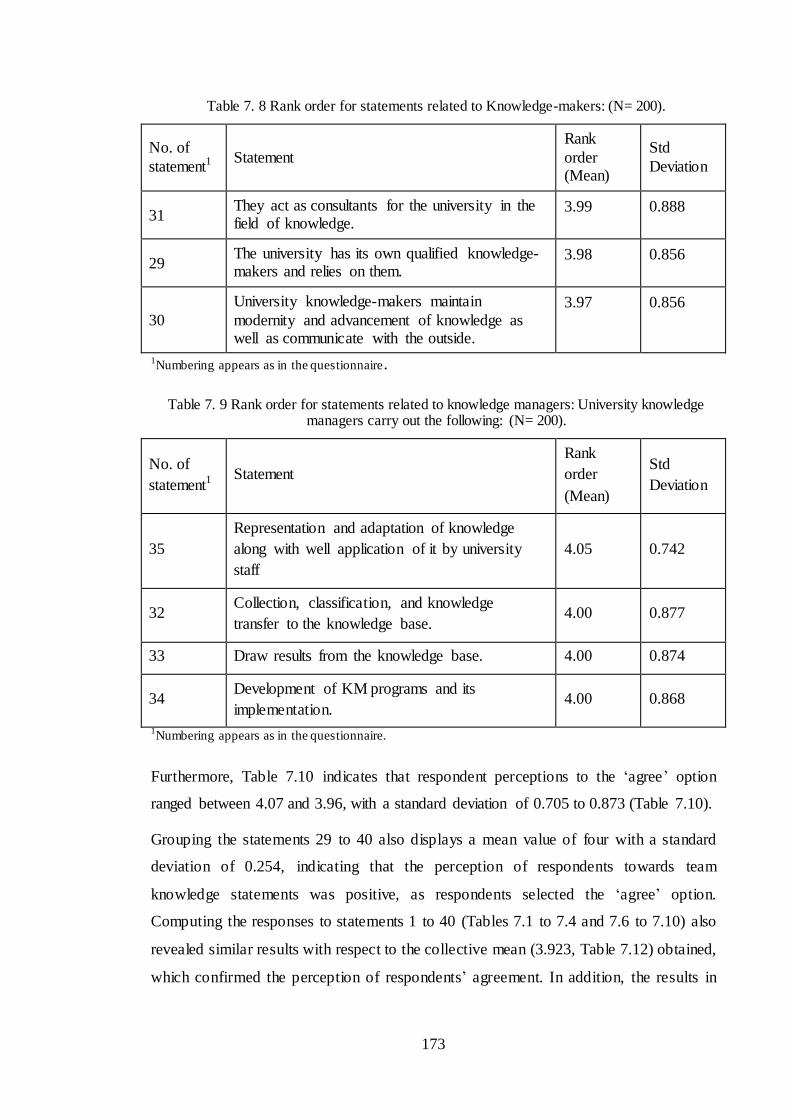
173
Table 7. 8 Rank order for statements related to Knowledge-makers: (N= 200).
No. of
statement1 Statement
Rank
order (Mean)
Std
Deviation
31 They act as consultants for the university in the field of knowledge.
3.99 0.888
29 The university has its own qualified knowledge-makers and relies on them.
3.98 0.856
30
University knowledge-makers maintain
modernity and advancement of knowledge as well as communicate with the outside.
3.97 0.856
1Numbering appears as in the questionnaire.
Table 7. 9 Rank order for statements related to knowledge managers: University knowledge managers carry out the following: (N= 200).
No. of
statement1 Statement
Rank
order
(Mean)
Std
Deviation
35
Representation and adaptation of knowledge
along with well application of it by university
staff
4.05 0.742
32 Collection, classification, and knowledge
transfer to the knowledge base. 4.00 0.877
33 Draw results from the knowledge base. 4.00 0.874
34 Development of KM programs and its
implementation. 4.00 0.868
1Numbering appears as in the questionnaire.
Furthermore, Table 7.10 indicates that respondent perceptions to the ‘agree’ option
ranged between 4.07 and 3.96, with a standard deviation of 0.705 to 0.873 (Table 7.10).
Grouping the statements 29 to 40 also displays a mean value of four with a standard
deviation of 0.254, indicating that the perception of respondents towards team
knowledge statements was positive, as respondents selected the ‘agree’ option.
Computing the responses to statements 1 to 40 (Tables 7.1 to 7.4 and 7.6 to 7.10) also
revealed similar results with respect to the collective mean (3.923, Table 7.12) obtained,
which confirmed the perception of respondents’ agreement. In addition, the results in

174
Table 7.12 represent a summary of the results of respondent perceptions of the KM
process, KM technology, and knowledge teams at public universities in Jordan.
Table 7. 10 Rank order for statements related to students' KM: student’s KM at the
university is keen on: (N= 200).
No. of
statement1 Statement
Rank order
(Mean)
Std
Deviation
37 Linking up students to student knowledge base at the college.
4.07 0.705
36 Collecting a great deal of knowledge about students (their needs, their desires, and the degree of their
loyalty to the college).
4.05 0.721
38 Linking students to groups of experts from the college.
4.00 0.777
40 Motivating students to submit their suggestions, opinions and ideas.
3.97 0.804
39 Adapting internal links so that it would become consistent with the student’s knowledge base.
3.96 0.873
1Numbering appears as in the questionnaire.
Table 7. 11 Statistics of the overall ranks for team knowledge (statements 29-40, Tables: 7.8-7.10).
Mean Standard deviation
Statements 29-40 4.002 0.254
Table 7. 12 Statistics of the overall ranks for KM (statements 1-40, Tables 7.1-7.4, 7.6-7.10).
Mean Standard deviation
Statements 1-40 3.923 0.216
7. 4 The Perception Towards TQM
7.4.1 Effective Leadership
Table 7.13 shows the rank order of seven means for statements related to effective
leadership, which are all close to the fourth option, ‘agree’. The range of the seven
means is 4.03 to 3.85, with a standard deviation of 0.740 to 0.903, respectively.
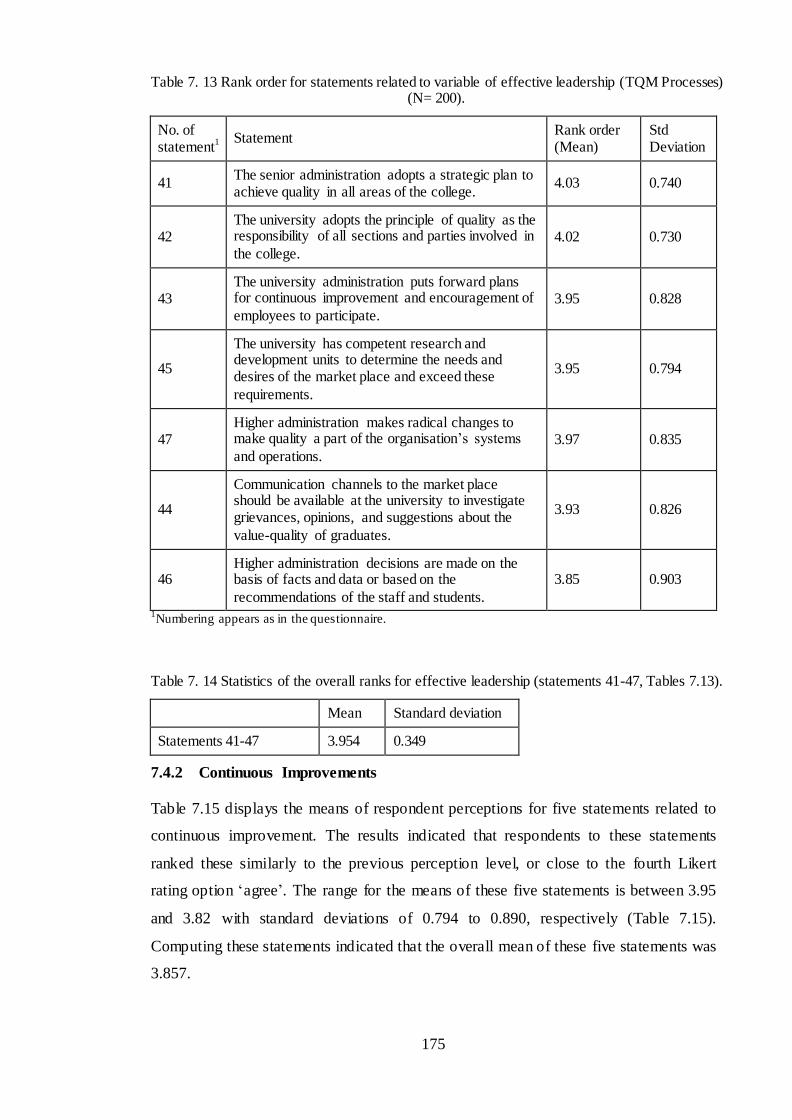
175
Table 7. 13 Rank order for statements related to variable of effective leadership (TQM Processes) (N= 200).
No. of statement
1 Statement Rank order (Mean)
Std Deviation
41 The senior administration adopts a strategic plan to achieve quality in all areas of the college.
4.03 0.740
42 The university adopts the principle of quality as the responsibility of all sections and parties involved in
the college. 4.02 0.730
43 The university administration puts forward plans for continuous improvement and encouragement of
employees to participate. 3.95 0.828
45
The university has competent research and development units to determine the needs and desires of the market place and exceed these
requirements.
3.95 0.794
47 Higher administration makes radical changes to make quality a part of the organisation’s systems
and operations. 3.97 0.835
44
Communication channels to the market place should be available at the university to investigate grievances, opinions, and suggestions about the
value-quality of graduates.
3.93 0.826
46 Higher administration decisions are made on the basis of facts and data or based on the
recommendations of the staff and students.
3.85 0.903
1Numbering appears as in the questionnaire.
Table 7. 14 Statistics of the overall ranks for effective leadership (statements 41-47, Tables 7.13).
Mean Standard deviation
Statements 41-47 3.954 0.349
7.4.2 Continuous Improvements
Table 7.15 displays the means of respondent perceptions for five statements related to
continuous improvement. The results indicated that respondents to these statements
ranked these similarly to the previous perception level, or close to the fourth Likert
rating option ‘agree’. The range for the means of these five statements is between 3.95
and 3.82 with standard deviations of 0.794 to 0.890, respectively (Table 7.15).
Computing these statements indicated that the overall mean of these five statements was
3.857.
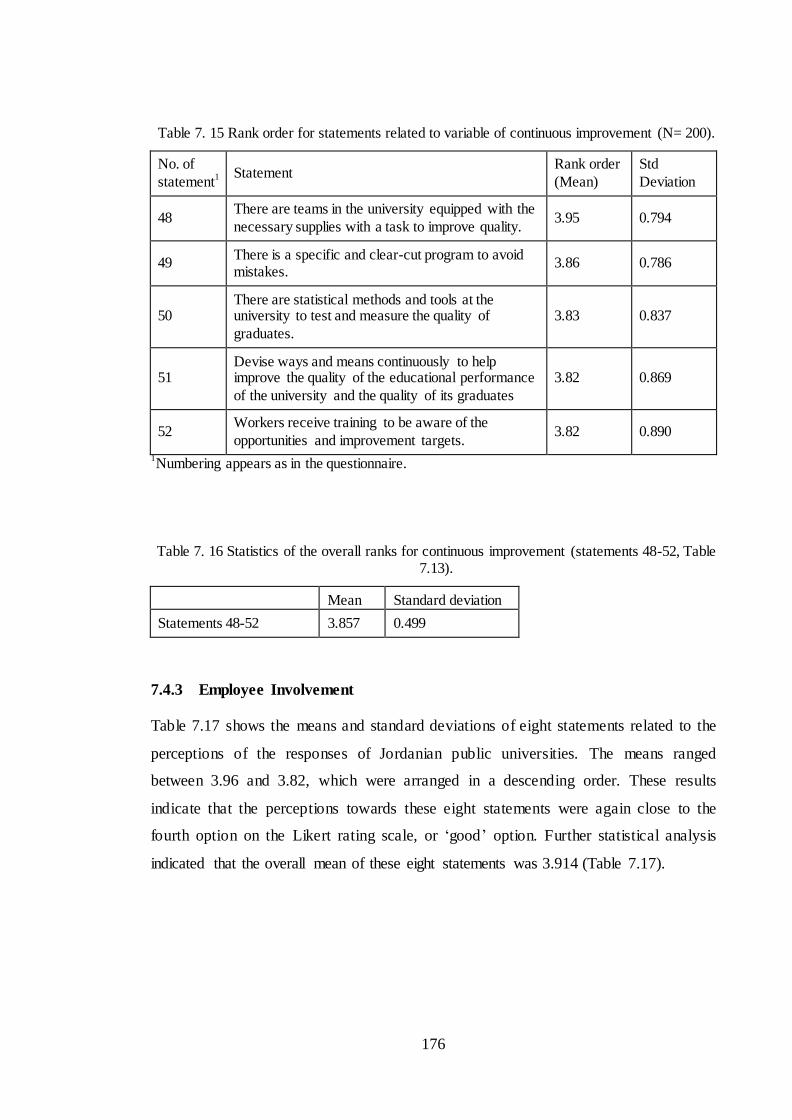
176
Table 7. 15 Rank order for statements related to variable of continuous improvement (N= 200).
No. of
statement1 Statement
Rank order
(Mean)
Std
Deviation
48 There are teams in the university equipped with the
necessary supplies with a task to improve quality. 3.95 0.794
49 There is a specific and clear-cut program to avoid mistakes.
3.86 0.786
50 There are statistical methods and tools at the university to test and measure the quality of
graduates.
3.83
0.837
51 Devise ways and means continuously to help improve the quality of the educational performance
of the university and the quality of its graduates
3.82 0.869
52 Workers receive training to be aware of the
opportunities and improvement targets. 3.82 0.890
1Numbering appears as in the questionnaire.
Table 7. 16 Statistics of the overall ranks for continuous improvement (statements 48-52, Table 7.13).
Mean Standard deviation
Statements 48-52 3.857 0.499
7.4.3 Employee Involvement
Table 7.17 shows the means and standard deviations of eight statements related to the
perceptions of the responses of Jordanian public universities. The means ranged
between 3.96 and 3.82, which were arranged in a descending order. These results
indicate that the perceptions towards these eight statements were again close to the
fourth option on the Likert rating scale, or ‘good’ option. Further statistical analysis
indicated that the overall mean of these eight statements was 3.914 (Table 7.17).
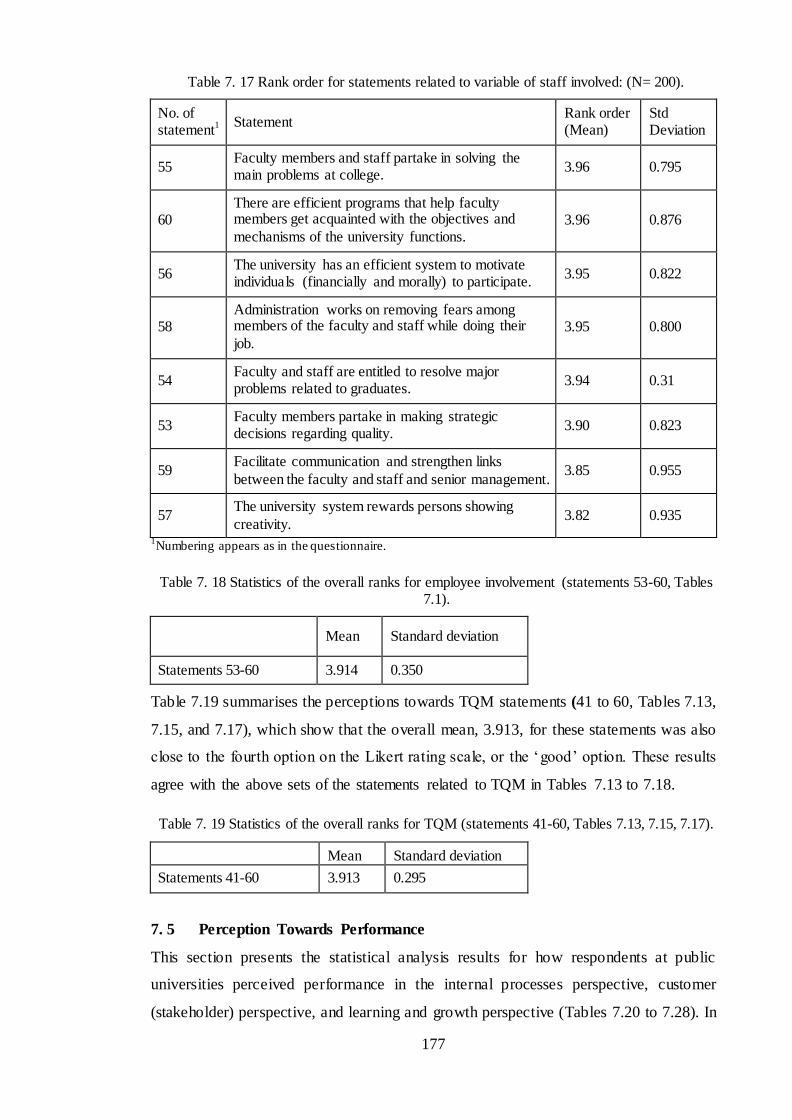
177
Table 7. 17 Rank order for statements related to variable of staff involved: (N= 200).
No. of statement
1 Statement Rank order (Mean)
Std Deviation
55 Faculty members and staff partake in solving the main problems at college.
3.96 0.795
60 There are efficient programs that help faculty members get acquainted with the objectives and
mechanisms of the university functions. 3.96 0.876
56 The university has an efficient system to motivate individuals (financially and morally) to participate.
3.95 0.822
58 Administration works on removing fears among members of the faculty and staff while doing their
job. 3.95 0.800
54 Faculty and staff are entitled to resolve major problems related to graduates.
3.94 0.31
53 Faculty members partake in making strategic decisions regarding quality.
3.90 0.823
59 Facilitate communication and strengthen links
between the faculty and staff and senior management. 3.85 0.955
57 The university system rewards persons showing
creativity. 3.82 0.935
1Numbering appears as in the questionnaire.
Table 7. 18 Statistics of the overall ranks for employee involvement (statements 53-60, Tables 7.1).
Mean Standard deviation
Statements 53-60 3.914 0.350
Table 7.19 summarises the perceptions towards TQM statements (41 to 60, Tables 7.13,
7.15, and 7.17), which show that the overall mean, 3.913, for these statements was also
close to the fourth option on the Likert rating scale, or the ‘good’ option. These results
agree with the above sets of the statements related to TQM in Tables 7.13 to 7.18.
Table 7. 19 Statistics of the overall ranks for TQM (statements 41-60, Tables 7.13, 7.15, 7.17).
Mean Standard deviation
Statements 41-60 3.913 0.295
7. 5 Perception Towards Performance
This section presents the statistical analysis results for how respondents at public
universities perceived performance in the internal processes perspective, customer
(stakeholder) perspective, and learning and growth perspective (Tables 7.20 to 7.28). In
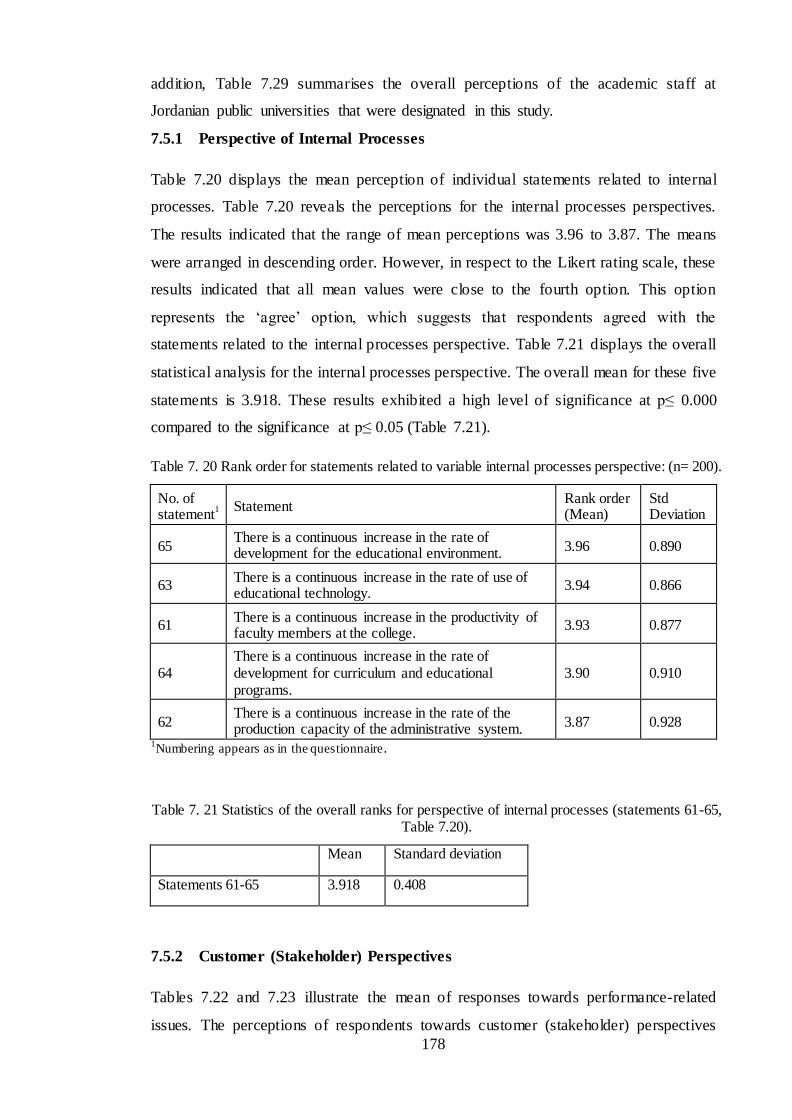
178
addition, Table 7.29 summarises the overall perceptions of the academic staff at
Jordanian public universities that were designated in this study.
7.5.1 Perspective of Internal Processes
Table 7.20 displays the mean perception of individual statements related to internal
processes. Table 7.20 reveals the perceptions for the internal processes perspectives.
The results indicated that the range of mean perceptions was 3.96 to 3.87. The means
were arranged in descending order. However, in respect to the Likert rating scale, these
results indicated that all mean values were close to the fourth option. This option
represents the ‘agree’ option, which suggests that respondents agreed with the
statements related to the internal processes perspective. Table 7.21 displays the overall
statistical analysis for the internal processes perspective. The overall mean for these five
statements is 3.918. These results exhibited a high level of significance at p≤ 0.000
compared to the significance at p≤ 0.05 (Table 7.21).
Table 7. 20 Rank order for statements related to variable internal processes perspective: (n= 200).
No. of statement
1 Statement Rank order (Mean)
Std Deviation
65 There is a continuous increase in the rate of development for the educational environment.
3.96 0.890
63 There is a continuous increase in the rate of use of educational technology.
3.94 0.866
61 There is a continuous increase in the productivity of faculty members at the college.
3.93 0.877
64 There is a continuous increase in the rate of development for curriculum and educational programs.
3.90 0.910
62 There is a continuous increase in the rate of the production capacity of the administrative system.
3.87 0.928
1Numbering appears as in the questionnaire.
Table 7. 21 Statistics of the overall ranks for perspective of internal processes (statements 61-65, Table 7.20).
Mean Standard deviation
Statements 61-65 3.918 0.408
7.5.2 Customer (Stakeholder) Perspectives
Tables 7.22 and 7.23 illustrate the mean of responses towards performance-related
issues. The perceptions of respondents towards customer (stakeholder) perspectives
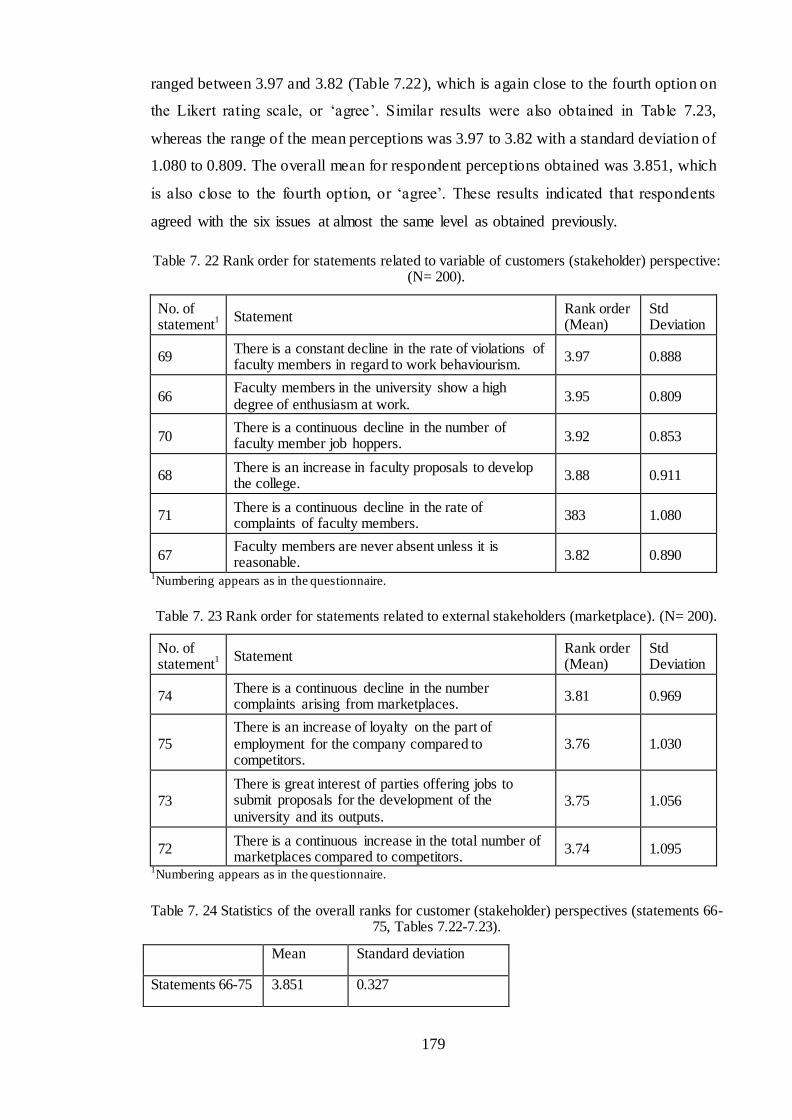
179
ranged between 3.97 and 3.82 (Table 7.22), which is again close to the fourth option on
the Likert rating scale, or ‘agree’. Similar results were also obtained in Table 7.23,
whereas the range of the mean perceptions was 3.97 to 3.82 with a standard deviation of
1.080 to 0.809. The overall mean for respondent perceptions obtained was 3.851, which
is also close to the fourth option, or ‘agree’. These results indicated that respondents
agreed with the six issues at almost the same level as obtained previously.
Table 7. 22 Rank order for statements related to variable of customers (stakeholder) perspective: (N= 200).
No. of statement
1 Statement Rank order (Mean)
Std Deviation
69 There is a constant decline in the rate of violations of faculty members in regard to work behaviourism.
3.97 0.888
66 Faculty members in the university show a high degree of enthusiasm at work.
3.95 0.809
70 There is a continuous decline in the number of faculty member job hoppers.
3.92 0.853
68 There is an increase in faculty proposals to develop the college.
3.88 0.911
71 There is a continuous decline in the rate of complaints of faculty members.
383 1.080
67 Faculty members are never absent unless it is reasonable.
3.82 0.890
1Numbering appears as in the questionnaire.
Table 7. 23 Rank order for statements related to external stakeholders (marketplace). (N= 200).
No. of statement
1 Statement Rank order (Mean)
Std Deviation
74 There is a continuous decline in the number complaints arising from marketplaces.
3.81 0.969
75 There is an increase of loyalty on the part of employment for the company compared to competitors.
3.76 1.030
73 There is great interest of parties offering jobs to submit proposals for the development of the university and its outputs.
3.75 1.056
72 There is a continuous increase in the total number of marketplaces compared to competitors.
3.74 1.095
1Numbering appears as in the questionnaire.
Table 7. 24 Statistics of the overall ranks for customer (stakeholder) perspectives (statements 66-75, Tables 7.22-7.23).
Mean Standard deviation
Statements 66-75 3.851 0.327
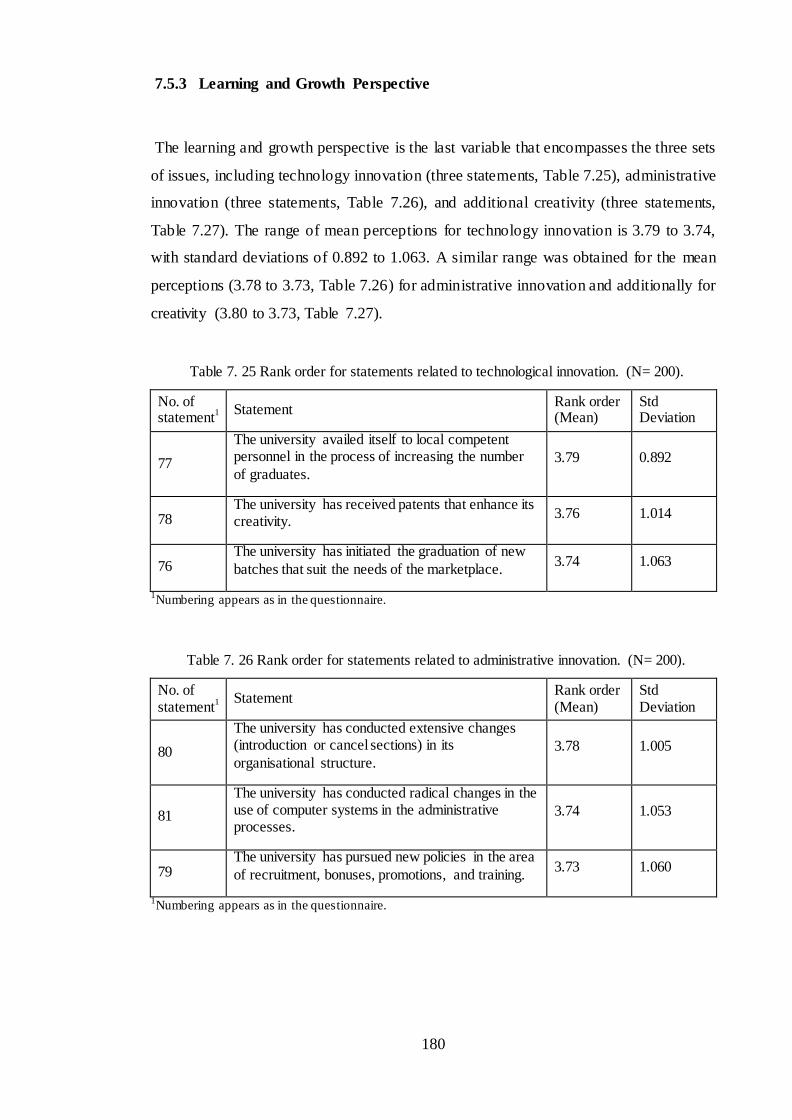
180
7.5.3 Learning and Growth Perspective
The learning and growth perspective is the last variable that encompasses the three sets
of issues, including technology innovation (three statements, Table 7.25), administrative
innovation (three statements, Table 7.26), and additional creativity (three statements,
Table 7.27). The range of mean perceptions for technology innovation is 3.79 to 3.74,
with standard deviations of 0.892 to 1.063. A similar range was obtained for the mean
perceptions (3.78 to 3.73, Table 7.26) for administrative innovation and additionally for
creativity (3.80 to 3.73, Table 7.27).
Table 7. 25 Rank order for statements related to technological innovation. (N= 200).
No. of statement
1 Statement Rank order (Mean)
Std Deviation
77
The university availed itself to local competent personnel in the process of increasing the number
of graduates. 3.79 0.892
78 The university has received patents that enhance its creativity.
3.76 1.014
76 The university has initiated the graduation of new
batches that suit the needs of the marketplace. 3.74 1.063
1Numbering appears as in the questionnaire.
Table 7. 26 Rank order for statements related to administrative innovation. (N= 200).
No. of statement
1 Statement Rank order (Mean)
Std Deviation
80
The university has conducted extensive changes (introduction or cancel sections) in its
organisational structure. 3.78 1.005
81
The university has conducted radical changes in the use of computer systems in the administrative processes.
3.74 1.053
79 The university has pursued new policies in the area
of recruitment, bonuses, promotions, and training. 3.73 1.060
1Numbering appears as in the questionnaire.
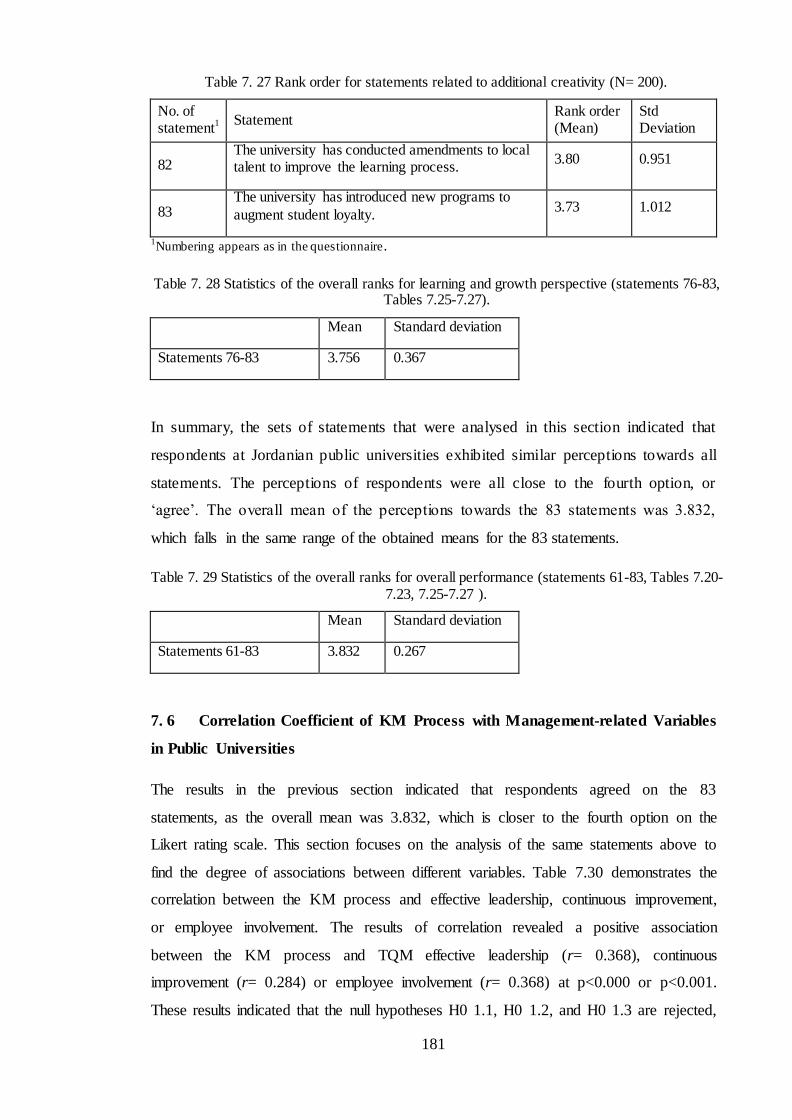
181
Table 7. 27 Rank order for statements related to additional creativity (N= 200).
No. of statement
1 Statement Rank order (Mean)
Std Deviation
82 The university has conducted amendments to local talent to improve the learning process.
3.80 0.951
83 The university has introduced new programs to
augment student loyalty. 3.73 1.012
1Numbering appears as in the questionnaire.
Table 7. 28 Statistics of the overall ranks for learning and growth perspective (statements 76-83, Tables 7.25-7.27).
Mean Standard deviation
Statements 76-83 3.756 0.367
In summary, the sets of statements that were analysed in this section indicated that
respondents at Jordanian public universities exhibited similar perceptions towards all
statements. The perceptions of respondents were all close to the fourth option, or
‘agree’. The overall mean of the perceptions towards the 83 statements was 3.832,
which falls in the same range of the obtained means for the 83 statements.
Table 7. 29 Statistics of the overall ranks for overall performance (statements 61-83, Tables 7.20-7.23, 7.25-7.27 ).
Mean Standard deviation
Statements 61-83 3.832 0.267
7. 6 Correlation Coefficient of KM Process with Management-related Variables
in Public Universities
The results in the previous section indicated that respondents agreed on the 83
statements, as the overall mean was 3.832, which is closer to the fourth option on the
Likert rating scale. This section focuses on the analysis of the same statements above to
find the degree of associations between different variables. Table 7.30 demonstrates the
correlation between the KM process and effective leadership, continuous improvement,
or employee involvement. The results of correlation revealed a positive association
between the KM process and TQM effective leadership (r= 0.368), continuous
improvement (r= 0.284) or employee involvement (r= 0.368) at p<0.000 or p<0.001.
These results indicated that the null hypotheses H0 1.1, H0 1.2, and H0 1.3 are rejected,

182
which means the alternative hypotheses H. 1.1, H.1.2, and H. 1.3 (see Chapter1) are
accepted.
Table 7 30 Correlation coefficient of KM processes with TQM effective leadership, continuous improvement, or employee involvement in public universities (N=200).
Variables
KM
Processes
Effective
Leadership
Continuous
Improvement
Employee
Involvement Correlation Coefficient Value (r)
0.368 0.284 0,368
Significance 0.000 0,001 0.000
Testing relevant hypothesis H0.1.1 is rejected
H0.1.2 is rejected
H0.1.3 is rejected
Table 7.31 also displays a positive association between KM technology and TQM
effective leadership (r= 0.383), employee involvement (r= 0.341), and continuous
improvement (r= 0.398) in public universities at p<0.000 or p<0.001. These results
indicate that the null hypotheses H0 1.4, H0 1.5, and H0 1.6 are rejected, which means
the alternative hypotheses H. 1.4, H. 1.5, and H. 1.6 (see Chapter 1) are accepted.
In addition, similar positive associations were found between team of knowledge and
effective leadership (r= 0.390), continuous improvement (r = 0.301), and employee
involvement (r = 0.354) at p<0.000. These results also indicate that the null hypotheses
H0 1.7, H0 1.8, and H0 1.9 are rejected, which means the alternative hypotheses H. 1.7,
H. 1.8, and H. 1.9 (see Chapter 1) are accepted.
Furthermore, the correlation coefficient between KM and TQM in public universities
demonstrated a moderate and positive correlation coefficient value (0.574) at p<0.000
(Table 7.32).
Table 7. 31 Correlation coefficient of KM technology with TQM effective leadership, employee involvement, and continuous improvement in the public universities (N=200).
Variables
KM
Technology
Effective
Leadership
Employee
Involvement
Continuous
Improvement
Correlation
Coefficient Value (r) 0.383 0.341 0.398
Significance 0.000 0.000 0.000
Testing relevant hypothesis H0.1.4 is rejected
H0.1.5 is rejected
H0.1.6 is rejected
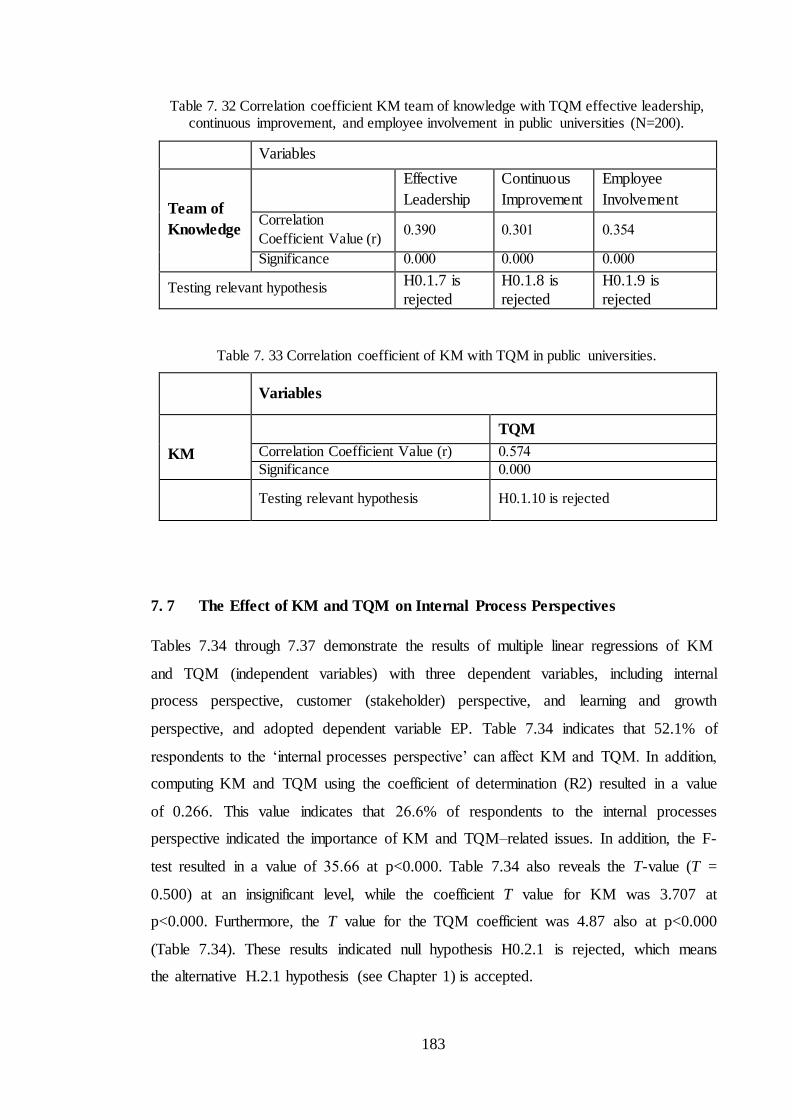
183
Table 7. 32 Correlation coefficient KM team of knowledge with TQM effective leadership, continuous improvement, and employee involvement in public universities (N=200).
Variables
Team of
Knowledge
Effective
Leadership
Continuous
Improvement
Employee
Involvement
Correlation
Coefficient Value (r) 0.390 0.301 0.354
Significance 0.000 0.000 0.000
Testing relevant hypothesis H0.1.7 is
rejected
H0.1.8 is
rejected
H0.1.9 is
rejected
Table 7. 33 Correlation coefficient of KM with TQM in public universities.
Variables
KM
TQM
Correlation Coefficient Value (r) 0.574
Significance 0.000
Testing relevant hypothesis H0.1.10 is rejected
7. 7 The Effect of KM and TQM on Internal Process Perspectives
Tables 7.34 through 7.37 demonstrate the results of multiple linear regressions of KM
and TQM (independent variables) with three dependent variables, including internal
process perspective, customer (stakeholder) perspective, and learning and growth
perspective, and adopted dependent variable EP. Table 7.34 indicates that 52.1% of
respondents to the ‘internal processes perspective’ can affect KM and TQM. In addition,
computing KM and TQM using the coefficient of determination (R2) resulted in a value
of 0.266. This value indicates that 26.6% of respondents to the internal processes
perspective indicated the importance of KM and TQM–related issues. In addition, the F-
test resulted in a value of 35.66 at p<0.000. Table 7.34 also reveals the T-value (T =
0.500) at an insignificant level, while the coefficient T value for KM was 3.707 at
p<0.000. Furthermore, the T value for the TQM coefficient was 4.87 also at p<0.000
(Table 7.34). These results indicated null hypothesis H0.2.1 is rejected, which means
the alternative H.2.1 hypothesis (see Chapter 1) is accepted.
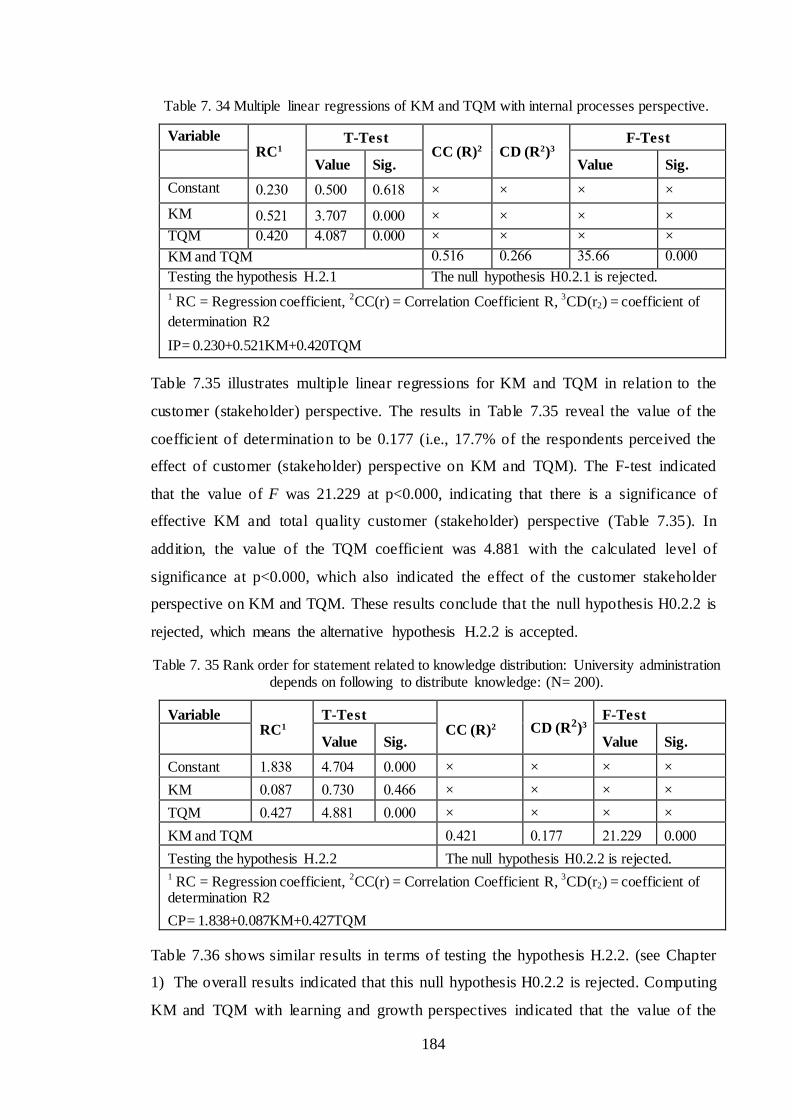
184
Table 7. 34 Multiple linear regressions of KM and TQM with internal processes perspective.
Variable RC1
T-Test CC (R)2 CD (R2)3
F-Test
Value Sig. Value Sig.
Constant 0.230 0.500 0.618 × × × ×
KM 0.521 3.707 0.000 × × × ×
TQM 0.420 4.087 0.000 × × × ×
KM and TQM 0.516 0.266 35.66 0.000
Testing the hypothesis H.2.1 The null hypothesis H0.2.1 is rejected.
1 RC = Regression coefficient,
2CC(r) = Correlation Coefficient R,
3CD(r2) = coefficient of
determination R2
IP= 0.230+0.521KM+0.420TQM
Table 7.35 illustrates multiple linear regressions for KM and TQM in relation to the
customer (stakeholder) perspective. The results in Table 7.35 reveal the value of the
coefficient of determination to be 0.177 (i.e., 17.7% of the respondents perceived the
effect of customer (stakeholder) perspective on KM and TQM). The F-test indicated
that the value of F was 21.229 at p<0.000, indicating that there is a significance of
effective KM and total quality customer (stakeholder) perspective (Table 7.35). In
addition, the value of the TQM coefficient was 4.881 with the calculated level of
significance at p<0.000, which also indicated the effect of the customer stakeholder
perspective on KM and TQM. These results conclude that the null hypothesis H0.2.2 is
rejected, which means the alternative hypothesis H.2.2 is accepted.
Table 7. 35 Rank order for statement related to knowledge distribution: University administration depends on following to distribute knowledge: (N= 200).
Variable RC1
T-Test CC (R)2 CD (R2)3
F-Test
Value Sig. Value Sig.
Constant 1.838 4.704 0.000 × × × ×
KM 0.087 0.730 0.466 × × × ×
TQM 0.427 4.881 0.000 × × × ×
KM and TQM 0.421 0.177 21.229 0.000
Testing the hypothesis H.2.2 The null hypothesis H0.2.2 is rejected. 1 RC = Regression coefficient,
2CC(r) = Correlation Coefficient R,
3CD(r2) = coefficient of
determination R2
CP= 1.838+0.087KM+0.427TQM
Table 7.36 shows similar results in terms of testing the hypothesis H.2.2. (see Chapter
1) The overall results indicated that this null hypothesis H0.2.2 is rejected. Computing
KM and TQM with learning and growth perspectives indicated that the value of the
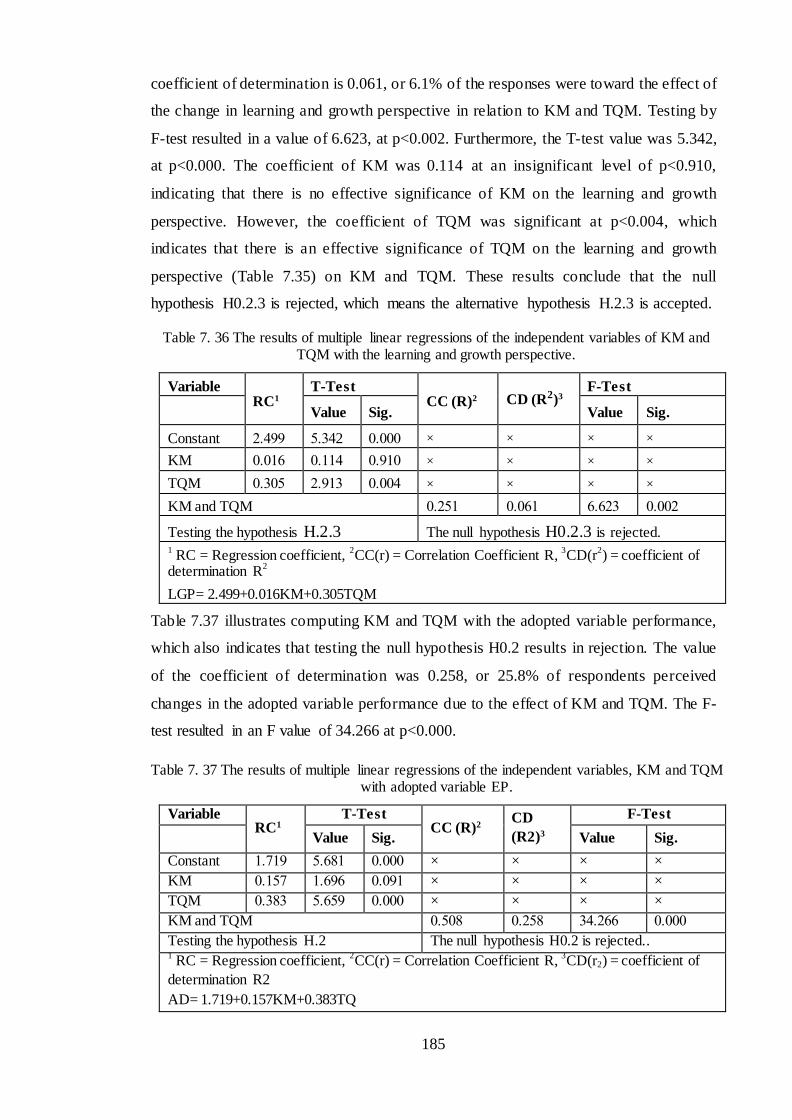
185
coefficient of determination is 0.061, or 6.1% of the responses were toward the effect of
the change in learning and growth perspective in relation to KM and TQM. Testing by
F-test resulted in a value of 6.623, at p<0.002. Furthermore, the T-test value was 5.342,
at p<0.000. The coefficient of KM was 0.114 at an insignificant level of p<0.910,
indicating that there is no effective significance of KM on the learning and growth
perspective. However, the coefficient of TQM was significant at p<0.004, which
indicates that there is an effective significance of TQM on the learning and growth
perspective (Table 7.35) on KM and TQM. These results conclude that the null
hypothesis H0.2.3 is rejected, which means the alternative hypothesis H.2.3 is accepted.
Table 7. 36 The results of multiple linear regressions of the independent variables of KM and TQM with the learning and growth perspective.
Variable
RC1 T-Test
CC (R)2 CD (R2)3 F-Test
Value Sig. Value Sig.
Constant 2.499 5.342 0.000 × × × ×
KM 0.016 0.114 0.910 × × × ×
TQM 0.305 2.913 0.004 × × × ×
KM and TQM 0.251 0.061 6.623 0.002
Testing the hypothesis H.2.3 The null hypothesis H0.2.3 is rejected. 1 RC = Regression coefficient,
2CC(r) = Correlation Coefficient R,
3CD(r
2) = coefficient of
determination R2
LGP= 2.499+0.016KM+0.305TQM
Table 7.37 illustrates computing KM and TQM with the adopted variable performance,
which also indicates that testing the null hypothesis H0.2 results in rejection. The value
of the coefficient of determination was 0.258, or 25.8% of respondents perceived
changes in the adopted variable performance due to the effect of KM and TQM. The F-
test resulted in an F value of 34.266 at p<0.000.
Table 7. 37 The results of multiple linear regressions of the independent variables, KM and TQM with adopted variable EP.
Variable RC1
T-Test CC (R)2
CD
(R2)3
F-Test
Value Sig. Value Sig.
Constant 1.719 5.681 0.000 × × × ×
KM 0.157 1.696 0.091 × × × ×
TQM 0.383 5.659 0.000 × × × ×
KM and TQM 0.508 0.258 34.266 0.000
Testing the hypothesis H.2 The null hypothesis H0.2 is rejected.. 1 RC = Regression coefficient,
2CC(r) = Correlation Coefficient R,
3CD(r2) = coefficient of
determination R2
AD= 1.719+0.157KM+0.383TQ
186
This result indicates that there is a significant effectiveness of both KM and TQM on
the adopted variable, performance. Table 7.37 also shows T value of 5.681, at p<0.000,
the T value for the coefficient of KM was 1.696, but at an insignificant level at p<0.091,
and the T value for the coefficient of TQM was 5.659, at a significant level at p<0.000.
7. 8 Summary
This chapter focused on the statistical analysis of data obtained from the online
questionnaire (Appendix A). Results indicated that the average perceptions of Jordanian
public university respondents towards different issues related to KM and TQM were
close to the fourth option on the Likert rating scale. This option indicates that
respondents agreed with the 83 statements on the questionnaire. In addition, all
correlation analyses demonstrated that the respondents’ perceptions exhibited positive
correlations at mostly high significance levels, which resulted in the support of the
hypotheses. These results indicated the presence of a significant effect of the integration
of KM and TQM in EP. The next chapter will focus on the analysis of respondents’
perceptions of Jordanian private universities.
187
CHAPTER EIGHT
RESEARCH FINDINGS FROM PRIVATE UNIVERSITIES
8. 1 Introduction
This chapter focuses on the findings that were obtained from respondents at Jordanian
private universities. As indicated in the previous chapter, respondents at public
universities agreed with the questionnaire’s statements and accepted the hypotheses. As
indicated in Chapters 2 and 7, KM and Chapters 3 and 7 TQM, are important issues
that support modern educational processes. Therefore, this chapter focuses on the
empirical data analysis generated by the online questionnaires (Appendix.A, Chapter 5).
It also focuses on the presentation and interpretation of the data to investigate how
respondents in private universities perceived KM and TQM related issues.
The Statistical Package for Social Sciences (SPSS) was also used to analyze the
perceptions of 151 respondents, aiming to answer the current research questions
(Chapter 1). The correlation between variables was mainly used to investigate the
relationship between variables. Therefore, the data were analyzed statistically using
different methods, including frequency, mean, Pearson Correlation, T-test, and F-test
methods for determining the relationship between different variable related to KM and
TQM. The magnitude of coefficients represents the level of strength of relationship
between computed variables. The optimum value of the correlation coefficient is +1 or
-1 which represents respectively the positive and negative correlation (Cohen et al.,
2003). Regardless of the direction, values of correlation coefficient (r) range between 1
(the strongest) and zero (no correlation). Thus, r = + 0.95 and r = -95 represent high
association and both values are equal in the degree of association of the measured
variables.
The structure of this Chapter is the same as in the previous Chapter which includes the
following sections:
• The Quantitative Data Analysis of Responses Perception in Private Universities.
• The Perception Towards KM.
• The Perception Towards TQM.
• Perception Towards Performance.
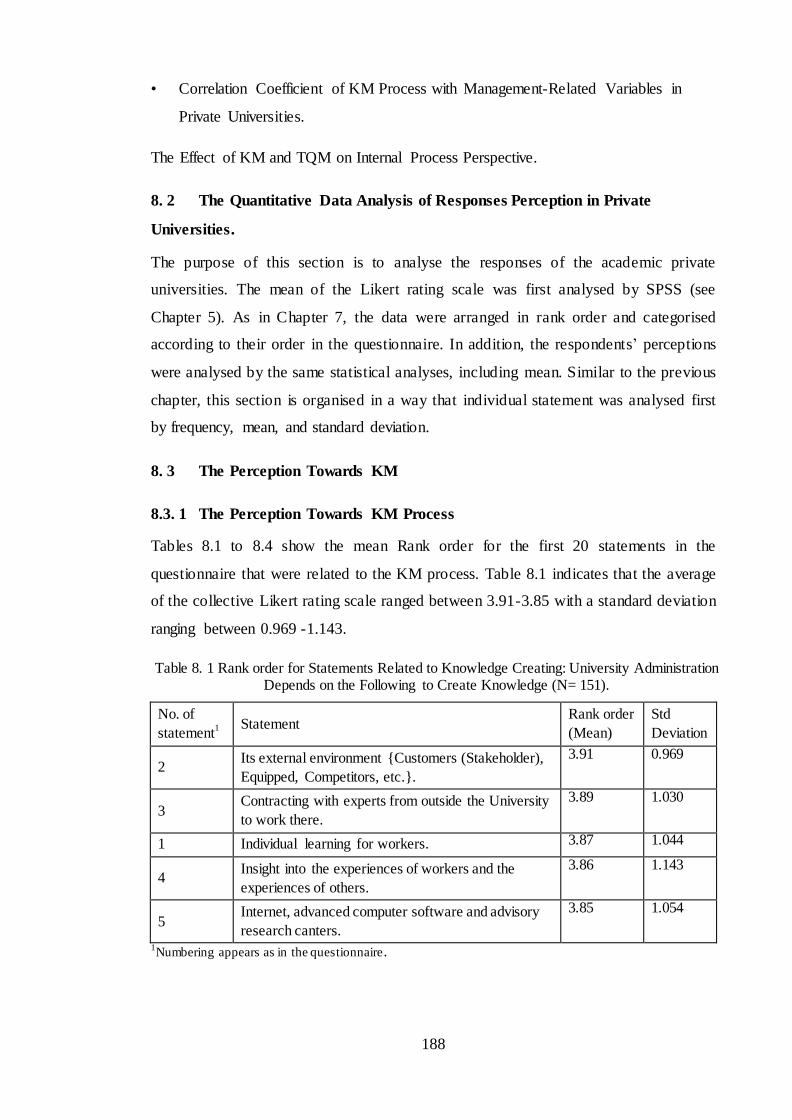
188
• Correlation Coefficient of KM Process with Management-Related Variables in
Private Universities.
The Effect of KM and TQM on Internal Process Perspective.
8. 2 The Quantitative Data Analysis of Responses Perception in Private
Universities.
The purpose of this section is to analyse the responses of the academic private
universities. The mean of the Likert rating scale was first analysed by SPSS (see
Chapter 5). As in Chapter 7, the data were arranged in rank order and categorised
according to their order in the questionnaire. In addition, the respondents’ perceptions
were analysed by the same statistical analyses, including mean. Similar to the previous
chapter, this section is organised in a way that individual statement was analysed first
by frequency, mean, and standard deviation.
8. 3 The Perception Towards KM
8.3. 1 The Perception Towards KM Process
Tables 8.1 to 8.4 show the mean Rank order for the first 20 statements in the
questionnaire that were related to the KM process. Table 8.1 indicates that the average
of the collective Likert rating scale ranged between 3.91-3.85 with a standard deviation
ranging between 0.969 -1.143.
Table 8. 1 Rank order for Statements Related to Knowledge Creating: University Administration Depends on the Following to Create Knowledge (N= 151).
No. of
statement1 Statement
Rank order
(Mean)
Std
Deviation
2 Its external environment {Customers (Stakeholder),
Equipped, Competitors, etc.}.
3.91 0.969
3 Contracting with experts from outside the University
to work there.
3.89 1.030
1 Individual learning for workers. 3.87 1.044
4 Insight into the experiences of workers and the
experiences of others.
3.86 1.143
5 Internet, advanced computer software and advisory
research canters.
3.85 1.054
1Numbering appears as in the questionnaire.
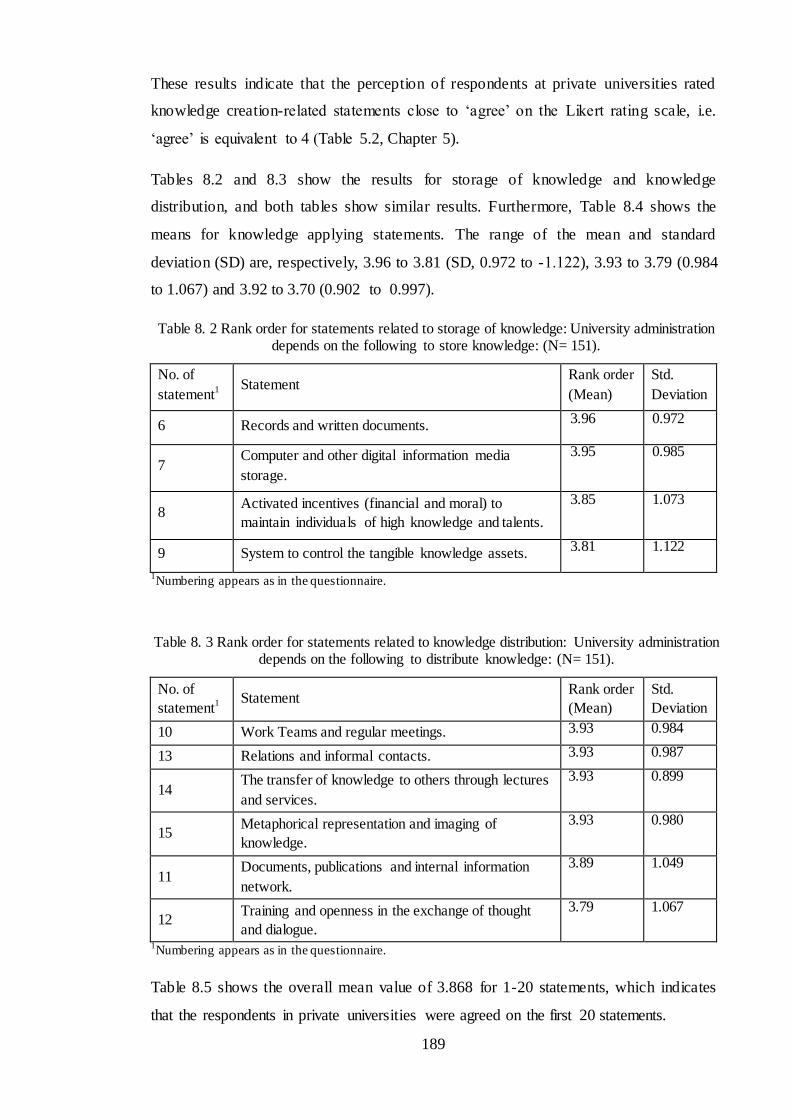
189
These results indicate that the perception of respondents at private universities rated
knowledge creation-related statements close to ‘agree’ on the Likert rating scale, i.e.
‘agree’ is equivalent to 4 (Table 5.2, Chapter 5).
Tables 8.2 and 8.3 show the results for storage of knowledge and knowledge
distribution, and both tables show similar results. Furthermore, Table 8.4 shows the
means for knowledge applying statements. The range of the mean and standard
deviation (SD) are, respectively, 3.96 to 3.81 (SD, 0.972 to -1.122), 3.93 to 3.79 (0.984
to 1.067) and 3.92 to 3.70 (0.902 to 0.997).
Table 8. 2 Rank order for statements related to storage of knowledge: University administration depends on the following to store knowledge: (N= 151).
No. of
statement1 Statement
Rank order
(Mean)
Std.
Deviation
6 Records and written documents. 3.96 0.972
7 Computer and other digital information media
storage.
3.95 0.985
8 Activated incentives (financial and moral) to
maintain individuals of high knowledge and talents.
3.85 1.073
9 System to control the tangible knowledge assets. 3.81 1.122
1Numbering appears as in the questionnaire.
Table 8. 3 Rank order for statements related to knowledge distribution: University administration depends on the following to distribute knowledge: (N= 151).
No. of
statement1 Statement
Rank order
(Mean)
Std.
Deviation
10 Work Teams and regular meetings. 3.93 0.984
13 Relations and informal contacts. 3.93 0.987
14 The transfer of knowledge to others through lectures
and services.
3.93 0.899
15 Metaphorical representation and imaging of
knowledge.
3.93 0.980
11 Documents, publications and internal information
network.
3.89 1.049
12 Training and openness in the exchange of thought
and dialogue.
3.79 1.067
1Numbering appears as in the questionnaire.
Table 8.5 shows the overall mean value of 3.868 for 1-20 statements, which indicates
that the respondents in private universities were agreed on the first 20 statements.
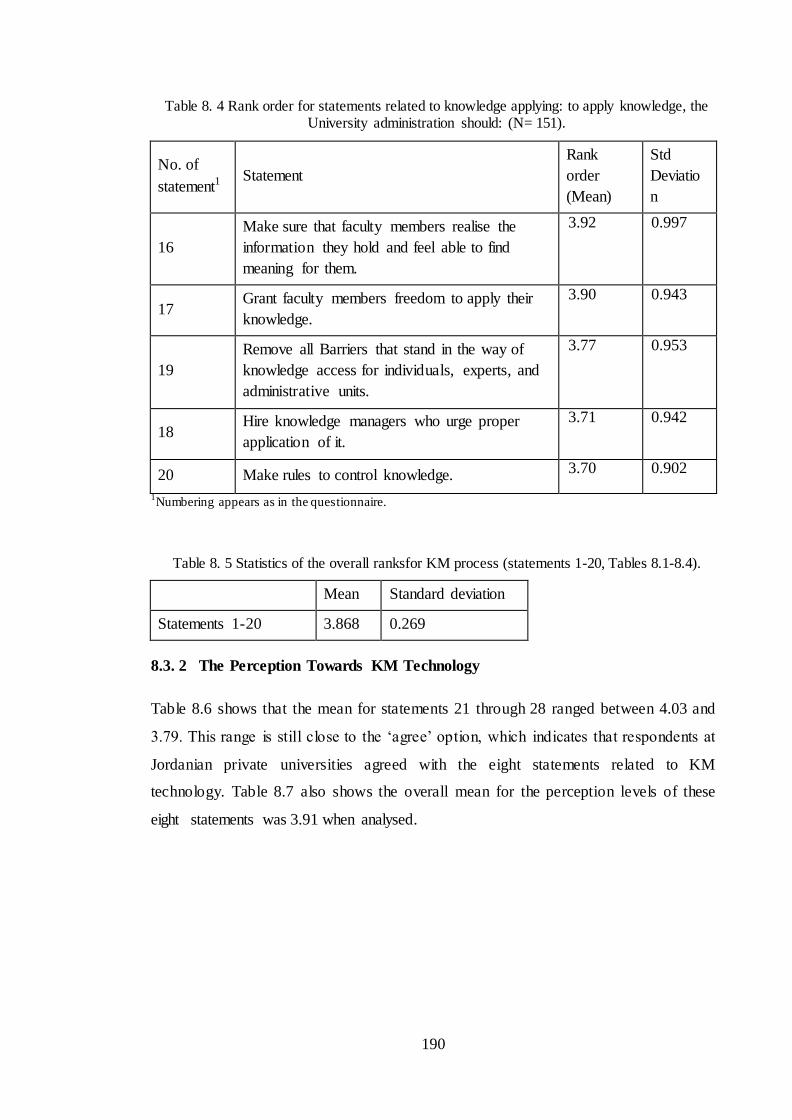
190
Table 8. 4 Rank order for statements related to knowledge applying: to apply knowledge, the University administration should: (N= 151).
No. of
statement1 Statement
Rank
order
(Mean)
Std
Deviatio
n
16
Make sure that faculty members realise the
information they hold and feel able to find
meaning for them.
3.92 0.997
17 Grant faculty members freedom to apply their
knowledge.
3.90 0.943
19
Remove all Barriers that stand in the way of
knowledge access for individuals, experts, and
administrative units.
3.77 0.953
18 Hire knowledge managers who urge proper
application of it.
3.71 0.942
20 Make rules to control knowledge. 3.70 0.902
1Numbering appears as in the questionnaire.
Table 8. 5 Statistics of the overall ranksfor KM process (statements 1-20, Tables 8.1-8.4).
Mean Standard deviation
Statements 1-20 3.868 0.269
8.3. 2 The Perception Towards KM Technology
Table 8.6 shows that the mean for statements 21 through 28 ranged between 4.03 and
3.79. This range is still close to the ‘agree’ option, which indicates that respondents at
Jordanian private universities agreed with the eight statements related to KM
technology. Table 8.7 also shows the overall mean for the perception levels of these
eight statements was 3.91 when analysed.
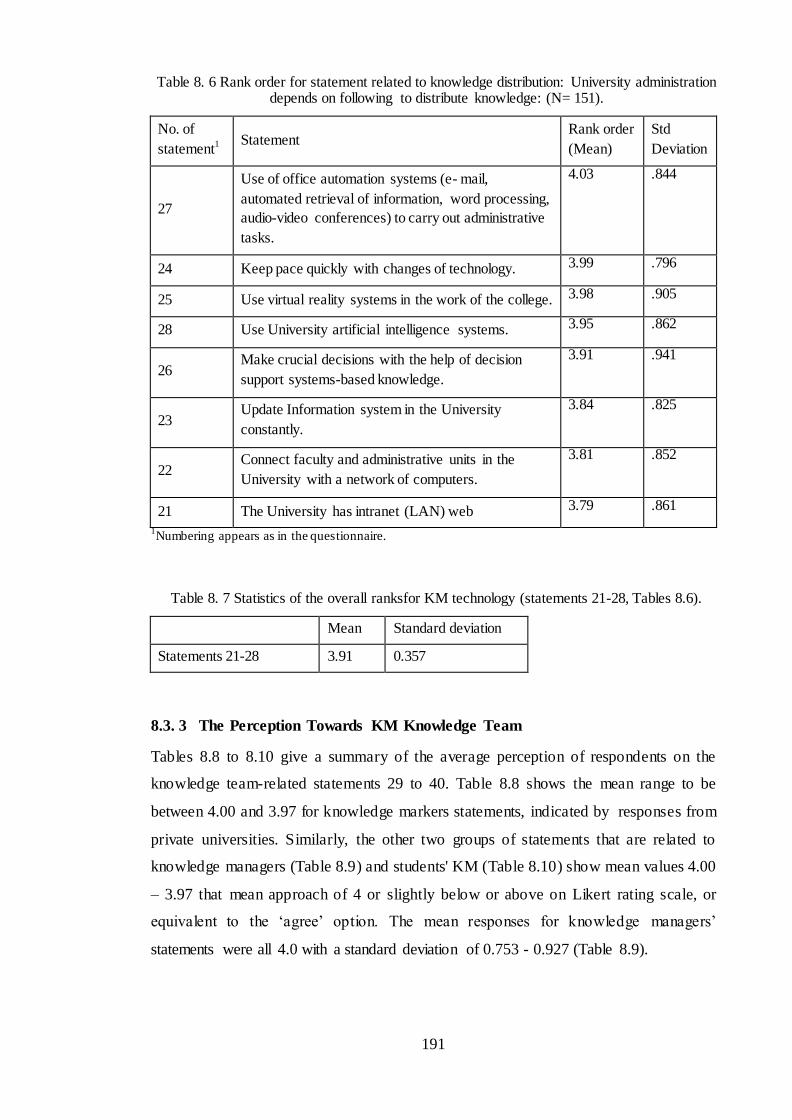
191
Table 8. 6 Rank order for statement related to knowledge distribution: University administration depends on following to distribute knowledge: (N= 151).
No. of
statement1 Statement
Rank order
(Mean)
Std
Deviation
27
Use of office automation systems (e- mail,
automated retrieval of information, word processing,
audio-video conferences) to carry out administrative
tasks.
4.03 .844
24 Keep pace quickly with changes of technology. 3.99 .796
25 Use virtual reality systems in the work of the college. 3.98 .905
28 Use University artificial intelligence systems. 3.95 .862
26 Make crucial decisions with the help of decision
support systems-based knowledge.
3.91 .941
23 Update Information system in the University
constantly.
3.84 .825
22 Connect faculty and administrative units in the
University with a network of computers.
3.81 .852
21 The University has intranet (LAN) web 3.79 .861
1Numbering appears as in the questionnaire.
Table 8. 7 Statistics of the overall ranksfor KM technology (statements 21-28, Tables 8.6).
Mean Standard deviation
Statements 21-28 3.91 0.357
8.3. 3 The Perception Towards KM Knowledge Team
Tables 8.8 to 8.10 give a summary of the average perception of respondents on the
knowledge team-related statements 29 to 40. Table 8.8 shows the mean range to be
between 4.00 and 3.97 for knowledge markers statements, indicated by responses from
private universities. Similarly, the other two groups of statements that are related to
knowledge managers (Table 8.9) and students' KM (Table 8.10) show mean values 4.00
– 3.97 that mean approach of 4 or slightly below or above on Likert rating scale, or
equivalent to the ‘agree’ option. The mean responses for knowledge managers’
statements were all 4.0 with a standard deviation of 0.753 - 0.927 (Table 8.9).

192
Table 8. 8 Rank Order for Statements Related to Knowledge-Makers: (N= 151).
No. of
statement1 Statement
Rank order
(Mean)
Std
Deviation
30
University knowledge-makers maintain modernity
and advancement of knowledge as well as
communicate with the outside
4.00 0.757
31 They act as consultants for the university in the field
of knowledge.
3.99 0.856
29 The University has its own qualified knowledge-
makers and relies on them.
3.97 0.832
1Numbering appears as in the questionnaire.
Table 8. 9 Rank Order for statements related to knowledge managers: University knowledge managers carry out the following: (N= 151).
No. of
statement1 Statement
Rank order (Mean)
Std Deviation
35 Representation and adaptation of knowledge along with well application of it by university staff
4.11 0.694
34 Development of KM programs and its
implementation. 4.03 0.836
33 Draw results from the knowledge base. 4.02 0.883
32 Collection, classification and knowledge transfer to
the knowledge base. 3.97 0.927
1Numbering appears as in the questionnaire.
Furthermore, Table 8.10 indicates that respondents’ perception to the ‘agree’ option
ranged between 4.11 and 3.99, with a standard deviation of 0.655 to 0.841 (Table 8.10).
Grouping the statements 29 to 40 also showed a mean value of four with standard
deviation of 0.244. This result indicates that the perception of respondents towards team
knowledge statements was positive, as respondents selected the ‘agree’ option.
Computing the responses to statements 1 to 40 (Tables 8.1 to 8.4, 8.6 to 8.10) also
showed similar results, with respect to the collective mean (3.933, Table 8.12) for
statements 1 to 40 was obtained which confirm the perception of respondents’
agreement. In addition, the results in Table 8.12 represent a summary of the results of
respondents’ perception of the KM process, KM technology, and knowledge teams at
private universities in Jordan.
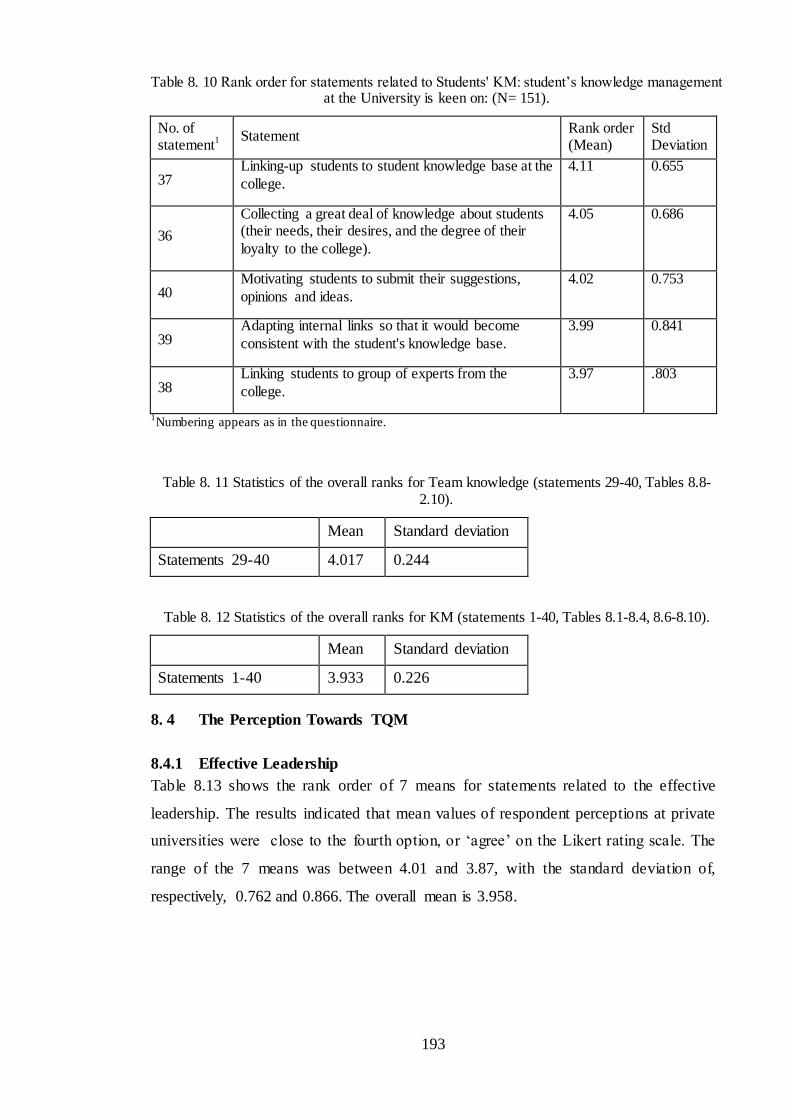
193
Table 8. 10 Rank order for statements related to Students' KM: student’s knowledge management at the University is keen on: (N= 151).
No. of statement
1 Statement Rank order (Mean)
Std Deviation
37 Linking-up students to student knowledge base at the
college.
4.11 0.655
36
Collecting a great deal of knowledge about students (their needs, their desires, and the degree of their
loyalty to the college).
4.05 0.686
40 Motivating students to submit their suggestions,
opinions and ideas.
4.02 0.753
39 Adapting internal links so that it would become
consistent with the student's knowledge base.
3.99 0.841
38 Linking students to group of experts from the
college.
3.97 .803
1Numbering appears as in the questionnaire.
Table 8. 11 Statistics of the overall ranks for Team knowledge (statements 29-40, Tables 8.8-2.10).
Mean Standard deviation
Statements 29-40 4.017 0.244
Table 8. 12 Statistics of the overall ranks for KM (statements 1-40, Tables 8.1-8.4, 8.6-8.10).
Mean Standard deviation
Statements 1-40 3.933 0.226
8. 4 The Perception Towards TQM
8.4.1 Effective Leadership
Table 8.13 shows the rank order of 7 means for statements related to the effective
leadership. The results indicated that mean values of respondent perceptions at private
universities were close to the fourth option, or ‘agree’ on the Likert rating scale. The
range of the 7 means was between 4.01 and 3.87, with the standard deviation of,
respectively, 0.762 and 0.866. The overall mean is 3.958.

194
Table 8. 13 Rank order for statements related to variable of effective leadership (TQM Processes) (N= 151).
No. of statement
1 Statement Rank order
(Mean)
Std
Deviation
45
The University has competent research and development units to determine the needs and desires
of the market place and exceed these requirements.
4.01 0.762
41 The senior administration adopts a strategic plan to
achieve quality in all areas of the college.
4.00 0.783
42
The university adopts the principle of quality as the responsibility of all sections and parties involved in
the college.
3.99 0.766
47 Higher administration makes radical changes to make the quality a part of the organisation’s systems and operations.
3.97 0.860
43 The university administration puts forward plans for continuous improvement and encouragement of employees to participate.
3.94 0.866
44
Communication channels to the market place should be available at the university to investigate grievances, opinions and suggestions about the value-quality of graduates.
3.93 0.806
46 Higher administration decisions are made on the basis of facts and data or based on the recommendations of the staff and students.
3.87 0.859
1Numbering appears as in the questionnaire.
Table 8. 14 Statistics of the overall ranks for effective leadership (statements 41-47, Tables 8.13).
Mean Standard deviation
Statements 41-47 3.958 0.350
8.4.2 Continuous Improvements
Table 8.15 shows the means of respondent perceptions for five statements related to
continuous improvement. The results indicated that respondents to these statements
were similar to the previous perception level, or close to the fourth Likert rating option
‘agree’. The range for the means of these five statements is between 3.97 and 3.85 with
0.734 and 0.86 respectively (Table 8.15). Computing these statements using overall
mean of these 5 statements was 3.86.
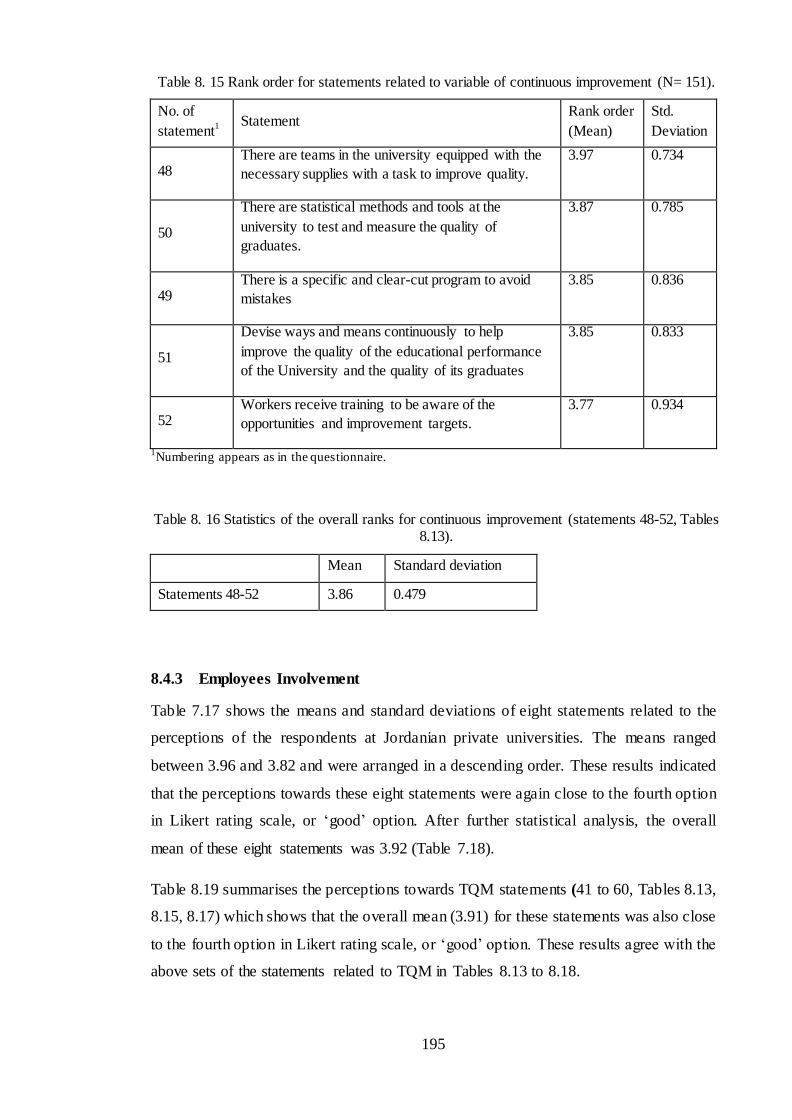
195
Table 8. 15 Rank order for statements related to variable of continuous improvement (N= 151).
No. of
statement1 Statement
Rank order
(Mean)
Std.
Deviation
48 There are teams in the university equipped with the
necessary supplies with a task to improve quality.
3.97 0.734
50
There are statistical methods and tools at the
university to test and measure the quality of
graduates.
3.87 0.785
49 There is a specific and clear-cut program to avoid
mistakes
3.85 0.836
51
Devise ways and means continuously to help
improve the quality of the educational performance
of the University and the quality of its graduates
3.85 0.833
52 Workers receive training to be aware of the
opportunities and improvement targets.
3.77 0.934
1Numbering appears as in the questionnaire.
Table 8. 16 Statistics of the overall ranks for continuous improvement (statements 48-52, Tables 8.13).
Mean Standard deviation
Statements 48-52 3.86 0.479
8.4.3 Employees Involvement
Table 7.17 shows the means and standard deviations of eight statements related to the
perceptions of the respondents at Jordanian private universities. The means ranged
between 3.96 and 3.82 and were arranged in a descending order. These results indicated
that the perceptions towards these eight statements were again close to the fourth option
in Likert rating scale, or ‘good’ option. After further statistical analysis, the overall
mean of these eight statements was 3.92 (Table 7.18).
Table 8.19 summarises the perceptions towards TQM statements (41 to 60, Tables 8.13,
8.15, 8.17) which shows that the overall mean (3.91) for these statements was also close
to the fourth option in Likert rating scale, or ‘good’ option. These results agree with the
above sets of the statements related to TQM in Tables 8.13 to 8.18.

196
Table 8. 17 Rank order for statements related to Variable of Staff Involved: (N= 151).
No. of
statement1 Statement
Rank
order
(Mean)
Std
Deviatio
n
59
Facilitate communication and strengthen links
between the faculty and staff and senior
management
3.99 0.792
54 Faculty and staff are empowered to resolve
major problems related to graduates.
3.98 0.787
56
The University has an efficient system to
motivate individuals (financially and morally) to
participate.
3.95 0.843
55 Faculty members and staff partake in solving the
main problems at college.
3.91 0.871
60
There are efficient programs that help faculty
members get acquainted with the objectives and
mechanisms of the university functions.
3.91 0.948
53 Faculty members partake in making strategic
decisions regarding quality
3.89 0.873
58
Administration works on removing fears among
members of the faculty and staff while doing
their job.
3.88 0.840
57 The university system rewards persons showing
creativity.
3.83 0.941
1Numbering appears as in the questionnaire.
Table 8. 18 Statistics of the overall ranks for employee involvement (statements 53-60, Table 8.1).
Mean Standard deviation
Statements 53-60 3.92 0.364
Table 8. 19 Statistics of the overall ranks for TQM (statements 41-60, Tables 8.13, 8.15, 8.17).
Mean Standard deviation
Statements 41-60 3.91 0.312
8. 5 Perception towards performance
This section presents the statistical analysis results for how respondents at private
universities perceive performance in the internal processes, customers’ (stakeholder)
perspective, and learning and growth perspective (Tables 8.20-8.28). In addition, Table
8.29 will summarise the overall perceptions of the academic staff at Jordanian private
universities that were selected in this study.

197
8.5.1 Perspective of Internal Processes
Table 8.20 shows the mean perception of individual statement related to the internal
processes. Table 8.20 showed the perceptions for the internal processes perspectives.
The results indicated that the range of mean perceptions was 3.97 -3.85.
Table 8. 20 Rank order for statements related to variable internal processes perspective: (n= 151).
No. of
statement1 Statement
Rank
order
(Mean)
Std
Deviatio
n
61 There is a continuous increase in the
productivity of faculty members at the college.
3.97 0.875
65 There is a continuous increase in the rate of
development for educational environment.
3.94 0.975
63 There is a continuous increase in the rate of use
of educational technology.
3.93 0.899
64
There is a continuous increase in the rate of
development for curriculum and educational
programs.
3.91 0.894
62
There is a continuous increase in the rate of the
production capacity of the administrative
system.
3.90 0.885
1Numbering appears as in the questionnaire.
The means were arranged in a descending order. However, in respect to the Likert rating
scale, these results indicated that all mean values were close to the fourth option. This
option represents the ‘agree’ option, which suggests that respondents agreed with the
statements related to the internal processes perspectives.
Table 8.21 shows the overall statistical analysis for internal processes perspectives. The
overall mean for these 5 statements is 3.93.
Table 8. 21 Statistics of the overall ranks for perspective of internal processes (statements 61-65, Table 8.20).
Mean Standard deviation
Statements 61-65 3.93 0.417
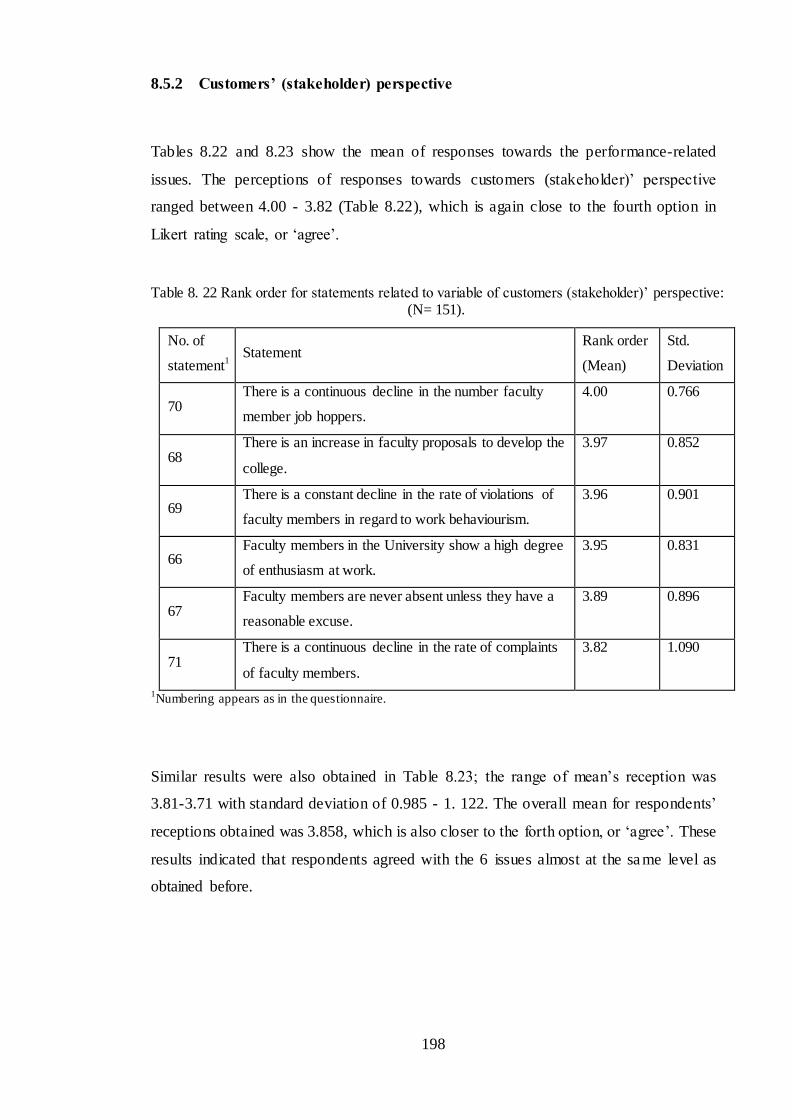
198
8.5.2 Customers’ (stakeholder) perspective
Tables 8.22 and 8.23 show the mean of responses towards the performance-related
issues. The perceptions of responses towards customers (stakeholder)’ perspective
ranged between 4.00 - 3.82 (Table 8.22), which is again close to the fourth option in
Likert rating scale, or ‘agree’.
Table 8. 22 Rank order for statements related to variable of customers (stakeholder)’ perspective: (N= 151).
No. of
statement1
Statement Rank order
(Mean)
Std.
Deviation
70 There is a continuous decline in the number faculty
member job hoppers.
4.00 0.766
68 There is an increase in faculty proposals to develop the
college.
3.97 0.852
69 There is a constant decline in the rate of violations of
faculty members in regard to work behaviourism.
3.96 0.901
66 Faculty members in the University show a high degree
of enthusiasm at work.
3.95 0.831
67 Faculty members are never absent unless they have a
reasonable excuse.
3.89 0.896
71 There is a continuous decline in the rate of complaints
of faculty members.
3.82 1.090
1Numbering appears as in the questionnaire.
Similar results were also obtained in Table 8.23; the range of mean’s reception was
3.81-3.71 with standard deviation of 0.985 - 1. 122. The overall mean for respondents’
receptions obtained was 3.858, which is also closer to the forth option, or ‘agree’. These
results indicated that respondents agreed with the 6 issues almost at the sa me level as
obtained before.

199
Table 8. 23 Rank order for statements related to external stakeholders (marketplace). (N= 151).
No. of
statement1 Statement
Rank
order
(Mean)
Std
Deviation
74 There is a continuous decline in the number complaints
arising from marketplaces.
3.81 0.985
73 There is great interest of parties offering jobs to submit
proposals for the development of the University and its outputs.
3.75 1.039
72 There is a continuous increase in the total number of
marketplaces compared to competitors.
3.72 1.122
75 There is an increase of loyalty on the part of employment for
the company compared to competitors
3.72 1.096
1Numbering appears as in the questionnaire.
Table 8. 24 Statistics of the overall ranks for customers’ (stakeholder) perspective (statements 66-75, Tables 8.22-8.23).
Mean Standard deviation
Statements 66-75 3.858 0.331
8.5.3 Learning and Growth perspective
The learning and growth perspective is the last variable, which encompasses 3 sets of
issues, including technology innovation (3 statements, Table 8.25), administrative
innovation (3 statements, Table 8.26), and additional creativity (3 statements, Table 8.27).
The range of mean perceptions for technology innovation is 3.92-3.78, with the standard
deviation of 0.918 - 0.973. A similar range was obtained for the mean perceptions (3.94
- 3.83, Table 8.26) for administrative innovation and for additional creativity (3.96-3.81,
6.27).
Table 8. 25 Rank order for statements related to technological innovation. (N= 151).
No. of
statement1 Statement
Rank order
(Mean)
Std
Deviation
76 The University has initiated the graduation of new
batches that suit and the needs of the marketplace. 3.92 0.973
78 The University has received patents that enhance its
creativity. 3.91 0.918
77
The University availed itself to local competent
personnel in the process of increasing the number of
graduates.
3.78 0.944
1Numbering appears as in the questionnaire.
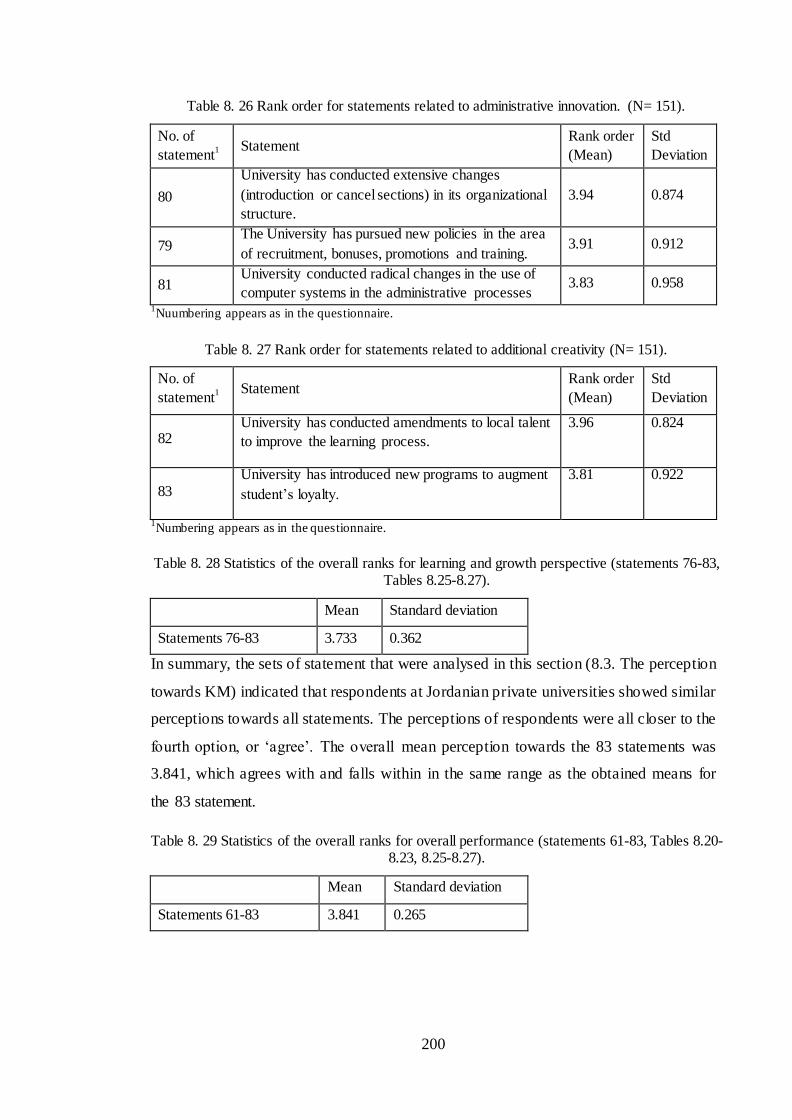
200
Table 8. 26 Rank order for statements related to administrative innovation. (N= 151).
No. of
statement1 Statement
Rank order
(Mean)
Std
Deviation
80
University has conducted extensive changes
(introduction or cancel sections) in its organizational
structure.
3.94 0.874
79 The University has pursued new policies in the area
of recruitment, bonuses, promotions and training. 3.91 0.912
81 University conducted radical changes in the use of
computer systems in the administrative processes 3.83 0.958
1Nuumbering appears as in the questionnaire.
Table 8. 27 Rank order for statements related to additional creativity (N= 151).
No. of
statement1 Statement
Rank order
(Mean)
Std
Deviation
82 University has conducted amendments to local talent
to improve the learning process.
3.96 0.824
83 University has introduced new programs to augment
student’s loyalty.
3.81 0.922
1Numbering appears as in the questionnaire.
Table 8. 28 Statistics of the overall ranks for learning and growth perspective (statements 76-83, Tables 8.25-8.27).
Mean Standard deviation
Statements 76-83 3.733 0.362
In summary, the sets of statement that were analysed in this section (8.3. The perception
towards KM) indicated that respondents at Jordanian private universities showed similar
perceptions towards all statements. The perceptions of respondents were all closer to the
fourth option, or ‘agree’. The overall mean perception towards the 83 statements was
3.841, which agrees with and falls within in the same range as the obtained means for
the 83 statement.
Table 8. 29 Statistics of the overall ranks for overall performance (statements 61-83, Tables 8.20-8.23, 8.25-8.27).
Mean Standard deviation
Statements 61-83 3.841 0.265

201
8. 6 Correlation coefficient of KM process with management-related variables
in private universities
The results in the previous section indicated that respondents agreed on the 83
statements, as the overall mean was closer to the fourth option in Likert rating scale.
This section focuses on the analysis of the same statements above to find the degree of
associations between different variables. Table 8.30 shows the correlation between KM
process and effective leadership, continuous improvement and? employee involvement.
The results of correlation showed positive association between KM process and
effective leadership (r = 0.414), continuous improvement (r = 0.249) or employee
involvement (r = 0.404) at p<0.000 or p<0.001. These results indicate that the null
hypotheses H0 1.1. H0 1.2 and H0 1.3 are rejected, and that means the alternative
hypotheses H 1.1. H 1.2 and H 1.3 (see Chapter 1) are accepted.
Table 8. 30 Correlation Coefficient of KM processes with effective leadership, continuous improvement or employee involvement in the private universities (N=151).
Variables
KM
Processes
Effective
leadership
Continuous
Improvement Employee
involvement
Correlation
Coefficient Value
(r)
0.414 0.249 0.404
Significance 0.000 0.001 0.000
Testing relevant hypothesis H0.1.1 is rejected
H0.1.2 is rejected
H0.1.3 is rejected
Table 8.31 also shows positive association between KM technology and effective
leadership (r= 0.406), employee involvement (r= 0.338) and continuous improvement
(r= 0.393) in the private universities at p<0.000 or p<0.001. These results indicate that
the null hypotheses H0 1.4. H0 1.5 and H0 1.6 are rejected, and that means the
alternative hypotheses H 1.4. H 1.5 and H 1.6 (see Chapter 1) are accepted.

202
Table 8. 31 Correlation coefficient of KM technology with effective leadership, continuous improvement in the private universities (N=151).
Variables
KM
Technology
Effective
leadership
Employee
involvement
Continuous
improvement
Correlation
Coefficient Value
(r)
0.406 0.338 0.393
Significance 0.000 0.000 0.000
Testing relevant hypothesis H0.1.4 is
rejected
H0.1.5 is
rejected
H0.1.6 is
rejected
In addition, similar positive association was found between team of knowledge and
effective leadership (r= 0.468), continuous improvement (r= 0.350), and? employee
involvement (r= 0.442) at p<0.000. These results also indicate that null hypotheses H0
1.7. H0 1.8 and H0 1.9 are rejected, and that means the alternative hypotheses H.1.7. H
1.8 and H 1.9 (see Chapter 1) are accepted.
Table 8. 32 Correlation coefficient KM team of knowledge with effective leadership, continuous improvement and? employee involvement in the private universities (N=151).
Variables
Team of
Knowledge
effective
leadership
continuous
improvement
employee
involvement
Correlation Coefficient
Value (r) 0.468 0.350 0.442
Significance 0.000 0.000 0.000
Testing relevant hypothesis H0.1.7 is
rejected
H0.1.8 is
rejected
H0.1.9 is
rejected
Furthermore, the correlation coefficient between KM and TQM in the private
universities showed moderate and positive correlation coefficient value (0.613) at
p<0.000 (Table 8.33).
Table 8. 33 Correlation coefficient of KM with TQM in the private universities.
Variables TQM
KM
Correlation Coefficient Value (r) 0.613
Significance 0.000
Testing relevant hypothesis H0.1.10 is rejected

203
8. 7 The effect of KM and TQM on internal process perspective
Tables 8.34-8.37 show the results of multiple linear regressions of KM and TQM
(independent variables) with 3 dependent variables, including internal process
perspective, customer (stakeholder) perspective, and learning and growth perspective,
and adopted independent variable EP. Table 8.34 indicates that 46.8 % of respondents
to the ‘internal possess perspective’ can affect KM and TQM. In addition, computing
KM and TQM using coefficient of determination (R2) gave a value of 0.259. This value
indicates that 25.9 % of respondents to the internal processes perspective indicated the
importance of KM and TQM –related issues. In addition, F-test gave a value of 25.872
at p<0.000. Table 8.34 also shows T-value (T = 0.892) at insignificance level while the
coefficient T value for KM was 2.839 at p<0.005. Furthermore, the T value for TQM
coefficient was 3.482 at also p<0.001 (Table 8.34).
Table 8. 34 Multiple linear regressions of KM and TQM with internal processes perspective.
Variable RC1
T-Test CC (R)2 CD (R2)3
F-Test
Value Sig. Value Sig.
Constant 0.462 0.892 0.274 × × × ×
KM 0.468 2.839 0.005 × × × ×
TQM 0.416 3.482 0.001 × × × ×
0.509 0.509 0.259 25.872 0.000
Testing the hypothesis H.2.1 The null hypothesis H0.2.1 is rejected. 1 RC = Regression coefficient, 2CC(r) = Correlation Coefficient R, 3CD(r2) = coefficient of determination R2
IP= 0.462+0.468KM+0.416TQM
These results indicated that the null hypothesis H0.2.1 is rejected, and that means
hypothesis H.2.1 (see Chapter 1) is accepted.
Table 8.35 shows the multiple linear regressions for KM and TQM in relation to
customer (stakeholder) perspective. The results in Table 8.35 show that the value of the
coefficient of determination (0.171) or 17.1 % of the respondents perceived the effect of
customer (stakeholder) perspective on KM and TQM. F-test indicated that the value of
F was 15.254 at p<0.000, indicating that KM and TQM have a significant effect on
Customer (Stakeholder) Perspective (Table 8.35).
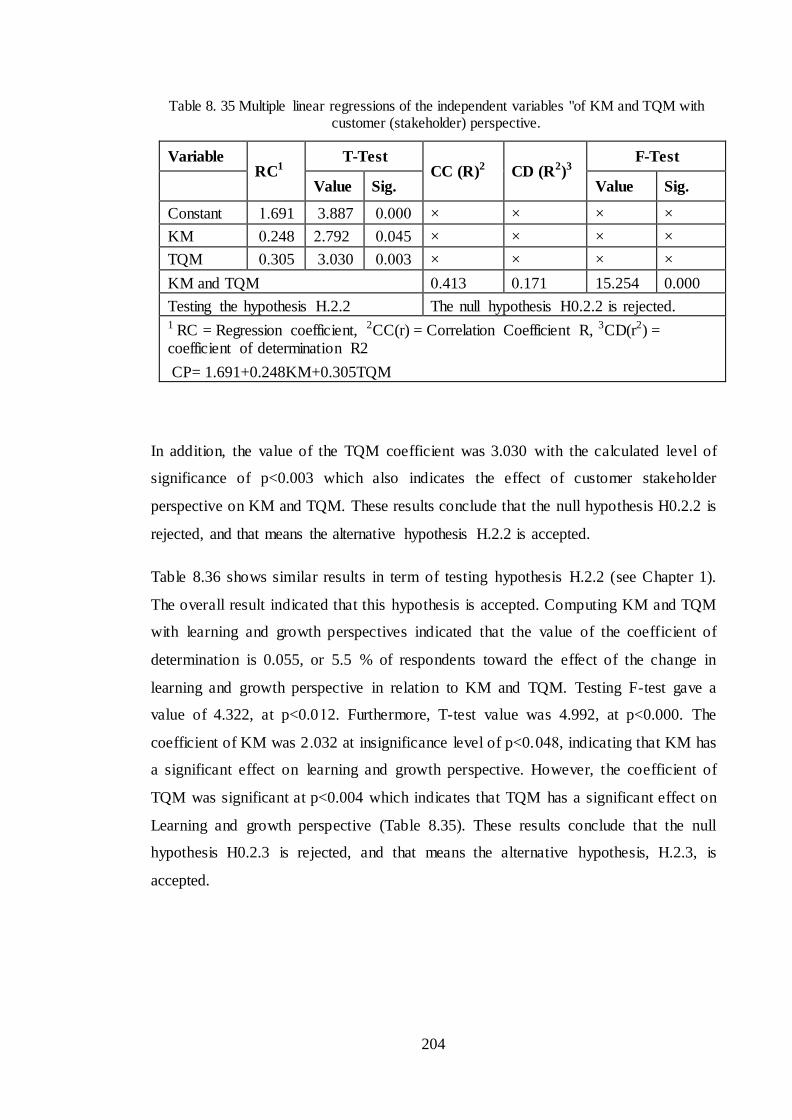
204
Table 8. 35 Multiple linear regressions of the independent variables "of KM and TQM with customer (stakeholder) perspective.
Variable RC1
T-Test CC (R)2 CD (R2)3
F-Test
Value Sig. Value Sig.
Constant 1.691 3.887 0.000 × × × ×
KM 0.248 2.792 0.045 × × × ×
TQM 0.305 3.030 0.003 × × × ×
KM and TQM 0.413 0.171 15.254 0.000
Testing the hypothesis H.2.2 The null hypothesis H0.2.2 is rejected. 1 RC = Regression coefficient, 2CC(r) = Correlation Coefficient R, 3CD(r2) = coefficient of determination R2
CP= 1.691+0.248KM+0.305TQM
In addition, the value of the TQM coefficient was 3.030 with the calculated level of
significance of p<0.003 which also indicates the effect of customer stakeholder
perspective on KM and TQM. These results conclude that the null hypothesis H0.2.2 is
rejected, and that means the alternative hypothesis H.2.2 is accepted.
Table 8.36 shows similar results in term of testing hypothesis H.2.2 (see Chapter 1).
The overall result indicated that this hypothesis is accepted. Computing KM and TQM
with learning and growth perspectives indicated that the value of the coefficient of
determination is 0.055, or 5.5 % of respondents toward the effect of the change in
learning and growth perspective in relation to KM and TQM. Testing F-test gave a
value of 4.322, at p<0.012. Furthermore, T-test value was 4.992, at p<0.000. The
coefficient of KM was 2.032 at insignificance level of p<0.048, indicating that KM has
a significant effect on learning and growth perspective. However, the coefficient of
TQM was significant at p<0.004 which indicates that TQM has a significant effect on
Learning and growth perspective (Table 8.35). These results conclude that the null
hypothesis H0.2.3 is rejected, and that means the alternative hypothesis, H.2.3, is
accepted.

205
Table 8. 36 The results of multiple linear regressions of the independent variables "of KM and TQM with learning and growth perspective.
Variable RC1
T-Test CC (R)2 CD (R2)3
F-Test
Value Sig. Value Sig.
Constant 2.535 4.992 0.000 × × × ×
KM 0.065 2.032 0.048 × × × ×
TQM 0.241 2.055 0.042 × × × ×
KM and TQM 0.235 0.055 4.322 0.015
Testing the hypothesis H.2.3 The null hypothesis H0.2.3 is rejected.
1 RC = Regression coefficient, 2CC(r) = Correlation Coefficient R, 3CD(r2) =
coefficient of determination R2
LGP= 2.535+0.065KM+0.241TQM
Table 8.37 shows computed values for KM and TQM with adopted variable
performance, which also indicates that testing the hypothesis H0.2 is rejected, and that
means the alternative hypothesis H.2 is accepted. The value of the coefficient of
determination was 0.294, or 29.4% of respondents perceive changes in adopted variable
performance due to the effect of KM and TQM.
Table 8. 37 The results of multiple linear regressions of the independent variables, KM and TQM with adopted variable EP.
Variable RC1
T-Test CC (R)2 CD (R2)3
F-Test
Value Sig. Value Sig.
Constant 1.563 4.856 0.000
KM 0.260 2.541 0.012 × × × ×
TQM 0.321 4.314 0.000 × × × ×
KM and TQM 0.542 5.294 30.834 0.000
Testing the hypothesis H.2 The null hypothesis H0.2 is rejected.
1 RC = Regression coefficient, 2CC(r) = Correlation Coefficient R, 3CD(r2) =
coefficient of determination R2
AD= 1.563+0.260KM+0.321TQM
F-test gave F value of 30.834 at p<0.000. This result indicates that there is a
significance effectiveness of both KM and TQM on adopted variable performance.
Table 8.37 also shows T value of 2.541, at p<0.01, the T value for coefficient of KM
was 2.541, but represented an insignificant level at p<0.012, and T value for coefficient
of TQM was 4.314, at a significant level of p<0.000.
206
8. 8 Summary
This Chapter focused on the statistical analysis of data obtained from the online
questionnaire (Appendix.A) for private universities in Jordan. The results in this
Chapter were similar to the ones that obtained for public universities in. Jordan. This
shows that the means of perceptions of Jordanian private universities towards different
issues related to KM and TQM were also close to the forth option in Likert rating scale.
This option indicates that respondents agreed with the 83 statements of the
questionnaire and that results were similar to the ones obtained for public universities.
Also, statistical analyses such as the correlation gave results similar to the
corresponding analyses conducted for public universities, which indicate that the
hypotheses were also accepted. The next Chapter will focus on the general discussion,
suggestions, and recommendations.
207
CHAPTER NINE
GENERAL DISCUSSION AND RECOMMENDATIONS
9. 1 Overview of the Current Research
The current chapter focuses on the general discussion related to the research findings in
the two parts of the case study. As indicated in Chapter 1, this research project aimed to
establish a framework that represents the integration of KM and TQM that reflects the
performance of HE at both public and private universities in Jordan. Literature has
highlighted the importance of KM and TQM in establishing best practices in modern
academic organisations (Chapter 2, 3 and 4). These two issues are closely related
disciplines (Ribière & Khorramshahgol, 2004). They complement each other for
successful management. Indeed, the review of literature in Chapter 2, 3 and 4 described
and discussed various issues related to KM and TQM. These literature studies helped to
clarify the theoretical concept of KM and TQM and how to approach the methodology,
mainly in setting up and designing the questionnaire for collecting the data (Chapter 5).
The data collected from the 351 respondents who responded to the online questionnaire
were analysed using various statistical methods, including skewness, kurtosis,
kolmogorov-Simrnov, Shapiro-Wilk, mean, standard division, correlation, and other
methods. The results of analyses indicated close similarities between the perceptions of
respondents in public (Chapters 7) and private (Chapters 8) universities. Therefore, the
discussion will focus on the overall perceptions of respondents and justifying the
hypotheses of this research (Chapter 1).
9. 2 General Discussion
This section focuses on the discussion of the results in relation to different variables
related to KM and TQM. Generally, the overall perception at both public and private
universities indicated that respondents agreed with the statements in the questionnaire.
The perceptions of respondents from public and private universities on knowledge
creation, storage of knowledge, knowledge distribution, and knowledge were
significant related to the KM process. Although there were slight differences between
public and private universities, the means for the first 40 statements were close to the
fourth option on the Likert rating scale. These results indicated that respondents from
both public and private universities agreed on statements related to KM. In this respect,
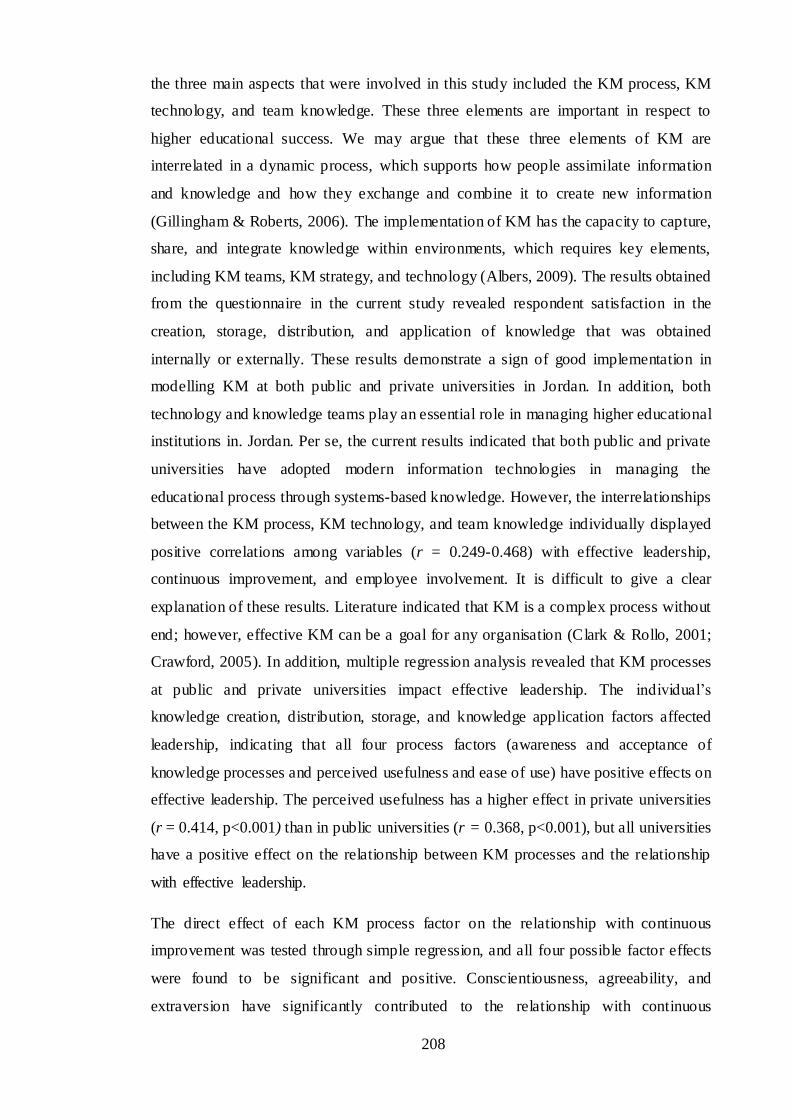
208
the three main aspects that were involved in this study included the KM process, KM
technology, and team knowledge. These three elements are important in respect to
higher educational success. We may argue that these three elements of KM are
interrelated in a dynamic process, which supports how people assimilate information
and knowledge and how they exchange and combine it to create new information
(Gillingham & Roberts, 2006). The implementation of KM has the capacity to capture,
share, and integrate knowledge within environments, which requires key elements,
including KM teams, KM strategy, and technology (Albers, 2009). The results obtained
from the questionnaire in the current study revealed respondent satisfaction in the
creation, storage, distribution, and application of knowledge that was obtained
internally or externally. These results demonstrate a sign of good implementation in
modelling KM at both public and private universities in Jordan. In addition, both
technology and knowledge teams play an essential role in managing higher educational
institutions in. Jordan. Per se, the current results indicated that both public and private
universities have adopted modern information technologies in managing the
educational process through systems-based knowledge. However, the interrelationships
between the KM process, KM technology, and team knowledge individually displayed
positive correlations among variables (r = 0.249-0.468) with effective leadership,
continuous improvement, and employee involvement. It is difficult to give a clear
explanation of these results. Literature indicated that KM is a complex process without
end; however, effective KM can be a goal for any organisation (Clark & Rollo, 2001;
Crawford, 2005). In addition, multiple regression analysis revealed that KM processes
at public and private universities impact effective leadership. The individual’s
knowledge creation, distribution, storage, and knowledge application factors affected
leadership, indicating that all four process factors (awareness and acceptance of
knowledge processes and perceived usefulness and ease of use) have positive effects on
effective leadership. The perceived usefulness has a higher effect in private universities
(r = 0.414, p<0.001) than in public universities (r = 0.368, p<0.001), but all universities
have a positive effect on the relationship between KM processes and the relationship
with effective leadership.
The direct effect of each KM process factor on the relationship with continuous
improvement was tested through simple regression, and all four possible factor effects
were found to be significant and positive. Conscientiousness, agreeability, and
extraversion have significantly contributed to the relationship with continuous
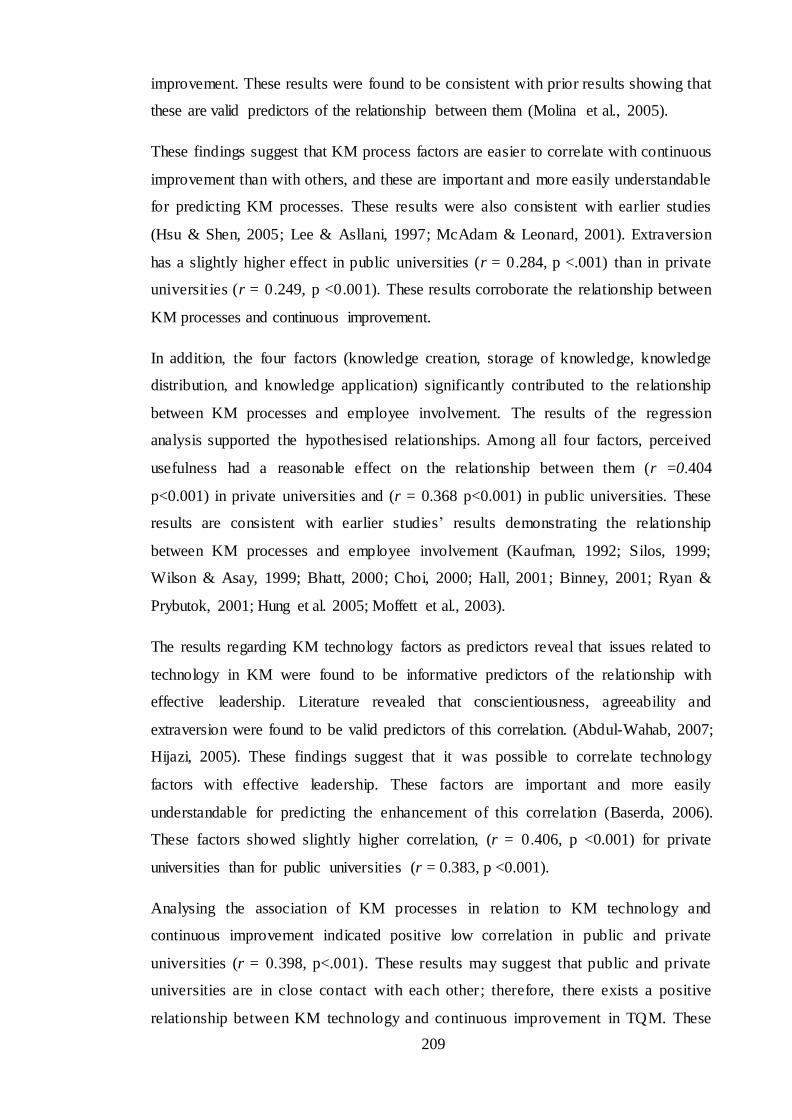
209
improvement. These results were found to be consistent with prior results showing that
these are valid predictors of the relationship between them (Molina et al., 2005).
These findings suggest that KM process factors are easier to correlate with continuous
improvement than with others, and these are important and more easily understandable
for predicting KM processes. These results were also consistent with earlier studies
(Hsu & Shen, 2005; Lee & Asllani, 1997; McAdam & Leonard, 2001). Extraversion
has a slightly higher effect in public universities (r = 0.284, p <.001) than in private
universit ies (r = 0.249, p <0.001). These results corroborate the relationship between
KM processes and continuous improvement.
In addition, the four factors (knowledge creation, storage of knowledge, knowledge
distribution, and knowledge application) significantly contributed to the relationship
between KM processes and employee involvement. The results of the regression
analysis supported the hypothesised relationships. Among all four factors, perceived
usefulness had a reasonable effect on the relationship between them (r =0.404
p<0.001) in private universities and (r = 0.368 p<0.001) in public universities. These
results are consistent with earlier studies’ results demonstrating the relationship
between KM processes and employee involvement (Kaufman, 1992; Silos, 1999;
Wilson & Asay, 1999; Bhatt, 2000; Choi, 2000; Hall, 2001; Binney, 2001; Ryan &
Prybutok, 2001; Hung et al. 2005; Moffett et al., 2003).
The results regarding KM technology factors as predictors reveal that issues related to
technology in KM were found to be informative predictors of the relationship with
effective leadership. Literature revealed that conscientiousness, agreeability and
extraversion were found to be valid predictors of this correlation. (Abdul-Wahab, 2007;
Hijazi, 2005). These findings suggest that it was possible to correlate technology
factors with effective leadership. These factors are important and more easily
understandable for predicting the enhancement of this correlation (Baserda, 2006).
These factors showed slightly higher correlation, (r = 0.406, p <0.001) for private
universities than for public universities (r = 0.383, p <0.001).
Analysing the association of KM processes in relation to KM technology and
continuous improvement indicated positive low correlation in public and private
universities (r = 0.398, p<.001). These results may suggest that public and private
universities are in close contact with each other; therefore, there exists a positive
relationship between KM technology and continuous improvement in TQM. These
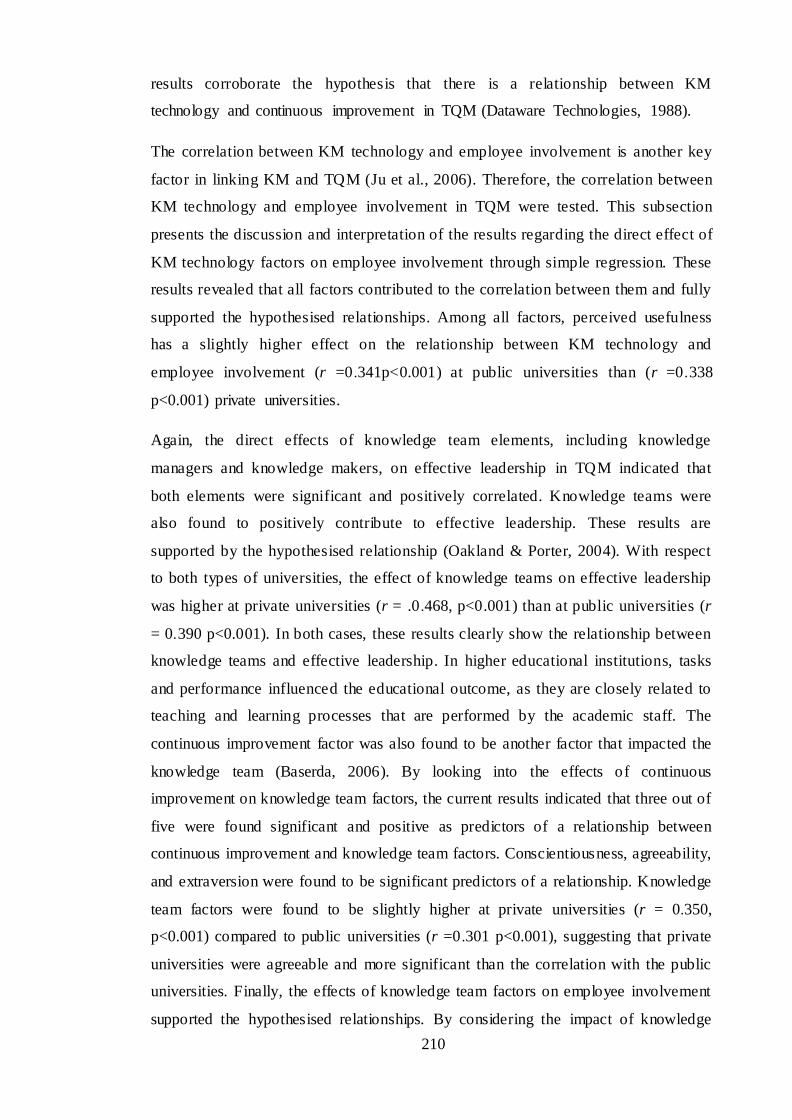
210
results corroborate the hypothesis that there is a relationship between KM
technology and continuous improvement in TQM (Dataware Technologies, 1988).
The correlation between KM technology and employee involvement is another key
factor in linking KM and TQM (Ju et al., 2006). Therefore, the correlation between
KM technology and employee involvement in TQM were tested. This subsection
presents the discussion and interpretation of the results regarding the direct effect of
KM technology factors on employee involvement through simple regression. These
results revealed that all factors contributed to the correlation between them and fully
supported the hypothesised relationships. Among all factors, perceived usefulness
has a slightly higher effect on the relationship between KM technology and
employee involvement (r =0.341p<0.001) at public universities than (r =0.338
p<0.001) private universities.
Again, the direct effects of knowledge team elements, including knowledge
managers and knowledge makers, on effective leadership in TQM indicated that
both elements were significant and positively correlated. Knowledge teams were
also found to positively contribute to effective leadership. These results are
supported by the hypothesised relationship (Oakland & Porter, 2004). With respect
to both types of universities, the effect of knowledge teams on effective leadership
was higher at private universities (r = .0.468, p<0.001) than at public universities (r
= 0.390 p<0.001). In both cases, these results clearly show the relationship between
knowledge teams and effective leadership. In higher educational institutions, tasks
and performance influenced the educational outcome, as they are closely related to
teaching and learning processes that are performed by the academic staff. The
continuous improvement factor was also found to be another factor that impacted the
knowledge team (Baserda, 2006). By looking into the effects of continuous
improvement on knowledge team factors, the current results indicated that three out of
five were found significant and positive as predictors of a relationship between
continuous improvement and knowledge team factors. Conscientiousness, agreeability,
and extraversion were found to be significant predictors of a relationship. Knowledge
team factors were found to be slightly higher at private universities (r = 0.350,
p<0.001) compared to public universities (r =0.301 p<0.001), suggesting that private
universities were agreeable and more significant than the correlation with the public
universities. Finally, the effects of knowledge team factors on employee involvement
supported the hypothesised relationships. By considering the impact of knowledge
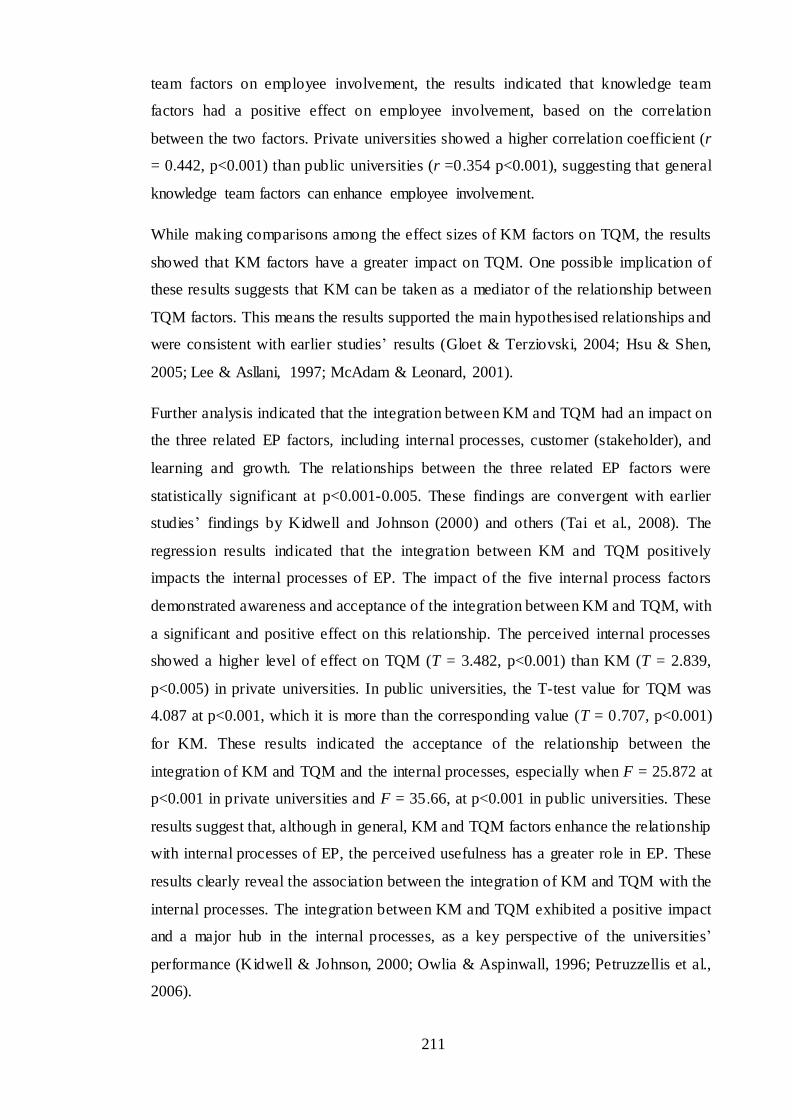
211
team factors on employee involvement, the results indicated that knowledge team
factors had a positive effect on employee involvement, based on the correlation
between the two factors. Private universities showed a higher correlation coefficient (r
= 0.442, p<0.001) than public universities (r =0.354 p<0.001), suggesting that general
knowledge team factors can enhance employee involvement.
While making comparisons among the effect sizes of KM factors on TQM, the results
showed that KM factors have a greater impact on TQM. One possible implication of
these results suggests that KM can be taken as a mediator of the relationship between
TQM factors. This means the results supported the main hypothesised relationships and
were consistent with earlier studies’ results (Gloet & Terziovski, 2004; Hsu & Shen,
2005; Lee & Asllani, 1997; McAdam & Leonard, 2001).
Further analysis indicated that the integration between KM and TQM had an impact on
the three related EP factors, including internal processes, customer (stakeholder), and
learning and growth. The relationships between the three related EP factors were
statistically significant at p<0.001-0.005. These findings are convergent with earlier
studies’ findings by Kidwell and Johnson (2000) and others (Tai et al., 2008). The
regression results indicated that the integration between KM and TQM positively
impacts the internal processes of EP. The impact of the five internal process factors
demonstrated awareness and acceptance of the integration between KM and TQM, with
a significant and positive effect on this relationship. The perceived internal processes
showed a higher level of effect on TQM (T = 3.482, p<0.001) than KM (T = 2.839,
p<0.005) in private universities. In public universities, the T-test value for TQM was
4.087 at p<0.001, which it is more than the corresponding value (T = 0.707, p<0.001)
for KM. These results indicated the acceptance of the relationship between the
integration of KM and TQM and the internal processes, especially when F = 25.872 at
p<0.001 in private universities and F = 35.66, at p<0.001 in public universities. These
results suggest that, although in general, KM and TQM factors enhance the relationship
with internal processes of EP, the perceived usefulness has a greater role in EP. These
results clearly reveal the association between the integration of KM and TQM with the
internal processes. The integration between KM and TQM exhibited a positive impact
and a major hub in the internal processes, as a key perspective of the universities’
performance (Kidwell & Johnson, 2000; Owlia & Aspinwall, 1996; Petruzzellis et al.,
2006).

212
With respect to the effect of the relationship between the integration of KM and TQM
and the customer (stakeholder) perspective of EP, results also indicated a positive
association among the related factors. The customer (stakeholder) perspective is
influenced by the integration of KM and TQM. Furthermore, this correlation has a
great impact on EP. The customer (stakeholder) perception had a high effect on TQM
in private universities (T = 3.0303, p<0.004), which is more than KM (T =2.792,
p<0.05), and in public universities TQM (T = 4.881, p<0.001) was more than KM (T =
0.730, p>0.05). This means that the result of public universities is negatively
significant. The overall results indicate the acceptance of the relationship between the
integration of KM and TQM with the stakeholder, especially when F = 21.229, at
p<0.001 in public universities and F = 15.254, p<.001 in private universities. These
results suggest that, although in general KM and TQM factors enhance the relationship
with the stakeholder of EP, the perceived usefulness has a medium role in EP (Kaplan
& Norton, 1996). Furthermore, the effects of integration of KM and TQM on learning
and growth factors (technological innovation, administrative innovation, and additional
creativity) were significant. These results indicated the impact of the integration of KM
and TQM on EP. The analysis of the learning and growth factors for TQM obtained a T
value of 2.055, at p<0.044), which is more than the corresponding value for KM (T =
2.032, p<0.05) in private universities. The T value for TQM was 2.913, at p<0.005,
which is more than the corresponding value for KM (T = 0.114, p>0.05) in public
universities. These results indicated that the result of public universities was negatively
significant. Nonetheless, the overall results reflect the acceptance of a relationship
between the integration of KM and TQM with learning and growth, especially when
the F value was 6.623, at p<0.001 in public universities and when the value of F =
4.322, at p<0.020, in private universities. These results suggest that, although in
general KM and TQM factors enhance the relationship between learning and growth of
EP, it is less than the previous perspectives of EP. In this respect, the perceived
usefulness was found to have a medium role in EP (Davis, 1996).
In the light of the previous results of the integration between KM and TQM and its
impact on EP perspectives, literature revealed a positive and large impact on the
performance of universities (Kidwell & Johnson, 2000; Kanji & Tambi, 1999; Hussein
& Aboud 2008).
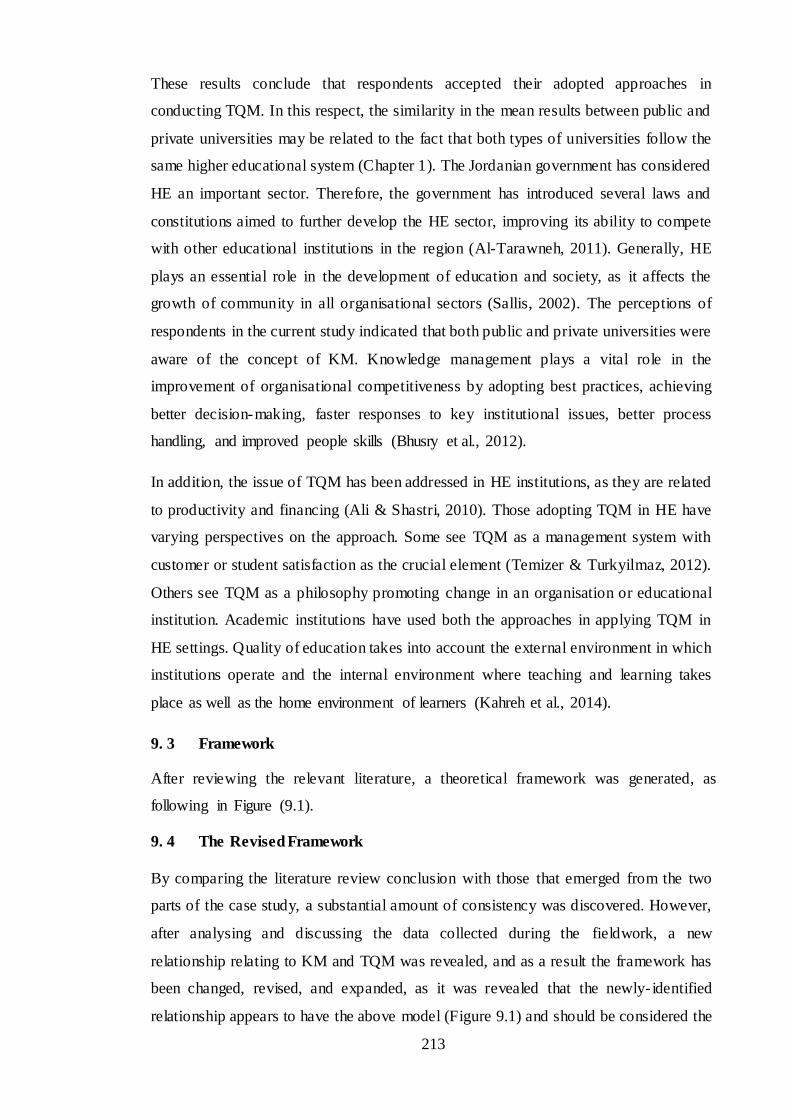
213
These results conclude that respondents accepted their adopted approaches in
conducting TQM. In this respect, the similarity in the mean results between public and
private universities may be related to the fact that both types of universities follow the
same higher educational system (Chapter 1). The Jordanian government has considered
HE an important sector. Therefore, the government has introduced several laws and
constitutions aimed to further develop the HE sector, improving its ability to compete
with other educational institutions in the region (Al-Tarawneh, 2011). Generally, HE
plays an essential role in the development of education and society, as it affects the
growth of community in all organisational sectors (Sallis, 2002). The perceptions of
respondents in the current study indicated that both public and private universities were
aware of the concept of KM. Knowledge management plays a vital role in the
improvement of organisational competitiveness by adopting best practices, achieving
better decision-making, faster responses to key institutional issues, better process
handling, and improved people skills (Bhusry et al., 2012).
In addition, the issue of TQM has been addressed in HE institutions, as they are related
to productivity and financing (Ali & Shastri, 2010). Those adopting TQM in HE have
varying perspectives on the approach. Some see TQM as a management system with
customer or student satisfaction as the crucial element (Temizer & Turkyilmaz, 2012).
Others see TQM as a philosophy promoting change in an organisation or educational
institution. Academic institutions have used both the approaches in applying TQM in
HE settings. Quality of education takes into account the external environment in which
institutions operate and the internal environment where teaching and learning takes
place as well as the home environment of learners (Kahreh et al., 2014).
9. 3 Framework
After reviewing the relevant literature, a theoretical framework was generated, as
following in Figure (9.1).
9. 4 The Revised Framework
By comparing the literature review conclusion with those that emerged from the two
parts of the case study, a substantial amount of consistency was discovered. However,
after analysing and discussing the data collected during the fieldwork, a new
relationship relating to KM and TQM was revealed, and as a result the framework has
been changed, revised, and expanded, as it was revealed that the newly- identified
relationship appears to have the above model (Figure 9.1) and should be considered the
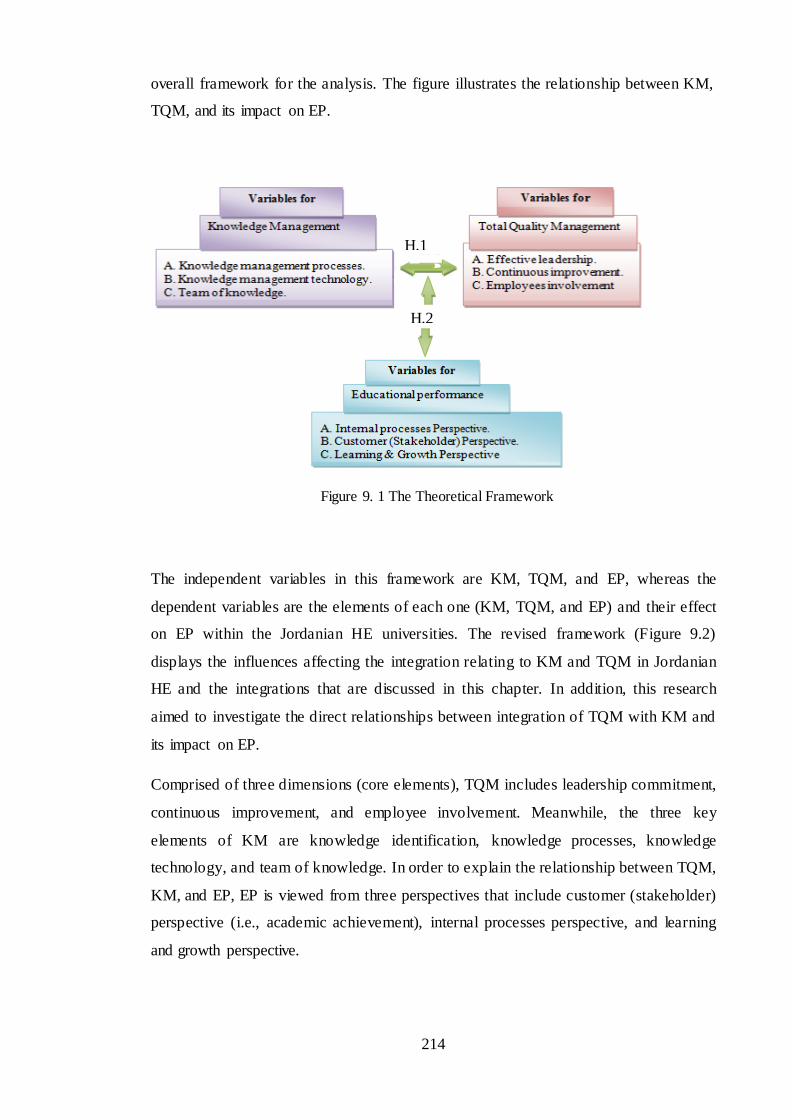
214
overall framework for the analysis. The figure illustrates the relationship between KM,
TQM, and its impact on EP.
Figure 9. 1 The Theoretical Framework
The independent variables in this framework are KM, TQM, and EP, whereas the
dependent variables are the elements of each one (KM, TQM, and EP) and their effect
on EP within the Jordanian HE universities. The revised framework (Figure 9.2)
displays the influences affecting the integration relating to KM and TQM in Jordanian
HE and the integrations that are discussed in this chapter. In addition, this research
aimed to investigate the direct relationships between integration of TQM with KM and
its impact on EP.
Comprised of three dimensions (core elements), TQM includes leadership commitment,
continuous improvement, and employee involvement. Meanwhile, the three key
elements of KM are knowledge identification, knowledge processes, knowledge
technology, and team of knowledge. In order to explain the relationship between TQM,
KM, and EP, EP is viewed from three perspectives that include customer (stakeholder)
perspective (i.e., academic achievement), internal processes perspective, and learning
and growth perspective.
H.2
H.1

215
Figure 9. 2 The Revised Framework of the Study
9. 5 Achieving the Aim and Objectives of the Study
The aim of this research was to establish a framework that represents the integration of
KM and TQM to measure the performance of higher education based on improvement
of teaching and learning. The aim has been achieved by addressing the research
objectives that follow.
The first objective was to review the relevant literature on the concepts of KM and
TQM and their significance for educational organisations and to contribute to their
conceptual framing. This objective was achieved by conducting a thorough review of
the literature and developing an understanding of KM, TQM, and EP. This
understanding has evolved from three main sources, which are experts’ experiences and
theories concerning the subject, KM, TQM, and EP universal models, and the
associated empirical studies. The literature review also covered KM and TQM-related
topics within the manufacturing sector and the service sector with a special focus on the
HE context (the main focus of this study). Most of the literature related to KM and
TQM originated in or referred to Western countries, and only a few studies were
216
reported from developing economies, with even less having been conducted within the
Arab world, which shares the same culture as Jordan (the research context).
The second objective was to contextualise a framework for the integration of KM and
TQM. The purpose of this was to guide the researcher in conducting the empirical study
and data collection. To meet this objective, a number of KM, TQM, and EP elements in
academic culture were identified from the earlier literature review. Based on this critical
literature review, three elements for each were identified and justified, which were
considered variables of this study, in addition to the academic culture element, which
formed the context investigated.
The third and fourth objectives were identifying integration and correlation between
KM and TQM and its impact on EP and identifying the impact of the integration of the
KM and TQM in the EP of organisations. To achieve these objectives, two parts of the
case study were selected from Jordanian public and private universities. The
questionnaires were carried out to gain an in-depth comprehension of the integration
and correlation between KM and TQM and their effect on EP within these institutions
and by implication and extension, other Jordanian universities.
The fifth objective was to refine the framework of scientific methods and techniques to
be followed and to take advantage of the integration of KM and TQM in enhancing the
competitive advantage through improved EP. To achieve this objective, nine hypotheses
were considered, as subsets of two main hypotheses. Each of these hypotheses are
subdivided into different sub-hypotheses depending on the variables of each element of
the three main components, which were KM, TQM, and EP. These hypotheses were
tested by statistical analysis of each part of the case study.
The method of data collection that was chosen as appropriate was the questionnaire,
which enhanced the validity of this research. It should be mentioned that meeting this
objective was highly dependent upon accomplishing the first objective. The findings
from the case study organisations were compared with the literature to verify whether
previous literature predictions were similar or different to the findings.
Finally, by achieving the research objectives, the main aim of this study mentioned
above has been successfully achieved.
9. 6 Contribution Knowledge
As indicated earlier, the modern approach to attain quality of performance in academic
institutions is associated with KM and TQM. Therefore, many organisations consider
217
KM and TQM effective approaches for management. Despite the need to improve
knowledge quality using enhanced capture activities, Fahey and Prusak (1998) observed
that most organisations focus more on the quantity of knowledge captured. Failure to
focus on knowledge quality results in reluctance by knowledge workers to use the
knowledge stored in repositories (Gray & Durcikova, 2006; Kulkarni, Ravindran, &
Freeze, 2007). The problem described above has an impact on knowledge users’
enthusiasm to use knowledge repositories because they perceive the knowledge
captured to be suboptimal (Gray & Durcikova, 2006). Kulkarni et al. (2007) contended
knowledge quality and knowledge use is integral to ensuring the success of KM
initiatives.
This study was able to contribute much towards widening the boundaries of knowledge
as well as providing more empirical evidence for practitioners as detailed here.
There are many concepts of management models from literature that have been
scrutinised and have become general management terminologies. For example, TQM
has survived and grown by the efforts of researchers and practitioners. As mentioned
earlier, the link between TQM and KM has been recognised, yet the studies have thus
far have been few and incomplete (Ju et al., 2006; Ooi, 2009).
The integration of TQM and KM has an influence on EP, especially in the emerging
knowledge economy, where all organisations (particularly educational organisations)
depend on knowledge. The concept of this study, therefore, has provided an opportunity
to investigate this area, striving to link the gap between theory and practice by using
empirical methods. However, most of the studies that have attempted to create a link
between the two concepts lack empirical evidence, and the results cannot be
generalizable. In this study, the researcher uses an empirical approach to investigate the
integration and correlation between TQM, KM, and EP, using a quantitative research
method. It is believed that the results of this research will contribute to the body of
knowledge in this area by arriving at a good model to improve EP.
Although many researchers have individually addressed the proposition of the
interrelationship between TQM, KM and performance, few of them have investigated
this interrelationship, empirically, in the education sector. The work carried out in this
study provides a potential for instrument validation. By testing two kinds of universities
(public and private), this study offers a reliable validation of TQM, KM, and EP
constructs that is helpful for future research.
218
Moreover, this study could benefit academic leadership and academics in educational
institutions by enhancing their knowledge concerning the elements of TQM and key
processes of KM to be considered when implementing these two models (TQM and
KM). Hence, the study contributes to the enhancement of the education sys tem. To
summarise, the importance of this study stems from the significance of the following:
In the current ambiguous environment, TQM and KM in business are necessary and
critical factors for organizational survival, and
To obtain and maintain supportable competitive advantage, organizations need a
TQM approach that considers KM as a potential source of EP improvement.
Moreover, to the best of our knowledge, this research project is one of the first KM and
TQM initiatives for universities in Jordan. Thus, it has adopted a case study strategy in
conducting this study. The current study provides an in-depth understanding of the
readiness for measuring EP using the integration between KM and TQM in HE
institutions in Jordan. As far as the researcher is aware, this is the first study to use this
approach and therefore provides a richer appreciation of KM and TQM in EP. In
addition, the current study will be a valuable resource for both researchers and
practitioners who have a strong interest in understand ing the integration of KM and
TQM and its impact on EP in HE institutions. It makes a contribution to the literature on
TQM and KM integration in the context of developing countries.
The scarcity of empirical studies outside developed economies is a problem given the
growing awareness of the importance of TQM and KM around the globe. This study
will provide benefits to academics and practitioners in developing economies where
there is a shortage of information concerning TQM and KM; hence, the systematic
approach adopted in this study and the results obtained from it will offer a new critical
mass of TQM and KM knowledge within a different cultural context.
The review of the literature in these fields has revealed gaps and the need for more
empirical studies to be conducted; therefore, this study integrates, refines, and extends
the empirical work conducted in these fields and fills in some of the gaps in the
literature of these fields, such as external stockholders and their influence and effect on
encouraging or discouraging universities in adopting TQM and KM.
The MoHESR in Jordan has established quality assurance and TQM programs in all
Jordanian HEIs with the objective of achieving better performance. On the other hand,
issues and problems related to the performance of Jordanian HEIs as reported in the
219
UNESCO and Jordan governmental reports indicate the lack of ability of Jordanian
HEIs to deliver suitable educational services. By integrating the KM literature together
with TQM literature, this study can scientifically influence the decision-makers of
Jordanian HEIs that the implementation of TQM is one essential, but insufficient step in
gaining high- level performance, unless supported by KM processes. Therefore, the
outcomes from this study provide much-needed information regarding the nature of
TQM elements of educational institutions and the intervening effect of KM on EP by
producing empirical evidence of these relations.
This study has revealed that in the Jordanian context, employee empowerment should
be studied as an element in TQM and KM and their effectiveness in EP, unlike other
studies in the field of TQM and KM that considered them integrative.
This study gives attention to social responsibility as an important TQM and KM
integration; this integration has not been studied in Jordan previously.
It provides empirical evidence of the nature of the impact of TQM and KM
implementation on EP as well as competitiveness as a strategic objective in any
educational organisation, which assists universities in identifying their approaches in
relation to achieving a competitive advantage.
This study recommends that managers give social responsibility (such as ethical
responsibility to employees and to the external environment) more attention as part of
their university strategies.
This study raises the awareness of the significance of the amalgamation between TQM
and KM programmes as important, strategically and philosophically, which could help
universities to have a better understanding of how that integration could be effectively
approached and implemented.
9. 7 Limitations of the Research
The current study focuses on the integration between KM and TQM and its impact on
EP. The results in this thesis can be applicable to Jordanian HEIs. Although KM and
TQM have been adopted in particular universities, this study is limited to the study of
the association between public and private universities in Jordan.
In addition, the college level varies from an academic leadership perception. Academic
leadership may differentiate the implementation of the core elements of TQM and KM
220
processes among the colleges. For these reasons, the deans or assistants of the deans
were chosen as target respondents of the present study.
The researcher in this study focused on the teaching and learning processes, where the
HE institutions are established for three main purposes, namely teaching and learning,
research, and community services because teaching and learning processes are the main
target of the educational system in any HE institution (Venkatraman, 2007).
Jordanian HEIs have been selected as organisations to be surveyed for this study
because they are still developing organisations. In addition, there are many issues and
problems associated with the performance of Jordanian HEIs. Therefore, it has become
necessary to improve the performance of these organisations. In addition, the researcher
himself is originally from the third world, and Jordan belongs to the third world as well,
which has facilitated working with the people and language. This has facilitated the
understanding of research data and information, as the researcher is familiar with the
culture and educational environment in Jordan compared to other countries.
9. 8 Suggestions and Recommendations
In view of the results and discussions in the current thesis (Chapters 4 through 6 and the
above section), the researcher suggests universities should consider the following
issues.
It is vital to consider each individual in the university a main element for supporting
the dynamic pace of the development of intellectual capacity among the members of the
university. This will likely improve the experiences of others and derive lessons from
successes and failures in order to capture useful knowledge that will enable the
university to achieve its objectives with respect to KM and TQM.
The university should support distinctive staff, those who have a high level of
knowledge and experience to ensure that the university achieves a high level of KM and
TQM.
The university should manage a high level of communication between workers to
facilitate better understanding of how to achieve better KM and TQM. It should also
take advantage of experts and prominent research centres and use modern technologies
to increase the university’s ability to transfer knowledge to students and others via its
services for a better reputation.
The university should consider removing any obstacle that may stand in the way of
maintaining high quality KM for workers. In addition, the university should set up
221
certain policies for controlling, managing, establishing, and maintaining a high standard
of KM and TQM.
The university should adapt good KM plans and identify the needs that encourage
positive interaction among workers via setting up training programmes and using the
modern technologies.
The university should create a knowledge base dedicated to university customers
and activate KM to initiate positive interactions with the workers. This will help to
encourage making changes that benefit the university educational outcomes.
The university should adapt a reform strategy for developing better approaches to its
KM and TQM.
The university should include in the reform a modern strategy for improvement of
the overall quality of the educational process that leads to recover better outcomes of the
university.
The university should increase the participation of workers in any reform that the
university considers. This will help the university to achieve better development in KM
and TQM and solve major problems.
The university should remove the possible barriers between management and
academic staff for better engagement in implementing and developing quality for KM
and TQM.
The researcher also suggests further points that could improve adapting and developing
better concepts for KM and TQM. These issues are as follows:
Encourage holding seminars, conferences, and workshops with the aim to increase
understanding the nature of the current KM and TQM for better strategy
implementation and development.
Activate the assessment approach for KM and TQM to increase and improve the
productivity and service of the university.
Establish comprehensive and precise databases that can be used for developing an
internal system to encourage better KM and TQM.
Invest in areas that improve communication for developing skills and improve the
intellectual perspectives of workers for better creativity.
Conduct comparative studies between community organisations and leading
universities in the fields of KM and TQM and assess their quality in comparison with
other national or international universities.
222
Include the concept of KM and TQM within the university education system and as
part of the curriculum.
Adapt the concept of modern management systems to ensure achieving overall
quality in KM and TQM.
As this study concentrated only on ten public and private Jordanian universities, it is
recommended that future should include ten other similar universities in order to
learn whether a generalisation of the findings is possible beyond their setting.
As this study focused on two types of Jordanian universities, it is recommended that
the methodology be used with other universities in other countries with a similar
culture (i.e. other Arab countries). The findings of the current study may be used in
those countries in order to conduct a comparative analysis and facilitate the
development of a deeper understanding of the topic in the Arab world.
.
As the governmental policy in Jordan is aimed at enhancing the quality of
education, it is recommended to conduct such studies in secondary schools in Jordan
because this sector could be considered as a key influencer of quality and is
regarded as an input to the higher education sector.
The list of variables identified by this research could be used by researchers
interested in investigating the integration between KM and TQM in other sectors.
9. 9 Conclusion
As a conclusion, issues regarding EP of HEIs will remain a vital agenda for academic
leadership, academics, researchers, local governments, and society. The findings of this
study strongly suggest that TQM and KM are significant practices for enhancing the EP
of HEIs.
This study contributes to the comprehension of the relationship between TQM, KM, and
EP. The results of the study indicate that both TQM core elements and KM elements
must be implemented holistically not individually. The TQM core elements are related
to leadership commitment, strategic planning, continuous improvement, customer focus,
process focus, employee involvement, training and learning, rewards and recognition,
and management and contribute significantly to KM elements and EP. Most
importantly, the evidence indicates that KM fully mediates the effects of TQM on EP.
The findings of this study have theoretical and practical contributions. From the
theoretical standpoint, the results acquired from this study were consistent with theories
223
and earlier literature, which sponsored these theories. The empirical evidence from this
study contributes to the body of knowledge in the fields of TQM and KM.
From a practical perspective, the results of this study strongly suggest the establishment
of TQM core elements as a solid strategy for EP improvement. On the other hand, TQM
has a significant impact on KM, which has a significant effect on organisational
performance. Given this important role of KM, the findings of this study also suggest
that HEIs that implement TQM must be willing to make improvements in KM elements
if they desire to improve the performance of their organisations effectively. In other
words, the empirical findings of this study provided evidence that the significant
success of implementing TQM core elements comprehensively could be yielded by
implementing a holistic approach of KM elements.

224
REFERENCES
A Higher Education Cooperation Scheme between EU Member States Partner Countries
(2007), [online] Available at:
http://ec.europa.eu/education/programmes/temupus/countries> Accessed:
05.12.2012].
AACSB (2012). Eligibility procedures and accreditation standards for business
accreditation. Association to Advance Collegiate Schools of Business (AACSB).
Retrieved from available online at http://www.aacsb.org
Aalamri, G. I. (2004). The Joint Use of Information Technology and Knowledge
Management to Achieve High Value in the Work of Jordanian Commercial Banks.
PhD thesis, University of Applied Studies Amman, Jordan.
Abas, Z. & Yaacob, Z. (2006). Exploring the relationships between total quality
management (TQM), strategic control systems (SCS) and organizational
performance (OP) using a SEM framework. The Journal of American Academy of
Business, 9(2), Cambridge, 161–167.
AbdulAziz, M. S. (2003). A proposed framework for the use of performance measures
in balanced non-governmental organizations in their application in private
universities. Egyptian Journal of Commercial Studies XXVII(III): 241–291.
Abdul Wahab, S. M. (2007). The role of local leadership in knowledge management
with reference to the heads of Egyptian.Cairo cities: PARC Public Administration
Aboyassin, N. A., Alnsour, M., & Alkloub, M. (2011). Achieving total quality
management using knowledge management practices: A field study of the
Jordanian insurance sector. International Journal of Commerce and Management
21(4), 394–409.
Abu-El-Haija, A. (2005). Higher education in Jordan. National TEMPUS Office.
Amman, Jordan, 1–21.
Abu-Fada, M. M. (2006). Towards the Development of a Balanced System for
Measuring Performance in Strategic Islamic Banking Institutions. Unpublished
doctoral dissertation, Arab Academy for Banking and Financial Sciences, Amman,
Jordan.
Abu-Farh, Y. and Hamad, K. (2010). The Role of Knowledge Management in the
Effectiveness of the Activities of the Civil Institutions in East Quds. Published
research on the Internet.
225
Abu-Hamatteh, Z., Al-Azab, T., & El-Amyan, M. (2003). Total quality management
achievement: King Abdullah award for excellence of Jordan as a model.
Technovation, Vol. 23, No.7, 649–652.
Abu-Khudair, E. (2009). Applications of Knowledge Management in Higher Education
Institutions: Ideas and Practices. Paper presented to the International Conference
for Management Development, Institute of Public Administration, Saudi Arabia.
Abu-Malouh, M. (2000). Total quality of learning in the classroom. Gaza: Qattan
Centre for Research and Development.
Adair, J. (2004). The handbook of management and leadership. London: GBR,
Thorogood.
Ahire, S. L., Waller, M. A., & Golhar, D. Y. (1996). Quality management in TQM
versus non-TQM firms: an empirical investigation. International Journal of Quality
& Reliability Management, 13(8), 8–27.
Ahmed, J. U. (2008). Quality and TQM at higher education institutions in the UK.
Lessons from the University of East London and Aston University (Working
paper No. 12): American International University.
Al-Alak, B. A. (2006). The impact of marketing actions on relationship quality in the
higher education sector in Jordan. Journal of Marketing for Higher
Education, 16(2), 1-23.
Al-Ali, A., Guendhilji, I. A., & Omari, I. G. (2009). An Introduction to Knowledge
Management. Second edition, Masier, Jordan, 39.
Alamry, G. E. (2004) Joint Use Of Information Technology And Knowledge
Management To Achieve A High Value To The Work Of The Jordanian
Commercial Banks, Doctoral dissertation, Applied StudiesUniversity.Amman
Jordan
Alavi, M. (1997). KPMG Peat Marwick US: one giant brain. Harvard Business School
Pub.
Alavi, M., & Leidner, D. E. (2001). Review: Knowledge management and knowledge
management systems: Conceptual foundations and research issues. MIS quarterly,
107-136.
Al-Awwad, K. I. (1991). Service Provision in Saudi Public Service Sector
Organizations: An Open System Approach.
Al-Azzawi, M. A. (2002). The Challenge of Total Quality in the Banking Business.
Rashidi Banking Journal, the third year, No. 7, November, Baghdad.
Al-Batal, M. I. M. (1994). Materials Management. Dar Al-Arab renaissance, Egypt.
226
Albers, J. A. (2009). A practical approach to implementing knowledge management.
Journal of Knowledge Management Practice, 10(1), 1-14.
Aldardekh, M. S. (2006). Total Quality Management and customer service. First
edition, Safa Publishing and Distribution, Amman, Jordan.
Alhakem, L. A., Zwain, A. A., & Alkhafaji, H. J. (2009). The role of the organizational learning tools in achieving excellence academic performance: A
case study at the University of Kufa. AL-Qadisiya Journal for Administrative & Economics Science, 11(2), 94-120.
Ali, M. & Shastri, R. K. (2010). Implementation of total quality management in higher
education. Asian Journal of Business Management, 2(1), 9–16.
Ali Zwain A (2012). The Impact Of Total Quality Management On Knowledge Management And Organizational Performance In Higher Education Institutions
In Iraq . Doctoral Dissertation, Universiti Utara Malaysia. Alian, R. (2008). Knowledge Management. First edition, Safa Publishing and
Distribution, Amman, Jordan.
Al-Khafaji; N. A (1996). Cognitive Entrance In The Strategic Choice Analysis: The
Study Of Risk Trial In The Insurance Industry, Doctoral Thesis, Baghdad.
Alkobaissy, S. A. (2002). Knowledge management and its impact on organizational
innovation: an exploratory study compared a sample of mixed industrial sector
companie, Doctoral Thesis, Baghdad
Al-Madi, F. N. (2005). Impediments to the adoption of total quality management (TQM)
in Jordanian ISO 9000 series certified manufacturing companies. Doctoral
dissertation.
Al-Meer, A. A. (1995). The relationships of work stress to organizational commitment,
job performance, job satisfaction and individual differences: a comparative study.
Public Administration, 35(2), 207–52. Dissertation, University of Salford.
Al-Mahjoub, B. F. (2004). Knowledge Management Processes: Introduction To transfer
for A Digital University. Zaytoonah University, Fourth Annual Scientific
Conference, Amman, Jordan.
Almalak, S, & Alathary, A (2002): Knowledge management and its role in supporting
the development of skills in organizations, the future of the Arab Journal of
Education, Vol. 8, No. (26), (pp. 143-157)
Almtiran, A. A. (2007). Knowledge Management Systems, the International
Conference on Total Quality in the light of the knowledge management and
information technology, University of Applied Sciences, Amman.
Al-Okalpi, A. D. (2008). Knowledge Management in Libraries and Information
Centers. Warraq Corporation for Publishing and Distribution, Amman, Jordan.
227
Al-Saba’a, S. (1997). The Transfer of Technology and Industrial Development in the
United Arab Emirates. Industry Trade Magazine, Vol. 22, Issue 263, November,
Dubai.
Al-Shaar, M. (2001). The concept of total quality management. Journal of Islamic
Economics, Vol. 21, No. 243, September, Dubai.
Altahayneh, Z. L. (2011). Implementation of total quality management in colleges of
physical education in Jordan.
Al-Shamary, S. A. (2006). Job satisfaction among workers and its impact on job
performance, applied study on the industrial sector in Al-Khafji Joint Operations,
unpublished Master Thesis, King Abdul Aziz University.
Alter, S. (1999). A general, yet useful theory of information systems. Communications
of the AIS, 1(3es), 3.
Al-Wani, H. (2006). Knowledge management concept, approach and theory. Second
Arab Conference, Jordan.
Al-Zamel, R. (2003). Knowledge Management for Arab Society’s Ability to Compete.
Journal of the Al-Jazira. Issue No. 1.
Al-Ziyadat, M. A. (2008). Recent Trends in Knowledge Management. Sixth edition,
Safa Publishing and Distribution, Amman, Jordan.
Altman, D. G. (1991). Some common problems in medical research. Practical statistics
for medical research, 1, 396-403.
Amer, N. (2008). Mechanisms for the advancement of the Arab mission of technical
colleges in the light of the experiences of some leading conferences of technical
and vocational education in Palestine.
Andrews, D., Nonnecke, B., & Preece, J. (2003). Electronic survey methodology: A
case study in reaching hard-to- involve Internet users. International Journal of
Human-Computer Interaction, 16(2), 185-210.
Armitage, H. M., & Atkinson, A. A. (1990). The choice of productivity measures in
organizations. Measures for Manufacturing Excellence, 91-126.
Aronson, J., Liang, T., & Turban, E. (2005). Decision support systems and intelligent
systems. Yoyakarta: Andi.
Arvinder, P. Loomba & Thomas P. & Johanesson, (1997) Malcolm Bridge National
Quality Award”, Benchmarking for Quality Management and Technology, Vol. 4,
No. 1, pp. 59-77.
Ashton, C., & Morton, L. (2005). Managing talent for competitive advantage: Taking a
systemic approach to talent management. Strategic HR Review, 4(5), 28-31.

228
Asllani, A. & Luthans, F. (2003). What knowledge managers really do: an empirical
and comparative analysis. Journal of knowledge management, 7(3), 53–66.
Awdah, F. (2010). The fact of knowledge management in Palestinian universities and
its support methods. Master’s dissertation, the Islamic University, Palestine.
Babbar, S. (1995). Applying total quality management to educational instruction.
International Journal of Public Sector Management 8(7), 35–55.
Badr, Y. (2010). Developing the skills of secondary schools in the provinces of Gaza, in
the light of the concept of knowledge management. Master’s dissertation, the
Islamic University, Palestine.
Bakri, S. (2002). Total Quality Management. University publisher, Alexandria.
Banchieri, L., Campa Planas, F., & Sanchez Rebull, M. (2011, June). What has been
said, and what remains to be said, about the balanced scorecard?. In Proceedings of
Rijeka Faculty of Economics, Journal of Economics and Business (Vol. 29, No. 1,
pp. 155-192).
Bank, J. (1992). The essence of total quality management. Hemel Hempstead: Prentice
Hall.
Bank, J. (2000) The Essence of Total Quality Management, (2nd ed.) London: Prentice
Hall.
Banna, R. R. (2007). Quality management concept and style linked with the orientations
of ministries to be applied in Schools of the Saudi Kingdom. A paper submitted to
the Twenty-first annual conference of secondary education for the period from
January 24th to 25th, 2007.
Barroso, A. & Gomes, E. (1998). Knowledge Management: trying to understand,
www.competent.org.br/evento/betgomes. pdf.
Bartley, B., Gomibuchi, S., & Mann, R. (2007). Best practices in achieving a customer-
focused culture. Benchmarking: An International Journal, 14(4), 482-496.
Barwari, N. A. (2000). Application requirements of total quality management and the
potential for application in Iraqi organizations: A future vision. Journal of
Mansour, Vol. 1, Issue 1, Baghdad.
Baserda, T. (2006). Integration of Knowledge Management and Total Quality
Management and Performance. Doctoral dissertation, Damascus University.
Bayazit, O. (2003). Total quality management (TQM) practices in Turkish
manufacturing organizations. The TQM Magazine, 15(5), 345-350.
229
Bayraktar, E., Tatoglu, E., & Zaim, S. (2008). An instrument for measuring the critical
factors of TQM in Turkish higher education. Total Quality Management, 19(6),
551-574.
Beard, D. F. (2009). Successful applications of the balanced scorecard in higher
education. Journal of Education for Business, 84(5), 275-282.
Beckford, J. (2003). Quality: a critical introduction. Routledge.
Beckford, J. (2002) Quality London, 2nd Edition, Routledge.
Bell, J. (2014). Doing Your Research Project: A guide for first-time researchers.
McGraw-Hill Education (UK).
Bell, J. (2006). Doing Your Research Project: A Guide for First-time Researchers in
Education, Health and Social Science-4/E.
Bendell, T., Penson, R., & Carr, S. (1995). The quality gurus-their approaches described
and considered. Managing Service Quality: An International Journal, 5(6), 44-48.
Bergman, B., & Klefsjo, B. (2003). Quality: from customer needs to customer
satisfaction, (2nd ed.). Studentlitteratur, Lund.
Bhatt, G. D. (2000). Organizing knowledge in the knowledge development cycle.
Journal of Knowledge Management, 4(1), 15-26.
Bhusry, M., & Ranjan, J. (2012). Enhancing the teaching- learning process: a knowledge
management approach. International Journal of Educational Management, 26(3),
313-329.
Bin Saeed, K. A. (1997). Total Quality Management: Application to the health sector.
First edition, Dermk, Riyadh.
Binney, D. (2001). The knowledge management spectrum-understanding the KM
landscape. Journal of knowledge management, 5(1), 33-42.
Black, S. A., & Porter, L. J. (1996). Identification of the Critical Factors of TQM*.
Decision sciences, 27(1), 1-21.
Blaxter, L., Hughes, C., & Tight, M. (2010). How to Research: Maidenhead.
Blumentritt, R. & Johnston, R. (1999). Towards a Strategy for Knowledge
Management, www.aciic.org.au/publication/towardsastrategy.pdf.
Bogdan, R. C., & Biklen, S. K. (1982). Qualitative researchfor education. inJ.
Wellington,(2000) Educational Research: Contemporary Issues and Practical
Research, London: Continuum.
Borahan, N. G., & Ziarati, R. (2002). Developing quality criteria for application in the
higher education sector in Turkey. Total quality management, 13(7), 913-926.
230
Bose, R. (2004). Knowledge management metrics. Industrial management & data
systems, 104(6), 457-468.
Bounds, G. M., Dobbins, G. H., & Fowler, O. S. (1995). Management: A total quality
perspective. South-Western Publishing Company.
Brigham, E., & Ehrhardt, M. (2013). Financial management: theory & practice.
Cengage Learning.
Brigham, E., & Houston, J. (2011). Fundamentals of financial management. Cengage
Learning.
Bryman, A. (2012). Social research methods. Oxford university press.
Btanony, A. (2004). The impact of connectivity and integration between the balanced
scale of performance and system cost on the basis of activity of business
organizations. Journal of the Faculty of Commerce for Scientific Research, Vol
378, Forty-first edition, 387.
Bundagji, M. R. (1996). Training Trends on the Total quality among food
manufacturers in the Greater Amman area. Studies Journal, Vol. 23, Issue 2, July,
Jordan
Carlsson, M., & Carlsson, D. (1996). Experiences of implementing ISO 9000 in
Swedish industry. International Journal of Quality & Reliability Management ,
13(7), 36-47.
Cascella, V. (2002). Effective strategic planning. Quality Progress, 35(11), 62-67.
Cavana, R. Y., Delahaya, B. L., & Sekaran, U. (2001). Applied business research:
Qualitative and quantitative methods. NY: John Wiley & Sons.
Central Bank of Jordan. (2006). Annual Report. Amman, Jordan.
Central Bank of Jordan. (2007). Annual Report, Amman Jordan.
Chang, H. H. (2006). An empirical evaluation of performance measurement systems for
total quality management. Total Quality Management, 17(8), 1093-1109.
Chang, O. H., & Chow, C. W. (1999). The balanced scorecard: A potential tool for
supporting change and continuous improvement in accounting education. Issues in
Accounting Education, 14(3), 395-412.
Chen, M. Y., Huang, M. J., & Cheng, Y. C. (2009). Measuring knowledge management
performance using a competitive perspective: An empirical study. Expert Systems
with Applications, 36(4), 8449-8459.
Choi, Y. S. (2000). An empirical study of factors affecting successful implementation of
Chowdhury, M., Paul, H., & Das, A. (2007). The impact of top management
231
commitment on total quality management practice: an exploratory study in the Thai
garment industry. Global Journal of Flexible Systems Management, 8(1/2), 17-29.
Chou, Y. & Yaying, M. (2005). The Implementation of Knowledge Management
System In Taiwan’s Higher Education, Journal of College Teaching& Learning,
Vol.2, No9, pp.35-42.
Choy Chong, S. (2006). KM critical success factors: a comparison of perceived
importance versus implementation in Malaysian ICT companies. The learning
organization, 13(3), 230-256.
Churchill, G. A., & Iacobucci, D. (2010). Marketing research: methodological
foundations.
Claver, E., Tari, J. J., & Molina, J. F. (2003). Critical factors and results of quality
management: an empirical study. Total Quality Management and Business
Excellence, 14(1), 91-118.
Clarke, T., & Rollo, C. (2001). Corporate initiatives in knowledge management.
Education and Training, 43(4/5), 206-214.
Coakes, E. (Ed.). (2003). Knowledge management: Current issues and challenges. IGI
Global.
Coakes, S. J., & Steed, L. (2007). SPSS 14.0 for windows: Analysis without anguish.
Australia: John Wiley & Sons Australia, Ltd.
Cohen, J., Cohen, P., West, S. G., & Aiken, L. S. (2003). Applied multiple
regression/correlation analysis for the behavioral sciences (3rd ed.). Mahwah, NJ:
Lawrence Erlbaum Associates. Cohen, J., Cohen, P., West, S. G., & Aiken, L. S.
(2013). Applied multiple regression/correlation analysis for the behavioral
sciences. Routledge.
Cohen, M. D., & James, G. March (1974) Leadership and Ambiguity: the American
College President. New York.: McGraw-Hill.
Collis, J., Hussey, R., Crowther, D., Lancaster, G., Saunders, M., Lewis, P., ... &
Robson, C. (2003). Business research methods. Palgrave Macmillan, New York.
Collis, J. & Hussey, R., (2009). Business Research – a practical guide for undergraduate
and postgraduate students. 3rd ed., Hampshire: Palgrave Macmillan
Comptroller iCenter, O. S. D. (2007). Knowledge Management: Maximizing Human
Potential.
Cornett, M. M., & Saunders, A. (2003). Financial institutions management: A risk
management approach. McGraw-Hill/Irwin.
232
Creswell, J. W. (2013). Research design: Qualitative, quantitative, and mixed methods
approaches. Sage publications.
Crosby, P. B. (1967). Cutting the cost of quality. Boston: Industrial Education Institute.
Boston, MA.
Crosby, P. B. (1979). Quality is free: The art of making quality certain. McGraw-Hill
Book Company New York.
Crawford, C. B. (2005). Effects of transformational leadership and organizational
position on knowledge management. Journal of Knowledge Management, 9(6), 6-
16.
Cullen, J., Joyce, J., Hassall, T., & Broadbent, M. (2003). Quality in higher education:
from monitoring to management. Quality Assurance in Education, 11(1), 5-14.
Cummings, J. L., & Teng, B. S. (2003). Transferring R&D knowledge: the key factors
affecting knowledge transfer success. Journal of Engineering and technology
management, 20(1), 39-68.
Dacey, W. (2007). Knowledge management and its role in achieving competitive
advantage. Empirical Study in Syrian government banks, Unpublished MA
dissertation, Damascus University.
Daft, R. L. (1992). Organization Theory and Design, West Publishing Co., New York.
Daft, R. L. (2001). Essentials of organization theory and design. South Western
Educational Publishing.
Daft, R. (2006). Organization theory and design. Suoth-Western College Pub,2006. 9th
Edition (2006).
Dagher, M. M. (2001). Total quality management strategy as an approach to the
development of higher education in the Arab world. The Arab Thought Forum for
International Standards for Universities of the Arab Organization for
Administrative Development, Iraq.
Dahlgaard, J. J., Khanji, G. K., & Kristensen, K. (2008). Fundamentals of total quality
management. Routledge.
Dahlgaard, J. J., Kristensen, K., Kanji, G. K., Juhl, H. J., & Sohal, A. S. (1998).
Fundamentals of Total Quality Management. The TQM Magazine 10, no. 4 (1998):
312-312.
Dale, B. (1994). Managing quality . (2nd edn.) Prentice Hall: Hemel Hempstead.
Dale, B. (2003). Managing quality. (4th edn.) Oxford: Blackwell.
Dale, Anders M., and Randy L. Buckner. "Selective averaging of rapidly presented
individual trials using fMRI." Human brain mapping 5.5 (1997): 329-340.
233
dxcDalkir, K. (2005). Knowledge Management Converting Theory into Practice.
Dalkir, K. (2013). Knowledge management in theory and practice. Publisher: Erin
Joyner Routledge.
D'Antoni, A. V., Zipp, G. P., Olson, V. G., & Cahill, T. F. (2010). Does the mind map
learning strategy facilitate information retrieval and critical thinking in medical
students?. BMC medical education, 10(1), 61.
Daradeka, M. (2005). Total Quality Management 2nd Ed. Safa for Publishing and
Distribution, Amman, 2005.
Daud, S., & Abdul Hamid, H. (2006). Successful knowledge sharing in private higher
institutions education: Factors and barriers. Paper presented at the Knowledge
Management International Conference and Exhibition, K.L., Malaysia, 542-546.
Davenpart, T. & Prusak, L. (1998). Working Knowledge How Organization Manage
What The Know, Harvard Business School Press, Boston
Davis, T. R. (1996). Developing an employee balanced scorecard: linking frontline
performance to corporate objectives. Management Decision, 34(4), 14-18.
Davies, J.,Hides, M. T. & Casey, S. (2001) Leadership in higher education. Total
Quality Management, 12, 7&8, 1025-1030.
Davok, D. F. (2007). Quality in education. Avaliação: revista da avaliação da
Educação Superior (Campinas), 12(3), 505-513.
Deem, R. (2004). The knowledge worker, the manager-academic and the contemporary
UK university: new and old forms of public management?. Financial
Accountability & Management, 20(2), 107-128.
DeLong, D. W. (2004). Lost knowledge: Confronting the threat of an aging workforce.
Oxford University Press.
Deming, W. E. (1982). Quality, productivity and competitive position. Cambridge, MIT:
center for Advance Engineering study.
Deming, W. E. (1986). Out of crisis. Cambridge, MA: MIT Center for Advanced
Engineering.
Denzin, N. K. Lincoln (1998). Strategies of qualitative inquiry. SAGE Publications,
Mar 9, 1998 - Social Science - 368 pages
Department of Statistics. (2006). Jordan in Figures. Issue 8 (May), Amman / Jordan.
Dept of Statistics Annual Statistical Report 2009; MOHESR Statistical Report 2014
Devinney, T. M. (1997). Knowledge, tacit understanding and strategy. WORKING
PAPER-AUSTRALIAN GRADUATE SCHOOL OF MANAGEMENT.
Dilworth, J. B. (1996). Operations management -2/E McGraw-Hill New York.
234
Dobbin, B. & Fowler, (1997). Management a Total Quality Perspective, South-
Western, U.S.A.
Doherty, G. D. (1993). Towards total quality management in higher education: a case
study of the University of Wolverhampton. Higher Education, 25(3), 321-339.
Dotchin, J. A., & Oakland, J. S. (1992). Theories and concepts in total quality
management. Total Quality Management, 3(2), 133-146.
Douglas, S. P., & Craig, C. S. (2007). Collaborative and iterative translation: An
alternative approach to back translation. Journal of International Marketing, 15(1),
30-43.
Drucker, P. F. (1999). Knowledge-worker productivity: The biggest challenge. The
knowledge management yearbook 2000-2001.
Drummond, H. (1992). The quality movement: what total quality management is really
all about!. Kogan Page.
Duffy, J. (2000). The KM technology infrastructure. Information Management Journal,
Vol. 34, No. 2 , April 2000
Earley, P. C., & Erez, M. (1997). The transplanted executive. New York: Oxford
University Press.(2006) Leading cultural research in the future: A matter of
paradigms and taste, Journal of International Business Studies, 37, 922-931.
Eccles, R. G. (1990). The performance measurement manifesto. Harvard business
review, 69(1), 131-137.
Economic & Social Commission For Western Asia. (2004). United Nations Workshop
on International Economic and Social Classifications. 19 – 23 July 2004, UN
House Beirut, Lebanon.
Ediger, M. (2010). Quality school education (Vol. 4). Discovery Publishing House.
EFQM. (1999). Assessing for Excellence: A Practical Guide for Self-Assessment.
European Foundation for Quality Management, 1999.
Enzi, S. H. (2001). Intellectual Capital: The Real Wealth Of Atheist Organizations
Work-First Century, Journal of Economic and Administrative Sciences, Vol. 8, No.
25, Baghdad.
EQUIS (2012). European quality improvement system accreditation standards and
criteria. European Foundation for Management Development (EFMD). Retrieved
from available online at www.efmd.org/images/stories/efmd/downloadables/EQUIS
Escanciano, C., Fernández, E., & Vázquez, C. (2001). Influence of ISO 9000
certification on the progress of Spanish industry towards TQM. International
Journal of Quality & Reliability Management, 18(5), 481-494.
235
Evans, J. R. (1997). Production/operations management: Quality, performance, and
value. West Publishing Company St Paul, MN.
Evans, J. R. & Dean, J. W. (2001). Total quality management, organization, and
strategy Cincinnati, Ohio 2nd Edition, South-Western College Publishing.
Evans, J. R., & Lindsay, W. M. (2005). The management and control of quality (pp. pp-
687). Mason, OH: South-Western.
Fahey, L., & Prusak, L. (1998). The eleven deadliest sins of knowledge management.
California management review, 40(3), 265.
Feigenbaum, A. V. (1956). Total quality-control. Harvard Business Review, 34(6), 93-
101.
Feigenbaum, A. V. (1961). Total quality control: engineering and management: the
technical and managerial field for improving product quality, including its
reliability, and for reducing operating costs and losses. New York: McGraw-Hill.
Feigenbaum, A. V. (1991). Total Quality Control, New York, 3rd, McGraw-Hill.
Ferrari, F. & Toledo, J. (2004). Analyzing the Knowledge Management through the
Product Development, Journal of Knowledge Management, Vol. 8, No. 1.
Ferreira, A., & Otley, D. (2009). The design and use of performance management
systems: An extended framework for analysis. Management Accounting Research,
20(4), 263-282.
Finger, S., & Dixon, J. R. (1989). A review of research in mechanical engineering
design. Part I: Descriptive, prescriptive, and computer-based models of design
processes. Research in engineering design, 1(1), 51-67.
Fisher, W. (2004). Jordan: Physical and Social Geography, in Regional Survey of the
World (2004). The Middle East and North Africa 2004, (50th Edn), European
Publications, Taylor and Francis Group.
Fleury, A. (1995). Quality and productivity in the competitive strategies of Brazilian
industrial enterprises. World Development, 23(1), 73-85.
Flood, R. L. (1993). Beyond TQM. Wiley.
Flynn, B. B., Schroeder, R. G., & Sakakibara, S. (1994). A framework for quality
management research and an associated measurement instrument. Journal of
Operations management, 11(4), 339-366.
Flynn, B. B., Schroeder, R. G., & Sakakibara, S. (1995). The impact of quality
management practices on performance and competitive advantage. Decision
Sciences, 26(5), 659-691.
236
Fotopoulos, C. V., & Psomas, E. L. (2010). The structural relationships between TQM
factors and organizational performance. The TQM Journal, 22(5), 539-552.
Fuentes, M. M. F., Montes, F. J. L. (2006). Total Quality Management, strategic
orientation and organizational performance: the case of Spanish companies.
Fujita, A., Sato, J.R., Demasi, M.A.A., Sogayar, M.C., Ferreira, C.E. and Miyano, S.,
2009. Comparing Pearson, Spearman and Hoeffding's D measure for gene
expression association analysis. Journal of bioinformatics and computational
biology, 7(04), pp.663-684.
Gaither, G. (1994). Measuring Up: The Promises and Pitfalls of Performance
Indicators in Higher Education. ASHE-ERIC Higher Education Report No. 5.
ERIC Clearinghouse on Higher Education, One Dupont Circle, NW, S uite 630,
Washington, DC 20036-1183.
Gall, M. D. Gall. JP, & Borg, WR (2007). Educational research: An introduction.
Galbraith, J., Downey, D., & Kates, A. (2001). Designing dynamic organizations: A
hands-on guide for leaders at all levels. AMACOM Div American Mgmt Assn.
Gapenski, L. C., & Pink, G. H. (2003). Understanding healthcare financial management.
AUPHA. 12. Fatma.bm, (2,010) "Interactions Between Free Cash Flow, Debt
Policy and Governance Structure" . working paper. www.ssrn.com
Gapenski, L. C., & Pink, G. H. (2007). Understanding healthcare financial
management. Health Administration Press.
Garvin, D. A (1988). Managing Quality, the Strategic and Competitive Edge. New
Garvin, D. A. (1986). Quality problems, policies, and attitudes in the United States and
Japan: An exploratory study. Academy of management journal, 29(4), 653-673.
Gatewood, R., Feild, H., & Barrick, M. (2010). Human resource selection. Cengage
Learning. South-Western; 7th edition (11 Oct. 2010)
Gering, M., & Rosmarin, K. (2000). Central beating. Management Accounting, 78(6),
25-35.
George, S., & Weimerskirch, G. (1998). Total quality management. New York: John
Wiley & Sons, Inc.
Gerosa, G. C. (1998). Total Quality Management is a hollow concept Journal of
Commerce and Industry, Volume 23, Issue 266, February.
Gering, Michael, & Keith Rosmarin, (2000). Central beating, Financial Management,
June, pp. 32-33.
237
Ghobadian, A., & Seng Woo, H. (1996). Characteristics, benefits and shortcomings of
four major quality awards. International Journal of Quality & Reliability
Management, 13(2), 10-44.
Ghobadian, A., Speller, S., & Jones, M. (1994). Service quality: concepts and models.
International Journal of Quality & Reliability Management, 11(9), 43-66.
Gibbert, M., Leibold, M., & Probst, G. (2002). Five styles of customer knowledge
management, and how smart companies use them to create value. European
Management Journal, 20(5), 459-469.
Gibbs, P. (2009). Quality in work‐based studies not lost, merely undiscovered. Quality
in Higher Education, 15(2), 167–176.
Gidley, J. M., Hampson, G. P., Wheeler, L., & Bereded-Samuel, E. (2010). From access
to success: An integrated approach to quality higher education informed by socia l
inclusion theory and practice. Higher Education Policy, 23(1), 123-147.
Gilbert, N. (Ed.). (2008). Researching social life. Sage.
Gillingham, H., & Roberts, B. (2006). Implementing knowledge management: a
practical approach. Journal of Knowledge Management Practice, 7(1).
Gloet, M., & Terziovski, M. (2004). Exploring the relationship between knowledge
management practices and innovation performance. Journal of Manufacturing
Technology Management, 15(5), 402-409.
Goetsch, D., & Davis, S. (1997). Introduction to Total Quality. Quality Management for
Production, Processing, and Services, Sec. ed.
Gomez-Mejia, L. R. & Balkin, D. B. (1992). Compensation, organizational strategy,
and firm performance. South-Western Pub.
Gomez-Mejia, L. R., & Balkin, D. B. (1992). Compensation, organizational strategy,
and firm performance. South-Western Pub.
Gray, P. H., & Durcikova, A. (2005). The role of knowledge repositories in technical
support environments: Speed versus learning in user performance. Journal of
Management Information Systems, 22(3), 159-190.
Gray, P.H. & Durcikova, A. (2006). The role of knowledge repositories in technical
support environments: speed versus learning in user performance, Journal of
Management Information Systems, Vol. 22 No. 3, pp. 159-190.
Greenway, P., & Simonis, D. (2000). Jordan. Melbourne, Lonely Planet Publications.
Grix, J. (2002). Introducing students to the generic terminology of social research.
Politics, 22(3), 175-186.
238
Creswell, J. W. (2013). Research design: Qualitative, quantitative, and mixed methods
approaches. Sage publications.
Guendhilji, A. (2005). Introduction to Knowledge Management. First edition. Al-
financial performance: An Empirical Study in a sample of Arab commercial banks,
Doctoral dissertation, Baghdad.
Hair, J. F., Black, W. C., Babin, B. J., & Anderson, R. E. (2010). Multivariate data
analysis: A global perspective (7th ed.). New Jersey: Person Prentice Hall.
Hair, J. F., Money, A. H., Samouel, P., & Page, M. (2007). Research methods for
business. Chichester, England: John Wiley & Sons, Inc.
Hakes, C. (Ed.). (1991). Total quality management: the key to business improvement .
Springer Science & Business Media.
Hall, B. P. (2001). Values development and learning organisations. Journal of
Knowledge Management 5(1), 19–32.
Halawi, M. M. (2000). Total quality management and its impact in improving the
financial performance: An Empirical Study in a sample of Arab commercial banks,
Doctoral thesis, Baghdad.
Hamdan, A. (2004): Some motivated graduates high school certificate for admission to
professional and technical colleges provinces of Gaza, Najah University Journal for
Research, Volume 18, Issue (1)
Hammersley, M. (2007) Methodological Paradigms in Educational Research. London:
TLRP. Online at http://www.tlrp.org/capacity/rm/wt/hammersley (accessed Mar
ز(2015
Hamoud, K. (2010). Knowledge Organization, he first edition, Dar Al Safa for
publication and distribution, Jordan.
Hansen, M. & Oetinger B. (2001). Introducing T – Shaped Manager Knowledge
Management's Next Generation, Harvard Business Review, Mar.
Harrington, H. J., & Harrington, J. S. (1995). Total improvement management: the next
generation in performance improvement (Vol. 198). New York, NY: McGraw-Hill.
Harrison, R. T., & Livingstone, D. N. (1980). Philosophy and problems in human
geography: a presuppositional approach. Area, 25-31.
Harvey, L. (1995) Student Satisfaction. The New Review of Academic Librarianship, 1,
161-173.
Harvey, L., & Williams, J. (2010). Fifteen years of quality in higher education (Part
Two).
239
Hassan H. S. (2003). The concept of the scientific revolution with Thomas Kuhn.
Master’s thesis, Baghdad: Literature.
Hassan, S. A. & Abboud, R. A. (2008). The Possibility of Applying the Principles of
Total Quality Management at the University of Karbala. Iraqi Journal of
Administrative Sciences, Issue (22), Volume (6), Faculty of Management and
Economics, University of Karbala, Iraq.
Hauke, J. and Kossowski, T., 2011. Comparison of values of Pearson's and Spearman's
correlation coefficients on the same sets of data. Quaestiones geographicae, 30(2),
pp.87-93.
Haworth, J. G., & Conrad, C. F. (1997). Emblems of Quality in Higher Education.
Developing and Sustaining High-Quality Programs. Allyn & Bacon, Longwood
Division, 160 Gould Street, Needham Heights, MA 02194-2310.
Hazelkorn, E. (2011). Rankings and the Reshaping of Higher Education: the Battle for
World Wide Excellence. Dublin Institute of Technology.
Heisig, P., & Vorbeck, J. (2001). Benchmarking survey results. In Knowledge
management (pp. 97-123). Springer Berlin Heidelberg.
Heizer, J. & Render, B. (2001), Operations Management, 6th ed., Prentice-Hall,
Englewood Cliffs, NJ.
Helal, M. A. H. (2000). Total quality management skills in training. Second edition.
Center for Development of Performance and Development, Cairo.
Helga, D. (1997). The TQM Movement, UBSPD, Delhi.
Heras, I., Casadesús, M., & Dick, G. P. (2002). ISO 9000 certification and the bottom
line: a comparative study of the profitability of Basque region companies.
Managerial Auditing Journal, 17(1/2), 72-78.
Herschel, R. T., & Nemati, H. R. (2000). Chief knowledge officer: critical success
factors for knowledge management. Information Strategy: The Executive's Journal,
16(4), 37-45.
Hesse-Biber, S. N., & Leavy, P. (2006). Emergent methods in social research. Sage.
Hesse-Biber, S. N., & Leavy, P. (2010). The practice of qualitative research. Sage.
Hides, M. T., Davies, J. & Jackson, S. (2004) Implementation of EFQM excellence
model self-assessment in the UK higher education sector- lessons learned from
other sectors. The TQM Magazine, 16, 3, 194-201.
Hijazi, H. (2005). Measuring the impact of understanding the dimensions of knowledge
management and employing them in Jordan. Doctoral dissertation, Amman Arab
University for Graduate Studies, Jordan.

240
Hijazi, H. A (2005). Knowledge management: a theoretical entrance. Oman: Ahlia, 50.
Hislop, D., Newell, S., Scarbrough, H., & Swan, J. (2000). Networks, knowledge and
power: Decision making, politics and the process of innovation. Technology
Analysis & Strategic Management, 12(3), 399-411.
Hoepfl, M. C. (1997). Choosing qualitative research: A primer for technology education
researchers. Journal of Technology Education, 9(1), 47-63. Retrieved February 25,
1998, from http://scholar.lib.vt.edu/ejournals/JTE/v9n1/pdf/hoepfl.pdf
Holmes, J. S., Amin Gutiérrez de Piñeres, S., & Douglas Kiel, L. (2006). Reforming
government agencies internationally: is there a role for the balanced scorecard?. Intl
Journal of Public Administration, 29(12), 1125-1145.
Holden, M. T., & Lynch, P. (2004). Choosing the appropriate methodology:
Understanding research philosophy.The Marketing Review, 4(4), 397-409. doi:
10.1362/1469347042772428
Honarpour, A., Jusoh, A., & Md Nor, K. (2012). Knowledge management, total quality
management and innovation: A new look. Journal of technology management &
innovation, 7(3), 22-31.
Houston, D. (2007). TQM and higher education: A critical systems perspective on
fitness for purpose. Quality in Higher Education, 13(1), 3-17.
http://ec.europa.eu/education/programmes/temupus/countries>[Accessed:
Hsu, S. H., & Shen, H. P. (2005). Knowledge management and its relationship with
TQM. Total Quality Management and Business Excellence, 16(3), 351-361.
Hughes, T. P. (1994). Catastrophes, phase shifts, and large-scale degradation of a
Caribbean coral reef. Science-AAAS-Weekly Paper Edition, 265(5178), 1547-1551.
Hung, R., & Lien, B. (2004, 3-7 March). Total quality management practices and their
effects on organizational performance. Paper presented at the Academy of Human
Resource Development International Conference, Austin, TX
Hung, Y. C., Huang, S. M., Lin, Q. P., & -Tsai, M. L. (2005). Critical factors in
adopting a knowledge management system for the pharmaceutical industry.
Industrial Management & Data Systems, 105(2), 164-183.
Huq, Z. (2005). Managing change: a barrier to TQM implementation in service
industries. Managing Service Quality: An International Journal, 15(5), 452-469.
Hussi, T. (2004). Reconfiguring knowledge management-combining intellectual capital,
intangible assets and knowledge creation. Journal of Knowledge Management,
8(2), 36-52.
241
Hussein, S. A. & Aboud, R. A. (2008). The Possibility of Applying The Principles of
Total Quality Management At The University of Karbala. Iraqi Journal of
Administrative Sciences, Issue (22), Volume (6), Faculty of Management and
Economics, University of Karbala, Iraq.
Iacobucci, D., & Churchill, G. (2009). Marketing research: methodological
foundations. Cengage Learning.
Ibraham, S. (1998). The impact of technological knowledge and creative behavior in the
performance of some industrial organizations Level: field study. Doctoral
dissertation, Mosul
Idris, T., & Morsi, J. (2006). Strategic Management: Concepts and models applied.
Cairo: University House.
ITC. (International Trade Center). (1996). Trade Support Service, Applying ISO 9000
Qu)ality Management System. Geneva.
James, L. R., Mulaik, S. A., & Brett, J. M. (2006). A tale of two
methods.Organizational Research Methods, 9(2), 233-244. James, P. (1996) Total Quality Management an Introductory Text. London: Prentice
Hall.
Jennex, M. E., & Olfman, L. (2004, January). Assessing knowledge management
success/effectiveness models. In System Sciences, 2004. Proceedings of the 37th
Annual Hawaii International Conference on (pp. 10-pp). IEEE.
Johnston, R. J. (1986). Philosophy & Human Geography: An Introduction to
Contemporary Approaches (2nd ed.). London: Edward Arnold.
Johnson, C. C., Beiman, I., & Thompson, J. (2007). Balanced Scorecard: for State-
owned Enterprises: Driving Performance and Corporate Governance.
Jones, J. K. (2011). Re-framing education as a thirdspace: neonarratives of pedagogy,
power and transformation (Doctoral dissertation, University of Southern
Queensland).
Jones, R., Arndt, G., & Kustin, R. (1997). ISO 9000 among Australian companies:
impact of time and reasons for seeking certification on perceptions of benefits
received. International Journal of Quality & Reliability Management, 14(7), 650-
660.
Jordan Institution for Standards and Metrology JISM (2007) [online]. Available at:
<http://www.jism.gov.jo/index.html> [Accessed: 25.3.2012]. Jordan Telecom.
Report, (2006).

242
Jordan Institution for Standards and Metrology JISM (2008). Objectives & Strategies.
[online]. Available at: http://www.jism.gov.jo/ [Accessed May 2013].
Ju, T. L., Lin, B., Lin, C., & Kuo, H. J. (2006). TQM critical factors and KM value
chain activities. Total Quality Management & Business Excellence, 17(3), 373-393.
Juran, J. M. (1986). The quality trilogy. Quality Progress, 9(8), 19-24.
Juran, J. M. (1989). Juran on leadership for qualit. New York, USA: Free Press. Juran,
J. M., & Gryna, F. M. (1988). Juran quality control handbook (4th ed.).
Juran, J. M. (Ed.). (1995). A history of managing for quality: The evolution, trends, and
future directions of managing for quality. Asq Press.
Kahreh, M. S., Tive, M., Babania, A., & Hesan, M. (2014). Analyzing the applications
of customer lifetime value (CLV) based on benefit segmentation for the banking
sector. Procedia-Social and Behavioral Sciences, 109, 590-594.
Kanaan, T., Al-Salamat, M., & Hanania, M. (2009). Financing Higher Education in
Jordan. Jordan Center for Policy Research and Dialogue (JCPP), Amman: Jordan,
Online,http://www.jcpprd.org/Files/ResearchDatabase/Financing%20Higher%20E
duction%20in%20Jordan.pdf
Kanji, G. K. (2002). Measuring business excellence London : Routledge.
Kanji, G. K., Malek, A., & Tambi, B. A. (1999). Total quality management in UK
higher education institutions. Total Quality Management, 10(1), 129-153.
Kaplan, R. and D. Norton (1992). The Balanced Scare Card, Measures That Drive
Performance. Harvard Business Review, Vol. 70, No. 1, Jan-Feb.
Kaplan, R. S., & Norton, D. P. (1996). Using the balanced scorecard as a strategic
management system. Harvard business review, January-February, pp. 37- 48.
Kaplan, R. S., & Norton, D. P. (2000). Having trouble with your strategy?: Then map it.
Harvard Business School Publishing Corporation.
Kaplan, R. S., & Norton, D. P. (2004). Measuring the strategic readiness of intangible
assets. Harvard business review, February, pp. 1-14.
Kaplan, R., & Norton, D. (1992). The Balanced Scorecare-Measures that Drive
Performance. Harvard Business School , 71-79.
Kartha, C. P. (2004). A comparison of ISO 9000: 2000 quality system standards,
QS9000, ISO/TS 16949 and Baldrige criteria. The TQM magazine, 16(5), 331-340.
Karuppusami, G., & Gandhinathan, R. (2006). Pareto analysis of critical success factors
of total quality management: A literature review and analysis. The TQM magazine,
18(4), 372-385.

243
Kathawala, Y. & Elmuti, D. (1991). An overview of the Baldrige Award: America’s
tool for global competition. Industrial Management, Vol. 33, No. 2, 27–29.
Kaufman, R. S. (1992). Why operations improvement programs fail: four managerial
contradictions. Sloan Management Review, 34, 83-83.
Kaufman, R. S. and S. S. o. Management (1992). Why Operations Improvement
Programs Fail: Four Managerial Contradictions, Sloan Management Review Assn.
at the Alfred P. Sloan School of Management, Massachusetts Institute of
Technology.
Kay Michael, R., Sower, V. E., & Motwani, J. (1997). A comprehensive model for
implementing total quality management in higher education. Benchmarking for
Quality Management & Technology, 4(2), 104-120.
Kelley, K., Clark, B., Brown, V., & Sitzia, J. (2003). Good practice in the conduct and
reporting of survey research. International Journal for Quality in Health Care,
15(3), 261-266.
Kenya, F. S. D. Central Bank of Kenya (2013). FinAccess National Survey 2013:
Profiling developments in financial access and usage in Kenya, Nairobi.
Khadra, O. B. (1998). Total Quality Management in the Banks. Journal of Banks in
Jordan, Issue 4, Amman.
Kholi, H. A. (2001). Using the measurement model for Balanced of performance in
measuring the strategic performance for businesses. Journal of Management
Accounting and Insurance, No. Seventh Session, Forty year. , Pp. 1-48
Kidwell, J. J., Vander Linde, K., & Johnson, S. L. (2000). Applying Corporate
Knowledge Management Practices in Higher Education. Educause quarterly, 23(4),
28-33.
Kiessling,T., Glenn, R. R., Meng, J. & Dabic, M. (2009). Exploring knowledge
management to organized performance outcomes in a transitional economy. Journal
of world business, 44(4), 421-433.
King Abdullah Centre for Excellence KACE (2008). The King Abdullah II Award for
Excellence in private sector. [online]. Available from:
http://www.kace.jo/private.shtm [Accessed May 2012].
Kirshenblatt-Gimblett, B. (2006). World heritage and cultural economics. Museum
frictions: Public cultures/global transformations, 161-202.
Klassen, A., Miller, A., Anderson, N., Shen, J., Schiariti, V., & O'Donnell, M. (2010).
Performance measurement and improvement frameworks in health, education and
244
social services systems: a systematic review. International Journal for Quality in
Health Care, 22(1), 44-69.
Kline, R. B. (2011). Principles and practice of structural equation modeling (3rd ed.): The Guilford Press. knowledge management.
Kristensen, K., Dahlgaard, J. J., & Kanji, G. K. (1995). A comparison of TQM-
performance in the Nordic and East Asian countries. In Total Quality Management
(pp. 39-49). Springer Netherlands.
Koch, J. V., & Fisher, J. L. (1998). Higher education and total quality management.
Total Quality Management, 9(8), 659-668.
Koch, J. V. (2003). TQM: why is its impact in higher education so small. The TQM
Magazine, 15(5), 325-333.
Koenigi; M. (2000). The Re Surgence of Intellectual Capital, Information Today, Vol.
17, Sep.
Kubaisi, S. A. (2002). Knowledge management and its impact on organizational
innovation: an exploratory study comparing a sample of mixed industrial sector
companies. Doctoral dissertation, Baghdad.
Kubaisi, S. A. (2004). Knowledge management and development organizations. The
Office of Universities, Arab Republic of Egypt.
Kuhn, J. (2000). Linking Continuous Improvement and Knowledge Management.
www.continuous- innovation.net/publications/papers-3rd/kuhn-ci.2000.pdf
Kuhn, W. (2001). Ontologies in support of activities in geographical space.
International Journal of Geographical Information Science, 15(7), 613-631.
Kulkarni, U. R., Ravindran, S., & Freeze, R. (2007). A knowledge management success
model: Theoretical development and empirical validation. Journal of management
information systems, 23(3), 309-347.
Labaree, R. (2013). The literature review: Organizing your social sciences research
paper (Writing Guide). Los Angeles, CA: University of Southern Carolina
Libraries. Retrieved September 10, 2013.
Lagrosen, S. (2001). Strengthening the weakest link of TQM-from customer focus to
customer understanding. The TQM Magazine, 13(5), 348-354.
Lagrosen, S., Seyyed-Hashemi, R., & Leitner, M. (2004). Examination of the
dimensions of quality in higher education. Quality Assurance in Education, 12(2),
61-69.
245
Lakhe, R. R., & Mohanty, R. P. (1994). Total quality management: concepts, evolution
and acceptability in developing economies. International Journal of Quality &
Reliability Management, 11(9), 9-33.
Lam, S. Y., Lee, V. H., Ooi, K. B., & Phusavat, K. (2012). A structural equation model
of TQM, market orientation and service quality: Evidence from a developing
nation. Managing Service Quality: An International Journal, 22(3), 281-309.
Lascelles, D. M., & Dale, B. G. (1988). A study of the quality management methods
employed by UK automotive suppliers. Quality and Reliability Engineering
International, 4(4), 301-309.
Lather, P. (2006). Paradigm proliferation as a good thing to think with: Teaching
research in education as a wild profusion. International journal of qualitative
studies in education, 19(1), 35-57.
Laudon, K. & Laudon, J. (2001)., Management Information systems, 4th/ed., Prentice
Hall, Inc., New York.
Landon, T. (2003). 13 steps to certification in less than a year. Quality Progress,
36(3), 32-42.
Laudon, K. C., & Laudon, J. P. (2007). Essentials of business information systems.
Pearson Prentice Hall.
Laudon, K. C., & Laudon, J. P. (2011). Essentials of management information systems.
Upper Saddle River: Pearson.
Lawler, E. E., Mohrman, S. A., & Ledford, G. E. (1995). Creating high performance
organizations: Practices and results of employee involvement and total quality
management in Fortune 1000 companies. San Francisco, CA: Jossey-Bass.
Lewis, R. G., & Smith, H. D. (1994). Total quality in higher education. Florida: St
Lucie Press.
Lawrence, R. J., & Robert, A. O. (1997). A violation of assumptions: Why TQM won‟t
work in the ivory tower. Journal of Quality Management, 2(2), 279- 291.
Lawrence, S., & Sharma, U. (2002). Commodification of education and academic
labour—using the balanced scorecard in a university setting. Critical perspectives
on accounting, 13(5), 661-677.
Lawson, S. (2003). Examining the relationship between organizational culture and
knowledge management (Doctoral dissertation, Nova southeastern university).
Lee, C. Y. (2004). Perception and development of total quality management in small
manufacturers: An exploratory study in China. Journal of Small Business
Management, 42(1), 102-115.

246
Lee, L. L. (2000). Knowledge sharing metrics for large organizations. Knowledge
management: Classic and contemporary works, 403-419.
Lee, S. M., & Asllani, A. (1997). TQM and BPR: symbiosis and a new approach for
integration. Management Decision, 35(6), 409-416.
Lee, V. H., Ooi, K. B., Tan, B. I., & Chong, A. Y. L. (2010). A structural analysis of the
relationship between TQM practices and product innovation. Asian Journal of
Technology Innovation, 18(1), 73-96.
Leesr, J. (2000). Knowledge Management: The intellectual revolution.
http://www.proquest.umi.com/pqdweb.
Likert, R. (1932). A technique for the measurement of attitudes. Archives of psychology.
Lim, K. T., Rushami, Z. Y., & Zainal, A. A. (2004). The impact of total qality
managenet principles on students' academic achievement: An empirical study.
Thaksin University Journal, 7(2), 14-25.
Lin, H. F., & Lee, G. G. (2005). Impact of organizational learning and knowledge
management factors on e-business adoption. Management Decision, 43(2), 171-
188.
Linder; J. & Jennifer; R. (1998). Human Research Management, West Publishing Co.,
New York.
Liao, S. H., & Wu, C. C. (2009). The relationship among knowledge management,
organizational learning, and organizational performance. International Journal of
Business and Management, 4(4), p64.
Logothetis, N. (1997). Managing for Total Quality from Deming to Taguchi. 1st/ed.,
Prentice-Hall of India, New Delhi.
Lomas, L. (2004). Embedding quality: the challenges for higher education. Quality
Assurance in education, 12(4), 157-165.
Loomba, A. P., & Johannessen, T. B. (1997). Malcolm Baldrige National Quality
Award: critical issues and inherent values. Benchmarking for Quality Management
& Technology, 4(1), 59-77.
Lopez, T. B., Babin, B. J., & Chung, C. (2009). Perceptions of ethical work climate and
person–organization fit among retail employees in Japan and the US: A cross-
cultural scale validation. Journal of Business Research, 62(6), 594-600.
Lozi, M. (2009). Organizational Development: Fundamentals and modern concepts. the
third edition, Dar Wael for publication, Amman.
Lynne, E., & Ross, B. (2007). Are students customers?- TQM and marketing
perspectives. Quality Assurance in Education, 15(1), 44-60.
247
Madi Bin Abdullah, M., Uli, J., & José Tarí, J. (2008). The influence of soft factors on
quality improvement and performance: Perceptions from managers. The TQM
Journal, 20(5), 436–452.
Mahyawi, Q. N. (2007). University Management In The Light Of Standards of Total
Quality. Journal of Union of Arab Universities, Number (4) -April 2007.
Maiah, A. (2006). Knowledge Management in Higher Education Institutions:
International Experiences. Information Studies, Issue (3), (P 143-157).
Malak, S., & Al-Athary, A. (2002). Knowledge Management and Its Role In Supporting
The Development of Skills In Organizations. Journal of the future of Arab
education, Volume (8), number (26), (pp. 143-157).
Mahesh, K., & Suresh, J. K. (2004). What is the K in KM Technology. The Electronic
Journal of Knowledge Management, 2(2), 11-22.
Malhotra, Y. (2000). Knowledge assets in the global economy: assessment of national
intellectual capital. Knowledge Management and Business Model Innovation, 232-
249.
Malhotra, N. K., & Peterson, M. (2006). Basic Research Marketing: A Decision-
Making Approach. (2nd Ed.). New Jersey: Pearson Education, Inc.
Malhotra, N, & Jon A. Krosnick. (2007). The E_ect of Survey Mode and Sampling on
Inferences about Political Attitudes and Behavior: Comparing the 2000 and 2004
ANES to Internet Surveys with Non-Probability Samples." Political Analysis.
15(3): 286-323.
Marquardt, M. J. (2002). Building the learning organization: Mastering the 5 elements
for corporate learning. Davies-Black Pub..
Martínez-Costa, M., Choi, T. Y., Martínez, J. A., & Martínez-Lorente, A. R. (2009).
ISO 9000/1994, ISO 9001/2000 and TQM: The performance debate revisited.
Journal of Operations Management, 27(6), 495-511.
Martinez-Lorente, A. R.,Dewhurst, F. & Dale, B. G. (1998). Total quality management:
origins and evolution of the term. The TQM Magazine, 10, 5, 378 - 386.
MBNQA. (2011-2012). Education criteria for performance excellence: Malcolm
Baldrige National Quality Award. Retrieved from available online at
http://quality.nist.gov
McAdam, R., & McCreedy, S. (1999). A critical review of knowledge management
models. The learning organization, 6(3), 91-101.
McAdam, R., &. Leonard, D. (2001). Developing TQM: The knowledge management
contribution. Journal of General Management 26(4): 47-61.
248
McDaniel, C. & Gates, R. (1999). Contemporary Marketing Research, 4th Edition,
Cincinnati, Ohio: South-Western College Publishing.
McGraw-Hill International.
McKeen, S., Grell, G., Peckham, S., Wilczak, J., Djalalova, I., Hsie, E. Y., ... & Mathur,
R. (2009). An evaluation of real‐time air quality forecasts and their urban emissions
over eastern Texas during the summer of 2006 Second Texas Air Quality Study
field study. Journal of Geophysical Research: Atmospheres (1984–2012), 114(D7).
McKenzie, A. (2006). Reading e-journal article pdf files--turn your laptop into an
electronic book. Anaesthesia and intensive care, 34(4), 519.
McShane, S. L., & Von Glinow, M. A. (2000). Organizational Behavior. NewYork.
America.
Meer, A. A. (1995). The relationship between job stress and between organizational
loyalty, performance and job satisfaction and personal qualities, the Journal of
Public Administration, Volume 35, the second issue, Riyadh, the Institute of Public
Administration, 1995.
Mello, J. A. (1999) Reframing leadership pedagogy through model and theory building.
Career Development International, 4, 16-16.
Menezes Ferrari, F., & Carlos de Toledo, J. (2004). Analyzing the knowledge
management through the product development process. Journal of Knowledge
Management, 8(1), 117-129
Merriam, S. B. (2014). Qualitative research: A guide to design and implementation.
John Wiley & Sons.
Mertins, K., Heisig, P., & Vorbeck, J. (2001). Knowledge management: best practices.
Michael, R. K., Sower, V. E., & Motwani, J. (1997). A comprehensive model for
implementing total quality management in higher education. Benchmarking: An
International Journal, 4(2), 104-120.
Microsoft, C. (1999). Practicing Knowledge Management: Turning Experience and
Information Results, www.microsoft.com/dns.
Mikulecká, J., & Mikulecky, P. (2000, September). University Knowledge
Management–Issues and Prospects. In Djamel A. Zighed, Jan Komoroswki, Jan
Zykow, Principles of Data Mining and Knowledge Discovery 4th European
Conference Proceedings, PKDD (pp. 157-165).
Miller, A., & Dess, G. (1996). Strategic Management. 2nd/ed., McGraw-Hill Co., Inc.,
U.S.A.
249
Miller, K. D., & Bromiley, P. (1990). Strategic risk and corporate performance: An
analysis of alternative risk measures. Academy of Management Journal, 33(4), 756-
779.
Mingers, J., & Stowell, F. (1997). Information systems: an emerging discipline?.
McGraw-Hill.
Moffett, S., McAdam, R., & Parkinson, S. (2003). An empirical analysis of knowledge
management applications. Journal of knowledge Management, 7(3), 6-26.
Mohammad, A. H., Hamdeh, M. A., & Sabri, A. T. (2010). Developing a theoretical
framework for knowledge acquisition. European Journal of Scientific Research,
453-463.
Molina, L. M., Lloréns Montes, F. J., & Del Mar Fuentes Fuentes, M. (2004). TQM and
ISO 9000 effects on knowledge transferability and knowledge transfers. Total
Quality Management & Business Excellence, 15(7), 1001-1015.
Molina, L. M., Montes, F. J. L., & Fuentes, M. D. M. F. (2005). TQM and ISO 9000
effects on knowledge transferability and knowledge transfers. Quality control and
applied statistics, 50(2), 159-160.
Motwani, J., & Kumar, A. (1997). The need for implementing total quality management
in education. International Journal of Educational Management, 11(3), 131-135.
Motwani, J., Kumar, A., & Hung Cheng, C. (1996). A roadmap to implementing ISO
9000. International Journal of Quality & Reliability Management , 13(1), 72-83.
Mustafa, A. S. (1999). Continuous Improvement: concept and mechanism. News
Bulletin of Administration, No. 29, December, Egypt.
Murray, J. (2013). Likert data: What to use, parametric or non-parametric?.
International Journal of Business and Social Science, 4(11).
Myers, M. D. (1997). Qualitative research in information systems. Management
Information Systems Quarterly, 21, 241-242.
Myers, D. G. (1998). The psychology of humility. Ten scientists.
N. I. S. T. (2008). Malcolm Baldrige National Quality Award Criteria. U. S. Department
of Commerce. National Institute of Standards and Technology, (2008).
Najeh, R. I. & Kara-Zaitri, C. (2007). A comparative study of critical quality factors in
Malaysia, Palestine, Saudi Arabia, Kuwait and Libya. Total Quality Management
and Business Excellence, 18(1–2), 189–200.
Najmi, M. & Kehoe, D. F. (2001). The role of performance measurement systems in
promoting quality development beyond ISO 9000. International Journal of
Operations & Production Management, 21(1/2), 159–172.

250
Negm, M. M. (2001). Intracanal use of a corticosteroid-antibiotic compound for the
management of posttreatment endodontic pain. Oral Surgery, Oral Medicine, Oral
Pathology, Oral Radiology, and Endodontology, 92(4), 435-439.
Ngah, R., & Jusoff, K. (2009). Tacit knowledge sharing and SMEs’ organizational
performance. International Journal of Economics and Finance, 1(1), p216.
Ni, T., Corcoran, D. L., Rach, E. A., Song, S., Spana, E. P., Gao, Y., ... & Zhu, J.
(2010). A paired-end sequencing strategy to map the complex landscape of
transcription initiation. Nature methods, 7(7), 521-527.
N. I. S. T. (2008) Malcolm Baldrige National Quality Award Criteria. U. S. Department
of Commerce. National Institute of Standards and Technology, (2008).
Niven, P. R. (2002). Balanced scorecard step-by-step: maximizing performance and
maintaining results. John Wiley & Sons.
Niven, P. R. (2005). Balanced scorecard diagnostics: Maintaining maximum
performance. John Wiley & Sons.
Niven, P. R. (2006). Balanced Scorecard Step-By-Step: Maximizing Performance and
Maintaining Results, 2006.
Nonaka, I., & Takeuchi, H. (1995). The knowledge-creating company: How Japanese
companies create the dynamics of innovation. Oxford university press.
Norman, G. (2010). Likert scales, levels of measurement and the “laws” of statistics.
Advances in health sciences education, 15(5), 625-632.
Nosow, S. (1981). The first-line supervisor, the linchpin in the Japanese quality control
circle. Industrial Management, 23(1), 19-23.
Oakland, J. (2000). Total quality management - text with cases (2 ed.). Oxford:
Butterworth Heinemann.
Oakland, J. S. (2003). Total quality management: text with cases. Routledge. Elsevier
Butterworth-Heinemann Linacre House, Jordan Hill, Oxford
Oakland, J., & Porter, L. (2004). Quality 21. Quality World, 30(1), 10-14.
Offsey, S. (1997). Knowledge management: linking people to knowledge for bottom
line results. Journal of Knowledge Management, 1(2), 113–122.
Olve, N. G., Petri, C. J., Roy, J., & Roy, S. (2003). Making scorecards actionable:
Balancing strategy and control. John Wiley & Sons.
Olve, N. G., Roy, J., & Wetter, M. (1999). Performance drivers: A practical guide to
using the balanced scorecard. J. Wiley.
Ooi, K. B. (2009). TQM and knowledge management: Literature review and proposed
framework. African Journal of Business Management, 3(11), 633-643.
251
OSD C. iC. (2002). Knowledge Management Maximizing Human Potential,
www.dtic.mil/comptroller/
Otaibi, Y. (2007). Knowledge management and the possibility of applying it in Saudi
universities: Application to the Umm Al-Qura University. Doctoral dissertation,
Umm Al-Qura University, Saudi Arabia.
Owen, J. (2002). Making Quality Sense: A Guide to Quality, Tools and Techniques,
Awards and the Thinking Behind Them. Learning and Skills Development Agency,
Regent Arcade House, 19-25 Argyll Street, London W1F 7LS, United Kingdom
(Reference no. 1201A).
Owlia, M. S., & Aspinwall, E. M. (1998). A framework for measuring quality in
engineering education. Total Quality Management, 9(6), 501- 518.
Owlia, M. S. (1996). Quality in higher education-a survey. Total Quality Management,
7(2), 161-172.
Palo, S., & Padhi, N. (2003). Measuring effectiveness of TQM training: an Indian study.
International Journal of Training and Development, 7(3), 203-216.
Pan, J. N. (2003). A comparative study on motivation for and experience with ISO 9000
and ISO 14000 certification among Far Eastern countries. Industrial Management
& Data Systems, 103(8), 564-578.
Partlow, C. G. (1996). Human-resources practices of TQM hotels. The Cornell Hotel
and Restaurant Administration Quarterly, 37(5), 67-77.
Parr, A., & Shanks, G. (2000). A Taxonomy of ERP implementation approaches. Paper
presented
at the 33rd Hawaii International Conference on System Sciences, Wailea Maui, Hawaii.
Perera, H. S. C., & Kuruppuarachchi, D. (2010). Impact of TQM and technology
management on operations performance. The IUP Journal of Operations
Management, 9(3), 23-47.
Peters, T. J., & Austin, N. (1985). A passion for excellence. The leadership difference.
Peat, M., Taylor, C. E., & Franklin, S. (2005). Re-engineering of undergraduate science
curriculato emphasise development of lifelong learning skills. Innovations in
Education and Teaching International, 42(2), 135-146. Petrides, L. A., & Nodine, T. R. (2003). Knowledge Management in Education:
Defining the Landscape.
Petruzzellis, L., D' Uggento, A. M., & Romanazzi, S. (2006). Student satisfaction and
quality of service in Italian universities. Managing Service Quality: An
International Journal, 16(4), 349-364.
252
Pim, R. (1997). The golden rules for implementing the balanced business scorecard.
Information Management & Computer Security, 5(5), 163-165.
Pingle, S., & Natashaa, K. (2011). Performance Management in Institutes of Higher
education Through Balanced Scorecard: A conceptual Study. Ganpat University-
Faculty of Management Studies Journal of Management and research, 2, 0-20.
Plant, E. (2007). Balanced Scorecard Masters . American Strategic Management
Institute, www.ASMLweb.com.
Porter, M. E. &Tanner, S. J. (1996) Assessing Business Excellence: A guide to self
assessment, Butterworth-Heinemann, Oxford.
Porter, M. E. (1996). What is strategy?. Published November.
Post, G. & Anderson, D. (2000). Management Information systems, 2nd/ed., Irwin
McGraw-Hill Co., Inc.
Post, V., & Anderson, L. D. (2002). Management Information Systems. The McGraw-
Hill Companies.
Powell, T. C. (1995). Total quality management as competitive advantage: a review and
empirical study. Strategic management journal, 16(1), 15-37.
Pratasavitskaya, H., & Stensaker, B. R. (2010). Quality management in higher
education: towards a better understanding of an emerging field. Quality in Higher
Education, 16(1), 37-50.
Probst, G., Raub, S., & Romhardt, K. (2001). Managing knowledge-Building blocks for
success. ORGANIZATION STUDIES-BERLIN-EUROPEAN GROUP FOR
ORGANIZATIONAL STUDIES-, 22(1), 186-186.
Prybutok, V. and Cutshall, R. (2004) “Malcolm Baldrige National Quality Award
leadership model”, Industrial Management & Data Systems, Vol. 104, No. 7,
pp.558-566
Punch, K. F. (2013). Introduction to social research: Quantitative and qualitative
approaches. Sage.
Pursglove, J., & Simpson, M. (2000). A balanced scorecard for university research.
Performance Measurement: Past Present and Future. Cransfield: Cransfield
School of Management.
Rad, A. M. M. (2005). A survey of total quality management in Iran: Barriers to
successful implementation in health care organizations. Leadership in Health
Services, 18(3), 12-34.
Rampersad, H. (2001). 75 painful questions about your customer satisfaction. The TQM
magazine, 13(5), 341-347.

253
Ragin C. C. (1994). Constructing social research, SAGE Publication company,
California, USA.
Ragin, C. C., & Amoroso, L. M. (2010). Constructing social research: The unity and
diversity of method. SAGE Publications.
Rahman, S. U. & Bullock, P. (2005). Soft TQM, hard TQM, and organisational
performance relationships: an empirical investigation. Omega, 33(1), 73–83.
Rastogi, P. N. (2000). Knowledge management and intellectual capital–the new
virtuous reality of competitiveness. Human Systems Management, 19(1), 39-48.
Rawabdeh, I. (2002). Assessment of products' standards in Jordanian manufacturing
companies. Benchmarking: An International Journal, 9(1), 28–42.
Rawabdeh, I. A. (2008). Jordan quality award (King Abdullah II award for excellence
(KAIIAE)) for characteristics, assessment and benchmarking. Benchmarking: An
International Journal, 15(1), 4–24.
Raykov, T., & Marcoulides, G. A. (2006). A first course in structural equation modeling
(2 ed.). New Jersey: Lawrence Erlbaum Associates, Inc.
Ribiere, M. V., & Khorramshahgol, R. (2004). Integrating total quality management and
knowledge management. Journal of Management Systems, 16(1), 39-54.
Robins, J., & Wiersema, M. F. (1995). A resource‐based approach to the multibusiness
firm: Empirical analysis of portfolio interrelationships and corporate financial
performance. Strategic Management Journal, 16(4), 277-299.
Rodman, H. (1980). Are Conceptual Frameworks Necessary for Theory Building? The
Case of Family Sociology*. The Sociological Quarterly, 21(3), 429-441.
Rodríguez Bolívar, M. P., López Hernández, A. M., & Ortiz Rodríguez, D. (2010).
Implementing the balanced scorecard in public sector agencies: An experience in
municipal sport services.
Roest, P. (1997). The golden rules for implementing the balanced business scorecard.
Information Management & Computer Security, 5(5), 163-165.
Rogerson. J. (1994). TQM and ISO 9000 the Way Ahead. Congress, Jan., New Delhi.
Rompho, N. (2008). Building the Balances Scorecard for the University Case Study:
The University in Thailand. Journal in Professional Accountancy , 4 (9), 55-67.
Rouse, P., & Putterill, M. (2003). An integral framework for performance measurement.
Management Decision, 41(8), 791-805.
Rowley, J. (2002). Eight questions for customer knowledge management in e-business.
Journal of knowledge management, 6(5), 500-511.
254
Rubin, R., Rubin, A., & Haridakis, P. (2009). Communication research: Strategies and
sources. Cengage Learning.
Rummler, G. A., Ramias, A., & Rummler, R. A. (2009). White space revisited:
Creating value through process. John Wiley & Sons.
Russel, R. S., & Taylor III, B. W. (1998). Operations management: focusing on quality
and competitiveness.
Russell, R., & Taylor, B. (1995). Production and Operations Management: Focusing on
Quality and Competitiveness. Prentice-Hall, Inc., New Jersey.
Ryan, S. D., & Prybutok, V. R. (2001). Factors affecting the adoption of knowledge
management technologies: A discriminative approach. Journal of Computer
Information Systems, 41(4), 31-37.
Safa, M. S., Shakir, F., & Boon, O. K. (2006). Knowledge management: Practice and
performance of NGO in Maldives.
Saffady, W. (2000). Knowledge Management. Information Management Journal, Vol.
34, No.3.
Sakthivel , P. B., Rajendran, G., & Raju, R. (2005). TQM implementation and
students‟ satisfaction of academic performance. The TQM Magazine, 17(6), 573-
589.
Saleh, A. A. (2001). Strategic Thinking And Their Relationship Factors To Maintain
The Intellectual Capital, Baghdad patterns.
Salaheldin, S. I. (2003). The implementation of TQM strategy in Egypt: a field-force
analysis. The TQM Magazine, 15(4), 266–274.
Salaheldin, S. I. (2009). Critical success factors for TQM implementation and their
impact on performance of SMEs. International Journal of Productivity and
Performance.
Sallis, J. F. (1993). Epidemiology of physical activity and fitness in children and
adolescents. Critical Reviewsin Food Science and Nutrition, 33, 403–408.
Sallis, E., & Jones, G. (2002). Knowledge management in education: Enhancing
learning & education. London, UK: Kogan Page Ltd.
Samson, D., & Terziovski, M. (1999). The relationship between total quality
management practices and operational performance. Journal of Operations
Management, 17(4), 393-409.
Santos-Vijande, M. L., & Alvarez-Gonzalez, L. I. (2007). TQM and firms performance:
An EFQM excellence model research based survey. International Journal of
Business Science and Applied Management, 2(2), 21-41.
255
Saqqaf, H. A. (2007). Entrance to Total Quality Management. Stated on 10/2007.
Saraph, J. V., Benson, P. G., & Schroeder, R. G. (1989). An instrument for measuring
the critical factors of quality management. Decision sciences, 20(4), 810-829.
Sarvan, F. (2005). Fundamentals of Quality Management in the University Context: the
Example of Akdeniz University/Sarvan F., Anafarta N. In The 49th EOQ Congress,
Antalya, Turkey.
Sarvary, M. (1999). Knowledge management and connpetition in the consulting
industry. California management review, 41(2), 95-107.
Saunders, M., Lewis, P., and Thornhill, A. (2007) Research Methods for Business
Students. (4th edn.) London: Financial Times Prentice Hall.
Saunders, M. N., Saunders, M., Lewis, P., & Thornhill, A. (2011). Research methods
for business students, 5/e. Pearson Education India.
Schermerhorn, J. & Hunt, J. & Osborn, R. (2000). Organizational Behaviour, 7th/ed.,
New York.
Schwab, K. (2012). The global compefifiveness report 2012− 2013. Geneva: World
Economic Forum. Available from http://www3. weforum. org/docs/WEF_
GlobalCompetitivenessReport_2012-13. pdf.
Schwandt, D. R. & Marquardt, M. J. (2000). Organizational learning: From world -
class theories to global best practices. Boca Raton: St. Lucie Press.
Schwartz, A. E. (2001). performance management the first edition, Jarir Bookstore,
Riyadh.
Secundo, G., Margherita, A., Elia, G., & Passiante, G. (2010). Intangible assets in
higher education and research: mission, performance or both?. Journal of
Intellectual Capital, 11(2), 140-157.
Seddon, P. B. (1997). A respecification and extension of the DeLone and McLean
model of IS success. Information systems research, 8(3), 240-253.
Sekaran, U., & Bougie, R. (2003). Business Research Methods.
Sekaran, U., & Bougie, R. (2010). Research methods for business (fifth ed.). UK: John
Wiley & Sons Ltd.
Shang, S., & Seddon, P. B. (2007). Managing process deficiencies with enterprise
systems. Business Process Management Journal, 13(3), 405-416.
Shapiro, A. C. (2008). Multinational financial management. John Wiley & Sons.
Shelley, S. (1999). Diversity of appraisal and performance-related pay practices in
higher education. Personnel Review, 28(5/6), 439-454.
256
Siddiqui, J., & Rahman, Z. (2006). TQM for Information Systems: Are Indian
Organizations Ready. Interdisciplinary Journal of Information, Knowledge, and
Management, 1, 135-146.
Sila, I., & Ebrahimpour, M. (2002). An investigation of the to tal quality management
survey based research published between 1989 and 2000: A literature review.
International Journal of Quality & Reliability Management, 19(7), 902-970.
Silos, I. M. (1999). Employee involvement-a component of total quality management.
Production and Inventory Management Journal, 40, 56-65.
Sinclair, D., & Zairi, M. (1995). Effective process management through performance
measurement: Part III-an integrated model of total quality-based performance
measurement. Business Process Re-Engineering & Management Journal, 1(3), 50-
65.
Sirvanci, M. B. (2004). Critical issues for TQM implementation in higher education.
The TQM Magazine, 16(6), 382-386.
Sloane-Seale, A. (2009). Research Design: Qualitative, Quantitative, and Mixed
Methods Approaches. Canadian Journal of University Continuing Education,
35(2).
Smith, H. (1973). Light quality and germination: ecological implications. Seed ecology,
219-231.
Soltani, E. & Lai, P. C. (2007). Approaches to quality management in the UK: survey
evidence and implications. Benchmarking: An International Journal, 14(4), 429–
454.
Soltani, E., Lai, P. C., & Mahmoudi, V. (2007). Managing change initiatives: Fantasy or
Reality? The case of public sector organisations. Total Quality Management and
Business Excellence, 18(1–2), 153–179.
Soo, C. & Devinney, T. & Midgley, D. & Deering, A. (2001). Knowledge Management:
Philosophy, Process, Pitfalls, and Performance,
www.agsm.edu.au/~timdev/research/soo2.pdf.
Southern, G. (2002). From Teaching to Practice, via Consultancy, and then to
Research?. European Management Journal, 20(4), 401-408.
Spenley, P. (1995). Step change total quality: achieving world class business
performance. Springer Science & Business Media.
Stading, G., & Vokurka, R. (2003). Building quality strategy content using the process
from national and international quality awards. Total Quality Management and
Business Excellence, 14(8), 931-946.
257
Staggs, P. (1999). Strategic planning as a total quality management critical success
factor. Journal of Organizational Leadership, 1(1), 5-17.
Stewart, A. C., & Carpenter-Hubin, J. (2000). The Balanced Scorecard Beyond Reports
and Rankings. Planning for Higher Education V , 29 (2), 37-42.
Storey, J. (2001). Human resource management: A critical text. Thomson.
Subai'i, M. (2008). Introduction to the organization of knowledge. is available on
www.ahewar.org/debat/show.art.asp?aid=164568.
Sutherland, T. (2000). Designing and implementing an academic scorecard. Accounting
Education News, (Summer), 11-14.
Sveiby, K. (1998). The New Organizational Wealth: Management and Measuring
Knowledge-Based Assests, Berrett Koehler Publishers, Inc., Sanfrancisco.
Swift, J. A., Omachonu, V. K., Ross, J. E., & JA Principles of total quality/Vincent K.
Omachonu Joel E. Ross Swift. (1998). Principles of total quality. St. Lucie Press.
Tai, Y. H., Abadi, M. F., & Abadi, H, F. (2008). Total Quality Management In Higher
Education , Dar Warraq for publication and distribution,
Tan, K. C. (2002). A comparative study of 16 national quality awards. The TQM
Magazine, 14(3), 165-171.
Tan, K. C., Wong, M. F., Mehta, T., & Khoo, H. H. (2003). Factors affecting the
development of national quality awards. Measuring Business Excellence, 7(3), 37-
45.
Tanninen, K., Puumalainen, K., & Sandström, J. (2010). The power of TQM: analysis
of its effects on profitability, productivity and customer satisfaction. Total Quality
Management, 21(2), 171-184.
Tanninen, K., Puumalainen, K., & Sandström, J. (2011). Who achieves continuous
improvement? TQM implementation in a global organisation. International Journal
of Business Excellence, 4(2), 225-243.
Tawfik, A. (2004). Knowledge Management: to change what can not be changed, the
center of the professional expertise of management, Cairo.
Taylor, W. A., & Wright, G. H. (2003). A longitudinal study of TQM implementation:
factors influencing success and failure. Omega, 31(2), 97-111.
Temizer, L., & Turkyilmaz, A. (2012). Implementation of student satisfaction index
model in higher education institutions. Procedia-Social and Behavioral Sciences,
46, 3802-3806.
258
Terziovski, M., & Samson, D. (1998). Increasing and Sustaining Performance Through
Integrated Quality Strategy. Working paper 50/90 Monash University, faculty of
Business and Economics.
Thiagaragan, T., Zairi, M., & Dale, B. G. (2001). A proposed model of TQM
implementation based on an empirical study of Malaysian industry. International
Journal of Quality & Reliability Management, 18(3), 289-306.
Thomas, G. (2013). How to do your research project: A guide for students in education
and applied social sciences. Sage.
Tikly, L., & Barrett, A. M. (2011). Social justice, capabilities and the quality of
education in low income countries. International Journal of Educational
Development, 31(1), 3-14.
Total Quality Management & Business Excellence 17(3): pp.303-323.
Trigg, J. (2000). Knowledge Management. Information Technology, Vol. 17, No. 12.
Tseng, M. L. (2010). Implementation and performance evaluation using the fuzzy
network balanced scorecard. Computers & Education, 55(1), 188-201.
Tsiotras, G., & Gotzamani, K. (1996). ISO 9000 as an entry key to TQM: the case of
Greek industry. International Journal of Quality & Reliability Management , 13(4),
64-76.
Tull, D., & Hawkins, D. (1987). Markerting Research.
Turban, E., & Aronson, J. (1998). Decision Support Systems and Intelligent Systems,
Prentice Hall. Upper Saddle River, New Jersey, USA.
Turban, E. & Rainer, K. & Potter, R. (2001). Introduction to Information Technology,
John Wiley & Sons, Inc., U.S.A.
Turban, E., Leidner, D., McLean, E., & Wetherbe, J. (2008). INFORMATION
TECHNOLOGY FOR MANAGEMENT, (With CD). John Wiley & Sons.
Ulrich, D. (1998). A new mandate for human resources. Harvard business review, 76,
124-135.
Van der Wal, R. W. E., Pampallis, A., & Bond, C. (2002). Service quality in a cellular
telecommunications company: a South African experience. Managing Service
Quality: An International Journal, 12(5), 323-335.
Van der Wiele, T., Van Iwaarden, J., Williams, R., & Dale, B. (2005). Perceptions
about the ISO 9000 (2000) quality system standard revision and its value: the Dutch
experience. International Journal of Quality & Reliability Management , 22(2),
101-119.

259
Vasu, M. L., Stewart, D. W., & Garson, G. D. (Eds.). (1998). Organizational Behavior
and Public Management, Revised and Expanded. CRC Press.
Venkatraman, S. (2007). A framework for implementing TQM in higher education
programs. Quality Assurance in Education, 15(1), 92-112.
Viedma, J. M. (2004). CICBS: a methodology and a framework for measuring and
managing intellectual capital of cities. A practical application in the city of Mataró.
Knowledge Management Research & Practice, 2(1), 13-23.
Vokurka, R. J. Stading, G. L. and Brazeal, J. (2000) “A comparative analysis of national
and regional quality award”, Quality Progress, August, pp. 41-49.
Vokurka, R. J., Stading, G. L., & Brazeal, J. (2001). A comparative analysis of national
and regional quality awards. Quality Control And Applied Statistics, 46(2), 181-
182.
Vollmann, T., (1990). Changing Manufacturing Performance Measurements, in Turney,
P. B. B. (ed.) Performance Excellence in Manufacturing and Service Organisations,
Sarasota, FL, American Accounting Association, pp. 53-62.
Wang, X. (2010). Performance Masurement in Universities: Managerial Perspective.
University of Twente Enschede, The Netherlands.
Warner, M., & Witzel, M. (2004). Managing in virtual organizations. Cengage
Learning EMEA.
Weick, K. E., Bougon, M. G., & Maruyama, G. (1976). The equity context.
Organizational Behavior and Human Performance, 15(1), 32-65.
Wheelen, T. L., & Hunger, J. D. (2000). Strategic issues in entrepreneurial ventures and
small businesses. Strategic Management: Year, 283-304.
Willem, B. J. (2007). Impact of Organizational Structure on Nurses' Job Satisfaction: A
Questionnaire Survey. International Journal of Nursing Studies, 44, 1011
1020.
Williams, R. (1999). Fundamentals of Total Quality Management. First Edition, Jarir
Bookstore, Riyadh.
Wilson, L. T., & Asay, D. (1999). Putting quality in knowledge management. Quality
Progress, 32(1), 25-31.
Withers, B. E., & Ebrahimpour, M. (2001). Impacts of ISO 9000 registration on
European firms: a case analysis. Integrated Manufacturing Systems, 12(2), 139-
151.
Wright, K. B. (2005). Researching Internet‐based populations: Advantages and
disadvantages of online survey research, online questionnaire authoring software

260
packages, and web survey services. Journal of Computer‐Mediated
Communication, 10(3).
Wright, P. L. (1996). Strategic management: concepts and cases. (4th Ed). Englewood
Cliffs, NJ: Prentice Hall.
Wright, P. M., & McMahan, G. C. (1992). Theoretical perspectives for strategic human
resource management. Journal of management, 18(2), 295-320.
Xiao, H., & Proverbs, D. (2002). The performance of contractors in Japan, the UK and
the USA: An evaluation of construction quality. International Journal of Quality &
Reliability Management, 19(6), 672-687.
Yassin, S. G. (2004). Decision Support Systems. Second edition, Al-Manahij
Publishing and Distribution, Amman.
Yeh, Y. M. C. (2011). The implementation of knowledge management system in
Taiwan’s higher education. Journal of College Teaching & Learning (TLC), 2(9).
Yeung, A. C. L., Cheng, T. E., & Lai, K. H. (2006). An operational and institutional
perspective on total quality management. Production and Operations Management,
15(1), 156-170.
York: The Free Press. London : Collier Macmillan, c1988.
Zairi, M. (1991). Total quality management for engineers. Elsevier. Cambridge:
Woodland publishing Limited.
Zairi, M. (1992). TQM-based performance measurement: practical guidelines.
Technical Communications.
Zairi, M., & Leonard, P. (1994). Practical Benchmarking: The Complete Guide: A
Complete Guide. Springer Science & Business Media.
Zairi, M. (1996) Benchmarking for Best Practice: Continuous Learning through
Sustainable Innovation. Oxford: Butterworth-Heinemann.
Zairi, M., & Youssef, M.A. (1995). Benchmarking critical factors for TQM: part 1:
Theory and foundation, Benchmarking for Quality Management & Technology,Vol.
2, No.1, pp.5-20.
Zairi, M. (2000). Managing customer satisfaction: A best practice perspective. The
TQM Magazine, 12(6), 389-494.
Zairi, M. (2002). Beyond TQM implementation: the new paradigm of TQM
sustainability. Total Quality Management, 13(8), 1161-1172.
Zakuan, N. M., Yusof, S. M., Laosirihongthong, T., & Shaharoun, A. M. (2010).
Proposed relationship of TQM and organisational performance using structured
equation modelling. Total Quality Management, 21(2), 185–203.
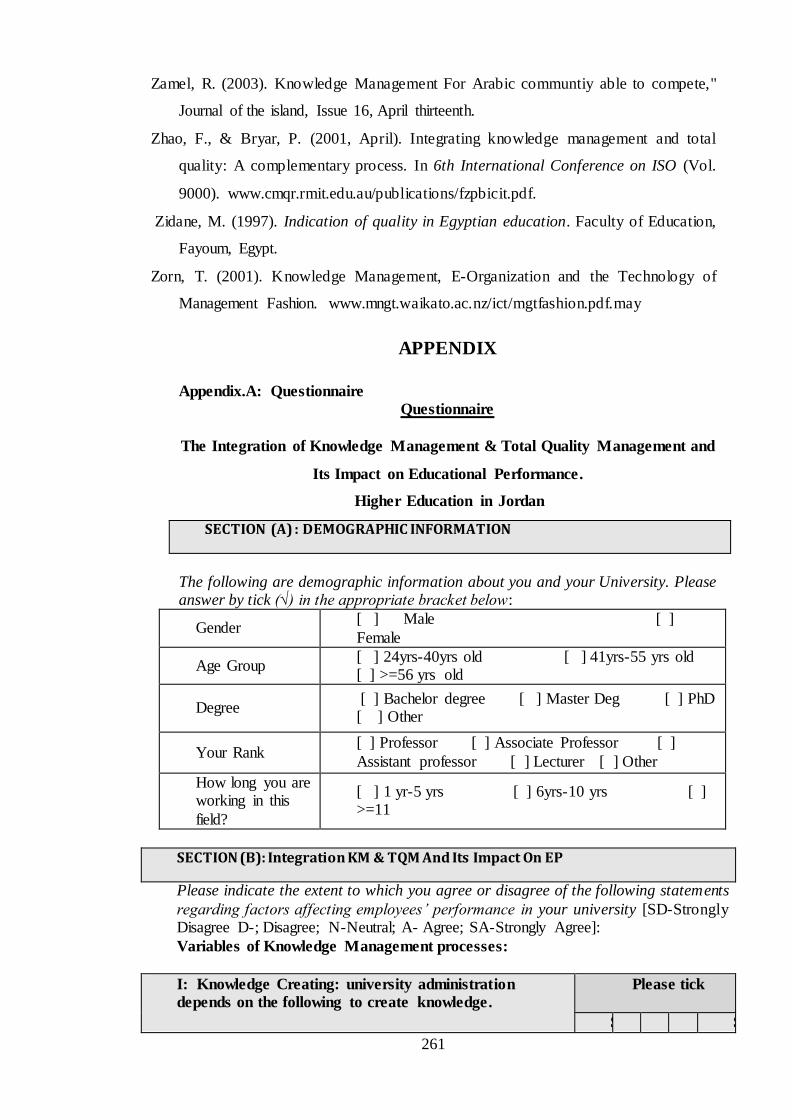
261
Zamel, R. (2003). Knowledge Management For Arabic communtiy able to compete,"
Journal of the island, Issue 16, April thirteenth.
Zhao, F., & Bryar, P. (2001, April). Integrating knowledge management and total
quality: A complementary process. In 6th International Conference on ISO (Vol.
9000). www.cmqr.rmit.edu.au/publications/fzpbicit.pdf.
Zidane, M. (1997). Indication of quality in Egyptian education. Faculty of Education,
Fayoum, Egypt.
Zorn, T. (2001). Knowledge Management, E-Organization and the Technology of
Management Fashion. www.mngt.waikato.ac.nz/ict/mgtfashion.pdf.may
APPENDIX
Appendix.A: Questionnaire
Questionnaire
The Integration of Knowledge Management & Total Quality Management and
Its Impact on Educational Performance.
Higher Education in Jordan
SECTION (A) : DEMOGRAPHIC INFORMATION
The following are demographic information about you and your University. Please answer by tick (√) in the appropriate bracket below:
Gender [ ] Male [ ]
Female
Age Group [ ] 24yrs-40yrs old [ ] 41yrs-55 yrs old [ ] >=56 yrs old
Degree [ ] Bachelor degree [ ] Master Deg [ ] PhD [ ] Other
Your Rank [ ] Professor [ ] Associate Professor [ ]
Assistant professor [ ] Lecturer [ ] Other
How long you are working in this
field?
[ ] 1 yr-5 yrs [ ] 6yrs-10 yrs [ ] >=11
SECTION (B): Integration KM & TQM And Its Impact On EP
Please indicate the extent to which you agree or disagree of the following statements
regarding factors affecting employees’ performance in your university [SD-Strongly Disagree D-; Disagree; N-Neutral; A- Agree; SA-Strongly Agree]:
Variables of Knowledge Management processes:
I: Knowledge Creating: university administration
depends on the following to create knowledge.
Please tick
S D N A S

262
D A
1. Individual learning for workers.
2. Its external environment {Customers (Stakeholder), Equipped, Competitors, etc}.
3. Contracting with experts from outside the university to work there.
4. Insight into the experiences of workers and the experiences of others.
5. Internet, advanced computers’ software and advisory research canters.
II: Store of knowledge: university administration
depends on the following to store knowledge:
Please tick
SD
D N A SD
6. Records and written documents.
7. Computer and other digital information media storage.
8. Activated incentives (financial and moral) to maintain individuals of high knowledge and talents.
9. System to control the tangible knowledge assets.
III: Knowledge Distribution: university administration
depends on the following to distribute knowledge: Please tick
SD
D N A SA
10. Work Teams and regular meetings.
11. Documents, publications and internal information network.
12. Training and openness in the exchange of thought and dialogue.
13. Relations and informal contacts.
14 The transfer of knowledge to others through lectures and services.
15. Metaphorical representation and imaging of knowledge.
IV: Knowledge Applying: to apply knowledge, the university administration should:
Please tick
SD
D N A SA
16. Make sure that faculty members realize the information they hold and feel able to find meaning for them.
17. Grant faculty members freedom to apply their knowledge.
18. Hire knowledge managers who urge well application to it.
19. Remove all Barriers that stand in the way of knowledge access for individuals, experts and administrative units.
20. Make Rules to control of knowledge.
Variable of Knowledge Management Technology
Please tick
S
D
D N A S
A
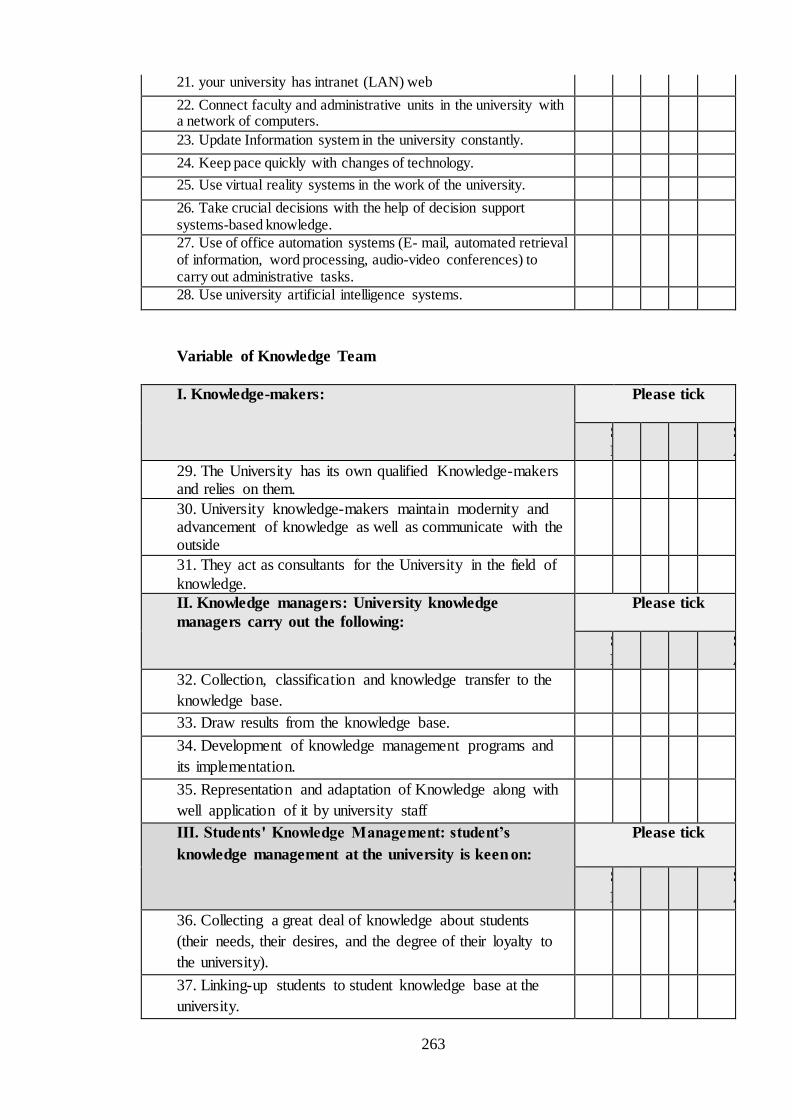
263
21. your university has intranet (LAN) web
22. Connect faculty and administrative units in the university with a network of computers.
23. Update Information system in the university constantly.
24. Keep pace quickly with changes of technology.
25. Use virtual reality systems in the work of the university.
26. Take crucial decisions with the help of decision support systems-based knowledge.
27. Use of office automation systems (E- mail, automated retrieval of information, word processing, audio-video conferences) to carry out administrative tasks.
28. Use university artificial intelligence systems.
Variable of Knowledge Team
I. Knowledge-makers: Please tick
S
D
D N A S
A
29. The University has its own qualified Knowledge-makers and relies on them.
30. University knowledge-makers maintain modernity and advancement of knowledge as well as communicate with the outside
31. They act as consultants for the University in the field of
knowledge.
II. Knowledge managers: University knowledge
managers carry out the following:
Please tick
S
D
D N A S
A
32. Collection, classification and knowledge transfer to the
knowledge base.
33. Draw results from the knowledge base.
34. Development of knowledge management programs and
its implementation.
35. Representation and adaptation of Knowledge along with
well application of it by university staff
III. Students' Knowledge Management: student’s
knowledge management at the university is keen on:
Please tick
S
D
D N A S
A
36. Collecting a great deal of knowledge about students
(their needs, their desires, and the degree of their loyalty to
the university).
37. Linking-up students to student knowledge base at the
university.
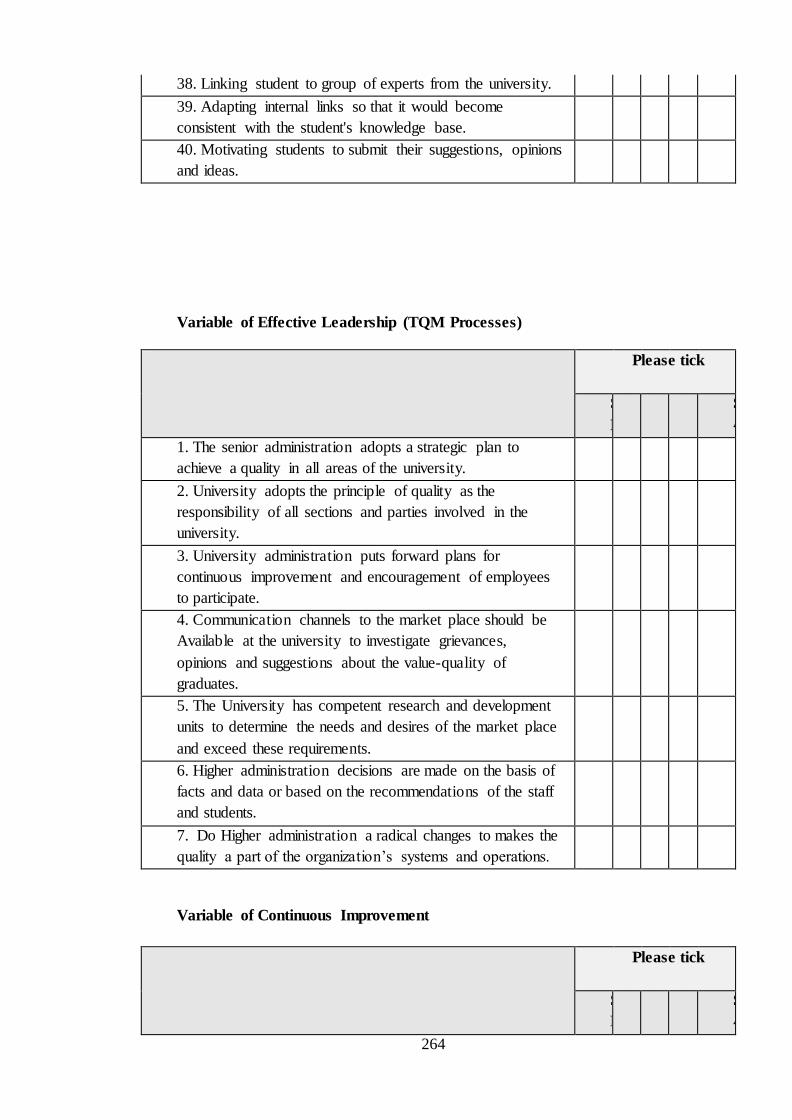
264
38. Linking student to group of experts from the university.
39. Adapting internal links so that it would become
consistent with the student's knowledge base.
40. Motivating students to submit their suggestions, opinions
and ideas.
Variable of Effective Leadership (TQM Processes)
Please tick
S
D
D N A S
A
1. The senior administration adopts a strategic plan to
achieve a quality in all areas of the university.
2. University adopts the principle of quality as the
responsibility of all sections and parties involved in the
university.
3. University administration puts forward plans for
continuous improvement and encouragement of employees
to participate.
4. Communication channels to the market place should be
Available at the university to investigate grievances,
opinions and suggestions about the value-quality of
graduates.
5. The University has competent research and development
units to determine the needs and desires of the market place
and exceed these requirements.
6. Higher administration decisions are made on the basis of
facts and data or based on the recommendations of the staff
and students.
7. Do Higher administration a radical changes to makes the
quality a part of the organization’s systems and operations.
Variable of Continuous Improvement
Please tick
S
D
D N A S
A
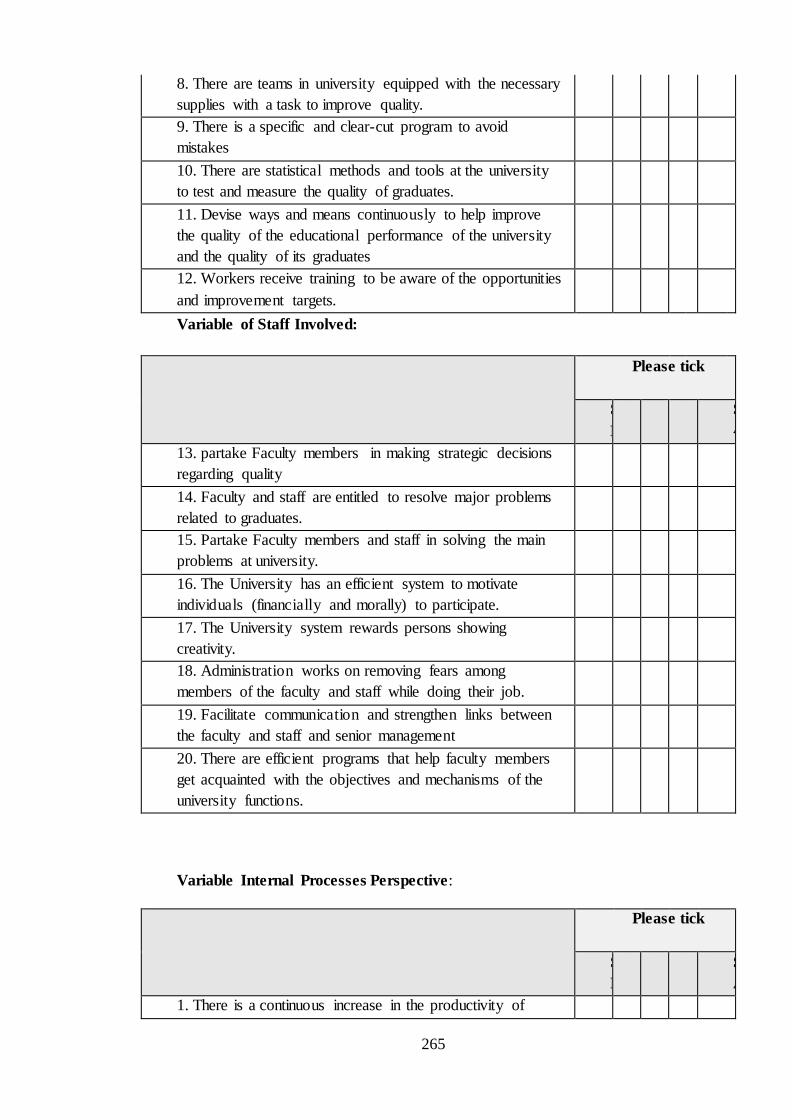
265
8. There are teams in university equipped with the necessary
supplies with a task to improve quality.
9. There is a specific and clear-cut program to avoid
mistakes
10. There are statistical methods and tools at the university
to test and measure the quality of graduates.
11. Devise ways and means continuously to help improve
the quality of the educational performance of the university
and the quality of its graduates
12. Workers receive training to be aware of the opportunities
and improvement targets.
Variable of Staff Involved:
Please tick
S
D
D N A S
A
13. partake Faculty members in making strategic decisions
regarding quality
14. Faculty and staff are entitled to resolve major problems
related to graduates.
15. Partake Faculty members and staff in solving the main
problems at university.
16. The University has an efficient system to motivate
individuals (financially and morally) to participate.
17. The University system rewards persons showing
creativity.
18. Administration works on removing fears among
members of the faculty and staff while doing their job.
19. Facilitate communication and strengthen links between
the faculty and staff and senior management
20. There are efficient programs that help faculty members
get acquainted with the objectives and mechanisms of the
university functions.
Variable Internal Processes Perspective:
Please tick
S
D
D N A S
A
1. There is a continuous increase in the productivity of
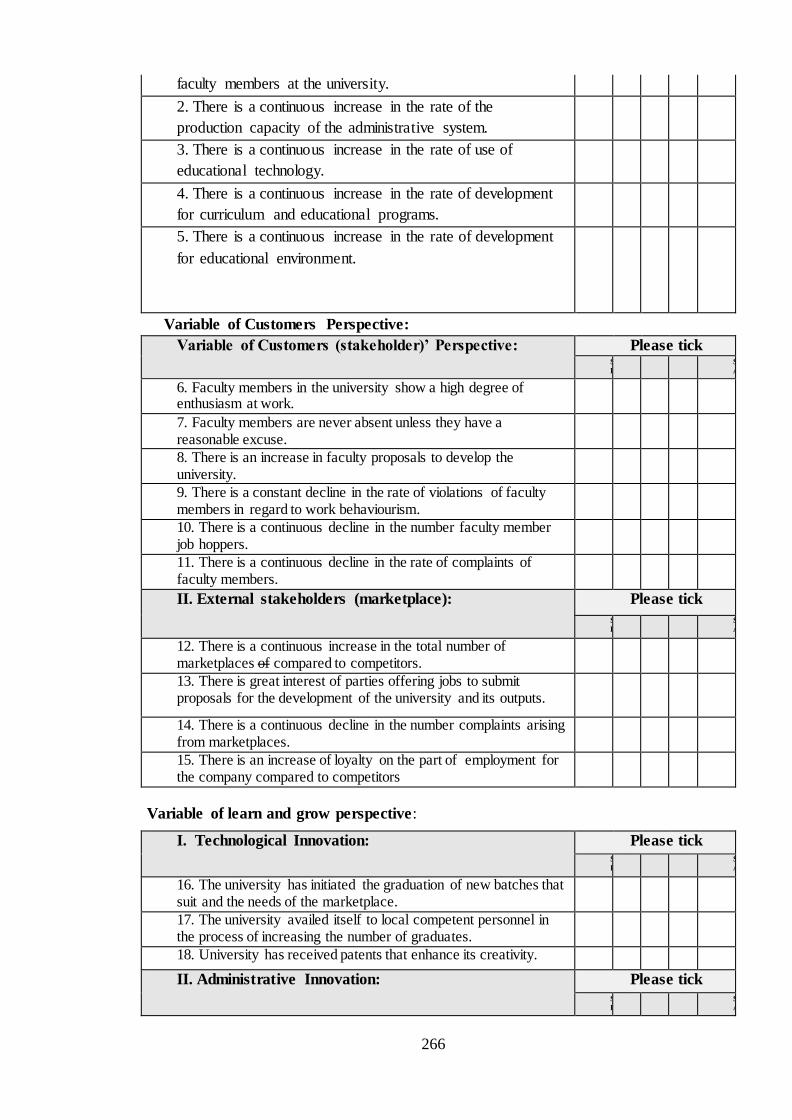
266
Variable of Customers Perspective:
faculty members at the university.
2. There is a continuous increase in the rate of the
production capacity of the administrative system.
3. There is a continuous increase in the rate of use of
educational technology.
4. There is a continuous increase in the rate of development
for curriculum and educational programs.
5. There is a continuous increase in the rate of development
for educational environment.
Variable of Customers (stakeholder)’ Perspective:
Please tick S
D
D N A S
A
6. Faculty members in the university show a high degree of enthusiasm at work.
7. Faculty members are never absent unless they have a reasonable excuse.
8. There is an increase in faculty proposals to develop the university.
9. There is a constant decline in the rate of violations of faculty members in regard to work behaviourism.
10. There is a continuous decline in the number faculty member job hoppers.
11. There is a continuous decline in the rate of complaints of faculty members.
II. External stakeholders (marketplace): Please tick
S
D
D N A S
A
12. There is a continuous increase in the total number of marketplaces of compared to competitors.
13. There is great interest of parties offering jobs to submit proposals for the development of the university and its outputs.
14. There is a continuous decline in the number complaints arising from marketplaces.
15. There is an increase of loyalty on the part of employment for the company compared to competitors
I. Technological Innovation: Please tick S
D
D N A S
A
16. The university has initiated the graduation of new batches that suit and the needs of the marketplace.
17. The university availed itself to local competent personnel in the process of increasing the number of graduates.
18. University has received patents that enhance its creativity.
II. Administrative Innovation: Please tick S
D
D N A S
A
Variable of learn and grow perspective:
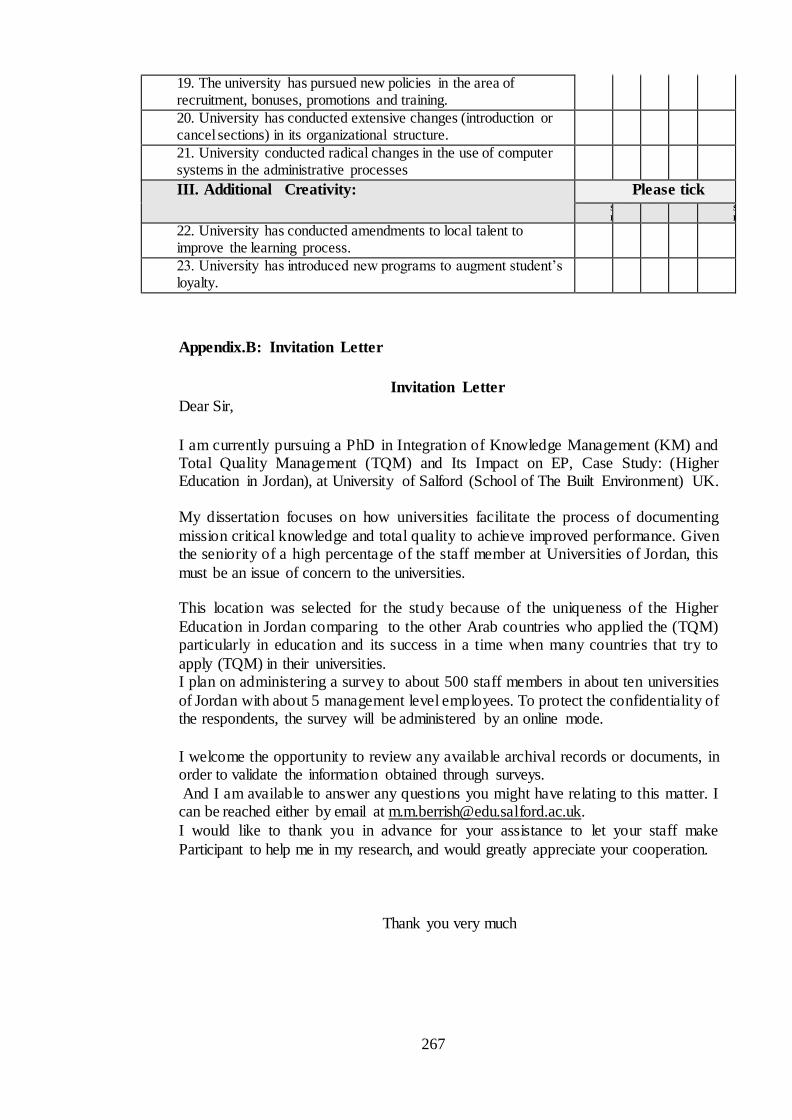
267
19. The university has pursued new policies in the area of recruitment, bonuses, promotions and training.
20. University has conducted extensive changes (introduction or cancel sections) in its organizational structure.
21. University conducted radical changes in the use of computer systems in the administrative processes
III. Additional Creativity: Please tick S
D
D N A S
D
22. University has conducted amendments to local talent to improve the learning process.
23. University has introduced new programs to augment student’s loyalty.
Appendix.B: Invitation Letter
Invitation Letter
Dear Sir,
I am currently pursuing a PhD in Integration of Knowledge Management (KM) and Total Quality Management (TQM) and Its Impact on EP, Case Study: (Higher Education in Jordan), at University of Salford (School of The Built Environment) UK.
My dissertation focuses on how universities facilitate the process of documenting
mission critical knowledge and total quality to achieve improved performance. Given the seniority of a high percentage of the staff member at Universities of Jordan, this
must be an issue of concern to the universities.
This location was selected for the study because of the uniqueness of the Higher
Education in Jordan comparing to the other Arab countries who applied the (TQM) particularly in education and its success in a time when many countries that try to
apply (TQM) in their universities. I plan on administering a survey to about 500 staff members in about ten universities
of Jordan with about 5 management level employees. To protect the confidentiality of the respondents, the survey will be administered by an online mode.
I welcome the opportunity to review any available archival records or documents, in order to validate the information obtained through surveys.
And I am available to answer any questions you might have relating to this matter. I can be reached either by email at [email protected].
I would like to thank you in advance for your assistance to let your staff make
Participant to help me in my research, and would greatly appreciate your cooperation.
Thank you very much
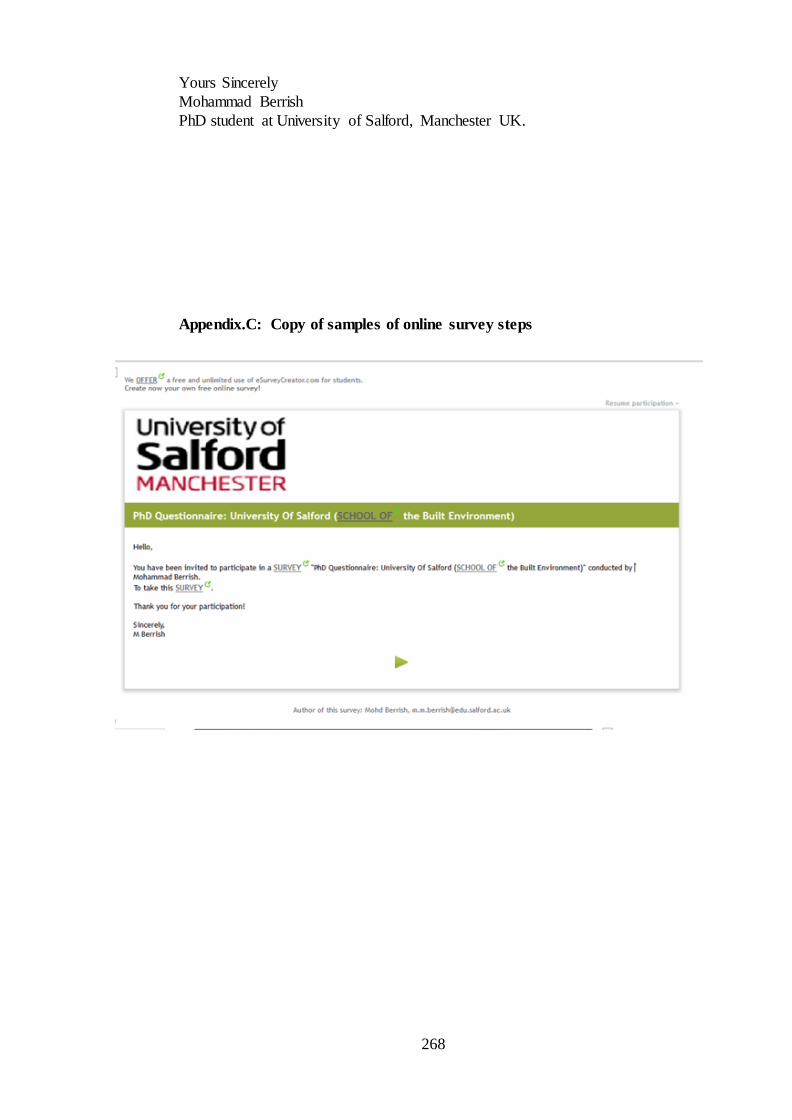
268
Yours Sincerely
Mohammad Berrish
PhD student at University of Salford, Manchester UK.
Appendix.C: Copy of samples of online survey steps
269
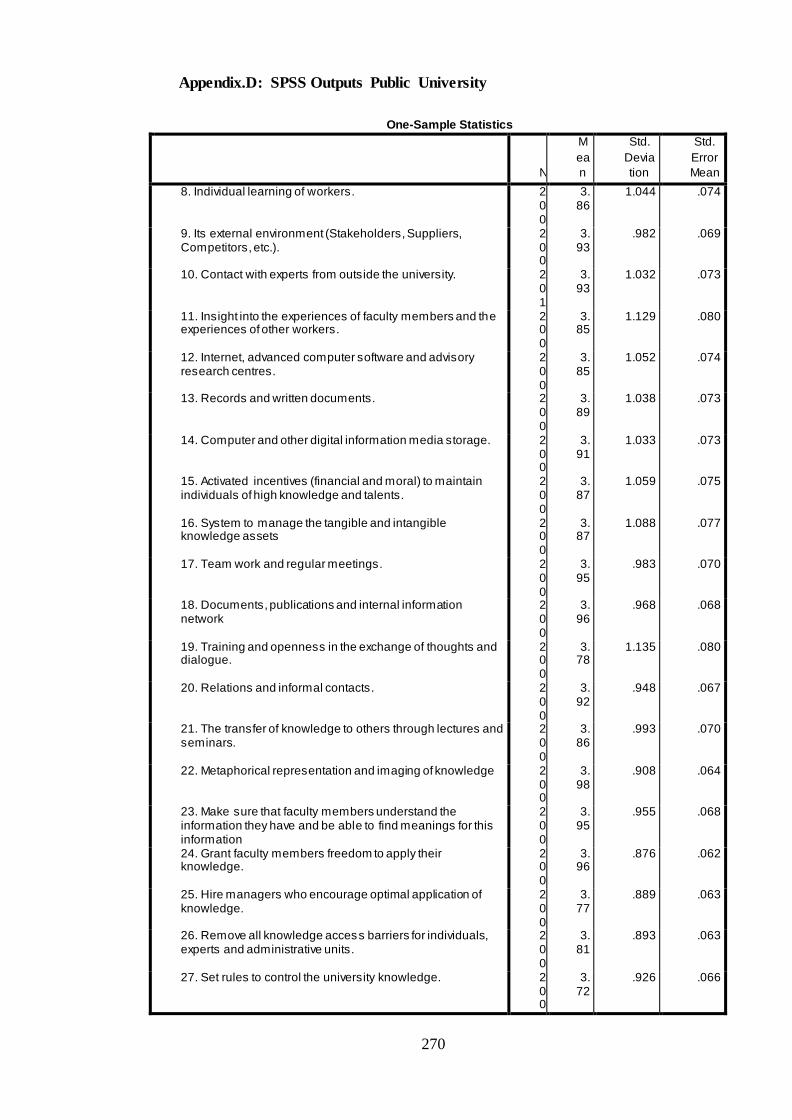
270
Appendix.D: SPSS Outputs Public University
One-Sample Statistics
N
M
ea
n
Std.
Devia
tion
Std.
Error
Mean
8. Individual learning of workers. 200
3.86
1.044 .074
9. Its external environment (Stakeholders, Suppliers, Competitors, etc.).
200
3.93
.982 .069
10. Contact with experts from outside the university. 201
3.93
1.032 .073
11. Insight into the experiences of faculty members and the experiences of other workers.
200
3.85
1.129 .080
12. Internet, advanced computer software and advisory research centres.
200
3.85
1.052 .074
13. Records and written documents. 200
3.89
1.038 .073
14. Computer and other digital information media storage. 200
3.91
1.033 .073
15. Activated incentives (financial and moral) to maintain individuals of high knowledge and talents.
200
3.87
1.059 .075
16. System to manage the tangible and intangible knowledge assets
200
3.87
1.088 .077
17. Team work and regular meetings. 200
3.95
.983 .070
18. Documents, publications and internal information network
200
3.96
.968 .068
19. Training and openness in the exchange of thoughts and dialogue.
200
3.78
1.135 .080
20. Relations and informal contacts. 200
3.92
.948 .067
21. The transfer of knowledge to others through lectures and seminars.
200
3.86
.993 .070
22. Metaphorical representation and imaging of knowledge 200
3.98
.908 .064
23. Make sure that faculty members understand the information they have and be able to find meanings for this information
200
3.95
.955 .068
24. Grant faculty members freedom to apply their knowledge.
200
3.96
.876 .062
25. Hire managers who encourage optimal application of knowledge.
200
3.77
.889 .063
26. Remove all knowledge access barriers for individuals, experts and administrative units.
200
3.81
.893 .063
27. Set rules to control the university knowledge. 200
3.72
.926 .066

271
One-Sample Statistics
N
Mean
Std. Deviation
Std. Error Mean
28. Your university has an effective intranet (web LAN) 200
3.80
.846 .060
29. The effectiveness of the connection of colleges and administrative units in the university to a centralized database.
200
3.84
.837 .059
30. Information systems in the university are constantly updated.
200
3.84
.794 .056
31. Keep pace quickly with changes of technology. 200
3.99
.830 .059
32. Use virtual reality systems in the work of the university. 200
3.97
.918 .065
33. Take crucial decisions with the help of decision support systems-based knowledge.
200
3.92
.979 .069
34. Use of office automation systems (E- mail, automated retrieval of information, word processing, audio-video conferences) to carry out administrative tasks.
200
3.99
.899 .064
35. Use university artificial intelligence systems. 200
3.97
.832 .059
One-Sample Statistics
N
Mea
n
Std.
Devi
atio
n
Std.
Error
Mean
36. The University has its ow n qualif ied Know ledge-makers and relies on them.
200
3.98 .856 .061
37. University know ledge-makers maintain modernity and
advancement of know ledge as w ell as communicating w ith the outside
2
00
3.97 .856 .061
38. They act as consultants for the University in the f ield of
know ledge.
2
00
3.99 .888 .063
39. Collection, classif ication and know ledge transfer to the know ledge base.
20
0
4.00 .877 .062
40. Draw results from the know ledge base. 200
4.00 .874 .062
41. Development of know ledge management programs and its implementation
200
4.00 .868 .061
42. Representation and adaptation of know ledge along w ith well
application of it by university staff
2
00
4.05 .742 .052
43. Collecting a great deal of know ledge about students (their needs, their desires, and the degree of their loyalty to the
university).
20
0
4.05 .721 .051
44. Linking-up students to student know ledge base at the university. 20
0
4.07 .705 .050
45. Linking student to group of experts from the university. 200
4.00 .777 .055
46. Adapting internal links so that it w ould become consistent w ith the student's know ledge base.
200
3.96 .873 .062
47. Motivating students to submit their suggestions, opinions and
ideas.
2
00
3.97 .804 .057

272
One-Sample Statistics
N
M
ea
n
Std.
Deviat
ion
Std.
Error
Mean
48. The senior administration adopts a strategic plan to achieve a
quality in all areas of the university.
2
0
0
4.
03
.740 .052
49. University adopts the principle of quality as the responsibility of
all sections and parties involved in the university.
2
0
0
4.
02
.730 .052
50. University administration puts forward plans for continuous
improvement and encouragement of employees to participate.
2
0
0
3.
95
.828 .059
51. Communication channels to the market place should be
available at the university to investigate grievances, opinions and
suggestions about the value-quality of graduates.
2
0
0
3.
93
.826 .058
52. The University has competent research and development units
to determine the needs and desires of the market place and exceed
these requirements.
2
0
0
3.
95
.794 .056
53. Higher administration decisions are made on the basis of facts
and data or based on the recommendations of the staff and
students.
2
0
0
3.
85
.903 .064
54. The University's administration constantly make changes in its
system to improve the quality of its operations.
2
0
0
3.
97
.835 .059
One-Sample Statistics
N
M
ea
n
Std.
Deviat
ion
Std.
Error
Mean
55. There are teams in university equipped w ith the necessary
supplies w ith a task to improve quality.
2
0
0
3.
95
.794 .056
56. There is a specif ic and clear-cut program to avoid mistakes 2
0
0
3.
86
.786 .056
57. There are statistical methods and tools at the university to test
and measure the quality of graduates.
1
9
8
3.
83
.837 .060
58. Devise w ays and means continuously to help improve the quality
of the educational performance of the university and the quality of its
graduates
1
9
8
3.
82
.869 .062
59. Workers receive training to be aw are of the opportunities and
improvement targets.
2
0
0
3.
82
.890 .063
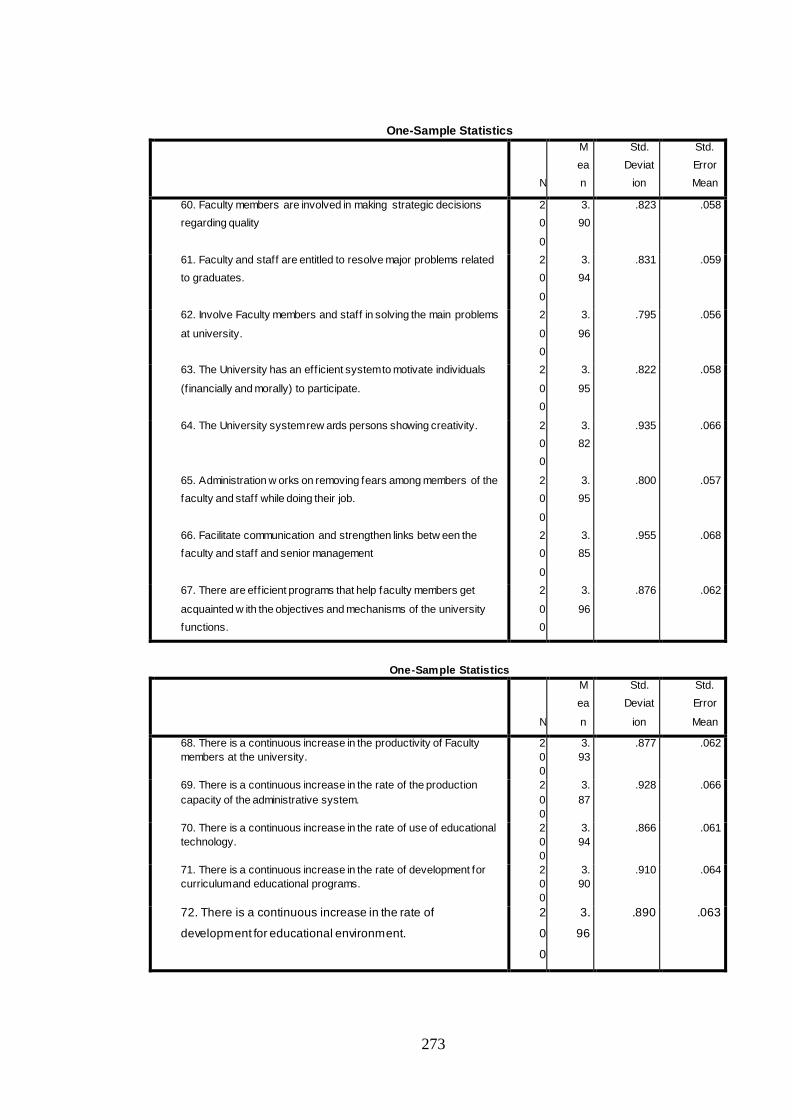
273
One-Sample Statistics
N
M
ea
n
Std.
Deviat
ion
Std.
Error
Mean
60. Faculty members are involved in making strategic decisions
regarding quality
2
0
0
3.
90
.823 .058
61. Faculty and staff are entitled to resolve major problems related
to graduates.
2
0
0
3.
94
.831 .059
62. Involve Faculty members and staff in solving the main problems
at university.
2
0
0
3.
96
.795 .056
63. The University has an eff icient system to motivate individuals
(f inancially and morally) to participate.
2
0
0
3.
95
.822 .058
64. The University system rew ards persons showing creativity. 2
0
0
3.
82
.935 .066
65. Administration w orks on removing fears among members of the
faculty and staff while doing their job.
2
0
0
3.
95
.800 .057
66. Facilitate communication and strengthen links betw een the
faculty and staff and senior management
2
0
0
3.
85
.955 .068
67. There are eff icient programs that help faculty members get
acquainted w ith the objectives and mechanisms of the university
functions.
2
0
0
3.
96
.876 .062
One-Sample Statistics
N
M
ea
n
Std.
Deviat
ion
Std.
Error
Mean
68. There is a continuous increase in the productivity of Faculty
members at the university.
2
0
0
3.
93
.877 .062
69. There is a continuous increase in the rate of the production
capacity of the administrative system.
2
0
0
3.
87
.928 .066
70. There is a continuous increase in the rate of use of educational
technology.
2
0
0
3.
94
.866 .061
71. There is a continuous increase in the rate of development for
curriculum and educational programs.
2
0
0
3.
90
.910 .064
72. There is a continuous increase in the rate of
development for educational environment.
2
0
0
3.
96
.890 .063
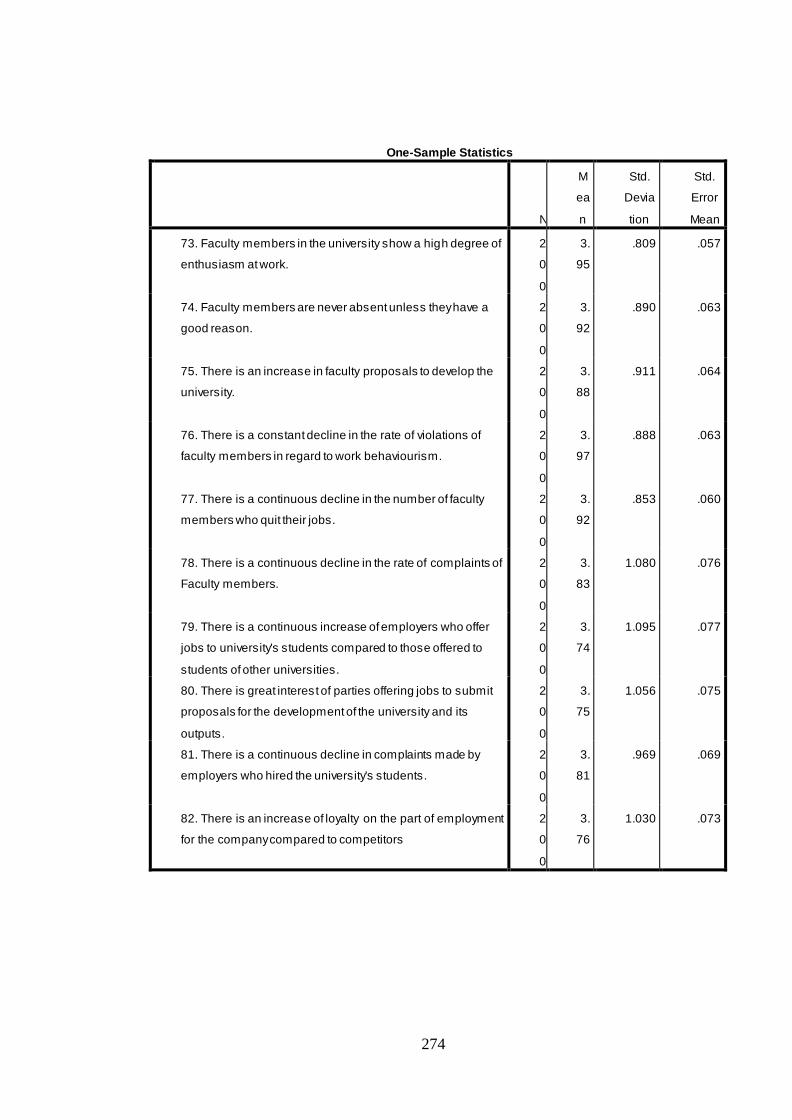
274
One-Sample Statistics
N
M
ea
n
Std.
Devia
tion
Std.
Error
Mean
73. Faculty members in the university show a high degree of
enthusiasm at work.
2
0
0
3.
95
.809 .057
74. Faculty members are never absent unless they have a
good reason.
2
0
0
3.
92
.890 .063
75. There is an increase in faculty proposals to develop the
university.
2
0
0
3.
88
.911 .064
76. There is a constant decline in the rate of violations of
faculty members in regard to work behaviourism.
2
0
0
3.
97
.888 .063
77. There is a continuous decline in the number of faculty
members who quit their jobs.
2
0
0
3.
92
.853 .060
78. There is a continuous decline in the rate of complaints of
Faculty members.
2
0
0
3.
83
1.080 .076
79. There is a continuous increase of employers who offer
jobs to university's students compared to those offered to
students of other universities.
2
0
0
3.
74
1.095 .077
80. There is great interest of parties offering jobs to submit
proposals for the development of the university and its
outputs.
2
0
0
3.
75
1.056 .075
81. There is a continuous decline in complaints made by
employers who hired the university's students.
2
0
0
3.
81
.969 .069
82. There is an increase of loyalty on the part of employment
for the company compared to competitors
2
0
0
3.
76
1.030 .073
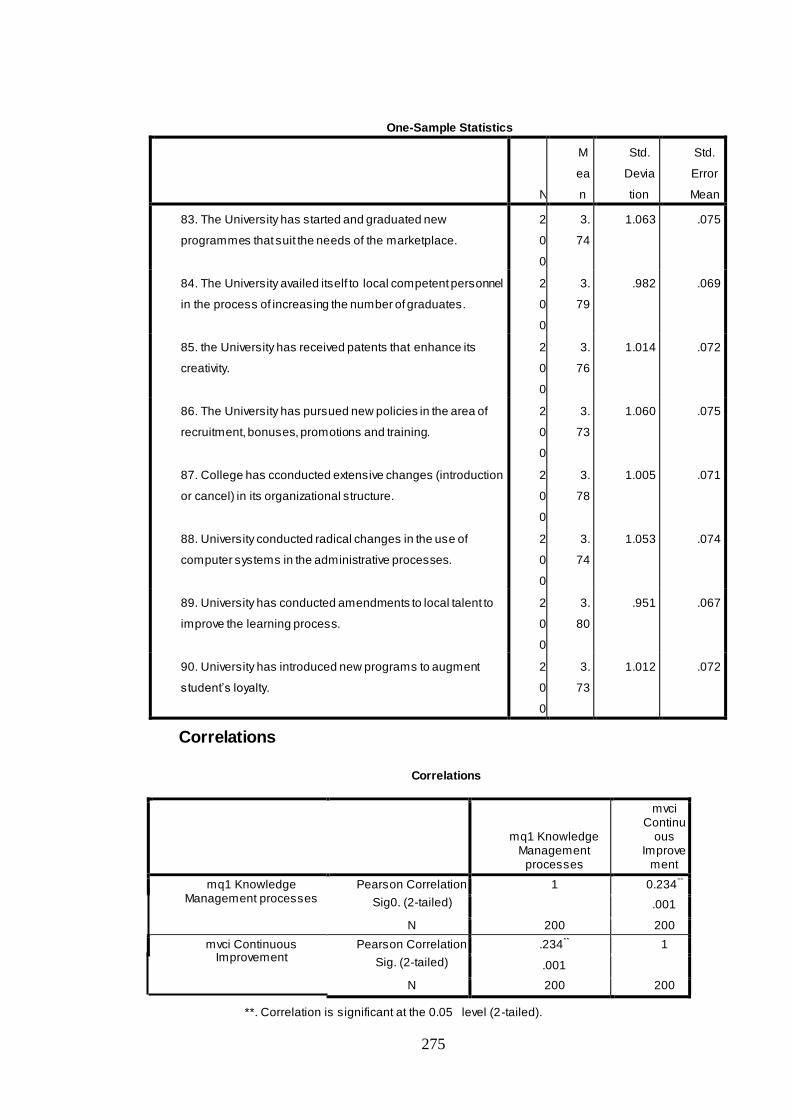
275
One-Sample Statistics
N
M
ea
n
Std.
Devia
tion
Std.
Error
Mean
83. The University has started and graduated new
programmes that suit the needs of the marketplace.
2
0
0
3.
74
1.063 .075
84. The University availed itself to local competent personnel
in the process of increasing the number of graduates.
2
0
0
3.
79
.982 .069
85. the University has received patents that enhance its
creativity.
2
0
0
3.
76
1.014 .072
86. The University has pursued new policies in the area of
recruitment, bonuses, promotions and training.
2
0
0
3.
73
1.060 .075
87. College has cconducted extensive changes (introduction
or cancel) in its organizational structure.
2
0
0
3.
78
1.005 .071
88. University conducted radical changes in the use of
computer systems in the administrative processes.
2
0
0
3.
74
1.053 .074
89. University has conducted amendments to local talent to
improve the learning process.
2
0
0
3.
80
.951 .067
90. University has introduced new programs to augment
student’s loyalty.
2
0
0
3.
73
1.012 .072
Correlations
Correlations
mq1 Knowledge Management
processes
mvci Continu
ous Improve
ment
mq1 Knowledge Management processes
Pearson Correlation 1 0.234**
Sig0. (2-tailed) .001
N 200 200
mvci Continuous Improvement
Pearson Correlation .234** 1
Sig. (2-tailed) .001
N 200 200
**. Correlation is significant at the 0.05 level (2-tailed).
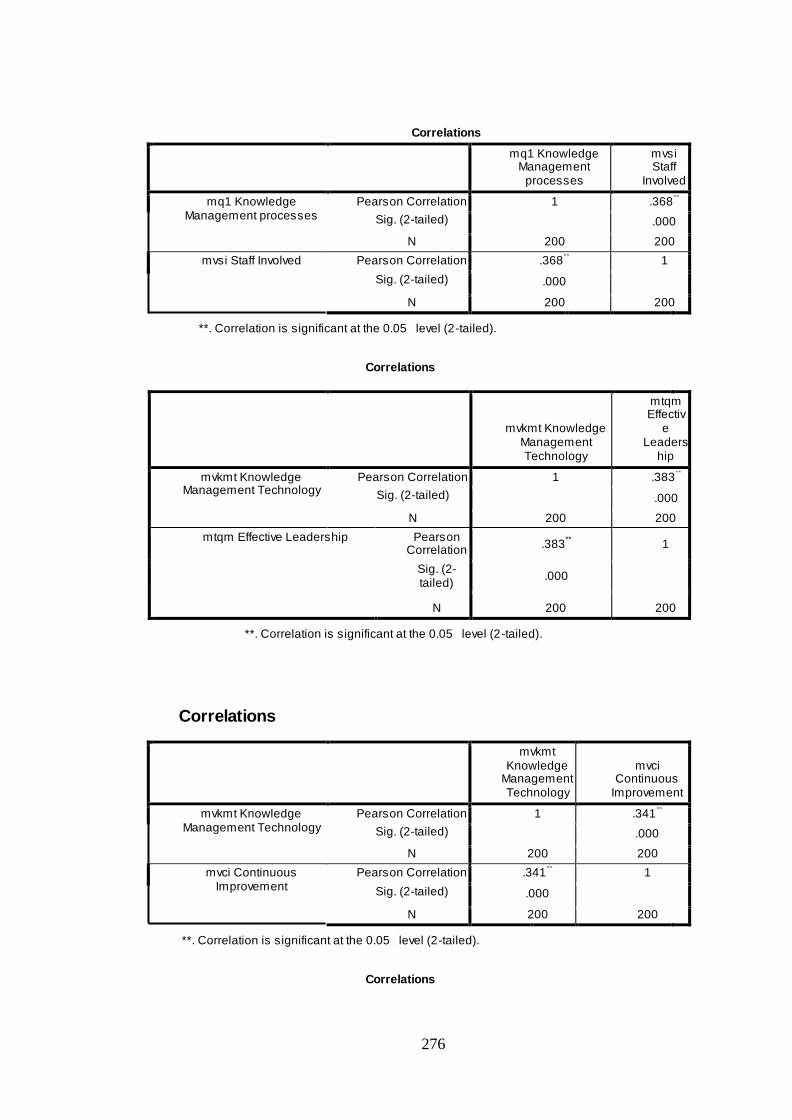
276
Correlations
mq1 Knowledge Management
processes
mvsi Staff
Involved
mq1 Knowledge Management processes
Pearson Correlation 1 .368**
Sig. (2-tailed) .000
N 200 200
mvsi Staff Involved Pearson Correlation .368** 1
Sig. (2-tailed) .000
N 200 200
**. Correlation is significant at the 0.05 level (2-tailed).
Correlations
mvkmt Knowledge Management Technology
mtqm Effectiv
e Leaders
hip
mvkmt Knowledge Management Technology
Pearson Correlation 1 .383**
Sig. (2-tailed) .000
N 200 200
mtqm Effective Leadership Pearson Correlation
.383** 1
Sig. (2-tailed)
.000
N 200 200
**. Correlation is significant at the 0.05 level (2-tailed).
Correlations
mvkmt Knowledge
Management Technology
mvci Continuous
Improvement
mvkmt Knowledge Management Technology
Pearson Correlation 1 .341**
Sig. (2-tailed) .000
N 200 200
mvci Continuous Improvement
Pearson Correlation .341** 1
Sig. (2-tailed) .000
N 200 200
**. Correlation is significant at the 0.05 level (2-tailed).
Correlations

277
mvkmt Knowledge
Management Technology
mvsi Staff Involved
mvkmt Knowledge Management Technology
Pearson Correlation 1 .398**
Sig. (2-tailed) .000
N 200 200
mvsi Staff Involved Pearson Correlation .398** 1
Sig. (2-tailed) .000 N 200 200
**. Correlation is significant at the 0.05 level (2-tailed).
Correlations
Correlations
mvkt
Knowledge
Team
mtqm Effective
Leadership
mvkt Knowledge Team Pearson Correlation 1 .390**
Sig. (2-tailed) .000
N 200 200
mtqm Effective Leadership Pearson Correlation .390** 1
Sig. (2-tailed) .000
N 200 200
**. Correlation is significant at the 0.05 level (2-tailed).
Correlations
mvkt Knowledge
Team mvci Continuous
Improvement
mvkt Knowledge Team Pearson Correlation 1 .301**
Sig. (2-tailed) .000
N 200 200
mvci Continuous Improvement
Pearson Correlation .301** 1
Sig. (2-tailed) .000 N 200 200
**. Correlation is significant at the 0.05 level (2-tailed).
Correlations

278
mvkt
Knowledge
Team
mvsi Staff
Involved
mvkt Knowledge Team Pearson Correlation 1 .354**
Sig. (2-tailed) .000
N 200 200
mvsi Staff Involved Pearson Correlation .354** 1
Sig. (2-tailed) .000
N 200 200
**. Correlation is significant at the 0.05 level (2-tailed).
Correlations
Correlations
mq Knowledge
Management mtq Total
quality
mq Knowledge Management
Pearson Correlation 1 .574**
Sig. (2-tailed) .000
N 200 200
mtq Total quality Pearson Correlation .574** 1
Sig. (2-tailed) .000 N 200 200
**. Correlation is significant at the 0.05 level (2-tailed).
Correlations
Correlations
mq Knowledge
Management
mvip Internal Processes Perspective
mq Knowledge Management
Pearson Correlation 1 .451**
Sig. (2-tailed) .000
N 200 200
mvip Internal Processes Perspective
Pearson Correlation .451** 1
Sig. (2-tailed) .000 N 200 200
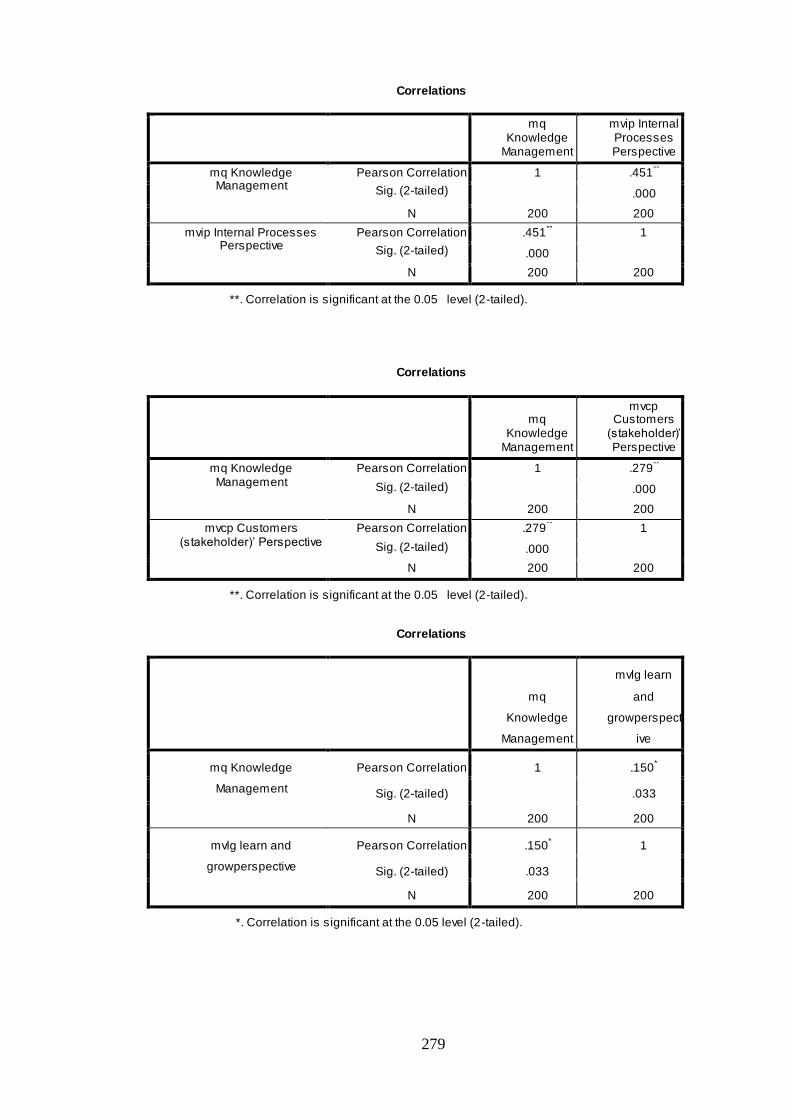
279
Correlations
mq Knowledge
Management
mvip Internal Processes Perspective
mq Knowledge Management
Pearson Correlation 1 .451**
Sig. (2-tailed) .000
N 200 200
mvip Internal Processes Perspective
Pearson Correlation .451** 1
Sig. (2-tailed) .000 N 200 200
**. Correlation is significant at the 0.05 level (2-tailed).
Correlations
mq
Knowledge Management
mvcp Customers
(stakeholder)’ Perspective
mq Knowledge Management
Pearson Correlation 1 .279**
Sig. (2-tailed) .000
N 200 200
mvcp Customers (stakeholder)’ Perspective
Pearson Correlation .279** 1
Sig. (2-tailed) .000 N 200 200
**. Correlation is significant at the 0.05 level (2-tailed).
Correlations
mq
Knowledge
Management
mvlg learn
and
growperspect
ive
mq Knowledge
Management
Pearson Correlation 1 .150*
Sig. (2-tailed) .033
N 200 200
mvlg learn and
growperspective
Pearson Correlation .150* 1
Sig. (2-tailed) .033
N 200 200
*. Correlation is significant at the 0.05 level (2-tailed).
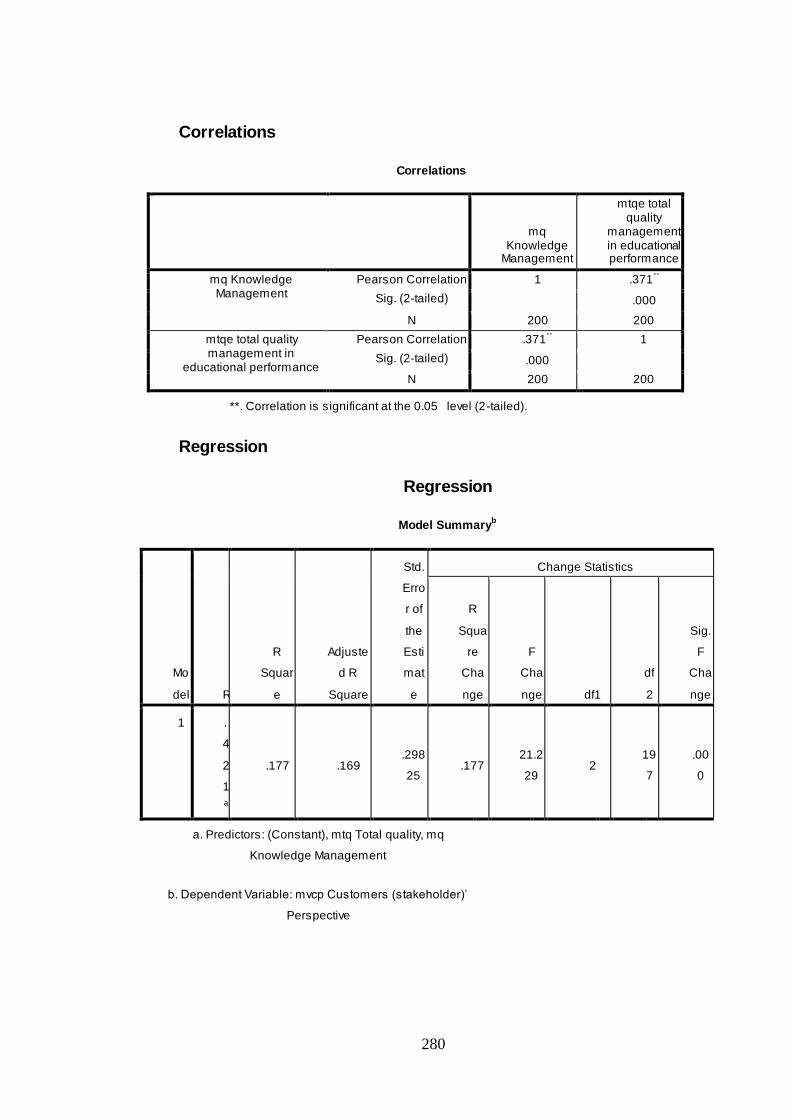
280
Correlations
Correlations
mq Knowledge
Management
mtqe total quality
management in educational performance
mq Knowledge Management
Pearson Correlation 1 .371**
Sig. (2-tailed) .000
N 200 200
mtqe total quality management in
educational performance
Pearson Correlation .371** 1
Sig. (2-tailed) .000 N 200 200
**. Correlation is significant at the 0.05 level (2-tailed).
Regression
Regression
Model Summaryb
Mo
del R
R
Squar
e
Adjuste
d R
Square
Std.
Erro
r of
the
Esti
mat
e
Change Statistics
R
Squa
re
Cha
nge
F
Cha
nge df1
df
2
Sig.
F
Cha
nge
1 .
4
2
1
a
.177 .169 .298
25 .177
21.2
29 2
19
7
.00
0
a. Predictors: (Constant), mtq Total quality, mq
Knowledge Management
b. Dependent Variable: mvcp Customers (stakeholder)’
Perspective
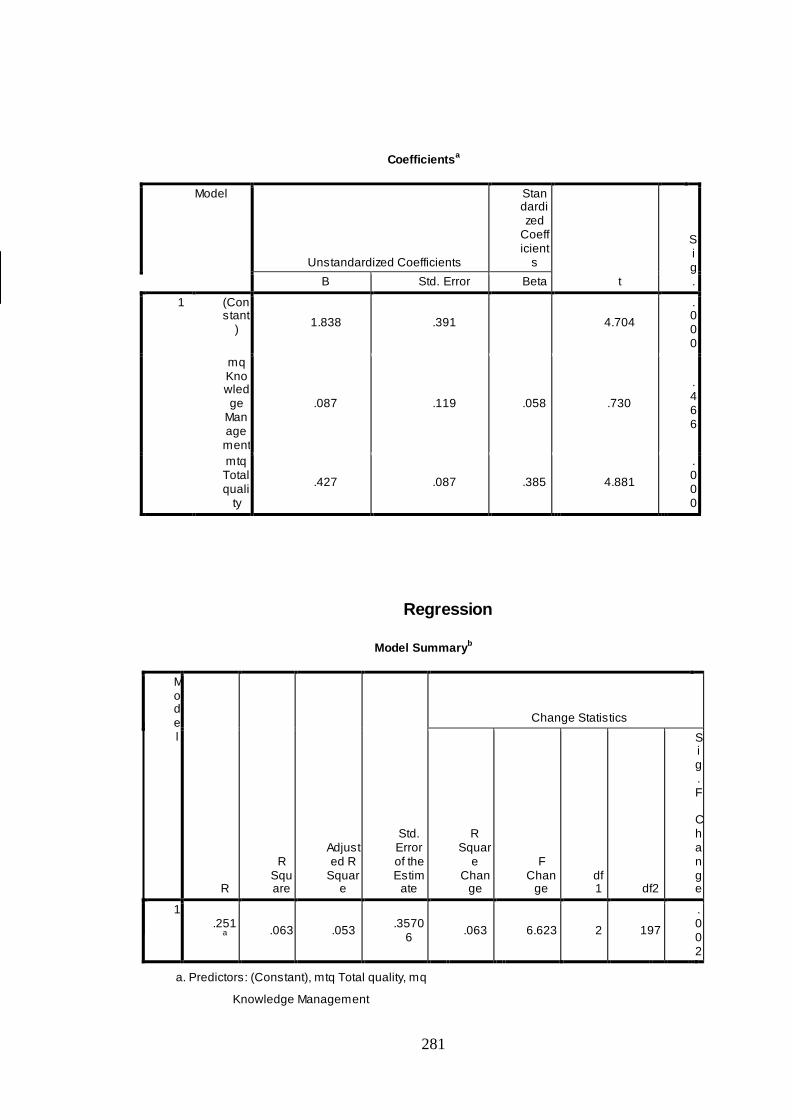
281
Coefficientsa
Model
Unstandardized Coefficients
Standardized
Coefficient
s
t
Sig. B Std. Error Beta
1 (Constant
) 1.838 .391
4.704
.000
mq Knowledge
Management
.087 .119 .058 .730
.466
mtq Total quali
ty
.427 .087 .385 4.881
.000
Regression
Model Summaryb
Model
R
R Square
Adjusted R
Square
Std. Error of the Estim
ate
Change Statistics
R Squar
e Chan
ge
F Chan
ge df1 df2
Sig. F Change
1 .251
a
.063 .053 .3570
6 .063 6.623 2 197
.002
a. Predictors: (Constant), mtq Total quality, mq
Knowledge Management
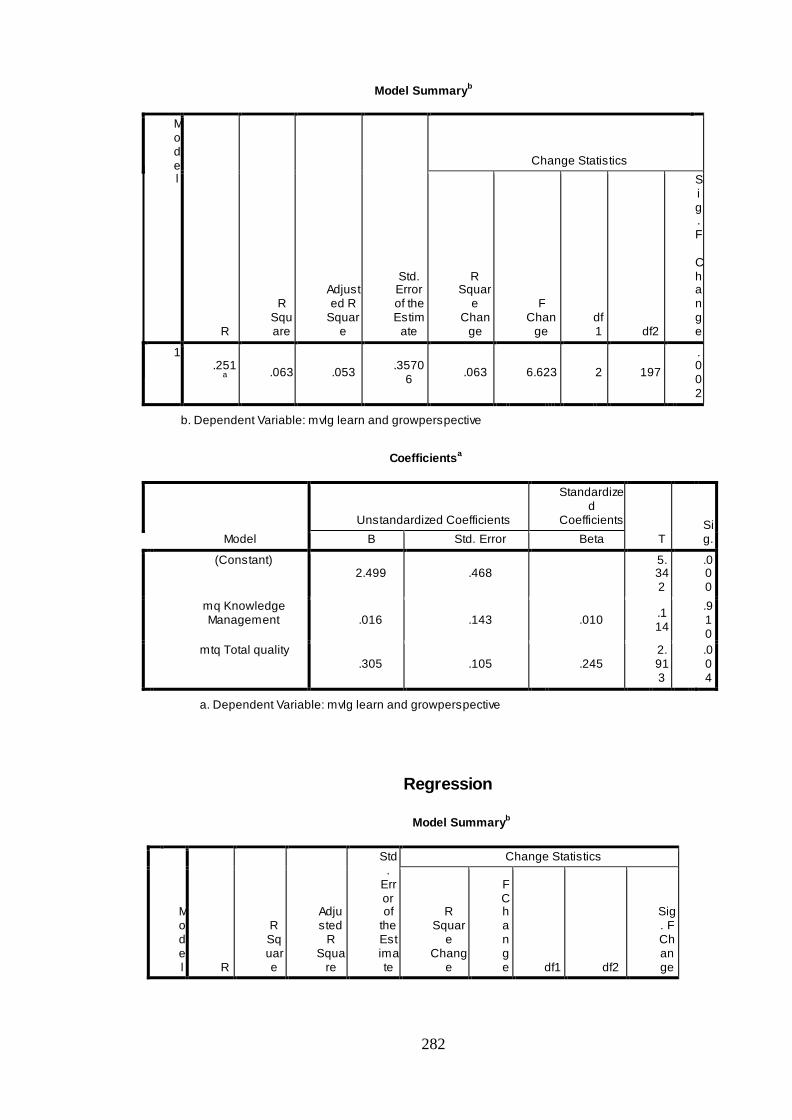
282
Model Summaryb
Model
R
R Square
Adjusted R
Square
Std. Error of the Estim
ate
Change Statistics
R Squar
e Chan
ge
F Chan
ge df1 df2
Sig. F Change
1 .251
a
.063 .053 .3570
6 .063 6.623 2 197
.002
b. Dependent Variable: mvlg learn and growperspective
Coefficientsa
Model
Unstandardized Coefficients
Standardized
Coefficients
T Sig. B Std. Error Beta
1 (Constant) 2.499 .468
5.342
.000
mq Knowledge Management .016 .143 .010
.114
.910
mtq Total quality .305 .105 .245
2.913
.004
a. Dependent Variable: mvlg learn and growperspective
Regression
Model Summaryb
Model R
R Square
Adjusted
R Squa
re
Std.
Error of
the Estimate
Change Statistics
R Squar
e Chang
e
F Change df1 df2
Sig. F Change

283
1 .508
a
.258
.251 .23087
.258
34.266
2 197 .000
a. Predictors: (Constant), mtq Total quality, mq
Knowledge Management
b. Dependent Variable: mtqe total quality management in
educational performance
Coefficientsa
Model
Unstandardized Coefficients
Standardize
d Coefficients
t Sig. B Std. Error Beta
1 (Constant) 1.719 .303
5.681 .000
mq Knowledg
e Managem
ent
.157 .092 .127 1.696 .091
mtq Total quality
.383 .068 .424 5.659 .000
a. Dependent Variable: mtqe total quality management in educational
performance
Related Documents