U. S. DEPARTMENT OF COMMERCE NATIONAL BUREAU OF STANDARDS RESEARCH PAPER RP1291 Part of Journal of Research of the National Bureau of Standards, Volume 24, April 1940 METHODS OF MEASURING pH IN ALKALINE CYANIDE PLATING BATHS 1 By Maurice R. Thompson ABSTRACT For many years the pH of acid plating baths ha s been measured and controlled, especially in nickel plating, but only recently has attention been given to similar control of alkali ne cyanide baths. It is more d ifficu lt to apply either the elec- trometric or the colorimetric method to the accurate measurement of these baths, mainly because of unce rtainty as to salt error. In the work de scribed, comparative r eadings were made on buffe red alkaline sodium chloride solutions (1 to 3 N) with the hydrogen electrode (which is free from salt error by definition), with a com- mercial bulb-t ype glass electrode, and with three colorimetric sets. Readings of pH by the glass electrode were too low by about 0. 5 to 1.5 pH unit. Readings with the indicators were usually too high by about 0. 5 to 1.0 pH u nit , varying with the indi cator. Th e glass electrode error increased both as the salt content and pH of a solut ion increa sed. The colorimetric error also increased as the salt content of a solution increa ed, but at a lesser rate than for the glass electrode. The colorimetric error decreased, however, as the pH increased. Corrections to readings of the glass el ectrode and of the indicators on several cyanide copper plating bath sample s, in which the hydrogen el ectro de could not be used, were made on the assumption that salt errors of alkaline chloride and cyanide are the sa me. The corrected readings by the two methods agreed within 0. 5 pH. More extensive measurement s would be desirable, however, before adopting definite corrections for the large errors involved. It seems desirable, therefore, to continue to report uncorrected pH values for alkaline cyanide plating solution s, stating the type and make of apparatus employed . The condition of glass electrodes should be checked occasionally, for example , by reading the pH of a buffered solution with a selt content comparable to that of the samples being measured and with a true pH value established by the hydrogen electrode. CONTENTS Page r. In troduction ___ _ ___ __ __ _ __ _ ___ __ ___ __ __ __ __ __ ____ _ __ __ _ _ ___ _ _ ___ 424 II. Principles involved ___________ ______ ___ ____________________ ___ __ 425 III. Determination of salt errors _____ ______ __ __________ _______________ 426 1. Electrometric meas urement s _____ _____________________ _______ 426 (a) Hydrogen electrode __ __ ______________________________ 426 (b) Glass electrode ______ ______________ ____________ _____ _ 427 2. Colorimetric measurements ______ _______________ __ _____ _______ 427 IV. Discussion of measurements __________ ___ ____________________ _____ 428 1. Hysteresis of glass electrode ___ ___ ___ __ ___ ___ ___ _ _ __ _ _ ___ _ _ _ __ 428 2. Variation between different glass electrodes ___ __________ ___ ___ _ 428 3. "Pseudoanion" effect upon glass electrode ___________ ______ ___ __ 429 4. Colorimetric measurements ____ ______________________________ 430 V. Application of the r esults to the pH measurement of cyanide copper plating baths _______ ______ ____________ __ ______________________ 433 ---- 1 A preliminary report upon this investigation, entitled "The Measurement of pH in Alkaline Cyanide Plating Baths", was presented to the 'r wenty-seventh Annual Convention and International Conference of the American Electroplaters' Society at Asbury Park, N. J., June 19 to 22, 1939, and was printed in the Convention Proceedings. 423

Ph Calculation in Cyanide Solutions
Dec 11, 2015
electroplatin
Welcome message from author
This document is posted to help you gain knowledge. Please leave a comment to let me know what you think about it! Share it to your friends and learn new things together.
Transcript

U. S. DEPARTMENT OF COMMERCE NATIONAL BUREAU OF STANDARDS
RESEARCH PAPER RP1291
Part of Journal of Research of the National Bureau of Standards, Volume 24, April 1940
METHODS OF MEASURING pH IN ALKALINE CYANIDE PLATING BATHS 1
By Maurice R. Thompson
ABSTRACT
For many years the pH of acid plating baths has been measured and controlled, especially in nickel plating, but only recently has attention been given to similar control of alkaline cyanide baths. It is more d ifficult to apply either the electrometric or the colorimetric method to the accurate measurement of these baths, mainly because of uncertainty as to salt error. In the work described, comparative readings were made on buffered alkaline sodium chloride solutions (1 to 3 N) with the hydrogen electrode (which is free from salt error by definition), with a commercial bulb-type glass electrode, and with three colorimetric set s. Readings of pH by the glass electrode were too low by about 0.5 to 1.5 pH unit. Readings with the indicators were usually too high by about 0.5 to 1.0 pH unit, varying with the indicator. The glass electrode error increased both as the salt content and pH of a solution increased. The colorimetric error also increased as the salt content of a solution increa ed, but at a lesser rate than for the glass electrode. The colorimetric error decreased, however, as the pH increased.
Corrections to readings of the glass electrode and of the indicators on several cyanide copper plating bath samples, in which the hydrogen electrode could not be used, were made on the assumption that salt errors of alkaline chloride and cyanide are the same. The corrected readings by the two methods agreed within 0.5 pH. More extensive measurements would be desirable, however, before adopting definite corrections for the large errors involved. It seems desirable, therefore, to continue to report uncorrected pH values for alkaline cyanide plating solutions, stating the type and make of apparatus employed. The condition of glass electrodes should be checked occasionally, for example, by reading the pH of a buffered solution with a selt content comparable to that of the samples being measured and with a true pH value established by the hydrogen electrode.
CONTENTS Page
r. In troduction _ _ _ _ _ _ _ _ _ _ _ _ _ _ _ _ _ _ _ _ _ _ _ _ _ _ _ _ _ _ _ _ _ _ _ _ _ _ _ _ _ _ _ _ _ _ _ _ _ _ _ _ 424 II. Principles involved ___________ ______ ___ ____________________ ___ __ 425
III. Determination of salt errors _____ ______ __ __________ _______________ 426 1. Electrometric measurements _____ _____________________ _______ 426
(a) Hydrogen electrode __ __ __________________________ ____ 426 (b) Glass electrode ______ ______________ ____________ _____ _ 427
2. Colorimetric measurements ______ _______________ __ _____ _______ 427 IV. Discussion of measurements __________ ___ ____________________ _____ 428
1. Hysteresis of glass electrode_ _ _ _ _ _ _ _ _ _ _ _ _ _ _ _ _ _ _ _ _ _ _ _ _ _ _ _ _ _ _ _ _ _ 428 2. Variation between different glass electrodes ___ __________ ___ ___ _ 428 3. "Pseudoanion" effect upon glass electrode ___________ ______ ___ __ 429 4. Colorimetric measurements ____ ______________________________ 430
V. Application of the results to the pH measurement of cyanide copper plating baths _______ ______ ____________ __ ______________________ 433 ----
1 A preliminary report upon this investigation, entitled "The Measurement of pH in Alkaline Cyanide Plating Baths", was presented to the 'r wenty-seventh Annual Convention and International Conference of the American Electroplaters' Society at Asbury Park, N. J., June 19 to 22, 1939, and was printed in the Convention Proceedings.
423

424 Journal oj Research oj the National Bureau oj Standards [Vol. 14
1. INTRODUCTION
For more than 15 years it has been customary to measure and.control the pH of nickel-plating baths,2 which are usually operated in the acid range, but only recently has this test been applied to alkaline cyanide baths, 3 4 5 such as those of copper, brass, silver, zinc, and cadmium. With nickel-plating baths, the pH was found to be one of the factors affecting current efficiency and the character of the deposit. Similar effects have also been reported for the cyanide baths. In controlling these cyanide baths, two questions naturally arise: (1) How concordant and how accurate are the present methods of measurement? (2) What are the favorable limits of pH for the operation of a given bath? At the present time there is little information available for answering the first question, to which the present paper is confined.
Both electrometric and colorimetric methods are now in use for measuring the pH of plating baths. The colorimetric method requires less experience and, for a limited range of pH, less investment in apparatus. The electrometric method, in one form or another, is applicable to a wider range of conditions, is suitable for automatic recording if this is required, and is free from the personal equation and eye fatigue which are associated to some extent with color matching.
Early experience with nickel baths showed that the indicators used in the colorimetric method were subject to "salt errors," which caused a discrepancy between the results of this and the electrometric method. By the salt error of a pH measurement is meant any deviation of either the electrometric or colorimetric reading, in a solution containing a high concentration of salts, from the value (the "true pH") that would have been obtained in that solution with a hydrogen electrode (if applicable). The hydrogen electrode as the primary standard has a zero salt error by definition. The difference between this true pH and that observed by any other method for the same solution gives the salt error and therefore the correction to be applied to the observed pH.
Blum and Bekkedahl 6 found that usually with nickel baths the ~ pH values obtained by the indicators were consistently too high by . about 0.5 unit. Therefore the subtraction of 0.5 pH from the colorimetric values made them concordant with hydrogen electrode read-ings. (Fortunately in this case the hydrogen electrode was appli-cable to sufficiently pure nickel solutions. Also, the quinhydrone electrode had a negligible salt error ill nickel solutions.) The recording of such corrected values facilitates the comparison of the results obtained by various investlgators with different methods. The present investIgation was designed to ascertain whether a similar standardization of methods could be applied to measurements of the pH of alkaline cyanide solutions.
'M. R. Thompson, 'l'rans. Am. EJectrochem. Soc. U, 333 (1922). 'R. Springer, Metal Ind. (New York) 34, 473 (1936) and 35,174 (1937). • G. B. Hogaboom, Monthly Review, Am. Electroplaters' Soc. U, 713 (19~7); Metal Ind. (New York) 36,
116 (1938) and 36,170 (1938) . l' • A. K. Graham and IT. J . Read, Metal Ind. (New York) 35,559 (1937); 35, 617 (1937); 36, 1511938); 36,
77 (1938): 36,120 (1938); and 36,169 (1938). , W. Blum and N. Bekkedahl. Trans. Am. Electrochem. Soc. 56, 291 (1929).

~----------------------~~ ~~----------------------------------------.
r
r I
I
Thompson] Measuring pH in Oyanide Plating Baths 425
II. PRINCIPLES INVOLVED
If it were possible to measure the pH of a metal cyanide solution with a hydrogen electrode, a comparison of this value with that obtained by any other method would show directly the error of the other measurement. The hydrogen electrode, however, is not applicable in metal cyanide solutions, as it is subject to disturbance by metal reduced upon it and to "poisoning" by cyanide. Unfortunately, there is no other electrode now available which is altogether satisfactory for these solutions. The quinhydrone electrode gives erroneous readings above pH 9; and the antimony electrode has many limitations, including disturbance by traces of copper salts. The glass electrode, perfected recently as a durable commercial device, has the disadvantage of an increasingly large sodium-ion error above pH 10. (The potassium-ion error is comparatively small, and the barium-ion error is almost negligible. Most cyanide plating baths however, are now prepared from sodium cyanide.) It has usually been considered, however, that this error is fairly reproducible when a uniform technique is employed. Moreover, it has been reported that the glass electrode is free from specific anion effects, that is, the sodium-ion error for 1 N N a+ is the same whether sodium chloride, sulfate, phosphate, or other salt, is employed.
This situation led to the use in this investigation of the glass electrode as a secondary electrometl'ic standard for the cyanide baths. Comparative measurements with the hydrogen and glass electrodes can be made in alkaline "buffered" solutions prepared with known high concentrations of such salts as sodium chloride or sodium sulfate. The difference in readings gives the sodium-ion error and hence the correction for the glass electrode. The assumption is then made that equivalent concentrations of sodium cyanide or of double sodium metal cyanides would affect the glass electrode reading to the same extent in plating solutions. (If these were not freshly prepared baths of known formula, the total sodium content could be determined by standard methods of analysis.) Then by applying the previously determined corrections, to such readings, corrected values approximating the true pH values of the plating bath samples are obtained. This procedure also involves the assumption that heavy metal compounds have no appreciable effect on the glass electrode measurements in alkaline solutions (no effect has been found in acid solutions). This appeared to be the most practicable electrometric procedure at present, although the numerous assumptions made and the difficulties involved in making gll1sS electrode measurements in alkaline solutions tend to make the results at best only approximate.
The situation with respect to the colorimetric method is very similar. The commercial indicator sets are calibrated by means of standard buffer solutions, which are dilute (except in the upper alkaline range), and the pH of which has been measured with the hydrogen electrode. The indicator sets are graduated in 0.2 pH intervals and normally give values that are correct within ±0.1 pH for similar dilute solutions, but not for solutions with high salt contents. Cyanide plating baths have fairly high concentrations of double cyanide, free sodium cyanide, sodium carbonate, and other salts. The effect of such salts, at a given pH, is to shift the color of the indicator, usually toward the alkaline side. As with the glass electrode, this error is
L
426 Journal oj Research oj the National Bureau oj Standards [Vol . £4
readily determined for solutions in which the true pH value can be measured by the hydrogen electrode, for instance in concentrated chloride or sulfate solutions. The corresponding correction of colorimetric readings on cyanide baths also involves the assumption that cyanide causes about the same salt error with indicators as does an equivalent concentration of other salts. Unfortunately, there are few data available on the specific salt errors of indicators.7 It is probable that these errors are correlated more directly with the ionic strength of a solution than with the salt concentration. As no high accuracy is required for the present purposes, however, the salt concentration will be used and, as will appear, it seems suitable as a first approximation.
Experimentally, it is found that the sodium-ion error of the glass electrode is negative in the alkaline range, that is, the observed pH reading is too low. The salt error of the indicators is commonly (but not always) positive, and thus the observed pH reading is ordinarily too high. The true pH is, therefore, generally between these two values but usually not exactly midway between them. These relations may be summarized as follows:
1. Hydrogen-electrode reading (if practicable) = true pH. 2. Glass electrode reading+glass electrode sodium-ion error=
corrected pH (approximately the true pH). 3. Colorimetric reading-indicator salt error = corrected pH (approx
imately the true pH). 4. Glass electrode reading+glass electrode sodium-ion error=
colorimetric reading-indicator salt error. Consequently, if the pH of a given cyanide bath is determined from a corrected glass electrode reading and also from a corrected colorimetric reading, the two results, if correct, should agree. Any difference between them indicates the present degree of uncertainty in the methods employed and in the assumptions made.
III. DETERMINATION OF SALT ERRORS
The various steps used to determine the salt errors of the instruments employed in this investigation may be summarized briefly as follows.
1. ELECTROMETRIC MEASUREMENTS
(a) HYDROGEN ELECTRODE
Readings were made on all of the buffer solutions and buffered salt solutions with the hydrogen electrode. Platinized platinum-foil electrodes were used in conjunction with saturated calomel reference electrodes in a suitable cell, which was placed in an air bath kept at a temperature of 25° O±0.2°. The electromotive force of the reference electrode was taken as 0.2458 volt. The hydrogen was purified by passage through heated palladium-asbestos and then presaturated with water vapor in a bubbling tube. Readings were corrected for barometric pressure in the usual manner. Borate buffer solutions with and without added salts were employed. All solutions were stored in waxed bottles.
1 W . W. Scott, Standard Methods of Chemical Analysis, led. 5]2, 2274 (Cbapter on Determination of pH by the Colorimetric Method by W. A. Taylor and F. R. M.cCrumb). (D . Van Nostrand Co., Inc., New York,N. Y.,1939.)

r-------------~--~-----------------------------------
I
Thompson] Measuring pH in Oyanide Plating Baths 427
(b) GLASSI ELECTRODE
Several makes 8 of commercial portable pH meters, or pH electrometers, are now available for use in the control of cyanide plating baths. These consist essentially of an electron-tube potentiometer, to which is connected an electrode chain of a bulb-type glass electrode and a saturated calomel electrode. The sample of solution is placed in a small movable cup which surrounds the glass electrode. The potentiometer scale can be read by estimation to ±0.01 pH.
For this investigation a Coleman Model 3- D electrometer was used, with several extra Coleman glass electrodes (made of Corning 015 ~ass) for comparative readings when necessary. The scale of the lJoleman potentiometer was checked by comparison with a precision potentiometer, after substituting a resistance of 200 megohms for the electrode cbain. (This instrument has only one scale, which is adjustable by means of a switch for either pH or millivolt readings.) The asymmetry potential of the glass electrode was balanced with 0.05 M acid potassium phthalate buffer solution (prepared from standard sample 84a of the National Bureau of Standards), for which the pH was taken as 3.97.9 Glass-electrode measurements on buffer solutions, on buffered salt solutions, and on plating samples were usually made at 250 C. (The Coleman instrument, however, contains a compensating device which automatically corrects for potential shift of the electrodes with temperature.)
The bandling of a glass electrode included two rinses with distilled water and two rinses with the sample to be measured, followed by a reading within 5 minutes. Frequent attention was given to flushing the liquid junction and to balancing the asymmetry potential against the phthalate buffer. The glass electrodes were kept in distilled water when not in use.
2. COLORIMETRIC MEASUREMENTS
Because the available colorimetric sets differ in the indicators employed and in the construction of the color standards, it was desirable to include several makes in this investigation. Equipment and indicators were lent by Hellige, Inc. (H), by LaMotte Chemical Products Co. (L), and by W. A. Taylor & Co. (T). The Hellige standards consist of colored glass disks mounted on a small wheel, the LaMotte Standards are separate ampoules used in a holder, and the Taylor standards are small ampoules mounted in separate slides for each indicator. All these sets are graduated at 0.2 pH intervals and under good conditions can be read to ±0.1 pH. The indicators used with each set and the various ranges of pH are listed under the name of the maker in table 1. (Other indicators furnished for the lower alkaline range were not required for the present investigation.)
8 Among these are the instruments supplied by the Ooleman Electric Co.; Hellige, Inc.; Leeds & Northrup 00.; and the National Technical Laboratories.
, This is the value given by W. M. Clarke, "The Determination of Hydrogen Ions" [ed. 3], p. 48a (Williams & Wilkins 00., Baltimore, Md., 1928). It is probahle that this value will shortly be revised to pH 4.01 in accordance with work done at the National Bureau of Standards and other laboratories. Such a change, however, is too smalJ to affect the results given in this paper.

428 Journal oj Research oj the National Bureau oj Standards [Vol . $4
TABLE I.-Colorimetric sets
pH range Hellige (H) indicators LaMotte (L) indicators Taylor (T) indicators
10.0 to 11.6 ____ __________ Nitro yelow ____ ____ ______ __ Nitro yollow __ ____ _________ _ Tolyl red . 11.0 to 12.6 ______________ . _______ _______ _____ __________ Sulpho omnge. ______ ___ ___ __ P arazo omnge. 11.2 to 12.8 __ ____________ Tropaeolin 0 __ ___ ____ ____ ___ _________ ____ ____ ___ ___ _______ . _________ ____ __ ___ _ 12.0 to 13.6 ____ _____ _____ VioleL _____ __ ___ ____ __ _____ Violet __________ __________ ___ Acyl hlue.
The original calibrations of these three colorimetric sets were checked by readings on buffer solutions which were prepared by partly neutralizing 0.1 N NaOH with 0 to 0.2 M HaBOa, and with few exceptions the standards were found to be correct within the reproducibility of the observations. These and the subsequent colorimetric readings were made at about 25° C by two or more observers, and the readings usually agreed within 0.2 pH, with an average deviation of about 0.1 pH. The indicator sets were then employed to measure the pH of the same buffered salt solutions and plating solution samples as were used with the glass electrode.
IV. DISCUSSION OF MEASUREMENTS
1. HYSTERESIS OF GLASS ELECTRODE
It was noted that a glass electrode of the type employed was subject to a lag or hysteresis when used in concentrated alkaline salt solutions. For instance, higher pH values were obtained for a series of solutions measured in the order of increasing salt content than when measured in the order of decreasing salt content. The maximum discrepancy observed was about 0.1 pH. This effect is probably connected with the difficulty of displacing the film of solution on the surface of the glass by another solution of different concentration. Thus, Perley 10 has stated: "The glass surface is highly adsorptive. When changing from a buffer solution to an unbuffered solution, considerable washing is required. The thicker and more robust the glass electrode, the greater must be the degree of washing."
Hysteresis was minimized by thorough rinsing, by making measurements in the same order of concentration, and by checking the asymmetry potential before each reading.
2. VARIATION BETWEEN DIFFERENT GLASS ELECTRODES
Previous investigators 11 have reported agreement within 0.05 pH for several commercial bulb-type glass electrodes of the same make. In this investigation, less close agreement was usually obtained. The electrodes used were not especially selected for the same age and condition. Differences of 0.1 pH or more were encountered, when the same buffered alkaline chloride solution was measured, especially in the upper range of pH. Such discrepancies, which are difficult to explain, may be connected with variations in the rate of attack of alkaline solutions upon the glass of different electrodes. This subject of attack has been studied by Hubbard, Hamilton, and Finn.12 In the present investigation the most concordant electrodes were found to be those used frequently under similar conditions.
10 G. A. Perley, Am. D yestuff Reptr. 26,832 (1937). 11 w. C. Gardiner and H . L. Sanders, Ind. Eng. Chern. , Anal. Ed. 9,274 (1937) . II J. Research NBS 22, 339 (1939) RP1187.
Thompson] Measuring pH in Oyanide Plating Baths 429
3. "PSEUDOANION" EFFECT UPON GLASS ELECTRODE
The fact that glass electrodes have usually been considered free from specific anion effects has been mentioned. However, most of the research on glass electrodes has been done with the membrane type, which is comparatively small, thin, and very sensitive. In this investigation, it was found that the salt error with sodium sulfate solutions 'fas slightly lower than with sodium chloride solutions. This effect
a:; o a: a:
-2.0
-'.5
!&! -'.0 % ...
-0.5
o 9.0
C
I B
I ~
AI
II I J '/!
I 1 J I I
/ ~
J II / V / /
" V V I/' V V 1/ V /1'"
10.0 11.0 12.0 OBSERVED pH
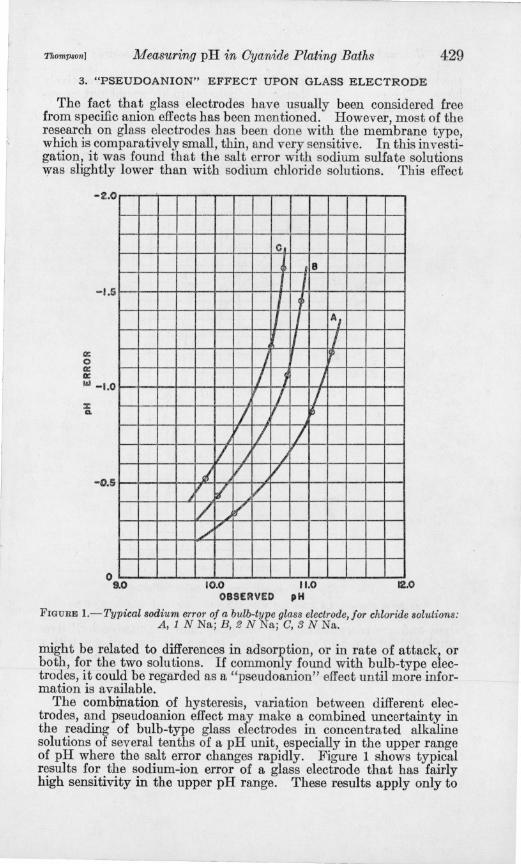
FIGURE I. - Typical sodium error of a bulb-type glass electrode, for chlO1'ide solutions: A, 1 N Na; B, :2 N Na; C, 3 N Na.
might be related to differences in adsorption, or in rate of attack, or both, for the two solutions. If commonly found with bulb-type electrodes, it could be regarded as a "pseudoanion" effect until more information is available.
The combi;nation of hysteresis, variation between different electrodes, and pseudo anion effect may make a combined uncertainty in the reading of bulb-type glass electrodes in concentrated alkaline solutions of several tenths of a pH unit, especially in the upper range of pH where the salt error changes rapidly. Figure 1 shows typical results for the sodium-ion error of a glass electrode that has fairly high sensitivity in the upper pH range. These results apply only to
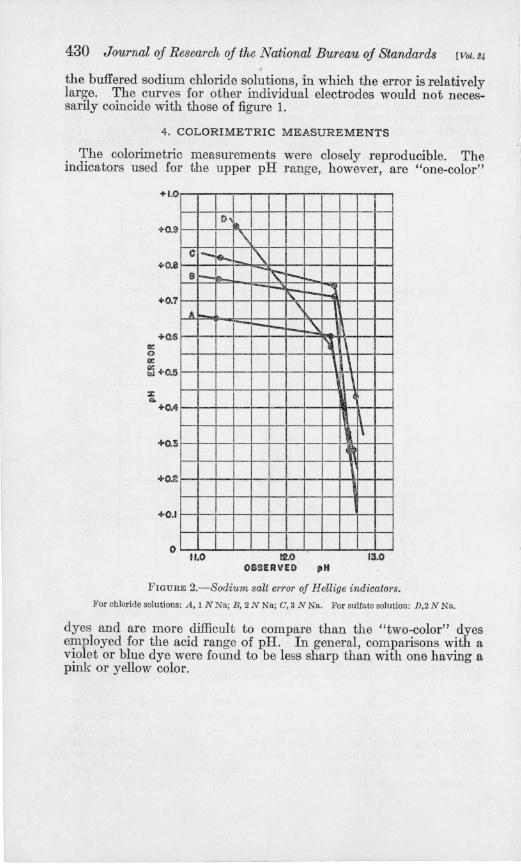
430 Journal of Research of the National Bureau of Standards [Vol. 24
the buffered sodium chloride solutions, in which the error is relatively large. The curves for other individual electrodes would not necessarily coincide with those of figure l.
4. COLORIMETRIC MEASUREMENTS
The colorimetric measurements were closely reproducible. The indicators used for the upper pH range, however, are "one-color"
:r: co.
+1.0
+0.9
+0.8
+0.7
+QG
+0.4
+0.3
+0.2
+0. 1
o
c_
8-
A
11.0
I) ~
e.... '\
I'\. ... ~ r-Io.... I'"-l ~ ~
\ -i--r-. '\ 1\ l"ll \ ,
1 \
12.0 OBSERVED pH
c
I
\
13.0
FIGURE 2.-Sodium salt error of Hellige indicators.
For chloride solutions: A, 1 N Na; E, 2 N Na; C,3 N Na. For sulfate solution: D,2 N Na.
dyes and are more difficult to compare than the "two-color" dyes employed for the acid range of pH. In general, comparisons with a violet or blue dye were found to be less sharp than with one having a pink or yellow color.
-;
I

Thompson] Measuring pH in Oyanide Plating Baths 431
With few exceptions, the indicators for a given set had salt errors of the same order of magnitude, which did not increase rapidly above 1 N Na+. The curves for salt error plotted against observed pH were of the same general shape and are shown in figures 2,3, and 4 for the individual sets. (Where the readings of different indicators of a
II: o II:
+1.0
+0.9
+0.8
+0.6
!5 +0.5
::: Q,
+0.4
+O.!
+0.2
+0.1
o
0 ,
-~ B"' ~ r-
A I-' ~
11.0
1\
\
\ -------~ r-~ ~ i\ , -~ K '-
I--' \,'
\
12.0 OBSERVED pH
~r-.. "\ ~ , " "
IS.O
FIGURE 3.-Sodium salt error of LaMotte indicators.
For chloride solutlous: A. 1 N Na; B. 2 N Na; C. 3 N Na. For sulfate solution: D. 2 N Na.
set overlapped, they agreed closely enough to warrant using averaged values for the points shown.) This situation made possible the combination of the results for each set into the generalized curve shown in figure 5, which, like figure 1, is based only on the buffered sodium chloride solutions. These generalized curves are reliable to about ±O.2 pH, which is sufficient for the present purpose. With some indicators, sulfate had a greater effect than chloride in the lower part of
218089-40--5

432 Journal oj Research oj the National Bureau oj Standards [Vol. t4
the pH range. All of the indicator curves showed a sharp decrease in error above pH 12, where the error approached zero. It was pointed out by F. R . McCrumb 13 that this result is caused by the necessity
:z: ...
+1.0
+0.9
+0.8
+0.7
+0.6
+0.5
+0.3
+0.2
+0. I
o
-0. I
-0. 2
'\ C\l
A[\
~
11.0
1\8 ~\ ~\ '1\ ~\
\ \' \ ~ 1\ \
\ ~
\ ~ ~ \
12.0 OBSERVED
., l\l\ , ~\ 1\ \\ \ l\ \ ~, \ \c \ \ \ \ 0
\ , !\A 19
13.0 pH
FIGURE 4.-Sodium salt error of Taylor indicators.
For ch loridejsolutions: A, 1 N Na; B, 2 N Na; C,[3 N Na. For sulfate solution: D, 2 N Na.
of calibrating the upper pH standards against solutions of fairly high sodium hydroxide content. At this end of the scale the color and rated pH for the indicator correspond, therefore, more closely to the concentrated than to the dilute salt solutions.
13 Chemical Director, W. A. 'I'aylor & Co., Inc. Pri vate communication.

Thompson) Measuring pH in Oyanide Plating Baths 433
V. APPLICATION OF THE RESULTS TO THE pH MEASUREMENT OF CYANIDE COPPER PLATING BATHS
A few solutions were prepared to represent cyanide copper plating baths, for testing the applicability of the proposed methods. Copper baths were selected because they are used extensively and are occasionally kept under pH control. Two types, a regular cyanide and a Rochelle salt bath, were prepared from chemicals of known purity.
+1.0
+0.1
+0.8
+0.7
+0.8
II: +0.5 o II: II: III +0.4
z .. +0.5
+0.2
+0.1
o
-0. 1
-0.2
T , H
L
11.0
~ ~
i""'-~ t- ..... , -~
1\ ~ , ~ \ ~ [\ ~ \ \
1\ \ ,
1\ \
12.0 15.0 OItSERVEO pH
FIGURE 5.- Generalized sodium salt error of indicators for chloride solutions of 1 N Na or greater: Hellige (ll); LaMotte (L); Taylor (T).
A portion of each was also adjusted to a higher pH value by adding sodium hydroxide. These portions furnished for measurement four solutions which had the compositions given in table 2.

-- - --- - - - - -----------~----
434 Journal oj Research oj the National Bureau oj Standards [Vot. S4
TABLE 2.-Composition of copper baths
Concentration Designation Compounds
N gfliter oz/gal ------1-----------_·_---------------lcopper cyanide, CuCN ----- ---------- ---- ------------Total sodium cyanide, NaCN ________________________ _ A ________________ (Free sodium cyanide), NaCN _______ ____ ___ __ ___ ____ _
Sodium carbonate, Na'CO' _____________ ______ _____ ___ _ Total sodium content, Na ___ _____ ____________________ _
B {SOlution 4 plus sodium bydroxide, NaOH _______ ____ _ ---------------- Total sodIUm content, Na _________ _____ ______ _______ _ _
lcopper cyanide, CuCN -- ---- --- ----------------------Total sodium cyanide, NaCN __ ____ ____________ ______ _ (Free sodium cyauide), NaCN _____ __ ___ _____ ________ _
C_ ___ ____________ Rochelle salt, NaKC,H,Oo.1H,O ______ ____ ___ ________ _ Sodium carbonate, Na'CO. _______________________ ____ _ Total sodium content, Na __ __________ ________________ _ Total potassium content, K _______ ___ ________________ _
{Solution C plus sodium bydroxide, NaOH ___ _____ ___ _
D ________________ Total sodium content, Na _____ ____ ___________________ _ Total potassium content, K ____ __ ____________________ _
0.25 .65 .15 .30 .95
.10 1. 05
0.34 .77 . 09 .32 . 57
1.50 0.16
.10 1.60 0.16
23 3 34 4.5 7.5 1
15 2
4 0.5
30 4 38 5 4.5 0.6
45 6 30 4
4 0.5
The pH of each of these cyanide copper solutions was measured with the same glass electrode used in obtaining the data for figure 1, and a correction was applied from this figure whenever possible. Similarly, the pH was measured with each indicator set and a correction applied from figure 5. The results are summarized in table 3.
TABLE 3.-pH measurements on cyanide copper baths
Bath Electrometric Colorimetric pH pH (By glass
electrode) SetH Set L Set T Designa- Composition tion Oh- Cor- Ob- Cor- Ob- Cor- Ob· Cor-
served rected served rected served rected served rected ---------------
A _________ Regular; 0.95 NNa ______ 10.8 11. 4 12. 4 11.7 11. 9 11.4 11. 9 11. 3 B _________ A+NaOH; 1.05 NNa ___ 11.3 12.7 12.8 12.6 12. 9 12. 6 12.7 12. 7 C _________ Rochelle salt; 1.50 NNa 10.9 11.9 12.6 11.9 12.0 11.5 12.0 n.5 D _______ __ C+NaOH; 1.60 NNa ___ n.6 -- ------ 12.8 12.6 13.0 12. 8 12.8 13. 0
Acknowledgment is made to W. A. Olson, A. Brenner, P. W. C. Strausser, and others who assisted in making the colorimetric readings; and to the following firms for their cooperation in lending extensive colorimetric equipment for use in this study: Hellige, Inc., Long Island City, N. Y.; LaMotte Chemical Products Co., Towson, Baltimore, Md.; W. A. Taylor & Co., Inc., Baltimore, Md.
WASHINGTON, January 13, 1940.
Related Documents