pg proctab Accessing System Stats in PostgreSQL Mark Wong [email protected] PostgreSQL Conference East 2010 March 25-28, 2010

pg_proctab: Accessing System Stats in PostgreSQL
May 19, 2015
Mark Wong
pg_proctab is a collection of PostgreSQL stored functions that provide access to the operating system process table using SQL. We'll show you which functions are available and where they collect the data, and give examples of their use to collect processor and I/O statistics on SQL queries.
pg_proctab is a collection of PostgreSQL stored functions that provide access to the operating system process table using SQL. We'll show you which functions are available and where they collect the data, and give examples of their use to collect processor and I/O statistics on SQL queries.
Welcome message from author
This document is posted to help you gain knowledge. Please leave a comment to let me know what you think about it! Share it to your friends and learn new things together.
Transcript
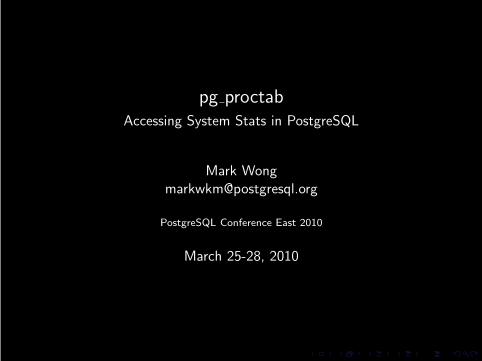
pg proctabAccessing System Stats in PostgreSQL
Mark [email protected]
PostgreSQL Conference East 2010
March 25-28, 2010


Agenda
◮ Brief review of what PostgreSQL stats are available
◮ How pg proctab may help

Review
Some of the PostgreSQL system catalog tables:
◮ pg stat activity
◮ pg stat database
◮ pg stat all tables
◮ pg stat all indexes
◮ pg statio all tables
◮ pg statio all indexes

Example: pg stat activity
SELECT datname, procpid, usename, current_query
FROM pg_stat_activity
WHERE current_query <> ’<IDLE>’;
datname dbt5
procpid 3260
usename postgres
current_query SELECT * FROM TradeLookupFrame3(
’2006-2-27 9:15:0’,43000050000,20,
’2005-11-23 12:6:8’,’ENGAPRB’)
...

Example: pg stat database
SELECT datname, numbackends, xact_commit, xact_rollback
FROM pg_stat_database
ORDER BY datname;
datname dbt5
numbackends 11
xact_commit 228458
xact_rollback 320
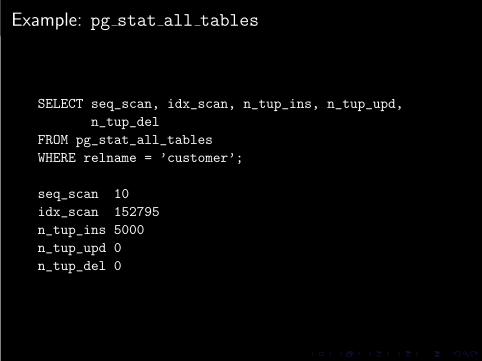
Example: pg stat all tables
SELECT seq_scan, idx_scan, n_tup_ins, n_tup_upd,
n_tup_del
FROM pg_stat_all_tables
WHERE relname = ’customer’;
seq_scan 10
idx_scan 152795
n_tup_ins 5000
n_tup_upd 0
n_tup_del 0
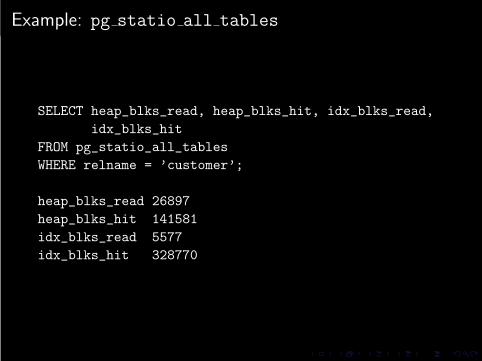
Example: pg statio all tables
SELECT heap_blks_read, heap_blks_hit, idx_blks_read,
idx_blks_hit
FROM pg_statio_all_tables
WHERE relname = ’customer’;
heap_blks_read 26897
heap_blks_hit 141581
idx_blks_read 5577
idx_blks_hit 328770
__ __
/ \~~~/ \ . o O ( Want more! )
,----( oo )
/ \__ __/
/| (\ |(
^ \ /___\ /\ |
|__| |__|-"
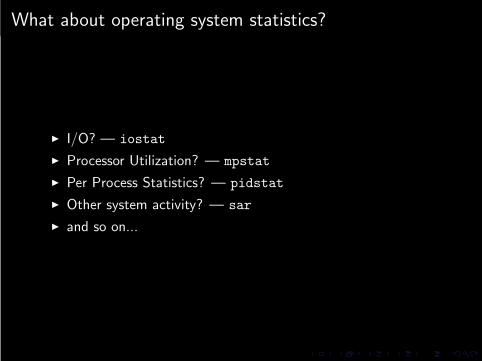
What about operating system statistics?
◮ I/O? — iostat
◮ Processor Utilization? — mpstat
◮ Per Process Statistics? — pidstat
◮ Other system activity? — sar
◮ and so on...

Introducing pg proctab
pg proctab is a collection of four C stored functions:
◮ pg cputime
◮ pg loadavg
◮ pg memusage
◮ pg proctab

__ __
/ \~~~/ \ . o O ( Examples? )
,----( oo )
/ \__ __/
/| (\ |(
^ \ /___\ /\ |
|__| |__|-"

Some of the things pg proctab should help with
◮ Query operating system process table
◮ Query operating system statistics◮ Processor time◮ Load averages◮ Memory usage
◮ Without escaping out to a shell!
◮ ...plus generate reports about timeslices
Note: Following examples are from Linux based systems.

pg cputime() Example
SELECT *
FROM pg_cputime();
user 31529387
nice 76
system 6865679
idle 574707718
iowait 1985455

pg cputime() Column Description
From Linux kernel source code atDocumentation/filesystems/proc.txt:user: normal processes executing in user modenice: niced processes executing in user modesystem: processes executing in kernel modeidle: processes twiddling thumbsiowait: waiting for I/O to complete

pg loadavg() Example
SELECT *
FROM pg_loadavg();
load1 7.71
load5 7.73
load15 7.62
last_pid 4623

pg loadavg() Column Description
load1: load average of last minuteload5: load average of last 5 minutesload15: load average of last 15 minuteslast pid: last pid running
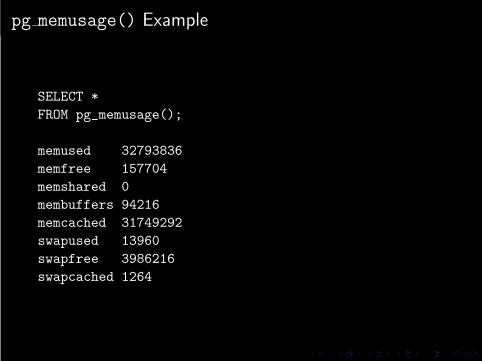
pg memusage() Example
SELECT *
FROM pg_memusage();
memused 32793836
memfree 157704
memshared 0
membuffers 94216
memcached 31749292
swapused 13960
swapfree 3986216
swapcached 1264

pg memusage() Column Description
Paraphrased from Linux kernel source code atDocumentation/filesystems/proc.txt:memused: Total physical RAM usedmemfree: Total physical RAM not usedmemshared: Not used, always 0. (For Solaris.)membuffers: Temporary storage for raw disk blocksmemcached: In-memory cache for files read from diskswapused: Total swap space usedswapfree: Memory evicted from RAM that is now temporary ondiskswapcached: Memory that was swapped out, now swapped in butstill in swap
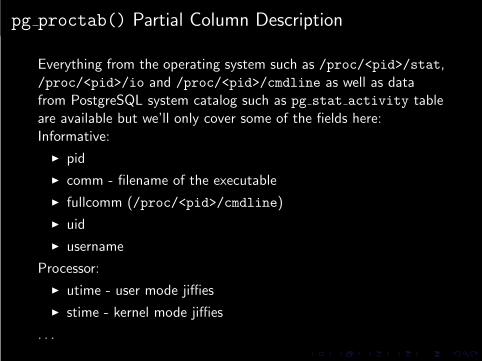
pg proctab() Partial Column Description
Everything from the operating system such as /proc/<pid>/stat,/proc/<pid>/io and /proc/<pid>/cmdline as well as datafrom PostgreSQL system catalog such as pg stat activity tableare available but we’ll only cover some of the fields here:Informative:
◮ pid
◮ comm - filename of the executable
◮ fullcomm (/proc/<pid>/cmdline)
◮ uid
◮ username
Processor:
◮ utime - user mode jiffies
◮ stime - kernel mode jiffies
. . .

pg proctab() Partial Column Description (cont.)
Memory:
◮ vsize - virtual memory size
◮ rss - resident set memory size
I/O:
◮ syscr - number of read I/O operations
◮ syscw - number of write I/O operations
◮ reads - number of bytes which this process really did cause tobe fetched from the storage layer
◮ writes - number of bytes which this process really did cause tobe sent from the storage layer
◮ cwrites - number of bytes which this process caused to nothappen, by truncating pagecache
__ __
/ \~~~/ \ . o O ( More useful examples? )
,----( oo )
/ \__ __/
/| (\ |(
^ \ /___\ /\ |
|__| |__|-"
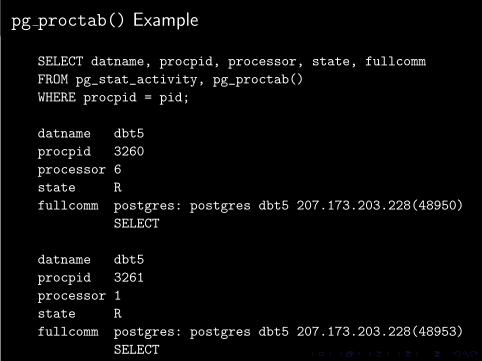
pg proctab() Example
SELECT datname, procpid, processor, state, fullcomm
FROM pg_stat_activity, pg_proctab()
WHERE procpid = pid;
datname dbt5
procpid 3260
processor 6
state R
fullcomm postgres: postgres dbt5 207.173.203.228(48950)
SELECT
datname dbt5
procpid 3261
processor 1
state R
fullcomm postgres: postgres dbt5 207.173.203.228(48953)
SELECT
__ __ / \
/ \~~~/ \ . o O | Measuring performance |
,----( oo ) | of a query. |
/ \__ __/ \ /
/| (\ |(
^ \ /___\ /\ |
|__| |__|-"
You can find the following helper scripts in the pg proctab
contrib directory.

Create snapshot tables
Create a set of tables to hold all of the information returned bythese 4 stored functions. Also creates a table to timestamp when asnapshot of data is taken.
psql -f create-ps_procstat-tables.sql
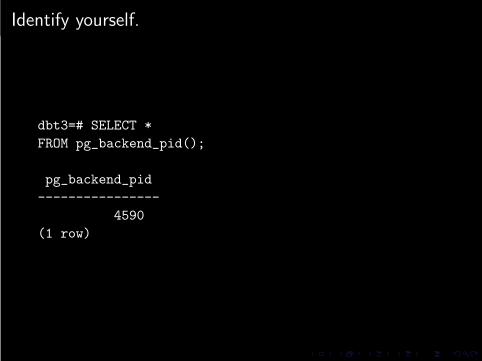
Identify yourself.
dbt3=# SELECT *
FROM pg_backend_pid();
pg_backend_pid
----------------
4590
(1 row)

Take a snapshot before running the query
dbt3=# \i ps_procstat-snap.sql
BEGIN
ps_snap_stats
---------------
1
(1 row)
COMMIT
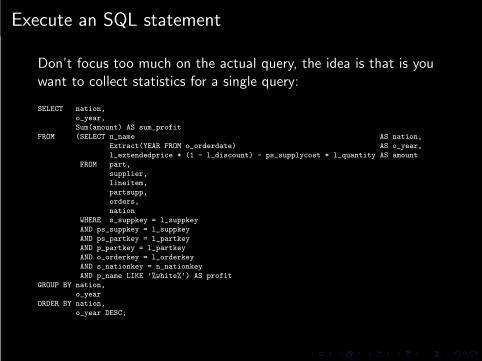
Execute an SQL statement
Don’t focus too much on the actual query, the idea is that is youwant to collect statistics for a single query:
SELECT nation,
o_year,
Sum(amount) AS sum_profit
FROM (SELECT n_name AS nation,
Extract(YEAR FROM o_orderdate) AS o_year,
l_extendedprice * (1 - l_discount) - ps_supplycost * l_quantity AS amount
FROM part,
supplier,
lineitem,
partsupp,
orders,
nation
WHERE s_suppkey = l_suppkey
AND ps_suppkey = l_suppkey
AND ps_partkey = l_partkey
AND p_partkey = l_partkey
AND o_orderkey = l_orderkey
AND s_nationkey = n_nationkey
AND p_name LIKE ’%white%’) AS profit
GROUP BY nation,
o_year
ORDER BY nation,
o_year DESC;

Take a snapshot after running the query
dbt3=# \i ps_procstat-snap.sql
BEGIN
ps_snap_stats
---------------
2
(1 row)
COMMIT

Calculate Processor Utilization
$ ./ps-processor-utilization.sh [pid] [before] [after]
$ ./ps-processor-utilization.sh 4590 1 2
Processor Utilization = 1.00 %
What the script does (partially) should be the same as top:
SELECT stime, utime, stime + utime AS total,
extract(epoch FROM time)
FROM ps_snaps a, ps_procstat b
WHERE pid = ${PID}
AND a.snap = b.snap
AND a.snap = ${SNAP1}

Calculate Disk Utilization
$ ./ps-io-utilization.sh 4590 1 2
Reads = 276981
Writes = 63803
Reads (Bytes) = 2164604928
Writes (Bytes) = 508166144
Cancelled (Bytes) = 36880384
SELECT syscr, syscw, reads, writes, cwrites
FROM ps_snaps a, ps_procstat b
WHERE pid = ${PID}
AND a.snap = b.snap
AND a.snap = ${SNAP1}

__ __ / \
/ \~~~/ \ . o O | Creating Custom |
,----( oo ) | Reports! |
/ \__ __/ \ /
/| (\ |(
^ \ /___\ /\ |
|__| |__|-"
ps-report-pl
__ __ / \
/ \~~~/ \ . o O | Warning! Too much data |
,----( oo ) | to fit on screen! |
/ \__ __/ \ /
/| (\ |(
^ \ /___\ /\ |
|__| |__|-"

Creating Reports: Section 1
Database : dbt5
Snapshot Start : 2010-03-26 15:24:51.516226-07
Snapshot End : 2010-03-26 15:25:51.57661-07
-------------------
Database Statistics
-------------------
Commits : 421
Rollbacks : 2
Blocks Read : 13919368
Blocks Hit : 7876506

Creating Reports: Section 2
================
Table Statistics
================
------------------------------------------ -------- ------------ -------- ------------- --------- ---------
Schema.Relation Seq Scan Seq Tup Read Idx Scan Idx Tup Fetch N Tup Ins N Tup Upd
------------------------------------------ -------- ------------ -------- ------------- --------- ---------
. . .
public.account_permission 0 0 3 3 0
public.address 0 0 488 732 0
public.broker 169 8067 259 259 0 39
public.cash_transaction 0 0 952 928 37 77
public.charge 39 585 0 0 0
public.commission_rate 60 9820 18 44 0
public.company 2 5000 1496 1496 0
public.company_competitor 0 0 61 183 0
public.customer 0 0 375 375 0
public.customer_account 0 0 690 968 0 37
public.customer_taxrate 20 200000 40 40 0
public.daily_market 0 0 4322 4962 0
. . .

Creating Reports: Section 2 - Falling off the right side...
◮ N Tup Upd
◮ N Tup Del
◮ Last Vacuum
◮ Last Autovacuum
◮ Last Analyze
◮ Last Autoanalyze
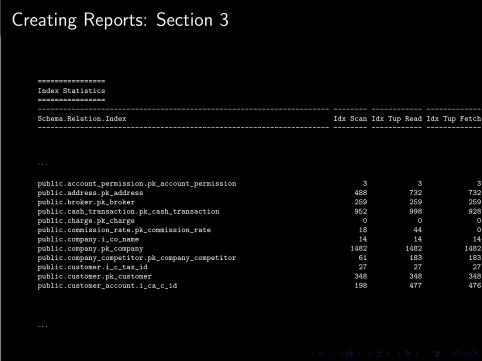
Creating Reports: Section 3
================
Index Statistics
================
--------------------------------------------------------------------- -------- ------------ -------------
Schema.Relation.Index Idx Scan Idx Tup Read Idx Tup Fetch
--------------------------------------------------------------------- -------- ------------ -------------
. . .
public.account_permission.pk_account_permission 3 3 3
public.address.pk_address 488 732 732
public.broker.pk_broker 259 259 259
public.cash_transaction.pk_cash_transaction 952 998 928
public.charge.pk_charge 0 0 0
public.commission_rate.pk_commission_rate 18 44 0
public.company.i_co_name 14 14 14
public.company.pk_company 1482 1482 1482
public.company_competitor.pk_company_competitor 61 183 183
public.customer.i_c_tax_id 27 27 27
public.customer.pk_customer 348 348 348
public.customer_account.i_ca_c_id 198 477 476
. . .

What else can we do with pg proctab?
Enable pg top to monitor remote databases by providing access tothe database system’s operating system process table.
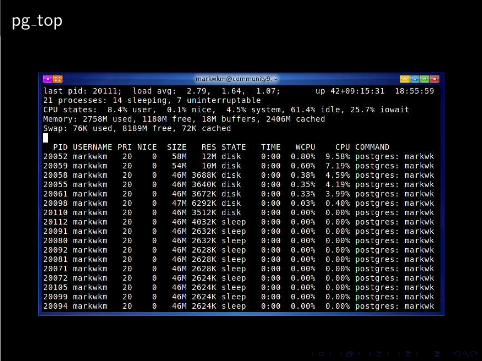
pg top

__ __
/ \~~~/ \ . o O ( Thank you! )
,----( oo )
/ \__ __/
/| (\ |(
^ \ /___\ /\ |
|__| |__|-"
. . . the fine print . . .
Links:
◮ http://git.postgresql.org/gitweb?p=pg_proctab.git
◮ git clone
git://git.postgresql.org/git/pg proctab.git

Acknowledgements
Haley Jane Wakenshaw
__ __
/ \~~~/ \
,----( oo )
/ \__ __/
/| (\ |(
^ \ /___\ /\ |
|__| |__|-"
License
This work is licensed under a Creative Commons Attribution 3.0Unported License. To view a copy of this license, (a) visithttp://creativecommons.org/licenses/by/3.0/us/; or, (b)send a letter to Creative Commons, 171 2nd Street, Suite 300, SanFrancisco, California, 94105, USA.
Related Documents