LT E X and Friends Data Plots Marc van Dongen The Purpose of Data Plots Pie Charts Introduction to pgfplots Bar Graphs Paired Bar Graphs Component Bar Graphs Coordinate Systems Line Graphs Scatter Plots References Acronyms & Abbreviations About this Document L T E X and Friends Data Plots http://csweb.ucc.ie/~dongen/LAF/LAF.html M. R. C. van Dongen

Welcome message from author
This document is posted to help you gain knowledge. Please leave a comment to let me know what you think about it! Share it to your friends and learn new things together.
Transcript

LaTEX and FriendsData Plots
Marc van Dongen
The Purpose of Data Plots
Pie Charts
Introduction to pgfplots
Bar Graphs
Paired Bar Graphs
Component Bar Graphs
Coordinate Systems
Line Graphs
Scatter Plots
References
Acronyms &Abbreviations
About this Document
LaTEX and FriendsData Plots
http://csweb.ucc.ie/~dongen/LAF/LAF.html
M. R. C. van Dongen
ucc

LaTEX and FriendsData Plots
Marc van Dongen
The Purpose of Data Plots
Pie Charts
Introduction to pgfplots
Bar Graphs
Paired Bar Graphs
Component Bar Graphs
Coordinate Systems
Line Graphs
Scatter Plots
References
Acronyms &Abbreviations
About this Document
The Purpose of Data Plots
global trends Show data has “trend.”differences Show differences between functions/trends.
rate of change Show rate of change within single function.

LaTEX and FriendsData Plots
Marc van Dongen
The Purpose of Data Plots
Pie Charts
Introduction to pgfplots
Bar Graphs
Paired Bar Graphs
Component Bar Graphs
Coordinate Systems
Line Graphs
Scatter Plots
References
Acronyms &Abbreviations
About this Document
Pie Charts
1%
1%
3%
5%
10%
15%
16%
24%
25%
Other incomeIncome of trust and designated funds
Publications and journals
Professional and clinical affairsDonations and legacies
Fellowship and membership subscriptions
Building appeal
Accommodation and conference facilities
Education and training

LaTEX and FriendsData Plots
Marc van Dongen
The Purpose of Data Plots
Pie Charts
Introduction to pgfplots
Bar Graphs
Paired Bar Graphs
Component Bar Graphs
Coordinate Systems
Line Graphs
Scatter Plots
References
Acronyms &Abbreviations
About this Document
Pie Charts: Why Not Use a Table?
1%
1%
3%
5%
10%
15%
16%
24%
25%
Other incomeIncome of trust and designated funds
Publications and journals
Professional and clinical affairsDonations and legacies
Fellowship and membership subscriptions
Building appeal
Accommodation and conference facilities
Education and training

LaTEX and FriendsData Plots
Marc van Dongen
The Purpose of Data Plots
Pie Charts
Introduction to pgfplots
Bar Graphs
Paired Bar Graphs
Component Bar Graphs
Coordinate Systems
Line Graphs
Scatter Plots
References
Acronyms &Abbreviations
About this Document
The axis Environment
LaTEX Input
\begin{tikzpicture}\begin{axis}[width=8cm,height=6cm,tick align=outside]
\addplot[draw=blue]coordinates {(0,1) (1,1) (2,3) (3,2) (4,2)};
\addlegendentry{Line 1}\addplot[draw=red]
coordinates {(0,0) (1,4) (2,4) (3,3) (4,3)};\addlegendentry{Line 2}
\end{axis}\end{tikzpicture}

LaTEX and FriendsData Plots
Marc van Dongen
The Purpose of Data Plots
Pie Charts
Introduction to pgfplots
Bar Graphs
Paired Bar Graphs
Component Bar Graphs
Coordinate Systems
Line Graphs
Scatter Plots
References
Acronyms &Abbreviations
About this Document
Output
LaTEX Output
0 1 2 3 4
0
2
4
Line 1Line 2

LaTEX and FriendsData Plots
Marc van Dongen
The Purpose of Data Plots
Pie Charts
Introduction to pgfplots
Bar Graphs
Paired Bar Graphs
Component Bar Graphs
Coordinate Systems
Line Graphs
Scatter Plots
References
Acronyms &Abbreviations
About this Document
Creating Graphs
pgfplots lets you draw graphs in various formats.Implemented on top of tikz.Resulting graphs have a consistent, professional look and feel.Package also lets you import data from matlab.The manual is impressive [Feuersänger 2010].

LaTEX and FriendsData Plots
Marc van Dongen
The Purpose of Data Plots
Pie Charts
Introduction to pgfplots
Bar Graphs
Paired Bar Graphs
Component Bar Graphs
Coordinate Systems
Line Graphs
Scatter Plots
References
Acronyms &Abbreviations
About this Document
The \pgfplotsset Command
LaTEX Input
\pgfplotsset{width=6cm,height=4cm,compat=newest,enlargelimits=0.18}

LaTEX and FriendsData Plots
Marc van Dongen
The Purpose of Data Plots
Pie Charts
Introduction to pgfplots
Bar Graphs
Paired Bar Graphs
Component Bar Graphs
Coordinate Systems
Line Graphs
Scatter Plots
References
Acronyms &Abbreviations
About this Document
Bar Graphs
0 5 10 15 20 25 30 35
KerryLaois
LondonWaterford
ClareOffaly
GalwayWexford
DublinLimerick
TipperaryCork
Kilkenny
111
23
44
66
726
3033
Number of All-Ireland Titles Won

LaTEX and FriendsData Plots
Marc van Dongen
The Purpose of Data Plots
Pie Charts
Introduction to pgfplots
Bar Graphs
Paired Bar Graphs
Component Bar Graphs
Coordinate Systems
Line Graphs
Scatter Plots
References
Acronyms &Abbreviations
About this Document
Creating Bar Graphs
LaTEX Input
\begin{axis}[xbar,width=11cm,height=8cm,bar width=10pt,enlargelimits=0.13,nodes near coords,nodes near coords align=horizontal,point meta=x * 1, % The displayed number.xlabel=\textbf{Frequency of Winning the Final},tick align=outside,xtick={0,5,...,35}, ytick={1,...,13},yticklabels={Kerry,Laois,London,Waterford,Clare,Offaly,Galway
Wexford,Dublin,Limerick,Tipperary,Cork,Kilkenny}]\addplot[draw=blue, fill=blue!15] coordinates
{(1,1) (1,2) (1,3) (2,4) (3,5) (4,6) (4,7)(6,8) (6,9) (7,10) (26,11) (30,12) (33,13)};
\end{axis}

LaTEX and FriendsData Plots
Marc van Dongen
The Purpose of Data Plots
Pie Charts
Introduction to pgfplots
Bar Graphs
Paired Bar Graphs
Component Bar Graphs
Coordinate Systems
Line Graphs
Scatter Plots
References
Acronyms &Abbreviations
About this Document
Paired Bar Graphs
0 50 100 150 200
satisfiable
unsatisfiable
low density
high density
random
Execution Time
MACFC

LaTEX and FriendsData Plots
Marc van Dongen
The Purpose of Data Plots
Pie Charts
Introduction to pgfplots
Bar Graphs
Paired Bar Graphs
Component Bar Graphs
Coordinate Systems
Line Graphs
Scatter Plots
References
Acronyms &Abbreviations
About this Document
Creating Paired Bar Graphs
LaTEX Input
\begin{axis}[xbar,enlargelimits=0.14,width=8cm,height=6cm,,bar width=10pt,area legend,legend pos=south east,legend style={legend pos=north east,
cells={anchor=west}},tick align=outside,xlabel=\textbf{Execution Time},ytick={1,...,5},yticklabels={satisfiable,unsatisfiable,
low density,high density,random}]\addplot[draw=blue,fill=blue!15]
coordinates {(5,1) (10,2) (25,3) (40,4) (80,5)};\addlegendentry{\textsc{MAC}}\addplot[draw=blue,fill=blue!50]
coordinates {(5,1) (15,2) (15,3) (50,4) (200,5)};\addlegendentry{\textsc{FC}}\end{axis}

LaTEX and FriendsData Plots
Marc van Dongen
The Purpose of Data Plots
Pie Charts
Introduction to pgfplots
Bar Graphs
Paired Bar Graphs
Component Bar Graphs
Coordinate Systems
Line Graphs
Scatter Plots
References
Acronyms &Abbreviations
About this Document
Component Bar Graphs
1 2 3 4 5 6 7
Russia
Netherlands
France
South Korea
Japan
Medals Won
GoldSilverBronze

LaTEX and FriendsData Plots
Marc van Dongen
The Purpose of Data Plots
Pie Charts
Introduction to pgfplots
Bar Graphs
Paired Bar Graphs
Component Bar Graphs
Coordinate Systems
Line Graphs
Scatter Plots
References
Acronyms &Abbreviations
About this Document
Creating Component Bar Graphs
LaTEX Input
\begin{axis}[xbar stacked, stack plots=x, tick align=outside,width=8cm, height=6cm, bar width=10pt,legend style={cells={anchor=west}}, area legend,xlabel=\textbf{Medals Won}, ytick={1,...,5},yticklabels={Russia,Netherlands,France,
South Korea,Japan}]\addplot[draw=black,yellow!50!brown]
coordinates {(1,1) (1,2) (2,3) (2,4) (3,5)};\addlegendentry{Gold}\addplot[draw=black,white!60!gray]
coordinates {(1,1) (2,2) (0,3) (0,4) (1,5)};\addlegendentry{Silver}\addplot[draw=black,orange!70!gray]
coordinates {(1,1) (0,2) (1,3) (3,4) (3,5)};\addlegendentry{Bronze}\end{axis}
LaTEX and FriendsData Plots
Marc van Dongen
The Purpose of Data Plots
Pie Charts
Introduction to pgfplots
Bar Graphs
Paired Bar Graphs
Component Bar Graphs
Coordinate Systems
Line Graphs
Scatter Plots
References
Acronyms &Abbreviations
About this Document
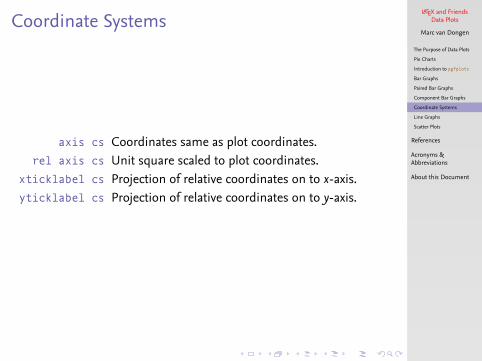
Coordinate Systems
axis cs Coordinates same as plot coordinates.rel axis cs Unit square scaled to plot coordinates.
xticklabel cs Projection of relative coordinates on to x-axis.yticklabel cs Projection of relative coordinates on to y-axis.

LaTEX and FriendsData Plots
Marc van Dongen
The Purpose of Data Plots
Pie Charts
Introduction to pgfplots
Bar Graphs
Paired Bar Graphs
Component Bar Graphs
Coordinate Systems
Line Graphs
Scatter Plots
References
Acronyms &Abbreviations
About this Document
Line Graphs
Jan Feb Mar Apr May Jun Jul Aug Sep Oct Nov Dec
0
50
100
150
200
250 Very Wet
Very Dry
Month
Rainfall
BelmulletBirrCork AirportDublin AirportShannon Airport

LaTEX and FriendsData Plots
Marc van Dongen
The Purpose of Data Plots
Pie Charts
Introduction to pgfplots
Bar Graphs
Paired Bar Graphs
Component Bar Graphs
Coordinate Systems
Line Graphs
Scatter Plots
References
Acronyms &Abbreviations
About this Document
Creating Line GraphsLaTEX Input
\begin{axis}[width=\textwidth,enlargelimits=0.18,tick align=outside,legend style={cells={anchor=west},legend pos=north east},xticklabels={Jan,Feb,Mar,Apr,May,Jun,Jul,Aug,Sep,Oct,Nov,Dec},xtick={1,2,3,4,5,6,7,8,9,10,11,12},xlabel=\textbf{Month}, ylabel=\textbf{Rainfall}]
\node[coordinate,pin=above:{Very Wet}] at (axis cs:1,223.9) {};\node[coordinate,pin=right:{Very Dry}] at (axis cs:2,14.7) {};\addplot+[sharp plot] coordinates
{(1,171.5) (2,116.4) (3,157.4) (4,67.7) (5,40.2) (6,127.6)(7,44.3) (8,192.1) (9,112.4) (10,177.5) (11,136.2) (12,94.8)};
\addlegendentry{Belmullet}\addplot+[sharp plot] coordinates
{(1,135.5) (2,30.8) (3,97.3) (4,28.6) (5,19.2) (6,90.2(7,100.6) (8,171.6) (9,81.8) (10,121.0) (11,77.0) (12,63.7)};
\addlegendentry{Birr}\addplot+[sharp plot] coordinates
{(1,195.1) (2,49.8) (3,113.5) (4,53.7) (5,75.6) (6,138.5(7,148.1) (8,163.6) (9,123.8) (10,139.2) (11,79.4) (12,60.2)};
\addlegendentry{Cork Airport}\addplot+[sharp plot] coordinates
{(1,96.9) (2,14.7) (3,102.4) (4,27.0) (5,32.7) (6,76.4(7,111.5) (8,192.4) (9,111.8) (10,97.4) (11,39.6) (12,39.5)};
\addlegendentry{Dublin Airport}\addplot+[sharp plot] coordinates
{(1,223.9) (2,58.0) (3,102.9) (4,49.2) (5,35.9) (6,110.8(7,100.8) (8,176.6) (9,86.4) (10,156.4) (11,92.2) (12,75.1)};
\addlegendentry{Shannon Airport}\end{axis}

LaTEX and FriendsData Plots
Marc van Dongen
The Purpose of Data Plots
Pie Charts
Introduction to pgfplots
Bar Graphs
Paired Bar Graphs
Component Bar Graphs
Coordinate Systems
Line Graphs
Scatter Plots
References
Acronyms &Abbreviations
About this Document
Scatter Plots
0 20 40 60 80 100
0
20
40
60
80
100
Algorithm 1
Algorithm
2

LaTEX and FriendsData Plots
Marc van Dongen
The Purpose of Data Plots
Pie Charts
Introduction to pgfplots
Bar Graphs
Paired Bar Graphs
Component Bar Graphs
Coordinate Systems
Line Graphs
Scatter Plots
References
Acronyms &Abbreviations
About this Document
Creating Scatter Plots
LaTEX Input
\begin{axis}[width=\textwidth, tick align=outside,xlabel=\textbf{Algorithm˜1},ylabel=\textbf{Algorithm˜2}]
\addplot{scatter,only marks,mark=o,draw=blue,scatter src=explicit}
file {data.dat};\draw[dashed,red!40]
(rel axis cs:0,0) -- (rel axis cs:1,1);\end{axis}

LaTEX and FriendsData Plots
Marc van Dongen
The Purpose of Data Plots
Pie Charts
Introduction to pgfplots
Bar Graphs
Paired Bar Graphs
Component Bar Graphs
Coordinate Systems
Line Graphs
Scatter Plots
References
Acronyms &Abbreviations
About this Document
Input
42.03947249608177 84.6482146367299935.46530214577332 8.47573135115004447.62850850655307 20.98953535065606249.440357534112174 45.7624016319447255.26331078124413 62.69333854422606643.70125549717245 1.802572561213567253.27409074259773 7.94484930247169282.63910390525706 40.2921547493130165.73269537881723 16.09550664238107569.86468729668312 29.08789038430851…

LaTEX and FriendsData Plots
Marc van Dongen
References
Acronyms &Abbreviations
About this Document
Bibliography
Feuersänger, Christian [5th Aug. 2010]. Manual for Packagepgfplots. Version 1.4.1.

LaTEX and FriendsData Plots
Marc van Dongen
References
Acronyms &Abbreviations
About this Document
Acronyms and Abbreviations
ams American Mathematical Societyapi Application Programming Interfaceapl A Programming Language
ctan Comprehensive TEX Archive Networkcd Compact Diskfaq Frequently Asked Questiongui Graphical User Interfaceide Integrated Development Environment
isbn International Standard Book Numberos Operating Systemsi Système International d’Unités/International System of Units
tug TEX Users Groupurl Uniform Resource Locator
wysiwyg What You See Is What You Get

LaTEX and FriendsData Plots
Marc van Dongen
References
Acronyms &Abbreviations
About this Document
About this Document
This document was created with pdflatex.The LaTEX document class is beamer.
Related Documents


