Name: ______________________ Date: _________________ Pg. 1 Chapter 7 Test Review Multiple Choice Identify the choice that best completes the statement or answers the question. Scenario 7-1 A CBS News/New York Times opinion poll asked 1,190 adults whether they would prefer balancing the Federal budget over cutting taxes; 59% of those asked said "Yes." Suppose that in fact 62% of all adults favor balancing the budget over cutting taxes. 1. Use Scenario 7-1. The number 62% a. is evidence of bias. b. must be an error, since the actual percentage is 59%. c. is a sampling distribution. d. is a statistic. e. is a parameter. 2. Use Scenario 7-1. If you take a large number of SRSs of size 1,190, the sample proportions who favor balancing the budget will vary. Some will be lower than 62% and some will be higher, but the average sample result will be very close to 62%. This fact is called a. low bias. b. small margin of error. c. high variability. d. large bias. e. low variability. 3. The variability of a statistic is described by a. the spread of its sampling distribution. b. the amount of bias present. c. the vagueness in the wording of the question used to collect the sample data. d. probability calculations. e. the stability of the population it describes.

Welcome message from author
This document is posted to help you gain knowledge. Please leave a comment to let me know what you think about it! Share it to your friends and learn new things together.
Transcript
Name: ______________________ Date: _________________
Pg. 1
Chapter 7 Test Review
Multiple ChoiceIdentify the choice that best completes the statement or answers the question.
Scenario 7-1
A CBS News/New York Times opinion poll asked 1,190 adults whether they would prefer balancing the Federal budget over cutting taxes; 59% of those asked said "Yes." Suppose that in fact 62% of all adults favor balancing the budget over cutting taxes.
1. Use Scenario 7-1. The number 62%a. is evidence of bias.b. must be an error, since the actual percentage is 59%.c. is a sampling distribution.d. is a statistic.e. is a parameter.
2. Use Scenario 7-1. If you take a large number of SRSs of size 1,190, the sample proportions who favor balancing the budget will vary. Some will be lower than 62% and some will be higher, but the average sample result will be very close to 62%. This fact is calleda. low bias.b. small margin of error.c. high variability.d. large bias.e. low variability.
3. The variability of a statistic is described bya. the spread of its sampling distribution.b. the amount of bias present.c. the vagueness in the wording of the question used to collect the sample data.d. probability calculations.e. the stability of the population it describes.

Pg. 2
Scenario 7-2
Below are dot plots of the values taken by three different statistics estimating the same parameter in 30 samples from the same population. The true value of the population parameter is marked with an arrow.
4. Use Scenario 7-2. The statistic that has the largest bias among these three isa. statistic A.b. statistic B.c. statistic C.d. A and B have similar bias, and it is larger than the bias of C.e. B and C have similar bias, and it is larger than the bias of A.
5. Use Scenario 7-2. The statistic that has the lowest variability among these three isa. statistic A.b. statistic B.c. statistic C.d. A and B have similar variability, and it is less than the variability of C.e. B and C have similar variability, and it is less than the variability of A.
6. Use Scenario 7-2. Based on the performance of the three statistics in many samples, which is preferred as an estimate of the parameter?a. statistic A.b. statistic B.c. statistic C.d. either A or B would be equally good.e. either B or C would be equally good.
7. A shocking fact: 66% of all teenagers have a TV set in their room. If an opinion poll chooses an SRS of 1000 teens and asks if they have a TV set in their room, the percent who say "Yes" will vary if the sampling procedure is repeated. But the distribution of the percent who say “Yes” in all the samples is centered at the truth about the population (66%). We call this desirable characteristic of sample proportionsa. absence of bias.b. low variability.c. symmetry.d. sample repeatability.e. statistical significance.
Pg. 3
8. To reduce the variability of estimates from a simple random sample, you shoulda. use a smaller sample.b. increase the bias.c. use a count, not a percent.d. use a larger sample.e. use a percent, not a count.
Scenario 7-3
A 2010 study of 240 randomly-selected residents of a subtropical resort city with 82,000 residents found that 5.4% of them had been exposed to the mosquito-borne virus that causes Dengue fever. Suppose the actual percentage of people in the city who have been exposed to the virus is 3%. Let = the proportion of residents who have been exposed in a random sample of 240,
9. Use Scenario 7-3. The mean of isa. 0.03.b. 0.054.c. 7.2.d. 13.e. 240.
10. Use Scenario 7-3. The standard deviation of is approximatelya. 0.000121.b. 0.00187.c. 0.0110.d. 2.643.e. 2.683.
11. Use Scenario 7-3. Which of the following conditions had to be met in order for us to use the formula for the standard deviation of a.b.
c.d.e. The population distribution is approximately Normal.
12. Use Scenario 7-3. If the true proportion is actually 0.03, the probability that is more than 0.054 is closest t oa. 0.b. 0.0222.c. 0.0207.d. 0.0146.e. We can’t calculate this probability because we haven’t satisfied the Normality
condition.
Pg. 4
13. According to a recent poll, 27% of Americans get 30 minutes of exercise at least five days each week. Let’s assume this is the parameter value for the population. If you take a simple random sample of 25 Americans and let = the proportion in the sample who get 30 minutes of exercise at least five days per week, what are the mean and standard deviation of the sampling distribution of ?a.
b.
c.
d.
e.
14. According to a recent poll, 27% of Americans get 30 minutes of exercise at least five days each week. Let’s assume this is the parameter value for the population. If you take a simple random sample of 25 Americans and let = the proportion in the sample who get 30 minutes of exercise at least five days per week, is the shape of the sampling distribution of approximately Normal?a. No, because b. No, because .c. Yes, because we can reasonably assume that there are more than
individuals in the population.d. Yes, because we took a simple random sample.e. Yes, because .
15. According to a recent poll, 27% of Americans get 30 minutes of exercise at least five days each week. Let’s assume this is the parameter value for the population. Suppose you increased the sample size to Americans and let = the proportion in the sample who get 30 minutes of exercise at least five days per week,. How would the sampling distribution of compare to the sampling distribution for ?a. Center and spread would be the same, both distributions would be approximately
Normal.b. Center and spread would be the same, but only the shape for the larger sample would
be approximately Normal.c. Center would be the same, spread would be smaller for , both distributions
would be approximately Normal.d. Center would be the same, spread would be smaller for , and only the shape for
the larger sample would be approximately Normal.e. Center would be the same, spread would be larger for , and only the shape for
the larger sample would be approximately Normal.
16. According to a recent poll, 27% of Americans get 30 minutes of exercise at least five days each week. Let’s assume this is the parameter value for the population. If a simple random sample of size were taken, what is the approximate probability that , the proportion who exercise at least five days per week, is higher than 0.30?a. nearly 0.b. 0.1081c. 0.1163d. 0.1227e. 0.3164
Pg. 5
17. Suppose we select an SRS of size n = 100 from a large population having proportion p of successes. Let X be the number of successes in the sample. For which value of p would it be safe to assume the sampling distribution of X is approximately normal?a. 0.01.b. 0.099.c. 1/9.d. 0.975.e. 0.9999.
18. A factory produces plate glass with a mean thickness of 4 mm and a standard deviation of 1.1 mm. A simple random sample of 100 sheets of glass is to be measured, and the sample mean thickness of the 100 sheets x is to be computed. We know the random variable x has approximately a normal distribution because of thea. law of large numbers.b. central limit theorem.c. law of proportions.d. fact that probability is the long run proportion of times an event occurs.e. normality of the population distribution.
19. A factory produces plate glass with a mean thickness of 4 mm and a standard deviation of 1.1 mm. A simple random sample of 100 sheets of glass is to be measured, and the sample mean thickness of the 100 sheets x computed. Which of the following is closest to the probability that the average thickness x of the 100 sheets of glass is less than 4.1 mm?a. 0.8183.b. 0.5361.c. 0.1814.d. 0.6817.e. 0.8413.
Pg. 6
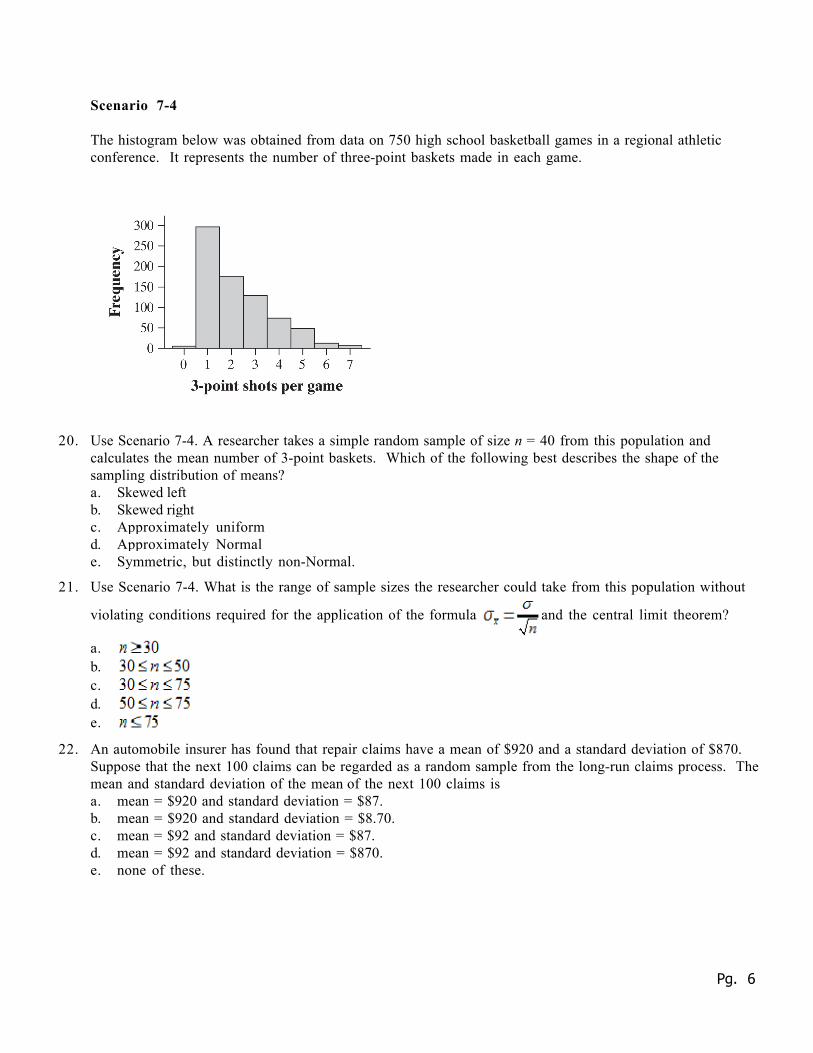
Scenario 7-4
The histogram below was obtained from data on 750 high school basketball games in a regional athletic conference. It represents the number of three-point baskets made in each game.
20. Use Scenario 7-4. A researcher takes a simple random sample of size n = 40 from this population and calculates the mean number of 3-point baskets. Which of the following best describes the shape of the sampling distribution of means?a. Skewed leftb. Skewed rightc. Approximately uniformd. Approximately Normale. Symmetric, but distinctly non-Normal.
21. Use Scenario 7-4. What is the range of sample sizes the researcher could take from this population without
violating conditions required for the application of the formula and the central limit theorem?
a.b.c.d.e.
22. An automobile insurer has found that repair claims have a mean of $920 and a standard deviation of $870. Suppose that the next 100 claims can be regarded as a random sample from the long-run claims process. The mean and standard deviation of the mean of the next 100 claims isa. mean = $920 and standard deviation = $87.b. mean = $920 and standard deviation = $8.70.c. mean = $92 and standard deviation = $87.d. mean = $92 and standard deviation = $870.e. none of these.
Pg. 7
23. An automobile insurer has found that repair claims have a mean of $920 and a standard deviation of $870. Suppose that the next 100 claims can be regarded as a random sample from the long-run claims process. The probability that the mean of the next 100 claims is larger than $1000 is approximatelya. 0.9200.b. 0.8212.c. 0.1788.d. 0.0800.e. close to 0.
24. The central limit theorem says that when a simple random sample of size n is drawn from any population with mean µ and standard deviation σ, then when n is sufficiently large, thea. standard deviation of the sample mean is σ2/n.b. distribution of the population is exactly normal.c. distribution of the sample mean is approximately normal.d. distribution of the sample mean is exactly normal.e. mean of the sampling distribution of x is µ.
25. The number of classified advertisements appearing on Mondays on a certain online community site has mean of 320 and standard deviation 30. Suppose that the results for 100 consecutive Mondays can be regarded as a simple random sample and let x denote the mean number of classified advertisements in the sample. Assuming a sample of 100 is sufficiently large, the random variable x has aa. distribution that is exactly normal by the central limit theorem.b. distribution that is approximately normal by the central limit theorem.c. mean of 3.2 by the law of large numbers.d. standard deviation of 3 by the law of large numbers.e. More than one of the above choices is true.
26. In order to use the formula σ X = σn
to calculate the standard deviation of the sampling distribution of the
sample mean, which of the following conditions must be met?
I. n ≥ 30II. The population’s distribution is approximately Normal.III. The sample size is less than 10% of the population size.
a. I onlyb. II onlyc. III onlyd. III and either I or e. All three conditions must be met
Pg. 8
27. The central limit theorem refers to which of the following characteristic of the sampling distribution of the sample mean?a. Regardless of the shape of the population’s distribution, the sampling distribution
of the sample mean from sufficiently large samples will be approximately Normally distributed
b. Regardless of the shape of the population’s distribution, the standard deviation of the sampling distribution of the sample mean from sufficiently large samples will
be σn
.
c. Regardless of the shape of the population’s distribution, the mean of the sampling distribution of the sample mean from sufficiently large samples will be equal to the mean of the population
d. As you take larger and larger samples from a Normally distributed population, the standard deviation of the sampling distribution of the sample mean gets smaller and smaller
e. As you take larger and larger samples from a Normally distributed population, the mean of the sampling distribution of the sample mean gets closer and closer to the population mean
28. Which of the following best describes a sampling distribution?a. The distribution of all values of a statistic found in a large number of simulated
samples of size n.b. The set of all values of a variable in a sample of size n.c. The set of all values of a variable in a large number of samples of size n.d. The distribution of parameter values in all possible samples of size ne. A probability distribution that describes the relative likelihood of all possible
values of a statistic.
Pg. 9
Other
1. For each description below, identify each underlined number as a parameter or statistic. Use appropriate notation to describe each number, e.g., p8 = 0.96.
(a) A 1993 survey conducted by the Richmond Times-Dispatch one week before election day asked voters which candidate for the state’s attorney general they would vote for. 37% of the respondents said they would vote for the Democratic candidate. On election day, 41% actually voted for the Democratic candidate.
(b) The National Center for Health Statistics reports that the mean systolic blood pressure for males 35 to 44 years of age is 128 and the standard deviation is 15. The medical director of a large company looks at the medical records of 72 executives in this age group and finds that the mean systolic blood pressure for these executives is 126.07.
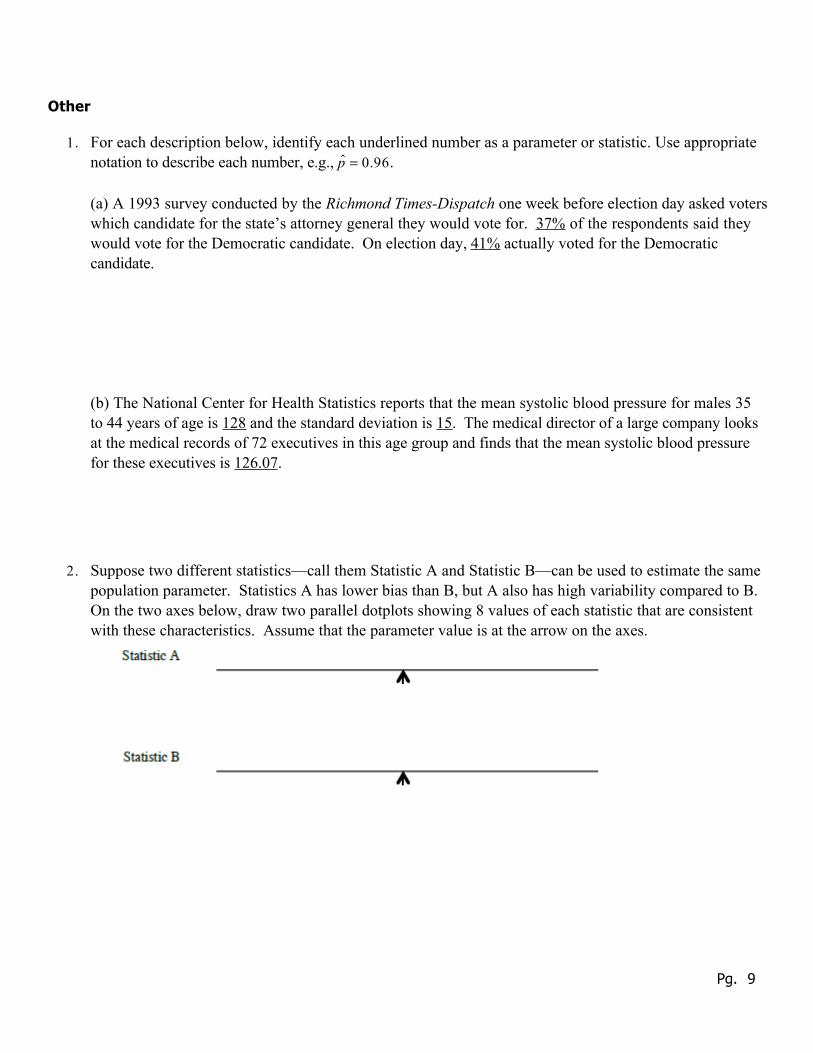
2. Suppose two different statistics—call them Statistic A and Statistic B—can be used to estimate the same population parameter. Statistics A has lower bias than B, but A also has high variability compared to B. On the two axes below, draw two parallel dotplots showing 8 values of each statistic that are consistent with these characteristics. Assume that the parameter value is at the arrow on the axes.
Pg. 10
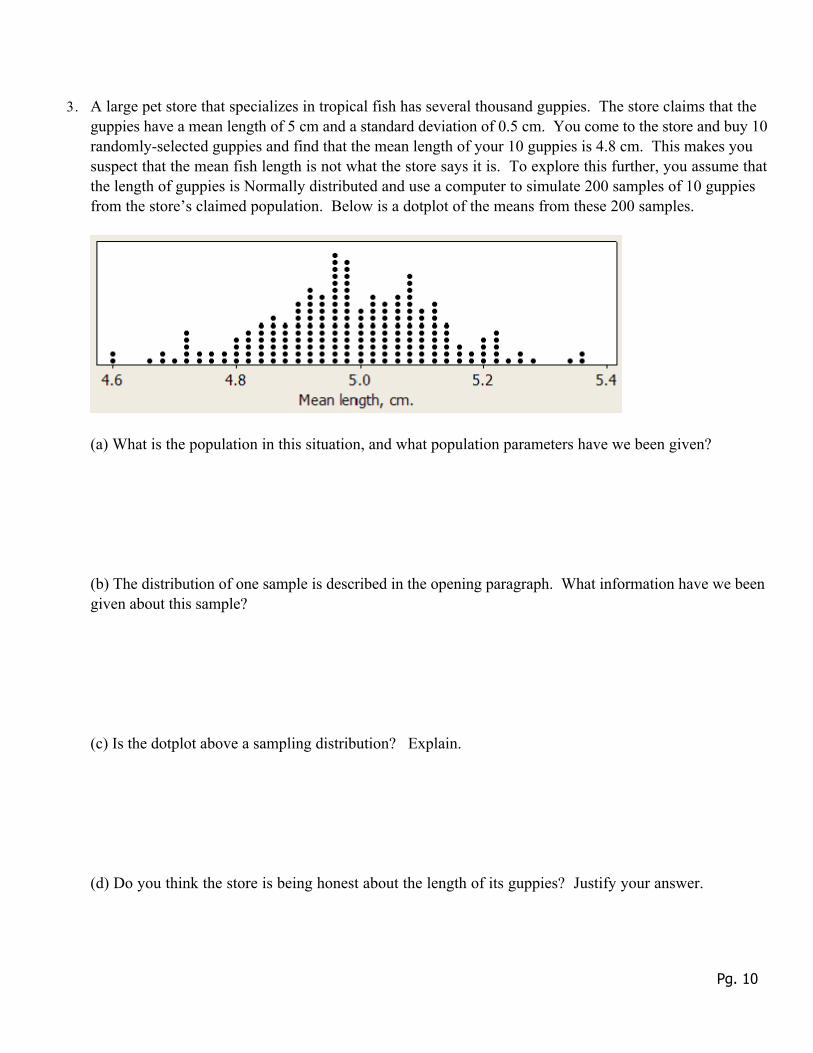
3. A large pet store that specializes in tropical fish has several thousand guppies. The store claims that the guppies have a mean length of 5 cm and a standard deviation of 0.5 cm. You come to the store and buy 10 randomly-selected guppies and find that the mean length of your 10 guppies is 4.8 cm. This makes you suspect that the mean fish length is not what the store says it is. To explore this further, you assume that the length of guppies is Normally distributed and use a computer to simulate 200 samples of 10 guppies from the store’s claimed population. Below is a dotplot of the means from these 200 samples.
(a) What is the population in this situation, and what population parameters have we been given?
(b) The distribution of one sample is described in the opening paragraph. What information have we been given about this sample?
(c) Is the dotplot above a sampling distribution? Explain.
(d) Do you think the store is being honest about the length of its guppies? Justify your answer.

Pg. 11
Pg. 12
4. Suppose that in a certain community, 40% of the residents would answer “Yes” to the question, “Do you know the names of at least five other people who live on your block?” Suppose you plan to take a random sample of 100 people from this community and calculate the proportion of people in your sample whose response to this question is “Yes”.
(a) What are the parameter and the statistic in this situation?
(b) What does the sampling distribution of this statistic describe?
(c) What does it mean to say that the statistic in this case is an unbiased estimator of the parameter?
(d) Suppose that in a much larger community, 40% of the residents would also answer “Yes” to the question. If you took a sample of 100 individuals from this much larger community, would the sampling distribution of the statistic be different? In what way?
(e) If you took a sample of 50 individuals instead of 100 from the original community, would the sampling distribution of the statistic change? In what way?
Pg. 13
Pg. 14
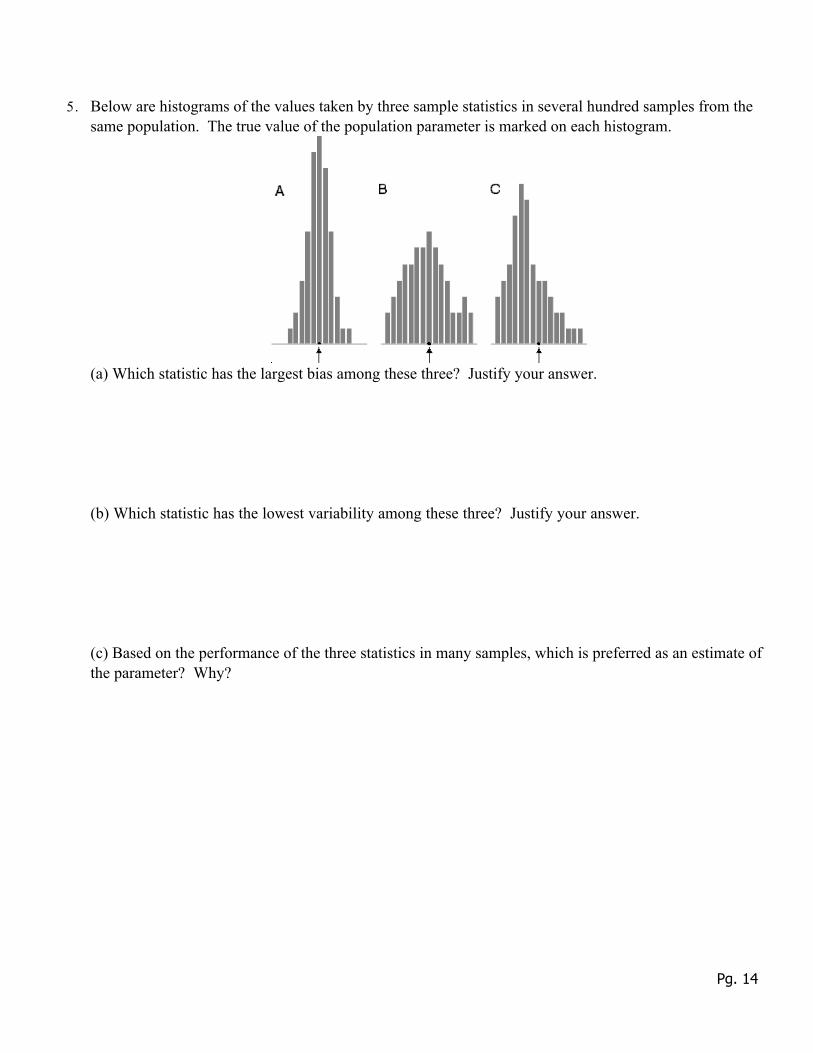
5. Below are histograms of the values taken by three sample statistics in several hundred samples from the same population. The true value of the population parameter is marked on each histogram.
(a) Which statistic has the largest bias among these three? Justify your answer.
(b) Which statistic has the lowest variability among these three? Justify your answer.
(c) Based on the performance of the three statistics in many samples, which is preferred as an estimate of the parameter? Why?
Pg. 15
6. A study of college freshmen’s study habits found that the time (in hours) that freshmen study each week follows a distribution with a mean of 7.2 hours and a standard deviation of 5.3 hours.
(a) Can you calculate the probability that a randomly chosen freshman studies more than 9 hours? If so, do it. If not, explain why not.
(b) What is the shape of the sampling distribution of the mean x for samples of 55 randomly selected freshmen? Justify your answer.
(c) What are the mean and standard deviation of the sampling distribution of the mean for samples of 55 randomly selected freshmen?
(d) Find the probability that the average number of hours spent studying by an SRS of 55 students is greater than 9 hours. Show your work.
Pg. 16
7. A friend has offered to play a game with you that involves flipping a coin that he has provided. Since a flip of heads will be to his advantage, you want to test the coin for fairness before you begin to play. Your friend is willing to let you flip the coin 50 times to determine if the probability of getting heads is actually 0.50, as it should be if the coin is fair.
(a) Assume for the moment that the coin is fair. If p8 is the proportion of heads in 50 flips of the coin, what are the mean and standard deviation of the sampling distribution of p8?
(b) Explain why you can use the formula for the standard deviation of p8 in this setting.
(c) You flip the coin 50 times and get 30 heads. Do you risk insulting your friend by refusing to play with his coin? Support your answer with an appropriate probability calculation.
Pg. 17
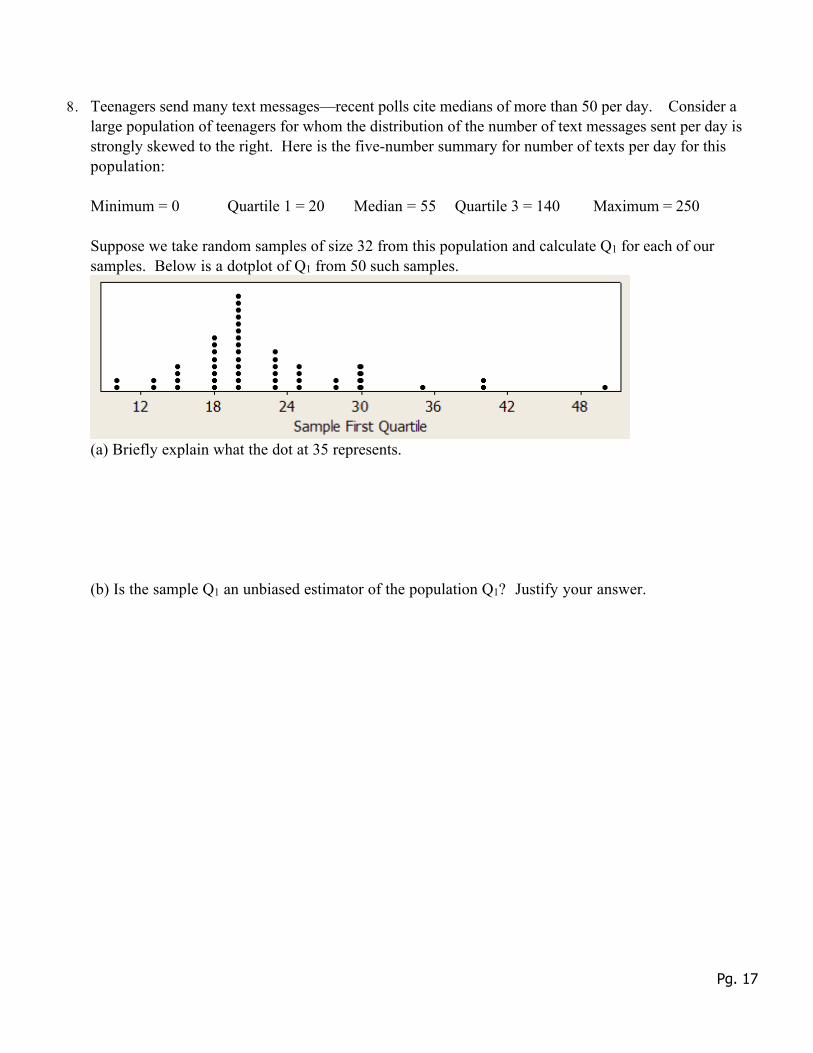
8. Teenagers send many text messages—recent polls cite medians of more than 50 per day. Consider a large population of teenagers for whom the distribution of the number of text messages sent per day is strongly skewed to the right. Here is the five-number summary for number of texts per day for this population:
Minimum = 0 Quartile 1 = 20 Median = 55 Quartile 3 = 140 Maximum = 250
Suppose we take random samples of size 32 from this population and calculate Q1 for each of our samples. Below is a dotplot of Q1 from 50 such samples.
(a) Briefly explain what the dot at 35 represents.
(b) Is the sample Q1 an unbiased estimator of the population Q1? Justify your answer.
Pg. 18
9. A certain beverage company is suspected of underfilling its cans of soft drink. The company advertises that its cans contain, on average, 12 ounces of soda with standard deviation 0.4 ounce. For the questions that follow, suppose that the company is telling the truth.
(a) Can you calculate the probability that a single randomly selected can contains 11.9 ounces or less? If so, do it. If not, explain why you cannot.
(b) A quality control inspector measures the contents of an SRS of 50 cans of the company’s soda and calculates the sample mean x. What are the mean and standard deviation of the sampling distribution of x for samples of size n = 50?
(c) The inspector in part B. obtains a sample mean of x = 11.9 ounces. Calculate the probability that a random sample of 50 cans produces a sample mean amount of 11.9 ounces or less. Be sure to explain why you can use a Normal calculation.
(d) What would you conclude about whether the company is underfilling its cans of soda? Justify your answer.
Pg. 19
10. An opinion poll asks a sample of 500 adults (an SRS) whether they favor giving parents of school-age children vouchers that can be exchanged for education at any public or private school of their choice. Each school would be paid by the government on the basis of how many vouchers it collected. Suppose that in fact 45% of the population favor this idea.
(a) What is the mean of the sampling distribution of , the proportion of adults in samples of 500 who favor giving parents of school-age children these vouchers?
(b) What is the standard deviation of ?
(c) Check that you can use the Normal approximation for the distribution of .
(d) What is the probability that more than half of the sample are in favor? Show your work.
Pg. 20
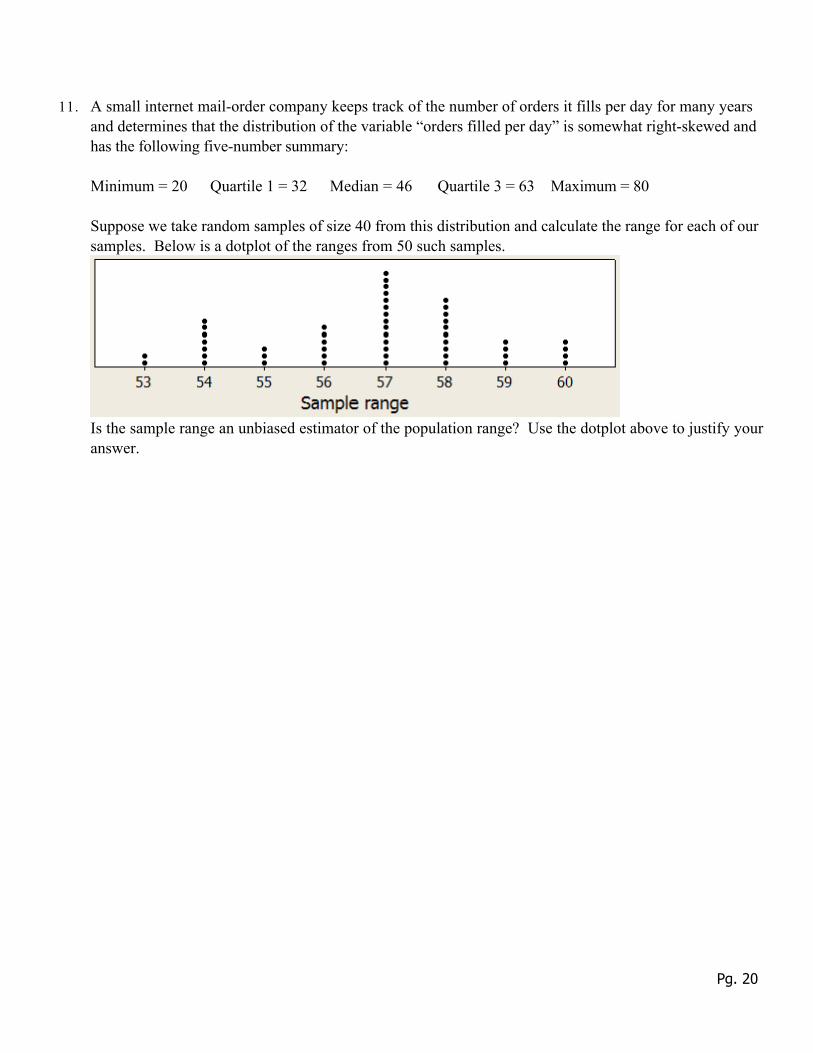
11. A small internet mail-order company keeps track of the number of orders it fills per day for many years and determines that the distribution of the variable “orders filled per day” is somewhat right-skewed and has the following five-number summary:
Minimum = 20 Quartile 1 = 32 Median = 46 Quartile 3 = 63 Maximum = 80
Suppose we take random samples of size 40 from this distribution and calculate the range for each of our samples. Below is a dotplot of the ranges from 50 such samples.
Is the sample range an unbiased estimator of the population range? Use the dotplot above to justify your answer.
ID: A
Pg. 1
Chapter 7 Test ReviewAnswer Section
MULTIPLE CHOICE
1. E2. A3. A4. C5. E6. B7. A8. D9. A
10. C11. D12. D13. D14. B15. D16. E17. C18. B19. A20. D21. C22. A23. C24. C25. B26. C27. A28. E
OTHER
1. A. p8 = 0.37 is a statistic; p = 0.41 is a parameter. B. µ = 128 is a parameter; σ = 15 is a parameter; x = 126.07 is a statistic.
2. Answers will vary, but the center of values for Statistic A should be closer to the arrow than the center of the values for Statistic B, and there should be more spread in the values for Statistic A.
ID: A
Pg. 2
3. A. The population is all the guppies in the pet store. We’ve been given the population mean µ = 5 cm and the population standard deviation σ = 0.5 cm. B. The sample mean is x = 4.8 cm and the sample size is n = 10 C. No, it’s merely an approximation of a sampling distribution generated by simulating 200 sample means. The actual sampling distribution includes the means from all possible samples of size 10 from the population—many more than 200 values. D. 21 out of 200, or 10.5% of the sample means in our simulation are as far or farther below 5.0 as our sample was. Our sample is not sufficiently unusual to arouse suspicions about the store’s claim.
4. A. The parameter is the proportion of people in the entire community who would answer “Yes” to the question. It’s equal to 0.40. The statistic is the proportion of people in the sample of 100 who would answer “Yes” to the question. B. The sampling distribution describes the distribution of the proportion of people who would answer “Yes” to this question in all possible samples of size 100 from this population. C. The mean of the statistic’s sampling distribution is equal to the parameter. D. No. As long as the sample is less than 10% of the population, the size of the population from which the sample is taken does not influence the sampling distribution. E. Yes. The standard deviation of the sampling distribution would be larger if the sample size were smaller
5. A. C has the largest bias: the center of the histogram is clearly to the left of the parameter value. B. A has the lowest variability, since most values of the statistic are close to the parameter value. C. Distribution A is unbiased and has the lowest variability, so it should give the best estimate.
6. A. No. We don’t know the shape of the distribution, so we can’t calculate this probability. B. Since 55 > 30, the central limit theorem applies, so we can say that the sampling distribution of the sample mean is
approximately Normal. C. µX = 7.2;σ X = 5.355
= 0.715 D.
P x > 9( ) = P z > 9 − 7.20.715
Ê
Ë
ÁÁÁÁÁÁ
ˆ
¯
˜̃̃˜̃̃ = P z > 2.52( ) = 0.0059 .
7. A.µp8 = p = 0.5;σ p8 =(0.5)(0.5
50= 0.071 B. Since the population of possible flips of this coin is
infinite, we need not be concerned about the 10% condition for finite populations. C. The probability of getting 30 or more heads in 50 flips of a fair coin is
P p8 > 0.6ÊËÁÁÁ
ˆ¯˜̃̃ = P z > 0.6 − 0.5
0.071
Ê
Ë
ÁÁÁÁÁÁ
ˆ
¯
˜̃̃˜̃̃ = P z > 1.41( ) = 0.0793. Roughly 2 out of 25 times, we will get this many
or more heads. This is probably not unusual enough to risk your friend’s good will by accusing him of using an unfair coin
8. A. The dot at 35 represents the first quartile of one of the 50 samples taken from this population. B. We know from the five-number summary that the true population value for Q1 is 20. The mean of the simulated sampling distribution appears to be higher than 20 (it is, in fact about 22), therefore the sample first quartile is a biased estimator.
ID: A
Pg. 3
9. A. No. We don’t know the shape of the distribution, so we can’t calculate this probability.
B. µx = 12 and σ x = 0.450
≈ 0.0566
C. Since n = 50, which is greater than 30, we can use the Normal probability distribution. D. If the true mean amount of soda in the cans is 12 ounces, there is about a 4% chance of getting a sample mean as low or lower than 11.9 ounces. This result is unlikely enough to make us suspicious and lead us to conclude that the company is under-filling its cans of soda!
10. A. µp8 = p = 0.45 B. σ p8 =(0.45)(0.55)
500= 0.0222. C. np = 500(0.45) = 225 > 10 and
n(1 − p) = 500(0.55) = 275 > 10. So the sampling distribution is approximately Normal.
D. P(p8 > 0.5) = P z > 0.5 − 0.450.0222
Ê
Ë
ÁÁÁÁÁÁ
ˆ
¯
˜̃̃˜̃̃ = P z > 2.25( ) = 0.0122
11. Sample range is not an unbiased estimator of population range. The population range is 80 – 20 = 60. The range of a sample will only be this large if the population’s minimum and maximum values in the distribution are both in the sample. Otherwise, the sample range will be smaller. Thus the mean of the sampling distribution of sample ranges will be somewhere below 60. In this particular case, the mean appears to be closer to 57.
Related Documents