PFSW Global Commerce Solutions January 2021

Welcome message from author
This document is posted to help you gain knowledge. Please leave a comment to let me know what you think about it! Share it to your friends and learn new things together.
Transcript

PFSW Global Commerce Solutions
January 2021
The matters discussed in this presentation, particularly information regarding future revenue, earnings, business plans and goals, consist of forward-looking information within the
meaning of Section 27A of the Securities Act of 1933 and Section 21E of the Securities Exchange Act of 1934 and are subject to the safe harbor created by these sections
and involve risks and uncertainties, which could cause actual results to differ materially from the forward-looking information. Such statements are not guarantees of future
performance and involve risks, uncertainties and assumptions that are difficult to predict. These statements are based on assumptions and estimates that management believes
are reasonable based on currently available information; however, management’s assumptions and the Company's future performance are both subject to a wide range of
business risks and uncertainties, and there is no assurance that these goals and projections can or will be met. Any number of factors could cause actual results to differ
materially. The Company undertakes no obligation to publicly update or revise any forward-looking statements. All forward-looking information contained herein is subject to the
risk factors and uncertainties described in the Company’s filings with the Securities and Exchange Commission, which risk factors and uncertainties are incorporated by reference
as though fully set forth herein.
This presentation contains certain non-GAAP measures including Service Fee Equivalent Revenue, Non-GAAP Net Income (Loss), EBITDA and Adjusted EBITDA. Service
fee equivalent revenue represents service fee revenue plus the gross profit earned on product revenue and does not alter existing revenue recognition. Non-GAAP net income
(loss) represents net income (loss) calculated in accordance with U.S. GAAP as adjusted for the impact of non-cash stock-based compensation expense, acquisition-related,
restructuring and other (income) costs (including certain client related bankruptcy costs), amortization of acquisition-related intangible assets and deferred tax expense for goodwill
amortization. EBITDA represents earnings (or losses) before interest, income taxes, depreciation, and amortization. Adjusted EBITDA further eliminates the effect of stock based
compensation, as well as acquisition-related, restructuring and other (income) costs. Service Fee Equivalent Revenue, Non-GAAP Net Income (Loss), EBITDA, and Adjusted
EBITDA are used by management, analysts, investors and other interested parties in evaluating our operating performance compared to that of other companies in our industry,
as the calculation of Non-GAAP Net Income (Loss) eliminates the effect of non-cash stock-based compensation, acquisition-related, restructuring and other costs (including certain
client related bankruptcy costs), amortization of acquisition related intangible assets and deferred tax expense for goodwill amortization. EBITDA eliminates the effect of financing,
income taxes, and the accounting effects of capital spending, and the amortization of acquisition-related intangible benefits, and Adjusted EBITDA further eliminates non-cash
stock-based compensation and acquisition-related, restructuring and other costs, which items may vary from different companies for reasons unrelated to overall operating
performance. Service Fee Equivalent Revenue allows client contracts with similar operational support models but different financial models to be combined as if all contracts were
being operated on a service fee revenue basis. The non-GAAP measures are not intended to be considered in isolation of, as a substitute for or superior to our GAAP financial
information. We have included reconciliations later in this presentation of the non-GAAP measures to the nearest GAAP measure.
Important Cautions Regarding
Forward Looking Statements
3
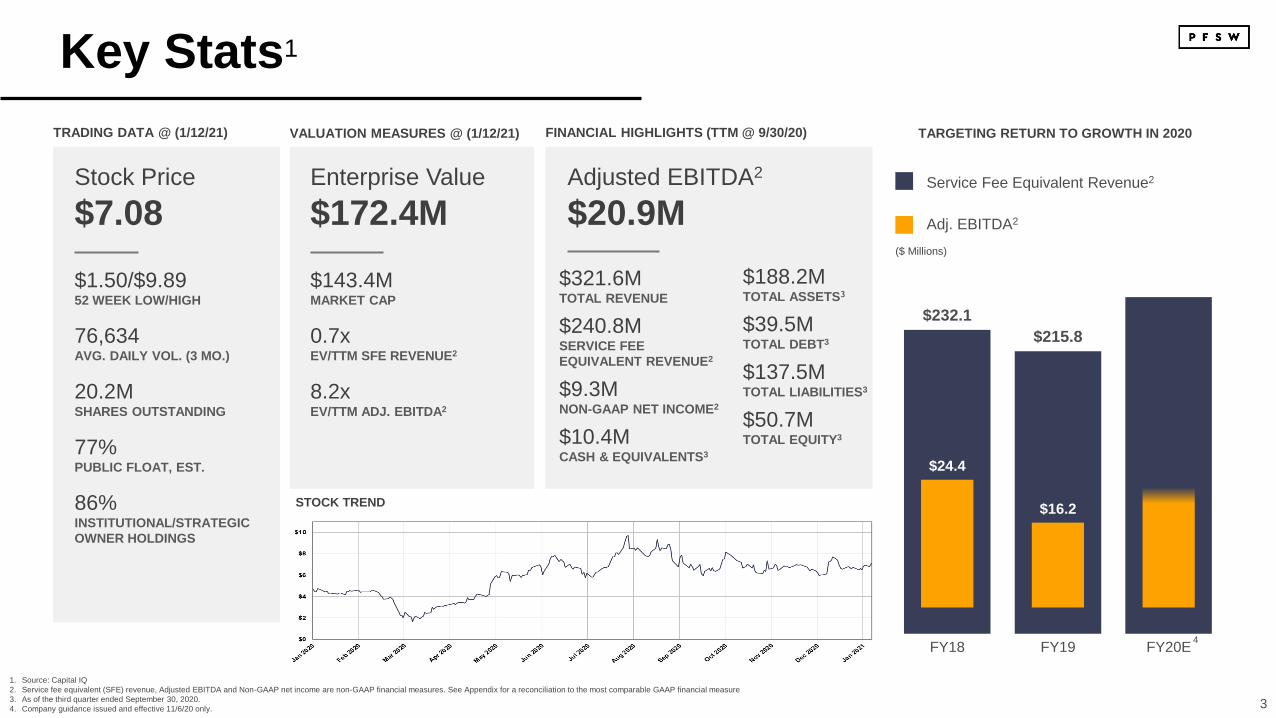
Key Stats1
Stock Price
$7.08
$1.50/$9.8952 WEEK LOW/HIGH
76,634AVG. DAILY VOL. (3 MO.)
20.2MSHARES OUTSTANDING
77%PUBLIC FLOAT, EST.
86%INSTITUTIONAL/STRATEGIC
OWNER HOLDINGS
TRADING DATA @ (1/12/21)
Enterprise Value
$172.4M
VALUATION MEASURES @ (1/12/21)
Adjusted EBITDA2
$20.9M
FINANCIAL HIGHLIGHTS (TTM @ 9/30/20)
$321.6MTOTAL REVENUE
$240.8MSERVICE FEE
EQUIVALENT REVENUE2
$9.3MNON-GAAP NET INCOME2
$10.4MCASH & EQUIVALENTS3
$188.2MTOTAL ASSETS3
$39.5MTOTAL DEBT3
$137.5MTOTAL LIABILITIES3
$50.7MTOTAL EQUITY3
$143.4MMARKET CAP
0.7xEV/TTM SFE REVENUE2
8.2xEV/TTM ADJ. EBITDA2
STOCK TREND
1. Source: Capital IQ
2. Service fee equivalent (SFE) revenue, Adjusted EBITDA and Non-GAAP net income are non-GAAP financial measures. See Appendix for a reconciliation to the most comparable GAAP financial measure
3. As of the third quarter ended September 30, 2020.
4. Company guidance issued and effective 11/6/20 only.
$232.1
$215.8
$24.4
$16.2
FY18 FY19 FY20E
Service Fee Equivalent Revenue2
Adj. EBITDA2
($ Millions)
TARGETING RETURN TO GROWTH IN 2020
4
4
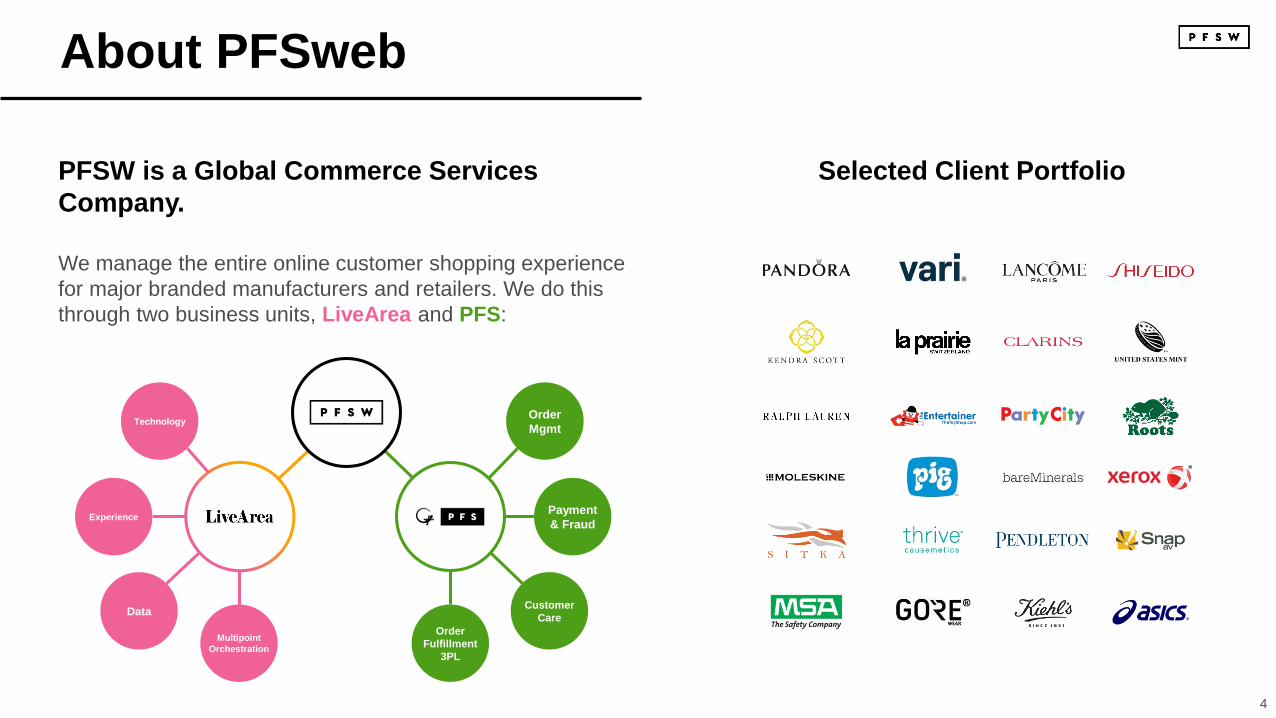
About PFSweb
Order
Fulfillment
3PL
Customer
Care
Payment
& FraudExperience
Data
Order
MgmtTechnology
Multipoint
Orchestration
PFSW is a Global Commerce Services
Company.
We manage the entire online customer shopping experience
for major branded manufacturers and retailers. We do this
through two business units, LiveArea and PFS:
Selected Client Portfolio
5
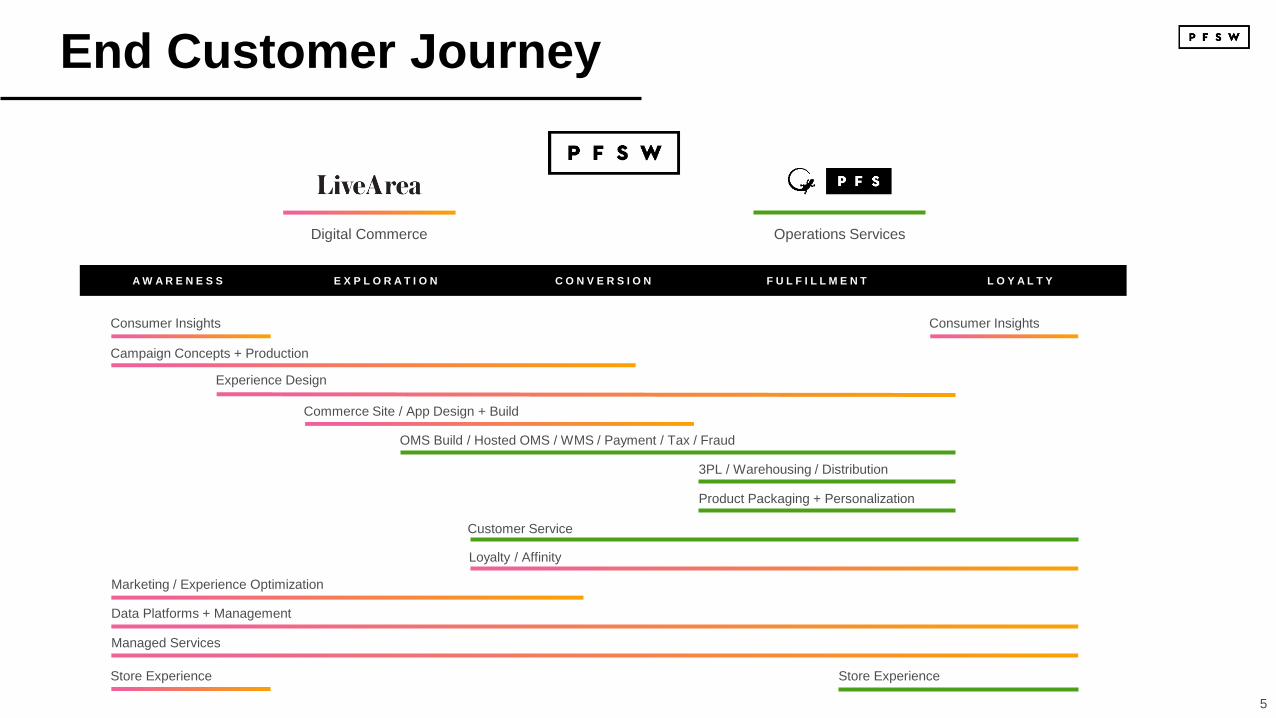
End Customer Journey
Digital Commerce Operations Services
A W A R E N E S S E X P L O R A T I O N C O N V E R S I O N F U L F I L L M E N T L O Y A L T Y
Campaign Concepts + Production
Experience Design
Commerce Site / App Design + Build
OMS Build / Hosted OMS / WMS / Payment / Tax / Fraud
3PL / Warehousing / Distribution
Product Packaging + Personalization
Customer Service
Loyalty / Affinity
Marketing / Experience Optimization
Data Platforms + Management
Managed Services
Consumer Insights Consumer Insights
Store Experience Store Experience
6
Why We Win
Our competitive advantage lies in our ability to
create exceptional branded digital and physical
shopping experiences at scale.
• Vertical expertise includes DTC and B2B brand manufacturers with a
focus on health & beauty, fashion, jewelry and collectables, activewear,
and premier CPG brands.
• Differentiated from retail marketplaces and general merchandise
retailers – everything from website design services to personalized
products and high-touch order fulfillment.
• Flexible approach to solutions that serve highly customized enterprise
implementations, as well as plug and play integrations for SMBs.
• Proven technology infrastructure and operational practices that scale up
for planned and unanticipated volume demand.
• Global footprint that spans three continents and enables clients to cost
effectively expand into new geographies.
• Innovative use of technology and software development to create
products and productized service offerings which expand our market
beyond traditional BPO and systems integration.
Market experience, a
complete end-to-end
solution and an
innovative, brand-
centric approach
separate us from our
competition.

7
State of the Business
Business Unit Updates & Technology Innovation
8
Business Unit Update
8
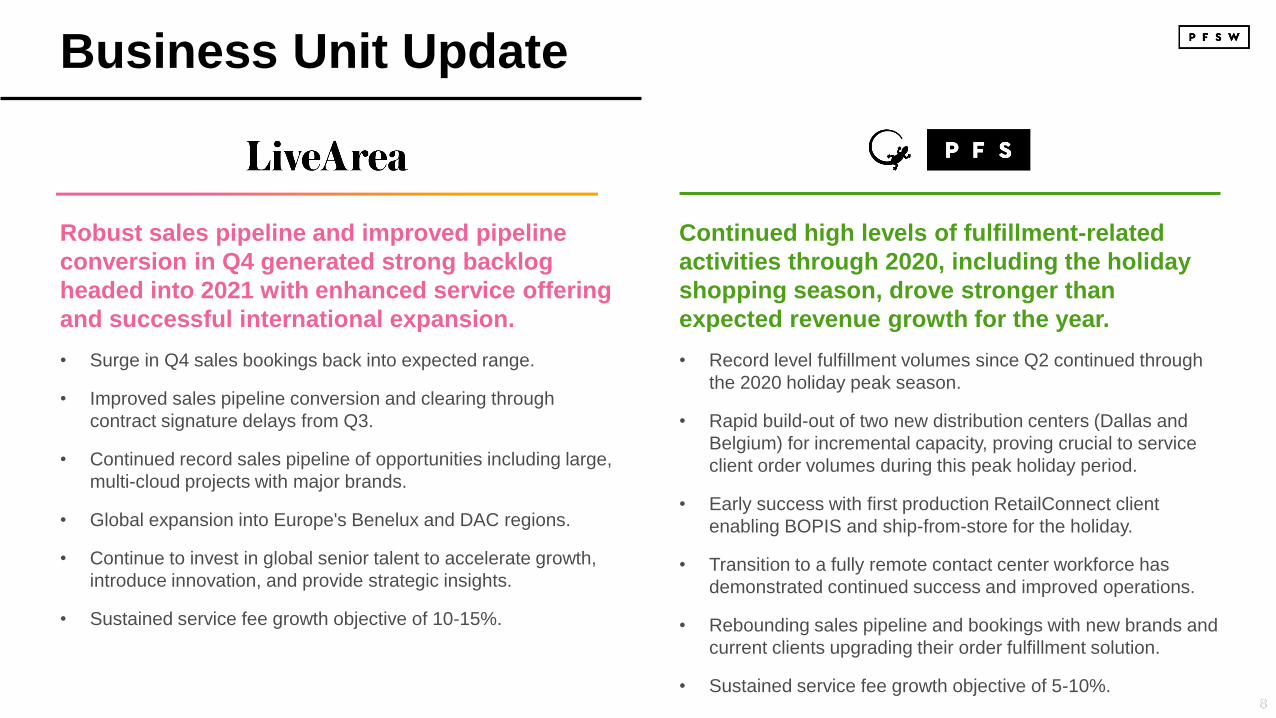
Robust sales pipeline and improved pipeline
conversion in Q4 generated strong backlog
headed into 2021 with enhanced service offering
and successful international expansion.
• Surge in Q4 sales bookings back into expected range.
• Improved sales pipeline conversion and clearing through
contract signature delays from Q3.
• Continued record sales pipeline of opportunities including large,
multi-cloud projects with major brands.
• Global expansion into Europe's Benelux and DAC regions.
• Continue to invest in global senior talent to accelerate growth,
introduce innovation, and provide strategic insights.
• Sustained service fee growth objective of 10-15%.
Continued high levels of fulfillment-related
activities through 2020, including the holiday
shopping season, drove stronger than
expected revenue growth for the year.
• Record level fulfillment volumes since Q2 continued through
the 2020 holiday peak season.
• Rapid build-out of two new distribution centers (Dallas and
Belgium) for incremental capacity, proving crucial to service
client order volumes during this peak holiday period.
• Early success with first production RetailConnect client
enabling BOPIS and ship-from-store for the holiday.
• Transition to a fully remote contact center workforce has
demonstrated continued success and improved operations.
• Rebounding sales pipeline and bookings with new brands and
current clients upgrading their order fulfillment solution.
• Sustained service fee growth objective of 5-10%.

9
PFS 2020 Performance
PFS performed at a high level for its clients in 2020, leading to a record DTC fulfillment
quarter and full year.
• During Q4, order fulfillment volumes began early and continued strong during traditional holiday peak period generating an 88% increase
in DTC order fulfillment activity compared to Q4 2019 with a total of 11 million orders – the largest quarter in company history.
• Orders fulfilled during Cyber Week increased 71% to over two million orders.
• In less than two full months of operations, PFS’ two new fulfillment centers in Dallas and Belgium meaningfully expanded fulfillment
capacity for key clients.
• Remote contact center operations continued to run smoothly, with less attrition than in previous years, resulting in over one million
customer contacts answered in Q4 2020.
• Processed over $3 billion in gross merchandise value through fulfillment activity in the full year 2020, and an additional $400 million for
order-to-cash platform only clients.
• Payment transaction value processed through PFS’ financial services increased 51% to $1.4 billion in the full year 2020.
4M+ORDERS FULFILLED
EACH IN NOVEMBER
AND DECEMBER 2020
1MCUSTOMER CONTACTS
ANSWERED IN Q4 2020
$1.4BPAYMENT
TRANSACTION VALUE
PROCESSED IN FY 2020
$3B+GMV THROUGH
FULFILLMENT ACTIVITY
IN FY 2020
2M+ORDERS FULFILLED
GLOBALLY FROM
BLACK FRIDAY TO
CYBER THURSDAY
10
YoY Weekly Fulfillment Comparison
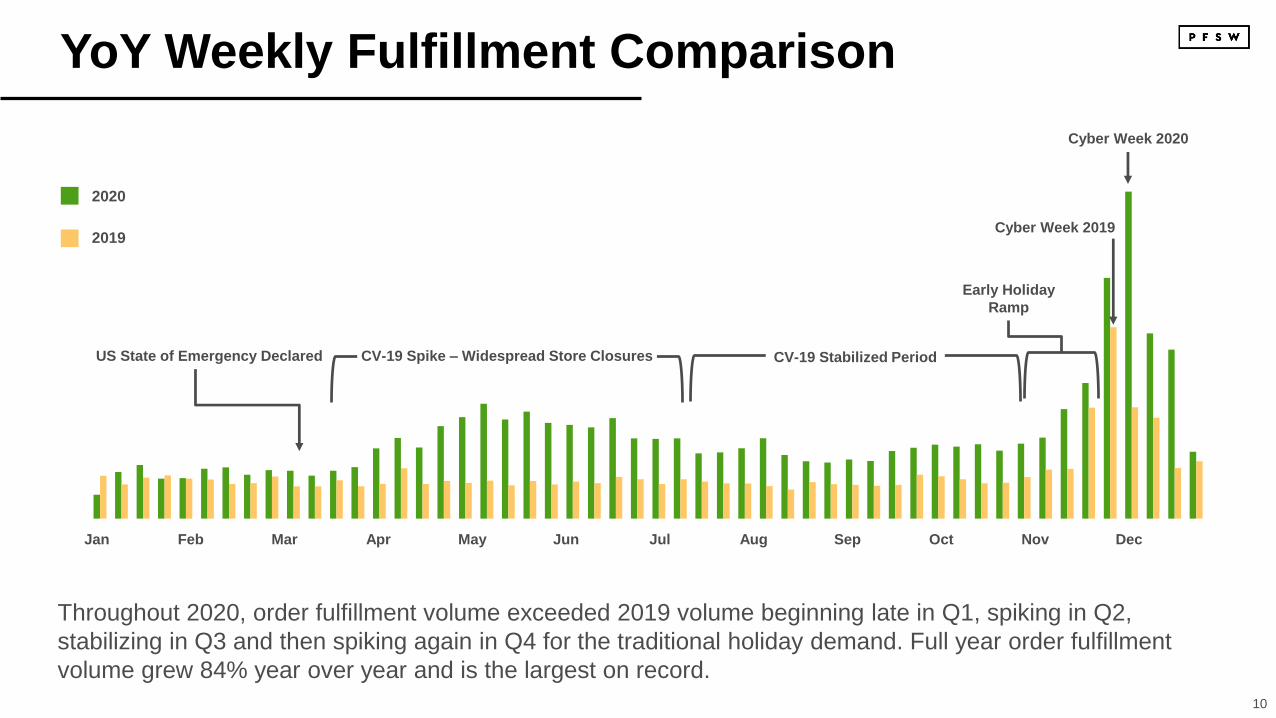
US State of Emergency Declared CV-19 Spike – Widespread Store Closures CV-19 Stabilized Period
Early Holiday
Ramp
Cyber Week 2020
Jan Feb Mar MayApr Jun Jul Aug Sep Oct Nov Dec
Throughout 2020, order fulfillment volume exceeded 2019 volume beginning late in Q1, spiking in Q2,
stabilizing in Q3 and then spiking again in Q4 for the traditional holiday demand. Full year order fulfillment
volume grew 84% year over year and is the largest on record.
2020
2019Cyber Week 2019
11
Fulfillment Enablement
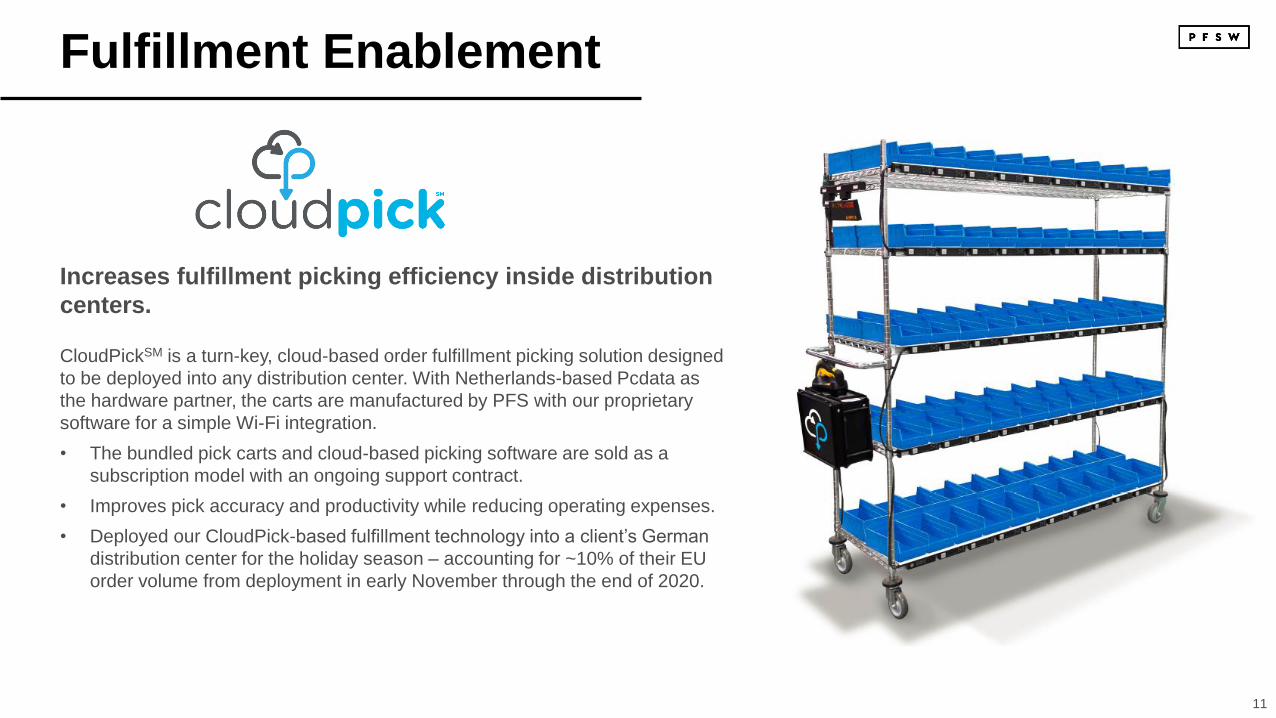
Increases fulfillment picking efficiency inside distribution
centers.
CloudPickSM is a turn-key, cloud-based order fulfillment picking solution designed
to be deployed into any distribution center. With Netherlands-based Pcdata as
the hardware partner, the carts are manufactured by PFS with our proprietary
software for a simple Wi-Fi integration.
• The bundled pick carts and cloud-based picking software are sold as a
subscription model with an ongoing support contract.
• Improves pick accuracy and productivity while reducing operating expenses.
• Deployed our CloudPick-based fulfillment technology into a client’s German
distribution center for the holiday season – accounting for ~10% of their EU
order volume from deployment in early November through the end of 2020.
12
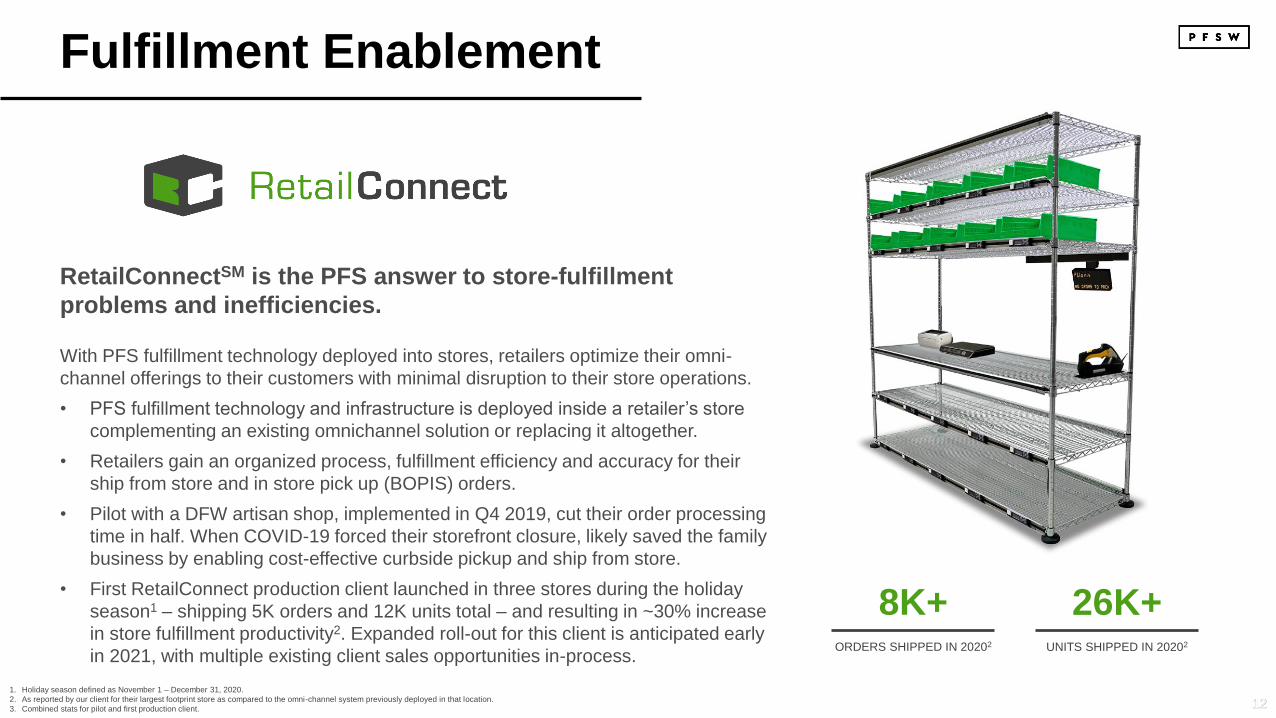
Fulfillment Enablement
RetailConnectSM is the PFS answer to store-fulfillment
problems and inefficiencies.
With PFS fulfillment technology deployed into stores, retailers optimize their omni-
channel offerings to their customers with minimal disruption to their store operations.
• PFS fulfillment technology and infrastructure is deployed inside a retailer’s store
complementing an existing omnichannel solution or replacing it altogether.
• Retailers gain an organized process, fulfillment efficiency and accuracy for their
ship from store and in store pick up (BOPIS) orders.
• Pilot with a DFW artisan shop, implemented in Q4 2019, cut their order processing
time in half. When COVID-19 forced their storefront closure, likely saved the family
business by enabling cost-effective curbside pickup and ship from store.
• First RetailConnect production client launched in three stores during the holiday
season1 – shipping 5K orders and 12K units total – and resulting in ~30% increase
in store fulfillment productivity2. Expanded roll-out for this client is anticipated early
in 2021, with multiple existing client sales opportunities in-process.
12
26K+UNITS SHIPPED IN 20202
8K+ORDERS SHIPPED IN 20202
1. Holiday season defined as November 1 – December 31, 2020.
2. As reported by our client for their largest footprint store as compared to the omni-channel system previously deployed in that location.
3. Combined stats for pilot and first production client.

13
Financials
Overview of PFSweb’s Financial Picture
14
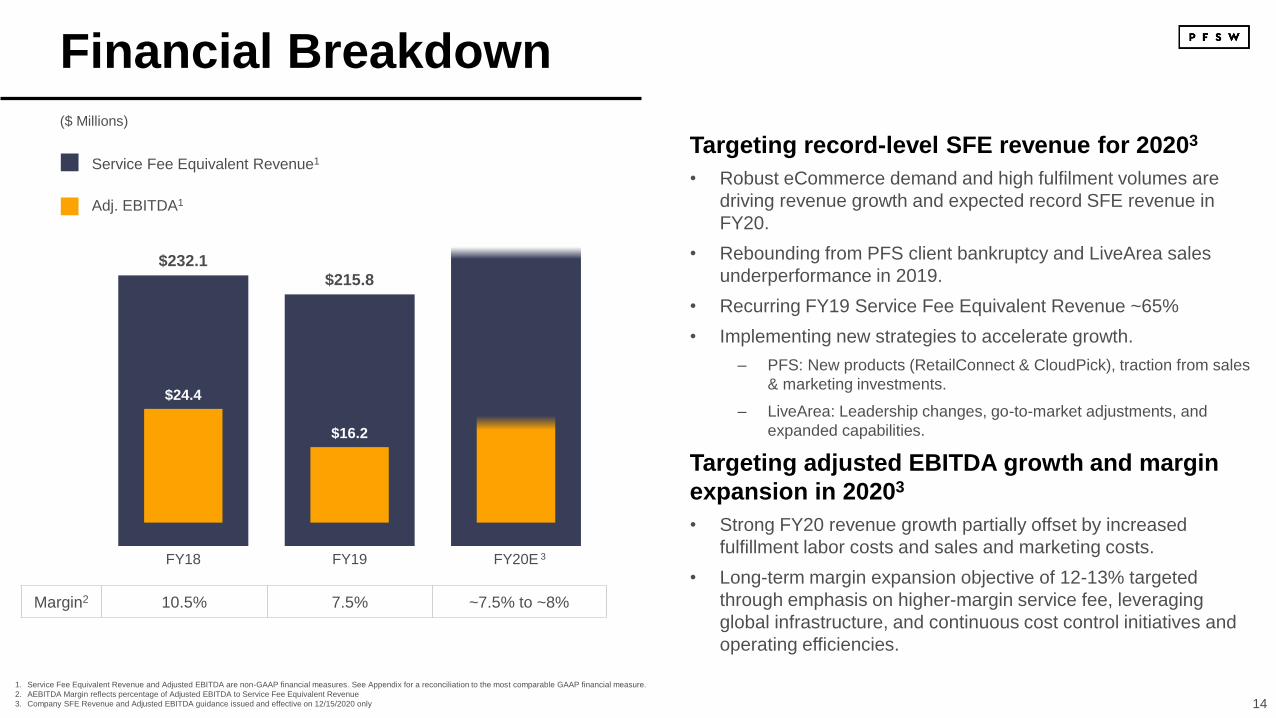
Financial Breakdown
Targeting record-level SFE revenue for 20203
• Robust eCommerce demand and high fulfilment volumes are
driving revenue growth and expected record SFE revenue in
FY20.
• Rebounding from PFS client bankruptcy and LiveArea sales
underperformance in 2019.
• Recurring FY19 Service Fee Equivalent Revenue ~65%
• Implementing new strategies to accelerate growth.
– PFS: New products (RetailConnect & CloudPick), traction from sales
& marketing investments.
– LiveArea: Leadership changes, go-to-market adjustments, and
expanded capabilities.
Targeting adjusted EBITDA growth and margin
expansion in 20203
• Strong FY20 revenue growth partially offset by increased
fulfillment labor costs and sales and marketing costs.
• Long-term margin expansion objective of 12-13% targeted
through emphasis on higher-margin service fee, leveraging
global infrastructure, and continuous cost control initiatives and
operating efficiencies.
($ Millions)
3
$232.1
$215.8
$24.4
$16.2
FY18 FY19 FY20E
Service Fee Equivalent Revenue1
Adj. EBITDA1
Margin2 10.5% 7.5% ~7.5% to ~8%
1. Service Fee Equivalent Revenue and Adjusted EBITDA are non-GAAP financial measures. See Appendix for a reconciliation to the most comparable GAAP financial measure.
2. AEBITDA Margin reflects percentage of Adjusted EBITDA to Service Fee Equivalent Revenue
3. Company SFE Revenue and Adjusted EBITDA guidance issued and effective on 12/15/2020 only
15
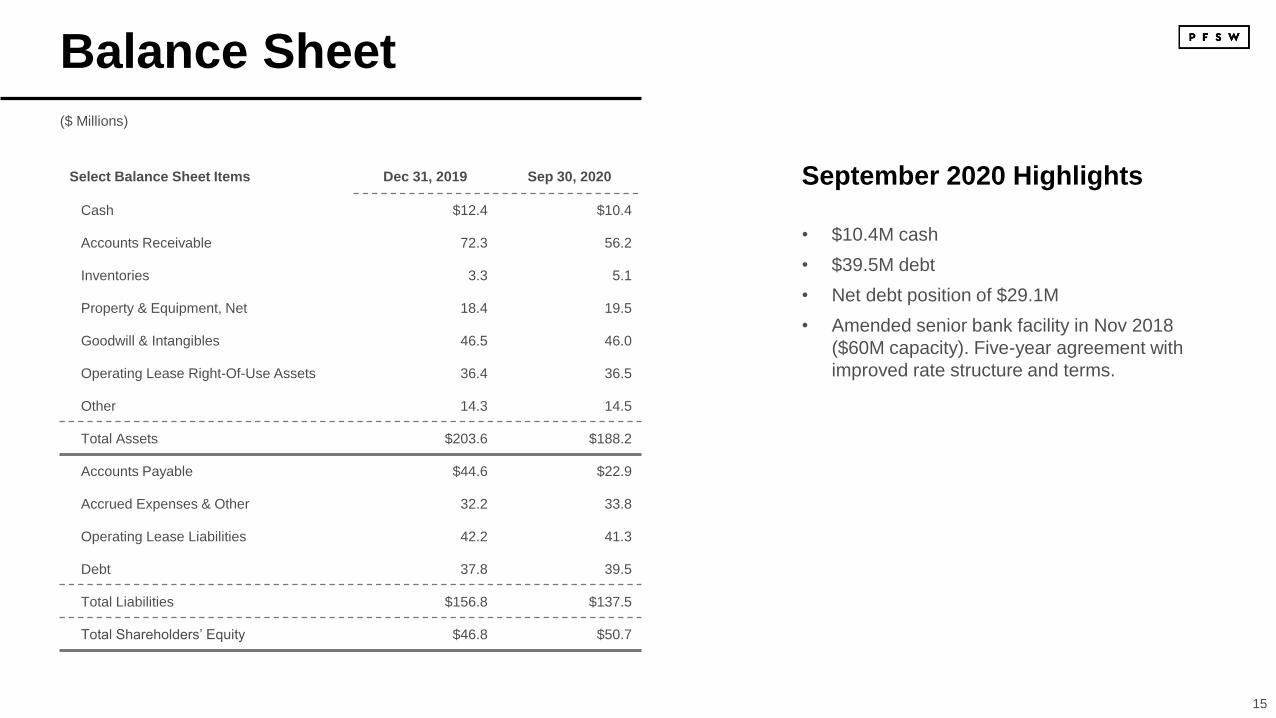
Balance Sheet
September 2020 Highlights
• $10.4M cash
• $39.5M debt
• Net debt position of $29.1M
• Amended senior bank facility in Nov 2018
($60M capacity). Five-year agreement with
improved rate structure and terms.
($ Millions)
Select Balance Sheet Items Dec 31, 2019 Sep 30, 2020
Cash $12.4 $10.4
Accounts Receivable 72.3 56.2
Inventories 3.3 5.1
Property & Equipment, Net 18.4 19.5
Goodwill & Intangibles 46.5 46.0
Operating Lease Right-Of-Use Assets 36.4 36.5
Other 14.3 14.5
Total Assets $203.6 $188.2
Accounts Payable $44.6 $22.9
Accrued Expenses & Other 32.2 33.8
Operating Lease Liabilities 42.2 41.3
Debt 37.8 39.5
Total Liabilities $156.8 $137.5
Total Shareholders’ Equity $46.8 $50.7
16
Investment Highlights
Rapid acceleration in online shopping brings tailwinds for PFSweb in 2021, as we are
uniquely positioned as a leader in global commerce with a strong value proposition and
can deliver branded commerce operations at scale.
PFSW’s competitive
advantage lies in our
ability to create
exceptional branded
digital and physical
shopping experiences at
scale.
• COVID crisis creating near and long-term benefits.
• Global footprint spanning three continents, brand-centric approach, and a
diversified portfolio of clients provide a strong foundation for growth.
• Multiple avenues for growth and margin expansion as we implement new
initiatives and introduce tech products that require limited PFS facility,
operations infrastructure and labor support costs.
• Forrester Research expects online buyer behavior to remain strong over the
next five years, with eCommerce driving more than half the growth in total
retail sales between 2021 and 2024.1
• Gartner recommends brands and retailers “accelerate the development and
availability of fulfillment services by adopting an aggressive, targeted
approach to expanding your last-mile fulfillment portfolio”.2
• Targeting 2020 SFE Revenue percentage growth in the mid to high-
teens3.
1. Source: Forrester Research, 2020 Online Retail Forecast, North America (COVID-19 Update). September 15, 2020.
2. Source: Gartner Research, Dead Ends, Diversions and New Directions: How Retail's Last Mile Needs to Adapt to a Post-COVID World, August 2020.
3. Company SFE Revenue guidance issued and effective on 12/15/2020 only

Thank
You

18
Senior Leadership Team
CEO
Mike Willoughby
• Promoted to CEO in March
2013
• 20 years with the company, 30+
years of business development
and digital marketing
experience
CFO
Tom Madden
• Appointed CFO in 1997
• 25 years with the company, 35+
years of finance and accounting
experience
EVP and PFS GM
Zach Thomann
• Promoted to EVP in January
2019, appointed as PFS GM in
2018
• 15 years with the company with
client services, operations and
technology experience
EVP and LiveArea GM
Jim Butler
• Hired in June 2019
• 20+ years of technology and
digital consulting experience,
most recently served as
president of Intersection and
former president of Isobar
19
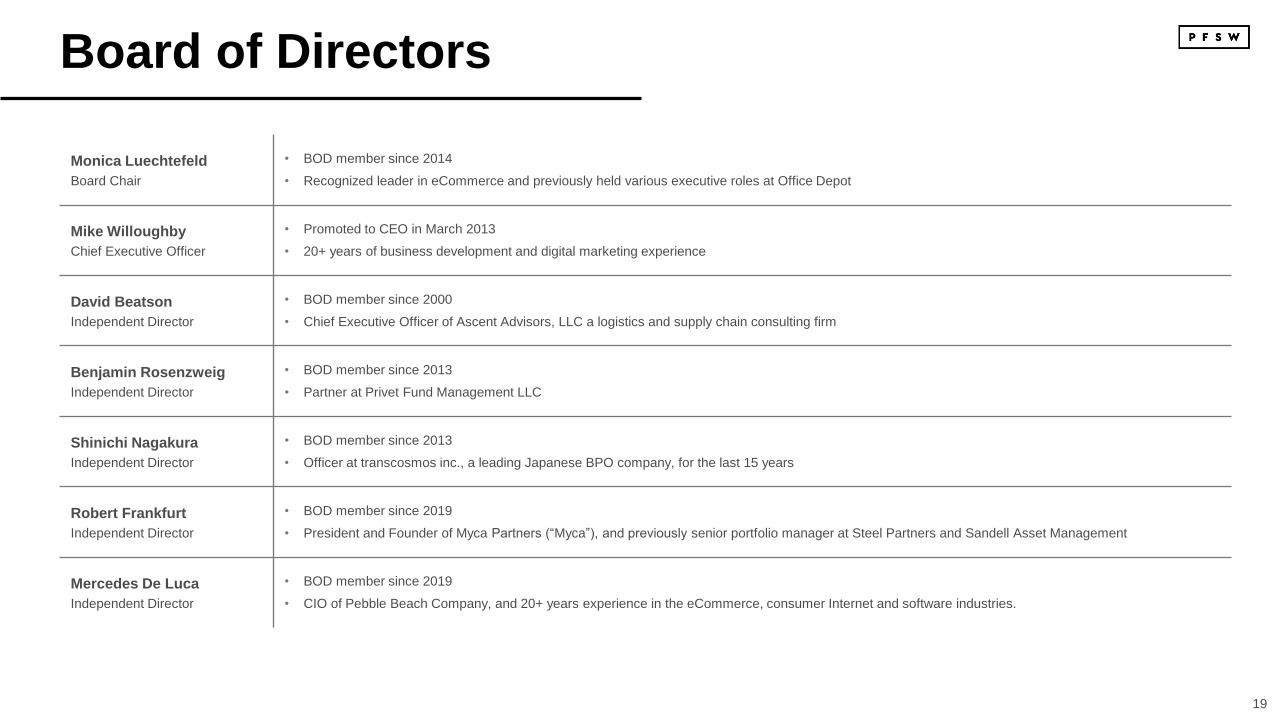
Board of Directors
Monica Luechtefeld
Board Chair
• BOD member since 2014
• Recognized leader in eCommerce and previously held various executive roles at Office Depot
Mike Willoughby
Chief Executive Officer
• Promoted to CEO in March 2013
• 20+ years of business development and digital marketing experience
David Beatson
Independent Director
• BOD member since 2000
• Chief Executive Officer of Ascent Advisors, LLC a logistics and supply chain consulting firm
Benjamin Rosenzweig
Independent Director
• BOD member since 2013
• Partner at Privet Fund Management LLC
Shinichi Nagakura
Independent Director
• BOD member since 2013
• Officer at transcosmos inc., a leading Japanese BPO company, for the last 15 years
Robert Frankfurt
Independent Director
• BOD member since 2019
• President and Founder of Myca Partners (“Myca”), and previously senior portfolio manager at Steel Partners and Sandell Asset Management
Mercedes De Luca
Independent Director
• BOD member since 2019
• CIO of Pebble Beach Company, and 20+ years experience in the eCommerce, consumer Internet and software industries.
20
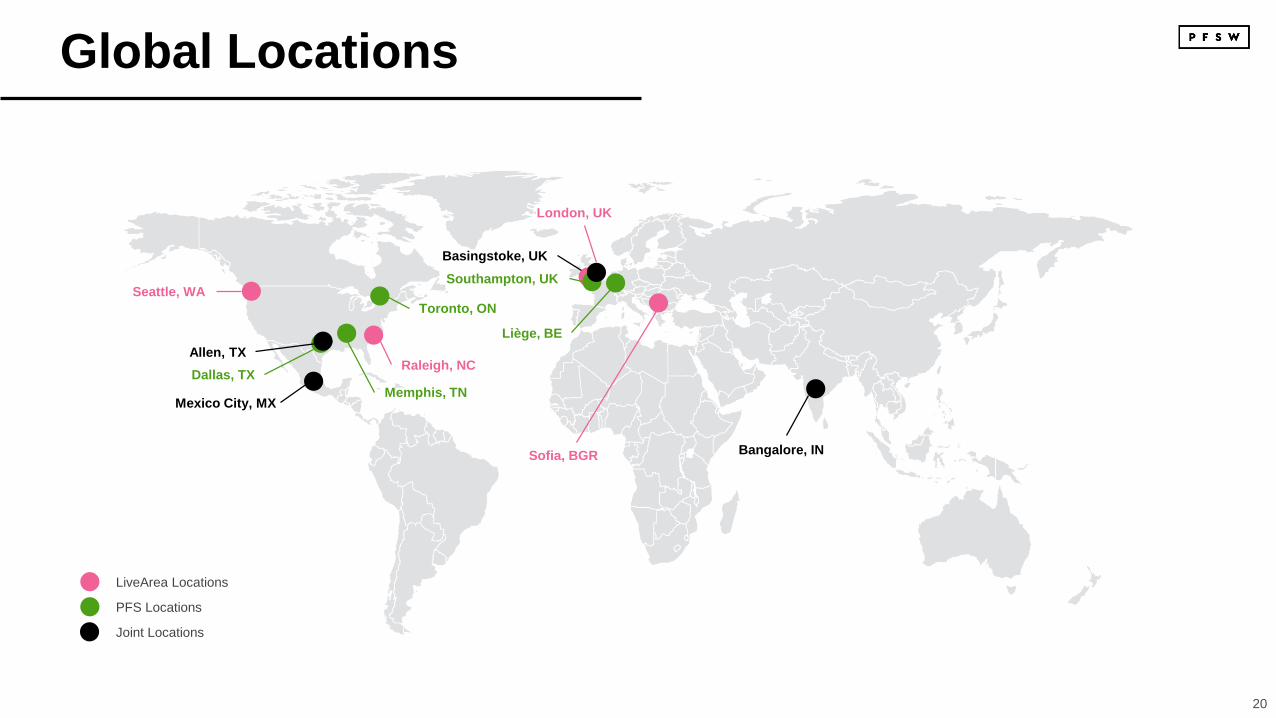
Global Locations
LiveArea Locations
PFS Locations
Joint Locations
Seattle, WA
Mexico City, MX
Dallas, TX
Allen, TX
Memphis, TN
Raleigh, NC
Toronto, ON
Bangalore, IN
London, UK
Southampton, UK
Liège, BE
Sofia, BGR
Basingstoke, UK
21
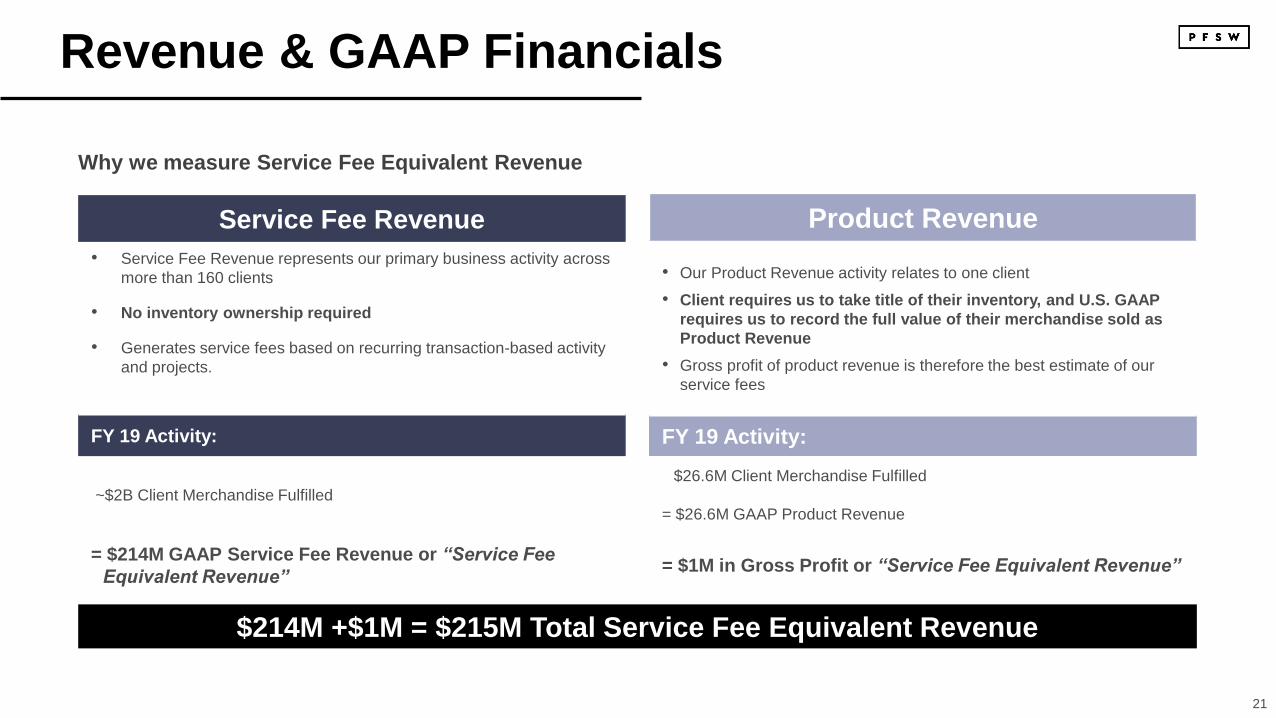
Revenue & GAAP Financials
Why we measure Service Fee Equivalent Revenue
Product Revenue
• Our Product Revenue activity relates to one client
• Client requires us to take title of their inventory, and U.S. GAAP
requires us to record the full value of their merchandise sold as
Product Revenue
• Gross profit of product revenue is therefore the best estimate of our
service fees
FY 19 Activity:
$26.6M Client Merchandise Fulfilled
= $26.6M GAAP Product Revenue
= $1M in Gross Profit or “Service Fee Equivalent Revenue”
Service Fee Revenue
• Service Fee Revenue represents our primary business activity across
more than 160 clients
• No inventory ownership required
• Generates service fees based on recurring transaction-based activity
and projects.
FY 19 Activity:
~$2B Client Merchandise Fulfilled
= $214M GAAP Service Fee Revenue or “Service Fee
Equivalent Revenue”
$214M +$1M = $215M Total Service Fee Equivalent Revenue
22
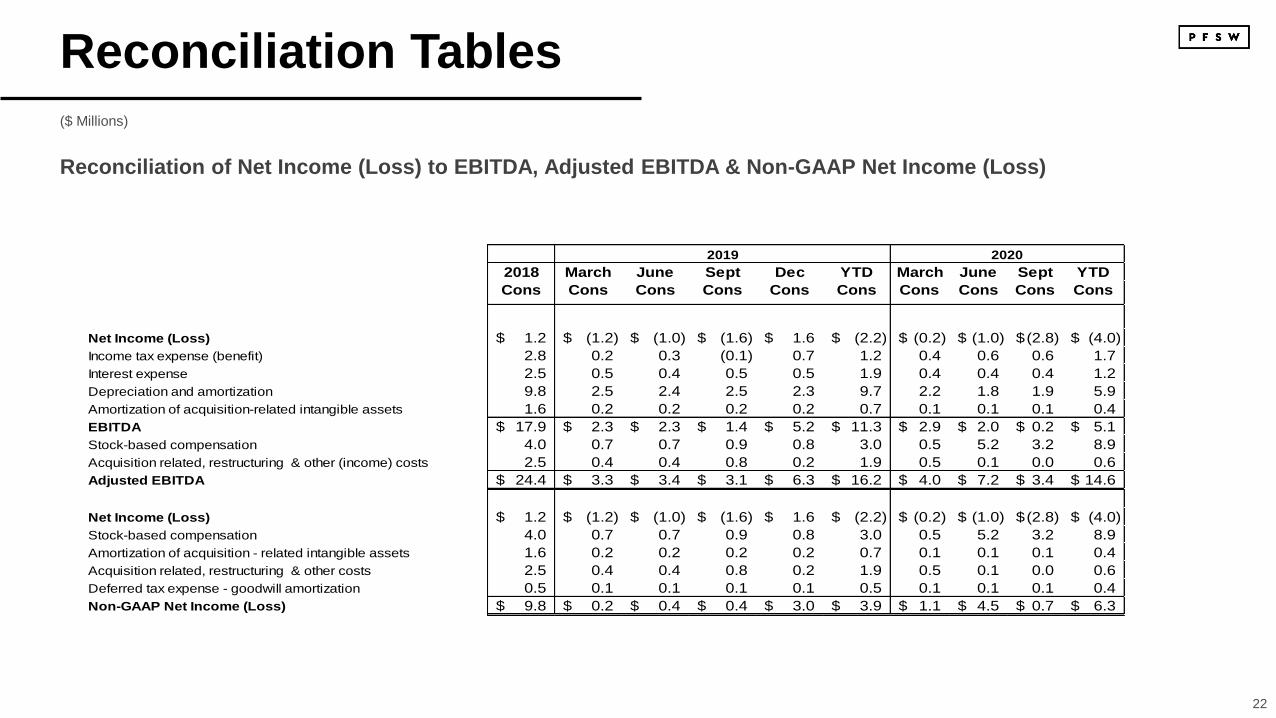
Reconciliation Tables
($ Millions)
Reconciliation of Net Income (Loss) to EBITDA, Adjusted EBITDA & Non-GAAP Net Income (Loss)
2019 2020
2018 March June Sept Dec YTD March June Sept YTD
Cons Cons Cons Cons Cons Cons Cons Cons Cons Cons
Net Income (Loss) 1.2$ (1.2)$ (1.0)$ (1.6)$ 1.6$ (2.2)$ (0.2)$ (1.0)$ (2.8)$ (4.0)$
Income tax expense (benefit) 2.8 0.2 0.3 (0.1) 0.7 1.2 0.4 0.6 0.6 1.7
Interest expense 2.5 0.5 0.4 0.5 0.5 1.9 0.4 0.4 0.4 1.2
Depreciation and amortization 9.8 2.5 2.4 2.5 2.3 9.7 2.2 1.8 1.9 5.9
Amortization of acquisition-related intangible assets 1.6 0.2 0.2 0.2 0.2 0.7 0.1 0.1 0.1 0.4
EBITDA 17.9$ 2.3$ 2.3$ 1.4$ 5.2$ 11.3$ 2.9$ 2.0$ 0.2$ 5.1$
Stock-based compensation 4.0 0.7 0.7 0.9 0.8 3.0 0.5 5.2 3.2 8.9
Acquisition related, restructuring & other (income) costs 2.5 0.4 0.4 0.8 0.2 1.9 0.5 0.1 0.0 0.6
Adjusted EBITDA 24.4$ 3.3$ 3.4$ 3.1$ 6.3$ 16.2$ 4.0$ 7.2$ 3.4$ 14.6$
Net Income (Loss) 1.2$ (1.2)$ (1.0)$ (1.6)$ 1.6$ (2.2)$ (0.2)$ (1.0)$ (2.8)$ (4.0)$
Stock-based compensation 4.0 0.7 0.7 0.9 0.8 3.0 0.5 5.2 3.2 8.9
Amortization of acquisition - related intangible assets 1.6 0.2 0.2 0.2 0.2 0.7 0.1 0.1 0.1 0.4
Acquisition related, restructuring & other costs 2.5 0.4 0.4 0.8 0.2 1.9 0.5 0.1 0.0 0.6
Deferred tax expense - goodwill amortization 0.5 0.1 0.1 0.1 0.1 0.5 0.1 0.1 0.1 0.4
Non-GAAP Net Income (Loss) 9.8$ 0.2$ 0.4$ 0.4$ 3.0$ 3.9$ 1.1$ 4.5$ 0.7$ 6.3$
23
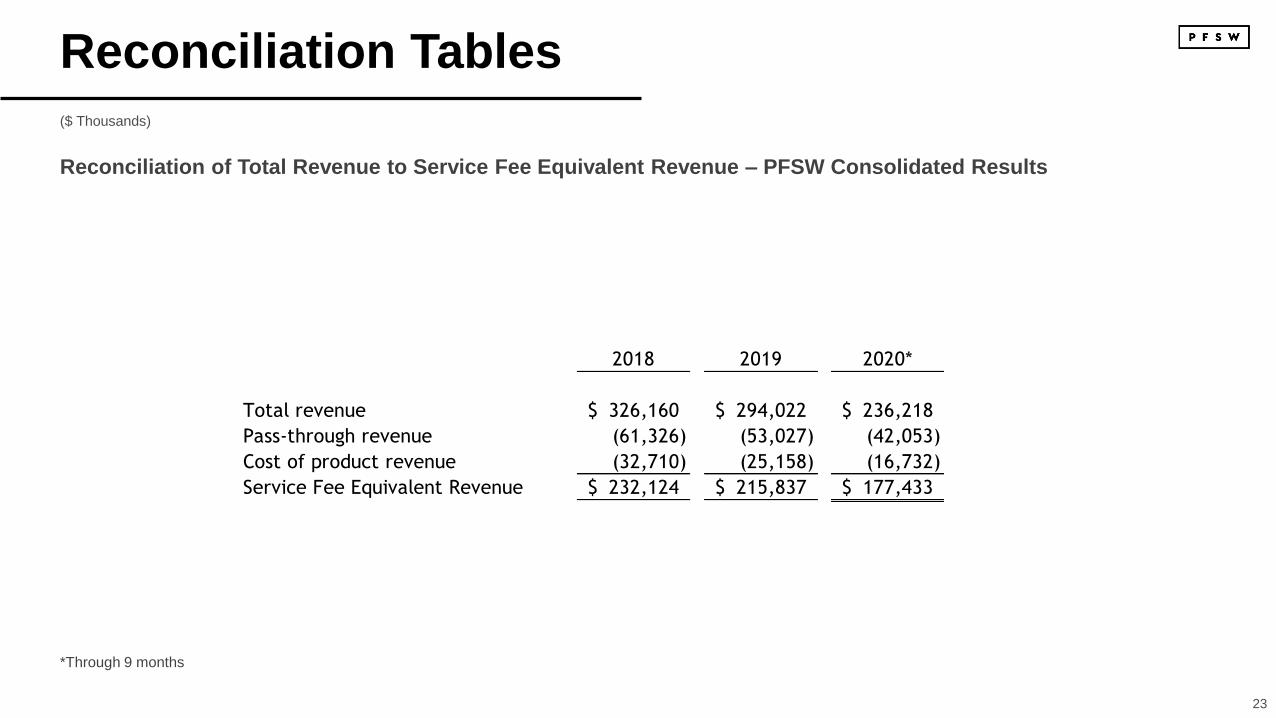
Reconciliation Tables
Reconciliation of Total Revenue to Service Fee Equivalent Revenue – PFSW Consolidated Results
2018 2019 2020*
Total revenue 326,160$ 294,022$ 236,218$
Pass-through revenue (61,326) (53,027) (42,053)
Cost of product revenue (32,710) (25,158) (16,732)
Service Fee Equivalent Revenue 232,124$ 215,837$ 177,433$
($ Thousands)
*Through 9 months
24
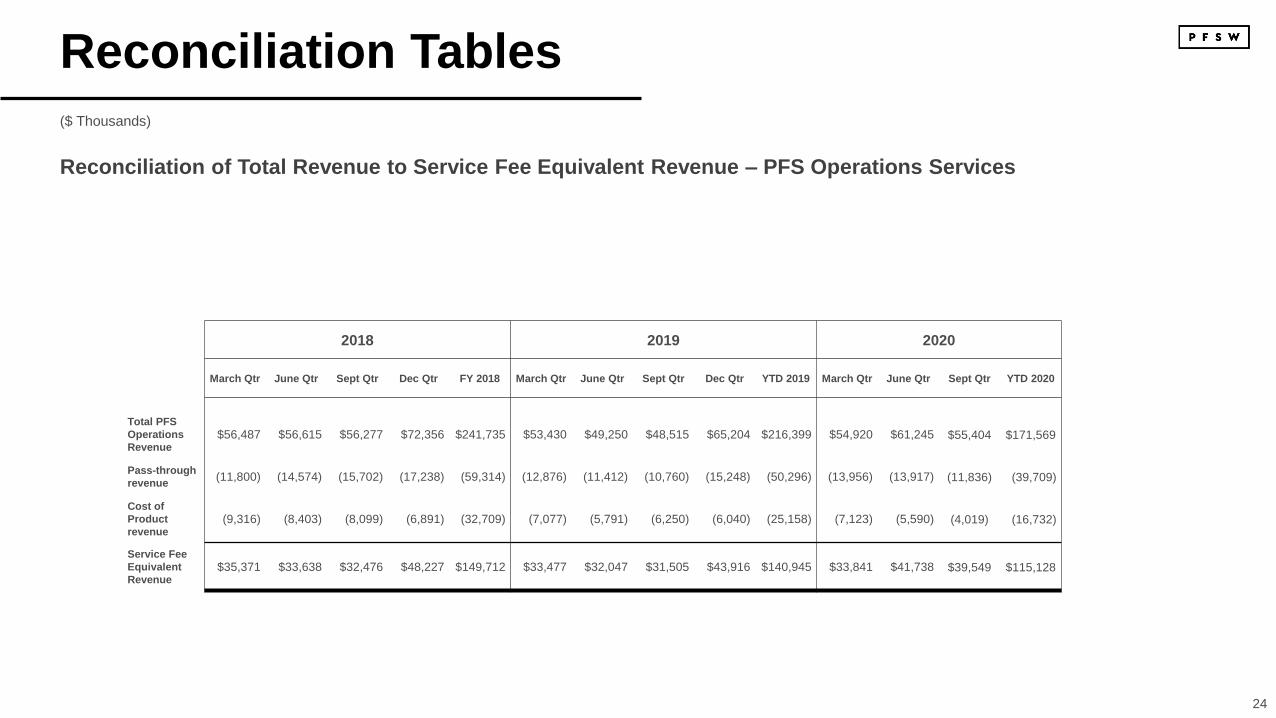
Reconciliation Tables
Reconciliation of Total Revenue to Service Fee Equivalent Revenue – PFS Operations Services
2018 2019 2020
March Qtr June Qtr Sept Qtr Dec Qtr FY 2018 March Qtr June Qtr Sept Qtr Dec Qtr YTD 2019 March Qtr June Qtr Sept Qtr YTD 2020
Total PFS
Operations
Revenue$56,487 $56,615 $56,277 $72,356 $241,735 $53,430 $49,250 $48,515 $65,204 $216,399 $54,920 $61,245 $55,404 $171,569
Pass-through
revenue(11,800) (14,574) (15,702) (17,238) (59,314) (12,876) (11,412) (10,760) (15,248) (50,296) (13,956) (13,917) (11,836) (39,709)
Cost of
Product
revenue(9,316) (8,403) (8,099) (6,891) (32,709) (7,077) (5,791) (6,250) (6,040) (25,158) (7,123) (5,590) (4,019) (16,732)
Service Fee
Equivalent
Revenue$35,371 $33,638 $32,476 $48,227 $149,712 $33,477 $32,047 $31,505 $43,916 $140,945 $33,841 $41,738 $39,549 $115,128
($ Thousands)
25
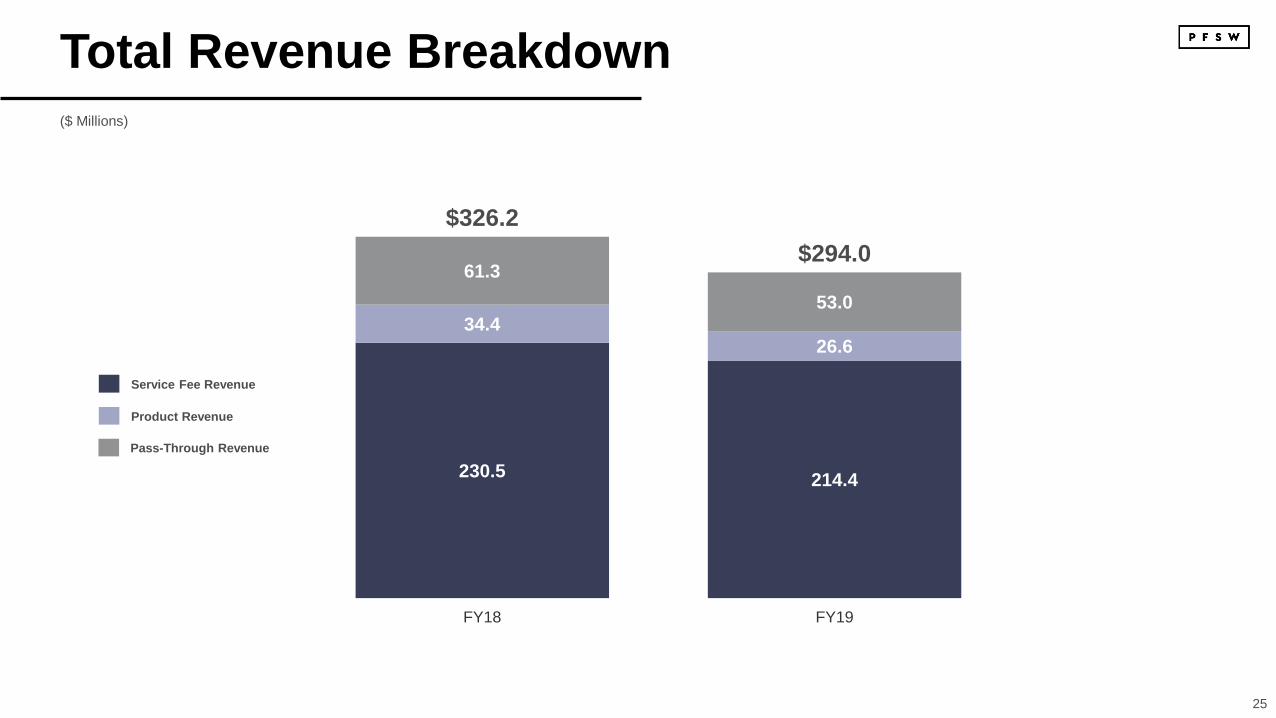
Total Revenue Breakdown
($ Millions)
230.5214.4
34.4
26.6
61.3
53.0
$326.2
$294.0
FY18 FY19
Service Fee Revenue
Product Revenue
Pass-Through Revenue
26
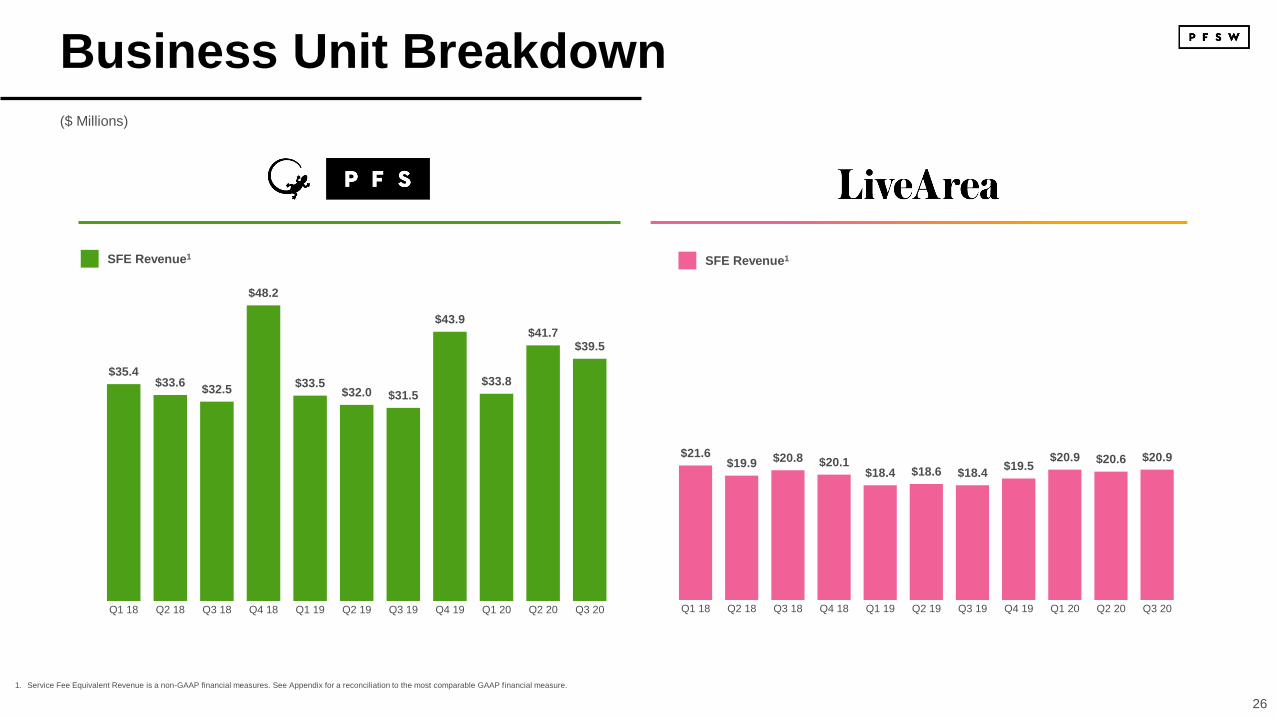
Business Unit Breakdown
($ Millions)
1. Service Fee Equivalent Revenue is a non-GAAP financial measures. See Appendix for a reconciliation to the most comparable GAAP financial measure.
SFE Revenue1
$21.6$19.9 $20.8 $20.1
$18.4 $18.6 $18.4$19.5
$20.9 $20.6 $20.9
Q1 18 Q2 18 Q3 18 Q4 18 Q1 19 Q2 19 Q3 19 Q4 19 Q1 20 Q2 20 Q3 20
$35.4$33.6
$32.5
$48.2
$33.5$32.0 $31.5
$43.9
$33.8
$41.7$39.5
Q1 18 Q2 18 Q3 18 Q4 18 Q1 19 Q2 19 Q3 19 Q4 19 Q1 20 Q2 20 Q3 20
SFE Revenue1
27
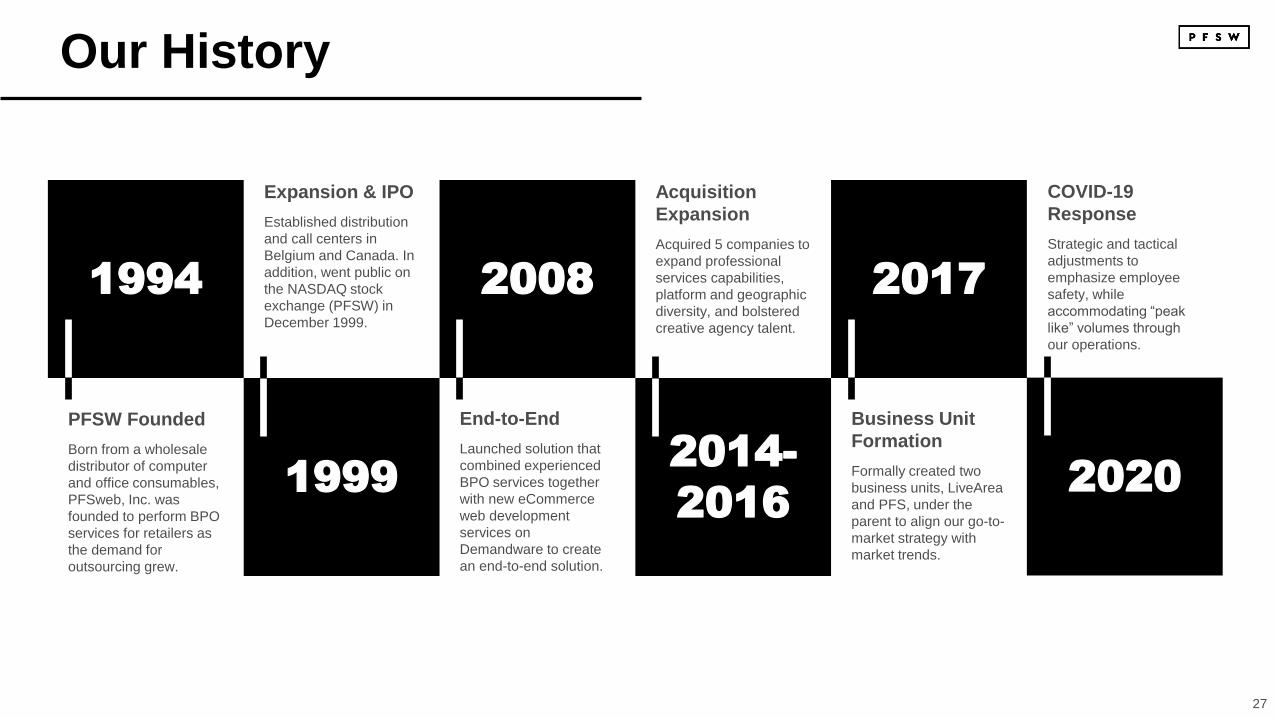
Our History
1994
1999
2008
2014-
2016
2017
PFSW Founded
Born from a wholesale
distributor of computer
and office consumables,
PFSweb, Inc. was
founded to perform BPO
services for retailers as
the demand for
outsourcing grew.
2020
Expansion & IPO
Established distribution
and call centers in
Belgium and Canada. In
addition, went public on
the NASDAQ stock
exchange (PFSW) in
December 1999.
End-to-End
Launched solution that
combined experienced
BPO services together
with new eCommerce
web development
services on
Demandware to create
an end-to-end solution.
Acquisition
Expansion
Acquired 5 companies to
expand professional
services capabilities,
platform and geographic
diversity, and bolstered
creative agency talent.
Business Unit
Formation
Formally created two
business units, LiveArea
and PFS, under the
parent to align our go-to-
market strategy with
market trends.
COVID-19
Response
Strategic and tactical
adjustments to
emphasize employee
safety, while
accommodating “peak
like” volumes through
our operations.
Related Documents