UNITED STATES SECURITIES AND EXCHANGE COMMISSION Washington, D.C. 20549 FORM 10-K (Mark One) x ANNUAL REPORT PURSUANT TO SECTION 13 OR 15(d) OF THE SECURITIES EXCHANGE ACT OF 1934 For the fiscal year ended December 31, 2016 o TRANSITION REPORT PURSUANT TO SECTION 13 OR 15(d) OF THE SECURITIES EXCHANGE ACT OF 1934 For the transition period from to Commission file number 1-3619 PFIZER INC. (Exact name of registrant as specified in its charter) Delaware 13-5315170 (State or other jurisdiction of incorporation or organization) (I.R.S. Employer Identification Number) 235 East 42nd Street New York, New York 10017-5755 (Address of principal executive offices) (Zip Code) (212) 733-2323 (Registrant’s telephone number, including area code) Securities registered pursuant to Section 12(b) of the Act: Title of each class Name of each exchange on which registered Common Stock, $.05 par value New York Stock Exchange Securities registered pursuant to Section 12(g) of the Act: None Indicate by check mark if the registrant is a well-known seasoned issuer, as defined in Rule 405 of the Securities Act. Yes x No o Indicate by check mark if the registrant is not required to file reports pursuant to Section 13 or Section 15(d) of the Act. Yes o No x Indicate by check mark whether the registrant (1) has filed all reports required to be filed by Section 13 or 15(d) of the Securities Exchange Act of 1934 during the preceding 12 months (or for such shorter period that the registrant was required to file such reports), and (2) has been subject to such filing requirements for the past 90 days. Yes x No o Indicate by check mark whether the registrant has submitted electronically and posted on its corporate Website, if any, every Interactive Data File required to be submitted and posted pursuant to Rule 405 of Regulation S-T (§232-405 of this chapter) during the preceding 12 months (or for such shorter period that the registrant was required to submit and post such files.) Yes x No o Indicate by check mark if disclosure of delinquent filers pursuant to Item 405 of Regulation S-K is not contained herein, and will not be contained, to the best of registrant’s knowledge, in definitive proxy or information statements incorporated by reference in Part III of this Form 10-K or any amendment to this Form 10-K. o Indicate by check mark whether the registrant is a large accelerated filer, an accelerated filer, a non-accelerated filer or a smaller reporting company. See the definitions of “large accelerated filer,” “accelerated filer” and “smaller reporting company” in Rule 12b-2 of the Exchange Act. Large accelerated filer x Accelerated filer o Non-accelerated filer o Smaller reporting company o Indicate by check mark whether the registrant is a shell company (as defined in Rule 12b-2 of the Exchange Act). Yes o No x The aggregate market value of the voting stock held by non-affiliates of the registrant, computed by reference to the closing price as of the last business day of the registrant’s most recently completed second fiscal quarter, July 3, 2016 , was approximately $216 billion . This excludes shares of common stock held by directors and executive officers at July 3, 2016. Exclusion of shares held by any person should not be construed to indicate that such person possesses the power, directly or indirectly, to direct or cause the direction of the management or policies of the registrant, or that such person is controlled by or under common control with the registrant. The registrant has no non-voting common stock. The number of shares outstanding of the registrant’s common stock as of February 21, 2017 was 5,951,872,174 shares of common stock, all of one class. DOCUMENTS INCORPORATED BY REFERENCE Portions of the 2016 Annual Report to Shareholders Parts I, II and IV Portions of the Proxy Statement for the 2017 Annual Meeting of Shareholders Part III

Welcome message from author
This document is posted to help you gain knowledge. Please leave a comment to let me know what you think about it! Share it to your friends and learn new things together.
Transcript
UNITED STATES SECURITIES AND EXCHANGE COMMISSIONWashington, D.C. 20549
FORM 10-K
(Mark One) x ANNUAL REPORT PURSUANT TO SECTION 13 OR 15(d) OF THE SECURITIES EXCHANGE ACT OF 1934
For the fiscal year ended December 31, 2016
o TRANSITION REPORT PURSUANT TO SECTION 13 OR 15(d) OF THE SECURITIES EXCHANGE ACT OF 1934
For the transition period from to Commission file number 1-3619
PFIZER INC.(Exact name of registrant as specified in its charter)
Delaware 13-5315170(State or other jurisdiction of incorporation or organization) (I.R.S. Employer Identification Number)
235 East 42nd Street New York, New York 10017-5755(Address of principal executive offices) (Zip Code)
(212) 733-2323(Registrant’s telephone number, including area code)
Securities registered pursuant to Section 12(b) of the Act:
Title of each class Name of each exchange on which registeredCommon Stock, $.05 par value New York Stock Exchange
Securities registered pursuant to Section 12(g) of the Act:None
Indicate by check mark if the registrant is a well-known seasoned issuer, as defined in Rule 405 of the Securities Act. Yes x No oIndicate by check mark if the registrant is not required to file reports pursuant to Section 13 or Section 15(d) of the Act. Yes o No xIndicate by check mark whether the registrant (1) has filed all reports required to be filed by Section 13 or 15(d) of the Securities Exchange Act of 1934 during the preceding 12months (or for such shorter period that the registrant was required to file such reports), and (2) has been subject to such filing requirements for the past 90 days. Yes xNo oIndicate by check mark whether the registrant has submitted electronically and posted on its corporate Website, if any, every Interactive Data File required to be submitted andposted pursuant to Rule 405 of Regulation S-T (§232-405 of this chapter) during the preceding 12 months (or for such shorter period that the registrant was required to submitand post such files.) Yes x No oIndicate by check mark if disclosure of delinquent filers pursuant to Item 405 of Regulation S-K is not contained herein, and will not be contained, to the best of registrant’sknowledge, in definitive proxy or information statements incorporated by reference in Part III of this Form 10-K or any amendment to this Form 10-K. oIndicate by check mark whether the registrant is a large accelerated filer, an accelerated filer, a non-accelerated filer or a smaller reporting company. See the definitions of“large accelerated filer,” “accelerated filer” and “smaller reporting company” in Rule 12b-2 of the Exchange Act.
Large accelerated filer x Accelerated filer o Non-accelerated filer o Smaller reporting company o
Indicate by check mark whether the registrant is a shell company (as defined in Rule 12b-2 of the Exchange Act). Yes o No xThe aggregate market value of the voting stock held by non-affiliates of the registrant, computed by reference to the closing price as of the last business day of the registrant’smost recently completed second fiscal quarter, July 3, 2016 , was approximately $216 billion . This excludes shares of common stock held by directors and executive officers atJuly 3, 2016. Exclusion of shares held by any person should not be construed to indicate that such person possesses the power, directly or indirectly, to direct or cause thedirection of the management or policies of the registrant, or that such person is controlled by or under common control with the registrant. The registrant has no non-votingcommon stock.The number of shares outstanding of the registrant’s common stock as of February 21, 2017 was 5,951,872,174 shares of common stock, all of one class.
DOCUMENTS INCORPORATED BY REFERENCEPortions of the 2016 Annual Report to Shareholders Parts I, II and IVPortions of the Proxy Statement for the 2017 Annual Meeting of Shareholders Part III
TABLE OF CONTENTS
PagePART I 1ITEM 1. BUSINESS 1
General 1Available Information and Pfizer Website 2Commercial Operations 3Innovative Health 4Essential Health 4Alliance Revenues 5Research and Development 6International Operations 7Marketing 7Patents and Other Intellectual Property Rights 8Competition 8Raw Materials 10Government Regulation and Price Constraints 10Environmental Matters 10Tax Matters 10Employees 10Disclosure Pursuant to Section 219 of the Iran Threat Reduction and Syria Human Rights Act of 2012 10
ITEM 1A. RISK FACTORS 11ITEM 1B. UNRESOLVED STAFF COMMENTS 22ITEM 2. PROPERTIES 22ITEM 3. LEGAL PROCEEDINGS 23ITEM 4. MINE SAFETY DISCLOSURES 23EXECUTIVE OFFICERS OF THE COMPANY 24 PART II 25ITEM 5. MARKET FOR THE COMPANY’S COMMON EQUITY, RELATED STOCKHOLDER MATTERS AND ISSUER PURCHASES OF EQUITYSECURITIES 25ITEM 6. SELECTED FINANCIAL DATA 25ITEM 7. MANAGEMENT’S DISCUSSION AND ANALYSIS OF FINANCIAL CONDITION AND RESULTS OF OPERATIONS 25ITEM 7A. QUANTITATIVE AND QUALITATIVE DISCLOSURES ABOUT MARKET RISK 26ITEM 8. FINANCIAL STATEMENTS AND SUPPLEMENTARY DATA 26ITEM 9. CHANGES IN AND DISAGREEMENTS WITH ACCOUNTANTS ON ACCOUNTING AND FINANCIAL DISCLOSURE 26ITEM 9A. CONTROLS AND PROCEDURES 26ITEM 9B. OTHER INFORMATION 26 PART III 27ITEM 10. DIRECTORS, EXECUTIVE OFFICERS AND CORPORATE GOVERNANCE 27ITEM 11. EXECUTIVE COMPENSATION 27ITEM 12. SECURITY OWNERSHIP OF CERTAIN BENEFICIAL OWNERS AND MANAGEMENT AND RELATED STOCKHOLDER MATTERS 27ITEM 13. CERTAIN RELATIONSHIPS AND RELATED TRANSACTIONS, AND DIRECTOR INDEPENDENCE 27ITEM 14. PRINCIPAL ACCOUNTING FEES AND SERVICES 27 PART IV 28ITEM 15. EXHIBITS, FINANCIAL STATEMENT SCHEDULES 28
15(a)(1) Financial Statements 2815(a)(2) Financial Statement Schedules 2815(a)(3) Exhibits 28
ITEM 16. FORM 10-K SUMMARY 28
Pfizer Inc. 2016 Form 10-K i
DEFINED TERMS
Unless the context requires otherwise, references to “Pfizer,” “the Company,” “we,” “us” or “our” in this 2016 Form 10-K (defined below) refer to Pfizer Inc. and itssubsidiaries. We also have used several other terms in this 2016 Form 10-K, most of which are explained or defined below.
2016 Financial Report Exhibit 13 to this 2016 Form 10-K2016 Form 10-K This Annual Report on Form 10-K for the fiscal year ended December 31, 20162017 Proxy Statement Proxy Statement for the 2017 Annual Meeting of ShareholdersACA U.S. Patient Protection and Affordable Care Act, as amended by the Health Care and Education Reconciliation ActAlliance revenues Revenues from alliance agreements under which we co-promote products discovered or developed by other companies or usAnacor Anacor Pharmaceuticals, Inc.ANDA Abbreviated New Drug ApplicationAstellas Astellas Pharma US, Inc.BLA Biologics License ApplicationBMS Bristol-Myers Squibb CompanycGMPs current Good Manufacturing PracticesCFDA China Food and Drug AdministrationDEA U.S. Drug Enforcement AgencyDeveloped Markets U.S., Western Europe, Japan, Canada, Australia, Scandinavian countries, South Korea, Finland and New ZealandEFPIA European Federation of Pharmaceutical Industries and AssociationsEH Essential HealthEMA European Medicines AgencyEmerging Markets Includes, but is not limited to, the following markets: Asia (excluding Japan and South Korea), Latin America, Africa, Eastern
Europe, Central Europe, the Middle East and TurkeyEU European UnionExchange Act Securities Exchange Act of 1934, as amendedFCPA U.S. Foreign Corrupt Practices ActFDA U.S. Food and Drug AdministrationFFDCA U.S. Federal Food, Drug and Cosmetic ActGPD Global Product Development organizationHIS Hospira Infusion SystemsHospira Hospira, Inc.ICU Medical ICU Medical, Inc.IH Innovative HealthIPR&D In-process Research and DevelopmentLOE Loss of ExclusivityMCO Managed Care OrganizationMedivation Medivation, Inc.NDA New Drug ApplicationNYSE New York Stock ExchangeOTC over-the-counterPBM Pharmacy Benefit ManagerPMDA Pharmaceuticals and Medical Device Agency in JapanR&D Research and DevelopmentSEC U.S. Securities and Exchange CommissionU.K. United KingdomU.S. United StatesWRD Worldwide Research and Development
Pfizer Inc. 2016 Form 10-K ii
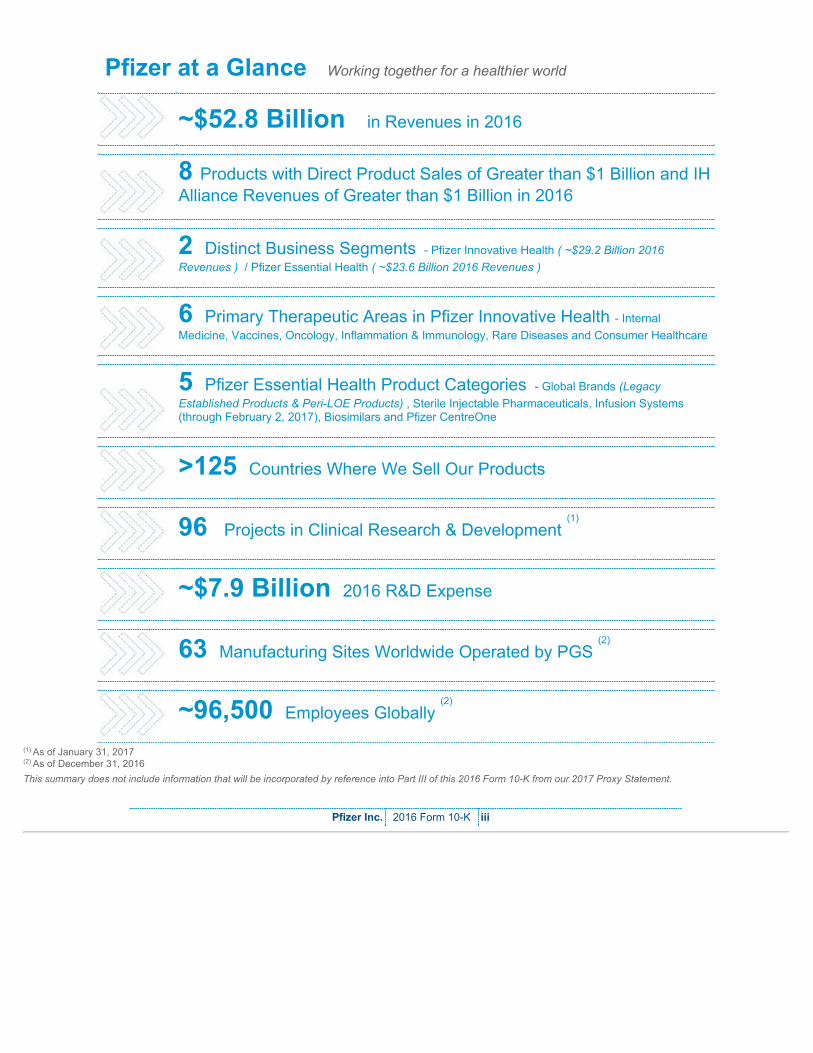
Pfizer at a Glance Working together for a healthier world
~$52.8 Billion in Revenues in 2016
8 Products with Direct Product Sales of Greater than $1 Billion and IHAlliance Revenues of Greater than $1 Billion in 2016
2 Distinct Business Segments - Pfizer Innovative Health ( ~$29.2 Billion 2016Revenues ) / Pfizer Essential Health ( ~$23.6 Billion 2016 Revenues )
6 Primary Therapeutic Areas in Pfizer Innovative Health - InternalMedicine, Vaccines, Oncology, Inflammation & Immunology, Rare Diseases and Consumer Healthcare
5 Pfizer Essential Health Product Categories - Global Brands (LegacyEstablished Products & Peri-LOE Products) , Sterile Injectable Pharmaceuticals, Infusion Systems(through February 2, 2017), Biosimilars and Pfizer CentreOne
>125 Countries Where We Sell Our Products
96 Projects in Clinical Research & Development (1)
~$7.9 Billion 2016 R&D Expense
63 Manufacturing Sites Worldwide Operated by PGS (2)
~96,500 Employees Globally (2)
(1) As of January 31, 2017(2) As of December 31, 2016This summary does not include information that will be incorporated by reference into Part III of this 2016 Form 10-K from our 2017 Proxy Statement.
Pfizer Inc. 2016 Form 10-K iii

TABLE OF CONTENTS
PART I
ITEM 1. BUSINESS
GENERAL
Pfizer Inc. is a research-based, global biopharmaceutical company. We apply science and our global resources to bring therapies to people that extend andsignificantly improve their lives through the discovery, development and manufacture of healthcare products. Our global portfolio includes medicines andvaccines, as well as many of the world’s best-known consumer healthcare products. We work across developed and emerging markets to advance wellness,prevention, treatments and cures that challenge the most feared diseases of our time. We collaborate with healthcare providers, governments and localcommunities to support and expand access to reliable, affordable healthcare around the world. Our revenues are derived from the sale of our products and, to amuch lesser extent, from alliance agreements, under which we co-promote products discovered or developed by other companies or us. The majority of ourrevenues come from the manufacture and sale of biopharmaceutical products. The Company was incorporated under the laws of the State of Delaware on June2, 1942.
We believe that our medicines provide significant value for both healthcare providers and patients, not only from the improved treatment of diseases but alsofrom a reduction in other healthcare costs, such as emergency room or hospitalization costs, as well as improvements in health, wellness and productivity. Wecontinue to actively engage in dialogues about the value of our medicines and how we can best work with patients, physicians and payers to prevent and treatdisease and improve outcomes. We continue to work within the current legal and pricing structures, as well as continue to review our pricing arrangements andcontracting methods with payers, to maximize patient access and minimize any adverse impact on our revenues. We remain firmly committed to fulfilling ourcompany’s purpose of innovating to bring therapies to patients that extend and significantly improve their lives. By doing so, we expect to create value for thepatients we serve and for our shareholders.
We are committed to capitalizing on growth opportunities by advancing our own pipeline and maximizing the value of our in-line products, as well as throughvarious forms of business development, which can include alliances, licenses, joint ventures, collaborations, equity- or debt-based investments, dispositions,mergers and acquisitions. We view our business development activity as an enabler of our strategies, and we seek to generate earnings growth and enhanceshareholder value by pursuing a disciplined, strategic and financial approach to evaluating business development opportunities.
On February 3, 2017, we completed the sale of our global infusion therapy net assets, HIS, to ICU Medical for up to approximately $900 million, composed ofcash and contingent cash consideration, ICU Medical common stock and seller financing. HIS includes IV pumps, solutions and devices. Under the terms of theagreement, we received 3.2 million newly issued shares of ICU Medical common stock, which we valued at approximately $430 million (based upon the closingprice of ICU Medical common stock on the closing date less a discount for lack of marketability), a promissory note from ICU Medical in the amount of $75million and net cash of approximately $200 million before customary adjustments for net working capital. In addition, we are entitled to receive a contingentamount of up to an additional $225 million in cash based on ICU Medical’s achievement of certain cumulative performance targets for the combined companythrough December 31, 2019. After receipt of the ICU Medical shares, we own approximately 16.4% of ICU Medical as of the closing date. We have agreed tocertain restrictions on transfer of our ICU Medical shares for 18 months. For additional information, see Notes to Consolidated Financial Statements— Note 2B.Acquisitions, Assets and Liabilities Held for Sale, Licensing Agreements, Research and Development and Collaborative Arrangements, Equity-MethodInvestments and Cost-Method Investment: Assets and Liabilities Held for Sale in our 2016 Financial Report.
On December 22, 2016, which falls in the first fiscal quarter of 2017 for our international operations, we acquired the development and commercialization rightsto AstraZeneca’s small molecule anti-infectives business, primarily outside the U.S., including the commercialization and development rights to the newlyapproved EU drug Zavicefta™ (ceftazidime-avibactam), the marketed agents Merrem™/Meronem™ (meropenem) and Zinforo™ (ceftaroline fosamil), and theclinical development assets aztreonam-avibactam and ceftaroline fosamil-avibactam. Under the terms of the agreement, we made an upfront payment ofapproximately $550 million to AstraZeneca upon the close of the transaction and will make a deferred payment of $175 million in January 2019. In addition,AstraZeneca is eligible to receive up to $250 million in milestone payments, up to $600 million in sales-related payments, as well as tiered royalties on sales ofZavicefta™ and aztreonam-avibactam in certain markets.
On September 28, 2016, we acquired Medivation for approximately $14.3 billion in cash ($13.9 billion, net of cash acquired). Medivation is now a wholly-ownedsubsidiary of Pfizer. Medivation is a biopharmaceutical company focused on developing and commercializing small molecules for oncology. Medivation’sportfolio includes Xtandi (enzalutamide), an androgen receptor inhibitor that blocks multiple steps in the androgen receptor signaling pathway within tumor cells,and two development-stage oncology assets. Xtandi is being developed and commercialized through a collaboration between Pfizer and Astellas. Astellas hasexclusive commercialization rights for Xtandi outside the U.S. For additional information, see the Notes to Consolidated Financial Statements— Note 2A.Acquisitions, Assets and Liabilities Held for Sale, Licensing Agreements, Research and Development and Collaborative Arrangements, Equity-MethodInvestments and Cost-Method Investment: Acquisitions in our 2016 Financial Report.
On June 24, 2016, we acquired Anacor for approximately $4.9 billion in cash ($4.5 billion net of cash acquired), plus $698 million debt assumed. Anacor is now awholly-owned subsidiary of Pfizer. Anacor is a biopharmaceutical company focused on novel small-molecule therapeutics derived from its boron chemistryplatform. Anacor’s crisaborole, a non-steroidal topical PDE-4 inhibitor with anti-inflammatory properties, was approved by the FDA on December 14, 2016 underthe trade name, Eucrisa . For additional information, see the Notes to Consolidated Financial Statements— Note 2A. Acquisitions, Assets and Liabilities Held forSale, Licensing Agreements, Research and Development and Collaborative Arrangements, Equity-Method Investments and Cost-Method Investment:Acquisitions in our 2016 Financial Report.
On September 3, 2015, we acquired Hospira, a leading provider of sterile injectable drugs and infusion technologies as well as a provider of biosimilars, forapproximately $16.1 billion in cash ( $15.7 billion , net of cash acquired). The combination of local Pfizer and Hospira entities may be pending in variousjurisdictions and integration is subject to completion of various local legal and regulatory steps. For additional information, see the Notes to ConsolidatedFinancial Statements— Note 2A. Acquisitions, Assets and Liabilities Held for Sale, Licensing Agreements, Research and Development and CollaborativeArrangements, Equity-Method Investments and Cost-Method Investment : Acquisitions in our 2016 Financial Report.
For a further discussion of our strategy and our business development initiatives, see the Overview of Our Performance, Operating Environment, Strategy andOutlook — Our Strategy — Our Business Development Initiatives section in our 2016 Financial Report.
Our businesses are heavily regulated in most of the countries in which we operate. In the U.S., the principal authority regulating our operations is the FDA. TheFDA regulates the safety and efficacy of the products we offer and our research, quality, manufacturing processes, product promotion, advertising and productlabeling. Similar regulations exist in most other countries, and in many countries the government also regulates our prices. In the EU, the EMA regulates thescientific evaluation, supervision and safety monitoring of our products, and employs a centralized procedure for approval of drugs for the EU and the European

Economic Area countries. In Japan, the PMDA is involved in a wide range of regulatory activities, including clinical studies, approvals, post-marketing reviewsand pharmaceutical safety. Health authorities in many middle and lower income countries require marketing approval by a recognized regulatory authority, suchas the FDA or EMA, before they begin to conduct their application review process and/or issue their final approval. For additional information, see theGovernment Regulation and Price Constraints section below.
Note: Some amounts in this 2016 Form 10-K may not add due to rounding. All percentages have been calculated using unrounded amounts.
Pfizer Inc. 2016 Form 10-K 1
TABLE OF CONTENTS
AVAILABLE INFORMATION AND PFIZER WEBSITE
Our website is located at www.pfizer.com . This 2016 Form 10-K, our Quarterly Reports on Form 10-Q and our Current Reports on Form 8-K, and amendmentsto those reports filed or furnished pursuant to Section 13(a) or 15(d) of the Exchange Act, are available (free of charge) on our website, in text format and, whereapplicable, in interactive data file format , as soon as reasonably practicable after we electronically file such material with, or furnish it to, the SEC.
Throughout this 2016 Form 10-K, we “incorporate by reference” certain information from other documents filed or to be filed with the SEC, including our 2017Proxy Statement and the 2016 Financial Report, portions of which are filed as Exhibit 13 to this 2016 Form 10-K, and which also will be contained in Appendix Ato our 2017 Proxy Statement. The SEC allows us to disclose important information by referring to it in that manner. Please refer to such information. Our 2016Annual Report to Shareholders consists of the 2016 Financial Report and the Corporate and Shareholder Information attached to the 2017 Proxy Statement. Our2016 Financial Report will be available on our website on or about February 23, 2017. Our 2017 Proxy Statement will be available on our website on or aboutMarch 16, 2017.
We may use our website as a means of disclosing material information and for complying with our disclosure obligations under Regulation Fair Disclosurepromulgated by the SEC. These disclosures are included on our website in the “Investors” or “News” sections. Accordingly, investors should monitor theseportions of our website, in addition to following Pfizer’s press releases, SEC filings, public conference calls and webcasts, as well as Pfizer’s social mediachannels (Pfizer’s Facebook, YouTube and LinkedIn pages and Twitter accounts ( @Pfizer and @Pfizer_News )).
Information relating to corporate governance at Pfizer, including our Corporate Governance Principles; Director Qualification Standards; Pfizer Policies onBusiness Conduct (for all of our employees, including our Chief Executive Officer, Chief Financial Officer and Principal Accounting Officer); Code of BusinessConduct and Ethics for Members of the Board of Directors; information concerning our Directors; ways to communicate by e-mail with our Directors; BoardCommittees; Committee Charters; Charter of the Lead Independent Director; and transactions in Pfizer securities by Directors and Officers; as well as ChiefExecutive Officer and Chief Financial Officer certifications, are available on our website. We will provide any of the foregoing information without charge uponwritten request to our Corporate Secretary, Pfizer Inc., 235 East 42nd Street, New York, NY 10017-5755. We will disclose any future amendments to, or waiversfrom, provisions of the Pfizer Policies on Business Conduct affecting our Chief Executive Officer, Chief Financial Officer and Controller on our website aspromptly as practicable, as may be required under applicable SEC and NYSE rules. Information relating to shareholder services, including the ComputershareInvestment Program, book-entry share ownership and direct deposit of dividends, is also available on our website.
The information contained on our website, our Facebook, YouTube and LinkedIn pages or our Twitter accounts does not, and shall not be deemed to, constitutea part of this 2016 Form 10-K. Pfizer’s references to the URLs for websites are intended to be inactive textual references only.
Pfizer Inc. 2016 Form 10-K 2
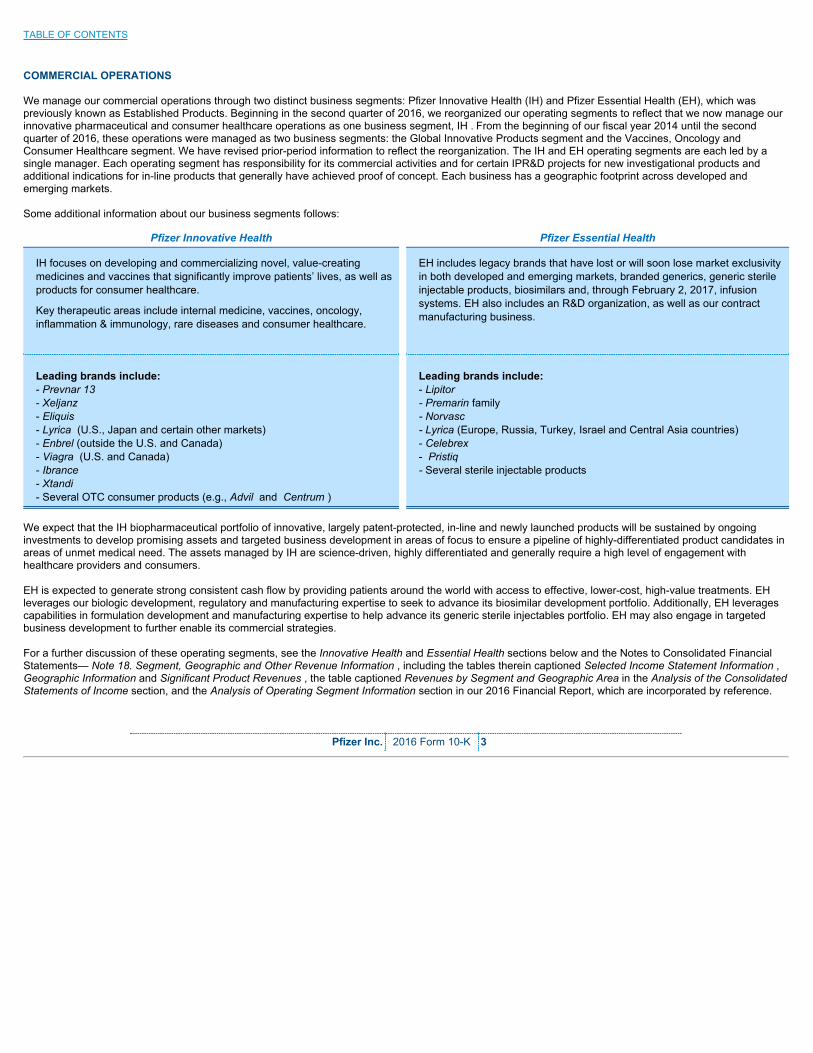
TABLE OF CONTENTS
COMMERCIAL OPERATIONS
We manage our commercial operations through two distinct business segments: Pfizer Innovative Health (IH) and Pfizer Essential Health (EH), which waspreviously known as Established Products. Beginning in the second quarter of 2016, we reorganized our operating segments to reflect that we now manage ourinnovative pharmaceutical and consumer healthcare operations as one business segment, IH . From the beginning of our fiscal year 2014 until the secondquarter of 2016, these operations were managed as two business segments: the Global Innovative Products segment and the Vaccines, Oncology andConsumer Healthcare segment. We have revised prior-period information to reflect the reorganization. The IH and EH operating segments are each led by asingle manager. Each operating segment has responsibility for its commercial activities and for certain IPR&D projects for new investigational products andadditional indications for in-line products that generally have achieved proof of concept. Each business has a geographic footprint across developed andemerging markets.
Some additional information about our business segments follows:
Pfizer Innovative Health Pfizer Essential Health
IH focuses on developing and commercializing novel, value-creatingmedicines and vaccines that significantly improve patients’ lives, as well asproducts for consumer healthcare.
Key therapeutic areas include internal medicine, vaccines, oncology,inflammation & immunology, rare diseases and consumer healthcare.
EH includes legacy brands that have lost or will soon lose market exclusivityin both developed and emerging markets, branded generics, generic sterileinjectable products, biosimilars and, through February 2, 2017, infusionsystems. EH also includes an R&D organization, as well as our contractmanufacturing business.
Leading brands include:- Prevnar 13- Xeljanz- Eliquis- Lyrica (U.S., Japan and certain other markets)- Enbrel (outside the U.S. and Canada)- Viagra (U.S. and Canada)- Ibrance- Xtandi- Several OTC consumer products (e.g., Advil and Centrum )
Leading brands include:- Lipitor- Premarin family- Norvasc- Lyrica (Europe, Russia, Turkey, Israel and Central Asia countries)- Celebrex- Pristiq- Several sterile injectable products
We expect that the IH biopharmaceutical portfolio of innovative, largely patent-protected, in-line and newly launched products will be sustained by ongoinginvestments to develop promising assets and targeted business development in areas of focus to ensure a pipeline of highly-differentiated product candidates inareas of unmet medical need. The assets managed by IH are science-driven, highly differentiated and generally require a high level of engagement withhealthcare providers and consumers.
EH is expected to generate strong consistent cash flow by providing patients around the world with access to effective, lower-cost, high-value treatments. EHleverages our biologic development, regulatory and manufacturing expertise to seek to advance its biosimilar development portfolio. Additionally, EH leveragescapabilities in formulation development and manufacturing expertise to help advance its generic sterile injectables portfolio. EH may also engage in targetedbusiness development to further enable its commercial strategies.
For a further discussion of these operating segments, see the Innovative Health and Essential Health sections below and the Notes to Consolidated FinancialStatements— Note 18. Segment, Geographic and Other Revenue Information , including the tables therein captioned Selected Income Statement Information ,Geographic Information and Significant Product Revenues , the table captioned Revenues by Segment and Geographic Area in the Analysis of the ConsolidatedStatements of Income section, and the Analysis of Operating Segment Information section in our 2016 Financial Report, which are incorporated by reference.
Pfizer Inc. 2016 Form 10-K 3
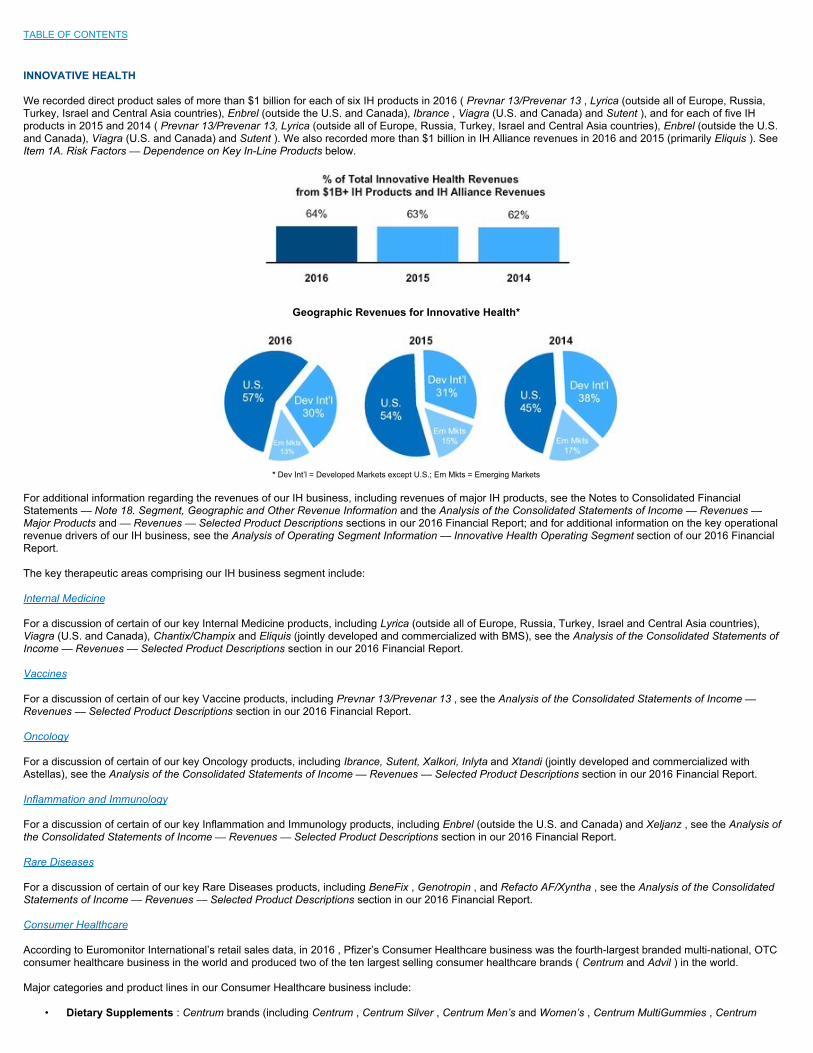
TABLE OF CONTENTS
INNOVATIVE HEALTH
We recorded direct product sales of more than $1 billion for each of six IH products in 2016 ( Prevnar 13/Prevenar 13 , Lyrica (outside all of Europe, Russia,Turkey, Israel and Central Asia countries), Enbrel (outside the U.S. and Canada), Ibrance , Viagra (U.S. and Canada) and Sutent ), and for each of five IHproducts in 2015 and 2014 ( Prevnar 13/Prevenar 13, Lyrica (outside all of Europe, Russia, Turkey, Israel and Central Asia countries), Enbrel (outside the U.S.and Canada), Viagra (U.S. and Canada) and Sutent ). We also recorded more than $1 billion in IH Alliance revenues in 2016 and 2015 (primarily Eliquis ). SeeItem 1A. Risk Factors –– Dependence on Key In-Line Products below.
Geographic Revenues for Innovative Health*
* Dev Int’l = Developed Markets except U.S.; Em Mkts = Emerging Markets
For additional information regarding the revenues of our IH business, including revenues of major IH products, see the Notes to Consolidated FinancialStatements –– Note 18. Segment, Geographic and Other Revenue Information and the Analysis of the Consolidated Statements of Income –– Revenues ––Major Products and –– Revenues –– Selected Product Descriptions sections in our 2016 Financial Report; and for additional information on the key operationalrevenue drivers of our IH business, see the Analysis of Operating Segment Information –– Innovative Health Operating Segment section of our 2016 FinancialReport.
The key therapeutic areas comprising our IH business segment include:
Internal Medicine
For a discussion of certain of our key Internal Medicine products, including Lyrica (outside all of Europe, Russia, Turkey, Israel and Central Asia countries),Viagra (U.S. and Canada), Chantix/Champix and Eliquis (jointly developed and commercialized with BMS), see the Analysis of the Consolidated Statements ofIncome –– Revenues –– Selected Product Descriptions section in our 2016 Financial Report.
Vaccines
For a discussion of certain of our key Vaccine products, including Prevnar 13/Prevenar 13 , see the Analysis of the Consolidated Statements of Income ––Revenues –– Selected Product Descriptions section in our 2016 Financial Report.
Oncology
For a discussion of certain of our key Oncology products, including Ibrance, Sutent, Xalkori, Inlyta and Xtandi (jointly developed and commercialized withAstellas), see the Analysis of the Consolidated Statements of Income –– Revenues –– Selected Product Descriptions section in our 2016 Financial Report.
Inflammation and Immunology
For a discussion of certain of our key Inflammation and Immunology products, including Enbrel (outside the U.S. and Canada) and Xeljanz , see the Analysis ofthe Consolidated Statements of Income –– Revenues –– Selected Product Descriptions section in our 2016 Financial Report.
Rare Diseases
For a discussion of certain of our key Rare Diseases products, including BeneFix , Genotropin , and Refacto AF/Xyntha , see the Analysis of the ConsolidatedStatements of Income –– Revenues –– Selected Product Descriptions section in our 2016 Financial Report.
Consumer Healthcare
According to Euromonitor International’s retail sales data, in 2016 , Pfizer’s Consumer Healthcare business was the fourth-largest branded multi-national, OTCconsumer healthcare business in the world and produced two of the ten largest selling consumer healthcare brands ( Centrum and Advil ) in the world.
Major categories and product lines in our Consumer Healthcare business include:
• Dietary Supplements : Centrum brands (including Centrum , Centrum Silver , Centrum Men’s and Women’s , Centrum MultiGummies , Centrum
VitaMints , Centrum Specialist , Centrum Flavor Burst and Centrum Kids ), Caltrate and Emergen-C ;
• Pain Management : Advil brands (including Advil , Advil PM , Advil Liqui-Gels , Advil Film Coated , Advil Menstrual Pain , Children’s Advil , Infants’Advil and Advil Migraine) and ThermaCare ;
• Gastrointestinal : Nexium 24HR/Nexium Control and Preparation H ; and
• Respiratory and Personal Care : Robitussin , Advil Cold & Sinus , Advil Sinus Congestion & Pain, Dimetapp and ChapStick .
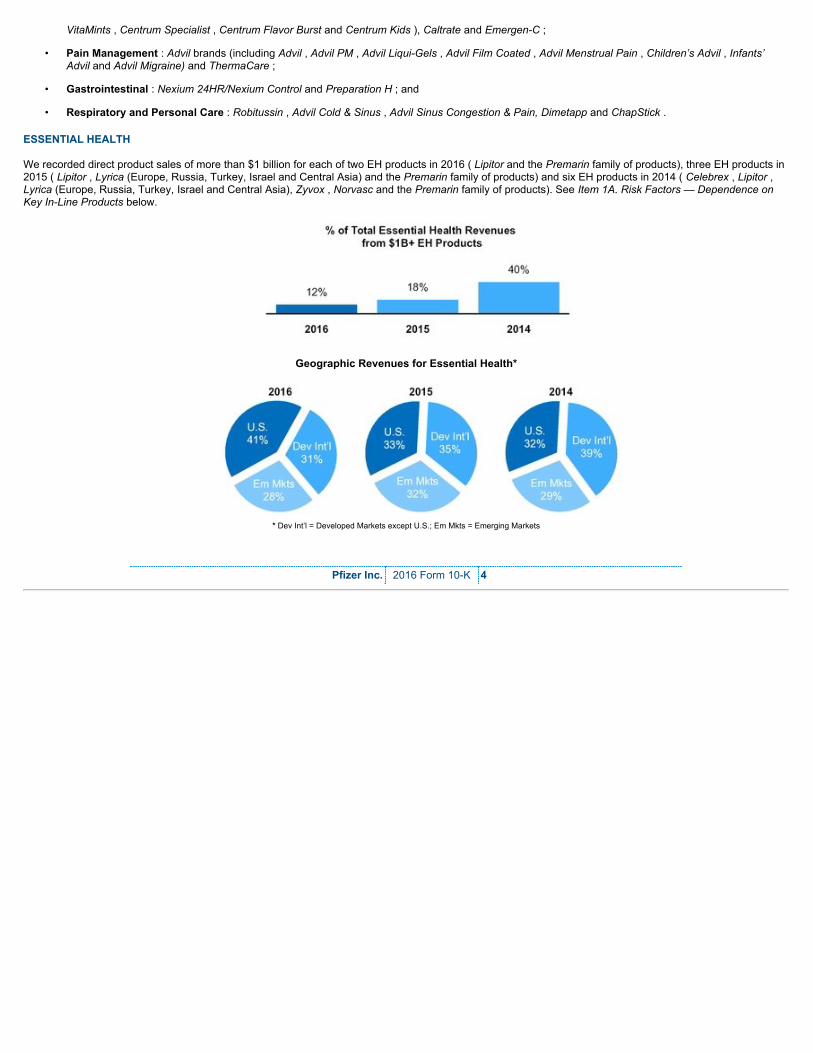
ESSENTIAL HEALTH
We recorded direct product sales of more than $1 billion for each of two EH products in 2016 ( Lipitor and the Premarin family of products), three EH products in2015 ( Lipitor , Lyrica (Europe, Russia, Turkey, Israel and Central Asia) and the Premarin family of products) and six EH products in 2014 ( Celebrex , Lipitor ,Lyrica (Europe, Russia, Turkey, Israel and Central Asia), Zyvox , Norvasc and the Premarin family of products). See Item 1A. Risk Factors –– Dependence onKey In-Line Products below.
Geographic Revenues for Essential Health*
* Dev Int’l = Developed Markets except U.S.; Em Mkts = Emerging Markets
Pfizer Inc. 2016 Form 10-K 4
TABLE OF CONTENTS
For additional information regarding the revenues of our EH business, including revenues of major EH products, see the Notes to Consolidated FinancialStatements –– Note 18. Segment, Geographic and Other Revenue Information and the Analysis of the Consolidated Statements of Income –– Revenues ––Major Products and –– Revenues –– Selected Product Descriptions sections in our 2016 Financial Report; and for additional information on the key operationalrevenue drivers of our EH business, see the Analysis of Operating Segment Information –– Essential Health Operating Segment section of our 2016 FinancialReport.
The product categories in our EH business segment include:
• Global Brands , which includes:◦ Legacy Established Products : includes products that have lost patent protection (excluding Sterile Injectable Pharmaceuticals and Peri-LOE
Products); and◦ Peri-LOE Products : includes products that have recently lost or are anticipated to soon lose patent protection. These products primarily include
Lyrica in certain developed Europe markets, Pristiq globally, Celebrex , Zyvox and Revatio in most developed markets, Vfend and Viagra in certaindeveloped Europe markets and Japan, and Inspra in the EU;
• Sterile Injectable Pharmaceuticals : includes generic injectables and proprietary specialty injectables (excluding Peri-LOE Products);
• Infusion Systems (through February 2, 2017): includes Medication Management Systems products composed of infusion pumps and related softwareand services, as well as intravenous infusion products, including large volume intravenous solutions and their associated administration sets;
• Biosimilars : includes Inflectra / Remsima (biosimilar infliximab) in the U.S. and certain international markets, Nivestim (biosimilar filgrastim) in certainEuropean, Asian and Africa/Middle East markets and Retacrit (biosimilar epoetin zeta) in certain European and Africa/Middle East markets; and
• Pfizer CentreOne : includes (i) revenues from legacy Pfizer’s contract manufacturing and active pharmaceutical ingredient sales operation (previouslyknown as Pfizer CentreSource), including revenues related to our manufacturing and supply agreements with Zoetis Inc.; and (ii) revenues from legacyHospira’s One-2-One sterile injectables contract manufacturing operation.
For a discussion of certain of our key EH products, including Lipitor , the Premarin family of products, Norvasc , Lyrica (Europe, Russia, Turkey, Israel andCentral Asia), Celebrex , Pristiq, Zyvox and Inflectra , see the Analysis of the Consolidated Statements of Income –– Revenues –– Selected ProductDescriptions section in our 2016 Financial Report.
ALLIANCE REVENUES
We are party to collaboration and/or co-promotion agreements relating to certain biopharmaceutical products, including Eliquis and Xtandi. Eliquis has beenjointly developed and is being commercialized in collaboration with BMS. The two companies share commercialization expenses and profit/losses equally on aglobal basis. In April 2015, we signed an agreement with BMS to transfer full commercialization rights in certain smaller markets to us, beginning in the thirdquarter of 2015. Xtandi is being developed and commercialized in collaboration with Astellas. The two companies share equally in the gross profits (losses)related to U.S. net sales of Xtandi . Subject to certain exceptions, Pfizer and Astellas also share equally all Xtandi commercialization costs attributable to theU.S. market. Pfizer and Astellas also share certain development and other collaboration expenses and Pfizer receives tiered royalties as a percentage ofinternational Xtandi net sales (recorded in Other (Income)/Deductions –– Net). Collaboration rights for Enbrel (in the U.S. and Canada), Spiriva and Rebif haveexpired. For additional information, including a description of certain of these collaboration and co-promotion agreements and their expiration dates, see theAnalysis of the Consolidated Statements of Income –– Revenues –– Selected Product Descriptions and the Overview of Our Performance, OperatingEnvironment, Strategy and Outlook –– Our Operating Environment –– Industry-Specific Challenges –– Intellectual Property Rights and Collaboration/LicensingRights sections in our 2016 Financial Report and Item 1A. Risk Factors –– Dependence on Key In-Line Products below.
Pfizer Inc. 2016 Form 10-K 5
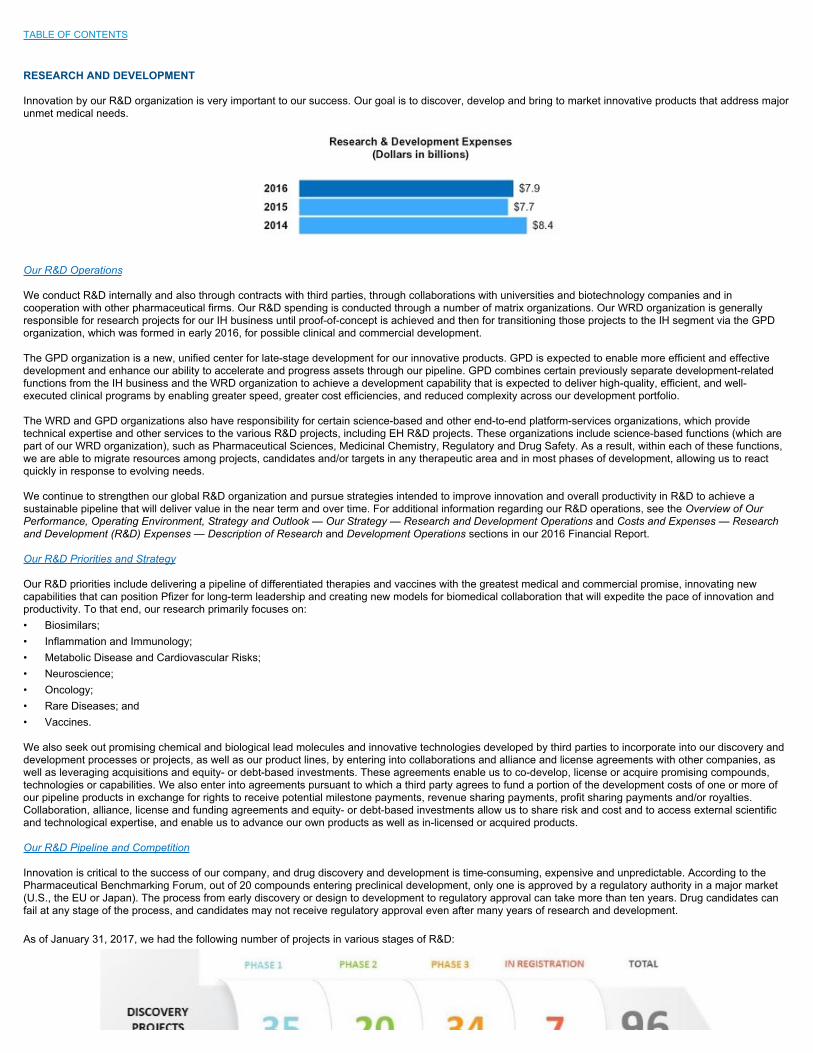
TABLE OF CONTENTS
RESEARCH AND DEVELOPMENT
Innovation by our R&D organization is very important to our success. Our goal is to discover, develop and bring to market innovative products that address majorunmet medical needs.
Our R&D Operations
We conduct R&D internally and also through contracts with third parties, through collaborations with universities and biotechnology companies and incooperation with other pharmaceutical firms. Our R&D spending is conducted through a number of matrix organizations. Our WRD organization is generallyresponsible for research projects for our IH business until proof-of-concept is achieved and then for transitioning those projects to the IH segment via the GPDorganization, which was formed in early 2016, for possible clinical and commercial development.
The GPD organization is a new, unified center for late-stage development for our innovative products. GPD is expected to enable more efficient and effectivedevelopment and enhance our ability to accelerate and progress assets through our pipeline. GPD combines certain previously separate development-relatedfunctions from the IH business and the WRD organization to achieve a development capability that is expected to deliver high-quality, efficient, and well-executed clinical programs by enabling greater speed, greater cost efficiencies, and reduced complexity across our development portfolio.
The WRD and GPD organizations also have responsibility for certain science-based and other end-to-end platform-services organizations, which providetechnical expertise and other services to the various R&D projects, including EH R&D projects. These organizations include science-based functions (which arepart of our WRD organization), such as Pharmaceutical Sciences, Medicinal Chemistry, Regulatory and Drug Safety. As a result, within each of these functions,we are able to migrate resources among projects, candidates and/or targets in any therapeutic area and in most phases of development, allowing us to reactquickly in response to evolving needs.
We continue to strengthen our global R&D organization and pursue strategies intended to improve innovation and overall productivity in R&D to achieve asustainable pipeline that will deliver value in the near term and over time. For additional information regarding our R&D operations, see the Overview of OurPerformance, Operating Environment, Strategy and Outlook — Our Strategy — Research and Development Operations and Costs and Expenses — Researchand Development (R&D) Expenses — Description of Research and Development Operations sections in our 2016 Financial Report.
Our R&D Priorities and Strategy
Our R&D priorities include delivering a pipeline of differentiated therapies and vaccines with the greatest medical and commercial promise, innovating newcapabilities that can position Pfizer for long-term leadership and creating new models for biomedical collaboration that will expedite the pace of innovation andproductivity. To that end, our research primarily focuses on:• Biosimilars;• Inflammation and Immunology;• Metabolic Disease and Cardiovascular Risks;• Neuroscience;• Oncology;• Rare Diseases; and• Vaccines.
We also seek out promising chemical and biological lead molecules and innovative technologies developed by third parties to incorporate into our discovery anddevelopment processes or projects, as well as our product lines, by entering into collaborations and alliance and license agreements with other companies, aswell as leveraging acquisitions and equity- or debt-based investments. These agreements enable us to co-develop, license or acquire promising compounds,technologies or capabilities. We also enter into agreements pursuant to which a third party agrees to fund a portion of the development costs of one or more ofour pipeline products in exchange for rights to receive potential milestone payments, revenue sharing payments, profit sharing payments and/or royalties.Collaboration, alliance, license and funding agreements and equity- or debt-based investments allow us to share risk and cost and to access external scientificand technological expertise, and enable us to advance our own products as well as in-licensed or acquired products.
Our R&D Pipeline and Competition
Innovation is critical to the success of our company, and drug discovery and development is time-consuming, expensive and unpredictable. According to thePharmaceutical Benchmarking Forum, out of 20 compounds entering preclinical development, only one is approved by a regulatory authority in a major market(U.S., the EU or Japan). The process from early discovery or design to development to regulatory approval can take more than ten years. Drug candidates canfail at any stage of the process, and candidates may not receive regulatory approval even after many years of research and development.
As of January 31, 2017, we had the following number of projects in various stages of R&D:

Development of a single compound is often pursued as part of multiple programs. While these drug candidates may or may not eventually receive regulatoryapproval, new drug candidates entering clinical development phases are the foundation for future products. In addition to discovering and developing newproducts, our R&D efforts seek to add value to our existing products by improving their effectiveness, enhancing ease of dosing and by discovering potential newindications for them.
Information concerning several of our drug candidates in development, as well as supplemental filings for existing products, is set forth in the Analysis of theConsolidated Statements of Income—Product Developments — Biopharmaceutical section in our 2016 Financial Report, which is incorporated by reference.
Our competitors also devote substantial funds and resources to R&D. We also compete against numerous small biotechnology companies in developingpotential drug candidates. The extent to which our competitors are successful in their research could result in erosion of the sales of our existing products andpotential sales of products in development, as well as unanticipated product obsolescence. In addition, several of our competitors operate without large R&Dexpenses and make a regular practice of challenging our product patents before their expiration. For additional information, see the Competition and Item 1A.Risk Factors — Competitive Products sections below.
Pfizer Inc. 2016 Form 10-K 6

TABLE OF CONTENTS
INTERNATIONAL OPERATIONS
We have significant operations outside the U.S. Operations in developed and emerging markets are managed through our two business segments: IH and EH.Emerging markets are an important component of our strategy for global leadership, and our commercial structure recognizes that the demographics and risingeconomic power of the fastest-growing emerging markets are becoming more closely aligned with the profile found within developed markets.
We sell our products in over 125 countries. Revenues from operations outside the U.S. of $26.5 billion accounted for 50% of our total revenues in 2016 . Japanis our largest national market outside the U.S. For a geographic breakdown of revenues, see the table captioned Geographic Information in the Notes toConsolidated Financial Statements— Note 18. Segment, Geographic and Other Revenue Information in our 2016 Financial Report, and the table captionedRevenues by Segment and Geographic Area in our 2016 Financial Report. Those tables are incorporated by reference.
Revenues by National Market
Our international operations are subject, in varying degrees, to a number of risks inherent in carrying on business in other countries. These include, among otherthings, currency fluctuations, capital and exchange control regulations, expropriation and other restrictive government actions. See Item 1A. Risk Factors —Risks Affecting International Operations below. Our international businesses are also subject to government-imposed constraints, including laws and regulationson pricing, reimbursement, and access to our products. See Government Regulation and Price Constraints — Outside the United States below for a discussionof these matters.
Depending on the direction of change relative to the U.S. dollar, foreign currency values can increase or decrease the reported dollar value of our net assets andresults of operations. While we cannot predict with certainty future changes in foreign exchange rates or the effect they will have on us, we attempt to mitigatetheir impact through operational means and by using various financial instruments, depending upon market conditions. For additional information, see the Notesto Consolidated Financial Statements— Note 7E. Financial Instruments: Derivative Financial Instruments and Hedging Activities in our 2016 Financial Report, aswell as the Forward-Looking Information and Factors That May Affect Future Results — Financial Risk Management section in our 2016 Financial Report. Thosesections of our 2016 Financial Report are incorporated by reference.
MARKETING
In our global biopharmaceutical businesses, we promote our products to healthcare providers and patients. Through our marketing organizations, we explain theapproved uses, benefits and risks of our products to healthcare providers, such as doctors, nurse practitioners, physician assistants and pharmacists; MCOs thatprovide insurance coverage, such as hospitals, Integrated Delivery Systems, PBMs and health plans; and employers and government agencies who hire MCOsto provide health benefits to their employees. We also market directly to consumers in the U.S. through direct-to-consumer advertising that seeks tocommunicate the approved uses, benefits and risks of our products while motivating people to have meaningful conversations with their doctors. In addition, wesponsor general advertising to educate the public on disease awareness, prevention and wellness, important public health issues, and our patient assistanceprograms.
Pfizer Inc. 2016 Form 10-K 7
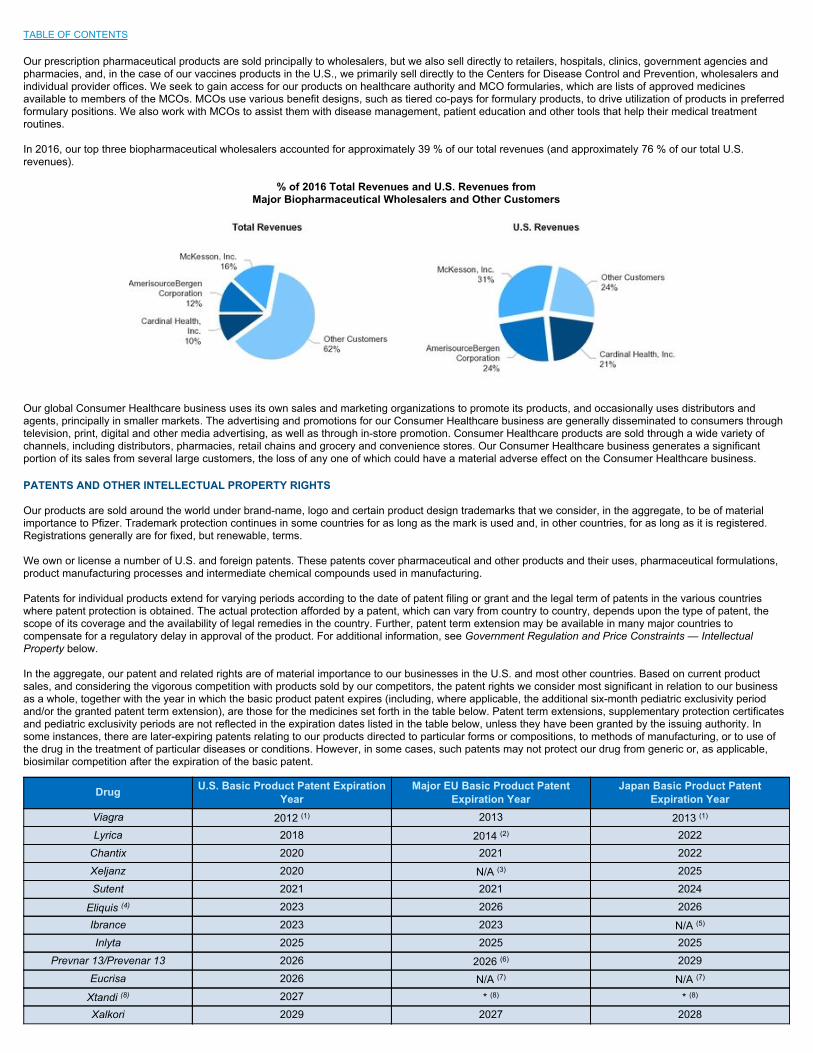
TABLE OF CONTENTS
Our prescription pharmaceutical products are sold principally to wholesalers, but we also sell directly to retailers, hospitals, clinics, government agencies andpharmacies, and, in the case of our vaccines products in the U.S., we primarily sell directly to the Centers for Disease Control and Prevention, wholesalers andindividual provider offices. We seek to gain access for our products on healthcare authority and MCO formularies, which are lists of approved medicinesavailable to members of the MCOs. MCOs use various benefit designs, such as tiered co-pays for formulary products, to drive utilization of products in preferredformulary positions. We also work with MCOs to assist them with disease management, patient education and other tools that help their medical treatmentroutines.
In 2016, our top three biopharmaceutical wholesalers accounted for approximately 39 % of our total revenues (and approximately 76 % of our total U.S.revenues).
% of 2016 Total Revenues and U.S. Revenues fromMajor Biopharmaceutical Wholesalers and Other Customers
Our global Consumer Healthcare business uses its own sales and marketing organizations to promote its products, and occasionally uses distributors andagents, principally in smaller markets. The advertising and promotions for our Consumer Healthcare business are generally disseminated to consumers throughtelevision, print, digital and other media advertising, as well as through in-store promotion. Consumer Healthcare products are sold through a wide variety ofchannels, including distributors, pharmacies, retail chains and grocery and convenience stores. Our Consumer Healthcare business generates a significantportion of its sales from several large customers, the loss of any one of which could have a material adverse effect on the Consumer Healthcare business.
PATENTS AND OTHER INTELLECTUAL PROPERTY RIGHTS
Our products are sold around the world under brand-name, logo and certain product design trademarks that we consider, in the aggregate, to be of materialimportance to Pfizer. Trademark protection continues in some countries for as long as the mark is used and, in other countries, for as long as it is registered.Registrations generally are for fixed, but renewable, terms.
We own or license a number of U.S. and foreign patents. These patents cover pharmaceutical and other products and their uses, pharmaceutical formulations,product manufacturing processes and intermediate chemical compounds used in manufacturing.
Patents for individual products extend for varying periods according to the date of patent filing or grant and the legal term of patents in the various countrieswhere patent protection is obtained. The actual protection afforded by a patent, which can vary from country to country, depends upon the type of patent, thescope of its coverage and the availability of legal remedies in the country. Further, patent term extension may be available in many major countries tocompensate for a regulatory delay in approval of the product. For additional information, see Government Regulation and Price Constraints — IntellectualProperty below.
In the aggregate, our patent and related rights are of material importance to our businesses in the U.S. and most other countries. Based on current productsales, and considering the vigorous competition with products sold by our competitors, the patent rights we consider most significant in relation to our businessas a whole, together with the year in which the basic product patent expires (including, where applicable, the additional six-month pediatric exclusivity periodand/or the granted patent term extension), are those for the medicines set forth in the table below. Patent term extensions, supplementary protection certificatesand pediatric exclusivity periods are not reflected in the expiration dates listed in the table below, unless they have been granted by the issuing authority. Insome instances, there are later-expiring patents relating to our products directed to particular forms or compositions, to methods of manufacturing, or to use ofthe drug in the treatment of particular diseases or conditions. However, in some cases, such patents may not protect our drug from generic or, as applicable,biosimilar competition after the expiration of the basic patent.
Drug U.S. Basic Product Patent ExpirationYear
Major EU Basic Product PatentExpiration Year
Japan Basic Product PatentExpiration Year
Viagra 2012 (1) 2013 2013 (1)
Lyrica 2018 2014 (2) 2022Chantix 2020 2021 2022Xeljanz 2020 N/A (3) 2025Sutent 2021 2021 2024
Eliquis (4) 2023 2026 2026Ibrance 2023 2023 N/A (5)
Inlyta 2025 2025 2025Prevnar 13/Prevenar 13 2026 2026 (6) 2029
Eucrisa 2026 N/A (7) N/A (7)
Xtandi (8) 2027 * (8) * (8)
Xalkori 2029 2027 2028
(1) In addition to the basic product patent covering Viagra , which expired in 2012, Viagra is covered by a U.S. method-of-treatment patent which, including the six-monthpediatric exclusivity period associated with Revatio (which has the same active ingredient as Viagra ), expires in 2020. However, as a result of a patent litigationsettlement, Teva Pharmaceuticals USA, Inc. will be allowed to launch a generic version of Viagra in the U.S. in December 2017, or earlier under certain circumstances.The corresponding method-of-treatment patent covering Viagra in Japan expired in May 2014.
(2) For Lyrica , regulatory exclusivity in the EU expired in July 2014.(3) The Xeljanz marketing authorization application has been filed and is under review in the EU.(4) Eliquis was developed and is being commercialized in collaboration with BMS.(5) The Ibrance marketing authorization application has been filed and is under review in Japan.(6) The EU patent that covers the combination of the 13 serotype conjugates of Prevenar 13 has been revoked following an opposition proceeding. This first instance decision
has been appealed. There are other EU patents and pending applications covering the formulation and various aspects of the manufacturing process of Prevenar 13 thatremain in force.
(7) Eucrisa is not approved in the EU and Japan.(8) Xtandi is being developed and commercialized in collaboration with Astellas, who has exclusive commercialization rights for Xtandi outside the U.S.
A number of our current products have experienced patent-based expirations or loss of regulatory exclusivity in certain markets in the last few years. Foradditional information, including a description of certain of our co-promotion agreements and their expiration dates, and a further discussion of our productsexperiencing, or expected to experience in 2017, patent expirations or loss of regulatory exclusivity in the U.S., Europe or Japan, see the Overview of OurPerformance, Operating Environment, Strategy and Outlook — Our Operating Environment — Industry-Specific Challenges — Intellectual Property Rights andCollaboration/Licensing Rights section in our 2016 Financial Report and Item 1A. Risk Factors — Dependence on Key In-Line Products below.
Companies have filed applications with the FDA seeking approval of product candidates that such companies claim do not infringe our patents; these includecandidates that would compete with, among other products, Xeljanz and Xtandi . For additional information, see the Notes to Consolidated Financial Statements— Note 17A1. Commitments and Contingencies—Legal Proceedings—Patent Litigation in our 2016 Financial Report.
The expiration of a basic product patent or loss of patent protection resulting from a legal challenge normally results in significant competition from genericproducts against the originally patented product and can result in a significant reduction in revenues for that product in a very short period of time. In somecases, however, we can continue to obtain commercial benefits from product manufacturing trade secrets; patents on uses for products; patents on processesand intermediates for the economical manufacture of the active ingredients; patents for special formulations of the product or delivery mechanisms; orconversion of the active ingredient to OTC products.
Biotechnology Products
Our biotechnology products, including BeneFIX , ReFacto , Xyntha and Enbrel (we market Enbrel outside the U.S. and Canada), may face in the future, oralready face, competition from biosimilars (also referred to as follow-on biologics). In the U.S., such biosimilars would reference biotechnology productsapproved under the U.S. Public Health Service Act. Additionally, the FDA has approved a follow-on recombinant human growth hormone that referenced ourbiotechnology product, Genotropin , which was approved under the FFDCA.
Biosimilars are versions of biologic medicines that have been developed and proven to be similar to the original biologic in terms of safety and efficacy and tohave no clinically meaningful differences. Biosimilars have the potential to offer high-quality, lower-cost alternatives to biologic medicines. Abbreviated legalpathways for the approval of biosimilars exist in certain international markets and, since the passage in 2010 of the ACA, a framework for such approval exists inthe U.S. The regulatory implementation of these ACA provisions is ongoing, and, since 2015, the FDA approved a number of biosimilars, including Inflectra(infliximab-dyyb). Pfizer has exclusive commercialization rights to Inflectra from Celltrion Inc. and Celltrion Healthcare, Co., Ltd. (collectively, Celltrion) in theU.S., Canada and certain other territories. Pfizer also shares Inflectra commercialization rights with Celltrion in Europe. For additional information on Inflectra ,see the Analysis of the Consolidated Statements of Income –– Revenues –– Selected Product Descriptions –– Inflectra/Remsima section in our 2016 FinancialReport. For additional information on the ACA’s approval framework for biosimilars, see Government Regulation and Price Constraints — Biosimilar Regulationbelow.
In Europe, the European Commission has granted marketing authorizations for several biosimilars pursuant to a set of general and product class-specificguidelines for biosimilar approvals issued over the past few years. In 2013, the EMA approved the first biosimilar of a monoclonal antibody, and in January 2016,the European Commission approved an etanercept biosimilar referencing Pfizer’s Enbrel . In Japan, the regulatory authority has granted marketingauthorizations for certain biosimilars pursuant to a guideline for biosimilar approvals issued in 2009.
If competitors are able to obtain marketing approval for biosimilars that reference our biotechnology products, our biotechnology products may become subjectto competition from these biosimilars, with attendant competitive pressure, and price reductions could follow. Expiration or successful challenge of applicablepatent rights could trigger this competition, assuming any relevant exclusivity period has expired. However, biosimilar manufacturing is complex. At least initiallyupon approval of a biosimilar competitor, biosimilar competition with respect to biologics may not be as significant as generic competition with respect to smallmolecule drugs.
As part of our business strategy, we are capitalizing on our expertise in biologics manufacturing, as well as our regulatory and commercial strengths, to developbiosimilar medicines. As such, a better-defined biosimilars approval pathway will assist us in pursuing approval of our own biosimilar products in the U.S. SeeItem 1A. Risk Factors — Biotechnology Products below.
We may face litigation with respect to the validity and/or scope of patents relating to our biotechnology products. Likewise, as we develop and manufacturebiosimilars and seek to launch products, patents may be asserted against us.
International
One of the main limitations on our operations in some countries outside the U.S. is the lack of effective intellectual property protection for our products. Underinternational and U.S. free trade agreements in recent years, global protection of intellectual property rights has been improving. For additional information, seeGovernment Regulation and Price Constraints — Intellectual Property below.
COMPETITION
Our businesses are conducted in intensely competitive and often highly regulated markets. Many of our prescription pharmaceutical products face competition inthe form of branded or generic drugs or biosimilars that treat similar diseases or indications. The principal forms of competition include efficacy, safety, ease ofuse, and cost effectiveness. Though the means of competition vary among product categories and business groups, demonstrating the value of our products is a

critical factor for success in all of our principal businesses.
Our competitors include other worldwide research-based biopharmaceutical companies, smaller research companies with more limited therapeutic focus,generic and biosimilar drug manufacturers and consumer healthcare manufacturers. We compete with other companies that manufacture and sell products thattreat diseases or indications similar to those treated by our major products.
This competition affects our core product business, which is focused on applying innovative science to discover and market products that satisfy unmet medicalneeds and provide therapeutic improvements. Our emphasis on innovation is underscored by our multi-billion-dollar investment in R&D, as well as our businessdevelopment transactions, both designed to result in a strong product pipeline. Our investment in research does not stop with drug approval; we continue toinvest in further understanding the value of our products for the conditions they treat, as well as potential new applications. We seek to protect the health andwell-being of patients by striving to ensure that medically sound knowledge of the benefits and risks of our medicines is understood and communicated topatients, physicians and global health authorities. We also seek to continually enhance the organizational effectiveness of all of our biopharmaceutical functions,including coordinating support for our salespersons’ efforts to accurately and ethically launch and promote our products to our customers.
Pfizer Inc. 2016 Form 10-K 8

TABLE OF CONTENTS
Operating conditions have become more challenging under mounting global pressures of competition, industry regulation and cost containment. We continue totake measures to evaluate, adapt and improve our organization and business practices to better meet customer and public needs. We believe that we havetaken an industry-leading role in evolving our approaches to U.S. direct-to-consumer advertising; interactions with, and payments to, healthcare professionals;and medical education grants. We also continue to sponsor programs to address patient affordability and access barriers, as we strive to advance fundamentalhealth system change through support for better healthcare solutions.
Our Consumer Healthcare business faces competition from OTC business units in other major pharmaceutical and consumer packaged goods companies, andretailers who carry their own private label brands. Our competitive position is affected by several factors, including the amount and effectiveness of our and ourcompetitors’ promotional resources; customer acceptance; product quality; our and our competitors’ introduction of new products, ingredients, claims, dosageforms, or other forms of innovation; and pricing, regulatory and legislative matters (such as product labeling, patient access and prescription to OTC switches).
Our vaccines business may face competition from the introduction of alternative or next generation vaccines. For example, Prevnar 13 may face competition inthe form of alternative 13-valent or additional valent next-generation pneumococcal conjugate vaccines prior to the expiration of its patents, which may adverselyaffect our future results.
Our generics and biosimilars businesses compete with branded products from competitors, as well as other generics and biosimilars manufacturers. Globally,Pfizer sells generic versions of Pfizer’s, as well as certain competitors’, solid oral dose and sterile injectable pharmaceutical products, as well as biosimilars. Weseek to maximize the opportunity to establish a “first-to-market” or early market position for our generic injectable drugs and biosimilars, as a “first-to-market”position provides customers a lower-cost alternative immediately when available and also may provide us with a period of exclusivity as the only generic orbiosimilar provider.
Managed Care Organizations
The evolution of managed care in the U.S. has been a major factor in the competitive makeup of the healthcare marketplace. Approximately 283 million peoplein the U.S. now have some form of health insurance coverage. Due to the expansion of health insurance coverage (see Government Regulation and PriceConstraints — In the United States below), the marketing of prescription drugs to both consumers and the entities that manage this expanded coverage in theU.S. continues to grow in importance.
The influence of MCOs has increased in recent years due to the growing number of patients receiving coverage through MCOs. At the same time, thoseorganizations have been consolidating into fewer, even larger entities. This consolidation enhances both their ability to negotiate, as well as their importance toPfizer.
The growth of MCOs has increased pressure on drug prices as well as revenues. One objective of MCOs is to contain and, where possible, reduce healthcareexpenditures. MCOs typically negotiate prices with pharmaceutical providers by using formularies (which are lists of approved medicines available to membersof the MCOs), clinical protocols (requiring prior authorization for a branded product if a generic product is available or requiring the patient to first fail on one ormore generic products before permitting access to a branded medicine), volume purchasing, long-term contracts and their ability to influence volume and marketshare of prescription drugs. In addition, by placing branded medicines on higher-tier status in their formularies (leading to higher patient co-pays) or non-preferred tier status, MCOs transfer a portion of the cost of the medicine to the patient, resulting in significant out-of-pocket expenses for the patient, especiallyfor chronic treatments. This financial disincentive is a tool for MCOs to manage drug costs and channel patients to medicines preferred by the MCOs. MCOshave recently introduced additional measures such as new-to-market blocks, exclusion lists, indication-based pricing, and value-based pricing/contracting toimprove their cost containment efforts. We are closely monitoring these new approaches and developing appropriate strategies to respond to them.
Due to their generally lower cost, generic medicines typically are placed in lowest cost tiers of MCO formularies. The breadth of the products covered byformularies can vary considerably from one MCO to another, and many formularies include alternative and competitive products for treatment of particularmedical problems. In 2015, the FDA approved the first biosimilar and MCOs are evaluating the appropriate placement of these new agents on their formularies.
Exclusion of a product from a formulary or other MCO-implemented restrictions can significantly impact drug usage in the MCO patient population.Consequently, pharmaceutical companies compete to gain access to formularies for their products. Unique product features, such as greater efficacy, betterpatient ease of use, or fewer side effects, are generally beneficial to achieving access to formularies. However, lower overall cost of therapy is also an importantfactor. We have been generally, although not universally, successful in having our major products included on MCO formularies. However, increasingly ourbranded products are being placed on the higher tiers or in a non-preferred status.
MCOs also emphasize primary and preventive care, out-patient treatment and procedures performed at doctors’ offices and clinics as another way to managecosts. Hospitalization and surgery, typically the most expensive forms of treatment, are
Pfizer Inc. 2016 Form 10-K 9
TABLE OF CONTENTS
carefully managed. Since the use of certain drugs can reduce the need for hospitalization, professional therapy, or even surgery, such drugs can becomefavored first-line treatments for certain diseases.
The ACA has accelerated payment reform by distributing risk across MCOs and other stakeholders in care delivery with the intent of improving quality whilereducing costs, which creates pressure on MCOs to tie reimbursement to defined outcomes. In 2017, there likely will be federal legislative and administrativeefforts to repeal, substantially modify or invalidate some or all of the provisions of the ACA. We are monitoring any such actions to see if any changes to the ACAwill be enacted that would impact our business.
Generic Products
One of the biggest competitive challenges that our branded products face is from generic pharmaceutical manufacturers. Upon the expiration or loss of patentprotection for a product, especially a small molecule product, we can lose the major portion of revenues for that product in a very short period of time. Severalcompetitors make a regular practice of challenging our product patents before their expiration. Generic competitors often operate without large R&D expenses,as well as without costs of conveying medical information about products to the medical community. In addition, the FDA approval process exempts genericsfrom costly and time-consuming clinical trials to demonstrate their safety and efficacy, allowing generic manufacturers to rely on the safety and efficacy data ofthe innovator product. Generic competitors do not generally need to conduct clinical trials and can market a competing version of our product after the expirationor loss of our patent and often charge much less.
In addition, our patent-protected products can face competition in the form of generic versions of competitors’ branded products that lose their market exclusivity.
As noted above, MCOs that focus primarily on the immediate cost of drugs often favor generics over brand-name drugs. Many governments also encourage theuse of generics as alternatives to brand-name drugs in their healthcare programs, including Medicaid in the U.S. Laws in the U.S. generally allow, and in somecases require, pharmacists to substitute, for brand-name drugs, generic drugs that have been rated under government procedures to be chemically andtherapeutically equivalent to brand-name drugs. In a small subset of states, prescribing physicians are able to expressly prevent such substitution.
RAW MATERIALS
Raw materials essential to our businesses are purchased worldwide in the ordinary course of business from numerous suppliers. In general, these materials areavailable from multiple sources. No serious shortages or delays of raw materials were encountered in 2016 , and none are expected in 2017 . We havesuccessfully secured the materials necessary to meet our requirements where there have been short-term imbalances between supply and demand, butgenerally at higher prices than those historically paid.
GOVERNMENT REGULATION AND PRICE CONSTRAINTS
Pharmaceutical companies are subject to extensive regulation by government authorities in the countries in which they do business. Certain laws andregulations that govern Pfizer’s business are discussed below.
General . Our business has been and will continue to be subject to numerous laws and regulations. Failure to comply with these laws and regulations, includingthose governing the manufacture and marketing of our products, could subject us to administrative and legal proceedings and actions by various governmentalbodies. For additional information on these proceedings and actions, see the Notes to Consolidated Financial Statements— Note 17A. Commitments andContingencies—Legal Proceedings in our 2016 Financial Report. Criminal charges, substantial fines and/or civil penalties, warning letters and product recalls orseizures, as well as limitations on our ability to conduct business in applicable jurisdictions, could result from such proceedings and actions.
In the United States
Drug Regulation . In the U.S., biopharmaceutical products are subject to extensive pre- and post-market regulations by the FDA, including regulations thatgovern the testing, manufacturing, safety, efficacy, labeling and storage of our products, record keeping, advertising and promotion. Our products are alsosubject to post-market surveillance under the FFDCA and its implementing regulations with respect to drugs, as well as the Public Health Service Act and itsimplementing regulations with respect to biologics. The FDA also regulates our Consumer Healthcare products.
Other U.S. federal agencies, including the DEA, also regulate certain of our products. The U.S. Federal Trade Commission has the authority to regulate theadvertising of consumer healthcare products, including OTC drugs and dietary supplements. Many of our activities also are subject to the jurisdiction of the SEC.
Before a new biopharmaceutical product may be marketed in the U.S., the FDA must approve an NDA for a new drug or a BLA for a biologic. The steps requiredbefore the FDA will approve an NDA or BLA generally include preclinical studies followed by multiple stages of clinical trials conducted by the study sponsor;sponsor submission of the application to the FDA for review; the FDA’s review of the data to assess the drug’s safety and effectiveness; and the FDA’sinspection of the facilities where the product will be manufactured.
Before a generic drug may be marketed in the U.S., the FDA must approve an ANDA. The ANDA review process typically does not require new preclinical andclinical studies, because it relies on the studies establishing safety and efficacy conducted for the referenced drug previously approved through the NDAprocess. The ANDA process, however, does require the sponsor to conduct one or more bioequivalence studies to show that the ANDA drug is bioequivalent tothe previously approved referenced brand drug, submission of an application to the FDA for review, and the FDA’s inspection of the facilities where the productwill be manufactured.
As a condition of product approval, the FDA may require a sponsor to conduct post-marketing clinical studies, known as Phase 4 studies, and surveillanceprograms to monitor the effect of the approved product. The FDA may limit further marketing of a product based on the results of these post-market studies andprograms. Any modifications to a drug or biologic, including new indications or changes to labeling or manufacturing processes or facilities, may require thesubmission and approval of a new or supplemental NDA or BLA before the modification can be implemented, which may require that we develop additional dataor conduct additional preclinical studies and clinical trials. Our ongoing manufacture and distribution of drugs and biologics is subject to continuing regulation bythe FDA, including recordkeeping requirements, reporting of adverse experiences associated with the product, and adherence to cGMPs, which regulate allaspects of the manufacturing process. We are also subject to numerous regulatory requirements relating to the advertising and promotion of drugs and biologics,including, but not limited to, standards and regulations for direct-to-consumer advertising. Failure to comply with the applicable regulatory requirementsgoverning the manufacture and marketing of our products may subject us to administrative or judicial sanctions, including warning letters, product recalls orseizures, injunctions, fines, civil penalties and/or criminal prosecution.
Biosimilar Regulation. The ACA created a framework for the approval of biosimilars (also known as follow-on biologics) following the expiration of 12 years ofexclusivity for the innovator biologic, with a potential six-month pediatric extension. Under the ACA, biosimilar applications may not be submitted until four years
after the approval of the reference, innovator biologic.
The FDA is responsible for implementation of the legislation and, since 2015, approved a number of biosimilars, including Inflectra . Through those approvalsand the issuance of draft and final guidance, the FDA has begun to address open questions about the naming convention for biosimilars and the use of datafrom a non-U.S.-licensed comparator to demonstrate biosimilarity and/or interchangeability with a U.S.-licensed reference product. Over the next several years,the FDA is expected to issue additional draft and final guidance documents impacting biosimilars. In 2017, there likely will be federal legislative andadministrative efforts to repeal, substantially modify or invalidate some or all of the provisions of the ACA. If the ACA is repealed, substantially modified, orinvalidated, it is unclear what, if any, impact such action would have on biosimilar regulation.
Sales and Marketing . The marketing practices of U.S. biopharmaceutical companies are generally subject to various federal and state healthcare laws that areintended to prevent fraud and abuse in the healthcare industry and protect the integrity of government healthcare programs. These laws include anti-kickbacklaws and false claims laws. Anti-kickback laws generally prohibit a biopharmaceutical company from soliciting, offering, receiving, or paying any remuneration togenerate business, including the purchase or prescription of a particular product. False claims laws generally prohibit anyone from knowingly and willinglypresenting, or causing to be presented, any claims for payment for goods (including drugs) or services to third-party payers (including Medicare and Medicaid)that are false or fraudulent. Although the specific provisions of these laws vary, their scope is generally broad and there may not be regulations, guidance orcourt decisions that apply the laws to any particular industry practices, including the marketing practices of pharmaceutical companies. Violations of fraud andabuse laws may be punishable by criminal or civil sanctions and/or exclusion from federal health care programs (including Medicare and Medicaid). The federalgovernment and various states have also enacted laws to regulate the sales and marketing practices of pharmaceutical companies. The laws and regulationsgenerally limit financial interactions between manufacturers and health care providers; require disclosure to the federal or state government and public of suchinteractions; and/or require the adoption of compliance standards or programs. Many of these laws and regulations contain ambiguous requirements or requireadministrative guidance for implementation. Individual states, acting through their attorneys general, have become active as well, seeking to regulate themarketing of prescription drugs under state consumer protection and false advertising laws. Given the lack of clarity in laws and their implementation, ouractivities could be subject to the penalties under the pertinent laws and regulations.
Pricing and Reimbursement . Pricing for our pharmaceutical products depends in part on government regulation. Pfizer must offer discounted pricing or rebateson purchases of pharmaceutical products under various federal and state healthcare programs, such as the Medicaid Drug Rebate Program, the “federal ceilingprice” drug pricing program, the 340B drug pricing program and the Medicare Part D Program. Pfizer must also report specific prices to government agenciesunder healthcare programs, such as the Medicaid Drug Rebate Program and Medicare Part B. The calculations necessary to determine the prices reported arecomplex and the failure to report prices accurately may expose Pfizer to penalties. See the discussion regarding rebates in the Analysis of the ConsolidatedStatements of Income — Revenues — Overview section in our 2016 Financial Report and in the Notes to Consolidated Financial Statements— Note 1G. Basisof Presentation and Significant Accounting Policies: Revenues and Trade Accounts Receivable in our 2016 Financial Report, which are incorporated byreference.
Government and private third-party payers routinely seek to manage utilization and control the costs of our products. For example, the majority of states usepreferred drug lists to restrict access to certain pharmaceutical products under Medicaid. Restrictions exist for some Pfizer products in certain states. As anotherexample, access to our products under the Medicaid managed care program is typically determined by the health plans with which state Medicaid agenciescontract to provide services to Medicaid beneficiaries. Given certain states’ current and potential ongoing fiscal crises, a growing number of states areconsidering a variety of cost-control strategies, including capitated managed care plans that typically contain cost by restricting access to certain treatments. Inaddition, we expect that consolidation and integration of pharmacy chains and wholesalers, who are the primary purchasers of our pharmaceutical products inthe U.S., will increase competitive and pricing pressures on pharmaceutical manufacturers, including us.
Healthcare Reform. The U.S. and state governments continue to propose and pass legislation designed to regulate the healthcare industry. In March 2010, theU.S. Congress enacted the ACA, which included changes that significantly affected the pharmaceutical industries, such as:
• increasing drug rebates paid to state Medicaid programs under the Medicaid Drug Rebate Program for brand name and generic prescription drugs andextending those rebates to Medicaid managed care;
• requiring pharmaceutical manufacturers to provide discounts on brand name prescription drugs sold to Medicare beneficiaries whose prescription drugcosts cause the beneficiaries to be subject to the Medicare Part D coverage gap; and
• imposing an annual fee on manufacturers and importers of brand name prescription drugs reimbursed under certain government programs, includingMedicare and Medicaid.
The ACA included provisions designed to increase the number of Americans covered by health insurance. Specifically, since 2014, the ACA has required mostindividuals to maintain health insurance coverage or potentially to pay a penalty for noncompliance and has offered states the option of expanding Medicaidcoverage to additional individuals. The implementation of the coverage expansion had a negligible impact on Pfizer’s 2016 revenues.
The ACA also establishes an Independent Payment Advisory Board (IPAB) to reduce the per capita rate of growth in Medicare spending by proposing changesto Medicare payments if expenditures exceed certain targets. The threshold for triggering IPAB proposals was not reached in 2016, so no adjustments will bemade under the IPAB until 2019 at the earliest. If no IPAB members are nominated, the duties of the IPAB will default to the Secretary of the Department ofHealth and Human Services.
Additionally, efforts by government officials or legislators to implement measures to regulate prices or payment for pharmaceutical products could adverselyaffect our business if implemented. There has recently been considerable public and government scrutiny of pharmaceutical pricing and proposals to addressthe perceived high cost of pharmaceuticals. We believe medicines are the most efficient and effective use of healthcare dollars based on the value they deliverto the overall healthcare system. We continue to work with stakeholders to ensure access to medicines within an efficient and affordable healthcare system.
Adoption of other new legislation at the federal or state level could further affect demand for, or pricing of, our products. In 2017, we may face uncertaintiesbecause there likely will be federal legislative and administrative efforts to repeal, substantially modify or invalidate some or all of the provisions of the ACA.There is no assurance that the ACA, as currently enacted or as amended in the future, will not adversely affect our business and financial results, and we cannotpredict how future federal or state legislative or administrative changes relating to healthcare reform will affect our business. We will continue to actively workwith law makers and advocate for solutions that effectively improve patient health outcomes and lower costs to the healthcare system.
Anti-Corruption. The FCPA prohibits U.S. corporations and their representatives from offering, promising, authorizing or making payments to any foreigngovernment official, government staff member, political party or political candidate in an attempt to obtain or retain business abroad. The scope of the FCPAincludes interactions with certain healthcare professionals in many countries. Other countries have enacted similar anti-corruption laws and/or regulations.
Outside the United States
We encounter similar regulatory and legislative issues in most other countries.
New Drug Approvals and Pharmacovigilance. In the EU, the approval of new drugs may be achieved using the Mutual Recognition Procedure, the DecentralizedProcedure or the EU Centralized Procedure. These procedures apply in the EU member states, plus the European Economic Area countries, Norway, Icelandand Liechtenstein. The Centralized Procedure, managed by the EMA, results in one single authorization for the whole EU which provides the most rapid andefficient means of gaining approval across the EU and is the one most commonly used for new products.
In Japan, the PMDA is the point of entry for businesses looking to sell drugs in the country. The PMDA, which is involved in a wide range of regulatory activities,including clinical studies, approvals, post-marketing reviews and pharmaceuticals safety, must approve an application before a new drug product may bemarketed in Japan. The PMDA also offers consultations on clinical trials of new drugs and provides advice on product classifications and approvals.
Health authorities in many middle and lower income countries require marketing approval by a recognized regulatory authority (i.e., similar to the authority of theFDA or the EMA) before they begin to conduct their application review process and/or issue their final approval. Many authorities also require local clinical datain the country’s population in order to receive final marketing approval. These requirements delay marketing authorization in those countries relative to the U.S.and Europe.
China’s regulatory system is unique in many ways, and its drug development and registration requirements are not always consistent with U.S. or otherinternational standards. It is common to see treatments entering the Chinese market two to eight years behind first marketing in the U.S. and Europe, becausehistorically China has only issued import drug licenses to treatments approved by a foreign regulatory authority. In addition, to obtain marketing approvals fornew drugs in China, a clinical trial authorization issued by the CFDA is required for the conduct of Phase I to III clinical trials. Foreign applicants of importeddrugs, if including China-originated data in their Multi-Regional Clinical Trials and meeting the relevant technical review requirements, may receive case-by-caseadditional local clinical trial waivers. Oral generics, on the other hand, only need to undergo bioequivalence studies upon a filing for record with the CFDA, whilesterile injectable generics may need local confirmatory trials for regulatory approval. A Chinese drug license will only be granted if, following review, the CFDAdetermines that the clinical data confirm the drug’s safety and effectiveness.
In the EU, there is detailed legislation and guidance on pharmacovigilance, which has been increased and strengthened in recent years. The EMA’sPharmacovigilance Risk Assessment Committee has the responsibility for reviewing and making recommendations on product safety issues for the EUauthorities. EU regulators may require pharmaceutical companies to conduct post-authorization safety and efficacy studies at the time of approval, or at any timeafterwards in light of scientific developments. There are also additional extensive requirements regarding adverse drug reaction reporting and additionalmonitoring of products. Outside developed markets such as the EU and Japan, pharmacovigilance requirements vary and are generally not as extensive, butthere is a trend toward increasing regulation.
Pricing and Reimbursement . In Europe, Japan, China, Canada, South Korea and some other international markets, governments provide healthcare at lowdirect cost to consumers and regulate pharmaceutical prices or patient reimbursement levels to control costs for the government-sponsored healthcare system,particularly under recent global economic pressures. Governments, including the different EU Member States, may use a variety of cost-containment measuresfor our pharmaceutical products, including price cuts, mandatory rebates, value-based pricing, and international reference pricing (i.e., the practice of manycountries linking their regulated medicine prices to those of other countries). This international patchwork of price regulation and differing economic conditionsand assessments of value across countries has led to different prices in different countries and some third-party trade in our products between countries.
In particular, international reference pricing adds to the regional impact of price cuts in individual countries and hinders patient access and innovation. Pricevariations, exacerbated by international reference pricing systems, also have resulted from exchange rate fluctuations. The downward pricing pressure resultingfrom this dynamic can be expected to continue as a result of reforms to international reference pricing policies and measures targeting pharmaceuticals in someEuropean countries.
In addition, several important multilateral organizations, such as the United Nations (UN) and the Organization for Economic Co-operation and Development(OECD), are increasing policy pressures and scrutiny of international pharmaceutical pricing through issuing reports and policy recommendations (e.g., 2016 UNHigh Level Panel Report on Access to Medicines , and 2017 OECD Report on New Health Technologies — Managing Access, Value and Sustainability ).Government adoption of these recommendations may lead to additional pricing pressures.
In Japan, the government recently released a basic framework for pharmaceutical pricing that may lead to the adoption of cost effectiveness assessments andpricing reviews. In China, government-set price caps were lifted for the vast majority of drug products on June 1, 2015. However, the government continues toexercise indirect price control by setting reimbursement standards through a negotiation mechanism between drug manufacturers and social insuranceadministrations. In addition, the CFDA is now asking some companies to enter into pricing commitments as a condition for regulatory approval.
EU Regulatory Changes . The EU adopted a new Clinical Trials Regulation in May 2014, which is expected to come into effect by October 2018. This newregulation is aimed at simplifying and harmonizing the governance of clinical trials in the EU and will require increased public posting of clinical trial results.
In another effort to increase the public availability of clinical trial results, the EMA adopted a new policy on Publication of Clinical Data for Medicinal Products forHuman Use, which became effective January 1, 2015 and is now being actively implemented. Under this policy, the EMA now proactively publishes clinical trialdata from application dossiers for new marketing authorizations, including data from trials taking place outside the EU, after the EMA has made a decision on themarketing authorization. The policy includes limited exceptions for commercially confidential information and the exclusion of any protected personal data.
Brexit . In June 2016, the U.K. electorate voted in a referendum to leave the EU, which is commonly referred to as “Brexit”. At present, it is unclear whether theU.K. will remain within, or affiliated to, the EU system of medicines approval and regulation, or separate itself completely. Immediately following Brexit, EU lawsare expected to continue to apply until amended or repealed by the U.K. Parliament. It is however probable that the EMA, currently in London, will have torelocate to an EU member state, many of which have already bid to become the new host country. For additional information on Brexit, see the Analysis ofFinancial Condition, Liquidity and Capital Resources — Global Economic Conditions — U.K. in our 2016 Financial Report .
China Regulatory Changes . In an effort to encourage drug innovation and reduce the existing drug approval backlogs, the CFDA unveiled several reforminitiatives for China’s drug approval system. The regulator now divides drugs into new drugs and generics, with the definition for new drugs changed from “drugsnever marketed in China” to “drugs that are neither marketed in or outside China.” This change in definition creates more incentives for China’s domestic drugmanufacturers than for multinational firms, because imported drugs first marketed outside China are no longer considered new drugs. Furthermore, the revisedrules do not clarify whether foreign regulatory approval is still required for imported drug final approval in China. Another major initiative is the piloting of the“marketing authorization holder” system in ten provinces in China, where the market authorization/drug license holders are no longer required to be the actualmanufacturers. The “marketing authorization holder” system will allow for more flexibilities in contract manufacturing arrangements and asset transfers, but it isnot applicable to imported drugs.
A number of other policy changes are expected to be able to streamline and accelerate domestic and imported drug approvals in China. These changes includeintroducing an umbrella clinical trial authorization for all three phases of registration studies (instead of the original phase-by-phase approvals), implementing afiling/recordation system for bioequivalence studies on generics (instead of the original review and approval system), and admitting more types of drugs asinnovative drugs eligible for the fast track/green channel approval pathway.
Healthcare Provider Transparency and Disclosures. A number of countries have implemented laws requiring (or their industry associations have recommended)disclosure of transfers of value made by pharmaceutical companies to healthcare providers. For example, in 2013, the EFPIA released its disclosure code oftransfers of value to healthcare professionals and organizations. The code requires all members of EFPIA, including Pfizer, to disclose transfers of value tohealthcare professionals and healthcare organizations beginning in 2016, covering the relevant transfers in 2015.
Intellectual Property . The World Trade Organization Agreement on Trade Related Aspects of Intellectual Property (WTO-TRIPS) required participant countriesto amend their intellectual property laws to provide patent protection for pharmaceutical products by 2005, with an extension until 2033 for least-developedcountries. While we still face patent grant, enforcement and other intellectual property challenges around the world, a number of countries have madeimprovements. We include stronger patent protection among the factors we consider for continued business expansion in other participant countries.
While the global intellectual property environment has improved following WTO-TRIPS and bilateral/multilateral trade agreements, our future business growthdepends on further progress in intellectual property protection. In emerging market countries in particular, governments have used intellectual property policiesas a tool for reducing the price of imported medicines, as well as to protect their local pharmaceutical industries. There is considerable political and economicpressure to weaken existing intellectual property protection and resist implementation of any further protection, which has led to policies such as more restrictivestandards for obtaining patents and more difficult procedures for patenting biopharmaceutical inventions, restrictions on patenting certain types of inventions(e.g., new medical treatment methods), revocation of patents, issuance (and threat of issuance) of compulsory licenses, weak intellectual property enforcementand failure to implement effective regulatory data protection. Our industry advocacy efforts focus on seeking a more balanced business environment for foreignmanufacturers, as well as on underscoring the importance of strong intellectual property systems for local innovative industries.
Canada’s intellectual property regime for drugs provides some level of patent protection and data exclusivity (eight years plus six-month pediatric extension), butit lacks the predictability and stability that otherwise comparable countries provide. Through intense negotiations as part of the Canada/EU ComprehensiveEconomic & Trade Agreement, Canadian authorities reluctantly agreed to introduce a right of appeal, a form of patent term restoration and to elevate the currentdata protection to a treaty obligation, further aligning its intellectual property regime to the EU.
In China, the intellectual property environment has improved, although effective enforcement and adequate legal remedies remain areas of concern. Thegovernment has taken steps to protect intellectual property rights in conformity with World Trade Organization provisions, and several companies, includingPfizer, have established R&D centers in China due to increased confidence in China’s intellectual property environment. Despite this, China remained on theU.S. Trade Representative’s Priority Watch List for 2016. Further, the standards for patentability in China remain more restrictive than in other major markets,including the U.S., Europe and Japan. Also, while a framework exists for protecting patents for 20 years, enforcement mechanisms are often lacking orinconsistent. For example, the absence of effective patent linkage mechanisms and preliminary injunctions, impractical evidentiary burdens, and heightenedsufficiency standards have been used to invalidate patents at the enforcement stage.
In Brazil and other Latin American countries, the role of health regulatory authorities in reviewing patents (e.g., National Health Surveillance Agency in Brazil),restrictive patentability rules, ambiguity regarding the term of certain patents and backlogs at patent agencies may limit our ability to protect our products throughpatents. The lack of regulatory data protection and difficulties in protecting certain types of inventions, such as new medical uses of drug products, may limit thecommercial lifespan of some pharmaceutical products.
In India, policies favoring compulsory licensing of patents, the increasing tendency of the Indian Patent Office to revoke pharmaceutical patents in oppositionproceedings (both pre- and post-grant), and restrictive standards for patentability of pharmaceutical products have made it difficult to safeguard many of ourinventions and our investments in innovation. These policies heighten the risk of additional patent challenges targeting innovative pharmaceutical products,especially in areas perceived as being important to the public health of the population. Challenges against Pfizer patents in India are ongoing.
In South Korea, the laws and regulations for the patent-regulatory approval linkage system was implemented as part of the U.S.-Korea Free Trade Agreement in2012. The Korean patent-regulatory approval linkage system includes biologics.
ENVIRONMENTAL MATTERS
Most of our operations are affected by national, state and/or local environmental laws. We have made, and intend to continue to make, the expendituresnecessary for compliance with applicable laws. We also are cleaning up environmental contamination from past industrial activity at certain sites. See the Notesto Consolidated Financial Statements— Note 17A3. Commitments and Contingencies—Legal Proceedings—Commercial and Other Matters in our 2016Financial Report. As a result, we incurred capital and operational expenditures in 2016 for environmental compliance purposes and for the clean-up of certainpast industrial activity as follows:
• environment-related capital expenditures— $27 million; and• other environment-related expenses— $126 million.
While capital expenditures or operating costs for environmental compliance cannot be predicted with certainty, we do not currently anticipate they will have amaterial effect on our capital expenditures or competitive position.
Climate change presents risks to our operations, including the potential for additional regulatory requirements and associated costs, and the potential for morefrequent and severe weather events and water availability challenges that may impact our facilities and those of our suppliers. We cannot provide assurance thatphysical risks to our facilities and supply chain due to climate change will not occur in the future; however, we have a program for reviewing our vulnerability tothese potential risks and we update our assessments periodically. To date, we have concluded that, because of our facility locations, our existing distributionnetworks and our controls, we do not anticipate that these risks will have a material impact on Pfizer in the near term.
TAX MATTERS
The discussion of tax-related matters in the Notes to Consolidated Financial Statements— Note 5. Tax Matters in our 2016 Financial Report, is incorporated byreference.
EMPLOYEES
In our innovation-intensive business, our employees are vital to our success. We believe we have good relationships with our employees. As of December 31,2016 , we employed approximately 96,500 people in our operations throughout the world.
DISCLOSURE PURSUANT TO SECTION 219 OF THE IRAN THREAT REDUCTION AND SYRIA HUMAN RIGHTS ACT OF 2012
Section 219 of Iran Threat Reduction and Syria Human Rights Act of 2012 (ITRSHRA) requires disclosure by public companies of certain transactions involvingthe Government of Iran, as well as entities and individuals designated under Executive Order 13382 and Executive Order 13224 (the Executive Orders). In some

instances, ITRSHRA requires companies to disclose these types of transactions, even if they were permissible under U.S. law or were conducted by a non-U.S.affiliate in accordance with the local law under which such entity operates.
As a global biopharmaceutical company, we conduct business in multiple jurisdictions throughout the world. During 2016 , our activities included supplying life-saving medicines, medical products and consumer products (Pfizer products) for patient and consumer use in Iran. We ship Pfizer products to Iran, and conductrelated activities, in accordance with licenses issued by the U.S. Department of the Treasury’s Office of Foreign Assets Control and other U.S. and non-U.S.governmental entities, and in line with our corporate policies. We will continue our global activities to improve the health and well-being of patients andconsumers in a manner consistent with applicable laws and our corporate policies. To our knowledge, none of our activities during 2016 are required to bedisclosed pursuant to ITRSHRA.
Pfizer Inc. 2016 Form 10-K 10
TABLE OF CONTENTS
ITEM 1A. RISK FACTORS
The statements in this Section describe the major risks to our business and should be considered carefully. In addition, these statements constitute ourcautionary statements under the Private Securities Litigation Reform Act of 1995.
Our disclosure and analysis in this 2016 Form 10-K and in our 2016 Annual Report to Shareholders contain forward-looking statements. From time to time, wealso provide forward-looking statements in other materials we release to the public, as well as oral forward-looking statements. Such forward-looking statementsinvolve substantial risks and uncertainties. We have tried, wherever possible, to identify such statements by using words such as “will,” “may,” “could,” “likely,”“ongoing,” “anticipate,” “estimate,” “expect,” “project,” “intend,” “plan,” “believe,” “target,” “forecast,” “goal,” “objective,” “aim” and other words and terms of similarmeaning or by using future dates in connection with any discussion of, among other things, our anticipated future operating and financial performance, businessplans and prospects, in-line products and product candidates, strategic reviews, capital allocation, business-development plans, and plans relating to sharerepurchases and dividends. In particular, these include statements relating to future actions, business plans and prospects, our acquisitions of Hospira, Anacor,Medivation and AstraZeneca’s small molecule anti-infectives business, the disposition of the Hospira Infusion Systems net assets, prospective products orproduct approvals, future performance or results of current and anticipated products, sales efforts, expenses, interest rates, foreign exchange rates, the outcomeof contingencies, such as legal proceedings, plans relating to share repurchases and dividends, government regulation and financial results, including, inparticular, the financial guidance set forth in the Overview of Our Performance, Operating Environment, Strategy and Outlook—Our Financial Guidance for 2017section in our 2016 Financial Report; the anticipated costs and cost savings, including from our acquisition of Hospira and our cost-reduction/productivityinitiatives, set forth in the Costs and Expenses—Restructuring Charges and Other Costs Associated with Acquisitions and Cost-Reduction/Productivity Initiativessection in our 2016 Financial Report and in the Notes to Consolidated Financial Statements—Note 3. Restructuring Charges and Other Costs Associated withAcquisitions and Cost-Reduction/Productivity Initiatives; the benefits expected from our business development transactions; the planned capital spending setforth in the Analysis of Financial Condition, Liquidity and Capital Resources—Selected Measures of Liquidity and Capital Resources—Contractual Obligationssection in our 2016 Financial Report; and the contributions that we expect to make from our general assets to the Company’s pension and postretirement plansduring 2017 set forth in the Analysis of Financial Condition, Liquidity and Capital Resources—Selected Measures of Liquidity and Capital Resources—Contractual Obligations section and in the Notes to Consolidated Financial Statements—Note 11. Pension and Postretirement Benefit Plans and DefinedContribution Plans in our 2016 Financial Report.
We cannot guarantee that any forward-looking statement will be realized. Achievement of anticipated results is subject to substantial risks, uncertainties andinaccurate assumptions. Should known or unknown risks or uncertainties materialize, or should underlying assumptions prove inaccurate, actual results couldvary materially from past results and those anticipated, estimated or projected. You should bear this in mind as you consider forward-looking statements, andyou are cautioned not to put undue reliance on forward-looking statements.
We undertake no obligation to publicly update forward-looking statements, whether as a result of new information, future events or otherwise, except as requiredby law or by the rules and regulations of the SEC. You are advised, however, to consult any further disclosures we make on related subjects. Also note that weprovide the following cautionary discussion of risks, uncertainties and possibly inaccurate assumptions relevant to our businesses. These are factors that,individually or in the aggregate, may cause our actual results to differ materially from expected, projected or historical results. We note these factors for investorsas permitted by the Private Securities Litigation Reform Act of 1995. You should understand that it is not possible to predict or identify all such factors.Consequently, you should not consider the following to be a complete discussion of all potential risks or uncertainties.
RISKS RELATED TO OUR BUSINESS, INDUSTRY AND OPERATIONS :
MANAGED CARE TRENDS
Consolidation among MCOs has increased the negotiating power of MCOs and other private insurers. Private third-party insurers, as well as governments,increasingly employ formularies to control costs by negotiating discounted prices in exchange for formulary inclusion. Failure to obtain or maintain timely oradequate pricing or formulary placement for our products or obtaining such pricing or placement at unfavorable pricing could adversely impact revenue. Inaddition to formulary tier co-pay differentials, private health insurance companies and self-insured employers have been raising co-payments required frombeneficiaries, particularly for branded pharmaceuticals and biotechnology products. This cost shifting has given consumers greater control of medicationchoices, as they pay for a larger portion of their prescription costs and may cause consumers to favor lower cost generic alternatives to brandedpharmaceuticals. MCOs have recently introduced additional measures such as new-to-market blocks, exclusion lists, indication-based pricing, and value-basedpricing/contracting to improve their cost containment efforts. Private health insurance companies also are increasingly imposing utilization management tools,such as clinical protocols, requiring prior authorization for a branded product if a generic product is available or requiring the patient to first fail on one or moregeneric products before permitting access to a branded medicine. As the U.S. payer market concentrates further and as more drugs become available in genericform, biopharmaceutical companies may face greater
Pfizer Inc. 2016 Form 10-K 11
TABLE OF CONTENTS
pricing pressure from private third-party payers, who will continue to drive more of their patients to use lower cost generic alternatives.
GENERIC COMPETITION
Competition from manufacturers of generic drugs is a major challenge for our branded products around the world, and the loss or expiration of intellectualproperty rights can have a significant adverse effect on our revenues. The date at which generic competition commences may be different from the date that thepatent or regulatory exclusivity expires. However, upon the loss or expiration of patent protection for one of our products, or upon the “at-risk” launch (despitepending patent infringement litigation against the generic product) by a generic manufacturer of a generic version of one of our patented products, we can losethe major portion of revenues for that product in a very short period of time, which can adversely affect our business. A number of our products are expected toface significantly increased generic competition over the next few years.
Also, generic manufacturers have filed applications with the FDA seeking approval of product candidates that such companies claim do not infringe our patents;these include candidates that would compete with, among other products, Xeljanz and Xtandi . Our licensing and collaboration partners also face challenges bygeneric drug manufacturers to patents covering several of their products that may impact our licenses or co-promotion rights to such products. In addition, ourpatent-protected products may face competition in the form of generic versions of competitors’ branded products that lose their market exclusivity.
COMPETITIVE PRODUCTS
We cannot predict with accuracy the timing or impact of the introduction of competitive products, including new product entrants, in-line branded products,generic products, private label products, biosimilars and product candidates that treat diseases and conditions similar to those treated by our in-line drugs anddrug candidates. The introduction of competitive products can result in erosion of the sales of our existing products and potential sales of products indevelopment, as well as unanticipated product obsolescence. Competitive product launches have occurred in recent years, and certain potentially competitiveproducts are in various stages of development, some of which have been filed for approval with the FDA and with regulatory authorities in other countries.
We also produce generic and biosimilar pharmaceutical products that compete with branded products from competitors, as well as other generic and biosimilarmanufacturers. The ability to launch a generic or biosimilar pharmaceutical product at or before anticipated generic or biosimilar market formation is important tothat product’s profitability. Prices for products typically decline, sometimes dramatically, following generic market formation, and as additional companies receiveapprovals to market that product, competition intensifies. If a company’s generic or biosimilar product can be “first-to-market” such that its only competition is thebranded drug for a period of time, higher levels of sales and profitability can be achieved until other generic or biosimilar competitors enter the market. Withincreasing competition in the generic or biosimilar product market, the timeliness with which we can market new generic or biosimilar products will increase inimportance. Our success will depend on our ability to bring new products to market quickly.
DEPENDENCE ON KEY IN-LINE PRODUCTS
We recorded direct product revenues of more than $1 billion for each of eight biopharmaceutical products: Prevnar 13/Prevenar 13 , Lyrica , Enbrel , Ibrance ,Lipitor , Viagra , Sutent and the Premarin family of products, as well as more than $1 billion in Alliance revenues (primarily Eliquis ) in 2016. Those products andAlliance revenues accounted for 43% of our total revenues in 2016. If these products or any of our other major products were to become subject to problemssuch as loss of patent protection (if applicable), changes in prescription growth rates, material product liability litigation, unexpected side effects, regulatoryproceedings, publicity affecting doctor or patient confidence, pressure from existing competitive products, changes in labeling or, if a new, more effectivetreatment should be introduced, the adverse impact on our revenues could be significant. Patents covering several of our best-selling medicines have recentlyexpired or will expire in the next few years (including some of our billion-dollar and previously billion-dollar products), and patents covering a number of our best-selling medicines are, or have been, the subject of pending legal challenges. For example, pursuant to terms of a settlement agreement, certain formulations ofZyvox became subject to generic competition in the U.S. in January 2015. In addition, our revenues could be significantly impacted by the timing and rate ofcommercial acceptance of key new products. For additional information, see the Overview of Our Performance, Operating Environment, Strategy and Outlook ––Our Operating Environment — Industry-Specific Challenges — Intellectual Property Rights and Collaboration/Licensing Rights — Recent Losses and ExpectedLosses of Product Exclusivity section in our 2016 Financial Report.
Further, our Alliance revenues will be adversely affected by the termination or expiration of collaboration and co-promotion agreements that we have entered intoand that we may enter into from time to time. For additional information on recent losses of collaborations rights, see the Overview of Our Performance,Operating Environment, Strategy and Outlook –– Our Operating Environment — Industry-Specific Challenges — Intellectual Property Rights andCollaboration/Licensing Rights — Recent Losses of Collaboration Rights section in our 2016 Financial Report.
Pfizer Inc. 2016 Form 10-K 12
TABLE OF CONTENTS
RESEARCH AND DEVELOPMENT INVESTMENT
The discovery and development of safe, effective new products, as well as the development of additional uses for existing products, are necessary for thecontinued strength of our businesses. Our product lines must be replenished over time in order to offset revenue losses when products lose their marketexclusivity, as well as to provide for earnings growth. Our growth potential depends in large part on our ability to identify and develop new products or newindications for existing products that address unmet medical needs and receive reimbursement from payers, either through internal R&D or throughcollaborations, acquisitions, joint ventures or licensing or other arrangements with third parties. However, balancing current growth, investment for future growthand the delivery of shareholder return remains a major challenge. The average costs of product development continue to rise, as do the regulatory requirementsin many therapeutic areas, which may affect the number of candidates funded as well as the sustainability of the R&D portfolio. Our ongoing investments in newproduct introductions and in R&D for new products and existing product extensions could exceed corresponding sales growth.
Additionally, our R&D investment plans and resources may not be correctly matched between science and markets, and failure to invest in the right technologyplatforms, therapeutic segments, product classes, geographic markets and/or in-licensing and out-licensing opportunities in order to deliver a robust pipelinecould adversely impact the productivity of our pipeline. Further, even if the areas with the greatest market attractiveness are identified, the science may not workfor any given program despite the significant investment required for R&D, and the commercial potential of the product may not be as competitive as expectedbecause of the highly dynamic market environment and the hurdles in terms of access and reimbursement.
We continue to strengthen our global R&D organization and pursue strategies intended to improve innovation and overall productivity in R&D to achieve asustainable pipeline that will deliver value in the near term and over time. There can be no assurance that these strategies will deliver the desired result, whichcould affect profitability in the future.
BIOTECHNOLOGY PRODUCTS
Abbreviated legal pathways for the approval of biosimilars exist in certain international markets and, since the passage of the ACA, a framework for suchapproval exists in the U.S. If competitors are able to obtain marketing approval for biosimilars referencing our biotechnology products, our biotechnologyproducts may become subject to competition from these biosimilars, with attendant competitive pressure, and price reductions could follow. The expiration orsuccessful challenge of applicable patent rights could trigger this competition, assuming any relevant exclusivity period has expired. We may face litigation withrespect to the validity and/or scope of patents relating to our biotechnology products.
We are developing biosimilar medicines. The evolving pathway for registration and approval of biosimilar products by the FDA and regulatory authorities incertain other countries could diminish the value of our investments in biosimilars. Other risks related to our development of biosimilars include the potential forsteeper than anticipated price erosion due to increased competitive intensity, coupled with high costs associated with clinical development or intellectual propertychallenges that may preclude timely commercialization of our potential biosimilar products. There is also a risk of lower prescriptions of biosimilars due topotential concerns over comparability with innovator medicines.
RESEARCH STUDIES
Decisions about research studies made early in the development process of a drug or vaccine candidate can have a substantial impact on the marketingstrategy and payer reimbursement possibilities if it receives regulatory approval. For example, a wider range of studies can lead to approval for a broader set ofindications that may impact the marketing and payer reimbursement process. However, each additional indication must be balanced against the time andresources required to demonstrate benefit, the increased complexity of development and the potential delays to approval of the lead indication. We try to planclinical trials prudently and to reasonably anticipate and address challenges, but there is no guarantee that an optimal balance between trial conduct, speed anddesired outcome will be achieved each time. The degree to which such potential challenges are foreseen and addressed could affect our future results.
RISKS AFFECTING INTERNATIONAL OPERATIONS
Our international operations could be affected by currency fluctuations, capital and exchange controls, expropriation and other restrictive government actions,changes in intellectual property legal protections and remedies, trade regulations and procedures and actions affecting approval, production, pricing, andmarketing of, reimbursement for and access to our products, as well as by political unrest, unstable governments and legal systems and inter-governmentaldisputes. Any of these changes could adversely affect our business.
Many emerging markets have experienced growth rates in excess of developed markets, leading to an increased contribution to the industry’s globalperformance. As a result, we have been employing strategies to grow in emerging markets, including the full integration of emerging markets into each of ourtwo distinct operating segments: IH and EH. However, there is no assurance that our strategies in emerging markets will be successful or that these countrieswill continue to sustain these growth rates. In addition, some emerging market countries may be particularly vulnerable to periods of financial or politicalinstability or significant currency fluctuations or may have limited resources for healthcare spending. Even though we constantly
Pfizer Inc. 2016 Form 10-K 13
TABLE OF CONTENTS
monitor the evolving emerging markets for any unanticipated risk to Pfizer, certain financial or political events in such markets, as discussed above, canadversely affect our results.
SPECIALTY PHARMACEUTICALS
Specialty pharmaceuticals are medicines that treat rare or life-threatening conditions that typically have smaller patient populations. The growing availability anduse of innovative specialty pharmaceuticals, combined with their relative higher cost as compared to other types of pharmaceutical products, has generatedpayer interest in developing cost-containment strategies targeted to this sector. While the impact of payers’ efforts to control access to and pricing of specialtypharmaceuticals has had limited impact on Pfizer to date, a number of factors may lead to a more significant adverse business impact in the future given ourgrowing specialty business portfolio. These include the increasing use of health technology assessments in markets around the world, U.S. PBMs seeking tonegotiate greater discounts, deteriorating finances of certain governments, the uptake of biosimilars as they become available and efforts by government officialsor legislators to implement measures to regulate prices or payment for pharmaceutical products.
CONSUMER HEALTHCARE
The Consumer Healthcare business may be impacted by economic volatility, the timing and severity of the cough, cold and flu season, generic or store brandcompetition affecting consumer spending patterns and market share gains of competitors’ branded products or generic store brands. In addition, regulatory andlegislative outcomes regarding the safety, efficacy or unintended uses of specific ingredients in our Consumer Healthcare products may require withdrawal,reformulation and/or relabeling of certain products (e.g., cough/cold products). See The Global Economic Environment risk factor below.
PRODUCT MANUFACTURING AND MARKETING RISKS
Difficulties or delays in product manufacturing or marketing could affect future results through regulatory actions, shut-downs, approval delays, withdrawals,recalls, penalties, supply disruptions or shortages, reputational harm, product liability, unanticipated costs or otherwise. Examples of such difficulties or delaysinclude, but are not limited to, the inability to increase production capacity commensurate with demand; the failure to predict market demand for, or to gainmarket acceptance of, approved products; the possibility that the supply of incoming materials may be delayed or become unavailable and that the quality ofincoming materials may be substandard and not detected; the possibility that we may fail to maintain appropriate quality standards throughout the internal andexternal supply network and/or comply with cGMPs and other applicable regulations such as serialization (which allows for track and trace of products in thesupply chain to enhance patient safety); risks to supply chain continuity as a result of natural or man-made disasters at our facilities or at a supplier or vendor,including those that may be related to climate change; or failure to maintain the integrity of our supply chains against intentional and criminal acts such aseconomic adulteration, product diversion, product theft, and counterfeit goods.
Regulatory agencies periodically inspect our drug manufacturing facilities to ensure compliance with applicable cGMP requirements. Failure to comply with theserequirements may subject us to possible legal or regulatory actions, such as warning letters, suspension of manufacturing, seizure of product, injunctions orvoluntary recall of a product, any of which could have a material adverse effect on our business, financial condition and results of operations. In February 2017,we received a warning letter from the FDA communicating FDA’s view that certain violations of cGMP regulations exist at Hospira’s manufacturing facility inMcPherson, Kansas. Hospira is undertaking corrective actions to address the concerns raised by the FDA. Communication with the FDA is ongoing. Until theviolations are corrected, the FDA may refuse to grant premarket approval applications and/or the FDA may refuse to grant export certificates related to productsmanufactured at McPherson, Kansas.
OUTSOURCING AND ENTERPRISE RESOURCE PLANNING
We outsource certain services to third parties in areas including transaction processing, accounting, information technology, manufacturing, clinical trialexecution, clinical lab services, non-clinical research, safety services, integrated facilities management and other areas. For example, in 2016, we placed themajority of our clinical trial execution services with four strategic Clinical Research Organizations (CROs). Service performance issues with these CROs mayadversely impact the progression of our clinical trial programs. Outsourcing of services to third parties could expose us to sub-optimal quality of service deliveryor deliverables, which may result in repercussions such as missed deadlines or other timeliness issues, erroneous data, supply disruptions, non-compliance(including with applicable legal requirements and industry standards) or reputational harm, with potential negative implications for our results.
We continue to pursue a multi-year initiative to outsource some transaction-processing activities within certain accounting processes and are migrating to aconsistent enterprise resource planning system across the organization. These are enhancements of ongoing activities to support the growth of our financialshared service capabilities and standardize our financial systems. If any difficulties in the migration to or in the operation of our enterprise resource planningsystem were to occur, they could adversely affect our operations, including, among other ways, through a failure to meet demand for our products, or adverselyaffect our ability to meet our financial reporting obligations.
Pfizer Inc. 2016 Form 10-K 14
TABLE OF CONTENTS
COLLABORATIONS AND OTHER RELATIONSHIPS WITH THIRD PARTIES
We depend on third-party collaborators, service providers, and others in the development and commercialization of our products and product candidates andalso enter into joint ventures and other business development transactions in connection with our business. To achieve expected longer term benefits, we maymake substantial upfront payments in such transactions, which may negatively impact our reported earnings. We rely heavily on these parties for multipleaspects of our drug development and commercialization activities, but we do not control many aspects of those activities. Third parties may not completeactivities on schedule or in accordance with our expectations. Failure by one or more of these third parties to meet their contractual, regulatory or otherobligations to Pfizer, or any disruption in the relationships between Pfizer and these third parties, could delay or prevent the development, approval orcommercialization of our products and product candidates and could also result in non-compliance or reputational harm, all with potential negative implicationsfor our product pipeline and business.
DIFFICULTIES OF OUR BIOPHARMACEUTICAL WHOLESALERS
In 2016, our largest biopharmaceutical wholesaler accounted for approximately 16% of our total revenues (and approximately 31% of our total U.S. revenues),and our top three biopharmaceutical wholesalers accounted for approximately 39 % of our total revenues (and approximately 76 % of our total U.S. revenues). Ifone of our significant biopharmaceutical wholesalers should encounter financial or other difficulties, such wholesaler might decrease the amount of business thatit does with us, and we might be unable to collect all the amounts that the wholesaler owes us on a timely basis or at all, which could negatively impact ourresults of operations.
BUSINESS DEVELOPMENT ACTIVITIES
We expect to continue to enhance our in-line products and product pipeline through collaborations, alliances, licenses, joint ventures, equity- or debt-basedinvestments, mergers and acquisitions. However, these enhancement plans are subject to the availability and cost of appropriate opportunities, competition fromother pharmaceutical companies that are seeking similar opportunities and our ability to successfully identify, structure and execute transactions, including theability to satisfy the conditions to closing of announced transactions in the anticipated timeframe or at all, and integrate acquisitions. Further, while we seek tomitigate risks and liabilities of such transactions through, among other things, due diligence, there may be risks and liabilities that such due diligence efforts failto discover, that are not disclosed to us, or that we inadequately assess. Additionally, we may not realize the anticipated benefits of such transactions, includingthe possibility that expected synergies and accretion will not be realized or will not be realized within the expected time frame.
COUNTERFEIT PRODUCTS
A counterfeit medicine is one that has been deliberately and fraudulently mislabeled as to its identity and source. A counterfeit Pfizer medicine, therefore, is onemanufactured by someone other than Pfizer, but which appears to be the same as an authentic Pfizer medicine. The prevalence of counterfeit medicines is asignificant and growing industry-wide issue due to a variety of factors, including, but not limited to, the following: the widespread use of the Internet, which hasgreatly facilitated the ease by which counterfeit medicines can be advertised, purchased and delivered to individual patients; the availability of sophisticatedtechnology that makes it easier for counterfeiters to make counterfeit medicines; the growing involvement in the medicine supply chain of under-regulatedwholesalers and repackagers; the lack of adequate inspection at certain international postal facilities as counterfeit medicines are increasingly delivered direct tocustomers in small parcel packages; and the relatively modest risk of penalties faced by counterfeiters. Further, laws against pharmaceutical counterfeiting varygreatly from country to country, and the enforcement of existing law varies greatly from jurisdiction to jurisdiction. For example, in some countries,pharmaceutical counterfeiting is not a crime; in others, it may result in only minimal sanctions. In addition, those involved in the distribution of counterfeitmedicines use complex transport routes in order to evade customs controls by disguising the true source of their products.
Pfizer’s global reputation makes its medicines prime targets for counterfeiting organizations. Counterfeit medicines pose a risk to patient health and safetybecause of the conditions under which they are manufactured—often in unregulated, unlicensed, uninspected and unsanitary sites—as well as the lack ofregulation of their contents. Failure to mitigate the threat of counterfeit medicines, which is exacerbated by the complexity of the supply chain, could adverselyimpact our business, by, among other things, causing the loss of patient confidence in the Pfizer name and in the integrity of our medicines, potentially resultingin lost sales, product recalls, and an increased threat of litigation.
We undertake significant efforts to counteract the threats associated with counterfeit medicines, including, among other things, working with the FDA and otherregulatory authorities and multinational coalitions to combat the counterfeiting of medicines and supporting efforts by law enforcement authorities to prosecutecounterfeiters; assessing new and existing technologies to seek to make it more difficult for counterfeiters to copy our products and easier for patients andhealthcare providers to distinguish authentic from counterfeit medicines; implementing business practices designed to protect patient health; promoting publicpolicies intended to hinder counterfeiting; working diligently to raise public awareness about the dangers of counterfeit medicines; and working collaborativelywith wholesalers, pharmacies, customs offices, and law enforcement agencies to increase inspection coverage, monitor distribution channels, and improvesurveillance of distributors and repackagers. No
Pfizer Inc. 2016 Form 10-K 15
TABLE OF CONTENTS
assurance can be given, however, that our efforts and the efforts of others will be entirely successful, and the presence of counterfeit medicines may continue toincrease.
RISKS RELATED TO GOVERNMENT REGULATION AND LEGAL PROCEEDINGS :
PRICING AND REIMBURSEMENT
U.S. and international governmental regulations that mandate price controls and limitations on patient access to our products or establish prices paid bygovernment entities or programs for our products impact our business, and our future results could be adversely affected by changes in such regulations orpolicies.
In the U.S., many of our products are subject to increasing pricing pressures. Pharmaceutical product pricing is subject to enhanced government and publicscrutiny and calls for reform. Some states have implemented, and other states are considering, pharmaceutical price controls or patient access constraints underthe Medicaid program, and some states are considering price-control regimes that would apply to broader segments of their populations that are not Medicaid-eligible. Additionally, efforts by government officials or legislators to implement measures to regulate prices or payment for pharmaceutical products couldadversely affect our business if implemented. Private third-party payers, such as health plans, increasingly challenge pharmaceutical product pricing, whichcould result in lower prices, lower reimbursement rates and a reduction in demand for our products. Pricing pressures for our products may occur as a result ofhighly competitive insurance markets. Healthcare provider purchasers, directly or through group purchasing organizations, are seeking enhanced discounts orimplementing more rigorous bidding or purchasing review processes.
We encounter similar regulatory and legislative issues in most other countries. In certain international markets, such as Europe, Japan, China, Canada andSouth Korea, governments take an active role in setting prices, access criteria (e.g., through public or private health technology assessments), or other means ofcost control, particularly under recent global financing pressures. As a result, we expect that pressures on the pricing component of operating results willcontinue.
The adoption of restrictive price controls in new jurisdictions or more restrictive ones in existing jurisdictions, failure to obtain timely or adequate government-approved pricing or formulary placement where required for our products or obtaining such pricing or placement at unfavorable pricing could also adverselyimpact revenue. In our vaccines business, we participate in a tender process in many countries for participation in national immunization programs. Failure tosecure participation in national immunization programs or to obtain acceptable pricing in the tender process could adversely affect our business.
U.S. HEALTHCARE REFORM/HEALTHCARE LEGISLATION
The U.S. healthcare industry is highly regulated and subject to frequent and substantial changes. For example, the ACA was enacted by Congress in March2010 and established a major expansion of health care coverage, financed in part by a number of new rebates, discounts, and taxes that had a significant effecton our expenses and profitability. See the discussion under the Overview of Our Performance, Operating Environment, Strategy and Outlook — Our OperatingEnvironment — Industry-Specific Challenges — Regulatory Environment/Pricing and Access — U.S. Healthcare Legislation section in our 2016 Financial Reportand in Item 1. Business under the caption Government Regulation and Price Constraints—In the United States . In 2017, we may face uncertainties becausethere likely will be federal legislative and administrative efforts to repeal, substantially modify or invalidate some or all of the provisions of the ACA. Although therevenues generated for Pfizer by the Medicaid expansion and health insurance exchanges under the ACA have been exceeded by the new rebates, discounts,and taxes, there is no assurance that repeal or replacement of the ACA will not adversely affect our business and financial results, particularly if replacementlegislation reduces incentives for employer-sponsored insurance coverage, and we cannot predict how future federal or state legislative or administrativechanges relating to healthcare reform will affect our business.
Other U.S. federal or state legislative or regulatory action and/or policy efforts could adversely affect our business, including, among others, changes in patentlaws, the importation of prescription drugs from outside the U.S. at prices that are regulated by governments of various foreign countries (which is among theU.S. presidential administration’s policy proposals), restrictions on U.S. direct-to-consumer advertising, limitations on interactions with healthcare professionals,or the use of comparative effectiveness methodologies that could be implemented in a manner that focuses primarily on cost differences and minimizes thetherapeutic differences among pharmaceutical products and restricts access to innovative medicines.
U.S. DEFICIT-REDUCTION ACTIONS
In the U.S., government actions to reduce the national deficit may affect payment by government programs for our products or services provided using ourproducts. The Congressional Budget Office routinely releases options for reducing the federal deficit, and the December 2016 release includes proposals to capMedicaid grants to the states, and to require manufacturers to pay a minimum rebate on drugs covered under part D of Medicare for low-income beneficiaries.Significant Medicare reductions could also result if Congress proceeds with certain proposals to convert the Medicare fee-for-service program into a premiumsupport program, or it chooses to implement the recommendations made annually by the Medicare Payment Advisory Commission, which are primarily intendedto extend the fiscal solvency of the Medicare program. These and any other significant spending reductions or cost controls affecting Medicare, Medicaid orother publicly funded or subsidized health
Pfizer Inc. 2016 Form 10-K 16
TABLE OF CONTENTS
programs that may be implemented, and/or any significant additional taxes or fees that may be imposed on us, as part of any broad deficit-reduction effort couldhave an adverse impact on our results of operations.
SUBSTANTIAL REGULATION
We are subject to extensive, complex, costly and evolving regulation by federal and state governmental authorities in the U.S., principally by the FDA and theDEA, and foreign regulatory authorities. Failure to comply with all applicable regulatory requirements may subject us to operating restrictions and criminalprosecution, monetary penalties and other disciplinary actions, including, sanctions, warning letters, product seizures, recalls, fines, injunctions, suspension,revocation of approvals, or exclusion from future participation in government healthcare programs.
DEVELOPMENT, REGULATORY APPROVAL AND MARKETING OF PRODUCTS
Innovation is critical to the success of our company. The outcome of the lengthy and complex process of identifying new compounds and developing newproducts is inherently uncertain and involves a high degree of risk and cost. Drug discovery and development is time-consuming, expensive and unpredictable.The process from early discovery or design to development to regulatory approval can take many years. Drug candidates can and do fail at any stage of theprocess, including as the result of unfavorable pre-clinical and clinical trial results, including unfavorable new clinical data and additional analyses of existingclinical data. There can be no assurance regarding our ability to meet anticipated pre-clinical and clinical trial commencement and completion dates, regulatorysubmission and approval dates, and launch dates for product candidates, or as to whether or when we will receive regulatory approval for new products or fornew indications or dosage forms for existing products, which will depend on the assessment by regulatory authorities of the benefit-risk profile suggested by thetotality of the efficacy and safety information submitted. Decisions by regulatory authorities regarding labeling, ingredients and other matters could adverselyaffect the availability or commercial potential of our products. There is no assurance that we will be able to address the comments in complete response lettersreceived by us with respect to certain of our drug applications to the satisfaction of the FDA, that any of our late stage pipeline products will receive regulatoryapproval and/or be commercially successful or that recently approved products will be approved in other markets and/or be commercially successful. There isalso a risk that we may not adequately address existing regulatory agency findings concerning the adequacy of our regulatory compliance processes andsystems or implement sustainable processes and procedures to maintain regulatory compliance and to address future regulatory agency findings, should theyoccur. In addition, there are risks associated with interim data, including the risk that final results of studies for which interim data have been provided and/oradditional clinical trials may be different from (including less favorable than) the interim data results and may not support further clinical development of theapplicable product candidate or indication.
There are many considerations that can affect the marketing of our products around the world. Regulatory delays, the inability to successfully complete oradequately design and implement clinical trials within the anticipated quality, time and cost guidelines or in compliance with applicable regulatory expectations,claims and concerns about safety and efficacy, new discoveries, patent disputes and claims about adverse side effects are a few of the factors that canadversely affect our business. Further, claims and concerns about safety and efficacy can result in a negative impact on product sales, product recalls orwithdrawals, and/or consumer fraud, product liability and other litigation and claims. Increasing regulatory scrutiny of drug safety and efficacy, with regulatoryauthorities increasingly focused on product safety and the risk/benefit profile of products as they relate to already-approved products, has resulted in a morechallenging, expensive and lengthy regulatory approval process due to requests for, among other things, additional clinical trials prior to granting approval orincreased post-approval requirements, such as risk evaluation and mitigation strategies.
In addition, failure to put in place adequate controls and/or resources for effective collection, reporting and management of adverse events from clinical trials andpost-marketing surveillance, in compliance with current and evolving regulatory requirements could result in risks to patient safety, regulatory actions and risks toproduct sales.
The FDA, along with other regulatory agencies around the world, has been experiencing a backlog of generic drug applications, which has delayed approvals ofnew generic products. These delays have become longer, and while the FDA has stated that it is taking steps to address the backlog of pending applications,continued approval delays may be experienced by generic drug applicants over the next few years.
POST-APPROVAL DATA
As a condition to granting marketing approval of a product, the FDA may require a company to conduct additional clinical trials. The results generated in thesePhase 4 trials could result in the loss of marketing approval, changes in product labeling, and/or new or increased concerns about the side effects or efficacy of aproduct. Regulatory agencies in countries outside the U.S. often have similar authority and may impose comparable requirements. Post-marketing studies,whether conducted by us or by others and whether mandated by regulatory agencies or voluntary, and other emerging data about marketed products, such asadverse event reports, may also adversely affect the availability or commercial potential of our products. Further, the discovery of significant problems with aproduct similar to one of our products that implicate (or are perceived to implicate) an entire class of products could have an adverse effect on the availability orcommercial potential of the affected products. Accordingly, new data about our products, or products similar to our products, could negatively impact demand forour products due to real or
Pfizer Inc. 2016 Form 10-K 17
TABLE OF CONTENTS
perceived side effects or uncertainty regarding efficacy and, in some cases, could result in updated labeling, restrictions on use, product withdrawal or recall.
INTERACTIONS WITH HEALTHCARE PROFESSIONALS AND GOVERNMENT OFFICIALS
Risks and uncertainties apply if we provide something of value to a healthcare professional and/or government official. If the interaction is found to be improper,government enforcement actions and penalties could result. These risks may increase as non-U.S. jurisdictions adopt or increase enforcement efforts of newanti-bribery laws and regulations.
CHANGES IN LAWS AND ACCOUNTING STANDARDS
Our future results could be adversely affected by changes in interpretations of existing laws and regulations, or changes in laws and regulations, including,among others, changes in accounting standards, taxation requirements (including tax rate changes, new tax laws, changes to existing tax laws and revised taxlaw and regulatory interpretations, including changes affecting the taxation by the U.S. of income earned outside the U.S. that may result from pending andpossible future proposals), competition laws, privacy laws and environmental laws in the U.S. and other countries. For additional information, see the Provisionfor Taxes on Income — Changes in Tax Law and New Accounting Standards sections, and Notes to Consolidated Financial Statements— Note 1B. Basis ofPresentation and Significant Accounting Policies: Adoption of New Accounting Standards in our 2016 Financial Report.
LEGAL PROCEEDINGS
We and certain of our subsidiaries are involved in various patent, product liability, consumer, commercial, securities, antitrust, environmental, employment andtax litigations and claims, government investigations and other legal proceedings that arise from time to time in the ordinary course of our business. Litigation isinherently unpredictable, and excessive verdicts do occur. Although we believe we have substantial defenses in these matters, we could in the future incurjudgments, enter into settlements of claims or revise our expectations regarding the outcomes of certain matters, and such developments could have a materialadverse effect on our results of operations in the period in which the amounts are accrued and/or our cash flows in the period in which the amounts are paid.
Claims against our patents include challenges to the coverage and/or validity of our patents on various products or processes. Although we believe we havesubstantial defenses to these challenges with respect to all of our material patents, there can be no assurance as to the outcome of these matters, and a loss inany of these cases could result in a loss of patent protection for the product at issue, which could lead to a significant loss of sales of that product and couldmaterially affect future results of operations.
Like other pharmaceutical companies, we are subject to investigations and extensive regulation by government agencies in the U.S., other developed marketsand multiple emerging markets in which we operate. As a result, we have interactions with government agencies on an ongoing basis. Criminal charges, andsubstantial fines and/or civil penalties, as well as limitations on our ability to conduct business in applicable jurisdictions, could result from governmentinvestigations.
Our activities relating to the sale and marketing and the pricing of our products are subject to extensive regulation under the FFDCA, the Medicaid Drug RebateProgram, the FCPA and other federal and state statutes, including those discussed elsewhere in this 2016 Form 10-K, as well as anti-kickback and false claimslaws, and similar laws in international jurisdictions. Like many companies in our industry, we have from time to time received inquiries and subpoenas and othertypes of information demands from government authorities, and been subject to claims and other actions related to our business activities brought bygovernmental authorities, as well as by consumers and private payers. In some instances, we have incurred significant expense, civil payments, fines and otheradverse consequences as a result of these claims, actions and inquiries. For example, these claims, actions and inquiries may relate to alleged failures toaccurately interpret or identify or prevent non-compliance with the laws and regulations associated with the dissemination of product information (approved andunapproved), potentially resulting in government enforcement and damage to our reputation. This risk may be heightened by digital marketing, including socialmedia, mobile applications and blogger outreach.
ENVIRONMENTAL CLAIMS AND PROCEEDINGS
We and certain of our subsidiaries are subject to numerous contingencies arising in the ordinary course of business relating to environmental claims andproceedings. Amounts recorded for contingencies can result from a complex series of judgments about future events and uncertainties and can rely heavily onestimates and assumptions. While we have accrued for worldwide environmental liabilities, there is no guarantee that additional costs will not be incurredbeyond the amounts accrued. If we fail to properly manage the safety of our facilities and the environmental risks associated therewith or if we are required toincrease our accruals for contingencies for environmental claims and proceedings in the future, it could potentially have an adverse effect on our results ofoperations.
Pfizer Inc. 2016 Form 10-K 18
TABLE OF CONTENTS
RISKS RELATED TO INTELLECTUAL PROPERTY :
PATENT PROTECTION
Our long-term success largely depends on our ability to market technologically competitive products. We rely and expect to continue to rely on a combination ofintellectual property, including patent, trademark, trade dress, copyright, trade secret and domain name protection laws, as well as confidentiality and licenseagreements, to protect our intellectual property and proprietary rights. If we fail to obtain and maintain adequate intellectual property protection, we may not beable to prevent third parties from launching generic versions of our branded products, using our proprietary technologies or from marketing products that arevery similar or identical to ours. Our currently pending or future patent applications may not result in issued patents, or be granted on a timely basis. Similarly,any term extensions that we seek may not be granted on a timely basis, if at all. In addition, our issued patents may not contain claims sufficiently broad toprotect us against third parties with similar technologies or products or provide us with any competitive advantage, including exclusivity in a particular productarea. The scope of our patent claims also may vary between countries, as individual countries have distinct patent laws. We may be subject to challenges bythird parties regarding our intellectual property, including, among others, claims regarding validity, enforceability, scope and effective term.
Our ability to enforce our patents also depends on the laws of individual countries and each country’s practice with respect to enforcement of intellectual propertyrights, and the extent to which certain sovereigns may seek to engage in a policy of routine compulsory licensing of pharmaceutical intellectual property as aresult of local political pressure or in the case of national emergencies. In countries that provide some form of regulatory exclusivity, mechanisms exist permittingsome form of challenge to our patents by competitors or generic drug marketers prior to or immediately following the expiration of such regulatory exclusivity,and generic companies are increasingly employing aggressive strategies, such as “at risk” launches to challenge our patent rights. Most of the suits by genericdrug manufacturers involve claims that patents covering our products, processes or dosage forms are invalid and/or do not cover the product of the generic drugmanufacturer. Also, counterclaims, as well as various independent actions, have been filed alleging that our assertions of, or attempts to enforce, patent rightswith respect to certain products constitute unfair competition and/or violations of antitrust laws. We are also party to other patent damages suits in variousjurisdictions pursuant to which generic drug manufacturers, payers, governments or other parties are seeking damages from us for alleged delay of genericentry. Further, if we are unable to maintain our existing license agreements or other agreements pursuant to which third parties grant us rights to intellectualproperty, including because such agreements expire or are terminated, our operating results and financial condition could be materially adversely affected.
Likewise, in the U.S. and other countries, we currently hold issued trademark registrations and have trademark applications pending, any of which may be thesubject of a governmental or third-party objection, which could prevent the maintenance or issuance of the trademark. As our products mature, our reliance onour trademarks and trade dress to differentiate us from our competitors increases and as a result, if we are unable to prevent third parties from adopting,registering or using trademarks and trade dress that infringe, dilute or otherwise violate our trademark rights, our business could be materially adverselyaffected. We actively seek to protect our proprietary information, including our trade secrets and proprietary know-how, by requiring our employees, consultants,other advisors and other third parties to execute proprietary information and confidentiality agreements upon the commencement of their employment,engagement or other relationship. Despite these efforts and precautions, we may be unable to prevent a third party from copying or otherwise obtaining andusing our trade secrets or our other intellectual property without authorization, and legal remedies in some countries may not adequately compensate us for thedamages caused by such unauthorized use. Further, others may independently and lawfully develop substantially similar or identical products that circumventour intellectual property by means of alternative designs or processes or otherwise.
THIRD PARTY INTELLECTUAL PROPERTY CLAIMS
A properly functioning intellectual property regime is essential to our business model. We are committed to respecting the valid intellectual property rights ofother companies, but the patent granting process is imperfect. Accordingly, the pursuit of valid business opportunities may require us to challenge intellectualproperty rights held by other companies that we believe were improperly granted. Such challenges may include negotiation and litigation, which may not besuccessful.
Part of our EH business depends upon successfully identifying generic pharmaceutical product and biosimilar opportunities and launching products to takeadvantage of those opportunities, which may involve litigation, associated costs and time delays, and may ultimately not be successful. These opportunities mayarise in situations where patent protection of equivalent branded products has expired, where patents have been declared invalid, or where products do notinfringe the patents of others. To achieve a “first-to-market” or early market position for generic pharmaceutical products and biosimilars, we may take action,such as litigation, asserting that our products do not infringe patents of existing products or that those patents are invalid or unenforceable.
Third parties may claim that our products infringe one or more patents owned or controlled by the third party. Claims of intellectual property infringement can becostly and time-consuming to resolve, may delay or prevent product launches, and may result in significant damages. We are involved in patent-related disputeswith third parties over our attempts to market generic pharmaceutical products and biosimilars. Once we have final regulatory approval of the related generic
Pfizer Inc. 2016 Form 10-K 19
TABLE OF CONTENTS
pharmaceuticals products or biosimilars, we may decide to commercially market these products even though associated legal proceedings (including anyappeals) have not been resolved (i.e., “at-risk” launch). If those proceedings ultimately determine that our products infringe the patent rights of third parties, wemay face patent infringement damages, including the possibility of owing the third party a reasonable royalty or the lost profits from the sale of the brandedproduct. Remedies also may include or consist of an injunction preventing us from further manufacture or sales of the affected product during the term of one ormore of the valid, infringed patents. Any of these adverse consequences could have a material adverse effect on our profitability and financial condition.
RISK RELATED TO TECHNOLOGY :
INFORMATION TECHNOLOGY AND SECURITY
Significant disruptions of information technology systems or breaches of information security could adversely affect our businesses. We rely to a large extentupon sophisticated information technology systems to operate our businesses. In the ordinary course of business, we collect, store and transmit large amountsof confidential information (including, but not limited to, personal information and intellectual property), and we deploy and operate an array of technical andprocedural controls to maintain the confidentiality and integrity of such confidential information. We also have outsourced significant elements of our operationsto third parties, including significant elements of our information technology infrastructure and, as a result, we are managing many independent vendorrelationships with third parties who may or could have access to our confidential information. The size and complexity of our information technology andinformation security systems, and those of our third-party vendors with whom we contract (and the large amounts of confidential information that is present onthem), make such systems potentially vulnerable to service interruptions or to security breaches from inadvertent or intentional actions by our employees orvendors, or from attacks by malicious third parties. Such attacks are of ever-increasing levels of sophistication and are made by groups and individuals with awide range of motives (including, but not limited to, industrial espionage) and expertise, including organized criminal groups, “hacktivists,” nation states andothers. As a global pharmaceutical company, our systems are subject to frequent attacks. Due to the nature of some of these attacks, there is a risk that theymay remain undetected for a period of time. While we have invested in the protection of data and information technology, there can be no assurance that ourefforts will prevent service interruptions or security breaches. Any such interruption or breach of our systems could adversely affect our business operationsand/or result in the loss of critical or sensitive confidential information or intellectual property, and could result in financial, legal, business and reputational harmto us. We maintain cyber liability insurance; however this insurance may not be sufficient to cover the financial, legal, business or reputational losses that mayresult from an interruption or breach of our systems.
RISKS RELATED TO OUR STRATEGIC TRANSACTIONS :
STRATEGIC ACQUISITIONS
The success of our acquisitions of Hospira, Anacor, Medivation and AstraZeneca’s small molecule anti-infectives business will depend, in large part, on ourability to realize anticipated benefits from combining these businesses with Pfizer. We, for example, may fail to achieve cost savings anticipated with theacquisition of Hospira, or such cost savings within the expected time frame. Similarly, the accretive impact anticipated from the acquisitions of Hospira, Anacorand Medivation may not be realized or may be delayed. Integration of these businesses may result in the loss of key employees, the disruption of ongoingbusiness, including third-party relationships, or inconsistencies in standards, controls, procedures and policies. We also may fail to generate the revenue growthfor the acquired business that we expected at the time of entering into the transaction. Expected revenue from acquired products and product candidates alsomay be constrained by developments outside of our control. Unsuccessful clinical trials, regulatory hurdles and commercialization challenges regularly adverselyimpact revenue and income contribution from products and product candidates, including those acquired in these acquisitions. Hospira, for example, hasexperienced manufacturing disruptions, device remediations and substantial regulatory scrutiny due to quality issues, including receiving a warning letter fromthe FDA in February 2017 communicating FDA ’ s view that certain violations of cGMP regulations exist at Hospira ’ s manufacturing facility in McPherson,Kansas. Manufacturing problems, as well as any corrective actions and their operational implementation, could adversely impact the revenue we generate fromproducts acquired from Hospira and result in substantial unanticipated costs.
OTHER RISKS:
THE GLOBAL ECONOMIC ENVIRONMENT
Like all businesses, we are exposed to both global and industry-specific economic conditions. Governments, corporations and insurance companies, whichprovide insurance benefits to patients, have implemented increases in cost-sharing and restrictions on access to medicines, potentially causing patients toswitch to generic products, delay treatments, skip doses or use less effective treatments. Government financing pressures can lead to negative pricing pressurein various markets where governments take an active role in setting prices, access criteria (e.g., through public or private health technology assessments), orother means of cost control. Examples include Europe, Japan, China, Canada, South Korea and a number of other international markets. The U.S. continues tomaintain competitive insurance markets, but has also seen significant
Pfizer Inc. 2016 Form 10-K 20
TABLE OF CONTENTS
increases in patient cost-sharing and growing government influence as government programs continue to grow as a source of coverage.
The global economic environment has not had, nor do we anticipate that it will have, a material impact on our liquidity or capital resources. Due to our significantoperating cash flows, financial assets, access to capital markets and available lines of credit and revolving credit agreements, we continue to believe that wehave, and will maintain, the ability to meet our liquidity needs for the foreseeable future. We monitor our liquidity position continuously in the face of evolvingeconomic conditions, but there can be no guarantee that changes in global financial markets and global economic conditions will not affect our liquidity or capitalresources or impact our ability to obtain financing in the future.
We continue to monitor credit, capital restrictions and economic situations in volatile regions and markets, especially where the ability to obtain U.S. dollars forlocal currency is unpredictable and challenging. We cannot predict the likelihood of future changes in these economic conditions, or what impact they may haveon our results of operations, financial condition or business.
In addition, given that a significant portion of our business is conducted in the EU, including the U.K., the formal change in the relationship between the U.K. andthe EU caused by Brexit may pose certain implications to our research, commercial and general business operations in the U.K. and the EU. Details on howBrexit will be executed and the impact on the remaining EU countries will dictate how and whether the broader EU will be impacted and what the resulting impacton our business may be, especially in EU nations with weaker economic conditions such as Greece. For additional information, see the Analysis of FinancialCondition, Liquidity and Capital Resources — Global Economic Conditions — U.K. section in our 2016 Financial Report.
We also continue to monitor the global trade environment and potential trade conflicts. If trade restrictions reduce global economic activity, or if other factors leadto a general economic downturn, potential impacts could include declining sales; increased costs; volatility in foreign exchange rates; a decline in the value ofour financial assets and pension plan investments; required increases of our pension funding obligations; increased government cost control efforts; delays orfailures in the performance of customers, suppliers, and other third parties on whom we may depend for the performance of our business; and the risk that ourallowance for doubtful accounts may not be adequate.
FOREIGN EXCHANGE AND INTEREST RATE RISK
Significant portions of our revenues and earnings, as well as our substantial international net assets, are exposed to changes in foreign exchange rates. 50% ofour total 2016 revenues were derived from international operations, including 21% from Europe and 20% from Japan and the rest of Asia. As we operate inmultiple foreign currencies, including the euro, the Japanese yen, the Chinese renminbi, the U.K. pound, the Canadian dollar and approximately 100 othercurrencies, changes in those currencies relative to the U.S. dollar will impact our revenues and expenses. If the U.S. dollar were to weaken against anothercurrency, assuming all other variables remained constant, our revenues would increase, having a positive impact on earnings, and our overall expenses wouldincrease, having a negative impact on earnings. Conversely, if the U.S. dollar were to strengthen against another currency, assuming all other variablesremained constant, our revenues would decrease, having a negative impact on earnings, and our overall expenses would decrease, having a positive impact onearnings. Therefore, significant changes in foreign exchange rates, including those changes resulting from the volatility following the U.K. referendum in whichvoters approved Brexit, can impact our results and our financial guidance.
The impact of possible currency devaluations in countries experiencing high inflation rates or significant exchange fluctuations can impact our results andfinancial guidance. For additional information about our exposure to foreign currency risk, see the Overview of Our Performance, Operating Environment,Strategy and Outlook––Our Financial Guidance for 2017 and Analysis of Financial Condition, Liquidity and Capital Resources sections in our 2016 FinancialReport.
In addition, our interest-bearing investments and borrowings, and our pension benefit obligations, net, and our postretirement benefit obligations, net, are subjectto risk from changes in interest rates and foreign exchange rates. These risks and the measures we have taken to help contain them are discussed in theForward-Looking Information and Factors That May Affect Future Results — Financial Risk Management section in our 2016 Financial Report. For additionaldetails, see the Notes to Consolidated Financial Statements— Note 7E. Financial Instruments: Derivative Financial Instruments and Hedging Activities and —Note 11. Pension and Postretirement Benefit Plans and Defined Contribution Plans in our 2016 Financial Report and the Significant Accounting Policies andApplication of Critical Accounting Estimates and Assumptions––Benefit Plans section in our 2016 Financial Report. Those sections of our 2016 Financial Reportare incorporated by reference.
Notwithstanding our efforts to foresee and mitigate the effects of changes in external fiscal circumstances, we cannot predict with certainty changes in currencyand interest rates, inflation or other related factors affecting our businesses.
Pfizer Inc. 2016 Form 10-K 21
TABLE OF CONTENTS
COST AND EXPENSE CONTROL/UNUSUAL EVENTS/FAILURE TO REALIZE THE ANTICIPATED BENEFITS OF STRATEGIC INITIATIVES ANDACQUISITIONS/INTANGIBLE ASSETS, GOODWILL AND EQUITY-METHOD INVESTMENTS
Growth in costs and expenses, changes in product, segment and geographic mix and the impact of acquisitions, divestitures, restructurings, internalreorganizations, product withdrawals, recalls and other unusual events that could result from evolving business strategies, evaluation of asset realization andorganizational restructuring could adversely affect future results. Such risks and uncertainties include, in particular, our ability to realize the projected benefits of(i) our cost-reduction and productivity initiatives; (ii) our internal separation of our commercial operations into our current operating structure; (iii) any othercorporate strategic initiatives; and (iv) any acquisitions, divestitures or other initiatives, such as our acquisitions of Hospira, Anacor, Medivation andAstraZeneca’s small molecule anti-infectives business.
In addition, our consolidated balance sheet contains significant amounts of intangible assets, including goodwill. For IPR&D assets, the risk of failure issignificant, and there can be no certainty that these assets ultimately will yield successful products. The nature of the biopharmaceutical business is high-riskand requires that we invest in a large number of projects in an effort to achieve a successful portfolio of approved products. Our ability to realize value on thesesignificant investments is often contingent upon, among other things, regulatory approvals and market acceptance. As such, we expect that many of theseIPR&D assets will become impaired and be written off at some time in the future. For goodwill, all reporting units can confront events and circumstances that canlead to a goodwill impairment charge (such as, among other things, unanticipated competition, an adverse action or assessment by a regulator, a significantadverse change in legal matters or in the business climate and/or a failure to replace the contributions of products that lose exclusivity). Any such charge may besignificant. Our other intangible assets, including developed technology rights and brands, face similar risks for impairment and charges related to such assetsmay be significant as well. For additional details, see the Significant Accounting Policies and Application of Critical Accounting Estimates and Assumptionssection in our 2016 Financial Report.
We also regularly review our equity-method investments for impairment. An impairment charge may result from the occurrence of unexpected adverse events ormanagement decisions that impact our estimates of expected cash flows to be generated from these investments. We may recognize impairment charges as aresult of a weak economic environment, events related to particular customers or asset types, challenging market conditions or decisions by management.
INTERNAL CONTROL OVER FINANCIAL REPORTING
The accuracy of our financial reporting depends on the effectiveness of our internal control over financial reporting. Internal control over financial reporting canprovide only reasonable assurance with respect to the preparation and fair presentation of financial statements and may not prevent or detect misstatements.Failure to maintain effective internal control over financial reporting, or lapses in disclosure controls and procedures, could undermine the ability to provideaccurate disclosure (including with respect to financial information) on a timely basis, which could cause investors to lose confidence in our disclosures(including with respect to financial information), require significant resources to remediate the lapse or deficiency, and expose us to legal or regulatoryproceedings.
TERRORIST ACTIVITY
Our future results could be adversely affected by changes in business, political and economic conditions, including the cost and availability of insurance, due tothe threat of terrorist activity in the U.S. and other parts of the world and related U.S. military action overseas.
ITEM 1B. UNRESOLVED STAFF COMMENTS
Not applicable.
ITEM 2. PROPERTIES
In 2016, we continued to consolidate operations to achieve efficiencies and dispose of excess space. As of December 31, 2016, we had 567 owned and leasedproperties, amounting to approximately 57 million square feet.
In 2016, we reduced the number of properties in our portfolio by 28 sites and 2.3 million square feet with the disposal of surplus real property assets and withreductions of operating space in all regions. These reductions include partial offsets due to acquisitions of Anacor, Bamboo Therapeutics Inc., substantially all ofthe assets of BIND Therapeutics, Inc. and Medivation.
Pfizer continues to own and lease space around the world for sales and marketing, customer service, regulatory compliance, R&D, manufacturing anddistribution, and administrative support functions. In many locations, business lines and operations are co-located to achieve synergy and operationalefficiencies.
Pfizer Inc. 2016 Form 10-K 22
TABLE OF CONTENTS
Pfizer’s corporate headquarters are in New York City and Pfizer’s properties extend internationally to over 90 countries.
In 2017, we intend to progress our plans to relocate from our current New York City corporate headquarters to a more modern facility in Manhattan. In addition,we plan continued execution on consolidating properties related to Hospira and other acquired companies. We also plan to further expand our global workplacestrategy to provide workplaces that enable collaboration and foster innovation.
We have numerous facilities across the world to support our R&D organizations, with a heavy concentration in North America. In 2017, we will continue toconsolidate our R&D operations in Cambridge, Massachusetts into the Kendall Square neighborhood, and continue to advance our operations in St. Louis,Missouri and Andover, Massachusetts.
Our Pfizer Global Supply (PGS) division is headquartered in various locations, with leadership teams primarily in New York City, New York and in Peapack, NewJersey. As of December 31, 2016, PGS operated 63 plants around the world, which manufacture products for our commercial divisions. Locations with majormanufacturing facilities include Belgium, China, Germany, India, Ireland, Italy, Japan, Puerto Rico, Singapore and the U.S. Our PGS division’s plant networkstrategy is expected to result in the exit of eight of these sites over the next several years. PGS also operates multiple distribution facilities around the world.
In general, we believe that our properties are well-maintained, adequate and suitable for their current requirements and for our operations in the foreseeablefuture. See the Notes to Consolidated Financial Statements— Note 9. Property, Plant and Equipment in our 2016 Financial Report, which provides amountsinvested in land, buildings and equipment and which is incorporated by reference. See also the discussion in the Notes to Consolidated Financial Statements—Note 15. Lease Commitments in our 2016 Financial Report, which is also incorporated by reference.
ITEM 3. LEGAL PROCEEDINGS
Certain legal proceedings in which we are involved are discussed in the Notes to Consolidated Financial Statements— Note 17A. Commitments andContingencies—Legal Proceedings in our 2016 Financial Report, which is incorporated by reference.
ITEM 4. MINE SAFETY DISCLOSURES
Not applicable.
Pfizer Inc. 2016 Form 10-K 23
TABLE OF CONTENTS
EXECUTIVE OFFICERS OF THE COMPANY
The executive officers of the Company are set forth in this table. Each holds the office or offices indicated until his or her successor is chosen and qualified at theregular meeting of the Board of Directors to be held on the date of the 2017 Annual Meeting of Shareholders, or until his or her earlier death, resignation orremoval. Each of the executive officers is a member of the Pfizer Executive Leadership Team.
Name Age Position Ian C. Read
63
Chairman of the Board and Chief Executive Officer of Pfizer since December 2011. President and ChiefExecutive Officer from December 2010. Previously, he served as Senior Vice President and Group President ofthe Worldwide Biopharmaceutical Businesses, which he led from 2006 through December 2010. In that role, heoversaw five global business units—Primary Care, Specialty Care, Oncology, Established Products andEmerging Markets. Mr. Read began his career with Pfizer in 1978 as an operational auditor. He worked in LatinAmerica through 1995, holding positions including Chief Financial Officer, Pfizer Mexico, and Country Manager,Pfizer Brazil. In 1996, he was appointed President of Pfizer’s International Pharmaceuticals Group, withresponsibility for Latin America and Canada. He became Executive Vice President, Europe, in 2000, wasnamed a Corporate Vice President in 2001, and assumed responsibility for Canada, in addition to Europe, in2002. Mr. Read later became accountable for operations in both the Africa/Middle East region and LatinAmerica as well. Director of Kimberly-Clark Corporation. Mr. Read serves on the Boards of PharmaceuticalResearch and Manufacturers of America (PhRMA) and the Partnership of New York City. Member of the U.S.-China Business Council. Our Director since December 2010.
Albert Bourla
55
Group President, Pfizer Innovative Health since June 2016; Group President, Global Innovative PharmaBusiness from February 2016 until June 2016 and Group President, Vaccines, Oncology and ConsumerHealthcare since January 2014. President and General Manager of Established Products Business Unit fromDecember 2010 until December 2013. Area President Europe, Africa, Asia and Pacific of Pfizer Animal Healthfrom 2009 until November 2010. Area President Europe, Africa and Middle East of Pfizer Animal Health from2005 until 2009.
Frank A. D’Amelio
59
Executive Vice President, Business Operations and Chief Financial Officer since December 2010. Senior VicePresident and Chief Financial Officer from September 2007 until December 2010. Prior to joining Pfizer, he wasSenior Executive Vice President of Integration and Chief Administrative Officer of Alcatel-Lucent fromNovember 2006 until August 2007. Prior to the Alcatel-Lucent merger, he was Chief Operating Officer of Lucentand before that Chief Financial Officer of Lucent. Director of Zoetis Inc. and of Humana Inc. and Chair of theHumana Audit Committee. He is a Director of the Independent College Fund of New Jersey.
Mikael Dolsten
58
President of Worldwide Research and Development since December 2010. Senior Vice President; President ofWorldwide Research and Development from May 2010 until December 2010. Senior Vice President; Presidentof Pfizer BioTherapeutics Research & Development Group from October 2009 until May 2010. He was SeniorVice President of Wyeth and President, Wyeth Research from June 2008 until October 2009. He was a PrivateEquity Partner at Orbimed Advisors, LLC from January 2008 until June 2008. Director of KaryopharmTherapeutics Inc. Chairman of the Translational Advisory Board of Apple Tree Partners.
Charles H. Hill III
61
Executive Vice President, Worldwide Human Resources since December 2010. Senior Vice President, HumanResources for Worldwide Biopharmaceuticals Businesses from 2008 through December 2010. Vice President,Human Resources, Worldwide Pharmaceutical Operations from 2004 through 2008. Director of Zoetis Inc. fromJuly 2012 until June 2013.
Rady A. Johnson
55
Executive Vice President, Chief Compliance and Risk Officer since December 2013. Senior Vice President andAssociate General Counsel from October 2006 until December 2013.
Douglas M. Lankler
51
Executive Vice President and General Counsel since December 2013. Corporate Secretary from January 2014until February 2014. Executive Vice President, Chief Compliance and Risk Officer from February 2011 untilDecember 2013. Executive Vice President, Chief Compliance Officer from December 2010 until February 2011.Senior Vice President and Chief Compliance Officer from January 2010 until December 2010. Senior VicePresident, Deputy General Counsel and Chief Compliance Officer from August 2009 until January 2010. SeniorVice President, Associate General Counsel and Chief Compliance Officer from October 2006 until August2009.
Freda C. Lewis-Hall
61
Executive Vice President, Chief Medical Officer since December 2010. Senior Vice President, Chief MedicalOfficer from May 2009 until December 2010. Previously, she was Chief Medical Officer and Executive VicePresident, Medicines Development at Vertex Pharmaceuticals from June 2008 until May 2009. Dr. Lewis-Hallwas Senior Vice President, U.S. Pharmaceuticals, Medical Affairs for Bristol-Myers Squibb Company from 2003until May 2008. Director of Tenet Healthcare Corporation.
Kirsten Lund-Jurgensen 57 Executive Vice President, President, Pfizer Global Supply since December 2016. Vice President, Innovative
Health Product Portfolio Management and Consumer Operations from August 2015 until December 2016. Vice
President, Vaccines, Oncology, Consumer Product Portfolio Management and Consumer Operations fromJanuary 2014 until August 2015. Vice President, Product Portfolio Management for Primary Care, EstablishedProducts and Oncology from December 2012 until December 2013. Vice President of the Primary Care andOncology Operating Unit (Manufacturing Sites in Europe, Singapore, Canada) from October 2009 untilNovember 2012. Vice President of the Patented Products Operating Unit (Manufacturing Sites in Europe,Singapore) from May 2008 until October 2009.
Alexander R. MacKenzie
57
Executive Vice President, Chief Development Officer since June 2016. Senior Vice President, ChiefDevelopment Officer from March 2016 until June 2016. Group Senior Vice President and Head, PharmaTherapeutics Research and Development from 2010 until March 2016. Senior Vice President, Head ofWorldwide Research from 2007 until 2010. Dr. MacKenzie represents Pfizer as a member of the Board ofDirectors of ViiV Healthcare Limited.
Laurie J. Olson
53
Executive Vice President, Strategy, Portfolio and Commercial Operations since July 2012. Senior VicePresident - Strategy and Portfolio Management from 2011 until July 2012. Senior Vice President - PortfolioManagement and Analytics from 2008 until 2010. Since joining Pfizer in 1987 as an Analyst in the Company’smarketing research organization, Ms. Olson has served in a variety of marketing leadership positions withincreasing responsibility in both the Company’s U.S. and global commercial organizations.
Sally Susman
55
Executive Vice President, Corporate Affairs (formerly Policy, External Affairs and Communications) sinceDecember 2010. Senior Vice President, Policy, External Affairs and Communications from December 2009 untilDecember 2010. Senior Vice President and Chief Communications Officer from February 2008 until December2009. Prior to joining Pfizer, Ms. Susman held senior level positions at The Est é e Lauder Companies,including Executive Vice President from 2004 to January 2008. Director of WPP plc.
John D. Young
52
Group President, Pfizer Essential Health since June 2016; Group President, Global Established PharmaBusiness from January 2014 until June 2016. President and General Manager, Pfizer Primary Care from June2012 until December 2013. Primary Care Business Unit’s Regional President for Europe and Canada from2009 until June 2012. U.K. Country Manager from 2007 until 2009.
Pfizer Inc. 2016 Form 10-K 24
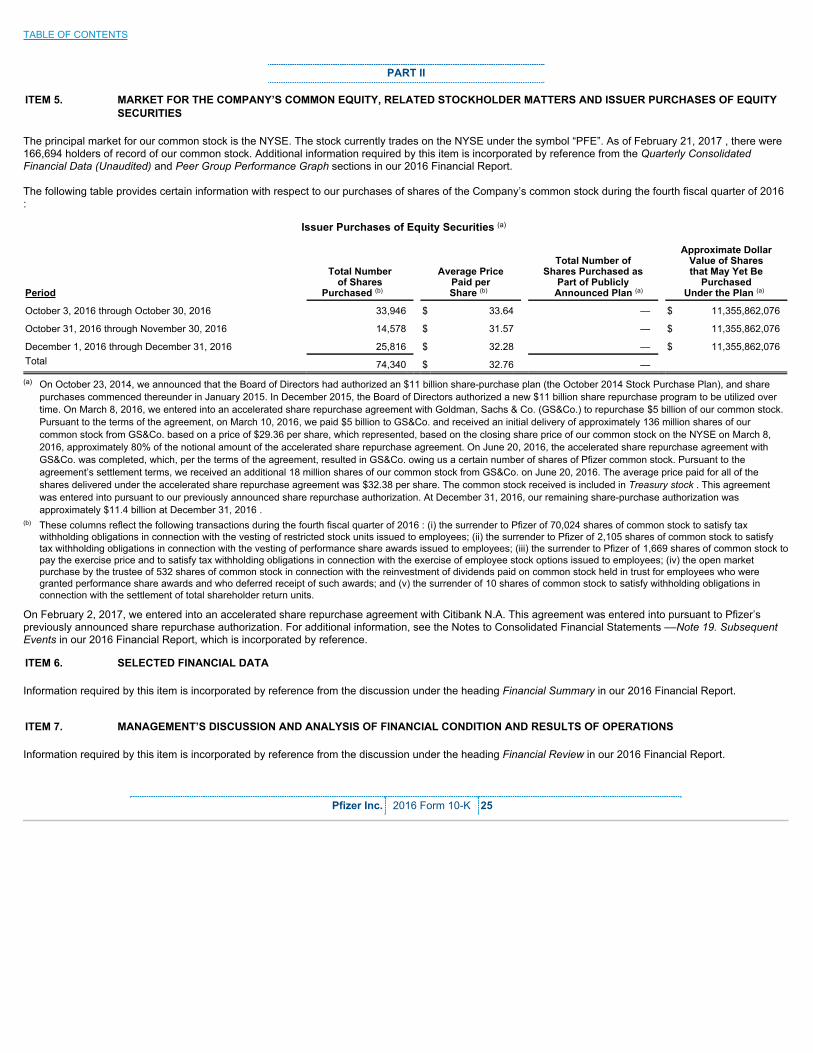
TABLE OF CONTENTS
PART II
ITEM 5. MARKET FOR THE COMPANY’S COMMON EQUITY, RELATED STOCKHOLDER MATTERS AND ISSUER PURCHASES OF EQUITYSECURITIES
The principal market for our common stock is the NYSE. The stock currently trades on the NYSE under the symbol “PFE”. As of February 21, 2017 , there were166,694 holders of record of our common stock. Additional information required by this item is incorporated by reference from the Quarterly ConsolidatedFinancial Data (Unaudited) and Peer Group Performance Graph sections in our 2016 Financial Report.
The following table provides certain information with respect to our purchases of shares of the Company’s common stock during the fourth fiscal quarter of 2016:
Issuer Purchases of Equity Securities (a)
Period
Total Numberof Shares
Purchased (b)
Average PricePaid per
Share (b)
Total Number ofShares Purchased as
Part of Publicly Announced Plan (a)
Approximate DollarValue of Sharesthat May Yet Be
Purchased Under the Plan (a)
October 3, 2016 through October 30, 2016 33,946 $ 33.64 — $ 11,355,862,076
October 31, 2016 through November 30, 2016 14,578 $ 31.57 — $ 11,355,862,076
December 1, 2016 through December 31, 2016 25,816 $ 32.28 — $ 11,355,862,076Total 74,340 $ 32.76 — (a) On October 23, 2014, we announced that the Board of Directors had authorized an $11 billion share-purchase plan (the October 2014 Stock Purchase Plan), and share
purchases commenced thereunder in January 2015. In December 2015, the Board of Directors authorized a new $11 billion share repurchase program to be utilized overtime. On March 8, 2016, we entered into an accelerated share repurchase agreement with Goldman, Sachs & Co. (GS&Co.) to repurchase $5 billion of our common stock.Pursuant to the terms of the agreement, on March 10, 2016, we paid $5 billion to GS&Co. and received an initial delivery of approximately 136 million shares of ourcommon stock from GS&Co. based on a price of $29.36 per share, which represented, based on the closing share price of our common stock on the NYSE on March 8,2016, approximately 80% of the notional amount of the accelerated share repurchase agreement. On June 20, 2016, the accelerated share repurchase agreement withGS&Co. was completed, which, per the terms of the agreement, resulted in GS&Co. owing us a certain number of shares of Pfizer common stock. Pursuant to theagreement’s settlement terms, we received an additional 18 million shares of our common stock from GS&Co. on June 20, 2016. The average price paid for all of theshares delivered under the accelerated share repurchase agreement was $32.38 per share. The common stock received is included in Treasury stock . This agreementwas entered into pursuant to our previously announced share repurchase authorization. At December 31, 2016, our remaining share-purchase authorization wasapproximately $11.4 billion at December 31, 2016 .
(b) These columns reflect the following transactions during the fourth fiscal quarter of 2016 : (i) the surrender to Pfizer of 70,024 shares of common stock to satisfy taxwithholding obligations in connection with the vesting of restricted stock units issued to employees; (ii) the surrender to Pfizer of 2,105 shares of common stock to satisfytax withholding obligations in connection with the vesting of performance share awards issued to employees; (iii) the surrender to Pfizer of 1,669 shares of common stock topay the exercise price and to satisfy tax withholding obligations in connection with the exercise of employee stock options issued to employees; (iv) the open marketpurchase by the trustee of 532 shares of common stock in connection with the reinvestment of dividends paid on common stock held in trust for employees who weregranted performance share awards and who deferred receipt of such awards; and (v) the surrender of 10 shares of common stock to satisfy withholding obligations inconnection with the settlement of total shareholder return units.
On February 2, 2017, we entered into an accelerated share repurchase agreement with Citibank N.A. This agreement was entered into pursuant to Pfizer’spreviously announced share repurchase authorization. For additional information, see the Notes to Consolidated Financial Statements ––Note 19. SubsequentEvents in our 2016 Financial Report, which is incorporated by reference.
ITEM 6. SELECTED FINANCIAL DATA
Information required by this item is incorporated by reference from the discussion under the heading Financial Summary in our 2016 Financial Report.
ITEM 7. MANAGEMENT’S DISCUSSION AND ANALYSIS OF FINANCIAL CONDITION AND RESULTS OF OPERATIONS
Information required by this item is incorporated by reference from the discussion under the heading Financial Review in our 2016 Financial Report.
Pfizer Inc. 2016 Form 10-K 25

TABLE OF CONTENTS
ITEM 7A. QUANTITATIVE AND QUALITATIVE DISCLOSURES ABOUT MARKET RISK
Information required by this item is incorporated by reference from the discussion under the Forward-Looking Information and Factors That May Affect FutureResults—Financial Risk Management section in our 2016 Financial Report.
ITEM 8. FINANCIAL STATEMENTS AND SUPPLEMENTARY DATA
Information required by this item is incorporated by reference from the Report of Independent Registered Public Accounting Firm on the Consolidated FinancialStatements in our 2016 Financial Report and from the consolidated financial statements, related notes and supplementary data in our 2016 Financial Report.
ITEM 9. CHANGES IN AND DISAGREEMENTS WITH ACCOUNTANTS ON ACCOUNTING AND FINANCIAL DISCLOSURE
None.
ITEM 9A. CONTROLS AND PROCEDURES
Disclosure Controls
As of the end of the period covered by this 2016 Form 10-K, we carried out an evaluation, under the supervision and with the participation of our principalexecutive officer and principal financial officer, of the effectiveness of the design and operation of our disclosure controls and procedures (as such term isdefined in Rules 13a-15(e) and 15d-15(e) under the Exchange Act). Based on this evaluation, our principal executive officer and principal financial officerconcluded that our disclosure controls and procedures are effective in alerting them in a timely manner to material information required to be disclosed in ourperiodic reports filed with the SEC.
Internal Control over Financial Reporting
Management’s report on the Company’s internal control over financial reporting (as such term is defined in Rules 13a-15(f) and 15d-15(f) under the ExchangeAct), and the related report of our independent registered public accounting firm, are included in our 2016 Financial Report under the headings Management’sReport on Internal Control Over Financial Reporting and Report of Independent Registered Public Accounting Firm on Internal Control Over Financial Reporting ,respectively, and are incorporated by reference.
Changes in Internal Controls
During our most recent fiscal quarter, there has not been any change in the Company’s internal control over financial reporting (as such term is defined in Rules13a-15(f) and 15d-15(f) under the Exchange Act) that has materially affected, or is reasonably likely to materially affect, the Company’s internal control overfinancial reporting.
ITEM 9B. OTHER INFORMATION
Not applicable.
Pfizer Inc. 2016 Form 10-K 26

TABLE OF CONTENTS
PART III
ITEM 10. DIRECTORS, EXECUTIVE OFFICERS AND CORPORATE GOVERNANCE
Information about our Directors is incorporated by reference from the discussion under the heading Item 1 — Election of Directors in our 2017 Proxy Statement.Information about compliance with Section 16(a) of the Exchange Act is incorporated by reference from the discussion under the heading Securities Ownership— Section 16(a) Beneficial Ownership Reporting Compliance in our 2017 Proxy Statement. Information about the Pfizer Policies on Business Ethics andConduct governing our employees, including our Chief Executive Officer, Chief Financial Officer and Principal Accounting Officer, and the Code of BusinessConduct and Ethics for Members of the Board of Directors, is incorporated by reference from the discussions under the headings Governance — OtherGovernance Practices and Policies—Pfizer Policies on Business Ethics and Conduct and — Code of conduct for Directors in our 2017 Proxy Statement.Information regarding the procedures by which our shareholders may recommend nominees to our Board of Directors is incorporated by reference from thediscussion under the headings Item 1 — Election of Directors — Criteria for Board Membership and Submitting Proxy Proposals and Director Nominations forthe 2018 Annual Meeting in our 2017 Proxy Statement. Information about our Audit Committee, including the members of the Committee, and our AuditCommittee financial experts, is incorporated by reference from the discussion under the heading Governance — Board Information—Board and CommitteeInformation — Board Committees—The Audit Committee in our 2017 Proxy Statement. The balance of the information required by this item is contained in thediscussion entitled Executive Officers of the Company in Part I of this 2016 Form 10-K.
ITEM 11. EXECUTIVE COMPENSATION
Information about Director and executive compensation is incorporated by reference from the discussion under the headings Non-Employee DirectorCompensation ; Executive Compensation ; and Governance—Board Information—Board and Committee Information—Board Committees — The CompensationCommittee — Compensation Committee Interlocks and Insider Participation in our 2017 Proxy Statement.
ITEM 12. SECURITY OWNERSHIP OF CERTAIN BENEFICIAL OWNERS AND MANAGEMENT AND RELATED STOCKHOLDER MATTERS
Information required by this item is incorporated by reference from the discussion under the headings Executive Compensation — Compensation Tables—Equity Compensation Plan Information and Securities Ownership in our 2017 Proxy Statement.
ITEM 13. CERTAIN RELATIONSHIPS AND RELATED TRANSACTIONS, AND DIRECTOR INDEPENDENCE
Information about certain relationships and transactions with related parties is incorporated by reference from the discussion under the headings Related-PersonTransactions and Indemnification — Transactions with Related Persons in our 2017 Proxy Statement. Information about director independence is incorporatedby reference from the discussion under the heading Governance — Other Governance Practices and Policies — Director Independence in our 2017 ProxyStatement.
ITEM 14. PRINCIPAL ACCOUNTING FEES AND SERVICES
Information about the fees for professional services rendered by our independent registered public accounting firm in 2016 and 2015 is incorporated byreference from the discussion under the heading Item 2 — Ratification of Selection of Our Independent Registered Public Accounting Firm — Audit and Non-Audit Fees in our 2017 Proxy Statement. Our Audit Committee’s policy on pre-approval of audit and permissible non-audit services of our independent registeredpublic accounting firm is incorporated by reference from the discussion under the heading Item 2 — Ratification of Selection of Our Independent RegisteredPublic Accounting Firm — Policy on Audit Committee Pre-Approval of Audit and Permissible Non-Audit Services of Independent Registered Public AccountingFirm in our 2017 Proxy Statement.
Pfizer Inc. 2016 Form 10-K 27

TABLE OF CONTENTS
PART IV
ITEM 15. EXHIBITS, FINANCIAL STATEMENT SCHEDULES
15(a)(1) Financial Statements. The following consolidated financial statements, related notes, report of independent registered public accounting firm andsupplementary data from our 2016 Financial Report are incorporated by reference into Item 8 of Part II of this 2016 Form 10-K:
• Report of Independent Registered Public Accounting Firm on the Consolidated Financial Statements
• Consolidated Statements of Income
• Consolidated Statements of Comprehensive Income
• Consolidated Balance Sheets
• Consolidated Statements of Equity
• Consolidated Statements of Cash Flows
• Notes to Consolidated Financial Statements
• Quarterly Consolidated Financial Data (Unaudited)
15(a)(2) Financial Statement Schedules. Schedules are omitted because they are not required or because the information is provided elsewhere in thefinancial statements. The financial statements of unconsolidated subsidiaries are omitted because, considered in the aggregate, they would not constitute asignificant subsidiary.
15(a)(3) Exhibits. These exhibits are available upon request. Requests should be directed to our Corporate Secretary, Pfizer Inc., 235 East 42nd Street, NewYork, New York 10017-5755. The exhibit numbers preceded by an asterisk (*) indicate exhibits filed with this 2016 Form 10-K. All other exhibit numbers indicateexhibits filed by incorporation by reference. Exhibit numbers 10.1 through 10.24 are management contracts or compensatory plans or arrangements.
2.1
Agreement and Plan of Merger, dated as of August 20, 2016, among Pfizer Inc., Montreal, Inc. and Medivation, Inc. is incorporated byreference from our Current Report on Form 8-K filed on August 22, 2016 (File No. 001-03619). (Pursuant to Item 601(b)(2) of Regulation S-K, the registrant hereby agrees to supplementally furnish to the Securities and Exchange Commission upon request any omitted schedule orexhibit to the Merger Agreement.)
3.1
Our Restated Certificate of Incorporation dated April 12, 2004, is incorporated by reference from our Quarterly Report on Form 10-Q for theperiod ended March 28, 2004 (File No. 001-03619).
3.2
Amendment dated May 1, 2006 to Restated Certificate of Incorporation dated April 12, 2004, is incorporated by reference from our QuarterlyReport on Form 10-Q for the period ended July 2, 2006 (File No. 001-03619).
3.3
Our By-laws, as amended December 14, 2015, are incorporated by reference from our Current Report on Form 8-K filed on December 18,2015 (File No. 001-03619).
4.1
Indenture, dated as of January 30, 2001, between us and The Chase Manhattan Bank, is incorporated by reference from our Current Reporton Form 8-K filed on January 30, 2001 (File No. 001-03619).
4.2
First Supplemental Indenture, dated as of March 24, 2009, between us and The Bank of New York Mellon (successor to JPMorgan ChaseBank, N.A. (formerly JPMorgan Chase Bank, formerly The Chase Manhattan Bank)), as Trustee, to Indenture dated as of January 30, 2001,is incorporated by reference from our Quarterly Report on Form 10-Q for the period ended June 28, 2009 (File No. 001-03619).
4.3
Second Supplemental Indenture, dated as of June 2, 2009, between us and The Bank of New York Mellon (successor to JPMorgan ChaseBank, N.A. (formerly JPMorgan Chase Bank, formerly The Chase Manhattan Bank)), as Trustee, to Indenture dated as of January 30, 2001,is incorporated by reference from our Current Report on Form 8-K filed on June 3, 2009 (File No. 001-03619).
4.4
Third Supplemental Indenture, dated as of June 3, 2013, between us and The Bank of New York Mellon (successor to JPMorgan ChaseBank, N.A. (formerly JPMorgan Chase Bank, formerly The Chase Manhattan Bank)), as Trustee, to Indenture dated as of January 30, 2001,is incorporated by reference from our Current Report on Form 8-K filed on June 3, 2013 (File No. 001-03619).
4.5
Fourth Supplemental Indenture, dated as of May 15, 2014, between us and The Bank of New York Mellon (successor to JPMorgan ChaseBank, N.A. (formerly JPMorgan Chase Bank, formerly The Chase Manhattan Bank)), as Trustee, to Indenture dated as of January 30, 2001,is incorporated by reference from our Current Report on Form 8-K report filed on May 15, 2014 (File No. 001-03619).
4.6
Fifth Supplemental Indenture, dated as of October 5, 2015, between us and The Bank of New York Mellon (successor to JPMorgan ChaseBank, N.A. (formerly JPMorgan Chase Bank, formerly The Chase Manhattan Bank)), as Trustee, to Indenture dated as of January 30, 2001,is incorporated by reference from our Current Report on Form 8-K report filed on October 6, 2015 (File No. 001-03619).
4.7
Sixth Supplemental Indenture, dated as of June 3, 2016, between us and The Bank of New York Mellon (formerly the Bank of New York(successor to JPMorgan Chase Bank, N.A. (formerly JPMorgan Chase Bank, formerly The Chase Manhattan Bank (National Association)))),as Trustee, to Indenture dated as of January 30, 2001, is incorporated by reference from our Current Report on Form 8-K report filed onJune 3, 2016 (File No. 001-03619).
4.8
Seventh Supplemental Indenture, dated as of November 21, 2016, between us and The Bank of New York Mellon (formerly the Bank of NewYork (successor to JPMorgan Chase Bank, N.A. (formerly JPMorgan Chase Bank, formerly The Chase Manhattan Bank (NationalAssociation)))), as Trustee, to Indenture dated as of January 30, 2001, is incorporated by reference from our Current Report on Form 8-Kreport filed on November 21, 2016 (File No. 001-03619).
4.9
Indenture, dated as of April 10, 1992, between Wyeth and The Bank of New York Mellon (as successor to JPMorgan Chase Bank, N.A.), asTrustee, is incorporated by reference from Wyeth’s Registration Statement on Form S-3 (File No. 33-57339), filed on January 18, 1995.
4.10
Supplemental Indenture, dated as of October 13, 1992, between Wyeth and The Bank of New York Mellon (as successor to JPMorganChase Bank, N.A.), as Trustee, is incorporated by reference from Wyeth’s Registration Statement on Form S-3 (File No. 33-57339), filed onJanuary 18, 1995.
4.11
Fifth Supplemental Indenture, dated as of December 16, 2003, between Wyeth and The Bank of New York Mellon (as successor toJPMorgan Chase Bank, N.A.), as Trustee, is incorporated by reference from Wyeth’s 2003 Annual Report on Form 10-K (File No. 001-01225).
4.12
Sixth Supplemental Indenture, dated as of November 14, 2005, between Wyeth and The Bank of New York Mellon (as successor toJPMorgan Chase Bank, N.A.), as Trustee, is incorporated by reference from Wyeth’s Current Report on Form 8-K filed on November 15,2005 (File No. 001-01225).
4.13
Seventh Supplemental Indenture, dated as of March 27, 2007, between Wyeth and The Bank of New York Mellon (as successor toJPMorgan Chase Bank, N.A.), as Trustee, is incorporated by reference from Wyeth’s Current Report on Form 8-K filed on March 28, 2007(File No. 001-01225).
4.14
Eighth Supplemental Indenture, dated as of October 30, 2009, between Wyeth, us and The Bank of New York Mellon (as successor toJPMorgan Chase Bank, formerly The Chase Manhattan Bank), as Trustee, to Indenture dated as of April 10, 1992 (as amended on October13, 1992), is incorporated by reference from our Current Report on Form 8-K filed on November 3, 2009 (File No. 001-03619).
4.15
Except as set forth in Exhibits 4.1-14 above, the instruments defining the rights of holders of long-term debt securities of the Company andits subsidiaries have been omitted. 1
10.1
2001 Stock and Incentive Plan is incorporated by reference from our Proxy Statement for the 2001 Annual Meeting of Shareholders (File No.001-03619).
10.2
Pfizer Inc. 2004 Stock Plan, as Amended and Restated is incorporated by reference from our 2011 Annual Report on Form 10-K (File No.001-03619).
10.3
Pfizer Inc. 2014 Stock Plan is incorporated by reference from our Proxy Statement for the 2014 Annual Meeting of Shareholders (File No.001-03619).
*10.4 Form of Stock Option Grant Notice and Summary of Key Terms.
10.5 Form of Executive Grant Letter is incorporated by reference from our 2015 Annual Report on Form 10-K (File No. 001-03619).
10.6
Amended and Restated Nonfunded Supplemental Retirement Plan, together with all material Amendments is incorporated by reference fromour 2011 Annual Report on Form 10-K (File No. 001-03619).
10.7
Pfizer Supplemental Savings Plan is incorporated by reference from our Quarterly Report on Form 10-Q for the period ended April 3, 2016(File No. 001-03619).
10.8 Pfizer Inc. Global Performance Plan is incorporated by reference from our 2015 Annual Report on Form 10-K (File No. 001-03619).
10.9 Executive Annual Incentive Plan is incorporated by reference from our 2012 Annual Report on Form 10-K (File No. 001-03619).
10.10
Amended and Restated Deferred Compensation Plan is incorporated by reference from our 2012 Annual Report on Form 10-K (File No.001-03619).
10.11
Amendment to Amended and Restated Deferred Compensation Plan, dated June 20, 2013, is incorporated by reference from our 2013Annual Report on Form 10-K (File No. 001-03619).
1 We agree to furnish to the SEC, upon request, a copy of each instrument with respect to issuances of long-term debt of the Company and its subsidiaries. 10.12
Amendment No. 2 to Amended and Restated Deferred Compensation Plan, dated April 27, 2016, is incorporated by reference from ourQuarterly Report on Form 10-Q for the period ended July 3, 2016 (File No. 001-03619).
10.13
Wyeth 2005 (409A) Deferred Compensation Plan (frozen as of January 2012), together with all material Amendments, is incorporated byreference from our 2013 Annual Report on Form 10-K (File No. 001-03619).
10.14
Amended and Restated Wyeth Supplemental Employee Savings Plan (effective as of January 1, 2005 and frozen as of January 2012),together with all material Amendments is incorporated by reference from our 2011 Annual Report on Form 10-K (File No. 001-03619).
10.15
Amendment to Amended and Restated Wyeth Supplemental Employee Savings Plan, dated June 20, 2013, is incorporated by referencefrom our 2013 Annual Report on Form 10-K (File No. 001-03619).
10.16
The form of Indemnification Agreement with each of our non-employee Directors is incorporated by reference from our 1996 Annual Reporton Form 10-K (File No. 001-03619).
10.17
The form of Indemnification Agreement with each of the Named Executive Officers identified in our 2016 Proxy Statement is incorporated byreference from our 1997 Annual Report on Form 10-K (File No. 001-03619).
10.18
Letter to Frank A. D’Amelio regarding replacement pension benefit dated August 22, 2007 is incorporated by reference from our CurrentReport on Form 8-K filed on August 22, 2007 (File No. 001-03619).
10.19
Executive Severance Plan is incorporated by referenced from our Current Report on Form 8-K filed on February 20, 2009 (File No. 001-03619).
10.20
Annual Retainer Unit Award Plan (for Non-Employee Directors) (frozen as of March 1, 2006) as amended, is incorporated by reference fromour 2008 Annual Report on Form 10-K (File No. 001-03619).
10.21
Nonfunded Deferred Compensation and Unit Award Plan for Non-Employee Directors, as amended, is incorporated by reference from ourQuarterly Report on Form 10-Q for the period ended September 28, 2014 (File No. 001-03619).
10.22
Form of Special Award Letter Agreement is incorporated by reference from our Current Report on Form 8-K filed on October 28, 2009 (FileNo. 001-03619).
10.23
Offer Letter to G. Mikael Dolsten, dated April 6, 2009, is incorporated by reference from our Quarterly Report on Form 10-Q for the periodended April 3, 2011 (File No. 001-03619).
10.24
Offer Letter to Geno J. Germano, dated April 6, 2009, is incorporated by reference from our Quarterly Report on Form 10-Q for the periodended April 3, 2011 (File No. 001-03619).
*12 Computation of Ratio of Earnings to Fixed Charges.
*13
Portions of the 2016 Financial Report, which, except for those sections incorporated by reference, are furnished solely for the information ofthe SEC and are not to be deemed “filed.”
*21 Subsidiaries of the Company.
*23 Consent of KPMG LLP, Independent Registered Public Accounting Firm.
*24 Power of Attorney (included as part of signature page).
*31.1 Certification by the Chief Executive Officer Pursuant to Section 302 of the Sarbanes-Oxley Act of 2002.
*31.2 Certification by the Chief Financial Officer Pursuant to Section 302 of the Sarbanes-Oxley Act of 2002.
*32.1
Certification by the Chief Executive Officer Pursuant to 18 U.S.C. Section 1350, as Adopted Pursuant to Section 906 of the Sarbanes-OxleyAct of 2002.
*32.2
Certification by the Chief Financial Officer Pursuant to 18 U.S.C. Section 1350, as Adopted Pursuant to Section 906 of the Sarbanes-OxleyAct of 2002.
*101.INS XBRL Instance Document
*101.SCH XBRL Taxonomy Extension Schema
*101.CAL XBRL Taxonomy Extension Calculation Linkbase
*101.LAB XBRL Taxonomy Extension Label Linkbase
*101.PRE XBRL Taxonomy Extension Presentation Linkbase
*101.DEF XBRL Taxonomy Extension Definition Document
ITEM 16. FORM 10-K SUMMARY
A Form 10-K summary is provided at the beginning of this 2016 Form 10-K, with hyperlinked cross-references. This allows users to easily locate thecorresponding items in this 2016 Form 10-K, where the disclosure is fully presented. The summary does not include certain Part III information that isincorporated by reference from our 2017 Proxy Statement.
Pfizer Inc. 2016 Form 10-K 28
TABLE OF CONTENTS
SIGNATURES
Under the requirements of Section 13 or 15(d) of the Securities Exchange Act of 1934, this report was signed on behalf of the Registrant by theauthorized person named below.
Pfizer Inc. Dated: February 23, 2017 By: /S/ MARGARET M. MADDEN
Margaret M. MaddenSenior Vice President and Corporate SecretaryChief Governance Counsel
We, the undersigned directors and officers of Pfizer Inc., hereby severally constitute Douglas M. Lankler and Margaret M. Madden, and each of them singly, ourtrue and lawful attorneys with full power to them and each of them to sign for us, in our names in the capacities indicated below, any and all amendments to thisAnnual Report on Form 10-K filed with the Securities and Exchange Commission.
Under the requirements of the Securities Exchange Act of 1934, this report was signed by the following persons on behalf of the Registrant and in the capacitiesand on the date indicated.
Signature Title Date
/S/ IAN C. READIan C. Read
Chairman, Chief Executive Officer and Director(Principal Executive Officer)
February 21, 2017
/S/ FRANK A. D’AMELIOFrank A. D’Amelio
Executive Vice President, Business Operations andChief Financial Officer (Principal Financial Officer)
February 21, 2017
/S/ LORETTA V. CANGIALOSILoretta V. Cangialosi
Senior Vice President—Controller(Principal Accounting Officer)
February 21, 2017
/S/ DENNIS A. AUSIELLODennis A. Ausiello
Director
February 21, 2017
/S/ W. DON CORNWELLW. Don Cornwell
Director
February 21, 2017
/S/ JOSEPH J. ECHEVARRIAJoseph J. Echevarria
Director
February 21, 2017
/S/ FRANCES D. FERGUSSONFrances D. Fergusson
Director
February 21, 2017
/S/ HELEN H. HOBBSHelen H. Hobbs
Director
February 22, 2017
TABLE OF CONTENTS
Signature Title Date
/S/ JAMES M. KILTSJames M. Kilts
Director
February 21, 2017
/S/ SHANTANU NARAYENShantanu Narayen
Director
February 22, 2017
/S/ SUZANNE NORA JOHNSONSuzanne Nora Johnson
Director
February 21, 2017
/S/ STEPHEN W. SANGERStephen W. Sanger
Director
February 22, 2017
/S/ JAMES C. SMITHJames C. Smith
Director
February 21, 2017

EXHIBIT 10.4
Form of Grant Notice and Summary of Key Terms Excerpted from Points of Interest Document (Prospectus)[Pfizer Logo Here]
Optionee:
On behalf of all our stakeholders, I want to thank you for the important role you play in Pfizer’s long-term success. I am pleased to inform you that on DATE (the"Grant Date") Pfizer’s Compensation Committee approved management’s recommendation to grant you the following awards:
Award TypeGrantPrice Shares (#) Dates
Stock Options $price Options Grant Date – DATEVesting Date – DATEExpiration Date – DATE
Restricted Stock Units (“RSUs”) N/A RSUs Grant Date – DATEVesting Date – DATE
Additional information about your Options and RSUs along with the Grant Agreement, Points of Interest (POI) document and Pfizer Inc. 2014 Stock Plan, will beposted on Fidelity NetBenefits [LINK] as part of the award acceptance process. The documents will also be posted on hrSource Online > My Stock & Benefits.
If you are receiving a grant for the first time, you will receive a welcome e-mail from Fidelity, Pfizer’s stock administrator, shortly after your grant has beenrecorded at Fidelity.
For questions about your stock awards, please call a Fidelity Representative at [Number] in the United States and Puerto Rico. All other locations, click here fordialing instructions. You will need your Username and Password.
This grant of Options and RSUs is governed by the terms and conditions set forth in this letter and the Grant Agreement, POI document and Pfizer Inc. 2014Stock Plan. These materials provide you with detailed information about the vesting and distribution of Options and RSUs, certain income tax consequences,and other pertinent information. It is important for you to read these materials, and we recommend that you consult a qualified financial or tax advisor beforemaking any decisions regarding disposing of your stock.
These awards help you build ownership in Pfizer and a greater stake in the Company’s future success. I have great confidence in Pfizer’s future, and I lookforward to working with you toward that future.
Sincerely,Chairman of the Board andChief Executive Officer
[Acknowledgement and Consent excerpted from the Grant Agreement document]A. Data Privacy. For Participants outside the U.S., you acknowledge receipt of the Employee Personal Information Protection Notice, which was
previously provided by your local HR. The Notice governs the collection, use and transfer of your personal information which is necessary foryour participation in the Plan. A hard copy of the Notice may be obtained from Pfizer.
B. Nature of Grant. In accepting the 2017 Award, you acknowledge, understand and agree that:
i. The Plan is established voluntarily by Pfizer, it is discretionary in nature and it may be modified, amended, suspended or terminated by Pfizer atany time as set forth in the Plan.
ii. The grant of the 2017 Award is exceptional, voluntary and occasional, and does not create any contractual or other right to receive future grantsof Awards, or benefits in lieu of Awards, even if Awards have been granted in the past.
iii. All decisions with respect to future Award grants, if any, will be at the sole discretion of Pfizer.iv. You voluntarily participate in the Plan.v. The future value of the underlying shares is unknown, indeterminable and cannot be predicted with certainty.vi. The 2017 Award and the shares subject to the 2017 Award, and the income and value of same, are not intended to replace any pension rights or
compensation.vii. If the underlying shares do not increase in value, the 2017 Award may have no value or may decrease in value, as applicable.

viii. The 2017 Award and the shares subject to the 2017 Award, and the income and value of same, are not part of normal or expected compensationfor purposes of calculating any severance, resignation, termination, redundancy, dismissal, end-of-service payments, holiday pay, bonuses, long-service awards, pension or retirement or welfare benefits or similar payments.
ix. For purposes of the 2017 Award, your employment or other services will be considered terminated as of the date you are no longer activelyproviding services to Pfizer or your Employer (regardless of the reason for such termination and whether or not later found to be invalid or inbreach of employment laws in the jurisdiction where you are employed, any applicable collective agreement or the terms of your employmentagreement, if any) and subject to the terms and conditions set forth in the Points of Interest, your right to vest in Awards under the Plan, if any, willterminate as of such date and will not be extended by any notice period ( e.g. , your period of service would not include any contractual noticeperiod or any period of “garden leave” or similar period mandated under local law, any applicable collective agreement or the terms of youremployment agreement, if any); the Committee shall have the exclusive discretion to determine when you are no longer actively providingservices for purposes of your 2017 Award (including whether you may still be considered to be providing services while on an approved leave ofabsence).
x. Unless otherwise provided in the Plan or by Pfizer in its discretion, the 2017 Award and the benefits evidenced by this Agreement do not createany entitlement to have the 2017 Award or any such benefits transferred to, or assumed by, another company nor to be exchanged, cashed out orsubstituted for, in connection with any corporate transaction affecting Pfizer’s shares.
xi. Unless otherwise agreed with Pfizer, the 2017 Award and the shares subject to the 2017 Award, and the income and value of same, are notgranted as consideration for, or in connection with, the service you may provide as a director of an Affiliate of Pfizer.
xii. Pfizer is not providing any tax, legal or financial advice, nor is Pfizer making any recommendations regarding your participation in the Plan, or youracquisition or sale of the underlying shares.
xiii. You are hereby advised to consult with your own personal tax, legal and financial advisors regarding your participation in the Plan before takingany action related to the Plan.
xiv. The following provisions apply only if you provide services outside the United States:a. The 2017 Award and the shares subject to the 2017 Award are not part of normal or expected compensation for any purpose.b. No claim or entitlement to compensation or damages shall arise from forfeiture of the 2017 Award resulting from your ceasing to provide
employment or other services to Pfizer or your Employer (for any reason whatsoever, whether or not later found to be invalid or in breach ofemployment laws in the jurisdiction where you are employed, any applicable collective agreement or the terms of your employmentagreement, if any). In consideration of the grant of the 2017 Award, you agree not to institute any claim against Pfizer and/or your Employeror any other Affiliate.
c. Pfizer, your Employer and any other Affiliate shall not be liable for any foreign exchange rate fluctuation between your local currency and theUnited States Dollar that may affect the value of the 2017 Award or of any amounts due to you pursuant to the settlement of the 2017 Awardor the subsequent sale of any shares acquired under the 2017 Award.
C. No Contract of Employment. The 2017 Award is not a contract of employment between the Company and you. You retain the right to terminate youremployment with Pfizer or one of its Affiliates as applicable, and Pfizer and its Affiliates as applicable, retains the right to terminate or modify the terms ofyour employment, subject to any rights retained by either party under your employment agreement, if you have an employment agreement, and no loss ofrights, contingent or otherwise, under this 2017 Award upon termination of employment shall be claimed by you as an element of damages in any disputeover such termination of employment.
D. Non-transferability of 2017 Award. This 2017 Award is not transferable by you other than by will or the laws of descent and distribution.
E. Rights as a Stockholder. Neither the Participant nor any person claiming under or through the Participant shall have any rights or privileges as astockholder of Pfizer in respect of any shares of Pfizer common stock deliverable pursuant to the 2017 Award, unless and until such shares have beenissued upon settlement of the 2017 Award.
F. Compliance with Laws and Regulations. The 2017 Award and the obligation of Pfizer to issue or deliver shares hereunder shall be subject in all respectsto (i) all applicable federal, state and local laws, rules and regulations and (ii) any registration, qualification, approvals or other requirements imposed by anygovernment or regulatory agency or body which the Committee shall, in its discretion, determine to be necessary or applicable. Moreover, the 2017 Awardmay not be settled if its settlement, or the receipt of shares pursuant thereto, would be contrary to applicable law. If at any time Pfizer determines, in itsdiscretion, that the listing, registration or qualification of shares upon any national securities exchange or under any state, federal or local law, or the consentor approval of any governmental regulatory body, is necessary or desirable, Pfizer shall not be required to deliver any certificates for shares to theParticipant or any other person pursuant to this Agreement, unless and until such listing, registration, qualification, consent or approval has been effected orobtained, or otherwise provided for, free of any conditions not acceptable to the Company.
G. Electronic Delivery and Acceptance. Pfizer may, in its sole discretion, decide to deliver any documents related to participation in the Plan by electronicmeans. You hereby consent to receive such documents by electronic delivery and agree to participate in the Plan through an on-line or electronic systemestablished and maintained by Pfizer, Fidelity Stock Plan Services or another third party designated by Pfizer.
H. Severability. The provisions of this Agreement are severable and if any one or more provisions are determined to be illegal or otherwise unenforceable, inwhole or in part, the remaining provisions shall nevertheless be binding and enforceable.
I. Termination of Employment Due to Retirement. Notwithstanding the definition of Retirement set forth above, if Pfizer receives an opinion of counsel thatthere has been a legal judgment and/or legal development in your jurisdiction that would likely result in the favorable retirement treatment that applies to the2017 Award being deemed unlawful and/or discriminatory, then the Committee will not apply the favorable retirement treatment at the time of yourseparation from your Employer or Pfizer and your 2017 Award will be treated as it would under the rules that apply if your employment with your Employeror Pfizer ends for the reasons set forth in Section II(A) (Not Retirement Eligible) of this Agreement.
J. Governing Law and Venue. The 2017 Award and the provisions of this Agreement are governed by, and subject to, United States federal and New YorkState law, except for the body of law pertaining to conflict of laws, as provided in the Plan, and the requirements of the New York Stock Exchange. Forpurposes of litigating any dispute that arises under the 2017 Award or this Agreement, the parties hereby submit to and consent to the jurisdiction of theState of New York, agree that such litigation shall be conducted in the courts of New York County, New York, or the federal courts for the United States forthe Southern District of New York, where this grant is made and/or to be performed.
K. Insider Trading Restrictions/Market Abuse Laws. You acknowledge that you may be subject to insider trading restrictions and/or market abuse laws inapplicable jurisdictions, including the United States and your country of residence, which may affect your ability to acquire or sell shares or rights to shares (e.g. , the 2017 Award) under the Plan during such times as you are considered to have “inside information” regarding Pfizer (as defined by the laws in yourcountry). Any restrictions under these laws or regulations are separate from and in addition to any restrictions that may be imposed under any applicableinsider trading policy of Pfizer. You acknowledge that it is your responsibility to comply with any applicable restrictions, and you are advised to speak to yourpersonal advisor on this matter.
L. Foreign Asset/Account Reporting Requirements, Exchange Controls and Tax Requirements. Your country may have certain foreign asset and/oraccount reporting requirements and exchange controls, which may affect your ability to acquire or hold shares under the Plan or cash received fromparticipating in the Plan (including from any dividends received or sale proceeds arising from the sale of shares) in a brokerage or bank account outsideyour country. You may be required to report such accounts, assets or transactions to the tax or other authorities in your country. You also may be requiredto repatriate sale proceeds or other funds received as a result of your participation in the Plan to your country through a designated bank or broker and/orwithin a certain time after receipt. In addition, you may be subject to tax payment and/or reporting obligations in connection with any income realized underthe Plan and/or from the sale of shares. You acknowledge that it is your responsibility to be compliant with all such requirements, and that you shouldconsult your personal legal and tax advisors, as applicable, to ensure compliance.
M. Language. If you have received this Agreement or any other document related to the Plan translated into a language other than English and if the meaningof the translated version is different than the English version, the English version will control.
N. Additional Terms and Conditions that Apply to Grants in Certain Countries & Imposition of Other Requirements. Any Awards granted to you underthe Plan are also subject to the additional terms and conditions set forth in Part 8 of the Points of Interest available on hrSource Online>My Stock &Benefits>Stock Awards Additional Information>Document Library for your country, if any. Moreover, if you relocate to one of the countries subject toadditional terms and conditions, the additional terms and conditions for such country will apply to you to the extent that Pfizer determines that the applicationof such terms and conditions is necessary or advisable for legal or administrative reasons. Pfizer reserves the right to impose any additional country-specificand/or other requirements on your participation in the Plan, on the 2017 Award, including requiring the immediate forced sale of shares issuable uponsettlement, and on any shares acquired under the Plan to the extent Pfizer determines it is necessary or advisable for legal or administrative reasons, and torequire you to accept any additional agreements or undertakings that may be necessary to accomplish the foregoing.
O. Waiver. You acknowledge that a waiver by Pfizer of breach of any provision of this Agreement shall not operate or be construed as a waiver of any otherprovision of this Agreement, or of any subsequent breach by yourself or any other participant.
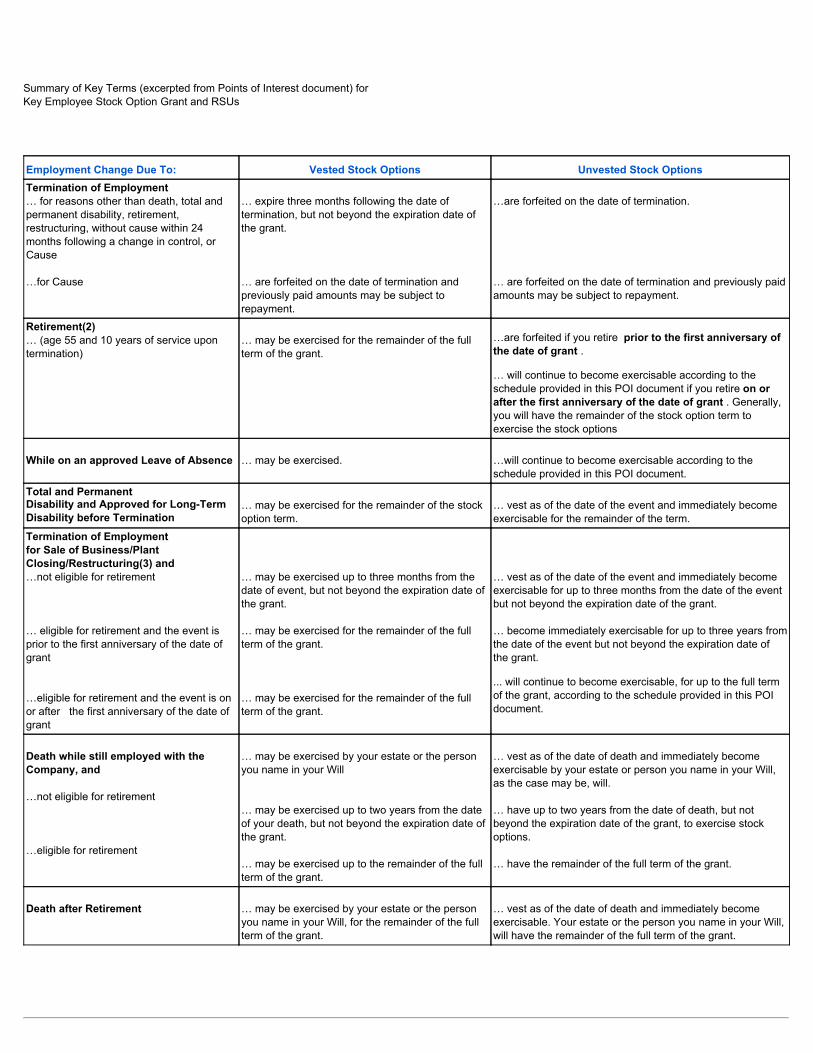
Summary of Key Terms (excerpted from Points of Interest document) forKey Employee Stock Option Grant and RSUs
Employment Change Due To: Vested Stock Options Unvested Stock OptionsTermination of Employment… for reasons other than death, total andpermanent disability, retirement,restructuring, without cause within 24months following a change in control, orCause
…for Cause
… expire three months following the date oftermination, but not beyond the expiration date ofthe grant.
… are forfeited on the date of termination andpreviously paid amounts may be subject torepayment.
…are forfeited on the date of termination.
… are forfeited on the date of termination and previously paidamounts may be subject to repayment.
Retirement(2)… (age 55 and 10 years of service upontermination)
… may be exercised for the remainder of the fullterm of the grant.
…are forfeited if you retire prior to the first anniversary ofthe date of grant .
… will continue to become exercisable according to theschedule provided in this POI document if you retire on orafter the first anniversary of the date of grant . Generally,you will have the remainder of the stock option term toexercise the stock options
While on an approved Leave of Absence … may be exercised. …will continue to become exercisable according to theschedule provided in this POI document.
Total and Permanent Disability and Approved for Long-TermDisability before Termination
… may be exercised for the remainder of the stockoption term.
… vest as of the date of the event and immediately becomeexercisable for the remainder of the term.
Termination of Employmentfor Sale of Business/PlantClosing/Restructuring(3) and…not eligible for retirement
… eligible for retirement and the event isprior to the first anniversary of the date ofgrant
…eligible for retirement and the event is onor after the first anniversary of the date ofgrant
… may be exercised up to three months from thedate of event, but not beyond the expiration date ofthe grant.
… may be exercised for the remainder of the fullterm of the grant.
… may be exercised for the remainder of the fullterm of the grant.
… vest as of the date of the event and immediately becomeexercisable for up to three months from the date of the eventbut not beyond the expiration date of the grant.
… become immediately exercisable for up to three years fromthe date of the event but not beyond the expiration date ofthe grant.
... will continue to become exercisable, for up to the full termof the grant, according to the schedule provided in this POIdocument.
Death while still employed with theCompany, and
…not eligible for retirement
…eligible for retirement
… may be exercised by your estate or the personyou name in your Will
… may be exercised up to two years from the dateof your death, but not beyond the expiration date ofthe grant.
… may be exercised up to the remainder of the fullterm of the grant.
… vest as of the date of death and immediately becomeexercisable by your estate or person you name in your Will,as the case may be, will.
… have up to two years from the date of death, but notbeyond the expiration date of the grant, to exercise stockoptions.
… have the remainder of the full term of the grant.
Death after Retirement … may be exercised by your estate or the personyou name in your Will, for the remainder of the fullterm of the grant.
… vest as of the date of death and immediately becomeexercisable. Your estate or the person you name in your Will,will have the remainder of the full term of the grant.
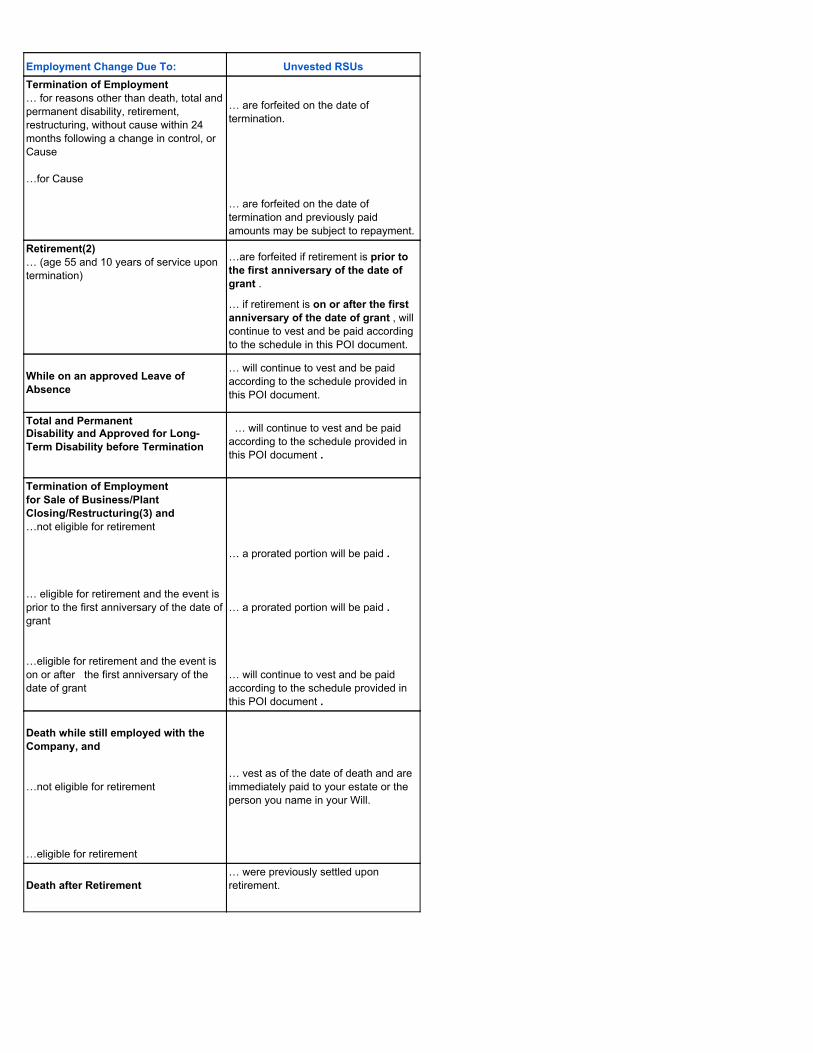
Employment Change Due To: Unvested RSUsTermination of Employment… for reasons other than death, total andpermanent disability, retirement,restructuring, without cause within 24months following a change in control, orCause
…for Cause
… are forfeited on the date oftermination.
… are forfeited on the date oftermination and previously paidamounts may be subject to repayment.
Retirement(2)… (age 55 and 10 years of service upontermination)
…are forfeited if retirement is prior tothe first anniversary of the date ofgrant .
… if retirement is on or after the firstanniversary of the date of grant , willcontinue to vest and be paid accordingto the schedule in this POI document.
While on an approved Leave ofAbsence
… will continue to vest and be paidaccording to the schedule provided inthis POI document.
Total and Permanent Disability and Approved for Long-Term Disability before Termination
… will continue to vest and be paidaccording to the schedule provided inthis POI document .
Termination of Employmentfor Sale of Business/PlantClosing/Restructuring(3) and…not eligible for retirement
… eligible for retirement and the event isprior to the first anniversary of the date ofgrant
…eligible for retirement and the event ison or after the first anniversary of thedate of grant
… a prorated portion will be paid .
… a prorated portion will be paid .
… will continue to vest and be paidaccording to the schedule provided inthis POI document .
Death while still employed with theCompany, and
…not eligible for retirement
…eligible for retirement
… vest as of the date of death and areimmediately paid to your estate or theperson you name in your Will.
Death after Retirement… were previously settled uponretirement.
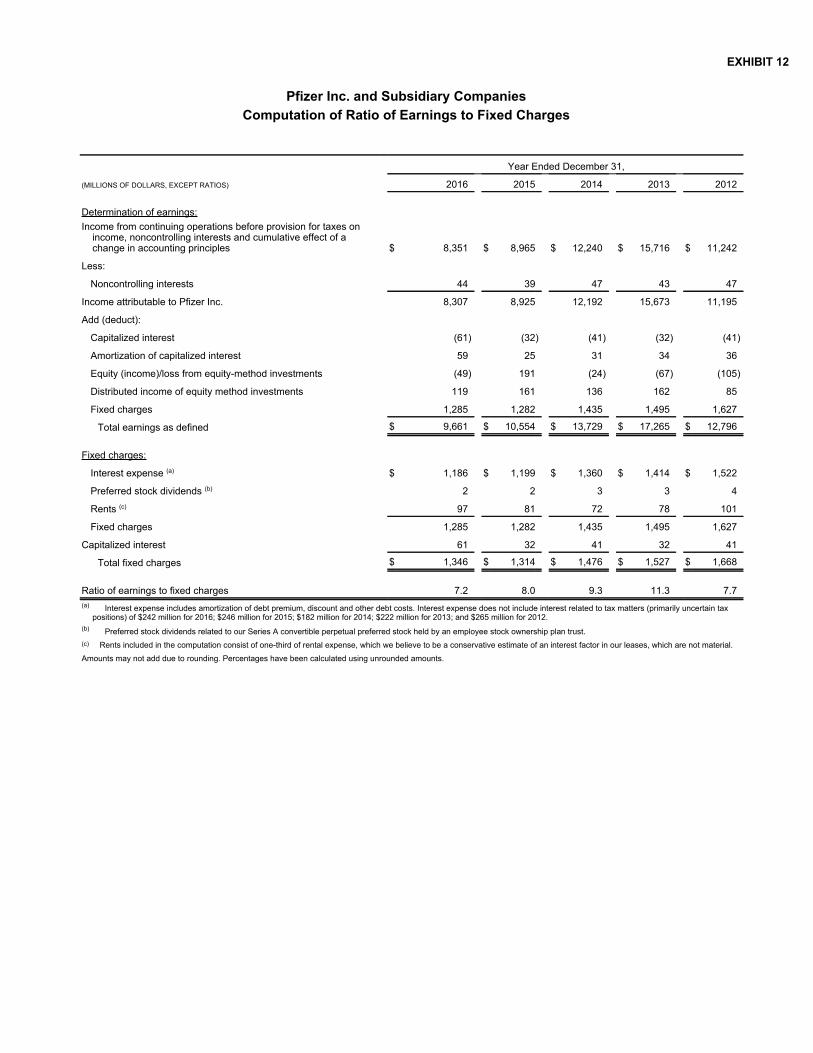
EXHIBIT 12
Pfizer Inc. and Subsidiary CompaniesComputation of Ratio of Earnings to Fixed Charges
Year Ended December 31,
(MILLIONS OF DOLLARS, EXCEPT RATIOS) 2016 2015 2014 2013 2012
Determination of earnings: Income from continuing operations before provision for taxes on
income, noncontrolling interests and cumulative effect of achange in accounting principles $ 8,351 $ 8,965 $ 12,240 $ 15,716 $ 11,242
Less:
Noncontrolling interests 44 39 47 43 47
Income attributable to Pfizer Inc. 8,307 8,925 12,192 15,673 11,195
Add (deduct):
Capitalized interest (61) (32) (41) (32) (41)
Amortization of capitalized interest 59 25 31 34 36
Equity (income)/loss from equity-method investments (49) 191 (24) (67) (105)
Distributed income of equity method investments 119 161 136 162 85
Fixed charges 1,285 1,282 1,435 1,495 1,627
Total earnings as defined $ 9,661 $ 10,554 $ 13,729 $ 17,265 $ 12,796
Fixed charges:
Interest expense (a) $ 1,186 $ 1,199 $ 1,360 $ 1,414 $ 1,522
Preferred stock dividends (b) 2 2 3 3 4
Rents (c) 97 81 72 78 101
Fixed charges 1,285 1,282 1,435 1,495 1,627
Capitalized interest 61 32 41 32 41
Total fixed charges $ 1,346 $ 1,314 $ 1,476 $ 1,527 $ 1,668
Ratio of earnings to fixed charges 7.2 8.0 9.3 11.3 7.7(a) Interest expense includes amortization of debt premium, discount and other debt costs. Interest expense does not include interest related to tax matters (primarily uncertain tax
positions) of $242 million for 2016; $246 million for 2015; $182 million for 2014; $222 million for 2013; and $265 million for 2012.(b) Preferred stock dividends related to our Series A convertible perpetual preferred stock held by an employee stock ownership plan trust.(c) Rents included in the computation consist of one-third of rental expense, which we believe to be a conservative estimate of an interest factor in our leases, which are not material.Amounts may not add due to rounding. Percentages have been calculated using unrounded amounts.

EXHIBIT 13
Pfizer Inc. 2016 Financial Report
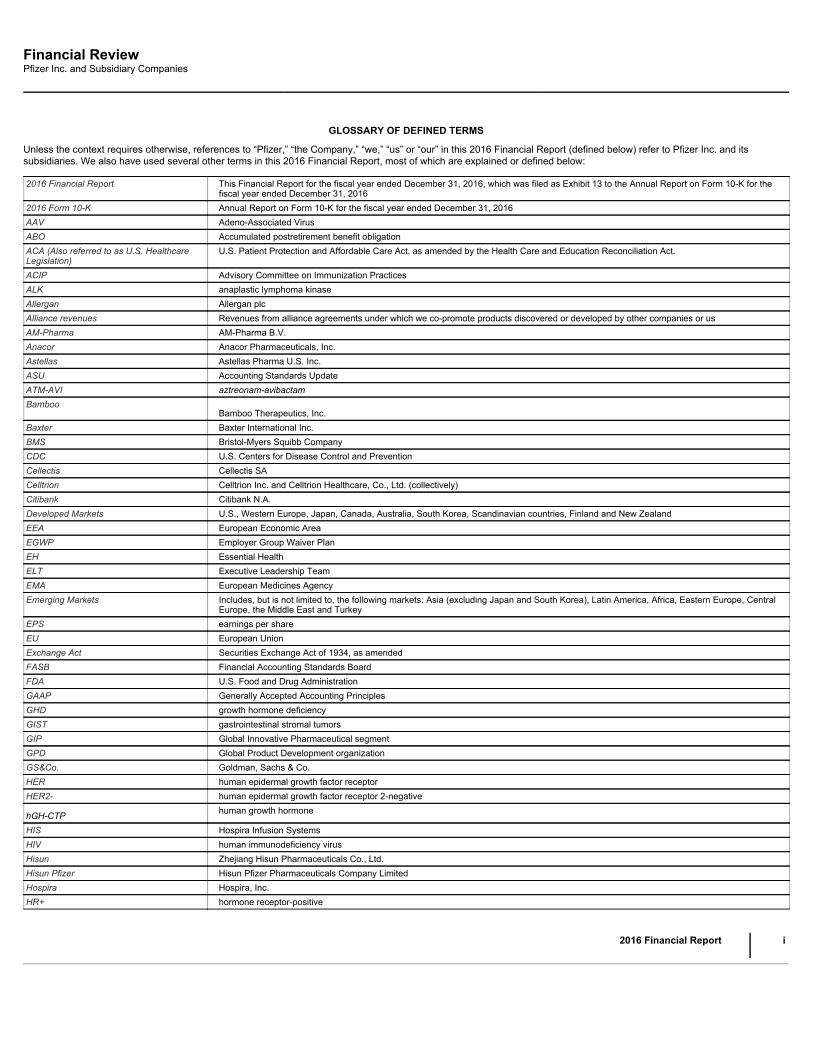
Financial ReviewPfizer Inc. and Subsidiary Companies
GLOSSARY OF DEFINED TERMS
Unless the context requires otherwise, references to “Pfizer,” “the Company,” “we,” “us” or “our” in this 2016 Financial Report (defined below) refer to Pfizer Inc. and itssubsidiaries. We also have used several other terms in this 2016 Financial Report, most of which are explained or defined below:
2016 Financial Report This Financial Report for the fiscal year ended December 31, 2016, which was filed as Exhibit 13 to the Annual Report on Form 10-K for thefiscal year ended December 31, 2016
2016 Form 10-K Annual Report on Form 10-K for the fiscal year ended December 31, 2016AAV Adeno-Associated VirusABO Accumulated postretirement benefit obligationACA (Also referred to as U.S. HealthcareLegislation)
U.S. Patient Protection and Affordable Care Act, as amended by the Health Care and Education Reconciliation Act.
ACIP Advisory Committee on Immunization PracticesALK anaplastic lymphoma kinaseAllergan Allergan plcAlliance revenues Revenues from alliance agreements under which we co-promote products discovered or developed by other companies or usAM-Pharma AM-Pharma B.V.Anacor Anacor Pharmaceuticals, Inc.Astellas Astellas Pharma U.S. Inc.ASU Accounting Standards UpdateATM-AVI aztreonam-avibactamBamboo
Bamboo Therapeutics, Inc.Baxter Baxter International Inc.BMS Bristol-Myers Squibb CompanyCDC U.S. Centers for Disease Control and PreventionCellectis Cellectis SACelltrion Celltrion Inc. and Celltrion Healthcare, Co., Ltd. (collectively)Citibank Citibank N.A.Developed Markets U.S., Western Europe, Japan, Canada, Australia, South Korea, Scandinavian countries, Finland and New ZealandEEA European Economic AreaEGWP Employer Group Waiver PlanEH Essential HealthELT Executive Leadership TeamEMA European Medicines AgencyEmerging Markets Includes, but is not limited to, the following markets: Asia (excluding Japan and South Korea), Latin America, Africa, Eastern Europe, Central
Europe, the Middle East and TurkeyEPS earnings per shareEU European UnionExchange Act Securities Exchange Act of 1934, as amendedFASB Financial Accounting Standards BoardFDA U.S. Food and Drug AdministrationGAAP Generally Accepted Accounting PrinciplesGHD growth hormone deficiencyGIST gastrointestinal stromal tumorsGIP Global Innovative Pharmaceutical segmentGPD Global Product Development organizationGS&Co. Goldman, Sachs & Co.HER human epidermal growth factor receptorHER2- human epidermal growth factor receptor 2-negative
hGH-CTP human growth hormone
HIS Hospira Infusion SystemsHIV human immunodeficiency virusHisun Zhejiang Hisun Pharmaceuticals Co., Ltd.Hisun Pfizer Hisun Pfizer Pharmaceuticals Company LimitedHospira Hospira, Inc.HR+ hormone receptor-positive
2016 Financial Report
i
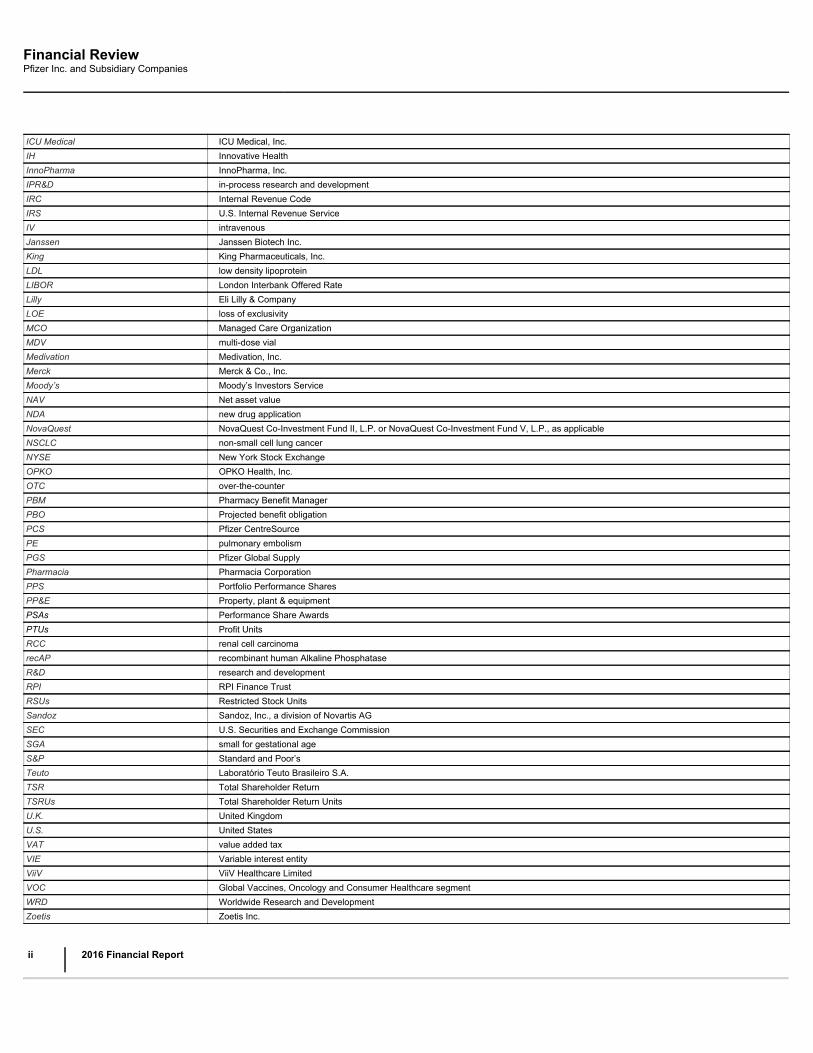
Financial ReviewPfizer Inc. and Subsidiary Companies
ICU Medical ICU Medical, Inc.IH Innovative HealthInnoPharma InnoPharma, Inc.IPR&D in-process research and developmentIRC Internal Revenue CodeIRS U.S. Internal Revenue ServiceIV intravenousJanssen Janssen Biotech Inc.King King Pharmaceuticals, Inc.LDL low density lipoproteinLIBOR London Interbank Offered RateLilly Eli Lilly & CompanyLOE loss of exclusivityMCO Managed Care OrganizationMDV multi-dose vialMedivation Medivation, Inc.Merck Merck & Co., Inc.Moody’s Moody’s Investors ServiceNAV Net asset valueNDA new drug applicationNovaQuest NovaQuest Co-Investment Fund II, L.P. or NovaQuest Co-Investment Fund V, L.P., as applicableNSCLC non-small cell lung cancerNYSE New York Stock ExchangeOPKO OPKO Health, Inc.OTC over-the-counterPBM Pharmacy Benefit ManagerPBO Projected benefit obligationPCS Pfizer CentreSourcePE pulmonary embolismPGS Pfizer Global SupplyPharmacia Pharmacia CorporationPPS Portfolio Performance SharesPP&E Property, plant & equipmentPSAs Performance Share AwardsPTUs Profit UnitsRCC renal cell carcinomarecAP recombinant human Alkaline PhosphataseR&D research and developmentRPI RPI Finance TrustRSUs Restricted Stock UnitsSandoz Sandoz, Inc., a division of Novartis AGSEC U.S. Securities and Exchange CommissionSGA small for gestational ageS&P Standard and Poor’sTeuto Laboratório Teuto Brasileiro S.A.TSR Total Shareholder ReturnTSRUs Total Shareholder Return UnitsU.K. United KingdomU.S. United StatesVAT value added taxVIE Variable interest entityViiV ViiV Healthcare LimitedVOC Global Vaccines, Oncology and Consumer Healthcare segmentWRD Worldwide Research and DevelopmentZoetis Zoetis Inc.
ii
2016 Financial Report
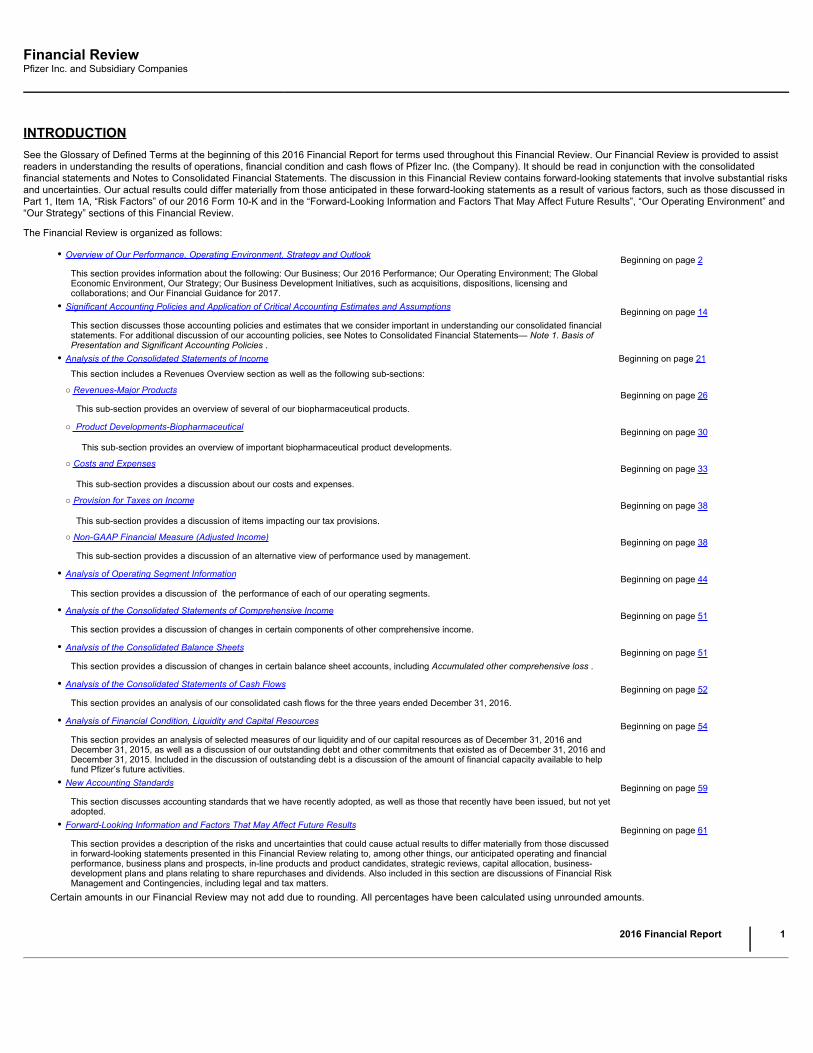
Financial ReviewPfizer Inc. and Subsidiary Companies
INTRODUCTIONSee the Glossary of Defined Terms at the beginning of this 2016 Financial Report for terms used throughout this Financial Review. Our Financial Review is provided to assistreaders in understanding the results of operations, financial condition and cash flows of Pfizer Inc. (the Company). It should be read in conjunction with the consolidatedfinancial statements and Notes to Consolidated Financial Statements. The discussion in this Financial Review contains forward-looking statements that involve substantial risksand uncertainties. Our actual results could differ materially from those anticipated in these forward-looking statements as a result of various factors, such as those discussed inPart 1, Item 1A, “Risk Factors” of our 2016 Form 10-K and in the “Forward-Looking Information and Factors That May Affect Future Results”, “Our Operating Environment” and“Our Strategy” sections of this Financial Review.
The Financial Review is organized as follows:
● Overview of Our Performance, Operating Environment, Strategy and Outlook Beginning on page 2
This section provides information about the following: Our Business; Our 2016 Performance; Our Operating Environment; The GlobalEconomic Environment, Our Strategy; Our Business Development Initiatives, such as acquisitions, dispositions, licensing andcollaborations; and Our Financial Guidance for 2017.
● Significant Accounting Policies and Application of Critical Accounting Estimates and Assumptions Beginning on page 14
This section discusses those accounting policies and estimates that we consider important in understanding our consolidated financialstatements. For additional discussion of our accounting policies, see Notes to Consolidated Financial Statements— Note 1. Basis ofPresentation and Significant Accounting Policies .
● Analysis of the Consolidated Statements of Income Beginning on page 21
This section includes a Revenues Overview section as well as the following sub-sections:
○ Revenues-Major Products Beginning on page 26
This sub-section provides an overview of several of our biopharmaceutical products. ○ Product Developments-Biopharmaceutical Beginning on page 30
This sub-section provides an overview of important biopharmaceutical product developments. ○ Costs and Expenses Beginning on page 33
This sub-section provides a discussion about our costs and expenses. ○ Provision for Taxes on Income Beginning on page 38
This sub-section provides a discussion of items impacting our tax provisions. ○ Non-GAAP Financial Measure (Adjusted Income) Beginning on page 38
This sub-section provides a discussion of an alternative view of performance used by management. ● Analysis of Operating Segment Information Beginning on page 44
This section provides a discussion of the performance of each of our operating segments. ● Analysis of the Consolidated Statements of Comprehensive Income Beginning on page 51
This section provides a discussion of changes in certain components of other comprehensive income. ● Analysis of the Consolidated Balance Sheets Beginning on page 51
This section provides a discussion of changes in certain balance sheet accounts, including Accumulated other comprehensive loss . ● Analysis of the Consolidated Statements of Cash Flows Beginning on page 52
This section provides an analysis of our consolidated cash flows for the three years ended December 31, 2016. ● Analysis of Financial Condition, Liquidity and Capital Resources Beginning on page 54
This section provides an analysis of selected measures of our liquidity and of our capital resources as of December 31, 2016 andDecember 31, 2015, as well as a discussion of our outstanding debt and other commitments that existed as of December 31, 2016 andDecember 31, 2015. Included in the discussion of outstanding debt is a discussion of the amount of financial capacity available to helpfund Pfizer’s future activities.
● New Accounting Standards Beginning on page 59
This section discusses accounting standards that we have recently adopted, as well as those that recently have been issued, but not yetadopted.
● Forward-Looking Information and Factors That May Affect Future Results Beginning on page 61
This section provides a description of the risks and uncertainties that could cause actual results to differ materially from those discussedin forward-looking statements presented in this Financial Review relating to, among other things, our anticipated operating and financialperformance, business plans and prospects, in-line products and product candidates, strategic reviews, capital allocation, business-development plans and plans relating to share repurchases and dividends. Also included in this section are discussions of Financial RiskManagement and Contingencies, including legal and tax matters.
Certain amounts in our Financial Review may not add due to rounding. All percentages have been calculated using unrounded amounts.
2016 Financial Report
1
Financial ReviewPfizer Inc. and Subsidiary Companies
OVERVIEW OF OUR PERFORMANCE, OPERATING ENVIRONMENT, STRATEGY AND OUTLOOK
Our Business
We apply science and our global resources to bring therapies to people that extend and significantly improve their lives through the discovery, development and manufacture ofhealthcare products. Our global portfolio includes medicines and vaccines, as well as many of the world’s best-known consumer healthcare products. We work acrossdeveloped and emerging markets to advance wellness, prevention, treatments and cures that challenge the most feared diseases of our time. We collaborate with healthcareproviders, governments and local communities to support and expand access to reliable, affordable healthcare around the world. Our revenues are derived from the sale of ourproducts and, to a much lesser extent, from alliance agreements, under which we co-promote products discovered or developed by other companies or us (Alliance revenues).
We manage our commercial operations through two distinct business segments: Pfizer Innovative Health (IH) and Pfizer Essential Health (EH). Each operating segment hasresponsibility for its commercial activities and for certain IPR&D projects for new investigational products and additional indications for in-line products that generally haveachieved proof-of-concept. For additional information, see Notes to Consolidated Financial Statements–– Note 18A. Segment, Geographic and Other Revenue Information:Segment Information and the “Our Strategy––Commercial Operations” section of this Financial Review below.
The majority of our revenues come from the manufacture and sale of biopharmaceutical products. The biopharmaceutical industry is highly competitive and highly regulated.As a result, we face a number of industry-specific factors and challenges, which can significantly impact our results. These factors include, among others: the loss or expirationof intellectual property rights and the expiration of co-promotion and licensing rights, healthcare legislation, pipeline productivity, the regulatory environment, pricing and accesspressures and competition. We also face challenges as a result of the global economic environment. For additional information about these factors and challenges, see the“Our Operating Environment” and “The Global Economic Environment” sections of this Financial Review and Part I, Item 1A, “Risk Factors,” of our 2016 Form 10-K.
The financial information included in our consolidated financial statements for our subsidiaries operating outside the United States (U.S.) is as of and for the year endedNovember 30 for each year presented. Pfizer's fiscal year-end for U.S. subsidiaries is as of and for the year ended December 31 for each year presented.
References to developed and emerging markets in this Financial Review include:Developed markets
U.S., Western Europe, Japan, Canada, Australia, South Korea, Scandinaviancountries, Finland and New Zealand
Emerging markets (include, but are not limited to)
Asia (excluding Japan and South Korea), Latin America, Africa, Eastern Europe,Central Europe, the Middle East and Turkey
References to operational variances in this Financial Review pertain to period-over-period growth rates that exclude the impact of foreign exchange as well as the negativecurrency impact related to Venezuela. The operational variances are determined by multiplying or dividing, as appropriate, our current year U.S. dollar results by the currentyear average foreign exchange rates and then multiplying or dividing, as appropriate, those amounts by the prior-year average foreign exchange rates. Although exchange ratechanges are part of our business, they are not within our control. Exchange rate changes, however, can mask positive or negative trends in the business; therefore, we believepresenting operational variances provides useful information to evaluate the results of our business.
Our significant business development activities include:• On February 3, 2017, we completed the sale of our global infusion therapy net assets, HIS, to ICU Medical for up to approximately $900 million , composed of cash and
contingent cash consideration, ICU Medical common stock and seller financing. Assets and liabilities associated with HIS are presented as held for sale in the consolidatedbalance sheet as of December 31, 2016.
• On December 22, 2016, which falls in the first fiscal quarter of 2017 for our international operations, we acquired the development and commercialization rights toAstraZeneca’s small molecule anti-infectives business, primarily outside the U.S., including the commercialization and development rights to the newly approved EUdrug Zavicefta™ (ceftazidime-avibactam), the marketed agents Merrem™/Meronem™ (meropenem) and Zinforo™ (ceftaroline fosamil), and the clinical development assetsATM-AVI and CXL (ceftaroline fosamil-AVI).
• On September 28, 2016, we acquired Medivation for $81.50 per share. The total fair value of consideration transferred for Medivation was approximately $14.3 billion in cash( $13.9 billion , net of cash acquired). Of this consideration, approximately $365 million was not paid as of December 31, 2016, and was recorded in Other current liabilities .Commencing from the acquisition date, our financial statements reflect the assets, liabilities, operating results and cash flows of Medivation, and, in accordance with ourdomestic reporting periods, our consolidated financial statements for the year ended December 31, 2016 reflect approximately three months of legacy Medivation operations.
• On June 24, 2016, we acquired Anacor for $99.25 per share. The total fair value of consideration transferred for Anacor was approximately $4.9 billion in cash ( $4.5 billion ,net of cash acquired), plus $698 million debt assumed. Commencing from the acquisition date, our financial statements reflect the assets, liabilities, operating results andcash flows of Anacor, and, in accordance with our domestic reporting periods, our consolidated financial statements for the year ended December 31, 2016 reflectapproximately six months of legacy Anacor operations, which were immaterial.
• On April 6, 2016, we announced that the merger agreement between Pfizer and Allergan entered into on November 22, 2015 was terminated by mutual agreement of thecompanies. The decision was driven by the actions announced by the U.S. Department of Treasury
2
2016 Financial Report
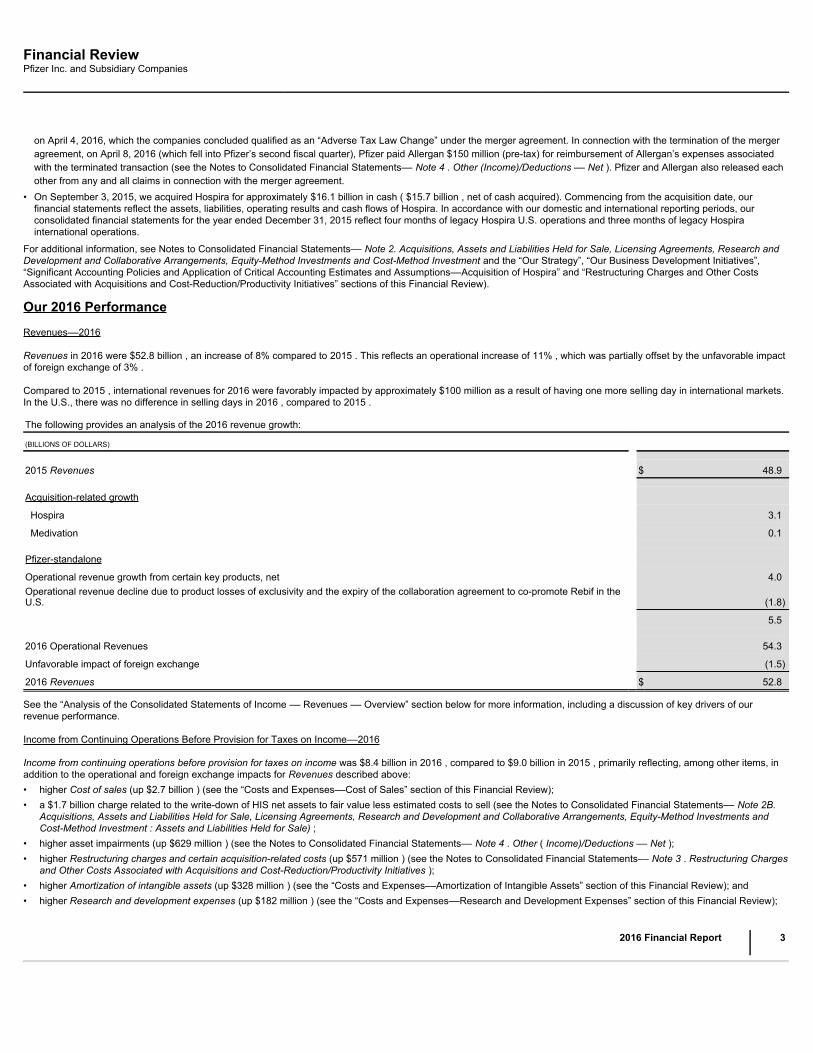
Financial ReviewPfizer Inc. and Subsidiary Companies
on April 4, 2016, which the companies concluded qualified as an “Adverse Tax Law Change” under the merger agreement. In connection with the termination of the mergeragreement, on April 8, 2016 (which fell into Pfizer’s second fiscal quarter), Pfizer paid Allergan $150 million (pre-tax) for reimbursement of Allergan’s expenses associatedwith the terminated transaction (see the Notes to Consolidated Financial Statements–– Note 4 . Other (Income)/Deductions –– Net ). Pfizer and Allergan also released eachother from any and all claims in connection with the merger agreement.
• On September 3, 2015, we acquired Hospira for approximately $16.1 billion in cash ( $15.7 billion , net of cash acquired). Commencing from the acquisition date, ourfinancial statements reflect the assets, liabilities, operating results and cash flows of Hospira. In accordance with our domestic and international reporting periods, ourconsolidated financial statements for the year ended December 31, 2015 reflect four months of legacy Hospira U.S. operations and three months of legacy Hospirainternational operations.
For additional information, see Notes to Consolidated Financial Statements–– Note 2. Acquisitions, Assets and Liabilities Held for Sale, Licensing Agreements, Research andDevelopment and Collaborative Arrangements, Equity-Method Investments and Cost-Method Investment and the “Our Strategy”, “Our Business Development Initiatives”,“Significant Accounting Policies and Application of Critical Accounting Estimates and Assumptions––Acquisition of Hospira” and “Restructuring Charges and Other CostsAssociated with Acquisitions and Cost-Reduction/Productivity Initiatives” sections of this Financial Review).
Our 2016 Performance
Revenues––2016
Revenues in 2016 were $52.8 billion , an increase of 8% compared to 2015 . This reflects an operational increase of 11% , which was partially offset by the unfavorable impactof foreign exchange of 3% .
Compared to 2015 , international revenues for 2016 were favorably impacted by approximately $100 million as a result of having one more selling day in international markets.In the U.S., there was no difference in selling days in 2016 , compared to 2015 .
The following provides an analysis of the 2016 revenue growth:
(BILLIONS OF DOLLARS) 2015 Revenues $ 48.9
Acquisition-related growth
Hospira 3.1
Medivation 0.1 Pfizer-standalone
Operational revenue growth from certain key products, net 4.0Operational revenue decline due to product losses of exclusivity and the expiry of the collaboration agreement to co-promote Rebif in theU.S. (1.8) 5.5 2016 Operational Revenues 54.3
Unfavorable impact of foreign exchange (1.5)
2016 Revenues $ 52.8
See the “Analysis of the Consolidated Statements of Income –– Revenues –– Overview” section below for more information, including a discussion of key drivers of ourrevenue performance.
Income from Continuing Operations Before Provision for Taxes on Income––2016
Income from continuing operations before provision for taxes on income was $8.4 billion in 2016 , compared to $9.0 billion in 2015 , primarily reflecting, among other items, inaddition to the operational and foreign exchange impacts for Revenues described above:• higher Cost of sales (up $2.7 billion ) (see the “Costs and Expenses––Cost of Sales” section of this Financial Review);• a $1.7 billion charge related to the write-down of HIS net assets to fair value less estimated costs to sell (see the Notes to Consolidated Financial Statements–– Note 2B.
Acquisitions, Assets and Liabilities Held for Sale, Licensing Agreements, Research and Development and Collaborative Arrangements, Equity-Method Investments andCost-Method Investment : Assets and Liabilities Held for Sale) ;
• higher asset impairments (up $629 million ) (see the Notes to Consolidated Financial Statements–– Note 4 . Other ( Income)/Deductions –– Net );• higher Restructuring charges and certain acquisition-related costs (up $571 million ) (see the Notes to Consolidated Financial Statements–– Note 3 . Restructuring Charges
and Other Costs Associated with Acquisitions and Cost-Reduction/Productivity Initiatives );• higher Amortization of intangible assets (up $328 million ) (see the “Costs and Expenses––Amortization of Intangible Assets” section of this Financial Review); and• higher Research and development expenses (up $182 million ) (see the “Costs and Expenses––Research and Development Expenses” section of this Financial Review);
2016 Financial Report
3
Financial ReviewPfizer Inc. and Subsidiary Companies
partially offset by:• the non-recurrence of a foreign currency loss ( $806 million ) related to Venezuela in 2015 (see the Notes to Financial Statements–– Note 4 . Other (Income)/Deductions ––
Net );• lower charges for legal matters (down $466 million ) (see the Notes to Financial Statements–– Note 4 . Other (Income)/Deductions –– Net ); and• lower Other, net deductions (down $318 million ) (see the Notes to Consolidated Financial Statements–– Note 4 . Other ( Income)/Deductions –– Net ).
For information on our tax provision and effective tax rate see the “Provision for Taxes on Income” section of the Financial Review and Notes to Consolidated FinancialStatements–– Note 5 . Tax Matters.
Our Operating Environment
Industry-Specific Challenges
Intellectual Property Rights and Collaboration/Licensing Rights
The loss or expiration of intellectual property rights and the expiration of co-promotion and licensing rights can have a significant adverse effect on our revenues. Many of ourbranded products have multiple patents that expire at varying dates, thereby strengthening our overall patent protection. However, once patent protection has expired or hasbeen lost prior to the expiration date as a result of a legal challenge, we lose exclusivity on these products, and generic pharmaceutical manufacturers generally producesimilar products and sell them for a lower price. The date at which generic competition commences may be different from the date that the patent or regulatory exclusivityexpires. However, when generic competition does commence, the resulting price competition can substantially decrease our revenues for the impacted products, often in avery short period of time.
Our biotechnology products, including BeneFIX, ReFacto, Xyntha and Enbrel (we market Enbrel outside the U.S. and Canada), may face in the future, or already face,competition from biosimilars (also referred to as follow-on biologics). If competitors are able to obtain marketing approval for biosimilars that reference our biotechnologyproducts, our biotechnology products may become subject to competition from these biosimilars, with attendant competitive pressure, and price reductions could follow.Expiration or successful challenge of applicable patent rights could trigger this competition, assuming any relevant exclusivity period has expired. However, biosimilarmanufacturing is complex. At least initially upon approval of a biosimilar competitor, biosimilar competition with respect to biologics may not be as significant as genericcompetition with respect to small molecule drugs.
We have lost exclusivity for a number of our products in certain markets and we have lost collaboration rights with respect to a number of our alliance products in certainmarkets, and we expect certain products to face significantly increased generic competition over the next few years.
4
2016 Financial Report
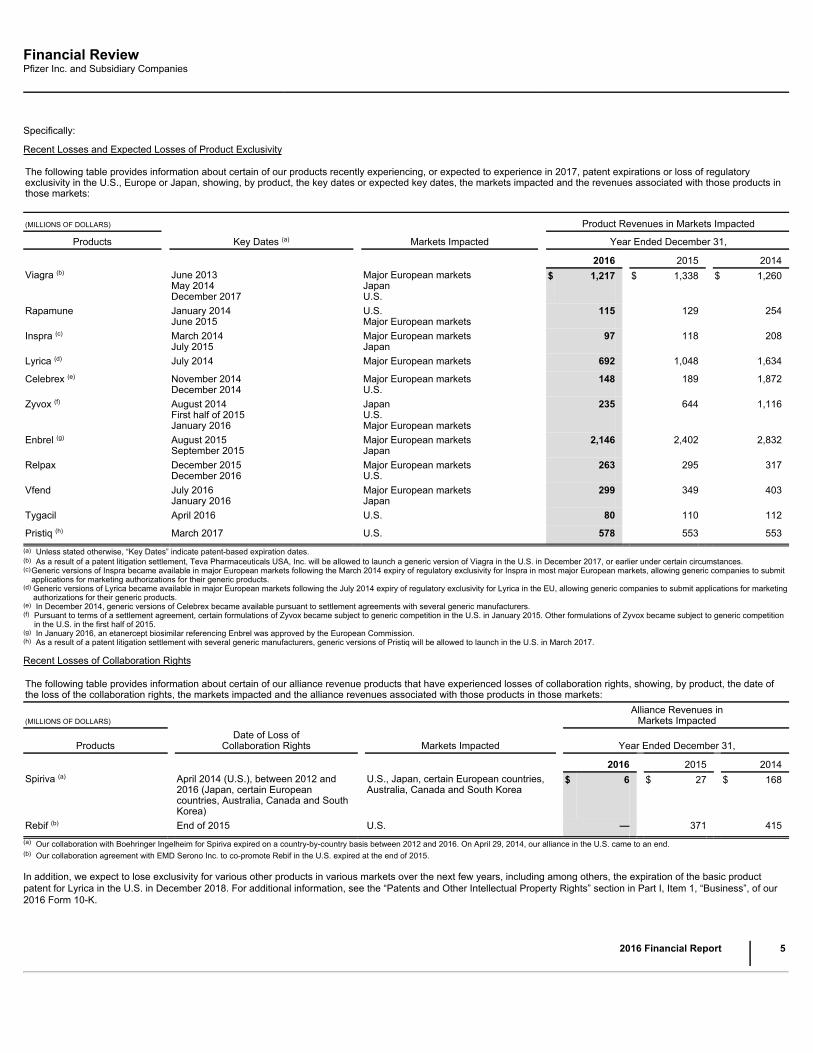
Financial ReviewPfizer Inc. and Subsidiary Companies
Specifically:
Recent Losses and Expected Losses of Product Exclusivity
The following table provides information about certain of our products recently experiencing, or expected to experience in 2017, patent expirations or loss of regulatoryexclusivity in the U.S., Europe or Japan, showing, by product, the key dates or expected key dates, the markets impacted and the revenues associated with those products inthose markets:
(MILLIONS OF DOLLARS) Product Revenues in Markets Impacted
Products Key Dates (a) Markets Impacted Year Ended December 31,
2016 2015 2014Viagra (b)
June 2013 May 2014 December 2017
Major European markets Japan U.S.
$ 1,217
$ 1,338
$ 1,260
Rapamune
January 2014 June 2015
U.S. Major European markets
115
129
254
Inspra (c)
March 2014July 2015
Major European marketsJapan
97
118
208
Lyrica (d) July 2014 Major European markets 692 1,048 1,634
Celebrex (e)
November 2014December 2014
Major European marketsU.S.
148
189
1,872
Zyvox (f)
August 2014First half of 2015January 2016
JapanU.S.Major European markets
235
644
1,116
Enbrel (g)
August 2015September 2015
Major European marketsJapan
2,146
2,402
2,832
Relpax
December 2015December 2016
Major European marketsU.S.
263
295
317
Vfend
July 2016January 2016
Major European marketsJapan
299
349
403
Tygacil April 2016 U.S. 80 110 112
Pristiq (h) March 2017 U.S. 578 553 553(a) Unless stated otherwise, “Key Dates” indicate patent-based expiration dates.(b) As a result of a patent litigation settlement, Teva Pharmaceuticals USA, Inc. will be allowed to launch a generic version of Viagra in the U.S. in December 2017, or earlier under certain circumstances.(c)
Generic versions of Inspra became available in major European markets following the March 2014 expiry of regulatory exclusivity for Inspra in most major European markets, allowing generic companies to submitapplications for marketing authorizations for their generic products.
(d)
Generic versions of Lyrica became available in major European markets following the July 2014 expiry of regulatory exclusivity for Lyrica in the EU, allowing generic companies to submit applications for marketingauthorizations for their generic products.
(e) In December 2014, generic versions of Celebrex became available pursuant to settlement agreements with several generic manufacturers.(f) Pursuant to terms of a settlement agreement, certain formulations of Zyvox became subject to generic competition in the U.S. in January 2015. Other formulations of Zyvox became subject to generic competition
in the U.S. in the first half of 2015.(g) In January 2016, an etanercept biosimilar referencing Enbrel was approved by the European Commission.(h) As a result of a patent litigation settlement with several generic manufacturers, generic versions of Pristiq will be allowed to launch in the U.S. in March 2017.
Recent Losses of Collaboration Rights
The following table provides information about certain of our alliance revenue products that have experienced losses of collaboration rights, showing, by product, the date ofthe loss of the collaboration rights, the markets impacted and the alliance revenues associated with those products in those markets:
(MILLIONS OF DOLLARS) Alliance Revenues in
Markets Impacted
Products Date of Loss of
Collaboration Rights Markets Impacted Year Ended December 31,
2016 2015 2014Spiriva (a)
April 2014 (U.S.), between 2012 and2016 (Japan, certain Europeancountries, Australia, Canada and SouthKorea)
U.S., Japan, certain European countries,Australia, Canada and South Korea
$ 6
$ 27
$ 168
Rebif (b) End of 2015 U.S. — 371 415(a) Our collaboration with Boehringer Ingelheim for Spiriva expired on a country-by-country basis between 2012 and 2016. On April 29, 2014, our alliance in the U.S. came to an end.(b) Our collaboration agreement with EMD Serono Inc. to co-promote Rebif in the U.S. expired at the end of 2015.
In addition, we expect to lose exclusivity for various other products in various markets over the next few years, including among others, the expiration of the basic productpatent for Lyrica in the U.S. in December 2018. For additional information, see the “Patents and Other Intellectual Property Rights” section in Part I, Item 1, “Business”, of our2016 Form 10-K.
2016 Financial Report
5
Financial ReviewPfizer Inc. and Subsidiary Companies
Our financial results in 2016 and our 2017 financial guidance, respectively, reflect the impact and projected impact of the loss of exclusivity of various products and theexpiration of certain alliance product contract rights discussed above. For additional information about our 2017 financial guidance, see the “Our Financial Guidance for 2017 ”section of this Financial Review.
We will continue to aggressively defend our patent rights whenever we deem appropriate. For more detailed information about our significant products, see the discussion inthe “Revenues––Major Products” and “Revenues––Selected Product Descriptions” sections of this Financial Review. For a discussion of certain recent developments withrespect to patent litigation, see Notes to Consolidated Financial Statements–– Note 17A1. Commitments and Contingencies: Legal Proceedings –– Patent Litigation .
Regulatory Environment/Pricing and Access––U.S. Healthcare Legislation
In March 2010, the ACA was enacted in the U.S. For additional information, see the “Government Regulation and Price Constraints” section in Part I, Item 1, “Business”, of our2016 Form 10-K.
Impacts on our 2016 Results
We recorded the following amounts in 2016 as a result of the U.S. Healthcare Legislation:
• $410 million recorded as a reduction to Revenues , related to the Medicare “coverage gap” discount provision; and
• $312 million recorded in Selling, informational and administrative expenses , related to the fee payable to the federal government (which is not deductible for U.S. incometax purposes) based on our prior-calendar-year share relative to other companies of branded prescription drug sales to specified government programs.
Impacts on our 2015 Results
We recorded the following amounts in 2015 as a result of the U.S. Healthcare Legislation:
• $399 million recorded as a reduction to Revenues , related to the Medicare “coverage gap” discount provision; and
• $251 million recorded in Selling, informational and administrative expenses , related to the fee payable to the federal government (which is not deductible for U.S. incometax purposes) based on our prior-calendar-year share relative to other companies of branded prescription drug sales to specified government programs. The decrease inthe impact of the U.S. Healthcare Legislation on Selling, informational and administrative expenses in 2015 compared to 2014 was primarily a result of the non-recurrenceof the $215 million charge in 2014 to account for an additional year of the non-tax deductible Branded Prescription Drug Fee, partially offset by a lower favorable true-up in2015, compared to the favorable true-up in 2014, associated with the final invoice for the respective prior-calendar year received from the federal government, whichreflected a lower share than that of the initial invoice.
Impacts on our 2014 Results
We recorded the following amounts in 2014 as a result of the U.S. Healthcare Legislation:
• $382 million recorded as a reduction to Revenues , related to the Medicare “coverage gap” discount provision; and
• $362 million recorded in Selling, informational and administrative expenses , related to the fee payable to the federal government. 2014 included a $215 million charge toaccount for an additional year of the non-tax deductible Branded Prescription Drug Fee in accordance with final regulations issued in the third quarter of 2014 by the IRS.The amount in 2014 also reflected a favorable true-up associated with the final 2013 invoice received from the federal government, which reflected a lower share than thatof the initial 2013 invoice.
The final regulations issued by the IRS did not change the payment schedule for the Branded Prescription Drug Fee; accordingly there was no cash flow impact in 2014 fromthe $215 million charge.
Regulatory Environment/Pricing and Access––Government and Other Payer Group Pressures
Governments, MCOs and other payer groups continue to seek increasing discounts on our products through a variety of means, such as leveraging their purchasing power,implementing price controls, and demanding price cuts (directly or by rebate actions). In Europe, Japan, China, Canada, South Korea and some other international markets,governments provide healthcare at low direct cost to patients and regulate pharmaceutical prices or patient reimbursement levels to control costs for the government-sponsored healthcare system, particularly under recent global economic pressures. In the U.S., a primary government activity with implications for pharmaceutical pricing isdeficit reduction. Any significant spending reductions affecting Medicare, Medicaid or other publicly funded or subsidized health programs that may be implemented, and/or anysignificant additional taxes or fees that may be imposed on us, as part of any broad deficit-reduction effort could have an adverse impact on our results of operations.Significant Medicare reductions could also result if Congress proceeds with certain proposals to convert the Medicare fee-for-service program into a premium support program,or it chooses to implement the recommendations made annually by the Medicare Payment Advisory Commission, which are primarily intended to extend the fiscal solvency ofthe Medicare program.
Consolidation among MCOs has increased the negotiating power of MCOs and other private insurers. Private third-party insurers, as well as governments, increasingly employformularies to control costs by negotiating discounted prices in exchange for formulary inclusion. Failure to obtain or maintain timely or adequate pricing or formulary placementfor our products or obtaining such pricing or placement at unfavorable pricing could adversely impact revenue.
Additionally, efforts by government officials or legislators to implement measures to regulate prices or payment for pharmaceutical products could adversely affect our businessif implemented. There has recently been considerable public and government scrutiny of pharmaceutical pricing and proposals to address the perceived high cost ofpharmaceuticals. We believe medicines are the most efficient and effective use of
6
2016 Financial Report
Financial ReviewPfizer Inc. and Subsidiary Companies
healthcare dollars based on the value they deliver to the overall healthcare system. We continue to work with stakeholders to ensure access to medicines within an efficientand affordable healthcare system.
Adoption of other new legislation at the federal or state level could further affect demand for, or pricing of, our products. In 2017, we may face uncertainties because there likelywill be federal legislative and administrative efforts to repeal, substantially modify or invalidate some or all of the provisions of the ACA. Although the revenues generated forPfizer by the Medicaid expansion and health insurance exchanges under the ACA have been exceeded by the new rebates, discounts, and taxes, there is no assurance thatrepeal or replacement of the ACA will not adversely affect our business and financial results, particularly if replacement legislation reduces incentives for employer-sponsoredinsurance coverage, and we cannot predict how future federal or state legislative or administrative changes relating to healthcare reform will affect our business. We willcontinue to actively work with law makers and advocate for solutions that effectively improve patient health outcomes and lower costs to the healthcare system.
The potential for additional pricing and access pressures in the commercial sector continues to be significant. Some employers, seeking to avoid the tax on high-cost healthinsurance in the ACA to be imposed in 2020, are already scaling back healthcare benefits and an increasing number are implementing high deductible benefit designs. This isa trend that is likely to continue, especially if proposals to limit the tax exclusion for employer sponsored health insurance ultimately become law. Private third-party payers,such as health plans, increasingly challenge pharmaceutical and medical device product pricing, which could result in lower prices, lower reimbursement rates and a reductionin demand for our products. Pricing pressures for our products may occur as a result of highly competitive insurance markets. Healthcare provider purchasers, directly orthrough group purchasing organizations, are seeking enhanced discounts or implementing more rigorous bidding or purchasing review processes.
Overall, there is increasing pressure on U.S. providers to deliver healthcare at a lower cost and to ensure that those expenditures deliver demonstrated value in terms of healthoutcomes. Longer term, we are seeing a shift in focus away from fee-for-service payments towards outcomes-based payments and risk-sharing arrangements that rewardproviders for cost reductions. These new payment models can, at times, lead to lower prices for, and restricted access to, new medicines. At the same time, these models canalso expand utilization by encouraging physicians to screen, diagnose and focus on outcomes.
Outside the U.S., governments, including the different EU Member States, may use a variety of cost-containment measures for our pharmaceutical products, including pricecuts, mandatory rebates, value-based pricing, and international reference pricing (i.e., the practice of many countries linking their regulated medicine prices to those of othercountries). This international patchwork of price regulation and differing economic conditions and assessments of value across countries has led to different prices in differentcountries and some third-party trade in our products between countries.
In particular, international reference pricing adds to the regional impact of price cuts in individual countries and hinders patient access and innovation. Price variations,exacerbated by international reference pricing systems, also have resulted from exchange rate fluctuations. The downward pricing pressure resulting from this dynamic can beexpected to continue as a result of reforms to international reference pricing policies and measures targeting pharmaceuticals in some European countries.
In addition, several important multilateral organizations, such as the United Nations (UN) and the Organization for Economic Cooperation and Development (OECD), areincreasing policy pressures and scrutiny of international pharmaceutical pricing through issuing reports and policy recommendations (e.g., 2016 UN High Level Panel Reporton Access to Medicines and 2017 OECD Report on New Health Technologies –– Managing Access, Value and Sustainability ). Government adoption of theserecommendations may lead to additional pricing pressures.
In response to the evolving U.S. and global healthcare spending landscape, we are continuing to work with health authorities, health technology assessment and qualitymeasurement bodies and major U.S. payers throughout the product-development process to better understand how these entities value our compounds and products. Further,we are seeking to develop stronger internal capabilities focused on demonstrating the value of the medicines that we discover or develop, register and manufacture, byrecognizing patterns of usage of our medicines and competitor medicines along with patterns of healthcare costs.
Regulatory Environment––Pipeline Productivity
The discovery and development of safe, effective new products, as well as the development of additional uses for existing products, are necessary for the continued strength ofour businesses. We have encountered increasing regulatory scrutiny of drug safety and efficacy, even as we continue to gather safety and other data on our products, beforeand after the products have been launched. Our product lines must be replenished over time in order to offset revenue losses when products lose their market exclusivity, aswell as to provide for earnings growth. We devote considerable resources to R&D activities. These activities involve a high degree of risk and cost and may take many years,and with respect to any specific R&D project, there can be no assurance that the development of any particular product candidate or new indication for an in-line product willachieve the desired clinical endpoints and safety profile, will be approved by regulators or will be successful commercially.
During the development of a product, we conduct clinical trials to provide data on the drug’s safety and efficacy to support the evaluation of its overall benefit-risk profile for aparticular patient population. In addition, after a product has been approved and launched, we continue to monitor its safety as long as it is available to patients, and post-marketing trials may be conducted, including trials requested by regulators and trials that we do voluntarily to gain additional medical knowledge. For the entire life of theproduct, we collect safety data and report potential problems to the FDA and other regulatory authorities. The FDA and regulatory authorities in other jurisdictions may evaluatepotential safety concerns related to a product or a class of products and take regulatory actions in response, such as updating a product’s labeling, restricting the use of aproduct, communicating new safety information to the public, or, in rare cases, removing a product from the market.
2016 Financial Report
7
Financial ReviewPfizer Inc. and Subsidiary Companies
Competition
Many of our prescription pharmaceutical products face competition in the form of branded or generic drugs or biosimilars that treat similar diseases or indications. Foradditional information, see the “Competition” section in Part I, Item 1, “Business”, of our 2016 Form 10-K.
The Global Economic Environment
In addition to the industry-specific factors discussed above, we, like other businesses, are exposed to the economic cycle, which impacts our biopharmaceutical operationsglobally.
• Governments, corporations, and insurance companies, which provide insurance benefits to patients, have implemented increases in cost-sharing and restrictions on accessto medicines, potentially causing patients to switch to generic products, delay treatments, skip doses or use less effective treatments. Government financing pressures canlead to negative pricing pressure in various markets where governments take an active role in setting prices, access criteria (e.g., through public or private healthtechnology assessments), or other means of cost control. Examples include Europe, Japan, China, Canada, South Korea and a number of other international markets. TheU.S. continues to maintain competitive insurance markets, but has also seen significant increases in patient cost-sharing and growing government influence as governmentprograms continue to grow as a source of coverage.
• We continue to monitor developments regarding government and government agency receivables in several European markets, including Greece, where economicconditions remain challenging and uncertain. For further information about our Accounts Receivable , see the “Analysis of Financial Condition, Liquidity and CapitalResources” section of this Financial Review.
• Significant portions of our revenues and earnings, as well as our substantial international net assets, are exposed to changes in foreign exchange rates. We seek tomanage our foreign exchange risk in part through operational means, including managing same-currency revenues in relation to same-currency costs and same-currencyassets in relation to same-currency liabilities. Depending on market conditions, foreign exchange risk also is managed through the use of derivative financial instrumentsand foreign currency debt. As we operate in multiple foreign currencies, including the euro, the Japanese yen, the Chinese renminbi, the U.K. pound, the Canadian dollarand approximately 100 other currencies, changes in those currencies relative to the U.S. dollar will impact our revenues and expenses. If the U.S. dollar were to weakenagainst another currency, assuming all other variables remained constant, our revenues would increase, having a positive impact on earnings, and our overall expenseswould increase, having a negative impact on earnings. Conversely, if the U.S. dollar were to strengthen against another currency, assuming all other variables remainedconstant, our revenues would decrease, having a negative impact on earnings, and our overall expenses would decrease, having a positive impact on earnings. Therefore,significant changes in foreign exchange rates, including those changes resulting from the volatility following the U.K. referendum in which voters approved the exit from theEU, can impact our results and our financial guidance.
The impact of possible currency devaluations in countries experiencing high inflation rates or significant exchange fluctuations, including Venezuela and more recentlyEgypt, can impact our results and financial guidance. In the fourth quarter of 2015, we recorded a foreign currency loss of $806 million and an inventory impairment chargeof $72 million related to conditions in Venezuela. For further information about our exposure to foreign currency risk, see the “Analysis of Financial Condition, Liquidity andCapital Resources” and the “Our Financial Guidance for 2017 ” sections of this Financial Review. For further information about our foreign currency losses related toVenezuela, see Notes to Consolidated Financial Statements–– Note 4 . Other (Income)/Deductions –– Net.
• In June 2016, the U.K. electorate voted in a referendum to leave the EU, which is commonly referred to as “Brexit”. The U.K. government has not formally notified theEuropean Council of their intention to leave the EU. In January 2017, the U.K. Parliament voted in favor of legislation to give the Prime Minister the power to trigger Article50 of the Lisbon Treaty to begin the two-year negotiation process establishing the terms of the exit and outlining the future relationship between the U.K. and the EU. TheU.K. Prime Minister has said the negotiations are expected to begin at the end of March 2017. This process is expected to be highly complex, and, in January 2017, thePrime Minister announced a 12-point plan of negotiating objectives and confirmed that the U.K. government will not seek continued membership of the EU single market.The end result of these negotiations may pose certain implications to our research, commercial and general business operations in the U.K. and the EU.
We generated approximately 2% of our worldwide revenues from the U.K. in 2016. However, except for the foreign currency exchange impact from the weakening U.K.pound relative to the U.S. dollar to date, there are no other immediate-term impacts to our business as there has not yet been a formal change in the relationship betweenthe U.K. and the EU. In addition, because of the significant uncertainties associated with the negotiation process, any potential long-term impacts are not currentlydeterminable.
Pfizer maintains a strong financial position while operating in a complex global environment. Due to our significant operating cash flows, financial assets, access to capitalmarkets and available lines of credit and revolving credit agreements, we continue to believe that we have, and will maintain, the ability to meet our liquidity needs for theforeseeable future. Our long-term debt is rated high quality by both S&P and Moody’s. As market conditions change, we continue to monitor our liquidity position. We havetaken and will continue to take a conservative approach to our financial investments. Both short-term and long-term investments consist primarily of high-quality, highly liquid,well-diversified, available-for-sale debt securities. For further discussion of our financial condition and credit ratings, see the “Analysis of Financial Condition, Liquidity andCapital Resources” section of this Financial Review.
These and other industry-wide factors that may affect our businesses should be considered along with information presented in the “Forward-Looking Information and FactorsThat May Affect Future Results” section of this Financial Review and in Part I, Item 1A, “Risk Factors,” of our 2016 Form 10-K.
8
2016 Financial Report
Financial ReviewPfizer Inc. and Subsidiary Companies
Our Strategy
We believe that our medicines provide significant value for both healthcare providers and patients, not only from the improved treatment of diseases but also from a reductionin other healthcare costs, such as emergency room or hospitalization costs, as well as improvements in health, wellness and productivity. We continue to actively engage indialogues about the value of our medicines and how we can best work with patients, physicians and payers to prevent and treat disease and improve outcomes. We continueto work within the current legal and pricing structures, as well as continue to review our pricing arrangements and contracting methods with payers, to maximize patient accessand minimize any adverse impact on our revenues. We remain firmly committed to fulfilling our company’s purpose of innovating to bring therapies to patients that extend andsignificantly improve their lives. By doing so, we expect to create value for the patients we serve and for our shareholders.
Commercial Operations
We manage our commercial operations through two distinct business segments: Pfizer Innovative Health (IH) and Pfizer Essential Health (EH), which was previously known asEstablished Products. Beginning in the second quarter of 2016, we reorganized our operating segments to reflect that we now manage our innovative pharmaceutical andconsumer healthcare operations as one business segment, IH. From the beginning of our fiscal year 2014 until the second quarter of 2016, these operations were managed astwo business segments: the GIP segment and the VOC segment. We have revised prior-period information to reflect the reorganization. The IH and EH operating segmentsare each led by a single manager. Each operating segment has responsibility for its commercial activities and for certain IPR&D projects for new investigational products andadditional indications for in-line products that generally have achieved proof-of-concept. Each business has a geographic footprint across developed and emerging markets.
Some additional information about our business segments follows:IH Segment EH Segment
IH focuses on developing and commercializing novel, value-creating medicines andvaccines that significantly improve patients’ lives, as well as products for consumerhealthcare.Key therapeutic areas include internal medicine, vaccines, oncology, inflammation &immunology, rare diseases and consumer healthcare.
EH includes legacy brands that have lost or will soon lose market exclusivity in bothdeveloped and emerging markets, branded generics, generic sterile injectableproducts, biosimilars and, through February 2, 2017, infusion systems. EH alsoincludes an R&D organization, as well as our contract manufacturing business.
Leading brands include:- Prevnar 13- Xeljanz- Eliquis- Lyrica (U.S., Japan and certain other markets)- Enbrel (outside the U.S. and Canada)- Viagra (U.S. and Canada)- Ibrance- Xtandi- Several OTC consumer products (e.g., Advil and Centrum )
Leading brands include:- Lipitor- Premarin family- Norvasc- Lyrica (Europe, Russia, Turkey, Israel and Central Asia countries)- Celebrex- Pristiq- Several sterile injectable products
We expect that the IH biopharmaceutical portfolio of innovative, largely patent-protected, in-line and newly launched products will be sustained by ongoing investments todevelop promising assets and targeted business development in areas of focus to help ensure a pipeline of highly-differentiated product candidates in areas of unmet medicalneed. The assets managed by IH are science-driven, highly differentiated and generally require a high-level of engagement with healthcare providers and consumers.
EH is expected to generate strong consistent cash flow by providing patients around the world with access to effective, lower-cost, high-value treatments. EH leverages ourbiologic development, regulatory and manufacturing expertise to seek to advance its biosimilar development portfolio. Additionally, EH leverages capabilities in formulationdevelopment and manufacturing expertise to help advance its generic sterile injectables portfolio. EH may also engage in targeted business development to further enable itscommercial strategies.
The following change in 2016 impacted IH:• In connection with the formation in early 2016 of the GPD organization, a new unified center for late-stage development for our innovative products, which is generally
responsible for the clinical development of assets that are in clinical trials for our WRD and Innovative portfolios, certain development-related functions transferred from IHto GPD.
The following changes in 2016 impacted EH:• Beginning in 2016, our contract manufacturing business, Pfizer CentreOne, is part of EH. Pfizer CentreOne consists of (i) the revenues and expenses of legacy Pfizer's
contract manufacturing and active pharmaceutical ingredient sales operation (previously known as Pfizer CentreSource or PCS), including the revenues and expensesrelated to our manufacturing and supply agreements with Zoetis, which prior to 2016 was managed outside EH as part of PGS and previously reported in “OtherUnallocated” costs; and (ii) the revenues and expenses of legacy Hospira's One-2-One sterile injectables contract manufacturing operation, which has been included in EHsince we acquired Hospira on September 3, 2015.
• In connection with the formation of a new EH R&D organization effective in the first quarter of 2016, certain functions transferred from Pfizer’s WRD organization to the newEH R&D organization. The new R&D organization within EH expects to develop potential new sterile injectable drugs and therapeutic solutions, as well as biosimilars.
2016 Financial Report
9
Financial ReviewPfizer Inc. and Subsidiary Companies
In September 2016, we announced our decision to maintain our current business structure and not pursue a split into two separate publicly-traded companies at that time.Following this decision, we will continue to operate two distinct businesses, each with a focus on our strategic priorities to grow and increase operational efficiency. For IH, thismeans a continued focus on R&D productivity and pipeline strength while maximizing the value of our recently launched brands and in-line portfolio. Our recent acquisitions ofAnacor and Medivation expanded our pipeline in the high priority therapeutic areas of inflammation and immunology and oncology. For EH, we will continue to invest in growthdrivers and manage the portfolio to extract additional value while seeking opportunities for operating efficiencies. This strategy includes active management of our portfolio;maximizing growth of core product segments; acquisitions to strengthen core areas of our portfolio further, such as our recent acquisition of AstraZeneca’s small molecule anti-infectives business; and divestitures to increase focus on our core strengths. In line with this strategy, on February 3, 2017, we completed the sale of Pfizer’s global infusiontherapy net assets, representing the infusion systems net assets that we acquired as part of the Hospira transaction, HIS, to ICU Medical, a global device manufacturer. Foradditional information, see Notes to Consolidated Financial Statements–– Note 2B. Acquisitions, Assets and Liabilities Held for Sale, Licensing Agreements, Research andDevelopment and Collaborative Arrangements, Equity-Method Investments and Cost-Method Investment : Assets and Liabilities Held for Sale.
For additional information about our operating structure, see Notes to Consolidated Financial Statements–– Note 18A. Segment, Geographic and Other Revenue Information:Segment Information.
For additional information about the 2016 performance of each of our operating segments, see the “Analysis of Operating Segment Information” section of this FinancialReview.
Research and Development Operations
We continue to strengthen our global R&D organization and pursue strategies intended to improve innovation and overall productivity in R&D to achieve a sustainable pipelinethat will deliver value in the near term and over time. Our R&D priorities include delivering a pipeline of differentiated therapies and vaccines with the greatest medical andcommercial promise, innovating new capabilities that can position Pfizer for long-term leadership and creating new models for biomedical collaboration that will expedite thepace of innovation and productivity. To that end, our research primarily focuses on:• Biosimilars;• Inflammation and Immunology;• Metabolic Disease and Cardiovascular Risks;• Neuroscience;• Oncology;• Rare Diseases; and• Vaccines.
While a significant portion of R&D is done internally, we also seek out promising chemical and biological lead molecules and innovative technologies developed by third partiesto incorporate into our discovery and development processes or projects, as well as our product lines, by entering into collaborations, alliance and license agreements withother companies, as well as leveraging acquisitions and equity- or debt-based investments. These agreements enable us to co-develop, license or acquire promisingcompounds, technologies or capabilities. We also enter into agreements pursuant to which a third party agrees to fund a portion of the development costs of one of our pipelineproducts in exchange for rights to receive potential milestone payments, revenue sharing payments, profit sharing payments and/or royalties. Collaboration, alliance, licenseand funding agreements and equity- or debt-based investments allow us to share risk and cost and to access external scientific and technological expertise, and enable us toadvance our own products as well as in-licensed or acquired products.
In early 2016, we formed the GPD organization, a new, unified center for late-stage development for our innovative products. GPD is expected to enable more efficient andeffective development and enhance our ability to accelerate and progress assets through our pipeline. GPD combines certain previously separate development-relatedfunctions from the IH business and the WRD organization to achieve a development capability that is expected to deliver high-quality, efficient, and well-executed clinicalprograms by enabling greater speed, greater cost efficiencies, and reduced complexity across our development portfolio.
For additional information about R&D by operating segment, see the “Analysis of Operating Segment Information” section of this Financial Review. For additional informationabout our pending new drug applications and supplemental filings, see the “Analysis of the Consolidated Statements of Income––Product Developments––Biopharmaceutical”section of this Financial Review. For additional information about recent transactions and strategic investments that we believe have the potential to advance our pipeline, seethe “Our Strategy––Our Business Development Initiatives” section of this Financial Review.
Intellectual Property Rights
We continue to aggressively defend our patent rights against increasingly aggressive infringement whenever appropriate, and we will continue to support efforts that strengthenworldwide recognition of patent rights while taking necessary steps to ensure appropriate patient access. In addition, we will continue to employ innovative approachesdesigned to prevent counterfeit pharmaceuticals from entering the supply chain and to achieve greater control over the distribution of our products, and we will continue toparticipate in the generics market for our products, whenever appropriate, once they lose exclusivity. Also, the pursuit of valid business opportunities may require us tochallenge intellectual property rights held by other companies that we believe were improperly granted. Such challenges may include negotiation and litigation, which may notbe successful. For additional information about our current efforts to enforce our intellectual property rights, see Notes to Consolidated Financial Statements–– Note 17A1.Commitments and Contingencies: Legal Proceedings –– Patent Litigation. For information on risks related to patent protection and intellectual property claims by third parties,see "Risks Related to Intellectual Property" in Part I, Item 1A, “Risk Factors” in our 2016 Form 10-K.
10
2016 Financial Report
Financial ReviewPfizer Inc. and Subsidiary Companies
Capital Allocation and Expense Management
We seek to maintain a strong balance sheet and robust liquidity so that we continue to have the financial resources necessary to take advantage of prudent commercial,research and business development opportunities and to directly enhance shareholder value through share repurchases and dividends. For additional information about ourfinancial condition, liquidity, capital resources, share repurchases (including accelerated share repurchases) and dividends, see the “Analysis of Financial Condition, Liquidityand Capital Resources” section of this Financial Review. For additional information about our recent business development activities, see the “Our Strategy––Our BusinessDevelopment Initiatives” section of this Financial Review.
On December 12, 2016 , our Board of Directors declared a first-quarter 2017 dividend of $0.32 per share, an increase from the $0.30 per-share quarterly dividend paid during2016 . For additional information, see the “Analysis of Financial Condition, Liquidity and Capital Resources” section of this Financial Review and Notes to ConsolidatedFinancial Statements–– Note 12. Equity.
We remain focused on achieving an appropriate cost structure for the Company. For additional information about our cost-reduction and productivity initiatives, see the “Costsand Expenses––Restructuring Charges and Other Costs Associated with Acquisitions and Cost-Reduction/Productivity Initiatives” section of this Financial Review and Notes toConsolidated Financial Statements–– Note 3 . Restructuring Charges and Other Costs Associated with Acquisitions and Cost-Reduction/Productivity Initiatives.
Our Business Development Initiatives
We are committed to capitalizing on growth opportunities by advancing our own pipeline and maximizing the value of our in-line products, as well as through various forms ofbusiness development, which can include alliances, licenses, joint ventures, collaborations, equity- or debt-based investments, dispositions, mergers and acquisitions. We viewour business development activity as an enabler of our strategies, and we seek to generate earnings growth and enhance shareholder value by pursuing a disciplined, strategicand financial approach to evaluating business development opportunities. We continue to evaluate business development transactions that have the potential to strengthenone or both of our businesses and their capabilities, such as our acquisitions of Hospira, Medivation, Anacor and AstraZeneca’s small molecule anti-infectives business, as wellas collaborations, and alliance and license agreements with other companies, including our collaborations with Cellectis, OPKO and Merck KGaA. We assess our businesses,assets and scientific capabilities/portfolio as part of our regular, ongoing portfolio review process and also continue to consider business development activities that willadvance our businesses. For additional information on our business development activities, see Notes to Consolidated Financial Statements–– Note 2. Acquisitions, Assetsand Liabilities Held for Sale, Licensing Agreements, Research and Development and Collaborative Arrangements, Equity-Method Investments and Cost-Method Investmentand the “Significant Accounting Policies and Application of Critical Accounting Estimates and Assumptions––Acquisition of Hospira” section of this Financial Review.The more significant recent transactions and events are described below:
• Sale of Hospira Infusion Systems Net Assets to ICU Medical, Inc. ––On February 3, 2017, we completed the sale of our global infusion therapy net assets, HIS, to ICUMedical for up to approximately $900 million , composed of cash and contingent cash consideration, ICU Medical common stock and seller financing. HIS includes IVpumps, solutions and devices. Under the terms of the agreement, we received 3.2 million newly issued shares of ICU Medical common stock, which we valued atapproximately $430 million (based upon the closing price of ICU Medical common stock on the closing date less a discount for lack of marketability), a promissory note inthe amount of $75 million and net cash of approximately $200 million before customary adjustments for net working capital. In addition, we are entitled to receive acontingent amount of up to an additional $225 million in cash based on ICU Medical’s achievement of certain cumulative performance targets for the combined companythrough December 31, 2019. After receipt of the ICU Medical shares, we own approximately 16.4% of ICU Medical as of the closing date. We have agreed to certainrestrictions on transfer of our ICU Medical shares for 18 months. The promissory note from ICU Medical has a term of three years and bears interest at LIBOR plus 2.25%for the first year and LIBOR plus 2.50% for the second and third years. At December 31, 2016, we determined that the carrying value of the HIS net assets held for saleexceeded their fair value less estimated costs to sell, resulting in a pre-tax impairment charge of $1.7 billion which is included in Other (income)/deductions––net (seeNotes to Consolidated Financial Statements ––Note 4. Other (Income)/Deductions––Net ) . The difference between the carrying value and fair value of the HIS net assetsheld for sale and the resulting pre-tax impairment may change when determined as of the February 3, 2017 closing date as a result of several factors, such as changes inthe carrying value of the HIS net assets between December 31, 2016 and the closing date.
• Acquisition of AstraZeneca’s Anti-Infectives Business (EH) ––On December 22, 2016, which falls in the first fiscal quarter of 2017 for our international operations, weacquired the development and commercialization rights to AstraZeneca’s small molecule anti-infectives business, primarily outside the U.S., including the commercializationand development rights to the newly approved EU drug Zavicefta™ (ceftazidime-avibactam), the marketed agents Merrem™/Meronem™ (meropenem)and Zinforo™ (ceftaroline fosamil), and the clinical development assets ATM-AVI and CXL (ceftaroline fosamil-AVI). Under the terms of the agreement, Pfizer made anupfront payment of approximately $550 million to AstraZeneca upon the close of the transaction and will make a deferred payment of $175 million in January 2019. Inaddition, AstraZeneca is eligible to receive up to $250 million in milestone payments, up to $600 million in sales-related payments, as well as tiered royalties on sales ofZavicefta™ and ATM-AVI in certain markets.
• Acquisition of Medivation, Inc. (IH) ––On September 28, 2016, we acquired Medivation for $81.50 per share. The total fair value of consideration transferred for Medivationwas approximately $14.3 billion in cash ( $13.9 billion , net of cash acquired). Medivation’s portfolio includes Xtandi (enzalutamide), an androgen receptor inhibitor thatblocks multiple steps in the androgen receptor signaling pathway within tumor cells. Xtandi is being developed and commercialized through a collaboration between Pfizerand Astellas. Astellas has exclusive commercialization rights for Xtandi outside the U.S. In addition, Medivation has two development-stage oncology assets in its pipeline:talazoparib, which is currently in a Phase 3 study for the treatment of BRCA-mutated breast cancer, and pidilizumab, an immuno-oncology asset being developed fordiffuse large B-cell lymphoma and other hematologic malignancies. We expect this acquisition will accelerate our leadership in Oncology –– a high priority area for ourcompany.
2016 Financial Report
11
Financial ReviewPfizer Inc. and Subsidiary Companies
• Acquisition of Bamboo Therapeutics, Inc. (R&D) ––On August 1, 2016, we acquired all the remaining equity in Bamboo, a privately-held biotechnology company, focusedon developing gene therapies for the potential treatment of patients with certain rare diseases relating to neuromuscular conditions and those affecting the central nervoussystem, for $150 million, plus potential milestone payments of up to $495 million contingent upon the progression of key assets through development, regulatory approvaland commercialization. We previously purchased a minority stake in Bamboo in the first quarter of 2016 for a payment of approximately $43 million. This acquisitionprovides us with several clinical and pre-clinical assets that complement our rare disease portfolio, an advanced recombinant AAV vector design and productiontechnology, and a fully functional Phase I/II gene therapy manufacturing facility.
• Acquisition of Anacor Pharmaceuticals, Inc. (IH) ––On June 24, 2016, we acquired Anacor for $99.25 per share. The total fair value of consideration transferred for Anacorwas approximately $4.9 billion in cash ( $4.5 billion net of cash acquired) plus $698 million debt assumed. Anacor’s crisaborole, a non-steroidal topical PDE-4 inhibitor withanti-inflammatory properties, was approved by the FDA on December 14, 2016 under the trade name, Eucrisa, for the treatment of mild-to-moderate atopic dermatitis inpatients two years of age and older, commonly referred to as a type of eczema. Anacor also holds the rights to Kerydin, a topical treatment for onychomycosis (toenailfungus) that is distributed and commercialized by Sandoz in the U.S.
• Research and Development Arrangement with NovaQuest Co-Investment Fund II, L.P. ––On November 1, 2016, we announced the discontinuation of the global clinicaldevelopment program for bococizumab. During December 2016, $31.3 million was refunded to NovaQuest representing amounts NovaQuest prepaid for developmentcosts (under the May 2016 agreement described below) that were not used for program expenses due to the discontinuation of the development program. No additionalpayments are expected to be received from or paid to NovaQuest under this agreement, which was effectively terminated on November 18, 2016.
In May 2016, our agreement with NovaQuest became effective, under which NovaQuest agreed to fund up to $250 million in development costs related to certain Phase IIIclinical trials of Pfizer’s bococizumab compound and Pfizer agreed to use commercially reasonable efforts to develop and obtain regulatory approvals for such compound.NovaQuest’s development funding was expected to cover up to 40% of the development costs and was to be received over five quarters during 2016 and 2017. As therewas a substantive and genuine transfer of risk to NovaQuest, the development funding applicable to program expenses during 2016 was recognized as an obligation toperform contractual services and therefore has been recognized as a reduction of Research and development expenses as incurred. The reduction to Research anddevelopment expenses for 2016 totaled $180.3 million .
• Research and Development Arrangement with NovaQuest Co-Investment Fund V, L.P. ––In April 2016, Pfizer entered into an agreement with NovaQuest under whichNovaQuest will fund up to $200 million in development costs related to certain Phase III clinical trials of Pfizer’s rivipansel compound and Pfizer will use commerciallyreasonable efforts to develop and obtain regulatory approvals for such compound. NovaQuest’s development funding is expected to cover up to 100% of the developmentcosts and will be received over approximately twelve quarters from 2016 to 2019. As there is a substantive and genuine transfer of risk to NovaQuest, the developmentfunding is recognized by us as an obligation to perform contractual services and therefore is a reduction of Research and development expenses as incurred. The reductionto Research and development expenses for 2016 totaled $46.6 million . Following potential regulatory approval, NovaQuest will be eligible to receive a combination of fixedmilestone payments of up to approximately $267 million in total, based on achievement of first commercial sale and certain levels of cumulative net sales as well asroyalties on rivipansel net sales over approximately eight years. Fixed sales-based milestone payments will be recorded as intangible assets and amortized to Amortizationof intangible assets over the estimated commercial life of the rivipansel product and royalties on net sales will be recorded as Cost of sales when incurred.
• Terminated Agreement to Combine with Allergan plc ––On April 6, 2016, we announced that the merger agreement between Pfizer and Allergan entered into on November22, 2015 was terminated by mutual agreement of the companies. In connection with the termination of the merger agreement, on April 8, 2016 (which fell into Pfizer’ssecond fiscal quarter), Pfizer paid Allergan $150 million (pre-tax) for reimbursement of Allergan’s expenses associated with the terminated transaction. Pfizer and Allerganalso released each other from any and all claims in connection with the merger agreement. For additional information, see Notes to Consolidated Financial Statements––Note 4. Other (Income)/Deductions — Net and the “Our Business” section of this Financial Review.
• Research and Development Arrangement with RPI Finance Trust ––In January 2016, Pfizer entered into an agreement with RPI, a subsidiary of Royalty Pharma, underwhich RPI will fund up to $300 million in development costs related to certain Phase III clinical trials of Pfizer’s Ibrance (palbociclib) product primarily for adjuvant treatmentof hormone receptor positive early breast cancer (the Indication). RPI’s development funding is expected to cover up to 100% of the costs primarily for the applicableclinical trials through 2021. As there is a substantive and genuine transfer of risk to RPI, the development funding is recognized by us as an obligation to performcontractual services and therefore is a reduction of Research and development expenses as incurred. The reduction to Research and development expenses for 2016totaled $44.9 million . If successful and upon approval of Ibrance in the U.S. or certain major markets in the EU for the Indication based on the applicable clinical trials, RPIwill be eligible to receive a combination of approval-based fixed milestone payments of up to $250 million dependent upon results of the clinical trials and royalties oncertain Ibrance sales over approximately seven years. Fixed milestone payments due upon approval will be recorded as intangible assets and amortized to Amortization ofintangible assets over the estimated commercial life of the Ibrance product and sales-based royalties will be recorded as Cost of sales when incurred.
• Acquisition of Hospira (EH) ––On September 3, 2015, we acquired Hospira, a leading provider of sterile injectable drugs and infusion technologies as well as a provider ofbiosimilars, for approximately $16.1 billion in cash ( $15.7 billion , net of cash acquired). For additional information, see the “Our Business” section of this Financial Review.
• Acquisition of a Minority Interest in AM-Pharma B.V. (IH) ––In April 2015, we acquired a minority equity interest in AM-Pharma, a privately-held Dutch biopharmaceuticalcompany focused on the development of recAP for inflammatory diseases, and secured an exclusive option to acquire the remaining equity in the company. The optionbecomes exercisable after completion of a Phase II trial of recAP in the treatment of Acute Kidney Injury related to sepsis, which is expected in 2017. Under the terms ofthe agreement, we paid $87.5 million for both the exclusive option and the minority equity interest, which was recorded as a cost-method investment in Long-terminvestments , and we may make additional payments of up to $512.5 million upon exercise of the option and potential launch of any product that may result from thisinvestment.
12
2016 Financial Report
Financial ReviewPfizer Inc. and Subsidiary Companies
• Collaboration with OPKO Health, Inc. ––We entered into a collaborative agreement with OPKO, which closed in January 2015, to develop and commercialize OPKO’s long-acting hGH-CTP for the treatment of GHD in adults and children, as well as for the treatment of growth failure in children born SGA who fail to show catch-up growth by twoyears of age. hGH-CTP has the potential to reduce the required dosing frequency of human growth hormone to a single weekly injection from the current standard of oneinjection per day. We have received the exclusive license to commercialize hGH-CTP worldwide. OPKO will lead the clinical activities and will be responsible for funding thedevelopment programs for the key indications, which include Adult and Pediatric GHD and Pediatric SGA. We will be responsible for all development costs for additionalindications, all postmarketing studies, manufacturing and commercialization activities for all indications, and we will lead the manufacturing activities related to productdevelopment. In February 2015, we made an upfront payment of $295 million to OPKO, which was recorded in Research and development expenses, and OPKO is eligibleto receive up to an additional $275 million upon the achievement of certain regulatory milestones. OPKO is also eligible to receive royalty payments associated with thecommercialization of hGH-CTP for Adult GHD, which is subject to regulatory approval. Upon the launch of hGH-CTP for Pediatric GHD, which is subject to regulatoryapproval, the royalties will transition to tiered gross profit sharing for both hGH-CTP and our product, Genotropin.
• Acquisition of Marketed Vaccines Business of Baxter International Inc. (IH) ––On December 1, 2014 (which fell in the first fiscal quarter of 2015 for our internationaloperations), we acquired Baxter’s portfolio of marketed vaccines for a final purchase price of $648 million. The portfolio that was acquired consists of NeisVac-C andFSME-IMMUN/TicoVac. NeisVac-C is a vaccine that helps protect against meningitis caused by group C meningococcal meningitis and FSME-IMMUN/TicoVac is avaccine that helps protect against tick-borne encephalitis.
• Collaboration with Merck KGaA (IH) ––In November 2014, we entered into a collaborative arrangement with Merck KGaA, to jointly develop and commercialize avelumab,the proposed international non-proprietary name for the investigational anti-PD-L1 antibody (MSB0010718C), currently in development as a potential treatment for multipletypes of cancer. We and Merck KGaA are exploring the therapeutic potential of this novel anti-PD-L1 antibody as a single agent as well as in various combinations with ourand Merck KGaA’s broad portfolio of approved and investigational oncology therapies. Our avelumab program with Merck KGaA has 30 programs on-going, ten of whichare potentially registration enabling trials (two in lung cancer, two in gastric cancer, two in ovarian cancer, and one each in bladder cancer, Merkel cell carcinoma (MCC),squamous cell carcinoma of the head and neck and RCC). We received FDA breakthrough therapy designation for avelumab in metastatic MCC. In the fourth quarter of2016, the FDA biologics license application and the EMA marketing authorization application for MCC were accepted for review. We and Merck KGaA are also combiningresources and expertise to advance Pfizer’s anti-PD-1 antibody into Phase 1 trials. Under the terms of the agreement, in the fourth quarter of 2014, we made an upfrontpayment of $850 million to Merck KGaA and Merck KGaA is eligible to receive regulatory and commercial milestone payments of up to approximately $2.0 billion . Bothcompanies will jointly fund all development and commercialization costs, and split equally any profits generated from selling any anti-PD-L1 or anti-PD-1 products from thiscollaboration. Also, as part of the agreement, we gave Merck KGaA certain co-promotion rights for Xalkori in the U.S. and several other key markets, and co-promotionactivities were initiated in key select markets in 2015. In 2014, we recorded $1.2 billion of Research and development expenses associated with this collaborativearrangement, composed of the $850 million upfront cash payment as well as an additional amount of $309 million, reflecting the estimated fair value of the co-promotionrights given to Merck KGaA.
• Acquisition of InnoPharma, Inc. (IH) ––On September 24, 2014, we completed our acquisition of InnoPharma, a privately-held pharmaceutical development company, foran upfront cash payment of $225 million and contingent consideration of up to $135 million.
• License from Cellectis SA ––In June 2014, we entered into a global arrangement with Cellectis to develop Chimeric Antigen Receptor T-cell immunotherapies in the field ofoncology directed at select cellular surface antigen targets. In August 2014, in connection with this licensing agreement, we made an upfront payment of $80 million toCellectis, which was recorded in Research and development expenses . We will also fund R&D costs associated with up to 15 Pfizer-selected targets and, for the benefit ofCellectis, a portion of the R&D costs associated with four Cellectis-selected targets within the arrangement. Cellectis is eligible to receive development, regulatory andcommercial milestone payments of up to $185 million per product that results from the Pfizer-selected targets as well as tiered royalties on net sales of any products thatare commercialized by Pfizer.
• Collaboration with Eli Lilly & Company ––In 2013, we entered into a collaboration agreement with Lilly to jointly develop and globally commercialize Pfizer ’ s tanezumab,which provides that Pfizer and Lilly will equally share product-development expenses as well as potential revenues and certain product-related costs. Following the decisionby the FDA in March 2015 to lift the partial clinical hold on the tanezumab development program, we received a $200 million upfront payment from Lilly in accordance withthe collaboration agreement between Pfizer and Lilly, which is recorded as deferred revenue in our consolidated balance sheet and is being recognized into Other(income)/deductions –– net over a multi-year period beginning in the second quarter of 2015. Pfizer and Lilly resumed the Phase 3 chronic pain program for tanezumab inJuly 2015. Under the collaboration agreement with Lilly, we are eligible to receive additional payments from Lilly upon the achievement of specified regulatory andcommercial milestones.
• License of Nexium OTC Rights ––In August 2012, we entered into an agreement with AstraZeneca for the exclusive, global, OTC rights for Nexium, a prescription drugapproved to treat the symptoms of gastroesophageal reflux disease. On May 27, 2014, we launched Nexium 24HR in the U.S., and on July 11, 2014, we paid AstraZenecaa related $200 million product launch milestone payment. On August 1, 2014, we launched Nexium Control in Europe, and on September 15, 2014, we paid AstraZeneca arelated $50 million product launch milestone payment. These post-approval milestone payments were recorded in Identifiable intangible assets, less accumulatedamortization and are being amortized over the estimated useful life of the Nexium brand. Included in Other current liabilities at December 31, 2015 are accrued milestonepayments to AstraZeneca of $93 million, which were subsequently paid to AstraZeneca in April 2016. AstraZeneca is eligible to receive additional milestone payments of upto approximately $200 million, based on the level of worldwide sales as well as quarterly royalty payments based on worldwide sales.
2016 Financial Report
13
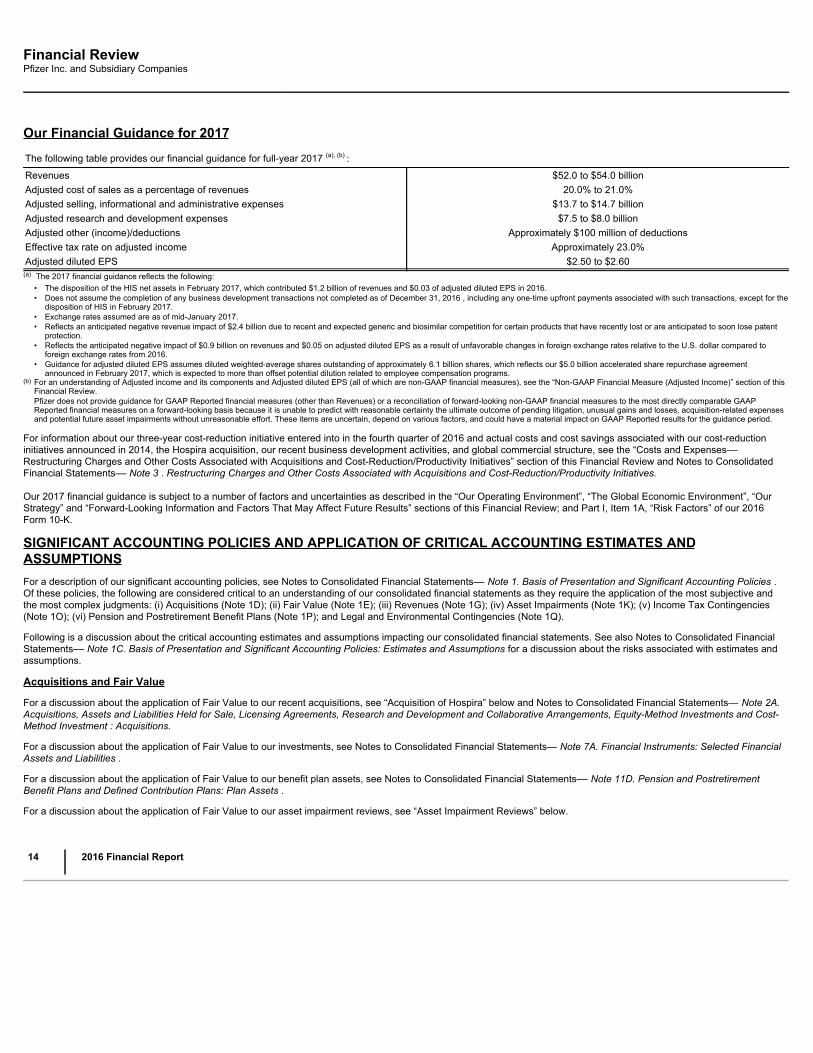
Financial ReviewPfizer Inc. and Subsidiary Companies
Our Financial Guidance for 2017
The following table provides our financial guidance for full-year 2017 (a), (b) :Revenues $52.0 to $54.0 billionAdjusted cost of sales as a percentage of revenues 20.0% to 21.0%Adjusted selling, informational and administrative expenses $13.7 to $14.7 billionAdjusted research and development expenses $7.5 to $8.0 billionAdjusted other (income)/deductions Approximately $100 million of deductionsEffective tax rate on adjusted income Approximately 23.0%Adjusted diluted EPS $2.50 to $2.60
(a) The 2017 financial guidance reflects the following:• The disposition of the HIS net assets in February 2017, which contributed $1.2 billion of revenues and $0.03 of adjusted diluted EPS in 2016.• Does not assume the completion of any business development transactions not completed as of December 31, 2016 , including any one-time upfront payments associated with such transactions, except for the
disposition of HIS in February 2017.• Exchange rates assumed are as of mid-January 2017.• Reflects an anticipated negative revenue impact of $2.4 billion due to recent and expected generic and biosimilar competition for certain products that have recently lost or are anticipated to soon lose patent
protection.• Reflects the anticipated negative impact of $0.9 billion on revenues and $0.05 on adjusted diluted EPS as a result of unfavorable changes in foreign exchange rates relative to the U.S. dollar compared to
foreign exchange rates from 2016.• Guidance for adjusted diluted EPS assumes diluted weighted-average shares outstanding of approximately 6.1 billion shares, which reflects our $5.0 billion accelerated share repurchase agreement
announced in February 2017, which is expected to more than offset potential dilution related to employee compensation programs.(b)
For an understanding of Adjusted income and its components and Adjusted diluted EPS (all of which are non-GAAP financial measures), see the “Non-GAAP Financial Measure (Adjusted Income)” section of thisFinancial Review.Pfizer does not provide guidance for GAAP Reported financial measures (other than Revenues) or a reconciliation of forward-looking non-GAAP financial measures to the most directly comparable GAAPReported financial measures on a forward-looking basis because it is unable to predict with reasonable certainty the ultimate outcome of pending litigation, unusual gains and losses, acquisition-related expensesand potential future asset impairments without unreasonable effort. These items are uncertain, depend on various factors, and could have a material impact on GAAP Reported results for the guidance period.
For information about our three-year cost-reduction initiative entered into in the fourth quarter of 2016 and actual costs and cost savings associated with our cost-reductioninitiatives announced in 2014, the Hospira acquisition, our recent business development activities, and global commercial structure, see the “Costs and Expenses––Restructuring Charges and Other Costs Associated with Acquisitions and Cost-Reduction/Productivity Initiatives” section of this Financial Review and Notes to ConsolidatedFinancial Statements–– Note 3 . Restructuring Charges and Other Costs Associated with Acquisitions and Cost-Reduction/Productivity Initiatives.
Our 2017 financial guidance is subject to a number of factors and uncertainties as described in the “Our Operating Environment”, “The Global Economic Environment”, “OurStrategy” and “Forward-Looking Information and Factors That May Affect Future Results” sections of this Financial Review; and Part I, Item 1A, “Risk Factors” of our 2016Form 10-K.
SIGNIFICANT ACCOUNTING POLICIES AND APPLICATION OF CRITICAL ACCOUNTING ESTIMATES ANDASSUMPTIONSFor a description of our significant accounting policies, see Notes to Consolidated Financial Statements–– Note 1. Basis of Presentation and Significant Accounting Policies .Of these policies, the following are considered critical to an understanding of our consolidated financial statements as they require the application of the most subjective andthe most complex judgments: (i) Acquisitions (Note 1D); (ii) Fair Value (Note 1E); (iii) Revenues (Note 1G); (iv) Asset Impairments (Note 1K); (v) Income Tax Contingencies(Note 1O); (vi) Pension and Postretirement Benefit Plans (Note 1P); and Legal and Environmental Contingencies (Note 1Q).
Following is a discussion about the critical accounting estimates and assumptions impacting our consolidated financial statements. See also Notes to Consolidated FinancialStatements–– Note 1C. Basis of Presentation and Significant Accounting Policies: Estimates and Assumptions for a discussion about the risks associated with estimates andassumptions.
Acquisitions and Fair Value
For a discussion about the application of Fair Value to our recent acquisitions, see “Acquisition of Hospira” below and Notes to Consolidated Financial Statements— Note 2A.Acquisitions, Assets and Liabilities Held for Sale, Licensing Agreements, Research and Development and Collaborative Arrangements, Equity-Method Investments and Cost-Method Investment : Acquisitions.
For a discussion about the application of Fair Value to our investments, see Notes to Consolidated Financial Statements— Note 7A. Financial Instruments: Selected FinancialAssets and Liabilities .
For a discussion about the application of Fair Value to our benefit plan assets, see Notes to Consolidated Financial Statements–– Note 11D. Pension and PostretirementBenefit Plans and Defined Contribution Plans: Plan Assets .
For a discussion about the application of Fair Value to our asset impairment reviews, see “Asset Impairment Reviews” below.
14
2016 Financial Report
Financial ReviewPfizer Inc. and Subsidiary Companies
Revenues
Our gross product revenues are subject to a variety of deductions that are generally estimated and recorded in the same period that the revenues are recognized, and primarilyrepresent chargebacks, rebates and sales allowances to wholesalers, and, to a lesser extent, distributors like MCOs, retailers and government agencies with respect to ourpharmaceutical products. Those deductions represent estimates of rebates and discounts related to gross sales for the reporting period, and, as such, knowledge andjudgment of market conditions and practice are required when estimating the impact of these revenue deductions on gross sales for a reporting period.
Historically, our adjustments of estimates, to reflect actual results or updated expectations, have not been material to our overall business. On a quarterly basis, ouradjustments of estimates to reflect actual results generally have been less than 1% of revenues, and have resulted in either a net increase or a net decrease in revenues.Product-specific rebates, however, can have a significant impact on year-over-year individual product growth trends. If any of our ratios, factors, assessments, experiences orjudgments are not indicative or accurate predictors of our future experience, our results could be materially affected. The sensitivity of our estimates can vary by program, typeof customer and geographic location. However, estimates associated with U.S. Medicare, Medicaid and performance-based contract rebates are most at risk for materialadjustment because of the extensive time delay between the recording of the accrual and its ultimate settlement, an interval that can generally range up to one year. Becauseof this time lag, in any given quarter, our adjustments to actual can incorporate revisions of several prior quarters.
Asset Impairment Reviews
We review all of our long-lived assets for impairment indicators throughout the year. We perform impairment testing for indefinite-lived intangible assets and goodwill at leastannually and for all other long-lived assets whenever impairment indicators are present. When necessary, we record charges for impairments of long-lived assets for theamount by which the fair value is less than the carrying value of these assets. Our impairment review processes are described in the Notes to Consolidated FinancialStatements–– Note 1K. Basis of Presentation and Significant Accounting Policies: Amortization of Intangible Assets, Depreciation and Certain Long-Lived Assets.
Examples of events or circumstances that may be indicative of impairment include:• A significant adverse change in legal factors or in the business climate that could affect the value of the asset. For example, a successful challenge of our patent rights
would likely result in generic competition earlier than expected.• A significant adverse change in the extent or manner in which an asset is used. For example, restrictions imposed by the FDA or other regulatory authorities could affect
our ability to manufacture or sell a product.• A projection or forecast that indicates losses or reduced profits associated with an asset. This could result, for example, from a change in a government reimbursement
program that results in an inability to sustain projected product revenues and profitability. This also could result from the introduction of a competitor’s product that results ina significant loss of market share or the inability to achieve the previously projected revenue growth, as well as the lack of acceptance of a product by patients, physiciansand payers. For IPR&D projects, this could result from, among other things, a change in outlook based on clinical trial data, a delay in the projected launch date oradditional expenditures to commercialize the product.
Identifiable Intangible Assets
As a result of our identifiable intangible asset impairment review work, we recognized a number of impairments of identifiable intangible assets for the years endedDecember 31, 2016 , 2015 and 2014 . See Notes to Consolidated Financial Statements–– Note 4. Other (Income)/Deductions — Net.
When we are required to determine the fair value of intangible assets other than goodwill, we use an income approach, specifically the discounted cash flow method. We startwith a forecast of all the expected net cash flows associated with the asset, which includes the application of a terminal value for indefinite-lived assets, and then we apply anasset-specific discount rate to arrive at a net present value amount. Some of the more significant estimates and assumptions inherent in this approach include: the amount andtiming of the projected net cash flows, which includes the expected impact of competitive, legal and/or regulatory forces on the projections and the impact of technological riskassociated with IPR&D assets, as well as the selection of a long-term growth rate; the discount rate, which seeks to reflect the various risks inherent in the projected cashflows; and the tax rate, which seeks to incorporate the geographic diversity of the projected cash flows.
While all intangible assets other than goodwill can face events and circumstances that can lead to impairment, in general, intangible assets other than goodwill that are most atrisk of impairment include IPR&D assets (approximately $10.1 billion as of December 31, 2016 ) and newly acquired or recently impaired indefinite-lived brand assets. IPR&Dassets are high-risk assets, as R&D is an inherently risky activity. Newly acquired and recently impaired indefinite-lived assets are more vulnerable to impairment as the assetsare recorded at fair value and are then subsequently measured at the lower of fair value or carrying value at the end of each reporting period. As such, immediately afteracquisition or impairment, even small declines in the outlook for these assets can negatively impact our ability to recover the carrying value and can result in an impairmentcharge.
Goodwill
As a result of our goodwill impairment review work, we concluded that none of our goodwill was impaired as of December 31, 2016 , and we do not believe the risk ofimpairment is significant at this time.
Fair value determinations require considerable judgment and are sensitive to changes in underlying assumptions and factors. Examples of events or circumstances that couldimpact the estimated fair value of a reporting unit may include items such as changes in operating results, anticipated future cash flows, the discount rate and market multiples,among others. Our Consumer Healthcare reporting unit has the
2016 Financial Report
15
Financial ReviewPfizer Inc. and Subsidiary Companies
narrowest difference between estimated fair value and estimated book value. However, we believe that it would take a significant negative change in the undiscounted cashflows, the discount rate and/or the market multiples in the consumer industry for the Consumer Healthcare reporting unit goodwill to be impaired. Our Consumer Healthcarereporting unit performance and consumer healthcare industry market multiples are highly correlated with the overall economy and our specific performance is also dependenton our and our competitors’ innovation and marketing effectiveness, and on regulatory developments affecting claims, formulations and ingredients of our products.
When we are required to determine the fair value of a reporting unit, as appropriate for the individual reporting unit, we mainly use the income approach but we may also usethe market approach, or a weighted-average combination of both approaches.• The income approach is a forward-looking approach to estimating fair value and relies primarily on internal forecasts. Within the income approach, the method that we use
is the discounted cash flow method. We start with a forecast of all the expected net cash flows associated with the reporting unit, which includes the application of aterminal value, and then we apply a reporting unit-specific discount rate to arrive at a net present value amount. Some of the more significant estimates and assumptionsinherent in this approach include: the amount and timing of the projected net cash flows, which includes the expected impact of technological risk and competitive, legaland/or regulatory forces on the projections, as well as the selection of a long-term growth rate; the discount rate, which seeks to reflect the various risks inherent in theprojected cash flows; and the tax rate, which seeks to incorporate the geographic diversity of the projected cash flows.
• The market approach is a historical approach to estimating fair value and relies primarily on external information. Within the market approach are two methods that we mayuse:◦ Guideline public company method—this method employs market multiples derived from market prices of stocks of companies that are engaged in the same or similar
lines of business and that are actively traded on a free and open market and the application of the identified multiples to the corresponding measure of our reportingunit’s financial performance.
◦ Guideline transaction method—this method relies on pricing multiples derived from transactions of significant interests in companies engaged in the same or similar linesof business and the application of the identified multiples to the corresponding measure of our reporting unit’s financial performance.
The market approach is only appropriate when the available external information is robust and deemed to be a reliable proxy for the specific reporting unit being valued;however, these assessments may prove to be incomplete or inaccurate. Some of the more significant estimates and assumptions inherent in this approach include: theselection of appropriate guideline companies and transactions and the determination of applicable premiums and discounts based on any differences in ownershippercentages, ownership rights, business ownership forms or marketability between the reporting unit and the guideline companies and transactions.
Specifically:• When we estimate the fair value of our six biopharmaceutical reporting units, we rely solely on the income approach. We use the income approach exclusively as the use of
the comparable guideline company method is not practical or reliable. For the income approach, we use the discounted cash flow method.• When we estimate the fair value of our Consumer Healthcare reporting unit, we use a combination of approaches and methods. We use the income approach and the
market approach, which we weight equally in our analysis. We weight them equally as we have equal confidence in the appropriateness of the approaches for this reportingunit. For the income approach, we use the discounted cash flow method and for the market approach, we use both the guideline public company method and the guidelinetransaction method, which we weight equally to arrive at our market approach value.
For all of our reporting units, there are a number of future events and factors that may impact future results and that could potentially have an impact on the outcome ofsubsequent goodwill impairment testing. For a list of these factors, see the “Forward-Looking Information and Factors That May Affect Future Results” section of this FinancialReview and Part I, Item 1A, “Risk Factors” in our 2016 Form 10-K.
Benefit Plans
The majority of our employees worldwide are covered by defined benefit pension plans, defined contribution plans or both. In the U.S., we have both IRC-qualified andsupplemental (non-qualified) defined benefit plans and defined contribution plans, as well as other postretirement benefit plans consisting primarily of medical insurance forretirees and their eligible dependents.
The accounting for benefit plans is highly dependent on actuarial estimates, assumptions and calculations, which can result from a complex series of judgments about futureevents and uncertainties. The assumptions and actuarial estimates required to estimate the net employee benefit obligations for the defined benefit and postretirement plansinclude the discount rate; expected salary increases; certain employee-related factors, such as turnover, retirement age and mortality (life expectancy); expected return on planassets; and healthcare cost trend rates.
Effective January 1, 2016, we changed the approach used to measure service and interest costs for certain international pension and other postretirement benefits. For fiscal2015 and 2014, we measured service and interest costs utilizing a single weighted-average discount rate derived from the yield curve used to measure the respective planobligations. For fiscal 2016, we elected to measure service and interest costs by applying the spot rates along the yield curve for certain international plans to the plans' liabilitycash flows. We believe the new approach provides a more precise measurement of service and interest costs by aligning the timing of the plans’ liability cash flows to thecorresponding spot rates on the yield curve. This change does not affect the measurement of our plan obligations. We have accounted for this change as a change inaccounting estimate and, accordingly, have accounted for it on a prospective basis. The reduction in expense for 2016 associated with this change in estimate was $42 million ,primarily related to certain international pension plans, which was recognized evenly over each quarter of the year. The change in approach for the postretirement benefit planswas not material to the 2016 consolidated statement of income.
16
2016 Financial Report
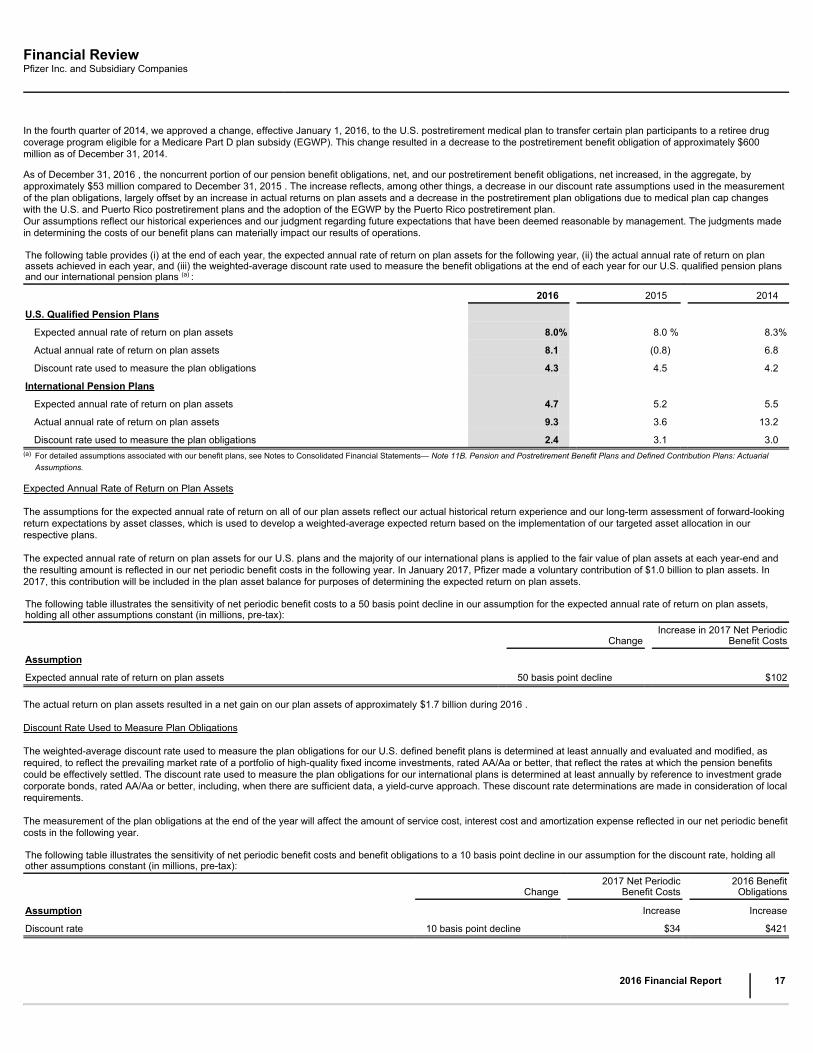
Financial ReviewPfizer Inc. and Subsidiary Companies
In the fourth quarter of 2014, we approved a change, effective January 1, 2016, to the U.S. postretirement medical plan to transfer certain plan participants to a retiree drugcoverage program eligible for a Medicare Part D plan subsidy (EGWP). This change resulted in a decrease to the postretirement benefit obligation of approximately $600million as of December 31, 2014.
As of December 31, 2016 , the noncurrent portion of our pension benefit obligations, net, and our postretirement benefit obligations, net increased, in the aggregate, byapproximately $53 million compared to December 31, 2015 . The increase reflects, among other things, a decrease in our discount rate assumptions used in the measurementof the plan obligations, largely offset by an increase in actual returns on plan assets and a decrease in the postretirement plan obligations due to medical plan cap changeswith the U.S. and Puerto Rico postretirement plans and the adoption of the EGWP by the Puerto Rico postretirement plan.Our assumptions reflect our historical experiences and our judgment regarding future expectations that have been deemed reasonable by management. The judgments madein determining the costs of our benefit plans can materially impact our results of operations.
The following table provides (i) at the end of each year, the expected annual rate of return on plan assets for the following year, (ii) the actual annual rate of return on planassets achieved in each year, and (iii) the weighted-average discount rate used to measure the benefit obligations at the end of each year for our U.S. qualified pension plansand our international pension plans (a) :
2016 2015 2014
U.S. Qualified Pension Plans
Expected annual rate of return on plan assets 8.0% 8.0 % 8.3%
Actual annual rate of return on plan assets 8.1 (0.8) 6.8
Discount rate used to measure the plan obligations 4.3 4.5 4.2
International Pension Plans
Expected annual rate of return on plan assets 4.7 5.2 5.5
Actual annual rate of return on plan assets 9.3 3.6 13.2
Discount rate used to measure the plan obligations 2.4 3.1 3.0(a)
For detailed assumptions associated with our benefit plans, see Notes to Consolidated Financial Statements— Note 11B. Pension and Postretirement Benefit Plans and Defined Contribution Plans: ActuarialAssumptions.
Expected Annual Rate of Return on Plan Assets
The assumptions for the expected annual rate of return on all of our plan assets reflect our actual historical return experience and our long-term assessment of forward-lookingreturn expectations by asset classes, which is used to develop a weighted-average expected return based on the implementation of our targeted asset allocation in ourrespective plans.
The expected annual rate of return on plan assets for our U.S. plans and the majority of our international plans is applied to the fair value of plan assets at each year-end andthe resulting amount is reflected in our net periodic benefit costs in the following year. In January 2017, Pfizer made a voluntary contribution of $1.0 billion to plan assets. In2017, this contribution will be included in the plan asset balance for purposes of determining the expected return on plan assets.
The following table illustrates the sensitivity of net periodic benefit costs to a 50 basis point decline in our assumption for the expected annual rate of return on plan assets,holding all other assumptions constant (in millions, pre-tax):
Change Increase in 2017 Net Periodic
Benefit Costs
Assumption
Expected annual rate of return on plan assets 50 basis point decline $102
The actual return on plan assets resulted in a net gain on our plan assets of approximately $1.7 billion during 2016 .
Discount Rate Used to Measure Plan Obligations
The weighted-average discount rate used to measure the plan obligations for our U.S. defined benefit plans is determined at least annually and evaluated and modified, asrequired, to reflect the prevailing market rate of a portfolio of high-quality fixed income investments, rated AA/Aa or better, that reflect the rates at which the pension benefitscould be effectively settled. The discount rate used to measure the plan obligations for our international plans is determined at least annually by reference to investment gradecorporate bonds, rated AA/Aa or better, including, when there are sufficient data, a yield-curve approach. These discount rate determinations are made in consideration of localrequirements.
The measurement of the plan obligations at the end of the year will affect the amount of service cost, interest cost and amortization expense reflected in our net periodic benefitcosts in the following year.
The following table illustrates the sensitivity of net periodic benefit costs and benefit obligations to a 10 basis point decline in our assumption for the discount rate, holding allother assumptions constant (in millions, pre-tax):
Change 2017 Net Periodic
Benefit Costs 2016 Benefit
Obligations
Assumption Increase Increase
Discount rate 10 basis point decline $34 $421
2016 Financial Report
17
Financial ReviewPfizer Inc. and Subsidiary Companies
The change in the discount rates used in measuring our plan obligations as of December 31, 2016 resulted in an increase in the measurement of our aggregate planobligations by approximately $2.0 billion .
Contingencies
For a discussion about income tax contingencies, see Notes to Consolidated Financial Statements— Note 5D. Tax Matters: Tax Contingencies.
For a discussion about legal and environmental contingencies, guarantees and indemnifications, see Notes to Consolidated Financial Statements— Note 17. Commitmentsand Contingencies .
Acquisition of Hospira
Description of Transaction
On September 3, 2015, we acquired Hospira, a leading provider of sterile injectable drugs and infusion technologies as well as a provider of biosimilars, for approximately$16.1 billion in cash ( $15.7 billion , net of cash acquired).
Recording of Assets Acquired and Liabilities Assumed
Our acquisition of Hospira has been accounted for using the acquisition method of accounting, which generally requires that most assets acquired and liabilities assumed berecorded at fair value as of the acquisition date. A single estimate of fair value results from a complex series of judgments about future events and uncertainties and reliesheavily on estimates and assumptions. Our judgments used to determine the estimated fair value assigned to each class of assets acquired and liabilities assumed, as well asasset lives, can materially impact our results of operations. For instance, the determination of asset lives can impact our results of operations as different types of assets willhave different useful lives and certain assets may even be considered to have indefinite useful lives.
For the amounts recognized for the Hospira assets acquired and liabilities assumed as of the acquisition date, including measurement period adjustments recognized in 2016to the amounts initially recorded in 2015, see Notes to Consolidated Financial Statements–– Note 2A. Acquisitions, Assets and Liabilities Held for Sale, Licensing Agreements,Research and Development and Collaborative Arrangements, Equity-Method Investments and Cost-Method Investment : Acquisitions .
Below is a summary of the methodologies and significant assumptions used in estimating the fair value of certain classes of assets and liabilities of Hospira as of theacquisition date.
For financial instruments acquired from Hospira, our valuation approach was consistent with our valuation methodologies used for our legacy Pfizer financial instruments. Foradditional information on the valuation of our financial instruments, see Notes to Consolidated Financial Statements— Note 7. Financial Instruments .
Inventories —The fair value of acquired inventory ( $1.9 billion ) was determined as follows:
• Finished goods— Estimated selling price, less an estimate of costs to be incurred to sell the inventory, and an estimate of a reasonable profit allowance for that sellingeffort.
• Work in process— Estimated selling price of an equivalent finished good, less an estimate of costs to be incurred to complete the work-in-process inventory, an estimate ofcosts to be incurred to sell the inventory and an estimate of a reasonable profit allowance for those manufacturing and selling efforts.
• Raw materials and supplies— Estimated cost to replace the raw materials and supplies.
The fair value of inventory is recognized in our results of operations as the inventory is sold. Some of the more significant estimates and assumptions inherent in the estimateof the fair value of inventory include stage of completion, costs to complete, costs to dispose and selling price. All of these judgments and estimates can materially impact ourresults of operations.
Property, Plant and Equipment —The fair value of acquired property, plant and equipment is determined using a variety of valuation approaches, depending on the nature ofthe asset and the quality of available information. The fair value of acquired property, plant and equipment was primarily determined as follows:• Land–– Market, a sales comparison approach that measures value of an asset through an analysis of sales and offerings of comparable property.• Buildings, Machinery and equipment and Furniture and fixtures —Replacement cost, an approach that measures the value of an asset by estimating the cost to acquire or
construct comparable assets. For buildings that are not highly specialized or that could be income producing if leased to a third party, we also considered market andincome factors.
• Construction in progress— Replacement cost, generally assumed to equal historical book value.
18
2016 Financial Report
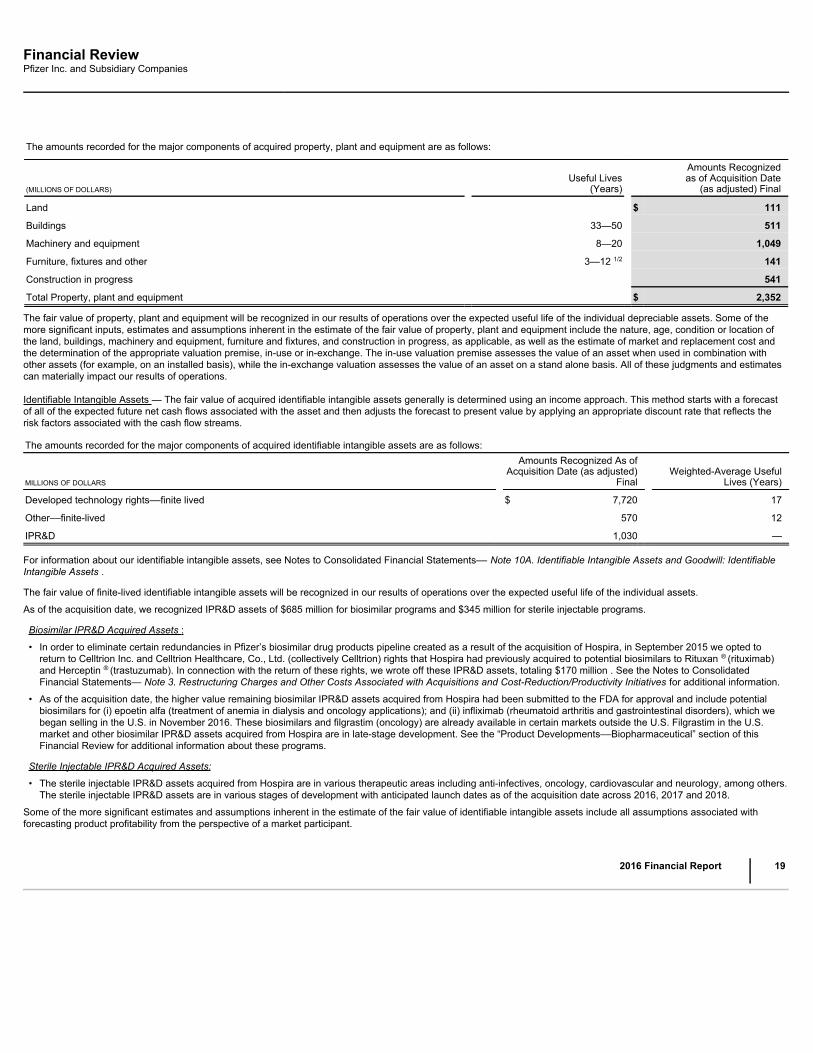
Financial ReviewPfizer Inc. and Subsidiary Companies
The amounts recorded for the major components of acquired property, plant and equipment are as follows:
(MILLIONS OF DOLLARS) Useful Lives
(Years)
Amounts Recognizedas of Acquisition Date
(as adjusted) Final
Land $ 111
Buildings 33—50 511
Machinery and equipment 8—20 1,049
Furniture, fixtures and other 3—12 1/2 141
Construction in progress 541
Total Property, plant and equipment $ 2,352
The fair value of property, plant and equipment will be recognized in our results of operations over the expected useful life of the individual depreciable assets. Some of themore significant inputs, estimates and assumptions inherent in the estimate of the fair value of property, plant and equipment include the nature, age, condition or location ofthe land, buildings, machinery and equipment, furniture and fixtures, and construction in progress, as applicable, as well as the estimate of market and replacement cost andthe determination of the appropriate valuation premise, in-use or in-exchange. The in-use valuation premise assesses the value of an asset when used in combination withother assets (for example, on an installed basis), while the in-exchange valuation assesses the value of an asset on a stand alone basis. All of these judgments and estimatescan materially impact our results of operations.
Identifiable Intangible Assets — The fair value of acquired identifiable intangible assets generally is determined using an income approach. This method starts with a forecastof all of the expected future net cash flows associated with the asset and then adjusts the forecast to present value by applying an appropriate discount rate that reflects therisk factors associated with the cash flow streams.
The amounts recorded for the major components of acquired identifiable intangible assets are as follows:
MILLIONS OF DOLLARS
Amounts Recognized As ofAcquisition Date (as adjusted)
Final Weighted-Average Useful
Lives (Years)
Developed technology rights––finite lived $ 7,720 17
Other––finite-lived 570 12
IPR&D 1,030 —
For information about our identifiable intangible assets, see Notes to Consolidated Financial Statements–– Note 10A. Identifiable Intangible Assets and Goodwill: IdentifiableIntangible Assets .
The fair value of finite-lived identifiable intangible assets will be recognized in our results of operations over the expected useful life of the individual assets.
As of the acquisition date, we recognized IPR&D assets of $685 million for biosimilar programs and $345 million for sterile injectable programs.
Biosimilar IPR&D Acquired Assets :
• In order to eliminate certain redundancies in Pfizer’s biosimilar drug products pipeline created as a result of the acquisition of Hospira, in September 2015 we opted toreturn to Celltrion Inc. and Celltrion Healthcare, Co., Ltd. (collectively Celltrion) rights that Hospira had previously acquired to potential biosimilars to Rituxan ® (rituximab)and Herceptin ® (trastuzumab). In connection with the return of these rights, we wrote off these IPR&D assets, totaling $170 million . See the Notes to ConsolidatedFinancial Statements— Note 3. Restructuring Charges and Other Costs Associated with Acquisitions and Cost-Reduction/Productivity Initiatives for additional information.
• As of the acquisition date, the higher value remaining biosimilar IPR&D assets acquired from Hospira had been submitted to the FDA for approval and include potentialbiosimilars for (i) epoetin alfa (treatment of anemia in dialysis and oncology applications); and (ii) infliximab (rheumatoid arthritis and gastrointestinal disorders), which webegan selling in the U.S. in November 2016. These biosimilars and filgrastim (oncology) are already available in certain markets outside the U.S. Filgrastim in the U.S.market and other biosimilar IPR&D assets acquired from Hospira are in late-stage development. See the “Product Developments––Biopharmaceutical” section of thisFinancial Review for additional information about these programs.
Sterile Injectable IPR&D Acquired Assets:
• The sterile injectable IPR&D assets acquired from Hospira are in various therapeutic areas including anti-infectives, oncology, cardiovascular and neurology, among others.The sterile injectable IPR&D assets are in various stages of development with anticipated launch dates as of the acquisition date across 2016, 2017 and 2018.
Some of the more significant estimates and assumptions inherent in the estimate of the fair value of identifiable intangible assets include all assumptions associated withforecasting product profitability from the perspective of a market participant.
2016 Financial Report
19
Financial ReviewPfizer Inc. and Subsidiary Companies
Specifically:• Revenue—We use historical, forecast, industry or other sources of market data including estimates of sales volume, selling prices, market penetration, market share and
year-over-year growth rates over the product’s life cycle.
• Cost of sales, Sales and marketing expenses, General and administrative expenses—We use historical, forecast, industry or other sources of market data to estimate thecosts associated with the identifiable intangible asset over the product’s life cycle.
• R&D expenses—In the case of approved products, we estimate the appropriate level of ongoing R&D support, and for unapproved compounds, we estimate the amountand timing of costs to develop the R&D into viable products.
• Estimated life of the asset—We assess the asset’s life cycle and the competitive trends impacting the asset, including consideration of any technical, legal, regulatory oreconomic barriers to entry, expected changes in standards of practice for indications addressed by the asset, as well as obsolescence factors and estimated contractrenewal rates.
• I nherent risk—We use a discount rate that is primarily based on the weighted-average cost of capital with an additional premium to reflect the risks associated with thespecific intangible asset, such as country risks (political, inflation, currency and property risks) and commercial risks. In addition, for unapproved assets, an additional riskfactor is added for the risk of technical and regulatory success, called the probability of technical and regulatory success (PTRS).
• The discount rates used in the intangible asset valuations ranged from 11% to 16%, and the estimated cash flows were projected over periods extending up to 20 years ormore. For IPR&D assets, the PTRS rates ranged from 44% to 88%. Within this broad range, we recorded approximately $20 million of assets with a PTRS of 44%, $230million of assets with a PTRS of 45% to 75% and $780 million of assets with a PTRS above 75% ( $610 million after the write-off of the acquired biosimilar IPR&D assetsdiscussed above). All of these judgments and estimates can materially impact our results of operations.
For IPR&D assets, the risk of failure has been factored into the fair value measure and there can be no certainty that these assets ultimately will yield a successful product.
Contingencies —For acquisition date contingencies, see Notes to Consolidated Financial Statements–– Note 2A. Acquisitions, Assets and Liabilities Held for Sale, LicensingAgreements, Research and Development and Collaborative Arrangements, Equity-Method Investments and Cost-Method Investment : Acquisitions .
20
2016 Financial Report
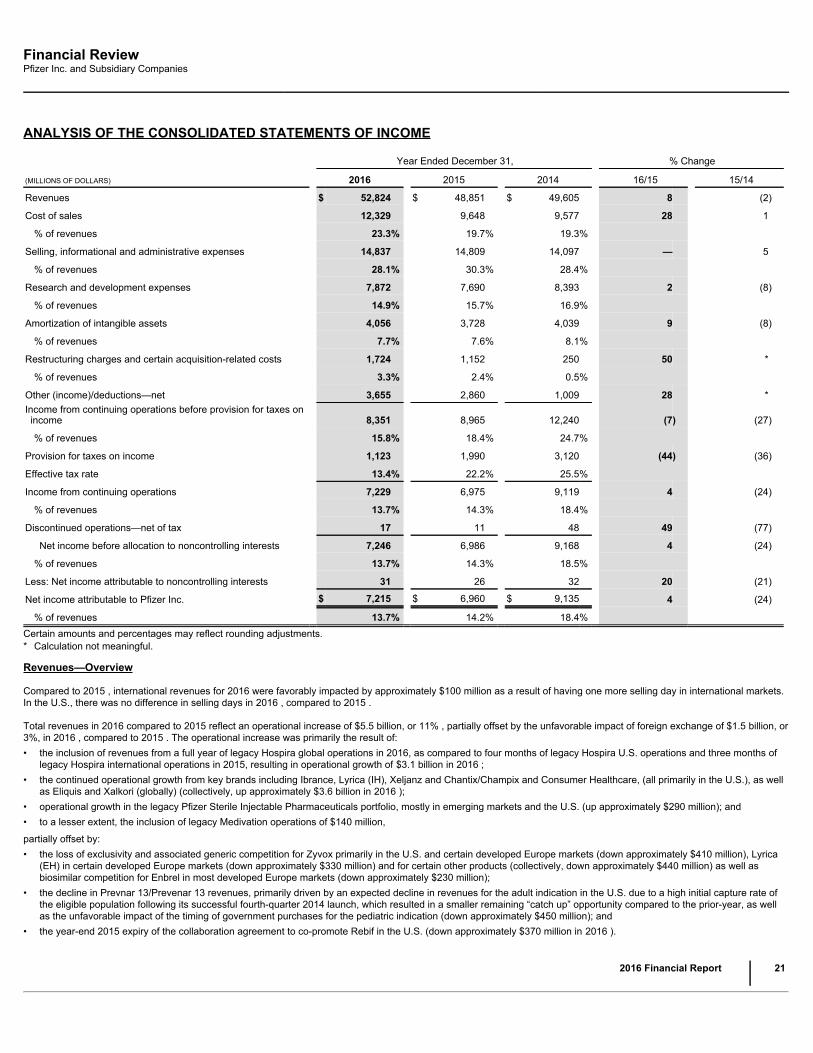
Financial ReviewPfizer Inc. and Subsidiary Companies
ANALYSIS OF THE CONSOLIDATED STATEMENTS OF INCOME
Year Ended December 31, % Change
(MILLIONS OF DOLLARS) 2016 2015 2014 16/15 15/14
Revenues $ 52,824 $ 48,851 $ 49,605 8 (2)
Cost of sales 12,329 9,648 9,577 28 1
% of revenues 23.3% 19.7% 19.3%
Selling, informational and administrative expenses 14,837 14,809 14,097 — 5
% of revenues 28.1% 30.3% 28.4%
Research and development expenses 7,872 7,690 8,393 2 (8)
% of revenues 14.9% 15.7% 16.9%
Amortization of intangible assets 4,056 3,728 4,039 9 (8)
% of revenues 7.7% 7.6% 8.1%
Restructuring charges and certain acquisition-related costs 1,724 1,152 250 50 *
% of revenues 3.3% 2.4% 0.5%
Other (income)/deductions—net 3,655 2,860 1,009 28 *Income from continuing operations before provision for taxes onincome 8,351 8,965 12,240 (7) (27)
% of revenues 15.8% 18.4% 24.7%
Provision for taxes on income 1,123 1,990 3,120 (44) (36)
Effective tax rate 13.4% 22.2% 25.5%
Income from continuing operations 7,229 6,975 9,119 4 (24)
% of revenues 13.7% 14.3% 18.4%
Discontinued operations—net of tax 17 11 48 49 (77)
Net income before allocation to noncontrolling interests 7,246 6,986 9,168 4 (24)
% of revenues 13.7% 14.3% 18.5%
Less: Net income attributable to noncontrolling interests 31 26 32 20 (21)
Net income attributable to Pfizer Inc. $ 7,215 $ 6,960 $ 9,135 4 (24)
% of revenues 13.7% 14.2% 18.4% Certain amounts and percentages may reflect rounding adjustments.* Calculation not meaningful.
Revenues—Overview
Compared to 2015 , international revenues for 2016 were favorably impacted by approximately $100 million as a result of having one more selling day in international markets.In the U.S., there was no difference in selling days in 2016 , compared to 2015 .
Total revenues in 2016 compared to 2015 reflect an operational increase of $5.5 billion, or 11% , partially offset by the unfavorable impact of foreign exchange of $1.5 billion, or3%, in 2016 , compared to 2015 . The operational increase was primarily the result of:• the inclusion of revenues from a full year of legacy Hospira global operations in 2016, as compared to four months of legacy Hospira U.S. operations and three months of
legacy Hospira international operations in 2015, resulting in operational growth of $3.1 billion in 2016 ;• the continued operational growth from key brands including Ibrance, Lyrica (IH), Xeljanz and Chantix/Champix and Consumer Healthcare, (all primarily in the U.S.), as well
as Eliquis and Xalkori (globally) (collectively, up approximately $3.6 billion in 2016 );• operational growth in the legacy Pfizer Sterile Injectable Pharmaceuticals portfolio, mostly in emerging markets and the U.S. (up approximately $290 million); and• to a lesser extent, the inclusion of legacy Medivation operations of $140 million,
partially offset by:• the loss of exclusivity and associated generic competition for Zyvox primarily in the U.S. and certain developed Europe markets (down approximately $410 million), Lyrica
(EH) in certain developed Europe markets (down approximately $330 million) and for certain other products (collectively, down approximately $440 million) as well asbiosimilar competition for Enbrel in most developed Europe markets (down approximately $230 million);
• the decline in Prevnar 13/Prevenar 13 revenues, primarily driven by an expected decline in revenues for the adult indication in the U.S. due to a high initial capture rate ofthe eligible population following its successful fourth-quarter 2014 launch, which resulted in a smaller remaining “catch up” opportunity compared to the prior-year, as wellas the unfavorable impact of the timing of government purchases for the pediatric indication (down approximately $450 million); and
• the year-end 2015 expiry of the collaboration agreement to co-promote Rebif in the U.S. (down approximately $370 million in 2016 ).
2016 Financial Report
21

Financial ReviewPfizer Inc. and Subsidiary Companies
Total revenues in 2015 compared to 2014 reflect an operational increase of $3.0 billion, or 6%, more than offset by the unfavorable impact of foreign exchange of $3.8 billion,or 8%, in 2015 compared to 2014. The operational increase was primarily the result of:• the performance of several key products in developed markets, including the continued strong uptake of Prevnar 13 among adults (largely in the U.S.), Ibrance (nearly all in
the U.S.), Eliquis, Lyrica (IH) (primarily in the U.S. and Japan), Xeljanz (primarily in the U.S.), Viagra (IH) (primarily in the U.S.) and Nexium 24HR (primarily in the U.S.)(collectively, up approximately $4.1 billion);
• the inclusion of four months of legacy Hospira U.S. operations and three months of legacy Hospira international operations of $1.5 billion;• a 7% operational increase in revenues in emerging markets, reflecting continued strong operational growth, primarily from Prevenar 13, Lipitor and Enbrel (up
approximately $810 million); and• inclusion of the vaccines acquired from Baxter of $178 million,
partially offset by:• the loss of exclusivity and immediate multi-source generic competition for Celebrex in the U.S. in December 2014 and certain other developed markets (down
approximately $1.8 billion), and the loss of exclusivity for Lyrica (EH) in certain developed Europe markets (down approximately $420 million), for Zyvox in the U.S. (downapproximately $420 million), for Rapamune in the U.S. (down approximately $120 million) and for certain other products (collectively, down approximately $330 million);
• the performance of certain other products in developed markets and BeneFIX in the U.S. (collectively, down approximately $370 million); and• the termination of the Spiriva co-promotion collaboration in certain countries (down approximately $100 million).
See the “Intellectual Property Rights and Collaboration/Licensing Rights” section of this Financial Report for information about (i) recent losses of product exclusivity impactingproduct revenues, (ii) recent losses of collaboration rights impacting alliance revenues and (iii) expected losses of product exclusivity in 2017 .
In addition, we expect to lose exclusivity for various other products in various markets over the next few years. For additional information, see the “Patents and OtherIntellectual Property Rights” section in Part I, Item 1, “Business”, of our 2016 Form 10-K.
We have significant operations outside the U.S., with revenues exceeding $500 million in the following number of countries:
The U.S. and Japan are our two largest national markets:
Revenues by National Market
Our policy relating to the supply of pharmaceutical inventory at domestic wholesalers, and in major international markets, is to generally maintain stocking levels under onemonth on average and to keep monthly levels consistent from year to year based on patterns of utilization. We historically have been able to closely monitor these customerstocking levels by purchasing information from our customers directly or by obtaining other third-party information. We believe our data sources to be directionally reliable butcannot verify their accuracy. Further, as we do not control this third-party data, we cannot be assured of continuing access. Unusual buying patterns and utilization are promptlyinvestigated.
Revenue Deductions
Our gross product revenues are subject to a variety of deductions that are generally estimated and recorded in the same period that the revenues are recognized, and primarilyrepresent chargebacks, rebates and sales allowances to wholesalers, and, to a lesser extent, distributors like MCOs, retailers and government agencies with respect to ourpharmaceutical products. Those deductions represent estimates
22
2016 Financial Report
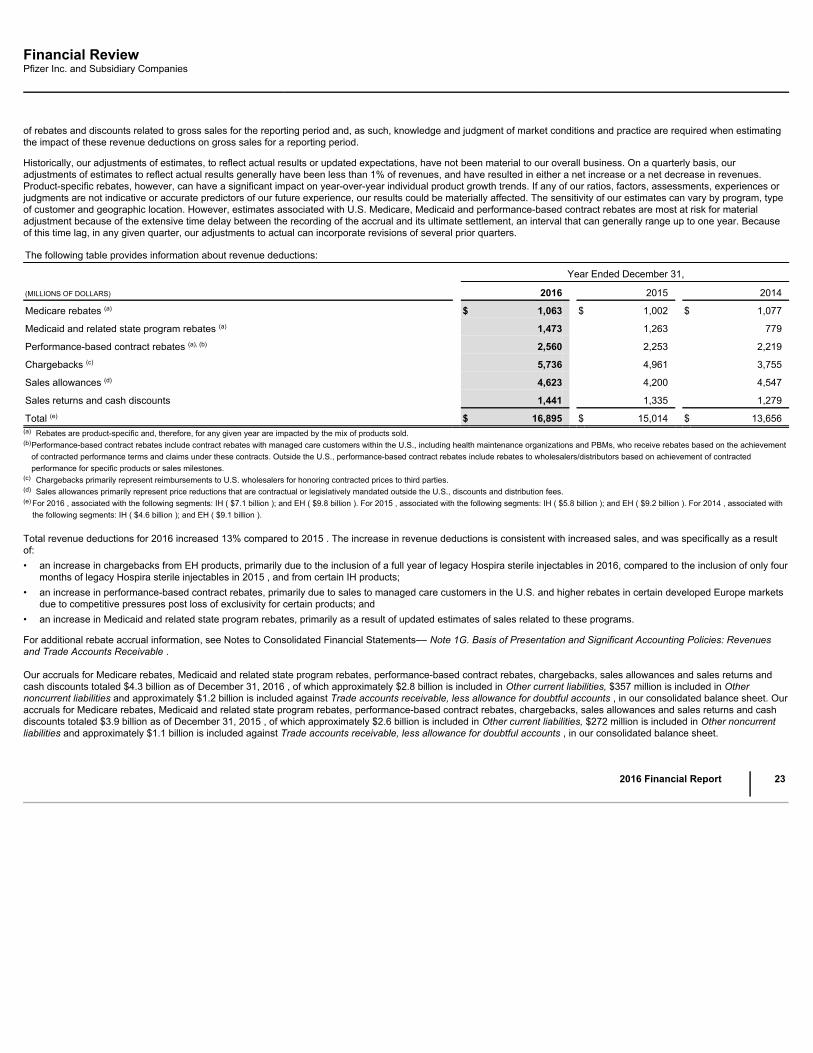
Financial ReviewPfizer Inc. and Subsidiary Companies
of rebates and discounts related to gross sales for the reporting period and, as such, knowledge and judgment of market conditions and practice are required when estimatingthe impact of these revenue deductions on gross sales for a reporting period.
Historically, our adjustments of estimates, to reflect actual results or updated expectations, have not been material to our overall business. On a quarterly basis, ouradjustments of estimates to reflect actual results generally have been less than 1% of revenues, and have resulted in either a net increase or a net decrease in revenues.Product-specific rebates, however, can have a significant impact on year-over-year individual product growth trends. If any of our ratios, factors, assessments, experiences orjudgments are not indicative or accurate predictors of our future experience, our results could be materially affected. The sensitivity of our estimates can vary by program, typeof customer and geographic location. However, estimates associated with U.S. Medicare, Medicaid and performance-based contract rebates are most at risk for materialadjustment because of the extensive time delay between the recording of the accrual and its ultimate settlement, an interval that can generally range up to one year. Becauseof this time lag, in any given quarter, our adjustments to actual can incorporate revisions of several prior quarters.
The following table provides information about revenue deductions:
Year Ended December 31,
(MILLIONS OF DOLLARS) 2016 2015 2014
Medicare rebates (a) $ 1,063 $ 1,002 $ 1,077
Medicaid and related state program rebates (a) 1,473 1,263 779
Performance-based contract rebates (a), (b) 2,560 2,253 2,219
Chargebacks (c) 5,736 4,961 3,755
Sales allowances (d) 4,623 4,200 4,547
Sales returns and cash discounts 1,441 1,335 1,279
Total (e) $ 16,895 $ 15,014 $ 13,656(a) Rebates are product-specific and, therefore, for any given year are impacted by the mix of products sold.(b)
Performance-based contract rebates include contract rebates with managed care customers within the U.S., including health maintenance organizations and PBMs, who receive rebates based on the achievementof contracted performance terms and claims under these contracts. Outside the U.S., performance-based contract rebates include rebates to wholesalers/distributors based on achievement of contractedperformance for specific products or sales milestones.
(c) Chargebacks primarily represent reimbursements to U.S. wholesalers for honoring contracted prices to third parties.(d) Sales allowances primarily represent price reductions that are contractual or legislatively mandated outside the U.S., discounts and distribution fees.(e)
For 2016 , associated with the following segments: IH ( $7.1 billion ); and EH ( $9.8 billion ). For 2015 , associated with the following segments: IH ( $5.8 billion ); and EH ( $9.2 billion ). For 2014 , associated withthe following segments: IH ( $4.6 billion ); and EH ( $9.1 billion ).
Total revenue deductions for 2016 increased 13% compared to 2015 . The increase in revenue deductions is consistent with increased sales, and was specifically as a resultof:• an increase in chargebacks from EH products, primarily due to the inclusion of a full year of legacy Hospira sterile injectables in 2016, compared to the inclusion of only four
months of legacy Hospira sterile injectables in 2015 , and from certain IH products;• an increase in performance-based contract rebates, primarily due to sales to managed care customers in the U.S. and higher rebates in certain developed Europe markets
due to competitive pressures post loss of exclusivity for certain products; and• an increase in Medicaid and related state program rebates, primarily as a result of updated estimates of sales related to these programs.
For additional rebate accrual information, see Notes to Consolidated Financial Statements–– Note 1G. Basis of Presentation and Significant Accounting Policies: Revenuesand Trade Accounts Receivable .
Our accruals for Medicare rebates, Medicaid and related state program rebates, performance-based contract rebates, chargebacks, sales allowances and sales returns andcash discounts totaled $4.3 billion as of December 31, 2016 , of which approximately $2.8 billion is included in Other current liabilities, $357 million is included in Othernoncurrent liabilities and approximately $1.2 billion is included against Trade accounts receivable, less allowance for doubtful accounts , in our consolidated balance sheet. Ouraccruals for Medicare rebates, Medicaid and related state program rebates, performance-based contract rebates, chargebacks, sales allowances and sales returns and cashdiscounts totaled $3.9 billion as of December 31, 2015 , of which approximately $2.6 billion is included in Other current liabilities, $272 million is included in Other noncurrentliabilities and approximately $1.1 billion is included against Trade accounts receivable, less allowance for doubtful accounts , in our consolidated balance sheet.
2016 Financial Report
23
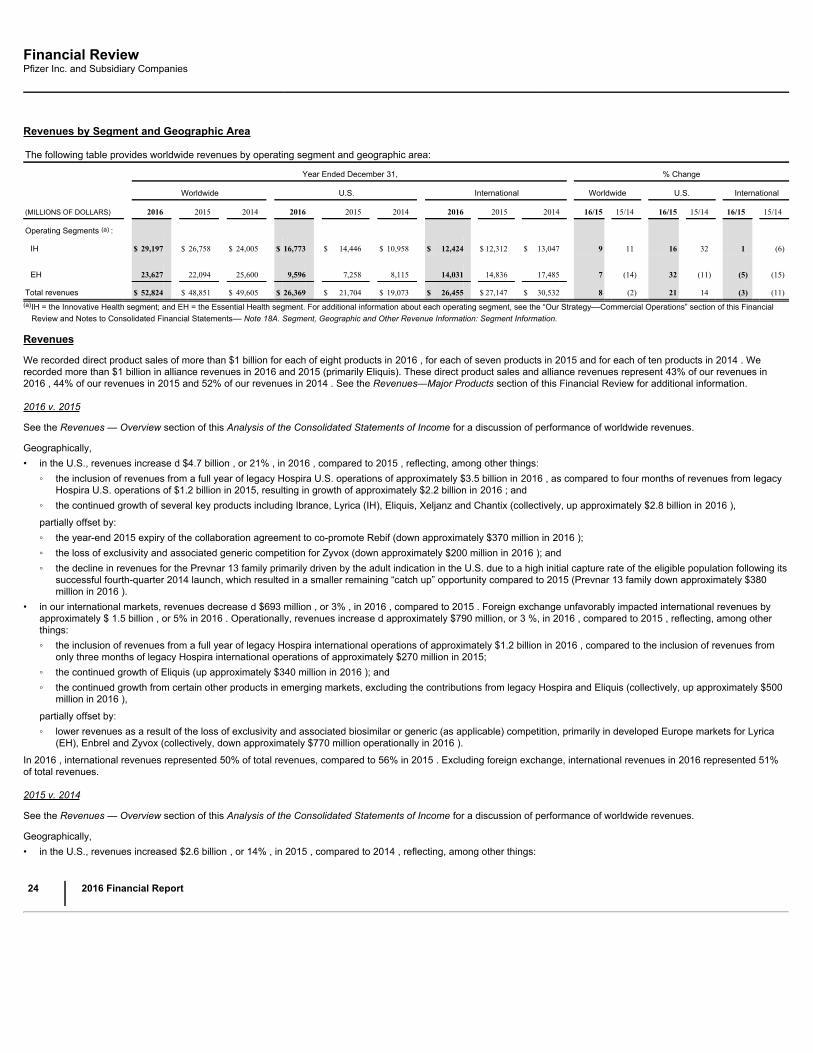
Financial ReviewPfizer Inc. and Subsidiary Companies
Revenues by Segment and Geographic Area
The following table provides worldwide revenues by operating segment and geographic area:
Year Ended December 31, % Change
Worldwide U.S. International Worldwide U.S. International
(MILLIONS OF DOLLARS) 2016 2015 2014 2016 2015 2014 2016 2015 2014 16/15 15/14 16/15 15/14 16/15 15/14
Operating Segments (a) :
IH $ 29,197 $ 26,758 $ 24,005 $ 16,773 $ 14,446 $ 10,958 $ 12,424 $ 12,312 $ 13,047 9 11 16 32 1 (6)
EH 23,627 22,094 25,600 9,596 7,258 8,115 14,031 14,836 17,485 7 (14) 32 (11) (5) (15)
Total revenues $ 52,824 $ 48,851 $ 49,605 $ 26,369 $ 21,704 $ 19,073 $ 26,455 $ 27,147 $ 30,532 8 (2) 21 14 (3) (11)(a)
IH = the Innovative Health segment; and EH = the Essential Health segment. For additional information about each operating segment, see the “Our Strategy––Commercial Operations” section of this FinancialReview and Notes to Consolidated Financial Statements–– Note 18A. Segment, Geographic and Other Revenue Information: Segment Information.
Revenues
We recorded direct product sales of more than $1 billion for each of eight products in 2016 , for each of seven products in 2015 and for each of ten products in 2014 . Werecorded more than $1 billion in alliance revenues in 2016 and 2015 (primarily Eliquis). These direct product sales and alliance revenues represent 43% of our revenues in2016 , 44% of our revenues in 2015 and 52% of our revenues in 2014 . See the Revenues—Major Products section of this Financial Review for additional information.
2016 v. 2015
See the Revenues — Overview section of this Analysis of the Consolidated Statements of Income for a discussion of performance of worldwide revenues.
Geographically,• in the U.S., revenues increase d $4.7 billion , or 21% , in 2016 , compared to 2015 , reflecting, among other things:
◦ the inclusion of revenues from a full year of legacy Hospira U.S. operations of approximately $3.5 billion in 2016 , as compared to four months of revenues from legacyHospira U.S. operations of $1.2 billion in 2015, resulting in growth of approximately $2.2 billion in 2016 ; and
◦ the continued growth of several key products including Ibrance, Lyrica (IH), Eliquis, Xeljanz and Chantix (collectively, up approximately $2.8 billion in 2016 ),
partially offset by:◦ the year-end 2015 expiry of the collaboration agreement to co-promote Rebif (down approximately $370 million in 2016 );◦ the loss of exclusivity and associated generic competition for Zyvox (down approximately $200 million in 2016 ); and◦ the decline in revenues for the Prevnar 13 family primarily driven by the adult indication in the U.S. due to a high initial capture rate of the eligible population following its
successful fourth-quarter 2014 launch, which resulted in a smaller remaining “catch up” opportunity compared to 2015 (Prevnar 13 family down approximately $380million in 2016 ).
• in our international markets, revenues decrease d $693 million , or 3% , in 2016 , compared to 2015 . Foreign exchange unfavorably impacted international revenues byapproximately $ 1.5 billion , or 5% in 2016 . Operationally, revenues increase d approximately $790 million, or 3 %, in 2016 , compared to 2015 , reflecting, among otherthings:◦ the inclusion of revenues from a full year of legacy Hospira international operations of approximately $1.2 billion in 2016 , compared to the inclusion of revenues from
only three months of legacy Hospira international operations of approximately $270 million in 2015;◦ the continued growth of Eliquis (up approximately $340 million in 2016 ); and◦ the continued growth from certain other products in emerging markets, excluding the contributions from legacy Hospira and Eliquis (collectively, up approximately $500
million in 2016 ),
partially offset by:◦ lower revenues as a result of the loss of exclusivity and associated biosimilar or generic (as applicable) competition, primarily in developed Europe markets for Lyrica
(EH), Enbrel and Zyvox (collectively, down approximately $770 million operationally in 2016 ).
In 2016 , international revenues represented 50% of total revenues, compared to 56% in 2015 . Excluding foreign exchange, international revenues in 2016 represented 51%of total revenues.
2015 v. 2014
See the Revenues — Overview section of this Analysis of the Consolidated Statements of Income for a discussion of performance of worldwide revenues.
Geographically,• in the U.S., revenues increased $2.6 billion , or 14% , in 2015 , compared to 2014 , reflecting, among other things:
24
2016 Financial Report
Financial ReviewPfizer Inc. and Subsidiary Companies
◦ the performance of several key products, including Prevnar 13 primarily in adults (up approximately $1.9 billion), Ibrance (which was launched in the U.S. in February2015, up approximately $720 million), as well as Lyrica (IH), Eliquis, Xeljanz, Viagra (IH) and Nexium 24HR (collectively, up approximately $1.0 billion in 2015 ); and
◦ the inclusion of four months of legacy Hospira U.S. operations of $1.2 billion in 2015 ,partially offset by:◦ losses of exclusivity and associated multi-source generic competition for Celebrex in the U.S. in December 2014 (down approximately $1.6 billion in 2015 );◦ the loss of exclusivity for Zyvox and Rapamune, as well as the termination of our Spiriva co-promotion collaboration (collectively, down approximately $620 million in
2015 ); and◦ the performance of Lipitor and BeneFIX (collectively, down approximately $160 million in 2015 ).
• in our international markets, revenues decreased $3.4 billion , or 11% , in 2015, compared to 2014 . Foreign exchange unfavorably impacted international revenues byapproximately $3.8 billion, or 12% in 2015. Operationally, revenues increased by $402 million, or 1%, in 2015 compared to 2014 reflecting, among other things:◦ the operational increase in revenues in emerging markets, reflecting continued strong operational growth primarily from the IH business, including Prevenar and Enbrel,
among other products, and Lipitor (up approximately $600 million in 2015 );◦ higher revenues in developed markets for Eliquis and Lyrica (IH), as well as from vaccines acquired in December 2014 from Baxter (in Europe) (collectively, up
approximately $590 million in 2015 ); and◦ the inclusion of three months of legacy Hospira international operations of $270 million in 2015 ,partially offset by:◦ lower revenues in developed markets for Lyrica (EH), Celebrex, Inspra and Viagra (EH) as a result of the loss of exclusivity, as well as the performance of Lipitor and
Norvasc in developed markets, and Zosyn/Tazocin in emerging markets (collectively, down approximately $1.0 billion in 2015 ).
In 2015 , international revenues represented 56% of total revenues, compared to 62% in 2014. Excluding foreign exchange, international revenues in 2015 represented 59% oftotal revenues.
For additional information about operating segment revenues, see the “Analysis of Operating Segment Information” section of this Financial Review.
2016 Financial Report
25

Financial ReviewPfizer Inc. and Subsidiary Companies
Revenues—Major Products
The following table provides revenue information for several of our major products:
(MILLIONS OF DOLLARS)
Year Ended December 31, % Change
PRODUCT PRIMARY INDICATIONS OR CLASS 2016 2015 2014 16/15 15/14
Total Oper. Total Oper.TOTAL REVENUES $ 52,824 $ 48,851 $ 49,605 8 11 (2) 6
PFIZER INNOVATIVE HEALTH (IH) (a) : $ 29,197 $ 26,758 $ 24,005 9 11 11 19
Internal Medicine $ 8,858 $ 7,611 $ 6,727 16 17 13 17
Lyrica IH (b) Epilepsy, post-herpetic neuralgia and diabetic peripheral neuropathy,
fibromyalgia, neuropathic pain due to spinal cord injury 4,165 3,655 3,350 14 14 9 13
Viagra IH (c) Erectile dysfunction 1,181 1,297 1,181 (9) (9) 10 10
Chantix/Champix An aid to smoking cessation treatment 842 671 647 26 27 4 9
Toviaz Overactive bladder 258 267 288 (3) (4) (7) 1
BMP2 Development of bone and cartilage 251 232 228 8 8 2 2
Alliance revenues (d) Various 1,588 1,256 759 26 26 66 75
All other Internal Medicine (e) Various 573 233 276 * * (16) (12)
Vaccines $ 6,071 $ 6,454 $ 4,480 (6) (5) 44 51
Prevnar 13/Prevenar 13 Vaccines for prevention of pneumococcal disease 5,718 6,245 4,464 (8) (7) 40 46
FSME/IMMUN-TicoVac Tick-borne encephalitis vaccine 114 104 — 10 10 * *
All other Vaccines Various 239 104 16 * * * *
Oncology $ 4,563 $ 2,955 $ 2,218 54 56 33 43
Ibrance Advanced breast cancer 2,135 723 — * * * *
Sutent Advanced and/or metastatic RCC, refractory GIST and advancedpancreatic neuroendocrine tumor 1,095 1,120 1,174 (2) 1 (5) 7
Xalkori ALK-positive NSCLC and ROS1-positive NSCLC 561 488 438 15 17 11 20
Inlyta Advanced RCC 401 430 410 (7) (6) 5 14
Xtandi alliance revenues Advanced prostate cancer 140 — — * * — —
All other Oncology Various 231 194 195 19 19 (1) 5
Inflammation & Immunology (I&I) $ 3,928 $ 3,918 $ 4,241 — 6 (8) 6
Enbrel (Outside the U.S. and Canada) Rheumatoid, juvenile rheumatoid and psoriatic arthritis, plaque psoriasisand ankylosing spondylitis 2,909 3,333 3,850 (13) (6) (13) 1
Xeljanz Rheumatoid arthritis 927 523 308 77 78 70 72
All othe r I&I Various 93 61 82 51 42 (25) (13)
Rare Disease $ 2,369 $ 2,425 $ 2,893 (2) — (16) (7)
BeneFIX Hemophilia 712 752 856 (5) (4) (12) (5)
Genotropin Replacement of human growth hormone 579 617 723 (6) (5) (15) (4)
Refacto AF/Xyntha Hemophilia 554 533 631 4 8 (16) (5)
Somavert Acromegaly 232 218 229 6 8 (5) 7
Rapamune Prevention of organ rejection in kidney transplantation 170 197 339 (14) (7) (42) (36)
All other Rare Disease Various 122 108 114 13 11 (4) 10
Consumer Healthcare $ 3,407 $ 3,395 $ 3,446 — 5 (1) 5
PFIZER ESSENTIAL HEALTH (EH) (f) $ 23,627 $ 22,094 $ 25,600 7 11 (14) (6)
Legacy Established Products (LEP) (g) $ 11,194 $ 11,745 $ 13,016 (5) — (10) (2)
Lipitor Reduction of LDL cholesterol 1,758 1,860 2,061 (6) 2 (10) (4)
Premarin family Symptoms of menopause 1,017 1,018 1,076 — — (5) (4)
Norvasc Hypertension 962 991 1,112 (3) 1 (11) (3)
EpiPen Epinephrine injection used in treatment of life-threatening allergicreactions 386 339 294 14 14 15 19
Xalatan/Xalacom Glaucoma and ocular hypertension 363 399 495 (9) (8) (19) (6)
Relpax Symptoms of migraine headache 323 352 382 (8) (8) (8) (2)
Zoloft Depression and certain anxiety disorders 304 374 423 (19) (14) (12) (1)
Effexor Depression and certain anxiety disorders 278 288 344 (3) — (16) (8)
Zithromax/Zmax Bacterial infections 272 275 311 (1) 1 (11) (3)

Xanax/Xanax XR Anxiety disorders 222 224 253 (1) 1 (11) 2
Cardura Hypertension/Benign prostatic hyperplasia 192 210 263 (9) (6) (20) (9)
Neurontin Seizures 182 196 210 (7) 2 (7) 2
Tikosyn Maintenance of normal sinus rhythm, conversion of atrial fibrillation/flutter 153 179 141 (15) (15) 27 27
Depo-Provera Contraceptive 126 170 201 (26) (22) (15) (10)
Diflucan Fungal infections 119 181 208 (34) (30) (13) (3)
All other LEP Various 4,538 4,689 5,242 (3) 4 (11) (2)
26
2016 Financial Report

Financial ReviewPfizer Inc. and Subsidiary Companies
(MILLIONS OF DOLLARS)
Year Ended December 31, % Change
PRODUCT PRIMARY INDICATIONS OR CLASS 2016 2015 2014 16/15 15/14
Total Oper. Total Oper.Sterile Injectable Pharmaceuticals (SIP) (h) $ 6,018 $ 3,944 $ 3,277 53 56 20 27
Medrol Adrenocortical steroid 450 402 381 12 16 5 12
Sulperazon Antibiotic 396 339 354 17 23 (4) (1)
Fragmin Anticoagulant 318 335 364 (5) — (8) 5
Tygacil Antibiotic 274 304 323 (10) (5) (6) 3
All other SIP Various 4,579 2,563 1,855 79 81 38 44
Peri-LOE Products (i) $ 4,220 $ 5,326 $ 8,855 (21) (18) (40) (32)
Lyrica EH (b) Epilepsy, neuropathic pain and generalized anxiety disorder 801 1,183 1,818 (32) (29) (35) (23)
Celebrex Arthritis pain and inflammation, acute pain 733 830 2,699 (12) (10) (69) (66)
Pristiq Depression 732 715 737 2 4 (3) 1
Vfend Fungal infections 590 682 756 (13) (10) (10) 3
Zyvox Bacterial infections 421 883 1,352 (52) (49) (35) (27)
Viagra EH (c) Erectile dysfunction 383 411 504 (7) (1) (18) (8)
Revatio Pulmonary arterial hypertension 285 260 276 10 10 (6) 7
All Other Peri-LOE Products Various 276 362 714 (24) (21) (49) (42)
Infusion Systems (j) Various $ 1,158 $ 403 $ — * * * *
Biosimilars (k) Various $ 319 $ 63 $ — * * * *
Inflectra/Remsima Inflammatory diseases 192 30 — * * * *
All Other Biosimilars Various 127 33 — * * * *
Pfizer CentreOne (l) $ 718 $ 612 $ 451 17 18 36 44
Total Lyrica (b) Epilepsy, post-herpetic neuralgia and diabetic peripheral neuropathy,
fibromyalgia, neuropathic pain due to spinal cord injury $ 4,966 $ 4,839 $ 5,168 3 4 (6) —
Total Viagra (c) Erectile dysfunction $ 1,564 $ 1,708 $ 1,685 (8) (7) 1 5
Total Alliance revenues Various $ 1,746 $ 1,312 $ 957 33 33 37 45
(a)
The IH business, previously known as the Innovative Products business, encompasses Internal Medicine, Vaccines, Oncology, Inflammation & Immunology, Rare Disease and Consumer Healthcare and includesall legacy Anacor and Medivation commercial operations. Anacor’s and Medivation’s commercial operations are included in IH’s operating results in our consolidated statements of income, commencing from theacquisition date of June 24, 2016 for Anacor and from the acquisition date of September 28, 2016 for Medivation. As a result, IH’s revenues for 2016 reflect approximately six months of legacy Anacor operations,which were immaterial, and three months of legacy Medivation operations.
(b)
Lyrica revenues from all of Europe, Russia, Turkey, Israel and Central Asia countries are included in Lyrica EH. All other Lyrica revenues are included in Lyrica-IH. Total Lyrica revenues represent the aggregate ofworldwide revenues from Lyrica IH and Lyrica EH.
(c)
Viagra revenues from the U.S. and Canada are included in Viagra IH. All other Viagra revenues are included in Viagra EH. Total Viagra revenues represent the aggregate of worldwide revenues from Viagra IHand Viagra EH.
(d) Includes Eliquis, (2016 and 2015) and Rebif (2015 only).(e) Includes Eliquis direct sales markets.(f) The EH business, previously known as the Established Products business, encompasses Legacy Established Products, Sterile Injectable Pharmaceuticals, Peri-LOE Products, Infusion Systems (through February
2, 2017), Biosimilars and Pfizer CentreOne and includes all legacy Hospira commercial operations. For additional information about changes impacting EH, see Notes to Consolidated Financial Statements––Note 18A. Segment, Geographic and Other Revenue Information: Segment Information.
(g) Legacy Established Products include products that have lost patent protection (excluding Sterile Injectable Pharmaceuticals and Peri-LOE Products). (h) Sterile Injectable Pharmaceuticals include generic injectables and proprietary specialty injectables (excluding Peri-LOE Products).(i) Peri-LOE Products include products that have recently lost or are anticipated to soon lose patent protection. These products primarily include Lyrica in certain developed Europe markets, Pristiq globally, Celebrex,
Zyvox and Revatio in most developed markets, Vfend and Viagra in certain developed Europe markets and Japan, and Inspra in the EU.(j) Infusion Systems (through February 2, 2017) include Medication Management Systems products composed of infusion pumps and related software and services, as well as IV Infusion Products, including large
volume IV solutions and their associated administration sets.(k)
Biosimilars include Inflectra/Remsima (biosimilar infliximab) in the U.S. and certain international markets, Nivestim (biosimilar filgrastim) in certain European, Asian and Africa/Middle East markets and Retacrit(biosimilar epoetin zeta) in certain European and Africa/Middle East markets.
(l) Pfizer CentreOne includes (i) revenues from legacy Pfizer's contract manufacturing and active pharmaceutical ingredient sales operation (previously known as Pfizer CentreSource or PCS), including revenuesrelated to our manufacturing and supply agreements with Zoetis and (ii) revenues from legacy Hospira’s One-2-One sterile injectables contract manufacturing operation. For additional information, see Notes toConsolidated Financial Statements–– Note 18A. Segment, Geographic and Other Revenue Information: Segment Information.
* Indicates calculation not meaningful or greater than 100%.
Revenues—Selected Product Descriptions
Compared to 2015 , international revenues were favorably impacted in 2016 as a result of having one more selling day in international markets. In the U.S., there was nodifference in selling days in 2016 , compared to 2015 .• Prevnar 13/Prevenar 13 (IH) is our pneumococcal conjugate vaccine for the prevention of pneumococcal disease. Overall, worldwide revenues for Prevnar 13/Prevenar 13
decreased 7% operationally in 2016 , compared to 2015 . Foreign exchange had an unfavorable impact on worldwide revenues of 1% in 2016 , compared to 2015 .In the U.S., revenues for Prevnar 13 decrease d 9% in 2016 , compared to 2015 , primarily driven by the decline in revenues for the adult indication in the U.S. due to ahigh initial capture rate of the eligible population following its successful fourth-quarter 2014 launch, which resulted in a smaller remaining “catch up” opportunity (i.e. theopportunity to reach adults age 65 and older who have not been previously vaccinated with Prevnar 13) compared to the prior year. Given the success since the launch ofthe adult indication, approximately 50% of the eligible patient pool 65 years and above in the U.S. has already been vaccinated. While the remaining eligible population islarge, this cohort is much more difficult to capture. The decrease was partially offset by the timing of government purchases for the pediatric indication.

2016 Financial Report
27
Financial ReviewPfizer Inc. and Subsidiary Companies
Internationally, revenues for Prevenar 13 decrease d 3% operationally in 2016 , compared to 2015 , primarily due to timing of government orders, partially offset by amodest increase in the uptake for the adult indication. Foreign exchange had an unfavorable impact on international revenues of 3% in 2016 , compared to 2015 .In 2014, the ACIP voted to recommend Prevnar 13 for routine use to help protect adults aged 65 years and older against pneumococcal disease, which for adults includespneumonia caused by the 13 pneumococcal serotypes included in the vaccine. These ACIP recommendations were subsequently approved by the directors at the CDCand U.S. Department of Health and Human Services, and were published in the Morbidity and Mortality Weekly Report in September 2014 by the CDC. As with othervaccines, the CDC regularly monitors the impact of vaccination and reviews the recommendations; in this case, however, the CDC announced formally that it will conductthis review in 2018. Currently, we are working with a number of U.S. investigators to monitor the proportion of community-acquired pneumonia caused by the serotypesincluded in Prevnar 13 and continue to observe trends.In July 2016, the FDA approved an expanded age indication to include adults 18 through 49 years of age, in addition to the already approved indications for adults 50 yearsand older, for active immunization for the prevention of pneumonia and invasive disease caused by 13 Streptococcus pneumoniae ( S. pneumoniae ) serotypes (1, 3, 4, 5,6A, 6B, 7F, 9V, 14, 18C, 19A, 19F, and 23F), and for children 6 weeks through 17 years of age (prior to the 18th birthday) for the prevention of invasive disease caused bythe 13 S treptococcus pneumoniae strains in the vaccine. Prevenar 13 is now approved in the U.S., the EU and more than 40 other countries for use in adults 18 to 49years of age. Prevnar 13 is the only pneumococcal vaccine approved across the entire lifespan.In April 2016, the EMA approved a new 4-dose, MDV presentation for Prevenar 13. In addition, in July 2016, we received the World Health Organization pre-qualificationapproval for the Prevenar 13 MDV presentation. This MDV presentation is being introduced under the Advance Market Commitment program in early 2017, for shipment tocountries covered by Gavi, the Vaccine Alliance. This new presentation will help to significantly reduce storage requirements and shipping costs in Gavi eligible countries.
• Lyrica (EH (revenues from all of Europe, Russia, Turkey, Israel and Central Asia)/IH (revenues from all other geographies)) is indicated in the U.S. for three neuropathicpain conditions, fibromyalgia and adjunctive therapy for adult patients with partial onset seizures. In certain markets outside the U.S., indications include neuropathic pain(peripheral and central), fibromyalgia, adjunctive treatment of epilepsy and generalized anxiety disorder. Worldwide revenues for Lyrica increase d 4% operationally in 2016, compared to 2015 . Foreign exchange had an unfavorable impact on worldwide revenues of 1% in 2016 , compared to 2015 .In the U.S., revenues increased 18% in 2016 , compared to 2015 , driven by increased demand and positive price impact.Internationally, Lyrica revenues decrease d 14% operationally in 2016 , compared to 2015 , primarily due to losses of exclusivity in developed Europe markets and a newNational Health Insurance (NHI) price in Japan starting in April 2016, partially offset by operational growth in certain markets, primarily in Australia, Asia and Africa andMiddle East. Foreign exchange had an unfavorable impact on international revenues of 2% in 2016 , compared to 2015 .Lyrica revenues in our IH segment increase d 14% operationally in 2016 , compared to 2015. Foreign exchange had a de minimis impact on Lyrica (IH) revenues in 2016 ,compared to 2015 . In our EH segment, revenues from Lyrica decrease d 29% operationally in 2016 , compared to 2015. Foreign exchange had an unfavorable impact of3% on Lyrica (EH) revenues in 2016 , compared to 2015 .
• Enbrel (IH, outside the U.S. and Canada), indicated for the treatment of moderate-to-severe rheumatoid arthritis, juvenile idiopathic arthritis, psoriatic arthritis, plaquepsoriasis, pediatric plaque psoriasis, ankylosing spondylitis and nonradiographic axial spondyloarthritis, recorded an operational decrease of 6% in worldwide revenues,excluding the U.S. and Canada, in 2016 , compared to 2015, primarily due to the impact of the entrance of the first etanercept biosimilar, as well as mandated pricereductions across certain markets in Europe, partially offset by stronger demand and price increases in emerging markets, specifically in Latin America. Foreign exchangehad an unfavorable impact on revenues of 7% in 2016 , compared to 2015 .
• Ibrance (IH) was launched in the U.S. in February 2015, and subsequently in certain international markets as a treatment for a certain form of advanced breast cancer.Ibrance recorded worldwide revenues of $2.1 billion in 2016 , nearly all of which were recorded in the U.S. The significant revenues relate to the strength of ourscientific/clinical data, continued positive patient experience as well as Ibrance being the only registered product in this class of medicines in any country as of December2016. Ibrance is currently approved in the U.S. and 57 other countries.
• Lipitor (EH) is indicated for the treatment of elevated LDL-cholesterol levels in the blood. Lipitor faces generic competition in all major developed markets. Worldwiderevenues for Lipitor increase d 2% operationally in 2016 , compared to 2015 . Foreign exchange had an unfavorable impact on worldwide revenues of 8% in 2016 ,compared to 2015 .In the U.S., revenues increase d 2% in 2016 , compared to 2015, primarily due to favorable rebates.In our international markets, revenues increase d 2% operationally in 2016 , compared to 2015, driven by strong volume growth in China, partially offset by lower volumesin certain other emerging markets, primarily in the Middle East and Latin America and in developed international markets, as well as pricing pressures in China. Foreignexchange had an unfavorable impact on international revenues of 8% in 2016 , compared to 2015 .
• Viagra (IH (U.S. and Canada revenues)/EH (all other revenues excluding U.S. and Canada)) is indicated for the treatment of erectile dysfunction. Viagra worldwiderevenues decrease d 7% operationally in 2016 , compared to 2015 , primarily due to new access constraints and increased rebates. Foreign exchange had an unfavorableimpact on worldwide revenues of 2% in 2016 , compared to 2015 . Revenues in the U.S. decrease d 9% in 2016 , compared to 2015 , primarily reflecting new accessconstraints and increases in rebates, partially offset by increases in pill quantity per prescription, higher sales to the Department of Veterans Affairs and the Department ofDefense and shifts in wholesaler buying patterns. International revenues decrease d 1% operationally in 2016 , compared to 2015 , primarily from lower volumes in Chinaand in developed international markets. Foreign exchange had an unfavorable impact on international revenues of 6% in 2016 , compared to 2015 .Viagra revenues in our IH segment decrease d 9% operationally in 2016 , compared to 2015. Foreign exchange had a de minimis impact on Viagra IH revenues in 2016 ,compared to 2015 . In our EH segment, revenues from Viagra decrease d 1% operationally in 2016 , compared to 2015. Foreign exchange had an unfavorable impact of6% on Viagra EH revenues in 2016 , compared to 2015 .
• Sutent (IH) is indicated for the treatment of advanced renal cell carcinoma, including metastatic renal cell carcinoma (mRCC); GIST after disease progression on, orintolerance to, imatinib mesylate; and advanced pancreatic neuroendocrine tumor. Sutent worldwide revenues increase d 1% operationally in 2016 , compared to 2015 ,primarily due to price increases in the U.S., as well as strong demand in Japan
28
2016 Financial Report
Financial ReviewPfizer Inc. and Subsidiary Companies
and key emerging markets, offset by strong competitive pressure and cost containment measure in certain developed international markets. Foreign exchange had anunfavorable impact on worldwide revenues of 3% in 2016 , compared to 2015 .
• Our Premarin family of products (EH) helps women address moderate-to-severe menopausal symptoms. Premarin worldwide revenues were relatively flat operationally in2016 , compared to 2015 . Revenues in the U.S. increase d 1% in 2016 , compared to 2015 , primarily driven by price increases, partially offset by prescription volumedeclines and lower market growth. Internationally, Premarin revenues decrease d 1% operationally in 2016 , compared to 2015 , primarily due to lower volume in developedmarkets and certain markets in Africa. Foreign exchange had an unfavorable impact on international revenues of 9% in 2016 , compared to 2015 .
• Norvasc (EH) is indicated for the treatment of hypertension. Norvasc worldwide revenues increase d 1% operationally in 2016 , compared to 2015 . Results for 2016 wereprimarily impacted by strong demand in China, offset by generic erosion in Japan. Foreign exchange had an unfavorable impact on worldwide revenues of 4% in 2016 ,compared to 2015 .
• Xeljanz (IH) is approved for use as a second-line therapy for the treatment of adult patients with moderate to severe active rheumatoid arthritis who have had aninadequate response or intolerance to methotrexate and is approved in over 50 markets including the U.S., Japan, Australia, Turkey, Canada, Switzerland and Brazil.Xeljanz worldwide revenues increase d 78% operationally in 2016 , compared to 2015 . In the U.S., Xeljanz revenues increased 71% in 2016 , compared to 2015 , drivenby increased adoption among rheumatologists, growing awareness among patients, improvements in payer access and price increases. Xeljanz recorded internationalrevenues of $122 million in 2016 . Foreign exchange had an unfavorable impact on worldwide revenues of 1% in 2016 , compared to 2015 .
• Chantix/Champix (IH) is approved as an aid to smoking-cessation treatment in adults 18 years of age and older in more than 100 countries. Worldwide revenues increased 27% operationally in 2016 , compared to 2015 . Foreign exchange had an unfavorable impact on worldwide revenues of 1% in 2016 , compared to 2015 .In the U.S., Chantix revenues increase d 40% in 2016 , compared to 2015 , primarily due to price increases, increased demand due to more effective branded direct-to-consumer campaigns, promotion of the Gradual Quit Approach and continued expansion of unrestricted managed care coverage.Internationally, Champix revenues increase d 4% operationally in 2016 , compared to 2015 , primarily due to growth in South Korea (driven by reforms to the governmentsponsored smoking cessation subsidy program), momentum of consumer digital initiatives in Spain and growth in the Netherlands, partially offset by market contraction inJapan and the timing of government purchases in Turkey. Foreign exchange had an unfavorable impact on international revenues of 3% in 2016 , compared to 2015 .In December 2016, the FDA approved updates to the Chantix labeling, including removal of the boxed warning regarding serious neuropsychiatric events. The removal ofthe boxed warning is based on the outcomes of EAGLES, the largest smoking cessation clinical trial in patients without and with a history of psychiatric disorder, and isconsistent with the recommendation of the FDA Psychopharmacologic Drugs and Drug Safety and Risk Management Advisory Committees. Additional labeling revisionsbased on EAGLES include updates to the corresponding warning regarding neuropsychiatric safety and the addition of information on the superior efficacy of Chantixcompared to bupropion or nicotine patch.
• Celebrex (EH) is indicated for the treatment of the signs and symptoms of osteoarthritis and rheumatoid arthritis worldwide and for the management of acute pain in adultsin the U.S., Japan and certain other markets. Celebrex worldwide revenues decrease d 10% operationally in 2016 , compared to 2015 , primarily driven by the loss ofexclusivity and associated generic competition in the U.S. and most developed international markets, partially offset by growth in China and lower chargebacks andfavorable rebates in the U.S. Foreign exchange had an unfavorable impact on worldwide revenues of 2% in 2016 , compared to 2015.
• Pristiq (EH) is indicated for the treatment of major depressive disorder in the U.S. and in various other countries. Pristiq has also been indicated for treatment of moderate-to-severe vasomotor symptoms associated with menopause in certain international markets. Worldwide revenues for Pristiq increase d 4% operationally in 2016 ,compared to 2015 , primarily due to growth in the U.S. Foreign exchange had an unfavorable impact on worldwide revenues of 1% in 2016 , compared to 2015 .
• BeneFIX and ReFacto AF/Xyntha (IH) are recombinant hemophilia products that assist patients with their lifelong hemophilia bleeding disorders. BeneFIX worldwiderevenues decrease d 4% operationally in 2016 , compared to 2015 , primarily as a result of erosion of market share in the U.S. and European countries due to the launch ofnew extended half-life treatment options. Foreign exchange had an unfavorable impact on worldwide revenues of 2% in 2016 , compared to 2015 .ReFacto AF/Xyntha recorded an 8% operational increase in 2016 , compared to 2015 , largely due to product demand across Europe and certain other internationalmarkets. Foreign exchange had an unfavorable impact on worldwide revenues of 4% in 2016 , compared to 2015 . In the U.S., ReFacto AF/Xyntha revenues increase d 5%in 2016 , compared to 2015 , mostly due to a price increase.
• Xalkori (IH) is indicated for the treatment of patients with locally advanced or metastatic NSCLC that is ALK-positive or ROS1-positive. Xalkori worldwide revenuesincrease d 17% operationally in 2016 , compared to 2015, as a result of a steady increase in diagnostic rates for the ALK gene mutation across key markets, which has ledto more patients being treated, and the March 2016 FDA approval of the supplemental NDA to treat patients with metastatic NSCLC whose tumors are ROS1-positive .Foreign exchange had an unfavorable impact on worldwide revenues of 2% in 2016 , compared to 2015 .
• Zyvox (EH) is used to treat serious Gram-positive pathogens, including methicillin-resistant staphylococcus-aureus. Zyvox worldwide revenues decrease d 49%operationally in 2016 , compared to 2015 , due to generic competition in the U.S. and developed international markets and corresponding pricing pressures. Foreignexchange had an unfavorable impact on worldwide revenues of 3% in 2016 , compared to 2015 .
• Inlyta (IH) is indicated for the treatment of patients with advanced RCC after failure of a prior systemic treatment. Worldwide revenues decrease d 6% operationally in 2016, compared to 2015 , primarily due to increased competition in North America and Europe, partially offset by performance in China, as well as Australia, Argentina andBrazil. Foreign exchange had a de minimis impact on worldwide revenues in 2016 , compared to 2015 .
• Inflectra/Remsima (EH), a biosimilar of Remicade® (infliximab), is indicated for the treatment of patients with certain inflammatory diseases. In 2009, Hospira entered intoan agreement to develop and market certain biosimilar molecules with Celltrion including Inflectra. Pfizer has exclusive commercialization rights to Inflectra in the U.S.,Canada and certain other territories. Pfizer also shares Inflectra commercialization rights with Celltrion in Europe. In Europe, Inflectra has now launched in 38 markets. InDecember 2014, Hospira launched Inflectra in Canada. In April 2016, the FDA approved Inflectra (infliximab-dyyb) across all eligible indications of Remicade®.
2016 Financial Report
29
Financial ReviewPfizer Inc. and Subsidiary Companies
In the fourth quarter of 2016, Pfizer launched Inflectra in the U.S., beginning with shipments to wholesalers on November 21, 2016. Patent litigation associated with Inflectrais ongoing, in which Janssen and New York University allege that the marketing of Inflectra in the U.S. would infringe one or more patents. If an appellate court ultimatelyholds such patents are valid and infringed, we could be liable for patent infringement damages, including the possibility of owing Janssen its lost profits, and/or arequirement to cease selling Inflectra in the U.S. during the term of one or more of any valid, infringed patents.Inflectra/Remsima worldwide revenues were $192 million in 2016 .
• Alliance revenues (IH/EH) increase d 33% operationally in 2016 , compared to 2015 , mainly due to:◦ an increase in Eliquis alliance revenues due to increased market share; and◦ the inclusion of Xtandi revenues of $140 million in the U.S. resulting from the acquisition of Medivation in September 2016,
partially offset by:◦ the year-end 2015 expiry of the collaboration agreement to co-promote Rebif in the U.S., which resulted in a decrease of approximately $370 million in 2016 , compared
to 2015 .Foreign exchange had a de minimis impact on alliance revenues in 2016 , compared to 2015 .◦ Eliquis (IH) has been jointly developed and is commercialized by Pfizer and BMS. Pfizer funds between 50% and 60% of all development costs depending on the study.
Profits and losses are shared equally on a global basis except for in certain countries where Pfizer commercializes Eliquis and pays BMS compensation based on apercentage of net sales. In April 2015, we signed an agreement with BMS to transfer full commercialization rights in certain smaller markets to us, beginning in the thirdquarter of 2015. BMS supplies the product to us at cost plus a percentage of the net sales to end-customers in these markets. Eliquis is part of the Novel OralAnticoagulant (NOAC) market; the agents in this class were developed as alternative treatment options to warfarin in appropriate patients. Eliquis (apixaban) is approvedfor multiple indications in major markets around the world:◦ to reduce the risk of stroke and systemic embolism in patients with nonvalvular atrial fibrillation;◦ for the treatment of deep vein thrombosis (DVT) and PE, and for the reduction in the risk of recurrent DVT and PE following initial therapy; and◦ for the prophylaxis of DVT, which may lead to PE, in patients who have undergone hip or knee replacement surgery.Eliquis utilization and adoption continues to expand across key markets. It is now the number one prescribed NOAC among cardiologists in the U.S., Japan and severalEuropean countries.
◦ Xtandi (IH) is being developed and commercialized through a collaboration between Pfizer and Astellas. The two companies share equally in the gross profits (losses)related to U.S. net sales of Xtandi. Subject to certain exceptions, Pfizer and Astellas also share equally all Xtandi commercialization costs attributable to the U.S. market.Pfizer and Astellas also share certain development and other collaboration expenses and Pfizer receives tiered royalties as a percentage of international Xtandi net sales(recorded in Other (income)/deductions––net ). Xtandi is approved for the following indications:◦ treatment of patients with metastatic castration-resistant prostate cancer in the U.S., Europe and many other countries worldwide; and◦ treatment of patients with castration-resistant prostate cancer in Japan.Post-acquisition on September 28, 2016, Pfizer recorded $140 million of Xtandi alliance revenues in 2016 , all of which was attributed to the U.S.
See the “Our Operating Environment—Industry-Specific Challenges—Intellectual Property Rights and Collaboration/Licensing Rights” section of this Financial Review forinformation regarding the expiration of various contract rights relating to Enbrel and Rebif.
See Notes to Consolidated Financial Statements— Note 17. Commitments and Contingencies for a discussion of recent developments concerning patent and product litigationrelating to certain of the products discussed above.
PRODUCT DEVELOPMENTS—BIOPHARMACEUTICAL
We continue to invest in R&D to provide potential future sources of revenues through the development of new products, as well as through additional uses for in-line andalliance products. Notwithstanding our efforts, there are no assurances as to when, or if, we will receive regulatory approval for additional indications for existing products orany of our other products in development.
We continue to strengthen our global R&D organization and pursue strategies intended to improve innovation and overall productivity in R&D to achieve a sustainable pipelinethat will deliver value in the near term and over time. Our R&D priorities include:• delivering a pipeline of differentiated therapies with the greatest scientific and commercial promise;• innovating new capabilities that can position Pfizer for long-term leadership; and• creating new models for biomedical collaboration that will expedite the pace of innovation and productivity.
Our R&D primarily focuses on:• Biosimilars;• Inflammation and Immunology;• Metabolic Disease and Cardiovascular Risks;• Neuroscience;• Oncology• Rare Diseases; and• Vaccines.
30
2016 Financial Report

Financial ReviewPfizer Inc. and Subsidiary Companies
In addition, we pursue biosimilars, which are being developed by our EH R&D organization. For additional information about the new EH R&D organization, see the “Overviewof Our Performance, Operating Environment, Strategy and Outlook—Our Strategy—Commercial Operations” section of this Financial Review.
A comprehensive update of Pfizer’s development pipeline was published on January 31, 2017 and is available at www.pfizer.com/pipeline. It includes an overview of ourresearch and a list of compounds in development with targeted indication and phase of development, as well as mechanism of action for candidates from Phase 2 throughregistration.
The following series of tables provides information about significant regulatory actions by, and filings pending with, the FDA and regulatory authorities in the EU and Japan, aswell as additional indications and new drug candidates in late-stage development.
RECENT FDA APPROVALSPRODUCT INDICATION DATE APPROVEDEucrisa (Crisaborole) A non-steroidal topical anti-inflammatory PDE-4 inhibitor for the treatment of mild-to-moderate atopic dermatitis December 2016
Troxyca (oxycodone HCI/naltrexone/HCI)
Extended-release capsules for the management of pain severe enough to require daily, around-the-clocklong-term opioid treatment and for which alternative treatment options are inadequate
August 2016
Xalkori (Crizotinib) Treatment of patients with ROS1-positive metastatic non-small cell lung cancer March 2016Xeljanz (Tofacitinib) Extended-release 11mg tablets for the once-daily treatment of moderate to severe rheumatoid arthritis in
patients who have had an inadequate response or intolerance to methotrexateFebruary 2016
Ibrance (Palbociclib) Treatment of HR+, HER2- advanced or metastatic breast cancer in combination with fulvestrant in womenwith disease progression following endocrine therapy
February 2016
PENDING U.S. NDAs AND SUPPLEMENTAL FILINGSPRODUCT PROPOSED INDICATION DATE FILED *Inotuzumab ozogamicin Treatment of acute lymphoblastic leukemia February 2017Lyrica (Pregabalin) Controlled Release (once-a-day) dosing February 2017Mylotarg ( Gemtuzumabozogamicin)
Treatment of acute myeloid leukemia January 2017
Avelumab (PF-06834635)(MSB0010718C)
Treatment of metastatic Merkel cell carcinoma November 2016
Retacrit (a) A potential biosimilar to Epogen® and Procrit® (epotein alfa) February 2015Tafamidis meglumine (b) Treatment of transthyretin familial amyloid polyneuropathy February 2012
* The dates set forth in this column are the dates on which the FDA accepted our submissions.(a)
Epogen® is a registered U.S. trademark of Amgen Inc.; Procrit® is a registered U.S. trademark of Johnson & Johnson. In October 2015, we received a “complete response” letter from the FDA with respect to ourbiologics license application for Retacrit, our proposed biosimilar to epoetin alfa, which was submitted for all indications of the reference product. In December 2016, we completed the resubmission of the biologicslicense application to the FDA for Retacrit in response to the “complete response” letter. We are continuing to work closely with the FDA on next steps.
(b)
In May 2012, the FDA’s Peripheral and Central Nervous System Drugs Advisory Committee voted that the tafamidis meglumine data provide substantial evidence of efficacy for a surrogate endpoint that isreasonably likely to predict a clinical benefit. In June 2012, the FDA issued a “complete response” letter with respect to the tafamidis NDA. The FDA has requested the completion of a second efficacy study, andalso has asked for additional information on the data within the current tafamidis NDA. Pfizer initiated study B3461028 in December 2013, a global Phase 3 study to support a potential new indication intransthyretin cardiomypathy, which includes transthyretin familial amyloid cardiomyopathy (TTR-FAC) and wild-type cardiomyopathy (WT-CM). We anticipate results from this study in 2018, and continue to workwith the FDA to identify next steps.
2016 Financial Report
31
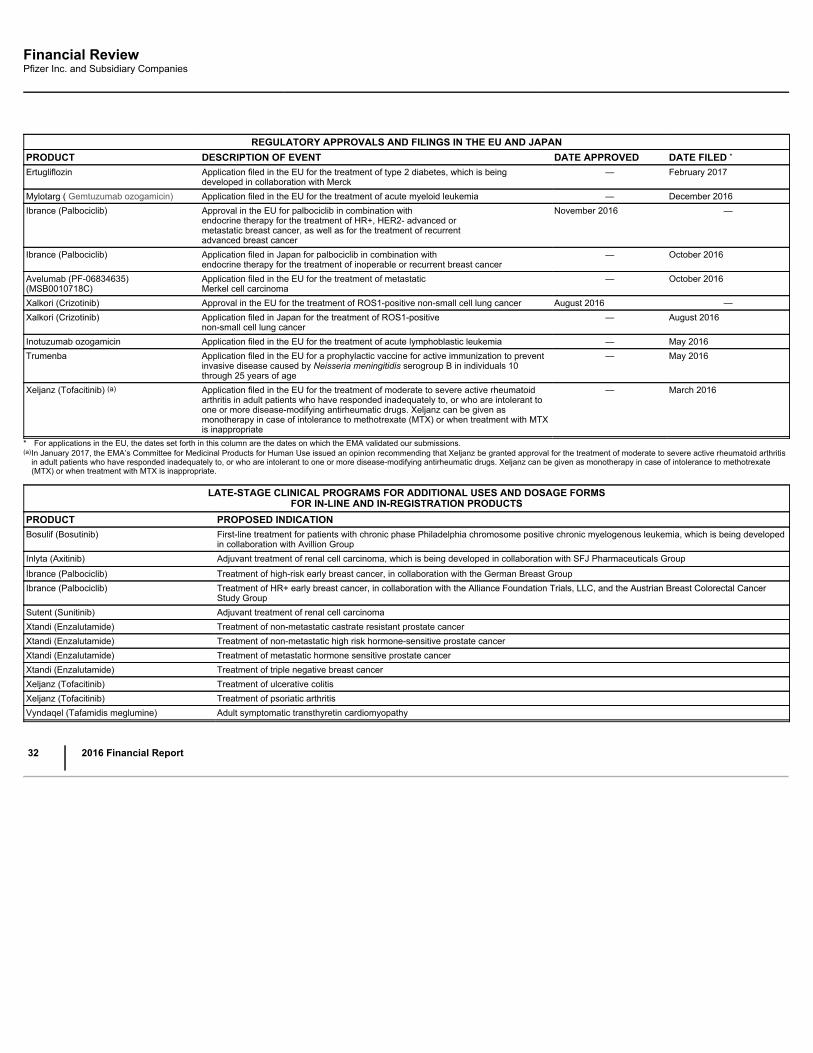
Financial ReviewPfizer Inc. and Subsidiary Companies
REGULATORY APPROVALS AND FILINGS IN THE EU AND JAPANPRODUCT DESCRIPTION OF EVENT DATE APPROVED DATE FILED *Ertugliflozin Application filed in the EU for the treatment of type 2 diabetes, which is being
developed in collaboration with Merck— February 2017
Mylotarg ( Gemtuzumab ozogamicin) Application filed in the EU for the treatment of acute myeloid leukemia — December 2016Ibrance (Palbociclib) Approval in the EU for palbociclib in combination with
endocrine therapy for the treatment of HR+, HER2- advanced ormetastatic breast cancer, as well as for the treatment of recurrentadvanced breast cancer
November 2016 —
Ibrance (Palbociclib) Application filed in Japan for palbociclib in combination withendocrine therapy for the treatment of inoperable or recurrent breast cancer
— October 2016
Avelumab (PF-06834635)(MSB0010718C)
Application filed in the EU for the treatment of metastaticMerkel cell carcinoma
— October 2016
Xalkori (Crizotinib) Approval in the EU for the treatment of ROS1-positive non-small cell lung cancer August 2016 —Xalkori (Crizotinib) Application filed in Japan for the treatment of ROS1-positive
non-small cell lung cancer— August 2016
Inotuzumab ozogamicin Application filed in the EU for the treatment of acute lymphoblastic leukemia — May 2016Trumenba Application filed in the EU for a prophylactic vaccine for active immunization to prevent
invasive disease caused by Neisseria meningitidis serogroup B in individuals 10through 25 years of age
— May 2016
Xeljanz (Tofacitinib) (a) Application filed in the EU for the treatment of moderate to severe active rheumatoidarthritis in adult patients who have responded inadequately to, or who are intolerant toone or more disease-modifying antirheumatic drugs. Xeljanz can be given asmonotherapy in case of intolerance to methotrexate (MTX) or when treatment with MTXis inappropriate
— March 2016
* For applications in the EU, the dates set forth in this column are the dates on which the EMA validated our submissions.(a)
In January 2017, the EMA’s Committee for Medicinal Products for Human Use issued an opinion recommending that Xeljanz be granted approval for the treatment of moderate to severe active rheumatoid arthritisin adult patients who have responded inadequately to, or who are intolerant to one or more disease-modifying antirheumatic drugs. Xeljanz can be given as monotherapy in case of intolerance to methotrexate(MTX) or when treatment with MTX is inappropriate.
LATE-STAGE CLINICAL PROGRAMS FOR ADDITIONAL USES AND DOSAGE FORMSFOR IN-LINE AND IN-REGISTRATION PRODUCTS
PRODUCT PROPOSED INDICATIONBosulif (Bosutinib) First-line treatment for patients with chronic phase Philadelphia chromosome positive chronic myelogenous leukemia, which is being developed
in collaboration with Avillion GroupInlyta (Axitinib) Adjuvant treatment of renal cell carcinoma, which is being developed in collaboration with SFJ Pharmaceuticals GroupIbrance (Palbociclib) Treatment of high-risk early breast cancer, in collaboration with the German Breast GroupIbrance (Palbociclib) Treatment of HR+ early breast cancer, in collaboration with the Alliance Foundation Trials, LLC, and the Austrian Breast Colorectal Cancer
Study GroupSutent (Sunitinib) Adjuvant treatment of renal cell carcinomaXtandi (Enzalutamide) Treatment of non-metastatic castrate resistant prostate cancerXtandi (Enzalutamide) Treatment of non-metastatic high risk hormone-sensitive prostate cancerXtandi (Enzalutamide) Treatment of metastatic hormone sensitive prostate cancerXtandi (Enzalutamide) Treatment of triple negative breast cancerXeljanz (Tofacitinib) Treatment of ulcerative colitisXeljanz (Tofacitinib) Treatment of psoriatic arthritisVyndaqel (Tafamidis meglumine) Adult symptomatic transthyretin cardiomyopathy
32
2016 Financial Report
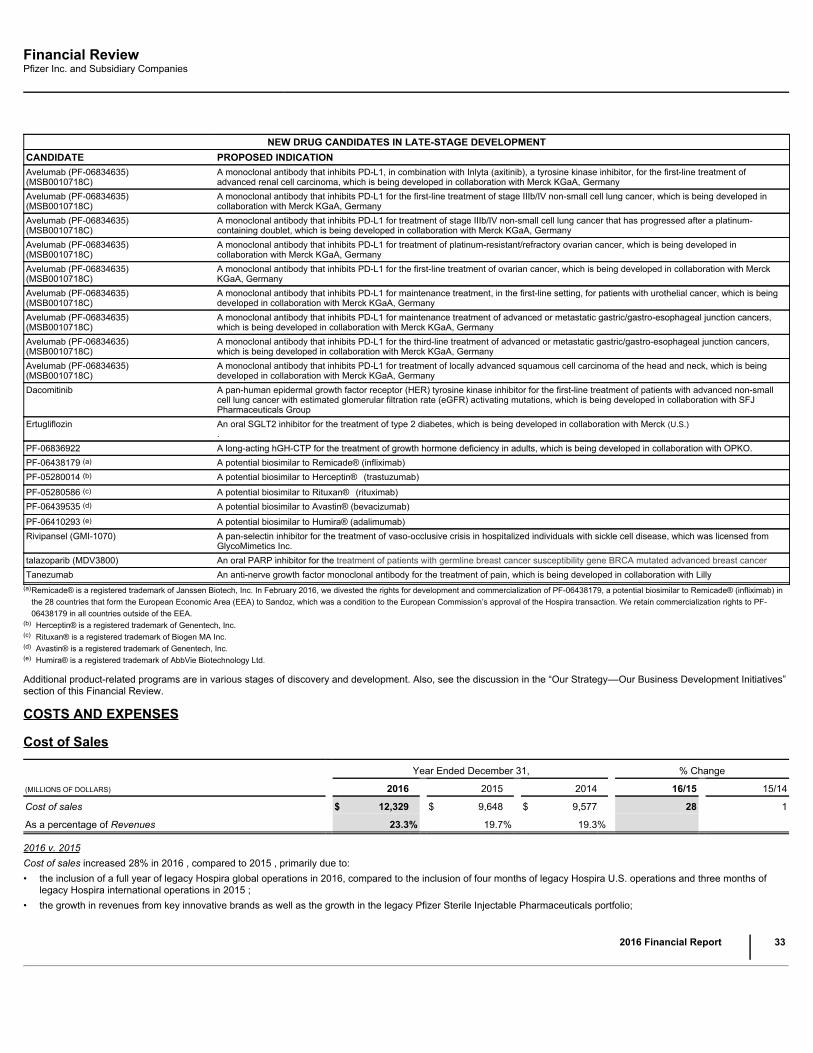
Financial ReviewPfizer Inc. and Subsidiary Companies
NEW DRUG CANDIDATES IN LATE-STAGE DEVELOPMENTCANDIDATE PROPOSED INDICATIONAvelumab (PF-06834635)(MSB0010718C)
A monoclonal antibody that inhibits PD-L1, in combination with Inlyta (axitinib), a tyrosine kinase inhibitor, for the first-line treatment ofadvanced renal cell carcinoma, which is being developed in collaboration with Merck KGaA, Germany
Avelumab (PF-06834635)(MSB0010718C)
A monoclonal antibody that inhibits PD-L1 for the first-line treatment of stage IIIb/IV non-small cell lung cancer, which is being developed incollaboration with Merck KGaA, Germany
Avelumab (PF-06834635)(MSB0010718C)
A monoclonal antibody that inhibits PD-L1 for treatment of stage IIIb/IV non-small cell lung cancer that has progressed after a platinum-containing doublet, which is being developed in collaboration with Merck KGaA, Germany
Avelumab (PF-06834635)(MSB0010718C)
A monoclonal antibody that inhibits PD-L1 for treatment of platinum-resistant/refractory ovarian cancer, which is being developed incollaboration with Merck KGaA, Germany
Avelumab (PF-06834635)(MSB0010718C)
A monoclonal antibody that inhibits PD-L1 for the first-line treatment of ovarian cancer, which is being developed in collaboration with MerckKGaA, Germany
Avelumab (PF-06834635)(MSB0010718C)
A monoclonal antibody that inhibits PD-L1 for maintenance treatment, in the first-line setting, for patients with urothelial cancer, which is beingdeveloped in collaboration with Merck KGaA, Germany
Avelumab (PF-06834635)(MSB0010718C)
A monoclonal antibody that inhibits PD-L1 for maintenance treatment of advanced or metastatic gastric/gastro-esophageal junction cancers,which is being developed in collaboration with Merck KGaA, Germany
Avelumab (PF-06834635)(MSB0010718C)
A monoclonal antibody that inhibits PD-L1 for the third-line treatment of advanced or metastatic gastric/gastro-esophageal junction cancers,which is being developed in collaboration with Merck KGaA, Germany
Avelumab (PF-06834635)(MSB0010718C)
A monoclonal antibody that inhibits PD-L1 for treatment of locally advanced squamous cell carcinoma of the head and neck, which is beingdeveloped in collaboration with Merck KGaA, Germany
Dacomitinib A pan-human epidermal growth factor receptor (HER) tyrosine kinase inhibitor for the first-line treatment of patients with advanced non-smallcell lung cancer with estimated glomerular filtration rate (eGFR) activating mutations, which is being developed in collaboration with SFJPharmaceuticals Group
Ertugliflozin An oral SGLT2 inhibitor for the treatment of type 2 diabetes, which is being developed in collaboration with Merck (U.S.).
PF-06836922 A long-acting hGH-CTP for the treatment of growth hormone deficiency in adults, which is being developed in collaboration with OPKO.PF-06438179 (a) A potential biosimilar to Remicade® (infliximab)PF-05280014 (b) A potential biosimilar to Herceptin® (trastuzumab)PF-05280586 (c) A potential biosimilar to Rituxan® (rituximab)PF-06439535 (d) A potential biosimilar to Avastin® (bevacizumab)PF-06410293 (e) A potential biosimilar to Humira® (adalimumab)Rivipansel (GMI-1070) A pan-selectin inhibitor for the treatment of vaso-occlusive crisis in hospitalized individuals with sickle cell disease, which was licensed from
GlycoMimetics Inc.talazoparib (MDV3800) An oral PARP inhibitor for the treatment of patients with germline breast cancer susceptibility gene BRCA mutated advanced breast cancerTanezumab An anti-nerve growth factor monoclonal antibody for the treatment of pain, which is being developed in collaboration with Lilly
(a)
Remicade® is a registered trademark of Janssen Biotech, Inc. In February 2016, we divested the rights for development and commercialization of PF-06438179, a potential biosimilar to Remicade® (infliximab) inthe 28 countries that form the European Economic Area (EEA) to Sandoz, which was a condition to the European Commission’s approval of the Hospira transaction. We retain commercialization rights to PF-06438179 in all countries outside of the EEA.
(b) Herceptin® is a registered trademark of Genentech, Inc.(c) Rituxan® is a registered trademark of Biogen MA Inc.(d) Avastin® is a registered trademark of Genentech, Inc.(e) Humira® is a registered trademark of AbbVie Biotechnology Ltd.
Additional product-related programs are in various stages of discovery and development. Also, see the discussion in the “Our Strategy––Our Business Development Initiatives”section of this Financial Review.
COSTS AND EXPENSES
Cost of Sales
Year Ended December 31, % Change
(MILLIONS OF DOLLARS) 2016 2015 2014 16/15 15/14
Cost of sales $ 12,329 $ 9,648 $ 9,577 28 1
As a percentage of Revenues 23.3% 19.7% 19.3%
2016 v. 2015Cost of sales increased 28% in 2016 , compared to 2015 , primarily due to:• the inclusion of a full year of legacy Hospira global operations in 2016, compared to the inclusion of four months of legacy Hospira U.S. operations and three months of
legacy Hospira international operations in 2015 ;• the growth in revenues from key innovative brands as well as the growth in the legacy Pfizer Sterile Injectable Pharmaceuticals portfolio;
2016 Financial Report
33

Financial ReviewPfizer Inc. and Subsidiary Companies
• production variances driven by changes in product mix, including products which have lost exclusivity and manufacturing production issues at certain sites (upapproximately $300 million);
• an increase in costs associated with our cost-reduction/productivity initiatives including plant network strategy (approximately $200 million); and• the unfavorable impact of foreign exchange of 3% or approximately $410 million in 2016 .
The increase in Cost of sales as a percentage of revenues in 2016 , compared to 2015 , was primarily due to:• an unfavorable change in product mix due to (i) the inclusion of a full year of legacy Hospira global operations in 2016 , compared to the inclusion of four months of legacy
Hospira U.S. operations and three months of legacy Hospira international operations in 2015 , with products that carry a higher cost, as well as the impact of acquiredHospira inventory which was measured at fair value on the acquisition date and amortized over the turn of the related inventory; and (ii) the impact of losses of exclusivityon products which formerly had a higher gross margin;
• the unfavorable impact of foreign exchange; and• the unfavorable impact of costs incurred to implement our cost-reduction/productivity initiatives (not related to acquisitions) in 2016, compared to 2015,partially offset by:• a favorable change in product mix related to legacy Pfizer products, excluding the impact of losses of exclusivity on products referred to above; and• non-recurring charges of $72 million related to manufacturing plant pension obligations and non-recurring charges of $72 million related to inventory impairment in
Venezuela in 2015 related to the foreign currency change described in the “Global Economic Conditions—Venezuela Operations” section in this Financial Review.
2015 v. 2014
Cost of sales increased 1% in 2015, compared to 2014, primarily due to:• an increase in sales volumes due to (i) the inclusion of four months of legacy Hospira U.S. operations and three months of legacy Hospira international operations and the
vaccine portfolio operations acquired from Baxter in fiscal 2015, both of which are comprised of inventory measured at fair value on the acquisition date (approximately $2.1billion); and (ii) the net increase in sales volume of Pfizer legacy products; and
• non-recurring charges of $72 million related to manufacturing plant pension obligations and $72 million related to inventory impairment in Venezuela in 2015 related to theforeign currency change described in the “Global Economic Conditions—Venezuela Operations” section in this Financial Review,
partially offset by:• favorable foreign exchange of 10% in 2015;• a change in the profit deferred in inventory relating to inventory that had not been sold to third parties resulting in a non-cash benefit of $306 million; and, to a lesser extent• manufacturing efficiencies; and• a decrease in royalty expense associated with products that recently lost marketing exclusivity.
The increase in Cost of sales as a percentage of Revenues in 2015, compared to 2014, was primarily due to:• an unfavorable change in product mix due to (i) the inclusion of four months of legacy Hospira U.S. operations, three months of legacy Hospira international operations, and
the vaccine portfolio operations acquired from Baxter in fiscal 2015, both of which are comprised of inventory measured at fair value on the acquisition date; and (ii) theimpact of losses of exclusivity,
partially offset by:• a change in the profit deferred in inventory relating to inventory that had not been sold to third parties (described above);• manufacturing efficiencies;• favorable foreign exchange;• a decrease in royalty expenses associated with products that have recently lost marketing exclusivity; and• an increase in alliance revenues which have no associated cost of sales.
Selling, Informational and Administrative (SI&A) Expenses
Year Ended December 31, % Change
(MILLIONS OF DOLLARS) 2016 2015 2014 16/15 15/14
Selling, informational and administrative expenses $ 14,837 $ 14,809 $ 14,097 — 5
As a percentage of Revenues 28.1% 30.3% 28.4%
2016 v. 2015
SI&A expenses were relatively flat in 2016 , compared to 2015 , primarily due to:• an increase in the allowance for doubtful trade accounts receivable, resulting from unfavorable developments with a distributor (approximately $280 million);
34
2016 Financial Report
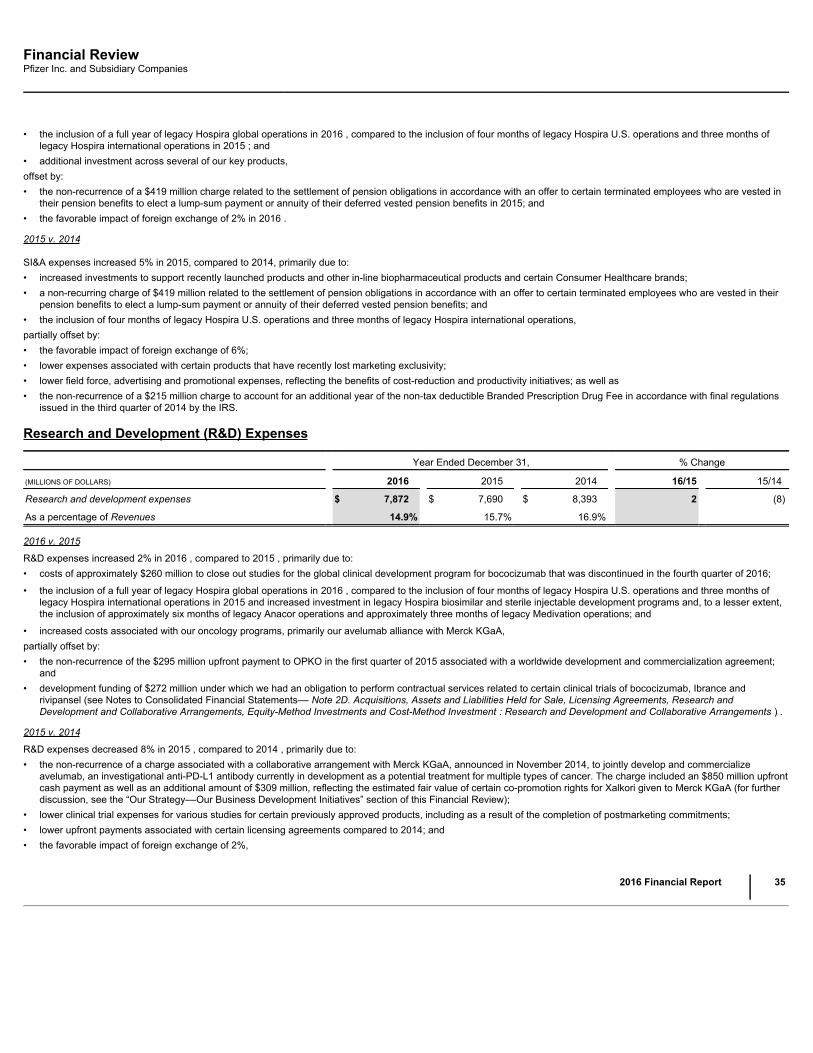
Financial ReviewPfizer Inc. and Subsidiary Companies
• the inclusion of a full year of legacy Hospira global operations in 2016 , compared to the inclusion of four months of legacy Hospira U.S. operations and three months oflegacy Hospira international operations in 2015 ; and
• additional investment across several of our key products,offset by:• the non-recurrence of a $419 million charge related to the settlement of pension obligations in accordance with an offer to certain terminated employees who are vested in
their pension benefits to elect a lump-sum payment or annuity of their deferred vested pension benefits in 2015; and• the favorable impact of foreign exchange of 2% in 2016 .
2015 v. 2014
SI&A expenses increased 5% in 2015, compared to 2014, primarily due to:• increased investments to support recently launched products and other in-line biopharmaceutical products and certain Consumer Healthcare brands;• a non-recurring charge of $419 million related to the settlement of pension obligations in accordance with an offer to certain terminated employees who are vested in their
pension benefits to elect a lump-sum payment or annuity of their deferred vested pension benefits; and• the inclusion of four months of legacy Hospira U.S. operations and three months of legacy Hospira international operations,partially offset by:• the favorable impact of foreign exchange of 6%;• lower expenses associated with certain products that have recently lost marketing exclusivity;• lower field force, advertising and promotional expenses, reflecting the benefits of cost-reduction and productivity initiatives; as well as• the non-recurrence of a $215 million charge to account for an additional year of the non-tax deductible Branded Prescription Drug Fee in accordance with final regulations
issued in the third quarter of 2014 by the IRS.
Research and Development (R&D) Expenses
Year Ended December 31, % Change
(MILLIONS OF DOLLARS) 2016 2015 2014 16/15 15/14
Research and development expenses $ 7,872 $ 7,690 $ 8,393 2 (8)
As a percentage of Revenues 14.9% 15.7% 16.9%
2016 v. 2015
R&D expenses increased 2% in 2016 , compared to 2015 , primarily due to:• costs of approximately $260 million to close out studies for the global clinical development program for bococizumab that was discontinued in the fourth quarter of 2016;
• the inclusion of a full year of legacy Hospira global operations in 2016 , compared to the inclusion of four months of legacy Hospira U.S. operations and three months oflegacy Hospira international operations in 2015 and increased investment in legacy Hospira biosimilar and sterile injectable development programs and, to a lesser extent,the inclusion of approximately six months of legacy Anacor operations and approximately three months of legacy Medivation operations; and
• increased costs associated with our oncology programs, primarily our avelumab alliance with Merck KGaA,partially offset by:• the non-recurrence of the $295 million upfront payment to OPKO in the first quarter of 2015 associated with a worldwide development and commercialization agreement;
and• development funding of $272 million under which we had an obligation to perform contractual services related to certain clinical trials of bococizumab, Ibrance and
rivipansel (see Notes to Consolidated Financial Statements–– Note 2D. Acquisitions, Assets and Liabilities Held for Sale, Licensing Agreements, Research andDevelopment and Collaborative Arrangements, Equity-Method Investments and Cost-Method Investment : Research and Development and Collaborative Arrangements ) .
2015 v. 2014
R&D expenses decreased 8% in 2015 , compared to 2014 , primarily due to:• the non-recurrence of a charge associated with a collaborative arrangement with Merck KGaA, announced in November 2014, to jointly develop and commercialize
avelumab, an investigational anti-PD-L1 antibody currently in development as a potential treatment for multiple types of cancer. The charge included an $850 million upfrontcash payment as well as an additional amount of $309 million, reflecting the estimated fair value of certain co-promotion rights for Xalkori given to Merck KGaA (for furtherdiscussion, see the “Our Strategy––Our Business Development Initiatives” section of this Financial Review);
• lower clinical trial expenses for various studies for certain previously approved products, including as a result of the completion of postmarketing commitments;• lower upfront payments associated with certain licensing agreements compared to 2014; and• the favorable impact of foreign exchange of 2%,
2016 Financial Report
35
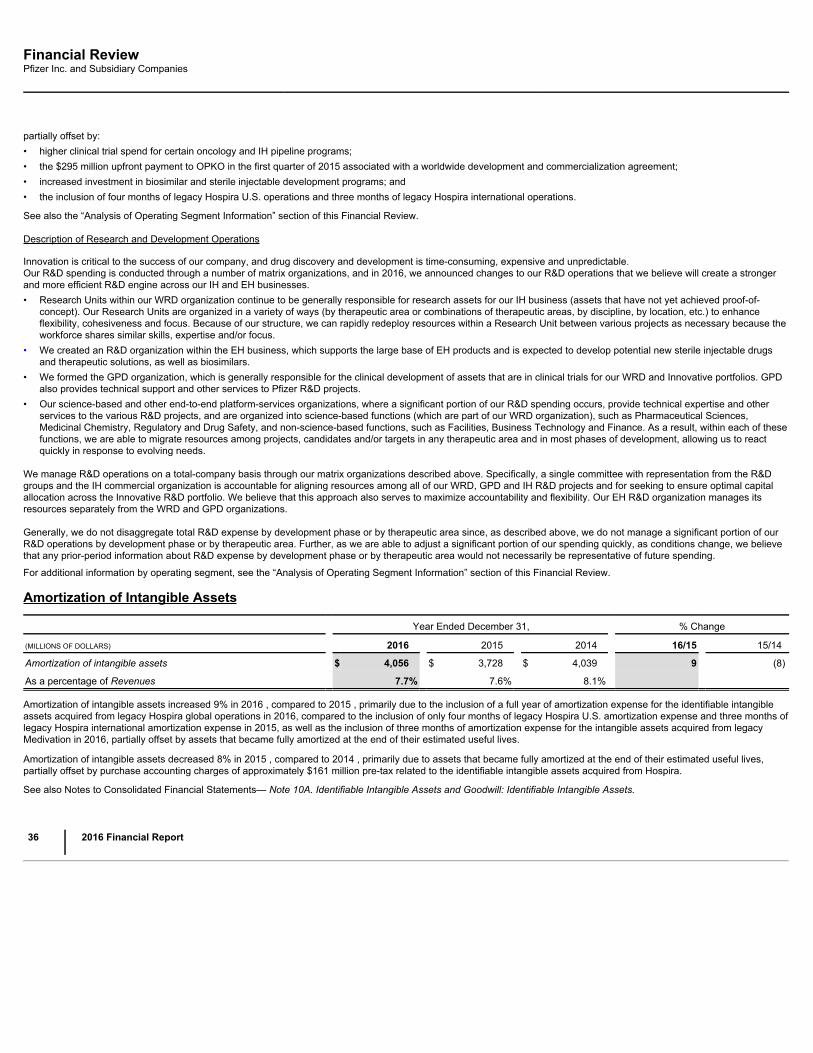
Financial ReviewPfizer Inc. and Subsidiary Companies
partially offset by:• higher clinical trial spend for certain oncology and IH pipeline programs;• the $295 million upfront payment to OPKO in the first quarter of 2015 associated with a worldwide development and commercialization agreement;• increased investment in biosimilar and sterile injectable development programs; and• the inclusion of four months of legacy Hospira U.S. operations and three months of legacy Hospira international operations.
See also the “Analysis of Operating Segment Information” section of this Financial Review.
Description of Research and Development Operations
Innovation is critical to the success of our company, and drug discovery and development is time-consuming, expensive and unpredictable.Our R&D spending is conducted through a number of matrix organizations, and in 2016, we announced changes to our R&D operations that we believe will create a strongerand more efficient R&D engine across our IH and EH businesses.• Research Units within our WRD organization continue to be generally responsible for research assets for our IH business (assets that have not yet achieved proof-of-
concept). Our Research Units are organized in a variety of ways (by therapeutic area or combinations of therapeutic areas, by discipline, by location, etc.) to enhanceflexibility, cohesiveness and focus. Because of our structure, we can rapidly redeploy resources within a Research Unit between various projects as necessary because theworkforce shares similar skills, expertise and/or focus.
• We created an R&D organization within the EH business, which supports the large base of EH products and is expected to develop potential new sterile injectable drugsand therapeutic solutions, as well as biosimilars.
• We formed the GPD organization, which is generally responsible for the clinical development of assets that are in clinical trials for our WRD and Innovative portfolios. GPDalso provides technical support and other services to Pfizer R&D projects.
• Our science-based and other end-to-end platform-services organizations, where a significant portion of our R&D spending occurs, provide technical expertise and otherservices to the various R&D projects, and are organized into science-based functions (which are part of our WRD organization), such as Pharmaceutical Sciences,Medicinal Chemistry, Regulatory and Drug Safety, and non-science-based functions, such as Facilities, Business Technology and Finance. As a result, within each of thesefunctions, we are able to migrate resources among projects, candidates and/or targets in any therapeutic area and in most phases of development, allowing us to reactquickly in response to evolving needs.
We manage R&D operations on a total-company basis through our matrix organizations described above. Specifically, a single committee with representation from the R&Dgroups and the IH commercial organization is accountable for aligning resources among all of our WRD, GPD and IH R&D projects and for seeking to ensure optimal capitalallocation across the Innovative R&D portfolio. We believe that this approach also serves to maximize accountability and flexibility. Our EH R&D organization manages itsresources separately from the WRD and GPD organizations.
Generally, we do not disaggregate total R&D expense by development phase or by therapeutic area since, as described above, we do not manage a significant portion of ourR&D operations by development phase or by therapeutic area. Further, as we are able to adjust a significant portion of our spending quickly, as conditions change, we believethat any prior-period information about R&D expense by development phase or by therapeutic area would not necessarily be representative of future spending.
For additional information by operating segment, see the “Analysis of Operating Segment Information” section of this Financial Review.
Amortization of Intangible Assets
Year Ended December 31, % Change
(MILLIONS OF DOLLARS) 2016 2015 2014 16/15 15/14
Amortization of intangible assets $ 4,056 $ 3,728 $ 4,039 9 (8)
As a percentage of Revenues 7.7% 7.6% 8.1%
Amortization of intangible assets increased 9% in 2016 , compared to 2015 , primarily due to the inclusion of a full year of amortization expense for the identifiable intangibleassets acquired from legacy Hospira global operations in 2016, compared to the inclusion of only four months of legacy Hospira U.S. amortization expense and three months oflegacy Hospira international amortization expense in 2015, as well as the inclusion of three months of amortization expense for the intangible assets acquired from legacyMedivation in 2016, partially offset by assets that became fully amortized at the end of their estimated useful lives.
Amortization of intangible assets decreased 8% in 2015 , compared to 2014 , primarily due to assets that became fully amortized at the end of their estimated useful lives,partially offset by purchase accounting charges of approximately $161 million pre-tax related to the identifiable intangible assets acquired from Hospira.
See also Notes to Consolidated Financial Statements— Note 10A. Identifiable Intangible Assets and Goodwill: Identifiable Intangible Assets.
36
2016 Financial Report

Financial ReviewPfizer Inc. and Subsidiary Companies
Restructuring Charges and Other Costs Associated with Acquisitions and Cost-Reduction/Productivity Initiatives
Year Ended December 31, % Change
(MILLIONS OF DOLLARS) 2016 2015 2014 16/15 15/14Restructuring charges and certain acquisition-related costs $ 1,724 $ 1,152 $ 250 50 *Total additional depreciation––asset restructuring 207 122 261 70 (53)Total implementation costs 340 203 270 67 (25)Costs associated with acquisitions and cost-reduction/productivity
initiatives (a) $ 2,271 $ 1,478 $ 781 54 89(a)
Comprises Restructuring charges and certain acquisition-related costs as well as costs associated with our cost-reduction/productivity initiatives included in Cost of sales , Research and development expensesand/or Selling, informational and administrative expenses , as appropriate.
* Calculation not meaningful.
Included in Restructuring charges and certain acquisition-related costs are (i) restructuring charges of $1.2 billion in 2016 for employee termination costs, exit costs and assetimpairments, which are largely associated with cost-reduction and productivity initiatives not associated with acquisitions, as well as our acquisitions of Hospira andMedivation; (ii) transaction costs, such as banking, legal, accounting and other similar services, of $127 million in 2016 , most of which are directly related to our acquisitions ofMedivation and Anacor, as well as costs associated with our terminated transaction with Allergan; and (iii) integration costs, representing external, incremental costs directlyrelated to integrating acquired businesses, and primarily include expenditures for consulting and the integration of systems and processes of $441 million for 2016, primarilyrelated to our acquisition of Hospira and the terminated transaction with Allergan. For additional information, see Notes to Consolidated Financial Statements— Note 3.Restructuring Charges and Other Costs Associated with Acquisitions and Cost-Reduction/Productivity Initiatives .
In connection with our acquisition of Hospira, we are focusing our efforts on achieving an appropriate cost structure for the combined company. We expect to achieve $1 billionof annual cost savings by 2018 in connection with the Hospira acquisition, 25% more than our initial cost savings target of $800 million, and have achieved approximately $500million of cost savings through December 31, 2016. The one-time costs to generate the savings are expected to be approximately $1 billion (not including costs of $215 millionfor full-year 2015 associated with the return of acquired IPR&D rights), incurred for up to a three-year period post-acquisition.
In 2016, we substantially completed previously disclosed cost-reduction initiatives begun in 2014 associated with our global commercial structure reorganization, manufacturingplant network rationalization and optimization initiatives, and additional cost-reduction/productivity initiatives across the enterprise.
Through December 31, 2016, we incurred $3.1 billion (pre-tax) in total costs for the 2014-2016 program. The cumulative ongoing annual cost savings associated with theabove-mentioned program (but not including expected cost savings associated with the Hospira acquisition), are approximately $3.1 billion. These savings were recognized, forthe most part, through the end of 2016. However, savings from costs incurred in the last half of 2016 are expected to largely occur in 2017. For additional information aboutthese programs and expected and actual total costs, see Notes to Consolidated Financial Statements— Note 3. Restructuring Charges and Other Costs Associated withAcquisitions and Cost-Reduction/Productivity Initiatives .
New Cost-Reduction/Productivity Initiatives — 2017 through 2019 Activities
As a result of the evaluation performed in connection with our decision in September 2016 to not pursue, at that time, splitting IH and EH into two separate publicly-tradedcompanies, we have identified new opportunities to potentially achieve greater optimization and efficiency to become more competitive in our business. Therefore, we haveinitiated new enterprise-wide cost-reduction/productivity initiatives, which we expect to complete by the end of 2019. These initiatives will encompass all areas of our cost baseand will include further centralization of our corporate and platform functions and optimization of our manufacturing plant network to support IH and EH products and pipelines,as well as activities in other areas where opportunities are identified. The action plans related to these new initiatives are underway and, in order to achieve targeted savings ofapproximately $1.2 billion by 2020, we expect to incur total costs of approximately $900 million over the next three years.
The expected cost savings in 2017 associated with these activities are reflected in our 2017 financial guidance.
In addition to these major initiatives, we continuously monitor our operations for cost reduction and/or productivity opportunities, especially in light of the losses of exclusivityand the expiration of collaborative arrangements for various products.
Other (Income)/Deductions––Net
Year Ended December 31, % Change
(MILLIONS OF DOLLARS) 2016 2015 2014 16/15 15/14
Other (income)/deductions—net $ 3,655 $ 2,860 $ 1,009 28 ** Calculation not meaningful.
For information about the components of Other (income)/deductions—net , see Notes to Consolidated Financial Statements— Note 4. Other (Income)/Deductions—Net .
See also the “Analysis of Operating Segment Information” section of this Financial Review.
2016 Financial Report
37
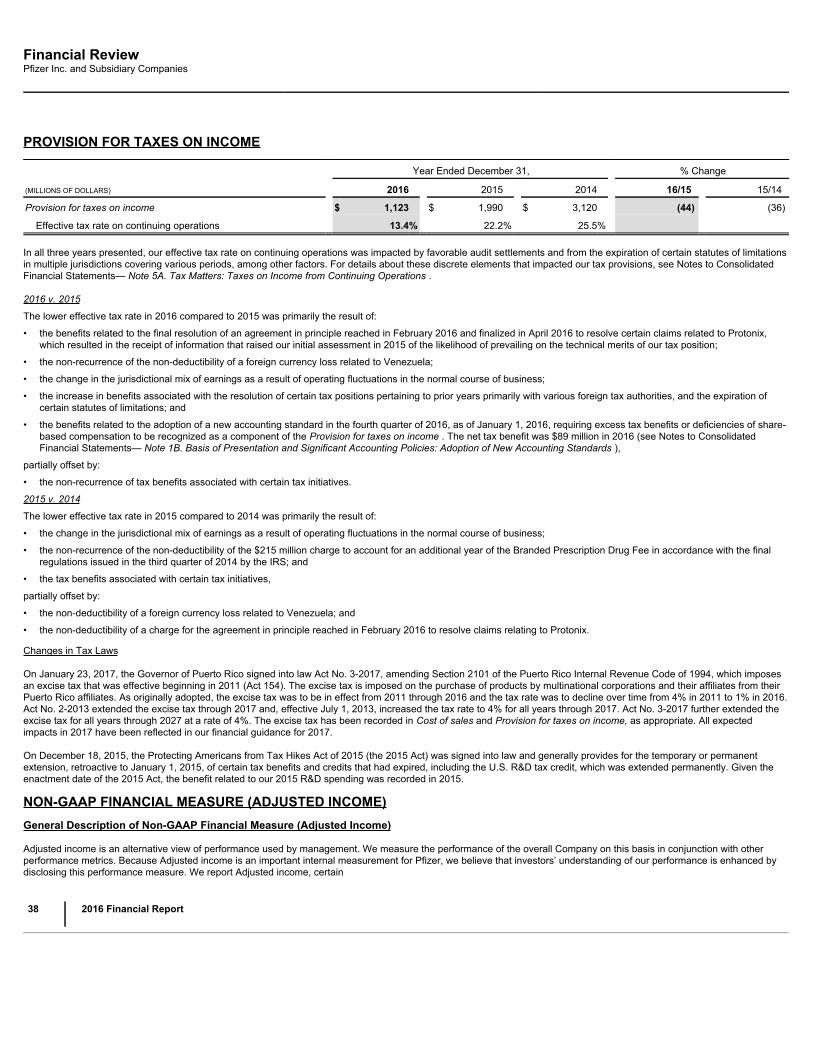
Financial ReviewPfizer Inc. and Subsidiary Companies
PROVISION FOR TAXES ON INCOME
Year Ended December 31, % Change
(MILLIONS OF DOLLARS) 2016 2015 2014 16/15 15/14
Provision for taxes on income $ 1,123 $ 1,990 $ 3,120 (44) (36)
Effective tax rate on continuing operations 13.4% 22.2% 25.5%
In all three years presented, our effective tax rate on continuing operations was impacted by favorable audit settlements and from the expiration of certain statutes of limitationsin multiple jurisdictions covering various periods, among other factors. For details about these discrete elements that impacted our tax provisions, see Notes to ConsolidatedFinancial Statements— Note 5A. Tax Matters: Taxes on Income from Continuing Operations .
2016 v. 2015
The lower effective tax rate in 2016 compared to 2015 was primarily the result of:
• the benefits related to the final resolution of an agreement in principle reached in February 2016 and finalized in April 2016 to resolve certain claims related to Protonix,which resulted in the receipt of information that raised our initial assessment in 2015 of the likelihood of prevailing on the technical merits of our tax position;
• the non-recurrence of the non-deductibility of a foreign currency loss related to Venezuela;
• the change in the jurisdictional mix of earnings as a result of operating fluctuations in the normal course of business;
• the increase in benefits associated with the resolution of certain tax positions pertaining to prior years primarily with various foreign tax authorities, and the expiration ofcertain statutes of limitations; and
• the benefits related to the adoption of a new accounting standard in the fourth quarter of 2016, as of January 1, 2016, requiring excess tax benefits or deficiencies of share-based compensation to be recognized as a component of the Provision for taxes on income . The net tax benefit was $89 million in 2016 (see Notes to ConsolidatedFinancial Statements— Note 1B. Basis of Presentation and Significant Accounting Policies: Adoption of New Accounting Standards ),
partially offset by:
• the non-recurrence of tax benefits associated with certain tax initiatives.
2015 v. 2014
The lower effective tax rate in 2015 compared to 2014 was primarily the result of:
• the change in the jurisdictional mix of earnings as a result of operating fluctuations in the normal course of business;
• the non-recurrence of the non-deductibility of the $215 million charge to account for an additional year of the Branded Prescription Drug Fee in accordance with the finalregulations issued in the third quarter of 2014 by the IRS; and
• the tax benefits associated with certain tax initiatives,
partially offset by:
• the non-deductibility of a foreign currency loss related to Venezuela; and
• the non-deductibility of a charge for the agreement in principle reached in February 2016 to resolve claims relating to Protonix.
Changes in Tax Laws
On January 23, 2017, the Governor of Puerto Rico signed into law Act No. 3-2017, amending Section 2101 of the Puerto Rico Internal Revenue Code of 1994, which imposesan excise tax that was effective beginning in 2011 (Act 154). The excise tax is imposed on the purchase of products by multinational corporations and their affiliates from theirPuerto Rico affiliates. As originally adopted, the excise tax was to be in effect from 2011 through 2016 and the tax rate was to decline over time from 4% in 2011 to 1% in 2016.Act No. 2-2013 extended the excise tax through 2017 and, effective July 1, 2013, increased the tax rate to 4% for all years through 2017. Act No. 3-2017 further extended theexcise tax for all years through 2027 at a rate of 4%. The excise tax has been recorded in Cost of sales and Provision for taxes on income, as appropriate. All expectedimpacts in 2017 have been reflected in our financial guidance for 2017.
On December 18, 2015, the Protecting Americans from Tax Hikes Act of 2015 (the 2015 Act) was signed into law and generally provides for the temporary or permanentextension, retroactive to January 1, 2015, of certain tax benefits and credits that had expired, including the U.S. R&D tax credit, which was extended permanently. Given theenactment date of the 2015 Act, the benefit related to our 2015 R&D spending was recorded in 2015.
NON-GAAP FINANCIAL MEASURE (ADJUSTED INCOME)General Description of Non-GAAP Financial Measure (Adjusted Income)
Adjusted income is an alternative view of performance used by management. We measure the performance of the overall Company on this basis in conjunction with otherperformance metrics. Because Adjusted income is an important internal measurement for Pfizer, we believe that investors’ understanding of our performance is enhanced bydisclosing this performance measure. We report Adjusted income, certain
38
2016 Financial Report
Financial ReviewPfizer Inc. and Subsidiary Companies
components of Adjusted income, and Adjusted diluted earnings per share in order to portray the results of our major operations––the discovery, development, manufacture,marketing and sale of prescription medicines, vaccines and consumer healthcare (OTC) products––prior to considering certain income statement elements. We have definedAdjusted income as Net income attributable to Pfizer Inc. before the impact of purchase accounting for acquisitions, acquisition-related costs, discontinued operations andcertain significant items, which are described below. Similarly, we have defined the Adjusted income components as Cost of sales, Selling, informational and administrativeexpenses, Research and development expenses, Amortization of intangible assets and Other (income)/deductions––net each before the impact of purchase accounting foracquisitions, acquisition-related costs and certain significant items. We have defined Adjusted diluted earnings per share as Earnings per common share attributable to PfizerInc.––diluted before the impact of purchase accounting for acquisitions, acquisition-related costs, discontinued operations and certain significant items. The Adjusted incomemeasure and the Adjusted income component measures and the Adjusted diluted earnings per share measure are not, and should not be viewed as, a substitute for U.S.GAAP net income, U.S. GAAP net income components or U.S. GAAP diluted earnings per share.
The following are examples of how the Adjusted income and Adjusted diluted earnings per share measures are utilized:
• senior management receives a monthly analysis of our operating results that is prepared on an Adjusted income basis and Adjusted diluted earnings per share basis;
• our annual budgets are prepared on an Adjusted income and Adjusted diluted earnings per share basis; and
• senior management’s annual compensation is derived, in part, using Adjusted income and Adjusted diluted earnings per share measures. Adjusted income is theperformance metric utilized in the determination of bonuses under the Pfizer Inc. Executive Annual Incentive Plan that is designed to limit the bonuses payable to theExecutive Leadership Team (ELT) for purposes of IRC Section 162(m). Subject to the Section 162(m) limitation, the bonuses are funded from a pool based on theperformance measured by three financial metrics, including adjusted diluted earnings per share, which is derived from Adjusted income. This metric accounts for 40% of thebonus pool funding. The pool applies to the bonus plans for virtually all bonus-eligible, non-sales-force employees worldwide, including the ELT members and othermembers of senior management. In addition, commencing with the 2015 Performance Share Awards, adjusted operating income is one of the measures utilized todetermine payout. Adjusted operating income is derived from Adjusted income.
Adjusted income and its components and Adjusted diluted earnings per share are non-GAAP financial measures that have no standardized meaning prescribed by U.S. GAAPand, therefore, are limited in their usefulness to investors. Because of their non-standardized definitions, Adjusted income and its components (unlike U.S. GAAP net incomeand its components) and Adjusted diluted earnings per share (unlike U.S. GAAP diluted earnings per share) may not be comparable to the calculation of similar measures ofother companies. Adjusted income and its components and Adjusted diluted earnings per share are presented solely to permit investors to more fully understand howmanagement assesses performance.
We also recognize that, as internal measures of performance, the Adjusted income and its components and Adjusted diluted earnings per share measures have limitations,and we do not restrict our performance-management process solely to these metrics. A limitation of these measures is that they provide a view of our operations withoutincluding all events during a period, such as the effects of an acquisition or amortization of purchased intangibles, and do not provide a comparable view of our performance toother companies in the biopharmaceutical industry. We also use other specifically tailored tools designed to achieve the highest levels of performance. For example, our R&Dorganization has productivity targets, upon which its effectiveness is measured. In addition, total shareholder return, both on an absolute basis and relative to a group ofpharmaceutical industry peers (pre-2015) or a publicly traded pharmaceutical index, plays a significant role in determining payouts under certain of Pfizer’s long-term incentivecompensation plans.
See the accompanying reconciliations of certain GAAP reported to non-GAAP adjusted information for 2016 , 2015 and 2014 below.
Purchase Accounting Adjustments
Adjusted income is calculated prior to considering certain significant purchase accounting impacts resulting from business combinations and net asset acquisitions. Theseimpacts, primarily associated with Wyeth (acquired in 2009), Hospira (acquired in 2015), Anacor (acquired in June 2016) and Medivation (acquired in September 2016), caninclude the incremental charge to cost of sales from the sale of acquired inventory that was written up to fair value, amortization related to the increase in fair value of theacquired finite-lived intangible assets, and to a much lesser extent, depreciation related to the increase/decrease in fair value of the acquired fixed assets (primarilymanufacturing facilities), amortization related to the increase in fair value of acquired debt, and the fair value changes associated with contingent consideration. Therefore, theAdjusted income measure includes the revenues earned upon the sale of the acquired products without considering the acquisition cost of those products.
Certain of the purchase accounting adjustments can occur through 20 or more years, but this presentation provides an alternative view of our performance that is used bymanagement to internally assess business performance. We believe the elimination of amortization attributable to acquired intangible assets provides management andinvestors an alternative view of our business results by trying to provide a degree of parity to internally developed intangible assets for which R&D costs previously have beenexpensed.
However, a completely accurate comparison of internally developed intangible assets and acquired intangible assets cannot be achieved through Adjusted income. Thiscomponent of Adjusted income is derived solely from the impacts of the items listed in the first paragraph of this section. We have not factored in the impacts of any otherdifferences in experience that might have occurred if we had discovered and developed those intangible assets on our own, and this approach does not intend to berepresentative of the results that would have occurred in those circumstances. For example, our R&D costs in total, and in the periods presented, may have been different; ourspeed to commercialization and resulting sales, if any, may have been different; or our costs to manufacture may have been different. In addition, our marketing efforts mayhave been received differently by our customers. As such, in total, there can be no assurance that our Adjusted income amounts would have been the same as presented hadwe discovered and developed the acquired intangible assets.
2016 Financial Report
39
Financial ReviewPfizer Inc. and Subsidiary Companies
Acquisition-Related Costs
Adjusted income is calculated prior to considering transaction, integration, restructuring and additional depreciation costs associated with business combinations becausethese costs are unique to each transaction and represent costs that were incurred to restructure and integrate two businesses as a result of the acquisition decision. Foradditional clarity, only transaction costs, additional depreciation and restructuring and integration activities that are associated with a business combination or a net-assetacquisition are included in acquisition-related costs. We have made no adjustments for the resulting synergies.
We believe that viewing income prior to considering these charges provides investors with a useful additional perspective because the significant costs incurred in connectionwith a business combination result primarily from the need to eliminate duplicate assets, activities or employees––a natural result of acquiring a fully integrated set of activities.For this reason, we believe that the costs incurred to convert disparate systems, to close duplicative facilities or to eliminate duplicate positions (for example, in the context of abusiness combination) can be viewed differently from those costs incurred in other, more normal, business contexts.
The integration and restructuring costs associated with a business combination may occur over several years, with the more significant impacts typically ending within threeyears of the transaction. Because of the need for certain external approvals for some actions, the span of time needed to achieve certain restructuring and integration activitiescan be lengthy. For example, due to the highly regulated nature of the pharmaceutical business, the closure of excess facilities can take several years, as all manufacturingchanges are subject to extensive validation and testing and must be approved by the FDA and/or other global regulatory authorities.
Discontinued Operations
Adjusted income is calculated prior to considering the results of operations included in discontinued operations, as well as any related gains or losses on the disposal of suchoperations. We believe that this presentation is meaningful to investors because, while we review our businesses and product lines for strategic fit with our operations, we donot build or run our businesses with the intent to sell them. Restatements due to discontinued operations do not impact compensation or change the Adjusted income measurefor the compensation in respect of the restated periods, but are presented for consistency across all periods.
Certain Significant Items
Adjusted income is calculated prior to considering certain significant items. Certain significant items represent substantive and/or unusual items that are evaluated on anindividual basis. Such evaluation considers both the quantitative and the qualitative aspects of their nature. Certain significant items may be highly variable and difficult topredict. Furthermore, in some cases it is reasonably possible that they could reoccur in future periods. For example, major non-acquisition-related cost-reduction programsstand on their own as they are specific to an event or goal with a defined term, but we may have subsequent programs based on reorganizations of the business, costproductivity or in response to loss of exclusivity or economic conditions. Legal charges to resolve litigation are also related to specific cases, which are facts and circumstancesspecific and, in some cases, may also be the result of litigation matters at acquired companies that were inestimable, not probable or unresolved at the date of acquisition.Unusual items may represent items that are not part of our ongoing business; items that, either as a result of their nature or size, we would not expect to occur as part of ournormal business on a regular basis; items that would be non-recurring; or items that relate to products we no longer sell. While not all-inclusive, examples of items that could beincluded as certain significant items would be a major non-acquisition-related restructuring charge and associated implementation costs; amounts related to certain disposals ofbusinesses, products or facilities that do not qualify as discontinued operations under U.S. GAAP; certain intangible asset impairments; adjustments related to the resolution ofcertain tax positions; the impact of adopting certain significant, event-driven tax legislation; or charges related to certain legal matters, such as certain of those discussed inNotes to Consolidated Financial Statements— Note 17A. Commitments and Contingencies: Legal Proceedings and in Part II, Item 1, “Legal Proceedings” in our QuarterlyReports on Form 10-Q. Normal, ongoing defense costs of the Company or settlements of and accruals for legal matters made in the normal course of our business would notbe considered certain significant items.
40
2016 Financial Report
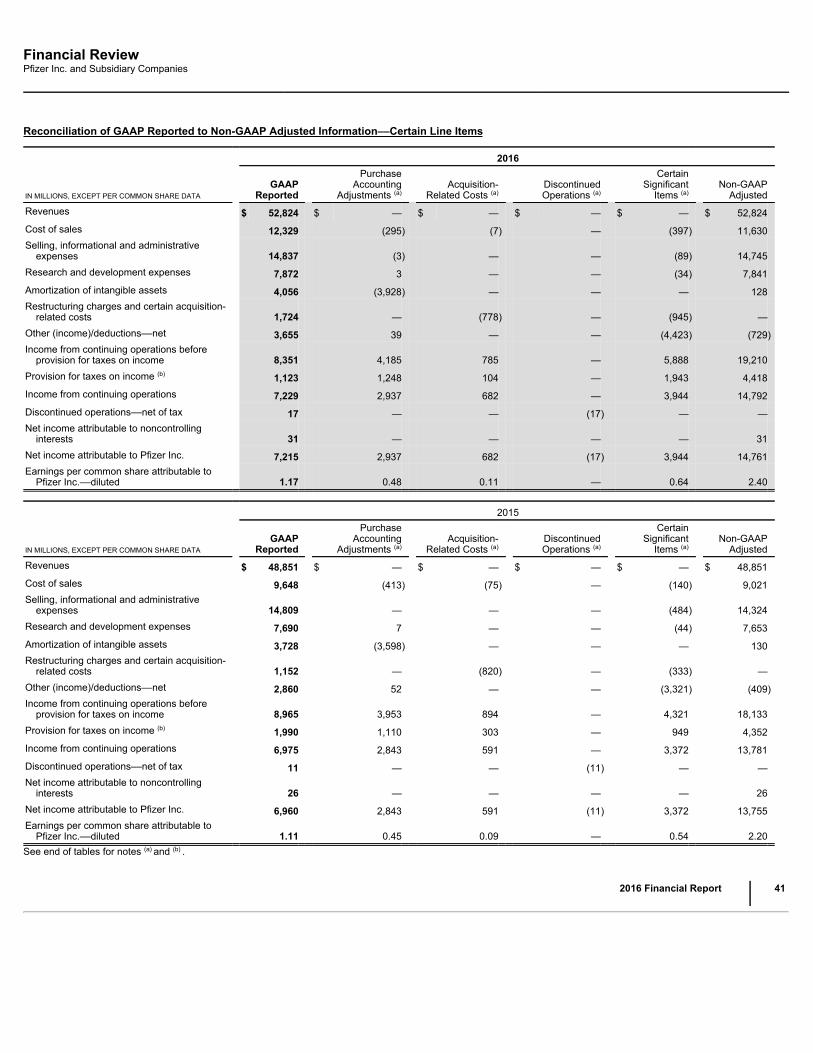
Financial ReviewPfizer Inc. and Subsidiary Companies
Reconciliation of GAAP Reported to Non-GAAP Adjusted Information––Certain Line Items
2016
IN MILLIONS, EXCEPT PER COMMON SHARE DATA GAAP
Reported
PurchaseAccounting
Adjustments (a) Acquisition-
Related Costs (a) DiscontinuedOperations (a)
CertainSignificant
Items (a) Non-GAAP
AdjustedRevenues $ 52,824 $ — $ — $ — $ — $ 52,824Cost of sales 12,329 (295) (7) — (397) 11,630Selling, informational and administrative
expenses 14,837 (3) — — (89) 14,745Research and development expenses 7,872 3 — — (34) 7,841Amortization of intangible assets 4,056 (3,928) — — — 128Restructuring charges and certain acquisition-
related costs 1,724 — (778) — (945) —Other (income)/deductions––net 3,655 39 — — (4,423) (729)Income from continuing operations before
provision for taxes on income 8,351 4,185 785 — 5,888 19,210Provision for taxes on income (b) 1,123 1,248 104 — 1,943 4,418Income from continuing operations 7,229 2,937 682 — 3,944 14,792Discontinued operations––net of tax 17 — — (17) — —Net income attributable to noncontrolling
interests 31 — — — — 31Net income attributable to Pfizer Inc. 7,215 2,937 682 (17) 3,944 14,761Earnings per common share attributable to
Pfizer Inc.––diluted 1.17 0.48 0.11 — 0.64 2.40
2015
IN MILLIONS, EXCEPT PER COMMON SHARE DATA GAAP
Reported
PurchaseAccounting
Adjustments (a) Acquisition-
Related Costs (a) DiscontinuedOperations (a)
CertainSignificant
Items (a) Non-GAAP
AdjustedRevenues $ 48,851 $ — $ — $ — $ — $ 48,851Cost of sales 9,648 (413) (75) — (140) 9,021Selling, informational and administrative
expenses 14,809 — — — (484) 14,324Research and development expenses 7,690 7 — — (44) 7,653Amortization of intangible assets 3,728 (3,598) — — — 130Restructuring charges and certain acquisition-
related costs 1,152 — (820) — (333) —Other (income)/deductions––net 2,860 52 — — (3,321) (409)Income from continuing operations before
provision for taxes on income 8,965 3,953 894 — 4,321 18,133Provision for taxes on income (b) 1,990 1,110 303 — 949 4,352Income from continuing operations 6,975 2,843 591 — 3,372 13,781Discontinued operations––net of tax 11 — — (11) — —Net income attributable to noncontrolling
interests 26 — — — — 26Net income attributable to Pfizer Inc. 6,960 2,843 591 (11) 3,372 13,755Earnings per common share attributable to
Pfizer Inc.––diluted 1.11 0.45 0.09 — 0.54 2.20See end of tables for notes (a) and (b) .
2016 Financial Report
41
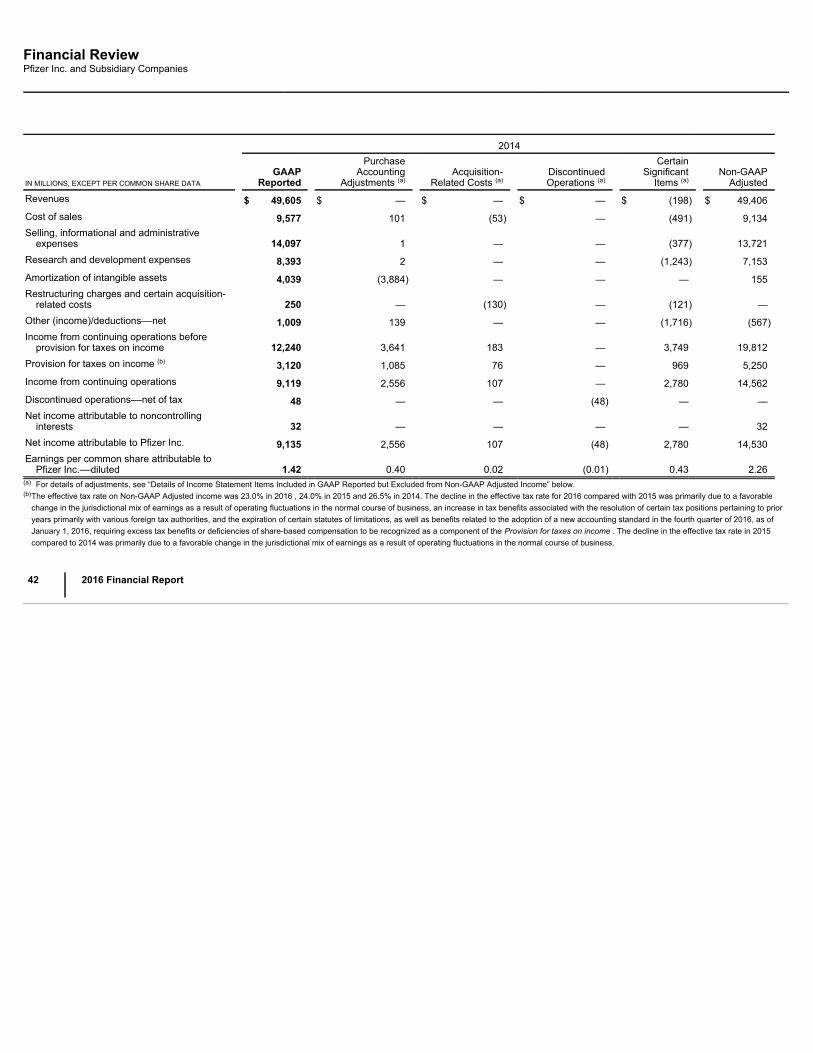
Financial ReviewPfizer Inc. and Subsidiary Companies
2014
IN MILLIONS, EXCEPT PER COMMON SHARE DATA GAAP
Reported
PurchaseAccounting
Adjustments (a) Acquisition-
Related Costs (a) DiscontinuedOperations (a)
CertainSignificant
Items (a) Non-GAAP
AdjustedRevenues $ 49,605 $ — $ — $ — $ (198) $ 49,406Cost of sales 9,577 101 (53) — (491) 9,134Selling, informational and administrative
expenses 14,097 1 — — (377) 13,721Research and development expenses 8,393 2 — — (1,243) 7,153Amortization of intangible assets 4,039 (3,884) — — — 155Restructuring charges and certain acquisition-
related costs 250 — (130) — (121) —Other (income)/deductions––net 1,009 139 — — (1,716) (567)Income from continuing operations before
provision for taxes on income 12,240 3,641 183 — 3,749 19,812Provision for taxes on income (b) 3,120 1,085 76 — 969 5,250Income from continuing operations 9,119 2,556 107 — 2,780 14,562Discontinued operations––net of tax 48 — — (48) — —Net income attributable to noncontrolling
interests 32 — — — — 32Net income attributable to Pfizer Inc. 9,135 2,556 107 (48) 2,780 14,530Earnings per common share attributable to
Pfizer Inc.––diluted 1.42 0.40 0.02 (0.01) 0.43 2.26(a) For details of adjustments, see “Details of Income Statement Items Included in GAAP Reported but Excluded from Non-GAAP Adjusted Income” below.(b)
The effective tax rate on Non-GAAP Adjusted income was 23.0% in 2016 , 24.0% in 2015 and 26.5% in 2014. The decline in the effective tax rate for 2016 compared with 2015 was primarily due to a favorablechange in the jurisdictional mix of earnings as a result of operating fluctuations in the normal course of business, an increase in tax benefits associated with the resolution of certain tax positions pertaining to prioryears primarily with various foreign tax authorities, and the expiration of certain statutes of limitations, as well as benefits related to the adoption of a new accounting standard in the fourth quarter of 2016, as ofJanuary 1, 2016, requiring excess tax benefits or deficiencies of share-based compensation to be recognized as a component of the Provision for taxes on income . The decline in the effective tax rate in 2015compared to 2014 was primarily due to a favorable change in the jurisdictional mix of earnings as a result of operating fluctuations in the normal course of business.
42
2016 Financial Report
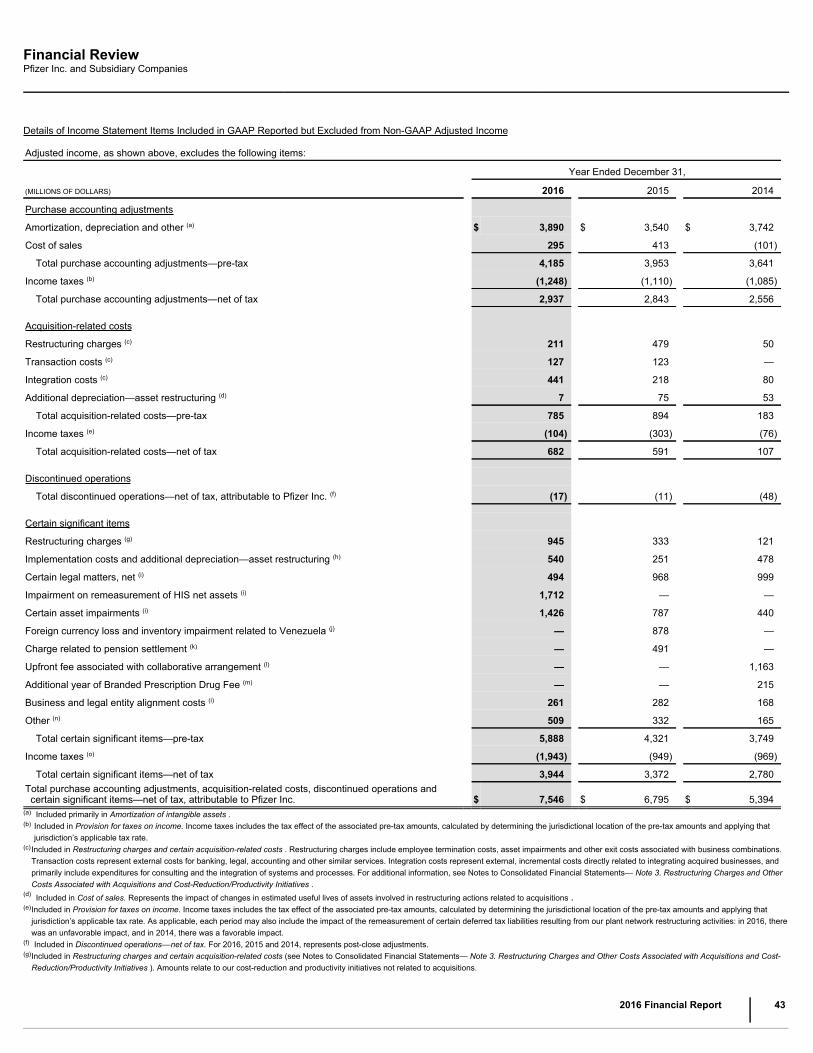
Financial ReviewPfizer Inc. and Subsidiary Companies
Details of Income Statement Items Included in GAAP Reported but Excluded from Non-GAAP Adjusted Income
Adjusted income, as shown above, excludes the following items:
Year Ended December 31,
(MILLIONS OF DOLLARS) 2016 2015 2014
Purchase accounting adjustments
Amortization, depreciation and other (a) $ 3,890 $ 3,540 $ 3,742
Cost of sales 295 413 (101)
Total purchase accounting adjustments—pre-tax 4,185 3,953 3,641
Income taxes (b) (1,248) (1,110) (1,085)
Total purchase accounting adjustments—net of tax 2,937 2,843 2,556
Acquisition-related costs
Restructuring charges (c) 211 479 50
Transaction costs (c) 127 123 —
Integration costs (c) 441 218 80
Additional depreciation—asset restructuring (d) 7 75 53
Total acquisition-related costs—pre-tax 785 894 183
Income taxes (e) (104) (303) (76)
Total acquisition-related costs—net of tax 682 591 107
Discontinued operations
Total discontinued operations—net of tax, attributable to Pfizer Inc. (f) (17) (11) (48)
Certain significant items
Restructuring charges (g) 945 333 121
Implementation costs and additional depreciation—asset restructuring (h) 540 251 478
Certain legal matters, net (i) 494 968 999
Impairment on remeasurement of HIS net assets (i) 1,712 — —
Certain asset impairments (i) 1,426 787 440
Foreign currency loss and inventory impairment related to Venezuela (j) — 878 —
Charge related to pension settlement (k) — 491 —
Upfront fee associated with collaborative arrangement (l) — — 1,163
Additional year of Branded Prescription Drug Fee (m) — — 215
Business and legal entity alignment costs (i) 261 282 168
Other (n) 509 332 165
Total certain significant items—pre-tax 5,888 4,321 3,749
Income taxes (o) (1,943) (949) (969)
Total certain significant items—net of tax 3,944 3,372 2,780Total purchase accounting adjustments, acquisition-related costs, discontinued operations andcertain significant items—net of tax, attributable to Pfizer Inc. $ 7,546 $ 6,795 $ 5,394
(a) Included primarily in Amortization of intangible assets .(b)
Included in Provision for taxes on income. Income taxes includes the tax effect of the associated pre-tax amounts, calculated by determining the jurisdictional location of the pre-tax amounts and applying thatjurisdiction’s applicable tax rate.
(c)
Included in Restructuring charges and certain acquisition-related costs . Restructuring charges include employee termination costs, asset impairments and other exit costs associated with business combinations.Transaction costs represent external costs for banking, legal, accounting and other similar services. Integration costs represent external, incremental costs directly related to integrating acquired businesses, andprimarily include expenditures for consulting and the integration of systems and processes. For additional information, see Notes to Consolidated Financial Statements— Note 3. Restructuring Charges and OtherCosts Associated with Acquisitions and Cost-Reduction/Productivity Initiatives .
(d) Included in Cost of sales. Represents the impact of changes in estimated useful lives of assets involved in restructuring actions related to acquisitions .(e)
Included in Provision for taxes on income. Income taxes includes the tax effect of the associated pre-tax amounts, calculated by determining the jurisdictional location of the pre-tax amounts and applying thatjurisdiction’s applicable tax rate. As applicable, each period may also include the impact of the remeasurement of certain deferred tax liabilities resulting from our plant network restructuring activities: in 2016, therewas an unfavorable impact, and in 2014, there was a favorable impact.
(f) Included in Discontinued operations––net of tax. For 2016, 2015 and 2014, represents post-close adjustments.(g)
Included in Restructuring charges and certain acquisition-related costs (see Notes to Consolidated Financial Statements— Note 3. Restructuring Charges and Other Costs Associated with Acquisitions and Cost-Reduction/Productivity Initiatives ). Amounts relate to our cost-reduction and productivity initiatives not related to acquisitions.
2016 Financial Report
43

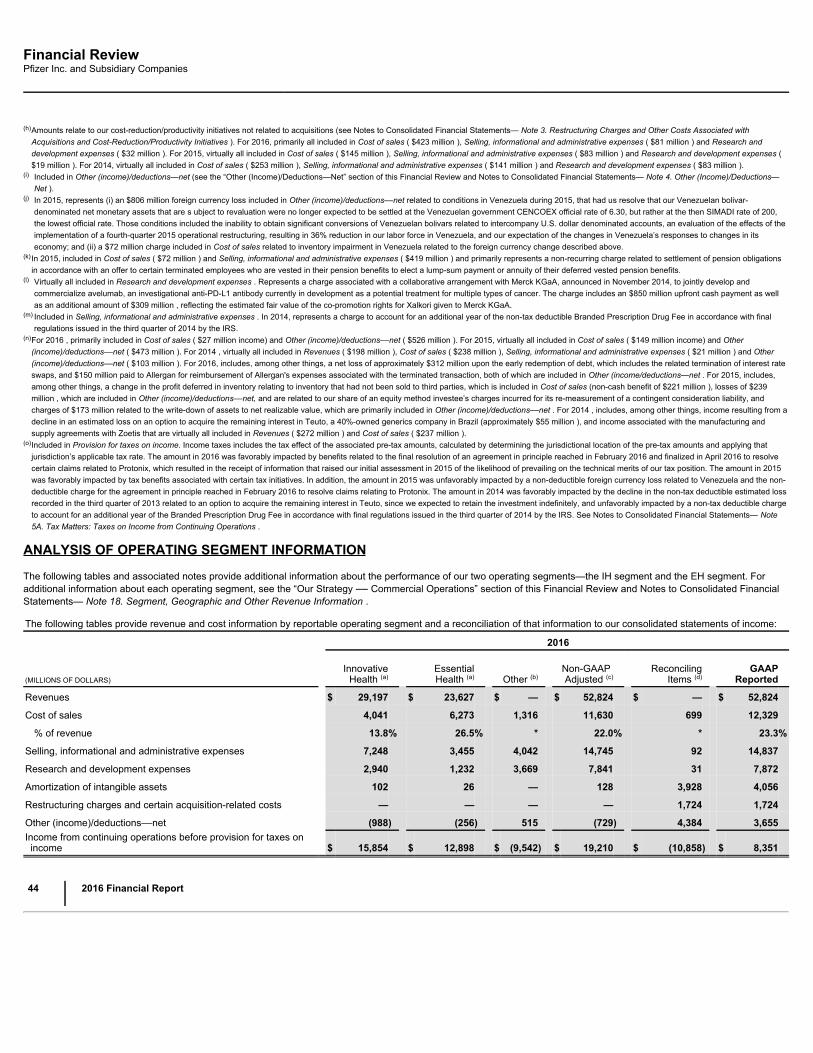
Financial ReviewPfizer Inc. and Subsidiary Companies
(h)
Amounts relate to our cost-reduction/productivity initiatives not related to acquisitions (see Notes to Consolidated Financial Statements— Note 3. Restructuring Charges and Other Costs Associated withAcquisitions and Cost-Reduction/Productivity Initiatives ). For 2016, primarily all included in Cost of sales ( $423 million ), Selling, informational and administrative expenses ( $81 million ) and Research anddevelopment expenses ( $32 million ). For 2015, virtually all included in Cost of sales ( $145 million ), Selling, informational and administrative expenses ( $83 million ) and Research and development expenses ($19 million ). For 2014, virtually all included in Cost of sales ( $253 million ), Selling, informational and administrative expenses ( $141 million ) and Research and development expenses ( $83 million ).
(i) Included in Other (income)/deductions—net (see the “Other (Income)/Deductions—Net” section of this Financial Review and Notes to Consolidated Financial Statements— Note 4. Other (Income)/Deductions—Net ).
(j) In 2015, represents (i) an $806 million foreign currency loss included in Other (income)/deductions––net related to conditions in Venezuela during 2015, that had us resolve that our Venezuelan bolivar-denominated net monetary assets that are s ubject to revaluation were no longer expected to be settled at the Venezuelan government CENCOEX official rate of 6.30, but rather at the then SIMADI rate of 200,the lowest official rate. Those conditions included the inability to obtain significant conversions of Venezuelan bolivars related to intercompany U.S. dollar denominated accounts, an evaluation of the effects of theimplementation of a fourth-quarter 2015 operational restructuring, resulting in 36% reduction in our labor force in Venezuela, and our expectation of the changes in Venezuela’s responses to changes in itseconomy; and (ii) a $72 million charge included in Cost of sales related to inventory impairment in Venezuela related to the foreign currency change described above.
(k)
In 2015, included in Cost of sales ( $72 million ) and Selling, informational and administrative expenses ( $419 million ) and primarily represents a non-recurring charge related to settlement of pension obligationsin accordance with an offer to certain terminated employees who are vested in their pension benefits to elect a lump-sum payment or annuity of their deferred vested pension benefits.
(l) Virtually all included in Research and development expenses . Represents a charge associated with a collaborative arrangement with Merck KGaA, announced in November 2014, to jointly develop andcommercialize avelumab, an investigational anti-PD-L1 antibody currently in development as a potential treatment for multiple types of cancer. The charge includes an $850 million upfront cash payment as wellas an additional amount of $309 million , reflecting the estimated fair value of the co-promotion rights for Xalkori given to Merck KGaA.
(m)
Included in Selling, informational and administrative expenses . In 2014, represents a charge to account for an additional year of the non-tax deductible Branded Prescription Drug Fee in accordance with finalregulations issued in the third quarter of 2014 by the IRS.
(n)
For 2016 , primarily included in Cost of sales ( $27 million income) and Other (income)/deductions––net ( $526 million ). For 2015, virtually all included in Cost of sales ( $149 million income) and Other(income)/deductions––net ( $473 million ). For 2014 , virtually all included in Revenues ( $198 million ), Cost of sales ( $238 million ), Selling, informational and administrative expenses ( $21 million ) and Other(income)/deductions––net ( $103 million ). For 2016, includes, among other things, a net loss of approximately $312 million upon the early redemption of debt, which includes the related termination of interest rateswaps, and $150 million paid to Allergan for reimbursement of Allergan's expenses associated with the terminated transaction, both of which are included in Other (income/deductions—net . For 2015, includes,among other things, a change in the profit deferred in inventory relating to inventory that had not been sold to third parties, which is included in Cost of sales (non-cash benefit of $221 million ), losses of $239million , which are included in Other (income)/deductions––net, and are related to our share of an equity method investee’s charges incurred for its re-measurement of a contingent consideration liability, andcharges of $173 million related to the write-down of assets to net realizable value, which are primarily included in Other (income)/deductions––net . For 2014 , includes, among other things, income resulting from adecline in an estimated loss on an option to acquire the remaining interest in Teuto, a 40%-owned generics company in Brazil (approximately $55 million ), and income associated with the manufacturing andsupply agreements with Zoetis that are virtually all included in Revenues ( $272 million ) and Cost of sales ( $237 million ).
(o)
Included in Provision for taxes on income. Income taxes includes the tax effect of the associated pre-tax amounts, calculated by determining the jurisdictional location of the pre-tax amounts and applying thatjurisdiction’s applicable tax rate. The amount in 2016 was favorably impacted by benefits related to the final resolution of an agreement in principle reached in February 2016 and finalized in April 2016 to resolvecertain claims related to Protonix, which resulted in the receipt of information that raised our initial assessment in 2015 of the likelihood of prevailing on the technical merits of our tax position. The amount in 2015was favorably impacted by tax benefits associated with certain tax initiatives. In addition, the amount in 2015 was unfavorably impacted by a non-deductible foreign currency loss related to Venezuela and the non-deductible charge for the agreement in principle reached in February 2016 to resolve claims relating to Protonix. The amount in 2014 was favorably impacted by the decline in the non-tax deductible estimated lossrecorded in the third quarter of 2013 related to an option to acquire the remaining interest in Teuto, since we expected to retain the investment indefinitely, and unfavorably impacted by a non-tax deductible chargeto account for an additional year of the Branded Prescription Drug Fee in accordance with final regulations issued in the third quarter of 2014 by the IRS. See Notes to Consolidated Financial Statements— Note5A. Tax Matters: Taxes on Income from Continuing Operations .
ANALYSIS OF OPERATING SEGMENT INFORMATION
The following tables and associated notes provide additional information about the performance of our two operating segments—the IH segment and the EH segment. Foradditional information about each operating segment, see the “Our Strategy –– Commercial Operations” section of this Financial Review and Notes to Consolidated FinancialStatements— Note 18. Segment, Geographic and Other Revenue Information .
The following tables provide revenue and cost information by reportable operating segment and a reconciliation of that information to our consolidated statements of income:
2016
(MILLIONS OF DOLLARS) Innovative
Health (a) EssentialHealth (a) Other (b)
Non-GAAP Adjusted (c)
ReconcilingItems (d)
GAAPReported
Revenues $ 29,197 $ 23,627 $ — $ 52,824 $ — $ 52,824
Cost of sales 4,041 6,273 1,316 11,630 699 12,329
% of revenue 13.8% 26.5% * 22.0% * 23.3%
Selling, informational and administrative expenses 7,248 3,455 4,042 14,745 92 14,837
Research and development expenses 2,940 1,232 3,669 7,841 31 7,872
Amortization of intangible assets 102 26 — 128 3,928 4,056
Restructuring charges and certain acquisition-related costs — — — — 1,724 1,724
Other (income)/deductions––net (988) (256) 515 (729) 4,384 3,655Income from continuing operations before provision for taxes onincome $ 15,854 $ 12,898 $ (9,542) $ 19,210 $ (10,858) $ 8,351
44
2016 Financial Report

Financial ReviewPfizer Inc. and Subsidiary Companies
2015
(MILLIONS OF DOLLARS) Innovative
Health (a) EssentialHealth (a) Other (b)
Non-GAAP Adjusted (c)
ReconcilingItems (d)
GAAPReported
Revenues $ 26,758 $ 22,094 $ — $ 48,851 $ — $ 48,851
Cost of sales 3,651 4,891 479 9,021 627 9,648
% of revenue 13.6% 22.1% * 18.5% * 19.7%
Selling, informational and administrative expenses 6,807 3,573 3,945 14,324 485 14,809
Research and development expenses 2,712 1,032 3,909 7,653 37 7,690
Amortization of intangible assets 94 36 — 130 3,598 3,728
Restructuring charges and certain acquisition-related costs — — — — 1,152 1,152
Other (income)/deductions––net (1,086) (152) 829 (409) 3,269 2,860Income from continuing operations before provision for taxes onincome $ 14,581 $ 12,714 $ (9,162) $ 18,133 $ (9,168) $ 8,965
2014
(MILLIONS OF DOLLARS) Innovative
Health (a) EssentialHealth (a) Other (b)
Non-GAAP Adjusted (c)
ReconcilingItems (d)
GAAPReported
Revenues $ 24,005 $ 25,401 $ — $ 49,406 $ 198 $ 49,605
Cost of sales 3,848 4,734 551 9,134 443 9,577
% of revenue 16.0% 18.6% * 18.5% * 19.3%
Selling, informational and administrative expenses 6,162 3,900 3,658 13,721 377 14,097
Research and development expenses 2,278 938 3,937 7,153 1,241 8,393
Amortization of intangible assets 69 85 — 155 3,884 4,039
Restructuring charges and certain acquisition-related costs — — — — 250 250
Other (income)/deductions––net (1,096) (276) 804 (567) 1,577 1,009Income from continuing operations before provision for taxes onincome $ 12,743 $ 16,020 $ (8,951) $ 19,812 $ (7,573) $ 12,240
(a) Amounts represent the revenues and costs managed by each of our operating segments. The expenses generally include only those costs directly attributable to the operating segment.• Our results of operations include the operating results of acquired businesses after the completion of the acquisition. On June 24, 2016, we acquired Anacor and on September 28, 2016, we acquired
Medivation. Commencing from their respective acquisition dates, our results of operations and IH’s operating results for 2016 include approximately six months of legacy Anacor operations, which wereimmaterial, and approximately three months of legacy Medivation operations. On September 3, 2015, we acquired Hospira. Commencing from the acquisition date, our results of operations and EH’s operatingresults include legacy Hospira commercial operations, including the legacy Hospira One-2-One contract manufacturing business. In accordance with our domestic and international reporting periods, our resultsof operations and EH’s operating results for 2015 reflect four months of legacy Hospira U.S. operations and three months of legacy Hospira international operations. See Notes to Consolidated FinancialStatements–– Note 2A. Acquisitions, Assets and Liabilities Held for Sale, Licensing Agreements, Research and Development and Collaborative Arrangements, Equity-Method Investments and Cost-MethodInvestment: Acquisitions for additional information.
• The following organizational changes in 2016 impacted our operating segments:IH ––In connection with the formation in early 2016 of the GPD organization, a new unified center for late-stage development for our innovative products, which is generally responsible for the clinicaldevelopment of assets that are in clinical trials for our WRD and Innovative portfolios, effective in the second quarter of 2016, certain development-related functions transferred from IH to GPD. We havereclassified approximately $ 76 million of costs in the first quarter of 2016, $318 million of costs in 2015 and $271 million of costs in 2014 from IH to GPD to conform to the presentation as part of GPD in 2016.EH ––Beginning in 2016, our contract manufacturing business, Pfizer CentreOne, is part of EH. Pfizer CentreOne consists of (i) the revenues and expenses of legacy Pfizer's contract manufacturing and activepharmaceutical ingredient sales operation (previously known as Pfizer CentreSource or PCS), including the revenues and expenses related to our manufacturing and supply agreements with Zoetis, which priorto 2016 was managed outside EH as part of PGS and previously reported in “Other Unallocated” costs; and (ii) the revenues and expenses of legacy Hospira's One-2-One sterile injectables contractmanufacturing operation, which has been included in EH since we acquired Hospira on September 3, 2015. We have reclassified prior period PCS operating results ( $506 million of PCS revenues and $96million of PCS earnings in 2015, which in 2015 includes revenues and expenses related to our manufacturing and supply agreements with Zoetis, and $253 million of PCS revenues and $69 million of PCSearnings in 2014) to conform to the current period presentation as part of EH.EH ––In connection with the formation of a new EH R&D organization, effective in the first quarter of 2016, certain functions transferred from Pfizer’s WRD organization to the new EH R&D organization. Wehave reclassified approximately $274 million of costs in 2015 and $281 million of costs in 2014 from WRD to EH to conform to the current period presentation as part of EH.
2016 Financial Report
45
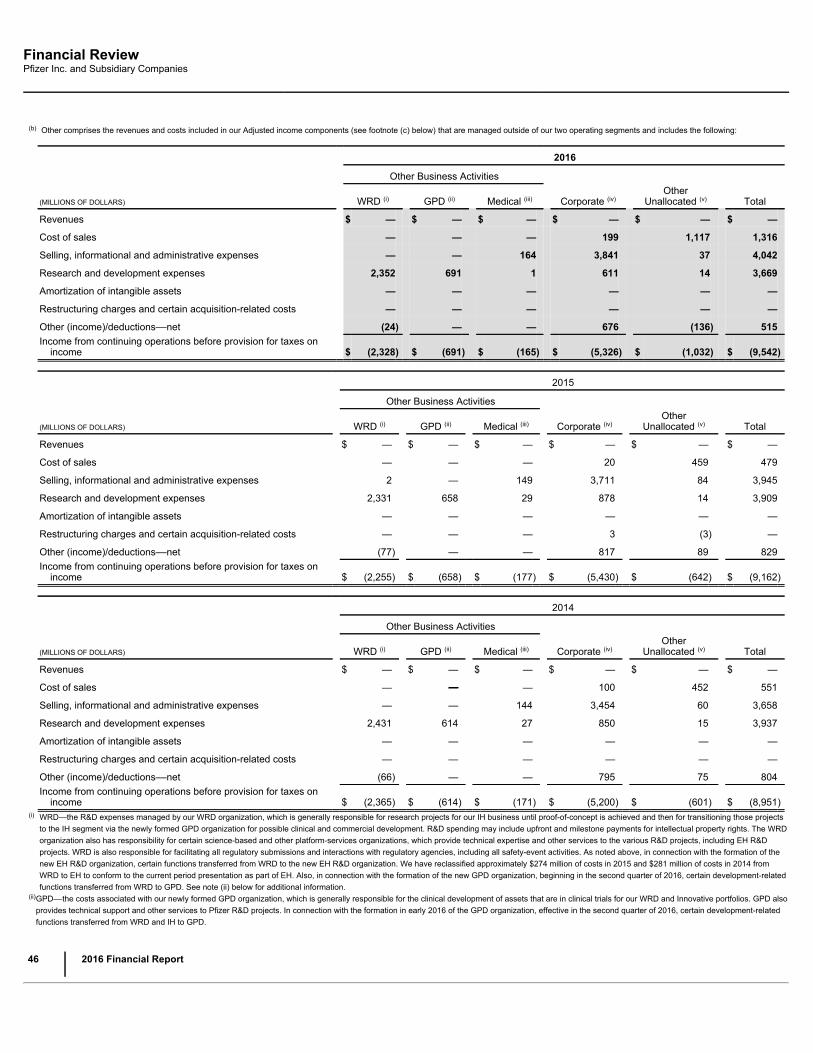
Financial ReviewPfizer Inc. and Subsidiary Companies
(b) Other comprises the revenues and costs included in our Adjusted income components (see footnote (c) below) that are managed outside of our two operating segments and includes the following:
2016 Other Business Activities
(MILLIONS OF DOLLARS) WRD (i) GPD (ii) Medical (iii) Corporate (iv) Other
Unallocated (v) Total
Revenues $ — $ — $ — $ — $ — $ —
Cost of sales — — — 199 1,117 1,316
Selling, informational and administrative expenses — — 164 3,841 37 4,042
Research and development expenses 2,352 691 1 611 14 3,669
Amortization of intangible assets — — — — — —
Restructuring charges and certain acquisition-related costs — — — — — —
Other (income)/deductions––net (24) — — 676 (136) 515Income from continuing operations before provision for taxes on
income $ (2,328) $ (691) $ (165) $ (5,326) $ (1,032) $ (9,542)
2015
Other Business Activities
(MILLIONS OF DOLLARS) WRD (i) GPD (ii) Medical (iii) Corporate (iv) Other
Unallocated (v) Total
Revenues $ — $ — $ — $ — $ — $ —
Cost of sales — — — 20 459 479
Selling, informational and administrative expenses 2 — 149 3,711 84 3,945
Research and development expenses 2,331 658 29 878 14 3,909
Amortization of intangible assets — — — — — —
Restructuring charges and certain acquisition-related costs — — — 3 (3) —
Other (income)/deductions––net (77) — — 817 89 829Income from continuing operations before provision for taxes on
income $ (2,255) $ (658) $ (177) $ (5,430) $ (642) $ (9,162)
2014
Other Business Activities
(MILLIONS OF DOLLARS) WRD (i) GPD (ii) Medical (iii) Corporate (iv) Other
Unallocated (v) Total
Revenues $ — $ — $ — $ — $ — $ —
Cost of sales — — — 100 452 551
Selling, informational and administrative expenses — — 144 3,454 60 3,658
Research and development expenses 2,431 614 27 850 15 3,937
Amortization of intangible assets — — — — — —
Restructuring charges and certain acquisition-related costs — — — — — —
Other (income)/deductions––net (66) — — 795 75 804Income from continuing operations before provision for taxes on
income $ (2,365) $ (614) $ (171) $ (5,200) $ (601) $ (8,951)(i) WRD—the R&D expenses managed by our WRD organization, which is generally responsible for research projects for our IH business until proof-of-concept is achieved and then for transitioning those projects
to the IH segment via the newly formed GPD organization for possible clinical and commercial development. R&D spending may include upfront and milestone payments for intellectual property rights. The WRDorganization also has responsibility for certain science-based and other platform-services organizations, which provide technical expertise and other services to the various R&D projects, including EH R&Dprojects. WRD is also responsible for facilitating all regulatory submissions and interactions with regulatory agencies, including all safety-event activities. As noted above, in connection with the formation of thenew EH R&D organization, certain functions transferred from WRD to the new EH R&D organization. We have reclassified approximately $274 million of costs in 2015 and $281 million of costs in 2014 fromWRD to EH to conform to the current period presentation as part of EH. Also, in connection with the formation of the new GPD organization, beginning in the second quarter of 2016, certain development-relatedfunctions transferred from WRD to GPD. See note (ii) below for additional information.
(ii)
GPD––the costs associated with our newly formed GPD organization, which is generally responsible for the clinical development of assets that are in clinical trials for our WRD and Innovative portfolios. GPD alsoprovides technical support and other services to Pfizer R&D projects. In connection with the formation in early 2016 of the GPD organization, effective in the second quarter of 2016, certain development-relatedfunctions transferred from WRD and IH to GPD.
46
2016 Financial Report
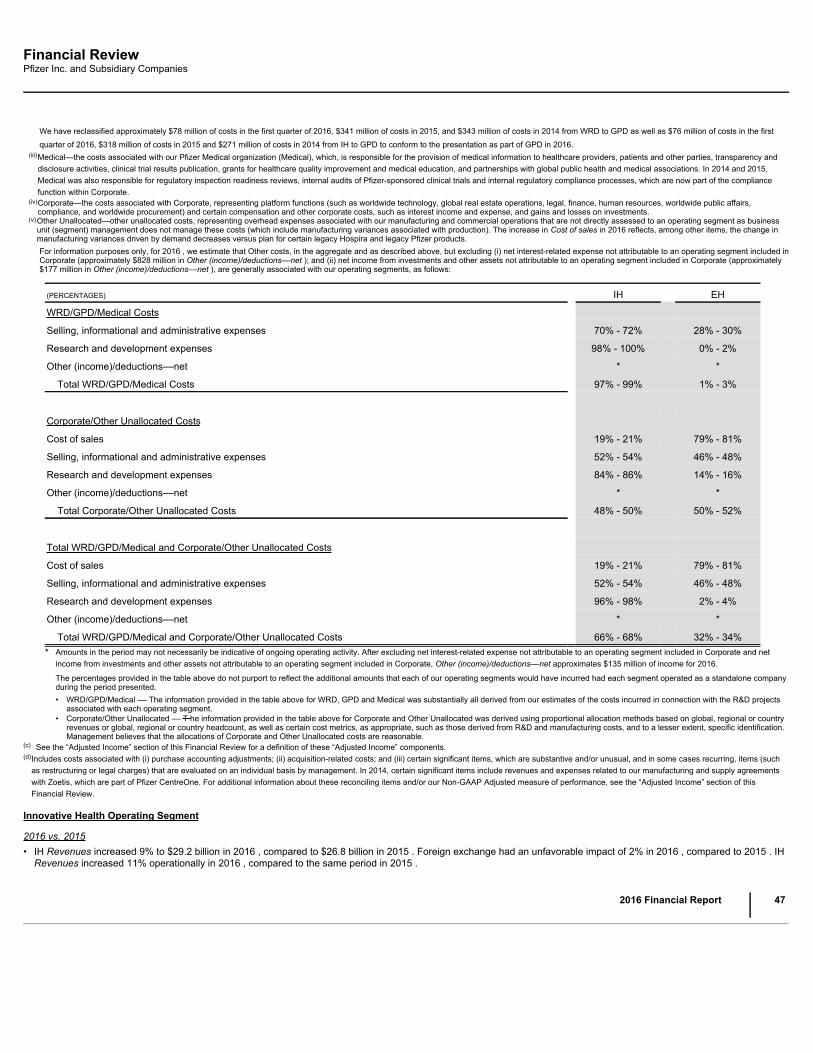
Financial ReviewPfizer Inc. and Subsidiary Companies
We have reclassified approximately $78 million of costs in the first quarter of 2016, $341 million of costs in 2015, and $343 million of costs in 2014 from WRD to GPD as well as $76 million of costs in the firstquarter of 2016, $318 million of costs in 2015 and $271 million of costs in 2014 from IH to GPD to conform to the presentation as part of GPD in 2016.
(iii)
Medical—the costs associated with our Pfizer Medical organization (Medical), which, is responsible for the provision of medical information to healthcare providers, patients and other parties, transparency anddisclosure activities, clinical trial results publication, grants for healthcare quality improvement and medical education, and partnerships with global public health and medical associations. In 2014 and 2015,Medical was also responsible for regulatory inspection readiness reviews, internal audits of Pfizer-sponsored clinical trials and internal regulatory compliance processes, which are now part of the compliancefunction within Corporate.
(iv)
Corporate—the costs associated with Corporate, representing platform functions (such as worldwide technology, global real estate operations, legal, finance, human resources, worldwide public affairs,compliance, and worldwide procurement) and certain compensation and other corporate costs, such as interest income and expense, and gains and losses on investments.
(v)
Other Unallocated—other unallocated costs, representing overhead expenses associated with our manufacturing and commercial operations that are not directly assessed to an operating segment as businessunit (segment) management does not manage these costs (which include manufacturing variances associated with production). The increase in Cost of sales in 2016 reflects, among other items, the change inmanufacturing variances driven by demand decreases versus plan for certain legacy Hospira and legacy Pfizer products.For information purposes only, for 2016 , we estimate that Other costs, in the aggregate and as described above, but excluding (i) net interest-related expense not attributable to an operating segment included inCorporate (approximately $828 million in Other (income)/deductions––net ); and (ii) net income from investments and other assets not attributable to an operating segment included in Corporate (approximately$177 million in Other (income)/deductions––net ), are generally associated with our operating segments, as follows:
(PERCENTAGES) IH EH
WRD/GPD/Medical Costs
Selling, informational and administrative expenses 70% - 72% 28% - 30%
Research and development expenses 98% - 100% 0% - 2%
Other (income)/deductions––net * *
Total WRD/GPD/Medical Costs 97% - 99% 1% - 3%
Corporate/Other Unallocated Costs
Cost of sales 19% - 21% 79% - 81%
Selling, informational and administrative expenses 52% - 54% 46% - 48%
Research and development expenses 84% - 86% 14% - 16%
Other (income)/deductions––net * *
Total Corporate/Other Unallocated Costs 48% - 50% 50% - 52%
Total WRD/GPD/Medical and Corporate/Other Unallocated Costs
Cost of sales 19% - 21% 79% - 81%
Selling, informational and administrative expenses 52% - 54% 46% - 48%
Research and development expenses 96% - 98% 2% - 4%
Other (income)/deductions––net * *
Total WRD/GPD/Medical and Corporate/Other Unallocated Costs 66% - 68% 32% - 34%* Amounts in the period may not necessarily be indicative of ongoing operating activity. After excluding net interest-related expense not attributable to an operating segment included in Corporate and net
income from investments and other assets not attributable to an operating segment included in Corporate, Other (income)/deductions––net approximates $135 million of income for 2016.
The percentages provided in the table above do not purport to reflect the additional amounts that each of our operating segments would have incurred had each segment operated as a standalone companyduring the period presented.• WRD/GPD/Medical –– The information provided in the table above for WRD, GPD and Medical was substantially all derived from our estimates of the costs incurred in connection with the R&D projects
associated with each operating segment.• Corporate/Other Unallocated –– T he information provided in the table above for Corporate and Other Unallocated was derived using proportional allocation methods based on global, regional or country
revenues or global, regional or country headcount, as well as certain cost metrics, as appropriate, such as those derived from R&D and manufacturing costs, and to a lesser extent, specific identification.Management believes that the allocations of Corporate and Other Unallocated costs are reasonable.
(c) See the “Adjusted Income” section of this Financial Review for a definition of these “Adjusted Income” components.(d)
Includes costs associated with (i) purchase accounting adjustments; (ii) acquisition-related costs; and (iii) certain significant items, which are substantive and/or unusual, and in some cases recurring, items (suchas restructuring or legal charges) that are evaluated on an individual basis by management. In 2014, certain significant items include revenues and expenses related to our manufacturing and supply agreementswith Zoetis, which are part of Pfizer CentreOne. For additional information about these reconciling items and/or our Non-GAAP Adjusted measure of performance, see the “Adjusted Income” section of thisFinancial Review.
Innovative Health Operating Segment
2016 vs. 2015• IH Revenues increased 9% to $29.2 billion in 2016 , compared to $26.8 billion in 2015 . Foreign exchange had an unfavorable impact of 2% in 2016 , compared to 2015 . IH
Revenues increased 11% operationally in 2016 , compared to the same period in 2015 .
2016 Financial Report
47
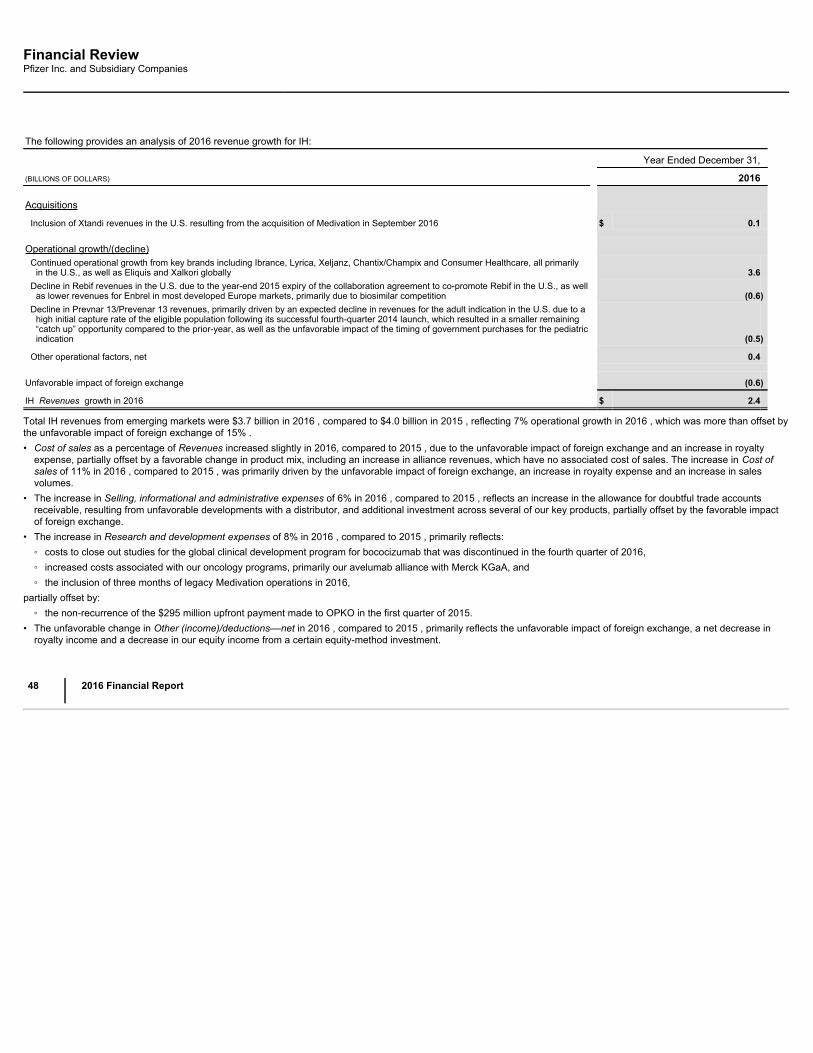
Financial ReviewPfizer Inc. and Subsidiary Companies
The following provides an analysis of 2016 revenue growth for IH:
Year Ended December 31,
(BILLIONS OF DOLLARS) 2016 Acquisitions
Inclusion of Xtandi revenues in the U.S. resulting from the acquisition of Medivation in September 2016 $ 0.1
Operational growth/(decline)
Continued operational growth from key brands including Ibrance, Lyrica, Xeljanz, Chantix/Champix and Consumer Healthcare, all primarilyin the U.S., as well as Eliquis and Xalkori globally 3.6
Decline in Rebif revenues in the U.S. due to the year-end 2015 expiry of the collaboration agreement to co-promote Rebif in the U.S., as wellas lower revenues for Enbrel in most developed Europe markets, primarily due to biosimilar competition (0.6)
Decline in Prevnar 13/Prevenar 13 revenues, primarily driven by an expected decline in revenues for the adult indication in the U.S. due to ahigh initial capture rate of the eligible population following its successful fourth-quarter 2014 launch, which resulted in a smaller remaining“catch up” opportunity compared to the prior-year, as well as the unfavorable impact of the timing of government purchases for the pediatricindication (0.5)
Other operational factors, net 0.4
Unfavorable impact of foreign exchange (0.6)
IH Revenues growth in 2016 $ 2.4
Total IH revenues from emerging markets were $3.7 billion in 2016 , compared to $4.0 billion in 2015 , reflecting 7% operational growth in 2016 , which was more than offset bythe unfavorable impact of foreign exchange of 15% .• Cost of sales as a percentage of Revenues increased slightly in 2016, compared to 2015 , due to the unfavorable impact of foreign exchange and an increase in royalty
expense, partially offset by a favorable change in product mix, including an increase in alliance revenues, which have no associated cost of sales. The increase in Cost ofsales of 11% in 2016 , compared to 2015 , was primarily driven by the unfavorable impact of foreign exchange, an increase in royalty expense and an increase in salesvolumes.
• The increase in Selling, informational and administrative expenses of 6% in 2016 , compared to 2015 , reflects an increase in the allowance for doubtful trade accountsreceivable, resulting from unfavorable developments with a distributor, and additional investment across several of our key products, partially offset by the favorable impactof foreign exchange.
• The increase in Research and development expenses of 8% in 2016 , compared to 2015 , primarily reflects:◦ costs to close out studies for the global clinical development program for bococizumab that was discontinued in the fourth quarter of 2016,◦ increased costs associated with our oncology programs, primarily our avelumab alliance with Merck KGaA, and◦ the inclusion of three months of legacy Medivation operations in 2016,
partially offset by:◦ the non-recurrence of the $295 million upfront payment made to OPKO in the first quarter of 2015.
• The unfavorable change in Other (income)/deductions––net in 2016 , compared to 2015 , primarily reflects the unfavorable impact of foreign exchange, a net decrease inroyalty income and a decrease in our equity income from a certain equity-method investment.
48
2016 Financial Report
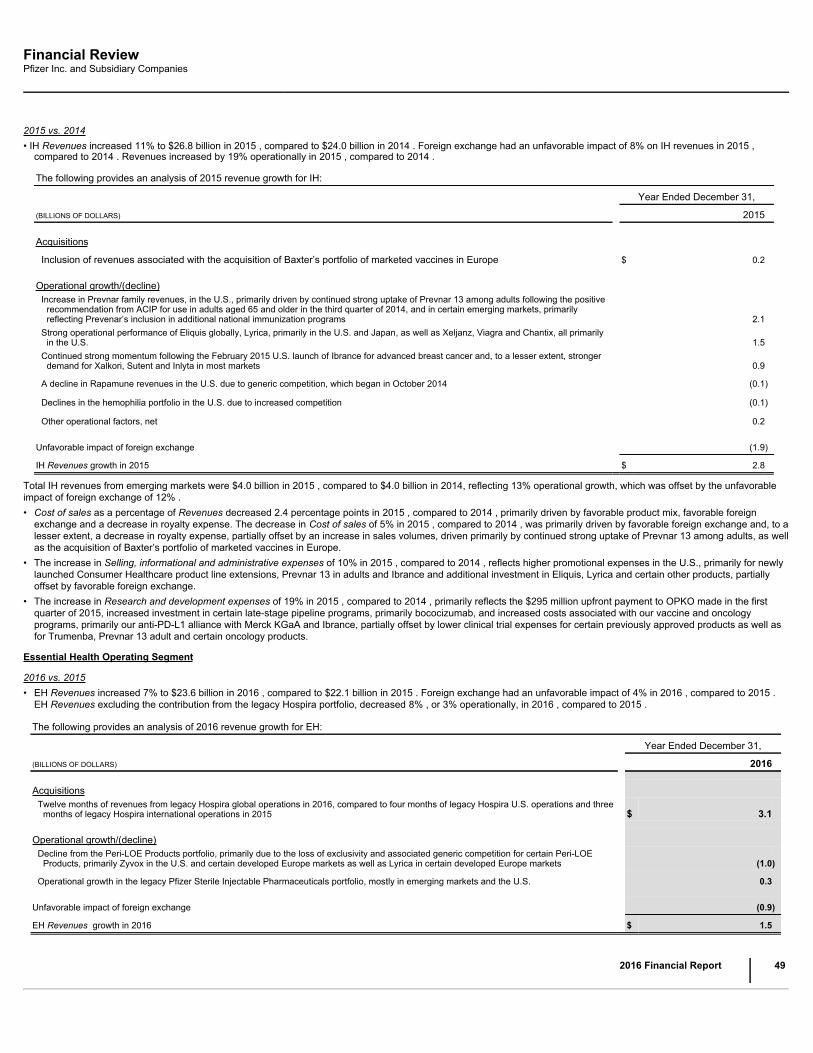
Financial ReviewPfizer Inc. and Subsidiary Companies
2015 vs. 2014• IH Revenues increased 11% to $26.8 billion in 2015 , compared to $24.0 billion in 2014 . Foreign exchange had an unfavorable impact of 8% on IH revenues in 2015 ,
compared to 2014 . Revenues increased by 19% operationally in 2015 , compared to 2014 .
The following provides an analysis of 2015 revenue growth for IH:
Year Ended December 31,
(BILLIONS OF DOLLARS) 2015
Acquisitions
Inclusion of revenues associated with the acquisition of Baxter’s portfolio of marketed vaccines in Europe $ 0.2
Operational growth/(decline)
Increase in Prevnar family revenues, in the U.S., primarily driven by continued strong uptake of Prevnar 13 among adults following the positiverecommendation from ACIP for use in adults aged 65 and older in the third quarter of 2014, and in certain emerging markets, primarilyreflecting Prevenar’s inclusion in additional national immunization programs 2.1
Strong operational performance of Eliquis globally, Lyrica, primarily in the U.S. and Japan, as well as Xeljanz, Viagra and Chantix, all primarilyin the U.S. 1.5
Continued strong momentum following the February 2015 U.S. launch of Ibrance for advanced breast cancer and, to a lesser extent, strongerdemand for Xalkori, Sutent and Inlyta in most markets 0.9
A decline in Rapamune revenues in the U.S. due to generic competition, which began in October 2014 (0.1)
Declines in the hemophilia portfolio in the U.S. due to increased competition (0.1)
Other operational factors, net 0.2
Unfavorable impact of foreign exchange (1.9)
IH Revenues growth in 2015 $ 2.8
Total IH revenues from emerging markets were $4.0 billion in 2015 , compared to $4.0 billion in 2014, reflecting 13% operational growth, which was offset by the unfavorableimpact of foreign exchange of 12% .• Cost of sales as a percentage of Revenues decreased 2.4 percentage points in 2015 , compared to 2014 , primarily driven by favorable product mix, favorable foreign
exchange and a decrease in royalty expense. The decrease in Cost of sales of 5% in 2015 , compared to 2014 , was primarily driven by favorable foreign exchange and, to alesser extent, a decrease in royalty expense, partially offset by an increase in sales volumes, driven primarily by continued strong uptake of Prevnar 13 among adults, as wellas the acquisition of Baxter’s portfolio of marketed vaccines in Europe.
• The increase in Selling, informational and administrative expenses of 10% in 2015 , compared to 2014 , reflects higher promotional expenses in the U.S., primarily for newlylaunched Consumer Healthcare product line extensions, Prevnar 13 in adults and Ibrance and additional investment in Eliquis, Lyrica and certain other products, partiallyoffset by favorable foreign exchange.
• The increase in Research and development expenses of 19% in 2015 , compared to 2014 , primarily reflects the $295 million upfront payment to OPKO made in the firstquarter of 2015, increased investment in certain late-stage pipeline programs, primarily bococizumab, and increased costs associated with our vaccine and oncologyprograms, primarily our anti-PD-L1 alliance with Merck KGaA and Ibrance, partially offset by lower clinical trial expenses for certain previously approved products as well asfor Trumenba, Prevnar 13 adult and certain oncology products.
Essential Health Operating Segment
2016 vs. 2015• EH Revenues increased 7% to $23.6 billion in 2016 , compared to $22.1 billion in 2015 . Foreign exchange had an unfavorable impact of 4% in 2016 , compared to 2015 .
EH Revenues excluding the contribution from the legacy Hospira portfolio, decreased 8% , or 3% operationally, in 2016 , compared to 2015 .
The following provides an analysis of 2016 revenue growth for EH:
Year Ended December 31,
(BILLIONS OF DOLLARS) 2016 Acquisitions
Twelve months of revenues from legacy Hospira global operations in 2016, compared to four months of legacy Hospira U.S. operations and threemonths of legacy Hospira international operations in 2015 $ 3.1
Operational growth/(decline)
Decline from the Peri-LOE Products portfolio, primarily due to the loss of exclusivity and associated generic competition for certain Peri-LOEProducts, primarily Zyvox in the U.S. and certain developed Europe markets as well as Lyrica in certain developed Europe markets (1.0)
Operational growth in the legacy Pfizer Sterile Injectable Pharmaceuticals portfolio, mostly in emerging markets and the U.S. 0.3
Unfavorable impact of foreign exchange (0.9)
EH Revenues growth in 2016 $ 1.5
2016 Financial Report
49
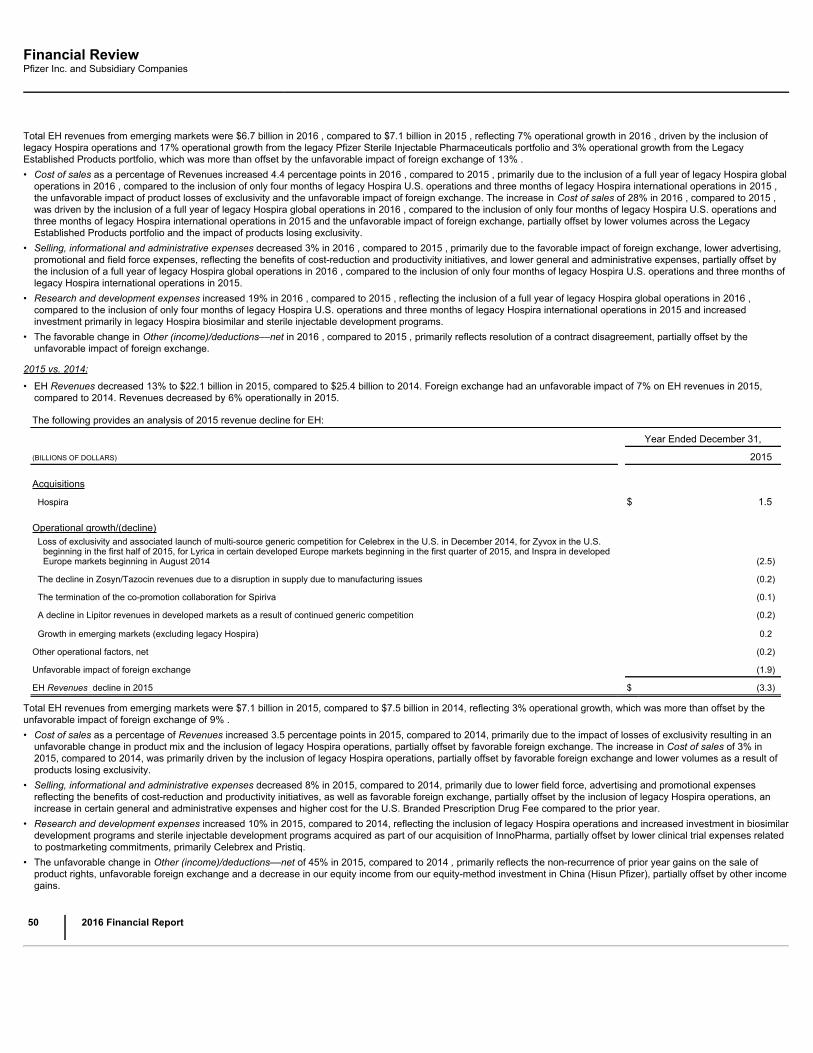
Financial ReviewPfizer Inc. and Subsidiary Companies
Total EH revenues from emerging markets were $6.7 billion in 2016 , compared to $7.1 billion in 2015 , reflecting 7% operational growth in 2016 , driven by the inclusion oflegacy Hospira operations and 17% operational growth from the legacy Pfizer Sterile Injectable Pharmaceuticals portfolio and 3% operational growth from the LegacyEstablished Products portfolio, which was more than offset by the unfavorable impact of foreign exchange of 13% .• Cost of sales as a percentage of Revenues increased 4.4 percentage points in 2016 , compared to 2015 , primarily due to the inclusion of a full year of legacy Hospira global
operations in 2016 , compared to the inclusion of only four months of legacy Hospira U.S. operations and three months of legacy Hospira international operations in 2015 ,the unfavorable impact of product losses of exclusivity and the unfavorable impact of foreign exchange. The increase in Cost of sales of 28% in 2016 , compared to 2015 ,was driven by the inclusion of a full year of legacy Hospira global operations in 2016 , compared to the inclusion of only four months of legacy Hospira U.S. operations andthree months of legacy Hospira international operations in 2015 and the unfavorable impact of foreign exchange, partially offset by lower volumes across the LegacyEstablished Products portfolio and the impact of products losing exclusivity.
• Selling, informational and administrative expenses decreased 3% in 2016 , compared to 2015 , primarily due to the favorable impact of foreign exchange, lower advertising,promotional and field force expenses, reflecting the benefits of cost-reduction and productivity initiatives, and lower general and administrative expenses, partially offset bythe inclusion of a full year of legacy Hospira global operations in 2016 , compared to the inclusion of only four months of legacy Hospira U.S. operations and three months oflegacy Hospira international operations in 2015.
• Research and development expenses increased 19% in 2016 , compared to 2015 , reflecting the inclusion of a full year of legacy Hospira global operations in 2016 ,compared to the inclusion of only four months of legacy Hospira U.S. operations and three months of legacy Hospira international operations in 2015 and increasedinvestment primarily in legacy Hospira biosimilar and sterile injectable development programs.
• The favorable change in Other (income)/deductions––net in 2016 , compared to 2015 , primarily reflects resolution of a contract disagreement, partially offset by theunfavorable impact of foreign exchange.
2015 vs. 2014:
• EH Revenues decreased 13% to $22.1 billion in 2015, compared to $25.4 billion to 2014. Foreign exchange had an unfavorable impact of 7% on EH revenues in 2015,compared to 2014. Revenues decreased by 6% operationally in 2015.
The following provides an analysis of 2015 revenue decline for EH:
Year Ended December 31,
(BILLIONS OF DOLLARS) 2015
Acquisitions
Hospira $ 1.5 Operational growth/(decline)
Loss of exclusivity and associated launch of multi-source generic competition for Celebrex in the U.S. in December 2014, for Zyvox in the U.S.beginning in the first half of 2015, for Lyrica in certain developed Europe markets beginning in the first quarter of 2015, and Inspra in developedEurope markets beginning in August 2014 (2.5)
The decline in Zosyn/Tazocin revenues due to a disruption in supply due to manufacturing issues (0.2)
The termination of the co-promotion collaboration for Spiriva (0.1)
A decline in Lipitor revenues in developed markets as a result of continued generic competition (0.2)
Growth in emerging markets (excluding legacy Hospira) 0.2
Other operational factors, net (0.2)
Unfavorable impact of foreign exchange (1.9)
EH Revenues decline in 2015 $ (3.3)
Total EH revenues from emerging markets were $7.1 billion in 2015, compared to $7.5 billion in 2014, reflecting 3% operational growth, which was more than offset by theunfavorable impact of foreign exchange of 9% .• Cost of sales as a percentage of Revenues increased 3.5 percentage points in 2015, compared to 2014, primarily due to the impact of losses of exclusivity resulting in an
unfavorable change in product mix and the inclusion of legacy Hospira operations, partially offset by favorable foreign exchange. The increase in Cost of sales of 3% in2015, compared to 2014, was primarily driven by the inclusion of legacy Hospira operations, partially offset by favorable foreign exchange and lower volumes as a result ofproducts losing exclusivity.
• Selling, informational and administrative expenses decreased 8% in 2015, compared to 2014, primarily due to lower field force, advertising and promotional expensesreflecting the benefits of cost-reduction and productivity initiatives, as well as favorable foreign exchange, partially offset by the inclusion of legacy Hospira operations, anincrease in certain general and administrative expenses and higher cost for the U.S. Branded Prescription Drug Fee compared to the prior year.
• Research and development expenses increased 10% in 2015, compared to 2014, reflecting the inclusion of legacy Hospira operations and increased investment in biosimilardevelopment programs and sterile injectable development programs acquired as part of our acquisition of InnoPharma, partially offset by lower clinical trial expenses relatedto postmarketing commitments, primarily Celebrex and Pristiq.
• The unfavorable change in Other (income)/deductions––net of 45% in 2015, compared to 2014 , primarily reflects the non-recurrence of prior year gains on the sale ofproduct rights, unfavorable foreign exchange and a decrease in our equity income from our equity-method investment in China (Hisun Pfizer), partially offset by other incomegains.
50
2016 Financial Report

Financial ReviewPfizer Inc. and Subsidiary Companies
ANALYSIS OF THE CONSOLIDATED STATEMENTS OF COMPREHENSIVE INCOME
Changes in the components of Accumulated other comprehensive loss reflect the following:
2016
• Foreign currency translation adjustments, net, primarily reflects the strengthening of the U.S. dollar against the U.K. pound, Chinese renminbi, Mexican peso, and Argentinepeso, partially offset by the weakening of the U.S. dollar against the Australian dollar and Japanese yen.
• For Unrealized holding gains/(losses) on derivative financial instruments, net and Unrealized holding gains/(losses) on available-for-sale securities, net, reflects the impact offair value remeasurements and the reclassification of realized amounts into income. For additional information, see Notes to Consolidated Financial Statements— Note 7.Financial Instruments .
• For Benefit plans: actuarial losses, net, reflects the actuarial losses related primarily to a decrease in the discount rate, partially offset by (i) the amortization of changes inthe pension benefit obligation previously recognized in Other Comprehensive Income, and (ii) higher actual return on plan assets as compared to the expected return onplan assets. For additional information, see Notes to Consolidated Financial Statements— Note 11. Pension and Postretirement Benefit Plans and Defined ContributionPlans and the “Significant Accounting Policies and Application of Critical Accounting Estimates and Assumptions––Benefit Plans” section of this Financial Review.
2015
• For Foreign currency translation adjustments, net, reflects primarily the strengthening of the U.S. dollar against the euro, Brazilian real, Canadian dollar, Australian dollar,British pound, Mexican peso and Japanese yen.
• For Unrealized holding gains/(losses) on derivative financial instruments, net and Unrealized holding gains/(losses) on available-for-sale securities, net, reflects the impact offair value remeasurements and the reclassification of realized amounts into income. For additional information, see Notes to Consolidated Financial Statements— Note 7.Financial Instruments .
• For Benefit plans: actuarial losses, net, primarily reflects the reclassification into income of amounts related to (i) the amortization of changes in the pension benefit obligationpreviously recognized in Other comprehensive income, (ii) lower actual return on plan assets as compared to the expected return on assets, and (iii) settlement activity, aswell as the impact of foreign exchange. For additional information, see Notes to Consolidated Financial Statements— Note 11. Pension and Postretirement Benefit Plansand Defined Contribution Plans and the “Significant Accounting Policies and Application of Critical Accounting Estimates and Assumptions––Benefit Plans” section of thisFinancial Review.
• For Benefit plans: prior service credits and other, net, reflects a $507 million reduction in our U.S. Postretirement Plan obligation due to a plan amendment approved in June2015 that introduced a cap on costs for certain groups within the plan, partially offset by the reclassification into income of amounts related to (i) amortization of changes inprior service costs and credits previously recognized in Other comprehensive income and (ii) curtailment activity. For additional information, see Notes to ConsolidatedFinancial Statements— Note 11. Pension and Postretirement Benefit Plans and Defined Contribution Plans .
2014
• For Foreign currency translation adjustments , reflects primarily the weakening of the euro against the U.S. dollar, and, to a lesser, extent the weakening of the Japaneseyen, Canadian dollar, Brazilian real and U.K. pound against the U.S. dollar. Also, includes the reclassification of amounts associated with legal entity dispositions intoincome.
• For Unrealized holding gains/(losses) on derivative financial instruments , net and Unrealized holding gains/(losses) on available-for-sale securities , net, reflects the impactof fair value remeasurements and the reclassification of realized amounts into income. For additional information, see Notes to Consolidated Financial Statements— Note 7.Financial Instruments .
• For Benefit plans: actuarial losses, net, reflects the actuarial losses related primarily to a decrease in the discount rate. For additional information, see Notes to ConsolidatedFinancial Statements— Note 11. Pension and Postretirement Benefit Plans and Defined Contribution Plans and the “Significant Accounting Policies and Application ofCritical Accounting Estimates and Assumptions––Benefit Plans” section of this Financial Review.
• For Benefit plans: prior service credits and other, net, reflects an amendment to our post-retirement plans that decreased the benefit obligation by transferring certain planparticipants to a retiree drug coverage program eligible for a Medicare Part D plan subsidy. For additional information, see Notes to Consolidated Financial Statements—Note 11. Pension and Postretirement Benefit Plans and Defined Contribution Plans .
ANALYSIS OF THE CONSOLIDATED BALANCE SHEETS
For information about certain of our financial assets and liabilities, including Cash and cash equivalents, Short-term investments, Long-term investments, Short-termborrowings, including current portion of long-term debt , and Long-term debt , see the “Analysis of the Consolidated Statements of Cash Flows” and “Analysis of FinancialCondition, Liquidity and Capital Resources: Selected Measures of Liquidity and Capital Resources” sections of this Financial Review and Notes to Consolidated FinancialStatements— Note 7. Financial Instruments .
For information about certain balances in Trade accounts receivable, less allowance for doubtful accounts, s ee also the “Analysis of Financial Condition, Liquidity and CapitalResources: Selected Measures of Liquidity and Capital Resources: Accounts Receivable” section of this Financial Review.
For information about events and circumstances impacting our tax-related accounts, see Notes to Consolidated Financial Statements— Note 5. Tax Matters .
For a description of changes in Total Equity , see the consolidated statements of equity.
2016 Financial Report
51
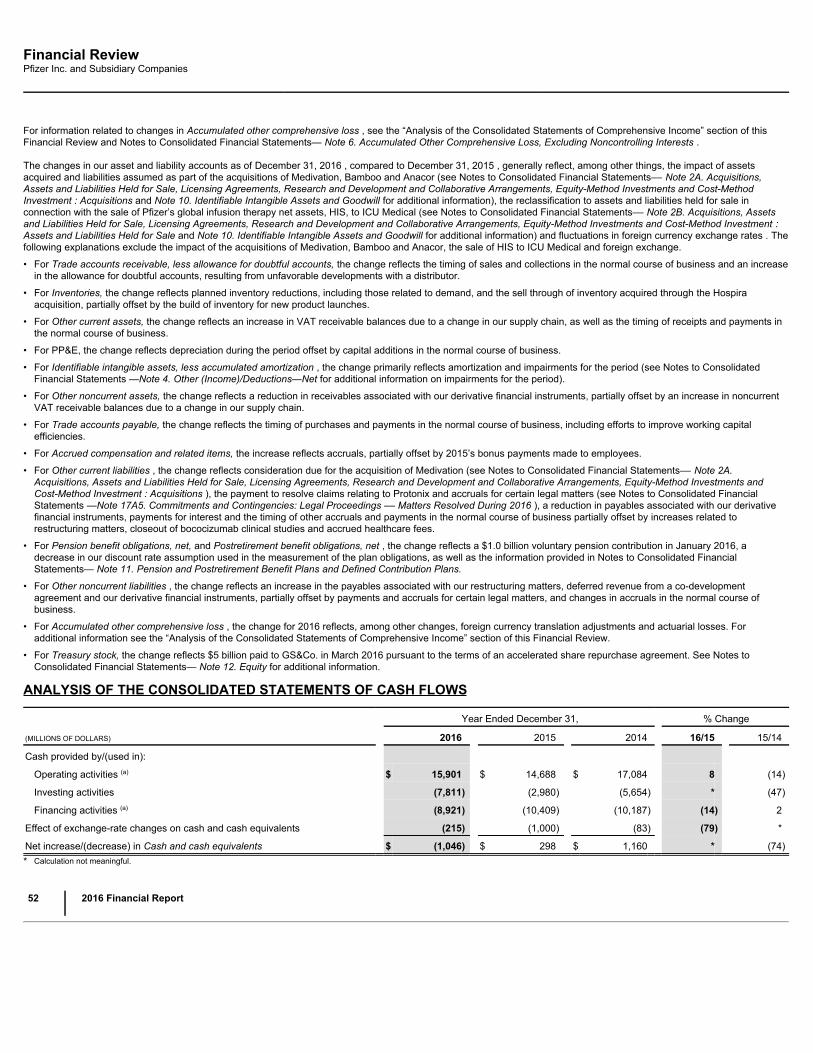
Financial ReviewPfizer Inc. and Subsidiary Companies
For information related to changes in Accumulated other comprehensive loss , see the “Analysis of the Consolidated Statements of Comprehensive Income” section of thisFinancial Review and Notes to Consolidated Financial Statements— Note 6. Accumulated Other Comprehensive Loss, Excluding Noncontrolling Interests .
The changes in our asset and liability accounts as of December 31, 2016 , compared to December 31, 2015 , generally reflect, among other things, the impact of assetsacquired and liabilities assumed as part of the acquisitions of Medivation, Bamboo and Anacor (see Notes to Consolidated Financial Statements–– Note 2A. Acquisitions,Assets and Liabilities Held for Sale, Licensing Agreements, Research and Development and Collaborative Arrangements, Equity-Method Investments and Cost-MethodInvestment : Acquisitions and Note 10. Identifiable Intangible Assets and Goodwill for additional information), the reclassification to assets and liabilities held for sale inconnection with the sale of Pfizer’s global infusion therapy net assets, HIS, to ICU Medical (see Notes to Consolidated Financial Statements–– Note 2B. Acquisitions, Assetsand Liabilities Held for Sale, Licensing Agreements, Research and Development and Collaborative Arrangements, Equity-Method Investments and Cost-Method Investment :Assets and Liabilities Held for Sale and Note 10. Identifiable Intangible Assets and Goodwill for additional information) and fluctuations in foreign currency exchange rates . Thefollowing explanations exclude the impact of the acquisitions of Medivation, Bamboo and Anacor, the sale of HIS to ICU Medical and foreign exchange.
• For Trade accounts receivable, less allowance for doubtful accounts, the change reflects the timing of sales and collections in the normal course of business and an increasein the allowance for doubtful accounts, resulting from unfavorable developments with a distributor.
• For Inventories, the change reflects planned inventory reductions, including those related to demand, and the sell through of inventory acquired through the Hospiraacquisition, partially offset by the build of inventory for new product launches.
• For Other current assets, the change reflects an increase in VAT receivable balances due to a change in our supply chain, as well as the timing of receipts and payments inthe normal course of business.
• For PP&E, the change reflects depreciation during the period offset by capital additions in the normal course of business.
• For Identifiable intangible assets, less accumulated amortization , the change primarily reflects amortization and impairments for the period (see Notes to ConsolidatedFinancial Statements —Note 4. Other (Income)/Deductions—Net for additional information on impairments for the period).
• For Other noncurrent assets, the change reflects a reduction in receivables associated with our derivative financial instruments, partially offset by an increase in noncurrentVAT receivable balances due to a change in our supply chain.
• For Trade accounts payable, the change reflects the timing of purchases and payments in the normal course of business, including efforts to improve working capitalefficiencies.
• For Accrued compensation and related items, the increase reflects accruals, partially offset by 2015’s bonus payments made to employees.
• For Other current liabilities , the change reflects consideration due for the acquisition of Medivation (see Notes to Consolidated Financial Statements–– Note 2A.Acquisitions, Assets and Liabilities Held for Sale, Licensing Agreements, Research and Development and Collaborative Arrangements, Equity-Method Investments andCost-Method Investment : Acquisitions ), the payment to resolve claims relating to Protonix and accruals for certain legal matters (see Notes to Consolidated FinancialStatements —Note 17A5. Commitments and Contingencies: Legal Proceedings –– Matters Resolved During 2016 ), a reduction in payables associated with our derivativefinancial instruments, payments for interest and the timing of other accruals and payments in the normal course of business partially offset by increases related torestructuring matters, closeout of bococizumab clinical studies and accrued healthcare fees.
• For Pension benefit obligations, net, and Postretirement benefit obligations, net , the change reflects a $1.0 billion voluntary pension contribution in January 2016, adecrease in our discount rate assumption used in the measurement of the plan obligations, as well as the information provided in Notes to Consolidated FinancialStatements— Note 11. Pension and Postretirement Benefit Plans and Defined Contribution Plans.
• For Other noncurrent liabilities , the change reflects an increase in the payables associated with our restructuring matters, deferred revenue from a co-developmentagreement and our derivative financial instruments, partially offset by payments and accruals for certain legal matters, and changes in accruals in the normal course ofbusiness.
• For Accumulated other comprehensive loss , the change for 2016 reflects, among other changes, foreign currency translation adjustments and actuarial losses. Foradditional information see the “Analysis of the Consolidated Statements of Comprehensive Income” section of this Financial Review.
• For Treasury stock, the change reflects $5 billion paid to GS&Co. in March 2016 pursuant to the terms of an accelerated share repurchase agreement. See Notes toConsolidated Financial Statements— Note 12. Equity for additional information.
ANALYSIS OF THE CONSOLIDATED STATEMENTS OF CASH FLOWS
Year Ended December 31, % Change
(MILLIONS OF DOLLARS) 2016 2015 2014 16/15 15/14
Cash provided by/(used in):
Operating activities (a) $ 15,901 $ 14,688 $ 17,084 8 (14)
Investing activities (7,811) (2,980) (5,654) * (47)
Financing activities (a) (8,921) (10,409) (10,187) (14) 2
Effect of exchange-rate changes on cash and cash equivalents (215) (1,000) (83) (79) *
Net increase/(decrease) in Cash and cash equivalents $ (1,046) $ 298 $ 1,160 * (74)* Calculation not meaningful.
52
2016 Financial Report
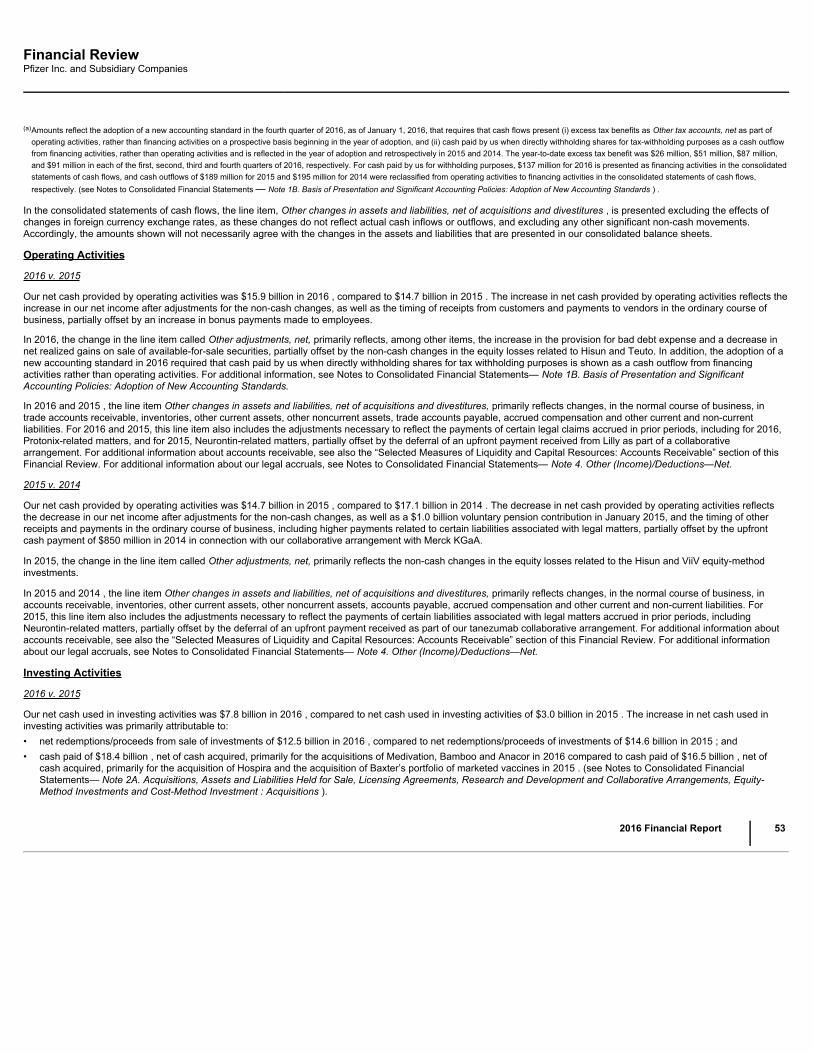
Financial ReviewPfizer Inc. and Subsidiary Companies
(a)
Amounts reflect the adoption of a new accounting standard in the fourth quarter of 2016, as of January 1, 2016, that requires that cash flows present (i) excess tax benefits as Other tax accounts, net as part ofoperating activities, rather than financing activities on a prospective basis beginning in the year of adoption, and (ii) cash paid by us when directly withholding shares for tax-withholding purposes as a cash outflowfrom financing activities, rather than operating activities and is reflected in the year of adoption and retrospectively in 2015 and 2014. The year-to-date excess tax benefit was $26 million, $51 million, $87 million,and $91 million in each of the first, second, third and fourth quarters of 2016, respectively. For cash paid by us for withholding purposes, $137 million for 2016 is presented as financing activities in the consolidatedstatements of cash flows, and cash outflows of $189 million for 2015 and $195 million for 2014 were reclassified from operating activities to financing activities in the consolidated statements of cash flows,respectively. (see Notes to Consolidated Financial Statements — Note 1B. Basis of Presentation and Significant Accounting Policies: Adoption of New Accounting Standards ) .
In the consolidated statements of cash flows, the line item, Other changes in assets and liabilities, net of acquisitions and divestitures , is presented excluding the effects ofchanges in foreign currency exchange rates, as these changes do not reflect actual cash inflows or outflows, and excluding any other significant non-cash movements.Accordingly, the amounts shown will not necessarily agree with the changes in the assets and liabilities that are presented in our consolidated balance sheets.
Operating Activities
2016 v. 2015
Our net cash provided by operating activities was $15.9 billion in 2016 , compared to $14.7 billion in 2015 . The increase in net cash provided by operating activities reflects theincrease in our net income after adjustments for the non-cash changes, as well as the timing of receipts from customers and payments to vendors in the ordinary course ofbusiness, partially offset by an increase in bonus payments made to employees.
In 2016, the change in the line item called Other adjustments, net, primarily reflects, among other items, the increase in the provision for bad debt expense and a decrease innet realized gains on sale of available-for-sale securities, partially offset by the non-cash changes in the equity losses related to Hisun and Teuto. In addition, the adoption of anew accounting standard in 2016 required that cash paid by us when directly withholding shares for tax withholding purposes is shown as a cash outflow from financingactivities rather than operating activities. For additional information, see Notes to Consolidated Financial Statements— Note 1B. Basis of Presentation and SignificantAccounting Policies: Adoption of New Accounting Standards.
In 2016 and 2015 , the line item Other changes in assets and liabilities, net of acquisitions and divestitures, primarily reflects changes, in the normal course of business, intrade accounts receivable, inventories, other current assets, other noncurrent assets, trade accounts payable, accrued compensation and other current and non-currentliabilities. For 2016 and 2015, this line item also includes the adjustments necessary to reflect the payments of certain legal claims accrued in prior periods, including for 2016,Protonix-related matters, and for 2015, Neurontin-related matters, partially offset by the deferral of an upfront payment received from Lilly as part of a collaborativearrangement. For additional information about accounts receivable, see also the “Selected Measures of Liquidity and Capital Resources: Accounts Receivable” section of thisFinancial Review. For additional information about our legal accruals, see Notes to Consolidated Financial Statements— Note 4. Other (Income)/Deductions—Net.
2015 v. 2014
Our net cash provided by operating activities was $14.7 billion in 2015 , compared to $17.1 billion in 2014 . The decrease in net cash provided by operating activities reflectsthe decrease in our net income after adjustments for the non-cash changes, as well as a $1.0 billion voluntary pension contribution in January 2015, and the timing of otherreceipts and payments in the ordinary course of business, including higher payments related to certain liabilities associated with legal matters, partially offset by the upfrontcash payment of $850 million in 2014 in connection with our collaborative arrangement with Merck KGaA.
In 2015, the change in the line item called Other adjustments, net, primarily reflects the non-cash changes in the equity losses related to the Hisun and ViiV equity-methodinvestments.
In 2015 and 2014 , the line item Other changes in assets and liabilities, net of acquisitions and divestitures, primarily reflects changes, in the normal course of business, inaccounts receivable, inventories, other current assets, other noncurrent assets, accounts payable, accrued compensation and other current and non-current liabilities. For2015, this line item also includes the adjustments necessary to reflect the payments of certain liabilities associated with legal matters accrued in prior periods, includingNeurontin-related matters, partially offset by the deferral of an upfront payment received as part of our tanezumab collaborative arrangement. For additional information aboutaccounts receivable, see also the “Selected Measures of Liquidity and Capital Resources: Accounts Receivable” section of this Financial Review. For additional informationabout our legal accruals, see Notes to Consolidated Financial Statements— Note 4. Other (Income)/Deductions—Net.
Investing Activities
2016 v. 2015
Our net cash used in investing activities was $7.8 billion in 2016 , compared to net cash used in investing activities of $3.0 billion in 2015 . The increase in net cash used ininvesting activities was primarily attributable to:• net redemptions/proceeds from sale of investments of $12.5 billion in 2016 , compared to net redemptions/proceeds of investments of $14.6 billion in 2015 ; and• cash paid of $18.4 billion , net of cash acquired, primarily for the acquisitions of Medivation, Bamboo and Anacor in 2016 compared to cash paid of $16.5 billion , net of
cash acquired, primarily for the acquisition of Hospira and the acquisition of Baxter’s portfolio of marketed vaccines in 2015 . (see Notes to Consolidated FinancialStatements— Note 2A. Acquisitions, Assets and Liabilities Held for Sale, Licensing Agreements, Research and Development and Collaborative Arrangements, Equity-Method Investments and Cost-Method Investment : Acquisitions ).
2016 Financial Report
53
Financial ReviewPfizer Inc. and Subsidiary Companies
2015 v. 2014
Our net cash used in investing activities was $3.0 billion in 2015 , compared to $5.7 billion in 2014 . The decrease in net cash used in investing activities was primarilyattributable to:• net redemptions/proceeds from sale of investments of $14.6 billion in 2015 , compared to net purchases of investments of $4.2 billion in 2014 ,
partially offset by:• cash paid of $16.5 billion , net of cash acquired, primarily for the acquisition of Hospira and the acquisition of Baxter’s portfolio of marketed vaccines in 2015 . (see Notes to
Consolidated Financial Statements— Note 2A. Acquisitions, Assets and Liabilities Held for Sale, Licensing Agreements, Research and Development and CollaborativeArrangements, Equity-Method Investments and Cost-Method Investment : Acquisitions ).
Financing Activities
2016 v. 2015
Our net cash used in financing activities was $8.9 billion in 2016 , compared to net cash used in financing activities of $10.4 billion in 2015 . The decrease in net cash used infinancing activities was primarily attributable to:• the issuance of long-term debt of $11 billion on June 3, 2016 and November 21, 2016; and• purchases of common stock of $5.0 billion in 2016 , compared to $6.2 billion in 2015 ,partially offset by:• net payments on short-term borrowings of $714 million in 2016 , compared to net proceeds on short-term borrowings of $4.3 billion in 2015 ;• higher repayments on long-term debt of $7.7 billion in 2016, compared to $3.0 billion in 2015;• higher cash dividends paid of $7.3 billion in 2016 , compared to $6.9 billion in 2015 ; and• lower proceeds from the exercise of stock options of $1.0 billion in 2016 , compared to $1.3 billion in 2015 .
2015 v. 2014
Our net cash used in financing activities was $10.4 billion in 2015 , compared to $10.2 billion in 2014 . The increase in net cash used in financing activities was primarilyattributable to:• net principal payments on long-term debt of $3.0 billion in 2015, compared to net proceeds from issuance of long-term debt of $2.4 billion in 2014; and• purchases of common stock of $6.2 billion in 2015 , compared to $5.0 billion in 2014 ,
partially offset by:• net proceeds from short-term borrowings of $4.3 billion in 2015 , compared to net payments on short-term borrowings of $1.8 billion in 2014 .
Supplemental Schedule of Non-Cash Investing and Financing Information
In 2015, we exchanged $1.7 billion debt of Hospira for virtually the same amount of Pfizer debt.
For further details on the 2015 debt exchange, see Notes to Consolidated Financial Statements— Note 7D. Financial Instruments: Long-Term Debt.
ANALYSIS OF FINANCIAL CONDITION, LIQUIDITY AND CAPITAL RESOURCESWe rely largely on operating cash flows, short-term investments, short-term commercial paper borrowings and long-term debt to provide for our liquidity requirements. Wecontinue our efforts to improve cash inflows through working capital efficiencies. We target specific areas of focus including accounts receivable, inventories, accounts payable,and other working capital, which allows us to optimize our operating cash flows. Due to our significant operating cash flows as well as our financial assets, access to capitalmarkets and available lines of credit and revolving credit agreements, we believe that we have, and will maintain, the ability to meet our liquidity needs for the foreseeablefuture, which include:• the working capital requirements of our operations, including our R&D activities;• investments in our business;• dividend payments and potential increases in the dividend rate;• share repurchases;• the cash requirements associated with our cost-reduction/productivity initiatives;• paying down outstanding debt;• contributions to our pension and postretirement plans; and• business-development activities.
For additional information about our share-purchase plans, see the “Share-Purchase Plans and Accelerated Share Repurchase Agreements” section of this Financial Review.
54
2016 Financial Report
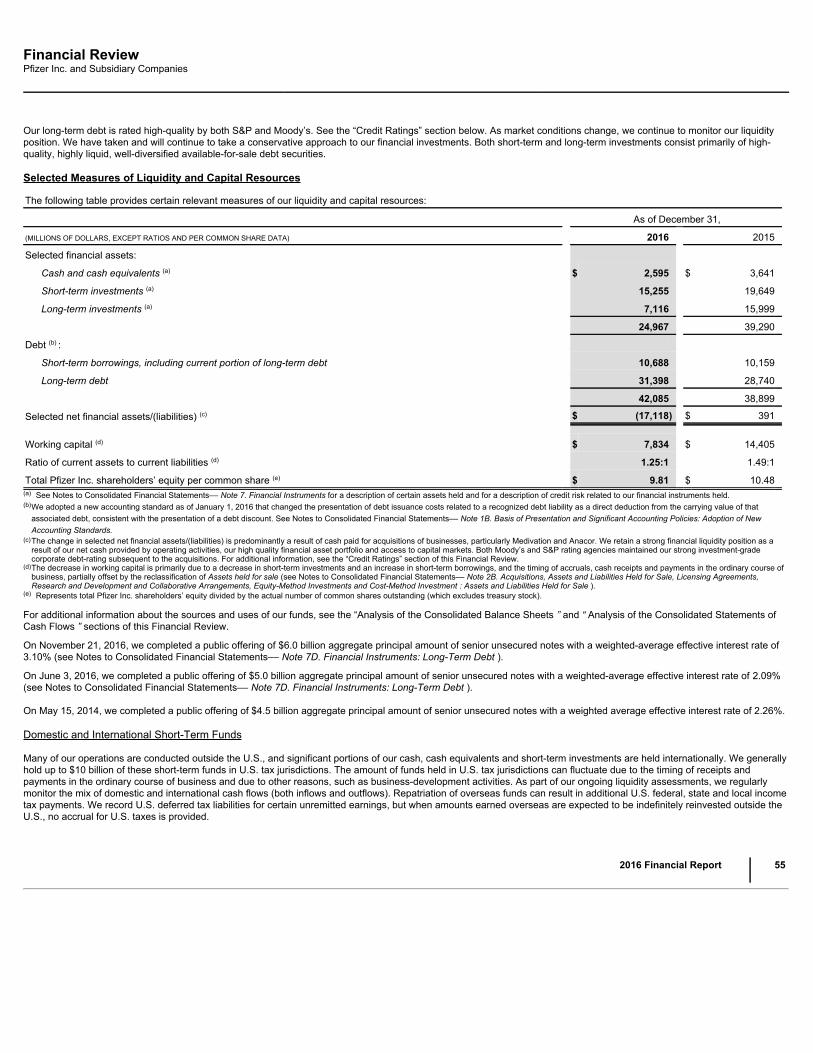
Financial ReviewPfizer Inc. and Subsidiary Companies
Our long-term debt is rated high-quality by both S&P and Moody’s. See the “Credit Ratings” section below. As market conditions change, we continue to monitor our liquidityposition. We have taken and will continue to take a conservative approach to our financial investments. Both short-term and long-term investments consist primarily of high-quality, highly liquid, well-diversified available-for-sale debt securities.
Selected Measures of Liquidity and Capital Resources
The following table provides certain relevant measures of our liquidity and capital resources:
As of December 31,
(MILLIONS OF DOLLARS, EXCEPT RATIOS AND PER COMMON SHARE DATA) 2016 2015
Selected financial assets:
Cash and cash equivalents (a) $ 2,595 $ 3,641
Short-term investments (a) 15,255 19,649
Long-term investments (a) 7,116 15,999
24,967 39,290
Debt (b) :
Short-term borrowings, including current portion of long-term debt 10,688 10,159
Long-term debt 31,398 28,740
42,085 38,899
Selected net financial assets/(liabilities) (c) $ (17,118) $ 391
Working capital (d) $ 7,834 $ 14,405
Ratio of current assets to current liabilities (d) 1.25:1 1.49:1
Total Pfizer Inc. shareholders’ equity per common share (e) $ 9.81 $ 10.48(a) See Notes to Consolidated Financial Statements–– Note 7. Financial Instruments for a description of certain assets held and for a description of credit risk related to our financial instruments held.(b)
We adopted a new accounting standard as of January 1, 2016 that changed the presentation of debt issuance costs related to a recognized debt liability as a direct deduction from the carrying value of thatassociated debt, consistent with the presentation of a debt discount. See Notes to Consolidated Financial Statements–– Note 1B. Basis of Presentation and Significant Accounting Policies: Adoption of NewAccounting Standards.
(c)
The change in selected net financial assets/(liabilities) is predominantly a result of cash paid for acquisitions of businesses, particularly Medivation and Anacor. We retain a strong financial liquidity position as aresult of our net cash provided by operating activities, our high quality financial asset portfolio and access to capital markets. Both Moody’s and S&P rating agencies maintained our strong investment-gradecorporate debt-rating subsequent to the acquisitions. For additional information, see the “Credit Ratings” section of this Financial Review.
(d)
The decrease in working capital is primarily due to a decrease in short-term investments and an increase in short-term borrowings, and the timing of accruals, cash receipts and payments in the ordinary course ofbusiness, partially offset by the reclassification of Assets held for sale (see Notes to Consolidated Financial Statements–– Note 2B. Acquisitions, Assets and Liabilities Held for Sale, Licensing Agreements,Research and Development and Collaborative Arrangements, Equity-Method Investments and Cost-Method Investment : Assets and Liabilities Held for Sale ).
(e) Represents total Pfizer Inc. shareholders’ equity divided by the actual number of common shares outstanding (which excludes treasury stock).
For additional information about the sources and uses of our funds, see the “Analysis of the Consolidated Balance Sheets ” and “ Analysis of the Consolidated Statements ofCash Flows ” sections of this Financial Review.
On November 21, 2016, we completed a public offering of $6.0 billion aggregate principal amount of senior unsecured notes with a weighted-average effective interest rate of3.10% (see Notes to Consolidated Financial Statements–– Note 7D. Financial Instruments: Long-Term Debt ).
On June 3, 2016, we completed a public offering of $5.0 billion aggregate principal amount of senior unsecured notes with a weighted-average effective interest rate of 2.09%(see Notes to Consolidated Financial Statements–– Note 7D. Financial Instruments: Long-Term Debt ).
On May 15, 2014, we completed a public offering of $4.5 billion aggregate principal amount of senior unsecured notes with a weighted average effective interest rate of 2.26%.
Domestic and International Short-Term Funds
Many of our operations are conducted outside the U.S., and significant portions of our cash, cash equivalents and short-term investments are held internationally. We generallyhold up to $10 billion of these short-term funds in U.S. tax jurisdictions. The amount of funds held in U.S. tax jurisdictions can fluctuate due to the timing of receipts andpayments in the ordinary course of business and due to other reasons, such as business-development activities. As part of our ongoing liquidity assessments, we regularlymonitor the mix of domestic and international cash flows (both inflows and outflows). Repatriation of overseas funds can result in additional U.S. federal, state and local incometax payments. We record U.S. deferred tax liabilities for certain unremitted earnings, but when amounts earned overseas are expected to be indefinitely reinvested outside theU.S., no accrual for U.S. taxes is provided.
2016 Financial Report
55
Financial ReviewPfizer Inc. and Subsidiary Companies
Accounts Receivable
We continue to monitor developments regarding government and government agency receivables in several European markets where economic conditions remain challengingand uncertain. Historically, payments from a number of these European governments and government agencies extend beyond the contractual terms of sale. Specifically, wereceived delayed payments for 2015 revenues and delayed payments for 2016 revenues from the Greek government; the vast majority of Greece government receivablespertain to 2016 revenues. Also, the Greek government has restructured its debt to other third parties in the third quarter of 2016. We adjusted our allowance for doubtfulaccounts to reflect these events, and have $43 million in net receivables from the Greek government as of December 31, 2016 . Reported revenues from all customers inGreece for the year ended December 31, 2016 were $278 million.
We believe that our allowance for doubtful accounts is appropriate. Our assessment is based on an analysis of the following: (i) payments received to date; (ii) the consistencyof payments from customers; (iii) direct and observed interactions with the governments (including court petitions) and with market participants (for example, the factoringindustry); and (iv) various third-party assessments of repayment risk (for example, rating agency publications and the movement of rates for credit default swap instruments).
As of December 31, 2016 , we had about $574 million aggregate gross accounts receivable from governments and/or government agencies in Italy, Spain, Greece andPortugal where economic conditions remain challenging and uncertain. Such receivables in excess of one year from the invoice date, totaling $70 million, were as follows: $44million in Italy; $18 million in Portugal; $4 million in Greece; and $4 million in Spain.
Although certain European governments and government agencies sometimes delay payments beyond the contractual terms of sale, we seek to appropriately balancerepayment risk with the desire to maintain good relationships with our customers and to ensure a humanitarian approach to local patient needs.
We will continue to closely monitor repayment risk and, when necessary, we will continue to adjust our allowance for doubtful accounts.
Our assessments about the recoverability of accounts receivables can result from a complex series of judgments about future events and uncertainties and can rely heavily onestimates and assumptions. For information about the risks associated with estimates and assumptions, see Notes to Consolidated Financial Statements–– Note 1C. Basis ofPresentation and Significant Accounting Policies: Estimates and Assumptions .
Credit Ratings
Two major corporate debt-rating organizations, Moody’s and S&P, assign ratings to our short-term and long-term debt. A security rating is not a recommendation to buy, sell orhold securities and the rating is subject to revision or withdrawal at any time by the rating organization. Each rating should be evaluated independently of any other rating.
The following table provides the current ratings assigned by these rating agencies to our commercial paper and senior unsecured long-term debt:
NAME OF RATING AGENCY
Pfizer
Commercial Paper Pfizer
Long-Term Debt
Date of Last Rating Change Rating Rating
Moody’s (a) P-1 A1 October 2009
S&P (b) A-1+ AA October 2009(a) In September 2016, Moody's updated its credit outlook from negative outlook to stable.(b) In April 2016, S&P updated its credit outlook from negative watch to stable.
Debt Capacity
We have available lines of credit and revolving credit agreements with a group of banks and other financial intermediaries. We maintain cash and cash equivalent balances andshort-term investments in excess of our commercial paper and other short-term borrowings. As of December 31, 2016 , we had access to $7.9 billion of lines of credit, of which$790 million expire within one year. Of these lines of credit, $7.8 billion were unused, of which our lenders have committed to loan us $7.1 billion at our request. Also, $7.0billion of our unused lines of credit, all of which expire in 2021, may be used to support our commercial paper borrowings.
Global Economic Conditions––General
The global economic environment has not had, nor do we anticipate that it will have, a material impact on our liquidity or capital resources. Due to our significant operating cashflows, financial assets, access to capital markets and available lines of credit and revolving credit agreements, we continue to believe that we have, and will maintain, the abilityto meet our liquidity needs for the foreseeable future. We monitor our liquidity position continuously in the face of evolving economic conditions.
56
2016 Financial Report
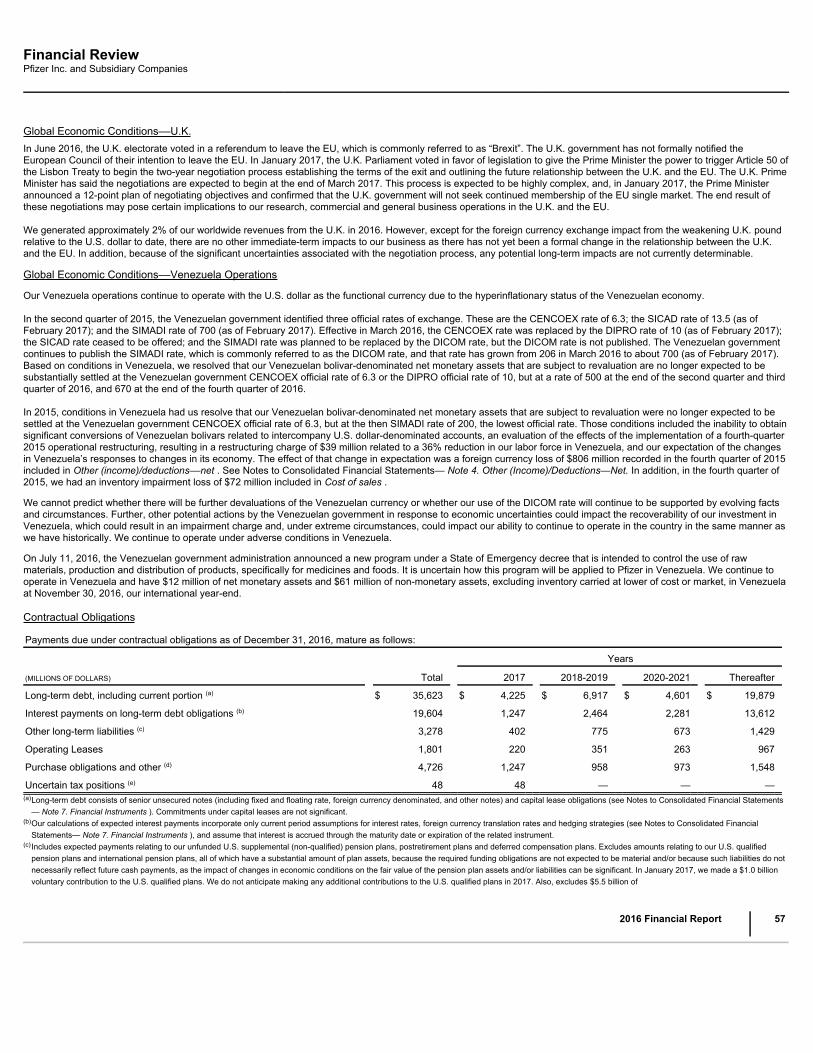
Financial ReviewPfizer Inc. and Subsidiary Companies
Global Economic Conditions––U.K.In June 2016, the U.K. electorate voted in a referendum to leave the EU, which is commonly referred to as “Brexit”. The U.K. government has not formally notified theEuropean Council of their intention to leave the EU. In January 2017, the U.K. Parliament voted in favor of legislation to give the Prime Minister the power to trigger Article 50 ofthe Lisbon Treaty to begin the two-year negotiation process establishing the terms of the exit and outlining the future relationship between the U.K. and the EU. The U.K. PrimeMinister has said the negotiations are expected to begin at the end of March 2017. This process is expected to be highly complex, and, in January 2017, the Prime Ministerannounced a 12-point plan of negotiating objectives and confirmed that the U.K. government will not seek continued membership of the EU single market. The end result ofthese negotiations may pose certain implications to our research, commercial and general business operations in the U.K. and the EU.
We generated approximately 2% of our worldwide revenues from the U.K. in 2016. However, except for the foreign currency exchange impact from the weakening U.K. poundrelative to the U.S. dollar to date, there are no other immediate-term impacts to our business as there has not yet been a formal change in the relationship between the U.K.and the EU. In addition, because of the significant uncertainties associated with the negotiation process, any potential long-term impacts are not currently determinable.
Global Economic Conditions––Venezuela Operations
Our Venezuela operations continue to operate with the U.S. dollar as the functional currency due to the hyperinflationary status of the Venezuelan economy.
In the second quarter of 2015, the Venezuelan government identified three official rates of exchange. These are the CENCOEX rate of 6.3; the SICAD rate of 13.5 (as ofFebruary 2017); and the SIMADI rate of 700 (as of February 2017). Effective in March 2016, the CENCOEX rate was replaced by the DIPRO rate of 10 (as of February 2017);the SICAD rate ceased to be offered; and the SIMADI rate was planned to be replaced by the DICOM rate, but the DICOM rate is not published. The Venezuelan governmentcontinues to publish the SIMADI rate, which is commonly referred to as the DICOM rate, and that rate has grown from 206 in March 2016 to about 700 (as of February 2017).Based on conditions in Venezuela, we resolved that our Venezuelan bolivar-denominated net monetary assets that are subject to revaluation are no longer expected to besubstantially settled at the Venezuelan government CENCOEX official rate of 6.3 or the DIPRO official rate of 10, but at a rate of 500 at the end of the second quarter and thirdquarter of 2016, and 670 at the end of the fourth quarter of 2016.
In 2015, conditions in Venezuela had us resolve that our Venezuelan bolivar-denominated net monetary assets that are subject to revaluation were no longer expected to besettled at the Venezuelan government CENCOEX official rate of 6.3, but at the then SIMADI rate of 200, the lowest official rate. Those conditions included the inability to obtainsignificant conversions of Venezuelan bolivars related to intercompany U.S. dollar-denominated accounts, an evaluation of the effects of the implementation of a fourth-quarter2015 operational restructuring, resulting in a restructuring charge of $39 million related to a 36% reduction in our labor force in Venezuela, and our expectation of the changesin Venezuela’s responses to changes in its economy. The effect of that change in expectation was a foreign currency loss of $806 million recorded in the fourth quarter of 2015included in Other (income)/deductions––net . See Notes to Consolidated Financial Statements— Note 4. Other (Income)/Deductions—Net. In addition, in the fourth quarter of2015, we had an inventory impairment loss of $72 million included in Cost of sales .
We cannot predict whether there will be further devaluations of the Venezuelan currency or whether our use of the DICOM rate will continue to be supported by evolving factsand circumstances. Further, other potential actions by the Venezuelan government in response to economic uncertainties could impact the recoverability of our investment inVenezuela, which could result in an impairment charge and, under extreme circumstances, could impact our ability to continue to operate in the country in the same manner aswe have historically. We continue to operate under adverse conditions in Venezuela.
On July 11, 2016, the Venezuelan government administration announced a new program under a State of Emergency decree that is intended to control the use of rawmaterials, production and distribution of products, specifically for medicines and foods. It is uncertain how this program will be applied to Pfizer in Venezuela. We continue tooperate in Venezuela and have $12 million of net monetary assets and $61 million of non-monetary assets, excluding inventory carried at lower of cost or market, in Venezuelaat November 30, 2016, our international year-end.
Contractual Obligations
Payments due under contractual obligations as of December 31, 2016, mature as follows:
Years
(MILLIONS OF DOLLARS) Total 2017 2018-2019 2020-2021 Thereafter
Long-term debt, including current portion (a) $ 35,623 $ 4,225 $ 6,917 $ 4,601 $ 19,879
Interest payments on long-term debt obligations (b) 19,604 1,247 2,464 2,281 13,612
Other long-term liabilities (c) 3,278 402 775 673 1,429
Operating Leases 1,801 220 351 263 967
Purchase obligations and other (d) 4,726 1,247 958 973 1,548
Uncertain tax positions (e) 48 48 — — —(a)
Long-term debt consists of senior unsecured notes (including fixed and floating rate, foreign currency denominated, and other notes) and capital lease obligations (see Notes to Consolidated Financial Statements— Note 7. Financial Instruments ). Commitments under capital leases are not significant.
(b)
Our calculations of expected interest payments incorporate only current period assumptions for interest rates, foreign currency translation rates and hedging strategies (see Notes to Consolidated FinancialStatements— Note 7. Financial Instruments ), and assume that interest is accrued through the maturity date or expiration of the related instrument.
(c)
Includes expected payments relating to our unfunded U.S. supplemental (non-qualified) pension plans, postretirement plans and deferred compensation plans. Excludes amounts relating to our U.S. qualifiedpension plans and international pension plans, all of which have a substantial amount of plan assets, because the required funding obligations are not expected to be material and/or because such liabilities do notnecessarily reflect future cash payments, as the impact of changes in economic conditions on the fair value of the pension plan assets and/or liabilities can be significant. In January 2017, we made a $1.0 billionvoluntary contribution to the U.S. qualified plans. We do not anticipate making any additional contributions to the U.S. qualified plans in 2017. Also, excludes $5.5 billion of
2016 Financial Report
57

Financial ReviewPfizer Inc. and Subsidiary Companies
liabilities related to legal matters, employee terminations and the fair value of derivative financial instruments and other, most of which do not represent contractual obligations. See also our liquidity discussionabove in this “Analysis of Financial Condition, Liquidity and Capital Resources” section, as well as the Notes to Consolidated Financial Statements— Note 3. Restructuring Charges and Other Costs Associated
with Acquisitions and Cost-Reduction/Productivity Initiatives, Note 7A. Financial Instruments: Selected Financial Assets and Liabilities, Note 11E. Pension and Postretirement Benefit Plans and Defined
Contribution Plans: Cash Flows, and Note 17. Commitments and Contingencies.(d)
Includes agreements to purchase goods and services that are enforceable and legally binding and includes amounts relating to advertising, information technology services, employee benefit administrationservices, and potential milestone payments deemed reasonably likely to occur.
(e)
Includes only income tax amounts currently payable. We are unable to predict the timing of tax settlements related to our noncurrent obligations for uncertain tax positions as tax audits can involve complex issuesand the resolution of those issues may span multiple years, particularly if subject to negotiation or litigation.
The above table includes amounts for potential milestone payments under collaboration, licensing or other arrangements, if the payments are deemed reasonably likely tooccur. Payments under these agreements generally become due and payable only upon the achievement of certain development, regulatory and/or commercializationmilestones, which may span several years and which may never occur.
In 2017 , we expect to spend approximately $1.9 billion on property, plant and equipment. We rely largely on operating cash flows to fund our capital investment needs. Due toour significant operating cash flows, we believe we have the ability to meet our capital investment needs and anticipate no delays to planned capital expenditures.
Off-Balance Sheet Arrangements
In the ordinary course of business and in connection with the sale of assets and businesses, we often indemnify our counterparties against certain liabilities that may arise inconnection with a transaction or that are related to activities prior to a transaction. These indemnifications typically pertain to environmental, tax, employee and/or product-related matters, and patent-infringement claims. If the indemnified party were to make a successful claim pursuant to the terms of the indemnification, we would be required toreimburse the loss. These indemnifications generally are subject to threshold amounts, specified claim periods and other restrictions and limitations. Historically, we have notpaid significant amounts under these provisions and, as of December 31, 2016 , recorded amounts for the estimated fair value of these indemnifications were not significant.
Certain of our co-promotion or license agreements give our licensors or partners the rights to negotiate for, or in some cases to obtain under certain financial conditions, co-promotion or other rights in specified countries with respect to certain of our products.
Share-Purchase Plans and Accelerated Share Repurchase Agreements
On October 23, 2014, we announced that the Board of Directors had authorized an $11 billion share-purchase plan, and share purchases commenced thereunder in January2015.
On February 9, 2015, we entered into an accelerated share repurchase agreement with GS&Co. to repurchase shares of our common stock. This agreement was entered intounder our previously announced share repurchase authorization. Pursuant to the terms of the agreement, on February 11, 2015, we paid $5 billion to GS&Co. and receivedapproximately 151 million shares of our common stock from GS&Co. This agreement was completed in July 2015, and pursuant to the agreement’s settlement terms, weelected to settle the agreement in cash and paid an additional $160 million to GS&Co. on July 13, 2015, resulting in a total of approximately $5.2 billion paid to GS&Co. Thefinal average price paid for the shares delivered under the accelerated share repurchase agreement was $34.13 per share. For additional information, see Notes toConsolidated Financial Statements–– Note 12. Equity .
In December 2015, the Board of Directors authorized a new $11 billion share repurchase program to be utilized over time.
On March 8, 2016, we entered into an accelerated share repurchase agreement with GS&Co. to repurchase $5 billion of our common stock. Pursuant to the terms of theagreement, on March 10, 2016, we paid $5 billion to GS&Co. and received an initial delivery of approximately 136 million shares of our common stock from GS&Co. based ona price of $29.36 per share, which represented, based on the closing share price of our common stock on the NYSE on March 8, 2016, approximately 80% of the notionalamount of the accelerated share repurchase agreement. On June 20, 2016, the accelerated share repurchase agreement with GS&Co. was completed, which, per the terms ofthe agreement, resulted in GS&Co. owing us a certain number of shares of Pfizer common stock. Pursuant to the agreement’s settlement terms, we received an additional 18million shares of our common stock from GS&Co. on June 20, 2016. The average price paid for all of the shares delivered under the accelerated share repurchase agreementwas $32.38 per share. The common stock received is included in Treasury stock . This agreement was entered into pursuant to our previously announced share repurchaseauthorization. For additional information, see Notes to Consolidated Financial Statements–– Note 12. Equity .
The following table provides the number of shares of our common stock purchased and the cost of purchases under our publicly announced share-purchase plans, includingour accelerated share repurchase agreements:
(SHARES IN MILLIONS, DOLLARS IN BILLIONS) 2016 (a) 2015 (b) 2014
Shares of common stock purchased 154 182 165Cost of purchase $ 5.0 $ 6.2 $ 5.0
(a) Represents shares purchased pursuant to and received upon settlement of the accelerated share repurchase agreement entered into on March 8, 2016. See above for additional information.(b)
Includes approximately 151 million shares purchased for $5.2 billion pursuant to the accelerated share repurchase agreement entered into on February 9, 2015 (see above for additional information), as well asother share repurchases through year-end 2015.
At December 31, 2016 , our remaining share-purchase authorization was approximately $11.4 billion .
58
2016 Financial Report
Financial ReviewPfizer Inc. and Subsidiary Companies
On February 2, 2017, we entered into an accelerated share repurchase agreement with Citibank to repurchase $5 billion of our common stock. This agreement was enteredinto pursuant to our previously announced share repurchase authorization. For additional information, see Notes to Consolidated Financial Statements–– Note 19. SubsequentEvent.
Dividends on Common Stock
We paid dividends on our common stock of $7.3 billion in 2016 , $6.9 billion in 2015 and $6.6 billion in 2014 . In December 2016 , our Board of Directors declared a first-quarter2017 dividend of $0.32 per share, payable on March 1, 2017 , to shareholders of record at the close of business on February 3, 2017 . The first-quarter 2017 cash dividend willbe our 313 th consecutive quarterly dividend.
Our current and projected dividends provide a return to shareholders while maintaining sufficient capital to invest in growing our businesses and to seek to increaseshareholder value. Our dividends are not restricted by debt covenants. While the dividend level remains a decision of Pfizer’s Board of Directors and will continue to beevaluated in the context of future business performance, we currently believe that we can support future annual dividend increases, barring significant unforeseen events.
NEW ACCOUNTING STANDARDSRecently Issued Accounting Standards, Not Adopted as of December 31, 2016See Notes to Consolidated Financial Statements— Note 1B. Basis of Presentation and Significant Accounting Policies: Adoption of New Accounting Standards.
The following table provides a brief description of recently issued accounting standards, not yet adopted:
Standard/Description Effective Date Effect on the Financial Statements or Other
Significant MattersIn October 2016, the FASB issued amended guidance on the assessment ofwhether an entity is the primary beneficiary of a VIE . Under this newguidance, when evaluating whether an entity is the primary beneficiary, asingle decision maker must consider its indirect interest held through relatedparties under common control proportionately.
January 1, 2017. Earlier applicationis permitted, including adoption inan interim period.
The provisions of this new standard will not have amaterial impact on our consolidated financialstatements.
In July 2015, the FASB issued an update related to inventory . The newguidance requires that inventory be measured at the lower of cost or netrealizable value.
January 1, 2017.
We do not expect the provisions of this new standardwill have a material impact on our consolidatedfinancial statements.
In May 2014, the FASB issued amended guidance related to revenue fromcontracts with customers . The new guidance introduces a new principles-based framework for revenue recognition and disclosure. Since its issuancethe FASB has issued six ASUs, amending the guidance and effective date,and the SEC has rescinded certain related SEC guidance; the most recent ofthese changes was issued in December 2016.
January 1, 2018. Earlier applicationis permitted only as of annualreporting periods beginning afterDecember 15, 2016, includinginterim reporting periods within thatreporting period.
We have made substantial progress in completing ourreview of the impact of this guidance across ourvarious business arrangements and revenue relatedactivities, and do not expect the adoption of thisstandard to have a material impact on our financialstatements and revenue recognition practices, or ourinternal controls. Under the development portion of ourcollaboration agreements, we expect the milestonepayments, which are recorded in Other(income)/deductions –– net, to be amortized over thedevelopment period rather than the life of theagreement, as we currently do. We continue to monitoradditional changes, modifications, clarifications orinterpretations undertaken by the FASB, which mayimpact our current conclusions. In addition, wecontinue to monitor other changes, such as changes inour business, new collaboration arrangements,business combinations, etc., which may impact ourcurrent conclusions prior to the adoption date.
In August 2016, the FASB issued new guidance on the classification ofcertain transactions in the Statement of Cash Flows.
January 1, 2018. Earlier applicationis permitted.
We are assessing the impact of this guidance on ourconsolidated financial statements.
In October 2016, the FASB issued new guidance on the presentation ofrestricted cash in the Statement of Cash Flows.
January 1, 2018. Earlier applicationis permitted.
We are assessing the impact of this guidance on ourconsolidated financial statements.
In October 2016, the FASB issued an update to its guidance on income tax accounting. The new guidance replaces the prohibition against recognizingcurrent and deferred income taxes for an intra-entity asset transfer until theasset has been sold to an outside party with a requirement to do so, unlessthe asset transferred is inventory.
January 1, 2018. Earlier applicationis permitted in the first interimperiod of an annual reportingperiod.
We have not yet completed our review of the impact ofthis new guidance on our consolidated financialstatements. The impact of adoption will be recorded asa cumulative effect adjustment to Retained earnings.
2016 Financial Report
59
Financial ReviewPfizer Inc. and Subsidiary Companies
Standard/Description Effective Date Effect on the Financial Statements or Other
Significant MattersIn January 2016, the FASB issued an update to its guidance on recognitionand measurement of financial assets and liabilities . Among other things,the new guidance makes the following targeted changes to existing guidance:1. Requires certain equity investments to be measured at fair value with
changes in fair value recognized in net income. However, an entity maychoose to measure equity investments that do not have readilydeterminable fair values at cost minus impairment, if any, plus or minuschanges resulting from observable price changes in orderly transactions forthe identical or similar investment of the same issuer.
2. Requires a qualitative assessment of equity investments without readilydeterminable fair values to identify impairment.
3. Requires separate presentation of financial assets and financial liabilities bymeasurement category and form of financial asset on the balance sheet orin the accompanying notes to the financial statements.
January 1, 2018. Earlier applicationis permitted as of the beginning ofan interim or annual reportingperiod.
We are assessing the impact of the provisions of thisnew guidance on our consolidated financialstatements.
In January 2017, the FASB issued new guidance to clarify the definition of abusiness . The new guidance provides a new framework for determiningwhether business development transactions should be accounted for asacquisitions (or disposals) of assets or businesses. If the fair value of thegross assets acquired is concentrated in a single identifiable asset, thetransaction will not qualify for treatment as a business. The new guidance alsorequires that to be considered a business, a set of integrated activities andassets must include, at a minimum, an input and a substantive process thattogether significantly contribute to the ability to create outputs, without regardas to whether a market participant could replace missing elements. Inaddition, the new guidance narrows the definition of the term "output" to makeit consistent with how outputs are described in the updated revenuerecognition guidance.
January 1, 2018. Earlier applicationis permitted for acquisition orderecognition events that occurredprior to issuance date or effectivedate of the guidance only when thetransaction has not been reportedin financial statements that havebeen issued or made available forissuance.
We have not yet completed our review of the impact ofthis guidance. However, we anticipate that afteradoption, fewer transactions will be accounted for asbusiness acquisitions (decreasing the amount ofgoodwill incurred and potentially increasing IPR&Dexpense), or disposals of a business.
In February 2017, the FASB issued amended guidance related to thederecognition of nonfinancial assets.
January 1, 2018. Earlier applicationis permitted only as of annualreporting periods beginning afterDecember 15, 2016, includinginterim reporting periods within thatreporting period. However, thisguidance must be applied at thesame time as the new guidance onrevenue recognition.
We are assessing the impact of theprovisions of this new guidance on ourconsolidated financial statements.
In February 2016, the FASB issued an update to its guidance on leases . Thenew ASU provides guidance for both lessee and lessor accounting models.Among other things, the new guidance requires that a right of use asset and alease liability be recognized for leases with a duration of greater than oneyear.
January 1, 2019. Earlier applicationis permitted.
We have not yet completed our review of the impact ofthis guidance. However, we anticipate recognition ofadditional assets and corresponding liabilities relatedto leases on our balance sheet.
In June 2016, the FASB issued new guidance on accounting for credit lossesof financial instruments . The new guidance replaces the incurred lossesmethodology in current GAAP with a methodology that reflects expectedcredit losses using an allowance account.
January 1, 2020. Earlier applicationis permitted as of fiscal yearsbeginning after December 15,2018, including interim periodswithin that fiscal year.
We have not yet completed our review of the impact ofthis new guidance on our consolidated financialstatements.
In January 2017, the FASB issued new guidance for goodwill impairmenttesting . The new guidance eliminates the requirement to perform ahypothetical purchase price allocation to measure goodwill impairment. Underthe new guidance the goodwill impairment test is performed by comparing thefair value of a reporting unit with its carrying amount, and recognizing animpairment charge for the amount by which the carrying amount of thereporting unit exceeds its fair value, although it cannot exceed the totalamount of goodwill allocated to that reporting unit.
January 1, 2020. Earlier applicationis permitted.
We have not yet completed our review of the impact ofthis new guidance on our consolidated financialstatements.
60
2016 Financial Report
Financial ReviewPfizer Inc. and Subsidiary Companies
FORWARD-LOOKING INFORMATION AND FACTORS THAT MAY AFFECT FUTURE RESULTS
This report and other written or oral statements that we make from time to time contain forward-looking statements. Such forward-looking statements involve substantial risksand uncertainties. We have tried, wherever possible, to identify such statements by using words such as “will,” “may,” “could,” “likely,” “ongoing,” “anticipate,” “estimate,”“expect,” “project,” “intend,” “plan,” “believe,” “target,” “forecast,” “goal”, “objective”, “aim” and other words and terms of similar meaning or by using future dates in connectionwith any discussion of, among other things, our anticipated future operating and financial performance, business plans and prospects, in-line products and product candidates,strategic reviews, capital allocation, business-development plans and plans relating to share repurchases and dividends. In particular, these include statements relating tofuture actions, business plans and prospects, our acquisitions of Hospira, Anacor, Medivation and AstraZeneca’s small molecule anti-infectives business, the disposition of theHospira Infusion Systems net assets, prospective products or product approvals, future performance or results of current and anticipated products, sales efforts, expenses,interest rates, foreign exchange rates, the outcome of contingencies, such as legal proceedings, plans relating to share repurchases and dividends, government regulation andfinancial results, including, in particular, the financial guidance set forth in the “Our Financial Guidance for 2017” section of this Financial Review, the anticipated costs and costsavings, including from our acquisition of Hospira and our cost-reduction/productivity initiatives set forth in the “Costs and Expenses––Restructuring Charges and Other CostsAssociated with Acquisitions and Cost-Reduction/Productivity Initiatives” section of this Financial Review and in Notes to Consolidated Financial Statements–– Note 3.Restructuring Charges and Other Costs Associated with Acquisitions and Cost-Reduction/Productivity Initiatives , the benefits expected from our business developmenttransactions, the planned capital spending set forth in the “Analysis of Financial Condition, Liquidity and Capital Resources––Selected Measures of Liquidity and CapitalResources––Contractual Obligations” section of this Financial Review and the contributions that we expect to make from our general assets to the Company’s pension andpostretirement plans during 2017 set forth in the “Analysis of Financial Condition, Liquidity and Capital Resources––Selected Measures of Liquidity and Capital Resources––Contractual Obligations” section of this Financial Review and in Notes to Consolidated Financial Statements–– Note 11. Pension and Postretirement Benefit Plans and DefinedContribution Plans . Among the factors that could cause actual results to differ materially from past results and future plans and projected future results are the following:
• the outcome of R&D activities, including, without limitation, the ability to meet anticipated pre-clinical and clinical trial commencement and completion dates, regulatorysubmission and approval dates, and launch dates for product candidates, as well as the possibility of unfavorable pre-clinical and clinical trial results, including unfavorablenew clinical data and additional analyses of existing clinical data;
• decisions by regulatory authorities regarding whether and when to approve our drug applications, which will depend on the assessment by such regulatory authorities of thebenefit-risk profile suggested by the totality of the efficacy and safety information submitted; decisions by regulatory authorities regarding labeling, ingredients and othermatters that could affect the availability or commercial potential of our products; and uncertainties regarding our ability to address the comments in complete response lettersreceived by us with respect to certain of our drug applications to the satisfaction of the FDA;
• the speed with which regulatory authorizations, pricing approvals and product launches may be achieved;
• the outcome of post-approval clinical trials, which could result in the loss of marketing approval for a product or changes in the labeling for, and/or increased or new concernsabout the safety or efficacy of, a product that could affect its availability or commercial potential;
• risks associated with interim data, including the risk that final results of studies for which interim data have been provided and/or additional clinical trials may be different from(including less favorable than) the interim data results and may not support further clinical development of the applicable product candidate or indication;
• the success of external business-development activities, including the ability to satisfy the conditions to closing of announced transactions in the anticipated time frame or atall;
• competitive developments, including the impact on our competitive position of new product entrants, in-line branded products, generic products, private label products,biosimilars and product candidates that treat diseases and conditions similar to those treated by our in-line drugs and drug candidates;
• the implementation by the FDA and regulatory authorities in certain other countries of an abbreviated legal pathway to approve biosimilar products, which could subject ourbiologic products to competition from biosimilar products, with attendant competitive pressures, after the expiration of any applicable exclusivity period and patent rights;
• risks related to our ability to develop and launch biosimilars, including risks associated with "at risk" launches, defined as the marketing of a product by Pfizer before the finalresolution of litigation (including any appeals) brought by a third party alleging that such marketing would infringe one or more patents owned or controlled by the third party;
• the ability to meet competition from generic, branded and biosimilar products after the loss or expiration of patent protection for our products or competitor products;
• the ability to successfully market both new and existing products domestically and internationally;
• difficulties or delays in manufacturing, including possible legal or regulatory actions, such as warning letters, suspension of manufacturing, seizure or product, injunctions orvoluntary recall of a product;
• trade buying patterns;
• the impact of existing and future legislation and regulatory provisions on product exclusivity;
• trends toward managed care and healthcare cost containment, and our ability to obtain or maintain timely or adequate pricing or formulary placement for our products;
• the impact of any significant spending reductions or cost controls affecting Medicare, Medicaid or other publicly funded or subsidized health programs or changes in the taxtreatment of employer-sponsored health insurance that may be implemented, and/or any significant additional taxes or fees that may be imposed on the pharmaceuticalindustry as part of any broad deficit-reduction effort;
2016 Financial Report
61
Financial ReviewPfizer Inc. and Subsidiary Companies
• the impact of any U.S. healthcare reform or legislation, including any repeal, substantial modification or invalidation of any or all of the provisions of the U.S. PatientProtection and Affordable Care Act, as amended by the Health Care and Education Reconciliation Act;
• U.S. federal or state legislation or regulatory action and/or policy efforts affecting, among other things, pharmaceutical product pricing, reimbursement or access, includingunder Medicaid, Medicare and other publicly funded or subsidized health programs; patient out-of-pocket costs for medicines, manufacturer prices and/or price increasesthat could result in new mandatory rebates and discounts or other pricing restrictions; the importation of prescription drugs from outside the U.S. at prices that are regulatedby governments of various foreign countries; restrictions on direct-to-consumer advertising; limitations on interactions with healthcare professionals; or the use ofcomparative effectiveness methodologies that could be implemented in a manner that focuses primarily on the cost differences and minimizes the therapeutic differencesamong pharmaceutical products and restricts access to innovative medicines; as well as pricing pressures for our products as a result of highly competitive insurancemarkets;
• legislation or regulatory action in markets outside the U.S. affecting pharmaceutical product pricing, reimbursement or access, including, in particular, continued government-mandated reductions in prices and access restrictions for certain biopharmaceutical products to control costs in those markets;
• the exposure of our operations outside the U.S. to possible capital and exchange controls, expropriation and other restrictive government actions, changes in intellectualproperty legal protections and remedies, as well as political unrest, unstable governments and legal systems and inter-governmental disputes;
• contingencies related to actual or alleged environmental contamination;
• claims and concerns that may arise regarding the safety or efficacy of in-line products and product candidates;
• any significant breakdown, infiltration or interruption of our information technology systems and infrastructure;
• legal defense costs, insurance expenses and settlement costs;
• the risk of an adverse decision or settlement and the adequacy of reserves related to legal proceedings, including patent litigation, product liability and other product-relatedlitigation, including personal injury, consumer, off-label promotion, securities, antitrust and breach of contract claims, commercial, environmental, government investigations,employment and other legal proceedings, including various means for resolving asbestos litigation, as well as tax issues;
• our ability to protect our patents and other intellectual property, both domestically and internationally;
• interest rate and foreign currency exchange rate fluctuations, including the impact of possible currency devaluations in countries experiencing high inflation rates and thevolatility following the U.K. referendum in which voters approved the exit from the EU;
• governmental laws and regulations affecting domestic and foreign operations, including, without limitation, tax obligations and changes affecting the tax treatment by theU.S. of income earned outside the U.S. that may result from pending and possible future proposals;
• any significant issues involving our largest wholesale distributors, which account for a substantial portion of our revenues;
• the possible impact of the increased presence of counterfeit medicines in the pharmaceutical supply chain on our revenues and on patient confidence in the integrity of ourmedicines;
• the end result of any negotiations between the U.K. government and the EU regarding the terms of the U.K.’s exit from the EU, which could have implications on ourresearch, commercial and general business operations in the U.K. and the EU;
• any significant issues that may arise related to the outsourcing of certain operational and staff functions to third parties, including with regard to quality, timeliness andcompliance with applicable legal requirements and industry standards;
• any significant issues that may arise related to our joint ventures and other third-party business arrangements;
• changes in U.S. generally accepted accounting principles;
• changes in interpretations of existing laws and regulations, or changes in laws and regulations, in the U.S. and other countries;
• uncertainties related to general economic, political, business, industry, regulatory and market conditions including, without limitation, uncertainties related to the impact onus, our customers, suppliers and lenders and counterparties to our foreign-exchange and interest-rate agreements of challenging global economic conditions and recent andpossible future changes in global financial markets; and the related risk that our allowance for doubtful accounts may not be adequate;
• any changes in business, political and economic conditions due to actual or threatened terrorist activity in the U.S. and other parts of the world, and related U.S. militaryaction overseas;
• growth in costs and expenses;
• changes in our product, segment and geographic mix;
• the impact of purchase accounting adjustments, acquisition-related costs, discontinued operations and certain significant items;
• the impact of acquisitions, divestitures, restructurings, internal reorganizations, product recalls, withdrawals and other unusual items, including our ability to realize theprojected benefits of our cost-reduction and productivity initiatives and of the internal separation of our commercial operations into our current operating structure;
• the risk of an impairment charge related to our intangible assets, goodwill or equity-method investments;
• risks related to internal control over financial reporting; and
• risks and uncertainties related to our recent acquisitions of Hospira, Anacor, Medivation and AstraZeneca’s small molecule anti-infectives business, including, among otherthings, the ability to realize the anticipated benefits of the acquisitions of Hospira, Anacor, Medivation and
62
2016 Financial Report

Financial ReviewPfizer Inc. and Subsidiary Companies
AstraZeneca’s small molecule anti-infectives business, including the possibility that expected cost savings related to the acquisition of Hospira and accretion related to theacquisition of Hospira, Anacor and Medivation will not be realized or will not be realized within the expected time frame; the risk that the businesses will not be integratedsuccessfully; disruption from the transactions making it more difficult to maintain business and operational relationships; significant transaction costs; and unknown liabilities.
We cannot guarantee that any forward-looking statement will be realized. Achievement of anticipated results is subject to substantial risks, uncertainties and inaccurateassumptions. Should known or unknown risks or uncertainties materialize or should underlying assumptions prove inaccurate, actual results could vary materially from pastresults and those anticipated, estimated or projected. Investors should bear this in mind as they consider forward-looking statements, and are cautioned not to put unduereliance on forward-looking statements.
We undertake no obligation to publicly update forward-looking statements, whether as a result of new information, future events or otherwise, except as required by law or bythe rules and regulations of the SEC. You are advised, however, to consult any further disclosures we make on related subjects.
Certain risks, uncertainties and assumptions are discussed here and under the heading entitled “Risk Factors” in Part I, Item 1A. of our Form 10-K for the year endedDecember 31, 2016 . We note these factors for investors as permitted by the Private Securities Litigation Reform Act of 1995. You should understand that it is not possible topredict or identify all such factors. Consequently, you should not consider any such list to be a complete set of all potential risks or uncertainties.
The operating segment information provided in this report does not purport to represent the revenues, costs and income from continuing operations before provision for taxeson income that each of our operating segments would have recorded had each segment operated as a standalone company during the periods presented.
This report includes discussion of certain clinical studies relating to various in-line products and/or product candidates. These studies typically are part of a larger body ofclinical data relating to such products or product candidates, and the discussion herein should be considered in the context of the larger body of data. In addition, clinical trialdata are subject to differing interpretations, and, even when we view data as sufficient to support the safety and/or effectiveness of a product candidate or a new indication foran in-line product, regulatory authorities may not share our views and may require additional data or may deny approval altogether.
Financial Risk Management
The objective of our financial risk management program is to minimize the impact of foreign exchange rate movements and interest rate movements on our earnings. Wemanage these financial exposures through operational means and through the use of third-party instruments. These practices may change as economic conditions change.
Foreign Exchange Risk
We operate globally and, as such, we are subject to foreign exchange risk in our commercial operations, as well as in our financial assets (investments) and liabilities(borrowings). Our net investments in foreign subsidiaries are also subject to currency risk.
On the commercial side, a significant portion of our revenues and earnings is exposed to changes in foreign exchange rates. See the “ Our Operating Environment — TheGlobal Economic Environment ” section of this Financial Review for the key currencies in which we operate. We seek to manage our foreign exchange risk, in part, throughoperational means, including managing same-currency revenues in relation to same-currency costs and same-currency assets in relation to same-currency liabilities. Whereforeign exchange risk cannot be mitigated via operational means, we may use foreign currency forward-exchange contracts and/or foreign currency swaps to manage that risk.
With respect to our financial assets and liabilities, our primary foreign exchange exposure arises predominantly from short-term and long-term intercompany receivables andpayables, and, to a lesser extent, from short-term and long-term investments and debt, where the assets and/or liabilities are denominated in currencies other than thefunctional currency of the business entity.
We also hedge some forecasted intercompany sales denominated in euro, Japanese yen, U.K. pound, Australian dollar, and Canadian dollar to protect against longer-termmovements.
In addition, under certain market conditions, we may seek to protect against possible declines in the reported net investments of our foreign business entities. In these cases,we may use foreign currency swaps, foreign currency forward-exchange contracts and/or foreign currency debt.
For details about these and other financial instruments, including fair valuation methodologies, see Notes to Consolidated Financial Statements— Note 7A. FinancialInstruments: Selected Financial Assets and Liabilities .
The fair values of our financial instrument holdings are analyzed at year-end to determine their sensitivity to foreign exchange rate changes. In this sensitivity analysis, holdingall other assumptions constant and assuming that a change in one currency’s rate relative to the U.S. dollar would not have any effect on another currency’s rates relative tothe U.S. dollar, if the dollar were to appreciate against all other currencies by 10%, as of December 31, 2016 , the expected adverse impact on our net income would not besignificant.
Interest Rate Risk
We are subject to interest rate risk on our investments and on our borrowings. We manage interest rate risk in the aggregate, while focusing on Pfizer’s immediate andintermediate liquidity needs.
2016 Financial Report
63

Financial ReviewPfizer Inc. and Subsidiary Companies
With respect to our investments, we strive to maintain a predominantly floating-rate basis position, but our strategy may change based on prevailing market conditions. Ourfloating-rate assets are subject to the risk that short-term interest rates may fall and, as a result, the investments would generate less interest income. Fixed-rate investmentsprovide a known amount of interest income regardless of a change in interest rates. We sometimes use interest rate swaps in our financial investment portfolio.
With respect to our long-term borrowings, we strive to maintain a predominantly floating-rate basis position, but here too, we may change our strategy depending uponprevailing market conditions. We generally issue debt with a fixed rate, and then use interest rate swaps to convert it into floating-rate debt as we deem appropriate in thecircumstances. This effective floating rate debt serves to offset some of the interest rate risks associated with our short-term and floating-rate investments.
For details about these and other financial instruments, including fair valuation methodologies, see Notes to Consolidated Financial Statements— Note 7A. FinancialInstruments: Selected Financial Assets and Liabilities .
The fair values of our financial instrument holdings are analyzed at year-end to determine their sensitivity to interest rate changes. In this sensitivity analysis, holding all otherassumptions constant and assuming a parallel shift in the interest rate curve for all maturities and for all instruments, if there were a one hundred basis point increase ininterest rates as of December 31, 2016 , the expected adverse impact on our net income would not be significant.
Contingencies
Legal Matters
We and certain of our subsidiaries are subject to numerous contingencies arising in the ordinary course of business, such as patent litigation, product liability and otherproduct-related litigation, commercial litigation, environmental claims and proceedings, government investigations and guarantees and indemnifications (see Notes toConsolidated Financial Statements— Note 17. Commitments and Contingencies).
Certain of these contingencies could result in losses, including damages, fines and/or civil penalties, and/or criminal charges, which could be substantial.
We believe that our claims and defenses in these matters are substantial, but litigation is inherently unpredictable and excessive verdicts do occur. We do not believe that anyof these matters will have a material adverse effect on our financial position. However, we could incur judgments, enter into settlements or revise our expectations regardingthe outcome of certain matters, and such developments could have a material adverse effect on our results of operations in the period in which the amounts are accrued and/orour cash flows in the period in which the amounts are paid.
We have accrued for losses that are both probable and reasonably estimable. Substantially all of our contingencies are subject to significant uncertainties and, therefore,determining the likelihood of a loss and/or the measurement of any loss can be complex. Consequently, we are unable to estimate the range of reasonably possible loss inexcess of amounts accrued. Our assessments are based on estimates and assumptions that have been deemed reasonable by management, but the assessment processrelies heavily on estimates and assumptions that may prove to be incomplete or inaccurate, and unanticipated events and circumstances may occur that might cause us tochange those estimates and assumptions.
Tax Matters
We and certain of our subsidiaries are subject to numerous contingencies arising in the ordinary course of business for tax matters (see Notes to Consolidated FinancialStatements— Note 5D. Tax Matters: Tax Contingencies).
We account for income tax contingencies using a benefit recognition model. If our initial assessment fails to result in the recognition of a tax benefit, we regularly monitor ourposition and subsequently recognize the tax benefit: (i) if there are changes in tax law, analogous case law or there is new information that sufficiently raise the likelihood ofprevailing on the technical merits of the position to “more likely than not”; (ii) if the statute of limitations expires; or (iii) if there is a completion of an audit resulting in a favorablesettlement of that tax year with the appropriate agency. We regularly re-evaluate our tax positions based on the results of audits of federal, state and foreign income tax filings,statute of limitations expirations, changes in tax law or receipt of new information that would either increase or decrease the technical merits of a position relative to the “more-likely-than-not” standard.
Our assessments are based on estimates and assumptions that have been deemed reasonable by management, but our estimates of unrecognized tax benefits and potentialtax benefits may not be representative of actual outcomes, and variation from such estimates could materially affect our financial statements in the period of settlement or whenthe statutes of limitations expire, as we treat these events as discrete items in the period of resolution. Finalizing audits with the relevant taxing authorities can include formaladministrative and legal proceedings, and, as a result, it is difficult to estimate the timing and range of possible changes related to our uncertain tax positions, and suchchanges could be significant.
64
2016 Financial Report
Management’s Report on Internal Control Over Financial Reporting
Management’s Report
We prepared and are responsible for the financial statements that appear in our 2016 Financial Report. These financial statements are in conformity with accounting principlesgenerally accepted in the United States of America and, therefore, include amounts based on informed judgments and estimates. We also accept responsibility for thepreparation of other financial information that is included in this document.
Report on Internal Control Over Financial Reporting
The management of the Company is responsible for establishing and maintaining adequate internal control over financial reporting as defined in Rules 13a-15(f) and 15d-15(f)under the Securities Exchange Act of 1934. The Company’s internal control over financial reporting is designed to provide reasonable assurance regarding the reliability offinancial reporting and the preparation of financial statements for external purposes in accordance with generally accepted accounting principles in the United States ofAmerica. The Company’s internal control over financial reporting includes those policies and procedures that: (i) pertain to the maintenance of records that, in reasonabledetail, accurately and fairly reflect the transactions and dispositions of the assets of the Company; (ii) provide reasonable assurance that transactions are recorded asnecessary to permit preparation of financial statements in accordance with generally accepted accounting principles and that receipts and expenditures of the Company arebeing made only in accordance with authorizations of management and directors of the Company; and (iii) provide reasonable assurance regarding prevention or timelydetection of unauthorized acquisition, use or disposition of the Company’s assets that could have a material effect on the financial statements.
Because of its inherent limitations, internal control over financial reporting may not prevent or detect misstatements. Also, projections of any evaluation of effectiveness tofuture periods are subject to the risk that controls may become inadequate because of changes in conditions or that the degree of compliance with the policies or proceduresmay deteriorate. Management assessed the effectiveness of the Company’s internal control over financial reporting as of December 31, 2016 . In making this assessment,management used the criteria set forth by the Committee of Sponsoring Organizations of the Treadway Commission in Internal Control—Integrated Framework (2013) . Basedon our assessment and those criteria, management believes that the Company maintained effective internal control over financial reporting as of December 31, 2016 .
The Company’s independent auditors have issued their auditors’ report on the Company’s internal control over financial reporting. That report appears in our 2016 FinancialReport under the heading, Report of Independent Registered Public Accounting Firm on Internal Control Over Financial Reporting.
Ian Read Chairman and Chief Executive Officer
Frank D’Amelio Loretta CangialosiPrincipal Financial Officer Principal Accounting Officer
February 23, 2017
2016 Financial Report
65
Audit Committee Report
The Audit Committee reviews Pfizer’s financial reporting process on behalf of the Board of Directors. Management has the primary responsibility for the financial statementsand the reporting process, including the system of internal controls.
The Committee met and held discussions with management and the independent registered public accounting firm regarding the fair and complete presentation of Pfizer’sresults and the assessment of Pfizer’s internal control over financial reporting. We discussed significant accounting policies applied in Pfizer’s financial statements, as well as,when applicable, alternative accounting treatments. Management represented to the Committee that the consolidated financial statements were prepared in accordance withaccounting principles generally accepted in the United States of America, and the Committee reviewed and discussed the consolidated financial statements with managementand the independent registered public accounting firm. The Committee discussed with the independent registered public accounting firm matters required to be discussedunder applicable Public Company Accounting Oversight Board (PCAOB) standards.
In addition, the Committee reviewed and discussed with the independent registered public accounting firm the auditor’s independence from Pfizer and its management. As partof that review, we received the written disclosures and the letter required by applicable requirements of the PCAOB regarding the independent registered public accountingfirm’s communications with the Audit Committee concerning independence, and the Committee discussed the independent registered public accounting firm’s independencefrom Pfizer.
We also considered whether the independent registered public accounting firm’s provision of non-audit services to Pfizer is compatible with the auditor’s independence. TheCommittee concluded that the independent registered public accounting firm is independent from Pfizer and its management.
As part of our responsibilities for oversight of Pfizer’s Enterprise Risk Management process, we reviewed and discussed company policies with respect to risk assessment andrisk management, including discussions of individual risk areas, as well as an annual summary of the overall process.
The Committee discussed with Pfizer’s Internal Audit Department and independent registered public accounting firm the overall scope of and plans for their respective audits.The Committee meets with the Chief Internal Auditor, Chief Compliance and Risk Officer and representatives of the independent registered public accounting firm, in regularand executive sessions, to discuss the results of their examinations, the evaluations of Pfizer’s internal controls, and the overall quality of Pfizer’s financial reporting andcompliance programs.
In reliance on the reviews and discussions referred to above, the Committee has recommended to the Board of Directors, and the Board has approved, that the auditedfinancial statements be included in Pfizer’s Annual Report on Form 10-K for the year ended December 31, 2016 , for filing with the U.S. Securities and Exchange Commission.The Committee has selected, and the Board of Directors has ratified, the selection of Pfizer’s independent registered public accounting firm for 2017 .
Suzanne Nora Johnson W. Don Cornwell
Chair, Audit Committee February 23, 2017
February 23, 2017
Joseph J. Echevarria Stephen W. Sanger
February 23, 2017 February 23, 2017
James C. Smith
February 23, 2017
The Audit Committee Report does not constitute soliciting material, and shall not be deemed to be filed or incorporated by reference into any Company filing under theSecurities Act of 1933, as amended, or the Securities Exchange Act of 1934, as amended, except to the extent that the Company specifically incorporates the Audit CommitteeReport by reference therein.
66
2016 Financial Report
Report of Independent Registered Public Accounting Firm on theConsolidated Financial Statements
The Board of Directors and Shareholders of Pfizer Inc.:
We have audited the accompanying consolidated balance sheets of Pfizer Inc. and Subsidiary Companies as of December 31, 2016 and 2015 , and the related consolidatedstatements of income, comprehensive income, equity, and cash flows for each of the years in the three-year period ended December 31, 2016 . These consolidated financialstatements are the responsibility of the Company’s management. Our responsibility is to express an opinion on these consolidated financial statements based on our audits.
We conducted our audits in accordance with the standards of the Public Company Accounting Oversight Board (United States). Those standards require that we plan andperform the audit to obtain reasonable assurance about whether the financial statements are free of material misstatement. An audit includes examining, on a test basis,evidence supporting the amounts and disclosures in the financial statements. An audit also includes assessing the accounting principles used and significant estimates madeby management, as well as evaluating the overall financial statement presentation. We believe that our audits provide a reasonable basis for our opinion.
In our opinion, the consolidated financial statements referred to above present fairly, in all material respects, the financial position of Pfizer Inc. and Subsidiary Companies as ofDecember 31, 2016 and 2015 , and the results of their operations and their cash flows for each of the years in the three-year period ended December 31, 2016 , in conformitywith U.S. generally accepted accounting principles.
We also have audited, in accordance with the standards of the Public Company Accounting Oversight Board (United States), the effectiveness of Pfizer Inc. and SubsidiaryCompanies’ internal control over financial reporting as of December 31, 2016 , based on criteria established in Internal Control — Integrated Framework (2013) issued by theCommittee of Sponsoring Organizations of the Treadway Commission (COSO), and our report dated February 23, 2017 expressed an unqualified opinion on the effectiveoperation of the Company’s internal control over financial reporting.
KPMG LLPNew York, New York February 23, 2017
2016 Financial Report
67
Report of Independent Registered Public Accounting Firm onInternal Control Over Financial Reporting
The Board of Directors and Shareholders of Pfizer Inc.:We have audited the internal control over financial reporting of Pfizer Inc. and Subsidiary Companies as of December 31, 2016 , based on criteria established in InternalControl — Integrated Framework (2013) issued by the Committee of Sponsoring Organizations of the Treadway Commission (COSO). Pfizer Inc. and Subsidiary Companies’management is responsible for maintaining effective internal control over financial reporting and for its assessment of the effectiveness of internal control over financialreporting, included in the accompanying Management’s Report on Internal Control Over Financial Reporting. Our responsibility is to express an opinion on the Company’sinternal control over financial reporting based on our audit.
We conducted our audit in accordance with the standards of the Public Company Accounting Oversight Board (United States). Those standards require that we plan andperform the audit to obtain reasonable assurance about whether effective internal control over financial reporting was maintained in all material respects. Our audit includedobtaining an understanding of internal control over financial reporting, assessing the risk that a material weakness exists, and testing and evaluating the design and operatingeffectiveness of internal control based on the assessed risk. Our audit also included performing such other procedures as we considered necessary in the circumstances. Webelieve that our audit provides a reasonable basis for our opinion.
A company’s internal control over financial reporting is a process designed to provide reasonable assurance regarding the reliability of financial reporting and the preparation offinancial statements for external purposes in accordance with generally accepted accounting principles. A company’s internal control over financial reporting includes thosepolicies and procedures that (i) pertain to the maintenance of records that, in reasonable detail, accurately and fairly reflect the transactions and dispositions of the assets ofthe company; (ii) provide reasonable assurance that transactions are recorded as necessary to permit preparation of financial statements in accordance with generallyaccepted accounting principles, and that receipts and expenditures of the company are being made only in accordance with authorizations of management and directors of thecompany; and (iii) provide reasonable assurance regarding prevention or timely detection of unauthorized acquisition, use, or disposition of the company’s assets that couldhave a material effect on the financial statements.
Because of its inherent limitations, internal control over financial reporting may not prevent or detect misstatements. Also, projections of any evaluation of effectiveness tofuture periods are subject to the risk that controls may become inadequate because of changes in conditions, or that the degree of compliance with the policies or proceduresmay deteriorate.
In our opinion, Pfizer Inc. and Subsidiary Companies maintained, in all material respects, effective internal control over financial reporting as of December 31, 2016 , based oncriteria established in Internal Control — Integrated Framework (2013) issued by COSO.
We also have audited, in accordance with the standards of the Public Company Accounting Oversight Board (United States), the consolidated balance sheets of Pfizer Inc. andSubsidiary Companies as of December 31, 2016 and 2015 , and the related consolidated statements of income, comprehensive income, equity, and cash flows for each of theyears in the three-year period ended December 31, 2016 , and our report dated February 23, 2017 expressed an unqualified opinion on those consolidated financialstatements.
KPMG LLPNew York, New York February 23, 2017
68
2016 Financial Report
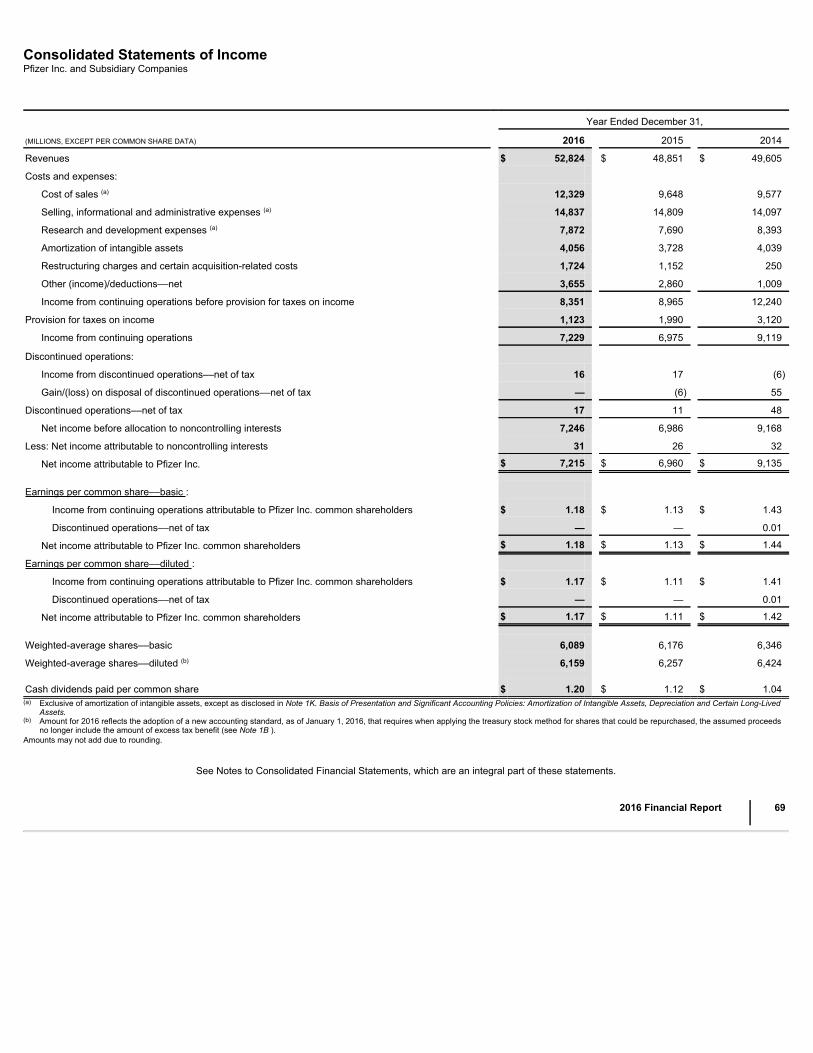
Consolidated Statements of IncomePfizer Inc. and Subsidiary Companies
Year Ended December 31,
(MILLIONS, EXCEPT PER COMMON SHARE DATA) 2016 2015 2014
Revenues $ 52,824 $ 48,851 $ 49,605
Costs and expenses:
Cost of sales (a) 12,329 9,648 9,577
Selling, informational and administrative expenses (a) 14,837 14,809 14,097
Research and development expenses (a) 7,872 7,690 8,393
Amortization of intangible assets 4,056 3,728 4,039
Restructuring charges and certain acquisition-related costs 1,724 1,152 250
Other (income)/deductions––net 3,655 2,860 1,009
Income from continuing operations before provision for taxes on income 8,351 8,965 12,240
Provision for taxes on income 1,123 1,990 3,120
Income from continuing operations 7,229 6,975 9,119
Discontinued operations:
Income from discontinued operations––net of tax 16 17 (6)
Gain/(loss) on disposal of discontinued operations––net of tax — (6) 55
Discontinued operations––net of tax 17 11 48
Net income before allocation to noncontrolling interests 7,246 6,986 9,168
Less: Net income attributable to noncontrolling interests 31 26 32
Net income attributable to Pfizer Inc. $ 7,215 $ 6,960 $ 9,135
Earnings per common share––basic :
Income from continuing operations attributable to Pfizer Inc. common shareholders $ 1.18 $ 1.13 $ 1.43
Discontinued operations––net of tax — — 0.01
Net income attributable to Pfizer Inc. common shareholders $ 1.18 $ 1.13 $ 1.44
Earnings per common share––diluted :
Income from continuing operations attributable to Pfizer Inc. common shareholders $ 1.17 $ 1.11 $ 1.41
Discontinued operations––net of tax — — 0.01
Net income attributable to Pfizer Inc. common shareholders $ 1.17 $ 1.11 $ 1.42
Weighted-average shares––basic 6,089 6,176 6,346
Weighted-average shares––diluted (b) 6,159 6,257 6,424 Cash dividends paid per common share $ 1.20 $ 1.12 $ 1.04
(a) Exclusive of amortization of intangible assets, except as disclosed in Note 1K. Basis of Presentation and Significant Accounting Policies: Amortization of Intangible Assets, Depreciation and Certain Long-LivedAssets.
(b) Amount for 2016 reflects the adoption of a new accounting standard, as of January 1, 2016, that requires when applying the treasury stock method for shares that could be repurchased, the assumed proceedsno longer include the amount of excess tax benefit (see Note 1B ).
Amounts may not add due to rounding.
See Notes to Consolidated Financial Statements, which are an integral part of these statements.
2016 Financial Report
69
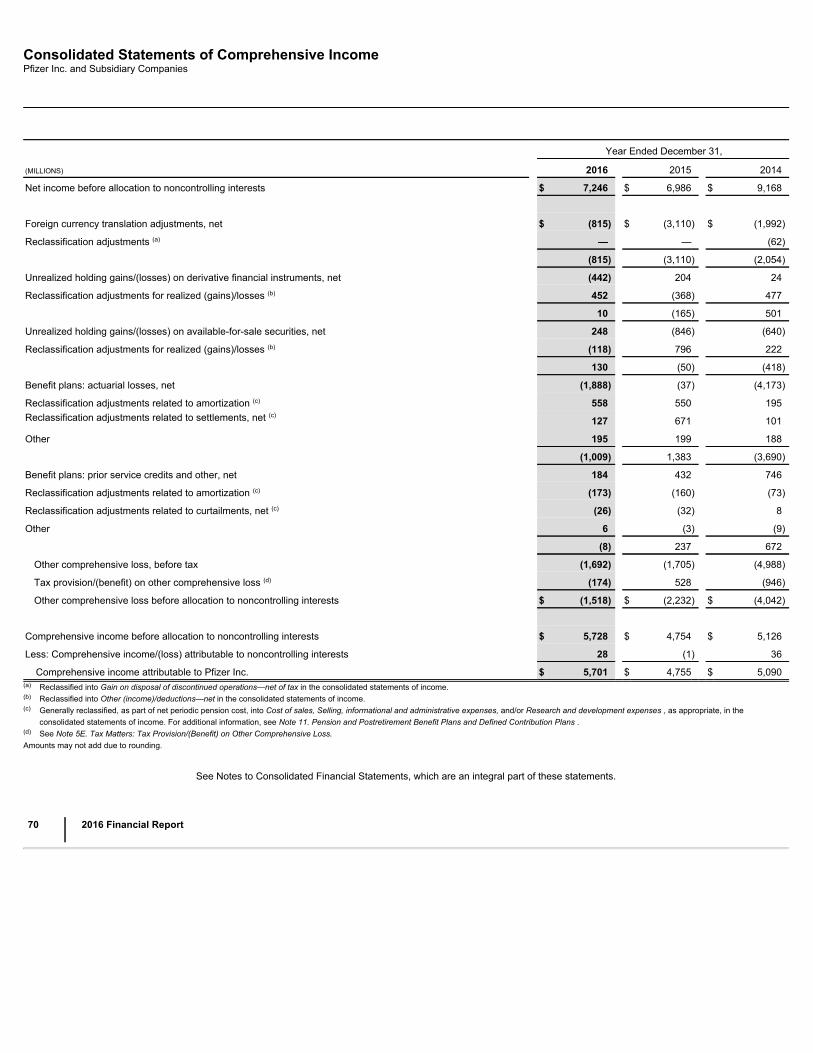
Consolidated Statements of Comprehensive IncomePfizer Inc. and Subsidiary Companies
Year Ended December 31,
(MILLIONS) 2016 2015 2014
Net income before allocation to noncontrolling interests $ 7,246 $ 6,986 $ 9,168
Foreign currency translation adjustments, net $ (815) $ (3,110) $ (1,992)
Reclassification adjustments (a) — — (62)
(815) (3,110) (2,054)
Unrealized holding gains/(losses) on derivative financial instruments, net (442) 204 24
Reclassification adjustments for realized (gains)/losses (b) 452 (368) 477
10 (165) 501
Unrealized holding gains/(losses) on available-for-sale securities, net 248 (846) (640)
Reclassification adjustments for realized (gains)/losses (b) (118) 796 222
130 (50) (418)
Benefit plans: actuarial losses, net (1,888) (37) (4,173)
Reclassification adjustments related to amortization (c) 558 550 195Reclassification adjustments related to settlements, net (c) 127 671 101
Other 195 199 188
(1,009) 1,383 (3,690)
Benefit plans: prior service credits and other, net 184 432 746
Reclassification adjustments related to amortization (c) (173) (160) (73)
Reclassification adjustments related to curtailments, net (c) (26) (32) 8
Other 6 (3) (9)
(8) 237 672
Other comprehensive loss, before tax (1,692) (1,705) (4,988)
Tax provision/(benefit) on other comprehensive loss (d) (174) 528 (946)
Other comprehensive loss before allocation to noncontrolling interests $ (1,518) $ (2,232) $ (4,042)
Comprehensive income before allocation to noncontrolling interests $ 5,728 $ 4,754 $ 5,126
Less: Comprehensive income/(loss) attributable to noncontrolling interests 28 (1) 36
Comprehensive income attributable to Pfizer Inc. $ 5,701 $ 4,755 $ 5,090(a) Reclassified into Gain on disposal of discontinued operations—net of tax in the consolidated statements of income.(b) Reclassified into Other (income)/deductions—net in the consolidated statements of income.(c) Generally reclassified, as part of net periodic pension cost, into Cost of sales, Selling, informational and administrative expenses, and/or Research and development expenses , as appropriate, in the
consolidated statements of income. For additional information, see Note 11. Pension and Postretirement Benefit Plans and Defined Contribution Plans .(d) See Note 5E. Tax Matters: Tax Provision/(Benefit) on Other Comprehensive Loss.Amounts may not add due to rounding.
See Notes to Consolidated Financial Statements, which are an integral part of these statements.
70
2016 Financial Report
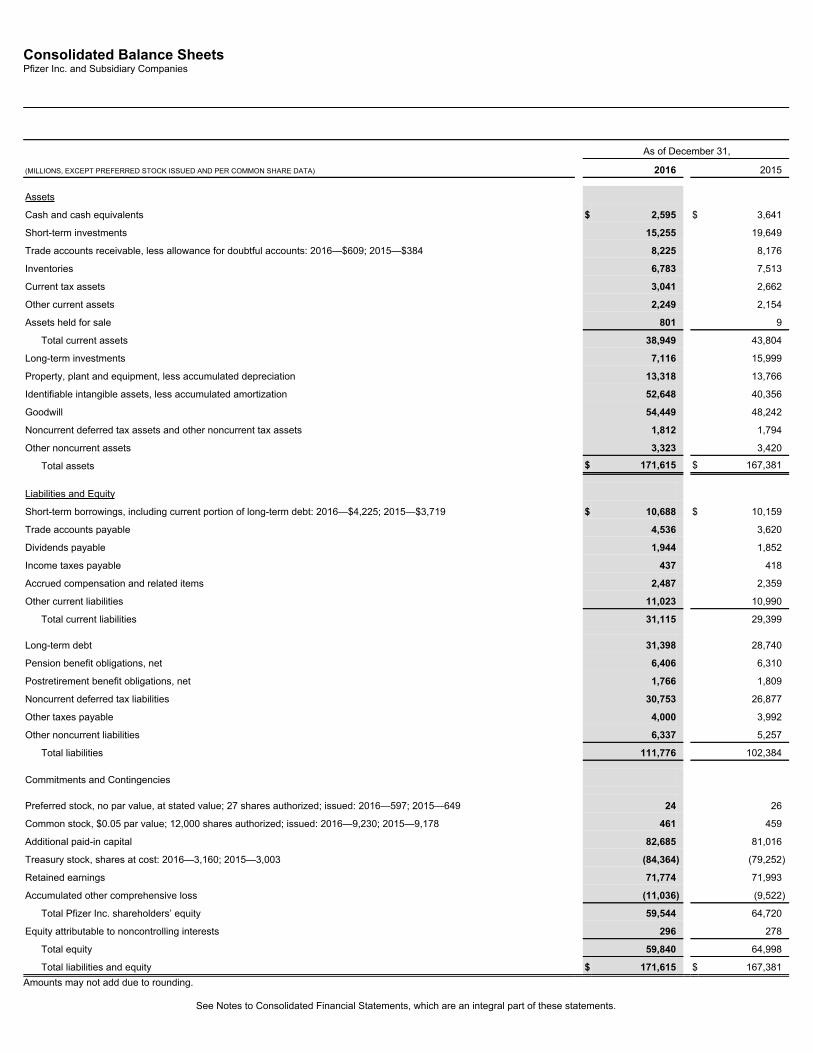
Consolidated Balance SheetsPfizer Inc. and Subsidiary Companies
As of December 31,
(MILLIONS, EXCEPT PREFERRED STOCK ISSUED AND PER COMMON SHARE DATA) 2016 2015
Assets
Cash and cash equivalents $ 2,595 $ 3,641
Short-term investments 15,255 19,649
Trade accounts receivable, less allowance for doubtful accounts: 2016—$609; 2015—$384 8,225 8,176
Inventories 6,783 7,513
Current tax assets 3,041 2,662
Other current assets 2,249 2,154
Assets held for sale 801 9
Total current assets 38,949 43,804
Long-term investments 7,116 15,999
Property, plant and equipment, less accumulated depreciation 13,318 13,766
Identifiable intangible assets, less accumulated amortization 52,648 40,356
Goodwill 54,449 48,242
Noncurrent deferred tax assets and other noncurrent tax assets 1,812 1,794
Other noncurrent assets 3,323 3,420
Total assets $ 171,615 $ 167,381
Liabilities and Equity
Short-term borrowings, including current portion of long-term debt: 2016—$4,225; 2015—$3,719 $ 10,688 $ 10,159
Trade accounts payable 4,536 3,620
Dividends payable 1,944 1,852
Income taxes payable 437 418
Accrued compensation and related items 2,487 2,359
Other current liabilities 11,023 10,990
Total current liabilities 31,115 29,399 Long-term debt 31,398 28,740
Pension benefit obligations, net 6,406 6,310
Postretirement benefit obligations, net 1,766 1,809
Noncurrent deferred tax liabilities 30,753 26,877
Other taxes payable 4,000 3,992
Other noncurrent liabilities 6,337 5,257
Total liabilities 111,776 102,384
Commitments and Contingencies Preferred stock, no par value, at stated value; 27 shares authorized; issued: 2016—597; 2015—649 24 26
Common stock, $0.05 par value; 12,000 shares authorized; issued: 2016—9,230; 2015—9,178 461 459
Additional paid-in capital 82,685 81,016
Treasury stock, shares at cost: 2016—3,160; 2015—3,003 (84,364) (79,252)
Retained earnings 71,774 71,993
Accumulated other comprehensive loss (11,036) (9,522)
Total Pfizer Inc. shareholders’ equity 59,544 64,720
Equity attributable to noncontrolling interests 296 278
Total equity 59,840 64,998
Total liabilities and equity $ 171,615 $ 167,381Amounts may not add due to rounding.
See Notes to Consolidated Financial Statements, which are an integral part of these statements.

2016 Financial Report
71
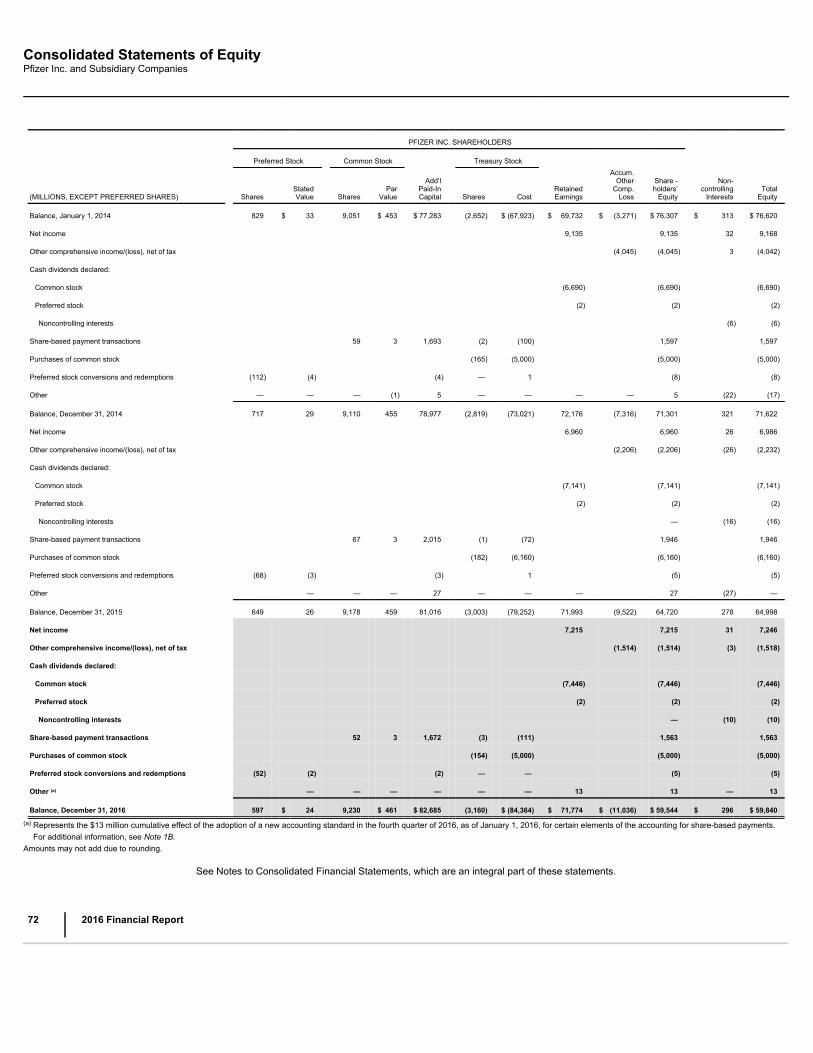
Consolidated Statements of EquityPfizer Inc. and Subsidiary Companies
PFIZER INC. SHAREHOLDERS
Preferred Stock Common Stock Treasury Stock
(MILLIONS, EXCEPT PREFERRED SHARES) Shares StatedValue Shares Par
Value Add’l
Paid-InCapital Shares Cost Retained
Earnings
Accum.Other
Comp.Loss
Share -holders’
Equity Non-
controllingInterests Total
Equity
Balance, January 1, 2014 829 $ 33 9,051 $ 453 $ 77,283 (2,652) $ (67,923) $ 69,732 $ (3,271) $ 76,307 $ 313 $ 76,620
Net income 9,135 9,135 32 9,168
Other comprehensive income/(loss), net of tax (4,045) (4,045) 3 (4,042)
Cash dividends declared:
Common stock (6,690) (6,690) (6,690)
Preferred stock (2) (2) (2)
Noncontrolling interests (6) (6)
Share-based payment transactions 59 3 1,693 (2) (100) 1,597 1,597
Purchases of common stock (165) (5,000) (5,000) (5,000)
Preferred stock conversions and redemptions (112) (4) (4) — 1 (8) (8)
Other — — — (1) 5 — — — — 5 (22) (17)
Balance, December 31, 2014 717 29 9,110 455 78,977 (2,819) (73,021) 72,176 (7,316) 71,301 321 71,622
Net income 6,960 6,960 26 6,986
Other comprehensive income/(loss), net of tax (2,206) (2,206) (26) (2,232)
Cash dividends declared:
Common stock (7,141) (7,141) (7,141)
Preferred stock (2) (2) (2)
Noncontrolling interests — (16) (16)
Share-based payment transactions 67 3 2,015 (1) (72) 1,946 1,946
Purchases of common stock (182) (6,160) (6,160) (6,160)
Preferred stock conversions and redemptions (68) (3) (3) 1 (5) (5)
Other — — — 27 — — — 27 (27) —
Balance, December 31, 2015 649 26 9,178 459 81,016 (3,003) (79,252) 71,993 (9,522) 64,720 278 64,998
Net income 7,215 7,215 31 7,246
Other comprehensive income/(loss), net of tax (1,514) (1,514) (3) (1,518)
Cash dividends declared:
Common stock (7,446) (7,446) (7,446)
Preferred stock (2) (2) (2)
Noncontrolling interests — (10) (10)
Share-based payment transactions 52 3 1,672 (3) (111) 1,563 1,563
Purchases of common stock (154) (5,000) (5,000) (5,000)
Preferred stock conversions and redemptions (52) (2) (2) — — (5) (5)
Other (a) — — — — — — 13 13 — 13
Balance, December 31, 2016 597 $ 24 9,230 $ 461 $ 82,685 (3,160) $ (84,364) $ 71,774 $ (11,036) $ 59,544 $ 296 $ 59,840(a)
Represents the $13 million cumulative effect of the adoption of a new accounting standard in the fourth quarter of 2016, as of January 1, 2016, for certain elements of the accounting for share-based payments.For additional information, see Note 1B.
Amounts may not add due to rounding.
See Notes to Consolidated Financial Statements, which are an integral part of these statements.
72
2016 Financial Report
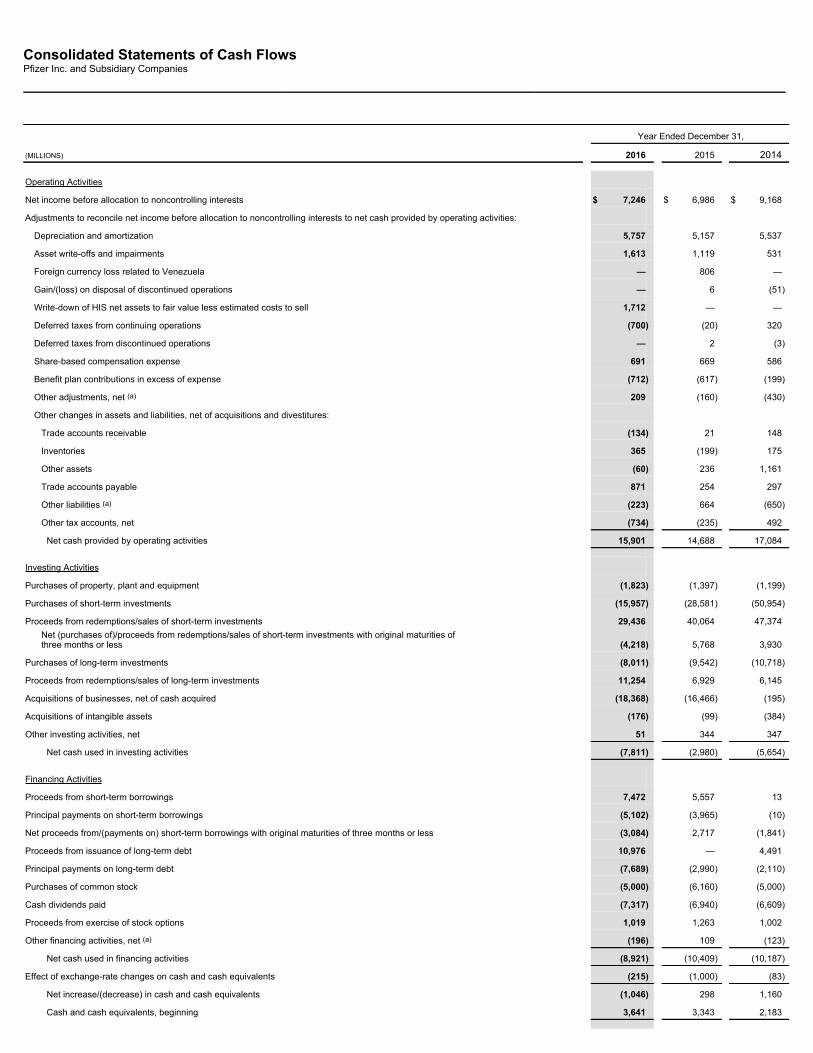
Consolidated Statements of Cash FlowsPfizer Inc. and Subsidiary Companies
Year Ended December 31,
(MILLIONS) 2016 2015 2014
Operating Activities
Net income before allocation to noncontrolling interests $ 7,246 $ 6,986 $ 9,168
Adjustments to reconcile net income before allocation to noncontrolling interests to net cash provided by operating activities:
Depreciation and amortization 5,757 5,157 5,537
Asset write-offs and impairments 1,613 1,119 531
Foreign currency loss related to Venezuela — 806 —
Gain/(loss) on disposal of discontinued operations — 6 (51)
Write-down of HIS net assets to fair value less estimated costs to sell 1,712 — —
Deferred taxes from continuing operations (700) (20) 320
Deferred taxes from discontinued operations — 2 (3)
Share-based compensation expense 691 669 586
Benefit plan contributions in excess of expense (712) (617) (199)
Other adjustments, net (a) 209 (160) (430)
Other changes in assets and liabilities, net of acquisitions and divestitures:
Trade accounts receivable (134) 21 148
Inventories 365 (199) 175
Other assets (60) 236 1,161
Trade accounts payable 871 254 297
Other liabilities (a) (223) 664 (650)
Other tax accounts, net (734) (235) 492
Net cash provided by operating activities 15,901 14,688 17,084
Investing Activities
Purchases of property, plant and equipment (1,823) (1,397) (1,199)
Purchases of short-term investments (15,957) (28,581) (50,954)
Proceeds from redemptions/sales of short-term investments 29,436 40,064 47,374Net (purchases of)/proceeds from redemptions/sales of short-term investments with original maturities ofthree months or less (4,218) 5,768 3,930
Purchases of long-term investments (8,011) (9,542) (10,718)
Proceeds from redemptions/sales of long-term investments 11,254 6,929 6,145
Acquisitions of businesses, net of cash acquired (18,368) (16,466) (195)
Acquisitions of intangible assets (176) (99) (384)
Other investing activities, net 51 344 347
Net cash used in investing activities (7,811) (2,980) (5,654)
Financing Activities
Proceeds from short-term borrowings 7,472 5,557 13
Principal payments on short-term borrowings (5,102) (3,965) (10)
Net proceeds from/(payments on) short-term borrowings with original maturities of three months or less (3,084) 2,717 (1,841)
Proceeds from issuance of long-term debt 10,976 — 4,491
Principal payments on long-term debt (7,689) (2,990) (2,110)
Purchases of common stock (5,000) (6,160) (5,000)
Cash dividends paid (7,317) (6,940) (6,609)
Proceeds from exercise of stock options 1,019 1,263 1,002
Other financing activities, net (a) (196) 109 (123)
Net cash used in financing activities (8,921) (10,409) (10,187)
Effect of exchange-rate changes on cash and cash equivalents (215) (1,000) (83)
Net increase/(decrease) in cash and cash equivalents (1,046) 298 1,160
Cash and cash equivalents, beginning 3,641 3,343 2,183

Cash and cash equivalents, end $ 2,595 $ 3,641 $ 3,343
- Continued -
2016 Financial Report
73
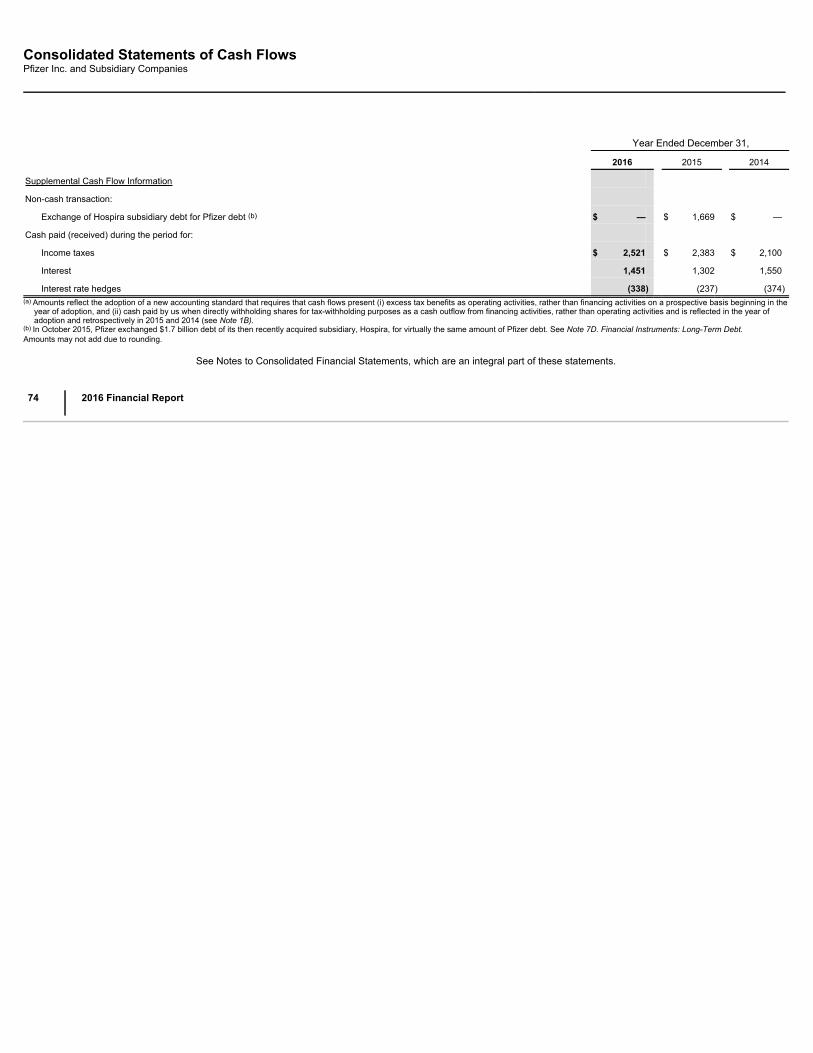
Consolidated Statements of Cash FlowsPfizer Inc. and Subsidiary Companies
Year Ended December 31,
2016 2015 2014
Supplemental Cash Flow Information
Non-cash transaction:
Exchange of Hospira subsidiary debt for Pfizer debt (b) $ — $ 1,669 $ —
Cash paid (received) during the period for:
Income taxes $ 2,521 $ 2,383 $ 2,100
Interest 1,451 1,302 1,550
Interest rate hedges (338) (237) (374)(a) Amounts reflect the adoption of a new accounting standard that requires that cash flows present (i) excess tax benefits as operating activities, rather than financing activities on a prospective basis beginning in the
year of adoption, and (ii) cash paid by us when directly withholding shares for tax-withholding purposes as a cash outflow from financing activities, rather than operating activities and is reflected in the year ofadoption and retrospectively in 2015 and 2014 (see Note 1B).
(b) In October 2015, Pfizer exchanged $1.7 billion debt of its then recently acquired subsidiary, Hospira, for virtually the same amount of Pfizer debt. See Note 7D. Financial Instruments: Long-Term Debt.Amounts may not add due to rounding.
See Notes to Consolidated Financial Statements, which are an integral part of these statements.
74
2016 Financial Report
Notes to Consolidated Financial StatementsPfizer Inc. and Subsidiary Companies
Note 1. Basis of Presentation and Significant Accounting Policies
A. Basis of Presentation
See the Glossary of Defined Terms at the beginning of this 2016 Financial Report for terms used throughout the consolidated financial statements and related notes of this2016 Financial Report.
The consolidated financial statements include our parent company and all subsidiaries, and are prepared in accordance with accounting principles generally accepted in theUnited States of America (U.S. GAAP). The decision of whether or not to consolidate an entity requires consideration of majority voting interests, as well as effective economicor other control over the entity. Typically, we do not seek control by means other than voting interests. For subsidiaries operating outside the U.S., the financial information isincluded as of and for the year ended November 30 for each year presented. Pfizer's fiscal year-end for U.S. subsidiaries is as of and for the year ended December 31 for eachyear presented. Substantially all unremitted earnings of international subsidiaries are free of legal and contractual restrictions. All significant transactions among our businesseshave been eliminated. Taxes paid on intercompany sales transactions are deferred until recognized upon sale of the asset to a third party.
In the consolidated statements of cash flows for the years ended December 31, 2015 and 2014, we performed reclassifications to conform to the current period presentationthat cash paid by us when directly withholding shares for tax-withholding purposes is presented as cash outflows from financing activities, rather than operating activities inaccordance with the adoption of a new accounting standard. For additional information, see Note 1B .
In the consolidated balance sheet as of December 31, 2015, we performed certain reclassifications to conform to the current period presentation of Other current assets , Othernoncurrent assets , Short-term borrowings, including current portion of long-term debt and Long-term debt , and in the consolidated statements of cash flows for the yearsended December 31, 2015 and 2014, we performed certain reclassifications to conform to the current presentation of Other changes in assets and liabilities, net of acquisitionsand divestitures , Principal payments on short-term borrowings, and Principal payments on long-term debt, for debt issuance costs in accordance with the adoption of a newaccounting standard. For additional information, see Note 1B .
We manage our commercial operations through two distinct business segments: Pfizer Innovative Health (IH) and Pfizer Essential Health (EH), which was previously known asEstablished Products. Beginning in the second quarter of 2016, we reorganized our operating segments to reflect that we now manage our innovative pharmaceutical andconsumer healthcare operations as one business segment, IH. From the beginning of our fiscal year 2014 until the second quarter of 2016, these operations were managed astwo business segments: the GIP segment and the VOC segment. We have revised prior-period segment information to reflect the reorganization. For additional information,see Note 18 .
On February 3, 2017, we completed the sale of our global infusion therapy net assets, HIS, to ICU Medical, a global device manufacturer, for up to approximately $900 million ,composed of cash and contingent cash consideration, ICU Medical common stock and seller financing. HIS includes IV pumps, solutions and devices. We have agreed tocertain restrictions on transfer of our ICU Medical shares for 18 months. Assets and liabilities associated with HIS are presented as held for sale in the consolidated balancesheet as of December 31, 2016. For additional information, see Note 2B.
On September 28, 2016, we acquired Medivation for $81.50 per share. The total fair value of consideration transferred for Medivation was approximately $14.3 billion in cash ($13.9 billion , net of cash acquired). Commencing from the acquisition date, our financial statements reflect the assets, liabilities, operating results and cash flows ofMedivation, and, in accordance with our domestic reporting periods, our consolidated financial statements for the year ended December 31, 2016 reflect approximately threemonths of legacy Medivation operations. For additional information, see Note 2A .
On June 24, 2016, we acquired Anacor for $99.25 per share. The total fair value of consideration transferred for Anacor was approximately $4.9 billion in cash ( $4.5 billion ,net of cash acquired), plus $698 million debt assumed. Commencing from the acquisition date, our financial statements reflect the assets, liabilities, operating results and cashflows of Anacor, and, in accordance with our domestic reporting periods, our consolidated financial statements for the year ended December 31, 2016 reflect approximately sixmonths of legacy Anacor operations, which were immaterial . For additional information, see Note 2A.
On April 6, 2016, we announced that the merger agreement between Pfizer and Allergan entered into on November 22, 2015 was terminated by mutual agreement of thecompanies. The decision was driven by the actions announced by the U.S. Department of Treasury on April 4, 2016, which the companies concluded qualified as an “AdverseTax Law Change” under the merger agreement. In connection with the termination of the merger agreement, on April 8, 2016 (which fell into Pfizer’s second fiscal quarter),Pfizer paid Allergan $150 million (pre-tax) for reimbursement of Allergan’s expenses associated with the terminated transaction (see Note 4 ). Pfizer and Allergan also releasedeach other from any and all claims in connection with the merger agreement.
On September 3, 2015, we acquired Hospira for approximately $16.1 billion in cash ( $15.7 billion , net of cash acquired). Commencing from the acquisition date, our financialstatements reflect the assets, liabilities, operating results and cash flows of Hospira. In accordance with our domestic and international reporting periods, our consolidatedfinancial statements for the year ended December 31, 2015 reflect four months of legacy Hospira U.S. operations and three months of legacy Hospira international operations.For additional information, see Note 2A.
Certain amounts in the consolidated financial statements and associated notes may not add due to rounding. All percentages have been calculated using unrounded amounts.
2016 Financial Report
75
Notes to Consolidated Financial StatementsPfizer Inc. and Subsidiary Companies
B. Adoption of New Accounting Standards
In the fourth quarter of 2016, we adopted a new accounting standard for certain elements of the accounting for share-based payments as of January 1, 2016. Specifically, thenew standard requires excess tax benefits or deficiencies (including tax benefits of dividend equivalents) of shared-based compensation to be recognized as a component ofthe Provision for taxes on income , whereas excess tax benefits or deficiencies previously were recognized in Additional paid-in capital . The net tax benefit for the Companywas $89 million for full-year 2016. The standard requires the modified retrospective transition method of adoption, and as such, does not permit retroactive presentation of thisbenefit to prior fiscal years in the consolidated statements of income. Further, the net cumulative effect of excess tax benefits not previously recognized because they had notreduced taxes payable, was $13 million and is reflected as an increase to Retained earnings as of January 1, 2016.
Another element of the new accounting standard is within our consolidated statements of cash flows, which now present excess tax benefits as operating activities. We haveelected to adopt this presentation on a prospective basis as of January 1, 2016, and, therefore, our consolidated statement of cash flows for fiscal years prior to 2016 have notbeen adjusted for this element. Additionally, cash paid by us when directly withholding shares for tax-withholding purposes is now a cash outflow from financing activities. Thisreclassification is required to be adopted retrospectively. As a result, $137 million for 2016 is presented as financing activities in the consolidated statement of cash flows, andcash outflows of $189 million for 2015 and $195 million for 2014 were reclassified from operating activities to financing activities in the consolidated statements of cash flows,respectively. We also elected to continue to estimate the impact of expected forfeitures of share-based payments when determining the amount of compensation cost to berecognized each period, rather than account for forfeitures as they occur. Finally, in the 2016 diluted net earnings per share calculation, when applying the treasury stockmethod for shares that could be repurchased, the assumed proceeds no longer include the amount of excess tax benefit.
We adopted a new accounting standard as of January 1, 2016 that changed the presentation of debt issuance costs related to a recognized debt liability as a direct deductionfrom the carrying value of that associated debt, consistent with the presentation of a debt discount. The update does not impact the measurement or recognition of debtissuance costs. As of December 31, 2016 , debt issuance costs were $115 million and are presented as contra-liabilities to Short-term borrowings, including current portion oflong-term debt ( $1 million ) and Long-term debt ( $114 million ). In the December 31, 2015 consolidated balance sheet, we have reclassified debt issuance costs of $79 million( $1 million from Other current assets and $79 million from Other noncurrent assets ) and have presented them as contra-liabilities to Short-term borrowings, including currentportion of long-term debt ( $1 million ) and Long-term debt ( $79 million ) to conform to the current period presentation. For additional information, see Note 7A.
We adopted a new accounting standard as of January 1, 2016 that requires an acquirer to recognize adjustments made in the measurement period to provisional amounts ofassets acquired and liabilities assumed in a business combination in the reporting period in which the adjustment amounts are determined. There was no material impact to ourconsolidated financial statements in 2016 from adopting this standard. For additional information, see Note 2A.
We adopted a new standard as of January 1, 2016 related to the accounting for hybrid financial instruments issued or held as investments and there was no material impact toour consolidated financial statements from adopting this standard.
C. Estimates and Assumptions
In preparing the consolidated financial statements, we use certain estimates and assumptions that affect reported amounts and disclosures, including amounts recorded anddisclosed in connection with acquisitions. These estimates and underlying assumptions can impact all elements of our financial statements. For example, in the consolidatedstatements of income, estimates are used when accounting for deductions from revenues (such as rebates, chargebacks, sales allowances and sales returns), determining thecost of inventory that is sold, allocating cost in the form of depreciation and amortization, and estimating restructuring charges and the impact of contingencies. On theconsolidated balance sheets, estimates are used in determining the valuation and recoverability of assets, such as accounts receivable, investments, inventories, deferred taxassets, fixed assets and intangible assets (including acquired IPR&D assets), and estimates are used in determining the reported amounts of liabilities, such as taxes payable,benefit obligations, accruals for contingencies, rebates, chargebacks, sales allowances and sales returns, and restructuring reserves, all of which also impact the consolidatedstatements of income.
Our estimates are often based on complex judgments and assumptions that we believe to be reasonable, but that can be inherently uncertain and unpredictable. If ourestimates and assumptions are not representative of actual outcomes, our results could be materially impacted.
As future events and their effects cannot be determined with precision, our estimates and assumptions may prove to be incomplete or inaccurate, or unanticipated events andcircumstances may occur that might cause us to change those estimates and assumptions. We are subject to risks and uncertainties that may cause actual results to differfrom estimated amounts, such as changes in the healthcare environment, competition, litigation, legislation and regulations. We regularly evaluate our estimates andassumptions using historical experience and expectations about the future. We adjust our estimates and assumptions when facts and circumstances indicate the need forchange. Those changes generally will be reflected in our financial statements on a prospective basis, unless they are required to be treated retrospectively under relevantaccounting standards. It is possible that others, applying reasonable judgment to the same facts and circumstances, could develop and support a range of alternative estimatedamounts.
D. Acquisitions
Our consolidated financial statements include the operations of an acquired business after the completion of the acquisition. We account for acquired businesses using theacquisition method of accounting, which requires, among other things, that most assets acquired and liabilities assumed be recognized at their estimated fair values as of theacquisition date and that the fair value of acquired IPR&D be recorded on the balance sheet. Transaction costs are expensed as incurred. Any excess of the considerationtransferred over the assigned values of the net
76
2016 Financial Report
Notes to Consolidated Financial StatementsPfizer Inc. and Subsidiary Companies
assets acquired is recorded as goodwill. When we acquire net assets that do not constitute a business, as defined in U.S. GAAP, no goodwill is recognized and acquiredIPR&D is expensed.
Contingent consideration in a business combination is included as part of the acquisition cost and is recognized at fair value as of the acquisition date. Fair value is generallyestimated by using a probability-weighted discounted cash flow approach. Any liability resulting from contingent consideration is remeasured to fair value at each reporting dateuntil the contingency is resolved. These changes in fair value are recognized in earnings in Other (income)/deductions––net .
Amounts recorded in connection with an acquisition can result from a complex series of judgments about future events and uncertainties and can rely heavily on estimates andassumptions. For information about the risks associated with estimates and assumptions, see Note 1C.
E. Fair Value
We are often required to measure certain assets and liabilities at fair value, either upon initial recognition or for subsequent accounting or reporting. For example, we use fairvalue extensively in the initial recognition of net assets acquired in a business combination, when measuring certain impairment losses and when accounting for and reportingof certain financial instruments. We estimate fair value using an exit price approach, which requires, among other things, that we determine the price that would be received tosell an asset or paid to transfer a liability in an orderly market. The determination of an exit price is considered from the perspective of market participants, considering thehighest and best use of non-financial assets and, for liabilities, assuming that the risk of non-performance will be the same before and after the transfer.
When estimating fair value, depending on the nature and complexity of the asset or liability, we may use one or all of the following techniques:• Income approach, which is based on the present value of a future stream of net cash flows.• Market approach, which is based on market prices and other information from market transactions involving identical or comparable assets or liabilities.• Cost approach, which is based on the cost to acquire or construct comparable assets, less an allowance for functional and/or economic obsolescence.
For some investments, if certain conditions exist, we may employ a practical expedient wherein we use the NAV per share (or its equivalent), as fair value. When this practicalexpedient is used, the NAV is not categorized for disclosure purposes within the fair value hierarchy for types of inputs used for valuation.
Our fair value methodologies depend on the following types of inputs:• Quoted prices for identical assets or liabilities in active markets (Level 1 inputs).• Quoted prices for similar assets or liabilities in active markets, or quoted prices for identical or similar assets or liabilities in markets that are not active, or inputs other than
quoted prices that are directly or indirectly observable, or inputs that are derived principally from, or corroborated by, observable market data by correlation or other means(Level 2 inputs).
• Unobservable inputs that reflect estimates and assumptions (Level 3 inputs).
A single estimate of fair value can result from a complex series of judgments about future events and uncertainties and can rely heavily on estimates and assumptions. Forinformation about the risks associated with estimates and assumptions, see Note 1C.
F. Foreign Currency Translation
For most of our international operations, local currencies have been determined to be the functional currencies. We translate functional currency assets and liabilities to theirU.S. dollar equivalents at exchange rates in effect as of the balance sheet date and we translate functional currency income and expense amounts to their U.S. dollarequivalents at average exchange rates for the period. The U.S. dollar effects that arise from changing translation rates are recorded in Other comprehensive income/(loss) .The effects of converting non-functional currency monetary assets and liabilities into the functional currency are recorded in Other (income)/deductions––net . For operations inhighly inflationary economies, we translate monetary items at rates in effect as of the balance sheet date, with translation adjustments recorded in Other (income)/deductions––net , and we translate non-monetary items at historical rates.
G. Revenues and Trade Accounts Receivable
Revenue Recognition —We record revenues from product sales when the goods are shipped and title passes to the customer. At the time of sale, we also record estimates fora variety of revenue deductions, such as chargebacks, rebates, sales allowances and sales returns. When we cannot reasonably estimate the amount of future sales returnsand/or other revenue deductions, we record revenues when the risk of product return and/or additional revenue deductions has been substantially eliminated.
Deductions from Revenues–– Our gross product revenues are subject to a variety of deductions, that generally are estimated and recorded in the same period that therevenues are recognized, and primarily represent chargebacks, rebates and sales allowances to wholesalers, and, to a lesser extent, distributors like managed careorganizations, retailers and government agencies with respect to our pharmaceutical products. These deductions represent estimates of the related obligations and, as such,knowledge and judgment is required when estimating the impact of these revenue deductions on gross sales for a reporting period.
Specifically:• In the U.S., we record provisions for pharmaceutical Medicare, Medicaid, and performance-based contract rebates based upon our experience ratio of rebates paid and
actual prescriptions written during prior quarters. We apply the experience ratio to the respective
2016 Financial Report
77
Notes to Consolidated Financial StatementsPfizer Inc. and Subsidiary Companies
period’s sales to determine the rebate accrual and related expense. This experience ratio is evaluated regularly to ensure that the historical trends are as current aspracticable. We estimate discounts on branded prescription drug sales to Medicare Part D participants in the Medicare “coverage gap,” also known as the “doughnut hole,”based on the historical experience of beneficiary prescriptions and consideration of the utilization that is expected to result from the discount in the coverage gap. Weevaluate this estimate regularly to ensure that the historical trends and future expectations are as current as practicable. For performance-based contract rebates, we alsoconsider current contract terms, such as changes in formulary status and rebate rates.
• Outside the U.S., the majority of our pharmaceutical sales allowances are contractual or legislatively mandated and our estimates are based on actual invoiced sales withineach period, which reduces the risk of variations in the estimation process. In certain European countries, rebates are calculated on the government’s total unbudgetedpharmaceutical spending or on specific product sales thresholds, and we apply an estimated allocation factor against our actual invoiced sales to project the expected levelof reimbursement. We obtain third-party information that helps us to monitor the adequacy of these accruals.
• Provisions for pharmaceutical chargebacks (primarily reimbursements to U.S. wholesalers for honoring contracted prices to third parties) closely approximate actual as wesettle these deductions generally within two to five weeks of incurring the liability.
• Provisions for pharmaceutical sales returns are based on a calculation for each market that incorporates the following, as appropriate: local returns policies and practices;historical returns as a percentage of sales; an understanding of the reasons for past returns; estimated shelf life by product; an estimate of the amount of time betweenshipment and return or lag time; and any other factors that could impact the estimate of future returns, such as loss of exclusivity, product recalls or a changing competitiveenvironment. Generally, returned products are destroyed, and customers are refunded the sales price in the form of a credit.
• We record sales incentives as a reduction of revenues at the time the related revenues are recorded or when the incentive is offered, whichever is later. We estimate thecost of our sales incentives based on our historical experience with similar incentives programs to predict customer behavior.
Our accruals for Medicare rebates, Medicaid and related state program rebates, performance-based contract rebates, chargebacks, sales allowances and sales returns andcash discounts totaled $4.3 billion as of December 31, 2016 , of which approximately $2.8 billion is included in Other current liabilities, $357 million is included in Othernoncurrent liabilities and approximately $1.2 billion is included against Trade accounts receivable, less allowance for doubtful accounts , in our consolidated balance sheet. Ouraccruals for Medicare rebates, Medicaid and related state program rebates, performance-based contract rebates, chargebacks, sales allowances and sales returns and cashdiscounts totaled $3.9 billion as of December 31, 2015 , of which approximately $2.6 billion is included in Other current liabilities, $272 million is included in Other noncurrentliabilities and approximately $1.1 billion is included against Trade accounts receivable, less allowance for doubtful accounts , in our consolidated balance sheet.
Amounts recorded for revenue deductions can result from a complex series of judgments about future events and uncertainties and can rely heavily on estimates andassumptions. For information about the risks associated with estimates and assumptions, see Note 1C.
Taxes collected from customers relating to product sales and remitted to governmental authorities are excluded from Revenues .
Collaborative Arrangements— Payments to and from our collaboration partners are presented in our consolidated statements of income based on the nature of thearrangement (including its contractual terms), the nature of the payments and applicable accounting guidance. Under co-promotion agreements, we record the amountsreceived from our collaboration partners as alliance revenues, a component of Revenues, when our collaboration partners are the principal in the transaction and we receive ashare of their net sales or profits. Alliance revenues are recorded when our collaboration partners ship the product and title passes to their customer. The related expenses forselling and marketing these products are included in Selling, informational and administrative expenses. In collaborative arrangements where we manufacture a product for ourcollaboration partners, we record revenues when our collaboration partners sell the product and title passes to their customers. All royalty payments to collaboration partnersare included in Cost of sales . Royalty payments received from collaboration partners are included in Other (income)/deductions—net.
Trade Accounts Receivable —Trade accounts receivable are stated at their net realizable value. The allowance against gross trade accounts receivable reflects the bestestimate of probable losses inherent in the receivables portfolio determined on the basis of historical experience, specific allowances for known troubled accounts and othercurrent information. Trade accounts receivable are written off after all reasonable means to collect the full amount (including litigation, where appropriate) have beenexhausted.
H. Cost of Sales and Inventories
We carry inventories at the lower of cost or market. The cost of finished goods, work in process and raw materials is determined using average actual cost. We regularly reviewour inventories for impairment and reserves are established when necessary.
I. Selling, Informational and Administrative Expenses
Selling, informational and administrative costs are expensed as incurred. Among other things, these expenses include the internal and external costs of marketing, advertising,shipping and handling, information technology and legal defense.
Advertising expenses totaled approximately $3.2 billion in 2016 , $3.1 billion in 2015 and $3.1 billion in 2014 . Production costs are expensed as incurred and the costs of radiotime, television time and space in publications are expensed when the related advertising occurs.
J. Research and Development Expenses
R&D costs are expensed as incurred. These expenses include the costs of our proprietary R&D efforts, as well as costs incurred in connection with certain licensingarrangements. Before a compound receives regulatory approval, we record upfront and milestone payments made by us
78
2016 Financial Report
Notes to Consolidated Financial StatementsPfizer Inc. and Subsidiary Companies
to third parties under licensing arrangements as expense. Upfront payments are recorded when incurred, and milestone payments are recorded when the specific milestonehas been achieved. Once a compound receives regulatory approval, we record any milestone payments in Identifiable intangible assets, less accumulated amortization and,unless the asset is determined to have an indefinite life, we amortize the payments on a straight-line basis over the remaining agreement term or the expected product lifecycle, whichever is shorter.
R&D expenses related to upfront and milestone payments for intellectual property rights totaled $82 million in 2016 , $429 million in 2015 and $1.4 billion in 2014 . Foradditional information, see Note 2C and Note 2D .
K. Amortization of Intangible Assets, Depreciation and Certain Long-Lived Assets
Long-lived assets include:• Property, plant and equipment, less accumulated depreciation —These assets are recorded at cost and are increased by the cost of any significant improvements after
purchase. Property, plant and equipment assets, other than land and construction in progress, are depreciated on a straight-line basis over the estimated useful life of theindividual assets. Depreciation begins when the asset is ready for its intended use. For tax purposes, accelerated depreciation methods are used as allowed by tax laws.
• Identifiable intangible assets, less accumulated amortization —These acquired assets are recorded at cost. Intangible assets with finite lives are amortized on a straight-linebasis over their estimated useful lives. Intangible assets with indefinite lives that are associated with marketed products are not amortized until a useful life can bedetermined. Intangible assets associated with IPR&D projects are not amortized until approval is obtained in a major market, typically either the U.S. or the EU, or in aseries of other countries, subject to certain specified conditions and management judgment. The useful life of an amortizing asset generally is determined by identifying theperiod in which substantially all of the cash flows are expected to be generated.
• Goodwill —Goodwill represents the excess of the consideration transferred for an acquired business over the assigned values of its net assets. Goodwill is not amortized.
Amortization expense related to finite-lived acquired intangible assets that contribute to our ability to sell, manufacture, research, market and distribute products, compoundsand intellectual property is included in Amortization of intangible assets as these intangible assets benefit multiple business functions. Amortization expense related tointangible assets that are associated with a single function and depreciation of property, plant and equipment are included in Cost of sales, Selling, informational andadministrative expenses and/or Research and development expenses, as appropriate.
We review all of our long-lived assets for impairment indicators throughout the year. We perform impairment testing for indefinite-lived intangible assets and goodwill at leastannually and for all other long-lived assets whenever impairment indicators are present. When necessary, we record charges for impairments of long-lived assets for theamount by which the fair value is less than the carrying value of these assets.
Specifically:• For finite-lived intangible assets, such as developed technology rights, and for other long-lived assets, such as property, plant and equipment, whenever impairment
indicators are present, we calculate the undiscounted value of the projected cash flows associated with the asset, or asset group, and compare this estimated amount tothe carrying amount. If the carrying amount is found to be greater, we record an impairment loss for the excess of book value over fair value. In addition, in all cases of animpairment review, we re-evaluate the remaining useful lives of the assets and modify them, as appropriate.
• For indefinite-lived intangible assets, such as Brands and IPR&D assets, when necessary, we determine the fair value of the asset and record an impairment loss, if any,for the excess of book value over fair value. In addition, in all cases of an impairment review other than for IPR&D assets, we re-evaluate whether continuing to characterizethe asset as indefinite-lived is appropriate.
• For goodwill, when necessary, we determine the fair value of each reporting unit and compare that value to its book value. If the carrying amount is found to be greater, wethen determine the implied fair value of goodwill by subtracting the fair value of all the identifiable net assets other than goodwill from the fair value of the reporting unit andrecord an impairment loss, if any, for the excess of the book value of goodwill over the implied fair value.
Impairment reviews can involve a complex series of judgments about future events and uncertainties and can rely heavily on estimates and assumptions. For information aboutthe risks associated with estimates and assumptions, see Note 1C.
L. Restructuring Charges and Certain Acquisition-Related Costs
We may incur restructuring charges in connection with acquisitions when we implement plans to restructure and integrate the acquired operations or in connection with ourcost-reduction and productivity initiatives. Included in Restructuring charges and certain acquisition-related costs are all restructuring charges, as well as certain other costsassociated with acquiring and integrating an acquired business. If the restructuring action results in a change in the estimated useful life of an asset, that incremental impact isclassified in Cost of sales, Selling, informational and administrative expenses and/or Research and development expenses , as appropriate. Termination costs are generallyrecorded when the actions are probable and estimable. Transaction costs, such as banking, legal, accounting and other costs incurred in connection with a businessacquisition are expensed as incurred .
Amounts recorded for restructuring charges and other associated costs can result from a complex series of judgments about future events and uncertainties and can relyheavily on estimates and assumptions. For information about the risks associated with estimates and assumptions, see Note 1C.
2016 Financial Report
79
Notes to Consolidated Financial StatementsPfizer Inc. and Subsidiary Companies
M. Cash Equivalents and Statement of Cash Flows
Cash equivalents include items almost as liquid as cash, such as certificates of deposit and time deposits with maturity periods of three months or less when purchased. Ifitems meeting this definition are part of a larger investment pool, we classify them as Short-term investments .Cash flows associated with financial instruments designated as fair value or cash flow hedges may be included in operating, investing or financing activities, depending on theclassification of the items being hedged. Cash flows associated with financial instruments designated as net investment hedges are classified according to the nature of thehedge instrument. Cash flows associated with financial instruments that do not qualify for hedge accounting treatment are classified according to their purpose and accountingnature.
N. Investments and Derivative Financial Instruments
Our investments are comprised of the following: trading funds and securities, available-for-sale securities, held-to-maturity securities (when we have both the positive intent andability to hold the investment to maturity) and private equity securities. The classification of an investment can depend on the nature of the investment, our intent and ability tohold the investment, and the degree to which we may exercise influence.• Trading securities are carried at fair value, with changes in fair value reported in Other (income)/deductions—net.• Available-for-sale debt and equity securities are carried at fair value, with changes in fair value reported in Other comprehensive income/(loss) until realized.• Held-to-maturity debt securities are carried at amortized cost.• Private equity securities are carried at equity-method or at cost-method. For equity investments where we have significant influence over the financial and operating policies
of the investee, we use the equity-method of accounting. Under the equity-method, we record our share of the investee’s income and expenses in Other (income)/deductions—net . The excess of the cost of the investment over our share of the equity of the investee as of the acquisition date is allocated to the identifiable assets of the investee,with any remaining excess amount allocated to goodwill. Such investments are initially recorded at cost, which typically does not include amounts of contingentconsideration.
Realized gains or losses on sales of investments are determined by using the specific identification cost method.
We regularly evaluate all of our financial assets for impairment. For investments in debt and equity securities, when a decline in fair value, if any, is determined to be other-than-temporary, an impairment charge is recorded and a new cost basis in the investment is established.
Derivative financial instruments are carried at fair value in various balance sheet categories (see Note 7A ), with changes in fair value reported in Net income or, for derivativefinancial instruments in certain qualifying hedging relationships, in Other comprehensive income/(loss) (see Note 7E ).
A single estimate of fair value and impairment reviews can involve a complex series of judgments about future events and uncertainties and can rely heavily on estimates andassumptions. For information about the risks associated with estimates and assumptions, see Note 1C.
O. Tax Assets and Liabilities and Income Tax Contingencies
Current tax assets primarily includes (i) tax effects associated with intercompany transfers of assets within our consolidated group, which are recognized in the consolidatedstatement of income when the asset transferred is sold to a third-party or recovered through amortization of the asset's remaining economic life; and (ii) income tax receivablesthat are expected to be recovered either as refunds from taxing authorities or as a reduction to future tax obligations.
Deferred tax assets and liabilities are recognized for the expected future tax consequences of differences between the financial reporting and tax bases of assets and liabilitiesusing enacted tax rates and laws. We provide a valuation allowance when we believe that our deferred tax assets are not recoverable based on an assessment of estimatedfuture taxable income that incorporates ongoing, prudent and feasible tax-planning strategies, that would be implemented, if necessary, to realize the deferred tax assets. Alldeferred tax assets and liabilities within the same tax jurisdiction are presented as a net amount in the noncurrent section of our consolidated balance sheet.
We account for income tax contingencies using a benefit recognition model. If we consider that a tax position is more likely than not to be sustained upon audit, based solely onthe technical merits of the position, we recognize the benefit. We measure the benefit by determining the amount that is greater than 50% likely of being realized uponsettlement, presuming that the tax position is examined by the appropriate taxing authority that has full knowledge of all relevant information.
Under the benefit recognition model, if our initial assessment fails to result in the recognition of a tax benefit, we regularly monitor our position and subsequently recognize thetax benefit: (i) if there are changes in tax law, analogous case law or there is new information that sufficiently raise the likelihood of prevailing on the technical merits of theposition to “more likely than not”; (ii) if the statute of limitations expires; or (iii) if there is a completion of an audit resulting in a favorable settlement of that tax year with theappropriate agency. We regularly re-evaluate our tax positions based on the results of audits of federal, state and foreign income tax filings, statute of limitations expirations,changes in tax law or receipt of new information that would either increase or decrease the technical merits of a position relative to the more-likely-than-not standard. Liabilitiesassociated with uncertain tax positions are classified as current only when we expect to pay cash within the next 12 months. Interest and penalties, if any, are recorded inProvision for taxes on income and are classified on our consolidated balance sheet with the related tax liability.
Amounts recorded for valuation allowances and income tax contingencies can result from a complex series of judgments about future events and uncertainties and can relyheavily on estimates and assumptions. For information about the risks associated with estimates and assumptions, see Note 1C.
80
2016 Financial Report
Notes to Consolidated Financial StatementsPfizer Inc. and Subsidiary Companies
P. Pension and Postretirement Benefit Plans
The majority of our employees worldwide are covered by defined benefit pension plans, defined contribution plans or both. In the U.S., we have both qualified andsupplemental (non-qualified) defined benefit and defined contribution plans, as well as other postretirement benefit plans consisting primarily of medical insurance for retirees.We recognize the overfunded or underfunded status of each of our defined benefit plans as an asset or liability on our consolidated balance sheet. The obligations aregenerally measured at the actuarial present value of all benefits attributable to employee service rendered, as provided by the applicable benefit formula. Our pension andother postretirement obligations may include assumptions such as expected employee turnover and participant mortality. For our pension plans, the obligation may also includeassumptions as to future compensation levels. For our other postretirement benefit plans, the obligation may include assumptions as to the expected cost of providing medicalinsurance benefits, as well as the extent to which those costs are shared with the employee or others (such as governmental programs). Plan assets are measured at fairvalue. Net periodic benefit costs are recognized, as required, into Cost of sales, Selling, informational and administrative expenses and/or Research and developmentexpenses , as appropriate.
Amounts recorded for pension and postretirement benefit plans can result from a complex series of judgments about future events and uncertainties and can rely heavily onestimates and assumptions. For information about the risks associated with estimates and assumptions, see Note 1C.
Q. Legal and Environmental Contingencies
We and certain of our subsidiaries are subject to numerous contingencies arising in the ordinary course of business, such as patent litigation, product liability and otherproduct-related litigation, commercial litigation, environmental claims and proceedings, government investigations and guarantees and indemnifications. We record accruals forthese contingencies to the extent that we conclude that a loss is both probable and reasonably estimable. If some amount within a range of loss appears to be a better estimatethan any other amount within the range, we accrue that amount. Alternatively, when no amount within a range of loss appears to be a better estimate than any other amount,we accrue the lowest amount in the range. We record anticipated recoveries under existing insurance contracts when recovery is assured.
Amounts recorded for contingencies can result from a complex series of judgments about future events and uncertainties and can rely heavily on estimates and assumptions.For information about the risks associated with estimates and assumptions, see Note 1C.
R. Share-Based Payments
Our compensation programs can include share-based payments. Generally, grants under share-based payment programs are accounted for at fair value and these fair valuesare generally amortized on a straight-line basis over the vesting terms into Cost of sales, Selling, informational and administrative expenses and/or Research and developmentexpenses , as appropriate.
Amounts recorded for share-based compensation can result from a complex series of judgments about future events and uncertainties and can rely heavily on estimates andassumptions. For information about the risks associated with estimates and assumptions, see Note 1C .
Note 2. Acquisitions, Assets and Liabilities Held for Sale, Licensing Agreements, Research and Development andCollaborative Arrangements, Equity-Method Investments and Cost-Method Investment
A. Acquisitions
Medivation, Inc.
On September 28, 2016, we acquired Medivation for $81.50 per share. The total fair value of consideration transferred for Medivation was approximately $14.3 billion in cash ($13.9 billion , net of cash acquired). Of this consideration, approximately $365 million was not paid as of December 31, 2016, and was recorded in Other current liabilities.Medivation is now a wholly-owned subsidiary of Pfizer. Medivation is a biopharmaceutical company focused on developing and commercializing small molecules for oncology.Medivation’s portfolio includes Xtandi (enzalutamide), an androgen receptor inhibitor that blocks multiple steps in the androgen receptor signaling pathway within tumor cells.Xtandi is being developed and commercialized through a collaboration between Pfizer and Astellas. Astellas has exclusive commercialization rights for Xtandi outside the U.S.In addition, Medivation has two development-stage oncology assets in its pipeline: talazoparib, which is currently in a Phase 3 study for the treatment of BRCA-mutated breastcancer, and pidilizumab, an immuno-oncology asset being developed for diffuse large B-cell lymphoma and other hematologic malignancies. In connection with this acquisition,we provisionally recorded $13.1 billion in Identifiable intangible assets , primarily consisting of $8.7 billion of Developed technology rights with an average useful life ofapproximately 12 years and $4.4 billion of IPR&D, and provisionally recorded $5.5 billion of Goodwill, $4.4 billion of net deferred tax liabilities, and $340 million of assumedcontingent consideration. We recorded changes in the estimated fair values recognized in the measurement period to better reflect market participant assumptions about factsand circumstances existing as of the acquisition date. The allocation of the consideration transferred to the assets acquired and the liabilities assumed has not yet beenfinalized.
Bamboo Therapeutics, Inc.
On August 1, 2016, we acquired all the remaining equity in Bamboo, a privately-held biotechnology company focused on developing gene therapies for the potential treatmentof patients with certain rare diseases relating to neuromuscular conditions and those affecting the central nervous system, for $150 million , plus potential milestone paymentsof up to $495 million contingent upon the progression of key assets through development, regulatory approval and commercialization. The total fair value of the considerationtransferred for Bamboo was approximately $331 million , including cash of $130 million ( $101 million , net of cash acquired), contingent consideration of $157 million ,consisting of milestone payments, and the fair value of Pfizer’s previously held equity interest in Bamboo of $44 million . We previously
2016 Financial Report
81

Notes to Consolidated Financial StatementsPfizer Inc. and Subsidiary Companies
purchased a minority stake in Bamboo in the first quarter of 2016 for a payment of approximately $43 million . Upon acquiring the remaining interest in Bamboo, we recognizeda gain of $1 million on our existing investment in Other (income)/deductions––net. This acquisition provides us with several clinical and pre-clinical assets that complement ourrare disease portfolio, an advanced recombinant AAV vector design and production technology, and a fully functional Phase I/II gene therapy manufacturing facility. Bamboo isnow a wholly-owned subsidiary of Pfizer. In connection with this acquisition, we provisionally recorded $325 million of Identifiable intangible assets, consisting entirely ofIPR&D. We also provisionally recorded $133 million of Goodwill and $93 million of net deferred tax liabilities. The allocation of the consideration transferred to the assetsacquired and the liabilities assumed has not yet been finalized.
Anacor Pharmaceuticals, Inc.
On June 24, 2016, we acquired Anacor for $99.25 per share. The total fair value of consideration transferred for Anacor was approximately $4.9 billion in cash ( $4.5 billion netof cash acquired), plus $698 million debt assumed. Anacor is now a wholly-owned subsidiary of Pfizer. Anacor is a biopharmaceutical company focused on novel small-molecule therapeutics derived from its boron chemistry platform. Anacor’s crisaborole, a non-steroidal topical PDE-4 inhibitor with anti-inflammatory properties, was approvedby the FDA on December 14, 2016 under the trade name, Eucrisa. In connection with this acquisition, we recorded $698 million as the fair value of notes payable in cash, andprovisionally recorded $4.9 billion in Identifiable intangible assets , primarily consisting of $4.8 billion of IPR&D , and provisionally recorded $647 million of Goodwill and $352million of net deferred tax liabilities. We recorded changes in the estimated fair values recognized in the measurement period to better reflect market participant assumptionsabout facts and circumstances existing as of the acquisition date. We do not expect significant adjustments to the allocation of the consideration transferred to the assetsacquired and the liabilities assumed, however the assessment has not yet been finalized.
Hospira, Inc.
On September 3, 2015, we acquired Hospira, a leading provider of sterile injectable drugs and infusion technologies as well as a provider of biosimilars, for $90 per share incash. The total fair value of consideration transferred for Hospira was approximately $16.1 billion in cash ( $15.7 billion , net of cash acquired). Hospira is now a subsidiary ofPfizer and its commercial operations are included in the EH segment. The combination of local Pfizer and Hospira entities may be pending in various jurisdictions andintegration is subject to completion of various local legal and regulatory steps.
Hospira’s principal business was the development, manufacture, marketing and distribution of generic acute-care and oncology injectables, biosimilars and integrated infusiontherapy and medication management systems (see Note 2B below). Hospira’s broad portfolio of products is used by hospitals and alternate site providers, such as clinics,home healthcare providers and long-term care facilities. We believe our acquisition of Hospira has strengthened our EH business, as EH now has a broadened portfolio ofgeneric and branded sterile injectables, marketed biosimilars and biosimilars in development.
The following table summarizes the amounts recognized for assets acquired and liabilities assumed as of the acquisition date, as well as adjustments made in 2016 to theamounts initially recorded in 2015 (measurement period adjustments) with a corresponding change to goodwill. The measurement period adjustments did not have a materialimpact on our earnings in any period. The final allocation of the consideration transferred to the assets acquired and the liabilities assumed has been completed.
(MILLIONS OF DOLLARS)
Amounts Recognizedas of Acquisition Date
(as previously reported as ofDecember 31, 2015)
MeasurementPeriod
Adjustments (a) Amounts Recognizedas of Acquisition Date
(as adjusted) Final
Working capital, excluding inventories (b) $ 274 $ 68 $ 342
Inventories 1,924 (23) 1,901
PP&E 2,410 (57) 2,352
Identifiable intangible assets, excluding IPR&D (c) 8,270 20 8,290
IPR&D 995 35 1,030
Other noncurrent assets 408 (46) 362
Long-term debt (1,928) — (1,928)
Benefit obligations (117) — (117)
Net income tax accounts (d) (3,394) 14 (3,380)
Other noncurrent liabilities (39) (23) (61)
Total identifiable net assets 8,803 (12) 8,791
Goodwill 7,284 12 7,295
Net assets acquired/total consideration transferred $ 16,087 $ — $ 16,087(a)
The changes in the estimated fair values are primarily to better reflect market participant assumptions about facts and circumstances existing as of the acquisition date. The measurement period adjustments didnot result from intervening events subsequent to the acquisition date.
(b) Includes cash and cash equivalents, short-term investments, accounts receivable, other current assets, assets held for sale, accounts payable and other current liabilities.(c)
Comprised of finite-lived developed technology rights with a weighted-average life of approximately 17 years ( $7.7 billion ) and other finite-lived identifiable intangible assets with a weighted-average life ofapproximately 12 years ( $570 million ).
(d)
Final amounts recognized as of the acquisition date (as adjusted), included in Current tax assets ( $57 million ), Noncurrent deferred tax assets and other noncurrent tax assets ( $58 million ), Income taxespayable ( $5 million ), Noncurrent deferred tax liabilities ( $3.4 billion ) and Other taxes payable ( $101 million , including accrued interest of $5 million ). Preliminary amounts recognized as of the acquisition date(as previously reported), included in Current tax assets ( $79 million ), Noncurrent deferred tax assets and other noncurrent tax assets ( $25 million ), Income taxes payable ( $5 million ), Noncurrent deferred taxliabilities ( $3.4 billion ) and Other taxes payable ( $114 million , including accrued interest of $5 million ).
82
2016 Financial Report
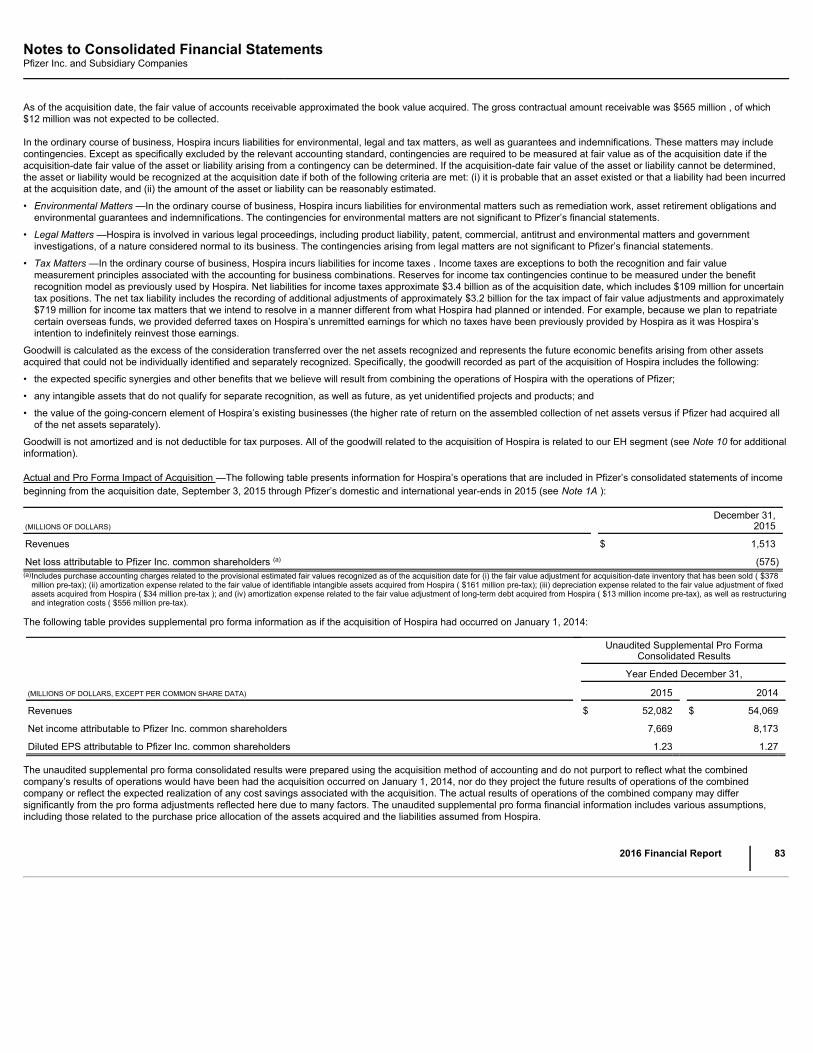
Notes to Consolidated Financial StatementsPfizer Inc. and Subsidiary Companies
As of the acquisition date, the fair value of accounts receivable approximated the book value acquired. The gross contractual amount receivable was $565 million , of which$12 million was not expected to be collected.
In the ordinary course of business, Hospira incurs liabilities for environmental, legal and tax matters, as well as guarantees and indemnifications. These matters may includecontingencies. Except as specifically excluded by the relevant accounting standard, contingencies are required to be measured at fair value as of the acquisition date if theacquisition-date fair value of the asset or liability arising from a contingency can be determined. If the acquisition-date fair value of the asset or liability cannot be determined,the asset or liability would be recognized at the acquisition date if both of the following criteria are met: (i) it is probable that an asset existed or that a liability had been incurredat the acquisition date, and (ii) the amount of the asset or liability can be reasonably estimated.
• Environmental Matters —In the ordinary course of business, Hospira incurs liabilities for environmental matters such as remediation work, asset retirement obligations andenvironmental guarantees and indemnifications. The contingencies for environmental matters are not significant to Pfizer’s financial statements.
• Legal Matters —Hospira is involved in various legal proceedings, including product liability, patent, commercial, antitrust and environmental matters and governmentinvestigations, of a nature considered normal to its business. The contingencies arising from legal matters are not significant to Pfizer’s financial statements.
• Tax Matters —In the ordinary course of business, Hospira incurs liabilities for income taxes . Income taxes are exceptions to both the recognition and fair valuemeasurement principles associated with the accounting for business combinations. Reserves for income tax contingencies continue to be measured under the benefitrecognition model as previously used by Hospira. Net liabilities for income taxes approximate $3.4 billion as of the acquisition date, which includes $109 million for uncertaintax positions. The net tax liability includes the recording of additional adjustments of approximately $3.2 billion for the tax impact of fair value adjustments and approximately$719 million for income tax matters that we intend to resolve in a manner different from what Hospira had planned or intended. For example, because we plan to repatriatecertain overseas funds, we provided deferred taxes on Hospira’s unremitted earnings for which no taxes have been previously provided by Hospira as it was Hospira’sintention to indefinitely reinvest those earnings.
Goodwill is calculated as the excess of the consideration transferred over the net assets recognized and represents the future economic benefits arising from other assetsacquired that could not be individually identified and separately recognized. Specifically, the goodwill recorded as part of the acquisition of Hospira includes the following:
• the expected specific synergies and other benefits that we believe will result from combining the operations of Hospira with the operations of Pfizer;
• any intangible assets that do not qualify for separate recognition, as well as future, as yet unidentified projects and products; and
• the value of the going-concern element of Hospira’s existing businesses (the higher rate of return on the assembled collection of net assets versus if Pfizer had acquired allof the net assets separately).
Goodwill is not amortized and is not deductible for tax purposes. All of the goodwill related to the acquisition of Hospira is related to our EH segment (see Note 10 for additionalinformation).
Actual and Pro Forma Impact of Acquisition —The following table presents information for Hospira’s operations that are included in Pfizer’s consolidated statements of incomebeginning from the acquisition date, September 3, 2015 through Pfizer’s domestic and international year-ends in 2015 (see Note 1A ):
(MILLIONS OF DOLLARS) December 31,
2015
Revenues $ 1,513
Net loss attributable to Pfizer Inc. common shareholders (a) (575)(a)
Includes purchase accounting charges related to the provisional estimated fair values recognized as of the acquisition date for (i) the fair value adjustment for acquisition-date inventory that has been sold ( $378million pre-tax); (ii) amortization expense related to the fair value of identifiable intangible assets acquired from Hospira ( $161 million pre-tax); (iii) depreciation expense related to the fair value adjustment of fixedassets acquired from Hospira ( $34 million pre-tax ); and (iv) amortization expense related to the fair value adjustment of long-term debt acquired from Hospira ( $13 million income pre-tax), as well as restructuringand integration costs ( $556 million pre-tax).
The following table provides supplemental pro forma information as if the acquisition of Hospira had occurred on January 1, 2014:
Unaudited Supplemental Pro Forma
Consolidated Results Year Ended December 31,
(MILLIONS OF DOLLARS, EXCEPT PER COMMON SHARE DATA) 2015 2014
Revenues $ 52,082 $ 54,069
Net income attributable to Pfizer Inc. common shareholders 7,669 8,173
Diluted EPS attributable to Pfizer Inc. common shareholders 1.23 1.27
The unaudited supplemental pro forma consolidated results were prepared using the acquisition method of accounting and do not purport to reflect what the combinedcompany’s results of operations would have been had the acquisition occurred on January 1, 2014, nor do they project the future results of operations of the combinedcompany or reflect the expected realization of any cost savings associated with the acquisition. The actual results of operations of the combined company may differsignificantly from the pro forma adjustments reflected here due to many factors. The unaudited supplemental pro forma financial information includes various assumptions,including those related to the purchase price allocation of the assets acquired and the liabilities assumed from Hospira.
2016 Financial Report
83
Notes to Consolidated Financial StatementsPfizer Inc. and Subsidiary Companies
The unaudited supplemental pro forma consolidated results reflect the historical financial information of Pfizer and Hospira, adjusted to give effect to the acquisition of Hospiraas if it had occurred on January 1, 2014, primarily for the following pre-tax adjustments:• Elimination of Hospira’s historical intangible asset amortization expense (approximately $33 million in 2015 and $77 million in 2014).• Additional amortization expense (approximately $342 million in 2015 and $502 million in 2014) related to the fair value of identifiable intangible assets acquired.• Additional depreciation expense (approximately $52 million in 2015 and $102 million in 2014) related to the fair value adjustment to PP&E acquired.• Adjustment related to the non-recurring fair value adjustment to acquisition-date inventory estimated to have been sold (the elimination of $364 million of charges in 2015
and the addition of $591 million of charges in 2014).• Adjustment to decrease interest expense (approximately $18 million in 2015 and $42 million in 2014) related to the fair value adjustment of Hospira debt.• Adjustment for non-recurring acquisition-related costs directly attributable to the acquisition (the elimination of $877 million of charges in 2015, and the addition of $877
million of charges in 2014), reflecting non-recurring charges incurred by both Hospira and Pfizer which would have been recorded in 2014 under the pro forma assumptionthat the Hospira acquisition was completed on January 1, 2014.
The above adjustments were adjusted for the applicable tax impact. The taxes associated with the adjustments related to the fair value adjustment for acquired intangibleassets, PP&E, inventory and debt reflect the statutory tax rates in the various jurisdictions where the adjustments are expected to be incurred. The taxes associated withelimination of Hospira’s historical intangible asset amortization expense and the adjustment for the acquisition-related costs directly attributable to the acquisition were basedon the tax rate in the jurisdiction in which the related deductible costs were incurred.
Marketed Vaccines Business of Baxter International Inc.
On December 1, 2014 (which fell in the first fiscal quarter of 2015 for our international operations), we acquired Baxter ’ s portfolio of marketed vaccines for a final purchaseprice of $648 million . The portfolio that was acquired consists of NeisVac-C and FSME-IMMUN/TicoVac. NeisVac-C is a vaccine that helps protect against meningitis causedby group C meningococcal meningitis and FSME-IMMUN/TicoVac is a vaccine that helps protect against tick-borne encephalitis. In connection with this acquisition, werecorded $376 million in Identifiable intangible assets, primarily consisting of $371 million in Developed technology rights. We also recorded $194 million of Inventories and$12 million in Goodwill . The final allocation of the consideration transferred to the assets acquired and the liabilities assumed has been completed.
InnoPharma, Inc.
On September 24, 2014, we completed our acquisition of InnoPharma, a privately-held pharmaceutical development company, for an upfront cash payment of $225 millionand contingent consideration with an estimated acquisition-date fair value of approximately $67 million . The contingent consideration consists of up to $135 million inadditional milestone payments based on application filing with, and acceptance by, the FDA, or approval of marketing applications related to certain pipeline products by theFDA. We believe this acquisition represents a potential innovative growth opportunity for our sterile injectables portfolio in areas such as oncology and central nervousdisorders. In connection with this acquisition, we recorded $247 million in Identifiable intangible assets consisting of $212 million in IPR&D and $35 million in Developedtechnology rights ; $81 million in net deferred tax liabilities; and $125 million in Goodwill . The final allocation of the consideration transferred to the assets acquired and theliabilities assumed has been completed.
B. Assets and Liabilities Held for Sale
On October 6, 2016, we announced that we entered into a definitive agreement under which ICU Medical agreed to acquire all of our global infusion therapy net assets, HIS,for approximately $1 billion in cash and ICU Medical common stock. HIS includes IV pumps, solutions, and devices. As a result of recent performance of HIS relative to ICUMedical’s expectations, on January 5, 2017 we entered into a revised agreement with ICU Medical under which ICU Medical would acquire HIS for up to approximately $900million , composed of cash and contingent cash consideration, ICU Medical common stock and seller financing.
The revised transaction closed on February 3, 2017. At closing, under the terms of the revised agreement, we received 3.2 million newly issued shares of ICU Medical commonstock (as originally agreed), which we valued at approximately $430 million (based upon the closing price of ICU Medical common stock on the closing date less a discount forlack of marketability), a promissory note in the amount of $75 million and net cash of approximately $200 million before customary adjustments for net working capital. Inaddition, we are entitled to receive a contingent amount of up to an additional $225 million in cash based on ICU Medical’s achievement of certain cumulative performancetargets for the combined company through December 31, 2019. After receipt of ICU Medical shares, we own approximately 16.4% of ICU Medical as of the closing date. Wehave agreed to certain restrictions on transfer of our ICU Medical shares for 18 months. The promissory note from ICU Medical has a term of three years and bears interest atLIBOR plus 2.25% for the first year and LIBOR plus 2.50% for the second and third years.
While we have received the full purchase price excluding the contingent amount as of the February 3, 2017 closing, the sale of the HIS net assets was not completed in certainnon-U.S. jurisdictions due to temporary regulatory or operational constraints. In these jurisdictions, which represent a relatively small portion of the HIS net assets, we continueto operate the net assets for the net economic benefit of ICU Medical, and we are indemnified by ICU Medical against any risk associated with such operations during theinterim period. We expect the sale of the HIS net assets in these jurisdictions to be completed by the first quarter of 2018. As such, and as we have already received all of thenon-contingent proceeds from the sale and ICU Medical is contractually obligated to complete the transaction, we have treated these jurisdictions as sold for accountingpurposes.
In connection with the sale transaction, we entered into certain transitional agreements designed to facilitate the orderly transition of the HIS net assets to ICU Medical. Theseagreements primarily relate to administrative services, which are generally to be provided for a period
84
2016 Financial Report
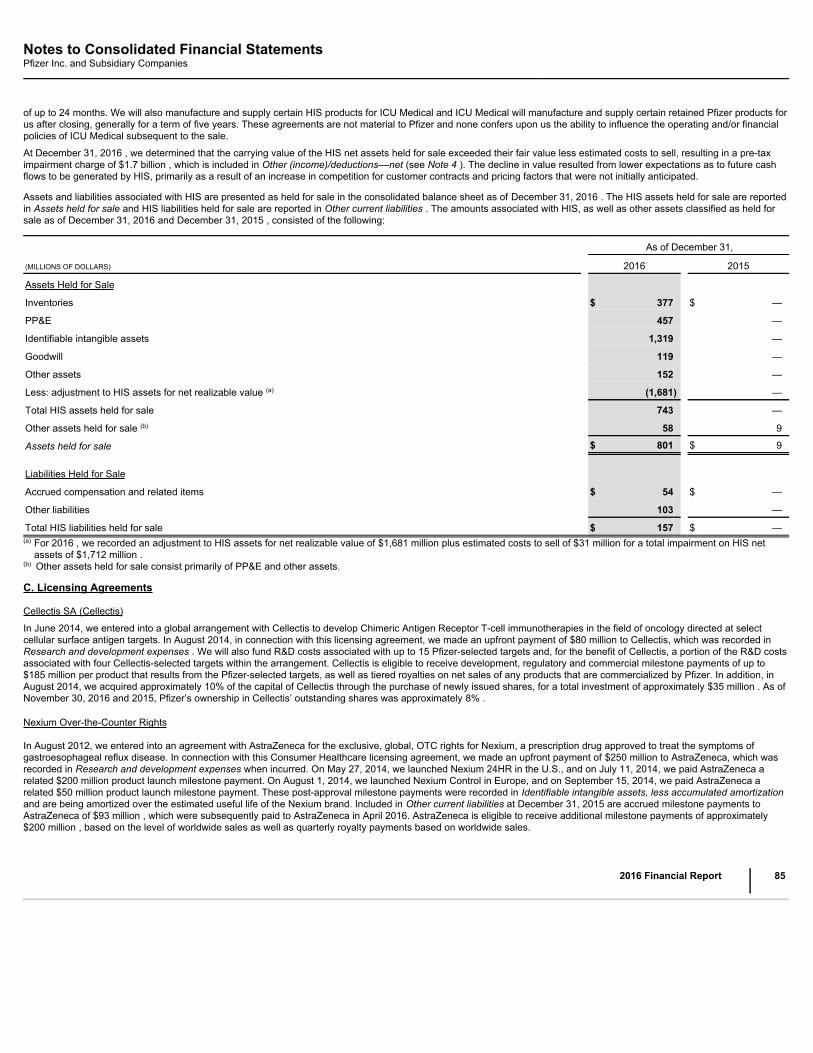
Notes to Consolidated Financial StatementsPfizer Inc. and Subsidiary Companies
of up to 24 months. We will also manufacture and supply certain HIS products for ICU Medical and ICU Medical will manufacture and supply certain retained Pfizer products forus after closing, generally for a term of five years. These agreements are not material to Pfizer and none confers upon us the ability to influence the operating and/or financialpolicies of ICU Medical subsequent to the sale.
At December 31, 2016 , we determined that the carrying value of the HIS net assets held for sale exceeded their fair value less estimated costs to sell, resulting in a pre-taximpairment charge of $1.7 billion , which is included in Other (income)/deductions––net (see Note 4 ). The decline in value resulted from lower expectations as to future cashflows to be generated by HIS, primarily as a result of an increase in competition for customer contracts and pricing factors that were not initially anticipated.
Assets and liabilities associated with HIS are presented as held for sale in the consolidated balance sheet as of December 31, 2016 . The HIS assets held for sale are reportedin Assets held for sale and HIS liabilities held for sale are reported in Other current liabilities . The amounts associated with HIS, as well as other assets classified as held forsale as of December 31, 2016 and December 31, 2015 , consisted of the following:
As of December 31,
(MILLIONS OF DOLLARS) 2016 2015
Assets Held for Sale
Inventories $ 377 $ —
PP&E 457 —
Identifiable intangible assets 1,319 —
Goodwill 119 —
Other assets 152 —
Less: adjustment to HIS assets for net realizable value (a) (1,681) —
Total HIS assets held for sale 743 —
Other assets held for sale (b) 58 9
Assets held for sale $ 801 $ 9
Liabilities Held for Sale
Accrued compensation and related items $ 54 $ —
Other liabilities 103 —
Total HIS liabilities held for sale $ 157 $ —(a)
For 2016 , we recorded an adjustment to HIS assets for net realizable value of $1,681 million plus estimated costs to sell of $31 million for a total impairment on HIS netassets of $1,712 million .
(b) Other assets held for sale consist primarily of PP&E and other assets.
C. Licensing Agreements
Cellectis SA (Cellectis)
In June 2014, we entered into a global arrangement with Cellectis to develop Chimeric Antigen Receptor T-cell immunotherapies in the field of oncology directed at selectcellular surface antigen targets. In August 2014, in connection with this licensing agreement, we made an upfront payment of $80 million to Cellectis, which was recorded inResearch and development expenses . We will also fund R&D costs associated with up to 15 Pfizer-selected targets and, for the benefit of Cellectis, a portion of the R&D costsassociated with four Cellectis-selected targets within the arrangement. Cellectis is eligible to receive development, regulatory and commercial milestone payments of up to$185 million per product that results from the Pfizer-selected targets, as well as tiered royalties on net sales of any products that are commercialized by Pfizer. In addition, inAugust 2014, we acquired approximately 10% of the capital of Cellectis through the purchase of newly issued shares, for a total investment of approximately $35 million . As ofNovember 30, 2016 and 2015, Pfizer’s ownership in Cellectis’ outstanding shares was approximately 8% .
Nexium Over-the-Counter Rights
In August 2012, we entered into an agreement with AstraZeneca for the exclusive, global, OTC rights for Nexium, a prescription drug approved to treat the symptoms ofgastroesophageal reflux disease. In connection with this Consumer Healthcare licensing agreement, we made an upfront payment of $250 million to AstraZeneca, which wasrecorded in Research and development expenses when incurred. On May 27, 2014, we launched Nexium 24HR in the U.S., and on July 11, 2014, we paid AstraZeneca arelated $200 million product launch milestone payment. On August 1, 2014, we launched Nexium Control in Europe, and on September 15, 2014, we paid AstraZeneca arelated $50 million product launch milestone payment. These post-approval milestone payments were recorded in Identifiable intangible assets, less accumulated amortizationand are being amortized over the estimated useful life of the Nexium brand. Included in Other current liabilities at December 31, 2015 are accrued milestone payments toAstraZeneca of $93 million , which were subsequently paid to AstraZeneca in April 2016. AstraZeneca is eligible to receive additional milestone payments of approximately$200 million , based on the level of worldwide sales as well as quarterly royalty payments based on worldwide sales.
2016 Financial Report
85
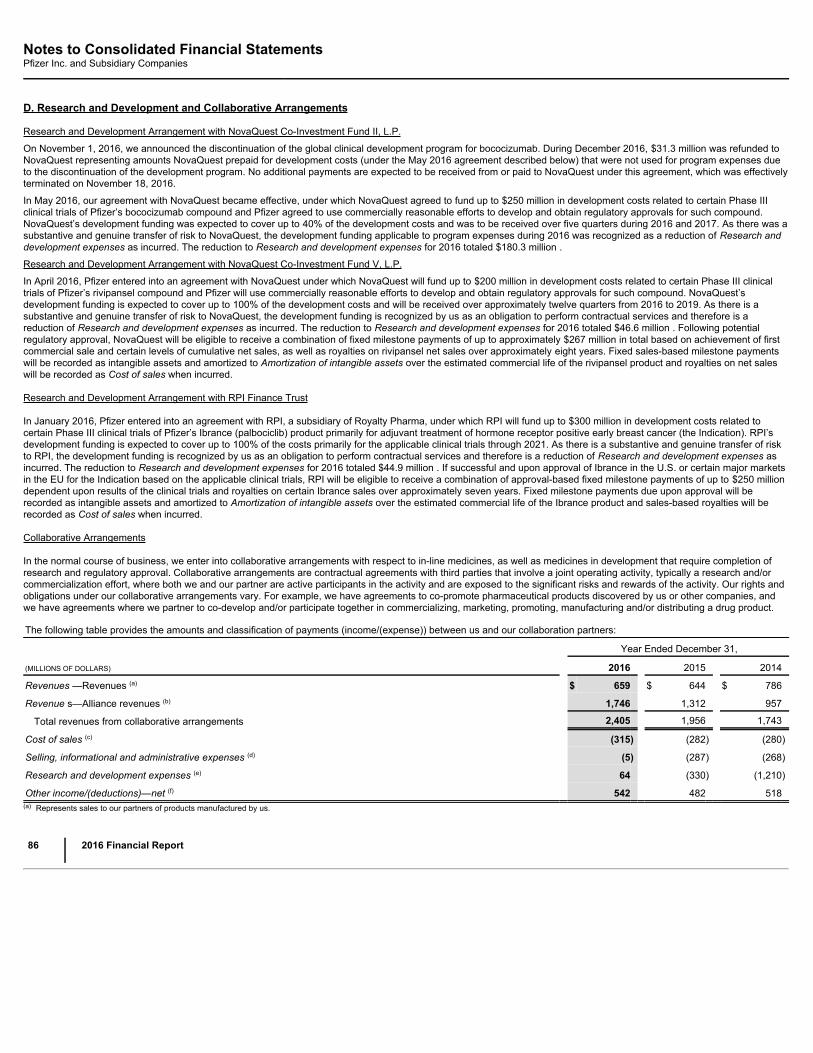
Notes to Consolidated Financial StatementsPfizer Inc. and Subsidiary Companies
D. Research and Development and Collaborative Arrangements
Research and Development Arrangement with NovaQuest Co-Investment Fund II, L.P.
On November 1, 2016, we announced the discontinuation of the global clinical development program for bococizumab. During December 2016, $31.3 million was refunded toNovaQuest representing amounts NovaQuest prepaid for development costs (under the May 2016 agreement described below) that were not used for program expenses dueto the discontinuation of the development program. No additional payments are expected to be received from or paid to NovaQuest under this agreement, which was effectivelyterminated on November 18, 2016.
In May 2016, our agreement with NovaQuest became effective, under which NovaQuest agreed to fund up to $250 million in development costs related to certain Phase IIIclinical trials of Pfizer’s bococizumab compound and Pfizer agreed to use commercially reasonable efforts to develop and obtain regulatory approvals for such compound.NovaQuest’s development funding was expected to cover up to 40% of the development costs and was to be received over five quarters during 2016 and 2017. As there was asubstantive and genuine transfer of risk to NovaQuest, the development funding applicable to program expenses during 2016 was recognized as a reduction of Research anddevelopment expenses as incurred. The reduction to Research and development expenses for 2016 totaled $180.3 million .
Research and Development Arrangement with NovaQuest Co-Investment Fund V, L.P.
In April 2016, Pfizer entered into an agreement with NovaQuest under which NovaQuest will fund up to $200 million in development costs related to certain Phase III clinicaltrials of Pfizer’s rivipansel compound and Pfizer will use commercially reasonable efforts to develop and obtain regulatory approvals for such compound. NovaQuest’sdevelopment funding is expected to cover up to 100% of the development costs and will be received over approximately twelve quarters from 2016 to 2019. As there is asubstantive and genuine transfer of risk to NovaQuest, the development funding is recognized by us as an obligation to perform contractual services and therefore is areduction of Research and development expenses as incurred. The reduction to Research and development expenses for 2016 totaled $46.6 million . Following potentialregulatory approval, NovaQuest will be eligible to receive a combination of fixed milestone payments of up to approximately $267 million in total based on achievement of firstcommercial sale and certain levels of cumulative net sales, as well as royalties on rivipansel net sales over approximately eight years. Fixed sales-based milestone paymentswill be recorded as intangible assets and amortized to Amortization of intangible assets over the estimated commercial life of the rivipansel product and royalties on net saleswill be recorded as Cost of sales when incurred.
Research and Development Arrangement with RPI Finance Trust
In January 2016, Pfizer entered into an agreement with RPI, a subsidiary of Royalty Pharma, under which RPI will fund up to $300 million in development costs related tocertain Phase III clinical trials of Pfizer’s Ibrance (palbociclib) product primarily for adjuvant treatment of hormone receptor positive early breast cancer (the Indication). RPI’sdevelopment funding is expected to cover up to 100% of the costs primarily for the applicable clinical trials through 2021. As there is a substantive and genuine transfer of riskto RPI, the development funding is recognized by us as an obligation to perform contractual services and therefore is a reduction of Research and development expenses asincurred. The reduction to Research and development expenses for 2016 totaled $44.9 million . If successful and upon approval of Ibrance in the U.S. or certain major marketsin the EU for the Indication based on the applicable clinical trials, RPI will be eligible to receive a combination of approval-based fixed milestone payments of up to $250 milliondependent upon results of the clinical trials and royalties on certain Ibrance sales over approximately seven years. Fixed milestone payments due upon approval will berecorded as intangible assets and amortized to Amortization of intangible assets over the estimated commercial life of the Ibrance product and sales-based royalties will berecorded as Cost of sales when incurred.
Collaborative Arrangements
In the normal course of business, we enter into collaborative arrangements with respect to in-line medicines, as well as medicines in development that require completion ofresearch and regulatory approval. Collaborative arrangements are contractual agreements with third parties that involve a joint operating activity, typically a research and/orcommercialization effort, where both we and our partner are active participants in the activity and are exposed to the significant risks and rewards of the activity. Our rights andobligations under our collaborative arrangements vary. For example, we have agreements to co-promote pharmaceutical products discovered by us or other companies, andwe have agreements where we partner to co-develop and/or participate together in commercializing, marketing, promoting, manufacturing and/or distributing a drug product.
The following table provides the amounts and classification of payments (income/(expense)) between us and our collaboration partners:
Year Ended December 31,
(MILLIONS OF DOLLARS) 2016 2015 2014
Revenues —Revenues (a) $ 659 $ 644 $ 786
Revenue s—Alliance revenues (b) 1,746 1,312 957
Total revenues from collaborative arrangements 2,405 1,956 1,743
Cost of sales (c) (315) (282) (280)
Selling, informational and administrative expenses (d) (5) (287) (268)
Research and development expenses (e) 64 (330) (1,210)
Other income/(deductions)—net (f) 542 482 518(a) Represents sales to our partners of products manufactured by us.
86
2016 Financial Report

Notes to Consolidated Financial StatementsPfizer Inc. and Subsidiary Companies
(b)
Substantially all relates to amounts earned from our partners under co-promotion agreements. The increase in 2016 reflects an increase in alliance revenues from Eliquis and the inclusion of Xtandi revenuesresulting from the acquisition of Medivation in September 2016, partially offset by the expiration of the Rebif co-promotion collaboration at the end of 2015. The increase in 2015 reflects an increase in alliancerevenues from Eliquis, partially offset by Spiriva (as a result of the expiration of the co-promotion collaboration in the U.S. and certain European countries during 2014).
(c) Primarily relates to royalties earned by our partners and cost of sales associated with inventory purchased from our partners.(d) Represents net reimbursements to our partners for selling, informational and administrative expenses incurred.(e)
Primarily relates to upfront payments and pre-approval milestone payments earned by our partners as well as net reimbursements. The upfront and milestone payments were as follows: $15 million in 2016 , $310million in 2015 (primarily related to our collaboration with OPKO, see below) and $1.2 billion in 2014 (related to our collaboration with Merck KGaA, see below). 2016 also includes a $120 million reimbursementrelated to our collaboration with Lilly (see below).
(f) In 2016 , 2015 and 2014 , includes royalties earned on sales of Enbrel in the U.S. and Canada after October 31, 2013. On that date, the co-promotion term of the collaboration agreement for Enbrel in the U.S.and Canada expired, and we became entitled to royalties for a 36 -month period thereafter until October 31, 2016.
The amounts disclosed in the above table do not include transactions with third parties other than our collaboration partners, or other costs associated with the products underthe collaborative arrangements.
In addition, in connection with our collaborative arrangements, we paid post-approval milestones to collaboration partners of $20 million in 2015 and $80 million in 2014 . Thesepayments were recorded in Identifiable intangible assets –– Developed technology rights. We did not pay post-approval milestones to collaboration partners in 2016. We alsoreceived upfront and milestone payments from our collaboration partners of $200 million in 2015, primarily related to our collaboration with Lilly (see below). This amount wasrecorded in our consolidated balance sheets as deferred revenue and is being recognized into Other (income)/deductions––net over a multi-year period.
Collaboration with Eli Lilly & Company
In 2013, we entered into a collaboration agreement with Lilly to jointly develop and globally commercialize Pfizer’s tanezumab, which provides that Pfizer and Lilly will equallyshare product-development expenses as well as potential revenues and certain product-related costs. Following the decision by the FDA in March 2015 to lift the partialclinical hold on the tanezumab development program, we received a $200 million upfront payment from Lilly in accordance with the collaboration agreement between Pfizerand Lilly, which is recorded as deferred revenue in our consolidated balance sheet and is being recognized into Other (income)/deductions––net over a multi-year periodbeginning in the second quarter of 2015. Pfizer and Lilly resumed the Phase 3 chronic pain program for tanezumab in July 2015. Under the collaboration agreement with Lilly,we are eligible to receive additional payments from Lilly upon the achievement of specified regulatory and commercial milestones.
Collaboration with OPKO Health, Inc.
We entered into a collaborative agreement with OPKO, which closed in January 2015, to develop and commercialize OPKO’s long-acting hGH-CTP for the treatment of GHD inadults and children, as well as for the treatment of growth failure in children born SGA who fail to show catch-up growth by two years of age. In February 2015, we made anupfront payment of $295 million to OPKO, which was recorded in Research and development expenses, and OPKO is eligible to receive up to an additional $275 million uponthe achievement of certain regulatory milestones. OPKO is also eligible to receive royalty payments associated with the commercialization of hGH-CTP for Adult GHD, which issubject to regulatory approval. Upon the launch of hGH-CTP for Pediatric GHD, which is subject to regulatory approval, the royalties will transition to tiered gross profit sharingfor both hGH-CTP and our product, Genotropin.
Collaboration with Merck KGaA
In November 2014, we entered into a collaborative arrangement with Merck KGaA, to jointly develop and commercialize avelumab, the proposed international non-proprietaryname for the investigational anti-PD-L1 antibody (MSB0010718C), currently in development as a potential treatment for multiple types of cancer. We and Merck KGaA areexploring the therapeutic potential of this novel anti-PD-L1 antibody as a single agent as well as in various combinations with our and Merck KGaA’s broad portfolio ofapproved and investigational oncology therapies. We and Merck KGaA are also combining resources and expertise to advance our anti-PD-1 antibody into Phase 1 trials.Under the terms of the agreement, in the fourth quarter of 2014, we made an upfront payment of $850 million to Merck KGaA and Merck KGaA is eligible to receive regulatoryand commercial milestone payments of up to approximately $2.0 billion . Both companies will jointly fund all development and commercialization costs, and split equally anyprofits generated from selling any anti-PD-L1 or anti-PD-1 products from this collaboration. Also, as part of the agreement, we gave Merck KGaA certain co-promotion rights forXalkori in the U.S. and several other key markets, and co-promotion activities were initiated in key select markets in 2015. In 2014, we recorded $1.2 billion of Research anddevelopment expenses associated with this collaborative arrangement, composed of the $850 million upfront cash payment as well as an additional amount of $309 million ,reflecting the estimated fair value of the co-promotion rights given to Merck KGaA.
E. Equity-Method Investments
Investment in Hisun Pfizer Pharmaceuticals Company Limited
In September 2012, we and Hisun, a leading pharmaceutical company in China, formed a new company, Hisun Pfizer, to develop, manufacture, market and sellpharmaceutical products, primarily branded generic products, predominately in China. Hisun Pfizer was established with registered capital of $250 million , of which our portionwas $122.5 million . On January 1, 2013, both parties transferred selected employees to Hisun Pfizer and contributed, among other things, certain rights to commercializedproducts and products in development, intellectual property rights, and facilities, equipment and distribution/customer contracts. Our contributions in 2013 constituted abusiness, as defined by U.S. GAAP, and included, among other things, the China rights to certain commercialized products and other products not yet commercialized and allassociated intellectual property rights. As a result of the contributions from both parties, Hisun Pfizer holds a broad portfolio of branded generics covering cardiovasculardisease, infectious disease, oncology, mental health and other therapeutic areas.
2016 Financial Report
87
Notes to Consolidated Financial StatementsPfizer Inc. and Subsidiary Companies
We also entered into certain transition agreements designed to ensure and facilitate the orderly transfer of the business operations to Hisun Pfizer, primarily the Pfizer ProductsTransition Period Agreement and a related supply and promotional services agreement. These agreements provide for a profit margin on the manufacturing services providedby Pfizer to Hisun Pfizer and govern the supply, promotion and distribution of Pfizer products until Hisun Pfizer is able to provide for its own manufacturing and distribution.While intended to be transitional, these agreements may be extended by mutual agreement of the parties for several years and, possibly, indefinitely. These agreements arenot material to Pfizer, and none confers upon us any additional ability to influence the operating and/or financial policies of Hisun Pfizer. We are accounting for our interest inHisun Pfizer as an equity-method investment, due to the significant influence we have over the operations of Hisun Pfizer through our board representation, minority veto rightsand 49% voting interest. Our investment in Hisun Pfizer is reported in Long-term investments , and our share of Hisun Pfizer’s net income is recorded in Other(income)/deductions––net.
In 2016, we determined that we had other-than-temporary declines in the value of Hisun Pfizer, and, therefore, we recognized a loss of $452 million in Other(income)/deductions––net (see Note 4 ), consisting of losses recognized in the first, second and fourth quarters of 2016. In the first and second quarters of 2016, wedetermined that we had other-than-temporary declines in the value of Hisun Pfizer and, therefore, we recognized a loss of $81 million and $130 million , respectively. Thedeclines in value resulted from lower expectations as to the future cash flows to be generated by Hisun Pfizer, primarily as a result of an increase in risk due to the continuedslowdown in the Chinese economy and changes in the expected timing and number of new product introductions by Hisun Pfizer. In the fourth quarter of 2016, we recognizeda loss of $241 million to reduce the carrying value of our investment in Hisun Pfizer to approximately $270 million at December 31, 2016. We are continuing to evaluatestrategic alternatives with Hisun. These strategic alternatives could impact the value of our investment in Hisun Pfizer in future periods.
In the third quarter of 2015, we determined that we had an other-than-temporary decline in the value of Hisun Pfizer, and, therefore, in 2015, we recognized a loss of $463million in Other (income)/deductions––net (see Note 4 ) . The decline in value resulted from lower expectations as to the future cash flows to be generated by Hisun Pfizer, as aresult of lower than expected recent performance, increased competition, a slowdown in the China economy in relation to their products, as well as certain changes in theregulatory environment.
In valuing our investment in Hisun Pfizer, we used discounted cash flow techniques, reflecting our best estimate of the various risks inherent in the projected cash flows, and anominal terminal year growth factor. Some of the more significant estimates and assumptions inherent in this approach include: the amount and timing of the projected netcash flows, which include the expected impact of competitive, legal, economic and/or regulatory forces on the products; the long-term growth rate, which seeks to project thesustainable growth rate over the long-term; and the discount rate, which seeks to reflect the various risks inherent in the projected cash flows, including country risk. As ofDecember 31, 2015 , the carrying value of our investment in Hisun Pfizer was approximately $ 775 million .
Investment in ViiV Healthcare Limited (ViiV)
On January 21, 2014, the European Commission approved Tivicay (dolutegravir), a product for the treatment of HIV-1 infection, developed by ViiV, a company formed in 2009by Pfizer and GlaxoSmithKline plc to focus solely on research, development and commercialization of HIV medicines and an equity-method investee. This approval, inaccordance with the agreement between GlaxoSmithKline plc and Pfizer, triggered a reduction in our equity interest in ViiV from 12.6% to 11.7% , effective April 1, 2014. As aresult, in 2014, we recognized a loss of approximately $30 million in Other (income)/deductions––net . We account for our investment in ViiV under the equity method due tothe significant influence that we continue to have through our board representation and minority veto rights.
Investment in Laboratório Teuto Brasileiro S.A. (Teuto)
We have an option to acquire the remaining 60% of Teuto, a 40% -owned generics company in Brazil, and Teuto’s shareholders have an option to sell their 60% stake in thecompany to us. Under the terms of our original agreement with Teuto’s other shareholders, 2016 was the final year in which the call and put options could be exercised. Weand the other Teuto shareholders have agreed to extend the period in which the options could be exercised into 2017. Our investment in Teuto is accounted for under theequity method due to the significant influence we have over the operations of Teuto through our board representation, minority veto rights and 40% voting interest.
• In 2016, we determined that we had an other-than-temporary decline in the value of Teuto, and, therefore, in 2016, we recognized a loss of $50 million in Other(income)/deductions––net (see Note 4 ) related to our equity-method investment. The decline in value resulted from lower expectations as to the future cash flows to begenerated by Teuto, primarily due to a slowdown in Brazilian economic conditions, which have been impacted by political risk, higher inflation, and the depreciation of theBrazilian Real.
• In 2014, we recorded income of approximately $55 million in Other (income)/deductions––net, resulting from a decline in the estimated loss from the net call/put optionrecorded in 2013 and an impairment loss of $56 million in Other (income)/deductions––net related to our equity method investment.
In valuing our investment in Teuto, we used discounted cash flow techniques, reflecting our best estimate of the various risks inherent in the projected cash flows, and anominal terminal year growth factor. Some of the more significant estimates and assumptions inherent in this approach include: the amount and timing of the projected netcash flows, which include the expected impact of competitive, legal, economic and/or regulatory forces on the products; the long-term growth rate, which seeks to project thesustainable growth rate over the long-term; and the discount rate, which seeks to reflect the various risks inherent in the projected cash flows, including country risk.
F. Cost-Method Investment
AM-Pharma B.V.
In April 2015, we acquired a minority equity interest in AM-Pharma, a privately-held Dutch biopharmaceutical company focused on the development of recAP for inflammatorydiseases, and secured an exclusive option to acquire the remaining equity in the company. The option
88
2016 Financial Report
Notes to Consolidated Financial StatementsPfizer Inc. and Subsidiary Companies
becomes exercisable after completion of a Phase II trial of recAP in the treatment of Acute Kidney Injury related to sepsis, which is expected in 2017. Under the terms of theagreement, we paid $87.5 million for both the exclusive option and the minority equity interest, which was recorded as a cost-method investment in Long-term investments ,and we may make additional payments of up to $512.5 million upon exercise of the option and potential launch of any product that may result from this investment.
Note 3. Restructuring Charges and Other Costs Associated with Acquisitions and Cost-Reduction/ProductivityInitiatives
We incur significant costs in connection with acquiring, integrating and restructuring businesses and in connection with our global cost-reduction/productivity initiatives. Forexample:• In connection with acquisition activity, we typically incur costs associated with executing the transactions, integrating the acquired operations (which may include
expenditures for consulting and the integration of systems and processes), and restructuring the combined company (which may include charges related to employees,assets and activities that will not continue in the combined company); and
• In connection with our cost-reduction/productivity initiatives, we typically incur costs and charges associated with site closings and other facility rationalization actions,workforce reductions and the expansion of shared services, including the development of global systems.
All of our businesses and functions may be impacted by these actions, including sales and marketing, manufacturing and R&D, as well as groups such as informationtechnology, shared services and corporate operations.
In connection with our acquisition of Hospira, we are focusing our efforts on achieving an appropriate cost structure for the combined company. For up to a three -year periodpost-acquisition, we expect to incur costs of approximately $1 billion (not including costs of $215 million in 2015 associated with the return of acquired IPR&D rights asdescribed in the Current-Period Key Activities section below) associated with the integration of Hospira.
In early 2014, we announced that we would incur costs in 2014-2016 related to new programs: our new global commercial structure reorganization and additional cost-reduction/productivity initiatives. We had the following initiatives associated with these programs:• The 2014 global commercial structure reorganization, which primarily includes the streamlining of certain functions, the realignment of regional locations and colleagues to
the support the businesses, as well as implementing the necessary system changes to support different reporting requirements. Through December 31, 2016, we incurredcosts of approximately $219 million and have completed this initiative.
• Manufacturing plant network rationalization and optimization, where execution timelines are necessarily long. In connection with our plant network strategy and facilityoptimization of manufacturing operations under the 2014-2016 initiatives, we incurred costs of approximately $367 million associated with prior acquisition activity and costsof approximately $1.1 billion associated with new non-acquisition-related cost-reduction initiatives.
• Other new cost-reduction/productivity initiatives, primarily related to commercial property rationalization and other consolidation and savings opportunities. In connectionwith these cost-reduction activities, during 2014-2016, we incurred costs of approximately $1.4 billion .
The costs incurred during 2014-2016, of approximately $3.1 billion in total for the above-mentioned programs (but not including expected costs associated with the Hospiraintegration), include restructuring charges, implementation costs and additional depreciation––asset restructuring. Of this amount, about a quarter of the charges were non-cash.
Current-Period Key Activities
In 2016 , we incurred approximately $2.1 billion in cost-reduction and acquisition-related costs (excluding transaction costs) primarily in connection with the integration ofHospira and the aforementioned programs.
2016 Financial Report
89

Notes to Consolidated Financial StatementsPfizer Inc. and Subsidiary Companies
The following table provides the components of costs associated with acquisitions and cost-reduction/productivity initiatives:
Year Ended December 31,
(MILLIONS OF DOLLARS) 2016 2015 2014
Restructuring charges (a) :
Employee terminations $ 940 $ 489 $ 68
Asset impairments 142 254 45
Exit costs 74 68 58
Total restructuring charges 1,156 811 170
Transaction costs (b) 127 123 —
Integration costs (c) 441 219 80
Restructuring charges and certain acquisition-related costs 1,724 1,152 250Additional depreciation––asset restructuring recorded in our
consolidated statements of income as follows (d) :
Cost of sales 201 117 228
Selling, informational and administrative expenses — — 1
Research and development expenses 7 5 31
Total additional depreciation––asset restructuring 207 122 261
Implementation costs recorded in our consolidated statements of income as follows (e) :
Cost of sales 230 102 78
Selling, informational and administrative expenses 81 82 140
Research and development expenses 25 14 52
Other (income)/deductions––net 3 5 1
Total implementation costs 340 203 270
Total costs associated with acquisitions and cost-reduction/productivity initiatives $ 2,271 $ 1,478 $ 781(a)
In 2016 , Employee terminations represent the expected reduction of the workforce by approximately 4,900 employees, mainly in manufacturing, sales, research and corporate. Employee termination costs aregenerally recorded when the actions are probable and estimable and include accrued severance benefits, pension and postretirement benefits, many of which may be paid out during periods after termination.
The restructuring charges in 2016 , are associated with the following:• IH ( $272 million ); EH ( $158 million ); WRD, GPD and Medical (M) (WRD/GPD/M) ( $169 million ); manufacturing operations ( $368 million ); and Corporate ( $189 million ).The restructuring charges in 2015 , which include a $39 million charge related to a 36% reduction in our labor force in Venezuela, are associated with the following:• IH ( $85 million ); EH ( $402 million ); WRD/GPD/M ( $80 million ); manufacturing operations ( $80 million ); and Corporate ( $164 million ),The restructuring charges in 2014 are associated with the following:
• IH ( $63 million ); EH ( $57 million ); WRD/GPD/M ( $37 million ); manufacturing operations ( $97 million ); and Corporate ( $65 million ). as well as $149 million of income related to the partial reversal of prior-period restructuring charges not directly associated with the new individual segments, and primarily reflecting a change in estimate with respect to our sales force restructuring plans.
In September 2015, in order to eliminate certain redundancies in Pfizer’s biosimilar drug products pipeline created as a result of the acquisition of Hospira, Pfizer opted to return rights to Celltrion that Hospira hadpreviously acquired to potential biosimilars to Rituxan® (rituximab) and Herceptin® (trastuzumab). As such, upon return of the acquired rights, in 2015, we incurred charges of $215 million , which are comprisedof (i) a write-off of the applicable IPR&D assets, totaling $170 million , which is included in Asset impairments ; (ii) a write-off of amounts prepaid to Celltrion in the amount of $25 million , which is included in Assetimpairments ; and (iii) a payment to Celltrion of $20 million , which is included in Exit costs .
(b)
Transaction costs represent external costs for banking, legal, accounting and other similar services, most of which in 2016 are directly related to our acquisitions of Medivation and Anacor, and the terminatedtransaction with Allergan. Transaction costs in 2015 represent external costs directly related to the acquisition of Hospira and the terminated transaction with Allergan and primarily include expenditures for banking,legal, accounting and other similar services.
(c)
I ntegration costs represent external, incremental costs directly related to integrating acquired businesses, and primarily include expenditures for consulting and the integration of systems and processes. In 2016,integration costs primarily relate to our acquisition of Hospira and the terminated transaction with Allergan. Integration costs in 2015 represent external incremental costs directly related to our acquisition ofHospira.
(d) Additional depreciation––asset restructuring represents the impact of changes in the estimated useful lives of assets involved in restructuring actions.(e) Implementation costs represent external, incremental costs directly related to implementing our non-acquisition-related cost-reduction/productivity initiatives.
90
2016 Financial Report
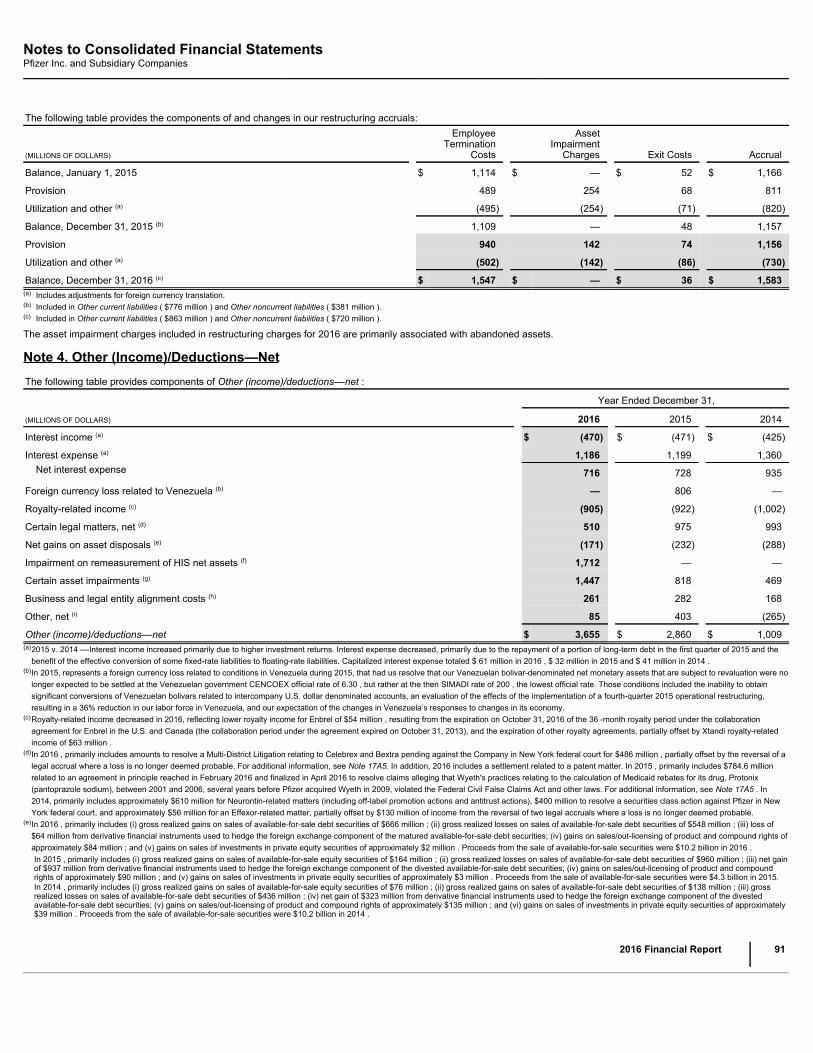
Notes to Consolidated Financial StatementsPfizer Inc. and Subsidiary Companies
The following table provides the components of and changes in our restructuring accruals:
(MILLIONS OF DOLLARS)
EmployeeTermination
Costs
AssetImpairment
Charges Exit Costs Accrual
Balance, January 1, 2015 $ 1,114 $ — $ 52 $ 1,166
Provision 489 254 68 811
Utilization and other (a) (495) (254) (71) (820)
Balance, December 31, 2015 (b) 1,109 — 48 1,157
Provision 940 142 74 1,156
Utilization and other (a) (502) (142) (86) (730)
Balance, December 31, 2016 (c) $ 1,547 $ — $ 36 $ 1,583(a) Includes adjustments for foreign currency translation.(b) Included in Other current liabilities ( $776 million ) and Other noncurrent liabilities ( $381 million ).(c) Included in Other current liabilities ( $863 million ) and Other noncurrent liabilities ( $720 million ).
The asset impairment charges included in restructuring charges for 2016 are primarily associated with abandoned assets.
Note 4. Other (Income)/Deductions—NetThe following table provides components of Other (income)/deductions––net :
Year Ended December 31,
(MILLIONS OF DOLLARS) 2016 2015 2014
Interest income (a) $ (470) $ (471) $ (425)
Interest expense (a) 1,186 1,199 1,360Net interest expense 716 728 935
Foreign currency loss related to Venezuela (b) — 806 —
Royalty-related income (c) (905) (922) (1,002)
Certain legal matters, net (d) 510 975 993
Net gains on asset disposals (e) (171) (232) (288)
Impairment on remeasurement of HIS net assets (f) 1,712 — —
Certain asset impairments (g) 1,447 818 469
Business and legal entity alignment costs (h) 261 282 168
Other, net (i) 85 403 (265)
Other (income)/deductions––net $ 3,655 $ 2,860 $ 1,009(a)
2015 v. 2014 ––Interest income increased primarily due to higher investment returns. Interest expense decreased, primarily due to the repayment of a portion of long-term debt in the first quarter of 2015 and thebenefit of the effective conversion of some fixed-rate liabilities to floating-rate liabilities. Capitalized interest expense totaled $ 61 million in 2016 , $ 32 million in 2015 and $ 41 million in 2014 .
(b)
In 2015, represents a foreign currency loss related to conditions in Venezuela during 2015, that had us resolve that our Venezuelan bolivar-denominated net monetary assets that are subject to revaluation were nolonger expected to be settled at the Venezuelan government CENCOEX official rate of 6.30 , but rather at the then SIMADI rate of 200 , the lowest official rate. Those conditions included the inability to obtainsignificant conversions of Venezuelan bolivars related to intercompany U.S. dollar denominated accounts, an evaluation of the effects of the implementation of a fourth-quarter 2015 operational restructuring,resulting in a 36% reduction in our labor force in Venezuela, and our expectation of the changes in Venezuela’s responses to changes in its economy.
(c)
Royalty-related income decreased in 2016, reflecting lower royalty income for Enbrel of $54 million , resulting from the expiration on October 31, 2016 of the 36 -month royalty period under the collaborationagreement for Enbrel in the U.S. and Canada (the collaboration period under the agreement expired on October 31, 2013), and the expiration of other royalty agreements, partially offset by Xtandi royalty-relatedincome of $63 million .
(d)
In 2016 , primarily includes amounts to resolve a Multi-District Litigation relating to Celebrex and Bextra pending against the Company in New York federal court for $486 million , partially offset by the reversal of alegal accrual where a loss is no longer deemed probable. For additional information, see Note 17A5. In addition, 2016 includes a settlement related to a patent matter. In 2015 , primarily includes $784.6 millionrelated to an agreement in principle reached in February 2016 and finalized in April 2016 to resolve claims alleging that Wyeth's practices relating to the calculation of Medicaid rebates for its drug, Protonix(pantoprazole sodium), between 2001 and 2006, several years before Pfizer acquired Wyeth in 2009, violated the Federal Civil False Claims Act and other laws. For additional information, see Note 17A5 . In2014, primarily includes approximately $610 million for Neurontin-related matters (including off-label promotion actions and antitrust actions), $400 million to resolve a securities class action against Pfizer in NewYork federal court, and approximately $56 million for an Effexor-related matter, partially offset by $130 million of income from the reversal of two legal accruals where a loss is no longer deemed probable.
(e)
In 2016 , primarily includes (i) gross realized gains on sales of available-for-sale debt securities of $666 million ; (ii) gross realized losses on sales of available-for-sale debt securities of $548 million ; (iii) loss of$64 million from derivative financial instruments used to hedge the foreign exchange component of the matured available-for-sale debt securities; (iv) gains on sales/out-licensing of product and compound rights ofapproximately $84 million ; and (v) gains on sales of investments in private equity securities of approximately $2 million . Proceeds from the sale of available-for-sale securities were $10.2 billion in 2016 .In 2015 , primarily includes (i) gross realized gains on sales of available-for-sale equity securities of $164 million ; (ii) gross realized losses on sales of available-for-sale debt securities of $960 million ; (iii) net gainof $937 million from derivative financial instruments used to hedge the foreign exchange component of the divested available-for-sale debt securities; (iv) gains on sales/out-licensing of product and compoundrights of approximately $90 million ; and (v) gains on sales of investments in private equity securities of approximately $3 million . Proceeds from the sale of available-for-sale securities were $4.3 billion in 2015.In 2014 , primarily includes (i) gross realized gains on sales of available-for-sale equity securities of $76 million ; (ii) gross realized gains on sales of available-for-sale debt securities of $138 million ; (iii) grossrealized losses on sales of available-for-sale debt securities of $436 million ; (iv) net gain of $323 million from derivative financial instruments used to hedge the foreign exchange component of the divestedavailable-for-sale debt securities; (v) gains on sales/out-licensing of product and compound rights of approximately $135 million ; and (vi) gains on sales of investments in private equity securities of approximately$39 million . Proceeds from the sale of available-for-sale securities were $10.2 billion in 2014 .
2016 Financial Report
91
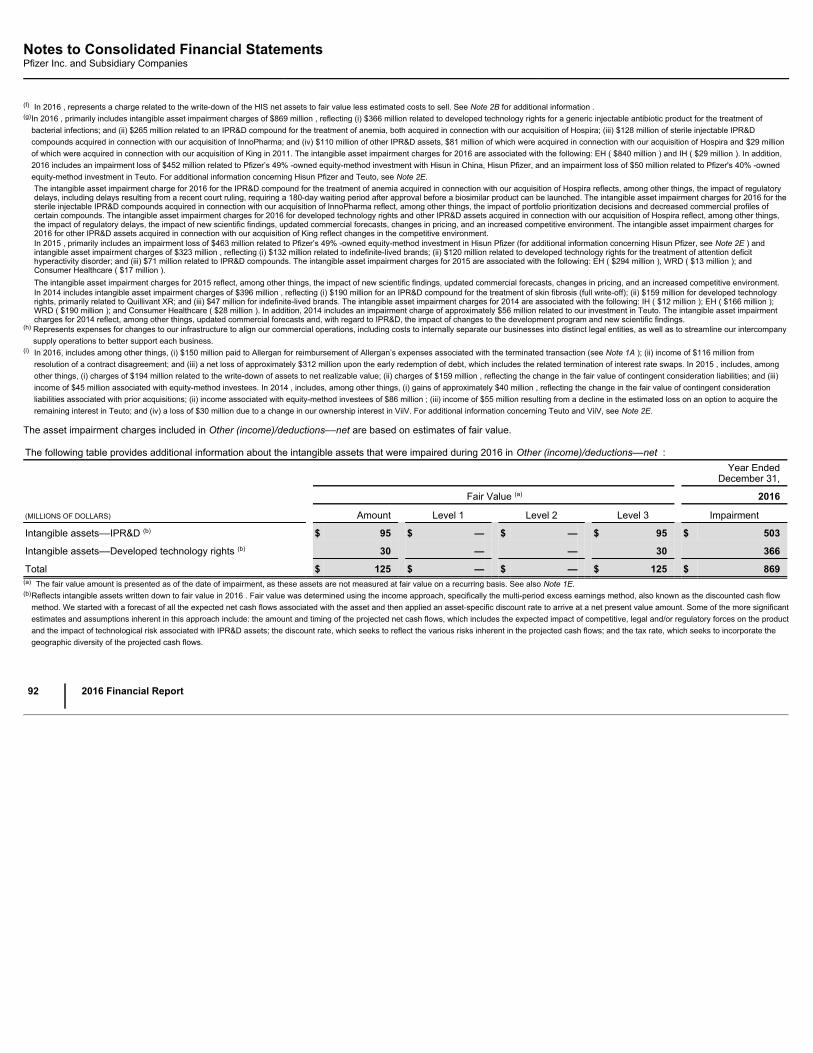
Notes to Consolidated Financial StatementsPfizer Inc. and Subsidiary Companies
(f) In 2016 , represents a charge related to the write-down of the HIS net assets to fair value less estimated costs to sell. See Note 2B for additional information .(g)
In 2016 , primarily includes intangible asset impairment charges of $869 million , reflecting (i) $366 million related to developed technology rights for a generic injectable antibiotic product for the treatment ofbacterial infections; and (ii) $265 million related to an IPR&D compound for the treatment of anemia, both acquired in connection with our acquisition of Hospira; (iii) $128 million of sterile injectable IPR&Dcompounds acquired in connection with our acquisition of InnoPharma; and (iv) $110 million of other IPR&D assets, $81 million of which were acquired in connection with our acquisition of Hospira and $29 millionof which were acquired in connection with our acquisition of King in 2011. The intangible asset impairment charges for 2016 are associated with the following: EH ( $840 million ) and IH ( $29 million ). In addition,2016 includes an impairment loss of $452 million related to Pfizer’s 49% -owned equity-method investment with Hisun in China, Hisun Pfizer, and an impairment loss of $50 million related to Pfizer's 40% -ownedequity-method investment in Teuto. For additional information concerning Hisun Pfizer and Teuto, see Note 2E.The intangible asset impairment charge for 2016 for the IPR&D compound for the treatment of anemia acquired in connection with our acquisition of Hospira reflects, among other things, the impact of regulatorydelays, including delays resulting from a recent court ruling, requiring a 180-day waiting period after approval before a biosimilar product can be launched. The intangible asset impairment charges for 2016 for thesterile injectable IPR&D compounds acquired in connection with our acquisition of InnoPharma reflect, among other things, the impact of portfolio prioritization decisions and decreased commercial profiles ofcertain compounds. The intangible asset impairment charges for 2016 for developed technology rights and other IPR&D assets acquired in connection with our acquisition of Hospira reflect, among other things,the impact of regulatory delays, the impact of new scientific findings, updated commercial forecasts, changes in pricing, and an increased competitive environment. The intangible asset impairment charges for2016 for other IPR&D assets acquired in connection with our acquisition of King reflect changes in the competitive environment.In 2015 , primarily includes an impairment loss of $463 million related to Pfizer’s 49% -owned equity-method investment in Hisun Pfizer (for additional information concerning Hisun Pfizer, see Note 2E ) andintangible asset impairment charges of $323 million , reflecting (i) $132 million related to indefinite-lived brands; (ii) $120 million related to developed technology rights for the treatment of attention deficithyperactivity disorder; and (iii) $71 million related to IPR&D compounds. The intangible asset impairment charges for 2015 are associated with the following: EH ( $294 million ), WRD ( $13 million ); andConsumer Healthcare ( $17 million ).The intangible asset impairment charges for 2015 reflect, among other things, the impact of new scientific findings, updated commercial forecasts, changes in pricing, and an increased competitive environment.In 2014 includes intangible asset impairment charges of $396 million , reflecting (i) $190 million for an IPR&D compound for the treatment of skin fibrosis (full write-off); (ii) $159 million for developed technologyrights, primarily related to Quillivant XR; and (iii) $47 million for indefinite-lived brands. The intangible asset impairment charges for 2014 are associated with the following: IH ( $12 million ); EH ( $166 million );WRD ( $190 million ); and Consumer Healthcare ( $28 million ). In addition, 2014 includes an impairment charge of approximately $56 million related to our investment in Teuto. The intangible asset impairmentcharges for 2014 reflect, among other things, updated commercial forecasts and, with regard to IPR&D, the impact of changes to the development program and new scientific findings.
(h)
Represents expenses for changes to our infrastructure to align our commercial operations, including costs to internally separate our businesses into distinct legal entities, as well as to streamline our intercompanysupply operations to better support each business.
(i) In 2016, includes among other things, (i) $150 million paid to Allergan for reimbursement of Allergan’s expenses associated with the terminated transaction (see Note 1A ); (ii) income of $116 million fromresolution of a contract disagreement; and (iii) a net loss of approximately $312 million upon the early redemption of debt, which includes the related termination of interest rate swaps. In 2015 , includes, amongother things, (i) charges of $194 million related to the write-down of assets to net realizable value; (ii) charges of $159 million , reflecting the change in the fair value of contingent consideration liabilities; and (iii)income of $45 million associated with equity-method investees. In 2014 , includes, among other things, (i) gains of approximately $40 million , reflecting the change in the fair value of contingent considerationliabilities associated with prior acquisitions; (ii) income associated with equity-method investees of $86 million ; (iii) income of $55 million resulting from a decline in the estimated loss on an option to acquire theremaining interest in Teuto; and (iv) a loss of $30 million due to a change in our ownership interest in ViiV. For additional information concerning Teuto and ViiV, see Note 2E.
The asset impairment charges included in Other (income)/deductions––net are based on estimates of fair value.
The following table provides additional information about the intangible assets that were impaired during 2016 in Other (income)/deductions––net :
Year Ended
December 31, Fair Value (a) 2016
(MILLIONS OF DOLLARS) Amount Level 1 Level 2 Level 3 Impairment
Intangible assets––IPR&D (b) $ 95 $ — $ — $ 95 $ 503
Intangible assets––Developed technology rights (b) 30 — — 30 366
Total $ 125 $ — $ — $ 125 $ 869(a) The fair value amount is presented as of the date of impairment, as these assets are not measured at fair value on a recurring basis. See also Note 1E.(b)
Reflects intangible assets written down to fair value in 2016 . Fair value was determined using the income approach, specifically the multi-period excess earnings method, also known as the discounted cash flowmethod. We started with a forecast of all the expected net cash flows associated with the asset and then applied an asset-specific discount rate to arrive at a net present value amount. Some of the more significantestimates and assumptions inherent in this approach include: the amount and timing of the projected net cash flows, which includes the expected impact of competitive, legal and/or regulatory forces on the productand the impact of technological risk associated with IPR&D assets; the discount rate, which seeks to reflect the various risks inherent in the projected cash flows; and the tax rate, which seeks to incorporate thegeographic diversity of the projected cash flows.
92
2016 Financial Report
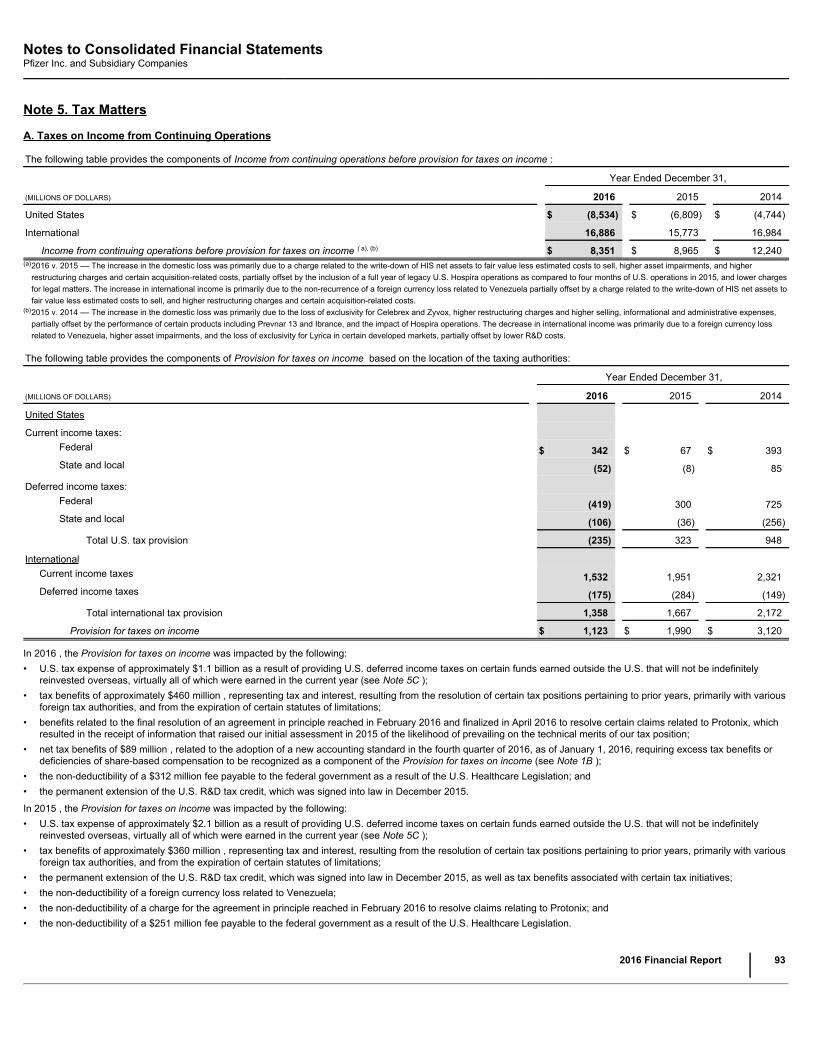
Notes to Consolidated Financial StatementsPfizer Inc. and Subsidiary Companies
Note 5. Tax Matters
A. Taxes on Income from Continuing Operations
The following table provides the components of Income from continuing operations before provision for taxes on income :
Year Ended December 31,
(MILLIONS OF DOLLARS) 2016 2015 2014
United States $ (8,534) $ (6,809) $ (4,744)
International 16,886 15,773 16,984
Income from continuing operations before provision for taxes on income ( a), (b) $ 8,351 $ 8,965 $ 12,240(a)
2016 v. 2015 –– The increase in the domestic loss was primarily due to a charge related to the write-down of HIS net assets to fair value less estimated costs to sell, higher asset impairments, and higherrestructuring charges and certain acquisition-related costs, partially offset by the inclusion of a full year of legacy U.S. Hospira operations as compared to four months of U.S. operations in 2015, and lower chargesfor legal matters. The increase in international income is primarily due to the non-recurrence of a foreign currency loss related to Venezuela partially offset by a charge related to the write-down of HIS net assets tofair value less estimated costs to sell, and higher restructuring charges and certain acquisition-related costs.
(b)
2015 v. 2014 –– The increase in the domestic loss was primarily due to the loss of exclusivity for Celebrex and Zyvox, higher restructuring charges and higher selling, informational and administrative expenses,partially offset by the performance of certain products including Prevnar 13 and Ibrance, and the impact of Hospira operations. The decrease in international income was primarily due to a foreign currency lossrelated to Venezuela, higher asset impairments, and the loss of exclusivity for Lyrica in certain developed markets, partially offset by lower R&D costs.
The following table provides the components of Provision for taxes on income based on the location of the taxing authorities:
Year Ended December 31,
(MILLIONS OF DOLLARS) 2016 2015 2014
United States
Current income taxes: Federal $ 342 $ 67 $ 393State and local (52) (8) 85
Deferred income taxes: Federal (419) 300 725State and local (106) (36) (256)
Total U.S. tax provision (235) 323 948
International Current income taxes 1,532 1,951 2,321Deferred income taxes (175) (284) (149)
Total international tax provision 1,358 1,667 2,172
Provision for taxes on income $ 1,123 $ 1,990 $ 3,120
In 2016 , the Provision for taxes on income was impacted by the following:• U.S. tax expense of approximately $1.1 billion as a result of providing U.S. deferred income taxes on certain funds earned outside the U.S. that will not be indefinitely
reinvested overseas, virtually all of which were earned in the current year (see Note 5C );• tax benefits of approximately $460 million , representing tax and interest, resulting from the resolution of certain tax positions pertaining to prior years, primarily with various
foreign tax authorities, and from the expiration of certain statutes of limitations;• benefits related to the final resolution of an agreement in principle reached in February 2016 and finalized in April 2016 to resolve certain claims related to Protonix, which
resulted in the receipt of information that raised our initial assessment in 2015 of the likelihood of prevailing on the technical merits of our tax position;• net tax benefits of $89 million , related to the adoption of a new accounting standard in the fourth quarter of 2016, as of January 1, 2016, requiring excess tax benefits or
deficiencies of share-based compensation to be recognized as a component of the Provision for taxes on income (see Note 1B );• the non-deductibility of a $312 million fee payable to the federal government as a result of the U.S. Healthcare Legislation; and• the permanent extension of the U.S. R&D tax credit, which was signed into law in December 2015.
In 2015 , the Provision for taxes on income was impacted by the following:• U.S. tax expense of approximately $2.1 billion as a result of providing U.S. deferred income taxes on certain funds earned outside the U.S. that will not be indefinitely
reinvested overseas, virtually all of which were earned in the current year (see Note 5C );• tax benefits of approximately $360 million , representing tax and interest, resulting from the resolution of certain tax positions pertaining to prior years, primarily with various
foreign tax authorities, and from the expiration of certain statutes of limitations;• the permanent extension of the U.S. R&D tax credit, which was signed into law in December 2015, as well as tax benefits associated with certain tax initiatives;• the non-deductibility of a foreign currency loss related to Venezuela;• the non-deductibility of a charge for the agreement in principle reached in February 2016 to resolve claims relating to Protonix; and• the non-deductibility of a $251 million fee payable to the federal government as a result of the U.S. Healthcare Legislation.
2016 Financial Report
93
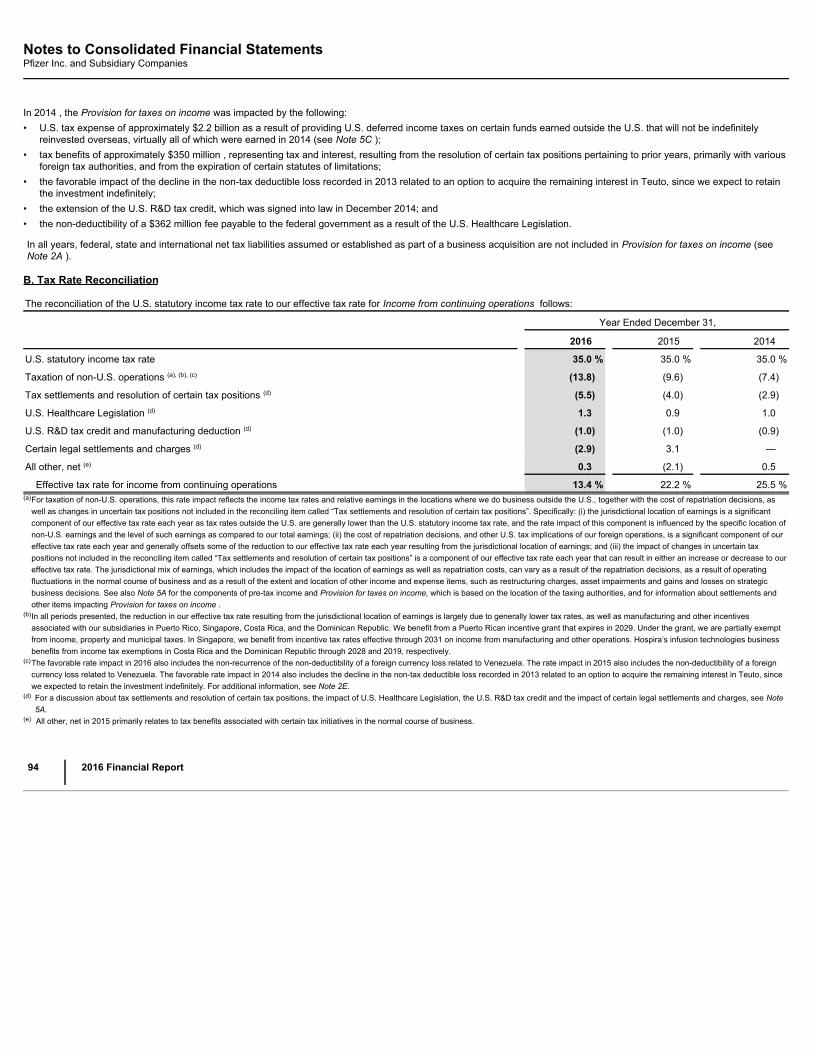
Notes to Consolidated Financial StatementsPfizer Inc. and Subsidiary Companies
In 2014 , the Provision for taxes on income was impacted by the following:• U.S. tax expense of approximately $2.2 billion as a result of providing U.S. deferred income taxes on certain funds earned outside the U.S. that will not be indefinitely
reinvested overseas, virtually all of which were earned in 2014 (see Note 5C );• tax benefits of approximately $350 million , representing tax and interest, resulting from the resolution of certain tax positions pertaining to prior years, primarily with various
foreign tax authorities, and from the expiration of certain statutes of limitations;• the favorable impact of the decline in the non-tax deductible loss recorded in 2013 related to an option to acquire the remaining interest in Teuto, since we expect to retain
the investment indefinitely;• the extension of the U.S. R&D tax credit, which was signed into law in December 2014; and• the non-deductibility of a $362 million fee payable to the federal government as a result of the U.S. Healthcare Legislation.
In all years, federal, state and international net tax liabilities assumed or established as part of a business acquisition are not included in Provision for taxes on income (seeNote 2A ).
B. Tax Rate Reconciliation
The reconciliation of the U.S. statutory income tax rate to our effective tax rate for Income from continuing operations follows:
Year Ended December 31,
2016 2015 2014
U.S. statutory income tax rate 35.0 % 35.0 % 35.0 %
Taxation of non-U.S. operations (a), (b), (c) (13.8) (9.6) (7.4)
Tax settlements and resolution of certain tax positions (d) (5.5) (4.0) (2.9)
U.S. Healthcare Legislation (d) 1.3 0.9 1.0
U.S. R&D tax credit and manufacturing deduction (d) (1.0) (1.0) (0.9)
Certain legal settlements and charges (d) (2.9) 3.1 —
All other, net (e) 0.3 (2.1) 0.5
Effective tax rate for income from continuing operations 13.4 % 22.2 % 25.5 %(a)
For taxation of non-U.S. operations, this rate impact reflects the income tax rates and relative earnings in the locations where we do business outside the U.S., together with the cost of repatriation decisions, aswell as changes in uncertain tax positions not included in the reconciling item called “Tax settlements and resolution of certain tax positions”. Specifically: (i) the jurisdictional location of earnings is a significantcomponent of our effective tax rate each year as tax rates outside the U.S. are generally lower than the U.S. statutory income tax rate, and the rate impact of this component is influenced by the specific location ofnon-U.S. earnings and the level of such earnings as compared to our total earnings; (ii) the cost of repatriation decisions, and other U.S. tax implications of our foreign operations, is a significant component of oureffective tax rate each year and generally offsets some of the reduction to our effective tax rate each year resulting from the jurisdictional location of earnings; and (iii) the impact of changes in uncertain taxpositions not included in the reconciling item called “Tax settlements and resolution of certain tax positions” is a component of our effective tax rate each year that can result in either an increase or decrease to oureffective tax rate. The jurisdictional mix of earnings, which includes the impact of the location of earnings as well as repatriation costs, can vary as a result of the repatriation decisions, as a result of operatingfluctuations in the normal course of business and as a result of the extent and location of other income and expense items, such as restructuring charges, asset impairments and gains and losses on strategicbusiness decisions. See also Note 5A for the components of pre-tax income and Provision for taxes on income, which is based on the location of the taxing authorities, and for information about settlements andother items impacting Provision for taxes on income .
(b)
In all periods presented, the reduction in our effective tax rate resulting from the jurisdictional location of earnings is largely due to generally lower tax rates, as well as manufacturing and other incentivesassociated with our subsidiaries in Puerto Rico, Singapore, Costa Rica, and the Dominican Republic. We benefit from a Puerto Rican incentive grant that expires in 2029. Under the grant, we are partially exemptfrom income, property and municipal taxes. In Singapore, we benefit from incentive tax rates effective through 2031 on income from manufacturing and other operations. Hospira’s infusion technologies businessbenefits from income tax exemptions in Costa Rica and the Dominican Republic through 2028 and 2019, respectively.
(c)
The favorable rate impact in 2016 also includes the non-recurrence of the non-deductibility of a foreign currency loss related to Venezuela. The rate impact in 2015 also includes the non-deductibility of a foreigncurrency loss related to Venezuela. The favorable rate impact in 2014 also includes the decline in the non-tax deductible loss recorded in 2013 related to an option to acquire the remaining interest in Teuto, sincewe expected to retain the investment indefinitely. For additional information, see Note 2E.
(d)
For a discussion about tax settlements and resolution of certain tax positions, the impact of U.S. Healthcare Legislation, the U.S. R&D tax credit and the impact of certain legal settlements and charges, see Note5A.
(e) All other, net in 2015 primarily relates to tax benefits associated with certain tax initiatives in the normal course of business.
94
2016 Financial Report

Notes to Consolidated Financial StatementsPfizer Inc. and Subsidiary Companies
C. Deferred Taxes
Deferred taxes arise as a result of basis differentials between financial statement accounting and tax amounts.
The components of our deferred tax assets and liabilities, shown before jurisdictional netting, follow:
2016 Deferred Tax 2015 Deferred Tax
(MILLIONS OF DOLLARS) Assets (Liabilities) Assets (Liabilities)
Prepaid/deferred items $ 2,180 $ (68) $ 2,247 $ (38)
Inventories 366 (47) 381 (190)
Intangible assets 1,139 (15,172) 1,063 (10,885)
Property, plant and equipment 92 (982) 65 (1,096)
Employee benefits 3,356 (74) 3,302 (167)
Restructurings and other charges 458 (2) 318 (20)
Legal and product liability reserves 650 — 730 —
Net operating loss/tax credit carryforwards (a) 2,957 — 3,808 —
Unremitted earnings (b) — (23,108) — (23,626)
State and local tax adjustments 301 — 328 —
All other 306 (503) 310 (646) 11,806 (39,956) 12,552 (36,668)
Valuation allowances (1,949) — (2,029) —
Total deferred taxes $ 9,857 $ (39,956) $ 10,523 $ (36,668)
Net deferred tax liability (c) $ (30,099) $ (26,145)(a)
The amounts in 2016 and 2015 are reduced for unrecognized tax benefits of $3.0 billion and $2.9 billion , respectively, where we have net operating loss carryforwards, similar tax losses, and/or tax creditcarryforwards that are available, under the tax law of the applicable jurisdiction, to settle any additional income taxes that would result from the disallowance of a tax position.
(b)
The decrease in 2016 reflects the reversal of certain prior year accruals for earnings outside the U.S. that were not indefinitely reinvested overseas, partially offset by additional accruals for certain funds earnedoutside the U.S. in the current year that will not be indefinitely reinvested overseas. For additional information, see Note 5A.
(c) In 2016 , Noncurrent deferred tax assets and other noncurrent tax assets ( $654 million ), and Noncurrent deferred tax liabilities ( $30.8 billion ). In 2015 , Noncurrent deferred tax assets and other noncurrent taxassets ( $732 million ), and Noncurrent deferred tax liabilities ( $26.8 billion ).
We have carryforwards, primarily related to foreign tax credits, net operating and capital losses and charitable contributions, which are available to reduce future U.S. federaland state, as well as international, income taxes payable with either an indefinite life or expiring at various times from 2017 to 2036. Certain of our U.S. net operating losses aresubject to limitations under IRC Section 382.
Valuation allowances are provided when we believe that our deferred tax assets are not recoverable based on an assessment of estimated future taxable income thatincorporates ongoing, prudent and feasible tax planning strategies, that would be implemented, if necessary, to realize the deferred tax assets.
As of December 31, 2016 , we have not made a U.S. tax provision on approximately $86.0 billion of unremitted earnings of our international subsidiaries. As these earnings areintended to be indefinitely reinvested overseas, the determination of a hypothetical unrecognized deferred tax liability as of December 31, 2016 , is not practicable.
D. Tax Contingencies
We are subject to income tax in many jurisdictions, and a certain degree of estimation is required in recording the assets and liabilities related to income taxes. All of our taxpositions are subject to audit by the local taxing authorities in each tax jurisdiction. These tax audits can involve complex issues, interpretations and judgments and theresolution of matters may span multiple years, particularly if subject to negotiation or litigation. Our assessments are based on estimates and assumptions that have beendeemed reasonable by management, but our estimates of unrecognized tax benefits and potential tax benefits may not be representative of actual outcomes, and variationfrom such estimates could materially affect our financial statements in the period of settlement or when the statutes of limitations expire, as we treat these events as discreteitems in the period of resolution.
For a description of our accounting policies associated with accounting for income tax contingencies, see Note 1O. For a description of the risks associated with estimates andassumptions, see Note 1C.
2016 Financial Report
95
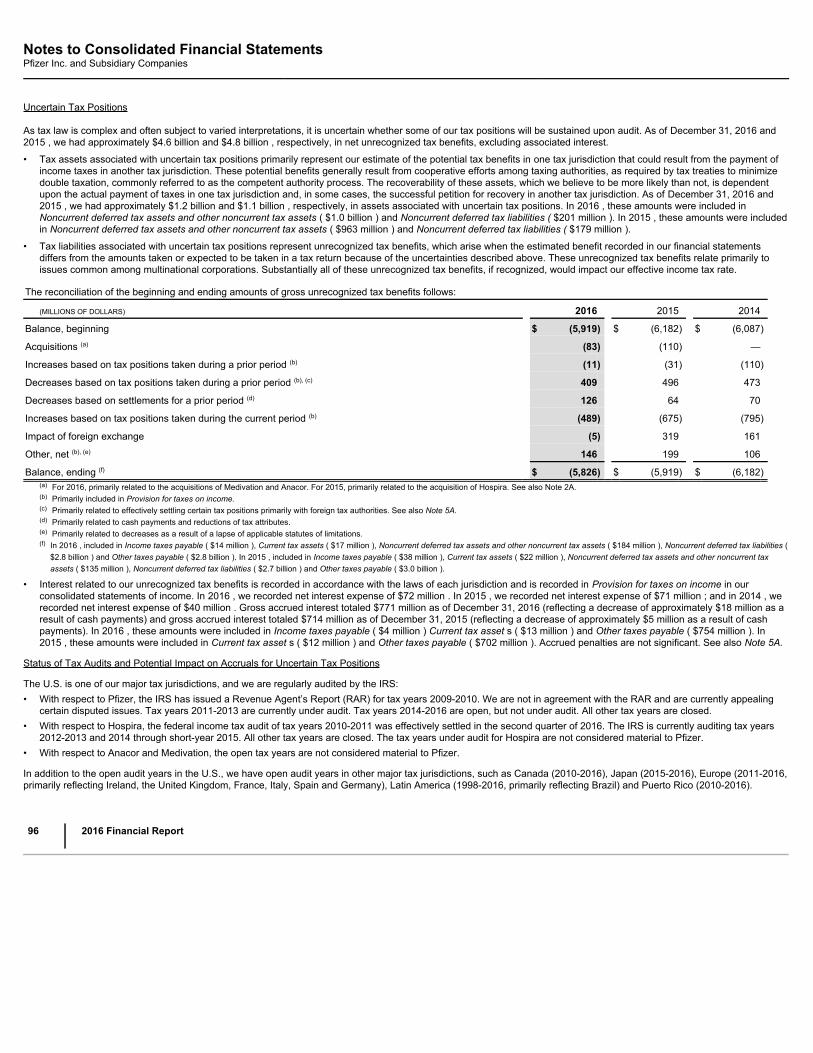
Notes to Consolidated Financial StatementsPfizer Inc. and Subsidiary Companies
Uncertain Tax Positions
As tax law is complex and often subject to varied interpretations, it is uncertain whether some of our tax positions will be sustained upon audit. As of December 31, 2016 and2015 , we had approximately $4.6 billion and $4.8 billion , respectively, in net unrecognized tax benefits, excluding associated interest.
• Tax assets associated with uncertain tax positions primarily represent our estimate of the potential tax benefits in one tax jurisdiction that could result from the payment ofincome taxes in another tax jurisdiction. These potential benefits generally result from cooperative efforts among taxing authorities, as required by tax treaties to minimizedouble taxation, commonly referred to as the competent authority process. The recoverability of these assets, which we believe to be more likely than not, is dependentupon the actual payment of taxes in one tax jurisdiction and, in some cases, the successful petition for recovery in another tax jurisdiction. As of December 31, 2016 and2015 , we had approximately $1.2 billion and $1.1 billion , respectively, in assets associated with uncertain tax positions. In 2016 , these amounts were included inNoncurrent deferred tax assets and other noncurrent tax assets ( $1.0 billion ) and Noncurrent deferred tax liabilities ( $201 million ). In 2015 , these amounts were includedin Noncurrent deferred tax assets and other noncurrent tax assets ( $963 million ) and Noncurrent deferred tax liabilities ( $179 million ).
• Tax liabilities associated with uncertain tax positions represent unrecognized tax benefits, which arise when the estimated benefit recorded in our financial statementsdiffers from the amounts taken or expected to be taken in a tax return because of the uncertainties described above. These unrecognized tax benefits relate primarily toissues common among multinational corporations. Substantially all of these unrecognized tax benefits, if recognized, would impact our effective income tax rate.
The reconciliation of the beginning and ending amounts of gross unrecognized tax benefits follows:
(MILLIONS OF DOLLARS) 2016 2015 2014
Balance, beginning $ (5,919) $ (6,182) $ (6,087)
Acquisitions (a) (83) (110) —
Increases based on tax positions taken during a prior period (b) (11) (31) (110)
Decreases based on tax positions taken during a prior period (b), (c) 409 496 473
Decreases based on settlements for a prior period (d) 126 64 70
Increases based on tax positions taken during the current period (b) (489) (675) (795)
Impact of foreign exchange (5) 319 161
Other, net (b), (e) 146 199 106
Balance, ending (f) $ (5,826) $ (5,919) $ (6,182)(a) For 2016, primarily related to the acquisitions of Medivation and Anacor. For 2015, primarily related to the acquisition of Hospira. See also Note 2A.(b) Primarily included in Provision for taxes on income.(c) Primarily related to effectively settling certain tax positions primarily with foreign tax authorities. See also Note 5A.(d) Primarily related to cash payments and reductions of tax attributes.(e) Primarily related to decreases as a result of a lapse of applicable statutes of limitations.(f) In 2016 , included in Income taxes payable ( $14 million ), Current tax assets ( $17 million ), Noncurrent deferred tax assets and other noncurrent tax assets ( $184 million ), Noncurrent deferred tax liabilities (
$2.8 billion ) and Other taxes payable ( $2.8 billion ). In 2015 , included in Income taxes payable ( $38 million ), Current tax assets ( $22 million ), Noncurrent deferred tax assets and other noncurrent taxassets ( $135 million ), Noncurrent deferred tax liabilities ( $2.7 billion ) and Other taxes payable ( $3.0 billion ).
• Interest related to our unrecognized tax benefits is recorded in accordance with the laws of each jurisdiction and is recorded in Provision for taxes on income in ourconsolidated statements of income. In 2016 , we recorded net interest expense of $72 million . In 2015 , we recorded net interest expense of $71 million ; and in 2014 , werecorded net interest expense of $40 million . Gross accrued interest totaled $771 million as of December 31, 2016 (reflecting a decrease of approximately $18 million as aresult of cash payments) and gross accrued interest totaled $714 million as of December 31, 2015 (reflecting a decrease of approximately $5 million as a result of cashpayments). In 2016 , these amounts were included in Income taxes payable ( $4 million ) Current tax asset s ( $13 million ) and Other taxes payable ( $754 million ). In2015 , these amounts were included in Current tax asset s ( $12 million ) and Other taxes payable ( $702 million ). Accrued penalties are not significant. See also Note 5A.
Status of Tax Audits and Potential Impact on Accruals for Uncertain Tax Positions
The U.S. is one of our major tax jurisdictions, and we are regularly audited by the IRS:• With respect to Pfizer, the IRS has issued a Revenue Agent’s Report (RAR) for tax years 2009-2010. We are not in agreement with the RAR and are currently appealing
certain disputed issues. Tax years 2011-2013 are currently under audit. Tax years 2014-2016 are open, but not under audit. All other tax years are closed.• With respect to Hospira, the federal income tax audit of tax years 2010-2011 was effectively settled in the second quarter of 2016. The IRS is currently auditing tax years
2012-2013 and 2014 through short-year 2015. All other tax years are closed. The tax years under audit for Hospira are not considered material to Pfizer.• With respect to Anacor and Medivation, the open tax years are not considered material to Pfizer.
In addition to the open audit years in the U.S., we have open audit years in other major tax jurisdictions, such as Canada (2010-2016), Japan (2015-2016), Europe (2011-2016,primarily reflecting Ireland, the United Kingdom, France, Italy, Spain and Germany), Latin America (1998-2016, primarily reflecting Brazil) and Puerto Rico (2010-2016).
96
2016 Financial Report
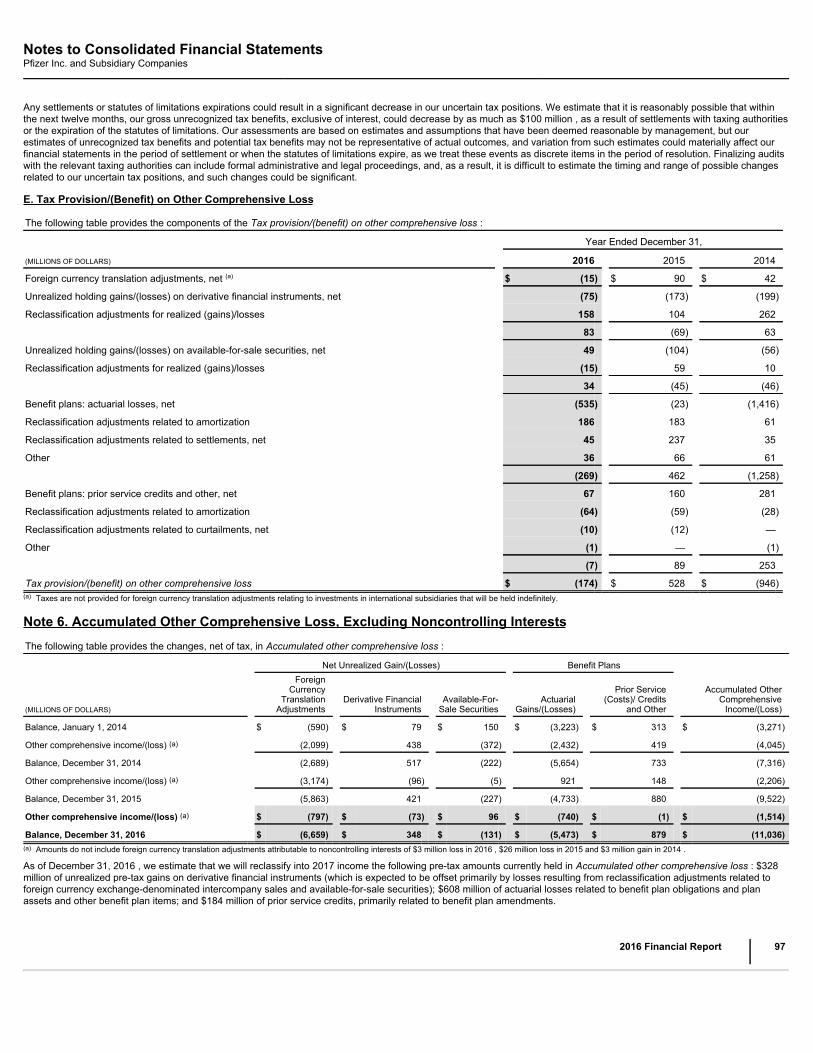
Notes to Consolidated Financial StatementsPfizer Inc. and Subsidiary Companies
Any settlements or statutes of limitations expirations could result in a significant decrease in our uncertain tax positions. We estimate that it is reasonably possible that withinthe next twelve months, our gross unrecognized tax benefits, exclusive of interest, could decrease by as much as $100 million , as a result of settlements with taxing authoritiesor the expiration of the statutes of limitations. Our assessments are based on estimates and assumptions that have been deemed reasonable by management, but ourestimates of unrecognized tax benefits and potential tax benefits may not be representative of actual outcomes, and variation from such estimates could materially affect ourfinancial statements in the period of settlement or when the statutes of limitations expire, as we treat these events as discrete items in the period of resolution. Finalizing auditswith the relevant taxing authorities can include formal administrative and legal proceedings, and, as a result, it is difficult to estimate the timing and range of possible changesrelated to our uncertain tax positions, and such changes could be significant.
E. Tax Provision/(Benefit) on Other Comprehensive Loss
The following table provides the components of the Tax provision/(benefit) on other comprehensive loss :
Year Ended December 31,
(MILLIONS OF DOLLARS) 2016 2015 2014
Foreign currency translation adjustments, net (a) $ (15) $ 90 $ 42
Unrealized holding gains/(losses) on derivative financial instruments, net (75) (173) (199)
Reclassification adjustments for realized (gains)/losses 158 104 262
83 (69) 63
Unrealized holding gains/(losses) on available-for-sale securities, net 49 (104) (56)
Reclassification adjustments for realized (gains)/losses (15) 59 10
34 (45) (46)
Benefit plans: actuarial losses, net (535) (23) (1,416)
Reclassification adjustments related to amortization 186 183 61
Reclassification adjustments related to settlements, net 45 237 35
Other 36 66 61
(269) 462 (1,258)
Benefit plans: prior service credits and other, net 67 160 281
Reclassification adjustments related to amortization (64) (59) (28)
Reclassification adjustments related to curtailments, net (10) (12) —
Other (1) — (1)
(7) 89 253
Tax provision/(benefit) on other comprehensive loss $ (174) $ 528 $ (946)(a) Taxes are not provided for foreign currency translation adjustments relating to investments in international subsidiaries that will be held indefinitely.
Note 6. Accumulated Other Comprehensive Loss, Excluding Noncontrolling InterestsThe following table provides the changes, net of tax, in Accumulated other comprehensive loss :
Net Unrealized Gain/(Losses) Benefit Plans
(MILLIONS OF DOLLARS)
ForeignCurrency
TranslationAdjustments
Derivative FinancialInstruments
Available-For-Sale Securities
ActuarialGains/(Losses)
Prior Service(Costs)/ Credits
and Other Accumulated Other
ComprehensiveIncome/(Loss)
Balance, January 1, 2014 $ (590) $ 79 $ 150 $ (3,223) $ 313 $ (3,271)
Other comprehensive income/(loss) (a) (2,099) 438 (372) (2,432) 419 (4,045)
Balance, December 31, 2014 (2,689) 517 (222) (5,654) 733 (7,316)
Other comprehensive income/(loss) (a) (3,174) (96) (5) 921 148 (2,206)
Balance, December 31, 2015 (5,863) 421 (227) (4,733) 880 (9,522)
Other comprehensive income/(loss) (a) $ (797) $ (73) $ 96 $ (740) $ (1) $ (1,514)
Balance, December 31, 2016 $ (6,659) $ 348 $ (131) $ (5,473) $ 879 $ (11,036)(a) Amounts do not include foreign currency translation adjustments attributable to noncontrolling interests of $3 million loss in 2016 , $26 million loss in 2015 and $3 million gain in 2014 .
As of December 31, 2016 , we estimate that we will reclassify into 2017 income the following pre-tax amounts currently held in Accumulated other comprehensive loss : $328million of unrealized pre-tax gains on derivative financial instruments (which is expected to be offset primarily by losses resulting from reclassification adjustments related toforeign currency exchange-denominated intercompany sales and available-for-sale securities); $608 million of actuarial losses related to benefit plan obligations and planassets and other benefit plan items; and $184 million of prior service credits, primarily related to benefit plan amendments.
2016 Financial Report
97
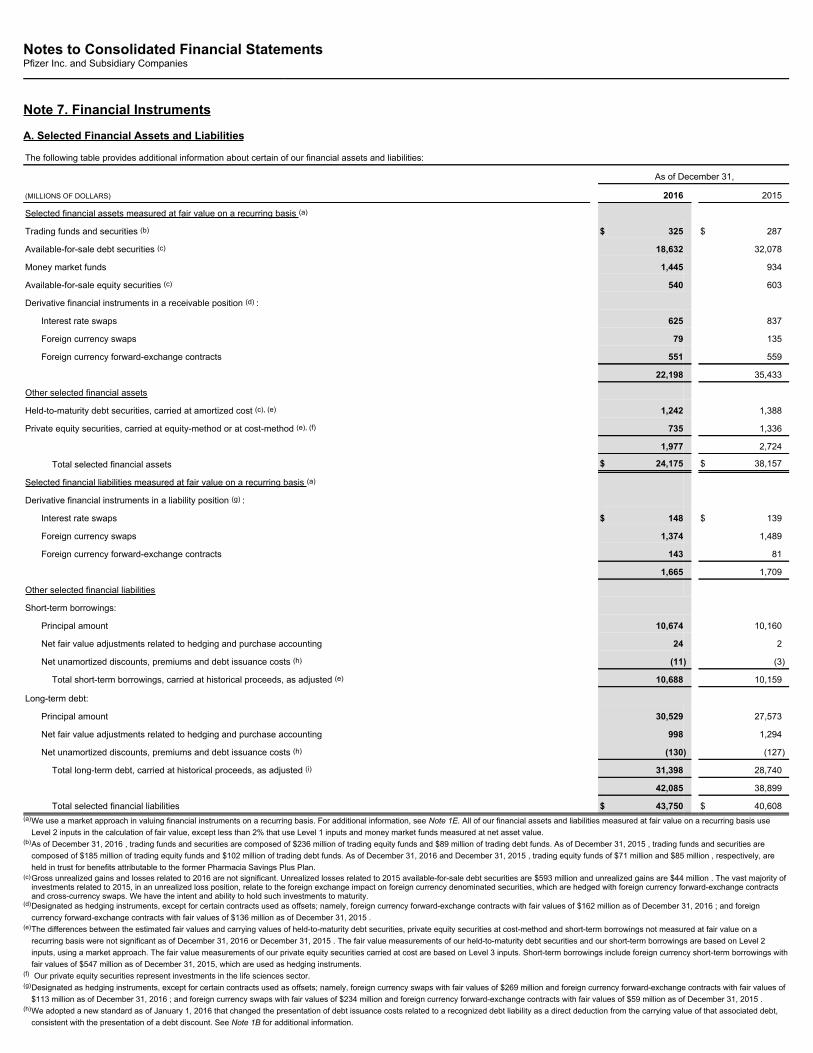
Notes to Consolidated Financial StatementsPfizer Inc. and Subsidiary Companies
Note 7. Financial Instruments
A. Selected Financial Assets and Liabilities
The following table provides additional information about certain of our financial assets and liabilities:
As of December 31,
(MILLIONS OF DOLLARS) 2016 2015
Selected financial assets measured at fair value on a recurring basis (a)
Trading funds and securities (b) $ 325 $ 287
Available-for-sale debt securities (c) 18,632 32,078
Money market funds 1,445 934
Available-for-sale equity securities (c) 540 603
Derivative financial instruments in a receivable position (d) :
Interest rate swaps 625 837
Foreign currency swaps 79 135
Foreign currency forward-exchange contracts 551 559
22,198 35,433
Other selected financial assets
Held-to-maturity debt securities, carried at amortized cost (c), (e) 1,242 1,388
Private equity securities, carried at equity-method or at cost-method (e), (f) 735 1,336
1,977 2,724
Total selected financial assets $ 24,175 $ 38,157
Selected financial liabilities measured at fair value on a recurring basis (a)
Derivative financial instruments in a liability position (g) :
Interest rate swaps $ 148 $ 139
Foreign currency swaps 1,374 1,489
Foreign currency forward-exchange contracts 143 81
1,665 1,709
Other selected financial liabilities
Short-term borrowings:
Principal amount 10,674 10,160
Net fair value adjustments related to hedging and purchase accounting 24 2
Net unamortized discounts, premiums and debt issuance costs (h) (11) (3)
Total short-term borrowings, carried at historical proceeds, as adjusted (e) 10,688 10,159
Long-term debt:
Principal amount 30,529 27,573
Net fair value adjustments related to hedging and purchase accounting 998 1,294
Net unamortized discounts, premiums and debt issuance costs (h) (130) (127)
Total long-term debt, carried at historical proceeds, as adjusted (i) 31,398 28,740
42,085 38,899
Total selected financial liabilities $ 43,750 $ 40,608(a)
We use a market approach in valuing financial instruments on a recurring basis. For additional information, see Note 1E. All of our financial assets and liabilities measured at fair value on a recurring basis useLevel 2 inputs in the calculation of fair value, except less than 2% that use Level 1 inputs and money market funds measured at net asset value.
(b)
As of December 31, 2016 , trading funds and securities are composed of $236 million of trading equity funds and $89 million of trading debt funds. As of December 31, 2015 , trading funds and securities arecomposed of $185 million of trading equity funds and $102 million of trading debt funds. As of December 31, 2016 and December 31, 2015 , trading equity funds of $71 million and $85 million , respectively, areheld in trust for benefits attributable to the former Pharmacia Savings Plus Plan.
(c)
Gross unrealized gains and losses related to 2016 are not significant. Unrealized losses related to 2015 available-for-sale debt securities are $593 million and unrealized gains are $44 million . The vast majority ofinvestments related to 2015, in an unrealized loss position, relate to the foreign exchange impact on foreign currency denominated securities, which are hedged with foreign currency forward-exchange contractsand cross-currency swaps. We have the intent and ability to hold such investments to maturity.
(d)
Designated as hedging instruments, except for certain contracts used as offsets; namely, foreign currency forward-exchange contracts with fair values of $162 million as of December 31, 2016 ; and foreigncurrency forward-exchange contracts with fair values of $136 million as of December 31, 2015 .
(e)
The differences between the estimated fair values and carrying values of held-to-maturity debt securities, private equity securities at cost-method and short-term borrowings not measured at fair value on arecurring basis were not significant as of December 31, 2016 or December 31, 2015 . The fair value measurements of our held-to-maturity debt securities and our short-term borrowings are based on Level 2inputs, using a market approach. The fair value measurements of our private equity securities carried at cost are based on Level 3 inputs. Short-term borrowings include foreign currency short-term borrowings withfair values of $547 million as of December 31, 2015, which are used as hedging instruments.
(f) Our private equity securities represent investments in the life sciences sector.(g)
Designated as hedging instruments, except for certain contracts used as offsets; namely, foreign currency swaps with fair values of $269 million and foreign currency forward-exchange contracts with fair values of$113 million as of December 31, 2016 ; and foreign currency swaps with fair values of $234 million and foreign currency forward-exchange contracts with fair values of $59 million as of December 31, 2015 .
(h)
We adopted a new standard as of January 1, 2016 that changed the presentation of debt issuance costs related to a recognized debt liability as a direct deduction from the carrying value of that associated debt,consistent with the presentation of a debt discount. See Note 1B for additional information.

98
2016 Financial Report
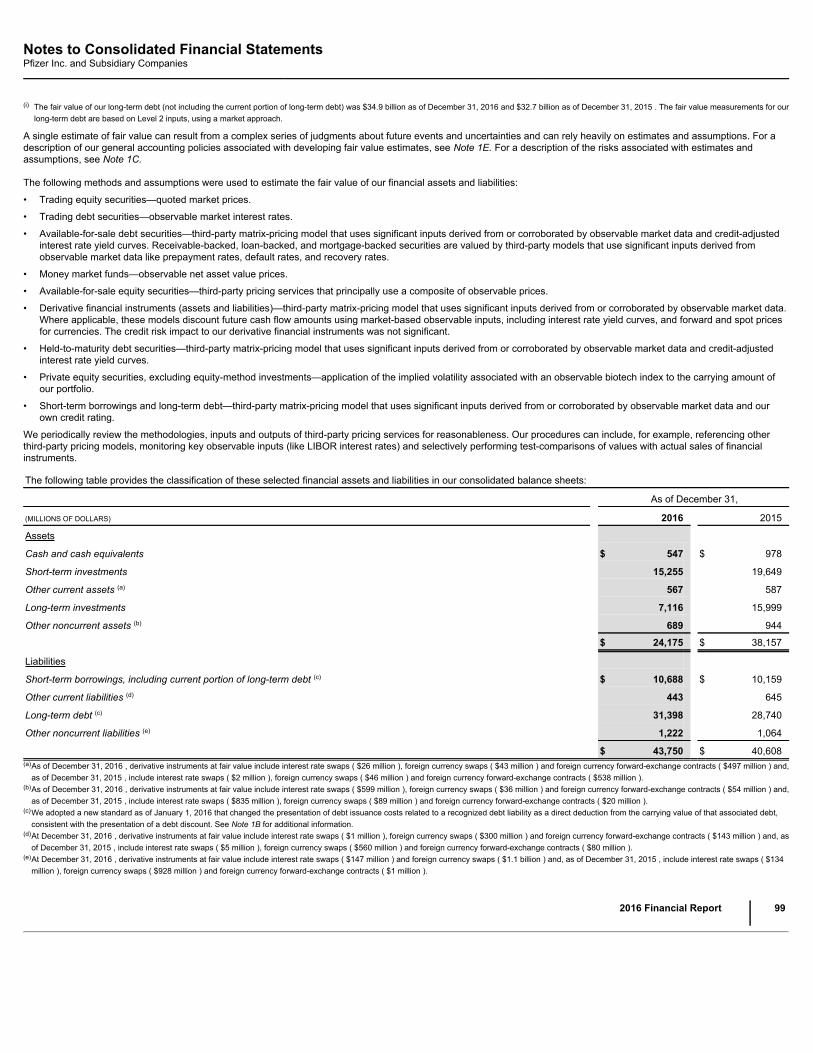
Notes to Consolidated Financial StatementsPfizer Inc. and Subsidiary Companies
(i) The fair value of our long-term debt (not including the current portion of long-term debt) was $34.9 billion as of December 31, 2016 and $32.7 billion as of December 31, 2015 . The fair value measurements for our
long-term debt are based on Level 2 inputs, using a market approach.
A single estimate of fair value can result from a complex series of judgments about future events and uncertainties and can rely heavily on estimates and assumptions. For adescription of our general accounting policies associated with developing fair value estimates, see Note 1E. For a description of the risks associated with estimates andassumptions, see Note 1C.
The following methods and assumptions were used to estimate the fair value of our financial assets and liabilities:
• Trading equity securities—quoted market prices.
• Trading debt securities—observable market interest rates.
• Available-for-sale debt securities—third-party matrix-pricing model that uses significant inputs derived from or corroborated by observable market data and credit-adjustedinterest rate yield curves. Receivable-backed, loan-backed, and mortgage-backed securities are valued by third-party models that use significant inputs derived fromobservable market data like prepayment rates, default rates, and recovery rates.
• Money market funds—observable net asset value prices.
• Available-for-sale equity securities—third-party pricing services that principally use a composite of observable prices.
• Derivative financial instruments (assets and liabilities)—third-party matrix-pricing model that uses significant inputs derived from or corroborated by observable market data.Where applicable, these models discount future cash flow amounts using market-based observable inputs, including interest rate yield curves, and forward and spot pricesfor currencies. The credit risk impact to our derivative financial instruments was not significant.
• Held-to-maturity debt securities—third-party matrix-pricing model that uses significant inputs derived from or corroborated by observable market data and credit-adjustedinterest rate yield curves.
• Private equity securities, excluding equity-method investments—application of the implied volatility associated with an observable biotech index to the carrying amount ofour portfolio.
• Short-term borrowings and long-term debt—third-party matrix-pricing model that uses significant inputs derived from or corroborated by observable market data and ourown credit rating.
We periodically review the methodologies, inputs and outputs of third-party pricing services for reasonableness. Our procedures can include, for example, referencing otherthird-party pricing models, monitoring key observable inputs (like LIBOR interest rates) and selectively performing test-comparisons of values with actual sales of financialinstruments.
The following table provides the classification of these selected financial assets and liabilities in our consolidated balance sheets:
As of December 31,
(MILLIONS OF DOLLARS) 2016 2015
Assets
Cash and cash equivalents $ 547 $ 978
Short-term investments 15,255 19,649
Other current assets (a) 567 587
Long-term investments 7,116 15,999
Other noncurrent assets (b) 689 944
$ 24,175 $ 38,157
Liabilities
Short-term borrowings, including current portion of long-term debt (c) $ 10,688 $ 10,159
Other current liabilities (d) 443 645
Long-term debt (c) 31,398 28,740
Other noncurrent liabilities (e) 1,222 1,064
$ 43,750 $ 40,608(a)
As of December 31, 2016 , derivative instruments at fair value include interest rate swaps ( $26 million ), foreign currency swaps ( $43 million ) and foreign currency forward-exchange contracts ( $497 million ) and,as of December 31, 2015 , include interest rate swaps ( $2 million ), foreign currency swaps ( $46 million ) and foreign currency forward-exchange contracts ( $538 million ).
(b)
As of December 31, 2016 , derivative instruments at fair value include interest rate swaps ( $599 million ), foreign currency swaps ( $36 million ) and foreign currency forward-exchange contracts ( $54 million ) and,as of December 31, 2015 , include interest rate swaps ( $835 million ), foreign currency swaps ( $89 million ) and foreign currency forward-exchange contracts ( $20 million ).
(c)
We adopted a new standard as of January 1, 2016 that changed the presentation of debt issuance costs related to a recognized debt liability as a direct deduction from the carrying value of that associated debt,consistent with the presentation of a debt discount. See Note 1B for additional information.
(d)
At December 31, 2016 , derivative instruments at fair value include interest rate swaps ( $1 million ), foreign currency swaps ( $300 million ) and foreign currency forward-exchange contracts ( $143 million ) and, asof December 31, 2015 , include interest rate swaps ( $5 million ), foreign currency swaps ( $560 million ) and foreign currency forward-exchange contracts ( $80 million ).
(e)
At December 31, 2016 , derivative instruments at fair value include interest rate swaps ( $147 million ) and foreign currency swaps ( $1.1 billion ) and, as of December 31, 2015 , include interest rate swaps ( $134million ), foreign currency swaps ( $928 million ) and foreign currency forward-exchange contracts ( $1 million ).
2016 Financial Report
99

Notes to Consolidated Financial StatementsPfizer Inc. and Subsidiary Companies
In addition, as of December 31, 2016 and 2015 , we had long-term receivables where the determination of fair value employs discounted future cash flows, using currentinterest rates at which similar loans would be made to borrowers with similar credit ratings and for the same remaining maturities. As of December 31, 2016 and 2015 , thedifferences between the estimated fair values and carrying values of these receivables were not significant.
There were no significant impairments of financial assets recognized in any period presented.
B. Investments in Debt Securities
The following table provides the contractual maturities, or as necessary, the estimated maturities, of the available-for-sale and held-to-maturity debt securities:
Years December 31,
2016
(MILLIONS OF DOLLARS) Within 1 Over 1
to 5 Over 5
to 10 Over 10 Total
Available-for-sale debt securities
Corporate debt (a) $ 2,783 $ 2,727 $ 1,557 $ 23 $ 7,089
Western European, Scandinavian and other government debt (b) 4,661 432 — — 5,093
U.S. government debt 2,134 88 — — 2,222
Western European, Scandinavian, Australian and other government agency debt (b) 1,746 137 — — 1,883
Supranational debt (b) 910 294 — — 1,204Other asset-backed debt (c) 367 217 18 3 605Government National Mortgage Association and other U.S. government guaranteed
asset-backed securities 535 — — — 535
Held-to-maturity debt securities
Time deposits and other 1,000 1 3 — 1,004
Western European government debt (b) 236 2 — — 238
Total debt securities $ 14,371 $ 3,898 $ 1,579 $ 26 $ 19,873(a) Issued by a diverse group of corporations, largely consisting of financial institutions, virtually all of which are investment-grade.(b) Issued by governments, government agencies or supranational entities, as applicable, all of which are investment-grade.(c)
Includes receivable-backed, loan-backed, and mortgage-backed securities, all of which are investment-grade and in senior positions in the capital structure of the security. Receivable-backed securities arecollateralized by credit cards receivables, and loan-backed securities are collateralized by senior secured obligations of a diverse pool of companies or student loans. Mortgage-backed securities are collateralizedby diversified pools of residential and commercial mortgages.
C. Short-Term Borrowings
Short-term borrowings include amounts for commercial paper of $5.8 billion as of December 31, 2016 and $4.9 billion as of December 31, 2015 . The weighted-averageeffective interest rate on short-term borrowings outstanding was approximately 1.3% as of December 31, 2016 and 1.9% as of December 31, 2015 .
On June 24, 2016, we acquired Anacor and assumed its short-term debt with an acquisition date fair value of $698 million which was redeemed in the second and thirdquarters of 2016.
As of December 31, 2016 , we had access to $7.9 billion of lines of credit, of which $790 million expire within one year . Of these lines of credit, $7.8 billion were unused, ofwhich our lenders have committed to loan us $7.1 billion at our request. Also, $7.0 billion of our unused lines of credit, all of which expire in 2021, may be used to support ourcommercial paper borrowings.
D. Long-Term Debt
November 2016 Public Debt Offering
On November 21, 2016, we completed a public offering of $6.0 billion aggregate principal amount of senior unsecured notes: $1.0 billion of notes due 2019; $1.0 billion ofnotes due 2021; $1.75 billion of notes due 2026; $1.0 billion of notes due 2036; and $1.25 billion of notes due 2046, with a weighted-average effective interest rate of 3.10% .The notes are redeemable, in whole or in part, at any time at our option, at a redemption price equal to the greater of 100% of the principal amount of the notes or the sum ofthe present value of the remaining scheduled payments of principal and interest discounted at the U.S. Treasury rate, plus an incremental spread ranging between 0.10% and0.20% , depending on the maturity; plus, in each case, accrued and unpaid interest.
We used a portion of the proceeds from the November 2016 public debt offering of $6.0 billion to repurchase a total of $3.4 billion carrying value of outstanding debt before thematurity date at a redemption value of $3.7 billion . The debt repurchased included $3.27 billion carrying value of 6.20% senior notes due March 2019. As a result, we recordeda total net loss of approximately $312 million upon the early redemption of debt, which includes the related termination of interest rate swaps, and which was recorded in Other(income)/deductions––net in the consolidated statement of income (see Note 4 ).
100
2016 Financial Report
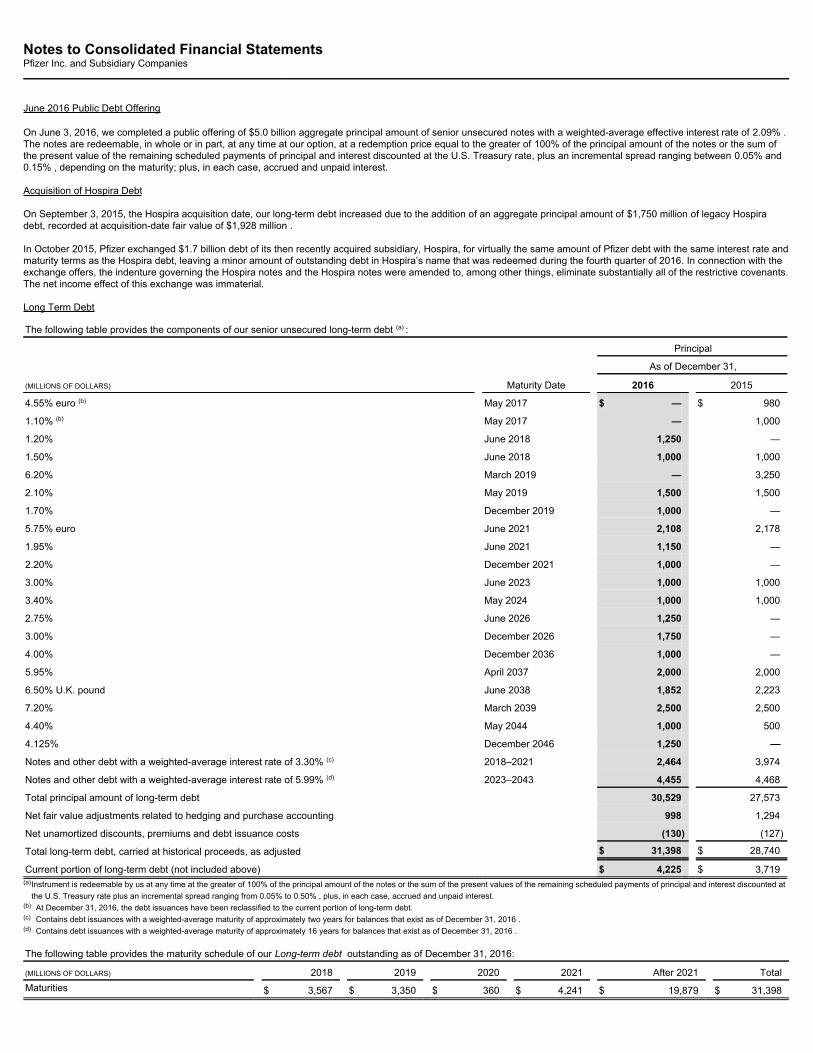
Notes to Consolidated Financial StatementsPfizer Inc. and Subsidiary Companies
June 2016 Public Debt Offering
On June 3, 2016, we completed a public offering of $5.0 billion aggregate principal amount of senior unsecured notes with a weighted-average effective interest rate of 2.09% .The notes are redeemable, in whole or in part, at any time at our option, at a redemption price equal to the greater of 100% of the principal amount of the notes or the sum ofthe present value of the remaining scheduled payments of principal and interest discounted at the U.S. Treasury rate, plus an incremental spread ranging between 0.05% and0.15% , depending on the maturity; plus, in each case, accrued and unpaid interest.
Acquisition of Hospira Debt
On September 3, 2015, the Hospira acquisition date, our long-term debt increased due to the addition of an aggregate principal amount of $1,750 million of legacy Hospiradebt, recorded at acquisition-date fair value of $1,928 million .
In October 2015, Pfizer exchanged $1.7 billion debt of its then recently acquired subsidiary, Hospira, for virtually the same amount of Pfizer debt with the same interest rate andmaturity terms as the Hospira debt, leaving a minor amount of outstanding debt in Hospira’s name that was redeemed during the fourth quarter of 2016. In connection with theexchange offers, the indenture governing the Hospira notes and the Hospira notes were amended to, among other things, eliminate substantially all of the restrictive covenants.The net income effect of this exchange was immaterial.
Long Term Debt
The following table provides the components of our senior unsecured long-term debt (a) :
Principal As of December 31,
(MILLIONS OF DOLLARS) Maturity Date 2016 2015
4.55% euro (b) May 2017 $ — $ 980
1.10% (b) May 2017 — 1,000
1.20% June 2018 1,250 —
1.50% June 2018 1,000 1,000
6.20% March 2019 — 3,250
2.10% May 2019 1,500 1,500
1.70% December 2019 1,000 —
5.75% euro June 2021 2,108 2,178
1.95% June 2021 1,150 —
2.20% December 2021 1,000 —
3.00% June 2023 1,000 1,000
3.40% May 2024 1,000 1,000
2.75% June 2026 1,250 —
3.00% December 2026 1,750 —
4.00% December 2036 1,000 —
5.95% April 2037 2,000 2,000
6.50% U.K. pound June 2038 1,852 2,223
7.20% March 2039 2,500 2,500
4.40% May 2044 1,000 500
4.125% December 2046 1,250 —
Notes and other debt with a weighted-average interest rate of 3.30% (c) 2018–2021 2,464 3,974
Notes and other debt with a weighted-average interest rate of 5.99% (d) 2023–2043 4,455 4,468
Total principal amount of long-term debt 30,529 27,573
Net fair value adjustments related to hedging and purchase accounting 998 1,294
Net unamortized discounts, premiums and debt issuance costs (130) (127)
Total long-term debt, carried at historical proceeds, as adjusted $ 31,398 $ 28,740
Current portion of long-term debt (not included above) $ 4,225 $ 3,719(a)
Instrument is redeemable by us at any time at the greater of 100% of the principal amount of the notes or the sum of the present values of the remaining scheduled payments of principal and interest discounted atthe U.S. Treasury rate plus an incremental spread ranging from 0.05% to 0.50% , plus, in each case, accrued and unpaid interest.
(b) At December 31, 2016, the debt issuances have been reclassified to the current portion of long-term debt.(c) Contains debt issuances with a weighted-average maturity of approximately two years for balances that exist as of December 31, 2016 .(d) Contains debt issuances with a weighted-average maturity of approximately 16 years for balances that exist as of December 31, 2016 .
The following table provides the maturity schedule of our Long-term debt outstanding as of December 31, 2016:
(MILLIONS OF DOLLARS) 2018 2019 2020 2021 After 2021 TotalMaturities $ 3,567 $ 3,350 $ 360 $ 4,241 $ 19,879 $ 31,398

2016 Financial Report
101
Notes to Consolidated Financial StatementsPfizer Inc. and Subsidiary Companies
E. Derivative Financial Instruments and Hedging Activities
Foreign Exchange Risk
A significant portion of our revenues, earnings and net investments in foreign affiliates is exposed to changes in foreign exchange rates. We seek to manage our foreignexchange risk, in part, through operational means, including managing same-currency revenues in relation to same-currency costs and same-currency assets in relation tosame-currency liabilities. Depending on market conditions, foreign exchange risk also is managed through the use of derivative financial instruments and foreign currency debt.These financial instruments serve to protect net income and net investments against the impact of the translation into U.S. dollars of certain foreign exchange-denominatedtransactions.
As of December 31, 2016 , the aggregate notional amount of foreign exchange derivative financial instruments hedging or offsetting foreign currency exposures was $27.5billion . The derivative financial instruments primarily hedge or offset exposures in the euro, U.K. pound, and Japanese yen. The maximum length of time over which we arehedging future foreign exchange cash flow relates to our $1.9 billion U.K. pound debt maturing in 2038.
All derivative contracts used to manage foreign currency risk are measured at fair value and are reported as assets or liabilities on the consolidated balance sheet. Changes infair value are reported in earnings or in Other comprehensive income/(loss) , depending on the nature and purpose of the financial instrument (offset or hedge relationship) andthe effectiveness of the hedge relationships, as follows:
• We record in Other comprehensive income/(loss) the effective portion of the gains or losses on foreign currency forward-exchange contracts and foreign currency swapsthat are designated as cash flow hedges and reclassify those amounts, as appropriate, into earnings in the same period or periods during which the hedged transactionaffects earnings.
• We recognize the gains and losses on foreign currency forward-exchange contracts and foreign currency swaps that are used to offset the same foreign currency assets orliabilities immediately into earnings along with the earnings impact of the items they generally offset. These contracts essentially take the opposite currency position of thatreflected in the month-end balance sheet to counterbalance the effect of any currency movement.
• We recognize the gain and loss impact on foreign currency swaps and foreign currency forward-exchange contracts designated as hedges of our net investments inearnings in three ways: over time—for the periodic net swap payments; immediately—to the extent of any change in the difference between the foreign exchange spot rateand forward rate; and upon sale or substantial liquidation of our net investments—to the extent of change in the foreign exchange spot rates.
• We record in Other comprehensive income/(loss) the foreign exchange gains and losses related to foreign exchange-denominated debt designated as a hedge of our netinvestments in foreign subsidiaries and reclassify those amounts into earnings upon the sale or substantial liquidation of our net investments.
We designate foreign currency forward-exchange contracts as cash flow hedges of a portion of our forecasted euro, Japanese yen, U.K. pound, Australian dollar, andCanadian dollar-denominated intercompany inventory sales expected to occur no more than two years from the date of each hedge. As of December 31, 2016, the notionalamount of outstanding foreign currency forward-exchange contracts hedging our intercompany forecasted sales was $3.1 billion , with a pre-tax gain of $222 million deferred inAccumulated other comprehensive loss. Based on year-end foreign exchange rates that are subject to change, we expect to reclassify a pre-tax gain of $164 million within thenext 12 months into Cost of sales.
Any ineffectiveness is recognized immediately into earnings. There was no significant ineffectiveness for any period presented.
Interest Rate Risk
Our interest-bearing investments and borrowings are subject to interest rate risk. We strive to invest and borrow primarily on a floating-rate basis; however, in light of currentmarket conditions, we currently borrow primarily on a long-term, fixed-rate basis. From time to time, depending on market conditions, we will change the profile of ouroutstanding debt by entering into derivative financial instruments like interest rate swaps. We entered into derivative financial instruments to hedge or offset the fixed interestrates on the hedged item, matching the amount and timing of the hedged item. As of December 31, 2016 , the aggregate notional amount of interest rate derivative financialinstruments was $16 billion . The derivative financial instruments primarily hedge U.S. dollar and euro fixed-rate debt.
All derivative contracts used to manage interest rate risk are measured at fair value and reported as assets or liabilities on the consolidated balance sheet. Changes in fairvalue are reported in earnings, as follows:
• We recognize the gains and losses on interest rate swaps that are designated as fair value hedges in earnings upon the recognition of the change in fair value of thehedged risk. We recognize the offsetting earnings impact of fixed-rate debt attributable to the hedged risk also in earnings.
Any ineffectiveness is recognized immediately into earnings. There was no significant ineffectiveness for any period presented.
102
2016 Financial Report
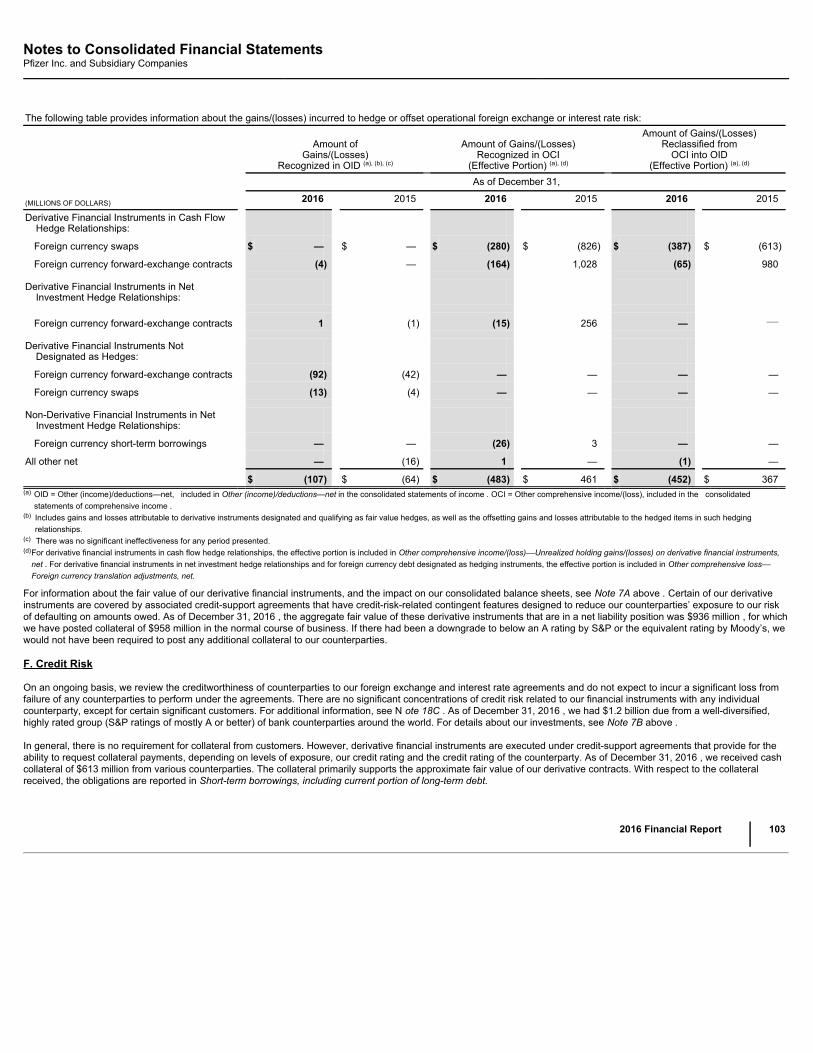
Notes to Consolidated Financial StatementsPfizer Inc. and Subsidiary Companies
The following table provides information about the gains/(losses) incurred to hedge or offset operational foreign exchange or interest rate risk:
Amount ofGains/(Losses)
Recognized in OID (a), (b), (c)
Amount of Gains/(Losses)Recognized in OCI
(Effective Portion) (a), (d)
Amount of Gains/(Losses)Reclassified from
OCI into OID(Effective Portion) (a), (d)
As of December 31,
(MILLIONS OF DOLLARS) 2016 2015 2016 2015 2016 2015
Derivative Financial Instruments in Cash FlowHedge Relationships:
Foreign currency swaps $ — $ — $ (280) $ (826) $ (387) $ (613)
Foreign currency forward-exchange contracts (4) — (164) 1,028 (65) 980 Derivative Financial Instruments in Net
Investment Hedge Relationships:
Foreign currency forward-exchange contracts 1 (1) (15) 256 — — Derivative Financial Instruments Not
Designated as Hedges:
Foreign currency forward-exchange contracts (92) (42) — — — —
Foreign currency swaps (13) (4) — — — — Non-Derivative Financial Instruments in Net
Investment Hedge Relationships:
Foreign currency short-term borrowings — — (26) 3 — —
All other net — (16) 1 — (1) —
$ (107) $ (64) $ (483) $ 461 $ (452) $ 367(a)
OID = Other (income)/deductions—net, included in Other (income)/deductions—net in the consolidated statements of income . OCI = Other comprehensive income/(loss), included in the consolidatedstatements of comprehensive income .
(b)
Includes gains and losses attributable to derivative instruments designated and qualifying as fair value hedges, as well as the offsetting gains and losses attributable to the hedged items in such hedgingrelationships.
(c) There was no significant ineffectiveness for any period presented.(d)
For derivative financial instruments in cash flow hedge relationships, the effective portion is included in Other comprehensive income/(loss)––Unrealized holding gains/(losses) on derivative financial instruments,net . For derivative financial instruments in net investment hedge relationships and for foreign currency debt designated as hedging instruments, the effective portion is included in Other comprehensive loss––Foreign currency translation adjustments, net.
For information about the fair value of our derivative financial instruments, and the impact on our consolidated balance sheets, see Note 7A above . Certain of our derivativeinstruments are covered by associated credit-support agreements that have credit-risk-related contingent features designed to reduce our counterparties’ exposure to our riskof defaulting on amounts owed. As of December 31, 2016 , the aggregate fair value of these derivative instruments that are in a net liability position was $936 million , for whichwe have posted collateral of $958 million in the normal course of business. If there had been a downgrade to below an A rating by S&P or the equivalent rating by Moody’s, wewould not have been required to post any additional collateral to our counterparties.
F. Credit Risk
On an ongoing basis, we review the creditworthiness of counterparties to our foreign exchange and interest rate agreements and do not expect to incur a significant loss fromfailure of any counterparties to perform under the agreements. There are no significant concentrations of credit risk related to our financial instruments with any individualcounterparty, except for certain significant customers. For additional information, see N ote 18C . As of December 31, 2016 , we had $1.2 billion due from a well-diversified,highly rated group (S&P ratings of mostly A or better) of bank counterparties around the world. For details about our investments, see Note 7B above .
In general, there is no requirement for collateral from customers. However, derivative financial instruments are executed under credit-support agreements that provide for theability to request collateral payments, depending on levels of exposure, our credit rating and the credit rating of the counterparty. As of December 31, 2016 , we received cashcollateral of $613 million from various counterparties. The collateral primarily supports the approximate fair value of our derivative contracts. With respect to the collateralreceived, the obligations are reported in Short-term borrowings, including current portion of long-term debt.
2016 Financial Report
103
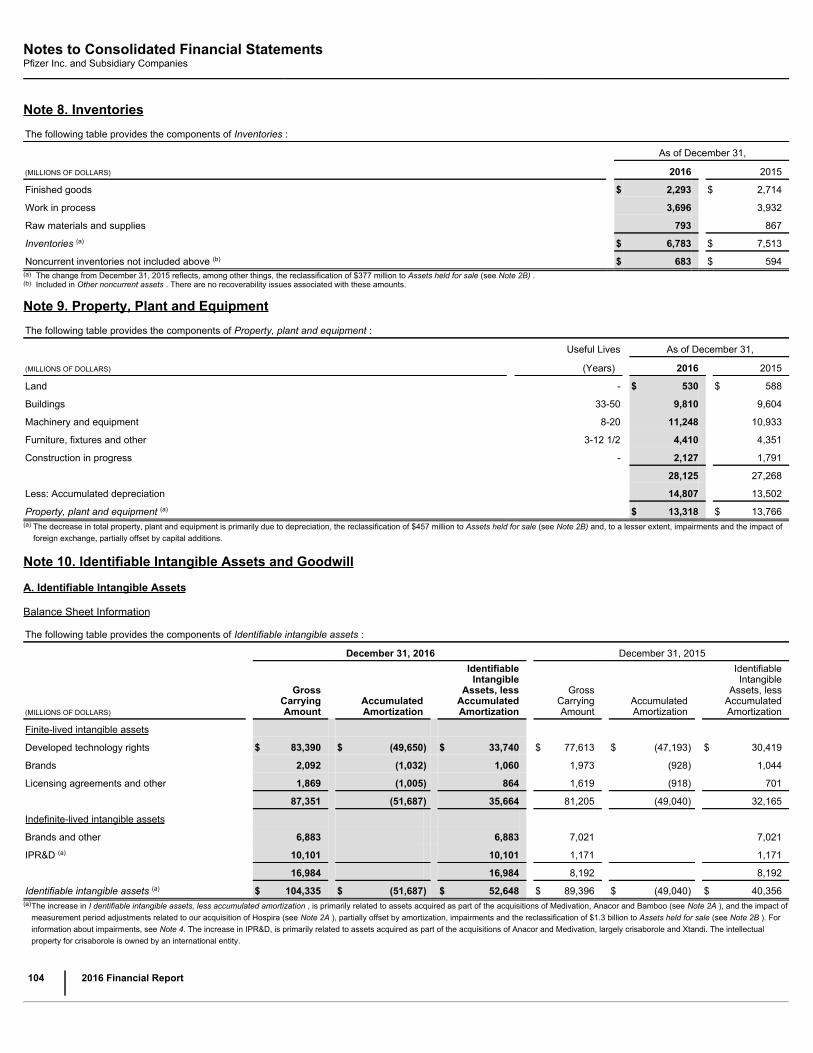
Notes to Consolidated Financial StatementsPfizer Inc. and Subsidiary Companies
Note 8. InventoriesThe following table provides the components of Inventories :
As of December 31,
(MILLIONS OF DOLLARS) 2016 2015
Finished goods $ 2,293 $ 2,714
Work in process 3,696 3,932
Raw materials and supplies 793 867
Inventories (a) $ 6,783 $ 7,513
Noncurrent inventories not included above (b) $ 683 $ 594(a) The change from December 31, 2015 reflects, among other things, the reclassification of $377 million to Assets held for sale (see Note 2B) .(b) Included in Other noncurrent assets . There are no recoverability issues associated with these amounts.
Note 9. Property, Plant and EquipmentThe following table provides the components of Property, plant and equipment :
Useful Lives As of December 31,
(MILLIONS OF DOLLARS) (Years) 2016 2015
Land - $ 530 $ 588
Buildings 33-50 9,810 9,604
Machinery and equipment 8-20 11,248 10,933
Furniture, fixtures and other 3-12 1/2 4,410 4,351
Construction in progress - 2,127 1,791 28,125 27,268
Less: Accumulated depreciation 14,807 13,502
Property, plant and equipment (a) $ 13,318 $ 13,766(a)
The decrease in total property, plant and equipment is primarily due to depreciation, the reclassification of $457 million to Assets held for sale (see Note 2B) and, to a lesser extent, impairments and the impact offoreign exchange, partially offset by capital additions.
Note 10. Identifiable Intangible Assets and Goodwill
A. Identifiable Intangible Assets
Balance Sheet Information
The following table provides the components of Identifiable intangible assets :
December 31, 2016 December 31, 2015
(MILLIONS OF DOLLARS)
GrossCarryingAmount
AccumulatedAmortization
IdentifiableIntangible
Assets, lessAccumulatedAmortization
GrossCarryingAmount
AccumulatedAmortization
IdentifiableIntangible
Assets, lessAccumulatedAmortization
Finite-lived intangible assets
Developed technology rights $ 83,390 $ (49,650) $ 33,740 $ 77,613 $ (47,193) $ 30,419
Brands 2,092 (1,032) 1,060 1,973 (928) 1,044
Licensing agreements and other 1,869 (1,005) 864 1,619 (918) 701
87,351 (51,687) 35,664 81,205 (49,040) 32,165
Indefinite-lived intangible assets
Brands and other 6,883 6,883 7,021 7,021
IPR&D (a) 10,101 10,101 1,171 1,171
16,984 16,984 8,192 8,192
Identifiable intangible assets (a) $ 104,335 $ (51,687) $ 52,648 $ 89,396 $ (49,040) $ 40,356(a)
The increase in I dentifiable intangible assets, less accumulated amortization , is primarily related to assets acquired as part of the acquisitions of Medivation, Anacor and Bamboo (see Note 2A ), and the impact ofmeasurement period adjustments related to our acquisition of Hospira (see Note 2A ), partially offset by amortization, impairments and the reclassification of $1.3 billion to Assets held for sale (see Note 2B ). Forinformation about impairments, see Note 4. The increase in IPR&D, is primarily related to assets acquired as part of the acquisitions of Anacor and Medivation, largely crisaborole and Xtandi. The intellectualproperty for crisaborole is owned by an international entity.
104
2016 Financial Report

Notes to Consolidated Financial StatementsPfizer Inc. and Subsidiary Companies
Our identifiable intangible assets are associated with the following, as a percentage of total identifiable intangible assets, less accumulated amortization:
December 31, 2016
IH EH WRD
Developed technology rights 64% 35% —
Brands, finite-lived 73% 27% —
Brands, indefinite-lived 71% 29% —
IPR&D 92% 5% 4%
Developed Technology Rights
Developed technology rights represent the amortized cost associated with developed technology, which has been acquired from third parties and which can include the right todevelop, use, market, sell and/or offer for sale the product, compounds and intellectual property that we have acquired with respect to products, compounds and/or processesthat have been completed. We possess a well-diversified portfolio of hundreds of developed technology rights across therapeutic categories, representing the commercializedproducts included in our biopharmaceutical businesses. The more significant components of developed technology rights are the following (in order of significance): Xtandi,Prevnar 13/Prevenar 13 Infant, Enbrel and, to a lesser extent, Premarin, Prevnar 13/Prevenar 13 Adult, Pristiq, Tygacil, Refacto AF and Effexor. Also included in this categoryare the post-approval milestone payments made under our alliance agreements for certain biopharmaceutical products.
Brands
Brands represent the amortized or unamortized cost associated with tradenames and know-how, as the products themselves do not receive patent protection. Most of theseassets are associated with our Consumer Healthcare business unit. The more significant components of indefinite-lived brands are the following (in order of significance): Advil,Xanax/Xanax XR, Centrum, Caltrate, Medrol and Preparation H. The more significant components of finite-lived brands are the following (in order of significance): Nexium,Depo-Provera, Zavedos and, to a lesser extent, Advil Cold and Sinus and Idoform Bifiform.
IPR&D
IPR&D assets represent R&D assets that have not yet received regulatory approval in a major market. The more significant components of IPR&D are the programs for thetreatment of mild-to-moderate atopic dermatitis acquired as part of the Anacor acquisition, the treatment of non-mestastatic and mestastatic prostate cancer acquired as part ofthe Medivation acquisition and the program for the treatment of patients with germline breast cancer susceptibility gene BRCA mutated advanced breast cancer.
IPR&D assets are required to be classified as indefinite-lived assets until the successful completion or the abandonment of the associated R&D effort. Accordingly, during thedevelopment period after the date of acquisition, these assets will not be amortized until approval is obtained in a major market, typically either the U.S. or the EU, or in a seriesof other countries, subject to certain specified conditions and management judgment. At that time, we will determine the useful life of the asset, reclassify the asset out ofIPR&D and begin amortization. If the associated R&D effort is abandoned, the related IPR&D assets will likely be written-off, and we will record an impairment charge.
For IPR&D assets, the risk of failure is significant and there can be no certainty that these assets ultimately will yield successful products. The nature of the biopharmaceuticalbusiness is high-risk and, as such, we expect that many of these IPR&D assets will become impaired and be written off at some time in the future.
Amortization
The weighted-average life for each of our total finite-lived intangible assets and the largest component, developed technology rights, is approximately 11 years. Totalamortization expense for finite-lived intangible assets was $4.1 billion in 2016 , $3.8 billion in 2015 and $4.1 billion in 2014 .
The following table provides the annual amortization expense expected for the years 2017 through 2021:
(MILLIONS OF DOLLARS) 2017 2018 2019 2020 2021Amortization expense $ 4,827 $ 4,706 $ 4,481 $ 3,442 $ 3,348
2016 Financial Report
105
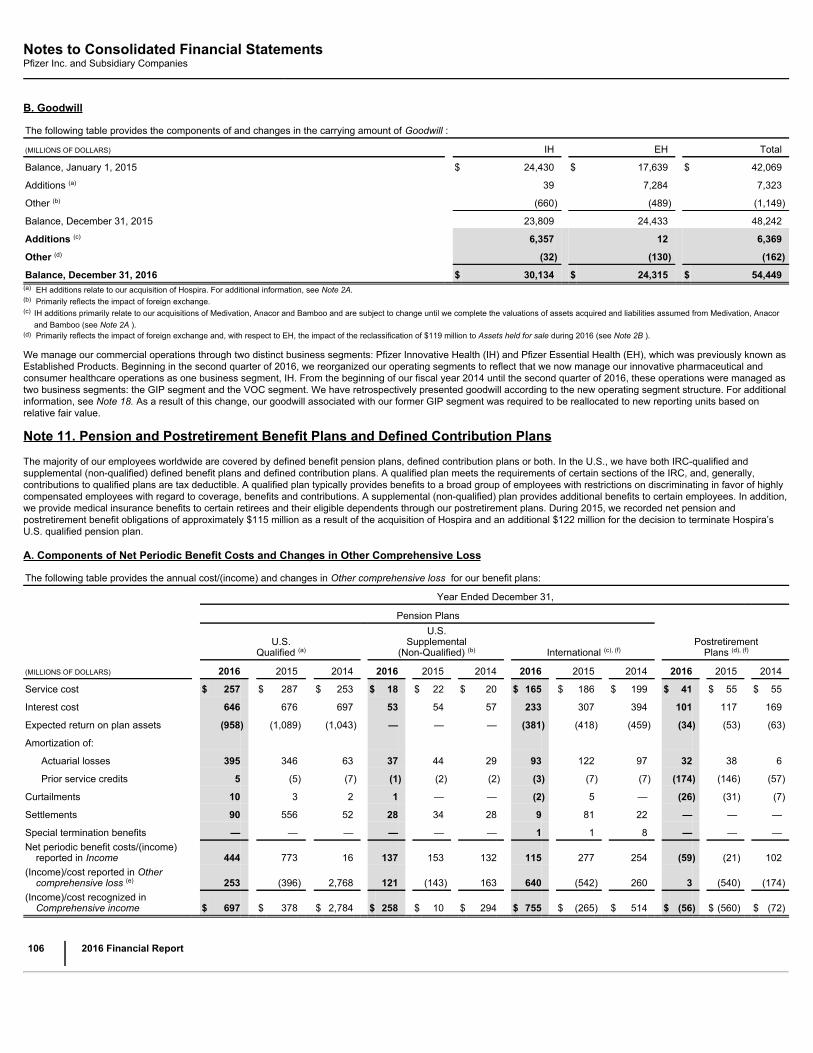
Notes to Consolidated Financial StatementsPfizer Inc. and Subsidiary Companies
B. Goodwill
The following table provides the components of and changes in the carrying amount of Goodwill :
(MILLIONS OF DOLLARS) IH EH Total
Balance, January 1, 2015 $ 24,430 $ 17,639 $ 42,069
Additions (a) 39 7,284 7,323
Other (b) (660) (489) (1,149)
Balance, December 31, 2015 23,809 24,433 48,242
Additions (c) 6,357 12 6,369
Other (d) (32) (130) (162)
Balance, December 31, 2016 $ 30,134 $ 24,315 $ 54,449(a) EH additions relate to our acquisition of Hospira. For additional information, see Note 2A.(b) Primarily reflects the impact of foreign exchange.(c)
IH additions primarily relate to our acquisitions of Medivation, Anacor and Bamboo and are subject to change until we complete the valuations of assets acquired and liabilities assumed from Medivation, Anacorand Bamboo (see Note 2A ).
(d) Primarily reflects the impact of foreign exchange and, with respect to EH, the impact of the reclassification of $119 million to Assets held for sale during 2016 (see Note 2B ).
We manage our commercial operations through two distinct business segments: Pfizer Innovative Health (IH) and Pfizer Essential Health (EH), which was previously known asEstablished Products. Beginning in the second quarter of 2016, we reorganized our operating segments to reflect that we now manage our innovative pharmaceutical andconsumer healthcare operations as one business segment, IH. From the beginning of our fiscal year 2014 until the second quarter of 2016, these operations were managed astwo business segments: the GIP segment and the VOC segment. We have retrospectively presented goodwill according to the new operating segment structure. For additionalinformation, see Note 18. As a result of this change, our goodwill associated with our former GIP segment was required to be reallocated to new reporting units based onrelative fair value.
Note 11. Pension and Postretirement Benefit Plans and Defined Contribution Plans
The majority of our employees worldwide are covered by defined benefit pension plans, defined contribution plans or both. In the U.S., we have both IRC-qualified andsupplemental (non-qualified) defined benefit plans and defined contribution plans. A qualified plan meets the requirements of certain sections of the IRC, and, generally,contributions to qualified plans are tax deductible. A qualified plan typically provides benefits to a broad group of employees with restrictions on discriminating in favor of highlycompensated employees with regard to coverage, benefits and contributions. A supplemental (non-qualified) plan provides additional benefits to certain employees. In addition,we provide medical insurance benefits to certain retirees and their eligible dependents through our postretirement plans. During 2015, we recorded net pension andpostretirement benefit obligations of approximately $115 million as a result of the acquisition of Hospira and an additional $122 million for the decision to terminate Hospira’sU.S. qualified pension plan.
A. Components of Net Periodic Benefit Costs and Changes in Other Comprehensive Loss
The following table provides the annual cost/(income) and changes in Other comprehensive loss for our benefit plans:
Year Ended December 31,
Pension Plans
U.S.
Qualified (a)
U.S.Supplemental
(Non-Qualified) (b) International (c), (f) Postretirement
Plans (d), (f)
(MILLIONS OF DOLLARS) 2016 2015 2014 2016 2015 2014 2016 2015 2014 2016 2015 2014
Service cost $ 257 $ 287 $ 253 $ 18 $ 22 $ 20 $ 165 $ 186 $ 199 $ 41 $ 55 $ 55
Interest cost 646 676 697 53 54 57 233 307 394 101 117 169
Expected return on plan assets (958) (1,089) (1,043) — — — (381) (418) (459) (34) (53) (63)
Amortization of:
Actuarial losses 395 346 63 37 44 29 93 122 97 32 38 6
Prior service credits 5 (5) (7) (1) (2) (2) (3) (7) (7) (174) (146) (57)
Curtailments 10 3 2 1 — — (2) 5 — (26) (31) (7)
Settlements 90 556 52 28 34 28 9 81 22 — — —
Special termination benefits — — — — — — 1 1 8 — — —Net periodic benefit costs/(income)
reported in Income 444 773 16 137 153 132 115 277 254 (59) (21) 102(Income)/cost reported in Other
comprehensive loss (e) 253 (396) 2,768 121 (143) 163 640 (542) 260 3 (540) (174)(Income)/cost recognized in
Comprehensive income $ 697 $ 378 $ 2,784 $ 258 $ 10 $ 294 $ 755 $ (265) $ 514 $ (56) $ (560) $ (72)
106
2016 Financial Report
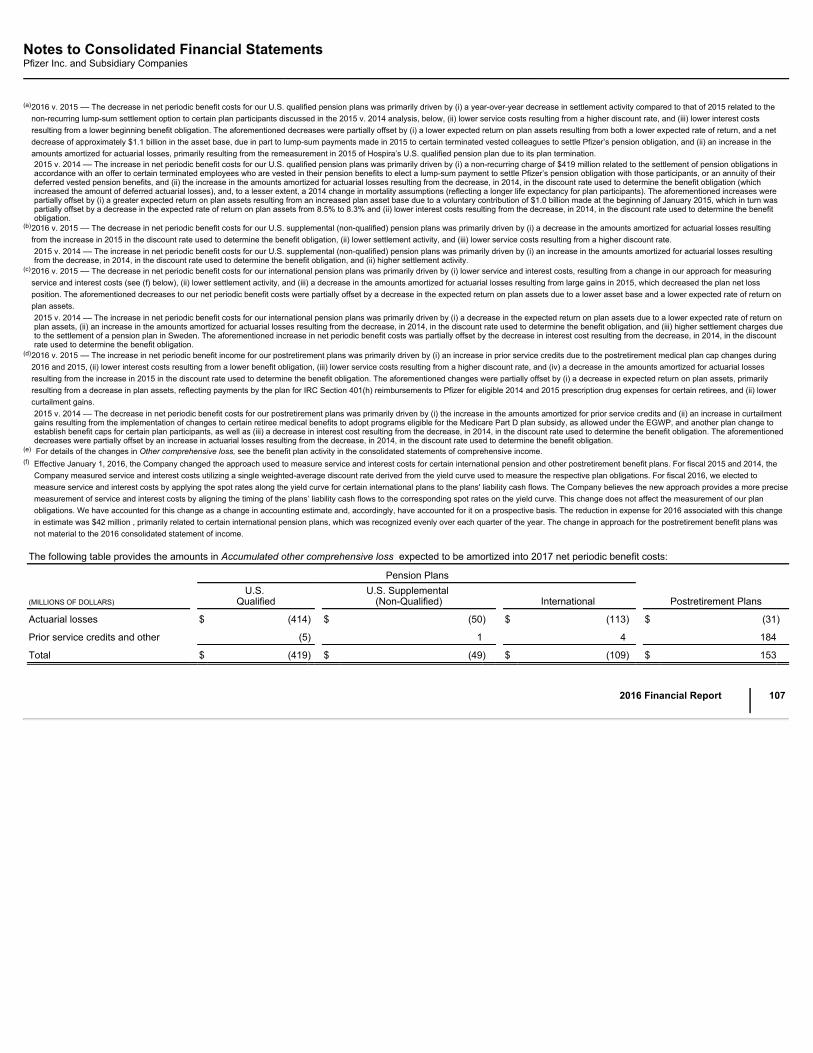
Notes to Consolidated Financial StatementsPfizer Inc. and Subsidiary Companies
(a)
2016 v. 2015 –– The decrease in net periodic benefit costs for our U.S. qualified pension plans was primarily driven by (i) a year-over-year decrease in settlement activity compared to that of 2015 related to thenon-recurring lump-sum settlement option to certain plan participants discussed in the 2015 v. 2014 analysis, below, (ii) lower service costs resulting from a higher discount rate, and (iii) lower interest costsresulting from a lower beginning benefit obligation. The aforementioned decreases were partially offset by (i) a lower expected return on plan assets resulting from both a lower expected rate of return, and a netdecrease of approximately $1.1 billion in the asset base, due in part to lump-sum payments made in 2015 to certain terminated vested colleagues to settle Pfizer’s pension obligation, and (ii) an increase in theamounts amortized for actuarial losses, primarily resulting from the remeasurement in 2015 of Hospira’s U.S. qualified pension plan due to its plan termination.2015 v. 2014 –– The increase in net periodic benefit costs for our U.S. qualified pension plans was primarily driven by (i) a non-recurring charge of $419 million related to the settlement of pension obligations inaccordance with an offer to certain terminated employees who are vested in their pension benefits to elect a lump-sum payment to settle Pfizer’s pension obligation with those participants, or an annuity of theirdeferred vested pension benefits, and (ii) the increase in the amounts amortized for actuarial losses resulting from the decrease, in 2014, in the discount rate used to determine the benefit obligation (whichincreased the amount of deferred actuarial losses), and, to a lesser extent, a 2014 change in mortality assumptions (reflecting a longer life expectancy for plan participants). The aforementioned increases werepartially offset by (i) a greater expected return on plan assets resulting from an increased plan asset base due to a voluntary contribution of $1.0 billion made at the beginning of January 2015, which in turn waspartially offset by a decrease in the expected rate of return on plan assets from 8.5% to 8.3% and (ii) lower interest costs resulting from the decrease, in 2014, in the discount rate used to determine the benefitobligation.
(b)
2016 v. 2015 –– The decrease in net periodic benefit costs for our U.S. supplemental (non-qualified) pension plans was primarily driven by (i) a decrease in the amounts amortized for actuarial losses resultingfrom the increase in 2015 in the discount rate used to determine the benefit obligation, (ii) lower settlement activity, and (iii) lower service costs resulting from a higher discount rate.2015 v. 2014 –– The increase in net periodic benefit costs for our U.S. supplemental (non-qualified) pension plans was primarily driven by (i) an increase in the amounts amortized for actuarial losses resultingfrom the decrease, in 2014, in the discount rate used to determine the benefit obligation, and (ii) higher settlement activity.
(c)
2016 v. 2015 –– The decrease in net periodic benefit costs for our international pension plans was primarily driven by (i) lower service and interest costs, resulting from a change in our approach for measuringservice and interest costs (see (f) below), (ii) lower settlement activity, and (iii) a decrease in the amounts amortized for actuarial losses resulting from large gains in 2015, which decreased the plan net lossposition. The aforementioned decreases to our net periodic benefit costs were partially offset by a decrease in the expected return on plan assets due to a lower asset base and a lower expected rate of return onplan assets.2015 v. 2014 –– The increase in net periodic benefit costs for our international pension plans was primarily driven by (i) a decrease in the expected return on plan assets due to a lower expected rate of return onplan assets, (ii) an increase in the amounts amortized for actuarial losses resulting from the decrease, in 2014, in the discount rate used to determine the benefit obligation, and (iii) higher settlement charges dueto the settlement of a pension plan in Sweden. The aforementioned increase in net periodic benefit costs was partially offset by the decrease in interest cost resulting from the decrease, in 2014, in the discountrate used to determine the benefit obligation.
(d)
2016 v. 2015 –– The increase in net periodic benefit income for our postretirement plans was primarily driven by (i) an increase in prior service credits due to the postretirement medical plan cap changes during2016 and 2015, (ii) lower interest costs resulting from a lower benefit obligation, (iii) lower service costs resulting from a higher discount rate, and (iv) a decrease in the amounts amortized for actuarial lossesresulting from the increase in 2015 in the discount rate used to determine the benefit obligation. The aforementioned changes were partially offset by (i) a decrease in expected return on plan assets, primarilyresulting from a decrease in plan assets, reflecting payments by the plan for IRC Section 401(h) reimbursements to Pfizer for eligible 2014 and 2015 prescription drug expenses for certain retirees, and (ii) lowercurtailment gains.2015 v. 2014 –– The decrease in net periodic benefit costs for our postretirement plans was primarily driven by (i) the increase in the amounts amortized for prior service credits and (ii) an increase in curtailmentgains resulting from the implementation of changes to certain retiree medical benefits to adopt programs eligible for the Medicare Part D plan subsidy, as allowed under the EGWP, and another plan change toestablish benefit caps for certain plan participants, as well as (iii) a decrease in interest cost resulting from the decrease, in 2014, in the discount rate used to determine the benefit obligation. The aforementioneddecreases were partially offset by an increase in actuarial losses resulting from the decrease, in 2014, in the discount rate used to determine the benefit obligation.
(e) For details of the changes in Other comprehensive loss, see the benefit plan activity in the consolidated statements of comprehensive income.(f) Effective January 1, 2016, the Company changed the approach used to measure service and interest costs for certain international pension and other postretirement benefit plans. For fiscal 2015 and 2014, the
Company measured service and interest costs utilizing a single weighted-average discount rate derived from the yield curve used to measure the respective plan obligations. For fiscal 2016, we elected tomeasure service and interest costs by applying the spot rates along the yield curve for certain international plans to the plans' liability cash flows. The Company believes the new approach provides a more precisemeasurement of service and interest costs by aligning the timing of the plans’ liability cash flows to the corresponding spot rates on the yield curve. This change does not affect the measurement of our planobligations. We have accounted for this change as a change in accounting estimate and, accordingly, have accounted for it on a prospective basis. The reduction in expense for 2016 associated with this changein estimate was $42 million , primarily related to certain international pension plans, which was recognized evenly over each quarter of the year. The change in approach for the postretirement benefit plans wasnot material to the 2016 consolidated statement of income.
The following table provides the amounts in Accumulated other comprehensive loss expected to be amortized into 2017 net periodic benefit costs:
Pension Plans
(MILLIONS OF DOLLARS) U.S.
Qualified U.S. Supplemental
(Non-Qualified) International Postretirement Plans
Actuarial losses $ (414) $ (50) $ (113) $ (31)
Prior service credits and other (5) 1 4 184
Total $ (419) $ (49) $ (109) $ 153
2016 Financial Report
107
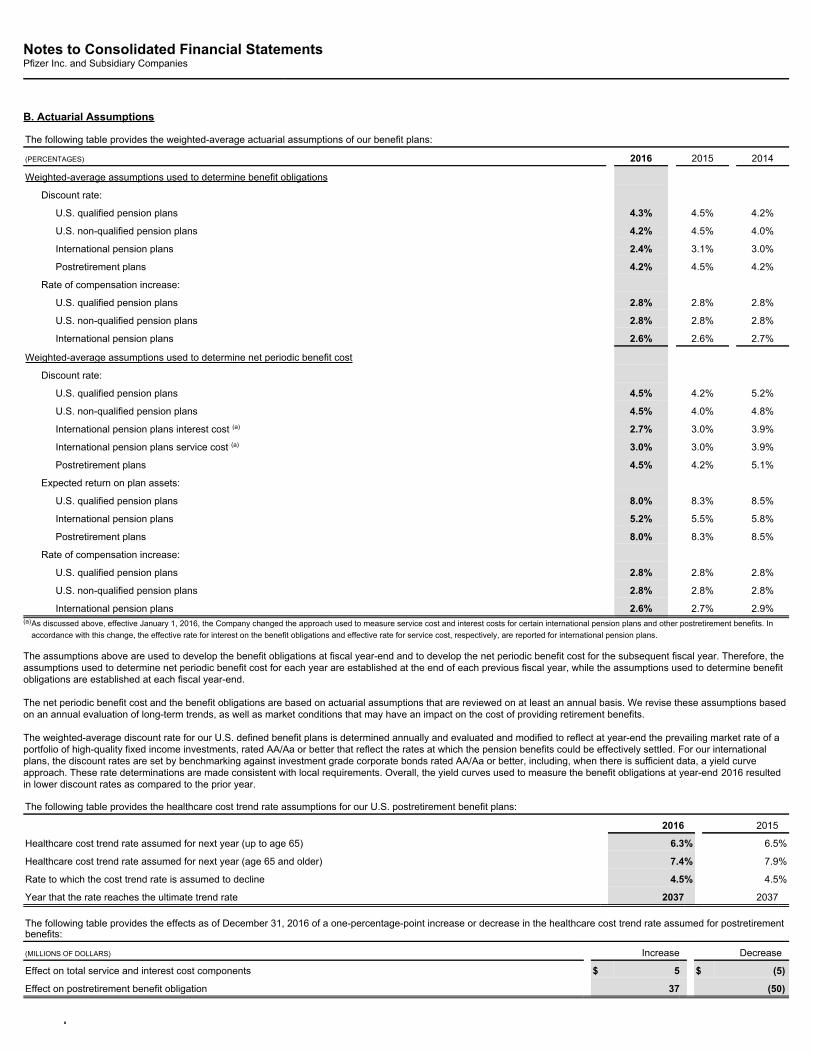
Notes to Consolidated Financial StatementsPfizer Inc. and Subsidiary Companies
B. Actuarial Assumptions
The following table provides the weighted-average actuarial assumptions of our benefit plans:
(PERCENTAGES) 2016 2015 2014
Weighted-average assumptions used to determine benefit obligations
Discount rate:
U.S. qualified pension plans 4.3% 4.5% 4.2%
U.S. non-qualified pension plans 4.2% 4.5% 4.0%
International pension plans 2.4% 3.1% 3.0%
Postretirement plans 4.2% 4.5% 4.2%
Rate of compensation increase:
U.S. qualified pension plans 2.8% 2.8% 2.8%
U.S. non-qualified pension plans 2.8% 2.8% 2.8%
International pension plans 2.6% 2.6% 2.7%
Weighted-average assumptions used to determine net periodic benefit cost
Discount rate:
U.S. qualified pension plans 4.5% 4.2% 5.2%
U.S. non-qualified pension plans 4.5% 4.0% 4.8%
International pension plans interest cost (a) 2.7% 3.0% 3.9%
International pension plans service cost (a) 3.0% 3.0% 3.9%
Postretirement plans 4.5% 4.2% 5.1%
Expected return on plan assets:
U.S. qualified pension plans 8.0% 8.3% 8.5%
International pension plans 5.2% 5.5% 5.8%
Postretirement plans 8.0% 8.3% 8.5%
Rate of compensation increase:
U.S. qualified pension plans 2.8% 2.8% 2.8%
U.S. non-qualified pension plans 2.8% 2.8% 2.8%
International pension plans 2.6% 2.7% 2.9%(a)
As discussed above, effective January 1, 2016, the Company changed the approach used to measure service cost and interest costs for certain international pension plans and other postretirement benefits. Inaccordance with this change, the effective rate for interest on the benefit obligations and effective rate for service cost, respectively, are reported for international pension plans.
The assumptions above are used to develop the benefit obligations at fiscal year-end and to develop the net periodic benefit cost for the subsequent fiscal year. Therefore, theassumptions used to determine net periodic benefit cost for each year are established at the end of each previous fiscal year, while the assumptions used to determine benefitobligations are established at each fiscal year-end.
The net periodic benefit cost and the benefit obligations are based on actuarial assumptions that are reviewed on at least an annual basis. We revise these assumptions basedon an annual evaluation of long-term trends, as well as market conditions that may have an impact on the cost of providing retirement benefits.
The weighted-average discount rate for our U.S. defined benefit plans is determined annually and evaluated and modified to reflect at year-end the prevailing market rate of aportfolio of high-quality fixed income investments, rated AA/Aa or better that reflect the rates at which the pension benefits could be effectively settled. For our internationalplans, the discount rates are set by benchmarking against investment grade corporate bonds rated AA/Aa or better, including, when there is sufficient data, a yield curveapproach. These rate determinations are made consistent with local requirements. Overall, the yield curves used to measure the benefit obligations at year-end 2016 resultedin lower discount rates as compared to the prior year.
The following table provides the healthcare cost trend rate assumptions for our U.S. postretirement benefit plans:
2016 2015
Healthcare cost trend rate assumed for next year (up to age 65) 6.3% 6.5%
Healthcare cost trend rate assumed for next year (age 65 and older) 7.4% 7.9%
Rate to which the cost trend rate is assumed to decline 4.5% 4.5%
Year that the rate reaches the ultimate trend rate 2037 2037
The following table provides the effects as of December 31, 2016 of a one-percentage-point increase or decrease in the healthcare cost trend rate assumed for postretirementbenefits:
(MILLIONS OF DOLLARS) Increase Decrease
Effect on total service and interest cost components $ 5 $ (5)
Effect on postretirement benefit obligation 37 (50)

108
2016 Financial Report
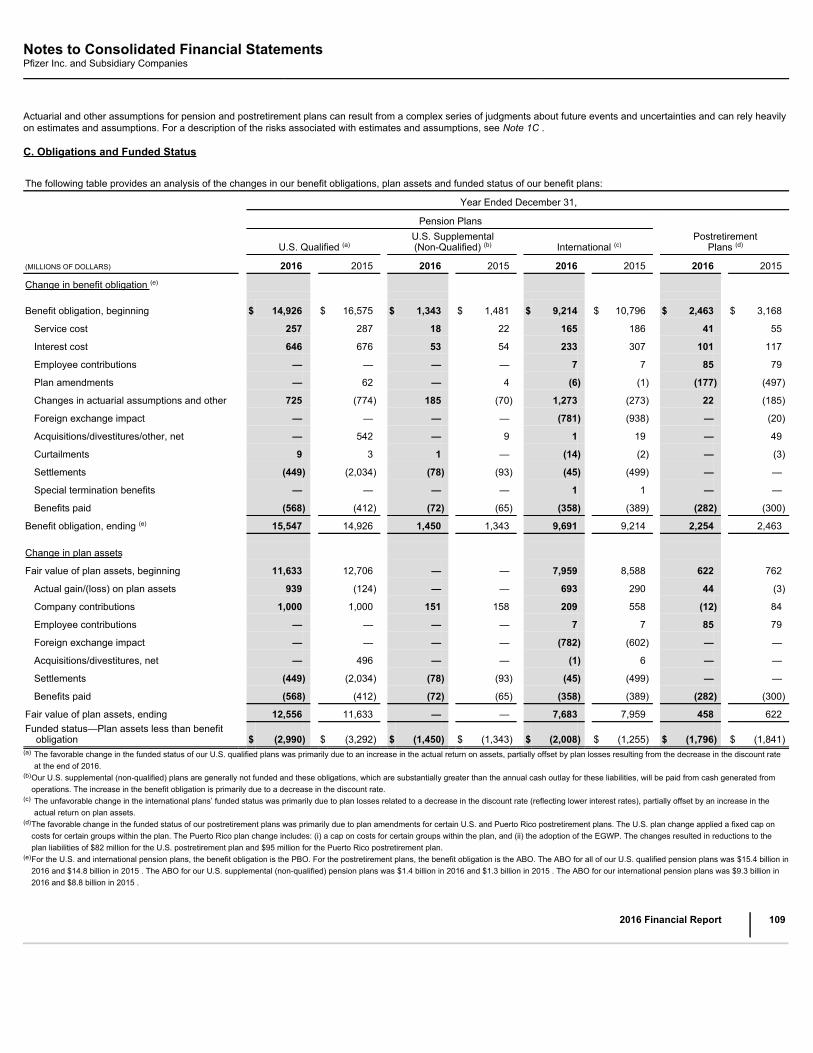
Notes to Consolidated Financial StatementsPfizer Inc. and Subsidiary Companies
Actuarial and other assumptions for pension and postretirement plans can result from a complex series of judgments about future events and uncertainties and can rely heavilyon estimates and assumptions. For a description of the risks associated with estimates and assumptions, see Note 1C .
C. Obligations and Funded Status
The following table provides an analysis of the changes in our benefit obligations, plan assets and funded status of our benefit plans:
Year Ended December 31,
Pension Plans
U.S. Qualified (a) U.S. Supplemental(Non-Qualified) (b) International (c)
PostretirementPlans (d)
(MILLIONS OF DOLLARS) 2016 2015 2016 2015 2016 2015 2016 2015
Change in benefit obligation (e) Benefit obligation, beginning $ 14,926 $ 16,575 $ 1,343 $ 1,481 $ 9,214 $ 10,796 $ 2,463 $ 3,168
Service cost 257 287 18 22 165 186 41 55
Interest cost 646 676 53 54 233 307 101 117
Employee contributions — — — — 7 7 85 79
Plan amendments — 62 — 4 (6) (1) (177) (497)
Changes in actuarial assumptions and other 725 (774) 185 (70) 1,273 (273) 22 (185)
Foreign exchange impact — — — — (781) (938) — (20)
Acquisitions/divestitures/other, net — 542 — 9 1 19 — 49
Curtailments 9 3 1 — (14) (2) — (3)
Settlements (449) (2,034) (78) (93) (45) (499) — —
Special termination benefits — — — — 1 1 — —
Benefits paid (568) (412) (72) (65) (358) (389) (282) (300)
Benefit obligation, ending (e) 15,547 14,926 1,450 1,343 9,691 9,214 2,254 2,463
Change in plan assets
Fair value of plan assets, beginning 11,633 12,706 — — 7,959 8,588 622 762
Actual gain/(loss) on plan assets 939 (124) — — 693 290 44 (3)
Company contributions 1,000 1,000 151 158 209 558 (12) 84
Employee contributions — — — — 7 7 85 79
Foreign exchange impact — — — — (782) (602) — —
Acquisitions/divestitures, net — 496 — — (1) 6 — —
Settlements (449) (2,034) (78) (93) (45) (499) — —
Benefits paid (568) (412) (72) (65) (358) (389) (282) (300)
Fair value of plan assets, ending 12,556 11,633 — — 7,683 7,959 458 622Funded status—Plan assets less than benefit
obligation $ (2,990) $ (3,292) $ (1,450) $ (1,343) $ (2,008) $ (1,255) $ (1,796) $ (1,841)(a)
The favorable change in the funded status of our U.S. qualified plans was primarily due to an increase in the actual return on assets, partially offset by plan losses resulting from the decrease in the discount rateat the end of 2016.
(b)
Our U.S. supplemental (non-qualified) plans are generally not funded and these obligations, which are substantially greater than the annual cash outlay for these liabilities, will be paid from cash generated fromoperations. The increase in the benefit obligation is primarily due to a decrease in the discount rate.
(c)
The unfavorable change in the international plans’ funded status was primarily due to plan losses related to a decrease in the discount rate (reflecting lower interest rates), partially offset by an increase in theactual return on plan assets.
(d)
The favorable change in the funded status of our postretirement plans was primarily due to plan amendments for certain U.S. and Puerto Rico postretirement plans. The U.S. plan change applied a fixed cap oncosts for certain groups within the plan. The Puerto Rico plan change includes: (i) a cap on costs for certain groups within the plan, and (ii) the adoption of the EGWP. The changes resulted in reductions to theplan liabilities of $82 million for the U.S. postretirement plan and $95 million for the Puerto Rico postretirement plan.
(e)
For the U.S. and international pension plans, the benefit obligation is the PBO. For the postretirement plans, the benefit obligation is the ABO. The ABO for all of our U.S. qualified pension plans was $15.4 billion in2016 and $14.8 billion in 2015 . The ABO for our U.S. supplemental (non-qualified) pension plans was $1.4 billion in 2016 and $1.3 billion in 2015 . The ABO for our international pension plans was $9.3 billion in2016 and $8.8 billion in 2015 .
2016 Financial Report
109
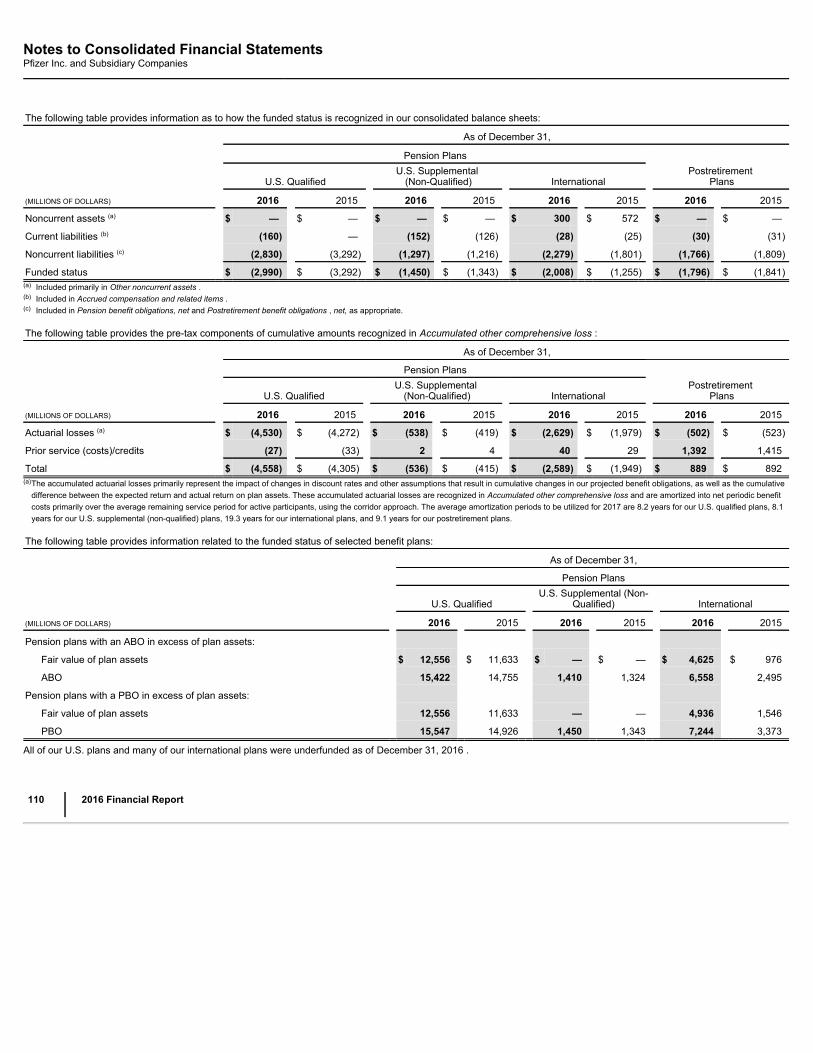
Notes to Consolidated Financial StatementsPfizer Inc. and Subsidiary Companies
The following table provides information as to how the funded status is recognized in our consolidated balance sheets:
As of December 31,
Pension Plans
U.S. Qualified U.S. Supplemental
(Non-Qualified) International Postretirement
Plans
(MILLIONS OF DOLLARS) 2016 2015 2016 2015 2016 2015 2016 2015
Noncurrent assets (a) $ — $ — $ — $ — $ 300 $ 572 $ — $ —
Current liabilities (b) (160) — (152) (126) (28) (25) (30) (31)
Noncurrent liabilities (c) (2,830) (3,292) (1,297) (1,216) (2,279) (1,801) (1,766) (1,809)
Funded status $ (2,990) $ (3,292) $ (1,450) $ (1,343) $ (2,008) $ (1,255) $ (1,796) $ (1,841)(a) Included primarily in Other noncurrent assets .(b) Included in Accrued compensation and related items .(c) Included in Pension benefit obligations, net and Postretirement benefit obligations , net, as appropriate.
The following table provides the pre-tax components of cumulative amounts recognized in Accumulated other comprehensive loss :
As of December 31, Pension Plans
U.S. Qualified U.S. Supplemental
(Non-Qualified) International Postretirement
Plans
(MILLIONS OF DOLLARS) 2016 2015 2016 2015 2016 2015 2016 2015
Actuarial losses (a) $ (4,530) $ (4,272) $ (538) $ (419) $ (2,629) $ (1,979) $ (502) $ (523)
Prior service (costs)/credits (27) (33) 2 4 40 29 1,392 1,415
Total $ (4,558) $ (4,305) $ (536) $ (415) $ (2,589) $ (1,949) $ 889 $ 892(a)
The accumulated actuarial losses primarily represent the impact of changes in discount rates and other assumptions that result in cumulative changes in our projected benefit obligations, as well as the cumulativedifference between the expected return and actual return on plan assets. These accumulated actuarial losses are recognized in Accumulated other comprehensive loss and are amortized into net periodic benefitcosts primarily over the average remaining service period for active participants, using the corridor approach. The average amortization periods to be utilized for 2017 are 8.2 years for our U.S. qualified plans, 8.1years for our U.S. supplemental (non-qualified) plans, 19.3 years for our international plans, and 9.1 years for our postretirement plans.
The following table provides information related to the funded status of selected benefit plans:
As of December 31, Pension Plans
U.S. Qualified U.S. Supplemental (Non-
Qualified) International
(MILLIONS OF DOLLARS) 2016 2015 2016 2015 2016 2015
Pension plans with an ABO in excess of plan assets:
Fair value of plan assets $ 12,556 $ 11,633 $ — $ — $ 4,625 $ 976
ABO 15,422 14,755 1,410 1,324 6,558 2,495
Pension plans with a PBO in excess of plan assets:
Fair value of plan assets 12,556 11,633 — — 4,936 1,546
PBO 15,547 14,926 1,450 1,343 7,244 3,373
All of our U.S. plans and many of our international plans were underfunded as of December 31, 2016 .
110
2016 Financial Report
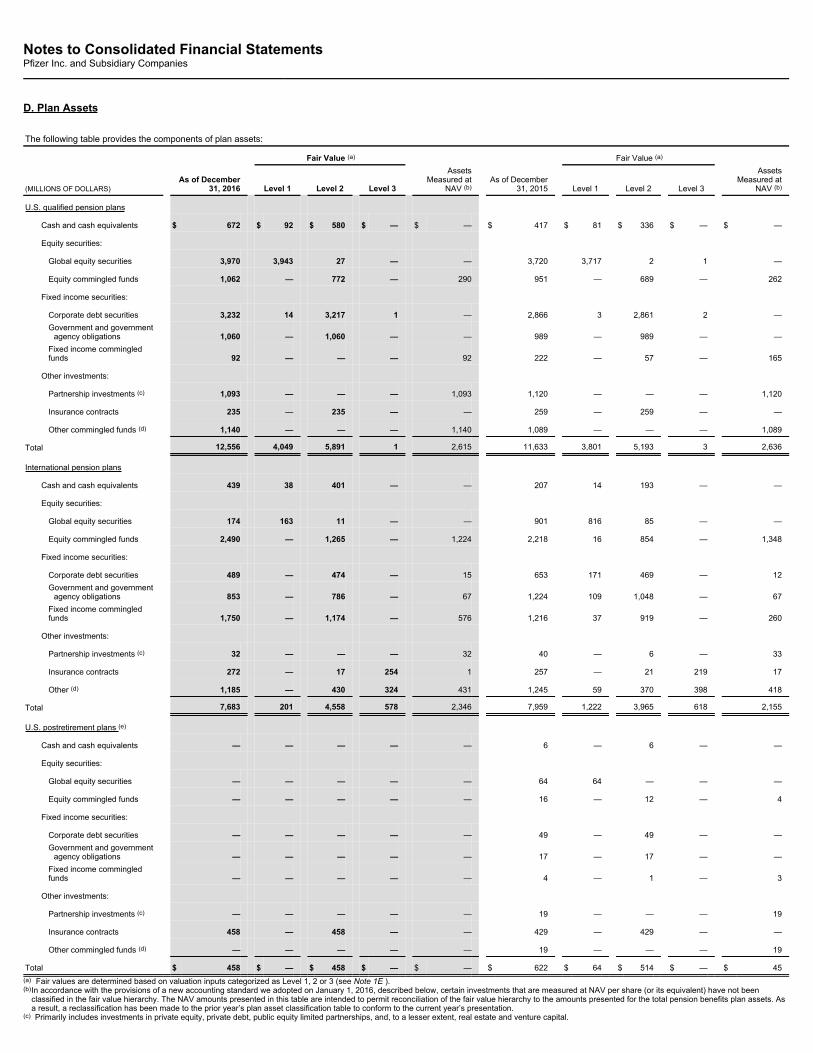
Notes to Consolidated Financial StatementsPfizer Inc. and Subsidiary Companies
D. Plan Assets
The following table provides the components of plan assets:
Fair Value (a) Fair Value (a)
(MILLIONS OF DOLLARS) As of December31, 2016 Level 1 Level 2 Level 3
AssetsMeasured at
NAV (b) As of December31, 2015 Level 1 Level 2 Level 3
AssetsMeasured at
NAV (b)
U.S. qualified pension plans
Cash and cash equivalents $ 672 $ 92 $ 580 $ — $ — $ 417 $ 81 $ 336 $ — $ —
Equity securities:
Global equity securities 3,970 3,943 27 — — 3,720 3,717 2 1 —
Equity commingled funds 1,062 — 772 — 290 951 — 689 — 262
Fixed income securities:
Corporate debt securities 3,232 14 3,217 1 — 2,866 3 2,861 2 —Government and government
agency obligations 1,060 — 1,060 — — 989 — 989 — —Fixed income commingledfunds 92 — — — 92 222 — 57 — 165
Other investments:
Partnership investments (c) 1,093 — — — 1,093 1,120 — — — 1,120
Insurance contracts 235 — 235 — — 259 — 259 — —
Other commingled funds (d) 1,140 — — — 1,140 1,089 — — — 1,089
Total 12,556 4,049 5,891 1 2,615 11,633 3,801 5,193 3 2,636
International pension plans
Cash and cash equivalents 439 38 401 — — 207 14 193 — —
Equity securities:
Global equity securities 174 163 11 — — 901 816 85 — —
Equity commingled funds 2,490 — 1,265 — 1,224 2,218 16 854 — 1,348
Fixed income securities:
Corporate debt securities 489 — 474 — 15 653 171 469 — 12Government and government
agency obligations 853 — 786 — 67 1,224 109 1,048 — 67Fixed income commingledfunds 1,750 — 1,174 — 576 1,216 37 919 — 260
Other investments:
Partnership investments (c) 32 — — — 32 40 — 6 — 33
Insurance contracts 272 — 17 254 1 257 — 21 219 17
Other (d) 1,185 — 430 324 431 1,245 59 370 398 418
Total 7,683 201 4,558 578 2,346 7,959 1,222 3,965 618 2,155
U.S. postretirement plans (e)
Cash and cash equivalents — — — — — 6 — 6 — —
Equity securities:
Global equity securities — — — — — 64 64 — — —
Equity commingled funds — — — — — 16 — 12 — 4
Fixed income securities:
Corporate debt securities — — — — — 49 — 49 — —Government and government
agency obligations — — — — — 17 — 17 — —Fixed income commingledfunds — — — — — 4 — 1 — 3
Other investments:
Partnership investments (c) — — — — — 19 — — — 19
Insurance contracts 458 — 458 — — 429 — 429 — —
Other commingled funds (d) — — — — — 19 — — — 19
Total $ 458 $ — $ 458 $ — $ — $ 622 $ 64 $ 514 $ — $ 45(a) Fair values are determined based on valuation inputs categorized as Level 1, 2 or 3 (see Note 1E ).(b)
In accordance with the provisions of a new accounting standard we adopted on January 1, 2016, described below, certain investments that are measured at NAV per share (or its equivalent) have not beenclassified in the fair value hierarchy. The NAV amounts presented in this table are intended to permit reconciliation of the fair value hierarchy to the amounts presented for the total pension benefits plan assets. Asa result, a reclassification has been made to the prior year’s plan asset classification table to conform to the current year’s presentation.
(c) Primarily includes investments in private equity, private debt, public equity limited partnerships, and, to a lesser extent, real estate and venture capital.

(d) Primarily includes, for U.S. plan assets, investments in hedge funds and, to a lesser extent, real estate and, for international plan assets, investments in real estate and hedge funds.(e) Reflects postretirement plan assets, which support a portion of our U.S. retiree medical plans.
2016 Financial Report
111
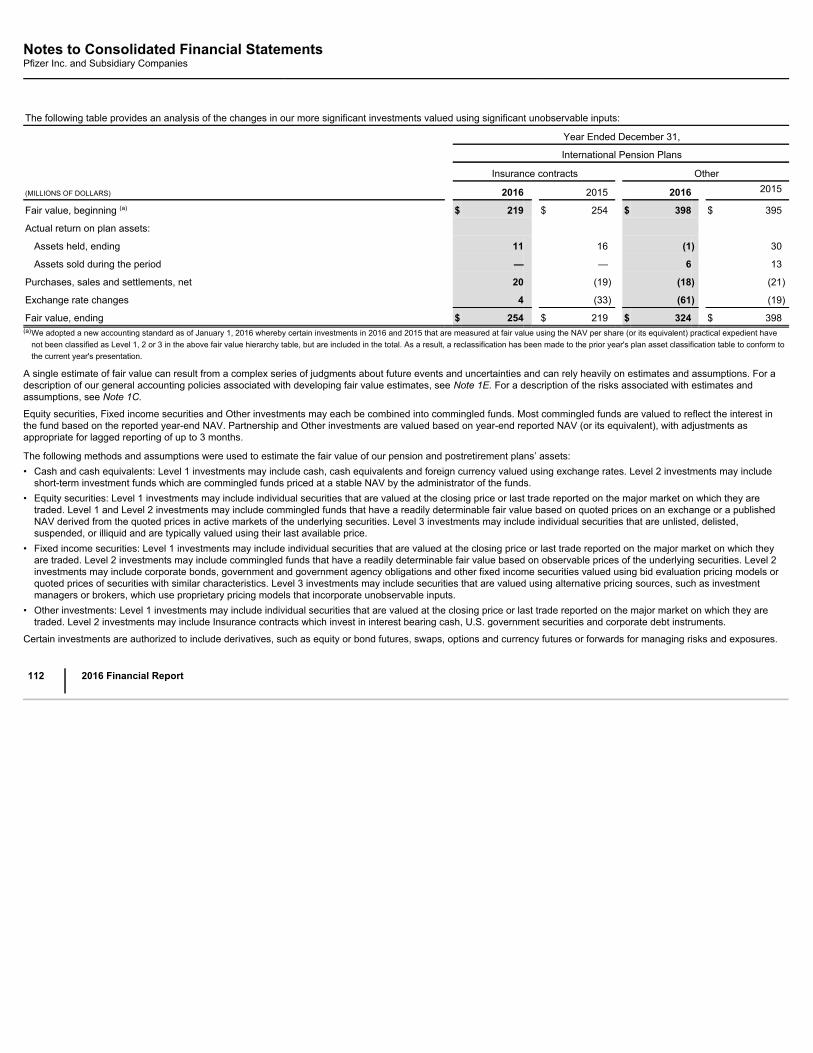
Notes to Consolidated Financial StatementsPfizer Inc. and Subsidiary Companies
The following table provides an analysis of the changes in our more significant investments valued using significant unobservable inputs:
Year Ended December 31, International Pension Plans
Insurance contracts Other
(MILLIONS OF DOLLARS) 2016 2015 2016 2015
Fair value, beginning (a) $ 219 $ 254 $ 398 $ 395
Actual return on plan assets:
Assets held, ending 11 16 (1) 30
Assets sold during the period — — 6 13
Purchases, sales and settlements, net 20 (19) (18) (21)
Exchange rate changes 4 (33) (61) (19)
Fair value, ending $ 254 $ 219 $ 324 $ 398(a)
We adopted a new accounting standard as of January 1, 2016 whereby certain investments in 2016 and 2015 that are measured at fair value using the NAV per share (or its equivalent) practical expedient havenot been classified as Level 1, 2 or 3 in the above fair value hierarchy table, but are included in the total. As a result, a reclassification has been made to the prior year's plan asset classification table to conform tothe current year's presentation.
A single estimate of fair value can result from a complex series of judgments about future events and uncertainties and can rely heavily on estimates and assumptions. For adescription of our general accounting policies associated with developing fair value estimates, see Note 1E. For a description of the risks associated with estimates andassumptions, see Note 1C.
Equity securities, Fixed income securities and Other investments may each be combined into commingled funds. Most commingled funds are valued to reflect the interest inthe fund based on the reported year-end NAV. Partnership and Other investments are valued based on year-end reported NAV (or its equivalent), with adjustments asappropriate for lagged reporting of up to 3 months.
The following methods and assumptions were used to estimate the fair value of our pension and postretirement plans’ assets:• Cash and cash equivalents: Level 1 investments may include cash, cash equivalents and foreign currency valued using exchange rates. Level 2 investments may include
short-term investment funds which are commingled funds priced at a stable NAV by the administrator of the funds.• Equity securities: Level 1 investments may include individual securities that are valued at the closing price or last trade reported on the major market on which they are
traded. Level 1 and Level 2 investments may include commingled funds that have a readily determinable fair value based on quoted prices on an exchange or a publishedNAV derived from the quoted prices in active markets of the underlying securities. Level 3 investments may include individual securities that are unlisted, delisted,suspended, or illiquid and are typically valued using their last available price.
• Fixed income securities: Level 1 investments may include individual securities that are valued at the closing price or last trade reported on the major market on which theyare traded. Level 2 investments may include commingled funds that have a readily determinable fair value based on observable prices of the underlying securities. Level 2investments may include corporate bonds, government and government agency obligations and other fixed income securities valued using bid evaluation pricing models orquoted prices of securities with similar characteristics. Level 3 investments may include securities that are valued using alternative pricing sources, such as investmentmanagers or brokers, which use proprietary pricing models that incorporate unobservable inputs.
• Other investments: Level 1 investments may include individual securities that are valued at the closing price or last trade reported on the major market on which they aretraded. Level 2 investments may include Insurance contracts which invest in interest bearing cash, U.S. government securities and corporate debt instruments.
Certain investments are authorized to include derivatives, such as equity or bond futures, swaps, options and currency futures or forwards for managing risks and exposures.
112
2016 Financial Report
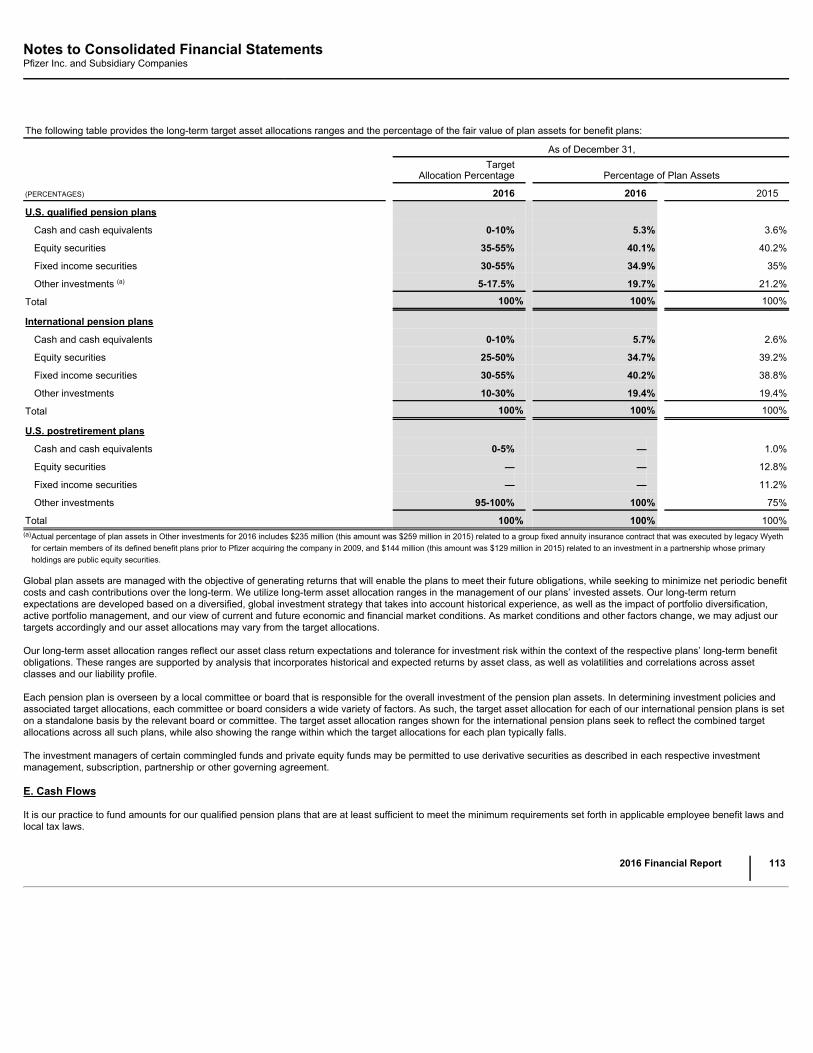
Notes to Consolidated Financial StatementsPfizer Inc. and Subsidiary Companies
The following table provides the long-term target asset allocations ranges and the percentage of the fair value of plan assets for benefit plans:
As of December 31,
Target
Allocation Percentage Percentage of Plan Assets
(PERCENTAGES) 2016 2016 2015
U.S. qualified pension plans
Cash and cash equivalents 0-10% 5.3% 3.6%
Equity securities 35-55% 40.1% 40.2%
Fixed income securities 30-55% 34.9% 35%
Other investments (a) 5-17.5% 19.7% 21.2%
Total 100% 100% 100%
International pension plans
Cash and cash equivalents 0-10% 5.7% 2.6%
Equity securities 25-50% 34.7% 39.2%
Fixed income securities 30-55% 40.2% 38.8%
Other investments 10-30% 19.4% 19.4%
Total 100% 100% 100%
U.S. postretirement plans
Cash and cash equivalents 0-5% — 1.0%
Equity securities — — 12.8%
Fixed income securities — — 11.2%
Other investments 95-100% 100% 75%
Total 100% 100% 100%(a)
Actual percentage of plan assets in Other investments for 2016 includes $235 million (this amount was $259 million in 2015) related to a group fixed annuity insurance contract that was executed by legacy Wyethfor certain members of its defined benefit plans prior to Pfizer acquiring the company in 2009, and $144 million (this amount was $129 million in 2015) related to an investment in a partnership whose primaryholdings are public equity securities.
Global plan assets are managed with the objective of generating returns that will enable the plans to meet their future obligations, while seeking to minimize net periodic benefitcosts and cash contributions over the long-term. We utilize long-term asset allocation ranges in the management of our plans’ invested assets. Our long-term returnexpectations are developed based on a diversified, global investment strategy that takes into account historical experience, as well as the impact of portfolio diversification,active portfolio management, and our view of current and future economic and financial market conditions. As market conditions and other factors change, we may adjust ourtargets accordingly and our asset allocations may vary from the target allocations.
Our long-term asset allocation ranges reflect our asset class return expectations and tolerance for investment risk within the context of the respective plans’ long-term benefitobligations. These ranges are supported by analysis that incorporates historical and expected returns by asset class, as well as volatilities and correlations across assetclasses and our liability profile.
Each pension plan is overseen by a local committee or board that is responsible for the overall investment of the pension plan assets. In determining investment policies andassociated target allocations, each committee or board considers a wide variety of factors. As such, the target asset allocation for each of our international pension plans is seton a standalone basis by the relevant board or committee. The target asset allocation ranges shown for the international pension plans seek to reflect the combined targetallocations across all such plans, while also showing the range within which the target allocations for each plan typically falls.
The investment managers of certain commingled funds and private equity funds may be permitted to use derivative securities as described in each respective investmentmanagement, subscription, partnership or other governing agreement.
E. Cash Flows
It is our practice to fund amounts for our qualified pension plans that are at least sufficient to meet the minimum requirements set forth in applicable employee benefit laws andlocal tax laws.
2016 Financial Report
113

Notes to Consolidated Financial StatementsPfizer Inc. and Subsidiary Companies
The following table provides the expected future cash flow information related to our benefit plans:
Pension Plans
(MILLIONS OF DOLLARS) U.S. Qualified U.S. Supplemental
(Non-Qualified) International Postretirement Plans
Expected employer contributions:
2017 (a) $ 1,160 $ 152 $ 175 $ 179
Expected benefit payments:
2017 $ 1,519 $ 152 $ 331 $ 186
2018 1,058 128 333 196
2019 947 118 335 198
2020 952 119 350 197
2021 930 112 356 196
2022–2026 4,391 503 1,867 919(a)
For the U.S. qualified plans, the $1.0 billion voluntary contribution, which was considered pre-funding for future anticipated mandatory contributions and is also expected to reduce Pension Benefit GuarantyCorporation variable rate premiums, was paid in January 2017.
The table reflects the total U.S. and international plan benefits projected to be paid from the plans or from our general assets under the current actuarial assumptions used forthe calculation of the benefit obligation and, therefore, actual benefit payments may differ from projected benefit payments.
F. Defined Contribution Plans
We have defined contribution plans in the U.S. and several other countries. For the majority of the U.S. defined contribution plans, employees may contribute a portion of theirsalaries and bonuses to the plans, and we match, in cash, a portion of the employee contributions. Beginning on January 1, 2011, for newly hired non-union employees, rehiresand transfers to the U.S. or Puerto Rico, we no longer offer a defined benefit pension plan and, instead, offer a Retirement Savings Contribution (RSC) in the definedcontribution plan. The RSC is an annual non-contributory employer contribution (that is, not dependent upon the participant making a contribution) determined based on eachemployee’s eligible compensation, age and years of service. Beginning on January 1, 2018, all non-union employees in those U.S. and Puerto Rico defined benefit plans willreceive the RSC in the defined contribution plans. We recorded charges related to the employer contributions to global defined contribution plans of $317 million in 2016 , $287million in 2015 and $278 million in 2014 .
Note 12. Equity
A. Common Stock
We purchase our common stock through privately negotiated transactions or in open market purchases as circumstances and prices warrant. Purchased shares under each ofthe share-purchase plans, which are authorized by our Board of Directors, are available for general corporate purposes. On June 27, 2013, we announced that the Board ofDirectors had authorized a $10 billion share-purchase plan, which was exhausted in the first quarter of 2015. On October 23, 2014, we announced that the Board of Directorshad authorized an additional $11 billion share-purchase plan (the October 2014 Stock Purchase Plan), and share purchases commenced thereunder in January 2015. InDecember 2015, the Board of Directors authorized a new $11 billion share repurchase program to be utilized over time.
On March 8, 2016, we entered into an accelerated share repurchase agreement with GS&Co. to repurchase $5 billion of our common stock. Pursuant to the terms of theagreement, on March 10, 2016, we paid $5 billion to GS&Co. and received an initial delivery of approximately 136 million shares of our common stock from GS&Co. based ona price of $29.36 per share, which represented, based on the closing share price of our common stock on the NYSE on March 8, 2016, approximately 80% of the notionalamount of the accelerated share repurchase agreement. On June 20, 2016, the accelerated share repurchase agreement with GS&Co. was completed, which, per the terms ofthe agreement, resulted in GS&Co. owing us a certain number of shares of Pfizer common stock. Pursuant to the agreement’s settlement terms, we received an additional 18million shares of our common stock from GS&Co. on June 20, 2016. The average price paid for all of the shares delivered under the accelerated share repurchase agreementwas $32.38 per share. The common stock received is included in Treasury stock . This agreement was entered into pursuant to our previously announced share repurchaseauthorization.
On February 9, 2015, we entered into an accelerated share repurchase agreement with GS&Co. to repurchase shares of our common stock. This agreement was entered intounder our previously announced share repurchase authorization. Pursuant to the terms of the agreement, on February 11, 2015, we paid $5 billion to GS&Co. and receivedapproximately 151 million shares of our common stock from GS&Co. On July 2, 2015, the accelerated share repurchase agreement with GS&Co. was completed, which, perthe terms of the agreement, resulted in us owing GS&Co. a certain number of shares of Pfizer common stock or its equivalent dollar value. Pursuant to the agreement’ssettlement terms, we elected to settle this amount in cash and paid an additional $160 million to GS&Co. on July 13, 2015, resulting in a total of approximately $5.2 billion paidto GS&Co. The final average price paid for the shares delivered under the accelerated share repurchase agreement was $34.13 per share.
114
2016 Financial Report
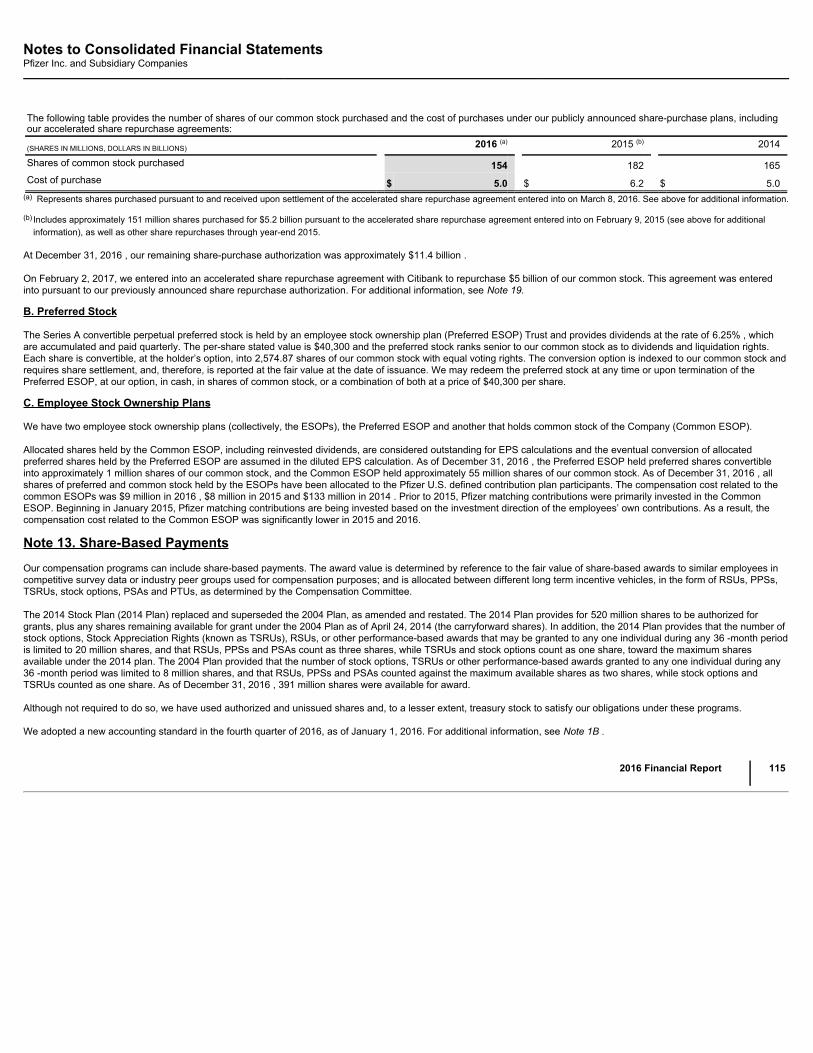
Notes to Consolidated Financial StatementsPfizer Inc. and Subsidiary Companies
The following table provides the number of shares of our common stock purchased and the cost of purchases under our publicly announced share-purchase plans, includingour accelerated share repurchase agreements:
(SHARES IN MILLIONS, DOLLARS IN BILLIONS) 2016 (a) 2015 (b) 2014
Shares of common stock purchased 154 182 165Cost of purchase $ 5.0 $ 6.2 $ 5.0
(a)
Represents shares purchased pursuant to and received upon settlement of the accelerated share repurchase agreement entered into on March 8, 2016. See above for additional information.
(b)
Includes approximately 151 million shares purchased for $5.2 billion pursuant to the accelerated share repurchase agreement entered into on February 9, 2015 (see above for additionalinformation), as well as other share repurchases through year-end 2015.
At December 31, 2016 , our remaining share-purchase authorization was approximately $11.4 billion .
On February 2, 2017, we entered into an accelerated share repurchase agreement with Citibank to repurchase $5 billion of our common stock. This agreement was enteredinto pursuant to our previously announced share repurchase authorization. For additional information, see Note 19.
B. Preferred Stock
The Series A convertible perpetual preferred stock is held by an employee stock ownership plan (Preferred ESOP) Trust and provides dividends at the rate of 6.25% , whichare accumulated and paid quarterly. The per-share stated value is $40,300 and the preferred stock ranks senior to our common stock as to dividends and liquidation rights.Each share is convertible, at the holder’s option, into 2,574.87 shares of our common stock with equal voting rights. The conversion option is indexed to our common stock andrequires share settlement, and, therefore, is reported at the fair value at the date of issuance. We may redeem the preferred stock at any time or upon termination of thePreferred ESOP, at our option, in cash, in shares of common stock, or a combination of both at a price of $40,300 per share.
C. Employee Stock Ownership Plans
We have two employee stock ownership plans (collectively, the ESOPs), the Preferred ESOP and another that holds common stock of the Company (Common ESOP).
Allocated shares held by the Common ESOP, including reinvested dividends, are considered outstanding for EPS calculations and the eventual conversion of allocatedpreferred shares held by the Preferred ESOP are assumed in the diluted EPS calculation. As of December 31, 2016 , the Preferred ESOP held preferred shares convertibleinto approximately 1 million shares of our common stock, and the Common ESOP held approximately 55 million shares of our common stock. As of December 31, 2016 , allshares of preferred and common stock held by the ESOPs have been allocated to the Pfizer U.S. defined contribution plan participants. The compensation cost related to thecommon ESOPs was $9 million in 2016 , $8 million in 2015 and $133 million in 2014 . Prior to 2015, Pfizer matching contributions were primarily invested in the CommonESOP. Beginning in January 2015, Pfizer matching contributions are being invested based on the investment direction of the employees’ own contributions. As a result, thecompensation cost related to the Common ESOP was significantly lower in 2015 and 2016.
Note 13. Share-Based Payments
Our compensation programs can include share-based payments. The award value is determined by reference to the fair value of share-based awards to similar employees incompetitive survey data or industry peer groups used for compensation purposes; and is allocated between different long term incentive vehicles, in the form of RSUs, PPSs,TSRUs, stock options, PSAs and PTUs, as determined by the Compensation Committee.
The 2014 Stock Plan (2014 Plan) replaced and superseded the 2004 Plan, as amended and restated. The 2014 Plan provides for 520 million shares to be authorized forgrants, plus any shares remaining available for grant under the 2004 Plan as of April 24, 2014 (the carryforward shares). In addition, the 2014 Plan provides that the number ofstock options, Stock Appreciation Rights (known as TSRUs), RSUs, or other performance-based awards that may be granted to any one individual during any 36 -month periodis limited to 20 million shares, and that RSUs, PPSs and PSAs count as three shares, while TSRUs and stock options count as one share, toward the maximum sharesavailable under the 2014 plan. The 2004 Plan provided that the number of stock options, TSRUs or other performance-based awards granted to any one individual during any36 -month period was limited to 8 million shares, and that RSUs, PPSs and PSAs counted against the maximum available shares as two shares, while stock options andTSRUs counted as one share. As of December 31, 2016 , 391 million shares were available for award.
Although not required to do so, we have used authorized and unissued shares and, to a lesser extent, treasury stock to satisfy our obligations under these programs.
We adopted a new accounting standard in the fourth quarter of 2016, as of January 1, 2016. For additional information, see Note 1B .
2016 Financial Report
115
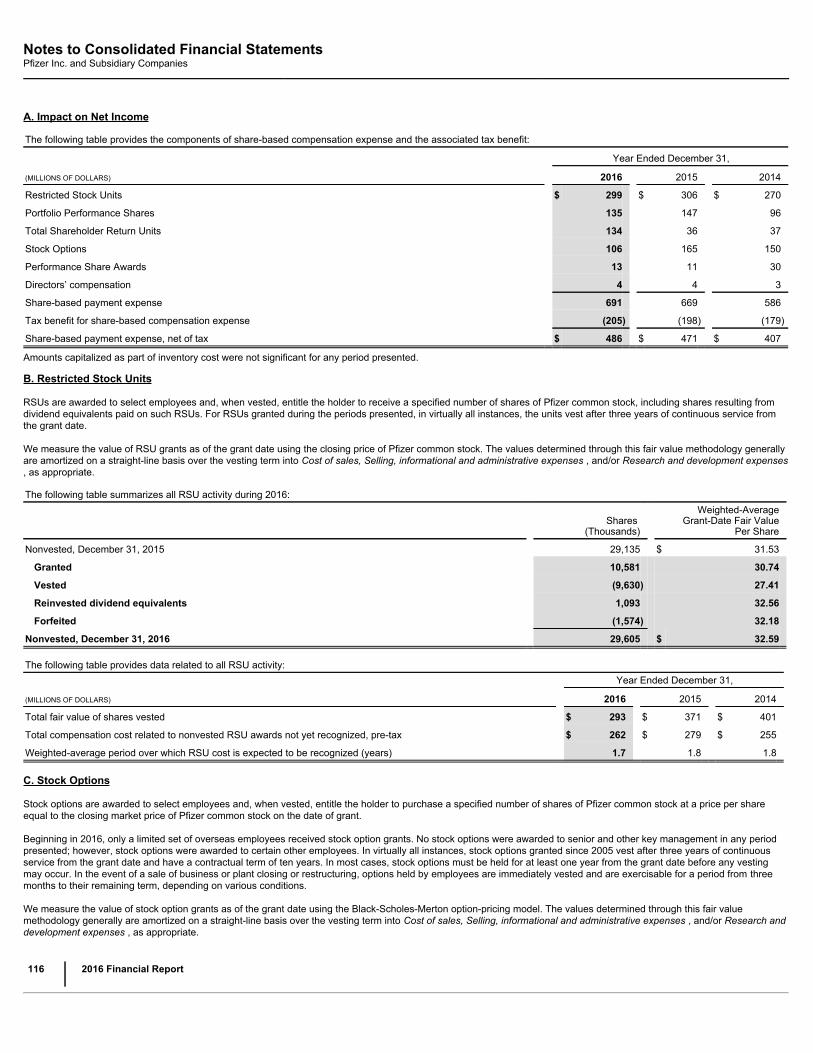
Notes to Consolidated Financial StatementsPfizer Inc. and Subsidiary Companies
A. Impact on Net Income
The following table provides the components of share-based compensation expense and the associated tax benefit:
Year Ended December 31,
(MILLIONS OF DOLLARS) 2016 2015 2014
Restricted Stock Units $ 299 $ 306 $ 270
Portfolio Performance Shares 135 147 96
Total Shareholder Return Units 134 36 37
Stock Options 106 165 150
Performance Share Awards 13 11 30
Directors’ compensation 4 4 3
Share-based payment expense 691 669 586
Tax benefit for share-based compensation expense (205) (198) (179)
Share-based payment expense, net of tax $ 486 $ 471 $ 407
Amounts capitalized as part of inventory cost were not significant for any period presented.
B. Restricted Stock Units
RSUs are awarded to select employees and, when vested, entitle the holder to receive a specified number of shares of Pfizer common stock, including shares resulting fromdividend equivalents paid on such RSUs. For RSUs granted during the periods presented, in virtually all instances, the units vest after three years of continuous service fromthe grant date.
We measure the value of RSU grants as of the grant date using the closing price of Pfizer common stock. The values determined through this fair value methodology generallyare amortized on a straight-line basis over the vesting term into Cost of sales, Selling, informational and administrative expenses , and/or Research and development expenses, as appropriate.
The following table summarizes all RSU activity during 2016:
Shares
(Thousands)
Weighted-AverageGrant-Date Fair Value
Per Share
Nonvested, December 31, 2015 29,135 $ 31.53
Granted 10,581 30.74
Vested (9,630) 27.41
Reinvested dividend equivalents 1,093 32.56
Forfeited (1,574) 32.18
Nonvested, December 31, 2016 29,605 $ 32.59
The following table provides data related to all RSU activity:
(MILLIONS OF DOLLARS) Year Ended December 31,
2016 2015 2014
Total fair value of shares vested $ 293 $ 371 $ 401
Total compensation cost related to nonvested RSU awards not yet recognized, pre-tax $ 262 $ 279 $ 255
Weighted-average period over which RSU cost is expected to be recognized (years) 1.7 1.8 1.8
C. Stock Options
Stock options are awarded to select employees and, when vested, entitle the holder to purchase a specified number of shares of Pfizer common stock at a price per shareequal to the closing market price of Pfizer common stock on the date of grant.
Beginning in 2016, only a limited set of overseas employees received stock option grants. No stock options were awarded to senior and other key management in any periodpresented; however, stock options were awarded to certain other employees. In virtually all instances, stock options granted since 2005 vest after three years of continuousservice from the grant date and have a contractual term of ten years. In most cases, stock options must be held for at least one year from the grant date before any vestingmay occur. In the event of a sale of business or plant closing or restructuring, options held by employees are immediately vested and are exercisable for a period from threemonths to their remaining term, depending on various conditions.
We measure the value of stock option grants as of the grant date using the Black-Scholes-Merton option-pricing model. The values determined through this fair valuemethodology generally are amortized on a straight-line basis over the vesting term into Cost of sales, Selling, informational and administrative expenses , and/or Research anddevelopment expenses , as appropriate.
116
2016 Financial Report
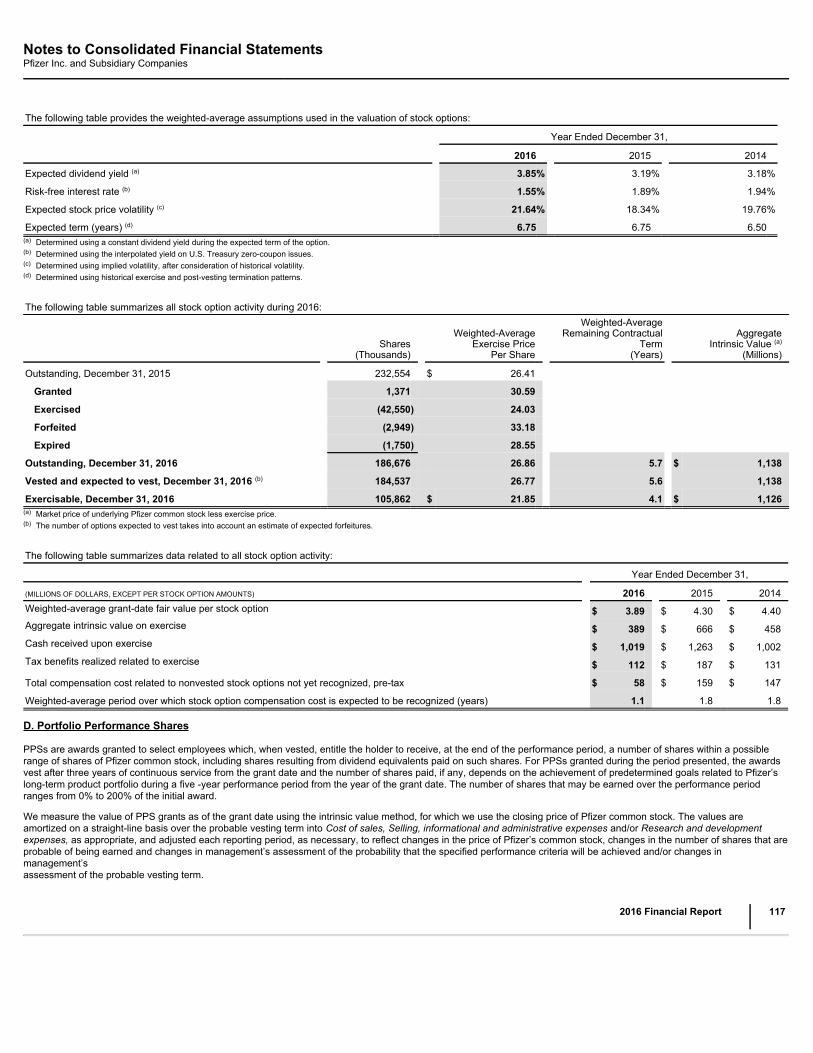
Notes to Consolidated Financial StatementsPfizer Inc. and Subsidiary Companies
The following table provides the weighted-average assumptions used in the valuation of stock options:
Year Ended December 31,
2016 2015 2014
Expected dividend yield (a) 3.85% 3.19% 3.18%
Risk-free interest rate (b) 1.55% 1.89% 1.94%
Expected stock price volatility (c) 21.64% 18.34% 19.76%
Expected term (years) (d) 6.75 6.75 6.50(a) Determined using a constant dividend yield during the expected term of the option.(b) Determined using the interpolated yield on U.S. Treasury zero-coupon issues.(c) Determined using implied volatility, after consideration of historical volatility.(d) Determined using historical exercise and post-vesting termination patterns.
The following table summarizes all stock option activity during 2016:
Shares
(Thousands)
Weighted-AverageExercise Price
Per Share
Weighted-AverageRemaining Contractual
Term(Years)
AggregateIntrinsic Value (a)
(Millions)
Outstanding, December 31, 2015 232,554 $ 26.41
Granted 1,371 30.59
Exercised (42,550) 24.03
Forfeited (2,949) 33.18
Expired (1,750) 28.55
Outstanding, December 31, 2016 186,676 26.86 5.7 $ 1,138
Vested and expected to vest, December 31, 2016 (b) 184,537 26.77 5.6 1,138
Exercisable, December 31, 2016 105,862 $ 21.85 4.1 $ 1,126(a) Market price of underlying Pfizer common stock less exercise price.(b) The number of options expected to vest takes into account an estimate of expected forfeitures.
The following table summarizes data related to all stock option activity:
Year Ended December 31,
(MILLIONS OF DOLLARS, EXCEPT PER STOCK OPTION AMOUNTS) 2016 2015 2014Weighted-average grant-date fair value per stock option $ 3.89 $ 4.30 $ 4.40Aggregate intrinsic value on exercise $ 389 $ 666 $ 458Cash received upon exercise $ 1,019 $ 1,263 $ 1,002Tax benefits realized related to exercise $ 112 $ 187 $ 131
Total compensation cost related to nonvested stock options not yet recognized, pre-tax $ 58 $ 159 $ 147
Weighted-average period over which stock option compensation cost is expected to be recognized (years) 1.1 1.8 1.8
D. Portfolio Performance Shares
PPSs are awards granted to select employees which, when vested, entitle the holder to receive, at the end of the performance period, a number of shares within a possiblerange of shares of Pfizer common stock, including shares resulting from dividend equivalents paid on such shares. For PPSs granted during the period presented, the awardsvest after three years of continuous service from the grant date and the number of shares paid, if any, depends on the achievement of predetermined goals related to Pfizer’slong-term product portfolio during a five -year performance period from the year of the grant date. The number of shares that may be earned over the performance periodranges from 0% to 200% of the initial award.
We measure the value of PPS grants as of the grant date using the intrinsic value method, for which we use the closing price of Pfizer common stock. The values areamortized on a straight-line basis over the probable vesting term into Cost of sales, Selling, informational and administrative expenses and/or Research and developmentexpenses, as appropriate, and adjusted each reporting period, as necessary, to reflect changes in the price of Pfizer’s common stock, changes in the number of shares that areprobable of being earned and changes in management’s assessment of the probability that the specified performance criteria will be achieved and/or changes inmanagement’sassessment of the probable vesting term.
2016 Financial Report
117
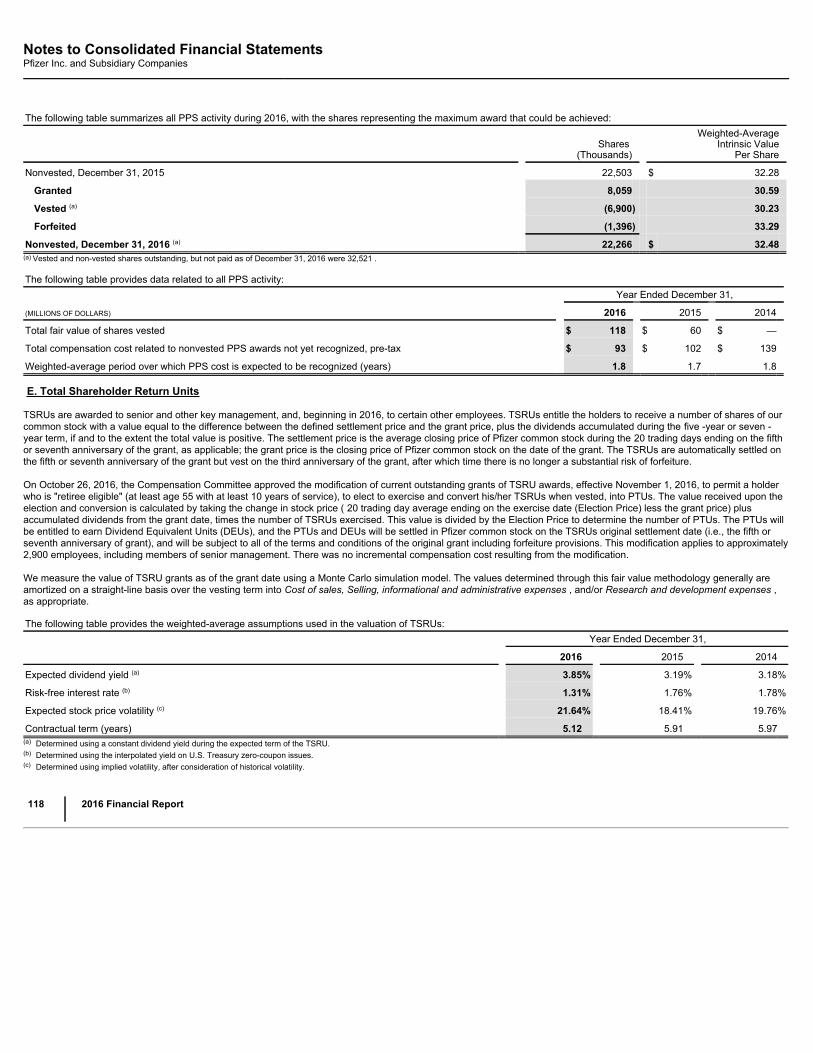
Notes to Consolidated Financial StatementsPfizer Inc. and Subsidiary Companies
The following table summarizes all PPS activity during 2016, with the shares representing the maximum award that could be achieved:
Shares
(Thousands)
Weighted-AverageIntrinsic Value
Per Share
Nonvested, December 31, 2015 22,503 $ 32.28
Granted 8,059 30.59
Vested (a) (6,900) 30.23
Forfeited (1,396) 33.29
Nonvested, December 31, 2016 (a) 22,266 $ 32.48(a) Vested and non-vested shares outstanding, but not paid as of December 31, 2016 were 32,521 .
The following table provides data related to all PPS activity:
(MILLIONS OF DOLLARS) Year Ended December 31,
2016 2015 2014
Total fair value of shares vested $ 118 $ 60 $ —
Total compensation cost related to nonvested PPS awards not yet recognized, pre-tax $ 93 $ 102 $ 139
Weighted-average period over which PPS cost is expected to be recognized (years) 1.8 1.7 1.8
E. Total Shareholder Return Units
TSRUs are awarded to senior and other key management, and, beginning in 2016, to certain other employees. TSRUs entitle the holders to receive a number of shares of ourcommon stock with a value equal to the difference between the defined settlement price and the grant price, plus the dividends accumulated during the five -year or seven -year term, if and to the extent the total value is positive. The settlement price is the average closing price of Pfizer common stock during the 20 trading days ending on the fifthor seventh anniversary of the grant, as applicable; the grant price is the closing price of Pfizer common stock on the date of the grant. The TSRUs are automatically settled onthe fifth or seventh anniversary of the grant but vest on the third anniversary of the grant, after which time there is no longer a substantial risk of forfeiture.
On October 26, 2016, the Compensation Committee approved the modification of current outstanding grants of TSRU awards, effective November 1, 2016, to permit a holderwho is "retiree eligible" (at least age 55 with at least 10 years of service), to elect to exercise and convert his/her TSRUs when vested, into PTUs. The value received upon theelection and conversion is calculated by taking the change in stock price ( 20 trading day average ending on the exercise date (Election Price) less the grant price) plusaccumulated dividends from the grant date, times the number of TSRUs exercised. This value is divided by the Election Price to determine the number of PTUs. The PTUs willbe entitled to earn Dividend Equivalent Units (DEUs), and the PTUs and DEUs will be settled in Pfizer common stock on the TSRUs original settlement date (i.e., the fifth orseventh anniversary of grant), and will be subject to all of the terms and conditions of the original grant including forfeiture provisions. This modification applies to approximately2,900 employees, including members of senior management. There was no incremental compensation cost resulting from the modification.
We measure the value of TSRU grants as of the grant date using a Monte Carlo simulation model. The values determined through this fair value methodology generally areamortized on a straight-line basis over the vesting term into Cost of sales, Selling, informational and administrative expenses , and/or Research and development expenses ,as appropriate.
The following table provides the weighted-average assumptions used in the valuation of TSRUs:
Year Ended December 31,
2016 2015 2014
Expected dividend yield (a) 3.85% 3.19% 3.18%
Risk-free interest rate (b) 1.31% 1.76% 1.78%
Expected stock price volatility (c) 21.64% 18.41% 19.76%
Contractual term (years) 5.12 5.91 5.97(a) Determined using a constant dividend yield during the expected term of the TSRU.(b) Determined using the interpolated yield on U.S. Treasury zero-coupon issues.(c) Determined using implied volatility, after consideration of historical volatility.
118
2016 Financial Report
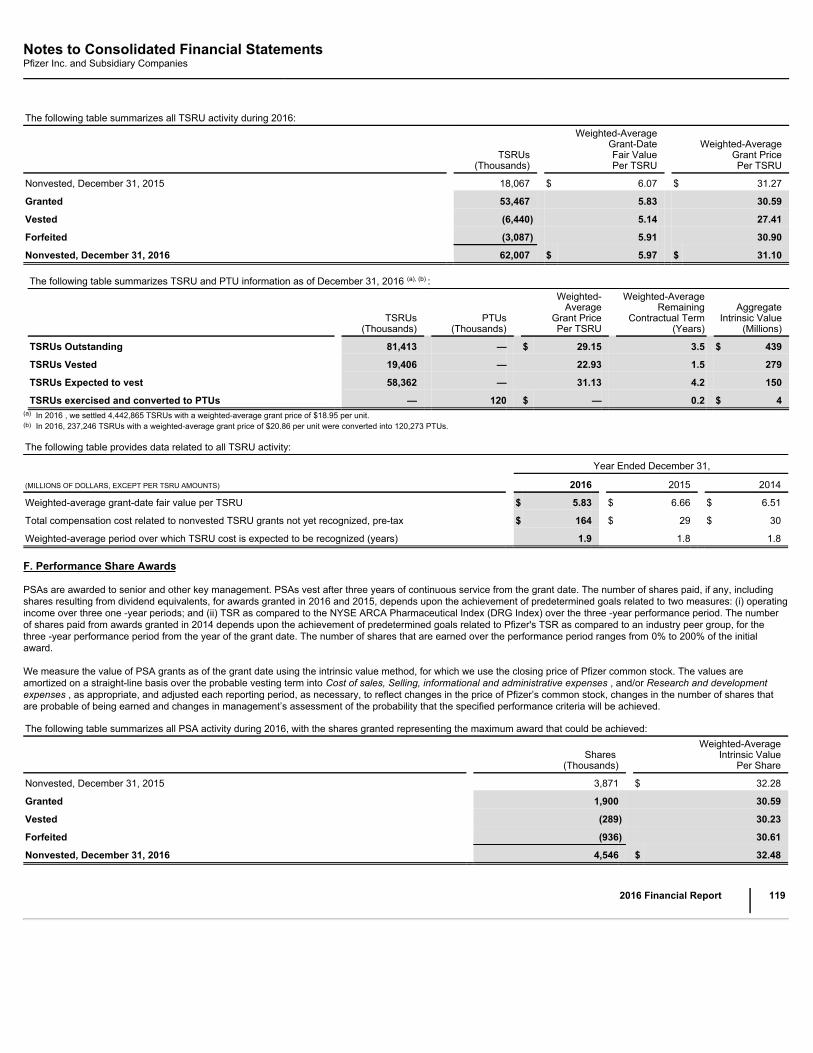
Notes to Consolidated Financial StatementsPfizer Inc. and Subsidiary Companies
The following table summarizes all TSRU activity during 2016:
TSRUs
(Thousands)
Weighted-AverageGrant-DateFair ValuePer TSRU
Weighted-AverageGrant PricePer TSRU
Nonvested, December 31, 2015 18,067 $ 6.07 $ 31.27
Granted 53,467 5.83 30.59
Vested (6,440) 5.14 27.41
Forfeited (3,087) 5.91 30.90
Nonvested, December 31, 2016 62,007 $ 5.97 $ 31.10
The following table summarizes TSRU and PTU information as of December 31, 2016 (a), (b) :
TSRUs
(Thousands) PTUs
(Thousands)
Weighted-Average
Grant PricePer TSRU
Weighted-AverageRemaining
Contractual Term(Years)
AggregateIntrinsic Value
(Millions)
TSRUs Outstanding 81,413 — $ 29.15 3.5 $ 439
TSRUs Vested 19,406 — 22.93 1.5 279
TSRUs Expected to vest 58,362 — 31.13 4.2 150
TSRUs exercised and converted to PTUs — 120 $ — 0.2 $ 4(a) In 2016 , we settled 4,442,865 TSRUs with a weighted-average grant price of $18.95 per unit.(b) In 2016, 237,246 TSRUs with a weighted-average grant price of $20.86 per unit were converted into 120,273 PTUs.
The following table provides data related to all TSRU activity:
Year Ended December 31,
(MILLIONS OF DOLLARS, EXCEPT PER TSRU AMOUNTS) 2016 2015 2014
Weighted-average grant-date fair value per TSRU $ 5.83 $ 6.66 $ 6.51
Total compensation cost related to nonvested TSRU grants not yet recognized, pre-tax $ 164 $ 29 $ 30
Weighted-average period over which TSRU cost is expected to be recognized (years) 1.9 1.8 1.8
F. Performance Share Awards
PSAs are awarded to senior and other key management. PSAs vest after three years of continuous service from the grant date. The number of shares paid, if any, includingshares resulting from dividend equivalents, for awards granted in 2016 and 2015, depends upon the achievement of predetermined goals related to two measures: (i) operatingincome over three one -year periods; and (ii) TSR as compared to the NYSE ARCA Pharmaceutical Index (DRG Index) over the three -year performance period. The numberof shares paid from awards granted in 2014 depends upon the achievement of predetermined goals related to Pfizer's TSR as compared to an industry peer group, for thethree -year performance period from the year of the grant date. The number of shares that are earned over the performance period ranges from 0% to 200% of the initialaward.
We measure the value of PSA grants as of the grant date using the intrinsic value method, for which we use the closing price of Pfizer common stock. The values areamortized on a straight-line basis over the probable vesting term into Cost of sales, Selling, informational and administrative expenses , and/or Research and developmentexpenses , as appropriate, and adjusted each reporting period, as necessary, to reflect changes in the price of Pfizer’s common stock, changes in the number of shares thatare probable of being earned and changes in management’s assessment of the probability that the specified performance criteria will be achieved.
The following table summarizes all PSA activity during 2016, with the shares granted representing the maximum award that could be achieved:
Shares
(Thousands)
Weighted-AverageIntrinsic Value
Per Share
Nonvested, December 31, 2015 3,871 $ 32.28
Granted 1,900 30.59
Vested (289) 30.23
Forfeited (936) 30.61
Nonvested, December 31, 2016 4,546 $ 32.48
2016 Financial Report
119
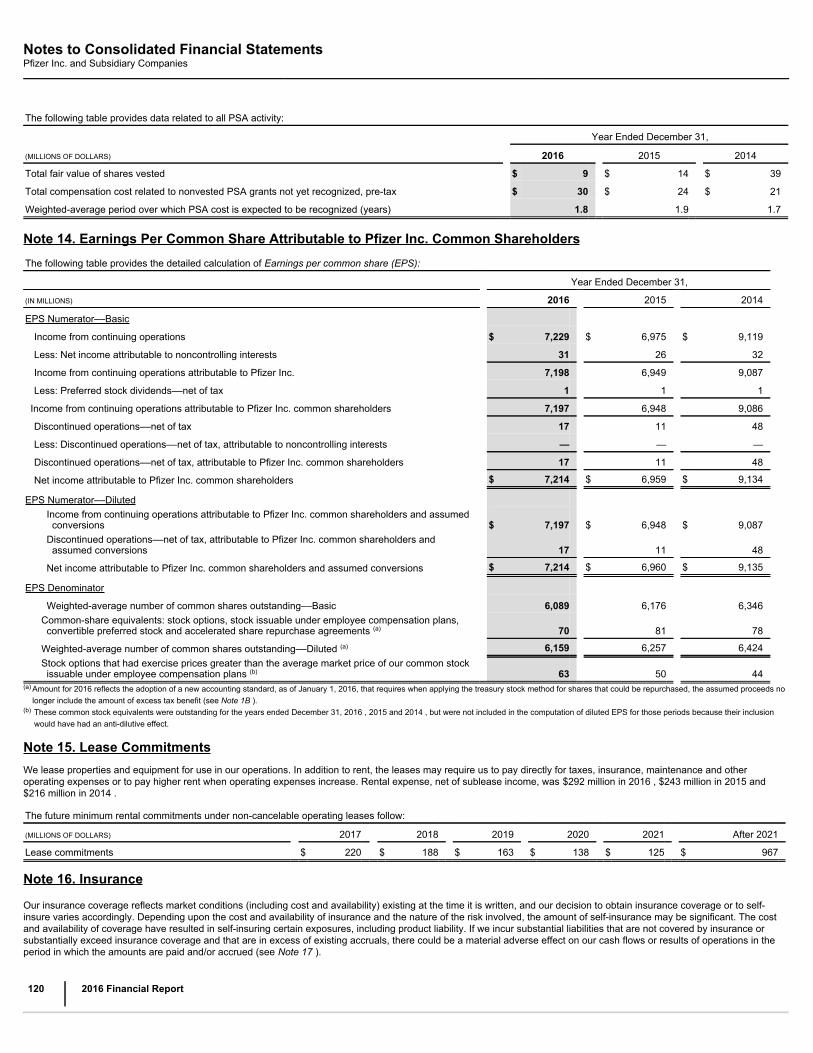
Notes to Consolidated Financial StatementsPfizer Inc. and Subsidiary Companies
The following table provides data related to all PSA activity:
Year Ended December 31,
(MILLIONS OF DOLLARS) 2016 2015 2014
Total fair value of shares vested $ 9 $ 14 $ 39
Total compensation cost related to nonvested PSA grants not yet recognized, pre-tax $ 30 $ 24 $ 21
Weighted-average period over which PSA cost is expected to be recognized (years) 1.8 1.9 1.7
Note 14. Earnings Per Common Share Attributable to Pfizer Inc. Common ShareholdersThe following table provides the detailed calculation of Earnings per common share (EPS):
Year Ended December 31,
(IN MILLIONS) 2016 2015 2014
EPS Numerator––Basic
Income from continuing operations $ 7,229 $ 6,975 $ 9,119
Less: Net income attributable to noncontrolling interests 31 26 32
Income from continuing operations attributable to Pfizer Inc. 7,198 6,949 9,087
Less: Preferred stock dividends––net of tax 1 1 1
Income from continuing operations attributable to Pfizer Inc. common shareholders 7,197 6,948 9,086
Discontinued operations––net of tax 17 11 48
Less: Discontinued operations––net of tax, attributable to noncontrolling interests — — —
Discontinued operations––net of tax, attributable to Pfizer Inc. common shareholders 17 11 48
Net income attributable to Pfizer Inc. common shareholders $ 7,214 $ 6,959 $ 9,134
EPS Numerator––Diluted Income from continuing operations attributable to Pfizer Inc. common shareholders and assumedconversions $ 7,197 $ 6,948 $ 9,087
Discontinued operations––net of tax, attributable to Pfizer Inc. common shareholders andassumed conversions 17 11 48
Net income attributable to Pfizer Inc. common shareholders and assumed conversions $ 7,214 $ 6,960 $ 9,135
EPS Denominator
Weighted-average number of common shares outstanding––Basic 6,089 6,176 6,346Common-share equivalents: stock options, stock issuable under employee compensation plans,convertible preferred stock and accelerated share repurchase agreements (a) 70 81 78
Weighted-average number of common shares outstanding––Diluted (a) 6,159 6,257 6,424Stock options that had exercise prices greater than the average market price of our common stockissuable under employee compensation plans (b) 63 50 44
(a)
Amount for 2016 reflects the adoption of a new accounting standard, as of January 1, 2016, that requires when applying the treasury stock method for shares that could be repurchased, the assumed proceeds nolonger include the amount of excess tax benefit (see Note 1B ).
(b)
These common stock equivalents were outstanding for the years ended December 31, 2016 , 2015 and 2014 , but were not included in the computation of diluted EPS for those periods because their inclusionwould have had an anti-dilutive effect.
Note 15. Lease CommitmentsWe lease properties and equipment for use in our operations. In addition to rent, the leases may require us to pay directly for taxes, insurance, maintenance and otheroperating expenses or to pay higher rent when operating expenses increase. Rental expense, net of sublease income, was $292 million in 2016 , $243 million in 2015 and$216 million in 2014 .
The future minimum rental commitments under non-cancelable operating leases follow:
(MILLIONS OF DOLLARS) 2017 2018 2019 2020 2021 After 2021
Lease commitments $ 220 $ 188 $ 163 $ 138 $ 125 $ 967
Note 16. Insurance
Our insurance coverage reflects market conditions (including cost and availability) existing at the time it is written, and our decision to obtain insurance coverage or to self-insure varies accordingly. Depending upon the cost and availability of insurance and the nature of the risk involved, the amount of self-insurance may be significant. The costand availability of coverage have resulted in self-insuring certain exposures, including product liability. If we incur substantial liabilities that are not covered by insurance orsubstantially exceed insurance coverage and that are in excess of existing accruals, there could be a material adverse effect on our cash flows or results of operations in theperiod in which the amounts are paid and/or accrued (see Note 17 ).
120
2016 Financial Report
Notes to Consolidated Financial StatementsPfizer Inc. and Subsidiary Companies
Note 17. Commitments and ContingenciesWe and certain of our subsidiaries are subject to numerous contingencies arising in the ordinary course of business. For a discussion of our tax contingencies, see Note 5D.
A. Legal Proceedings
Our non-tax contingencies include, but are not limited to, the following:• Patent litigation, which typically involves challenges to the coverage and/or validity of patents on various products, processes or dosage forms. We are the plaintiff in the
vast majority of these actions. An adverse outcome in actions in which we are the plaintiff could result in loss of patent protection for a drug, a significant loss of revenuesfrom that drug or impairment of the value of associated assets.
• Product liability and other product-related litigation, which can include personal injury, consumer, off-label promotion, securities, antitrust and breach of contract claims,among others, often involves highly complex issues relating to medical causation, label warnings and reliance on those warnings, scientific evidence and findings, actual,provable injury and other matters.
• Commercial and other matters, which can include merger-related and product-pricing claims and environmental claims and proceedings, can involve complexities that willvary from matter to matter.
• Government investigations, which often are related to the extensive regulation of pharmaceutical companies by national, state and local government agencies in the U.S.and in other countries.
Certain of these contingencies could result in losses, including damages, fines and/or civil penalties, and/or criminal charges, which could be substantial.
We believe that our claims and defenses in these matters are substantial, but litigation is inherently unpredictable and excessive verdicts do occur. We do not believe that anyof these matters will have a material adverse effect on our financial position. However, we could incur judgments, enter into settlements or revise our expectations regardingthe outcome of certain matters, and such developments could have a material adverse effect on our results of operations in the period in which the amounts are accrued and/orour cash flows in the period in which the amounts are paid.
We have accrued for losses that are both probable and reasonably estimable. Substantially all of our contingencies are subject to significant uncertainties and, therefore,determining the likelihood of a loss and/or the measurement of any loss can be complex. Consequently, we are unable to estimate the range of reasonably possible loss inexcess of amounts accrued. Our assessments are based on estimates and assumptions that have been deemed reasonable by management, but the assessment processrelies heavily on estimates and assumptions that may prove to be incomplete or inaccurate, and unanticipated events and circumstances may occur that might cause us tochange those estimates and assumptions.
Amounts recorded for legal and environmental contingencies can result from a complex series of judgments about future events and uncertainties and can rely heavily onestimates and assumptions.
The principal pending matters to which we are a party are discussed below. In determining whether a pending matter is a principal matter, we consider both quantitative andqualitative factors in order to assess materiality, such as, among other things, the amount of damages and the nature of any other relief sought in the proceeding, if suchdamages and other relief are specified; our view of the merits of the claims and of the strength of our defenses; whether the action purports to be, or is, a class action and, ifnot certified, our view of the likelihood that a class will be certified by the court; the jurisdiction in which the proceeding is pending; any experience that we or, to our knowledge,other companies have had in similar proceedings; whether disclosure of the action would be important to a reader of our financial statements, including whether disclosuremight change a reader’s judgment about our financial statements in light of all of the information that is available to the reader; the potential impact of the proceeding on ourreputation; and the extent of public interest in the matter. In addition, with respect to patent matters in which we are the plaintiff, we consider, among other things, the financialsignificance of the product protected by the patent. As a result of considering qualitative factors in our determination of principal matters, there are some matters discussedbelow with respect to which management believes that the likelihood of possible loss in excess of amounts accrued is remote.
A1. Legal Proceedings––Patent Litigation
Like other pharmaceutical companies, we are involved in numerous suits relating to our patents, including but not limited to, those discussed below. Most of the suits involveclaims by generic drug manufacturers that patents covering our products, processes or dosage forms are invalid and/or do not cover the product of the generic drugmanufacturer. Also, counterclaims, as well as various independent actions, have been filed alleging that our assertions of, or attempts to enforce, patent rights with respect tocertain products constitute unfair competition and/or violations of antitrust laws. In addition to the challenges to the U.S. patents on a number of our products that are discussedbelow, patent rights to certain of our products are being challenged in various other countries. We are also party to other patent damages suits in various jurisdictions pursuantto which generic drug manufacturers, payers, governments or other parties are seeking damages from us for alleged delay of generic entry. Additionally, our licensing andcollaboration partners face challenges by generic drug manufacturers to patents covering several of their products that may impact our licenses or co-promotion rights to suchproducts. We are also subject to patent litigation pursuant to which one or more third parties seeks damages and/or injunctive relief to compensate for alleged infringement ofits patents by our commercial or other activities. For example, our subsidiary, Hospira, is involved in patent and patent-related disputes over its attempts to bring genericpharmaceutical and biosimilar products to market. If one of our marketed products is found to infringe valid patent rights of a third party, such third party may be awardedsignificant damages, or we may be prevented from further sales of that product. Such damages may be enhanced as much as three-fold in the event that we or one of oursubsidiaries, like Hospira, is found to have willfully infringed valid patent rights of a third party.
2016 Financial Report
121
Notes to Consolidated Financial StatementsPfizer Inc. and Subsidiary Companies
Actions In Which We Are The Plaintiff
Bosulif (bosutinib)In December 2016, Wyeth LLC, Wyeth Pharmaceuticals Inc., and PF Prism C.V. (collectively, Wyeth) brought a patent-infringement action against Alembic Pharmaceuticals,Ltd, Alembic Pharmaceuticals, Inc. (collectively, Alembic), Sun Pharmaceutical Industries, Inc., and Sun Pharmaceutical Industries Limited (collectively, Sun), in the U.S.District Court for the District of Delaware in connection with abbreviated new drug applications respectively filed with the FDA by Alembic and Sun, each seeking approval tomarket generic versions of bosutinib. Both Alembic and Sun are challenging patents, which expire in 2026, covering polymorphic forms of bosutinib and methods of treatingchronic myelogenous leukemia.
EpiPenIn July 2010, King, which we acquired in 2011 and is a wholly-owned subsidiary, brought a patent-infringement action against Sandoz, Inc., a division of Novartis AG (Sandoz),in the U.S. District Court for the District of New Jersey in connection with Sandoz’s abbreviated new drug application filed with the FDA seeking approval to market anepinephrine injectable product. Sandoz is challenging patents, which expire in 2025, covering the next-generation autoinjector for use with epinephrine that is sold under theEpiPen brand name.
Flector Patch (diclofenac)In October 2015, the owners (Teikoku Seiyaku Co., Ltd. and Altergon SA) of a patent covering Pfizer's Flector Patch product, along with the New Drug Application holder (IBSAInstitut Biochemique SA), brought a patent-infringement action against Actavis Laboratories UT, Inc. in the U.S. District Court for the District of Delaware in connection with anabbreviated new drug application filed by Actavis Laboratories UT, Inc. with the FDA requesting approval to launch a generic version of Flector Patch prior to the 2019expiration of the patent. In August 2016, Pfizer subsidiary Alpharma Pharmaceuticals LLC was added as a plaintiff to the lawsuit.
Precedex PremixIn June 2014, Ben Venue Laboratories, Inc. (Ben Venue) notified our subsidiary, Hospira, that it had filed an abbreviated new drug application with the FDA seeking approval tomarket a generic version of Hospira’s premix version of Precedex and containing allegations that a patent relating to the use of Precedex in an intensive care unit setting, whichexpires in March 2019, was invalid or not infringed. In August 2014, Hospira and Orion Corporation (co-owner of the patent that is the subject of the lawsuit) filed suit againstBen Venue, Hikma Pharmaceuticals PLC (Hikma), and West-Ward Pharmaceutical Corp. in the U.S. District Court for the District of Delaware asserting the validity andinfringement of the patent that is the subject of the lawsuit. In October 2014, Eurohealth International Sarl was substituted for Ben Venue and Hikma. In June 2016, this casewas settled on terms not material to Pfizer.
In June 2015, Amneal Pharmaceuticals LLC (Amneal) notified Hospira that it had filed an abbreviated new drug application with the FDA seeking approval to market a genericversion of Hospira’s premix version of Precedex and containing allegations that four patents relating to the Precedex premix formulations and their use, all of which expire in2032, were invalid or not infringed. In August 2015, Hospira filed suit against Amneal in the U.S. District Court for the District of Delaware asserting the validity and infringementof the patents that are the subject of the lawsuit.
In December 2015, Fresenius Kabi USA LLC (Fresenius) notified Hospira that it had filed an abbreviated new drug application with the FDA seeking approval to market ageneric version of Hospira’s premix version of Precedex and containing allegations that four patents relating to the Precedex premix formulations and their use, all of whichexpire in 2032, were invalid or not infringed. In January 2016, Hospira filed suit against Fresenius in the U.S. District Court for the Northern District of Illinois asserting thevalidity and infringement of the patents that are the subject of the lawsuit.
In August 2016, Par Sterile Products, LLC (Par) notified Hospira that it had filed an abbreviated new drug application with the FDA seeking approval to market a genericversion of Hospira’s premix version of Precedex and containing allegations that four patents relating to the Precedex premix formulations and their use, all of which expire in2032, were invalid or not infringed. In September 2016, Hospira filed suit against Par in the U.S. District Court for the District of Delaware asserting the validity and infringementof the patents that are the subject of the lawsuit. In December 2016, the case was stayed pending the outcome of Hospira’s suit against Amneal (including all appeals).
Toviaz (fesoterodine)We have an exclusive, worldwide license to market Toviaz from UCB Pharma GmbH (UCB), which owns the patents relating to Toviaz.
Beginning in May 2013, several generic drug manufacturers notified us that they had filed abbreviated new drug applications with the FDA seeking approval to market genericversions of Toviaz and asserting the invalidity, unenforceability and/or non-infringement of all of our patents for Toviaz that are listed in the FDA’s list of Approved DrugProducts with Therapeutic Equivalence Evaluations, commonly referred to as the “Orange Book”. Beginning in June 2013, we filed actions against all of those generic drugmanufacturers in the U.S. District Court for the District of Delaware, asserting the infringement of five of the patents for Toviaz: three composition-of-matter patents and amethod-of-use patent that expire in 2019 and a patent covering salts of fesoterodine that expires in 2022. In June and July 2015, we settled with four of the genericdefendants. The trial relating to the four remaining defendants occurred in July 2015. In April 2016, the District Court held that the patents that were the subject of the lawsuitwere valid and infringed. The defendants’ deadline to appeal this decision expired in June 2016.
In December 2014, Mylan Pharmaceuticals, Inc. (Mylan Pharmaceuticals) notified us that it had filed an abbreviated new drug application with the FDA seeking approval tomarket a generic version of Toviaz and asserting the invalidity, unenforceability and/or non-infringement of all of our patents for Toviaz that are listed in the Orange Book. InJanuary 2015, we filed an action against Mylan Pharmaceuticals in the U.S. District Court for the District of Delaware, asserting the infringement of five of the patents forToviaz: three composition-of-matter patents and a method-of-use patent that expire in 2019 and a patent covering salts of fesoterodine that expires in 2022. In January 2017,the District Court issued a verdict finding that the five patents that are the subject of the lawsuit are valid and infringed.
Tygacil (tigecycline)In November 2014, Mylan Laboratories Limited (formerly Agila Specialties Private Limited) (Mylan Laboratories) notified us that it had filed an abbreviated new drug applicationwith the FDA seeking approval to market a generic version of Tygacil. Mylan Laboratories asserts the
122
2016 Financial Report
Notes to Consolidated Financial StatementsPfizer Inc. and Subsidiary Companies
invalidity and non-infringement of the polymorph patent for Tygacil that expires in 2030 and the formulation patent for Tygacil that expires in 2029. Mylan Laboratories has notchallenged the composition-of-matter patent. In January 2015, we filed suit against Mylan Laboratories in the U.S. District Court for the District of Delaware, asserting thevalidity and infringement of the polymorph patent and the formulation patent for Tygacil. In December 2016, we settled our claims against Mylan Laboratories on terms notmaterial to Pfizer and the case was dismissed.
In addition, in September 2015 and December 2015, we received notices of Section 505(b)(2) new drug applications filed by each of Mylan Laboratories and AccordHealthcare Inc. (Accord) for tigecycline injectable products. Mylan Laboratories and Accord assert the invalidity and non-infringement of the polymorph patent for Tygacil andtwo formulation patents for Tygacil that expire in 2028 and 2029, respectively. In October 2015, we filed suit against Mylan Laboratories in the U.S. District Court for the Districtof Delaware and in the U.S. District Court for the District of West Virginia asserting the validity and infringement of the patents that are the subject of the lawsuit. In December2016, we settled our claims against Mylan Laboratories on terms not material to Pfizer and the case against Mylan Laboratories was dismissed.
In February 2016, we filed suit against Accord in the U.S. District Court for the District of Delaware and in the U.S. District Court for the Middle District of North Carolinaasserting the validity and infringement of the patents that are the subject of the lawsuit. In February 2017, we settled our claims against Accord on terms not material to Pfizerand the case against Accord was dismissed.
Xeljanz (tofacitinib)In February 2017, we brought a patent-infringement action against MicroLabs USA Inc. and MicroLabs Ltd. (collectively, MicroLabs) in the U.S. District Court for the District ofDelaware asserting the infringement and validity of three patents challenged by MicroLabs in its abbreviated new drug application seeking approval to market a generic versionof tofacitinib 5 mg tablets. Of the three patents that are the subject of the lawsuit, one covers the active ingredient and expires in December 2020, the second covers anenantiomer of tofacitinib and expires in 2022, and the third covers a polymorphic form of tofacitinib and expires in 2023. Three other patents for Xeljanz expiring in December2020 have not been challenged by MicroLabs.
Separately, also in February 2017, we brought a patent-infringement action against Sun Pharmaceutical Industries Ltd. in the U.S. District Court for the District of Delawareasserting the infringement and validity of our patent covering a polymorphic form of tofacitinib, expiring in 2023, that was challenged by Sun Pharmaceutical Industries Ltd. inits abbreviated new drug application seeking approval to market a generic version of tofacitinib 11 mg extended release tablets.
Xtandi (enzalutamide)In December 2016, Medivation and Medivation Prostate Therapeutics, Inc. (collectively, the Medivation Group); Astellas Pharma Inc., Astellas US LLC and Astellas PharmaUS, Inc. (collectively, Astellas); and The Regents of the University of California filed patent-infringement suits in the U.S. District Court for the District of Delaware againstActavis Laboratories FL, Inc. and Actavis LLC (collectively, Actavis); and Zydus Pharmaceuticals (USA) Inc. and Cadila Healthcare Ltd (collectively, Zydus); and Apotex Inc.and Apotex Corp. (collectively, Apotex) in connection with those companies’ respective abbreviated new drug applications filed with the FDA for approval to market genericversions of enzalutamide. The generic manufacturers are challenging patents, which expire as early as 2026, covering enzalutamide and treatments for prostate cancer.
Matters Involving Our Collaboration/Licensing Partners
Nexium 24HR (esomeprazole)We have an exclusive license from AstraZeneca PLC (AstraZeneca) to market in the U.S. the OTC version of Nexium (Nexium 24HR). Beginning in October 2014, ActavisLaboratories FL, Inc., and subsequently Andrx Labs, LLC (Andrx), Perrigo Company plc (Perrigo), Lupin Limited and, in October 2015, Dr. Reddy’s Laboratories, Inc. & Ltd.(Dr. Reddy’s) notified us that they had filed abbreviated new drug applications with the FDA seeking approval to market generic versions of Nexium 24HR prior to the expirationof one or more of AstraZeneca’s patents listed in the Orange Book for Nexium 24HR. From November 2014 through November 2015, AstraZeneca filed actions against each ofActavis Laboratories FL, Inc., Andrx, Perrigo, Lupin Limited and Dr. Reddy’s in the U.S. District Court for the District of New Jersey asserting the infringement of the challengedpatents. We are not a party to AstraZeneca’s patent-infringement actions.
Toviaz (fesoterodine)––Inter Partes ReviewsIn January 2016, Mylan Pharmaceuticals and Mylan Laboratories filed petitions with the U.S. Patent & Trademark Office requesting Inter Partes Reviews of five of the patentscovering fesoterodine, the active ingredient in Toviaz: three composition-of-matter patents and a method-of-use patent that expire in 2019 and a patent covering salts offesoterodine that expires in 2022. The patents are owned by UCB, and we have an exclusive, worldwide license to market Toviaz from UCB. In July 2016, the Patent Trial andAppeal Board agreed to institute Inter Partes Reviews of all five patents. Amerigen Pharmaceuticals Limited, Alembic Pharmaceuticals Limited and Torrent PharmaceuticalsLimited have joined the Inter-Partes Reviews.
Action In Which We Are The Defendant
Inflectra (infliximab-dyyb)In March 2015, Janssen and New York University, together, brought a patent-infringement action in the U.S. District Court for the District of Massachusetts against Hospira,Celltrion Healthcare Co. Ltd. and Celltrion Inc. alleging that infliximab-dyyb, to be marketed by Hospira in the U.S. under the brand name Inflectra, would infringe six patentsrelating to infliximab, its manufacture and use. Four of the patents have since been dismissed by the plaintiffs, leaving two patents at issue in the ongoing action: the infliximabantibody patent and a patent relating to cell culture media. In August 2016, the U.S. District Court for the District of Massachusetts ruled that the antibody patent was invalid,and Janssen has appealed that ruling to the Court of Appeals for the Federal Circuit.
2016 Financial Report
123
Notes to Consolidated Financial StatementsPfizer Inc. and Subsidiary Companies
A2. Legal Proceedings––Product Litigation
Like other pharmaceutical companies, we are defendants in numerous cases, including but not limited to those discussed below, related to our pharmaceutical and otherproducts. Plaintiffs in these cases seek damages and other relief on various grounds for alleged personal injury and economic loss.
AsbestosBetween 1967 and 1982, Warner-Lambert owned American Optical Corporation, which manufactured and sold respiratory protective devices and asbestos safety clothing. Inconnection with the sale of American Optical in 1982, Warner-Lambert agreed to indemnify the purchaser for certain liabilities, including certain asbestos-related and otherclaims. As of December 31, 2016 , approximately 56,200 claims naming American Optical and numerous other defendants were pending in various federal and state courtsseeking damages for alleged personal injury from exposure to asbestos and other allegedly hazardous materials. Warner-Lambert was acquired by Pfizer in 2000 and is awholly-owned subsidiary of Pfizer. Warner-Lambert is actively engaged in the defense of, and will continue to explore various means of resolving, these claims.
Numerous lawsuits are pending against Pfizer in various federal and state courts seeking damages for alleged personal injury from exposure to products allegedly containingasbestos and other allegedly hazardous materials sold by Pfizer and certain of its previously owned subsidiaries.
There also are a small number of lawsuits pending in various federal and state courts seeking damages for alleged exposure to asbestos in facilities owned or formerly ownedby Pfizer or its subsidiaries.
Effexor• Personal Injury ActionsA number of individual lawsuits and multi-plaintiff lawsuits have been filed against us and/or our subsidiaries in various federal and state courts alleging personal injury as aresult of the purported ingestion of Effexor. Among other types of actions, the Effexor personal injury litigation includes actions alleging a variety of birth defects as a result ofthe purported ingestion of Effexor by women during pregnancy. Plaintiffs in these birth-defect actions seek compensatory and punitive damages. In August 2013, the federalbirth-defect cases were transferred for consolidated pre-trial proceedings to a Multi-District Litigation ( In re Effexor ( Venlafaxine Hydrochloride) Products Liability LitigationMDL-2458 ) in the U.S. District Court for the Eastern District of Pennsylvania. Almost all plaintiffs have voluntarily dismissed their actions. The Multi-District Litigation, as well asthe coordinated state court proceedings in California, have been administratively stayed.
• Antitrust ActionsBeginning in May 2011, actions, including purported class actions, were filed in various federal courts against Wyeth and, in certain of the actions, affiliates of Wyeth andcertain other defendants relating to Effexor XR, which is the extended-release formulation of Effexor. The plaintiffs in each of the class actions seek to represent a classconsisting of all persons in the U.S. and its territories who directly purchased, indirectly purchased or reimbursed patients for the purchase of Effexor XR or generic Effexor XRfrom any of the defendants from June 14, 2008 until the time the defendants’ allegedly unlawful conduct ceased. The plaintiffs in all of the actions allege delay in the launch ofgeneric Effexor XR in the U.S. and its territories, in violation of federal antitrust laws and, in certain of the actions, the antitrust, consumer protection and various other laws ofcertain states, as the result of Wyeth fraudulently obtaining and improperly listing certain patents for Effexor XR in the Orange Book, enforcing certain patents for Effexor XRand entering into a litigation settlement agreement with a generic drug manufacturer with respect to Effexor XR. Each of the plaintiffs seeks treble damages (for itself in theindividual actions or on behalf of the putative class in the purported class actions) for alleged price overcharges for Effexor XR or generic Effexor XR in the U.S. and itsterritories since June 14, 2008. All of these actions have been consolidated in the U.S. District Court for the District of New Jersey.
In October 2014, the District Court dismissed the direct purchaser plaintiffs’ claims based on the litigation settlement agreement, but declined to dismiss the other directpurchaser plaintiff claims. In January 2015, the District Court entered partial final judgments as to all settlement agreement claims, including those asserted by directpurchasers and end-payer plaintiffs, which plaintiffs have appealed to the U.S. Court of Appeals for the Third Circuit. Motions to dismiss remain pending as to the end-payerplaintiffs’ remaining claims.
ZoloftA number of individual lawsuits and multi-plaintiff lawsuits have been filed against us and/or our subsidiaries in various federal and state courts alleging personal injury as aresult of the purported ingestion of Zoloft. Among other types of actions, the Zoloft personal injury litigation includes actions alleging a variety of birth defects as a result of thepurported ingestion of Zoloft by women during pregnancy. Plaintiffs in these birth-defect actions seek compensatory and punitive damages and the disgorgement of profitsresulting from the sale of Zoloft. In April 2012, the federal birth-defect cases were transferred for consolidated pre-trial proceedings to a Multi-District Litigation ( In re ZoloftProducts Liability Litigation MDL-2342 ) in the U.S. District Court for the Eastern District of Pennsylvania. A number of plaintiffs have voluntarily dismissed their actions. In April2016, the District Court granted our motion for summary judgment, dismissing the claims of almost all of the remaining plaintiffs. In May 2016, the plaintiffs appealed the DistrictCourt’s decision to the U.S. Court of Appeals for the Third Circuit.
Lipitor• Antitrust ActionsBeginning in November 2011, purported class actions relating to Lipitor were filed in various federal courts against, among others, Pfizer, certain affiliates of Pfizer, and, inmost of the actions, Ranbaxy, Inc. (Ranbaxy) and certain affiliates of Ranbaxy. The plaintiffs in these various actions seek to represent nationwide, multi-state or statewideclasses consisting of persons or entities who directly purchased, indirectly purchased or reimbursed patients for the purchase of Lipitor (or, in certain of the actions, genericLipitor) from any of the defendants from March 2010 until the cessation of the defendants’ allegedly unlawful conduct (the Class Period). The plaintiffs allege delay in thelaunch of generic Lipitor, in violation of federal antitrust laws and/or state antitrust, consumer protection and various other laws, resulting from (i) the 2008 agreement pursuantto which Pfizer and Ranbaxy settled certain patent litigation involving Lipitor, and Pfizer granted Ranbaxy a license
124
2016 Financial Report
Notes to Consolidated Financial StatementsPfizer Inc. and Subsidiary Companies
to sell a generic version of Lipitor in various markets beginning on varying dates, and (ii) in certain of the actions, the procurement and/or enforcement of certain patents forLipitor. Each of the actions seeks, among other things, treble damages on behalf of the putative class for alleged price overcharges for Lipitor (or, in certain of the actions,generic Lipitor) during the Class Period. In addition, individual actions have been filed against Pfizer, Ranbaxy and certain of their affiliates, among others, that assert claimsand seek relief for the plaintiffs that are substantially similar to the claims asserted and the relief sought in the purported class actions described above. These various actionshave been consolidated for pre-trial proceedings in a Multi-District Litigation ( In re Lipitor Antitrust Litigation MDL-2332 ) in the U.S. District Court for the District of New Jersey.
In September 2013 and 2014, the District Court dismissed with prejudice the claims by direct purchasers. In October and November 2014, the District Court dismissed withprejudice the claims of all other Multi-District Litigation plaintiffs. All plaintiffs have appealed the District Court’s orders dismissing their claims with prejudice to the U.S. Court ofAppeals for the Third Circuit. In addition, the direct purchaser class plaintiffs appealed the order denying their motion to amend the judgment and for leave to amend theircomplaint to the U.S. Court of Appeals for the Third Circuit.
Also, in January 2013, the State of West Virginia filed an action in West Virginia state court against Pfizer and Ranbaxy, among others, that asserts claims and seeks relief onbehalf of the State of West Virginia and residents of that state that are substantially similar to the claims asserted and the relief sought in the purported class actions describedabove.
• Personal Injury ActionsA number of individual and multi-plaintiff lawsuits have been filed against us in various federal and state courts alleging that the plaintiffs developed type 2 diabetes as a resultof the purported ingestion of Lipitor. Plaintiffs seek compensatory and punitive damages.
In February 2014, the federal actions were transferred for consolidated pre-trial proceedings to a Multi-District Litigation ( In re Lipitor (Atorvastatin Calcium) Marketing, SalesPractices and Products Liability Litigation (No. II) MDL-2502 ) in the U.S. District Court for the District of South Carolina. In 2016, certain cases in the Multi-District Litigationwere remanded to federal courts in California and certain state courts. In January 2017, the District Court granted our motion for summary judgment, dismissing substantiallyall of the remaining cases pending in the Multi-District Litigation. In January 2017, the plaintiffs appealed the District Court's decision to the U.S. Court of Appeals for the FourthCircuit.
ViagraA number of individual and multi-plaintiff lawsuits have been filed against us in various federal and state courts alleging that the plaintiffs developed melanoma and/or theexacerbation of melanoma as a result of the purported ingestion of Viagra. Plaintiffs seek compensatory and punitive damages.
In April 2016, the federal actions were transferred for coordinated pre-trial proceedings to a Multi-District Litigation ( In Re: Viagra (Sildenafil Citrate) Products LiabilityLitigation, MDL-2691 ) in the U.S. District Court for the Northern District of California.
Chantix/ChampixBeginning in December 2008, purported class actions were filed against us in the Ontario Superior Court of Justice (Toronto Region), the Superior Court of Quebec (District ofMontreal), the Court of Queen’s Bench of Alberta, Judicial District of Calgary, and the Superior Court of British Columbia (Vancouver Registry) on behalf of all individuals andthird-party payers in Canada who have purchased and ingested Champix or reimbursed patients for the purchase of Champix. Each of these actions asserts claims underCanadian product liability law, including with respect to the safety and efficacy of Champix, and, on behalf of the putative class, seeks monetary relief, including punitivedamages. In June 2012, the Ontario Superior Court of Justice certified the Ontario proceeding as a class action, defining the class as consisting of the following: (i) all personsin Canada who ingested Champix during the period from April 2, 2007 to May 31, 2010 and who experienced at least one of a number of specified neuropsychiatric adverseevents; (ii) all persons who are entitled to assert claims in respect of Champix pursuant to Canadian legislation as the result of their relationship with a class member; and (iii)all health insurers who are entitled to assert claims in respect of Champix pursuant to Canadian legislation. The Ontario Superior Court of Justice certified the class againstPfizer Canada Inc. only and ruled that the action against Pfizer should be stayed until after the trial of the issues that are common to the class members. The actions inQuebec, Alberta and British Columbia have been stayed in favor of the Ontario action, which is proceeding on a national basis.
CelebrexBeginning in July 2014, purported class actions were filed in the U.S. District Court for the Eastern District of Virginia against Pfizer and certain subsidiaries of Pfizer relating toCelebrex. The plaintiffs seek to represent U.S. nationwide or multi-state classes consisting of persons or entities who directly purchased from the defendants, or indirectlypurchased or reimbursed patients for some or all of the purchase price of, Celebrex or generic Celebrex from May 31, 2014 until the cessation of the defendants’ allegedlyunlawful conduct. The plaintiffs allege delay in the launch of generic Celebrex in violation of federal antitrust laws or certain state antitrust, consumer protection and variousother laws as a result of Pfizer fraudulently obtaining and improperly listing a patent on Celebrex, engaging in sham litigation and prolonging the impact of sham litigationthrough settlement activity that further delayed generic entry. Each of the actions seeks treble damages on behalf of the putative class for alleged price overcharges forCelebrex since May 31, 2014. In December 2014, the District Court granted the parties’ joint motions to consolidate the direct purchaser and end-payer cases, and all suchcases were consolidated as of March 2015. In October 2014 and March 2015, we filed motions to dismiss the direct purchasers’ and end-payers’ amended complaints,respectively. In November 2015, the District Court denied in part and granted in part our motion to dismiss the direct purchasers’ amended complaint. In February 2016, theDistrict Court denied in part and granted in part our motion to dismiss the end-payers’ amended complaint, and in August 2016, the District Court dismissed substantially all ofthe end-payer’s remaining claims.
Intravenous Saline SolutionBeginning in November 2016, purported class actions were filed in the U.S. District Court for the Northern District of Illinois against Hospira, Hospira Worldwide, Inc. andcertain other defendants relating to intravenous saline solution. Plaintiffs seek to represent classes consisting of all persons and entities in the U.S. who directly purchasedintravenous saline solution sold by any of the defendants from January 1, 2013 until
2016 Financial Report
125
Notes to Consolidated Financial StatementsPfizer Inc. and Subsidiary Companies
the time the defendants’ allegedly unlawful conduct ceases. Plaintiffs allege that the defendants’ conduct restricts output and artificially fixes, raises, maintains and/or stabilizesthe prices of intravenous saline solution sold throughout the U.S. in violation of federal antitrust laws. Plaintiffs seek treble damages (for themselves and on behalf of theputative classes) and an injunction against defendants for alleged price overcharges for intravenous saline solution in the U.S. since January 1, 2013. On February 3, 2017, wecompleted the sale of our global infusion therapy net assets, HIS, which includes intravenous saline solution, to ICU Medical.
XtandiIn April 2014, the Regents of the University of California (the Regents) filed a complaint against the Medivation Group in California Superior Court in San Francisco. Medivationwas acquired by Pfizer in September 2016 and is now a wholly-owned subsidiary of Pfizer. The Regents’ complaint seeks a 10% share, under a license agreement betweenthe Medivation Group and the Regents, of certain payments the Medivation Group receives with respect to Xtandi under the Medivation Group’s sub-licensing and collaborationagreement with Astellas. Trial is scheduled to commence in May 2017.
Hormone Therapy Consumer Class ActionA certified consumer class action is pending against Wyeth in the U.S. District Court for the Southern District of California based on the alleged off-label marketing of itshormone therapy products. The case was originally filed in December 2003. The class consists of California consumers who purchased Wyeth’s hormone-replacementproducts between January 1995 and January 2003 and who do not seek personal injury damages therefrom. The class seeks compensatory and punitive damages, including afull refund of the purchase price.
EliquisA number of individual and multi-plaintiff lawsuits have been filed against us and Bristol-Myers Squibb Company in various federal and state courts pursuant to which plaintiffsseek to recover for personal injuries, including wrongful death, due to bleeding as a result of the alleged ingestion of Eliquis. Plaintiffs seek compensatory and punitivedamages.
In February 2017, the federal actions were transferred for coordinated pre-trial proceedings to a Multi-District Litigation ( In Re: Eliquis (Apixaban) Products Liability LitigationMDL-2754 ) in the U.S. District Court for the Southern District of New York.
A3. Legal Proceedings––Commercial and Other Matters
Average Wholesale Price LitigationPfizer, certain of its subsidiaries and other pharmaceutical manufacturers were sued in various state courts by a number of states alleging that the defendants providedaverage wholesale price (AWP) information for certain of their products that was higher than the actual average prices at which those products were sold. The AWP is used todetermine reimbursement levels under Medicare Part B and Medicaid and in many private-sector insurance policies and medical plans. All but one of those actions have beenresolved through settlement, dismissal or final judgment. The plaintiff state, Illinois, in the one remaining action claims that the alleged spread between the AWPs at whichpurchasers were reimbursed and the actual sale prices was promoted by the defendants as an incentive to purchase certain of their products. The action alleges, among otherthings, fraud and violation of the state’s unfair trade practices and consumer protection statutes and seeks monetary and other relief, including civil penalties and trebledamages.
Monsanto-Related MattersIn 1997, Monsanto Company (Former Monsanto) contributed certain chemical manufacturing operations and facilities to a newly formed corporation, Solutia Inc. (Solutia), andspun off the shares of Solutia. In 2000, Former Monsanto merged with Pharmacia & Upjohn Company to form Pharmacia. Pharmacia then transferred its agricultural operationsto a newly created subsidiary, named Monsanto Company (New Monsanto), which it spun off in a two-stage process that was completed in 2002. Pharmacia was acquired byPfizer in 2003 and is a wholly-owned subsidiary of Pfizer.
In connection with its spin-off that was completed in 2002, New Monsanto assumed, and agreed to indemnify Pharmacia for, any liabilities related to Pharmacia’s formeragricultural business. New Monsanto is defending and indemnifying Pharmacia in connection with various claims and litigation arising out of, or related to, the agriculturalbusiness.
In connection with its spin-off in 1997, Solutia assumed, and agreed to indemnify Pharmacia for, liabilities related to Former Monsanto’s chemical businesses. As the result ofits reorganization under Chapter 11 of the U.S. Bankruptcy Code, Solutia’s indemnification obligations relating to Former Monsanto’s chemical businesses are limited to sitesthat Solutia has owned or operated. In addition, in connection with its spinoff that was completed in 2002, New Monsanto assumed, and agreed to indemnify Pharmacia for,any liabilities primarily related to Former Monsanto’s chemical businesses, including, but not limited to, any such liabilities that Solutia assumed. Solutia’s and New Monsanto’sassumption of, and agreement to, indemnify Pharmacia for these liabilities apply to pending actions and any future actions related to Former Monsanto’s chemical businessesin which Pharmacia is named as a defendant, including, without limitation, actions asserting environmental claims, including alleged exposure to polychlorinated biphenyls.Solutia and New Monsanto are defending and indemnifying Pharmacia in connection with various claims and litigation arising out of, or related to, Former Monsanto’s chemicalbusinesses.
Environmental MattersIn 2009, we submitted to the U.S. Environmental Protection Agency (EPA) a corrective measures study report with regard to Pharmacia’s discontinued industrial chemicalfacility in North Haven, Connecticut and a revised site-wide feasibility study with regard to Wyeth Holdings Corporation’s discontinued industrial chemical facility in BoundBrook, New Jersey. In September 2010, our corrective measures study report with regard to the North Haven facility was approved by the EPA, and we commencedconstruction of the site remedy in late 2011 under an Updated Administrative Order on Consent with the EPA. In July 2011, Wyeth Holdings Corporation finalized anAdministrative Settlement Agreement and Order on Consent for Removal Action (the 2011 Administrative Settlement Agreement) with the EPA with regard to the Bound Brookfacility. In May 2012, we completed construction of an interim remedy to address the discharge of impacted groundwater from that facility to the Raritan River. In September2012, the EPA issued a final remediation plan for the Bound Brook facility’s main plant area, which is generally in accordance with one of the remedies evaluated in our revisedsite-wide feasibility study. In March 2013, Wyeth Holdings Corporation (now Wyeth Holdings LLC) entered into an Administrative Settlement Agreement and Order on Consentwith the EPA to allow us
126
2016 Financial Report
Notes to Consolidated Financial StatementsPfizer Inc. and Subsidiary Companies
to undertake detailed engineering design of the remedy for the main plant area and to perform a focused feasibility study for two adjacent lagoons. In September 2015, theU.S., on behalf of the EPA, lodged a complaint and consent decree with the federal District Court for the District of New Jersey that will allow Wyeth Holdings LLC to completethe design and to implement the remedy for the main plant area. In December 2015, the consent decree (which supersedes the 2011 Administrative Settlement Agreement)was entered by the District Court. We have accrued for the estimated costs of the site remedy for the North Haven facility and the site remediation for the Bound Brook facility.
We are a party to a number of other proceedings brought under the Comprehensive Environmental Response, Compensation, and Liability Act of 1980, as amended, and otherstate, local or foreign laws in which the primary relief sought is the cost of past and/or future remediation.
A4. Legal Proceedings––Government Investigations
Like other pharmaceutical companies, we are subject to investigations and extensive regulation by government agencies in the U.S., other developed markets and multipleemerging markets in which we operate. As a result, we have interactions with government agencies on an ongoing basis. Criminal charges, and substantial fines and/or civilpenalties, as well as limitations on our ability to conduct business in applicable jurisdictions, could result from government investigations. Among the investigations bygovernment agencies are the matters discussed below.
Phenytoin Sodium CapsulesIn 2012, Pfizer sold the U.K. Marketing Authorisation for phenytoin sodium capsules to a third party, but retained the right to supply the finished product to that third party. InMay 2013, the U.K. Competition & Markets Authority (CMA) informed us that it had launched an investigation into the supply of phenytoin sodium capsules in the U.K. market.In August 2015, the CMA issued a Statement of Objections alleging that Pfizer and Pfizer Limited, a U.K. subsidiary, engaged in conduct that violates U.K. and EU antitrustlaws. In December 2016, the CMA imposed a £ 84 million fine on Pfizer and Pfizer Limited. Pfizer appealed the CMA Decision to The Competition Appeal Tribunal in February2017 .
Civil Investigative Demand relating to Pharmacy Benefit ManagersIn March 2016, Pfizer received a Civil Investigative Demand from the U.S. Attorney’s Office for the Southern District of New York related to Pfizer’s contractual relationshipswith pharmacy benefit managers with respect to certain pharmaceutical products over the period from January 1, 2006 to the present. We have been providing information tothe government in response to this Civil Investigative Demand.
Subpoenas relating to Copayment Assistance OrganizationsIn December 2015 and July 2016, Pfizer received subpoenas from the U.S. Attorney’s Office for the District of Massachusetts requesting documents related to the PatientAccess Network Foundation and other 501(c)(3) organizations that provide financial assistance to Medicare patients. We have been providing information to the governmentin response to these subpoenas.
A5. Legal Proceedings––Matters Resolved During 2016
During 2016 , certain matters, including the matters discussed below, were resolved or were the subject of definitive settlement agreements or settlement agreements-in-principle.
Sutent (sunitinib malate)In May 2010, Mylan Pharmaceuticals notified us that it had filed an abbreviated new drug application with the FDA seeking approval to market a generic version of Sutent andchallenging on various grounds the Sutent composition-of-matter patent, which expires in 2021, and two other patents that expire in 2020 and 2021, respectively. In June 2010,we filed suit against Mylan Pharmaceuticals in the U.S. District Court for the District of Delaware asserting the infringement of those three patents. The patent expiring in 2020was dismissed from the case prior to trial. In October 2014, the court held that the two patents expiring in 2021 were valid and infringed. In October 2014, MylanPharmaceuticals appealed the decision to the U.S. Court of Appeals for the Federal Circuit. In January 2016, the U.S. Court of Appeals for the Federal Circuit affirmed theDistrict Court’s decision upholding the validity and infringement of the two patents expiring in 2021.
ProtonixIn 2009, the U.S. Department of Justice (DOJ) filed a civil complaint in intervention in two qui tam actions that had been filed under seal in the U.S. District Court for the Districtof Massachusetts. The complaint alleged that Wyeth’s practices relating to the pricing for Protonix for Medicaid rebate purposes between 2001 and 2006, prior to Wyeth’sacquisition by Pfizer, violated the Federal Civil False Claims Act and federal common law. The two qui tam actions have been unsealed, and the complaints includedsubstantially similar allegations. In addition, in 2009, several states and the District of Columbia filed a complaint under the same docket number in the U.S. District Court forthe District of Massachusetts asserting violations of various state laws based on allegations substantially similar to those set forth in the civil complaint filed by the DOJ. OnFebruary 12, 2016, Wyeth and the DOJ reached an agreement in principle to resolve the actions pending in the U.S. District Court for the District of Massachusetts for $784.6million , which was recorded in Other (income)/deductions––net for the year ended December 31, 2015 and paid on April 29, 2016. In April 2016, the agreement was finalized.The final agreement does not include an admission of liability by Wyeth. In August 2016, the Court entered an Order of Dismissal.
Effexor XR (venlafaxine HCl)In 2006, Wyeth and Wyeth Canada Limited (the Wyeth companies) filed an action in the Federal Court in Canada against Ratiopharm Inc. (Ratiopharm) seeking to preventRatiopharm from obtaining approval in Canada for its generic version of Effexor XR prior to the expiration of one of the Wyeth companies’ patents. As a result of that action,Ratiopharm was enjoined from obtaining regulatory approval for its generic product. However, in August 2007, the Federal Court of Appeal in Canada ruled that the patent atissue could not be asserted against Ratiopharm under the applicable Canadian regulations governing approvals, and it dismissed the Wyeth companies’ action.
Following the dismissal, in 2007, Ratiopharm filed an action in the Federal Court in Canada seeking damages from the Wyeth companies for preventing Ratiopharm frommarketing its generic version of Effexor XR in Canada from January 2006 through August 2007. The Federal Court dismissed Ratiopharm’s action in 2011, but the FederalCourt of Appeal reinstated it in 2012. In 2011 and 2012, Pfizer made payments to Teva Canada Limited, which had acquired Ratiopharm, totaling Canadian dollars 52.5 millionin partial settlement of this action.
2016 Financial Report
127
Notes to Consolidated Financial StatementsPfizer Inc. and Subsidiary Companies
The trial in this action was held in January 2014, and the Federal Court issued various findings in March 2014. On June 30, 2014, the Federal Court issued a judgment basedon those findings, awarding Teva Canada Limited damages of approximately Canadian dollars 125 million , consisting of compensatory damages, pre-judgment interest andlegal costs. This judgment was satisfied by Pfizer Canada Inc., as successor to the Wyeth companies, in July 2014. In September 2014, Pfizer Canada Inc. appealed thejudgment and, in May 2016, the Federal Court of Appeal vacated the lower court’s decision and remanded the case to the lower court for further proceedings. The lower courtwill determine whether to affirm, decrease or raise this amount. Ratiopharm has sought leave from the Canada Supreme Court to review the decision of the Court of Appeal.
Lipitor Whistleblower ActionIn 2004, a former employee filed a “whistleblower” action against us in the U.S. District Court for the Eastern District of New York. The complaint remained under seal untilSeptember 2007, at which time the U.S. Attorney for the Eastern District of New York declined to intervene in the case. We were served with the complaint in December 2007.Plaintiff alleges off-label promotion of Lipitor in violation of the Federal Civil False Claims Act and the false claims acts of certain states, and plaintiff seeks treble damages andcivil penalties on behalf of the federal government and the specified states as the result of their purchase, or reimbursement of patients for the purchase, of Lipitor allegedly forsuch off-label uses. Plaintiff also seeks compensation as a whistleblower under those federal and state statutes. In addition, plaintiff alleges that he was wrongfully terminated,in violation of the anti-retaliation provisions of applicable federal and New York law, and plaintiff seeks damages and the reinstatement of his employment. In 2009, the DistrictCourt dismissed without prejudice the off-label promotion claims and, in 2010, plaintiff filed an amended complaint containing off-label promotion allegations that aresubstantially similar to the allegations in the original complaint. In November 2012, the District Court dismissed the amended complaint. In December 2012, plaintiff appealedthe District Court's decision to the U.S. Court of Appeals for the Second Circuit. In August 2014, the U.S. Court of Appeals for the Second Circuit dismissed the appeal for lackof jurisdiction and sent the case back to the District Court for clarification of its ruling regarding the plaintiff's employment claims. In November 2014, the District Court grantedplaintiff’s motion for a partial final judgment certifying the dismissal of the false claims counts, and plaintiff appealed the order dismissing those claims to the U.S. Court ofAppeals for the Second Circuit. In May 2016, the U.S. Court of Appeals for the Second Circuit affirmed the District Court’s dismissal of the false claims counts, and itsubsequently denied a petition for panel rehearing. The plaintiff’s time to file a petition for certiorari requesting a review by the U.S. Supreme Court expired in January 2017. InNovember 2016, the District Court administratively closed plaintiff’s employment law claims, subject to Plaintiff requesting to reopen them by January 2017. In December 2016,plaintiff’s request to reopen the case to consider his employment law claims was granted. We expect to resolve plaintiff’s employment claims on terms not material to Pfizer.
Celebrex and BextraBeginning in late 2004, several purported class actions were filed in federal and state courts alleging that Pfizer and certain of our current and former officers violated federalsecurities laws by misrepresenting the safety of Celebrex and Bextra. In June 2005, the federal actions were transferred for consolidated pre-trial proceedings to a Multi-DistrictLitigation ( In re Pfizer Inc. Securities, Derivative and “ERISA” Litigation MDL-1688 ) in the U.S. District Court for the Southern District of New York. In March 2012, the court inthe Multi-District Litigation certified a class consisting of all persons who purchased or acquired Pfizer stock between October 31, 2000 and October 19, 2005. In May 2014, thecourt in the Multi-District Litigation granted Pfizer’s motion to exclude the testimony of the plaintiffs’ loss causation and damages expert. We subsequently filed a motion forsummary judgment seeking dismissal of the litigation, and the plaintiffs filed a motion for leave to submit an amended report by their expert. In July 2014, the court denied theplaintiffs’ motion for leave to submit an amended report and granted our motion for summary judgment, dismissing the plaintiffs’ claims in their entirety. In August 2014, theplaintiffs appealed the District Court’s decision to the U.S. Court of Appeals for the Second Circuit. In April 2016, the U.S. Court of Appeals for the Second Circuit reversed theDistrict Court’s decision and remanded the case to the District Court for further proceedings. In July 2016, the parties reached an agreement in principle to resolve this matterfor all defendants for $486 million , which was recorded in Other (income)/deductions––net for the year ended December 31, 2016, and was paid in accordance with the termsof the settlement agreement. In December 2016, the District Court approved the settlement agreement.
B. Guarantees and Indemnifications
In the ordinary course of business and in connection with the sale of assets and businesses, we often indemnify our counterparties against certain liabilities that may arise inconnection with the transaction or related to activities prior to the transaction. These indemnifications typically pertain to environmental, tax, employee and/or product-relatedmatters and patent-infringement claims. If the indemnified party were to make a successful claim pursuant to the terms of the indemnification, we would be required toreimburse the loss. These indemnifications are generally subject to threshold amounts, specified claim periods and other restrictions and limitations. Historically, we have notpaid significant amounts under these provisions and, as of December 31, 2016 , recorded amounts for the estimated fair value of these indemnifications were not significant.
Pfizer Inc. has also guaranteed the long-term debt of certain companies that it acquired and that now are subsidiaries of Pfizer.
C. Purchase Commitments
As of December 31, 2016 , we had agreements totaling $4.7 billion to purchase goods and services that are enforceable and legally binding and include amounts relating toadvertising, information technology services, employee benefit administration services, and potential milestone payments deemed reasonably likely to occur.
Note 18. Segment, Geographic and Other Revenue Information
A. Segment Information
We manage our commercial operations through two distinct business segments: Pfizer Innovative Health (IH) and Pfizer Essential Health (EH), which was previously known asEstablished Products. Beginning in the second quarter of 2016, we reorganized our operating segments to reflect that we now manage our innovative pharmaceutical andconsumer healthcare operations as one business segment, IH. From the
128
2016 Financial Report
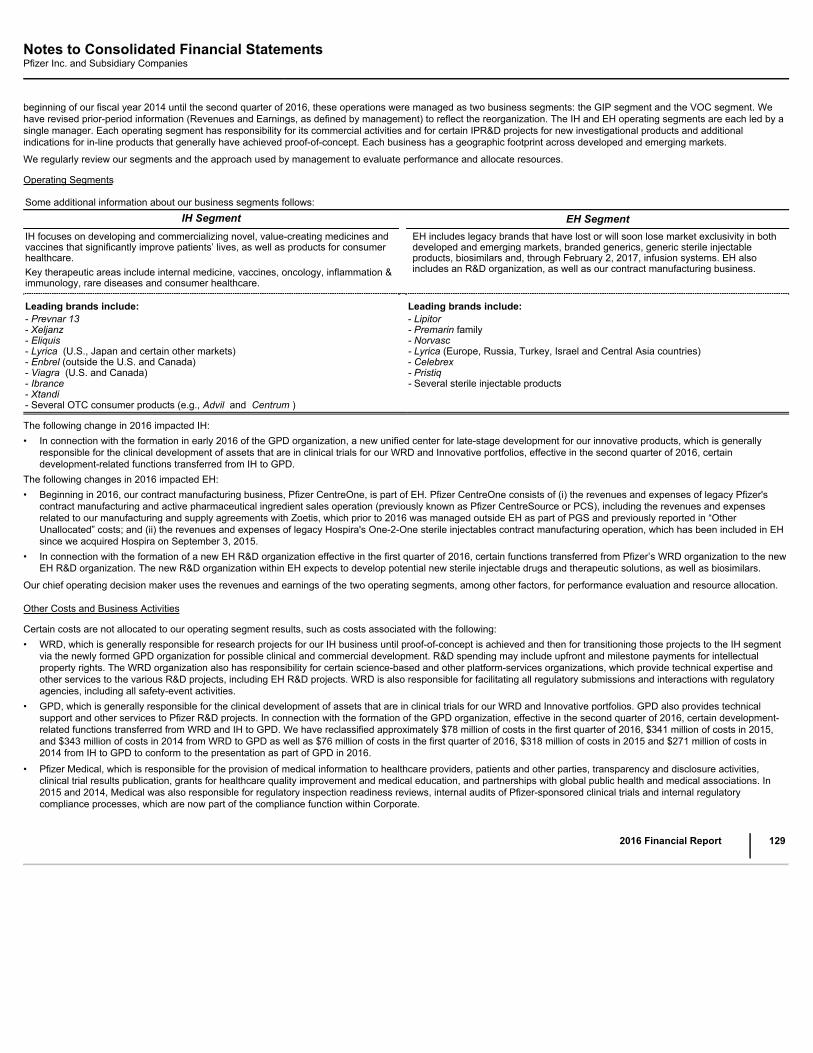
Notes to Consolidated Financial StatementsPfizer Inc. and Subsidiary Companies
beginning of our fiscal year 2014 until the second quarter of 2016, these operations were managed as two business segments: the GIP segment and the VOC segment. Wehave revised prior-period information (Revenues and Earnings, as defined by management) to reflect the reorganization. The IH and EH operating segments are each led by asingle manager. Each operating segment has responsibility for its commercial activities and for certain IPR&D projects for new investigational products and additionalindications for in-line products that generally have achieved proof-of-concept. Each business has a geographic footprint across developed and emerging markets.
We regularly review our segments and the approach used by management to evaluate performance and allocate resources.
Operating Segments
Some additional information about our business segments follows:IH Segment EH Segment
IH focuses on developing and commercializing novel, value-creating medicines andvaccines that significantly improve patients’ lives, as well as products for consumerhealthcare.Key therapeutic areas include internal medicine, vaccines, oncology, inflammation &immunology, rare diseases and consumer healthcare.
EH includes legacy brands that have lost or will soon lose market exclusivity in bothdeveloped and emerging markets, branded generics, generic sterile injectableproducts, biosimilars and, through February 2, 2017, infusion systems. EH alsoincludes an R&D organization, as well as our contract manufacturing business.
Leading brands include:- Prevnar 13- Xeljanz- Eliquis- Lyrica (U.S., Japan and certain other markets)- Enbrel (outside the U.S. and Canada)- Viagra (U.S. and Canada)- Ibrance- Xtandi- Several OTC consumer products (e.g., Advil and Centrum )
Leading brands include:- Lipitor- Premarin family- Norvasc- Lyrica (Europe, Russia, Turkey, Israel and Central Asia countries)- Celebrex- Pristiq- Several sterile injectable products
The following change in 2016 impacted IH:• In connection with the formation in early 2016 of the GPD organization, a new unified center for late-stage development for our innovative products, which is generally
responsible for the clinical development of assets that are in clinical trials for our WRD and Innovative portfolios, effective in the second quarter of 2016, certaindevelopment-related functions transferred from IH to GPD.
The following changes in 2016 impacted EH:• Beginning in 2016, our contract manufacturing business, Pfizer CentreOne, is part of EH. Pfizer CentreOne consists of (i) the revenues and expenses of legacy Pfizer's
contract manufacturing and active pharmaceutical ingredient sales operation (previously known as Pfizer CentreSource or PCS), including the revenues and expensesrelated to our manufacturing and supply agreements with Zoetis, which prior to 2016 was managed outside EH as part of PGS and previously reported in “OtherUnallocated” costs; and (ii) the revenues and expenses of legacy Hospira's One-2-One sterile injectables contract manufacturing operation, which has been included in EHsince we acquired Hospira on September 3, 2015.
• In connection with the formation of a new EH R&D organization effective in the first quarter of 2016, certain functions transferred from Pfizer’s WRD organization to the newEH R&D organization. The new R&D organization within EH expects to develop potential new sterile injectable drugs and therapeutic solutions, as well as biosimilars.
Our chief operating decision maker uses the revenues and earnings of the two operating segments, among other factors, for performance evaluation and resource allocation.
Other Costs and Business Activities
Certain costs are not allocated to our operating segment results, such as costs associated with the following:• WRD, which is generally responsible for research projects for our IH business until proof-of-concept is achieved and then for transitioning those projects to the IH segment
via the newly formed GPD organization for possible clinical and commercial development. R&D spending may include upfront and milestone payments for intellectualproperty rights. The WRD organization also has responsibility for certain science-based and other platform-services organizations, which provide technical expertise andother services to the various R&D projects, including EH R&D projects. WRD is also responsible for facilitating all regulatory submissions and interactions with regulatoryagencies, including all safety-event activities.
• GPD, which is generally responsible for the clinical development of assets that are in clinical trials for our WRD and Innovative portfolios. GPD also provides technicalsupport and other services to Pfizer R&D projects. In connection with the formation of the GPD organization, effective in the second quarter of 2016, certain development-related functions transferred from WRD and IH to GPD. We have reclassified approximately $78 million of costs in the first quarter of 2016, $341 million of costs in 2015,and $343 million of costs in 2014 from WRD to GPD as well as $76 million of costs in the first quarter of 2016, $318 million of costs in 2015 and $271 million of costs in2014 from IH to GPD to conform to the presentation as part of GPD in 2016.
• Pfizer Medical, which is responsible for the provision of medical information to healthcare providers, patients and other parties, transparency and disclosure activities,clinical trial results publication, grants for healthcare quality improvement and medical education, and partnerships with global public health and medical associations. In2015 and 2014, Medical was also responsible for regulatory inspection readiness reviews, internal audits of Pfizer-sponsored clinical trials and internal regulatorycompliance processes, which are now part of the compliance function within Corporate.
2016 Financial Report
129

Notes to Consolidated Financial StatementsPfizer Inc. and Subsidiary Companies
• Corporate, representing platform functions (such as worldwide technology, global real estate operations, legal, finance, human resources, worldwide public affairs,compliance and worldwide procurement) and certain compensation and other corporate costs, such as interest income and expense, and gains and losses on investments.
• Other unallocated costs, representing overhead expenses associated with our manufacturing and commercial operations that are not directly assessed to an operatingsegment as business unit (segment) management does not manage these costs (which include manufacturing variances associated with production). The increase in Costof sales in 2016 reflects, among other items, the change in manufacturing variances driven by demand decreases versus plan for certain legacy Hospira and legacy Pfizerproducts.
• Certain transactions and events such as (i) purchase accounting adjustments, where we incur expenses associated with the amortization of fair value adjustments toinventory, intangible assets and PP&E; (ii) acquisition-related costs, where we incur costs for executing the transaction, integrating the acquired operations andrestructuring the combined company; and (iii) certain significant items, which are substantive and/or unusual, and in some cases recurring, items that are evaluated on anindividual basis by management and which include non-acquisition-related restructuring costs, as well as costs incurred for legal settlements, asset impairments anddisposals of assets or businesses, including, as applicable, any associated transition activities.
Segment Assets
We manage our assets on a total company basis, not by operating segment, as many of our operating assets are shared (such as our plant network assets) or commingled(such as accounts receivable, as many of our customers are served by multiple operating segments). Therefore, our chief operating decision maker does not regularly reviewany asset information by operating segment and, accordingly, we do not report asset information by operating segment. Total assets were approximately $172 billion as ofDecember 31, 2016 and approximately $167 billion as of December 31, 2015 .
Selected Income Statement Information
The following table provides selected income statement information by reportable segment:
Revenues Earnings (a) Depreciation and Amortization (b)
Year Ended December 31, Year Ended December 31, Year Ended December 31,
(MILLIONS OF DOLLARS) 2016 2015 2014 2016 2015 2014 2016 2015 2014
Reportable Segments:
IH (c) $ 29,197 $ 26,758 $ 24,005 $ 15,854 $ 14,581 $ 12,743 $ 583 $ 552 $ 522
EH (d) 23,627 22,094 25,401 12,898 12,714 16,020 600 446 490
Total reportable segments 52,824 48,851 49,406 28,752 27,295 28,763 1,183 998 1,012
Other business activities (e) — — — (3,184) (3,091) (3,151) 86 77 74
Reconciling Items:
Corporate (f) — — — (5,326) (5,430) (5,200) 356 354 384
Purchase accounting adjustments (f) — — — (4,185) (3,953) (3,641) 3,890 3,573 3,782
Acquisition-related costs (f) — — — (785) (894) (183) 7 75 53
Certain significant items (g) — — 198 (5,888) (4,321) (3,749) 200 48 207
Other unallocated (f) — — — (1,032) (642) (601) 35 33 24
$ 52,824 $ 48,851 $ 49,605 $ 8,351 $ 8,965 $ 12,240 $ 5,757 $ 5,157 $ 5,537(a) Income from continuing operations before provision for taxes on income.(b) Certain production facilities are shared. Depreciation is allocated based on estimates of physical production. Amounts here relate solely to the depreciation and amortization associated with continuing operations.(c)
On June 24, 2016, we acquired Anacor and on September 28, 2016, we acquired Medivation. Commencing from their respective acquisition dates, our results of operations and IH’s operating results for 2016include approximately six months of legacy Anacor operations, which were immaterial, and approximately three months of legacy Medivation operations. Additionally, in connection with the formation in early 2016of the GPD organization, effective in the second quarter of 2016, certain development-related functions transferred from IH to GPD. We have reclassified approximately $76 million of costs in the first quarter of2016, $318 million of costs in 2015 and $271 million of costs in 2014 from IH to GPD to conform to the presentation as part of GPD in 2016.
(d)
On September 3, 2015, we acquired Hospira. Commencing from the acquisition date, our results of operations and EH’s operating results include legacy Hospira commercial operations, including the legacyHospira One-2-One contract manufacturing business. In accordance with our domestic and international reporting periods, our results of operations and EH's operating results for 2015 reflect four months of legacyHospira U.S. operations and three months of legacy Hospira International operations. See Note 2A for additional information. Beginning in 2016, our contract manufacturing business, Pfizer CentreOne, is part ofEH. Pfizer CentreOne consists of (i) the revenues and expenses of legacy Pfizer's contract manufacturing and active pharmaceutical ingredient sales operation (previously known as Pfizer CentreSource or PCS),including the revenues and expenses related to our manufacturing and supply agreements with Zoetis, which prior to 2016 was managed outside EH as part of PGS and previously reported in “Other Unallocated”costs; and (ii) the revenues and expenses of legacy Hospira's One-2-One sterile injectables contract manufacturing operation, which has been included in EH since we acquired Hospira on September 3, 2015. Wehave reclassified prior period PCS operating results ( $506 million of PCS revenues and $96 million of PCS earnings in 2015, which in 2015 includes revenues and expenses related to our manufacturing andsupply agreements with Zoetis, and $253 million of PCS revenues and $69 million of PCS earnings in 2014) to conform to the current period presentation as part of EH. As noted above, in connection with theformation in 2016 of a new EH R&D organization, certain functions transferred from Pfizer’s WRD organization to the new EH R&D organization. We have reclassified approximately $274 million of costs in 2015and $281 million of costs in 2014 from WRD to EH to conform to the current period presentation as part of EH.
(e) Other business activities includes the costs managed by our WRD, GPD and Pfizer Medical organizations.(f) For a description, see the “Other Costs and Business Activities” section above.(g)
Certain significant items are substantive and/or unusual, and in some cases recurring, items (such as restructuring or legal charges) that, either as a result of their nature or size, would not be expected to occur aspart of our normal business on a regular basis.
130
2016 Financial Report

Notes to Consolidated Financial StatementsPfizer Inc. and Subsidiary Companies
For Revenues in 2014, certain significant items primarily represent revenues related to our manufacturing and supply agreements with Zoetis.For Earnings in 2016 , certain significant items includes: (i) restructuring charges and implementation costs associated with our cost-reduction initiatives that are not associated with an acquisition of $1.5 billion ,(ii) charges for certain legal matters of $494 million , (iii) an impairment charge related to the write-down of the HIS net assets to fair value less estimated costs to sell of $1.7 billion , (iv) certain asset impairmentcharges of $1.4 billion , (v) charges for business and legal entity alignment of $261 million and (vi) other charges of $509 million . For additional information, see Note 2B, Note 3 and Note 4 .For Earnings in 2015, certain significant items includes: (i) restructuring charges and implementation costs associated with our cost-reduction initiatives that are not associated with an acquisition of $584 million ,(ii) foreign currency loss and inventory impairment related to Venezuela of $878 million , (iii) certain asset impairment charges of $787 million , (iv) a charge related to pension settlements of $491 million , (v)charges for business and legal entity alignment of $282 million , (vi) charges for certain legal matters of $968 million and (vii) other charges of $332 million . For additional information, see Note 3 and Note 4.For Earnings in 2014, certain significant items includes: (i) charges for certain legal matters of $999 million , (ii) certain asset impairments of $440 million , (iii) a charge for an additional year of BrandedPrescription Drug Fee of $215 million , (iv) restructuring charges and implementation costs associated with our cost-reduction initiatives that are not associated with an acquisition of $598 million , (v) an upfrontfee associated with collaborative arrangement with Merck KGaA of $1.2 billion , (vi) charges for business and legal entity alignment of $168 million and (vii) other charges of $165 million . For additionalinformation, see Note 2D, Note 3 and Note 4 .
Equity in the net income of investees accounted for by the equity method is not significant for any of our operating segments.
The operating segment information does not purport to represent the revenues, costs and income from continuing operations before provision for taxes on income that each ofour operating segments would have recorded had each segment operated as a standalone company during the periods presented.
B. Geographic Information
Revenues exceeded $500 million in each of 11 countries outside the U.S. in 2016 and in each of 12 countries outside the U.S. in 2015 and 2014 , respectively. The U.S. is theonly country to contribute more than 10% of total revenue in 2016 , 2015 and 2014.
The following table provides revenues by geographic area:
Year Ended December 31,
(MILLIONS OF DOLLARS) 2016 2015 2014
United States (a) $ 26,369 $ 21,704 $ 19,073
Developed Europe (a), (b) 9,306 9,714 11,719
Developed Rest of World (a), (c) 6,729 6,298 7,314
Emerging Markets (a), (d) 10,420 11,136 11,499
Revenues $ 52,824 $ 48,851 $ 49,605(a)
On June 24, 2016, we acquired Anacor and on September 28, 2016, we acquired Medivation. Commencing from their respective acquisition dates, our results of operations include the operating results of Anacorand Medivation. In accordance with our domestic reporting period, our results of operations for 2016 include approximately six months of legacy Anacor operations, which were immaterial, and approximately threemonths of legacy Medivation operations. On September 3, 2015, we acquired Hospira. Commencing from the acquisition date, our results of operations include the operating results of Hospira. In accordance withour domestic and international reporting periods, our results of operations for 2015 reflect four months of legacy Hospira U.S. operations and three months of legacy Hospira international operations. See Note 2Afor additional information.
(b)
Developed Europe region includes the following markets: Western Europe, Scandinavian countries and Finland. Revenues denominated in euros were $7.2 billion in 2016 , $7.4 billion in 2015 and $9.0 billion in2014 .
(c) Developed Rest of World region includes the following markets: Japan, Canada, Australia, South Korea and New Zealand.(d) Emerging Markets region includes, but is not limited to, the following markets: Asia (excluding Japan and South Korea), Latin America, Africa, Eastern Europe, Central Europe, the Middle East and Turkey.
Long-lived assets by geographic region follow (a) :
As of December 31,
(MILLIONS OF DOLLARS) 2016 2015 2014
Property, plant and equipment, net
United States $ 6,649 $ 7,072 $ 5,575
Developed Europe (b) 4,228 4,376 4,606
Developed Rest of World (c) 643 660 617
Emerging Markets (d) 1,797 1,658 963
Property, plant and equipment, net $ 13,318 $ 13,766 $ 11,762(a)
Reflects legacy Medivation and legacy Anacor amounts in 2016, commencing on the Medivation acquisition date, September 28, 2016, and Anacor acquisition date, June 24, 2016. Reflects legacy Hospiraamounts in 2016 and 2015 commencing on the Hospira acquisition date, September 3, 2015.
(b) Developed Europe region includes the following markets: Western Europe, Scandinavian countries and Finland.(c)
Developed Rest of World region includes the following markets: Japan, Canada, Australia, South Korea and New Zealand. Emerging Markets region includes, but is not limited to, the following markets: Asia(excluding Japan and South Korea), Latin America, Africa, Eastern Europe, Central Europe, the Middle East and Turkey.
2016 Financial Report
131
Notes to Consolidated Financial StatementsPfizer Inc. and Subsidiary Companies
C. Other Revenue Information
Significant Customers
We sell our biopharmaceutical products primarily to customers in the wholesale sector. In 2016 , sales to our three largest U.S. wholesaler customers representedapproximately 16% , 12% and 10% of total revenues, respectively, and, collectively, represented approximately 29% of total trade accounts receivable as of December 31,2016 . In 2015, sales to our three largest U.S. wholesaler customers represented approximately 14% , 11% and 10% of total revenues, respectively, and, collectively,represented approximately 23% of total trade accounts receivable as of December 31, 2015 . In 2014, sales to our three largest U.S. wholesaler customers representedapproximately 13% , 10% and 9% of total revenues, respectively, and, collectively, represented approximately 25% of total trade accounts receivable as of December 31, 2014. For all years presented, these sales and related trade accounts receivable were concentrated in our biopharmaceutical businesses.
132
2016 Financial Report
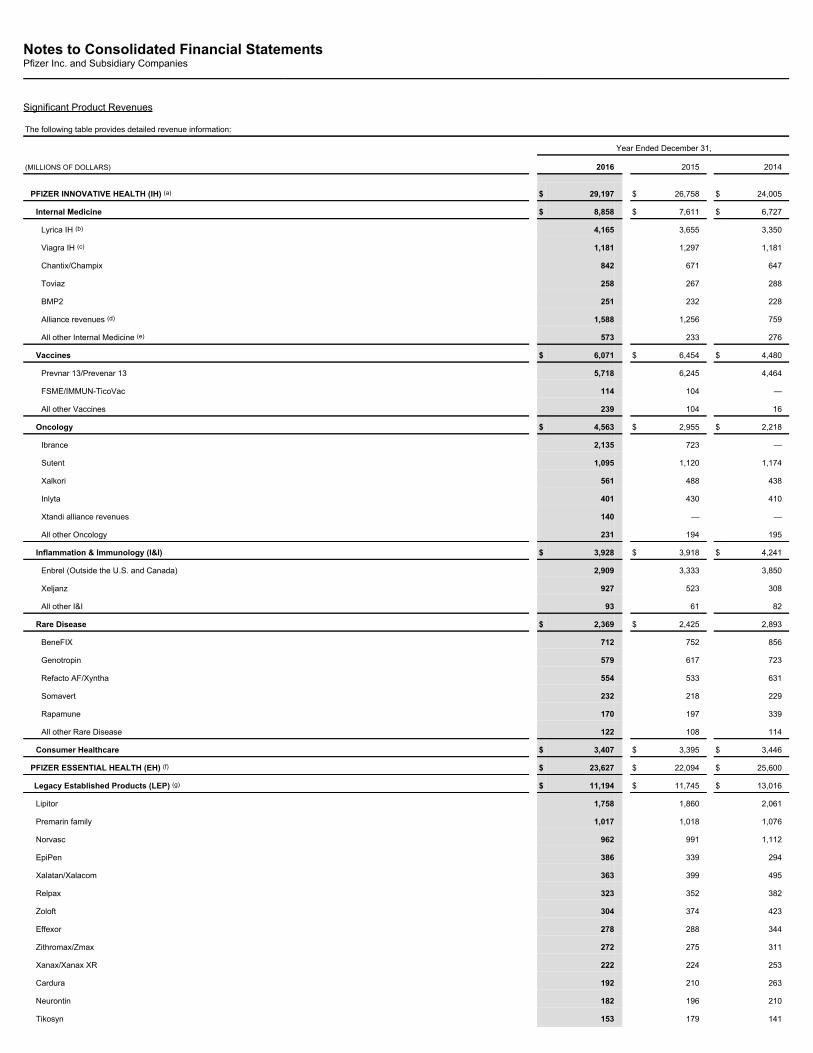
Notes to Consolidated Financial StatementsPfizer Inc. and Subsidiary Companies
Significant Product Revenues
The following table provides detailed revenue information:
Year Ended December 31,
(MILLIONS OF DOLLARS) 2016 2015 2014
PFIZER INNOVATIVE HEALTH (IH) (a) $ 29,197 $ 26,758 $ 24,005
Internal Medicine $ 8,858 $ 7,611 $ 6,727
Lyrica IH (b) 4,165 3,655 3,350
Viagra IH (c) 1,181 1,297 1,181
Chantix/Champix 842 671 647
Toviaz 258 267 288
BMP2 251 232 228
Alliance revenues (d) 1,588 1,256 759
All other Internal Medicine (e) 573 233 276
Vaccines $ 6,071 $ 6,454 $ 4,480
Prevnar 13/Prevenar 13 5,718 6,245 4,464
FSME/IMMUN-TicoVac 114 104 —
All other Vaccines 239 104 16
Oncology $ 4,563 $ 2,955 $ 2,218
Ibrance 2,135 723 —
Sutent 1,095 1,120 1,174
Xalkori 561 488 438
Inlyta 401 430 410
Xtandi alliance revenues 140 — —
All other Oncology 231 194 195
Inflammation & Immunology (I&I) $ 3,928 $ 3,918 $ 4,241
Enbrel (Outside the U.S. and Canada) 2,909 3,333 3,850
Xeljanz 927 523 308
All other I&I 93 61 82
Rare Disease $ 2,369 $ 2,425 2,893
BeneFIX 712 752 856
Genotropin 579 617 723
Refacto AF/Xyntha 554 533 631
Somavert 232 218 229
Rapamune 170 197 339
All other Rare Disease 122 108 114
Consumer Healthcare $ 3,407 $ 3,395 $ 3,446
PFIZER ESSENTIAL HEALTH (EH) (f) $ 23,627 $ 22,094 $ 25,600
Legacy Established Products (LEP) (g) $ 11,194 $ 11,745 $ 13,016
Lipitor 1,758 1,860 2,061
Premarin family 1,017 1,018 1,076
Norvasc 962 991 1,112
EpiPen 386 339 294
Xalatan/Xalacom 363 399 495
Relpax 323 352 382
Zoloft 304 374 423
Effexor 278 288 344
Zithromax/Zmax 272 275 311
Xanax/Xanax XR 222 224 253
Cardura 192 210 263
Neurontin 182 196 210
Tikosyn 153 179 141

Depo-Provera 126 170 201
Diflucan 119 181 208
All other LEP 4,538 4,689 5,242
Sterile Injectable Pharmaceuticals (SIP) (h) $ 6,018 $ 3,944 $ 3,277
Medrol 450 402 381
Sulperazon 396 339 354
Fragmin 318 335 364
Tygacil 274 304 323
All other SIP 4,579 2,563 1,855
2016 Financial Report
133
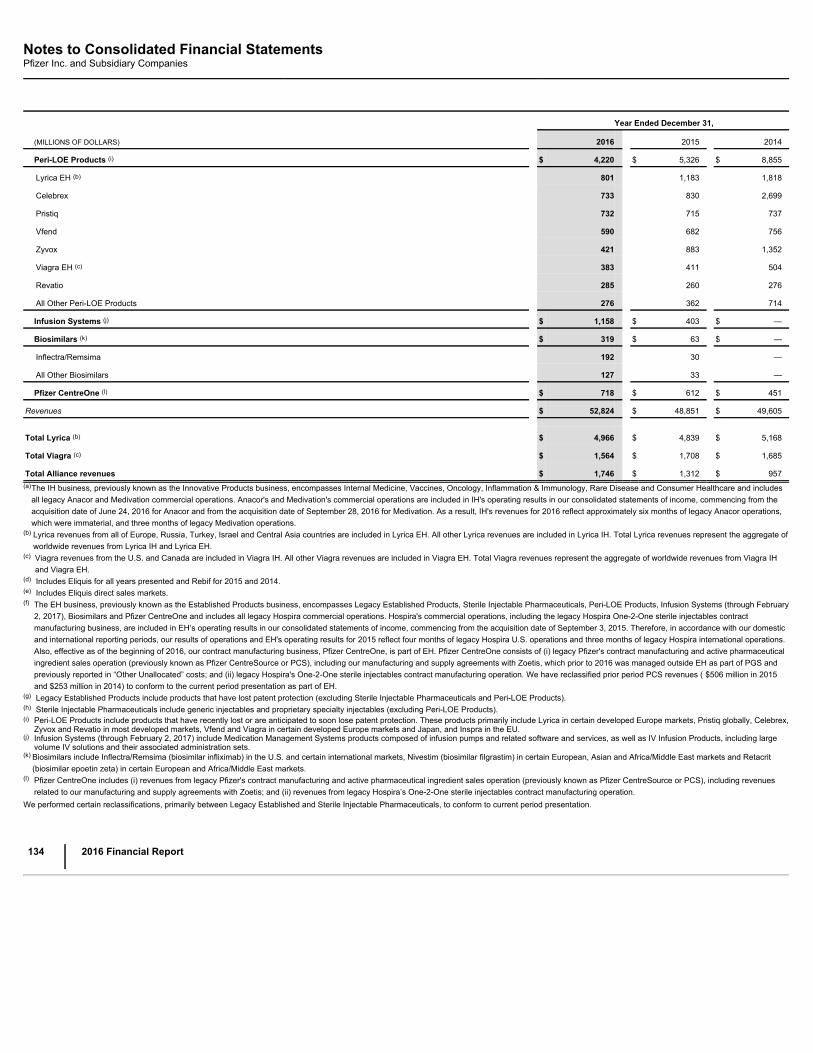
Notes to Consolidated Financial StatementsPfizer Inc. and Subsidiary Companies
Year Ended December 31,
(MILLIONS OF DOLLARS) 2016 2015 2014
Peri-LOE Products (i) $ 4,220 $ 5,326 $ 8,855
Lyrica EH (b) 801 1,183 1,818
Celebrex 733 830 2,699
Pristiq 732 715 737
Vfend 590 682 756
Zyvox 421 883 1,352
Viagra EH (c) 383 411 504
Revatio 285 260 276
All Other Peri-LOE Products 276 362 714
Infusion Systems (j) $ 1,158 $ 403 $ —
Biosimilars (k) $ 319 $ 63 $ —
Inflectra/Remsima 192 30 —
All Other Biosimilars 127 33 —
Pfizer CentreOne (l) $ 718 $ 612 $ 451
Revenues $ 52,824 $ 48,851 $ 49,605
Total Lyrica (b) $ 4,966 $ 4,839 $ 5,168
Total Viagra (c) $ 1,564 $ 1,708 $ 1,685
Total Alliance revenues $ 1,746 $ 1,312 $ 957(a)
The IH business, previously known as the Innovative Products business, encompasses Internal Medicine, Vaccines, Oncology, Inflammation & Immunology, Rare Disease and Consumer Healthcare and includesall legacy Anacor and Medivation commercial operations. Anacor's and Medivation's commercial operations are included in IH's operating results in our consolidated statements of income, commencing from theacquisition date of June 24, 2016 for Anacor and from the acquisition date of September 28, 2016 for Medivation. As a result, IH's revenues for 2016 reflect approximately six months of legacy Anacor operations,which were immaterial, and three months of legacy Medivation operations.
(b)
Lyrica revenues from all of Europe, Russia, Turkey, Israel and Central Asia countries are included in Lyrica EH. All other Lyrica revenues are included in Lyrica IH. Total Lyrica revenues represent the aggregate ofworldwide revenues from Lyrica IH and Lyrica EH.
(c)
Viagra revenues from the U.S. and Canada are included in Viagra IH. All other Viagra revenues are included in Viagra EH. Total Viagra revenues represent the aggregate of worldwide revenues from Viagra IHand Viagra EH.
(d) Includes Eliquis for all years presented and Rebif for 2015 and 2014.(e) Includes Eliquis direct sales markets.(f) The EH business, previously known as the Established Products business, encompasses Legacy Established Products, Sterile Injectable Pharmaceuticals, Peri-LOE Products, Infusion Systems (through February
2, 2017), Biosimilars and Pfizer CentreOne and includes all legacy Hospira commercial operations. Hospira's commercial operations, including the legacy Hospira One-2-One sterile injectables contractmanufacturing business, are included in EH’s operating results in our consolidated statements of income, commencing from the acquisition date of September 3, 2015. Therefore, in accordance with our domesticand international reporting periods, our results of operations and EH's operating results for 2015 reflect four months of legacy Hospira U.S. operations and three months of legacy Hospira international operations.Also, effective as of the beginning of 2016, our contract manufacturing business, Pfizer CentreOne, is part of EH. Pfizer CentreOne consists of (i) legacy Pfizer's contract manufacturing and active pharmaceuticalingredient sales operation (previously known as Pfizer CentreSource or PCS), including our manufacturing and supply agreements with Zoetis, which prior to 2016 was managed outside EH as part of PGS andpreviously reported in “Other Unallocated” costs; and (ii) legacy Hospira's One-2-One sterile injectables contract manufacturing operation. We have reclassified prior period PCS revenues ( $506 million in 2015and $253 million in 2014) to conform to the current period presentation as part of EH.
(g) Legacy Established Products include products that have lost patent protection (excluding Sterile Injectable Pharmaceuticals and Peri-LOE Products). (h) Sterile Injectable Pharmaceuticals include generic injectables and proprietary specialty injectables (excluding Peri-LOE Products).(i) Peri-LOE Products include products that have recently lost or are anticipated to soon lose patent protection. These products primarily include Lyrica in certain developed Europe markets, Pristiq globally, Celebrex,
Zyvox and Revatio in most developed markets, Vfend and Viagra in certain developed Europe markets and Japan, and Inspra in the EU.(j) Infusion Systems (through February 2, 2017) include Medication Management Systems products composed of infusion pumps and related software and services, as well as IV Infusion Products, including large
volume IV solutions and their associated administration sets.(k)
Biosimilars include Inflectra/Remsima (biosimilar infliximab) in the U.S. and certain international markets, Nivestim (biosimilar filgrastim) in certain European, Asian and Africa/Middle East markets and Retacrit(biosimilar epoetin zeta) in certain European and Africa/Middle East markets.
(l) Pfizer CentreOne includes (i) revenues from legacy Pfizer's contract manufacturing and active pharmaceutical ingredient sales operation (previously known as Pfizer CentreSource or PCS), including revenuesrelated to our manufacturing and supply agreements with Zoetis; and (ii) revenues from legacy Hospira’s One-2-One sterile injectables contract manufacturing operation.
We performed certain reclassifications, primarily between Legacy Established and Sterile Injectable Pharmaceuticals, to conform to current period presentation.
134
2016 Financial Report
Notes to Consolidated Financial StatementsPfizer Inc. and Subsidiary Companies
Note 19. Subsequent Event
A. Accelerated Share Repurchase Agreement
On February 2, 2017, we entered into an accelerated share repurchase agreement with Citibank to repurchase $5 billion of our common stock. Pursuant to the terms of theagreement, on February 6, 2017, we paid $5 billion to Citibank and received an initial delivery of approximately 126 million shares of our common stock from Citibank at a priceof $31.73 per share, which represented, based on the closing price of our common stock on the NYSE on February 2, 2017, approximately 80% of the notional amount of theaccelerated share repurchase agreement. As of February 6, 2017, the common stock received is included in Treasury Stock . At settlement of the agreement, which isexpected to occur during or prior to the third quarter of 2017, Citibank may be required to deliver additional shares of common stock to us, or, under certain circumstances, wemay be required to deliver shares of our common stock or may elect to make a cash payment to Citibank, with the number of shares to be delivered or the amount of suchpayment, as well as the final average price per share, based on the difference between the volume-weighted average price, less a discount, of Pfizer’s common stock duringthe term of the transaction. This agreement was entered into pursuant to our previously announced share repurchase authorization. After giving effect to the accelerated sharerepurchase agreement, our remaining share-purchase authorization was approximately $6.4 billion at February 6, 2017.
2016 Financial Report
135
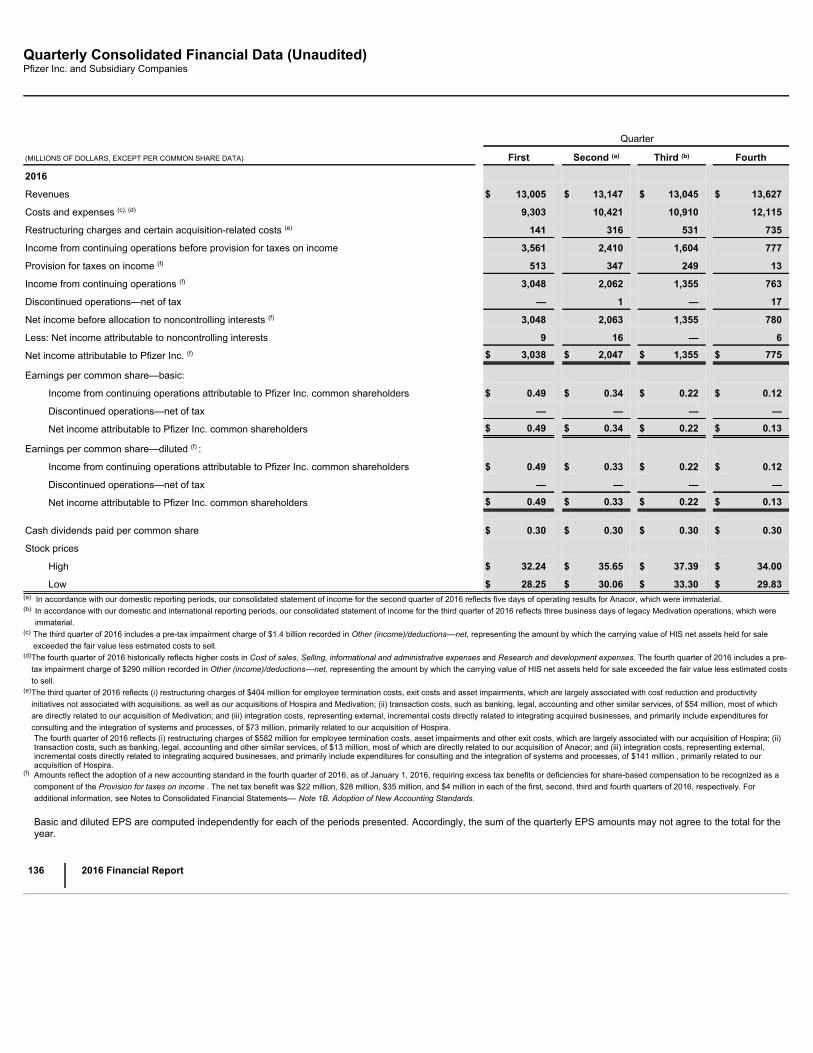
Quarterly Consolidated Financial Data (Unaudited)Pfizer Inc. and Subsidiary Companies
Quarter
(MILLIONS OF DOLLARS, EXCEPT PER COMMON SHARE DATA) First Second (a) Third (b) Fourth
2016
Revenues $ 13,005 $ 13,147 $ 13,045 $ 13,627
Costs and expenses (c), (d) 9,303 10,421 10,910 12,115
Restructuring charges and certain acquisition-related costs (e) 141 316 531 735
Income from continuing operations before provision for taxes on income 3,561 2,410 1,604 777
Provision for taxes on income (f) 513 347 249 13
Income from continuing operations (f) 3,048 2,062 1,355 763
Discontinued operations—net of tax — 1 — 17
Net income before allocation to noncontrolling interests (f) 3,048 2,063 1,355 780
Less: Net income attributable to noncontrolling interests 9 16 — 6
Net income attributable to Pfizer Inc. (f) $ 3,038 $ 2,047 $ 1,355 $ 775
Earnings per common share—basic:
Income from continuing operations attributable to Pfizer Inc. common shareholders $ 0.49 $ 0.34 $ 0.22 $ 0.12
Discontinued operations—net of tax — — — —
Net income attributable to Pfizer Inc. common shareholders $ 0.49 $ 0.34 $ 0.22 $ 0.13
Earnings per common share—diluted (f) :
Income from continuing operations attributable to Pfizer Inc. common shareholders $ 0.49 $ 0.33 $ 0.22 $ 0.12
Discontinued operations—net of tax — — — —
Net income attributable to Pfizer Inc. common shareholders $ 0.49 $ 0.33 $ 0.22 $ 0.13
Cash dividends paid per common share $ 0.30 $ 0.30 $ 0.30 $ 0.30
Stock prices
High $ 32.24 $ 35.65 $ 37.39 $ 34.00
Low $ 28.25 $ 30.06 $ 33.30 $ 29.83(a) In accordance with our domestic reporting periods, our consolidated statement of income for the second quarter of 2016 reflects five days of operating results for Anacor, which were immaterial.(b)
In accordance with our domestic and international reporting periods, our consolidated statement of income for the third quarter of 2016 reflects three business days of legacy Medivation operations, which wereimmaterial.
(c)
The third quarter of 2016 includes a pre-tax impairment charge of $1.4 billion recorded in Other (income)/deductions––net, representing the amount by which the carrying value of HIS net assets held for saleexceeded the fair value less estimated costs to sell.
(d)
The fourth quarter of 2016 historically reflects higher costs in Cost of sales, Selling, informational and administrative expenses and Research and development expenses. The fourth quarter of 2016 includes a pre-tax impairment charge of $290 million recorded in Other (income)/deductions––net, representing the amount by which the carrying value of HIS net assets held for sale exceeded the fair value less estimated coststo sell.
(e)
The third quarter of 2016 reflects (i) restructuring charges of $404 million for employee termination costs, exit costs and asset impairments, which are largely associated with cost reduction and productivityinitiatives not associated with acquisitions, as well as our acquisitions of Hospira and Medivation; (ii) transaction costs, such as banking, legal, accounting and other similar services, of $54 million, most of whichare directly related to our acquisition of Medivation; and (iii) integration costs, representing external, incremental costs directly related to integrating acquired businesses, and primarily include expenditures forconsulting and the integration of systems and processes, of $73 million, primarily related to our acquisition of Hospira.The fourth quarter of 2016 reflects (i) restructuring charges of $582 million for employee termination costs, asset impairments and other exit costs, which are largely associated with our acquisition of Hospira; (ii)transaction costs, such as banking, legal, accounting and other similar services, of $13 million, most of which are directly related to our acquisition of Anacor; and (iii) integration costs, representing external,incremental costs directly related to integrating acquired businesses, and primarily include expenditures for consulting and the integration of systems and processes, of $141 million , primarily related to ouracquisition of Hospira.
(f) Amounts reflect the adoption of a new accounting standard in the fourth quarter of 2016, as of January 1, 2016, requiring excess tax benefits or deficiencies for share-based compensation to be recognized as acomponent of the Provision for taxes on income . The net tax benefit was $22 million, $28 million, $35 million, and $4 million in each of the first, second, third and fourth quarters of 2016, respectively. Foradditional information, see Notes to Consolidated Financial Statements–– Note 1B. Adoption of New Accounting Standards.
Basic and diluted EPS are computed independently for each of the periods presented. Accordingly, the sum of the quarterly EPS amounts may not agree to the total for theyear.
136
2016 Financial Report
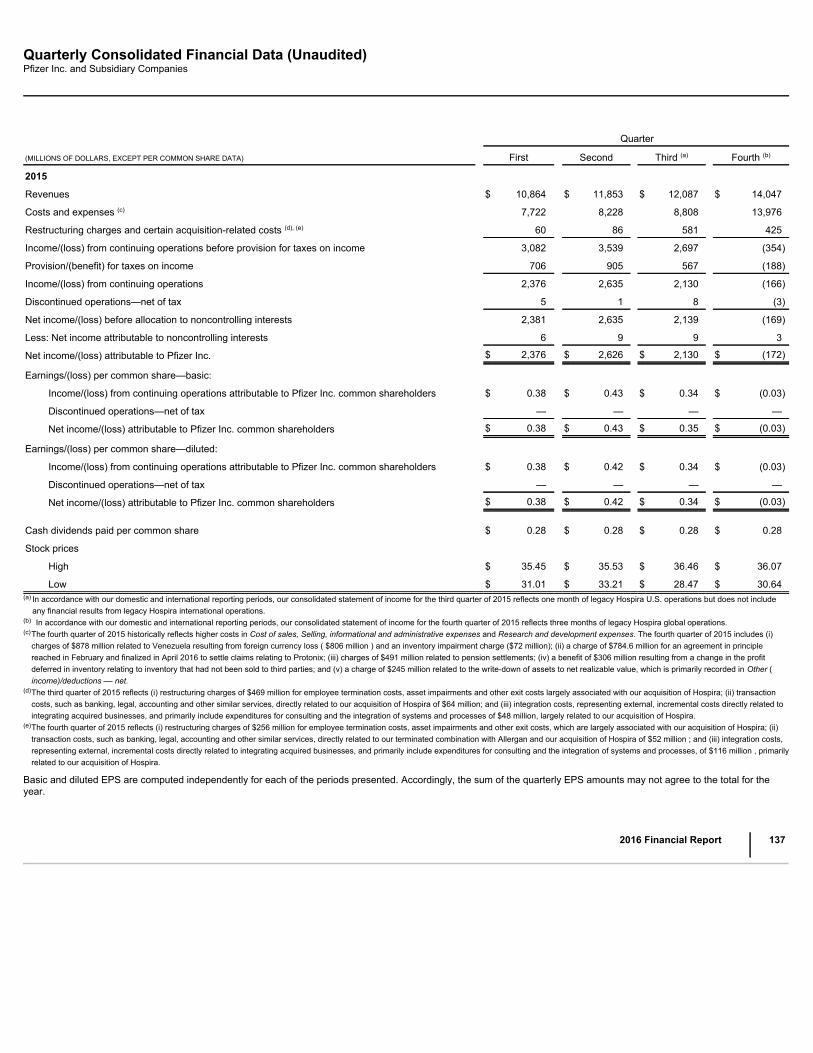
Quarterly Consolidated Financial Data (Unaudited)Pfizer Inc. and Subsidiary Companies
Quarter
(MILLIONS OF DOLLARS, EXCEPT PER COMMON SHARE DATA) First Second Third (a) Fourth (b)
2015
Revenues $ 10,864 $ 11,853 $ 12,087 $ 14,047
Costs and expenses (c) 7,722 8,228 8,808 13,976
Restructuring charges and certain acquisition-related costs (d), (e) 60 86 581 425
Income/(loss) from continuing operations before provision for taxes on income 3,082 3,539 2,697 (354)
Provision/(benefit) for taxes on income 706 905 567 (188)
Income/(loss) from continuing operations 2,376 2,635 2,130 (166)
Discontinued operations—net of tax 5 1 8 (3)
Net income/(loss) before allocation to noncontrolling interests 2,381 2,635 2,139 (169)
Less: Net income attributable to noncontrolling interests 6 9 9 3
Net income/(loss) attributable to Pfizer Inc. $ 2,376 $ 2,626 $ 2,130 $ (172)
Earnings/(loss) per common share—basic:
Income/(loss) from continuing operations attributable to Pfizer Inc. common shareholders $ 0.38 $ 0.43 $ 0.34 $ (0.03)
Discontinued operations—net of tax — — — —
Net income/(loss) attributable to Pfizer Inc. common shareholders $ 0.38 $ 0.43 $ 0.35 $ (0.03)
Earnings/(loss) per common share—diluted:
Income/(loss) from continuing operations attributable to Pfizer Inc. common shareholders $ 0.38 $ 0.42 $ 0.34 $ (0.03)
Discontinued operations—net of tax — — — —
Net income/(loss) attributable to Pfizer Inc. common shareholders $ 0.38 $ 0.42 $ 0.34 $ (0.03)
Cash dividends paid per common share $ 0.28 $ 0.28 $ 0.28 $ 0.28
Stock prices
High $ 35.45 $ 35.53 $ 36.46 $ 36.07
Low $ 31.01 $ 33.21 $ 28.47 $ 30.64(a)
In accordance with our domestic and international reporting periods, our consolidated statement of income for the third quarter of 2015 reflects one month of legacy Hospira U.S. operations but does not includeany financial results from legacy Hospira international operations.
(b) In accordance with our domestic and international reporting periods, our consolidated statement of income for the fourth quarter of 2015 reflects three months of legacy Hospira global operations.(c)
The fourth quarter of 2015 historically reflects higher costs in Cost of sales, Selling, informational and administrative expenses and Research and development expenses. The fourth quarter of 2015 includes (i)charges of $878 million related to Venezuela resulting from foreign currency loss ( $806 million ) and an inventory impairment charge ($72 million); (ii) a charge of $784.6 million for an agreement in principlereached in February and finalized in April 2016 to settle claims relating to Protonix; (iii) charges of $491 million related to pension settlements; (iv) a benefit of $306 million resulting from a change in the profitdeferred in inventory relating to inventory that had not been sold to third parties; and (v) a charge of $245 million related to the write-down of assets to net realizable value, which is primarily recorded in Other (income)/deductions –– net.
(d)
The third quarter of 2015 reflects (i) restructuring charges of $469 million for employee termination costs, asset impairments and other exit costs largely associated with our acquisition of Hospira; (ii) transactioncosts, such as banking, legal, accounting and other similar services, directly related to our acquisition of Hospira of $64 million; and (iii) integration costs, representing external, incremental costs directly related tointegrating acquired businesses, and primarily include expenditures for consulting and the integration of systems and processes of $48 million, largely related to our acquisition of Hospira.
(e)
The fourth quarter of 2015 reflects (i) restructuring charges of $256 million for employee termination costs, asset impairments and other exit costs, which are largely associated with our acquisition of Hospira; (ii)transaction costs, such as banking, legal, accounting and other similar services, directly related to our terminated combination with Allergan and our acquisition of Hospira of $52 million ; and (iii) integration costs,representing external, incremental costs directly related to integrating acquired businesses, and primarily include expenditures for consulting and the integration of systems and processes, of $116 million , primarilyrelated to our acquisition of Hospira.
Basic and diluted EPS are computed independently for each of the periods presented. Accordingly, the sum of the quarterly EPS amounts may not agree to the total for theyear.
2016 Financial Report
137
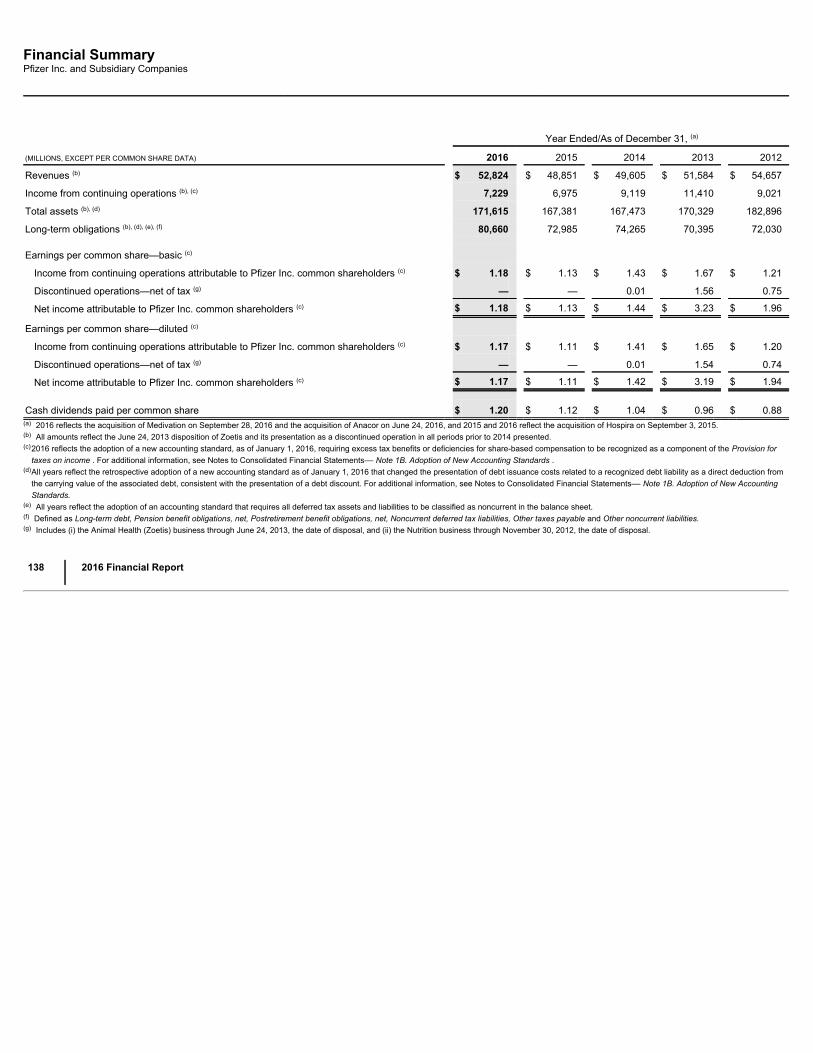
Financial SummaryPfizer Inc. and Subsidiary Companies
Year Ended/As of December 31, (a)
(MILLIONS, EXCEPT PER COMMON SHARE DATA) 2016 2015 2014 2013 2012
Revenues (b) $ 52,824 $ 48,851 $ 49,605 $ 51,584 $ 54,657
Income from continuing operations (b), (c) 7,229 6,975 9,119 11,410 9,021
Total assets (b), (d) 171,615 167,381 167,473 170,329 182,896
Long-term obligations (b), (d), (e), (f) 80,660 72,985 74,265 70,395 72,030 Earnings per common share—basic (c)
Income from continuing operations attributable to Pfizer Inc. common shareholders (c) $ 1.18 $ 1.13 $ 1.43 $ 1.67 $ 1.21
Discontinued operations—net of tax (g) — — 0.01 1.56 0.75
Net income attributable to Pfizer Inc. common shareholders (c) $ 1.18 $ 1.13 $ 1.44 $ 3.23 $ 1.96
Earnings per common share—diluted (c)
Income from continuing operations attributable to Pfizer Inc. common shareholders (c) $ 1.17 $ 1.11 $ 1.41 $ 1.65 $ 1.20
Discontinued operations—net of tax (g) — — 0.01 1.54 0.74
Net income attributable to Pfizer Inc. common shareholders (c) $ 1.17 $ 1.11 $ 1.42 $ 3.19 $ 1.94
Cash dividends paid per common share $ 1.20 $ 1.12 $ 1.04 $ 0.96 $ 0.88
(a) 2016 reflects the acquisition of Medivation on September 28, 2016 and the acquisition of Anacor on June 24, 2016, and 2015 and 2016 reflect the acquisition of Hospira on September 3, 2015.(b) All amounts reflect the June 24, 2013 disposition of Zoetis and its presentation as a discontinued operation in all periods prior to 2014 presented.(c)
2016 reflects the adoption of a new accounting standard, as of January 1, 2016, requiring excess tax benefits or deficiencies for share-based compensation to be recognized as a component of the Provision fortaxes on income . For additional information, see Notes to Consolidated Financial Statements–– Note 1B. Adoption of New Accounting Standards .
(d)
All years reflect the retrospective adoption of a new accounting standard as of January 1, 2016 that changed the presentation of debt issuance costs related to a recognized debt liability as a direct deduction fromthe carrying value of the associated debt, consistent with the presentation of a debt discount. For additional information, see Notes to Consolidated Financial Statements–– Note 1B. Adoption of New AccountingStandards.
(e) All years reflect the adoption of an accounting standard that requires all deferred tax assets and liabilities to be classified as noncurrent in the balance sheet.(f) Defined as Long-term debt, Pension benefit obligations, net, Postretirement benefit obligations, net, Noncurrent deferred tax liabilities, Other taxes payable and Other noncurrent liabilities.(g) Includes (i) the Animal Health (Zoetis) business through June 24, 2013, the date of disposal, and (ii) the Nutrition business through November 30, 2012, the date of disposal.
138
2016 Financial Report
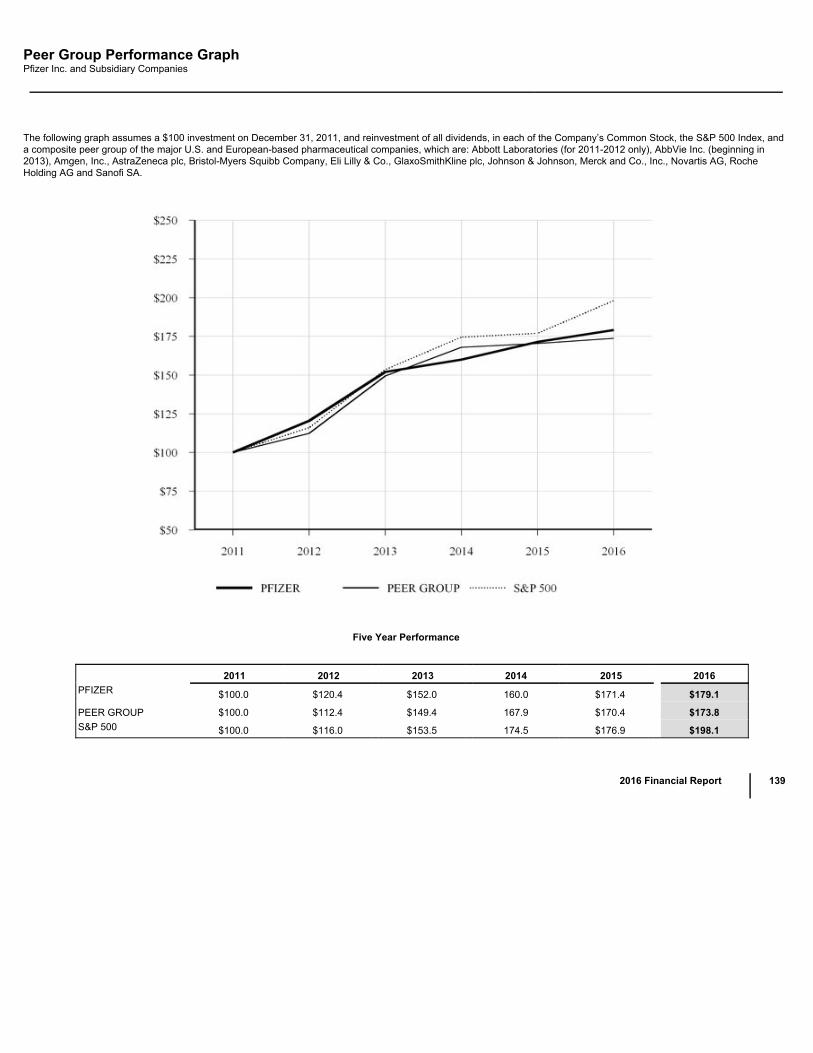
Peer Group Performance GraphPfizer Inc. and Subsidiary Companies
The following graph assumes a $100 investment on December 31, 2011, and reinvestment of all dividends, in each of the Company’s Common Stock, the S&P 500 Index, anda composite peer group of the major U.S. and European-based pharmaceutical companies, which are: Abbott Laboratories (for 2011-2012 only), AbbVie Inc. (beginning in2013), Amgen, Inc., AstraZeneca plc, Bristol-Myers Squibb Company, Eli Lilly & Co., GlaxoSmithKline plc, Johnson & Johnson, Merck and Co., Inc., Novartis AG, RocheHolding AG and Sanofi SA.
Five Year Performance
2011 2012 2013 2014 2015 2016PFIZER $100.0 $120.4 $152.0 160.0 $171.4 $179.1
PEER GROUP $100.0 $112.4 $149.4 167.9 $170.4 $173.8S&P 500 $100.0 $116.0 $153.5 174.5 $176.9 $198.1
2016 Financial Report
139
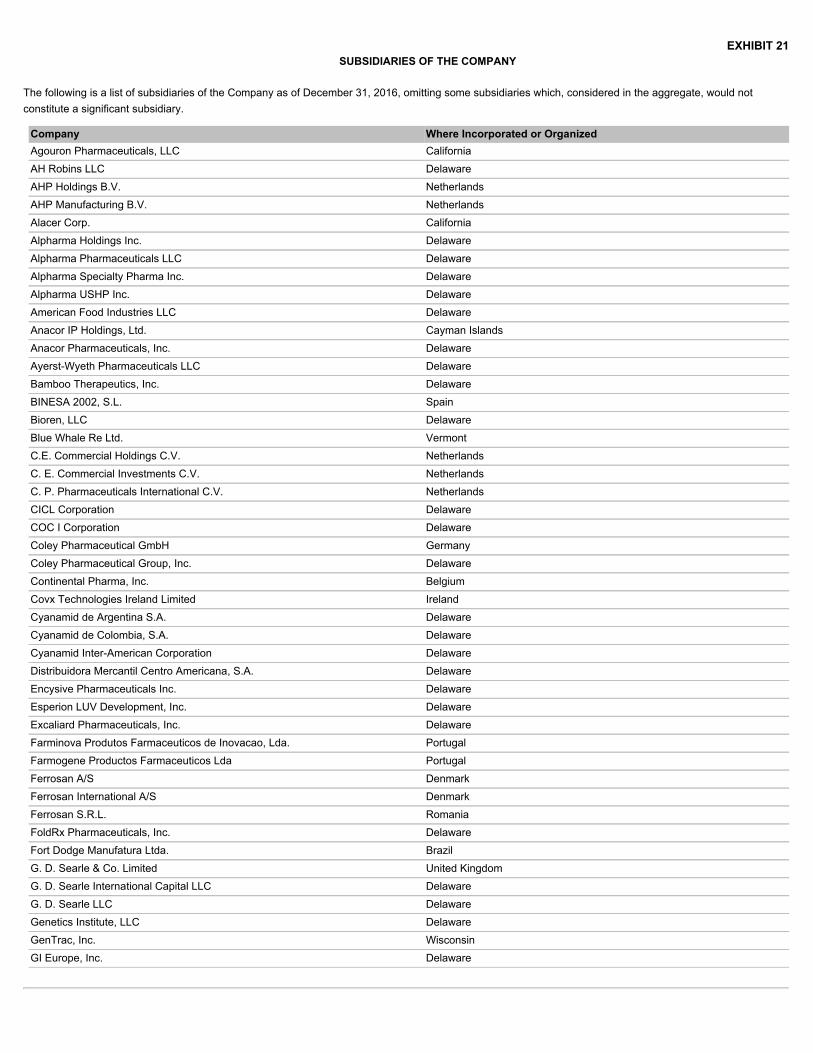
EXHIBIT 21SUBSIDIARIES OF THE COMPANY
The following is a list of subsidiaries of the Company as of December 31, 2016, omitting some subsidiaries which, considered in the aggregate, would notconstitute a significant subsidiary.
Company Where Incorporated or OrganizedAgouron Pharmaceuticals, LLC CaliforniaAH Robins LLC DelawareAHP Holdings B.V. NetherlandsAHP Manufacturing B.V. NetherlandsAlacer Corp. CaliforniaAlpharma Holdings Inc. DelawareAlpharma Pharmaceuticals LLC DelawareAlpharma Specialty Pharma Inc. DelawareAlpharma USHP Inc. DelawareAmerican Food Industries LLC DelawareAnacor IP Holdings, Ltd. Cayman IslandsAnacor Pharmaceuticals, Inc. DelawareAyerst-Wyeth Pharmaceuticals LLC DelawareBamboo Therapeutics, Inc. DelawareBINESA 2002, S.L. SpainBioren, LLC DelawareBlue Whale Re Ltd. VermontC.E. Commercial Holdings C.V. NetherlandsC. E. Commercial Investments C.V. NetherlandsC. P. Pharmaceuticals International C.V. NetherlandsCICL Corporation DelawareCOC I Corporation DelawareColey Pharmaceutical GmbH GermanyColey Pharmaceutical Group, Inc. DelawareContinental Pharma, Inc. BelgiumCovx Technologies Ireland Limited IrelandCyanamid de Argentina S.A. DelawareCyanamid de Colombia, S.A. DelawareCyanamid Inter-American Corporation DelawareDistribuidora Mercantil Centro Americana, S.A. DelawareEncysive Pharmaceuticals Inc. DelawareEsperion LUV Development, Inc. DelawareExcaliard Pharmaceuticals, Inc. DelawareFarminova Produtos Farmaceuticos de Inovacao, Lda. PortugalFarmogene Productos Farmaceuticos Lda PortugalFerrosan A/S DenmarkFerrosan International A/S DenmarkFerrosan S.R.L. RomaniaFoldRx Pharmaceuticals, Inc. DelawareFort Dodge Manufatura Ltda. BrazilG. D. Searle & Co. Limited United KingdomG. D. Searle International Capital LLC DelawareG. D. Searle LLC DelawareGenetics Institute, LLC DelawareGenTrac, Inc. WisconsinGI Europe, Inc. Delaware

GI Japan, Inc. DelawareGreenstone LLC DelawareHaptogen Limited United KingdomHBAF Ltd. BahamasHospira (China) Enterprise Management Co. Ltd. People's Republic of ChinaHospira Adelaide Pty Ltd AustraliaHospira Argentina S.R.L. ArgentinaHospira Aseptic Services Limited United KingdomHospira Australia Pty Ltd AustraliaHospira Bahamas (Australia) Holdings Ltd. BahamasHospira Bahamas (Ireland) Corp. BahamasHospira Bahamas Biologics Ltd. BahamasHospira Bahamas International Holdings Ltd. BahamasHospira Benelux BVBA BelgiumHospira Boulder, Inc. DelawareHospira Chile Limitada ChileHospira Costa Rica Ltd. BahamasHospira Deutschland GmbH GermanyHospira Enterprises B.V. NetherlandsHospira Fleet Services, LLC DelawareHospira France SAS FranceHospira Healthcare B.V. NetherlandsHospira Healthcare Corporation CanadaHospira Healthcare India Private Limited IndiaHospira Holding Ltd. BahamasHospira Holdings (S.A.) Pty Ltd AustraliaHospira Invicta, S.A. SpainHospira Ireland Holdings Unlimited Company IrelandHospira Ireland Sales Limited IrelandHospira Italia S.r.l. ItalyHospira Japan G.K. JapanHospira Korea Co. Ltd Republic of KoreaHospira Limitada ColombiaHospira Limited Hong KongHospira Ltd. BahamasHospira Malaysia Sdn Bhd MalaysiaHospira Nordic AB SwedenHospira NZ Limited New ZealandHospira Peru SRL PeruHospira Philippines, Inc. PhilippinesHospira Portugal LDA PortugalHospira Productos Farmaceuticos y Hospitalarios, S.L. SpainHospira Produtos Hospitalares Ltda. BrazilHospira Pte. Ltd. SingaporeHospira Pty Limited AustraliaHospira Puerto Rico, LLC DelawareHospira S.p.A. ItalyHospira Singapore Pte Ltd SingaporeHospira UK Limited United KingdomHospira Unlimited Company IrelandHospira Worldwide, LLC DelawareHospira Zagreb d.o.o. CroatiaHospira, Inc. Delaware
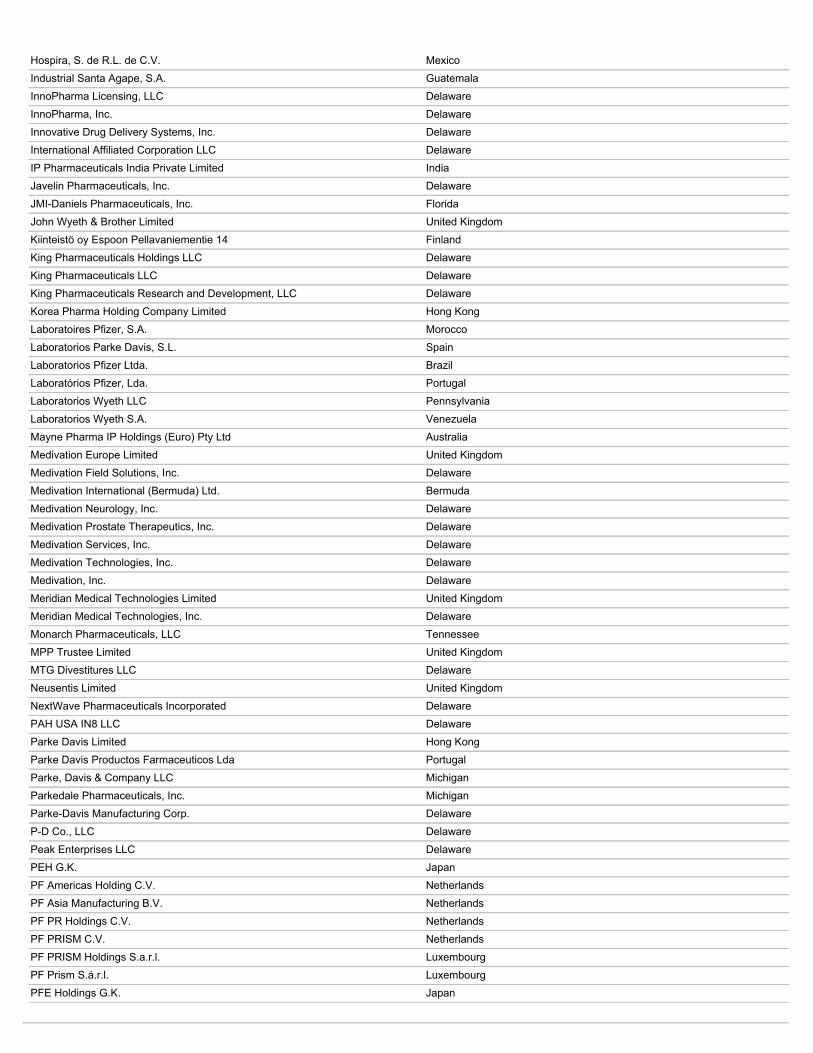
Hospira, S. de R.L. de C.V. MexicoIndustrial Santa Agape, S.A. GuatemalaInnoPharma Licensing, LLC DelawareInnoPharma, Inc. DelawareInnovative Drug Delivery Systems, Inc. DelawareInternational Affiliated Corporation LLC DelawareIP Pharmaceuticals India Private Limited IndiaJavelin Pharmaceuticals, Inc. DelawareJMI-Daniels Pharmaceuticals, Inc. FloridaJohn Wyeth & Brother Limited United KingdomKiinteistö oy Espoon Pellavaniementie 14 FinlandKing Pharmaceuticals Holdings LLC DelawareKing Pharmaceuticals LLC DelawareKing Pharmaceuticals Research and Development, LLC DelawareKorea Pharma Holding Company Limited Hong KongLaboratoires Pfizer, S.A. MoroccoLaboratorios Parke Davis, S.L. SpainLaboratorios Pfizer Ltda. BrazilLaboratórios Pfizer, Lda. PortugalLaboratorios Wyeth LLC PennsylvaniaLaboratorios Wyeth S.A. VenezuelaMayne Pharma IP Holdings (Euro) Pty Ltd AustraliaMedivation Europe Limited United KingdomMedivation Field Solutions, Inc. DelawareMedivation International (Bermuda) Ltd. BermudaMedivation Neurology, Inc. DelawareMedivation Prostate Therapeutics, Inc. DelawareMedivation Services, Inc. DelawareMedivation Technologies, Inc. DelawareMedivation, Inc. DelawareMeridian Medical Technologies Limited United KingdomMeridian Medical Technologies, Inc. DelawareMonarch Pharmaceuticals, LLC TennesseeMPP Trustee Limited United KingdomMTG Divestitures LLC DelawareNeusentis Limited United KingdomNextWave Pharmaceuticals Incorporated DelawarePAH USA IN8 LLC DelawareParke Davis Limited Hong KongParke Davis Productos Farmaceuticos Lda PortugalParke, Davis & Company LLC MichiganParkedale Pharmaceuticals, Inc. MichiganParke-Davis Manufacturing Corp. DelawareP-D Co., LLC DelawarePeak Enterprises LLC DelawarePEH G.K. JapanPF Americas Holding C.V. NetherlandsPF Asia Manufacturing B.V. NetherlandsPF PR Holdings C.V. NetherlandsPF PRISM C.V. NetherlandsPF PRISM Holdings S.a.r.l. LuxembourgPF Prism S.á.r.l. LuxembourgPFE Holdings G.K. Japan
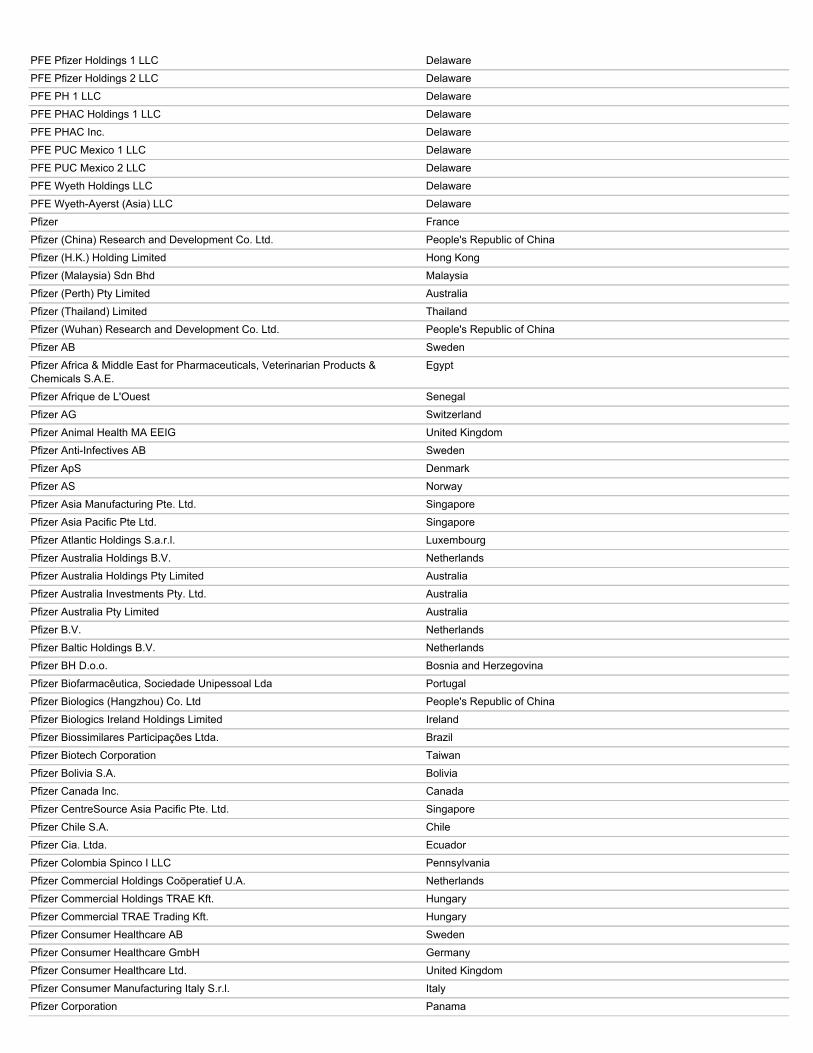
PFE Pfizer Holdings 1 LLC DelawarePFE Pfizer Holdings 2 LLC DelawarePFE PH 1 LLC DelawarePFE PHAC Holdings 1 LLC DelawarePFE PHAC Inc. DelawarePFE PUC Mexico 1 LLC DelawarePFE PUC Mexico 2 LLC DelawarePFE Wyeth Holdings LLC DelawarePFE Wyeth-Ayerst (Asia) LLC DelawarePfizer FrancePfizer (China) Research and Development Co. Ltd. People's Republic of ChinaPfizer (H.K.) Holding Limited Hong KongPfizer (Malaysia) Sdn Bhd MalaysiaPfizer (Perth) Pty Limited AustraliaPfizer (Thailand) Limited ThailandPfizer (Wuhan) Research and Development Co. Ltd. People's Republic of ChinaPfizer AB SwedenPfizer Africa & Middle East for Pharmaceuticals, Veterinarian Products &Chemicals S.A.E.
Egypt
Pfizer Afrique de L'Ouest SenegalPfizer AG SwitzerlandPfizer Animal Health MA EEIG United KingdomPfizer Anti-Infectives AB SwedenPfizer ApS DenmarkPfizer AS NorwayPfizer Asia Manufacturing Pte. Ltd. SingaporePfizer Asia Pacific Pte Ltd. SingaporePfizer Atlantic Holdings S.a.r.l. LuxembourgPfizer Australia Holdings B.V. NetherlandsPfizer Australia Holdings Pty Limited AustraliaPfizer Australia Investments Pty. Ltd. AustraliaPfizer Australia Pty Limited AustraliaPfizer B.V. NetherlandsPfizer Baltic Holdings B.V. NetherlandsPfizer BH D.o.o. Bosnia and HerzegovinaPfizer Biofarmacêutica, Sociedade Unipessoal Lda PortugalPfizer Biologics (Hangzhou) Co. Ltd People's Republic of ChinaPfizer Biologics Ireland Holdings Limited IrelandPfizer Biossimilares Participações Ltda. BrazilPfizer Biotech Corporation TaiwanPfizer Bolivia S.A. BoliviaPfizer Canada Inc. CanadaPfizer CentreSource Asia Pacific Pte. Ltd. SingaporePfizer Chile S.A. ChilePfizer Cia. Ltda. EcuadorPfizer Colombia Spinco I LLC PennsylvaniaPfizer Commercial Holdings Coöperatief U.A. NetherlandsPfizer Commercial Holdings TRAE Kft. HungaryPfizer Commercial TRAE Trading Kft. HungaryPfizer Consumer Healthcare AB SwedenPfizer Consumer Healthcare GmbH GermanyPfizer Consumer Healthcare Ltd. United KingdomPfizer Consumer Manufacturing Italy S.r.l. ItalyPfizer Corporation Panama


Pfizer Corporation Austria Gesellschaft m.b.H. AustriaPfizer Corporation Hong Kong Limited Hong KongPfizer Costa Rica PFE, Sociedad de Responsabilidad Limitada Costa RicaPfizer Croatia d.o.o. CroatiaPfizer Deutschland GmbH GermanyPfizer Deutschland PFE Holding GmbH GermanyPfizer Development LP United KingdomPfizer Development Services (UK) Limited United KingdomPfizer Domestic Ventures Limited JerseyPfizer Dominicana, S.R.L Dominican RepublicPfizer East India B.V. NetherlandsPfizer Eastern Investments B.V. NetherlandsPfizer Egypt S.A.E. EgyptPfizer Enterprise Holdings B.V. NetherlandsPfizer Enterprises LLC DelawarePfizer Enterprises SARL LuxembourgPfizer ESP Pty Ltd AustraliaPfizer EU PFE MA EEIG United KingdomPfizer Europe Finance B.V. NetherlandsPfizer Europe Holdings SARL LuxembourgPfizer Europe MA EEIG United KingdomPfizer Export B.V. NetherlandsPfizer Export Company IrelandPfizer Export Holding Company B.V NetherlandsPfizer Finance Share Service (Dalian) Co., Ltd. People's Republic of ChinaPfizer Financial Services N.V./S.A. BelgiumPfizer France International Investments FrancePfizer Free Zone Panama, S. de R.L. PanamaPfizer GEP, S.L. SpainPfizer Germany Partner B.V. NetherlandsPfizer Global Holdings B.V. NetherlandsPfizer Global Supply Japan Inc. JapanPfizer Global Trading IrelandPfizer Group Luxembourg Sarl LuxembourgPfizer Gulf FZ-LLC United Arab EmiratesPfizer H.C.P. Corporation New YorkPfizer Health AB SwedenPfizer Health Solutions Inc. DelawarePfizer Healthcare Ireland IrelandPfizer Hellas, A.E. GreecePfizer Himalaya Holdings Coöperatief U.A. NetherlandsPfizer HK Service Company Limited Hong KongPfizer Holding France FrancePfizer Holding Ventures IrelandPfizer Holdings Americas Corporation DelawarePfizer Holdings Corporation DelawarePfizer Holdings Europe Unlimited Company IrelandPfizer Holdings G.K. JapanPfizer Holdings International Corporation DelawarePfizer Holdings International Luxembourg (PHIL) Sarl LuxembourgPfizer Holdings North America SARL LuxembourgPfizer Holdings Turkey Limited JerseyPfizer Hungary Holdings TRAE Kft. Hungary

Pfizer Ilaclari Limited Sirketi TurkeyPfizer Innovations AB SwedenPfizer Innovations LLC RussiaPfizer Innovative Supply Point International BVBA BelgiumPfizer International Business Europe Unlimited Company IrelandPfizer International LLC New YorkPfizer International Markets Coöperatief U.A. NetherlandsPfizer International Operations FrancePfizer International S. de R.L. PanamaPfizer International Trading (Shanghai) Limited People's Republic of ChinaPfizer Investment Capital Unlimited Company IrelandPfizer Investment Co. Ltd. People's Republic of ChinaPfizer Investment Holdings S.a.r.l. LuxembourgPfizer Ireland Investments Limited IrelandPfizer Ireland Limited IrelandPfizer Ireland PFE Holding 1 LLC DelawarePfizer Ireland PFE Holding 2 LLC DelawarePfizer Ireland Pharmaceuticals IrelandPfizer Ireland Production Limited IrelandPfizer Ireland Ventures Unlimited Company IrelandPfizer Italia S.r.l. ItalyPfizer Italy Group Holding S.r.l. ItalyPfizer Japan Inc. JapanPfizer Laboratories (Pty) Limited South AfricaPfizer Laboratories Limited KenyaPfizer Laboratories PFE (Pty) Ltd South AfricaPfizer Leasing Ireland Limited IrelandPfizer Leasing UK Limited United KingdomPfizer Limited IndiaPfizer Limited TaiwanPfizer Limited TanzaniaPfizer Limited UgandaPfizer Limited United KingdomPfizer LLC RussiaPfizer Luxco Holdings SARL LuxembourgPfizer Luxembourg Global Holdings S.à r.l. LuxembourgPfizer Luxembourg SARL LuxembourgPfizer Manufacturing Austria G.m.b.H. AustriaPfizer Manufacturing Belgium N.V. BelgiumPfizer Manufacturing Deutschland GmbH GermanyPfizer Manufacturing Deutschland Grundbesitz GmbH & Co. KG GermanyPfizer Manufacturing Deutschland PFE GmbH GermanyPfizer Manufacturing Holdings LLC DelawarePfizer Manufacturing Ireland Unlimited Company IrelandPfizer Manufacturing LLC DelawarePfizer Manufacturing Services IrelandPfizer Medical Technology Group (Belgium) N.V. BelgiumPfizer Medicamentos Genericos e Participacoes Ltda. BrazilPfizer Mexico Luxco SARL LuxembourgPfizer Mexico, S.A. de C.V. MexicoPfizer Middle East for Pharmaceuticals, Animal Health and Chemicals S.A.E. EgyptPfizer Namibia (Proprietary) Limited NamibiaPfizer New Zealand Limited New Zealand
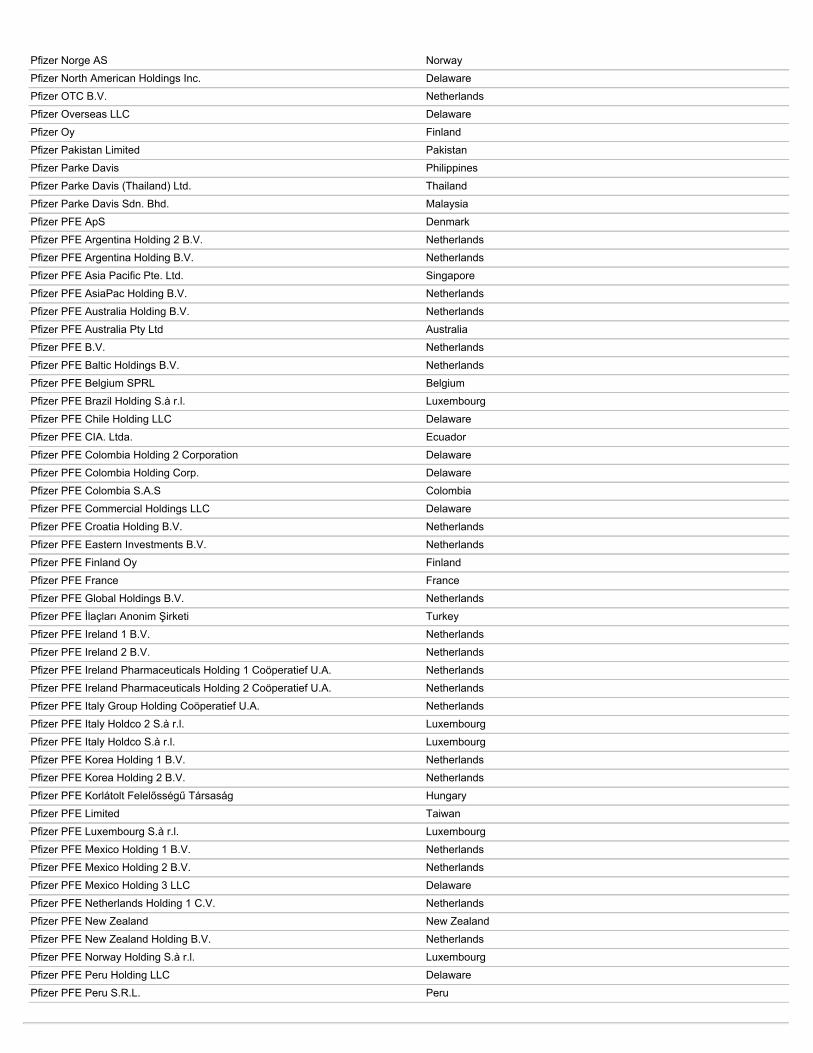
Pfizer Norge AS NorwayPfizer North American Holdings Inc. DelawarePfizer OTC B.V. NetherlandsPfizer Overseas LLC DelawarePfizer Oy FinlandPfizer Pakistan Limited PakistanPfizer Parke Davis PhilippinesPfizer Parke Davis (Thailand) Ltd. ThailandPfizer Parke Davis Sdn. Bhd. MalaysiaPfizer PFE ApS DenmarkPfizer PFE Argentina Holding 2 B.V. NetherlandsPfizer PFE Argentina Holding B.V. NetherlandsPfizer PFE Asia Pacific Pte. Ltd. SingaporePfizer PFE AsiaPac Holding B.V. NetherlandsPfizer PFE Australia Holding B.V. NetherlandsPfizer PFE Australia Pty Ltd AustraliaPfizer PFE B.V. NetherlandsPfizer PFE Baltic Holdings B.V. NetherlandsPfizer PFE Belgium SPRL BelgiumPfizer PFE Brazil Holding S.à r.l. LuxembourgPfizer PFE Chile Holding LLC DelawarePfizer PFE CIA. Ltda. EcuadorPfizer PFE Colombia Holding 2 Corporation DelawarePfizer PFE Colombia Holding Corp. DelawarePfizer PFE Colombia S.A.S ColombiaPfizer PFE Commercial Holdings LLC DelawarePfizer PFE Croatia Holding B.V. NetherlandsPfizer PFE Eastern Investments B.V. NetherlandsPfizer PFE Finland Oy FinlandPfizer PFE France FrancePfizer PFE Global Holdings B.V. NetherlandsPfizer PFE İlaçları Anonim Şirketi TurkeyPfizer PFE Ireland 1 B.V. NetherlandsPfizer PFE Ireland 2 B.V. NetherlandsPfizer PFE Ireland Pharmaceuticals Holding 1 Coöperatief U.A. NetherlandsPfizer PFE Ireland Pharmaceuticals Holding 2 Coöperatief U.A. NetherlandsPfizer PFE Italy Group Holding Coöperatief U.A. NetherlandsPfizer PFE Italy Holdco 2 S.à r.l. LuxembourgPfizer PFE Italy Holdco S.à r.l. LuxembourgPfizer PFE Korea Holding 1 B.V. NetherlandsPfizer PFE Korea Holding 2 B.V. NetherlandsPfizer PFE Korlátolt Felelősségű Társaság HungaryPfizer PFE Limited TaiwanPfizer PFE Luxembourg S.à r.l. LuxembourgPfizer PFE Mexico Holding 1 B.V. NetherlandsPfizer PFE Mexico Holding 2 B.V. NetherlandsPfizer PFE Mexico Holding 3 LLC DelawarePfizer PFE Netherlands Holding 1 C.V. NetherlandsPfizer PFE New Zealand New ZealandPfizer PFE New Zealand Holding B.V. NetherlandsPfizer PFE Norway Holding S.à r.l. LuxembourgPfizer PFE Peru Holding LLC DelawarePfizer PFE Peru S.R.L. Peru

Pfizer PFE Pharmaceuticals Holding B.V. NetherlandsPfizer PFE Pharmaceuticals Israel Holding LLC DelawarePfizer PFE Pharmaceuticals Israel Ltd. IsraelPfizer PFE PHIL UAE Holding 2 B.V NetherlandsPfizer PFE PHIL UAE Holding 3 B.V NetherlandsPfizer PFE PHIL UAE Holding 4 B.V. NetherlandsPfizer PFE Philippines Holding 1 B.V. NetherlandsPfizer PFE Philippines Holding 2 B.V. NetherlandsPfizer PFE PILSA Holdco S.à r.l. LuxembourgPfizer PFE Poland Holding B.V. NetherlandsPfizer PFE Private Limited SingaporePfizer PFE S.R.L ArgentinaPfizer PFE Service Company Holding Coöperatief U.A. NetherlandsPfizer PFE Servicios Mexico, S. de R.L. C.V. MexicoPfizer PFE Singapore Holding Coöperatief U.A. NetherlandsPfizer PFE Singapore Pte. Ltd. SingaporePfizer PFE South Africa Holding B.V. NetherlandsPfizer PFE Spain B.V. NetherlandsPfizer PFE Spain Holding, S.L. SpainPfizer PFE Spain Holdings LLC DelawarePfizer PFE Sweden Holding 2 S.á.r.l. LuxembourgPfizer PFE Sweden Holding S.á.r.l. LuxembourgPfizer PFE Switzerland GmbH SwitzerlandPfizer PFE Turkey Holding 1 B.V. NetherlandsPfizer PFE Turkey Holding 2 B.V. NetherlandsPfizer PFE UK Holding 4 LP United KingdomPfizer PFE UK Limited United KingdomPfizer PFE US Holdings 1 LLC DelawarePfizer PFE US Holdings 2 LLC DelawarePfizer PFE US Holdings 3 LLC DelawarePfizer PFE US Holdings 4 LLC DelawarePfizer PFE US Holdings 5 LLC DelawarePfizer PFE US Holdings 6 LLC DelawarePfizer PFE, Inc. PhilippinesPfizer PFE, spol. s r.o. Czech RepublicPfizer PGM FrancePfizer PGRD FrancePfizer Pharm Algerie AlgeriaPfizer Pharma GmbH GermanyPfizer Pharma PFE GmbH GermanyPfizer Pharmaceutical (Wuxi) Co., Ltd. People's Republic of ChinaPfizer Pharmaceutical Trading Limited Liability Company (a/k/a Pfizer Kft. orPfizer LLC)
Hungary
Pfizer Pharmaceuticals B.V. NetherlandsPfizer Pharmaceuticals Global Coöperatief U.A. NetherlandsPfizer Pharmaceuticals Israel Ltd. IsraelPfizer Pharmaceuticals Korea Limited Republic of KoreaPfizer Pharmaceuticals Limited Cayman IslandsPfizer Pharmaceuticals Limited IrelandPfizer Pharmaceuticals LLC DelawarePfizer Pharmaceuticals Ltd. People's Republic of ChinaPfizer Pharmaceuticals PFE Korea Limited Republic of KoreaPfizer Pharmaceuticals Tunisie Sarl TunisiaPfizer Pigments Inc. Delaware

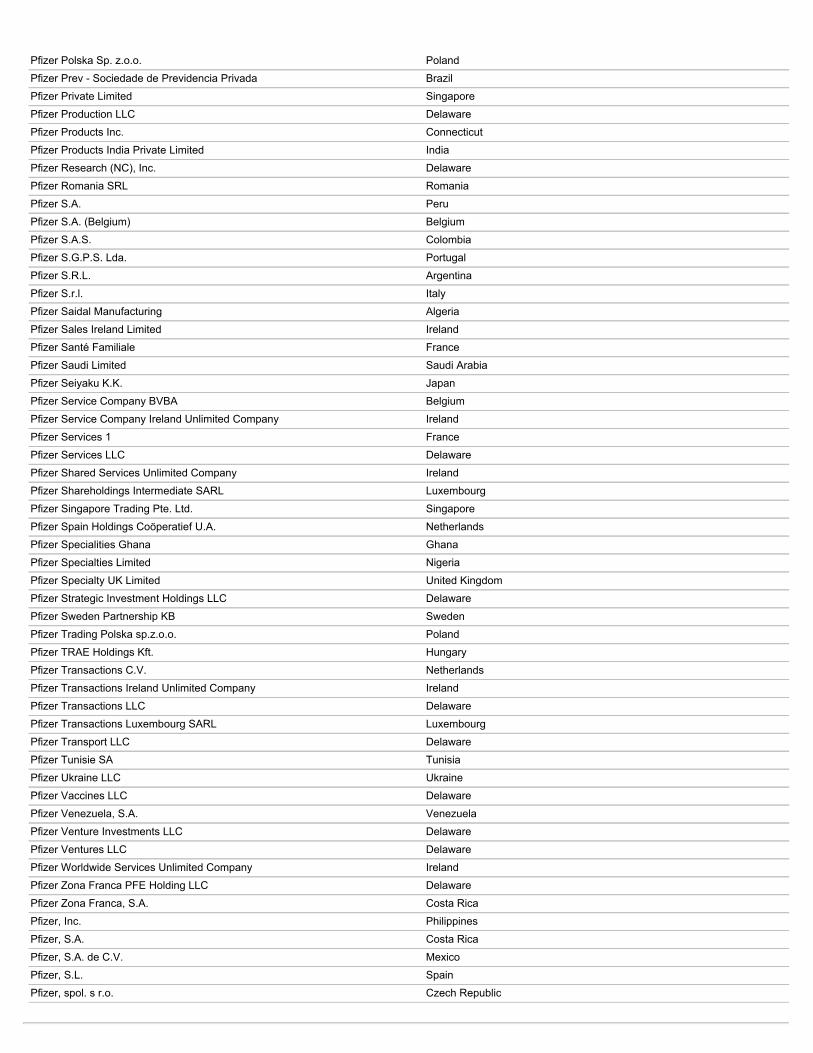
Pfizer Polska Sp. z.o.o. PolandPfizer Prev - Sociedade de Previdencia Privada BrazilPfizer Private Limited SingaporePfizer Production LLC DelawarePfizer Products Inc. ConnecticutPfizer Products India Private Limited IndiaPfizer Research (NC), Inc. DelawarePfizer Romania SRL RomaniaPfizer S.A. PeruPfizer S.A. (Belgium) BelgiumPfizer S.A.S. ColombiaPfizer S.G.P.S. Lda. PortugalPfizer S.R.L. ArgentinaPfizer S.r.l. ItalyPfizer Saidal Manufacturing AlgeriaPfizer Sales Ireland Limited IrelandPfizer Santé Familiale FrancePfizer Saudi Limited Saudi ArabiaPfizer Seiyaku K.K. JapanPfizer Service Company BVBA BelgiumPfizer Service Company Ireland Unlimited Company IrelandPfizer Services 1 FrancePfizer Services LLC DelawarePfizer Shared Services Unlimited Company IrelandPfizer Shareholdings Intermediate SARL LuxembourgPfizer Singapore Trading Pte. Ltd. SingaporePfizer Spain Holdings Coöperatief U.A. NetherlandsPfizer Specialities Ghana GhanaPfizer Specialties Limited NigeriaPfizer Specialty UK Limited United KingdomPfizer Strategic Investment Holdings LLC DelawarePfizer Sweden Partnership KB SwedenPfizer Trading Polska sp.z.o.o. PolandPfizer TRAE Holdings Kft. HungaryPfizer Transactions C.V. NetherlandsPfizer Transactions Ireland Unlimited Company IrelandPfizer Transactions LLC DelawarePfizer Transactions Luxembourg SARL LuxembourgPfizer Transport LLC DelawarePfizer Tunisie SA TunisiaPfizer Ukraine LLC UkrainePfizer Vaccines LLC DelawarePfizer Venezuela, S.A. VenezuelaPfizer Venture Investments LLC DelawarePfizer Ventures LLC DelawarePfizer Worldwide Services Unlimited Company IrelandPfizer Zona Franca PFE Holding LLC DelawarePfizer Zona Franca, S.A. Costa RicaPfizer, Inc. PhilippinesPfizer, S.A. Costa RicaPfizer, S.A. de C.V. MexicoPfizer, S.L. SpainPfizer, spol. s r.o. Czech Republic
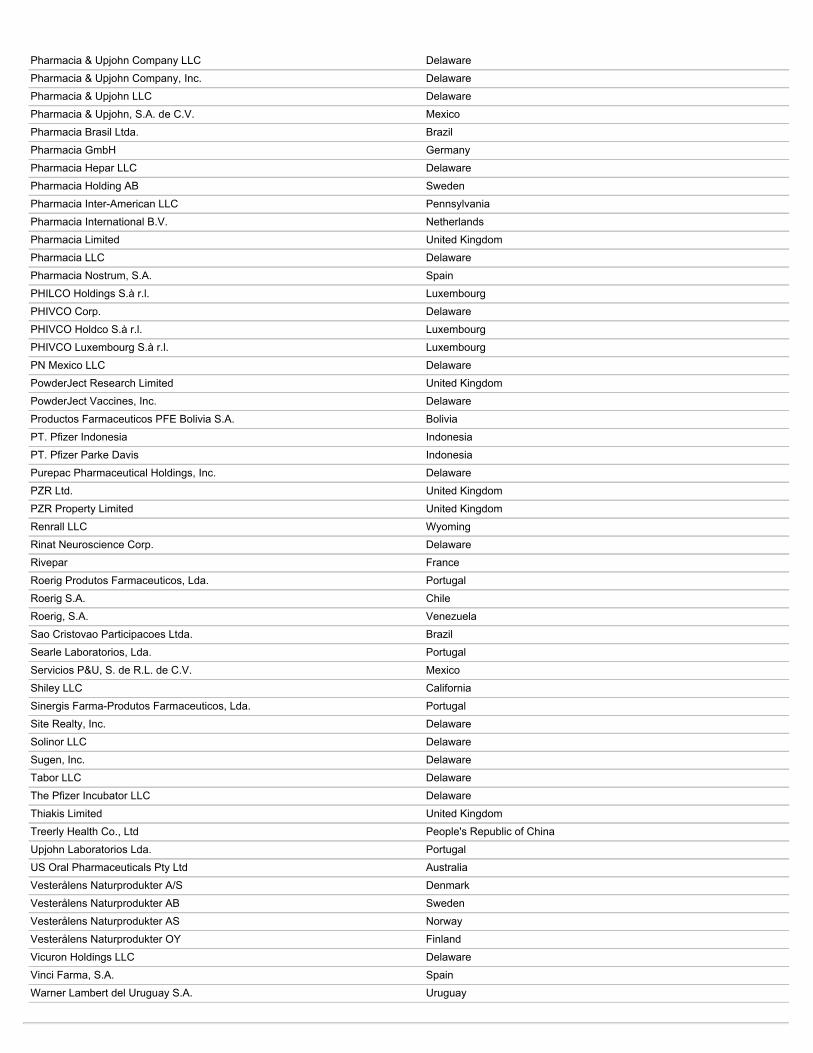
Pharmacia & Upjohn Company LLC DelawarePharmacia & Upjohn Company, Inc. DelawarePharmacia & Upjohn LLC DelawarePharmacia & Upjohn, S.A. de C.V. MexicoPharmacia Brasil Ltda. BrazilPharmacia GmbH GermanyPharmacia Hepar LLC DelawarePharmacia Holding AB SwedenPharmacia Inter-American LLC PennsylvaniaPharmacia International B.V. NetherlandsPharmacia Limited United KingdomPharmacia LLC DelawarePharmacia Nostrum, S.A. SpainPHILCO Holdings S.à r.l. LuxembourgPHIVCO Corp. DelawarePHIVCO Holdco S.à r.l. LuxembourgPHIVCO Luxembourg S.à r.l. LuxembourgPN Mexico LLC DelawarePowderJect Research Limited United KingdomPowderJect Vaccines, Inc. DelawareProductos Farmaceuticos PFE Bolivia S.A. BoliviaPT. Pfizer Indonesia IndonesiaPT. Pfizer Parke Davis IndonesiaPurepac Pharmaceutical Holdings, Inc. DelawarePZR Ltd. United KingdomPZR Property Limited United KingdomRenrall LLC WyomingRinat Neuroscience Corp. DelawareRivepar FranceRoerig Produtos Farmaceuticos, Lda. PortugalRoerig S.A. ChileRoerig, S.A. VenezuelaSao Cristovao Participacoes Ltda. BrazilSearle Laboratorios, Lda. PortugalServicios P&U, S. de R.L. de C.V. MexicoShiley LLC CaliforniaSinergis Farma-Produtos Farmaceuticos, Lda. PortugalSite Realty, Inc. DelawareSolinor LLC DelawareSugen, Inc. DelawareTabor LLC DelawareThe Pfizer Incubator LLC DelawareThiakis Limited United KingdomTreerly Health Co., Ltd People's Republic of ChinaUpjohn Laboratorios Lda. PortugalUS Oral Pharmaceuticals Pty Ltd AustraliaVesterålens Naturprodukter A/S DenmarkVesterålens Naturprodukter AB SwedenVesterålens Naturprodukter AS NorwayVesterålens Naturprodukter OY FinlandVicuron Holdings LLC DelawareVinci Farma, S.A. SpainWarner Lambert del Uruguay S.A. Uruguay
Warner Lambert Ilac Sanayi ve Ticaret Limited Sirketi TurkeyWarner-Lambert (Tanzania), Limited TanzaniaWarner-Lambert (Thailand) Limited ThailandWarner-Lambert Company AG SwitzerlandWarner-Lambert Company LLC DelawareWarner-Lambert Guatemala, Sociedad Anonima GuatemalaWarner-Lambert, S.A. DelawareWhitehall International Inc. New YorkWhitehall Laboratories Inc. DelawareW-L LLC DelawareWyeth (Asia) Limited DelawareWyeth (Thailand) Ltd. ThailandWyeth AB SwedenWyeth Advertising Inc. New YorkWyeth Ayerst Inc. DelawareWyeth Ayerst S.à r.l. LuxembourgWyeth Consumer Healthcare LLC PennsylvaniaWyeth Europa Limited United KingdomWyeth Farma, S.A. SpainWyeth Holdings LLC MaineWyeth Industria Farmaceutica Ltda. BrazilWyeth KFT. HungaryWyeth Lederle S.r.l. ItalyWyeth Lederle Vaccines S.A. BelgiumWyeth LLC DelawareWyeth Pakistan Limited PakistanWyeth Pharmaceutical Co., Ltd. People's Republic of ChinaWyeth Pharmaceuticals Company Puerto RicoWyeth Pharmaceuticals FZ-LLC United Arab EmiratesWyeth Pharmaceuticals Inc. DelawareWyeth Pharmaceuticals India Private Limited IndiaWyeth Pharmaceuticals Limited IrelandWyeth Prev-Sociedade de Previdencia Privada BrazilWyeth Puerto Rico, Inc. Puerto RicoWyeth S.A.S ColombiaWyeth Subsidiary Illinois Corporation IllinoisWyeth Whitehall Export GmbH AustriaWyeth Whitehall SARL LuxembourgWyeth-Ayerst (Asia) Limited DelawareWyeth-Ayerst International LLC DelawareWyeth-Ayerst Promotions Limited DelawareYusafarm D.O.O. Serbia
EXHIBIT 23
Consent of Independent Registered Public Accounting Firm
To the Board of Directors and the Shareholders of Pfizer Inc.:
We consent to the incorporation by reference in this 2016 Annual Report on Form 10-K of Pfizer Inc. of our reports dated February 23, 2017 , with respect to the consolidatedbalance sheets of Pfizer Inc. and Subsidiary Companies as of December 31, 2016 and 2015 , and the related consolidated statements of income, comprehensive income,equity and cash flows for each of the years in the three-year period ended December 31, 2016 , and the effectiveness of internal control over financial reporting as ofDecember 31, 2016 , which reports appear in the 2016 Annual Report on Form 10-K of Pfizer Inc.
We also consent to the incorporation by reference of our reports in the following Registration Statements:
-Form S-8 dated October 27, 1983 (File No. 2-87473),-Form S-8 dated March 22, 1990 (File No. 33-34139),-Form S-8 dated January 24, 1991 (File No. 33-38708),-Form S-8 dated November 18, 1991 (File No. 33-44053),-Form S-8 dated May 27, 1993 (File No. 33-49631),-Form S-8 dated May 19, 1994 (File No. 33-53713),-Form S-8 dated October 5, 1994 (File No. 33-55771),-Form S-8 dated December 20, 1994 (File No. 33-56979),-Form S-8 dated March 29, 1996 (File No. 333-02061),-Form S-8 dated September 25, 1997 (File No. 333-36371),-Form S-8 dated June 19, 2000 (File No. 333-39610),-Form S-8 dated June 19, 2000 (File No. 333-39606),-Form S-8 dated April 27, 2001 (File No. 333-59660),-Form S-8 dated April 16, 2003 (File No. 333-104581),-Form S-8 dated April 16, 2003 (File No. 333-104582),-Form S-8 dated November 18, 2003 (File No. 333-110571),-Form S-8 dated December 18, 2003 (File No. 333-111333),-Form S-8 dated April 26, 2004 (File No. 333-114852),-Form S-8 dated March 1, 2007 (File No. 333-140987),-Form S-4 dated March 27, 2009 (File No. 333-158237),-Form S-8 dated October 16, 2009 (File No. 333-162519),-Form S-8 dated October 16, 2009 (File No. 333-162520),-Form S-8 dated October 16, 2009 (File No. 333-162521),-Form S-8 dated March 1, 2010 (File No. 333-165121),-Form S-3ASR dated March 2, 2015 (File No. 333-202430),-Form S-8 dated March 2, 2015 (File No. 333-202437), and-Form S-4 dated September 3, 2015 (File No. 333-206758).
/s/KPMG LLPNew York, New YorkFebruary 23, 2017

EXHIBIT 31.1Certification by the Chief Executive Officer Pursuant to
Section 302 of the Sarbanes-Oxley Act of 2002
I, Ian C. Read, certify that:
1. I have reviewed this Annual Report on Form 10-K of Pfizer Inc.;
2. Based on my knowledge, this report does not contain any untrue statement of a material fact or omit to state a material fact necessary to make thestatements made, in light of the circumstances under which such statements were made, not misleading with respect to the period covered by this report;
3. Based on my knowledge, the financial statements, and other financial information included in this report, fairly present in all material respects thefinancial condition, results of operations and cash flows of the registrant as of, and for, the periods presented in this report;
4. The registrant's other certifying officer and I are responsible for establishing and maintaining disclosure controls and procedures (as defined inExchange Act Rules 13a-15(e) and 15d-15(e)) and internal control over financial reporting (as defined in Exchange Act Rules 13a-15(f) and 15d-15(f)) for theregistrant and have:
(a) Designed such disclosure controls and procedures, or caused such disclosure controls and procedures to be designed under our supervision, toensure that material information relating to the registrant, including its consolidated subsidiaries, is made known to us by others within those entities,particularly during the period in which this report is being prepared;
(b) Designed such internal control over financial reporting, or caused such internal control over financial reporting to be designed under oursupervision, to provide reasonable assurance regarding the reliability of financial reporting and the preparation of financial statements for external purposesin accordance with generally accepted accounting principles;
(c) Evaluated the effectiveness of the registrant's disclosure controls and procedures and presented in this report our conclusions about theeffectiveness of the disclosure controls and procedures, as of the end of the period covered by this report based on such evaluation; and
(d) Disclosed in this report any change in the registrant's internal control over financial reporting that occurred during the registrant's most recentfiscal quarter (the registrant's fourth fiscal quarter in the case of an annual report) that has materially affected, or is reasonably likely to materially affect, theregistrant's internal control over financial reporting; and
5. The registrant's other certifying officer and I have disclosed, based on our most recent evaluation of internal control over financial reporting, to theregistrant's auditors and the audit committee of the registrant's board of directors (or persons performing the equivalent functions):
(a) All significant deficiencies and material weaknesses in the design or operation of internal control over financial reporting which are reasonablylikely to adversely affect the registrant's ability to record, process, summarize and report financial information; and
(b) Any fraud, whether or not material, that involves management or other employees who have a significant role in the registrant's internal controlover financial reporting.
Date: February 23, 2017
/s/ IAN C. READ Ian C. Read Chairman and Chief Executive Officer
EXHIBIT 31.2Certification by the Chief Financial Officer Pursuant to
Section 302 of the Sarbanes-Oxley Act of 2002
I, Frank A. D'Amelio, certify that:
1. I have reviewed this Annual Report on Form 10-K of Pfizer Inc.;
2. Based on my knowledge, this report does not contain any untrue statement of a material fact or omit to state a material fact necessary to make thestatements made, in light of the circumstances under which such statements were made, not misleading with respect to the period covered by this report;
3. Based on my knowledge, the financial statements, and other financial information included in this report, fairly present in all material respects thefinancial condition, results of operations and cash flows of the registrant as of, and for, the periods presented in this report;
4. The registrant's other certifying officer and I are responsible for establishing and maintaining disclosure controls and procedures (as defined inExchange Act Rules 13a-15(e) and 15d-15(e)) and internal control over financial reporting (as defined in Exchange Act Rules 13a-15(f) and 15d-15(f)) for theregistrant and have:
(a) Designed such disclosure controls and procedures, or caused such disclosure controls and procedures to be designed under our supervision, toensure that material information relating to the registrant, including its consolidated subsidiaries, is made known to us by others within those entities,particularly during the period in which this report is being prepared;
(b) Designed such internal control over financial reporting, or caused such internal control over financial reporting to be designed under oursupervision, to provide reasonable assurance regarding the reliability of financial reporting and the preparation of financial statements for external purposesin accordance with generally accepted accounting principles;
(c) Evaluated the effectiveness of the registrant's disclosure controls and procedures and presented in this report our conclusions about theeffectiveness of the disclosure controls and procedures, as of the end of the period covered by this report based on such evaluation; and
(d) Disclosed in this report any change in the registrant's internal control over financial reporting that occurred during the registrant's most recentfiscal quarter (the registrant's fourth fiscal quarter in the case of an annual report) that has materially affected, or is reasonably likely to materially affect, theregistrant's internal control over financial reporting; and
5. The registrant's other certifying officer and I have disclosed, based on our most recent evaluation of internal control over financial reporting, to theregistrant's auditors and the audit committee of the registrant's board of directors (or persons performing the equivalent functions):
(a) All significant deficiencies and material weaknesses in the design or operation of internal control over financial reporting which are reasonablylikely to adversely affect the registrant's ability to record, process, summarize and report financial information; and
(b) Any fraud, whether or not material, that involves management or other employees who have a significant role in the registrant's internal controlover financial reporting.
Date: February 23, 2017
/s/ FRANK A. D'AMELIO Frank A. D'Amelio Executive Vice President, Business Operations and Chief Financial Officer

EXHIBIT 32.1
Certification by the Chief Executive Officer Pursuant to 18 U.S.C. Section 1350, as Adopted Pursuant toSection 906 of the Sarbanes-Oxley Act of 2002
Pursuant to 18 U.S.C. Section 1350, I, Ian C. Read, hereby certify that, to the best of my knowledge, the Annual Report on Form 10-K of Pfizer Inc. forthe year ended December 31, 2016 (the “Report”) fully complies with the requirements of Section 13(a) or Section 15(d) of the Securities Exchange Act of 1934,and that the information contained in that Report fairly presents, in all material respects, the financial condition and results of operations of Pfizer Inc.
/s/ IAN C. READ Ian C. Read Chairman and Chief Executive Officer February 23, 2017
This certification accompanies this Annual Report on Form 10-K pursuant to Section 906 of the Sarbanes-Oxley Act of 2002 and shall not, except to theextent required by such Act, be deemed filed by the Company for purposes of Section 18 of the Securities Exchange Act of 1934, as amended (the “ExchangeAct”). Such certification will not be deemed to be incorporated by reference into any filing under the Securities Act of 1933, as amended, or the Exchange Act,except to the extent that the Company specifically incorporates it by reference.
EXHIBIT 32.2
Certification by the Chief Financial Officer Pursuant to 18 U.S.C. Section 1350, as Adopted Pursuant toSection 906 of the Sarbanes-Oxley Act of 2002
Pursuant to 18 U.S.C. Section 1350, I, Frank A. D'Amelio, hereby certify that, to the best of my knowledge, the Annual Report on Form 10-K of PfizerInc. for the year ended December 31, 2016 (the “Report”) fully complies with the requirements of Section 13(a) or Section 15(d) of the Securities Exchange Actof 1934, and that the information contained in that Report fairly presents, in all material respects, the financial condition and results of operations of Pfizer Inc.
/s/ FRANK A. D'AMELIO Frank A. D'Amelio Executive Vice President, Business Operations andChief Financial Officer February 23, 2017
This certification accompanies this Annual Report on Form 10-K pursuant to Section 906 of the Sarbanes-Oxley Act of 2002 and shall not, except to theextent required by such Act, be deemed filed by the Company for purposes of Section 18 of the Securities Exchange Act of 1934, as amended (the “ExchangeAct”). Such certification will not be deemed to be incorporated by reference into any filing under the Securities Act of 1933, as amended, or the Exchange Act,except to the extent that the Company specifically incorporates it by reference.
Related Documents