Citation: Miniewska, K.; Maliszewska, K.; Pietrowska, K.; Godzie ´ n, J.; Labieniec, L.; Mojsak, M.; Kr˛ etowski, A.; Ciborowski, M. PET/MRI-Evaluated Activation of Brown Adipose Tissue via Cold Exposure Impacts Lipid Metabolism. Metabolites 2022, 12, 456. https:// doi.org/10.3390/metabo12050456 Academic Editor: Maria João Pereira Received: 28 April 2022 Accepted: 13 May 2022 Published: 19 May 2022 Publisher’s Note: MDPI stays neutral with regard to jurisdictional claims in published maps and institutional affil- iations. Copyright: © 2022 by the authors. Licensee MDPI, Basel, Switzerland. This article is an open access article distributed under the terms and conditions of the Creative Commons Attribution (CC BY) license (https:// creativecommons.org/licenses/by/ 4.0/). metabolites H OH OH Article PET/MRI-Evaluated Activation of Brown Adipose Tissue via Cold Exposure Impacts Lipid Metabolism Katarzyna Miniewska 1, *, Katarzyna Maliszewska 2 , Karolina Pietrowska 1 , Joanna Godzie ´ n 1 , Lukasz Labieniec 3 , Malgorzata Mojsak 4 , Adam Kr ˛ etowski 2,5 and Michal Ciborowski 1, * 1 Metabolomics Laboratory, Clinical Research Centre, Medical University of Bialystok, Marii Sklodowskiej-Curie 24A, 15-276 Bialystok, Poland; [email protected] (K.P.); [email protected] (J.G.) 2 Department of Endocrinology, Diabetology and Internal Medicine, Medical University of Bialystok, Marii Sklodowskiej-Curie 24A, 15-276 Bialystok, Poland; [email protected] (K.M.); [email protected] (A.K.) 3 Department of Condensed Matter Physics, University of Bialystok, Konstantego Ciolkowskiego 1L, 15-245 Bialystok, Poland; [email protected] 4 Independent Laboratory of Molecular Imaging, Medical University of Bialystok, Zurawia 71A, 15-540 Bialystok, Poland; [email protected] 5 Clinical Research Centre, Medical University of Bialystok, Marii Sklodowskiej-Curie 24A, 15-276 Bialystok, Poland * Correspondence: [email protected] (K.M.); [email protected] (M.C.) Abstract: Although brown adipose tissue (BAT) is considered to play a protective role against obesity and type 2 diabetes, the mechanisms of its activation and associations with clinical parameters are not well described. Male adults underwent a 2 h cold exposure (CE) to activate BAT and, based on the results of PET/MRI performed after the CE, were divided into BAT(+) and BAT(-) groups. During the CE procedure, blood samples were collected and alterations in plasma metabolome in both groups were investigated using LC-MS. Additionally, associations between clinical factors and BAT were examined. Moreover, levels of glucose, insulin, leptin, TNF-α, FGF21, and FABP4 were assessed in serum samples. In the BAT(+) group, levels of LPC(17:0), LPE(20:4), LPE(22:4), LPE(22:6), DHA, linoleic acid, and oleic acid increased during CE, whereas levels of sphinganine-phosphate and sphingosine-1-phosphate decreased. Levels of LPE(O-18:0), 9-HpODE, and oleic acid were elevated, while the level of LPE(20:5) was reduced in BAT(+) compared to BAT(-) subjects. AUCs of LPC(18:2), LPC(O-18:2)/LPC(P-18:1), and SM(d32:2) negatively correlated with BAT. In the BAT(+) group, the concentration of FABP4 during and after CE was decreased compared to the basal level. No alterations were observed in the BAT(-) group. In conclusion, using untargeted metabolomics, we proved that the plasma metabolome is affected by cold-induced BAT activation. Keywords: brown adipose tissue; cold exposure; untargeted metabolomics; plasma lipids 1. Introduction As reported by Eurostat, in 2019, 53% of adult Europeans were overweight, one third of which were obese [1]. Obesity is a key factor in the development of insulin resistance (IR), which occurs ten to twenty years before type 2 diabetes (T2DM) onset [2]. The risk of T2DM can be diminished with the reduction of IR and IR decreases with weight loss. Although a change in lifestyle (improvement of nutritional habits and physical activity) is usually effective and individuals lose weight, it is difficult for them to accept a new lifestyle and, unfortunately, they regain weight [3]. On this account, new therapeutic strategies for fighting obesity, and thus IR, are needed. One of the potential targets is brown adipose tissue (BAT) and its role in metabolic processes [4]. BAT is of great importance in heat production via non-shivering thermogenesis, regulated by the activity of uncoupling protein 1 (UCP1), occurring in the inner mitochondrial membrane [5]. Protons released in Metabolites 2022, 12, 456. https://doi.org/10.3390/metabo12050456 https://www.mdpi.com/journal/metabolites

Welcome message from author
This document is posted to help you gain knowledge. Please leave a comment to let me know what you think about it! Share it to your friends and learn new things together.
Transcript
Citation: Miniewska, K.;
Maliszewska, K.; Pietrowska, K.;
Godzien, J.; Łabieniec, Ł.; Mojsak, M.;
Kretowski, A.; Ciborowski, M.
PET/MRI-Evaluated Activation of
Brown Adipose Tissue via Cold
Exposure Impacts Lipid Metabolism.
Metabolites 2022, 12, 456. https://
doi.org/10.3390/metabo12050456
Academic Editor: Maria João Pereira
Received: 28 April 2022
Accepted: 13 May 2022
Published: 19 May 2022
Publisher’s Note: MDPI stays neutral
with regard to jurisdictional claims in
published maps and institutional affil-
iations.
Copyright: © 2022 by the authors.
Licensee MDPI, Basel, Switzerland.
This article is an open access article
distributed under the terms and
conditions of the Creative Commons
Attribution (CC BY) license (https://
creativecommons.org/licenses/by/
4.0/).
metabolites
H
OH
OH
Article
PET/MRI-Evaluated Activation of Brown Adipose Tissue viaCold Exposure Impacts Lipid MetabolismKatarzyna Miniewska 1,*, Katarzyna Maliszewska 2, Karolina Pietrowska 1 , Joanna Godzien 1,Łukasz Łabieniec 3, Małgorzata Mojsak 4, Adam Kretowski 2,5 and Michał Ciborowski 1,*
1 Metabolomics Laboratory, Clinical Research Centre, Medical University of Bialystok,Marii Sklodowskiej-Curie 24A, 15-276 Bialystok, Poland; [email protected] (K.P.);[email protected] (J.G.)
2 Department of Endocrinology, Diabetology and Internal Medicine, Medical University of Bialystok,Marii Sklodowskiej-Curie 24A, 15-276 Bialystok, Poland; [email protected] (K.M.);[email protected] (A.K.)
3 Department of Condensed Matter Physics, University of Bialystok, Konstantego Ciolkowskiego 1L,15-245 Białystok, Poland; [email protected]
4 Independent Laboratory of Molecular Imaging, Medical University of Bialystok, Zurawia 71A,15-540 Bialystok, Poland; [email protected]
5 Clinical Research Centre, Medical University of Bialystok, Marii Sklodowskiej-Curie 24A,15-276 Bialystok, Poland
* Correspondence: [email protected] (K.M.); [email protected] (M.C.)
Abstract: Although brown adipose tissue (BAT) is considered to play a protective role against obesityand type 2 diabetes, the mechanisms of its activation and associations with clinical parameters arenot well described. Male adults underwent a 2 h cold exposure (CE) to activate BAT and, basedon the results of PET/MRI performed after the CE, were divided into BAT(+) and BAT(−) groups.During the CE procedure, blood samples were collected and alterations in plasma metabolome inboth groups were investigated using LC-MS. Additionally, associations between clinical factors andBAT were examined. Moreover, levels of glucose, insulin, leptin, TNF-α, FGF21, and FABP4 wereassessed in serum samples. In the BAT(+) group, levels of LPC(17:0), LPE(20:4), LPE(22:4), LPE(22:6),DHA, linoleic acid, and oleic acid increased during CE, whereas levels of sphinganine-phosphateand sphingosine-1-phosphate decreased. Levels of LPE(O-18:0), 9-HpODE, and oleic acid wereelevated, while the level of LPE(20:5) was reduced in BAT(+) compared to BAT(−) subjects. AUCs ofLPC(18:2), LPC(O-18:2)/LPC(P-18:1), and SM(d32:2) negatively correlated with BAT. In the BAT(+)group, the concentration of FABP4 during and after CE was decreased compared to the basal level.No alterations were observed in the BAT(−) group. In conclusion, using untargeted metabolomics,we proved that the plasma metabolome is affected by cold-induced BAT activation.
Keywords: brown adipose tissue; cold exposure; untargeted metabolomics; plasma lipids
1. Introduction
As reported by Eurostat, in 2019, 53% of adult Europeans were overweight, one thirdof which were obese [1]. Obesity is a key factor in the development of insulin resistance(IR), which occurs ten to twenty years before type 2 diabetes (T2DM) onset [2]. The riskof T2DM can be diminished with the reduction of IR and IR decreases with weight loss.Although a change in lifestyle (improvement of nutritional habits and physical activity)is usually effective and individuals lose weight, it is difficult for them to accept a newlifestyle and, unfortunately, they regain weight [3]. On this account, new therapeuticstrategies for fighting obesity, and thus IR, are needed. One of the potential targets is brownadipose tissue (BAT) and its role in metabolic processes [4]. BAT is of great importance inheat production via non-shivering thermogenesis, regulated by the activity of uncouplingprotein 1 (UCP1), occurring in the inner mitochondrial membrane [5]. Protons released in
Metabolites 2022, 12, 456. https://doi.org/10.3390/metabo12050456 https://www.mdpi.com/journal/metabolites
Metabolites 2022, 12, 456 2 of 16
the lipolysis of triradylglycerols (TG) are transferred inside mitochondria, bypassing theoxidative phosphorylation pathway and subsequent ATP synthesis, which results in energyrelease in the form of heat [5,6]. For many years, scientists believed that BAT occurredonly in infants and it disappeared with age. However, in 2003, accidental findings werepublished, changing this concept, as it was suggested that regions of higher glucose uptakedetected during positron emission tomography (PET) might in fact be BAT [7,8]. Sincethen, the method used for BAT determination in humans has been PET coupled with eithercomputer tomography (CT) or magnetic resonance (MR). In recent years, mass spectrometry(MS) has become widely applied in the measurement of numerous compounds, particularlysmall molecules [9]. A combination of MS and separation techniques, especially liquid orgas chromatography (LC or GC, respectively), allows the measurement of even thousandsof compounds in biological samples. Since the cold-induced alterations in the plasmametabolome associated with BAT are not well described, untargeted metabolomics seemsto be a promising tool in elucidating this scientific problem. With the emerging expectationsof BAT as a tool to fight obesity and T2DM, it is crucial to understand the mechanismsof its activation and seek associations between BAT and clinical parameters describingIR. Therefore, the aim of this study was to activate BAT via cold exposure (CE) and toinvestigate alterations in the plasma metabolome during CE in individuals possessing BATin comparison to those lacking it, as well as to examine associations between clinical factorsand BAT volume and activity.
2. Results2.1. Study Group Characteristics
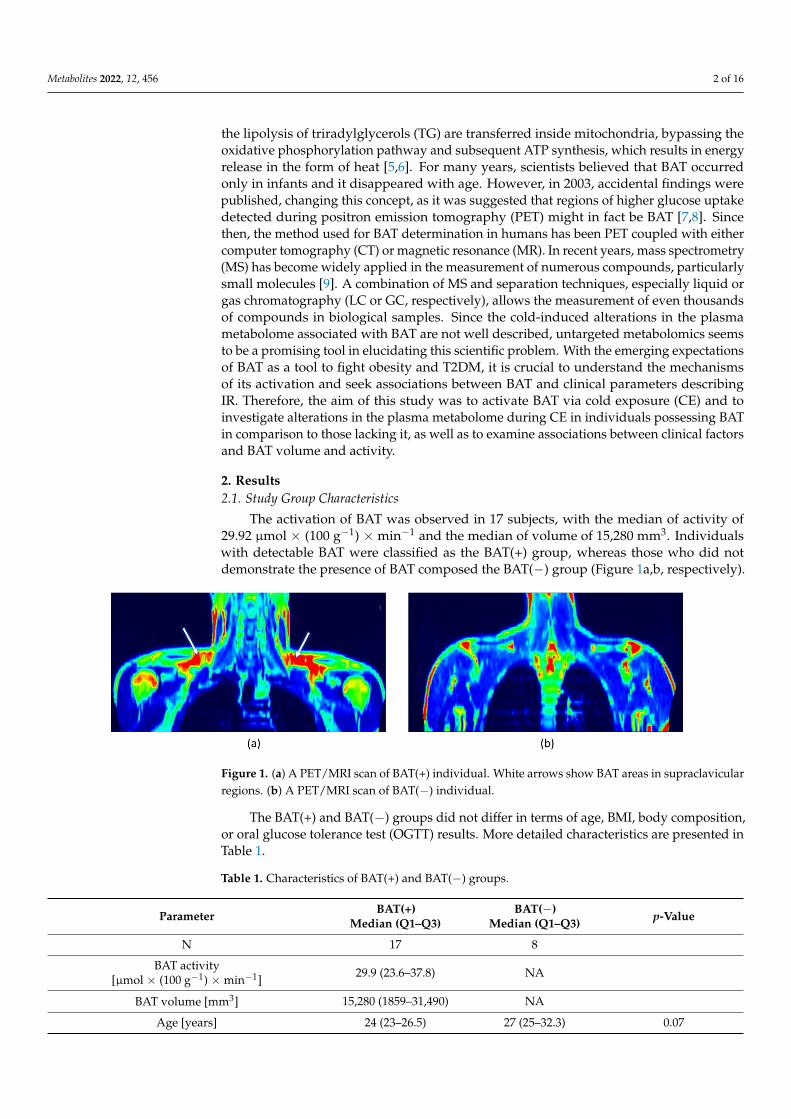
The activation of BAT was observed in 17 subjects, with the median of activity of29.92 µmol × (100 g−1) × min−1 and the median of volume of 15,280 mm3. Individualswith detectable BAT were classified as the BAT(+) group, whereas those who did notdemonstrate the presence of BAT composed the BAT(−) group (Figure 1a,b, respectively).
Metabolites 2022, 12, x FOR PEER REVIEW 2 of 16
protein 1 (UCP1), occurring in the inner mitochondrial membrane [5]. Protons released in the lipolysis of triradylglycerols (TG) are transferred inside mitochondria, bypassing the oxidative phosphorylation pathway and subsequent ATP synthesis, which results in en-ergy release in the form of heat [5,6]. For many years, scientists believed that BAT occurred only in infants and it disappeared with age. However, in 2003, accidental findings were published, changing this concept, as it was suggested that regions of higher glucose up-take detected during positron emission tomography (PET) might in fact be BAT [7,8]. Since then, the method used for BAT determination in humans has been PET coupled with either computer tomography (CT) or magnetic resonance (MR). In recent years, mass spec-trometry (MS) has become widely applied in the measurement of numerous compounds, particularly small molecules [9]. A combination of MS and separation techniques, espe-cially liquid or gas chromatography (LC or GC, respectively), allows the measurement of even thousands of compounds in biological samples. Since the cold-induced alterations in the plasma metabolome associated with BAT are not well described, untargeted metab-olomics seems to be a promising tool in elucidating this scientific problem. With the emerging expectations of BAT as a tool to fight obesity and T2DM, it is crucial to under-stand the mechanisms of its activation and seek associations between BAT and clinical parameters describing IR. Therefore, the aim of this study was to activate BAT via cold exposure (CE) and to investigate alterations in the plasma metabolome during CE in in-dividuals possessing BAT in comparison to those lacking it, as well as to examine associ-ations between clinical factors and BAT volume and activity.
2. Results 2.1. Study Group Characteristics
The activation of BAT was observed in 17 subjects, with the median of activity of 29.92 µmol × (100 g−1) × min−1 and the median of volume of 15,280 mm3. Individuals with detectable BAT were classified as the BAT(+) group, whereas those who did not demon-strate the presence of BAT composed the BAT(−) group (Figure 1a,b, respectively).
Figure 1. (a) A PET/MRI scan of BAT(+) individual. White arrows show BAT areas in supraclavicular regions. (b) A PET/MRI scan of BAT(−) individual.
The BAT(+) and BAT(−) groups did not differ in terms of age, BMI, body composition, or oral glucose tolerance test (OGTT) results. More detailed characteristics are presented in Table 1.
Figure 1. (a) A PET/MRI scan of BAT(+) individual. White arrows show BAT areas in supraclavicularregions. (b) A PET/MRI scan of BAT(−) individual.
The BAT(+) and BAT(−) groups did not differ in terms of age, BMI, body composition,or oral glucose tolerance test (OGTT) results. More detailed characteristics are presented inTable 1.
Table 1. Characteristics of BAT(+) and BAT(−) groups.
Parameter BAT(+)Median (Q1–Q3)
BAT(−)Median (Q1–Q3) p-Value
N 17 8
BAT activity[µmol × (100 g−1) ×min−1] 29.9 (23.6–37.8) NA
BAT volume [mm3] 15,280 (1859–31,490) NA
Age [years] 24 (23–26.5) 27 (25–32.3) 0.07
Metabolites 2022, 12, 456 3 of 16
Table 1. Cont.
Parameter BAT(+)Median (Q1–Q3)
BAT(−)Median (Q1–Q3) p-Value
BMI [kg/m2] 24.5 (22.6–28.7) 26.7 (23.2–31.1) 0.37
% AT [%] 16.5 (13.3–22.0) 22.0 (16.0–25.9) 0.34
% SMM [%] 47.5 (44.2–49.7) 44.5 (42.3–47.0) 0.22
VAT volume [cm3] 420 (251–761.5) 775.5 (297.8–1275) 0.29
VAT mass [g] 396 (237.5–718.5) 731.5 (291.8–1203.3) 0.24
HbA1c [mmol/L] 4.9 (4.8–5.2) 5.1 (4.9–5.1) 0.42
OGTT
glc 0′ [µIU/L] 97 (90.8–98.8) 94 (91.5–95.5) 0.25
AUC glc 183 (171.3–199.5) 175 (166.5–193.5) 0.45
ins 0′ [µIU/L] 7.6 (6.3–11.8) 8.8 (7.4–10.9) 0.48
AUC ins 22.4 (14.7–33.4) 26.1 (21.9–51.9) 0.19
Cholesterol [mg/dL] 155 (135–177.5) 174 (148.3–182) 0.40
LDL-cholesterol [mg/dL] 77.6 (65.9–111.5) 101.5 (77.3–106.5) 0.41
HDL-cholesterol [mg/dL] 52 (39–73) 57.5 (47.5–72.5) 0.62
Triglycerides [mg/dL] 86 (46.5–110) 83 (46.3–108.5) 0.98
CRP [mg/L] 0.7 (0.3–2.7) 0.7 (0.4–1.1) 0.93
Creatinine [mg/dL] 1 (0.9–1.1) 0.9 (0.9–1.0) 0.56
ALT [IU/L] 21.8 (16.3–26.6) 17.8 (15.7–28.3) 0.54
AST [IU/L] 20.4 (18.8–25.4) 23.8 (18.3–31.0) 0.66
TSH [µIU/mL] 1.9 (1.5–3.2) 197 (1.4–2.5) 0.51
BAT—brown adipose tissue; BAT(+)—group possessing BAT; BAT(−)—group lacking BAT; %—percentage ofadipose tissue in total body mass; % SMM—percentage of skeletal muscle in total body mass; VAT—visceraladipose tissue; OGTT—oral glucose tolerance test; glc 0′—fasting glucose concentration; ins 0′—fasting insulinactivity; AUC—area under the curve; HbA1c—glycated hemoglobin; CRP—C-reactive protein; ALT—alaninetransaminase; AST—aspartate transaminase; TSH—thyrotropic hormone.
2.2. Metabolic Fingerprinting of Plasma Samples
The untargeted analysis of plasma samples obtained during CE was conducted andtwo datasets (one from positive and the other from negative ion mode) were generated.They subsequently underwent a filtering and QA procedure and, as a result, 1540 metabolicfeatures (in total from positive and negative ion mode) were obtained.
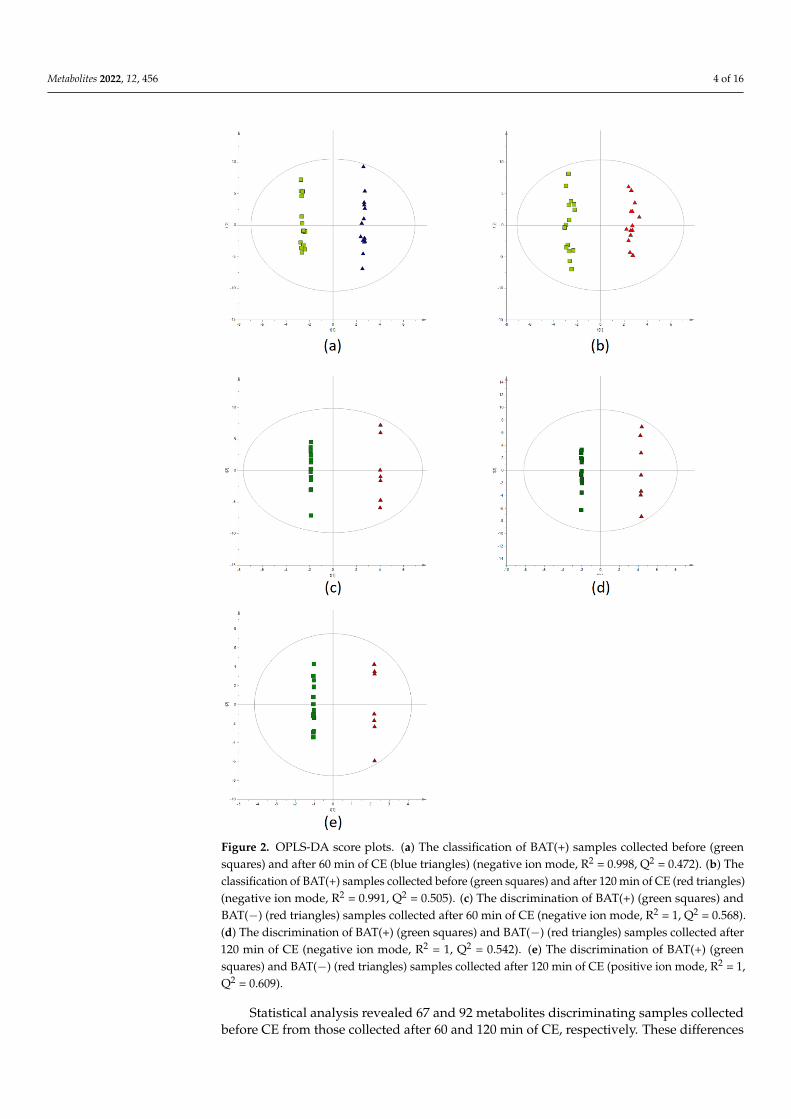
Multivariate statistics (OPLS-DA models) were used to examine the discriminationbetween the samples from different time points (0′ vs. 60′ and 0′ vs. 120′) for BAT(+) andBAT(−) data separately, as well as between BAT(+) and BAT(−) samples in each time point(0′, 60′, and 120′). In case of time point comparisons, it was not possible to build modelswith acceptable quality for BAT(−) data recorded in negative ion mode. On the contrary,models for BAT(+) revealed good separation between the samples from 0′ and 60′ of CE,as well as samples from 0′ and 120′ (Figure 2a,b, respectively). In terms of positive ionmode, building the models with accepted quality was not possible. For the comparisons ofBAT(+) and BAT(−) metabolites’ levels at particular time points, two satisfactory modelswere created based on negative ion mode data obtained for samples collected after 60 and120 min of CE (Figure 2c,d, respectively). In positive ion mode data, the only satisfactorymodel was created for samples collected after 120 min of CE (Figure 2e).
Metabolites 2022, 12, 456 4 of 16Metabolites 2022, 12, x FOR PEER REVIEW 4 of 16
Figure 2. OPLS-DA score plots. (a) The classification of BAT(+) samples collected before (green squares) and after 60 min of CE (blue triangles) (negative ion mode, R2 = 0.998, Q2 = 0.472). (b) The classification of BAT(+) samples collected before (green squares) and after 120 min of CE (red trian-gles) (negative ion mode, R2 = 0.991, Q2 = 0.505). (c) The discrimination of BAT(+) (green squares) and BAT(−) (red triangles) samples collected after 60 min of CE (negative ion mode, R2 = 1, Q2 = 0.568). (d) The discrimination of BAT(+) (green squares) and BAT(−) (red triangles) samples collected after 120 min of CE (negative ion mode, R2 = 1, Q2 = 0.542). (e) The discrimination of BAT(+) (green squares) and BAT(−) (red triangles) samples collected after 120 min of CE (positive ion mode, R2 = 1, Q2 = 0.609).
Statistical analysis revealed 67 and 92 metabolites discriminating samples collected before CE from those collected after 60 and 120 min of CE, respectively. These differences
Figure 2. OPLS-DA score plots. (a) The classification of BAT(+) samples collected before (greensquares) and after 60 min of CE (blue triangles) (negative ion mode, R2 = 0.998, Q2 = 0.472). (b) Theclassification of BAT(+) samples collected before (green squares) and after 120 min of CE (red triangles)(negative ion mode, R2 = 0.991, Q2 = 0.505). (c) The discrimination of BAT(+) (green squares) andBAT(−) (red triangles) samples collected after 60 min of CE (negative ion mode, R2 = 1, Q2 = 0.568).(d) The discrimination of BAT(+) (green squares) and BAT(−) (red triangles) samples collected after120 min of CE (negative ion mode, R2 = 1, Q2 = 0.542). (e) The discrimination of BAT(+) (greensquares) and BAT(−) (red triangles) samples collected after 120 min of CE (positive ion mode, R2 = 1,Q2 = 0.609).
Statistical analysis revealed 67 and 92 metabolites discriminating samples collectedbefore CE from those collected after 60 and 120 min of CE, respectively. These differences
Metabolites 2022, 12, 456 5 of 16
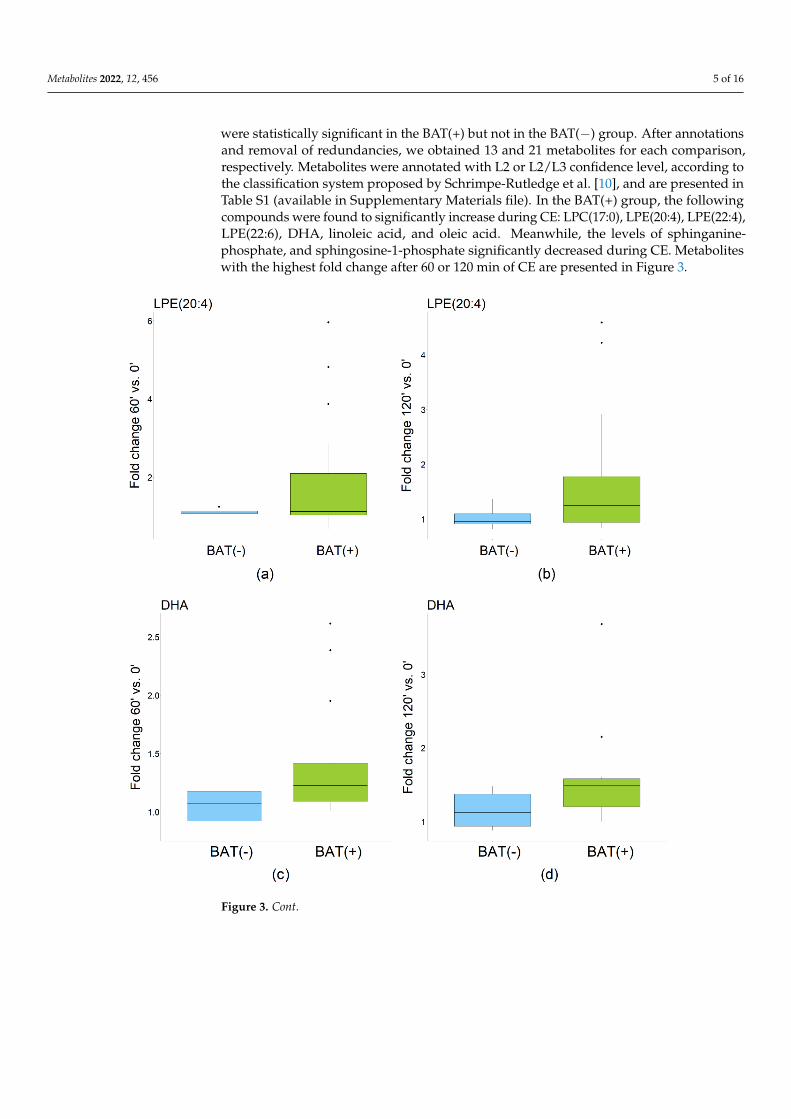
were statistically significant in the BAT(+) but not in the BAT(−) group. After annotationsand removal of redundancies, we obtained 13 and 21 metabolites for each comparison,respectively. Metabolites were annotated with L2 or L2/L3 confidence level, according tothe classification system proposed by Schrimpe-Rutledge et al. [10], and are presented inTable S1 (available in Supplementary Materials file). In the BAT(+) group, the followingcompounds were found to significantly increase during CE: LPC(17:0), LPE(20:4), LPE(22:4),LPE(22:6), DHA, linoleic acid, and oleic acid. Meanwhile, the levels of sphinganine-phosphate, and sphingosine-1-phosphate significantly decreased during CE. Metaboliteswith the highest fold change after 60 or 120 min of CE are presented in Figure 3.
Metabolites 2022, 12, x FOR PEER REVIEW 6 of 16
Figure 3. Fold change (FC) of most significant metabolites in BAT(+) and BAT(−) group. (a) Fold change of LPE(20:4) after 60 min of CE; (b) Fold change of LPE(20:4) after 120 min of CE; (c) Fold change of DHA after 60 min of CE; (d) Fold change of DHA after 120 min of CE; (e) Fold change of sphinganine-phosphate after 60 min of CE; (f) Fold change of sphinganine-phosphate after 120 min of CE. The dots indicate outliers.
Figure 3. Cont.
Metabolites 2022, 12, 456 6 of 16
Metabolites 2022, 12, x FOR PEER REVIEW 6 of 16
Figure 3. Fold change (FC) of most significant metabolites in BAT(+) and BAT(−) group. (a) Fold change of LPE(20:4) after 60 min of CE; (b) Fold change of LPE(20:4) after 120 min of CE; (c) Fold change of DHA after 60 min of CE; (d) Fold change of DHA after 120 min of CE; (e) Fold change of sphinganine-phosphate after 60 min of CE; (f) Fold change of sphinganine-phosphate after 120 min of CE. The dots indicate outliers.
Figure 3. Fold change (FC) of most significant metabolites in BAT(+) and BAT(−) group. (a) Foldchange of LPE(20:4) after 60 min of CE; (b) Fold change of LPE(20:4) after 120 min of CE; (c) Foldchange of DHA after 60 min of CE; (d) Fold change of DHA after 120 min of CE; (e) Fold change ofsphinganine-phosphate after 60 min of CE; (f) Fold change of sphinganine-phosphate after 120 minof CE. The dots indicate outliers.
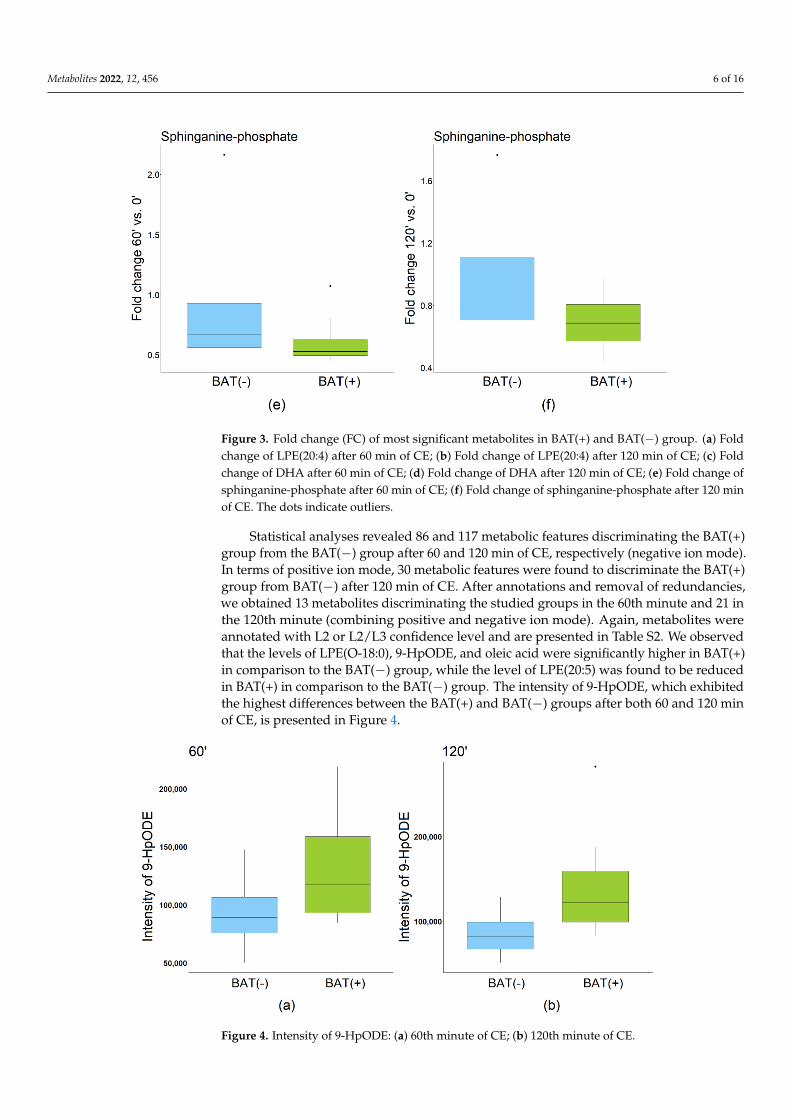
Statistical analyses revealed 86 and 117 metabolic features discriminating the BAT(+)group from the BAT(−) group after 60 and 120 min of CE, respectively (negative ion mode).In terms of positive ion mode, 30 metabolic features were found to discriminate the BAT(+)group from BAT(−) after 120 min of CE. After annotations and removal of redundancies,we obtained 13 metabolites discriminating the studied groups in the 60th minute and 21 inthe 120th minute (combining positive and negative ion mode). Again, metabolites wereannotated with L2 or L2/L3 confidence level and are presented in Table S2. We observedthat the levels of LPE(O-18:0), 9-HpODE, and oleic acid were significantly higher in BAT(+)in comparison to the BAT(−) group, while the level of LPE(20:5) was found to be reducedin BAT(+) in comparison to the BAT(−) group. The intensity of 9-HpODE, which exhibitedthe highest differences between the BAT(+) and BAT(−) groups after both 60 and 120 minof CE, is presented in Figure 4.
Metabolites 2022, 12, x FOR PEER REVIEW 7 of 16
Figure 4. Intensity of 9-HpODE: (a) 60th minute of CE; (b) 120th minute of CE.
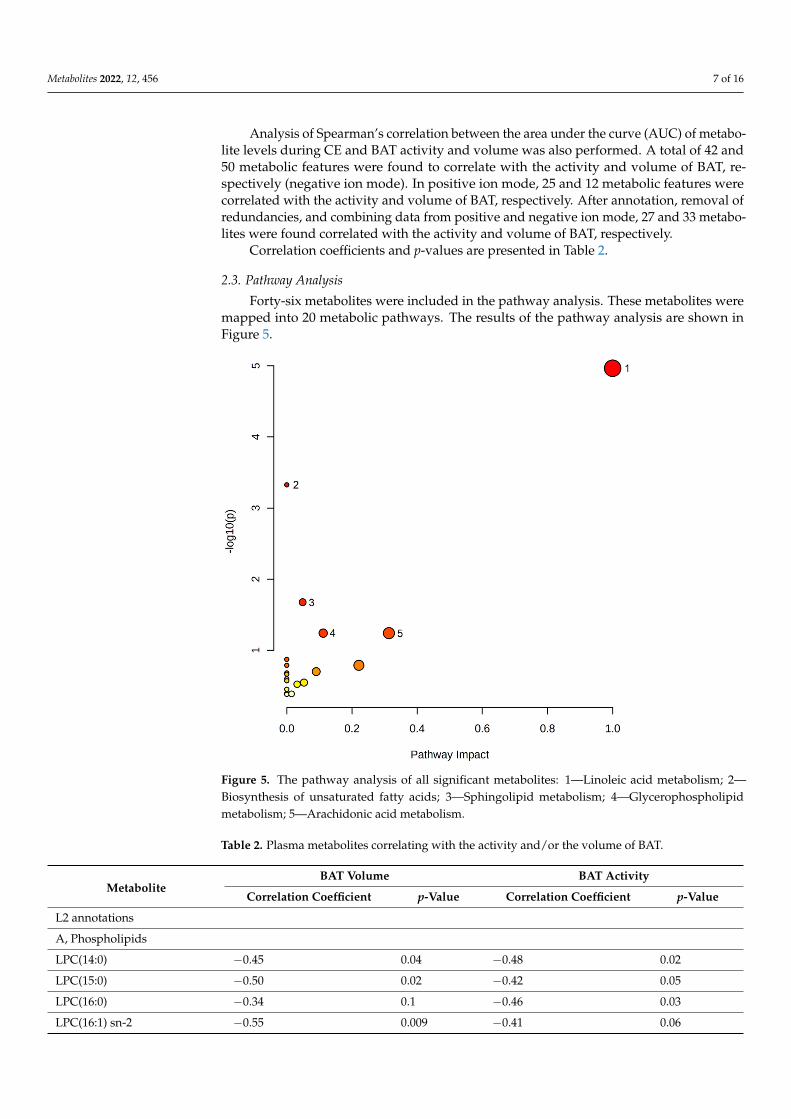
2.3. Pathway Analysis Forty-six metabolites were included in the pathway analysis. These metabolites were
mapped into 20 metabolic pathways. The results of the pathway analysis are shown in Figure 5.
Figure 5. The pathway analysis of all significant metabolites: 1—Linoleic acid metabolism; 2—Bio-synthesis of unsaturated fatty acids; 3—Sphingolipid metabolism; 4—Glycerophospholipid metab-olism; 5—Arachidonic acid metabolism.
Figure 4. Intensity of 9-HpODE: (a) 60th minute of CE; (b) 120th minute of CE.
Metabolites 2022, 12, 456 7 of 16
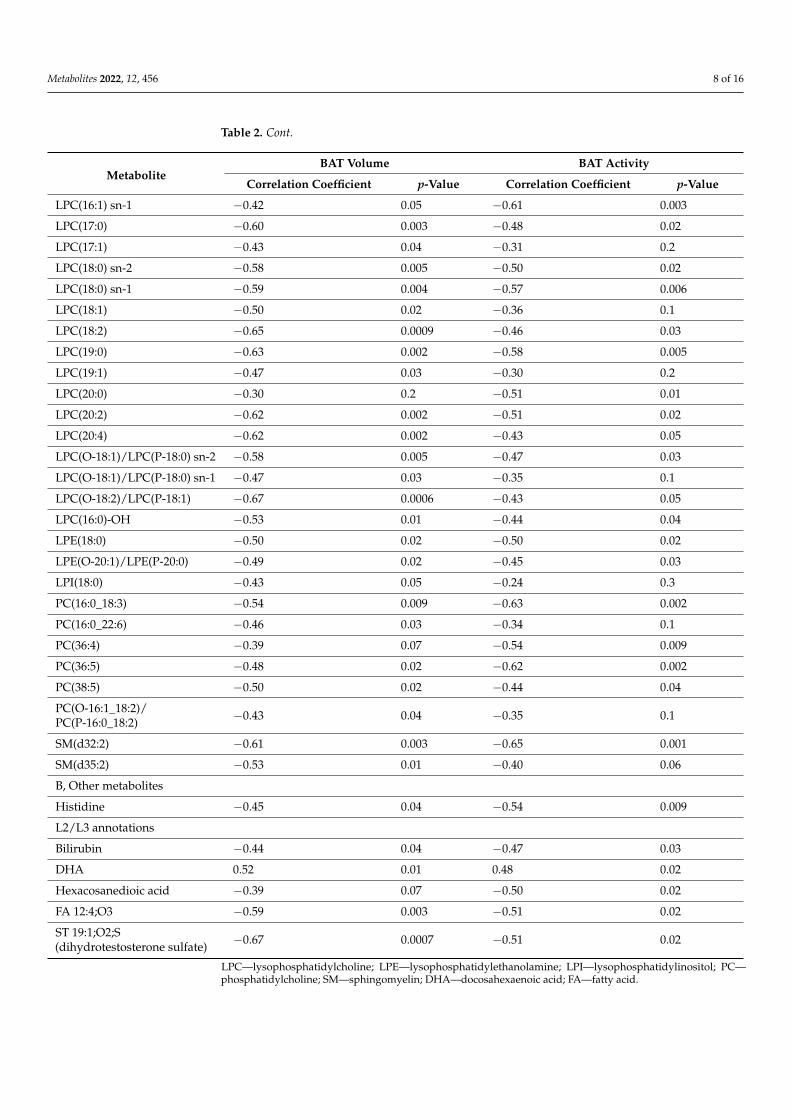
Analysis of Spearman’s correlation between the area under the curve (AUC) of metabo-lite levels during CE and BAT activity and volume was also performed. A total of 42 and50 metabolic features were found to correlate with the activity and volume of BAT, re-spectively (negative ion mode). In positive ion mode, 25 and 12 metabolic features werecorrelated with the activity and volume of BAT, respectively. After annotation, removal ofredundancies, and combining data from positive and negative ion mode, 27 and 33 metabo-lites were found correlated with the activity and volume of BAT, respectively.
Correlation coefficients and p-values are presented in Table 2.
2.3. Pathway Analysis
Forty-six metabolites were included in the pathway analysis. These metabolites weremapped into 20 metabolic pathways. The results of the pathway analysis are shown inFigure 5.
Metabolites 2022, 12, x FOR PEER REVIEW 7 of 16
Figure 4. Intensity of 9-HpODE: (a) 60th minute of CE; (b) 120th minute of CE.
2.3. Pathway Analysis Forty-six metabolites were included in the pathway analysis. These metabolites were
mapped into 20 metabolic pathways. The results of the pathway analysis are shown in Figure 5.
Figure 5. The pathway analysis of all significant metabolites: 1—Linoleic acid metabolism; 2—Bio-synthesis of unsaturated fatty acids; 3—Sphingolipid metabolism; 4—Glycerophospholipid metab-olism; 5—Arachidonic acid metabolism.
Figure 5. The pathway analysis of all significant metabolites: 1—Linoleic acid metabolism; 2—Biosynthesis of unsaturated fatty acids; 3—Sphingolipid metabolism; 4—Glycerophospholipidmetabolism; 5—Arachidonic acid metabolism.
Table 2. Plasma metabolites correlating with the activity and/or the volume of BAT.
MetaboliteBAT Volume BAT Activity
Correlation Coefficient p-Value Correlation Coefficient p-Value
L2 annotations
A, Phospholipids
LPC(14:0) −0.45 0.04 −0.48 0.02
LPC(15:0) −0.50 0.02 −0.42 0.05
LPC(16:0) −0.34 0.1 −0.46 0.03
LPC(16:1) sn-2 −0.55 0.009 −0.41 0.06
Metabolites 2022, 12, 456 8 of 16
Table 2. Cont.
MetaboliteBAT Volume BAT Activity
Correlation Coefficient p-Value Correlation Coefficient p-Value
LPC(16:1) sn-1 −0.42 0.05 −0.61 0.003
LPC(17:0) −0.60 0.003 −0.48 0.02
LPC(17:1) −0.43 0.04 −0.31 0.2
LPC(18:0) sn-2 −0.58 0.005 −0.50 0.02
LPC(18:0) sn-1 −0.59 0.004 −0.57 0.006
LPC(18:1) −0.50 0.02 −0.36 0.1
LPC(18:2) −0.65 0.0009 −0.46 0.03
LPC(19:0) −0.63 0.002 −0.58 0.005
LPC(19:1) −0.47 0.03 −0.30 0.2
LPC(20:0) −0.30 0.2 −0.51 0.01
LPC(20:2) −0.62 0.002 −0.51 0.02
LPC(20:4) −0.62 0.002 −0.43 0.05
LPC(O-18:1)/LPC(P-18:0) sn-2 −0.58 0.005 −0.47 0.03
LPC(O-18:1)/LPC(P-18:0) sn-1 −0.47 0.03 −0.35 0.1
LPC(O-18:2)/LPC(P-18:1) −0.67 0.0006 −0.43 0.05
LPC(16:0)-OH −0.53 0.01 −0.44 0.04
LPE(18:0) −0.50 0.02 −0.50 0.02
LPE(O-20:1)/LPE(P-20:0) −0.49 0.02 −0.45 0.03
LPI(18:0) −0.43 0.05 −0.24 0.3
PC(16:0_18:3) −0.54 0.009 −0.63 0.002
PC(16:0_22:6) −0.46 0.03 −0.34 0.1
PC(36:4) −0.39 0.07 −0.54 0.009
PC(36:5) −0.48 0.02 −0.62 0.002
PC(38:5) −0.50 0.02 −0.44 0.04
PC(O-16:1_18:2)/PC(P-16:0_18:2) −0.43 0.04 −0.35 0.1
SM(d32:2) −0.61 0.003 −0.65 0.001
SM(d35:2) −0.53 0.01 −0.40 0.06
B, Other metabolites
Histidine −0.45 0.04 −0.54 0.009
L2/L3 annotations
Bilirubin −0.44 0.04 −0.47 0.03
DHA 0.52 0.01 0.48 0.02
Hexacosanedioic acid −0.39 0.07 −0.50 0.02
FA 12:4;O3 −0.59 0.003 −0.51 0.02
ST 19:1;O2;S(dihydrotestosterone sulfate) −0.67 0.0007 −0.51 0.02
LPC—lysophosphatidylcholine; LPE—lysophosphatidylethanolamine; LPI—lysophosphatidylinositol; PC—phosphatidylcholine; SM—sphingomyelin; DHA—docosahexaenoic acid; FA—fatty acid.
Metabolites 2022, 12, 456 9 of 16
2.4. Additional Analyses
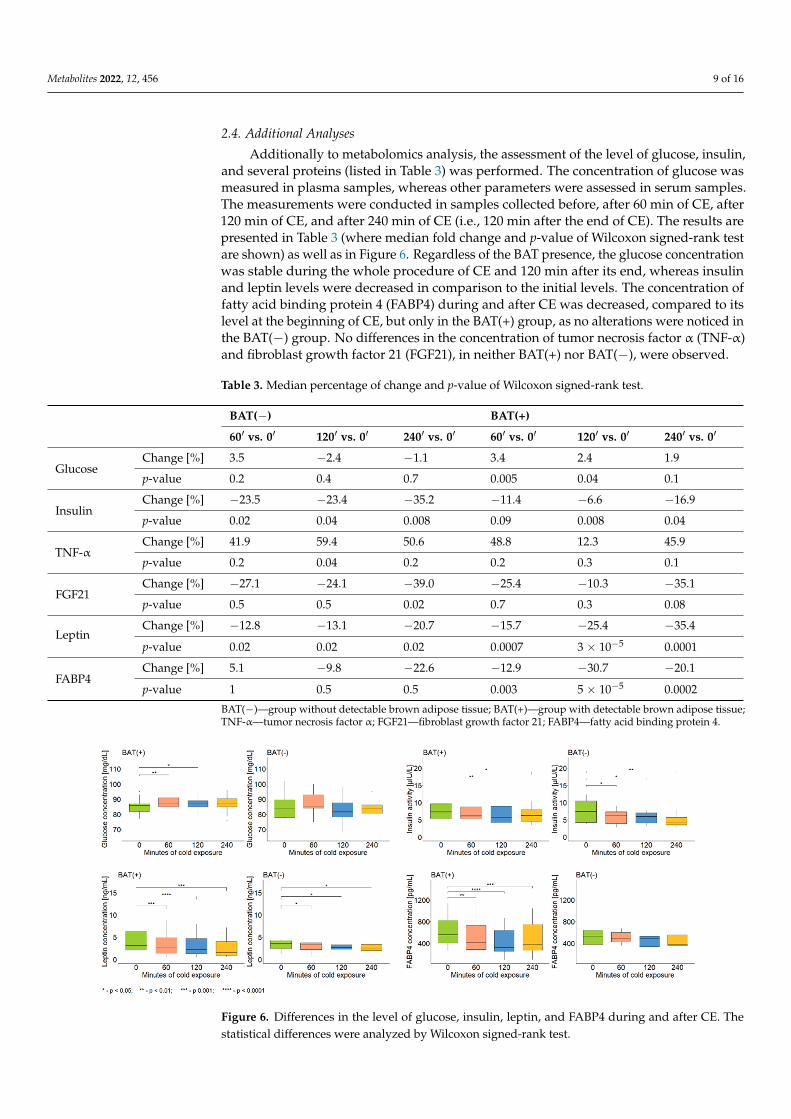
Additionally to metabolomics analysis, the assessment of the level of glucose, insulin,and several proteins (listed in Table 3) was performed. The concentration of glucose wasmeasured in plasma samples, whereas other parameters were assessed in serum samples.The measurements were conducted in samples collected before, after 60 min of CE, after120 min of CE, and after 240 min of CE (i.e., 120 min after the end of CE). The results arepresented in Table 3 (where median fold change and p-value of Wilcoxon signed-rank testare shown) as well as in Figure 6. Regardless of the BAT presence, the glucose concentrationwas stable during the whole procedure of CE and 120 min after its end, whereas insulinand leptin levels were decreased in comparison to the initial levels. The concentration offatty acid binding protein 4 (FABP4) during and after CE was decreased, compared to itslevel at the beginning of CE, but only in the BAT(+) group, as no alterations were noticed inthe BAT(−) group. No differences in the concentration of tumor necrosis factor α (TNF-α)and fibroblast growth factor 21 (FGF21), in neither BAT(+) nor BAT(−), were observed.
Table 3. Median percentage of change and p-value of Wilcoxon signed-rank test.
BAT(−) BAT(+)
60′ vs. 0′ 120′ vs. 0′ 240′ vs. 0′ 60′ vs. 0′ 120′ vs. 0′ 240′ vs. 0′
GlucoseChange [%] 3.5 −2.4 −1.1 3.4 2.4 1.9
p-value 0.2 0.4 0.7 0.005 0.04 0.1
InsulinChange [%] −23.5 −23.4 −35.2 −11.4 −6.6 −16.9
p-value 0.02 0.04 0.008 0.09 0.008 0.04
TNF-αChange [%] 41.9 59.4 50.6 48.8 12.3 45.9
p-value 0.2 0.04 0.2 0.2 0.3 0.1
FGF21Change [%] −27.1 −24.1 −39.0 −25.4 −10.3 −35.1
p-value 0.5 0.5 0.02 0.7 0.3 0.08
LeptinChange [%] −12.8 −13.1 −20.7 −15.7 −25.4 −35.4
p-value 0.02 0.02 0.02 0.0007 3 × 10⁻⁵ 0.0001
FABP4Change [%] 5.1 −9.8 −22.6 −12.9 −30.7 −20.1
p-value 1 0.5 0.5 0.003 5 × 10⁻⁵ 0.0002
BAT(−)—group without detectable brown adipose tissue; BAT(+)—group with detectable brown adipose tissue;TNF-α—tumor necrosis factor α; FGF21—fibroblast growth factor 21; FABP4—fatty acid binding protein 4.
Metabolites 2022, 12, x FOR PEER REVIEW 9 of 16
2.4. Additional Analyses Additionally to metabolomics analysis, the assessment of the level of glucose, insulin,
and several proteins (listed in Table 3) was performed. The concentration of glucose was measured in plasma samples, whereas other parameters were assessed in serum samples. The measurements were conducted in samples collected before, after 60 min of CE, after 120 min of CE, and after 240 min of CE (i.e., 120 min after the end of CE). The results are presented in Table 3 (where median fold change and p-value of Wilcoxon signed-rank test are shown) as well as in Figure 6. Regardless of the BAT presence, the glucose concentra-tion was stable during the whole procedure of CE and 120 min after its end, whereas in-sulin and leptin levels were decreased in comparison to the initial levels. The concentra-tion of fatty acid binding protein 4 (FABP4) during and after CE was decreased, compared to its level at the beginning of CE, but only in the BAT(+) group, as no alterations were noticed in the BAT(−) group. No differences in the concentration of tumor necrosis factor α (TNF-α) and fibroblast growth factor 21 (FGF21), in neither BAT(+) nor BAT(−), were observed.
Table 3. Median percentage of change and p-value of Wilcoxon signed-rank test.
BAT(−) BAT(+) 60′ vs. 0′ 120′ vs. 0′ 240′ vs. 0′ 60′ vs. 0′ 120′ vs. 0′ 240′ vs. 0′
Glucose Change [%] 3.5 −2.4 −1.1 3.4 2.4 1.9 p-value 0.2 0.4 0.7 0.005 0.04 0.1
Insulin Change [%] −23.5 −23.4 −35.2 −11.4 −6.6 −16.9 p-value 0.02 0.04 0.008 0.09 0.008 0.04
TNF-α Change [%] 41.9 59.4 50.6 48.8 12.3 45.9 p-value 0.2 0.04 0.2 0.2 0.3 0.1
FGF21 Change [%] −27.1 −24.1 −39.0 −25.4 −10.3 −35.1 p-value 0.5 0.5 0.02 0.7 0.3 0.08
Leptin Change [%] −12.8 −13.1 −20.7 −15.7 −25.4 −35.4 p-value 0.02 0.02 0.02 0.0007 3 × 10⁻⁵ 0.0001
FABP4 Change [%] 5.1 −9.8 −22.6 −12.9 −30.7 −20.1 p-value 1 0.5 0.5 0.003 5 × 10⁻⁵ 0.0002
BAT(−)—group without detectable brown adipose tissue; BAT(+)—group with detectable brown adipose tissue; TNF-α—tumor necrosis factor α; FGF21—fibroblast growth factor 21; FABP4—fatty acid binding protein 4.
Figure 6. Differences in the level of glucose, insulin, leptin, and FABP4 during and after CE. The statistical differences were analyzed by Wilcoxon signed-rank test.
3. Discussion
Figure 6. Differences in the level of glucose, insulin, leptin, and FABP4 during and after CE. Thestatistical differences were analyzed by Wilcoxon signed-rank test.
Metabolites 2022, 12, 456 10 of 16
3. Discussion
The aim of this paper was to find metabolites associated with the activity and volumeof BAT. Therefore, participants underwent the procedure of CE to activate BAT, and after-wards, a PET/MRI scan was performed to assess its activity and volume. Metabolomicsanalysis was conducted to understand the influence of this tissue on small molecules’ regu-lation. We focused not only on metabolites significantly changing after CE, but also discrim-inating BAT(+) and BAT(−) individuals. In the BAT(+) group, the following compoundswere found to significantly increase during CE: LPC(17:0), LPE(20:4), LPE(22:4), LPE(22:6),DHA, linoleic acid, and oleic acid. Meanwhile, the levels of sphinganine-phosphate andsphingosine-1-phosphate significantly decreased during CE. We also obtained significantdifferences in metabolite levels in the 60th and 120th minute of CE between the BAT(+)and BAT(−) groups, and the levels of LPE(O-18:0), 9-HpODE, and oleic acid were foundsignificantly higher in BAT(+) in comparison to the BAT(−) group, while the level ofLPE(20:5) was found to be reduced in BAT(+) in comparison to the BAT(−) group. TheAUCs of the following metabolites were negatively correlated with the activity and volumeof BAT: LPC(18:2), LPC(O-18:2)/LPC(P-18:1), and SM(d32:2). Additionally, pathway analy-sis was performed for statistically significant metabolites. The results of pathway analysis(Figure 5) revealed that linoleic acid metabolism was the most affected. Other involvedpathways included the biosynthesis of unsaturated fatty acids, sphingolipid metabolism,glycerophospholipid metabolism, and arachidonic acid metabolism.
The association between the serum/plasma metabolome and BAT in humans has beeninvestigated but knowledge on this topic is still very limited. Boon et al. [11] conducteda study in which healthy lean adults underwent the procedure of CE and subsequentlyhad the activity and volume of BAT assessed by 18F-FDG PET/CT. They discovered thatfasting levels of LPC(16:0), LPC(16:1), and PC(32:1) positively correlated with BAT activityand/or volume; additionally, the level of PC(32:1) was increased after 120 min of CE (incomparison to its fasting level). In our study, we also observed an association between BATand LPC(16:0) and LPC(16:1), although the correlation was negative. It has to be consideredthat we examined the AUC of these metabolites (reflecting their alterations during CE),which could have resulted in the different findings. Xiang et al. [12] aimed to identifyplasma non-esterified fatty acids (NEFAs) and oxylipins potentially associated with cold-activated BAT in humans. They discovered that levels of 33 NEFA species were elevatedduring CE and the largest alterations were observed in the levels of NEFA C14:1 and NEFAC14:2. Furthermore, there was a positive correlation between DHA and EPA baseline leveland BAT activity, as well as between the level of 18 NEFA species after CE and BAT activity.Additionally, Xiang et al. noted an increase in the levels of 11 oxylipins species duringCE, as well as a positive correlation between BAT volume and the concentration change of14(15)-EpETrE, 15-HETE, and 15-HETrE. These results are in line with our findings as weobserved an increase in DHA level during CE, as well as a positive correlation between itsAUC and BAT activity and volume. In terms of oxylipins, we discovered that the level of9-HpODE after 120 min of CE was significantly higher in BAT(+) individuals. Kovanicováet al. [13] examined changes in the plasma metabolome in humans after 10–15 min of ice-water swimming and found changes in 70 metabolites, the majority of which were aminoacids. In the presented study, we did not observe changes in amino acids in response toCE; however, it should be noted that the procedures of CE were significantly different. Theinvolvement of fatty acids and oxylipins in BAT activation was also noted in animal studies.Bargut et al. [14] examined the influence of EPA and DHA supplementation on the markersof browning in WAT, and of thermogenesis in BAT in mice fed with a high-fructose diet.The results showed the enhancement of the expression of browning genes in subcutaneousWAT and thermogenic genes in BAT. Félix-Soriano et al. [15] discovered that a high-fat dietwith DHA supplementation restored UCP1 expression in BAT. Lynes et al. [16] observedthat the level 12,13-diHOME was elevated in the plasma of humans and mice exposed tocold. All these findings stand in compliance with our observations: the increase in DHA,
Metabolites 2022, 12, 456 11 of 16
linoleic, and oleic acid levels during CE, as well as the elevated level of 9-HpODE after120 min of CE in BAT(+) individuals.
With the exception of fatty acids and related metabolites, our study revealed theassociation between sphingolipids and sphingoid base lipids and BAT. We observed adecline in the levels of sphinganine-phosphate and sphingosine-1-phosphate during CE inthe BAT(+) group, as well as a negative correlation between the AUC of SM(d32:2) and BATactivity and volume. To the best of our knowledge, this is the first study identifying thesemetabolites in the context of BAT activity and volume in humans, although it is knownthat sphingolipids and sphingoid base lipids are associated with obesity and IR. Błachnio-Zabielska et al. [17] observed increased levels of sphingosine-1-phosphate in the adiposetissue of obese subjects and a negative correlation between HOMA-IR and total ceramidecontent in fat tissue. Furthermore, in another study from the same group [18], it wasdiscovered that adipocyte sphinganine, sphingosine, and sphingosine-1-phosphate contentwas higher in obese compared to lean individuals. Ravichandran et al. [19] examined therole of sphingosine kinase 2 (Sphk2) (involved in the phosphorylation of sphingosine toform sphingosine-1-phosphate) in glucose and lipid metabolism. The authors found thatdeletion of the Sphk2 gene in mice resulted in protection against age-related weight gainand IR, and knocked-out mice exhibited lower fat mass but greater lean mass as well asincreased energy expenditure in comparison to the wild type. Regarding the associationbetween sphingolipids and BAT, Christoffersen et al. [20] suggested that apolipoprotein M(Apom) is involved in BAT activity control, which is mediated by sphingosine-1-phosphate.Apom-/- mice fed with a high-fat diet had lower body weight and better glucose tolerancethan wild-type mice. In addition, the authors analyzed the influence of a functionalsphingosine-1-phosphate receptor antagonist (FTY720) and discovered an increase in BATweight in wild-type mice but observed no changes in knocked-out mice. Rajakumariet al. [21] examined the effects of β3-adrenergic stimulation on the mitochondrial lipidomeof adipose tissue. It was observed that WAT mitochondria had increased SM levels incomparison to BAT, and as a result of β3-adrenergic stimulation, the level of SM(16:0),SM(22:0), and SM(24:1) was decreased in WAT, but not in BAT mitochondria. As weobserved the inverse association between sphingolipids and sphingoid base lipids and BAT,and the abovementioned findings show that the decline in sphingolipids level, especiallysphingosine-1-phosphate, may play a crucial role in the protective action of BAT in IR andobesity development, more research is needed to discover its exact mechanism.
In addition, to better understand BAT physiology, we measured levels of glucose,insulin, and several serum proteins and examined their alterations during CE. The con-centration of glucose was steady during CE, whereas the activity of insulin decreasedduring this procedure, which is in line with many data claiming that CE improves glucosehomeostasis and insulin sensitivity [22–24]. In terms of leptin, our findings also confirmedthe literature data, showing a drop in its concentration in response to CE [25–27].
Because of the fact that several of observed metabolites were fatty acids, we decidedto further examine this topic and assess the level of FABP4 before, during, and 2 h afterCE. Interestingly, we observed a decrease in FABP4 concentration in serum during CE, butonly in the BAT(+) group. Yamamoto et al. [28] analyzed the expression level of 10 FABPisoforms in the BAT of rats and discovered that FABP4 was the most abundantly expressed,while FABP3 and FABP5 were also, but less, expressed. Furthermore, the authors examinedchanges in these proteins’ expression in response to CE and found that FABP3 and FABP5levels were elevated but the FABP4 level remained stable. We noted a decline in FABP4level during CE, but it is crucial to remember that we measured the FABP4 concentrationin serum samples, whereas Yamamoto et al. analyzed tissue samples. Vergnes et al. [29]discovered that although the FABP4 gene was most abundantly expressed in BAT, it was theFABP3 gene whose level was increased during CE, while FABP4 remained unaltered. Again,a possible explanation for our results being contrary is the difference in biological materialanalyzed. Shu et al. [30] investigated the role of FABP4 in cold-induced thermogenesis inmice and observed an increase in the FABP4 level in serum after 1 h of CE and a further
Metabolites 2022, 12, 456 12 of 16
decline to a basal level. This is partially contrary to our findings, as we only observed thedecline in its concentration. However, the study of Shu et al. was performed on an animalmodel and it is possible that the dynamics of the FABP4 level during CE are different inhumans. These findings and the lack of studies on FABPs’ role in BAT activation in humanssuggest the need for deeper investigation on this topic.
Our study did not avoid certain limitations and the small study group is one of them.However, one should note the cost of the PET/MRI test and the fact that the procedureof CE could only be performed during cold seasons. Furthermore, we could use ourPET/MRI center only twice a week to perform this study, which additionally reduced ourability to examine more participants. Another limitation is the restriction in terms of thesex of participants. The body composition of women may be associated with the day ofthe menstruation cycle [31]; therefore, all potential female participants should have beenexamined in the same cycle phase. Given the above-described limitations, collecting ahomogenous group of women would be unusually difficult.
4. Materials and Methods4.1. Study Group
We performed the CE procedure and PET/MR scanning in a group of 37 healthyadult individuals. All procedures were performed from October to April of 2016–2018. Itturned out that 17 of them possessed BAT, and to make the study group as coherent aspossible, other participants matched in terms of age and BMI were chosen as a controlgroup. Finally, the group consisted of 25 healthy, non-smoking Caucasian males (n = 17 instudy group, and n = 8 in control group). The exclusion criteria were any acute or chronicdiseases (e.g., asthma, hypo- or hyperthyroidism, cardiovascular diseases), or taking anymedication (e.g., beta-blockers or statins). Clinical characteristics are presented in Table 1in the Results section.
4.2. Screening Visit
The screening visit comprised basic laboratory tests (liver enzymes, creatinine, C-reactive protein, lipid profile, TSH, and glycated hemoglobin (HbA1C)) as well as OGTTperformed according to WHO guidelines with the ingestion of 75 g glucose load (results canbe seen in Table 1). Basic laboratory tests were performed on fasting samples (whole bloodfor HbA1C, serum for other parameters), whereas glucose and insulin levels (in plasma orserum, respectively) were assessed at the beginning of OGTT (before glucose ingestion)and 30, 60, and 120 min after glucose ingestion. Glucose concentration was measuredwith the enzymatic hexokinase method using the Cobas c111 analyzer (Roche Diagnostics,Basel, Switzerland) and insulin activity was evaluated with the immunoradiometric assay(DIAsource, Nivelles, Belgium).
During the screening visit, all subjects also underwent body composition analysesusing two methods: bioimpedance (InBody 720, Biospace, Seul, Korea) and dual energyX-ray absorption (DXA) (Lunar iDXA, GE Healthcare, Chicago, IL, USA). The followingparameters were measured: adipose tissue mass and percentage (AT and AT%, respectively),skeletal muscle mass and percentage (SMM and SMM%, respectively), visceral adiposetissue (VAT) volume and mass.
4.3. CE and PET-MR Scanning
The second visit consisted of two hours of CE followed by PET-MR scanning, asdescribed previously [32]. A personalized procedure of cooling was applied to activateBAT. Briefly, individuals lay on a bed between two water-filled blankets (Blanketroll III,Cincinnati Sub-Zero, Cincinnati, OH, USA). The initial water temperature was 22 ◦C and itwas gradually decreased by 2 ◦C every 10 min until shivering was observed or reported bysubjects, and it was then increased by 4 ◦C. Subjects had their blood collected before and 60and 120 min after the beginning of the procedure of cooling.
Metabolites 2022, 12, 456 13 of 16
Afterwards, participants underwent a whole-body PET-MR scan (Biograph mMR3T, Siemens Healthcare, Erlangen, Germany) with an 18F-fluorodeoxyglucose injection(18F-FDG) (4 MBq/kg of body mass). PET-MR results were analyzed using the Carimassoftware, developed at the Turku PET Centre in Finland. To assess the activity of BAT,the influx rate constant (Ki) of 18F-FGD was determined using the Gjedde-Patlak model.A lumped constant (LC) value of 1.14 was used for calculations [33]. The glucose uptakerate was calculated as follows: plasma glucose concentration × Ki × LC−1. The activationof BAT was defined as a glucose uptake rate higher than 2.0 µmol × (100 g−1) × min−1.Individuals were classified as BAT-positive (BAT(+)) or BAT-negative (BAT(−)), based ondetected or non-detected BAT, respectively.
4.4. Plasma Metabolic Fingerprinting
Plasma metabolic fingerprinting was performed on plasma samples collected duringCE. Whole blood was collected into vacuum system tubes with sodium EDTA as an anti-coagulant, and plasma was obtained by immediate centrifugation. Samples were storedat −80 ◦C until analysis. Analyses were conducted as described previously [34]. Briefly,samples were thawed on ice on the day of analysis. Protein precipitation and metabolite ex-traction were performed with methanol/ethanol (1:1) mixture containing 1 ppm zomepiracas internal standard. A mixture of an equal volume of all samples was prepared to obtainquality control (QC) samples. All samples were randomly analyzed by an LC-MS system(Agilent Technologies, Santa Clara, CA, USA). Analyses were performed in positive (ESI+)and negative (ESI-) ion modes. The raw data collected by the analytical instrumentationwere cleaned of background noise and unrelated ions by the molecular feature extraction(MFE) tool in Mass Hunter Qualitative Analysis Software (B.07.00, Agilent, Santa Clara,CA, USA). Sample alignment and data filtering were performed using Mass Profiler Profes-sional 12.6.1 (Agilent, Santa Clara, CA, USA). Parameters applied for the alignment were1% for RT and 15 ppm for the mass variation. In the quality assurance (QA) procedure,metabolic features detected in >50% in QC samples with the coefficient of variation (CV)<20% were kept for further data treatment. Metabolite annotation was performed based ontandem mass spectroscopy (MS/MS) fragmentation. The identity of metabolites was con-firmed (1) by matching the experimental MS/MS spectra to MS/MS spectra from databases(i.e., METLIN, KEGG, LIPIDMAPS, and HMDB) or (2) based on the fragmentation pattern.Characteristic fragments of identified metabolites are presented in Table S3.
4.5. Serum Protein Measurement
The concentration of the following proteins was assessed in serum samples collectedduring CE: FGF21, TNF-α, FABP4, and leptin. Whole blood was collected into vacuumsystem tubes with gel clotting activator. Tubes were placed vertically at room tempera-ture for 60 min to form a clot. Afterwards, tubes were centrifuged to obtain serum andsamples were stored at −80 ◦C until analysis. Concentration of FGF21, TNF-α, and FABP4was determined using a dedicated enzyme-linked immunosorbent assay kit (QuantikineELISA, R&D Systems, Minneapolis, MN, USA) according to the manufacturer’s instruc-tions. Leptin concentration was determined using an enzyme-linked immunosorbent assaykit (BioVendor, Brno, Czech Republic).
4.6. Statistical Analysis
Statistical analysis of the clinical, body composition, and serum protein data consistedof the Wilcoxon signed-rank test for the comparison of paired data, the Mann–Whitney Utest for estimation of differences between BAT(+) and BAT(−) groups (calculations wereprepared in R (version 4.0.5, https://www.R-project.org/, accessed on 6 April 2021)), andSpearman’s correlation for the analysis of numerical variables (performed by in-house builtscript for MATLAB (2018b, MathWorks, Natick, MA, USA)).
Multivariate statistics were used to evaluate the quality of metabolomics data bychecking the location of the QC samples on principal component analysis (PCA) plots and
Metabolites 2022, 12, 456 14 of 16
to observe sample classification on orthogonal projections to latent structures discriminantanalysis (OPLS-DA) plots. The OPLS-DAs were performed to examine the differencesbetween BAT(+) and BAT(−) groups, as well as the alterations between particular timepoints. Statistically significant metabolites were chosen based on predictive loading values(p(corr)) and variable influence on projection (VIP). Multivariate calculations and plotswere performed by using SIMCA−P + 13.0.3.0 (Umetrics, Umea, Sweden). Additionally,AUCs of metabolites during CE were calculated and Spearman’s correlation analysis withclinical parameters was conducted.
Non-parametric methods were chosen due to the small sample size.
4.7. Pathway Analysis
Pathway analysis was performed using MetaboAnalyst 5.0 (http://www.metaboanalyst.ca/, accessed on 11 May 2022) [35]. Metabolites that were found to be statistically significantin any comparison were taken into consideration and the analysis was performed based onthe Human Metabolome Database identifier. The Kyoto Encyclopedia of Genes and Genomes(KEGG)-based Homo sapiens library was selected for analysis, with a hypergeometric test asthe enrichment method and relative-betweenness centrality in pathway typology analysis.
5. Conclusions
In conclusion, using untargeted metabolomics, we proved that the plasma metabolomeis affected by cold-induced BAT activation. Our results, for the first time, indicated thatsphingolipids and sphingoid base lipids are inversely associated with BAT activation aswell as its volume and activity. Moreover, we observed a cold-induced decline in the FABP4concentration only in BAT(+) individuals. The lack of similar studies in humans proves theneed for further and more detailed research on this subject.
Supplementary Materials: The following supporting information can be downloaded at: https://www.mdpi.com/article/10.3390/metabo12050456/s1, Table S1. Plasma metabolites discriminatingsamples collected during cold exposure from the samples collected at the beginning of the procedure.Table S2. Plasma metabolites discriminating BAT(+) group from BAT(−) group after 60 and 120 minof cold exposure. Table S3. Annotation of plasma metabolites significantly associated with BATactivation. Pathway analysis report.
Author Contributions: Conceptualization, K.M. (Katarzyna Miniewska), K.M. (Katarzyna Mal-iszewska), A.K. and M.C.; Data curation, K.M. (Katarzyna Miniewska), J.G. and Ł.Ł.; Formal analysis,K.M. (Katarzyna Miniewska) and M.C.; Funding acquisition, K.M. (Katarzyna Miniewska), A.K. andM.C.; Investigation, K.M. (Katarzyna Miniewska); Methodology, K.M. (Katarzyna Miniewska), K.P.and M.M.; Project administration, K.M. (Katarzyna Miniewska) and K.M. (Katarzyna Maliszewska);Resources, K.M. (Katarzyna Miniewska) and A.K.; Software, K.M. (Katarzyna Miniewska) and Ł.Ł.;Super-vision, A.K. and M.C.; Validation, K.M. (Katarzyna Miniewska) and M.C.; Visualization, K.M.(Katarzyna Miniewska); Writing—original draft, K.M. (Katarzyna Miniewska); Writing—review andediting, M.C. All authors have read and agreed to the published version of the manuscript.
Funding: The study was funded by a Research Grant from The Polish Diabetes Association (2017)awarded to M.C., as well as Medical University of Bialystok (SUB/1/DN/21/008/4406) grantedto K.M.
Institutional Review Board Statement: The study was conducted according to the guidelines of theDeclaration of Helsinki and approved by the Ethics Committee of Medical University of Bialystok,Poland (R-I-002/233/2015 and R-I-002/203/2019).
Informed Consent Statement: Informed consent was obtained from all subjects involved in the study.
Data Availability Statement: Data are available upon request in justified cases.
Conflicts of Interest: The authors declare no conflict of interest.
Metabolites 2022, 12, 456 15 of 16
References1. Europe Obesity. Available online: https://ec.europa.eu/eurostat/web/products-eurostat-news/-/ddn-20210721-2. (accessed on
30 March 2022).2. DeFronzo, R.A.; Bonadonna, R.C.; Ferrannini, E. Pathogenesis of NIDDM. A balanced overview. Diabetes Care 1992, 15, 318–368.
[CrossRef]3. Ochner, C.N.; Barrios, D.M.; Lee, C.D.; Pi-Sunyer, F.X. Biological mechanisms that promote weight regain following weight loss in
obese humans. Physiol. Behav. 2013, 120, 106–113. [CrossRef]4. Maliszewska, K.; Kretowski, A. Brown Adipose Tissue and Its Role in Insulin and Glucose Homeostasis. Int. J. Mol. Sci. 2021,
22, 1530. [CrossRef]5. Fenzl, A.; Kiefer, F.W. Brown adipose tissue and thermogenesis. Horm. Mol. Biol. Clin. Investig. 2014, 19, 25–37. [CrossRef]6. Saely, C.H.; Geiger, K.; Drexel, H. Brown versus white adipose tissue: A mini-review. Gerontology 2012, 58, 15–23. [CrossRef]7. Cohade, C.; Osman, M.; Pannu, H.K.; Wahl, R.L. Uptake in supraclavicular area fat (“USA-Fat”): Description on 18F-FDG PET/CT.
J. Nucl. Med. 2003, 44, 170–176.8. Yeung, H.W.; Grewal, R.K.; Gonen, M.; Schöder, H.; Larson, S.M. Patterns of (18)F-FDG uptake in adipose tissue and muscle: A
potential source of false-positives for PET. J. Nucl. Med. 2003, 44, 1789–1796.9. Chen, L.; Lu, W.; Wang, L.; Xing, X.; Chen, Z.; Teng, X.; Zeng, X.; Muscarella, A.D.; Shen, Y.; Cowan, A.; et al. Metabolite discovery
through global annotation of untargeted metabolomics data. Nat. Methods 2021, 18, 1377–1385. [CrossRef]10. Schrimpe-Rutledge, A.C.; Codreanu, S.G.; Sherrod, S.D.; McLean, J.A. Untargeted Metabolomics Strategies-Challenges and
Emerging Directions. J. Am. Soc. Mass Spectrom. 2016, 27, 1897–1905. [CrossRef]11. Boon, M.R.; Bakker, L.E.H.; Prehn, C.; Adamski, J.; Vosselman, M.J.; Jazet, I.M.; Arias-Bouda, L.M.P.; van Lichtenbelt, W.D.M.; van
Dijk, K.W.; Rensen, P.C.N.; et al. LysoPC-acyl C16:0 is associated with brown adipose tissue activity in men. Metabolomics 2017,13, 48. [CrossRef]
12. Xiang, A.S.; Giles, C.; Loh, R.K.C.; Formosa, M.F.; Eikelis, N.; Lambert, G.W.; Meikle, P.J.; Kingwell, B.A.; Carey, A.L. PlasmaDocosahexaenoic Acid and Eicosapentaenoic Acid Concentrations Are Positively Associated with Brown Adipose Tissue Activityin Humans. Metabolites 2020, 10, 388. [CrossRef]
13. Kovanicová, Z.; Karhánek, M.; Kurdiová, T.; Baláž, M.; Wolfrum, C.; Ukropcová, B.; Ukropec, J. Metabolomic Analysis Re-veals Changes in Plasma Metabolites in Response to Acute Cold Stress and Their Relationships to Metabolic Health in Cold-Acclimatized Humans. Metabolites 2021, 11, 619. [CrossRef]
14. Bargut, T.C.L.; Martins, F.F.; Santos, L.P.; Aguila, M.B.; Mandarim-de-Lacerda, C.A. Administration of eicosapentaenoic anddocosahexaenoic acids may improve the remodeling and browning in subcutaneous white adipose tissue and thermogenicmarkers in brown adipose tissue in mice. Mol. Cell. Endocrinol. 2019, 482, 18–27. [CrossRef]
15. Félix-Soriano, E.; Sáinz, N.; Gil-Iturbe, E.; Collantes, M.; Fernández-Galilea, M.; Castilla-Madrigal, R.; Ly, L.; Dalli, J.; Moreno-Aliaga, M.J. Changes in brown adipose tissue lipid mediator signatures with aging, obesity, and DHA supplementation in femalemice. FASEB J. 2021, 35, e21592. [CrossRef]
16. Lynes, M.D.; Leiria, L.O.; Lundh, M.; Bartelt, A.; Shamsi, F.; Huang, T.L.; Takahashi, H.; Hirshman, M.F.; Schlein, C.; Lee, A.; et al.The cold-induced lipokine 12,13-diHOME promotes fatty acid transport into brown adipose tissue. Nat. Med. 2017, 23, 631–637.[CrossRef]
17. Błachnio-Zabielska, A.U.; Pułka, M.; Baranowski, M.; Nikołajuk, A.; Zabielski, P.; Górska, M.; Górski, J. Ceramide metabolism isaffected by obesity and diabetes in human adipose tissue. J. Cell. Physiol. 2012, 227, 550–557. [CrossRef]
18. Blachnio-Zabielska, A.U.; Koutsari, C.; Tchkonia, T.; Jensen, M.D. Sphingolipid content of human adipose tissue: Relationship toadiponectin and insulin resistance. Obesity 2012, 20, 2341–2347. [CrossRef]
19. Ravichandran, S.; Finlin, B.S.; Kern, P.A.; Özcan, S. Sphk2. Biochim. Biophys. Acta Mol. Basis Dis. 2019, 1865, 570–576. [CrossRef]20. Christoffersen, C.; Federspiel, C.K.; Borup, A.; Christensen, P.M.; Madsen, A.N.; Heine, M.; Nielsen, C.H.; Kjaer, A.; Holst, B.;
Heeren, J.; et al. The Apolipoprotein M/S1P Axis Controls Triglyceride Metabolism and Brown Fat Activity. Cell Rep. 2018, 22,175–188. [CrossRef]
21. Rajakumari, S.; Srivastava, S. Aging and β3-adrenergic stimulation alter mitochondrial lipidome of adipose tissue. Biochim.Biophys. Acta Mol. Cell Biol. Lipids 2021, 1866, 158922. [CrossRef]
22. Wang, X.; Wahl, R. Responses of the insulin signaling pathways in the brown adipose tissue of rats following cold exposure. PLoSONE 2014, 9, e99772. [CrossRef]
23. Hanssen, M.J.; Hoeks, J.; Brans, B.; van der Lans, A.A.; Schaart, G.; van den Driessche, J.J.; Jörgensen, J.A.; Boekschoten, M.V.;Hesselink, M.K.; Havekes, B.; et al. Short-term cold acclimation improves insulin sensitivity in patients with type 2 diabetesmellitus. Nat. Med. 2015, 21, 863–865. [CrossRef]
24. Wang, T.Y.; Liu, C.; Wang, A.; Sun, Q. Intermittent cold exposure improves glucose homeostasis associated with brown and whiteadipose tissues in mice. Life Sci. 2015, 139, 153–159. [CrossRef]
25. Zhang, Q.; Lin, Y.; Zhang, X.Y.; Wang, D.H. Cold exposure inhibits hypothalamic Kiss-1 gene expression, serum leptin concentra-tion, and delays reproductive development in male Brandt’s vole (Lasiopodomys brandtii). Int. J. Biometeorol. 2015, 59, 679–691.[CrossRef]
26. Ricci, M.R.; Fried, S.K.; Mittleman, K.D. Acute cold exposure decreases plasma leptin in women. Metabolism 2000, 49, 421–423.[CrossRef]
Metabolites 2022, 12, 456 16 of 16
27. Peinó, R.; Piñeiro, V.; Gualillo, O.; Menéndez, C.; Brenlla, J.; Casabiell, X.; Diéguez, C.; Casanueva, F.F. Cold exposure inhibitsleptin secretion in vitro by a direct and non-specific action on adipose tissue. Eur. J. Endocrinol. 2000, 142, 195–199. [CrossRef]
28. Yamamoto, T.; Yamamoto, A.; Watanabe, M.; Kataoka, M.; Terada, H.; Shinohara, Y. Quantitative evaluation of the effects ofcold exposure of rats on the expression levels of ten FABP isoforms in brown adipose tissue. Biotechnol. Lett. 2011, 33, 237–242.[CrossRef]
29. Vergnes, L.; Chin, R.; Young, S.G.; Reue, K. Heart-type fatty acid-binding protein is essential for efficient brown adipose tissuefatty acid oxidation and cold tolerance. J. Biol. Chem. 2011, 286, 380–390. [CrossRef]
30. Shu, L.; Hoo, R.L.; Wu, X.; Pan, Y.; Lee, I.P.; Cheong, L.Y.; Bornstein, S.R.; Rong, X.; Guo, J.; Xu, A. A-FABP mediates adaptivethermogenesis by promoting intracellular activation of thyroid hormones in brown adipocytes. Nat. Commun. 2017, 8, 14147.[CrossRef]
31. Stachon, A.J. Menstrual Changes in Body Composition of Female Athletes. Coll. Antropol. 2016, 40, 111–122.32. Maliszewska, K.; Adamska-Patruno, E.; Miniewska, K.; Bauer, W.; Mojsak, M.; Kretowski, A. PET/MRI-evaluated brown adipose
tissue activity may be related to dietary MUFA and omega-6 fatty acids intake. Sci. Rep. 2022, 12, 4112. [CrossRef] [PubMed]33. Virtanen, K.A.; Peltoniemi, P.; Marjamäki, P.; Asola, M.; Strindberg, L.; Parkkola, R.; Huupponen, R.; Knuuti, J.; Lönnroth, P.;
Nuutila, P. Human adipose tissue glucose uptake determined using [(18)F]-fluoro-deoxy-glucose ([(18)F]FDG) and PET incombination with microdialysis. Diabetologia 2001, 44, 2171–2179. [CrossRef] [PubMed]
34. Daniluk, U.; Daniluk, J.; Kucharski, R.; Kowalczyk, T.; Pietrowska, K.; Samczuk, P.; Filimoniuk, A.; Kretowski, A.; Lebensztejn, D.;Ciborowski, M. Untargeted Metabolomics and Inflammatory Markers Profiling in Children with Crohn’s Disease and UlcerativeColitis-A Preliminary Study. Inflamm. Bowel Dis. 2019, 25, 1120–1128. [CrossRef] [PubMed]
35. Pang, Z.; Chong, J.; Zhou, G.; de Lima Morais, D.A.; Chang, L.; Barrette, M.; Gauthier, C.; Jacques, P.; Li, S.; Xia, J. MetaboAnalyst5.0: Narrowing the gap between raw spectra and functional insights. Nucleic Acids Res. 2021, 49, W388–W396. [CrossRef]
Related Documents