Before the U.S. Environmental Protection Agency PETITION OF THE AMERICAN CHEMISTRY COUNCIL’S ETHYLENE GLYCOL ETHERS PANEL TO REMOVE ETHYLENE GLYCOL MONOBUTYL ETHER FROM THE TOXICS RELEASE INVENTORY UNDER SECTION 313 OF THE EMERGENCY PLANNING AND COMMUNITY RIGHT-TO-KNOW ACT OF 1986 Jonathon Busch Director, Ethylene Glycol Ethers Panel Technical Consultants: Miranda Henning Suzanne Persyn Duncan Turnbull, D.Phil. ENVIRON International Corporation 136 Commercial Street, Suite 402 Portland, ME 04101 American Chemistry Council 700 2 nd Street, NE Washington, DC 20002 (202) 249-6725 December 29, 2014

Welcome message from author
This document is posted to help you gain knowledge. Please leave a comment to let me know what you think about it! Share it to your friends and learn new things together.
Transcript

Before the U.S. Environmental Protection Agency
PETITION OF THE AMERICAN CHEMISTRY COUNCIL’S ETHYLENE GLYCOL ETHERS PANEL
TO REMOVE ETHYLENE GLYCOL MONOBUTYL ETHER FROM THE TOXICS RELEASE INVENTORY UNDER SECTION 313
OF THE EMERGENCY PLANNING AND COMMUNITY RIGHT-TO-KNOW ACT OF 1986
Jonathon Busch Director, Ethylene Glycol Ethers Panel
Technical Consultants:
Miranda Henning Suzanne Persyn
Duncan Turnbull, D.Phil. ENVIRON International Corporation 136 Commercial Street, Suite 402
Portland, ME 04101
American Chemistry Council
700 2nd Street, NE
Washington, DC 20002
(202) 249-6725
December 29, 2014

Petition Pursuant to Section 313(d) & (e) of the Emergency Planning and Community Right-to-
Know Act of 1986 (EPCRA), the Ethylene Glycol Ethers Panel of the American Chemistry
Council hereby petitions the United States Environmental Protection Agency (EPA) to remove
ethylene glycol monobutyl ether (EGBE) from the list of chemicals subject to the Toxics Release
Inventory (TRI) reporting requirements of the EPCRA Section 313.
As demonstrated below, available scientific data indicate that EGBE poses low potential
hazards to human health and the environment, making an assessment of exposure appropriate
under EPA’s policy for making TRI listing decisions under EPCRA. Conservative estimates of
exposures resulting from plant emissions of EGBE are well below Integrated Risk Information
System reference values for human inhalation and ingestion health risks and are also far below
conservative benchmarks for acute human health effects and ecotoxicity. When the
Administrator removed EGBE from the Clean Air Act’s list of Hazardous Air Pollutants in
November 2004, he specifically determined, based on exposure assessments utilizing 1993 TRI
data, that there is “reasonable assurance” that any potential adverse human health and
environmental effects “will not occur” from EGBE facility releases (68 FR 65660). He concluded
“with confidence” that releases of EGBE “may not reasonably be anticipated to cause any
adverse effects to human health” or “adverse environmental effects” (69 FR 69322).
As demonstrated in this petition, there is an even stronger basis for making essentially
the same statutory findings under EPCRA and removing EGBE from the TRI reporting list.
Based on the most recent TRI data available, EGBE releases and exposures are significantly
lower than those that formed the basis for EPA’s Hazardous Air Pollutants (HAPs)
determinations. Delisting under EPCRA would remove a significant disincentive to the use of
EGBE, a solvent that has proven to be highly effective in a variety of important water-based
coating formulations with demonstrable volatile organic compound (VOC)-reduction benefits.
Delisting would also eliminate the potential for confusion and misdirected community priorities
that currently exists because EGBE-using facilities are unfairly singled-out as significant sources
of “toxics” despite the Administrator’s findings that EGBE releases may not reasonably be
anticipated to cause adverse human health or environmental effects. Accordingly, for the
reasons set forth in full in this petition, the EPCRA delisting criteria are satisfied and the Panel
therefore respectfully requests that EPA remove EGBE from the TRI reporting list.

ii
TABLE OF CONTENTS EXECUTIVE SUMMARY 1
1.0 INTRODUCTION 6
2.0 BACKGROUND 10
2.1 Synonyms 10
2.2 History of EGBE Regulation under EPCRA 10
2.3 Removal of EGBE from the Clean Air Act HAPs List 11
2.4 Regulatory Standards and Guidelines 13
2.5 Production and Use 13
3.0 HAZARD ASSESSMENT 16
3.1 Chemical and Physical Properties 16
3.2 Potential Human Health Hazards 17
3.2.1 Noncancer Toxicity 17 3.2.2 Potential Carcinogenicity 22
3.3 Ecotoxicity 26
3.4 Evaluation of Potential Hazards of EGBE and Implications for TRI Listing 27
3.4.1 Low Potential for Adverse Chronic Human Health Effects 27 3.4.2 Low Potential for Significant Adverse Ecological Effects 29 3.4.3 Conclusion 29
4.0 CRITERIA FOR EVALUATING ACUTE AND CHRONIC HUMAN EXPOSURES 31
4.1 Acute Toxicity 31
4.2 Chronic Toxicity 31
5.0 EMISSIONS INVENTORY 34
6.0 INHALATION EXPOSURE ASSESSMENT AND RISK CHARACTERIZATION 35
6.1 Overview of the Tiered Modeling Method for Assessing Risks from Air Exposures 37
6.2 Step A and B Prescreening 40
6.2.1 Step A Prescreening Methodology 40 6.2.2 Step A Results 41 6.2.3 Step B Prescreening Methodology 41 6.2.4 Step B Results 44
6.3 Chronic Inhalation Exposure Assessment for Individual Facilities 44
6.3.1 Tier 1 Screening for Individual Facilities 44 6.3.2 Tier 2 Screening for Individual Facilities 47
6.4 Chronic Inhalation Exposure Assessment for Clusters of Facilities 52
6.4.1 Facility Cluster Evaluation Tiered Screening Methodology 52 6.4.2 Step A Screening (Cluster Evaluation) 52 6.4.3 Step B Screening (Cluster Evaluation) 54 6.4.4 Tier 2 Screening (Cluster Evaluation) 56
6.5 Uncertainty Analysis 58

iii
6.5.1 Conservatism of Step A through Tier 2 59 6.5.2 Tier 3 Modeling (Individual Facilities) 61 6.5.3 Tier 3 Modeling (Clusters of Facilities) 64 6.5.4 Conservatism of the Tiered Modeling Approach 65
6.6 Acute Exposure Margin of Exposure (MOE) Assessment 67
6.6.1 Acute Exposure Assessment for Individual Facilities 68 6.6.2 Acute Exposure Assessment for Clusters of Facilities 70 6.6.3 Acute Margin of Exposure (MOE) Assessment 71
6.7 Risk Characterization Conclusions for Potential EGBE Inhalation Exposures 72
7.0 SURFACE WATER EXPOSURES AND RISKS 73
7.1 Exposure Profiles 73
7.2 Exposure Equations 74
7.3 Exposure Assumptions 75
7.4 Results and Conclusions 77
8.0 ECOLOGICAL RISKS 79
8.1 HAPs Delisting Ecological Risk Assessments 79
8.1.1 The Panel’s ERA 79 8.1.2 EPA ERAs 80 8.1.3 Tier 1 ERA 81 8.1.4 Tier 2 ERA 82
8.2 Updated ERA 82
8.2.1 Problem Formulation 83 8.2.2 Exposure Assessment 83 8.2.3 Effects Assessment 84 8.2.4 Risk Characterization 87
8.3 Conclusions 88
9.0 SUMMARY AND RATIONALE FOR DELISTING EGBE 90
9.1 Delisting EGBE Is Fully Consistent with EPCRA’s TRI Listing Criteria as Interpreted by EPA 90
9.2 Substantial Conservatism is Incorporated into Every Primary Element of the Toxicological, Exposure, and Ecological Assessments Presented in this Petition 93
9.2.1 IRIS Reference Values 93 9.2.2 Exposure Assessments 94 9.2.3 Ecological Risk Assessment 95
9.3 In Light of the HAPs Delisting Decision, EPA’s Policy of Ensuring Consistency with Other Agency Decisions Supports Removal of EGBE from the TRI Reporting List 96
9.4 Removing EGBE from the TRI Would Promote the Local Risk Management and Pollution Prevention Objectives of EPCRA 97
10.0 REFERENCES 101
iv
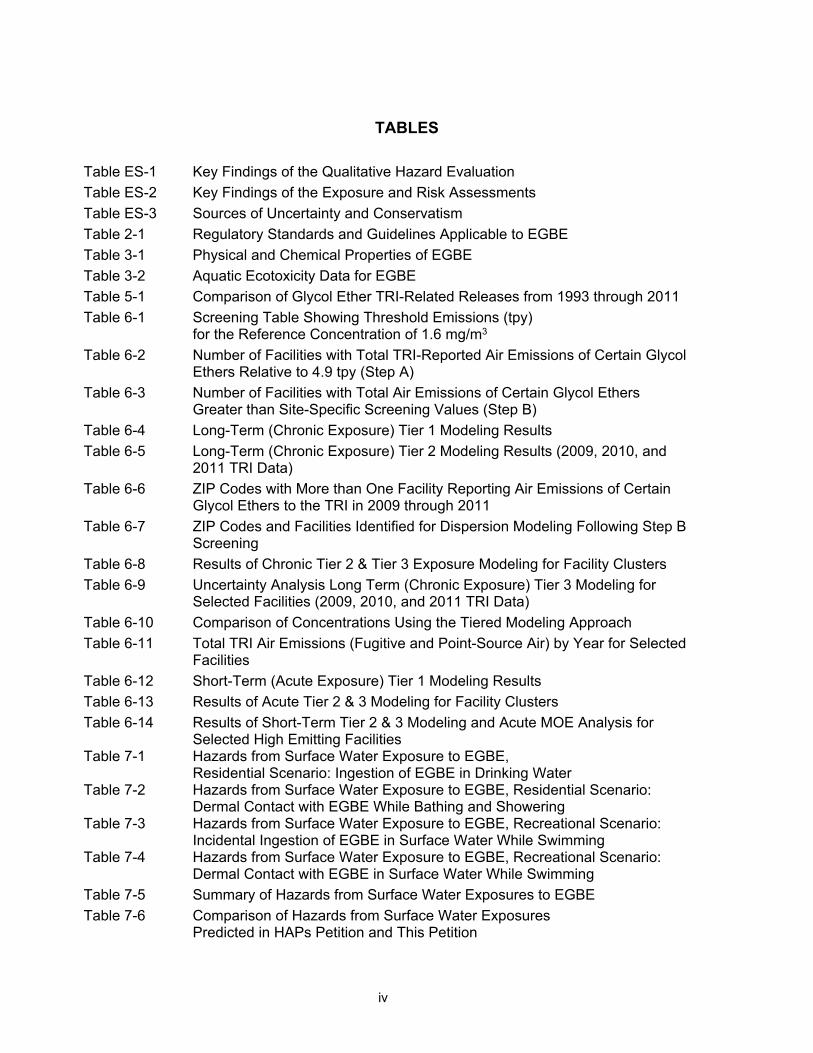
TABLES
Table ES-1 Key Findings of the Qualitative Hazard Evaluation
Table ES-2 Key Findings of the Exposure and Risk Assessments
Table ES-3 Sources of Uncertainty and Conservatism
Table 2-1 Regulatory Standards and Guidelines Applicable to EGBE
Table 3-1 Physical and Chemical Properties of EGBE
Table 3-2 Aquatic Ecotoxicity Data for EGBE
Table 5-1 Comparison of Glycol Ether TRI-Related Releases from 1993 through 2011
Table 6-1 Screening Table Showing Threshold Emissions (tpy) for the Reference Concentration of 1.6 mg/m3
Table 6-2 Number of Facilities with Total TRI-Reported Air Emissions of Certain Glycol Ethers Relative to 4.9 tpy (Step A)
Table 6-3 Number of Facilities with Total Air Emissions of Certain Glycol Ethers Greater than Site-Specific Screening Values (Step B)
Table 6-4 Long-Term (Chronic Exposure) Tier 1 Modeling Results
Table 6-5 Long-Term (Chronic Exposure) Tier 2 Modeling Results (2009, 2010, and 2011 TRI Data)
Table 6-6 ZIP Codes with More than One Facility Reporting Air Emissions of Certain Glycol Ethers to the TRI in 2009 through 2011
Table 6-7 ZIP Codes and Facilities Identified for Dispersion Modeling Following Step B Screening
Table 6-8 Results of Chronic Tier 2 & Tier 3 Exposure Modeling for Facility Clusters
Table 6-9 Uncertainty Analysis Long Term (Chronic Exposure) Tier 3 Modeling for Selected Facilities (2009, 2010, and 2011 TRI Data)
Table 6-10 Comparison of Concentrations Using the Tiered Modeling Approach
Table 6-11 Total TRI Air Emissions (Fugitive and Point-Source Air) by Year for Selected Facilities
Table 6-12 Short-Term (Acute Exposure) Tier 1 Modeling Results
Table 6-13 Results of Acute Tier 2 & 3 Modeling for Facility Clusters
Table 6-14 Results of Short-Term Tier 2 & 3 Modeling and Acute MOE Analysis for Selected High Emitting Facilities
Table 7-1 Hazards from Surface Water Exposure to EGBE, Residential Scenario: Ingestion of EGBE in Drinking Water
Table 7-2 Hazards from Surface Water Exposure to EGBE, Residential Scenario: Dermal Contact with EGBE While Bathing and Showering
Table 7-3 Hazards from Surface Water Exposure to EGBE, Recreational Scenario: Incidental Ingestion of EGBE in Surface Water While Swimming
Table 7-4 Hazards from Surface Water Exposure to EGBE, Recreational Scenario: Dermal Contact with EGBE in Surface Water While Swimming
Table 7-5 Summary of Hazards from Surface Water Exposures to EGBE
Table 7-6 Comparison of Hazards from Surface Water Exposures Predicted in HAPs Petition and This Petition

v
TABLES
Table 8-1 EGBE Emissions Rates Used in Level III Mackay Distribution Model (kg/hr)
Table 8-2 Modeled EGBE Exposure Concentrations Used in This and Previous Ecological Risk Assessments
Table 8-3 EQC Level III Input Parameter Values
Table 8-4 Exposure Assumptions for Small Mammals
Table 8-5 Chronic Species Sensitivity Distribution Calculations for EGBE
Table 9-1 Key Findings of the Qualitative Hazard Evaluation
Table 9-2 Key Findings of the Exposure and Risk Assessments
Table 9-3 Sources of Uncertainty and Conservatism
FIGURES
Figure 1-1 Structure of Ethylene Glycol Monobutyl Ether (EGBE)
Figure 2-1 Annual Production and Consumption of EGBE in the United States (1970 -2009)
Figure 5-1 Maximum Individual Facility Annual Certain Glycol Ether Releases to Air (2000 – 2011)
Figure 8-1 Aquatic Organism Species Sensitivity Distribution Approach
Figure 8-2 Aquatic Organism Species Sensitivity Distributions for EGBE
APPENDICES
Appendix A Toxicity Values in Laboratory Mammals
Appendix B Emissions Inventory
Appendix C Outcome of Screening Procedure for Long-Term Exposures
Appendix D Outcome of Long-Term Tiered Modeling in Support of Uncertainty Analysis
Appendix E Outcome of Short-Term Tiered Modeling
Appendix F Tier 2 and Tier 3 Modeling Output Files (CDROM)
vi
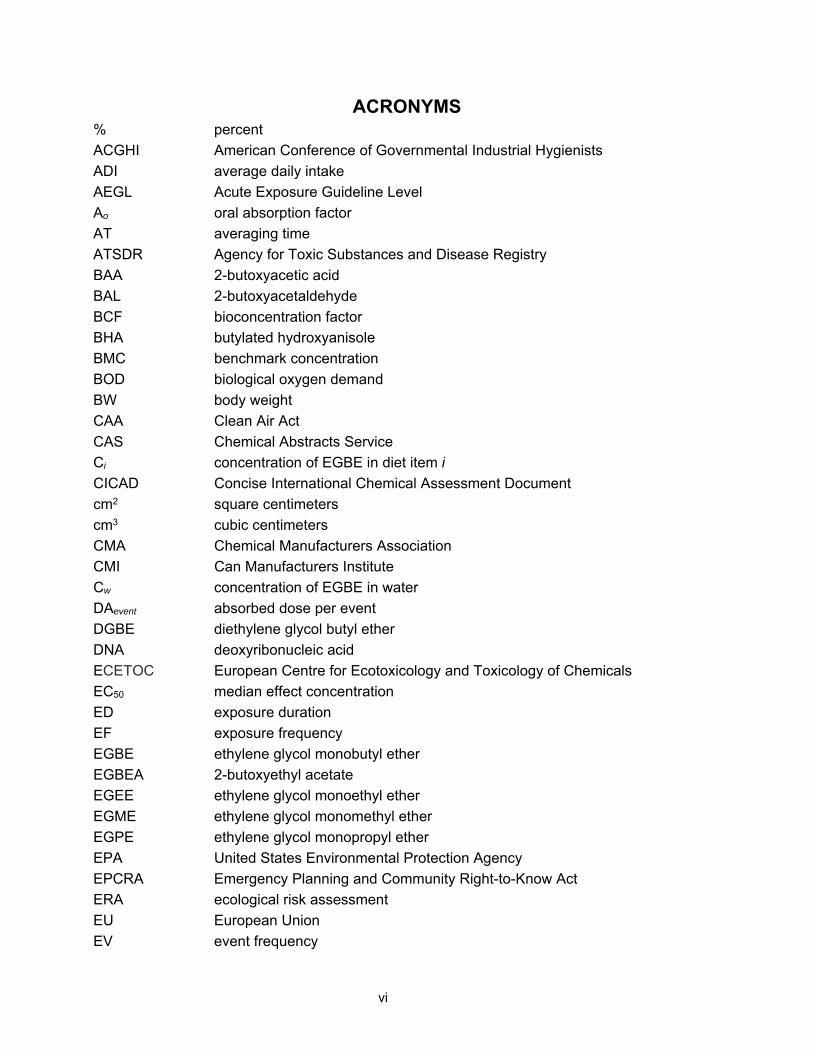
ACRONYMS % percent
ACGHI American Conference of Governmental Industrial Hygienists
ADI average daily intake
AEGL Acute Exposure Guideline Level
Ao oral absorption factor
AT averaging time
ATSDR Agency for Toxic Substances and Disease Registry
BAA 2-butoxyacetic acid
BAL 2-butoxyacetaldehyde
BCF bioconcentration factor
BHA butylated hydroxyanisole
BMC benchmark concentration
BOD biological oxygen demand
BW body weight
CAA Clean Air Act
CAS Chemical Abstracts Service
Ci concentration of EGBE in diet item i
CICAD Concise International Chemical Assessment Document
cm2 square centimeters
cm3 cubic centimeters
CMA Chemical Manufacturers Association
CMI Can Manufacturers Institute
Cw concentration of EGBE in water
DAevent absorbed dose per event
DGBE diethylene glycol butyl ether
DNA deoxyribonucleic acid
ECETOC
EC50
European Centre for Ecotoxicology and Toxicology of Chemicals
median effect concentration
ED exposure duration
EF exposure frequency
EGBE ethylene glycol monobutyl ether
EGBEA 2-butoxyethyl acetate
EGEE ethylene glycol monoethyl ether
EGME ethylene glycol monomethyl ether
EGPE ethylene glycol monopropyl ether
EPA United States Environmental Protection Agency
EPCRA Emergency Planning and Community Right-to-Know Act
ERA ecological risk assessment
EU European Union
EV event frequency

vii
ACRONYMS gps grams per second
HAP hazardous air pollutant
Hb hemoglobin
HQ hazard quotient
HSDB Hazardous Substance Data Bank
IARC International Agency for Research on Cancer
IR ingestion rate
IRa inhalation rate
IRdiet food ingestion rate
IRIS Integrated Risk Information System
IRw water ingestion rate
kg kilograms
kg/hr kilograms per hour
kg/kg BW-day kilograms per kilogram body weight per day
km kilometers
km2 square kilometers
Kow octanol-water partition coefficient
L/day liter per day
LC50 lethal concentration for 50% of test organisms
LD50 lethal dose for 50% of test organisms
LOAEL lowest observed adverse effect level
m meter
m3/kg BW-day cubic meters per kilogram body weight per day
MCV mean corpuscular volume
MEK methyl ethyl ketone
mg/cm2 milligrams per square centimeter
mg/kg milligrams per kilogram
mg/kg BW-day milligrams per kilogram body weight per day
mg/L milligrams per liter
mg/m3 milligrams per cubic meter
MIBK methyl isobutyl ketone
mM millimolars
MOE Margin of Exposure
µg/m3 micrograms per cubic meter
NED National Elevation Dataset
NEI National Emissions Inventory
NIOSH National Institute of Occupational Safety and Health
NOAEL no observed adverse effect level
NOEC no observed effect concentration
viii
ACRONYMS NTP National Toxicology Program
OEM original equipment manufacturing
PBPK physiologically based pharmacokinetic
Pi proportion of organism’s diet made up by diet item i
POTW publicly owned treatment works
ppm parts per million
RfC reference concentration
RfD reference dose
RME reasonable maximum exposure
ROS reactive oxygen species
SA skin surface area exposed
SARA Superfund Amendment and Reauthorization Act of 1986
TDI total daily intake
TGME triethylene glycol methyl ether
TLV threshold limit value
TNF∞ tumor necrosis factor alpha
tpy tons per year
TRI Toxics Release Inventory
TRV toxicity reference value
USGS U.S. Geological Survey
UTM Universal Transverse Mercator
VOC volatile organic compound
WHO World Health Organization

1
EXECUTIVE SUMMARY
Ethylene glycol monobutyl ether (EGBE) (Chemical Abstract Service [CAS] number 111-
76-2) is used primarily as a solvent in the manufacture of paints, coatings, metal cleaners, and
household cleaners and as a chemical intermediate in the production of other chemicals. It has
been used for more than 60 years because of its valuable and unique properties, especially its
ability to make water-based, environmentally sound products work effectively. EGBE is
regulated under Section 313 of the Emergency Planning and Community Right-to-Know Act
(EPCRA) because it is a member of the “Certain Glycol Ethers” category of compounds as
currently defined on the Toxics Release Inventory (TRI).
Section 313(d) of EPCRA calls for the removal of a chemical from the TRI where “there
is not sufficient evidence to establish” that the chemical “is known to cause or can reasonably
be anticipated to cause” any of three types of effects:
(A) significant adverse acute human health effects;
(B) (i) cancer or teratogenic effects, or (ii) serious or irreversible reproductive dysfunctions, neurological disorders, heritable genetic mutations, or other chronic health effects; or
(C) a significant adverse effect on the environment of sufficient seriousness, in the judgment of the Administrator, to warrant reporting of facility releases.
As detailed in the human health and ecological hazard assessment presented in Section
3 of this petition and summarized in Table ES-1, the available evidence indicates that EGBE
presents low potential hazards to human health and the environment. The scientific data
support the conclusions in the current Integrated Risk Information System (IRIS) assessment
(EPA 2010)a that EGBE is not immunotoxic, genotoxic, or teratogenic, and does not cause
adverse reproductive effects. The toxic effects of EGBE are secondary to its irritant and
hemolytic effects, and United States Environmental Protection Agency (EPA) has determined
that prevention of hemolytic effects in humans will also protect against all other potential toxic
effects (EPA 2010, 68 FR 65656, 69 FR 69322). The data show, moreover, that humans are
relatively insensitive to the hemolytic effects of EGBE. Even minor prehemolytic effects are
expected to occur in humans, if they occur at all, only at exposure concentrations/doses far in
excess of levels that might occur near EGBE-using facilities. The human-equivalent lowest
observed adverse effect level (LOAEL) is significantly above 500 milligrams per kilogram body
weight per day (mg/kg BW-day), and prehemolytic effects are not predicted in humans even in
EGBE-saturated atmospheres (EPA 2010, Udden 2000, 2002).
a Although the 1999 IRIS assessment is currently under review, the review is limited to updating the carcinogenicity evaluation to incorporate EPA’s recent cancer hazard evaluation for EGBE (EPA 2005a). See 71 Federal Register [FR] 77018 (EPA 2006).

2
For similar reasons, the potential carcinogenicity of EGBE in humans is appropriately
characterized under EPA’s TRI listing criteria as low to nonexistent based on a hazard
evaluation. The IRIS assessment finds “limited” animal evidence of carcinogenicity and
concludes that the human carcinogenic potential of EGBE “cannot be determined” (EPA 2010).
Subsequent mechanistic studies led EPA to determine that that nonlinear, nongenotoxic modes
of action are likely responsible for the increased incidence of tumors observed in rodent studies
(EPA 2005a). Consequently, even if the limited rodent findings are relevant to humans, the
relatively low sensitivity of humans (including subpopulations such as children) to the hemolytic
effects of EGBE means that, as EPA has stated, “we would not expect to find these tumors in
humans following environmental exposures” (69 FR 69322).
EGBE likewise poses a very low potential ecological hazard judged by the criteria EPA
has developed for making listing decisions under EPCRA. As summarized in Table ES-1, it has
a relatively short residence time in the atmosphere, high water solubility, low octanol-water
partition coefficient (Kow), low vapor pressure, and low bioconcentration factor. Thus, EGBE has
very low potential for persistence or bioaccumulation.
Consistent with the findings of a series of comprehensive ecotoxicity assessments—
including the recently updated Concise International Chemical Assessment Document (CICAD)
(WHO 2010), the European Union (EU) Risk Assessment (INERIS 2005); and Environment
Canada (2002)—EPA determined in the Hazardous Air Pollutant (HAPs) proceeding that that
EGBE causes only “very minor” effects that “are unlikely to be ecologically significant” (68 Fed.
Reg. 65657). The updated ecological hazard evaluation in Section 3 of this petition supports
that conclusion. Acute toxicity to most aquatic organisms has been found at concentrations in
the vicinity of 1,000 milligrams per liter (mg/L) while chronic toxicity to most aquatic organisms
has been found at concentrations above 100 mg/L. For the most sensitive species, acute and
chronic aquatic toxicity likewise has been reported only at levels that are properly evaluated as
high under EPA’s TRI listing criteria (Table ES-1). No data have been found indicating that
EGBE is toxic to terrestrial mammals or birds. The data indicate, in short, that EGBE is
“practically non-toxic” to fish and invertebrates under established EPA criteria and, therefore,
presents “a low risk to the environment” (Staples 1998).
For these reasons, the human health and ecological hazard evaluation presented here
supports a determination that EGBE has “low toxicity and unrealistic exposures would be
necessary for it to pose a risk to communities” (59 FR 61442). Under these circumstances,
EPA’s interpretation of EPCRA Section 313(d)(2) calls for the consideration of exposure levels
in determining whether to delete EGBE from the TRI reporting list.
Significantly, this is an issue the Agency has addressed in a statutory setting that is
virtually identical to Section 313(d) of EPCRA. On November 29, 2004, EPA Administrator
Michael O. Leavitt granted the Panel’s petition to remove EGBE from the list of HAPs under
Section 112 of the Clean Air Act (CAA) (EPA 2004a). Section 112 authorizes the removal of a
listed HAP based on a determination that “the substance may not reasonably be anticipated to
cause any adverse effects to the human health or any adverse environmental effects.” In
assessing exposures to EGBE, EPA determined that the 1993 TRI data (on which our HAPs

3
petition was largely based) provided an “adequate” and “reasonable representation” of the
sources and levels of EGBE emissions. Application of conservative exposure models led the
Administrator to find that maximum estimated exposures from EGBE-emitting facilities are well
below the IRIS reference concentration (RfC) and reference dose (RfD). He therefore
concluded, “with confidence,” that releases of EGBE “may not reasonably be anticipated to
cause any adverse effects to human health” (69 FR 69322). Relying on similar conservative
modeling based on the 1993 TRI data, the Administrator likewise found that there are adequate
data on environmental effects of EGBE to determine that ambient concentrations,
bioaccumulation, or deposition of EGBE are not reasonably anticipated to cause any adverse
environmental effects (68 FR 65657).
This petition updates the hazard, exposure, and ecological assessments that EPA
reviewed and prepared in the HAPs delisting proceeding, consistent with the assumptions and
methodologies that EPA found to be “appropriate,” “acceptable,” and “conservative.”
Section 4 reviews the bases for and substantial conservatism built into the IRIS RfC and
RfD, which are used to evaluate the results of the exposure assessments prepared for this
petition, as they were in the HAPs decision.
Nationwide exposure potential is assessed in Section 5 by developing an inventory of
Certain Glycol Ether releases using 2009, 2010, and 2011 TRI data. Because EGBE comprises
52 percent (%) of the United States annual consumption of glycol ethers (SRI 2010), the
inventory’s assumption that all releases of Certain Glycol Ether are EGBE (in the absence of
facility-specific data to the contrary) generally overstates EGBE releases by a factor of two.
As described in Section 6, every facility listed in the TRI database is subjected to a
screening process very similar to that used in the HAPs proceeding to determine which facilities
have the potential to have maximum annual average concentrations of EGBE at or beyond the
fenceline greater than the IRIS RfC of 1.6 milligrams per cubic meter (mg/m3). In addition, an
analysis of clusters of multiple facilities within the same zip code is used to evaluate the
maximum potential combined exposures from closely located sources of EGBE. A comparison
of annual emissions reported to TRI from 2000 through 2011 is used to demonstrate that
interannual variability in reported emissions among high emitting facilities is relatively low and
that the tiered modeling approach in this petition provides a sufficient margin of safety that
encompasses reasonable interannual variability in facility EGBE emissions. Section 6 also
includes a reasonable worst-case assessment of the potential for acute irritation effects from
EGBE facility releases using the Margin of Exposure (MOE) methodology EPA has employed in
prior TRI listing decisions.
Section 7 evaluates the potential health effects of EGBE posed by human surface water
ingestion and dermal exposures against the IRIS RfD of 0.1 mg/kg BW-day, based on
essentially the same conservative assumptions and models that EPA characterized in the HAPs
evaluation, with updates to reflect the estimated surface water concentration based on 2009,
2010, and 2011 TRI data, the current RfD, and changes in EPA (2004b) guidance for dermal
risk assessment.

4
Section 8 updates the three ecological risk assessments (ERAs) conducted in the HAPs
proceeding by applying 2009, 2010, and 2011 TRI data to the Mackay Level III fugacity model,
to yield updated estimates of the maximum surface water concentration. In addition, Section 7
applies an updated toxicity reference value (TRV) for aquatic organisms that was identified in a
supplemental review of the ecotoxicity literature for EGBE.
The results, summarized in Table ES-2, reveal that EGBE exposures are well below the
IRIS RfC and RfD for inhalation and dermal/ingestion exposures as well as appropriate
ecotoxicity reference values. Consequently, the hazard quotients (HQs)—the ratio of maximum
exposures to applicable health and environmental reference values—are also well below 1
indicating, in accordance with the National Contingency Plan (EPA 1990a) and EPA (1989) risk
assessment guidance, that adverse health and environmental effects are unlikely. Similarly, the
acute MOE for the estimated maximum hourly concentration of EGBE is above 5, which
indicates no significant concern for potential acute effects because, among other things, the no
observed adverse effect level (NOAEL) is based on human data.
As discussed in Section 9.2 and as summarized in Table ES-3, the exposure and risk
estimates developed in this petition are likely overstated by wide margins, perhaps by as much
as five orders of magnitude. EPA (2003) has acknowledged that substantial conservatism is
incorporated into every primary element of the evaluation, including the IRIS and ecotoxicity
reference values, the emissions inventory, and the models and assumptions used to estimate
maximum exposures. The scientific evidence therefore supports a finding that “there is not
sufficient evidence to establish” that EGBE satisfies any of the three listing criteria of EPCRA
Section 313(d).
Delisting EGBE is also consistent with the policies and goals of the TRI program as
articulated by EPA. As developed in Section 9.3, the Agency has emphasized the need to
ensure that TRI listing decisions are consistent with “other EPA decisions on the same
chemical, to the extent that such decisions relate to the same basic criteria for human health
and the environment” (52 FR 5481). That consideration is especially important here because, as
summarized in Table ES-2, human and environmental exposures are consistent with or less
than those that formed the basis of the Agency’s November 2004 HAPs findings that releases of
EGBE “may not reasonably be anticipated to cause any adverse effects to the human health” or
“adverse environmental effects” (EPA 2004a, 69 FR 69322). By their terms, these findings
encompass the health and ecotoxicity listing criteria of EPCRA Section 313(d) and, therefore,
should be accorded considerable weight here.
Delisting EGBE also would promote the goals of the TRI program by focusing
community risk management and pollution prevention efforts on other chemicals that EPA has
determined present significant human health and environmental risks (see Section 9.4). Of
special importance in this regard is the fact that delisting would remove the current disincentive
to the use of EGBE in waterborne coating formulations that have demonstrable environmental
benefits in the form of substantial reductions in volatile organic compound (VOC) emissions.
Deleting EGBE from the TRI reporting list also would maintain the credibility of the program by
eliminating the confusion that currently results because facilities are inappropriately singled out
5
as major sources of “toxics” on the basis of EGBE releases that, as EPA has found, may not
reasonably be anticipated to cause adverse human health or environmental effects.
The case for deleting EGBE from the TRI reporting list, in sum, is straightforward and
compelling. Because the delisting criteria of EPCRA Section 313(d) as interpreted by EPA are
met, and because the local risk management and pollution prevention purposes of the statute
would be well served by delisting, the Panel respectfully asks EPA to grant this petition.

6
1.0 INTRODUCTION This petition, submitted by the American Chemistry Council’s Ethylene Glycol Ethers
Panel (the Panel) under Section 313(d) & (e) of the Emergency Planning and Community Right-
to-Know Act (EPCRA), seeks the removal of ethylene glycol monobutyl ether (EGBE) from the
list of chemicals subject to the reporting requirements of the Emergency Planning and
Community Right-to-Know Act (EPCRA) Toxics Release Inventory (TRI) program. The
Chemical Abstracts Service (CAS) number for EGBE is 111-76-2, and its chemical structure is
illustrated in Figure 1-1 below.
The American Chemistry Council is a trade organization for chemical manufacturers.
The American Chemistry Council’s contact is Mr. Jonathon Busch, Director of the Ethylene
Glycol Ethers Panel. He can be reached at the mailing address listed on the cover of this
petition, by phone at 202-249-6725, or by e-mail at [email protected]
Members of the Ethylene Glycol Ethers Panel are The Dow Chemical
Company, Eastman Chemical, and LyondellBasell. Panel members Dow, Eastman, along
with LyondellBasell account for all domestic manufacture of EGBE (SRI 2010).
Section 313(d) of EPCRA (42 U.S.C. §11023(d)(2)(A)-(C) & (d)(3)) calls for the delisting
of a chemical where “there is not sufficient evidence to establish” that—
(A) The chemical is known to cause or can reasonably be anticipated to cause significant adverse acute human health effects at concentrations expected to exist beyond facility site boundaries as result of continuous or frequently recurring releases;
(B) The chemical is known to cause or can reasonably be anticipated to cause in humans—
(i) cancer or teratogenic effects, or
b There is an underscore symbol between Mr. Busch’s first and last names within his email address.
C
C O
C
C
C
CH
H H H
H
H H H
H H H HO
HH
Figure 1-1. Structure of Ethylene Glycol Monobutyl Ether (EGBE)
7
(ii) serious or irreversible— (I) reproductive dysfunctions, (II) neurological disorders,
(III) heritable genetic mutations, or (IV) other chronic health effects.
(C) The chemical is known to cause or can reasonably be anticipated to cause, because of— (i) its toxicity, (ii) its toxicity and persistence in the environment, or (iii) its toxicity and tendency to bioaccumulate in the
environment, a significant adverse effect on the environment of sufficient seriousness, in the judgment of the Administrator, to warrant reporting under this section.
This petition evaluates EGBE based on these criteria. In accordance with United States
Environmental Protection Agency’s (EPA’s) interpretation of the EPCRA listing criteria (59 Fed.
Reg. 61432 [EPA 1994a]), the petition presents in Section 3 a qualitative assessment of the
potential hazards EGBE poses to human health and the environment. Because the hazard
assessment supports the conclusion that EGBE presents a low potential for adverse human
health and ecological effects, we also present in Sections 4 through 8 conservative
assessments of potential human and environmental exposures resulting from facility releases of
EGBE and how such exposures compare to highly protective criteria for preventing adverse
human health and ecological effects. Specifically, the petition is organized as follows:
Section 2 presents background information on the chemical identity of EGBE, regulatory
history, current standards and guidelines, production, and use.
Section 3 presents a qualitative evaluation of the potential human health and ecological
hazards posed by EGBE:
The physical and chemical properties of EGBE are reviewed, focusing on properties
relevant to potential health and environmental effects including persistence and
bioaccumulation.
The human health hazard evaluation reviews and updates the current Integrated Risk
Information System (IRIS) toxicological assessment of EGBE (EPA 2010) and the reviews
appearing in the 2004 Hazardous Air Pollutants (HAPs) delisting decision (68 Fed. Reg. 65648
[EPA 2003], 69 FR 69320 [EPA 2004a]) and in EPA’s (2005a) report, An Evaluation of the
Human Carcinogenic Potential of Ethylene Glycol Butyl Ether. Acute and chronic health effects
are addressed separately in order to directly evaluate EGBE against the first two listing criteria
set forth in EPCRA Section 313(d)(2)(A) & (B).
The ecological hazard evaluation likewise builds on the ecotoxicity assessments
developed or approved by EPA in the HAPs rulemaking as well as a series of recent
comprehensive reviews by the World Health Organization (WHO), the European Union (EU),
and Environment Canada, all of which have reached similar conclusions about the low potential
ecotoxicity of EGBE.

8
Section 3 closes with a review and application of EPA’s criteria for considering exposure
in making TRI listing decisions under EPCRA (59 Fed. Reg. 61432 [EPA 1994a). The next five
sections of the petition evaluate potential human and environmental exposures resulting from
EGBE facility releases based on conservative modeling and highly protective criteria for
preventing potential health and ecological effects.
Section 4 describes the criteria used in this petition for evaluating chronic human
exposures to EGBE, viz. the IRIS reference concentration (RfC) and reference dose (RfD).
Section 5 follows the general approach used in the HAPs delisting decision by
constructing an inventory of EGBE releases based on the 2009, 2010, and 2011 TRI reports for
Certain Glycol Ethers, which provide the most up-to-date data available (the HAPs assessment
was based largely on 1993 TRI data).
Section 6 presents the screening approach used to evaluate both chronic and acute
exposures.
Chronic exposures are assessed by applying EPA modeling guidance to develop
conservative estimates of maximum annual average concentrations of EGBE at or beyond
facility fencelines and comparing those estimates against the IRIS RfC. Because estimated
maximum annual average concentrations for all facilities in the 2009, 2010 and 2011 inventories
are below the RfC based on unrealistically conservative screening assumptions, application of
more sophisticated tiered modeling is unnecessary in this case under EPA (1992a) modeling
guidelines. Nevertheless, tiered modeling is used for a sample of the highest EGBE-emitting
facilities in order to estimate the degree of conservatism incorporated into the screening results.
It should be noted, an examination of trends in maximum TRI-reported Certain Glycol Ether
emissions from for reporting years from 2000 to 2011 (see Figure 5-1) indicated there has been
remarkably little variability in the Certain Glycol Ether emissions from the highest emitting
facilities over the past decade.
Similar to the HAPs assessment, cumulative exposures from closely located sources of
EGBE (i.e., within the same zip code) are evaluated.
Acute exposures are assessed by developing conservative estimates of maximum
hourly average concentrations of EGBE at or beyond facility fencelines for the highest emitting
facilities (i.e. those facilities that did not screen out in two highly conservative prescreening
steps). The resulting estimates of the maximum hourly EGBE concentration in ambient air for
the facilities are evaluated using the Margin of Exposure (MOE) methodology EPA has used in
previous TRI listing decisions, using the no observed adverse effect level (NOAEL) derived from
human data in Section 3 of the petition.
Section 7 evaluates human health exposure and risks associated with EGBE in surface
water against the IRIS RfD. Again, the same models and assumptions used in the HAPs
assessment are employed here, updated to reflect the surface water concentration modeled
from 2010 TRI release data, the most recent version of the Mackay fugacity model (EQC v2.02;
CEMC 2003), and current EPA (2004b) guidance for dermal risk assessment. Potential
exposures were evaluated based on 2009, 2010, and 2011 TRI release data but the human
health exposure assessment was conducted with the 2010 TRI data because they represented

9
the worst-case scenario from the recent TRI data. The estimated exposures based on these
data are well below the RfD.
Section 8 presents an ecological risk assessment (ERA) for EGBE, based on the
models and assumptions used in the HAPs assessment, EGBE releases to air, land, and water
as reported in the 2009, 2010, and 2011 TRI, and a supplemental literature review to identify
appropriate target species and toxicity reference values (TRVs).
Section 9 presents a summary of the hazard, exposure, and risk assessments
developed in the preceding sections, identifies the elements of conservatism built into these
assessments, and evaluates the results under the listing/delisting criteria of EPCRA Section
313(d)(2). In addition, EPA policies for the interpretation and administration of the TRI program
are reviewed, and other considerations relevant to the question of whether to delist EGBE are
discussed.
References are listed in Section 10, and five appendices provide detailed data and
analysis that form the basis for the hazard, release inventory and exposure assessments
described in Sections 3 through 8. Appendix A tabulates laboratory bioassay studies of EGBE,
including the compilation published in the 1998 Agency for Toxic Substances and Disease
Registry (ATSDR) toxicological profile of EGBE, and a table of subsequent studies. Appendix B
is the emissions inventory. Appendix C presents the chronic screening results for airborne
emissions. Appendix D provides results of a quantitative uncertainty analysis, which
demonstrates the health protectiveness of the overall approach to evaluating inhalation
exposures. Appendix E presents the acute screening results for airborne emissions. Finally,
Appendix F, provided as electronic files on CDROM, are the model output files from both the
Tier 2 and Tier 3 modeling.

10
2.0 BACKGROUND This section provides background information on EGBE (CAS 111-76-2), including a list
of synonyms, history of EGBE regulation, regulatory standards and guidelines, chemical and
physical properties, and production and use.
2.1 Synonyms EGBE has many synonyms (NICNAS 1996, HSDB 1997, ECETOC 1994), including:
2-butoxyethanol
2-butoxy-1-ethanol
2-BE
2-n-butoxyethanol
3-oxa-1-heptanol
beta-butoxyethanol
butoxyethanol
butyl glycol
butyl glycol ether
ethanol 2-butoxy
ethylene glycol butyl ether
ethylene glycol monobutyl ether
ethylene glycol mono-n-butyl ether
ethylene glycol n-butyl ether
glycol butyl ether
glycol monobutyl ether
monobutyl ethylene glycol ether
monobutyl glycol ether
n-butoxyethanol
o-butyl ethylene glycol
EGBE is marketed in the United States under various trade names, including:
Eastman® EB Solvent
Butyl CELLOSOLVE® Solvent
Butyl OXITOL®
DOWANOL® EB
Ektasolve EB
Glycol Ether EB
Poly-Solv EB
2.2 History of EGBE Regulation under EPCRA EGBE is regulated under EPCRA because it is a member of the “Certain Glycol Ethers”
category of chemicals as currently defined in the TRI. Regulation of glycol ethers is an
outgrowth of developmental studies conducted or sponsored by industry in the late 1970s and
early 1980s. Subsequently, the National Institute of Occupational Safety and Health (NIOSH)
concluded that two glycol ethers—ethylene glycol monomethyl ether (EGME) and ethylene
glycol monoethyl ether (EGEE)—had the potential to cause adverse reproductive, embryotoxic,
and teratogenic effects in laboratory animals (NIOSH 1983). Several state regulatory agencies
assumed that the effects observed in EGME and EGEE were applicable to all glycol ethers.
Thus, as a result of the 1983 NIOSH findings, the Maryland Department of Environmental
Protection included glycol ethers in a list of chemicals for which it planned to collect use
information (Maryland 1985). Maryland’s list of chemicals was subsequently incorporated into

11
the Section 313 list of Title III of the Superfund Amendment and Reauthorization Act of 1986
(SARA), or EPCRA. Glycol ethers were initially defined as chemicals with the formula,
R-(OCH2CH2)n-OR´ Eqn. 1
where:
R = alkyl or aryl groups
R´ = R, H, or groups which, when removed, yield glycol ethers with the structure:
R-(OCH2CH2)n-OH
n = 1, 2, or 3.
In 1994, EPA redefined the glycol ether category to exclude compounds having alkyl
chains of more than seven carbon members in length (59 FR 34386 [EPA 1994b]). The
redefinition eliminated the need for nonionic surfactant manufacturers and users to report
emissions of those chemicals to the TRI. As a result, the category, which is now called “Certain
Glycol Ethers,” is defined as follows (http://www.epa.gov/ttn/atw/glycol2000.pdf):
R-(OCH2CH2)n-OR´ Eqn. 2
where:
n = 1, 2, or 3
R = alkyl C7 or less; or
R = phenyl or alkyl substituted phenyl;
R´ = H, or alkyl C7 or less; or
OR´ consisting of carboxylic acid ester, sulfate, phosphate, nitrate, or sulfonate.
2.3 Removal of EGBE from the Clean Air Act HAPs List In the 1990 Amendments to Clean Air Act (CAA), Congress expanded the list of HAPs,
based on the EPCRA Section 313 list and other compilations of chemicals, to include the glycol
ether category. EGBE remained on the CAA HAPs list, as part of the glycol ethers category,
until it was delisted on November 29, 2004 (69 FR 69320 [EPA 2004a]). The Administrator’s
HAPs delisting decision granted our 1997 petition (CMA 1997),c which used 1993 TRI data (and
other sources of information on potential sources) and exposure modeling adapted from EPA
(1992a) modeling guidance to demonstrate that maximum EGBE exposures fall below IRIS
reference values. Additionally, we prepared an ERA, also in accordance with EPA guidelines,
showing that EGBE releases are not reasonably anticipated to pose adverse effects on the
environment.
The delisting provision of Section 112(b)(3)(C) of CAA [42 U.S.C. §7412(b)(3)(C)] is
substantively at least as broad and stringent as that in EPCRA. The CAA provides that a
chemical may be removed from the HAPs list if EPA finds that:
cAt that time, the American Chemistry Council was known as the Chemical Manufacturers Association (CMA).

12
there is adequate data on the health and environmental effects of the substance to determine that emissions, ambient concentrations, bioaccumulation of deposition of the substance may not reasonably be anticipated to cause any adverse effects to the human health or adverse environmental effects.
In reviewing and granting our HAPs delisting petition, EPA reevaluated the adequacy of
the existing IRIS reference values by examining scientific data published after the 1999 IRIS
assessment (EPA 1999a), including new toxicological studies addressing the relevance of
limited rodent carcinogenicity data to humans, and conducted supplemental exposure modeling
on some of the issues raised by the petition (discussed in greater detail below). The Agency’s
review of the scientific record included a series of findings that should weigh heavily in the
evaluation of this petition to remove EGBE from EPCRA’s TRI reporting list.
First, with respect to the potential human health effects of EGBE exposure, EPA
reaffirmed the adequacy of the previous IRIS RfC (13 milligrams per cubic meter [mg/m3]) and
RfD (0.5 milligrams per kilogram body weight per day [mg/kg BW-day]) as protective against all
known or potential human health effects of EGBE, including any potential sensitive
subpopulations (68 FR 65654, 65656 [EPA 2003]). This review included a reevaluation of the
1999 IRIS carcinogenicity assessment, which had concluded, under the then-current EPA
(1986a) Guidelines for Carcinogen Risk Assessment, that EGBE is a “possible human
carcinogen based on limited laboratory animal evidence and a lack of human studies” (EPA
1999a). Based on post-IRIS toxicological studies testing the relevance of the limited animal
findings to humans, EPA concluded that the previous IRIS “RfC and RfD values for EGBE have
been set at levels that prevent … the precursor events that would lead to tumors” in rodents.
The Agency found, accordingly, that even if the rodent tumor findings are relevant to humans at
all, “we would not expect to find these tumors in humans following environmental exposures”
(69 FR 69322).
Second, EPA found “the petition’s overall approach to exposure assessment to be
acceptable” (68 FR 65653), and made the following specific determinations.
The use of the 1993 TRI database to construct a complete list of emitting sources and
emission levels “provides an adequate basis for dispersion modeling and the exposure
assessment and is acceptable for that purpose” (68 FR 65652).
The five-tier modeling approach used in our HAPs petition to evaluate maximum
inhalation exposures “followed appropriate modeling guidance” and “would tend to overestimate
rather than underestimate maximum annual ambient average concentrations” (68 FR 65652).
EPA also observed that the modeling and assumptions used to assess ingestion and
dermal exposures arising from surface water levels of EGBE, including supplemental analyses
conducted by the Agency, were “conservative,” and the exposure estimates found to be below
the IRIS RfD represented a “worst-case exposure scenario” (68 FR 65653-54).
Third, EPA’s evaluation of potential environmental risks included the development of its
own ERA, which was based in part on the same “worst-case exposure scenario” for predicted
maximum surface water concentrations used in the evaluation of human ingestion and dermal

13
exposures. In addition, the Agency noted that the TRVs for small mammals and aquatic species
used in the ERA “were derived from very minor effects which were unlikely to be ecologically
significant at the population level of ecological organization” (68 FR 65657).
Based on these and other findings, EPA concluded that maximum exposures to EGBE
fall well below the IRIS RfC and RfD, as well as the TRVs developed to assess ecological risks.
The Administrator (69 FR 69322) summarized the basis for the HAPs delisting of EGBE as
follows:
We can therefore conclude with confidence that emissions, ambient concentrations, bioaccumulation, or deposition of EGBE may not reasonably be anticipated to cause any adverse effects to the human health.
Likewise, EPA found, based on the ERA, that “there are adequate data on
environmental effects of EGBE to determine that ambient concentrations, bioaccumulation, or
deposition of EGBE are not reasonably anticipated to cause adverse environmental effects” (68
FR 65657).
2.4 Regulatory Standards and Guidelines Federal and state regulatory standards and guidelines for EGBE are listed in Table 2-1.
2.5 Production and Use As described by ATSDR (1998), ethylene glycol monoalkyl ethers are not manufactured
as pure compounds but must be separated from the diethers and higher glycols (NTP 1993, as
cited in ATSDR 1998; NIOSH 1990, as cited in ATSDR 1998). There are two common methods
of producing EGBE: (1) reaction of ethylene oxide with anhydrous butyl alcohol in the presence
of a catalyst, and (2) direct alkylation of ethylene chlorohydrin or ethylene glycol using sodium
hydroxide and an alkylating agent such as dibutyl sulfate (HSDB 1997, as cited in ATSDR 1998;
NIOSH 1990, as cited in ATSDR 1998; Rowe and Wolf 1982, as cited in ATSDR 1998). By far,
the dominant method of EGBE production is treatment of butyl alcohol with ethylene oxide.
Three facilities—Dow Chemical USA’s Seadrift, Texas plant, Eastman Chemical
Company’s Longview, Texas plant and Equistar Chemicals, LP’s Bayport Texas plant—produce
all domestic EGBE (SRI 2010). Between 1970 and 2009, production of EGBE in the United
States increased by nearly five-fold from 53,500 tons per year (tpy) to approximately 250,000
tpy (Figure 2-1, SRI 2010). Between 1999 and 2007, however, production of EGBE has
fluctuated between 254,500 and 292,000 tpy, without showing a clear increase in production
from year to year (SRI 2010). There was a 14% decrease in production of EGBE between 2007
and 2009 (SRI 2010). The overall average annual growth rate in EGBE production is expected
to be 2.8% between 2009 and 2014 (SRI 2010).
Because of its favorable physical, chemical, and technical characteristics, EGBE has
become the largest volume glycol ether consumed in the United States (SRI 2010). In 2009,
United States consumption of EGBE was 135,000 tpy, which represents approximately 52% of
all ethylene glycol ethers consumed (SRI 2010). This rate of consumption of EGBE represents a

14
1% increase since 1990, when consumption was 132,000 tpy (SRI 2010). During the economic
recession in 2008-2009, the United States EGBE consumption dropped 19% from 166,500 tpy
to 133,500 tpy between 2007 and 2009. The overall average annual growth rate of domestic
EGBE consumption was expected to be 3.1% between 2009 and 2014 (SRI 2010). Because
this growth in consumption is predicted to outpace growth in production, a concurrent decrease
in exports was expected (SRI 2010).
Despite growth in consumption since 1990, overall nationwide emissions of Certain
Glycol Ethers to all media have decreased from 26,782 tpy in 1990 to 7,229 tpy in 2011, a
reduction of 70% (www.epa.gov/triexplorer). The reduction in emissions is likely attributable
principally to increased regulation under the CAA and state air pollution laws; corporate product
stewardship programs (some no doubt in response to “right-to-know” initiatives like EPCRA
itself); and the 1994 redefinition of the Certain Glycol Ethers category, which removed nonionic
surfactant glycol ethers from the chemicals covered by the listing.
Of the 135,000 tpy of EGBE consumed in the United States in 2009, 68,500 tons (51%)
were used as solvents in paints, coatings, and inks (SRI 2010). In addition, 20,500 tons (15%)
were used as solvents in metal cleaners and liquid household cleaners and 29,000 tons (21%)
were used as solvents in other products (SRI 2010). Consumption of EGBE as a chemical
intermediate in the production of 2-butoxyethyl acetate (EGBEA) accounted for 9,000 tons (7%)
of EGBE consumption (SRI 2010). Consumption for production of other chemicals [including
tris(2-butoxyethyl)phosphate, di(2-butoxyethyl)adipate and di(2-butoxyethyl)phthalate]
accounted for another 7,500 tons (6%) of EGBE consumption (SRI 2010).
Approximately 80% of EGBE consumed in surface coatings is used for industrial and
specialty coatings; the remainder is used in architectural coatings (SRI 2010). Industrial
coatings are defined as coatings that are factory-applied to manufactured goods as part of the
production process (SRI 2004). They are also known as original equipment manufacturing
(OEM) coatings. OEM coatings that contain EGBE include automotive paints, lacquers, quick
drying varnishes, and enamels. Other industrial paints and coatings that employ EGBE include
(1) coatings for metal cans and coils, ships, trucks, buses, and farm machinery and (2) paints
and finishes for wood products, metal furniture, and fixtures (NPCA 1997, as cited in SRI 2004).
Specialty coatings are those that are used primarily where durability is a key objective. Specialty
coatings include high performance maintenance coatings, automotive refinishing paints, and
aerosol paints (NPCA 1997, as cited in SRI 2004). Architectural coatings are paints and
coatings that are applied onsite to new and existing residential, commercial, institutional, and
industrial buildings. These products are generally distributed through retail and wholesale
outlets and are bought by consumers, painters, contractors, builders, and government agencies
(NPCA 1997, as cited in SRI 2004).
The following are source categories that use EGBE and thus are potentially affected by
this petition:
Auto and light duty truck (surface coating)
Leather tanning and finishing operations

15
Manufacture of paints, coatings, and adhesives
Metal can (surface coating)
Metal coil (surface coating)
Metal furniture (surface coating)
Printing, coating, and dyeing of fabrics
Printing/publishing (surface coating)
Wood furniture (surface coating)
Synthetic organic chemical manufacturing
Ship building and repair (surface coating)
Semiconductor manufacturing

16
3.0 HAZARD ASSESSMENT Given EGBE’s (CAS 111-76-2) widespread use (as detailed in Section 2.5), it has
undergone extensive toxicological testing in laboratory animals. Animal bioassay data are
supplemented by information from case reports of intentional human ingestion episodes and
controlled human exposure experiments, as well as ecotoxicological testing on microbes, plants,
and aquatic organisms. EGBE has been tested for acute, subchronic, and chronic toxicity,
reproductive and developmental toxicity, immunotoxicity, genotoxicity, and carcinogenicity.
Although no toxicity data are available for terrestrial wildlife or birds, acute and chronic toxicity
tests have been performed on a variety of aquatic organisms.
The extensive database on the potential adverse human health effects of EGBE is
reviewed in the EGBE IRIS assessment (EPA 2010) and the ATSDR toxicological profile of
EGBE (ATSDR 1998). EGBE’s potential ecological hazards have been extensively reviewed in
a series of assessments by WHO the Concise International Chemical Assessment Document or
CICAD (WHO 1998, 2010), EU (INERIS 2006), and Environment Canada (2002). These
assessments provide the starting point and primary basis for the qualitative hazard assessment
presented in this section of the petition, supplemented as appropriate by descriptions of
subsequently published studies.
3.1 Chemical and Physical Properties EGBE’s chemical and physical properties, excerpted from the ATSDR toxicological
profile for EGBE (ATSDR 1998), are summarized in Table 3-1. Additional information and
implications of these properties are discussed in this subsection.
EGBE is considered “readily” biodegradable (Price et al. 1974, as cited in ATSDR 1998)
and has a relatively short residence time in the environment. Its half-life in both surface water
and soil ranges from 7 days to 4 weeks, while its half-life in groundwater is 14 days to 8 weeks,
and its half-life in the atmosphere is approximately 3.3 hours to 33 hours (Howard et al. 1991,
as cited in ATSDR 1998).
EGBE is highly mobile in soil and unlikely to partition from the water column to organic
matter contained in sediments or suspended solids (Swann et al. 1983). The volatilization of
EGBE from surface water and moist soil is slow (Lyman et al. 1982, as cited in ATSDR 1998). In
the atmosphere, EGBE is expected to exist almost entirely in the vapor phase, although EGBE
may be physically removed from air by precipitation (Eisenreich et al. 1981, as cited in ATSDR
1998). The Hazardous Substance Data Bank (HSDB; http://toxnet.nlm.nih.gov) reports that an
estimated bioconcentration factor (BCF) of 3 was calculated for EGBE, concluding that the
potential for bioconcentration in aquatic organisms is low.
The most important mechanism of removal of EGBE from aerobic soil and water is
microbiotic degradation (ATSDR 1998). Concentrations of EGBE of less than 500 milligrams per
liter (mg/L) were readily degraded by microorganisms in bench scale degradation tests using
domestic activated sludge, with reported biodegradation rates of greater than 63% after three
days and 100% after five days (Assessment Technologies, Inc. 1996). A 20-day biological

17
oxygen demand (BOD) test and an aerobic degradability 28-day closed bottle test resulted in
EGBE degradation rates of 75% and 88% respectively (NICNAS 1996).
Because EGBE does not undergo hydrolysis or direct photolysis in aquatic environments
(Howard 1993, as cited in ATSDR 1998), abiotic degradation processes are assumed to play a
negligible role in determining the ultimate fate of EGBE in surface water, groundwater, and soil.
However, Atkinson (1987) calculated an atmospheric half-life of 17 hours for EGBE based on a
second order photooxidation rate of 2.3 x 10⁻¹¹ cubic centimeters (cm3)/molecules-second.
Therefore, abiotic degradation can significantly affect the fate of EGBE in air.
Limited data are available regarding degradation products of EGBE. The intermediate
products of aerobic biodegradation were not identified in any of the screening tests considered
by ATSDR (1998). However, as observed in human and animal studies (Johanson et al. 1989,
as cited in ATSDR 1998), 2-butoxy-ethanol acetate (BAA) may enzymatically hydrolyze to
EGBE and acetic acid as a result of biodegradation. By analogy to animal metabolism
(Ghanayem et al. 1987, as cited in ATSDR 1998), it is possible that any EGBE formed through
enzymatic hydrolysis may undergo further enzymatic oxidation (e.g., via dehydrogenase) to the
butoxyacetaldehyde and finally to 2-butoxyacetic acid before being degraded to carbon dioxide
and water. The reported products of photodegradation of EGBE in the atmosphere are
propionaldehyde (CAS 123-38-6), butyraldehyde (CAS 123-72-8), butyl formate (CAS 592-84-
7), 2-hydroxyethyl formate (CAS 628-35-3), 3-hydroxybutyl formate, 2-hydroxybutyl formate,
and an organic nitrate (Tuazon et al. 1998, as cited in INERIS 2005). No data are available on
the anaerobic degradation products of EGBE.
Given its relatively short residence time in the atmosphere, high water solubility, low
octanol-water partition coefficient (Kow), and low vapor pressure (Table 3-1), EGBE released to
the atmosphere partitions to surface water and soil. The Mackay fugacity model predicts that,
although approximately 99% of EGBE released to the environment is released to the air,
approximately 98% of the EGBE released partitions into soil and surface water at equilibrium
(Section 8.2.2, below; Cadmus 2000a).
3.2 Potential Human Health Hazards In this section, we briefly describe the pertinent information available on the potential
health effects of human exposure to EGBE, both noncancer effects from brief (acute) and
repeated (subchronic and chronic) exposures, and information on the potential carcinogenicity
of EGBE.
3.2.1 Noncancer Toxicity EGBE is well absorbed via the inhalation, dermal, and oral routes of exposure and is
widely distributed throughout the body and metabolized primarily via alcohol dehydrogenase to
BAA, which is rapidly excreted in urine. Studies in humans and rats indicate that the metabolic
pathways are similar for both species. However, in humans, unlike rats, some BAA is
conjugated with glycine or glutamine prior to excretion, while rats also have a minor oxidation
pathway involving O-dealkylation by a cytochrome P450 dealkylase (CYP 2E1) that is not
18
involved in human metabolism of EGBE (EPA 2010). The following subsections describe the
acute and chronic health effects of EGBE. More detailed information on these effects is
available in the ATSDR (1998) and EPA (2010) toxicology profiles.
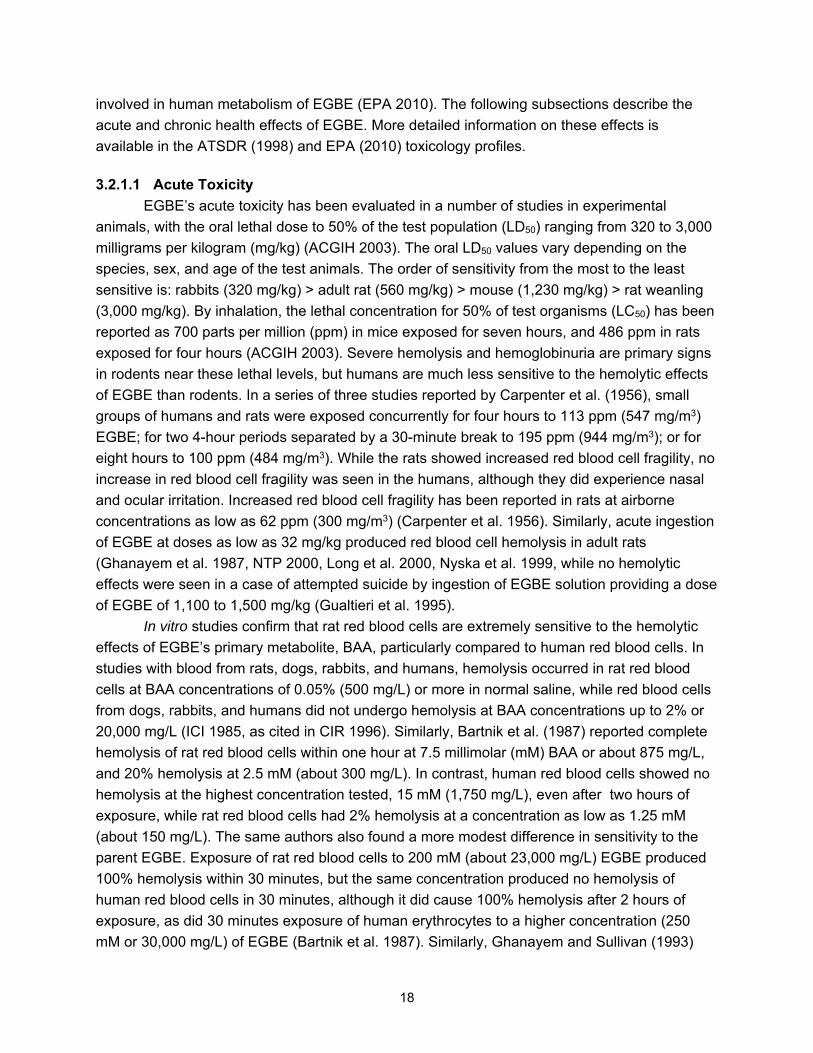
3.2.1.1 Acute Toxicity EGBE’s acute toxicity has been evaluated in a number of studies in experimental
animals, with the oral lethal dose to 50% of the test population (LD50) ranging from 320 to 3,000
milligrams per kilogram (mg/kg) (ACGIH 2003). The oral LD50 values vary depending on the
species, sex, and age of the test animals. The order of sensitivity from the most to the least
sensitive is: rabbits (320 mg/kg) > adult rat (560 mg/kg) > mouse (1,230 mg/kg) > rat weanling
(3,000 mg/kg). By inhalation, the lethal concentration for 50% of test organisms (LC50) has been
reported as 700 parts per million (ppm) in mice exposed for seven hours, and 486 ppm in rats
exposed for four hours (ACGIH 2003). Severe hemolysis and hemoglobinuria are primary signs
in rodents near these lethal levels, but humans are much less sensitive to the hemolytic effects
of EGBE than rodents. In a series of three studies reported by Carpenter et al. (1956), small
groups of humans and rats were exposed concurrently for four hours to 113 ppm (547 mg/m3)
EGBE; for two 4-hour periods separated by a 30-minute break to 195 ppm (944 mg/m3); or for
eight hours to 100 ppm (484 mg/m3). While the rats showed increased red blood cell fragility, no
increase in red blood cell fragility was seen in the humans, although they did experience nasal
and ocular irritation. Increased red blood cell fragility has been reported in rats at airborne
concentrations as low as 62 ppm (300 mg/m3) (Carpenter et al. 1956). Similarly, acute ingestion
of EGBE at doses as low as 32 mg/kg produced red blood cell hemolysis in adult rats
(Ghanayem et al. 1987, NTP 2000, Long et al. 2000, Nyska et al. 1999, while no hemolytic
effects were seen in a case of attempted suicide by ingestion of EGBE solution providing a dose
of EGBE of 1,100 to 1,500 mg/kg (Gualtieri et al. 1995).
In vitro studies confirm that rat red blood cells are extremely sensitive to the hemolytic
effects of EGBE’s primary metabolite, BAA, particularly compared to human red blood cells. In
studies with blood from rats, dogs, rabbits, and humans, hemolysis occurred in rat red blood
cells at BAA concentrations of 0.05% (500 mg/L) or more in normal saline, while red blood cells
from dogs, rabbits, and humans did not undergo hemolysis at BAA concentrations up to 2% or
20,000 mg/L (ICI 1985, as cited in CIR 1996). Similarly, Bartnik et al. (1987) reported complete
hemolysis of rat red blood cells within one hour at 7.5 millimolar (mM) BAA or about 875 mg/L,
and 20% hemolysis at 2.5 mM (about 300 mg/L). In contrast, human red blood cells showed no
hemolysis at the highest concentration tested, 15 mM (1,750 mg/L), even after two hours of
exposure, while rat red blood cells had 2% hemolysis at a concentration as low as 1.25 mM
(about 150 mg/L). The same authors also found a more modest difference in sensitivity to the
parent EGBE. Exposure of rat red blood cells to 200 mM (about 23,000 mg/L) EGBE produced
100% hemolysis within 30 minutes, but the same concentration produced no hemolysis of
human red blood cells in 30 minutes, although it did cause 100% hemolysis after 2 hours of
exposure, as did 30 minutes exposure of human erythrocytes to a higher concentration (250
mM or 30,000 mg/L) of EGBE (Bartnik et al. 1987). Similarly, Ghanayem and Sullivan (1993)

19
observed no effect on mean corpuscular volume (MCV) or hematocrit in vitro in human red
blood cells exposed to concentrations of BAA causing 50% to 60% increases in these
parameters in rat red blood cells.
Udden (2002) reported similar patterns of changes in red cell rigidity and MCV in rat and
human red blood cells exposed to 100-fold different concentrations of BAA; rat red blood cells
were 100-fold more sensitive than human red blood cells to these effects. Physiologically based
pharmacokinetic (PBPK) modeling (Corley et al. 1994) predicts that the acute exposures
necessary for such concentrations of BAA are unlikely even in consumer product or
occupational settings (Udden 2002, ACGIH 2003), much less in the ambient air near EGBE-
emitting facilities, where limited empirical data as well as estimates based on air quality
modeling indicate that concentrations well below 1 mg/m3 are likely (WHO 2010, INERIS 2006;
EPA 2003).
Because of what the American Conference of Governmental Industrial Hygienists
(ACGIH) has called the “minimal potential for 2-butoxyethanol exposures to produce red blood
cell hemolysis in humans as compared to rats,” assessments of acute health hazards have
defined mucous membrane irritation of the nose and eye as the critical effect of short-term
exposures in humans, not hemolytic effects (CalEPA 1999, ACGIH 2003). As already
mentioned, Carpenter et al. (1956) found that four adult male volunteers exposed to 113 ppm
(550 mg/m³) EGBE for four hours, and two men and two women exposed to 100 ppm (485
mg/m³) for eight hours reported eye, nose, and throat irritation. Erythrocyte osmotic fragility and
urinalysis were normal in the subjects during and after exposure, and no other evidence of
systemic toxicity was found. In another study (Johanson et al. 1986), seven healthy male adults
were exposed to 20 ppm (97 mg/m³) EGBE in a chamber experiment designed to assess
pulmonary uptake and metabolism of EGBE during light exercise. The authors reported that
none of the subjects complained or showed any adverse effects from two hours of exposure. As
described in detail in Section 6, the short-term Tier 3 modeling results indicate that ambient
concentrations near EGBE-emitting facilities are at least a factor of 5 below the NOAEL in this
study. Hence, no acute toxic effects due to EGBE are likely adjacent to EGBE-emitting facilities.
3.2.1.2 Subchronic and Chronic Toxicity The 2010 IRIS assessment directly addresses the subject of the subchronic and chronic
toxicity of EGBE, concluding that it is not immunotoxic, genotoxic, or teratogenic, and does not
cause adverse reproductive effects of the sort that have been attributed to EGME and EGEE
(EPA 2010). There was no reduction in the immune response to injected antigens in two studies
in rats exposed to EGBE at up to 500 mg/kg BW-day, for up to 21 days (EPA 2010). EGBE had
negative results in tests for genotoxicity in multiple studies: Salmonella typhimurium bacteria,
Chinese hamster ovary cells (gene mutation, sister chromatid exchange, and chromosome
aberration assays), and in vivo mouse micronucleus assay. Weakly positive, but not
reproducible, responses were seen in a few in vitro studies, but EPA has determined in the IRIS
assessment (EPA 2010) and the HAPs delisting decision (68 Fed. Reg. 65655 [EPA 2003]), that
the overall weight of evidence indicates that EGBE is neither mutagenic nor clastogenic.

20
As summarized in the IRIS assessment (EPA 2010), EGBE has been extensively tested
for reproductive and developmental effects by oral and inhalation exposure in rats, mice, and
rabbits. While some generalized toxicity was seen at high exposure levels associated with
EGBE’s hematologic effects, there was no indication of the specific reproductive effects
attributed to EGME and EGEE, and no adverse effects on reproduction or development at
doses below those associated with hematologic effects (EPA 2010). These studies support the
conclusion that hemolysis is the most sensitive toxicity endpoint for rodents from a variety of
exposure routes (EPA 2010).
The extensive EGBE animal toxicology database lacks any indication of neurotoxicity.
Human experience indicates that intentional ingestion of large amounts of EGBE (i.e., suicide
attempts) can result in coma, possibly secondary to metabolic acidosis, but exposure from
normal use has not resulted in any reports of potential neurotoxicity. Specific neurotoxicology
studies have been performed in animals by standard testing guidelines for three other ethylene
glycol ethers (diethylene glycol butyl ether [DGBE], triethylene glycol methyl ether [TGME], and
ethylene glycol monopropyl ether [EGPE]) and none of these studies have indicated a concern
for neurotoxicity. Any neurotoxicity testing of EGBE would be constrained by the well-known
hemolytic effects in rodents that would limit the highest dose that could be tested.
As described in the IRIS assessment, intravascular red blood cell hemolysis is the
primary response in sensitive species following inhalation, oral, or dermal exposure to EGBE
(EPA 2010). This primary hemolytic effect may also result in secondary toxic effects in spleen,
liver, kidney, bone marrow, and thymus. However, hemolysis is the effect seen at the lowest
exposure levels—i.e., it is the most sensitive endpoint (EPA 2010). The IRIS assessment
concludes, therefore, that prevention of hemolysis will also be protective for all other toxic
effects. Review of the recent research on the hemolytic effects of EGBE has led EPA (2010) to
draw the following conclusions, apart from contact-site irritant effects.
Other effects resulting from EGBE are secondary to hemolysis.
The primary metabolite of EGBE, BAA, is the proximate toxicant.
Several species including humans are less sensitive than rats to the hemolytic effects ofBAA.
Groups who might be thought to be more sensitive than average (including children, theelderly, or those with congenital hemolytic diseases) do not show an increased hemolyticresponse to BAA.
3.2.1.3 Relative Insensitivity of Humans to EGBE’s Hemolytic Effects It is important to note that EGBE is an exception to the general default assumption that
humans are as sensitive as or more sensitive than the most sensitive animal species. In the
case of EGBE, substantial rigorous data exist that demonstrate that humans are much less
sensitive to the critical hemolytic effects of EGBE and its metabolite, BAA. The IRIS assessment
describes six published PBPK models for EGBE. Employing the Corley et al. (1994, 1997)
model, which allows both EGBE and BAA to be modeled in both humans and rats, EPA (2010)
calculated tissue dose (BAA in blood) as a function of EGBE dose, route, and species. The

21
model demonstrated that prehemolytic changes in rat red blood cells occur at less than 1% of
the level at which such changes are observed in human red blood cells. In the study used as the
basis for the RfC and RfD, for example, the EGBE lowest observed adverse effect level
(LOAEL) for prehemolytic changes in rat red blood cells, 31 ppm, 6 hours/day, 5 days/week was
predicted to produce a peak blood concentration of BAA of 0.167 mM (EPA 2010). As noted
earlier, Bartnik et al. (1987) reported no hemolysis of human red blood cells exposed to BAA
levels almost 100 times higher (i.e., 15 mM) for three hours in vitro.
Udden’s (2002) comprehensive study supports a susceptibility factor for rats as
compared to humans of at least 100 (i.e., humans are at least 100times less sensitive than
rats). Udden (2002) used a series of more specific and sensitive indicators of subhemolytic
effects to quantify the difference in susceptibility to BAA of rat and human erythrocytes. Rat red
blood cells were exposed to BAA at concentrations of 0, 0.025, 0.050, 0.075 and 0.1 mM, about
an order of a magnitude lower than those used in previous work by Ghanayem (1989).
Heparinized blood samples obtained from healthy adult volunteers were exposed to BAA at
concentrations of 0, 2.5, 5.0, 7.5 and 10 mM, concentrations 100 times greater than those used
for rat erythrocytes. The indices used to evaluate subhemolytic changes caused by BAA
included microhematocrit, hemoglobin, red blood cell count, percent hemolysis determined by a
colorimetric procedure, MCV calculated from microhematocrit and red blood cell count,
distribution of red blood cell size, red cell deformability, erythrocyte osmotic fragility, erythrocyte
density and red blood cell morphology.
For each of these measures of prehemolytic effects, Udden (2002) found that human
blood was at least 100 times less sensitive than rat blood. Specifically, a significant change in
human erythrocyte deformability was observed at 7.5 and 10 mM while in rat a significant
change was first seen at 0.05 mM. There was a comparable increase in human and rat red
blood cell size at concentrations of 10 mM and 0.1 mM BAA, respectively. BAA did not
significantly affect the osmotic fragility of human erythrocytes until reaching concentrations
greater than 7.5 mM, while significant effects were noted in rat erythrocytes at BAA
concentrations as low as 0.05 mM. Cell density was also markedly decreased in rat erythrocytes
treated with 0.1 mM BAA while only slight effects were noted in human erythrocytes treated with
10 mM BAA. Finally, no changes were noted in the morphology of the human erythrocytes
treated with 10 mM BAA while rat erythrocytes treated with 0.1 mM showed increased numbers
of spherocytes compared to controls. Udden (2000) previously demonstrated that
“[S]tomatocytes, cup-shaped cells, and spherocytes are the principal morphological features of
erythrocytes from rats exposed [in vivo] to [EGBE], or in vitro exposure to BAA.”
Udden (2002) also conducted investigations on the blood from 11 more healthy subjects
as well as hospitalized children and adults treated with 10 mM BAA. There was a slight increase
in hemolysis in the samples from hospitalized adults, but the degree was not considered
physiologically significant and was no greater than the hemolysis seen in the controls of the
healthy adults. No difference was seen in the degree of hemolysis of the BAA treated
erythrocytes of children. These findings are consistent with previous work by Udden (1994)
showing that erythrocytes from potentially sensitive populations of humans, including young and
22
elderly subjects as well as those suffering from sickle cell disease and hereditary spherocytosis,
were resistant to the hemolytic effect of BAA.
The findings of Udden (2002) are supported by Gualtieri (1995), who reported actual
data from suicide attempts by an individual whose blood concentration reached at least 4.9 mM
BAA with no evidence of hemolysis. The Corley et al. (2005) PBPK model also predicts that the
level of BAA in humans exposed continuously by inhalation to an EGBE-saturated atmosphere
(greater than 1,000 ppm)d would result in maximum blood concentrations of BAA of just 2 mM,
well below the level needed to produce hemolysis in human red blood cells (Udden 2002, EPA
2010).
These observation and modeling predictions imply that it would be physically impossible
to achieve a blood concentration of BAA in humans high enough to cause the critical toxic effect
of EGBE in rodents, hemolysis, via inhalation of EGBE vapor, further confirming its low toxicity
potential in humans.
The low hemolytic potential of EGBE in humans is further supported by the limited data
on the effects of ingestion of EGBE by humans. EPA (2010) summarizes several cases of
suicide attempts involving ingestion of large quantities of mixtures containing EGBE. These
cases rarely resulted in hemolysis, despite ingestion of doses of EGBE as high as 1,500 mg/kg
in some cases. Hematuria was noted in a couple of cases, but it is unclear whether this was due
to hemolysis caused by EGBE and its metabolite BAA, or if it was secondary to the metabolic
acidosis that developed at these high doses.
3.2.2 Potential Carcinogenicity The National Toxicology Program (NTP) (2000) evaluated the carcinogenicity of EGBE
in rats and mice exposed by inhalation. NTP (2000) reported that its study results indicate no
evidence of carcinogenic activity in male F344/N rats and equivocal evidence of carcinogenic
activity in female F344/N rats, based on increased combined incidence of benign and malignant
pheochromocytomas (mostly benign). NTP (2000) also reported some evidence of carcinogenic
activity in male B6C3F1 mice based on increased incidence of hemangiosarcomas of the liver,
and some evidence of carcinogenic activity in female B6C3F1 mice based on increased
incidence of forestomach squamous cell papillomas or carcinomas.
EPA concluded in the HAPs delisting decision in 2003 (68 FR 65656) “that the available
data establish a plausible nonlinear, nongenotoxic mode of action for the moderate increase
observed by NTP (2000) in the incidence of forestomach tumors in female mice.” The Agency
summarized the impact of this finding on its assessment of human health risk due to EGBE
emissions as follows:
… the exposure concentrations necessary to cause hyperplasticeffects in humans would be much higher than the existing RfD and
dThe theoretical EGBE maximum airborne concentration is greater than 1,100 ppm, but in recent acute studies, the highest attainable concentrations were 600 to 700 ppm.

23
RfC for EGBE. Given that humans, including potentially sensitive subpopulations such as children, have no known organ for the retention of a comparable target dose of EGBE or its metabolites, we feel it is reasonable to conclude that the RfC and RfD developed for EGBE are sufficient for the prevention of hyperplasia and associate tumors in humans.
Similarly, EPA (68 FR 65656) found that the available data “establish a plausible
nonlinear, nongenotoxic mode of action for the moderate increase observed by NTP (2000) in
the incidence of liver tumors in male mice.” Thus, given “the relatively low sensitivity of humans,
including subpopulations such as children, to the hemolytic effects of EGBE, we feel it is
reasonable to conclude that the [1999] EGBE RfC and RfD (EPA 1999a) are sufficient for the
prevention of hemolysis and associate tumors in humans.” Accordingly, the Administrator (69
FR 69322) determined that the IRIS reference values will protect against both cancer and
noncancer effects:
… it is reasonable to expect that a lack of hemolytic effects inhumans would preclude the formation of liver tumors in humans and that a lack of hyperplastic effects in the region of the gastroesophogeal junction in humans would preclude the formation of gastrointestinal tumors in humans. That is, the data support the finding that we would not expect to find these tumors in humans following environmental exposures. The RfC and RfD values for EGBE have been set at levels that prevent both the precursor events that would lead to tumors and other noncancer effects …
The HAPs delisting findings are reaffirmed in the IRIS toxicological review of EGBE
(EPA 2010), which concluded that the data establish a plausible nonlinear mode of action for
both the forestomach and liver tumors in mice. Regarding the pheochromocytomas in female
rats, EPA (2010) noted that, “given the marginal dose response, lack of tumor evidence in any
other organ system of the rats, and reported difficulties in distinguishing pheochromocytomas
from nonneoplastic adrenal medullary hyperplasia, this tumor type was not given significant
weight in the qualitative or quantitative assessment of EGBE cancer potential.”
The forestomach tumors were found to develop through sustained cytotoxicity and cell
regeneration brought about by irritation and breakdown of the forestomach’s gastric mucosal
barrier. This mechanism has been proposed for several other chemicals that cause rodent
forestomach tumors, such as butylated hydroxyanisole (BHA), propionic acid, and ethyl acrylate
(Kroes and Wester 1986, Harrison 1992, Clayson et al. 1990, 1991). A recent International
Agency for Research on Cancer (IARC) assessment of the mechanism of rodent forestomach
tumors and their potential relevance to humans specifically finds that the same irritation-based
epigenetic mode of action accepted in EPA’s carcinogenicity assessment is supported for EGBE
(IARC 2006).
The EPA (2010) evaluation identifies a multistep mode of action for EGBE-induced
mouse forestomach tumors:
24
1. Deposition of EGBE/BAA in the stomach and forestomach via consumption orreingestion of EGBE laden mucus, salivary excretions, and fur material
2. Retention of EGBE/BAA in food particles of the forestomach long after being clearedfrom other organs
3. Metabolism of EGBE to 2-butoxyacetaldehyde (BAL), which is rapidly metabolized toBAA systemically and in the forestomach
4. Irritation of target cells by BAA leading to hyperplasia and ulceration
5. Continued injury by BAA and degeneration leading to high cell proliferation and turnover
6. High levels of cell proliferation and turnover leading to clonal growth of spontaneouslyinitiated forestomach cells
While such a process might theoretically occur in humans exposed to a sufficiently high
dose of EGBE, that dose would be substantially higher than the RfC or RfD, given that humans
do not possess an anatomical equivalent to the mouse forestomach where EGBE and
metabolites might be retained. Also, humans would not be expected to produce sufficiently high
concentrations of BAA in other potentially sensitive tissues chronically to permit tumors to
develop via this mode of action.
Similarly, EPA (2010) concluded that the mouse liver tumors arose secondary to iron-
induced oxidative stress resulting from the EGBE-induced hemolysis. It presented the following
nine-step summary mode of action:
1. EGBE is metabolized to BAL, which is subsequently oxidized to BAA
2. BAA causes red blood cell swelling, triggering sequestration in the spleen by residentmacrophages. When the capacity of these macrophages becomes overwhelmed, thedamaged red blood cells make their way into the liver
3. Excess hemoglobin (Hb) from damaged red blood cells is taken up by phagocytic(Kupffer) cells of the liver and stored as hemosiderin
4. Oxidative damage and increased synthesis of endothelial and hepatocytedeoxyribonucleic acid (DNA) are initiated by one or more of the following events:
Generation of reactive oxygen species (ROS) from Hb-derived iron withinKupffer cells and perhaps from within hepatocytes and sinusoidal endothelialcells
Activation of Kupffer cells to produce cytokines/growth factors that suppressapoptosis and promote cell proliferation
5. ROS results in oxidative DNA damage to hepatocytes and endothelial cells
6. ROS modulates hepatocyte and endothelial cell gene expression
7. ROS stimulates hepatocyte and endothelial cell proliferation
8. ROS promotes initiation of hepatocyte and endothelial cells
9. ROS promotes neoplasm formation
25
Support for the importance of several of these steps in the mode of action, particularly
Steps 4, 5, 6, and 7, has accrued from studies performed since the initial publication of the NTP
draft report in 1998. The validity of this pathway has been endorsed by independent scientific
peer review of EPA’s analysis (EPA 2010).
Corthals et al. (2006) addresses one previous area of uncertainty regarding EPA’s mode
of action and the potential involvement of the short-lived intermediate metabolite of EGBE, BAL.
Because BAL has exhibited some genotoxic activity in some assay systems, EPA scientists
reviewing the HAPs delisting petition noted that the possibility of a genotoxic mode of action
involving BAL had not been ruled out (68 Fed. Reg. 65660). Thus, although the Agency found
PBPK modeling sufficient to find “that genotoxicity is not a factor in tumor development” when it
deleted EGBE as a HAP; it nevertheless called for additional research (69 Fed. Reg. 69322).
The study by Corthals et al. (2006), conducted in Dr. James Klaunig’s laboratory at the Indiana
University School of Medicine, was specifically designed to further explore the possible BAL-
genotoxicity mode of action.
Corthals et al. (2006) demonstrate that BAL does not express any genotoxic activity, as
measured by the Comet assay, in mouse endothelial cells, the cell type from which
hemangiosarcomas develop. EGBE and BAA also showed no genotoxic activity in this assay.
DNA damage was produced in these cells, however, when treated with hemolyzed red blood
cells, ferrous sulfate, or hydrogen peroxide, supporting the proposed role of reactive oxygen
species generated from red blood cell hemolysis in the mode of action for mouse liver
hemangiosarcomas. Hemolyzed red blood cells were also shown to activate macrophages, as
evidenced by increased levels of tumor necrosis factor alpha (TNFα), and activated
macrophages produced DNA damage in endothelial cells and stimulated endothelial cell
proliferation (Corthals et al. 2006), providing further support for the mode of action accepted by
EPA.
Subsequently, EPA (2010) concluded:
Under the Guidelines for Carcinogen Risk Assessment (U.S. EPA, 2005, 086237), EGBE is deemed “not likely to be carcinogenic to humans” at environmental concentrations below or equivalent to the RfD and RfC, based on laboratory animal evidence, mode-of-action information, and limited human study information. The available data indicate that carcinogenic effects from EGBE are not likely to occur in humans in the absence of the critical noncancer effects, including hepatic hemosiderin staining and irritant effects at the portal of entry, and are not likely to be carcinogenic to humans exposed to levels at or below the RfC and RfD values derived in this assessment.
Similar considerations led IARC to conclude that EGBE is not classifiable as to its
carcinogenicity to humans (Group 3) on the basis of limited evidence in experimental animals
and inadequate evidence in humans (IARC 2006, Cogliano 2004).
Based on these considerations, it is reasonable to conclude that EGBE presents no
cancer risk to individual living near EGBE-emitting facilities.

26
3.3 Ecotoxicity The ecotoxicity of EGBE has been evaluated in five reviews, all of which conclude that
EGBE poses a low potential for adverse ecological effects (WHO 1998, Staples 1998, Devillers
et al. 2002, Environment Canada and Health Canada 2002, INERIS 2006). No information on
the toxicity of EGBE to terrestrial organisms, including reptiles, birds, or wild mammalian
species, was identified from the primary scientific literature or reviews. Acute aquatic ecotoxicity
data are available for nine fish species and seven aquatic invertebrate species, while chronic
ecotoxicity data are available for one amphibian species, two fish species, four aquatic
invertebrate species, and eight species of algae, bacteria, and protozoans. Species tested
include freshwater and marine vertebrates and invertebrates. All aquatic toxicity values listed in
the five recent reviews cited above and identified in a supplemental search of the primary
literature are compiled and sorted by organism, endpoint, and exposure duration in Table 3-2.
Based on acute ecotoxicity testing, the most sensitive aquatic species to EGBE are
mummichog (Fundulus heteroclitus) and grass shrimp (Palaeomonetes pugio), which have 96-
hour LC50 values of 6.7 mg/L and 5.4 mg/L, respectively (Biospherics 1981, as cited in
Environment Canada and Health Canada 2002). However, both concentrations are more than
an order of magnitude less than any other reported acute concentrations for EGBE. The
ecotoxicity evaluation in the CICAD declined to rely on these findings because they represent
“such an extreme outlier compared with the range of other data that it is difficult to justify [their]
use as the basis for” selecting a toxicity criterion (WHO 2005). The primary study (Biospherics
1981, as cited in Environment Canada and Health Canada 2002) was not available. However,
the EU concluded that the study was not valid in the derivation of its predicted no effect
concentration because of the methods employed in the original study (INERIS 2005). Therefore,
the reliability of the grass shrimp and mummichog LC50 values is open to question. The next
most sensitive species to acute exposures is an oyster (Crassostrea virginica), which has an
LC50 of 89 mg/L (EPA 1984, as cited in WHO 1998; 2010). Several other fish and invertebrate
species have LC50 values between 100 and 200 mg/L, but most fish species tested have LC50
values greater than 1,000 mg/L (Table 3-2).
Relatively few aquatic chronic toxicity data are available for EGBE. The lowest reported
chronic value for EGBE is from a reproduction study on a rotifer (Brachionus calyciflorus). Ten
percent of the test population was affected at 7.2 mg/L and the median effect concentration
(EC50) was 164 mg/L (Devillers et al. 2002). A blue-green algae species (Microcystis
aeruginosa) and a protozoan (Entosiphon sulcatum) experienced growth effects with EGBE
concentrations of 35 and 91 mg/L, respectively (Bringmann and Kuhn 1980, as cited in Staples
et al. 1998). Two copepods (Daphnia magna and Ceriodaphnia dubia) experienced reproduction
effects at EGBE concentrations near 130 mg/L (Devillers et al. 2002, 2003). Overall, most
available aquatic chronic toxicity values for EGBE are below 1,000 mg/L (Table 3-2).

27
3.4 Evaluation of Potential Hazards of EGBE and Implications for TRI Listing EPA has interpreted the listing criteria of Section 313(d)(2) of EPCRA to call for a
weight-of-evidence hazard assessment of the potential for a chemical to cause the three types
of adverse effects specified in the statutory text: acute, chronic, and ecotoxic effects. Because
“virtually any chemical substance can elicit a toxicological response at some dose level,” EPA’s
interpretation recognizes that “the mere presence of the toxic response is not used in isolation in
listing decisions under EPCRA Section 313” (59 FR 61445 [EPA 1994b]). Accordingly, EPA’s
interpretation of the listing criteria calls for the consideration of exposure in certain
circumstances, depending on the type of hazard in question.
In the case of adverse acute human health effects, Section 313(d)(2)(A) explicitly callsfor an exposure evaluation of whether such effects occur “at concentration levels thatare reasonably likely to exist beyond facility site boundaries as a result of continuous, orfrequently recurring, releases” (42 U.S.C. §11023(d)(2)(A)). Thus, EPA’s interpretationprovides for the consideration of exposure in determining whether to list or delist basedon acute health effects.
For chronic human health hazards addressed in EPCRA Section 313(d)(2)(B), theAgency has adopted the view that exposure considerations are not appropriate inmaking listing determinations “for chemicals that exhibit moderately high to high humantoxicity … based on a hazard assessment.” Consideration of exposure is called for,however, in the case of “chemicals that exhibit low to moderately low toxicity based on ahazard assessment” (59 FR 61441). Thus, “in instances where the hazard assessmentindicates that … a chemical is of low toxicity and unrealistic exposures would benecessary for it to pose a risk to communities …, EPA may use exposure considerationsin its listing decisions” (59 FR 61442).
For the adverse environmental effects subject to EPCRA Section 313(d)(2)(c), EPAreads EPCRA to call for listing solely on the basis of a hazard assessment “forchemicals that are highly ecotoxic or induce well-established adverse environmentaleffects” that “do not affect solely one or two species but rather cause changes across awhole ecosystem,” such as chemicals that threaten the “sustainability of a fragileecosystem such as an estuary.” Exposure is an appropriate factor, however, in listingand delisting decisions on “chemicals that are low or moderately ecotoxic but do notinduce well-documented serious adverse effects” on entire ecosystems (59 FR 61433,61441).
The hazard assessment presented above indicates that EGBE poses low potential
hazards to human health and the environment. Because exposure is always a relevant factor for
acute human health effects, the following discussion focuses on chronic human health and
ecological hazards with respect to the appropriateness of considering exposure.
3.4.1 Low Potential for Adverse Chronic Human Health Effects The extensive data on the mode of action of EGBE as a toxicant, its limited spectrum of
toxic effects, and the documentation in vitro and in vivo that humans are relatively insensitive to
28
its toxic effects, all show that EGBE is appropriately considered a low-toxicity chemical. The
scientific evidence supports the conclusion that EGBE is not immunotoxic, genotoxic, or
teratogenic, and it does not cause adverse reproductive effects. All of the toxic effects of EGBE
seen in rodents are secondary to the irritant and hemolytic effects of EGBE and its primary
metabolite, BAA, and EPA has determined that prevention of hemolytic effects in humans will
also protect against other toxic effects (EPA 2010). The current IRIS assessment concludes that
EGBE is “not likely to be carcinogenic to humans at environmental concentrations below or
equivalent to the RfD and RfC” and that tumors observed in rodent studies are secondary to
EGBE’s noncarcinogenic toxic effects (EPA 2010).
The available data also demonstrate that the primary toxic effect of EGBE exposure—
hemolysis produced by EGBE’s primary metabolite BAA—can reasonably be expected to occur
in humans only at doses that are unrealistically high, thus making EGBE a low-toxicity chemical
for which exposure is a relevant consideration in the delisting determination. Because human
red blood cells are relatively resistant to the hemolytic effects of EGBE, particularly compared to
laboratory rats, based on the PBPK model used by EPA (2010) in its assessment, the daily oral
dose necessary to achieve a blood BAA concentration high enough to cause even minor
prehemolytic effects (≥10 mM, based on Udden [2002]) would be at least 700 mg/kg BW-day.
Evaluated under EPA’s TRI listing criteria (EPA 1994a, 1992c) and previous listing decisions,
EGBE is clearly a low-toxicity chemical (like e.g., ethylene glycol, 62 FR 24919 [EPA 1997a]).
Such ingestion exposures to EGBE, moreover, are unrealistically high in relation to expected
community exposures in the vicinity of EGBE-emitting facilities. Assuming water consumption of
2 liters per day (L/day) by a 70-kilogram (kg) human, the water concentration that theoretically
would be needed to achieve a hemolytic concentration of BAA in blood would be more than
4,000 times greater than the highest surface water concentration of EGBE that has been
reported at a contaminated site (ATSDR 1998, Environment Canada 2002), and over 140 times
previous estimates of surface water concentrations resulting from EGBE facility emissions
(WHO 2010, INERIS 2006).
For the primary anticipated route of exposure to EGBE for TRI-related exposures—
inhalation—the available data indicate that hemolysis is not expected to occur in humans, even
if exposed continuously by inhalation to an EGBE-saturated atmosphere (greater than 1,000
ppm) (see Section 3.2.1.2 above).e Such concentrations are, of course, physically impossible,
and in any case they are 100 to 1,000 times higher than typical occupational exposure levels,
and 50 times higher than the occupational threshold limit value (TLV) (ATSDR 1998, ACGIH
2003), even farther above available (albeit limited) data on ambient air concentrations of EGBE
(IPCS 1997, ECETOC 2005, WHO 2005), and much higher still—by a factor of approximately
100,000—than previous estimates of ambient air concentrations based on air dispersion
modeling of emissions from EGBE-using facilities (WHO 2010, INERIS 2006).
eThe theoretical EGBE maximum airborne concentration is greater than 1,100 ppm, but in recent acute studies, the highest attainable concentrations were 600 to 700 ppm.

29
The limited laboratory animal carcinogenicity data do not justify an elevated hazard
evaluation for EGBE under EPA’s TRI listing criteria and listing precedents. As noted in Section
3.2.2, the current IRIS assessment classifies EGBE as “not likely to be carcinogenic to humans
at environmental concentrations below or equivalent to the RfD and RfC” (EPA 2010). EPA has
twice determined that even the higher carcinogenicity classification (based on the former cancer
classification criteria) of “possible” human carcinogen does not support listing under EPCRA
§313(d)(2)(B) (titanium dioxide, 53 FR 23108 [EPA 1988]; butyl benzyl phthalate, 60 FR 9299
[EPA 1995a]). Based on these precedents, it would be inappropriate to list a chemical that is
classified as “not likely to be carcinogenic to humans.”
3.4.2 Low Potential for Significant Adverse Ecological Effects EGBE’s potential to cause adverse ecological effects should likewise be characterized
as low under EPA’s TRI listing criteria. The Agency found recently that EGBE causes only “very
minor effects which were unlikely to be ecologically significant at the population level of
ecological organization” (68 Fed. Reg. 65657 [EPA 2003]). EGBE therefore cannot be
considered a high toxicity ecological hazard under the EPA’s TRI listing criteria on the basis of
“well-established adverse environmental effects” “across a whole ecosystem” (59 FR 61441
[EPA 1994b]).
Furthermore, the “very minor” ecological effects of EGBE do not occur at concentrations
that are considered to be low or moderate-to-low under EPA’s TRI listing guidelines. To the
contrary, EGBE has low potential for persistence and bioaccumulation. LOAELs for acute
toxicity to aquatic organisms are in most cases 1,000 mg/L or higher, and most chronic toxicity
values are between 100 and 1,000 mg/L. The lowest LC50 for acute toxicity to an aquatic
organism is 89 mg/L, and the lowest concentration reported to cause chronic aquatic toxicity is 7
mg/L. Under EPA’s TRI listing criteria (EPA 1994a, 1992c) and previous listing decisions, EGBE
meets the criteria for a low-toxicity chemical based on ecological effects. See, for example,
Butyl Benzyl Phthalate (60 FR 9299 [EPA 1995a]); Diethyl Phthalate (61 FR 39356 [EPA
1996b]); Di-(2-Ethylhexyl) Adipate (61 FR 39891 [EPA 1996c]); Ethylene Glycol (62 FR 24919
[EPA 1997a]); Methyl Ethyl Ketone (63 FR 15195 [EPA 1998a]); Methyl Isobutyl Ketone (64 FR
8769 [EPA 1999c]).
It is also readily apparent that the concentrations found to cause aquatic toxicity are far
above the surface water concentrations likely to be present in communities near EGBE-emitting
facilities. The lowest reported aquatic toxicity level (7 mg/L for chronic effects) is greater than
the highest surface water concentration of EGBE that has been reported at a contaminated site
(5.7 mg/L; ATSDR 1998, Environment Canada 2002), and about a thousand times higher than
available empirical and modeled estimates of surface water concentrations resulting from EGBE
facility emissions (Environment Canada 2002, WHO 2010, INERIS 2006).
3.4.3 Conclusion EPA’s interpretation of the TRI listing criteria of EPCRA Section 313(d)(2) calls for the
consideration of exposure levels for potential adverse chronic human health and significant
30
environmental effects if “a chemical is of low toxicity and unrealistic exposures would be
necessary for it to pose a risk to communities” (59 FR 61442).
As discussed above, even relatively minor prehemolytic effects are not expected in
humans even at exposures: (1) that are considered high under EPA’s TRI listing criteria and
precedents and (2) that are far above exposures likely to occur in communities near EGBE-
emitting facilities. EPA’s findings in the HAPs delisting decision and in its carcinogenicity
evaluation (EPA 2010) confirm that prevention of hemolysis protects against any other potential
adverse health effect of EGBE exposure. Similarly, the available ecotoxicity data continue to
support EPA’s determination in the HAPs proceeding that EGBE emissions present the potential
for only “very minor effects” that are “unlikely to be ecologically significant,” and indicate that
such minor effects are expected to occur only at concentrations (1) that are clearly high under
EPA’s TRI listing criteria and precedents and (2) that are far above exposures likely to occur in
communities near EGBE-emitting facilities.
Accordingly, EGBE presents a low potential for adverse effects on human health or the
environment, and an exposure assessment is warranted.

31
4.0 CRITERIA FOR EVALUATING ACUTE AND CHRONIC HUMAN EXPOSURES
As noted earlier, under Section 313 of EPCRA, a chemical may be added to TRI on the
basis of acute toxicity in humans, chronic toxicity in humans, or significant adverse effects on
the environment. The criteria for evaluating acute and chronic human exposures are addressed
below as they relate to EGBE.
4.1 Acute Toxicity As specified in Section 313(d)(2) of the statute, a chemical may be added to the list of
chemicals requiring reporting under Section 313 if:
the chemical is known to cause or can reasonably be anticipated to cause significant adverse acute human health effects at concentration levels that are reasonably likely to exist beyond facility site boundaries as a result of continuous or frequently recurring releases;
As discussed by EPA (2010) and ATSDR (1998), and noted in Section 3.2.1.1 of this
petition, EGBE is of low acute toxicity, with the most sensitive endpoint in humans being eye
and upper respiratory tract irritation at airborne concentrations above the occupational TLV of
20 ppm (97 mg/m3). Such a concentration is far higher than anything that has been monitored or
modeled near an EGBE-emitting facility (IPCS 1997, ECETOC 2005, WHO 2010, INERIS
2006), and would not, therefore be “reasonably likely to exist beyond facility site boundaries as
a result of continuous, or frequently recurring, releases.”
4.2 Chronic Toxicity The EPA HAPs delisting decision used the IRIS RfC and RfD to evaluate potential
chronic human health effects from facility releases of EGBE. EPA’s policies and precedents
under EPCRA’s TRI listing provisions strongly support the use of IRIS criteria where available
(59 FR 61444-45 [EPA 1994b]). Accordingly, the evaluation of chronic human exposures and
risks in this petition is based on the IRIS reference levels. EPA derived the RfC and RfDf after a
careful review of the available dose-response database for EGBE, emphasizing mechanistic
information. EPA used dose-response information for EGBE-induced hematological effects as
the basis for the IRIS RfC and RfD values. EPA derived both the RfC and the RfD from data on
hemosiderin staining in the liver in rats in the 2-year NTP (2000) inhalation study. Using
benchmark concentration (BMC) and PBPK modeling, EPA estimated that the 95% lower
f The RfD is defined by EPA as “an estimate (with uncertainty spanning perhaps an order of magnitude) of a daily oral exposure to the human population (including sensitive subgroups) that is likely to be without an appreciable risk of deleterious effects during a lifetime.” Similarly, the RfC is defined as “an estimate (with uncertainty spanning perhaps an order of magnitude) of a continuous inhalation exposure to the human population (including sensitive subgroups) that is likely to be without an appreciable risk of deleterious effects during a lifetime.

32
confidence limit on the concentration predicted to produce a 10% increase in hemosiderin
staining was 16 mg/m3. To derive the RfC, EPA applied an intraspecies uncertainty factor of 10,
to account for variation in sensitivity within the human population. Because the PBPK model
was used, and because the adverse effect endpoint was a minimally adverse effect in a species
more sensitive than humans, EPA used an uncertainty factor of 1 for LOAEL-to-NOAEL
extrapolation, resulting in the final RfC of 1.6 mg/m3.
EPA derived the oral RfD based on the same data as the RfC by using the Corley et al.
1994, 1997) PBPK model to perform route-to-route extrapolation to derive the 95% lower
confidence limit on the daily oral dose of EGBE predicted to produce a 10% increase in
hemosiderin staining of 1.4 mg/kg BW-day. To derive the RfD, EPA applied an intraspecies
uncertainty factor of 10, to account for variation in sensitivity within the human population.
Because the PBPK model was used, and because the adverse effect endpoint was a minimally
adverse effect in a species more sensitive than humans, EPA used an uncertainty factor of 1 for
LOAEL-to-NOAEL extrapolation, resulting in the final RfD of 0.1 mg/kg BW-day (rounded).
Both the RfD and RfC are based on the occurrence of hemolytic effects in rats. As noted
previously, there is extensive evidence, both in vivo and in vitro that humans are much less
sensitive than rats to the hemolytic effects of EGBE. Studies by Udden (2000, 2002) show that
prehemolytic effects occur in rat red blood cells at concentrations of BAA, the proximate
hemolytic agent, at least 100 times lower than concentrations that might affect human red blood
cells. EPA accounts for this difference in susceptibility only partially in its derivation of the RfD
and RfC by not using the standard 10-fold uncertainty factor for interspecies extrapolation, but
rather assumes an interspecies correction factor of 1, implying that humans are equally
sensitive rather than less sensitive than rats. However, the available relative toxicity data
indicate that the actual interspecies factor from rats to humans is much less than 1. The
hemolytic anemia comparative data from Udden et al. (2000, 2002) indicates that this
interspecies factor should be no greater than 0.01, rather than 1, as used by EPA in deriving the
RfD and RfC. This clearly demonstrates the very conservative nature of hemolytic effects in rats
as a point of departure for establishing the EPA IRIS RfD and RfC.
Clearly, the interspecies uncertainty factor and point of departure are very conservative.
Indeed, there is also little reason to believe that the IRIS intraspecies uncertainty factor of 10 is
scientifically justified. As discussed in the IRIS assessment, investigation of population groups
that might be expected to show increased sensitivity to hemolytic effects of EGBE (e.g., the
young, the old, and individuals with sickle cell anemia or hereditary spherocytosis), did not
reveal increased susceptibility. Thus, the IRIS intraspecies uncertainty factor of 10 is also likely
to contribute undue conservatism to the RfC and RfD.
Another significant element of conservatism in the RfC and RfD relates to the fact that
they were designed to be protective for continuous daily exposure for a full lifetime to EGBE.
The emissions of interest in this petition are likely to fluctuate over time. As EPA recognized in
the HAPs delisting decision (see Section 6.2.3, below), the lifetime average exposure level
(which is the relevant metric for comparison to the RfD and RfC) will be substantially lower than

33
the peak concentration at the point of maximum impact (as assumed in the exposure
assessment of this petition), thus providing an additional margin of safety.

34
5.0 EMISSIONS INVENTORY As previously discussed, EPA determined in the HAPs delisting proceeding (68 FR
65651-52 [EPA 2003]) that the EPCRA TRI database “provide[s] a reasonable representation of
… EGBE emissions” and “an adequate basis for dispersion modeling and … exposure
assessment.” Accordingly, this petition has conservatively developed an emission inventory of
potential EGBE sources that includes all facilities that submitted TRI reports for Certain Glycol
Ethers for the 2009, 2010, and 2011 calendar years, and which reported a non-zero release of
Certain Glycol Ethers to air, either from onsite point or fugitive sources. In addition, because this
petition also includes an assessment of potential human health and ecological risks based on
exposures to other environmental media, facilities reporting non-zero releases of Certain Glycol
Ethers to soil and surface water were added to the facilities included in emissions inventory
(www.epa.gov/triexplorer). For the risk evaluation presented in Sections 6 through 8, it was
conservatively assumed that all Certain Glycol Ethers released are EGBE for facilities without
site-specific data on the proportion of Certain Glycol Ethers released that is EGBE.g Because
EGBE represents 52% of ethylene glycol ethers consumed in the United States (SRI 2010), the
application of this assumption in Sections 6 through 8 of this petition may overestimate
exposures by two-fold.
Table 5-1 presents summary information on the distributions and magnitude of releases
to air, water, and land, as well as changes in releases since 1993 and the mid-2000s. The 1993
data are used as a point of comparison because they formed the basis for the HAPs delisting
decision and the 2003 through 2006 data were provided because they were compiled for ACC’s
previous petition prior to EPA’s revision to the RfC and RfD. Because the Administrator
determined in the HAPs delisting decision that releases of EGBE “may not reasonably be
anticipated to cause any adverse effects” to human health or the environment (69 FR 69322), it
is reasonable to expect that the same findings are justified in light of the substantial broad-
based decrease in emissions since 1993, as shown in Table 5-1. In addition, Figure 5-1 shows
the maximum reported emissions for Certain Glycol Ethers to the air by individual facilities for
each year from 2000 through 2011. Note that the maximum facility air emissions have slowly
declined over this time period. Those facilities that reported non-zero TRI emissions of Certain Glycol Ethers during
2009, 2010, and/or 2011 are the basis for the emission inventory used for evaluating potential
inhalation exposures and risks (Section 6). This emission inventory includes 1,109 facilities that
reported non-zero emissions of Certain Glycol Ethers during 2009, 1,149 facilities that reported
non-zero emissions during 2010, and 1,099 facilities reporting non-zero emissions during 2011.
g Facility-specific information on the percentage of Certain Glycol Ethers that is EGBE was requested for facilities evaluated in Steps B through Tier 3

35
6.0 INHALATION EXPOSURE ASSESSMENT AND RISK CHARACTERIZATION
For the purposes of this petition, the exposure assessment and risk characterization
related to EGBE has two specific objectives: (a) to determine whether emissions of EGBE to
ambient air could result in air concentrations that may pose a risk for acute and/or chronic
human health effects; and (b) to determine whether emissions of EGBE from clusters of facilities
within a limited geographic area could result in air concentrations of EGBE that pose a risk for
acute and/or chronic health effects, at or beyond facility boundaries. This introduction provides
an overview of the approach and findings of these analyses, while subsequent subsections
detail all aspects of the inhalation exposure assessment and risk characterization.
The chronic (longer-term) and acute (short-term) exposure assessments were
conducted for all facilities in the emissions inventory database developed as described in
Section 5, in combination with a modified version of EPA’s tiered modeling approach for
assessing risks from stationary emission sources, which is described in A Tiered Modeling
Approach for Assessing the Risks Due to Sources of Hazardous Air Pollutants (EPA 1992a).
The tiered screening approach used in this petition follows the same general methodology used
for the 2004 EGBE HAPs delisting decision; a methodology EPA reviewed, approved, and
deemed as appropriate and conservative (in the sense that it overstates exposures). In brief, the
tiered modeling approach involves performing analytical simulations (modeling) of air pollutant
dispersion of emissions from stationary emission sources, given that measurement of long-term
and short-term ambient concentrations of a pollutant in the vicinity of each source would be a
prohibitively expensive task. The first modeling tier in this approach is designed to address the
question of whether or not an emission source has the potential to result in EGBE air
concentrations above the air concentrations of concern, and is performed using a table of
lookup values that provides an estimate of the worst-case impact of the emission source being
modeled. For this petition, the first tier (i.e., Tier 1) is preceded by two additional precursor
screening steps (Steps A and B) designed to reduce the number of facilities for which additional
site-specific data collection is required, through the use of conservative assumptions for
parameters such as the proportion of certain glycol ether reported emissions that are EGBE,
emission release height, and distance to nearest receptor. Facilities retained following these
conservative, precursor screening steps are then subjected to the additional three tiers of the
tiered modeling approach. In the tiered modeling approach, if predicted screening impacts at a
given tier are less than the appropriate level(s) of concern, then no further modeling is needed
in order to rule out the potential for adverse effects. Thus, facilities “screen out” of this tiered
analysis only if their estimated maximum airborne concentrations of EGBE are determined not
to pose a potential risk to human health. In the application of the tiered modeling approach in
this petition, the exposure assessments performed for all facilities consistently employed
conservative assumptions for emission-related parameters.
The screening approach for evaluating chronic EGBE exposures estimated the worst-
case annual average airborne EGBE concentrations associated with EGBE emissions from

36
individual facilities or clusters of facilities at or beyond the facility property boundaries, for
comparison to the EGBE RfC of 1.6 mg/m3, in order to determine whether EGBE-emitting
facilities pose a significant risk of adverse chronic human health effects. The analysis evaluated
chronic exposures for all facilities that reported non-zero emissions of Certain Glycol Ethers to
TRI in 2009, 2010, and/or 2011. The results of the tiered screening for chronic EGBE exposures
demonstrated that maximum annual average EGBE concentrations at or beyond facility property
boundaries, both for individual facilities and clusters of facilities emitting EGBE, are below the
EGBE RfC, thus supporting a conclusion that emissions of EGBE do not result in a significant
risk of chronic health effects.
The primary outcomes of the chronic exposure emissions modeling, as described in
detail in this section, is a demonstration that (a) no ambient air concentrations of EGBE in the
United States are predicted to exceed the EGBE RfC of 1.6 mg/m3 and (b) the vast majority of
EGBE air concentrations throughout the United States are well below that value. The first
outcome is demonstrated through modeling performed for facilities that reported non-zero
emissions of Certain Glycol Ethers in their TRI reports during 2009 through 2011: 1,109 facilities
reporting Certain Glycol Ethers emissions for 2009; 1,149 facilities reporting Certain Glycol
Ethers emissions for 2010; and 1,099 facilities reporting Certain Glycol Ethers emissions for
2011. The modeling demonstrated that long-term ambient air concentrations of EGBE at or
beyond the fencelines of all these facilities are below 1.6 mg/m3.
The conservatism of this conclusion is demonstrated in several ways. First, the modeled
air concentration estimates in the initial modeling tiers (e.g. Tier 1) are based on a screening
dispersion model. Screening dispersion models are intentionally designed to overestimate
ambient air concentrations. Thus a facility that screens out in the earlier tiers does so based on
a substantial overestimate of its EGBE ambient air concentrations. Second, when facilities that
do not screen out at earlier tiers (e.g., Tier 1) are modeled in successive Tiers using
increasingly realistic yet still conservative estimates, the results show substantial reductions in
the predicted maximum EGBE concentrations compared to earlier modeling tiers, thus further
demonstrating the conservatism of the conclusion that emissions of EGBE from even the
highest emitting facilities and clusters of closely located facilities do not result in long-term
ambient air concentrations of EGBE above the RfC. For example, up to an average 92%
reduction in maximum predicted concentrations was realized in moving from Tier 1 modeling to
Tier 2 modeling to Tier 3 modeling, and an average 99.3% reduction was realized in moving
from Step A to Tier 3 modeling. Facilities predicted under Tier 1 modeling to have maximum
annual average concentrations greater than 1.6 mg/m3 were predicted under Tiers 2 and 3 to
have maximum annual average concentrations as low as 0.043 mg/m3.
Because an EPA RfC for short-term exposures is not available, the tiered screening
approach for evaluating potential acute EGBE exposures uses the estimated worst-case 1-hour
average airborne EGBE concentrations combined with a MOE methodology frequently used by
EPA in TRI delisting decisions, in cases where an EPA reference concentration for short-term
exposures is not available. The results of the analysis indicated that maximum 1-hour average
concentrations at or beyond facility property boundaries equate to a MOE in excess of 5 below

37
the NOAEL for all facilities evaluated, supporting a conclusion that acute effects from EGBE
emissions are highly unlikely. For the acute exposure assessment for clusters of facilities
(located within a small geographic area), the maximum 1-hour average concentrations at or
beyond facility property boundaries for the clustered facilities equate to a MOE in excess of 4.
As a further note on the conservatism in this analysis, the acute NOAEL on which the MOE is
based is derived from 2-hour human exposure data that was not adjusted to the 1-hour
concentration. If the MOE was adjusted to the 1-hour concentration, the MOE would increase by
about 40%.
6.1 Overview of the Tiered Modeling Method for Assessing Risks from Air Exposures As described in Section 5, an emissions inventory of potential EGBE-emitting facilities
was developed based on all facilities that reported non-zero emissions of Certain Glycol Ethers
in their TRI reports for the 2009, 2010, and/or 2011 reporting years. For each facility reporting
non-zero Certain Glycol Ethers emissions to EPA during these years, the potential for each
facility’s emissions to result in ambient air concentrations of EGBE above acute or chronic
exposure concentrations of concern was evaluated using a conservative risk-based screening
approach consistent with EPA’s (1992a) guidance document, A Tiered Modeling Approach for
Assessing the Risks Due to Sources of Hazardous Air Pollutants (“EPA’s Tiered Modeling
Guidance”). This guidance outlines EPA-approved procedures for assessing risks due to the
atmospheric dispersion of emissions of pollutants from stationary sources. In brief, EPA’s Tiered
Modeling Guidance describes an approach that involves performing analytical simulations of air
pollutant dispersion from stationary sources, given that measurement of long-term and short-
term ambient concentrations of a pollutant in the vicinity of each source would be a prohibitively
expensive task.
EPA’s Tiered Modeling Guidance describes a three-tiered modeling approach,
consisting of the following:
Tier 1 – Lookup table
Tier 2 – Screening air dispersion modeling
Tier 3 – Detailed air dispersion modeling
EPA’s Tiered Modeling Guidance states that if predicted screening impacts at a given
tier are less than the appropriate level(s) of concern, then no further (refined) modeling is
indicated. However, if the predicted screening impacts are above any levels of concern, the
guidance states that further (refined) analysis of these impacts at a higher tier would be
performed (i.e. successive refined modeling tiers) to obtain more accurate (realistic) results.
In EPA’s Tiered Modeling Guidance, Tier 1 is designed to address the question of
whether or not an emission source has the potential to cause a significant impact. Tier 1

38
screening uses lookup tables based on EPA’s 1992h guidance, which are straightforward to use
and require fairly limited input data. The values provided by the lookup table are the estimated
worst-case air concentration associated with each emission source being modeled. Although
EPA’s (1992a) Tier 1 modeling step involves use of a lookup table that is straightforward to use
and requires fairly limited input data, it requires more information than is available solely from
TRI reports. As such, a more conservative and simpler two-step precursor screening procedure
was developed for use prior to the Tier 1 screening step. The precursor procedure is designed
to reduce the number of facilities for which additional data collection was required to perform the
more refined Tier 1 screening. Thus, Step A of the two-step precursor screening procedure
relies solely on data available from TRI submissions (i.e. total annual emissions of Certain
Glycol Ethers), while Step B requires the total annual emissions data from TRI plus a small
number of additional facility-specific parameters (though less than are required for Tier 1
screening). In instances where facility specific inputs were not available for Step B, conservative
default assumptions for those parameters were used.
Step A uses an “inverted” Tier 1 table (see Table 6-1) that was generated using the
same methodology that was used to generate the inverted Tier 1 table used for the same
purpose in the HAPs delisting petition (CMA 1997). The inverted Tier 1 table (Table 6-1)
provides a threshold emission rate below which a facility is not predicted to exceed a specific
ambient air concentration, based on an assumed release height and distance to fenceline.
Highly conservative assumptions were used to generate the “inverted” Tier 1 table used in Step
A, such as an assumption that all emissions (combined point and fugitive emissions) of Certain
Glycol Ethers are assumed to be EGBEi, and that all emissions are assumed to be released
from a single point source with a release height of zero meters. In the HAPs delisting decision,
EPA specifically approved this adaptation of EPA’s modeling guidelines as ”reasonable”
because it is based on “sound analytic principles” “and would tend to overestimate rather than
underestimate maximum annual ambient average concentrations” (68 FR 65652, 65660 [EPA
2003]).
The Step B precursor screening step uses a modified version of EPA’s Tier 1 lookup
table (the same lookup table used for the Tier 1 screening step), along with a small number of
facility-specific parameters required to model the maximum impact from each facility. However,
as described in Section 6.2.3, Step B is more conservative than the Tier 1 screening. For Step B
highly conservative assumptions were applied for facilities for which existing facility-specific
h Note that EPA’s 2004 Community Air Screening How-To Manual (EPA 2004c) guidance also includes an analogous screening lookup table. However, an analysis of the 2004 lookup table using a subset of the highest emitting facilities evaluated as part of this petition, indicates that the 2004 screening lookup table is less conservative (predicts lower modeled concentrations) than the lookup table based on EPA’s 1992 Tiered Modeling Guidance. As such, to maximize the conservatism of the tiered modeling approach used in this petition, a screening lookup table based on EPA’s 1992 guidance lookup table is used, which is the same screening lookup table used for the same purpose in the HAPs delisting petition (CMA 1997).
i This assumption is considered conservative because EGBE comprises 52 percent (%) of the United States annual consumption of glycol ethers (SRI 2010).
39
information had been obtained for the 2007 EGBE TRI delisting petition, or was obtained from
Step B survey responses received as part of this petition. For each of these facilities, very
conservative assumptions were used with the lookup table, such as assuming that the
combined point-source emissions for a facility were emitted from a single hypothetical stack,
with a release height equal to the minimum stack height among all facility stacks, and the
minimum distance to fenceline among all facility stacks. For all facilities without site-specific
information for the required parameters, conservative default Step B input parameters were
assumed, as described further below.
The conservative nature of the Step A and Step B prescreening steps is designed to
ensure that maximum EGBE concentrations in ambient air at/beyond the fenceline of facilities
that screen out using this methodology will not exceed the applicable levels of concern for
EGBE for both chronic and acute inhalation exposures. For those facilities that did not screen
out from Step A and Step B, more refined screening for both acute and chronic exposures was
performed using slightly modified versions of EPA’s Tier 1 lookup table (identical to the Tier 1
table used for the EGBE HAPs delisting petition). The Tier 1 lookup tables (acute and chronic)
require additional site-specific data not required for the Step B screening step. Thus, the
maximum concentrations predicted by the Tier 1 lookup tables, more precisely estimate the
short-term and long-term ambient concentrations of EGBE, compared to Step A and Step B.
Those facilities for which the maximum Tier 1 predicted concentrations are below the
applicable levels of concern for EGBE for acute or chronic inhalation exposures do not require
further refined analysis. For the remaining facilities with predicted Tier 1 EGBE air
concentrations above the acute or chronic concentrations of concern, more refined screening
modeling was performed in the Tier 2 screening step using EPA’s AERSCREEN v.11126.
AERSCREEN is a screening-level air dispersion model designed to produce estimates of worst-
case 1-hour concentrations for a single source, without the need for hourly meteorological data,
and also includes conversion factors to estimate "worst-case" annual concentrations. If any
facility with maximum predicted Tier 2 modeled EGBE concentrations in ambient air had
exceeded the applicable levels of concern for EGBE for acute or chronic inhalation exposures,
then the most refined and realistic analysis (Tier 3) using EPA’s refined dispersion model
AERMOD v.12060, would have been used. However, although all facilities screened out at Tier
2, in order to further test the conservatism of the screening procedure and to estimate the
margin of safetyj provided by the screening procedure, a subset of facilities screening out at Tier
2 were nonetheless subjected to Tier 3 analysis as part of the sensitivity and uncertainty
analysis discussed in Section 6.6.
As discussed further in the remainder of this section, the exposure assessments
performed for all facilities using EPA’s tiered modeling approach consistently employed
j For purposes of this petition, margin of safety is defined as the factor by which concentrations could increase while remaining below the short-term reference concentration (e.g., predicted concentration divided by the no adverse effects level). It is recognized that in other applications, margin of safety does not incorporate the uncertainty factors that are built into the IRIS RFC.

40
conservative estimates of emission-related parameters whenever data were incomplete. Details
of the tiered methodology used to support this delisting petition and the resulting risks for
estimated long-term and short-term exposures to potential EGBE-emitting facilities are
described in further detail in Sections 6.2 through 6.5.
6.2 Step A and B Prescreening
6.2.1 Step A Prescreening Methodology Step A uses an “inverted” Tier 1 table, developed using the same methods used to
develop the inverted Tier 1 table in the 1997 HAPs delisting petition (CMA 1997).k This inverted
screening table provides annual EGBE emission thresholds (expressed as tpy) above which the
annual average EGBE concentration would be predicted to exceed the RfC of 1.6 mg/m3. The
Step A inverted Tier 1 table is shown in Table 6-1.
The annual threshold emission levels listed in this table are computed by dividing the
RfC by the normalized ambient concentrations in EPA’s (1992a) Tier 1 table:
Qthreshold = RfC ÷ [χ/Q] Tier 1 Eqn. 3
where:
Qthreshold = threshold emissions (tpy)
RfC = Reference Concentration (expressed in micrograms per cubic meter or
μg/m3), and
[χ/Q]Tier 1 = normalized ambient concentration in Tier 1 table (μg•m-3/tpy)
The annual emission thresholds for the screening table are tabulated by source type,
release height, and downwind distance.l
For Step A, each facility’s annual TRI combined stack and fugitive Certain Glycol Ethers
emissions are conservatively used to represent each facility’s total annual EGBE emissions.
Consistent with the HAPs petition’s (CMA 1997) inverted Tier 1 table screening, Step A
assumed that all stack and fugitive emissions from a given facility exhaust from a single point
source with an emission height of zero meters and a minimum distance to fenceline of 50
meters. Based on the EGBE RfC of 1.6 mg/m3, the corresponding threshold EGBE annual
threshold emission rate for Step A screening is 4.9 tpy (Table 6-1). Based on these conservative
assumptions regarding point-source releases, distances to fenceline, and percent of Certain
Glycol Ethers that are EGBE, any facility emitting less than 4.9 tpy of Certain Glycol Ethers is
predicted to have fenceline concentrations below the RfC.
k The difference between the inverted Tier 1 table developed for the 1997 HAP delisting petition and the inverted Tier 1 table developed for this petition is that the former was derived based on the prior EGBE reference concentration of 13 mg/m3, while the Step A screening table for this petition is derived from the current RfC of 1.6 mg/m3 based on the 2010 IRIS assessment.
l The emission source types in the screening table are identical to those listed in the Tier 1 lookup table.

41
6.2.2 Step A Results All facilities reporting non-zero Certain Glycol Ethers emissions during the 2009, 2010,
and/or 2011 TRI reporting years were evaluated using Step A. Step A screens out facilities that
emit Certain Glycol Ethers (combined point and fugitive emissions) less than the lowest
emission threshold for a 50 meter fenceline distance (i.e., 4.9 tpy). The results of the Step A
screening are summarized below and in Table 6-2:
Of the 1,109 facilities that reported non-zero emissions of Certain Glycol Ethers to air in2009, 824 (76%) screened out from further analysis based on Step A, leaving 260facilities warranting further evaluation in Step B.
Of the 1,149 facilities that reported non-zero emissions of Certain Glycol Ethers to air in2010, 850 (76%) were screened out from further analysis based on Step A, leaving 273facilities warranting further evaluation in Step B.
Of the 1,099 facilities that reported non-zero emissions of Certain Glycol Ethers to air in2011, 823 (75%) were screened out from further analysis based on Step A, leaving 276facilities warranting further evaluation in Step B.
A detailed listing of each facility included in the Step A analysis is provided in Tables C-
1, C-2, and C-3 of Appendix C. For those facilities that reported total Certain Glycol Ethers
emissions of more than the 4.9 tpy during 2009, 2010, and/or 2011, a more refined Step B
screening evaluation was performed, as described below.
6.2.3 Step B Prescreening Methodology Step B uses the same lookup table used for the Tier 1 analysis, which is a modified
version of EPA’s Tier 1 lookup table (similar to the Tier 1 table used for the EGBE HAPs
delisting petition), along with a small number of facility-specific parameters required to model
the maximum impact from each facilitym – i.e. projected EGBE ambient air concentrations at or
beyond the property boundary. Step B screening conservatively models all point-source
emissions from a facility as if released from a single stack, and models fugitive releases as a
single volume source, consistent with the EPA’s Tier 1 screening process (EPA 1992a).
The parameters required for Step B for each facility are
1. point and fugitive release heights for EGBE emissions sources at each facility;
2. distance from each EGBE emission source to fenceline; and
3. proportion of Certain Glycol Ethers emissions reported to TRI that is EGBE.
The values assumed for each of these parameters were based on site-specific data or
conservative default assumptions, as described in detail below. In addition, Step B was
performed as a two-part process in order to reduce the number of facilities for which a survey
was performed to collect additional site-specific information for this petition.
m Facilities that closed after emissions were reported to the TRI were excluded from subsequent modeling tiers, given the inability to obtain site-specific data and the lack of current emissions from the facility.

42
In the first part of Step B, existing available facility-specific information was used to
perform a Step B screening, when such information had been previously obtained for facilities
as part of ACC’s work on a previous version of the EGBE delisting petition that was prepared in
2007, prior to EPA’s revision to the RfC and RfDn. For each facility, the combined point-source
emissions were conservatively assumed to be released from a single stack with a release height
equivalent to lowest release height among all of that facility’s stacks, thereby maximizing
calculated off-site concentrations of EGBE in ambient air. The combined maximum annual
average concentration of EGBE in ambient air associated with each facility’s point and fugitive
emissions was calculated as follows:
The greatest emission height in the table that is less than or equal to the minimum stackheight for the facility’s EGBE point sources (stacks) was selected from the modified Tier1 Table (see Appendix D Table D-1).
The greatest distance in the table that is less than or equal to the minimum distancebetween any facility stack and the property line was selected (regardless of whether itcorresponded to the facility stack with the minimum height).
If available, the site-specific percent of Certain Glycol Ethers emissions that are EGBEwas applied to the point and fugitive source emission rates obtained from TRI. If notavailable, all TRI-reported Certain Glycol Ethers releases were assumed to be EGBE.
The appropriate normalized maximum annual concentration for the stack (based on theselected release height and distance to property line) was identified and multiplied by theannual combined point-source EGBE emission rate (in tpy) to obtain the maximumannual average ambient air concentration estimate (in µg/m3) associated with EGBEpoint-source emission from the facility.
The appropriate normalized maximum annual concentration for the fugitive emissions(using the default volume source parameters described below in combination with theminimum reported site-specific property line distance) was identified in the modifiedlookup table (Table D-1) and multiplied by the annual combined point-source EGBEemission rate (in tpy). This calculation provides the annual average ambient airconcentration estimate (in µg/m3) associated with EGBE fugitive emissions from thefacility.
The cumulative annual average ambient air concentration estimate associated with eachfacility (in µg/m3) is conservatively calculated by adding the maximum predicted ambientair concentrations associated with the point-source emissions with the maximumpredicted concentration associated with the fugitive emissions.
For all facilities lacking site-specific data from the 2007 EGBE TRI delisting petition
(numbers of facilities provided in Table 6-3), the following conservative default assumptions
were used in the first part of the Step B screening:
n Site-specific data had previously been compiled for certain facilities as part of the American Chemistry Council’s petition submitted in 2007, prior to EPA’s revision to the RfC and RfD for EGBE.

43
1. All TRI-reported Certain Glycol Ethers releases to air were assumed to be EGBE.
2. Point emissions were modeled as a 10 meter stack.
3. Fugitive emissions were modeled as a volume source with a lateral dimension of 10meters and a release height of 3 meters.
4. The distance from each emission source (point or volume) to the nearest fenceline wasassumed to be 50 meters.
These Step B default parameter assumptions for stack and fugitive emissions are
identical to those used in EPA’s exposure assessment for ethylene glycol (EPA 1995b) and the
EGBE HAP delisting petition (CMA 1997).
The total maximum impact (maximum predicted ambient air concentration at or beyond
the fenceline) for each facility lacking site-specific parameters was calculated based on these
default assumptions, as the sum of stack and fugitive impacts derived from the modified EPA
Tier 1 lookup table (see Appendix D Table D-1).
At the conclusion of the first part of the Step B analysis, each facility’s total maximum
impact (maximum predicted ambient air concentration at or beyond the fenceline) was
compared to the RfC for EGBE of 1.6 mg/m3. A survey was conducted for all facilities modeled
using only default parameter assumptions for which the maximum predicted annual average
concentration was above the RfC. The survey was intended to collect the site-specific
information for use in the Step B screening. To increase responsiveness to the survey, the Can
Manufacturers Institute (CMI) was enlisted to provide assistance with survey implementation for
the CMI member facilities subject to this Step B screening. CMI identified contact names and
addresses, distributed the Step B surveys to its member facilities, and provided survey follow
up. Two facilities that were contacted as part of the Step B survey effort did not respond to the
survey (Ford Dearborn and RR Donnelley Harrisonburg). For these two, facility-specific
information was obtained from publically available sources to the extent that such information
was publically available. In particular, EPA’s National Emissions Inventoryo (NEI) database was
used to obtain information on facility stack heights. EPA prepares the NEI every three years,
largely relying on EPA emission estimates and emission model inputs provided by state, local,
and tribal air agencies for sources in their jurisdictions. As the NEI is a comprehensive and
detailed estimate of air emissions of criteria pollutants (including volatile organic compounds or
VOCs) from all air emissions sources, NEI’s stack information is a reasonable estimate of facility
stack parameters for purposes of subjecting these facilities to Step B modeling. Because the
NEI database does not contain information on distances between each stack and a facility’s
property boundary, this distance was estimated for each stack by measuring distances between
facility structures in aerial imagery and property boundaries obtained from municipal tax
assessors’ databases.
o http://www.epa.gov/ttn/chief/eiinformation.html. Data from both the 2005 and 2008 NEI datasets werequeried for this petition.

44
Table C-4 in Appendix C summarizes all site-specific minimum stack height and distance
to property line data obtained and used in the Step B screening analysis. Using these values,
the maximum annual average concentration of EGBE in ambient air associated with each
facility’s point-source emissions was calculated described above. As described previously, for
all other facilities lacking site-specific data for the required input parameters, the Step B default
assumptions were used for stack and fugitive emissions. The total maximum impact for each
facility was calculated as the sum of the facility’s stack and fugitive impacts from the lookup
table based on these assumptions, and then compared to the RfC for EGBE of 1.6 mg/m3.
6.2.4 Step B Results Based on the above assumptions, the modified Tier 1 lookup table was used to obtain
maximum impacts associated with EGBE point and fugitive emissions. The total maximum
impact for each facility was then calculated by summing stack and fugitive impacts, and the total
impact was compared to EGBE’s RfC of 1.6 mg/m3. The final results of the Step B screening are
summarized below and in Table 6-3 and Appendix C (Table C-4):
Of the 260 facilities that reported non-zero emissions Certain Glycol Ethers to air during2009 and that did not screen out based on Step A, 245 (94%) screened out from furtheranalysis at Step B, leaving 15 facilities warranting further evaluation in Tier 1.
Of the 273 facilities that reported non-zero emissions Certain Glycol Ethers to air during2010 and that did not screen out based on Step A, 258 (95%) screened out from furtheranalysis based on Step B, leaving 15 facilities warranting further evaluation in Tier 1.
Of the 276 facilities that reported non-zero emissions Certain Glycol Ethers to air in 2011and did not screen out based on Step A, 262 (95%) screened out from further analysisbased on Step B, leaving 14 facilities warranting further evaluation in Tier 1.
For the 2009 TRI reporting year, one facility did not screen out at Step B, but was
excluded from further analysis because it has since closed. Thus, it was not possible to obtain
the site-specific data needed for more refined modeling. In any event, a facility that is not
operating also would not emit Certain Glycol Ethers. This facility was the Aurora Casket in
Aurora, IL. However, as discussed further in the uncertainty analysis (Section 6.6), if this facility
was operating, it would be expected to screen out at the higher tiers based on the reported
emissions of Certain Glycol Ethers when it was operating, as well as the demonstrated margin
of safety provided by the analysis.
6.3 Chronic Inhalation Exposure Assessment for Individual Facilities
6.3.1 Tier 1 Screening for Individual Facilities
6.3.1.1 Tier 1 Methodology Tier 1 screening was performed based on the Tier 1 of EPA’s Tiered Modeling Guidance
(1992a) guidance using a slightly modified version of EPA’s Tier 1 lookup table (Appendix D,
Table D-1). This approach is also consistent with that used for the EGBE HAPs delisting petition

45
(and the same used for Step B in this petition). As with Step B, the Tier 1 analysis for chronic
exposures accounts for both fugitive emissions and individual point-source (stack) EGBE
emissions. However, Tier 1 screening methodology differs from the Step B screening analysis in
that Tier 1 screening individually evaluates each EGBE-emitting stack at a facility and each
stack’s respective minimum distance to the fenceline (assuming all point-source emissions are
emitted by the given stack); whereas, Step B conservatively evaluates a single hypothetical
stack (assuming all point-source emissions are emitted by the given stack) using the minimum
emission height and minimum distance to fenceline among all stacks at a given facility. In other
words, the principle difference between Step B and Tier 1 is that Step B uses the minimum
fenceline distance and stack height among all stacks at a facility, regardless of whether those
values relate to the same stack. The other difference is that Tier 1 uses more site-specific
information for the estimation of impacts from fugitive emissions (e.g, it uses the actual fenceline
distance from fugitive sources rather than the minimum stack distance to represent fenceline
distances from fugitive sources).
The following site-specific information was required for Tier 1 modeling of each facility’s
EGBE emissions:
The proportion of Certain Glycol Ethers emissions reported to TRI that is EGBE
Annual emissions of EGBE (point and fugitive emissions) from each facility in tpy
Height of the release point above ground in meters, for each point source
Nearest distance to the property line in meters for point sources and fugitive sources
Point-source emissions release heights and receptor distances were derived from
facility-specific data obtained from facility survey responses. Those responses were collected as
part of Step B. As with Step B, for facilities that did not provide facility-specific data, information
was obtained from publically available sources to the extent relevant information was available
(i.e. EPA’s NEI, aerial imagery, and municipal tax assessors’ information). Because nearly all
facilities requiring Tier 1 modeling responded to the Step B survey, information from publically
available sources was only needed for one facility in the Tier 1 screening for all three years of
TRI data (2009-2011)–the RR Donnelly facility in Harrisonburg, Virginia.
The Tier 1 point-source contribution to each facility’s maximum annual ambient air
concentration of EGBE was determined for each stack at each facility using the following
procedure:
The facility’s combined point-source EGBE emissions were assumed to be emitted fromeach stack evaluated at the facility.
The greatest emission height in the table that is less than or equal to the stack height forthe EGBE-emitting stack was selected from the modified Tier 1 Table (see Appendix DTable D-1).
The greatest distance in the table that is less than or equal to the distance between thisstack and the property line was selected.

46
The appropriate normalized maximum annual concentration for this stack (based on itsrelease height and distance to fenceline) was selected and multiplied by the annualcombined point-source EGBE emission rate (in tpy) to obtain the maximum annualaverage ambient air concentration estimate (in µg/m3) associated with EGBE point- source emission from the facility.
For Tier 1 screening, this procedure described above was performed for each EGBE-
emitting stack at a facility. Then, the maximum annual Tier 1 concentration among these
individual stack analyses was conservatively selected to represent the maximum impact for
facility point-source emissions of EGBE. Each facility’s fugitive EGBE emissions were assumed
to be represented by a single volume source with a lateral dimension of 10 meters and a
release height of 3 meters, as was the case for Step B. These assumptions are identical to
those used in EPA’s exposure assessment for ethylene glycol (EPA 1995b) and the EGBE HAP
delisting petition (CMA 1997). The distances to the nearest receptors for fugitive emissions were
based on site-specific data from the survey responses or from measurements of the minimum
distance from the fugitive source (facility building) to the property boundary based on aerial
imagery. For each facility, the maximum Tier 1 modeled annual average concentration of EGBE
in ambient air was conservatively assumed to be the sum of fugitive impact and worst-case
stack impact for the facility.
6.3.1.2 Tier 1 Results for Individual Facilities For each facility, the maximum chronic EGBE exposure (impact) in ambient air at or
beyond the property boundary was determined as described above, and the result was
compared to the RfC of 1.6 mg/m3 by calculating the chronic Hazard Quotient (HQ)p. Those
facilities, for which the Tier 1 modeling result was less than the RfC, screened out and did not
undergo further analysis. As summarized below and further detailed in Table 6-4 and Appendix
D, two of the facilities subjected to Tier 1 screened out at this step:
For the 14 facilities reporting non-zero emissions Certain Glycol Ethers in 2009 that didnot screen out in Step B, 2 screened out in the Tier 1 screening step, leaving 12 facilitiesfor additional refined evaluation in Tier 2.
For the 15 facilities reporting non-zero emissions Certain Glycol Ethers in 2010 that didnot screen out in Step B, 2 screened out in the Tier 1 screening step, leaving 13 facilitiesfor additional refined evaluation in Tier 2.
For the 14 facilities reporting non-zero emissions Certain Glycol Ethers in 2011 that didnot screen out in Step B, 3 screened out in the Tier 1 screening step, leaving 11 facilitiesfor additional refined evaluation in Tier 2.
For facilities subject to Tier 1 screening, the Tier 1 results were approximately 24%
lower, on average, than Step B modeled impacts, with individual facility reductions (Step B to
p The HQ is calculated as the ratio of the maximum estimated exposure concentration to the RfC.

47
Tier 1) in the maximum estimated EGBE exposure concentrations that ranged from 0% to
approximately 70% (see Table 6-10). Few additional facilities screened out in the Tier 1
screening. This result is not unexpected given general similarities between the Step B and Tier
1 approaches (i.e. use of the same lookup table). As discussed above, the principle difference
between Step B and Tier 1 for point source emissions is that Step B uses the minimum
fenceline distances and stack heights, regardless of whether those values relate to the same
emission source. Thus, small reductions from Step B to Tier 1 indicate that the worst-case
hypothetical stack assumed for Step B had only slightly worse dispersion characteristics than
the worst case individual stack selected from among each facility’s actual EGBE emitting stacks.
Large reductions in the modeled exposure concentration from Step B to Tier 1 indicated that the
Step B hypothetical stack height and minimum distance to fenceline assumptions had worse
dispersion characteristics than any actual stack at the facility, further demonstrating the
conservativeness of the Step B approach, with respect to Tier 1. Those facilities that did not
screen out with the Tier 1 analysis were subjected to more refined Tier 2 modeling using EPA’s
AERSCREEN air dispersion model, as discussed in the next subsection.
6.3.2 Tier 2 Screening for Individual Facilities Chronic exposure Tier 2 modeling was performed for each facility that did not screen out
using the Tier 1 screening analysis. Tier 2 modeling was performed using EPA’s recommended
screening air dispersion model, AERSCREEN (EPA 2011a)q. AERSCREEN is designed to
provide conservative estimates of ambient air concentrations. AERSCREEN requires additional
facility-specific information beyond that which was required for the Tier 1 modeling. Specifically,
the following facility-specific data is required for the Tier 2 modeling with AERSCREEN: (1)
inside stack diameters; (2) exhaust velocities; (3) exit gas temperatures for all stack (point)
releases; (4) extent of the facility property boundary; (5) building dimensions (used to
parameterize fugitive EGBE emissions and evaluate the building downwash impacts for point
sources); and (6) classification of the surrounding area as urban or rural. AERSCREEN also
requires additional information related to land surface characteristics around each facility, as
well as information on general meteorological characteristics for each site, which are used to
generate the screening meteorological data applied with AERSCREEN.
AERSCREEN models the worst-case 1-hour average ambient air concentration based
on a closely spaced receptor grid around each facility, which extends outward a distance of
5,000 meters (16,404 feet) and assumes the AERSCREEN default receptor spacing (within this
grid) of 25 meters (82 feet). To estimate the maximum (chronic) annual average EGBE ambient
air concentrations, AERSCREEN applies a scaling factor of 0.1 to the model-generated
maximum 1-hour average concentration output, in accordance with EPA’s AERSCREEN
q AERSCREEN is a screening-level air quality model based on AERMOD. AERSCREEN was implemented as the screening option in AERMOD, using a nonsequential meteorological data file representing a matrix of conditions, specifically worst-case meteorological conditions generated by the MAKEMET program.
48
guidance (EPA 2011). For each facility modeled using this approach, the Tier 2 AERSCREEN
result represents the combined impact of point and fugitive EGBE emissions. Because
AERSCREEN is limited to modeling a single emission source in each model run, point and
fugitive sources for a facility were modeled separately in Tier 2. The maximum impact for the
facility’s total EGBE emissions (point and fugitive) was conservatively calculated as the sum of
the maximum predicted AERSCREEN result for the point-source EGBE emissions combined
with the maximum predicted AERSCREEN result for the facility’s fugitive EGBE emissions.
A detailed discussion of inputs required by AERSCREEN and the methodology used to
perform the modeling is provided in the remainder of this section. The results of the Tier 2
Screening are provided in Section 6.3.2.5.
6.3.2.1 AERSCREEN Meteorological Inputs AERSCREEN modeling was carried out using simulated location-specific (worst-case)
screening meteorological data generated by MAKEMET program version 09183 (EPA 2011a),
using local temperature extremes and surface characteristics information. The screening
meteorological data produced by MAKEMET is a location-specific matrix of meteorological
conditions intended to be representative the meteorological possibilities for that geographic
location. The screening meteorological data was generated for each facility subject to Tier 2
modeling using minimum and maximum ambient temperatures derived from historical daily
temperature records at meteorological station closets to the facility, in the United States
Historical Climatology Network. Extremes were determined using all historical records, spanning
from 50 and over 100 years, depending on the station location. Site-specific surface
characteristic data for the area around the facility were processed using United States
Geological Survey National Land Cover Data (USGS) and EPA model AERSUFRACE (EPA
2008). Surface characteristics (albedo, Bowen ration and surface roughness) were provided in
the form of seasonal 12 sector characteristics representative of a one kilometer (km) radius area
centered at the facility. The remaining MAKEMET input parameters, such as minimum wind
speed, anemometer height, and specified number of wind directions etc. used the default
AERSCREEN values.
6.3.2.2 AERSCREEN Buildings and Receptor Location Inputs EGBE 1-hour modeled concentrations are calculated by AERSCREEN at specific
locations within the user-specified grid. For the Tier 2 screening, the specified receptor grid for
each facility extended outward from each facility’s property line to a distance of 5,000 meters
(16,404 feet). The AERSCREEN default receptor spacing (within this grid) of 25 meters (82 feet)
was used for the entire grid.
Property boundary information required for AERSCREEN modeling was obtained from
Tier 2 survey responses, or was obtained from publically available sources, as described for
Step B and Tier 1 screening. The property plans and images obtained from the local agencies
were georeferenced by overlaying them onto an aerial image from Google Earth. For Tier 2
screening, the building dimensions, orientation, and distance to the property line were

49
determined using the Google Earth program. For buildings with multiple roof heights, each roof
level was estimated using Google Earth’s “Street View” feature and comparing the building
height to a known height (e.g., a door). In the absence of a clear street view image, the height of
the building’s shadow was compared to that of a known shadow height such as that of a truck
trailer or power line post, in order to estimate the building height.
6.3.2.3 AERSCREEN Elevation Data Inputs AERSCREEN requires a determination whether complex terrainr is present within 5 km
of the facility being modeled. Aerial imagery with elevations was also used to make that
determination. Only one facility subject to Tier 2 modeling was identified as having the potential
for complex terrain—the Crown facility in Weirton, WV (“Crown-Weirton”). All remaining sites for
which Tier 2 modeling was required are located in areas with relatively flat terrain. For the
Crown-Weirton facility in WV, potential effects of complex terrain were evaluated in
AERSCREEN by incorporating digital elevation data from the National Elevation Dataset (NED)
(USGS; EPA 2009), at the resolution of 0.33 arc-second. For this facility, the results of the
AERSCREEN modeling with terrain effects produced slightly lower annual average EGBE
concentrations than if terrain effects were omitted. Consequently, complex terrain effects are not
significant at the Crown-Weirton WV facility. Nonetheless, to be conservative, the slightly higher
AERSCREEN results that excluded terrain effects were used to represent the Tier 2 modeling
results for this facility.
6.3.2.4 AERSCREEN EGBE Point and Fugitive Source Inputs Tier 2 surveys were distributed to all facilities requiring Tier 2 modeling in order to collect
the following facility-specific information: stack inside diameters, exit gas temperatures, building
dimensions/configuration, and detailed information on the extent of the property boundary. As
with the Step B/Tier 1 surveys, in order to increase responsiveness among the CMI-member
facilities, CMI was enlisted to assist with survey distribution and follow up.
Following survey data collection, facilities were categorized as either (1) facilities for
which Tier 2 survey responses were received or (2) facilities for which Tier 2 survey information
was not provided. For facilities that did not respond, the missing information was obtained from
publically available sources, in the same manner as described above with respect to Step B and
Tier 1 screening. Where required parameters were not available from either survey responses
or publically available sources, default assumptions were used, as described further below.
EGBE Point and Fugitive Emission Rates
Stack and fugitive emission rates used for chronic exposure modeling in the model (in
units of grams per second [gps]) were derived from annual Certain Glycol Ether emissions
reported to TRI and the proportion of Certain Glycol Ether emissions that EGBE comprises (as
r Complex terrain term refers to the setting where terrain features surrounding the facility, within a 5 km radius, exceed the stack height.

50
reported by each facility in their Tier 2 survey response). Where facilities did not provide this
information, EGBE emissions were conservatively assumed to be 100% of the Certain Glycol
Ether emissions reported to TRI. For evaluating chronic exposures, the EGBE emission rates
used to model each point (stack) and volume source were developed from annual EGBE
emissions for each facility, based on an assumption that facilities operate continuously. Based
on survey responses received for facilities modeled during Tier 2 (surveys were received from
92% of facilities modeled during Tier 2), this assumption is reasonable. All respondents
indicated that their facilities operated continuously throughout the year.
EGBE Point-Source Parameters
Separate AERSCREEN model runs were performed for each facility’s stack emissions.
In each model run, the facility’s total EGBE point-source emissions were assumed to exhaust
from a single stack. Sources of information for stack parameters used in Tier 2 modeling are
discussed below.
For the two facilities that did not provide Tier 2 survey responses (i.e., RR Donnelley in
Harrisonburg, VA and Crown in La Crosse, WI), information from the 2005 and 2008 NEI
databases was used to estimate individual stack parameters. Based on the NEI database
information, these facilities each reported VOC releases from a single stack at each facility. The
NEI data provided the following stack parameters for these two facilities: stack height; stack
inner diameter; exhaust temperature; and exit velocity. However, because the NEI database
does not provide specific information on the location of the stacks at a facility, a sensitivity
analysis was performed using AERSCREEN to determine the most conservative hypothetical
stack location for the stack at each of these two facilities (i.e., the location that produced the
highest modeled air concentration based on the stack parameters in the NEI database). First, to
determine the likely location of the stack at each facility, aerial images were analyzed to first
identify the section of each facility’s building(s) that was most likely associated with process
emissions (i.e., the portion of the building where stacks were visible). For point-sources (stacks),
this analysis involved modeling a range of stack-to-property distances and stack-to-building
configurations, including hypothetical stack locations that would be expected to result in higher
modeled concentrations due to building downwash effects or proximity of the source to the
property line. The worst-case stack location at each facility as determined in the sensitivity
analyses was used for the final point-source AERSCREEN model run for these two facilities.
For facilities that provided Tier 2 survey responses, AERSCREEN was used to model
each facility’s total point-source EGBE emissions. For each stack determined to emit or
potentially emit EGBE at the facility, individual AERSCREEN model runs were performed. For
each model run, the facility’s combined EGBE stack emissions were assumed to exhaust from
each stack independently. The AERSCREEN model run that resulted in the highest predicted
annual average EGBE concentration for a facility was conservatively selected to represent the
worst-case (maximum) predicted airborne EGBE concentration for all point-source EGBE
emissions from that facility.

51
EGBE Fugitive Source Parameters
For Tier 2, fugitive EGBE emissions were modeled as a single volume source, where the
initial vertical dimension (y) was derived from the facility’s roof height and the initial horizontal
dimension (z) was derived from the building area, consistent with EPA guidance for selecting
volume source parameters (EPA 1995d). The information provided by the facilities in Tier 2
survey indicates that fugitive EGBE emissions are released from rooftop vents on the portion of
the building encompassing manufacturing operations. The release height of the volume source
was therefore considered to be equivalent to each building’s height. For facilities that did not
respond to the Tier 2 survey and that had multiple buildings on site, aerial images were
examined to identify likely production areas, based on presence of stacks, roof vents, etc.
Fugitive emissions were assumed to be associated with those likely production areas. For all
facilities (both with and without Tier 2 survey responses), volume sources were checked for the
presence of an “exclusion zone condition” in AERSCREEN. Specifically, an exclusion zone
condition applies if the distance between the volume center and closest property line (referred to
as “PD”) is less than or equal to 2.15 times the initial horizontal lateral dimension. In such cases,
the volume source lateral dimension was reduced to ensure that the resulting z was equal to
(PD-1)/2.15.
6.3.2.5 Tier 2 Results For each facility in the three TRI emission data sets (2009, 2010, 2011 calendar years)
subjected to Tier 2 screening, a facility’s Tier 2 worst-case (maximum) predicted airborne EGBE
concentration was compared to the EGBE RfC of 1.6 mg/m3. Facilities for which the worst-case
Tier 2 concentration of EGBE in ambient air was less than the RfC screened out and required
no further analysis. As summarized in Table 6-5 and detailed in Appendix D, all facilities
screened out at Tier 2 because all worst-case EGBE airborne concentrations at or beyond the
property boundaries were predicted to be below the EGBE RfC of 1.6 mg/m3. The results of the
Tier 2 chronic exposure assessment are summarized below:
For the 12 facilities retained for Tier 2 modeling based on 2009 emissions, the maximumpredicted annual average concentration was 1.20 mg/m3 (i.e., 75% of the RfC). Theminimum and average concentrations modeled for all facilities were 0.25 mg/m3 and0.54 mg/m3 (corresponding to 15% and 33% of the RfC), respectively.
For the 13 facilities retained for Tier 2 analysis based on 2010 emissions, the maximumpredicted annual average concentration was 1.04 mg/m3 (i.e., 65% of the RfC). Theminimum and average concentrations modeled for all facilities were 0.25 mg/m3 and0.54 mg/m3 (corresponding to 15% and 33% of the RfC), respectively.
For the 12 facilities retained for Tier 2 analysis based on 2011 emissions, the maximumpredicted annual concentration was less than or equal to 1.16 mg/m3 (i.e., 73% of theRfC). The minimum and average concentrations modeled for all facilities were 0.24mg/m3 and 0.51 mg/m3 (corresponding to 15% and 31% of the RfC), respectively.
Of the facilities for which Tier 2 modeling was performed, the Crown facility in Lawrence,
MA produced the highest modeled chronic EGBE impacts for all three years, with a maximum

52
annual average EGBE concentration of 1.20 mg/m3 (i.e., 75% of the RfC), based on 2009
emissions data. Despite the use of very conservative assumptions and the inherent
conservatism of the AERSCREEN model and screening meteorological data, the Tier 2
screening results demonstrate that EGBE emissions from individual facilities do not pose a
significant risk of chronic health effects at or beyond the property boundaries for individual
facilities. AERSCREEN model output files are provided in Appendix F.
Although all facilities screened out at Tier 2, in order to further test the conservatism of
the screening procedure and to estimate the margin of safety provided by the screening
procedure, six facilities that had screened out in Tier 2 modeling were subjected to additional
analysis using EPA’s long-term Tier 3 analysis. This analysis is described in Section 6.6, which
discusses an analysis of uncertainty and conservatism of assumptions used to model chronic
exposures from individual facilities.
6.4 Chronic Inhalation Exposure Assessment for Clusters of Facilities The preceding analysis focused on potential risks associated with exposures to
emissions from individual facilities. In the event that several emitting facilities are located within
a limited geographic area, local residents may be exposed to the combined emissions from
clusters of facilities. Therefore, the potential for chronic EGBE ambient air impacts from clusters
of facilities was also evaluated as part of this petition.
Zip codes were selected as the geographic area used in this analysis, which evaluated
potential chronic EGBE concentrations in ambient air from facilities located within all zip codes
containing at least two facilities reporting non-zero emissions of Certain Glycol Ether emissions
to TRI in 2009, 2010, and 2011. For the reasons described in greater detail below (Section
6.5.3), the zip code approach used in this petition is more conservative than the zip
code/census tract approach used by Dolinoy and Miranda (2004). In addition, the method used
for this facility cluster evaluation is similar to, but more refined than use of the metropolitan
areas for the cluster evaluation used in the HAP delisting petition, a methodology EPA reviewed
and accepted as appropriate and conservative that metropolitan area cluster evaluation as part
of the HAPs delisting decision (68 FR 65653).
6.4.1 Facility Cluster Evaluation Tiered Screening Methodology A conservative tiered modeling approach was also used to evaluate potential chronic
airborne EGBE concentrations in ambient air from clusters of proximate facilities. The
methodology used is analogous to the tiered modeling approach applied to individual facilities
(see Sections 6.2 and 6.3), as discussed further below.
6.4.2 Step A Screening (Cluster Evaluation) For the facility cluster evaluation, Step A was used to prescreen the inventory of all
facilities that reported non-zero emissions of Certain Glycol Ethers to TRI for the 2009, 2010
and 2011 reporting years. Any zip code that contained at least two facilities reporting emissions
of Certain Glycol Ethers during these three years was retained for evaluation in Step A. As with
53
the Step A screening performed on individual facilities, each facility’s annual TRI combined
stack and fugitive Certain Glycol Ethers emissions were conservatively combined and used to
represent the facility’s total annual EGBE emissions.
This approach differs from that employed by Dolinoy and Miranda (2004) in their
evaluation of TRI-reported and potential non-TRI-reported emissions, but is a more conservative
and appropriate basis for screening the clusters of facilities throughout the United States.
Dolinoy and Miranda (2004) evaluated different spatial scales for estimating exposures to glycol
ethers by modeling potential air concentrations at specific locations. Their approach took into
account the relative distances to each source and the dispersion that occurs over those
distances. They concluded that, for the purposes of determining spatially explicit exposure
patterns, finer-grained resolution (e.g., census blocks) modeling revealed potential localized
exposure hot-spots that are not apparent when modeling at higher resolution (e.g., zip codes).
The screening approach in this petition, however, is not spatially explicit and combines facilities
over geographic areas and treats them as a single source. Therefore, this approach does not
account for air dispersion that occurs between facility boundaries. In addition, pooling facilities
from larger geographic areas (i.e., zip codes rather than census blocks) captures more facilities
within a single unit, and thus is considered more conservative than use of the potentially smaller
subset of facilities when using smaller geographic areas.
In the facility cluster evaluation, Step A used the same “inverted” Tier 1 table described
in Section 6.2.1. The inverted Tier 1 table provides annual EGBE emission thresholds
(expressed as tpy) above which the annual average EGBE concentration would be predicted to
exceed the RfC of 1.6 mg/m3. Stack and fugitive emissions of Certain Glycol Ethers from all
facilities in the same zip code were summed, and treated as if exhausted from a single point
source with an emission height of zero meters and a minimum distance to fenceline of 50
meters. Based on the EGBE RfC of 1.6 mg/m3, the corresponding threshold EGBE annual
threshold emission rate for Step A screening is 4.9 tpy. Consistent with the Step A screening for
individual facilities, any zip code for which the combined EGBE (point and fugitive) exceeded
4.9 tpy, was retained for further refined analysis.
The number of zip codes containing more than one facility reporting Certain Glycol Ether
emissions was 158 in 2009, 164 in 2010, and 159 in 2011 (Table 6-6). The greatest number of
facilities within a single zip code was 6 (zip code 60007, Elk Grove Village, IL). These zip codes
were subjected to the Step A screening, with the following results:
Of the 158 zip codes subjected to Step A screening for the 2009 TRI reporting year, 58had cumulative emissions of Certain Glycol Ethers (assumed to be 100% EGBE) greaterthan 4.9 tpy;
Of the 164 zip codes subjected to Step A screening for the 2010 TRI reporting year, 62had cumulative emissions of Certain Glycol Ethers (assumed to be 100% EGBE) greaterthan 4.9 tpy; and
Of the 159 zip codes subjected to Step A screening for the 2011 TRI reporting year, 65had cumulative emissions of Certain Glycol Ethers (assumed to be 100% EGBE) greaterthan 4.9 tpy.
54
Those zip codes with combined emissions of Certain Glycol Ethers above 4.9 tpy
underwent Step B screening, as discussed below.
6.4.3 Step B Screening (Cluster Evaluation) The purpose of the Step B screening for facility clusters is to provide an initial
assessment of chronic exposures for geographic areas (zip codes) that contain more than one
facility emitting EGBE (or potentially emitting EGBE—i.e., reported TRI emissions of Certain
Glycol Ethers). This screening consisted of two components. The first component included zip
codes where emissions were dominated by a single facility. The second component included
the remaining zip codes, where emissions were more evenly distributed across multiple
facilities.
In order to identify the clusters dominated by one facility, the Certain Glycol Ethers
emissions from the top reporting facility were compared to the cumulative Certain Glycol Ethers
emissions for the zip code. If the percentage of cumulative emissions from one facility was at
least 90% of the total, the zip code was evaluated as part of the first component of the Step B
screen (i.e., dominated by a single facility). Any zip code for which the percentage of emissions
from a single facility was less than 90% of the total was evaluated as part of the second
component of the Step B screening.
For those zip codes evaluated under the first component of the facility cluster Step B
screening, the maximum impacts from the individual facility Step B screening (Section 6.2.4 and
Appendix C, Table C-4) for each facility in the zip code were compared to the RfC of 1.6 mg/m3.
If the maximum annual average EGBE concentration among all facilities in the zip code was
less than 90% of the RfC, the zip code screened out and no further analysis was required. The
cumulative zip code emissions from those zip codes that did not screen out at this point were
compared to a threshold emissions level derived from the inverted Tier 1 lookup table
developed for the Step A screening (Table 6-1). The threshold emissions level was determined
based on the following assumptions, consistent with the Step B screening for individual facilities
(Section 6.2.3):
1. All air emissions of Certain Glycol Ethers were assumed to be EGBE.
2. All air emissions in the zip code were assumed to be released from a single point sourcethat was 10 meters high and 50 meters from the fenceline.
3. Fugitive emissions were combined with point-source emissions.
Based on these conservative assumptions, the threshold emissions rate that would
correspond to the RfC is 75.8 tpy (Table 6-1). Zip codes with cumulative emissions greater than
75.8 tpy were retained for more refined facility cluster evaluation. The screening results from
this first analysis are summarized below:
Based on the 2009 TRI inventory of facilities emitting Certain Glycol Ethers, 31 of the 58
zip codes that did not screen out at Step A contained one facility that represented more than
90% of the Certain Glycol Ethers emissions released in that zip code. The estimated maximum
annual average EGBE concentrations for all 31 zip codes were less than 90% of the RfC. Thus,

55
none of the 31 zip codes were retained for the more refined Tier 1 analysis based on 2009 TRI
data.
Based on the 2010 TRI inventory of facilities emitting Certain Glycol Ethers, 30 of the 62
zip codes that did not screen out at Step A contained one facility that represented more than
90% of the Certain Glycol Ethers emissions released in that zip code. The estimated maximum
annual average EGBE concentrations for 29 of these zip codes were less than 90% of the RfC.
Thus, one of these zip codes (i.e., 27320 in Reidsville, NC), was retained for the more refined
Tier 1 analysis based on 2010 TRI data.
Based on the 2011 TRI inventory of facilities emitting Certain Glycol Ethers, 30 of the 64
zip codes that did not screen out at Step A contained one facility that represented more than
90% of the Certain Glycol Ethers emissions released in that zip code. The estimated maximum
annual average EGBE concentrations for 29 of these zip codes were less than 90% of the RfC.
Thus, one of these zip codes (i.e., 27320 in Reidsville, NC), was retained for the more refined
Tier 1 analysis based on 2011 TRI data.
The second component of the Step B facility cluster evaluation evaluated all remaining
zip codes that contain at least two facilities emitting EGBE (or potentially emitting EGBE—i.e.,
reported TRI emissions of Certain Glycol Ethers) and were not included in the preceding
analysis. This second component of Step B was conducted for the following zip codes: (1) 24
zip codes for the 2009 TRI emission inventory; (2) 26 zip codes for the 2010 TRI emission
inventory; and (3) 31 zip codes for the 2011 emission TRI inventory). The cumulative EGBE
emissions (sum of the EGBE emissions for the TRI-reporting facilities in the zip code) for each
zip code were compared to the threshold emissions level of 75.8 tpy, described above.
Based on these conservative assumptions, the majority of zip codes evaluated in the
second component of Step B screened out. Those retained are shown in Table 6-7 and
summarized below:
21 of the 24 zip codes analyzed based on the 2009 TRI emission inventory screened out
at Step B. The three zip codes retained for more refined modeling were 60609 in Chicago, IL;
45840 in Findlay, OH; and 26062 in Weirton, WV.
22 of 26 zip codes analyzed based on the 2010 TRI emission inventory screened out at
Step B. The four zip codes retained for more refined modeling were 60609 in Chicago, IL;
45840 in Findlay, OH; 46350 in La Porte, IN; and 26062 in Weirton, WV.
29 of 31 zip codes zip codes analyzed based on the 2011 TRI emission inventory
screened out at Step B. The two zip codes retained for more refined modeling were 45840 in
Findlay, OH and 26062 in Weirton, WV.
Combining the results from the two component analyses of the Step B screening, a total
of five unique zip codes required further refined modeling in the Tier 2 screening using
AERSCREEN to determine if long-term EGBE exposures resulting from EGBE emissions from
clusters of facilities in these zip codes exceed the RfC, when less conservative assumptions are
used. This included three zip codes based on the 2009 TRI data, five zip codes for 2010, and
three zip codes for 2011.
56
6.4.4 Tier 2 Screening (Cluster Evaluation) Because the initial Tier 1 lookup table for point sources does not lend itself for use in
screening clusters of sources beyond the initial Step B screening step described in the previous
section, Tier 1 analysis was not conducted as part of the cluster evaluation. As such, the five zip
codes that did not screen out during Step B (cluster evaluation) were subjected to Tier 2
modeling instead. The Tier 2 modeling for the facility clusters was carried out using the same
general approach used for the Tier 2 AERSCREEN modeling of individual facilities described in
Section 6.3, with some minor differences discussed below.
AERSCREEN modeling of each facility within the five zip codes was performed using
location-specific screening meteorological data generated by MAKEMET. However, while local
meteorological inputs into the MAKEMET (e.g., temperature extremes) were identical for all
facilities within the zip code, surface characteristic inputs were unique for each facility and were
therefore based on the land cover characteristics of a 1-km radius area surrounding the
individual facility. All individual facilities within the five zip codes were modeled assuming flat
terrains and using the same receptor grid configuration described in Section 6.3. As with the Tier
2 modeling of individual facilities, AERSCREEN 1-hour concentration results were converted to
maximum annual average (chronic) impacts for comparison to the RfC, by multiplying the 1-hour
average values by the scaling factor of 0.1t.
As with the Tier 2 analysis for individual facilities, the facility cluster evaluation included
facilities that provided Tier 2 survey responses and those that did not. Of the 12 facilities
included in the facility cluster evaluation, 7 provided Tier 2 survey responses and 5 did not. For
facilities that provided Tier 2 survey responses, source parameterization and AERSCREEN
modeling of each facility was carried out in the same manner as described in Section 6.3.2 for
individual facilities. Modeling was based on facility-specific information provided in the survey
response, including actual stack parameters (stack height, diameter, temperature, and exit
velocity), building dimensions, property boundary information and urban or rural setting
designation.
Five facilities (one in each of these five zip codes) did not provide Tier 2 survey
responses. For these facilities, point and fugitive emission source parameter inputs required for
Tier 2 modeling were derived from publically available sources. Where the NEI database
provided information on stack parameters, a sensitivity analysis was performed to determine the
worst-case stack-to-building configuration and stack-to-fenceline distance, in the same manner
s As discussed in Section 6.2.3.2, with the exception of one facility in WV, all other facilities subject to Tier 2 modeling were located in areas of relatively flat terrain. For the facility in WV, the potential effects for complex terrain were evaluated in AERSCREEN by incorporating digital elevation data. For this facility, the results of the AERSCREEN modeling with terrain effects produced slightly lower annual average EGBE concentrations than if terrain effects were omitted. Consequently, complex terrain effects are not significant at this facility. Nonetheless, to be conservative, the slightly higher AERSCREEN results that excluded terrain effects were used to represent the Tier 2 modeling results for this facility.
t To estimate the maximum (chronic) annual average EGBE ambient air concentrations, AERSCREEN applies a scaling factor of 0.1 to the model-generated maximum 1-hour average concentration output, in accordance with EPA’s AERSCREEN guidance (EPA 2011)

57
described in Section 6.3.2. A summary of the treatment of NEI stack data for these facilities is
provided below:
For two facilities, Whirlpool in Findlay, OH and Dystar LP in Reidsville, NC, the NEIdatabase provided information on a single stack at each facility. For these, stackparameters from the NEI database were used for the Tier 2 modeling, and the mostconservative location for the single stack was determined through a sensitivity analysisperformed in the same manner described for the Tier 2 screening for individual facilities(see Section 6.3.2).
For two other facilities, Edsal in Chicago, IL and Roll Coater in La Porte, IN, the NEIdatabase provided information on multiple stacks at each facility (e.g., NEI providesinformation on 20 stacks for Edsal). For these facilities, the sensitivity analysis wassimplified by selecting the most conservative combination of stack parameters among allstacks for which parameters were provided (i.e. conservative, from the perspective ofresulting in the highest modeled annual average EGBE concentration). In other words,the hypothetical stack used in the Tier 2 modeling for that facility would have the heightof the shortest NEI reported stacks, the exhaust temperature of the coolest stack, andthe smallest diameter and the lowest velocity among all NEI stacks reported for thefacility. This practice yields a hypothetical stack with the most conservative combinedassumptions (more conservative than any of the individual stacks), and thusapproximates the worst possible dispersion scenario for point-source emissions. Themost conservative location for this hypothetical stack was determined through asensitivity analysis performed in the same manner described for the Tier 2 screening forindividual facilities.
For the fifth facility (i.e., Roll Coater in Weirton, WV) lacking a survey response, the NEIdatabase included no information on stack parameters. For this facility, all point-sourcereleases were therefore very conservatively modeled as fugitive emissions for the Tier 2modeling (i.e. both point and fugitive emission rates were combined and modeled as asingle volume source centered on the presumed production area of the facility building).
Fugitive emissions at each facility were modeled as a volume source, with modeling
input parameters developed in the same manner as described in Section 6.3.2. The maximum
modeled chronic impact for each facility in the zip code was calculated as the sum of the
modeled maximum concentration from the volume source and the worst-case stack.
The maximum annual average air concentration for the entire zip code was calculated as
the sum of the maximum impacts from each of the modeled facilities within the zip code
(calculated using AERSCREEN in the same manner as described in Section 6.3.2). The
individual facility maximum impacts were summed, regardless of where these maximum impacts
occurred—i.e. for each facility modeled, the maximum impact for that facility may not occur at
the same receptor location as the other facilities. The Tier 2 results of the maximum chronic
(annual average) impacts for each cluster (zip code) are presented in Table 6-8 and modeling
output files for the Tier 2 modeling are provided in Appendix F.
58
As shown in Table 6-8 for all three inventories (2009, 2010, and 2011), projected worst-
case annual average EGBE concentrations at or beyond the property line for all five zip codes
were appreciably below the RfC of 1.6 mg/m3, as summarized below:
Based on 2009 TRI emissions of facilities emitting Certain Glycol Ethers, the predictedmaximum annual average concentration across all five zip codes modeled using Tier 2was 0.91 mg/m3 (i.e., 57% of the RfC). The minimum and average results for the five zipcodes were 0.26 mg/m3 and 0.52 mg/m3, respectively (corresponding to 16% and 32%of the RfC, respectively).
Based on 2010 TRI emissions of facilities emitting Certain Glycol Ethers, the maximumannual average concentration across all five zip codes modeled using Tier 2 was 1.16mg/m3 (i.e., 73% of the RfC). The minimum and average results for the five zip codeswere 0.27 mg/m3 and 0.58 mg/m3 respectively (corresponding to 17% and 36% of theRfC, respectively).
Based on 2011 TRI emissions of facilities emitting Certain Glycol Ethers, the maximumannual average concentration across all five zip codes modeled using Tier 2 was 0.74mg/m3 (i.e., 47% of the RfC). The minimum and average results for the five zip codeswere 0.26 mg/m3 and 0.49 mg/m3 respectively (corresponding to 16% and 31% of theRfC, respectively).
Tier 2 modeling of the zip codes based on 2009, 2010, and 2011 TRI data indicated that the
Chicago IL zip code (facility cluster) yielded the highest predicted chronic EGBE impact for all
years evaluated, with a maximum calculated maximum annual average concentration of 1.16
mg/m3 (i.e., 73% of the RfC) based on 2010 emissions.
Section 6.5 provides an analysis of uncertainty and conservatism of assumptions used in
modeling chronic exposures from clusters of EGBE-emitting facilities.
6.5 Uncertainty Analysis Based on the results of the tiered modeling approach for individual facilities and clusters
of facilities presented in Sections 6.2 through 6.4 of this petition, the maximum annual average
emissions of EGBE are not predicted to exceed the RfC for EGBE. Thus, even under highly
conservative assumptions, EGBE emissions from facilities in the U.S. do not pose a risk to
populations living around the facilities.
Nonetheless, to further demonstrate the margin of safety for this conclusion, all facilities
and zip code clusters screened out at Tier 2 modeling were subjected to more refined modeling
using AERMOD (Tier 3). In addition, the conservatism of assumptions made during each of the
steps of the tiered analysis is discussed in further detail in this uncertainty analysis, and
generally would apply to both the chronic and acute tiered modeling, although for the acute
exposure assessment additional discussion of uncertainty is provided in the acute MOE
assessment found in Section 6.6.3.

59
6.5.1 Conservatism of Step A through Tier 2 In several ways, Step A and Step B provide a more conservative screening approach
than EPA’s long-term Tier 1 analysis:
In Step A, all reported Certain Glycol Ethers emissions were assumed to be EGBE, eventhough EGBE represents only about 52% of the market share (SRI 2010).
In Steps A and B, all stack emissions were conservatively assumed to exhaust from onestack.
In Step A, all emissions data were initially evaluated as if they are emitted through asingle stack with a release height of 0 meters with a distance to fenceline of 50 meters.This scenario is not likely to occur often, if at all. The conservatism of the defaultassumption of a 0-meter emissions source height was evaluated based on the site-specific data provided by the facilities. The minimum release height reported is just over3 meters. Furthermore, if the Step A screening is based on a release height of 2 metersand a distance to fence line of 10 meters, the screening threshold is 8.6 tpy (Table 6-1),75% higher than the screening emission threshold used in our analysis.
The Tier 1 screening analysis also affords significant conservatism in the treatment of
point and fugitive emission sources of EGBE:
For Tier 1 screening, all point-source emissions are conservatively assumed to bereleased from a single stack from the list of all stacks onsite that could possibly releaseEGBE. The single stack selected was the one that yields the maximum potentialfenceline concentration, regardless of whether it is the stack from which the majority ofthe EGBE is actually released.
For Tier 1 screening, all fugitive emissions are assumed to be released from a singlefugitive source, wherein the distance to fenceline was determined by the minimumdistance from the edge of the fugitive source to the property boundary.
Conservatism of the Tier 2 analysis is also present on several levels. It is inherent in the
use of a screening-level model such as AERSCREEN, and in the use of screening meteorology
used by the model. Conservatism is also provided by the selection of parameters used for the
Tier 2 modeling of each facility’s point and fugitive EGBE emissions, and in the methodology
used to calculate the combined point and fugitive impacts for each facility. These various levels
of conservatism in the Tier 2 analysis are discussed in more detail in the remainder of this
section.
Screening air quality models such as AERSCREEN are conservative by design, and are
intended to provide the means for performing a prescreening analysis prior to engaging in full
scale modeling using models such as AERMOD/AERMET (EPA 2012, 2004d). AERSCREEN’s
conservatism stems from the following key model characteristics and assumptions:
The use of screening meteorological data in AERSCREEN (generated by MAKEMET) isdesigned to include the worst-case meteorological extremes for a given geographiclocation, including the least favorable dispersion conditions, which would be expected toproduce the highest modeled ambient air concentrations (impacts). These most extreme
60
combinations of meteorological parameters in the screening meteorological dataset would rarely if ever occur in actual meteorological data and thus represent a level of conservativeness in the AERSCREEN modeling.
The screening meteorological data is a theoretical sequence of meteorological hourlyconditions that AERSCREEN uses to predict the maximum 1-hour averageconcentration at each prescribed location. As discussed above, for purposes ofevaluating maximum predicted long-term air concentrations in the Tier 2 modeling, thismaximum 1-hour result is scaled by 0.1 to approximate a maximum annual average airconcentration. The resulting maximum annual average result is therefore based on aworst-case meteorological hour. This practice is far more conservative than theapproach used in AERMOD, which employs actual meteorological data to calculate anannual average result from all meteorological hours.
While AERSCREEN uses the same algorithms as the full-scale dispersion modelAERMOD, AERSCREEN employs certain conservative assumptions not used inAERMOD modeling. For instance, information on the closest distance between thesource and the fenceline is treated conservatively in AERSCREEN, which uniformlyassumes this distance for all directions from the emission source. AERMOD insteadallows that the property boundary be defined realistically at varying distances to thesource in different directions.
In addition to the built in conservatism of the AERSCREEN model, the assumptions
used in modeling point-source emissions at each facility provides an additional level of
conservatism in Tier 2 modeling, as summarized below:
As with the very conservative Step A screening, stack impacts were modeled as if eachfacility’s total stack emissions were emitted from the single stack that produced theworst-case results, even though point-source emissions would actually be distributedacross multiple stacks (providing greater dispersion).
AERSCREEN is capable of modeling only one source at the time. As such, for multipleemission sources such as those modeled for this petition, the combined contribution ofall sources at a facility are conservatively calculated as the sum of maximum resultsfrom the individual emission source model runs. In almost all circumstances, thispractice would overestimate the result achieved by modeling all emission sourcessimultaneously.
In addition to the conservatism of the assumptions and methods used in the Tier 2
modeling of individual facilities, the facility cluster evaluation also incorporated the following
additional conservative elements:
Each of the five zip codes (clusters) modeled using the Tier 2 methodology included onefacility for which a Tier 2 survey response was not received. For these facilities, highlyconservative assumptions were used to model facility EGBE emissions. Specifically,point-source emission for each of these facilities were conservatively modeled using theleast favorable stack location (based on a sensitivity analysis of predicted AERSCREENresults) and the most conservative combination of stack parameters reported to the NEI.

61
In addition, all Certain Glycol Ether reported air emissions from these facilities were conservatively assumed to be 100% EGBE.
As an additional source of “spatial” conservatism in the AERSCREEN modeled resultsfor each cluster, the cumulative impacts from multiple facilities in each zip code modeledwere calculated as the sum of the maximum predicted impact from each facility at orbeyond the property boundary, regardless of the specific (receptor) location that thisimpact was determined by the model to occur. Given that the receptor location ofmaximum impact for each facility is invariably closely located to the facility boundary,and distances between individual facilities in certain clusters are as much as 1,500meters, the estimated maximum cumulative impact for each cluster was almost certainlyoverestimated.
And finally, in addition to the spatial conservatism resulting from summing each facilityimpacts irrespective of the receptor location at which they occurred, a “temporal”conservatism is also present in the Tier 2 application of AERSCREEN for modelingfacility clusters. AERSCREEN calculates a worst-case result for each facility emissionsource, which is based on the worst-case meteorological hour in the screeningmeteorological data set. This worst-case meteorological hour is likely to differ fromemission source to emission source at a facility as well as from facility to facility. Assuch, the summing of maximum impacts across facilities introduces a level of temporalconservatism that almost certainly overestimates the maximum cumulative impact foreach cluster.
Even though all individual facilities and facility clusters (zip codes) with non-zero Certain
Glycol Ether emissions reported to TRI for 2009, 2010, and 2011 screened out at the
conservative Tier 2 modeling step (i.e. the maximum annual average EGBE air concentrations
at/beyond facility boundaries were below the RfC), in order to further demonstrate the margin of
safety afforded in the tiered modeling approach, Tier 3 modeling using the EPA-approved
refined air dispersion model AERMOD was performed, as discussed below.
6.5.2 Tier 3 Modeling (Individual Facilities) As a further demonstration of the conservatism of the tiered modeling approach for
individual facilities, and to provide further evidence of the “margin of safety” afforded for all
facilities that screened out at Step A, Step B, Tier 1, or Tier 2, six facilities were modeled using
EPA’s regulatory AERMOD (EPA 2004d, EPA 2012) and AERMET (EPA 2004f, EPA 2011b)
system (i.e., Tier 3 of the tiered modeling approach). These six facilities all previously screened
out at Tier 2 based on their 2009, 2010, and 2011 TRI emissions and were also facilities that
provided detailed information in Tier 2 survey responses. They included
the three individual facilities that had the highest Tier 2 modeled maximum annualaverage EGBE concentrations (Crown Beverage in Lawrence, MA, Rexam in Kent, WA,and Rexam in Bishopville, SC);
two additional facilities that were also part of the Tier 2 facility cluster evaluations, andwhich were top emitters within their respective zip codes (Crown Beverage in Weirton,WV, Rexam in Chicago, IL); and
62
one additional facility that reported the maximum annual emissions of Certain GlycolEthers in the TRI from 2009 through 2011 (Rexam in Winston Salem, NC).
The six facilities subjected to Tier 3 modeling were also among the top 4% of emitters
among all facilities reporting Certain Glycol Ethers emissions in their TRI reports for 2009
through 2011 (see Appendix B Tables B-1 through B-3). For each of these facilities, EGBE
comprised between 85% and 100% of each facility’s Certain Glycol Ether reported emissions.
Tier 3 modeling using AERMOD is the most refined analysis step, and is consistent with
EPA’s Tiered Modeling Guidelines (EPA 1992a). The Tier 3 analysis was conducted with the
AERMOD model (v.12345, EPA 2012) in accordance with EPA’s Guideline on Air Quality
Models (40 CFR Part 51 Appendix W), EPA’s tiered modeling guidelines (EPA 1992a), the
AERMOD User Guide (EPA 2004d), and the AERMOD Implementation Guide (EPA 2009).
Compared to Tier 2 modeling, Tier 3 modeling with AERMOD provides more realistic (yet still
conservative) estimates of projected impacts of EGBE emission at locations at or beyond each
facility’s fenceline. The principle refinements afforded by AERMOD over AERSCREEN are
summarized below, and discussed in more detail in the remainder of this section:
The Tier 3 AERMOD modeling uses actual meteorological data from the closest weatherstation, rather than the artificially generated screening meteorological data sets usedwith AERSCREEN.
Tier 3 modeling takes into account the variability of the actual property boundary, ratherthan using a single distance between each emission source and the property boundary,as is assumed for AERSCREEN. This refinement allows a more realistic treatment ofdispersion effects between a stack and receptors.
The Tier 3 modeling incorporates the distribution of EGBE emissions across stacks at afacility, rather than assuming that all stack emissions of EGBE occur from a single stack(with the worst stack location assumed).
Tier 3 modeling with AERMOD permits simultaneous modeling of multiple emissionsources, which yields collective impacts from all sources for each receptor location.
Tier 3 modeling with AERMOD modeling allows for the direct calculation of long-termaverages for predicted air concentrations through use of multi-year meteorological datasets.
The use of representative meteorological data processed using AERMET provides more
realistic estimates of predicted impacts under actual atmospheric dispersion conditions
characteristic of the geographic setting at each facility. The AERMOD modeling for each
location was performed using five years of recent representative meteorological data (2006
through 2010 calendar years), from the meteorological stations closest to each facility.
Meteorological data were processed using EPA’s AERMET v. 11059 (EPA 2004f, EPA 2011b)
meteorological preprocessor. The use of five years of hourly meteorological data ensures that
AERMOD modeling results incorporate expected interyear meteorological variability at each
location, while capturing the occasional short-term extreme meteorological conditions. The use
of actual meteorological measurements in sequence also allows for the modeling of long-term

63
(chronic) concentrations directly, without needing to estimate them empirically by scaling 1-hour
(short-term) impacts, as was required when using AERSCREEN.
Finally, AERMOD’s capability to model multiple sources in a single run allows that the
combined impacts from multiple sources within a facility, or those from multiple facilities in a
given domain be estimated more realistically than by simply superimposing their maxima as it
was done in the Tier 2 screening.
The Tier 3 AERMOD modeling used Universal Transverse Mercator (UTM) geographic
coordinates for all emission sources, buildings and receptor locations modeled. NED terrain
elevation data from USGS with resolution at 0.33 arc-second were used to incorporate elevation
information for emission sources and receptor locations. Offsite concentrations were calculated
at specified receptor locations within a nested receptor grid and along each facility’s property
boundary. Property boundary receptors were spaced at 25 meter intervals. Offsite receptors
were spaced at 50 meters in the Cartesian receptor grid out to a distance of 350 meters from
the facility. A second coarser receptor grid with spacing of 100 meters was used for distances
between 350 meters up to 2 km from each facility; 500 meter receptor spacing was used for
receptors at distances from 2 km to 5 km from the approximate center of each facility.
While the Tier 3 modeling for all six facilities relied on the same individual stack and
volume source parameters used for Tier 2 modeling, the Tier 3 modeling also considered the
distribution of EGBE emissions among the different stacks at a given facility, which was a level
of refinement not considered in the Tier 2 screening. For one of the six facilities evaluated using
Tier 3 modeling (the Crown facility located in Lawrence, MA), the distribution of EGBE
emissions between stacks was not provided. For this facility, stack emissions were assumed to
be equally distributed among facility stacks for the Tier 3 modeling.
As discussed above, the Tier 3 modeling used five years of actual meteorological data.
The AERMOD modeling was performed independently for each year, resulting in predicted
maximum annual average concentrations at each receptor for each year of meteorological data.
The maximum predicted annual average concentration for each receptor location was then
conservatively calculated as the highest of the five modeled annual average concentrations for
a given receptor. Results of the chronic (annual average) Tier 3 AERMOD modeling results for
individual facilities is provided in Table 6-9 and model output files are provided in Appendix F.
As shown in Table 6-9:
Based on 2009 emissions, the maximum Tier 3 result among the six facilities was 0.269mg/m3, for the Rexam facility in WA, which represents less than 17% of the RfC.
Based on 2010 emissions, the maximum Tier 3 result among the six facilities was 0.253mg/m3, again for the Rexam facility in WA, which represents less than 16% of the RfC.
Based on 2011 emissions, the maximum Tier 3 result among the six facilities was 0.256mg/m3, for the Crown facility in MA, which represents less than 16% of the RfC.
These results indicate that, with the more refined and realistic (yet still conservative)
assumptions used in the Tier 3 modeling, chronic exposures to EGBE for the highest emitting
facilities are well below the RfC.

64
6.5.3 Tier 3 Modeling (Clusters of Facilities) As a further demonstration of the conservatism of the tiered modeling approach for
clusters of facilities, Tier 3 modeling was performed for facility clusters in two zip codes: (1)
60609 in Chicago, IL, which had the highest cumulative Tier 2 impact among the five zip codes
evaluated in Tier 2; and (2) 26062 in Weirton, WV, the zip code evaluated in Tier 2 that
contained the largest number of individual facilities (i.e., five) reporting emissions of Certain
Glycol Ethers to TRI in a single zip code.
Tier 3 modeling for the facility cluster evaluation was performed with AERMOD using the
same general methodology used for the Tier 3 modeling of individual facilities described in
Section 6.5.2. Specifically, the AERMOD modeling for each facility relied on five years of
representative meteorological data, with location information (UTM coordinates) and elevation
data for all emission sources and buildings. Worst-case impacts from EGBE emissions at each
facility were modeled for all receptor locations at or beyond each facility’s property boundary
using the same receptor grid spacing specified in Section 6.5.2. The principle difference
between Tier 3 modeling of individual facilities (Section 6.5.2) and the Tier 3 modeling of facility
clusters is that for facility cluster modeling, all modeled facilities were modeled simultaneously in
AERMOD, and thus the cumulative impact from all facilities was calculated by AERMOD
simultaneously.
Results of the chronic (annual average) Tier 3 AERMOD modeling of the two zip codes
is provided in Table 6-8 (model output files are provided in Appendix F), and briefly summarized
below:
Zip Code 60609 in Chicago, IL – The maximum Tier 3 impact for this zip code was 0.11mg/m3 (2009 emissions), 0.18 mg/m3 (2010 emissions), and 0.14 mg/m3 (2011emissions) corresponding to 7%, 12%, and 9% of the RfC, respectively.
Zip Code 26062 in Weirton, WV – The maximum Tier 3 impact for this zip code was 0.16mg/m3 (2009 emissions), 0.16 mg/m3 (2010 emissions), and 0.15 mg/m3 (2011emissions) corresponding to 10% of the RfC, in each year.
Predicted worst-case EGBE air concentrations for all modeled clusters based on 2009,
2010, and 2011 emissions averaged 0.15 mg/m3, or 10% of the RfC. As these cluster analysis
results demonstrate, even when considering the collective impacts of clusters of facilities in a
zip code, and conservatively assuming the worst-case meteorological data year, the maximum
annual average concentration of EGBE for all clusters modeled is predicted to be well below the
RfC.
The predicted worst-case clusters impacts were less than the highest individual facility
impacts presented in Section 6.5.2. This outcome reflects the fact that none of the individual
facilities with the highest individual impacts are located in zip codes considered in the facility
cluster evaluation (i.e. none were located in zip codes that contained more than one facility
reporting emissions of Certain Glycol Ethers to the TRI during 2009, 2010, or 2011).

65
6.5.4 Conservatism of the Tiered Modeling Approach In total, the potential for facility emissions of EGBE to result in chronic exposures greater
than the RfC was evaluated for all United States facilities reporting non-zero emissions of
Certain Glycol Ether to TRI during 2009 (1,109 facilities), 2010 (1,149 facilities), and 2011
(1,099 facilities).
The magnitude of conservatism (and margin of safety) built into the tiered modeling
approach can be clearly demonstrated by comparing the reduction in maximum long-term
modeled impacts between the lowest (most conservative) tier to the highest (most refined)
modeling tiers. This reduction was demonstrated for the subset of individual facilities evaluated
in all five tiers of the tiered modeling approach (Step A through Tier 3), the results of which are
summarized below:
In comparing initial (Step A and B) screening results to the results of the chronicexposure Tier 1, 2, and 3 analyses of high-emitting facilities, the maximum annualaverage concentrations decreased by an average of 84% when the same facility wasevaluated first under Step Au and then under Step B.
For the individual facilities subject to Tier 1, Tier 2, and Tier 3 modeling, the reduction inmaximum predicted annual average concentrations in moving from Step B to Tier 1averaged 24%. The reduction in the maximum predicted annual average concentrationsin moving from Tier 1 to Tier 2 averaged 80% (based on 2009, 2010, and 2011 TRIemissions). The reduction observed in moving from Tier 2 to Tier 3 averaged 70%(Table 6-10).
Thus, the cumulative conservatism of evaluating facilities using Step A, relative to Tier 3,averaged 99%.
These results demonstrated that for the highest emitting facilities, the modeled maximum
annual average ambient concentrations resulting from Tier 3 modeling were consistently at least
two orders of magnitude lower than the most conservative (Step A) screen applied, providing a
significant margin of safety for those facilities screening out at lower tiers of modeling (Table 6-
10). This tiered modeling approach also indicates a significant margin of safety even when
considering possible year to year variability of EGBE emissions from facilities. As a
demonstration of this margin of safety, consider that even the facility with the highest Tier 3
result of 0.269 mg/m3 (Rexam Beverage facility in Kent, Washington based on its 2009
emissions) was well below (i.e., 17% of) the RfC. A gross estimate of range for overall interyear
variability of EGBE emissions might be expected to generally follow the overall United States
EGBE consumption trend, which is shown in Figure 2-1(SRI 2010). As illustrated in this figure,
United States total EGBE consumption peaked in approximately 2005, and has steadily
declined since then. The calculated ratio of United States total EGBE consumption in 2005
u Although impacts were not explicitly calculated for the Step A screening, they were calculated for the comparison in Table 6-10 by using the EPA tier 1 lookup table and the conservative Step A assumptions (EGBE is 100% of Certain Glycol Ether emissions, all air emissions are released from a single point source with a stack height of 0 meters and a fenceline distance of 50 meters).

66
versus 2009 is 1.3 (i.e., consumption was 30% higher in 2005 than in 2009). By comparison, the
margin of safety (ratio) for the RfC compared to the maximum Tier 3 result is 5.9. The results of
this analysis support the conclusion that the tiered modeling approach provides a sufficient
margin of safety that encompasses reasonable interyear variability in facility EGBE emissions.
A second analysis was conducted to further demonstrate that the margin of safety
indicated by the tiered modeling is sufficient to account for interyear variability in facility EGBE
emissions over time. This analysis considered the historical changes in the reported total
Certain Glycol Ether emissions for all 13 facilities that were subject to Tier 2 modeling. Tier 3
modeling performed for 6 of these high emitting facilities indicated that the highest Tier 3 chronic
impact was 0.269 mg/m3, which represented only 17% of the RfC. This equates to a ratio
(margin of safety) between the RfC and the worst-case Tier 3 impact of 5.9. For purposes of
comparison, a review of the historical Certain Glycol Ether emissions reported for these six
facilities (see Table 6-11) between 2000 and 2011 was used to calculate the ratio between the
peak (highest) emissions of Certain Glycol Ethers and the emissions reported during 2009,
2010, and 2011 (i.e. the years for which emissions were evaluated using the tiered modeling
approach). These ratios also provide a reasonable representation of the expected maximum
interyear variability in chronic impacts for each facility. The calculated ratios ranged from 1.1 to
2.3, indicating that the interyear variability that is less than the calculated margin of safety (i.e.,
5.9) between the RfC and the worst-case Tier 3 modeled result. Similarly, this analysis can be
extended to the eight other high emitting facilities modeled using the Tier 2 methodology. For
these facilities, the calculated maximum ratios between peak year and 2009-2011 Certain
Glycol Ether emissions ranged from 1.0 and 4.1, again demonstrating that interyear variability
remains within the margin of safety demonstrated with the conservative Tier 3 modeling. Thus, it
is highly unlikely that any facilities would have exceeded the RfC for EGBE even during each
facility’s peak emission years. This analysis further supports the conclusion that the tiered
modeling approach provides a sufficient margin of safety that encompasses reasonable
interyear variability in facility EGBE emissions. This analysis conservatively assumed that
historical EGBE emissions represent the same fraction of Certain Glycol Ether emissions as in
recent years (2009-2011).
Finally, the same conclusion of a sufficient margin of safety is also reached by
examining trends in maximum TRI-reported Certain Glycol Ether emissions from any facility for
each reporting year from 2000 to 2011 (see Figure 5-1). As shown in this figure, there has been
remarkably little variability in the Certain Glycol Ether emissions from the highest emitting
facilities over the past decade. Further, this variability is well within the margin of safety
indicated by the ratio (5.9) between the 2009 Tier 3 modeled worst-case result and the RfC.
Consistent with EPA’s conclusion in the HAPs delisting decision, the use of maximum
annual average concentrations in each of the models significantly overstates the likely exposure
levels of the actual exposed population (68 FR 65653):
The use of the maximum annual average ambient concentration for each emission
source to characterize the exposed population provides a conservative approach to

67
chronic exposure modeling. Furthermore, based on our experience, we judge that a
refined exposure assessment estimating exposures for actual people living near these
facilities would result in maximum individual exposures significantly lower than the
maximum annual average ambient approach. Given the likely proximity of inhabitable
areas and the variability of human activity patterns over an annualized time period, it is
our expectation that actual maximum individual exposure would be at least a factor of 2
less than predicted by the models.
In conclusion, the maximum long-term exposures of persons in the vicinity of EGBE-
emitting facilities are likely to be far below the estimates generated by the screening and
modeling approach employed in this petition. Despite that considerable conservatism, these
estimates were determined to pose a negligible risk for chronic health effects to the populations
around the facilities that emit EGBE.
6.6 Acute Exposure Margin of Exposure (MOE) Assessment As previously discussed, in the absence of an EPA Acute Exposure Guideline Level
(AEGL) or other RfC for acute effects, the tiered screening approach for evaluating potential
acute EGBE exposures uses a MOE methodology, which is frequently used by EPA in TRI
delisting decisions in cases where an EPA RfC for short-term exposures is not available. The
remainder of this section outlines the methodology and results of the acute exposure and MOE
assessment of the potential short-term exposures to EGBE from individual facilities and clusters
of facilities.
As discussed in Section 3.2.1.1, due to the relatively low sensitivity of human red blood
cells to the hemolytic effects of EGBE, acute health effects are not expected to result from
short-term ambient concentrations near EGBE-emitting facilities, and acute effects evaluations
for EGBE have identified nonsystemic eye and upper respiratory tract irritation as the critical
effect. Based on controlled studies of human volunteers, the lowest short-term concentration at
which such irritation effects have been reported is 550 mg/m3 (Carpenter 1956), and no irritation
effects have been observed from exposure to 97 mg/m3 for two hours during light physical
exercise (Johanson et al., 1986). These acute air concentrations of concern are much higher
than the predicted maximum annual average (chronic) air concentrations of EGBE estimated in
Sections 6.3 through 6.5. In fact, the worst-case Tier 2 modeled chronic air concentrations for
individual facilities and clusters of facilities were below these acute air concentrations of concern
by factors of > 3,000 and > 500, respectively. Acute concentrations (typically evaluated based
on maximum 1-hour averages) estimated using EPA tiered modeling are generally expected to
be higher than chronic estimates (maximum annual averages) using the same modeling
approaches. However, acute modeled concentrations that are 500 to 3,000 times greater than
chronic results are highly unlikely.
In addition, a comparison of Tier 2 modeled chronic air concentrations to acute
concentration of concern (i.e. the NOAEL) itself does not likely reflect the full margin of safety as
the NOAEL is based on a 2-hour exposure duration, while acute tiered-modeling results are
68
based on a 1-hour average. A 1-hour-equivalent NOAEL would be 137 mg/m3 (CalEPA 1999),
over 40% higher. There is, therefore, a convincing basis to conclude that adverse acute effects
from EGBE releases in the vicinity of emitting sources are unlikely.
To confirm this conclusion, a tiered screening analysis based on EPA’s tiered modeling
approach for short-term exposures to HAPs (EPA 1992a) was conducted for the 15 TRI facilities
that did not screen out from Steps A & B of the chronic exposures assessment in Section 6.2.
An additional tiered screening evaluation of potential short-term EGBE exposures was also
conducted on the five zip codes evaluated in Section 6.3.1.
6.6.1 Acute Exposure Assessment for Individual Facilities The tiered analysis used for short-term exposures is similar to the methodology
presented for long-term exposures in Section 6.2, except that rather than modeling the
maximum annual average concentrations of EGBE, the short-term modeling estimates
maximum 1-hour concentrations of EGBE. The sections below describe the acute Tier 1 through
Tier 2 screening methodology and results. As all individual facilities screened out at the Tier 2
step, no further refined modeling was required. However, Tier 3 modeling was performed as
part of the margin of safety analysis used for the acute exposure assessment.
6.6.1.1 Tiered Modeling Methodology for Acute Exposures (Individual Facilities) Tier 1 screening for acute exposures was performed for all 15 facilities that did not
screen out at Step B chronic exposure screening. These facilities were among the top 6% of all
facilities in terms of the mass of Certain Glycol Ether air emissions reported to TRI for the 2009,
2010, and 2011 (see Appendix B). These facilities also reported that EGBE made up at least
85% of all Certain Glycol Ethers used at each facility. Because these facilities represent the
highest Certain Glycol Ether emitting facilities and because EGBE is the dominant or only glycol
ether used at these facilities, these facilities offer a reasonable approximation of “worst-case”
facilities.
A Tier 1 lookup table (Table E-1 of Appendix E) again was used to determine maximum
acute (1-hour average) emissions based on distance to fenceline and stack height, consistent
with EPA’s Tiered Modeling Guidance (EPA 1992a). For the acute Tier 1 analysis, the short-
term EGBE emissions rates (in gps) were calculated from facility annual EGBE emissions,
based on the conservative assumption that EGBE releases occurred during a typical 40 hour
work week for 50 weeks per year.
These short-term emission rates were used in combination with the short-term Tier 1
lookup table to determine the maximum point and fugitive 1-hour average (acute)
concentrations (EPA 1992a), consistent with the method described for chronic exposure Tier 1
analysis (see Section 6.3.1). Facility total EGBE point-source releases (in gps) were
conservatively assumed to be emitted from each individual stack, and the maximum short-term
concentration from the Tier 1 short-term lookup table for the individual stacks was
conservatively selected to represent the maximum point-source-related impact for the entire
facility. Fugitive emissions were modeled as a volume source with a release height of 0 meters

69
and a lateral dimension of 10 meters. The release height of 0 meters is more conservative than
the default release height used in the long-term Tier 1 analysis (3 meters), which was based on
a modified version of EPA’s Tier 1 table. This more conservative practice was adopted for
consistency with the EGBE HAP delisting petition (CMA 1997). As such, the short-term
exposure analysis for this petition uses an unmodified version of EPA’s short-term Tier 1 lookup
table (1992a). For the Tier 1 analysis, the maximum acute impact for each facility was derived
from the sum of each facility’s worst-case acute point and fugitive EGBE impacts, consistent
with the chronic Tier 1 modeling (see Section 6.3.1).
Acute exposure Tier 2 modeling was performed for all 13 facilities that did not screen out
using the Tier 1 acute screening analysis. As with the chronic exposure Tier 2 modeling for
individual facilities, the Tier 2 acute exposure modeling used AERSCREEN (EPA 2011a),
which is designed to provide conservative estimates of ambient air concentrations. The same
facility-specific inputs for point and fugitive sources used for the chronic Tier 2 modeling were
used for the acute Tier 2 modeling. However, the acute exposure analysis uses AERSCREEN’s
worst-case 1-hour average ambient air concentration results.
Tier 3 modeling of short-term exposures was carried out using the same general
methodology employed in long-term Tier 3 modeling for longer-term exposures (Section 6.5.2).
The same dispersion model (AERMOD) and site-specific meteorological data were used to
model the same six individual facilities modeled with AERMOD in Section 6.5.2. These six
facilities include the top three ranked facilities from Tier 2 acute analysis, two dominant emitters
in the top three ranked clusters in Tier 2 acute facility cluster evaluation, and the facility
reporting the largest emissions of Certain Glycol Ethers in the TRI from 2009 through 2011. Tier
3 modeling of short-term impacts was performed using the same source parameterization
(assuming realistic emission distribution among stacks). The conservatism associated with
AERMOD modeling is discussed in Section 6.5.4.
6.6.1.2 Acute Tiered Modeling Results (Individual Facilities) The results from the short-term Tier 1 through Tier 3 modeling are presented in
Appendix E. At the most conservative screening level (Tier 1), all but 2 of the 15 facilities had
predicted maximum 1-hour concentrations above the NOAEL for acute irritation effects, 97
mg/m3. The Ball Metal Food Container facility in Williamsburg, Virginia had the highest predicted
1-hour Tier 1 concentrations (1,760 mg/m3 in 2010) from all three years of TRI datav (2009,
2010, and 2011). Predicted 1-hour Tier 1 point-source and fugitive air concentrations are
presented in Table 6-12. With the incorporation of site-specific data and more realistic
accounting of stack emissions in Tier 2 and Tier 3 modeling, the predicted maximum 1-hour
concentrations at all 13 remaining modeled facilities were significantly lower, as expected. The
facility with the highest short-term Tier 2 concentration based on 2009-2011 TRI data the
Crown Beverage Packaging facility in Lawrence, Massachusetts, which had a maximum short-
v Concentrations presented are the sum of the combined maximum predicted 1-hour concentrations, at or beyond the fenceline, for fugitive/volume source emissions and point-source emissions.
70
term concentration of 52.41 mg/m3 (54% of the NOAEL) based on 2009 TRI data (see Appendix
E Table E-4). The maximum predicted 1-hour concentration for the short-term Tier 3 modeling
for this facility was 15.24 mg/m3 in 2009, 13.24 mg/m3 in 2010, and 14.82 mg/m3 in 2011 (see
Appendix E Table E-6). These concentrations represent less than 15% of the acute NOAEL.
The Tier 3 results, presented in Table E-6 (Appendix E), show that maximum 1-hour
concentrations of EGBE at all six facilities are far below the acute NOAEL with an average
predicted facility impact over the three years (i.e., less than 10% of the acute NOAEL.
6.6.2 Acute Exposure Assessment for Clusters of Facilities
6.6.2.1 Tiered Modeling Methodology for Acute Exposures (Clusters of Facilities) Modeling the combined short-term impacts from multiple facilities within the same zip
code was carried out using the same approach used in long-term facility cluster modeling. The
five zip code areas that did not screen out in Step B were subjected to Tier 2 modeling. Short-
term Tier 2 impacts from the five zip codes were estimated using the same screening
meteorological data developed for long-term analysis and AERSCREEN model. As discussed
further in Section 6.6.3, short-term emission rates were estimated using the conservative
assumption that facilities operate for only 40 hours per week and only 50 weeks per year. This
assumption is likely to overestimate the short-term emission rates because the high emitting
facilities are CMI members and CMI reported that member facilities typically operate those
manufacturing processes that use EGBE continuously and year-round.
All five zip codes screened out at Tier 2. Nonetheless, Tier 3 modeling was conducted
as part of the margin of safety analysis of acute exposures associated with clusters of facilities.
Of the three clusters with highest estimated Tier 2 impacts, two zip codes with sufficient site-
specific data were selected for Tier 3 modeling. Tier 3 modeling of short-term impacts for two of
the five zip codes for which sufficient site-specific data was available was performed using
AERMOD and the same type of site-specific meteorological data developed for long-term
analysis.
As with short-term modeling of individual facilities, Tier 2 and Tier 3 modeling was used
the same average annual emission rates originally developed and used in long-term Tier 2 and
Tier 3 cluster modeling. As discussed in Section 6.3.1.3, conservative Tier 2 treatment of stack
emissions assumes that total EGBE stack emissions from a facility are released from a single
stack. More realistic parameterization of stack emissions in Tier 3 accounts for actual
breakdown and proportioning of EGBE emissions among the different stacks at a facility (see
Section 6.4.1).
Maximum acute Tier 2 and Tier 3 impacts from clustered facilities were estimated
following the same methodology used for long-term analysis (Sections 6.4.4 and 6.5.3).
Maximum acute Tier 2 impacts for individual facilities were obtained by conservatively summing
the maximum impacts for the separate volume and the worst-case stack scenarios, and the
maximum cumulative impact for the entire cluster estimated by summing the maximum impacts
from all individual facilities within the same zip code (irrespective of the specific receptor
71
location that each facility’s maximum impacts occurred). In Tier 3, the maximum combined
impact from multiple sources within a facility and the multiple facilities within a cluster were
modeled using AERMOD. As discussed previously, AERMOD allows for the simultaneous
modeling (in a single model execution) of all facilities in the cluster, as well as the modeled
emission sources at each facility.
6.6.2.2 Acute Exposure Tiered Modeling Results (Clusters of Facilities) Acute EGBE impacts from Tier 2 and Tier 3 cluster modeling are presented in Table 6-
13. The highest short-term Tier 2 concentration based on TRI emission data from 2009 to 2011
was 50.9 mg/m3 (for zip code 60609, Chicago IL in 2010). The maximum predicted 1-hour
concentration for the short-term Tier 3 modeling for this same cluster was 14.0 mg/m3, 23.5
mg/m3, and 18.5 mg/m3 for 2009, 2010, and 2011, respectively. The highest of these
concentrations represents less than 24% of the acute NOAEL.
6.6.3 Acute Margin of Exposure (MOE) Assessment The MOE approach used to evaluate the risk of potential acute irritation effects
associated with short-term exposures to EGBE is consistent with previous TRI listing decisions
(e.g., MEK, EPA 1998a; MIBK, EPA 1999c). The MOE was calculated as the ratio of the
NOAEL for acute irritation effects, 97 mg/m3, to the estimated short-term exposure level in the
vicinity of EGBE-emitting facilities. The MOEs for the predicted 1-hour maximum concentrations
for the 13 high-emitting facilities subjected to Tier 2 modeling, and the 6 facilities subjected to
Tier 3 modeling, are presented in Table 6-14.
In each case that EPA applied the MOE approach in TRI listing decisions, EPA identified
a numerical level below which the MOE “is associated with a concern for toxic effects.” This
level is generally expressed as the product of the applicable uncertainty and modifying factors
uncertainty factors that the Agency considers for noncancer toxic effects. A MOE greater than
this level “would generally indicate a low level of concern,” whereas a MOE less than the level
“is judged to be of concern” (MIBK, EPA 1999c). In the case of EGBE’s acute irritation effects,
the MOE determination is based on a NOAEL derived from human data. There is accordingly no
need to apply uncertainty factors for interspecies extrapolation, or for LOAEL-to-NOAEL
extrapolation. An intraspecies uncertainty factor of 10 has often been used to account for
potentially susceptible subpopulations in EPA TRI and other program precedents.
Although the minimum MOE among facilities subjected to the most sophisticated and
realistic modeling ranges from 5 to 46 (Table 6-14), the level of concern is even lower than the
MOE analysis indicates for several reasons. The Standard Operating Procedures for EPA’s
AEGL program (NRC 2001) allow for interspecies uncertainty factors below 10 in some
circumstances, and suggest that an intraspecies uncertainty factor of 3 is appropriate for
substances for which only one or a small number of nonsystemic effects have been
documented. As discussed in Section 3
EGBE’s systemic toxic effects are secondary to hemolysis;

72
because of the relative insensitivity of humans to EGBE’s hemolytic effects, andbecause investigation of potentially sensitive subgroups have consistently failed toreveal increased susceptibility, hemolytic effects—and other systemic effects—are notexpected to occur from short-term exposures near emitting facilities; and
nonsystemic eye and upper respiratory irritation is the sole acute health effect that hasbeen associated with short-term exposures, and this effect is unlikely to dependsubstantially on metabolic, pharmacokinetic or other systemic factors that introducevariability into responses across the exposed human population.
Second, as observed above, the NOAEL for EGBE’s acute irritation effects is based on a
2-hour exposure duration, and a 1-hour-equivalent NOAEL would be 137 mg/m3 (CalEPA 1999),
over 40% higher. Taken together, these two considerations effectively reduce the MOE concern
level from 10 to about 2, a more than a factor of two below the lowest MOE derived from the
reasonable worst-case short-term exposure assessment summarized above (Table 6-14).
Accordingly, there is a persuasive basis for concluding that there is a low level of concern for
acute health effects from EGBE facility emissions.
Finally, short-term emission rates were estimated using the conservative assumption
that facilities operate for only 40 hours per week and only 50 weeks per year. This assumption
is likely to overestimate the short-term emission rates because the high emitting facilities are
CMI members and CMI reported that member facilities typically operate those manufacturing
processes that use EGBE continuously, with little variability year-round. Therefore, actual hourly
emission rates could be as much as four orders of magnitude lower than those used in the
acute assessment.w
6.7 Risk Characterization Conclusions for Potential EGBE Inhalation Exposures None of the facilities that reported non-zero emissions of Certain Glycol Ethers to the air
to TRI during the 2009, 2010, and 2011 reporting years were is associated with maximum
annual average concentrations of EGBE at or above the current IRIS RfC. By subjecting
facilities to the more refined long-term Tier 1, 2, and/or 3 analyses in accordance with EPA’s
(1992a) Tiered Modeling Guidance, this petition has demonstrated that there exists at least a
six-fold margin of safety as a result of the conservative screening procedure employed, not
including the additional margin of safety built into the RfC value itself (see Section 3.1.3).
Additionally, it was demonstrated that EGBE exposures at or above the RfC are not expected to
result from emissions from multiple facilities within a limited geographic area (for this analysis,
within the same zip code). Finally, screening of a subset of facilities with some of the highest
annual EGBE emissions reported to TRI during 2009, 2010, and 2011 demonstrated that short-
term EGBE exposures near facilities reporting Certain Glycol Ethers emissions are also highly
unlikely to be associated sufficient to have resulted in any acute health effects.
w Continuous operations assume more than 4.3 times more hours of operations (and emissions) over the course of the year than the 40 hours per week, 50 weeks per year assumption (8,736 hours vs. 2,000 hours).
73
7.0 SURFACE WATER EXPOSURES AND RISKS Although the 2009, 2010, and 2011 TRI data and the emissions inventory (Appendix B)
indicate that releases to air far exceed releases to all other environmental media combined,
chronic health effects posed by direct releases to water and partitioning to water were also
evaluated. As previously discussed, EGBE (CAS 111-76-2) possesses physical characteristics
that indicate a propensity to remain dissolved in water or to be transported to the water column.
As detailed in Section 3.1, EGBE is readily biodegradable (Price et al. 1974, as cited in ATSDR
1998) and has a relatively short residence time in the environment. Its half-life in both surface
water and soil ranges from 7 days to 4 weeks, while its half-life in groundwater is 14 days to 8
weeks, and its half-life in the atmosphere is approximately 3.3 to 33 hours (Howard et al. 1991,
as cited in ATSDR 1998). EGBE is highly mobile in soil and is unlikely to partition from the water
column to organic matter contained in sediments or suspended solids (Swann et al. 1983). The
volatilization of EGBE from surface water and moist soil is slow (Lyman et al. 1982, as cited in
ATSDR 1998). HSDB (http://toxnet.nlm.nih.gov) reports that an estimated BCF of 3 was
calculated for EGBE, concluding that the potential for bioconcentration in aquatic organisms is
low. In summary, EGBE is miscible in water and has low overall volatility, a limited tendency to
bind to soil and low lipophilicity and thus low bioaccumulation potential. These characteristics
indicate that the majority of EGBE in soil is in the more mobile soil water phase rather than the
solid phase (Section 8.2.2). Thus, EGBE released to soil would be expected to readily move via
surface runoff to surface water.
In light of the fate and transport behaviors of EGBE, this section evaluates potential risks
associated with human exposures to EGBE in surface water. The same methodologies
reviewed and conducted by EPA in the HAPs delisting matter are employed here, with updates
to reflect surface water concentrations based on 2009, 2010, and 2011 TRI release data, the
most recent version of the Mackay fugacity model (EQC v2.02; CEMC 2003), the IRIS RfD, and
current EPA (2004b) guidance for dermal risk assessment. Conservative exposure assumptions
were used to determine potential for adverse effects associated with reasonable maximum
exposure (RME) scenarios.
7.1 Exposure Profiles Because this evaluation is meant to apply broadly to any surface water body used for
recreational and/or potable water (i.e., residential) purposes, all assumptions employed are
purposefully generic and conservative. As such, this profile describes RME scenarios, likely
representing at most a very small proportion of the overall United States population. The bases
for all assumptions presented below are further detailed in Section 7.3.
Under the recreational scenario, three age groups (young children 1 through 5 years of
age, older children 6 through 12 years of age, and adolescents/adults over 12 years of age)
were assumed to swim and play in and around a lake, pond, stream, or river containing an
estimated upper bound EGBE concentration of 0.000376 mg/L (i.e., the exposure point
concentration). While playing and swimming in the water body, recreators were assumed to
74
contact EGBE dermally and through incidental ingestion of surface water. Under the residential
scenario, the same three age groups were assumed to live at a house supplied with tap water
containing the same exposure point concentration of EGBE. Individuals were assumed to
contact EGBE in tap water through drinking water consumption and through dermal contact
while showering and bathing.
The exposure point concentration of EGBE in surface water was developed using the
Mackay III distributional model (EQC v2.02; CEMC 2003), based on 2010 TRI data on
discharges to air, land, and water, as detailed in Section 8.2.2. In brief, it was assumed that all
emissions of Certain Glycol Ethers to air, soil, and surface water throughout the United States
(as reported in the 2010 TRI reports; www.epa.gov/triexplorer) are EGBE.x It was further
assumed that all emissions are concentrated into a 100,000 square kilometer (km2) area
(approximately the size of Ohio), which is the Mackay model’s default unit area (CEMC 2003).
Because emissions of Certain Glycol Ethers to all media were greater in 2010 than in 2009 or
2011, the predicted surface water EGBE concentration using 2010 TRI data (0.000198 mg/L)
was greater than the predicted surface water concentration based on 2009 and 2011 data
(0.000190 mg/L and 0.000193 mg/L). Therefore, the water concentration based on the 20010
TRI data was used as the more conservative estimate of the upper bound concentration of
EGBE in surface water. The implications of increases in EGBE releases in the future are
qualitatively addressed in the Section 9.
7.2 Exposure Equations Potential dermal and ingestion exposures were modeled based on the average daily
intake (ADI), expressed in units of mg/kg BW-day, consistent with EPA (1989, 2004b) risk
assessment guidance. The equations for estimating ADI for each exposure pathway are
presented below. Definitions of variables that remain constant across pathways are provided for
the first pathway only. Parameters that are unique to a pathway are defined for that specific
pathway. While the equation listed below for the ingestion pathway is identical to that used in
the HAPs petition (CMA 1997), the equation listed below for the dermal pathway is updated to
reflect current EPA (2004b) guidance for dermal risk assessment and consequently differs from
that used in the HAPs petition.
Ingestion of Drinking Water/Incidental Ingestion of Surface Water:
Eqn. 4
ADI (mg/kg BW-day) = Cw x IRw x EF x ED x Ao x (1/BW) x (1/AT)
where:
Cw = Concentration of EGBE in water (mg/L)
IRw = Ingestion rate (L/day)
x Releases to air were defined as those reported via On-Site Fugitive Air Emissions and On-Site Point Source Air Emissions. Releases to surface water were defined as those reported as On-Site Surface Water Discharges and releases to soil were defined as those reported as On-Site and Off-Site Land Treatment and Other Land Disposal.
75
EF = Exposure frequency (days/year)
ED = Exposure duration (years)
Ao = Oral absorption factor (unitless)
BW = Body weight (kg)
AT = Averaging time (days)
Dermal Contact with Tap Water/Surface Water While Bathing, Showering, or Swimming:
Eqn. 5
ADI (mg/kg BW-day) = DAevent x EV x ED x EF x SA x (1/BW) x (1/AT)
where:
DAevent = Absorbed dose per event (mg/cm2-event)
EV = Event frequency (events/day)
SA = Skin surface area exposed (square centimeters or cm2)
7.3 Exposure Assumptions Calculation of ADI for the two pathways identified above requires the selection of
exposure parameter values that reflect assumptions regarding individual behavior that results in
contact with EGBE in surface water. All exposure factor values are listed in Tables 7-1 through
7-4 and are further described below. In all cases, exposure factor values were selected with the
objective of describing RME scenarios (i.e., using assumptions that are consistently
conservative in the sense that they significantly overstate the exposures likely to be experienced
by the general population).
Chemical concentration in water (Cw) − The assumed concentration of EGBE in surfacewater, 0.000198 mg/L, is estimated by applying Mackay’s fugacity model to 2010 TRIdata on releases of Certain Glycol Ethers to land, air, and water (assuming that EGBEcomprises 100% of this chemical group), as further described in Section 8.2.2. For theHAPs petition, the assumed concentration of EGBE in surface water was 0.13 mg/L.Given the stronger technical basis for the value applied in this petition, it is likely moreappropriate than that used for the HAPs petition. That said, Section 7.4 explores theeffect that the value used in the HAPs petition has on predicted risks.
Ingestion rate (IR) − Water IR values for both drinking water and incidental events whileswimming from EPA (1989) risk assessment guidance were employed in this analysis.EPA (1989) reports a drinking water IR (IRw) of 2 L/day for adults and older children.Young children are reported to drink 1 L/day of drinking water. For incidental ingestion ofwater while swimming, EPA (1989) reports IRs of 0.13 L/day for all three age groups.The same values were employed in the HAPs petition.
Exposure frequency (EF) − Consistent with EPA (1989) risk assessment guidance, a350 day/year EF was used for residential exposures for all age groups, assuming thatindividuals vacation away from home a total of 15 days/year. For recreational exposures,it was conservatively estimated that a warm climate that would permit swimming ninemonths/year. Therefore, adults and young children were assumed to swim once per

76
week, while older children were assumed to swim three times per week, yielding exposure frequencies of 36 and 108 days/year, respectively. For a cooler climate, these exposure frequencies could also represent a 4.5 month swimming season, in which adults and young children swim twice per week and older children swim six times per week. The same values were employed in the HAPs petition.
Exposure duration (ED) − For both recreational and residential exposures, the ED wasassumed to be 30 years broken down into 5 years as a young child, 7 years as an olderchild, and 18 years as an adolescent and adult. This assumption is similar to EPA (1989)risk assessment guidance and is consistent with the HAPs petition.
Oral absorption factor (Ao) – It was conservatively assumed that 100% of the EGBEingested is absorbed in the gastrointestinal tract. This assumption was employed in theHAPs petition.
Body weight (BW) − EPA (1989) risk assessment guidance provides age-specific BWs of70 kg, 30 kg, and 15 kg for adults and adolescents, older children, and young children,respectively. Although slightly higher (and therefore less conservative) BWs are offeredin more recent EPA (1997b) guidance, the values first proposed by EPA (1989) wereemployed in this analysis for consistency with most other risk assessments and toensure the conservatism of the overall assessment. The same values were employed inthe HAPs petition.
Averaging time (AT) − The AT for noncarcinogens represents the length of time betweenthe first and last exposure, in days. Hence, the ATs for adults and adolescents, olderchildren, and young children were set equal to 6,570 days, 2,555 days, and 1,825 days,respectively. The same values were employed in the HAPs petition.
Event frequency (EV) – Consistent with EPA (2004b) dermal risk assessment guidance,it was assumed that residents take one shower or bath daily. Although residents mayoccasionally take two showers per day, they may also occasionally go without showeringfor a day or shower at places other than their residence. Thus, on average, thisassumption is reasonable and conservative. Recreators are assumed to swim or wadethree times each day that they visit recreational water bodies. When the HAPs petitionwas prepared, EPA guidance for dermal risk assessment did not require characterizationof EV.
Skin surface area exposed (SA) − Age-specific skin surface areas were derived fromEPA (1997b) exposure assessment guidance. Surface areas of 23,000 cm2, 12,914 cm2,and 7,446 cm2 are reported as upper percentile values for adults and adolescents, olderchildren, and young children, respectively. These values are consistent with more recentEPA (2004b) guidance. It was assumed that 100% of the body contacts water duringswimming, showering, and bathing. Skin surface areas applied in the HAPs petition werebased on older EPA (1989) guidance and were slightly lower (i.e., less conservative)than those listed above. The HAPs petition employed surface areas of 20,900 cm2,12,349 cm2, and 7,252 cm2 for adults, older children, and young children, respectively.
Absorbed Dose (DAevent) – Exhibit B-3 of EPA’s (2004b) current dermal risk assessmentguidelines lists a calculated value of 1.8E-6 milligrams per square centimeter (mg/cm2)-event for the absorbed dose of EGBE via dermal contact with water (listed in the exhibitas butoxyethanol-2), assuming a chemical concentration of 1 mg/L in water. Thus, the

77
value of DAevent employed in this risk assessment was 3.6 x10⁻¹⁰ mg/cm2-event, which is the product of the estimated concentration in water (0.000198 mg/L) and the default value listed in Exhibit B-3 (1.8 x 10⁻⁶ mg/cm2-event). When the HAPs petition was prepared, EPA guidance for dermal risk assessment did not require characterization of DAevent.
7.4 Results and Conclusions The exposure factor values were entered into the exposure equations listed above to
yield ADIs for each exposure scenario, as presented in Tables 7-1 through 7-4. The ADIs were
then divided by the IRIS RfD of 0.1 mg/kg BW-day (EPA 2010), to yield pathway-specific hazard
quotients (HQs). Pathway-specific HQs were then summed to yield cumulative hazard indices,
presented in Table 7-5. All HQs are several orders of magnitude below 1, the benchmark of
acceptable hazard specified in the National Contingency Plan (EPA 1990a). Because the ADIs
estimated here represent RME levels, it is likely that the ADIs and HQs in Table 7-5 represent
significant overstatements of exposures and potential health risks for the vast majority of the
United States population. Thus, adverse health effects are not anticipated to result from either
recreational or residential exposures to EGBE in surface water. As shown in Table 7-6, there are three main differences between the methods employed
in the HAPs petition and in this petition to evaluate dermal and ingestion exposures from EGBE
in surface water. First, both the underlying data (i.e., 1993 vs. 2010 TRI release data) and the
model used to estimate the concentration of EGBE in surface water differ, such that the HAPs
petition employed an exposure point concentration of 0.13 mg/L, while this petition uses a value
of 0.00020 mg/L, a value that is 650-fold lower. Because the lower value is based on the latest
release data and the current version of Mackay’s fugacity model, it is expected to be the more
accurate value. Nonetheless, the impact of assuming that surface water contains 0.13 mg/L on
overall hazard estimates is evident by simply multiplying the maximum HQ shown in Table 7-5
(i.e., 0.0001) by 650, which yields a theoretical HQ of 0.08. Because this value is also well
below 1, the assumed exposure point concentration does not affect the overall conclusions of
this risk assessment.
The second main difference between the surface water hazards calculated in the HAPs
petition and in this petition relates to the RfD. In 1997, EPA had not yet completed work on the
IRIS RfD, and accordingly the draft interim value of 3 mg/kg BW-day under review at that time
was employed in the 1997 HAPs petition. Thus, the final IRIS RfD of 0.1 mg/kg BW-day
employed in this petition has a stronger scientific basis and is 30-fold more conservative than
that used in the HAPs petition.
Third, in 1997, the equation typically used to estimate dermal dose differed from that
now recommended by EPA (2004b) dermal exposure guidelines. However, given the much
greater influence of the ingestion pathway over the dermal pathway in terms of the cumulative
hazard, the change in approach to dermal risk assessment has minimal effect on overall
conclusions regarding risk. Nonetheless, the method employed was updated to reflect the
strongest technical basis and current regulatory practice.

78
In conclusion, the three main changes to the approach employed to calculate surface
water hazards reflect the most recent emissions data, and advances in knowledge and practice
related to fugacity modeling, EGBE toxicity, and dermal risk assessment. While these updates
are certainly appropriate for generating more realistic estimates of potential hazards, they do not
substantially change the overall conclusions of the assessment that predicted ingestion/dermal
hazards (as measured by HQs) are well below 1 regardless of the combination of assumptions
employed. Indeed, the maximum surface water HQ predicted in the HAPs petition was 0.007,
while the maximum value predicted in this petition is 0.0001 (Table 7-6).

79
8.0 ECOLOGICAL RISKS A series of ERAs has been prepared for EGBE (CAS 111-76-2), including several ERAs
prepared in the HAPs delisting proceeding. All have concluded that EGBE is not expected to
cause significant adverse environmental effects. Nevertheless, an updated ERA was performed
as part of this petition to account for changes in emissions rates since the mid-1990s, as well as
to incorporate more recent ecotoxicological information. The ERAs conducted for the HAPs
delisting petition are summarized below, followed by a detailed description of the updated ERA
developed to support this petition.
8.1 HAPs Delisting Ecological Risk Assessments Several ERAs were conducted for EGBE in connection with EPA’s review of the petition
to remove EGBE from the CAA HAPs list. The first was prepared on behalf of the Panel as part
of the HAPs delisting petition (CMA 1997). EPA’s Office of Air Quality Planning and Standards
then retained the Cadmus Group to prepare Tier 1 and Tier 2 ERAs. The Tier 1 ERA (Cadmus
2000b) employed extremely conservative point estimates of exposure and effects, while
somewhat less conservative assumptions were used for the Tier 2 ERA (Cadmus 2000a). While
the same general approach was employed in all three ERAs, specific assumptions varied.
Nonetheless, the Panel and the EPA Tier 2 ERAs concluded that EGBE is not expected to
cause significant adverse ecological effects, and the Agency ultimately made the same finding
when it removed EGBE from the CAA HAPs list. The HAPs ERAs for EGBE are summarized
below.
8.1.1 The Panel’s ERA Based on a review of the ecotoxicological literature and an evaluation of the relative
sensitivities to EGBE by many receptors, the Panel’s HAPs ERA (CMA 1997) evaluated two
assessment endpoints: (1) sustainability of aquatic plant communities and (2) sustainability of
small mammal populations.
The Panel’s HAPs assessment used the Mackay Level III model to calculate the
distribution of EGBE in air, water, and soil based on 1996 TRI national emissions. EGBE
releases into the 100,000 km2 area contained within the Mackay model were estimated by
assuming that EGBE represents 50% of all Certain Glycol Ethers releases reported nationally
as (1) point and fugitive air emissions; (2) releases directly to surface water; (3) releases to
publicly owned treatment works (POTWs); (4) onsite land releases; and (5) transfers off site for
disposal. The 1996 releases to air, water, and soil used in the Panel’s HAPs analysis are listed
in Table 8-1.
The Mackay model predicted that the majority of EGBE released to air is deposited to
soil and water, while EGBE released to water and soil tends to remain in those media. The
overall persistence of EGBE in the environment was estimated to be 19 days and losses were
largely attributed to advection and reactions (e.g., degradation). Application of the Mackay Level
80
III model predicted concentrations of EGBE in air, water, and soil (at equilibrium), as shown in
Table 8-2.
The predicted equilibrium water concentration (0.00135 mg/L) was used to evaluate
exposure of aquatic plants to EGBE. Exposure of small mammals to EGBE was estimated
based on EPA’s (1993a) exposure equations for deer mice (Peromyscus maniculatus),
considering direct ingestion of soil, water, and food, resulting in an EGBE dose of 0.203 mg/kg
BW-day for small mammals.
An aquatic TRV was derived from the lowest relevant toxicity value available for aquatic
plants—a 125 mg/L acute no observed effect concentration (NOEC) for growth rate inhibition in
green algae (Dow 1988, Table 3-2). An uncertainty factor of 100 was applied to adjust the acute
NOEC to be representative of chronic effects, because no data were available to clarify the
potential difference in effects between acute and chronic exposures. Therefore, the Panel’s
HAPs assessment (CMA 1997) employed a TRV of 1.25 mg/L for evaluating risk to aquatic
plants.
In the absence of any available studies of EGBE toxicity in wildlife, the small mammal
TRV was derived from the 91-day drinking water study in female Fischer rats, which was also
used in the IRIS assessment that was available at that time (EPA 1999a) to develop the human
oral RfD for EGBE. The chronic LOAEL for this study was 59 mg/kg BW-day (Appendix A-2).y
The rat chronic LOAEL was divided by a uncertainty factor of three to adjust for the absence of
a NOAEL, to derive a TRV of 20 mg/kg BW-day for small mammals (CMA 1997). Dividing the surface water concentration predicted by Mackay Level III modeling
(0.00135 mg/L) by the aquatic TRV (1.25 mg/L) yielded an HQ of 0.0012. For small mammals,
the predicted dose of 0.203 mg/kg BW-day was divided by the TRV of 20 mg/kg BW-day, to
yield an HQ of 0.01. HQs less than 1.0 indicate that ecological effects are unlikely to occur.
Thus, the Panel’s HAPs assessment (CMA 1997) concluded that EGBE was unlikely to pose
significant ecological risk under current or future uses.
8.1.2 EPA ERAs The EPA HAPs ERAs (Cadmus 2000a, b) narrowed the assessment endpoints selected
by CMA (1997) to some degree, selecting the following receptors for their analysis: (1) aquatic
microorganisms in waters receiving atmospheric emissions of EGBE from nearby large sources
and (2) small mammals with home ranges located immediately downwind of large sources of
EGBE emissions. These endpoints are inherently more conservative than those employed by
the earlier Panel assessment because they focus on those organisms that are in the immediate
vicinity of EGBE emissions. EPA employed a tiered approach, wherein the first tier of analysis
was intentionally very conservative. The Tier 1 ERA was not designed to generate a definitive
y The chronic LOAEL used to calculate the RfD differs slightly form the published LOAEL in the original study (82 mg/kg BW-day; NTP 1993) and presented in Appendix A-2 because IRIS (EPA 1999a) used water consumption rates and female body weights measured during the last week of exposure to calculate dose.

81
conclusion regarding potential ecological risks. Rather, it was intended to screen out those
scenarios that clearly do not present concern.
8.1.3 Tier 1 ERA EPA’s application of the Mackay model differed somewhat from that used in the Panel’s
HAPs analysis. In particular, for Tier 1, EPA used the Level I Mackay model to determine the
equilibrium distribution of EGBE in a model environment with 1,000 kg of EGBE emitted to the
air. The Level I model does not account for any advection or degradation reaction losses of
EGBE, and it predicted that more than 99% of the EGBE released to the model environment
partitioned to water. The predicted air concentration was 0.000000423 mg/m3, the predicted
water concentration was 0.000497 mg/L, and the predicted soil concentration was 0.000024
mg/kg (Cadmus 2000b).
Because the assumed EGBE release rate used in the EPA Tier 1 assessment (1,000 kg)
is arbitrary and unrelated to actual releases, the exposure concentrations were scaled as a
function of both the distribution of EGBE determined from the Level I Mackay model and the
predicted maximum annual average concentration of EGBE from the highest emitter in the 1993
TRI. The predicted maximum annual average concentration (0.327 mg/m3) was 773,050 times
greater than the air concentration (4.23 x 10⁻⁷ mg/m3) predicted by the Level I Mackay model
using the arbitrary release of 1,000 kg. The predicted water and soil concentrations were
converted to concentrations that would be in equilibrium with the maximum annual average
concentration at or beyond the fenceline, by multiplying each Mackay Level I modeled
concentration by 773,050. This assumption is unrealistically high by a very large margin
because maximum annual average air concentrations were calculated by assuming no
interchange between EGBE in air, soil, or water. The Mackay model indicates that EGBE
preferentially partitions to soil and water from air, which would dramatically lower maximum
annual average concentrations at or beyond the fenceline. This assumption is also unrealistic
because it does not account for the effect of dilution of air concentrations over time or space.
The concentrations used in the EPA Tier 1 assessment (Cadmus 2000b) are presented in Table
8-2. The equilibrium water concentration listed in Table 8-2 was used to evaluate exposure of
aquatic microorganisms to EGBE. For small mammals, EPA’s Tier 1 ERA used the meadow
vole (Microtus pennsylvanicus) rather than the deer mouse, because the vole’s diet has a higher
proportion of plants and thus would likely have higher exposures to EGBE (Cadmus 2000b). In
addition to dietary and drinking water pathways, the inhalation pathway for small mammals was
evaluated. Exposure factor values and the dose equation were drawn from EPA (1993a) wildlife
exposure assessment guidance, resulting in an estimated dose of 163.8 mg/kg BW-day for the
meadow vole.
The lowest relevant toxicity value identified in the EPA Tier 1 assessment (Cadmus
2000b) for aquatic microorganisms was for the protozoan Endosiphon sulcatum, which
experienced inhibition of cell multiplication following a 72-hour acute exposure to 91 mg/L. An
acute-to-chronic uncertainty factor of 100 was applied to derive a TRV of 0.91 mg/L for aquatic

82
microorganisms. For small mammals, the EPA Tier 1 assessment adopted the same TRV
developed by the Panel, 20 mg/kg BW-day. The resulting Tier 1 HQ for aquatic microorganisms
was 422, while the Tier 1 HQ for small mammals was 8.2. Therefore, EPA concluded that
additional ecological evaluation for both receptors was warranted and proceeded with a Tier 2
ERA.
8.1.4 Tier 2 ERA The EPA Tier 2 ERA (Cadmus 2000a) evaluated the same assessment endpoints and
pathways considered in the Tier 1 ERA; however, several of the unrealistic assumptions used in
the Tier 1 assessment were replaced with more plausible estimates of exposure and effects.
The Mackay Level III model was used to determine the equilibrium distribution of EGBE in a
model environment with 1,000 kilograms per hour (kg/hr) of EGBE emitted to the air. Because
advection and degradation reactions are accounted for in the Level III model, the predicted
equilibrium concentrations were considerably lower than the Tier 1 model predictions. The
predicted air concentration was 5.89 x 10⁻⁵ mg/m3, the predicted water concentration was 6.56 x
10-4 mg/L, and the predicted soil concentration was 1.19 x 10⁻² mg/kg (Cadmus 2000a).
Because the assumed release rate (1,000 kg/hr) was arbitrary, it was again necessary to scale
the predicted concentration based on the maximum annual average concentration predicted
from the 1993 TRI (0.327 mg/m3). The resulting concentrations, listed in Table 8-2, were used in
the Tier 2 exposure assessment.
A water concentration of 3.64 mg/L (Table 8-2) was used to evaluate exposure of
aquatic microorganisms to EGBE. The exposure model for the meadow vole (EPA 1993a) was
used to estimate small mammal exposure to EGBE, yielding an estimated dose of 2.15 mg/kg
BW-day.
For the Tier 2 effects assessment, EPA applied an acute-to-chronic uncertainty factor of
10 to the lowest relevant toxicity value of 91 mg/L, yielding a TRV of 9.1 mg/L for aquatic
microorganisms. For small mammals, the same TRV (20 mg/kg BW-day) used in the Panel ERA
and EPA’s Tier 1 ERA was also applied in the Tier 2 ERA. The Tier 2 HQ for aquatic
microorganisms was 0.40 and the Tier 2 HQ for small mammals was 0.11. Because both HQs
were less than 1, the ERA conducted on behalf of EPA concluded that ecological risks due to
exposure to EGBE are unlikely (Cadmus 2000a). When EPA evaluated these results in the
HAPs delisting determination, it found the water concentration of 3.64 mg/L predicted in the Tier
2 ERA to be a “worst-case estimate” that would not be approached in communities near EGBE-
emitting facilities, “because numerous variables were not taken into consideration that, if
considered, were likely to reduce estimates of EGBE in water” (68 FR 65653 [EPA 2003]).
8.2 Updated ERA For this petition, the previous HAPs ERAs were updated to reflect more realistic
assumptions related to EGBE fate and transport in environmental media, current data on EGBE
releases, and recent publications on EGBE ecotoxicity.

83
8.2.1 Problem Formulation The assessment endpoints selected for this ERA were (1) sustainability of aquatic
populations and communities and (2) sustainability of small terrestrial mammal populations. As
detailed below in the effects assessment, because the aquatic organism TRV was selected
based on the most sensitive aquatic species tested, the first assessment endpoint is considered
protective of all types of aquatic organisms. Thus, it is not necessary to limit this endpoint to
aquatic plants (as had been done in the Panel’s HAPs assessment [CMA 1997]) or aquatic
microorganisms (as had been done in the EPA HAPs ERAs [Cadmus 2000a,b]). As in the
previous ERAs, the selected assessment endpoints were evaluated based on HQs, which are
equal to the ratio of the estimated exposure concentration (or dose) to the TRV.
As in the EPA HAPs analyses, this ERA used meadow voles to represent small
terrestrial mammals, given their expected higher exposures compared to other small mammal
species. The same pathways used in the previous ERAs were also used in this analysis.
Therefore, aquatic organism exposure was evaluated based on estimated surface water
concentrations, and small terrestrial mammal exposure was evaluated based on the same
exposure model used by the EPA HAPs analyses, considering the exposure pathways of
inhalation and direct ingestion of soil, water, and food.
8.2.2 Exposure Assessment The Mackay Level III fugacity model (EQC v2.02; CEMC 2003) was used to estimate the
distribution of EGBE in air, water, and soils based on 2009, 2010, and 2011 TRI release data.
Four types of releases of Certain Glycol Ethers were applied to the model: (1) point and fugitive
air emissions; (2) releases directly to surface water; (3) onsite land treatment and other land
releases; and (4) transfers off site for land treatment and other land disposal. These reported
releases were used to estimate national release rates (in kg/hr) to air, water, and soil. Although
EGBE comprises less than 50% of all ethylene glycol ethers consumed in the United States
(SRI 2010), it was conservatively assumed to make up 100% of Certain Glycol Ethers reported
by TRI as released in 2009, 2010, and 2011. National release rates from 2009, 2010, and 2011
were used to model the distribution of EGBE in air, water, and soil within the modeled area
(100,000 km2). That is, it was assumed that all Certain Glycol Ethers released nationwide in
2009, 2010, and 2011 were actually EGBE and were actually released within an area the size of
the state of Ohio. While these assumptions are clearly conservative, because they are not
arbitrary (i.e., they are based on actual release data), they require substantially less
extrapolation and therefore introduce considerably less uncertainty compared to those applied
in the EPA ERAs. Table 8-1 lists the 2009, 2010, and 2011 release rates used in the model.
With the exception of the updated release rates, input parameter values used in the Level III
model (Table 8-3) were consistent with those used by EPA (Cadmus 2000a). The predicted air,
water, and soil concentrations based on 2009, 2010, and 2011 release rates are presented in
Table 8-2.
Because the equilibrium air, surface water, and soil concentrations were highest in 2010,
all ecological risk assessment calculations were conducted based on the 2010 TRI release data.
84
The predicted equilibrium water concentration (1.98 x 10⁻⁴ mg/L) of EGBE was used to evaluate
exposure of aquatic organisms. Exposure of small terrestrial mammals to EGBE was estimated
based on inhalation and direct ingestion of soil, water, and plants using the same total daily
intake (TDI) equation and input values used by EPA (Cadmus 2000a) for meadow voles:
Eqn. 6
N
i iidietwwaa PCIRIRCIRCTDI1
)()()3(
where:
Ca = concentration of EGBE in air (mg/m3)
IRa = inhalation rate (cubic meters per kilogram body weight per day or
m3/kg BW-day)
Cw = concentration of EGBE in water (mg/L)
IRw = water ingestion rate (kilograms per kilogram body weight per day or
kg/kg BW-day)
IRdiet = total food ingestion rate (kg/kg BW-day)
Ci = concentration of EGBE in diet item i (mg/kg)
Pi = proportion of diet made up by diet item i (unitless)
In this equation, consistent with EPA (1993a) wildlife exposure assessment guidance
and EPA’s HAPs ERA for EGBE (Cadmus 2000a), the inhalation rate was multiplied by three to
account for the inhalation rates derived in the laboratory, rather than from field metabolic rates.
EPA (1993a) guidance recommends adjusting inhalation rates upwards by a factor of two to
three to estimate rates expected in the wild. The values used for each of these parameters are
presented in Table 8-4. The resulting EGBE dose for small terrestrial mammals is predicted to
be 0.029 mg/kg BW-day.
8.2.3 Effects Assessment The toxicity data compiled for aquatic organisms in Table 3-2 were reviewed to
determine whether the TRVs used in the HAPs ERAs warrant updating. Because aquatic
toxicity data are available for a variety of aquatic species representing a range of taxa and
trophic levels (Table 3-2), a species sensitivity distribution approach was used for the aquatic
organism effects assessment. The species sensitivity distribution approach can be used when
toxicity values for the same endpoint (i.e., mortality) are available for a range of species. The
advantage of this approach is that it incorporates all available toxicity data rather than relying on
a single critical study. It is not possible, however, to use a species sensitivity distribution
approach for the terrestrial mammalian effects assessment, because the available laboratory
mammal toxicity data cover many different endpoints, but only a few species. Therefore, this
assessment relies on the same TRV approach to assess potential risks to terrestrial mammals
as used in the Panel and EPA HAPs ERAs. The following two subsections further detail the
effects assessments for aquatic organisms and terrestrial mammals.

85
8.2.3.1 Aquatic Species Effects Assessment Acute toxicity tests have been conducted on a variety of aquatic species (Table 3-2).
Therefore, rather than relying on a single critical study, a species sensitivity distribution
approach is used to assess potential effects to all aquatic organisms. Species sensitivity
distributions have been used in previous ERAs (Solomon et al. 1996, Hall et al. 1998), they are
included in the EPA guidance for ERAs (EPA 1998b), are implicit in EPA’s derivation of ambient
water quality criteria (Stephan et al. 1985, Fisher and Burton 2003), and they are the focus of a
book reviewing their use in ecotoxicology in North America and Europe (Posthuma et al. 2002).
In short, the approach is well tested and well accepted by the scientific and regulatory
communities alike.
Species sensitivity distributions incorporate toxicity data from all species tested for
similar endpoints (e.g., LC50 findings) into a distribution showing the percent of organisms that
are affected at various chemical concentrations. The distribution of toxicity values can then be
easily compared to environmental concentrations to determine the percent of species likely to
be affected at the observed or predicted environmental concentrations.
Acute species sensitivity distributions were compiled from the aquatic vertebrate and
invertebrate values presented in Table 3-2. For consistency across species, the following rules
were adapted from EPA guidance on calculating ambient water quality criteria (Stephan et al.
1985) for selecting toxicity values to incorporate into the acute species sensitivity distribution:
Endpoint – Only LC50 determinations were included.
Exposure duration – With one exception, values derived from 96-hour exposures werepreferred for most species. Per Stephan et al. (1985), 48-hour exposures were preferredfor Daphnia sp. If values derived from 96-hour exposures were not available for a givenspecies, 72-hour or 48-hour exposures were used.
Species weighting – Rather than using the geometric mean of multiple acute values for agiven species to obtain a species mean acute value (in accordance with Stephan et al.1985), each acceptable acute value for a species was retained as a discrete point in thedistribution. Acute values were then weighted by the number of tests per species toaccount for intraspecies variability, using methods described by Duboudin et al. (2004b).
Chronic toxicity values were available for seven species of aquatic vertebrates and
invertebrates (Table 3-2) and the lowest chronic value (7.2 mg/L, rotifer) was greater than the
lowest acute value (5.4 mg/L, grass shrimp). As discussed in Section 3.3 above, questions have
been raised about the validity of the toxicity finding in the grass shrimp. Because the species
sensitivity distribution generated from the chronic toxicity data incorporated fewer species and
did not include values for the most sensitive species from the acute data, a more conservative
approach was used to generate a chronic species sensitivity distribution, as follows.
Duboudin et al. (2004a) present a method for extrapolating chronic species sensitivity
distributions for chemicals with limited chronic toxicity data by using the acute species sensitivity
distributions for vertebrates and invertebrates (Figure 8-1). The acute species sensitivity
distributions are used to calculate means and standard deviations for chronic vertebrate and

86
invertebrate species sensitivity distributions, based on empirical relationships between the acute
and chronic toxicity distributions for 25 representative chemicals (Duboudin et al. 2004a). The
calculated chronic distribution means and standard deviations for vertebrate and invertebrate
species are then used to calculate chronic values from each of the acute toxicity values, thus
populating the chronic species sensitivity distributions for vertebrates and invertebrates (Table
8-5). The calculated vertebrate and invertebrate chronic toxicity values are then combined with
any algae or microbe toxicity data that might be available for the chemical, in order to generate
a chronic species sensitivity distribution representative of all aquatic organisms (Duboudin et al.
2004a). The vertebrate and invertebrate acute species sensitivity distributions and the chronic
species sensitivity distribution for all aquatic organisms for EGBE are presented in Figure 8-2.
The chronic species sensitivity distribution was used to assess effects to aquatic
organisms by using the distribution to determine the EGBE surface water concentration that is
predicted to protect at least 80% of aquatic organisms. Because the acute to chronic distribution
relationship was established using LC50 findings for acute values and NOECs for chronic values
(Duboudin et al. 2004a), the calculated chronic values for aquatic organisms (Table 8-5)
represent predicted NOECs following chronic exposures. Therefore, the 80th percentile of the
calculated chronic species sensitivity distribution represents the concentration at which no
chronic effects (e.g., growth or reproduction) occur in at least 80% of the species tested. The
80th percentile of the no effect distribution was selected for this assessment based on a review
of regulatory precedents to establish minimum acceptable ecological effect levels for remedial
decisions at hazardous waste sites (Suter et al. 1995). Twenty percent was determined to be
the minimum detectable effect level in the chronic and subchronic toxicity tests and field-based
bioassessment protocols that are typically used to detect effects in ecological endpoints (Suter
et al. 1995). One advantage of the species sensitivity distribution approach, however, is that any
percentile can be readily identified and used, depending upon the degree of protection
preferred. For example, ambient water quality criteria are derived based on the 95th percentile of
the acute effect distribution (Stephan et al. 1985, Fisher and Burton 2003), while the 90th
percentile of chronic effect distributions has been used in several ERAs (Klaine et al. 1996,
Solomon et al. 1996, Hall et al. 1998). The 80th percentile of the no effect chronic distribution is
8.7 mg/L (Figure 8-2). While this value is used to evaluate risks to aquatic organisms in Section
8.2.4, the effect of using the 90th and 95th percentiles is also discussed.
8.2.3.2 Mammalian Effects Assessment Several EGBE toxicity studies in laboratory mammals have been released since the last
compilation of toxicity values (ATSDR 1998), but few provide relevant endpoints for ERA
(Appendix A-2). As discussed above, due to its low Kow and relatively short atmospheric half-life,
EGBE released into the environment partitions into surface water (Section 8.1.2, Table 8-3).
Therefore, laboratory mammal toxicity studies focusing on inhalation, injection, or in vitro routes
of exposure do not represent environmental exposure to EGBE for small mammals. The results
from three drinking water studies have been published since the ATSDR (1998) compilation was
issued (Appendix A-2). One is an acute toxicity study on F344 rats where a LOAEL for

87
histopathological effects of 250 mg/kg BW-day is reported after two to four doses (Nyska et al.
2003); the second is from a single dose mortality study with guinea pigs where an LD50 of 1,414
mg/kg BW is reported (Gingell et al. 1998); and the third is from a multigenerational chronic
study with mice where the LOAEL for mortality, growth, and reproductive effects was 10,000
mg/kg BW-day (Lamb et al. 1997). The first two acute studies do not provide an appropriate
representation of environmental exposures to EGBE and all three studies present toxicity values
much greater than the toxicity value that is the basis for EPA’s RfD. In addition, none of the
other oral exposure studies (e.g., oral gavage) provide a more sensitive toxicity value than the
basis for the RfD (Appendix A-2). Therefore, this assessment uses the same small mammal
TRV (20 mg/kg BW-day) applied in the previous HAPs ERAs. However, in light of the Lamb et
al. (1997) study, this TRV is certainly conservative.
8.2.4 Risk Characterization HQs were calculated to evaluate ecological risks using the equation below:
Eqn. 7
TRVExposureHQ
Based on 80th percentile, the HQ for aquatic organisms is 0.00002, indicating that they
are not likely to be at risk from the highly conservative EGBE exposure scenario presented
above. Based on the 95th and 90th percentiles, the HQs for aquatic organisms are 0.00005 and
0.00009, respectively. Similarly, the HQ for small mammals was 0.001, indicating that they also
are not likely to be at risk, even under the conservative assumptions used in this exposure
scenario.
Both calculations reflect a high margin of safety because the HQs are much less
than 1. For example, surface water concentrations would have to be more than 10,000 times
higher than was predicted using the Mackay Level III model in order for exposures to approach
the 80th percentile of the chronic species sensitivity distribution for aquatic organisms. Similarly,
the dose to small mammals would have to be 300 times higher in order for exposures to
approach the mammalian TRV.
The many conservative assumptions used to determine EGBE distribution, toxicity, and
exposure further contribute to the margin of safety provided by this ERA. For example, in the
Level III Mackay model, the total 2010 national emission rates for Certain Glycol Ethers were
applied to a default model area approximately the size of the state of Ohio. Although the
equilibrium distributions based on the 2009 and 2011 national emissions were also modeled,
the equilibrium concentrations from the 2010 were used in the ERA because they were the
highest from the three most recent years. In addition, the modeled area is 100,000 km2 (Mackay
et al. 1992) which is approximately 1.3% of the size of the continental United States. Because
the modeled area is based on a default value, the modeled concentrations are expected to
overestimate actual ambient concentrations, by up to three orders of magnitude.

88
In addition, although EGBE makes up only about half of the ethylene glycol ethers
consumed in the United States, all releases of Certain Glycol Ethers in the TRI were
conservatively assumed to be EGBE. Thus, the ERA was based on the conservative
assumption that EGBE consumption is two-fold higher than most recent data suggest (SRI
2010).. Uncertainty is also potentially contributed to this analysis through the selected TRVs.
The 80th percentile from the calculated chronic species sensitivity distribution was used for the
aquatic organism TRV in this assessment. Although the 80th percentile of the no effect
distribution is believed to be the most appropriate effect level for evaluating population and
community level effects, it is worth noting that using the 95th percentile (2.3 mg/L) or the 90th
percentile (4.2 mg/L) would only slightly increase the HQ for aquatic organisms. In addition,
because the Duboudin et al. (2004a) method for extrapolating chronic species sensitivity
distributions from acute distributions is still being evaluated for a variety of chemicals, it is worth
noting that the TRV derived from the 80th percentile of the chronic species sensitivity distribution
in this analysis is generally comparable to the TRVs used in the HAPs ERAs: 1.25 mg/L (CMA
1997), 0.91 mg/L (Cadmus 2000b), and 9.1 mg/L (Cadmus 2000a). Aquatic HQs calculated
using the TRVs employed by the Panel (CMA 1997) and in EPA’s Tier 1 and 2 assessments
(Cadmus 2000a,b) would be 0.0002, 0.0002, and 0.00002, respectively. Therefore, using any of
the TRVs from the previous ERAs would not significantly change the HQ for aquatic organisms
calculated above.
8.3 Conclusions Potential ecological risks posed by EGBE are the subject of three separate ERAs—the
Panel’s HAPs ERA (CMA 1997), EPA’s HAPs ERA (Cadmus 2000a, b; EPA 2003, 2004a), and
the analysis presented in this petition. Each assessment is consistent with EPA modeling and
exposure assessment guidance and founded on highly conservative assumptions about EGBE
distribution, toxicity, and exposure. The findings of all three assessments support the conclusion
that EGBE does not meet the ecotoxicity listing criteria in Section 313(d)(2)(C). The Panel’s
HAPs analysis found no evidence of risk to aquatic plants or small terrestrial mammals from
EGBE using national emissions data from the 1996 TRI when glycol ether emissions were
almost double their current levels. The EPA HAPs analyses used what the Agency has called
“worst-case” assumptions about EGBE mixing in the environment downwind of the facility with
the highest glycol ether emissions in the country, but nevertheless found no evidence of risk to
aquatic microorganisms and small terrestrial mammals. The updated assessment presented in
this petition blends the most scientifically sound methods and assumptions from the previous
analyses with updated emissions and ecotoxicological data and the more conservative
assumption that EGBE represents 100% of reported releases of Certain Glycol Ethers. Like its
predecessors, this ERA finds no evidence of adverse effects in aquatic organisms or small
mammals from facility releases of EGBE. The margins of safety associated with the HQs
generated in this ERA are sufficiently large to ensure that adjustments to individual input values
(such as those related to the concentration of EGBE in surface water and the TRV) will not

89
change the conclusion of this ERA that EGBE is not expected to cause significant adverse
environmental effects.
90
9.0 SUMMARY AND RATIONALE FOR DELISTING EGBE The case for removing EGBE (CAS 111-76-2) from the EPCRA TRI reporting list is
straightforward and compelling. The available scientific data indicate that EGBE poses a low
potential for adverse human health and environmental effects, thus making an exposure
assessment appropriate under EPA’s interpretation of the TRI listing criteria in Section 313(d)(2)
of EPCRA. This petition uses essentially the same protective health and environmental criteria
and is consistent with the conservative exposure assessment methods that formed the basis of
the Agency’s HAPs delisting decision. Because emissions of EGBE are about half the levels
evaluated in the HAPs delisting decision, EPA’s HAPs findings that EGBE releases may not
reasonably be anticipated to cause any adverse effects to the human health or the environment
have an even stronger basis in the context of this petition.
In addition, the policies and goals of the TRI program would be well served by deleting
EGBE from the EPCRA Section 313 reporting list. EPA’s policy of ensuring consistency with
other Agency decisions should be highly influential here, particularly in light of the confusion—
and the concomitant potential for misdirected community priorities—that currently exists
because EGBE has been found not to be “hazardous” under the CAA but remains on the
EPCRA list of chemicals deemed to be “toxic” based on essentially identical statutory criteria. In
this instance, misdirected local priorities can have real environmental consequences. Because
EGBE is an effective cosolvent for water-based coatings, inks, and similar products, removing it
from the TRI list would eliminate the disincentive that currently exists under EPCRA to its use in
formulations that have substantial VOC-reduction benefits as compared to many other solvents.
9.1 Delisting EGBE Is Fully Consistent with EPCRA’s TRI Listing Criteria as Interpreted by EPA
Section 313(d) of EPCRA calls for the delisting of a chemical where “there is not
sufficient evidence to establish” that the chemical “is known to cause or can reasonably be
anticipated to cause” any of three types of effects:
(A) significant adverse acute human health effects;
(B) (i) cancer or teratogenic effects, or (ii) serious or irreversible reproductive dysfunctions, neurological disorders, heritable genetic mutations, or other chronic health effects; or
(C) a significant adverse effect on the environment of sufficient seriousness, in the judgment of the Administrator, to warrant reporting under EPCRA.
As EPA has interpreted these criteria (59 FR 61432 [EPA 1994a]), exposure may be
considered for chronic human health and environmental effects if a substance exhibits “low to
moderately low toxicity based on a hazard assessment,” so that “unrealistic exposures would be
necessary for it to pose a risk to communities.” As detailed in the qualitative hazard evaluation
presented in Section 3 above and summarized in Table 9-1, EGBE’s potential to cause adverse

91
human health or environmental effects is appropriately assessed as low under EPA’s hazard
assessment criteria for TRI listing determinations.
With respect to potential adverse chronic human health effects, EPA has determined
that hemolysis is the critical effect, and that prevention of hemolysis will protect against any
other systemic effect potentially associated with EGBE exposure (Section 3.2). The scientific
data show, moreover, that humans are resistant to the hemolytic effects of EGBE (Section
3.2.1.3). The PBPK model used in the IRIS assessment (Corley et al. 1994) predicts that, even
in humans exposed continuously by inhalation to an EGBE-saturated atmosphere, maximum
blood concentrations of EGBE’s toxic metabolite (BAA) would be well below the level needed to
produce hemolysis in humans (Udden 2002, EPA 2010). Likewise, even minor prehemolytic
effects are not expected to occur in humans from ingestion exposures in excess of 500 mg/kg
BW-day. Such inhalation and ingestion doses are not realistically expected to occur in the
vicinity of EGBE-emitting facilities, where empirical and modeling-based estimates of air and
surface water concentrations are many orders of magnitude below such exposures. (See
Section 3.4.1 and Table 9-1).
EGBE’s potential to cause significant adverse ecological effects is likewise appropriately
evaluated as low under EPA’s TRI hazard assessment criteria and past listing decisions. EGBE
exhibits low potential for persistence or bioaccumulation (Section 3.1). Consistent with the
findings of a series of ecotoxicity reviews of EGBE (WHO 1998, 2010, Staples 1998, Devillers et
al. 2002, Environment Canada 2002, INERIS 2006), EPA concluded in the HAPs delisting
rulemaking that EGBE causes only “very minor” effects that “are unlikely to be ecologically
significant” (68 Fed. Reg. 65657 [EPA 2003]). In addition to the absence of any impacts on
ecosystems, the scientific data indicate that EGBE’s limited adverse effects on aquatic
organisms occur only at what EPA’s TRI listing criteria consider to be high exposures, meaning
that EGBE is properly evaluated as a low-toxicity chemical in terms of potential environmental
effects (see Sections 3.3 and 3.4.2; Table 9-1). Because EGBE “is of low toxicity and unrealistic exposures would be necessary for it to
pose a risk to communities,” EPA’s interpretation of EPCRA’s TRI listing criteria calls for the
consideration of exposures in determining whether to grant this petition and delist EGBE (59 FR
61442 [EPA 2004a]). Potential human and environmental exposures to EGBE were studied
intensively by EPA in the HAPs rulemaking. There, EPA stated it was “confident” that “the
results are more likely to overestimate rather than underestimate true exposures and risks” and,
accordingly, determined that “the potential for adverse human health and environmental effects
to occur from projected exposures is sufficiently low to provide reasonable assurance that such
adverse effects will not occur” (68 Fed. Reg. 65660 [EPA 2003]). As summarized in Table 9-2,
there is an even stronger basis for making this finding here.
Specifically, the general approach and specific assumptions employed in the exposure
assessment presented here (Sections 4 through 8) are consistent with those that the
Administrator’s HAPs delisting decision found to be appropriate and conservative. EPA
determined in the HAPs delisting proceeding (68 FR 65651-52) that the EPCRA TRI database
“provide[s] a reasonable representation of … EGBE emissions” and “an adequate basis for
92
dispersion modeling and … exposure assessment.” Accordingly, nationwide exposure potential
is assessed in Section 5 by developing an inventory of Certain Glycol Ether releases using
2009, 2010, and 2011 TRI data, applying the assumption, in the absence of facility-specific
information to the contrary, that EGBE represents 100% of reported glycol ether releases. More
importantly, because this petition is based on current TRI data showing that emissions have
declined by more than half from the 1993 TRI data used in the HAPs delisting rulemaking,
predicted exposures have fallen substantially from the levels EPA evaluated in the HAPs
context.
As described in Section 6, every EGBE-emitting facility listed in the TRI database has
been subjected to a screening process very similar to that used in the HAPs proceeding to
determine whether any facility has the potential to have maximum annual average
concentrations of EGBE greater than the IRIS RfC of 1.6 mg/m3 at or beyond the fenceline.
Despite the highly conservative assumptions used in the screening, no EGBE-emitting facility
was found to have potential maximum exposures above the RfC. AERMOD modeling conducted
to test the conservatism of the screening step predicts that the maximum annual average
concentrations are likely to be approximately two orders of magnitude below the RfC (see
Section 6.5). Similarly, potential cumulative impacts from clusters of smaller sources are
separately evaluated in Sections 6.4 and 6.5 using a methodology more conservative than that
used in the HAPs proceeding, and the results show predicted maximum annual average
concentrations of EGBE resulting from clusters of smaller sources within the same zip code are
well below the RfC. The key findings of the facility and cluster assessments appear in Table 9-2. In addition to screening facilities for long-term exposures to EGBE, we also evaluated
the potential for short-term exposures near EGBE-emitting facilities to cause acute human
health effects, viz., eye and upper respiratory tract irritation, which has been identified as the
critical effect for short-term exposures. As discussed in Section 3.2.1.1, above, because of the
relatively high insensitivity of human red blood cells to the hemolytic effects of EGBE, the lowest
short-term exposure level at which such irritation effects have been reported is 550 mg/m3, and
no irritation effects have been observed at 97 mg/m3. These concentrations are higher than the
maximum annual average concentrations estimated above based on EPA modeling guidelines
by factors of >3,000 and >500, respectively. There is, accordingly, a convincing basis to
conclude that adverse acute effects from EGBE facility releases is unlikely. Nevertheless, six
high-emitting facilities offering a reasonable approximation of “worst-case” acute exposures
were screened using EPA’s short-term modeling methods for HAPs (EPA 1992a). The results
were evaluated against the NOAEL of 97 mg/m3 in a MOE analysis. Predicted maximum 1-hour
concentrations at or beyond the fencelines of all six facilities screened were far below the
NOAEL based on Tier 2 and 3 modeling, with Tier 3 MOEs ranging from 25 to 198. These
results, presented in Section 6.6 and summarized in Table 9-2, are more than adequate to
support a finding that EPCRA’s acute effects delisting criterion is met, because the NOAEL is
derived from human data meaning, in accordance with EPA TRI listing decisions, that MOEs
above 10 “indicate a low level of concern” for potential acute effects. As developed in Section

93
6.4, several additional considerations suggest strongly that the potential for acute effects is far
lower than the MOE analysis indicates.
This petition also evaluates the potential for chronic health effects posed by human
contact with EGBE in surface water, based on essentially the same conservative assumptions
and models that EPA used in the HAPs evaluation, with updates to reflect: the estimated
surface water concentration based on 2009, 2010, and 2011 TRI data, the current RfD, and
changes in EPA (2004b) guidance for dermal risk assessment. As developed in Section 7, the
worst-case dose—for residents that consume and bathe in impacted water year-round for 30
years—was estimated to be 0.00001 mg/kg BW-day. Dividing the dose by the RfD yields an HQ
of 0.0001 (see Table 9-2).
To assess potential adverse environmental effects, Section 8 builds on the three ERAs
conducted in the HAPs proceeding by applying 2009, 2010, and 2011 TRI data to the Mackay
Level III fugacity model to yield updated estimates of the maximum surface water concentration.
Applying an updated TRV for aquatic organisms identified in a supplemental review of the
ecotoxicity literature for EGBE, the ERA presented in this petition predicts HQs of 0.00002 for
aquatic organisms and 0.001 for small mammals. (See Table 9-2.)
The results of these assessments show that estimated EGBE exposures in the vicinity of
emitting facilities anywhere in the United States are well below the IRIS RfC and RfD for
inhalation and dermal/ingestion exposures as well as appropriate ecological TRVs. All HQs
generated by the exposure assessments developed for this petition are well below 1.0 and even
lower than the HQs that led EPA to find in the HAPs delisting proceeding that releases of EGBE
may not reasonably be anticipated to cause adverse human health or environmental effects.
Because this petition uses assessment methods consistent with those EPA found appropriate
and conservative in the HAPs case, there is an even stronger basis for making the same
determination here.
9.2 Substantial Conservatism is Incorporated into Every Primary Element of the Toxicological, Exposure, and Ecological Assessments Presented in this Petition
The HQs estimated in this petition are overstated by at least three to five orders of
magnitude because of the substantial conservatism built into every principal part of HHRA and
ERA presented here, as summarized in Table 9-3 and discussed below.
9.2.1 IRIS Reference Values In general, IRIS reference values are conservative criteria establishing a “daily exposure
to the human population, including sensitive subgroups, that is likely to be without an
appreciable risk of deleterious effects during a lifetime” (EPA 2010). As discussed in Section 4.2
above and summarized in Table 9-3, the specific IRIS RfC and RfD values that EPA derived for
EGBE should provide ample protection against acute human health effects and reflect several
significant elements of conservatism that likely render them significantly lower than necessary to
protect against chronic health effects.

94
First, both the RfC and RfD were based on hemolytic effects in rats and, although the
available data indicate that humans are 100 times less sensitive to the hemolytic effects of
EGBE (see Section 3.2.1.3), the IRIS assessment uses interspecies uncertainty factors of 1
(ingestion) and 3 (inhalation) in deriving the reference values. The IRIS values therefore may
reflect an additional safety margin of 100 to 300, and the available scientific data suggest that
they may be far below exposure levels that would be fully protective of human health (EPA
2010).
Second, both the RfC and RfD incorporate an intraspecies uncertainty factor of 10 (EPA
2010). This factor is probably unnecessarily high by a factor of 3 to 10, because investigations
of population groups that might be expected to show increased sensitivity to hemolytic effects of
EGBE (including the young, the old, and individuals with sickle cell anemia or hereditary
spherocytosis) do not show increased susceptibility.
Third, although the RfC is developed to be protective of continuous exposures over a
human lifetime, the air concentrations that are compared to the RfC in the analysis are
maximum predicted annual average concentrations. Concentrations averaged over a 70-year
lifetime would be expected to be considerably lower than maximum annual averages, although
the degree of conservatism contributed by this assumption cannot be quantified.
Finally, although the 2010 IRIS assessment finds “limited” evidence of potential
carcinogenicity from rodent studies, subsequent mechanistic studies have led EPA to conclude
that, even if the limited tumor findings in rodents are relevant to humans, the current RfC and
RfD provide adequate protection against any such risk. Therefore, any uncertainties relating to
the limited animal carcinogenicity data evaluated in the IRIS assessment have been eliminated
and should not be significant considerations in an up-to-date assessment of human health risks.
9.2.2 Exposure Assessments As developed in Sections 5, 6, and 7 of this petition and as summarized in Table 9-3, the
models and assumptions used in the human inhalation and surface water exposure
assessments presented in this petition reflect several significant elements of conservatism.
First, the inventory developed here (Section 5) assumes that all releases of Certain
Glycol Ethers reported in the TRI database are EGBE, unless facility-specific information to the
contrary is available. Because EGBE comprises 52% of United States annual consumption of
glycol ethers (SRI 2010), the inventory’s assumption that all releases of Certain Glycol Ether are
EGBE (in the absence of facility-specific information to the contrary) generally overstates EGBE
releases by a factor of two.
Second, the chronic screening approach used in this petition (Section 6) predicts
maximum annual average concentrations of EGBE for every emitting facility in the United States
required to file Form R reports under TRI. Similarly, the acute screening approach predicts the
maximum 1-hour average concentration of EGBE at facility fencelines. As EPA observed in the
HAPs proceeding, the “use of the maximum annual average ambient concentration for each
emission source to characterize the exposed population provides a conservative approach to
chronic exposure modeling” and “[g]iven the likely proximity of inhabitable areas and the

95
variability of human activity patterns over an annualized time period, it is our expectation that
actual maximum individual exposure would be at least a factor of 2 less than predicted by the
models” (68 FR 65653 [EPA 2003]).
Third, the conservatism built into the screening procedure is evident when a subset of
those facilities that screened out at Step B was subjected to Tier 1, 2, and/or 3 analyses. On
average, the maximum annual average concentrations decreased by 99.3% when the same
facility that was first evaluated under Step A was subsequently evaluated under Tier 3. That is,
the maximum predicted annual average concentration generated under the more robust Tier 3
modeling was more than two orders of magnitude lower than that generated by the most
conservative Step A screen. The Step B screen yielded maximum predicted annual average
concentrations that were, on average, more than 26-fold higher than those generated using Tier
3 modeling.
Fourth, our assessment of potential acute health effects, based on (1) the NOAEL of 97
mg/m3 derived from human data and (2) the estimated reasonable worst-case estimated
maximum hourly average concentration, resulted in acute MOEs of over 5. An MOE above 5 is
protective because the NOAEL is based on human data, EPA AEGL guidance calls for an
interspecies uncertainty factor from 3 to 10 for nonsystemic irritation effects, and an appropriate
time-adjustment would support an estimated 1-hr NOAEL of 137 mg/m3, over 40% higher that
the value used in the MOE derivation.
Fifth, EPA found that the modeling and assumptions used to assess ingestion and
dermal exposures arising from EGBE in surface water levels were conservative and the
maximum exposure estimates developed using the Agency’s model, shown in Table 7-5,
represents a worst-case exposure scenario (68 FR 65653-54). In addition, exposure point
concentrations in surface water were calculated by assuming that 100% of releases of Certain
Glycol Ethers to all media were EGBE and were concentrated into 100,000 km2. In reality,
because EGBE represents 52% of the market share of ethylene glycol ethers, actual releases of
EGBE are likely overestimated by two-fold. Because the 100,000 km2 unit area represents 1.3%
of the total land area of the United States, actual concentrations may be overestimated by up to
two orders of magnitude.
9.2.3 Ecological Risk Assessment The ERAs previously conducted in the HAPs delisting proceeding and the updated ERA
prepared for this petition conclude that EGBE concentrations are three or more orders of
magnitude lower than highly protective levels of ecotoxicological concern (Section 8). In
addition, EPA noted in the HAPs delisting decision that the TRVs used in the ERA “were derived
from very minor effects which were unlikely to be ecologically significant” (68 FR 65657 [EPA
2003]).
As noted above, the exposure point concentrations in surface water are likely
overestimated by up to 150-fold, due to the assumptions that 100% of releases of Certain Glycol
Ethers to all media are EGBE and are concentrated into 100,000 km2 (an area that is
approximately 1.3% of the area of the United States). Conservative exposure assumptions

96
applied to the TDI calculation for small mammals are consistent with those employed in EPA’s
HAPs ERAs. Conservatism is also contributed by the TRVs for aquatic species (based on the
most sensitive organism tested), and small mammals (based on the same underlying study
used to generate the RfD, which may be too low by a factor of 50 to 100). Finally, as EPA found
in the HAPs delisting decision, the evaluation of relatively nonsevere effects on individual
organisms rather than effects that are likely to be ecologically significant at more complex levels
of organization (population, community, ecosystem) contributes substantial conservatism to the
ERA.
As summarized in Table 9-3, the above considerations, taken together, indicate that the
already low HQs derived in Sections 6 through 8 and summarized in Table 9-2 may overstate
potential chronic health and environmental risks of EGBE releases by as much as two to five
orders of magnitude. Accordingly, the toxicity, exposure, and ecotoxicity assessments
presented in this petition support an even higher level of confidence than EPA expressed in the
HAPs delisting decision for the conclusion that there is “reasonable assurance” that “adverse
human health and environmental effects” from EGBE facility emissions “will not occur.”
9.3 In Light of the HAPs Delisting Decision, EPA’s Policy of Ensuring Consistency with Other Agency Decisions Supports Removal of EGBE from the TRI Reporting List
EPA has emphasized the need to ensure that TRI listing decisions are consistent with
“other EPA decisions on the same chemical, to the extent that such decisions relate to the same
basic criteria for human health and the environment” (52 FR 5481 [EPA 1987a]). A policy of
maintaining consistency across different environmental programs has long been in place at
EPA, because it is essential to maintain the Agency’s credibility as a scientific and regulatory
body. But it has special significance here because, as developed below, the conclusion that
EGBE should be removed from the TRI reporting list follows directly from the findings the
Administrator made recently in the HAPs delisting.
CAA Section 112 calls for the removal of substances from the HAPs list where EPA finds
that “there is adequate data on the health and environmental effects of the substance to
determine that … the substance may not reasonably be anticipated to cause any adverse
effects to the human health or adverse environmental effects.” By its plain language, Section
112 places a higher burden on delisting decisions than does EPCRA Section 313. EPCRA calls
for delisting where “there is not sufficient evidence to establish” that a chemical “can reasonably
be anticipated to cause” the designated health and environmental effects. Section 112, in
contrast, requires more than a finding that the data are “not sufficient” to establish the stated
health and environmental findings. Section 112 requires “adequate data” “to determine that …
the substance may not reasonably be anticipated to cause” adverse health or environmental
effects.
Moreover, Section 112 requires a showing that a substance may not reasonably be
anticipated to cause “any adverse effects to the human health.” The CAA finding clearly
encompasses the EPCRA human health delisting criteria in Section 313(d)(2)(A) & (B), which
are limited to the specific health effects mentioned in the statute. Likewise, Section 112 requires

97
a demonstration that the substance to be delisted may not reasonably be anticipated to cause
“adverse environmental effects,” a test that is at least as broad, if not broader, than EPCRA
Section 313(d)(2)(C), which refers to “a significant adverse effect on the environment of
sufficient seriousness … to warrant reporting under this section.”
In short, the Administrator’s finding under Section 112 that EGBE “may not reasonably
be anticipated to cause any adverse effects to the human health” or “adverse environmental
effects” should be given at least heavy weight in applying the EPCRA delisting criteria to this
petition unless, of course, significant changes in the relevant scientific and other data indicate
that potential adverse human health and ecological risks are significantly greater than EPA
found in 2004. This petition demonstrates that any such risks are far lower.
As demonstrated above, this petition is based on essentially the same exposure
assessment methodology and ecological criteria that formed the basis for EPA’s HAPs findings.
The only significant differences between the scientific and factual record the Agency evaluated
in the HAPs proceeding and the demonstrations made here are updates to human health
criteria and use of the most recent TRI data available. Despite (i.e., 1%) growth in consumption
since 1990 (SRI 2010), EGBE emissions have declined significantly as compared to the 1993
TRI data considered in the HAPs case, principally as a result of VOC emission control
regulations and other environmental programs. Although the toxicity criteria have changed due
to refinement of the data and modeling procedures used by EPA in deriving its RfD and RfC, as
shown in Table 9-3, these criteria incorporate substantial levels of conservatism. Furthermore,
the greater stringency in the toxicity criteria is more than balanced by the reduction in emissions
and resultant human exposure such that predicted risks have decreased since the HAPs
evaluation.
The human and environmental exposures conservatively estimated here are significantly
lower than those EPA found appropriate to delist EGBE under Section 112. Consequently,
EPA’s determinations in the HAPs delisting proceeding, that EGBE releases “may not
reasonably be anticipated to cause any adverse effects to the human health” or “adverse
environmental effects,” have an even stronger scientific and factual basis in the context of this
petition under EPCRA. Further, the concurrent increase in consumption (+1%) and decrease in
emissions (-70%) since 1993 suggests that the scientific basis for these findings would not be
undermined even if current consumption and emission patterns of EGBE are taken into account.
9.4 Removing EGBE from the TRI Would Promote the Local Risk Management and Pollution Prevention Objectives of EPCRA
The purposes of EPCRA are to “to inform persons about releases of toxic chemicals to
the environment; to assist governmental agencies, researchers, and other persons in the
conduct of research and data gathering; [and] to aid in the development of appropriate
regulations, guidelines, and standards” (42 U.S.C. § 11023(h)). Thus, the EPA TRI website
(http://www.epa.gov/tri/whatis.htm) describes the objectives of the program as follows:
One of Emergency Planning and Community Right-to-Know Act (EPCRA)’s primary purposes is to inform citizens of toxic chemical

98
releases in their areas. EPCRA Section 313 requires EPA and the States to collect data annually on releases and transfers of certain toxic chemicals from industrial facilities and make the data available to the public through the Toxics Release Inventory (TRI)…..The goal of the Toxics Release Inventory Program is to provide communities with information about toxic chemical releases and waste management activities and to support informed decision making at all levels by industry, government, non-governmental organizations, and the public.
EPA has indicated elsewhere (59 FR 61443) that “[b]y listing chemicals that present a
hazard and providing TRI data on these chemicals to the public, EPA allows the public to make
the determination as to whether there is a risk in their community.” As this passage indicates,
the dissemination of accurate information on “chemicals that present a hazard” is critical to the
success of the TRI program. An inventory that includes nonhazardous chemicals, particularly
high-volume chemicals like EGBE, undermines the statutory goals by diverting the attention and
resources of the public, regulatory officials, and researchers away from facilities and chemicals
that should be the focus of local risk management and pollution prevention programs.
These considerations are significant in the case of EGBE. Many EGBE-using facilities,
particularly can manufacturing plants, do not release reportable quantities of other TRI
chemicals, including other chemicals in the “Certain Glycol Ethers” category. Nevertheless, as
long as EGBE remains on the TRI, many of these facilities will continue to routinely appear on
local and regional lists of “top toxics emitters” even though EPA has found that EGBE releases
may not reasonably be anticipated to cause adverse human health or environmental effects.
The contradictory signals that EPA is sending to local communities are confusing, undermine
the credibility of the TRI program as a reliable source of information on toxic releases, and
unfairly brand some EGBE-using facilities as major sources of “toxics.”
VOC control considerations also support the delisting of EGBE from the TRI. Although it
is now settled that EGBE’s status as a VOC is not a sufficient basis for keeping it on the TRI
reporting list,z facilities emitting EGBE remain subject to national and state/local emissions
reporting and control programs under the ozone attainment provisions of Title I of the CAA. In
fact, when EPA removed EGBE from the CAA HAPs list, it emphasized that it “will continue to
be … regulated under EPA’s criteria pollutant (ozone) program (69 FR 69321 [EPA 2004a]).aa
Accordingly, removal of EGBE from the TRI reporting list should not adversely affect ozone
attainment programs under Title I of the CAA.
Delisting EGBE may assist in achieving objectives of Title I. VOC emission control has
long been a bedrock of EPA’s ozone attainment strategy, particularly in consumer and
z American Chemistry Council v. Whitman, 406 F.3d 738, 742 (D.C. Cir. 2005).
aaEPA also indicated in the same passage that EGBE would continue to be listed on the TRI, but at that time the Agency continued to adhere to the position, since reversed on judicial review, that EGBE’s status as a VOC is an adequate basis for listing on the TRI.

99
commercial products (EPA 1995, 2007). Although EGBE is a VOC, its physical characteristics
support its use as a cosolvent for water-based formulations in many consumer and commercial
coating products. In some applications, the switch to waterborne solvent formulations may
reduce solvent content from up to 80% of the formulation to as little as 2% to 10%. EPA has
often recognized that waterborne formulation, where commercially feasible, can contribute
significantly to the ozone attainment objectives of the CAA. As recently as July 2007, the
Agency emphasized that “water-based coatings are an environmentally friendly technology that
we do not want to be lost as an option to manufacturers” (72 FR 38966 [EPA 2007]). EPA also
has acknowledged that “it is important that manufacturers retain as much flexibility as possible”
in developing reformulations that reduce the ozone-forming potential of their products while
continuing to “meet the performance specifications required” (ibid.). The Agency has
recognized, accordingly, the need to avoid regulatory measures that needlessly discourage
manufacturers from using “environmentally friendly technologies” or unintentionally encourage
the public, local regulators and manufacturers to use other solvents that may be toxic or highly
reactive compounds that actually generate more ozone (ibid.).
As mentioned above, the primary goal of the TRI program, as EPA has put it, is to
“empower” citizens and local regulators to “hold companies accountable” for releases of toxic
chemicals, and to “make informed decisions about how toxic chemicals are to be managed.”
Maintaining EGBE on the TRI, particularly after the Agency has concluded that facility releases
are not hazardous to human health or the environment, invites confusion and the concomitant
potential for local decisions that actually impede the ozone attainment goals of Title I of the
CAA. Conversely, removing EGBE from the TRI would eliminate an existing impediment to the
replacement of solvent-based products with EGBE/water-based solvents with the potential to
significantly lower overall VOC emissions. In short, as long as EGBE remains on the TRI, the
Inventory cannot achieve its fundamental objective of providing accurate information that will
enable business, regulators and the public to make environmentally sound decisions.
Significantly, the possibility of future increases in EGBE consumption—whether as a
continuation of current favorable trends in favor of water-based solvents as a result of the
removal of EGBE from the TRI reporting list or for other reasons—would not cast doubt, now or
in the future, on the conclusion that facility releases of EGBE may not reasonably be anticipated
to cause any adverse human health or adverse environmental effects. As discussed in Section
2.5, VOC emission limits, together with other potential factors such as corporate product
stewardship programs, are likely responsible for the substantial (about 70%) reduction in EGBE
emissions since the mid-1990s even while annual consumption increased through the 1990s
and early 2000s (Figure 2-1). More recently, the national consumption of EGBE has stabilized
and even declined. These factors keep to a minimum the potential for increased community
exposures to EGBE in the future even if production or consumption rise in response to its
removal from the TRI reporting list or for other reasons. In any case, the substantial
conservatism built into very significant element of the toxicological, exposure, and ecological
assessments presented in this petition—as measured by the two-to-five orders of magnitude
overstatements in the HQs presented in Tables 9-2 and 9-3 above, render theoretical any

100
concern that future increases in EGBE production or consumption might justify a reevaluation of
the determination that facility releases of EGBE may not reasonably be anticipated to cause any
adverse human health or adverse environmental effects.
In conclusion, removing EGBE from the TRI reporting list is called for under the listing
criteria of EPCRA Section 313(d)(2) as interpreted by EPA, is necessary to ensure consistency
with other EPA programs (particularly the HAPs program), and would promote the objectives of
the statute by encouraging increased use of a chemical with demonstrated environmental
benefits without interfering with other federal or local environmental programs and policies.
Accordingly, the Panel respectfully requests that the Administrator grant this petition and
remove EGBE from the TRI reporting list.
101
10.0 REFERENCES ACGIH. 1991. Documentation of the Threshold Limit Values and Biological Exposure Indices.
Sixth Edition. American Conference of Governmental Industrial Hygienists, Cincinnati, OH. 162-163. (As cited in ATSDR 1998.)
ACGIH. 2003. 2-Butoxyethanol. In: Documentation of the TLVs and BEIs with Other Worldwide Occupational Exposure Values, 2004 CD-ROM. American Conference of Governmental Industrial Hygienists, Cincinnati, Ohio.
ACGIH. 2012. Threshold Limit Values for Chemical Substances and Physical Agents and Biological Exposure Indices. American Conference of Governmental Industrial Hygienists, Cincinnati, Ohio.
Amoore, J.E. and E. Hautala. 1983. Odor as an aid to chemical safety: Odor thresholds compared with threshold limit values and volatilities for 214 industrial chemicals in air and water dilution. J. Appl. Toxicol. 3(6):272-289. (As cited in ATSDR 1998.)
Assessment Technologies, Inc. 1996. Ethylene Glycol mono-Butyl Ether (EGBE): An Environmental Risk Assessment – Final Report. Fairfax. VA. December 4.
ASTER. 1995. ASTER (Assessment Tools for the Evaluation of Risk) Ecotoxicity Profile: Ethanol, 2-Butoxy. Duluth, MN: Environmental Research Laboratory, United States Environmental Protection Agency. February 17, 1995. (As cited in ATSDR 1998.)
Atkinson, R. 1987. A structure-activity relationship for the estimation of rate constants for the gas-phase reactions of OH radicals with organic-compounds. Intern. J. Chem. Kin. 19(9):799-828. (As cited in ATSDR 1998.)
ATSDR. 1998. Toxicological Profile for 2-Butoxyethanol and 2-Butoxyethanol Acetate. Agency for Toxic Substances and Disease Registry, U. S. Department of Health and Human Services, Public Health Service. Atlanta, Georgia. August.
Bartnik, F.G., A.K. Reddy, G. Klecak, V. Zimmermann, J.J. Hostynek, and K. Kunstler. 1987. Percutaneous absorption, metabolism, and hemolytic activity of n-butoxyethanol. Fundam. Appl. Toxicol. 8:59-70.
Boatman, R.J. 2004. Review of studies concerning the tumorigenicity of 2-butoxyethanol in B6C3F1 and its relevance for human risk assessment. Journal of Toxicology and Environmental Health 7(5):385-398.
Cadmus. 2000a. A Tier II Ecological Risk Assessment for Air Emission of Ethylene Glycol Butyl Ether. March 13, 2000, Prepared by The Cadmus Group, Inc. for U.S. Environmental Protection Agency Office of Air Quality and Planning Standards, Research Triangle Park, NC 27711.
Cadmus. 2000b. Ecological Risk Assessment for Ethylene Glycol Butyl Ether to Address the Clean Air Act Section 112(b) Petition Submitted by the Chemical Manufacturers Association to Delist this Substance. Revised February 15th, 2000, Prepared by The Cadmus Group, Inc. for U.S. Environmental Protection Agency Office of Air Quality and Planning Standards. Research Triangle Park, NC 27711.
CalEPA. 1999. Determination of Acute Reference Exposure Levels for Airborne Toxicants. California Environmental Protection Agency, office of Environmental Health Hazard Assessment. March. http://www.oehha.ca.gov/air/pdf/acuterel.pdf

102
Carpenter, C.P., U.C. Pozzani, C.S. Weil, J.H. Nair, III, G.A. Keck, and H.F. Smyth, Jr. 1956. The toxicity of butyl cellosolve solvent. AMA Arch. Ind. Health 14:114-131.
CEMC. 2003. Fugacity-Based EQC Equilibrium Criterion Model. Version 2.02. Canadian Environmental Modeling Center. Trent University. Peterborough, Ontario. May. http://www.trentu.ca/cemc/models/EQC2.html
CIBA-GEIGY 1976 (table 3-2)
CIR. 1996. Final report on the safety assessment of butoxyethanol. J. Am. Coll. Toxicol. 15:462-526
Clayson, D.B., F. Iverson, E.A. Nera, and E. Lok. 1990. The significance of induced forestomach tumors. Ann. Rev. Pharmacol. Toxicol. 30:441-463.
Clayson, D.B., F. Iverson, E.A. Nera, and E. Lok. 1991. Early indicators of potential neoplasia produced in the rat forestomach by non-genotoxic agents: the importance of induced cellular proliferation. Mutat. Res. 248:321-331.
CMA. 1996. Petition of the Chemical Manufacturers Association Ketones Panel to Delist Methyl Ethyl Ketone Under Section 313 of the Emergency Planning and Community Right-to-Know Act of 1986. Prepared by the Chemical Manufacturers Association for submittal to the United States Environmental Protection Agency, Washington, D.C.
CMA. 1997. Petition of the Chemical Manufacturers Association Ethylene Glycol Ethers Panel to Remove Ethylene Glycol Butyl Ether from the List of Hazardous Air Pollutants under Section 112(b) of the Clean Air Act Amendments of 1990. Prepared by the Chemical Manufacturers Association for submittal to the United States Environmental Protection Agency, Washington, D.C.
Cogliano, V., Y. Grosse, R. Baan, K. Straif, B. Secretan, F. El Ghissassi. 2004. Advice on formaldehyde and glycol ethers. The Lancet Oncology. 5:528.
Corley, R.A., G.A. Bormett, B.I. Ghanayem. 1994. Physiologically-based pharmacokinetics of 2-butoxyethanol and its major metabolite, 2-butoxyacetic acid, in rats and humans. Toxicol Appl Pharmacol 129:61-79. (As cited in EPA 1999a.)
Corley, R.A., D.A. Marham, C. Banks, P. Delorme, A. Masterman, and J.M. Houlel. 1997. Physiologically based pharmacookinetics and the dermal absorption of 2-butoxyethanol vapor by humans. Fundam. Appl. Toxicol. 39:120-130 (As cited in EPA 2010)
Corley, R.A., D.M. Grant, E. Farris, KK Weitz, J.J. Soelberg, KD. Thrall, and T.S. Poet. 2005. Determination of age and gender differences in biochemical processes affecting the disposition of 2-butoxyethanol and its metabolites in mice and rats to improve PBPK modeling. Toxicol. Let. 156:127-161.
Corthals, S. M., L. M. Kamendulis, J. E. Klaunig. 2006. Mechanisms of 2-butoxyethanol-induced hemangiosarcomas. Toxicol Sci 92(2):378-86.
Dartsch, P.C., S. Hildenbrand, W. Gforer, R. Kimmel, and F.W. Schmahl. 1999. Cytotoxic effects of 2-butoxythanol in vitro are related to butoxyacetaldehyde, an intermediate oxidation product. Environmental Toxicology and Pharmacology 7:135-142.
Deisinger, P.J., and R.J. Boatman. 2004. In vivo metabolism and kinetics of ethylene glycol monobutyl ether and its metabolites, 2-butoxyacetaldehyde and 2-butoxyacetic acid as measured in blood, liver and forestomach in mice. Xenobiotica 34 (7):675-685.
Devillers, J., A. Chezeau, V. Poulson, E. Thybaud. 2003. Effects of ethylene glycol ethers on the reproduction of Ceriodaphnia dubia. Chemosphere. 50:373-376.

103
Devillers, J., A. Chezeau, E. Thybaud, V. Poulsen, J.M. Porcher, L. Graff, P. Vasseur, F. Mouchet, V. Ferrier, F. Quiniou. 2002. Ecotoxicity of ethylene glycol monobutyl ether and its acetate. Toxicology Mechanisms and Methods 12:255-263.
Dill, J.A., K.M. Lee, D.J. Bates, D.J. Anderson, R.E. Johnson, B.J. Chou, L.T. Burke, and J.H. Roycroft. 1998. Toxicokinetics of inhaled 2-butoxyethanol and its major metabolite, 2-butoxyacetic acid, in F344 rats and B6C3F1 mice. Toxicology and Applied Pharmacology 153:227-242.
Dolinoy, D.C. and M.L. Miranda. 2004. GIS Modeling of Air Toxics Releases from TRI-Reporting and Non-TRI-Reporting Facilities: Impacts for Environmental Justice. Environmental Health Perspectives 112(17): 1717-1724.
DOT. 1990. Hazardous materials and special provisions. Department of Transportation. Code of Federal Regulations. 49 CFR 172.101. (As cited in ATSDR 1998.)
Dow. 1988. DOWANOL EB Glycol Ether: Evaluation of Toxicity to the Green Algae, Selenastrum capricornutum printz. The Dow Chemical Company, Mammalian and Environmental Toxicology Research Laboratory. June 21.
Dow. 1993. The Glycol Ethers Handbook. Dow Chemical Co. Midland MI. (As cited in ATSDR 1998.)
Duboudin C, Ciffroy P and Magaud H. 2004a. Acute-to-chronic species sensitivity distribution extrapolation. Environmental Toxicology and Chemistry 23:1774-1785.
Duboudin C, Ciffroy P and Magaud H. 2004b. Effects of data manipulation and statistical methods on species sensitivity distributions. Environmental Toxicology and Chemistry 23:489-499.
ECETOC. 1994. Special Report No.7 -- Butoxyethanol Criteria Document Including a Supplement for 2-Butoxyethyl Acetate. European Centre for Ecotoxicology and Toxicology of Chemicals, Brussels, Belgium.
ECETOC. 2005. The Toxicology of Glycol Ethers and its Relevance to Man. Technical Report 64. European Centre for Ecotoxicology and Toxicology of Chemicals, Brussels, Belgium.
Eisenreich, S.J., B.B. Looney, and J.D. Thornton. 1981. Airborne organic contaminants in the Great Lakes ecosystem. Environ. Sci. Technol. 15 (1):30 38. (As cited in ATSDR 1998.)
Environment Canada and Health Canada. 2002. Priority Substances List Assessment Report, 2-Butoxyethanol.(http://www.hc-sc.gc.ca/ewh-semt/alt_formats/hecs-sesc/pdf/pubs/contaminants/psl2-lsp2/2_butoxyethanol/2_butoxyethanol_e.pdf ).
EPA. 1971. Tolerance range for agriculture products. United States Environmental protection Agency. 40 CFR 180.1001. (As cited in ATSDR 1998.)
EPA. 1977. List of chemicals produced by affected facilities. 40 CFR 60.489. (As cited in ATSDR 1998.)
EPA. 1982. Preliminary Assessment Information Manufacturers Report. 40 CFR 712.30. (As cited in ATSDR 1998.)
EPA. 1984. Acute toxicity studies on Wellaid 31. Study submitted to the US Environmental Protection Agency by Amoco Corporation. (As cited in WHO 1998; 2010)

104
EPA. 1986a. Guidelines for Carcinogen Risk Assessment. U.S. Environmental Protection Agency, Risk Assessment Forum, Washington, DC. September 24. 51 FR 33993-34003.
EPA. 1986b. Substances subject to all provisions of health and safety data report. 40 CFR 716.120. (As cited in ATSDR 1998.)
EPA. 1987a. Statement of Policy and Guidance Regarding Petitions Under Section 313 of Title III of the Superfund Amendments and Reauthorization Act of 1986. Federal Register Vol. 52, pp. 3479-3483.
EPA. 1987b. Bulk Organic Chemical. 40 CFR 414 Subpart G. (As cited in ATSDR 1998.)
EPA. 1988. Toxic Chemical Release Reporting; Community Right-to-Know; Titanium Dioxide. Federal Register June 20, 1998, Volume 53, pp. 23108-23112.
EPA. 1989. Risk Assessment Guidance for Superfund, Volume I: Human Health Evaluation Manual (Part A), Interim Final. United States Environmental Protection Agency, Office of Emergency and Remedial Response, Washington, DC. EPA/540/1-89/002. December.
EPA. 1990a. National Oil and Hazardous Substances Pollution Contingency Plan. 40 CFR Chapter 1, Subchapter J, Part 300. United States Environmental Protection Agency. (http://www.epa.gov/oilspill/pdfs/40cfr300.pdf )
EPA. 1990b. Chemicals Affected by Subpart NNN. 40 CFR 60.667. (As cited in ATSDR 1998.)
EPA. 1992a. A Tiered Modeling Approach for Assessing the Risks due to Sources of Hazardous Air Pollutants. United States Environmental Protection Agency, Office of Air Quality, Planning and Standards. Research Triangle Park, N.C. EPA-450/4-92-001.
EPA. 1992b. Synthetic Organic Chemical Manufacturing Industry Chemicals. 40 CFR 63.106. (As cited in ATSDR 1998.)
EPA. 1992c. Hazard Assessment Guidelines for Listing Chemicals on the Toxic Release Inventory. Revised Draft, May 26, 1992.
EPA. 1993a. Wildlife Exposure Factors Handbook: Volume 1. United States Environmental Protection Agency, Office of Research and Development, Washington, D.C. EPA/600/R-93/187a.
EPA. 1993b. Exemptions from the Requirement of a Tolerance. Chemicals affected by standards of performance for volatile organic compound emissions from synthetic organic chemical manufacturing industry reactor process. 40 CFR 60.707. (As cited in ATSDR 1998.)
EPA. 1994a. Addition of Certain Chemicals; Toxic Chemical Release Reporting; Community Right-to-Know; Final Rule. Federal Register Vol. 59. pp. 61432-61485.
EPA. 1994b. Glycol Ethers Category; Toxic Chemical Release Reporting; Community Right-to-Know. Federal Register Vol. 59. pp. 34386-34391.
EPA. 1995a. Butyl Benzyl Phthalate; Toxic Chemical Release Reporting; Community Right-to-Know. Federal Register February 17, 1995, Volume 60, pp. 9299-9301.
EPA. 1995b. Expanded Exposure Assessment for Ethylene Glycol in Response to Delisting Petition. United States Environmental Protection Agency, Office of Prevention, Pesticides and Toxic Substances, Washington, DC. June.
105
EPA 1995c. Study of volatile Organic Compound Emissions from Consumer and Commercial Products: Report to Congress. United States Environmental Protection Agency, EPA-453-R-94-066-A, Washington, DC. June.
EPA. 1995d. User’s Guide for the Industrial Source Complex (ISC3) Dispersion Models, Volume I – User Instructions, U.S. Environmental Protection Agency, Office of Air Quality Planning and Standards, Emissions, Monitoring, and Analysis Division, Research Triangle Park, NC. EPA-454/B-95-003a, September 1995.
EPA. 1996a. Proposed Guidelines for Carcinogen Risk Assessment. U.S. Environmental Protection Agency, Office of Research and Development, Washington, DC. EPA/600/P-92/003C. April. 61 FR 17960-18011.
EPA. 1996b. Diethyl Phthalate; Toxic Chemical Release Reporting; Community Right-to-Know. Federal Register July 29, 1996, Volume 61, Number 146, pp. 39356-39359.
EPA. 1996c. Di-(2-ethylhexyl) Adipate; Toxic Chemical Release Reporting; Community Right-to-Know. Federal Register July 31, 1996, Volume 61, Number 148, pp. 39891-39894.
EPA. 1997a. Ethylene Glycol; Toxic Chemical Release Reporting; Community Right-to-Know. Federal Register May 7, 1997, Volume 63, Number 88, pp. 24919-24924.
EPA. 1997b. Exposure Factors Handbook, Volume I – General Factors. United States Environmental Protection Agency, Office of Research and Development, National Center for Environmental Assessment, Washington, DC. EPA/600/P-95/002Fa. August.
EPA. 1998a. Methyl Ethyl Ketone; Toxic Chemical Release Reporting; Community Right-to-Know. Federal Register March 30, 1998, Volume 63, Number 60, pp. 15195-15200.
EPA. 1998b. Guidelines for Ecological Risk Assessment. U.S. Environmental Protection Agency. Washington, DC, USA. April. EPA/630/R-95/002F.
EPA. 1999a. Toxicological Review of Ethylene Glycol Monobutyl Ether (EGBE) (CASRN 111-76-2) In Support of Summary Information on the Integrated Risk Information System (IRIS). US. Environmental Protection Agency. October. http://www.epa.gov/iris/toxreviews/0500-tr.pdf
EPA. 1999b. Ethylene Glycol Monobutyl Ether (EGBE) (2-Butoxyethanol) (CASRN 111-76-2). United States Environmental Protection Agency, Integrated Risk Information System. http://www.epa.gov/iris/subst/0500.htm
EPA. 1999c. Methyl Isobutyl Ketone; Toxic Chemical Release Reporting; Community Right-to-Know. Federal Register February 23, 1999, Volume 64, Number 35, pp. 8769-8774.
EPA. 1999d. Acetonitrile; Community Right-to-Know Toxic Chemical Release Reporting. 64 Federal Register March 5, 1999, Volume 64, Number 43, pp. 10597-10604.
EPA. 2003. List of Hazardous Air Pollutants, Proposed Rule. Federal Register November 21, 2003, Volume 68, Number 225, pp. 65648-65663. http://www.epa.gov/fedrgstr/EPA-AIR/2003/November/Day-21/a28787.htm .
EPA. 2004a. Petition to Delist of Ethylene Glycol Monobutyl Ether, Final Rule. Federal Register November 29, 2004, Volume 69, Number 228, pp. 69320-69325. http://www.epa.gov/fedrgstr/EPA-AIR/2004/November/Day-29/a26071.htm .
EPA. 2004b. Risk Assessment Guidance for Superfund, Volume I: Human Health Evaluation Manual (Part E, Supplemental Guidance for Dermal Risk Assessment), Final. United States Environmental Protection Agency, Office of Superfund Remediation and

106
Technology Innovation, Washington, DC. EPA/540/R/99/005. OSWER 9285.7-02EP, PB99-963312. July.
EPA. 2004c. Community Air Screening How-to-Manual. U.S. Environmental Protection Agency, Washington, DC. EPA 744-B-04-001.
EPA. 2004d. AMS/EPA Regulatory Model – AERMOD. Version 04300. U.S. Environmental Protection Agency, Office of Air Quality Planning and Standards, Emissions Monitoring and Analysis Division, Research Triangle Park, NC. October. http://www.epa.gov/scram001/dispersion_prefrec.htm#aermod
EPA. 2004e. User’s Guide for the AMS/EPA Regulatory Model – AERMOD. U.S. Environmental Protection Agency, Office of Air Quality Planning and Standards, Emissions Monitoring and Analysis Division, Research Triangle Park, NC. October.
EPA. 2004f. Addendum – User’s Guide for the AMS/EPA Regulatory Model – AERMOD. U.S. Environmental Protection Agency, Office of Air Quality Planning and Standards, Emissions Monitoring and Analysis Division, Research Triangle Park, NC. EPA-454/B-03-001. September.
EPA 2004g. User’s Guide for the AERMOD Meteorological Preprocessor (AERMET). U.S. Environmental Protection Agency, Office of Air Quality Planning and Standards, Emissions Monitoring and Analysis Division, Research Triangle Park, NC. EPA-454/B-03-002. November.
EPA. 2005a. An Evaluation of the Human Carcinogenic Potential of Ethylene Glycol Butyl Ether. U.S. Environmental Protection Agency. EPA 600/R-04/123.
EPA. 2005b. AERMOD Implementation Guide. U.S. Environmental Protection Agency, Office of Air Quality Planning and Standards, Emissions Monitoring and Analysis Division, Research Triangle Park, NC. September.
EPA. 2006. Integrated Risk Information System (IRIS); Request for Chemical Substance Nominations for 2007 Program. Federal Register December 22, 2006, Volume 71, Number 246, pp. 77017-77019. http://www.epa.gov/fedrgstr/EPA-ESEARCH/2006/December/Day-22/r21970.pdf .
EPA. 2007. National Volatile Organic Compound Emission Standards for Aerosol Coatings; Proposed Rule. Federal Register July 16, 2007, Volume 72, Number 135, pp. 38952-38991.
EPA. 2008. AERSURFACE User’s Guide. U.S. Environmental Protection Agency, Office of Air Quality Planning and Standards, Air Quality Assessment Division, Air Quality Modeling Group, Research Triangle Park, NC. EPA-454/B-08-001, January 2008.
EPA. 2009. AERMOD Implementation Guide, AERMOD Implementation Workgroup, U.S. Environmental Protection Agency, Office of Air Quality Planning and Standards, Air Quality Assessment Division, Research Triangle Park, NC. Last Revised: March 19., 2009.
EPA. 2010. Ethylene glycol monobutyl ether (EGBE) (2-Butoxyethanol) (CASRN 111-76-2). U.S. Environmental Protection agency. Integrated Risk Information System. http://222.epa.gov/iris/subst/0500.htm
EPA. 2011a. AERSCREEN User’s Guide. U.S. Environmental Protection Agency, Office of Air Quality Planning and Standards, Air Quality Assessment Division, Air Quality Modeling Group, Research Triangle Park, NC. EPA-454/B-11-011, March.
107
EPA. 2011b. User’s Guide for the AERMOD Meteorological Preprocessor (AERMET). Addendum. U.S. Environmental Protection Agency, Office of Air Quality Planning and Standards, Air Quality Assessment Division, Air Quality Modeling Group, Research Triangle Park, NC. EPA-454/B-11-011, February.
EPA. 2012. User’s Guide for the AMS/EPA Regulatory Model – AERMOD. Addendum. U.S. Environmental Protection Agency, Office of Air Quality Planning and Standards, Air Quality Assessment Division, Research Triangle Park, NC. EPA-454/B-03-001, December.
Fisher, D.J., and D.T. Burton. 2003. Comparison of two U.S. Environmental Protection Agency species sensitivity distribution methods for calculating ecological risk criteria. Human and Ecological Risk Assessment 9 (3):675-690.
Foster, J. R. 2000. EGBE (Ethylene Glycol Butyl Ether, EGBE): The Proposed Mode of Action in the Induction of Hemangiosarcomas in Male Mouse Liver and Its Significance for Man. Macclesfield, Cheshire, United Kingdom: Central Toxicology Laboratory, Alderley Park; report no: Ctl/r/1465. (As cited in EPA 2005a.)
Ghanayem, B.I. and C.A. Sullivan. 1993. Assessment of haemolytic activity of 2-butoxyethanol and its major metabolite, butoxyacetic acid, in various mammals including humans. Hum. Exp. Toxicol. 12(4):305-311. (As cited in ATSDR 1998.)
Ghanayem, B.I., P.C. Blair, M.B. Thompson, et al. 1987. Effect of age on the toxicity and metabolism of ethylene glycol monobutyl ether (2-butoxyethanol) in rats. Toxicol. Appl. Pharmacol. 91:222-234. (As cited in ATSDR 1998.)
Ghanayem, B.I., P.H. Long, S.M. Ward, B. Chanas, M. Nyska, and A. Nyska. 2001. Hemolytic anemia, thrombosis, and infarction in male and female F344 rats following gavage exposure to 2-butoxyethanol. Ex. Toxic Pathol 53:97-105.
Ghanayem, B.I., S.M. Ward, B. Chanas, and A. Nyska. 2000. Comparison of the acute hematotoxicity of 2-butoxyethanol in male and female F344 rats. Human and Experimental Toxicology 19:185-192.
Gingell, R., R.J. Boatman, and S. Lewis. 1998. Acute toxicity of ethylene glycol mono-n-butyl ether in the guinea pig. Food and Chemical Toxicology 36:825-829.
Green, T., A. Toghill, R. Lee, R. Moore, and J. Foster. 2000. The development of forestomach tumours in the mouse following exposure to 2-butoxyethanol by inhalation: Studies on the mode of action and relevance to humans. Toxicology 180:257-273.
Gualtieri, J.F., L. DeBoer, C.R. Harris, and R. Corley. 1995. Repeated ingestion of 2- butoxyethanol: Case report and literature review. J. Toxicol. Clin. Toxicol. 41:57-62.
Hall, L.W. Jr, M.C. Scott, and W.D. Killen. 1998. Ecological risk assessment of copper and cadmium in surface waters of Chesapeake Bay watershed. Environmental Toxicology and Chemistry 17 (6):1172-1189.
Harrison, P.T.C. 1992. Propionic acid and the phenomenon of rodent forestomach tumorigenesis: a review. Food Chem. Toxicol. 30:333-340.
Hoflack, J.C., M.J. Durand, G.G. Poirier, A. Maul, and P. Vasseur. 1997. Alteration in methyl-methanesulfonate-induced poly(ADP-ribosyl)ation by 2-butoxyethanol in Syrian hamster embro cells. Carcinogenesis 18 (12):2333-2338.
Howard, P.H. 1993. Handbook of Environmental Fate and Exposure Data; Vol. IV. Chelsea, MI: Lewis Publishers. (As cited in ATSDR 1998.)

108
Howard, P.H., R.S. Boethling, W.F. Jarvis, W.M. Meylan, and E.M. Michalenko. 1991. Handbook of Environmental Degradation Rates. Lewis Publishers Inc., Chelsea, MI.
HSDB. 1997. Hazardous Substances Data Bank. National Library of Medicine, National Toxicology Program (via TOXNET), Bethesda, MD. October. (As cited in ATSDR 1999.)
HSDB. 2005. Ethylene Glycol Mono-N-Butyl Ether. Hazardous Substances Data Bank, National Library of Medicine. National Institutes of Health. National Toxicology Program (via TOXNET http://toxnet.nlm.nih.gov).
IARC. 2004. Recent Meetings; Volume 88: Formaldehyde, 2-Butoxyethanol and 1-tert-Butoxy-2-propanol 2-9 June 2004. International Agency for Research on Cancer, Lyon, France (http://monographs.iarc.fr/ENG/Meetings/vol88.php).
IARC. 2006. IARC Monographs on the Evaluation of Carcinogenic Risks to Humans. Volume 88: Formaldehyde, 2-Butoxyethanol and 1-tert-Butoxy-2-propanol. International Agency for Research on Cancer, Lyon, France. December 2006.
Imperial Chemical Industries (ICI). 1985. Ethylene glycol butyl ether and butoxyacetic acid: their effects on erythrocyte fragility in four species. Study No. WV 0062. NTIS Report No. OTS0521233. As cited in CIR (1996).
INERIS. 2005. European Union Risk Assessment Report: 2-butoxyethanol. Draft. Institut Nationel de l'Environnement Industriel et des Risques. Verneuil-en-Halatte, France.
INERIS. 2006. 2-Butoxyethanol (EGBE). Part I - Environment. Summary Risk Assessment Report. Institut Nationel de l'Environnement Industriel et des Risques. Verneuil-en-Halatte, France.
IPCS. 1997. SIDS Initial Assessment Report for 6th SIAM, 2-Butoxyethanol. International Programme on Chemical Safety, World Health Organization, Geneva, Switzerland http://www.inchem.org/documents/sids/sids/111762.pdf.
Johanson G, Kronborg H, Naslund PH, Nordquist MB. 1986. Toxicokinetics of inhaled 2-butoxyethanol (ethylene glycol monobutyl ether) in man. Scand J Work Environ Health 12:594-602.
Johanson, G., I. Michel, D. Norback, et al. 1989. Biological monitoring of exposure to ethylene glycol ethers. Arch Toxicol (Suppl 13): 108-l 11. (As cited in ATSDR 1998.)
Klaine, S.J., G.P. Cobb, R.L. Dickerson, K.R. Dixon, R.J. Kendall, E.E. Smith, and K.R. Solomon. 1996. An ecological risk assessment for the use of the biocide, dibromonitrilopropionamide (DBNPA), in industrial cooling systems. Environmental Toxicology and Chemistry 15 (1):21-30.
Koshkaryev, A., G. Barshtein, A. Nyska, N. Ezov, T. Levin-Harrus, S. Shabat, M. Nyska, M. Redlich, F. Tsipia, and S. Yedgar. 2003. 2-butoxyethanol enhances the adherence of red blood cells. Archive Toxicology 77:465-469.
Kroes, R. and P.W. Wester. 1986. Forestomach carcinogens: Possible mechanisms of action. Food Chem. Toxicol. 24:1083-1089.
Lamb, J.C., D.K. Gulati, L.M. Hommel, and K.B. Poonacha. 1997. Ethylene glycol monobutyl ether. Environmental Health Perspectives 105 (supplement):217.
Long, P.H., R.R. Maronpot, B.I. Ghanayem, J.H. Roycroft, and A. Nyska. 2000. Dental pulp infarction in female rats following inhalation exposure to 2-butoxyethanol. Toxicologic Pathology 28 (2):246-252.

109
Lyman, W.J., W.F. Reehl, and D.H. Rosenblatt. 1982. Handbook of Chemical Property Estimation Methods. New York: McGraw-Hill. pp. 4-9, 5-4, 6-3, 15-16. (As cited in ATSDR 1998.)
Mackay, D., S. Paterson, W.Y. Shiu. 1992. Generic models for evaluating the regional fate of chemicals. Chemosphere. 24:695-717.
Marsden, C. and S. Mann, eds. 1963. Solvents Guide. New York, NY: Interscience Publishers, 111-112. (As cited in ATSDR 1998.)
Maryland. 1985. Maryland Industrial Survey. Bethesda, MD.
Merck. 1989. The Merck Index: An Encyclopedia of Chemicals, Drugs, and Biologicals. Rahway, NJ: Merck & Co., Inc. 1566. (As cited in ATSDR 1998.)
NICNAS. 1996. Summary Report: 2-Butoxyethanol in Cleaning Products: Priority Existing Chemical No. 6. National Industrial Chemicals Notification and Assessment Scheme, Commonwealth of Australia, Australian Government Publishing Service, Canberra. 35 pp.
NIOSH. 1983. The Glycol Ethers, with Particular Reference to 2-Methoxyethanol and 2-Ethoxyethanol: Evidence of Adverse Reproductive Effects. Current Intelligence Bulletin No. 39. United States Department of Health and Human Services, Public Health Service, Centers for Disease Control and National Institute for Occupational Safety and Health, Cincinnati, OH. PB 84-155142. May.
NIOSH. 1990. Criteria for a recommended standard: Occupational exposure to ethylene glycol monobutyl ether and ethylene glycol monobutyl ether acetate. Cincinnati, OH: National Institute for Occupational Safety and Health, Public Health Service, U.S. Department of Health, Education and Welfare. NTIS No. PB91-173369. (As cited in ATSDR 1998.)
NIOSH. 2001. NIOSH Pocket Guide to Chemical Hazards & Other Databases. Cincinnati, OH: United States Department of Health and Human Services, Public Health Service, Centers for Disease Control, National Institutes for Occupational Safety and Health. DHHS (NIOSH) Publication No. 2001-145 (CD-OM). August.
NPCA. 1997. National Paint and Coatings Association. http:/www.paint.org/value.htm. January 1. (As cited in SRI 2004.)
NTP. 1993. Ethylene glycol ethers, 2-ethoxyethanoI, 2-butoxyethanol administered in drinking water to F344/N rats and B6C3Fl mice. NTP toxicity report series no. 26. National Toxicology Program, National Institutes of Health, Public Health Services, U.S. Department of Health and Human Services. NIH publication 93-3349. (As cited in ATSDR 1998.)
NTP. 2000. Toxicology and Carcinogenesis Studies of 2-Butoxyethanol (CAS no. 111-76-2) in F344/N Rats and B6C3F1 Mice (Inhalation Studies). National Toxicology Program, Washington, DC. NTP technical report series no. 484. http://ntp.niehs.nih.gov/ntp/htdocs/LT_rpts/tr484.pdf.
NRC. 2001. Standing Operating Procedures for Developing Acute Exposure Guideline Levels for Hazardous Chemicals. Subcommittee on Acute Exposure Guideline Levels, Committee on Toxicology, Board on Environmental Studies and Toxicology, Commission on Life Sciences, National Research Council. National Academy Press, Washington, D.C.
Nyska, A., C.R. Moomaw, N. Ezov, S. Shabat, T. Levin-Harrus, M. Nyska, M. Redlich, M. Mittelman, S. Yedgar, and J. Foley. 2003. Ocular expression of vascular cell adhesion
110
molecule (VCAM-1) in 2-butoxyethanol-induced hemolysis and thrombosis in female rats. Ex. Toxic Pathol 55:231-236.
Nyska, A., R.R. Maronpot, P.H. Long, J.H. Roycroft, J.R. Hailey, G.S. Travlos, and B.I. Ghanayem. 1999. Disseminated thrombosis and bone infarction in female rats following inhalation exposure to 2-butoxyethanol. Toxicologic Pathology 27 (3):287-294.
OECD. 1997. Screening Information Dataset (SIDS) initial assessment report on 2 butoxyethanol. 6th SIDS Initial Assessment Meeting. Paris, Organisation for Economic Cooperation and Development.
OSHA. 1974. Occupational Safety and Health Administration. 29 CFR 1910.100. (As cited in ATSDR 1998)
OSHA. 1990. 2-Butoxyethanol (Butyl Cellosolve), 2-Butoxyethyl Acetate (Butyl Cellosolve Acetate), Method 83. Salt Lake City, Utah: Organic Methods Evaluation Branch. OSHA Analytical Laboratory, Occupational Safety and Health Administration. (As cited in ATSDR 1998)
Park, J., L.M. Kamendulis, J.E. Klaunig. 2002a. Effects of 2-Butoxyethanol on Hepatic Oxidative Damage. Toxicol. Lett. 126: 19-29. (As cited in EPA 2005a)
Park, J., L.M. Kamendulis, J.E. Klaunig. 2002b. Mechanisms of 2-butoxyethanol carcinogenicity: studies on Syrian hamster embryo (SHE) cell transformation. Toxicol. Sci. 68: 43-50. (As cited in EPA 2005a)
Poet, T.S., J.J. Soelberg, K.K. Weitz, T.J. Mast, R.A. Miller, B.D. Thrall, and R.A. Corley. 2003. Mode of action and pharmacokinetic studies of 2-butoxyethanol in the mouse with an emphasis on forestomach dosimetry. Toxicological Sciences 71:176-189.
Posthuma, L., G.W. Suter II, and T.P. Traas. 2002. Species Sensitivity Distributions in Ecotoxicology. CRC Press: Boca Raton, FL, USA.
Price, K.S., G.T. Waggy, and R.A. Conway. 1974. Brine shrimp bioassay and seawater BOD of petrochemicals. J. Water Pollut. Control Fed. 46:63-77. (As cited in ATSDR 1998.)
Riddick, J.A. and W.B. Bunger, ed. 1970. Organic solvents. New York, NY: Wiley-Interscience, 471, 862-863. (As cited in ATSDR 1998.)
Rowe, V.K. and M.A. Wolf. 1982. Derivatives of gylcols. In: Patty’s industrial hygiene and toxicology. 3rd ed. New York, NY: John Wiley and Sons. 2C: 3909-3911,3931-3939. (As cited in ATSDR 1998.)
Sawant, S.D., P.G. Doucet, W. Slob, B.L. Blaylock, and H.M. Mehendale. 1999. Experimental mathematical validation of a novel concept of extended 2-butoxyethanol autoprotection. International Journal of Toxicology 18:307-316.
Siesky, A. M., L.M. Kamendulis, J.E. Klaunig. 2002. Hepatic effects of 2-butoxyethanol in rodents. Toxicol. Sci. 70: 252-260. (As cited in EPA 2005a.)
Singh, P., B. Morris, S. Zhao, and B.L. Blaylock. 2002. Suppression of the contact hypersensitivity response following topical exposure to 2-butoxyethanol in female BALB/c mice. International Journal of Toxicology 21:107-115.
Singh, P., S. Zhao, and B.L. Blaylock. 2001. Topical Exposure to 2-butoxyethanol alters immune responses in female BALB/c mice. International Journal of Toxicology 20:383-390.
Solomon, K.R., D.B. Baker, P. Richards, K.R. Dixon, S.J. Klaine, T.W. La Point, R.J. Kendall, C.P. Weisskopf, J.M. Giddings, J.P. Giesy, L.W. Hall Jr, and W.M. Williams. 1996.

111
Ecological risk assessment of atrazine in North American surface waters. Environmental Toxicology and Chemistry 15 (1):31-76.
SRI. 2004. Chemical Economics Handbook Marketing Research Report: Glycol Ethers. Prepared by H. Chinn, U. Lochner, and K. Yagi for SRI Consulting. July. 663.5000 A
SRI. 2010. Chemical Economics Handbook Marketing Research Report: Glycol Ethers. Prepared by H. Chinn, T. Kaelin, J. Liu, and H. Mori for SRI Consulting. November. 663.5000 A.
Staples, C.A., R.J. Boatman, and M.L. Cano. 1998. Ethylene glycol ethers: An environmental risk assessment. Chemosphere 36 (7):1585-1613.
Stephan, C.E., D.I. Mount, D.J. Hansen, J.H. Gentile, G.A. Chapman, and W.A. Brungs. 1985. Guidelines for Deriving Numerical National Water Quality Criteria for the Protection of Aquatic Organisms and Their Uses. U.S. Environmental Protection Agency, Office of Research and Development. Duluth, MN, USA. PB85-227049.
Suter, G.W. II, B.W. Cornaby, C.T. Hadden, R.N. Hull, M. Stack, and F.A. Zafran. 1995. An approach for balancing health and ecological risks at hazardous waste sites. Risk Analysis 15 (2):221-231.
Swann, R.L., D.A. Laskowski, P.J. McCall, K. Vanderkuy, and H.J. Dishburger. 1983. A rapid method for the estimation of the environmental parameters octanol water partition-coefficient, soil sorption constant, water to air ratio, and water solubility. Res. Rev. 85:16-28.
Tuazon, E.C., S.M. Aschmann, and R. Atkinson. 1998. Products of the gas-phase reactions of the OH radicals with 1-methoxy-2-propanol and 2-butoxyethanol. Environ. Sci. Technol. 32(21): 3336-3345. (As cited in INERIS 2005)
Udden M.M 1994. Hemolysis and deformability of erythrocytes exposed to butoxyacetic acid, a metabolite of 2-butoxyethanol: II Resistance in red blood cells from humans with potential susceptibility. J Appl Toxicol, 14: 97-102.
Udden, M.M. 2000. Rat erythrocyte morphological changes after gavage dosing with 2-butoxyethanol: A comparison with the in vitro effects of butoxyacetic acid on rat and human erythrocytes. J. Appl. Toxicol. 20:381-387.
Udden, M.M. 2002. In vitro sub-hemolytic effects of butoxyacetic acid on human and rat erythrocytes. Toxicological Sciences 69:258-264.
Weast, R.C., ed. 1975. Handbook of Chemistry and Physics, 55th edition. Cleveland, OH: CRC Press, Inc., C-290. (As cited in ATSDR 1998.)
Weast, R.C., ed. 1989. The CRC Handbook of Chemistry and Physics, 70th edition. Boca Raton, FL: CRC Press, Inc. C-266. (As cited in ATSDR 1998.)
WHO. 1998. Concise International Chemical Assessment Document 10: 2-butoxyethanol. World Health Organization. Geneva.
WHO. 2005. Selected Alkoxyethanols 2-Butoxyethanal. Concise International Chemical Assessment Document 67. World Health Organization. Geneva.
WHO. 2010. Concise International Chemical Assessment Document 67: Selected alkoxyethanols. World Health Organization. Geneva.

TABLES

Toxicity Endpoint
Acute Toxicity
Chronic Toxicity
Carcinogenicity
Mutagenicity
Developmental Toxicity
Reproductive Toxicity
Immunotoxicity
Other Chronic Toxicity
Environmental Toxicity
Persistence
Bioaccumulation
Terrestrial Mammals and Birds
• Most sensitive credible LC50 = 89 mg/L
• Most LC50 values > 1000 mg/L
• Most sensitive EC50 = 164 mg/L
• Most sensitive LOAEL = 7.2 mg/L
• Most LOAELs > 100 mg/L
EGBE: ethylene glycol monobutyl etherEPA: U.S. Environmental Protection AgencyIRIS: Integrated risk information systemLOAEL: lowest observed adverse effect levelmg/kg-day: milligrams per kilogram body weight per daymg/L: milligrams per litermg/m3: milligrams per cubic meterNOAEL: no observed adverse effect level
EGBE causes only “very minor” effects that “are unlikely to be ecologically significant” (EPA 2003 [68 Fed. Reg. 65657])
• Because nonlinear, nongenotoxic modes of action are likely responsible for the tumorsobserved in rodent studies, the IRIS RfD and RfC are adequately protective of any possible carcinogenic effects in humans (EPA Cancer Evaluation [EPA 2005a]).
Table ES-1. Key Findings of the Qualitative Hazard Evaluation
Summary Evaluation and Principal Reference
Primary acute effects in humans are eye and nasal irritation at levels >500 mg/m3 (Carpenter
1956); no irritation was found at current occupational exposure limits - 97 mg/m3 (Johansen 1986). Facility fenceline and environmental concentrations are far lower.
Releases of EGBE “may not reasonably be anticipated to cause any adverse effects to human health” (EPA, 69 FR 69322).
• “Limited” evidence of carcinogenicity in animals; the human carcinogenic potential ofEGBE cannot be determined (IARC 2006).
Not expected to be mutagenic or clastogenic. (EPA 2010)
A “minimal” LOAEL for developmental effects = 700 mg/kg-day based on a very slight decrease in pup weight (EPA 2010).
700 and 1,300 mg/kg-day are considered to be NOAEL and LOAEL, respectively, for both maternal and reproductive effects (EPA 2010).
Not immunotoxic (EPA 2010)
Continuous inhalation exposure to an EGBE-saturated atmosphere expected to result in maximum blood concentrations of EGBE’s toxic metabolite (BAA) well below the level needed to produce hemolysis in humans (Udden 2002, EPA 2010).
• Readily biodegradable
• Half-life = 1-4 weeks in water and soil (ATSDR 1998)
• Bioconcentration factor = 3
• Octanol-water partition coefficient (Log Kow) = 0.8 (HSDB 1997)
No Data [Section 3.3, below]
Acute Aquatic Toxicity(Section 3.3, below)
Chronic Aquatic Toxicity
(Section 3.3, below)
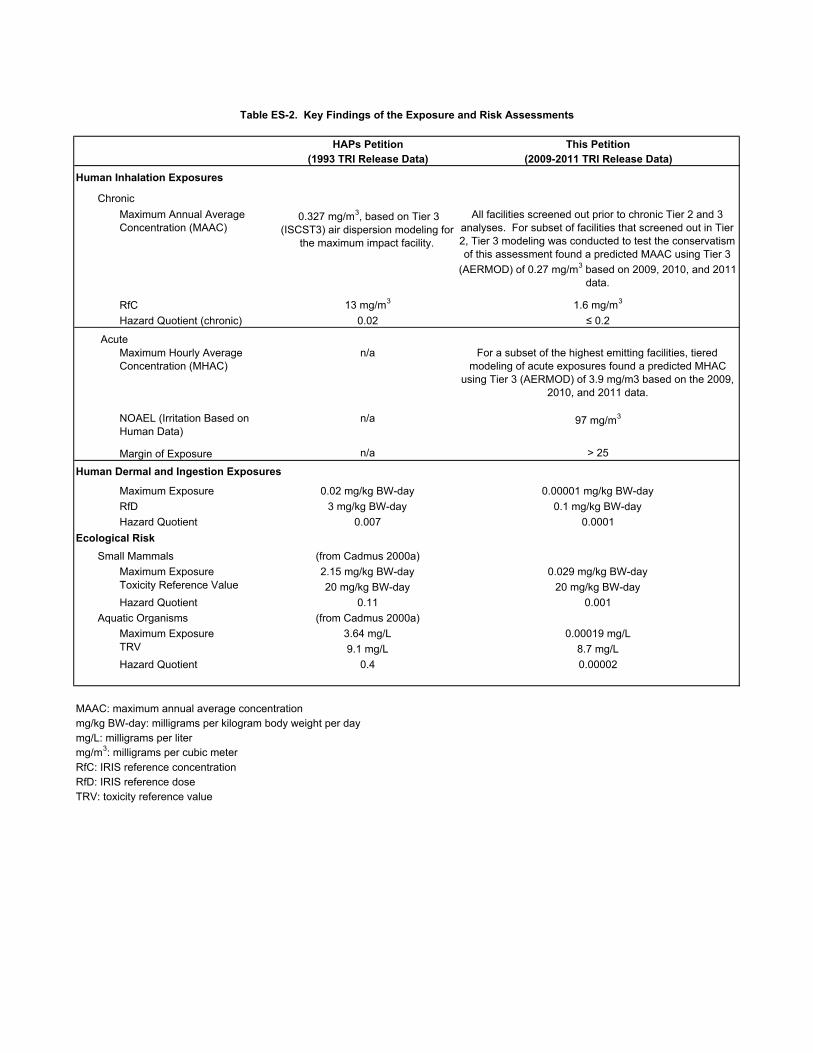
HAPs Petition This Petition(1993 TRI Release Data) (2009-2011 TRI Release Data)
Human Inhalation Exposures
Chronic
Maximum Annual Average Concentration (MAAC)
0.327 mg/m3, based on Tier 3 (ISCST3) air dispersion modeling for
the maximum impact facility.
All facilities screened out prior to chronic Tier 2 and 3 analyses. For subset of facilities that screened out in Tier 2, Tier 3 modeling was conducted to test the conservatism of this assessment found a predicted MAAC using Tier 3
(AERMOD) of 0.27 mg/m3 based on 2009, 2010, and 2011 data.
RfC 13 mg/m3 1.6 mg/m3
Hazard Quotient (chronic) 0.02 ≤ 0.2
AcuteMaximum Hourly Average Concentration (MHAC)
n/a For a subset of the highest emitting facilities, tiered modeling of acute exposures found a predicted MHAC
using Tier 3 (AERMOD) of 3.9 mg/m3 based on the 2009, 2010, and 2011 data.
NOAEL (Irritation Based on Human Data)
n/a 97 mg/m3
Margin of Exposure n/a > 25
Human Dermal and Ingestion Exposures
Maximum Exposure 0.02 mg/kg BW-day 0.00001 mg/kg BW-day
RfD 3 mg/kg BW-day 0.1 mg/kg BW-day
Hazard Quotient 0.007 0.0001
Ecological RiskSmall Mammals (from Cadmus 2000a)
Maximum Exposure 2.15 mg/kg BW-day 0.029 mg/kg BW-dayToxicity Reference Value 20 mg/kg BW-day 20 mg/kg BW-day
Hazard Quotient 0.11 0.001
Aquatic Organisms (from Cadmus 2000a)
Maximum Exposure 3.64 mg/L 0.00019 mg/LTRV 9.1 mg/L 8.7 mg/L
Hazard Quotient 0.4 0.00002
MAAC: maximum annual average concentrationmg/kg BW-day: milligrams per kilogram body weight per daymg/L: milligrams per litermg/m3: milligrams per cubic meterRfC: IRIS reference concentrationRfD: IRIS reference doseTRV: toxicity reference value
Table ES-2. Key Findings of the Exposure and Risk Assessments
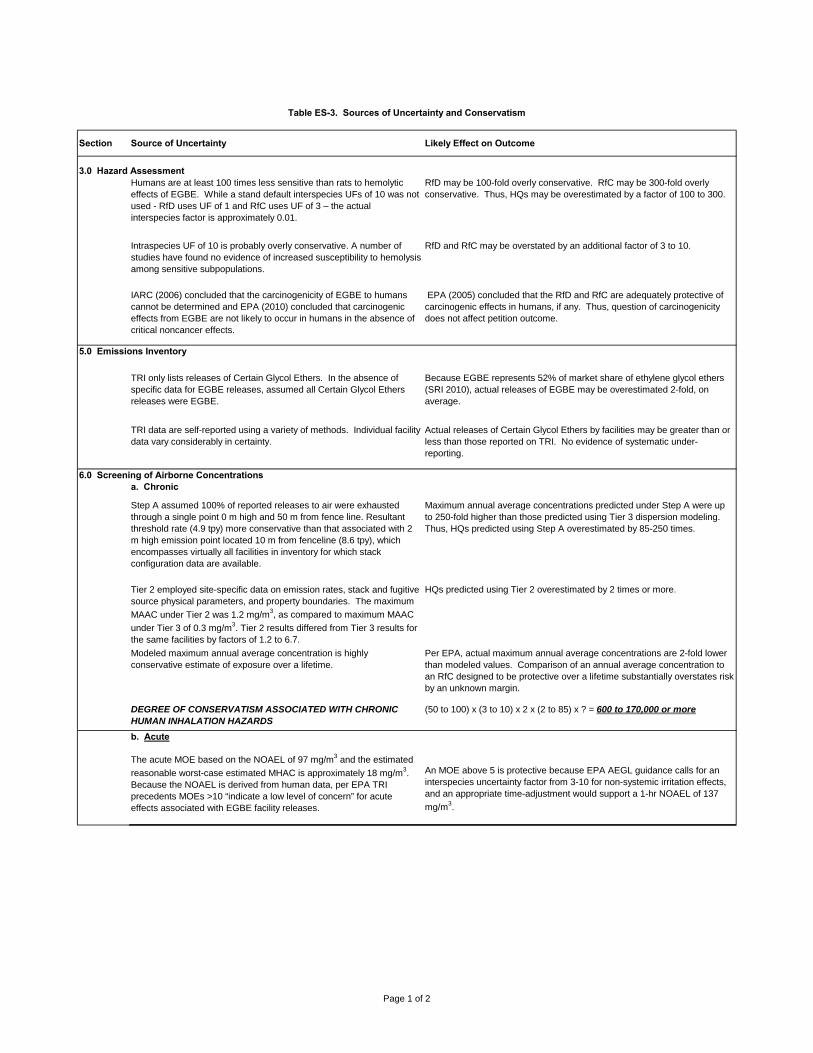
Section Source of Uncertainty Likely Effect on Outcome
3.0 Hazard AssessmentHumans are at least 100 times less sensitive than rats to hemolytic effects of EGBE. While a stand default interspecies UFs of 10 was not used - RfD uses UF of 1 and RfC uses UF of 3 – the actual interspecies factor is approximately 0.01.
RfD may be 100-fold overly conservative. RfC may be 300-fold overly conservative. Thus, HQs may be overestimated by a factor of 100 to 300.
Intraspecies UF of 10 is probably overly conservative. A number of studies have found no evidence of increased susceptibility to hemolysis among sensitive subpopulations.
RfD and RfC may be overstated by an additional factor of 3 to 10.
IARC (2006) concluded that the carcinogenicity of EGBE to humans cannot be determined and EPA (2010) concluded that carcinogenic effects from EGBE are not likely to occur in humans in the absence of critical noncancer effects.
EPA (2005) concluded that the RfD and RfC are adequately protective of carcinogenic effects in humans, if any. Thus, question of carcinogenicity does not affect petition outcome.
5.0 Emissions Inventory
TRI only lists releases of Certain Glycol Ethers. In the absence of specific data for EGBE releases, assumed all Certain Glycol Ethers releases were EGBE.
Because EGBE represents 52% of market share of ethylene glycol ethers (SRI 2010), actual releases of EGBE may be overestimated 2-fold, on average.
TRI data are self-reported using a variety of methods. Individual facility data vary considerably in certainty.
Actual releases of Certain Glycol Ethers by facilities may be greater than or less than those reported on TRI. No evidence of systematic under-reporting.
6.0 Screening of Airborne Concentrationsa. Chronic
Step A assumed 100% of reported releases to air were exhausted through a single point 0 m high and 50 m from fence line. Resultant threshold rate (4.9 tpy) more conservative than that associated with 2 m high emission point located 10 m from fenceline (8.6 tpy), which encompasses virtually all facilities in inventory for which stack configuration data are available.
Maximum annual average concentrations predicted under Step A were up to 250-fold higher than those predicted using Tier 3 dispersion modeling. Thus, HQs predicted using Step A overestimated by 85-250 times.
Tier 2 employed site-specific data on emission rates, stack and fugitive source physical parameters, and property boundaries. The maximum
MAAC under Tier 2 was 1.2 mg/m3, as compared to maximum MAAC
under Tier 3 of 0.3 mg/m3. Tier 2 results differed from Tier 3 results for the same facilities by factors of 1.2 to 6.7.
HQs predicted using Tier 2 overestimated by 2 times or more.
Modeled maximum annual average concentration is highly conservative estimate of exposure over a lifetime.
Per EPA, actual maximum annual average concentrations are 2-fold lower than modeled values. Comparison of an annual average concentration to an RfC designed to be protective over a lifetime substantially overstates risk by an unknown margin.
DEGREE OF CONSERVATISM ASSOCIATED WITH CHRONIC HUMAN INHALATION HAZARDS
(50 to 100) x (3 to 10) x 2 x (2 to 85) x ? = 600 to 170,000 or more
b. Acute
The acute MOE based on the NOAEL of 97 mg/m3 and the estimated
reasonable worst-case estimated MHAC is approximately 18 mg/m3. Because the NOAEL is derived from human data, per EPA TRI precedents MOEs >10 “indicate a low level of concern” for acute effects associated with EGBE facility releases.
An MOE above 5 is protective because EPA AEGL guidance calls for an interspecies uncertainty factor from 3-10 for non-systemic irritation effects, and an appropriate time-adjustment would support a 1-hr NOAEL of 137
mg/m3.
Table ES-3. Sources of Uncertainty and Conservatism
Page 1 of 2

Section Source of Uncertainty Likely Effect on Outcome
Table ES-3. Sources of Uncertainty and Conservatism
7.0 Surface Water Exposures and Risks
Exposure point concentrations in surface water calculated by assuming that 100% of U.S. releases of Certain Glycol Ethers to all media are EGBE and are concentrated into an area the size of the state of Ohio.
Because EGBE represents 52% of consumption of ethylene glycol ethers (SRI 2010), actual releases of EGBE may be overestimated 2-fold, on
average. Because 100,000 km2 represents 1.3% of total land area of U.S., actual concentrations of EGBE may be overestimated 77-fold.
Exposure assumptions (350 day/yr, 70 years, all water contacted contains EGBE)
Actual exposure intensity likely to be considerably lower, but degree of conservatism cannot be quantified.
DEGREE OF CONSERVATISM ASSOCIATED WITH HUMAN DERMAL AND INGESTION HAZARDS
(50 to 100) x (3 to 10) x 2 x 77 x ? = 23,100 to 154,000 or more
8.0 Ecological Risk Assessment
Exposure point concentrations in surface water calculated by assuming that 100% of U.S. releases of Certain Glycol Ethers to all media are EGBE and are concentrated into an area the size of the state of Ohio.
As previously noted, actual releases of EGBE may be overestimated 2-fold, on average, and actual concentrations of EGBE may be overestimated 77-fold.
Conservative exposure assumptions for small mammals (inhalation rate, ingestion rate, bioaccumulation factor) consistent with Cadmus (2000a)
Actual exposure intensity likely to be considerably lower, but degree of conservatism cannot be quantified.
TRV for aquatic organisms based on most sensitive species tested, which may not be representative of aquatic community present in most U.S. water bodies.
Although actual sensitivity of other aquatic organisms to EGBE may be considerably lower, degree of conservatism cannot be quantified.
TRV for small mammals is based on same underlying data used to derive RfD. Thus, small mammal TRV shares same uncertainties as listed above with respect to Section 3.0.
TRV may be 50 to 1,000-fold overly conservative due to UFs.
HQs focused on what EPA calls “very minor” effects on individual organisms, rather than effects that are likely to be ecologically significant.
Although individual organisms are likely to be substantially more sensitive than populations, communities, or ecosystems, degree of conservatism cannot be quantified.
DEGREE OF CONSERVATISM ASSOCIATED WITH RISKS TO AQUATIC ORGANISMS
2 x 77 x ? = 154 or more
DEGREE OF CONSERVATISM ASSOCIATED WITH RISKS TO SMALL MAMMALS
2 x 77 x (50 to 1,000) x ? = 7,700 to 154,000 or more
EGBE: ethylene glycol monobutyl etherEPA: U.S. Environmental Protection AgencyFR: Federal RegisterHQ: hazard quotientIARC: International Agency for Research on CancerIRIS: Integrated Risk Information Servicekm2: square kilometerm: meterMAAC: Maximum annual average concentrationmg/m3: milligrams per cubic meterRfC: reference concentrationRfD: reference dosetpy: tons per yearTRI: Toxics Release InventoryTRV: toxicity reference valueUF: uncertainty factor
Page 2 of 2

Media Agency Description Information References a
AirEPA OAQPS
List of Chemicals Produced by Affected Facilities Yes 40 CFR 60.489, EPA 1977
EPA OAQPS
Chemicals Affected by Standards of Performance for Volatile Organic Emissions from Synthetic Organic Chemical Manufacturing Industry Distillation Operations
Yes 40 CFR 60.667, EPA 1990b
EPA OAQPS
Chemicals Affected by Standards of Performance for Volatile Organic Compound Emissions from Synthetic Organic Chemical Manufacturing Industry Reactor Processes
Yes 40 CFR 60.707, EPA 1993b
EPA OAQPS
Synthetic Organic Chemical Manufacturing Industry Chemicals
Yes40 CFR 63 Table 1 to Subpart F, EPA 1992b
OSHA Permissible Exposure Limit (TWA)b 50 ppm (240
mg/m3) skin c29 CFR 1910.100, OSHA 1974
Water EPA OWEffluent Guidelines and Standards - Organic Chemicals, Plastics, and Synthetic Fibers - Bulk Organic Chemicals
Yes40 CFR 414, subpart G, EPA 1987b
OtherEPA OPPTS
Tolerance Range for Agriculture ProductsConditionally
Exempted from Tolerance
40 CFR 180.920, EPA 1971
EPA OPPTS
Substance Subject to All Provisions of Health and Safety Data Reporting
Yes 40 CFR 716.120, EPA 1986b
20 ppm
(97 mg/m3)
50 ppm
(240 mg/m3) skin b
NIOSH Immediately Dangerous to Life or Health (IDLH)700 ppm (3,383
mg/m3)NIOSH 2001
NIOSHRecommended Exposure Limit for Occupational
Exposure (TWA)e5 ppm (24 mg/m3)
skin bNIOSH 1990
Air AZ AZ Ambient Air Quality Guidelines (24 hours) 0.9 mg/m3
AZ AZ Ambient Air Quality Guidelines (1 hour) 3.6 mg/m3
CA Inhalation Reference Level (1 hour) 14 mg/m3 CalEPA 1999
CT Hazard Limit Value (8 hours) 2.4 mg/m3
Hazard Limit Value (30 minutes) 12 mg/m3
NATIONAL
STATE
Regulations and Guidelines:
http://www.azdeq.gov/environ/air/download/modeling.pdf
Reg. of CT State Agencies, Section 22a-174-29
OSHAPermissible Exposure Limit - TWA for Occupational
Exposure d29 CFR 1910.1000
Table 2-1. Regulatory Standards and Guidelines Applicable to EGBE
Regulations:
Guidelines:
Air ACGIH TLV-TWA for Occupational Exposure d ACGIH 2012
Page 1 of 2

Media Agency Description Information References a
NATIONAL
Table 2-1. Regulatory Standards and Guidelines Applicable to EGBE
Air ND Guideline Concentration (8 hours) 1.9 mg/m3http://www.ndhealth.gov/AQ/Toxics/North%20Dakota%20Air%20Toxics%20Policy.pdf
TX Effects Screening Level (1 hour) 0.21 mg/m3
TX Effects Screening Level (Annual) 3.7 mg/m3
a. As cited in ATSDR 1998
d. ACGIH TLV-TWA is a time-weighted averaged concentration for an 8-hour workday and a 40-hour workweek.
ACGIH: American Conference of Governmental Industrial HygienistsEGBE: ethylene glycol monobutyl etherEPA: U.S. Environmental Protection Agencymg/m3: milligrams per cubic meterNIOSH: Naitonal Institute for Occupational Safety and HealthOAQPS: Office of Air Quality Planning and StandardsOPPTS: Office of Pollution Prevention and Toxic SubstancesOSHA: Occupational Safety and Health AdministrationOW: Office of Waterppm: parts per millionTLV: Threshold Limit ValueTWA: Time Weighted Average
c. Skin designation that there is a potential for dermal absorption and that skin exposure should be prevented through the use ofgloves, coveralls, goggles, and other appropriate equipment.
e. Recommended exposure limit is a time-weighted average concentration for up to a 10-hour workday during a 40-hour work week.
http://www.tceq.texas.gov/toxicology/esl/list_main.html#esl_1
b. Time-weighted average concentrations that must not be exceeded during any 8-hour work shift of a 40-hour week
Page 2 of 2

Table 3-1. Physical and Chemical Properties of EGBE
Property Information Reference a
Molecular weight 118.17 Merck 1989
colorless Marsden and Mann 1963
Physical state liquid Merck 1989-70 C HSDB 1997-75 C ASTER 1995
171 C at 760 mm Hg Weast 197550 C at 4 mm Hg Weast 1989
0.9019 g/mL Merck 1989Faint odor Marsden and Mann 1963
Mild ethereal odor ACGIH 1991Odor threshold
Air 0.10 ppm (v/v) Amoore and Hautala 19830.4 ppm (v/v) OSHA 1990
Water No dataSolubility
Water at 25 C Soluble in all proportions Riddick and Bunger 1970, Weast 1975Organic solvent(s) Miscible with alcohol, ether Weast 1975
Soluble in most organic solvents Merck 1989Partition coefficients
Log Kow 0.83 HSDB 19970.84 ASTER 1995
Log Koc 1.83 (calculated) HSDB 1997, Lyman et al. 19821.79 (calculated) ASTER 1995
Bioconcentration factorLog BCF 0.40 (calculated) HSDB 1997, Lyman et al. 1982
Vapor pressureAt 20 C 0.76 mm Hg HSDB 1997At 25 C 0.88 mmHg Dow 1993
Henry's law constant 2.08 x 10⁻⁸ (calculated) Howard 1993, HSDB 1997(atm-m3/mol) 5.44 x 10⁻⁶ (calculated) ASTER 1995
1.96 x 10⁻¹¹ cm3/molecule-second at 25 C (estimated)
Atkinson 198717 hours (calculated) HSDB 1997
Autoignition temperature 238 C HSDB 1997244 C Marsden and Mann 1963, OSHA 1990
60°C (closed cup) Merck 198962°C (closed cup) HSDB 199769°C (open cup) OSHA 199074°C (open cup) Marsden and Mann 1963
Explosive limits 1.1% (lower); 10.1% (upper) OSHA 1990
a. All references are as cited in ATSDR 1998ASTER: Assessment Tools for the Evaluation of RiskATSDR: Agency for Toxic Substances and Disease RegistryBCF: bioconcentration factorC: degrees CelsiusEGBE: ethylene glycol monobutyl etherHSDB: Hazardous Substance Data BankKoc: organic carbon partition coefficientKow: octanol-water partition coefficientOSHA: Occupational Safety and Health Administration
Flashpoint
Flammability HSDB 1997
Atmospheric half-life at 25 C and 5 x
105 hydroxyl radicals/m3
Vapor-phase rate constant for reaction with photochemically produced hydroxy radicals
May be ignited by heat, sparks or open flame
Color
Melting point
Boiling point
Density at 20 C
Odor
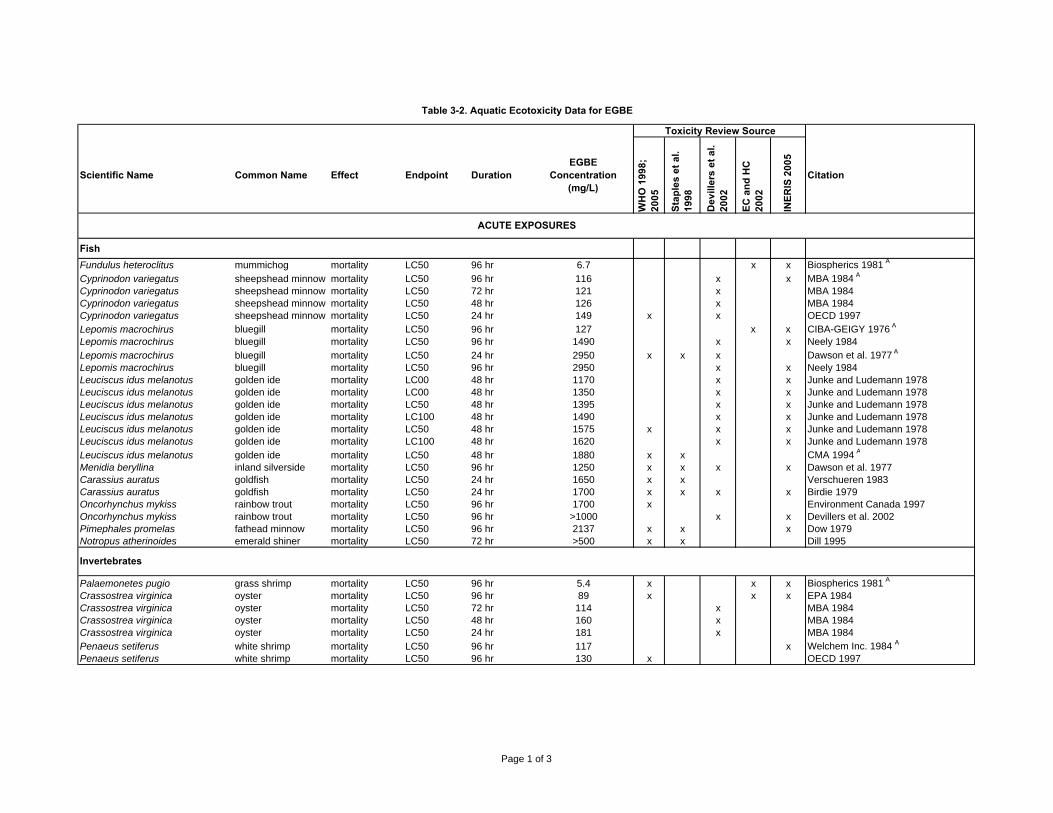
Table 3-2. Aquatic Ecotoxicity Data for EGBE
Toxicity Review Source
Scientific Name Common Name Effect Endpoint DurationEGBE
Concentration (mg/L)
WH
O 1
998;
20
05
Stap
les
et a
l. 19
98
Dev
iller
s et
al.
2002
EC a
nd H
C
2002
INER
IS 2
005
Citation
FishFundulus heteroclitus mummichog mortality LC50 96 hr 6.7 x x Biospherics 1981 A
Cyprinodon variegatus sheepshead minnow mortality LC50 96 hr 116 x x MBA 1984 A
Cyprinodon variegatus sheepshead minnow mortality LC50 72 hr 121 x MBA 1984Cyprinodon variegatus sheepshead minnow mortality LC50 48 hr 126 x MBA 1984Cyprinodon variegatus sheepshead minnow mortality LC50 24 hr 149 x x OECD 1997Lepomis macrochirus bluegill mortality LC50 96 hr 127 x x CIBA-GEIGY 1976 A
Lepomis macrochirus bluegill mortality LC50 96 hr 1490 x x Neely 1984Lepomis macrochirus bluegill mortality LC50 24 hr 2950 x x x Dawson et al. 1977 A
Lepomis macrochirus bluegill mortality LC50 96 hr 2950 x x Neely 1984Leuciscus idus melanotus golden ide mortality LC00 48 hr 1170 x x Junke and Ludemann 1978Leuciscus idus melanotus golden ide mortality LC00 48 hr 1350 x x Junke and Ludemann 1978Leuciscus idus melanotus golden ide mortality LC50 48 hr 1395 x x Junke and Ludemann 1978Leuciscus idus melanotus golden ide mortality LC100 48 hr 1490 x x Junke and Ludemann 1978Leuciscus idus melanotus golden ide mortality LC50 48 hr 1575 x x x Junke and Ludemann 1978Leuciscus idus melanotus golden ide mortality LC100 48 hr 1620 x x Junke and Ludemann 1978Leuciscus idus melanotus golden ide mortality LC50 48 hr 1880 x x CMA 1994 A
Menidia beryllina inland silverside mortality LC50 96 hr 1250 x x x x Dawson et al. 1977Carassius auratus goldfish mortality LC50 24 hr 1650 x x Verschueren 1983Carassius auratus goldfish mortality LC50 24 hr 1700 x x x x Birdie 1979Oncorhynchus mykiss rainbow trout mortality LC50 96 hr 1700 x Environment Canada 1997Oncorhynchus mykiss rainbow trout mortality LC50 96 hr >1000 x x Devillers et al. 2002Pimephales promelas fathead minnow mortality LC50 96 hr 2137 x x x Dow 1979Notropus atherinoides emerald shiner mortality LC50 72 hr >500 x x Dill 1995
Palaemonetes pugio grass shrimp mortality LC50 96 hr 5.4 x x x Biospherics 1981 A
Crassostrea virginica oyster mortality LC50 96 hr 89 x x x EPA 1984Crassostrea virginica oyster mortality LC50 72 hr 114 x MBA 1984Crassostrea virginica oyster mortality LC50 48 hr 160 x MBA 1984Crassostrea virginica oyster mortality LC50 24 hr 181 x MBA 1984Penaeus setiferus white shrimp mortality LC50 96 hr 117 x Welchem Inc. 1984 A
Penaeus setiferus white shrimp mortality LC50 96 hr 130 x OECD 1997
ACUTE EXPOSURES
Invertebrates
Page 1 of 3

Table 3-2. Aquatic Ecotoxicity Data for EGBE
Toxicity Review Source
Scientific Name Common Name Effect Endpoint DurationEGBE
Concentration (mg/L)
WH
O 1
998;
20
05
Stap
les
et a
l. 19
98
Dev
iller
s et
al.
2002
EC a
nd H
C
2002
INER
IS 2
005
Citation
Penaeus setiferus white shrimp mortality LC50 72 hr 147 x MBA 1984Penaeus setiferus white shrimp mortality LC50 48 hr 173 x MBA 1984Crangon crangon brown shrimp mortality LC50 96 hr 550 x x Verschueren 1983Crangon crangon brown shrimp mortality LC50 48 hr 600 x x Verschueren 1983Crangon crangon brown shrimp mortality LC50 96 hr 698 x Blackman 1974 A
Hydra vulgaris coelenterate mortality LC50 72 hr 690 x x Bowden et al. 1995Daphnia magna water flea mortality LC50 48 hr 835 x x x Dow 1979Daphnia magna water flea mortality LC00 24 hr 1140 x x Bringmann and Kuhn 1977Daphnia magna water flea mortality EC00 24 hr 1283 x x Bringmann and Kuhn 1982Daphnia magna water flea immobilization EC50 48 hr 1600 x x Devillers et al. 2002Daphnia magna water flea mortality LC50 24 hr 1698 x x x x Bringmann and Kuhn 1982Daphnia magna water flea mortality LC50 24 hr 1720 x x x x Bringmann and Kuhn 1977Daphnia magna water flea mortality LC100 24 hr 2500 x x Bringmann and Kuhn 1977Daphnia magna water flea mortality EC100 24 hr 2500 x x Bringmann and Kuhn 1982Daphnia magna water flea mortality LC50 24 hr 5000 x x x CMA 1994 A
Artemia salina brine shrimp mortality LC50 24 hr 1000 x x Price et al. 1974
Xenopus laevis African clawed frog mortality LOEC 12 d 2000 x Devillers et al. 2002
FishBrachydanio rerio zebrafish mortality LOEC 21 d >100 x European Union 2005Poecilia reticulata guppy mortality LC50 7 day 982 x x x x Koenemann 1981
Invertebrates
Brachionus calyciflorus rotifer reproduction EC10 48 hr 7.2 x x Devillers et al. 2002Brachionus calyciflorus rotifer reproduction EC20 48 hr 14.3 x x Devillers et al. 2002Brachionus calyciflorus rotifer reproduction EC50 48 hr 164 x x Devillers et al. 2002Daphnia magna water flea reproduction NOEC 21 d 100 x x Devillers et al. 2002Daphnia magna water flea reproduction EC10 21 d 134 x European Union 2005Daphnia magna water flea reproduction EC20 21 d 175 x European Union 2005
Daphnia magna water flea reproduction EC50 21 d 297 x European Union 2005Ceriodaphnia dubia water flea reproduction EC10 7 d 134.9 x x Devillers et al. 2003Crassostrea gigas Japanese oyster development NOEC 24 hr 100 x Devillers et al. 2002Crassostrea gigas Japanese oyster development LOEC 24 hr 1000 x Devillers et al. 2002
CHRONIC/INTERMEDIATE EXPOSURES
Amphibian
Page 2 of 3

Table 3-2. Aquatic Ecotoxicity Data for EGBE
Toxicity Review Source
Scientific Name Common Name Effect Endpoint DurationEGBE
Concentration (mg/L)
WH
O 1
998;
20
05
Stap
les
et a
l. 19
98
Dev
iller
s et
al.
2002
EC a
nd H
C
2002
INER
IS 2
005
Citation
Microcystis aeruginosa cyanobacterium growth LOEC 8 day 35 x x x x x Bringmann and Kuhn 1980aEntosiphon sulcatum protozoan growth LOEC 72 hr 91 x x x x Bringmann and Kuhn 1980aSelenastrum capricornutum green alga growth NOEC 7 day 125 x x x Dow 1988Selenastrum capricornutum green alga growth LOEC 7 day 250 x x Dow 1988Selenastrum capricornutum green alga growth EC50 7 day >1000 x x x Dow 1988Uronema parduczi protozoan growth EC05 48 hr 463 x x x x Bringmann and Kuhn 1980bPseudomonas putida bacterium growth LOEC 16 hr 700 x x x x Bringmann and Kuhn 1980aScenedesmus quadricaudata green alga growth LOEC 7 day 900 x x x x Bringmann and Kuhn 1980aChilomonas parmecium protozoan growth EC05 48 hr 911 x x x x Bringmann and Kuhn 1980bPseudokirchneriella subcapitata algae growth (biomass NOEC 72 hr 88.2 x Devillers et al. 2002Pseudokirchneriella subcapitata algae growth (rate) NOEC 72 hr 286 x x Devillers et al. 2002Pseudokirchneriella subcapitata algae growth EC50 72 hr 944 x Devillers et al. 2002Pseudokirchneriella subcapitata algae growth EC50 72 hr 1840 x Devillers et al. 2002Pseudokirchneriella subcapitata algae growth EC50 24 hr 4183 Escher et al. 2008
A. Ecotoxicity values did not meet data quality requirements for inclusion in other risk assessments (INERIS 2005)EC: Environment CanadaEC00: effect concentration for 0 percent of organisms testedEC05: effect concentration for 5 percent of organisms testedEC10: effect concentration for 10 percent of organisms testedEC100: effect concentration for 100 percent of organisms testedEC20: effect concentration for 20 percent of organisms testedEC50: median effect concentrationEGBE: ethylene glycol monobutyl etherHC: Health CanadaINERIS: National Institute for Industrial Environment and Risks (France)LC00: lethal concentration for 0 percent of organisms testedLC100: lethal concentration for 100 percent of organisms testedLC50: median lethal concentrationLOEC: lowest observed effect concentrationNOEC: no observed effect concentrationWHO: World Health Organization
Algae, Bacteria, Protozoans
Page 3 of 3

Table 5-1. Comparison of Glycol Ether TRI-Reported Releases from 1993 through 2011
Information 1993a 2003 2004 2005 2006 2008 2009 2010 2011 % Change (1993-2011)
Number of Facilities Reporting GE Emissions to Any Media
2,251 1,913 1,850 1,793 1,740 1,579 1,478 1,510 1,492 -34%
Number of Facilities Reporting Non-zero GE Emissions to Any Media
2,036 1,459 1,423 1,372 1,247 1,198 1,109 1,149 1,099 -46%
Total GE Releases (All Facilities) (tpy) 24,106 12,463 11,774 10,924 10,148 8,353 7,015 7,434 7,229 -70%
Maximum GE Release per Facility (tpy) 375 196 347 495 396 393 293 365 361 -4%
95th Percentile Release per Facility (tpy) 57 44 39 35 36 29 31 29 27 -53%
50th Percentile Release per Facility (tpy) 1.9 1.4 1.2 1.0 1.3 0.9 0.7 0.6 0.5 -73%
Average Release per Facility (tpy) 12 8.5 8.3 8.0 8.1 7.0 6.3 6.5 6.0 -49%
% Releases to Air (All Facilities) 97% 94% 93% 89% 90% 87% 90% 88% 87% -10%
Average % Released to Air (by Facility) 92% 89% 89% 89% 89% 87% 88% 88% 88% -4%
Total GE Releases to Air (All Facilities) (tpy) 23,448 11,699 10,942 9,699 9,101 7,282 6,285 6,541 6,304 -73%
Maximum GE Release to Air per Facility (tpy) 375 196 176 187 179 167 172 189 173 -54%
95th Percentile Release to Air per Facility (tpy)
56 41 37 35 35 28 31 28 21 -63%
50th Percentile Release to Air per Facility (tpy)
1.5 0.86 0.75 0.75 0.88 0.55 0.49 0.43 0.13 -91%
Average Release to Air per Facility (tpy) 12 8.0 7.7 7.2 7.4 6.2 5.8 5.8 5.2 -55%
Source: www.epa.gov/tria. 1993 TRI data are included because they were the basis for the Hazardous Air Pollutants petition (CMA 1997)GE: Certain Glycol Etherstpy: tons per yearTRI: Toxic Release Inventory
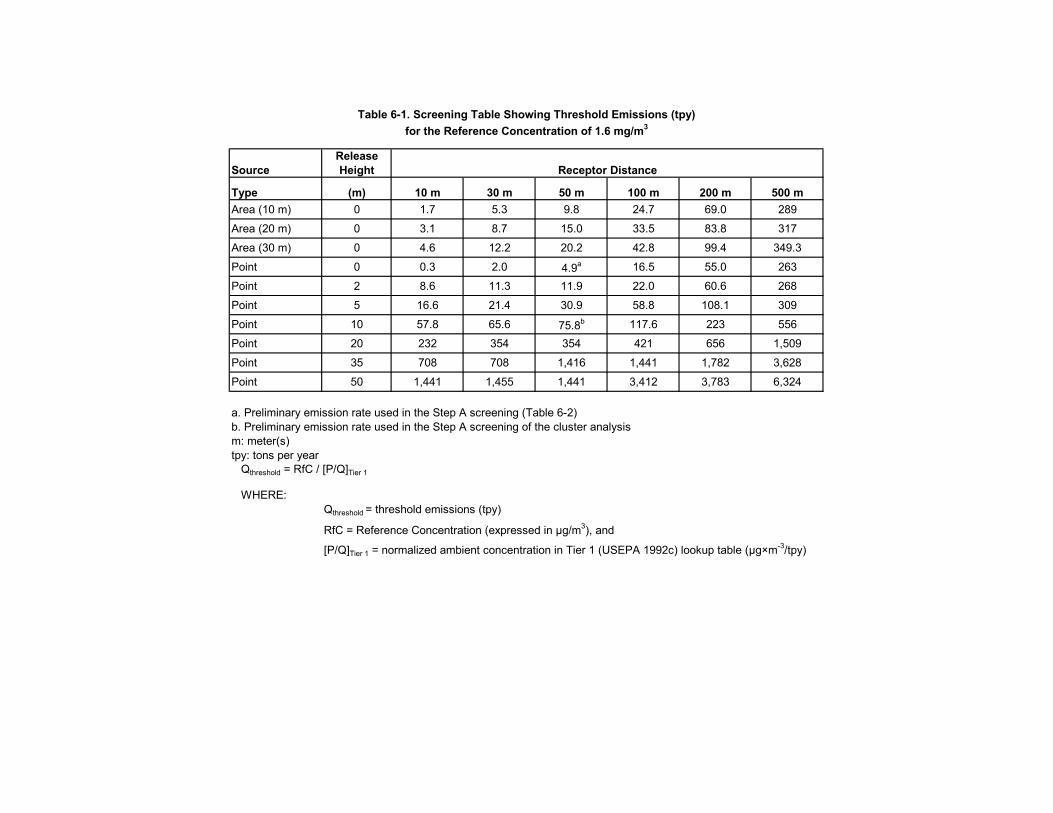
Table 6-1. Screening Table Showing Threshold Emissions (tpy) for the Reference Concentration of 1.6 mg/m3
ReleaseSource Height Receptor Distance
Type (m) 10 m 30 m 50 m 100 m 200 m 500 mArea (10 m) 0 1.7 5.3 9.8 24.7 69.0 289
Area (20 m) 0 3.1 8.7 15.0 33.5 83.8 317
Area (30 m) 0 4.6 12.2 20.2 42.8 99.4 349.3
Point 0 0.3 2.0 4.9a 16.5 55.0 263
Point 2 8.6 11.3 11.9 22.0 60.6 268
Point 5 16.6 21.4 30.9 58.8 108.1 309
Point 10 57.8 65.6 75.8b 117.6 223 556
Point 20 232 354 354 421 656 1,509
Point 35 708 708 1,416 1,441 1,782 3,628
Point 50 1,441 1,455 1,441 3,412 3,783 6,324
a. Preliminary emission rate used in the Step A screening (Table 6-2)b. Preliminary emission rate used in the Step A screening of the cluster analysism: meter(s)tpy: tons per year
WHERE:
[P/Q]Tier 1 = normalized ambient concentration in Tier 1 (USEPA 1992c) lookup table (μg×m-3/tpy)
Qthreshold = RfC / [P/Q]Tier 1
Qthreshold = threshold emissions (tpy)
RfC = Reference Concentration (expressed in μg/m3), and

Table 6-2. Number of Facilities with Total TRI-Reported Air Emissions of Certain Glycol Ethers Relative to 4.9 tpy (Step A)
Classification No. Facilities (2009) No. Facilities (2010) No. Facilities (2011)
Less than 4.9 tpy 824 850 823
Equal to or Greater than 4.9 tpy 260 273 276
Total 1,084 1,123 1,099
Percent of Total Less than 4.9 tpy 76% 76% 75%
tpy: tons per yearEmissions Data Source: Toxics Release Inventory (TRI)

Table 6-3. Number of Facilities with Total Air Emissions of Certain Glycol Ethers Greater than Site-Specific Screening Values (Step B)
2009 2010 2011
Classification
Number of Facilities Screened
Number Screened Outa
Number Retained
Number of Facilities Screened
Number Screened Out
Number Retained
Number of Facilities Screened
Number Screened Out
Number Retained
Complete Site-Specific Data Received 35 21 14 34 20 14 31 18 13
Partial Site-Specific Data Received 4 4 0 4 3 1 4 3 1
Default Assumptions Used 221 220 1 235 235 0 241 241 0
Total 260 245 15 273 258 15 276 262 14
a. All facilities retained for additional screening following Step A in any of the 3 years were subjected to Step B screening.Note that one facility retained from the 2009 TRI (Aurora Casket) was not subjected to additional Tier 1 screening because it is no longer operational.Emissions Data Source: Toxics Release Inventory (TRI)Note: Site-specific data employed:
1) Minimum stack release height (meters)2) Minimum distance to property fenceline (meters)3) Percent of certain glycol ethers released as ethylene glycol monobutyl ether (EGBE)

Table 6-4. Long-Term (Chronic Exposure) Tier 1 Modeling Results
2009 TRI 2010 TRI 2011 TRI
Maximum Annual Tier I EGBE Conc.
(µg/m3)
Long-Term HQ
(combined)
Maximum Annual Tier I EGBE Conc.
(µg/m3)
Long-Term HQ
(combined)
Maximum Annual Tier I EGBE Conc.
(µg/m3)
Long-Term HQ
(combined)
Crown Beverage Packaging - Lawrence Point 3654.7 3176.1 3553.4
Volume 589.5 512.3 573.2
RR Donnelley-Harrisonburg Point 104.4 87.5 74.7
Volume 498.5 535.1 623.5
Ball Metal Food Container Corp- Williamsburg Point 2852.4 3056.1 2954.3
Volume 651.8 688.0 675.9
Crown Cork & Seal Co (USA) - Weirton Point 1753.1 1665.4 1598.8
Volume 1526.5 1450.2 1392.2
Rexam Beverage Can Company- Winston-Salem Point 2885.0 3158.4 2214.1
Volume 971.0 1070.7 882.0
Rexam Beverage Can Company- Bishopville Point 2268.3 2275.3 2099.0
Volume 521.7 523.3 482.6
Ball Container LLC - Columbus Point 1049.7 1364.6 1469.6
Volume 718.4 413.1 431.0
Ball Metal Beverage Container Corp- Findlay Point 2743.0 2743.0 2848.5
Volume 884.5 902.5 920.6
Silgan Containers Manufacturing Corp- LaPorte Point 1329.8 1354.2 1298.8
Volume 451.3 463.9 440.1
Crown Beverage Packaging - Lacrosse Point 47.4 46.0 49.8
Volume 823.6 799.2 865.6
Crown Food Packaging - Owatonna Point 1833.0 1919.7 1998.5
Volume 725.5 761.0 789.3
Rexam Beverage Can Company- Chicago Point 1342.4 1395.9 691.5
Volume 515.3 536.8 246.4
Crown Beverage Packaging - Bradley Point 1253.3 1171.5 1185.5
Volume 608.1 568.4 575.2Rexam Beverage Can Company- Kent Point 2068.4 1953.6 1950.4
Volume 475.7 449.3 448.6Crown Beverage Packaging - Olympia Point 1177.4 1336.4 1100.4
Volume 579.7 659.1 542.7
Hazard quotient (HQ) equals the sum of the maximum annual average concentration for fugitive/volume source emissions and point source emissions, at or beyond the feEGBE: ethylene glycol monobutyl etherHQ: hazard quotientRfC: reference concentrationTRI: Toxics Release Inventory
µg/m3: micrograms per cubic meterBold text indicates an HQ greater than 1
2 2 1
1 1 1
1 1 0.6
1 1 1
0.5 0.5 0.6
2 2 2
2 2 2
1 1 1
1 1 1
2 3 2
2 2 2
2 2 2
2 2 2
0.4 0.4 0.4
Site Name Source Type
3 2 3

Table 6-5. Long-Term (Chronic Exposure) Tier 2 Modeling Results (2009, 2010, and 2011 TRI Data)
Facility Name City State ZipCode
Maximum Predicted
Annual Concentration
(mg/m3)a
Chronic HQ (combined fugitive and
point)
Maximum Predicted
Annual Concentration
(mg/m3)a
Chronic HQ (combined fugitive and
point)
Maximum Predicted
Annual Concentration
(mg/m3)a
Chronic HQ (combined fugitive and
point)
Crown Beverage Packaging Lawrence MA 01843 1.20 0.7 1.04 0.6 1.16 0.7Ball Metal Beverage Container Corp Williamsburg VA 23185 0.54 0.3 0.58 0.4 0.56 0.4Crown Cork & Seal Co (Usa) Inc Crown Closure Div Weirton WV 26062 0.28 0.2 0.26 0.2 0.25 0.2Rexam Beverage Can Co Re: Winston Salem Plant Winston-Salem NC 27107 0.36 0.2 0.40 0.2 0.29 0.2Rexam Beverage Can Co Re: Bishopville Sc Facility Bishopville SC 29010 0.89 0.6 0.89 0.6 0.83 0.5Ball Container Llc - Columbus Can Plant Columbus OH 43213 0.46 0.3 0.56 0.3 0.60 0.4Ball Metal Beverage Container Corp Findlay OH 45840 0.28 0.2 0.28 0.2 0.29 0.2Silgan Containers Manufacturing Corp La Porte IN 46350 0.25 0.2 0.25 0.2 0.24 0.1Crown Food Packaging Owatonna MN 55060 0.30 0.2 0.32 0.2 0.33 0.2Rexam Beverage Can Co Re : Chicago Plant Chicago IL 60609 0.57 0.4 0.59 0.4 0.29 0.2Crown Beverage Packaging Bradley IL 60915 0.28 0.2 0.26 0.2 0.27 0.2Rexam Beverage Can Co Kent Wa Facility Kent WA 98032 1.08 0.7 1.02 0.6 1.02 0.6Crown Beverage Packaging Olympia WA 98501 0.47 0.3 0.54 0.3 0.44 0.3*: Rexam Chicago facility was screened out from further analysis for the 2011 data following Step B.
HQ: hazard quotient. Maximum Predicted Annual Concentrations/RfCmg/m3: milligrams per cubic meterRfC: Reference concentration (1.6 mg/m3)TRI: Toxics Release Inventory
a. Concentrations include point and volume/fugitive source emissions. For point sources, the result for the individual stack at the facility with the maximum predicted concentration is shown at that
2011 TRI2010 TRI2009 TRI

2009 2010 2011 2009 2010 201100985 Carolina Puerto Rico 2 2 2 30.2 27.7 24.301843 Lawrence Massachusetts 2 2 NA 72.2 62.7 NA01950 Newburyport Massachusetts NA NA 2 NA NA 0.102021 Canton Massachusetts 2 2 2 0.4 0.4 0.407001 Avenel New Jersey 2 2 2 1.2 1.3 1.207036 Linden New Jersey 2 NA NA 0.0 NA NA07105 Newark New Jersey NA NA 2 NA NA 0.312866 Saratoga Springs New York 2 NA 2 24.2 NA 23.116148 Hermitage Pennsylvania NA 2 2 NA 2.3 2.416323 Franklin Pennsylvania 2 2 2 11.4 11.9 8.717331 Hanover Pennsylvania 2 2 2 37.4 37.7 33.317402 York Pennsylvania NA 2 2 NA 1.2 1.117601 Lancaster Pennsylvania 2 2 2 12.8 11.5 17.017603 Lancaster Pennsylvania 2 NA NA 1.7 NA NA19067 Morrisville Pennsylvania 2 NA 2 0.4 NA 1.319605 Reading Pennsylvania 2 2 2 0.3 0.3 0.319904 Dover Delaware 2 2 2 6.5 4.0 2.626062 Weirton West Virginia 5 5 5 149.5 132.2 110.127261 High Point North Carolina 3 2 NA 0.8 0.3 NA27320 Reidsville North Carolina 2 2 2 77.1 94.6 102.127409 Greensboro North Carolina 2 2 2 0.1 0.2 0.127703 Durham North Carolina 2 2 2 5.6 6.6 0.228273 Charlotte North Carolina 4 3 5 2.3 2.7 3.029605 Greenville South Carolina NA NA 2 NA NA 0.429644 Fountain Inn South Carolina 2 2 2 0.2 0.1 0.129730 Rock Hill South Carolina 2 2 2 0.3 0.1 0.230043 Lawrenceville Georgia 2 2 2 0.9 2.3 2.730062 Marietta Georgia 2 2 2 0.4 0.4 0.530253 Mc Donough Georgia 2 3 4 8.8 20.5 20.530260 Morrow Georgia 2 2 2 0.4 0.4 0.432254 Jacksonville Florida NA 2 2 NA 35.0 25.632837 Orlando Florida NA 2 2 NA 2.0 1.633760 Clearwater Florida 2 2 NA 0.5 0.4 NA35064 Fairfield Alabama 2 2 2 3.7 3.6 2.735234 Birmingham Alabama 2 2 NA 11.6 10.3 NA35401 Tuscaloosa Alabama 3 3 NA 0.8 0.9 NA37355 Manchester Tennessee NA 2 2 NA 20.6 34.638024 Dyersburg Tennessee 2 2 NA 6.4 1.5 NA38109 Memphis Tennessee NA 3 2 NA 0.1 0.038113 Memphis Tennessee 3 3 2 7.1 3.4 1.838118 Memphis Tennessee 2 NA NA 0.0 NA NA38606 Batesville Mississippi 2 2 2 29.5 25.7 26.038654 Olive Branch Mississippi 3 NA NA 92.2 NA NA39272 Jackson Mississippi 2 2 2 18.7 15.0 15.440210 Louisville Kentucky 2 2 4 1.7 1.9 4.142101 Bowling Green Kentucky 2 2 2 1.0 1.1 1.243015 Delaware Ohio 2 2 2 0.1 0.1 0.143207 Columbus Ohio 2 2 2 0.1 0.1 0.143537 Maumee Ohio 2 2 2 0.8 1.0 1.043607 Toledo Ohio 2 2 2 11.3 17.2 16.843612 Toledo Ohio 3 3 3 12.5 15.4 29.3
Table 6-6. ZIP Codes with More than One Facility Reporting Air Emissions of Certain Glycol Ethers to the TRI in 2009 through 2011
Number of Facilities Total Reported Emissions (tpy)StateCityZIP
Page 1 of 4

2009 2010 2011 2009 2010 2011
Table 6-6. ZIP Codes with More than One Facility Reporting Air Emissions of Certain Glycol Ethers to the TRI in 2009 through 2011
Number of Facilities Total Reported Emissions (tpy)StateCityZIP
43615 Toledo Ohio 2 2 2 1.1 1.0 1.244062 Middlefield Ohio NA 2 NA NA 0.2 NA44077 Painesville Ohio 2 2 2 0.3 0.8 1.144087 Twinsburg Ohio 2 2 2 0.3 0.3 0.344109 Cleveland Ohio 2 2 2 0.1 0.1 0.344483 Warren Ohio 2 2 2 21.7 19.4 22.345036 Lebanon Ohio NA 2 NA NA 3.8 NA45365 Sidney Ohio 2 2 2 15.8 17.7 24.045840 Findlay Ohio 2 2 2 177.3 177.4 182.046135 Greencastle Indiana 2 NA 2 3.2 NA 6.946225 Indianapolis Indiana 2 2 NA 0.0 0.1 NA46320 Hammond Indiana 2 2 2 6.0 6.3 5.946350 La Porte Indiana 2 2 2 72.0 76.1 72.446540 Middlebury Indiana NA 2 2 NA 4.0 6.146705 Ashley Indiana NA 2 NA NA 10.1 NA46721 Butler Indiana 2 2 NA 31.0 29.8 NA47331 Connersville Indiana 2 2 2 0.1 0.1 0.147905 Lafayette Indiana 3 3 3 23.3 37.7 32.347933 Crawfordsville Indiana 2 2 2 23.7 26.1 28.248091 Warren Michigan 3 3 3 7.0 6.2 9.448121 Dearborn Michigan 3 3 3 88.8 66.5 66.248174 Romulus Michigan NA 2 2 NA 0.2 0.248184 Wayne Michigan 2 3 2 8.6 11.6 6.248192 Wyandotte Michigan 2 2 2 2.4 3.1 3.148211 Detroit Michigan 2 2 2 4.1 3.6 2.848220 Ferndale Michigan 2 2 2 0.0 0.0 0.148312 Sterling Heights Michigan 2 2 2 2.2 1.7 5.048341 Pontiac Michigan 2 NA NA 3.5 NA NA48359 Lake Orion Michigan NA NA 2 NA NA 4.053014 Chilton Wisconsin NA NA 2 NA NA 11.553027 Hartford Wisconsin 2 2 2 23.2 21.7 20.653051 Menomonee Falls Wisconsin 3 4 4 5.8 5.5 6.153066 Oconomowoc Wisconsin NA NA 2 NA NA 7.153095 West Bend Wisconsin 2 2 2 0.3 0.3 0.253154 Oak Creek Wisconsin 2 3 3 15.9 46.0 54.253177 Sturtevant Wisconsin 2 2 3 0.5 0.5 0.853223 Milwaukee Wisconsin 2 2 NA 0.4 0.3 NA53224 Milwaukee Wisconsin 3 3 3 51.7 47.4 44.453913 Baraboo Wisconsin NA NA 2 NA NA 30.154143 Marinette Wisconsin 2 NA NA 3.2 NA NA54220 Manitowoc Wisconsin NA NA 2 NA NA 2.660007 Elk Grove Village Illinois 6 6 6 8.4 12.3 9.960090 Wheeling Illinois 2 2 2 0.2 0.2 0.260174 Saint Charles Illinois 2 2 2 2.4 1.4 1.360178 Sycamore Illinois NA 2 2 NA 10.6 7.460410 Channahon Illinois 2 NA NA 0.0 NA NA60411 Chicago Heights Illinois 2 2 2 31.5 37.6 36.260426 Harvey Illinois 2 2 2 16.2 25.9 7.260439 Lemont Illinois 2 2 2 0.1 0.1 0.160455 Bridgeview Illinois 2 2 2 8.4 9.5 8.560501 Bedford Park Illinois 2 NA NA 0.5 NA NA
Page 2 of 4

2009 2010 2011 2009 2010 2011
Table 6-6. ZIP Codes with More than One Facility Reporting Air Emissions of Certain Glycol Ethers to the TRI in 2009 through 2011
Number of Facilities Total Reported Emissions (tpy)StateCityZIP
60510 Batavia Illinois 3 3 3 0.8 1.1 2.260517 Woodridge Illinois 2 NA NA 0.0 NA NA60608 Chicago Illinois 2 2 2 9.9 14.4 3.460609 Chicago Illinois 2 2 2 91.1 111.1 67.160623 Chicago Illinois 3 3 3 24.7 48.0 46.160632 Chicago Illinois NA 2 2 NA 6.6 8.960633 Chicago Illinois 2 2 2 1.1 1.6 1.260803 Alsip Illinois NA NA 2 NA NA 19.061104 Rockford Illinois 2 NA NA 1.2 NA NA61265 Moline Illinois 2 2 2 1.7 1.6 1.662040 Granite City Illinois NA 2 2 NA 6.0 5.862201 Sauget Illinois NA 2 2 NA 0.0 0.063043 Maryland Heights Missouri 2 NA NA 2.1 NA NA63077 Saint Clair Missouri 2 2 2 0.3 0.7 0.163111 Saint Louis Missouri 2 2 NA 0.2 0.2 NA63147 Saint Louis Missouri 2 2 2 0.3 0.3 0.364116 North Kansas City Missouri 3 3 3 4.8 2.9 2.965708 Monett Missouri NA 2 NA NA 11.2 NA65712 Mount Vernon Missouri 2 2 NA 12.8 11.7 NA66106 Kansas City Kansas 2 2 2 0.2 0.2 0.267219 Wichita Kansas NA 2 2 NA 6.1 5.968701 Norfolk Nebraska 2 2 2 11.5 10.4 10.470560 New Iberia Louisiana NA 2 2 NA 1.6 1.970765 Plaquemine Louisiana 2 2 NA 0.6 1.9 NA70776 Saint Gabriel Louisiana 2 NA NA 0.5 NA NA70805 Baton Rouge Louisiana 2 2 2 0.4 0.8 0.172315 Blytheville Arizona NA NA 2 NA NA 12.072764 Springdale Arizona NA NA 2 NA NA 12.172764 Springdale Arkansas 2 2 NA 12.9 10.0 NA73036 El Reno Oklahoma NA 2 2 NA 7.8 7.774063 Sand Springs Oklahoma NA 2 2 NA 0.2 0.174075 Stillwater Oklahoma 2 2 2 4.9 2.3 3.574601 Ponca City Oklahoma 2 2 NA 24.0 20.6 NA75006 Carrollton Texas 2 3 3 3.2 2.3 2.375041 Garland Texas 3 3 4 0.2 0.2 0.275149 Mesquite Texas NA NA 2 NA NA 2.075165 Waxahachie Texas 4 2 NA 0.7 0.1 NA75501 Texarkana Texas 2 NA NA 0.6 NA NA75604 Longview Texas NA NA 2 NA NA 52.575662 Kilgore Texas NA 2 2 NA 0.1 0.175901 Lufkin Texas 2 2 2 2.2 2.3 1.876011 Arlington Texas 2 2 2 4.7 1.5 3.476063 Mansfield Texas NA NA 2 NA NA 0.677041 Houston Texas 2 2 2 1.8 1.3 1.477051 Houston Texas 2 2 2 1.1 1.0 0.877303 Conroe Texas 2 2 3 18.9 18.8 49.777478 Sugar Land Texas NA NA 2 NA NA 31.577507 Pasadena Texas 5 5 5 8.8 10.5 8.377571 La Porte Texas 2 2 NA 4.8 2.1 NA77630 Orange Texas NA 2 2 NA 0.3 0.377651 Port Neches Texas NA 2 2 NA 0.3 0.2
Page 3 of 4
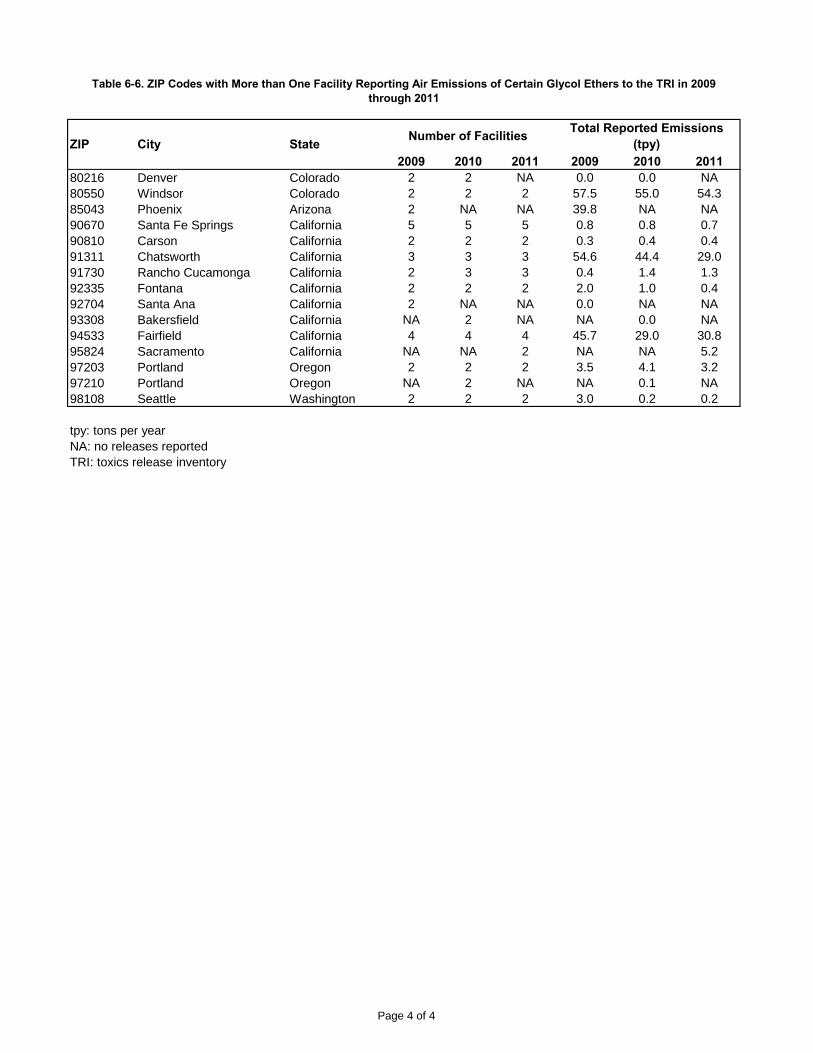
2009 2010 2011 2009 2010 2011
Table 6-6. ZIP Codes with More than One Facility Reporting Air Emissions of Certain Glycol Ethers to the TRI in 2009 through 2011
Number of Facilities Total Reported Emissions (tpy)StateCityZIP
80216 Denver Colorado 2 2 NA 0.0 0.0 NA80550 Windsor Colorado 2 2 2 57.5 55.0 54.385043 Phoenix Arizona 2 NA NA 39.8 NA NA90670 Santa Fe Springs California 5 5 5 0.8 0.8 0.790810 Carson California 2 2 2 0.3 0.4 0.491311 Chatsworth California 3 3 3 54.6 44.4 29.091730 Rancho Cucamonga California 2 3 3 0.4 1.4 1.392335 Fontana California 2 2 2 2.0 1.0 0.492704 Santa Ana California 2 NA NA 0.0 NA NA93308 Bakersfield California NA 2 NA NA 0.0 NA94533 Fairfield California 4 4 4 45.7 29.0 30.895824 Sacramento California NA NA 2 NA NA 5.297203 Portland Oregon 2 2 2 3.5 4.1 3.297210 Portland Oregon NA 2 NA NA 0.1 NA98108 Seattle Washington 2 2 2 3.0 0.2 0.2
tpy: tons per yearNA: no releases reportedTRI: toxics release inventory
Page 4 of 4
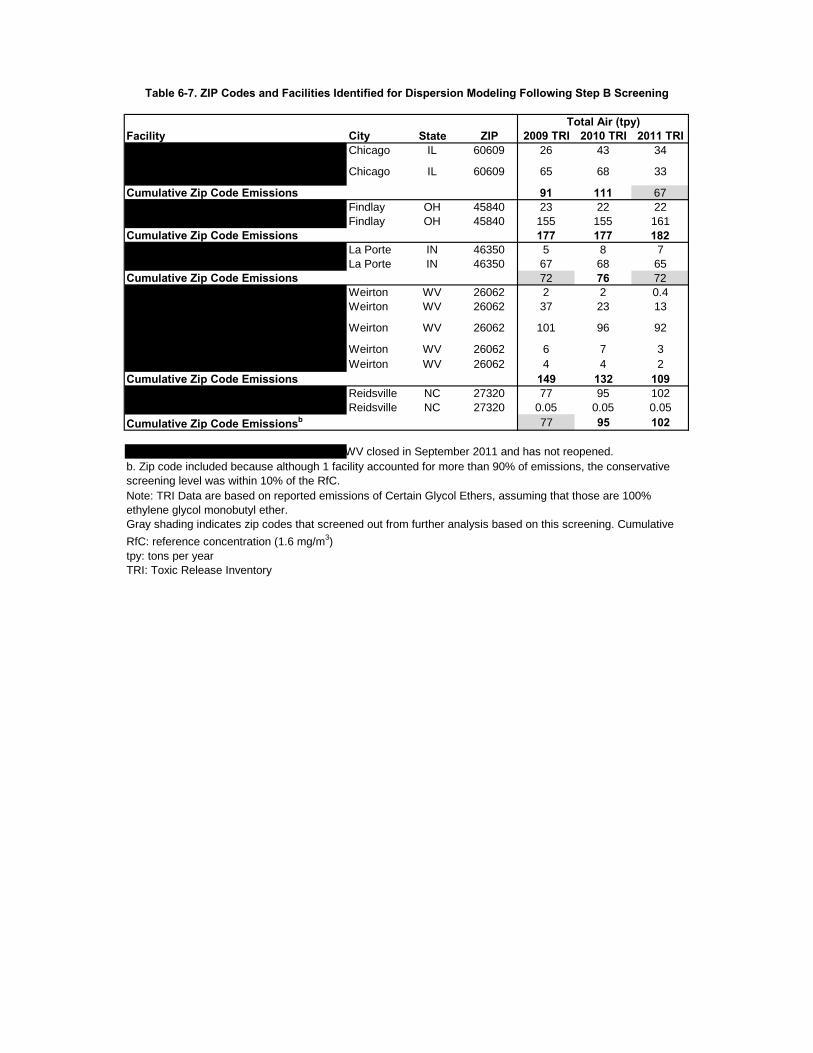
Table 6-7. ZIP Codes and Facilities Identified for Dispersion Modeling Following Step B Screening
Total Air (tpy)Facility City State ZIP 2009 TRI 2010 TRI 2011 TRIEdsal Manufacturing Co Inc Chicago IL 60609 26 43 34Rexam Beverage Can Co Re : Chicago Plant
Chicago IL 60609 65 68 33
Cumulative Zip Code Emissions 91 111 67Whirlpool Corp Findlay Div Findlay OH 45840 23 22 22Ball Metal Beverage Container Corp Findlay OH 45840 155 155 161Cumulative Zip Code Emissions 177 177 182Precoat Metals La Porte IN 46350 5 8 7Silgan Containers Manufacturing Corp La Porte IN 46350 67 68 65Cumulative Zip Code Emissions 72 76 72Ardagh Metal Packaging USA Inc Weirton WV 26062 2 2 0.4Ball Metal Food Container Corp Weirton WV 26062 37 23 13Crown Cork & Seal Co (USA) Inc. Crown Closure Div.
Weirton WV 26062 101 96 92
Precoat Metals Weirton WV 26062 6 7 3
Nestle Purina Petcarea Weirton WV 26062 4 4 2Cumulative Zip Code Emissions 149 132 109Ball Metal Beverage Container Corp Reidsville NC 27320 77 95 102Dystar LP Reidsville NC 27320 0.05 0.05 0.05
Cumulative Zip Code Emissionsb 77 95 102
a. Nestle Purina Petcare facility in Weirton, WV closed in September 2011 and has not reopened.
RfC: reference concentration (1.6 mg/m3)tpy: tons per yearTRI: Toxic Release Inventory
b. Zip code included because although 1 facility accounted for more than 90% of emissions, the conservativescreening level was within 10% of the RfC.Note: TRI Data are based on reported emissions of Certain Glycol Ethers, assuming that those are 100% ethylene glycol monobutyl ether.Gray shading indicates zip codes that screened out from further analysis based on this screening. Cumulative
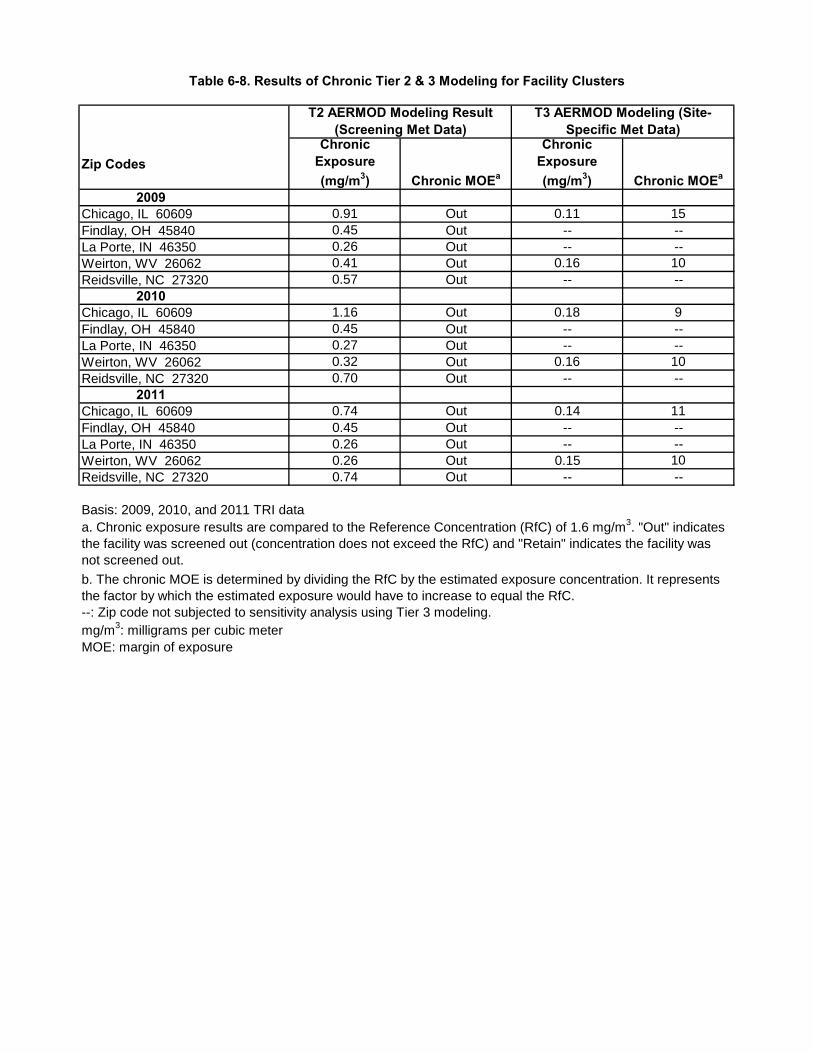
Table 6-8. Results of Chronic Tier 2 & 3 Modeling for Facility Clusters
T2 AERMOD Modeling Result (Screening Met Data)
T3 AERMOD Modeling (Site-Specific Met Data)
Zip Codes Chronic
Exposure (mg/m3) Chronic MOEa
Chronic Exposure (mg/m3) Chronic MOEa
2009Chicago, IL 60609 0.91 Out 0.11 15Findlay, OH 45840 0.45 Out -- --La Porte, IN 46350 0.26 Out -- --Weirton, WV 26062 0.41 Out 0.16 10Reidsville, NC 27320 0.57 Out -- --
2010Chicago, IL 60609 1.16 Out 0.18 9Findlay, OH 45840 0.45 Out -- --La Porte, IN 46350 0.27 Out -- --Weirton, WV 26062 0.32 Out 0.16 10Reidsville, NC 27320 0.70 Out -- --
2011Chicago, IL 60609 0.74 Out 0.14 11Findlay, OH 45840 0.45 Out -- --La Porte, IN 46350 0.26 Out -- --Weirton, WV 26062 0.26 Out 0.15 10Reidsville, NC 27320 0.74 Out -- --
Basis: 2009, 2010, and 2011 TRI data
--: Zip code not subjected to sensitivity analysis using Tier 3 modeling.mg/m3: milligrams per cubic meterMOE: margin of exposure
a. Chronic exposure results are compared to the Reference Concentration (RfC) of 1.6 mg/m3. "Out" indicatesthe facility was screened out (concentration does not exceed the RfC) and "Retain" indicates the facility was not screened out.
b. The chronic MOE is determined by dividing the RfC by the estimated exposure concentration. It representsthe factor by which the estimated exposure would have to increase to equal the RfC.
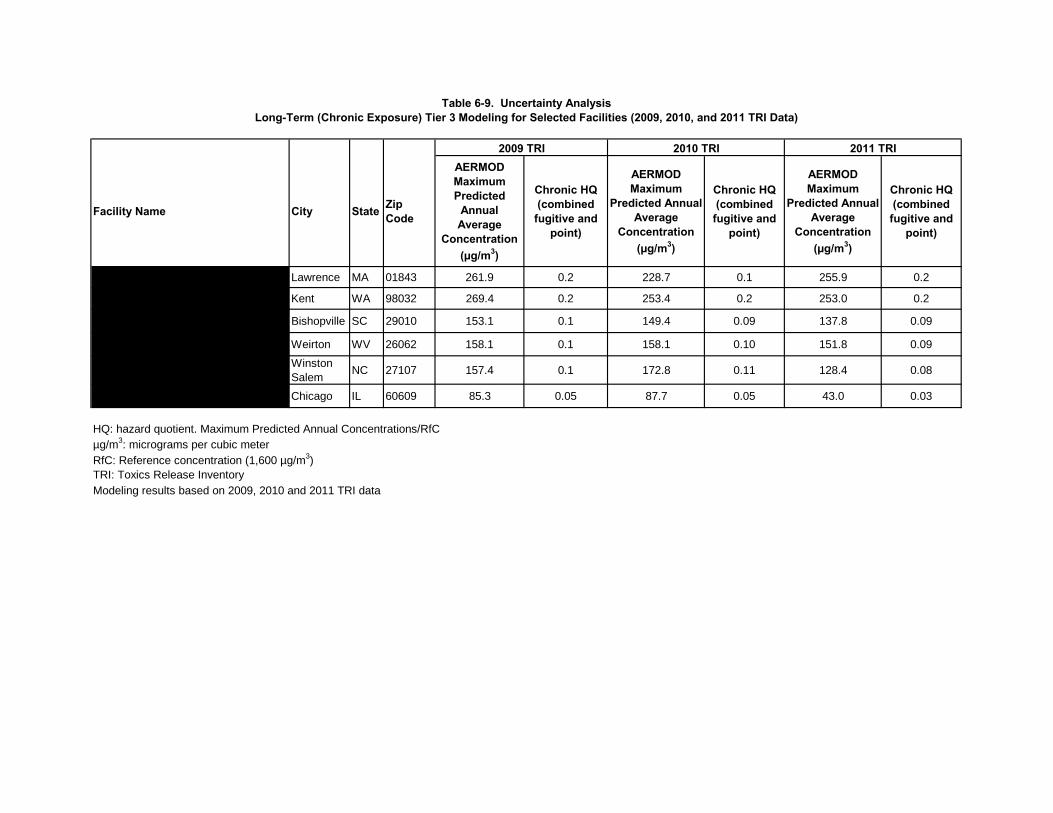
Table 6-9. Uncertainty AnalysisLong-Term (Chronic Exposure) Tier 3 Modeling for Selected Facilities (2009, 2010, and 2011 TRI Data)
Facility Name City State ZipCode
AERMOD Maximum Predicted
Annual Average
Concentration (µg/m3)
Chronic HQ (combined
fugitive and point)
AERMOD Maximum
Predicted Annual Average
Concentration (µg/m3)
Chronic HQ (combined
fugitive and point)
AERMOD Maximum
Predicted Annual Average
Concentration (µg/m3)
Chronic HQ (combined
fugitive and point)
Crown Beverage Packaging Lawrence MA 01843 261.9 0.2 228.7 0.1 255.9 0.2
Rexam Beverage Can Company Kent WA 98032 269.4 0.2 253.4 0.2 253.0 0.2
Rexam Beverage Can Company Bishopville SC 29010 153.1 0.1 149.4 0.09 137.8 0.09
Crown Cork & Seal Co (USA) Weirton WV 26062 158.1 0.1 158.1 0.10 151.8 0.09
Rexam Beverage Can CompanyWinston Salem
NC 27107 157.4 0.1 172.8 0.11 128.4 0.08
Rexam Beverage Can Company Chicago IL 60609 85.3 0.05 87.7 0.05 43.0 0.03
HQ: hazard quotient. Maximum Predicted Annual Concentrations/RfCµg/m3: micrograms per cubic meterRfC: Reference concentration (1,600 µg/m3)TRI: Toxics Release InventoryModeling results based on 2009, 2010 and 2011 TRI data
2011 TRI2010 TRI2009 TRI
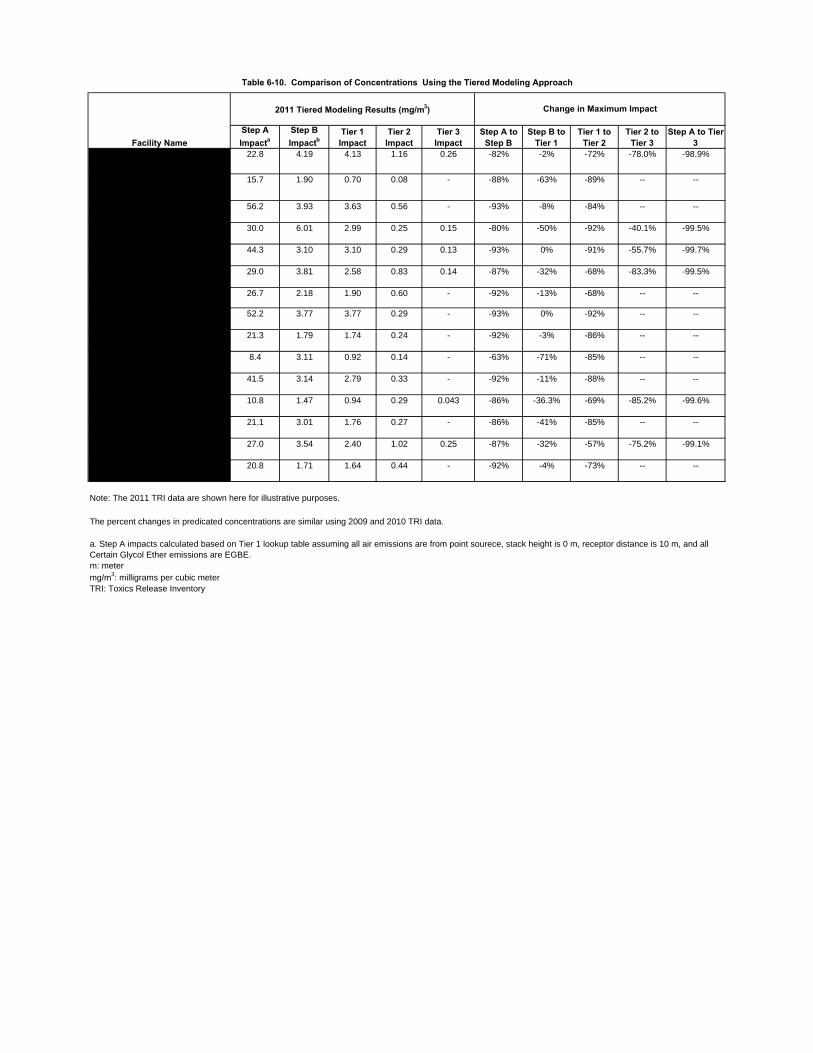
Table 6-10. Comparison of Concentrations Using the Tiered Modeling Approach
Facility NameStep A Impacta
Step B Impactb
Tier 1 Impact
Tier 2 Impact
Tier 3 Impact
Step A to Step B
Step B to Tier 1
Tier 1 to Tier 2
Tier 2 to Tier 3
Step A to Tier 3
Crown Beverage Packaging - Lawrence
22.8 4.19 4.13 1.16 0.26 -82% -2% -72% -78.0% -98.9%
RR Donnelley-Harrisonburg 15.7 1.90 0.70 0.08 - -88% -63% -89% -- --
Ball Metal Food Container Corp- Williamsburg
56.2 3.93 3.63 0.56 - -93% -8% -84% -- --
Crown Cork & Seal Co (USA) - Weirton
30.0 6.01 2.99 0.25 0.15 -80% -50% -92% -40.1% -99.5%
Rexam Beverage Can Company- Winston-Salem
44.3 3.10 3.10 0.29 0.13 -93% 0% -91% -55.7% -99.7%
Rexam Beverage Can Company- Bishopville
29.0 3.81 2.58 0.83 0.14 -87% -32% -68% -83.3% -99.5%
Ball Container LLC - Columbus 26.7 2.18 1.90 0.60 - -92% -13% -68% -- --
Ball Metal Beverage Container Corp-Findlay
52.2 3.77 3.77 0.29 - -93% 0% -92% -- --
Silgan Containers Manufacturing Corp- LaPorte
21.3 1.79 1.74 0.24 - -92% -3% -86% -- --
Crown Beverage Packaging - Lacrosse
8.4 3.11 0.92 0.14 - -63% -71% -85% -- --
Crown Food Packaging - Owatonna 41.5 3.14 2.79 0.33 - -92% -11% -88% -- --
Rexam Beverage Can Company- Chicago
10.8 1.47 0.94 0.29 0.043 -86% -36.3% -69% -85.2% -99.6%
Crown Beverage Packaging - Bradley
21.1 3.01 1.76 0.27 - -86% -41% -85% -- --
Rexam Beverage Can Company- Kent
27.0 3.54 2.40 1.02 0.25 -87% -32% -57% -75.2% -99.1%
Crown Beverage Packaging - Olympia
20.8 1.71 1.64 0.44 - -92% -4% -73% -- --
Note: The 2011 TRI data are shown here for illustrative purposes.
m: metermg/m3: milligrams per cubic meterTRI: Toxics Release Inventory
a. Step A impacts calculated based on Tier 1 lookup table assuming all air emissions are from point sourece, stack height is 0 m, receptor distance is 10 m, and all Certain Glycol Ether emissions are EGBE.
2011 Tiered Modeling Results (mg/m3) Change in Maximum Impact
The percent changes in predicated concentrations are similar using 2009 and 2010 TRI data.
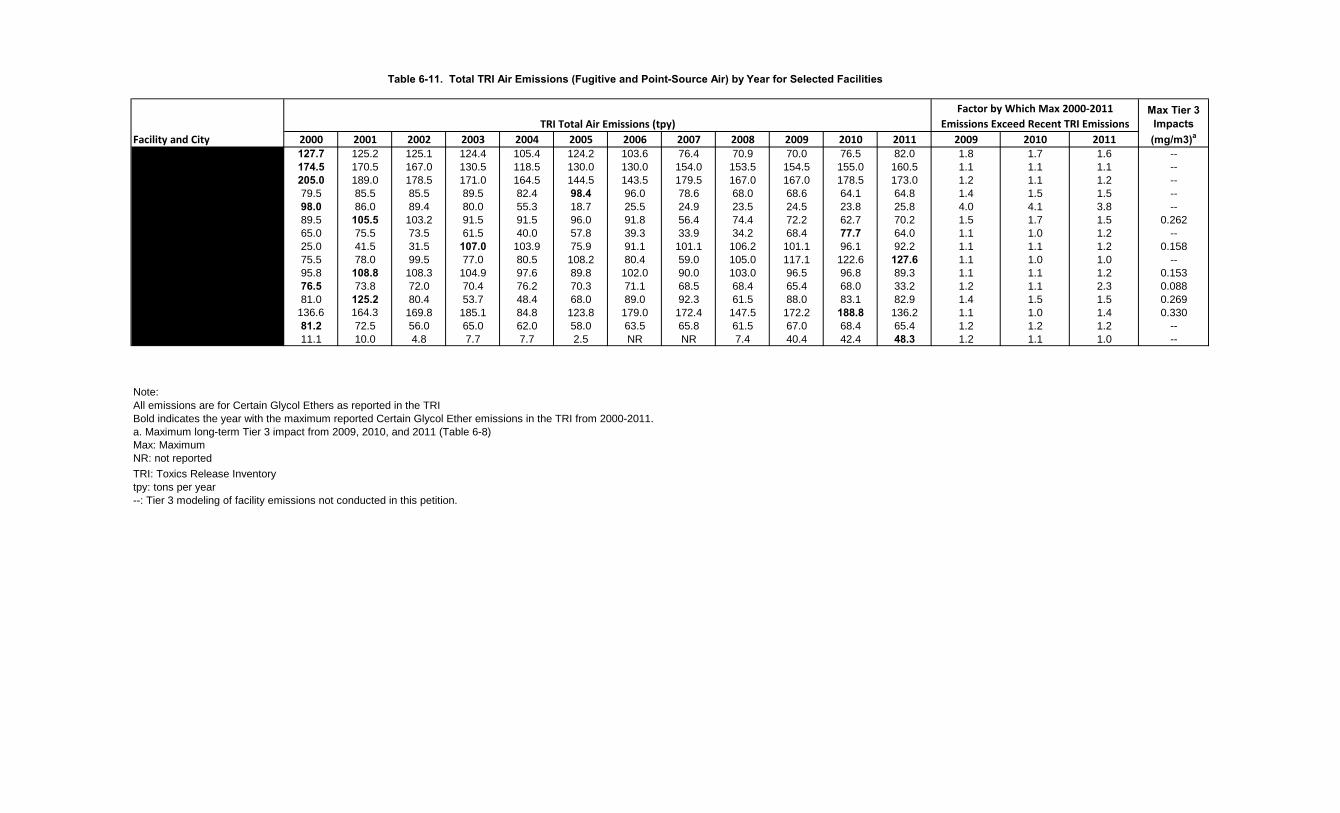
Table 6-11. Total TRI Air Emissions (Fugitive and Point-Source Air) by Year for Selected Facilities
Factor by Which Max 2000‐2011 Emissions Exceed Recent TRI Emissions
Facility and City 2000 2001 2002 2003 2004 2005 2006 2007 2008 2009 2010 2011 2009 2010 2011Ball Columbus 127.7 125.2 125.1 124.4 105.4 124.2 103.6 76.4 70.9 70.0 76.5 82.0 1.8 1.7 1.6 --Ball Findlay 174.5 170.5 167.0 130.5 118.5 130.0 130.0 154.0 153.5 154.5 155.0 160.5 1.1 1.1 1.1 --Ball Williamsburg 205.0 189.0 178.5 171.0 164.5 144.5 143.5 179.5 167.0 167.0 178.5 173.0 1.2 1.1 1.2 --Crown Bradley 79.5 85.5 85.5 89.5 82.4 98.4 96.0 78.6 68.0 68.6 64.1 64.8 1.4 1.5 1.5 --Crown Lacrosse 98.0 86.0 89.4 80.0 55.3 18.7 25.5 24.9 23.5 24.5 23.8 25.8 4.0 4.1 3.8 --Crown Lawrence 89.5 105.5 103.2 91.5 91.5 96.0 91.8 56.4 74.4 72.2 62.7 70.2 1.5 1.7 1.5 0.262Crown Olympia 65.0 75.5 73.5 61.5 40.0 57.8 39.3 33.9 34.2 68.4 77.7 64.0 1.1 1.0 1.2 --Crown Weirton 25.0 41.5 31.5 107.0 103.9 75.9 91.1 101.1 106.2 101.1 96.1 92.2 1.1 1.1 1.2 0.158Crown Owatonna 75.5 78.0 99.5 77.0 80.5 108.2 80.4 59.0 105.0 117.1 122.6 127.6 1.1 1.0 1.0 --Rexam Bishopville 95.8 108.8 108.3 104.9 97.6 89.8 102.0 90.0 103.0 96.5 96.8 89.3 1.1 1.1 1.2 0.153Rexam Chicago 76.5 73.8 72.0 70.4 76.2 70.3 71.1 68.5 68.4 65.4 68.0 33.2 1.2 1.1 2.3 0.088Rexam Kent 81.0 125.2 80.4 53.7 48.4 68.0 89.0 92.3 61.5 88.0 83.1 82.9 1.4 1.5 1.5 0.269Rexam Winston Salem 136.6 164.3 169.8 185.1 84.8 123.8 179.0 172.4 147.5 172.2 188.8 136.2 1.1 1.0 1.4 0.330Silgan LaPorte 81.2 72.5 56.0 65.0 62.0 58.0 63.5 65.8 61.5 67.0 68.4 65.4 1.2 1.2 1.2 --RR Donnelly Harrisonburg 11.1 10.0 4.8 7.7 7.7 2.5 NR NR 7.4 40.4 42.4 48.3 1.2 1.1 1.0 --
Note:All emissions are for Certain Glycol Ethers as reported in the TRIBold indicates the year with the maximum reported Certain Glycol Ether emissions in the TRI from 2000-2011.a. Maximum long-term Tier 3 impact from 2009, 2010, and 2011 (Table 6-8)Max: MaximumNR: not reported
TRI: Toxics Release Inventorytpy: tons per year--: Tier 3 modeling of facility emissions not conducted in this petition.
TRI Total Air Emissions (tpy)Max Tier 3
Impacts (mg/m3)a

Table 6-12. Short-Term (Acute Exposure) Tier 1 Modeling Results
2009 TRI 2010 TRI 2011 TRI
Site Name Source Type
Maximum 1-Hour Average Tier I EGBE
Conc. (µg/m3)
Short-Term HQ
(combined)
Maximum 1-Hour Average Tier I EGBE
Conc. (µg/m3)
Short-Term HQ
(combined)
Maximum 1-Hour Average Tier I EGBE
Conc. (µg/m3)
Short-Term HQ
(combined)
Crown Beverage Packaging - Lawrence Point 1674648.6 1455360.1 1628244.9
Volume 25839.6 22455.8 25123.6
RR Donnelley-Harrisonburg Point 4575.2 3835.5 3274.4
Volume 21848.5 23455.4 27327.9
Ball Metal Food Container Corp- Williamsburg Point 1614548.3 1729873.2 1672210.7
Volume 28567.5 30154.6 29625.6
Crown Cork & Seal Co (USA) - Weirton Point 153263.2 145599.8 139775.7
Volume 66907.0 63561.5 61019.1
Rexam Beverage Can Company- Winston-Salem Point 126797.7 138811.6 97310.1
Volume 42558.5 46926.7 38656.2
Rexam Beverage Can Company- Bishopville Point 781664.4 784081.0 723321.2
Volume 22865.5 22936.6 21153.3
Ball Container LLC - Columbus Point 516703.7 671714.9 723385.2
Volume 31488.0 18105.6 18892.8
Ball Metal Beverage Container Corp- Findlay Point 602446.2 602446.2 625617.2
Volume 38766.6 39557.8 40348.9
Silgan Containers Manufacturing Corp- LaPorte Point 625779.2 637261.3 611214.0
Volume 19778.9 20332.7 19289.9
Crown Beverage Packaging - Lacrosse Point 2071.7 2010.6 2177.7
Volume 36099.6 35030.0 37941.4
Crown Food Packaging - Owatonna Point 373793.1 391475.5 407543.5
Volume 31796.9 33353.0 34594.6
Rexam Beverage Can Company- Chicago Point 487099.1 506509.5 250922.0
Volume 22587.1 23527.5 10798.1
Crown Beverage Packaging - Bradley Point 364345.2 340549.6 344624.2
Volume 26654.8 24914.5 25212.3
Rexam Beverage Can Company- Kent Point 884003.8 834954.6 833594.9
Volume 20850.7 19693.1 19661.5
Crown Beverage Packaging - Olympia Point 185857.0 210964.4 173700.7
Volume 25408.8 28888.5 23785.3
Hazard quotient (HQ) equals the sum of the maximum annual average concentration for fugitive/volume source emissions and point source emissions, at or beyond the feEGBE: ethylene glycol monobutyl etherHQ: hazard quotientRfC: reference concentrationTRI: Toxics Release Inventory
µg/m3: micrograms per cubic meter
9 9 9
2 2 2
5 5 3
4 4 4
0.4 0.4 0.4
4 4 5
7 7 7
7 7 7
6 7 8
2 2 1
8 8 8
17 18 18
2 2 2
18 15 17
0.3 0.3 0.3

Table 6-13. Results of Acute Tier 2 & 3 Modeling for Facility Clusters
T2 AERMOD Modeling Result (Screening Met Data)
T3 AERMOD Modeling (Site-Specific Met Data)
Zip Code and FacilitiesAcute Exposure
(mg/m3) Acute MOEaAcute Exposure
(mg/m3) Acute MOEa
2009Chicago, IL 60609 39.7 Out 14.0 7Findlay, OH 45840 19.7 Out -- --La Porte, IN 46350 11.4 Out -- --Weirton, WV 26062 18.4 Out 8.25 12Reidsville, NC 27320 24.9 Out -- --
2010Chicago, IL 60609 50.9 Out 23.5 4Findlay, OH 45840 19.6 Out -- --La Porte, IN 46350 12.0 Out -- --Weirton, WV 26062 16.0 Out 7.84 12Reidsville, NC 27320 30.6 Out -- --
2011Chicago, IL 60609 32.4 Out 18.5 5Findlay, OH 45840 19.7 Out -- --La Porte, IN 46350 11.4 Out -- --Weirton, WV 26062 13.5 Out 7.52 13Reidsville, NC 27320 32.6 Out -- --
Basis: 2009, 2010, and 2011 TRI data
-- : Zip code not subjected to sensitivity analysis using Tier 3 modeling.mg/m3: milligrams per cubic meterMOE: margin of exposure
a. Acute exposure results are compared to the no observed adverse effects level (NOAEL) of 97 mg/m3. "Out"indicates the facility was screened out (concentration does not exceed the NOAEL) and "Retain" indicates the facility was not screened out.
b. The acute MOE is determined by dividing the NOAEL by the estimated exposure concentration. Itrepresents the factor by which the estimated exposure would have to increase to equal the NOAEL.

Table 6-14. Results of Short-Term Tier 2 & 3 Modeling and Acute MOE Analysis for Selected High Emitting Facilities
Tier 2 Tier 3 Tier 2 Tier 3 Tier 2 Tier 3
Facility City State ZipMaximum 1-Hr Concentration
(mg/m3)aAcute MOE b
Maximum 1-Hr Concentration
(mg/m3)aAcute MOE b
Maximum 1-Hr Concentration
(mg/m3)aAcute MOE b
Maximum 1-Hr Concentration
(mg/m3)aAcute MOE b
Maximum 1-Hr Concentration
(mg/m3)aAcute MOE b
Maximum 1-Hr Concentration
(mg/m3)aAcute MOE b
Ball Container LLC Columbus OH 43213 19.99 4.9 -- -- 24.42 4.0 -- -- 26.26 3.7 -- --Ball Metal Beverage Container Corp Findlay OH 45840 12.10 8.0 -- -- 12.19 8.0 -- -- 12.58 7.7 -- --Ball Metal Food Container Corp Williamsburg VA 23185 23.80 4.1 -- -- 25.47 3.8 -- -- 24.65 3.9 -- --Crown Beverage Packaging Bradley IL 60915 12.39 7.8 -- -- 11.58 8.4 -- -- 11.72 8.3 -- --Crown Beverage Packaging Olympia WA 98501 20.76 4.7 -- -- 23.56 4.1 -- -- 19.40 5.0 -- --Crown Beverage Packaging Lawrence MA 01843 52.41 1.9 15.24 6.4 45.54 2.1 13.24 7.3 50.95 1.9 14.82 6.5Crown Cork & Seal Co (USA) Weirton WV 26062 12.16 8.0 8.24 12 11.55 8.4 7.83 12 11.09 8.7 7.52 13Crown Food Packaging Owatonna MN 55060 13.23 7.3 -- -- 13.86 7.0 -- -- 14.42 6.7 -- --Rexam Beverage Can Company Bishopville SC 29010 39.05 2.5 9.06 11 39.17 2.5 9.09 11 36.13 2.7 8.38 12Rexam Beverage Can Company Chicago IL 60609 24.75 3.9 4.16 23 25.74 3.8 4.33 22 12.69 7.6 2.12 46Rexam Beverage Can Company Kent WA 98032 47.46 2.0 7.66 13 44.83 2.2 7.23 13 44.76 2.2 7.22 13Rexam Beverage Can Company Winston Salem NC 27107 15.36 6.3 16.71 5.8 16.85 5.8 18.31 5.3 12.32 7.9 13.126 7.4Silgan Containers Manufacturing Corp LaPorte IN 46350 10.76 9.0 -- -- 10.97 8.8 -- -- 10.51 9.2 -- --
Basis: 2009, 2010, and 2011 TRI data
--: Facility not subjected to sensitivity analysis using Tier 3 modeling.mg/m3: milligrams per cubic meter MOE: margin of exposure
2009 2010 2011
a. Concentrations are the sum of the predicted maximum 1-hour concentration for (i) fugitive/volume source emissions and (ii) point sourceemissions, at or beyond the fence line.
b. To calculate the MOE, the no observed adverse effect level (NOAEL) for irritation in humans of 97 mg/m3 is divided by the concentration fromcombined fugitive/volume and point source emissions.
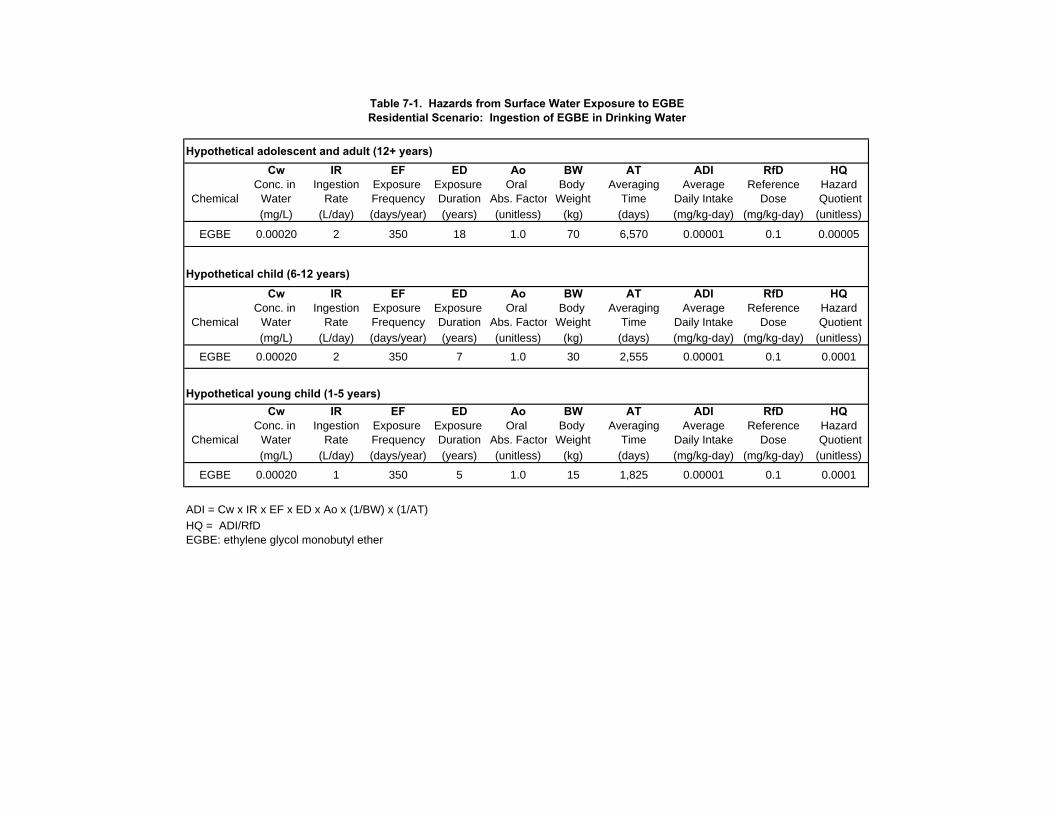
Table 7-1. Hazards from Surface Water Exposure to EGBEResidential Scenario: Ingestion of EGBE in Drinking Water
Hypothetical adolescent and adult (12+ years)Cw IR EF ED Ao BW AT ADI RfD HQ
Conc. in Ingestion Exposure Exposure Oral Body Averaging Average Reference HazardChemical Water Rate Frequency Duration Abs. Factor Weight Time Daily Intake Dose Quotient
(mg/L) (L/day) (days/year) (years) (unitless) (kg) (days) (mg/kg-day) (mg/kg-day) (unitless)
EGBE 0.00020 2 350 18 1.0 70 6,570 0.00001 0.1 0.00005
Hypothetical child (6-12 years)
Cw IR EF ED Ao BW AT ADI RfD HQConc. in Ingestion Exposure Exposure Oral Body Averaging Average Reference Hazard
Chemical Water Rate Frequency Duration Abs. Factor Weight Time Daily Intake Dose Quotient(mg/L) (L/day) (days/year) (years) (unitless) (kg) (days) (mg/kg-day) (mg/kg-day) (unitless)
EGBE 0.00020 2 350 7 1.0 30 2,555 0.00001 0.1 0.0001
Hypothetical young child (1-5 years)Cw IR EF ED Ao BW AT ADI RfD HQ
Conc. in Ingestion Exposure Exposure Oral Body Averaging Average Reference HazardChemical Water Rate Frequency Duration Abs. Factor Weight Time Daily Intake Dose Quotient
(mg/L) (L/day) (days/year) (years) (unitless) (kg) (days) (mg/kg-day) (mg/kg-day) (unitless)
EGBE 0.00020 1 350 5 1.0 15 1,825 0.00001 0.1 0.0001
ADI = Cw x IR x EF x ED x Ao x (1/BW) x (1/AT)
HQ = ADI/RfDEGBE: ethylene glycol monobutyl ether
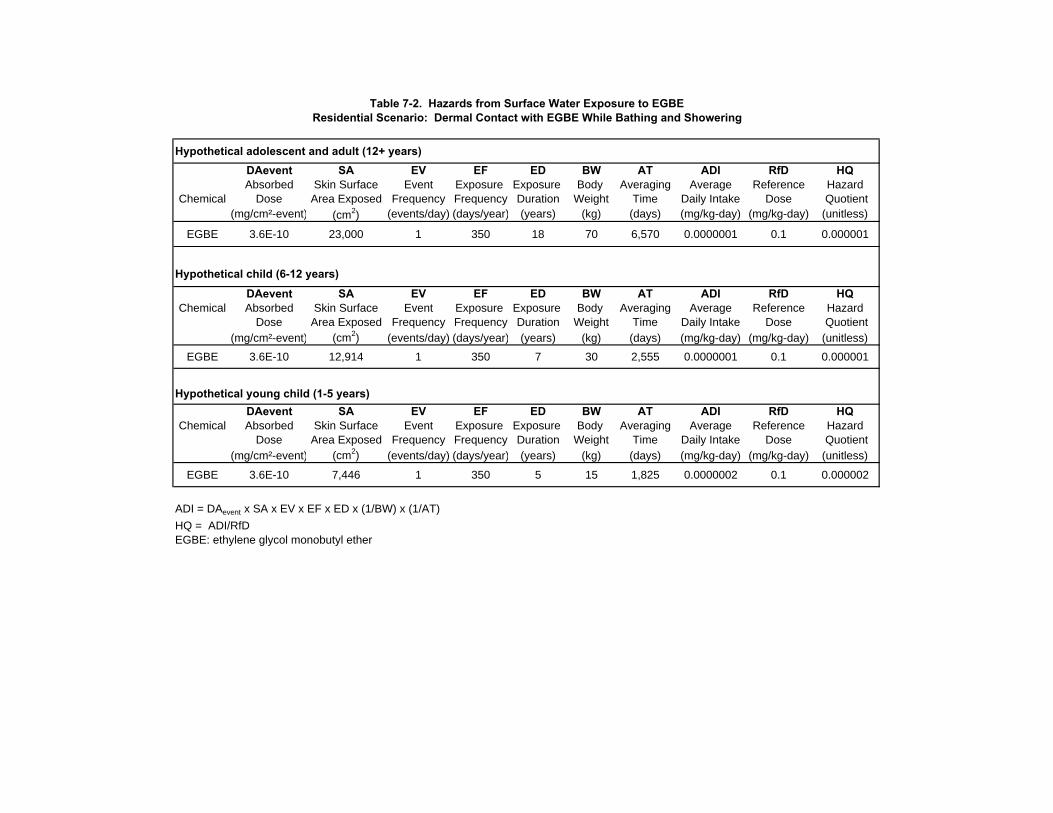
Table 7-2. Hazards from Surface Water Exposure to EGBEResidential Scenario: Dermal Contact with EGBE While Bathing and Showering
Hypothetical adolescent and adult (12+ years)DAevent SA EV EF ED BW AT ADI RfD HQAbsorbed Skin Surface Event Exposure Exposure Body Averaging Average Reference Hazard
Chemical Dose Area Exposed Frequency Frequency Duration Weight Time Daily Intake Dose Quotient(mg/cm²-event) (cm2) (events/day) (days/year) (years) (kg) (days) (mg/kg-day) (mg/kg-day) (unitless)
EGBE 3.6E-10 23,000 1 350 18 70 6,570 0.0000001 0.1 0.000001
Hypothetical child (6-12 years)
DAevent SA EV EF ED BW AT ADI RfD HQChemical Absorbed Skin Surface Event Exposure Exposure Body Averaging Average Reference Hazard
Dose Area Exposed Frequency Frequency Duration Weight Time Daily Intake Dose Quotient(mg/cm²-event) (cm2) (events/day) (days/year) (years) (kg) (days) (mg/kg-day) (mg/kg-day) (unitless)
EGBE 3.6E-10 12,914 1 350 7 30 2,555 0.0000001 0.1 0.000001
Hypothetical young child (1-5 years)DAevent SA EV EF ED BW AT ADI RfD HQ
Chemical Absorbed Skin Surface Event Exposure Exposure Body Averaging Average Reference HazardDose Area Exposed Frequency Frequency Duration Weight Time Daily Intake Dose Quotient
(mg/cm²-event) (cm2) (events/day) (days/year) (years) (kg) (days) (mg/kg-day) (mg/kg-day) (unitless)
EGBE 3.6E-10 7,446 1 350 5 15 1,825 0.0000002 0.1 0.000002
ADI = DAevent x SA x EV x EF x ED x (1/BW) x (1/AT)
HQ = ADI/RfDEGBE: ethylene glycol monobutyl ether

Table 7-3. Hazards from Surface Water Exposure to EGBERecreational Scenario: Incidental Ingestion of EGBE in Surface Water While Swimming
Hypothetical adolescent and adult (12+ years)Cw IR EF ED Ao BW AT ADI RfD HQ
Conc. in Ingestion Exposure Exposure Oral Body Averaging Average Reference HazardChemical Water Rate Frequency Duration Abs. Factor Weight Time Daily Intake Dose Quotient
(mg/L) (L/day) (days/year) (years) (unitless) (kg) (days) (mg/kg-day) (mg/kg-day) (unitless)
EGBE 0.00020 0.13 36 18 1.0 70 6,570 0.00000004 0.1 0.0000004
Hypothetical child (6-12 years)Cw IR EF ED Ao BW AT ADI RfD HQ
Conc. in Ingestion Exposure Exposure Oral Body Averaging Average Reference HazardChemical Water Rate Frequency Duration Abs. Factor Weight Time Daily Intake Dose Quotient
(mg/L) (L/day) (days/year) (years) (unitless) (kg) (days) (mg/kg-day) (mg/kg-day) (unitless)
EGBE 0.00020 0.13 108 7 1.0 30 2,555 0.0000003 0.1 0.000003
Hypothetical young child (1-5 years)Cw IR EF ED Ao BW AT ADI RfD
Chemical Conc. in Ingestion Exposure Exposure Oral Body Averaging Average ReferenceWater Rate Frequency Duration Abs. Factor Weight Time Daily Intake Dose Hazard(mg/L) (L/day) (days/year) (years) (unitless) (kg) (days) (mg/kg-day) (mg/kg-day) (unitless)
EGBE 0.00020 0.13 36 5 1.0 15 1,825 0.0000002 0.1 0.0000017
ADI = Cw x IR x EF x ED x Ao x (1/BW) x (1/AT)
HQ = ADI/RfDEGBE: ethylene glycol monobutyl ether
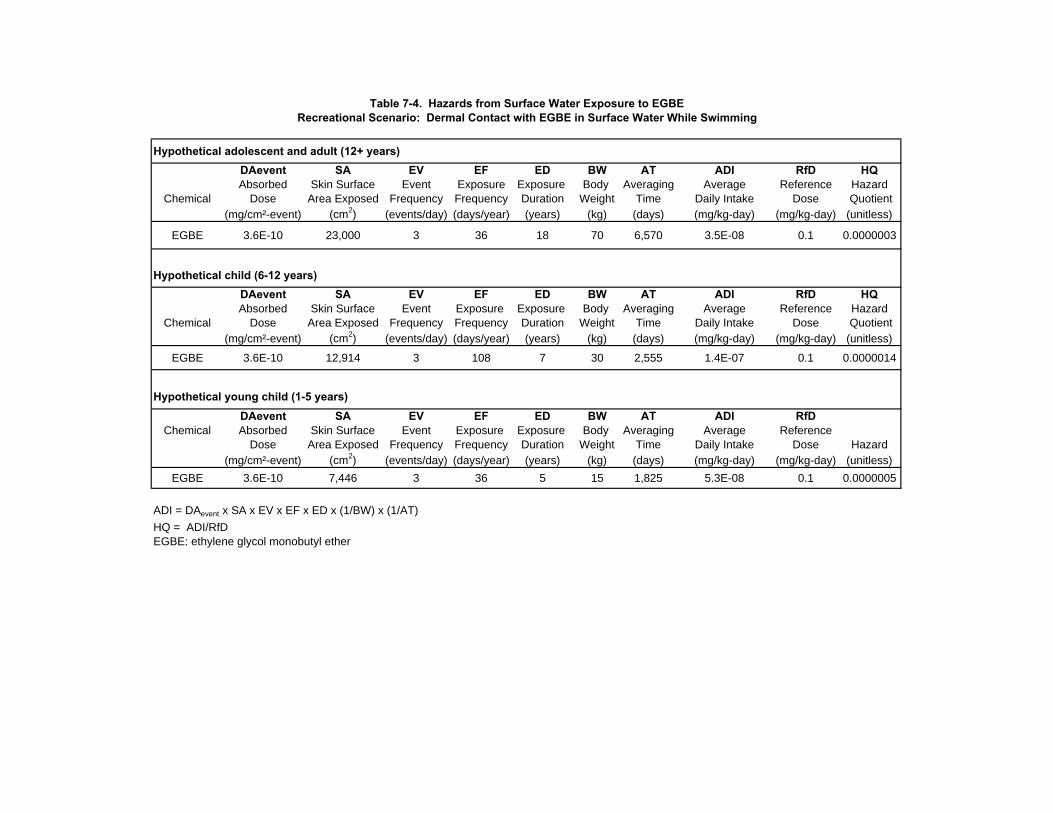
Table 7-4. Hazards from Surface Water Exposure to EGBERecreational Scenario: Dermal Contact with EGBE in Surface Water While Swimming
Hypothetical adolescent and adult (12+ years)DAevent SA EV EF ED BW AT ADI RfD HQAbsorbed Skin Surface Event Exposure Exposure Body Averaging Average Reference Hazard
Chemical Dose Area Exposed Frequency Frequency Duration Weight Time Daily Intake Dose Quotient(mg/cm²-event) (cm2) (events/day) (days/year) (years) (kg) (days) (mg/kg-day) (mg/kg-day) (unitless)
EGBE 3.6E-10 23,000 3 36 18 70 6,570 3.5E-08 0.1 0.0000003
Hypothetical child (6-12 years)DAevent SA EV EF ED BW AT ADI RfD HQAbsorbed Skin Surface Event Exposure Exposure Body Averaging Average Reference Hazard
Chemical Dose Area Exposed Frequency Frequency Duration Weight Time Daily Intake Dose Quotient(mg/cm²-event) (cm2) (events/day) (days/year) (years) (kg) (days) (mg/kg-day) (mg/kg-day) (unitless)
EGBE 3.6E-10 12,914 3 108 7 30 2,555 1.4E-07 0.1 0.0000014
Hypothetical young child (1-5 years)DAevent SA EV EF ED BW AT ADI RfD
Chemical Absorbed Skin Surface Event Exposure Exposure Body Averaging Average ReferenceDose Area Exposed Frequency Frequency Duration Weight Time Daily Intake Dose Hazard
(mg/cm²-event) (cm2) (events/day) (days/year) (years) (kg) (days) (mg/kg-day) (mg/kg-day) (unitless)
EGBE 3.6E-10 7,446 3 36 5 15 1,825 5.3E-08 0.1 0.0000005
ADI = DAevent x SA x EV x EF x ED x (1/BW) x (1/AT)
HQ = ADI/RfDEGBE: ethylene glycol monobutyl ether

Table 7-5. Summary of Hazards from Surface Water Exposures to EGBE
Pathway HazardScenario Age Group Ingestion Dermal Contact QuotientResidential
Adolescent and adult (12+ years) 0.00005 0.000001 0.0001Child (6-12 years) 0.0001 0.000001 0.0001Young Child (1-5 years) 0.0001 0.000002 0.0001
30-year lifetime 0.0003 0.000004 0.0003
RecreationalAdolescent and adult (12+ years) 0.0000004 0.0000003 0.000001Child (6-12 years) 0.000003 0.000001 0.00000Young Child (1-5 years) 0.000002 0.0000005 0.000002
30-year lifetime 0.00000 0.000002 0.00001
EGBE: ethylene glycol monobutyl ether
Note: Hazard quotients less than 1 indicate that average daily intake is less than the reference dose and that negligible health effects are anticipated.

HAPs Petition This Petition
Maximum Exposed Individual Resident Resident
Concentration of EGBE in Water (mg/L) 0.13 0.00020Predicted Ingestion Dose (mg/kg BW-day) 0.02 0.00001Predicted Dermal Dose (mg/kg BW-day) 0.00004 0.0000002Cumulative Predicted Dose (mg/kg BW-day) 0.02 0.00001
Reference Dose (mg/kg BW-day) 3 0.1
Maximum Hazard Quotient 0.007 0.0001
EGBE: ethylene glycol monobutyl ethermg/L: milligrams per litermg/kg BW-day: milligrams per kilogram body weight per day
Table 7-6. Comparison of Hazards from Surface Water Exposures Predicted in HAPs Petition and This Petition

Table 8-1. EGBE Emissions Rates Used in Level III Mackay Distribution Model (kg/hr)
Receiving Media CMA 1997 aUpdated Analysis
with 2009 TRI databUpdated Analysis
with 2010 TRI databUpdated Analysis
with 2011 TRI databc
Air 1,047 651 679 653
Soil 18 1.2 0.8 1.0
Water 292 3 3 5
a. CMA (1997) assumed 50 percent of Certain Glycol Ethers emitted was EGBE, based on 1996 TRI data.b. These analyses assume 100 percent of Certain Glycol Ethers emitted were EGBE.c. The emissions rates for 2011 are based on the preliminary 2011 TRI data, as acquired on September 12, 2012.Air releases consisted of reported releases to "On-site Fugitive Air" and "On-site Point Source Air"
EGBE: ethylene glycol monobutyl etherkg/hr: kilograms per hourTRI: Toxics Release Inventory
Soil releases consisted of reported releases to onsite and offsite "Land Treatment" and "Other Land Disposal"Water releases consisted of reported releases to "On-site Surface Water Discharges."

Table 8-2. Modeled EGBE Exposure Concentrations Used in This and Previous Ecological Risk Assessments
Cadmus Cadmus Updated Updated Updated Percent of TotalEnvironmental CMA 2000b 2000a Analysis Analysis Analysis EGBE
Media 1997 a Tier 1 b Tier 2 c 2009 TRI d 2010 TRI d 2011 TRI de Units (2011 TRI)f
Air 6.20E-05 3.27E-01 3.27E-01 3.82E-05 3.98E-05 3.83E-05 mg/m3 2
Surface water 1.40E-03 3.84E+02 3.64E+00 1.90E-04 1.98E-04 1.93E-04 mg/L 18
Soil 1.30E-02 1.86E+01 7.00E-02 6.26E-03 6.53E-03 6.28E-03 mg/kg 80
e. The emissions rates for 2011 are based on the preliminary 2011 TRI data, as acquired on September 12, 2012.f. Percent of the total EGBE in each pool at equilibrium. Based on the modeled environment in EQC.EGBE: ethylene glycol monobutyl etherTRI: Toxics Release Inventorymg/m3: milligrams per cubic metermg/L: milligrams per litermg/kg: milligrams per kilogram
c. EQC Level III was used to determine the equilibrium distribution of EGBE in the model environment (Cadmus 2000a). Concentrations were scaled to same fencelineconcentration as in Cadmus (2000b).
d. EQC Level III was used to determine the equilibrium concentrations of EGBE in model environment receiving all national emissions of Certain Glycol Ethers from TRI, assumingthat all Certain Glycol Ethers are EGBE.
b. The Level I Mackay model was used to determine the equilibrium distribution of EGBE in the model environment (Cadmus 2000b). Concentrations were then scaled to thepredicted worst-case fenceline concentration, based on CMA (1997) (Confidential Facility 25).
a. The Level III Mackay model was used to determine equilibrium concentrations of EGBE in model environment receiving all national EGBE emissions from the 1996 TRI andassuming that 50 percent of all Certain Glycol Ethers are EGBE.
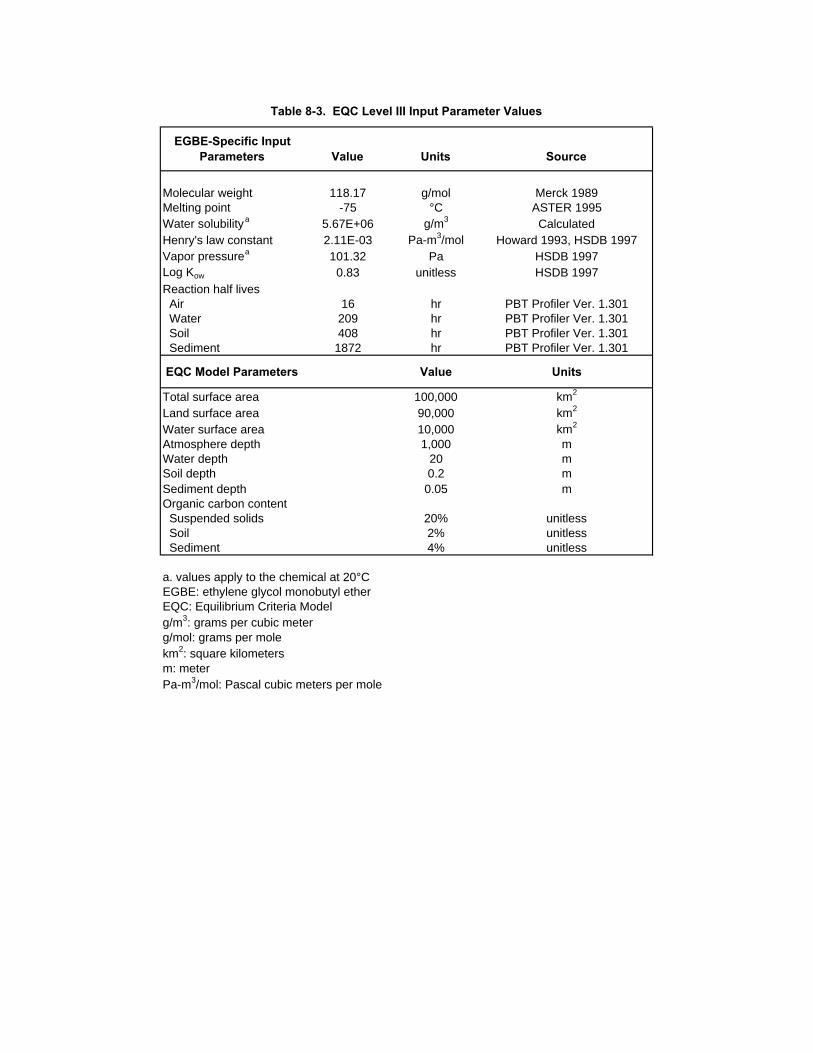
EGBE-Specific InputParameters Value Units Source
Molecular weight 118.17 g/mol Merck 1989Melting point -75 °C ASTER 1995Water solubilitya 5.67E+06 g/m3 CalculatedHenry's law constant 2.11E-03 Pa-m3/mol Howard 1993, HSDB 1997Vapor pressurea 101.32 Pa HSDB 1997Log Kow 0.83 unitless HSDB 1997Reaction half lives Air 16 hr PBT Profiler Ver. 1.301 Water 209 hr PBT Profiler Ver. 1.301 Soil 408 hr PBT Profiler Ver. 1.301 Sediment 1872 hr PBT Profiler Ver. 1.301
EQC Model Parameters Value Units
Total surface area 100,000 km2
Land surface area 90,000 km2
Water surface area 10,000 km2
Atmosphere depth 1,000 mWater depth 20 mSoil depth 0.2 mSediment depth 0.05 m
Suspended solids 20% unitless Soil 2% unitless Sediment 4% unitless
a. values apply to the chemical at 20°CEGBE: ethylene glycol monobutyl etherEQC: Equilibrium Criteria Modelg/m3: grams per cubic meterg/mol: grams per molekm2: square kilometersm: meterPa-m3/mol: Pascal cubic meters per mole
Table 8-3. EQC Level III Input Parameter Values
Organic carbon content
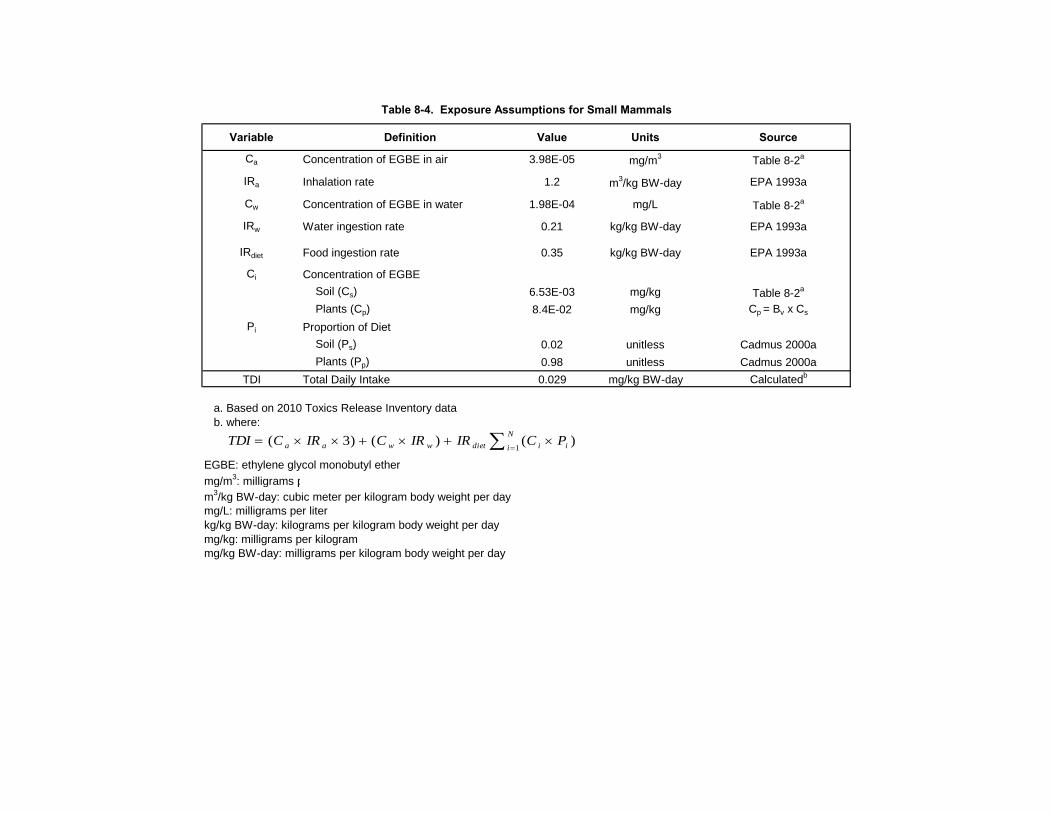
Variable Definition Value Units Source
Ca Concentration of EGBE in air 3.98E-05 mg/m3 Table 8-2a
IRa Inhalation rate 1.2 m3/kg BW-day EPA 1993a
Cw Concentration of EGBE in water 1.98E-04 mg/L Table 8-2a
IRw Water ingestion rate 0.21 kg/kg BW-day EPA 1993a
IRdiet Food ingestion rate 0.35 kg/kg BW-day EPA 1993a
Ci Concentration of EGBE
Soil (Cs) 6.53E-03 mg/kg Table 8-2a
Plants (Cp) 8.4E-02 mg/kg Cp = Bv x Cs
Pi Proportion of Diet
Soil (Ps) 0.02 unitless Cadmus 2000a
Plants (Pp) 0.98 unitless Cadmus 2000a
TDI Total Daily Intake 0.029 mg/kg BW-day Calculatedb
a. Based on 2010 Toxics Release Inventory datab. where:
EGBE: ethylene glycol monobutyl ether
mg/m3: milligrams p
m3/kg BW-day: cubic meter per kilogram body weight per daymg/L: milligrams per literkg/kg BW-day: kilograms per kilogram body weight per daymg/kg: milligrams per kilogrammg/kg BW-day: milligrams per kilogram body weight per day
Table 8-4. Exposure Assumptions for Small Mammals
N
i iidietwwaa PCIRIRCIRCTDI1
)()()3(

Table 8-5. Chronic Species Sensitivity Distribution Calculations for EGBE
Calculated Distribution
Group Species Endpoint a Duration LC50(mg/L)
LC50 (log)
Calc CV (log) b
Calc CV (mg/L) b
Rank among all
CVs
Percent Protected
Fish mummichog LC50 96 hr 6.7 0.826 -0.159 0.7 1 99.3Fish sheepshead minnow LC50 96 hr 116 2.064 0.761 5.8 3 90.6Fish bluegill LC50 96 hr 127 2.104 0.790 6.2 4 86.3Fish emerald shiner LC50 72 hr 500 2.699 1.232 17.1 8 76.3Fish rainbow trout LC50 96 hr 1000 3.000 1.456 28.6 9 71.9Fish inland silverside LC50 96 hr 1250 3.097 1.528 33.7 10 69.8Fish golden ide LC50 48 hr 1395 3.145 1.563 36.6 12 61.2Fish bluegill LC50 96 hr 1490 3.173 1.584 38.4 13 59.7Fish golden ide LC50 48 hr 1575 3.197 1.602 40.0 14 58.3Fish goldfish LC50 24 hr 1650 3.217 1.617 41.4 15 56.8Fish rainbow trout LC50 96 hr 1700 3.230 1.627 42.4 16 54.7Fish goldfish LC50 24 hr 1700 3.230 1.627 42.4 16 54.7Fish golden ide LC50 48 hr 1880 3.274 1.659 45.6 18 50.4Fish fathead minnow LC50 96 hr 2137 3.330 1.701 50.2 20 46.8Fish bluegill LC50 96 hr 2950 3.470 1.805 63.8 23 36.0
Mean vertebrate (weighted) 524.3 2.720 1.247 17.7Standard deviation (weighted) 6.2 0.794 0.59 3.9
Invertebrate grass shrimp LC50 96 hr 5.4 0.732 0.093 1.2 2 95.0Invertebrate oyster LC50 96 hr 89 1.949 1.052 11.3 5 84.9Invertebrate white shrimp LC50 96 hr 117 2.068 1.146 14.0 6 80.6Invertebrate white shrimp LC50 96 hr 130 2.114 1.182 15.2 7 78.4Invertebrate brown shrimp LC50 96 hr 550 2.740 1.676 47.4 19 48.9Invertebrate coelenterate LC50 72 hr 690 2.839 1.753 56.6 21 42.4Invertebrate brown shrimp LC50 96 hr 698 2.844 1.757 57.2 22 38.1Invertebrate water flea LC50 48 hr 835 2.922 1.818 65.8 24 34.5Invertebrate water flea EC50 48 hr 1600 3.204 2.041 109.9 26 28.1
Mean invertebrate acute (weighted) 175.6 2.244 1.285 19.3Standard deviation (weighted) 6.7 0.825 0.65 4.5
Algae/microbes cyanobacterium LOEC 8 day na na 1.544 35 11 65.5Algae/microbes protozoan LOEC 72 hr na na 1.959 91 25 32.4Algae/microbes green alga LOEC 7 day na na 2.398 250 27 25.9Algae/microbes algae NOEC 72 hr na na 2.456 286 28 21.6Algae/microbes protozoan EC05 48 hr na na 2.666 463 29 17.3Algae/microbes bacterium LOEC 16 hr na na 2.845 700 30 12.9Algae/microbes green alga LOEC 7 day na na 2.954 900 31 8.6Algae/microbes protozoan EC05 48 hr na na 2.960 911 32 4.3
a. All algae endpoints are growthb. Algae/microbe chronic values are as reported in the literature; they are not calculatedCV: chronic valueEC05: concentration at which 5% of the population was affectedEC50: median effect concentrationEGBE: ethylene glycol monobutyl etherLC50: median lethal concentrationLOEC: lowest observed effect concentrationmg/L: milligrams of EGBE per liter of waterna: not available/applicableNOEC: no observed effect concentration
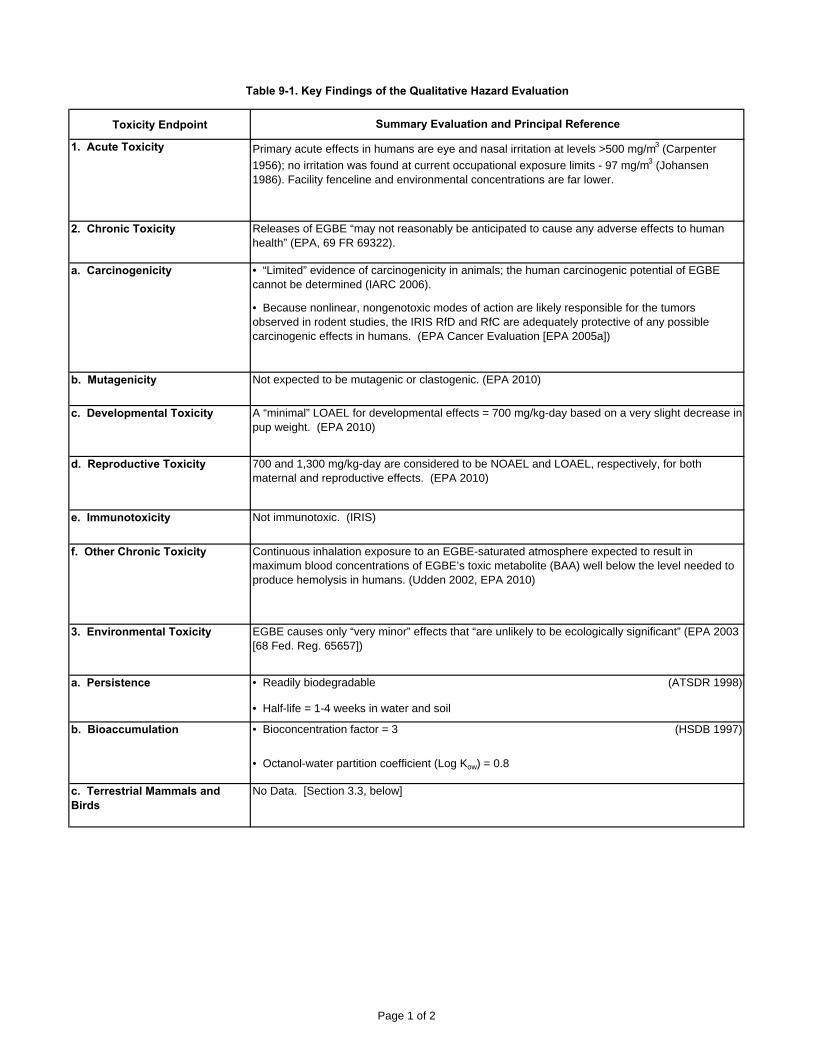
Table 9-1. Key Findings of the Qualitative Hazard Evaluation
Toxicity Endpoint
1. Acute Toxicity
2. Chronic Toxicity
b. Mutagenicity
c. Developmental Toxicity
d. Reproductive Toxicity
e. Immunotoxicity
f. Other Chronic Toxicity
3. Environmental Toxicity
c. Terrestrial Mammals andBirds
Summary Evaluation and Principal Reference
Primary acute effects in humans are eye and nasal irritation at levels >500 mg/m3 (Carpenter
1956); no irritation was found at current occupational exposure limits - 97 mg/m3 (Johansen 1986). Facility fenceline and environmental concentrations are far lower.
Not immunotoxic. (IRIS)
Continuous inhalation exposure to an EGBE-saturated atmosphere expected to result in maximum blood concentrations of EGBE’s toxic metabolite (BAA) well below the level needed to produce hemolysis in humans. (Udden 2002, EPA 2010)
EGBE causes only “very minor” effects that “are unlikely to be ecologically significant” (EPA 2003 [68 Fed. Reg. 65657])
Releases of EGBE “may not reasonably be anticipated to cause any adverse effects to human health” (EPA, 69 FR 69322).
• “Limited” evidence of carcinogenicity in animals; the human carcinogenic potential of EGBEcannot be determined (IARC 2006).
• Because nonlinear, nongenotoxic modes of action are likely responsible for the tumorsobserved in rodent studies, the IRIS RfD and RfC are adequately protective of any possible carcinogenic effects in humans. (EPA Cancer Evaluation [EPA 2005a])
Not expected to be mutagenic or clastogenic. (EPA 2010)
A “minimal” LOAEL for developmental effects = 700 mg/kg-day based on a very slight decrease in pup weight. (EPA 2010)
a. Carcinogenicity
700 and 1,300 mg/kg-day are considered to be NOAEL and LOAEL, respectively, for both maternal and reproductive effects. (EPA 2010)
(ATSDR 1998)a. Persistence
b. Bioaccumulation
• Readily biodegradable
• Half-life = 1-4 weeks in water and soil
• Bioconcentration factor = 3 (HSDB 1997)
• Octanol-water partition coefficient (Log Kow) = 0.8
No Data. [Section 3.3, below]
Page 1 of 2
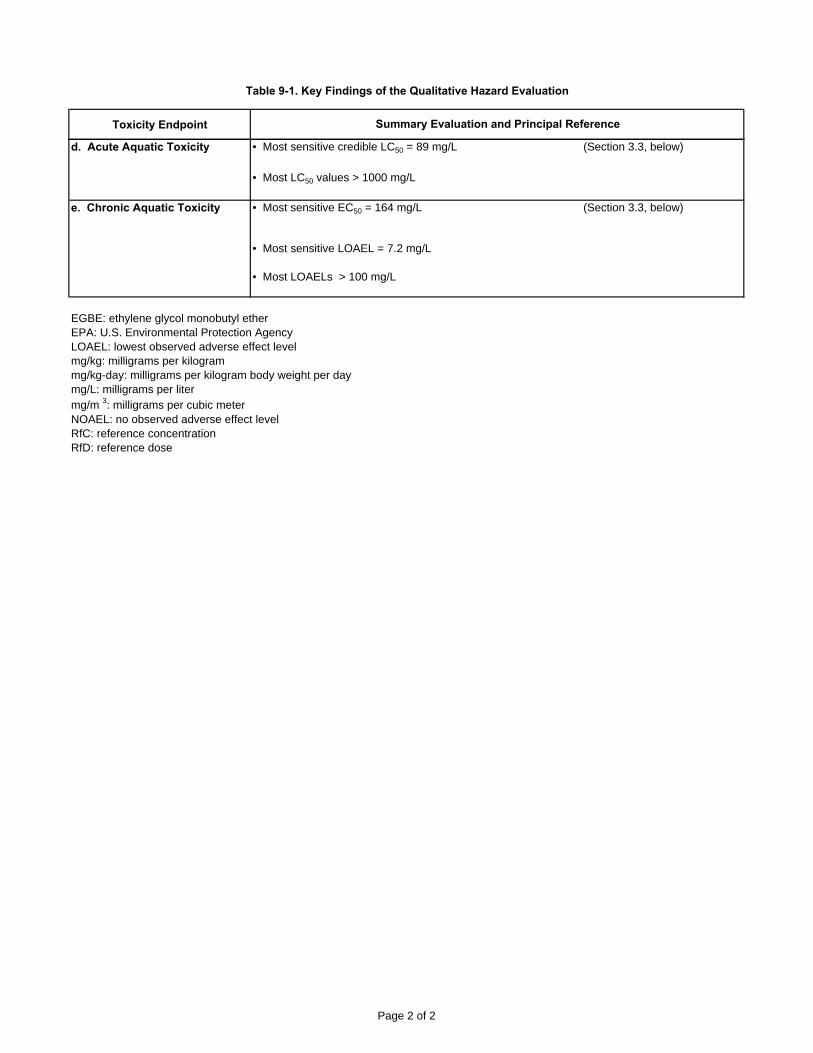
Table 9-1. Key Findings of the Qualitative Hazard Evaluation
Toxicity Endpoint Summary Evaluation and Principal Reference
• Most sensitive credible LC50 = 89 mg/L
• Most LC50 values > 1000 mg/L
• Most sensitive EC50 = 164 mg/L
• Most sensitive LOAEL = 7.2 mg/L
• Most LOAELs > 100 mg/L
EGBE: ethylene glycol monobutyl etherEPA: U.S. Environmental Protection AgencyLOAEL: lowest observed adverse effect levelmg/kg: milligrams per kilogrammg/kg-day: milligrams per kilogram body weight per daymg/L: milligrams per litermg/m 3: milligrams per cubic meterNOAEL: no observed adverse effect levelRfC: reference concentrationRfD: reference dose
(Section 3.3, below)
(Section 3.3, below)e. Chronic Aquatic Toxicity
d. Acute Aquatic Toxicity
Page 2 of 2
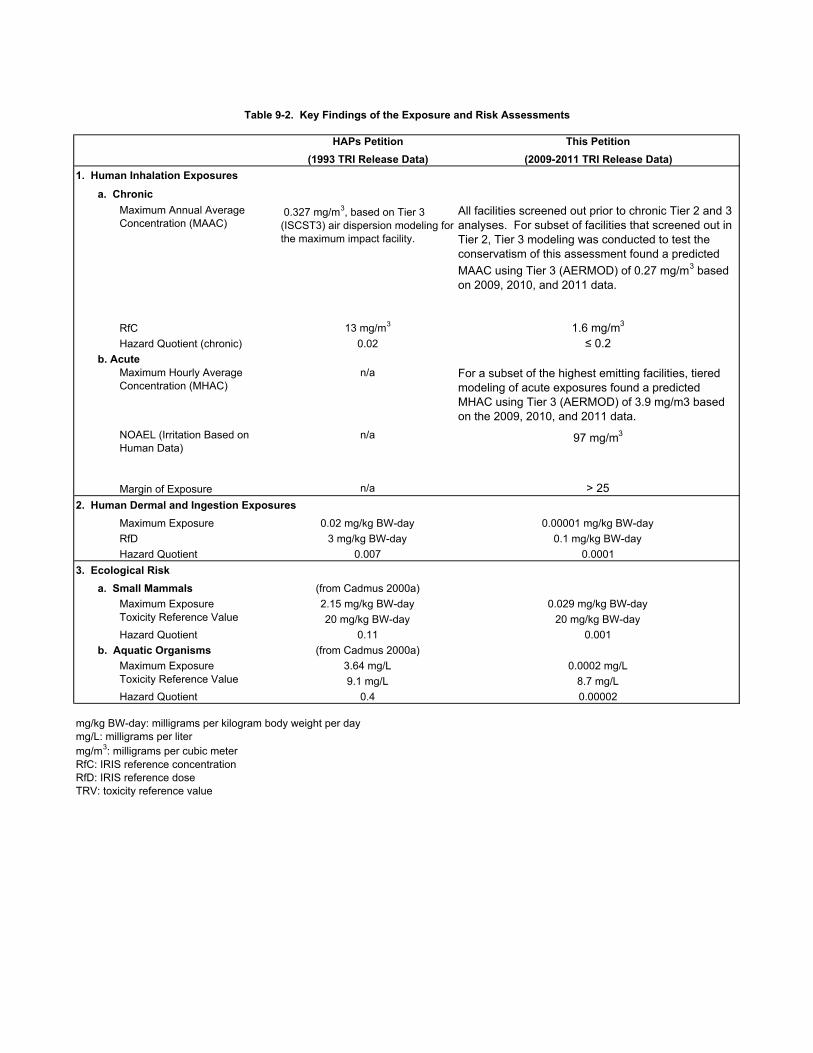
HAPs Petition This Petition(1993 TRI Release Data) (2009-2011 TRI Release Data)
1. Human Inhalation Exposures
a. ChronicMaximum Annual Average Concentration (MAAC)
0.327 mg/m3, based on Tier 3 (ISCST3) air dispersion modeling for the maximum impact facility.
All facilities screened out prior to chronic Tier 2 and 3 analyses. For subset of facilities that screened out in Tier 2, Tier 3 modeling was conducted to test the conservatism of this assessment found a predicted
MAAC using Tier 3 (AERMOD) of 0.27 mg/m3 based on 2009, 2010, and 2011 data.
RfC 13 mg/m3 1.6 mg/m3
Hazard Quotient (chronic) 0.02 ≤ 0.2b. Acute
Maximum Hourly Average Concentration (MHAC)
n/a For a subset of the highest emitting facilities, tiered modeling of acute exposures found a predicted MHAC using Tier 3 (AERMOD) of 3.9 mg/m3 based on the 2009, 2010, and 2011 data.
NOAEL (Irritation Based on Human Data)
n/a 97 mg/m3
Margin of Exposure n/a > 25
2. Human Dermal and Ingestion ExposuresMaximum Exposure 0.02 mg/kg BW-day 0.00001 mg/kg BW-day
RfD 3 mg/kg BW-day 0.1 mg/kg BW-day
Hazard Quotient 0.007 0.0001
3. Ecological Riska. Small Mammals (from Cadmus 2000a)
Maximum Exposure 2.15 mg/kg BW-day 0.029 mg/kg BW-dayToxicity Reference Value 20 mg/kg BW-day 20 mg/kg BW-day
Hazard Quotient 0.11 0.001
b. Aquatic Organisms (from Cadmus 2000a)
Maximum Exposure 3.64 mg/L 0.0002 mg/LToxicity Reference Value 9.1 mg/L 8.7 mg/L
Hazard Quotient 0.4 0.00002
mg/kg BW-day: milligrams per kilogram body weight per daymg/L: milligrams per litermg/m3: milligrams per cubic meterRfC: IRIS reference concentrationRfD: IRIS reference doseTRV: toxicity reference value
Table 9-2. Key Findings of the Exposure and Risk Assessments

Section Source of Uncertainty Likely Effect on Outcome
3.0 Hazard AssessmentHumans are at least 100 times less sensitive than rats to hemolytic effects of EGBE. While a stand default interspecies UFs of 10 was not used - RfD uses UF of 1 and RfC uses UF of 3 – the actual interspecies factor is approximately 0.01.
RfD may be 100-fold overly conservative. RfC may be 300-fold overly conservative. Thus, HQs may be overestimated by a factor of 100 to 300.
Intraspecies UF of 10 is probably overly conservative. A number of studies have found no evidence of increased susceptibility to hemolysis among sensitive subpopulations.
RfD and RfC may be overstated by an additional factor of 3 to 10.
IARC (2006) concluded that the carcinogenicity of EGBE to humans cannot be determined and EPA (2010) concluded that carcinogenic effects from EGBE are not likely to occur in humans in the absence of critical noncancer effects.
EPA (2005) concluded that the RfD and RfC are adequately protective of carcinogenic effects in humans, if any. Thus, question of carcinogenicity does not affect petition outcome.
5.0 Emissions InventoryTRI only lists releases of Certain Glycol Ethers. In the absence of specific data for EGBE releases, assumed all Certain Glycol Ethers releases were EGBE.
Because EGBE represents 52% of market share of ethylene glycol ethers (SRI 2010), actual releases of EGBE may be overestimated 2-fold, on average.
TRI data are self-reported using a variety of methods. Individual facility data vary considerably in certainty.
Actual releases of Certain Glycol Ethers by facilities may be greater than or less than those reported on TRI. No evidence of systematic under-reporting.
6.0 Screening of Airborne Concentrationsa. ChronicStep A assumed 100% of reported releases to air were exhausted through a single point 0 m high and 50 m from fence line. Resultant threshold rate (4.9 tpy) more conservative than that associated with 2 m high emission point located 10 m from fenceline (8.6 tpy), which encompasses virtually all facilities in inventory for which stack configuration data are available.
Maximum annual average concentrations predicted under Step A were up to 250-fold higher than those predicted using Tier 3 dispersion modeling. Thus, HQs predicted using Step A overestimated by 85-250 times.
Tier 2 employed site-specific data on emission rates, stack and fugitive source physical parameters, and property boundaries. The
maximum MAAC under Tier 2 was 1.2 mg/m3, as compared to
maximum MAAC under Tier 3 of 0.3 mg/m3. Tier 2 results differed from Tier 3 results for the same facilities by factors of 1.2 to 6.7.
HQs predicted using Tier 2 overestimated by 2 times or more.
Modeled maximum annual average concentration is highly conservative estimate of exposure over a lifetime.
Per EPA, actual maximum annual average concentrations are 2-fold lower than modeled values. Comparison of an annual average concentration to an RfC designed to be protective over a lifetime substantially overstates risk by an unknown margin.
DEGREE OF CONSERVATISM ASSOCIATED WITH CHRONIC HUMAN INHALATION HAZARDS
(50 to 100) x (3 to 10) x 2 x (2 to 85) x ? = 600 to 170,000 or more
b. AcuteThe acute MOE based on the NOAEL of 97 mg/m3 and the estimated reasonable worst-case estimated MHAC is approximately
18 mg/m3. Because the NOAEL is derived from human data, per EPA TRI precedents MOEs >10 “indicate a low level of concern” for acute effects associated with EGBE facility releases.
An MOE above 5 is protective because EPA AEGL guidance calls for an interspecies uncertainty factor from 3-10 for non-systemic irritation effects, and an appropriate time-adjustment would support a 1-hr
NOAEL of 137 mg/m3.
Table 9-3. Sources of Uncertainty and Conservatism
Page 1 of 2

Section Source of Uncertainty Likely Effect on Outcome
Table 9-3. Sources of Uncertainty and Conservatism
7.0 Surface Water Exposures and RisksExposure point concentrations in surface water calculated by assuming that 100% of U.S. releases of Certain Glycol Ethers to all media are EGBE and are concentrated into an area the size of the state of Ohio.
Because EGBE represents 52% of consumption of ethylene glycol ethers (SRI 2010), actual releases of EGBE may be overestimated 2-fold, on average.
Because 100,000 km2 represents 1.3% of total land area of U.S., actual concentrations of EGBE may be overestimated 77-fold.
Exposure assumptions (350 day/yr, 70 years, all water contacted contains EGBE)
Actual exposure intensity likely to be considerably lower, but degree of conservatism cannot be quantified.
DEGREE OF CONSERVATISM ASSOCIATED WITH HUMAN DERMAL AND INGESTION HAZARDS
(50 to 100) x (3 to 10) x 2 x 77 x ? = 23,100 to 154,000 or more
8.0 Ecological Risk AssessmentExposure point concentrations in surface water calculated by assuming that 100% of U.S. releases of Certain Glycol Ethers to all media are EGBE and are concentrated into an area the size of the state of Ohio.
Actual releases of EGBE may be overestimated 2-fold, on average, and actual concentrations of EGBE may be overestimated 77-fold.
Conservative exposure assumptions for small mammals (inhalation rate, ingestion rate, bioaccumulation factor) consistent with Cadmus (2000a)
Actual exposure intensity likely to be considerably lower, but degree of conservatism cannot be quantified.
TRV for aquatic organisms based on most sensitive species tested, which may not be representative of aquatic community present in most U.S. water bodies
Although actual sensitivity of other aquatic organisms to EGBE may be considerably lower, degree of conservatism cannot be quantified.
TRV for small mammals is based on same underlying data used to derive RfD. Thus, small mammal TRV shares same uncertainties as listed above with respect to Section 3.0.
TRV may be 50 to 1,000-fold overly conservative due to UFs.
HQs focused on what EPA calls “very minor” effects on individual organisms, rather than effects that are likely to be ecologically significant.
Although individual organisms are likely to be substantially more sensitive than populations, communities, or ecosystems, degree of conservatism cannot be quantified.
DEGREE OF CONSERVATISM ASSOCIATED WITH RISKS TO AQUATIC ORGANISMS
2 x 77 x ? = 154 or more
DEGREE OF CONSERVATISM ASSOCIATED WITH RISKS TO SMALL MAMMALS
2 x 77 x (50 to 1,000) x ? = 7,700 to 154,000 or more
EGBE: ethylene glycol monobutyl etherFR: Federal RegisterHQ: hazard quotientIRIS: Integrated Risk Information Servicekm2: square kilometerm: metermg/m3: milligrams per cubic meterRfC: reference concentrationRfD: reference dosetpy: tons per yearTRI: Toxics Release InventoryTRV: toxicity reference valueUF: uncertainty factorEPA: U.S. Environmental Protection Agency
Page 2 of 2

FIGURES

Figure2-1Annual Production and Consumption of EGBE in the United States (1970-2009)

0
25
50
75
100
125
150
175
200
225
250
1998 2000 2002 2004 2006 2008 2010 2012
Tota
l Cer
tain
Gly
col
Ethe
rs (t
py)
Year
Figure5-1Maximum Individual Facility Annual Certain Glycol Ether Releases to Air (2000 – 2011)
Source: Toxics Release Inventorytpy: tons per year
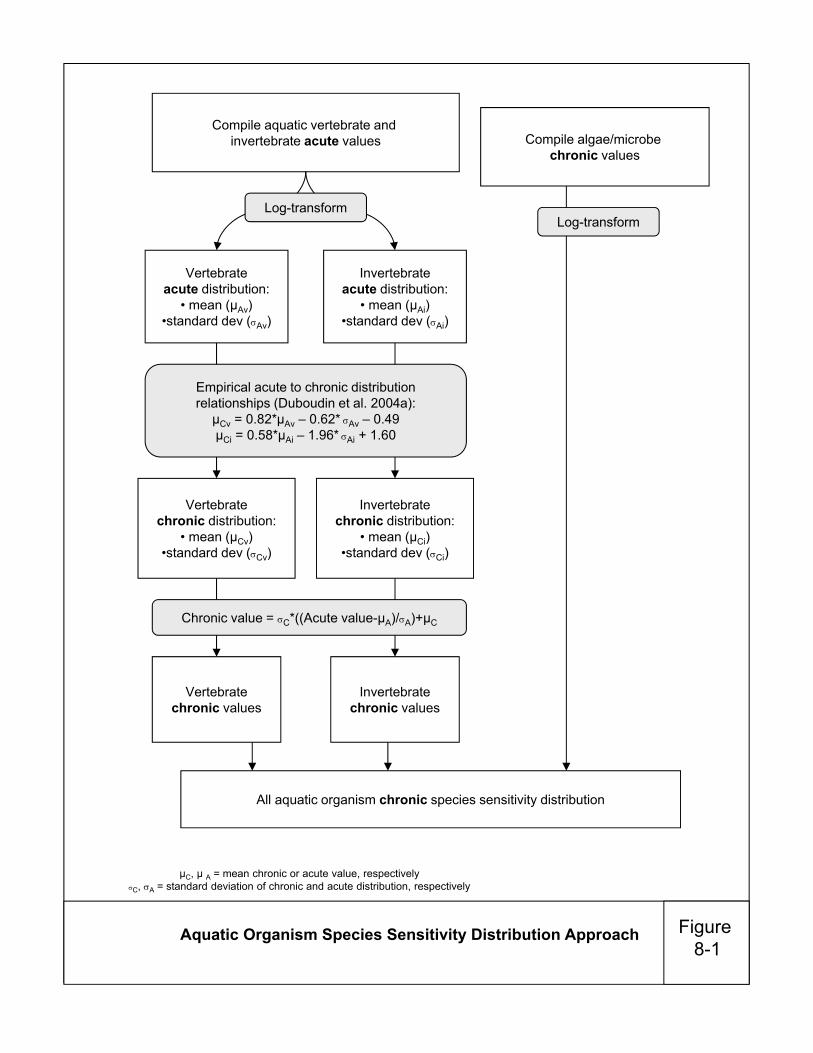
Figure8-1
Compile aquatic vertebrate and invertebrate acute values
Vertebrateacute distribution:
• mean (μAv)•standard dev (Av)
Vertebratechronic distribution:
• mean (μCv)•standard dev (Cv)
Empirical acute to chronic distributionrelationships (Duboudin et al. 2004a):
μCv = 0.82*μAv – 0.62* Av – 0.49μCi = 0.58*μAi – 1.96* Ai + 1.60
Vertebratechronic values
Invertebratechronic values
All aquatic organism chronic species sensitivity distribution
Compile algae/microbe chronic values
Aquatic Organism Species Sensitivity Distribution Approach
Invertebrateacute distribution:
• mean (μAi)•standard dev (Ai)
Invertebratechronic distribution:
• mean (μCi)•standard dev (Ci)
Log-transformLog-transform
Chronic value = C*((Acute value-μA)/A)+μC
μC, μ A = mean chronic or acute value, respectivelyC, A = standard deviation of chronic and acute distribution, respectively

Figure8-2Aquatic Organism Species Sensitivity Distributions for EGBE
* Includes observed chronic values for algae and microbes and calculated chronic values forvertebrates and invertebrates (Duboudin et al. 2004a)
8.7
80th percentile
4.2
90th percentile
2.3
95th percentile
0.0
10.0
20.0
30.0
40.0
50.0
60.0
70.0
80.0
90.0
100.0
0.1 1 10 100 1000 10000
Perc
ent s
peci
es p
rote
cted
EGBE (mg/L)
Aquatic organisms: Chronic*
Calculated chronic distribution
Aquatic vertebrates: Acute
Aquatic invertebrates: Acute
APPENDIX A
Toxicity Values in Laboratory Mammals
APPENDIX A-1
Toxicity Values in Laboratory Mammals from ATSDR 1998

Appendix A. Mammalian Toxicity Values from ATSDR 1998
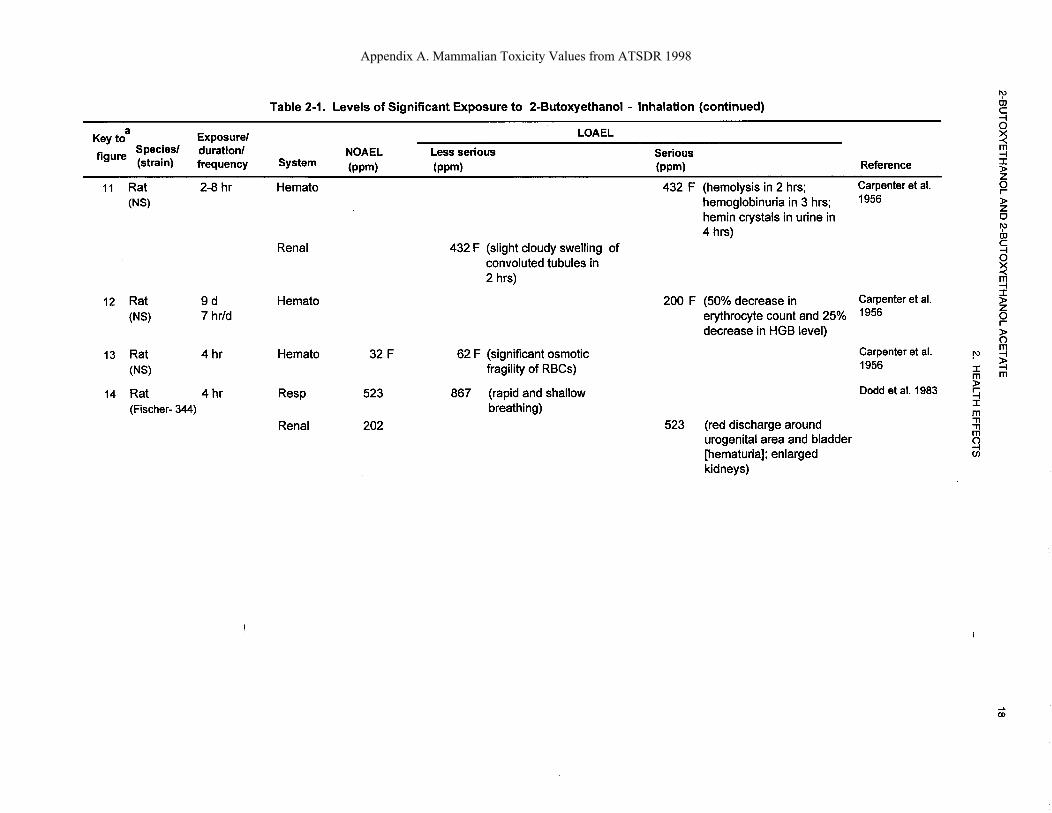
Appendix A. Mammalian Toxicity Values from ATSDR 1998

Appendix A. Mammalian Toxicity Values from ATSDR 1998

Appendix A. Mammalian Toxicity Values from ATSDR 1998

Appendix A. Mammalian Toxicity Values from ATSDR 1998
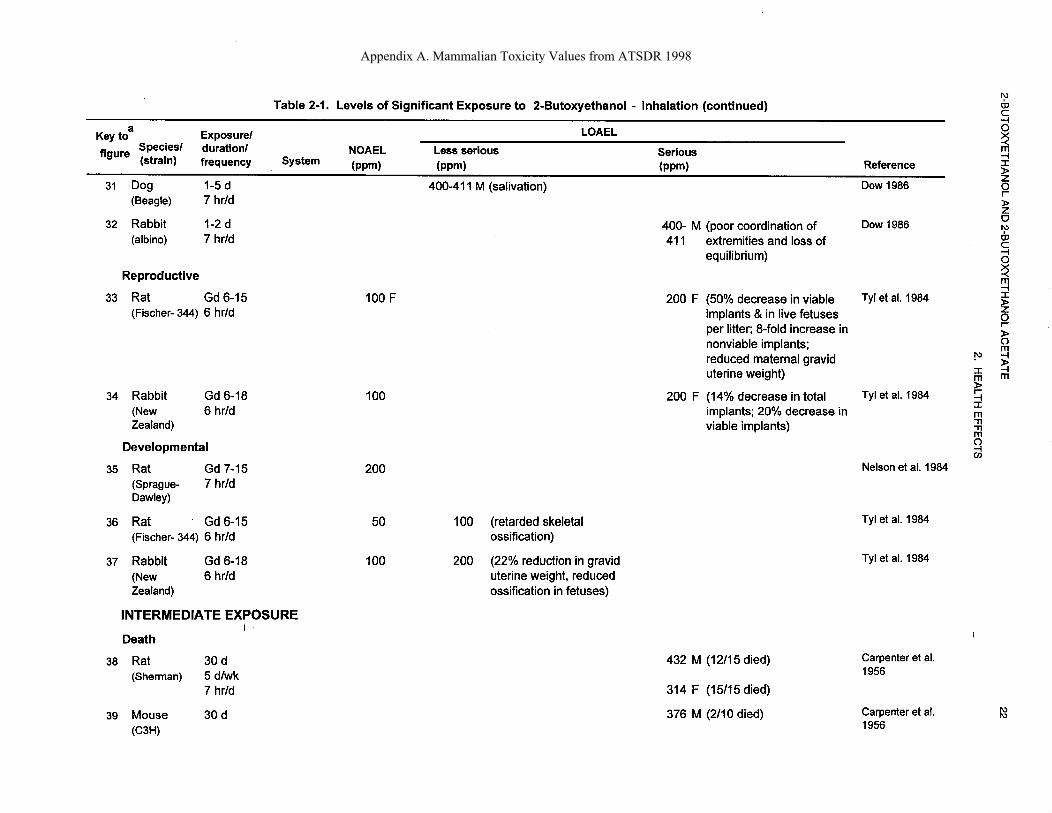
Appendix A. Mammalian Toxicity Values from ATSDR 1998

Appendix A. Mammalian Toxicity Values from ATSDR 1998
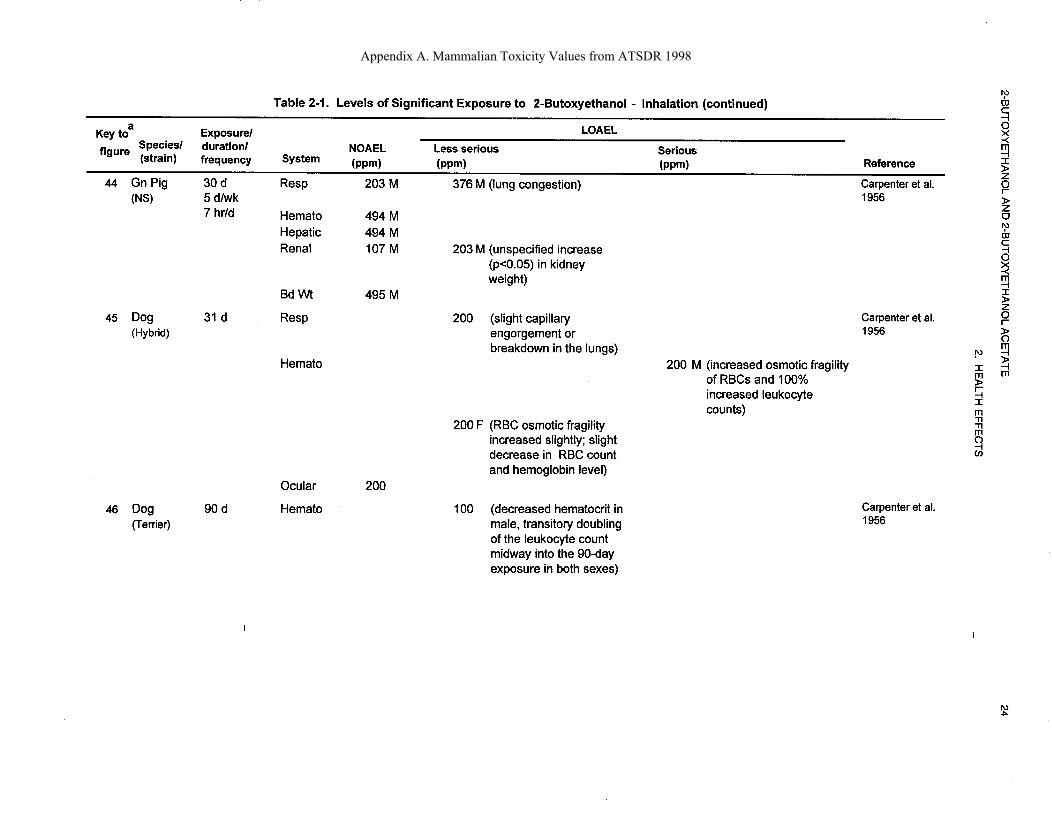
Appendix A. Mammalian Toxicity Values from ATSDR 1998

Appendix A. Mammalian Toxicity Values from ATSDR 1998

Appendix A. Mammalian Toxicity Values from ATSDR 1998

Appendix A. Mammalian Toxicity Values from ATSDR 1998

Appendix A. Mammalian Toxicity Values from ATSDR 1998
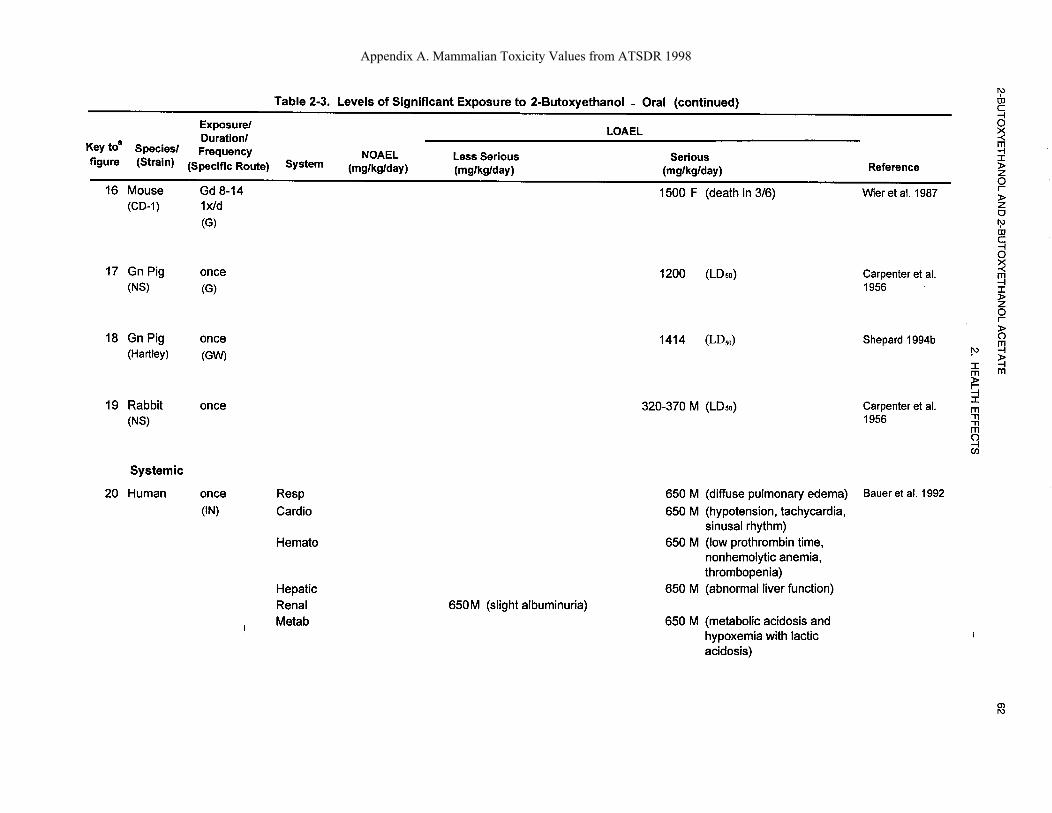
Appendix A. Mammalian Toxicity Values from ATSDR 1998

Appendix A. Mammalian Toxicity Values from ATSDR 1998

Appendix A. Mammalian Toxicity Values from ATSDR 1998

Appendix A. Mammalian Toxicity Values from ATSDR 1998

Appendix A. Mammalian Toxicity Values from ATSDR 1998

Appendix A. Mammalian Toxicity Values from ATSDR 1998

Appendix A. Mammalian Toxicity Values from ATSDR 1998

Appendix A. Mammalian Toxicity Values from ATSDR 1998

Appendix A. Mammalian Toxicity Values from ATSDR 1998

Appendix A. Mammalian Toxicity Values from ATSDR 1998

Appendix A. Mammalian Toxicity Values from ATSDR 1998

Appendix A. Mammalian Toxicity Values from ATSDR 1998

Appendix A. Mammalian Toxicity Values from ATSDR 1998

Appendix A. Mammalian Toxicity Values from ATSDR 1998

Appendix A. Mammalian Toxicity Values from ATSDR 1998
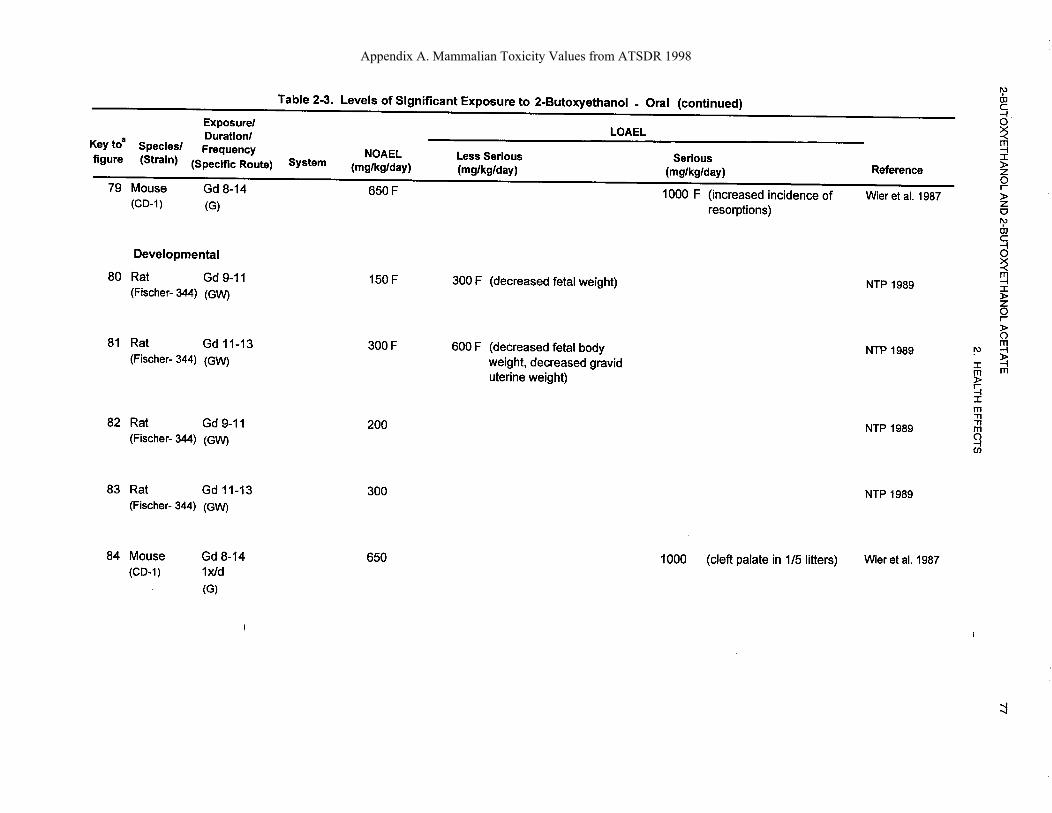
Appendix A. Mammalian Toxicity Values from ATSDR 1998
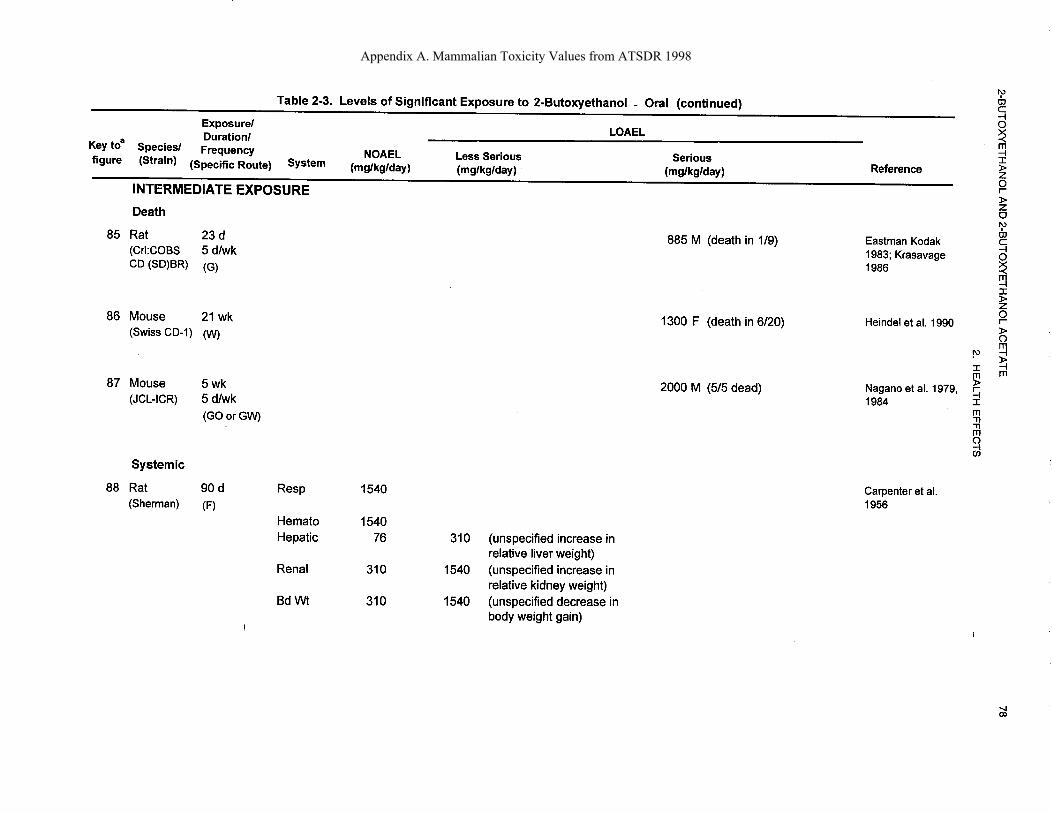
Appendix A. Mammalian Toxicity Values from ATSDR 1998

Appendix A. Mammalian Toxicity Values from ATSDR 1998

Appendix A. Mammalian Toxicity Values from ATSDR 1998

Appendix A. Mammalian Toxicity Values from ATSDR 1998

Appendix A. Mammalian Toxicity Values from ATSDR 1998

Appendix A. Mammalian Toxicity Values from ATSDR 1998

Appendix A. Mammalian Toxicity Values from ATSDR 1998

Appendix A. Mammalian Toxicity Values from ATSDR 1998
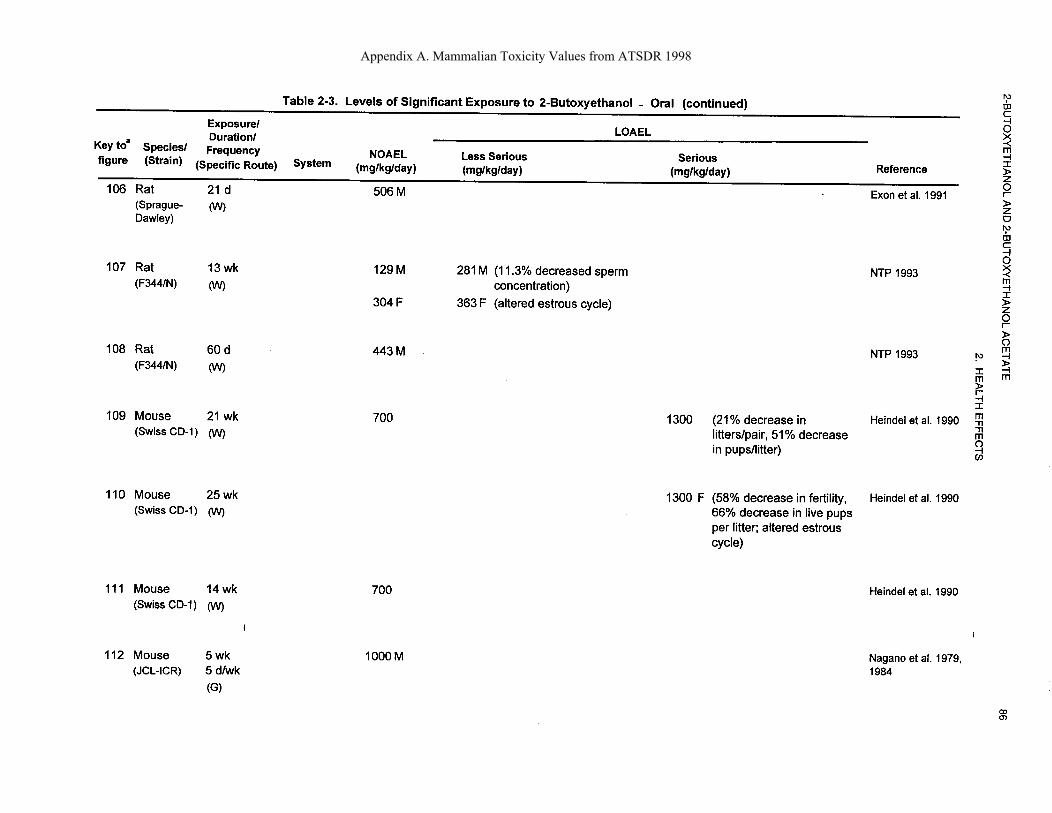
Appendix A. Mammalian Toxicity Values from ATSDR 1998

Appendix A. Mammalian Toxicity Values from ATSDR 1998

Appendix A. Mammalian Toxicity Values from ATSDR 1998
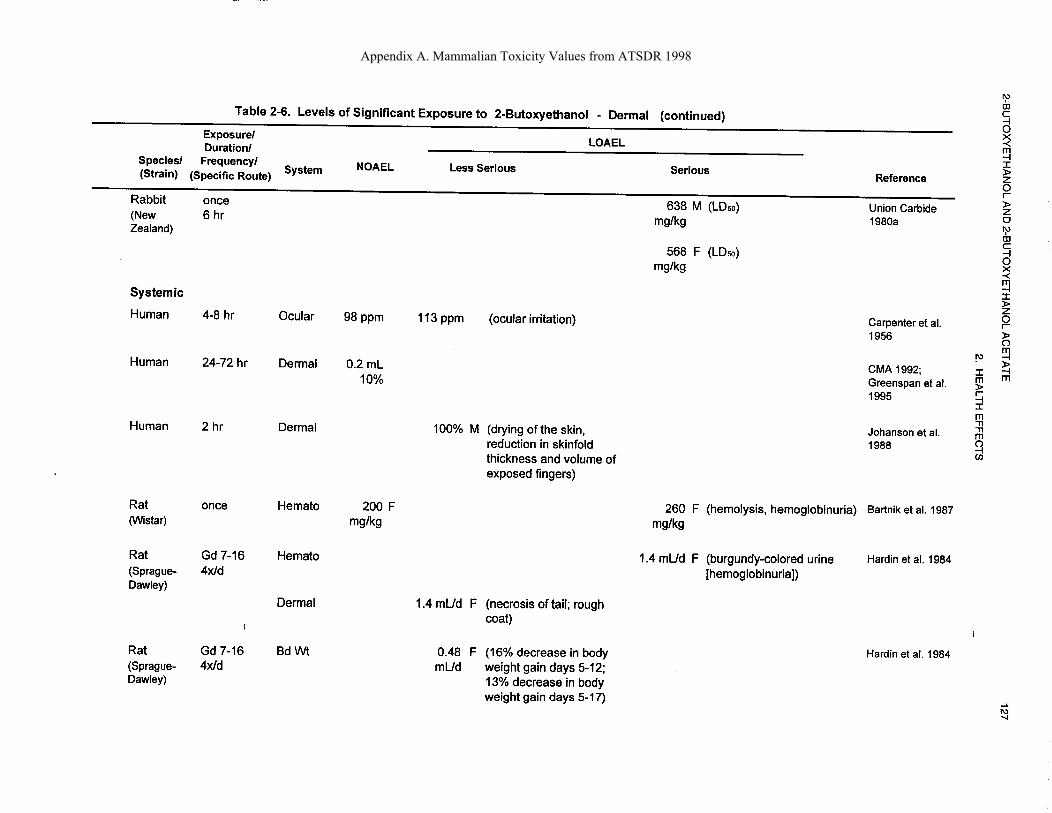
Appendix A. Mammalian Toxicity Values from ATSDR 1998
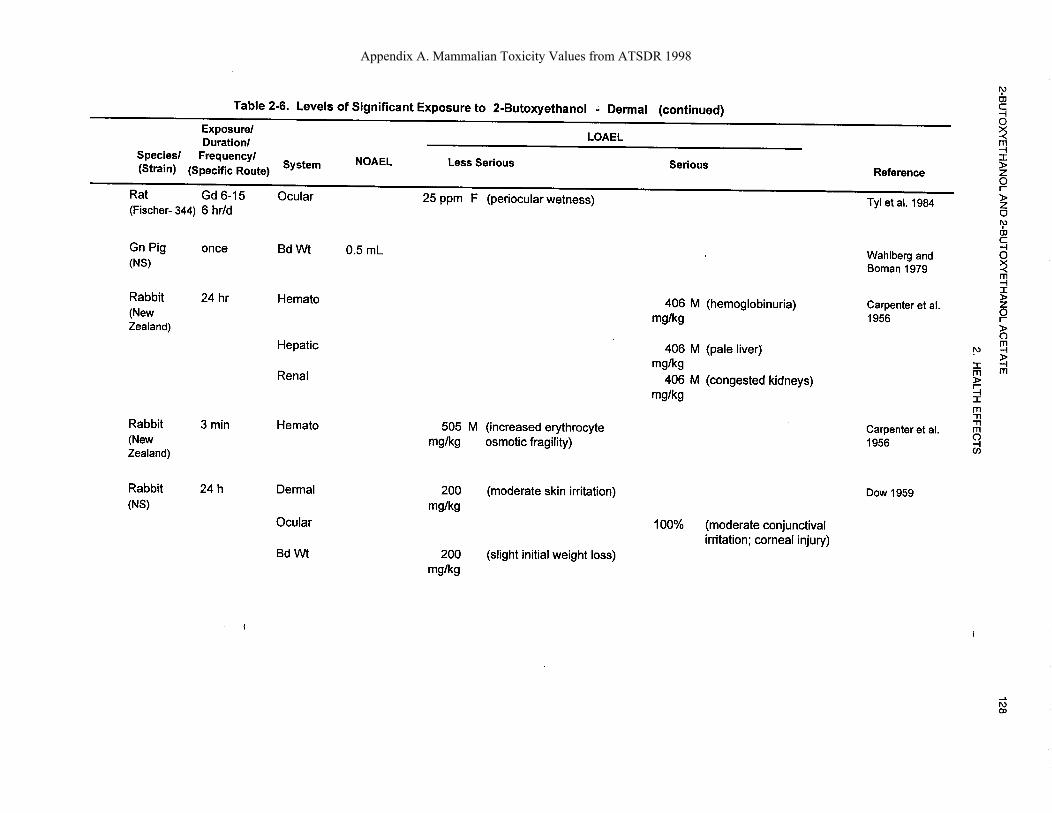
Appendix A. Mammalian Toxicity Values from ATSDR 1998
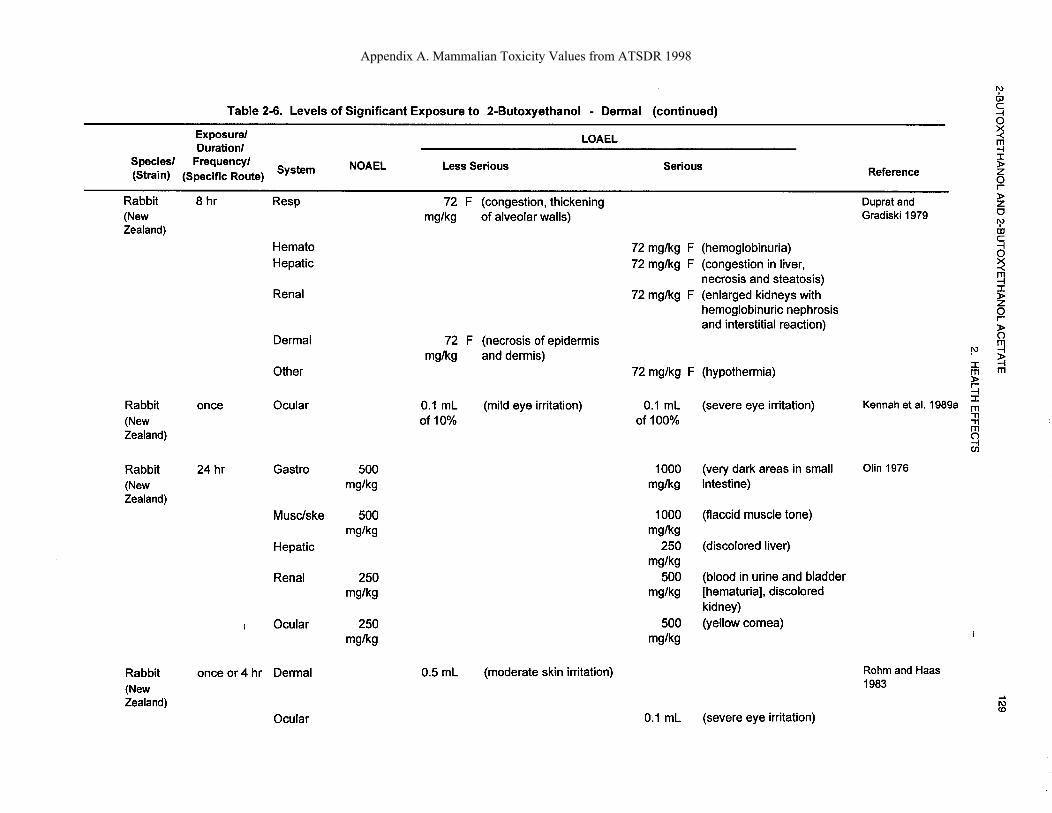
Appendix A. Mammalian Toxicity Values from ATSDR 1998
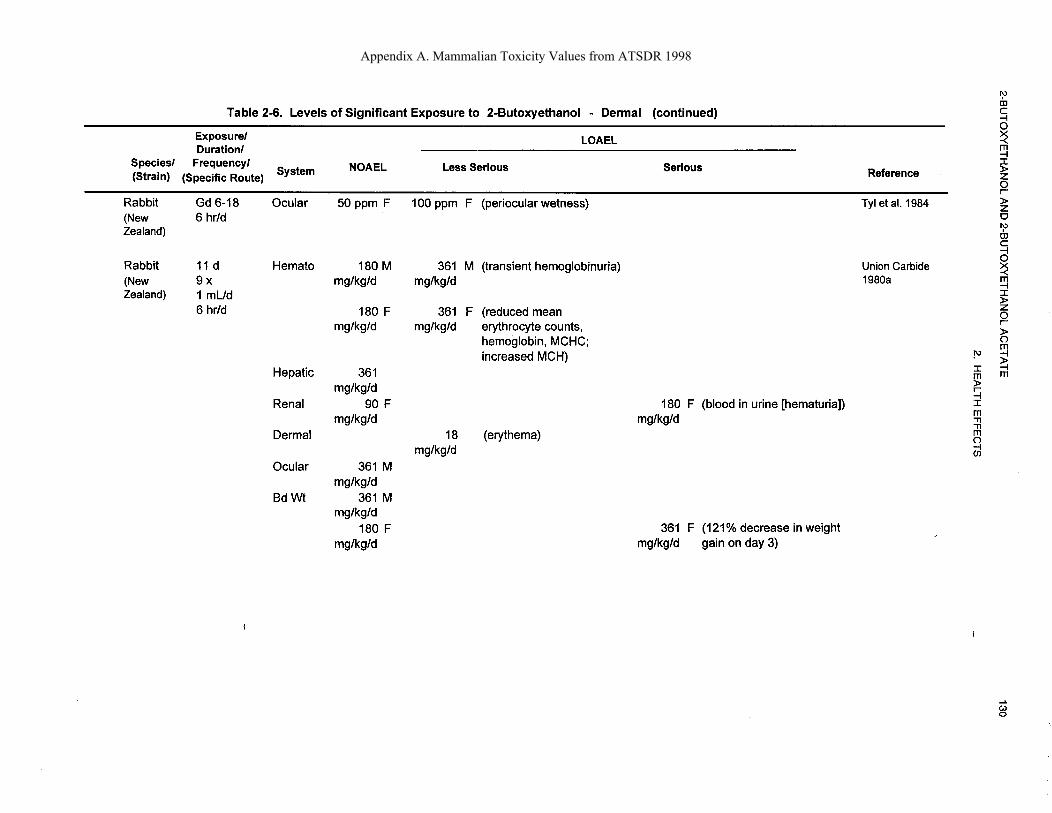
Appendix A. Mammalian Toxicity Values from ATSDR 1998
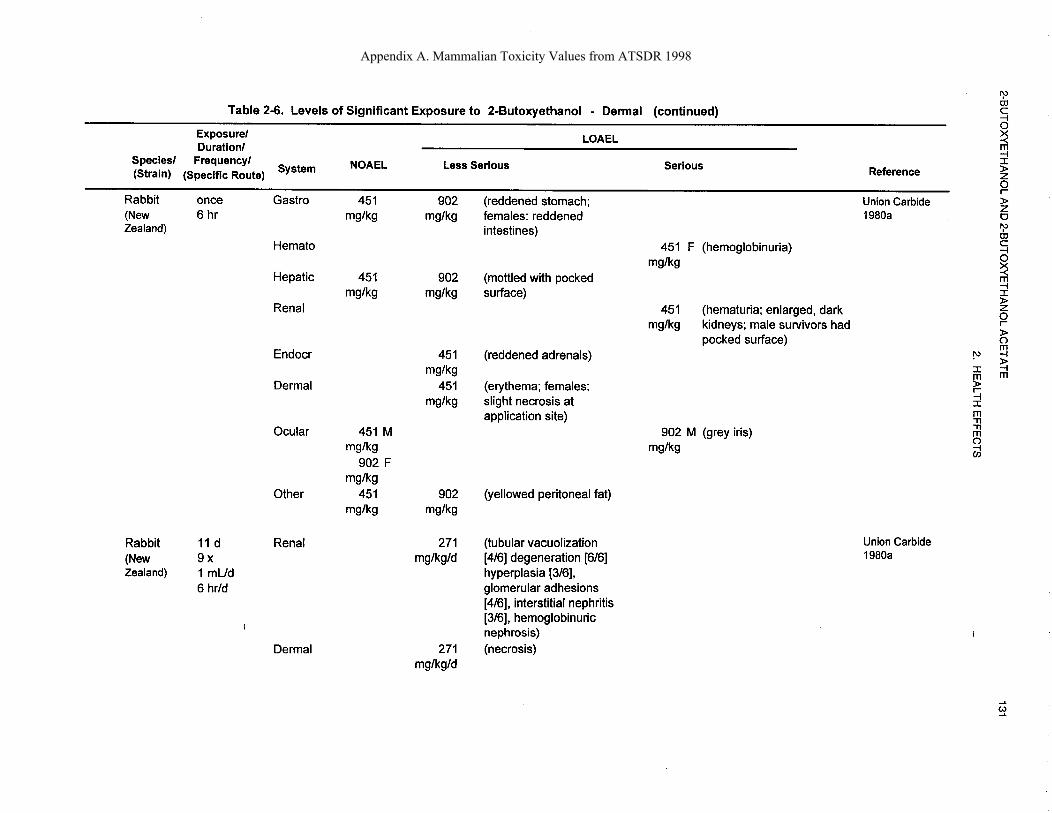
Appendix A. Mammalian Toxicity Values from ATSDR 1998
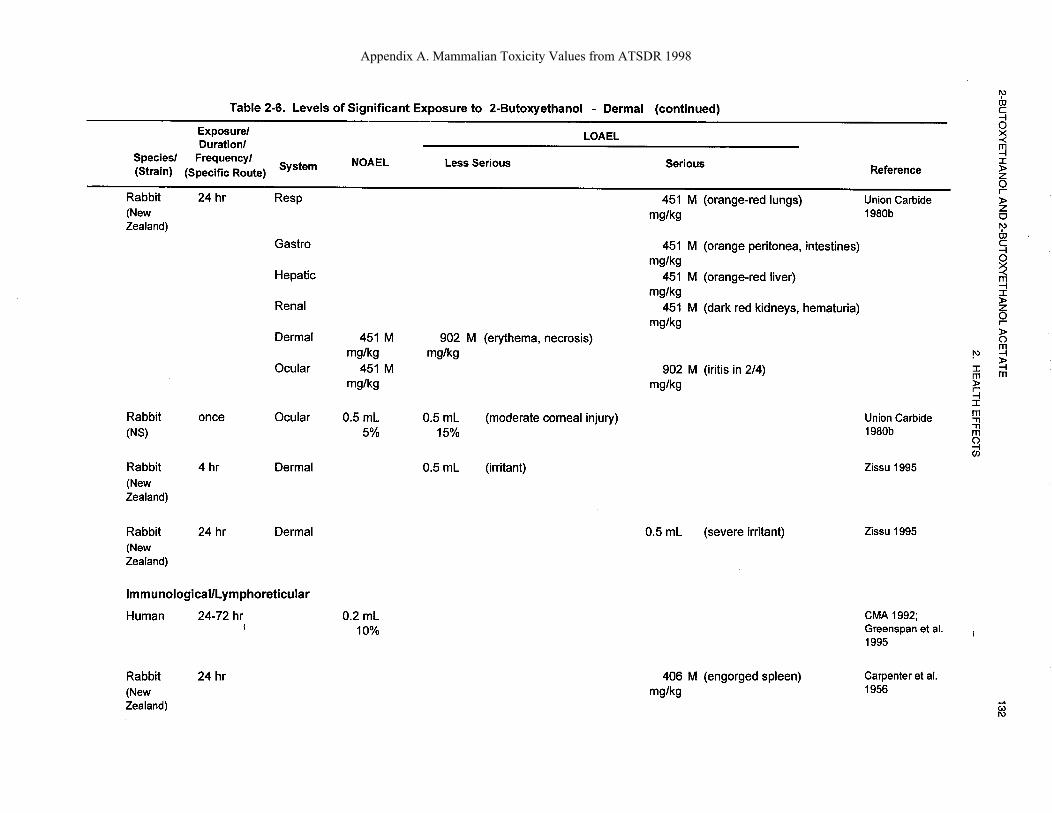
Appendix A. Mammalian Toxicity Values from ATSDR 1998

Appendix A. Mammalian Toxicity Values from ATSDR 1998

Appendix A. Mammalian Toxicity Values from ATSDR 1998

Appendix A. Mammalian Toxicity Values from ATSDR 1998
APPENDIX A-2
Toxicity Values in Laboratory Mammals Published After 1998
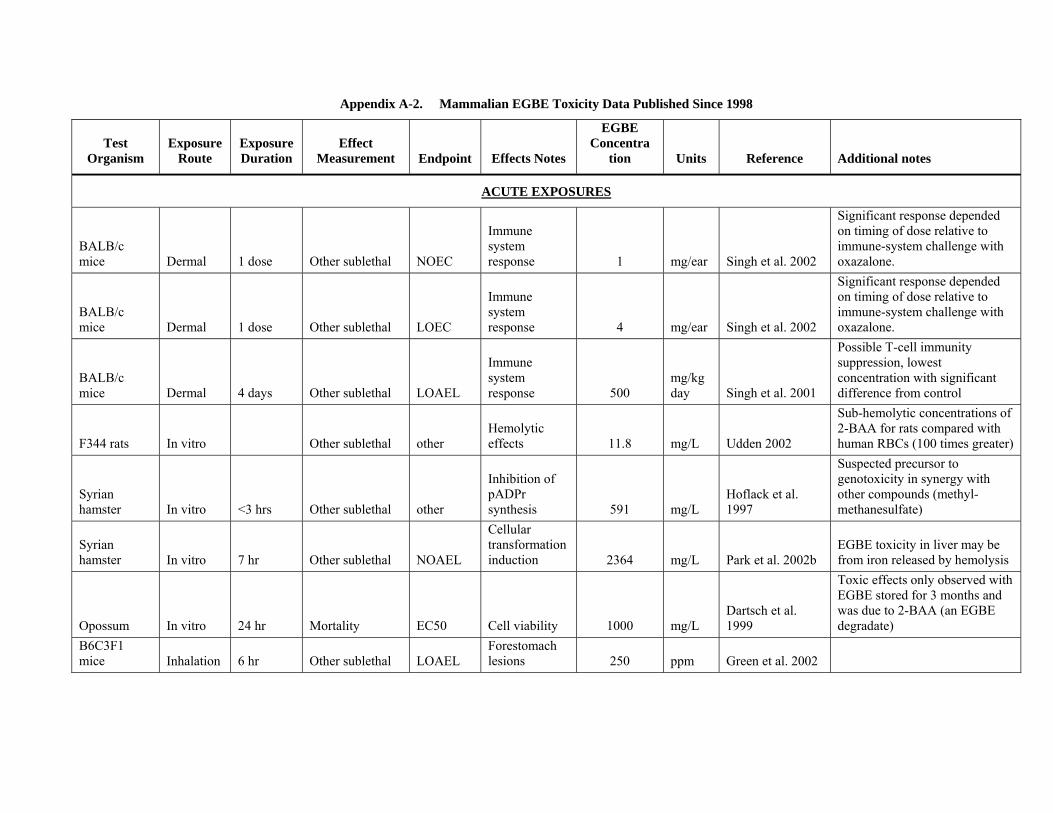
Appendix A-2. Mammalian EGBE Toxicity Data Published Since 1998
Test Organism
Exposure Route
Exposure Duration
Effect Measurement Endpoint Effects Notes
EGBE Concentra
tion Units Reference Additional notes
ACUTE EXPOSURES
BALB/c mice Dermal 1 dose Other sublethal NOEC
Immune system response 1 mg/ear Singh et al. 2002
Significant response depended on timing of dose relative to immune-system challenge with oxazalone.
BALB/c mice Dermal 1 dose Other sublethal LOEC
Immune system response 4 mg/ear Singh et al. 2002
Significant response depended on timing of dose relative to immune-system challenge with oxazalone.
BALB/c mice Dermal 4 days Other sublethal LOAEL
Immune system response 500
mg/kg day Singh et al. 2001
Possible T-cell immunity suppression, lowest concentration with significant difference from control
F344 rats In vitro Other sublethal other Hemolytic effects 11.8 mg/L Udden 2002
Sub-hemolytic concentrations of 2-BAA for rats compared with human RBCs (100 times greater)
Syrian hamster In vitro <3 hrs Other sublethal other
Inhibition of pADPr synthesis 591 mg/L
Hoflack et al. 1997
Suspected precursor to genotoxicity in synergy with other compounds (methyl-methanesulfate)
Syrian hamster In vitro 7 hr Other sublethal NOAEL
Cellular transformation induction 2364 mg/L Park et al. 2002b
EGBE toxicity in liver may be from iron released by hemolysis
Opossum In vitro 24 hr Mortality EC50 Cell viability 1000 mg/L Dartsch et al. 1999
Toxic effects only observed with EGBE stored for 3 months and was due to 2-BAA (an EGBE degradate)
B6C3F1 mice Inhalation 6 hr Other sublethal LOAEL
Forestomach lesions 250 ppm Green et al. 2002

Appendix A-2. Mammalian EGBE Toxicity Data Published Since 1998
Test Organism
Exposure Route
Exposure Duration
Effect Measurement Endpoint Effects Notes
EGBE Concentra
tion Units Reference Additional notes
guinea pig Inhalation 1 hr Mortality NOEC 633 ppm Gingell et al. 1998
Max vapor concentrations able to maintain. No mortalities/signs of toxicity for 14 days.
B6C3F1 mice Injection 1 dose Other sublethal LOAEL
Forestomach lesions 10
mg/kg bw Green et al. 2002
guinea pig Injection 1 dose Mortality NOAEL 2000 mg/kg bw
Gingell et al. 1998
LD50 test with no mortalities or other symptoms displayed after 14 days of monitoring
F344 rats Oral - dw 2-4 days Other sublethal LOAEL Histopathology 250
mg/kg bw-day Nyska et al. 2003 Hemolysis and thrombosis
guinea pig Oral - dw 1 dose Mortality LD50 1414 mg/kg bw
Gingell et al. 1998
B6C3F1 mice
Oral - gavage 4 days Other sublethal LOAEL
Forestomach lesions 400
mg/kg bw-day Poet et al. 2003
Minimal to mild forestomach epithelial hyperplasia. No stats presented.
B6C3F1 mice
Oral - gavage 4 days Mortality LOAEL 400
mg/kg bw-day Poet et al. 2003
Mortality attributed to dosing method, not necessarily to actual EGBE dose
B6C3F1 mice
Oral - gavage 7 days Other sublethal LOAEL Hepatic stress 450
mg/kg bw-day Park et al. 2002a
Significant decrease in vitamin E, increase in oxidative DNA damage
B6C3F1 mice
Oral - gavage 1 dose Other sublethal other
EGBE metabolism and distribution 600
mg/kg bw
Deisinger et al. 2004
Mice monitored for 90 minutes, toxicity not reported or monitored for
F344 rats Oral - gavage 1 dose Other sublethal LOAEL
Hemolytic effects 125
mg/kg bw Udden 2000
Morphological changes in erythrocytes w/in 30 minutes of dose, persists > 4 hours

Appendix A-2. Mammalian EGBE Toxicity Data Published Since 1998
Test Organism
Exposure Route
Exposure Duration
Effect Measurement Endpoint Effects Notes
EGBE Concentra
tion Units Reference Additional notes
F344 rats Oral - gavage 2-4 days Other sublethal LOEC
Increased adherence of RBCs to extracellular matrix 250
mg/kg bw-day
Koshkaryev et al. 2003
2, 3, and 4 doses tested. All showed a response. Greatest was in the 2 dose group.
F344 rats Oral - gavage 1-3 days Other sublethal LOAEL
Acute regenerative hemolytic anemia 250
mg/kg bw-day
Ghanayem et al. 2001
Significant morphological changes in erythrocytes
F344 rats Oral - gavage 1 dose Other sublethal LOAEL
Various hemotologic parameters 250
mg/kg bw
Ghanayem et al. 2000
Erythrocyte swelling, increase in MCV, increased spleen/body weight ratio
F344 rats Oral - gavage 3 days Other sublethal LOAEL
Histopathology 250
mg/kg bw-day
Nyska et al. 1999a
Ocular thrombosis and retinal degeneration
Sprague Dawley rats
Oral - gavage 1-4 doses Mortality NOEC 500
mg/kg bw-day
Sawant et al. 1999
Dose concentration and timing varied, mortality rates depended on dose timing
Sprague Dawley rats
Oral - gavage 1-4 doses Mortality LOEC 1500
mg/kg bw-day
Sawant et al. 1999
Dose concentration and timing varied, mortality rates depended on dose timing
CHRONIC EXPOSURES
B6C3F1 mice Inhalation 14 wk Other sublethal LOEC
Hemolytic effects 31.2 ppm NTP 2000
Significant changes in female hematology at all doses in both 14 wk/2 yr study. Min 2 yr dose = 62.5 ppm
B6C3F1 mice Inhalation 2 years Other sublethal LOAEL
Hepatic lesions and forestomach effects 62.5 ppm
Boatman et al. 2004
Significant increase in cell pigmentation, ulcers, and eptithelial hyperplasia (Tables 1,2)

Appendix A-2. Mammalian EGBE Toxicity Data Published Since 1998
Test Organism
Exposure Route
Exposure Duration
Effect Measurement Endpoint Effects Notes
EGBE Concentra
tion Units Reference Additional notes
B6C3F1 mice Inhalation 2 years Mortality NOEC 62.5 ppm NTP 2000
Male mortality significantly affected, no change in female mortality in any dose (Table 15)
B6C3F1 mice Inhalation 14 wk Growth NOEC 62.5 ppm NTP 2000
No significant effects on body weight in 14 wk test (male or female)
B6C3F1 mice Inhalation 2 years Mortality LOEC 125 ppm NTP 2000
Significant increase in male mortality in 2 yr test (Table 15)
B6C3F1 mice Inhalation 14 wk Growth LOEC 125 ppm NTP 2000
Body weight gains for males significantly less than control in 14 wk study. Less obvious in 2 yr study.
B6C3F1 mice Inhalation 18 mo Mortality NOEC
Elimination kinetics study, no mortality observed 250 ppm Dill et al. 1998
Max blood concentration = 6.27 ug/g (males) and 12.96 ug/g (females)
F344 rats Inhalation 2 years Other sublethal LOEC
Hemolytic effects (e.g., anemia) 31.2 ppm NTP 2000
Significant changes in female hematology parameters at all doses (Table 3)
F344 rats Inhalation 13 wks Other sublethal LOEC Histopathology 32 ppm
Long et al. 2000, Nyska et al. 1999b
Histopathological effects observed in all groups tested (but not in controls)
F344 rats Inhalation 2 years Growth NOEC 62.5 ppm NTP 2000
No obvious difference in weights in males or females from controls (Tables 7,8)
F344 rats Inhalation 18 mo Mortality NOEC
Elimination kinetics study, no mortality observed 125 ppm Dill et al. 1998
Max blood concentration = 4.22 ug/g (males) and 3.16 ug/g (females)
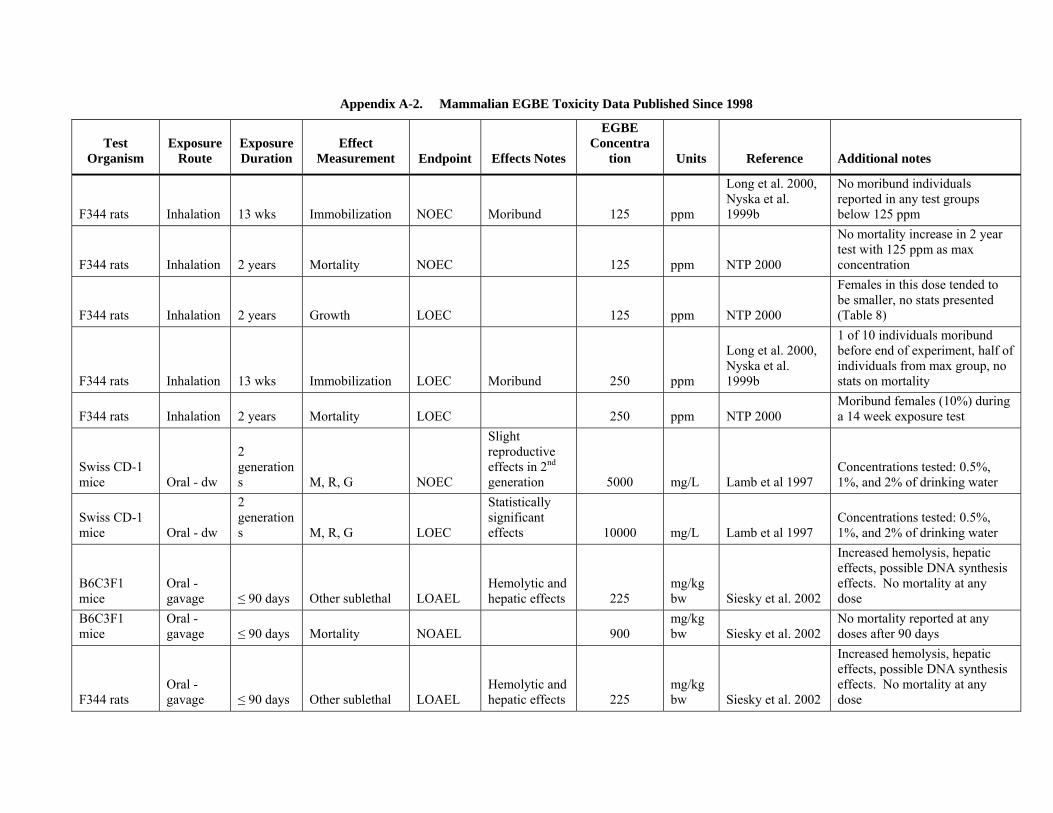
Appendix A-2. Mammalian EGBE Toxicity Data Published Since 1998
Test Organism
Exposure Route
Exposure Duration
Effect Measurement Endpoint Effects Notes
EGBE Concentra
tion Units Reference Additional notes
F344 rats Inhalation 13 wks Immobilization NOEC Moribund 125 ppm
Long et al. 2000, Nyska et al. 1999b
No moribund individuals reported in any test groups below 125 ppm
F344 rats Inhalation 2 years Mortality NOEC 125 ppm NTP 2000
No mortality increase in 2 year test with 125 ppm as max concentration
F344 rats Inhalation 2 years Growth LOEC 125 ppm NTP 2000
Females in this dose tended to be smaller, no stats presented (Table 8)
F344 rats Inhalation 13 wks Immobilization LOEC Moribund 250 ppm
Long et al. 2000, Nyska et al. 1999b
1 of 10 individuals moribund before end of experiment, half of individuals from max group, no stats on mortality
F344 rats Inhalation 2 years Mortality LOEC 250 ppm NTP 2000 Moribund females (10%) during a 14 week exposure test
Swiss CD-1 mice Oral - dw
2 generations M, R, G NOEC
Slight reproductive effects in 2nd generation 5000 mg/L Lamb et al 1997
Concentrations tested: 0.5%, 1%, and 2% of drinking water
Swiss CD-1 mice Oral - dw
2 generations M, R, G LOEC
Statistically significant effects 10000 mg/L Lamb et al 1997
Concentrations tested: 0.5%, 1%, and 2% of drinking water
B6C3F1 mice
Oral - gavage ≤ 90 days Other sublethal LOAEL
Hemolytic and hepatic effects 225
mg/kg bw Siesky et al. 2002
Increased hemolysis, hepatic effects, possible DNA synthesis effects. No mortality at any dose
B6C3F1 mice
Oral - gavage ≤ 90 days Mortality NOAEL 900
mg/kg bw Siesky et al. 2002
No mortality reported at any doses after 90 days
F344 rats Oral - gavage ≤ 90 days Other sublethal LOAEL
Hemolytic and hepatic effects 225
mg/kg bw Siesky et al. 2002
Increased hemolysis, hepatic effects, possible DNA synthesis effects. No mortality at any dose
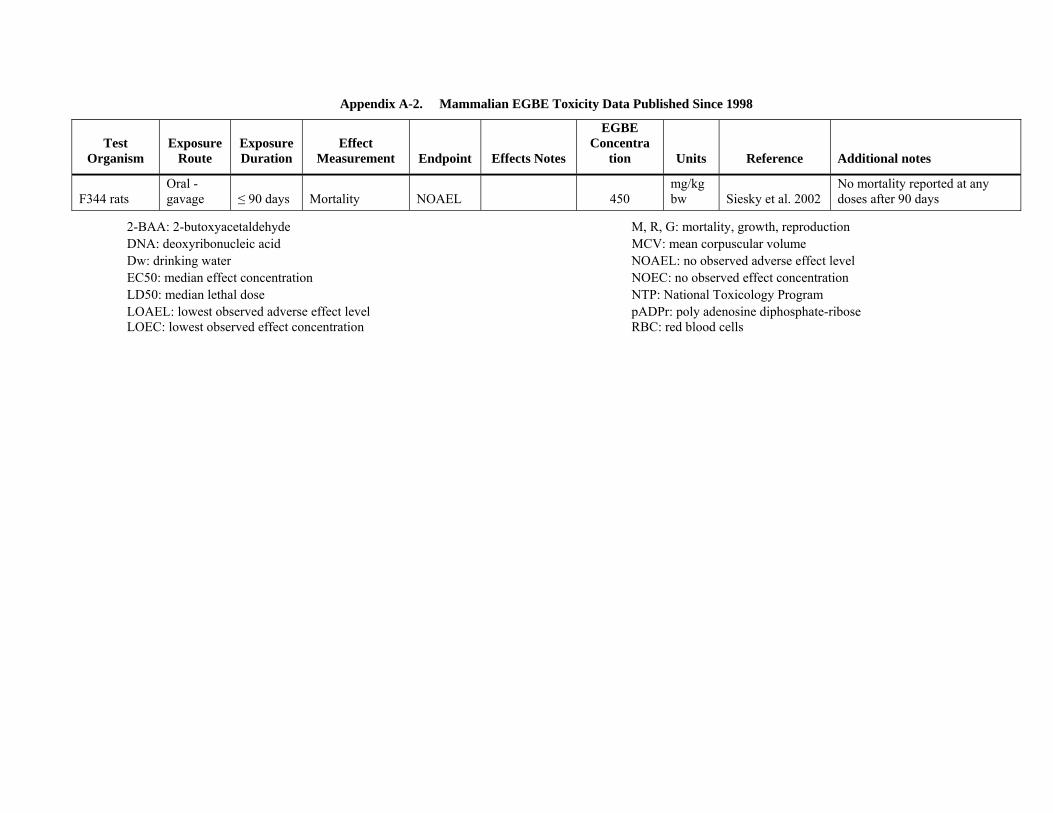
Appendix A-2. Mammalian EGBE Toxicity Data Published Since 1998
Test Organism
Exposure Route
Exposure Duration
Effect Measurement Endpoint Effects Notes
EGBE Concentra
tion Units Reference Additional notes
F344 rats Oral - gavage ≤ 90 days Mortality NOAEL 450
mg/kg bw Siesky et al. 2002
No mortality reported at any doses after 90 days
2-BAA: 2-butoxyacetaldehyde M, R, G: mortality, growth, reproduction DNA: deoxyribonucleic acid MCV: mean corpuscular volume Dw: drinking water NOAEL: no observed adverse effect level EC50: median effect concentration NOEC: no observed effect concentration LD50: median lethal dose NTP: National Toxicology Program LOAEL: lowest observed adverse effect level pADPr: poly adenosine diphosphate-ribose LOEC: lowest observed effect concentration RBC: red blood cells

APPENDIX B
Emissions Inventory
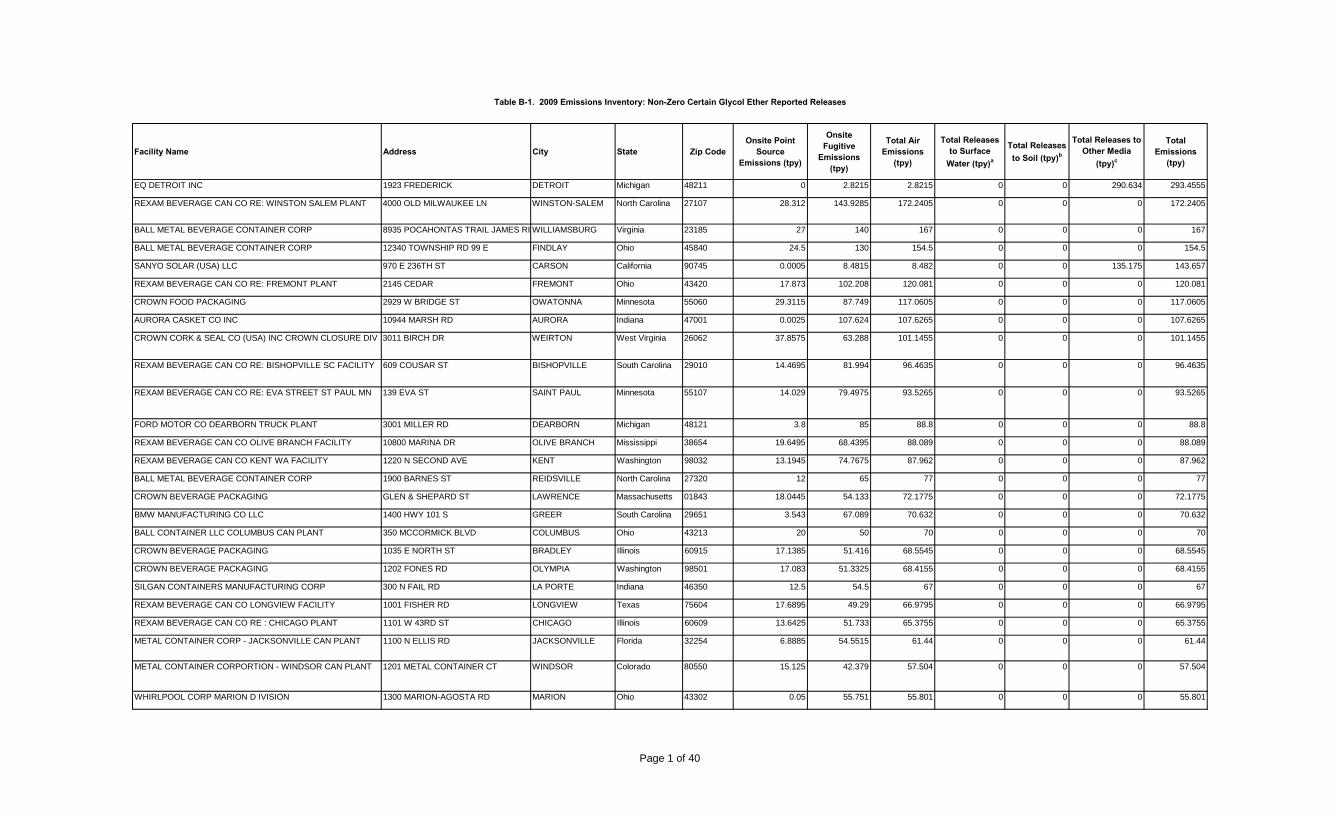
Table B-1. 2009 Emissions Inventory: Non-Zero Certain Glycol Ether Reported Releases
Facility Name Address City State Zip CodeOnsite Point
Source Emissions (tpy)
Onsite Fugitive
Emissions (tpy)
Total Air Emissions
(tpy)
Total Releases to Surface
Water (tpy)a
Total Releases to Soil (tpy)b
Total Releases to Other Media
(tpy)c
Total Emissions
(tpy)
EQ DETROIT INC 1923 FREDERICK DETROIT Michigan 48211 0 2.8215 2.8215 0 0 290.634 293.4555
REXAM BEVERAGE CAN CO RE: WINSTON SALEM PLANT 4000 OLD MILWAUKEE LN WINSTON-SALEM North Carolina 27107 28.312 143.9285 172.2405 0 0 0 172.2405
BALL METAL BEVERAGE CONTAINER CORP 8935 POCAHONTAS TRAIL JAMES RI WILLIAMSBURG Virginia 23185 27 140 167 0 0 0 167
BALL METAL BEVERAGE CONTAINER CORP 12340 TOWNSHIP RD 99 E FINDLAY Ohio 45840 24.5 130 154.5 0 0 0 154.5
SANYO SOLAR (USA) LLC 970 E 236TH ST CARSON California 90745 0.0005 8.4815 8.482 0 0 135.175 143.657
REXAM BEVERAGE CAN CO RE: FREMONT PLANT 2145 CEDAR FREMONT Ohio 43420 17.873 102.208 120.081 0 0 0 120.081
CROWN FOOD PACKAGING 2929 W BRIDGE ST OWATONNA Minnesota 55060 29.3115 87.749 117.0605 0 0 0 117.0605
AURORA CASKET CO INC 10944 MARSH RD AURORA Indiana 47001 0.0025 107.624 107.6265 0 0 0 107.6265
CROWN CORK & SEAL CO (USA) INC CROWN CLOSURE DIV 3011 BIRCH DR WEIRTON West Virginia 26062 37.8575 63.288 101.1455 0 0 0 101.1455
REXAM BEVERAGE CAN CO RE: BISHOPVILLE SC FACILITY 609 COUSAR ST BISHOPVILLE South Carolina 29010 14.4695 81.994 96.4635 0 0 0 96.4635
REXAM BEVERAGE CAN CO RE: EVA STREET ST PAUL MN 139 EVA ST SAINT PAUL Minnesota 55107 14.029 79.4975 93.5265 0 0 0 93.5265
FORD MOTOR CO DEARBORN TRUCK PLANT 3001 MILLER RD DEARBORN Michigan 48121 3.8 85 88.8 0 0 0 88.8
REXAM BEVERAGE CAN CO OLIVE BRANCH FACILITY 10800 MARINA DR OLIVE BRANCH Mississippi 38654 19.6495 68.4395 88.089 0 0 0 88.089
REXAM BEVERAGE CAN CO KENT WA FACILITY 1220 N SECOND AVE KENT Washington 98032 13.1945 74.7675 87.962 0 0 0 87.962
BALL METAL BEVERAGE CONTAINER CORP 1900 BARNES ST REIDSVILLE North Carolina 27320 12 65 77 0 0 0 77
CROWN BEVERAGE PACKAGING GLEN & SHEPARD ST LAWRENCE Massachusetts 01843 18.0445 54.133 72.1775 0 0 0 72.1775
BMW MANUFACTURING CO LLC 1400 HWY 101 S GREER South Carolina 29651 3.543 67.089 70.632 0 0 0 70.632
BALL CONTAINER LLC COLUMBUS CAN PLANT 350 MCCORMICK BLVD COLUMBUS Ohio 43213 20 50 70 0 0 0 70
CROWN BEVERAGE PACKAGING 1035 E NORTH ST BRADLEY Illinois 60915 17.1385 51.416 68.5545 0 0 0 68.5545
CROWN BEVERAGE PACKAGING 1202 FONES RD OLYMPIA Washington 98501 17.083 51.3325 68.4155 0 0 0 68.4155
SILGAN CONTAINERS MANUFACTURING CORP 300 N FAIL RD LA PORTE Indiana 46350 12.5 54.5 67 0 0 0 67
REXAM BEVERAGE CAN CO LONGVIEW FACILITY 1001 FISHER RD LONGVIEW Texas 75604 17.6895 49.29 66.9795 0 0 0 66.9795
REXAM BEVERAGE CAN CO RE : CHICAGO PLANT 1101 W 43RD ST CHICAGO Illinois 60609 13.6425 51.733 65.3755 0 0 0 65.3755
METAL CONTAINER CORP - JACKSONVILLE CAN PLANT 1100 N ELLIS RD JACKSONVILLE Florida 32254 6.8885 54.5515 61.44 0 0 0 61.44
METAL CONTAINER CORPORTION - WINDSOR CAN PLANT 1201 METAL CONTAINER CT WINDSOR Colorado 80550 15.125 42.379 57.504 0 0 0 57.504
WHIRLPOOL CORP MARION D IVISION 1300 MARION-AGOSTA RD MARION Ohio 43302 0.05 55.751 55.801 0 0 0 55.801
Page 1 of 40

Table B-1. 2009 Emissions Inventory: Non-Zero Certain Glycol Ether Reported Releases
Facility Name Address City State Zip CodeOnsite Point
Source Emissions (tpy)
Onsite Fugitive
Emissions (tpy)
Total Air Emissions
(tpy)
Total Releases to Surface
Water (tpy)a
Total Releases to Soil (tpy)b
Total Releases to Other Media
(tpy)c
Total Emissions
(tpy)
REXAM BEVERAGE CAN CO CHATSWORTH FACILITY 20730 PRAIRIE ST CHATSWORTH California 91311 14.307 40.3275 54.6345 0 0 0 54.6345
SILGAN CONTAINERS MANUFACTURING CORP 1400 PLOVER RD PO BOX 97 PLOVER Wisconsin 54467 10.75 40 50.75 0 0 0 50.75
BALL CONTAINER LLC ROME CAN PLANT 110 MCC DR ROME Georgia 30161 34.5 15 49.5 0 0 0 49.5
REXAM BEVERAGE CAN CO RE: WHITEHOUSE PLANT 10444 WATERVILLE WHITEHOUSE Ohio 43571 16.48 31.601 48.081 0 0 0 48.081
METAL CONTAINER CORP - NEWBURGH CAN PLANT 130 BREUNIG RD NEW WINDSOR New York 12553 12.0965 34.362 46.4585 0 0 0 46.4585
HONDA OF AMERICA MANUFACTURING INC 24000 HONDA PKY MARYSVILLE Ohio 43040 10.078 34.795 44.873 0 0 0.21 45.083
CROWN BEVERAGE PACKAGING 620 N 4TH ST WORLAND Wyoming 82401 11.1305 33.391 44.5215 0 0 0 44.5215
METAL CONTAINER CORP - ARNOLD CAN PLANT 42 TENBROOK INDUSTRIAL PARK ARNOLD Missouri 63010 17.1215 27.065 44.1865 0 0 0 44.1865
BALL METAL BEVERAGE CONTAINER CORP 8500 W TOWER AVE MILWAUKEE Wisconsin 53224 35.5 7 42.5 0 0 0 42.5
FORD MOTOR COMPANY--KANSAS CITY ASSEMBLY PLANT 8121 E US HWY 69 CLAYCOMO Missouri 64119 2.25 39.5 41.75 0 0 0.0125 41.7625
RR DONNELLEY 2347 KRATZER RD HARRISONBURG Virginia 22802 36.14 4.277 40.417 0 0 0 40.417
REXAM BEVERAGE CAN CO PHOENIX FACILITY 211 N 51ST AVE PHOENIX Arizona 85043 5.2365 34.4115 39.648 0 0 0 39.648
ROCKY MOUNTAIN METAL CONTAINER 17755 W 32ND AVE GOLDEN Colorado 80401 30.5 6 36.5 0 0 2.4 38.9
CHRYSLER ST LOUIS NORTH ASSEMBLY PLANT 1050 DODGE DR FENTON Missouri 63026 5.5 32 37.5 0 0 0.0045 37.5045
NEW UNITED MOTOR MANUFACTURING INC 45500 FREMONT BLVD MAIL STOP 16FREMONT California 94538 29.686 7.438 37.124 0 0 0 37.124
BALL METAL FOOD CONTAINER CORP 3010 BIRCH DR WEIRTON West Virginia 26062 25.5 11.5 37 0 0 0 37
WHIRLPOOL CORP - CLYDE DIV 119 BIRDSEYE ST CLYDE Ohio 43410 1.0635 34.295 35.3585 0 0 1.0645 36.423
GM TRUCK GROUP FLINT ASSEMBLY PLANT VAN SLYKE COMPLEX
G-3100 VAN SLYKE RD FLINT Michigan 48551 0.29 35.5 35.79 0 0 0.23 36.02
BALL METAL BEVERAGE CONTAINER CORP 501 N SIXTH ST MONTICELLO Indiana 47960 26 10 36 0 0 0 36
CROWN BEVERAGE PACKAGING 2501 N FRAZIER ST CONROE Texas 77305 29.291 4.775 34.066 0 0 0 34.066
CROWN FOOD PACKAGING 8801 CITATION RD BALTIMORE Maryland 21221 8.4905 25.471 33.9615 0 0 0 33.9615
BALL METAL BEVERAGE CONTAINER CORP 500 CRENSHAW BLVD TORRANCE California 90503 31 2.65 33.65 0 0 0 33.65
REXAM BEVERAGE CAN CO RE:OKLAHOMA CITY PLANT 3400 S COUNCIL RD OKLAHOMA CITY Oklahoma 73179 5.032 28.5175 33.5495 0 0 0 33.5495
FORD MOTOR CO KENTUCKY TRUCK PLANT 3001 CHAMBERLAIN LN LOUISVILLE Kentucky 40241 0.9 32.5 33.4 0 0 0.13 33.53
NISSAN NA INC SMYRNA MANUFACTURING PLANT 983 NISSAN DR SMYRNA Tennessee 37167 1.379 31.939 33.318 0 0 0 33.318
Page 2 of 40

Table B-1. 2009 Emissions Inventory: Non-Zero Certain Glycol Ether Reported Releases
Facility Name Address City State Zip CodeOnsite Point
Source Emissions (tpy)
Onsite Fugitive
Emissions (tpy)
Total Air Emissions
(tpy)
Total Releases to Surface
Water (tpy)a
Total Releases to Soil (tpy)b
Total Releases to Other Media
(tpy)c
Total Emissions
(tpy)
METAL CONTAINER CORP - MIRA LOMA CAN PLANT 10980 INLAND AVE MIRA LOMA California 91752 29.0325 3.7525 32.785 0 0 0 32.785
GREIF PACKAGING LLC 7425 INDUSTRIAL RD FLORENCE Kentucky 41042 1.3765 26.154 27.5305 0 0 4.7335 32.264
CROWN BEVERAGE PACKAGING 12910 JESS PIRTLE BLVD SUGAR LAND Texas 77478 27.9735 4.196 32.1695 0 0 0 32.1695
BALL METAL BEVERAGE CONTAINER CORP 2400 HUNTINGTON DR FAIRFIELD California 94533 12.5 19 31.5 0 0 0 31.5
BALL METAL BEVERAGE CONTAINER CORP 4525 INDIANA ST GOLDEN Colorado 80403 21 10.5 31.5 0 0 0 31.5
CHICAGO HEIGHTS STEEL 211 E MAIN ST CHICAGO HEIGHTS Illinois 60411 6.2785 25.113 31.3915 0 0 0 31.3915
THERMA-TRU CORP 601 RE JONES RD BUTLER Indiana 46721 0 31.029 31.029 0 0 0 31.029
SENECA FOODS CORP 801 SAUK AVE BARABOO Wisconsin 53913 0 29.8385 29.8385 0 0 1.0045 30.843
CROWN BEVERAGE PACKAGING 380 CALLE FABRIL ST KM 126 PR-3, PCAROLINA Puerto Rico 00985 7.531 22.5935 30.1245 0 0 30.1245
HONDA OF AMERICA MANUFACTURING INC 11000 STATE RT 347 EAST LIBERTY Ohio 43319 1.95 27.5 29.45 0 0 0.11 29.56
EFCO CORP 1000 COUNTY RD MONETT Missouri 65708 1.1695 28.0645 29.234 0 0 0 29.234
BALL METAL BEVERAGE CONTAINER CORP 4700 WHITEWAY DR TAMPA Florida 33617 11.5 15.5 27 0 0 0 27
NISSAN NORTH AMERICA INC CANTON MS 300 NISSAN DR CANTON Mississippi 39046 2.0275 24.5915 26.619 0 0 0 26.619
CHRYSLER JEFFERSON NORTH ASSEMBLY PLANT 2101 CONNOR AVE DETROIT Michigan 48215 6.5 20 26.5 0 0 0.002 26.502
FLINT HILLS RESOURCES LP - WEST PLANT 2825 SUNTIDE RD CORPUS CHRISTI Texas 78410 0.055 0 0.055 0 0 26.2985 26.3535
NYW REALTY LLC/ HANOVER 500 E MIDDLE ST HANOVER Pennsylvania 17331 0 25.986 25.986 0 0 25.986
EDSAL MANUFACTURING CO INC 4400 S PACKER CHICAGO Illinois 60609 0 25.7385 25.7385 0 0 0 25.7385
AVX CORP MYRTLE BEACH 801 17TH AVE S MYRTLE BEACH South Carolina 29577 7.2445 2.136 9.3805 0.0005 0 15.955 25.336
CROWN BEVERAGE PACKAGING 195 CROWN RD BATESVILLE Mississippi 38606 22.54 2.711 25.251 0 0 0 25.251
CROWN BEVERAGE PACKAGING 1501 ST JAMES ST LA CROSSE Wisconsin 54603 22.8145 1.711 24.5255 0 0 0 24.5255
SAPA EXTRUSIONS INC 2500 ALUMAX RD YANKTON South Dakota 57078 0 24.4475 24.4475 0 0 0 24.4475
MAGNA STEYR NORTH AMERICA 3800 STICKNEY AVE TOLEDO Ohio 43608 2.95 21 23.95 0 0 0 23.95
AIR SYSTEM COMPONENTS LP 900 DARR PARK DR PONCA CITY Oklahoma 74601 0.2435 23.6125 23.856 0 0 0 23.856
MOBIL CHEMICAL CO 41501 WOLVERINE RD SHAWNEE Oklahoma 74804 0.375 23 23.375 0 0 0.0025 23.3775
WHIRLPOOL CORP FINDLAY DIV 4901 N MAIN ST FINDLAY Ohio 45840 2.2845 20.562 22.8465 0 0 0 22.8465
S B FOOT TANNING CO 805 BENCH ST RED WING Minnesota 55066 0 22.8265 22.8265 0 0 0 22.8265
CROWN BEVERAGE PACKAGING 100 EVANS ROW CHERAW South Carolina 29520 19.606 2.5155 22.1215 0 0 0 22.1215
SUBARU OF INDIANA AUTOMOTIVE INC 5500 STATE RD 38E LAFAYETTE Indiana 47905 0.22 21.9 22.12 0 0 0 22.12
BATESVILLE MANUFACTURING INC 175 MONOGARD DR MANCHESTER Tennessee 37355 1.088 20.6735 21.7615 0 0 0.0075 21.769
Page 3 of 40

Table B-1. 2009 Emissions Inventory: Non-Zero Certain Glycol Ether Reported Releases
Facility Name Address City State Zip CodeOnsite Point
Source Emissions (tpy)
Onsite Fugitive
Emissions (tpy)
Total Air Emissions
(tpy)
Total Releases to Surface
Water (tpy)a
Total Releases to Soil (tpy)b
Total Releases to Other Media
(tpy)c
Total Emissions
(tpy)
MEMC PASADENA INC 3000 N S ST PASADENA Texas 77503 12.6555 8.0295 20.685 0 0 0.89 21.575
PPG INDUSTRIES OHIO INC - DELAWARE 760 PITTSBURGH DR DELAWARE Ohio 43015 0.057 0 0.057 0 0 19.714 19.771
BWAY CORP 1601 VALDOSTA HWY HOMERVILLE Georgia 31634 19.247 0.3615 19.6085 0 0 0 19.6085
BALL METAL BEVERAGE CONTAINER CORP 1001 N FM 3083 E CONROE Texas 77303 14 4.6 18.6 0 0 0 18.6
SPECTRUM METAL FINISHING 535 BEV RD YOUNGSTOWN Ohio 44512 0.37 18.05 18.42 0 0 0 18.42
DEXTER CHASSIS GROUP PLANT 55 501 S MILLER DR WHITE PIGEON Michigan 49099 0 18.265 18.265 0 0 0.0985 18.3635
ROLL COATER INC 1950 E MAIN ST GREENFIELD Indiana 46140 0.033 18.318 18.351 0 0 0 18.351
BALL METAL BEVERAGE CONTAINER CORP 11 ADAMS RD SARATOGA SPRINGSNew York 12866 3.3 15 18.3 0 0 0 18.3
GM SPRING HILL MANUFACTURING 100 SATURN PKWY MAIL DROP 371-9SPRING HILL Tennessee 37174 0.175 18 18.175 0 0 0 18.175
OLDCASTLE BUILDING ENVELOPE TEXAS FACILITY 803 AIRPORT RD TERRELL Texas 75160 2.7755 14.8745 17.65 0 0 0 17.65
UNION CARBIDE CORP SEADRIFT PLANT 7501 N HWY 185 SEADRIFT Texas 77983 13.899 3.1365 17.0355 0 0 0.027 17.0625
HONDA MANUFACTURING OF ALABAMA LLC 1800 HONDA DR LINCOLN Alabama 35096 0.198 16.555 16.753 0 0 0 16.753
NUCOR VULCRAFT GROUP GRAPELAND DIV 175 COUNTY RD 2345 GRAPELAND Texas 75844 0.15 16.287 16.437 0 0 0 16.437
PPG INDUSTRIES INC-OAK CREEK 10800 S 13TH ST OAK CREEK Wisconsin 53154 15.48 0.374 15.854 0 0 0.424 16.278
NORTH COAST CONTAINER CORP 8806 CRANE AVE CLEVELAND Ohio 44105 0 16.0815 16.0815 0 0 0 16.0815
TOYOTA MOTOR MANUFACTURING INDIANA INC 4000 TULIP TREE DR PRINCETON Indiana 47670 9.7535 6.3155 16.069 0 0 0 16.069
ALLIED TUBE & CONDUIT CORP 16100 S LATHROP AVE HARVEY Illinois 60426 10.022 5.9115 15.9335 0 0 0 15.9335
NOVELIS CORP 390 GRISWOLD ST NE WARREN Ohio 44483 4.657 11.265 15.922 0 0 0 15.922
METAL INDUSTRIES INC - BUSHNELL 400 W WALKER AVE BUSHNELL Florida 33513 0.0765 15.742 15.8185 0 0 0 15.8185
BOEING COMMERCIAL AIRPLANE GROUP - EVERETT 3003 W CASINO RD EVERETT Washington 98204 1.6 14 15.6 0 0.0075 0 15.6075
AIR SYSTEM COMPONENTS LP 3301 N MAIN ST TARBORO North Carolina 27886 0.155 14.7635 14.9185 0 0 0.2665 15.185
HAMMER PACKAGING CORP 200 LUCIUS GORDON DR WEST HENRIETTA New York 14586 0 15.118 15.118 0 0 0 15.118
S D WARREN CO 89 CUMBERLAND ST WESTBROOK Maine 04098 0.0015 15 15.0015 0.055 0 0 15.0565
SEIDEL TANNING CORP 1306 E MEINECKE AVE MILWAUKEE Wisconsin 53212 0 14.8525 14.8525 0 0 0 14.8525
HART & COOLEY INC 4910 MOORES MILL RD HUNTSVILLE Alabama 35811 0.852 13.4005 14.2525 0 0 0.598 14.8505
PELLA CORP 102 MAIN ST PELLA Iowa 50219 0.125 14.444 14.569 0 0 0 14.569
BALL CONTAINER LLC 105 E BLACKHAWK DR FORT ATKINSON Wisconsin 53538 3.55 11 14.55 0 0 0 14.55
ALCOA INC - WARRICK OPERATIONS HWYS 66 & 61 NEWBURGH Indiana 47629 0 14.5275 14.5275 0 0 0 14.5275
L A DARLING CO - PIGGOTT AR FACILITY HWY 49 S PIGGOTT Arkansas 72454 0.167 14.203 14.37 0 0 0 14.37
Page 4 of 40
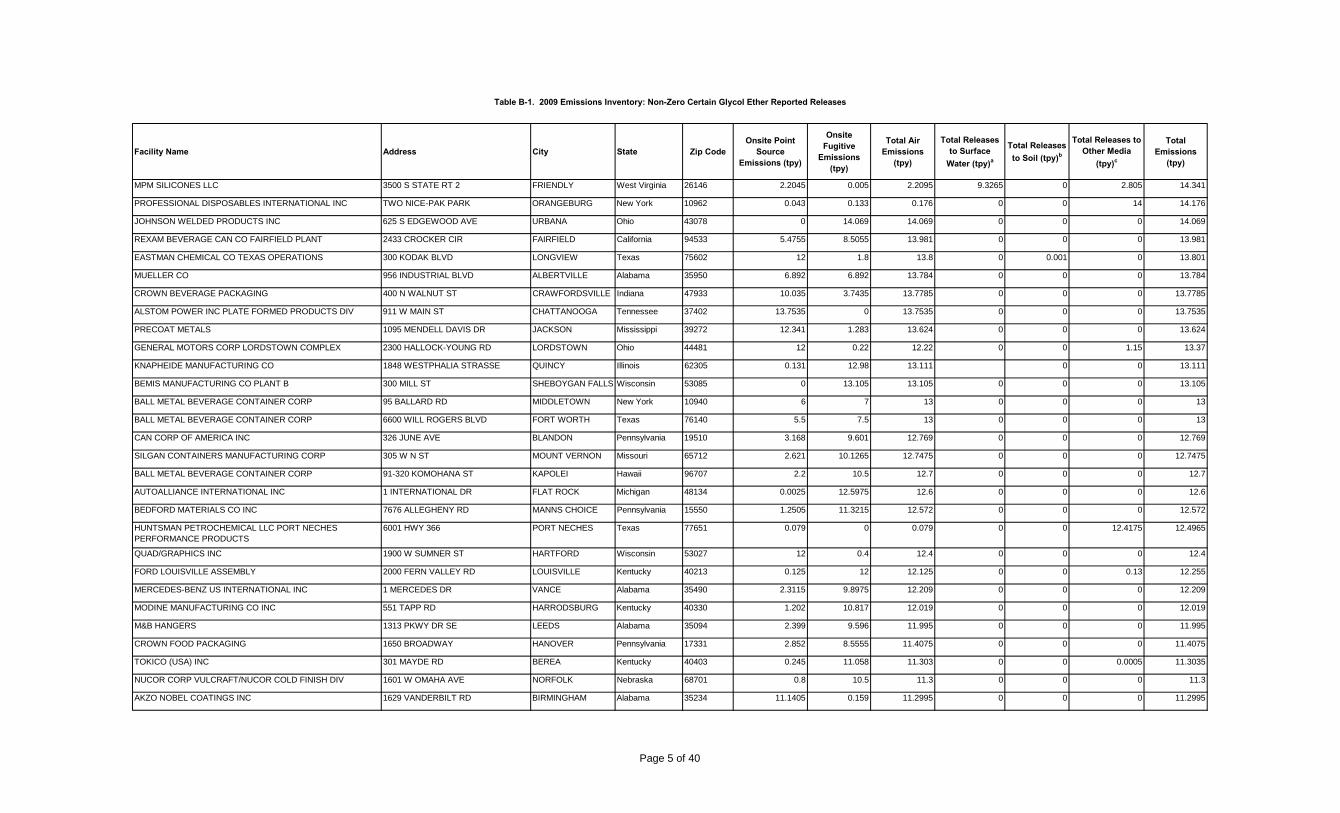
Table B-1. 2009 Emissions Inventory: Non-Zero Certain Glycol Ether Reported Releases
Facility Name Address City State Zip CodeOnsite Point
Source Emissions (tpy)
Onsite Fugitive
Emissions (tpy)
Total Air Emissions
(tpy)
Total Releases to Surface
Water (tpy)a
Total Releases to Soil (tpy)b
Total Releases to Other Media
(tpy)c
Total Emissions
(tpy)
MPM SILICONES LLC 3500 S STATE RT 2 FRIENDLY West Virginia 26146 2.2045 0.005 2.2095 9.3265 0 2.805 14.341
PROFESSIONAL DISPOSABLES INTERNATIONAL INC TWO NICE-PAK PARK ORANGEBURG New York 10962 0.043 0.133 0.176 0 0 14 14.176
JOHNSON WELDED PRODUCTS INC 625 S EDGEWOOD AVE URBANA Ohio 43078 0 14.069 14.069 0 0 0 14.069
REXAM BEVERAGE CAN CO FAIRFIELD PLANT 2433 CROCKER CIR FAIRFIELD California 94533 5.4755 8.5055 13.981 0 0 0 13.981
EASTMAN CHEMICAL CO TEXAS OPERATIONS 300 KODAK BLVD LONGVIEW Texas 75602 12 1.8 13.8 0 0.001 0 13.801
MUELLER CO 956 INDUSTRIAL BLVD ALBERTVILLE Alabama 35950 6.892 6.892 13.784 0 0 0 13.784
CROWN BEVERAGE PACKAGING 400 N WALNUT ST CRAWFORDSVILLE Indiana 47933 10.035 3.7435 13.7785 0 0 0 13.7785
ALSTOM POWER INC PLATE FORMED PRODUCTS DIV 911 W MAIN ST CHATTANOOGA Tennessee 37402 13.7535 0 13.7535 0 0 0 13.7535
PRECOAT METALS 1095 MENDELL DAVIS DR JACKSON Mississippi 39272 12.341 1.283 13.624 0 0 0 13.624
GENERAL MOTORS CORP LORDSTOWN COMPLEX 2300 HALLOCK-YOUNG RD LORDSTOWN Ohio 44481 12 0.22 12.22 0 0 1.15 13.37
KNAPHEIDE MANUFACTURING CO 1848 WESTPHALIA STRASSE QUINCY Illinois 62305 0.131 12.98 13.111 0 0 13.111
BEMIS MANUFACTURING CO PLANT B 300 MILL ST SHEBOYGAN FALLS Wisconsin 53085 0 13.105 13.105 0 0 0 13.105
BALL METAL BEVERAGE CONTAINER CORP 95 BALLARD RD MIDDLETOWN New York 10940 6 7 13 0 0 0 13
BALL METAL BEVERAGE CONTAINER CORP 6600 WILL ROGERS BLVD FORT WORTH Texas 76140 5.5 7.5 13 0 0 0 13
CAN CORP OF AMERICA INC 326 JUNE AVE BLANDON Pennsylvania 19510 3.168 9.601 12.769 0 0 0 12.769
SILGAN CONTAINERS MANUFACTURING CORP 305 W N ST MOUNT VERNON Missouri 65712 2.621 10.1265 12.7475 0 0 0 12.7475
BALL METAL BEVERAGE CONTAINER CORP 91-320 KOMOHANA ST KAPOLEI Hawaii 96707 2.2 10.5 12.7 0 0 0 12.7
AUTOALLIANCE INTERNATIONAL INC 1 INTERNATIONAL DR FLAT ROCK Michigan 48134 0.0025 12.5975 12.6 0 0 0 12.6
BEDFORD MATERIALS CO INC 7676 ALLEGHENY RD MANNS CHOICE Pennsylvania 15550 1.2505 11.3215 12.572 0 0 0 12.572
HUNTSMAN PETROCHEMICAL LLC PORT NECHES PERFORMANCE PRODUCTS
6001 HWY 366 PORT NECHES Texas 77651 0.079 0 0.079 0 0 12.4175 12.4965
QUAD/GRAPHICS INC 1900 W SUMNER ST HARTFORD Wisconsin 53027 12 0.4 12.4 0 0 0 12.4
FORD LOUISVILLE ASSEMBLY 2000 FERN VALLEY RD LOUISVILLE Kentucky 40213 0.125 12 12.125 0 0 0.13 12.255
MERCEDES-BENZ US INTERNATIONAL INC 1 MERCEDES DR VANCE Alabama 35490 2.3115 9.8975 12.209 0 0 0 12.209
MODINE MANUFACTURING CO INC 551 TAPP RD HARRODSBURG Kentucky 40330 1.202 10.817 12.019 0 0 0 12.019
M&B HANGERS 1313 PKWY DR SE LEEDS Alabama 35094 2.399 9.596 11.995 0 0 0 11.995
CROWN FOOD PACKAGING 1650 BROADWAY HANOVER Pennsylvania 17331 2.852 8.5555 11.4075 0 0 0 11.4075
TOKICO (USA) INC 301 MAYDE RD BEREA Kentucky 40403 0.245 11.058 11.303 0 0 0.0005 11.3035
NUCOR CORP VULCRAFT/NUCOR COLD FINISH DIV 1601 W OMAHA AVE NORFOLK Nebraska 68701 0.8 10.5 11.3 0 0 0 11.3
AKZO NOBEL COATINGS INC 1629 VANDERBILT RD BIRMINGHAM Alabama 35234 11.1405 0.159 11.2995 0 0 0 11.2995
Page 5 of 40

Table B-1. 2009 Emissions Inventory: Non-Zero Certain Glycol Ether Reported Releases
Facility Name Address City State Zip CodeOnsite Point
Source Emissions (tpy)
Onsite Fugitive
Emissions (tpy)
Total Air Emissions
(tpy)
Total Releases to Surface
Water (tpy)a
Total Releases to Soil (tpy)b
Total Releases to Other Media
(tpy)c
Total Emissions
(tpy)
MEADWESTVACO CONSUMER PACKAGING GROUP LLC 7411 OAKWOOD ST MEBANE North Carolina 27302 11.2585 0 11.2585 0 0 0 11.2585
CROWN FOOD PACKAGING 5201 ENTERPRISE BLVD TOLEDO Ohio 43612 2.806 8.409 11.215 0 0 0 11.215
AMERICAN TRIM LLC 1501 W MICHIGAN ST SIDNEY Ohio 45365 0 11.167 11.167 0 0 0 11.167
GEA BPO LLC 301 N CURRY PIKE BLOOMINGTON Indiana 47404 0 11.046 11.046 0 0 0 11.046
HEXION SPECIALTY CHEMICALS INC 2525 S COMBEE RD LAKELAND Florida 33801 9.3205 0.0195 9.34 0 0 1.686 11.026
GERSTENSLAGER CO 1425 E BOWMAN ST WOOSTER Ohio 44691 0.325 10.512 10.837 0 0 0.004 10.841
BROAN-NUTONE LLC 926 W STATE ST HARTFORD Wisconsin 53027 0.1135 10.6365 10.75 0 0 0 10.75
POWER PARTNERS INC 200 NEWTON BRIDGE RD ATHENS Georgia 30607 0 10.75 10.75 0 0 0 10.75
VESTAL MANUFACTURING ENTERPRISES INC 177 INDUSTRIAL PARK RD SWEETWATER Tennessee 37874 10.7105 0 10.7105 0 0 0 10.7105
FRANKLIN INVESTMENT CORP 600 ATLANTIC AVE FRANKLIN Pennsylvania 16323 10.7 0 10.7 0 0 0 10.7
TRI VULCRAFT OF NEW YORK INC 5362 RAILROAD ST CHEMUNG New York 14825 4.5235 5.7985 10.322 0 0 0.2615 10.5835
CECO DOOR PRODUCTS 9159 TELECOM DR MILAN Tennessee 38358 5.289 5.289 10.578 0 0 0 10.578
INGERSOLL-RAND CO STEELCRAFT DIV 9017 BLUE ASH RD CINCINNATI Ohio 45242 2.5475 7.9325 10.48 0 0 0 10.48
MEYER STEEL DRUM INC 2000 S KILBOURN AVE CHICAGO Illinois 60623 1.1265 9.112 10.2385 0 0 0 10.2385
BALL AEROSOL & SPECIALTY CONTAINER INC 1717 GIFFORD RD ELGIN Illinois 60120 1.65 8.5 10.15 0 0 0 10.15
CARDONE INDUSTRIES 5660 RISING SUN AVE PHILADELPHIA Pennsylvania 19120 1.987 8.1175 10.1045 0 0 0 10.1045
KAWNEER CO INC 600 KAWNEER DR SPRINGDALE Arkansas 72764 4.781 5.2985 10.0795 0 0 0 10.0795
MAYFLOWER VEHICLE SYSTEMS INC NORWALK FACILITY 55 N GARFIELD ST NORWALK Ohio 44857 0 10 10 0 0 0 10
YKK AP AMERICA INC 332 FIRETOWER RD DUBLIN Georgia 31021 9.541 0.351 9.892 0 0 0 9.892
RR DONNELLEY CRAWFORDSVILLE 1009 SLOAN ST CRAWFORDSVILLE Indiana 47933 5.107 4.785 9.892 0 0 0 9.892
BERENFIELD CONTAINERS SW LTD 3300 N HUTCHINSON ST WHITE HALL Arkansas 71602 0 9.8915 9.8915 0 0 0 9.8915
COOK COMPOSITES & POLYMERS CO 340 RAILROAD ST SAUKVILLE Wisconsin 53080 0.7885 0.0595 0.848 0 0 9.0035 9.8515
KEYMARK CORP OF FLORIDA 2540 KNIGHTS STATION RD LAKELAND Florida 33810 0.4925 9.355 9.8475 0 0 0 9.8475
LAKESIDE LITHOGRAPHY LLC 1600 S LAFLIN ST CHICAGO Illinois 60608 1 8.75 9.75 0 0 0 9.75
PENN COLOR INC 2755 BERGEY RD HATFIELD Pennsylvania 19440 0.2255 0.479 0.7045 0 0 9.0065 9.711
NUCOR VULCRAFT GROUP SAINT JOE DIV 6610 COUNTY RD 60 SAINT JOE Indiana 46785 4.2105 1.6955 5.906 0 0 3.7695 9.6755
RINECO 1007 VULCAN RD- HASKELL BENTON Arkansas 72015 0.0495 0 0.0495 0 0 9.6 9.6495
ROYAL MOULDINGS LTD; MARION VIRGINIA 135 BEAR CREEK RD MARION Virginia 24354 0.3835 9.1695 9.553 0 0 0 9.553
Page 6 of 40

Table B-1. 2009 Emissions Inventory: Non-Zero Certain Glycol Ether Reported Releases
Facility Name Address City State Zip CodeOnsite Point
Source Emissions (tpy)
Onsite Fugitive
Emissions (tpy)
Total Air Emissions
(tpy)
Total Releases to Surface
Water (tpy)a
Total Releases to Soil (tpy)b
Total Releases to Other Media
(tpy)c
Total Emissions
(tpy)
HEWLETT-PACKARD CARIBE BV SITE HWY 110 N KM 5.1 AGUADILLA Puerto Rico 00605 0.125 9.405 9.53 0 0 0 9.53
3M CO - GUIN 6675 US HWY 43 GUIN Alabama 35563 0.001 9.5 9.501 0 0 0 9.501
STANLEY WORKS HAND TOOLS DIV 600 MYRTLE ST NEW BRITAIN Connecticut 06052 0.946 8.514 9.46 0 0 0 9.46
CIRCLE GRAPHICS INC 120 9TH AVE LONGMONT Colorado 80501 3.05 1.9 4.95 0 0 4.5 9.45
NUCOR CORP VULCRAFT DIV 1501 W DARLINGTON ST FLORENCE South Carolina 29501 8.525 0.9115 9.4365 0 0 0 9.4365
EPCO EXTRUSION PAINTING CO 413 MCCLURG RD BOARDMAN Ohio 44512 0.8375 8.375 9.2125 0 0 0 9.2125
QUAD/GRAPHICS INC N63 W23075 STATE HWY 74 ATTN: E SUSSEX Wisconsin 53089 8.275 0.925 9.2 0 0 0 9.2
HALLSTAR CO ESTER SOLUTIONS FACILITY 5851 W 73RD ST BEDFORD PARK Illinois 60638 1.134 0.1295 1.2635 0 0 7.931 9.1945
SILGAN CONTAINERS MANUFACTURING CORP 2115 SW LOWER LAKE RD SAINT JOSEPH Missouri 64504 6.299 2.891 9.19 0 0 0 9.19
KUBIN-NICHOLSON CORP 8448 N 87TH ST MILWAUKEE Wisconsin 53224 9.148 0 9.148 0 0 0 9.148
SILGAN CAN CO 2120 NC HWY N UNIT A MAXTON North Carolina 28364 2.965 6.16 9.125 0 0 0 9.125
SILGAN CAN CO 12-773 ST RT 110 NAPOLEON Ohio 43545 2.438 6.571 9.009 0 0 0 9.009
SQUARE D CO 1601 MERCER RD LEXINGTON Kentucky 40511 0 9.0085 9.0085 0 0 0 9.0085
HESS PRINT SOLUTIONS 3765 SUNNYBROOK RD BRIMFIELD Ohio 44240 9 0 9 0 0 0 9
CROWN AEROSOL PACKAGING 3737 E EXCHANGE AVE AURORA Illinois 60504 7.8805 0.991 8.8715 0 0 0 8.8715
SILGAN CONTAINERS MANAUFACTURING CORP 520 W 2ND ST OCONOMOWOC Wisconsin 53066 1.75 7.05 8.8 0 0 0 8.8
GENERAL MOTORS LANSING DELTA TOWNSHIP 8175 MILLETT HWY LANSING Michigan 48917 0.23 8.5 8.73 0 0 0.0105 8.7405
TOPPAN INTERAMERICA INC 1131 HWY 155 S MC DONOUGH Georgia 30253 0 8.7 8.7 0 0 0 8.7
SILGAN WHITE CAP CORP 2201 W MARYLAND ST EVANSVILLE Indiana 47710 1.9 6.75 8.65 0 0 0 8.65
TOYOTA MOTOR MANUFACTURING TEX AS INC 1 LONE STAR PASS SAN ANTONIO Texas 78264 5.2135 3.4115 8.625 0 0 0 8.625
FORD MOTOR COMPANY-WAYNE ASSEMBLY 37625 MICHIGAN AVE WAYNE Michigan 48184 0.085 8.5 8.585 0 0 0 8.585
MAYTAG CORP CLEVELAND COOKING PRODUCTS PLANT 1 740 KING EDWARD AVE SE CLEVELAND Tennessee 37311 0 8.5585 8.5585 0 0 0 8.5585
RR DONNELLEY & SONS CO 1145 CONWELL AVE WILLARD Ohio 44890 6.0815 2.366 8.4475 0 0 0 8.4475
SIGNODE 7701 W 71ST ST BRIDGEVIEW Illinois 60455 0.85 7.55 8.4 0 0 0 8.4
BERENFIELD CONTAINERS INC 31 RAILROAD ST CLARENDON Pennsylvania 16313 0.0755 8.2925 8.368 0 0 8.368
GM ORION ASSEMBLY CENTER 4555 GIDDINGS RD ORION Michigan 48359 6.5 0.8 7.3 0 1.05 0 8.35
MASTERBRAND CABINETS INC 217 S OAK ST ARTHUR Illinois 61911 0 8.25 8.25 0 0 0 8.25
SILGAN CAN CO 500 NW LOOP 286 SUITE 101 PARIS Texas 75460 4.945 3.217 8.162 0 0 0 8.162
BERENFIELD CONTAINERS INC MASON 1229 CASTLE DR MASON Ohio 45040 0.375 7.508 7.883 0 0 7.883
Page 7 of 40

Table B-1. 2009 Emissions Inventory: Non-Zero Certain Glycol Ether Reported Releases
Facility Name Address City State Zip CodeOnsite Point
Source Emissions (tpy)
Onsite Fugitive
Emissions (tpy)
Total Air Emissions
(tpy)
Total Releases to Surface
Water (tpy)a
Total Releases to Soil (tpy)b
Total Releases to Other Media
(tpy)c
Total Emissions
(tpy)
NOV DOWNHOLE TOOLS CASPER 778 CIR DR CASPER Wyoming 82601 0 0 0 0 0 7.857 7.857
LA-Z-BOY TENNESSEE 500 WALNUT GROVE RD DAYTON Tennessee 37321 0 7.823 7.823 0 0 0 7.823
DECORATIVE PANELS INTERNATIONA L 2900 HILL AVE TOLEDO Ohio 43607 7.5945 0.0135 7.608 0 0 0 7.608
GREIF PACKAGING LLC 2400 COOPER AVE MERCED California 95348 6.4965 1.0605 7.557 0 0 0 7.557
GM TRUCK GROUP FORT WAYNE ASSEMBLY 12200 LAFAYETTE CENTER RD ROANOKE Indiana 46783 0.475 7 7.475 0 0 0 7.475
WHITING DOOR MANUFACTURING CORP 113 CEDAR ST AKRON New York 14001 0 7.4105 7.4105 0 0 0 7.4105
HOWARD FINISHING LLC 32565 DEQUINDRE MADISON HEIGHTS Michigan 48071 0.0025 7.3555 7.358 0 0 0 7.358
SILGAN CONTAINERS MANUFACTURING CORP 135 NATIONAL RD EDISON New Jersey 08817 6 1.35 7.35 0 0 0 7.35
BWAY CORP 3200 S KILBOURN AVE CHICAGO Illinois 60623 4.3655 2.886 7.2515 0 0 0 7.2515
SILGAN CONTAINERS MANUFACTURING CORP 1416 INDIANHEAD DR MENOMONIE Wisconsin 54751 1.45 5.8 7.25 0 0 0 7.25
NASHVILLE WIRE PRODUCTS 1604 COUNTY HOSPITAL RD NASHVILLE Tennessee 37218 0.7 6.5 7.2 0 0 0 7.2
CHICAGO STEEL CONTAINER CORP 1846 S KILBOURN AVE CHICAGO Illinois 60623 1.3 5.89 7.19 0 0 0 7.19
DOW CHEMICAL CO FREEPORT FACILITY 2301 N BRAZOSPORT BLVD BUILDIN FREEPORT Texas 77541 0.1645 0.0035 0.168 3.2305 0 3.7895 7.188
BENJAMIN MOORE & CO JOHNSTOWN UNION AVE EXTENSION JOHNSTOWN New York 12095 0.014 0 0.014 0 0 7.1215 7.1355
SHIELDCOAT TECHNOLOGIES INC (DBA CYBERSHIELD OF TEXAS)
2602 SPENCE ST LUFKIN Texas 75904 7.1205 0 7.1205 0 0 0 7.1205
WIX FILTRATION CORP - ALLEN PLANT 2900 NW BLVD GASTONIA North Carolina 28052 0.0025 7.1 7.1025 0 0 0 7.1025
RR DONNELLEY LANCASTER WEST 1375 HARRISBURG PIKE LANCASTER Pennsylvania 17601 6.6515 0.445 7.0965 0 0 0 7.0965
NUCOR CORP VULCRAFT DIV 7205 GAULT AVE N FORT PAYNE Alabama 35967 5.101 1.822 6.923 0 0 0 6.923
GREIF PACKAGING LLC 6000 JEFFERSON HWY NEW ORLEANS Louisiana 70123 2.673 4.1805 6.8535 0 0 0 6.8535
SONOCO PHOENIX - PRESIDENTS ISLAND 2755 HARBOR AVE MEMPHIS Tennessee 38113 0 6.841 6.841 0 0 0 6.841
AFTON CHEMICAL CORP 725 CANNON BRIDGE RD ORANGEBURG South Carolina 29115 3.179 0.526 3.705 0.247 0 2.8645 6.8165
ACME FINISHING CO INC 1595 E OAKTON ST ELK GROVE VILLAGEIllinois 60007 1.359 5.435 6.794 0 0 0 6.794
EQUISTAR CHEMICALS BAYPORT CHEMICALS PLANT 5761 UNDERWOOD RD PASADENA Texas 77507 6.753 0.0095 6.7625 0 0 0 6.7625
COLOR COMMUNICATIONS INC 4242 W FILLMORE CHICAGO Illinois 60624 1.419 5.3145 6.7335 0 0 0 6.7335
CHRYSLER WARREN TRUCK ASSEMBLY PLANT (PART) 21500 MOUND RD WARREN Michigan 48091 6 0.7 6.7 0 0 0.0055 6.7055
IMPRESS USA INC 936 BARRACUDA ST TERMINAL ISLAND California 90731 6.15 0.55 6.7 0 0 0 6.7
BERENFIELD CONTAINERS SE LTD 12180 UNIVERSITY CITY BLVD HARRISBURG North Carolina 28075 0 6.6745 6.6745 0 0 0 6.6745
GMVM-LANSING GRAND RIVER ASSEMBLY 920 TOWNSEND ST MAIL CODE: 489-LANSING Michigan 48921 3.55 3.1 6.65 0 0 0 6.65
Page 8 of 40
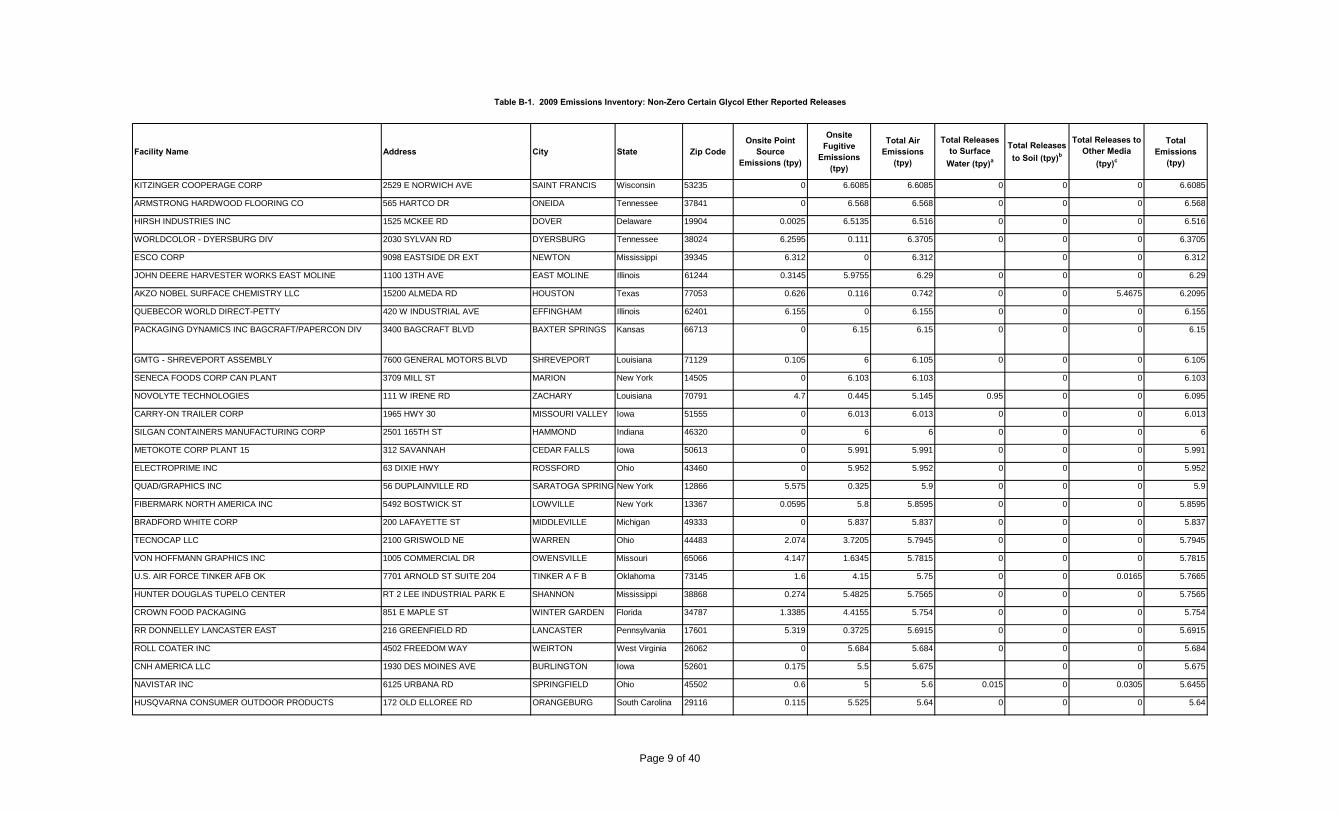
Table B-1. 2009 Emissions Inventory: Non-Zero Certain Glycol Ether Reported Releases
Facility Name Address City State Zip CodeOnsite Point
Source Emissions (tpy)
Onsite Fugitive
Emissions (tpy)
Total Air Emissions
(tpy)
Total Releases to Surface
Water (tpy)a
Total Releases to Soil (tpy)b
Total Releases to Other Media
(tpy)c
Total Emissions
(tpy)
KITZINGER COOPERAGE CORP 2529 E NORWICH AVE SAINT FRANCIS Wisconsin 53235 0 6.6085 6.6085 0 0 0 6.6085
ARMSTRONG HARDWOOD FLOORING CO 565 HARTCO DR ONEIDA Tennessee 37841 0 6.568 6.568 0 0 0 6.568
HIRSH INDUSTRIES INC 1525 MCKEE RD DOVER Delaware 19904 0.0025 6.5135 6.516 0 0 0 6.516
WORLDCOLOR - DYERSBURG DIV 2030 SYLVAN RD DYERSBURG Tennessee 38024 6.2595 0.111 6.3705 0 0 0 6.3705
ESCO CORP 9098 EASTSIDE DR EXT NEWTON Mississippi 39345 6.312 0 6.312 0 0 6.312
JOHN DEERE HARVESTER WORKS EAST MOLINE 1100 13TH AVE EAST MOLINE Illinois 61244 0.3145 5.9755 6.29 0 0 0 6.29
AKZO NOBEL SURFACE CHEMISTRY LLC 15200 ALMEDA RD HOUSTON Texas 77053 0.626 0.116 0.742 0 0 5.4675 6.2095
QUEBECOR WORLD DIRECT-PETTY 420 W INDUSTRIAL AVE EFFINGHAM Illinois 62401 6.155 0 6.155 0 0 0 6.155
PACKAGING DYNAMICS INC BAGCRAFT/PAPERCON DIV 3400 BAGCRAFT BLVD BAXTER SPRINGS Kansas 66713 0 6.15 6.15 0 0 0 6.15
GMTG - SHREVEPORT ASSEMBLY 7600 GENERAL MOTORS BLVD SHREVEPORT Louisiana 71129 0.105 6 6.105 0 0 0 6.105
SENECA FOODS CORP CAN PLANT 3709 MILL ST MARION New York 14505 0 6.103 6.103 0 0 6.103
NOVOLYTE TECHNOLOGIES 111 W IRENE RD ZACHARY Louisiana 70791 4.7 0.445 5.145 0.95 0 0 6.095
CARRY-ON TRAILER CORP 1965 HWY 30 MISSOURI VALLEY Iowa 51555 0 6.013 6.013 0 0 0 6.013
SILGAN CONTAINERS MANUFACTURING CORP 2501 165TH ST HAMMOND Indiana 46320 0 6 6 0 0 0 6
METOKOTE CORP PLANT 15 312 SAVANNAH CEDAR FALLS Iowa 50613 0 5.991 5.991 0 0 0 5.991
ELECTROPRIME INC 63 DIXIE HWY ROSSFORD Ohio 43460 0 5.952 5.952 0 0 0 5.952
QUAD/GRAPHICS INC 56 DUPLAINVILLE RD SARATOGA SPRINGSNew York 12866 5.575 0.325 5.9 0 0 0 5.9
FIBERMARK NORTH AMERICA INC 5492 BOSTWICK ST LOWVILLE New York 13367 0.0595 5.8 5.8595 0 0 0 5.8595
BRADFORD WHITE CORP 200 LAFAYETTE ST MIDDLEVILLE Michigan 49333 0 5.837 5.837 0 0 0 5.837
TECNOCAP LLC 2100 GRISWOLD NE WARREN Ohio 44483 2.074 3.7205 5.7945 0 0 0 5.7945
VON HOFFMANN GRAPHICS INC 1005 COMMERCIAL DR OWENSVILLE Missouri 65066 4.147 1.6345 5.7815 0 0 0 5.7815
U.S. AIR FORCE TINKER AFB OK 7701 ARNOLD ST SUITE 204 TINKER A F B Oklahoma 73145 1.6 4.15 5.75 0 0 0.0165 5.7665
HUNTER DOUGLAS TUPELO CENTER RT 2 LEE INDUSTRIAL PARK E SHANNON Mississippi 38868 0.274 5.4825 5.7565 0 0 0 5.7565
CROWN FOOD PACKAGING 851 E MAPLE ST WINTER GARDEN Florida 34787 1.3385 4.4155 5.754 0 0 0 5.754
RR DONNELLEY LANCASTER EAST 216 GREENFIELD RD LANCASTER Pennsylvania 17601 5.319 0.3725 5.6915 0 0 0 5.6915
ROLL COATER INC 4502 FREEDOM WAY WEIRTON West Virginia 26062 0 5.684 5.684 0 0 0 5.684
CNH AMERICA LLC 1930 DES MOINES AVE BURLINGTON Iowa 52601 0.175 5.5 5.675 0 0 5.675
NAVISTAR INC 6125 URBANA RD SPRINGFIELD Ohio 45502 0.6 5 5.6 0.015 0 0.0305 5.6455
HUSQVARNA CONSUMER OUTDOOR PRODUCTS 172 OLD ELLOREE RD ORANGEBURG South Carolina 29116 0.115 5.525 5.64 0 0 0 5.64
Page 9 of 40

Table B-1. 2009 Emissions Inventory: Non-Zero Certain Glycol Ether Reported Releases
Facility Name Address City State Zip CodeOnsite Point
Source Emissions (tpy)
Onsite Fugitive
Emissions (tpy)
Total Air Emissions
(tpy)
Total Releases to Surface
Water (tpy)a
Total Releases to Soil (tpy)b
Total Releases to Other Media
(tpy)c
Total Emissions
(tpy)
PRECOAT METALS 25 NORTHGATE INDUSTRIAL DR GRANITE CITY Illinois 62040 4.4645 1.0945 5.559 0 0 0 5.559
LOGAN ALUMINUM INC US HWY 431 N RUSSELLVILLE Kentucky 42276 0.0475 5.4965 5.544 0 0 0 5.544
PPG INDUSTRIES,INC-SPRINGDALE COMPLEX 125 COLFAX ST SPRINGDALE Pennsylvania 15144 5.4805 0.0435 5.524 0 0 0 5.524
GREIF PACKAGING LLC 4300 W 130TH ST ALSIP Illinois 60803 1.5795 3.93 5.5095 0 0 0 5.5095
USS - CLAIRTON WORKS 400 STATE ST CLAIRTON Pennsylvania 15025 5.5 0 5.5 0 0 0 5.5
CREE INC 4600 SILICON DR DURHAM North Carolina 27703 1.34 4.1565 5.4965 0 0 0 5.4965
TOYOTA MOTOR MANUFACTURING KENTUCKY INC 1001 CHERRY BLOSSOM WAY GEORGETOWN Kentucky 40324 0.125 5.35 5.475 0 0 0 5.475
PRIME TANNING CO - HARTLAND 9 MAIN ST HARTLAND Maine 04943 0.1085 5.3265 5.435 0 0 0 5.435
NAZDAR SHAWNEE 8501 HEDGE LN TERRACE SHAWNEE Kansas 66227 1.623 3.7875 5.4105 0 0 0 5.4105
BALL METAL FOOD CONTAINER CORP 300 W GREGER RD OAKDALE California 95361 0.75 4.65 5.4 0 0 0 5.4
3M CO - CORDOVA 22614 RT 84 N CORDOVA Illinois 61242 0.27 0.0385 0.3085 5.05 0 4.44089E-16 5.3585
OWENS CORNING VETROTEX LLC 4837 HWY 81 S STARR South Carolina 29684 0.5355 4.819 5.3545 0 0 0 5.3545
NEW MILLENNIUM BUILDING SYSTEMS 100 DIUGUIDS LN SALEM Virginia 24153 5.296 0 5.296 0 0 0 5.296
MID CONTINENT CABINETRY 67 E 2ND ST N COTTONWOOD Minnesota 56229 0.5285 4.758 5.2865 0 0 0 5.2865
AVERY DENNISON - IBMD LENOIR 950 GERMAN ST LENOIR North Carolina 28645 3.73 1.556 5.286 0 0 0 5.286
GREIF PACKAGING LLC 10850 STRANG RD LA PORTE Texas 77571 4.1335 0.085 4.2185 0 0 1.063 5.2815
SILGAN CAN CO 6200 FRANKLIN BLVD SUITE #100 SACRAMENTO California 95824 4.864 0.407 5.271 0 0 0 5.271
ENKEI AMERICA INC 2900 W INWOOD DR COLUMBUS Indiana 47201 0 5.25 5.25 0 0 0.012 5.262
WORTHINGTON CYLINDERS WISCONSI N LLC 300 E BREED ST CHILTON Wisconsin 53014 0.9375 4.3205 5.258 0 0 0 5.258
METAL COATERS MISSISSIPPI 951 PRISOCK RD JACKSON Mississippi 39272 0 5.1255 5.1255 0 0 0 5.1255
MEDALLION CABINETRY INC 180 INDUSTRIAL BLVD WACONIA Minnesota 55387 0 5.0815 5.0815 0 0 0 5.0815
PRECOAT METALS 16402 JACINTOPORT BLVD HOUSTON Texas 77015 4.8145 0.2605 5.075 0 0 0 5.075
TRAD NA INC 210 BILL BRYAN BLVD HOPKINSVILLE Kentucky 42240 0.004 5.066 5.07 0 0 0 5.07
AGY AIKEN LLC 2556 WAGENER RD AIKEN South Carolina 29801 2.9835 0.8965 3.88 0 1.183 0 5.063
GREENWICH INDUSTRIES LP CLARIN DIV 927 N SHORE DR LAKE BLUFF Illinois 60044 0.0505 5.0075 5.058 0 0 0 5.058
ROLL COATER 858 E HUPP RD LA PORTE Indiana 46350 0.0025 5.0255 5.028 0 0 0 5.028
ALCOA HOME EXTERIORS INC 2615 CAMPBELL RD SIDNEY Ohio 45365 0.6675 3.95 4.6175 0 0 0.3 4.9175
SCHAEFFER MANUFACTURING 102 BARTON ST SAINT LOUIS Missouri 63104 4.8465 0 4.8465 0 0 0 4.8465
ASHLEY INDUSTRIAL MOLDING INC 310 S WABASH ASHLEY Indiana 46705 0.475 4.35 4.825 0 0 0 4.825
Page 10 of 40

Table B-1. 2009 Emissions Inventory: Non-Zero Certain Glycol Ether Reported Releases
Facility Name Address City State Zip CodeOnsite Point
Source Emissions (tpy)
Onsite Fugitive
Emissions (tpy)
Total Air Emissions
(tpy)
Total Releases to Surface
Water (tpy)a
Total Releases to Soil (tpy)b
Total Releases to Other Media
(tpy)c
Total Emissions
(tpy)
US ARMY LAKE CITY ARMY AMMUNITION PLANT INTERSECTION OF MO HWYS 7 & 78 INDEPENDENCE Missouri 64051 1.3775 3.349 4.7265 0 0 0 4.7265
INX DIGITAL INK CO 405 INDUSTRIAL WAY DIXON California 95620 4.7155 0 4.7155 0 0 0 4.7155
NAHAN PRINTING INC 7000 SAUKVIEW DR SAINT CLOUD Minnesota 56303 4.577 0.132 4.709 0 0 0 4.709
AAP ST MARYS CORP 1100 MCKINLEY RD SAINT MARYS Ohio 45885 0.031 4.6575 4.6885 0 0 0 4.6885
ZURN INDUSTRIES LLC 1301 RASPBERRY ST ERIE Pennsylvania 16502 4.674 0 4.674 0 0 0 4.674
DUPONT PONTCHARTRAIN WORKS 586 HWY 44 LA PLACE Louisiana 70068 0.005 0 0.005 0 0 4.596 4.601
ARVINMERITOR HEAVY VEHICLE SYSTEMS LLC 801 RAILROAD AVE YORK South Carolina 29745 0.001 4.5785 4.5795 0 0 0 4.5795
OMG AMERICAS TWO MILE RUN RD FRANKLIN Pennsylvania 16323 0.025 0.634 0.659 0 0 3.8855 4.5445
SABIC INNOVATIVE PLASTICS MT VERNON LLC 1 LEXAN LN MOUNT VERNON Indiana 47620 2.7 1.7 4.4 0.125 0 0 4.525
GENERAL MOTORS WENTZVILLE ASSEMBLY 1500 E RT A WENTZVILLE Missouri 63385 0.85 3.65 4.5 0 0 0 4.5
RUSKIN CO HWY 27 N GENEVA Alabama 36340 0.027 4.4635 4.4905 0 0 0 4.4905
ALLIANCE INDUSTRIES WAUPACA N 2467 VAUGHAN RD WAUPACA Wisconsin 54981 0.447 4.0215 4.4685 0 0 0 4.4685
GENIE INDUSTRIES SOUTH CAMPUS 18700 NE 65TH ST REDMOND Washington 98052 0.125 4.29 4.415 0 0 0 4.415
ENDICOTT INTERCONNECT TECHNOLOGIES INC 1093 CLARK ST ENDICOTT New York 13760 0.25 4.1155 4.3655 0.031 0 0 4.3965
BROWN PRINTING CO 2300 BROWN AVE WASECA Minnesota 56093 4.2665 0.057 4.3235 0 0 0 4.3235
BALL METAL BEVERAGE CONTAINER CORP 1800 REYNOLDS AVE KANSAS CITY Missouri 64120 4.15 0.09 4.24 0 0 0 4.24
BATESVILLE MANUFACTURING INC 310 CROWN RD BATESVILLE Mississippi 38606 0.6345 3.5955 4.23 0 0 0 4.23
SILGAN CONTAINERS MANUFACTURING CORP N90 W14600 COMMERCE DR MENOMONEE FALLSWisconsin 53051 0 4.2 4.2 0 0 0 4.2
GREIF PACKAGING LLC 695 LOUIS DR WARMINSTER Pennsylvania 18974 0.4005 0.65 1.0505 0 0 3.144 4.1945
SEQUA COATINGS CORP-PRECOAT M ETALS DIV US HWY 12 AT RT 249 PORTAGE Indiana 46368 0.2925 3.8895 4.182 0 0 0 4.182
R R DONNELLEY & SONS CO DANVILLE DIV JOHN HILL BAILEY INDL PARK HWY 3DANVILLE Kentucky 40422 3.8845 0.272 4.1565 0 0 0 4.1565
BROWN PRINTING CO 11595 MCCONNELL RD WOODSTOCK Illinois 60098 4.035 0.09 4.125 0 0 0 4.125
SILGAN CONTAINER MANUFACTURING CORP 3250 PATTERSON RD RIVERBANK California 95367 0.218 3.8875 4.1055 0 0 0 4.1055
QUEBECOR WORLD 8649 HACKS CROSS RD OLIVE BRANCH Mississippi 38654 0.375 3.722 4.097 0 0 4.097
CLARIANT CORP - MOUNT HOLLY WEST PLANT 625 E CATAWBA AVE MOUNT HOLLY North Carolina 28120 0 0.0545 0.0545 0 3.48 0.534 4.0685
VAN CAN CO 10837 ETIWANDA AVE FONTANA California 92337 3.5 0.55 4.05 0 0 0 4.05
WORLDCOLOR STILLWATER (WAS QUEBECOR WORLD - STILLWATER DIV)
100 W AIRPORT RD STILLWATER Oklahoma 74075 3.517 0.4105 3.9275 0 0 0 3.9275
PRO LINE PRINTING ARLINGTON 401 N GREAT SW PKWY ARLINGTON Texas 76011 3.8005 0.125 3.9255 0 0 0 3.9255
ALERIS ROLLED PRODUCTS INC 1372 KY HWY 1957 LEWISPORT Kentucky 42351 0.125 3.6985 3.8235 0 0 0 3.8235
Page 11 of 40

Table B-1. 2009 Emissions Inventory: Non-Zero Certain Glycol Ether Reported Releases
Facility Name Address City State Zip CodeOnsite Point
Source Emissions (tpy)
Onsite Fugitive
Emissions (tpy)
Total Air Emissions
(tpy)
Total Releases to Surface
Water (tpy)a
Total Releases to Soil (tpy)b
Total Releases to Other Media
(tpy)c
Total Emissions
(tpy)
NESTLE PURINA PETCARE 1000 HAMILTON RD WEIRTON West Virginia 26062 0.993 2.809 3.802 0 0 0 3.802
RR DONNELLEY LOS ANGELES MANUFACTURING 19681 PACIFIC GATEWAY DR TORRANCE California 90502 3.706 0.0865 3.7925 0 0 0 3.7925
BROWN PRINTING CO 668 GRAVEL PIKE EAST GREENVILLE Pennsylvania 18041 3.6115 0.125 3.7365 0 0 0.006 3.7425
INLAND LABEL & MARKETING 2009 W AVE S LA CROSSE Wisconsin 54601 3.7245 0 3.7245 0 0 0 3.7245
PHOENIX CONTAINER INC 1202 AIRPORT RD NORTH BRUNSWICKNew Jersey 08902 1.4665 2.21 3.6765 0 0 0 3.6765
BETCO CORP 1001 BROWN AVE TOLEDO Ohio 43607 3.674 0 3.674 0 0 0 3.674
FUJIFILM NORTH AMERICA CORP 20 W 14TH AVE NORTH KANSAS CIT Missouri 64116 0 3.547 3.547 0 0 0 3.547
FORD MOTOR CO TWIN CITIES ASSEMBLY PLANT 966 S MISSISSIPPI RIVER BLVD SAINT PAUL Minnesota 55116 0.41 3 3.41 0 0 0.13 3.54
AVERY DENNISON INDUSTRIAL PRODUCTS DIV 17700 FOLTZ PKWY STRONGSVILLE Ohio 44149 0.4595 3.0755 3.535 0 0 0 3.535
BATESVILLE MANUFACTURING INC -DOLL PLANT 1000 E PEARL ST BATESVILLE Indiana 47006 0.175 3.329 3.504 0 0 0 3.504
KODAK COLORADO DIV 9952 EASTMAN PARK DR WINDSOR Colorado 80551 0 0 0 3.486 0 0 3.486
MERIX CORP 1521 POPLAR LN FOREST GROVE Oregon 97116 0.0895 3.3955 3.485 0 0 0 3.485
SCHWAN'S GLOBAL SUPPLY CHAIN - SALINA KS 3019 SCANLAN SALINA Kansas 67401 0 3.4845 3.4845 0 0 0 3.4845
BWAY CORP BWAY PACKAGING DIV 8200 BROADWELL RD CINCINNATI Ohio 45244 3.1135 0.3665 3.48 0 0 0 3.48
APOLLO COLORS INC 1550 MOUND RD ROCKDALE Illinois 60436 0 0 0 0 0 3.469 3.469
TTM PRINTED CIRCUIT GROUP - S TAFFORD DIV 4 OLD MONSON RD STAFFORD Connecticut 06075 0 3.403 3.403 0 0 0 3.403
BON L MANUFACTURING CO 508 W WILSON ST KENTLAND Indiana 47951 0.33 3.05 3.38 0 0 0.005 3.385
PONTIAC ASSEMBLY CENTER 2100 S OPDYKE RD PONTIAC Michigan 48341 0.335 3.05 3.385 0 0 0 3.385
WORLDCOLOR LEBANON DIV 760 FUJITEC DR LEBANON Ohio 45036 2.938 0.438 3.376 0 0 0 3.376
QUEBECOR WORLD INC WINCHESTER VIRGINIA 160 CENTURY LN STONEWALL INDU WINCHESTER Virginia 22603 3.202 0.1495 3.3515 0 0 0 3.3515
AK STEEL CORP - ZANESVI LLE WORKS 1724 LINDEN AVE ZANESVILLE Ohio 43701 0 2.45 2.45 0 0 0.9 3.35
SHERWIN-WILLIAMS CO 2150 W SAND LAKE RD ORLANDO Florida 32809 0 0.0015 0.0015 0 0 3.3465 3.348
KAWASAKI MOTORS MANUFACTURING CORP USA 6600 NW 27TH ST LINCOLN Nebraska 68524 0.3235 2.8725 3.196 0 0 0.125 3.321
SILGAN CONTAINERS MANUFACTURING CORP 8673 LYONS-MARENGO RD LYONS New York 14489 0.6 2.7 3.3 0 0 0 3.3
TYCO FIRE SUPPRESSION & BUILDING PRODUCTS 1 STANTON ST MARINETTE Wisconsin 54143 0.0065 3.189 3.1955 0 0 0 3.1955
CROWN FOOD PACKAGING 10200 N LOMBARD ST PORTLAND Oregon 97203 1.191 1.9725 3.1635 0 0 0 3.1635
ST CHARLES OPERATIONS (TAFT/STAR) UNION CARBIDE CORP
355 LA HWY 3142 (GATE 1) TAFT Louisiana 70057 0.62 0.925 1.545 1.565 0 0.0005 3.1105
CROWN EQUIPMENT CORP 2600 E STATE RD 240 GREENCASTLE Indiana 46135 0 3.104 3.104 0 0 0 3.104
SILGAN CONTAINERS MANUFACTURING CORP 400 N 15TH ST ROCHELLE Illinois 61068 1.8115 1.26 3.0715 0 0 0 3.0715
Page 12 of 40

Table B-1. 2009 Emissions Inventory: Non-Zero Certain Glycol Ether Reported Releases
Facility Name Address City State Zip CodeOnsite Point
Source Emissions (tpy)
Onsite Fugitive
Emissions (tpy)
Total Air Emissions
(tpy)
Total Releases to Surface
Water (tpy)a
Total Releases to Soil (tpy)b
Total Releases to Other Media
(tpy)c
Total Emissions
(tpy)
3M CO - MENOMONIE 1425 STOKKE PKWY MENOMONIE Wisconsin 54751 0 0 0 0 0 3.05 3.05
MERCK SHARP & DOHME CORP 2778 SE SIDE HWY ELKTON Virginia 22827 0.705 0.805 1.51 1.465 0 0 2.975
DISC GRAPHICS 10 GILPIN AVE HAUPPAUGE New York 11788 0.7425 2.2275 2.97 0 0 0 2.97
DOW CHEMICAL CO 1790 BUILDING MIDLAND Michigan 48667 2.65 0.045 2.695 0.0035 0 0.256 2.9545
PPG INDUSTRIES ARCHITECTURAL FINISHES 1020 OLYMPIC DR BATAVIA Illinois 60510 0 0.52 0.52 0 0 2.431 2.951
ACCESS BUSINESS GROUP LLC 7575 FULTON ST E ADA Michigan 49355 2.815 0.132 2.947 0 0 0 2.947
ITW DYMON 805 E OLD 56 HWY OLATHE Kansas 66061 0.8825 2.059 2.9415 0 0 0 2.9415
MAXIM INTEGRATED PRODUCTS INC 9651 WESTOVER HILLS BLVD SAN ANTONIO Texas 78251 0 2.9395 2.9395 0 0 0 2.9395
SAPA EXTRUDER INC 2905 OLD OAKWOOD RD GAINESVILLE Georgia 30504 0 2.926 2.926 0 0 0 2.926
U.S. AIR FORCE ROBINS AFB GA 775 MACON ST BUILDING 1555 ROBINS AFB Georgia 31098 1.597 0.93 2.527 0 0 0.382 2.909
PRECOAT METALS 3399 DAVEY ALLISON BLVD HUEYTOWN Alabama 35023 2.209 0.6895 2.8985 0 0 0 2.8985
VERTIS COMMUNICATIONS 4051 FONDORF DR COLUMBUS Ohio 43228 2.579 0.301 2.88 0 0 0 2.88
MAUSER CORP 14 CONVERY BLVD WOODBRIDGE New Jersey 07095 0.023 2.854 2.877 0 0 0 2.877
MOTOR CASTINGS CO 1323 S 65TH MILWAUKEE Wisconsin 53214 0 1.466 1.466 0 0 1.3885 2.8545
CURTIS METAL FINISHING CO 6645 SIMS DR STERLING HEIGHTS Michigan 48313 2.039 0.813 2.852 0 0 0 2.852
TITAN COATINGS INC 2025 EXCHANGE PL BESSEMER Alabama 35023 2.85 0 2.85 0 0 0 2.85
BALL METAL FOOD CONTAINER CORP 1200 S CRUTCHER ST SPRINGDALE Arkansas 72764 0.015 2.8 2.815 0 0 0 2.815
MAXIM INTEGRATED PRODUCTS INC 3725 N FIRST ST SAN JOSE California 95134 2.785 0 2.785 0 0 0 2.785
3M CO - HUTCHINSON 905/915 ADAMS ST SE HUTCHINSON Minnesota 55350 0 2.767 2.767 0 0 0 2.767
MICHELIN NORTH AMERICA INC 5101 21ST ST TUSCALOOSA Alabama 35401 0.004 0.006 0.01 0 0 2.737 2.747
GOODYEAR TIRE & RUBBER CO. AKRON TECHNICAL CENTER
200 S. MARTHA AVE AKRON Ohio 44309 0 0 0 0 0 2.7435 2.7435
WORLDCOLOR ATGLEN 4581 LOWER VALLEY RD ATGLEN Pennsylvania 19310 2.5835 0.1205 2.704 0 0 0 2.704
RR DONNELLEY STRASBURG DIV ONE SHENANDOAH VALLEY DR STRASBURG Virginia 22657 2.6 0.1 2.7 0 0 0.0025 2.7025
RHODIA INC 2ND ST & BLUEBALL AVE MARCUS HOOK Pennsylvania 19061 0.161 0.0005 0.1615 0 0 2.492 2.6535
CENTRIA 530 N SECOND ST CAMBRIDGE Ohio 43725 1.3625 1.289 2.6515 0 0 0 2.6515
BON L MANUFACTURING CO HWY 53 BONNELL RD CARTHAGE Tennessee 37030 0.9755 1.2295 2.205 0 0.36 0.037 2.602
MISSION KLEENSWEEP PRODUCTS INC 2434 BIRKDALE ST LOS ANGELES California 90031 2.6 0 2.6 0 0 2.6
SOLIANT LLC 1872 HWY 9 BYPASS W LANCASTER South Carolina 29721 0.566 1.995 2.561 0 0 0 2.561
GREIF INDUSTRIAL PACKAGING & SERVICES 7604 RAILROAD AVE WINFIELD Kansas 67156 0.255 2.2955 2.5505 0 0 0 2.5505
Page 13 of 40

Table B-1. 2009 Emissions Inventory: Non-Zero Certain Glycol Ether Reported Releases
Facility Name Address City State Zip CodeOnsite Point
Source Emissions (tpy)
Onsite Fugitive
Emissions (tpy)
Total Air Emissions
(tpy)
Total Releases to Surface
Water (tpy)a
Total Releases to Soil (tpy)b
Total Releases to Other Media
(tpy)c
Total Emissions
(tpy)
KNS COMPANYS INC 475 RANDY RD CAROL STREAM Illinois 60188 0.5035 2.015 2.5185 0 0 0 2.5185
BRILLION IRON WORKS INC 200 PARK AVE BRILLION Wisconsin 54110 2.0315 0.3605 2.392 0 0 0.125 2.517
TEXAS FINISHING CO 1801 SURVEYOR BLVD CARROLLTON Texas 75006 0 2.4885 2.4885 0 0 0 2.4885
WORLDCOLOR 451 INTERNATIONAL BLVD CLARKSVILLE Tennessee 37040 2.35 0.12 2.47 0 0 0 2.47
BRUNSWICK CORP MERCURY MARINE DIV W6250 PIONEER RD FOND DU LAC Wisconsin 54935 0.2425 2.1815 2.424 0 0 0 2.424
DENSO MANUFACTURING TENNESSEE INC 1720, 1725, 1755 ROBERT C JACKSO MARYVILLE Tennesee 37801 0 2.3935 2.3935 0 0 2.3935
MASTER GUARD CORP 1200 E 8TH ST VEEDERSBURG Indiana 47987 0.024 2.349 2.373 0.0025 0.0025 0 2.3775
SANFORD LP 1 PENCIL ST SHELBYVILLE Tennessee 37160 0.125 2.226 2.351 0.0025 0 0 2.3535
ABC COMPOUNDING CO INC 6970 JONESBORO RD MORROW Georgia 30260 0.0025 0.375 0.3775 0.0025 0 1.964 2.344
ROPPE CORP 1602 N UNION ST FOSTORIA Ohio 44830 0.125 2.2045 2.3295 0 0 0 2.3295
AMERICAN COLOR GRAPHICS INC 215 N ZARFOSS DR YORK Pennsylvania 17404 2.073 0.2395 2.3125 0 0 0 2.3125
SUN CHEMICAL CORP 2445 PRODUCTION DR SAINT CHARLES Illinois 60174 0.299 1.9925 2.2915 0 0 0 2.2915
3M CO - BROWNWOOD 4501 HWY 377 S BROWNWOOD Texas 76801 0.065 2.2 2.265 0 0 0.007 2.272
KIK (HOUSTON) INC 2921 CORDER ST HOUSTON Texas 77054 2.265 0 2.265 0 0 2.265
SAFETY-KLEEN SYSTEMS INC 130 A FRONTAGE RD LEXINGTON South Carolina 29073 0 2.216 2.216 0 0 0 2.216
KAWNEER CO INC 2785 MCCRACKEN RD HERNANDO Mississippi 38632 0.2475 1.9595 2.207 0 0 0 2.207
AMERICAN COLOR GRAPHICS - LUFKIN 3001 ATKINSON DR LUFKIN Texas 75901 2.009 0.172 2.181 0 0 0 2.181
CENTURY INDUSTRIAL COATINGS I NC HWY 69 S JACKSONVILLE Texas 75766 0.089 1.69 1.779 0 0 0.357 2.136
LEHIGH PRESS CADILLAC (DBA LEHIGH DIRECT DIVISION) 1900 S 25TH AVE BROADVIEW Illinois 60153 1.9755 0.1495 2.125 0 0 0 2.125
MACDERMID PRINTING SOLUTIONS 260 S PACIFIC ST SAN MARCOS California 92078 0 2.122 2.122 0 0.0005 2.1225
UNION CARBIDE CORP SOUTH CHARLESTON FACILITY 437 MACCORKLE AVE SW SOUTH CHARLESTOWest Virginia 25303 2.058 0.0595 2.1175 0 0 0 2.1175
THREE RIVERS ALUMINUM CO 71 PROGRESS AVE CRANBERRY TOWNSPennsylvania 16066 0.2195 1.8905 2.11 0 0 0 2.11
NCP COATINGS INC 225 FORT ST NILES Michigan 49120 2.1075 0 2.1075 0 0 0 2.1075
PRECOAT METALS 4301 S SPRING AVE SAINT LOUIS Missouri 63116 0.57 1.523 2.093 0 0 0 2.093
VERTIS COMMUNICATIONS 10911 GRANITE ST CHARLOTTE North Carolina 28273 1.841 0.215 2.056 0 0 0 2.056
DUPONT YERKES PLANT 3115 RIVER RD BUFFALO New York 14207 0.039 2.014 2.053 0 0 0 2.053
TORO CO 200 SIME AVE TOMAH Wisconsin 54660 0 2.0475 2.0475 0 0 0 2.0475
CADON PLATING CO 3715 11TH ST WYANDOTTE Michigan 48192 1.121 0.915 2.036 0 0 0 2.036
WORLD COLOR PRESS 50 JOHN HANCOCK RD TAUNTON Massachusetts 02780 1.605 0.032 1.637 0 0 0.3745 2.0115
Page 14 of 40

Table B-1. 2009 Emissions Inventory: Non-Zero Certain Glycol Ether Reported Releases
Facility Name Address City State Zip CodeOnsite Point
Source Emissions (tpy)
Onsite Fugitive
Emissions (tpy)
Total Air Emissions
(tpy)
Total Releases to Surface
Water (tpy)a
Total Releases to Soil (tpy)b
Total Releases to Other Media
(tpy)c
Total Emissions
(tpy)
AVX CORP CONWAY 2875 HWY 501 E CONWAY South Carolina 29526 0.888 1.085 1.973 0 0 0 1.973
SILGAN CONTAINERS MANUFACTURING CORP 2200 WILBUR AVE ANTIOCH California 94509 0 1.9645 1.9645 0 0 0 1.9645
STEELSCAPE INC 7001 ALLISON-BONNET MEMORIAL DFAIRFIELD Alabama 35064 0.0045 1.9495 1.954 0 0 0 1.954
BASF CORP - CLEAR LAKE PLANT 11200 BAY AREA BLVD PASADENA Texas 77507 1.95 0.0005 1.9505 0 0 0 1.9505
BOEING COMMERCIAL AIRPLANE GROUP NORTH BOEING FIELD (PART)
7500 E MARGINAL WAY S SEATTLE Washington 98108 0.1155 1.8345 1.95 0 0 0 1.95
RR DONNELLEY PINEVILLE 10519 INDUSTRIAL DR PINEVILLE North Carolina 28134 1.85 0.098 1.948 0 0 0 1.948
THIRD COAST PACKAGING INC PEARLAND 1871 MYKAWA PEARLAND Texas 77581 0 0 0 0 0 1.942 1.942
NOV TUBOSCOPE NAVASOTA 9574 FM 1227 NAVASOTA Texas 77868 0.8325 0.31 1.1425 0 0 0.7975 1.94
TYSON FRESH MEATS INC HWY 66 E & FARM RD 1912 AMARILLO Texas 79187 0.07 0 0.07 0 1.86 0.0025 1.9325
TREND OFFSET PRINTING SERVICES INC 3791 CATALINA ST LOS ALAMITOS California 90720 1.8 0.125 1.925 0 0 0 1.925
WARREN UNILUBE INC 1200 S 8TH ST WEST MEMPHIS Arkansas 72301 1.9085 0.007 1.9155 0 0 0 1.9155
HYUNDAI MOTOR MANUFACTURING ALABAMA LLC 700 HYUNDAI BLVD MONTGOMERY Alabama 36105 1.2395 0.66 1.8995 0 0 0 1.8995
PRIOR COATED METALS 2233 26TH ST SW ALLENTOWN Pennsylvania 18103 1.305 0.581 1.886 0 0 0 1.886
KEYMARK CORP 1188 CAYADUTTA ST RT 334 FONDA New York 12068 0.007 1.8765 1.8835 0 0 0 1.8835
BUCKEYE INTERNATIONAL INC 2700 WAGNER PL MARYLAND HEIGHTSMissouri 63043 0.125 1.7515 1.8765 0 0 0 1.8765
AMERICAN COLOR GRAPHICS 810 E S ST MARENGO Iowa 52301 1.669 0.1985 1.8675 0 0 0 1.8675
HANNA STEEL CORP 3812 COMMERCE AVE FAIRFIELD Alabama 35064 0.6905 1.027 1.7175 0 0 0.1435 1.861
DUPONT CHAMBERS WORKS RT 130 DEEPWATER New Jersey 08023 0.139 0.001 0.14 1.628 0 0.09 1.858
ASTRO COATINGS INC 27 MAIN ST STRUTHERS Ohio 44471 0.65 1.15 1.8 0 0 0.0195 1.8195
IMPRESS USA INC 3030 BIRCH DR HALF MOON INDUST WEIRTON West Virginia 26062 0.006 1.8125 1.8185 0 0 0 1.8185
EASTMAN KODAK CO EASTMAN BUSINESS PARK 1669 LAKE AVE ROCHESTER New York 14652 0.001 0.0165 0.0175 1.2285 0 0.5685 1.8145
CUMMINS POWER GENERATION 1400 73RD AVE NE FRIDLEY Minnesota 55432 0.09 1.7 1.79 0 0 0 1.79
NOV TUBOSCOPE WEST LITTLE YORK COATING 12100 W LITTLE YORK RD HOUSTON Texas 77041 0.0535 1.41 1.4635 0 0 0.323 1.7865
TTM TECHNOLOGIES INC 710 N 600 W LOGAN Utah 84321 0.12 1.079 1.199 0 0 0.5835 1.7825
FORD MOTOR CO - OHIO ASSEMBLY PLANT 650 MILLER RD AVON LAKE Ohio 44012 1.65 0.12 1.77 0 0 0 1.77
LION COPOLYMER LLC 5955 SCENIC HWY BATON ROUGE Louisiana 70805 0 0 0 0.0015 0 1.75 1.7515
REICHHOLD INC 425 S PACE BLVD PENSACOLA Florida 32502 0.1065 1.628 1.7345 0 0 0 1.7345
J&M MANUFACTURING CO INC 284 RAILROAD ST FORT RECOVERY Ohio 45846 0 1.7285 1.7285 0 0 0 1.7285
RR DONNELLEY 100 QUALITY CT CHARLESTOWN Indiana 47111 1.6325 0.076 1.7085 0 0 0 1.7085
Page 15 of 40

Table B-1. 2009 Emissions Inventory: Non-Zero Certain Glycol Ether Reported Releases
Facility Name Address City State Zip CodeOnsite Point
Source Emissions (tpy)
Onsite Fugitive
Emissions (tpy)
Total Air Emissions
(tpy)
Total Releases to Surface
Water (tpy)a
Total Releases to Soil (tpy)b
Total Releases to Other Media
(tpy)c
Total Emissions
(tpy)
BOEING COMMERCIAL AIRPLANE GROUP - RENTON 8TH & LOGAN AVE N RENTON Washington 98055 0.697 1.0065 1.7035 0 0 0 1.7035
GMC TRUCK GROUP ARLINGTON ASSEMBLY PLANT 2525 E ABRAMS ST ARLINGTON Texas 76010 0.5 1.2 1.7 0 0 0 1.7
PRO LINE PRINTING / RR DONNELLEY 365 PARR CIR RENO Nevada 89512 1.5035 0.1755 1.679 0 0 0 1.679
TRELLEBORG COATED SYSTEMS US INC / GRACE ADVANCED MATERIALS
715 RAILROAD AVE & HWY 74 RUTHERFORDTON North Carolina 28139 0 0.125 0.125 0 0 1.5385 1.6635
EASTMAN CHEMICAL CO TENNESSEE OPERATIONS 100 EASTMAN RD KINGSPORT Tennessee 37662 0.5725 0.825 1.3975 0.262 0 0 1.6595
RR DONNELLEY VON HOFFMANN CORP 321 WILSON DR JEFFERSON CITY Missouri 65109 1.6195 0.038 1.6575 0 0 0 1.6575
COMPLEMENTARY COATINGS CORP 308 OLD COUNTY RD EDGEWATER Florida 32132 1.639 0 1.639 0 0 0 1.639
CHRYSLER STERLING HEIGHTS ASSEMBLY PLANT 38111 VAN DYKE STERLING HEIGHTS Michigan 48312 0.9 0.7 1.6 0 0 0 1.6
COLOR CORP OF AMERICA 1630 W HILL ST LOUISVILLE Kentucky 40210 0 1.59 1.59 0 0 0 1.59
U S CHEMICAL 316 HART ST WATERTOWN Wisconsin 53094 0 0 0 0 0 1.5605 1.5605
U.S. AIR FORCE OGDEN AIR LOGISTICS CENTER 7274 WARDLEIGH DR HILL AFB Utah 84056 0.8625 0.69 1.5525 0 0 0 1.5525
AKZONOBEL AEROSPACE COATINGS 1 E WATER ST WAUKEGAN Illinois 60085 0.775 0.7765 1.5515 0 0 0 1.5515
ENGINEERED POLYMER SOLUTIONS INC D/B/A VALSPAR COATINGS
901 N GREENWOOD AVE KANKAKEE Illinois 60901 0.9585 0.545 1.5035 0 0 0 1.5035
BENCHMARK ENERGY PRODUCTS LLC 4113 W INDUSTRIAL AVE MIDLAND Texas 79703 0.125 1.3725 1.4975 0 0 0 1.4975
IVC INDUSTRIAL COATINGS INC 2245-50 VALLEY AVE INDIANAPOLIS Indiana 46218 0.2955 1.183 1.4785 0 0 0 1.4785
VANEX INC 1700 S SHAWNEE ST MOUNT VERNON Illinois 62864 0 1.467 1.467 0 0 0 1.467
SAPA INC COATINGS DIVSION 5325 NE SKYPORT WAY PORTLAND Oregon 97218 1.0905 0.376 1.4665 0 0 0 1.4665
VEYANCE TECHNOLOGIES INC 2701 W OMAHA AVE NORFOLK Nebraska 68701 0.0615 0.183 0.2445 0 0 1.208 1.4525
ARANDELL CORP N82 W13118 LEON RD MENOMONEE FALLSWisconsin 53051 1.418 0.033 1.451 0 0 0 1.451
WHEELING CORRUGATING CO - BEECH BOTTOM PLANT 2481 RIVER RD WELLSBURG West Virginia 26070 0 1.45 1.45 0 0 0 1.45
ZEP INC 1310 SEABOARD INDUSTRIAL BLVD ATLANTA Georgia 30318 0.1435 0.287 0.4305 0.1235 0.8565 0.027 1.4375
CARDINAL ALUMINUM CO PLAN T 3 4005 OAKLAWN DR LOUISVILLE Kentucky 40219 0.05 1.3855 1.4355 0 0 0 1.4355
GREIF INDUSTRIAL PACKAGING & SERVICES LLC 8250 ALMERIA AVE FONTANA California 92335 0.1915 1.2415 1.433 0 0 0 1.433
DECOSTAR INDUSTRIES INC 1 DECOMA DR CARROLLTON Georgia 30117 0.125 1.307 1.432 0 0 0 1.432
ALERIS ROLLED PRODUCTS INC 1 REYNOLDS RD ASHVILLE Ohio 43103 0.668 0.748 1.416 0 0 0 1.416
MITSUBISHI MOTORS NORTH AMERICA INC 100 N MITSUBISHI MOTORWAY NORMAL Illinois 61761 1.41 0.0035 1.4135 0 0 0 1.4135
GATES CORP - CHARLESTON 1300 S PLANT RD CHARLESTON Missouri 63834 0.0795 0.119 0.1985 0 0 1.2095 1.408
BRENNTAG SOUTHWEST INC HOUS TON 14826 HOOPER RD HOUSTON Texas 77047 0.02 0.0175 0.0375 0 0 1.3675 1.405
Page 16 of 40
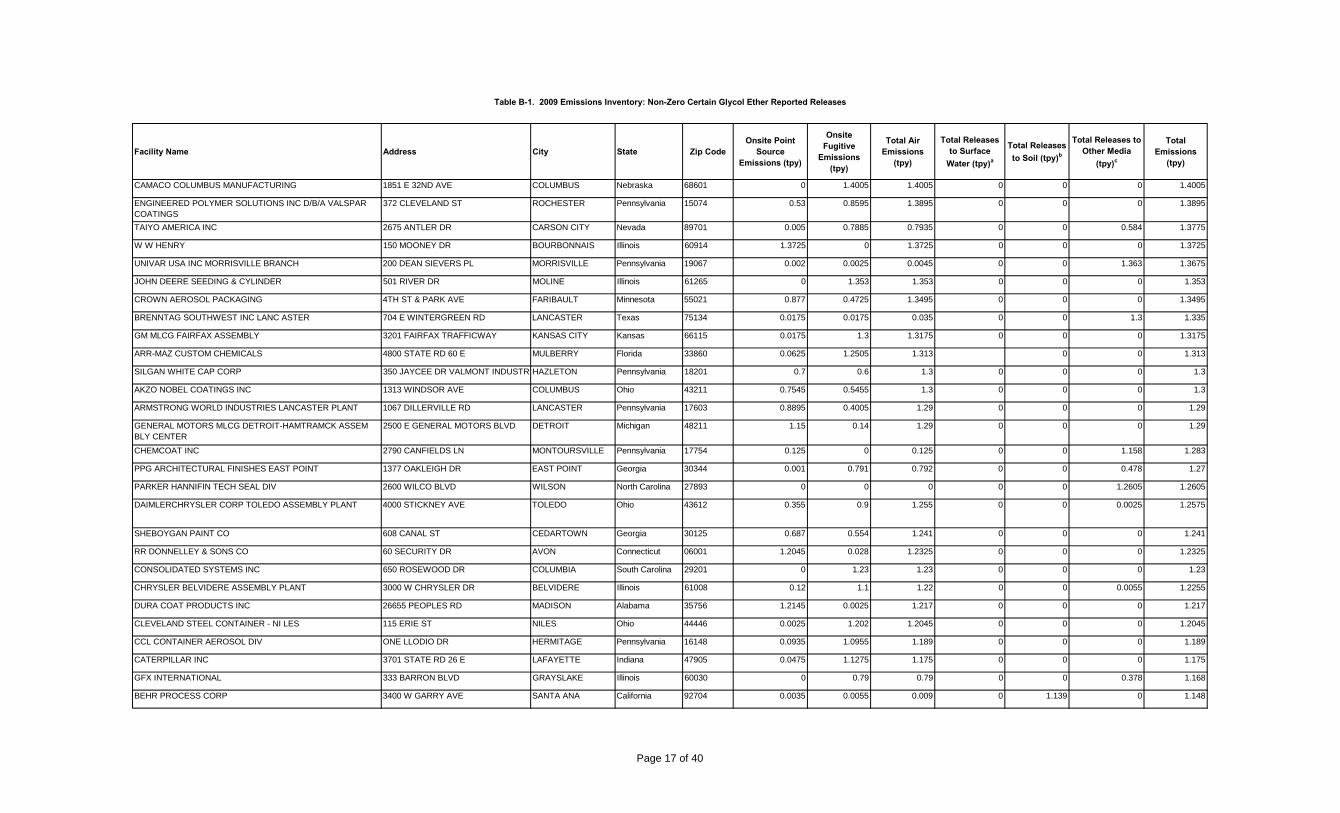
Table B-1. 2009 Emissions Inventory: Non-Zero Certain Glycol Ether Reported Releases
Facility Name Address City State Zip CodeOnsite Point
Source Emissions (tpy)
Onsite Fugitive
Emissions (tpy)
Total Air Emissions
(tpy)
Total Releases to Surface
Water (tpy)a
Total Releases to Soil (tpy)b
Total Releases to Other Media
(tpy)c
Total Emissions
(tpy)
CAMACO COLUMBUS MANUFACTURING 1851 E 32ND AVE COLUMBUS Nebraska 68601 0 1.4005 1.4005 0 0 0 1.4005
ENGINEERED POLYMER SOLUTIONS INC D/B/A VALSPAR COATINGS
372 CLEVELAND ST ROCHESTER Pennsylvania 15074 0.53 0.8595 1.3895 0 0 0 1.3895
TAIYO AMERICA INC 2675 ANTLER DR CARSON CITY Nevada 89701 0.005 0.7885 0.7935 0 0 0.584 1.3775
W W HENRY 150 MOONEY DR BOURBONNAIS Illinois 60914 1.3725 0 1.3725 0 0 0 1.3725
UNIVAR USA INC MORRISVILLE BRANCH 200 DEAN SIEVERS PL MORRISVILLE Pennsylvania 19067 0.002 0.0025 0.0045 0 0 1.363 1.3675
JOHN DEERE SEEDING & CYLINDER 501 RIVER DR MOLINE Illinois 61265 0 1.353 1.353 0 0 0 1.353
CROWN AEROSOL PACKAGING 4TH ST & PARK AVE FARIBAULT Minnesota 55021 0.877 0.4725 1.3495 0 0 0 1.3495
BRENNTAG SOUTHWEST INC LANC ASTER 704 E WINTERGREEN RD LANCASTER Texas 75134 0.0175 0.0175 0.035 0 0 1.3 1.335
GM MLCG FAIRFAX ASSEMBLY 3201 FAIRFAX TRAFFICWAY KANSAS CITY Kansas 66115 0.0175 1.3 1.3175 0 0 0 1.3175
ARR-MAZ CUSTOM CHEMICALS 4800 STATE RD 60 E MULBERRY Florida 33860 0.0625 1.2505 1.313 0 0 1.313
SILGAN WHITE CAP CORP 350 JAYCEE DR VALMONT INDUSTRIHAZLETON Pennsylvania 18201 0.7 0.6 1.3 0 0 0 1.3
AKZO NOBEL COATINGS INC 1313 WINDSOR AVE COLUMBUS Ohio 43211 0.7545 0.5455 1.3 0 0 0 1.3
ARMSTRONG WORLD INDUSTRIES LANCASTER PLANT 1067 DILLERVILLE RD LANCASTER Pennsylvania 17603 0.8895 0.4005 1.29 0 0 0 1.29
GENERAL MOTORS MLCG DETROIT-HAMTRAMCK ASSEM BLY CENTER
2500 E GENERAL MOTORS BLVD DETROIT Michigan 48211 1.15 0.14 1.29 0 0 0 1.29
CHEMCOAT INC 2790 CANFIELDS LN MONTOURSVILLE Pennsylvania 17754 0.125 0 0.125 0 0 1.158 1.283
PPG ARCHITECTURAL FINISHES EAST POINT 1377 OAKLEIGH DR EAST POINT Georgia 30344 0.001 0.791 0.792 0 0 0.478 1.27
PARKER HANNIFIN TECH SEAL DIV 2600 WILCO BLVD WILSON North Carolina 27893 0 0 0 0 0 1.2605 1.2605
DAIMLERCHRYSLER CORP TOLEDO ASSEMBLY PLANT 4000 STICKNEY AVE TOLEDO Ohio 43612 0.355 0.9 1.255 0 0 0.0025 1.2575
SHEBOYGAN PAINT CO 608 CANAL ST CEDARTOWN Georgia 30125 0.687 0.554 1.241 0 0 0 1.241
RR DONNELLEY & SONS CO 60 SECURITY DR AVON Connecticut 06001 1.2045 0.028 1.2325 0 0 0 1.2325
CONSOLIDATED SYSTEMS INC 650 ROSEWOOD DR COLUMBIA South Carolina 29201 0 1.23 1.23 0 0 0 1.23
CHRYSLER BELVIDERE ASSEMBLY PLANT 3000 W CHRYSLER DR BELVIDERE Illinois 61008 0.12 1.1 1.22 0 0 0.0055 1.2255
DURA COAT PRODUCTS INC 26655 PEOPLES RD MADISON Alabama 35756 1.2145 0.0025 1.217 0 0 0 1.217
CLEVELAND STEEL CONTAINER - NI LES 115 ERIE ST NILES Ohio 44446 0.0025 1.202 1.2045 0 0 0 1.2045
CCL CONTAINER AEROSOL DIV ONE LLODIO DR HERMITAGE Pennsylvania 16148 0.0935 1.0955 1.189 0 0 0 1.189
CATERPILLAR INC 3701 STATE RD 26 E LAFAYETTE Indiana 47905 0.0475 1.1275 1.175 0 0 0 1.175
GFX INTERNATIONAL 333 BARRON BLVD GRAYSLAKE Illinois 60030 0 0.79 0.79 0 0 0.378 1.168
BEHR PROCESS CORP 3400 W GARRY AVE SANTA ANA California 92704 0.0035 0.0055 0.009 0 1.139 0 1.148
Page 17 of 40

Table B-1. 2009 Emissions Inventory: Non-Zero Certain Glycol Ether Reported Releases
Facility Name Address City State Zip CodeOnsite Point
Source Emissions (tpy)
Onsite Fugitive
Emissions (tpy)
Total Air Emissions
(tpy)
Total Releases to Surface
Water (tpy)a
Total Releases to Soil (tpy)b
Total Releases to Other Media
(tpy)c
Total Emissions
(tpy)
WINSLOW-BROWNING INC 215 BROWNSVILLE AVE LIBERTY Indiana 47353 1.148 0 1.148 0 0 0 1.148
CHEMTURA CORP - TAFT PLANT 471 HWY 3142 KILLONA Louisiana 70066 0.105 1.0405 1.1455 0 0 0 1.1455
J L CLARK INC 923 23RD AVE ROCKFORD Illinois 61104 0.304 0.8415 1.1455 0 0 0 1.1455
PRECOAT METALS 6754 SANTA BARBARA CT ELKRIDGE Maryland 21075 0 1.1415 1.1415 0 0 0 1.1415
HARCROS CHEMICALS INC 5200 SPEAKER RD KANSAS CITY Kansas 66106 0.0175 0.07 0.0875 0.0005 0.002 1.05 1.14
NICHOLS ALUMINUM ALABAMA INC 2001 HWY 20 W DECATUR Alabama 35601 0.913 0.2245 1.1375 0 0 0 1.1375
SONY ELECTRONICS INC 4275 W MAIN ST DOTHAN Alabama 36305 0 0 0 0 0 1.137 1.137
GENTEK BUILDING PRODUCTS 11 CRAGWOOD RD AVENEL New Jersey 07001 0.2 0.9335 1.1335 0 0 0 1.1335
OHIO ART CO ONE TOY ST BRYAN Ohio 43506 0.8965 0.2295 1.126 0 0 0 1.126
RED SPOT WESTLAND INC 550 S EDWIN ST WESTLAND Michigan 48186 0.628 0.483 1.111 0 0 0 1.111
TRELLEBORG OFFSHORE US RANKIN ROAD FACILITY 1902 RANKIN RD HOUSTON Texas 77073 1.1105 0 1.1105 0 0 0 1.1105
INCHEM CORP 800 CEL-RIVER RD ROCK HILL South Carolina 29730 0.125 0.125 0.25 0 0 0.8545 1.1045
HUNTSMAN PETROCHEMICAL LLC 3892 US HWY 90 DAYTON Texas 77535 0.001 0 0.001 0 0 1.1025 1.1035
TEXAS INSTRUMENTS INC 12201 SW FWY MS600 STAFFORD Texas 77477 0.0025 0.125 0.1275 0 0 0.975 1.1025
TESORO REFINING & MARKETING CO - MANDAN REFINERY 900 OLD RED TRAIL NE MANDAN North Dakota 58554 1.1 0.0005 1.1005 0 0 0 1.1005
CANFIELD METAL COATING CORP 460 W MAIN ST CANFIELD Ohio 44406 0 1.1 1.1 0 0 0 1.1
BEAULIEU OF AMERICA PLANT 560-MODEL 950 RIVERBEND RD DALTON Georgia 30721 0 1.0865 1.0865 0 0 0 1.0865
COOK COMPOSITES & POLYMERS CO 1415 STEELE AVE SW GRAND RAPIDS Michigan 49507 0.7325 0.3525 1.085 0 0 0 1.085
ENGINEERED POLYMER SOLUTIONS INC D/B/A VALSPAR COATINGS
701 SHILOH RD GARLAND Texas 75042 0.644 0.4405 1.0845 0 0 0 1.0845
POLYMERIC IMAGING INC 117 E 14TH AVE NORTH KANSAS CIT Missouri 64116 0 1.0705 1.0705 0 0 0 1.0705
CELLU TISSUE/CITYFOREST LLC 1215 WORDEN AVE E LADYSMITH Wisconsin 54848 0 0 0 1.07 0 0 1.07
COMBE PRODUCTS INC EL DUQUE INDUSTRIAL PARK RD 97 NAGUABO Puerto Rico 00718 0 0 0 0 0 1.053 1.053
CANBERRA CORP 3610 HOLLAND-SYLVANIA RD TOLEDO Ohio 43615 0.675 0.375 1.05 0 0 0 1.05
NEXTEER AUTOMOTIVE CORP 3900 HOLLAND RD SAGINAW Michigan 48601 0.1045 0.9385 1.043 0 0 0 1.043
SPRAYLAT CORP CA 3465 S LA CIENAGA BLVD LOS ANGELES California 90016 0.52 0.52 1.04 0 0 0 1.04
AKZONOBEL COATINGS INC 120 FRANKLIN RD PONTIAC Michigan 48341 0.105 0.026 0.131 0 0 0.901 1.032
ROLL COATER INC 2604 RIVER RD HAWESVILLE Kentucky 42348 0 1.032 1.032 0 0 0 1.032
RED SPOT PAINT & VARNISH CO INC 1016 E COLUMBIA ST EVANSVILLE Indiana 47711 0.6065 0.416 1.0225 0 0 0 1.0225
Page 18 of 40
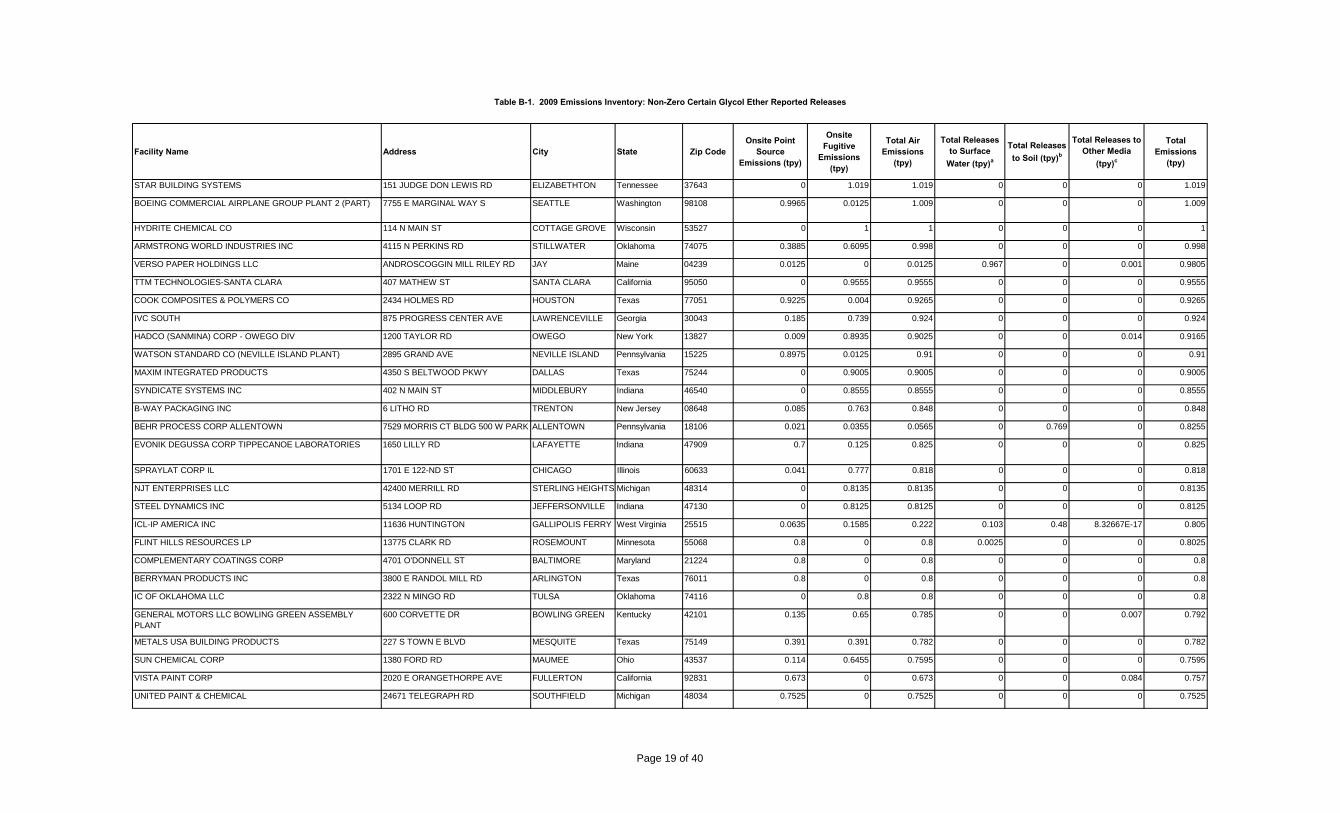
Table B-1. 2009 Emissions Inventory: Non-Zero Certain Glycol Ether Reported Releases
Facility Name Address City State Zip CodeOnsite Point
Source Emissions (tpy)
Onsite Fugitive
Emissions (tpy)
Total Air Emissions
(tpy)
Total Releases to Surface
Water (tpy)a
Total Releases to Soil (tpy)b
Total Releases to Other Media
(tpy)c
Total Emissions
(tpy)
STAR BUILDING SYSTEMS 151 JUDGE DON LEWIS RD ELIZABETHTON Tennessee 37643 0 1.019 1.019 0 0 0 1.019
BOEING COMMERCIAL AIRPLANE GROUP PLANT 2 (PART) 7755 E MARGINAL WAY S SEATTLE Washington 98108 0.9965 0.0125 1.009 0 0 0 1.009
HYDRITE CHEMICAL CO 114 N MAIN ST COTTAGE GROVE Wisconsin 53527 0 1 1 0 0 0 1
ARMSTRONG WORLD INDUSTRIES INC 4115 N PERKINS RD STILLWATER Oklahoma 74075 0.3885 0.6095 0.998 0 0 0 0.998
VERSO PAPER HOLDINGS LLC ANDROSCOGGIN MILL RILEY RD JAY Maine 04239 0.0125 0 0.0125 0.967 0 0.001 0.9805
TTM TECHNOLOGIES-SANTA CLARA 407 MATHEW ST SANTA CLARA California 95050 0 0.9555 0.9555 0 0 0 0.9555
COOK COMPOSITES & POLYMERS CO 2434 HOLMES RD HOUSTON Texas 77051 0.9225 0.004 0.9265 0 0 0 0.9265
IVC SOUTH 875 PROGRESS CENTER AVE LAWRENCEVILLE Georgia 30043 0.185 0.739 0.924 0 0 0 0.924
HADCO (SANMINA) CORP - OWEGO DIV 1200 TAYLOR RD OWEGO New York 13827 0.009 0.8935 0.9025 0 0 0.014 0.9165
WATSON STANDARD CO (NEVILLE ISLAND PLANT) 2895 GRAND AVE NEVILLE ISLAND Pennsylvania 15225 0.8975 0.0125 0.91 0 0 0 0.91
MAXIM INTEGRATED PRODUCTS 4350 S BELTWOOD PKWY DALLAS Texas 75244 0 0.9005 0.9005 0 0 0 0.9005
SYNDICATE SYSTEMS INC 402 N MAIN ST MIDDLEBURY Indiana 46540 0 0.8555 0.8555 0 0 0 0.8555
B-WAY PACKAGING INC 6 LITHO RD TRENTON New Jersey 08648 0.085 0.763 0.848 0 0 0 0.848
BEHR PROCESS CORP ALLENTOWN 7529 MORRIS CT BLDG 500 W PARK ALLENTOWN Pennsylvania 18106 0.021 0.0355 0.0565 0 0.769 0 0.8255
EVONIK DEGUSSA CORP TIPPECANOE LABORATORIES 1650 LILLY RD LAFAYETTE Indiana 47909 0.7 0.125 0.825 0 0 0 0.825
SPRAYLAT CORP IL 1701 E 122-ND ST CHICAGO Illinois 60633 0.041 0.777 0.818 0 0 0 0.818
NJT ENTERPRISES LLC 42400 MERRILL RD STERLING HEIGHTS Michigan 48314 0 0.8135 0.8135 0 0 0 0.8135
STEEL DYNAMICS INC 5134 LOOP RD JEFFERSONVILLE Indiana 47130 0 0.8125 0.8125 0 0 0 0.8125
ICL-IP AMERICA INC 11636 HUNTINGTON GALLIPOLIS FERRY West Virginia 25515 0.0635 0.1585 0.222 0.103 0.48 8.32667E-17 0.805
FLINT HILLS RESOURCES LP 13775 CLARK RD ROSEMOUNT Minnesota 55068 0.8 0 0.8 0.0025 0 0 0.8025
COMPLEMENTARY COATINGS CORP 4701 O'DONNELL ST BALTIMORE Maryland 21224 0.8 0 0.8 0 0 0 0.8
BERRYMAN PRODUCTS INC 3800 E RANDOL MILL RD ARLINGTON Texas 76011 0.8 0 0.8 0 0 0 0.8
IC OF OKLAHOMA LLC 2322 N MINGO RD TULSA Oklahoma 74116 0 0.8 0.8 0 0 0 0.8
GENERAL MOTORS LLC BOWLING GREEN ASSEMBLY PLANT
600 CORVETTE DR BOWLING GREEN Kentucky 42101 0.135 0.65 0.785 0 0 0.007 0.792
METALS USA BUILDING PRODUCTS 227 S TOWN E BLVD MESQUITE Texas 75149 0.391 0.391 0.782 0 0 0 0.782
SUN CHEMICAL CORP 1380 FORD RD MAUMEE Ohio 43537 0.114 0.6455 0.7595 0 0 0 0.7595
VISTA PAINT CORP 2020 E ORANGETHORPE AVE FULLERTON California 92831 0.673 0 0.673 0 0 0.084 0.757
UNITED PAINT & CHEMICAL 24671 TELEGRAPH RD SOUTHFIELD Michigan 48034 0.7525 0 0.7525 0 0 0 0.7525
Page 19 of 40

Table B-1. 2009 Emissions Inventory: Non-Zero Certain Glycol Ether Reported Releases
Facility Name Address City State Zip CodeOnsite Point
Source Emissions (tpy)
Onsite Fugitive
Emissions (tpy)
Total Air Emissions
(tpy)
Total Releases to Surface
Water (tpy)a
Total Releases to Soil (tpy)b
Total Releases to Other Media
(tpy)c
Total Emissions
(tpy)
DELEET MERCHANDISING 26 BLANCHARD ST NEWARK New Jersey 07105 0.375 0.375 0.75 0 0 0 0.75
TEXAS TILE MANUFACTURING LLC 1705 N OLIVER HOUSTON Texas 77007 0.001 0.748 0.749 0 0 0 0.749
HB FULLER 12110 HARLAND DR NE COVINGTON Georgia 30014 0.386 0.275 0.661 0 0.0765 0 0.7375
LONGABERGER CO 5565 RAIDERS RD FRAZEYSBURG Ohio 43822 0.2325 0.214 0.4465 0 0 0.288 0.7345
KAWNEER CO INC 7200 DOE AVE VISALIA California 93291 0.5005 0.225 0.7255 0 0 0 0.7255
HUNT REFINING CO A CORP 1855 FAIRLAWN RD TUSCALOOSA Alabama 35401 0.7205 0 0.7205 0 0 0 0.7205
RYCOLINE PRODUCTS LLC 5540 NW HWY CHICAGO Illinois 60630 0.108 0.6115 0.7195 0 0 0 0.7195
VEYANCE TECHNOLOGIES INC 400 N GOODYEAR RD MOUNT PLEASANT Iowa 52641 0.0005 0 0.0005 0 0 0.7075 0.708
MARCUS PAINT CO 235 E MARKET ST LOUISVILLE Kentucky 40202 0.7 0.0025 0.7025 0 0 0 0.7025
WESTERN EXTRUSIONS CORP 1735 SANDY LAKE RD CARROLLTON Texas 75006 0.125 0.5735 0.6985 0.0025 0 0 0.701
ELEMENTIS SPECIALTIES 400 CLAREMONT AVE JERSEY CITY New Jersey 07304 0.2 0.5 0.7 0 0 0 0.7
SPARTAN CHEMICAL CO INC 1110 SPARTAN DR MAUMEE Ohio 43537 0.0675 0 0.0675 0 0 0.6325 0.7
KAWNEER CO INC 500 E 12TH ST BLOOMSBURG Pennsylvania 17815 0.117 0.579 0.696 0 0 0 0.696
CLEVELAND STEEL CONTAINER - PE OTONE FACILITY 117 E LINCOLN ST PEOTONE Illinois 60468 0.008 0.6865 0.6945 0 0 0 0.6945
WEST PENN OIL CO, INC130130 2305 MARKET ST EXT WARREN Pennsylvania 16365 0.6945 0 0.6945 0 0 0 0.6945
TERNIUM USA INC 2500 RON BEAN BLVD SHREVEPORT Louisiana 71115 0.0165 0.674 0.6905 0 0 0 0.6905
SONOCO PRODUCTS CO 1854 CENTRAL FLORIDA PKWY ORLANDO Florida 32837 0.385 0.292 0.677 0 0 0 0.677
FERRO GLASS & COLOR CORP W WYLIE AVE WASHINGTON Pennsylvania 15301 0.1255 0.548 0.6735 0 0 0 0.6735
BJ CHEMICAL SERVICES 707 N LEECH HOBBS New Mexico 88240 0.0065 0.0015 0.008 0 0 0.663 0.671
FINISHES UNLIMITED INC 482 WHEELER RD SUGAR GROVE Illinois 60554 0.3325 0.3325 0.665 0 0 0 0.665
VANGUARD PAINTS & FINISHES INC 1409 GREENE ST MARIETTA Ohio 45750 0.648 0 0.648 0 0 0.648
SYNGENTA CROP PROTECTION INC SAINT GABRIEL FACILITY
3905 HWY 75 SAINT GABRIEL Louisiana 70776 0.249 0.201 0.45 0.0005 0 0.1965 0.647
SILGAN CONTAINERS MANUFACTURING CORP 12130 LYNN AVE S SAVAGE Minnesota 55378 0 0.642 0.642 0 0 0 0.642
CRYSTAL FINISHING SYSTEMS INC 2608 ROSS AVE SCHOFIELD Wisconsin 54476 0 0.6405 0.6405 0 0 0 0.6405
HERCULES INC KENEDY TEXAS ONE MILL ST KENEDY Texas 78119 0.602 0.033 0.635 0 0 0 0.635
BASF CORP 1175 MARTIN ST GREENVILLE Ohio 45331 0.12 0.13 0.25 0 0 0.385 0.635
CENTRIA 500 PERTH DR NEW ECONOMY BUS AMBRIDGE Pennsylvania 15003 0 0.635 0.635 0 0 0 0.635
TRINKOTE INDUSTRIAL FINISHES INC 1800 PARK PL AVE FORT WORTH Texas 76110 0 0.628 0.628 0 0 0 0.628
ALERIS ROLLED PRODUCTS INC 3321 DURHAM RD ROXBORO North Carolina 27573 0.0025 0.624 0.6265 0 0 0 0.6265
Page 20 of 40

Table B-1. 2009 Emissions Inventory: Non-Zero Certain Glycol Ether Reported Releases
Facility Name Address City State Zip CodeOnsite Point
Source Emissions (tpy)
Onsite Fugitive
Emissions (tpy)
Total Air Emissions
(tpy)
Total Releases to Surface
Water (tpy)a
Total Releases to Soil (tpy)b
Total Releases to Other Media
(tpy)c
Total Emissions
(tpy)
CHROMASOURCE INC 2433 S CR 600 E COLUMBIA CITY Indiana 46725 0 0.621 0.621 0 0 0 0.621
MULTICIRCUITS 2301 UNIVERSAL ST OSHKOSH Wisconsin 54903 0.619 0 0.619 0 0 0 0.619
TCI COATINGS INC 4501 BRADLEY ST LUBBOCK Texas 79415 0.616 0 0.616 0 0 0 0.616
BRENNTAG SOUTHWEST INC ST GABRIEL 7200 HWY 74 SAINT GABRIEL Louisiana 70776 0.0075 0.008 0.0155 0 0 0.6 0.6155
GREIF INDUSTRIAL PACKAGING & SERVICES LLC 10700 STRANG RD LA PORTE Texas 77571 0.595 0.0025 0.5975 0 0 0 0.5975
ROCK TENN CO 2301 S 21ST ST CLINTON Iowa 52732 0 0.585 0.585 0 0 0.0025 0.5875
ASHLAND DISTRIBUTION 8500 S WILLOW SPRINGS RD WILLOW SPRINGS Illinois 60480 0.538 0.048 0.586 0 0 0 0.586
CLEVELAND STEEL CONTAINER CORP - STREETSBORO PLANT
10048 AURORA-HUDSON RD STREETSBORO Ohio 44241 0.006 0.5735 0.5795 0 0 0 0.5795
BECKER SPECIALTY CORP 15310 ARROW BLVD FONTANA California 92335 0.0285 0.55 0.5785 0 0 0.5785
COMPLEX CHEMICALS CO INC MADISON PARISH INDUSTRIAL PARKTALLULAH Louisiana 71282 0.3 0.2 0.5 0.072 0 0 0.572
NICHOLS ALUMINUM DAVENPORT 1725 ROCKINGHAM RD DAVENPORT Iowa 52802 0.159 0.408 0.567 0 0 0 0.567
SUPERIOR OIL CO INC RECLAIMED ENERGY DIV 1500 WESTERN AVE CONNERSVILLE Indiana 47331 0.041 0.025 0.066 0 0 0.5 0.566
SOUTHERN CLAY PRODUCTS INC 1335 S 13TH ST LOUISVILLE Kentucky 40210 0.0025 0.125 0.1275 0.0025 0.425 0.555
ALUMAX MILL PRODUCTS INC 300 ALUMAX DR TEXARKANA Texas 75501 0 0.5505 0.5505 0 0 0 0.5505
CHRYSLER GROUP LLC STERLING STAMPING PLANT (PART)
35777 VAN DYKE STERLING HEIGHTS Michigan 48312 0.55 0 0.55 0 0 0 0.55
HB FULLER CO 4440 MALSBARY RD BLUE ASH Ohio 45242 0.545 0.0015 0.5465 0 0 0 0.5465
BRADLEY COATINGS GROUP 608 W CRAWFORD AVE CONNELLSVILLE Pennsylvania 15425 0.389 0 0.389 0 0 0.157 0.546
HOVENSA LLC 1 ESTATE HOPE CHRISTIANSTED Virgin Islands 00820 0.351 0 0.351 0.1805 0 0 0.5315
FLINT GROUP NORTH AMERICA CORP 104 NATIONAL DR ANNISTON Alabama 36207 0.265 0.265 0.53 0 0 0 0.53
GLASS COATINGS & CONCEPTS 300 LAWTON AVE MONROE Ohio 45050 0.5245 0.002 0.5265 0 0 0 0.5265
NAPCO INC 125 MCFANN RD VALENCIA Pennsylvania 16059 0.48 0.0445 0.5245 0 0 0 0.5245
LEVLAD 9200 MASON AVE CHATSWORTH California 91311 0.0005 0 0.0005 0 0 0.5235 0.524
ARROW GROUP INDUSTRIES INC 1 THIRD AVE HASKELL New Jersey 07420 0.0025 0.219 0.2215 0 0 0.3005 0.522
RADIATOR SPECIALTY CO 600 RADIATOR RD INDIAN TRAIL North Carolina 28079 0.161 0 0.161 0 0 0.36 0.521
NB COATINGS INC 2701 E 170TH ST LANSING Illinois 60438 0.315 0.08 0.395 0 0 0.119 0.514
DUBOIS CHEMICALS INC 3630 E KEMPER RD SHARONVILLE Ohio 45241 0 0 0 0 0 0.513 0.513
FORREST PAINT CO 1011 MCKINLEY ST EUGENE Oregon 97402 0.206 0.307 0.513 0 0 0 0.513
LOCKHEED MARTIN AERONAUTICS CO 1011 LOCKHEED WAY MZ 6607 PALMDALE California 93599 0.0715 0.431 0.5025 0 0 0.005 0.5075
Page 21 of 40

Table B-1. 2009 Emissions Inventory: Non-Zero Certain Glycol Ether Reported Releases
Facility Name Address City State Zip CodeOnsite Point
Source Emissions (tpy)
Onsite Fugitive
Emissions (tpy)
Total Air Emissions
(tpy)
Total Releases to Surface
Water (tpy)a
Total Releases to Soil (tpy)b
Total Releases to Other Media
(tpy)c
Total Emissions
(tpy)
INEOS OXIDE A DIV OF INEOS AMERICAS LLC 21255A HWY 1 S PLAQUEMINE Louisiana 70765 0.4805 0.0255 0.506 0 0 0.0005 0.5065
PPG INDUSTRIES ARCHITECTURAL FINISHES 1886 LYNNBURY WOODS RD DOVER Delaware 19904 0.0025 0.0025 0.005 0 0 0.5 0.505
BRIGHTSMITH LLC 120 ENTERPRISE AVE MORRISVILLE Pennsylvania 19067 0.1025 0.2435 0.346 0 0.1585 0.5045
CLARIANT CORP MARTIN PLANT 788 CHERT QUARRY RD MARTIN South Carolina 29836 0.125 0.0025 0.1275 0.375 0 0 0.5025
STEELSCAPE 222 W KALAMA RIVER RD KALAMA Washington 98625 0.003 0.4995 0.5025 0 0 0 0.5025
PPG INDUSTRIES INC 500 PITTSBURGH AVE MCCARRAN Nevada 89434 0 0.125 0.125 0 0 0.3775 0.5025
ARCADIA INC 3225 E WASHINGTON BLVD VERNON California 90023 0.125 0.375 0.5 0 0 0 0.5
SILBOND CORP 9901 SAND CREEK HWY WESTON Michigan 49289 0.125 0.375 0.5 0 0 0 0.5
RUST-OLEUM CORP 8105 95TH ST PLEASANT PRAIRIE Wisconsin 53158 0.125 0.375 0.5 0 0 0 0.5
SC JOHNSON & SON INC WAXDALE FACILITY 8311 16TH ST STURTEVANT Wisconsin 53177 0.125 0.375 0.5 0 0 0 0.5
DERRICK CORP 3350 UNION RD CHEEKTOWAGA New York 14225 0 0.4975 0.4975 0 0 0 0.4975
HEXION SPECIALTY CHEMICALS INC 8600 W 71ST ST BEDFORD PARK Illinois 60501 0 0.4925 0.4925 0 0 0.4925
EXXONMOBIL CHEMICAL BATON ROUGE CHEMICAL PLANT 4999 SCENIC HWY BATON ROUGE Louisiana 70805 0.245 0.0015 0.2465 0.245 0 0 0.4915
BECKER SPECIALTY CORP 2500 DELTA LN ELK GROVE VILLAGEIllinois 60007 0.005 0.485 0.49 0 0 0.49
TTM TECHNOLOGIES INC 234 CASHMAN DR CHIPPEWA FALLS Wisconsin 54729 0 0.4895 0.4895 0 0 0 0.4895
PARKER HANNIFIN 400 S ST MC COOK Nebraska 69001 0 0 0 0 0 0.486 0.486
ENGINEERED POLYMER SOLUTIONS I NC D/B/A VALSPAR COATINGS
90 CARSON RD BIRMINGHAM Alabama 35215 0.125 0.36 0.485 0 0 0 0.485
UNIVAR USA INC SALEM BRANCH COLONIAL RD SALEM Massachusetts 01970 0.001 0.001 0.002 0 0 0.4775 0.4795
SHERWIN-WILLIAMS CO 2802 W MILLER RD GARLAND Texas 75041 0.003 0.0315 0.0345 0 0 0.4405 0.475
SNAP-ON TOOLS MANUFACTURING CO 2600 US HWY 18 E ALGONA Iowa 50511 0.0055 0.465 0.4705 0 0 0.0025 0.473
SKF SEALING SOLUTIONS 900 N STATE ST ELGIN Illinois 60123 0 0 0 0 0 0.463 0.463
IVC INDUSTRIAL COATINGS INC 550-560 W CENTENNIAL BLVD CASA GRANDE Arizona 85222 0.091 0.3635 0.4545 0 0 0 0.454
UNIVERSAL CHEMICALS & COATINGS INC 1124 ELMHURST RD ELK GROVE VILLAGEIllinois 60007 0 0.4505 0.4505 0 0 0 0.4505
DUPONT MOUNT CLEMENS PLANT 400 GROESBECK HWY MOUNT CLEMENS Michigan 48043 0.0005 0.449 0.4495 0 0 0 0.4495
NAZDAR CHICAGO 1087 N N BRANCH ST CHICAGO Illinois 60622 0.131 0.3055 0.4365 0 0 0 0.4365
APOLLO CHEMICAL 2001 WILLOW SPRINGS LN BURLINGTON North Carolina 27215 0.14 0 0.14 0 0 0.2955 0.4355
ROHM & HAAS CHEMICALS LLC KNOXVILLE SITE 730 DALE AVE KNOXVILLE Tennessee 37921 0.002 0.0005 0.0025 0 0 0.431 0.4335
PFI INC 9215 SANTA FE SPRINGS RD SANTA FE SPRINGS California 90670 0.42 0 0.42 0 0 0 0.42
Page 22 of 40

Table B-1. 2009 Emissions Inventory: Non-Zero Certain Glycol Ether Reported Releases
Facility Name Address City State Zip CodeOnsite Point
Source Emissions (tpy)
Onsite Fugitive
Emissions (tpy)
Total Air Emissions
(tpy)
Total Releases to Surface
Water (tpy)a
Total Releases to Soil (tpy)b
Total Releases to Other Media
(tpy)c
Total Emissions
(tpy)
SILGAN WHITE CAP CORP 1701 WILLIAMSBURG PIKE RICHMOND Indiana 47375 0.055 0.3625 0.4175 0 0 0 0.4175
STANDARD PAINTS INC 940 S 6TH AVE MANSFIELD Texas 76063 0 0.3865 0.3865 0 0 0.03 0.4165
MUTI-PACK LLC 8372 N STEVEN RD MILWAUKEE Wisconsin 53223 0.415 0 0.415 0 0 0 0.415
UNITED STATES ALUMINUM CORP 200 SINGLETON DR WAXAHACHIE Texas 75165 0.3775 0.03 0.4075 0 0 0 0.4075
AMERIMAX HOME PRODUCTS INC 450 RICHARDSON DR LANCASTER Pennsylvania 17603 0.0115 0.3905 0.402 0 0 0 0.402
STP PRODUCTS MANUFACTURING CO 477 LEXINGTON AVE PAINESVILLE Ohio 44077 0.298 0 0.298 0 0 0.102 0.4
DIAMOND VOGEL PAINTS 5111 E 36TH ST N TULSA Oklahoma 74115 0.008 0.3895 0.3975 0 0 0 0.3975
AMERICAN METALS CORP 1000 CROCKER RD WESTLAKE Ohio 44145 0 0.3955 0.3955 0 0 0 0.3955
FORBO ADHESIVES LLC 7440 W DUPONT RD MORRIS Illinois 60450 0.3905 0 0.3905 0 0 0 0.3905
ROLLEX CORP 800 CHASE AVE ELK GROVE VILLAGEIllinois 60007 0 0.387 0.387 0 0 0 0.387
GSP MARKETING TECHNOLOGIES 5400 140TH AVE N CLEARWATER Florida 33760 0.384 0 0.384 0 0 0 0.384
NALCO CO TULSA PLANT 102 6717 S 61ST W AVE TULSA Oklahoma 74131 0.0015 0.006 0.0075 0 0 0.375 0.3825
EXXONMOBIL REFINING & SUPPLY BATON ROUGE REFINERY
4045 SCENIC HWY BATON ROUGE Louisiana 70805 0.175 0.001 0.176 0.205 0 2.77556E-17 0.381
BASF CORP 1609 BIDDLE AVE WYANDOTTE Michigan 48192 0.375 0.0025 0.3775 0 0 0 0.3775
INTERNATIONAL PAINT LLC 6001 ANTOINE DR HOUSTON Texas 77091 0.0025 0.375 0.3775 0 0 0 0.3775
TYSON FRESH MEATS INC JOSLIN IL HWY 92 & I-88 28424 38TH AVE N HILLSDALE Illinois 61257 0.0125 0.0025 0.015 0.115 0.005 0.24 0.375
FIBRO CHEM LLC 1804 KIMBERLY PARK DR DALTON Georgia 30720 0.125 0 0.125 0 0 0.25 0.375
TOWER PRODUCTS INC 2703 FREEMANSBURG AVE EASTON Pennsylvania 18045 0.375 0 0.375 0 0 0 0.375
RODDA PAINT CO 6123 N MARINE DR PORTLAND Oregon 97203 0.373 0.002 0.375 0 0 0 0.375
QUEST CHEMICAL CORP 12255 FM 529 HOUSTON Texas 77041 0.375 0 0.375 0 0 0 0.375
PARISER INDUSTRIES INC 91 MICHIGAN AVE PATERSON New Jersey 07503 0.375 0 0.375 0 0 0 0.375
HILLYARD INDUSTRIES INC 402 N 3TH ST SAINT JOSEPH Missouri 64501 0.334 0.0335 0.3675 0 0 0 0.3675
SIKA CORP SIKA SARNAFIL DIV 100 DAN RD CANTON Massachusetts 02021 0 0.366 0.366 0 0 0 0.366
NASCOTE INDUSTRIES 18310 ENTERPRISE AVE NASHVILLE Illinois 62263 0.1275 0.2375 0.365 0 0 0.0005 0.3655
MASCO RETAIL CABINET GROUP LLC 423 HOPEWELL RD WAVERLY Ohio 45690 0.0055 0.3525 0.358 0 0 0 0.358
FULLER BRUSH CO ONE FULLER WAY GREAT BEND Kansas 67530 0.1185 0.237 0.3555 0 0 0 0.3555
WATSON LABORATORIES INC UTAH 575, 577, 579 CHIPETA WAY SALT LAKE CITY Utah 84108 0.353 0 0.353 0 0 0 0.353
SHERWIN-WILLIAMS AUTOMOTIVE FINISHES CORP 395 BOGGS LN - S RICHMOND Kentucky 40475 0.32 0.03 0.35 0 0 0 0.35
Page 23 of 40
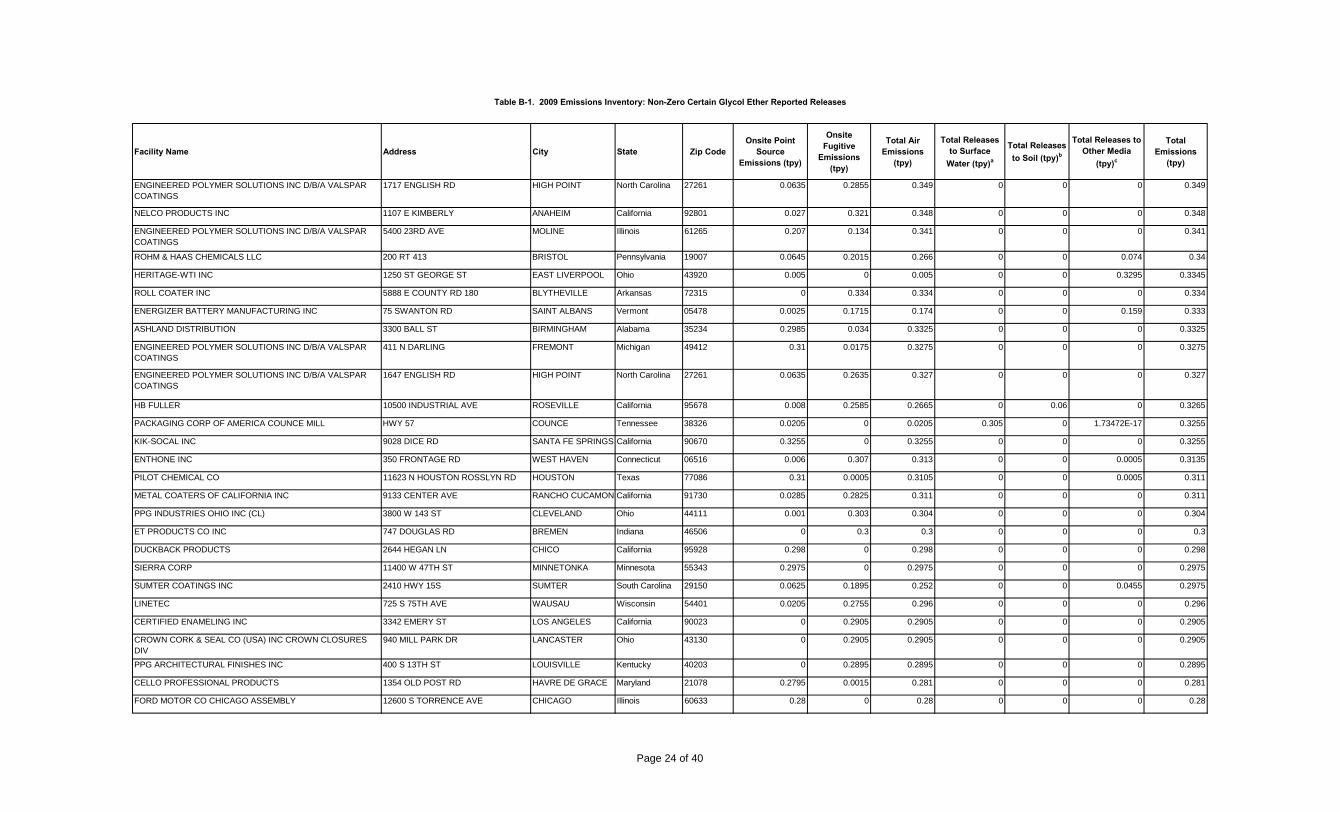
Table B-1. 2009 Emissions Inventory: Non-Zero Certain Glycol Ether Reported Releases
Facility Name Address City State Zip CodeOnsite Point
Source Emissions (tpy)
Onsite Fugitive
Emissions (tpy)
Total Air Emissions
(tpy)
Total Releases to Surface
Water (tpy)a
Total Releases to Soil (tpy)b
Total Releases to Other Media
(tpy)c
Total Emissions
(tpy)
ENGINEERED POLYMER SOLUTIONS INC D/B/A VALSPAR COATINGS
1717 ENGLISH RD HIGH POINT North Carolina 27261 0.0635 0.2855 0.349 0 0 0 0.349
NELCO PRODUCTS INC 1107 E KIMBERLY ANAHEIM California 92801 0.027 0.321 0.348 0 0 0 0.348
ENGINEERED POLYMER SOLUTIONS INC D/B/A VALSPAR COATINGS
5400 23RD AVE MOLINE Illinois 61265 0.207 0.134 0.341 0 0 0 0.341
ROHM & HAAS CHEMICALS LLC 200 RT 413 BRISTOL Pennsylvania 19007 0.0645 0.2015 0.266 0 0 0.074 0.34
HERITAGE-WTI INC 1250 ST GEORGE ST EAST LIVERPOOL Ohio 43920 0.005 0 0.005 0 0 0.3295 0.3345
ROLL COATER INC 5888 E COUNTY RD 180 BLYTHEVILLE Arkansas 72315 0 0.334 0.334 0 0 0 0.334
ENERGIZER BATTERY MANUFACTURING INC 75 SWANTON RD SAINT ALBANS Vermont 05478 0.0025 0.1715 0.174 0 0 0.159 0.333
ASHLAND DISTRIBUTION 3300 BALL ST BIRMINGHAM Alabama 35234 0.2985 0.034 0.3325 0 0 0 0.3325
ENGINEERED POLYMER SOLUTIONS INC D/B/A VALSPAR COATINGS
411 N DARLING FREMONT Michigan 49412 0.31 0.0175 0.3275 0 0 0 0.3275
ENGINEERED POLYMER SOLUTIONS INC D/B/A VALSPAR COATINGS
1647 ENGLISH RD HIGH POINT North Carolina 27261 0.0635 0.2635 0.327 0 0 0 0.327
HB FULLER 10500 INDUSTRIAL AVE ROSEVILLE California 95678 0.008 0.2585 0.2665 0 0.06 0 0.3265
PACKAGING CORP OF AMERICA COUNCE MILL HWY 57 COUNCE Tennessee 38326 0.0205 0 0.0205 0.305 0 1.73472E-17 0.3255
KIK-SOCAL INC 9028 DICE RD SANTA FE SPRINGS California 90670 0.3255 0 0.3255 0 0 0 0.3255
ENTHONE INC 350 FRONTAGE RD WEST HAVEN Connecticut 06516 0.006 0.307 0.313 0 0 0.0005 0.3135
PILOT CHEMICAL CO 11623 N HOUSTON ROSSLYN RD HOUSTON Texas 77086 0.31 0.0005 0.3105 0 0 0.0005 0.311
METAL COATERS OF CALIFORNIA INC 9133 CENTER AVE RANCHO CUCAMON California 91730 0.0285 0.2825 0.311 0 0 0 0.311
PPG INDUSTRIES OHIO INC (CL) 3800 W 143 ST CLEVELAND Ohio 44111 0.001 0.303 0.304 0 0 0 0.304
ET PRODUCTS CO INC 747 DOUGLAS RD BREMEN Indiana 46506 0 0.3 0.3 0 0 0 0.3
DUCKBACK PRODUCTS 2644 HEGAN LN CHICO California 95928 0.298 0 0.298 0 0 0 0.298
SIERRA CORP 11400 W 47TH ST MINNETONKA Minnesota 55343 0.2975 0 0.2975 0 0 0 0.2975
SUMTER COATINGS INC 2410 HWY 15S SUMTER South Carolina 29150 0.0625 0.1895 0.252 0 0 0.0455 0.2975
LINETEC 725 S 75TH AVE WAUSAU Wisconsin 54401 0.0205 0.2755 0.296 0 0 0 0.296
CERTIFIED ENAMELING INC 3342 EMERY ST LOS ANGELES California 90023 0 0.2905 0.2905 0 0 0 0.2905
CROWN CORK & SEAL CO (USA) INC CROWN CLOSURES DIV
940 MILL PARK DR LANCASTER Ohio 43130 0 0.2905 0.2905 0 0 0 0.2905
PPG ARCHITECTURAL FINISHES INC 400 S 13TH ST LOUISVILLE Kentucky 40203 0 0.2895 0.2895 0 0 0 0.2895
CELLO PROFESSIONAL PRODUCTS 1354 OLD POST RD HAVRE DE GRACE Maryland 21078 0.2795 0.0015 0.281 0 0 0 0.281
FORD MOTOR CO CHICAGO ASSEMBLY 12600 S TORRENCE AVE CHICAGO Illinois 60633 0.28 0 0.28 0 0 0 0.28
Page 24 of 40

Table B-1. 2009 Emissions Inventory: Non-Zero Certain Glycol Ether Reported Releases
Facility Name Address City State Zip CodeOnsite Point
Source Emissions (tpy)
Onsite Fugitive
Emissions (tpy)
Total Air Emissions
(tpy)
Total Releases to Surface
Water (tpy)a
Total Releases to Soil (tpy)b
Total Releases to Other Media
(tpy)c
Total Emissions
(tpy)
SERIGRAPH INC 3801 E DECORAH RD WEST BEND Wisconsin 53095 0.0455 0.234 0.2795 0 0 0 0.2795
VIDEOJET TECHNOLOGIES INC 1855 ESTES AVE ELK GROVE VILLAGEIllinois 60007 0 0.275 0.275 0 0 0 0.275
QUANTUM MARKETING INC 3606 CRAFTSMAN BLVD LAKELAND Florida 33803 0.272 0 0.272 0 0 0 0.272
FUCHS LUBRICANTS CO-CORPORATE OFFICE 17050 S LATHROP AVE HARVEY Illinois 60426 0.2675 0 0.2675 0 0 0 0.2675
HELEN,INC DBA ENVIRONMENTAL COATINGS,INC 6450 HANNA LAKE AVE SE CALEDONIA Michigan 49316 0.2 0.065 0.265 0 0 0 0.265
SEQUA COATINGS CORP PRECOAT METALS DIV 3500 WALNUT ST MC KEESPORT Pennsylvania 15132 0.2105 0.0535 0.264 0 0 0 0.264
OLDCASTLE BUILDING ENVELOPE TENNESSEE FACILITY 920 POTTERTOWN RD MIDWAY Tennessee 37809 0 0.2615 0.2615 0 0 0 0.2615
HARLEY-DAVIDSON MOTOR CO OPERATIONS INC 1425 EDEN RD YORK Pennsylvania 17402 0.2365 0.024 0.2605 0 0 0 0.2605
ASHLAND DISTRIBUTION CO 395 JAMES AVE SAINT PAUL Minnesota 55102 0.248 0.0115 0.2595 0 0 0 0.2595
GATES CORP 630 US HWY 150 E GALESBURG Illinois 61401 0 0 0 0 0 0.259 0.259
HEXION SPECIALTY CHEMICALS INC 400 E COTTAGE PL CARPENTERSVILLE Illinois 60110 0.0645 0.194 0.2585 0 0 0 0.2585
SHERWIN-WILLIAMS CO 180 CANAL ST TERRE HAUTE Indiana 47808 0.0165 0.042 0.0585 0 0 0.196 0.2545
ASHLAND DISTRIBUTION 2315 CLIFTON AVE NASHVILLE Tennessee 37209 0.2435 0.0105 0.254 0 0 0 0.254
CHASE PRODUCTS CO 2727 GARDNER RD BROADVIEW Illinois 60155 0.0015 0.252 0.2535 0 0 0.2535
MOC PRODUCTS CO INC 12306 MONTAGUE ST PACOIMA California 91331 0.125 0.0025 0.1275 0 0 0.125 0.2525
BF GOODRICH TIRE MANUFACTURING 18906 US 24 E WOODBURN Indiana 46797 0.0025 0.125 0.1275 0 0 0.125 0.2525
BACHMAN SERVICES INC 2220 S PROSPECT OKLAHOMA CITY Oklahoma 73129 0.125 0.125 0.25 0 0 0.0025 0.2525
ASHLAND DISTRIBUTION CO 350 ROOSEVELT AVE CARTERET New Jersey 07008 0.229 0.023 0.252 0 0 0 0.252
MISCO PRODUCTS CORP 1048 STINSON DR READING Pennsylvania 19605 0.125 0.125 0.25 0 0 0 0.25
YENKIN-MAJESTIC PAINT CORPORAT ION 1920 LEONARD AVE COLUMBUS Ohio 43219 0.125 0.125 0.25 0 0 0 0.25
QUANTUM COATINGS INC 1337 N WOOD BRANCH DR CHARLOTTE North Carolina 28273 0.125 0.125 0.25 0 0 0 0.25
HONDA MANUFACTURING OF INDIANA LLC 2755 N MICHIGAN AVE GREENSBURG Indiana 47240 0.125 0.125 0.25 0 0 0 0.25
MALCO PRODUCTS INC 361 FAIRVIEW AVE BARBERTON Ohio 44203 0.125 0.125 0.25 0 0 0.25
UNIVAR USA INC BERKELEY 8925 SEEGER INDUSTRIAL DR BERKELEY Missouri 63134 0.125 0.125 0.25 0 0 0 0.25
CHEMICAL SPECIALISTS & DEVELOPMENT INC 9733 MEADOR RD CONROE Texas 77303 0.125 0.125 0.25 0 0 0 0.25
EQUILON CARSON TERMINAL 20945 S WILMINGTON AVE CARSON California 90810 0.125 0.125 0.25 0 0 0 0.25
PREMIER INK SYSTEMS INC 10420 N STATE ST HARRISON Ohio 45030 0.125 0 0.125 0 0 0.125 0.25
PROCLEAN OF ARIZONA INC 4315 W VAN BUREN PHOENIX Arizona 85043 0 0.125 0.125 0 0 0.125 0.25
UNIVAR USA INC METRO BLVD 2646 METRO BLVD MARYLAND HEIGHTSMissouri 63043 0.125 0.125 0.25 0 0 0 0.25
Page 25 of 40

Table B-1. 2009 Emissions Inventory: Non-Zero Certain Glycol Ether Reported Releases
Facility Name Address City State Zip CodeOnsite Point
Source Emissions (tpy)
Onsite Fugitive
Emissions (tpy)
Total Air Emissions
(tpy)
Total Releases to Surface
Water (tpy)a
Total Releases to Soil (tpy)b
Total Releases to Other Media
(tpy)c
Total Emissions
(tpy)
BERGQUIST CO 301 WASHINGTON ST CANNON FALLS Minnesota 55009 0.125 0.125 0.25 0 0 0 0.25
REICHHOLD INC 249 ST LOUIS AVE VALLEY PARK Missouri 63088 0.125 0.125 0.25 0 0 0 0.25
CPJ TECHNOLOGIES 200 TANNER DR TAYLORS South Carolina 29687 0.125 0.125 0.25 0 0 0 0.25
ASHLAND DISTRIBUTION CO 1610 E HIGHLAND RD TWINSBURG Ohio 44087 0.229 0.019 0.248 0 0 0 0.248
EFI / INKWARE 189 WAUKEWAN ST MEREDITH New Hampshire 03253 0 0.0635 0.0635 0 0 0.1835 0.247
FLINT GROUP NORTH AMERICA 4675 W PARK DR ATLANTA Georgia 30339 0.12 0.12 0.24 0 0 0 0.24
ATMI MATERIALS LTD 706 HOUSTON CLINTON DR BURNET Texas 78611 0.051 0.0005 0.0515 0 0 0.1885 0.24
CAR PRODUCTS INC 630 BEAULIEU ST HOLYOKE Massachusetts 01040 0.236 0 0.236 0 0 0 0.236
ENGINEERED POLYMER SOLUTIONS INC D/B/A VALSPAR COATINGS
347 CENTRAL AVE BOWLING GREEN Kentucky 42101 0.1285 0.1045 0.233 0 0 0 0.233
WARREN STAMPING PLANT (PART) 22800 MOUND RD WARREN Michigan 48091 0.23 0 0.23 0 0 0 0.23
METAL COATERS OF GEORGIA 1150 MARIETTA INDUSTRIAL DR NE MARIETTA Georgia 30062 0.003 0.225 0.228 0 0 0 0.228
CLEARWATER INTERNATIONAL LLC 4420 S FLORES ELMENDORF Texas 78112 0.0005 0.002 0.0025 0 0 0.225 0.2275
COSMETIC LABORATORIES OF AMERICA 20245 SUNBURST ST CHATSWORTH California 91311 0 0.002 0.002 0 0 0.225 0.227
FLUID ROUTING SOLUTIONS 1921 N BROAD ST LEXINGTON Tennessee 38351 0 0 0 0 0 0.225 0.225
PERMA-PIPE OIL & GAS 5008-11 CURTIS LN NEW IBERIA Louisiana 70560 0.22 0 0.22 0 0 0 0.22
MARY KAY INC 1330 REGAL ROW DALLAS Texas 75247 0.0005 0 0.0005 0 0 0.214 0.2145
INTERNATIONAL EXTRUSION CORP TEXAS 202 SINGLETON DR WAXAHACHIE Texas 75165 0 0.2115 0.2115 0 0 0 0.2115
COLWELL INC 231 S PROGRESS DR E KENDALLVILLE Indiana 46755 0.19 0.02 0.21 0 0 0 0.21
ACTEGA KELSTAR INC 1050 TAYLORS LN CINNAMINSON New Jersey 08077 0.0015 0.005 0.0065 0 0 0.2 0.2065
GUARDIAN AUTOMOTIVE - MOREHEAD PLANT 200 GUARDIAN AVE MOREHEAD Kentucky 40351 0 0.203 0.203 0 0 0 0.203
ASHLAND DISTRIBUTION CO 4550 NE EXPRESSWAY DORAVILLE Georgia 30340 0.1555 0.047 0.2025 0 0 0 0.2025
CHAMPION TECHNOLOGIES INC 3303 HWY 135 N KILGORE Texas 75662 0.194 0.002 0.196 0 0 0 0.196
RHODIA INC 577 BANKHEAD HWY WINDER Georgia 30680 0.16 0.0335 0.1935 0 0 0 0.1935
ROCKLINE INDUSTRIES 1113 MARYLAND AVE SHEBOYGAN Wisconsin 53081 0.193 0 0.193 0 0 0 0.193
FIRST AMERICAN RESOURCES CO 2030 RIVERVIEW INDUSTRIAL DR MABLETON Georgia 30126 0 0.191 0.191 0 0 0 0.191
SASOL NORTH AMERICA INC LAKE CHARLES CHEMICAL COMPLEX
2201 OLD SPANISH TRAIL WESTLAKE Louisiana 70669 0.124 0.0645 0.1885 0 0 0 0.1885
RUDD CO INC 1141 NW 50TH ST SEATTLE Washington 98107 0.175 0.0125 0.1875 0 0 0 0.1875
ASHLAND DISTRIBUTION 7710 POLK ST SAINT LOUIS Missouri 63111 0.1845 0.0015 0.186 0 0 0 0.186
CURTIS METAL FINISHING CO 9917 N ALPINE MACHESNEY PARK Illinois 61115 0.1325 0.053 0.1855 0 0 0 0.1855
Page 26 of 40
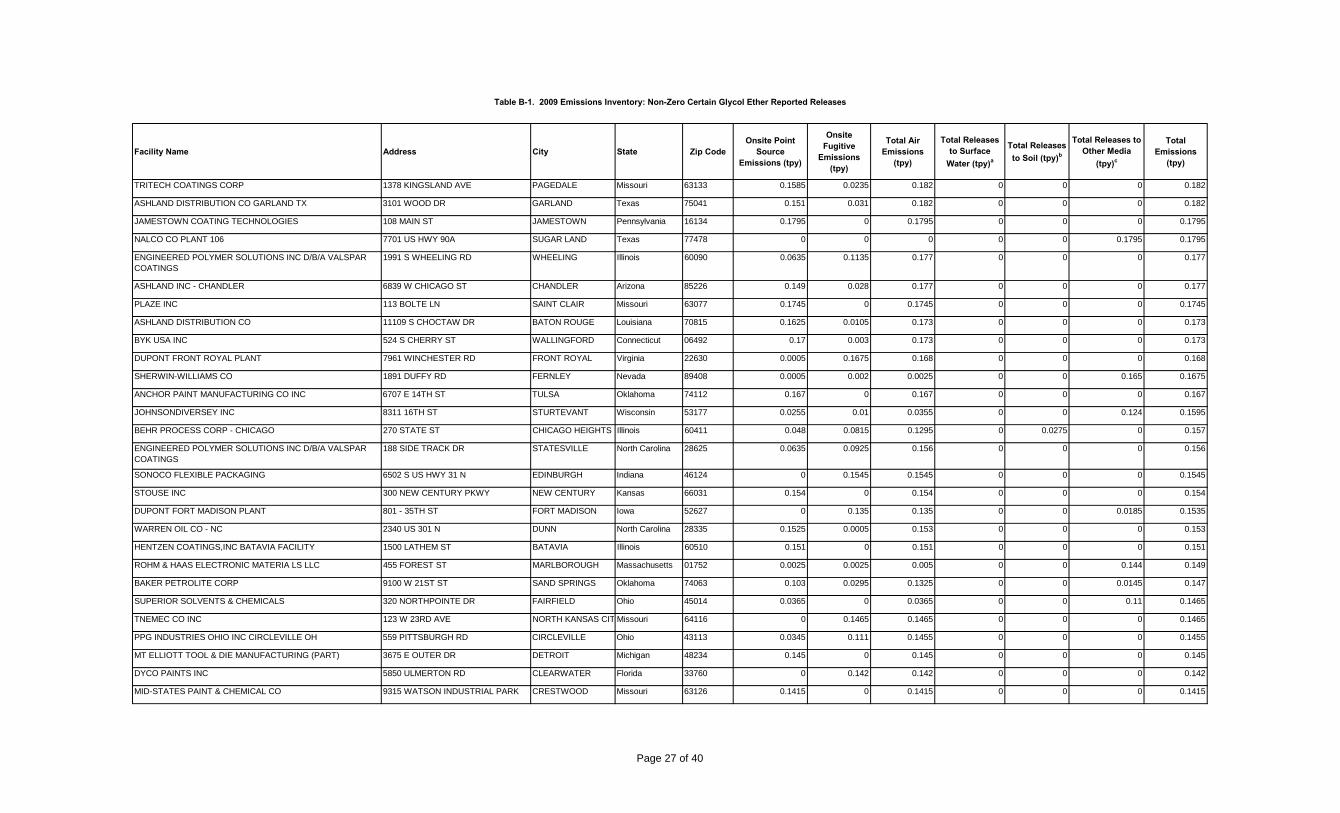
Table B-1. 2009 Emissions Inventory: Non-Zero Certain Glycol Ether Reported Releases
Facility Name Address City State Zip CodeOnsite Point
Source Emissions (tpy)
Onsite Fugitive
Emissions (tpy)
Total Air Emissions
(tpy)
Total Releases to Surface
Water (tpy)a
Total Releases to Soil (tpy)b
Total Releases to Other Media
(tpy)c
Total Emissions
(tpy)
TRITECH COATINGS CORP 1378 KINGSLAND AVE PAGEDALE Missouri 63133 0.1585 0.0235 0.182 0 0 0 0.182
ASHLAND DISTRIBUTION CO GARLAND TX 3101 WOOD DR GARLAND Texas 75041 0.151 0.031 0.182 0 0 0 0.182
JAMESTOWN COATING TECHNOLOGIES 108 MAIN ST JAMESTOWN Pennsylvania 16134 0.1795 0 0.1795 0 0 0 0.1795
NALCO CO PLANT 106 7701 US HWY 90A SUGAR LAND Texas 77478 0 0 0 0 0 0.1795 0.1795
ENGINEERED POLYMER SOLUTIONS INC D/B/A VALSPAR COATINGS
1991 S WHEELING RD WHEELING Illinois 60090 0.0635 0.1135 0.177 0 0 0 0.177
ASHLAND INC - CHANDLER 6839 W CHICAGO ST CHANDLER Arizona 85226 0.149 0.028 0.177 0 0 0 0.177
PLAZE INC 113 BOLTE LN SAINT CLAIR Missouri 63077 0.1745 0 0.1745 0 0 0 0.1745
ASHLAND DISTRIBUTION CO 11109 S CHOCTAW DR BATON ROUGE Louisiana 70815 0.1625 0.0105 0.173 0 0 0 0.173
BYK USA INC 524 S CHERRY ST WALLINGFORD Connecticut 06492 0.17 0.003 0.173 0 0 0 0.173
DUPONT FRONT ROYAL PLANT 7961 WINCHESTER RD FRONT ROYAL Virginia 22630 0.0005 0.1675 0.168 0 0 0 0.168
SHERWIN-WILLIAMS CO 1891 DUFFY RD FERNLEY Nevada 89408 0.0005 0.002 0.0025 0 0 0.165 0.1675
ANCHOR PAINT MANUFACTURING CO INC 6707 E 14TH ST TULSA Oklahoma 74112 0.167 0 0.167 0 0 0 0.167
JOHNSONDIVERSEY INC 8311 16TH ST STURTEVANT Wisconsin 53177 0.0255 0.01 0.0355 0 0 0.124 0.1595
BEHR PROCESS CORP - CHICAGO 270 STATE ST CHICAGO HEIGHTS Illinois 60411 0.048 0.0815 0.1295 0 0.0275 0 0.157
ENGINEERED POLYMER SOLUTIONS INC D/B/A VALSPAR COATINGS
188 SIDE TRACK DR STATESVILLE North Carolina 28625 0.0635 0.0925 0.156 0 0 0 0.156
SONOCO FLEXIBLE PACKAGING 6502 S US HWY 31 N EDINBURGH Indiana 46124 0 0.1545 0.1545 0 0 0 0.1545
STOUSE INC 300 NEW CENTURY PKWY NEW CENTURY Kansas 66031 0.154 0 0.154 0 0 0 0.154
DUPONT FORT MADISON PLANT 801 - 35TH ST FORT MADISON Iowa 52627 0 0.135 0.135 0 0 0.0185 0.1535
WARREN OIL CO - NC 2340 US 301 N DUNN North Carolina 28335 0.1525 0.0005 0.153 0 0 0 0.153
HENTZEN COATINGS,INC BATAVIA FACILITY 1500 LATHEM ST BATAVIA Illinois 60510 0.151 0 0.151 0 0 0 0.151
ROHM & HAAS ELECTRONIC MATERIA LS LLC 455 FOREST ST MARLBOROUGH Massachusetts 01752 0.0025 0.0025 0.005 0 0 0.144 0.149
BAKER PETROLITE CORP 9100 W 21ST ST SAND SPRINGS Oklahoma 74063 0.103 0.0295 0.1325 0 0 0.0145 0.147
SUPERIOR SOLVENTS & CHEMICALS 320 NORTHPOINTE DR FAIRFIELD Ohio 45014 0.0365 0 0.0365 0 0 0.11 0.1465
TNEMEC CO INC 123 W 23RD AVE NORTH KANSAS CIT Missouri 64116 0 0.1465 0.1465 0 0 0 0.1465
PPG INDUSTRIES OHIO INC CIRCLEVILLE OH 559 PITTSBURGH RD CIRCLEVILLE Ohio 43113 0.0345 0.111 0.1455 0 0 0 0.1455
MT ELLIOTT TOOL & DIE MANUFACTURING (PART) 3675 E OUTER DR DETROIT Michigan 48234 0.145 0 0.145 0 0 0 0.145
DYCO PAINTS INC 5850 ULMERTON RD CLEARWATER Florida 33760 0 0.142 0.142 0 0 0 0.142
MID-STATES PAINT & CHEMICAL CO 9315 WATSON INDUSTRIAL PARK CRESTWOOD Missouri 63126 0.1415 0 0.1415 0 0 0 0.1415
Page 27 of 40

Table B-1. 2009 Emissions Inventory: Non-Zero Certain Glycol Ether Reported Releases
Facility Name Address City State Zip CodeOnsite Point
Source Emissions (tpy)
Onsite Fugitive
Emissions (tpy)
Total Air Emissions
(tpy)
Total Releases to Surface
Water (tpy)a
Total Releases to Soil (tpy)b
Total Releases to Other Media
(tpy)c
Total Emissions
(tpy)
DOW CHEMICAL CO - LOUISIANA OPERATIONS 21255 LA HWY 1 S PLAQUEMINE Louisiana 70765 0.139 0 0.139 0 0 0 0.139
ASHLAND DISTRIBUTION 2351 CHANNEL AVE MEMPHIS Tennessee 38113 0.1225 0.012 0.1345 0 0 0 0.1345
AMREP INC 990 INDUSTRIAL PARK DR MARIETTA Georgia 30062 0.0435 0.088 0.1315 0 0 0 0.1315
ENGINEERED POLYMER SOLUTIONS INC D/B/A VALSPAR COATINGS
3050 HANFORD DR LEBANON Pennsylvania 17046 0.0635 0.068 0.1315 0 0 0 0.1315
NALCO CO - ODESSA PLANT 114 12205 W COUNTY RD 125 ODESSA Texas 79765 0 0.125 0.125 0 0 0.006 0.131
VARN INTERNATIONAL 1333 N KIRK RD BATAVIA Illinois 60510 0.125 0.0025 0.1275 0.0025 0 0 0.13
WATSON STANDARD CO HARWICK PLANT 616 HITE RD HARWICK Pennsylvania 15049 0.1165 0.011 0.1275 0 0 0 0.1275
POWER SERVICE PRODUCTS INC 513 PEASTER HWY WEATHERFORD Texas 76086 0.0025 0.125 0.1275 0 0 0.1275
BASF CORP 3455 SOUTHPORT RD SPARTANBURG South Carolina 29302 0.125 0.0025 0.1275 0 0 0 0.1275
PERMATEX SOLON 6875 PARKLAND BLVD SOLON Ohio 44139 0.0025 0.125 0.1275 0 0 0 0.1275
CONOCOPHILLIPS PONCA CITY REFINERY 1000 S PINE ST PONCA CITY Oklahoma 74601 0.0025 0.125 0.1275 0 0 0 0.1275
CONOCOPHILLIPS OKLAHOMA CITY PRODUCTS TERMINAL 4600 NE 10TH ST OKLAHOMA CITY Oklahoma 73117 0.0025 0.125 0.1275 0 0 0 0.1275
GEORGE S COYNE CHEMICAL CO INC 3015 STATE RD CROYDON Pennsylvania 19021 0.125 0.0025 0.1275 0 0 0 0.1275
TAKASAGO INTERNATIONAL CORP (USA) 267 UNION ST NORTHVALE New Jersey 07647 0.125 0.0025 0.1275 0 0 0 0.1275
BRYCE CO LLC 4505 OLD LAMAR AVE MEMPHIS Tennessee 38118 0 0.0025 0.0025 0 0 0.125 0.1275
CHEMICALS INC 12321 HATCHERVILLE RD BAYTOWN Texas 77520 0.125 0.0025 0.1275 0 0 0 0.1275
COASTAL CHEMICAL CO LLC 3520 VETERANS MEMORIAL BLVD ABBEVILLE Louisiana 70510 0.125 0.0025 0.1275 0 0 0 0.1275
OAKLEY INC 1 ICON FOOTHILL RANCH California 92610 0.0025 0.125 0.1275 0 0 0 0.1275
GE WATER & PROCESS TECHNOLOGIES ORANGE FACILITY 3901 WILLIAMS DR ORANGE Texas 77630 0.125 0.0025 0.1275 0 0 0 0.1275
BRENNTAG GREAT LAKES LLC 14765 W BOBOLINK AVE MENOMONEE FALLSWisconsin 53051 0.0025 0.125 0.1275 0 0 0 0.1275
RESEARCH SOLVENTS & CHEMICALS INC 402 INDUSTRIAL PARK DR PELHAM Alabama 35124 0.125 0.0025 0.1275 0 0 0 0.1275
RESEARCH SOLVENTS & CHEMICALS INC 133 BAIN DR LA VERGNE Tennessee 37086 0.125 0.0025 0.1275 0 0 0 0.1275
UNITED LABORATORIES INC 320 37TH AVE SAINT CHARLES Illinois 60174 0.125 0.0025 0.1275 0 0 0 0.1275
RR STREET & CO INC 2353 S BLUE ISLAND AVE CHICAGO Illinois 60608 0.0025 0.125 0.1275 0 0 0 0.1275
NICCA USA INC 1044 S NELSON RD FOUNTAIN INN South Carolina 29644 0.0025 0.125 0.1275 0 0 0 0.1275
ELANTAS PDG INC 5200 N SECOND ST SAINT LOUIS Missouri 63147 0.0025 0.125 0.1275 0 0 0 0.1275
HARCROS CHEMICALS INC 4606 NEW W DR PASADENA Texas 77507 0.0345 0.0035 0.038 0 0.0025 0.085 0.1255
ACTON TECHNOLOGIES INC 100 THOMPSON ST PITTSTON Pennsylvania 18640 0.125 0 0.125 0 0 0 0.125
Page 28 of 40
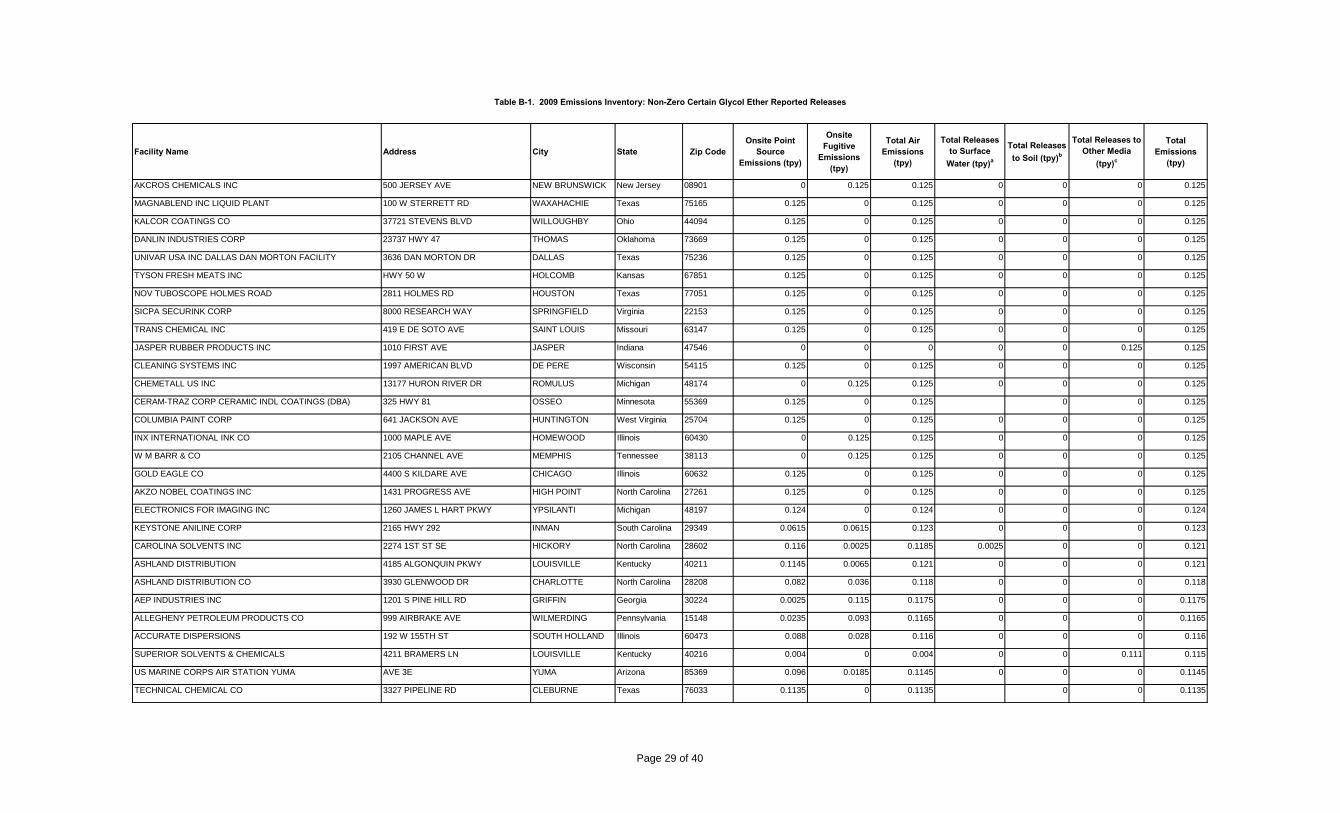
Table B-1. 2009 Emissions Inventory: Non-Zero Certain Glycol Ether Reported Releases
Facility Name Address City State Zip CodeOnsite Point
Source Emissions (tpy)
Onsite Fugitive
Emissions (tpy)
Total Air Emissions
(tpy)
Total Releases to Surface
Water (tpy)a
Total Releases to Soil (tpy)b
Total Releases to Other Media
(tpy)c
Total Emissions
(tpy)
AKCROS CHEMICALS INC 500 JERSEY AVE NEW BRUNSWICK New Jersey 08901 0 0.125 0.125 0 0 0 0.125
MAGNABLEND INC LIQUID PLANT 100 W STERRETT RD WAXAHACHIE Texas 75165 0.125 0 0.125 0 0 0 0.125
KALCOR COATINGS CO 37721 STEVENS BLVD WILLOUGHBY Ohio 44094 0.125 0 0.125 0 0 0 0.125
DANLIN INDUSTRIES CORP 23737 HWY 47 THOMAS Oklahoma 73669 0.125 0 0.125 0 0 0 0.125
UNIVAR USA INC DALLAS DAN MORTON FACILITY 3636 DAN MORTON DR DALLAS Texas 75236 0.125 0 0.125 0 0 0 0.125
TYSON FRESH MEATS INC HWY 50 W HOLCOMB Kansas 67851 0.125 0 0.125 0 0 0 0.125
NOV TUBOSCOPE HOLMES ROAD 2811 HOLMES RD HOUSTON Texas 77051 0.125 0 0.125 0 0 0 0.125
SICPA SECURINK CORP 8000 RESEARCH WAY SPRINGFIELD Virginia 22153 0.125 0 0.125 0 0 0 0.125
TRANS CHEMICAL INC 419 E DE SOTO AVE SAINT LOUIS Missouri 63147 0.125 0 0.125 0 0 0 0.125
JASPER RUBBER PRODUCTS INC 1010 FIRST AVE JASPER Indiana 47546 0 0 0 0 0 0.125 0.125
CLEANING SYSTEMS INC 1997 AMERICAN BLVD DE PERE Wisconsin 54115 0.125 0 0.125 0 0 0 0.125
CHEMETALL US INC 13177 HURON RIVER DR ROMULUS Michigan 48174 0 0.125 0.125 0 0 0 0.125
CERAM-TRAZ CORP CERAMIC INDL COATINGS (DBA) 325 HWY 81 OSSEO Minnesota 55369 0.125 0 0.125 0 0 0.125
COLUMBIA PAINT CORP 641 JACKSON AVE HUNTINGTON West Virginia 25704 0.125 0 0.125 0 0 0 0.125
INX INTERNATIONAL INK CO 1000 MAPLE AVE HOMEWOOD Illinois 60430 0 0.125 0.125 0 0 0 0.125
W M BARR & CO 2105 CHANNEL AVE MEMPHIS Tennessee 38113 0 0.125 0.125 0 0 0 0.125
GOLD EAGLE CO 4400 S KILDARE AVE CHICAGO Illinois 60632 0.125 0 0.125 0 0 0 0.125
AKZO NOBEL COATINGS INC 1431 PROGRESS AVE HIGH POINT North Carolina 27261 0.125 0 0.125 0 0 0 0.125
ELECTRONICS FOR IMAGING INC 1260 JAMES L HART PKWY YPSILANTI Michigan 48197 0.124 0 0.124 0 0 0 0.124
KEYSTONE ANILINE CORP 2165 HWY 292 INMAN South Carolina 29349 0.0615 0.0615 0.123 0 0 0 0.123
CAROLINA SOLVENTS INC 2274 1ST ST SE HICKORY North Carolina 28602 0.116 0.0025 0.1185 0.0025 0 0 0.121
ASHLAND DISTRIBUTION 4185 ALGONQUIN PKWY LOUISVILLE Kentucky 40211 0.1145 0.0065 0.121 0 0 0 0.121
ASHLAND DISTRIBUTION CO 3930 GLENWOOD DR CHARLOTTE North Carolina 28208 0.082 0.036 0.118 0 0 0 0.118
AEP INDUSTRIES INC 1201 S PINE HILL RD GRIFFIN Georgia 30224 0.0025 0.115 0.1175 0 0 0 0.1175
ALLEGHENY PETROLEUM PRODUCTS CO 999 AIRBRAKE AVE WILMERDING Pennsylvania 15148 0.0235 0.093 0.1165 0 0 0 0.1165
ACCURATE DISPERSIONS 192 W 155TH ST SOUTH HOLLAND Illinois 60473 0.088 0.028 0.116 0 0 0 0.116
SUPERIOR SOLVENTS & CHEMICALS 4211 BRAMERS LN LOUISVILLE Kentucky 40216 0.004 0 0.004 0 0 0.111 0.115
US MARINE CORPS AIR STATION YUMA AVE 3E YUMA Arizona 85369 0.096 0.0185 0.1145 0 0 0 0.1145
TECHNICAL CHEMICAL CO 3327 PIPELINE RD CLEBURNE Texas 76033 0.1135 0 0.1135 0 0 0.1135
Page 29 of 40

Table B-1. 2009 Emissions Inventory: Non-Zero Certain Glycol Ether Reported Releases
Facility Name Address City State Zip CodeOnsite Point
Source Emissions (tpy)
Onsite Fugitive
Emissions (tpy)
Total Air Emissions
(tpy)
Total Releases to Surface
Water (tpy)a
Total Releases to Soil (tpy)b
Total Releases to Other Media
(tpy)c
Total Emissions
(tpy)
ARDEX LABORATORIES INC 2050 BYBERRY RD PHILADELPHIA Pennsylvania 19116 0.1125 0 0.1125 0 0 0 0.1125
ASHLAND INC - EVENDALE 2788 GLENDALE-MILFORD RD EVENDALE Ohio 45241 0.0805 0.032 0.1125 0 0 0 0.1125
SHERWIN-WILLIAMS CO 2121 NEW WORLD DR COLUMBUS Ohio 43207 0.0085 0.0065 0.015 0 0 0.097 0.112
SHERWIN-WILLIAMS CO 1025 HOWARD ST GREENSBORO North Carolina 27403 0.053 0.057 0.11 0 0 0.001 0.111
3M CO - NEVADA 2120 E AUSTIN BLVD NEVADA Missouri 64772 0.01 0.1 0.11 0 0 0 0.11
DELTA LABORATORIES INC 3710 COUNTY RD 326 W OCALA Florida 34475 0.1085 0.0005 0.109 0 0 0 0.109
SHERWIN-WILLIAMS CO 636 E 40TH ST HOLLAND Michigan 49423 0.1045 0.0015 0.106 0 0 0 0.106
SUPERIOR OIL CO INC 400 W REGENT ST INDIANAPOLIS Indiana 46225 0.0045 0 0.0045 0 0 0.0995 0.104
FRAZEE INDUSTRIES 6625 MIRAMAR RD SAN DIEGO California 92121 0 0.103 0.103 0 0 0 0.103
HENKEL CORP 23343 SHERWOOD AVE WARREN Michigan 48091 0.044 0.044 0.088 0 0 0.015 0.103
CENTRAL MOTOR WHEEL OF AMERICA (DBA CMWA) 125 WHEAT DR PARIS Kentucky 40361 0 0.103 0.103 0 0 0.103
ASHLAND DISTRIBUTION CO 2461 CROCKER CIR FAIRFIELD California 94533 0.1015 0.001 0.1025 0 0 0 0.1025
STEELSCAPE INC RANCHO 11200 ARROW RT RANCHO CUCAMON California 91730 0.0035 0.0975 0.101 0 0 0 0.101
ASHLAND DISTRIBUTION CO 20915 S WILMINGTON AVE CARSON California 90810 0.0925 0.0055 0.098 0 0 0 0.098
MRCG-KRAFTMAID P3 150 GRAND VALLEY AVE ORWELL Ohio 44076 0.002 0.0775 0.0795 0 0 0.0175 0.097
UNIVAR USA INC HAMILTON BRANCH 12 STANDEN DR HAMILTON Ohio 45015 0.007 0.02 0.027 0 0 0.0685 0.0955
GROTTOES PLASTICS PLANT 149 GRAND CAVERNS DR GROTTOES Virginia 24441 0.022 0.0375 0.0595 0.004 0 0.03 0.0935
CYTEC INDUSTRIES INC LANGLEY PLANT 403 CARLINE RD LANGLEY South Carolina 29834 0.0835 0.01 0.0935 0 0 0 0.0935
ASHLAND DISTRIBUTION CO 200 NE 181ST ST MIAMI Florida 33162 0.075 0.018 0.093 0 0 0 0.093
CE BRADLEY LABORATORIES INC 55 BENNETT DR BRATTLEBORO Vermont 05301 0.093 0 0.093 0 0 0 0.093
MULTI-COLOR CORP 2281 S US 31 SCOTTSBURG Indiana 47170 0 0.091 0.091 0 0 0 0.091
ATHEA LABORATORIES INC 7855 N FAULKNER RD MILWAUKEE Wisconsin 53224 0.0905 0 0.0905 0 0 0 0.0905
BRENNTAG PACIFIC INC 10747 PATTERSON PL SANTA FE SPRINGS California 90670 0.081 0.0065 0.0875 0 0 0 0.0875
DIC IMAGING PRODUCTS USA LLC 7335 S 10TH ST OAK CREEK Wisconsin 53154 0.0085 0.0775 0.086 0 0 0 0.086
NORTHERN COATINGS & CHEMICAL CO INC 705 6TH AVE MENOMINEE Michigan 49858 0.085 0 0.085 0 0 0 0.085
CCI MANUFACTURING IL CORP 15550 CANAL BANK RD LEMONT Illinois 60439 0 0.0835 0.0835 0 0 0 0.0835
UNION TANK CAR ALEXANDRIA MANUFACTURING FACILITY 6325 HWY 1 N ALEXANDRIA Louisiana 71303 0.004 0.0795 0.0835 0 0 0 0.0835
CHAMPION TECHNOLOGIES INC 350 CENTAURUS RD CORPUS CHRISTI Texas 78405 0.0805 0.002 0.0825 0 0 0 0.0825
ASHLAND DISTRIBUTION 400 MAIN ST TEWKSBURY Massachusetts 01876 0.076 0.006 0.082 0 0 0 0.082
Page 30 of 40

Table B-1. 2009 Emissions Inventory: Non-Zero Certain Glycol Ether Reported Releases
Facility Name Address City State Zip CodeOnsite Point
Source Emissions (tpy)
Onsite Fugitive
Emissions (tpy)
Total Air Emissions
(tpy)
Total Releases to Surface
Water (tpy)a
Total Releases to Soil (tpy)b
Total Releases to Other Media
(tpy)c
Total Emissions
(tpy)
THIRD COAST PACKAGING INC FRIENDSWOOD 18410 W CLOVER LN FRIENDSWOOD Texas 77549 0 0 0 0 0 0.0815 0.0815
BERNER CHEESE CORP 2034 E FACTORY RD DAKOTA Illinois 61018 0 0 0 0 0 0.0805 0.0805
CHAMPION TECHNOLOGIES INC 1100 HUGHIE LONG RD CRESSON Texas 76035 0.0795 0.0005 0.08 0 0 0 0.08
BUZZI UNICEM USA - GREENCASTLE PLANT 3301 S COUNTY RD 150 W GREENCASTLE Indiana 46135 0.0155 0.064 0.0795 0 0 0 0.0795
KEY POLYMER 17 SHEPARD ST LAWRENCE INDUSTLAWRENCE Massachusetts 01843 0 0.0165 0.0165 0 0 0.063 0.0795
TEXAS INSTRUMENTS INC 13500 N CENTRAL EXPRESSWAY DALLAS Texas 75243 0 0.0795 0.0795 0 0 0 0.0795
AVERY DENNISON PFD 650 W 67TH AVE SCHERERVILLE Indiana 46375 0.0545 0.025 0.0795 0 0 0 0.0795
ECOLAB 18383 E RAILROAD ST CITY OF INDUSTRY California 91748 0.018 0.061 0.079 0 0 0 0.079
LUBRIZOL 9550 W 55TH ST MC COOK Illinois 60525 0 0.078 0.078 0 0 0.078
ARCH CHEMICALS INC HWY 933 BRANDENBURG Kentucky 40108 0.02 0.058 0.078 0 0 0 0.078
PLAZE INC 105 BOLTE LN SAINT CLAIR Missouri 63077 0.078 0 0.078 0 0 0 0.078
ASHLAND DISTRIBUTION CO 5420 SPEAKER RD KANSAS CITY Kansas 66106 0.069 0.0085 0.0775 0 0 0 0.0775
AKZO NOBEL COATINGS INC 1000 INDUSTRIAL PARK DR CLINTON Mississippi 39056 0.0765 0 0.0765 0 0 0 0.0765
MATTHEWS INTERNATIONAL CORP 101 FAIRVIEW AVE PITTSBURGH Pennsylvania 15238 0.064 0.0125 0.0765 0 0 0 0.0765
CHEMICAL SOLVENTS JENNINGS ROAD FACILITY 3751 JENNINGS RD CLEVELAND Ohio 44109 0.069 0.003 0.072 0 0 0.0025 0.0745
CLOROX PRODUCTS MANUFACTURING CO 2600 HUNTINGTON DR FAIRFIELD California 94533 0.074 0.0005 0.0745 0 0 0 0.0745
LAMBERTI USA INC WHARTON CHEMICAL COMPLEX HWY 59 AT COUNTY RD 212 HUNGERFORD Texas 77448 0.0115 0 0.0115 0.021 0 0.042 0.0745
SPRAYLAT CORP 716 S COLUMBUS AVE MOUNT VERNON New York 10550 0.0035 0.0705 0.074 0 0 0 0.074
ENGINEERED POLYMER SOLUTIONS INC D/B/A VALSPAR COATINGS
2000 WESTHALL ST PITTSBURGH Pennsylvania 15233 0.063 0.0105 0.0735 0 0 0 0.0735
AKZO NOBEL COATINGS INC 1660 CROSS ST SE SALEM Oregon 97302 0.043 0.03 0.073 0 0 0 0.073
BOEHRINGER INGELHEIM CHEMICALS INC 2820 N NORMANDY RD PETERSBURG Virginia 23805 0.009 0.0635 0.0725 0 0 0 0.0725
VEYANCE TECHNOLOGIES INC 4021 N 56TH ST LINCOLN Nebraska 68504 0 0 0 0 0 0.072 0.072
VEOLIA ES TECHNICAL SOLUTIONS LLC PORT ARTHUR FACILITY
HWY 73, 35 MILES W OF TAYLOR BA PORT ARTHUR Texas 77640 0.071 0 0.071 0 0 0 0.071
ADCO CLEANING PRODUCTS LLC 900 W MAIN ST SEDALIA Missouri 65301 0.0235 0.0475 0.071 0 0 0 0.071
WARSAW CHEMICAL CO INC 390 ARGONNE RD WARSAW Indiana 46580 0.048 0.022 0.07 0 0 0 0.07
ENGINEERED POLYMER SOLUTIONS INC D/B/A VALSPAR COATINGS
901 W UNION ST MONTEBELLO California 90640 0.0635 0.0065 0.07 0 0 0 0.07
GENERAL DYNAMICS ORDNANCE & TACTICAL SYSTEMS GARLAND
1200 N GLENBROOK GARLAND Texas 75040 0.003 0 0.003 0 0 0.064 0.067
Page 31 of 40

Table B-1. 2009 Emissions Inventory: Non-Zero Certain Glycol Ether Reported Releases
Facility Name Address City State Zip CodeOnsite Point
Source Emissions (tpy)
Onsite Fugitive
Emissions (tpy)
Total Air Emissions
(tpy)
Total Releases to Surface
Water (tpy)a
Total Releases to Soil (tpy)b
Total Releases to Other Media
(tpy)c
Total Emissions
(tpy)
CARDINAL INDUSTRIAL FINISHES 1329 POTRERO AVE SOUTH EL MONTE California 91733 0.048 0.018 0.066 0 0 0 0.066
MINUTEMAN INTERNATIONAL MULTI-CLEAN DIV 600 CARDIGAN RD SHOREVIEW Minnesota 55126 0.063 0.0025 0.0655 0 0 0 0.0655
UNIVAR USA INC INDIANAPOLIS WEST BRANCH 5850 W 82ND ST INDIANAPOLIS Indiana 46268 0.003 0.0085 0.0115 0 0 0.0515 0.063
KARCHER NORTH AMERICA- PROCHEM 325 S PRICE RD CHANDLER Arizona 85224 0.0625 0 0.0625 0 0 0 0.0625
ICI PAINTS PUERTO RICO INC 65 INFANTERIA KM 134 CAROLINA Puerto Rico 00985 0.0615 0 0.0615 0 0 0 0.0615
COOK COMPOSITES & POLYMERS C O 13511 MAIN ST LEMONT Illinois 60439 0.017 0.044 0.061 0 0 0 0.061
MRCG-KRAFTMAID P1 16052 INDUSTRIAL PKWY MIDDLEFIELD Ohio 44062 0 0.0485 0.0485 0 0 0.0105 0.059
BRENNTAG SOUTHEAST INC 2000 E PETTIGREW ST DURHAM North Carolina 27703 0.043 0.015 0.058 0 0 0 0.058
CONOCOPHILLIPS CO EAST ST LOUIS TERMINAL 3300 MISSISSIPPI AVE CAHOKIA Illinois 62206 0 0.0575 0.0575 0 0 0 0.0575
CONTINENTAL CEMENT CO LLC 10107 HWY 79 HANNIBAL Missouri 63401 0.057 0 0.057 0 0 0 0.057
ECOLAB INC 261 HWY 155 S MC DONOUGH Georgia 30253 0.0185 0.0385 0.057 0 0 0.057
COGNIS CORP MAULDIN PLANT 1520 OLD STAGE RD MAULDIN South Carolina 29662 0.0465 0.0105 0.057 0 0 0 0.057
GRAPHIC CONTROLS LLC 400 EXCHANGE ST BUFFALO New York 14204 0.054 0 0.054 0 0 0 0.054
UNIVAR USA INC 7050 W 71ST ST BEDFORD PARK Illinois 60499 0.0285 0.025 0.0535 0 0 0 0.0535
ABC COMPOUNDING CO OF TEXAS INC 1102 AVE J E GRAND PRAIRIE Texas 75050 0.0025 0.051 0.0535 0 0 0 0.0535
HANNA STEEL CORP 220 HANNA DR PEKIN Illinois 61554 0.0035 0.0495 0.053 0 0 0 0.053
DYSTAR LP 209 WATLINGTON INDUSTRIAL DR REIDSVILLE North Carolina 27320 0.035 0.015 0.05 0 0 0 0.05
NORTHERN LABS INC WEST DRIVE 5800 W DR MANITOWOC Wisconsin 54220 0.049 0 0.049 0 0 0 0.049
BARTON SOLVENTS INC BETTENDORF 204 36TH ST BETTENDORF Iowa 52722 0.0115 0.0375 0.049 0 0 0 0.049
WHITFORD CORP 47 PARK AVE ELVERSON Pennsylvania 19520 0.046 0.0025 0.0485 0 0 0 0.0485
AMERICAN COATINGS INC 10625 MAHAFFEY RD TOMBALL Texas 77375 0.013 0.0355 0.0485 0 0 0 0.0485
NORMAN FOX & CO 5511 S BOYLE AVE VERNON California 90058 0.0025 0.046 0.0485 0 0 0.0485
KAY CHEMICAL CO 8300 CAPITAL DR GREENSBORO North Carolina 27409 0.0095 0.0385 0.048 0 0 0 0.048
ASHLAND DISTRIBUTION CO 5125 W HANNA AVE TAMPA Florida 33634 0.0015 0.0455 0.047 0 0 0 0.047
FRANKLIN INTERNATIONAL 2020 BRUCK ST COLUMBUS Ohio 43207 0.0045 0.0425 0.047 0 0 0 0.047
RECKITT BENCKISER 799 RT 206 & HILLSBOROUGH RD HILLSBOROUGH New Jersey 08844 0.045 0.001 0.046 0 0 0 0.046
INOAC PACKAGING GROUP 901 NUTTER DR BARDSTOWN Kentucky 40004 0 0.044 0.044 0 0 0 0.044
ECOLAB INC 3001 CHANNAHON RD JOLIET Illinois 60436 0.0305 0.0125 0.043 0 0 0 0.043
CORSICANA TECHNOLOGIES INC 2733 E HWY 31 CORSICANA Texas 75109 0.0065 0.018 0.0245 0 0 0.018 0.0425
Page 32 of 40

Table B-1. 2009 Emissions Inventory: Non-Zero Certain Glycol Ether Reported Releases
Facility Name Address City State Zip CodeOnsite Point
Source Emissions (tpy)
Onsite Fugitive
Emissions (tpy)
Total Air Emissions
(tpy)
Total Releases to Surface
Water (tpy)a
Total Releases to Soil (tpy)b
Total Releases to Other Media
(tpy)c
Total Emissions
(tpy)
KBP COIL COATERS INC 3600 E 44TH AVE DENVER Colorado 80216 0 0.042 0.042 0 0 0 0.042
ENTHONE INC 9809 INDUSTRIAL DR BRIDGEVIEW Illinois 60455 0.004 0.0375 0.0415 0 0 0 0.0415
FORD MOTOR CO MICHIGAN ASSEMBLY PLANT 38303 MICHIGAN AVE WAYNE Michigan 48184 0.0405 0 0.0405 0 0 0 0.0405
RECTICEL INTERIORS NORTH AMERICA LLC 1420 INDUSTRIAL PARK DR TUSCALOOSA Alabama 35401 0.0005 0.039 0.0395 0 0 0 0.0395
BIOLAB INC 1735 DOGWOOD DR CONYERS Georgia 30012 0.039 0 0.039 0 0 0 0.039
BARTON SOLVENTS INC WICHITA 201 S CEDAR VALLEY CENTER Kansas 67147 0.008 0.031 0.039 0 0 0 0.039
BARTON SOLVENTS INC KANSAS CITY 901 S 66TH TERRACE KANSAS CITY Kansas 66111 0.008 0.031 0.039 0 0 0 0.039
SHERWIN-WILLIAMS CO 630 E 13TH ANDOVER Kansas 67002 0.0285 0.01 0.0385 0 0 0 0.0385
CLEAN HARBORS EL DORADO LLC 309 AMERICAN CIR UNION EL DORADO Arkansas 71730 0.037 0 0.037 0 0 0.0005 0.0375
ECOLAB 383 N HIGH ST HEBRON Ohio 43025 0.0265 0.0105 0.037 0 0 0 0.037
EXCEL-POLYMERS LLC HWY 353 S PO BOX 377 JONESBOROUGH Tennessee 37659 0 0.0365 0.0365 0 0 0 0.0365
AIR PRODUCTS PERFORMANCE MANUFACTURING INC 337 VINCENT DR MILTON Wisconsin 53563 0.0025 0.0335 0.036 0 0 0 0.036
ECOLAB INC 942 BAKER RD MARTINSBURG West Virginia 25405 0.022 0.0135 0.0355 0 0 0 0.0355
HUNTSMAN ADVANCED MATERIALS AMERICAS INC 555 HUNTSMAN RD MC INTOSH Alabama 36553 0.0125 0.023 0.0355 0 0 0 0.0355
ETHOX CHEMICALS LLC 1801 PERIMETER RD GREENVILLE South Carolina 29605 0.0025 0.0325 0.035 0 0 0 0.035
RICHARDSAPEX INC 4202-24 MAIN ST PHILADELPHIA Pennsylvania 19127 0.025 0 0.025 0 0 0.0095 0.0345
GIANT CEMENT CO HWY 453 & I-26 (654 JUDGE ST) HARLEYVILLE South Carolina 29448 0.0015 0.0005 0.002 0 0 0.032 0.034
BRENNTAG NORTHEAST INC 81 W HULLER LN READING Pennsylvania 19605 0.0185 0.015 0.0335 0 0 0 0.0335
LUBRIZOL CORP 29400 LAKELAND BLVD WICKLIFFE Ohio 44092 0.033 0 0.033 0 0 0 0.033
RANBAR ELECTRICAL MATERIALS INC RTE 993 ONE MILE W OF RTE 130 MANOR Pennsylvania 15665 0 0.023 0.023 0 0 0.01 0.033
DUPONT PARLIN PLANT CHEESEQUAKE RD PARLIN New Jersey 08859 0.004 0.028 0.032 0 0 0 0.032
BARTON SOLVENTS INC WEST BEND 800 RAIL WAY WEST BEND Wisconsin 53095 0.005 0.0265 0.0315 0 0 0 0.0315
3M CO - KNOXVILLE 3406 E PLEASANT KNOXVILLE Iowa 50138 0 0.0315 0.0315 0 0 0 0.0315
SI GROUP INC 1000 MAIN ST ROTTERDAM JUNCTNew York 12150 0.009 0.0145 0.0235 0.007 0 0 0.0305
UNIVAR USA INC - INDIANAPOLIS 7425 E 30TH ST INDIANAPOLIS Indiana 46219 0.008 0.0225 0.0305 0 0 0 0.0305
MACDERMID INC 1221 FARROW AVE FERNDALE Michigan 48220 0.0135 0.015 0.0285 0 0 0 0.0285
MEADWESTVACO SOUTH CAROLINA LLC 400 CROSBY RD DERIDDER Louisiana 70634 0.0025 0.0255 0.028 0 0 0 0.028
CARBOLINE CO 900 OPELOUSAS ST LAKE CHARLES Louisiana 70601 0 0.028 0.028 0 0 0 0.028
ASHLAND DISTRIBUTION 2011 TURNER ST LANSING Michigan 48906 0.025 0.0025 0.0275 0 0 0 0.0275
Page 33 of 40
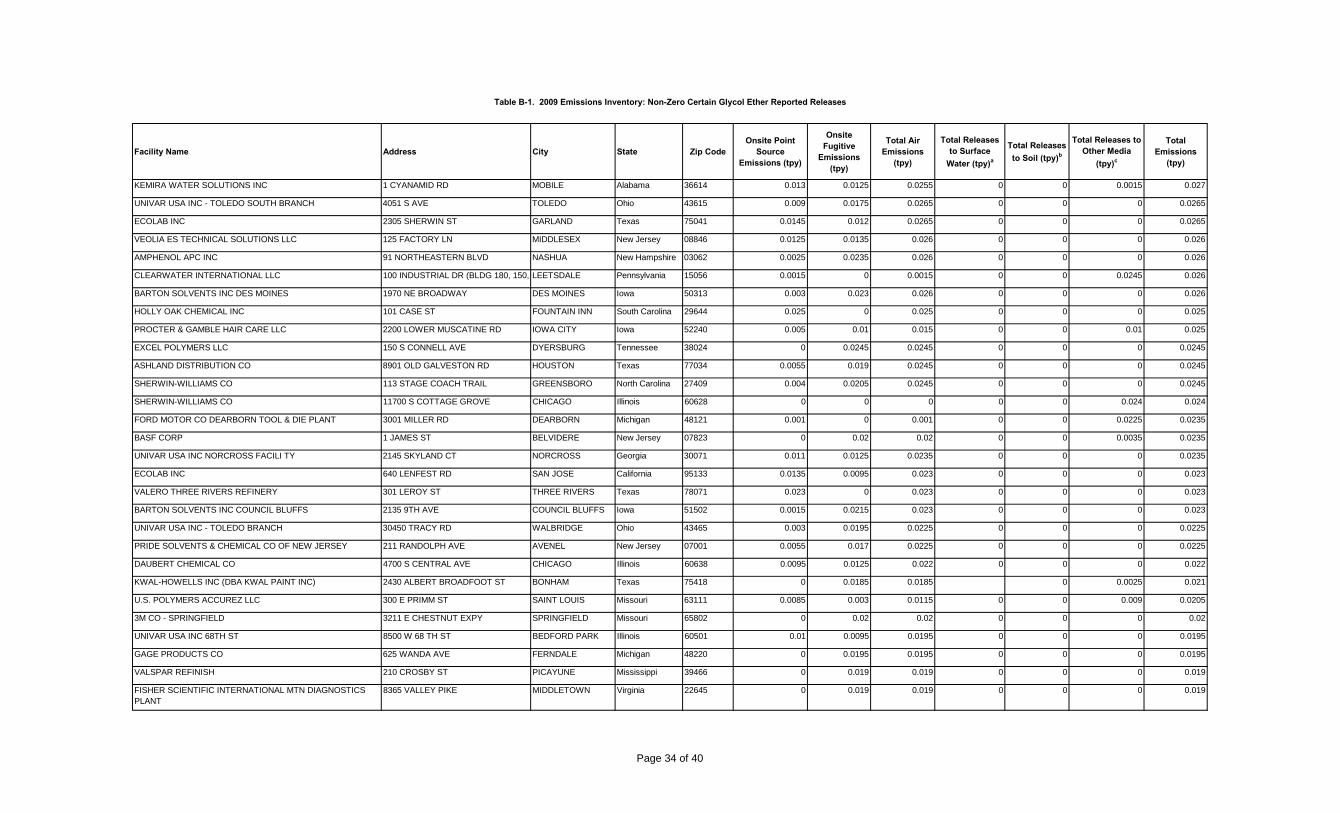
Table B-1. 2009 Emissions Inventory: Non-Zero Certain Glycol Ether Reported Releases
Facility Name Address City State Zip CodeOnsite Point
Source Emissions (tpy)
Onsite Fugitive
Emissions (tpy)
Total Air Emissions
(tpy)
Total Releases to Surface
Water (tpy)a
Total Releases to Soil (tpy)b
Total Releases to Other Media
(tpy)c
Total Emissions
(tpy)
KEMIRA WATER SOLUTIONS INC 1 CYANAMID RD MOBILE Alabama 36614 0.013 0.0125 0.0255 0 0 0.0015 0.027
UNIVAR USA INC - TOLEDO SOUTH BRANCH 4051 S AVE TOLEDO Ohio 43615 0.009 0.0175 0.0265 0 0 0 0.0265
ECOLAB INC 2305 SHERWIN ST GARLAND Texas 75041 0.0145 0.012 0.0265 0 0 0 0.0265
VEOLIA ES TECHNICAL SOLUTIONS LLC 125 FACTORY LN MIDDLESEX New Jersey 08846 0.0125 0.0135 0.026 0 0 0 0.026
AMPHENOL APC INC 91 NORTHEASTERN BLVD NASHUA New Hampshire 03062 0.0025 0.0235 0.026 0 0 0 0.026
CLEARWATER INTERNATIONAL LLC 100 INDUSTRIAL DR (BLDG 180, 150, LEETSDALE Pennsylvania 15056 0.0015 0 0.0015 0 0 0.0245 0.026
BARTON SOLVENTS INC DES MOINES 1970 NE BROADWAY DES MOINES Iowa 50313 0.003 0.023 0.026 0 0 0 0.026
HOLLY OAK CHEMICAL INC 101 CASE ST FOUNTAIN INN South Carolina 29644 0.025 0 0.025 0 0 0 0.025
PROCTER & GAMBLE HAIR CARE LLC 2200 LOWER MUSCATINE RD IOWA CITY Iowa 52240 0.005 0.01 0.015 0 0 0.01 0.025
EXCEL POLYMERS LLC 150 S CONNELL AVE DYERSBURG Tennessee 38024 0 0.0245 0.0245 0 0 0 0.0245
ASHLAND DISTRIBUTION CO 8901 OLD GALVESTON RD HOUSTON Texas 77034 0.0055 0.019 0.0245 0 0 0 0.0245
SHERWIN-WILLIAMS CO 113 STAGE COACH TRAIL GREENSBORO North Carolina 27409 0.004 0.0205 0.0245 0 0 0 0.0245
SHERWIN-WILLIAMS CO 11700 S COTTAGE GROVE CHICAGO Illinois 60628 0 0 0 0 0 0.024 0.024
FORD MOTOR CO DEARBORN TOOL & DIE PLANT 3001 MILLER RD DEARBORN Michigan 48121 0.001 0 0.001 0 0 0.0225 0.0235
BASF CORP 1 JAMES ST BELVIDERE New Jersey 07823 0 0.02 0.02 0 0 0.0035 0.0235
UNIVAR USA INC NORCROSS FACILI TY 2145 SKYLAND CT NORCROSS Georgia 30071 0.011 0.0125 0.0235 0 0 0 0.0235
ECOLAB INC 640 LENFEST RD SAN JOSE California 95133 0.0135 0.0095 0.023 0 0 0 0.023
VALERO THREE RIVERS REFINERY 301 LEROY ST THREE RIVERS Texas 78071 0.023 0 0.023 0 0 0 0.023
BARTON SOLVENTS INC COUNCIL BLUFFS 2135 9TH AVE COUNCIL BLUFFS Iowa 51502 0.0015 0.0215 0.023 0 0 0 0.023
UNIVAR USA INC - TOLEDO BRANCH 30450 TRACY RD WALBRIDGE Ohio 43465 0.003 0.0195 0.0225 0 0 0 0.0225
PRIDE SOLVENTS & CHEMICAL CO OF NEW JERSEY 211 RANDOLPH AVE AVENEL New Jersey 07001 0.0055 0.017 0.0225 0 0 0 0.0225
DAUBERT CHEMICAL CO 4700 S CENTRAL AVE CHICAGO Illinois 60638 0.0095 0.0125 0.022 0 0 0 0.022
KWAL-HOWELLS INC (DBA KWAL PAINT INC) 2430 ALBERT BROADFOOT ST BONHAM Texas 75418 0 0.0185 0.0185 0 0.0025 0.021
U.S. POLYMERS ACCUREZ LLC 300 E PRIMM ST SAINT LOUIS Missouri 63111 0.0085 0.003 0.0115 0 0 0.009 0.0205
3M CO - SPRINGFIELD 3211 E CHESTNUT EXPY SPRINGFIELD Missouri 65802 0 0.02 0.02 0 0 0 0.02
UNIVAR USA INC 68TH ST 8500 W 68 TH ST BEDFORD PARK Illinois 60501 0.01 0.0095 0.0195 0 0 0 0.0195
GAGE PRODUCTS CO 625 WANDA AVE FERNDALE Michigan 48220 0 0.0195 0.0195 0 0 0 0.0195
VALSPAR REFINISH 210 CROSBY ST PICAYUNE Mississippi 39466 0 0.019 0.019 0 0 0 0.019
FISHER SCIENTIFIC INTERNATIONAL MTN DIAGNOSTICS PLANT
8365 VALLEY PIKE MIDDLETOWN Virginia 22645 0 0.019 0.019 0 0 0 0.019
Page 34 of 40

Table B-1. 2009 Emissions Inventory: Non-Zero Certain Glycol Ether Reported Releases
Facility Name Address City State Zip CodeOnsite Point
Source Emissions (tpy)
Onsite Fugitive
Emissions (tpy)
Total Air Emissions
(tpy)
Total Releases to Surface
Water (tpy)a
Total Releases to Soil (tpy)b
Total Releases to Other Media
(tpy)c
Total Emissions
(tpy)
ZEP COMMERCIAL 350 JOE FRANK HARRIS PKWY EMERSON Georgia 30137 0 0.019 0.019 0 0 0 0.019
STEEL DYNAMICS INC 4500 COUNTY RD 59 BUTLER Indiana 46721 0 0.0185 0.0185 0 0 0 0.0185
TRANSTAR AUTOBODY TECHNOLOGIES 2040 HEISERMAN DR BRIGHTON Michigan 48114 0.009 0.009 0.018 0 0 0 0.0175
ASHLAND DISTRIBUTION CO 1842 ENTERPRISE PKWY TWINSBURG Ohio 44087 0.0025 0.0145 0.017 0 0 0 0.017
BLENTECH CORP 1305 RYE ST HOUSTON Texas 77029 0.0125 0.0015 0.014 0 0 0.0025 0.0165
ARLON INC ADHESIVES & FILMS DIV 2811 S HARBOR BLVD SANTA ANA California 92704 0 0.0165 0.0165 0 0 0 0.0165
HENKEL 14351 HWY 221 ENOREE South Carolina 29335 0.0005 0.0145 0.015 0 0 0 0.015
CHEMDESIGN PRODUCTS INC 2 STANTON ST MARINETTE Wisconsin 54143 0.006 0.0085 0.0145 0 0 0 0.0145
MONSANTO CO 2500 WIGGINS RD MUSCATINE Iowa 52761 0.0135 0.001 0.0145 0 0 0 0.0145
SHERWIN-WILLIAMS CO 6795 S MAIN ST MORROW Georgia 30260 0.004 0.0105 0.0145 0 0 0 0.0145
PRIDE SOLVENT & CHEMICAL CO OF NY INC 6 LONG ISLAND AVE HOLTSVILLE New York 11742 0.0035 0.0105 0.014 0 0 0 0.014
SIMONIZ USA INC 201 BOSTON TURNPIKE BOLTON Connecticut 06043 0.0125 0.001 0.0135 0 0 0 0.013
BRULIN CORP 2920 DR ANDREW J BROWN AVE INDIANAPOLIS Indiana 46205 0.003 0.0095 0.0125 0 0 0 0.0125
EVONIK DEGUSSA CORP 4201 DEGUSSA RD THEODORE Alabama 36582 0.012 0.0005 0.0125 0 0 0 0.0125
UNIVAR USA INC 2600 S GARFIELD AVE COMMERCE California 90040 0.011 0.0015 0.0125 0 0 0 0.0125
HUBBARD-HALL INC 563 S LEONARD ST WATERBURY Connecticut 06708 0.0005 0.0115 0.012 0 0 0 0.012
GOODWIN CO 700 PROGRESS CENTER AVE LAWRENCEVILLE Georgia 30043 0.011 0.0005 0.0115 0 0 0 0.0115
HENKEL CORP 421 LONDON RD DELAWARE Ohio 43015 0.005 0.0065 0.0115 0 0 0 0.0115
SHERWIN-WILLIAMS CO 2325 HOLLINS FERRY RD BALTIMORE Maryland 21230 0.0065 0.004 0.0105 0 0 0 0.0105
PRC-DESOTO INTERNATIONAL INC 11601 UNITED ST MOJAVE California 93501 0.004 0.006 0.01 0 0 0 0.01
BERRIDGE MANUFACTURING CO 6515 FRATT RD SAN ANTONIO Texas 78218 0 0.01 0.01 0 0 0 0.01
BUCKLEY OIL CO 1809 ROCK ISLAND ST DALLAS Texas 75207 0.0075 0.0025 0.01 0 0 0 0.01
CHEMOL CO INC 2300 RANDOLPH AVE GREENSBORO North Carolina 27406 0 0.0095 0.0095 0 0 0 0.0095
HYDRITE CHEMICAL CO 2545 BOND ST UNIVERSITY PARK Illinois 60466 0 0.0095 0.0095 0 0 0 0.0095
TRUE VALUE MANUFACTURING 201 JANDUS RD CARY Illinois 60013 0.0025 0.007 0.0095 0 0 0 0.0095
DAVIES IMPERIAL COATINGS INC 1275 STATE ST HAMMOND Indiana 46320 0.0095 0 0.0095 0 0 0 0.0095
UNIVAR USA INC SANTA FE SPRINGS 13900 CARMENITA RD SANTA FE SPRINGS California 90670 0.003 0.0065 0.0095 0 0 0 0.0095
HENKEL ONTARIO 1496 E FRANCIS ST ONTARIO California 91761 0.0015 0.0075 0.009 0 0 0 0.009
BENJAMIN MOORE & CO PELL CITY 109 BAMBERG DR PELL CITY Alabama 35125 0.0085 0 0.0085 0 0 0 0.0085
Page 35 of 40

Table B-1. 2009 Emissions Inventory: Non-Zero Certain Glycol Ether Reported Releases
Facility Name Address City State Zip CodeOnsite Point
Source Emissions (tpy)
Onsite Fugitive
Emissions (tpy)
Total Air Emissions
(tpy)
Total Releases to Surface
Water (tpy)a
Total Releases to Soil (tpy)b
Total Releases to Other Media
(tpy)c
Total Emissions
(tpy)
GEORGIA-PACIFIC CHEMICALS LLC 1429 E LUFKIN AVE LUFKIN Texas 75901 0.008 0.0005 0.0085 0 0 0 0.0085
SHERWIN-WILLIAMS CO 26300 FARGO AVE BEDFORD HEIGHTS Ohio 44146 0.0005 0.0015 0.002 0 0 0.0065 0.0085
CRODA INC 315 CHERRY LN NEW CASTLE Delaware 19720 0.0075 0.0005 0.008 0 0 0 0.008
TARR ACQUISITION LLC 2429 N BORTHWICK AVE PORTLAND Oregon 97227 0.008 0 0.008 0 0 0 0.008
INTERSTATE CHEMICAL CO INC 23247 W EAMES ST CHANNAHON Illinois 60410 0.0025 0.0055 0.008 0 0 0 0.0075
DSM DESOTECH INC 1101 HWY 27 S STANLEY North Carolina 28164 0 0.0075 0.0075 0 0 0 0.0075
NEW DAWN MANUFACTURING CO 16001 TRADE ZONE AVE UPPER MARLBORO Maryland 20774 0.0075 0 0.0075 0 0 0 0.0075
RUSTOLEUM CORP 7850 OHIO RIVER RD LESAGE West Virginia 25537 0.0025 0.005 0.0075 0 0 0 0.0075
3M COTTAGE GROVE CENTER 10746 INNOVATION RD COTTAGE GROVE Minnesota 55016 0 0.002 0.002 0 0 0.0055 0.0075
SHERWIN-WILLIAMS CO 12401 INDUSTRIAL BLVD VICTORVILLE California 92392 0.0035 0.004 0.0075 0 0 0 0.0075
DYNALOY LLC 6445 OLIVIA LN INDIANAPOLIS Indiana 46226 0.0015 0.006 0.0075 0 0 0 0.0075
LUBRIZOL CORP PAINESVIL LE PLANT 155 FREEDOM RD PAINESVILLE Ohio 44077 0.0065 0.001 0.0075 0 0 0 0.0075
SCOT LABORATORIES 16841 PARK CIR DR CHAGRIN FALLS Ohio 44023 0.0025 0 0.0025 0 0.0025 0.0025 0.0075
CLOROX PRODUCTS MANUFACTURING CO 17 LAKE MIRROR RD FOREST PARK Georgia 30297 0.0035 0.0035 0.007 0 0 0.0005 0.0075
CUSTOM CHEMICAL FORMULATORS 8707 MILLERGROVE DR SANTA FE SPRINGS California 90670 0.007 0 0.007 0 0 0 0.007
HENKEL CORP 923 MAULDIN RD CALHOUN Georgia 30701 0 0.0065 0.0065 0 0 0 0.0065
UNIVAR USA INC - SAN JOSE 2256 JUNCTION AVE SAN JOSE California 95131 0.003 0.0035 0.0065 0 0 0 0.0065
DOW CHEMICAL JOLIET SITE 26332 S FRONTAGE RD W CHANNAHON Illinois 60410 0 0.0065 0.0065 0 0 0 0.0065
KEYSTONE CEMENT CO RT 329 BATH Pennsylvania 18014 0 0.0065 0.0065 0 0 0 0.0065
PROCTER & GAMBLE MANUFACTURING CO 1900 KANSAS AVE KANSAS CITY Kansas 66105 0.006 0 0.006 0 0 0 0.006
ENGINEERED POLYMER SOLUTIONS INC D/B/A VALSPAR COATINGS
546 W ABBOTT ST INDIANAPOLIS Indiana 46225 0 0.006 0.006 0 0 0 0.006
AROMATIC TECHNOLOGIES INC 130 INDUSTRIAL PKWY SOMERVILLE New Jersey 08876 0.0055 0 0.0055 0 0 0 0.0055
CALLAHAN CHEMICAL CO 200 INDUSTRIAL AVE RIDGEFIELD PARK New Jersey 07660 0.003 0.0025 0.0055 0 0 0 0.0055
ACTEGA RADCURE INC 5 MANSARD CT WAYNE New Jersey 07470 0.0025 0.0025 0.005 0 0 0 0.005
INDEPENDENT INK INC 14705 S AVALON BLVD GARDENA California 90248 0.0025 0.0025 0.005 0 0 0.005
US ECOLOGY TEXAS INC 3277 COUNTY RD 69 ROBSTOWN Texas 78380 0.0025 0 0.0025 0 0.0025 0 0.005
CUSTOM SYNTHESIS LLC 1704 DENVER RD ANDERSON South Carolina 29625 0.0025 0.0025 0.005 0 0 0 0.005
WORWAG COATINGS LLC NA 3420 KOSSUTH ST LAFAYETTE Indiana 47905 0.0025 0.0025 0.005 0 0 0.005
CR BRANDS INC 141 VENTURE BLVD SPARTANBURG South Carolina 29306 0.0025 0.0025 0.005 0 0 0 0.005
Page 36 of 40

Table B-1. 2009 Emissions Inventory: Non-Zero Certain Glycol Ether Reported Releases
Facility Name Address City State Zip CodeOnsite Point
Source Emissions (tpy)
Onsite Fugitive
Emissions (tpy)
Total Air Emissions
(tpy)
Total Releases to Surface
Water (tpy)a
Total Releases to Soil (tpy)b
Total Releases to Other Media
(tpy)c
Total Emissions
(tpy)
CENTRAL SOLUTIONS INC 401 FUNSTON RD KANSAS CITY Kansas 66115 0 0 0 0 0.005 0 0.005
UNIVAR USA INC LAKEVILLE 21675 HAMBURG AVE LAKEVILLE Minnesota 55044 0.0025 0.0025 0.005 0 0 0 0.005
CAR CARE PACKAGING LLC 1910 S STATE AVE INDIANAPOLIS Indiana 46203 0.0005 0.0045 0.005 0 0 0 0.005
SHIELD PACKAGING CO INC 50 OXFORD AVE DUDLEY Massachusetts 01571 0.0025 0.0025 0.005 0 0 0 0.005
GOODWIN CO 12361 MONARCH ST GARDEN GROVE California 92841 0.0045 0.0005 0.005 0 0 0 0.005
C P INC 196 S WATER CONNERSVILLE Indiana 47331 0.0025 0.0025 0.005 0 0 0 0.005
INTEL CORP - RONLER ACRES CAMPUS 2501 NW 229TH ST HILLSBORO Oregon 97124 0.0025 0.0025 0.005 0 0 0 0.005
BRAIN POWER INC 4470 SW 74TH AVE MIAMI Florida 33155 0.0025 0.0025 0.005 0 0 0 0.005
SARTOMER CO INC 601 TIGHTSQUEEZE INDUSTRIAL RDCHATHAM Virginia 24531 0.0025 0.0025 0.005 0 0 0 0.005
CHAMPION PACKAGING & DISTRIBUTING INC 1840 INTERNATIONALE PKWY WOODRIDGE Illinois 60517 0.0025 0.0025 0.005 0 0 0 0.005
INTEL CORP 4500 S DOBSON RD MAIL STOP: OC4CHANDLER Arizona 85248 0.0025 0.0025 0.005 0 0 0 0.005
SARTOMER CO INC 610 S BOLMAR ST WEST CHESTER Pennsylvania 19382 0.0025 0.0025 0.005 0 0 0 0.005
ASHLAND DISTRIBUTION CO FREEPORT CENTER BUILDING 12 POCLEARFIELD Utah 84016 0.0015 0.003 0.0045 0 0 0 0.0045
ENGINEERED POLYMER SOLUTIONS INC D/B/A VALSPAR COATINGS
1215 NELSON BLVD ROCKFORD Illinois 61104 0 0.0045 0.0045 0 0 0 0.0045
KING INDUSTRIES INC SCIENCE RD NORWALK Connecticut 06852 0.002 0.002 0.004 0 0 0 0.004
COGNIS CORP -- CHARLOTT E PLANT 3300 WESTINGHOUSE BLVD CHARLOTTE North Carolina 28273 0.004 0 0.004 0 0 0 0.004
OMNIUM 1280 IMPERIAL RD HAMPTON Iowa 50441 0.0025 0.0015 0.004 0 0 0 0.004
CALLAHAN CHEMICAL CO 18 INDUSTRIAL RD WALPOLE Massachusetts 02081 0.002 0.0015 0.0035 0 0 0 0.0035
UNIVAR USA INC HOUSTON 777 BRISBANE ST HOUSTON Texas 77061 0.0035 0 0.0035 0 0 0 0.0035
PENRAY COMPANIES INC 1801 ESTES AVE ELK GROVE VILLAGEIllinois 60007 0.0005 0.0005 0.001 0.0025 0 0 0.0035
ENGINEERED POLYMER SOLUTIONS INC 5501 E SLAUSON AVE CITY OF COMMERCECalifornia 90040 0.003 0.0005 0.0035 0 0 0 0.0035
CARESTREAM HEALTH COLORADO 2000 HOWARD SMITH AVE W C42 WINDSOR Colorado 80550 0.0035 0 0.0035 0 0 0 0.0035
BAKER PETROLITE BAYPORT FACILI TY 13200 BAYPARK RD PASADENA Texas 77507 0.0035 0 0.0035 0 0 0 0.0035
PENRAY COMPANIES INC 440 DENNISTON CT WHEELING Illinois 60090 0.0005 0.0005 0.001 0.0025 0 0 0.0035
BAKER PETROLITE 5135 BOYLAN ST BAKERSFIELD California 93308 0.0025 0.0005 0.003 0 0 0 0.003
DYNASOL INC 330 PINE ST CANTON Massachusetts 02021 0.003 0 0.003 0 0 0 0.003
NORLITE CORP 628 S SARATOGA ST COHOES New York 12047 0.003 0 0.003 0 0 0 0.003
FORD MOTOR CO DEARBORN DIVERSIFIED MANUFACTURING
3001 MILLER RD DEARBORN Michigan 48121 0.003 0 0.003 0 0 0 0.003
Page 37 of 40

Table B-1. 2009 Emissions Inventory: Non-Zero Certain Glycol Ether Reported Releases
Facility Name Address City State Zip CodeOnsite Point
Source Emissions (tpy)
Onsite Fugitive
Emissions (tpy)
Total Air Emissions
(tpy)
Total Releases to Surface
Water (tpy)a
Total Releases to Soil (tpy)b
Total Releases to Other Media
(tpy)c
Total Emissions
(tpy)
CALLAHAN CHEMICAL CO BROAD ST & FILMORE AVE PALMYRA New Jersey 08065 0.0015 0.0015 0.003 0 0 0 0.003
BAKER PETROLITE CORP 16950 WALLISVILLE RD HOUSTON Texas 77049 0.0005 0.002 0.0025 0 0 0.0005 0.003
HEXION SPECIALTY CHEMICALS INC 2801 LYNWOOD RD LYNWOOD California 90262 0.0005 0.0025 0.003 0 0 0 0.003
MAINTEX INC 13300 E NELSON AVE CITY OF INDUSTRY California 91746 0.0025 0 0.0025 0 0 0 0.0025
CLEAN HARBORS ENVIRONMENTAL SERVICES INC 2247 S HWY 71 KIMBALL Nebraska 69145 0.002 0.0005 0.0025 0 0 0 0.0025
ECP INC WOODRIDGE 11210 KATHERINE'S CROSSING SUITWOODRIDGE Illinois 60517 0.0025 0 0.0025 0 0 0 0.0025
UNIVAR USA INC MEMPHIS 3909 OUTLAND RD MEMPHIS Tennessee 38118 0.0025 0 0.0025 0 0 0 0.0025
CR BRANDS INC 230 OLD CONVERSE RD SPARTANBURG South Carolina 29307 0.0025 0 0.0025 0 0 0 0.0025
MAHONING PAINT CORP 653 JONES ST YOUNGSTOWN Ohio 44502 0.0025 0 0.0025 0 0 0.0025
UNION SPECIALTIES INC 3 MALCOLM HOYT DR NEWBURYPORT Massachusetts 01950 0.0005 0.002 0.0025 0 0 0 0.0025
UNIVAR USA INC DENVER 4300 HOLLY ST DENVER Colorado 80216 0.0025 0 0.0025 0 0 0 0.0025
SINCLAIR WYOMING REFINING CO 100 E LINCOLN AVE SINCLAIR Wyoming 82334 0 0.0025 0.0025 0 0 0 0.0025
ATOTECH USA 1750 OVERVIEW DR ROCK HILL South Carolina 29730 0.0025 0 0.0025 0 0 0 0.0025
FINGER LAKES CHEMICAL INC 418-424 ST PAUL ST ROCHESTER New York 14605 0.0025 0 0.0025 0 0 0 0.0025
MALLINCKRODT BAKER INC 600 N BROAD ST PHILLIPSBURG New Jersey 08865 0.0025 0 0.0025 0 0 0 0.0025
CHEMTEX LABORATORIES INC 2725 ARMENTROUT DR CONCORD North Carolina 28025 0.0025 0 0.0025 0 0 0 0.0025
WYNNEWOOD REFINING CO 906 S POWELL WYNNEWOOD Oklahoma 73098 0 0.0025 0.0025 0 0 0 0.0025
BASF CORP 100 INDUSTRIAL BLVD SEAFORD Delaware 19973 0.0025 0 0.0025 0 0 0 0.0025
CONOCOPHILLIPS CO TREMLEY POINT TERMINAL FOOT OF S WOOD AVE LINDEN New Jersey 07036 0.0025 0 0.0025 0 0 0 0.0025
CONOCOPHILLIPS MT VERNON PRODUCTS TERMINAL 15138 HWY 96 MOUNT VERNON Missouri 65712 0 0.0025 0.0025 0 0 0 0.0025
NIACET CORP 400 47TH ST NIAGARA FALLS New York 14304 0.0025 0 0.0025 0 0 0 0.0025
MAGNABLEND INC-CENTRAL PLANT 1601 W HWY 287 BYPASS WAXAHACHIE Texas 75165 0.0025 0 0.0025 0 0 0.0025
INTEL CORP 4100 SARA RD MS RR5-491 RIO RANCHO New Mexico 87124 0.0025 0 0.0025 0 0 0 0.0025
HERCULES INC 1111 HERCULES RD HOPEWELL Virginia 23860 0.0025 0 0.0025 0 0 0 0.0025
MILPORT ENTERPRISES INC 2829 S 5TH CT MILWAUKEE Wisconsin 53207 0 0.002 0.002 0 0 0 0.002
DELTA HOUSTON 334 TIDAL RD DEER PARK Texas 77536 0.0015 0 0.0015 0 0 0.0005 0.002
ASTRO CHEMICALS INC 126 MEMORIAL DR SPRINGFIELD Massachusetts 01104 0.0015 0.0005 0.002 0 0 0 0.002
DUPONT EKC TECHNOLOGY 2520 BARRINGTON CT HAYWARD California 94545 0.0005 0.0015 0.002 0 0 0 0.002
DOBER CHEMICAL CORP 14461 WAVERLY AVE MIDLOTHIAN Illinois 60445 0.002 0 0.002 0 0 0 0.002
Page 38 of 40
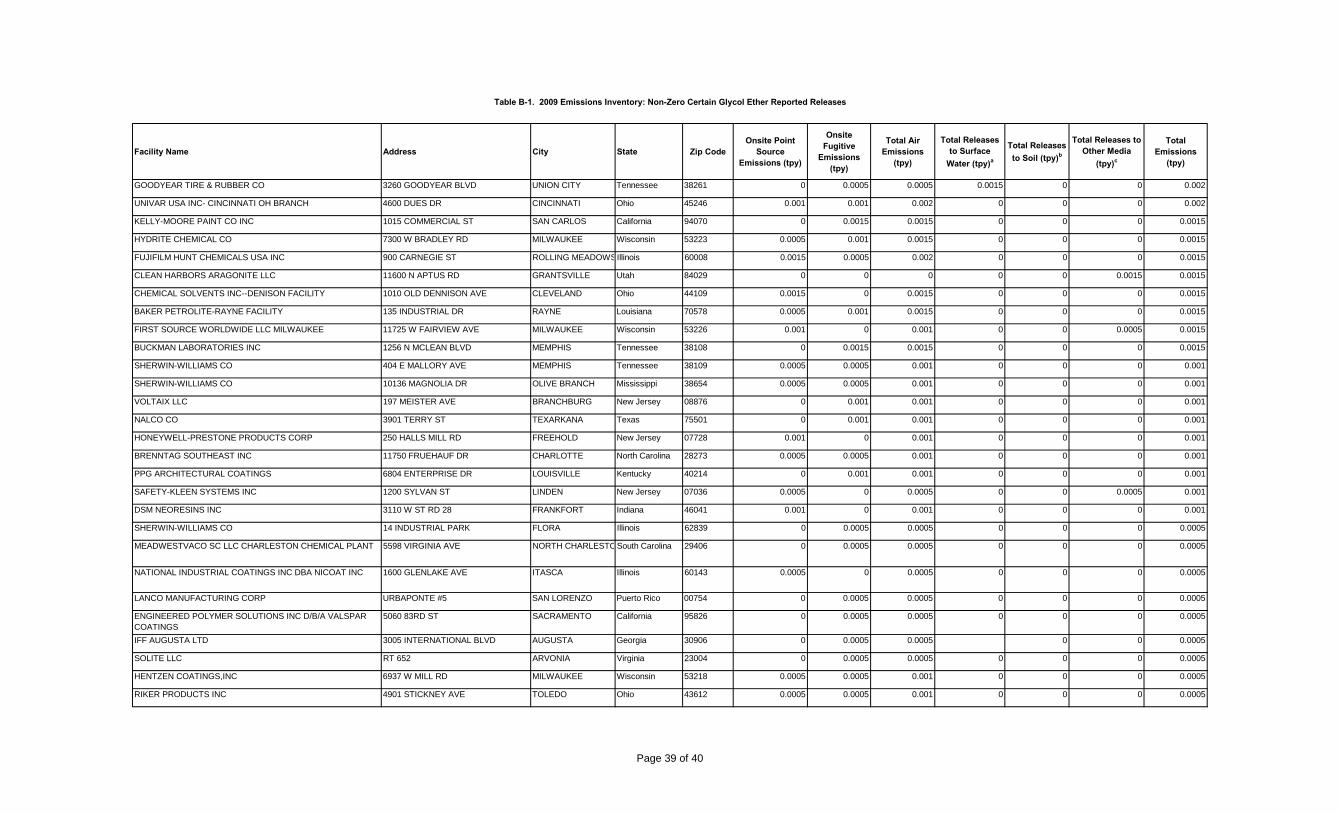
Table B-1. 2009 Emissions Inventory: Non-Zero Certain Glycol Ether Reported Releases
Facility Name Address City State Zip CodeOnsite Point
Source Emissions (tpy)
Onsite Fugitive
Emissions (tpy)
Total Air Emissions
(tpy)
Total Releases to Surface
Water (tpy)a
Total Releases to Soil (tpy)b
Total Releases to Other Media
(tpy)c
Total Emissions
(tpy)
GOODYEAR TIRE & RUBBER CO 3260 GOODYEAR BLVD UNION CITY Tennessee 38261 0 0.0005 0.0005 0.0015 0 0 0.002
UNIVAR USA INC- CINCINNATI OH BRANCH 4600 DUES DR CINCINNATI Ohio 45246 0.001 0.001 0.002 0 0 0 0.002
KELLY-MOORE PAINT CO INC 1015 COMMERCIAL ST SAN CARLOS California 94070 0 0.0015 0.0015 0 0 0 0.0015
HYDRITE CHEMICAL CO 7300 W BRADLEY RD MILWAUKEE Wisconsin 53223 0.0005 0.001 0.0015 0 0 0 0.0015
FUJIFILM HUNT CHEMICALS USA INC 900 CARNEGIE ST ROLLING MEADOWSIllinois 60008 0.0015 0.0005 0.002 0 0 0 0.0015
CLEAN HARBORS ARAGONITE LLC 11600 N APTUS RD GRANTSVILLE Utah 84029 0 0 0 0 0 0.0015 0.0015
CHEMICAL SOLVENTS INC--DENISON FACILITY 1010 OLD DENNISON AVE CLEVELAND Ohio 44109 0.0015 0 0.0015 0 0 0 0.0015
BAKER PETROLITE-RAYNE FACILITY 135 INDUSTRIAL DR RAYNE Louisiana 70578 0.0005 0.001 0.0015 0 0 0 0.0015
FIRST SOURCE WORLDWIDE LLC MILWAUKEE 11725 W FAIRVIEW AVE MILWAUKEE Wisconsin 53226 0.001 0 0.001 0 0 0.0005 0.0015
BUCKMAN LABORATORIES INC 1256 N MCLEAN BLVD MEMPHIS Tennessee 38108 0 0.0015 0.0015 0 0 0 0.0015
SHERWIN-WILLIAMS CO 404 E MALLORY AVE MEMPHIS Tennessee 38109 0.0005 0.0005 0.001 0 0 0 0.001
SHERWIN-WILLIAMS CO 10136 MAGNOLIA DR OLIVE BRANCH Mississippi 38654 0.0005 0.0005 0.001 0 0 0 0.001
VOLTAIX LLC 197 MEISTER AVE BRANCHBURG New Jersey 08876 0 0.001 0.001 0 0 0 0.001
NALCO CO 3901 TERRY ST TEXARKANA Texas 75501 0 0.001 0.001 0 0 0 0.001
HONEYWELL-PRESTONE PRODUCTS CORP 250 HALLS MILL RD FREEHOLD New Jersey 07728 0.001 0 0.001 0 0 0 0.001
BRENNTAG SOUTHEAST INC 11750 FRUEHAUF DR CHARLOTTE North Carolina 28273 0.0005 0.0005 0.001 0 0 0 0.001
PPG ARCHITECTURAL COATINGS 6804 ENTERPRISE DR LOUISVILLE Kentucky 40214 0 0.001 0.001 0 0 0 0.001
SAFETY-KLEEN SYSTEMS INC 1200 SYLVAN ST LINDEN New Jersey 07036 0.0005 0 0.0005 0 0 0.0005 0.001
DSM NEORESINS INC 3110 W ST RD 28 FRANKFORT Indiana 46041 0.001 0 0.001 0 0 0 0.001
SHERWIN-WILLIAMS CO 14 INDUSTRIAL PARK FLORA Illinois 62839 0 0.0005 0.0005 0 0 0 0.0005
MEADWESTVACO SC LLC CHARLESTON CHEMICAL PLANT 5598 VIRGINIA AVE NORTH CHARLESTOSouth Carolina 29406 0 0.0005 0.0005 0 0 0 0.0005
NATIONAL INDUSTRIAL COATINGS INC DBA NICOAT INC 1600 GLENLAKE AVE ITASCA Illinois 60143 0.0005 0 0.0005 0 0 0 0.0005
LANCO MANUFACTURING CORP URBAPONTE #5 SAN LORENZO Puerto Rico 00754 0 0.0005 0.0005 0 0 0 0.0005
ENGINEERED POLYMER SOLUTIONS INC D/B/A VALSPAR COATINGS
5060 83RD ST SACRAMENTO California 95826 0 0.0005 0.0005 0 0 0 0.0005
IFF AUGUSTA LTD 3005 INTERNATIONAL BLVD AUGUSTA Georgia 30906 0 0.0005 0.0005 0 0 0.0005
SOLITE LLC RT 652 ARVONIA Virginia 23004 0 0.0005 0.0005 0 0 0 0.0005
HENTZEN COATINGS,INC 6937 W MILL RD MILWAUKEE Wisconsin 53218 0.0005 0.0005 0.001 0 0 0 0.0005
RIKER PRODUCTS INC 4901 STICKNEY AVE TOLEDO Ohio 43612 0.0005 0.0005 0.001 0 0 0 0.0005
Page 39 of 40

Table B-1. 2009 Emissions Inventory: Non-Zero Certain Glycol Ether Reported Releases
Facility Name Address City State Zip CodeOnsite Point
Source Emissions (tpy)
Onsite Fugitive
Emissions (tpy)
Total Air Emissions
(tpy)
Total Releases to Surface
Water (tpy)a
Total Releases to Soil (tpy)b
Total Releases to Other Media
(tpy)c
Total Emissions
(tpy)
CLARIANT CORP CLEAR LAKE PLANT 9502 BAYPORT BLVD - ETOX UNIT PASADENA Texas 77507 0.0005 0 0.0005 0 0 0 0.0005
LAMBERTI SYNTHESIS USA INC 4001 N HAWTHORNE ST CHATTANOOGA Tennessee 37406 0.0005 0 0.0005 0 0 0 0.0005
a. Releases to Surface Water reported as "On-Site Releases to Surface Water."b. Releases to Soil is the sum of reported releases to onsite and offsite releases to land treatment and other land disposal.c. Releases to other media include reported releases to onsite and offsite groundwater and landfills.tpy: tons per year
Page 40 of 40

Table B-2. 2010 Emissions Inventory: Non-Zero Certain Glycol Ether Reported Releases
Facility Name Address City State Zip Code
Onsite Point Source
Emissions (tpy)
Onsite Fugitive
Emissions (tpy)
Total Air Emissions
(tpy)
Total Releases to Surface
Water (tpy)a
Total Releases to Soil (tpy)b
Total Releases to Other Media
(tpy)c
Total Emissions (tpy)
EQ DETROIT INC 1923 FREDERICK DETROIT Michigan 48211 0 1.8155 1.8155 0 363.538 365.3535
REXAM BEVERAGE CAN CO RE: WINSTON SALEM PLANT 4000 OLD MILWAUKEE LN WINSTON-SALEM North Carolina 27107 31.218 157.5655 188.7835 0 0 0 188.7835
BALL METAL BEVERAGE CONTAINER CORP 8935 POCAHONTAS TRAIL J WILLIAMSBURG Virginia 23185 28.5 150 178.5 0 0 0 178.5
SANYO SOLAR (USA) LLC 970 E 236TH ST CARSON California 90745 0.0005 7.184275 7.184775 0 168.4595129 175.6442879
BALL METAL BEVERAGE CONTAINER CORP 12340 TOWNSHIP RD 99 E FINDLAY Ohio 45840 25 130 155 0 0 155
CROWN FOOD PACKAGING 2929 W BRIDGE ST OWATONNA Minnesota 55060 30.746 91.9 122.646 0 0 122.646
REXAM BEVERAGE CAN CO RE: FREMONT PLANT 2145 CEDAR FREMONT Ohio 43420 15.931 90.3915 106.3225 0 0 0 106.3225
REXAM BEVERAGE CAN CO RE: BISHOPVILLE SC FACILITY 609 COUSAR ST BISHOPVILLE South Carolina 29010 14.5145 82.2475 96.762 0 0 0 96.762
CROWN CORK & SEAL CO (USA) INC CROWN CLOSURE DIV
3011 BIRCH DR WEIRTON West Virginia 26062 35.9645 60.1235 96.088 0 0 0 96.088
BALL METAL BEVERAGE CONTAINER CORP 1900 BARNES ST REIDSVILLE North Carolina 27320 14.5 80 94.5 0 0 0 94.5
BMW MANUFACTURING CO LLC 1400 HWY 101 S GREER South Carolina 29651 1.8155 89.397 91.2125 0 0 91.2125
REXAM BEVERAGE CAN CO RE: EVA STREET ST PAUL MN 139 EVA ST SAINT PAUL Minnesota 55107 13.4245 76.0735 89.498 0 0 0 89.498
REXAM BEVERAGE CAN CO KENT WA FACILITY 1220 N SECOND AVE KENT Washington 98032 12.462 70.619 83.081 0 0 0 83.081
CROWN BEVERAGE PACKAGING 1202 FONES RD OLYMPIA Washington 98501 19.4225 58.267 77.6895 0 0 0 77.6895
REXAM BEVERAGE CAN CO OLIVE BRANCH FACILITY 10800 MARINA DR OLIVE BRANCH Mississippi 38654 20.551 56.273 76.824 0 0 0 76.824
BALL CONTAINER LLC COLUMBUS CAN PLANT 350 MCCORMICK BLVD COLUMBUS Ohio 43213 11.5 65 76.5 0 0 0 76.5
SILGAN CONTAINERS MANUFACTURING CORP 300 N FAIL RD LA PORTE Indiana 46350 12.85 55.5 68.35 0 0 0 68.35
AURORA CASKET CO INC 10944 MARSH RD AURORA Indiana 47001 0 68.17917 68.17917 0 0 0 68.17917
REXAM BEVERAGE CAN CO RE : CHICAGO PLANT 1101 W 43RD ST CHICAGO Illinois 60609 14.2105 53.7945 68.005 0 0 0 68.005
REXAM BEVERAGE CAN CO RE: WHITEHOUSE PLANT 10444 WATERVILLE WHITEHOUSE Ohio 43571 23.1975 44.6385 67.836 0 0 0 67.836
FORD MOTOR CO DEARBORN TRUCK PLANT 3001 MILLER RD DEARBORN Michigan 48121 1.5 65 66.5 0 0 66.5
CROWN BEVERAGE PACKAGING 1035 E NORTH ST BRADLEY Illinois 60915 16.0195 48.058 64.0775 0 0 0 64.0775
CROWN BEVERAGE PACKAGING GLEN & SHEPARD ST LAWRENCE Massachusetts 01843 15.6815 47.0445 62.726 0 0 0 62.726
REXAM BEVERAGE CAN CO LONGVIEW FACILITY 1001 FISHER RD LONGVIEW Texas 75604 14.4385 43.014 57.4525 0 0 0 57.4525
WHIRLPOOL CORP MARION D IVISION 1300 MARION-AGOSTA RD MARION Ohio 43302 0.05 57.1625 57.2125 0 0 57.2125
BALL CONTAINER LLC ROME CAN PLANT 110 MCC DR ROME Georgia 30161 33.5 22 55.5 0 0 0 55.5
METAL CONTAINER CORPORTION - WINDSOR CAN PLANT 1201 METAL CONTAINER CTWINDSOR Colorado 80550 14.9135 40.085 54.9985 0 0 54.9985
Page 1 of 40

Table B-2. 2010 Emissions Inventory: Non-Zero Certain Glycol Ether Reported Releases
Facility Name Address City State Zip Code
Onsite Point Source
Emissions (tpy)
Onsite Fugitive
Emissions (tpy)
Total Air Emissions
(tpy)
Total Releases to Surface
Water (tpy)a
Total Releases to Soil (tpy)b
Total Releases to Other Media
(tpy)c
Total Emissions (tpy)
FORD MOTOR COMPANY--KANSAS CITY ASSEMBLY PLANT 8121 E US HWY 69 CLAYCOMO Missouri 64119 1.5 50 51.5 0 0.013 51.513
CROWN BEVERAGE PACKAGING 620 N 4TH ST WORLAND Wyoming 82401 12.782 38.346 51.128 0 0 0 51.128
HONDA OF AMERICA MANUFACTURING INC 11000 STATE RT 347 EAST LIBERTY Ohio 43319 2.2 45 47.2 0 0.191 47.391
METAL CONTAINER CORP - ARNOLD CAN PLANT 42 TENBROOK INDUSTRIAL ARNOLD Missouri 63010 17.9475 28.3695 46.317 0 0 46.317
BWAY CORP 1601 VALDOSTA HWY HOMERVILLE Georgia 31634 37.053 8.9105 45.9635 0 0 0 45.9635
MEMC PASADENA INC 3000 N S ST PASADENA Texas 77503 12.77 8.793 21.563 0 0 23.7725 45.3355
REXAM BEVERAGE CAN CO CHATSWORTH FACILITY 20730 PRAIRIE ST CHATSWORTH California 91311 8.9005 35.513 44.4135 0 0 0 44.4135
EDSAL MANUFACTURING CO INC 4400 S PACKER CHICAGO Illinois 60609 0 43.1447 43.1447 0 0 43.1447
HONDA OF AMERICA MANUFACTURING INC 24000 HONDA PKY MARYSVILLE Ohio 43040 3.8 38.5 42.3 0 0.2335 42.5335
RR DONNELLEY 2347 KRATZER RD HARRISONBURG Virginia 22802 38.798 3.5855 42.3835 0 0 42.3835
METAL CONTAINER CORP - NEWBURGH CAN PLANT 130 BREUNIG RD NEW WINDSOR New York 12553 11.4875 30.7785 42.266 0 0 42.266
REXAM BEVERAGE CAN CO PHOENIX FACILITY 211 N 51ST AVE PHOENIX Arizona 85043 5.2035 32.9575 38.161 0 0 0 38.161
BALL METAL BEVERAGE CONTAINER CORP 8500 W TOWER AVE MILWAUKEE Wisconsin 53224 29 9 38 0 0 38
MAGNA STEYR NORTH AMERICA 3800 STICKNEY AVE TOLEDO Ohio 43608 4.65 33 37.65 0 0 37.65
CHICAGO HEIGHTS STEEL 211 E MAIN ST CHICAGO HEIGHTS Illinois 60411 7.496 29.984 37.48 0 0 0 37.48
ROCKY MOUNTAIN METAL CONTAINER 17755 W 32ND AVE GOLDEN Colorado 80401 29.5 6 35.5 0 0 1.9 37.4
CROWN BEVERAGE PACKAGING 2501 N FRAZIER ST CONROE Texas 77305 30.8465 5.0285 35.875 0 0 0 35.875
SUBARU OF INDIANA AUTOMOTIVE INC 5500 STATE RD 38E LAFAYETTE Indiana 47905 0.355 35.335 35.69 0 0 35.69
CHRYSLER JEFFERSON NORTH ASSEMBLY PLANT 2101 CONNOR AVE DETROIT Michigan 48215 4.1 31.5 35.6 0 0.003 35.603
NISSAN NA INC SMYRNA MANUFACTURING PLANT 983 NISSAN DR SMYRNA Tennessee 37167 1.307 34.2725 35.5795 0 0 0 35.5795
FORD MOTOR CO KENTUCKY TRUCK PLANT 3001 CHAMBERLAIN LN LOUISVILLE Kentucky 40241 2.4 33 35.4 0 0.13 35.53
GREIF PACKAGING LLC 7425 INDUSTRIAL RD FLORENCE Kentucky 41042 1.7475 33.1985 34.946 0 0.5 35.446
SILGAN CONTAINERS MANUFACTURING CORP 1400 PLOVER RD PO BOX 97PLOVER Wisconsin 54467 7.6 27.75 35.35 0 0 0 35.35
METAL CONTAINER CORP - JACKSONVILLE CAN PLANT 1100 N ELLIS RD JACKSONVILLE Florida 32254 6.952 28.0305 34.9825 0 0 34.9825
CROWN FOOD PACKAGING 8801 CITATION RD BALTIMORE Maryland 21221 8.5165 25.5495 34.066 0 0 34.066
CROWN BEVERAGE PACKAGING 12910 JESS PIRTLE BLVD SUGAR LAND Texas 77478 28.1175 4.2175 32.335 0 0 0 32.335
METAL CONTAINER CORP - MIRA LOMA CAN PLANT 10980 INLAND AVE MIRA LOMA California 91752 28.5415 3.7115 32.253 0 0 32.253
BALL METAL BEVERAGE CONTAINER CORP 500 CRENSHAW BLVD TORRANCE California 90503 29 3 32 0 0 0 32
BERENFIELD CONTAINERS SE LTD 12180 UNIVERSITY CITY BLVHARRISBURG North Carolina 28075 0 31.510045 31.510045 0 0 0 31.510045
SENECA FOODS CORP 801 SAUK AVE BARABOO Wisconsin 53913 0 30.575 30.575 0 0 0.855 31.43
Page 2 of 40

Table B-2. 2010 Emissions Inventory: Non-Zero Certain Glycol Ether Reported Releases
Facility Name Address City State Zip Code
Onsite Point Source
Emissions (tpy)
Onsite Fugitive
Emissions (tpy)
Total Air Emissions
(tpy)
Total Releases to Surface
Water (tpy)a
Total Releases to Soil (tpy)b
Total Releases to Other Media
(tpy)c
Total Emissions (tpy)
THERMA-TRU CORP 601 RE JONES RD BUTLER Indiana 46721 0 29.7775 29.7775 0 0 0 29.7775
BALL METAL BEVERAGE CONTAINER CORP 4525 INDIANA ST GOLDEN Colorado 80403 19.5 9.5 29 0 0 0 29
BALL METAL BEVERAGE CONTAINER CORP 501 N SIXTH ST MONTICELLO Indiana 47960 12.5 16 28.5 0 0 0 28.5
HUNTSMAN PETROCHEMICAL LLC PORT NECHES PERFORMANCE PRODUCTS
6001 HWY 366 PORT NECHES Texas 77651 0.141 0 0.141 0 0 27.6245 27.7655
CROWN BEVERAGE PACKAGING 380 CALLE FABRIL ST KM 12CAROLINA Puerto Rico 00985 6.91 20.7295 27.6395 0 0 0 27.6395
S B FOOT TANNING CO 805 BENCH ST RED WING Minnesota 55066 0 27.586 27.586 0 0 27.586
PPG INDUSTRIES INC-OAK CREEK 10800 S 13TH ST OAK CREEK Wisconsin 53154 25.224 0.407 25.631 0 0 1.208 26.839
DEXTER CHASSIS GROUP PLANT 55 501 S MILLER DR WHITE PIGEON Michigan 49099 0 26.3225 26.3225 0 0 0.1285 26.451
MERCEDES-BENZ US INTERNATIONAL INC 1 MERCEDES DR VANCE Alabama 35490 0.366025 25.58058 25.946605 0 0 0 25.946605
INGERSOLL-RAND CO STEELCRAFT DIV 9017 BLUE ASH RD CINCINNATI Ohio 45242 5.6855 19.8995 25.585 0 0 0 25.585
ALLIED TUBE & CONDUIT CORP 16100 S LATHROP AVE HARVEY Illinois 60426 16.0515 9.4675 25.519 0 0 0 25.519
BWAY CORP 3200 S KILBOURN AVE CHICAGO Illinois 60623 6.818275 18.679745 25.49802 0 3.55271E-15 25.49802
GM TRUCK GROUP FLINT ASSEMBLY PLANT VAN SLYKE COMPLEX
G-3100 VAN SLYKE RD FLINT Michigan 48551 0.45 24.5 24.95 0 0 0.26 25.21
WHIRLPOOL CORP - CLYDE DIV 119 BIRDSEYE ST CLYDE Ohio 43410 0.718 22.64 23.358 0 1.2415 24.5995
ROLL COATER INC 1950 E MAIN ST GREENFIELD Indiana 46140 0 24.2775 24.2775 0 0 0 24.2775
NYW REALTY LLC/ HANOVER 500 E MIDDLE ST HANOVER Pennsylvania 17331 0 24.2 24.2 0 0 0 24.2
TOYOTA MOTOR MANUFACTURING INDIANA INC 4000 TULIP TREE DR PRINCETON Indiana 47670 10.3485 13.83 24.1785 0 0 0 24.1785
CROWN BEVERAGE PACKAGING 100 EVANS ROW CHERAW South Carolina 29520 21.398 2.7455 24.1435 0 0 0 24.1435
BALL METAL BEVERAGE CONTAINER CORP 4700 WHITEWAY DR TAMPA Florida 33617 9 15 24 0 0 0 24
HONDA MANUFACTURING OF ALABAMA LLC 1800 HONDA DR LINCOLN Alabama 35096 0.4995 23.484 23.9835 0 0 23.9835
CROWN BEVERAGE PACKAGING 1501 ST JAMES ST LA CROSSE Wisconsin 54603 22.1385 1.6605 23.799 0 0 0 23.799
GENERAL MOTORS LANSING DELTA TOWNSHIP 8175 MILLETT HWY LANSING Michigan 48917 0.5 23 23.5 0 0.1415 23.6415
S D WARREN CO 89 CUMBERLAND ST WESTBROOK Maine 04098 0.0025 23.5 23.5025 0.0835 0 0 23.586
GREIF PACKAGING LLC 4300 W 130TH ST ALSIP Illinois 60803 1.99 21.267 23.257 0 0 0 23.257
BALL METAL FOOD CONTAINER CORP 3010 BIRCH DR WEIRTON West Virginia 26062 14.5 8 22.5 0 0 0 22.5
CROWN BEVERAGE PACKAGING 195 CROWN RD BATESVILLE Mississippi 38606 19.5525 2.933 22.4855 0 0 0 22.4855
WHIRLPOOL CORP FINDLAY DIV 4901 N MAIN ST FINDLAY Ohio 45840 2.2375 20.1375 22.375 0 0 22.375
AVX CORP MYRTLE BEACH 801 17TH AVE S MYRTLE BEACH South Carolina 29577 3.3725 2.492 5.8645 0 0 16.405 22.2695
MOBIL CHEMICAL CO 41501 WOLVERINE RD SHAWNEE Oklahoma 74804 0.375 21.5 21.875 0 0.0025 21.8775
Page 3 of 40
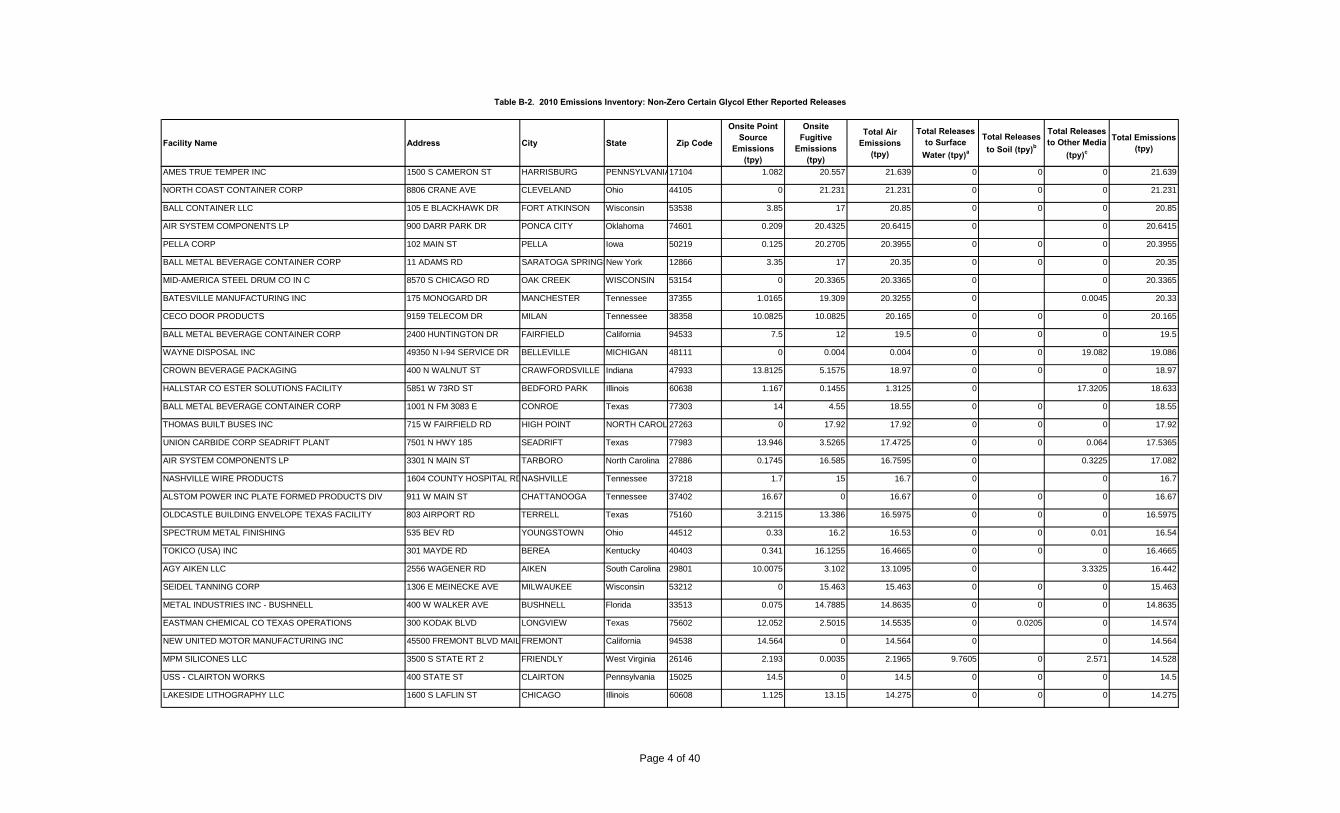
Table B-2. 2010 Emissions Inventory: Non-Zero Certain Glycol Ether Reported Releases
Facility Name Address City State Zip Code
Onsite Point Source
Emissions (tpy)
Onsite Fugitive
Emissions (tpy)
Total Air Emissions
(tpy)
Total Releases to Surface
Water (tpy)a
Total Releases to Soil (tpy)b
Total Releases to Other Media
(tpy)c
Total Emissions (tpy)
AMES TRUE TEMPER INC 1500 S CAMERON ST HARRISBURG PENNSYLVANIA17104 1.082 20.557 21.639 0 0 0 21.639
NORTH COAST CONTAINER CORP 8806 CRANE AVE CLEVELAND Ohio 44105 0 21.231 21.231 0 0 0 21.231
BALL CONTAINER LLC 105 E BLACKHAWK DR FORT ATKINSON Wisconsin 53538 3.85 17 20.85 0 0 0 20.85
AIR SYSTEM COMPONENTS LP 900 DARR PARK DR PONCA CITY Oklahoma 74601 0.209 20.4325 20.6415 0 0 20.6415
PELLA CORP 102 MAIN ST PELLA Iowa 50219 0.125 20.2705 20.3955 0 0 0 20.3955
BALL METAL BEVERAGE CONTAINER CORP 11 ADAMS RD SARATOGA SPRINGSNew York 12866 3.35 17 20.35 0 0 0 20.35
MID-AMERICA STEEL DRUM CO IN C 8570 S CHICAGO RD OAK CREEK WISCONSIN 53154 0 20.3365 20.3365 0 0 20.3365
BATESVILLE MANUFACTURING INC 175 MONOGARD DR MANCHESTER Tennessee 37355 1.0165 19.309 20.3255 0 0.0045 20.33
CECO DOOR PRODUCTS 9159 TELECOM DR MILAN Tennessee 38358 10.0825 10.0825 20.165 0 0 0 20.165
BALL METAL BEVERAGE CONTAINER CORP 2400 HUNTINGTON DR FAIRFIELD California 94533 7.5 12 19.5 0 0 0 19.5
WAYNE DISPOSAL INC 49350 N I-94 SERVICE DR BELLEVILLE MICHIGAN 48111 0 0.004 0.004 0 0 19.082 19.086
CROWN BEVERAGE PACKAGING 400 N WALNUT ST CRAWFORDSVILLE Indiana 47933 13.8125 5.1575 18.97 0 0 0 18.97
HALLSTAR CO ESTER SOLUTIONS FACILITY 5851 W 73RD ST BEDFORD PARK Illinois 60638 1.167 0.1455 1.3125 0 17.3205 18.633
BALL METAL BEVERAGE CONTAINER CORP 1001 N FM 3083 E CONROE Texas 77303 14 4.55 18.55 0 0 0 18.55
THOMAS BUILT BUSES INC 715 W FAIRFIELD RD HIGH POINT NORTH CAROL 27263 0 17.92 17.92 0 0 0 17.92
UNION CARBIDE CORP SEADRIFT PLANT 7501 N HWY 185 SEADRIFT Texas 77983 13.946 3.5265 17.4725 0 0 0.064 17.5365
AIR SYSTEM COMPONENTS LP 3301 N MAIN ST TARBORO North Carolina 27886 0.1745 16.585 16.7595 0 0.3225 17.082
NASHVILLE WIRE PRODUCTS 1604 COUNTY HOSPITAL RDNASHVILLE Tennessee 37218 1.7 15 16.7 0 0 16.7
ALSTOM POWER INC PLATE FORMED PRODUCTS DIV 911 W MAIN ST CHATTANOOGA Tennessee 37402 16.67 0 16.67 0 0 0 16.67
OLDCASTLE BUILDING ENVELOPE TEXAS FACILITY 803 AIRPORT RD TERRELL Texas 75160 3.2115 13.386 16.5975 0 0 0 16.5975
SPECTRUM METAL FINISHING 535 BEV RD YOUNGSTOWN Ohio 44512 0.33 16.2 16.53 0 0 0.01 16.54
TOKICO (USA) INC 301 MAYDE RD BEREA Kentucky 40403 0.341 16.1255 16.4665 0 0 0 16.4665
AGY AIKEN LLC 2556 WAGENER RD AIKEN South Carolina 29801 10.0075 3.102 13.1095 0 3.3325 16.442
SEIDEL TANNING CORP 1306 E MEINECKE AVE MILWAUKEE Wisconsin 53212 0 15.463 15.463 0 0 0 15.463
METAL INDUSTRIES INC - BUSHNELL 400 W WALKER AVE BUSHNELL Florida 33513 0.075 14.7885 14.8635 0 0 0 14.8635
EASTMAN CHEMICAL CO TEXAS OPERATIONS 300 KODAK BLVD LONGVIEW Texas 75602 12.052 2.5015 14.5535 0 0.0205 0 14.574
NEW UNITED MOTOR MANUFACTURING INC 45500 FREMONT BLVD MAIL FREMONT California 94538 14.564 0 14.564 0 0 14.564
MPM SILICONES LLC 3500 S STATE RT 2 FRIENDLY West Virginia 26146 2.193 0.0035 2.1965 9.7605 0 2.571 14.528
USS - CLAIRTON WORKS 400 STATE ST CLAIRTON Pennsylvania 15025 14.5 0 14.5 0 0 0 14.5
LAKESIDE LITHOGRAPHY LLC 1600 S LAFLIN ST CHICAGO Illinois 60608 1.125 13.15 14.275 0 0 0 14.275
Page 4 of 40

Table B-2. 2010 Emissions Inventory: Non-Zero Certain Glycol Ether Reported Releases
Facility Name Address City State Zip Code
Onsite Point Source
Emissions (tpy)
Onsite Fugitive
Emissions (tpy)
Total Air Emissions
(tpy)
Total Releases to Surface
Water (tpy)a
Total Releases to Soil (tpy)b
Total Releases to Other Media
(tpy)c
Total Emissions (tpy)
HART & COOLEY INC 4910 MOORES MILL RD HUNTSVILLE Alabama 35811 0.8045 12.8325 13.637 0 0.564 14.201
JOHNSON WELDED PRODUCTS INC 625 S EDGEWOOD AVE URBANA Ohio 43078 0 14.1725 14.1725 0 0 0 14.1725
BEDFORD MATERIALS CO INC 7676 ALLEGHENY RD MANNS CHOICE Pennsylvania 15550 1.403 12.701 14.104 0 0 0 14.104
BALL METAL BEVERAGE CONTAINER CORP 95 BALLARD RD MIDDLETOWN New York 10940 6.5 7.5 14 0 0 0 14
QUAD/GRAPHICS INC 1900 W SUMNER ST HARTFORD Wisconsin 53027 13.5 0.435 13.935 0 0 13.935
BEMIS MANUFACTURING CO PLANT B 300 MILL ST SHEBOYGAN FALLS Wisconsin 53085 0 13.9125 13.9125 0 0 13.9125
SILGAN WHITE CAP CORP 2201 W MARYLAND ST EVANSVILLE Indiana 47710 11.15 2.75 13.9 0 0 0 13.9
CROWN FOOD PACKAGING 5201 ENTERPRISE BLVD TOLEDO Ohio 43612 3.457 10.3605 13.8175 0 0 0 13.8175
GERSTENSLAGER CO 1425 E BOWMAN ST WOOSTER Ohio 44691 0.4135 13.3765 13.79 0 0.0045 13.7945
ROYAL MOULDINGS LTD; MARION VIRGINIA 135 BEAR CREEK RD MARION Virginia 24354 0.6885 13.076 13.7645 0 0 0 13.7645
TOPPAN INTERAMERICA INC 1131 HWY 155 S MC DONOUGH Georgia 30253 0 13.7 13.7 0 0 0 13.7
M&B HANGERS 1313 PKWY DR SE LEEDS Alabama 35094 2.732 10.929 13.661 0 0 13.661
KNAPHEIDE MANUFACTURING CO 1848 WESTPHALIA STRASSEQUINCY Illinois 62305 0.175 13.4385 13.6135 0 0 13.6135
CROWN FOOD PACKAGING 1650 BROADWAY HANOVER Pennsylvania 17331 3.382 10.1465 13.5285 0 0 13.5285
NUCOR VULCRAFT GROUP GRAPELAND DIV 175 COUNTY RD 2345 GRAPELAND Texas 75844 0.174 13.333 13.507 0 0 0 13.507
BALL METAL BEVERAGE CONTAINER CORP 6600 WILL ROGERS BLVD FORT WORTH Texas 76140 5.5 8 13.5 0 0 0 13.5
PENN COLOR INC 2755 BERGEY RD HATFIELD Pennsylvania 19440 0.176 0.058 0.234 0 0 13.2355 13.4695
FLINT HILLS RESOURCES LP - WEST PLANT 2825 SUNTIDE RD CORPUS CHRISTI Texas 78410 0.0075 0 0.0075 0 0 13.38 13.3875
DECORATIVE PANELS INTERNATIONA L 2900 HILL AVE TOLEDO Ohio 43607 13.32944 0 13.32944 0 0 13.32944
L A DARLING CO - PIGGOTT AR FACILITY HWY 49 S PIGGOTT Arkansas 72454 0.152 13.158 13.31 0 0 13.31
TRI VULCRAFT OF NEW YORK INC 5362 RAILROAD ST CHEMUNG New York 14825 5.101 7.1315 12.2325 0 0 0.666 12.8985
BALL METAL BEVERAGE CONTAINER CORP 91-320 KOMOHANA ST KAPOLEI Hawaii 96707 2.3 10.5 12.8 0 0 0 12.8
3M CO - GUIN 6675 US HWY 43 GUIN Alabama 35563 0.001 12.75 12.751 0 0 0 12.751
TOYOTA MOTOR MANUFACTURING KENTUCKY INC 1001 CHERRY BLOSSOM WAGEORGETOWN Kentucky 40324 0.375 12.302 12.677 0 0 12.677
AMERICAN TRIM LLC 1501 W MICHIGAN ST SIDNEY Ohio 45365 0 12.659 12.659 0 0 0 12.659
KEYMARK CORP OF FLORIDA 2540 KNIGHTS STATION RD LAKELAND Florida 33810 0.619 11.7595 12.3785 0 0 0 12.3785
VESTAL MANUFACTURING ENTERPRISES INC 177 INDUSTRIAL PARK RD SWEETWATER Tennessee 37874 12.168 0 12.168 0 0 12.168
GM TRUCK GROUP FORT WAYNE ASSEMBLY 12200 LAFAYETTE CENTER ROANOKE Indiana 46783 0.65 11.5 12.15 0 0 12.15
NOVELIS CORP 390 GRISWOLD ST NE WARREN Ohio 44483 3.543 8.579 12.122 0 0 0 12.122
BERENFIELD CONTAINERS INC MASON 1229 CASTLE DR MASON Ohio 45040 0.125 11.6705 11.7955 0 0 0 11.7955
Page 5 of 40

Table B-2. 2010 Emissions Inventory: Non-Zero Certain Glycol Ether Reported Releases
Facility Name Address City State Zip Code
Onsite Point Source
Emissions (tpy)
Onsite Fugitive
Emissions (tpy)
Total Air Emissions
(tpy)
Total Releases to Surface
Water (tpy)a
Total Releases to Soil (tpy)b
Total Releases to Other Media
(tpy)c
Total Emissions (tpy)
HOWARD FINISHING LLC 32565 DEQUINDRE MADISON HEIGHTS Michigan 48071 0.0025 11.751 11.7535 0 0 0 11.7535
SILGAN CONTAINERS MANUFACTURING CORP 305 W N ST MOUNT VERNON Missouri 65712 2.35 9.327 11.677 0 0 0 11.677
FRANKLIN INVESTMENT CORP 600 ATLANTIC AVE FRANKLIN Pennsylvania 16323 11.6 0 11.6 0 0 11.6
CHICAGO STEEL CONTAINER CORP 1846 S KILBOURN AVE CHICAGO Illinois 60623 1.453 9.7415 11.1945 0 0 0.25 11.4445
MEYER STEEL DRUM INC 2000 S KILBOURN AVE CHICAGO Illinois 60623 1.247 10.09 11.337 0 0 11.337
RINECO 1007 VULCAN RD- HASKELL BENTON Arkansas 72015 0.0495 0 0.0495 0 0 11.25 11.2995
CARRY-ON TRAILER CORP 101 JOE HARVEY ST LAVONIA GEORGIA 30553 0 11.244 11.244 0 0 0 11.244
SHAMROCK TECHNOLOGIES FOOT OF PACIFIC ST NEWARK NEW JERSEY 07114 0 0 0 0 11.1435 11.1435
FORD MOTOR COMPANY-WAYNE ASSEMBLY 37625 MICHIGAN AVE WAYNE Michigan 48184 0.125 11 11.125 0 0 11.125
PRECOAT METALS 1095 MENDELL DAVIS DR JACKSON Mississippi 39272 10.083 0.9495 11.0325 0 0 0 11.0325
BOEING COMMERCIAL AIRPLANE GROUP - EVERETT 3003 W CASINO RD EVERETT Washington 98204 2 9 11 0 0.0175 11.0175
PHOENIX COLOR CORP 18249 PHOENIX DR HAGERSTOWN MARYLAND 21742 11 0 11 0 0 0 11
GEA BPO LLC 301 N CURRY PIKE BLOOMINGTON Indiana 47404 0 11 11 0 0 0 11
PROFESSIONAL DISPOSABLES INTERNATIONAL INC TWO NICE-PAK PARK ORANGEBURG New York 10962 0.10232 0.032815 0.135135 0 10.8205 10.955635
TRILLA ST LOUIS CORP 2391 CASSENS DR FENTON MISSOURI 63026 1.59594 8.216745 9.812685 0 0 1.13675 10.949435
CARRY-ON TRAILER CORP 931 INDUSTRIAL BLVD MEXIA TEXAS 76667 0 10.7145 10.7145 0 0 0 10.7145
MAVERICK TUBE LLC DBA TENARISCONROE 699 FM 3083 CONROE TEXAS 77301 0.423225 10.1492388 10.5724638 0 0 0 10.5724638
ACME FINISHING CO INC 1595 E OAKTON ST ELK GROVE VILLAGEIllinois 60007 2.089 8.356 10.445 0 0 0 10.445
STATE INDUSTRIES INC 500 TENNESSEE WALTZ PKWASHLAND CITY TENNESSEE 37015 0.104 10.3115 10.4155 0 0 0 10.4155
ANDERSON TULLY LUMBER CO WALTERSVILLE LUMBER MILL
1725 N WASHINGTON ST VICKSBURG MISSISSIPPI 39181 10.4095 0 10.4095 0 0 10.4095
3M CO - CORDOVA 22614 RT 84 N CORDOVA Illinois 61242 0.7 0.065 0.765 9.5 0 5.55112E-16 10.265
NUCOR CORP VULCRAFT/NUCOR COLD FINISH DIV 1601 W OMAHA AVE NORFOLK Nebraska 68701 0.26 10 10.26 0 0 10.26
SILGAN CAN CO 2120 NC HWY N UNIT A MAXTON North Carolina 28364 3.2155 6.97 10.1855 0 0 0 10.1855
SYCAMORE SYSTEMS LLC 449 N CALIFORNIA ST SYCAMORE ILLINOIS 60178 0 10.144 10.144 0 0 10.144
ASHLEY INDUSTRIAL MOLDING INC 310 S WABASH ASHLEY Indiana 46705 1.05 9.05 10.1 0 0 0 10.1
BERENFIELD CONTAINERS SW LTD 3300 N HUTCHINSON ST WHITE HALL Arkansas 71602 0 10.0855 10.0855 0 0 0 10.0855
STANLEY WORKS HAND TOOLS DIV 600 MYRTLE ST NEW BRITAIN Connecticut 06052 0.997 8.972 9.969 0 0 0 9.969
SILGAN CONTAINERS MANAUFACTURING CORP 520 W 2ND ST OCONOMOWOC Wisconsin 53066 1.65 8.3 9.95 0 0 0 9.95
RR DONNELLEY & SONS CO 1145 CONWELL AVE WILLARD Ohio 44890 7.5445 2.3705 9.915 0 0 9.915
Page 6 of 40
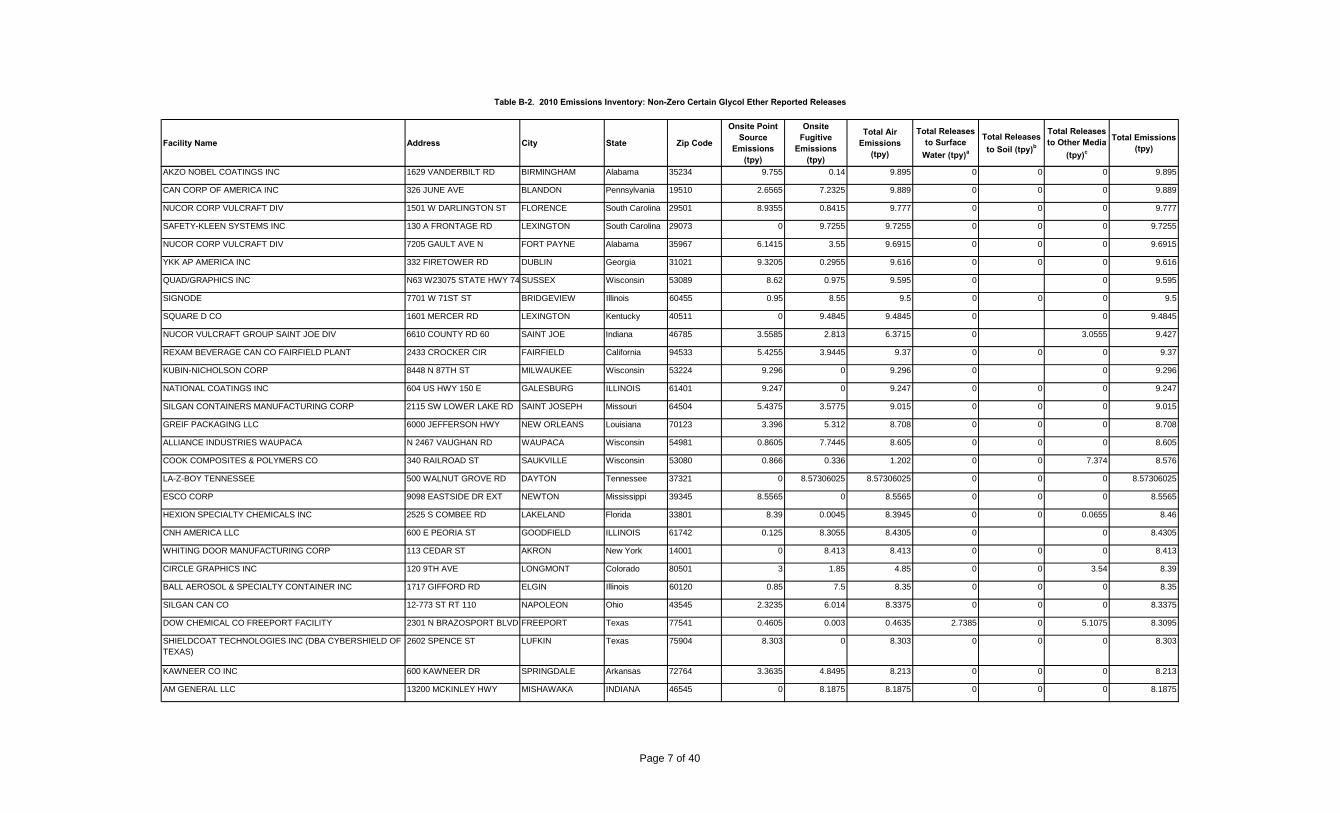
Table B-2. 2010 Emissions Inventory: Non-Zero Certain Glycol Ether Reported Releases
Facility Name Address City State Zip Code
Onsite Point Source
Emissions (tpy)
Onsite Fugitive
Emissions (tpy)
Total Air Emissions
(tpy)
Total Releases to Surface
Water (tpy)a
Total Releases to Soil (tpy)b
Total Releases to Other Media
(tpy)c
Total Emissions (tpy)
AKZO NOBEL COATINGS INC 1629 VANDERBILT RD BIRMINGHAM Alabama 35234 9.755 0.14 9.895 0 0 0 9.895
CAN CORP OF AMERICA INC 326 JUNE AVE BLANDON Pennsylvania 19510 2.6565 7.2325 9.889 0 0 0 9.889
NUCOR CORP VULCRAFT DIV 1501 W DARLINGTON ST FLORENCE South Carolina 29501 8.9355 0.8415 9.777 0 0 0 9.777
SAFETY-KLEEN SYSTEMS INC 130 A FRONTAGE RD LEXINGTON South Carolina 29073 0 9.7255 9.7255 0 0 0 9.7255
NUCOR CORP VULCRAFT DIV 7205 GAULT AVE N FORT PAYNE Alabama 35967 6.1415 3.55 9.6915 0 0 0 9.6915
YKK AP AMERICA INC 332 FIRETOWER RD DUBLIN Georgia 31021 9.3205 0.2955 9.616 0 0 0 9.616
QUAD/GRAPHICS INC N63 W23075 STATE HWY 74 SUSSEX Wisconsin 53089 8.62 0.975 9.595 0 0 9.595
SIGNODE 7701 W 71ST ST BRIDGEVIEW Illinois 60455 0.95 8.55 9.5 0 0 0 9.5
SQUARE D CO 1601 MERCER RD LEXINGTON Kentucky 40511 0 9.4845 9.4845 0 0 9.4845
NUCOR VULCRAFT GROUP SAINT JOE DIV 6610 COUNTY RD 60 SAINT JOE Indiana 46785 3.5585 2.813 6.3715 0 3.0555 9.427
REXAM BEVERAGE CAN CO FAIRFIELD PLANT 2433 CROCKER CIR FAIRFIELD California 94533 5.4255 3.9445 9.37 0 0 0 9.37
KUBIN-NICHOLSON CORP 8448 N 87TH ST MILWAUKEE Wisconsin 53224 9.296 0 9.296 0 0 9.296
NATIONAL COATINGS INC 604 US HWY 150 E GALESBURG ILLINOIS 61401 9.247 0 9.247 0 0 0 9.247
SILGAN CONTAINERS MANUFACTURING CORP 2115 SW LOWER LAKE RD SAINT JOSEPH Missouri 64504 5.4375 3.5775 9.015 0 0 0 9.015
GREIF PACKAGING LLC 6000 JEFFERSON HWY NEW ORLEANS Louisiana 70123 3.396 5.312 8.708 0 0 0 8.708
ALLIANCE INDUSTRIES WAUPACA N 2467 VAUGHAN RD WAUPACA Wisconsin 54981 0.8605 7.7445 8.605 0 0 0 8.605
COOK COMPOSITES & POLYMERS CO 340 RAILROAD ST SAUKVILLE Wisconsin 53080 0.866 0.336 1.202 0 0 7.374 8.576
LA-Z-BOY TENNESSEE 500 WALNUT GROVE RD DAYTON Tennessee 37321 0 8.57306025 8.57306025 0 0 0 8.57306025
ESCO CORP 9098 EASTSIDE DR EXT NEWTON Mississippi 39345 8.5565 0 8.5565 0 0 0 8.5565
HEXION SPECIALTY CHEMICALS INC 2525 S COMBEE RD LAKELAND Florida 33801 8.39 0.0045 8.3945 0 0 0.0655 8.46
CNH AMERICA LLC 600 E PEORIA ST GOODFIELD ILLINOIS 61742 0.125 8.3055 8.4305 0 0 8.4305
WHITING DOOR MANUFACTURING CORP 113 CEDAR ST AKRON New York 14001 0 8.413 8.413 0 0 0 8.413
CIRCLE GRAPHICS INC 120 9TH AVE LONGMONT Colorado 80501 3 1.85 4.85 0 0 3.54 8.39
BALL AEROSOL & SPECIALTY CONTAINER INC 1717 GIFFORD RD ELGIN Illinois 60120 0.85 7.5 8.35 0 0 0 8.35
SILGAN CAN CO 12-773 ST RT 110 NAPOLEON Ohio 43545 2.3235 6.014 8.3375 0 0 0 8.3375
DOW CHEMICAL CO FREEPORT FACILITY 2301 N BRAZOSPORT BLVD FREEPORT Texas 77541 0.4605 0.003 0.4635 2.7385 0 5.1075 8.3095
SHIELDCOAT TECHNOLOGIES INC (DBA CYBERSHIELD OF TEXAS)
2602 SPENCE ST LUFKIN Texas 75904 8.303 0 8.303 0 0 0 8.303
KAWNEER CO INC 600 KAWNEER DR SPRINGDALE Arkansas 72764 3.3635 4.8495 8.213 0 0 0 8.213
AM GENERAL LLC 13200 MCKINLEY HWY MISHAWAKA INDIANA 46545 0 8.1875 8.1875 0 0 0 8.1875
Page 7 of 40

Table B-2. 2010 Emissions Inventory: Non-Zero Certain Glycol Ether Reported Releases
Facility Name Address City State Zip Code
Onsite Point Source
Emissions (tpy)
Onsite Fugitive
Emissions (tpy)
Total Air Emissions
(tpy)
Total Releases to Surface
Water (tpy)a
Total Releases to Soil (tpy)b
Total Releases to Other Media
(tpy)c
Total Emissions (tpy)
CNH AMERICA LLC 1930 DES MOINES AVE BURLINGTON Iowa 52601 0.175 8 8.175 0 0 8.175
SUPERIOR INDUSTRIES INTERNATIONAL ARKANSAS LLC 1901 E BORICK DR FAYETTEVILLE ARKANSAS 72701 0 7.3 7.3 0 0.64 7.94
SILGAN CONTAINERS MANUFACTURING CORP 1416 INDIANHEAD DR MENOMONIE Wisconsin 54751 1.6 6.25 7.85 0 0 0 7.85
CROWN AEROSOL PACKAGING 3737 E EXCHANGE AVE AURORA Illinois 60504 7.0285 0.808 7.8365 0 0 0 7.8365
CARRY-ON TRAILER CORP 1965 HWY 30 MISSOURI VALLEY Iowa 51555 0 7.834 7.834 0 0 0 7.834
BROAN-NUTONE LLC 926 W STATE ST HARTFORD Wisconsin 53027 0.1135 7.6235 7.737 0 0 7.737
ROLL COATER 858 E HUPP RD LA PORTE Indiana 46350 0 7.7325 7.7325 0 0 0 7.7325
VON HOFFMANN GRAPHICS INC 1005 COMMERCIAL DR OWENSVILLE Missouri 65066 6.5635 1.1015 7.665 0 0 7.665
GMVM-LANSING GRAND RIVER ASSEMBLY 920 TOWNSEND ST MAIL COLANSING Michigan 48921 3.45 4.1 7.55 0 0.0195 7.5695
GREIF INDUSTRIAL PACKAGING & SERVICES 7604 RAILROAD AVE WINFIELD Kansas 67156 0.7535 6.7795 7.533 0 0 0 7.533
HUTCHENS INDUSTRIES INC MANSFIELD FACILITY 898 E COMMERCIAL MANSFIELD MISSOURI 65704 0 7.505 7.505 0 0 7.505
3M CO - MENOMONIE 1425 STOKKE PKWY MENOMONIE Wisconsin 54751 0 0 0 0 0 7.5 7.5
CARRY-ON TRAILER CORP 5300 WESTMORELAND RD WINNEMUCCA NEVADA 89445 0 7.4985 7.4985 0 0 0 7.4985
AKZO NOBEL SURFACE CHEMISTRY LLC 15200 ALMEDA RD HOUSTON Texas 77053 0.445 0.145 0.59 0 0 6.845 7.435
ELECTROPRIME INC 63 DIXIE HWY ROSSFORD Ohio 43460 0 7.4105 7.4105 0 0 7.4105
DEXTER AXLE 500 SE 27TH EL RENO OKLAHOMA 73036 0 7.409 7.409 0 0 0 7.409
EQUISTAR CHEMICALS BAYPORT CHEMICALS PLANT 5761 UNDERWOOD RD PASADENA Texas 77507 6.7145 0.689 7.4035 0 0 7.4035
MICHELIN NORTH AMERICA INC 5101 21ST ST TUSCALOOSA Alabama 35401 0.003 0.004 0.007 0 0 7.35 7.357
U.S. AIR FORCE TINKER AFB OK 7701 ARNOLD ST SUITE 204 TINKER A F B Oklahoma 73145 1.3 6 7.3 0 0 0.05 7.35
NAHAN PRINTING INC 7000 SAUKVIEW DR SAINT CLOUD Minnesota 56303 7.061195 0.276025 7.33722 0 0 8.88178E-16 7.33722
CHRYSLER BELVIDERE ASSEMBLY PLANT 3000 W CHRYSLER DR BELVIDERE Illinois 61008 0.8 6.5 7.3 0 0.0075 7.3075
TECNOCAP LLC 2100 GRISWOLD NE WARREN Ohio 44483 1.5755 5.7295 7.305 0 0 0 7.305
AFTON CHEMICAL CORP 725 CANNON BRIDGE RD ORANGEBURG South Carolina 29115 2.813 0.6965 3.5095 0.3 0 3.479 7.2885
GENERAL MOTORS WENTZVILLE ASSEMBLY 1500 E RT A WENTZVILLE Missouri 63385 1.25 6 7.25 0 0 7.25
GENERAL MOTORS CORP LORDSTOWN COMPLEX 2300 HALLOCK-YOUNG RD LORDSTOWN Ohio 44481 3.15 0.75 3.9 0 3.35 7.25
ROLL COATER INC 4502 FREEDOM WAY WEIRTON West Virginia 26062 0 7.2295 7.2295 0 0 0 7.2295
WIX FILTRATION CORP - ALLEN PLANT 2900 NW BLVD GASTONIA North Carolina 28052 0.0025 7.2 7.2025 0 0 0 7.2025
ALCOA INC - WARRICK OPERATIONS HWYS 66 & 61 NEWBURGH Indiana 47629 0 7 7 0.14 0 0 7.14
RR DONNELLEY CRAWFORDSVILLE 1009 SLOAN ST CRAWFORDSVILLE Indiana 47933 6.805 0.3175 7.1225 0 0 7.1225
Page 8 of 40

Table B-2. 2010 Emissions Inventory: Non-Zero Certain Glycol Ether Reported Releases
Facility Name Address City State Zip Code
Onsite Point Source
Emissions (tpy)
Onsite Fugitive
Emissions (tpy)
Total Air Emissions
(tpy)
Total Releases to Surface
Water (tpy)a
Total Releases to Soil (tpy)b
Total Releases to Other Media
(tpy)c
Total Emissions (tpy)
KITZINGER COOPERAGE CORP 2529 E NORWICH AVE SAINT FRANCIS Wisconsin 53235 0 7.09505 7.09505 0 0 7.09505
JOHN DEERE DES MOINES WORKS 825 SW IRVINEDALE DR ANKENY IOWA 50023 0 7.0485 7.0485 0 0 0 7.0485
AVERY DENNISON - IBMD LENOIR 950 GERMAN ST LENOIR North Carolina 28645 5.725 1.3205 7.0455 0 0 0 7.0455
BRIGHTSMITH LLC 120 ENTERPRISE AVE MORRISVILLE Pennsylvania 19067 0.06 0.205 0.265 0 0 6.7285 6.9935
SILGAN CAN CO 500 NW LOOP 286 SUITE 101PARIS Texas 75460 4.034 2.919 6.953 0 0 0 6.953
ENKEI AMERICA INC 2900 W INWOOD DR COLUMBUS Indiana 47201 0 6.95 6.95 0 0 0 6.95
CARDONE INDUSTRIES 5660 RISING SUN AVE PHILADELPHIA Pennsylvania 19120 1.367 5.5745 6.9415 0 0 0 6.9415
MAUSER CORP 14 CONVERY BLVD WOODBRIDGE New Jersey 07095 0.0585 6.772 6.8305 0 0 0 6.8305
HAMMER PACKAGING CORP 200 LUCIUS GORDON DR WEST HENRIETTA New York 14586 0 6.7935 6.7935 0 0 6.7935
BRIGGS & STRATTON YARD POWER PRODUCTS MCDONOUGH OPERATIONS
535 MACON RD MC DONOUGH GEORGIA 30253 0 6.7395 6.7395 0 0 6.7395
SUPERIOR INDUSTRIES INTERNATIONAL ARKANSAS LLC 1301 N DIXIELAND RD ROGERS ARKANSAS 72756 0.0025 6.7325 6.735 0 0 6.735
AAP ST MARYS CORP 1100 MCKINLEY RD SAINT MARYS Ohio 45885 0.0245 6.707 6.7315 0 0 0 6.7315
BERENFIELD CONTAINERS INC 31 RAILROAD ST CLARENDON Pennsylvania 16313 0.073365 6.65362 6.726985 0 0 0 6.726985
SENECA FOODS CORP CAN PLANT 3709 MILL ST MARION New York 14505 0 6.6935 6.6935 0 0 0 6.6935
RR DONNELLEY LANCASTER EAST 216 GREENFIELD RD LANCASTER Pennsylvania 17601 6.2035 0.434 6.6375 0 0 6.6375
CREE INC 4600 SILICON DR DURHAM North Carolina 27703 0 6.601 6.601 0 0 6.601
HUSQVARNA CONSUMER OUTDOOR PRODUCTS 172 OLD ELLOREE RD ORANGEBURG South Carolina 29116 0.1325 6.4275 6.56 0 0 6.56
OWENS CORNING VETROTEX LLC 4837 HWY 81 S STARR South Carolina 29684 0.656 5.903 6.559 0 0 0 6.559
WHEELING MACHINE PRODUCTS DIV PINE BLUFF 5411 INDUSTRIAL DR S PINE BLUFF ARKANSAS 71602 6.5 0 6.5 0 0 0 6.5
SILGAN CONTAINERS MANUFACTURIN G CORP 3591 MAPLE DR FORT DODGE IOWA 50501 0.00028 6.4915 6.49178 0 0 6.49178
SKOLNIK INDUSTRIES 4900 S KILBOURN AVE CHICAGO ILLINOIS 60632 0.65 5.8 6.45 0 0 6.45
NISSAN NORTH AMERICA INC CANTON MS 300 NISSAN DR CANTON Mississippi 39046 2.534 3.8215 6.3555 0 0 0 6.3555
SILGAN CONTAINERS MANUFACTURING CORP 2501 165TH ST HAMMOND Indiana 46320 0 6.331 6.331 0 0 0 6.331
SAPA EXTRUSIONS INC 2500 ALUMAX RD YANKTON South Dakota 57078 0 6.31004485 6.31004485 0 0 0 6.31004485
BRADFORD WHITE CORP 200 LAFAYETTE ST MIDDLEVILLE Michigan 49333 0 6.2995 6.2995 0 0 0 6.2995
MAYTAG CORP CLEVELAND COOKING PRODUCTS PLANT 1
740 KING EDWARD AVE SE CLEVELAND Tennessee 37311 0 6.25 6.25 0 0 0 6.25
EFCO CORP 1000 COUNTY RD MONETT Missouri 65708 0.958 5.2355 6.1935 0 0 0 6.1935
HUNTER DOUGLAS TUPELO CENTER RT 2 LEE INDUSTRIAL PARKSHANNON Mississippi 38868 0.2935 5.870515 6.164015 0 0 0 6.164015
Page 9 of 40

Table B-2. 2010 Emissions Inventory: Non-Zero Certain Glycol Ether Reported Releases
Facility Name Address City State Zip Code
Onsite Point Source
Emissions (tpy)
Onsite Fugitive
Emissions (tpy)
Total Air Emissions
(tpy)
Total Releases to Surface
Water (tpy)a
Total Releases to Soil (tpy)b
Total Releases to Other Media
(tpy)c
Total Emissions (tpy)
NAVISTAR INC 6125 URBANA RD SPRINGFIELD Ohio 45502 0.6 5.5 6.1 0.02 0 0.032 6.152
SILGAN CAN CO 6200 FRANKLIN BLVD SUITESACRAMENTO California 95824 5.1925 0.8925 6.085 0 0 6.085
THE COLEMAN CO INC 3600 N HYDRAULIC WICHITA KANSAS 67219 0.001 6.05 6.051 0 0 0 6.051
AK STEEL CORP - ZANESVI LLE WORKS 1724 LINDEN AVE ZANESVILLE Ohio 43701 0 4.7 4.7 0 0 1.35 6.05
BOBCAT CO (MELROE) 210 1ST AVE NE GWINNER NORTH DAKOT 58040 0 5.964 5.964 0 0 5.964
PACKAGING DYNAMICS INC BAGCRAFT/PAPERCON DIV 3400 BAGCRAFT BLVD BAXTER SPRINGS Kansas 66713 5.9425 0 5.9425 0 0 5.9425
CHRYSLER WARREN TRUCK ASSEMBLY PLANT (PART) 21500 MOUND RD WARREN Michigan 48091 5.5 0.415 5.915 0 0.0095 5.9245
QUEBECOR WORLD INC WINCHESTER VIRGINIA 160 CENTURY LN STONEWAWINCHESTER Virginia 22603 5.48138 0.2558 5.73718 0 0 0.166475 5.903655
GREIF PACKAGING LLC 2400 COOPER AVE MERCED California 95348 4.5705 1.2955 5.866 0 0 0 5.866
SCHAEFFER MANUFACTURING 102 BARTON ST SAINT LOUIS Missouri 63104 5.84243 0 5.84243 0 0 5.84243
WORTHINGTON CYLINDERS WISCONSI N LLC 300 E BREED ST CHILTON Wisconsin 53014 0.8835 4.948 5.8315 0 0 0 5.8315
SILGAN CONTAINERS MANUFACTURING CORP 400 N 15TH ST ROCHELLE Illinois 61068 4.3695 1.4365 5.806 0 0 0 5.806
TTM TECHNOLOGIES INC 710 N 600 W LOGAN Utah 84321 0.432 3.888 4.32 0 1.484 5.804
NAZDAR SHAWNEE 8501 HEDGE LN TERRACE SHAWNEE Kansas 66227 1.7235 4.0215 5.745 0 0 0 5.745
ALCOA HOME EXTERIORS INC 2615 CAMPBELL RD SIDNEY Ohio 45365 0.8075 4.225 5.0325 0 0.7 5.7325
TACO INC - CRANSTON 1160 CRANSTON ST CRANSTON RHODE ISLAND02920 0.0575 5.662 5.7195 0 0 0 5.7195
METOKOTE CORP PLANT 15 312 SAVANNAH CEDAR FALLS Iowa 50613 0 5.66847 5.66847 0 0 0 5.66847
INX DIGITAL INK CO 405 INDUSTRIAL WAY DIXON California 95620 5.621 0 5.621 0 0 0 5.621
NOVOLYTE TECHNOLOGIES 111 W IRENE RD ZACHARY Louisiana 70791 5.05 0.495 5.545 0.075 0 0 5.62
PRECOAT METALS 25 NORTHGATE INDUSTRIA GRANITE CITY Illinois 62040 4.516 1.0955 5.6115 0 0 0 5.6115
DUPONT PONTCHARTRAIN WORKS 586 HWY 44 LA PLACE Louisiana 70068 0.006 0 0.006 0 0 5.601 5.607
SILGAN CONTAINERS MANUFACTURING CORP 135 NATIONAL RD EDISON New Jersey 08817 4.45 1.1 5.55 0 0 0 5.55
KNS COMPANYS INC 475 RANDY RD CAROL STREAM Illinois 60188 1.099 4.397 5.496 0 0 5.496
LOGAN ALUMINUM INC US HWY 431 N RUSSELLVILLE Kentucky 42276 0.0355 5.3625 5.398 0 0 0 5.398
DU PONT ELECTRONICS MICROCIRCU ITS INDUSTRIES LTD
HWY 686 KM 23 MANATI PUERTO RICO 00674 0 0.0725 0.0725 0 0 5.3235 5.396
NOV TUBOSCOPE NAVASOTA 9574 FM 1227 NAVASOTA Texas 77868 4.911 0.48 5.391 0 0 0 5.391
AJAX METAL PROCESSING INC 4651 BELLEVUE AVE DETROIT MICHIGAN 48207 0 5.384 5.384 0 0 0 5.384
FIBERMARK NORTH AMERICA INC 5492 BOSTWICK ST LOWVILLE New York 13367 0.083 5.2795 5.3625 0 0 5.3625
PPG INDUSTRIES,INC-SPRINGDALE COMPLEX 125 COLFAX ST SPRINGDALE Pennsylvania 15144 5.2425 0.062 5.3045 0 0 0 5.3045
Page 10 of 40
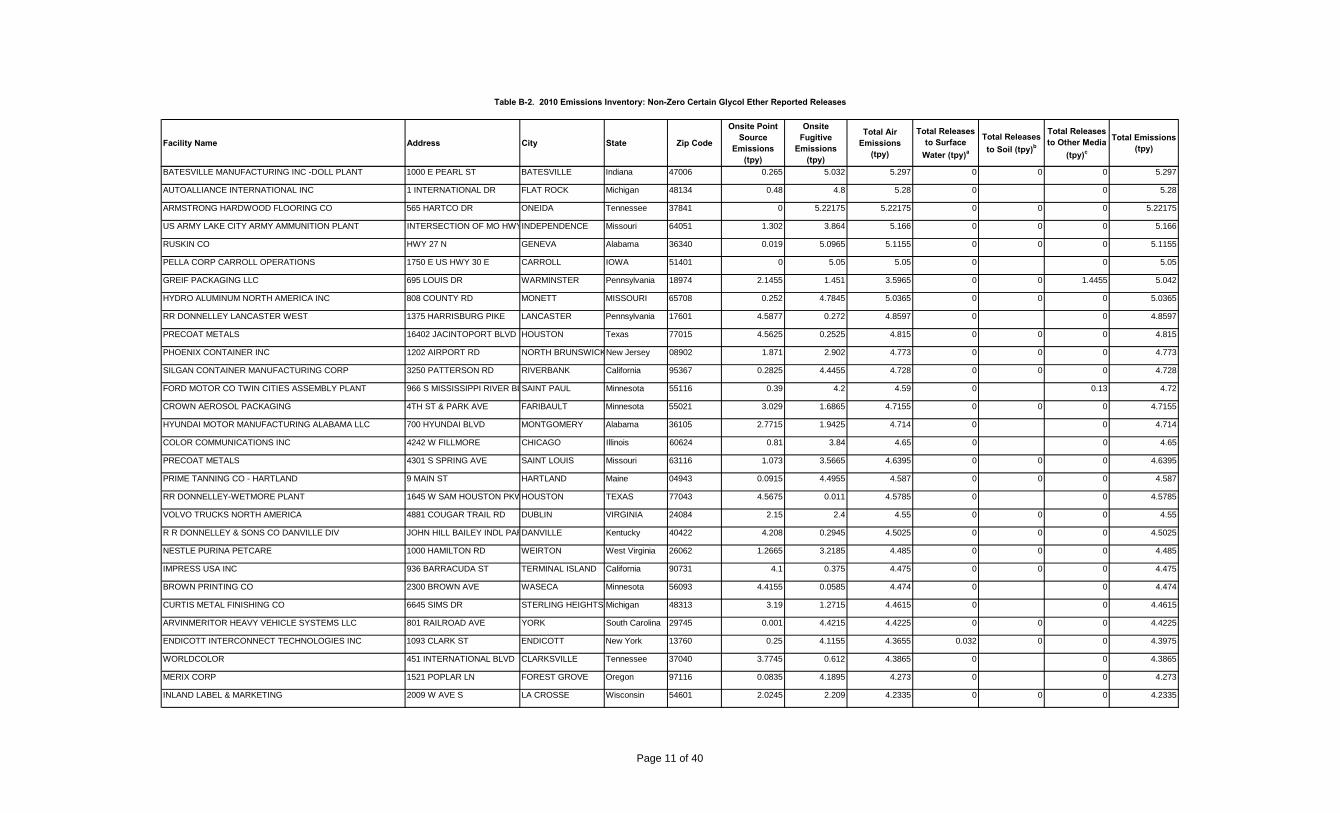
Table B-2. 2010 Emissions Inventory: Non-Zero Certain Glycol Ether Reported Releases
Facility Name Address City State Zip Code
Onsite Point Source
Emissions (tpy)
Onsite Fugitive
Emissions (tpy)
Total Air Emissions
(tpy)
Total Releases to Surface
Water (tpy)a
Total Releases to Soil (tpy)b
Total Releases to Other Media
(tpy)c
Total Emissions (tpy)
BATESVILLE MANUFACTURING INC -DOLL PLANT 1000 E PEARL ST BATESVILLE Indiana 47006 0.265 5.032 5.297 0 0 0 5.297
AUTOALLIANCE INTERNATIONAL INC 1 INTERNATIONAL DR FLAT ROCK Michigan 48134 0.48 4.8 5.28 0 0 5.28
ARMSTRONG HARDWOOD FLOORING CO 565 HARTCO DR ONEIDA Tennessee 37841 0 5.22175 5.22175 0 0 0 5.22175
US ARMY LAKE CITY ARMY AMMUNITION PLANT INTERSECTION OF MO HWYINDEPENDENCE Missouri 64051 1.302 3.864 5.166 0 0 0 5.166
RUSKIN CO HWY 27 N GENEVA Alabama 36340 0.019 5.0965 5.1155 0 0 0 5.1155
PELLA CORP CARROLL OPERATIONS 1750 E US HWY 30 E CARROLL IOWA 51401 0 5.05 5.05 0 0 5.05
GREIF PACKAGING LLC 695 LOUIS DR WARMINSTER Pennsylvania 18974 2.1455 1.451 3.5965 0 0 1.4455 5.042
HYDRO ALUMINUM NORTH AMERICA INC 808 COUNTY RD MONETT MISSOURI 65708 0.252 4.7845 5.0365 0 0 0 5.0365
RR DONNELLEY LANCASTER WEST 1375 HARRISBURG PIKE LANCASTER Pennsylvania 17601 4.5877 0.272 4.8597 0 0 4.8597
PRECOAT METALS 16402 JACINTOPORT BLVD HOUSTON Texas 77015 4.5625 0.2525 4.815 0 0 0 4.815
PHOENIX CONTAINER INC 1202 AIRPORT RD NORTH BRUNSWICKNew Jersey 08902 1.871 2.902 4.773 0 0 0 4.773
SILGAN CONTAINER MANUFACTURING CORP 3250 PATTERSON RD RIVERBANK California 95367 0.2825 4.4455 4.728 0 0 0 4.728
FORD MOTOR CO TWIN CITIES ASSEMBLY PLANT 966 S MISSISSIPPI RIVER BLSAINT PAUL Minnesota 55116 0.39 4.2 4.59 0 0.13 4.72
CROWN AEROSOL PACKAGING 4TH ST & PARK AVE FARIBAULT Minnesota 55021 3.029 1.6865 4.7155 0 0 0 4.7155
HYUNDAI MOTOR MANUFACTURING ALABAMA LLC 700 HYUNDAI BLVD MONTGOMERY Alabama 36105 2.7715 1.9425 4.714 0 0 4.714
COLOR COMMUNICATIONS INC 4242 W FILLMORE CHICAGO Illinois 60624 0.81 3.84 4.65 0 0 4.65
PRECOAT METALS 4301 S SPRING AVE SAINT LOUIS Missouri 63116 1.073 3.5665 4.6395 0 0 0 4.6395
PRIME TANNING CO - HARTLAND 9 MAIN ST HARTLAND Maine 04943 0.0915 4.4955 4.587 0 0 0 4.587
RR DONNELLEY-WETMORE PLANT 1645 W SAM HOUSTON PKWHOUSTON TEXAS 77043 4.5675 0.011 4.5785 0 0 4.5785
VOLVO TRUCKS NORTH AMERICA 4881 COUGAR TRAIL RD DUBLIN VIRGINIA 24084 2.15 2.4 4.55 0 0 0 4.55
R R DONNELLEY & SONS CO DANVILLE DIV JOHN HILL BAILEY INDL PARDANVILLE Kentucky 40422 4.208 0.2945 4.5025 0 0 0 4.5025
NESTLE PURINA PETCARE 1000 HAMILTON RD WEIRTON West Virginia 26062 1.2665 3.2185 4.485 0 0 0 4.485
IMPRESS USA INC 936 BARRACUDA ST TERMINAL ISLAND California 90731 4.1 0.375 4.475 0 0 0 4.475
BROWN PRINTING CO 2300 BROWN AVE WASECA Minnesota 56093 4.4155 0.0585 4.474 0 0 4.474
CURTIS METAL FINISHING CO 6645 SIMS DR STERLING HEIGHTS Michigan 48313 3.19 1.2715 4.4615 0 0 4.4615
ARVINMERITOR HEAVY VEHICLE SYSTEMS LLC 801 RAILROAD AVE YORK South Carolina 29745 0.001 4.4215 4.4225 0 0 0 4.4225
ENDICOTT INTERCONNECT TECHNOLOGIES INC 1093 CLARK ST ENDICOTT New York 13760 0.25 4.1155 4.3655 0.032 0 0 4.3975
WORLDCOLOR 451 INTERNATIONAL BLVD CLARKSVILLE Tennessee 37040 3.7745 0.612 4.3865 0 0 4.3865
MERIX CORP 1521 POPLAR LN FOREST GROVE Oregon 97116 0.0835 4.1895 4.273 0 0 4.273
INLAND LABEL & MARKETING 2009 W AVE S LA CROSSE Wisconsin 54601 2.0245 2.209 4.2335 0 0 0 4.2335
Page 11 of 40
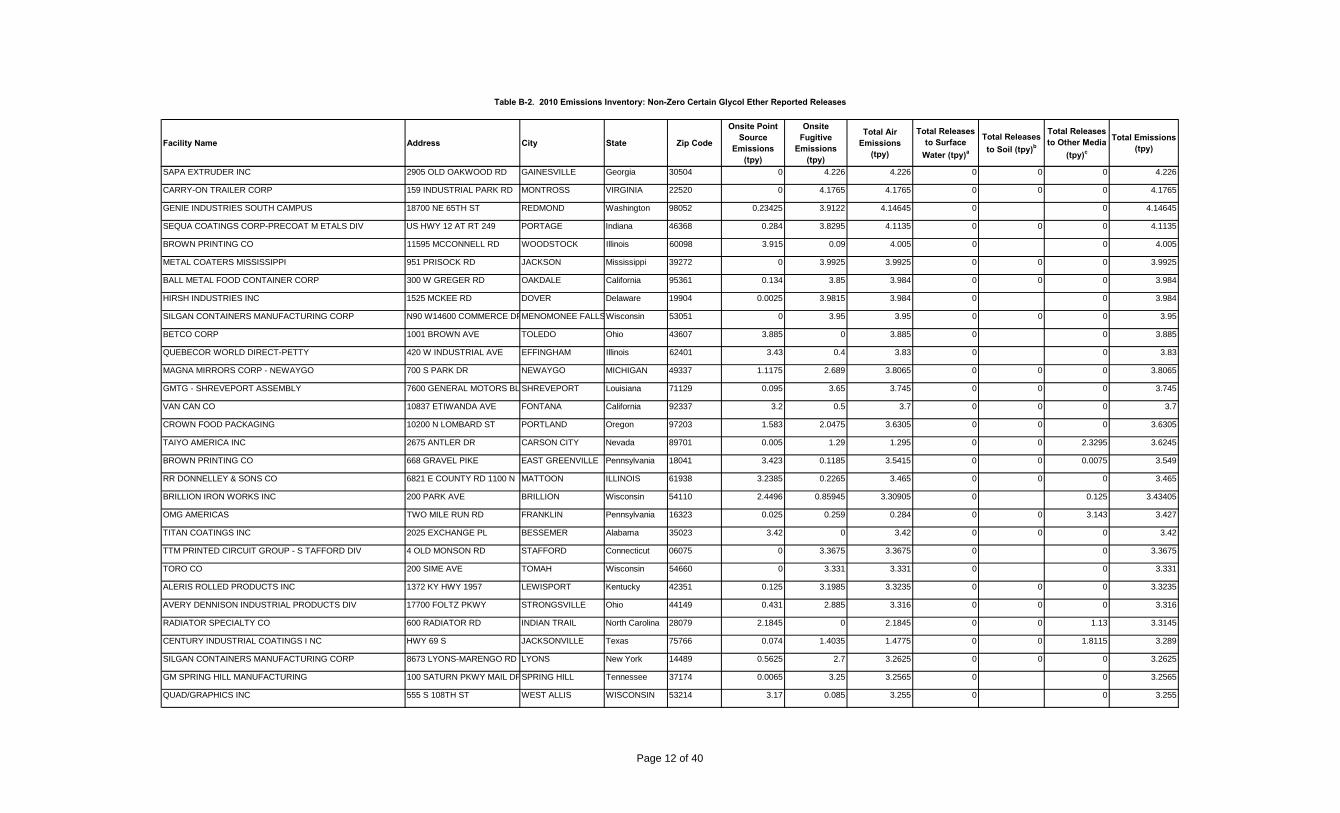
Table B-2. 2010 Emissions Inventory: Non-Zero Certain Glycol Ether Reported Releases
Facility Name Address City State Zip Code
Onsite Point Source
Emissions (tpy)
Onsite Fugitive
Emissions (tpy)
Total Air Emissions
(tpy)
Total Releases to Surface
Water (tpy)a
Total Releases to Soil (tpy)b
Total Releases to Other Media
(tpy)c
Total Emissions (tpy)
SAPA EXTRUDER INC 2905 OLD OAKWOOD RD GAINESVILLE Georgia 30504 0 4.226 4.226 0 0 0 4.226
CARRY-ON TRAILER CORP 159 INDUSTRIAL PARK RD MONTROSS VIRGINIA 22520 0 4.1765 4.1765 0 0 0 4.1765
GENIE INDUSTRIES SOUTH CAMPUS 18700 NE 65TH ST REDMOND Washington 98052 0.23425 3.9122 4.14645 0 0 4.14645
SEQUA COATINGS CORP-PRECOAT M ETALS DIV US HWY 12 AT RT 249 PORTAGE Indiana 46368 0.284 3.8295 4.1135 0 0 0 4.1135
BROWN PRINTING CO 11595 MCCONNELL RD WOODSTOCK Illinois 60098 3.915 0.09 4.005 0 0 4.005
METAL COATERS MISSISSIPPI 951 PRISOCK RD JACKSON Mississippi 39272 0 3.9925 3.9925 0 0 0 3.9925
BALL METAL FOOD CONTAINER CORP 300 W GREGER RD OAKDALE California 95361 0.134 3.85 3.984 0 0 0 3.984
HIRSH INDUSTRIES INC 1525 MCKEE RD DOVER Delaware 19904 0.0025 3.9815 3.984 0 0 3.984
SILGAN CONTAINERS MANUFACTURING CORP N90 W14600 COMMERCE DRMENOMONEE FALLSWisconsin 53051 0 3.95 3.95 0 0 0 3.95
BETCO CORP 1001 BROWN AVE TOLEDO Ohio 43607 3.885 0 3.885 0 0 3.885
QUEBECOR WORLD DIRECT-PETTY 420 W INDUSTRIAL AVE EFFINGHAM Illinois 62401 3.43 0.4 3.83 0 0 3.83
MAGNA MIRRORS CORP - NEWAYGO 700 S PARK DR NEWAYGO MICHIGAN 49337 1.1175 2.689 3.8065 0 0 0 3.8065
GMTG - SHREVEPORT ASSEMBLY 7600 GENERAL MOTORS BL SHREVEPORT Louisiana 71129 0.095 3.65 3.745 0 0 0 3.745
VAN CAN CO 10837 ETIWANDA AVE FONTANA California 92337 3.2 0.5 3.7 0 0 0 3.7
CROWN FOOD PACKAGING 10200 N LOMBARD ST PORTLAND Oregon 97203 1.583 2.0475 3.6305 0 0 0 3.6305
TAIYO AMERICA INC 2675 ANTLER DR CARSON CITY Nevada 89701 0.005 1.29 1.295 0 0 2.3295 3.6245
BROWN PRINTING CO 668 GRAVEL PIKE EAST GREENVILLE Pennsylvania 18041 3.423 0.1185 3.5415 0 0 0.0075 3.549
RR DONNELLEY & SONS CO 6821 E COUNTY RD 1100 N MATTOON ILLINOIS 61938 3.2385 0.2265 3.465 0 0 0 3.465
BRILLION IRON WORKS INC 200 PARK AVE BRILLION Wisconsin 54110 2.4496 0.85945 3.30905 0 0.125 3.43405
OMG AMERICAS TWO MILE RUN RD FRANKLIN Pennsylvania 16323 0.025 0.259 0.284 0 0 3.143 3.427
TITAN COATINGS INC 2025 EXCHANGE PL BESSEMER Alabama 35023 3.42 0 3.42 0 0 0 3.42
TTM PRINTED CIRCUIT GROUP - S TAFFORD DIV 4 OLD MONSON RD STAFFORD Connecticut 06075 0 3.3675 3.3675 0 0 3.3675
TORO CO 200 SIME AVE TOMAH Wisconsin 54660 0 3.331 3.331 0 0 3.331
ALERIS ROLLED PRODUCTS INC 1372 KY HWY 1957 LEWISPORT Kentucky 42351 0.125 3.1985 3.3235 0 0 0 3.3235
AVERY DENNISON INDUSTRIAL PRODUCTS DIV 17700 FOLTZ PKWY STRONGSVILLE Ohio 44149 0.431 2.885 3.316 0 0 0 3.316
RADIATOR SPECIALTY CO 600 RADIATOR RD INDIAN TRAIL North Carolina 28079 2.1845 0 2.1845 0 0 1.13 3.3145
CENTURY INDUSTRIAL COATINGS I NC HWY 69 S JACKSONVILLE Texas 75766 0.074 1.4035 1.4775 0 0 1.8115 3.289
SILGAN CONTAINERS MANUFACTURING CORP 8673 LYONS-MARENGO RD LYONS New York 14489 0.5625 2.7 3.2625 0 0 0 3.2625
GM SPRING HILL MANUFACTURING 100 SATURN PKWY MAIL DRSPRING HILL Tennessee 37174 0.0065 3.25 3.2565 0 0 3.2565
QUAD/GRAPHICS INC 555 S 108TH ST WEST ALLIS WISCONSIN 53214 3.17 0.085 3.255 0 0 3.255
Page 12 of 40
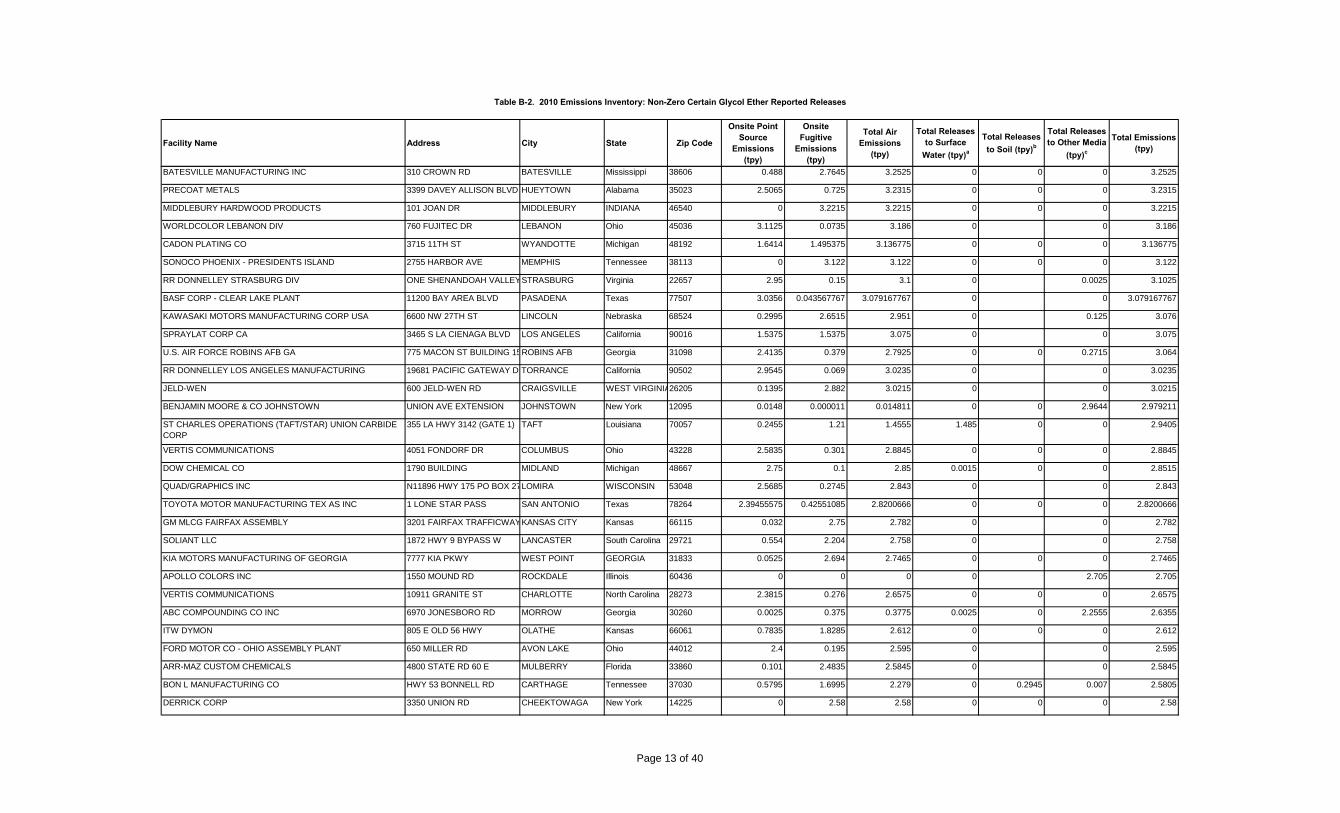
Table B-2. 2010 Emissions Inventory: Non-Zero Certain Glycol Ether Reported Releases
Facility Name Address City State Zip Code
Onsite Point Source
Emissions (tpy)
Onsite Fugitive
Emissions (tpy)
Total Air Emissions
(tpy)
Total Releases to Surface
Water (tpy)a
Total Releases to Soil (tpy)b
Total Releases to Other Media
(tpy)c
Total Emissions (tpy)
BATESVILLE MANUFACTURING INC 310 CROWN RD BATESVILLE Mississippi 38606 0.488 2.7645 3.2525 0 0 0 3.2525
PRECOAT METALS 3399 DAVEY ALLISON BLVD HUEYTOWN Alabama 35023 2.5065 0.725 3.2315 0 0 0 3.2315
MIDDLEBURY HARDWOOD PRODUCTS 101 JOAN DR MIDDLEBURY INDIANA 46540 0 3.2215 3.2215 0 0 0 3.2215
WORLDCOLOR LEBANON DIV 760 FUJITEC DR LEBANON Ohio 45036 3.1125 0.0735 3.186 0 0 3.186
CADON PLATING CO 3715 11TH ST WYANDOTTE Michigan 48192 1.6414 1.495375 3.136775 0 0 0 3.136775
SONOCO PHOENIX - PRESIDENTS ISLAND 2755 HARBOR AVE MEMPHIS Tennessee 38113 0 3.122 3.122 0 0 0 3.122
RR DONNELLEY STRASBURG DIV ONE SHENANDOAH VALLEYSTRASBURG Virginia 22657 2.95 0.15 3.1 0 0.0025 3.1025
BASF CORP - CLEAR LAKE PLANT 11200 BAY AREA BLVD PASADENA Texas 77507 3.0356 0.043567767 3.079167767 0 0 3.079167767
KAWASAKI MOTORS MANUFACTURING CORP USA 6600 NW 27TH ST LINCOLN Nebraska 68524 0.2995 2.6515 2.951 0 0.125 3.076
SPRAYLAT CORP CA 3465 S LA CIENAGA BLVD LOS ANGELES California 90016 1.5375 1.5375 3.075 0 0 3.075
U.S. AIR FORCE ROBINS AFB GA 775 MACON ST BUILDING 15ROBINS AFB Georgia 31098 2.4135 0.379 2.7925 0 0 0.2715 3.064
RR DONNELLEY LOS ANGELES MANUFACTURING 19681 PACIFIC GATEWAY D TORRANCE California 90502 2.9545 0.069 3.0235 0 0 3.0235
JELD-WEN 600 JELD-WEN RD CRAIGSVILLE WEST VIRGINIA26205 0.1395 2.882 3.0215 0 0 3.0215
BENJAMIN MOORE & CO JOHNSTOWN UNION AVE EXTENSION JOHNSTOWN New York 12095 0.0148 0.000011 0.014811 0 0 2.9644 2.979211
ST CHARLES OPERATIONS (TAFT/STAR) UNION CARBIDE CORP
355 LA HWY 3142 (GATE 1) TAFT Louisiana 70057 0.2455 1.21 1.4555 1.485 0 0 2.9405
VERTIS COMMUNICATIONS 4051 FONDORF DR COLUMBUS Ohio 43228 2.5835 0.301 2.8845 0 0 0 2.8845
DOW CHEMICAL CO 1790 BUILDING MIDLAND Michigan 48667 2.75 0.1 2.85 0.0015 0 0 2.8515
QUAD/GRAPHICS INC N11896 HWY 175 PO BOX 27LOMIRA WISCONSIN 53048 2.5685 0.2745 2.843 0 0 2.843
TOYOTA MOTOR MANUFACTURING TEX AS INC 1 LONE STAR PASS SAN ANTONIO Texas 78264 2.39455575 0.42551085 2.8200666 0 0 0 2.8200666
GM MLCG FAIRFAX ASSEMBLY 3201 FAIRFAX TRAFFICWAYKANSAS CITY Kansas 66115 0.032 2.75 2.782 0 0 2.782
SOLIANT LLC 1872 HWY 9 BYPASS W LANCASTER South Carolina 29721 0.554 2.204 2.758 0 0 2.758
KIA MOTORS MANUFACTURING OF GEORGIA 7777 KIA PKWY WEST POINT GEORGIA 31833 0.0525 2.694 2.7465 0 0 0 2.7465
APOLLO COLORS INC 1550 MOUND RD ROCKDALE Illinois 60436 0 0 0 0 2.705 2.705
VERTIS COMMUNICATIONS 10911 GRANITE ST CHARLOTTE North Carolina 28273 2.3815 0.276 2.6575 0 0 0 2.6575
ABC COMPOUNDING CO INC 6970 JONESBORO RD MORROW Georgia 30260 0.0025 0.375 0.3775 0.0025 0 2.2555 2.6355
ITW DYMON 805 E OLD 56 HWY OLATHE Kansas 66061 0.7835 1.8285 2.612 0 0 0 2.612
FORD MOTOR CO - OHIO ASSEMBLY PLANT 650 MILLER RD AVON LAKE Ohio 44012 2.4 0.195 2.595 0 0 2.595
ARR-MAZ CUSTOM CHEMICALS 4800 STATE RD 60 E MULBERRY Florida 33860 0.101 2.4835 2.5845 0 0 2.5845
BON L MANUFACTURING CO HWY 53 BONNELL RD CARTHAGE Tennessee 37030 0.5795 1.6995 2.279 0 0.2945 0.007 2.5805
DERRICK CORP 3350 UNION RD CHEEKTOWAGA New York 14225 0 2.58 2.58 0 0 0 2.58
Page 13 of 40

Table B-2. 2010 Emissions Inventory: Non-Zero Certain Glycol Ether Reported Releases
Facility Name Address City State Zip Code
Onsite Point Source
Emissions (tpy)
Onsite Fugitive
Emissions (tpy)
Total Air Emissions
(tpy)
Total Releases to Surface
Water (tpy)a
Total Releases to Soil (tpy)b
Total Releases to Other Media
(tpy)c
Total Emissions (tpy)
TYCO FIRE SUPPRESSION & BUILDING PRODUCTS 1 STANTON ST MARINETTE Wisconsin 54143 0.0035 2.555 2.5585 0 0 2.5585
IC OF OKLAHOMA LLC 2322 N MINGO RD TULSA Oklahoma 74116 0 2.55 2.55 0 0 2.55
BWAY CORP BWAY PACKAGING DIV 8200 BROADWELL RD CINCINNATI Ohio 45244 1.65079 0.8941 2.54489 0 0 2.54489
BRUNSWICK CORP MERCURY MARINE DIV W6250 PIONEER RD FOND DU LAC Wisconsin 54935 0.2525 2.271 2.5235 0 0 2.5235
ACCESS BUSINESS GROUP LLC 7575 FULTON ST E ADA Michigan 49355 2.3755 0.128 2.5035 0 0 2.5035
MISSION KLEENSWEEP PRODUCTS INC 2434 BIRKDALE ST LOS ANGELES California 90031 2.5 0 2.5 0 0 2.5
ROHM & HAAS CHEMICALS LLC 200 RT 413 BRISTOL Pennsylvania 19007 0.05715 0.19785 0.255 0 0 2.214 2.469
POWER PARTNERS INC 200 NEWTON BRIDGE RD ATHENS Georgia 30607 0 2.4385 2.4385 0 0 2.4385
AMERICAN COLOR GRAPHICS 810 E S ST MARENGO Iowa 52301 2.2715 0.1575 2.429 0 0 2.429
CENTRIA 530 N SECOND ST CAMBRIDGE Ohio 43725 1.209 1.2115 2.4205 0 0 0 2.4205
CUMMINS POWER GENERATION 1400 73RD AVE NE FRIDLEY Minnesota 55432 0.12 2.3 2.42 0 0 2.42
HEWLETT-PACKARD CARIBE BV SITE HWY 110 N KM 5.1 AGUADILLA Puerto Rico 00605 0.125 2.248 2.373 0 0 0 2.373
MOTOR CASTINGS CO 1323 S 65TH MILWAUKEE Wisconsin 53214 0 1.159 1.159 0 0 1.213 2.372
VERTIS INC RNS SPRINGFIELD DIV 245 BENTON DR EAST LONGMEADOWMASSACHUSET01028 2.311 0.0535 2.3645 0 0 0 2.3645
CADMUS SPECIALTY PUBLICATIONS 2901 BYRDHILL RD RICHMOND VIRGINIA 23228 2.242785 0.104675 2.34746 0 0 2.34746
ROPPE CORP 1602 N UNION ST FOSTORIA Ohio 44830 0.125 2.22 2.345 0 0 2.345
CCL CONTAINER AEROSOL DIV ONE LLODIO DR HERMITAGE Pennsylvania 16148 0.1835 2.1485 2.332 0 0 0 2.332
AMERICAN COLOR GRAPHICS - LUFKIN 3001 ATKINSON DR LUFKIN Texas 75901 2.2015 0.1025 2.304 0 0 2.304
IVC SOUTH 875 PROGRESS CENTER AVLAWRENCEVILLE Georgia 30043 0.4575 1.8305 2.288 0 0 2.288
NCP COATINGS INC 225 FORT ST NILES Michigan 49120 2.275 0 2.275 0 0 0 2.275
DENSO MANUFACTURING TENNESSEE INC 1720, 1725, 1755 ROBERT C MARYVILLE Tennesee 37801 0 2.2585 2.2585 0 0 0 2.2585
3M CO - HUTCHINSON 905/915 ADAMS ST SE HUTCHINSON Minnesota 55350 0 2.2255 2.2255 0 0 0 2.2255
SABIC INNOVATIVE PLASTICS MT VERNON LLC 1 LEXAN LN MOUNT VERNON Indiana 47620 1.3 0.8 2.1 0.125 0 0 2.225
HONDA MANUFACTURING OF INDIANA LLC 2755 N MICHIGAN AVE GREENSBURG Indiana 47240 1.7 0.5 2.2 0 0 0.0025 2.2025
GATES CORP 1450 MONTANA RD IOLA KANSAS 66749 0 0.0023 0.0023 0 0 2.1605 2.1628
GREIF PACKAGING LLC 10850 STRANG RD LA PORTE Texas 77571 1.6775 0.462 2.1395 0 0 2.1395
VANEX INC 1700 S SHAWNEE ST MOUNT VERNON Illinois 62864 0 2.1145 2.1145 0 0 2.1145
RED SPOT WESTLAND INC 550 S EDWIN ST WESTLAND Michigan 48186 1.192 0.912 2.104 0 0 0 2.104
BENCHMARK ENERGY PRODUCTS LLC 4113 W INDUSTRIAL AVE MIDLAND Texas 79703 0.191 1.912 2.103 0 0 2.103
VERTIS 7619 DOANE DR MANASSAS VIRGINIA 20109 1.9855 0.065 2.0505 0 0 2.0505
Page 14 of 40
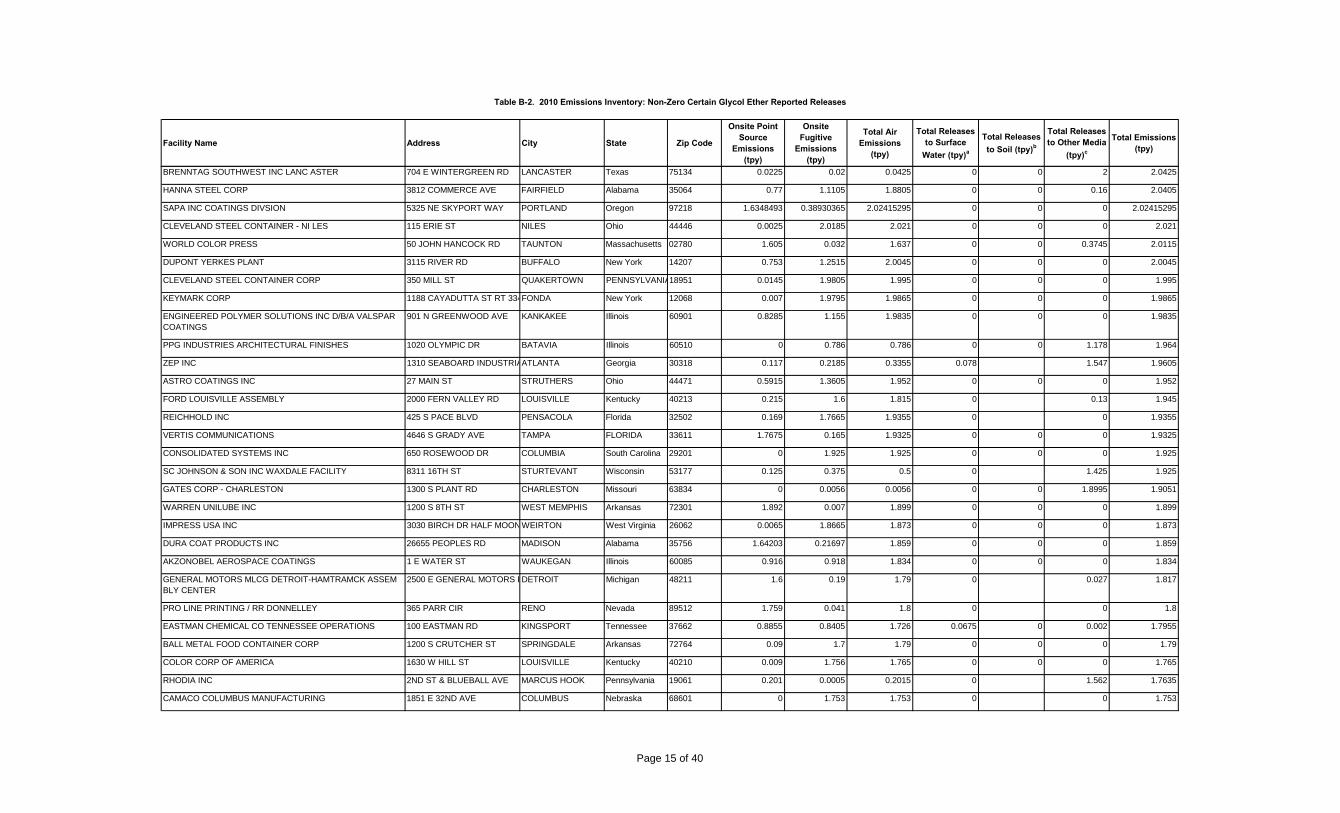
Table B-2. 2010 Emissions Inventory: Non-Zero Certain Glycol Ether Reported Releases
Facility Name Address City State Zip Code
Onsite Point Source
Emissions (tpy)
Onsite Fugitive
Emissions (tpy)
Total Air Emissions
(tpy)
Total Releases to Surface
Water (tpy)a
Total Releases to Soil (tpy)b
Total Releases to Other Media
(tpy)c
Total Emissions (tpy)
BRENNTAG SOUTHWEST INC LANC ASTER 704 E WINTERGREEN RD LANCASTER Texas 75134 0.0225 0.02 0.0425 0 0 2 2.0425
HANNA STEEL CORP 3812 COMMERCE AVE FAIRFIELD Alabama 35064 0.77 1.1105 1.8805 0 0 0.16 2.0405
SAPA INC COATINGS DIVSION 5325 NE SKYPORT WAY PORTLAND Oregon 97218 1.6348493 0.38930365 2.02415295 0 0 0 2.02415295
CLEVELAND STEEL CONTAINER - NI LES 115 ERIE ST NILES Ohio 44446 0.0025 2.0185 2.021 0 0 0 2.021
WORLD COLOR PRESS 50 JOHN HANCOCK RD TAUNTON Massachusetts 02780 1.605 0.032 1.637 0 0 0.3745 2.0115
DUPONT YERKES PLANT 3115 RIVER RD BUFFALO New York 14207 0.753 1.2515 2.0045 0 0 0 2.0045
CLEVELAND STEEL CONTAINER CORP 350 MILL ST QUAKERTOWN PENNSYLVANIA18951 0.0145 1.9805 1.995 0 0 0 1.995
KEYMARK CORP 1188 CAYADUTTA ST RT 334FONDA New York 12068 0.007 1.9795 1.9865 0 0 0 1.9865
ENGINEERED POLYMER SOLUTIONS INC D/B/A VALSPAR COATINGS
901 N GREENWOOD AVE KANKAKEE Illinois 60901 0.8285 1.155 1.9835 0 0 0 1.9835
PPG INDUSTRIES ARCHITECTURAL FINISHES 1020 OLYMPIC DR BATAVIA Illinois 60510 0 0.786 0.786 0 0 1.178 1.964
ZEP INC 1310 SEABOARD INDUSTRIAATLANTA Georgia 30318 0.117 0.2185 0.3355 0.078 1.547 1.9605
ASTRO COATINGS INC 27 MAIN ST STRUTHERS Ohio 44471 0.5915 1.3605 1.952 0 0 0 1.952
FORD LOUISVILLE ASSEMBLY 2000 FERN VALLEY RD LOUISVILLE Kentucky 40213 0.215 1.6 1.815 0 0.13 1.945
REICHHOLD INC 425 S PACE BLVD PENSACOLA Florida 32502 0.169 1.7665 1.9355 0 0 1.9355
VERTIS COMMUNICATIONS 4646 S GRADY AVE TAMPA FLORIDA 33611 1.7675 0.165 1.9325 0 0 0 1.9325
CONSOLIDATED SYSTEMS INC 650 ROSEWOOD DR COLUMBIA South Carolina 29201 0 1.925 1.925 0 0 0 1.925
SC JOHNSON & SON INC WAXDALE FACILITY 8311 16TH ST STURTEVANT Wisconsin 53177 0.125 0.375 0.5 0 1.425 1.925
GATES CORP - CHARLESTON 1300 S PLANT RD CHARLESTON Missouri 63834 0 0.0056 0.0056 0 0 1.8995 1.9051
WARREN UNILUBE INC 1200 S 8TH ST WEST MEMPHIS Arkansas 72301 1.892 0.007 1.899 0 0 0 1.899
IMPRESS USA INC 3030 BIRCH DR HALF MOONWEIRTON West Virginia 26062 0.0065 1.8665 1.873 0 0 0 1.873
DURA COAT PRODUCTS INC 26655 PEOPLES RD MADISON Alabama 35756 1.64203 0.21697 1.859 0 0 0 1.859
AKZONOBEL AEROSPACE COATINGS 1 E WATER ST WAUKEGAN Illinois 60085 0.916 0.918 1.834 0 0 0 1.834
GENERAL MOTORS MLCG DETROIT-HAMTRAMCK ASSEM BLY CENTER
2500 E GENERAL MOTORS BDETROIT Michigan 48211 1.6 0.19 1.79 0 0.027 1.817
PRO LINE PRINTING / RR DONNELLEY 365 PARR CIR RENO Nevada 89512 1.759 0.041 1.8 0 0 1.8
EASTMAN CHEMICAL CO TENNESSEE OPERATIONS 100 EASTMAN RD KINGSPORT Tennessee 37662 0.8855 0.8405 1.726 0.0675 0 0.002 1.7955
BALL METAL FOOD CONTAINER CORP 1200 S CRUTCHER ST SPRINGDALE Arkansas 72764 0.09 1.7 1.79 0 0 0 1.79
COLOR CORP OF AMERICA 1630 W HILL ST LOUISVILLE Kentucky 40210 0.009 1.756 1.765 0 0 0 1.765
RHODIA INC 2ND ST & BLUEBALL AVE MARCUS HOOK Pennsylvania 19061 0.201 0.0005 0.2015 0 1.562 1.7635
CAMACO COLUMBUS MANUFACTURING 1851 E 32ND AVE COLUMBUS Nebraska 68601 0 1.753 1.753 0 0 1.753
Page 15 of 40

Table B-2. 2010 Emissions Inventory: Non-Zero Certain Glycol Ether Reported Releases
Facility Name Address City State Zip Code
Onsite Point Source
Emissions (tpy)
Onsite Fugitive
Emissions (tpy)
Total Air Emissions
(tpy)
Total Releases to Surface
Water (tpy)a
Total Releases to Soil (tpy)b
Total Releases to Other Media
(tpy)c
Total Emissions (tpy)
RR DONNELLEY PINEVILLE 10519 INDUSTRIAL DR PINEVILLE North Carolina 28134 1.6305 0.0865 1.717 0 0 1.717
STEELSCAPE INC 7001 ALLISON-BONNET MEMFAIRFIELD Alabama 35064 0.003895 1.709215 1.71311 0 0 0 1.71311
SILGAN CONTAINERS MANUFACTURING CORP 2200 WILBUR AVE ANTIOCH California 94509 0 1.7065 1.7065 0 0 0 1.7065
FUJIFILM NORTH AMERICA CORP 20 W 14TH AVE NORTH KANSAS CIT Missouri 64116 0 1.683 1.683 0 0 0 1.683
U S CHEMICAL 316 HART ST WATERTOWN Wisconsin 53094 0.00011 0.00003 0.00014 0 1.6775 1.67764
EASTMAN KODAK CO EASTMAN BUSINESS PARK 1669 LAKE AVE ROCHESTER New York 14652 0.001 0.0035 0.0045 1.19 0 0.438 1.6325
DAIMLERCHRYSLER CORP TOLEDO ASSEMBLY PLANT 4000 STICKNEY AVE TOLEDO Ohio 43612 0.50765 1.1 1.60765 0 0 0.0025 1.61015
STP PRODUCTS MANUFACTURING CO 477 LEXINGTON AVE PAINESVILLE Ohio 44077 0.81 0 0.81 0 0 0.772 1.582
HUNTSMAN PETROCHEMICAL LLC 5451 JEFFERSON CHEMICALCONROE Texas 77301 0 0 0 0 0 1.5735 1.5735
RR DONNELLEY VON HOFFMANN CORP 321 WILSON DR JEFFERSON CITY Missouri 65109 1.534445 0.03795 1.572395 0 0 1.572395
J L CLARK INC 923 23RD AVE ROCKFORD Illinois 61104 0.26 1.2795 1.5395 0 0 0 1.5395
DOW CHEMICAL CO - LOUISIANA OPERATIONS 21255 LA HWY 1 S PLAQUEMINE Louisiana 70765 1.538 0 1.538 0 0 0 1.538
WORLDCOLOR - DYERSBURG DIV 2030 SYLVAN RD DYERSBURG Tennessee 38024 1.4305 0.0985 1.529 0 0 1.529
RANBAR ELECTRICAL MATERIALS INC RTE 993 ONE MILE W OF RTMANOR Pennsylvania 15665 0 0.006 0.006 0 0 1.4975 1.5035
SILGAN WHITE CAP CORP 350 JAYCEE DR VALMONT INHAZLETON Pennsylvania 18201 0.75 0.75 1.5 0 0 0 1.5
TEXAS FINISHING CO 1801 SURVEYOR BLVD CARROLLTON Texas 75006 0 1.4565 1.4565 0 0 1.4565
CARESTREAM HEALTH COLORADO 2000 HOWARD SMITH AVE WWINDSOR Colorado 80550 0.002 0 0.002 1.4505 0 1.73472E-18 1.4525
CHRYSLER STERLING HEIGHTS ASSEMBLY PLANT 38111 VAN DYKE STERLING HEIGHTS Michigan 48312 0.55 0.9 1.45 0 0 1.45
WORLDCOLOR STILLWATER (WAS QUEBECOR WORLD - STILLWATER DIV)
100 W AIRPORT RD STILLWATER Oklahoma 74075 1.2965 0.1515 1.448 0 0 0 1.448
THIRD COAST PACKAGING INC PEARLAND 1871 MYKAWA PEARLAND Texas 77581 0 0 0 0 0 1.431 1.431
RR DONNELLEY 100 QUALITY CT CHARLESTOWN Indiana 47111 1.362 0.0635 1.4255 0 0 1.4255
BAYOU COS INC 5200 CURTIS LN NEW IBERIA LOUISIANA 70560 1.4245 0 1.4245 0 0 0 1.4245
NICHOLS ALUMINUM ALABAMA INC 2001 HWY 20 W DECATUR Alabama 35601 1.135 0.279 1.414 0 0 1.414
GMC TRUCK GROUP ARLINGTON ASSEMBLY PLANT 2525 E ABRAMS ST ARLINGTON Texas 76010 0.36 1.05 1.41 0 0 1.41
CARDINAL ALUMINUM CO PLAN T 3 4005 OAKLAWN DR LOUISVILLE Kentucky 40219 0.0485 1.354 1.4025 0 0 0 1.4025
WHEELING CORRUGATING CO - BEECH BOTTOM PLANT 2481 RIVER RD WELLSBURG West Virginia 26070 0 1.4 1.4 0 0 0 1.4
OHIO ART CO ONE TOY ST BRYAN Ohio 43506 0.944 0.444 1.388 0 0 0 1.388
PRO LINE PRINTING ARLINGTON 401 N GREAT SW PKWY ARLINGTON Texas 76011 1.25 0.125 1.375 0 0 1.375
Page 16 of 40

Table B-2. 2010 Emissions Inventory: Non-Zero Certain Glycol Ether Reported Releases
Facility Name Address City State Zip Code
Onsite Point Source
Emissions (tpy)
Onsite Fugitive
Emissions (tpy)
Total Air Emissions
(tpy)
Total Releases to Surface
Water (tpy)a
Total Releases to Soil (tpy)b
Total Releases to Other Media
(tpy)c
Total Emissions (tpy)
ENGINEERED POLYMER SOLUTIONS INC D/B/A VALSPAR COATINGS
372 CLEVELAND ST ROCHESTER Pennsylvania 15074 0.523 0.8515 1.3745 0 0 0 1.3745
GFX INTERNATIONAL 333 BARRON BLVD GRAYSLAKE Illinois 60030 0 0.82 0.82 0 0.55 1.37
HUNTSMAN PETROCHEMICAL LLC 3892 US HWY 90 DAYTON Texas 77535 0.001 0.001 0.002 0 0 1.368 1.37
CHROMASOURCE INC 2433 S CR 600 E COLUMBIA CITY Indiana 46725 0 1.338 1.338 0 0 0 1.338
VEYANCE TECHNOLOGIES INC 400 N GOODYEAR RD MOUNT PLEASANT Iowa 52641 0.0005 0 0.0005 0 1.3175 1.318
SHEBOYGAN PAINT CO 608 CANAL ST CEDARTOWN Georgia 30125 0.635 0.677 1.312 0 0 0 1.312
COOK COMPOSITES & POLYMERS CO 1415 STEELE AVE SW GRAND RAPIDS Michigan 49507 1.061 0.251 1.312 0 0 0 1.312
ICL-IP AMERICA INC 11636 HUNTINGTON GALLIPOLIS FERRY West Virginia 25515 0.005715 0.344885 0.3506 0.9545 0 0 1.3051
RR DONNELLEY & SONS CO 60 SECURITY DR AVON Connecticut 06001 1.258 0.0295 1.2875 0 0 1.2875
MASCO RETAIL CABINET GROUP LLC 423 HOPEWELL RD WAVERLY Ohio 45690 0.0055 1.1675 1.173 0 0 0.1105 1.2835
CLEVELAND STEEL CONTAINER - PE OTONE FACILITY 117 E LINCOLN ST PEOTONE Illinois 60468 0.053 1.214 1.267 0 0 0 1.267
CATERPILLAR INC 3701 STATE RD 26 E LAFAYETTE Indiana 47905 0.04 1.2155 1.2555 0 0 0 1.2555
LION COPOLYMER LLC 5955 SCENIC HWY BATON ROUGE Louisiana 70805 0 0 0 0.0015 0 1.25 1.2515
GOODYEAR TIRE & RUBBER CO. AKRON TECHNICAL CENTER
200 S. MARTHA AVE AKRON Ohio 44309 0 0 0 0 0 1.25 1.25
GENTEK BUILDING PRODUCTS 11 CRAGWOOD RD AVENEL New Jersey 07001 0.122 1.126 1.248 0 0 0 1.248
SUN CHEMICAL CORP 2445 PRODUCTION DR SAINT CHARLES Illinois 60174 0.185 1.049 1.234 0 0 0 1.234
PPG ARCHITECTURAL FINISHES EAST POINT 1377 OAKLEIGH DR EAST POINT Georgia 30344 0 0.691 0.691 0 0 0.541 1.232
AKZO NOBEL COATINGS INC 1313 WINDSOR AVE COLUMBUS Ohio 43211 0.7885 0.4365 1.225 0 0 0 1.225
SPIRALKOTE FLEXIBLE PACKAGING 1200 CENTRAL FLORIDA PK ORLANDO FLORIDA 32837 0 1.2105 1.2105 0 0 0 1.2105
SPRAYLAT CORP IL 1701 E 122-ND ST CHICAGO Illinois 60633 0.06 1.141 1.201 0 0 0 1.201
KIK (HOUSTON) INC 2921 CORDER ST HOUSTON Texas 77054 1.19 0 1.19 0 0 1.19
CP CONVERTERS INC 15 GRUMBACHER RD YORK PENNSYLVANIA17402 1.17007 0 1.17007 0 0 0 1.17007
RED SPOT PAINT & VARNISH CO INC 1016 E COLUMBIA ST EVANSVILLE Indiana 47711 0.6865 0.4695 1.156 0 0 0 1.156
JOHN DEERE SEEDING & CYLINDER 501 RIVER DR MOLINE Illinois 61265 0 1.15 1.15 0 0 0 1.15
VEYANCE TECHNOLOGIES INC 2701 W OMAHA AVE NORFOLK Nebraska 68701 0.03668 0.108535 0.145215 0 0 1.000835 1.14605
BJ CHEMICAL SERVICES 707 N LEECH HOBBS New Mexico 88240 0.014 0.00335 0.01735 0 1.12405 1.1414
ARANDELL CORP N82 W13118 LEON RD MENOMONEE FALLSWisconsin 53051 1.094 0.0255 1.1195 0 0 0 1.1195
CHEMCOAT INC 2790 CANFIELDS LN MONTOURSVILLE Pennsylvania 17754 0.125 0 0.125 0 0 0.986 1.111
W W HENRY 150 MOONEY DR BOURBONNAIS Illinois 60914 1.1105 0 1.1105 0 0 0 1.1105
Page 17 of 40

Table B-2. 2010 Emissions Inventory: Non-Zero Certain Glycol Ether Reported Releases
Facility Name Address City State Zip Code
Onsite Point Source
Emissions (tpy)
Onsite Fugitive
Emissions (tpy)
Total Air Emissions
(tpy)
Total Releases to Surface
Water (tpy)a
Total Releases to Soil (tpy)b
Total Releases to Other Media
(tpy)c
Total Emissions (tpy)
DUBOIS CHEMICALS INC 3630 E KEMPER RD SHARONVILLE Ohio 45241 0 0 0 0 1.11 1.11
BEAULIEU OF AMERICA PLANT 560-MODEL 950 RIVERBEND RD DALTON Georgia 30721 0 1.1095 1.1095 0 0 1.1095
TESORO REFINING & MARKETING CO - MANDAN REFINERY
900 OLD RED TRAIL NE MANDAN North Dakota 58554 1.1 0.0005 1.1005 0 0 0 1.1005
IVC INDUSTRIAL COATINGS INC 2245-50 VALLEY AVE INDIANAPOLIS Indiana 46218 0.21965 0.87855 1.0982 0 0 0 1.0982
VANGUARD PAINTS & FINISHES INC 1409 GREENE ST MARIETTA Ohio 45750 1.078 0 1.078 0 0 0 1.078
WINSLOW-BROWNING INC 215 BROWNSVILLE AVE LIBERTY Indiana 47353 1.077 0 1.077 0 0 0 1.077
ENGINEERED POLYMER SOLUTIONS INC D/B/A VALSPAR COATINGS
701 SHILOH RD GARLAND Texas 75042 0.5915 0.4765 1.068 0 0 1.068
GENERAL DYNAMICS ORDNANCE & TACTICAL SYSTEMS GARLAND
1200 N GLENBROOK GARLAND Texas 75040 0.002985 0.000005 0.00299 0 0 1.06475 1.06774
POLYMERIC IMAGING INC 117 E 14TH AVE NORTH KANSAS CIT Missouri 64116 0 1.0665 1.0665 0 0 0 1.0665
3M CO - BROWNWOOD 4501 HWY 377 S BROWNWOOD Texas 76801 0.0435 1 1.0435 0 0 0.006 1.0495
HB FULLER 12110 HARLAND DR NE COVINGTON Georgia 30014 0.5815 0.2815 0.863 0 0.1855 1.0485
COMPLEMENTARY COATINGS CORP 4701 O'DONNELL ST BALTIMORE Maryland 21224 1.029 0 1.029 0 0 0 1.029
UNITED PAINT & CHEMICAL 24671 TELEGRAPH RD SOUTHFIELD Michigan 48034 1.023 0 1.023 0 0 0 1.023
COOK COMPOSITES & POLYMERS CO 2434 HOLMES RD HOUSTON Texas 77051 1.013 0.006 1.019 0 0 0 1.019
TTM TECHNOLOGIES INC 234 CASHMAN DR CHIPPEWA FALLS Wisconsin 54729 0 1.002 1.002 0 0 1.002
GENERAL MOTORS LLC BOWLING GREEN ASSEMBLY PLANT
600 CORVETTE DR BOWLING GREEN Kentucky 42101 0.1 0.9 1 0 0 1
TTM TECHNOLOGIES-SANTA CLARA 407 MATHEW ST SANTA CLARA California 95050 0 0.9985 0.9985 0 0 0.9985
NICHOLS ALUMINUM DAVENPORT 1725 ROCKINGHAM RD DAVENPORT Iowa 52802 0.2795 0.717 0.9965 0 0 0.9965
THREE RIVERS ALUMINUM CO 71 PROGRESS AVE CRANBERRY TOWNSPennsylvania 16066 0.3575 0.637 0.9945 0 0 0 0.9945
LEVLAD 9200 MASON AVE CHATSWORTH California 91311 0.000185 0 0.000185 0 0.9875 0.987685
SONY ELECTRONICS INC 4275 W MAIN ST DOTHAN Alabama 36305 0 0 0 0 0 0.983 0.983
CANBERRA CORP 3610 HOLLAND-SYLVANIA R TOLEDO Ohio 43615 0.6 0.375 0.975 0 0 0.975
PPG INDUSTRIES OHIO INC (CL) 3800 W 143 ST CLEVELAND Ohio 44111 0.4135 0.554 0.9675 0 0 0 0.9675
TEXAS INSTRUMENTS INC 12201 SW FWY MS600 STAFFORD Texas 77477 0.0025 0.125 0.1275 0 0 0.825 0.9525
B-WAY PACKAGING INC 6 LITHO RD TRENTON New Jersey 08648 0.095 0.857 0.952 0 0 0 0.952
GATES CORP 1650 ROWE PKWY POPLAR BLUFF MISSOURI 63901 0 0.0005 0.0005 0 0 0.948 0.9485
WESTERN METAL DECORATING CO 8875 INDUSTRIAL AVE RANCHO CUCAMON CALIFORNIA 91730 0.55 0.375 0.925 0 0 0 0.925
HILLYARD INDUSTRIES INC 402 N 3TH ST SAINT JOSEPH Missouri 64501 0.3575 0.563 0.9205 0 0 0.9205
Page 18 of 40

Table B-2. 2010 Emissions Inventory: Non-Zero Certain Glycol Ether Reported Releases
Facility Name Address City State Zip Code
Onsite Point Source
Emissions (tpy)
Onsite Fugitive
Emissions (tpy)
Total Air Emissions
(tpy)
Total Releases to Surface
Water (tpy)a
Total Releases to Soil (tpy)b
Total Releases to Other Media
(tpy)c
Total Emissions (tpy)
U.S. POLYMERS ACCUREZ LLC 300 E PRIMM ST SAINT LOUIS Missouri 63111 0.0045 0.0025 0.007 0 0.8995 0.9065
FORBO ADHESIVES LLC 7440 W DUPONT RD MORRIS Illinois 60450 0.896 0 0.896 0 0 0.896
NAPCO INC 125 MCFANN RD VALENCIA Pennsylvania 16059 0.817 0.076 0.893 0 0 0 0.893
CRYSTAL FINISHING SYSTEMS INC 2608 ROSS AVE SCHOFIELD Wisconsin 54476 0 0.89296195 0.89296195 0 0 0 0.89296195
HUNT REFINING CO A CORP 1855 FAIRLAWN RD TUSCALOOSA Alabama 35401 0.8905 0 0.8905 0 0 0 0.8905
POLARTEC LLC 46 STAFFORD ST LAWRENCE MASSACHUSET1841 0.89 0 0.89 0 0 0.89
SUN CHEMICAL CORP 1380 FORD RD MAUMEE Ohio 43537 0.133 0.7545 0.8875 0 0 0 0.8875
EXXONMOBIL CHEMICAL BATON ROUGE CHEMICAL PLANT
4999 SCENIC HWY BATON ROUGE Louisiana 70805 0.6 0 0.6 0.285 0 1.11022E-16 0.885
HOVENSA LLC 1 ESTATE HOPE CHRISTIANSTED Virgin Islands 00820 0.702 0 0.702 0.1805 0 0 0.8825
FINISHES UNLIMITED INC 482 WHEELER RD SUGAR GROVE Illinois 60554 0.438 0.438 0.876 0 0 0.876
UNIVAR USA INC HOUSTON FM 529 11235 FM 529 HOUSTON TEXAS 77041 0.375 0.5 0.875 0 0 0 0.875
UNIVERSAL CHEMICALS & COATINGS INC 1124 ELMHURST RD ELK GROVE VILLAGEIllinois 60007 0 0.8735 0.8735 0 0 0 0.8735
ARMSTRONG WORLD INDUSTRIES INC 4115 N PERKINS RD STILLWATER Oklahoma 74075 0.33403 0.52419 0.85822 0 0 0 0.85822
BRENNTAG SOUTHWEST INC HOUS TON 14826 HOOPER RD HOUSTON Texas 77047 0.0125 0.0125 0.025 0 0 0.83 0.855
MITSUBISHI MOTORS NORTH AMERICA INC 100 N MITSUBISHI MOTORWNORMAL Illinois 61761 0.843 0.0055 0.8485 0 0 0 0.8485
CROWN CORK & SEAL CO (USA) INC CROWN CLOSURES DIV
940 MILL PARK DR LANCASTER Ohio 43130 0 0.8195 0.8195 0 0 0 0.8195
DPIX LLC 1635 AEROPLAZA DR COLORADO SPRING COLORADO 80916 0.3395 0.1355 0.475 0 0 0.3375 0.8125
SONOCO PRODUCTS CO 1854 CENTRAL FLORIDA PK ORLANDO Florida 32837 0.59 0.22 0.81 0 0 0 0.81
NEXTEER AUTOMOTIVE CORP 3900 HOLLAND RD SAGINAW Michigan 48601 0.08 0.72 0.8 0 0 0.8
FIVE STAR COATINGS GROUP 36616 89TH ST TWIN LAKES WISCONSIN 53181 0 0.798 0.798 0 0 0 0.798
PEORIA DISPOSAL CO #1 4349 W SOUTHPORT RD PEORIA Illinois 61615 0.7925 0 0.7925 0.0005 1.11022E-16 0.793
TRELLEBORG OFFSHORE US RANKIN ROAD FACILITY 1902 RANKIN RD HOUSTON Texas 77073 0.785 0 0.785 0 0 0 0.785
SILGAN CONTAINERS MANUFACTURING CORP 12130 LYNN AVE S SAVAGE Minnesota 55378 0 0.785 0.785 0 0 0 0.785
KAWNEER CO INC 500 E 12TH ST BLOOMSBURG Pennsylvania 17815 0.1305 0.645 0.7755 0 0 0 0.7755
ASHLAND DISTRIBUTION CO GARLAND TX 3101 WOOD DR GARLAND Texas 75041 0.152 0.035 0.187 0 0 0.5845 0.7715
TCI COATINGS INC 4501 BRADLEY ST LUBBOCK Texas 79415 0.7665 0 0.7665 0 0 0.7665
STEEL DYNAMICS INC 5134 LOOP RD JEFFERSONVILLE Indiana 47130 0 0.763 0.763 0 0 0 0.763
WORWAG COATINGS LLC NA 3420 KOSSUTH ST LAFAYETTE Indiana 47905 0.6285 0.125 0.7535 0 0 0 0.7535
ROHM & HAAS ELECTRONIC MATERIA LS LLC 455 FOREST ST MARLBOROUGH Massachusetts 01752 0.0025 0.0025 0.005 0 0.7465 0.7515
Page 19 of 40
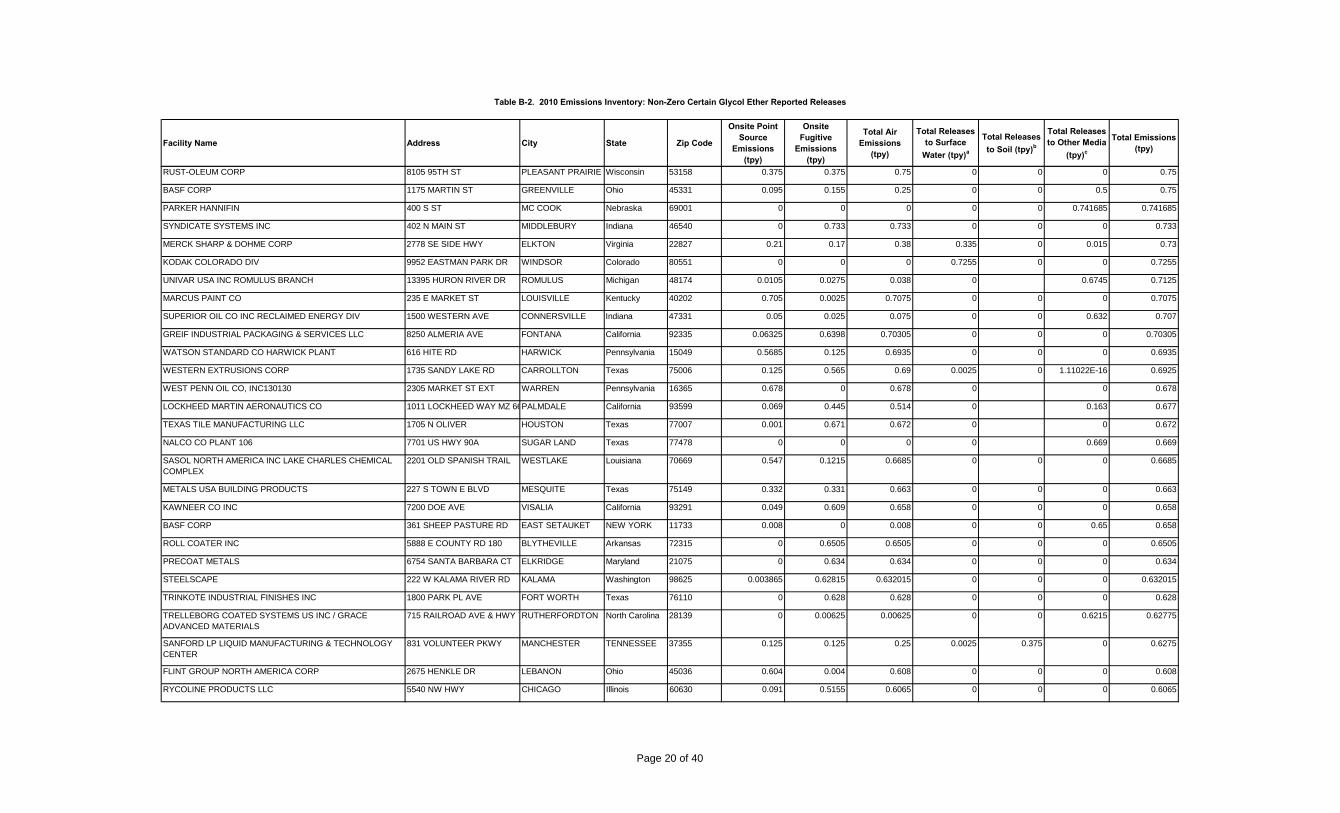
Table B-2. 2010 Emissions Inventory: Non-Zero Certain Glycol Ether Reported Releases
Facility Name Address City State Zip Code
Onsite Point Source
Emissions (tpy)
Onsite Fugitive
Emissions (tpy)
Total Air Emissions
(tpy)
Total Releases to Surface
Water (tpy)a
Total Releases to Soil (tpy)b
Total Releases to Other Media
(tpy)c
Total Emissions (tpy)
RUST-OLEUM CORP 8105 95TH ST PLEASANT PRAIRIE Wisconsin 53158 0.375 0.375 0.75 0 0 0 0.75
BASF CORP 1175 MARTIN ST GREENVILLE Ohio 45331 0.095 0.155 0.25 0 0 0.5 0.75
PARKER HANNIFIN 400 S ST MC COOK Nebraska 69001 0 0 0 0 0 0.741685 0.741685
SYNDICATE SYSTEMS INC 402 N MAIN ST MIDDLEBURY Indiana 46540 0 0.733 0.733 0 0 0 0.733
MERCK SHARP & DOHME CORP 2778 SE SIDE HWY ELKTON Virginia 22827 0.21 0.17 0.38 0.335 0 0.015 0.73
KODAK COLORADO DIV 9952 EASTMAN PARK DR WINDSOR Colorado 80551 0 0 0 0.7255 0 0 0.7255
UNIVAR USA INC ROMULUS BRANCH 13395 HURON RIVER DR ROMULUS Michigan 48174 0.0105 0.0275 0.038 0 0.6745 0.7125
MARCUS PAINT CO 235 E MARKET ST LOUISVILLE Kentucky 40202 0.705 0.0025 0.7075 0 0 0 0.7075
SUPERIOR OIL CO INC RECLAIMED ENERGY DIV 1500 WESTERN AVE CONNERSVILLE Indiana 47331 0.05 0.025 0.075 0 0 0.632 0.707
GREIF INDUSTRIAL PACKAGING & SERVICES LLC 8250 ALMERIA AVE FONTANA California 92335 0.06325 0.6398 0.70305 0 0 0 0.70305
WATSON STANDARD CO HARWICK PLANT 616 HITE RD HARWICK Pennsylvania 15049 0.5685 0.125 0.6935 0 0 0 0.6935
WESTERN EXTRUSIONS CORP 1735 SANDY LAKE RD CARROLLTON Texas 75006 0.125 0.565 0.69 0.0025 0 1.11022E-16 0.6925
WEST PENN OIL CO, INC130130 2305 MARKET ST EXT WARREN Pennsylvania 16365 0.678 0 0.678 0 0 0.678
LOCKHEED MARTIN AERONAUTICS CO 1011 LOCKHEED WAY MZ 66PALMDALE California 93599 0.069 0.445 0.514 0 0.163 0.677
TEXAS TILE MANUFACTURING LLC 1705 N OLIVER HOUSTON Texas 77007 0.001 0.671 0.672 0 0 0.672
NALCO CO PLANT 106 7701 US HWY 90A SUGAR LAND Texas 77478 0 0 0 0 0.669 0.669
SASOL NORTH AMERICA INC LAKE CHARLES CHEMICAL COMPLEX
2201 OLD SPANISH TRAIL WESTLAKE Louisiana 70669 0.547 0.1215 0.6685 0 0 0 0.6685
METALS USA BUILDING PRODUCTS 227 S TOWN E BLVD MESQUITE Texas 75149 0.332 0.331 0.663 0 0 0 0.663
KAWNEER CO INC 7200 DOE AVE VISALIA California 93291 0.049 0.609 0.658 0 0 0 0.658
BASF CORP 361 SHEEP PASTURE RD EAST SETAUKET NEW YORK 11733 0.008 0 0.008 0 0 0.65 0.658
ROLL COATER INC 5888 E COUNTY RD 180 BLYTHEVILLE Arkansas 72315 0 0.6505 0.6505 0 0 0 0.6505
PRECOAT METALS 6754 SANTA BARBARA CT ELKRIDGE Maryland 21075 0 0.634 0.634 0 0 0 0.634
STEELSCAPE 222 W KALAMA RIVER RD KALAMA Washington 98625 0.003865 0.62815 0.632015 0 0 0 0.632015
TRINKOTE INDUSTRIAL FINISHES INC 1800 PARK PL AVE FORT WORTH Texas 76110 0 0.628 0.628 0 0 0 0.628
TRELLEBORG COATED SYSTEMS US INC / GRACE ADVANCED MATERIALS
715 RAILROAD AVE & HWY 7RUTHERFORDTON North Carolina 28139 0 0.00625 0.00625 0 0 0.6215 0.62775
SANFORD LP LIQUID MANUFACTURING & TECHNOLOGY CENTER
831 VOLUNTEER PKWY MANCHESTER TENNESSEE 37355 0.125 0.125 0.25 0.0025 0.375 0 0.6275
FLINT GROUP NORTH AMERICA CORP 2675 HENKLE DR LEBANON Ohio 45036 0.604 0.004 0.608 0 0 0 0.608
RYCOLINE PRODUCTS LLC 5540 NW HWY CHICAGO Illinois 60630 0.091 0.5155 0.6065 0 0 0 0.6065
Page 20 of 40
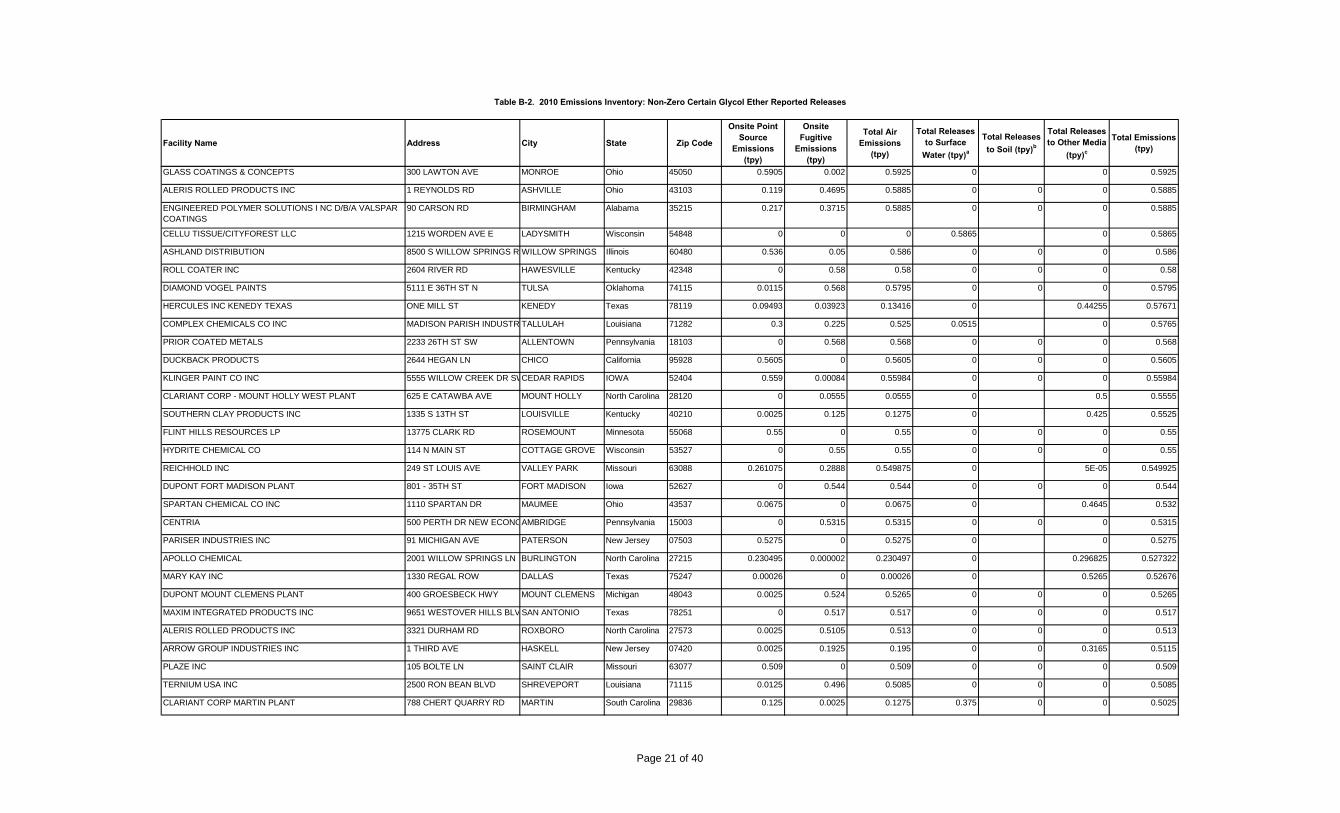
Table B-2. 2010 Emissions Inventory: Non-Zero Certain Glycol Ether Reported Releases
Facility Name Address City State Zip Code
Onsite Point Source
Emissions (tpy)
Onsite Fugitive
Emissions (tpy)
Total Air Emissions
(tpy)
Total Releases to Surface
Water (tpy)a
Total Releases to Soil (tpy)b
Total Releases to Other Media
(tpy)c
Total Emissions (tpy)
GLASS COATINGS & CONCEPTS 300 LAWTON AVE MONROE Ohio 45050 0.5905 0.002 0.5925 0 0 0.5925
ALERIS ROLLED PRODUCTS INC 1 REYNOLDS RD ASHVILLE Ohio 43103 0.119 0.4695 0.5885 0 0 0 0.5885
ENGINEERED POLYMER SOLUTIONS I NC D/B/A VALSPAR COATINGS
90 CARSON RD BIRMINGHAM Alabama 35215 0.217 0.3715 0.5885 0 0 0 0.5885
CELLU TISSUE/CITYFOREST LLC 1215 WORDEN AVE E LADYSMITH Wisconsin 54848 0 0 0 0.5865 0 0.5865
ASHLAND DISTRIBUTION 8500 S WILLOW SPRINGS R WILLOW SPRINGS Illinois 60480 0.536 0.05 0.586 0 0 0 0.586
ROLL COATER INC 2604 RIVER RD HAWESVILLE Kentucky 42348 0 0.58 0.58 0 0 0 0.58
DIAMOND VOGEL PAINTS 5111 E 36TH ST N TULSA Oklahoma 74115 0.0115 0.568 0.5795 0 0 0 0.5795
HERCULES INC KENEDY TEXAS ONE MILL ST KENEDY Texas 78119 0.09493 0.03923 0.13416 0 0.44255 0.57671
COMPLEX CHEMICALS CO INC MADISON PARISH INDUSTR TALLULAH Louisiana 71282 0.3 0.225 0.525 0.0515 0 0.5765
PRIOR COATED METALS 2233 26TH ST SW ALLENTOWN Pennsylvania 18103 0 0.568 0.568 0 0 0 0.568
DUCKBACK PRODUCTS 2644 HEGAN LN CHICO California 95928 0.5605 0 0.5605 0 0 0 0.5605
KLINGER PAINT CO INC 5555 WILLOW CREEK DR SWCEDAR RAPIDS IOWA 52404 0.559 0.00084 0.55984 0 0 0 0.55984
CLARIANT CORP - MOUNT HOLLY WEST PLANT 625 E CATAWBA AVE MOUNT HOLLY North Carolina 28120 0 0.0555 0.0555 0 0.5 0.5555
SOUTHERN CLAY PRODUCTS INC 1335 S 13TH ST LOUISVILLE Kentucky 40210 0.0025 0.125 0.1275 0 0.425 0.5525
FLINT HILLS RESOURCES LP 13775 CLARK RD ROSEMOUNT Minnesota 55068 0.55 0 0.55 0 0 0 0.55
HYDRITE CHEMICAL CO 114 N MAIN ST COTTAGE GROVE Wisconsin 53527 0 0.55 0.55 0 0 0 0.55
REICHHOLD INC 249 ST LOUIS AVE VALLEY PARK Missouri 63088 0.261075 0.2888 0.549875 0 5E-05 0.549925
DUPONT FORT MADISON PLANT 801 - 35TH ST FORT MADISON Iowa 52627 0 0.544 0.544 0 0 0 0.544
SPARTAN CHEMICAL CO INC 1110 SPARTAN DR MAUMEE Ohio 43537 0.0675 0 0.0675 0 0.4645 0.532
CENTRIA 500 PERTH DR NEW ECONOAMBRIDGE Pennsylvania 15003 0 0.5315 0.5315 0 0 0 0.5315
PARISER INDUSTRIES INC 91 MICHIGAN AVE PATERSON New Jersey 07503 0.5275 0 0.5275 0 0 0.5275
APOLLO CHEMICAL 2001 WILLOW SPRINGS LN BURLINGTON North Carolina 27215 0.230495 0.000002 0.230497 0 0.296825 0.527322
MARY KAY INC 1330 REGAL ROW DALLAS Texas 75247 0.00026 0 0.00026 0 0.5265 0.52676
DUPONT MOUNT CLEMENS PLANT 400 GROESBECK HWY MOUNT CLEMENS Michigan 48043 0.0025 0.524 0.5265 0 0 0 0.5265
MAXIM INTEGRATED PRODUCTS INC 9651 WESTOVER HILLS BLV SAN ANTONIO Texas 78251 0 0.517 0.517 0 0 0 0.517
ALERIS ROLLED PRODUCTS INC 3321 DURHAM RD ROXBORO North Carolina 27573 0.0025 0.5105 0.513 0 0 0 0.513
ARROW GROUP INDUSTRIES INC 1 THIRD AVE HASKELL New Jersey 07420 0.0025 0.1925 0.195 0 0 0.3165 0.5115
PLAZE INC 105 BOLTE LN SAINT CLAIR Missouri 63077 0.509 0 0.509 0 0 0 0.509
TERNIUM USA INC 2500 RON BEAN BLVD SHREVEPORT Louisiana 71115 0.0125 0.496 0.5085 0 0 0 0.5085
CLARIANT CORP MARTIN PLANT 788 CHERT QUARRY RD MARTIN South Carolina 29836 0.125 0.0025 0.1275 0.375 0 0 0.5025
Page 21 of 40
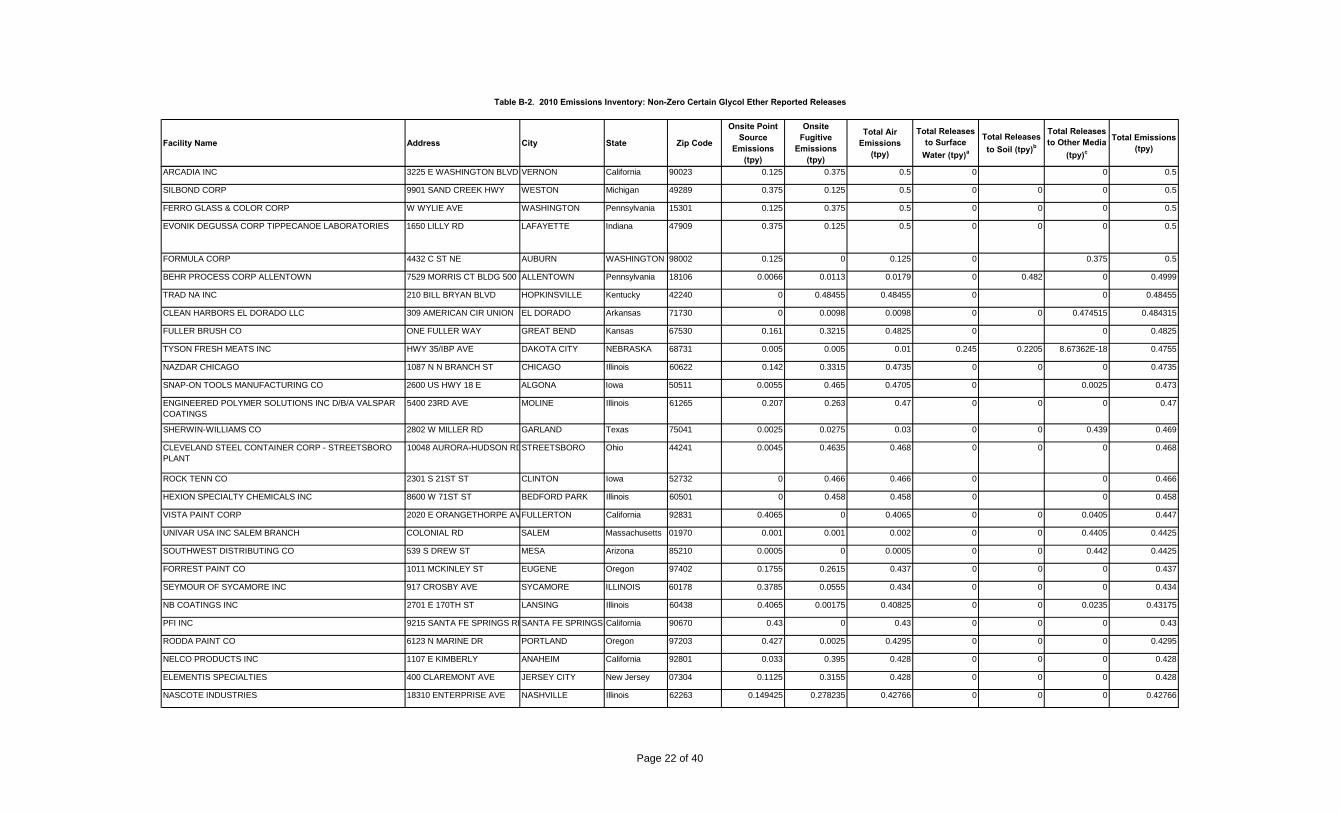
Table B-2. 2010 Emissions Inventory: Non-Zero Certain Glycol Ether Reported Releases
Facility Name Address City State Zip Code
Onsite Point Source
Emissions (tpy)
Onsite Fugitive
Emissions (tpy)
Total Air Emissions
(tpy)
Total Releases to Surface
Water (tpy)a
Total Releases to Soil (tpy)b
Total Releases to Other Media
(tpy)c
Total Emissions (tpy)
ARCADIA INC 3225 E WASHINGTON BLVD VERNON California 90023 0.125 0.375 0.5 0 0 0.5
SILBOND CORP 9901 SAND CREEK HWY WESTON Michigan 49289 0.375 0.125 0.5 0 0 0 0.5
FERRO GLASS & COLOR CORP W WYLIE AVE WASHINGTON Pennsylvania 15301 0.125 0.375 0.5 0 0 0 0.5
EVONIK DEGUSSA CORP TIPPECANOE LABORATORIES 1650 LILLY RD LAFAYETTE Indiana 47909 0.375 0.125 0.5 0 0 0 0.5
FORMULA CORP 4432 C ST NE AUBURN WASHINGTON 98002 0.125 0 0.125 0 0.375 0.5
BEHR PROCESS CORP ALLENTOWN 7529 MORRIS CT BLDG 500 WALLENTOWN Pennsylvania 18106 0.0066 0.0113 0.0179 0 0.482 0 0.4999
TRAD NA INC 210 BILL BRYAN BLVD HOPKINSVILLE Kentucky 42240 0 0.48455 0.48455 0 0 0.48455
CLEAN HARBORS EL DORADO LLC 309 AMERICAN CIR UNION EL DORADO Arkansas 71730 0 0.0098 0.0098 0 0 0.474515 0.484315
FULLER BRUSH CO ONE FULLER WAY GREAT BEND Kansas 67530 0.161 0.3215 0.4825 0 0 0.4825
TYSON FRESH MEATS INC HWY 35/IBP AVE DAKOTA CITY NEBRASKA 68731 0.005 0.005 0.01 0.245 0.2205 8.67362E-18 0.4755
NAZDAR CHICAGO 1087 N N BRANCH ST CHICAGO Illinois 60622 0.142 0.3315 0.4735 0 0 0 0.4735
SNAP-ON TOOLS MANUFACTURING CO 2600 US HWY 18 E ALGONA Iowa 50511 0.0055 0.465 0.4705 0 0.0025 0.473
ENGINEERED POLYMER SOLUTIONS INC D/B/A VALSPAR COATINGS
5400 23RD AVE MOLINE Illinois 61265 0.207 0.263 0.47 0 0 0 0.47
SHERWIN-WILLIAMS CO 2802 W MILLER RD GARLAND Texas 75041 0.0025 0.0275 0.03 0 0 0.439 0.469
CLEVELAND STEEL CONTAINER CORP - STREETSBORO PLANT
10048 AURORA-HUDSON RDSTREETSBORO Ohio 44241 0.0045 0.4635 0.468 0 0 0 0.468
ROCK TENN CO 2301 S 21ST ST CLINTON Iowa 52732 0 0.466 0.466 0 0 0.466
HEXION SPECIALTY CHEMICALS INC 8600 W 71ST ST BEDFORD PARK Illinois 60501 0 0.458 0.458 0 0 0.458
VISTA PAINT CORP 2020 E ORANGETHORPE AVFULLERTON California 92831 0.4065 0 0.4065 0 0 0.0405 0.447
UNIVAR USA INC SALEM BRANCH COLONIAL RD SALEM Massachusetts 01970 0.001 0.001 0.002 0 0 0.4405 0.4425
SOUTHWEST DISTRIBUTING CO 539 S DREW ST MESA Arizona 85210 0.0005 0 0.0005 0 0 0.442 0.4425
FORREST PAINT CO 1011 MCKINLEY ST EUGENE Oregon 97402 0.1755 0.2615 0.437 0 0 0 0.437
SEYMOUR OF SYCAMORE INC 917 CROSBY AVE SYCAMORE ILLINOIS 60178 0.3785 0.0555 0.434 0 0 0 0.434
NB COATINGS INC 2701 E 170TH ST LANSING Illinois 60438 0.4065 0.00175 0.40825 0 0 0.0235 0.43175
PFI INC 9215 SANTA FE SPRINGS RDSANTA FE SPRINGS California 90670 0.43 0 0.43 0 0 0 0.43
RODDA PAINT CO 6123 N MARINE DR PORTLAND Oregon 97203 0.427 0.0025 0.4295 0 0 0 0.4295
NELCO PRODUCTS INC 1107 E KIMBERLY ANAHEIM California 92801 0.033 0.395 0.428 0 0 0 0.428
ELEMENTIS SPECIALTIES 400 CLAREMONT AVE JERSEY CITY New Jersey 07304 0.1125 0.3155 0.428 0 0 0 0.428
NASCOTE INDUSTRIES 18310 ENTERPRISE AVE NASHVILLE Illinois 62263 0.149425 0.278235 0.42766 0 0 0 0.42766
Page 22 of 40

Table B-2. 2010 Emissions Inventory: Non-Zero Certain Glycol Ether Reported Releases
Facility Name Address City State Zip Code
Onsite Point Source
Emissions (tpy)
Onsite Fugitive
Emissions (tpy)
Total Air Emissions
(tpy)
Total Releases to Surface
Water (tpy)a
Total Releases to Soil (tpy)b
Total Releases to Other Media
(tpy)c
Total Emissions (tpy)
ASHLAND DISTRIBUTION 3300 BALL ST BIRMINGHAM Alabama 35234 0.3735 0.048 0.4215 0 0 0.4215
GEMINI COATINGS INC 2300 HOLLOWAY DR EL RENO OKLAHOMA 73036 0.4005 0.0025 0.403 0.0025 0 0 0.4055
BEHR PROCESS CORP - CHICAGO 270 STATE ST CHICAGO HEIGHTS Illinois 60411 0.0291 0.0496 0.0787 0 0.326 0 0.4047
MAGNABLEND INC-CENTRAL PLANT 1601 W HWY 287 BYPASS WAXAHACHIE Texas 75165 0.0025 0 0.0025 0 0.4 0.4025
BRADLEY COATINGS GROUP 608 W CRAWFORD AVE CONNELLSVILLE Pennsylvania 15425 0.28171 0 0.28171 0 0 0.11381 0.39552
ROLLEX CORP 800 CHASE AVE ELK GROVE VILLAGEIllinois 60007 0 0.3955 0.3955 0 0 0.3955
NALCO CO TULSA PLANT 102 6717 S 61ST W AVE TULSA Oklahoma 74131 0 0 0 0 0 0.3935 0.3935
INCHEM CORP 800 CEL-RIVER RD ROCK HILL South Carolina 29730 0.0025 0.125 0.1275 0 0.264 0.3915
SIKA CORP SIKA SARNAFIL DIV 100 DAN RD CANTON Massachusetts 02021 0 0.3895 0.3895 0 0 0 0.3895
IMS ENGINEERED PRODUCTS LLC ONE INNOVATION DR DES PLAINES ILLINOIS 60016 0.0025 0.375 0.3775 0 0.0025 0.38
ZSCHIMMER & SCHWARZ 70 GA HWY 22 W MILLEDGEVILLE GEORGIA 31061 0.0025 0.375 0.3775 0 0 0.3775
INTERNATIONAL PAINT LLC 6001 ANTOINE DR HOUSTON Texas 77091 0.0025 0.375 0.3775 0 0 0 0.3775
QUEST CHEMICAL CORP 12255 FM 529 HOUSTON Texas 77041 0.375 0 0.375 0 0 0 0.375
TOWER PRODUCTS INC 2703 FREEMANSBURG AVE EASTON Pennsylvania 18045 0.375 0 0.375 0 0 0.375
PATRIOT PAINT LLC 304 S BLAINE PIKE PORTLAND INDIANA 47371 0.375 0 0.375 0 0 0 0.375
BRYCE CO LLC 450 S BENTON ST SEARCY ARKANSAS 72143 0.125 0.125 0.25 0 0 0.125 0.375
JASPER RUBBER PRODUCTS INC 1010 FIRST AVE JASPER Indiana 47546 0 0 0 0 0.375 0.375
MARCHEM TECHNOLOGIES LLC 20851 S SANTA FE AVE LONG BEACH California 90810 0 0 0 0 0.375 0.375
FUCHS LUBRICANTS CO-CORPORATE OFFICE 17050 S LATHROP AVE HARVEY Illinois 60426 0.3715 0 0.3715 0 0 0 0.3715
FLINT GROUP NORTH AMERICA CORP 104 NATIONAL DR ANNISTON Alabama 36207 0.185 0.185 0.37 0 0 0.37
METAL COATERS OF CALIFORNIA INC 9133 CENTER AVE RANCHO CUCAMON California 91730 0.033515 0.33515 0.368665 0 0 5.55112E-17 0.368665
TYSON FRESH MEATS INC JOSLIN IL HWY 92 & I-88 28424 38TH A HILLSDALE Illinois 61257 0.015 0.0025 0.0175 0.11 0.03 0.21 0.3675
MIDWEST METAL COATINGS 9 KONZEN CT GRANITE CITY ILLINOIS 62040 0.3 0.067 0.367 0 0 0 0.367
IVC INDUSTRIAL COATINGS INC 1825 E NATIONAL AVE BRAZIL INDIANA 47834 0.07321 0.29284 0.36605 0 0 5.55112E-17 0.36605
AKZONOBEL COATINGS INC 120 FRANKLIN RD PONTIAC Michigan 48341 0.0915 0.0075 0.099 0 0.2635 0.3625
COMBE PRODUCTS INC EL DUQUE INDUSTRIAL PARNAGUABO Puerto Rico 00718 0 0 0 0 0.3615 0.3615
CELLO PROFESSIONAL PRODUCTS 1354 OLD POST RD HAVRE DE GRACE Maryland 21078 0.3525 0.0015 0.354 0 0 0.354
EXXONMOBIL REFINING & SUPPLY BATON ROUGE REFINERY
4045 SCENIC HWY BATON ROUGE Louisiana 70805 0.16 0.0015 0.1615 0.19 0 0 0.3515
FORD MOTOR CO CHICAGO ASSEMBLY 12600 S TORRENCE AVE CHICAGO Illinois 60633 0.35 0 0.35 0 0 0.35
Page 23 of 40

Table B-2. 2010 Emissions Inventory: Non-Zero Certain Glycol Ether Reported Releases
Facility Name Address City State Zip Code
Onsite Point Source
Emissions (tpy)
Onsite Fugitive
Emissions (tpy)
Total Air Emissions
(tpy)
Total Releases to Surface
Water (tpy)a
Total Releases to Soil (tpy)b
Total Releases to Other Media
(tpy)c
Total Emissions (tpy)
SHERWIN-WILLIAMS CO 180 CANAL ST TERRE HAUTE Indiana 47808 0.0235 0.06 0.0835 0 0 0.2665 0.35
LONGABERGER CO 5565 RAIDERS RD FRAZEYSBURG Ohio 43822 0.2105 0.01425 0.22475 0 0 0.125 0.34975
INEOS OXIDE A DIV OF INEOS AMERICAS LLC 21255A HWY 1 S PLAQUEMINE Louisiana 70765 0.318275 0.02926 0.347535 0 0 5.55112E-17 0.347535
QUEST SPECIALTY COATINGS LLC MENOMONEE FALLS N92 W14701 ANTHONY AVE MENOMONEE FALLSWISCONSIN 53051 0.3475 0 0.3475 0 0 0 0.3475
INX INTERNATIONAL INK CO 1000 MAPLE AVE HOMEWOOD Illinois 60430 0.00566 0 0.00566 0 0.3395 0.34516
PACKAGING CORP OF AMERICA COUNCE MILL HWY 57 COUNCE Tennessee 38326 0.0215 0 0.0215 0.32 0 2.08167E-17 0.3415
DIVERSIFIED COATING SYSTEMS INC 309 ECHELON RD GREENVILLE SOUTHSOUTH CAROL 29605 0.0035 0.334 0.3375 0 0 0 0.3375
SIERRA CORP 11400 W 47TH ST MINNETONKA Minnesota 55343 0.336 0 0.336 0 0 0 0.336
SHERWIN-WILLIAMS AUTOMOTIVE FINISHES CORP 395 BOGGS LN - S RICHMOND Kentucky 40475 0.3175 0.0185 0.336 0 0 0 0.336
BECKER SPECIALTY CORP 2500 DELTA LN ELK GROVE VILLAGEIllinois 60007 0.0275 0.3075 0.335 0 0 0 0.335
AMERIMAX HOME PRODUCTS INC 450 RICHARDSON DR LANCASTER Pennsylvania 17603 0.0095 0.323 0.3325 0 0 0 0.3325
ENGINEERED POLYMER SOLUTIONS INC D/B/A VALSPAR COATINGS
411 N DARLING FREMONT Michigan 49412 0.31 0.021 0.331 0 0 0 0.331
GATES CORP 630 US HWY 150 E GALESBURG Illinois 61401 0 0 0 0 0.329 0.329
ENGLERT INC 1200 AMBOY AVE PERTH AMBOY NEW JERSEY 08861 0.1315 0.187 0.3185 0 0 0.3185
ENERGIZER BATTERY MANUFACTURING INC 75 SWANTON RD SAINT ALBANS Vermont 05478 0.0025 0.157 0.1595 0 0 0.157 0.3165
AMERIMAX COATED PRODUCTS 215 PHILLIPS 324 RD HELENA ARKANSAS 72342 0 0.30835 0.30835 0 0 0 0.30835
CURTIS METAL FINISHING CO 9917 N ALPINE MACHESNEY PARK Illinois 61115 0.22 0.0875 0.3075 0 0 0.3075
LINETEC 725 S 75TH AVE WAUSAU Wisconsin 54401 0.0205 0.2815 0.302 0 0 0 0.302
FORD MOTOR CO MICHIGAN ASSEMBLY PLANT 38303 MICHIGAN AVE WAYNE Michigan 48184 0.0015 0.3 0.3015 0 0 0.3015
ET PRODUCTS CO INC 747 DOUGLAS RD BREMEN Indiana 46506 0 0.3 0.3 0 0 0.3
AMERICAN METALS CORP 1000 CROCKER RD WESTLAKE Ohio 44145 0 0.296 0.296 0 0 0 0.296
MAXIM INTEGRATED PRODUCTS INC 3725 N FIRST ST SAN JOSE California 95134 0 0.295 0.295 0 0 0 0.295
ATMI MATERIALS LTD 706 HOUSTON CLINTON DR BURNET Texas 78611 0.050745 0.000765 0.05151 0 0 0.23997 0.29148
MUTI-PACK LLC 8372 N STEVEN RD MILWAUKEE Wisconsin 53223 0.29 0 0.29 0 0 0.29
VIDEOJET TECHNOLOGIES INC 1855 ESTES AVE ELK GROVE VILLAGEIllinois 60007 0 0.287 0.287 0 0 0 0.287
TRITECH COATINGS CORP 1378 KINGSLAND AVE PAGEDALE Missouri 63133 0.194 0.0925 0.2865 0 0 0 0.2865
ENTHONE INC 350 FRONTAGE RD WEST HAVEN Connecticut 06516 0.005595 0.279675 0.28527 0 0 0 0.28527
SHERWIN-WILLIAMS CO 2150 W SAND LAKE RD ORLANDO Florida 32809 0 0.002 0.002 0 0 0.2765 0.2785
SUMTER COATINGS INC 2410 HWY 15S SUMTER South Carolina 29150 0.058 0.1755 0.2335 0 0 0.0425 0.276
Page 24 of 40
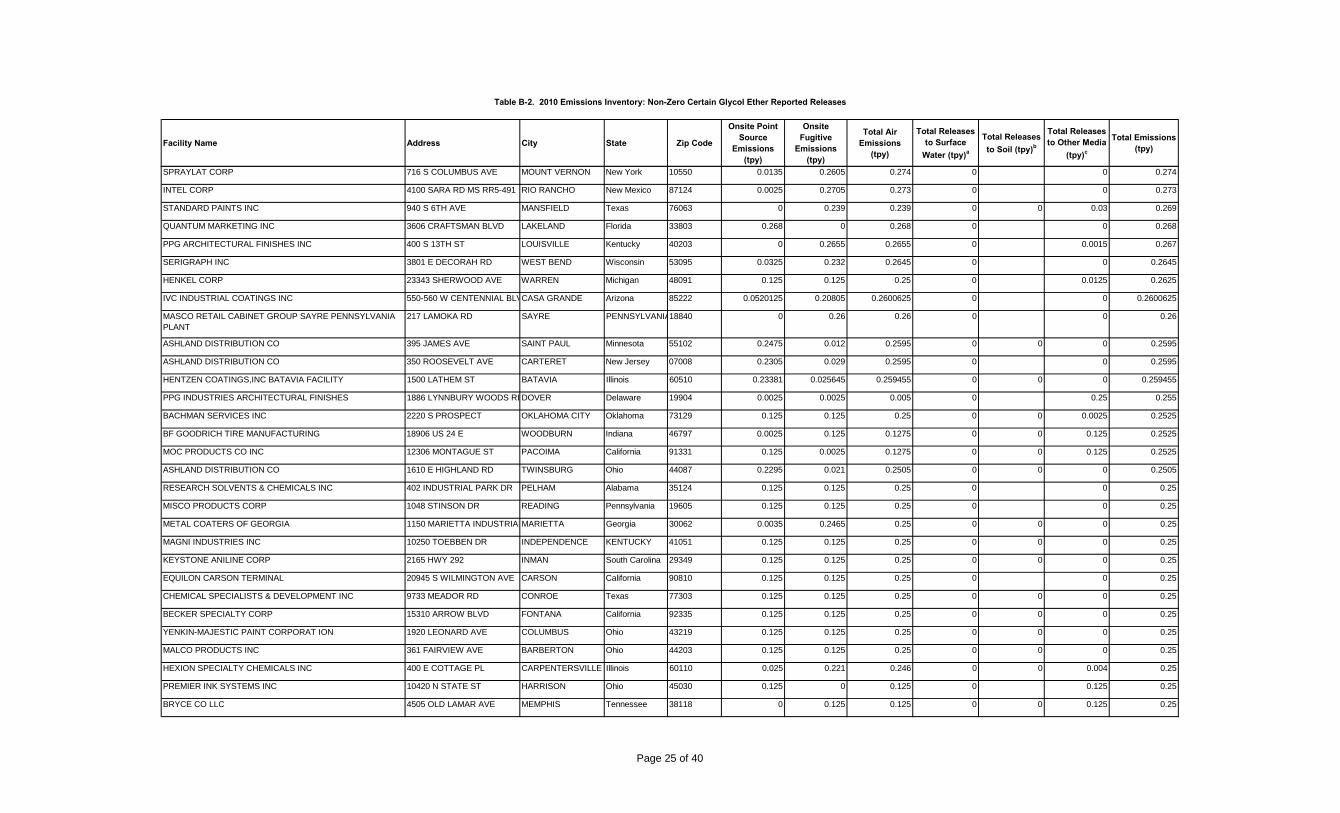
Table B-2. 2010 Emissions Inventory: Non-Zero Certain Glycol Ether Reported Releases
Facility Name Address City State Zip Code
Onsite Point Source
Emissions (tpy)
Onsite Fugitive
Emissions (tpy)
Total Air Emissions
(tpy)
Total Releases to Surface
Water (tpy)a
Total Releases to Soil (tpy)b
Total Releases to Other Media
(tpy)c
Total Emissions (tpy)
SPRAYLAT CORP 716 S COLUMBUS AVE MOUNT VERNON New York 10550 0.0135 0.2605 0.274 0 0 0.274
INTEL CORP 4100 SARA RD MS RR5-491 RIO RANCHO New Mexico 87124 0.0025 0.2705 0.273 0 0 0.273
STANDARD PAINTS INC 940 S 6TH AVE MANSFIELD Texas 76063 0 0.239 0.239 0 0 0.03 0.269
QUANTUM MARKETING INC 3606 CRAFTSMAN BLVD LAKELAND Florida 33803 0.268 0 0.268 0 0 0.268
PPG ARCHITECTURAL FINISHES INC 400 S 13TH ST LOUISVILLE Kentucky 40203 0 0.2655 0.2655 0 0.0015 0.267
SERIGRAPH INC 3801 E DECORAH RD WEST BEND Wisconsin 53095 0.0325 0.232 0.2645 0 0 0.2645
HENKEL CORP 23343 SHERWOOD AVE WARREN Michigan 48091 0.125 0.125 0.25 0 0.0125 0.2625
IVC INDUSTRIAL COATINGS INC 550-560 W CENTENNIAL BLVCASA GRANDE Arizona 85222 0.0520125 0.20805 0.2600625 0 0 0.2600625
MASCO RETAIL CABINET GROUP SAYRE PENNSYLVANIA PLANT
217 LAMOKA RD SAYRE PENNSYLVANIA18840 0 0.26 0.26 0 0 0.26
ASHLAND DISTRIBUTION CO 395 JAMES AVE SAINT PAUL Minnesota 55102 0.2475 0.012 0.2595 0 0 0 0.2595
ASHLAND DISTRIBUTION CO 350 ROOSEVELT AVE CARTERET New Jersey 07008 0.2305 0.029 0.2595 0 0 0.2595
HENTZEN COATINGS,INC BATAVIA FACILITY 1500 LATHEM ST BATAVIA Illinois 60510 0.23381 0.025645 0.259455 0 0 0 0.259455
PPG INDUSTRIES ARCHITECTURAL FINISHES 1886 LYNNBURY WOODS RDDOVER Delaware 19904 0.0025 0.0025 0.005 0 0.25 0.255
BACHMAN SERVICES INC 2220 S PROSPECT OKLAHOMA CITY Oklahoma 73129 0.125 0.125 0.25 0 0 0.0025 0.2525
BF GOODRICH TIRE MANUFACTURING 18906 US 24 E WOODBURN Indiana 46797 0.0025 0.125 0.1275 0 0 0.125 0.2525
MOC PRODUCTS CO INC 12306 MONTAGUE ST PACOIMA California 91331 0.125 0.0025 0.1275 0 0 0.125 0.2525
ASHLAND DISTRIBUTION CO 1610 E HIGHLAND RD TWINSBURG Ohio 44087 0.2295 0.021 0.2505 0 0 0 0.2505
RESEARCH SOLVENTS & CHEMICALS INC 402 INDUSTRIAL PARK DR PELHAM Alabama 35124 0.125 0.125 0.25 0 0 0.25
MISCO PRODUCTS CORP 1048 STINSON DR READING Pennsylvania 19605 0.125 0.125 0.25 0 0 0.25
METAL COATERS OF GEORGIA 1150 MARIETTA INDUSTRIALMARIETTA Georgia 30062 0.0035 0.2465 0.25 0 0 0 0.25
MAGNI INDUSTRIES INC 10250 TOEBBEN DR INDEPENDENCE KENTUCKY 41051 0.125 0.125 0.25 0 0 0 0.25
KEYSTONE ANILINE CORP 2165 HWY 292 INMAN South Carolina 29349 0.125 0.125 0.25 0 0 0 0.25
EQUILON CARSON TERMINAL 20945 S WILMINGTON AVE CARSON California 90810 0.125 0.125 0.25 0 0 0.25
CHEMICAL SPECIALISTS & DEVELOPMENT INC 9733 MEADOR RD CONROE Texas 77303 0.125 0.125 0.25 0 0 0 0.25
BECKER SPECIALTY CORP 15310 ARROW BLVD FONTANA California 92335 0.125 0.125 0.25 0 0 0 0.25
YENKIN-MAJESTIC PAINT CORPORAT ION 1920 LEONARD AVE COLUMBUS Ohio 43219 0.125 0.125 0.25 0 0 0 0.25
MALCO PRODUCTS INC 361 FAIRVIEW AVE BARBERTON Ohio 44203 0.125 0.125 0.25 0 0 0 0.25
HEXION SPECIALTY CHEMICALS INC 400 E COTTAGE PL CARPENTERSVILLE Illinois 60110 0.025 0.221 0.246 0 0 0.004 0.25
PREMIER INK SYSTEMS INC 10420 N STATE ST HARRISON Ohio 45030 0.125 0 0.125 0 0.125 0.25
BRYCE CO LLC 4505 OLD LAMAR AVE MEMPHIS Tennessee 38118 0 0.125 0.125 0 0 0.125 0.25
Page 25 of 40
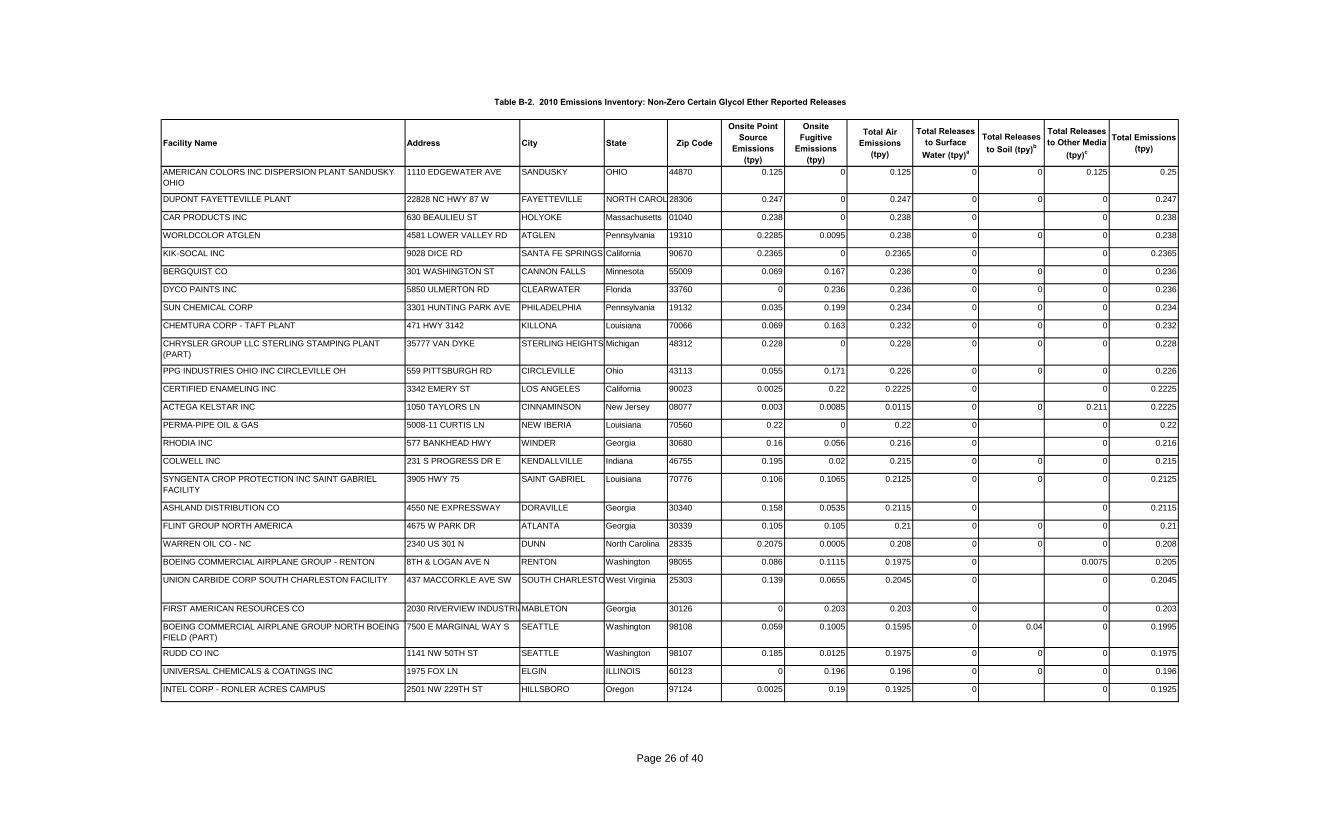
Table B-2. 2010 Emissions Inventory: Non-Zero Certain Glycol Ether Reported Releases
Facility Name Address City State Zip Code
Onsite Point Source
Emissions (tpy)
Onsite Fugitive
Emissions (tpy)
Total Air Emissions
(tpy)
Total Releases to Surface
Water (tpy)a
Total Releases to Soil (tpy)b
Total Releases to Other Media
(tpy)c
Total Emissions (tpy)
AMERICAN COLORS INC DISPERSION PLANT SANDUSKY OHIO
1110 EDGEWATER AVE SANDUSKY OHIO 44870 0.125 0 0.125 0 0 0.125 0.25
DUPONT FAYETTEVILLE PLANT 22828 NC HWY 87 W FAYETTEVILLE NORTH CAROL 28306 0.247 0 0.247 0 0 0 0.247
CAR PRODUCTS INC 630 BEAULIEU ST HOLYOKE Massachusetts 01040 0.238 0 0.238 0 0 0.238
WORLDCOLOR ATGLEN 4581 LOWER VALLEY RD ATGLEN Pennsylvania 19310 0.2285 0.0095 0.238 0 0 0 0.238
KIK-SOCAL INC 9028 DICE RD SANTA FE SPRINGS California 90670 0.2365 0 0.2365 0 0 0.2365
BERGQUIST CO 301 WASHINGTON ST CANNON FALLS Minnesota 55009 0.069 0.167 0.236 0 0 0 0.236
DYCO PAINTS INC 5850 ULMERTON RD CLEARWATER Florida 33760 0 0.236 0.236 0 0 0 0.236
SUN CHEMICAL CORP 3301 HUNTING PARK AVE PHILADELPHIA Pennsylvania 19132 0.035 0.199 0.234 0 0 0 0.234
CHEMTURA CORP - TAFT PLANT 471 HWY 3142 KILLONA Louisiana 70066 0.069 0.163 0.232 0 0 0 0.232
CHRYSLER GROUP LLC STERLING STAMPING PLANT (PART)
35777 VAN DYKE STERLING HEIGHTS Michigan 48312 0.228 0 0.228 0 0 0 0.228
PPG INDUSTRIES OHIO INC CIRCLEVILLE OH 559 PITTSBURGH RD CIRCLEVILLE Ohio 43113 0.055 0.171 0.226 0 0 0 0.226
CERTIFIED ENAMELING INC 3342 EMERY ST LOS ANGELES California 90023 0.0025 0.22 0.2225 0 0 0.2225
ACTEGA KELSTAR INC 1050 TAYLORS LN CINNAMINSON New Jersey 08077 0.003 0.0085 0.0115 0 0 0.211 0.2225
PERMA-PIPE OIL & GAS 5008-11 CURTIS LN NEW IBERIA Louisiana 70560 0.22 0 0.22 0 0 0.22
RHODIA INC 577 BANKHEAD HWY WINDER Georgia 30680 0.16 0.056 0.216 0 0 0.216
COLWELL INC 231 S PROGRESS DR E KENDALLVILLE Indiana 46755 0.195 0.02 0.215 0 0 0 0.215
SYNGENTA CROP PROTECTION INC SAINT GABRIEL FACILITY
3905 HWY 75 SAINT GABRIEL Louisiana 70776 0.106 0.1065 0.2125 0 0 0 0.2125
ASHLAND DISTRIBUTION CO 4550 NE EXPRESSWAY DORAVILLE Georgia 30340 0.158 0.0535 0.2115 0 0 0.2115
FLINT GROUP NORTH AMERICA 4675 W PARK DR ATLANTA Georgia 30339 0.105 0.105 0.21 0 0 0 0.21
WARREN OIL CO - NC 2340 US 301 N DUNN North Carolina 28335 0.2075 0.0005 0.208 0 0 0 0.208
BOEING COMMERCIAL AIRPLANE GROUP - RENTON 8TH & LOGAN AVE N RENTON Washington 98055 0.086 0.1115 0.1975 0 0.0075 0.205
UNION CARBIDE CORP SOUTH CHARLESTON FACILITY 437 MACCORKLE AVE SW SOUTH CHARLESTOWest Virginia 25303 0.139 0.0655 0.2045 0 0 0.2045
FIRST AMERICAN RESOURCES CO 2030 RIVERVIEW INDUSTRIAMABLETON Georgia 30126 0 0.203 0.203 0 0 0.203
BOEING COMMERCIAL AIRPLANE GROUP NORTH BOEING FIELD (PART)
7500 E MARGINAL WAY S SEATTLE Washington 98108 0.059 0.1005 0.1595 0 0.04 0 0.1995
RUDD CO INC 1141 NW 50TH ST SEATTLE Washington 98107 0.185 0.0125 0.1975 0 0 0 0.1975
UNIVERSAL CHEMICALS & COATINGS INC 1975 FOX LN ELGIN ILLINOIS 60123 0 0.196 0.196 0 0 0 0.196
INTEL CORP - RONLER ACRES CAMPUS 2501 NW 229TH ST HILLSBORO Oregon 97124 0.0025 0.19 0.1925 0 0 0.1925
Page 26 of 40

Table B-2. 2010 Emissions Inventory: Non-Zero Certain Glycol Ether Reported Releases
Facility Name Address City State Zip Code
Onsite Point Source
Emissions (tpy)
Onsite Fugitive
Emissions (tpy)
Total Air Emissions
(tpy)
Total Releases to Surface
Water (tpy)a
Total Releases to Soil (tpy)b
Total Releases to Other Media
(tpy)c
Total Emissions (tpy)
U.S. NAVY NAVAL AIR STATION JACKSONVILLE 6500 ROOSEVELT BLVD BUI JACKSONVILLE FLORIDA 32212 0.07 0.045 0.115 0.05 0 0.025 0.19
HADCO (SANMINA) CORP - OWEGO DIV 1200 TAYLOR RD OWEGO New York 13827 0.0045 0.1725 0.177 0 0.0109 0.1879
ENGINEERED POLYMER SOLUTIONS INC D/B/A VALSPAR COATINGS
1991 S WHEELING RD WHEELING Illinois 60090 0.0635 0.1165 0.18 0 0 0.18
QUAD GRAPHICS NASHVILLE 2947 BRICK CHURCH PIKE NASHVILLE TENNESSEE 37207 0.1585 0.0185 0.177 0 0 0 0.177
LAMBERTI USA INC WHARTON CHEMICAL COMPLEX HWY 59 AT COUNTY RD 212HUNGERFORD Texas 77448 0.0405 0 0.0405 0.0455 0 0.0905 0.1765
SILGAN WHITE CAP CORP 1701 WILLIAMSBURG PIKE RICHMOND Indiana 47375 0.05 0.125 0.175 0 0 0 0.175
BYK USA INC 524 S CHERRY ST WALLINGFORD Connecticut 06492 0.17 0.004 0.174 0 0 0.174
ASHLAND DISTRIBUTION CO 11109 S CHOCTAW DR BATON ROUGE Louisiana 70815 0.1625 0.011 0.1735 0 0 0 0.1735
CHAMPION TECHNOLOGIES INC 115 PROCTOR ODESSA Texas 79762 0.1615 0.008 0.1695 0 0 0 0.1695
ASHLAND DISTRIBUTION 7710 POLK ST SAINT LOUIS Missouri 63111 0.1685 0 0.1685 0 0 0.1685
KAY CHEMICAL CO 8300 CAPITAL DR GREENSBORO North Carolina 27409 0.0075 0.1575 0.165 0 0 0.165
AMREP INC 990 INDUSTRIAL PARK DR MARIETTA Georgia 30062 0.054 0.1085 0.1625 0 0 0 0.1625
SUPERIOR SOLVENTS & CHEMICALS 320 NORTHPOINTE DR FAIRFIELD Ohio 45014 0.02254 0 0.02254 0 0 0.138295 0.160835
ANCHOR PAINT MANUFACTURING CO INC 6707 E 14TH ST TULSA Oklahoma 74112 0.16 0 0.16 0 0 0.16
ENGINEERED POLYMER SOLUTIONS INC D/B/A VALSPAR COATINGS
1717 ENGLISH RD HIGH POINT North Carolina 27261 0.0635 0.0965 0.16 0 0 0 0.16
INTEL CORP 4500 S DOBSON RD MAIL STCHANDLER Arizona 85248 0.0025 0.154 0.1565 0 0 0.1565
SHERWIN-WILLIAMS CO 1891 DUFFY RD FERNLEY Nevada 89408 0.0005 0.002 0.0025 0 0 0.152 0.1545
SUPERIOR SOLVENTS & CHEMICALS 4211 BRAMERS LN LOUISVILLE Kentucky 40216 0.0045 0 0.0045 0 0 0.147585 0.152085
PLAZE INC 113 BOLTE LN SAINT CLAIR Missouri 63077 0.152 0 0.152 0 0 0 0.152
BAKER PETROLITE CORP 9100 W 21ST ST SAND SPRINGS Oklahoma 74063 0.123525 0.013275 0.1368 0 0 0.014705 0.151505
MID-STATES PAINT & CHEMICAL CO 9315 WATSON INDUSTRIAL CRESTWOOD Missouri 63126 0.151 0 0.151 0 0 0.151
SONOCO FLEXIBLE PACKAGING 6502 S US HWY 31 N EDINBURGH Indiana 46124 0 0.14951 0.14951 0 0 0 0.14951
CENTRAL MOTOR WHEEL OF AMERICA (DBA CMWA) 125 WHEAT DR PARIS Kentucky 40361 0 0.1475 0.1475 0 0 0 0.1475
GOJO INDUSTRIES INC 3783 STATE RD CUYAHOGA FALLS OHIO 44223 0.0015 0.0001295 0.0016295 0 0.1442 0.1458295
CHASE PRODUCTS CO 2727 GARDNER RD BROADVIEW Illinois 60155 0.0005 0.145 0.1455 0 0 0 0.1455
DAVIS-FROST INC 3420 CANDLER'S MOUNTAINLYNCHBURG VIRGINIA 24506 0.1415 0 0.1415 0 0 0 0.1415
BLENTECH CORP 1305 RYE ST HOUSTON Texas 77029 0.0125 0.0025 0.015 0 0 0.125 0.14
ENGINEERED POLYMER SOLUTIONS INC D/B/A VALSPAR COATINGS
3050 HANFORD DR LEBANON Pennsylvania 17046 0.0635 0.0725 0.136 0 0 0 0.136
Page 27 of 40
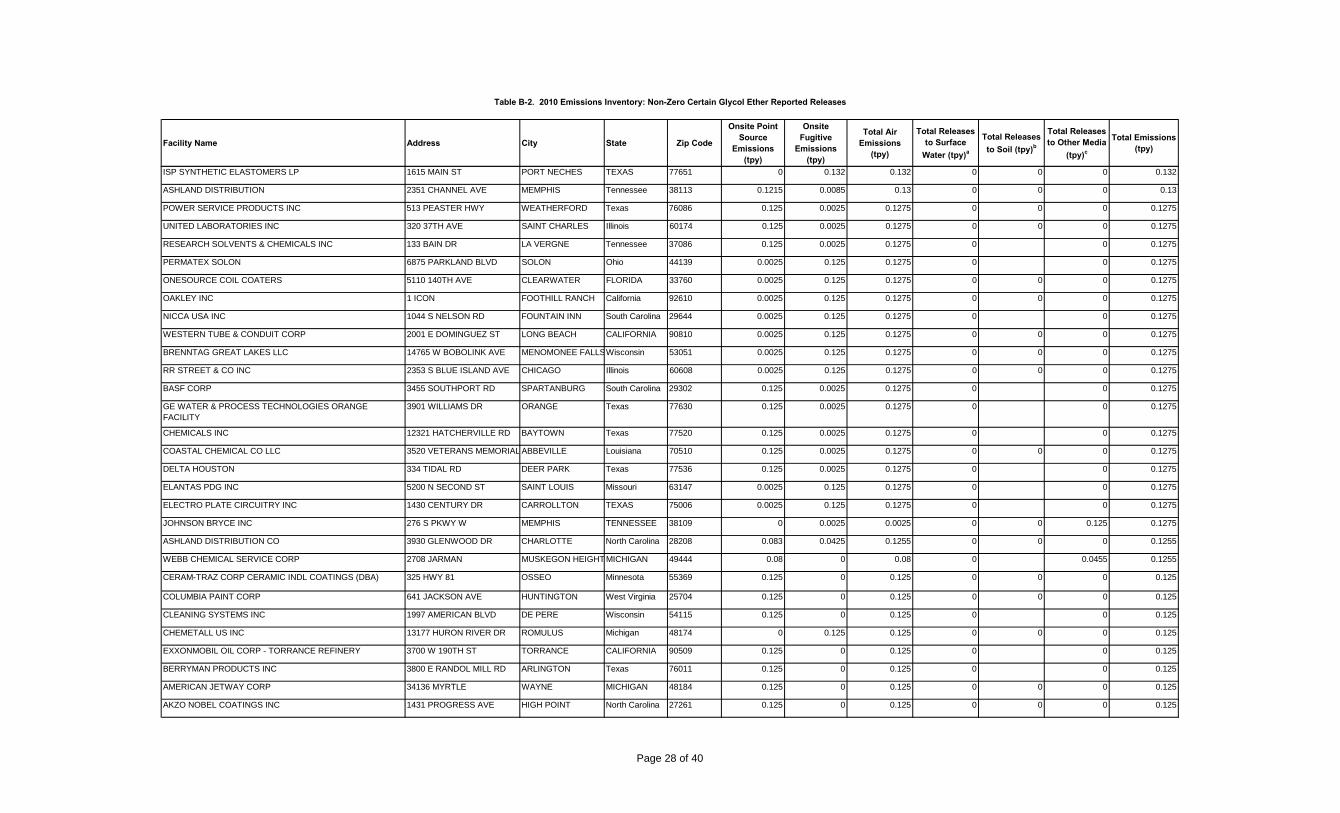
Table B-2. 2010 Emissions Inventory: Non-Zero Certain Glycol Ether Reported Releases
Facility Name Address City State Zip Code
Onsite Point Source
Emissions (tpy)
Onsite Fugitive
Emissions (tpy)
Total Air Emissions
(tpy)
Total Releases to Surface
Water (tpy)a
Total Releases to Soil (tpy)b
Total Releases to Other Media
(tpy)c
Total Emissions (tpy)
ISP SYNTHETIC ELASTOMERS LP 1615 MAIN ST PORT NECHES TEXAS 77651 0 0.132 0.132 0 0 0 0.132
ASHLAND DISTRIBUTION 2351 CHANNEL AVE MEMPHIS Tennessee 38113 0.1215 0.0085 0.13 0 0 0 0.13
POWER SERVICE PRODUCTS INC 513 PEASTER HWY WEATHERFORD Texas 76086 0.125 0.0025 0.1275 0 0 0 0.1275
UNITED LABORATORIES INC 320 37TH AVE SAINT CHARLES Illinois 60174 0.125 0.0025 0.1275 0 0 0 0.1275
RESEARCH SOLVENTS & CHEMICALS INC 133 BAIN DR LA VERGNE Tennessee 37086 0.125 0.0025 0.1275 0 0 0.1275
PERMATEX SOLON 6875 PARKLAND BLVD SOLON Ohio 44139 0.0025 0.125 0.1275 0 0 0.1275
ONESOURCE COIL COATERS 5110 140TH AVE CLEARWATER FLORIDA 33760 0.0025 0.125 0.1275 0 0 0 0.1275
OAKLEY INC 1 ICON FOOTHILL RANCH California 92610 0.0025 0.125 0.1275 0 0 0 0.1275
NICCA USA INC 1044 S NELSON RD FOUNTAIN INN South Carolina 29644 0.0025 0.125 0.1275 0 0 0.1275
WESTERN TUBE & CONDUIT CORP 2001 E DOMINGUEZ ST LONG BEACH CALIFORNIA 90810 0.0025 0.125 0.1275 0 0 0 0.1275
BRENNTAG GREAT LAKES LLC 14765 W BOBOLINK AVE MENOMONEE FALLSWisconsin 53051 0.0025 0.125 0.1275 0 0 0 0.1275
RR STREET & CO INC 2353 S BLUE ISLAND AVE CHICAGO Illinois 60608 0.0025 0.125 0.1275 0 0 0 0.1275
BASF CORP 3455 SOUTHPORT RD SPARTANBURG South Carolina 29302 0.125 0.0025 0.1275 0 0 0.1275
GE WATER & PROCESS TECHNOLOGIES ORANGE FACILITY
3901 WILLIAMS DR ORANGE Texas 77630 0.125 0.0025 0.1275 0 0 0.1275
CHEMICALS INC 12321 HATCHERVILLE RD BAYTOWN Texas 77520 0.125 0.0025 0.1275 0 0 0.1275
COASTAL CHEMICAL CO LLC 3520 VETERANS MEMORIAL ABBEVILLE Louisiana 70510 0.125 0.0025 0.1275 0 0 0 0.1275
DELTA HOUSTON 334 TIDAL RD DEER PARK Texas 77536 0.125 0.0025 0.1275 0 0 0.1275
ELANTAS PDG INC 5200 N SECOND ST SAINT LOUIS Missouri 63147 0.0025 0.125 0.1275 0 0 0.1275
ELECTRO PLATE CIRCUITRY INC 1430 CENTURY DR CARROLLTON TEXAS 75006 0.0025 0.125 0.1275 0 0 0.1275
JOHNSON BRYCE INC 276 S PKWY W MEMPHIS TENNESSEE 38109 0 0.0025 0.0025 0 0 0.125 0.1275
ASHLAND DISTRIBUTION CO 3930 GLENWOOD DR CHARLOTTE North Carolina 28208 0.083 0.0425 0.1255 0 0 0 0.1255
WEBB CHEMICAL SERVICE CORP 2708 JARMAN MUSKEGON HEIGHT MICHIGAN 49444 0.08 0 0.08 0 0.0455 0.1255
CERAM-TRAZ CORP CERAMIC INDL COATINGS (DBA) 325 HWY 81 OSSEO Minnesota 55369 0.125 0 0.125 0 0 0 0.125
COLUMBIA PAINT CORP 641 JACKSON AVE HUNTINGTON West Virginia 25704 0.125 0 0.125 0 0 0 0.125
CLEANING SYSTEMS INC 1997 AMERICAN BLVD DE PERE Wisconsin 54115 0.125 0 0.125 0 0 0.125
CHEMETALL US INC 13177 HURON RIVER DR ROMULUS Michigan 48174 0 0.125 0.125 0 0 0 0.125
EXXONMOBIL OIL CORP - TORRANCE REFINERY 3700 W 190TH ST TORRANCE CALIFORNIA 90509 0.125 0 0.125 0 0 0.125
BERRYMAN PRODUCTS INC 3800 E RANDOL MILL RD ARLINGTON Texas 76011 0.125 0 0.125 0 0 0.125
AMERICAN JETWAY CORP 34136 MYRTLE WAYNE MICHIGAN 48184 0.125 0 0.125 0 0 0 0.125
AKZO NOBEL COATINGS INC 1431 PROGRESS AVE HIGH POINT North Carolina 27261 0.125 0 0.125 0 0 0 0.125
Page 28 of 40

Table B-2. 2010 Emissions Inventory: Non-Zero Certain Glycol Ether Reported Releases
Facility Name Address City State Zip Code
Onsite Point Source
Emissions (tpy)
Onsite Fugitive
Emissions (tpy)
Total Air Emissions
(tpy)
Total Releases to Surface
Water (tpy)a
Total Releases to Soil (tpy)b
Total Releases to Other Media
(tpy)c
Total Emissions (tpy)
GOLD KEY PROCESSING INC 14910 MADISON RD MIDDLEFIELD OHIO 44062 0.125 0 0.125 0 0 0 0.125
ACTON TECHNOLOGIES INC 100 THOMPSON ST PITTSTON Pennsylvania 18640 0.125 0 0.125 0 0 0.125
GOLD EAGLE CO 4400 S KILDARE AVE CHICAGO Illinois 60632 0.125 0 0.125 0 0 0 0.125
AKCROS CHEMICALS INC 500 JERSEY AVE NEW BRUNSWICK New Jersey 08901 0 0.125 0.125 0 0 0.125
WM BARR & CO INC 2170 BUOY ST MEMPHIS TENNESSEE 38113 0 0.125 0.125 0 0 0 0.125
INVISTA SARL - ORANGE SITE 3055A FM 1006 ORANGE TEXAS 77630 0.125 0 0.125 0 0 0 0.125
KALCOR COATINGS CO 37721 STEVENS BLVD WILLOUGHBY Ohio 44094 0.125 0 0.125 0 0 0 0.125
MAGNABLEND INC LIQUID PLANT 100 W STERRETT RD WAXAHACHIE Texas 75165 0.125 0 0.125 0 0 0 0.125
MAINTEX INC 13300 E NELSON AVE CITY OF INDUSTRY California 91746 0.125 0 0.125 0 0 0.125
NORTHERN COATINGS & CHEMICAL CO INC 705 6TH AVE MENOMINEE Michigan 49858 0.125 0 0.125 0 0 0 0.125
PPG INDUSTRIES INC 500 PITTSBURGH AVE MCCARRAN Nevada 89434 0 0.125 0.125 0 0 0 0.125
SICPA SECURINK CORP 8000 RESEARCH WAY SPRINGFIELD Virginia 22153 0.125 0 0.125 0 0 0 0.125
TNEMEC CO INC 123 W 23RD AVE NORTH KANSAS CIT Missouri 64116 0 0.125 0.125 0 0 0 0.125
TRANS CHEMICAL INC 419 E DE SOTO AVE SAINT LOUIS Missouri 63147 0.125 0 0.125 0 0 0 0.125
TYSON FRESH MEATS INC HWY 50 W HOLCOMB Kansas 67851 0.125 0 0.125 0 0 0 0.125
DANLIN INDUSTRIES CORP 23737 HWY 47 THOMAS Oklahoma 73669 0.125 0 0.125 0 0 0.125
HERCULES INC 1111 HERCULES RD HOPEWELL Virginia 23860 0.125 0 0.125 0 0 0.125
FLUID ROUTING SOLUTIONS 1921 N BROAD ST LEXINGTON Tennessee 38351 0 0 0 0 0.125 0.125
WATSON LABORATORIES INC UTAH 575, 577, 579 CHIPETA WAY SALT LAKE CITY Utah 84108 0.124456 0 0.124456 0 0 0.124456
TECHNICAL CHEMICAL CO 3327 PIPELINE RD CLEBURNE Texas 76033 0.123 0 0.123 0 0 0.123
CYTEC INDUSTRIES INC LANGLEY PLANT 403 CARLINE RD LANGLEY South Carolina 29834 0.1075 0.0155 0.123 0 0 0.123
AEP INDUSTRIES INC 1201 S PINE HILL RD GRIFFIN Georgia 30224 0.00275 0.12 0.12275 0 0 0.12275
ASHLAND INC - EVENDALE 2788 GLENDALE-MILFORD REVENDALE Ohio 45241 0.0815 0.04 0.1215 0 0 0.1215
FRAZEE INDUSTRIES 6625 MIRAMAR RD SAN DIEGO California 92121 0 0.12 0.12 0 0 0 0.12
ARDEX LABORATORIES INC 2050 BYBERRY RD PHILADELPHIA Pennsylvania 19116 0.119 0 0.119 0 0 0.119
STOUSE INC 300 NEW CENTURY PKWY NEW CENTURY Kansas 66031 0.118 0 0.118 0 0 0.118
SUPERIOR OIL CO INC 400 W REGENT ST INDIANAPOLIS Indiana 46225 0.007465 0 0.007465 0 0 0.107 0.114465
PILOT CHEMICAL CO 11623 N HOUSTON ROSSLY HOUSTON Texas 77086 0.11 0.0005 0.1105 0 0 0.0005 0.111
ELECTRONICS FOR IMAGING INC 1260 JAMES L HART PKWY YPSILANTI Michigan 48197 0.11 0 0.11 0 0 0 0.11
VEYANCE TECHNOLOGIES INC 4021 N 56TH ST LINCOLN Nebraska 68504 7.5E-09 2.5E-09 0.00000001 0 0.10956147 0.10956148
Page 29 of 40

Table B-2. 2010 Emissions Inventory: Non-Zero Certain Glycol Ether Reported Releases
Facility Name Address City State Zip Code
Onsite Point Source
Emissions (tpy)
Onsite Fugitive
Emissions (tpy)
Total Air Emissions
(tpy)
Total Releases to Surface
Water (tpy)a
Total Releases to Soil (tpy)b
Total Releases to Other Media
(tpy)c
Total Emissions (tpy)
TEXAS INSTRUMENTS INC 13500 N CENTRAL EXPRESSDALLAS Texas 75243 0 0.1095 0.1095 0 0 0 0.1095
DELTA LABORATORIES INC 3710 COUNTY RD 326 W OCALA Florida 34475 0.108 0.0005 0.1085 0 0 0 0.1085
ENGINEERED POLYMER SOLUTIONS INC D/B/A VALSPAR COATINGS
347 CENTRAL AVE BOWLING GREEN Kentucky 42101 0.065 0.043 0.108 0 0 0 0.108
CAROLINA SOLVENTS INC 2274 1ST ST SE HICKORY North Carolina 28602 0.1015 0.0025 0.104 0.0025 0 0 0.1065
SKF SEALING SOLUTIONS 900 N STATE ST ELGIN Illinois 60123 0 0 0 0 0 0.1065 0.1065
CHAMPION TECHNOLOGIES INC 350 CENTAURUS RD CORPUS CHRISTI Texas 78405 0.05455 0.0016 0.05615 0 0 0.05 0.10615
SHERWIN-WILLIAMS CO 636 E 40TH ST HOLLAND Michigan 49423 0.1045 0.0015 0.106 0 0 0 0.106
ACCURATE DISPERSIONS 192 W 155TH ST SOUTH HOLLAND Illinois 60473 0.0825 0.021 0.1035 0 0 0.1035
CCI MANUFACTURING IL CORP 15550 CANAL BANK RD LEMONT Illinois 60439 0 0.1035 0.1035 0 0 0 0.1035
ASHLAND DISTRIBUTION CO 200 NE 181ST ST MIAMI Florida 33162 0.0755 0.0265 0.102 0 0 0.102
TWINCO ROMAX 3100 W MILL RD MILWAUKEE WISCONSIN 53209 0.0995 0.00116 0.10066 0 0 0.10066
ASHLAND DISTRIBUTION CO 20915 S WILMINGTON AVE CARSON California 90810 0.0905 0.0095 0.1 0 0 0.1
ARCH CHEMICALS INC HWY 933 BRANDENBURG Kentucky 40108 0.042 0.058 0.1 0 0 0 0.1
BUZZI UNICEM USA - GREENCASTLE PLANT 3301 S COUNTY RD 150 W GREENCASTLE Indiana 46135 0.0225 0.0775 0.1 0 0 0 0.1
BRENNTAG PACIFIC INC 10747 PATTERSON PL SANTA FE SPRINGS California 90670 0.0955 0.0045 0.1 0 0 0.1
HARCROS CHEMICALS INC 5200 SPEAKER RD KANSAS CITY Kansas 66106 0.0245 0.0725 0.097 0.0005 0.002 0.0995
CE BRADLEY LABORATORIES INC 55 BENNETT DR BRATTLEBORO Vermont 05301 0.0985 0 0.0985 0 0 0 0.0985
OLDCASTLE BUILDING ENVELOPE TENNESSEE FACILITY 920 POTTERTOWN RD MIDWAY Tennessee 37809 0 0.0945 0.0945 0 0 0 0.0945
ALLEGHENY PETROLEUM PRODUCTS CO 999 AIRBRAKE AVE WILMERDING Pennsylvania 15148 0.019 0.0755 0.0945 0 0 0 0.0945
SHERWIN-WILLIAMS CO 1025 HOWARD ST GREENSBORO North Carolina 27403 0.0065 0.0145 0.021 0 0.0725 0.0935
CPJ TECHNOLOGIES 200 TANNER DR TAYLORS South Carolina 29687 0.034 0.058 0.092 0 0 0.092
TNEMEC CO INC 2300 EDGEWATER AVE BALTIMORE Maryland 21222 0 0.09 0.09 0 0 0 0.09
STEELSCAPE INC RANCHO 11200 ARROW RT RANCHO CUCAMON California 91730 0.0031 0.086845 0.089945 0 0 0 0.089945
ATHEA LABORATORIES INC 7855 N FAULKNER RD MILWAUKEE Wisconsin 53224 0.08874 0.00006 0.0888 0 0 0.0888
COSMETIC LABORATORIES OF AMERICA 20245 SUNBURST ST CHATSWORTH California 91311 0 0.002 0.002 0 0.085 0.087
MRCG-KRAFTMAID P3 150 GRAND VALLEY AVE ORWELL Ohio 44076 0 0.069 0.069 0 0 0.0175 0.0865
ASHLAND DISTRIBUTION CO 2461 CROCKER CIR FAIRFIELD California 94533 0.0845 0.001 0.0855 0 0 0 0.0855
ASHLAND DISTRIBUTION CO 5420 SPEAKER RD KANSAS CITY Kansas 66106 0.0755 0.0085 0.084 0 0 0 0.084
AKZO NOBEL COATINGS INC 1000 INDUSTRIAL PARK DR CLINTON Mississippi 39056 0.082 0 0.082 0 0 0 0.082
Page 30 of 40

Table B-2. 2010 Emissions Inventory: Non-Zero Certain Glycol Ether Reported Releases
Facility Name Address City State Zip Code
Onsite Point Source
Emissions (tpy)
Onsite Fugitive
Emissions (tpy)
Total Air Emissions
(tpy)
Total Releases to Surface
Water (tpy)a
Total Releases to Soil (tpy)b
Total Releases to Other Media
(tpy)c
Total Emissions (tpy)
ASHLAND DISTRIBUTION 400 MAIN ST TEWKSBURY Massachusetts 01876 0.075 0.0045 0.0795 0 0 0 0.0795
MATTHEWS INTERNATIONAL CORP 101 FAIRVIEW AVE PITTSBURGH Pennsylvania 15238 0.0565 0.021 0.0775 0 0 0 0.0775
ICI PAINTS PUERTO RICO INC 65 INFANTERIA KM 134 CAROLINA Puerto Rico 00985 0.050405 0.02682 0.077225 0 0 0 0.077225
CORSICANA TECHNOLOGIES INC 2733 E HWY 31 CORSICANA Texas 75109 0.01949 0.05759 0.07708 0 0 6.7015E-05 0.077147015
CHEMICAL SOLVENTS JENNINGS ROAD FACILITY 3751 JENNINGS RD CLEVELAND Ohio 44109 0.071 0.00296 0.07396 0 0 0.0025 0.07646
IMPERIAL PAINT CO INC 2526 NW YEON AVE PORTLAND OREGON 97210 0 0.076 0.076 0 0 0.076
AKZO NOBEL COATINGS INC 1660 CROSS ST SE SALEM Oregon 97302 0.045 0.02915 0.07415 0 0 0.07415
WHITFORD CORP 47 PARK AVE ELVERSON Pennsylvania 19520 0.069255 0.003645 0.0729 0 0 1.38778E-17 0.0729
CHAMPION TECHNOLOGIES INC 304 IDA RD BROUSSARD Louisiana 70518 0.071 0.001 0.072 0 0 0 0.072
PPG INDUSTRIES OHIO INC - DELAWARE 760 PITTSBURGH DR DELAWARE Ohio 43015 0.0695 0.00006 0.06956 0 0 0.06956
WARSAW CHEMICAL CO INC 390 ARGONNE RD WARSAW Indiana 46580 0.0465 0.0225 0.069 0 0 0.069
LUBRIZOL 9550 W 55TH ST MC COOK Illinois 60525 0 0.067 0.067 0 0 0 0.067
CARDINAL INDUSTRIAL FINISHES 1329 POTRERO AVE SOUTH EL MONTE California 91733 0.0475 0.0195 0.067 0 0 0.067
ADCO CLEANING PRODUCTS LLC 900 W MAIN ST SEDALIA Missouri 65301 0.022 0.0445 0.0665 0 0 0 0.0665
ENGINEERED POLYMER SOLUTIONS INC D/B/A VALSPAR COATINGS
901 W UNION ST MONTEBELLO California 90640 0.0635 0.002 0.0655 0 0 0 0.0655
MRCG-KRAFTMAID P1 16052 INDUSTRIAL PKWY MIDDLEFIELD Ohio 44062 0 0.0555 0.0555 0 0 0.01 0.0655
KEY POLYMER 17 SHEPARD ST LAWRENCELAWRENCE Massachusetts 01843 0 0.01365 0.01365 0 0.0507 0.06435
VEOLIA ES TECHNICAL SOLUTIONS LLC 125 FACTORY LN MIDDLESEX New Jersey 08846 0.045 0.0145 0.0595 0 0.001 0.0605
WARREN STAMPING PLANT (PART) 22800 MOUND RD WARREN Michigan 48091 0.06 0 0.06 0 0 0 0.06
KARCHER NORTH AMERICA- PROCHEM 325 S PRICE RD CHANDLER Arizona 85224 0.0595 0 0.0595 0 0 0.0595
ABC COMPOUNDING CO OF TEXAS INC 1102 AVE J E GRAND PRAIRIE Texas 75050 0.0025 0.0565 0.059 0 0 0 0.059
AMPHENOL APC INC 91 NORTHEASTERN BLVD NASHUA New Hampshire 03062 0.0025 0.0549235 0.0574235 0 0 0.0574235
MINUTEMAN INTERNATIONAL MULTI-CLEAN DIV 600 CARDIGAN RD SHOREVIEW Minnesota 55126 0.0545 0.0025 0.057 0 0 0.057
ECOLAB INC 3001 CHANNAHON RD JOLIET Illinois 60436 0.044 0.013 0.057 0 0 0.057
CHEVRON PRODUCTS CO PASCAGOULA REFINERY 250 INDUSTRIAL RD PASCAGOULA MISSISSIPPI 39581 0.055 0 0.055 0 0 0 0.055
UNIVAR USA INC 2600 S GARFIELD AVE COMMERCE California 90040 0.0505 0.004 0.0545 0 0 0 0.0545
CLEVELAND STEEL CONTAINER - KILGORE 5005 ELDER LAKE RD KILGORE TEXAS 75662 0.0025 0.052 0.0545 0 0 0 0.0545
HARLEY-DAVIDSON MOTOR CO OPERATIONS INC 1425 EDEN RD YORK Pennsylvania 17402 0.02725 0.0271 0.05435 0 0 0.05435
3M CO - NEVADA 2120 E AUSTIN BLVD NEVADA Missouri 64772 0.004 0.05 0.054 0 0 0.054
Page 31 of 40

Table B-2. 2010 Emissions Inventory: Non-Zero Certain Glycol Ether Reported Releases
Facility Name Address City State Zip Code
Onsite Point Source
Emissions (tpy)
Onsite Fugitive
Emissions (tpy)
Total Air Emissions
(tpy)
Total Releases to Surface
Water (tpy)a
Total Releases to Soil (tpy)b
Total Releases to Other Media
(tpy)c
Total Emissions (tpy)
UNIVAR USA INC - TOLEDO BRANCH 30450 TRACY RD WALBRIDGE Ohio 43465 0.017 0.0365 0.0535 0 0 0.0535
CLOROX PRODUCTS MANUFACTURING CO 2600 HUNTINGTON DR FAIRFIELD California 94533 0.053 0.0005 0.0535 0 0 0.0535
ROCKLINE INDUSTRIES 1113 MARYLAND AVE SHEBOYGAN Wisconsin 53081 0.0535 0 0.0535 0 0 0.0535
FRANKLIN INTERNATIONAL 2020 BRUCK ST COLUMBUS Ohio 43207 0.0055 0.048 0.0535 0 0 0.0535
ECOLAB INC 942 BAKER RD MARTINSBURG West Virginia 25405 0.0385 0.0145 0.053 0 0 0.053
ECOLAB INC 261 HWY 155 S MC DONOUGH Georgia 30253 0.0155 0.037 0.0525 0 0 0.0525
NEWMAN TECHNOLOGY INC 100 CAIRNS RD MANSFIELD OHIO 44903 0 0.0025 0.0025 0 0.049 0.0515
HANNA STEEL CORP 220 HANNA DR PEKIN Illinois 61554 0.0025 0.04811 0.05061 0 0 0 0.05061
BENJAMIN MOORE & CO PELL CITY 109 BAMBERG DR PELL CITY Alabama 35125 0.04945 0.00055 0.05 0 0 0 0.05
DYSTAR LP 209 WATLINGTON INDUSTR REIDSVILLE North Carolina 27320 0.035 0.015 0.05 0 0 0.05
CONOCOPHILLIPS OKLAHOMA CITY PRODUCTS TERMINAL
4600 NE 10TH ST OKLAHOMA CITY Oklahoma 73117 0.0025 0.0475 0.05 0 0 0.05
CHAMPION TECHNOLOGIES INC 3130 FM 521 FRESNO Texas 77545 0.0495 0.0001 0.0496 0 0 0 0.0496
VALERO REFINING CO - TENNESSEE LLC 2385 RIVERPORT RD MEMPHIS TENNESSEE 38109 0.0495 0 0.0495 0 0 0.0495
AIR PRODUCTS & CHEMICALS INC 412 N MAIN ST CALVERT CITY Kentucky 42029 0 0.049 0.049 0 0 0 0.049
BARTON SOLVENTS INC BETTENDORF 204 36TH ST BETTENDORF Iowa 52722 0.0115 0.0375 0.049 0 0 0.049
UNIVAR USA INC HAMILTON BRANCH 12 STANDEN DR HAMILTON Ohio 45015 0.013 0.036 0.049 0 0 0.049
EXCEL-POLYMERS LLC HWY 353 S PO BOX 377 JONESBOROUGH Tennessee 37659 0 0.0485 0.0485 0 0 0 0.0485
GRAPHIC CONTROLS LLC 400 EXCHANGE ST BUFFALO New York 14204 0.048 0 0.048 0 0 0.048
ENGINEERED POLYMER SOLUTIONS INC D/B/A VALSPAR COATINGS
546 W ABBOTT ST INDIANAPOLIS Indiana 46225 0 0.0465 0.0465 0 0 0 0.0465
LUBRIZOL CORP 29400 LAKELAND BLVD WICKLIFFE Ohio 44092 0.0455 0 0.0455 0 0 0 0.0455
RECKITT BENCKISER 799 RT 206 & HILLSBOROUGHILLSBOROUGH New Jersey 08844 0.0445 0.001 0.0455 0 0 0.0455
BRENNTAG SOUTHEAST INC 2000 E PETTIGREW ST DURHAM North Carolina 27703 0.028 0.016 0.044 0 0 0 0.044
WATSON STANDARD CO (NEVILLE ISLAND PLANT) 2895 GRAND AVE NEVILLE ISLAND Pennsylvania 15225 0.038 0.006 0.044 0 0 0 0.044
UNIVAR USA INC DALLAS DAN MORTON FACILITY 3636 DAN MORTON DR DALLAS Texas 75236 0.0165 0.027 0.0435 0 0 0 0.0435
HARCROS CHEMICALS INC 4606 NEW W DR PASADENA Texas 77507 0.015 0.0255 0.0405 0 0.0025 0 0.043
CUSTOM SYNTHESIS LLC 1704 DENVER RD ANDERSON South Carolina 29625 0.0025 0.04 0.0425 0 0 0 0.0425
ASHLAND DISTRIBUTION CO 5125 W HANNA AVE TAMPA Florida 33634 0.0015 0.0405 0.042 0 0 0 0.042
BARTON SOLVENTS INC KANSAS CITY 901 S 66TH TERRACE KANSAS CITY Kansas 66111 0.009 0.0325 0.0415 0 0 0 0.0415
SHERWIN-WILLIAMS CO 630 E 13TH ANDOVER Kansas 67002 0.0315 0.0095 0.041 0 0 0 0.041
Page 32 of 40

Table B-2. 2010 Emissions Inventory: Non-Zero Certain Glycol Ether Reported Releases
Facility Name Address City State Zip Code
Onsite Point Source
Emissions (tpy)
Onsite Fugitive
Emissions (tpy)
Total Air Emissions
(tpy)
Total Releases to Surface
Water (tpy)a
Total Releases to Soil (tpy)b
Total Releases to Other Media
(tpy)c
Total Emissions (tpy)
BRENNTAG SOUTHWEST INC SAND SPRINGS 206 E MORROW RD SAND SPRINGS Oklahoma 74063 0.02 0.02 0.04 0 0 0 0.04
RECTICEL INTERIORS NORTH AMERICA LLC 1420 INDUSTRIAL PARK DR TUSCALOOSA Alabama 35401 0.0005 0.0395 0.04 0 0 0 0.04
ENGINEERED POLYMER SOLUTIONS INC D/B/A VALSPAR COATINGS
2000 WESTHALL ST PITTSBURGH Pennsylvania 15233 0.032 0.0075 0.0395 0 0 0 0.0395
AIR PRODUCTS PERFORMANCE MANUFACTURING INC 337 VINCENT DR MILTON Wisconsin 53563 0.0025 0.037 0.0395 0 0 0.0395
BIOLAB INC 1735 DOGWOOD DR CONYERS Georgia 30012 0.03915 0 0.03915 0 0 0 0.03915
HUNTSMAN ADVANCED MATERIALS AMERICAS INC 555 HUNTSMAN RD MC INTOSH Alabama 36553 0.0125 0.0263 0.0388 0 0 0.0388
BASF CORP 100 INDUSTRIAL BLVD SEAFORD Delaware 19973 0.0025 0 0.0025 0 0.036 0.0385
CLEARWATER INTERNATIONAL LLC 100 INDUSTRIAL DR (BLDG 1LEETSDALE Pennsylvania 15056 0 0 0 0 0.038 0.038
RICHARDSAPEX INC 4202-24 MAIN ST PHILADELPHIA Pennsylvania 19127 0.02673425 0 0.02673425 0 0.0103555 0.03708975
KEMIRA WATER SOLUTIONS INC 1 CYANAMID RD MOBILE Alabama 36614 0.013 0.0235 0.0365 0 0 0.0365
CONOCOPHILLIPS CO EAST ST LOUIS TERMINAL 3300 MISSISSIPPI AVE CAHOKIA Illinois 62206 0 0.0355 0.0355 0 0 0 0.0355
CONTINENTAL CEMENT CO LLC 10107 HWY 79 HANNIBAL Missouri 63401 0.0351 0.000025 0.035125 0 0 0 0.035125
SI GROUP INC 1000 MAIN ST ROTTERDAM JUNCTNew York 12150 0 0.0245 0.0245 0.0095 0 0 0.034
BRENNTAG NORTHEAST INC 81 W HULLER LN READING Pennsylvania 19605 0.01975 0.014 0.03375 0 0 0 0.03375
UNIVAR USA INC BERKELEY 8925 SEEGER INDUSTRIAL DBERKELEY Missouri 63134 0.0295 0.0035 0.033 0 0 0 0.033
VEOLIA ES TECHNICAL SOLUTIONS LLC 7 MOBILE AVE SAUGET ILLINOIS 62201 0.0015 0.0015 0.003 0 0 0.03 0.033
TRANSTAR AUTOBODY TECHNOLOGIES 2040 HEISERMAN DR BRIGHTON Michigan 48114 0.016435 0.01611 0.032545 0 0 0 0.032545
VALSPAR REFINISH 210 CROSBY ST PICAYUNE Mississippi 39466 0 0.0315 0.0315 0 0 0 0.0315
DUPONT PARLIN PLANT CHEESEQUAKE RD PARLIN New Jersey 08859 0.004 0.027 0.031 0 0 0 0.031
ASHLAND DISTRIBUTION 2011 TURNER ST LANSING Michigan 48906 0.026 0.005 0.031 0 0 0.031
AMERICAN COATINGS INC 10625 MAHAFFEY RD TOMBALL Texas 77375 0.0085 0.022 0.0305 0 0 0 0.0305
COOK COMPOSITES & POLYMERS C O 13511 MAIN ST LEMONT Illinois 60439 0.0075 0.0225 0.03 0 0 0 0.03
BERNER CHEESE CORP 2034 E FACTORY RD DAKOTA Illinois 61018 0 0 0 0 0.03 0.03
GEORGIA-PACIFIC CHEMICALS LLC 1429 E LUFKIN AVE LUFKIN Texas 75901 0.0285 0.001 0.0295 0 0 0.0295
ECOLAB 18383 E RAILROAD ST CITY OF INDUSTRY California 91748 0.015 0.0145 0.0295 0 0 0.0295
VERSO PAPER BUCKSPORT MILL RIVER RD BUCKSPORT MAINE 4416 0.0003 0 0.0003 0.018 0.0112 0.0295
BARTON SOLVENTS INC DES MOINES 1970 NE BROADWAY DES MOINES Iowa 50313 0.004 0.025 0.029 0 0 0 0.029
KWAL-HOWELLS INC (DBA KWAL PAINT INC) 2430 ALBERT BROADFOOT SBONHAM Texas 75418 0 0.029 0.029 0 0 0 0.029
SHERWIN-WILLIAMS CO 113 STAGE COACH TRAIL GREENSBORO North Carolina 27409 0.0045 0.024 0.0285 0 0 0 0.0285
Page 33 of 40

Table B-2. 2010 Emissions Inventory: Non-Zero Certain Glycol Ether Reported Releases
Facility Name Address City State Zip Code
Onsite Point Source
Emissions (tpy)
Onsite Fugitive
Emissions (tpy)
Total Air Emissions
(tpy)
Total Releases to Surface
Water (tpy)a
Total Releases to Soil (tpy)b
Total Releases to Other Media
(tpy)c
Total Emissions (tpy)
BARTON SOLVENTS INC WEST BEND 800 RAIL WAY WEST BEND Wisconsin 53095 0.0015 0.0265 0.028 0 0 0 0.028
ASHLAND DISTRIBUTION CO 8901 OLD GALVESTON RD HOUSTON Texas 77034 0.0055 0.022 0.0275 0 0 0.0275
VEOLIA ES TECHNICAL SOLUTIONS LLC PORT ARTHUR FACILITY
HWY 73, 35 MILES W OF TAYPORT ARTHUR Texas 77640 0.026735 0.00006 0.026795 0 0 3.46945E-18 0.026795
DIC IMAGING PRODUCTS USA LLC 7335 S 10TH ST OAK CREEK Wisconsin 53154 0.0025 0.0235 0.026 0 0 0 0.026
NORTHERN LABS INC WEST DRIVE 5800 W DR MANITOWOC Wisconsin 54220 0.025225 0 0.025225 0 0 0.025225
SUN CHEMICAL CORP 135 W LAKE ST NORTHLAKE ILLINOIS 60164 0.0035 0.021 0.0245 0 0 0 0.0245
BARTON SOLVENTS INC COUNCIL BLUFFS 2135 9TH AVE COUNCIL BLUFFS Iowa 51502 0.0015 0.0215 0.023 0 0 0.023
VALERO THREE RIVERS REFINERY 301 LEROY ST THREE RIVERS Texas 78071 0.023 0 0.023 0 0 0 0.023
BARTON SOLVENTS INC WICHITA 201 S CEDAR VALLEY CENTER Kansas 67147 0.01 0.013 0.023 0 0 0 0.023
DAUBERT CHEMICAL CO 4700 S CENTRAL AVE CHICAGO Illinois 60638 0.009615 0.013335 0.02295 0 0 0 0.02295
ARLON INC ADHESIVES & FILMS DIV 2811 S HARBOR BLVD SANTA ANA California 92704 0 0.0225 0.0225 0 0 0 0.0225
KBP COIL COATERS INC 3600 E 44TH AVE DENVER Colorado 80216 0 0.0225 0.0225 0 0 0 0.0225
GAGE PRODUCTS CO 625 WANDA AVE FERNDALE Michigan 48220 0 0.0215 0.0215 0 0 0 0.0215
PROCTER & GAMBLE HAIR CARE LLC 2200 LOWER MUSCATINE R IOWA CITY Iowa 52240 0.0065 0.01 0.0165 0 0.005 0.0215
SHERWIN-WILLIAMS CO 11700 S COTTAGE GROVE CHICAGO Illinois 60628 0 0 0 0 0 0.0215 0.0215
BASF CORP 1 JAMES ST BELVIDERE New Jersey 07823 0 0.02 0.02 0 0 0.001 0.021
HERITAGE-WTI INC 1250 ST GEORGE ST EAST LIVERPOOL Ohio 43920 0.005 0.000065 0.005065 0 0.0155 0.020565
EXCEL POLYMERS LLC 14330 KINSMAN RD BURTON OHIO 44021 0 0.02 0.02 0 0 0 0.02
3M CO - SPRINGFIELD 3211 E CHESTNUT EXPY SPRINGFIELD Missouri 65802 0 0.02 0.02 0 0 0 0.02
AFTON CHEMICAL CORP 501 MONSANTO AVE SAUGET ILLINOIS 62201 0.005 0.015 0.02 0 0 0.02
PRIDE SOLVENTS & CHEMICAL CO OF NEW JERSEY 211 RANDOLPH AVE AVENEL New Jersey 07001 0.005 0.015 0.02 0 0 0 0.02
UNIVAR USA INC - TOLEDO SOUTH BRANCH 4051 S AVE TOLEDO Ohio 43615 0.009 0.01 0.019 0 0 0.019
ECOLAB INC 2305 SHERWIN ST GARLAND Texas 75041 0.0085 0.01 0.0185 0 0 0.0185
STEEL DYNAMICS INC 4500 COUNTY RD 59 BUTLER Indiana 46721 0 0.0185 0.0185 0 0 0 0.0185
UNIVAR USA INC JACKSONVILLE FA CILITY 155 ELLIS RD S JACKSONVILLE Florida 32254 0.0145 0.0035 0.018 0 0 0 0.018
ZEP COMMERCIAL 350 JOE FRANK HARRIS PKWEMERSON Georgia 30137 0 0.018 0.018 0 0 0 0.018
TAKASAGO INTERNATIONAL CORP (USA) 267 UNION ST NORTHVALE New Jersey 07647 0.017325 0.000295 0.01762 0 0 0.01762
SHERWIN-WILLIAMS CO 6795 S MAIN ST MORROW Georgia 30260 0.005 0.0125 0.0175 0 0 0 0.0175
DAVIES IMPERIAL COATINGS INC 1275 STATE ST HAMMOND Indiana 46320 0.0175 0 0.0175 0 0 0.0175
SHERWIN-WILLIAMS CO 2121 NEW WORLD DR COLUMBUS Ohio 43207 0.009 0.0085 0.0175 0 0 0 0.0175
Page 34 of 40
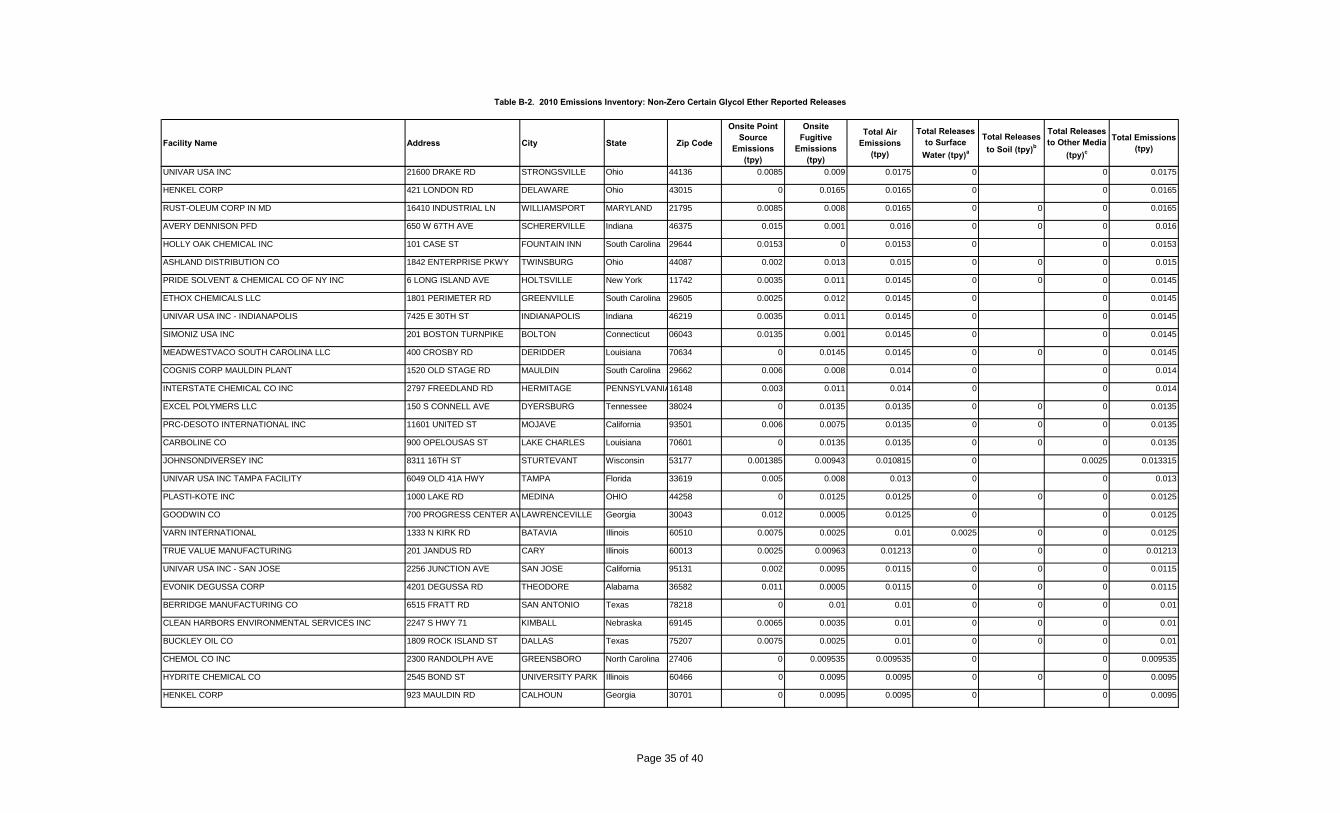
Table B-2. 2010 Emissions Inventory: Non-Zero Certain Glycol Ether Reported Releases
Facility Name Address City State Zip Code
Onsite Point Source
Emissions (tpy)
Onsite Fugitive
Emissions (tpy)
Total Air Emissions
(tpy)
Total Releases to Surface
Water (tpy)a
Total Releases to Soil (tpy)b
Total Releases to Other Media
(tpy)c
Total Emissions (tpy)
UNIVAR USA INC 21600 DRAKE RD STRONGSVILLE Ohio 44136 0.0085 0.009 0.0175 0 0 0.0175
HENKEL CORP 421 LONDON RD DELAWARE Ohio 43015 0 0.0165 0.0165 0 0 0.0165
RUST-OLEUM CORP IN MD 16410 INDUSTRIAL LN WILLIAMSPORT MARYLAND 21795 0.0085 0.008 0.0165 0 0 0 0.0165
AVERY DENNISON PFD 650 W 67TH AVE SCHERERVILLE Indiana 46375 0.015 0.001 0.016 0 0 0 0.016
HOLLY OAK CHEMICAL INC 101 CASE ST FOUNTAIN INN South Carolina 29644 0.0153 0 0.0153 0 0 0.0153
ASHLAND DISTRIBUTION CO 1842 ENTERPRISE PKWY TWINSBURG Ohio 44087 0.002 0.013 0.015 0 0 0 0.015
PRIDE SOLVENT & CHEMICAL CO OF NY INC 6 LONG ISLAND AVE HOLTSVILLE New York 11742 0.0035 0.011 0.0145 0 0 0 0.0145
ETHOX CHEMICALS LLC 1801 PERIMETER RD GREENVILLE South Carolina 29605 0.0025 0.012 0.0145 0 0 0.0145
UNIVAR USA INC - INDIANAPOLIS 7425 E 30TH ST INDIANAPOLIS Indiana 46219 0.0035 0.011 0.0145 0 0 0.0145
SIMONIZ USA INC 201 BOSTON TURNPIKE BOLTON Connecticut 06043 0.0135 0.001 0.0145 0 0 0.0145
MEADWESTVACO SOUTH CAROLINA LLC 400 CROSBY RD DERIDDER Louisiana 70634 0 0.0145 0.0145 0 0 0 0.0145
COGNIS CORP MAULDIN PLANT 1520 OLD STAGE RD MAULDIN South Carolina 29662 0.006 0.008 0.014 0 0 0.014
INTERSTATE CHEMICAL CO INC 2797 FREEDLAND RD HERMITAGE PENNSYLVANIA16148 0.003 0.011 0.014 0 0 0.014
EXCEL POLYMERS LLC 150 S CONNELL AVE DYERSBURG Tennessee 38024 0 0.0135 0.0135 0 0 0 0.0135
PRC-DESOTO INTERNATIONAL INC 11601 UNITED ST MOJAVE California 93501 0.006 0.0075 0.0135 0 0 0 0.0135
CARBOLINE CO 900 OPELOUSAS ST LAKE CHARLES Louisiana 70601 0 0.0135 0.0135 0 0 0 0.0135
JOHNSONDIVERSEY INC 8311 16TH ST STURTEVANT Wisconsin 53177 0.001385 0.00943 0.010815 0 0.0025 0.013315
UNIVAR USA INC TAMPA FACILITY 6049 OLD 41A HWY TAMPA Florida 33619 0.005 0.008 0.013 0 0 0.013
PLASTI-KOTE INC 1000 LAKE RD MEDINA OHIO 44258 0 0.0125 0.0125 0 0 0 0.0125
GOODWIN CO 700 PROGRESS CENTER AVLAWRENCEVILLE Georgia 30043 0.012 0.0005 0.0125 0 0 0.0125
VARN INTERNATIONAL 1333 N KIRK RD BATAVIA Illinois 60510 0.0075 0.0025 0.01 0.0025 0 0 0.0125
TRUE VALUE MANUFACTURING 201 JANDUS RD CARY Illinois 60013 0.0025 0.00963 0.01213 0 0 0 0.01213
UNIVAR USA INC - SAN JOSE 2256 JUNCTION AVE SAN JOSE California 95131 0.002 0.0095 0.0115 0 0 0 0.0115
EVONIK DEGUSSA CORP 4201 DEGUSSA RD THEODORE Alabama 36582 0.011 0.0005 0.0115 0 0 0 0.0115
BERRIDGE MANUFACTURING CO 6515 FRATT RD SAN ANTONIO Texas 78218 0 0.01 0.01 0 0 0 0.01
CLEAN HARBORS ENVIRONMENTAL SERVICES INC 2247 S HWY 71 KIMBALL Nebraska 69145 0.0065 0.0035 0.01 0 0 0 0.01
BUCKLEY OIL CO 1809 ROCK ISLAND ST DALLAS Texas 75207 0.0075 0.0025 0.01 0 0 0 0.01
CHEMOL CO INC 2300 RANDOLPH AVE GREENSBORO North Carolina 27406 0 0.009535 0.009535 0 0 0.009535
HYDRITE CHEMICAL CO 2545 BOND ST UNIVERSITY PARK Illinois 60466 0 0.0095 0.0095 0 0 0 0.0095
HENKEL CORP 923 MAULDIN RD CALHOUN Georgia 30701 0 0.0095 0.0095 0 0 0.0095
Page 35 of 40

Table B-2. 2010 Emissions Inventory: Non-Zero Certain Glycol Ether Reported Releases
Facility Name Address City State Zip Code
Onsite Point Source
Emissions (tpy)
Onsite Fugitive
Emissions (tpy)
Total Air Emissions
(tpy)
Total Releases to Surface
Water (tpy)a
Total Releases to Soil (tpy)b
Total Releases to Other Media
(tpy)c
Total Emissions (tpy)
SHERWIN-WILLIAMS CO 2325 HOLLINS FERRY RD BALTIMORE Maryland 21230 0.004 0.0055 0.0095 0 0 0.0095
SHERWIN-WILLIAMS CO 26300 FARGO AVE BEDFORD HEIGHTS Ohio 44146 0.0005 0.0015 0.002 0 0 0.0075 0.0095
DSM DESOTECH INC 1101 HWY 27 S STANLEY North Carolina 28164 0 0.0093 0.0093 0 0 0 0.0093
MULTI-COLOR CORP 2281 S US 31 SCOTTSBURG Indiana 47170 0 0.008625 0.008625 0 0 0.008625
MARATHON PETROLEUM CO LLC 502 10TH ST S TEXAS CITY Texas 77590 0 0.0085 0.0085 0 0 0 0.0085
FERRO CORP WALTON HILLS OPERATIONS 7050 KRICK RD WALTON HILLS OHIO 44146 0.0035 0.0005 0.004 0 0.0045 0.0085
CLOROX PRODUCTS MANUFACTURING CO 17 LAKE MIRROR RD FOREST PARK Georgia 30297 0.003985 0.003985 0.00797 0 0 0.00797
MALLINCKRODT BAKER INC 600 N BROAD ST PHILLIPSBURG New Jersey 08865 0.0075 0 0.0075 0 0 0 0.0075
US DOD USAF JOINT BASE ELMENDORF-RICHARDSON 6326 ARCTIC WARRIOR DR ELMENDORF AFB ALASKA 99506 0.005 0.0025 0.0075 0 0 0 0.0075
RUSTOLEUM CORP 7850 OHIO RIVER RD LESAGE West Virginia 25537 0.0025 0.005 0.0075 0 0 0 0.0075
INTERSTATE CHEMICAL CO INC 23247 W EAMES ST CHANNAHON Illinois 60410 0.002 0.0055 0.0075 0 0 0.0075
DYNALOY LLC 6445 OLIVIA LN INDIANAPOLIS Indiana 46226 0.0015 0.006 0.0075 0 0 0.0075
BASF CORP 1609 BIDDLE AVE WYANDOTTE Michigan 48192 0.0025 0.0025 0.005 0.0025 0 0.0075
NATIONAL INDUSTRIAL COATINGS INC DBA NICOAT INC 1600 GLENLAKE AVE ITASCA Illinois 60143 0.0005 0 0.0005 0 0 0.007 0.0075
BRULIN CORP 2920 DR ANDREW J BROWNINDIANAPOLIS Indiana 46205 0.0030875 0.00417 0.0072575 0 0 0.0072575
FORD MOTOR CO DEARBORN DIVERSIFIED MANUFACTURING
3001 MILLER RD DEARBORN Michigan 48121 0.007 0 0.007 0 0 0.007
MARATHON PETROLEUM CO LLC - SPEEDWAY IN TERMINAL
1304 OLIN AVE INDIANAPOLIS Indiana 46222 0.007 0 0.007 0 0 0.007
HONEYWELL-PRESTONE PRODUCTS CORP 250 HALLS MILL RD FREEHOLD New Jersey 07728 0.0035 0.0035 0.007 0 0 0 0.007
LANCO MANUFACTURING CORP URBAPONTE #5 SAN LORENZO Puerto Rico 00754 0.0068 0.00004 0.00684 0 0 0.00684
NEW DAWN MANUFACTURING CO 16001 TRADE ZONE AVE UPPER MARLBORO Maryland 20774 0.006732805 0 0.006732805 0 0 0.006732805
UNIVAR USA INC NORCROSS FACILI TY 2145 SKYLAND CT NORCROSS Georgia 30071 0.003 0.0035 0.0065 0 0 0.0065
SHERWIN-WILLIAMS CO 12401 INDUSTRIAL BLVD VICTORVILLE California 92392 0.003 0.0035 0.0065 0 0 0 0.0065
VERSO PAPER HOLDINGS LLC ANDROSCOGGIN MILL RILEYJAY Maine 04239 0.0025 0 0.0025 0.0035 0.0005 0.0065
PROCTER & GAMBLE MANUFACTURING CO 1900 KANSAS AVE KANSAS CITY Kansas 66105 0.005915 0.00018 0.006095 0 0 0.006095
BP PRODUCTS NORTH AMERICA WHITING 2815 INDIANAPOLIS BLVD WHITING Indiana 46394 0.006 0 0.006 0 0 0 0.006
CONOCOCPHILLIPS CO WICHITA TERMINAL 2400 E 37TH ST N WICHITA KANSAS 67219 0 0.0059 0.0059 0 0 0 0.0059
CALLAHAN CHEMICAL CO 200 INDUSTRIAL AVE RIDGEFIELD PARK New Jersey 07660 0.003 0.0025 0.0055 0 0 0.0055
GOODWIN CO 12361 MONARCH ST GARDEN GROVE California 92841 0.005 0.0005 0.0055 0 0 0.0055
Page 36 of 40

Table B-2. 2010 Emissions Inventory: Non-Zero Certain Glycol Ether Reported Releases
Facility Name Address City State Zip Code
Onsite Point Source
Emissions (tpy)
Onsite Fugitive
Emissions (tpy)
Total Air Emissions
(tpy)
Total Releases to Surface
Water (tpy)a
Total Releases to Soil (tpy)b
Total Releases to Other Media
(tpy)c
Total Emissions (tpy)
HUBBARD-HALL INC 563 S LEONARD ST WATERBURY Connecticut 06708 0.0005 0.005 0.0055 0 0 0.0055
LUBRIZOL CORP PAINESVIL LE PLANT 155 FREEDOM RD PAINESVILLE Ohio 44077 0.0045 0.001 0.0055 0 0 0.0055
UNIVAR USA INC - BUNOLA BRANC H 328 BUNOLA RIVER RD BUNOLA Pennsylvania 15020 0.0025 0.003 0.0055 0 0 0 0.0055
ENTHONE INC 9809 INDUSTRIAL DR BRIDGEVIEW Illinois 60455 0.00053 0.004765 0.005295 0 0 0 0.005295
GE WATER & PROCESS TECHNOLOGIES 333 S LOMBARD RD ADDISON ILLINOIS 60101 0.0025 0.0025 0.005 0 0 0.005
SHIELD PACKAGING CO INC 50 OXFORD AVE DUDLEY Massachusetts 01571 0.0025 0.0025 0.005 0 0 0 0.005
SARTOMER CO INC 601 TIGHTSQUEEZE INDUSTCHATHAM Virginia 24531 0.0025 0.0025 0.005 0 0 0.005
UNIVAR USA INC LAKEVILLE 21675 HAMBURG AVE LAKEVILLE Minnesota 55044 0.0025 0.0025 0.005 0 0 0 0.005
PVS NOLWOOD CHEMICALS INC 9000 HUBBELL AVE DETROIT MICHIGAN 48228 0.0025 0.0025 0.005 0 0 0 0.005
INTERNATIONAL PAINT LLC 640 N ROCKY RIVER DR BEREA OHIO 44017 0.0025 0.0025 0.005 0 0 0 0.005
INDEPENDENT INK INC 14705 S AVALON BLVD GARDENA California 90248 0.0025 0.0025 0.005 0 0 0 0.005
GE WATER & PROCESS TECHNOLOGIES 2118 REISER AVE SE NEW PHILADELPHIA OHIO 44663 0.0025 0.0025 0.005 0 0 0.005
SARTOMER CO INC 610 S BOLMAR ST WEST CHESTER Pennsylvania 19382 0.0025 0.0025 0.005 0 0 0.005
FORD MOTOR CO DEARBORN TOOL & DIE PLANT 3001 MILLER RD DEARBORN Michigan 48121 0.005 0 0.005 0 0 0.005
CR BRANDS INC 141 VENTURE BLVD SPARTANBURG South Carolina 29306 0.0025 0.0025 0.005 0 0 0.005
C P INC 196 S WATER CONNERSVILLE Indiana 47331 0.0025 0.0025 0.005 0 0 0 0.005
BRAIN POWER INC 4470 SW 74TH AVE MIAMI Florida 33155 0.0025 0.0025 0.005 0 0 0.005
ACTEGA RADCURE INC 5 MANSARD CT WAYNE New Jersey 07470 0.0025 0.0025 0.005 0 0 0 0.005
GE WATER & PROCESS TECHNOLOGIES - BAKERSFIELD 3050 PEGASUS RD BAKERSFIELD CALIFORNIA 93308 0.0025 0.0025 0.005 0 0 0.005
BOEING COMMERCIAL AIRPLANE GROUP PLANT 2 (PART) 7755 E MARGINAL WAY S SEATTLE Washington 98108 0.001 0 0.001 0 0.004 0 0.005
CENTRAL SOLUTIONS INC 401 FUNSTON RD KANSAS CITY Kansas 66115 0 0 0 0 0.005 0 0.005
BAKER PETROLITE BAYPORT FACILI TY 13200 BAYPARK RD PASADENA Texas 77507 0.0045 0.000135 0.004635 0 0 0 0.004635
EDCO PRODUCTS INC 8700 EXCELSIOR BLVD HOPKINS MINNESOTA 55343 0 0.0045 0.0045 0 0 0 0.0045
MEADWESTVACO SC LLC CHARLESTON CHEMICAL PLANT 5598 VIRGINIA AVE NORTH CHARLESTOSouth Carolina 29406 0.004475 0.000025 0.0045 0 0 0 0.0045
LAFARGE MIDWEST INC (INCLD SYSTECH ENVIRONMENTAL)
1400 S CEMENT RD FREDONIA KANSAS 66736 0.0045 0 0.0045 0 0 0 0.0045
COGNIS CORP -- CHARLOTT E PLANT 3300 WESTINGHOUSE BLVDCHARLOTTE North Carolina 28273 0.0045 0 0.0045 0 0 0.0045
OMNIUM 1280 IMPERIAL RD HAMPTON Iowa 50441 0.0015 0.0025 0.004 0 0 0 0.004
CUSTOM CHEMICAL FORMULATORS 8707 MILLERGROVE DR SANTA FE SPRINGS California 90670 0.004 0 0.004 0 0 0.004
Page 37 of 40
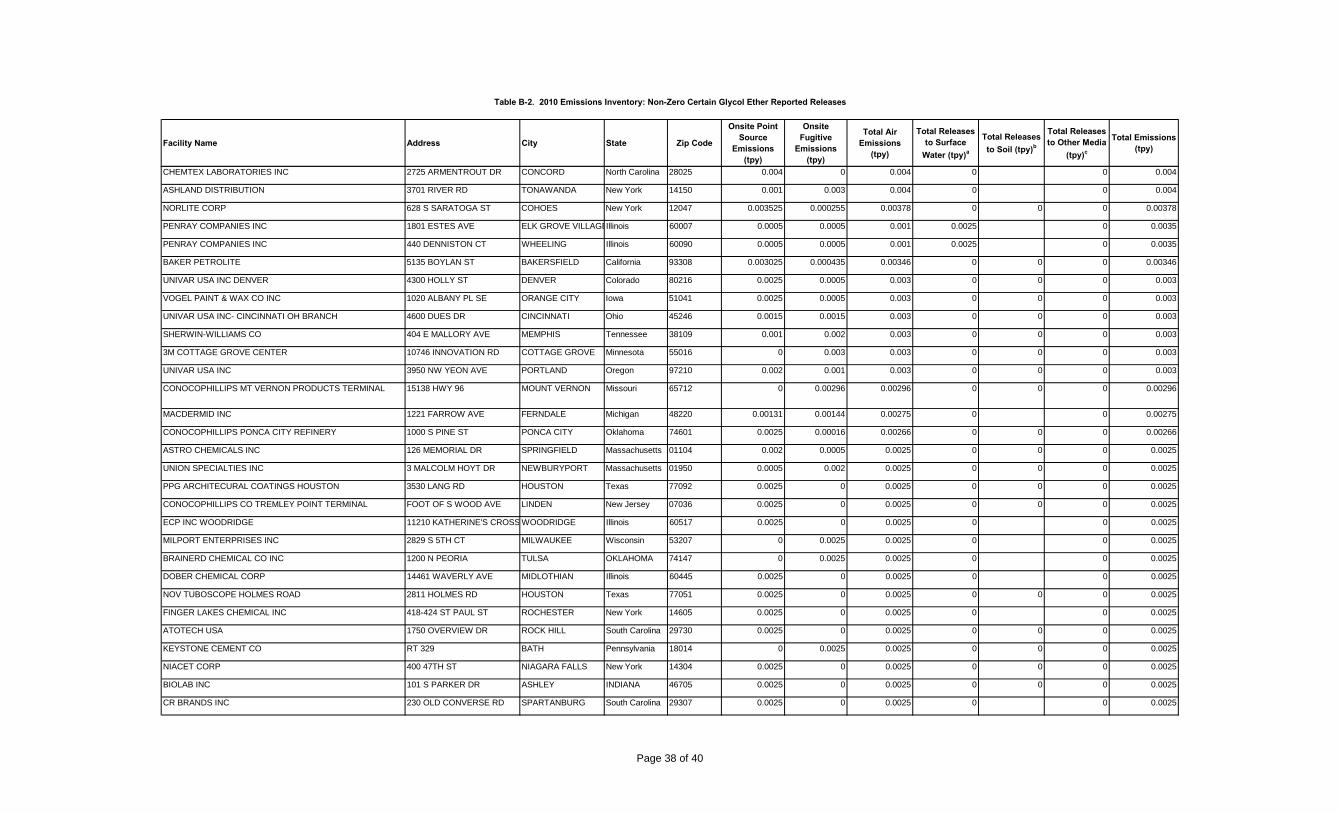
Table B-2. 2010 Emissions Inventory: Non-Zero Certain Glycol Ether Reported Releases
Facility Name Address City State Zip Code
Onsite Point Source
Emissions (tpy)
Onsite Fugitive
Emissions (tpy)
Total Air Emissions
(tpy)
Total Releases to Surface
Water (tpy)a
Total Releases to Soil (tpy)b
Total Releases to Other Media
(tpy)c
Total Emissions (tpy)
CHEMTEX LABORATORIES INC 2725 ARMENTROUT DR CONCORD North Carolina 28025 0.004 0 0.004 0 0 0.004
ASHLAND DISTRIBUTION 3701 RIVER RD TONAWANDA New York 14150 0.001 0.003 0.004 0 0 0.004
NORLITE CORP 628 S SARATOGA ST COHOES New York 12047 0.003525 0.000255 0.00378 0 0 0 0.00378
PENRAY COMPANIES INC 1801 ESTES AVE ELK GROVE VILLAGEIllinois 60007 0.0005 0.0005 0.001 0.0025 0 0.0035
PENRAY COMPANIES INC 440 DENNISTON CT WHEELING Illinois 60090 0.0005 0.0005 0.001 0.0025 0 0.0035
BAKER PETROLITE 5135 BOYLAN ST BAKERSFIELD California 93308 0.003025 0.000435 0.00346 0 0 0 0.00346
UNIVAR USA INC DENVER 4300 HOLLY ST DENVER Colorado 80216 0.0025 0.0005 0.003 0 0 0 0.003
VOGEL PAINT & WAX CO INC 1020 ALBANY PL SE ORANGE CITY Iowa 51041 0.0025 0.0005 0.003 0 0 0 0.003
UNIVAR USA INC- CINCINNATI OH BRANCH 4600 DUES DR CINCINNATI Ohio 45246 0.0015 0.0015 0.003 0 0 0 0.003
SHERWIN-WILLIAMS CO 404 E MALLORY AVE MEMPHIS Tennessee 38109 0.001 0.002 0.003 0 0 0 0.003
3M COTTAGE GROVE CENTER 10746 INNOVATION RD COTTAGE GROVE Minnesota 55016 0 0.003 0.003 0 0 0 0.003
UNIVAR USA INC 3950 NW YEON AVE PORTLAND Oregon 97210 0.002 0.001 0.003 0 0 0 0.003
CONOCOPHILLIPS MT VERNON PRODUCTS TERMINAL 15138 HWY 96 MOUNT VERNON Missouri 65712 0 0.00296 0.00296 0 0 0 0.00296
MACDERMID INC 1221 FARROW AVE FERNDALE Michigan 48220 0.00131 0.00144 0.00275 0 0 0.00275
CONOCOPHILLIPS PONCA CITY REFINERY 1000 S PINE ST PONCA CITY Oklahoma 74601 0.0025 0.00016 0.00266 0 0 0 0.00266
ASTRO CHEMICALS INC 126 MEMORIAL DR SPRINGFIELD Massachusetts 01104 0.002 0.0005 0.0025 0 0 0 0.0025
UNION SPECIALTIES INC 3 MALCOLM HOYT DR NEWBURYPORT Massachusetts 01950 0.0005 0.002 0.0025 0 0 0 0.0025
PPG ARCHITECURAL COATINGS HOUSTON 3530 LANG RD HOUSTON Texas 77092 0.0025 0 0.0025 0 0 0 0.0025
CONOCOPHILLIPS CO TREMLEY POINT TERMINAL FOOT OF S WOOD AVE LINDEN New Jersey 07036 0.0025 0 0.0025 0 0 0 0.0025
ECP INC WOODRIDGE 11210 KATHERINE'S CROSS WOODRIDGE Illinois 60517 0.0025 0 0.0025 0 0 0.0025
MILPORT ENTERPRISES INC 2829 S 5TH CT MILWAUKEE Wisconsin 53207 0 0.0025 0.0025 0 0 0.0025
BRAINERD CHEMICAL CO INC 1200 N PEORIA TULSA OKLAHOMA 74147 0 0.0025 0.0025 0 0 0.0025
DOBER CHEMICAL CORP 14461 WAVERLY AVE MIDLOTHIAN Illinois 60445 0.0025 0 0.0025 0 0 0.0025
NOV TUBOSCOPE HOLMES ROAD 2811 HOLMES RD HOUSTON Texas 77051 0.0025 0 0.0025 0 0 0 0.0025
FINGER LAKES CHEMICAL INC 418-424 ST PAUL ST ROCHESTER New York 14605 0.0025 0 0.0025 0 0 0.0025
ATOTECH USA 1750 OVERVIEW DR ROCK HILL South Carolina 29730 0.0025 0 0.0025 0 0 0 0.0025
KEYSTONE CEMENT CO RT 329 BATH Pennsylvania 18014 0 0.0025 0.0025 0 0 0 0.0025
NIACET CORP 400 47TH ST NIAGARA FALLS New York 14304 0.0025 0 0.0025 0 0 0 0.0025
BIOLAB INC 101 S PARKER DR ASHLEY INDIANA 46705 0.0025 0 0.0025 0 0 0 0.0025
CR BRANDS INC 230 OLD CONVERSE RD SPARTANBURG South Carolina 29307 0.0025 0 0.0025 0 0 0.0025
Page 38 of 40

Table B-2. 2010 Emissions Inventory: Non-Zero Certain Glycol Ether Reported Releases
Facility Name Address City State Zip Code
Onsite Point Source
Emissions (tpy)
Onsite Fugitive
Emissions (tpy)
Total Air Emissions
(tpy)
Total Releases to Surface
Water (tpy)a
Total Releases to Soil (tpy)b
Total Releases to Other Media
(tpy)c
Total Emissions (tpy)
WYNNEWOOD REFINING CO 906 S POWELL WYNNEWOOD Oklahoma 73098 0 0.0025 0.0025 0 0 0 0.0025
CHEMICAL SOLVENTS INC--DENISON FACILITY 1010 OLD DENNISON AVE CLEVELAND Ohio 44109 0.0025 0 0.0025 0 0 0 0.0025
BAKER PETROLITE CORP 16950 WALLISVILLE RD HOUSTON Texas 77049 0.0003495 0.002085 0.0024345 0 0 0 0.0024345
KING INDUSTRIES INC SCIENCE RD NORWALK Connecticut 06852 0.00125 0.00115 0.0024 0 0 0.0024
CLARIANT CORP CLEAR LAKE PLANT 9502 BAYPORT BLVD - ETOXPASADENA Texas 77507 0.0023 0 0.0023 0 0 0.0023
HENTZEN COATINGS,INC 6937 W MILL RD MILWAUKEE Wisconsin 53218 0.000875 0.00131 0.002185 0 0 0 0.002185
DYNASOL INC 330 PINE ST CANTON Massachusetts 02021 0.00215 0 0.00215 0 0 0.00215
UNIVAR USA INC SANTA FE SPRINGS 13900 CARMENITA RD SANTA FE SPRINGS California 90670 0.001 0.001 0.002 0 0 0 0.002
DUPONT EKC TECHNOLOGY 2520 BARRINGTON CT HAYWARD California 94545 0.0005 0.0015 0.002 0 0 0.002
CALLAHAN CHEMICAL CO 18 INDUSTRIAL RD WALPOLE Massachusetts 02081 0.0015 0.0005 0.002 0 0 0 0.002
ASHLAND DISTRIBUTION CO FREEPORT CENTER BUILDI CLEARFIELD Utah 84016 0.0005 0.0015 0.002 0 0 0 0.002
CRODA INC 315 CHERRY LN NEW CASTLE Delaware 19720 0.001405 0.0005 0.001905 0 0 0.001905
TARR ACQUISITION LLC 2429 N BORTHWICK AVE PORTLAND Oregon 97227 0.001825 0 0.001825 0 0 0 0.001825
BAKER PETROLITE-RAYNE FACILITY 135 INDUSTRIAL DR RAYNE Louisiana 70578 0.0005 0.001 0.0015 0 0 0.0015
VOLTAIX LLC 197 MEISTER AVE BRANCHBURG New Jersey 08876 0.0005 0.001 0.0015 0 0 0 0.0015
GIANT CEMENT CO HWY 453 & I-26 (654 JUDGE HARLEYVILLE South Carolina 29448 0.001 0.0005 0.0015 0 0 0 0.0015
BUCKMAN LABORATORIES INC 1256 N MCLEAN BLVD MEMPHIS Tennessee 38108 0 0.0015 0.0015 0 0 0.0015
KELLY-MOORE PAINT CO INC 1015 COMMERCIAL ST SAN CARLOS California 94070 0 0.0015 0.0015 0 0 0 0.0015
HYDRITE CHEMICAL CO 7300 W BRADLEY RD MILWAUKEE Wisconsin 53223 0.0005 0.001 0.0015 0 0 0.0015
NALCO CO - ODESSA PLANT 114 12205 W COUNTY RD 125 ODESSA Texas 79765 0 0 0 0 0 0.0015 0.0015
PPG ARCHITECTURAL COATINGS 6804 ENTERPRISE DR LOUISVILLE Kentucky 40214 0 0.0008 0.0008 0 0 0.0005 0.0013
FUJIFILM HUNT CHEMICALS USA INC 900 CARNEGIE ST ROLLING MEADOWSIllinois 60008 0.00105 0.0002 0.00125 0 0 0.00125
FIRST SOURCE WORLDWIDE LLC MILWAUKEE 11725 W FAIRVIEW AVE MILWAUKEE Wisconsin 53226 0.0011 0.00015 0.00125 0 0 0.00125
MANN DISTRIBUTION 3134 POST RD WARWICK Rhode Island 02886 0.00112 0 0.00112 0 0 0.00112
SHERWIN-WILLIAMS CO 14 INDUSTRIAL PARK FLORA Illinois 62839 0.0005 0.0005 0.001 0 0 0 0.001
MONSANTO CO 2500 WIGGINS RD MUSCATINE Iowa 52761 0 0.001 0.001 0 0 0 0.001
CLEAN HARBORS DEER PARK LLC 2027 INDEPENDENCE PKWYLA PORTE TEXAS 77571 0.001 0 0.001 0 0 0 0.001
BRENNTAG SOUTHEAST INC 11750 FRUEHAUF DR CHARLOTTE North Carolina 28273 0.0005 0.0005 0.001 0 0 0 0.001
BENJAMIN MOORE & CO - NEWARK 134 LISTER AVE NEWARK New Jersey 07105 0.001 0 0.001 0 0 0 0.001
LAFARGE NA (INCLUDING SYSTECH ENV CORP) 11435 COUNTY RD 176 PAULDING OHIO 45879 0 0.001 0.001 0 0 0 0.001
Page 39 of 40

Table B-2. 2010 Emissions Inventory: Non-Zero Certain Glycol Ether Reported Releases
Facility Name Address City State Zip Code
Onsite Point Source
Emissions (tpy)
Onsite Fugitive
Emissions (tpy)
Total Air Emissions
(tpy)
Total Releases to Surface
Water (tpy)a
Total Releases to Soil (tpy)b
Total Releases to Other Media
(tpy)c
Total Emissions (tpy)
OMNOVA SOLUTIONS INC 1455 J A COCHRAN BY-PASSCHESTER South Carolina 29706 0.00075 0.00002 0.00077 0 0 0.00077
NALCO CO 3901 TERRY ST TEXARKANA Texas 75501 0 0.0005 0.0005 0 0 0.0005
HARWICK STANDARD DISTRIBUTION CORP 60 S SEIBERLING ST AKRON Ohio 44305 0.0005 0 0.0005 0 0 0 0.0005
NALCO CO - EVANSVILLE PLANT 108 4900 E YELLOWSTONE HWYEVANSVILLE WYOMING 82636 0 0 0 0 0 0.0005 0.0005
SURPASS CHEMICAL CO INC 1254 BROADWAY ALBANY New York 12204 0.000485 0 0.000485 0 0 0.000485
NALCO CO 812 RENAUD DR SCOTT Louisiana 70583 0.000011 0.0003275 0.0003385 0 0 0 0.0003385
PARKER HANNIFIN TECH SEAL DIV 2600 WILCO BLVD WILSON North Carolina 27893 0 0.00029 0.00029 0 0 0 0.00029
LAMBERTI SYNTHESIS USA INC 4001 N HAWTHORNE ST CHATTANOOGA Tennessee 37406 0.0002205 0 0.0002205 0 0 0 0.0002205
CHEMETALL US INC 1610 CLARA ST JACKSON Michigan 49203 0.0000441 0.0001213 0.0001654 0 0 0 0.0001654
IFF AUGUSTA LTD 3005 INTERNATIONAL BLVD AUGUSTA Georgia 30906 0 0.000085 0.000085 0 0 0 0.000085
RIKER PRODUCTS INC 4901 STICKNEY AVE TOLEDO Ohio 43612 0.000082 0 0.000082 0 0 0 0.000082
BAKER PETROLITE KILGORE BLEND PLANT 806 PALUXY ST KILGORE Texas 75662 0.0000212 0.0000595 0.0000807 0 0 0 0.0000807
EMERALD SERVICES INC 1825 E ALEXANDER AVE TACOMA Washington 98421 0 0.000005 0.000005 0 0 0.00005 0.000055
NALCO CO 125 NALCO WAY/RT 65 ELLWOOD CITY Pennsylvania 16117 0.0000028 0.000009 0.0000118 0 0 0 0.0000118
AIR PRODUCTS PERFORMANCE MANUFACTURING INC 474 W 19TH ST RESERVE Louisiana 70084 0 0.000002 0.000002 0 0 0.000002
a. Releases to Surface Water reported as "On-Site Releases to Surface Water."b. Releases to Soil is the sum of reported releases to onsite and offsite releases to land treatment and other land disposal.c. Releases to other media include reported releases to onsite and offsite groundwater and landfills.tpy: tons per year
Page 40 of 40

Table B-3. 2011 Emissions Inventory: Non-Zero Certain Glycol Ether Reported Releases
Facility Name Address City State Zip Code
Onsite Point Source
Emissions (tpy)
Onsite Fugitive
Emissions (tpy)
Total Air Emissions
(tpy)
Total Releases to Surface
Water (tpy)a
Total Releases to Soil (tpy)b
Total Releases to Other Media
(tpy)c
Total Emissions
(tpy)
EQ DETROIT INC 1923 FREDERICK DETROIT MI 48211 0 1.778 1.778 0 358.8295 360.6075
BALL METAL BEVERAGE CONTAINER CORP 8935 POCAHONTAS TRAIL JWILLIAMSBURG VA 23185 28 145 173 0 0 0 173
BALL METAL BEVERAGE CONTAINER CORP 12340 TOWNSHIP RD 99 E FINDLAY OH 45840 25.5 135 160.5 0 0 160.5
BMW MANUFACTURING CO LLC 1400 HWY 101 S GREER SC 29651 2.4745 150.0455 152.52 0 0 152.52
REXAM BEVERAGE CAN CO RE: WINSTON SALEM PLANT
4000 OLD MILWAUKEE LN WINSTON-SALEM NC 27107 25.716 110.457 136.173 0 0 0.441 136.614
CROWN FOOD PACKAGING 2929 W BRIDGE ST OWATONNA MN 55060 31.8905 95.672 127.5625 0 0 127.5625
REXAM BEVERAGE CAN CO RE: FREMONT PLANT 2145 CEDAR FREMONT OH 43420 19.034 107.921 126.955 0 0 0 126.955
BALL METAL BEVERAGE CONTAINER CORP 1900 BARNES ST REIDSVILLE NC 27320 17 85 102 0 0 0 102
FLINT HILLS RESOURCES CORPUS CHRISTI LLC - WEST PLANT
2825 SUNTIDE RD CORPUS CHRISTI TX 78409 0.1435 0 0.1435 0 0 97.9 98.0435
CROWN CORK & SEAL CO (USA) INC CROWN CLOSURE DIV
3011 BIRCH DR WEIRTON WV 26062 34.526 57.7185 92.2445 0 0 0 92.2445
REXAM BEVERAGE CAN CO RE: BISHOPVILLE SC FACILITY
609 COUSAR ST BISHOPVILLE SC 29010 13.386 75.874 89.26 0 0 0.2515 89.5115
REXAM BEVERAGE CAN CO RE: KENT WA FACILITY 1220 N SECOND AVE KENT WA 98032 12.442 70.504 82.946 0 0 0 82.946
REXAM BEVERAGE CAN CO RE: OLIVE BRANCH FACILITY
10800 MARINA DR OLIVE BRANCH MS 38654 18.811 63.4835 82.2945 0 0 0.1425 82.437
BALL CONTAINER LLC - COLUMBUS CAN PLANT 350 MCCORMICK BLVD COLUMBUS OH 43213 12 70 82 0 0 0 82
REXAM BEVERAGE CAN CO RE: EVA STREET ST PAUL MN
139 EVA ST SAINT PAUL MN 55107 11.8215 66.994 78.8155 0 0 0 78.8155
REXAM BEVERAGE CAN CO RE: WHITEHOUSE PLANT 10444 WATERVILLE WHITEHOUSE OH 43571 24.8555 51.4725 76.328 0 0 0.301 76.629
CROWN BEVERAGE PACKAGING GLEN & SHEPARD ST LAWRENCE MA 01843 17.5445 52.633 70.1775 0 0 0 70.1775
FORD MOTOR CO DEARBORN TRUCK PLANT 3001 MILLER RD DEARBORN MI 48121 1.15 65 66.15 0 0 66.15
PPG INDUSTRIES INC-OAK CREEK 10800 S 13TH ST OAK CREEK WI 53154 35.178 0.402 35.58 0 0 30.2865 65.8665
SILGAN CONTAINERS MANUFACTURING CORP 300 N FAIL RD LA PORTE IN 46350 12.191 53.2315 65.4225 0 0 65.4225
CROWN BEVERAGE PACKAGING 1035 E N ST BRADLEY IL 60915 16.211 48.633 64.844 0 0 0 64.844
CROWN BEVERAGE PACKAGING 1202 FONES RD OLYMPIA WA 98501 15.9915 47.975 63.9665 0 0 0 63.9665
FORD MOTOR COMPANY--KANSAS CITY ASSEMBLY PLANT
8121 E U.S. HWY 69 CLAYCOMO MO 64119 1.55 55 56.55 0 0.0185 56.5685
CHRYSLER JEFFERSON NORTH ASSEMBLY PLANT 2101 CONNOR AVE DETROIT MI 48215 6 50 56 0 0.0225 56.0225
METAL CONTAINER CORPORTION - WINDSOR CAN PLANT
1201 METAL CONTAINER CTWINDSOR CO 80550 14.5265 39.731 54.2575 0 0 54.2575
CROWN BEVERAGE PACKAGING 620 N 4TH ST WORLAND WY 82401 13.335 40.0055 53.3405 0 0 0 53.3405
REXAM BEVERAGE CAN CO RE: LONGVIEW FACILITY 1001 FISHER RD LONGVIEW TX 75604 4.823 47.662 52.485 0 0 0 52.485
Page 1 of 38

Table B-3. 2011 Emissions Inventory: Non-Zero Certain Glycol Ether Reported Releases
Facility Name Address City State Zip Code
Onsite Point Source
Emissions (tpy)
Onsite Fugitive
Emissions (tpy)
Total Air Emissions
(tpy)
Total Releases to Surface
Water (tpy)a
Total Releases to Soil (tpy)b
Total Releases to Other Media
(tpy)c
Total Emissions
(tpy)
WHIRLPOOL CORP MARION DIV 1300 MARION-AGOSTA RD MARION OH 43302 0.05 51.411 51.461 0 0 51.461
RR DONNELLEY 2347 KRATZER RD HARRISONBURG VA 22802 45.2035 3.061 48.2645 0 0 48.2645
HUNTSMAN PETROCHEMICAL LLC PORT NECHES FACILITY
6001 HWY 366 PORT NECHES TX 77651 0.11 0 0.11 0 0 46.92 47.03
BALL CONTAINER LLC ROME CAN PLANT 110 BALL DR ROME GA 30161 31 13.5 44.5 0 0 0 44.5
FORD MOTOR CO KENTUCKY TRUCK PLANT 3001 CHAMBERLAIN LN LOUISVILLE KY 40241 3.25 41 44.25 0 0.13 44.38
METAL CONTAINER CORP - ARNOLD CAN PLANT 42 TENBROOK INDUSTRIALARNOLD MO 63010 16.3535 25.671 42.0245 0 0 42.0245
REXAM BEVERAGE CAN CO RE: PHOENIX FACILITY 211 N 51AVE PHOENIX AZ 85043 5.7315 36.1725 41.904 0 0 0 41.904
USS - CLAIRTON PLANT 400 STATE ST CLAIRTON PA 15025 41 0 41 0 0 0 41
METAL CONTAINER CORP - NEWBURGH CAN PLANT 130 BREUNIG RD NEW WINDSOR NY 12553 11.0015 29.428 40.4295 0 0 40.4295
HONDA OF AMERICA MANUFACTURING INC 24000 HONDA PKWY MARYSVILLE OH 43040 2.7 37.5 40.2 0 0.213 40.413
HONDA OF AMERICA MANUFACTURING INC 11000 STATE RT 347 EAST LIBERTY OH 43319 2.3 36 38.3 0 0.1495 38.4495
GREIF PACKAGING LLC 7425 INDUSTRIAL RD FLORENCE KY 41042 3.4725 31.252 34.7245 0 2.166 36.8905
CHICAGO HEIGHTS STEEL 211 E MAIN ST CHICAGO HEIGHTS IL 60411 7.172 28.6875 35.8595 0 0 0 35.8595
S D WARREN CO 89 CUMBERLAND ST WESTBROOK ME 04098 0.00391 35.2055 35.20941 0.125 0 0 35.33441
BALL METAL BEVERAGE CONTAINER CORP 8500 W TOWER AVE MILWAUKEE WI 53224 27.5 7.5 35 0 0 35
ROCKY MOUNTAIN METAL CONTAINER 17755 W 32ND AVE GOLDEN CO 80401 26.5 7 33.5 0 0 1.4 34.9
CROWN FOOD PACKAGING 8801 CITATION RD BALTIMORE MD 21221 8.637 25.911 34.548 0 0 34.548
BATESVILLE MANUFACTURING INC 175 MONOGARD DR MANCHESTER TN 37355 1.709 32.4675 34.1765 0 0.0045 34.181
EDSAL MANUFACTURING CO INC 4400 S PACKER CHICAGO IL 60609 0 33.9425 33.9425 0 0 33.9425
REXAM BEVERAGE CAN CO RE : CHICAGO PLANT 1101 W 43RD ST CHICAGO IL 60609 6.522 26.6495 33.1715 0 0 0.0805 33.252
BALL METAL BEVERAGE CONTAINER CORP 501 N SIXTH ST MONTICELLO IN 47960 14.5 18.5 33 0 0 0 33
INGERSOLL-RAND CO STEELCRAFT DIV 9017 BLUE ASH RD CINCINNATI OH 45242 7.5 25 32.5 0 0 0 32.5
CROWN BEVERAGE PACKAGING 2501 N FRAZIER ST CONROE TX 77303 27.5695 4.4945 32.064 0 0 0 32.064
BALL METAL BEVERAGE CONTAINER CORP 4525 INDIANA ST GOLDEN CO 80403 20 11.5 31.5 0 0 0 31.5
CROWN BEVERAGE PACKAGING 12910 JESS PIRTLE BLVD SUGAR LAND TX 77478 27.381 4.107 31.488 0 0 0 31.488
METAL CONTAINER CORP - MIRA LOMA CAN PLANT 10980 INLAND AVE MIRA LOMA CA 91752 27.5195 3.656 31.1755 0 0 31.1755
NISSAN NA INC SMYRNA MANUFACTURING PLANT 983 NISSAN DR SMYRNA TN 37167 0.02302895 30.7183514 30.74138035 0 0 0 30.74138035
SUBARU OF INDIANA AUTOMOTIVE INC 5500 STATE RD 38E LAFAYETTE IN 47905 0.295 29.34 29.635 0 0 29.635
REXAM BEVERAGE CAN CO RE: CHATSWORTH FACILITY
20730 PRAIRIE ST CHATSWORTH CA 91311 6.4125 22.592 29.0045 0 0 0 29.0045
MERCEDES-BENZ US INTERNATIONAL INC 1 MERCEDES DR VANCE AL 35490 0.501 27.801 28.302 0 0 0 28.302
Page 2 of 38

Table B-3. 2011 Emissions Inventory: Non-Zero Certain Glycol Ether Reported Releases
Facility Name Address City State Zip Code
Onsite Point Source
Emissions (tpy)
Onsite Fugitive
Emissions (tpy)
Total Air Emissions
(tpy)
Total Releases to Surface
Water (tpy)a
Total Releases to Soil (tpy)b
Total Releases to Other Media
(tpy)c
Total Emissions
(tpy)
NEW YORK WIRE 500 E MIDDLE ST HANOVER PA 17331 0 28.0405 28.0405 0 0 0 28.0405
ARKEMA COATING RESINS 340 RAILROAD ST SAUKVILLE WI 53080 0.6965 0.204 0.9005 0 0 27.0115 27.912
AMES TRUE TEMPER INC 1500 S CAMERON ST HARRISBURG PA 17104 1.381 26.2385 27.6195 0 0 0 27.6195
SENECA FOODS CORP 801 SAUK AVE BARABOO WI 53913 0 25.711 25.711 0 0 0.823 26.534
GM LLC POWERTRAIN FLINT ENGINE OPERATIONS 2100 BRISTOL RD FLINT MI 48552 0.6855 25.5 26.1855 0 0 0.255 26.4405
CROWN BEVERAGE PACKAGING 1501 ST JAMES ST LA CROSSE WI 54603 23.9785 1.7985 25.777 0 0 0 25.777
METAL CONTAINER CORP - JACKSONVILLE CAN PLANT
1100 N ELLIS RD JACKSONVILLE FL 32254 6.4585 19.1565 25.615 0 0 25.615
HONDA MANUFACTURING OF ALABAMA LLC 1800 HONDA DR LINCOLN AL 35096 0.4995 24.7705 25.27 0 0 25.27
GENERAL MOTORS LANSING DELTA TOWNSHIP 8175 MILLETT HWY LANSING MI 48917 0.55 24 24.55 0 0 24.55
THERMA-TRU CORP 601 RE JONES RD BUTLER IN 46721 0 24.3635 24.3635 0 0 0 24.3635
S B FOOT TANNING CO 805 BENCH ST RED WING MN 55066 0 24.362 24.362 0 0 24.362
CROWN BEVERAGE PACKAGING 380 CALLE FABRIL ST KM 1 CAROLINA PR 00985 6.0485 18.1455 24.194 0 0 0 24.194
MEMC PASADENA INC 3000 N S ST PASADENA TX 77503 15.043 8.7685 23.8115 0 0 0.19505 24.00655
ALSTOM POWER INC CHATTANOOGA BOILERS 1119 RIVERFRONT PKWY CHATTANOOGA TN 37402 23.9355 0 23.9355 0 0 0 23.9355
CROWN BEVERAGE PACKAGING 100 EVANS ROW CHERAW SC 29520 21.161 2.715 23.876 0 0 0 23.876
BWAY CORP 3200 S KILBOURN AVE CHICAGO IL 60623 7.24545 15.749 22.99445 0 0 22.99445
CROWN BEVERAGE PACKAGING 195 CROWN RD BATESVILLE MS 38606 19.269 2.8905 22.1595 0 0 0 22.1595
MAVERICK TUBE LLC DBA TENARISCONROE 699 F.M. 3083 CONROE TX 77301 0.95633545 5.98814565 6.9444811 0 0 14.96 21.9044811
CROWN BEVERAGE PACKAGING 400 N WALNUT ST CRAWFORDSVILLE IN 47933 15.725 5.872 21.597 0 0 0 21.597
WHIRLPOOL CORP FINDLAY DIV 4901 N MAIN ST FINDLAY OH 45840 2.1509 19.3581 21.509 0 0 21.509
BALL METAL BEVERAGE CONTAINER CORP 2400 HUNTINGTON DR FAIRFIELD CA 94533 9 12.5 21.5 0 0 0 21.5
SAF-HOLLAND USA INC 101 S ELM WARRENTON MO 63383 18.5495 2.93 21.4795 0 0 0 21.4795
JOHN DEERE DES MOINES WORKS 825 SW IRVINEDALE DR ANKENY IA 50023 0 21.1695 21.1695 0 0 21.1695
ALCOA INC - WARRICK OPERATIONS HWYS 66 & 61 NEWBURGH IN 47629 0 8.5 8.5 0.185 0 12.2 20.885
BOEING COMMERCIAL AIRPLANES - EVERETT 3003 W CASINO RD EVERETT WA 98204 3.45 17 20.45 0 0.0095 20.4595
AIR SYSTEM COMPONENTS LP 900 DARR PARK DR PONCA CITY OK 74601 0.2025 19.677 19.8795 0 0 19.8795
AGY AIKEN LLC 2556 WAGENER RD AIKEN SC 29801 12.247 2.269 14.516 0 5.2685 19.7845
PELLA CORP 102 MAIN ST PELLA IA 50219 0.125 19.3945 19.5195 0 0 0 19.5195
ITW SEXTON INC 3101 SEXTON RD DECATUR AL 35603 0.96278 18.29282 19.2556 0 0 0 19.2556
BALL METAL BEVERAGE CONTAINER CORP 11 ADAMS RD SARATOGA SPRINGNY 12866 3.25 16 19.25 0 0 0 19.25
Page 3 of 38

Table B-3. 2011 Emissions Inventory: Non-Zero Certain Glycol Ether Reported Releases
Facility Name Address City State Zip Code
Onsite Point Source
Emissions (tpy)
Onsite Fugitive
Emissions (tpy)
Total Air Emissions
(tpy)
Total Releases to Surface
Water (tpy)a
Total Releases to Soil (tpy)b
Total Releases to Other Media
(tpy)c
Total Emissions
(tpy)
MOBIL CHEMICAL CO 41501 WOLVERINE RD SHAWNEE OK 74804 0.375 18.7 19.075 0 0.0025 19.0775
GREIF PACKAGING LLC 4300 W 130TH ST ALSIP IL 60803 4.1295 14.601 18.7305 0 0 0 18.7305
MID-AMERICA STEEL DRUM CO IN C 8570 S CHICAGO RD OAK CREEK WI 53154 0 18.578 18.578 0 0 18.578
NASHVILLE WIRE PRODUCTS 1604 COUNTY HOSPITAL RDNASHVILLE TN 37218 16.5 1.85 18.35 0 0 18.35
TOYOTA MOTOR MANUFACTURING INDIANA INC 4000 TULIP TREE DR PRINCETON IN 47670 12.595 5.374 17.969 0 0 0 17.969
UNION CARBIDE CORP SEADRIFT PLANT 7501 N HWY 185 SEADRIFT TX 77983 14.188 3.478 17.666 0.0875 0 0.097 17.8505
BALL METAL BEVERAGE CONTAINER CORP 95 BALLARD RD MIDDLETOWN NY 10940 8 9.5 17.5 0 0 0 17.5
CARRY-ON TRAILER CORP 101 JOE HARVEY ST LAVONIA GA 30553 0 17.346 17.346 0 0 0 17.346
NORTH COAST CONTAINER CORP 8806 CRANE AVE CLEVELAND OH 44105 0 17.316 17.316 0 0 0 17.316
BALL METAL BEVERAGE CONTAINER CORP 1001 N FM 3083 E CONROE TX 77303 13 4.15 17.15 0 0 0 17.15
BALL METAL BEVERAGE CONTAINER CORP 4700 WHITEWAY DR TAMPA FL 33617 8 9 17 0 0 0 17
PENN COLOR INC 2755 BERGEY RD HATFIELD PA 19440 2.951 0.065805 3.016805 0 0 13.952 16.968805
MAVERICK TUBE LLC 4950 N COUNTY RD 967 BLYTHEVILLE AR 72315 11.16161105 0 11.16161105 0 0 5.775 16.93661105
AIR SYSTEM COMPONENTS LP 3301 N MAIN ST TARBORO NC 27886 0.172 16.3515 16.5235 0 0.324 16.8475
CECO DOOR PRODUCTS 9159 TELECOM DR MILAN TN 38358 8.377 8.377 16.754 0 0 0 16.754
CNH AMERICA LLC 600 E PEORIA ST GOODFIELD IL 61742 1.6725 15.0505 16.723 0 0 16.723
BALL METAL BEVERAGE CONTAINER CORP 500 CRENSHAW BLVD TORRANCE CA 90503 16 0.65 16.65 0 0 0 16.65
KUKA TOLEDO PRODUCTION OPERATIONS 3770 STICKNEY AVE TOLEDO OH 43612 2.0510995 14.5 16.5510995 0 0 0.034 16.5850995
DEXTER CHASSIS GROUP PLANT 55 501 S MILLER DR WHITE PIGEON MI 49099 0 16.1035 16.1035 0 0 0.08 16.1835
THE KNAPHEIDE MANUFACTURING CO 1848 WESTPHALIA STRASSQUINCY IL 62305 0.141 15.94 16.081 0 0 16.081
THOMAS BUILT BUSES INC 715 W FAIRFIELD RD HIGH POINT NC 27263 0 15.9935 15.9935 0 0 0 15.9935
MPM SILICONES LLC 3500 S STATE RT 2 FRIENDLY WV 26146 2.1935 0.0035 2.197 10.845 0 2.922 15.964
NOVOLYTE PERFORMANCE MATERIALS 111 W IRENE RD ZACHARY LA 70791 4.75 0.605 5.355 10.6 0 0 15.955
AVX CORP MYRTLE BEACH 801 17TH AVE S MYRTLE BEACH SC 29577 1.6645 1.028 2.6925 0 0 12.8455 15.538
SILGAN WHITE CAP CORP 2201 W MARYLAND ST EVANSVILLE IN 47710 11.6705 3.742 15.4125 0 0 0 15.4125
EASTMAN CHEMICAL CO TEXAS OPERATIONS 300 KODAK BLVD LONGVIEW TX 75602 12.262 3.0575 15.3195 0 0 0 15.3195
OLDCASTLE BUILDING ENVELOPE - TEXAS FACILITY 803 AIRPORT RD TERRELL TX 75160 0 15.309 15.309 0 0 0 15.309
GM TRUCK GROUP FORT WAYNE ASSEMBLY 12200 LAFAYETTE CENTERROANOKE IN 46783 0.7 14.5 15.2 0 0 15.2
NOVELIS CORP 390 GRISWOLD ST NE WARREN OH 44483 4.568 10.398 14.966 0 0 0 14.966
HITACHI AUTOMOTIVE SYSTEMS AMERICAS INC-BEREA KY
301 MAYDE RD BEREA KY 40403 0.0675 14.7307 14.7982 0 0 0 14.7982
Page 4 of 38

Table B-3. 2011 Emissions Inventory: Non-Zero Certain Glycol Ether Reported Releases
Facility Name Address City State Zip Code
Onsite Point Source
Emissions (tpy)
Onsite Fugitive
Emissions (tpy)
Total Air Emissions
(tpy)
Total Releases to Surface
Water (tpy)a
Total Releases to Soil (tpy)b
Total Releases to Other Media
(tpy)c
Total Emissions
(tpy)
BEDFORD MATERIALS CO INC 7676 ALLEGHENY RD MANNS CHOICE PA 15550 1.4135 12.7915 14.205 0 0 0 14.205
ANDERSON TULLY LUMBER CO WALTERSVILLE LUMBER MILL
1725 N WASHINGTON ST VICKSBURG MS 39181 14.1275 0 14.1275 0 0 14.1275
SILGAN CONTAINERS MANUFACTURIN G CORP 3591 MAPLE DR FORT DODGE IA 50501 0.002535 13.684 13.686535 0 0 13.686535
M&B HANGERS 1313 PKWY DR SE LEEDS AL 35094 2.6945 10.7775 13.472 0 0 13.472
ARTIFLEX MANUFACTURING LLC GERSTCO DIV WOOSTER
1425 E BOWMAN ST WOOSTER OH 44691 0.401 12.9615 13.3625 0 0.0075 13.37
BALL METAL FOOD CONTAINER CORP 3010 BIRCH DR WEIRTON WV 26062 9.95 3.3 13.25 0 0 0 13.25
GRAPHIC PACKAGING INTERNATIONAL INC 10300 ROBERTS BLVD FORT SMITH AR 72916 0 13.2445 13.2445 0 0 13.2445
DECORATIVE PANELS INTERNATIONA L 2900 HILL AVE TOLEDO OH 43607 13.1175 0.023 13.1405 0 0 13.1405
VESTAL MANUFACTURING ENTERPRISES INC 177 INDUSTRIAL PARK RD SWEETWATER TN 37874 13.094 0 13.094 0 0 13.094
SIGNCRAFT SCREEN PRINT 100 A.J. HARLE DR GALENA IL 61036 12.185 0 12.185 0 0 0.841 13.026
HALLSTAR CO ESTER SOLUTIONS FACILITY 5851 W 73RD ST BEDFORD PARK IL 60638 1.1705 0.1565 1.327 0 11.6165 12.9435
SUPERIOR INDUSTRIES INTERNATIONAL ARKANSAS LLC
1301 N DIXIELAND RD ROGERS AR 72756 0.0025 12.8805 12.883 0.0025 1.77636E-15 12.8855
QUAD/GRAPHICS INC N61 W23044 HARRY'S WAY SUSSEX WI 53089 11.55 1.3 12.85 0 0 12.85
RUSKIN CO HWY 27 N GENEVA AL 36340 0.0565 12.7365 12.793 0 0 0 12.793
BEMIS MANUFACTURING CO PLANT B 300 MILL ST SHEBOYGAN FALLSWI 53085 0 12.7415 12.7415 0 0 12.7415
SILGAN CAN CO 12-773 ST RT 110 NAPOLEON OH 43545 5.3645 7.366 12.7305 0 0 0 12.7305
CROWN FOOD PACKAGING 5201 ENTERPRISE BLVD TOLEDO OH 43612 3.1835 9.541 12.7245 0 0 0 12.7245
BERENFIELD CONTAINERS INC MASON 1229 CASTLE DR MASON OH 45040 0.125 12.564 12.689 0 0 0 12.689
CLEAN HARBORS LONE MOUNTAIN LLC LONE MOUNTAIN FACILITY
5 MILES E & 1 MILE N OF JUWAYNOKA OK 73860 0.00125 0.0004 0.00165 0 12.5485 12.55015
3M CO - GUIN 6675 US HWY 43 GUIN AL 35563 0.001 12.5 12.501 0 0 0 12.501
BALL METAL BEVERAGE CONTAINER CORP 6600 WILL ROGERS BLVD FORT WORTH TX 76140 5.5 7 12.5 0 0 0 12.5
NUCOR VULCRAFT GROUP SAINT JOE DIV 6610 COUNTY RD 60 SAINT JOE IN 46785 2.877 5.354 8.231 0 4.2115 12.4425
AKZO NOBEL COATINGS INC 1629 VANDERBILT RD BIRMINGHAM AL 35234 12.1875 0.175 12.3625 0 0 0 12.3625
HOWARD FINISHING LLC 32565 DEQUINDRE MADISON HEIGHTS MI 48071 0.0025 12.358 12.3605 0 0 0 12.3605
MEYER STEEL DRUM INC 2000 S KILBOURN AVE CHICAGO IL 60623 1.3505 10.927 12.2775 0 0 12.2775
NUCOR CORP VULCRAFT DIV 1501 W DARLINGTON ST FLORENCE SC 29501 10.9885 1.255 12.2435 0 0 0 12.2435
NUCOR VULCRAFT GROUP - GRAPELAND DIV 175 COUNTY RD 2345 GRAPELAND TX 75844 4.282 7.922 12.204 0 0 0 12.204
PLY GEM 2615 CAMPBELL RD SIDNEY OH 45365 0.705 11.45 12.155 0 0 12.155
BALL CONTAINER LLC 105 E BLACKHAWK DR FORT ATKINSON WI 53538 3.45 8.5 11.95 0 0 0 11.95
Page 5 of 38

Table B-3. 2011 Emissions Inventory: Non-Zero Certain Glycol Ether Reported Releases
Facility Name Address City State Zip Code
Onsite Point Source
Emissions (tpy)
Onsite Fugitive
Emissions (tpy)
Total Air Emissions
(tpy)
Total Releases to Surface
Water (tpy)a
Total Releases to Soil (tpy)b
Total Releases to Other Media
(tpy)c
Total Emissions
(tpy)
AMERICAN TRIM LLC 1501 W MICHIGAN ST SIDNEY OH 45365 0 11.892 11.892 0 0 0 11.892
QUAD/GRAPHICS INC 1900 W SUMNER ST HARTFORD WI 53027 11.5 0.35 11.85 0 0 11.85
SHAMROCK TECHNOLOGIES INC FOOT OF PACIFIC ST NEWARK NJ 07114 0 0 0 0 11.718 11.718
WHITING DOOR MANUFACTURING CORP 113 CEDAR ST AKRON NY 14001 0 11.6965 11.6965 0 0 0 11.6965
CNH AMERICA LLC 1930 DES MOINES AVE BURLINGTON IA 52601 0.18 11 11.18 0 0 11.18
CHRYSLER BELVIDERE ASSEMBLY PLANT 3000 W CHRYSLER DR BELVIDERE IL 61008 1.15 10 11.15 0 0.0095 11.1595
TOPPAN INTERAMERICA INC 1131 HWY 155 S MC DONOUGH GA 30253 0 11.15 11.15 0 0 0 11.15
VULCRAFT OF NEW YORK INC 5362 RAILROAD ST CHEMUNG NY 14825 4.005 6.4505 10.4555 0 0 0.61 11.0655
SILGAN CONTAINERS MANUFACTURING CORP 400 N 15TH ST ROCHELLE IL 61068 7.265 3.78 11.045 0 0 0 11.045
SUPERIOR INDUSTRIES INTERNATIONAL ARKANSAS LLC
1901 E BORICK DR FAYETTEVILLE AR 72701 0 10.9685 10.9685 0 0.0625 11.031
VOLKSWAGEN GROUP OF AMERICA CHATTANOOGA OPERATIONS LLC
8001 VOLKSWAGEN DR CHATTANOOGA TN 37416 0 11.0214265 11.0214265 0 0 0 11.0214265
BALL METAL BEVERAGE CONTAINER CORP 91-320 KOMOHANA ST KAPOLEI HI 96707 1.95 9 10.95 0 0 0 10.95
TRADEBE TREATMENT & RECYCLING LLC 4343 KENNEDY AVE EAST CHICAGO IN 46312 0.4655 0 0.4655 0 0.02 10.45 10.9355
PRECOAT METALS 1095 MENDELL DAVIS DR JACKSON MS 39272 9.879 1.0255 10.9045 0 0 0 10.9045
CHICAGO STEEL CONTAINER CORP 1846 S KILBOURN AVE CHICAGO IL 60623 0.898 9.9355 10.8335 0 0 0.0535 10.887
TRILLA ST LOUIS CORP 2391 CASSENS DR FENTON MO 63026 1.3775 8.2505 9.628 0 0 1.2326 10.8606
METAL INDUSTRIES INC - BUSHNELL 400 W WALKER AVE BUSHNELL FL 33513 0.0765 10.621 10.6975 0 0 0 10.6975
STANLEY WORKS HAND TOOLS DIV 600 MYRTLE ST NEW BRITAIN CT 06052 1.055 9.4965 10.5515 0 0 10.5515
TYSON FRESH MEATS INC 5000 N FM 1912 AMARILLO TX 79108 0.02 0 0.02 0 0.72 9.74 10.48
PROFESSIONAL DISPOSABLES INTERNATIONAL INC TWO NICE-PAK PARK ORANGEBURG NY 10962 0.097675 0.03133 0.129005 0 10.329 10.458005
ALLIANCE INDUSTRIES WAUPACA N 2467 VAUGHAN RD WAUPACA WI 54981 1.0415 9.3735 10.415 0 0 0 10.415
TRELLEBORG OFFSHORE US RANKIN ROAD FACILITY 1902 RANKIN RD HOUSTON TX 77073 0.5125 0 0.5125 0 0 9.7895 10.302
NUCOR CORP - VULCRAFT/NUCOR COLD FINISH DIV 1601 W OMAHA AVE NORFOLK NE 68701 0.25 10 10.25 0 0 10.25
THE DIAL CORP A SUBSIDIARY OF HENKEL CONSUMER GOODS
6901 MCKISSOCK AVE SAINT LOUIS MO 63147 0.081 0.081 0.162 0 10.0435 10.2055
KAWNEER CO INC 600 KAWNEER DR SPRINGDALE AR 72764 4.094 5.9025 9.9965 0 0 0 9.9965
TOYOTA MOTOR MANUFACTURING TEX AS INC 1 LONE STAR PASS SAN ANTONIO TX 78264 6.8057207 3.13111505 9.93683575 0 0 0 9.93683575
SILGAN CAN CO 2120 NC HWY N UNIT A MAXTON NC 28364 3.112 6.6775 9.7895 0 0 0 9.7895
KITZINGER COOPERAGE CORP 2529 E NORWICH AVE SAINT FRANCIS WI 53235 0 9.7653 9.7653 0 0 9.7653
NISSAN NORTH AMERICA INC CANTON MS 300 NISSAN DR CANTON MS 39046 7.6025 2.0095 9.612 0 0 0 9.612
Page 6 of 38
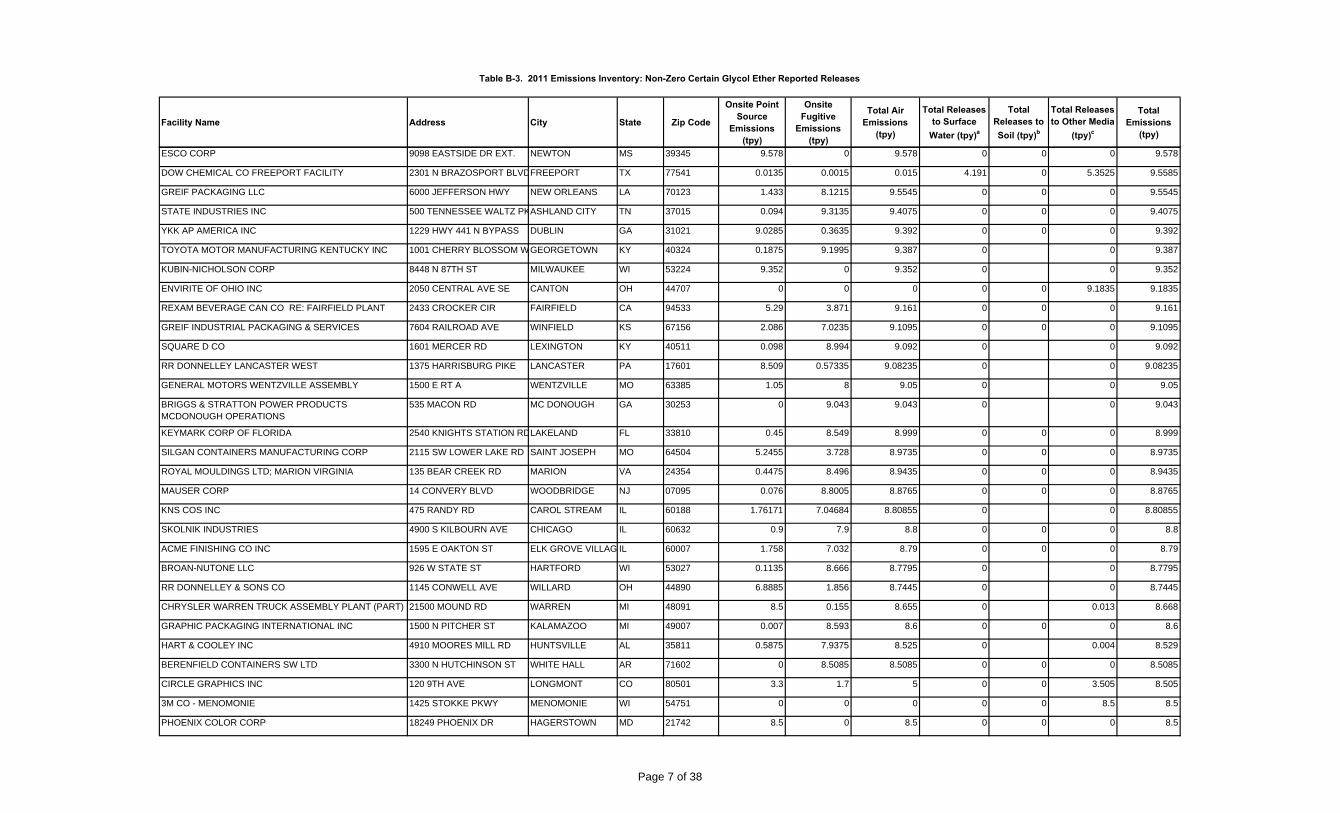
Table B-3. 2011 Emissions Inventory: Non-Zero Certain Glycol Ether Reported Releases
Facility Name Address City State Zip Code
Onsite Point Source
Emissions (tpy)
Onsite Fugitive
Emissions (tpy)
Total Air Emissions
(tpy)
Total Releases to Surface
Water (tpy)a
Total Releases to Soil (tpy)b
Total Releases to Other Media
(tpy)c
Total Emissions
(tpy)
ESCO CORP 9098 EASTSIDE DR EXT. NEWTON MS 39345 9.578 0 9.578 0 0 0 9.578
DOW CHEMICAL CO FREEPORT FACILITY 2301 N BRAZOSPORT BLVDFREEPORT TX 77541 0.0135 0.0015 0.015 4.191 0 5.3525 9.5585
GREIF PACKAGING LLC 6000 JEFFERSON HWY NEW ORLEANS LA 70123 1.433 8.1215 9.5545 0 0 0 9.5545
STATE INDUSTRIES INC 500 TENNESSEE WALTZ PKASHLAND CITY TN 37015 0.094 9.3135 9.4075 0 0 0 9.4075
YKK AP AMERICA INC 1229 HWY 441 N BYPASS DUBLIN GA 31021 9.0285 0.3635 9.392 0 0 0 9.392
TOYOTA MOTOR MANUFACTURING KENTUCKY INC 1001 CHERRY BLOSSOM WGEORGETOWN KY 40324 0.1875 9.1995 9.387 0 0 9.387
KUBIN-NICHOLSON CORP 8448 N 87TH ST MILWAUKEE WI 53224 9.352 0 9.352 0 0 9.352
ENVIRITE OF OHIO INC 2050 CENTRAL AVE SE CANTON OH 44707 0 0 0 0 0 9.1835 9.1835
REXAM BEVERAGE CAN CO RE: FAIRFIELD PLANT 2433 CROCKER CIR FAIRFIELD CA 94533 5.29 3.871 9.161 0 0 0 9.161
GREIF INDUSTRIAL PACKAGING & SERVICES 7604 RAILROAD AVE WINFIELD KS 67156 2.086 7.0235 9.1095 0 0 0 9.1095
SQUARE D CO 1601 MERCER RD LEXINGTON KY 40511 0.098 8.994 9.092 0 0 9.092
RR DONNELLEY LANCASTER WEST 1375 HARRISBURG PIKE LANCASTER PA 17601 8.509 0.57335 9.08235 0 0 9.08235
GENERAL MOTORS WENTZVILLE ASSEMBLY 1500 E RT A WENTZVILLE MO 63385 1.05 8 9.05 0 0 9.05
BRIGGS & STRATTON POWER PRODUCTS MCDONOUGH OPERATIONS
535 MACON RD MC DONOUGH GA 30253 0 9.043 9.043 0 0 9.043
KEYMARK CORP OF FLORIDA 2540 KNIGHTS STATION RDLAKELAND FL 33810 0.45 8.549 8.999 0 0 0 8.999
SILGAN CONTAINERS MANUFACTURING CORP 2115 SW LOWER LAKE RD SAINT JOSEPH MO 64504 5.2455 3.728 8.9735 0 0 0 8.9735
ROYAL MOULDINGS LTD; MARION VIRGINIA 135 BEAR CREEK RD MARION VA 24354 0.4475 8.496 8.9435 0 0 0 8.9435
MAUSER CORP 14 CONVERY BLVD WOODBRIDGE NJ 07095 0.076 8.8005 8.8765 0 0 0 8.8765
KNS COS INC 475 RANDY RD CAROL STREAM IL 60188 1.76171 7.04684 8.80855 0 0 8.80855
SKOLNIK INDUSTRIES 4900 S KILBOURN AVE CHICAGO IL 60632 0.9 7.9 8.8 0 0 0 8.8
ACME FINISHING CO INC 1595 E OAKTON ST ELK GROVE VILLAG IL 60007 1.758 7.032 8.79 0 0 0 8.79
BROAN-NUTONE LLC 926 W STATE ST HARTFORD WI 53027 0.1135 8.666 8.7795 0 0 8.7795
RR DONNELLEY & SONS CO 1145 CONWELL AVE WILLARD OH 44890 6.8885 1.856 8.7445 0 0 8.7445
CHRYSLER WARREN TRUCK ASSEMBLY PLANT (PART) 21500 MOUND RD WARREN MI 48091 8.5 0.155 8.655 0 0.013 8.668
GRAPHIC PACKAGING INTERNATIONAL INC 1500 N PITCHER ST KALAMAZOO MI 49007 0.007 8.593 8.6 0 0 0 8.6
HART & COOLEY INC 4910 MOORES MILL RD HUNTSVILLE AL 35811 0.5875 7.9375 8.525 0 0.004 8.529
BERENFIELD CONTAINERS SW LTD 3300 N HUTCHINSON ST WHITE HALL AR 71602 0 8.5085 8.5085 0 0 0 8.5085
CIRCLE GRAPHICS INC 120 9TH AVE LONGMONT CO 80501 3.3 1.7 5 0 0 3.505 8.505
3M CO - MENOMONIE 1425 STOKKE PKWY MENOMONIE WI 54751 0 0 0 0 0 8.5 8.5
PHOENIX COLOR CORP 18249 PHOENIX DR HAGERSTOWN MD 21742 8.5 0 8.5 0 0 0 8.5
Page 7 of 38
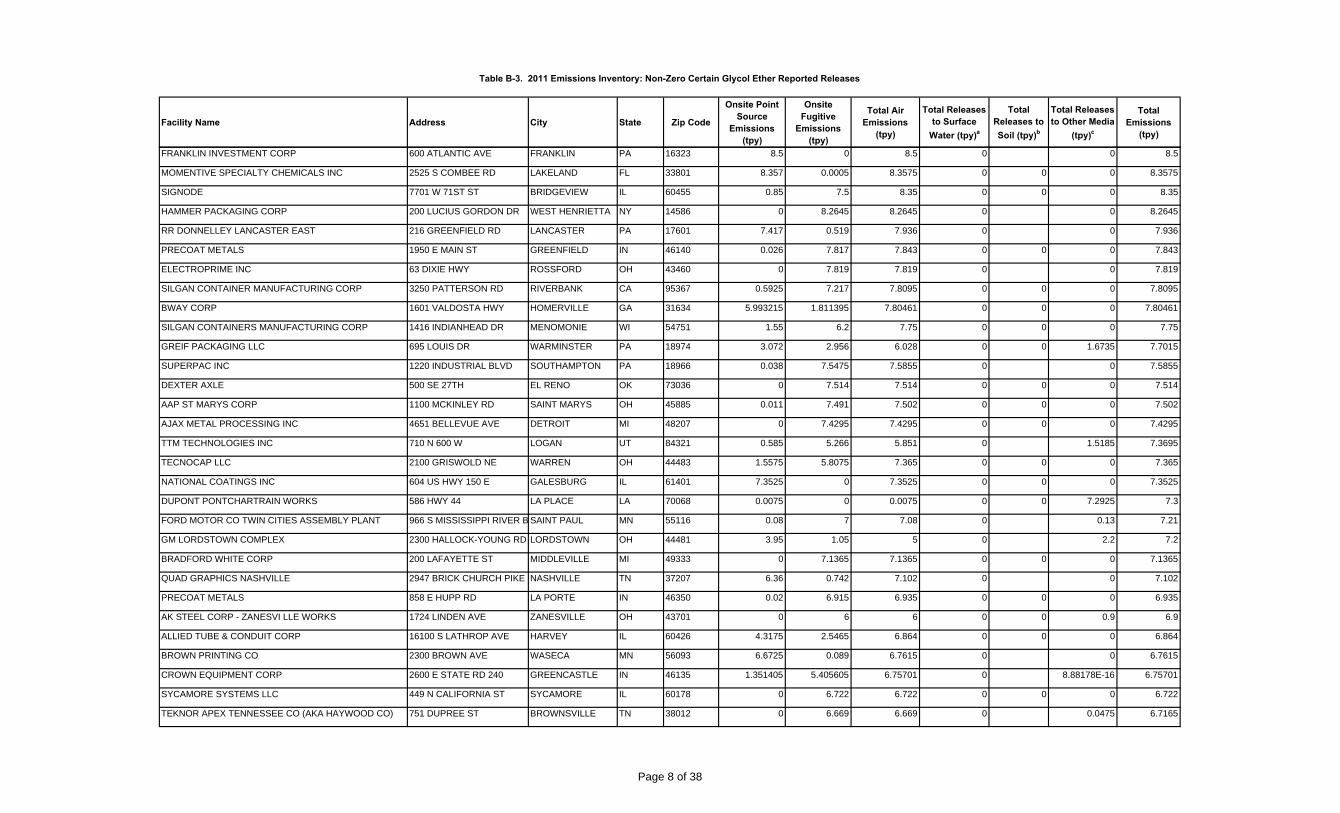
Table B-3. 2011 Emissions Inventory: Non-Zero Certain Glycol Ether Reported Releases
Facility Name Address City State Zip Code
Onsite Point Source
Emissions (tpy)
Onsite Fugitive
Emissions (tpy)
Total Air Emissions
(tpy)
Total Releases to Surface
Water (tpy)a
Total Releases to Soil (tpy)b
Total Releases to Other Media
(tpy)c
Total Emissions
(tpy)
FRANKLIN INVESTMENT CORP 600 ATLANTIC AVE FRANKLIN PA 16323 8.5 0 8.5 0 0 8.5
MOMENTIVE SPECIALTY CHEMICALS INC 2525 S COMBEE RD LAKELAND FL 33801 8.357 0.0005 8.3575 0 0 0 8.3575
SIGNODE 7701 W 71ST ST BRIDGEVIEW IL 60455 0.85 7.5 8.35 0 0 0 8.35
HAMMER PACKAGING CORP 200 LUCIUS GORDON DR WEST HENRIETTA NY 14586 0 8.2645 8.2645 0 0 8.2645
RR DONNELLEY LANCASTER EAST 216 GREENFIELD RD LANCASTER PA 17601 7.417 0.519 7.936 0 0 7.936
PRECOAT METALS 1950 E MAIN ST GREENFIELD IN 46140 0.026 7.817 7.843 0 0 0 7.843
ELECTROPRIME INC 63 DIXIE HWY ROSSFORD OH 43460 0 7.819 7.819 0 0 7.819
SILGAN CONTAINER MANUFACTURING CORP 3250 PATTERSON RD RIVERBANK CA 95367 0.5925 7.217 7.8095 0 0 0 7.8095
BWAY CORP 1601 VALDOSTA HWY HOMERVILLE GA 31634 5.993215 1.811395 7.80461 0 0 0 7.80461
SILGAN CONTAINERS MANUFACTURING CORP 1416 INDIANHEAD DR MENOMONIE WI 54751 1.55 6.2 7.75 0 0 0 7.75
GREIF PACKAGING LLC 695 LOUIS DR WARMINSTER PA 18974 3.072 2.956 6.028 0 0 1.6735 7.7015
SUPERPAC INC 1220 INDUSTRIAL BLVD SOUTHAMPTON PA 18966 0.038 7.5475 7.5855 0 0 7.5855
DEXTER AXLE 500 SE 27TH EL RENO OK 73036 0 7.514 7.514 0 0 0 7.514
AAP ST MARYS CORP 1100 MCKINLEY RD SAINT MARYS OH 45885 0.011 7.491 7.502 0 0 0 7.502
AJAX METAL PROCESSING INC 4651 BELLEVUE AVE DETROIT MI 48207 0 7.4295 7.4295 0 0 0 7.4295
TTM TECHNOLOGIES INC 710 N 600 W LOGAN UT 84321 0.585 5.266 5.851 0 1.5185 7.3695
TECNOCAP LLC 2100 GRISWOLD NE WARREN OH 44483 1.5575 5.8075 7.365 0 0 0 7.365
NATIONAL COATINGS INC 604 US HWY 150 E GALESBURG IL 61401 7.3525 0 7.3525 0 0 0 7.3525
DUPONT PONTCHARTRAIN WORKS 586 HWY 44 LA PLACE LA 70068 0.0075 0 0.0075 0 0 7.2925 7.3
FORD MOTOR CO TWIN CITIES ASSEMBLY PLANT 966 S MISSISSIPPI RIVER B SAINT PAUL MN 55116 0.08 7 7.08 0 0.13 7.21
GM LORDSTOWN COMPLEX 2300 HALLOCK-YOUNG RD LORDSTOWN OH 44481 3.95 1.05 5 0 2.2 7.2
BRADFORD WHITE CORP 200 LAFAYETTE ST MIDDLEVILLE MI 49333 0 7.1365 7.1365 0 0 0 7.1365
QUAD GRAPHICS NASHVILLE 2947 BRICK CHURCH PIKE NASHVILLE TN 37207 6.36 0.742 7.102 0 0 7.102
PRECOAT METALS 858 E HUPP RD LA PORTE IN 46350 0.02 6.915 6.935 0 0 0 6.935
AK STEEL CORP - ZANESVI LLE WORKS 1724 LINDEN AVE ZANESVILLE OH 43701 0 6 6 0 0 0.9 6.9
ALLIED TUBE & CONDUIT CORP 16100 S LATHROP AVE HARVEY IL 60426 4.3175 2.5465 6.864 0 0 0 6.864
BROWN PRINTING CO 2300 BROWN AVE WASECA MN 56093 6.6725 0.089 6.7615 0 0 6.7615
CROWN EQUIPMENT CORP 2600 E STATE RD 240 GREENCASTLE IN 46135 1.351405 5.405605 6.75701 0 8.88178E-16 6.75701
SYCAMORE SYSTEMS LLC 449 N CALIFORNIA ST SYCAMORE IL 60178 0 6.722 6.722 0 0 0 6.722
TEKNOR APEX TENNESSEE CO (AKA HAYWOOD CO) 751 DUPREE ST BROWNSVILLE TN 38012 0 6.669 6.669 0 0.0475 6.7165
Page 8 of 38

Table B-3. 2011 Emissions Inventory: Non-Zero Certain Glycol Ether Reported Releases
Facility Name Address City State Zip Code
Onsite Point Source
Emissions (tpy)
Onsite Fugitive
Emissions (tpy)
Total Air Emissions
(tpy)
Total Releases to Surface
Water (tpy)a
Total Releases to Soil (tpy)b
Total Releases to Other Media
(tpy)c
Total Emissions
(tpy)
SILGAN CAN CO 500 NW LOOP 286 SUITE 10PARIS TX 75460 3.412 3.2385 6.6505 0 0 0 6.6505
RR DONNELLEY CRAWFORDSVILLE 1009 SLOAN ST CRAWFORDSVILLE IN 47933 6.3135 0.2945 6.608 0 0 6.608
HUSQVARNA CONSUMER OUTDOOR PRODUCTS 172 OLD ELLOREE RD ORANGEBURG SC 29116 0.1325 6.4715 6.604 0 0 6.604
CAN CORP OF AMERICA INC 326 JUNE AVE BLANDON PA 19510 1.6585 4.938 6.5965 0 0 0 6.5965
LA-Z-BOY TENNESSEE 500 WALNUT GROVE RD DAYTON TN 37321 0 6.58324085 6.58324085 0 0 0 6.58324085
SNAP-ON TOOLS MANUFACTURING CO 2600 US HWY 18 E ALGONA IA 50511 0.0015 0.119 0.1205 0 6.395 6.5155
GEA BPO LLC 301 N CURRY PIKE BLOOMINGTON IN 47404 0 6.5 6.5 0 0 0 6.5
SILGAN CONTAINERS MANUFACTURING CORP 520 W 2ND ST OCONOMOWOC WI 53066 1.3 5.175 6.475 0 0 0 6.475
DUPONT CHAMBERS WORKS RT 130 DEEPWATER NJ 08023 0.092 0.0695 0.1615 5.9625 0 0.3305 6.4545
SCHAEFFER MANUFACTURING 102 BARTON ST SAINT LOUIS MO 63104 6.34465 0 6.34465 0 0.0225 6.36715
NUCOR CORP VULCRAFT DIV 7205 GAULT AVE N FORT PAYNE AL 35967 3.6825 2.66 6.3425 0 0 0 6.3425
NORTHLAND ALUMINUM PRODUCTS I NC 5005 COUNTY RD 25 MINNEAPOLIS MN 55416 0 6.3187 6.3187 0 0 0 6.3187
AMERICAN FINISHING RESOURCES INC 476 CLAY ST CHILTON WI 53014 6.272 0 6.272 0 0 6.272
BROWN PRINTING CO 11595 MCCONNELL RD WOODSTOCK IL 60098 6.125 0.14 6.265 0 0 6.265
MAYTAG CORP CLEVELAND COOKING PRODUCTS PLANT 1
740 KING EDWARD AVE SE CLEVELAND TN 37311 0 6.264 6.264 0 0 0 6.264
AKZO NOBEL SURFACE CHEMISTRY LLC 15200 ALMEDA RD HOUSTON TX 77053 0.045 0.129 0.174 0 0 6.0785 6.2525
DU PONT ELECTRONICS MICROCIRCU ITS INDUSTRIES LTD (PART)
HWY 686 KM 2.3 MANATI PR 00674 0 0 0 0 0 6.21 6.21
CURTIS METAL FINISHING CO 6645 SIMS DR STERLING HEIGHTSMI 48313 4.411 1.758 6.169 0 0 6.169
HUNTER DOUGLAS TUPELO CENTER RT. 2 LEE INDUSTRIAL PARSHANNON MS 38868 0.2925 5.864 6.1565 0 0 0 6.1565
3M CO - CORDOVA 22614 RT 84 N CORDOVA IL 61242 0.434 0.18 0.614 5.5 0 0 6.114
FORD MOTOR CO MICHIGAN ASSEMBLY PLANT 38303 MICHIGAN AVE WAYNE MI 48184 0.065 6 6.065 0 0 6.065
WHEELING MACHINE PRODUCTS DIV PINE BLUFF 5411 INDUSTRIAL DR S PINE BLUFF AR 71602 6 0 6 0 0 0 6
ASHLEY INDUSTRIAL MOLDING INC 310 S WABASH ASHLEY IN 46705 0.6 5.4 6 0 0 0 6
ENKEI AMERICA INC 2900 W INWOOD DR COLUMBUS IN 47201 0 6 6 0 0 0 6
WIX FILTRATION CORP - ALLEN PLANT 2900 NW BLVD GASTONIA NC 28052 0.0025 5.95 5.9525 0 0 0 5.9525
SILGAN CONTAINERS MANUFACTURING CORP 2501 165TH ST HAMMOND IN 46320 0 5.873 5.873 0 0 0 5.873
THE COLEMAN CO INC 3600 N HYDRAULIC WICHITA KS 67219 0.001 5.857 5.858 0 0 0 5.858
NAHAN PRINTING INC 7000 SAUKVIEW DR SAINT CLOUD MN 56303 5.67614 0.180825 5.856965 0 0 0 5.856965
QG PRINTING II CORP 4708 KRUEGER DR JONESBORO AR 72401 3.55 2.3 5.85 0 0 5.85
Page 9 of 38

Table B-3. 2011 Emissions Inventory: Non-Zero Certain Glycol Ether Reported Releases
Facility Name Address City State Zip Code
Onsite Point Source
Emissions (tpy)
Onsite Fugitive
Emissions (tpy)
Total Air Emissions
(tpy)
Total Releases to Surface
Water (tpy)a
Total Releases to Soil (tpy)b
Total Releases to Other Media
(tpy)c
Total Emissions
(tpy)
PPG INDUSTRIES,INC-SPRINGDALE COMPLEX 125 COLFAX ST SPRINGDALE PA 15144 5.754 0.0585 5.8125 0 0 0 5.8125
GMVM-LANSING GRAND RIVER ASSEMBLY 920 TOWNSEND ST MAIL COLANSING MI 48921 2.6 3.2 5.8 0 0 5.8
CROWN AEROSOL PACKAGING 3737 E EXCHANGE AVE AURORA IL 60504 5.0525 0.717 5.7695 0 0 0 5.7695
AVERY DENNISON RBIS LENOIR 950 GERMAN ST LENOIR NC 28645 4.668 1.066 5.734 0 0 0 5.734
TACO INC - CRANSTON 1160 CRANSTON ST CRANSTON RI 02920 0.058 5.6685 5.7265 0 0 0 5.7265
PELLA CORP CARROLL OPERATIONS 1750 E US HWY 30 E CARROLL IA 51401 0 5.5825 5.5825 0 0 5.5825
GREIF PACKAGING LLC 10850 STRANG RD LA PORTE TX 77571 4.47095 0.5371 5.00805 0 0.566795 5.574845
JOHN DEERE HORICON WORKS-DT 300 N VINE ST HORICON WI 53032 0 5.5 5.5 0 0 5.5
CARRY-ON TRAILER CORP 1965 HWY 30 MISSOURI VALLEY IA 51555 0 5.464 5.464 0 0 0 5.464
L A DARLING CO - PIGGOTT AR FACILITY HWY 49 S PIGGOTT AR 72454 0.073 5.3855 5.4585 0 0 5.4585
TORO CO 200 SIME AVE TOMAH WI 54660 0 5.426 5.426 0 0 5.426
SENECA FOODS CORP CAN PLANT 3709 MILL ST MARION NY 14505 0 5.423 5.423 0 0 5.423
COLOR COMMUNICATIONS INC 4242 W FILLMORE CHICAGO IL 60624 1.05 4.35 5.4 0 0 5.4
MIDDLEBURY HARDWOOD PRODUCTS 101 JOAN DR MIDDLEBURY IN 46540 0 5.3965 5.3965 0 0 0 5.3965
SABIC INNOVATIVE PLASTICS MT VERNON LLC 1 LEXAN LN MOUNT VERNON IN 47620 3.2 2.05 5.25 0.125 0 0 5.375
QUAD/GRAPHICS INC N11896 HWY 175 PO BOX 2 LOMIRA WI 53048 4.836 0.5315 5.3675 0 0 5.3675
BATESVILLE MANUFACTURING INC -DOLL PLANT 1000 E PEARL ST BATESVILLE IN 47006 0.2675 5.085 5.3525 0 0 0 5.3525
BERENFIELD CONTAINERS SE LTD 12180 UNIVERSITY CITY BL HARRISBURG NC 28075 0 5.351 5.351 0 0 0 5.351
GATES CORP 1450 MONTANA RD IOLA KS 66749 0 0.00295 0.00295 0 0 5.3455 5.34845
KOHLER CO 2000 N 5TH ST UNION CITY TN 38261 0.5345 4.8125 5.347 0 0 5.347
DUNBARTON CORP REDIFRAME DIV 1101 TECHNOLOGY DR DOTHAN AL 36303 0 5.3 5.3 0 0 0 5.3
WORTHINGTON CYLINDERS WISCONSI N LLC 300 E BREED ST CHILTON WI 53014 0.2495 5.020885 5.270385 0 0 0 5.270385
PRECOAT METALS 25 NORTHGATE INDUSTRIAGRANITE CITY IL 62040 4.232 1.0355 5.2675 0 0 0 5.2675
POWER PARTNERS INC 200 NEWTON BRIDGE RD ATHENS GA 30607 0 5.246 5.246 0 0 5.246
EQUISTAR CHEMICALS BAYPORT CHEMICALS PLANT 5761 UNDERWOOD RD PASADENA TX 77507 5.0705 0.168 5.2385 0 0 5.2385
CROWN FOOD PACKAGING 1650 BROADWAY HANOVER PA 17331 1.3065 3.92 5.2265 0 0 5.2265
PRECOAT METALS 2604 RIVER RD HAWESVILLE KY 42348 0.007 5.211 5.218 0 0 0 5.218
US DOD USAF TINKER AFB 72 CEG/CEA 7535 FIFTH ST TINKER AFB OK 73145 1.9 3.2 5.1 0 0 0.065 5.165
COORSTEK 2449 RIVERSIDE PKWY GRAND JUNCTION CO 81505 0.0025 4.84 4.8425 0 0.25 0 5.0925
VON HOFFMANN GRAPHICS INC 1005 COMMERCIAL DR OWENSVILLE MO 65066 3.703 1.3745 5.0775 0 0 5.0775
Page 10 of 38
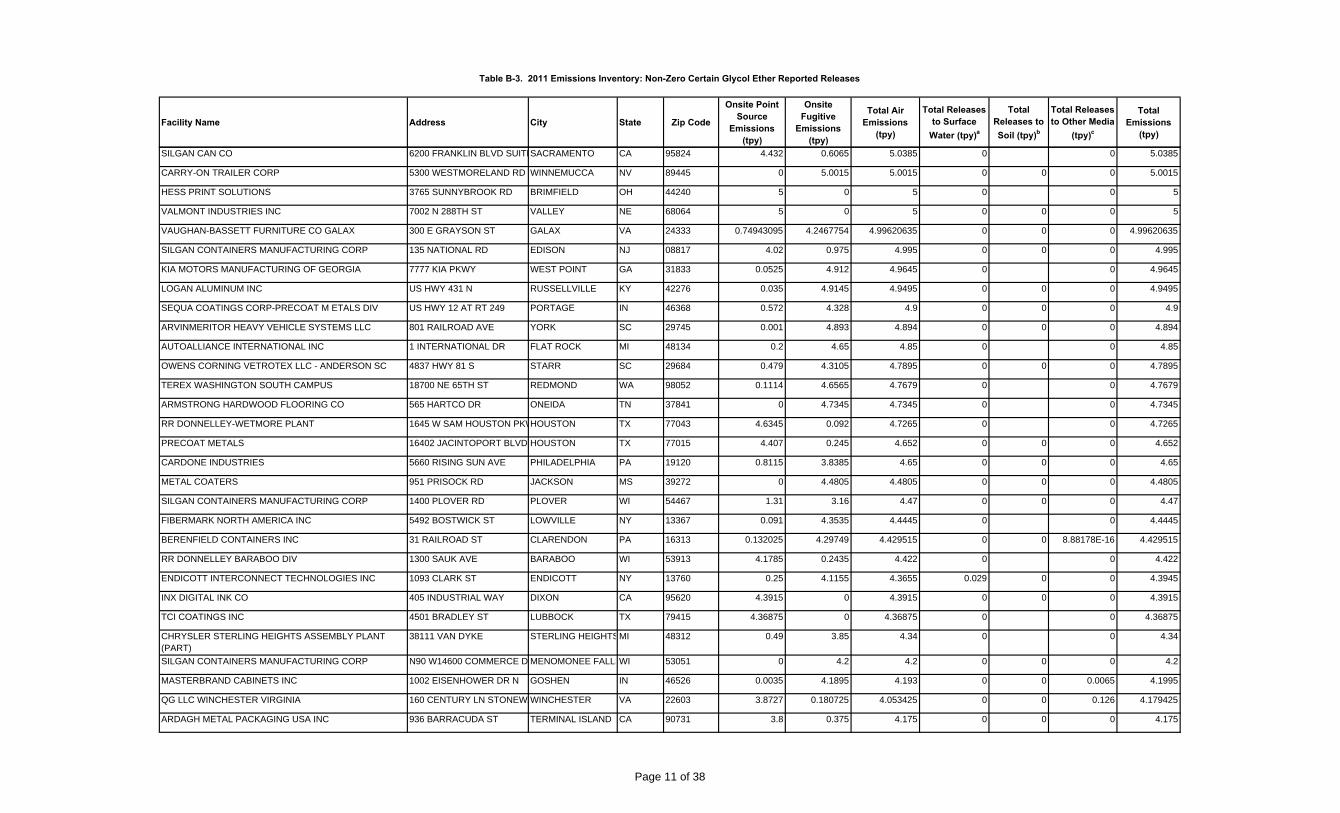
Table B-3. 2011 Emissions Inventory: Non-Zero Certain Glycol Ether Reported Releases
Facility Name Address City State Zip Code
Onsite Point Source
Emissions (tpy)
Onsite Fugitive
Emissions (tpy)
Total Air Emissions
(tpy)
Total Releases to Surface
Water (tpy)a
Total Releases to Soil (tpy)b
Total Releases to Other Media
(tpy)c
Total Emissions
(tpy)
SILGAN CAN CO 6200 FRANKLIN BLVD SUITESACRAMENTO CA 95824 4.432 0.6065 5.0385 0 0 5.0385
CARRY-ON TRAILER CORP 5300 WESTMORELAND RD WINNEMUCCA NV 89445 0 5.0015 5.0015 0 0 0 5.0015
HESS PRINT SOLUTIONS 3765 SUNNYBROOK RD BRIMFIELD OH 44240 5 0 5 0 0 5
VALMONT INDUSTRIES INC 7002 N 288TH ST VALLEY NE 68064 5 0 5 0 0 0 5
VAUGHAN-BASSETT FURNITURE CO GALAX 300 E GRAYSON ST GALAX VA 24333 0.74943095 4.2467754 4.99620635 0 0 0 4.99620635
SILGAN CONTAINERS MANUFACTURING CORP 135 NATIONAL RD EDISON NJ 08817 4.02 0.975 4.995 0 0 0 4.995
KIA MOTORS MANUFACTURING OF GEORGIA 7777 KIA PKWY WEST POINT GA 31833 0.0525 4.912 4.9645 0 0 4.9645
LOGAN ALUMINUM INC US HWY 431 N RUSSELLVILLE KY 42276 0.035 4.9145 4.9495 0 0 0 4.9495
SEQUA COATINGS CORP-PRECOAT M ETALS DIV US HWY 12 AT RT 249 PORTAGE IN 46368 0.572 4.328 4.9 0 0 0 4.9
ARVINMERITOR HEAVY VEHICLE SYSTEMS LLC 801 RAILROAD AVE YORK SC 29745 0.001 4.893 4.894 0 0 0 4.894
AUTOALLIANCE INTERNATIONAL INC 1 INTERNATIONAL DR FLAT ROCK MI 48134 0.2 4.65 4.85 0 0 4.85
OWENS CORNING VETROTEX LLC - ANDERSON SC 4837 HWY 81 S STARR SC 29684 0.479 4.3105 4.7895 0 0 0 4.7895
TEREX WASHINGTON SOUTH CAMPUS 18700 NE 65TH ST REDMOND WA 98052 0.1114 4.6565 4.7679 0 0 4.7679
ARMSTRONG HARDWOOD FLOORING CO 565 HARTCO DR ONEIDA TN 37841 0 4.7345 4.7345 0 0 4.7345
RR DONNELLEY-WETMORE PLANT 1645 W SAM HOUSTON PKWHOUSTON TX 77043 4.6345 0.092 4.7265 0 0 4.7265
PRECOAT METALS 16402 JACINTOPORT BLVD HOUSTON TX 77015 4.407 0.245 4.652 0 0 0 4.652
CARDONE INDUSTRIES 5660 RISING SUN AVE PHILADELPHIA PA 19120 0.8115 3.8385 4.65 0 0 0 4.65
METAL COATERS 951 PRISOCK RD JACKSON MS 39272 0 4.4805 4.4805 0 0 0 4.4805
SILGAN CONTAINERS MANUFACTURING CORP 1400 PLOVER RD PLOVER WI 54467 1.31 3.16 4.47 0 0 0 4.47
FIBERMARK NORTH AMERICA INC 5492 BOSTWICK ST LOWVILLE NY 13367 0.091 4.3535 4.4445 0 0 4.4445
BERENFIELD CONTAINERS INC 31 RAILROAD ST CLARENDON PA 16313 0.132025 4.29749 4.429515 0 0 8.88178E-16 4.429515
RR DONNELLEY BARABOO DIV 1300 SAUK AVE BARABOO WI 53913 4.1785 0.2435 4.422 0 0 4.422
ENDICOTT INTERCONNECT TECHNOLOGIES INC 1093 CLARK ST ENDICOTT NY 13760 0.25 4.1155 4.3655 0.029 0 0 4.3945
INX DIGITAL INK CO 405 INDUSTRIAL WAY DIXON CA 95620 4.3915 0 4.3915 0 0 0 4.3915
TCI COATINGS INC 4501 BRADLEY ST LUBBOCK TX 79415 4.36875 0 4.36875 0 0 4.36875
CHRYSLER STERLING HEIGHTS ASSEMBLY PLANT (PART)
38111 VAN DYKE STERLING HEIGHTSMI 48312 0.49 3.85 4.34 0 0 4.34
SILGAN CONTAINERS MANUFACTURING CORP N90 W14600 COMMERCE D MENOMONEE FALLSWI 53051 0 4.2 4.2 0 0 0 4.2
MASTERBRAND CABINETS INC 1002 EISENHOWER DR N GOSHEN IN 46526 0.0035 4.1895 4.193 0 0 0.0065 4.1995
QG LLC WINCHESTER VIRGINIA 160 CENTURY LN STONEWAWINCHESTER VA 22603 3.8727 0.180725 4.053425 0 0 0.126 4.179425
ARDAGH METAL PACKAGING USA INC 936 BARRACUDA ST TERMINAL ISLAND CA 90731 3.8 0.375 4.175 0 0 0 4.175
Page 11 of 38

Table B-3. 2011 Emissions Inventory: Non-Zero Certain Glycol Ether Reported Releases
Facility Name Address City State Zip Code
Onsite Point Source
Emissions (tpy)
Onsite Fugitive
Emissions (tpy)
Total Air Emissions
(tpy)
Total Releases to Surface
Water (tpy)a
Total Releases to Soil (tpy)b
Total Releases to Other Media
(tpy)c
Total Emissions
(tpy)
R R DONNELLEY & SONS CO DANVILLE DIV 3201 LEBANON RD DANVILLE KY 40422 3.8985 0.273 4.1715 0 0 0 4.1715
ROHM & HAAS CHEMICALS LLC 200 RT 413 BRISTOL PA 19007 0.0519 0.1905 0.2424 0 0 3.9055 4.1479
INLAND LABEL & MARKETING 2009 W AVE S LA CROSSE WI 54601 2.2045 1.9285 4.133 0 0 0 4.133
SC JOHNSON & SON INC WAXDALE FACILITY 8311 16TH ST STURTEVANT WI 53177 0.125 0.375 0.5 0 3.628795 4.128795
HYUNDAI MOTOR MANUFACTURING ALABAMA LLC 700 HYUNDAI BLVD MONTGOMERY AL 36105 2.6025 1.506 4.1085 0 0 4.1085
US ARMY LAKE CITY ARMY AMMUNITION PLANT INTERSECTION OF MO HWYINDEPENDENCE MO 64051 1.579 2.516 4.095 0 0 0 4.095
CROWN AEROSOL PACKAGING 4TH ST & PARK AVE FARIBAULT MN 55021 2.6265 1.4625 4.089 0 0 0 4.089
CLEVELAND STEEL CONTAINER CORP 350 MILL ST QUAKERTOWN PA 18951 0.035 4.04 4.075 0 0 0 4.075
RRD MAPLE GROVE 7401 KILMER LN MAPLE GROVE MN 55369 3.9335 0.1045 4.038 0 0 4.038
SILGAN CONTAINERS MANUFACTURING CORP 8673 LYONS-MARENGO RD LYONS NY 14489 0.7275 3.3065 4.034 0 0 0 4.034
THIRD COAST TERMINALS PEARLAND 1871 MYKAWA PEARLAND TX 77581 0 0 0 0 0 3.9915 3.9915
PRO LINE PRINTING ARLINGTON 401 N GREAT SW PKWY ARLINGTON TX 76011 3.088685 0.17821 3.266895 0 0.701975 0 3.96887
TTM PRINTED CIRCUIT GROUP - S TAFFORD DIV 4 OLD MONSON RD STAFFORD CT 06075 0 3.9505 3.9505 0 0 3.9505
CARRY-ON TRAILER CORP 159 INDUSTRIAL PARK RD MONTROSS VA 22520 0 3.925 3.925 0 0 0 3.925
QUAD/GRAPHICS INC 56 DUPLAINVILLE RD SARATOGA SPRINGNY 12866 3.68 0.1875 3.8675 0 0 0 3.8675
NAVISTAR INC 6125 URBANA RD SPRINGFIELD OH 45502 0.415 3.4 3.815 0.014 0 0.02 3.849
AFTON CHEMICAL CORP 725 CANNON BRIDGE RD ORANGEBURG SC 29115 2.813 0.488 3.301 0.0405 0 0.4705 3.812
BATESVILLE MANUFACTURING INC 310 CROWN RD BATESVILLE MS 38606 0.5695 3.2265 3.796 0 0 0 3.796
BENCHMARK ENERGY PRODUCTS LLC 4113 W INDUSTRIAL AVE MIDLAND TX 79703 0.344 3.4415 3.7855 0 0 3.7855
OMG AMERICAS TWO MILE RUN RD FRANKLIN PA 16323 0.025 0.223 0.248 0 0 3.4725 3.7205
BETCO CORP 1001 BROWN AVE TOLEDO OH 43607 3.69 0 3.69 0 0 3.69
NAZDAR SHAWNEE 8501 HEDGE LN TERRACE SHAWNEE KS 66227 1.0955 2.556 3.6515 0 0 0 3.6515
VIASYSTEMS CORP 1521 POPLAR LN FOREST GROVE OR 97116 0.0675 3.58 3.6475 0 0 3.6475
TITAN COATINGS INC 2025 EXCHANGE PL BESSEMER AL 35023 3.59 0 3.59 0 0 0 3.59
AUTOMOTIVE COMPONENTS HOLDINGS LLC SALINE PLANT
7700 MICHIGAN AVE SALINE MI 48176 0.06 3.5 3.56 0 0 0 3.56
BALL METAL FOOD CONTAINER CORP 300 W GREGER RD OAKDALE CA 95361 0.152 3.4 3.552 0 0 0 3.552
QUAD/GRAPHICS INC 555 S 108TH ST WEST ALLIS WI 53214 3.41 0.095 3.505 0 0 3.505
MOTOR CASTINGS CO 1323 S 65TH MILWAUKEE WI 53214 0 1.5915 1.5915 0 0 1.894 3.4855
GM MLCG FAIRFAX ASSEMBLY 3201 FAIRFAX TRAFFICWAYKANSAS CITY KS 66115 0.1 3.35 3.45 0 0 3.45
FORD MOTOR CO - OHIO ASSEMBLY PLANT 650 MILLER RD AVON LAKE OH 44012 0.395 3 3.395 0 0.0035 3.3985
Page 12 of 38

Table B-3. 2011 Emissions Inventory: Non-Zero Certain Glycol Ether Reported Releases
Facility Name Address City State Zip Code
Onsite Point Source
Emissions (tpy)
Onsite Fugitive
Emissions (tpy)
Total Air Emissions
(tpy)
Total Releases to Surface
Water (tpy)a
Total Releases to Soil (tpy)b
Total Releases to Other Media
(tpy)c
Total Emissions
(tpy)
BROWN PRINTING CO 668 GRAVEL PIKE EAST GREENVILLE PA 18041 3.2665 0.1135 3.38 0 0.0075 4.44089E-16 3.3875
RHODIA INC 2ND ST & BLUEBALL AVE MARCUS HOOK PA 19061 0.1915 0.0005 0.192 0 3.167 3.359
SPRAYLAT CORP CA 3465 S LA CIENAGA BLVD LOS ANGELES CA 90016 1.679 1.679 3.358 0 0 3.358
PRECOAT METALS 4301 S SPRING AVE SAINT LOUIS MO 63116 0.926 2.429 3.355 0 0 0 3.355
LAKESIDE LITHOGRAPHY LLC 1600 S LAFLIN ST CHICAGO IL 60608 2.65 0.6 3.25 0 0 0 3.25
AVERY DENNISON 17700 FOLTZ INDUSTRIAL PSTRONGSVILLE OH 44149 0.422 2.824 3.246 0 0 3.246
HEWLETT-PACKARD CARIBE BV SITE HWY 110 N KM 5.1 AGUADILLA PR 00605 0 3.2155 3.2155 0 0 3.2155
QUAD GRAPHICS TAUNTON RETAIL 50 JOHN HANCOCK RD TAUNTON MA 02780 1.91685 0.04475 1.9616 0 0 1.24606 3.20766
RR DONNELLEY STRASBURG DIV ONE SHENANDOAH VALLEYSTRASBURG VA 22657 3.1 0.04 3.14 0 0.011 3.151
BRILLION IRON WORKS INC 200 PARK AVE BRILLION WI 54110 2.13095 0.8037 2.93465 0 0.21095 3.1456
CADON PLATING CO 3715 11TH ST WYANDOTTE MI 48192 1.708 1.41 3.118 0 0 0 3.118
ABC COMPOUNDING CO INC 6970 JONESBORO RD MORROW GA 30260 0.0025 0.375 0.3775 0.0025 0 2.6855 3.0655
CLEAR LAKE CHEMICALS LLC 11200 BAY AREA BLVD PASADENA TX 77507 3.0356 0.00095 3.03655 0 4.44089E-16 3.03655
CENTURY INDUSTRIAL COATINGS I NC HWY 69 S JACKSONVILLE TX 75766 0.085 1.611 1.696 0 0 1.3035 2.9995
CLEVELAND STEEL CONTAINER - NI LES 115 ERIE ST NILES OH 44446 0.0025 2.988 2.9905 0 0 0 2.9905
MEADWESTVACO CONSUMER PACKAGING GROUP LLC
7411 OAKWOOD ST MEBANE NC 27302 2.9255 0 2.9255 0 0 2.9255
UNIVAR USA INC - BUNOLA BRANCH 328 BUNOLA RIVER RD BUNOLA PA 15020 0.125 0.0025 0.1275 0 0 2.786 2.9135
ARR-MAZ CUSTOM CHEMICALS 4800 STATE RD 60 E MULBERRY FL 33860 0.1415 2.76 2.9015 0 0 2.9015
IVC INDUSTRIAL COATINGS INC 1825 E NATIONAL AVE BRAZIL IN 47834 0.577852 2.311408 2.88926 0 0 4.44089E-16 2.88926
ROPPE CORP 1602 N UNION ST FOSTORIA OH 44830 0.125 2.7255 2.8505 0 0 2.8505
VAN CAN CO 10837 ETIWANDA AVE FONTANA CA 92337 2.45 0.375 2.825 0 0 0 2.825
VANEX INC 1700 S SHAWNEE ST MOUNT VERNON IL 62864 0 2.818 2.818 0 0 2.818
CROWN FOOD PACKAGING 10200 N LOMBARD ST PORTLAND OR 97203 1.2615 1.4975 2.759 0 0 0 2.759
CENTRIA 530 N SECOND ST CAMBRIDGE OH 43725 1.411 1.335 2.746 0 0 0 2.746
RED SPOT WESTLAND INC 550 S EDWIN ST WESTLAND MI 48186 1.226 1.4995 2.7255 0 0 0 2.7255
CLEVELAND STEEL CONTAINER CORP - STREETSBORO PLANT
10048 AURORA-HUDSON R STREETSBORO OH 44241 0.0025 2.715 2.7175 0 0 0 2.7175
ALERIS ROLLED PRODUCTS INC 1372 KY HWY 1957 LEWISPORT KY 42351 0.125 2.571 2.696 0 0 0 2.696
IVC SOUTH 875 PROGRESS CENTER AVLAWRENCEVILLE GA 30043 0.538 2.1515 2.6895 0 0 2.6895
MAGNA MIRRORS CORP - NEWAYGO 700 S PARK DR NEWAYGO MI 49337 1.4755 1.1975 2.673 0 0 0 2.673
ASTRO COATINGS INC 27 MAIN ST STRUTHERS OH 44471 0.5225 2.1285 2.651 0 0 0 2.651
Page 13 of 38

Table B-3. 2011 Emissions Inventory: Non-Zero Certain Glycol Ether Reported Releases
Facility Name Address City State Zip Code
Onsite Point Source
Emissions (tpy)
Onsite Fugitive
Emissions (tpy)
Total Air Emissions
(tpy)
Total Releases to Surface
Water (tpy)a
Total Releases to Soil (tpy)b
Total Releases to Other Media
(tpy)c
Total Emissions
(tpy)
IC OF OKLAHOMA LLC 2322 N MINGO RD TULSA OK 74116 0 2.65 2.65 0 0 2.65
AKZONOBEL 1872 HWY 9 BYPASS W LANCASTER SC 29720 0.4955 2.148 2.6435 0 0 2.6435
HIRSH INDUSTRIES INC 1525 MCKEE RD DOVER DE 19904 0.0025 2.633 2.6355 0 0 2.6355
PRECOAT METALS 4502 FREEDOM WAY WEIRTON WV 26062 0 2.6315 2.6315 0 0 0 2.6315
RADIATOR SPECIALTY CO 600 RADIATOR RD INDIAN TRAIL NC 28079 0.146 0 0.146 0 0 2.4785 2.6245
PRECOAT METALS 3399 DAVEY ALLISON BLVDHUEYTOWN AL 35023 2.041 0.5505 2.5915 0 0 0 2.5915
ROBROY INDUSTRIES TEXAS LP 1100 US HWY 271 S GILMER TX 75644 0 0.041 0.041 0 2.55 2.591
NORTHERN LABS INC WEST DRIVE 5800 W DR MANITOWOC WI 54220 1.0045 1.5835 2.588 0 0 2.588
GMTG - SHREVEPORT ASSEMBLY 7600 GENERAL MOTORS BLSHREVEPORT LA 71129 0.125 2.45 2.575 0 0 0 2.575
INTERNATIONAL PAPER PINE HILL MILL 7600 HWY 10 W PINE HILL AL 36769 0.058 0 0.058 2.4305 2.70617E-16 2.4885
QG LLC 420 W INDUSTRIAL AVE EFFINGHAM IL 62401 2.19 0.255 2.445 0 0 2.445
RR DONNELLEY LOS ANGELES MANUFACTURING 19681 PACIFIC GATEWAY DTORRANCE CA 90502 2.3775 0.0555 2.433 0 0 2.433
VERTIS COMMUNICATIONS 4051 FONDORF DR COLUMBUS OH 43228 2.1765 0.2535 2.43 0 0 0 2.43
CCL CONTAINER AEROSOL DIV ONE LLODIO DR HERMITAGE PA 16148 0.19 2.2265 2.4165 0 0 0 2.4165
SAPA EXTRUSIONS INC 2500 ALUMAX RD YANKTON SD 57078 0 2.4011901 2.4011901 0 0 0 2.4011901
CUMMINS POWER GENERATION 1400 73RD AVE NE FRIDLEY MN 55432 0.12 2.28 2.4 0 0 2.4
QUAD/GRAPHICS INC 100 DUPLAINVILLE RD THE ROCK GA 30285 2.285 0.11 2.395 0 0 0 2.395
SCHNEIDER ELECTRIC 1990 SANDIFER BLVD SENECA SC 29678 0 2.35 2.35 0 0.0345 2.3845
APOLLO COLORS INC 1550 MOUND RD ROCKDALE IL 60436 0 0 0 0 2.3445 2.3445
SAPA EXTRUDER INC 2905 OLD OAKWOOD RD GAINESVILLE GA 30504 0 2.317 2.317 0 0 0 2.317
PPG INDUSTRIES ARCHITECTURAL FINISHES 1020 OLYMPIC DR BATAVIA IL 60510 0 0.821 0.821 0 0 1.491 2.312
ST CHARLES OPERATIONS (TAFT/STAR) UNION CARBIDE CORP
355 LA HWY 3142 (GATE 1) TAFT LA 70057 0.6 1.07 1.67 0.64 0 0 2.31
HANNA STEEL CORP 3812 COMMERCE AVE FAIRFIELD AL 35064 0.9095 1.201 2.1105 0 0 0.189 2.2995
THE DOW CHEMICAL CO 1790 BUILDING MIDLAND MI 48667 2.2 0.09 2.29 0.0035 0 0.0025 2.296
DUPONT TOWANDA PLANT 192 PATTERSON BLVD TOWANDA PA 18848 0.252 2.0365 2.2885 0 0 0 2.2885
HONDA MANUFACTURING OF INDIANA LLC 2755 N MICHIGAN AVE GREENSBURG IN 47240 1.785 0.497 2.282 0 0 0.0025 2.2845
COLOR CORP OF AMERICA 1630 W HILL ST LOUISVILLE KY 40210 0.009 2.2185 2.2275 0 0 0 2.2275
BRENNTAG SOUTHWEST INC LANC ASTER 704 E WINTERGREEN RD LANCASTER TX 75134 0.0225 0.025 0.0475 0 0 2.175 2.2225
KAY AUTOMOTIVE GRAPHICS 57 KAY INDUSTRIAL DR LAKE ORION MI 48359 0 2.2135 2.2135 0 0 0 2.2135
MAGNABLEND INC- LIQUID PLANT 100 W STERRETT RD WAXAHACHIE TX 75165 0.125 0 0.125 0 0 2.0785 2.2035
Page 14 of 38

Table B-3. 2011 Emissions Inventory: Non-Zero Certain Glycol Ether Reported Releases
Facility Name Address City State Zip Code
Onsite Point Source
Emissions (tpy)
Onsite Fugitive
Emissions (tpy)
Total Air Emissions
(tpy)
Total Releases to Surface
Water (tpy)a
Total Releases to Soil (tpy)b
Total Releases to Other Media
(tpy)c
Total Emissions
(tpy)
VERTIS 7619 DOANE DR MANASSAS VA 20109 2.1285 0.0695 2.198 0 0 2.198
NCP COATINGS INC 225 FORT ST NILES MI 49120 2.1685 0 2.1685 0 0 0 2.1685
AMERICAN COLOR GRAPHICS 810 E S ST MARENGO IA 52301 2.02 0.1395 2.1595 0 0 2.1595
DERRICK CORP 3350 UNION RD CHEEKTOWAGA NY 14225 0 2.1335 2.1335 0 0 0 2.1335
BALL METAL FOOD CONTAINER CORP 1200 S CRUTCHER ST SPRINGDALE AR 72764 0.23 1.9 2.13 0 0 0 2.13
RR DONNELLEY & SONS CO 6821 E COUNTY RD 1100 N MATTOON IL 61938 1.9725 0.138 2.1105 0 0 0 2.1105
KEYMARK CORP 1188 CAYADUTTA ST RT 33 FONDA NY 12068 0 2.105 2.105 0.00012 0 0 2.10512
RR DONNELLEY 100 QUALITY CT CHARLESTOWN IN 47111 1.955 0.148 2.103 0 0 2.103
BON L MANUFACTURING CO HWY 53 BONNELL RD CARTHAGE TN 37030 0.644 1.229 1.873 0 0.214 0.013 2.1
BWAY CORP 1202 AIRPORT RD NORTH BRUNSWICKNJ 08902 0.8015 1.2945 2.096 0 0 0 2.096
NEXTEER AUTOMOTIVE CORP 3900 HOLLAND RD SAGINAW MI 48601 0.2085 1.875 2.0835 0 0 2.0835
VERTIS COMMUNICATIONS 10911 GRANITE ST CHARLOTTE NC 28273 1.8595 0.215 2.0745 0 0 0 2.0745
GM ORION ASSEMBLY CENTER 4555 GIDDINGS RD LAKE ORION MI 48359 0.9 0.85 1.75 0 0.32 2.07
SILGAN CONTAINERS MANUFACTURING CORP 2200 WILBUR AVE ANTIOCH CA 94509 0 2.067 2.067 0 0 0 2.067
CONSOLIDATED SYSTEMS INC 650 ROSEWOOD DR COLUMBIA SC 29201 0 2.0475 2.0475 0 0 0 2.0475
QG LLC (WAS WORLDCOLOR STILLWATER) 100 W AIRPORT RD STILLWATER OK 74075 1.8275 0.213 2.0405 0 0 0 2.0405
DURA COAT PRODUCTS INC 26655 PEOPLES RD MADISON AL 35756 1.75171 0.28554 2.03725 0 0 0 2.03725
ITW DYMON 805 E OLD 56 HWY OLATHE KS 66061 0.6005 1.4015 2.002 0 0 0 2.002
CANFIELD METAL COATING CORP 460 W MAIN ST CANFIELD OH 44406 0 2 2 0 0 0 2
VERTIS COMMUNICATIONS 4646 S GRADY AVE TAMPA FL 33611 1.818 0.1695 1.9875 0 0 0 1.9875
ACCESS BUSINESS GROUP LLC 7575 FULTON ST E ADA MI 49355 1.8935 0.092 1.9855 0 0 1.9855
VEYANCE TECHNOLOGIES INC 2701 W OMAHA AVE NORFOLK NE 68701 0.037085 0.10976 0.146845 0 0 1.829935 1.97678
CATERPILLAR INC 3701 STATE RD 26 E LAFAYETTE IN 47905 0.1205 1.8545 1.975 0 0 0 1.975
VANGUARD PAINTS & FINISHES INC 1409 GREENE ST MARIETTA OH 45750 1.965 0 1.965 0 0 1.965
SENOX CORP 227 S TOWN E BLVD MESQUITE TX 75149 0.9865 0.9765 1.963 0 0 0 1.963
RR DONNELLEY / PINEVILLE 10519 INDUSTRIAL DR PINEVILLE NC 28134 1.8475 0.098 1.9455 0 0 1.9455
CAMACO COLUMBUS MANUFACTURING 1851 E 32ND AVE COLUMBUS NE 68601 0 1.94 1.94 0 0 1.94
OHIO ART CO ONE TOY ST BRYAN OH 43506 1.1855 0.6985 1.884 0 0 0 1.884
STEEL DYNAMICS INC 5134 LOOP RD JEFFERSONVILLE IN 47130 0 1.87 1.87 0 0 0 1.87
DUPONT YERKES PLANT 3115 RIVER RD BUFFALO NY 14207 0.5085 1.354 1.8625 0 0 0 1.8625
Page 15 of 38
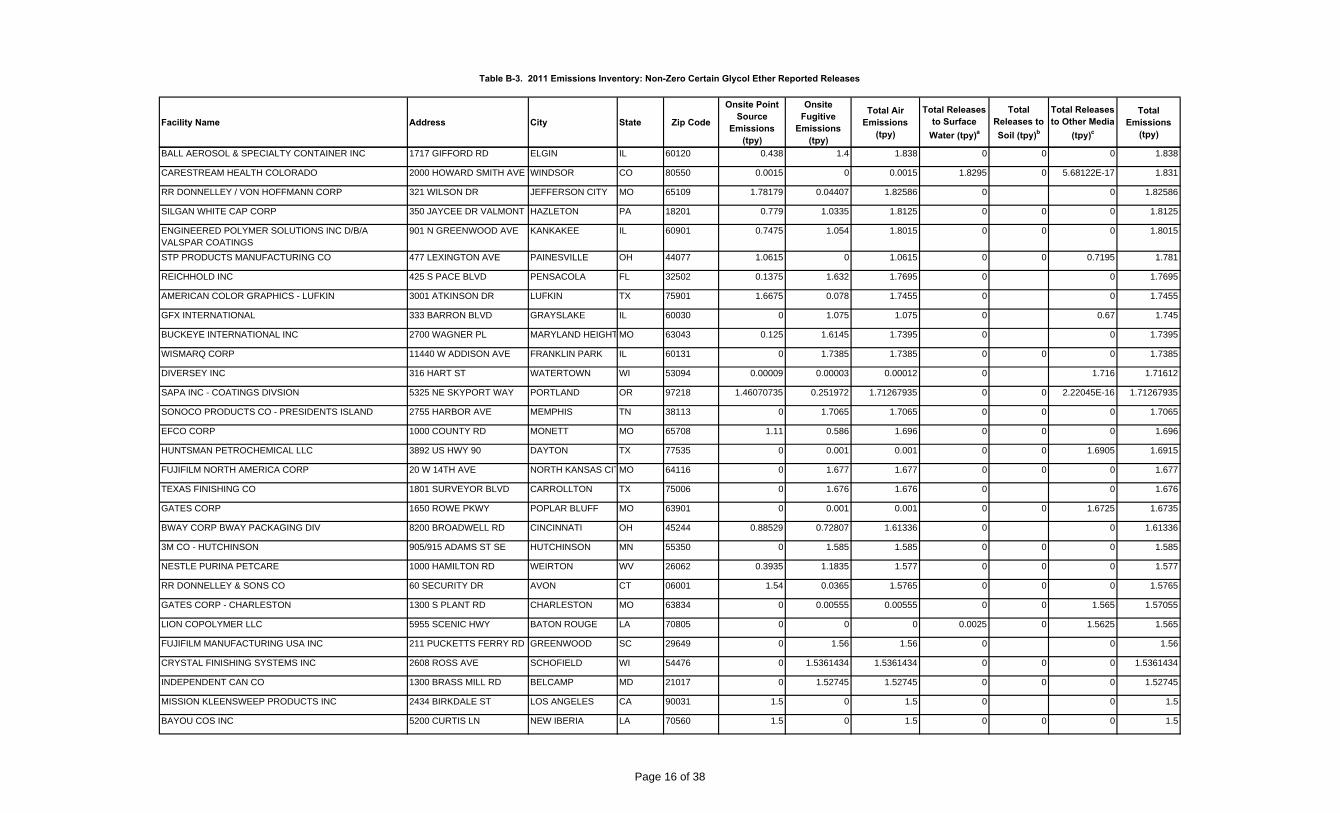
Table B-3. 2011 Emissions Inventory: Non-Zero Certain Glycol Ether Reported Releases
Facility Name Address City State Zip Code
Onsite Point Source
Emissions (tpy)
Onsite Fugitive
Emissions (tpy)
Total Air Emissions
(tpy)
Total Releases to Surface
Water (tpy)a
Total Releases to Soil (tpy)b
Total Releases to Other Media
(tpy)c
Total Emissions
(tpy)
BALL AEROSOL & SPECIALTY CONTAINER INC 1717 GIFFORD RD ELGIN IL 60120 0.438 1.4 1.838 0 0 0 1.838
CARESTREAM HEALTH COLORADO 2000 HOWARD SMITH AVE WWINDSOR CO 80550 0.0015 0 0.0015 1.8295 0 5.68122E-17 1.831
RR DONNELLEY / VON HOFFMANN CORP 321 WILSON DR JEFFERSON CITY MO 65109 1.78179 0.04407 1.82586 0 0 1.82586
SILGAN WHITE CAP CORP 350 JAYCEE DR VALMONT HAZLETON PA 18201 0.779 1.0335 1.8125 0 0 0 1.8125
ENGINEERED POLYMER SOLUTIONS INC D/B/A VALSPAR COATINGS
901 N GREENWOOD AVE KANKAKEE IL 60901 0.7475 1.054 1.8015 0 0 0 1.8015
STP PRODUCTS MANUFACTURING CO 477 LEXINGTON AVE PAINESVILLE OH 44077 1.0615 0 1.0615 0 0 0.7195 1.781
REICHHOLD INC 425 S PACE BLVD PENSACOLA FL 32502 0.1375 1.632 1.7695 0 0 1.7695
AMERICAN COLOR GRAPHICS - LUFKIN 3001 ATKINSON DR LUFKIN TX 75901 1.6675 0.078 1.7455 0 0 1.7455
GFX INTERNATIONAL 333 BARRON BLVD GRAYSLAKE IL 60030 0 1.075 1.075 0 0.67 1.745
BUCKEYE INTERNATIONAL INC 2700 WAGNER PL MARYLAND HEIGHT MO 63043 0.125 1.6145 1.7395 0 0 1.7395
WISMARQ CORP 11440 W ADDISON AVE FRANKLIN PARK IL 60131 0 1.7385 1.7385 0 0 0 1.7385
DIVERSEY INC 316 HART ST WATERTOWN WI 53094 0.00009 0.00003 0.00012 0 1.716 1.71612
SAPA INC - COATINGS DIVSION 5325 NE SKYPORT WAY PORTLAND OR 97218 1.46070735 0.251972 1.71267935 0 0 2.22045E-16 1.71267935
SONOCO PRODUCTS CO - PRESIDENTS ISLAND 2755 HARBOR AVE MEMPHIS TN 38113 0 1.7065 1.7065 0 0 0 1.7065
EFCO CORP 1000 COUNTY RD MONETT MO 65708 1.11 0.586 1.696 0 0 0 1.696
HUNTSMAN PETROCHEMICAL LLC 3892 US HWY 90 DAYTON TX 77535 0 0.001 0.001 0 0 1.6905 1.6915
FUJIFILM NORTH AMERICA CORP 20 W 14TH AVE NORTH KANSAS CITMO 64116 0 1.677 1.677 0 0 0 1.677
TEXAS FINISHING CO 1801 SURVEYOR BLVD CARROLLTON TX 75006 0 1.676 1.676 0 0 1.676
GATES CORP 1650 ROWE PKWY POPLAR BLUFF MO 63901 0 0.001 0.001 0 0 1.6725 1.6735
BWAY CORP BWAY PACKAGING DIV 8200 BROADWELL RD CINCINNATI OH 45244 0.88529 0.72807 1.61336 0 0 1.61336
3M CO - HUTCHINSON 905/915 ADAMS ST SE HUTCHINSON MN 55350 0 1.585 1.585 0 0 0 1.585
NESTLE PURINA PETCARE 1000 HAMILTON RD WEIRTON WV 26062 0.3935 1.1835 1.577 0 0 0 1.577
RR DONNELLEY & SONS CO 60 SECURITY DR AVON CT 06001 1.54 0.0365 1.5765 0 0 0 1.5765
GATES CORP - CHARLESTON 1300 S PLANT RD CHARLESTON MO 63834 0 0.00555 0.00555 0 0 1.565 1.57055
LION COPOLYMER LLC 5955 SCENIC HWY BATON ROUGE LA 70805 0 0 0 0.0025 0 1.5625 1.565
FUJIFILM MANUFACTURING USA INC 211 PUCKETTS FERRY RD GREENWOOD SC 29649 0 1.56 1.56 0 0 1.56
CRYSTAL FINISHING SYSTEMS INC 2608 ROSS AVE SCHOFIELD WI 54476 0 1.5361434 1.5361434 0 0 0 1.5361434
INDEPENDENT CAN CO 1300 BRASS MILL RD BELCAMP MD 21017 0 1.52745 1.52745 0 0 0 1.52745
MISSION KLEENSWEEP PRODUCTS INC 2434 BIRKDALE ST LOS ANGELES CA 90031 1.5 0 1.5 0 0 1.5
BAYOU COS INC 5200 CURTIS LN NEW IBERIA LA 70560 1.5 0 1.5 0 0 0 1.5
Page 16 of 38
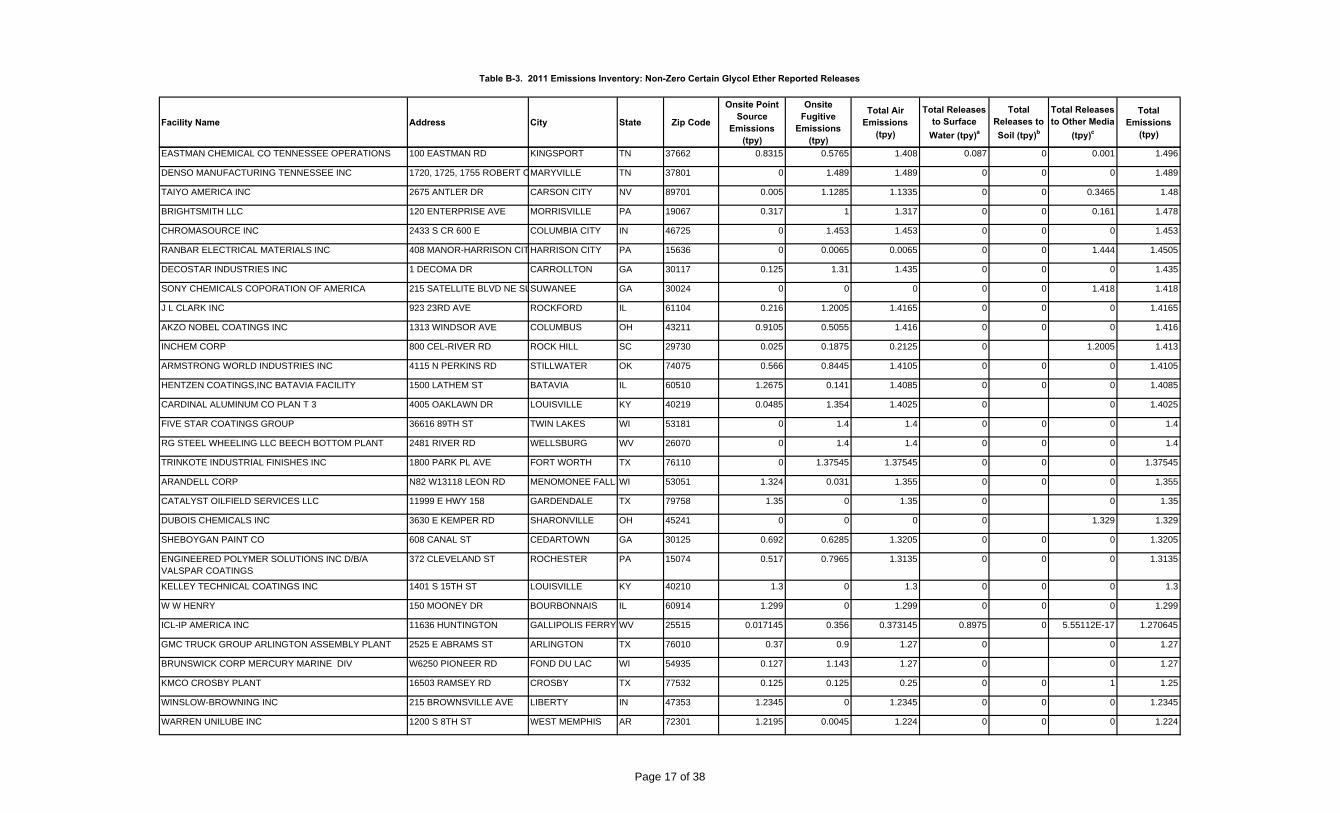
Table B-3. 2011 Emissions Inventory: Non-Zero Certain Glycol Ether Reported Releases
Facility Name Address City State Zip Code
Onsite Point Source
Emissions (tpy)
Onsite Fugitive
Emissions (tpy)
Total Air Emissions
(tpy)
Total Releases to Surface
Water (tpy)a
Total Releases to Soil (tpy)b
Total Releases to Other Media
(tpy)c
Total Emissions
(tpy)
EASTMAN CHEMICAL CO TENNESSEE OPERATIONS 100 EASTMAN RD KINGSPORT TN 37662 0.8315 0.5765 1.408 0.087 0 0.001 1.496
DENSO MANUFACTURING TENNESSEE INC 1720, 1725, 1755 ROBERT CMARYVILLE TN 37801 0 1.489 1.489 0 0 0 1.489
TAIYO AMERICA INC 2675 ANTLER DR CARSON CITY NV 89701 0.005 1.1285 1.1335 0 0 0.3465 1.48
BRIGHTSMITH LLC 120 ENTERPRISE AVE MORRISVILLE PA 19067 0.317 1 1.317 0 0 0.161 1.478
CHROMASOURCE INC 2433 S CR 600 E COLUMBIA CITY IN 46725 0 1.453 1.453 0 0 0 1.453
RANBAR ELECTRICAL MATERIALS INC 408 MANOR-HARRISON CITHARRISON CITY PA 15636 0 0.0065 0.0065 0 0 1.444 1.4505
DECOSTAR INDUSTRIES INC 1 DECOMA DR CARROLLTON GA 30117 0.125 1.31 1.435 0 0 0 1.435
SONY CHEMICALS COPORATION OF AMERICA 215 SATELLITE BLVD NE SUSUWANEE GA 30024 0 0 0 0 0 1.418 1.418
J L CLARK INC 923 23RD AVE ROCKFORD IL 61104 0.216 1.2005 1.4165 0 0 0 1.4165
AKZO NOBEL COATINGS INC 1313 WINDSOR AVE COLUMBUS OH 43211 0.9105 0.5055 1.416 0 0 0 1.416
INCHEM CORP 800 CEL-RIVER RD ROCK HILL SC 29730 0.025 0.1875 0.2125 0 1.2005 1.413
ARMSTRONG WORLD INDUSTRIES INC 4115 N PERKINS RD STILLWATER OK 74075 0.566 0.8445 1.4105 0 0 0 1.4105
HENTZEN COATINGS,INC BATAVIA FACILITY 1500 LATHEM ST BATAVIA IL 60510 1.2675 0.141 1.4085 0 0 0 1.4085
CARDINAL ALUMINUM CO PLAN T 3 4005 OAKLAWN DR LOUISVILLE KY 40219 0.0485 1.354 1.4025 0 0 1.4025
FIVE STAR COATINGS GROUP 36616 89TH ST TWIN LAKES WI 53181 0 1.4 1.4 0 0 0 1.4
RG STEEL WHEELING LLC BEECH BOTTOM PLANT 2481 RIVER RD WELLSBURG WV 26070 0 1.4 1.4 0 0 0 1.4
TRINKOTE INDUSTRIAL FINISHES INC 1800 PARK PL AVE FORT WORTH TX 76110 0 1.37545 1.37545 0 0 0 1.37545
ARANDELL CORP N82 W13118 LEON RD MENOMONEE FALLSWI 53051 1.324 0.031 1.355 0 0 0 1.355
CATALYST OILFIELD SERVICES LLC 11999 E HWY 158 GARDENDALE TX 79758 1.35 0 1.35 0 0 1.35
DUBOIS CHEMICALS INC 3630 E KEMPER RD SHARONVILLE OH 45241 0 0 0 0 1.329 1.329
SHEBOYGAN PAINT CO 608 CANAL ST CEDARTOWN GA 30125 0.692 0.6285 1.3205 0 0 0 1.3205
ENGINEERED POLYMER SOLUTIONS INC D/B/A VALSPAR COATINGS
372 CLEVELAND ST ROCHESTER PA 15074 0.517 0.7965 1.3135 0 0 0 1.3135
KELLEY TECHNICAL COATINGS INC 1401 S 15TH ST LOUISVILLE KY 40210 1.3 0 1.3 0 0 0 1.3
W W HENRY 150 MOONEY DR BOURBONNAIS IL 60914 1.299 0 1.299 0 0 0 1.299
ICL-IP AMERICA INC 11636 HUNTINGTON GALLIPOLIS FERRY WV 25515 0.017145 0.356 0.373145 0.8975 0 5.55112E-17 1.270645
GMC TRUCK GROUP ARLINGTON ASSEMBLY PLANT 2525 E ABRAMS ST ARLINGTON TX 76010 0.37 0.9 1.27 0 0 1.27
BRUNSWICK CORP MERCURY MARINE DIV W6250 PIONEER RD FOND DU LAC WI 54935 0.127 1.143 1.27 0 0 1.27
KMCO CROSBY PLANT 16503 RAMSEY RD CROSBY TX 77532 0.125 0.125 0.25 0 0 1 1.25
WINSLOW-BROWNING INC 215 BROWNSVILLE AVE LIBERTY IN 47353 1.2345 0 1.2345 0 0 0 1.2345
WARREN UNILUBE INC 1200 S 8TH ST WEST MEMPHIS AR 72301 1.2195 0.0045 1.224 0 0 0 1.224
Page 17 of 38

Table B-3. 2011 Emissions Inventory: Non-Zero Certain Glycol Ether Reported Releases
Facility Name Address City State Zip Code
Onsite Point Source
Emissions (tpy)
Onsite Fugitive
Emissions (tpy)
Total Air Emissions
(tpy)
Total Releases to Surface
Water (tpy)a
Total Releases to Soil (tpy)b
Total Releases to Other Media
(tpy)c
Total Emissions
(tpy)
VEOLIA ES TECHNICAL SOLUTIONS LLC PORT ARTHUR FACILITY
HWY 73, 3.5 MILES W OF TAPORT ARTHUR TX 77640 0.01137 0.000025 0.011395 0 0 1.2015 1.212895
SUN CHEMICAL CORP 2445 PRODUCTION DR SAINT CHARLES IL 60174 0.1815 1.027 1.2085 0 0 0 1.2085
NICHOLS ALUMINUM ALABAMA INC 2001 HWY 20 W DECATUR AL 35601 0.9685 0.2385 1.207 0 0 1.207
RYCOLINE PRODUCTS LLC 5540 NW HWY CHICAGO IL 60630 0.179 1.015 1.194 0 0 0 1.194
ENGINEERED POLYMER SOLUTIONS INC D/B/A VALSPAR COATINGS
701 SHILOH RD GARLAND TX 75042 0.701 0.477 1.178 0 0 1.178
MOMENTIVE SPECIALTY CHEMICALS INC 8600 W 71ST ST BEDFORD PARK IL 60501 0.202 0.966 1.168 0 0 0 1.168
LOCKHEED MARTIN AERONAUTICS CO 1011 LOCKHEED WAY MZ 0 PALMDALE CA 93599 0.0475 0.4305 0.478 0 0.6769 1.1549
GENTEK BUILDING PRODUCTS 11 CRAGWOOD RD AVENEL NJ 07001 0.1105 1.0205 1.131 0 0 0 1.131
CANBERRA CORP 3610 N HOLLAND-SYLVANIATOLEDO OH 43615 0.75 0.375 1.125 0 0 1.125
HILLYARD INDUSTRIES INC 402 N 3TH ST SAINT JOSEPH MO 64501 0.41 0.7075 1.1175 0 0 1.1175
WISMARQ VALENCIA LLC 125 MCFANN RD VALENCIA PA 16059 1.0195 0.095 1.1145 0 0 0 1.1145
CROWN CORK & SEAL CO (USA) INC CROWN CLOSURES DIV
940 MILL PARK DR LANCASTER OH 43130 0 1.1105 1.1105 0 0 0 1.1105
CELLU TISSUE/CITYFOREST LLC 1215 WORDEN AVE E LADYSMITH WI 54848 0 0 0 1.092 0 1.092
GENERAL MOTORS GM VA DETROIT-HAMTRAMCK ASSEMBLY CENTER
2500 E GENERAL MOTORS DETROIT MI 48211 0.85 0.21 1.06 0 0.0315 1.0915
POLYMERIC IMAGING INC 117 E 14TH AVE NORTH KANSAS CITMO 64116 0 1.0535 1.0535 0 0 0 1.0535
JOHN DEERE SEEDING & CYLINDER 501 RIVER DR MOLINE IL 61265 0 1 1 0 0 0.052 1.052
TESORO REFINING & MARKETING CO - MANDAN REFINERY
900 OLD RED TRAIL NE MANDAN ND 58554 1.05 0.0005 1.0505 0 0 0 1.0505
RED SPOT PAINT & VARNISH CO INC 1016 E COLUMBIA ST EVANSVILLE IN 47711 0.621 0.426 1.047 0 0 0 1.047
PPG INDUSTRIES OHIO INC (CL) 3800 W 143 ST CLEVELAND OH 44111 0.3955 0.647 1.0425 0 0 0 1.0425
PPG ARCHITECTURAL FINISHES EAST POINT 1377 OAKLEIGH DR EAST POINT GA 30344 0.0025 0.459 0.4615 0 0 0.5645 1.026
MITSUBISHI MOTORS NORTH AMERICA INC 100 N MITSUBISHI MOTORWNORMAL IL 61761 1.0115 0.01 1.0215 0 0 0 1.0215
CP CONVERTERS INC 15 GRUMBACHER RD YORK PA 17402 1.01857 0 1.01857 0 0 0 1.01857
TTM TECHNOLOGIES-SANTA CLARA 407 MATHEW ST SANTA CLARA CA 95050 0 1.0005 1.0005 0 0 1.0005
POLARTEC LLC 46 STAFFORD ST LAWRENCE MA 01841 0.998 0 0.998 0 0 0.998
AKZONOBEL AEROSPACE COATINGS 1 E WATER ST WAUKEGAN IL 60085 0.491 0.493 0.984 0 0 0 0.984
SUN CHEMICAL CORP 1380 FORD RD MAUMEE OH 43537 0.145 0.821 0.966 0 0 0 0.966
UNITED PAINT & CHEMICAL 24671 TELEGRAPH RD SOUTHFIELD MI 48034 0.9615 0 0.9615 0 0 0 0.9615
INTEL CORP - RONLER ACRES CAMPUS 2501 NW 229TH ST HILLSBORO OR 97124 0.0025 0.95 0.9525 0 0 0.9525
SPIRALKOTE FLEXIBLE PACKAGING 1200 CENTRAL FLORIDA PKORLANDO FL 32837 0 0.941 0.941 0 0 0 0.941
Page 18 of 38

Table B-3. 2011 Emissions Inventory: Non-Zero Certain Glycol Ether Reported Releases
Facility Name Address City State Zip Code
Onsite Point Source
Emissions (tpy)
Onsite Fugitive
Emissions (tpy)
Total Air Emissions
(tpy)
Total Releases to Surface
Water (tpy)a
Total Releases to Soil (tpy)b
Total Releases to Other Media
(tpy)c
Total Emissions
(tpy)
HUNT REFINING CO A CORP 1855 FAIRLAWN RD TUSCALOOSA AL 35401 0.932 0 0.932 0 0 0.932
PARKER HANNIFIN 400 S ST MC COOK NE 69001 0 0 0 0 0 0.9275 0.9275
COMPLEMENTARY COATINGS CORP 4701 O'DONNELL ST BALTIMORE MD 21224 0.9215 0 0.9215 0 0 0 0.9215
3M CO - BROWNWOOD 4501 HWY 377 S BROWNWOOD TX 76801 0.06 0.85 0.91 0 0 0.007 0.917
FINISHES UNLIMITED INC 482 WHEELER RD SUGAR GROVE IL 60554 0.4455 0.4455 0.891 0 0 0.891
WESTERN METAL DECORATING CO 8875 INDUSTRIAL AVE RANCHO CUCAMONCA 91730 0.5 0.375 0.875 0 0 0 0.875
PRECOAT METALS 5888 E COUNTY RD 180 BLYTHEVILLE AR 72315 0 0.874 0.874 0 0 0 0.874
LEVLAD 9200 MASON AVE CHATSWORTH CA 91311 0.00017 0 0.00017 0 0.8475 0.84767
PARISER INDUSTRIES INC 91 MICHIGAN AVE PATERSON NJ 07503 0.845 0 0.845 0 0 0.845
CURTIS METAL FINISHING CO 9917 N ALPINE MACHESNEY PARK IL 61115 0.594 0.237 0.831 0 0 0.831
GREIF PACKAGING LLC 2400 COOPER AVE MERCED CA 95348 0.174 0.652 0.826 0 0 0 0.826
GENERAL MOTORS LLC BOWLING GREEN ASSEMBLY PLANT
600 CORVETTE DR BOWLING GREEN KY 42101 0.165 0.65 0.815 0 0 0.815
CCP COMPOSITES US 2434 HOLMES RD HOUSTON TX 77051 0.8 0.0026 0.8026 0 0 0 0.8026
ALCOA COMMERCIAL WINDOWS LLC (DBA TRACO) 71 PROGRESS AVE CRANBERRY TOWN PA 16066 0.032 0.7645 0.7965 0 0 0 0.7965
TTM TECHNOLOGIES INC 234 CASHMAN DR CHIPPEWA FALLS WI 54729 0 0.793 0.793 0 0 0.793
KAWNEER CO INC 7200 DOE AVE VISALIA CA 93291 0.054 0.7295 0.7835 0 0 0 0.7835
WATSON STANDARD CO (NEVILLE ISLAND PLANT) 2895 GRAND AVE PITTSBURGH PA 15225 0.6695 0.1055 0.775 0 0 0 0.775
CHAMPION TECHNOLOGIES INC 115 PROCTOR ODESSA TX 79762 0.2845 0.0085 0.293 0 0 0.4805 0.7735
NICHOLS ALUMINUM DAVENPORT 1725 ROCKINGHAM RD DAVENPORT IA 52802 0.217 0.556 0.773 0 0 0.773
SPECTRUM METAL FINISHING 535 BEV RD YOUNGSTOWN OH 44512 0.4 0.35 0.75 0 0 0.002 0.752
UNIVAR USA INC HOUSTON FM 529 11235 FM 529 HOUSTON TX 77041 0.375 0.375 0.75 0 0 0.75
RUST-OLEUM CORP 8105 95TH ST PLEASANT PRAIRIE WI 53158 0.375 0.375 0.75 0 0 0 0.75
STEELSCAPE 222 W KALAMA RIVER RD KALAMA WA 98625 0.00447 0.731035 0.735505 0 0 0 0.735505
ZEP INC 1310 SEABOARD INDUSTRI ATLANTA GA 30318 0.104 0.138 0.242 0.0705 0.4195 0.732
GLASS COATINGS & CONCEPTS 300 LAWTON AVE MONROE OH 45050 0.7245 0.0025 0.727 0 0 0.727
BASF CORP 1175 MARTIN ST GREENVILLE OH 45331 0.085 0.135 0.22 0 0 0.5 0.72
SYNDICATE SYSTEMS INC 402 N MAIN ST MIDDLEBURY IN 46540 0 0.712 0.712 0 0 0 0.712
CHRYSLER GROUP LLC STERLING STAMPING PLANT (PART)
35777 VAN DYKE STERLING HEIGHTSMI 48312 0.7 0 0.7 0 0 0 0.7
SPARTAN CHEMICAL CO INC 1110 SPARTAN DR MAUMEE OH 43537 0.0675 0 0.0675 0 0.608 0.6755
WORWAG COATINGS LLC NORTH AMERICA 3420 KOSSUTH ST LAFAYETTE IN 47905 0.5495 0.125 0.6745 0 0 0 0.6745
Page 19 of 38
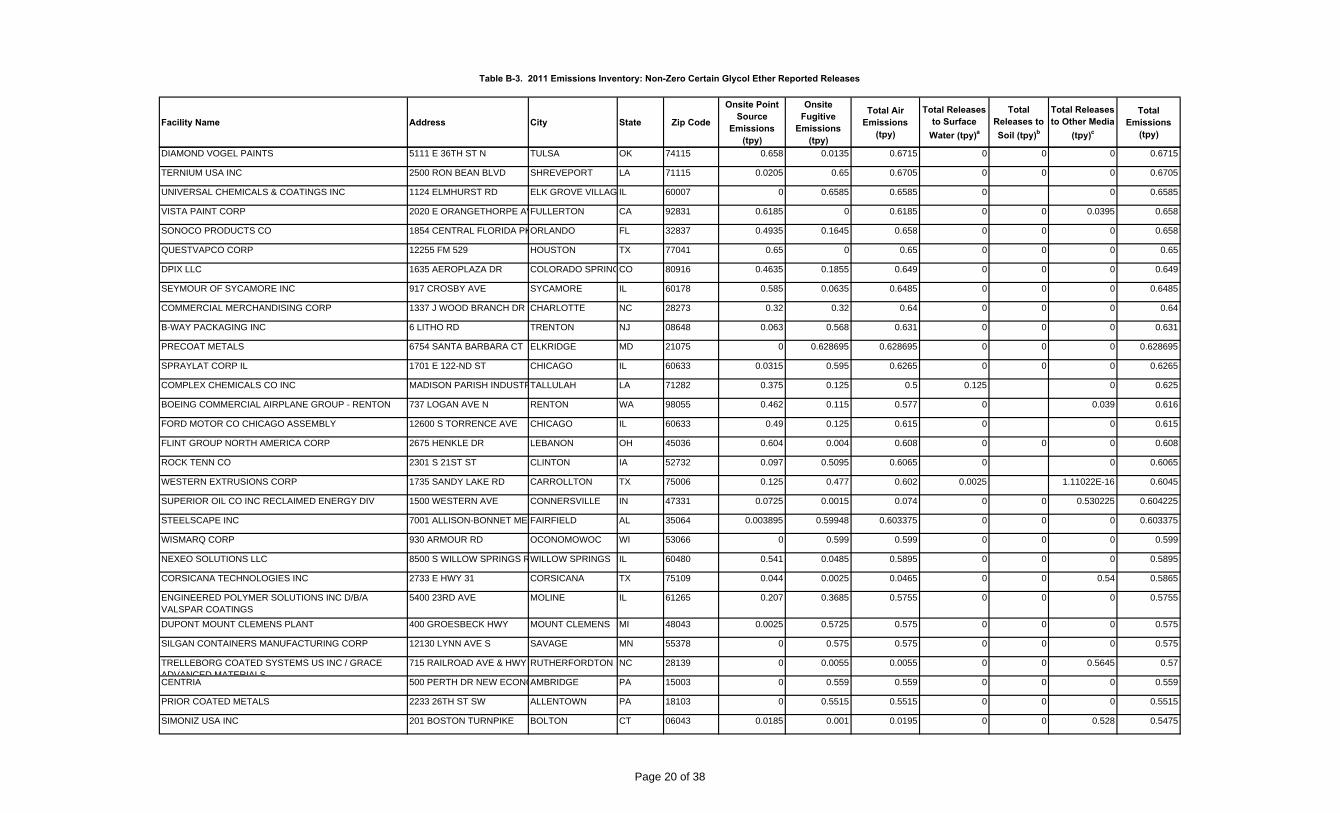
Table B-3. 2011 Emissions Inventory: Non-Zero Certain Glycol Ether Reported Releases
Facility Name Address City State Zip Code
Onsite Point Source
Emissions (tpy)
Onsite Fugitive
Emissions (tpy)
Total Air Emissions
(tpy)
Total Releases to Surface
Water (tpy)a
Total Releases to Soil (tpy)b
Total Releases to Other Media
(tpy)c
Total Emissions
(tpy)
DIAMOND VOGEL PAINTS 5111 E 36TH ST N TULSA OK 74115 0.658 0.0135 0.6715 0 0 0 0.6715
TERNIUM USA INC 2500 RON BEAN BLVD SHREVEPORT LA 71115 0.0205 0.65 0.6705 0 0 0 0.6705
UNIVERSAL CHEMICALS & COATINGS INC 1124 ELMHURST RD ELK GROVE VILLAG IL 60007 0 0.6585 0.6585 0 0 0.6585
VISTA PAINT CORP 2020 E ORANGETHORPE AVFULLERTON CA 92831 0.6185 0 0.6185 0 0 0.0395 0.658
SONOCO PRODUCTS CO 1854 CENTRAL FLORIDA PKORLANDO FL 32837 0.4935 0.1645 0.658 0 0 0 0.658
QUESTVAPCO CORP 12255 FM 529 HOUSTON TX 77041 0.65 0 0.65 0 0 0 0.65
DPIX LLC 1635 AEROPLAZA DR COLORADO SPRINGCO 80916 0.4635 0.1855 0.649 0 0 0 0.649
SEYMOUR OF SYCAMORE INC 917 CROSBY AVE SYCAMORE IL 60178 0.585 0.0635 0.6485 0 0 0 0.6485
COMMERCIAL MERCHANDISING CORP 1337 J WOOD BRANCH DR CHARLOTTE NC 28273 0.32 0.32 0.64 0 0 0 0.64
B-WAY PACKAGING INC 6 LITHO RD TRENTON NJ 08648 0.063 0.568 0.631 0 0 0 0.631
PRECOAT METALS 6754 SANTA BARBARA CT ELKRIDGE MD 21075 0 0.628695 0.628695 0 0 0 0.628695
SPRAYLAT CORP IL 1701 E 122-ND ST CHICAGO IL 60633 0.0315 0.595 0.6265 0 0 0 0.6265
COMPLEX CHEMICALS CO INC MADISON PARISH INDUSTRTALLULAH LA 71282 0.375 0.125 0.5 0.125 0 0.625
BOEING COMMERCIAL AIRPLANE GROUP - RENTON 737 LOGAN AVE N RENTON WA 98055 0.462 0.115 0.577 0 0.039 0.616
FORD MOTOR CO CHICAGO ASSEMBLY 12600 S TORRENCE AVE CHICAGO IL 60633 0.49 0.125 0.615 0 0 0.615
FLINT GROUP NORTH AMERICA CORP 2675 HENKLE DR LEBANON OH 45036 0.604 0.004 0.608 0 0 0 0.608
ROCK TENN CO 2301 S 21ST ST CLINTON IA 52732 0.097 0.5095 0.6065 0 0 0.6065
WESTERN EXTRUSIONS CORP 1735 SANDY LAKE RD CARROLLTON TX 75006 0.125 0.477 0.602 0.0025 1.11022E-16 0.6045
SUPERIOR OIL CO INC RECLAIMED ENERGY DIV 1500 WESTERN AVE CONNERSVILLE IN 47331 0.0725 0.0015 0.074 0 0 0.530225 0.604225
STEELSCAPE INC 7001 ALLISON-BONNET ME FAIRFIELD AL 35064 0.003895 0.59948 0.603375 0 0 0 0.603375
WISMARQ CORP 930 ARMOUR RD OCONOMOWOC WI 53066 0 0.599 0.599 0 0 0 0.599
NEXEO SOLUTIONS LLC 8500 S WILLOW SPRINGS RWILLOW SPRINGS IL 60480 0.541 0.0485 0.5895 0 0 0 0.5895
CORSICANA TECHNOLOGIES INC 2733 E HWY 31 CORSICANA TX 75109 0.044 0.0025 0.0465 0 0 0.54 0.5865
ENGINEERED POLYMER SOLUTIONS INC D/B/A VALSPAR COATINGS
5400 23RD AVE MOLINE IL 61265 0.207 0.3685 0.5755 0 0 0 0.5755
DUPONT MOUNT CLEMENS PLANT 400 GROESBECK HWY MOUNT CLEMENS MI 48043 0.0025 0.5725 0.575 0 0 0 0.575
SILGAN CONTAINERS MANUFACTURING CORP 12130 LYNN AVE S SAVAGE MN 55378 0 0.575 0.575 0 0 0 0.575
TRELLEBORG COATED SYSTEMS US INC / GRACE ADVANCED MATERIALS
715 RAILROAD AVE & HWY RUTHERFORDTON NC 28139 0 0.0055 0.0055 0 0 0.5645 0.57
CENTRIA 500 PERTH DR NEW ECONOAMBRIDGE PA 15003 0 0.559 0.559 0 0 0 0.559
PRIOR COATED METALS 2233 26TH ST SW ALLENTOWN PA 18103 0 0.5515 0.5515 0 0 0 0.5515
SIMONIZ USA INC 201 BOSTON TURNPIKE BOLTON CT 06043 0.0185 0.001 0.0195 0 0 0.528 0.5475
Page 20 of 38

Table B-3. 2011 Emissions Inventory: Non-Zero Certain Glycol Ether Reported Releases
Facility Name Address City State Zip Code
Onsite Point Source
Emissions (tpy)
Onsite Fugitive
Emissions (tpy)
Total Air Emissions
(tpy)
Total Releases to Surface
Water (tpy)a
Total Releases to Soil (tpy)b
Total Releases to Other Media
(tpy)c
Total Emissions
(tpy)
SOUTHERN CLAY PRODUCTS INC 1335 S 13TH ST LOUISVILLE KY 40210 0.0025 0.125 0.1275 0 0.4175 0.545
ENGINEERED POLYMER SOLUTIONS I NC D/B/A VALSPAR COATINGS
90 CARSON RD BIRMINGHAM AL 35215 0.2075 0.331 0.5385 0 0 0 0.5385
SOUTHWEST DISTRIBUTING CO 539 S DREW ST MESA AZ 85210 0.006 0 0.006 0 0 0.53 0.536
HYDRITE CHEMICAL CO 114 N MAIN ST COTTAGE GROVE WI 53527 0.07 0.46 0.53 0 0 0 0.53
MARY KAY INC 1330 REGAL ROW DALLAS TX 75247 0.00026 0 0.00026 0 0.5265 0.52676
VEYANCE TECHNOLOGIES INC 400 N GOODYEAR RD MOUNT PLEASANT IA 52641 0.0005 0 0.0005 0 0.522 0.5225
MARCUS PAINT CO 235 E MARKET ST LOUISVILLE KY 40202 0.52 0.0025 0.5225 0 0 0 0.5225
CLEVELAND STEEL CONTAINER - PE OTONE FACILITY 117 E LINCOLN ST PEOTONE IL 60468 0.0065 0.5115 0.518 0 0 0 0.518
NALCO CO TULSA PLANT 102 6717 S 61ST W AVE TULSA OK 74131 0.000435 0.00335 0.003785 0 0 0.512 0.515785
REICHHOLD INC 249 ST LOUIS AVE VALLEY PARK MO 63088 0.256615 0.25603 0.512645 0 5E-06 0.51265
BRADLEY COATINGS GROUP 608 W CRAWFORD AVE CONNELLSVILLE PA 15425 0.364595 0 0.364595 0 0 0.147295 0.51189
NALCO CO 812 RENAUD DR SCOTT LA 70583 0.000325 0.0005335 0.0008585 0 0 0.51 0.5108585
MIDWEST METAL COATINGS 9 KONZEN CT GRANITE CITY IL 62040 0.412 0.098 0.51 0 0 0 0.51
BASF CORP 361 SHEEP PASTURE RD EAST SETAUKET NY 11733 0.008 0 0.008 0 0 0.5 0.508
KAWNEER CO INC 500 E 12TH ST BLOOMSBURG PA 17815 0.3415 0.164 0.5055 0 0 0 0.5055
CLARIANT CORP MARTIN PLANT 788 CHERT QUARRY RD MARTIN SC 29836 0.125 0.0025 0.1275 0.375 0 0 0.5025
FERRO CORP 251 W WYLIE AVE WASHINGTON PA 15301 0.125 0.375 0.5 0 0 0 0.5
CHEMICAL SPECIALISTS & DEVELOPMENT INC 9733 MEADOR RD CONROE TX 77303 0.125 0.375 0.5 0 0 0 0.5
ARKEMA INC 1415 STEELE AVE SW GRAND RAPIDS MI 49507 0.375 0.125 0.5 0 0 0 0.5
FORMULA CORP 4432 C ST NE AUBURN WA 98002 0.125 0 0.125 0 0.375 0.5
SASOL NORTH AMERICA INC LAKE CHARLES CHEMICAL COMPLEX
2201 OLD SPANISH TRAIL WESTLAKE LA 70669 0.3395 0.151 0.4905 0 0 0 0.4905
ALERIS ROLLED PRODUCTS INC 3321 DURHAM RD ROXBORO NC 27573 0.0025 0.4795 0.482 0 0 0 0.482
QG LLC 4581 LOWER VALLEY RD ATGLEN PA 19310 0.457 0.013 0.47 0 0 0 0.47
WARREN STAMPING PLANT (PART) 22800 MOUND RD WARREN MI 48091 0.46 0 0.46 0 0 0 0.46
SHERWIN-WILLIAMS CO 2802 W MILLER RD GARLAND TX 75041 0.003 0.025 0.028 0 0 0.421 0.449
KELLEY TECHNICAL COATINGS INC 1445 S 15TH ST LOUISVILLE KY 40210 0.445 0.0025 0.4475 0 0 0 0.4475
FORREST PAINT CO 1011 MCKINLEY ST EUGENE OR 97402 0.1785 0.2665 0.445 0 0 0.445
ARDAGH METAL PACKAGING USA INC 3030 BIRCH DR HALF MOONWEIRTON WV 26062 0.0695 0.375 0.4445 0 0 0 0.4445
RODDA PAINT CO 6123 N MARINE DR PORTLAND OR 97203 0.442 0 0.442 0 0 0 0.442
ENGLERT INC 1200 AMBOY AVE PERTH AMBOY NJ 08861 0.1825 0.2595 0.442 0 0 0 0.442
Page 21 of 38

Table B-3. 2011 Emissions Inventory: Non-Zero Certain Glycol Ether Reported Releases
Facility Name Address City State Zip Code
Onsite Point Source
Emissions (tpy)
Onsite Fugitive
Emissions (tpy)
Total Air Emissions
(tpy)
Total Releases to Surface
Water (tpy)a
Total Releases to Soil (tpy)b
Total Releases to Other Media
(tpy)c
Total Emissions
(tpy)
ARROW SHED LLC 1 THIRD AVE HASKELL NJ 07420 0.0025 0.166 0.1685 0 0 0.2685 0.437
SPRAYLAT CORP 716 S COLUMBUS AVE MOUNT VERNON NY 10550 0.0215 0.412 0.4335 0 0 0.4335
SIKA CORP SIKA SARNAFIL DIV 100 DAN RD CANTON MA 02021 0 0.433 0.433 0 0 0 0.433
WEST PENN OIL CO,INC130130 2305 MARKET ST EXT. WARREN PA 16365 0.4305 0 0.4305 0 0 0.4305
PCCR USA INC 400 E COTTAGE AVE CARPENTERSVILLE IL 60110 0.008 0.4215 0.4295 0 0 0 0.4295
PACKAGING CORP OF AMERICA COUNCE MILL HWY 57 COUNCE TN 38326 0.025 0 0.025 0.395 0 0.0025 0.4225
DUCKBACK PRODUCTS 2644 HEGAN LN CHICO CA 95928 0.4186 0 0.4186 0 0 0 0.4186
NB COATINGS INC 2701 E 170TH ST LANSING IL 60438 0.4055 0 0.4055 0 0 0.008 0.4135
WEBB CHEMICAL SERVICE CORP 2708 JARMAN MUSKEGON HEIGHTMI 49444 0.2605 0 0.2605 0 0.148 0.4085
INTEL CORP 4100 SARA RD M/S RR5-491RIO RANCHO NM 87124 0.0025 0.405 0.4075 0 0 0.4075
NAZDAR CHICAGO 1087 N N BRANCH ST CHICAGO IL 60622 0.1215 0.2835 0.405 0 0 0 0.405
BASF CORP 100 INDUSTRIAL BLVD SEAFORD DE 19973 0.0025 0 0.0025 0 0.3985 0.401
SEWELL PRODUCTS OF FLORIDA LLC 909 MAGNOLIA AVE AUBURNDALE FL 33823 0.398 0 0.398 0 0 0.398
THE DOW CHEMICAL CO - LOUISIANA OPERATIONS 21255 LA HWY 1 S PLAQUEMINE LA 70764 0.396 0 0.396 0 0 0 0.396
PERMA-PIPE OIL & GAS 5008-11 CURTIS LN NEW IBERIA LA 70560 0.395 0 0.395 0 0 0 0.395
AMERICAN METALS CORP 1000 CROCKER RD WESTLAKE OH 44145 0 0.391 0.391 0 0 0 0.391
DIVERSIFIED COATING SYSTEMS INC 309 ECHELON RD GREENVILLE SC 29605 0.078 0.309 0.387 0 0 0 0.387
VAN CAN CO 1226 S MANUFACTURERS RTRENTON TN 38382 0.003815 0.3815 0.385315 0 0 0 0.385315
SPECTRUM CUBIC INC 13 MCCONNELL ST SW GRAND RAPIDS MI 49503 0.0185 0.3665 0.385 0 0 0 0.385
3M CO - NEVADA 2120 E AUSTIN BLVD NEVADA MO 64772 0.195 0.19 0.385 0 0 0.385
INEOS AMERICAS LLC INEOS OXIDE DIV 21255A HWY 1 S PLAQUEMINE LA 70765 0.348 0.036 0.384 0 0 0 0.384
WISCONSIN ALUMINUM FOUNDRY CO INC 838 S 16TH ST MANITOWOC WI 54220 0 0.03505 0.03505 0 0.34875 0.3838
METAL COATERS 9133 CENTER AVE RANCHO CUCAMONCA 91730 0.03486 0.34859 0.38345 0 0 0 0.38345
BASF CORP 1609 BIDDLE AVE WYANDOTTE MI 48192 0.0025 0.0025 0.005 0.0025 0.375 0.3825
EURAMAX INTERNATIONAL INC 450 RICHARDSON DR LANCASTER PA 17603 0.01 0.371 0.381 0 0 0 0.381
NASCOTE INDUSTRIES 18310 ENTERPRISE AVE NASHVILLE IL 62263 0.132475 0.24667 0.379145 0 0 0 0.379145
ALERIS ROLLED PRODUCTS INC 1 REYNOLDS RD ASHVILLE OH 43103 0.0355 0.3435 0.379 0 0 0 0.379
ZSCHIMMER & SCHWARZ 70 GA HWY 22 W MILLEDGEVILLE GA 31061 0.0025 0.375 0.3775 0 0 0 0.3775
SANFORD LP LIQUID MANUFACTURING & TECHNOLOGY CENTER
831 VOLUNTEER PKWY MANCHESTER TN 37355 0.0025 0.375 0.3775 0 0 0 0.3775
Page 22 of 38

Table B-3. 2011 Emissions Inventory: Non-Zero Certain Glycol Ether Reported Releases
Facility Name Address City State Zip Code
Onsite Point Source
Emissions (tpy)
Onsite Fugitive
Emissions (tpy)
Total Air Emissions
(tpy)
Total Releases to Surface
Water (tpy)a
Total Releases to Soil (tpy)b
Total Releases to Other Media
(tpy)c
Total Emissions
(tpy)
QUEST SPECIALTY COATINGS LLC - MENOMONEE FALLS
N92 W14701 ANTHONY AVEMENOMONEE FALLSWI 53051 0.375 0 0.375 0 0 0 0.375
PATRIOT PAINT LLC 304 S BLAINE PIKE PORTLAND IN 47371 0.375 0 0.375 0 0 0 0.375
CHEMICAL SOLVENTS JENNINGS ROAD FACILITY 3751 JENNINGS RD CLEVELAND OH 44109 0.125 0.125 0.25 0 0 0.125 0.375
JASPER RUBBER PRODUCTS INC 1010 FIRST AVE JASPER IN 47546 0 0 0 0 0.375 0.375
TOWER PRODUCTS INC 2703 FREEMANSBURG AVEEASTON PA 18045 0.375 0 0.375 0 0 0.375
HB FULLER CO 7440 W DUPONT RD MORRIS IL 60450 0.3745 0 0.3745 0 0 0.3745
FULLER BRUSH CO ONE FULLER WAY GREAT BEND KS 67530 0.1245 0.2485 0.373 0 0 0.373
LINETEC 725 S 75TH AVE WAUSAU WI 54401 0.0205 0.3515 0.372 0 0 0 0.372
ENGINEERED POLYMER SOLUTIONS INC D/B/A VALSPAR COATINGS
347 CENTRAL AVE BOWLING GREEN KY 42101 0.1285 0.2415 0.37 0 0 0 0.37
NALCO CO PLANT 106 7701 US HWY 90A SUGAR LAND TX 77478 0.0552903 0.000065 0.0553553 0 0.31436 0.3697153
PFI INC 9215 SANTA FE SPRINGS RSANTA FE SPRINGSCA 90670 0.369 0 0.369 0 0 0 0.369
NELCO PRODUCTS INC 1107 E KIMBERLY ANAHEIM CA 92801 0.028 0.3355 0.3635 0 0 0 0.3635
COMBE PRODUCTS INC EL DUQUE INDUSTRIAL PARNAGUABO PR 00718 0 0 0 0 0.3615 0.3615
BEHR PROCESS CORP - CHICAGO 270 STATE ST CHICAGO HEIGHTS IL 60411 0.32265 0.00325 0.3259 0 0.0335 0 0.3594
DUPONT FORT MADISON PLANT 801 - 35TH ST FORT MADISON IA 52627 0 0.357 0.357 0 0 0 0.357
UNIVAR USA INC SALEM BRANCH COLONIAL RD SALEM MA 01970 0.001 0.001 0.002 0 0 0.352 0.354
CELLO PROFESSIONAL PRODUCTS 1354 OLD POST RD HAVRE DE GRACE MD 21078 0.3425 0.0015 0.344 0 0 0.344
SHERWIN-WILLIAMS CO 395 BOGGS LN - S RICHMOND KY 40475 0.321 0.021 0.342 0 0 0.002 0.344
CHEMGUARD INC 204 S 6TH AVE MANSFIELD TX 76063 0.2265 0.1105 0.337 0.002 0 0.339
EVONIK DEGUSSA CORP TIPPECANOE LABORATORIES 1650 LILLY RD LAFAYETTE IN 47909 0.235 0.096 0.331 0 0 0 0.331
ENGINEERED POLYMER SOLUTIONS INC D/B/A VALSPAR COATINGS
411 N DARLING FREMONT MI 49412 0.31 0.0195 0.3295 0 0 0 0.3295
FUCHS LUBRICANTS CO-CORPORATE OFFICE 17050 S LATHROP AVE HARVEY IL 60426 0.329 0 0.329 0 0 0 0.329
BEHR PROCESS CORP ATLANTA 130 DECLARATION DR MC DONOUGH GA 30253 0.299 0.00155 0.30055 0 0.0235 0 0.32405
ENERGIZER BATTERY MANUFACTURING INC 75 SWANTON RD SAINT ALBANS VT 05478 0.0025 0.1595 0.162 0 0 0.1615 0.3235
CHEMCOAT INC 2790 CANFIELDS LN MONTOURSVILLE PA 17754 0.0025 0 0.0025 0 0 0.3155 0.318
CNH AMERICA LLC 2701 OAKES RD STURTEVANT WI 53177 0.317 0 0.317 0 0 0.317
ACTEGA KELSTAR INC 1050 TAYLORS LN CINNAMINSON NJ 08077 0.0025 0.0075 0.01 0 0 0.3 0.31
EASTMAN KODAK CO EASTMAN BUSINESS PARK 1669 LAKE AVE ROCHESTER NY 14652 0 0.0035 0.0035 0.0315 0 0.2735 0.3085
AKZONOBEL COATINGS INC 120 FRANKLIN RD PONTIAC MI 48341 0.0485 0.012 0.0605 0 0.245 0.3055
Page 23 of 38
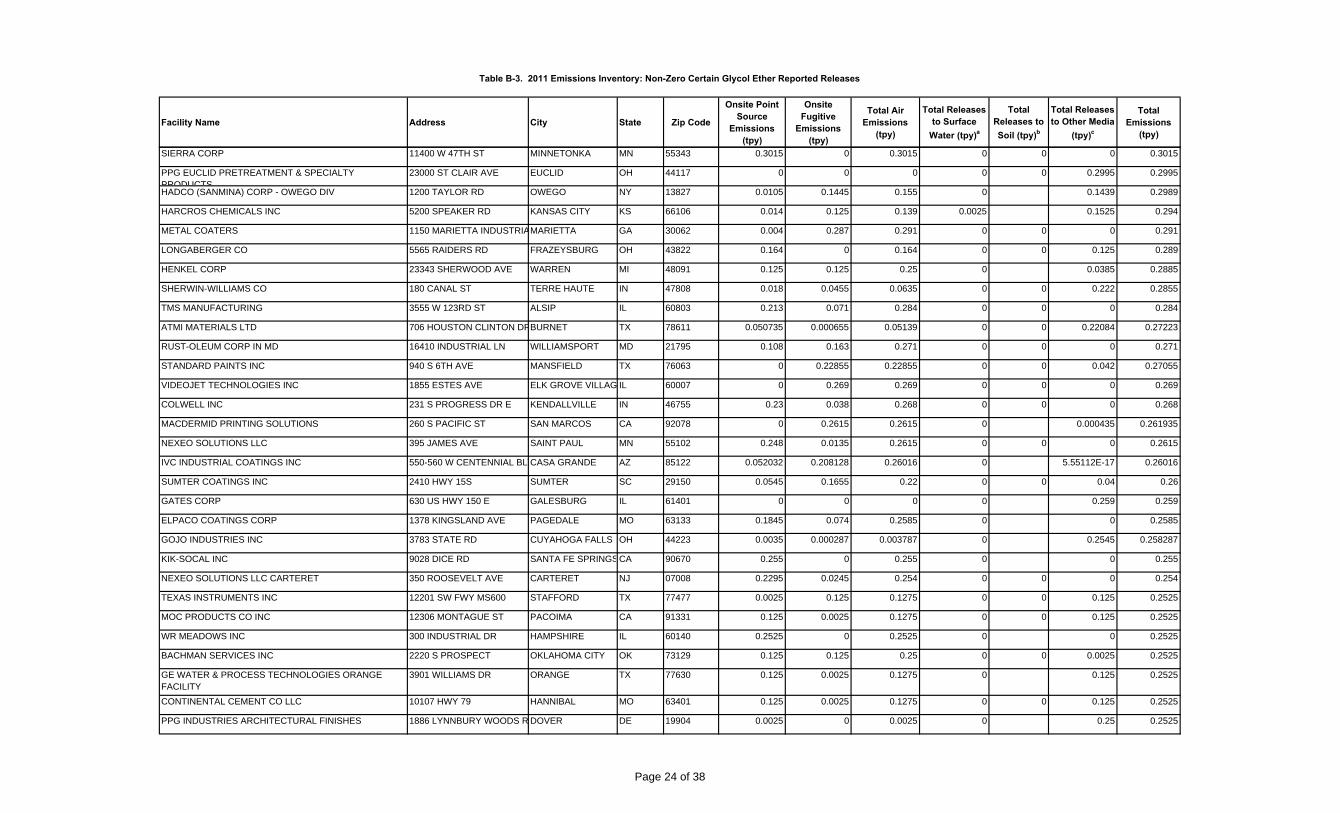
Table B-3. 2011 Emissions Inventory: Non-Zero Certain Glycol Ether Reported Releases
Facility Name Address City State Zip Code
Onsite Point Source
Emissions (tpy)
Onsite Fugitive
Emissions (tpy)
Total Air Emissions
(tpy)
Total Releases to Surface
Water (tpy)a
Total Releases to Soil (tpy)b
Total Releases to Other Media
(tpy)c
Total Emissions
(tpy)
SIERRA CORP 11400 W 47TH ST MINNETONKA MN 55343 0.3015 0 0.3015 0 0 0 0.3015
PPG EUCLID PRETREATMENT & SPECIALTY PRODUCTS
23000 ST CLAIR AVE EUCLID OH 44117 0 0 0 0 0 0.2995 0.2995
HADCO (SANMINA) CORP - OWEGO DIV 1200 TAYLOR RD OWEGO NY 13827 0.0105 0.1445 0.155 0 0.1439 0.2989
HARCROS CHEMICALS INC 5200 SPEAKER RD KANSAS CITY KS 66106 0.014 0.125 0.139 0.0025 0.1525 0.294
METAL COATERS 1150 MARIETTA INDUSTRIAMARIETTA GA 30062 0.004 0.287 0.291 0 0 0 0.291
LONGABERGER CO 5565 RAIDERS RD FRAZEYSBURG OH 43822 0.164 0 0.164 0 0 0.125 0.289
HENKEL CORP 23343 SHERWOOD AVE WARREN MI 48091 0.125 0.125 0.25 0 0.0385 0.2885
SHERWIN-WILLIAMS CO 180 CANAL ST TERRE HAUTE IN 47808 0.018 0.0455 0.0635 0 0 0.222 0.2855
TMS MANUFACTURING 3555 W 123RD ST ALSIP IL 60803 0.213 0.071 0.284 0 0 0 0.284
ATMI MATERIALS LTD 706 HOUSTON CLINTON DRBURNET TX 78611 0.050735 0.000655 0.05139 0 0 0.22084 0.27223
RUST-OLEUM CORP IN MD 16410 INDUSTRIAL LN WILLIAMSPORT MD 21795 0.108 0.163 0.271 0 0 0 0.271
STANDARD PAINTS INC 940 S 6TH AVE MANSFIELD TX 76063 0 0.22855 0.22855 0 0 0.042 0.27055
VIDEOJET TECHNOLOGIES INC 1855 ESTES AVE ELK GROVE VILLAG IL 60007 0 0.269 0.269 0 0 0 0.269
COLWELL INC 231 S PROGRESS DR E KENDALLVILLE IN 46755 0.23 0.038 0.268 0 0 0 0.268
MACDERMID PRINTING SOLUTIONS 260 S PACIFIC ST SAN MARCOS CA 92078 0 0.2615 0.2615 0 0.000435 0.261935
NEXEO SOLUTIONS LLC 395 JAMES AVE SAINT PAUL MN 55102 0.248 0.0135 0.2615 0 0 0 0.2615
IVC INDUSTRIAL COATINGS INC 550-560 W CENTENNIAL BLVCASA GRANDE AZ 85122 0.052032 0.208128 0.26016 0 5.55112E-17 0.26016
SUMTER COATINGS INC 2410 HWY 15S SUMTER SC 29150 0.0545 0.1655 0.22 0 0 0.04 0.26
GATES CORP 630 US HWY 150 E GALESBURG IL 61401 0 0 0 0 0.259 0.259
ELPACO COATINGS CORP 1378 KINGSLAND AVE PAGEDALE MO 63133 0.1845 0.074 0.2585 0 0 0.2585
GOJO INDUSTRIES INC 3783 STATE RD CUYAHOGA FALLS OH 44223 0.0035 0.000287 0.003787 0 0.2545 0.258287
KIK-SOCAL INC 9028 DICE RD SANTA FE SPRINGSCA 90670 0.255 0 0.255 0 0 0.255
NEXEO SOLUTIONS LLC CARTERET 350 ROOSEVELT AVE CARTERET NJ 07008 0.2295 0.0245 0.254 0 0 0 0.254
TEXAS INSTRUMENTS INC 12201 SW FWY MS600 STAFFORD TX 77477 0.0025 0.125 0.1275 0 0 0.125 0.2525
MOC PRODUCTS CO INC 12306 MONTAGUE ST PACOIMA CA 91331 0.125 0.0025 0.1275 0 0 0.125 0.2525
WR MEADOWS INC 300 INDUSTRIAL DR HAMPSHIRE IL 60140 0.2525 0 0.2525 0 0 0.2525
BACHMAN SERVICES INC 2220 S PROSPECT OKLAHOMA CITY OK 73129 0.125 0.125 0.25 0 0 0.0025 0.2525
GE WATER & PROCESS TECHNOLOGIES ORANGE FACILITY
3901 WILLIAMS DR ORANGE TX 77630 0.125 0.0025 0.1275 0 0.125 0.2525
CONTINENTAL CEMENT CO LLC 10107 HWY 79 HANNIBAL MO 63401 0.125 0.0025 0.1275 0 0 0.125 0.2525
PPG INDUSTRIES ARCHITECTURAL FINISHES 1886 LYNNBURY WOODS R DOVER DE 19904 0.0025 0 0.0025 0 0.25 0.2525
Page 24 of 38

Table B-3. 2011 Emissions Inventory: Non-Zero Certain Glycol Ether Reported Releases
Facility Name Address City State Zip Code
Onsite Point Source
Emissions (tpy)
Onsite Fugitive
Emissions (tpy)
Total Air Emissions
(tpy)
Total Releases to Surface
Water (tpy)a
Total Releases to Soil (tpy)b
Total Releases to Other Media
(tpy)c
Total Emissions
(tpy)
WATSON STANDARD CO HARWICK PLANT 616 HITE RD HARWICK PA 15049 0.229 0.0215 0.2505 0 0 0 0.2505
QUANTUM COATINGS INC 1337 N WOOD BRANCH DR CHARLOTTE NC 28273 0.125 0.125 0.25 0 0 0.25
MISCO PRODUCTS CORP 1048 STINSON DR READING PA 19605 0.125 0.125 0.25 0 0 0.25
MALCO PRODUCTS INC 361 FAIRVIEW AVE BARBERTON OH 44203 0.125 0.125 0.25 0 0 0 0.25
KEYSTONE ANILINE CORP 2165 HWY 292 INMAN SC 29349 0.125 0.125 0.25 0 0 0 0.25
EQUILON CARSON TERMINAL 20945 S WILMINGTON AVE CARSON CA 90810 0.125 0.125 0.25 0 0 0.25
PREMIER INK SYSTEMS INC 10420 N STATE ST HARRISON OH 45030 0.125 0 0.125 0 0.125 0.25
DELEET MERCHANDISING 26 BLANCHARD ST NEWARK NJ 07105 0.125 0.125 0.25 0 0 0.25
CERAM TRAZ CORP CERAMIC INDL COATINGS 325 HWY 81 OSSEO MN 55369 0.125 0.125 0.25 0 0 0.25
BECKER SPECIALTY CORP 15310 ARROW BLVD FONTANA CA 92335 0.125 0.125 0.25 0 0 0 0.25
UNIVAR USA INC STRONGSVILLE BRANCH 21600 DRAKE RD STRONGSVILLE OH 44136 0.125 0.125 0.25 0 0 0.25
ARCADIA INC 3225 E WASHINGTON BLVDVERNON CA 90058 0.125 0.125 0.25 0 0 0.25
UNIVAR USA INC HOUSTON 777 BRISBANE ST HOUSTON TX 77061 0.125 0.125 0.25 0 0 0 0.25
SILBOND CORP 9901 SAND CREEK HWY WESTON MI 49289 0.125 0.125 0.25 0 0 0 0.25
YENKIN-MAJESTIC PAINT CORPORAT ION 1920 LEONARD AVE COLUMBUS OH 43219 0.125 0.125 0.25 0 0 0 0.25
UNIVAR USA INC DALLAS DAN MORTON FACILITY 3636 DAN MORTON DR DALLAS TX 75236 0.125 0.125 0.25 0 0 0 0.25
UNIVAR USA INC HAMILTON BRANCH 12 STANDEN DR HAMILTON OH 45015 0.125 0.125 0.25 0 0 0.25
POWER SERVICE PRODUCTS INC 513 PEASTER HWY WEATHERFORD TX 76086 0.125 0.125 0.25 0 0 0 0.25
BERGQUIST CO 301 WASHINGTON ST W CANNON FALLS MN 55009 0.078 0.171 0.249 0 0 0 0.249
NEXEO SOLUTIONS LLC TWINSBURG HIGHLAND 1610 E HIGHLAND RD TWINSBURG OH 44087 0.2285 0.0195 0.248 0 0 0 0.248
AMREP INC 990 INDUSTRIAL PARK DR MARIETTA GA 30062 0.129 0.115 0.244 0 0 0 0.244
ARLON INC ADHESIVES & FILMS DIV 2811 S HARBOR BLVD SANTA ANA CA 92704 0.132 0.1045 0.2365 0 0 0 0.2365
NEXEO SOLUTIONS LLC DORAVILLE 4550 NE EXPRESSWAY DORAVILLE GA 30340 0.159 0.0695 0.2285 0 0 0 0.2285
GEMINI COATINGS INC 2300 HOLLOWAY DR EL RENO OK 73036 0.219 0.0025 0.2215 0.0025 0 0 0.224
ROLLEX CORP 800 CHASE AVE ELK GROVE VILLAG IL 60007 0 0.2235 0.2235 0 0 0.2235
INTEL CORP 4500 S DOBSON RD MAIL S CHANDLER AZ 85248 0.0025 0.22 0.2225 0 0 0.2225
DAVIS-FROST INC 3420 CANDLER'S MOUNTAI LYNCHBURG VA 24506 0.221 0 0.221 0 0 0 0.221
LAMBERTI USA INC - WHARTON CHEMICAL COMPLEX HWY 59 AT COUNTY RD 212HUNGERFORD TX 77448 0.0495 0 0.0495 0.055 0 0.11 0.2145
HENKEL CORP 923 MAULDIN RD CALHOUN GA 30701 0 0.0065 0.0065 0 0.205 0.2115
SERIGRAPH INC 3801 E DECORAH RD WEST BEND WI 53095 0.028 0.178 0.206 0 0 0.206
Page 25 of 38
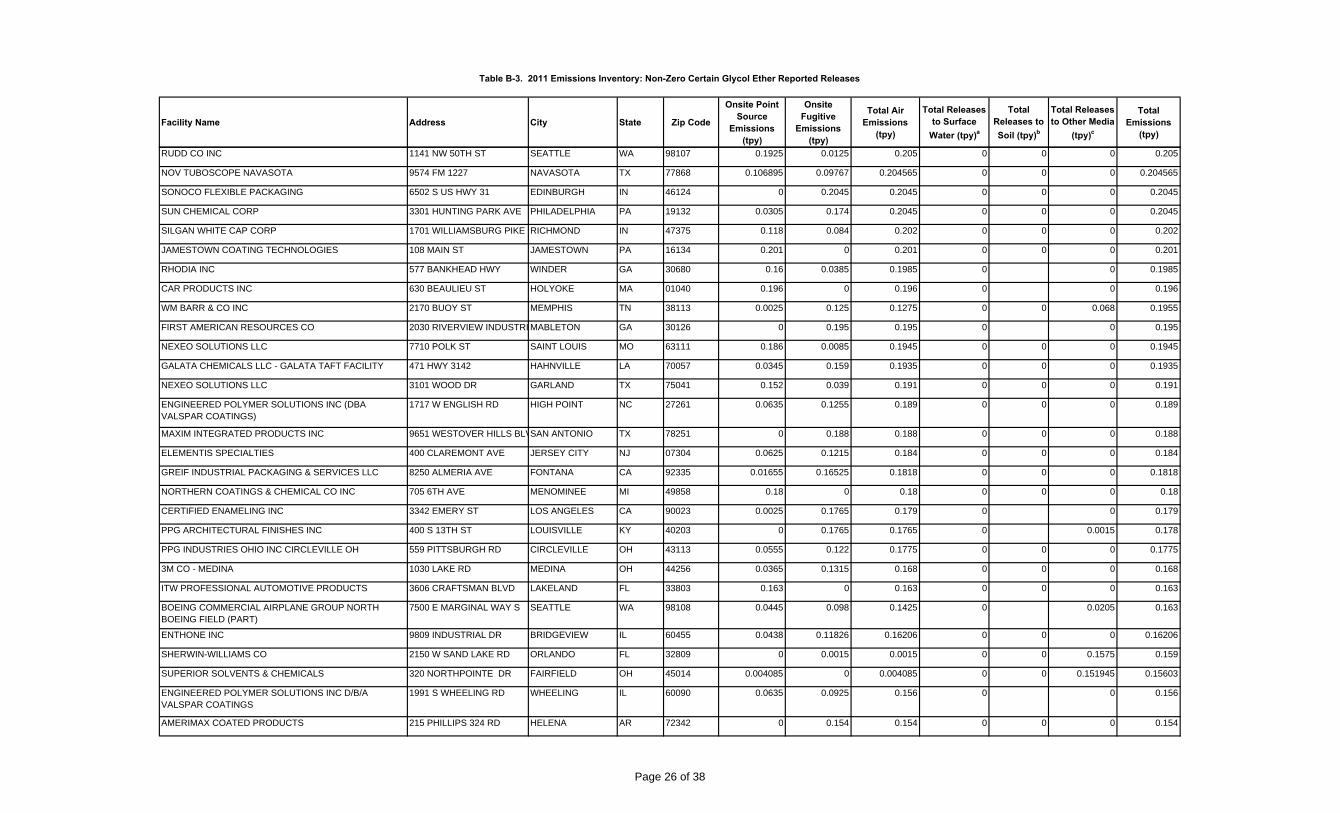
Table B-3. 2011 Emissions Inventory: Non-Zero Certain Glycol Ether Reported Releases
Facility Name Address City State Zip Code
Onsite Point Source
Emissions (tpy)
Onsite Fugitive
Emissions (tpy)
Total Air Emissions
(tpy)
Total Releases to Surface
Water (tpy)a
Total Releases to Soil (tpy)b
Total Releases to Other Media
(tpy)c
Total Emissions
(tpy)
RUDD CO INC 1141 NW 50TH ST SEATTLE WA 98107 0.1925 0.0125 0.205 0 0 0 0.205
NOV TUBOSCOPE NAVASOTA 9574 FM 1227 NAVASOTA TX 77868 0.106895 0.09767 0.204565 0 0 0 0.204565
SONOCO FLEXIBLE PACKAGING 6502 S US HWY 31 EDINBURGH IN 46124 0 0.2045 0.2045 0 0 0 0.2045
SUN CHEMICAL CORP 3301 HUNTING PARK AVE PHILADELPHIA PA 19132 0.0305 0.174 0.2045 0 0 0 0.2045
SILGAN WHITE CAP CORP 1701 WILLIAMSBURG PIKE RICHMOND IN 47375 0.118 0.084 0.202 0 0 0 0.202
JAMESTOWN COATING TECHNOLOGIES 108 MAIN ST JAMESTOWN PA 16134 0.201 0 0.201 0 0 0 0.201
RHODIA INC 577 BANKHEAD HWY WINDER GA 30680 0.16 0.0385 0.1985 0 0 0.1985
CAR PRODUCTS INC 630 BEAULIEU ST HOLYOKE MA 01040 0.196 0 0.196 0 0 0.196
WM BARR & CO INC 2170 BUOY ST MEMPHIS TN 38113 0.0025 0.125 0.1275 0 0 0.068 0.1955
FIRST AMERICAN RESOURCES CO 2030 RIVERVIEW INDUSTRI MABLETON GA 30126 0 0.195 0.195 0 0 0.195
NEXEO SOLUTIONS LLC 7710 POLK ST SAINT LOUIS MO 63111 0.186 0.0085 0.1945 0 0 0 0.1945
GALATA CHEMICALS LLC - GALATA TAFT FACILITY 471 HWY 3142 HAHNVILLE LA 70057 0.0345 0.159 0.1935 0 0 0 0.1935
NEXEO SOLUTIONS LLC 3101 WOOD DR GARLAND TX 75041 0.152 0.039 0.191 0 0 0 0.191
ENGINEERED POLYMER SOLUTIONS INC (DBA VALSPAR COATINGS)
1717 W ENGLISH RD HIGH POINT NC 27261 0.0635 0.1255 0.189 0 0 0 0.189
MAXIM INTEGRATED PRODUCTS INC 9651 WESTOVER HILLS BLVSAN ANTONIO TX 78251 0 0.188 0.188 0 0 0 0.188
ELEMENTIS SPECIALTIES 400 CLAREMONT AVE JERSEY CITY NJ 07304 0.0625 0.1215 0.184 0 0 0 0.184
GREIF INDUSTRIAL PACKAGING & SERVICES LLC 8250 ALMERIA AVE FONTANA CA 92335 0.01655 0.16525 0.1818 0 0 0 0.1818
NORTHERN COATINGS & CHEMICAL CO INC 705 6TH AVE MENOMINEE MI 49858 0.18 0 0.18 0 0 0 0.18
CERTIFIED ENAMELING INC 3342 EMERY ST LOS ANGELES CA 90023 0.0025 0.1765 0.179 0 0 0.179
PPG ARCHITECTURAL FINISHES INC 400 S 13TH ST LOUISVILLE KY 40203 0 0.1765 0.1765 0 0.0015 0.178
PPG INDUSTRIES OHIO INC CIRCLEVILLE OH 559 PITTSBURGH RD CIRCLEVILLE OH 43113 0.0555 0.122 0.1775 0 0 0 0.1775
3M CO - MEDINA 1030 LAKE RD MEDINA OH 44256 0.0365 0.1315 0.168 0 0 0 0.168
ITW PROFESSIONAL AUTOMOTIVE PRODUCTS 3606 CRAFTSMAN BLVD LAKELAND FL 33803 0.163 0 0.163 0 0 0 0.163
BOEING COMMERCIAL AIRPLANE GROUP NORTH BOEING FIELD (PART)
7500 E MARGINAL WAY S SEATTLE WA 98108 0.0445 0.098 0.1425 0 0.0205 0.163
ENTHONE INC 9809 INDUSTRIAL DR BRIDGEVIEW IL 60455 0.0438 0.11826 0.16206 0 0 0 0.16206
SHERWIN-WILLIAMS CO 2150 W SAND LAKE RD ORLANDO FL 32809 0 0.0015 0.0015 0 0 0.1575 0.159
SUPERIOR SOLVENTS & CHEMICALS 320 NORTHPOINTE DR FAIRFIELD OH 45014 0.004085 0 0.004085 0 0 0.151945 0.15603
ENGINEERED POLYMER SOLUTIONS INC D/B/A VALSPAR COATINGS
1991 S WHEELING RD WHEELING IL 60090 0.0635 0.0925 0.156 0 0 0.156
AMERIMAX COATED PRODUCTS 215 PHILLIPS 324 RD HELENA AR 72342 0 0.154 0.154 0 0 0 0.154
Page 26 of 38

Table B-3. 2011 Emissions Inventory: Non-Zero Certain Glycol Ether Reported Releases
Facility Name Address City State Zip Code
Onsite Point Source
Emissions (tpy)
Onsite Fugitive
Emissions (tpy)
Total Air Emissions
(tpy)
Total Releases to Surface
Water (tpy)a
Total Releases to Soil (tpy)b
Total Releases to Other Media
(tpy)c
Total Emissions
(tpy)
BYK USA INC 524 S CHERRY ST WALLINGFORD CT 06492 0.15 0.004 0.154 0 0 0.154
SUPERIOR OIL CO INC 400 W REGENT ST INDIANAPOLIS IN 46225 0.007065 0 0.007065 0 0 0.14669 0.153755
FRAZEE INDUSTRIES 6625 MIRAMAR RD SAN DIEGO CA 92121 0 0.1517 0.1517 0 0 0 0.1517
WR MEADOWS OF ARIZONA INC 4220 S SARIVAL RD GOODYEAR AZ 85338 0.1515 0 0.1515 0 0 0.1515
BLENTECH CORP 1305 RYE ST HOUSTON TX 77029 0.0125 0.01 0.0225 0 0.125 0.1475
STOUSE INC 300 NEW CENTURY PKWY NEW CENTURY KS 66031 0.1475 0 0.1475 0 0 0.1475
NEXEO SOLUTIONS LLC 2011 TURNER ST LANSING MI 48906 0.11 0.036 0.146 0 0 0 0.146
ENTHONE INC 350 FRONTAGE RD WEST HAVEN CT 06516 0.00284 0.142075 0.144915 0 0 0 0.144915
UNION CARBIDE CORP SOUTH CHARLESTON FACILITY 437 MACCORKLE AVE SW SOUTH CHARLESTOWV 25303 0.0745 0.0695 0.144 0 0 0.144
NEXEO SOLUTIONS LLC 3930 GLENWOOD DR CHARLOTTE NC 28208 0.085 0.055 0.14 0 0 0 0.14
MEADWESTVACO SOUTH CAROLINA LLC 400 CROSBY RD DERIDDER LA 70634 0.05 0.09 0.14 0 0 0 0.14
BJ CHEMICAL SERVICES 707 N LEECH HOBBS NM 88240 0.01 0.001905 0.011905 0 0.127845 0.13975
SKF SEALING SOLUTIONS 900 N STATE ST ELGIN IL 60123 0 0 0 0 0 0.139 0.139
ACCURATE DISPERSIONS 192 W 155TH ST SOUTH HOLLAND IL 60473 0.103 0.0305 0.1335 0 0.0045 0.138
WARREN OIL CO - NC 2340 US 301 N DUNN NC 28335 0.137 0.0005 0.1375 0 0 0 0.1375
ARDEX LABORATORIES INC 2050 BYBERRY RD PHILADELPHIA PA 19116 0.1365 0 0.1365 0 0 0.1365
SYNGENTA CROP PROTECTION LLC SAINT GABRIEL FACILITY
3905 HWY 75 SAINT GABRIEL LA 70776 0.0685 0.0645 0.133 0.0005 0 0 0.1335
MID-STATES PAINT & CHEMICAL CO 9315 WATSON INDUSTRIAL CRESTWOOD MO 63126 0.1325 0 0.1325 0 0 0.1325
ISP SYNTHETIC ELASTOMERS LP 1615 MAIN ST PORT NECHES TX 77651 0 0.132 0.132 0 0 0 0.132
BF GOODRICH TIRE MANUFACTURING 18906 US 24 E WOODBURN IN 46797 0.0025 0.0025 0.005 0 0 0.125 0.13
CYTEC INDUSTRIES INC LANGLEY PLANT 403 CARLINE RD LANGLEY SC 29834 0.12 0.009 0.129 0 0 0.129
BASF CORP 3455 SOUTHPORT RD SPARTANBURG SC 29302 0.125 0.0025 0.1275 0 0 0.1275
BRENNTAG GREAT LAKES LLC 14765 W BOBOLINK AVE MENOMONEE FALLSWI 53051 0.0025 0.125 0.1275 0 0 0 0.1275
CLEANING SYSTEMS INC 1997 AMERICAN BLVD DE PERE WI 54115 0.125 0.0025 0.1275 0 0 0.1275
COASTAL CHEMICAL CO LLC 3520 VETERANS MEMORIALABBEVILLE LA 70510 0.125 0.0025 0.1275 0 0 0 0.1275
US DOD DFSP SAN PEDRO 3171 N GAFFEY ST SAN PEDRO CA 90731 0.125 0.0025 0.1275 0 0 0.1275
NICCA USA INC 1044 S NELSON RD FOUNTAIN INN SC 29644 0.0025 0.125 0.1275 0 0 0.1275
OAKLEY INC 1 ICON FOOTHILL RANCH CA 92610 0.0025 0.125 0.1275 0 0 0 0.1275
PERMATEX SOLON 6875 PARKLAND BLVD SOLON OH 44139 0.0025 0.125 0.1275 0 0 0.1275
RR STREET & CO INC 2353 S BLUE ISLAND AVE CHICAGO IL 60608 0.0025 0.125 0.1275 0 0 0 0.1275
Page 27 of 38

Table B-3. 2011 Emissions Inventory: Non-Zero Certain Glycol Ether Reported Releases
Facility Name Address City State Zip Code
Onsite Point Source
Emissions (tpy)
Onsite Fugitive
Emissions (tpy)
Total Air Emissions
(tpy)
Total Releases to Surface
Water (tpy)a
Total Releases to Soil (tpy)b
Total Releases to Other Media
(tpy)c
Total Emissions
(tpy)
UNITED LABORATORIES INC 320 37TH AVE SAINT CHARLES IL 60174 0.125 0.0025 0.1275 0 0 0 0.1275
INTERNATIONAL PAINT LLC 6001 ANTOINE DR HOUSTON TX 77091 0.0025 0.125 0.1275 0 0 0 0.1275
COSMETIC LABORATORIES OF AMERICA 20245 SUNBURST ST CHATSWORTH CA 91311 0 0.002 0.002 0 0.125 0.127
SACRAMENTO- CAMPBELL SOUP SUPPLY CO 6200 FRANKLIN BLVD SACRAMENTO CA 95824 0.125 0 0.125 0 0 0.125
MICHELMAN INC 9080 SHELL RD CINCINNATI OH 45236 0 0 0 0 0.125 0.125
FLUID ROUTING SOLUTIONS INC 1921 N BROAD ST LEXINGTON TN 38351 0 0 0 0 0 0.125 0.125
MAINTEX INC 13300 E NELSON AVE CITY OF INDUSTRY CA 91746 0.125 0 0.125 0 0 0.125
PPG INDUSTRIES INC 500 PITTSBURGH AVE MCCARRAN NV 89434 0 0.125 0.125 0 0 0.125
CHEMETALL US INC 13177 HURON RIVER DR ROMULUS MI 48174 0 0.125 0.125 0 0 0 0.125
SICPA SECURINK CORP 8000 RESEARCH WAY SPRINGFIELD VA 22153 0.125 0 0.125 0 0 0 0.125
TNEMEC CO INC 2300 EDGEWATER AVE BALTIMORE MD 21222 0 0.125 0.125 0 0 0 0.125
TNEMEC CO INC 123 W 23RD AVE NORTH KANSAS CITMO 64116 0 0.125 0.125 0 0 0 0.125
KALCOR COATINGS CO 37721 STEVENS BLVD WILLOUGHBY OH 44094 0.125 0 0.125 0 0 0 0.125
TYSON FRESH MEATS INC HWY 50 W HOLCOMB KS 67851 0.125 0 0.125 0 0 0 0.125
SAFETY-KLEEN SYSTEMS INC 130 A FRONTAGE RD LEXINGTON SC 29073 0 0.125 0.125 0 0 0 0.125
CREE INC 4600 SILICON DR DURHAM NC 27703 0 0.125 0.125 0 0 0.125
DANLIN INDUSTRIES CORP 23737 HWY 47 THOMAS OK 73669 0.125 0 0.125 0 0 0.125
GAGE PRODUCTS CO 625 WANDA AVE FERNDALE MI 48220 0 0.125 0.125 0 0 0.125
GOLD EAGLE CO 4400 S KILDARE AVE CHICAGO IL 60632 0.125 0 0.125 0 0 0 0.125
COLUMBIA PAINT CORP 641 JACKSON AVE HUNTINGTON WV 25704 0.125 0 0.125 0 0 0 0.125
BERRYMAN PRODUCTS INC 3800 E RANDOL MILL RD ARLINGTON TX 76011 0.125 0 0.125 0 0 0.125
TRANS CHEMICAL INC 419 E DE SOTO AVE SAINT LOUIS MO 63147 0.125 0 0.125 0 0 0 0.125
AVON AUTOMOTIVE PLANT 1 603 W 7TH ST CADILLAC MI 49601 0.125 0 0.125 0 0 0 0.125
AKCROS CHEMICALS INC 500 JERSEY AVE NEW BRUNSWICK NJ 08901 0 0.125 0.125 0 0 0.125
AKZO NOBEL COATINGS INC 1431 PROGRESS AVE HIGH POINT NC 27260 0.125 0 0.125 0 0 0 0.125
INVISTA SARL - ORANGE SITE 3055A FM 1006 ORANGE TX 77630 0 0.125 0.125 0 0 0 0.125
AMERICAN JETWAY CORP 34136 MYRTLE WAYNE MI 48184 0.125 0 0.125 0 0 0 0.125
ARCH CHEMICALS INC HWY 933 BRANDENBURG KY 40108 0.065 0.059 0.124 0 0 0 0.124
HOLCIM (US) INC HOLLY HILL PLANT 200 SAFETY ST / HWY 453 HOLLY HILL SC 29059 0.0045 0.118 0.1225 0 0 0 0.1225
ENGINEERED POLYMER SOLUTIONS INC D/B/A VALSPAR COATINGS
3050 HANFORD DR LEBANON PA 17046 0.0635 0.059 0.1225 0 0 0 0.1225
Page 28 of 38
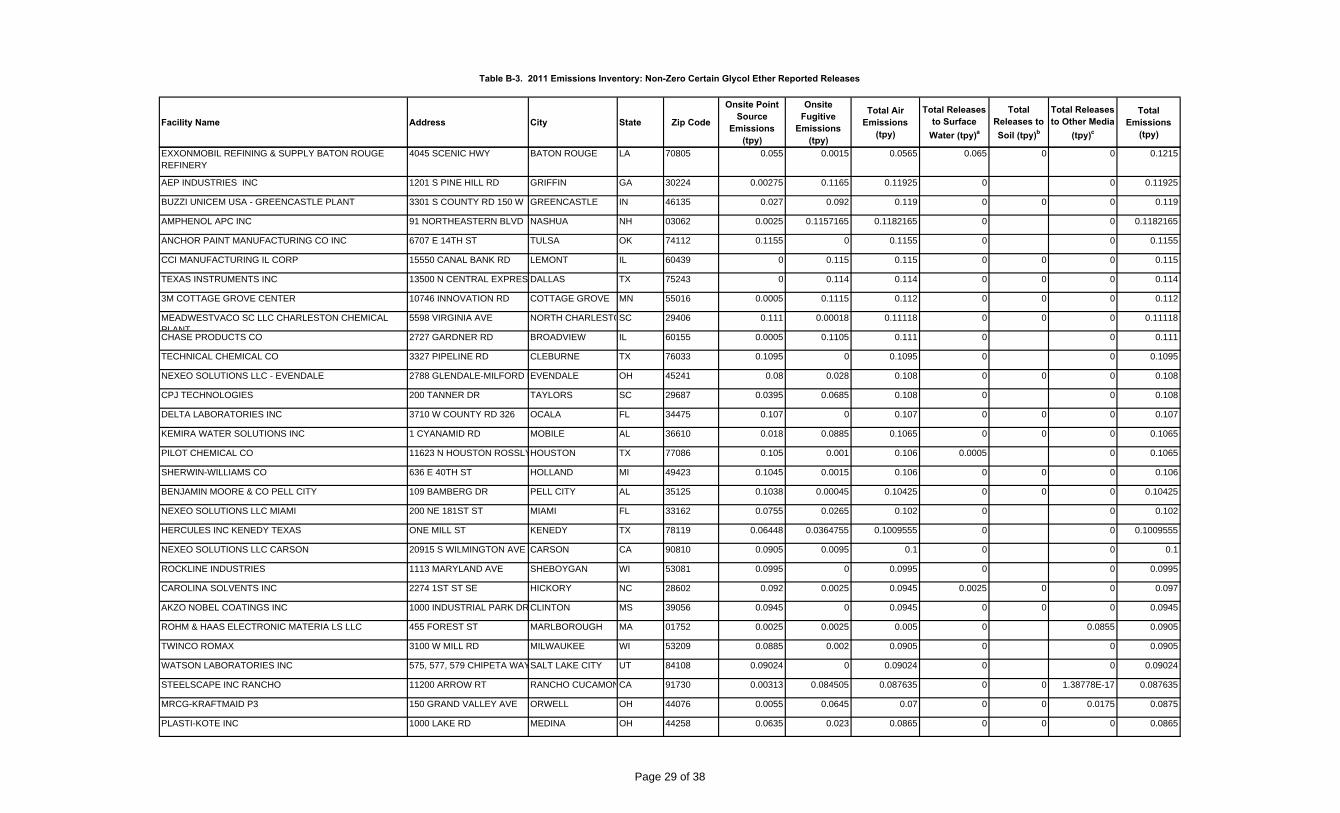
Table B-3. 2011 Emissions Inventory: Non-Zero Certain Glycol Ether Reported Releases
Facility Name Address City State Zip Code
Onsite Point Source
Emissions (tpy)
Onsite Fugitive
Emissions (tpy)
Total Air Emissions
(tpy)
Total Releases to Surface
Water (tpy)a
Total Releases to Soil (tpy)b
Total Releases to Other Media
(tpy)c
Total Emissions
(tpy)
EXXONMOBIL REFINING & SUPPLY BATON ROUGE REFINERY
4045 SCENIC HWY BATON ROUGE LA 70805 0.055 0.0015 0.0565 0.065 0 0 0.1215
AEP INDUSTRIES INC 1201 S PINE HILL RD GRIFFIN GA 30224 0.00275 0.1165 0.11925 0 0 0.11925
BUZZI UNICEM USA - GREENCASTLE PLANT 3301 S COUNTY RD 150 W GREENCASTLE IN 46135 0.027 0.092 0.119 0 0 0 0.119
AMPHENOL APC INC 91 NORTHEASTERN BLVD NASHUA NH 03062 0.0025 0.1157165 0.1182165 0 0 0.1182165
ANCHOR PAINT MANUFACTURING CO INC 6707 E 14TH ST TULSA OK 74112 0.1155 0 0.1155 0 0 0.1155
CCI MANUFACTURING IL CORP 15550 CANAL BANK RD LEMONT IL 60439 0 0.115 0.115 0 0 0 0.115
TEXAS INSTRUMENTS INC 13500 N CENTRAL EXPRES DALLAS TX 75243 0 0.114 0.114 0 0 0 0.114
3M COTTAGE GROVE CENTER 10746 INNOVATION RD COTTAGE GROVE MN 55016 0.0005 0.1115 0.112 0 0 0 0.112
MEADWESTVACO SC LLC CHARLESTON CHEMICAL PLANT
5598 VIRGINIA AVE NORTH CHARLESTOSC 29406 0.111 0.00018 0.11118 0 0 0 0.11118
CHASE PRODUCTS CO 2727 GARDNER RD BROADVIEW IL 60155 0.0005 0.1105 0.111 0 0 0.111
TECHNICAL CHEMICAL CO 3327 PIPELINE RD CLEBURNE TX 76033 0.1095 0 0.1095 0 0 0.1095
NEXEO SOLUTIONS LLC - EVENDALE 2788 GLENDALE-MILFORD REVENDALE OH 45241 0.08 0.028 0.108 0 0 0 0.108
CPJ TECHNOLOGIES 200 TANNER DR TAYLORS SC 29687 0.0395 0.0685 0.108 0 0 0.108
DELTA LABORATORIES INC 3710 W COUNTY RD 326 OCALA FL 34475 0.107 0 0.107 0 0 0 0.107
KEMIRA WATER SOLUTIONS INC 1 CYANAMID RD MOBILE AL 36610 0.018 0.0885 0.1065 0 0 0 0.1065
PILOT CHEMICAL CO 11623 N HOUSTON ROSSLYHOUSTON TX 77086 0.105 0.001 0.106 0.0005 0 0.1065
SHERWIN-WILLIAMS CO 636 E 40TH ST HOLLAND MI 49423 0.1045 0.0015 0.106 0 0 0 0.106
BENJAMIN MOORE & CO PELL CITY 109 BAMBERG DR PELL CITY AL 35125 0.1038 0.00045 0.10425 0 0 0 0.10425
NEXEO SOLUTIONS LLC MIAMI 200 NE 181ST ST MIAMI FL 33162 0.0755 0.0265 0.102 0 0 0.102
HERCULES INC KENEDY TEXAS ONE MILL ST KENEDY TX 78119 0.06448 0.0364755 0.1009555 0 0 0.1009555
NEXEO SOLUTIONS LLC CARSON 20915 S WILMINGTON AVE CARSON CA 90810 0.0905 0.0095 0.1 0 0 0.1
ROCKLINE INDUSTRIES 1113 MARYLAND AVE SHEBOYGAN WI 53081 0.0995 0 0.0995 0 0 0.0995
CAROLINA SOLVENTS INC 2274 1ST ST SE HICKORY NC 28602 0.092 0.0025 0.0945 0.0025 0 0 0.097
AKZO NOBEL COATINGS INC 1000 INDUSTRIAL PARK DRCLINTON MS 39056 0.0945 0 0.0945 0 0 0 0.0945
ROHM & HAAS ELECTRONIC MATERIA LS LLC 455 FOREST ST MARLBOROUGH MA 01752 0.0025 0.0025 0.005 0 0.0855 0.0905
TWINCO ROMAX 3100 W MILL RD MILWAUKEE WI 53209 0.0885 0.002 0.0905 0 0 0.0905
WATSON LABORATORIES INC 575, 577, 579 CHIPETA WAYSALT LAKE CITY UT 84108 0.09024 0 0.09024 0 0 0.09024
STEELSCAPE INC RANCHO 11200 ARROW RT RANCHO CUCAMONCA 91730 0.00313 0.084505 0.087635 0 0 1.38778E-17 0.087635
MRCG-KRAFTMAID P3 150 GRAND VALLEY AVE ORWELL OH 44076 0.0055 0.0645 0.07 0 0 0.0175 0.0875
PLASTI-KOTE INC 1000 LAKE RD MEDINA OH 44258 0.0635 0.023 0.0865 0 0 0 0.0865
Page 29 of 38

Table B-3. 2011 Emissions Inventory: Non-Zero Certain Glycol Ether Reported Releases
Facility Name Address City State Zip Code
Onsite Point Source
Emissions (tpy)
Onsite Fugitive
Emissions (tpy)
Total Air Emissions
(tpy)
Total Releases to Surface
Water (tpy)a
Total Releases to Soil (tpy)b
Total Releases to Other Media
(tpy)c
Total Emissions
(tpy)
NEXEO SOLUTIONS LLC 5420 SPEAKER RD KANSAS CITY KS 66106 0.078 0.008 0.086 0 0 0 0.086
CE BRADLEY LABORATORIES INC 55 BENNETT DR BRATTLEBORO VT 05301 0.0845 0 0.0845 0 0 0 0.0845
OLDCASTLE BUILDING ENVELOPE - TENNESSEE FACILITY
920 POTTERTOWN RD MIDWAY TN 37809 0 0.0845 0.0845 0 0 0 0.0845
NEXEO SOLUTIONS LLC 400 MAIN ST TEWKSBURY MA 01876 0.0755 0.0075 0.083 0 0 0 0.083
EXXONMOBIL CHEMICAL BATON ROUGE CHEMICAL PLANT
4999 SCENIC HWY BATON ROUGE LA 70805 0.032 0 0.032 0.05 0 0 0.082
AKZO NOBEL PAINTS PUERTO RICO LLC 65TH INFANTRY AVE KM. 13CAROLINA PR 00985 0.047 0.034845 0.081845 0 0 0.081845
ATHEA LABORATORIES INC 7855 N FAULKNER RD MILWAUKEE WI 53224 0.0816 0.00006 0.08166 0 0 0.08166
UNIVAR USA INC ROMULUS BRANCH 13395 HURON RIVER DR ROMULUS MI 48174 0.034 0.0465 0.0805 0 0 0 0.0805
SOUTH FLORIDA MATERIALS CORP DBA VECENERGY-PORT EVERGLADES
1200 SE 32ND ST FT LAUDERDALE FL 33316 0.078 0 0.078 0 0 0.078
LUBRIZOL 9550 W 55TH ST MC COOK IL 60525 0 0.0745 0.0745 0 0 0.0745
SUPERIOR SOLVENTS & CHEMICALS 4211 BRAMERS LN LOUISVILLE KY 40216 0.0035 0 0.0035 0 0 0.066175 0.069675
PPG INDUSTRIES OHIO INC - DELAWARE 760 PITTSBURGH DR DELAWARE OH 43015 0.03892 0.0298 0.06872 0 0 0.06872
PROCTER & GAMBLE HAIR CARE LLC 2200 LOWER MUSCATINE RIOWA CITY IA 52240 0.0205 0.009 0.0295 0 0.0375 0.067
MATTHEWS INTERNATIONAL CORP 101 FAIRVIEW AVE PITTSBURGH PA 15238 0.0515 0.0155 0.067 0 0 0 0.067
PLAZE INC 105 BOLTE LN SAINT CLAIR MO 63077 0.066 0 0.066 0 0 0 0.066
WHITFORD CORP 47 PARK AVE ELVERSON PA 19520 0.062295 0.00328 0.065575 0 0 0 0.065575
KARCHER NORTH AMERICA PROCHEM 325 S PRICE RD CHANDLER AZ 85224 0.0655 0 0.0655 0 0 0.0655
IMPERIAL PAINT CO INC 2526 NW YEON AVE PORTLAND OR 97210 0 0.0635 0.0635 0 0 0.0635
NEXEO SOLUTIONS LLC FAIRFIELD 2461 CROCKER CIR FAIRFIELD CA 94533 0.0615 0.001 0.0625 0 0 0 0.0625
VALVOLINE 720 VAIDEN DR HERNANDO MS 38632 0.017 0.0445 0.0615 0 0 0.0615
MAXIM INTEGRATED PRODUCTS INC 3725 N FIRST ST SAN JOSE CA 95134 0 0.0615 0.0615 0 0 0 0.0615
VEOLIA ES TECHNICAL SOLUTIONS LLC 125 FACTORY LN MIDDLESEX NJ 08846 0.045 0.0145 0.0595 0 0.001 0.0605
ADCO CLEANING PRODUCTS LLC 900 W MAIN ST SEDALIA MO 65301 0.0195 0.041 0.0605 0 0 0 0.0605
ABC COMPOUNDING CO OF TEXAS INC 1102 AVE J E GRAND PRAIRIE TX 75050 0.0025 0.0575 0.06 0 0 0 0.06
KAY CHEMICAL CO 8300 CAPITAL DR GREENSBORO NC 27409 0.011 0.0485 0.0595 0 0 0.0595
CLOROX PRODUCTS MANUFACTURING CO 2600 HUNTINGTON DR FAIRFIELD CA 94533 0.0585 0.0005 0.059 0 0 0.059
NPA COATINGS INC 11120 BEREA RD CLEVELAND OH 44102 0 0.0585 0.0585 0 0 0 0.0585
MINUTEMAN INTERNATIONAL MULTI-CLEAN DIV 600 CARDIGAN RD SHOREVIEW MN 55126 0.056 0.0025 0.0585 0 0 0.0585
FRANKLIN INTERNATIONAL 2020 BRUCK ST COLUMBUS OH 43207 0.0055 0.052 0.0575 0 0 0.0575
Page 30 of 38

Table B-3. 2011 Emissions Inventory: Non-Zero Certain Glycol Ether Reported Releases
Facility Name Address City State Zip Code
Onsite Point Source
Emissions (tpy)
Onsite Fugitive
Emissions (tpy)
Total Air Emissions
(tpy)
Total Releases to Surface
Water (tpy)a
Total Releases to Soil (tpy)b
Total Releases to Other Media
(tpy)c
Total Emissions
(tpy)
MRCG-KRAFTMAID P1 16052 INDUSTRIAL PKWY MIDDLEFIELD OH 44062 0 0.047 0.047 0 0 0.01 0.057
ECOLAB INC 942 BAKER RD MARTINSBURG WV 25405 0.0415 0.0145 0.056 0 0 0.056
ECOLAB INC 18383 E RAILROAD ST CITY OF INDUSTRY CA 91748 0.0195 0.0355 0.055 0 0 0.055
CLEVELAND STEEL CONTAINER - KILGORE 5005 ELDER LAKE RD KILGORE TX 75662 0.0025 0.052 0.0545 0 0 0 0.0545
HARLEY-DAVIDSON MOTOR CO OPERATIONS INC 1425 EDEN RD YORK PA 17402 0.007 0.0475 0.0545 0 0 0.0545
RECKITT BENCKISER 799 RT 206 & HILLSBOROUGHILLSBOROUGH NJ 08844 0.0445 0.01 0.0545 0 0 0.0545
VALSPAR SAMUEL CABOT DIV 100 HALE ST NEWBURYPORT MA 01950 0.0505 0.002 0.0525 0 0 0 0.0525
CONOCOPHILLIPS PONCA CITY REFINERY 1000 S PINE ST PONCA CITY OK 74602 0.0025 0.0495 0.052 0 0 0 0.052
AKZO NOBEL COATINGS INC 1660 CROSS ST SE SALEM OR 97302 0.0275 0.0244 0.0519 0 0 0.0519
HUNTSMAN ADVANCED MATERIALS AMERICAS INC 555 HUNTSMAN RD MC INTOSH AL 36553 0.0146 0.03655 0.05115 0 0 0.05115
ECOLAB INC 3001 CHANNAHON RD JOLIET IL 60436 0.0375 0.013 0.0505 0 0 0.0505
SHERWIN-WILLIAMS CO 630 E 13TH ANDOVER KS 67002 0.036 0.0145 0.0505 0 0 0 0.0505
UNIVAR USA INC - TOLEDO SOUTH BRANCH 4051 S AVE TOLEDO OH 43615 0.01 0.0405 0.0505 0 0 0.0505
CONOCOPHILLIPS OKLAHOMA CITY PRODUCTS TERMINAL
4700 NE 10TH ST OKLAHOMA CITY OK 73117 0.0025 0.0475 0.05 0 0 0.05
DYSTAR LP 209 WATLINGTON INDUSTRREIDSVILLE NC 27320 0.035 0.015 0.05 0 0 0.05
HENKEL CORP 137 FOLLY MILL RD SEABROOK NH 03874 0.0025 0.04705 0.04955 0 0 0 0.04955
CUSTOM SYNTHESIS LLC 1704 DENVER RD ANDERSON SC 29625 0.0025 0.047 0.0495 0 0 0 0.0495
BARTON SOLVENTS INC BETTENDORF 204 36TH ST BETTENDORF IA 52722 0.0115 0.0375 0.049 0 0 0.049
SHERWIN-WILLIAMS CO 113 STAGE COACH TRAIL GREENSBORO NC 27409 0.015 0.034 0.049 0 0 0 0.049
ELECTRONICS FOR IMAGING INC 1260 JAMES L HART PKWY YPSILANTI MI 48197 0.0485 0 0.0485 0 0 0 0.0485
BRENNTAG SOUTHEAST INC 2000 E PETTIGREW ST DURHAM NC 27703 0.029 0.017 0.046 0 0 0 0.046
DIC IMAGING PRODUCTS USA LLC 7335 S 10TH ST OAK CREEK WI 53154 0.0045 0.0415 0.046 0 0 0 0.046
GRAPHIC CONTROLS LLC 400 EXCHANGE ST BUFFALO NY 14204 0.046 0 0.046 0 0 0.046
ENGINEERED POLYMER SOLUTIONS INC D/B/A VALSPAR COATINGS
901 W UNION ST MONTEBELLO CA 90640 0.037 0.007 0.044 0 0 0 0.044
CHAMPION TECHNOLOGIES INC 3130 FM 521 FRESNO TX 77545 0.043 0 0.043 0 0 0 0.043
BRENNTAG PACIFIC INC 10747 PATTERSON PL SANTA FE SPRINGSCA 90670 0.038 0.0045 0.0425 0 0 0 0.0425
CHAMPION TECHNOLOGIES INC 1816 S JACKSON ST MAGNOLIA AR 71753 0.042 0.00005 0.04205 0 0 0 0.04205
ECOLAB INC 261 HWY 155 S MC DONOUGH GA 30253 0.0075 0.0335 0.041 0 0 0.041
ENGINEERED POLYMER SOLUTIONS INC D/B/A VALSPAR COATINGS
2000 WESTHALL ST PITTSBURGH PA 15233 0.0315 0.009 0.0405 0 0 0 0.0405
Page 31 of 38

Table B-3. 2011 Emissions Inventory: Non-Zero Certain Glycol Ether Reported Releases
Facility Name Address City State Zip Code
Onsite Point Source
Emissions (tpy)
Onsite Fugitive
Emissions (tpy)
Total Air Emissions
(tpy)
Total Releases to Surface
Water (tpy)a
Total Releases to Soil (tpy)b
Total Releases to Other Media
(tpy)c
Total Emissions
(tpy)
VALERO THREE RIVERS REFINERY 301 LEROY ST THREE RIVERS TX 78071 0.0395 0 0.0395 0 0 0 0.0395
BIOLAB INC 1735 DOGWOOD DR CONYERS GA 30012 0.03915 0 0.03915 0 0 0 0.03915
HANNA STEEL CORP 220 HANNA DR PEKIN IL 61554 0.0025 0.0355 0.038 0 0 0 0.038
CONOCOPHILLIPS CO EAST ST LOUIS TERMINAL 3300 MISSISSIPPI AVE CAHOKIA IL 62206 0 0.036 0.036 0 0.002 0 0.038
BRENNTAG SOUTHWEST INC SAND SPRINGS 206 E MORROW RD SAND SPRINGS OK 74063 0.0175 0.02 0.0375 0 0 0 0.0375
LUBRIZOL CORP 29400 LAKELAND BLVD WICKLIFFE OH 44092 0.0365 0 0.0365 0 0 0 0.0365
CHAMPION TECHNOLOGIES INC 710 MARVIN A SMITH BLVD LONGVIEW TX 75662 0.035 0.0015 0.0365 0 0 0 0.0365
HARCROS CHEMICALS INC 4606 NEW W DR PASADENA TX 77507 0.0125 0.0215 0.034 0 0.0025 0 0.0365
KWAL-HOWELLS INC (DBA KWAL PAINT INC) 2430 ALBERT BROADFOOT BONHAM TX 75418 0 0.0355 0.0355 0 0 0 0.0355
BARTON SOLVENTS INC DES MOINES 1970 NE BROADWAY DES MOINES IA 50313 0.0065 0.029 0.0355 0 0 0 0.0355
BARTON SOLVENTS INC KANSAS CITY 901 S 66TH TERRACE KANSAS CITY KS 66111 0.01 0.025 0.035 0 0 0 0.035
BRENNTAG NORTHEAST INC 81 W HULLER LN READING PA 19605 0.0177 0.0172 0.0349 0 0 0 0.0349
GEORGIA-PACIFIC CHEMICALS LLC 1429 E LUFKIN AVE LUFKIN TX 75901 0.032 0.002 0.034 0 0 0.034
DAUBERT CHEMICAL CO 4700 S CENTRAL AVE CHICAGO IL 60638 0.01723 0.015975 0.033205 0 0 0 0.033205
SI GROUP INC 1000 MAIN ST ROTTERDAM JUNCTNY 12150 0 0.02354 0.02354 0.0095 0 0 0.03304
NEXEO SOLUTIONS LLC TAMPA 5125 W HANNA AVE TAMPA FL 33634 0.0015 0.0315 0.033 0 0 0 0.033
BOEING COMMERCIAL AIRPLANE GROUP PLANT 2 (PART)
7755 E MARGINAL WAY S SEATTLE WA 98108 0.0305 0 0.0305 0 0.0025 3.46945E-18 0.033
NEXEO SOLUTIONS LLC HOUSTON 8901 OLD GALVESTON RD HOUSTON TX 77034 0.005 0.0265 0.0315 0 0 0 0.0315
HENKEL CORP 421 LONDON RD DELAWARE OH 43015 0 0.031 0.031 0 0 0.031
BAKER PETROLITE CORP 9100 W 21ST ST SAND SPRINGS OK 74063 0.01406 0.00076 0.01482 0 0 0.01577 0.03059
VALERO REFINING CO - TENNESSEE LLC 2385 RIVERPORT RD MEMPHIS TN 38109 0.03 0 0.03 0 0 0 0.03
UNIVAR USA INC MORRISVILLE BRANCH 200 DEAN SIEVERS PL MORRISVILLE PA 19067 0.0135 0.0165 0.03 0 0 0 0.03
ARKEMA COATINGS & RESINS 13511 MAIN ST LEMONT IL 60439 0.0075 0.0225 0.03 0 0 0 0.03
RICHARDSAPEX INC 4202-24 MAIN ST PHILADELPHIA PA 19127 0.021111 0 0.021111 0 0.0080495 0.0291605
HEXPOL COMPOUNDING BURTON RUBBER PROCESSING
HWY 353 S JONESBOROUGH TN 37659 0 0.0275 0.0275 0 0 0 0.0275
BARTON SOLVENTS INC WEST BEND 800 RAIL WAY WEST BEND WI 53095 0.0025 0.024 0.0265 0 0 0 0.0265
SHERWIN-WILLIAMS CO 1025 HOWARD ST GREENSBORO NC 27403 0.0055 0.021 0.0265 0 0 0.0265
TYCO FIRE SUPPRESSION & BUILDING PRODUCTS 1 STANTON ST MARINETTE WI 54143 0.002595 0.02347 0.026065 0 3.46945E-18 0.026065
BRENNTAG SOUTHWEST INC LONG VIEW 610 FISHER RD LONGVIEW TX 75604 0.014 0.012 0.026 0 0 0.026
Page 32 of 38

Table B-3. 2011 Emissions Inventory: Non-Zero Certain Glycol Ether Reported Releases
Facility Name Address City State Zip Code
Onsite Point Source
Emissions (tpy)
Onsite Fugitive
Emissions (tpy)
Total Air Emissions
(tpy)
Total Releases to Surface
Water (tpy)a
Total Releases to Soil (tpy)b
Total Releases to Other Media
(tpy)c
Total Emissions
(tpy)
PLAZE INC 1000 INTEGRAM DR PACIFIC MO 63069 0.025 0 0.025 0 0 0 0.025
BARTON SOLVENTS INC COUNCIL BLUFFS 2135 9TH AVE COUNCIL BLUFFS IA 51502 0.0015 0.0215 0.023 0 0 0 0.023
SHERWIN-WILLIAMS CO 2121 NEW WORLD DR COLUMBUS OH 43207 0.008 0.0135 0.0215 0 0 0 0.0215
SHERWIN-WILLIAMS CO 11700 S COTTAGE GROVE CHICAGO IL 60628 0 0 0 0 0 0.0215 0.0215
ECOLAB INC 2305 SHERWIN ST GARLAND TX 75041 0.0105 0.01 0.0205 0 0 0.0205
HERITAGE-WTI INC 1250 ST GEORGE ST EAST LIVERPOOL OH 43920 0.00495 0.00006 0.00501 0 0.015 0.02001
3M CO - SPRINGFIELD 3211 E CHESTNUT EXPY SPRINGFIELD MO 65802 0 0.02 0.02 0 0 0 0.02
AFTON CHEMICAL CORP 501 MONSANTO AVE SAUGET IL 62201 0.005 0.015 0.02 0 0 0.02
EXXONMOBIL OIL CORP - TORRANCE REFINERY 3700 W 190TH ST TORRANCE CA 90509 0.02 0 0.02 0 0 0.02
PRIDE SOLVENTS & CHEMICAL CO OF NEW JERSEY 211 RANDOLPH AVE AVENEL NJ 07001 0.005 0.0145 0.0195 0 0 0 0.0195
HEXPOL COMPOUNDING BURTON RUBBER PROCESSING
14330 KINSMAN RD BURTON OH 44021 0 0.0195 0.0195 0 0 0 0.0195
BARTON SOLVENTS INC WICHITA 201 S CEDAR VALLEY CENTER KS 67147 0.01 0.0095 0.0195 0 0 0 0.0195
UNIVAR USA INC JACKSONVILLE FA CILITY 155 ELLIS RD S JACKSONVILLE FL 32254 0.015 0.0045 0.0195 0 0 0 0.0195
ZEP COMMERCIAL 350 JOE FRANK HARRIS PKEMERSON GA 30137 0 0.019 0.019 0 0 0 0.019
VALSPAR REFINISH 210 CROSBY ST PICAYUNE MS 39466 0 0.019 0.019 0 0 0 0.019
VEOLIA ES TECHNICAL SOLUTIONS LLC 7 MOBILE AVE SAUGET IL 62201 0.0015 0.002 0.0035 0 0 0.0155 0.019
BENJAMIN MOORE & CO JOHNSTOWN UNION AVE EXTENSION JOHNSTOWN NY 12095 0.01885 0.0000175 0.0188675 0 0 0 0.0188675
VEYANCE TECHNOLOGIES INC 4021 N 56TH ST LINCOLN NE 68504 0.00000135 0.00000005 0.0000014 0 0.0179517 0.0179531
PRC-DESOTO INTERNATIONAL INC 11601 UNITED ST MOJAVE CA 93501 0.0075 0.0085 0.016 0 0 0 0.016
PLAZE INC 113 BOLTE LN SAINT CLAIR MO 63077 0.016 0 0.016 0 0 0 0.016
DUPONT PARLIN PLANT CHEESEQUAKE RD PARLIN NJ 08859 0.002 0.0135 0.0155 0 0 0 0.0155
CLEARWATER INTERNATIONAL LLC 100 INDUSTRIAL DR (BLDG LEETSDALE PA 15056 0.006 0.000085 0.006085 0 0.0092 0.015285
Z TECHNOLOGIES CORP 26500 CAPITOL AVE REDFORD MI 48239 0 0.0125 0.0125 0 0 0.0025 0.015
SHERWIN-WILLIAMS CO 6795 S MAIN ST MORROW GA 30260 0.004 0.0105 0.0145 0 0 0 0.0145
TOYO INK AMERICA LLC 2400 N HARVEY MITCHELL BRYAN TX 77807 0.005 0.009 0.014 0 0 0 0.014
INTERSTATE CHEMICAL CO INC 2797 FREEDLAND RD HERMITAGE PA 16148 0.003 0.011 0.014 0 0 0.014
RUSTOLEUM CORP 7850 OHIO RIVER RD LESAGE WV 25537 0.001 0.0125 0.0135 0 0 0 0.0135
AIR PRODUCTS PERFORMANCE MANUFACTURING INC 337 VINCENT DR MILTON WI 53563 0.0025 0.011 0.0135 0 0 0.0135
DAVIES IMPERIAL COATINGS INC 1275 STATE ST HAMMOND IN 46320 0.013 0 0.013 0 0 0.013
VARN INTERNATIONAL 1333 N KIRK RD BATAVIA IL 60510 0.008 0.0025 0.0105 0.0025 0 0 0.013
Page 33 of 38

Table B-3. 2011 Emissions Inventory: Non-Zero Certain Glycol Ether Reported Releases
Facility Name Address City State Zip Code
Onsite Point Source
Emissions (tpy)
Onsite Fugitive
Emissions (tpy)
Total Air Emissions
(tpy)
Total Releases to Surface
Water (tpy)a
Total Releases to Soil (tpy)b
Total Releases to Other Media
(tpy)c
Total Emissions
(tpy)
GOODWIN CO 700 PROGRESS CENTER AVLAWRENCEVILLE GA 30043 0.01091 0.002 0.01291 0 0 0.01291
PRIDE SOLVENT & CHEMICAL CO OF NY INC 6 LONG ISLAND AVE HOLTSVILLE NY 11742 0.003 0.0095 0.0125 0 0 0 0.0125
SHERWIN-WILLIAMS CO 2325 HOLLINS FERRY RD BALTIMORE MD 21230 0.0015 0.0105 0.012 0 0 0 0.012
NEXEO SOLUTIONS LLC TWINSBURG ENTERPRISE 1842 ENTERPRISE PKWY TWINSBURG OH 44087 0.002 0.0095 0.0115 0 0 0 0.0115
DSM DESOTECH INC 1101 HWY 27 S STANLEY NC 28164 0 0.0112 0.0112 0 0 0 0.0112
RESEARCH SOLUTIONS GROUP INC 133 BAIN DR LA VERGNE TN 37086 0.0003 0.01087 0.01117 0 0 0.01117
TRUE VALUE MANUFACTURING 201 JANDUS RD CARY IL 60013 0.0025 0.0085 0.011 0 0 0 0.011
DUPONT FRONT ROYAL PLANT 7961 WINCHESTER RD FRONT ROYAL VA 22630 0.001 0.01 0.011 0 0 0 0.011
SHERWIN-WILLIAMS CO 26300 FARGO AVE BEDFORD HEIGHTS OH 44146 0.0005 0.0015 0.002 0 0 0.009 0.011
HYDRITE CHEMICAL CO 2545 BOND ST UNIVERSITY PARK IL 60466 0 0.011 0.011 0 0 0 0.011
GIANT CEMENT CO HWY 453 & I-26 (654 JUDGEHARLEYVILLE SC 29448 0.001 0.001 0.002 0 0 0.0085 0.0105
FERRO CORP WALTON HILLS OPERATIONS 7050 KRICK RD WALTON HILLS OH 44146 0.0035 0.0005 0.004 0 0.0065 0.0105
TAKASAGO INTERNATIONAL CORP (USA) 267 UNION ST NORTHVALE NJ 07647 0.01 0.0005 0.0105 0 0 0.0105
VOGEL PAINT & WAX CO INC 1020 ALBANY PL SE ORANGE CITY IA 51041 0.0025 0.008 0.0105 0 0 0 0.0105
HOLLY OAK CHEMICAL INC 101 CASE ST FOUNTAIN INN SC 29644 0.010345 0 0.010345 0 0 0.010345
SHERWIN-WILLIAMS CO 12401 INDUSTRIAL BLVD VICTORVILLE CA 92392 0.0045 0.0055 0.01 0 0 0 0.01
UNIVAR USA INC NORCROSS FACILI TY 2145 SKYLAND CT NORCROSS GA 30071 0.0035 0.006 0.0095 0 0 0.0095
HUBBARD-HALL INC 563 S LEONARD ST WATERBURY CT 06708 0.0005 0.009 0.0095 0 0 0.0095
CARBOLINE CO 900 OPELOUSAS ST LAKE CHARLES LA 70601 0 0.0095 0.0095 0 0 0 0.0095
ETHOX CHEMICALS LLC 1801 PERIMETER RD GREENVILLE SC 29605 0.0025 0.0065 0.009 0 0 0.009
BUCKLEY OIL CO 1809 ROCK ISLAND ST DALLAS TX 75207 0.007 0.002 0.009 0 0 0 0.009
UNIVAR USA INC 7050 W 71ST ST BEDFORD PARK IL 60499 0.00472 0.00415 0.00887 0 0 0 0.00887
BERRIDGE MANUFACTURING CO 6515 FRATT RD SAN ANTONIO TX 78218 0 0.0085 0.0085 0 0 0 0.0085
GACO WESTERN 1245 CHAPMAN DR WAUKESHA WI 53186 0.0085 0 0.0085 0 0 0 0.0085
CHEMOL CO INC 2300 RANDOLPH AVE GREENSBORO NC 27406 0 0.00812 0.00812 0 0 0.00812
INTERSTATE CHEMICAL CO INC 23247 W EAMES ST CHANNAHON IL 60410 0.002 0.0055 0.0075 0 0 0.0075
CLEAN HARBORS ENVIRONMENTAL SERVICES INC 2247 S HWY 71 KIMBALL NE 69145 0.005 0.0025 0.0075 0 0 0 0.0075
UNIVAR USA INC NEW BERLIN 2400 S 170TH ST NEW BERLIN WI 53151 0.00505 0.00197 0.00702 0 0 0 0.00702
FORD MOTOR CO DEARBORN TOOL & DIE PLANT 3001 MILLER RD DEARBORN MI 48121 0.007 0 0.007 0 0 0.007
VERSO PAPER HOLDINGS LLC ANDROSCOGGIN MILL RILEJAY ME 04239 0.0025 0 0.0025 0.0035 0 0.0005 0.0065
Page 34 of 38

Table B-3. 2011 Emissions Inventory: Non-Zero Certain Glycol Ether Reported Releases
Facility Name Address City State Zip Code
Onsite Point Source
Emissions (tpy)
Onsite Fugitive
Emissions (tpy)
Total Air Emissions
(tpy)
Total Releases to Surface
Water (tpy)a
Total Releases to Soil (tpy)b
Total Releases to Other Media
(tpy)c
Total Emissions
(tpy)
PROCTER & GAMBLE CO GPDF 5348 VINE ST CINCINNATI OH 45217 0.0065 0 0.0065 0 0 0 0.0065
UNIVAR USA INC TAMPA FACILITY 6049 OLD 41A HWY TAMPA FL 33619 0.002 0.0045 0.0065 0 0 0 0.0065
UNIVAR USA INC DORAVILLE FACILITY 1 ALCHEMY PL DORAVILLE GA 30362 0.003 0.0035 0.0065 0 0 0.0065
SHERWIN-WILLIAMS CO 404 E MALLORY AVE MEMPHIS TN 38109 0.002 0.0045 0.0065 0 0 0 0.0065
PPG ARCHITECURAL COATINGS HOUSTON 3530 LANG RD HOUSTON TX 77092 0.0025 0.004 0.0065 0 0 0 0.0065
IGM RESINS CHARLOTTE 3300 WESTINGHOUSE BLVDCHARLOTTE NC 28273 0.0065 0 0.0065 0 0 0.0065
CONOCOCPHILLIPS CO WICHITA TERMINAL 2400 E 37TH ST N WICHITA KS 67219 0 0.00648 0.00648 0 0 0 0.00648
BRULIN CORP 2920 DR ANDREW J BROWNINDIANAPOLIS IN 46205 0.002642 0.003495 0.006137 0 0 0.006137
PROCTER & GAMBLE MANUFACTURING CO 1900 KANSAS AVE KANSAS CITY KS 66105 0.005905 0.000205 0.00611 0 0 0.00611
NEW DAWN MANUFACTURING CO 16001 TRADE ZONE AVE UPPER MARLBORO MD 20774 0.0060048 0 0.0060048 0 0 0.0060048
UNIVAR USA INC JAMESTOWN FACILITY 108 OAKDALE RD JAMESTOWN NC 27282 0.003 0.003 0.006 0 0 0.006
UNIVAR USA INC 2600 S GARFIELD AVE COMMERCE CA 90040 0.006 0 0.006 0 0 0 0.006
KING INDUSTRIES INC SCIENCE RD NORWALK CT 06852 0.0031 0.00275 0.00585 0 0 0.00585
LANCO MANUFACTURING CORP URB.APONTE #5 SAN LORENZO PR 00754 0.0056 0.00003 0.00563 0 0 0.00563
DIVERSEY INC - WAXDALE FACILITY 8311 16TH ST STURTEVANT WI 53177 0.00025 0.005285 0.005535 0 0 0.005535
CHEMTEX LABORATORIES INC 2725 ARMENTROUT DR CONCORD NC 28025 0.0055 0 0.0055 0 0 0.0055
OMNIUM 1280 IMPERIAL RD HAMPTON IA 50441 0.002 0.0035 0.0055 0 0 0 0.0055
CALLAHAN CHEMICAL CO 200 INDUSTRIAL AVE RIDGEFIELD PARK NJ 07660 0.0025 0.003 0.0055 0 0 0 0.0055
INTERNATIONAL PAINT LLC 640 N ROCKY RIVER DR BEREA OH 44017 0.0025 0.0025 0.005 0 0 0 0.005
CENTRAL SOLUTIONS INC 401 FUNSTON RD KANSAS CITY KS 66115 0 0 0 0 0.005 0 0.005
SARTOMER USA LLC 601 TIGHTSQUEEZE INDUS CHATHAM VA 24531 0.0025 0.0025 0.005 0 0 0.005
ANDERSON DEVELOPMENT CO 1415 E MICHIGAN ST ADRIAN MI 49221 0.0025 0.0025 0.005 0 0 0 0.005
CUSTOM CHEMICAL FORMULATORS INC 8707 MILLERGROVE DR SANTA FE SPRINGSCA 90670 0.005 0 0.005 0 0 0.005
GE WATER & PROCESS TECHNOLOGIES 333 S LOMBARD RD ADDISON IL 60101 0.0025 0.0025 0.005 0 0 0.005
CR BRANDS INC 141 VENTURE BLVD SPARTANBURG SC 29306 0.0025 0.0025 0.005 0 0 0.005
ACTON TECHNOLOGIES INC 100 THOMPSON ST PITTSTON PA 18640 0.005 0 0.005 0 0 0.005
CLOROX PRODUCTS MANUFACTURING CO 17 LAKE MIRROR RD FOREST PARK GA 30297 0.0025 0.0025 0.005 0 0 0.005
GE WATER & PROCESS TECHNOLOGIES 2118 REISER AVE SE NEW PHILADELPHIAOH 44663 0.0025 0.0025 0.005 0 0 0.005
C P INC 196 S WATER CONNERSVILLE IN 47331 0.0025 0.0025 0.005 0 0 0 0.005
INDEPENDENT INK INC 14705 S AVALON BLVD GARDENA CA 90248 0.0025 0.0025 0.005 0 0 0.005
Page 35 of 38

Table B-3. 2011 Emissions Inventory: Non-Zero Certain Glycol Ether Reported Releases
Facility Name Address City State Zip Code
Onsite Point Source
Emissions (tpy)
Onsite Fugitive
Emissions (tpy)
Total Air Emissions
(tpy)
Total Releases to Surface
Water (tpy)a
Total Releases to Soil (tpy)b
Total Releases to Other Media
(tpy)c
Total Emissions
(tpy)
OAKITE PRODUCTS INC (AKA CHEMETALL OAKITE) 16961 KNOTT AVE LA MIRADA CA 90638 0.0025 0.0025 0.005 0 0 0.005
PVS NOLWOOD CHEMICALS INC 9000 HUBBELL AVE DETROIT MI 48228 0.0025 0.0025 0.005 0 0 0 0.005
SARTOMER USA LLC 610 S BOLMAR ST WEST CHESTER PA 19382 0.0025 0.0025 0.005 0 0 0.005
GOODWIN CO 12361 MONARCH ST GARDEN GROVE CA 92841 0.004 0.001 0.005 0 0 0.005
BRAIN POWER INC 4470 SW 74TH AVE MIAMI FL 33155 0.0025 0.0025 0.005 0 0 0.005
REICHHOLD INC - AZUSA PLANT 237 S MOTOR AVE AZUSA CA 91702 0.0025 0.0025 0.005 0 0 0 0.005
EDCO PRODUCTS INC 8700 EXCELSIOR BLVD HOPKINS MN 55343 0 0.0045 0.0045 0 0 0 0.0045
EVONIK DEGUSSA CORP 4201 DEGUSSA RD THEODORE AL 36582 0.004 0.0005 0.0045 0 0 0 0.0045
LUBRIZOL CORP PAINESVIL LE PLANT 155 FREEDOM RD PAINESVILLE OH 44077 0.004 0.0005 0.0045 0 0 0.0045
RESEARCH SOLUTIONS GROUP INC 402 INDUSTRIAL PARK DR PELHAM AL 35124 0.00241 0.00184 0.00425 0 0 0 0.00425
TRANSTAR AUTOBODY TECHNOLOGIES 2040 HEISERMAN DR BRIGHTON MI 48114 0.00211 0.00207 0.00418 0 0 0 0.00418
PRESTONE PRODUCTS CORP 250 HALLS MILL RD FREEHOLD NJ 07728 0.002 0.002 0.004 0 0 0 0.004
MACDERMID INC 1221 FARROW AVE FERNDALE MI 48220 0.00178 0.00196 0.00374 0 0 0.00374
UNIVAR USA INC SANTA FE SPRINGS 13900 CARMENITA RD SANTA FE SPRINGSCA 90670 0.0005 0.003 0.0035 0 0 0 0.0035
PENRAY COS INC 1801 ESTES AVE ELK GROVE VILLAG IL 60007 0.0005 0.0005 0.001 0.0025 0 0.0035
SHERWIN-WILLIAMS CO 14 INDUSTRIAL PARK FLORA IL 62839 0.0015 0.002 0.0035 0 0 0 0.0035
BOEHRINGER INGELHEIM CHEMICALS INC 2820 N NORMANDY DR PETERSBURG VA 23805 0.0015 0.002 0.0035 0 0 0 0.0035
CLARIANT CORP CLEAR LAKE PLANT 9502 BAYPORT BLVD - ETO PASADENA TX 77507 0.0031 0 0.0031 0 0 0.0031
HENTZEN COATINGS,INC 6937 W MILL RD MILWAUKEE WI 53218 0.00125 0.00185 0.0031 0 0 0 0.0031
SUN CHEMICAL CORP 135 W LAKE ST NORTHLAKE IL 60164 0.0005 0.0025 0.003 0 0 0 0.003
AVANTOR PERFORMANCE MATERIALS 600 N BROAD ST PHILLIPSBURG NJ 08865 0.003 0 0.003 0 0 0 0.003
CONOCOPHILLIPS MT VERNON PRODUCTS TERMINAL 15138 HWY 96 MOUNT VERNON MO 65712 0 0.003 0.003 0 0 0 0.003
BRAINERD CHEMICAL CO INC 1200 N PEORIA TULSA OK 74147 0 0.0025 0.0025 0 0 0.0025
ECP INC WOODRIDGE 11210 KATHERINE'S CROSSWOODRIDGE IL 60517 0.0025 0 0.0025 0 0 0.0025
WYNNEWOOD REFINING CO 906 S POWELL WYNNEWOOD OK 73098 0 0.0025 0.0025 0 0 0 0.0025
US DOD DFSP VERONA 5449 W MAIN ST VERONA NY 13478 0.0025 0 0.0025 0 0 0 0.0025
UNION SPECIALTIES INC 3 MALCOLM HOYT DR NEWBURYPORT MA 01950 0.0005 0.002 0.0025 0 0 0 0.0025
RENESSENZ LLC JACKSONVILLE 601 CRESTWOOD ST JACKSONVILLE FL 32208 0.0025 0 0.0025 0 0 0 0.0025
NOV TUBOSCOPE HOLMES ROAD 2811 HOLMES RD HOUSTON TX 77051 0.0025 0 0.0025 0 0 0 0.0025
NIACET CORP 400 47TH ST NIAGARA FALLS NY 14304 0.0025 0 0.0025 0 0 0 0.0025
Page 36 of 38

Table B-3. 2011 Emissions Inventory: Non-Zero Certain Glycol Ether Reported Releases
Facility Name Address City State Zip Code
Onsite Point Source
Emissions (tpy)
Onsite Fugitive
Emissions (tpy)
Total Air Emissions
(tpy)
Total Releases to Surface
Water (tpy)a
Total Releases to Soil (tpy)b
Total Releases to Other Media
(tpy)c
Total Emissions
(tpy)
KEYSTONE CEMENT CO RT 329 BATH PA 18014 0 0.0025 0.0025 0 0 0 0.0025
HERCULES INC 1111 HERCULES RD HOPEWELL VA 23860 0.0025 0 0.0025 0 0 0.0025
HARWICK STANDARD DISTRIBUTION CORP 60 S SEIBERLING ST AKRON OH 44305 0.0025 0 0.0025 0 0 0.0025
A BRITE CO 3217 WOOD DR GARLAND TX 75041 0.0025 0 0.0025 0 0 0.0025
FINGER LAKES CHEMICAL INC 418-424 ST PAUL ST ROCHESTER NY 14605 0.0025 0 0.0025 0 0 0.0025
ATOTECH USA 1750 OVERVIEW DR ROCK HILL SC 29730 0.0025 0 0.0025 0 0 0 0.0025
DUPONT EKC TECHNOLOGY 2520 BARRINGTON CT HAYWARD CA 94545 0.0005 0.002 0.0025 0 0 0.0025
CR BRANDS INC 230 OLD CONVERSE RD SPARTANBURG SC 29307 0.0025 0 0.0025 0 0 0.0025
CHEMICAL SOLVENTS INC--DENISON FACILITY 1010 OLD DENISON AVE CLEVELAND OH 44109 0.0025 0 0.0025 0 0 0 0.0025
BRENNTAG SOUTHEAST INC 11750 FRUEHAUF DR CHARLOTTE NC 28273 0.001 0.0015 0.0025 0 0 0 0.0025
FISHER SCIENTIFIC INTERNATIONAL MTN DIAGNOSTICS PLANT
8365 VALLEY PIKE MIDDLETOWN VA 22645 0 0.0025 0.0025 0 0 0 0.0025
ASTRO CHEMICALS INC 126 MEMORIAL DR SPRINGFIELD MA 01104 0.0015 0.0005 0.002 0 0 0 0.002
CALLAHAN CHEMICAL CO 18 INDUSTRIAL RD WALPOLE MA 02081 0.001 0.001 0.002 0 0 0 0.002
FORD MOTOR CO DEARBORN DIVERSIFIED MANUFACTURING
3001 MILLER RD DEARBORN MI 48121 0.002 0 0.002 0 0 0 0.002
INTERCOASTAL PAINT CO INC 14029 W HARDY HOUSTON TX 77060 0.002 0 0.002 0 0 0.002
MARATHON PETROLEUM CO - SPEEDWAY IN TERMINAL
1304 OLIN AVE INDIANAPOLIS IN 46222 0.002 0 0.002 0 0 0.002
GENERAL DYNAMICS ORDNANCE & TACTICAL SYSTEMS GARLAND
1200 N GLENBROOK GARLAND TX 75040 0.00199 0.000005 0.001995 0 0 4.33681E-19 0.001995
UNIVAR USA INC - TOLEDO BRANCH 30450 TRACY RD WALBRIDGE OH 43465 0.001005 0.000885 0.00189 0 0 0.00189
VOLTAIX LLC 197 MEISTER AVE BRANCHBURG NJ 08876 0.0005 0.001 0.0015 0 0 0 0.0015
ROHM & HAAS CHEMICALS LLC 2401 E PRATT BLVD ELK GROVE VILLAG IL 60007 0 0.0015 0.0015 0 0 0 0.0015
PENRAY COS INC 440 DENNISTON CT WHEELING IL 60090 0.0005 0.0005 0.001 0.0005 0 0.0015
HYDRITE CHEMICAL CO 7300 W BRADLEY RD MILWAUKEE WI 53223 0.0005 0.001 0.0015 0 0 0.0015
ENGINEERED POLYMER SOLUTIONS INC 5501 E SLAUSON AVE CITY OF COMMERC CA 90040 0 0.0015 0.0015 0 0 0 0.0015
BUCKMAN LABORATORIES INC 1256 N MCLEAN BLVD MEMPHIS TN 38108 0 0.0015 0.0015 0 0 0.0015
DYNASOL INC 330 PINE ST CANTON MA 02021 0.00145 0 0.00145 0 0 0.00145
BENJAMIN MOORE & CO - NEWARK 134 LISTER AVE NEWARK NJ 07105 0.00135 0 0.00135 0 0 0 0.00135
BENJAMIN MOORE & CO - DALLAS 700 W KEARNEY MESQUITE TX 75149 0.001315 0.000012 0.001327 0 0 0 0.001327
NORLITE CORP 628 S SARATOGA ST COHOES NY 12047 0.00108 0.000205 0.001285 0 0 0 0.001285
CRODA INC 315 CHERRY LN NEW CASTLE DE 19720 0.000645 0.0005 0.001145 0 0 0.001145
Page 37 of 38

Table B-3. 2011 Emissions Inventory: Non-Zero Certain Glycol Ether Reported Releases
Facility Name Address City State Zip Code
Onsite Point Source
Emissions (tpy)
Onsite Fugitive
Emissions (tpy)
Total Air Emissions
(tpy)
Total Releases to Surface
Water (tpy)a
Total Releases to Soil (tpy)b
Total Releases to Other Media
(tpy)c
Total Emissions
(tpy)
FUJIFILM HUNT CHEMICALS USA INC 900 CARNEGIE ST ROLLING MEADOWSIL 60008 0.00095 0.00017 0.00112 0 2.1684E-19 0.00112
MANN DISTRIBUTION 3134 POST RD WARWICK RI 02886 0.001055 0 0.001055 0 0 0.001055
SINCLAIR WYOMING REFINING CO 100 E LINCOLN AVE SINCLAIR WY 82334 0.0005 0.0005 0.001 0 0 0 0.001
SDC TECHNOLOGIES INC 45 PARKER IRVINE CA 92618 0.0005 0.0005 0.001 0 0 0 0.001
OMNOVA SOLUTIONS INC 1455 J A COCHRAN BY-PASCHESTER SC 29706 0.000955 0.000025 0.00098 0 0 0.00098
RIKER PRODUCTS INC 4901 STICKNEY AVE TOLEDO OH 43612 0.000945 0 0.000945 0 0 0 0.000945
PPG ARCHITECTURAL COATINGS 6804 ENTERPRISE DR LOUISVILLE KY 40214 0 0.0007 0.0007 0 0 0 0.0007
LAMBERTI SYNTHESIS USA INC 4001 N HAWTHORNE ST CHATTANOOGA TN 37406 0.0005255 0 0.0005255 0 0 0 0.0005255
BP PRODUCTS NORTH AMERICA WHITING 2815 INDIANAPOLIS BLVD WHITING IN 46394 0.0005 0 0.0005 0 0 0 0.0005
NATIONAL INDUSTRIAL COATINGS INC DBA NICOAT INC
1600 GLENLAKE AVE ITASCA IL 60143 0.0005 0 0.0005 0 0 0 0.0005
NALCO CO 3901 TERRY ST TEXARKANA TX 75501 0 0.0005 0.0005 0 0 0.0005
BAKER PETROLITE-RAYNE FACILITY 135 INDUSTRIAL DR RAYNE LA 70578 0 0.0005 0.0005 0 0 0.0005
IFF AUGUSTA LTD 3005 INTERNATIONAL BLVDAUGUSTA GA 30906 0 0.0004385 0.0004385 0 0 0 0.0004385
PARKER HANNIFIN TECH SEAL DIV 2600 WILCO BLVD WILSON NC 27893 0 0.000405 0.000405 0 0 0.000405
GLIDDEN CO 1900 N JOSEY LN CARROLLTON TX 75006 0 0.000285 0.000285 0 0 0 0.000285
BAKER PETROLITE KILGORE BLEND PLANT 806 PALUXY ST KILGORE TX 75662 0.0001935 0.000079 0.0002725 0 0 0 0.0002725
BAKER PETROLITE CORP 16950 WALLISVILLE RD HOUSTON TX 77049 0.000048 0.000171 0.000219 0 0 0 0.000219
CHEMETALL US INC 1610 CLARA ST JACKSON MI 49203 0.0000441 0.0001213 0.0001654 0 0 0 0.0001654
BAKER PETROLITE BAYPORT FACILI TY 13200 BAYPARK RD PASADENA TX 77507 0 0.0001595 0.0001595 0 0 0 0.0001595
MULTI-COLOR CORP 2281 S US 31 SCOTTSBURG IN 47170 0 0.000156929 0.000156929 0 0 0.000156929
NALCO CO 125 NALCO WAY/RT 65 ELLWOOD CITY PA 16117 0.00000224 0.00007 0.00007224 0 0 0 0.00007224
EMERALD SERVICES INC 1825 E ALEXANDER AVE TACOMA WA 98421 0 0.00001 0.00001 0 0 0.00002 0.00003
AIR PRODUCTS PERFORMANCE MANUFACTURING INC 474 W 19TH ST RESERVE LA 70084 0 0.0000025 0.0000025 0 0 0.0000025
a. Releases to Surface Water reported as "On-Site Releases to Surface Water"b. Releases to Soil is the sum of reported releases to onsite and offsite releases to land treatment and other land disposal.c. Releases to other media include reported releases to on-site and offsite groundwater and landfills.tpy: tons per year
Page 38 of 38
APPENDIX C
Outcome of Screening Procedure for Long-Term Exposures

Table C-1. Comparisons of 2009 TRI Air Emissions Data for Certain Glycol Ethers to the Step A Screening Value of 4.9 tpy
Facility Name City State Zip Code2009 Air
Emissions (tpy)
Outcome
REXAM BEVERAGE CAN CO RE: WINSTON SALEM PLANT WINSTON-SALEM North Carolina 27107 172.2405 RetainBALL METAL BEVERAGE CONTAINER CORP WILLIAMSBURG Virginia 23185 167 RetainBALL METAL BEVERAGE CONTAINER CORP FINDLAY Ohio 45840 154.5 RetainREXAM BEVERAGE CAN CO RE: FREMONT PLANT FREMONT Ohio 43420 120.081 RetainCROWN FOOD PACKAGING OWATONNA Minnesota 55060 117.0605 RetainAURORA CASKET CO INC AURORA Indiana 47001 107.6265 RetainCROWN CORK & SEAL CO (USA) INC CROWN CLOSURE DIV WEIRTON West Virginia 26062 101.1455 RetainREXAM BEVERAGE CAN CO RE: BISHOPVILLE SC FACILITY BISHOPVILLE South Carolina 29010 96.4635 RetainREXAM BEVERAGE CAN CO RE: EVA STREET ST PAUL MN SAINT PAUL Minnesota 55107 93.5265 RetainFORD MOTOR CO DEARBORN TRUCK PLANT DEARBORN Michigan 48121 88.8 RetainREXAM BEVERAGE CAN CO OLIVE BRANCH FACILITY OLIVE BRANCH Mississippi 38654 88.089 RetainREXAM BEVERAGE CAN CO KENT WA FACILITY KENT Washington 98032 87.962 RetainBALL METAL BEVERAGE CONTAINER CORP REIDSVILLE North Carolina 27320 77 RetainCROWN BEVERAGE PACKAGING LAWRENCE Massachusetts 01843 72.1775 RetainBMW MANUFACTURING CO LLC GREER South Carolina 29651 70.632 RetainBALL CONTAINER LLC COLUMBUS CAN PLANT COLUMBUS Ohio 43213 70 RetainCROWN BEVERAGE PACKAGING BRADLEY Illinois 60915 68.5545 RetainCROWN BEVERAGE PACKAGING OLYMPIA Washington 98501 68.4155 RetainSILGAN CONTAINERS MANUFACTURING CORP LA PORTE Indiana 46350 67 RetainREXAM BEVERAGE CAN CO LONGVIEW FACILITY LONGVIEW Texas 75604 66.9795 RetainREXAM BEVERAGE CAN CO RE : CHICAGO PLANT CHICAGO Illinois 60609 65.3755 RetainMETAL CONTAINER CORP - JACKSONVILLE CAN PLANT JACKSONVILLE Florida 32254 61.44 RetainMETAL CONTAINER CORPORTION - WINDSOR CAN PLANT WINDSOR Colorado 80550 57.504 RetainWHIRLPOOL CORP MARION D IVISION MARION Ohio 43302 55.801 RetainREXAM BEVERAGE CAN CO CHATSWORTH FACILITY CHATSWORTH California 91311 54.6345 RetainSILGAN CONTAINERS MANUFACTURING CORP PLOVER Wisconsin 54467 50.75 RetainBALL CONTAINER LLC ROME CAN PLANT ROME Georgia 30161 49.5 RetainREXAM BEVERAGE CAN CO RE: WHITEHOUSE PLANT WHITEHOUSE Ohio 43571 48.081 RetainMETAL CONTAINER CORP - NEWBURGH CAN PLANT NEW WINDSOR New York 12553 46.4585 RetainHONDA OF AMERICA MANUFACTURING INC MARYSVILLE Ohio 43040 44.873 RetainCROWN BEVERAGE PACKAGING WORLAND Wyoming 82401 44.5215 RetainMETAL CONTAINER CORP - ARNOLD CAN PLANT ARNOLD Missouri 63010 44.1865 RetainBALL METAL BEVERAGE CONTAINER CORP MILWAUKEE Wisconsin 53224 42.5 RetainFORD MOTOR COMPANY--KANSAS CITY ASSEMBLY PLANT CLAYCOMO Missouri 64119 41.75 RetainRR DONNELLEY HARRISONBURG Virginia 22802 40.417 RetainREXAM BEVERAGE CAN CO PHOENIX FACILITY PHOENIX Arizona 85043 39.648 RetainCHRYSLER ST LOUIS NORTH ASSEMBLY PLANT FENTON Missouri 63026 37.5 RetainNEW UNITED MOTOR MANUFACTURING INC FREMONT California 94538 37.124 RetainBALL METAL FOOD CONTAINER CORP WEIRTON West Virginia 26062 37 RetainROCKY MOUNTAIN METAL CONTAINER GOLDEN Colorado 80401 36.5 RetainBALL METAL BEVERAGE CONTAINER CORP MONTICELLO Indiana 47960 36 RetainGM TRUCK GROUP FLINT ASSEMBLY PLANT VAN SLYKE COMPLEX
FLINT Michigan 48551 35.79 Retain
WHIRLPOOL CORP - CLYDE DIV CLYDE Ohio 43410 35.3585 RetainCROWN BEVERAGE PACKAGING CONROE Texas 77305 34.066 RetainCROWN FOOD PACKAGING BALTIMORE Maryland 21221 33.9615 RetainBALL METAL BEVERAGE CONTAINER CORP TORRANCE California 90503 33.65 RetainREXAM BEVERAGE CAN CO RE:OKLAHOMA CITY PLANT OKLAHOMA CITY Oklahoma 73179 33.5495 RetainFORD MOTOR CO KENTUCKY TRUCK PLANT LOUISVILLE Kentucky 40241 33.4 RetainNISSAN NA INC SMYRNA MANUFACTURING PLANT SMYRNA Tennessee 37167 33.318 RetainMETAL CONTAINER CORP - MIRA LOMA CAN PLANT MIRA LOMA California 91752 32.785 RetainCROWN BEVERAGE PACKAGING SUGAR LAND Texas 77478 32.1695 RetainBALL METAL BEVERAGE CONTAINER CORP FAIRFIELD California 94533 31.5 RetainBALL METAL BEVERAGE CONTAINER CORP GOLDEN Colorado 80403 31.5 RetainCHICAGO HEIGHTS STEEL CHICAGO HEIGHTS Illinois 60411 31.3915 RetainTHERMA-TRU CORP BUTLER Indiana 46721 31.029 RetainCROWN BEVERAGE PACKAGING CAROLINA Puerto Rico 00985 30.1245 RetainSENECA FOODS CORP BARABOO Wisconsin 53913 29.8385 RetainHONDA OF AMERICA MANUFACTURING INC EAST LIBERTY Ohio 43319 29.45 RetainEFCO CORP MONETT Missouri 65708 29.234 RetainGREIF PACKAGING LLC FLORENCE Kentucky 41042 27.5305 RetainBALL METAL BEVERAGE CONTAINER CORP TAMPA Florida 33617 27 RetainNISSAN NORTH AMERICA INC CANTON MS CANTON Mississippi 39046 26.619 RetainCHRYSLER JEFFERSON NORTH ASSEMBLY PLANT DETROIT Michigan 48215 26.5 RetainNYW REALTY LLC/ HANOVER HANOVER Pennsylvania 17331 25.986 RetainEDSAL MANUFACTURING CO INC CHICAGO Illinois 60609 25.7385 RetainCROWN BEVERAGE PACKAGING BATESVILLE Mississippi 38606 25.251 RetainCROWN BEVERAGE PACKAGING LA CROSSE Wisconsin 54603 24.5255 RetainSAPA EXTRUSIONS INC YANKTON South Dakota 57078 24.4475 RetainMAGNA STEYR NORTH AMERICA TOLEDO Ohio 43608 23.95 RetainAIR SYSTEM COMPONENTS LP PONCA CITY Oklahoma 74601 23.856 RetainMOBIL CHEMICAL CO SHAWNEE Oklahoma 74804 23.375 Retain
Page 1 of 16

Table C-1. Comparisons of 2009 TRI Air Emissions Data for Certain Glycol Ethers to the Step A Screening Value of 4.9 tpy
Facility Name City State Zip Code2009 Air
Emissions (tpy)
Outcome
WHIRLPOOL CORP FINDLAY DIV FINDLAY Ohio 45840 22.8465 RetainS B FOOT TANNING CO RED WING Minnesota 55066 22.8265 RetainCROWN BEVERAGE PACKAGING CHERAW South Carolina 29520 22.1215 RetainSUBARU OF INDIANA AUTOMOTIVE INC LAFAYETTE Indiana 47905 22.12 RetainBATESVILLE MANUFACTURING INC MANCHESTER Tennessee 37355 21.7615 RetainMEMC PASADENA INC PASADENA Texas 77503 20.685 RetainBWAY CORP HOMERVILLE Georgia 31634 19.6085 RetainBALL METAL BEVERAGE CONTAINER CORP CONROE Texas 77303 18.6 RetainSPECTRUM METAL FINISHING YOUNGSTOWN Ohio 44512 18.42 RetainROLL COATER INC GREENFIELD Indiana 46140 18.351 RetainBALL METAL BEVERAGE CONTAINER CORP SARATOGA SPRINGS New York 12866 18.3 RetainDEXTER CHASSIS GROUP PLANT 55 WHITE PIGEON Michigan 49099 18.265 RetainGM SPRING HILL MANUFACTURING SPRING HILL Tennessee 37174 18.175 RetainOLDCASTLE BUILDING ENVELOPE TEXAS FACILITY TERRELL Texas 75160 17.65 RetainUNION CARBIDE CORP SEADRIFT PLANT SEADRIFT Texas 77983 17.0355 RetainHONDA MANUFACTURING OF ALABAMA LLC LINCOLN Alabama 35096 16.753 RetainNUCOR VULCRAFT GROUP GRAPELAND DIV GRAPELAND Texas 75844 16.437 RetainNORTH COAST CONTAINER CORP CLEVELAND Ohio 44105 16.0815 RetainTOYOTA MOTOR MANUFACTURING INDIANA INC PRINCETON Indiana 47670 16.069 RetainALLIED TUBE & CONDUIT CORP HARVEY Illinois 60426 15.9335 RetainNOVELIS CORP WARREN Ohio 44483 15.922 RetainPPG INDUSTRIES INC-OAK CREEK OAK CREEK Wisconsin 53154 15.854 RetainMETAL INDUSTRIES INC - BUSHNELL BUSHNELL Florida 33513 15.8185 RetainBOEING COMMERCIAL AIRPLANE GROUP - EVERETT EVERETT Washington 98204 15.6 RetainHAMMER PACKAGING CORP WEST HENRIETTA New York 14586 15.118 RetainS D WARREN CO WESTBROOK Maine 04098 15.0015 RetainAIR SYSTEM COMPONENTS LP TARBORO North Carolina 27886 14.9185 RetainSEIDEL TANNING CORP MILWAUKEE Wisconsin 53212 14.8525 RetainPELLA CORP PELLA Iowa 50219 14.569 RetainBALL CONTAINER LLC FORT ATKINSON Wisconsin 53538 14.55 RetainALCOA INC - WARRICK OPERATIONS NEWBURGH Indiana 47629 14.5275 RetainL A DARLING CO - PIGGOTT AR FACILITY PIGGOTT Arkansas 72454 14.37 RetainHART & COOLEY INC HUNTSVILLE Alabama 35811 14.2525 RetainJOHNSON WELDED PRODUCTS INC URBANA Ohio 43078 14.069 RetainREXAM BEVERAGE CAN CO FAIRFIELD PLANT FAIRFIELD California 94533 13.981 RetainEASTMAN CHEMICAL CO TEXAS OPERATIONS LONGVIEW Texas 75602 13.8 RetainMUELLER CO ALBERTVILLE Alabama 35950 13.784 RetainCROWN BEVERAGE PACKAGING CRAWFORDSVILLE Indiana 47933 13.7785 RetainALSTOM POWER INC PLATE FORMED PRODUCTS DIV CHATTANOOGA Tennessee 37402 13.7535 RetainPRECOAT METALS JACKSON Mississippi 39272 13.624 RetainKNAPHEIDE MANUFACTURING CO QUINCY Illinois 62305 13.111 RetainBEMIS MANUFACTURING CO PLANT B SHEBOYGAN FALLS Wisconsin 53085 13.105 RetainBALL METAL BEVERAGE CONTAINER CORP MIDDLETOWN New York 10940 13 RetainBALL METAL BEVERAGE CONTAINER CORP FORT WORTH Texas 76140 13 RetainCAN CORP OF AMERICA INC BLANDON Pennsylvania 19510 12.769 RetainSILGAN CONTAINERS MANUFACTURING CORP MOUNT VERNON Missouri 65712 12.7475 RetainBALL METAL BEVERAGE CONTAINER CORP KAPOLEI Hawaii 96707 12.7 RetainAUTOALLIANCE INTERNATIONAL INC FLAT ROCK Michigan 48134 12.6 RetainBEDFORD MATERIALS CO INC MANNS CHOICE Pennsylvania 15550 12.572 RetainQUAD/GRAPHICS INC HARTFORD Wisconsin 53027 12.4 RetainGENERAL MOTORS CORP LORDSTOWN COMPLEX LORDSTOWN Ohio 44481 12.22 RetainMERCEDES-BENZ US INTERNATIONAL INC VANCE Alabama 35490 12.209 RetainFORD LOUISVILLE ASSEMBLY LOUISVILLE Kentucky 40213 12.125 RetainMODINE MANUFACTURING CO INC HARRODSBURG Kentucky 40330 12.019 RetainM&B HANGERS LEEDS Alabama 35094 11.995 RetainCROWN FOOD PACKAGING HANOVER Pennsylvania 17331 11.4075 RetainTOKICO (USA) INC BEREA Kentucky 40403 11.303 RetainNUCOR CORP VULCRAFT/NUCOR COLD FINISH DIV NORFOLK Nebraska 68701 11.3 RetainAKZO NOBEL COATINGS INC BIRMINGHAM Alabama 35234 11.2995 RetainMEADWESTVACO CONSUMER PACKAGING GROUP LLC MEBANE North Carolina 27302 11.2585 RetainCROWN FOOD PACKAGING TOLEDO Ohio 43612 11.215 RetainAMERICAN TRIM LLC SIDNEY Ohio 45365 11.167 RetainGEA BPO LLC BLOOMINGTON Indiana 47404 11.046 RetainGERSTENSLAGER CO WOOSTER Ohio 44691 10.837 RetainBROAN-NUTONE LLC HARTFORD Wisconsin 53027 10.75 RetainPOWER PARTNERS INC ATHENS Georgia 30607 10.75 RetainVESTAL MANUFACTURING ENTERPRISES INC SWEETWATER Tennessee 37874 10.7105 RetainFRANKLIN INVESTMENT CORP FRANKLIN Pennsylvania 16323 10.7 RetainCECO DOOR PRODUCTS MILAN Tennessee 38358 10.578 RetainINGERSOLL-RAND CO STEELCRAFT DIV CINCINNATI Ohio 45242 10.48 RetainTRI VULCRAFT OF NEW YORK INC CHEMUNG New York 14825 10.322 RetainMEYER STEEL DRUM INC CHICAGO Illinois 60623 10.2385 Retain
Page 2 of 16

Table C-1. Comparisons of 2009 TRI Air Emissions Data for Certain Glycol Ethers to the Step A Screening Value of 4.9 tpy
Facility Name City State Zip Code2009 Air
Emissions (tpy)
Outcome
BALL AEROSOL & SPECIALTY CONTAINER INC ELGIN Illinois 60120 10.15 RetainCARDONE INDUSTRIES PHILADELPHIA Pennsylvania 19120 10.1045 RetainKAWNEER CO INC SPRINGDALE Arkansas 72764 10.0795 RetainMAYFLOWER VEHICLE SYSTEMS INC NORWALK FACILITY NORWALK Ohio 44857 10 RetainYKK AP AMERICA INC DUBLIN Georgia 31021 9.892 RetainRR DONNELLEY CRAWFORDSVILLE CRAWFORDSVILLE Indiana 47933 9.892 RetainBERENFIELD CONTAINERS SW LTD WHITE HALL Arkansas 71602 9.8915 RetainKEYMARK CORP OF FLORIDA LAKELAND Florida 33810 9.8475 RetainLAKESIDE LITHOGRAPHY LLC CHICAGO Illinois 60608 9.75 RetainROYAL MOULDINGS LTD; MARION VIRGINIA MARION Virginia 24354 9.553 RetainHEWLETT-PACKARD CARIBE BV SITE AGUADILLA Puerto Rico 00605 9.53 Retain3M CO - GUIN GUIN Alabama 35563 9.501 RetainSTANLEY WORKS HAND TOOLS DIV NEW BRITAIN Connecticut 06052 9.46 RetainNUCOR CORP VULCRAFT DIV FLORENCE South Carolina 29501 9.4365 RetainAVX CORP MYRTLE BEACH MYRTLE BEACH South Carolina 29577 9.3805 RetainHEXION SPECIALTY CHEMICALS INC LAKELAND Florida 33801 9.34 RetainEPCO EXTRUSION PAINTING CO BOARDMAN Ohio 44512 9.2125 RetainQUAD/GRAPHICS INC SUSSEX Wisconsin 53089 9.2 RetainSILGAN CONTAINERS MANUFACTURING CORP SAINT JOSEPH Missouri 64504 9.19 RetainKUBIN-NICHOLSON CORP MILWAUKEE Wisconsin 53224 9.148 RetainSILGAN CAN CO MAXTON North Carolina 28364 9.125 RetainSILGAN CAN CO NAPOLEON Ohio 43545 9.009 RetainSQUARE D CO LEXINGTON Kentucky 40511 9.0085 RetainHESS PRINT SOLUTIONS BRIMFIELD Ohio 44240 9 RetainCROWN AEROSOL PACKAGING AURORA Illinois 60504 8.8715 RetainSILGAN CONTAINERS MANAUFACTURING CORP OCONOMOWOC Wisconsin 53066 8.8 RetainGENERAL MOTORS LANSING DELTA TOWNSHIP LANSING Michigan 48917 8.73 RetainTOPPAN INTERAMERICA INC MC DONOUGH Georgia 30253 8.7 RetainSILGAN WHITE CAP CORP EVANSVILLE Indiana 47710 8.65 RetainTOYOTA MOTOR MANUFACTURING TEX AS INC SAN ANTONIO Texas 78264 8.625 RetainFORD MOTOR COMPANY-WAYNE ASSEMBLY WAYNE Michigan 48184 8.585 RetainMAYTAG CORP CLEVELAND COOKING PRODUCTS PLANT 1 CLEVELAND Tennessee 37311 8.5585 RetainSANYO SOLAR (USA) LLC CARSON California 90745 8.482 RetainRR DONNELLEY & SONS CO WILLARD Ohio 44890 8.4475 RetainSIGNODE BRIDGEVIEW Illinois 60455 8.4 RetainBERENFIELD CONTAINERS INC CLARENDON Pennsylvania 16313 8.368 RetainMASTERBRAND CABINETS INC ARTHUR Illinois 61911 8.25 RetainSILGAN CAN CO PARIS Texas 75460 8.162 RetainBERENFIELD CONTAINERS INC MASON MASON Ohio 45040 7.883 RetainLA-Z-BOY TENNESSEE DAYTON Tennessee 37321 7.823 RetainDECORATIVE PANELS INTERNATIONA L TOLEDO Ohio 43607 7.608 RetainGREIF PACKAGING LLC MERCED California 95348 7.557 RetainGM TRUCK GROUP FORT WAYNE ASSEMBLY ROANOKE Indiana 46783 7.475 RetainWHITING DOOR MANUFACTURING CORP AKRON New York 14001 7.4105 RetainHOWARD FINISHING LLC MADISON HEIGHTS Michigan 48071 7.358 RetainSILGAN CONTAINERS MANUFACTURING CORP EDISON New Jersey 08817 7.35 RetainGM ORION ASSEMBLY CENTER ORION Michigan 48359 7.3 RetainBWAY CORP CHICAGO Illinois 60623 7.2515 RetainSILGAN CONTAINERS MANUFACTURING CORP MENOMONIE Wisconsin 54751 7.25 RetainNASHVILLE WIRE PRODUCTS NASHVILLE Tennessee 37218 7.2 RetainCHICAGO STEEL CONTAINER CORP CHICAGO Illinois 60623 7.19 RetainSHIELDCOAT TECHNOLOGIES INC (DBA CYBERSHIELD OF TEXAS)
LUFKIN Texas 75904 7.1205 Retain
WIX FILTRATION CORP - ALLEN PLANT GASTONIA North Carolina 28052 7.1025 RetainRR DONNELLEY LANCASTER WEST LANCASTER Pennsylvania 17601 7.0965 RetainNUCOR CORP VULCRAFT DIV FORT PAYNE Alabama 35967 6.923 RetainGREIF PACKAGING LLC NEW ORLEANS Louisiana 70123 6.8535 RetainSONOCO PHOENIX - PRESIDENTS ISLAND MEMPHIS Tennessee 38113 6.841 RetainACME FINISHING CO INC ELK GROVE VILLAGE Illinois 60007 6.794 RetainEQUISTAR CHEMICALS BAYPORT CHEMICALS PLANT PASADENA Texas 77507 6.7625 RetainCOLOR COMMUNICATIONS INC CHICAGO Illinois 60624 6.7335 RetainCHRYSLER WARREN TRUCK ASSEMBLY PLANT (PART) WARREN Michigan 48091 6.7 RetainIMPRESS USA INC TERMINAL ISLAND California 90731 6.7 RetainBERENFIELD CONTAINERS SE LTD HARRISBURG North Carolina 28075 6.6745 RetainGMVM-LANSING GRAND RIVER ASSEMBLY LANSING Michigan 48921 6.65 RetainKITZINGER COOPERAGE CORP SAINT FRANCIS Wisconsin 53235 6.6085 RetainARMSTRONG HARDWOOD FLOORING CO ONEIDA Tennessee 37841 6.568 RetainHIRSH INDUSTRIES INC DOVER Delaware 19904 6.516 RetainWORLDCOLOR - DYERSBURG DIV DYERSBURG Tennessee 38024 6.3705 RetainESCO CORP NEWTON Mississippi 39345 6.312 RetainJOHN DEERE HARVESTER WORKS EAST MOLINE EAST MOLINE Illinois 61244 6.29 RetainQUEBECOR WORLD DIRECT-PETTY EFFINGHAM Illinois 62401 6.155 Retain
Page 3 of 16

Table C-1. Comparisons of 2009 TRI Air Emissions Data for Certain Glycol Ethers to the Step A Screening Value of 4.9 tpy
Facility Name City State Zip Code2009 Air
Emissions (tpy)
Outcome
PACKAGING DYNAMICS INC BAGCRAFT/PAPERCON DIV BAXTER SPRINGS Kansas 66713 6.15 RetainGMTG - SHREVEPORT ASSEMBLY SHREVEPORT Louisiana 71129 6.105 RetainSENECA FOODS CORP CAN PLANT MARION New York 14505 6.103 RetainCARRY-ON TRAILER CORP MISSOURI VALLEY Iowa 51555 6.013 RetainSILGAN CONTAINERS MANUFACTURING CORP HAMMOND Indiana 46320 6 RetainMETOKOTE CORP PLANT 15 CEDAR FALLS Iowa 50613 5.991 RetainELECTROPRIME INC ROSSFORD Ohio 43460 5.952 RetainNUCOR VULCRAFT GROUP SAINT JOE DIV SAINT JOE Indiana 46785 5.906 RetainQUAD/GRAPHICS INC SARATOGA SPRINGS New York 12866 5.9 RetainFIBERMARK NORTH AMERICA INC LOWVILLE New York 13367 5.8595 RetainBRADFORD WHITE CORP MIDDLEVILLE Michigan 49333 5.837 RetainTECNOCAP LLC WARREN Ohio 44483 5.7945 RetainVON HOFFMANN GRAPHICS INC OWENSVILLE Missouri 65066 5.7815 RetainHUNTER DOUGLAS TUPELO CENTER SHANNON Mississippi 38868 5.7565 RetainCROWN FOOD PACKAGING WINTER GARDEN Florida 34787 5.754 RetainU.S. AIR FORCE TINKER AFB OK TINKER A F B Oklahoma 73145 5.75 RetainRR DONNELLEY LANCASTER EAST LANCASTER Pennsylvania 17601 5.6915 RetainROLL COATER INC WEIRTON West Virginia 26062 5.684 RetainCNH AMERICA LLC BURLINGTON Iowa 52601 5.675 RetainHUSQVARNA CONSUMER OUTDOOR PRODUCTS ORANGEBURG South Carolina 29116 5.64 RetainNAVISTAR INC SPRINGFIELD Ohio 45502 5.6 RetainPRECOAT METALS GRANITE CITY Illinois 62040 5.559 RetainLOGAN ALUMINUM INC RUSSELLVILLE Kentucky 42276 5.544 RetainPPG INDUSTRIES,INC-SPRINGDALE COMPLEX SPRINGDALE Pennsylvania 15144 5.524 RetainGREIF PACKAGING LLC ALSIP Illinois 60803 5.5095 RetainUSS - CLAIRTON WORKS CLAIRTON Pennsylvania 15025 5.5 RetainCREE INC DURHAM North Carolina 27703 5.4965 RetainTOYOTA MOTOR MANUFACTURING KENTUCKY INC GEORGETOWN Kentucky 40324 5.475 RetainPRIME TANNING CO - HARTLAND HARTLAND Maine 04943 5.435 RetainNAZDAR SHAWNEE SHAWNEE Kansas 66227 5.4105 RetainBALL METAL FOOD CONTAINER CORP OAKDALE California 95361 5.4 RetainOWENS CORNING VETROTEX LLC STARR South Carolina 29684 5.3545 RetainNEW MILLENNIUM BUILDING SYSTEMS SALEM Virginia 24153 5.296 RetainMID CONTINENT CABINETRY COTTONWOOD Minnesota 56229 5.2865 RetainAVERY DENNISON - IBMD LENOIR LENOIR North Carolina 28645 5.286 RetainSILGAN CAN CO SACRAMENTO California 95824 5.271 RetainWORTHINGTON CYLINDERS WISCONSI N LLC CHILTON Wisconsin 53014 5.258 RetainENKEI AMERICA INC COLUMBUS Indiana 47201 5.25 RetainNOVOLYTE TECHNOLOGIES ZACHARY Louisiana 70791 5.145 RetainMETAL COATERS MISSISSIPPI JACKSON Mississippi 39272 5.1255 RetainMEDALLION CABINETRY INC WACONIA Minnesota 55387 5.0815 RetainPRECOAT METALS HOUSTON Texas 77015 5.075 RetainTRAD NA INC HOPKINSVILLE Kentucky 42240 5.07 RetainGREENWICH INDUSTRIES LP CLARIN DIV LAKE BLUFF Illinois 60044 5.058 RetainROLL COATER LA PORTE Indiana 46350 5.028 RetainCIRCLE GRAPHICS INC LONGMONT Colorado 80501 4.95 RetainSCHAEFFER MANUFACTURING SAINT LOUIS Missouri 63104 4.8465 Screened OutASHLEY INDUSTRIAL MOLDING INC ASHLEY Indiana 46705 4.825 Screened OutUS ARMY LAKE CITY ARMY AMMUNITION PLANT INDEPENDENCE Missouri 64051 4.7265 Screened OutINX DIGITAL INK CO DIXON California 95620 4.7155 Screened OutNAHAN PRINTING INC SAINT CLOUD Minnesota 56303 4.709 Screened OutAAP ST MARYS CORP SAINT MARYS Ohio 45885 4.6885 Screened OutZURN INDUSTRIES LLC ERIE Pennsylvania 16502 4.674 Screened OutALCOA HOME EXTERIORS INC SIDNEY Ohio 45365 4.6175 Screened OutARVINMERITOR HEAVY VEHICLE SYSTEMS LLC YORK South Carolina 29745 4.5795 Screened OutGENERAL MOTORS WENTZVILLE ASSEMBLY WENTZVILLE Missouri 63385 4.5 Screened OutRUSKIN CO GENEVA Alabama 36340 4.4905 Screened OutALLIANCE INDUSTRIES WAUPACA WAUPACA Wisconsin 54981 4.4685 Screened OutGENIE INDUSTRIES SOUTH CAMPUS REDMOND Washington 98052 4.415 Screened OutSABIC INNOVATIVE PLASTICS MT VERNON LLC MOUNT VERNON Indiana 47620 4.4 Screened OutENDICOTT INTERCONNECT TECHNOLOGIES INC ENDICOTT New York 13760 4.3655 Screened OutBROWN PRINTING CO WASECA Minnesota 56093 4.3235 Screened OutBALL METAL BEVERAGE CONTAINER CORP KANSAS CITY Missouri 64120 4.24 Screened OutBATESVILLE MANUFACTURING INC BATESVILLE Mississippi 38606 4.23 Screened OutGREIF PACKAGING LLC LA PORTE Texas 77571 4.2185 Screened OutSILGAN CONTAINERS MANUFACTURING CORP MENOMONEE FALLS Wisconsin 53051 4.2 Screened OutSEQUA COATINGS CORP-PRECOAT M ETALS DIV PORTAGE Indiana 46368 4.182 Screened OutR R DONNELLEY & SONS CO DANVILLE DIV DANVILLE Kentucky 40422 4.1565 Screened OutBROWN PRINTING CO WOODSTOCK Illinois 60098 4.125 Screened OutSILGAN CONTAINER MANUFACTURING CORP RIVERBANK California 95367 4.1055 Screened OutQUEBECOR WORLD OLIVE BRANCH Mississippi 38654 4.097 Screened OutVAN CAN CO FONTANA California 92337 4.05 Screened Out
Page 4 of 16
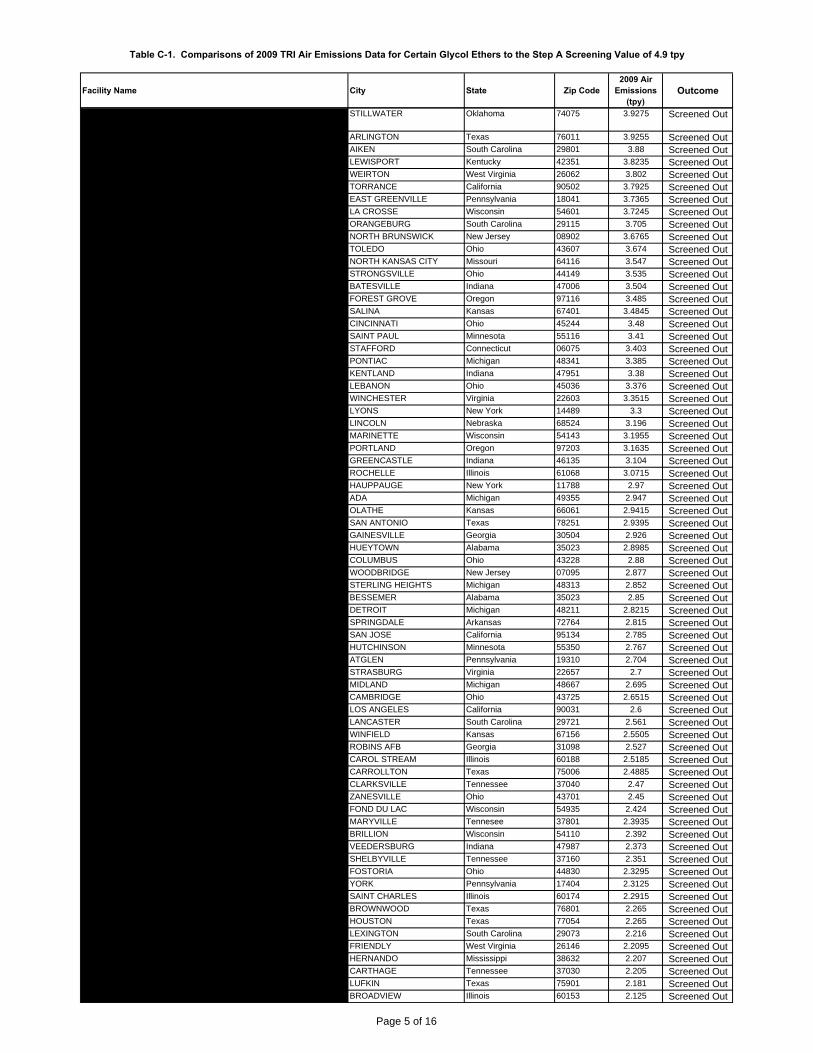
Table C-1. Comparisons of 2009 TRI Air Emissions Data for Certain Glycol Ethers to the Step A Screening Value of 4.9 tpy
Facility Name City State Zip Code2009 Air
Emissions (tpy)
Outcome
WORLDCOLOR STILLWATER (WAS QUEBECOR WORLD - STILLWATER DIV)
STILLWATER Oklahoma 74075 3.9275 Screened Out
PRO LINE PRINTING ARLINGTON ARLINGTON Texas 76011 3.9255 Screened OutAGY AIKEN LLC AIKEN South Carolina 29801 3.88 Screened OutALERIS ROLLED PRODUCTS INC LEWISPORT Kentucky 42351 3.8235 Screened OutNESTLE PURINA PETCARE WEIRTON West Virginia 26062 3.802 Screened OutRR DONNELLEY LOS ANGELES MANUFACTURING TORRANCE California 90502 3.7925 Screened OutBROWN PRINTING CO EAST GREENVILLE Pennsylvania 18041 3.7365 Screened OutINLAND LABEL & MARKETING LA CROSSE Wisconsin 54601 3.7245 Screened OutAFTON CHEMICAL CORP ORANGEBURG South Carolina 29115 3.705 Screened OutPHOENIX CONTAINER INC NORTH BRUNSWICK New Jersey 08902 3.6765 Screened OutBETCO CORP TOLEDO Ohio 43607 3.674 Screened OutFUJIFILM NORTH AMERICA CORP NORTH KANSAS CITY Missouri 64116 3.547 Screened OutAVERY DENNISON INDUSTRIAL PRODUCTS DIV STRONGSVILLE Ohio 44149 3.535 Screened OutBATESVILLE MANUFACTURING INC -DOLL PLANT BATESVILLE Indiana 47006 3.504 Screened OutMERIX CORP FOREST GROVE Oregon 97116 3.485 Screened OutSCHWAN'S GLOBAL SUPPLY CHAIN - SALINA KS SALINA Kansas 67401 3.4845 Screened OutBWAY CORP BWAY PACKAGING DIV CINCINNATI Ohio 45244 3.48 Screened OutFORD MOTOR CO TWIN CITIES ASSEMBLY PLANT SAINT PAUL Minnesota 55116 3.41 Screened OutTTM PRINTED CIRCUIT GROUP - S TAFFORD DIV STAFFORD Connecticut 06075 3.403 Screened OutPONTIAC ASSEMBLY CENTER PONTIAC Michigan 48341 3.385 Screened OutBON L MANUFACTURING CO KENTLAND Indiana 47951 3.38 Screened OutWORLDCOLOR LEBANON DIV LEBANON Ohio 45036 3.376 Screened OutQUEBECOR WORLD INC WINCHESTER VIRGINIA WINCHESTER Virginia 22603 3.3515 Screened OutSILGAN CONTAINERS MANUFACTURING CORP LYONS New York 14489 3.3 Screened OutKAWASAKI MOTORS MANUFACTURING CORP USA LINCOLN Nebraska 68524 3.196 Screened OutTYCO FIRE SUPPRESSION & BUILDING PRODUCTS MARINETTE Wisconsin 54143 3.1955 Screened OutCROWN FOOD PACKAGING PORTLAND Oregon 97203 3.1635 Screened OutCROWN EQUIPMENT CORP GREENCASTLE Indiana 46135 3.104 Screened OutSILGAN CONTAINERS MANUFACTURING CORP ROCHELLE Illinois 61068 3.0715 Screened OutDISC GRAPHICS HAUPPAUGE New York 11788 2.97 Screened OutACCESS BUSINESS GROUP LLC ADA Michigan 49355 2.947 Screened OutITW DYMON OLATHE Kansas 66061 2.9415 Screened OutMAXIM INTEGRATED PRODUCTS INC SAN ANTONIO Texas 78251 2.9395 Screened OutSAPA EXTRUDER INC GAINESVILLE Georgia 30504 2.926 Screened OutPRECOAT METALS HUEYTOWN Alabama 35023 2.8985 Screened OutVERTIS COMMUNICATIONS COLUMBUS Ohio 43228 2.88 Screened OutMAUSER CORP WOODBRIDGE New Jersey 07095 2.877 Screened OutCURTIS METAL FINISHING CO STERLING HEIGHTS Michigan 48313 2.852 Screened OutTITAN COATINGS INC BESSEMER Alabama 35023 2.85 Screened OutEQ DETROIT INC DETROIT Michigan 48211 2.8215 Screened OutBALL METAL FOOD CONTAINER CORP SPRINGDALE Arkansas 72764 2.815 Screened OutMAXIM INTEGRATED PRODUCTS INC SAN JOSE California 95134 2.785 Screened Out3M CO - HUTCHINSON HUTCHINSON Minnesota 55350 2.767 Screened OutWORLDCOLOR ATGLEN ATGLEN Pennsylvania 19310 2.704 Screened OutRR DONNELLEY STRASBURG DIV STRASBURG Virginia 22657 2.7 Screened OutDOW CHEMICAL CO MIDLAND Michigan 48667 2.695 Screened OutCENTRIA CAMBRIDGE Ohio 43725 2.6515 Screened OutMISSION KLEENSWEEP PRODUCTS INC LOS ANGELES California 90031 2.6 Screened OutSOLIANT LLC LANCASTER South Carolina 29721 2.561 Screened OutGREIF INDUSTRIAL PACKAGING & SERVICES WINFIELD Kansas 67156 2.5505 Screened OutU.S. AIR FORCE ROBINS AFB GA ROBINS AFB Georgia 31098 2.527 Screened OutKNS COMPANYS INC CAROL STREAM Illinois 60188 2.5185 Screened OutTEXAS FINISHING CO CARROLLTON Texas 75006 2.4885 Screened OutWORLDCOLOR CLARKSVILLE Tennessee 37040 2.47 Screened OutAK STEEL CORP - ZANESVI LLE WORKS ZANESVILLE Ohio 43701 2.45 Screened OutBRUNSWICK CORP MERCURY MARINE DIV FOND DU LAC Wisconsin 54935 2.424 Screened OutDENSO MANUFACTURING TENNESSEE INC MARYVILLE Tennesee 37801 2.3935 Screened OutBRILLION IRON WORKS INC BRILLION Wisconsin 54110 2.392 Screened OutMASTER GUARD CORP VEEDERSBURG Indiana 47987 2.373 Screened OutSANFORD LP SHELBYVILLE Tennessee 37160 2.351 Screened OutROPPE CORP FOSTORIA Ohio 44830 2.3295 Screened OutAMERICAN COLOR GRAPHICS INC YORK Pennsylvania 17404 2.3125 Screened OutSUN CHEMICAL CORP SAINT CHARLES Illinois 60174 2.2915 Screened Out3M CO - BROWNWOOD BROWNWOOD Texas 76801 2.265 Screened OutKIK (HOUSTON) INC HOUSTON Texas 77054 2.265 Screened OutSAFETY-KLEEN SYSTEMS INC LEXINGTON South Carolina 29073 2.216 Screened OutMPM SILICONES LLC FRIENDLY West Virginia 26146 2.2095 Screened OutKAWNEER CO INC HERNANDO Mississippi 38632 2.207 Screened OutBON L MANUFACTURING CO CARTHAGE Tennessee 37030 2.205 Screened OutAMERICAN COLOR GRAPHICS - LUFKIN LUFKIN Texas 75901 2.181 Screened OutLEHIGH PRESS CADILLAC (DBA LEHIGH DIRECT DIVISION) BROADVIEW Illinois 60153 2.125 Screened Out
Page 5 of 16

Table C-1. Comparisons of 2009 TRI Air Emissions Data for Certain Glycol Ethers to the Step A Screening Value of 4.9 tpy
Facility Name City State Zip Code2009 Air
Emissions (tpy)
Outcome
MACDERMID PRINTING SOLUTIONS SAN MARCOS California 92078 2.122 Screened OutUNION CARBIDE CORP SOUTH CHARLESTON FACILITY SOUTH CHARLESTON West Virginia 25303 2.1175 Screened OutTHREE RIVERS ALUMINUM CO CRANBERRY TOWNSHIP Pennsylvania 16066 2.11 Screened OutNCP COATINGS INC NILES Michigan 49120 2.1075 Screened OutPRECOAT METALS SAINT LOUIS Missouri 63116 2.093 Screened OutVERTIS COMMUNICATIONS CHARLOTTE North Carolina 28273 2.056 Screened OutDUPONT YERKES PLANT BUFFALO New York 14207 2.053 Screened OutTORO CO TOMAH Wisconsin 54660 2.0475 Screened OutCADON PLATING CO WYANDOTTE Michigan 48192 2.036 Screened OutAVX CORP CONWAY CONWAY South Carolina 29526 1.973 Screened OutSILGAN CONTAINERS MANUFACTURING CORP ANTIOCH California 94509 1.9645 Screened OutSTEELSCAPE INC FAIRFIELD Alabama 35064 1.954 Screened OutBASF CORP - CLEAR LAKE PLANT PASADENA Texas 77507 1.9505 Screened OutBOEING COMMERCIAL AIRPLANE GROUP NORTH BOEING FIELD (PART)
SEATTLE Washington 98108 1.95 Screened Out
RR DONNELLEY PINEVILLE PINEVILLE North Carolina 28134 1.948 Screened OutTREND OFFSET PRINTING SERVICES INC LOS ALAMITOS California 90720 1.925 Screened OutWARREN UNILUBE INC WEST MEMPHIS Arkansas 72301 1.9155 Screened OutHYUNDAI MOTOR MANUFACTURING ALABAMA LLC MONTGOMERY Alabama 36105 1.8995 Screened OutPRIOR COATED METALS ALLENTOWN Pennsylvania 18103 1.886 Screened OutKEYMARK CORP FONDA New York 12068 1.8835 Screened OutBUCKEYE INTERNATIONAL INC MARYLAND HEIGHTS Missouri 63043 1.8765 Screened OutAMERICAN COLOR GRAPHICS MARENGO Iowa 52301 1.8675 Screened OutIMPRESS USA INC WEIRTON West Virginia 26062 1.8185 Screened OutASTRO COATINGS INC STRUTHERS Ohio 44471 1.8 Screened OutCUMMINS POWER GENERATION FRIDLEY Minnesota 55432 1.79 Screened OutCENTURY INDUSTRIAL COATINGS I NC JACKSONVILLE Texas 75766 1.779 Screened OutFORD MOTOR CO - OHIO ASSEMBLY PLANT AVON LAKE Ohio 44012 1.77 Screened OutREICHHOLD INC PENSACOLA Florida 32502 1.7345 Screened OutJ&M MANUFACTURING CO INC FORT RECOVERY Ohio 45846 1.7285 Screened OutHANNA STEEL CORP FAIRFIELD Alabama 35064 1.7175 Screened OutRR DONNELLEY CHARLESTOWN Indiana 47111 1.7085 Screened OutBOEING COMMERCIAL AIRPLANE GROUP - RENTON RENTON Washington 98055 1.7035 Screened OutGMC TRUCK GROUP ARLINGTON ASSEMBLY PLANT ARLINGTON Texas 76010 1.7 Screened OutPRO LINE PRINTING / RR DONNELLEY RENO Nevada 89512 1.679 Screened OutRR DONNELLEY VON HOFFMANN CORP JEFFERSON CITY Missouri 65109 1.6575 Screened OutCOMPLEMENTARY COATINGS CORP EDGEWATER Florida 32132 1.639 Screened OutWORLD COLOR PRESS TAUNTON Massachusetts 02780 1.637 Screened OutCHRYSLER STERLING HEIGHTS ASSEMBLY PLANT STERLING HEIGHTS Michigan 48312 1.6 Screened OutCOLOR CORP OF AMERICA LOUISVILLE Kentucky 40210 1.59 Screened OutU.S. AIR FORCE OGDEN AIR LOGISTICS CENTER HILL AFB Utah 84056 1.5525 Screened OutAKZONOBEL AEROSPACE COATINGS WAUKEGAN Illinois 60085 1.5515 Screened OutST CHARLES OPERATIONS (TAFT/STAR) UNION CARBIDE CORP TAFT Louisiana 70057 1.545 Screened Out
MERCK SHARP & DOHME CORP ELKTON Virginia 22827 1.51 Screened OutENGINEERED POLYMER SOLUTIONS INC D/B/A VALSPAR COATINGS
KANKAKEE Illinois 60901 1.5035 Screened Out
BENCHMARK ENERGY PRODUCTS LLC MIDLAND Texas 79703 1.4975 Screened OutIVC INDUSTRIAL COATINGS INC INDIANAPOLIS Indiana 46218 1.4785 Screened OutVANEX INC MOUNT VERNON Illinois 62864 1.467 Screened OutSAPA INC COATINGS DIVSION PORTLAND Oregon 97218 1.4665 Screened OutMOTOR CASTINGS CO MILWAUKEE Wisconsin 53214 1.466 Screened OutNOV TUBOSCOPE WEST LITTLE YORK COATING HOUSTON Texas 77041 1.4635 Screened OutARANDELL CORP MENOMONEE FALLS Wisconsin 53051 1.451 Screened OutWHEELING CORRUGATING CO - BEECH BOTTOM PLANT WELLSBURG West Virginia 26070 1.45 Screened OutCARDINAL ALUMINUM CO PLAN T 3 LOUISVILLE Kentucky 40219 1.4355 Screened OutGREIF INDUSTRIAL PACKAGING & SERVICES LLC FONTANA California 92335 1.433 Screened OutDECOSTAR INDUSTRIES INC CARROLLTON Georgia 30117 1.432 Screened OutALERIS ROLLED PRODUCTS INC ASHVILLE Ohio 43103 1.416 Screened OutMITSUBISHI MOTORS NORTH AMERICA INC NORMAL Illinois 61761 1.4135 Screened OutCAMACO COLUMBUS MANUFACTURING COLUMBUS Nebraska 68601 1.4005 Screened OutEASTMAN CHEMICAL CO TENNESSEE OPERATIONS KINGSPORT Tennessee 37662 1.3975 Screened OutENGINEERED POLYMER SOLUTIONS INC D/B/A VALSPAR COATINGS
ROCHESTER Pennsylvania 15074 1.3895 Screened Out
W W HENRY BOURBONNAIS Illinois 60914 1.3725 Screened OutJOHN DEERE SEEDING & CYLINDER MOLINE Illinois 61265 1.353 Screened OutCROWN AEROSOL PACKAGING FARIBAULT Minnesota 55021 1.3495 Screened OutGM MLCG FAIRFAX ASSEMBLY KANSAS CITY Kansas 66115 1.3175 Screened OutARR-MAZ CUSTOM CHEMICALS MULBERRY Florida 33860 1.313 Screened OutSILGAN WHITE CAP CORP HAZLETON Pennsylvania 18201 1.3 Screened OutAKZO NOBEL COATINGS INC COLUMBUS Ohio 43211 1.3 Screened OutARMSTRONG WORLD INDUSTRIES LANCASTER PLANT LANCASTER Pennsylvania 17603 1.29 Screened Out
Page 6 of 16

Table C-1. Comparisons of 2009 TRI Air Emissions Data for Certain Glycol Ethers to the Step A Screening Value of 4.9 tpy
Facility Name City State Zip Code2009 Air
Emissions (tpy)
Outcome
GENERAL MOTORS MLCG DETROIT-HAMTRAMCK ASSEM BLY CENTER
DETROIT Michigan 48211 1.29 Screened Out
HALLSTAR CO ESTER SOLUTIONS FACILITY BEDFORD PARK Illinois 60638 1.2635 Screened OutDAIMLERCHRYSLER CORP TOLEDO ASSEMBLY PLANT TOLEDO Ohio 43612 1.255 Screened OutSHEBOYGAN PAINT CO CEDARTOWN Georgia 30125 1.241 Screened OutRR DONNELLEY & SONS CO AVON Connecticut 06001 1.2325 Screened OutCONSOLIDATED SYSTEMS INC COLUMBIA South Carolina 29201 1.23 Screened OutCHRYSLER BELVIDERE ASSEMBLY PLANT BELVIDERE Illinois 61008 1.22 Screened OutDURA COAT PRODUCTS INC MADISON Alabama 35756 1.217 Screened OutCLEVELAND STEEL CONTAINER - NI LES NILES Ohio 44446 1.2045 Screened OutTTM TECHNOLOGIES INC LOGAN Utah 84321 1.199 Screened OutCCL CONTAINER AEROSOL DIV HERMITAGE Pennsylvania 16148 1.189 Screened OutCATERPILLAR INC LAFAYETTE Indiana 47905 1.175 Screened OutWINSLOW-BROWNING INC LIBERTY Indiana 47353 1.148 Screened OutJ L CLARK INC ROCKFORD Illinois 61104 1.1455 Screened OutCHEMTURA CORP - TAFT PLANT KILLONA Louisiana 70066 1.1455 Screened OutNOV TUBOSCOPE NAVASOTA NAVASOTA Texas 77868 1.1425 Screened OutPRECOAT METALS ELKRIDGE Maryland 21075 1.1415 Screened OutNICHOLS ALUMINUM ALABAMA INC DECATUR Alabama 35601 1.1375 Screened OutGENTEK BUILDING PRODUCTS AVENEL New Jersey 07001 1.1335 Screened OutOHIO ART CO BRYAN Ohio 43506 1.126 Screened OutRED SPOT WESTLAND INC WESTLAND Michigan 48186 1.111 Screened OutTRELLEBORG OFFSHORE US RANKIN ROAD FACILITY HOUSTON Texas 77073 1.1105 Screened OutTESORO REFINING & MARKETING CO - MANDAN REFINERY MANDAN North Dakota 58554 1.1005 Screened OutCANFIELD METAL COATING CORP CANFIELD Ohio 44406 1.1 Screened OutBEAULIEU OF AMERICA PLANT 560-MODEL DALTON Georgia 30721 1.0865 Screened OutCOOK COMPOSITES & POLYMERS CO GRAND RAPIDS Michigan 49507 1.085 Screened OutENGINEERED POLYMER SOLUTIONS INC D/B/A VALSPAR COATINGS
GARLAND Texas 75042 1.0845 Screened Out
POLYMERIC IMAGING INC NORTH KANSAS CITY Missouri 64116 1.0705 Screened OutGREIF PACKAGING LLC WARMINSTER Pennsylvania 18974 1.0505 Screened OutCANBERRA CORP TOLEDO Ohio 43615 1.05 Screened OutNEXTEER AUTOMOTIVE CORP SAGINAW Michigan 48601 1.043 Screened OutSPRAYLAT CORP CA LOS ANGELES California 90016 1.04 Screened OutROLL COATER INC HAWESVILLE Kentucky 42348 1.032 Screened OutRED SPOT PAINT & VARNISH CO INC EVANSVILLE Indiana 47711 1.0225 Screened OutSTAR BUILDING SYSTEMS ELIZABETHTON Tennessee 37643 1.019 Screened OutBOEING COMMERCIAL AIRPLANE GROUP PLANT 2 (PART) SEATTLE Washington 98108 1.009 Screened OutHYDRITE CHEMICAL CO COTTAGE GROVE Wisconsin 53527 1 Screened OutARMSTRONG WORLD INDUSTRIES INC STILLWATER Oklahoma 74075 0.998 Screened OutTTM TECHNOLOGIES-SANTA CLARA SANTA CLARA California 95050 0.9555 Screened OutCOOK COMPOSITES & POLYMERS CO HOUSTON Texas 77051 0.9265 Screened OutIVC SOUTH LAWRENCEVILLE Georgia 30043 0.924 Screened OutWATSON STANDARD CO (NEVILLE ISLAND PLANT) NEVILLE ISLAND Pennsylvania 15225 0.91 Screened OutHADCO (SANMINA) CORP - OWEGO DIV OWEGO New York 13827 0.9025 Screened OutMAXIM INTEGRATED PRODUCTS DALLAS Texas 75244 0.9005 Screened OutSYNDICATE SYSTEMS INC MIDDLEBURY Indiana 46540 0.8555 Screened OutCOOK COMPOSITES & POLYMERS CO SAUKVILLE Wisconsin 53080 0.848 Screened OutB-WAY PACKAGING INC TRENTON New Jersey 08648 0.848 Screened OutEVONIK DEGUSSA CORP TIPPECANOE LABORATORIES LAFAYETTE Indiana 47909 0.825 Screened OutSPRAYLAT CORP IL CHICAGO Illinois 60633 0.818 Screened OutNJT ENTERPRISES LLC STERLING HEIGHTS Michigan 48314 0.8135 Screened OutSTEEL DYNAMICS INC JEFFERSONVILLE Indiana 47130 0.8125 Screened OutFLINT HILLS RESOURCES LP ROSEMOUNT Minnesota 55068 0.8 Screened OutCOMPLEMENTARY COATINGS CORP BALTIMORE Maryland 21224 0.8 Screened OutBERRYMAN PRODUCTS INC ARLINGTON Texas 76011 0.8 Screened OutIC OF OKLAHOMA LLC TULSA Oklahoma 74116 0.8 Screened OutTAIYO AMERICA INC CARSON CITY Nevada 89701 0.7935 Screened OutPPG ARCHITECTURAL FINISHES EAST POINT EAST POINT Georgia 30344 0.792 Screened OutGFX INTERNATIONAL GRAYSLAKE Illinois 60030 0.79 Screened OutGENERAL MOTORS LLC BOWLING GREEN ASSEMBLY PLANT BOWLING GREEN Kentucky 42101 0.785 Screened OutMETALS USA BUILDING PRODUCTS MESQUITE Texas 75149 0.782 Screened OutSUN CHEMICAL CORP MAUMEE Ohio 43537 0.7595 Screened OutUNITED PAINT & CHEMICAL SOUTHFIELD Michigan 48034 0.7525 Screened OutDELEET MERCHANDISING NEWARK New Jersey 07105 0.75 Screened OutTEXAS TILE MANUFACTURING LLC HOUSTON Texas 77007 0.749 Screened OutAKZO NOBEL SURFACE CHEMISTRY LLC HOUSTON Texas 77053 0.742 Screened OutKAWNEER CO INC VISALIA California 93291 0.7255 Screened OutHUNT REFINING CO A CORP TUSCALOOSA Alabama 35401 0.7205 Screened OutRYCOLINE PRODUCTS LLC CHICAGO Illinois 60630 0.7195 Screened OutPENN COLOR INC HATFIELD Pennsylvania 19440 0.7045 Screened OutMARCUS PAINT CO LOUISVILLE Kentucky 40202 0.7025 Screened Out
Page 7 of 16

Table C-1. Comparisons of 2009 TRI Air Emissions Data for Certain Glycol Ethers to the Step A Screening Value of 4.9 tpy
Facility Name City State Zip Code2009 Air
Emissions (tpy)
Outcome
ELEMENTIS SPECIALTIES JERSEY CITY New Jersey 07304 0.7 Screened OutWESTERN EXTRUSIONS CORP CARROLLTON Texas 75006 0.6985 Screened OutKAWNEER CO INC BLOOMSBURG Pennsylvania 17815 0.696 Screened OutCLEVELAND STEEL CONTAINER - PE OTONE FACILITY PEOTONE Illinois 60468 0.6945 Screened OutWEST PENN OIL CO, INC130130 WARREN Pennsylvania 16365 0.6945 Screened OutTERNIUM USA INC SHREVEPORT Louisiana 71115 0.6905 Screened OutSONOCO PRODUCTS CO ORLANDO Florida 32837 0.677 Screened OutFERRO GLASS & COLOR CORP WASHINGTON Pennsylvania 15301 0.6735 Screened OutVISTA PAINT CORP FULLERTON California 92831 0.673 Screened OutFINISHES UNLIMITED INC SUGAR GROVE Illinois 60554 0.665 Screened OutHB FULLER COVINGTON Georgia 30014 0.661 Screened OutOMG AMERICAS FRANKLIN Pennsylvania 16323 0.659 Screened OutVANGUARD PAINTS & FINISHES INC MARIETTA Ohio 45750 0.648 Screened OutSILGAN CONTAINERS MANUFACTURING CORP SAVAGE Minnesota 55378 0.642 Screened OutCRYSTAL FINISHING SYSTEMS INC SCHOFIELD Wisconsin 54476 0.6405 Screened OutHERCULES INC KENEDY TEXAS KENEDY Texas 78119 0.635 Screened OutCENTRIA AMBRIDGE Pennsylvania 15003 0.635 Screened OutTRINKOTE INDUSTRIAL FINISHES INC FORT WORTH Texas 76110 0.628 Screened OutALERIS ROLLED PRODUCTS INC ROXBORO North Carolina 27573 0.6265 Screened OutCHROMASOURCE INC COLUMBIA CITY Indiana 46725 0.621 Screened OutMULTICIRCUITS OSHKOSH Wisconsin 54903 0.619 Screened OutTCI COATINGS INC LUBBOCK Texas 79415 0.616 Screened OutGREIF INDUSTRIAL PACKAGING & SERVICES LLC LA PORTE Texas 77571 0.5975 Screened OutASHLAND DISTRIBUTION WILLOW SPRINGS Illinois 60480 0.586 Screened OutROCK TENN CO CLINTON Iowa 52732 0.585 Screened OutCLEVELAND STEEL CONTAINER CORP - STREETSBORO PLANT STREETSBORO Ohio 44241 0.5795 Screened Out
BECKER SPECIALTY CORP FONTANA California 92335 0.5785 Screened OutNICHOLS ALUMINUM DAVENPORT DAVENPORT Iowa 52802 0.567 Screened OutALUMAX MILL PRODUCTS INC TEXARKANA Texas 75501 0.5505 Screened OutCHRYSLER GROUP LLC STERLING STAMPING PLANT (PART) STERLING HEIGHTS Michigan 48312 0.55 Screened OutHB FULLER CO BLUE ASH Ohio 45242 0.5465 Screened OutFLINT GROUP NORTH AMERICA CORP ANNISTON Alabama 36207 0.53 Screened OutGLASS COATINGS & CONCEPTS MONROE Ohio 45050 0.5265 Screened OutNAPCO INC VALENCIA Pennsylvania 16059 0.5245 Screened OutPPG INDUSTRIES ARCHITECTURAL FINISHES BATAVIA Illinois 60510 0.52 Screened OutFORREST PAINT CO EUGENE Oregon 97402 0.513 Screened OutINEOS OXIDE A DIV OF INEOS AMERICAS LLC PLAQUEMINE Louisiana 70765 0.506 Screened OutLOCKHEED MARTIN AERONAUTICS CO PALMDALE California 93599 0.5025 Screened OutSTEELSCAPE KALAMA Washington 98625 0.5025 Screened OutCOMPLEX CHEMICALS CO INC TALLULAH Louisiana 71282 0.5 Screened OutSC JOHNSON & SON INC WAXDALE FACILITY STURTEVANT Wisconsin 53177 0.5 Screened OutRUST-OLEUM CORP PLEASANT PRAIRIE Wisconsin 53158 0.5 Screened OutSILBOND CORP WESTON Michigan 49289 0.5 Screened OutARCADIA INC VERNON California 90023 0.5 Screened OutDERRICK CORP CHEEKTOWAGA New York 14225 0.4975 Screened OutHEXION SPECIALTY CHEMICALS INC BEDFORD PARK Illinois 60501 0.4925 Screened OutBECKER SPECIALTY CORP ELK GROVE VILLAGE Illinois 60007 0.49 Screened OutTTM TECHNOLOGIES INC CHIPPEWA FALLS Wisconsin 54729 0.4895 Screened OutENGINEERED POLYMER SOLUTIONS I NC D/B/A VALSPAR COATINGS
BIRMINGHAM Alabama 35215 0.485 Screened Out
SNAP-ON TOOLS MANUFACTURING CO ALGONA Iowa 50511 0.4705 Screened OutIVC INDUSTRIAL COATINGS INC CASA GRANDE Arizona 85222 0.4545 Screened OutUNIVERSAL CHEMICALS & COATINGS INC ELK GROVE VILLAGE Illinois 60007 0.4505 Screened OutSYNGENTA CROP PROTECTION INC SAINT GABRIEL FACILITY SAINT GABRIEL Louisiana 70776 0.45 Screened OutDUPONT MOUNT CLEMENS PLANT MOUNT CLEMENS Michigan 48043 0.4495 Screened OutLONGABERGER CO FRAZEYSBURG Ohio 43822 0.4465 Screened OutNAZDAR CHICAGO CHICAGO Illinois 60622 0.4365 Screened OutZEP INC ATLANTA Georgia 30318 0.4305 Screened OutPFI INC SANTA FE SPRINGS California 90670 0.42 Screened OutSILGAN WHITE CAP CORP RICHMOND Indiana 47375 0.4175 Screened OutMUTI-PACK LLC MILWAUKEE Wisconsin 53223 0.415 Screened OutUNITED STATES ALUMINUM CORP WAXAHACHIE Texas 75165 0.4075 Screened OutAMERIMAX HOME PRODUCTS INC LANCASTER Pennsylvania 17603 0.402 Screened OutDIAMOND VOGEL PAINTS TULSA Oklahoma 74115 0.3975 Screened OutAMERICAN METALS CORP WESTLAKE Ohio 44145 0.3955 Screened OutNB COATINGS INC LANSING Illinois 60438 0.395 Screened OutFORBO ADHESIVES LLC MORRIS Illinois 60450 0.3905 Screened OutBRADLEY COATINGS GROUP CONNELLSVILLE Pennsylvania 15425 0.389 Screened OutROLLEX CORP ELK GROVE VILLAGE Illinois 60007 0.387 Screened OutSTANDARD PAINTS INC MANSFIELD Texas 76063 0.3865 Screened OutGSP MARKETING TECHNOLOGIES CLEARWATER Florida 33760 0.384 Screened Out
Page 8 of 16

Table C-1. Comparisons of 2009 TRI Air Emissions Data for Certain Glycol Ethers to the Step A Screening Value of 4.9 tpy
Facility Name City State Zip Code2009 Air
Emissions (tpy)
Outcome
ABC COMPOUNDING CO INC MORROW Georgia 30260 0.3775 Screened OutBASF CORP WYANDOTTE Michigan 48192 0.3775 Screened OutINTERNATIONAL PAINT LLC HOUSTON Texas 77091 0.3775 Screened OutTOWER PRODUCTS INC EASTON Pennsylvania 18045 0.375 Screened OutRODDA PAINT CO PORTLAND Oregon 97203 0.375 Screened OutQUEST CHEMICAL CORP HOUSTON Texas 77041 0.375 Screened OutPARISER INDUSTRIES INC PATERSON New Jersey 07503 0.375 Screened OutHILLYARD INDUSTRIES INC SAINT JOSEPH Missouri 64501 0.3675 Screened OutSIKA CORP SIKA SARNAFIL DIV CANTON Massachusetts 02021 0.366 Screened OutNASCOTE INDUSTRIES NASHVILLE Illinois 62263 0.365 Screened OutMASCO RETAIL CABINET GROUP LLC WAVERLY Ohio 45690 0.358 Screened OutFULLER BRUSH CO GREAT BEND Kansas 67530 0.3555 Screened OutWATSON LABORATORIES INC UTAH SALT LAKE CITY Utah 84108 0.353 Screened OutHOVENSA LLC CHRISTIANSTED Virgin Islands 00820 0.351 Screened OutSHERWIN-WILLIAMS AUTOMOTIVE FINISHES CORP RICHMOND Kentucky 40475 0.35 Screened OutENGINEERED POLYMER SOLUTIONS INC D/B/A VALSPAR COATINGS
HIGH POINT North Carolina 27261 0.349 Screened Out
NELCO PRODUCTS INC ANAHEIM California 92801 0.348 Screened OutBRIGHTSMITH LLC MORRISVILLE Pennsylvania 19067 0.346 Screened OutENGINEERED POLYMER SOLUTIONS INC D/B/A VALSPAR COATINGS
MOLINE Illinois 61265 0.341 Screened Out
ROLL COATER INC BLYTHEVILLE Arkansas 72315 0.334 Screened OutASHLAND DISTRIBUTION BIRMINGHAM Alabama 35234 0.3325 Screened OutENGINEERED POLYMER SOLUTIONS INC D/B/A VALSPAR COATINGS
FREMONT Michigan 49412 0.3275 Screened Out
ENGINEERED POLYMER SOLUTIONS INC D/B/A VALSPAR COATINGS
HIGH POINT North Carolina 27261 0.327 Screened Out
KIK-SOCAL INC SANTA FE SPRINGS California 90670 0.3255 Screened OutENTHONE INC WEST HAVEN Connecticut 06516 0.313 Screened OutMETAL COATERS OF CALIFORNIA INC RANCHO CUCAMONGA California 91730 0.311 Screened OutPILOT CHEMICAL CO HOUSTON Texas 77086 0.3105 Screened Out3M CO - CORDOVA CORDOVA Illinois 61242 0.3085 Screened OutPPG INDUSTRIES OHIO INC (CL) CLEVELAND Ohio 44111 0.304 Screened OutET PRODUCTS CO INC BREMEN Indiana 46506 0.3 Screened OutSTP PRODUCTS MANUFACTURING CO PAINESVILLE Ohio 44077 0.298 Screened OutDUCKBACK PRODUCTS CHICO California 95928 0.298 Screened OutSIERRA CORP MINNETONKA Minnesota 55343 0.2975 Screened OutLINETEC WAUSAU Wisconsin 54401 0.296 Screened OutCERTIFIED ENAMELING INC LOS ANGELES California 90023 0.2905 Screened OutCROWN CORK & SEAL CO (USA) INC CROWN CLOSURES DIV LANCASTER Ohio 43130 0.2905 Screened OutPPG ARCHITECTURAL FINISHES INC LOUISVILLE Kentucky 40203 0.2895 Screened OutCELLO PROFESSIONAL PRODUCTS HAVRE DE GRACE Maryland 21078 0.281 Screened OutFORD MOTOR CO CHICAGO ASSEMBLY CHICAGO Illinois 60633 0.28 Screened OutSERIGRAPH INC WEST BEND Wisconsin 53095 0.2795 Screened OutVIDEOJET TECHNOLOGIES INC ELK GROVE VILLAGE Illinois 60007 0.275 Screened OutQUANTUM MARKETING INC LAKELAND Florida 33803 0.272 Screened OutFUCHS LUBRICANTS CO-CORPORATE OFFICE HARVEY Illinois 60426 0.2675 Screened OutHB FULLER ROSEVILLE California 95678 0.2665 Screened OutROHM & HAAS CHEMICALS LLC BRISTOL Pennsylvania 19007 0.266 Screened OutHELEN,INC DBA ENVIRONMENTAL COATINGS,INC CALEDONIA Michigan 49316 0.265 Screened OutSEQUA COATINGS CORP PRECOAT METALS DIV MC KEESPORT Pennsylvania 15132 0.264 Screened OutOLDCASTLE BUILDING ENVELOPE TENNESSEE FACILITY MIDWAY Tennessee 37809 0.2615 Screened OutHARLEY-DAVIDSON MOTOR CO OPERATIONS INC YORK Pennsylvania 17402 0.2605 Screened OutASHLAND DISTRIBUTION CO SAINT PAUL Minnesota 55102 0.2595 Screened OutHEXION SPECIALTY CHEMICALS INC CARPENTERSVILLE Illinois 60110 0.2585 Screened OutASHLAND DISTRIBUTION NASHVILLE Tennessee 37209 0.254 Screened OutCHASE PRODUCTS CO BROADVIEW Illinois 60155 0.2535 Screened OutSUMTER COATINGS INC SUMTER South Carolina 29150 0.252 Screened OutASHLAND DISTRIBUTION CO CARTERET New Jersey 07008 0.252 Screened OutINCHEM CORP ROCK HILL South Carolina 29730 0.25 Screened OutBASF CORP GREENVILLE Ohio 45331 0.25 Screened OutBACHMAN SERVICES INC OKLAHOMA CITY Oklahoma 73129 0.25 Screened OutREICHHOLD INC VALLEY PARK Missouri 63088 0.25 Screened OutBERGQUIST CO CANNON FALLS Minnesota 55009 0.25 Screened OutMISCO PRODUCTS CORP READING Pennsylvania 19605 0.25 Screened OutCPJ TECHNOLOGIES TAYLORS South Carolina 29687 0.25 Screened OutEQUILON CARSON TERMINAL CARSON California 90810 0.25 Screened OutCHEMICAL SPECIALISTS & DEVELOPMENT INC CONROE Texas 77303 0.25 Screened OutUNIVAR USA INC BERKELEY BERKELEY Missouri 63134 0.25 Screened OutMALCO PRODUCTS INC BARBERTON Ohio 44203 0.25 Screened OutHONDA MANUFACTURING OF INDIANA LLC GREENSBURG Indiana 47240 0.25 Screened OutQUANTUM COATINGS INC CHARLOTTE North Carolina 28273 0.25 Screened Out
Page 9 of 16

Table C-1. Comparisons of 2009 TRI Air Emissions Data for Certain Glycol Ethers to the Step A Screening Value of 4.9 tpy
Facility Name City State Zip Code2009 Air
Emissions (tpy)
Outcome
YENKIN-MAJESTIC PAINT CORPORAT ION COLUMBUS Ohio 43219 0.25 Screened OutUNIVAR USA INC METRO BLVD MARYLAND HEIGHTS Missouri 63043 0.25 Screened OutASHLAND DISTRIBUTION CO TWINSBURG Ohio 44087 0.248 Screened OutEXXONMOBIL CHEMICAL BATON ROUGE CHEMICAL PLANT BATON ROUGE Louisiana 70805 0.2465 Screened OutVEYANCE TECHNOLOGIES INC NORFOLK Nebraska 68701 0.2445 Screened OutFLINT GROUP NORTH AMERICA ATLANTA Georgia 30339 0.24 Screened OutCAR PRODUCTS INC HOLYOKE Massachusetts 01040 0.236 Screened OutENGINEERED POLYMER SOLUTIONS INC D/B/A VALSPAR COATINGS
BOWLING GREEN Kentucky 42101 0.233 Screened Out
WARREN STAMPING PLANT (PART) WARREN Michigan 48091 0.23 Screened OutMETAL COATERS OF GEORGIA MARIETTA Georgia 30062 0.228 Screened OutICL-IP AMERICA INC GALLIPOLIS FERRY West Virginia 25515 0.222 Screened OutARROW GROUP INDUSTRIES INC HASKELL New Jersey 07420 0.2215 Screened OutPERMA-PIPE OIL & GAS NEW IBERIA Louisiana 70560 0.22 Screened OutINTERNATIONAL EXTRUSION CORP TEXAS WAXAHACHIE Texas 75165 0.2115 Screened OutCOLWELL INC KENDALLVILLE Indiana 46755 0.21 Screened OutGUARDIAN AUTOMOTIVE - MOREHEAD PLANT MOREHEAD Kentucky 40351 0.203 Screened OutASHLAND DISTRIBUTION CO DORAVILLE Georgia 30340 0.2025 Screened OutGATES CORP - CHARLESTON CHARLESTON Missouri 63834 0.1985 Screened OutCHAMPION TECHNOLOGIES INC KILGORE Texas 75662 0.196 Screened OutRHODIA INC WINDER Georgia 30680 0.1935 Screened OutROCKLINE INDUSTRIES SHEBOYGAN Wisconsin 53081 0.193 Screened OutFIRST AMERICAN RESOURCES CO MABLETON Georgia 30126 0.191 Screened OutSASOL NORTH AMERICA INC LAKE CHARLES CHEMICAL COMPLEX
WESTLAKE Louisiana 70669 0.1885 Screened Out
RUDD CO INC SEATTLE Washington 98107 0.1875 Screened OutASHLAND DISTRIBUTION SAINT LOUIS Missouri 63111 0.186 Screened OutCURTIS METAL FINISHING CO MACHESNEY PARK Illinois 61115 0.1855 Screened OutASHLAND DISTRIBUTION CO GARLAND TX GARLAND Texas 75041 0.182 Screened OutTRITECH COATINGS CORP PAGEDALE Missouri 63133 0.182 Screened OutJAMESTOWN COATING TECHNOLOGIES JAMESTOWN Pennsylvania 16134 0.1795 Screened OutENGINEERED POLYMER SOLUTIONS INC D/B/A VALSPAR COATINGS
WHEELING Illinois 60090 0.177 Screened Out
ASHLAND INC - CHANDLER CHANDLER Arizona 85226 0.177 Screened OutPROFESSIONAL DISPOSABLES INTERNATIONAL INC ORANGEBURG New York 10962 0.176 Screened OutEXXONMOBIL REFINING & SUPPLY BATON ROUGE REFINERY BATON ROUGE Louisiana 70805 0.176 Screened OutPLAZE INC SAINT CLAIR Missouri 63077 0.1745 Screened OutENERGIZER BATTERY MANUFACTURING INC SAINT ALBANS Vermont 05478 0.174 Screened OutBYK USA INC WALLINGFORD Connecticut 06492 0.173 Screened OutASHLAND DISTRIBUTION CO BATON ROUGE Louisiana 70815 0.173 Screened OutDOW CHEMICAL CO FREEPORT FACILITY FREEPORT Texas 77541 0.168 Screened OutDUPONT FRONT ROYAL PLANT FRONT ROYAL Virginia 22630 0.168 Screened OutANCHOR PAINT MANUFACTURING CO INC TULSA Oklahoma 74112 0.167 Screened OutRHODIA INC MARCUS HOOK Pennsylvania 19061 0.1615 Screened OutRADIATOR SPECIALTY CO INDIAN TRAIL North Carolina 28079 0.161 Screened OutENGINEERED POLYMER SOLUTIONS INC D/B/A VALSPAR COATINGS
STATESVILLE North Carolina 28625 0.156 Screened Out
SONOCO FLEXIBLE PACKAGING EDINBURGH Indiana 46124 0.1545 Screened OutSTOUSE INC NEW CENTURY Kansas 66031 0.154 Screened OutWARREN OIL CO - NC DUNN North Carolina 28335 0.153 Screened OutHENTZEN COATINGS,INC BATAVIA FACILITY BATAVIA Illinois 60510 0.151 Screened OutTNEMEC CO INC NORTH KANSAS CITY Missouri 64116 0.1465 Screened OutPPG INDUSTRIES OHIO INC CIRCLEVILLE OH CIRCLEVILLE Ohio 43113 0.1455 Screened OutMT ELLIOTT TOOL & DIE MANUFACTURING (PART) DETROIT Michigan 48234 0.145 Screened OutDYCO PAINTS INC CLEARWATER Florida 33760 0.142 Screened OutMID-STATES PAINT & CHEMICAL CO CRESTWOOD Missouri 63126 0.1415 Screened OutDUPONT CHAMBERS WORKS DEEPWATER New Jersey 08023 0.14 Screened OutAPOLLO CHEMICAL BURLINGTON North Carolina 27215 0.14 Screened OutDOW CHEMICAL CO - LOUISIANA OPERATIONS PLAQUEMINE Louisiana 70765 0.139 Screened OutDUPONT FORT MADISON PLANT FORT MADISON Iowa 52627 0.135 Screened OutASHLAND DISTRIBUTION MEMPHIS Tennessee 38113 0.1345 Screened OutBAKER PETROLITE CORP SAND SPRINGS Oklahoma 74063 0.1325 Screened OutAMREP INC MARIETTA Georgia 30062 0.1315 Screened OutENGINEERED POLYMER SOLUTIONS INC D/B/A VALSPAR COATINGS
LEBANON Pennsylvania 17046 0.1315 Screened Out
AKZONOBEL COATINGS INC PONTIAC Michigan 48341 0.131 Screened OutBEHR PROCESS CORP - CHICAGO CHICAGO HEIGHTS Illinois 60411 0.1295 Screened OutTEXAS INSTRUMENTS INC STAFFORD Texas 77477 0.1275 Screened OutSOUTHERN CLAY PRODUCTS INC LOUISVILLE Kentucky 40210 0.1275 Screened OutCLARIANT CORP MARTIN PLANT MARTIN South Carolina 29836 0.1275 Screened OutMOC PRODUCTS CO INC PACOIMA California 91331 0.1275 Screened OutBF GOODRICH TIRE MANUFACTURING WOODBURN Indiana 46797 0.1275 Screened Out
Page 10 of 16

Table C-1. Comparisons of 2009 TRI Air Emissions Data for Certain Glycol Ethers to the Step A Screening Value of 4.9 tpy
Facility Name City State Zip Code2009 Air
Emissions (tpy)
Outcome
VARN INTERNATIONAL BATAVIA Illinois 60510 0.1275 Screened OutRR STREET & CO INC CHICAGO Illinois 60608 0.1275 Screened OutUNITED LABORATORIES INC SAINT CHARLES Illinois 60174 0.1275 Screened OutELANTAS PDG INC SAINT LOUIS Missouri 63147 0.1275 Screened OutRESEARCH SOLVENTS & CHEMICALS INC LA VERGNE Tennessee 37086 0.1275 Screened OutRESEARCH SOLVENTS & CHEMICALS INC PELHAM Alabama 35124 0.1275 Screened OutBRENNTAG GREAT LAKES LLC MENOMONEE FALLS Wisconsin 53051 0.1275 Screened OutGE WATER & PROCESS TECHNOLOGIES ORANGE FACILITY ORANGE Texas 77630 0.1275 Screened OutOAKLEY INC FOOTHILL RANCH California 92610 0.1275 Screened OutNICCA USA INC FOUNTAIN INN South Carolina 29644 0.1275 Screened OutCHEMICALS INC BAYTOWN Texas 77520 0.1275 Screened OutPOWER SERVICE PRODUCTS INC WEATHERFORD Texas 76086 0.1275 Screened OutBASF CORP SPARTANBURG South Carolina 29302 0.1275 Screened OutPERMATEX SOLON SOLON Ohio 44139 0.1275 Screened OutCONOCOPHILLIPS PONCA CITY REFINERY PONCA CITY Oklahoma 74601 0.1275 Screened OutCONOCOPHILLIPS OKLAHOMA CITY PRODUCTS TERMINAL OKLAHOMA CITY Oklahoma 73117 0.1275 Screened OutCOASTAL CHEMICAL CO LLC ABBEVILLE Louisiana 70510 0.1275 Screened OutTAKASAGO INTERNATIONAL CORP (USA) NORTHVALE New Jersey 07647 0.1275 Screened OutWATSON STANDARD CO HARWICK PLANT HARWICK Pennsylvania 15049 0.1275 Screened OutGEORGE S COYNE CHEMICAL CO INC CROYDON Pennsylvania 19021 0.1275 Screened OutTRELLEBORG COATED SYSTEMS US INC / GRACE ADVANCED MATERIALS
RUTHERFORDTON North Carolina 28139 0.125 Screened Out
CHEMCOAT INC MONTOURSVILLE Pennsylvania 17754 0.125 Screened OutPPG INDUSTRIES INC MCCARRAN Nevada 89434 0.125 Screened OutFIBRO CHEM LLC DALTON Georgia 30720 0.125 Screened OutPROCLEAN OF ARIZONA INC PHOENIX Arizona 85043 0.125 Screened OutPREMIER INK SYSTEMS INC HARRISON Ohio 45030 0.125 Screened OutNALCO CO - ODESSA PLANT 114 ODESSA Texas 79765 0.125 Screened OutAKZO NOBEL COATINGS INC HIGH POINT North Carolina 27261 0.125 Screened OutGOLD EAGLE CO CHICAGO Illinois 60632 0.125 Screened OutW M BARR & CO MEMPHIS Tennessee 38113 0.125 Screened OutINX INTERNATIONAL INK CO HOMEWOOD Illinois 60430 0.125 Screened OutCOLUMBIA PAINT CORP HUNTINGTON West Virginia 25704 0.125 Screened OutCERAM-TRAZ CORP CERAMIC INDL COATINGS (DBA) OSSEO Minnesota 55369 0.125 Screened OutSICPA SECURINK CORP SPRINGFIELD Virginia 22153 0.125 Screened OutCLEANING SYSTEMS INC DE PERE Wisconsin 54115 0.125 Screened OutCHEMETALL US INC ROMULUS Michigan 48174 0.125 Screened OutNOV TUBOSCOPE HOLMES ROAD HOUSTON Texas 77051 0.125 Screened OutACTON TECHNOLOGIES INC PITTSTON Pennsylvania 18640 0.125 Screened OutAKCROS CHEMICALS INC NEW BRUNSWICK New Jersey 08901 0.125 Screened OutMAGNABLEND INC LIQUID PLANT WAXAHACHIE Texas 75165 0.125 Screened OutKALCOR COATINGS CO WILLOUGHBY Ohio 44094 0.125 Screened OutDANLIN INDUSTRIES CORP THOMAS Oklahoma 73669 0.125 Screened OutUNIVAR USA INC DALLAS DAN MORTON FACILITY DALLAS Texas 75236 0.125 Screened OutTYSON FRESH MEATS INC HOLCOMB Kansas 67851 0.125 Screened OutTRANS CHEMICAL INC SAINT LOUIS Missouri 63147 0.125 Screened OutELECTRONICS FOR IMAGING INC YPSILANTI Michigan 48197 0.124 Screened OutKEYSTONE ANILINE CORP INMAN South Carolina 29349 0.123 Screened OutASHLAND DISTRIBUTION LOUISVILLE Kentucky 40211 0.121 Screened OutCAROLINA SOLVENTS INC HICKORY North Carolina 28602 0.1185 Screened OutASHLAND DISTRIBUTION CO CHARLOTTE North Carolina 28208 0.118 Screened OutAEP INDUSTRIES INC GRIFFIN Georgia 30224 0.1175 Screened OutALLEGHENY PETROLEUM PRODUCTS CO WILMERDING Pennsylvania 15148 0.1165 Screened OutACCURATE DISPERSIONS SOUTH HOLLAND Illinois 60473 0.116 Screened OutUS MARINE CORPS AIR STATION YUMA YUMA Arizona 85369 0.1145 Screened OutTECHNICAL CHEMICAL CO CLEBURNE Texas 76033 0.1135 Screened OutARDEX LABORATORIES INC PHILADELPHIA Pennsylvania 19116 0.1125 Screened OutASHLAND INC - EVENDALE EVENDALE Ohio 45241 0.1125 Screened OutSHERWIN-WILLIAMS CO GREENSBORO North Carolina 27403 0.11 Screened Out3M CO - NEVADA NEVADA Missouri 64772 0.11 Screened OutDELTA LABORATORIES INC OCALA Florida 34475 0.109 Screened OutSHERWIN-WILLIAMS CO HOLLAND Michigan 49423 0.106 Screened OutFRAZEE INDUSTRIES SAN DIEGO California 92121 0.103 Screened OutCENTRAL MOTOR WHEEL OF AMERICA (DBA CMWA) PARIS Kentucky 40361 0.103 Screened OutASHLAND DISTRIBUTION CO FAIRFIELD California 94533 0.1025 Screened OutSTEELSCAPE INC RANCHO RANCHO CUCAMONGA California 91730 0.101 Screened OutASHLAND DISTRIBUTION CO CARSON California 90810 0.098 Screened OutCYTEC INDUSTRIES INC LANGLEY PLANT LANGLEY South Carolina 29834 0.0935 Screened OutASHLAND DISTRIBUTION CO MIAMI Florida 33162 0.093 Screened OutCE BRADLEY LABORATORIES INC BRATTLEBORO Vermont 05301 0.093 Screened OutMULTI-COLOR CORP SCOTTSBURG Indiana 47170 0.091 Screened OutATHEA LABORATORIES INC MILWAUKEE Wisconsin 53224 0.0905 Screened Out
Page 11 of 16

Table C-1. Comparisons of 2009 TRI Air Emissions Data for Certain Glycol Ethers to the Step A Screening Value of 4.9 tpy
Facility Name City State Zip Code2009 Air
Emissions (tpy)
Outcome
HENKEL CORP WARREN Michigan 48091 0.088 Screened OutHARCROS CHEMICALS INC KANSAS CITY Kansas 66106 0.0875 Screened OutBRENNTAG PACIFIC INC SANTA FE SPRINGS California 90670 0.0875 Screened OutDIC IMAGING PRODUCTS USA LLC OAK CREEK Wisconsin 53154 0.086 Screened OutNORTHERN COATINGS & CHEMICAL CO INC MENOMINEE Michigan 49858 0.085 Screened OutCCI MANUFACTURING IL CORP LEMONT Illinois 60439 0.0835 Screened OutUNION TANK CAR ALEXANDRIA MANUFACTURING FACILITY ALEXANDRIA Louisiana 71303 0.0835 Screened OutCHAMPION TECHNOLOGIES INC CORPUS CHRISTI Texas 78405 0.0825 Screened OutASHLAND DISTRIBUTION TEWKSBURY Massachusetts 01876 0.082 Screened OutCHAMPION TECHNOLOGIES INC CRESSON Texas 76035 0.08 Screened OutMRCG-KRAFTMAID P3 ORWELL Ohio 44076 0.0795 Screened OutBUZZI UNICEM USA - GREENCASTLE PLANT GREENCASTLE Indiana 46135 0.0795 Screened OutAVERY DENNISON PFD SCHERERVILLE Indiana 46375 0.0795 Screened OutTEXAS INSTRUMENTS INC DALLAS Texas 75243 0.0795 Screened OutHUNTSMAN PETROCHEMICAL LLC PORT NECHES PERFORMANCE PRODUCTS
PORT NECHES Texas 77651 0.079 Screened Out
ECOLAB CITY OF INDUSTRY California 91748 0.079 Screened OutLUBRIZOL MC COOK Illinois 60525 0.078 Screened OutARCH CHEMICALS INC BRANDENBURG Kentucky 40108 0.078 Screened OutPLAZE INC SAINT CLAIR Missouri 63077 0.078 Screened OutASHLAND DISTRIBUTION CO KANSAS CITY Kansas 66106 0.0775 Screened OutAKZO NOBEL COATINGS INC CLINTON Mississippi 39056 0.0765 Screened OutMATTHEWS INTERNATIONAL CORP PITTSBURGH Pennsylvania 15238 0.0765 Screened OutCLOROX PRODUCTS MANUFACTURING CO FAIRFIELD California 94533 0.0745 Screened OutSPRAYLAT CORP MOUNT VERNON New York 10550 0.074 Screened OutENGINEERED POLYMER SOLUTIONS INC D/B/A VALSPAR COATINGS
PITTSBURGH Pennsylvania 15233 0.0735 Screened Out
AKZO NOBEL COATINGS INC SALEM Oregon 97302 0.073 Screened OutBOEHRINGER INGELHEIM CHEMICALS INC PETERSBURG Virginia 23805 0.0725 Screened OutCHEMICAL SOLVENTS JENNINGS ROAD FACILITY CLEVELAND Ohio 44109 0.072 Screened OutVEOLIA ES TECHNICAL SOLUTIONS LLC PORT ARTHUR FACILITY
PORT ARTHUR Texas 77640 0.071 Screened Out
ADCO CLEANING PRODUCTS LLC SEDALIA Missouri 65301 0.071 Screened OutTYSON FRESH MEATS INC AMARILLO Texas 79187 0.07 Screened OutWARSAW CHEMICAL CO INC WARSAW Indiana 46580 0.07 Screened OutENGINEERED POLYMER SOLUTIONS INC D/B/A VALSPAR COATINGS
MONTEBELLO California 90640 0.07 Screened Out
SPARTAN CHEMICAL CO INC MAUMEE Ohio 43537 0.0675 Screened OutSUPERIOR OIL CO INC RECLAIMED ENERGY DIV CONNERSVILLE Indiana 47331 0.066 Screened OutCARDINAL INDUSTRIAL FINISHES SOUTH EL MONTE California 91733 0.066 Screened OutMINUTEMAN INTERNATIONAL MULTI-CLEAN DIV SHOREVIEW Minnesota 55126 0.0655 Screened OutEFI / INKWARE MEREDITH New Hampshire 03253 0.0635 Screened OutKARCHER NORTH AMERICA- PROCHEM CHANDLER Arizona 85224 0.0625 Screened OutICI PAINTS PUERTO RICO INC CAROLINA Puerto Rico 00985 0.0615 Screened OutCOOK COMPOSITES & POLYMERS C O LEMONT Illinois 60439 0.061 Screened OutGROTTOES PLASTICS PLANT GROTTOES Virginia 24441 0.0595 Screened OutSHERWIN-WILLIAMS CO TERRE HAUTE Indiana 47808 0.0585 Screened OutBRENNTAG SOUTHEAST INC DURHAM North Carolina 27703 0.058 Screened OutCONOCOPHILLIPS CO EAST ST LOUIS TERMINAL CAHOKIA Illinois 62206 0.0575 Screened OutPPG INDUSTRIES OHIO INC - DELAWARE DELAWARE Ohio 43015 0.057 Screened OutCONTINENTAL CEMENT CO LLC HANNIBAL Missouri 63401 0.057 Screened OutECOLAB INC MC DONOUGH Georgia 30253 0.057 Screened OutCOGNIS CORP MAULDIN PLANT MAULDIN South Carolina 29662 0.057 Screened OutBEHR PROCESS CORP ALLENTOWN ALLENTOWN Pennsylvania 18106 0.0565 Screened OutFLINT HILLS RESOURCES LP - WEST PLANT CORPUS CHRISTI Texas 78410 0.055 Screened OutCLARIANT CORP - MOUNT HOLLY WEST PLANT MOUNT HOLLY North Carolina 28120 0.0545 Screened OutGRAPHIC CONTROLS LLC BUFFALO New York 14204 0.054 Screened OutUNIVAR USA INC BEDFORD PARK Illinois 60499 0.0535 Screened OutABC COMPOUNDING CO OF TEXAS INC GRAND PRAIRIE Texas 75050 0.0535 Screened OutHANNA STEEL CORP PEKIN Illinois 61554 0.053 Screened OutATMI MATERIALS LTD BURNET Texas 78611 0.0515 Screened OutDYSTAR LP REIDSVILLE North Carolina 27320 0.05 Screened OutRINECO BENTON Arkansas 72015 0.0495 Screened OutNORTHERN LABS INC WEST DRIVE MANITOWOC Wisconsin 54220 0.049 Screened OutBARTON SOLVENTS INC BETTENDORF BETTENDORF Iowa 52722 0.049 Screened OutMRCG-KRAFTMAID P1 MIDDLEFIELD Ohio 44062 0.0485 Screened OutNORMAN FOX & CO VERNON California 90058 0.0485 Screened OutWHITFORD CORP ELVERSON Pennsylvania 19520 0.0485 Screened OutAMERICAN COATINGS INC TOMBALL Texas 77375 0.0485 Screened OutKAY CHEMICAL CO GREENSBORO North Carolina 27409 0.048 Screened OutASHLAND DISTRIBUTION CO TAMPA Florida 33634 0.047 Screened OutFRANKLIN INTERNATIONAL COLUMBUS Ohio 43207 0.047 Screened Out
Page 12 of 16

Table C-1. Comparisons of 2009 TRI Air Emissions Data for Certain Glycol Ethers to the Step A Screening Value of 4.9 tpy
Facility Name City State Zip Code2009 Air
Emissions (tpy)
Outcome
RECKITT BENCKISER HILLSBOROUGH New Jersey 08844 0.046 Screened OutINOAC PACKAGING GROUP BARDSTOWN Kentucky 40004 0.044 Screened OutECOLAB INC JOLIET Illinois 60436 0.043 Screened OutKBP COIL COATERS INC DENVER Colorado 80216 0.042 Screened OutENTHONE INC BRIDGEVIEW Illinois 60455 0.0415 Screened OutFORD MOTOR CO MICHIGAN ASSEMBLY PLANT WAYNE Michigan 48184 0.0405 Screened OutRECTICEL INTERIORS NORTH AMERICA LLC TUSCALOOSA Alabama 35401 0.0395 Screened OutBIOLAB INC CONYERS Georgia 30012 0.039 Screened OutBARTON SOLVENTS INC WICHITA VALLEY CENTER Kansas 67147 0.039 Screened OutBARTON SOLVENTS INC KANSAS CITY KANSAS CITY Kansas 66111 0.039 Screened OutSHERWIN-WILLIAMS CO ANDOVER Kansas 67002 0.0385 Screened OutHARCROS CHEMICALS INC PASADENA Texas 77507 0.038 Screened OutBRENNTAG SOUTHWEST INC HOUS TON HOUSTON Texas 77047 0.0375 Screened OutCLEAN HARBORS EL DORADO LLC EL DORADO Arkansas 71730 0.037 Screened OutECOLAB HEBRON Ohio 43025 0.037 Screened OutSUPERIOR SOLVENTS & CHEMICALS FAIRFIELD Ohio 45014 0.0365 Screened OutEXCEL-POLYMERS LLC JONESBOROUGH Tennessee 37659 0.0365 Screened OutAIR PRODUCTS PERFORMANCE MANUFACTURING INC MILTON Wisconsin 53563 0.036 Screened OutJOHNSONDIVERSEY INC STURTEVANT Wisconsin 53177 0.0355 Screened OutECOLAB INC MARTINSBURG West Virginia 25405 0.0355 Screened OutHUNTSMAN ADVANCED MATERIALS AMERICAS INC MC INTOSH Alabama 36553 0.0355 Screened OutBRENNTAG SOUTHWEST INC LANC ASTER LANCASTER Texas 75134 0.035 Screened OutETHOX CHEMICALS LLC GREENVILLE South Carolina 29605 0.035 Screened OutSHERWIN-WILLIAMS CO GARLAND Texas 75041 0.0345 Screened OutBRENNTAG NORTHEAST INC READING Pennsylvania 19605 0.0335 Screened OutLUBRIZOL CORP WICKLIFFE Ohio 44092 0.033 Screened OutDUPONT PARLIN PLANT PARLIN New Jersey 08859 0.032 Screened OutBARTON SOLVENTS INC WEST BEND WEST BEND Wisconsin 53095 0.0315 Screened Out3M CO - KNOXVILLE KNOXVILLE Iowa 50138 0.0315 Screened OutUNIVAR USA INC - INDIANAPOLIS INDIANAPOLIS Indiana 46219 0.0305 Screened OutMACDERMID INC FERNDALE Michigan 48220 0.0285 Screened OutMEADWESTVACO SOUTH CAROLINA LLC DERIDDER Louisiana 70634 0.028 Screened OutCARBOLINE CO LAKE CHARLES Louisiana 70601 0.028 Screened OutASHLAND DISTRIBUTION LANSING Michigan 48906 0.0275 Screened OutUNIVAR USA INC HAMILTON BRANCH HAMILTON Ohio 45015 0.027 Screened OutECOLAB INC GARLAND Texas 75041 0.0265 Screened OutUNIVAR USA INC - TOLEDO SOUTH BRANCH TOLEDO Ohio 43615 0.0265 Screened OutBARTON SOLVENTS INC DES MOINES DES MOINES Iowa 50313 0.026 Screened OutVEOLIA ES TECHNICAL SOLUTIONS LLC MIDDLESEX New Jersey 08846 0.026 Screened OutAMPHENOL APC INC NASHUA New Hampshire 03062 0.026 Screened OutKEMIRA WATER SOLUTIONS INC MOBILE Alabama 36614 0.0255 Screened OutRICHARDSAPEX INC PHILADELPHIA Pennsylvania 19127 0.025 Screened OutHOLLY OAK CHEMICAL INC FOUNTAIN INN South Carolina 29644 0.025 Screened OutCORSICANA TECHNOLOGIES INC CORSICANA Texas 75109 0.0245 Screened OutEXCEL POLYMERS LLC DYERSBURG Tennessee 38024 0.0245 Screened OutASHLAND DISTRIBUTION CO HOUSTON Texas 77034 0.0245 Screened OutSHERWIN-WILLIAMS CO GREENSBORO North Carolina 27409 0.0245 Screened OutSI GROUP INC ROTTERDAM JUNCTION New York 12150 0.0235 Screened OutUNIVAR USA INC NORCROSS FACILI TY NORCROSS Georgia 30071 0.0235 Screened OutRANBAR ELECTRICAL MATERIALS INC MANOR Pennsylvania 15665 0.023 Screened OutBARTON SOLVENTS INC COUNCIL BLUFFS COUNCIL BLUFFS Iowa 51502 0.023 Screened OutECOLAB INC SAN JOSE California 95133 0.023 Screened OutVALERO THREE RIVERS REFINERY THREE RIVERS Texas 78071 0.023 Screened OutPRIDE SOLVENTS & CHEMICAL CO OF NEW JERSEY AVENEL New Jersey 07001 0.0225 Screened OutUNIVAR USA INC - TOLEDO BRANCH WALBRIDGE Ohio 43465 0.0225 Screened OutDAUBERT CHEMICAL CO CHICAGO Illinois 60638 0.022 Screened OutPACKAGING CORP OF AMERICA COUNCE MILL COUNCE Tennessee 38326 0.0205 Screened OutBASF CORP BELVIDERE New Jersey 07823 0.02 Screened Out3M CO - SPRINGFIELD SPRINGFIELD Missouri 65802 0.02 Screened OutUNIVAR USA INC 68TH ST BEDFORD PARK Illinois 60501 0.0195 Screened OutGAGE PRODUCTS CO FERNDALE Michigan 48220 0.0195 Screened OutVALSPAR REFINISH PICAYUNE Mississippi 39466 0.019 Screened OutFISHER SCIENTIFIC INTERNATIONAL MTN DIAGNOSTICS PLANT MIDDLETOWN Virginia 22645 0.019 Screened Out
ZEP COMMERCIAL EMERSON Georgia 30137 0.019 Screened OutKWAL-HOWELLS INC (DBA KWAL PAINT INC) BONHAM Texas 75418 0.0185 Screened OutSTEEL DYNAMICS INC BUTLER Indiana 46721 0.0185 Screened OutTRANSTAR AUTOBODY TECHNOLOGIES BRIGHTON Michigan 48114 0.018 Screened OutEASTMAN KODAK CO EASTMAN BUSINESS PARK ROCHESTER New York 14652 0.0175 Screened OutASHLAND DISTRIBUTION CO TWINSBURG Ohio 44087 0.017 Screened OutKEY POLYMER LAWRENCE Massachusetts 01843 0.0165 Screened OutARLON INC ADHESIVES & FILMS DIV SANTA ANA California 92704 0.0165 Screened Out
Page 13 of 16

Table C-1. Comparisons of 2009 TRI Air Emissions Data for Certain Glycol Ethers to the Step A Screening Value of 4.9 tpy
Facility Name City State Zip Code2009 Air
Emissions (tpy)
Outcome
BRENNTAG SOUTHWEST INC ST GABRIEL SAINT GABRIEL Louisiana 70776 0.0155 Screened OutTYSON FRESH MEATS INC JOSLIN IL HILLSDALE Illinois 61257 0.015 Screened OutSHERWIN-WILLIAMS CO COLUMBUS Ohio 43207 0.015 Screened OutPROCTER & GAMBLE HAIR CARE LLC IOWA CITY Iowa 52240 0.015 Screened OutHENKEL ENOREE South Carolina 29335 0.015 Screened OutCHEMDESIGN PRODUCTS INC MARINETTE Wisconsin 54143 0.0145 Screened OutMONSANTO CO MUSCATINE Iowa 52761 0.0145 Screened OutSHERWIN-WILLIAMS CO MORROW Georgia 30260 0.0145 Screened OutBENJAMIN MOORE & CO JOHNSTOWN JOHNSTOWN New York 12095 0.014 Screened OutBLENTECH CORP HOUSTON Texas 77029 0.014 Screened OutPRIDE SOLVENT & CHEMICAL CO OF NY INC HOLTSVILLE New York 11742 0.014 Screened OutSIMONIZ USA INC BOLTON Connecticut 06043 0.0135 Screened OutVERSO PAPER HOLDINGS LLC JAY Maine 04239 0.0125 Screened OutBRULIN CORP INDIANAPOLIS Indiana 46205 0.0125 Screened OutEVONIK DEGUSSA CORP THEODORE Alabama 36582 0.0125 Screened OutUNIVAR USA INC COMMERCE California 90040 0.0125 Screened OutHUBBARD-HALL INC WATERBURY Connecticut 06708 0.012 Screened OutLAMBERTI USA INC WHARTON CHEMICAL COMPLEX HUNGERFORD Texas 77448 0.0115 Screened OutUNIVAR USA INC INDIANAPOLIS WEST BRANCH INDIANAPOLIS Indiana 46268 0.0115 Screened OutU.S. POLYMERS ACCUREZ LLC SAINT LOUIS Missouri 63111 0.0115 Screened OutGOODWIN CO LAWRENCEVILLE Georgia 30043 0.0115 Screened OutHENKEL CORP DELAWARE Ohio 43015 0.0115 Screened OutSHERWIN-WILLIAMS CO BALTIMORE Maryland 21230 0.0105 Screened OutMICHELIN NORTH AMERICA INC TUSCALOOSA Alabama 35401 0.01 Screened OutPRC-DESOTO INTERNATIONAL INC MOJAVE California 93501 0.01 Screened OutBERRIDGE MANUFACTURING CO SAN ANTONIO Texas 78218 0.01 Screened OutBUCKLEY OIL CO DALLAS Texas 75207 0.01 Screened OutCHEMOL CO INC GREENSBORO North Carolina 27406 0.0095 Screened OutHYDRITE CHEMICAL CO UNIVERSITY PARK Illinois 60466 0.0095 Screened OutTRUE VALUE MANUFACTURING CARY Illinois 60013 0.0095 Screened OutDAVIES IMPERIAL COATINGS INC HAMMOND Indiana 46320 0.0095 Screened OutUNIVAR USA INC SANTA FE SPRINGS SANTA FE SPRINGS California 90670 0.0095 Screened OutBEHR PROCESS CORP SANTA ANA California 92704 0.009 Screened OutHENKEL ONTARIO ONTARIO California 91761 0.009 Screened OutBENJAMIN MOORE & CO PELL CITY PELL CITY Alabama 35125 0.0085 Screened OutGEORGIA-PACIFIC CHEMICALS LLC LUFKIN Texas 75901 0.0085 Screened OutBJ CHEMICAL SERVICES HOBBS New Mexico 88240 0.008 Screened OutCRODA INC NEW CASTLE Delaware 19720 0.008 Screened OutTARR ACQUISITION LLC PORTLAND Oregon 97227 0.008 Screened OutINTERSTATE CHEMICAL CO INC CHANNAHON Illinois 60410 0.008 Screened OutNALCO CO TULSA PLANT 102 TULSA Oklahoma 74131 0.0075 Screened OutDSM DESOTECH INC STANLEY North Carolina 28164 0.0075 Screened OutNEW DAWN MANUFACTURING CO UPPER MARLBORO Maryland 20774 0.0075 Screened OutRUSTOLEUM CORP LESAGE West Virginia 25537 0.0075 Screened OutSHERWIN-WILLIAMS CO VICTORVILLE California 92392 0.0075 Screened OutDYNALOY LLC INDIANAPOLIS Indiana 46226 0.0075 Screened OutLUBRIZOL CORP PAINESVIL LE PLANT PAINESVILLE Ohio 44077 0.0075 Screened OutCLOROX PRODUCTS MANUFACTURING CO FOREST PARK Georgia 30297 0.007 Screened OutCUSTOM CHEMICAL FORMULATORS SANTA FE SPRINGS California 90670 0.007 Screened OutACTEGA KELSTAR INC CINNAMINSON New Jersey 08077 0.0065 Screened OutDOW CHEMICAL JOLIET SITE CHANNAHON Illinois 60410 0.0065 Screened OutHENKEL CORP CALHOUN Georgia 30701 0.0065 Screened OutUNIVAR USA INC - SAN JOSE SAN JOSE California 95131 0.0065 Screened OutKEYSTONE CEMENT CO BATH Pennsylvania 18014 0.0065 Screened OutPROCTER & GAMBLE MANUFACTURING CO KANSAS CITY Kansas 66105 0.006 Screened OutENGINEERED POLYMER SOLUTIONS INC D/B/A VALSPAR COATINGS
INDIANAPOLIS Indiana 46225 0.006 Screened Out
AROMATIC TECHNOLOGIES INC SOMERVILLE New Jersey 08876 0.0055 Screened OutCALLAHAN CHEMICAL CO RIDGEFIELD PARK New Jersey 07660 0.0055 Screened OutDUPONT PONTCHARTRAIN WORKS LA PLACE Louisiana 70068 0.005 Screened OutPPG INDUSTRIES ARCHITECTURAL FINISHES DOVER Delaware 19904 0.005 Screened OutHERITAGE-WTI INC EAST LIVERPOOL Ohio 43920 0.005 Screened OutROHM & HAAS ELECTRONIC MATERIA LS LLC MARLBOROUGH Massachusetts 01752 0.005 Screened OutCHAMPION PACKAGING & DISTRIBUTING INC WOODRIDGE Illinois 60517 0.005 Screened OutSARTOMER CO INC CHATHAM Virginia 24531 0.005 Screened OutUNIVAR USA INC LAKEVILLE LAKEVILLE Minnesota 55044 0.005 Screened OutBRAIN POWER INC MIAMI Florida 33155 0.005 Screened OutSARTOMER CO INC WEST CHESTER Pennsylvania 19382 0.005 Screened OutINTEL CORP - RONLER ACRES CAMPUS HILLSBORO Oregon 97124 0.005 Screened OutC P INC CONNERSVILLE Indiana 47331 0.005 Screened OutGOODWIN CO GARDEN GROVE California 92841 0.005 Screened OutINTEL CORP CHANDLER Arizona 85248 0.005 Screened Out
Page 14 of 16

Table C-1. Comparisons of 2009 TRI Air Emissions Data for Certain Glycol Ethers to the Step A Screening Value of 4.9 tpy
Facility Name City State Zip Code2009 Air
Emissions (tpy)
Outcome
CAR CARE PACKAGING LLC INDIANAPOLIS Indiana 46203 0.005 Screened OutINDEPENDENT INK INC GARDENA California 90248 0.005 Screened OutCUSTOM SYNTHESIS LLC ANDERSON South Carolina 29625 0.005 Screened OutCR BRANDS INC SPARTANBURG South Carolina 29306 0.005 Screened OutSHIELD PACKAGING CO INC DUDLEY Massachusetts 01571 0.005 Screened OutACTEGA RADCURE INC WAYNE New Jersey 07470 0.005 Screened OutWORWAG COATINGS LLC NA LAFAYETTE Indiana 47905 0.005 Screened OutUNIVAR USA INC MORRISVILLE BRANCH MORRISVILLE Pennsylvania 19067 0.0045 Screened OutSUPERIOR OIL CO INC INDIANAPOLIS Indiana 46225 0.0045 Screened OutASHLAND DISTRIBUTION CO CLEARFIELD Utah 84016 0.0045 Screened OutENGINEERED POLYMER SOLUTIONS INC D/B/A VALSPAR COATINGS
ROCKFORD Illinois 61104 0.0045 Screened Out
SUPERIOR SOLVENTS & CHEMICALS LOUISVILLE Kentucky 40216 0.004 Screened OutOMNIUM HAMPTON Iowa 50441 0.004 Screened OutCOGNIS CORP -- CHARLOTT E PLANT CHARLOTTE North Carolina 28273 0.004 Screened OutKING INDUSTRIES INC NORWALK Connecticut 06852 0.004 Screened OutUNIVAR USA INC HOUSTON HOUSTON Texas 77061 0.0035 Screened OutCALLAHAN CHEMICAL CO WALPOLE Massachusetts 02081 0.0035 Screened OutENGINEERED POLYMER SOLUTIONS INC CITY OF COMMERCE California 90040 0.0035 Screened OutCARESTREAM HEALTH COLORADO WINDSOR Colorado 80550 0.0035 Screened OutBAKER PETROLITE BAYPORT FACILI TY PASADENA Texas 77507 0.0035 Screened OutGENERAL DYNAMICS ORDNANCE & TACTICAL SYSTEMS GARLAND
GARLAND Texas 75040 0.003 Screened Out
BAKER PETROLITE BAKERSFIELD California 93308 0.003 Screened OutNORLITE CORP COHOES New York 12047 0.003 Screened OutFORD MOTOR CO DEARBORN DIVERSIFIED MANUFACTURING DEARBORN Michigan 48121 0.003 Screened OutCALLAHAN CHEMICAL CO PALMYRA New Jersey 08065 0.003 Screened OutHEXION SPECIALTY CHEMICALS INC LYNWOOD California 90262 0.003 Screened OutDYNASOL INC CANTON Massachusetts 02021 0.003 Screened OutROHM & HAAS CHEMICALS LLC KNOXVILLE SITE KNOXVILLE Tennessee 37921 0.0025 Screened OutCLEARWATER INTERNATIONAL LLC ELMENDORF Texas 78112 0.0025 Screened OutSHERWIN-WILLIAMS CO FERNLEY Nevada 89408 0.0025 Screened OutBRYCE CO LLC MEMPHIS Tennessee 38118 0.0025 Screened OutSCOT LABORATORIES CHAGRIN FALLS Ohio 44023 0.0025 Screened OutUS ECOLOGY TEXAS INC ROBSTOWN Texas 78380 0.0025 Screened OutBAKER PETROLITE CORP HOUSTON Texas 77049 0.0025 Screened OutFINGER LAKES CHEMICAL INC ROCHESTER New York 14605 0.0025 Screened OutUNIVAR USA INC MEMPHIS MEMPHIS Tennessee 38118 0.0025 Screened OutNIACET CORP NIAGARA FALLS New York 14304 0.0025 Screened OutHERCULES INC HOPEWELL Virginia 23860 0.0025 Screened OutCONOCOPHILLIPS CO TREMLEY POINT TERMINAL LINDEN New Jersey 07036 0.0025 Screened OutBASF CORP SEAFORD Delaware 19973 0.0025 Screened OutMAINTEX INC CITY OF INDUSTRY California 91746 0.0025 Screened OutMALLINCKRODT BAKER INC PHILLIPSBURG New Jersey 08865 0.0025 Screened OutINTEL CORP RIO RANCHO New Mexico 87124 0.0025 Screened OutATOTECH USA ROCK HILL South Carolina 29730 0.0025 Screened OutSINCLAIR WYOMING REFINING CO SINCLAIR Wyoming 82334 0.0025 Screened OutUNIVAR USA INC DENVER DENVER Colorado 80216 0.0025 Screened OutUNION SPECIALTIES INC NEWBURYPORT Massachusetts 01950 0.0025 Screened OutMAHONING PAINT CORP YOUNGSTOWN Ohio 44502 0.0025 Screened OutCR BRANDS INC SPARTANBURG South Carolina 29307 0.0025 Screened OutMAGNABLEND INC-CENTRAL PLANT WAXAHACHIE Texas 75165 0.0025 Screened OutWYNNEWOOD REFINING CO WYNNEWOOD Oklahoma 73098 0.0025 Screened OutCONOCOPHILLIPS MT VERNON PRODUCTS TERMINAL MOUNT VERNON Missouri 65712 0.0025 Screened OutCHEMTEX LABORATORIES INC CONCORD North Carolina 28025 0.0025 Screened OutECP INC WOODRIDGE WOODRIDGE Illinois 60517 0.0025 Screened OutCLEAN HARBORS ENVIRONMENTAL SERVICES INC KIMBALL Nebraska 69145 0.0025 Screened OutUNIVAR USA INC SALEM BRANCH SALEM Massachusetts 01970 0.002 Screened OutCOSMETIC LABORATORIES OF AMERICA CHATSWORTH California 91311 0.002 Screened OutGIANT CEMENT CO HARLEYVILLE South Carolina 29448 0.002 Screened OutSHERWIN-WILLIAMS CO BEDFORD HEIGHTS Ohio 44146 0.002 Screened Out3M COTTAGE GROVE CENTER COTTAGE GROVE Minnesota 55016 0.002 Screened OutDOBER CHEMICAL CORP MIDLOTHIAN Illinois 60445 0.002 Screened OutMILPORT ENTERPRISES INC MILWAUKEE Wisconsin 53207 0.002 Screened OutDUPONT EKC TECHNOLOGY HAYWARD California 94545 0.002 Screened OutUNIVAR USA INC- CINCINNATI OH BRANCH CINCINNATI Ohio 45246 0.002 Screened OutASTRO CHEMICALS INC SPRINGFIELD Massachusetts 01104 0.002 Screened OutFUJIFILM HUNT CHEMICALS USA INC ROLLING MEADOWS Illinois 60008 0.002 Screened OutSHERWIN-WILLIAMS CO ORLANDO Florida 32809 0.0015 Screened OutCLEARWATER INTERNATIONAL LLC LEETSDALE Pennsylvania 15056 0.0015 Screened OutDELTA HOUSTON DEER PARK Texas 77536 0.0015 Screened OutBUCKMAN LABORATORIES INC MEMPHIS Tennessee 38108 0.0015 Screened Out
Page 15 of 16

Table C-1. Comparisons of 2009 TRI Air Emissions Data for Certain Glycol Ethers to the Step A Screening Value of 4.9 tpy
Facility Name City State Zip Code2009 Air
Emissions (tpy)
Outcome
HYDRITE CHEMICAL CO MILWAUKEE Wisconsin 53223 0.0015 Screened OutKELLY-MOORE PAINT CO INC SAN CARLOS California 94070 0.0015 Screened OutCHEMICAL SOLVENTS INC--DENISON FACILITY CLEVELAND Ohio 44109 0.0015 Screened OutBAKER PETROLITE-RAYNE FACILITY RAYNE Louisiana 70578 0.0015 Screened OutHUNTSMAN PETROCHEMICAL LLC DAYTON Texas 77535 0.001 Screened OutFORD MOTOR CO DEARBORN TOOL & DIE PLANT DEARBORN Michigan 48121 0.001 Screened OutPENRAY COMPANIES INC WHEELING Illinois 60090 0.001 Screened OutPENRAY COMPANIES INC ELK GROVE VILLAGE Illinois 60007 0.001 Screened OutFIRST SOURCE WORLDWIDE LLC MILWAUKEE MILWAUKEE Wisconsin 53226 0.001 Screened OutDSM NEORESINS INC FRANKFORT Indiana 46041 0.001 Screened OutSHERWIN-WILLIAMS CO OLIVE BRANCH Mississippi 38654 0.001 Screened OutSHERWIN-WILLIAMS CO MEMPHIS Tennessee 38109 0.001 Screened OutVOLTAIX LLC BRANCHBURG New Jersey 08876 0.001 Screened OutNALCO CO TEXARKANA Texas 75501 0.001 Screened OutHONEYWELL-PRESTONE PRODUCTS CORP FREEHOLD New Jersey 07728 0.001 Screened OutBRENNTAG SOUTHEAST INC CHARLOTTE North Carolina 28273 0.001 Screened OutPPG ARCHITECTURAL COATINGS LOUISVILLE Kentucky 40214 0.001 Screened OutHENTZEN COATINGS,INC MILWAUKEE Wisconsin 53218 0.001 Screened OutRIKER PRODUCTS INC TOLEDO Ohio 43612 0.001 Screened OutVEYANCE TECHNOLOGIES INC MOUNT PLEASANT Iowa 52641 0.0005 Screened OutLEVLAD CHATSWORTH California 91311 0.0005 Screened OutMARY KAY INC DALLAS Texas 75247 0.0005 Screened OutGOODYEAR TIRE & RUBBER CO UNION CITY Tennessee 38261 0.0005 Screened OutSAFETY-KLEEN SYSTEMS INC LINDEN New Jersey 07036 0.0005 Screened OutCLARIANT CORP CLEAR LAKE PLANT PASADENA Texas 77507 0.0005 Screened OutNATIONAL INDUSTRIAL COATINGS INC DBA NICOAT INC ITASCA Illinois 60143 0.0005 Screened OutIFF AUGUSTA LTD AUGUSTA Georgia 30906 0.0005 Screened OutENGINEERED POLYMER SOLUTIONS INC D/B/A VALSPAR COATINGS
SACRAMENTO California 95826 0.0005 Screened Out
SHERWIN-WILLIAMS CO FLORA Illinois 62839 0.0005 Screened OutLANCO MANUFACTURING CORP SAN LORENZO Puerto Rico 00754 0.0005 Screened OutMEADWESTVACO SC LLC CHARLESTON CHEMICAL PLANT NORTH CHARLESTON South Carolina 29406 0.0005 Screened OutSOLITE LLC ARVONIA Virginia 23004 0.0005 Screened OutLAMBERTI SYNTHESIS USA INC CHATTANOOGA Tennessee 37406 0.0005 Screened Out
tpy: tons per year
Page 16 of 16

Table C-2. Comparisons of 2010 TRI Air Emissions Data for Certain Glycol Ethers to the Step A Screening Value of 4.9 tpy
Facility Name City State Zip Code 2010 Air Emissions (tpy) Outcome
REXAM BEVERAGE CAN CO RE: WINSTON SALEM PLANT
WINSTON-SALEM North Carolina 27107 188.7835 Retain
BALL METAL BEVERAGE CONTAINER CORP WILLIAMSBURG Virginia 23185 178.5 RetainBALL METAL BEVERAGE CONTAINER CORP FINDLAY Ohio 45840 155 RetainCROWN FOOD PACKAGING OWATONNA Minnesota 55060 122.646 RetainREXAM BEVERAGE CAN CO RE: FREMONT PLANT FREMONT Ohio 43420 106.3225 RetainREXAM BEVERAGE CAN CO RE: BISHOPVILLE SC FACILITY
BISHOPVILLE South Carolina 29010 96.762 Retain
CROWN CORK & SEAL CO (USA) INC CROWN CLOSURE DIV
WEIRTON West Virginia 26062 96.088 Retain
BALL METAL BEVERAGE CONTAINER CORP REIDSVILLE North Carolina 27320 94.5 RetainBMW MANUFACTURING CO LLC GREER South Carolina 29651 91.2125 RetainREXAM BEVERAGE CAN CO RE: EVA STREET ST PAUL MN
SAINT PAUL Minnesota 55107 89.498 Retain
REXAM BEVERAGE CAN CO KENT WA FACILITY KENT Washington 98032 83.081 RetainCROWN BEVERAGE PACKAGING OLYMPIA Washington 98501 77.6895 RetainREXAM BEVERAGE CAN CO OLIVE BRANCH FACILITY OLIVE BRANCH Mississippi 38654 76.824 Retain
BALL CONTAINER LLC COLUMBUS CAN PLANT COLUMBUS Ohio 43213 76.5 RetainSILGAN CONTAINERS MANUFACTURING CORP LA PORTE Indiana 46350 68.35 RetainAURORA CASKET CO INC AURORA Indiana 47001 68.17917 RetainREXAM BEVERAGE CAN CO RE : CHICAGO PLANT CHICAGO Illinois 60609 68.005 RetainREXAM BEVERAGE CAN CO RE: WHITEHOUSE PLANT WHITEHOUSE Ohio 43571 67.836 Retain
FORD MOTOR CO DEARBORN TRUCK PLANT DEARBORN Michigan 48121 66.5 RetainCROWN BEVERAGE PACKAGING BRADLEY Illinois 60915 64.0775 RetainCROWN BEVERAGE PACKAGING LAWRENCE Massachusetts 01843 62.726 RetainREXAM BEVERAGE CAN CO LONGVIEW FACILITY LONGVIEW Texas 75604 57.4525 RetainWHIRLPOOL CORP MARION D IVISION MARION Ohio 43302 57.2125 RetainBALL CONTAINER LLC ROME CAN PLANT ROME Georgia 30161 55.5 RetainMETAL CONTAINER CORPORTION - WINDSOR CAN PLANT
WINDSOR Colorado 80550 54.9985 Retain
FORD MOTOR COMPANY--KANSAS CITY ASSEMBLY PLANT
CLAYCOMO Missouri 64119 51.5 Retain
CROWN BEVERAGE PACKAGING WORLAND Wyoming 82401 51.128 RetainHONDA OF AMERICA MANUFACTURING INC EAST LIBERTY Ohio 43319 47.2 RetainMETAL CONTAINER CORP - ARNOLD CAN PLANT ARNOLD Missouri 63010 46.317 RetainBWAY CORP HOMERVILLE Georgia 31634 45.9635 RetainREXAM BEVERAGE CAN CO CHATSWORTH FACILITY CHATSWORTH California 91311 44.4135 Retain
EDSAL MANUFACTURING CO INC CHICAGO Illinois 60609 43.1447 RetainRR DONNELLEY HARRISONBURG Virginia 22802 42.3835 RetainHONDA OF AMERICA MANUFACTURING INC MARYSVILLE Ohio 43040 42.3 RetainMETAL CONTAINER CORP - NEWBURGH CAN PLANT NEW WINDSOR New York 12553 42.266 RetainREXAM BEVERAGE CAN CO PHOENIX FACILITY PHOENIX Arizona 85043 38.161 RetainBALL METAL BEVERAGE CONTAINER CORP MILWAUKEE Wisconsin 53224 38 RetainMAGNA STEYR NORTH AMERICA TOLEDO Ohio 43608 37.65 RetainCHICAGO HEIGHTS STEEL CHICAGO HEIGHTS Illinois 60411 37.48 RetainCROWN BEVERAGE PACKAGING CONROE Texas 77305 35.875 RetainSUBARU OF INDIANA AUTOMOTIVE INC LAFAYETTE Indiana 47905 35.69 RetainCHRYSLER JEFFERSON NORTH ASSEMBLY PLANT DETROIT Michigan 48215 35.6 RetainNISSAN NA INC SMYRNA MANUFACTURING PLANT SMYRNA Tennessee 37167 35.5795 RetainROCKY MOUNTAIN METAL CONTAINER GOLDEN Colorado 80401 35.5 RetainFORD MOTOR CO KENTUCKY TRUCK PLANT LOUISVILLE Kentucky 40241 35.4 RetainSILGAN CONTAINERS MANUFACTURING CORP PLOVER Wisconsin 54467 35.35 RetainMETAL CONTAINER CORP - JACKSONVILLE CAN PLANT
JACKSONVILLE Florida 32254 34.9825 Retain
GREIF PACKAGING LLC FLORENCE Kentucky 41042 34.946 RetainCROWN FOOD PACKAGING BALTIMORE Maryland 21221 34.066 RetainCROWN BEVERAGE PACKAGING SUGAR LAND Texas 77478 32.335 RetainMETAL CONTAINER CORP - MIRA LOMA CAN PLANT MIRA LOMA California 91752 32.253 RetainBALL METAL BEVERAGE CONTAINER CORP TORRANCE California 90503 32 RetainBERENFIELD CONTAINERS SE LTD HARRISBURG North Carolina 28075 31.510045 RetainSENECA FOODS CORP BARABOO Wisconsin 53913 30.575 RetainTHERMA-TRU CORP BUTLER Indiana 46721 29.7775 RetainBALL METAL BEVERAGE CONTAINER CORP GOLDEN Colorado 80403 29 RetainBALL METAL BEVERAGE CONTAINER CORP MONTICELLO Indiana 47960 28.5 RetainCROWN BEVERAGE PACKAGING CAROLINA Puerto Rico 00985 27.6395 RetainS B FOOT TANNING CO RED WING Minnesota 55066 27.586 RetainDEXTER CHASSIS GROUP PLANT 55 WHITE PIGEON Michigan 49099 26.3225 RetainMERCEDES-BENZ US INTERNATIONAL INC VANCE Alabama 35490 25.946605 RetainPPG INDUSTRIES INC-OAK CREEK OAK CREEK Wisconsin 53154 25.631 RetainINGERSOLL-RAND CO STEELCRAFT DIV CINCINNATI Ohio 45242 25.585 Retain
Page 1 of 18

Table C-2. Comparisons of 2010 TRI Air Emissions Data for Certain Glycol Ethers to the Step A Screening Value of 4.9 tpy
Facility Name City State Zip Code 2010 Air Emissions (tpy) Outcome
ALLIED TUBE & CONDUIT CORP HARVEY Illinois 60426 25.519 RetainBWAY CORP CHICAGO Illinois 60623 25.49802 RetainGM TRUCK GROUP FLINT ASSEMBLY PLANT VAN SLYKE COMPLEX
FLINT Michigan 48551 24.95 Retain
ROLL COATER INC GREENFIELD Indiana 46140 24.2775 RetainNYW REALTY LLC/ HANOVER HANOVER Pennsylvania 17331 24.2 RetainTOYOTA MOTOR MANUFACTURING INDIANA INC PRINCETON Indiana 47670 24.1785 RetainCROWN BEVERAGE PACKAGING CHERAW South Carolina 29520 24.1435 RetainBALL METAL BEVERAGE CONTAINER CORP TAMPA Florida 33617 24 RetainHONDA MANUFACTURING OF ALABAMA LLC LINCOLN Alabama 35096 23.9835 RetainCROWN BEVERAGE PACKAGING LA CROSSE Wisconsin 54603 23.799 RetainS D WARREN CO WESTBROOK Maine 04098 23.5025 RetainGENERAL MOTORS LANSING DELTA TOWNSHIP LANSING Michigan 48917 23.5 RetainWHIRLPOOL CORP - CLYDE DIV CLYDE Ohio 43410 23.358 RetainGREIF PACKAGING LLC ALSIP Illinois 60803 23.257 RetainBALL METAL FOOD CONTAINER CORP WEIRTON West Virginia 26062 22.5 RetainCROWN BEVERAGE PACKAGING BATESVILLE Mississippi 38606 22.4855 RetainWHIRLPOOL CORP FINDLAY DIV FINDLAY Ohio 45840 22.375 RetainMOBIL CHEMICAL CO SHAWNEE Oklahoma 74804 21.875 RetainAMES TRUE TEMPER INC HARRISBURG PENNSYLVANIA 17104 21.639 RetainMEMC PASADENA INC PASADENA Texas 77503 21.563 RetainNORTH COAST CONTAINER CORP CLEVELAND Ohio 44105 21.231 RetainBALL CONTAINER LLC FORT ATKINSON Wisconsin 53538 20.85 RetainAIR SYSTEM COMPONENTS LP PONCA CITY Oklahoma 74601 20.6415 RetainPELLA CORP PELLA Iowa 50219 20.3955 RetainBALL METAL BEVERAGE CONTAINER CORP SARATOGA SPRINGS New York 12866 20.35 RetainMID-AMERICA STEEL DRUM CO IN C OAK CREEK WISCONSIN 53154 20.3365 RetainBATESVILLE MANUFACTURING INC MANCHESTER Tennessee 37355 20.3255 RetainCECO DOOR PRODUCTS MILAN Tennessee 38358 20.165 RetainBALL METAL BEVERAGE CONTAINER CORP FAIRFIELD California 94533 19.5 RetainCROWN BEVERAGE PACKAGING CRAWFORDSVILLE Indiana 47933 18.97 RetainBALL METAL BEVERAGE CONTAINER CORP CONROE Texas 77303 18.55 RetainTHOMAS BUILT BUSES INC HIGH POINT NORTH CAROLINA 27263 17.92 RetainUNION CARBIDE CORP SEADRIFT PLANT SEADRIFT Texas 77983 17.4725 RetainAIR SYSTEM COMPONENTS LP TARBORO North Carolina 27886 16.7595 RetainNASHVILLE WIRE PRODUCTS NASHVILLE Tennessee 37218 16.7 RetainALSTOM POWER INC PLATE FORMED PRODUCTS DIV CHATTANOOGA Tennessee 37402 16.67 Retain
OLDCASTLE BUILDING ENVELOPE TEXAS FACILITY TERRELL Texas 75160 16.5975 RetainSPECTRUM METAL FINISHING YOUNGSTOWN Ohio 44512 16.53 RetainTOKICO (USA) INC BEREA Kentucky 40403 16.4665 RetainSEIDEL TANNING CORP MILWAUKEE Wisconsin 53212 15.463 RetainMETAL INDUSTRIES INC - BUSHNELL BUSHNELL Florida 33513 14.8635 RetainNEW UNITED MOTOR MANUFACTURING INC FREMONT California 94538 14.564 RetainEASTMAN CHEMICAL CO TEXAS OPERATIONS LONGVIEW Texas 75602 14.5535 RetainUSS - CLAIRTON WORKS CLAIRTON Pennsylvania 15025 14.5 RetainLAKESIDE LITHOGRAPHY LLC CHICAGO Illinois 60608 14.275 RetainJOHNSON WELDED PRODUCTS INC URBANA Ohio 43078 14.1725 RetainBEDFORD MATERIALS CO INC MANNS CHOICE Pennsylvania 15550 14.104 RetainBALL METAL BEVERAGE CONTAINER CORP MIDDLETOWN New York 10940 14 RetainQUAD/GRAPHICS INC HARTFORD Wisconsin 53027 13.935 RetainBEMIS MANUFACTURING CO PLANT B SHEBOYGAN FALLS Wisconsin 53085 13.9125 RetainSILGAN WHITE CAP CORP EVANSVILLE Indiana 47710 13.9 RetainCROWN FOOD PACKAGING TOLEDO Ohio 43612 13.8175 RetainGERSTENSLAGER CO WOOSTER Ohio 44691 13.79 RetainROYAL MOULDINGS LTD; MARION VIRGINIA MARION Virginia 24354 13.7645 RetainTOPPAN INTERAMERICA INC MC DONOUGH Georgia 30253 13.7 RetainM&B HANGERS LEEDS Alabama 35094 13.661 RetainHART & COOLEY INC HUNTSVILLE Alabama 35811 13.637 RetainKNAPHEIDE MANUFACTURING CO QUINCY Illinois 62305 13.6135 RetainCROWN FOOD PACKAGING HANOVER Pennsylvania 17331 13.5285 RetainNUCOR VULCRAFT GROUP GRAPELAND DIV GRAPELAND Texas 75844 13.507 RetainBALL METAL BEVERAGE CONTAINER CORP FORT WORTH Texas 76140 13.5 RetainDECORATIVE PANELS INTERNATIONA L TOLEDO Ohio 43607 13.32944 RetainL A DARLING CO - PIGGOTT AR FACILITY PIGGOTT Arkansas 72454 13.31 RetainAGY AIKEN LLC AIKEN South Carolina 29801 13.1095 RetainBALL METAL BEVERAGE CONTAINER CORP KAPOLEI Hawaii 96707 12.8 Retain3M CO - GUIN GUIN Alabama 35563 12.751 RetainTOYOTA MOTOR MANUFACTURING KENTUCKY INC GEORGETOWN Kentucky 40324 12.677 RetainAMERICAN TRIM LLC SIDNEY Ohio 45365 12.659 RetainKEYMARK CORP OF FLORIDA LAKELAND Florida 33810 12.3785 RetainTRI VULCRAFT OF NEW YORK INC CHEMUNG New York 14825 12.2325 Retain
Page 2 of 18

Table C-2. Comparisons of 2010 TRI Air Emissions Data for Certain Glycol Ethers to the Step A Screening Value of 4.9 tpy
Facility Name City State Zip Code 2010 Air Emissions (tpy) Outcome
VESTAL MANUFACTURING ENTERPRISES INC SWEETWATER Tennessee 37874 12.168 RetainGM TRUCK GROUP FORT WAYNE ASSEMBLY ROANOKE Indiana 46783 12.15 RetainNOVELIS CORP WARREN Ohio 44483 12.122 RetainBERENFIELD CONTAINERS INC MASON MASON Ohio 45040 11.7955 RetainHOWARD FINISHING LLC MADISON HEIGHTS Michigan 48071 11.7535 RetainSILGAN CONTAINERS MANUFACTURING CORP MOUNT VERNON Missouri 65712 11.677 RetainFRANKLIN INVESTMENT CORP FRANKLIN Pennsylvania 16323 11.6 RetainMEYER STEEL DRUM INC CHICAGO Illinois 60623 11.337 RetainCARRY-ON TRAILER CORP LAVONIA GEORGIA 30553 11.244 RetainCHICAGO STEEL CONTAINER CORP CHICAGO Illinois 60623 11.1945 RetainFORD MOTOR COMPANY-WAYNE ASSEMBLY WAYNE Michigan 48184 11.125 RetainPRECOAT METALS JACKSON Mississippi 39272 11.0325 RetainBOEING COMMERCIAL AIRPLANE GROUP - EVERETT EVERETT Washington 98204 11 RetainPHOENIX COLOR CORP HAGERSTOWN MARYLAND 21742 11 RetainGEA BPO LLC BLOOMINGTON Indiana 47404 11 RetainCARRY-ON TRAILER CORP MEXIA TEXAS 76667 10.7145 RetainMAVERICK TUBE LLC DBA TENARISCONROE CONROE TEXAS 77301 10.5724638 RetainACME FINISHING CO INC ELK GROVE VILLAGE Illinois 60007 10.445 RetainSTATE INDUSTRIES INC ASHLAND CITY TENNESSEE 37015 10.4155 RetainANDERSON TULLY LUMBER CO WALTERSVILLE LUMBER MILL
VICKSBURG MISSISSIPPI 39181 10.4095 Retain
NUCOR CORP VULCRAFT/NUCOR COLD FINISH DIV NORFOLK Nebraska 68701 10.26 RetainSILGAN CAN CO MAXTON North Carolina 28364 10.1855 RetainSYCAMORE SYSTEMS LLC SYCAMORE ILLINOIS 60178 10.144 RetainASHLEY INDUSTRIAL MOLDING INC ASHLEY Indiana 46705 10.1 RetainBERENFIELD CONTAINERS SW LTD WHITE HALL Arkansas 71602 10.0855 RetainSTANLEY WORKS HAND TOOLS DIV NEW BRITAIN Connecticut 06052 9.969 RetainSILGAN CONTAINERS MANAUFACTURING CORP OCONOMOWOC Wisconsin 53066 9.95 RetainRR DONNELLEY & SONS CO WILLARD Ohio 44890 9.915 RetainAKZO NOBEL COATINGS INC BIRMINGHAM Alabama 35234 9.895 RetainCAN CORP OF AMERICA INC BLANDON Pennsylvania 19510 9.889 RetainTRILLA ST LOUIS CORP FENTON MISSOURI 63026 9.812685 RetainNUCOR CORP VULCRAFT DIV FLORENCE South Carolina 29501 9.777 RetainSAFETY-KLEEN SYSTEMS INC LEXINGTON South Carolina 29073 9.7255 RetainNUCOR CORP VULCRAFT DIV FORT PAYNE Alabama 35967 9.6915 RetainYKK AP AMERICA INC DUBLIN Georgia 31021 9.616 RetainQUAD/GRAPHICS INC SUSSEX Wisconsin 53089 9.595 RetainSIGNODE BRIDGEVIEW Illinois 60455 9.5 RetainSQUARE D CO LEXINGTON Kentucky 40511 9.4845 RetainREXAM BEVERAGE CAN CO FAIRFIELD PLANT FAIRFIELD California 94533 9.37 RetainKUBIN-NICHOLSON CORP MILWAUKEE Wisconsin 53224 9.296 RetainNATIONAL COATINGS INC GALESBURG ILLINOIS 61401 9.247 RetainSILGAN CONTAINERS MANUFACTURING CORP SAINT JOSEPH Missouri 64504 9.015 RetainGREIF PACKAGING LLC NEW ORLEANS Louisiana 70123 8.708 RetainALLIANCE INDUSTRIES WAUPACA WAUPACA Wisconsin 54981 8.605 RetainLA-Z-BOY TENNESSEE DAYTON Tennessee 37321 8.57306025 RetainESCO CORP NEWTON Mississippi 39345 8.5565 RetainCNH AMERICA LLC GOODFIELD ILLINOIS 61742 8.4305 RetainWHITING DOOR MANUFACTURING CORP AKRON New York 14001 8.413 RetainHEXION SPECIALTY CHEMICALS INC LAKELAND Florida 33801 8.3945 RetainBALL AEROSOL & SPECIALTY CONTAINER INC ELGIN Illinois 60120 8.35 RetainSILGAN CAN CO NAPOLEON Ohio 43545 8.3375 RetainSHIELDCOAT TECHNOLOGIES INC (DBA CYBERSHIELD OF TEXAS)
LUFKIN Texas 75904 8.303 Retain
KAWNEER CO INC SPRINGDALE Arkansas 72764 8.213 RetainAM GENERAL LLC MISHAWAKA INDIANA 46545 8.1875 RetainCNH AMERICA LLC BURLINGTON Iowa 52601 8.175 RetainSILGAN CONTAINERS MANUFACTURING CORP MENOMONIE Wisconsin 54751 7.85 RetainCROWN AEROSOL PACKAGING AURORA Illinois 60504 7.8365 RetainCARRY-ON TRAILER CORP MISSOURI VALLEY Iowa 51555 7.834 RetainBROAN-NUTONE LLC HARTFORD Wisconsin 53027 7.737 RetainROLL COATER LA PORTE Indiana 46350 7.7325 RetainVON HOFFMANN GRAPHICS INC OWENSVILLE Missouri 65066 7.665 RetainGMVM-LANSING GRAND RIVER ASSEMBLY LANSING Michigan 48921 7.55 RetainGREIF INDUSTRIAL PACKAGING & SERVICES WINFIELD Kansas 67156 7.533 RetainHUTCHENS INDUSTRIES INC MANSFIELD FACILITY MANSFIELD MISSOURI 65704 7.505 RetainCARRY-ON TRAILER CORP WINNEMUCCA NEVADA 89445 7.4985 RetainELECTROPRIME INC ROSSFORD Ohio 43460 7.4105 RetainDEXTER AXLE EL RENO OKLAHOMA 73036 7.409 RetainEQUISTAR CHEMICALS BAYPORT CHEMICALS PLANT PASADENA Texas 77507 7.4035 Retain
NAHAN PRINTING INC SAINT CLOUD Minnesota 56303 7.33722 Retain
Page 3 of 18

Table C-2. Comparisons of 2010 TRI Air Emissions Data for Certain Glycol Ethers to the Step A Screening Value of 4.9 tpy
Facility Name City State Zip Code 2010 Air Emissions (tpy) Outcome
TECNOCAP LLC WARREN Ohio 44483 7.305 RetainSUPERIOR INDUSTRIES INTERNATIONAL ARKANSAS LLC
FAYETTEVILLE ARKANSAS 72701 7.3 Retain
U.S. AIR FORCE TINKER AFB OK TINKER A F B Oklahoma 73145 7.3 RetainCHRYSLER BELVIDERE ASSEMBLY PLANT BELVIDERE Illinois 61008 7.3 RetainGENERAL MOTORS WENTZVILLE ASSEMBLY WENTZVILLE Missouri 63385 7.25 RetainROLL COATER INC WEIRTON West Virginia 26062 7.2295 RetainWIX FILTRATION CORP - ALLEN PLANT GASTONIA North Carolina 28052 7.2025 RetainSANYO SOLAR (USA) LLC CARSON California 90745 7.184775 RetainRR DONNELLEY CRAWFORDSVILLE CRAWFORDSVILLE Indiana 47933 7.1225 RetainKITZINGER COOPERAGE CORP SAINT FRANCIS Wisconsin 53235 7.09505 RetainJOHN DEERE DES MOINES WORKS ANKENY IOWA 50023 7.0485 RetainAVERY DENNISON - IBMD LENOIR LENOIR North Carolina 28645 7.0455 RetainALCOA INC - WARRICK OPERATIONS NEWBURGH Indiana 47629 7 RetainSILGAN CAN CO PARIS Texas 75460 6.953 RetainENKEI AMERICA INC COLUMBUS Indiana 47201 6.95 RetainCARDONE INDUSTRIES PHILADELPHIA Pennsylvania 19120 6.9415 RetainMAUSER CORP WOODBRIDGE New Jersey 07095 6.8305 RetainHAMMER PACKAGING CORP WEST HENRIETTA New York 14586 6.7935 RetainBRIGGS & STRATTON YARD POWER PRODUCTS MCDONOUGH OPERATIONS
MC DONOUGH GEORGIA 30253 6.7395 Retain
SUPERIOR INDUSTRIES INTERNATIONAL ARKANSAS LLC
ROGERS ARKANSAS 72756 6.735 Retain
AAP ST MARYS CORP SAINT MARYS Ohio 45885 6.7315 RetainBERENFIELD CONTAINERS INC CLARENDON Pennsylvania 16313 6.726985 RetainSENECA FOODS CORP CAN PLANT MARION New York 14505 6.6935 RetainRR DONNELLEY LANCASTER EAST LANCASTER Pennsylvania 17601 6.6375 RetainCREE INC DURHAM North Carolina 27703 6.601 RetainHUSQVARNA CONSUMER OUTDOOR PRODUCTS ORANGEBURG South Carolina 29116 6.56 RetainOWENS CORNING VETROTEX LLC STARR South Carolina 29684 6.559 RetainWHEELING MACHINE PRODUCTS DIV PINE BLUFF PINE BLUFF ARKANSAS 71602 6.5 RetainSILGAN CONTAINERS MANUFACTURIN G CORP FORT DODGE IOWA 50501 6.49178 RetainSKOLNIK INDUSTRIES CHICAGO ILLINOIS 60632 6.45 RetainNUCOR VULCRAFT GROUP SAINT JOE DIV SAINT JOE Indiana 46785 6.3715 RetainNISSAN NORTH AMERICA INC CANTON MS CANTON Mississippi 39046 6.3555 RetainSILGAN CONTAINERS MANUFACTURING CORP HAMMOND Indiana 46320 6.331 RetainSAPA EXTRUSIONS INC YANKTON South Dakota 57078 6.31004485 RetainBRADFORD WHITE CORP MIDDLEVILLE Michigan 49333 6.2995 RetainMAYTAG CORP CLEVELAND COOKING PRODUCTS PLANT 1
CLEVELAND Tennessee 37311 6.25 Retain
EFCO CORP MONETT Missouri 65708 6.1935 RetainHUNTER DOUGLAS TUPELO CENTER SHANNON Mississippi 38868 6.164015 RetainNAVISTAR INC SPRINGFIELD Ohio 45502 6.1 RetainSILGAN CAN CO SACRAMENTO California 95824 6.085 RetainTHE COLEMAN CO INC WICHITA KANSAS 67219 6.051 RetainBOBCAT CO (MELROE) GWINNER NORTH DAKOTA 58040 5.964 RetainPACKAGING DYNAMICS INC BAGCRAFT/PAPERCON DIV
BAXTER SPRINGS Kansas 66713 5.9425 Retain
CHRYSLER WARREN TRUCK ASSEMBLY PLANT (PART) WARREN Michigan 48091 5.915 Retain
GREIF PACKAGING LLC MERCED California 95348 5.866 RetainAVX CORP MYRTLE BEACH MYRTLE BEACH South Carolina 29577 5.8645 RetainSCHAEFFER MANUFACTURING SAINT LOUIS Missouri 63104 5.84243 RetainWORTHINGTON CYLINDERS WISCONSI N LLC CHILTON Wisconsin 53014 5.8315 RetainSILGAN CONTAINERS MANUFACTURING CORP ROCHELLE Illinois 61068 5.806 RetainNAZDAR SHAWNEE SHAWNEE Kansas 66227 5.745 RetainQUEBECOR WORLD INC WINCHESTER VIRGINIA WINCHESTER Virginia 22603 5.73718 RetainTACO INC - CRANSTON CRANSTON RHODE ISLAND 02920 5.7195 RetainMETOKOTE CORP PLANT 15 CEDAR FALLS Iowa 50613 5.66847 RetainINX DIGITAL INK CO DIXON California 95620 5.621 RetainPRECOAT METALS GRANITE CITY Illinois 62040 5.6115 RetainSILGAN CONTAINERS MANUFACTURING CORP EDISON New Jersey 08817 5.55 RetainNOVOLYTE TECHNOLOGIES ZACHARY Louisiana 70791 5.545 RetainKNS COMPANYS INC CAROL STREAM Illinois 60188 5.496 RetainLOGAN ALUMINUM INC RUSSELLVILLE Kentucky 42276 5.398 RetainNOV TUBOSCOPE NAVASOTA NAVASOTA Texas 77868 5.391 RetainAJAX METAL PROCESSING INC DETROIT MICHIGAN 48207 5.384 RetainFIBERMARK NORTH AMERICA INC LOWVILLE New York 13367 5.3625 RetainPPG INDUSTRIES,INC-SPRINGDALE COMPLEX SPRINGDALE Pennsylvania 15144 5.3045 RetainBATESVILLE MANUFACTURING INC -DOLL PLANT BATESVILLE Indiana 47006 5.297 RetainAUTOALLIANCE INTERNATIONAL INC FLAT ROCK Michigan 48134 5.28 RetainARMSTRONG HARDWOOD FLOORING CO ONEIDA Tennessee 37841 5.22175 Retain
Page 4 of 18

Table C-2. Comparisons of 2010 TRI Air Emissions Data for Certain Glycol Ethers to the Step A Screening Value of 4.9 tpy
Facility Name City State Zip Code 2010 Air Emissions (tpy) Outcome
US ARMY LAKE CITY ARMY AMMUNITION PLANT INDEPENDENCE Missouri 64051 5.166 RetainRUSKIN CO GENEVA Alabama 36340 5.1155 RetainPELLA CORP CARROLL OPERATIONS CARROLL IOWA 51401 5.05 RetainHYDRO ALUMINUM NORTH AMERICA INC MONETT MISSOURI 65708 5.0365 RetainALCOA HOME EXTERIORS INC SIDNEY Ohio 45365 5.0325 RetainRR DONNELLEY LANCASTER WEST LANCASTER Pennsylvania 17601 4.8597 Screened OutCIRCLE GRAPHICS INC LONGMONT Colorado 80501 4.85 Screened OutPRECOAT METALS HOUSTON Texas 77015 4.815 Screened OutPHOENIX CONTAINER INC NORTH BRUNSWICK New Jersey 08902 4.773 Screened OutSILGAN CONTAINER MANUFACTURING CORP RIVERBANK California 95367 4.728 Screened OutCROWN AEROSOL PACKAGING FARIBAULT Minnesota 55021 4.7155 Screened OutHYUNDAI MOTOR MANUFACTURING ALABAMA LLC MONTGOMERY Alabama 36105 4.714 Screened OutAK STEEL CORP - ZANESVI LLE WORKS ZANESVILLE Ohio 43701 4.7 Screened OutCOLOR COMMUNICATIONS INC CHICAGO Illinois 60624 4.65 Screened OutPRECOAT METALS SAINT LOUIS Missouri 63116 4.6395 Screened OutFORD MOTOR CO TWIN CITIES ASSEMBLY PLANT SAINT PAUL Minnesota 55116 4.59 Screened OutPRIME TANNING CO - HARTLAND HARTLAND Maine 04943 4.587 Screened OutRR DONNELLEY-WETMORE PLANT HOUSTON TEXAS 77043 4.5785 Screened OutVOLVO TRUCKS NORTH AMERICA DUBLIN VIRGINIA 24084 4.55 Screened OutR R DONNELLEY & SONS CO DANVILLE DIV DANVILLE Kentucky 40422 4.5025 Screened OutNESTLE PURINA PETCARE WEIRTON West Virginia 26062 4.485 Screened OutIMPRESS USA INC TERMINAL ISLAND California 90731 4.475 Screened OutBROWN PRINTING CO WASECA Minnesota 56093 4.474 Screened OutCURTIS METAL FINISHING CO STERLING HEIGHTS Michigan 48313 4.4615 Screened OutARVINMERITOR HEAVY VEHICLE SYSTEMS LLC YORK South Carolina 29745 4.4225 Screened OutWORLDCOLOR CLARKSVILLE Tennessee 37040 4.3865 Screened OutENDICOTT INTERCONNECT TECHNOLOGIES INC ENDICOTT New York 13760 4.3655 Screened OutTTM TECHNOLOGIES INC LOGAN Utah 84321 4.32 Screened OutMERIX CORP FOREST GROVE Oregon 97116 4.273 Screened OutINLAND LABEL & MARKETING LA CROSSE Wisconsin 54601 4.2335 Screened OutSAPA EXTRUDER INC GAINESVILLE Georgia 30504 4.226 Screened OutCARRY-ON TRAILER CORP MONTROSS VIRGINIA 22520 4.1765 Screened OutGENIE INDUSTRIES SOUTH CAMPUS REDMOND Washington 98052 4.14645 Screened OutSEQUA COATINGS CORP-PRECOAT M ETALS DIV PORTAGE Indiana 46368 4.1135 Screened OutBROWN PRINTING CO WOODSTOCK Illinois 60098 4.005 Screened OutMETAL COATERS MISSISSIPPI JACKSON Mississippi 39272 3.9925 Screened OutHIRSH INDUSTRIES INC DOVER Delaware 19904 3.984 Screened OutBALL METAL FOOD CONTAINER CORP OAKDALE California 95361 3.984 Screened OutSILGAN CONTAINERS MANUFACTURING CORP MENOMONEE FALLS Wisconsin 53051 3.95 Screened OutGENERAL MOTORS CORP LORDSTOWN COMPLEX LORDSTOWN Ohio 44481 3.9 Screened OutBETCO CORP TOLEDO Ohio 43607 3.885 Screened OutQUEBECOR WORLD DIRECT-PETTY EFFINGHAM Illinois 62401 3.83 Screened OutMAGNA MIRRORS CORP - NEWAYGO NEWAYGO MICHIGAN 49337 3.8065 Screened OutGMTG - SHREVEPORT ASSEMBLY SHREVEPORT Louisiana 71129 3.745 Screened OutVAN CAN CO FONTANA California 92337 3.7 Screened OutCROWN FOOD PACKAGING PORTLAND Oregon 97203 3.6305 Screened OutGREIF PACKAGING LLC WARMINSTER Pennsylvania 18974 3.5965 Screened OutBROWN PRINTING CO EAST GREENVILLE Pennsylvania 18041 3.5415 Screened OutAFTON CHEMICAL CORP ORANGEBURG South Carolina 29115 3.5095 Screened OutRR DONNELLEY & SONS CO MATTOON ILLINOIS 61938 3.465 Screened OutTITAN COATINGS INC BESSEMER Alabama 35023 3.42 Screened OutTTM PRINTED CIRCUIT GROUP - S TAFFORD DIV STAFFORD Connecticut 06075 3.3675 Screened OutTORO CO TOMAH Wisconsin 54660 3.331 Screened OutALERIS ROLLED PRODUCTS INC LEWISPORT Kentucky 42351 3.3235 Screened OutAVERY DENNISON INDUSTRIAL PRODUCTS DIV STRONGSVILLE Ohio 44149 3.316 Screened OutBRILLION IRON WORKS INC BRILLION Wisconsin 54110 3.30905 Screened OutSILGAN CONTAINERS MANUFACTURING CORP LYONS New York 14489 3.2625 Screened OutGM SPRING HILL MANUFACTURING SPRING HILL Tennessee 37174 3.2565 Screened OutQUAD/GRAPHICS INC WEST ALLIS WISCONSIN 53214 3.255 Screened OutBATESVILLE MANUFACTURING INC BATESVILLE Mississippi 38606 3.2525 Screened OutPRECOAT METALS HUEYTOWN Alabama 35023 3.2315 Screened OutMIDDLEBURY HARDWOOD PRODUCTS MIDDLEBURY INDIANA 46540 3.2215 Screened OutWORLDCOLOR LEBANON DIV LEBANON Ohio 45036 3.186 Screened OutCADON PLATING CO WYANDOTTE Michigan 48192 3.136775 Screened OutSONOCO PHOENIX - PRESIDENTS ISLAND MEMPHIS Tennessee 38113 3.122 Screened OutRR DONNELLEY STRASBURG DIV STRASBURG Virginia 22657 3.1 Screened OutBASF CORP - CLEAR LAKE PLANT PASADENA Texas 77507 3.079167767 Screened OutSPRAYLAT CORP CA LOS ANGELES California 90016 3.075 Screened OutRR DONNELLEY LOS ANGELES MANUFACTURING TORRANCE California 90502 3.0235 Screened OutJELD-WEN CRAIGSVILLE WEST VIRGINIA 26205 3.0215 Screened OutKAWASAKI MOTORS MANUFACTURING CORP USA LINCOLN Nebraska 68524 2.951 Screened OutVERTIS COMMUNICATIONS COLUMBUS Ohio 43228 2.8845 Screened Out
Page 5 of 18
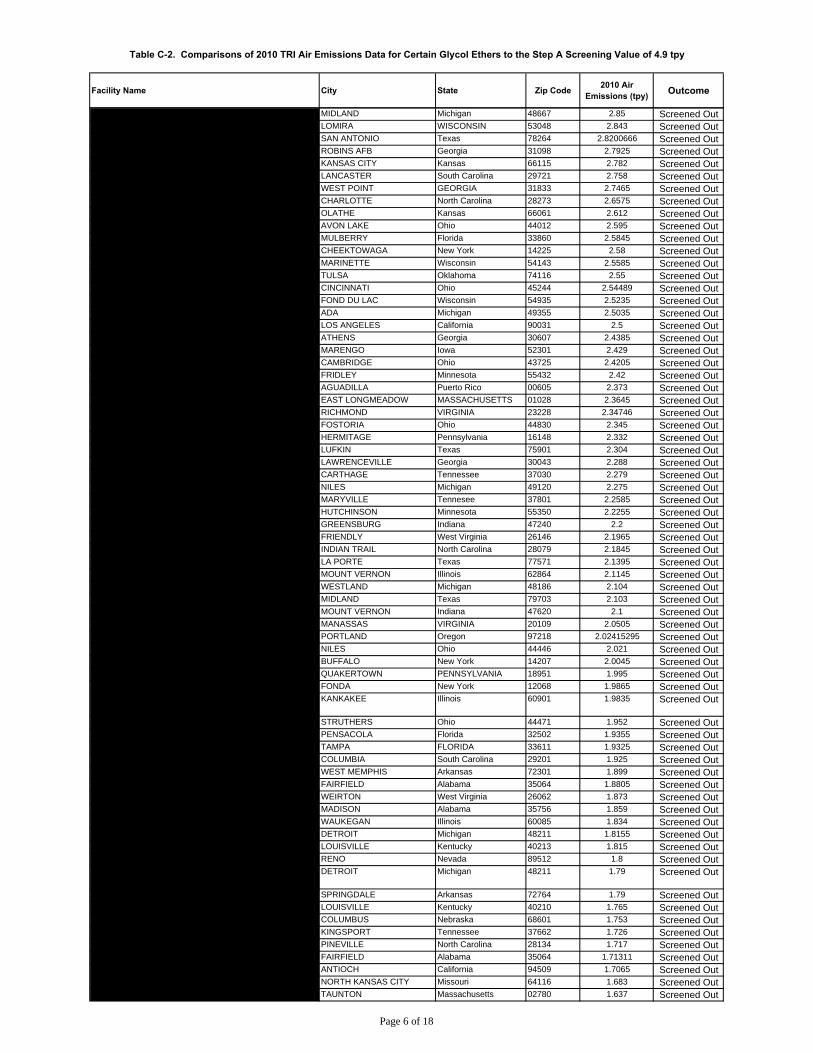
Table C-2. Comparisons of 2010 TRI Air Emissions Data for Certain Glycol Ethers to the Step A Screening Value of 4.9 tpy
Facility Name City State Zip Code 2010 Air Emissions (tpy) Outcome
DOW CHEMICAL CO MIDLAND Michigan 48667 2.85 Screened OutQUAD/GRAPHICS INC LOMIRA WISCONSIN 53048 2.843 Screened OutTOYOTA MOTOR MANUFACTURING TEX AS INC SAN ANTONIO Texas 78264 2.8200666 Screened OutU.S. AIR FORCE ROBINS AFB GA ROBINS AFB Georgia 31098 2.7925 Screened OutGM MLCG FAIRFAX ASSEMBLY KANSAS CITY Kansas 66115 2.782 Screened OutSOLIANT LLC LANCASTER South Carolina 29721 2.758 Screened OutKIA MOTORS MANUFACTURING OF GEORGIA WEST POINT GEORGIA 31833 2.7465 Screened OutVERTIS COMMUNICATIONS CHARLOTTE North Carolina 28273 2.6575 Screened OutITW DYMON OLATHE Kansas 66061 2.612 Screened OutFORD MOTOR CO - OHIO ASSEMBLY PLANT AVON LAKE Ohio 44012 2.595 Screened OutARR-MAZ CUSTOM CHEMICALS MULBERRY Florida 33860 2.5845 Screened OutDERRICK CORP CHEEKTOWAGA New York 14225 2.58 Screened OutTYCO FIRE SUPPRESSION & BUILDING PRODUCTS MARINETTE Wisconsin 54143 2.5585 Screened OutIC OF OKLAHOMA LLC TULSA Oklahoma 74116 2.55 Screened OutBWAY CORP BWAY PACKAGING DIV CINCINNATI Ohio 45244 2.54489 Screened OutBRUNSWICK CORP MERCURY MARINE DIV FOND DU LAC Wisconsin 54935 2.5235 Screened OutACCESS BUSINESS GROUP LLC ADA Michigan 49355 2.5035 Screened OutMISSION KLEENSWEEP PRODUCTS INC LOS ANGELES California 90031 2.5 Screened OutPOWER PARTNERS INC ATHENS Georgia 30607 2.4385 Screened OutAMERICAN COLOR GRAPHICS MARENGO Iowa 52301 2.429 Screened OutCENTRIA CAMBRIDGE Ohio 43725 2.4205 Screened OutCUMMINS POWER GENERATION FRIDLEY Minnesota 55432 2.42 Screened OutHEWLETT-PACKARD CARIBE BV SITE AGUADILLA Puerto Rico 00605 2.373 Screened OutVERTIS INC RNS SPRINGFIELD DIV EAST LONGMEADOW MASSACHUSETTS 01028 2.3645 Screened OutCADMUS SPECIALTY PUBLICATIONS RICHMOND VIRGINIA 23228 2.34746 Screened OutROPPE CORP FOSTORIA Ohio 44830 2.345 Screened OutCCL CONTAINER AEROSOL DIV HERMITAGE Pennsylvania 16148 2.332 Screened OutAMERICAN COLOR GRAPHICS - LUFKIN LUFKIN Texas 75901 2.304 Screened OutIVC SOUTH LAWRENCEVILLE Georgia 30043 2.288 Screened OutBON L MANUFACTURING CO CARTHAGE Tennessee 37030 2.279 Screened OutNCP COATINGS INC NILES Michigan 49120 2.275 Screened OutDENSO MANUFACTURING TENNESSEE INC MARYVILLE Tennesee 37801 2.2585 Screened Out3M CO - HUTCHINSON HUTCHINSON Minnesota 55350 2.2255 Screened OutHONDA MANUFACTURING OF INDIANA LLC GREENSBURG Indiana 47240 2.2 Screened OutMPM SILICONES LLC FRIENDLY West Virginia 26146 2.1965 Screened OutRADIATOR SPECIALTY CO INDIAN TRAIL North Carolina 28079 2.1845 Screened OutGREIF PACKAGING LLC LA PORTE Texas 77571 2.1395 Screened OutVANEX INC MOUNT VERNON Illinois 62864 2.1145 Screened OutRED SPOT WESTLAND INC WESTLAND Michigan 48186 2.104 Screened OutBENCHMARK ENERGY PRODUCTS LLC MIDLAND Texas 79703 2.103 Screened OutSABIC INNOVATIVE PLASTICS MT VERNON LLC MOUNT VERNON Indiana 47620 2.1 Screened OutVERTIS MANASSAS VIRGINIA 20109 2.0505 Screened OutSAPA INC COATINGS DIVSION PORTLAND Oregon 97218 2.02415295 Screened OutCLEVELAND STEEL CONTAINER - NI LES NILES Ohio 44446 2.021 Screened OutDUPONT YERKES PLANT BUFFALO New York 14207 2.0045 Screened OutCLEVELAND STEEL CONTAINER CORP QUAKERTOWN PENNSYLVANIA 18951 1.995 Screened OutKEYMARK CORP FONDA New York 12068 1.9865 Screened OutENGINEERED POLYMER SOLUTIONS INC D/B/A VALSPAR COATINGS
KANKAKEE Illinois 60901 1.9835 Screened Out
ASTRO COATINGS INC STRUTHERS Ohio 44471 1.952 Screened OutREICHHOLD INC PENSACOLA Florida 32502 1.9355 Screened OutVERTIS COMMUNICATIONS TAMPA FLORIDA 33611 1.9325 Screened OutCONSOLIDATED SYSTEMS INC COLUMBIA South Carolina 29201 1.925 Screened OutWARREN UNILUBE INC WEST MEMPHIS Arkansas 72301 1.899 Screened OutHANNA STEEL CORP FAIRFIELD Alabama 35064 1.8805 Screened OutIMPRESS USA INC WEIRTON West Virginia 26062 1.873 Screened OutDURA COAT PRODUCTS INC MADISON Alabama 35756 1.859 Screened OutAKZONOBEL AEROSPACE COATINGS WAUKEGAN Illinois 60085 1.834 Screened OutEQ DETROIT INC DETROIT Michigan 48211 1.8155 Screened OutFORD LOUISVILLE ASSEMBLY LOUISVILLE Kentucky 40213 1.815 Screened OutPRO LINE PRINTING / RR DONNELLEY RENO Nevada 89512 1.8 Screened OutGENERAL MOTORS MLCG DETROIT-HAMTRAMCK ASSEM BLY CENTER
DETROIT Michigan 48211 1.79 Screened Out
BALL METAL FOOD CONTAINER CORP SPRINGDALE Arkansas 72764 1.79 Screened OutCOLOR CORP OF AMERICA LOUISVILLE Kentucky 40210 1.765 Screened OutCAMACO COLUMBUS MANUFACTURING COLUMBUS Nebraska 68601 1.753 Screened OutEASTMAN CHEMICAL CO TENNESSEE OPERATIONS KINGSPORT Tennessee 37662 1.726 Screened OutRR DONNELLEY PINEVILLE PINEVILLE North Carolina 28134 1.717 Screened OutSTEELSCAPE INC FAIRFIELD Alabama 35064 1.71311 Screened OutSILGAN CONTAINERS MANUFACTURING CORP ANTIOCH California 94509 1.7065 Screened OutFUJIFILM NORTH AMERICA CORP NORTH KANSAS CITY Missouri 64116 1.683 Screened OutWORLD COLOR PRESS TAUNTON Massachusetts 02780 1.637 Screened Out
Page 6 of 18

Table C-2. Comparisons of 2010 TRI Air Emissions Data for Certain Glycol Ethers to the Step A Screening Value of 4.9 tpy
Facility Name City State Zip Code 2010 Air Emissions (tpy) Outcome
DAIMLERCHRYSLER CORP TOLEDO ASSEMBLY PLANT TOLEDO Ohio 43612 1.60765 Screened Out
RR DONNELLEY VON HOFFMANN CORP JEFFERSON CITY Missouri 65109 1.572395 Screened OutJ L CLARK INC ROCKFORD Illinois 61104 1.5395 Screened OutDOW CHEMICAL CO - LOUISIANA OPERATIONS PLAQUEMINE Louisiana 70765 1.538 Screened OutWORLDCOLOR - DYERSBURG DIV DYERSBURG Tennessee 38024 1.529 Screened OutSILGAN WHITE CAP CORP HAZLETON Pennsylvania 18201 1.5 Screened OutCENTURY INDUSTRIAL COATINGS I NC JACKSONVILLE Texas 75766 1.4775 Screened OutTEXAS FINISHING CO CARROLLTON Texas 75006 1.4565 Screened OutST CHARLES OPERATIONS (TAFT/STAR) UNION CARBIDE CORP
TAFT Louisiana 70057 1.4555 Screened Out
CHRYSLER STERLING HEIGHTS ASSEMBLY PLANT STERLING HEIGHTS Michigan 48312 1.45 Screened OutWORLDCOLOR STILLWATER (WAS QUEBECOR WORLD - STILLWATER DIV)
STILLWATER Oklahoma 74075 1.448 Screened Out
RR DONNELLEY CHARLESTOWN Indiana 47111 1.4255 Screened OutBAYOU COS INC NEW IBERIA LOUISIANA 70560 1.4245 Screened OutNICHOLS ALUMINUM ALABAMA INC DECATUR Alabama 35601 1.414 Screened OutGMC TRUCK GROUP ARLINGTON ASSEMBLY PLANT ARLINGTON Texas 76010 1.41 Screened OutCARDINAL ALUMINUM CO PLAN T 3 LOUISVILLE Kentucky 40219 1.4025 Screened OutWHEELING CORRUGATING CO - BEECH BOTTOM PLANT
WELLSBURG West Virginia 26070 1.4 Screened Out
OHIO ART CO BRYAN Ohio 43506 1.388 Screened OutPRO LINE PRINTING ARLINGTON ARLINGTON Texas 76011 1.375 Screened OutENGINEERED POLYMER SOLUTIONS INC D/B/A VALSPAR COATINGS
ROCHESTER Pennsylvania 15074 1.3745 Screened Out
CHROMASOURCE INC COLUMBIA CITY Indiana 46725 1.338 Screened OutHALLSTAR CO ESTER SOLUTIONS FACILITY BEDFORD PARK Illinois 60638 1.3125 Screened OutSHEBOYGAN PAINT CO CEDARTOWN Georgia 30125 1.312 Screened OutCOOK COMPOSITES & POLYMERS CO GRAND RAPIDS Michigan 49507 1.312 Screened OutTAIYO AMERICA INC CARSON CITY Nevada 89701 1.295 Screened OutRR DONNELLEY & SONS CO AVON Connecticut 06001 1.2875 Screened OutCLEVELAND STEEL CONTAINER - PE OTONE FACILITY PEOTONE Illinois 60468 1.267 Screened Out
CATERPILLAR INC LAFAYETTE Indiana 47905 1.2555 Screened OutGENTEK BUILDING PRODUCTS AVENEL New Jersey 07001 1.248 Screened OutSUN CHEMICAL CORP SAINT CHARLES Illinois 60174 1.234 Screened OutAKZO NOBEL COATINGS INC COLUMBUS Ohio 43211 1.225 Screened OutSPIRALKOTE FLEXIBLE PACKAGING ORLANDO FLORIDA 32837 1.2105 Screened OutCOOK COMPOSITES & POLYMERS CO SAUKVILLE Wisconsin 53080 1.202 Screened OutSPRAYLAT CORP IL CHICAGO Illinois 60633 1.201 Screened OutKIK (HOUSTON) INC HOUSTON Texas 77054 1.19 Screened OutMASCO RETAIL CABINET GROUP LLC WAVERLY Ohio 45690 1.173 Screened OutCP CONVERTERS INC YORK PENNSYLVANIA 17402 1.17007 Screened OutMOTOR CASTINGS CO MILWAUKEE Wisconsin 53214 1.159 Screened OutRED SPOT PAINT & VARNISH CO INC EVANSVILLE Indiana 47711 1.156 Screened OutJOHN DEERE SEEDING & CYLINDER MOLINE Illinois 61265 1.15 Screened OutARANDELL CORP MENOMONEE FALLS Wisconsin 53051 1.1195 Screened OutW W HENRY BOURBONNAIS Illinois 60914 1.1105 Screened OutBEAULIEU OF AMERICA PLANT 560-MODEL DALTON Georgia 30721 1.1095 Screened OutTESORO REFINING & MARKETING CO - MANDAN REFINERY
MANDAN North Dakota 58554 1.1005 Screened Out
IVC INDUSTRIAL COATINGS INC INDIANAPOLIS Indiana 46218 1.0982 Screened OutVANGUARD PAINTS & FINISHES INC MARIETTA Ohio 45750 1.078 Screened OutWINSLOW-BROWNING INC LIBERTY Indiana 47353 1.077 Screened OutENGINEERED POLYMER SOLUTIONS INC D/B/A VALSPAR COATINGS
GARLAND Texas 75042 1.068 Screened Out
POLYMERIC IMAGING INC NORTH KANSAS CITY Missouri 64116 1.0665 Screened Out3M CO - BROWNWOOD BROWNWOOD Texas 76801 1.0435 Screened OutCOMPLEMENTARY COATINGS CORP BALTIMORE Maryland 21224 1.029 Screened OutUNITED PAINT & CHEMICAL SOUTHFIELD Michigan 48034 1.023 Screened OutCOOK COMPOSITES & POLYMERS CO HOUSTON Texas 77051 1.019 Screened OutTTM TECHNOLOGIES INC CHIPPEWA FALLS Wisconsin 54729 1.002 Screened OutGENERAL MOTORS LLC BOWLING GREEN ASSEMBLY PLANT
BOWLING GREEN Kentucky 42101 1 Screened Out
TTM TECHNOLOGIES-SANTA CLARA SANTA CLARA California 95050 0.9985 Screened OutNICHOLS ALUMINUM DAVENPORT DAVENPORT Iowa 52802 0.9965 Screened OutTHREE RIVERS ALUMINUM CO CRANBERRY TOWNSHIP Pennsylvania 16066 0.9945 Screened OutCANBERRA CORP TOLEDO Ohio 43615 0.975 Screened OutPPG INDUSTRIES OHIO INC (CL) CLEVELAND Ohio 44111 0.9675 Screened OutB-WAY PACKAGING INC TRENTON New Jersey 08648 0.952 Screened OutWESTERN METAL DECORATING CO RANCHO CUCAMONGA CALIFORNIA 91730 0.925 Screened OutHILLYARD INDUSTRIES INC SAINT JOSEPH Missouri 64501 0.9205 Screened OutFORBO ADHESIVES LLC MORRIS Illinois 60450 0.896 Screened Out
Page 7 of 18

Table C-2. Comparisons of 2010 TRI Air Emissions Data for Certain Glycol Ethers to the Step A Screening Value of 4.9 tpy
Facility Name City State Zip Code 2010 Air Emissions (tpy) Outcome
NAPCO INC VALENCIA Pennsylvania 16059 0.893 Screened OutCRYSTAL FINISHING SYSTEMS INC SCHOFIELD Wisconsin 54476 0.89296195 Screened OutHUNT REFINING CO A CORP TUSCALOOSA Alabama 35401 0.8905 Screened OutPOLARTEC LLC LAWRENCE MASSACHUSETTS 1841 0.89 Screened OutSUN CHEMICAL CORP MAUMEE Ohio 43537 0.8875 Screened OutFINISHES UNLIMITED INC SUGAR GROVE Illinois 60554 0.876 Screened OutUNIVAR USA INC HOUSTON FM 529 HOUSTON TEXAS 77041 0.875 Screened OutUNIVERSAL CHEMICALS & COATINGS INC ELK GROVE VILLAGE Illinois 60007 0.8735 Screened OutHB FULLER COVINGTON Georgia 30014 0.863 Screened OutARMSTRONG WORLD INDUSTRIES INC STILLWATER Oklahoma 74075 0.85822 Screened OutMITSUBISHI MOTORS NORTH AMERICA INC NORMAL Illinois 61761 0.8485 Screened OutGFX INTERNATIONAL GRAYSLAKE Illinois 60030 0.82 Screened OutCROWN CORK & SEAL CO (USA) INC CROWN CLOSURES DIV
LANCASTER Ohio 43130 0.8195 Screened Out
STP PRODUCTS MANUFACTURING CO PAINESVILLE Ohio 44077 0.81 Screened OutSONOCO PRODUCTS CO ORLANDO Florida 32837 0.81 Screened OutNEXTEER AUTOMOTIVE CORP SAGINAW Michigan 48601 0.8 Screened OutFIVE STAR COATINGS GROUP TWIN LAKES WISCONSIN 53181 0.798 Screened OutPEORIA DISPOSAL CO #1 PEORIA Illinois 61615 0.7925 Screened OutPPG INDUSTRIES ARCHITECTURAL FINISHES BATAVIA Illinois 60510 0.786 Screened OutTRELLEBORG OFFSHORE US RANKIN ROAD FACILITY HOUSTON Texas 77073 0.785 Screened Out
SILGAN CONTAINERS MANUFACTURING CORP SAVAGE Minnesota 55378 0.785 Screened OutKAWNEER CO INC BLOOMSBURG Pennsylvania 17815 0.7755 Screened OutTCI COATINGS INC LUBBOCK Texas 79415 0.7665 Screened Out3M CO - CORDOVA CORDOVA Illinois 61242 0.765 Screened OutSTEEL DYNAMICS INC JEFFERSONVILLE Indiana 47130 0.763 Screened OutWORWAG COATINGS LLC NA LAFAYETTE Indiana 47905 0.7535 Screened OutRUST-OLEUM CORP PLEASANT PRAIRIE Wisconsin 53158 0.75 Screened OutSYNDICATE SYSTEMS INC MIDDLEBURY Indiana 46540 0.733 Screened OutMARCUS PAINT CO LOUISVILLE Kentucky 40202 0.7075 Screened OutGREIF INDUSTRIAL PACKAGING & SERVICES LLC FONTANA California 92335 0.70305 Screened OutHOVENSA LLC CHRISTIANSTED Virgin Islands 00820 0.702 Screened OutWATSON STANDARD CO HARWICK PLANT HARWICK Pennsylvania 15049 0.6935 Screened OutPPG ARCHITECTURAL FINISHES EAST POINT EAST POINT Georgia 30344 0.691 Screened OutWESTERN EXTRUSIONS CORP CARROLLTON Texas 75006 0.69 Screened OutWEST PENN OIL CO, INC130130 WARREN Pennsylvania 16365 0.678 Screened OutTEXAS TILE MANUFACTURING LLC HOUSTON Texas 77007 0.672 Screened OutSASOL NORTH AMERICA INC LAKE CHARLES CHEMICAL COMPLEX
WESTLAKE Louisiana 70669 0.6685 Screened Out
METALS USA BUILDING PRODUCTS MESQUITE Texas 75149 0.663 Screened OutKAWNEER CO INC VISALIA California 93291 0.658 Screened OutROLL COATER INC BLYTHEVILLE Arkansas 72315 0.6505 Screened OutPRECOAT METALS ELKRIDGE Maryland 21075 0.634 Screened OutSTEELSCAPE KALAMA Washington 98625 0.632015 Screened OutTRINKOTE INDUSTRIAL FINISHES INC FORT WORTH Texas 76110 0.628 Screened OutFLINT GROUP NORTH AMERICA CORP LEBANON Ohio 45036 0.608 Screened OutRYCOLINE PRODUCTS LLC CHICAGO Illinois 60630 0.6065 Screened OutEXXONMOBIL CHEMICAL BATON ROUGE CHEMICAL PLANT
BATON ROUGE Louisiana 70805 0.6 Screened Out
GLASS COATINGS & CONCEPTS MONROE Ohio 45050 0.5925 Screened OutAKZO NOBEL SURFACE CHEMISTRY LLC HOUSTON Texas 77053 0.59 Screened OutENGINEERED POLYMER SOLUTIONS I NC D/B/A VALSPAR COATINGS
BIRMINGHAM Alabama 35215 0.5885 Screened Out
ALERIS ROLLED PRODUCTS INC ASHVILLE Ohio 43103 0.5885 Screened OutASHLAND DISTRIBUTION WILLOW SPRINGS Illinois 60480 0.586 Screened OutROLL COATER INC HAWESVILLE Kentucky 42348 0.58 Screened OutDIAMOND VOGEL PAINTS TULSA Oklahoma 74115 0.5795 Screened OutPRIOR COATED METALS ALLENTOWN Pennsylvania 18103 0.568 Screened OutDUCKBACK PRODUCTS CHICO California 95928 0.5605 Screened OutKLINGER PAINT CO INC CEDAR RAPIDS IOWA 52404 0.55984 Screened OutHYDRITE CHEMICAL CO COTTAGE GROVE Wisconsin 53527 0.55 Screened OutFLINT HILLS RESOURCES LP ROSEMOUNT Minnesota 55068 0.55 Screened OutREICHHOLD INC VALLEY PARK Missouri 63088 0.549875 Screened OutDUPONT FORT MADISON PLANT FORT MADISON Iowa 52627 0.544 Screened OutCENTRIA AMBRIDGE Pennsylvania 15003 0.5315 Screened OutPARISER INDUSTRIES INC PATERSON New Jersey 07503 0.5275 Screened OutDUPONT MOUNT CLEMENS PLANT MOUNT CLEMENS Michigan 48043 0.5265 Screened OutCOMPLEX CHEMICALS CO INC TALLULAH Louisiana 71282 0.525 Screened OutMAXIM INTEGRATED PRODUCTS INC SAN ANTONIO Texas 78251 0.517 Screened OutLOCKHEED MARTIN AERONAUTICS CO PALMDALE California 93599 0.514 Screened OutALERIS ROLLED PRODUCTS INC ROXBORO North Carolina 27573 0.513 Screened Out
Page 8 of 18

Table C-2. Comparisons of 2010 TRI Air Emissions Data for Certain Glycol Ethers to the Step A Screening Value of 4.9 tpy
Facility Name City State Zip Code 2010 Air Emissions (tpy) Outcome
PLAZE INC SAINT CLAIR Missouri 63077 0.509 Screened OutTERNIUM USA INC SHREVEPORT Louisiana 71115 0.5085 Screened OutSC JOHNSON & SON INC WAXDALE FACILITY STURTEVANT Wisconsin 53177 0.5 Screened OutSILBOND CORP WESTON Michigan 49289 0.5 Screened OutFERRO GLASS & COLOR CORP WASHINGTON Pennsylvania 15301 0.5 Screened OutEVONIK DEGUSSA CORP TIPPECANOE LABORATORIES
LAFAYETTE Indiana 47909 0.5 Screened Out
ARCADIA INC VERNON California 90023 0.5 Screened OutTRAD NA INC HOPKINSVILLE Kentucky 42240 0.48455 Screened OutFULLER BRUSH CO GREAT BEND Kansas 67530 0.4825 Screened OutDPIX LLC COLORADO SPRINGS COLORADO 80916 0.475 Screened OutNAZDAR CHICAGO CHICAGO Illinois 60622 0.4735 Screened OutSNAP-ON TOOLS MANUFACTURING CO ALGONA Iowa 50511 0.4705 Screened OutENGINEERED POLYMER SOLUTIONS INC D/B/A VALSPAR COATINGS
MOLINE Illinois 61265 0.47 Screened Out
CLEVELAND STEEL CONTAINER CORP - STREETSBORO PLANT
STREETSBORO Ohio 44241 0.468 Screened Out
ROCK TENN CO CLINTON Iowa 52732 0.466 Screened OutDOW CHEMICAL CO FREEPORT FACILITY FREEPORT Texas 77541 0.4635 Screened OutHEXION SPECIALTY CHEMICALS INC BEDFORD PARK Illinois 60501 0.458 Screened OutFORREST PAINT CO EUGENE Oregon 97402 0.437 Screened OutSEYMOUR OF SYCAMORE INC SYCAMORE ILLINOIS 60178 0.434 Screened OutPFI INC SANTA FE SPRINGS California 90670 0.43 Screened OutRODDA PAINT CO PORTLAND Oregon 97203 0.4295 Screened OutNELCO PRODUCTS INC ANAHEIM California 92801 0.428 Screened OutELEMENTIS SPECIALTIES JERSEY CITY New Jersey 07304 0.428 Screened OutNASCOTE INDUSTRIES NASHVILLE Illinois 62263 0.42766 Screened OutASHLAND DISTRIBUTION BIRMINGHAM Alabama 35234 0.4215 Screened OutNB COATINGS INC LANSING Illinois 60438 0.40825 Screened OutVISTA PAINT CORP FULLERTON California 92831 0.4065 Screened OutGEMINI COATINGS INC EL RENO OKLAHOMA 73036 0.403 Screened OutROLLEX CORP ELK GROVE VILLAGE Illinois 60007 0.3955 Screened OutSIKA CORP SIKA SARNAFIL DIV CANTON Massachusetts 02021 0.3895 Screened OutMERCK SHARP & DOHME CORP ELKTON Virginia 22827 0.38 Screened OutABC COMPOUNDING CO INC MORROW Georgia 30260 0.3775 Screened OutIMS ENGINEERED PRODUCTS LLC DES PLAINES ILLINOIS 60016 0.3775 Screened OutZSCHIMMER & SCHWARZ MILLEDGEVILLE GEORGIA 31061 0.3775 Screened OutINTERNATIONAL PAINT LLC HOUSTON Texas 77091 0.3775 Screened OutTOWER PRODUCTS INC EASTON Pennsylvania 18045 0.375 Screened OutQUEST CHEMICAL CORP HOUSTON Texas 77041 0.375 Screened OutPATRIOT PAINT LLC PORTLAND INDIANA 47371 0.375 Screened OutFUCHS LUBRICANTS CO-CORPORATE OFFICE HARVEY Illinois 60426 0.3715 Screened OutFLINT GROUP NORTH AMERICA CORP ANNISTON Alabama 36207 0.37 Screened OutMETAL COATERS OF CALIFORNIA INC RANCHO CUCAMONGA California 91730 0.368665 Screened OutMIDWEST METAL COATINGS GRANITE CITY ILLINOIS 62040 0.367 Screened OutIVC INDUSTRIAL COATINGS INC BRAZIL INDIANA 47834 0.36605 Screened OutCELLO PROFESSIONAL PRODUCTS HAVRE DE GRACE Maryland 21078 0.354 Screened OutICL-IP AMERICA INC GALLIPOLIS FERRY West Virginia 25515 0.3506 Screened OutFORD MOTOR CO CHICAGO ASSEMBLY CHICAGO Illinois 60633 0.35 Screened OutINEOS OXIDE A DIV OF INEOS AMERICAS LLC PLAQUEMINE Louisiana 70765 0.347535 Screened OutQUEST SPECIALTY COATINGS LLC MENOMONEE FALLS
MENOMONEE FALLS WISCONSIN 53051 0.3475 Screened Out
DIVERSIFIED COATING SYSTEMS INC GREENVILLE SOUTH SOUTH CAROLINA 29605 0.3375 Screened OutSIERRA CORP MINNETONKA Minnesota 55343 0.336 Screened OutSHERWIN-WILLIAMS AUTOMOTIVE FINISHES CORP RICHMOND Kentucky 40475 0.336 Screened OutZEP INC ATLANTA Georgia 30318 0.3355 Screened OutBECKER SPECIALTY CORP ELK GROVE VILLAGE Illinois 60007 0.335 Screened OutAMERIMAX HOME PRODUCTS INC LANCASTER Pennsylvania 17603 0.3325 Screened OutENGINEERED POLYMER SOLUTIONS INC D/B/A VALSPAR COATINGS
FREMONT Michigan 49412 0.331 Screened Out
ENGLERT INC PERTH AMBOY NEW JERSEY 08861 0.3185 Screened OutAMERIMAX COATED PRODUCTS HELENA ARKANSAS 72342 0.30835 Screened OutCURTIS METAL FINISHING CO MACHESNEY PARK Illinois 61115 0.3075 Screened OutLINETEC WAUSAU Wisconsin 54401 0.302 Screened OutFORD MOTOR CO MICHIGAN ASSEMBLY PLANT WAYNE Michigan 48184 0.3015 Screened OutET PRODUCTS CO INC BREMEN Indiana 46506 0.3 Screened OutAMERICAN METALS CORP WESTLAKE Ohio 44145 0.296 Screened OutMAXIM INTEGRATED PRODUCTS INC SAN JOSE California 95134 0.295 Screened OutMUTI-PACK LLC MILWAUKEE Wisconsin 53223 0.29 Screened OutVIDEOJET TECHNOLOGIES INC ELK GROVE VILLAGE Illinois 60007 0.287 Screened OutTRITECH COATINGS CORP PAGEDALE Missouri 63133 0.2865 Screened OutENTHONE INC WEST HAVEN Connecticut 06516 0.28527 Screened Out
Page 9 of 18
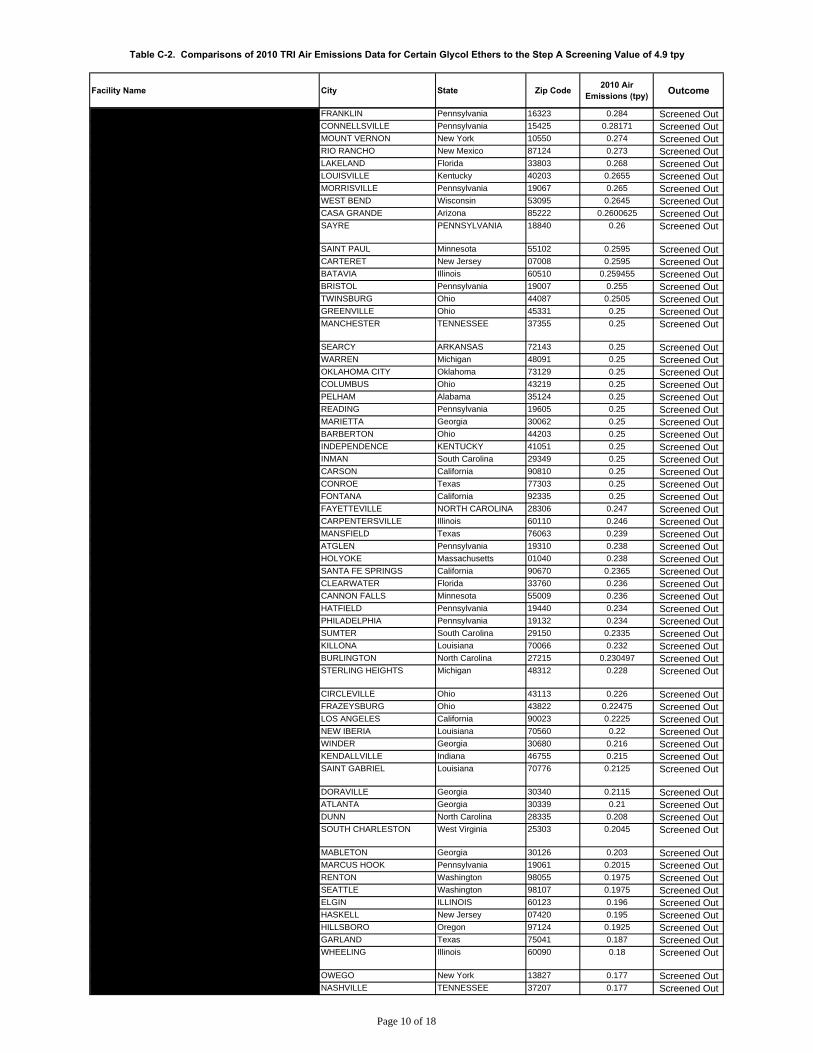
Table C-2. Comparisons of 2010 TRI Air Emissions Data for Certain Glycol Ethers to the Step A Screening Value of 4.9 tpy
Facility Name City State Zip Code 2010 Air Emissions (tpy) Outcome
OMG AMERICAS FRANKLIN Pennsylvania 16323 0.284 Screened OutBRADLEY COATINGS GROUP CONNELLSVILLE Pennsylvania 15425 0.28171 Screened OutSPRAYLAT CORP MOUNT VERNON New York 10550 0.274 Screened OutINTEL CORP RIO RANCHO New Mexico 87124 0.273 Screened OutQUANTUM MARKETING INC LAKELAND Florida 33803 0.268 Screened OutPPG ARCHITECTURAL FINISHES INC LOUISVILLE Kentucky 40203 0.2655 Screened OutBRIGHTSMITH LLC MORRISVILLE Pennsylvania 19067 0.265 Screened OutSERIGRAPH INC WEST BEND Wisconsin 53095 0.2645 Screened OutIVC INDUSTRIAL COATINGS INC CASA GRANDE Arizona 85222 0.2600625 Screened OutMASCO RETAIL CABINET GROUP SAYRE PENNSYLVANIA PLANT
SAYRE PENNSYLVANIA 18840 0.26 Screened Out
ASHLAND DISTRIBUTION CO SAINT PAUL Minnesota 55102 0.2595 Screened OutASHLAND DISTRIBUTION CO CARTERET New Jersey 07008 0.2595 Screened OutHENTZEN COATINGS,INC BATAVIA FACILITY BATAVIA Illinois 60510 0.259455 Screened OutROHM & HAAS CHEMICALS LLC BRISTOL Pennsylvania 19007 0.255 Screened OutASHLAND DISTRIBUTION CO TWINSBURG Ohio 44087 0.2505 Screened OutBASF CORP GREENVILLE Ohio 45331 0.25 Screened OutSANFORD LP LIQUID MANUFACTURING & TECHNOLOGY CENTER
MANCHESTER TENNESSEE 37355 0.25 Screened Out
BRYCE CO LLC SEARCY ARKANSAS 72143 0.25 Screened OutHENKEL CORP WARREN Michigan 48091 0.25 Screened OutBACHMAN SERVICES INC OKLAHOMA CITY Oklahoma 73129 0.25 Screened OutYENKIN-MAJESTIC PAINT CORPORAT ION COLUMBUS Ohio 43219 0.25 Screened OutRESEARCH SOLVENTS & CHEMICALS INC PELHAM Alabama 35124 0.25 Screened OutMISCO PRODUCTS CORP READING Pennsylvania 19605 0.25 Screened OutMETAL COATERS OF GEORGIA MARIETTA Georgia 30062 0.25 Screened OutMALCO PRODUCTS INC BARBERTON Ohio 44203 0.25 Screened OutMAGNI INDUSTRIES INC INDEPENDENCE KENTUCKY 41051 0.25 Screened OutKEYSTONE ANILINE CORP INMAN South Carolina 29349 0.25 Screened OutEQUILON CARSON TERMINAL CARSON California 90810 0.25 Screened OutCHEMICAL SPECIALISTS & DEVELOPMENT INC CONROE Texas 77303 0.25 Screened OutBECKER SPECIALTY CORP FONTANA California 92335 0.25 Screened OutDUPONT FAYETTEVILLE PLANT FAYETTEVILLE NORTH CAROLINA 28306 0.247 Screened OutHEXION SPECIALTY CHEMICALS INC CARPENTERSVILLE Illinois 60110 0.246 Screened OutSTANDARD PAINTS INC MANSFIELD Texas 76063 0.239 Screened OutWORLDCOLOR ATGLEN ATGLEN Pennsylvania 19310 0.238 Screened OutCAR PRODUCTS INC HOLYOKE Massachusetts 01040 0.238 Screened OutKIK-SOCAL INC SANTA FE SPRINGS California 90670 0.2365 Screened OutDYCO PAINTS INC CLEARWATER Florida 33760 0.236 Screened OutBERGQUIST CO CANNON FALLS Minnesota 55009 0.236 Screened OutPENN COLOR INC HATFIELD Pennsylvania 19440 0.234 Screened OutSUN CHEMICAL CORP PHILADELPHIA Pennsylvania 19132 0.234 Screened OutSUMTER COATINGS INC SUMTER South Carolina 29150 0.2335 Screened OutCHEMTURA CORP - TAFT PLANT KILLONA Louisiana 70066 0.232 Screened OutAPOLLO CHEMICAL BURLINGTON North Carolina 27215 0.230497 Screened OutCHRYSLER GROUP LLC STERLING STAMPING PLANT (PART)
STERLING HEIGHTS Michigan 48312 0.228 Screened Out
PPG INDUSTRIES OHIO INC CIRCLEVILLE OH CIRCLEVILLE Ohio 43113 0.226 Screened OutLONGABERGER CO FRAZEYSBURG Ohio 43822 0.22475 Screened OutCERTIFIED ENAMELING INC LOS ANGELES California 90023 0.2225 Screened OutPERMA-PIPE OIL & GAS NEW IBERIA Louisiana 70560 0.22 Screened OutRHODIA INC WINDER Georgia 30680 0.216 Screened OutCOLWELL INC KENDALLVILLE Indiana 46755 0.215 Screened OutSYNGENTA CROP PROTECTION INC SAINT GABRIEL FACILITY
SAINT GABRIEL Louisiana 70776 0.2125 Screened Out
ASHLAND DISTRIBUTION CO DORAVILLE Georgia 30340 0.2115 Screened OutFLINT GROUP NORTH AMERICA ATLANTA Georgia 30339 0.21 Screened OutWARREN OIL CO - NC DUNN North Carolina 28335 0.208 Screened OutUNION CARBIDE CORP SOUTH CHARLESTON FACILITY SOUTH CHARLESTON West Virginia 25303 0.2045 Screened Out
FIRST AMERICAN RESOURCES CO MABLETON Georgia 30126 0.203 Screened OutRHODIA INC MARCUS HOOK Pennsylvania 19061 0.2015 Screened OutBOEING COMMERCIAL AIRPLANE GROUP - RENTON RENTON Washington 98055 0.1975 Screened OutRUDD CO INC SEATTLE Washington 98107 0.1975 Screened OutUNIVERSAL CHEMICALS & COATINGS INC ELGIN ILLINOIS 60123 0.196 Screened OutARROW GROUP INDUSTRIES INC HASKELL New Jersey 07420 0.195 Screened OutINTEL CORP - RONLER ACRES CAMPUS HILLSBORO Oregon 97124 0.1925 Screened OutASHLAND DISTRIBUTION CO GARLAND TX GARLAND Texas 75041 0.187 Screened OutENGINEERED POLYMER SOLUTIONS INC D/B/A VALSPAR COATINGS
WHEELING Illinois 60090 0.18 Screened Out
HADCO (SANMINA) CORP - OWEGO DIV OWEGO New York 13827 0.177 Screened OutQUAD GRAPHICS NASHVILLE NASHVILLE TENNESSEE 37207 0.177 Screened Out
Page 10 of 18

Table C-2. Comparisons of 2010 TRI Air Emissions Data for Certain Glycol Ethers to the Step A Screening Value of 4.9 tpy
Facility Name City State Zip Code 2010 Air Emissions (tpy) Outcome
SILGAN WHITE CAP CORP RICHMOND Indiana 47375 0.175 Screened OutBYK USA INC WALLINGFORD Connecticut 06492 0.174 Screened OutASHLAND DISTRIBUTION CO BATON ROUGE Louisiana 70815 0.1735 Screened OutCHAMPION TECHNOLOGIES INC ODESSA Texas 79762 0.1695 Screened OutASHLAND DISTRIBUTION SAINT LOUIS Missouri 63111 0.1685 Screened OutKAY CHEMICAL CO GREENSBORO North Carolina 27409 0.165 Screened OutAMREP INC MARIETTA Georgia 30062 0.1625 Screened OutEXXONMOBIL REFINING & SUPPLY BATON ROUGE REFINERY
BATON ROUGE Louisiana 70805 0.1615 Screened Out
ENGINEERED POLYMER SOLUTIONS INC D/B/A VALSPAR COATINGS
HIGH POINT North Carolina 27261 0.16 Screened Out
ANCHOR PAINT MANUFACTURING CO INC TULSA Oklahoma 74112 0.16 Screened OutENERGIZER BATTERY MANUFACTURING INC SAINT ALBANS Vermont 05478 0.1595 Screened OutBOEING COMMERCIAL AIRPLANE GROUP NORTH BOEING FIELD (PART)
SEATTLE Washington 98108 0.1595 Screened Out
INTEL CORP CHANDLER Arizona 85248 0.1565 Screened OutPLAZE INC SAINT CLAIR Missouri 63077 0.152 Screened OutMID-STATES PAINT & CHEMICAL CO CRESTWOOD Missouri 63126 0.151 Screened OutSONOCO FLEXIBLE PACKAGING EDINBURGH Indiana 46124 0.14951 Screened OutCENTRAL MOTOR WHEEL OF AMERICA (DBA CMWA) PARIS Kentucky 40361 0.1475 Screened Out
CHASE PRODUCTS CO BROADVIEW Illinois 60155 0.1455 Screened OutVEYANCE TECHNOLOGIES INC NORFOLK Nebraska 68701 0.145215 Screened OutDAVIS-FROST INC LYNCHBURG VIRGINIA 24506 0.1415 Screened OutHUNTSMAN PETROCHEMICAL LLC PORT NECHES PERFORMANCE PRODUCTS
PORT NECHES Texas 77651 0.141 Screened Out
BAKER PETROLITE CORP SAND SPRINGS Oklahoma 74063 0.1368 Screened OutENGINEERED POLYMER SOLUTIONS INC D/B/A VALSPAR COATINGS
LEBANON Pennsylvania 17046 0.136 Screened Out
PROFESSIONAL DISPOSABLES INTERNATIONAL INC ORANGEBURG New York 10962 0.135135 Screened OutHERCULES INC KENEDY TEXAS KENEDY Texas 78119 0.13416 Screened OutISP SYNTHETIC ELASTOMERS LP PORT NECHES TEXAS 77651 0.132 Screened OutASHLAND DISTRIBUTION MEMPHIS Tennessee 38113 0.13 Screened OutTEXAS INSTRUMENTS INC STAFFORD Texas 77477 0.1275 Screened OutSOUTHERN CLAY PRODUCTS INC LOUISVILLE Kentucky 40210 0.1275 Screened OutCLARIANT CORP MARTIN PLANT MARTIN South Carolina 29836 0.1275 Screened OutINCHEM CORP ROCK HILL South Carolina 29730 0.1275 Screened OutMOC PRODUCTS CO INC PACOIMA California 91331 0.1275 Screened OutBF GOODRICH TIRE MANUFACTURING WOODBURN Indiana 46797 0.1275 Screened OutWESTERN TUBE & CONDUIT CORP LONG BEACH CALIFORNIA 90810 0.1275 Screened OutUNITED LABORATORIES INC SAINT CHARLES Illinois 60174 0.1275 Screened OutRR STREET & CO INC CHICAGO Illinois 60608 0.1275 Screened OutRESEARCH SOLVENTS & CHEMICALS INC LA VERGNE Tennessee 37086 0.1275 Screened OutPOWER SERVICE PRODUCTS INC WEATHERFORD Texas 76086 0.1275 Screened OutPERMATEX SOLON SOLON Ohio 44139 0.1275 Screened OutONESOURCE COIL COATERS CLEARWATER FLORIDA 33760 0.1275 Screened OutOAKLEY INC FOOTHILL RANCH California 92610 0.1275 Screened OutNICCA USA INC FOUNTAIN INN South Carolina 29644 0.1275 Screened OutGE WATER & PROCESS TECHNOLOGIES ORANGE FACILITY
ORANGE Texas 77630 0.1275 Screened Out
ELECTRO PLATE CIRCUITRY INC CARROLLTON TEXAS 75006 0.1275 Screened OutELANTAS PDG INC SAINT LOUIS Missouri 63147 0.1275 Screened OutDELTA HOUSTON DEER PARK Texas 77536 0.1275 Screened OutCOASTAL CHEMICAL CO LLC ABBEVILLE Louisiana 70510 0.1275 Screened OutCHEMICALS INC BAYTOWN Texas 77520 0.1275 Screened OutBRENNTAG GREAT LAKES LLC MENOMONEE FALLS Wisconsin 53051 0.1275 Screened OutBASF CORP SPARTANBURG South Carolina 29302 0.1275 Screened OutASHLAND DISTRIBUTION CO CHARLOTTE North Carolina 28208 0.1255 Screened OutCHEMCOAT INC MONTOURSVILLE Pennsylvania 17754 0.125 Screened OutFORMULA CORP AUBURN WASHINGTON 98002 0.125 Screened OutPREMIER INK SYSTEMS INC HARRISON Ohio 45030 0.125 Screened OutBRYCE CO LLC MEMPHIS Tennessee 38118 0.125 Screened OutAMERICAN COLORS INC DISPERSION PLANT SANDUSKY OHIO
SANDUSKY OHIO 44870 0.125 Screened Out
WM BARR & CO INC MEMPHIS TENNESSEE 38113 0.125 Screened OutTYSON FRESH MEATS INC HOLCOMB Kansas 67851 0.125 Screened OutTRANS CHEMICAL INC SAINT LOUIS Missouri 63147 0.125 Screened OutTNEMEC CO INC NORTH KANSAS CITY Missouri 64116 0.125 Screened OutSICPA SECURINK CORP SPRINGFIELD Virginia 22153 0.125 Screened OutPPG INDUSTRIES INC MCCARRAN Nevada 89434 0.125 Screened OutNORTHERN COATINGS & CHEMICAL CO INC MENOMINEE Michigan 49858 0.125 Screened OutMAINTEX INC CITY OF INDUSTRY California 91746 0.125 Screened OutMAGNABLEND INC LIQUID PLANT WAXAHACHIE Texas 75165 0.125 Screened Out
Page 11 of 18

Table C-2. Comparisons of 2010 TRI Air Emissions Data for Certain Glycol Ethers to the Step A Screening Value of 4.9 tpy
Facility Name City State Zip Code 2010 Air Emissions (tpy) Outcome
KALCOR COATINGS CO WILLOUGHBY Ohio 44094 0.125 Screened OutINVISTA SARL - ORANGE SITE ORANGE TEXAS 77630 0.125 Screened OutHERCULES INC HOPEWELL Virginia 23860 0.125 Screened OutGOLD KEY PROCESSING INC MIDDLEFIELD OHIO 44062 0.125 Screened OutGOLD EAGLE CO CHICAGO Illinois 60632 0.125 Screened OutEXXONMOBIL OIL CORP - TORRANCE REFINERY TORRANCE CALIFORNIA 90509 0.125 Screened OutDANLIN INDUSTRIES CORP THOMAS Oklahoma 73669 0.125 Screened OutCOLUMBIA PAINT CORP HUNTINGTON West Virginia 25704 0.125 Screened OutCLEANING SYSTEMS INC DE PERE Wisconsin 54115 0.125 Screened OutCHEMETALL US INC ROMULUS Michigan 48174 0.125 Screened OutCERAM-TRAZ CORP CERAMIC INDL COATINGS (DBA) OSSEO Minnesota 55369 0.125 Screened Out
BERRYMAN PRODUCTS INC ARLINGTON Texas 76011 0.125 Screened OutAMERICAN JETWAY CORP WAYNE MICHIGAN 48184 0.125 Screened OutAKZO NOBEL COATINGS INC HIGH POINT North Carolina 27261 0.125 Screened OutAKCROS CHEMICALS INC NEW BRUNSWICK New Jersey 08901 0.125 Screened OutACTON TECHNOLOGIES INC PITTSTON Pennsylvania 18640 0.125 Screened OutWATSON LABORATORIES INC UTAH SALT LAKE CITY Utah 84108 0.124456 Screened OutTECHNICAL CHEMICAL CO CLEBURNE Texas 76033 0.123 Screened OutCYTEC INDUSTRIES INC LANGLEY PLANT LANGLEY South Carolina 29834 0.123 Screened OutAEP INDUSTRIES INC GRIFFIN Georgia 30224 0.12275 Screened OutASHLAND INC - EVENDALE EVENDALE Ohio 45241 0.1215 Screened OutFRAZEE INDUSTRIES SAN DIEGO California 92121 0.12 Screened OutARDEX LABORATORIES INC PHILADELPHIA Pennsylvania 19116 0.119 Screened OutSTOUSE INC NEW CENTURY Kansas 66031 0.118 Screened OutU.S. NAVY NAVAL AIR STATION JACKSONVILLE JACKSONVILLE FLORIDA 32212 0.115 Screened OutPILOT CHEMICAL CO HOUSTON Texas 77086 0.1105 Screened OutELECTRONICS FOR IMAGING INC YPSILANTI Michigan 48197 0.11 Screened OutTEXAS INSTRUMENTS INC DALLAS Texas 75243 0.1095 Screened OutDELTA LABORATORIES INC OCALA Florida 34475 0.1085 Screened OutENGINEERED POLYMER SOLUTIONS INC D/B/A VALSPAR COATINGS
BOWLING GREEN Kentucky 42101 0.108 Screened Out
SHERWIN-WILLIAMS CO HOLLAND Michigan 49423 0.106 Screened OutCAROLINA SOLVENTS INC HICKORY North Carolina 28602 0.104 Screened OutCCI MANUFACTURING IL CORP LEMONT Illinois 60439 0.1035 Screened OutACCURATE DISPERSIONS SOUTH HOLLAND Illinois 60473 0.1035 Screened OutASHLAND DISTRIBUTION CO MIAMI Florida 33162 0.102 Screened OutTWINCO ROMAX MILWAUKEE WISCONSIN 53209 0.10066 Screened OutBUZZI UNICEM USA - GREENCASTLE PLANT GREENCASTLE Indiana 46135 0.1 Screened OutBRENNTAG PACIFIC INC SANTA FE SPRINGS California 90670 0.1 Screened OutASHLAND DISTRIBUTION CO CARSON California 90810 0.1 Screened OutARCH CHEMICALS INC BRANDENBURG Kentucky 40108 0.1 Screened OutAKZONOBEL COATINGS INC PONTIAC Michigan 48341 0.099 Screened OutCE BRADLEY LABORATORIES INC BRATTLEBORO Vermont 05301 0.0985 Screened OutHARCROS CHEMICALS INC KANSAS CITY Kansas 66106 0.097 Screened OutOLDCASTLE BUILDING ENVELOPE TENNESSEE FACILITY
MIDWAY Tennessee 37809 0.0945 Screened Out
ALLEGHENY PETROLEUM PRODUCTS CO WILMERDING Pennsylvania 15148 0.0945 Screened OutCPJ TECHNOLOGIES TAYLORS South Carolina 29687 0.092 Screened OutTNEMEC CO INC BALTIMORE Maryland 21222 0.09 Screened OutSTEELSCAPE INC RANCHO RANCHO CUCAMONGA California 91730 0.089945 Screened OutATHEA LABORATORIES INC MILWAUKEE Wisconsin 53224 0.0888 Screened OutASHLAND DISTRIBUTION CO FAIRFIELD California 94533 0.0855 Screened OutASHLAND DISTRIBUTION CO KANSAS CITY Kansas 66106 0.084 Screened OutSHERWIN-WILLIAMS CO TERRE HAUTE Indiana 47808 0.0835 Screened OutAKZO NOBEL COATINGS INC CLINTON Mississippi 39056 0.082 Screened OutWEBB CHEMICAL SERVICE CORP MUSKEGON HEIGHTS MICHIGAN 49444 0.08 Screened OutASHLAND DISTRIBUTION TEWKSBURY Massachusetts 01876 0.0795 Screened OutBEHR PROCESS CORP - CHICAGO CHICAGO HEIGHTS Illinois 60411 0.0787 Screened OutMATTHEWS INTERNATIONAL CORP PITTSBURGH Pennsylvania 15238 0.0775 Screened OutICI PAINTS PUERTO RICO INC CAROLINA Puerto Rico 00985 0.077225 Screened OutCORSICANA TECHNOLOGIES INC CORSICANA Texas 75109 0.07708 Screened OutIMPERIAL PAINT CO INC PORTLAND OREGON 97210 0.076 Screened OutSUPERIOR OIL CO INC RECLAIMED ENERGY DIV CONNERSVILLE Indiana 47331 0.075 Screened OutAKZO NOBEL COATINGS INC SALEM Oregon 97302 0.07415 Screened OutCHEMICAL SOLVENTS JENNINGS ROAD FACILITY CLEVELAND Ohio 44109 0.07396 Screened OutWHITFORD CORP ELVERSON Pennsylvania 19520 0.0729 Screened OutDU PONT ELECTRONICS MICROCIRCU ITS INDUSTRIES LTD
MANATI PUERTO RICO 00674 0.0725 Screened Out
CHAMPION TECHNOLOGIES INC BROUSSARD Louisiana 70518 0.072 Screened OutPPG INDUSTRIES OHIO INC - DELAWARE DELAWARE Ohio 43015 0.06956 Screened OutMRCG-KRAFTMAID P3 ORWELL Ohio 44076 0.069 Screened Out
Page 12 of 18

Table C-2. Comparisons of 2010 TRI Air Emissions Data for Certain Glycol Ethers to the Step A Screening Value of 4.9 tpy
Facility Name City State Zip Code 2010 Air Emissions (tpy) Outcome
WARSAW CHEMICAL CO INC WARSAW Indiana 46580 0.069 Screened OutSPARTAN CHEMICAL CO INC MAUMEE Ohio 43537 0.0675 Screened OutLUBRIZOL MC COOK Illinois 60525 0.067 Screened OutCARDINAL INDUSTRIAL FINISHES SOUTH EL MONTE California 91733 0.067 Screened OutADCO CLEANING PRODUCTS LLC SEDALIA Missouri 65301 0.0665 Screened OutENGINEERED POLYMER SOLUTIONS INC D/B/A VALSPAR COATINGS
MONTEBELLO California 90640 0.0655 Screened Out
WARREN STAMPING PLANT (PART) WARREN Michigan 48091 0.06 Screened OutVEOLIA ES TECHNICAL SOLUTIONS LLC MIDDLESEX New Jersey 08846 0.0595 Screened OutKARCHER NORTH AMERICA- PROCHEM CHANDLER Arizona 85224 0.0595 Screened OutABC COMPOUNDING CO OF TEXAS INC GRAND PRAIRIE Texas 75050 0.059 Screened OutAMPHENOL APC INC NASHUA New Hampshire 03062 0.0574235 Screened OutMINUTEMAN INTERNATIONAL MULTI-CLEAN DIV SHOREVIEW Minnesota 55126 0.057 Screened OutECOLAB INC JOLIET Illinois 60436 0.057 Screened OutCHAMPION TECHNOLOGIES INC CORPUS CHRISTI Texas 78405 0.05615 Screened OutCLARIANT CORP - MOUNT HOLLY WEST PLANT MOUNT HOLLY North Carolina 28120 0.0555 Screened OutMRCG-KRAFTMAID P1 MIDDLEFIELD Ohio 44062 0.0555 Screened OutCHEVRON PRODUCTS CO PASCAGOULA REFINERY PASCAGOULA MISSISSIPPI 39581 0.055 Screened OutUNIVAR USA INC COMMERCE California 90040 0.0545 Screened OutCLEVELAND STEEL CONTAINER - KILGORE KILGORE TEXAS 75662 0.0545 Screened OutHARLEY-DAVIDSON MOTOR CO OPERATIONS INC YORK Pennsylvania 17402 0.05435 Screened Out3M CO - NEVADA NEVADA Missouri 64772 0.054 Screened OutUNIVAR USA INC - TOLEDO BRANCH WALBRIDGE Ohio 43465 0.0535 Screened OutROCKLINE INDUSTRIES SHEBOYGAN Wisconsin 53081 0.0535 Screened OutFRANKLIN INTERNATIONAL COLUMBUS Ohio 43207 0.0535 Screened OutCLOROX PRODUCTS MANUFACTURING CO FAIRFIELD California 94533 0.0535 Screened OutECOLAB INC MARTINSBURG West Virginia 25405 0.053 Screened OutECOLAB INC MC DONOUGH Georgia 30253 0.0525 Screened OutATMI MATERIALS LTD BURNET Texas 78611 0.05151 Screened OutHANNA STEEL CORP PEKIN Illinois 61554 0.05061 Screened OutDYSTAR LP REIDSVILLE North Carolina 27320 0.05 Screened OutCONOCOPHILLIPS OKLAHOMA CITY PRODUCTS TERMINAL
OKLAHOMA CITY Oklahoma 73117 0.05 Screened Out
BENJAMIN MOORE & CO PELL CITY PELL CITY Alabama 35125 0.05 Screened OutCHAMPION TECHNOLOGIES INC FRESNO Texas 77545 0.0496 Screened OutRINECO BENTON Arkansas 72015 0.0495 Screened OutVALERO REFINING CO - TENNESSEE LLC MEMPHIS TENNESSEE 38109 0.0495 Screened OutUNIVAR USA INC HAMILTON BRANCH HAMILTON Ohio 45015 0.049 Screened OutBARTON SOLVENTS INC BETTENDORF BETTENDORF Iowa 52722 0.049 Screened OutAIR PRODUCTS & CHEMICALS INC CALVERT CITY Kentucky 42029 0.049 Screened OutEXCEL-POLYMERS LLC JONESBOROUGH Tennessee 37659 0.0485 Screened OutGRAPHIC CONTROLS LLC BUFFALO New York 14204 0.048 Screened OutENGINEERED POLYMER SOLUTIONS INC D/B/A VALSPAR COATINGS
INDIANAPOLIS Indiana 46225 0.0465 Screened Out
RECKITT BENCKISER HILLSBOROUGH New Jersey 08844 0.0455 Screened OutLUBRIZOL CORP WICKLIFFE Ohio 44092 0.0455 Screened OutWATSON STANDARD CO (NEVILLE ISLAND PLANT) NEVILLE ISLAND Pennsylvania 15225 0.044 Screened OutBRENNTAG SOUTHEAST INC DURHAM North Carolina 27703 0.044 Screened OutUNIVAR USA INC DALLAS DAN MORTON FACILITY DALLAS Texas 75236 0.0435 Screened OutBRENNTAG SOUTHWEST INC LANC ASTER LANCASTER Texas 75134 0.0425 Screened OutCUSTOM SYNTHESIS LLC ANDERSON South Carolina 29625 0.0425 Screened OutASHLAND DISTRIBUTION CO TAMPA Florida 33634 0.042 Screened OutBARTON SOLVENTS INC KANSAS CITY KANSAS CITY Kansas 66111 0.0415 Screened OutSHERWIN-WILLIAMS CO ANDOVER Kansas 67002 0.041 Screened OutLAMBERTI USA INC WHARTON CHEMICAL COMPLEX HUNGERFORD Texas 77448 0.0405 Screened OutHARCROS CHEMICALS INC PASADENA Texas 77507 0.0405 Screened OutRECTICEL INTERIORS NORTH AMERICA LLC TUSCALOOSA Alabama 35401 0.04 Screened OutBRENNTAG SOUTHWEST INC SAND SPRINGS SAND SPRINGS Oklahoma 74063 0.04 Screened OutENGINEERED POLYMER SOLUTIONS INC D/B/A VALSPAR COATINGS
PITTSBURGH Pennsylvania 15233 0.0395 Screened Out
AIR PRODUCTS PERFORMANCE MANUFACTURING INC MILTON Wisconsin 53563 0.0395 Screened Out
BIOLAB INC CONYERS Georgia 30012 0.03915 Screened OutHUNTSMAN ADVANCED MATERIALS AMERICAS INC MC INTOSH Alabama 36553 0.0388 Screened OutUNIVAR USA INC ROMULUS BRANCH ROMULUS Michigan 48174 0.038 Screened OutKEMIRA WATER SOLUTIONS INC MOBILE Alabama 36614 0.0365 Screened OutCONOCOPHILLIPS CO EAST ST LOUIS TERMINAL CAHOKIA Illinois 62206 0.0355 Screened OutCONTINENTAL CEMENT CO LLC HANNIBAL Missouri 63401 0.035125 Screened OutBRENNTAG NORTHEAST INC READING Pennsylvania 19605 0.03375 Screened OutUNIVAR USA INC BERKELEY BERKELEY Missouri 63134 0.033 Screened OutTRANSTAR AUTOBODY TECHNOLOGIES BRIGHTON Michigan 48114 0.032545 Screened OutVALSPAR REFINISH PICAYUNE Mississippi 39466 0.0315 Screened Out
Page 13 of 18
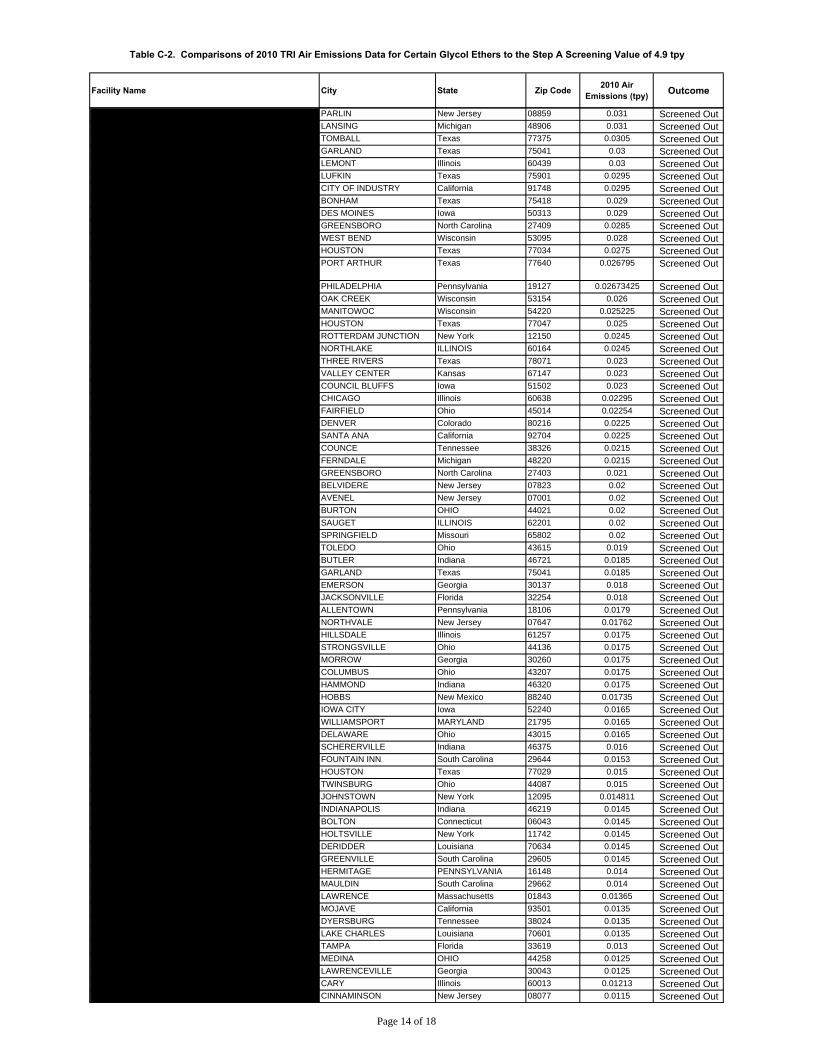
Table C-2. Comparisons of 2010 TRI Air Emissions Data for Certain Glycol Ethers to the Step A Screening Value of 4.9 tpy
Facility Name City State Zip Code 2010 Air Emissions (tpy) Outcome
DUPONT PARLIN PLANT PARLIN New Jersey 08859 0.031 Screened OutASHLAND DISTRIBUTION LANSING Michigan 48906 0.031 Screened OutAMERICAN COATINGS INC TOMBALL Texas 77375 0.0305 Screened OutSHERWIN-WILLIAMS CO GARLAND Texas 75041 0.03 Screened OutCOOK COMPOSITES & POLYMERS C O LEMONT Illinois 60439 0.03 Screened OutGEORGIA-PACIFIC CHEMICALS LLC LUFKIN Texas 75901 0.0295 Screened OutECOLAB CITY OF INDUSTRY California 91748 0.0295 Screened OutKWAL-HOWELLS INC (DBA KWAL PAINT INC) BONHAM Texas 75418 0.029 Screened OutBARTON SOLVENTS INC DES MOINES DES MOINES Iowa 50313 0.029 Screened OutSHERWIN-WILLIAMS CO GREENSBORO North Carolina 27409 0.0285 Screened OutBARTON SOLVENTS INC WEST BEND WEST BEND Wisconsin 53095 0.028 Screened OutASHLAND DISTRIBUTION CO HOUSTON Texas 77034 0.0275 Screened OutVEOLIA ES TECHNICAL SOLUTIONS LLC PORT ARTHUR FACILITY
PORT ARTHUR Texas 77640 0.026795 Screened Out
RICHARDSAPEX INC PHILADELPHIA Pennsylvania 19127 0.02673425 Screened OutDIC IMAGING PRODUCTS USA LLC OAK CREEK Wisconsin 53154 0.026 Screened OutNORTHERN LABS INC WEST DRIVE MANITOWOC Wisconsin 54220 0.025225 Screened OutBRENNTAG SOUTHWEST INC HOUS TON HOUSTON Texas 77047 0.025 Screened OutSI GROUP INC ROTTERDAM JUNCTION New York 12150 0.0245 Screened OutSUN CHEMICAL CORP NORTHLAKE ILLINOIS 60164 0.0245 Screened OutVALERO THREE RIVERS REFINERY THREE RIVERS Texas 78071 0.023 Screened OutBARTON SOLVENTS INC WICHITA VALLEY CENTER Kansas 67147 0.023 Screened OutBARTON SOLVENTS INC COUNCIL BLUFFS COUNCIL BLUFFS Iowa 51502 0.023 Screened OutDAUBERT CHEMICAL CO CHICAGO Illinois 60638 0.02295 Screened OutSUPERIOR SOLVENTS & CHEMICALS FAIRFIELD Ohio 45014 0.02254 Screened OutKBP COIL COATERS INC DENVER Colorado 80216 0.0225 Screened OutARLON INC ADHESIVES & FILMS DIV SANTA ANA California 92704 0.0225 Screened OutPACKAGING CORP OF AMERICA COUNCE MILL COUNCE Tennessee 38326 0.0215 Screened OutGAGE PRODUCTS CO FERNDALE Michigan 48220 0.0215 Screened OutSHERWIN-WILLIAMS CO GREENSBORO North Carolina 27403 0.021 Screened OutBASF CORP BELVIDERE New Jersey 07823 0.02 Screened OutPRIDE SOLVENTS & CHEMICAL CO OF NEW JERSEY AVENEL New Jersey 07001 0.02 Screened OutEXCEL POLYMERS LLC BURTON OHIO 44021 0.02 Screened OutAFTON CHEMICAL CORP SAUGET ILLINOIS 62201 0.02 Screened Out3M CO - SPRINGFIELD SPRINGFIELD Missouri 65802 0.02 Screened OutUNIVAR USA INC - TOLEDO SOUTH BRANCH TOLEDO Ohio 43615 0.019 Screened OutSTEEL DYNAMICS INC BUTLER Indiana 46721 0.0185 Screened OutECOLAB INC GARLAND Texas 75041 0.0185 Screened OutZEP COMMERCIAL EMERSON Georgia 30137 0.018 Screened OutUNIVAR USA INC JACKSONVILLE FA CILITY JACKSONVILLE Florida 32254 0.018 Screened OutBEHR PROCESS CORP ALLENTOWN ALLENTOWN Pennsylvania 18106 0.0179 Screened OutTAKASAGO INTERNATIONAL CORP (USA) NORTHVALE New Jersey 07647 0.01762 Screened OutTYSON FRESH MEATS INC JOSLIN IL HILLSDALE Illinois 61257 0.0175 Screened OutUNIVAR USA INC STRONGSVILLE Ohio 44136 0.0175 Screened OutSHERWIN-WILLIAMS CO MORROW Georgia 30260 0.0175 Screened OutSHERWIN-WILLIAMS CO COLUMBUS Ohio 43207 0.0175 Screened OutDAVIES IMPERIAL COATINGS INC HAMMOND Indiana 46320 0.0175 Screened OutBJ CHEMICAL SERVICES HOBBS New Mexico 88240 0.01735 Screened OutPROCTER & GAMBLE HAIR CARE LLC IOWA CITY Iowa 52240 0.0165 Screened OutRUST-OLEUM CORP IN MD WILLIAMSPORT MARYLAND 21795 0.0165 Screened OutHENKEL CORP DELAWARE Ohio 43015 0.0165 Screened OutAVERY DENNISON PFD SCHERERVILLE Indiana 46375 0.016 Screened OutHOLLY OAK CHEMICAL INC FOUNTAIN INN South Carolina 29644 0.0153 Screened OutBLENTECH CORP HOUSTON Texas 77029 0.015 Screened OutASHLAND DISTRIBUTION CO TWINSBURG Ohio 44087 0.015 Screened OutBENJAMIN MOORE & CO JOHNSTOWN JOHNSTOWN New York 12095 0.014811 Screened OutUNIVAR USA INC - INDIANAPOLIS INDIANAPOLIS Indiana 46219 0.0145 Screened OutSIMONIZ USA INC BOLTON Connecticut 06043 0.0145 Screened OutPRIDE SOLVENT & CHEMICAL CO OF NY INC HOLTSVILLE New York 11742 0.0145 Screened OutMEADWESTVACO SOUTH CAROLINA LLC DERIDDER Louisiana 70634 0.0145 Screened OutETHOX CHEMICALS LLC GREENVILLE South Carolina 29605 0.0145 Screened OutINTERSTATE CHEMICAL CO INC HERMITAGE PENNSYLVANIA 16148 0.014 Screened OutCOGNIS CORP MAULDIN PLANT MAULDIN South Carolina 29662 0.014 Screened OutKEY POLYMER LAWRENCE Massachusetts 01843 0.01365 Screened OutPRC-DESOTO INTERNATIONAL INC MOJAVE California 93501 0.0135 Screened OutEXCEL POLYMERS LLC DYERSBURG Tennessee 38024 0.0135 Screened OutCARBOLINE CO LAKE CHARLES Louisiana 70601 0.0135 Screened OutUNIVAR USA INC TAMPA FACILITY TAMPA Florida 33619 0.013 Screened OutPLASTI-KOTE INC MEDINA OHIO 44258 0.0125 Screened OutGOODWIN CO LAWRENCEVILLE Georgia 30043 0.0125 Screened OutTRUE VALUE MANUFACTURING CARY Illinois 60013 0.01213 Screened OutACTEGA KELSTAR INC CINNAMINSON New Jersey 08077 0.0115 Screened Out
Page 14 of 18

Table C-2. Comparisons of 2010 TRI Air Emissions Data for Certain Glycol Ethers to the Step A Screening Value of 4.9 tpy
Facility Name City State Zip Code 2010 Air Emissions (tpy) Outcome
UNIVAR USA INC - SAN JOSE SAN JOSE California 95131 0.0115 Screened OutEVONIK DEGUSSA CORP THEODORE Alabama 36582 0.0115 Screened OutJOHNSONDIVERSEY INC STURTEVANT Wisconsin 53177 0.010815 Screened OutTYSON FRESH MEATS INC DAKOTA CITY NEBRASKA 68731 0.01 Screened OutVARN INTERNATIONAL BATAVIA Illinois 60510 0.01 Screened OutCLEAN HARBORS ENVIRONMENTAL SERVICES INC KIMBALL Nebraska 69145 0.01 Screened OutBUCKLEY OIL CO DALLAS Texas 75207 0.01 Screened OutBERRIDGE MANUFACTURING CO SAN ANTONIO Texas 78218 0.01 Screened OutCLEAN HARBORS EL DORADO LLC EL DORADO Arkansas 71730 0.0098 Screened OutCHEMOL CO INC GREENSBORO North Carolina 27406 0.009535 Screened OutSHERWIN-WILLIAMS CO BALTIMORE Maryland 21230 0.0095 Screened OutHYDRITE CHEMICAL CO UNIVERSITY PARK Illinois 60466 0.0095 Screened OutHENKEL CORP CALHOUN Georgia 30701 0.0095 Screened OutDSM DESOTECH INC STANLEY North Carolina 28164 0.0093 Screened OutMULTI-COLOR CORP SCOTTSBURG Indiana 47170 0.008625 Screened OutMARATHON PETROLEUM CO LLC TEXAS CITY Texas 77590 0.0085 Screened OutBASF CORP EAST SETAUKET NEW YORK 11733 0.008 Screened OutCLOROX PRODUCTS MANUFACTURING CO FOREST PARK Georgia 30297 0.00797 Screened OutFLINT HILLS RESOURCES LP - WEST PLANT CORPUS CHRISTI Texas 78410 0.0075 Screened OutUS DOD USAF JOINT BASE ELMENDORF-RICHARDSON ELMENDORF AFB ALASKA 99506 0.0075 Screened Out
RUSTOLEUM CORP LESAGE West Virginia 25537 0.0075 Screened OutMALLINCKRODT BAKER INC PHILLIPSBURG New Jersey 08865 0.0075 Screened OutINTERSTATE CHEMICAL CO INC CHANNAHON Illinois 60410 0.0075 Screened OutDYNALOY LLC INDIANAPOLIS Indiana 46226 0.0075 Screened OutSUPERIOR OIL CO INC INDIANAPOLIS Indiana 46225 0.007465 Screened OutBRULIN CORP INDIANAPOLIS Indiana 46205 0.0072575 Screened OutMICHELIN NORTH AMERICA INC TUSCALOOSA Alabama 35401 0.007 Screened OutU.S. POLYMERS ACCUREZ LLC SAINT LOUIS Missouri 63111 0.007 Screened OutMARATHON PETROLEUM CO LLC - SPEEDWAY IN TERMINAL
INDIANAPOLIS Indiana 46222 0.007 Screened Out
HONEYWELL-PRESTONE PRODUCTS CORP FREEHOLD New Jersey 07728 0.007 Screened OutFORD MOTOR CO DEARBORN DIVERSIFIED MANUFACTURING
DEARBORN Michigan 48121 0.007 Screened Out
LANCO MANUFACTURING CORP SAN LORENZO Puerto Rico 00754 0.00684 Screened OutNEW DAWN MANUFACTURING CO UPPER MARLBORO Maryland 20774 0.006732805 Screened OutUNIVAR USA INC NORCROSS FACILI TY NORCROSS Georgia 30071 0.0065 Screened OutSHERWIN-WILLIAMS CO VICTORVILLE California 92392 0.0065 Screened OutTRELLEBORG COATED SYSTEMS US INC / GRACE ADVANCED MATERIALS
RUTHERFORDTON North Carolina 28139 0.00625 Screened Out
PROCTER & GAMBLE MANUFACTURING CO KANSAS CITY Kansas 66105 0.006095 Screened OutDUPONT PONTCHARTRAIN WORKS LA PLACE Louisiana 70068 0.006 Screened OutRANBAR ELECTRICAL MATERIALS INC MANOR Pennsylvania 15665 0.006 Screened OutBP PRODUCTS NORTH AMERICA WHITING WHITING Indiana 46394 0.006 Screened OutCONOCOCPHILLIPS CO WICHITA TERMINAL WICHITA KANSAS 67219 0.0059 Screened OutINX INTERNATIONAL INK CO HOMEWOOD Illinois 60430 0.00566 Screened OutGATES CORP - CHARLESTON CHARLESTON Missouri 63834 0.0056 Screened OutUNIVAR USA INC - BUNOLA BRANC H BUNOLA Pennsylvania 15020 0.0055 Screened OutLUBRIZOL CORP PAINESVIL LE PLANT PAINESVILLE Ohio 44077 0.0055 Screened OutHUBBARD-HALL INC WATERBURY Connecticut 06708 0.0055 Screened OutGOODWIN CO GARDEN GROVE California 92841 0.0055 Screened OutCALLAHAN CHEMICAL CO RIDGEFIELD PARK New Jersey 07660 0.0055 Screened OutENTHONE INC BRIDGEVIEW Illinois 60455 0.005295 Screened OutHERITAGE-WTI INC EAST LIVERPOOL Ohio 43920 0.005065 Screened OutROHM & HAAS ELECTRONIC MATERIA LS LLC MARLBOROUGH Massachusetts 01752 0.005 Screened OutPPG INDUSTRIES ARCHITECTURAL FINISHES DOVER Delaware 19904 0.005 Screened OutBASF CORP WYANDOTTE Michigan 48192 0.005 Screened OutUNIVAR USA INC LAKEVILLE LAKEVILLE Minnesota 55044 0.005 Screened OutSHIELD PACKAGING CO INC DUDLEY Massachusetts 01571 0.005 Screened OutSARTOMER CO INC WEST CHESTER Pennsylvania 19382 0.005 Screened OutSARTOMER CO INC CHATHAM Virginia 24531 0.005 Screened OutPVS NOLWOOD CHEMICALS INC DETROIT MICHIGAN 48228 0.005 Screened OutINTERNATIONAL PAINT LLC BEREA OHIO 44017 0.005 Screened OutINDEPENDENT INK INC GARDENA California 90248 0.005 Screened OutGE WATER & PROCESS TECHNOLOGIES - BAKERSFIELD
BAKERSFIELD CALIFORNIA 93308 0.005 Screened Out
GE WATER & PROCESS TECHNOLOGIES NEW PHILADELPHIA OHIO 44663 0.005 Screened OutGE WATER & PROCESS TECHNOLOGIES ADDISON ILLINOIS 60101 0.005 Screened OutFORD MOTOR CO DEARBORN TOOL & DIE PLANT DEARBORN Michigan 48121 0.005 Screened OutCR BRANDS INC SPARTANBURG South Carolina 29306 0.005 Screened OutC P INC CONNERSVILLE Indiana 47331 0.005 Screened OutBRAIN POWER INC MIAMI Florida 33155 0.005 Screened Out
Page 15 of 18

Table C-2. Comparisons of 2010 TRI Air Emissions Data for Certain Glycol Ethers to the Step A Screening Value of 4.9 tpy
Facility Name City State Zip Code 2010 Air Emissions (tpy) Outcome
ACTEGA RADCURE INC WAYNE New Jersey 07470 0.005 Screened OutBAKER PETROLITE BAYPORT FACILI TY PASADENA Texas 77507 0.004635 Screened OutEASTMAN KODAK CO EASTMAN BUSINESS PARK ROCHESTER New York 14652 0.0045 Screened OutSUPERIOR SOLVENTS & CHEMICALS LOUISVILLE Kentucky 40216 0.0045 Screened OutMEADWESTVACO SC LLC CHARLESTON CHEMICAL PLANT
NORTH CHARLESTON South Carolina 29406 0.0045 Screened Out
LAFARGE MIDWEST INC (INCLD SYSTECH ENVIRONMENTAL)
FREDONIA KANSAS 66736 0.0045 Screened Out
COGNIS CORP -- CHARLOTT E PLANT CHARLOTTE North Carolina 28273 0.0045 Screened OutEDCO PRODUCTS INC HOPKINS MINNESOTA 55343 0.0045 Screened OutWAYNE DISPOSAL INC BELLEVILLE MICHIGAN 48111 0.004 Screened OutFERRO CORP WALTON HILLS OPERATIONS WALTON HILLS OHIO 44146 0.004 Screened OutOMNIUM HAMPTON Iowa 50441 0.004 Screened OutCUSTOM CHEMICAL FORMULATORS SANTA FE SPRINGS California 90670 0.004 Screened OutCHEMTEX LABORATORIES INC CONCORD North Carolina 28025 0.004 Screened OutASHLAND DISTRIBUTION TONAWANDA New York 14150 0.004 Screened OutNORLITE CORP COHOES New York 12047 0.00378 Screened OutBAKER PETROLITE BAKERSFIELD California 93308 0.00346 Screened OutVEOLIA ES TECHNICAL SOLUTIONS LLC SAUGET ILLINOIS 62201 0.003 Screened OutVOGEL PAINT & WAX CO INC ORANGE CITY Iowa 51041 0.003 Screened OutUNIVAR USA INC- CINCINNATI OH BRANCH CINCINNATI Ohio 45246 0.003 Screened OutUNIVAR USA INC DENVER DENVER Colorado 80216 0.003 Screened OutUNIVAR USA INC PORTLAND Oregon 97210 0.003 Screened OutSHERWIN-WILLIAMS CO MEMPHIS Tennessee 38109 0.003 Screened Out3M COTTAGE GROVE CENTER COTTAGE GROVE Minnesota 55016 0.003 Screened OutGENERAL DYNAMICS ORDNANCE & TACTICAL SYSTEMS GARLAND
GARLAND Texas 75040 0.00299 Screened Out
CONOCOPHILLIPS MT VERNON PRODUCTS TERMINAL MOUNT VERNON Missouri 65712 0.00296 Screened Out
MACDERMID INC FERNDALE Michigan 48220 0.00275 Screened OutCONOCOPHILLIPS PONCA CITY REFINERY PONCA CITY Oklahoma 74601 0.00266 Screened OutMAGNABLEND INC-CENTRAL PLANT WAXAHACHIE Texas 75165 0.0025 Screened OutSHERWIN-WILLIAMS CO FERNLEY Nevada 89408 0.0025 Screened OutJOHNSON BRYCE INC MEMPHIS TENNESSEE 38109 0.0025 Screened OutNEWMAN TECHNOLOGY INC MANSFIELD OHIO 44903 0.0025 Screened OutBASF CORP SEAFORD Delaware 19973 0.0025 Screened OutVERSO PAPER HOLDINGS LLC JAY Maine 04239 0.0025 Screened OutWYNNEWOOD REFINING CO WYNNEWOOD Oklahoma 73098 0.0025 Screened OutUNION SPECIALTIES INC NEWBURYPORT Massachusetts 01950 0.0025 Screened OutPPG ARCHITECURAL COATINGS HOUSTON HOUSTON Texas 77092 0.0025 Screened OutNOV TUBOSCOPE HOLMES ROAD HOUSTON Texas 77051 0.0025 Screened OutNIACET CORP NIAGARA FALLS New York 14304 0.0025 Screened OutMILPORT ENTERPRISES INC MILWAUKEE Wisconsin 53207 0.0025 Screened OutKEYSTONE CEMENT CO BATH Pennsylvania 18014 0.0025 Screened OutFINGER LAKES CHEMICAL INC ROCHESTER New York 14605 0.0025 Screened OutECP INC WOODRIDGE WOODRIDGE Illinois 60517 0.0025 Screened OutDOBER CHEMICAL CORP MIDLOTHIAN Illinois 60445 0.0025 Screened OutCR BRANDS INC SPARTANBURG South Carolina 29307 0.0025 Screened OutCONOCOPHILLIPS CO TREMLEY POINT TERMINAL LINDEN New Jersey 07036 0.0025 Screened OutCHEMICAL SOLVENTS INC--DENISON FACILITY CLEVELAND Ohio 44109 0.0025 Screened OutBRAINERD CHEMICAL CO INC TULSA OKLAHOMA 74147 0.0025 Screened OutBIOLAB INC ASHLEY INDIANA 46705 0.0025 Screened OutATOTECH USA ROCK HILL South Carolina 29730 0.0025 Screened OutASTRO CHEMICALS INC SPRINGFIELD Massachusetts 01104 0.0025 Screened OutBAKER PETROLITE CORP HOUSTON Texas 77049 0.0024345 Screened OutKING INDUSTRIES INC NORWALK Connecticut 06852 0.0024 Screened OutGATES CORP IOLA KANSAS 66749 0.0023 Screened OutCLARIANT CORP CLEAR LAKE PLANT PASADENA Texas 77507 0.0023 Screened OutHENTZEN COATINGS,INC MILWAUKEE Wisconsin 53218 0.002185 Screened OutDYNASOL INC CANTON Massachusetts 02021 0.00215 Screened OutCARESTREAM HEALTH COLORADO WINDSOR Colorado 80550 0.002 Screened OutHUNTSMAN PETROCHEMICAL LLC DAYTON Texas 77535 0.002 Screened OutUNIVAR USA INC SALEM BRANCH SALEM Massachusetts 01970 0.002 Screened OutSHERWIN-WILLIAMS CO ORLANDO Florida 32809 0.002 Screened OutCOSMETIC LABORATORIES OF AMERICA CHATSWORTH California 91311 0.002 Screened OutSHERWIN-WILLIAMS CO BEDFORD HEIGHTS Ohio 44146 0.002 Screened OutUNIVAR USA INC SANTA FE SPRINGS SANTA FE SPRINGS California 90670 0.002 Screened OutDUPONT EKC TECHNOLOGY HAYWARD California 94545 0.002 Screened OutCALLAHAN CHEMICAL CO WALPOLE Massachusetts 02081 0.002 Screened OutASHLAND DISTRIBUTION CO CLEARFIELD Utah 84016 0.002 Screened OutCRODA INC NEW CASTLE Delaware 19720 0.001905 Screened OutTARR ACQUISITION LLC PORTLAND Oregon 97227 0.001825 Screened Out
Page 16 of 18

Table C-2. Comparisons of 2010 TRI Air Emissions Data for Certain Glycol Ethers to the Step A Screening Value of 4.9 tpy
Facility Name City State Zip Code 2010 Air Emissions (tpy) Outcome
GOJO INDUSTRIES INC CUYAHOGA FALLS OHIO 44223 0.0016295 Screened OutVOLTAIX LLC BRANCHBURG New Jersey 08876 0.0015 Screened OutKELLY-MOORE PAINT CO INC SAN CARLOS California 94070 0.0015 Screened OutHYDRITE CHEMICAL CO MILWAUKEE Wisconsin 53223 0.0015 Screened OutGIANT CEMENT CO HARLEYVILLE South Carolina 29448 0.0015 Screened OutBUCKMAN LABORATORIES INC MEMPHIS Tennessee 38108 0.0015 Screened OutBAKER PETROLITE-RAYNE FACILITY RAYNE Louisiana 70578 0.0015 Screened OutFUJIFILM HUNT CHEMICALS USA INC ROLLING MEADOWS Illinois 60008 0.00125 Screened OutFIRST SOURCE WORLDWIDE LLC MILWAUKEE MILWAUKEE Wisconsin 53226 0.00125 Screened OutMANN DISTRIBUTION WARWICK Rhode Island 02886 0.00112 Screened OutBOEING COMMERCIAL AIRPLANE GROUP PLANT 2 (PART)
SEATTLE Washington 98108 0.001 Screened Out
PENRAY COMPANIES INC ELK GROVE VILLAGE Illinois 60007 0.001 Screened OutPENRAY COMPANIES INC WHEELING Illinois 60090 0.001 Screened OutSHERWIN-WILLIAMS CO FLORA Illinois 62839 0.001 Screened OutMONSANTO CO MUSCATINE Iowa 52761 0.001 Screened OutLAFARGE NA (INCLUDING SYSTECH ENV CORP) PAULDING OHIO 45879 0.001 Screened OutCLEAN HARBORS DEER PARK LLC LA PORTE TEXAS 77571 0.001 Screened OutBRENNTAG SOUTHEAST INC CHARLOTTE North Carolina 28273 0.001 Screened OutBENJAMIN MOORE & CO - NEWARK NEWARK New Jersey 07105 0.001 Screened OutPPG ARCHITECTURAL COATINGS LOUISVILLE Kentucky 40214 0.0008 Screened OutOMNOVA SOLUTIONS INC CHESTER South Carolina 29706 0.00077 Screened OutVEYANCE TECHNOLOGIES INC MOUNT PLEASANT Iowa 52641 0.0005 Screened OutGATES CORP POPLAR BLUFF MISSOURI 63901 0.0005 Screened OutSOUTHWEST DISTRIBUTING CO MESA Arizona 85210 0.0005 Screened OutNATIONAL INDUSTRIAL COATINGS INC DBA NICOAT INC
ITASCA Illinois 60143 0.0005 Screened Out
NALCO CO TEXARKANA Texas 75501 0.0005 Screened OutHARWICK STANDARD DISTRIBUTION CORP AKRON Ohio 44305 0.0005 Screened OutSURPASS CHEMICAL CO INC ALBANY New York 12204 0.000485 Screened OutNALCO CO SCOTT Louisiana 70583 0.0003385 Screened OutVERSO PAPER BUCKSPORT MILL BUCKSPORT MAINE 4416 0.0003 Screened OutPARKER HANNIFIN TECH SEAL DIV WILSON North Carolina 27893 0.00029 Screened OutMARY KAY INC DALLAS Texas 75247 0.00026 Screened OutLAMBERTI SYNTHESIS USA INC CHATTANOOGA Tennessee 37406 0.0002205 Screened OutLEVLAD CHATSWORTH California 91311 0.000185 Screened OutCHEMETALL US INC JACKSON Michigan 49203 0.0001654 Screened OutU S CHEMICAL WATERTOWN Wisconsin 53094 0.00014 Screened OutIFF AUGUSTA LTD AUGUSTA Georgia 30906 0.000085 Screened OutRIKER PRODUCTS INC TOLEDO Ohio 43612 0.000082 Screened OutBAKER PETROLITE KILGORE BLEND PLANT KILGORE Texas 75662 0.0000807 Screened OutNALCO CO ELLWOOD CITY Pennsylvania 16117 0.0000118 Screened OutEMERALD SERVICES INC TACOMA Washington 98421 0.000005 Screened OutAIR PRODUCTS PERFORMANCE MANUFACTURING INC RESERVE Louisiana 70084 0.000002 Screened Out
VEYANCE TECHNOLOGIES INC LINCOLN Nebraska 68504 0.00000001 Screened Out
Page 17 of 18

Table C-2. Comparisons of 2010 TRI Air Emissions Data for Certain Glycol Ethers to the Step A Screening Value of 4.9 tpy
Facility Name City State Zip Code 2010 Air Emissions (tpy) Outcome
tpy: tons per year
Page 18 of 18

Table C-3. Comparisons of 2011 TRI Air Emissions Data for Certain Glycol Ethers to the Step A Screening Value of 4.9 tpy
Facility Name Address City State Zip Code2011 Air
Emissions (tpy)
Outcome
CROWN BEVERAGE PACKAGING 1202 FONES RD OLYMPIA WA 98501 63.9665 RetainBOEING COMMERCIAL AIRPLANES - EVERETT
3003 W CASINO RD EVERETT WA 98204 20.45 Retain
REXAM BEVERAGE CAN CO RE: KENT WA FACILITY
1220 N SECOND AVE KENT WA 98032 82.946 Retain
BALL METAL BEVERAGE CONTAINER CORP 91-320 KOMOHANA ST KAPOLEI HI 96707 10.95 Retain
SILGAN CAN CO 6200 FRANKLIN BLVD SUITE #100 SACRAMENTO CA 95824 5.0385 RetainSILGAN CONTAINER MANUFACTURING CORP 3250 PATTERSON RD RIVERBANK CA 95367 7.8095 Retain
REXAM BEVERAGE CAN CO RE: FAIRFIELD PLANT
2433 CROCKER CIR FAIRFIELD CA 94533 9.161 Retain
BALL METAL BEVERAGE CONTAINER CORP 2400 HUNTINGTON DR FAIRFIELD CA 94533 21.5 Retain
METAL CONTAINER CORP - MIRA LOMA CAN PLANT
10980 INLAND AVE MIRA LOMA CA 91752 31.1755 Retain
REXAM BEVERAGE CAN CO RE: CHATSWORTH FACILITY
20730 PRAIRIE ST CHATSWORTH CA 91311 29.0045 Retain
BALL METAL BEVERAGE CONTAINER CORP 500 CRENSHAW BLVD TORRANCE CA 90503 16.65 Retain
CARRY-ON TRAILER CORP 5300 WESTMORELAND RD WINNEMUCCA NV 89445 5.0015 RetainREXAM BEVERAGE CAN CO RE: PHOENIX FACILITY
211 N 51AVE PHOENIX AZ 85043 41.904 Retain
TTM TECHNOLOGIES INC 710 N 600 W LOGAN UT 84321 5.851 RetainCROWN BEVERAGE PACKAGING 620 N 4TH ST WORLAND WY 82401 53.3405 RetainMETAL CONTAINER CORPORTION - WINDSOR CAN PLANT
1201 METAL CONTAINER CT WINDSOR CO 80550 54.2575 Retain
CIRCLE GRAPHICS INC 120 9TH AVE LONGMONT CO 80501 5 RetainBALL METAL BEVERAGE CONTAINER CORP 4525 INDIANA ST GOLDEN CO 80403 31.5 Retain
ROCKY MOUNTAIN METAL CONTAINER 17755 W 32ND AVE GOLDEN CO 80401 33.5 RetainTOYOTA MOTOR MANUFACTURING TEX AS INC
1 LONE STAR PASS SAN ANTONIO TX 78264 9.93683575 Retain
UNION CARBIDE CORP SEADRIFT PLANT 7501 N HWY 185 SEADRIFT TX 77983 17.666 RetainGREIF PACKAGING LLC 10850 STRANG RD LA PORTE TX 77571 5.00805 RetainEQUISTAR CHEMICALS BAYPORT CHEMICALS PLANT
5761 UNDERWOOD RD PASADENA TX 77507 5.2385 Retain
MEMC PASADENA INC 3000 N S ST PASADENA TX 77503 23.8115 RetainCROWN BEVERAGE PACKAGING 12910 JESS PIRTLE BLVD SUGAR LAND TX 77478 31.488 RetainCROWN BEVERAGE PACKAGING 2501 N FRAZIER ST CONROE TX 77303 32.064 RetainBALL METAL BEVERAGE CONTAINER CORP 1001 N FM 3083 E CONROE TX 77303 17.15 Retain
MAVERICK TUBE LLC DBA TENARISCONROE 699 F.M. 3083 CONROE TX 77301 6.9444811 Retain
BALL METAL BEVERAGE CONTAINER CORP 6600 WILL ROGERS BLVD FORT WORTH TX 76140 12.5 Retain
NUCOR VULCRAFT GROUP - GRAPELAND DIV
175 COUNTY RD 2345 GRAPELAND TX 75844 12.204 Retain
EASTMAN CHEMICAL CO TEXAS OPERATIONS
300 KODAK BLVD LONGVIEW TX 75602 15.3195 Retain
REXAM BEVERAGE CAN CO RE: LONGVIEW FACILITY
1001 FISHER RD LONGVIEW TX 75604 52.485 Retain
SILGAN CAN CO 500 NW LOOP 286 SUITE 101 PARIS TX 75460 6.6505 RetainOLDCASTLE BUILDING ENVELOPE - TEXAS FACILITY
803 AIRPORT RD TERRELL TX 75160 15.309 Retain
MOBIL CHEMICAL CO 41501 WOLVERINE RD SHAWNEE OK 74804 19.075 RetainAIR SYSTEM COMPONENTS LP 900 DARR PARK DR PONCA CITY OK 74601 19.8795 RetainUS DOD USAF TINKER AFB 72 CEG/CEA 7535 FIFTH ST TINKER AFB OK 73145 5.1 RetainDEXTER AXLE 500 SE 27TH EL RENO OK 73036 7.514 RetainGRAPHIC PACKAGING INTERNATIONAL INC 10300 ROBERTS BLVD FORT SMITH AR 72916 13.2445 Retain
KAWNEER CO INC 600 KAWNEER DR SPRINGDALE AR 72764 9.9965 RetainSUPERIOR INDUSTRIES INTERNATIONAL ARKANSAS LLC
1301 N DIXIELAND RD ROGERS AR 72756 12.883 Retain
SUPERIOR INDUSTRIES INTERNATIONAL ARKANSAS LLC
1901 E BORICK DR FAYETTEVILLE AR 72701 10.9685 Retain
L A DARLING CO - PIGGOTT AR FACILITY HWY 49 S PIGGOTT AR 72454 5.4585 RetainQG PRINTING II CORP 4708 KRUEGER DR JONESBORO AR 72401 5.85 RetainMAVERICK TUBE LLC 4950 N COUNTY RD 967 BLYTHEVILLE AR 72315 11.16161105 RetainWHEELING MACHINE PRODUCTS DIV PINE BLUFF
5411 INDUSTRIAL DR S PINE BLUFF AR 71602 6 Retain
BERENFIELD CONTAINERS SW LTD 3300 N HUTCHINSON ST WHITE HALL AR 71602 8.5085 RetainNOVOLYTE PERFORMANCE MATERIALS 111 W IRENE RD ZACHARY LA 70791 5.355 RetainGREIF PACKAGING LLC 6000 JEFFERSON HWY NEW ORLEANS LA 70123 9.5545 RetainNUCOR CORP - VULCRAFT/NUCOR COLD FINISH DIV
1601 W OMAHA AVE NORFOLK NE 68701 10.25 Retain
VALMONT INDUSTRIES INC 7002 N 288TH ST VALLEY NE 68064 5 RetainTHE COLEMAN CO INC 3600 N HYDRAULIC WICHITA KS 67219 5.858 Retain
Page 1 of 19
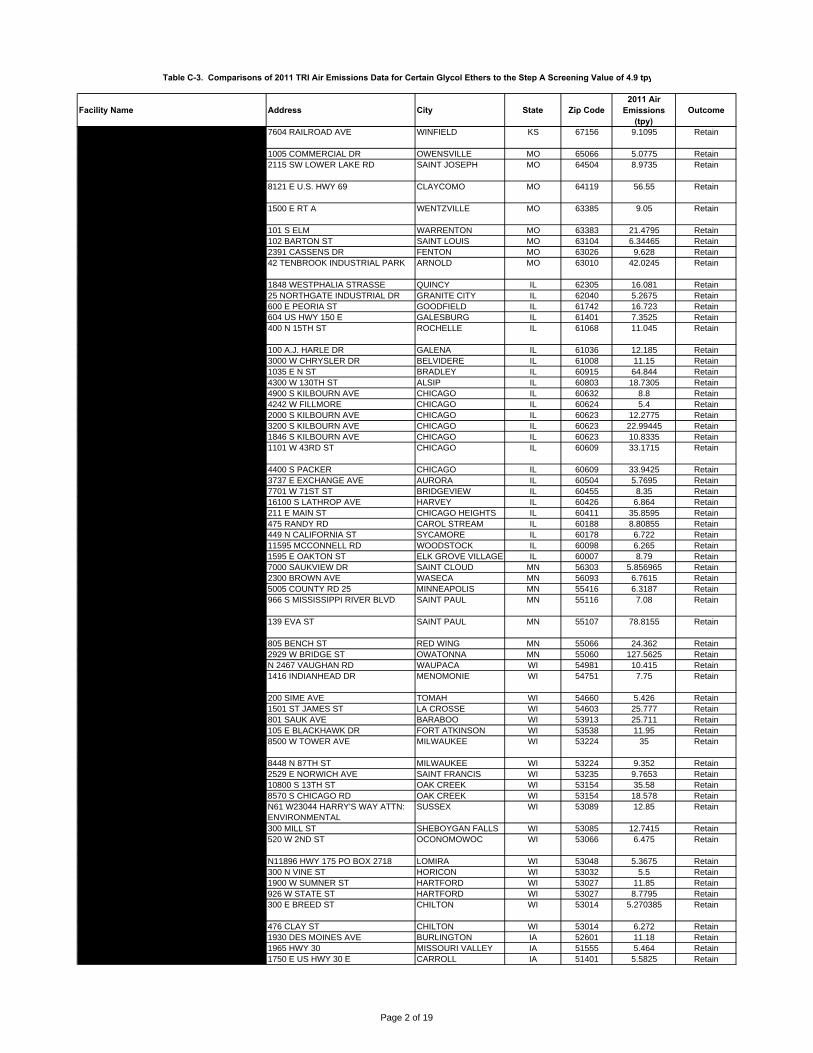
Table C-3. Comparisons of 2011 TRI Air Emissions Data for Certain Glycol Ethers to the Step A Screening Value of 4.9 tpy
Facility Name Address City State Zip Code2011 Air
Emissions (tpy)
Outcome
GREIF INDUSTRIAL PACKAGING & SERVICES 7604 RAILROAD AVE WINFIELD KS 67156 9.1095 Retain
VON HOFFMANN GRAPHICS INC 1005 COMMERCIAL DR OWENSVILLE MO 65066 5.0775 RetainSILGAN CONTAINERS MANUFACTURING CORP
2115 SW LOWER LAKE RD SAINT JOSEPH MO 64504 8.9735 Retain
FORD MOTOR COMPANY--KANSAS CITY ASSEMBLY PLANT
8121 E U.S. HWY 69 CLAYCOMO MO 64119 56.55 Retain
GENERAL MOTORS WENTZVILLE ASSEMBLY 1500 E RT A WENTZVILLE MO 63385 9.05 Retain
SAF-HOLLAND USA INC 101 S ELM WARRENTON MO 63383 21.4795 RetainSCHAEFFER MANUFACTURING 102 BARTON ST SAINT LOUIS MO 63104 6.34465 RetainTRILLA ST LOUIS CORP 2391 CASSENS DR FENTON MO 63026 9.628 RetainMETAL CONTAINER CORP - ARNOLD CAN PLANT
42 TENBROOK INDUSTRIAL PARK ARNOLD MO 63010 42.0245 Retain
THE KNAPHEIDE MANUFACTURING CO 1848 WESTPHALIA STRASSE QUINCY IL 62305 16.081 RetainPRECOAT METALS 25 NORTHGATE INDUSTRIAL DR GRANITE CITY IL 62040 5.2675 RetainCNH AMERICA LLC 600 E PEORIA ST GOODFIELD IL 61742 16.723 RetainNATIONAL COATINGS INC 604 US HWY 150 E GALESBURG IL 61401 7.3525 RetainSILGAN CONTAINERS MANUFACTURING CORP
400 N 15TH ST ROCHELLE IL 61068 11.045 Retain
SIGNCRAFT SCREEN PRINT 100 A.J. HARLE DR GALENA IL 61036 12.185 RetainCHRYSLER BELVIDERE ASSEMBLY PLANT 3000 W CHRYSLER DR BELVIDERE IL 61008 11.15 RetainCROWN BEVERAGE PACKAGING 1035 E N ST BRADLEY IL 60915 64.844 RetainGREIF PACKAGING LLC 4300 W 130TH ST ALSIP IL 60803 18.7305 RetainSKOLNIK INDUSTRIES 4900 S KILBOURN AVE CHICAGO IL 60632 8.8 RetainCOLOR COMMUNICATIONS INC 4242 W FILLMORE CHICAGO IL 60624 5.4 RetainMEYER STEEL DRUM INC 2000 S KILBOURN AVE CHICAGO IL 60623 12.2775 RetainBWAY CORP 3200 S KILBOURN AVE CHICAGO IL 60623 22.99445 RetainCHICAGO STEEL CONTAINER CORP 1846 S KILBOURN AVE CHICAGO IL 60623 10.8335 RetainREXAM BEVERAGE CAN CO RE : CHICAGO PLANT
1101 W 43RD ST CHICAGO IL 60609 33.1715 Retain
EDSAL MANUFACTURING CO INC 4400 S PACKER CHICAGO IL 60609 33.9425 RetainCROWN AEROSOL PACKAGING 3737 E EXCHANGE AVE AURORA IL 60504 5.7695 RetainSIGNODE 7701 W 71ST ST BRIDGEVIEW IL 60455 8.35 RetainALLIED TUBE & CONDUIT CORP 16100 S LATHROP AVE HARVEY IL 60426 6.864 RetainCHICAGO HEIGHTS STEEL 211 E MAIN ST CHICAGO HEIGHTS IL 60411 35.8595 RetainKNS COS INC 475 RANDY RD CAROL STREAM IL 60188 8.80855 RetainSYCAMORE SYSTEMS LLC 449 N CALIFORNIA ST SYCAMORE IL 60178 6.722 RetainBROWN PRINTING CO 11595 MCCONNELL RD WOODSTOCK IL 60098 6.265 RetainACME FINISHING CO INC 1595 E OAKTON ST ELK GROVE VILLAGE IL 60007 8.79 RetainNAHAN PRINTING INC 7000 SAUKVIEW DR SAINT CLOUD MN 56303 5.856965 RetainBROWN PRINTING CO 2300 BROWN AVE WASECA MN 56093 6.7615 RetainNORTHLAND ALUMINUM PRODUCTS I NC 5005 COUNTY RD 25 MINNEAPOLIS MN 55416 6.3187 RetainFORD MOTOR CO TWIN CITIES ASSEMBLY PLANT
966 S MISSISSIPPI RIVER BLVD SAINT PAUL MN 55116 7.08 Retain
REXAM BEVERAGE CAN CO RE: EVA STREET ST PAUL MN
139 EVA ST SAINT PAUL MN 55107 78.8155 Retain
S B FOOT TANNING CO 805 BENCH ST RED WING MN 55066 24.362 RetainCROWN FOOD PACKAGING 2929 W BRIDGE ST OWATONNA MN 55060 127.5625 RetainALLIANCE INDUSTRIES WAUPACA N 2467 VAUGHAN RD WAUPACA WI 54981 10.415 RetainSILGAN CONTAINERS MANUFACTURING CORP
1416 INDIANHEAD DR MENOMONIE WI 54751 7.75 Retain
TORO CO 200 SIME AVE TOMAH WI 54660 5.426 RetainCROWN BEVERAGE PACKAGING 1501 ST JAMES ST LA CROSSE WI 54603 25.777 RetainSENECA FOODS CORP 801 SAUK AVE BARABOO WI 53913 25.711 RetainBALL CONTAINER LLC 105 E BLACKHAWK DR FORT ATKINSON WI 53538 11.95 RetainBALL METAL BEVERAGE CONTAINER CORP 8500 W TOWER AVE MILWAUKEE WI 53224 35 Retain
KUBIN-NICHOLSON CORP 8448 N 87TH ST MILWAUKEE WI 53224 9.352 RetainKITZINGER COOPERAGE CORP 2529 E NORWICH AVE SAINT FRANCIS WI 53235 9.7653 RetainPPG INDUSTRIES INC-OAK CREEK 10800 S 13TH ST OAK CREEK WI 53154 35.58 RetainMID-AMERICA STEEL DRUM CO IN C 8570 S CHICAGO RD OAK CREEK WI 53154 18.578 RetainQUAD/GRAPHICS INC N61 W23044 HARRY'S WAY ATTN:
ENVIRONMENTALSUSSEX WI 53089 12.85 Retain
BEMIS MANUFACTURING CO PLANT B 300 MILL ST SHEBOYGAN FALLS WI 53085 12.7415 RetainSILGAN CONTAINERS MANUFACTURING CORP
520 W 2ND ST OCONOMOWOC WI 53066 6.475 Retain
QUAD/GRAPHICS INC N11896 HWY 175 PO BOX 2718 LOMIRA WI 53048 5.3675 RetainJOHN DEERE HORICON WORKS-DT 300 N VINE ST HORICON WI 53032 5.5 RetainQUAD/GRAPHICS INC 1900 W SUMNER ST HARTFORD WI 53027 11.85 RetainBROAN-NUTONE LLC 926 W STATE ST HARTFORD WI 53027 8.7795 RetainWORTHINGTON CYLINDERS WISCONSI N LLC
300 E BREED ST CHILTON WI 53014 5.270385 Retain
AMERICAN FINISHING RESOURCES INC 476 CLAY ST CHILTON WI 53014 6.272 RetainCNH AMERICA LLC 1930 DES MOINES AVE BURLINGTON IA 52601 11.18 RetainCARRY-ON TRAILER CORP 1965 HWY 30 MISSOURI VALLEY IA 51555 5.464 RetainPELLA CORP CARROLL OPERATIONS 1750 E US HWY 30 E CARROLL IA 51401 5.5825 Retain
Page 2 of 19

Table C-3. Comparisons of 2011 TRI Air Emissions Data for Certain Glycol Ethers to the Step A Screening Value of 4.9 tpy
Facility Name Address City State Zip Code2011 Air
Emissions (tpy)
Outcome
SILGAN CONTAINERS MANUFACTURIN G CORP
3591 MAPLE DR FORT DODGE IA 50501 13.686535 Retain
PELLA CORP 102 MAIN ST PELLA IA 50219 19.5195 RetainJOHN DEERE DES MOINES WORKS 825 SW IRVINEDALE DR ANKENY IA 50023 21.1695 RetainBRADFORD WHITE CORP 200 LAFAYETTE ST MIDDLEVILLE MI 49333 7.1365 RetainDEXTER CHASSIS GROUP PLANT 55 501 S MILLER DR WHITE PIGEON MI 49099 16.1035 RetainGRAPHIC PACKAGING INTERNATIONAL INC 1500 N PITCHER ST KALAMAZOO MI 49007 8.6 Retain
GMVM-LANSING GRAND RIVER ASSEMBLY 920 TOWNSEND ST MAIL CODE: 489-066-600
LANSING MI 48921 5.8 Retain
GENERAL MOTORS LANSING DELTA TOWNSHIP
8175 MILLETT HWY LANSING MI 48917 24.55 Retain
GM LLC POWERTRAIN FLINT ENGINE OPERATIONS
2100 BRISTOL RD FLINT MI 48552 26.1855 Retain
CHRYSLER JEFFERSON NORTH ASSEMBLY PLANT
2101 CONNOR AVE DETROIT MI 48215 56 Retain
AJAX METAL PROCESSING INC 4651 BELLEVUE AVE DETROIT MI 48207 7.4295 RetainFORD MOTOR CO MICHIGAN ASSEMBLY PLANT
38303 MICHIGAN AVE WAYNE MI 48184 6.065 Retain
FORD MOTOR CO DEARBORN TRUCK PLANT 3001 MILLER RD DEARBORN MI 48121 66.15 Retain
CHRYSLER WARREN TRUCK ASSEMBLY PLANT (PART)
21500 MOUND RD WARREN MI 48091 8.655 Retain
CURTIS METAL FINISHING CO 6645 SIMS DR STERLING HEIGHTS MI 48313 6.169 RetainHOWARD FINISHING LLC 32565 DEQUINDRE MADISON HEIGHTS MI 48071 12.3605 RetainBALL METAL BEVERAGE CONTAINER CORP 501 N SIXTH ST MONTICELLO IN 47960 33 Retain
RR DONNELLEY CRAWFORDSVILLE 1009 SLOAN ST CRAWFORDSVILLE IN 47933 6.608 RetainCROWN BEVERAGE PACKAGING 400 N WALNUT ST CRAWFORDSVILLE IN 47933 21.597 RetainSUBARU OF INDIANA AUTOMOTIVE INC 5500 STATE RD 38E LAFAYETTE IN 47905 29.635 RetainSILGAN WHITE CAP CORP 2201 W MARYLAND ST EVANSVILLE IN 47710 15.4125 RetainTOYOTA MOTOR MANUFACTURING INDIANA INC
4000 TULIP TREE DR PRINCETON IN 47670 17.969 Retain
ALCOA INC - WARRICK OPERATIONS HWYS 66 & 61 NEWBURGH IN 47629 8.5 RetainSABIC INNOVATIVE PLASTICS MT VERNON LLC
1 LEXAN LN MOUNT VERNON IN 47620 5.25 Retain
ASHLEY INDUSTRIAL MOLDING INC 310 S WABASH ASHLEY IN 46705 6 RetainGEA BPO LLC 301 N CURRY PIKE BLOOMINGTON IN 47404 6.5 RetainENKEI AMERICA INC 2900 W INWOOD DR COLUMBUS IN 47201 6 RetainBATESVILLE MANUFACTURING INC -DOLL PLANT
1000 E PEARL ST BATESVILLE IN 47006 5.3525 Retain
NUCOR VULCRAFT GROUP SAINT JOE DIV 6610 COUNTY RD 60 SAINT JOE IN 46785 8.231 RetainGM TRUCK GROUP FORT WAYNE ASSEMBLY 12200 LAFAYETTE CENTER RD ROANOKE IN 46783 15.2 Retain
THERMA-TRU CORP 601 RE JONES RD BUTLER IN 46721 24.3635 RetainMIDDLEBURY HARDWOOD PRODUCTS 101 JOAN DR MIDDLEBURY IN 46540 5.3965 RetainSEQUA COATINGS CORP-PRECOAT M ETALS DIV
US HWY 12 AT RT 249 PORTAGE IN 46368 4.9 Screened Out
SILGAN CONTAINERS MANUFACTURING CORP
300 N FAIL RD LA PORTE IN 46350 65.4225 Retain
PRECOAT METALS 858 E HUPP RD LA PORTE IN 46350 6.935 RetainSILGAN CONTAINERS MANUFACTURING CORP
2501 165TH ST HAMMOND IN 46320 5.873 Retain
PRECOAT METALS 1950 E MAIN ST GREENFIELD IN 46140 7.843 RetainCROWN EQUIPMENT CORP 2600 E STATE RD 240 GREENCASTLE IN 46135 6.75701 RetainAAP ST MARYS CORP 1100 MCKINLEY RD SAINT MARYS OH 45885 7.502 RetainWHIRLPOOL CORP FINDLAY DIV 4901 N MAIN ST FINDLAY OH 45840 21.509 RetainBALL METAL BEVERAGE CONTAINER CORP 12340 TOWNSHIP RD 99 E FINDLAY OH 45840 160.5 Retain
AMERICAN TRIM LLC 1501 W MICHIGAN ST SIDNEY OH 45365 11.892 RetainPLY GEM 2615 CAMPBELL RD SIDNEY OH 45365 12.155 RetainINGERSOLL-RAND CO STEELCRAFT DIV 9017 BLUE ASH RD CINCINNATI OH 45242 32.5 RetainBERENFIELD CONTAINERS INC MASON 1229 CASTLE DR MASON OH 45040 12.689 RetainRR DONNELLEY & SONS CO 1145 CONWELL AVE WILLARD OH 44890 8.7445 RetainARTIFLEX MANUFACTURING LLC GERSTCO DIV WOOSTER
1425 E BOWMAN ST WOOSTER OH 44691 13.3625 Retain
NOVELIS CORP 390 GRISWOLD ST NE WARREN OH 44483 14.966 RetainTECNOCAP LLC 2100 GRISWOLD NE WARREN OH 44483 7.365 RetainGM LORDSTOWN COMPLEX 2300 HALLOCK-YOUNG RD LORDSTOWN OH 44481 5 RetainHESS PRINT SOLUTIONS 3765 SUNNYBROOK RD BRIMFIELD OH 44240 5 RetainNORTH COAST CONTAINER CORP 8806 CRANE AVE CLEVELAND OH 44105 17.316 RetainAK STEEL CORP - ZANESVI LLE WORKS 1724 LINDEN AVE ZANESVILLE OH 43701 6 RetainCROWN FOOD PACKAGING 5201 ENTERPRISE BLVD TOLEDO OH 43612 12.7245 RetainKUKA TOLEDO PRODUCTION OPERATIONS 3770 STICKNEY AVE TOLEDO OH 43612 16.5510995 Retain
DECORATIVE PANELS INTERNATIONA L 2900 HILL AVE TOLEDO OH 43607 13.1405 RetainREXAM BEVERAGE CAN CO RE: WHITEHOUSE PLANT
10444 WATERVILLE WHITEHOUSE OH 43571 76.328 Retain
Page 3 of 19

Table C-3. Comparisons of 2011 TRI Air Emissions Data for Certain Glycol Ethers to the Step A Screening Value of 4.9 tpy
Facility Name Address City State Zip Code2011 Air
Emissions (tpy)
Outcome
SILGAN CAN CO 12-773 ST RT 110 NAPOLEON OH 43545 12.7305 RetainELECTROPRIME INC 63 DIXIE HWY ROSSFORD OH 43460 7.819 RetainREXAM BEVERAGE CAN CO RE: FREMONT PLANT
2145 CEDAR FREMONT OH 43420 126.955 Retain
HONDA OF AMERICA MANUFACTURING INC 11000 STATE RT 347 EAST LIBERTY OH 43319 38.3 Retain
WHIRLPOOL CORP MARION DIV 1300 MARION-AGOSTA RD MARION OH 43302 51.461 RetainBALL CONTAINER LLC - COLUMBUS CAN PLANT
350 MCCORMICK BLVD COLUMBUS OH 43213 82 Retain
HONDA OF AMERICA MANUFACTURING INC 24000 HONDA PKWY MARYSVILLE OH 43040 40.2 Retain
PRECOAT METALS 2604 RIVER RD HAWESVILLE KY 42348 5.218 RetainLOGAN ALUMINUM INC US HWY 431 N RUSSELLVILLE KY 42276 4.9495 RetainGREIF PACKAGING LLC 7425 INDUSTRIAL RD FLORENCE KY 41042 34.7245 RetainSQUARE D CO 1601 MERCER RD LEXINGTON KY 40511 9.092 RetainHITACHI AUTOMOTIVE SYSTEMS AMERICAS INC-BEREA KY
301 MAYDE RD BEREA KY 40403 14.7982 Retain
TOYOTA MOTOR MANUFACTURING KENTUCKY INC
1001 CHERRY BLOSSOM WAY GEORGETOWN KY 40324 9.387 Retain
FORD MOTOR CO KENTUCKY TRUCK PLANT 3001 CHAMBERLAIN LN LOUISVILLE KY 40241 44.25 Retain
ESCO CORP 9098 EASTSIDE DR EXT. NEWTON MS 39345 9.578 RetainPRECOAT METALS 1095 MENDELL DAVIS DR JACKSON MS 39272 10.9045 RetainANDERSON TULLY LUMBER CO WALTERSVILLE LUMBER MILL
1725 N WASHINGTON ST VICKSBURG MS 39181 14.1275 Retain
NISSAN NORTH AMERICA INC CANTON MS 300 NISSAN DR CANTON MS 39046 9.612 RetainHUNTER DOUGLAS TUPELO CENTER RT. 2 LEE INDUSTRIAL PARK E SHANNON MS 38868 6.1565 RetainREXAM BEVERAGE CAN CO RE: OLIVE BRANCH FACILITY
10800 MARINA DR OLIVE BRANCH MS 38654 82.2945 Retain
CROWN BEVERAGE PACKAGING 195 CROWN RD BATESVILLE MS 38606 22.1595 RetainCECO DOOR PRODUCTS 9159 TELECOM DR MILAN TN 38358 16.754 RetainKOHLER CO 2000 N 5TH ST UNION CITY TN 38261 5.347 RetainTEKNOR APEX TENNESSEE CO (AKA HAYWOOD CO)
751 DUPREE ST BROWNSVILLE TN 38012 6.669 Retain
VESTAL MANUFACTURING ENTERPRISES INC
177 INDUSTRIAL PARK RD SWEETWATER TN 37874 13.094 Retain
VOLKSWAGEN GROUP OF AMERICA CHATTANOOGA OPERATIONS LLC
8001 VOLKSWAGEN DR CHATTANOOGA TN 37416 11.0214265 Retain
ALSTOM POWER INC CHATTANOOGA BOILERS
1119 RIVERFRONT PKWY CHATTANOOGA TN 37402 23.9355 Retain
BATESVILLE MANUFACTURING INC 175 MONOGARD DR MANCHESTER TN 37355 34.1765 RetainLA-Z-BOY TENNESSEE 500 WALNUT GROVE RD DAYTON TN 37321 6.58324085 RetainMAYTAG CORP CLEVELAND COOKING PRODUCTS PLANT 1
740 KING EDWARD AVE SE CLEVELAND TN 37311 6.264 Retain
NASHVILLE WIRE PRODUCTS 1604 COUNTY HOSPITAL RD NASHVILLE TN 37218 18.35 RetainQUAD GRAPHICS NASHVILLE 2947 BRICK CHURCH PIKE NASHVILLE TN 37207 7.102 RetainNISSAN NA INC SMYRNA MANUFACTURING PLANT
983 NISSAN DR SMYRNA TN 37167 30.74138035 Retain
STATE INDUSTRIES INC 500 TENNESSEE WALTZ PKWY ASHLAND CITY TN 37015 9.4075 RetainRUSKIN CO HWY 27 N GENEVA AL 36340 12.793 RetainDUNBARTON CORP REDIFRAME DIV 1101 TECHNOLOGY DR DOTHAN AL 36303 5.3 RetainNUCOR CORP VULCRAFT DIV 7205 GAULT AVE N FORT PAYNE AL 35967 6.3425 RetainHART & COOLEY INC 4910 MOORES MILL RD HUNTSVILLE AL 35811 8.525 RetainITW SEXTON INC 3101 SEXTON RD DECATUR AL 35603 19.2556 Retain3M CO - GUIN 6675 US HWY 43 GUIN AL 35563 12.501 RetainMERCEDES-BENZ US INTERNATIONAL INC 1 MERCEDES DR VANCE AL 35490 28.302 RetainAKZO NOBEL COATINGS INC 1629 VANDERBILT RD BIRMINGHAM AL 35234 12.3625 RetainHONDA MANUFACTURING OF ALABAMA LLC 1800 HONDA DR LINCOLN AL 35096 25.27 Retain
M&B HANGERS 1313 PKWY DR SE LEEDS AL 35094 13.472 RetainKEYMARK CORP OF FLORIDA 2540 KNIGHTS STATION RD LAKELAND FL 33810 8.999 RetainMOMENTIVE SPECIALTY CHEMICALS INC 2525 S COMBEE RD LAKELAND FL 33801 8.3575 RetainBALL METAL BEVERAGE CONTAINER CORP 4700 WHITEWAY DR TAMPA FL 33617 17 Retain
METAL INDUSTRIES INC - BUSHNELL 400 W WALKER AVE BUSHNELL FL 33513 10.6975 RetainMETAL CONTAINER CORP - JACKSONVILLE CAN PLANT
1100 N ELLIS RD JACKSONVILLE FL 32254 25.615 Retain
KIA MOTORS MANUFACTURING OF GEORGIA 7777 KIA PKWY WEST POINT GA 31833 4.9645 Retain
BWAY CORP 1601 VALDOSTA HWY HOMERVILLE GA 31634 7.80461 RetainYKK AP AMERICA INC 1229 HWY 441 N BYPASS DUBLIN GA 31021 9.392 RetainPOWER PARTNERS INC 200 NEWTON BRIDGE RD ATHENS GA 30607 5.246 RetainCARRY-ON TRAILER CORP 101 JOE HARVEY ST LAVONIA GA 30553 17.346 RetainTOPPAN INTERAMERICA INC 1131 HWY 155 S MC DONOUGH GA 30253 11.15 RetainBRIGGS & STRATTON POWER PRODUCTS MCDONOUGH OPERATIONS
535 MACON RD MC DONOUGH GA 30253 9.043 Retain
BALL CONTAINER LLC ROME CAN PLANT 110 BALL DR ROME GA 30161 44.5 RetainAGY AIKEN LLC 2556 WAGENER RD AIKEN SC 29801 14.516 Retain
Page 4 of 19

Table C-3. Comparisons of 2011 TRI Air Emissions Data for Certain Glycol Ethers to the Step A Screening Value of 4.9 tpy
Facility Name Address City State Zip Code2011 Air
Emissions (tpy)
Outcome
BMW MANUFACTURING CO LLC 1400 HWY 101 S GREER SC 29651 152.52 RetainCROWN BEVERAGE PACKAGING 100 EVANS ROW CHERAW SC 29520 23.876 RetainNUCOR CORP VULCRAFT DIV 1501 W DARLINGTON ST FLORENCE SC 29501 12.2435 RetainHUSQVARNA CONSUMER OUTDOOR PRODUCTS
172 OLD ELLOREE RD ORANGEBURG SC 29116 6.604 Retain
REXAM BEVERAGE CAN CO RE: BISHOPVILLE SC FACILITY
609 COUSAR ST BISHOPVILLE SC 29010 89.26 Retain
AVERY DENNISON RBIS LENOIR 950 GERMAN ST LENOIR NC 28645 5.734 RetainSILGAN CAN CO 2120 NC HWY N UNIT A MAXTON NC 28364 9.7895 RetainBERENFIELD CONTAINERS SE LTD 12180 UNIVERSITY CITY BLVD HARRISBURG NC 28075 5.351 RetainWIX FILTRATION CORP - ALLEN PLANT 2900 NW BLVD GASTONIA NC 28052 5.9525 RetainAIR SYSTEM COMPONENTS LP 3301 N MAIN ST TARBORO NC 27886 16.5235 RetainBALL METAL BEVERAGE CONTAINER CORP 1900 BARNES ST REIDSVILLE NC 27320 102 Retain
THOMAS BUILT BUSES INC 715 W FAIRFIELD RD HIGH POINT NC 27263 15.9935 RetainREXAM BEVERAGE CAN CO RE: WINSTON SALEM PLANT
4000 OLD MILWAUKEE LN WINSTON-SALEM NC 27107 136.173 Retain
CROWN CORK & SEAL CO (USA) INC CROWN CLOSURE DIV
3011 BIRCH DR WEIRTON WV 26062 92.2445 Retain
BALL METAL FOOD CONTAINER CORP 3010 BIRCH DR WEIRTON WV 26062 13.25 RetainROYAL MOULDINGS LTD; MARION VIRGINIA 135 BEAR CREEK RD MARION VA 24354 8.9435 RetainVAUGHAN-BASSETT FURNITURE CO GALAX 300 E GRAYSON ST GALAX VA 24333 4.99620635 Retain
BALL METAL BEVERAGE CONTAINER CORP 8935 POCAHONTAS TRAIL JAMES RIVER COMMERCE CENTER
WILLIAMSBURG VA 23185 173 Retain
RR DONNELLEY 2347 KRATZER RD HARRISONBURG VA 22802 48.2645 RetainPHOENIX COLOR CORP 18249 PHOENIX DR HAGERSTOWN MD 21742 8.5 RetainCROWN FOOD PACKAGING 8801 CITATION RD BALTIMORE MD 21221 34.548 RetainCAN CORP OF AMERICA INC 326 JUNE AVE BLANDON PA 19510 6.5965 RetainGREIF PACKAGING LLC 695 LOUIS DR WARMINSTER PA 18974 6.028 RetainSUPERPAC INC 1220 INDUSTRIAL BLVD SOUTHAMPTON PA 18966 7.5855 RetainRR DONNELLEY LANCASTER EAST 216 GREENFIELD RD LANCASTER PA 17601 7.936 RetainRR DONNELLEY LANCASTER WEST 1375 HARRISBURG PIKE LANCASTER PA 17601 9.08235 RetainNEW YORK WIRE 500 E MIDDLE ST HANOVER PA 17331 28.0405 RetainCROWN FOOD PACKAGING 1650 BROADWAY HANOVER PA 17331 5.2265 RetainAMES TRUE TEMPER INC 1500 S CAMERON ST HARRISBURG PA 17104 27.6195 RetainFRANKLIN INVESTMENT CORP 600 ATLANTIC AVE FRANKLIN PA 16323 8.5 RetainBEDFORD MATERIALS CO INC 7676 ALLEGHENY RD MANNS CHOICE PA 15550 14.205 RetainPPG INDUSTRIES,INC-SPRINGDALE COMPLEX
125 COLFAX ST SPRINGDALE PA 15144 5.8125 Retain
USS - CLAIRTON PLANT 400 STATE ST CLAIRTON PA 15025 41 RetainVULCRAFT OF NEW YORK INC 5362 RAILROAD ST CHEMUNG NY 14825 10.4555 RetainHAMMER PACKAGING CORP 200 LUCIUS GORDON DR WEST HENRIETTA NY 14586 8.2645 RetainSENECA FOODS CORP CAN PLANT 3709 MILL ST MARION NY 14505 5.423 RetainWHITING DOOR MANUFACTURING CORP 113 CEDAR ST AKRON NY 14001 11.6965 RetainBALL METAL BEVERAGE CONTAINER CORP 11 ADAMS RD SARATOGA SPRINGS NY 12866 19.25 Retain
METAL CONTAINER CORP - NEWBURGH CAN PLANT
130 BREUNIG RD NEW WINDSOR NY 12553 40.4295 Retain
BALL METAL BEVERAGE CONTAINER CORP 95 BALLARD RD MIDDLETOWN NY 10940 17.5 Retain
SILGAN CONTAINERS MANUFACTURING CORP
135 NATIONAL RD EDISON NJ 08817 4.995 Retain
MAUSER CORP 14 CONVERY BLVD WOODBRIDGE NJ 07095 8.8765 RetainSTANLEY WORKS HAND TOOLS DIV 600 MYRTLE ST NEW BRITAIN CT 06052 10.5515 RetainS D WARREN CO 89 CUMBERLAND ST WESTBROOK ME 04098 35.20941 RetainTACO INC - CRANSTON 1160 CRANSTON ST CRANSTON RI 02920 5.7265 RetainCROWN BEVERAGE PACKAGING GLEN & SHEPARD ST LAWRENCE MA 01843 70.1775 RetainCROWN BEVERAGE PACKAGING 380 CALLE FABRIL ST KM 126 PR-3,
PR INDUSTRIAL PARKCAROLINA PR 00985 24.194 Retain
3M CO - SPRINGFIELD 3211 E CHESTNUT EXPY SPRINGFIELD MO 65802 0.02 Screened OutECOLAB INC 261 HWY 155 S MC DONOUGH GA 30253 0.041 Screened OutARLON GRAPHICS LLC 2811 S HARBOR BLVD SANTA ANA CA 92704 0.2365 Screened OutCNH AMERICA LLC 2701 OAKES RD STURTEVANT WI 53177 0.317 Screened Out3M CO - CORDOVA 22614 RT 84 N CORDOVA IL 61242 0.614 Screened Out3M CO - BROWNWOOD 4501 HWY 377 S BROWNWOOD TX 76801 0.91 Screened Out3M CO - HUTCHINSON 905/915 ADAMS ST SE HUTCHINSON MN 55350 1.585 Screened Out3M CO - MEDINA 1030 LAKE RD MEDINA OH 44256 0.168 Screened Out3M CO - NEVADA 2120 E AUSTIN BLVD NEVADA MO 64772 0.385 Screened Out3M COTTAGE GROVE CENTER 10746 INNOVATION RD COTTAGE GROVE MN 55016 0.112 Screened OutA BRITE CO 3217 WOOD DR GARLAND TX 75041 0.0025 Screened OutABC COMPOUNDING CO INC 6970 JONESBORO RD MORROW GA 30260 0.3775 Screened OutABC COMPOUNDING CO OF TEXAS INC 1102 AVE J E GRAND PRAIRIE TX 75050 0.06 Screened OutACCESS BUSINESS GROUP LLC 7575 FULTON ST E ADA MI 49355 1.9855 Screened OutACCURATE DISPERSIONS 192 W 155TH ST SOUTH HOLLAND IL 60473 0.1335 Screened OutACTEGA KELSTAR INC 1050 TAYLORS LN CINNAMINSON NJ 08077 0.01 Screened OutACTON TECHNOLOGIES INC 100 THOMPSON ST PITTSTON PA 18640 0.005 Screened OutADCO CLEANING PRODUCTS LLC 900 W MAIN ST SEDALIA MO 65301 0.0605 Screened Out
Page 5 of 19

Table C-3. Comparisons of 2011 TRI Air Emissions Data for Certain Glycol Ethers to the Step A Screening Value of 4.9 tpy
Facility Name Address City State Zip Code2011 Air
Emissions (tpy)
Outcome
AEP INDUSTRIES INC 1201 S PINE HILL RD GRIFFIN GA 30224 0.11925 Screened OutAFTON CHEMICAL CORP 501 MONSANTO AVE SAUGET IL 62201 0.02 Screened OutAFTON CHEMICAL CORP 725 CANNON BRIDGE RD ORANGEBURG SC 29115 3.301 Screened OutAIR PRODUCTS PERFORMANCE MANUFACTURING INC
474 W 19TH ST RESERVE LA 70084 0.0000025 Screened Out
AIR PRODUCTS PERFORMANCE MANUFACTURING INC
337 VINCENT DR MILTON WI 53563 0.0135 Screened Out
AKCROS CHEMICALS INC 500 JERSEY AVE NEW BRUNSWICK NJ 08901 0.125 Screened OutAKZO NOBEL COATINGS INC 1660 CROSS ST SE SALEM OR 97302 0.0519 Screened OutAKZO NOBEL COATINGS INC 1000 INDUSTRIAL PARK DR CLINTON MS 39056 0.0945 Screened OutAKZO NOBEL COATINGS INC 1431 PROGRESS AVE HIGH POINT NC 27260 0.125 Screened OutAKZO NOBEL COATINGS INC 1313 WINDSOR AVE COLUMBUS OH 43211 1.416 Screened OutAKZO NOBEL PAINTS PUERTO RICO LLC 65TH INFANTRY AVE KM. 13.4 CAROLINA PR 00985 0.081845 Screened OutAKZO NOBEL SURFACE CHEMISTRY LLC 15200 ALMEDA RD HOUSTON TX 77053 0.174 Screened OutAKZONOBEL 1872 HWY 9 BYPASS W LANCASTER SC 29720 2.6435 Screened OutAKZONOBEL AEROSPACE COATINGS 1 E WATER ST WAUKEGAN IL 60085 0.984 Screened OutAKZONOBEL COATINGS INC 120 FRANKLIN RD PONTIAC MI 48341 0.0605 Screened OutALCOA COMMERCIAL WINDOWS LLC (DBA TRACO)
71 PROGRESS AVE CRANBERRY TOWNSH PA 16066 0.7965 Screened Out
ALERIS ROLLED PRODUCTS INC 1 REYNOLDS RD ASHVILLE OH 43103 0.379 Screened OutALERIS ROLLED PRODUCTS INC 3321 DURHAM RD ROXBORO NC 27573 0.482 Screened OutALERIS ROLLED PRODUCTS INC 1372 KY HWY 1957 LEWISPORT KY 42351 2.696 Screened OutAMERICAN COLOR GRAPHICS 810 E S ST MARENGO IA 52301 2.1595 Screened OutAMERICAN COLOR GRAPHICS - LUFKIN 3001 ATKINSON DR LUFKIN TX 75901 1.7455 Screened OutAMERICAN JETWAY CORP 34136 MYRTLE WAYNE MI 48184 0.125 Screened OutAMERICAN METALS CORP 1000 CROCKER RD WESTLAKE OH 44145 0.391 Screened OutAMERIMAX COATED PRODUCTS 215 PHILLIPS 324 RD HELENA AR 72342 0.154 Screened OutAMPHENOL APC INC 91 NORTHEASTERN BLVD NASHUA NH 03062 0.1182165 Screened OutAMREP INC 990 INDUSTRIAL PARK DR MARIETTA GA 30062 0.244 Screened OutANCHOR PAINT MANUFACTURING CO INC 6707 E 14TH ST TULSA OK 74112 0.1155 Screened OutANDERSON DEVELOPMENT CO 1415 E MICHIGAN ST ADRIAN MI 49221 0.005 Screened OutARANDELL CORP N82 W13118 LEON RD MENOMONEE FALLS WI 53051 1.355 Screened OutARCADIA INC 3225 E WASHINGTON BLVD VERNON CA 90058 0.25 Screened OutARCH CHEMICALS INC HWY 933 BRANDENBURG KY 40108 0.124 Screened OutARDAGH METAL PACKAGING USA INC 3030 BIRCH DR HALF MOON
INDUSTRIAL PARKWEIRTON WV 26062 0.4445 Screened Out
ARDAGH METAL PACKAGING USA INC 936 BARRACUDA ST TERMINAL ISLAND CA 90731 4.175 Screened OutARDEX LABORATORIES INC 2050 BYBERRY RD PHILADELPHIA PA 19116 0.1365 Screened OutARKEMA COATING RESINS 340 RAILROAD ST SAUKVILLE WI 53080 0.9005 Screened OutARKEMA COATINGS & RESINS 13511 MAIN ST LEMONT IL 60439 0.03 Screened OutARKEMA INC 1415 STEELE AVE SW GRAND RAPIDS MI 49507 0.5 Screened OutARMSTRONG HARDWOOD FLOORING CO 565 HARTCO DR ONEIDA TN 37841 4.7345 Screened OutARMSTRONG WORLD INDUSTRIES INC 4115 N PERKINS RD STILLWATER OK 74075 1.4105 Screened OutARR-MAZ CUSTOM CHEMICALS 4800 STATE RD 60 E MULBERRY FL 33860 2.9015 Screened OutARROW SHED LLC 1 THIRD AVE HASKELL NJ 07420 0.1685 Screened OutARVINMERITOR HEAVY VEHICLE SYSTEMS LLC
801 RAILROAD AVE YORK SC 29745 4.894 Screened Out
ASTRO CHEMICALS INC 126 MEMORIAL DR SPRINGFIELD MA 01104 0.002 Screened OutASTRO COATINGS INC 27 MAIN ST STRUTHERS OH 44471 2.651 Screened OutATHEA LABORATORIES INC 7855 N FAULKNER RD MILWAUKEE WI 53224 0.08166 Screened OutATMI MATERIALS LTD 706 HOUSTON CLINTON DR BURNET TX 78611 0.05139 Screened OutATOTECH USA 1750 OVERVIEW DR ROCK HILL SC 29730 0.0025 Screened OutAUTOALLIANCE INTERNATIONAL INC 1 INTERNATIONAL DR FLAT ROCK MI 48134 4.85 Screened OutAUTOMOTIVE COMPONENTS HOLDINGS LLC SALINE PLANT
7700 MICHIGAN AVE SALINE MI 48176 3.56 Screened Out
AVANTOR PERFORMANCE MATERIALS 600 N BROAD ST PHILLIPSBURG NJ 08865 0.003 Screened OutAVERY DENNISON 17700 FOLTZ INDUSTRIAL PKWY STRONGSVILLE OH 44149 3.246 Screened OutAVON AUTOMOTIVE PLANT 1 603 W 7TH ST CADILLAC MI 49601 0.125 Screened OutAVX CORP MYRTLE BEACH 801 17TH AVE S MYRTLE BEACH SC 29577 2.6925 Screened OutBACHMAN SERVICES INC 2220 S PROSPECT OKLAHOMA CITY OK 73129 0.25 Screened OutBAKER PETROLITE BAYPORT FACILI TY 13200 BAYPARK RD PASADENA TX 77507 0.0001595 Screened OutBAKER PETROLITE CORP 16950 WALLISVILLE RD HOUSTON TX 77049 0.000219 Screened OutBAKER PETROLITE CORP 9100 W 21ST ST SAND SPRINGS OK 74063 0.01482 Screened OutBAKER PETROLITE KILGORE BLEND PLANT 806 PALUXY ST KILGORE TX 75662 0.0002725 Screened Out
BAKER PETROLITE-RAYNE FACILITY 135 INDUSTRIAL DR RAYNE LA 70578 0.0005 Screened OutBALL AEROSOL & SPECIALTY CONTAINER INC
1717 GIFFORD RD ELGIN IL 60120 1.838 Screened Out
BALL METAL FOOD CONTAINER CORP 1200 S CRUTCHER ST SPRINGDALE AR 72764 2.13 Screened OutBALL METAL FOOD CONTAINER CORP 300 W GREGER RD OAKDALE CA 95361 3.552 Screened OutBARTON SOLVENTS INC BETTENDORF 204 36TH ST BETTENDORF IA 52722 0.049 Screened OutBARTON SOLVENTS INC COUNCIL BLUFFS 2135 9TH AVE COUNCIL BLUFFS IA 51502 0.023 Screened OutBARTON SOLVENTS INC DES MOINES 1970 NE BROADWAY DES MOINES IA 50313 0.0355 Screened OutBARTON SOLVENTS INC KANSAS CITY 901 S 66TH TERRACE KANSAS CITY KS 66111 0.035 Screened OutBARTON SOLVENTS INC WEST BEND 800 RAIL WAY WEST BEND WI 53095 0.0265 Screened OutBARTON SOLVENTS INC WICHITA 201 S CEDAR VALLEY CENTER KS 67147 0.0195 Screened OutBASF CORP 100 INDUSTRIAL BLVD SEAFORD DE 19973 0.0025 Screened OutBASF CORP 1609 BIDDLE AVE WYANDOTTE MI 48192 0.005 Screened Out
Page 6 of 19
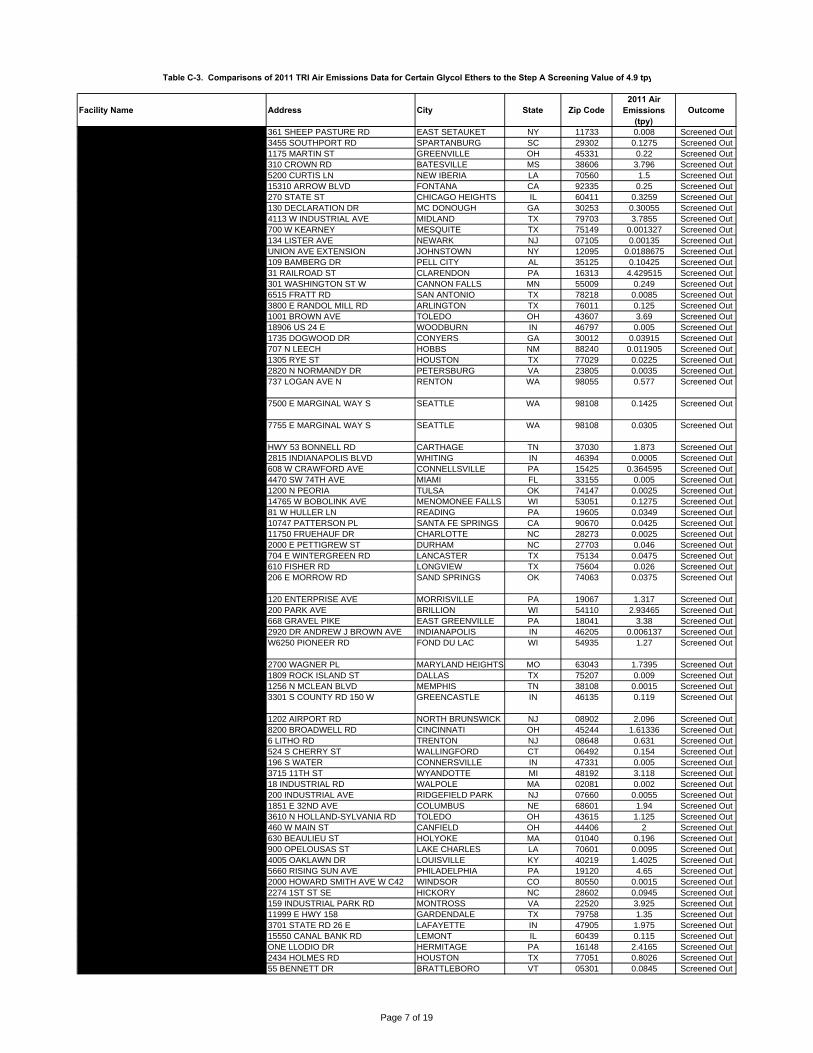
Table C-3. Comparisons of 2011 TRI Air Emissions Data for Certain Glycol Ethers to the Step A Screening Value of 4.9 tpy
Facility Name Address City State Zip Code2011 Air
Emissions (tpy)
Outcome
BASF CORP 361 SHEEP PASTURE RD EAST SETAUKET NY 11733 0.008 Screened OutBASF CORP 3455 SOUTHPORT RD SPARTANBURG SC 29302 0.1275 Screened OutBASF CORP 1175 MARTIN ST GREENVILLE OH 45331 0.22 Screened OutBATESVILLE MANUFACTURING INC 310 CROWN RD BATESVILLE MS 38606 3.796 Screened OutBAYOU COS INC 5200 CURTIS LN NEW IBERIA LA 70560 1.5 Screened OutBECKER SPECIALTY CORP 15310 ARROW BLVD FONTANA CA 92335 0.25 Screened OutBEHR PROCESS CORP - CHICAGO 270 STATE ST CHICAGO HEIGHTS IL 60411 0.3259 Screened OutBEHR PROCESS CORP ATLANTA 130 DECLARATION DR MC DONOUGH GA 30253 0.30055 Screened OutBENCHMARK ENERGY PRODUCTS LLC 4113 W INDUSTRIAL AVE MIDLAND TX 79703 3.7855 Screened OutBENJAMIN MOORE & CO - DALLAS 700 W KEARNEY MESQUITE TX 75149 0.001327 Screened OutBENJAMIN MOORE & CO - NEWARK 134 LISTER AVE NEWARK NJ 07105 0.00135 Screened OutBENJAMIN MOORE & CO JOHNSTOWN UNION AVE EXTENSION JOHNSTOWN NY 12095 0.0188675 Screened OutBENJAMIN MOORE & CO PELL CITY 109 BAMBERG DR PELL CITY AL 35125 0.10425 Screened OutBERENFIELD CONTAINERS INC 31 RAILROAD ST CLARENDON PA 16313 4.429515 Screened OutBERGQUIST CO 301 WASHINGTON ST W CANNON FALLS MN 55009 0.249 Screened OutBERRIDGE MANUFACTURING CO 6515 FRATT RD SAN ANTONIO TX 78218 0.0085 Screened OutBERRYMAN PRODUCTS INC 3800 E RANDOL MILL RD ARLINGTON TX 76011 0.125 Screened OutBETCO CORP 1001 BROWN AVE TOLEDO OH 43607 3.69 Screened OutBF GOODRICH TIRE MANUFACTURING 18906 US 24 E WOODBURN IN 46797 0.005 Screened OutBIOLAB INC 1735 DOGWOOD DR CONYERS GA 30012 0.03915 Screened OutBJ CHEMICAL SERVICES 707 N LEECH HOBBS NM 88240 0.011905 Screened OutBLENTECH CORP 1305 RYE ST HOUSTON TX 77029 0.0225 Screened OutBOEHRINGER INGELHEIM CHEMICALS INC 2820 N NORMANDY DR PETERSBURG VA 23805 0.0035 Screened OutBOEING COMMERCIAL AIRPLANE GROUP - RENTON
737 LOGAN AVE N RENTON WA 98055 0.577 Screened Out
BOEING COMMERCIAL AIRPLANE GROUP NORTH BOEING FIELD (PART)
7500 E MARGINAL WAY S SEATTLE WA 98108 0.1425 Screened Out
BOEING COMMERCIAL AIRPLANE GROUP PLANT 2 (PART)
7755 E MARGINAL WAY S SEATTLE WA 98108 0.0305 Screened Out
BON L MANUFACTURING CO HWY 53 BONNELL RD CARTHAGE TN 37030 1.873 Screened OutBP PRODUCTS NORTH AMERICA WHITING 2815 INDIANAPOLIS BLVD WHITING IN 46394 0.0005 Screened OutBRADLEY COATINGS GROUP 608 W CRAWFORD AVE CONNELLSVILLE PA 15425 0.364595 Screened OutBRAIN POWER INC 4470 SW 74TH AVE MIAMI FL 33155 0.005 Screened OutBRAINERD CHEMICAL CO INC 1200 N PEORIA TULSA OK 74147 0.0025 Screened OutBRENNTAG GREAT LAKES LLC 14765 W BOBOLINK AVE MENOMONEE FALLS WI 53051 0.1275 Screened OutBRENNTAG NORTHEAST INC 81 W HULLER LN READING PA 19605 0.0349 Screened OutBRENNTAG PACIFIC INC 10747 PATTERSON PL SANTA FE SPRINGS CA 90670 0.0425 Screened OutBRENNTAG SOUTHEAST INC 11750 FRUEHAUF DR CHARLOTTE NC 28273 0.0025 Screened OutBRENNTAG SOUTHEAST INC 2000 E PETTIGREW ST DURHAM NC 27703 0.046 Screened OutBRENNTAG SOUTHWEST INC LANC ASTER 704 E WINTERGREEN RD LANCASTER TX 75134 0.0475 Screened OutBRENNTAG SOUTHWEST INC LONG VIEW 610 FISHER RD LONGVIEW TX 75604 0.026 Screened OutBRENNTAG SOUTHWEST INC SAND SPRINGS
206 E MORROW RD SAND SPRINGS OK 74063 0.0375 Screened Out
BRIGHTSMITH LLC 120 ENTERPRISE AVE MORRISVILLE PA 19067 1.317 Screened OutBRILLION IRON WORKS INC 200 PARK AVE BRILLION WI 54110 2.93465 Screened OutBROWN PRINTING CO 668 GRAVEL PIKE EAST GREENVILLE PA 18041 3.38 Screened OutBRULIN CORP 2920 DR ANDREW J BROWN AVE INDIANAPOLIS IN 46205 0.006137 Screened OutBRUNSWICK CORP MERCURY MARINE DIV W6250 PIONEER RD FOND DU LAC WI 54935 1.27 Screened Out
BUCKEYE INTERNATIONAL INC 2700 WAGNER PL MARYLAND HEIGHTS MO 63043 1.7395 Screened OutBUCKLEY OIL CO 1809 ROCK ISLAND ST DALLAS TX 75207 0.009 Screened OutBUCKMAN LABORATORIES INC 1256 N MCLEAN BLVD MEMPHIS TN 38108 0.0015 Screened OutBUZZI UNICEM USA - GREENCASTLE PLANT 3301 S COUNTY RD 150 W GREENCASTLE IN 46135 0.119 Screened Out
BWAY CORP 1202 AIRPORT RD NORTH BRUNSWICK NJ 08902 2.096 Screened OutBWAY CORP BWAY PACKAGING DIV 8200 BROADWELL RD CINCINNATI OH 45244 1.61336 Screened OutB-WAY PACKAGING INC 6 LITHO RD TRENTON NJ 08648 0.631 Screened OutBYK USA INC 524 S CHERRY ST WALLINGFORD CT 06492 0.154 Screened OutC P INC 196 S WATER CONNERSVILLE IN 47331 0.005 Screened OutCADON PLATING CO 3715 11TH ST WYANDOTTE MI 48192 3.118 Screened OutCALLAHAN CHEMICAL CO 18 INDUSTRIAL RD WALPOLE MA 02081 0.002 Screened OutCALLAHAN CHEMICAL CO 200 INDUSTRIAL AVE RIDGEFIELD PARK NJ 07660 0.0055 Screened OutCAMACO COLUMBUS MANUFACTURING 1851 E 32ND AVE COLUMBUS NE 68601 1.94 Screened OutCANBERRA CORP 3610 N HOLLAND-SYLVANIA RD TOLEDO OH 43615 1.125 Screened OutCANFIELD METAL COATING CORP 460 W MAIN ST CANFIELD OH 44406 2 Screened OutCAR PRODUCTS INC 630 BEAULIEU ST HOLYOKE MA 01040 0.196 Screened OutCARBOLINE CO 900 OPELOUSAS ST LAKE CHARLES LA 70601 0.0095 Screened OutCARDINAL ALUMINUM CO PLAN T 3 4005 OAKLAWN DR LOUISVILLE KY 40219 1.4025 Screened OutCARDONE INDUSTRIES 5660 RISING SUN AVE PHILADELPHIA PA 19120 4.65 Screened OutCARESTREAM HEALTH COLORADO 2000 HOWARD SMITH AVE W C42 WINDSOR CO 80550 0.0015 Screened OutCAROLINA SOLVENTS INC 2274 1ST ST SE HICKORY NC 28602 0.0945 Screened OutCARRY-ON TRAILER CORP 159 INDUSTRIAL PARK RD MONTROSS VA 22520 3.925 Screened OutCATALYST OILFIELD SERVICES LLC 11999 E HWY 158 GARDENDALE TX 79758 1.35 Screened OutCATERPILLAR INC 3701 STATE RD 26 E LAFAYETTE IN 47905 1.975 Screened OutCCI MANUFACTURING IL CORP 15550 CANAL BANK RD LEMONT IL 60439 0.115 Screened OutCCL CONTAINER AEROSOL DIV ONE LLODIO DR HERMITAGE PA 16148 2.4165 Screened OutCCP COMPOSITES US 2434 HOLMES RD HOUSTON TX 77051 0.8026 Screened OutCE BRADLEY LABORATORIES INC 55 BENNETT DR BRATTLEBORO VT 05301 0.0845 Screened Out
Page 7 of 19
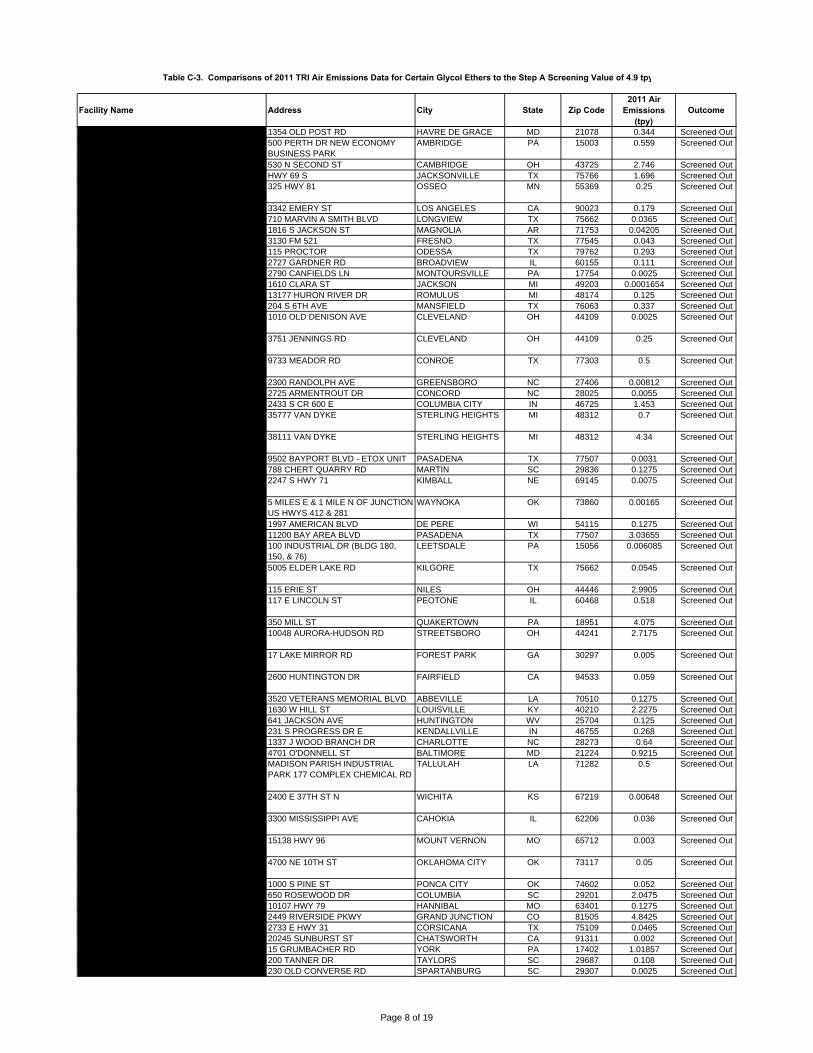
Table C-3. Comparisons of 2011 TRI Air Emissions Data for Certain Glycol Ethers to the Step A Screening Value of 4.9 tpy
Facility Name Address City State Zip Code2011 Air
Emissions (tpy)
Outcome
CELLO PROFESSIONAL PRODUCTS 1354 OLD POST RD HAVRE DE GRACE MD 21078 0.344 Screened OutCENTRIA 500 PERTH DR NEW ECONOMY
BUSINESS PARKAMBRIDGE PA 15003 0.559 Screened Out
CENTRIA 530 N SECOND ST CAMBRIDGE OH 43725 2.746 Screened OutCENTURY INDUSTRIAL COATINGS I NC HWY 69 S JACKSONVILLE TX 75766 1.696 Screened OutCERAM TRAZ CORP CERAMIC INDL COATINGS
325 HWY 81 OSSEO MN 55369 0.25 Screened Out
CERTIFIED ENAMELING INC 3342 EMERY ST LOS ANGELES CA 90023 0.179 Screened OutCHAMPION TECHNOLOGIES INC 710 MARVIN A SMITH BLVD LONGVIEW TX 75662 0.0365 Screened OutCHAMPION TECHNOLOGIES INC 1816 S JACKSON ST MAGNOLIA AR 71753 0.04205 Screened OutCHAMPION TECHNOLOGIES INC 3130 FM 521 FRESNO TX 77545 0.043 Screened OutCHAMPION TECHNOLOGIES INC 115 PROCTOR ODESSA TX 79762 0.293 Screened OutCHASE PRODUCTS CO 2727 GARDNER RD BROADVIEW IL 60155 0.111 Screened OutCHEMCOAT INC 2790 CANFIELDS LN MONTOURSVILLE PA 17754 0.0025 Screened OutCHEMETALL US INC 1610 CLARA ST JACKSON MI 49203 0.0001654 Screened OutCHEMETALL US INC 13177 HURON RIVER DR ROMULUS MI 48174 0.125 Screened OutCHEMGUARD INC 204 S 6TH AVE MANSFIELD TX 76063 0.337 Screened OutCHEMICAL SOLVENTS INC--DENISON FACILITY
1010 OLD DENISON AVE CLEVELAND OH 44109 0.0025 Screened Out
CHEMICAL SOLVENTS JENNINGS ROAD FACILITY
3751 JENNINGS RD CLEVELAND OH 44109 0.25 Screened Out
CHEMICAL SPECIALISTS & DEVELOPMENT INC
9733 MEADOR RD CONROE TX 77303 0.5 Screened Out
CHEMOL CO INC 2300 RANDOLPH AVE GREENSBORO NC 27406 0.00812 Screened OutCHEMTEX LABORATORIES INC 2725 ARMENTROUT DR CONCORD NC 28025 0.0055 Screened OutCHROMASOURCE INC 2433 S CR 600 E COLUMBIA CITY IN 46725 1.453 Screened OutCHRYSLER GROUP LLC STERLING STAMPING PLANT (PART)
35777 VAN DYKE STERLING HEIGHTS MI 48312 0.7 Screened Out
CHRYSLER STERLING HEIGHTS ASSEMBLY PLANT (PART)
38111 VAN DYKE STERLING HEIGHTS MI 48312 4.34 Screened Out
CLARIANT CORP CLEAR LAKE PLANT 9502 BAYPORT BLVD - ETOX UNIT PASADENA TX 77507 0.0031 Screened OutCLARIANT CORP MARTIN PLANT 788 CHERT QUARRY RD MARTIN SC 29836 0.1275 Screened OutCLEAN HARBORS ENVIRONMENTAL SERVICES INC
2247 S HWY 71 KIMBALL NE 69145 0.0075 Screened Out
CLEAN HARBORS LONE MOUNTAIN LLC LONE MOUNTAIN FACILITY
5 MILES E & 1 MILE N OF JUNCTION US HWYS 412 & 281
WAYNOKA OK 73860 0.00165 Screened Out
CLEANING SYSTEMS INC 1997 AMERICAN BLVD DE PERE WI 54115 0.1275 Screened OutCLEAR LAKE CHEMICALS LLC 11200 BAY AREA BLVD PASADENA TX 77507 3.03655 Screened OutCLEARWATER INTERNATIONAL LLC 100 INDUSTRIAL DR (BLDG 180,
150, & 76)LEETSDALE PA 15056 0.006085 Screened Out
CLEVELAND STEEL CONTAINER - KILGORE 5005 ELDER LAKE RD KILGORE TX 75662 0.0545 Screened Out
CLEVELAND STEEL CONTAINER - NI LES 115 ERIE ST NILES OH 44446 2.9905 Screened OutCLEVELAND STEEL CONTAINER - PE OTONE FACILITY
117 E LINCOLN ST PEOTONE IL 60468 0.518 Screened Out
CLEVELAND STEEL CONTAINER CORP 350 MILL ST QUAKERTOWN PA 18951 4.075 Screened OutCLEVELAND STEEL CONTAINER CORP - STREETSBORO PLANT
10048 AURORA-HUDSON RD STREETSBORO OH 44241 2.7175 Screened Out
CLOROX PRODUCTS MANUFACTURING CO 17 LAKE MIRROR RD FOREST PARK GA 30297 0.005 Screened Out
CLOROX PRODUCTS MANUFACTURING CO 2600 HUNTINGTON DR FAIRFIELD CA 94533 0.059 Screened Out
COASTAL CHEMICAL CO LLC 3520 VETERANS MEMORIAL BLVD ABBEVILLE LA 70510 0.1275 Screened OutCOLOR CORP OF AMERICA 1630 W HILL ST LOUISVILLE KY 40210 2.2275 Screened OutCOLUMBIA PAINT CORP 641 JACKSON AVE HUNTINGTON WV 25704 0.125 Screened OutCOLWELL INC 231 S PROGRESS DR E KENDALLVILLE IN 46755 0.268 Screened OutCOMMERCIAL MERCHANDISING CORP 1337 J WOOD BRANCH DR CHARLOTTE NC 28273 0.64 Screened OutCOMPLEMENTARY COATINGS CORP 4701 O'DONNELL ST BALTIMORE MD 21224 0.9215 Screened OutCOMPLEX CHEMICALS CO INC MADISON PARISH INDUSTRIAL
PARK 177 COMPLEX CHEMICAL RDTALLULAH LA 71282 0.5 Screened Out
CONOCOCPHILLIPS CO WICHITA TERMINAL 2400 E 37TH ST N WICHITA KS 67219 0.00648 Screened Out
CONOCOPHILLIPS CO EAST ST LOUIS TERMINAL
3300 MISSISSIPPI AVE CAHOKIA IL 62206 0.036 Screened Out
CONOCOPHILLIPS MT VERNON PRODUCTS TERMINAL
15138 HWY 96 MOUNT VERNON MO 65712 0.003 Screened Out
CONOCOPHILLIPS OKLAHOMA CITY PRODUCTS TERMINAL
4700 NE 10TH ST OKLAHOMA CITY OK 73117 0.05 Screened Out
CONOCOPHILLIPS PONCA CITY REFINERY 1000 S PINE ST PONCA CITY OK 74602 0.052 Screened OutCONSOLIDATED SYSTEMS INC 650 ROSEWOOD DR COLUMBIA SC 29201 2.0475 Screened OutCONTINENTAL CEMENT CO LLC 10107 HWY 79 HANNIBAL MO 63401 0.1275 Screened OutCOORSTEK 2449 RIVERSIDE PKWY GRAND JUNCTION CO 81505 4.8425 Screened OutCORSICANA TECHNOLOGIES INC 2733 E HWY 31 CORSICANA TX 75109 0.0465 Screened OutCOSMETIC LABORATORIES OF AMERICA 20245 SUNBURST ST CHATSWORTH CA 91311 0.002 Screened OutCP CONVERTERS INC 15 GRUMBACHER RD YORK PA 17402 1.01857 Screened OutCPJ TECHNOLOGIES 200 TANNER DR TAYLORS SC 29687 0.108 Screened OutCR BRANDS INC 230 OLD CONVERSE RD SPARTANBURG SC 29307 0.0025 Screened Out
Page 8 of 19

Table C-3. Comparisons of 2011 TRI Air Emissions Data for Certain Glycol Ethers to the Step A Screening Value of 4.9 tpy
Facility Name Address City State Zip Code2011 Air
Emissions (tpy)
Outcome
CR BRANDS INC 141 VENTURE BLVD SPARTANBURG SC 29306 0.005 Screened OutCREE INC 4600 SILICON DR DURHAM NC 27703 0.125 Screened OutCRODA INC 315 CHERRY LN NEW CASTLE DE 19720 0.001145 Screened OutCROWN AEROSOL PACKAGING 4TH ST & PARK AVE FARIBAULT MN 55021 4.089 Screened OutCROWN CORK & SEAL CO (USA) INC CROWN CLOSURES DIV
940 MILL PARK DR LANCASTER OH 43130 1.1105 Screened Out
CROWN FOOD PACKAGING 10200 N LOMBARD ST PORTLAND OR 97203 2.759 Screened OutCRYSTAL FINISHING SYSTEMS INC 2608 ROSS AVE SCHOFIELD WI 54476 1.5361434 Screened OutCUMMINS POWER GENERATION 1400 73RD AVE NE FRIDLEY MN 55432 2.4 Screened OutCURTIS METAL FINISHING CO 9917 N ALPINE MACHESNEY PARK IL 61115 0.831 Screened OutCUSTOM CHEMICAL FORMULATORS INC 8707 MILLERGROVE DR SANTA FE SPRINGS CA 90670 0.005 Screened OutCUSTOM SYNTHESIS LLC 1704 DENVER RD ANDERSON SC 29625 0.0495 Screened OutCYTEC INDUSTRIES INC LANGLEY PLANT 403 CARLINE RD LANGLEY SC 29834 0.129 Screened OutDANLIN INDUSTRIES CORP 23737 HWY 47 THOMAS OK 73669 0.125 Screened OutDAUBERT CHEMICAL CO 4700 S CENTRAL AVE CHICAGO IL 60638 0.033205 Screened OutDAVIES IMPERIAL COATINGS INC 1275 STATE ST HAMMOND IN 46320 0.013 Screened OutDAVIS-FROST INC 3420 CANDLER'S MOUNTAIN RD LYNCHBURG VA 24506 0.221 Screened OutDECOSTAR INDUSTRIES INC 1 DECOMA DR CARROLLTON GA 30117 1.435 Screened OutDELEET MERCHANDISING 26 BLANCHARD ST NEWARK NJ 07105 0.25 Screened OutDELTA LABORATORIES INC 3710 W COUNTY RD 326 OCALA FL 34475 0.107 Screened OutDENSO MANUFACTURING TENNESSEE INC 1720, 1725, 1755 ROBERT C
JACKSON DRMARYVILLE TN 37801 1.489 Screened Out
DERRICK CORP 3350 UNION RD CHEEKTOWAGA NY 14225 2.1335 Screened OutDIAMOND VOGEL PAINTS 5111 E 36TH ST N TULSA OK 74115 0.6715 Screened OutDIC IMAGING PRODUCTS USA LLC 7335 S 10TH ST OAK CREEK WI 53154 0.046 Screened OutDIVERSEY INC 316 HART ST WATERTOWN WI 53094 0.00012 Screened OutDIVERSEY INC - WAXDALE FACILITY 8311 16TH ST STURTEVANT WI 53177 0.005535 Screened OutDIVERSIFIED COATING SYSTEMS INC 309 ECHELON RD GREENVILLE SC 29605 0.387 Screened OutDOW CHEMICAL CO FREEPORT FACILITY 2301 N BRAZOSPORT BLVD FREEPORT TX 77541 0.015 Screened OutDPIX LLC 1635 AEROPLAZA DR COLORADO SPRINGS CO 80916 0.649 Screened OutDSM DESOTECH INC 1101 HWY 27 S STANLEY NC 28164 0.0112 Screened OutDUCKBACK PRODUCTS 2644 HEGAN LN CHICO CA 95928 0.4186 Screened OutDUPONT CHAMBERS WORKS RT 130 DEEPWATER NJ 08023 0.1615 Screened OutDUPONT EKC TECHNOLOGY 2520 BARRINGTON CT HAYWARD CA 94545 0.0025 Screened OutDUPONT FORT MADISON PLANT 801 - 35TH ST FORT MADISON IA 52627 0.357 Screened OutDUPONT FRONT ROYAL PLANT 7961 WINCHESTER RD FRONT ROYAL VA 22630 0.011 Screened OutDUPONT MOUNT CLEMENS PLANT 400 GROESBECK HWY MOUNT CLEMENS MI 48043 0.575 Screened OutDUPONT PARLIN PLANT CHEESEQUAKE RD PARLIN NJ 08859 0.0155 Screened OutDUPONT PONTCHARTRAIN WORKS 586 HWY 44 LA PLACE LA 70068 0.0075 Screened OutDUPONT TOWANDA PLANT 192 PATTERSON BLVD TOWANDA PA 18848 2.2885 Screened OutDUPONT YERKES PLANT 3115 RIVER RD BUFFALO NY 14207 1.8625 Screened OutDURA COAT PRODUCTS INC 26655 PEOPLES RD MADISON AL 35756 2.03725 Screened OutDYNASOL INC 330 PINE ST CANTON MA 02021 0.00145 Screened OutDYSTAR LP 209 WATLINGTON INDUSTRIAL DR REIDSVILLE NC 27320 0.05 Screened Out
EASTMAN CHEMICAL CO TENNESSEE OPERATIONS
100 EASTMAN RD KINGSPORT TN 37662 1.408 Screened Out
EASTMAN KODAK CO EASTMAN BUSINESS PARK
1669 LAKE AVE ROCHESTER NY 14652 0.0035 Screened Out
ECOLAB INC 2305 SHERWIN ST GARLAND TX 75041 0.0205 Screened OutECOLAB INC 3001 CHANNAHON RD JOLIET IL 60436 0.0505 Screened OutECOLAB INC 18383 E RAILROAD ST CITY OF INDUSTRY CA 91748 0.055 Screened OutECOLAB INC 942 BAKER RD MARTINSBURG WV 25405 0.056 Screened OutECP INC WOODRIDGE 11210 KATHERINE'S CROSSING
SUITE 100WOODRIDGE IL 60517 0.0025 Screened Out
EDCO PRODUCTS INC 8700 EXCELSIOR BLVD HOPKINS MN 55343 0.0045 Screened OutEFCO CORP 1000 COUNTY RD MONETT MO 65708 1.696 Screened OutELECTRONICS FOR IMAGING INC 1260 JAMES L HART PKWY YPSILANTI MI 48197 0.0485 Screened OutELEMENTIS SPECIALTIES 400 CLAREMONT AVE JERSEY CITY NJ 07304 0.184 Screened OutELPACO COATINGS CORP 1378 KINGSLAND AVE PAGEDALE MO 63133 0.2585 Screened OutEMERALD SERVICES INC 1825 E ALEXANDER AVE TACOMA WA 98421 0.00001 Screened OutENDICOTT INTERCONNECT TECHNOLOGIES INC
1093 CLARK ST ENDICOTT NY 13760 4.3655 Screened Out
ENERGIZER BATTERY MANUFACTURING INC 75 SWANTON RD SAINT ALBANS VT 05478 0.162 Screened Out
ENGINEERED POLYMER SOLUTIONS I NC D/B/A VALSPAR COATINGS
90 CARSON RD BIRMINGHAM AL 35215 0.5385 Screened Out
ENGINEERED POLYMER SOLUTIONS INC 5501 E SLAUSON AVE CITY OF COMMERCE CA 90040 0.0015 Screened OutENGINEERED POLYMER SOLUTIONS INC (DBA VALSPAR COATINGS)
1717 W ENGLISH RD HIGH POINT NC 27261 0.189 Screened Out
ENGINEERED POLYMER SOLUTIONS INC D/B/A VALSPAR COATINGS
2000 WESTHALL ST PITTSBURGH PA 15233 0.0405 Screened Out
ENGINEERED POLYMER SOLUTIONS INC D/B/A VALSPAR COATINGS
901 W UNION ST MONTEBELLO CA 90640 0.044 Screened Out
ENGINEERED POLYMER SOLUTIONS INC D/B/A VALSPAR COATINGS
3050 HANFORD DR LEBANON PA 17046 0.1225 Screened Out
ENGINEERED POLYMER SOLUTIONS INC D/B/A VALSPAR COATINGS
1991 S WHEELING RD WHEELING IL 60090 0.156 Screened Out
Page 9 of 19
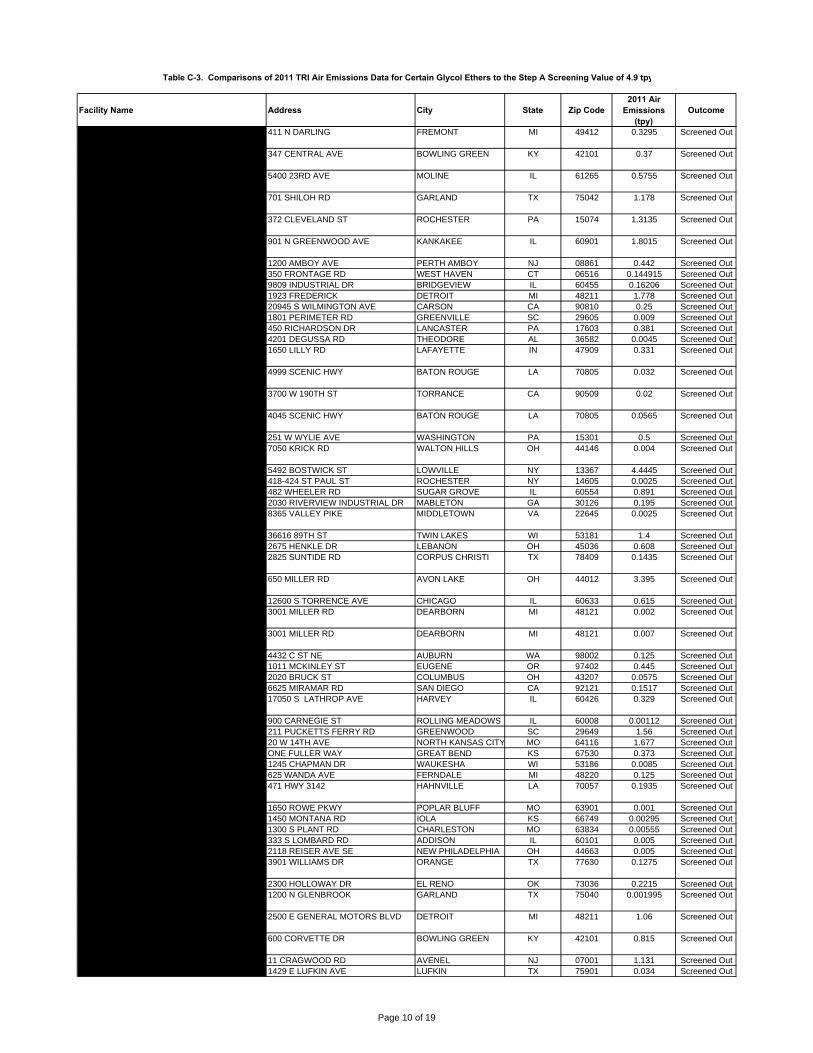
Table C-3. Comparisons of 2011 TRI Air Emissions Data for Certain Glycol Ethers to the Step A Screening Value of 4.9 tpy
Facility Name Address City State Zip Code2011 Air
Emissions (tpy)
Outcome
ENGINEERED POLYMER SOLUTIONS INC D/B/A VALSPAR COATINGS
411 N DARLING FREMONT MI 49412 0.3295 Screened Out
ENGINEERED POLYMER SOLUTIONS INC D/B/A VALSPAR COATINGS
347 CENTRAL AVE BOWLING GREEN KY 42101 0.37 Screened Out
ENGINEERED POLYMER SOLUTIONS INC D/B/A VALSPAR COATINGS
5400 23RD AVE MOLINE IL 61265 0.5755 Screened Out
ENGINEERED POLYMER SOLUTIONS INC D/B/A VALSPAR COATINGS
701 SHILOH RD GARLAND TX 75042 1.178 Screened Out
ENGINEERED POLYMER SOLUTIONS INC D/B/A VALSPAR COATINGS
372 CLEVELAND ST ROCHESTER PA 15074 1.3135 Screened Out
ENGINEERED POLYMER SOLUTIONS INC D/B/A VALSPAR COATINGS
901 N GREENWOOD AVE KANKAKEE IL 60901 1.8015 Screened Out
ENGLERT INC 1200 AMBOY AVE PERTH AMBOY NJ 08861 0.442 Screened OutENTHONE INC 350 FRONTAGE RD WEST HAVEN CT 06516 0.144915 Screened OutENTHONE INC 9809 INDUSTRIAL DR BRIDGEVIEW IL 60455 0.16206 Screened OutEQ DETROIT INC 1923 FREDERICK DETROIT MI 48211 1.778 Screened OutEQUILON CARSON TERMINAL 20945 S WILMINGTON AVE CARSON CA 90810 0.25 Screened OutETHOX CHEMICALS LLC 1801 PERIMETER RD GREENVILLE SC 29605 0.009 Screened OutEURAMAX INTERNATIONAL INC 450 RICHARDSON DR LANCASTER PA 17603 0.381 Screened OutEVONIK DEGUSSA CORP 4201 DEGUSSA RD THEODORE AL 36582 0.0045 Screened OutEVONIK DEGUSSA CORP TIPPECANOE LABORATORIES
1650 LILLY RD LAFAYETTE IN 47909 0.331 Screened Out
EXXONMOBIL CHEMICAL BATON ROUGE CHEMICAL PLANT
4999 SCENIC HWY BATON ROUGE LA 70805 0.032 Screened Out
EXXONMOBIL OIL CORP - TORRANCE REFINERY
3700 W 190TH ST TORRANCE CA 90509 0.02 Screened Out
EXXONMOBIL REFINING & SUPPLY BATON ROUGE REFINERY
4045 SCENIC HWY BATON ROUGE LA 70805 0.0565 Screened Out
FERRO CORP 251 W WYLIE AVE WASHINGTON PA 15301 0.5 Screened OutFERRO CORP WALTON HILLS OPERATIONS 7050 KRICK RD WALTON HILLS OH 44146 0.004 Screened Out
FIBERMARK NORTH AMERICA INC 5492 BOSTWICK ST LOWVILLE NY 13367 4.4445 Screened OutFINGER LAKES CHEMICAL INC 418-424 ST PAUL ST ROCHESTER NY 14605 0.0025 Screened OutFINISHES UNLIMITED INC 482 WHEELER RD SUGAR GROVE IL 60554 0.891 Screened OutFIRST AMERICAN RESOURCES CO 2030 RIVERVIEW INDUSTRIAL DR MABLETON GA 30126 0.195 Screened OutFISHER SCIENTIFIC INTERNATIONAL MTN DIAGNOSTICS PLANT
8365 VALLEY PIKE MIDDLETOWN VA 22645 0.0025 Screened Out
FIVE STAR COATINGS GROUP 36616 89TH ST TWIN LAKES WI 53181 1.4 Screened OutFLINT GROUP NORTH AMERICA CORP 2675 HENKLE DR LEBANON OH 45036 0.608 Screened OutFLINT HILLS RESOURCES CORPUS CHRISTI LLC - WEST PLANT
2825 SUNTIDE RD CORPUS CHRISTI TX 78409 0.1435 Screened Out
FORD MOTOR CO - OHIO ASSEMBLY PLANT 650 MILLER RD AVON LAKE OH 44012 3.395 Screened Out
FORD MOTOR CO CHICAGO ASSEMBLY 12600 S TORRENCE AVE CHICAGO IL 60633 0.615 Screened OutFORD MOTOR CO DEARBORN DIVERSIFIED MANUFACTURING
3001 MILLER RD DEARBORN MI 48121 0.002 Screened Out
FORD MOTOR CO DEARBORN TOOL & DIE PLANT
3001 MILLER RD DEARBORN MI 48121 0.007 Screened Out
FORMULA CORP 4432 C ST NE AUBURN WA 98002 0.125 Screened OutFORREST PAINT CO 1011 MCKINLEY ST EUGENE OR 97402 0.445 Screened OutFRANKLIN INTERNATIONAL 2020 BRUCK ST COLUMBUS OH 43207 0.0575 Screened OutFRAZEE INDUSTRIES 6625 MIRAMAR RD SAN DIEGO CA 92121 0.1517 Screened OutFUCHS LUBRICANTS CO-CORPORATE OFFICE
17050 S LATHROP AVE HARVEY IL 60426 0.329 Screened Out
FUJIFILM HUNT CHEMICALS USA INC 900 CARNEGIE ST ROLLING MEADOWS IL 60008 0.00112 Screened OutFUJIFILM MANUFACTURING USA INC 211 PUCKETTS FERRY RD GREENWOOD SC 29649 1.56 Screened OutFUJIFILM NORTH AMERICA CORP 20 W 14TH AVE NORTH KANSAS CITY MO 64116 1.677 Screened OutFULLER BRUSH CO ONE FULLER WAY GREAT BEND KS 67530 0.373 Screened OutGACO WESTERN 1245 CHAPMAN DR WAUKESHA WI 53186 0.0085 Screened OutGAGE PRODUCTS CO 625 WANDA AVE FERNDALE MI 48220 0.125 Screened OutGALATA CHEMICALS LLC - GALATA TAFT FACILITY
471 HWY 3142 HAHNVILLE LA 70057 0.1935 Screened Out
GATES CORP 1650 ROWE PKWY POPLAR BLUFF MO 63901 0.001 Screened OutGATES CORP 1450 MONTANA RD IOLA KS 66749 0.00295 Screened OutGATES CORP - CHARLESTON 1300 S PLANT RD CHARLESTON MO 63834 0.00555 Screened OutGE WATER & PROCESS TECHNOLOGIES 333 S LOMBARD RD ADDISON IL 60101 0.005 Screened OutGE WATER & PROCESS TECHNOLOGIES 2118 REISER AVE SE NEW PHILADELPHIA OH 44663 0.005 Screened OutGE WATER & PROCESS TECHNOLOGIES ORANGE FACILITY
3901 WILLIAMS DR ORANGE TX 77630 0.1275 Screened Out
GEMINI COATINGS INC 2300 HOLLOWAY DR EL RENO OK 73036 0.2215 Screened OutGENERAL DYNAMICS ORDNANCE & TACTICAL SYSTEMS GARLAND
1200 N GLENBROOK GARLAND TX 75040 0.001995 Screened Out
GENERAL MOTORS GM VA DETROIT-HAMTRAMCK ASSEMBLY CENTER
2500 E GENERAL MOTORS BLVD DETROIT MI 48211 1.06 Screened Out
GENERAL MOTORS LLC BOWLING GREEN ASSEMBLY PLANT
600 CORVETTE DR BOWLING GREEN KY 42101 0.815 Screened Out
GENTEK BUILDING PRODUCTS 11 CRAGWOOD RD AVENEL NJ 07001 1.131 Screened OutGEORGIA-PACIFIC CHEMICALS LLC 1429 E LUFKIN AVE LUFKIN TX 75901 0.034 Screened Out
Page 10 of 19

Table C-3. Comparisons of 2011 TRI Air Emissions Data for Certain Glycol Ethers to the Step A Screening Value of 4.9 tpy
Facility Name Address City State Zip Code2011 Air
Emissions (tpy)
Outcome
GFX INTERNATIONAL 333 BARRON BLVD GRAYSLAKE IL 60030 1.075 Screened OutGIANT CEMENT CO HWY 453 & I-26 (654 JUDGE ST) HARLEYVILLE SC 29448 0.002 Screened OutGLASS COATINGS & CONCEPTS 300 LAWTON AVE MONROE OH 45050 0.727 Screened OutGLIDDEN CO 1900 N JOSEY LN CARROLLTON TX 75006 0.000285 Screened OutGM MLCG FAIRFAX ASSEMBLY 3201 FAIRFAX TRAFFICWAY KANSAS CITY KS 66115 3.45 Screened OutGM ORION ASSEMBLY CENTER 4555 GIDDINGS RD LAKE ORION MI 48359 1.75 Screened OutGMC TRUCK GROUP ARLINGTON ASSEMBLY PLANT
2525 E ABRAMS ST ARLINGTON TX 76010 1.27 Screened Out
GMTG - SHREVEPORT ASSEMBLY 7600 GENERAL MOTORS BLVD SHREVEPORT LA 71129 2.575 Screened OutGOJO INDUSTRIES INC 3783 STATE RD CUYAHOGA FALLS OH 44223 0.003787 Screened OutGOLD EAGLE CO 4400 S KILDARE AVE CHICAGO IL 60632 0.125 Screened OutGOODWIN CO 12361 MONARCH ST GARDEN GROVE CA 92841 0.005 Screened OutGOODWIN CO 700 PROGRESS CENTER AVE LAWRENCEVILLE GA 30043 0.01291 Screened OutGRAPHIC CONTROLS LLC 400 EXCHANGE ST BUFFALO NY 14204 0.046 Screened OutGREIF INDUSTRIAL PACKAGING & SERVICES LLC
8250 ALMERIA AVE FONTANA CA 92335 0.1818 Screened Out
GREIF PACKAGING LLC 2400 COOPER AVE MERCED CA 95348 0.826 Screened OutHADCO (SANMINA) CORP - OWEGO DIV 1200 TAYLOR RD OWEGO NY 13827 0.155 Screened OutHALLSTAR CO ESTER SOLUTIONS FACILITY 5851 W 73RD ST BEDFORD PARK IL 60638 1.327 Screened Out
HANNA STEEL CORP 220 HANNA DR PEKIN IL 61554 0.038 Screened OutHANNA STEEL CORP 3812 COMMERCE AVE FAIRFIELD AL 35064 2.1105 Screened OutHARCROS CHEMICALS INC 4606 NEW W DR PASADENA TX 77507 0.034 Screened OutHARCROS CHEMICALS INC 5200 SPEAKER RD KANSAS CITY KS 66106 0.139 Screened OutHARLEY-DAVIDSON MOTOR CO OPERATIONS INC
1425 EDEN RD YORK PA 17402 0.0545 Screened Out
HARWICK STANDARD DISTRIBUTION CORP 60 S SEIBERLING ST AKRON OH 44305 0.0025 Screened Out
HB FULLER CO 7440 W DUPONT RD MORRIS IL 60450 0.3745 Screened OutHENKEL CORP 923 MAULDIN RD CALHOUN GA 30701 0.0065 Screened OutHENKEL CORP 421 LONDON RD DELAWARE OH 43015 0.031 Screened OutHENKEL CORP 137 FOLLY MILL RD SEABROOK NH 03874 0.04955 Screened OutHENKEL CORP 23343 SHERWOOD AVE WARREN MI 48091 0.25 Screened OutHENTZEN COATINGS,INC 6937 W MILL RD MILWAUKEE WI 53218 0.0031 Screened OutHENTZEN COATINGS,INC BATAVIA FACILITY 1500 LATHEM ST BATAVIA IL 60510 1.4085 Screened Out
HERCULES INC 1111 HERCULES RD HOPEWELL VA 23860 0.0025 Screened OutHERCULES INC KENEDY TEXAS ONE MILL ST KENEDY TX 78119 0.1009555 Screened OutHERITAGE-WTI INC 1250 ST GEORGE ST EAST LIVERPOOL OH 43920 0.00501 Screened OutHEWLETT-PACKARD CARIBE BV SITE HWY 110 N KM 5.1 AGUADILLA PR 00605 3.2155 Screened OutHEXPOL COMPOUNDING BURTON RUBBER PROCESSING
14330 KINSMAN RD BURTON OH 44021 0.0195 Screened Out
HEXPOL COMPOUNDING BURTON RUBBER PROCESSING
HWY 353 S JONESBOROUGH TN 37659 0.0275 Screened Out
HILLYARD INDUSTRIES INC 402 N 3TH ST SAINT JOSEPH MO 64501 1.1175 Screened OutHIRSH INDUSTRIES INC 1525 MCKEE RD DOVER DE 19904 2.6355 Screened OutHOLCIM (US) INC HOLLY HILL PLANT 200 SAFETY ST / HWY 453 HOLLY HILL SC 29059 0.1225 Screened OutHOLLY OAK CHEMICAL INC 101 CASE ST FOUNTAIN INN SC 29644 0.010345 Screened OutHONDA MANUFACTURING OF INDIANA LLC 2755 N MICHIGAN AVE GREENSBURG IN 47240 2.282 Screened OutHUBBARD-HALL INC 563 S LEONARD ST WATERBURY CT 06708 0.0095 Screened OutHUNT REFINING CO A CORP 1855 FAIRLAWN RD TUSCALOOSA AL 35401 0.932 Screened OutHUNTSMAN ADVANCED MATERIALS AMERICAS INC
555 HUNTSMAN RD MC INTOSH AL 36553 0.05115 Screened Out
HUNTSMAN PETROCHEMICAL LLC 3892 US HWY 90 DAYTON TX 77535 0.001 Screened OutHUNTSMAN PETROCHEMICAL LLC PORT NECHES FACILITY
6001 HWY 366 PORT NECHES TX 77651 0.11 Screened Out
HYDRITE CHEMICAL CO 7300 W BRADLEY RD MILWAUKEE WI 53223 0.0015 Screened OutHYDRITE CHEMICAL CO 2545 BOND ST UNIVERSITY PARK IL 60466 0.011 Screened OutHYDRITE CHEMICAL CO 114 N MAIN ST COTTAGE GROVE WI 53527 0.53 Screened OutHYUNDAI MOTOR MANUFACTURING ALABAMA LLC
700 HYUNDAI BLVD MONTGOMERY AL 36105 4.1085 Screened Out
IC OF OKLAHOMA LLC 2322 N MINGO RD TULSA OK 74116 2.65 Screened OutICL-IP AMERICA INC 11636 HUNTINGTON GALLIPOLIS FERRY WV 25515 0.373145 Screened OutIFF AUGUSTA LTD 3005 INTERNATIONAL BLVD AUGUSTA GA 30906 0.0004385 Screened OutIGM RESINS CHARLOTTE 3300 WESTINGHOUSE BLVD CHARLOTTE NC 28273 0.0065 Screened OutIMPERIAL PAINT CO INC 2526 NW YEON AVE PORTLAND OR 97210 0.0635 Screened OutINCHEM CORP 800 CEL-RIVER RD ROCK HILL SC 29730 0.2125 Screened OutINDEPENDENT CAN CO 1300 BRASS MILL RD BELCAMP MD 21017 1.52745 Screened OutINDEPENDENT INK INC 14705 S AVALON BLVD GARDENA CA 90248 0.005 Screened OutINEOS AMERICAS LLC INEOS OXIDE DIV 21255A HWY 1 S PLAQUEMINE LA 70765 0.384 Screened OutINLAND LABEL & MARKETING 2009 W AVE S LA CROSSE WI 54601 4.133 Screened OutINTEL CORP 4500 S DOBSON RD MAIL STOP:
OC4-005CHANDLER AZ 85248 0.2225 Screened Out
INTEL CORP 4100 SARA RD M/S RR5-491 RIO RANCHO NM 87124 0.4075 Screened OutINTEL CORP - RONLER ACRES CAMPUS 2501 NW 229TH ST HILLSBORO OR 97124 0.9525 Screened OutINTERCOASTAL PAINT CO INC 14029 W HARDY HOUSTON TX 77060 0.002 Screened OutINTERNATIONAL PAINT LLC 640 N ROCKY RIVER DR BEREA OH 44017 0.005 Screened OutINTERNATIONAL PAINT LLC 6001 ANTOINE DR HOUSTON TX 77091 0.1275 Screened Out
Page 11 of 19

Table C-3. Comparisons of 2011 TRI Air Emissions Data for Certain Glycol Ethers to the Step A Screening Value of 4.9 tpy
Facility Name Address City State Zip Code2011 Air
Emissions (tpy)
Outcome
INTERNATIONAL PAPER PINE HILL MILL 7600 HWY 10 W PINE HILL AL 36769 0.058 Screened OutINTERSTATE CHEMICAL CO INC 23247 W EAMES ST CHANNAHON IL 60410 0.0075 Screened OutINTERSTATE CHEMICAL CO INC 2797 FREEDLAND RD HERMITAGE PA 16148 0.014 Screened OutINVISTA SARL - ORANGE SITE 3055A FM 1006 ORANGE TX 77630 0.125 Screened OutINX DIGITAL INK CO 405 INDUSTRIAL WAY DIXON CA 95620 4.3915 Screened OutISP SYNTHETIC ELASTOMERS LP 1615 MAIN ST PORT NECHES TX 77651 0.132 Screened OutITW DYMON 805 E OLD 56 HWY OLATHE KS 66061 2.002 Screened OutITW PROFESSIONAL AUTOMOTIVE PRODUCTS
3606 CRAFTSMAN BLVD LAKELAND FL 33803 0.163 Screened Out
IVC INDUSTRIAL COATINGS INC 550-560 W CENTENNIAL BLVD CASA GRANDE AZ 85122 0.26016 Screened OutIVC INDUSTRIAL COATINGS INC 1825 E NATIONAL AVE BRAZIL IN 47834 2.88926 Screened OutIVC SOUTH 875 PROGRESS CENTER AVE LAWRENCEVILLE GA 30043 2.6895 Screened OutJ L CLARK INC 923 23RD AVE ROCKFORD IL 61104 1.4165 Screened OutJAMESTOWN COATING TECHNOLOGIES 108 MAIN ST JAMESTOWN PA 16134 0.201 Screened OutJOHN DEERE SEEDING & CYLINDER 501 RIVER DR MOLINE IL 61265 1 Screened OutKALCOR COATINGS CO 37721 STEVENS BLVD WILLOUGHBY OH 44094 0.125 Screened OutKARCHER NORTH AMERICA PROCHEM 325 S PRICE RD CHANDLER AZ 85224 0.0655 Screened OutKAWNEER CO INC 500 E 12TH ST BLOOMSBURG PA 17815 0.5055 Screened OutKAWNEER CO INC 7200 DOE AVE VISALIA CA 93291 0.7835 Screened OutKAY AUTOMOTIVE GRAPHICS 57 KAY INDUSTRIAL DR LAKE ORION MI 48359 2.2135 Screened OutKAY CHEMICAL CO 8300 CAPITAL DR GREENSBORO NC 27409 0.0595 Screened OutKELLEY TECHNICAL COATINGS INC 1445 S 15TH ST LOUISVILLE KY 40210 0.4475 Screened OutKELLEY TECHNICAL COATINGS INC 1401 S 15TH ST LOUISVILLE KY 40210 1.3 Screened OutKEMIRA WATER SOLUTIONS INC 1 CYANAMID RD MOBILE AL 36610 0.1065 Screened OutKEYMARK CORP 1188 CAYADUTTA ST RT 334 FONDA NY 12068 2.105 Screened OutKEYSTONE ANILINE CORP 2165 HWY 292 INMAN SC 29349 0.25 Screened OutKEYSTONE CEMENT CO RT 329 BATH PA 18014 0.0025 Screened OutKIK-SOCAL INC 9028 DICE RD SANTA FE SPRINGS CA 90670 0.255 Screened OutKING INDUSTRIES INC SCIENCE RD NORWALK CT 06852 0.00585 Screened OutKMCO CROSBY PLANT 16503 RAMSEY RD CROSBY TX 77532 0.25 Screened OutKWAL-HOWELLS INC (DBA KWAL PAINT INC) 2430 ALBERT BROADFOOT ST BONHAM TX 75418 0.0355 Screened Out
LAKESIDE LITHOGRAPHY LLC 1600 S LAFLIN ST CHICAGO IL 60608 3.25 Screened OutLAMBERTI SYNTHESIS USA INC 4001 N HAWTHORNE ST CHATTANOOGA TN 37406 0.0005255 Screened OutLAMBERTI USA INC - WHARTON CHEMICAL COMPLEX
HWY 59 AT COUNTY RD 212 HUNGERFORD TX 77448 0.0495 Screened Out
LANCO MANUFACTURING CORP URB.APONTE #5 SAN LORENZO PR 00754 0.00563 Screened OutLEVLAD 9200 MASON AVE CHATSWORTH CA 91311 0.00017 Screened OutLINETEC 725 S 75TH AVE WAUSAU WI 54401 0.372 Screened OutLOCKHEED MARTIN AERONAUTICS CO 1011 LOCKHEED WAY MZ 0824 PALMDALE CA 93599 0.478 Screened OutLONGABERGER CO 5565 RAIDERS RD FRAZEYSBURG OH 43822 0.164 Screened OutLUBRIZOL 9550 W 55TH ST MC COOK IL 60525 0.0745 Screened OutLUBRIZOL CORP 29400 LAKELAND BLVD WICKLIFFE OH 44092 0.0365 Screened OutLUBRIZOL CORP PAINESVIL LE PLANT 155 FREEDOM RD PAINESVILLE OH 44077 0.0045 Screened OutMACDERMID INC 1221 FARROW AVE FERNDALE MI 48220 0.00374 Screened OutMACDERMID PRINTING SOLUTIONS 260 S PACIFIC ST SAN MARCOS CA 92078 0.2615 Screened OutMAGNA MIRRORS CORP - NEWAYGO 700 S PARK DR NEWAYGO MI 49337 2.673 Screened OutMAGNABLEND INC- LIQUID PLANT 100 W STERRETT RD WAXAHACHIE TX 75165 0.125 Screened OutMAINTEX INC 13300 E NELSON AVE CITY OF INDUSTRY CA 91746 0.125 Screened OutMALCO PRODUCTS INC 361 FAIRVIEW AVE BARBERTON OH 44203 0.25 Screened OutMANN DISTRIBUTION 3134 POST RD WARWICK RI 02886 0.001055 Screened OutMARATHON PETROLEUM CO - SPEEDWAY IN TERMINAL
1304 OLIN AVE INDIANAPOLIS IN 46222 0.002 Screened Out
MARCUS PAINT CO 235 E MARKET ST LOUISVILLE KY 40202 0.5225 Screened OutMARY KAY INC 1330 REGAL ROW DALLAS TX 75247 0.00026 Screened OutMASTERBRAND CABINETS INC 1002 EISENHOWER DR N GOSHEN IN 46526 4.193 Screened OutMATTHEWS INTERNATIONAL CORP 101 FAIRVIEW AVE PITTSBURGH PA 15238 0.067 Screened OutMAXIM INTEGRATED PRODUCTS INC 3725 N FIRST ST SAN JOSE CA 95134 0.0615 Screened OutMAXIM INTEGRATED PRODUCTS INC 9651 WESTOVER HILLS BLVD SAN ANTONIO TX 78251 0.188 Screened OutMEADWESTVACO CONSUMER PACKAGING GROUP LLC
7411 OAKWOOD ST MEBANE NC 27302 2.9255 Screened Out
MEADWESTVACO SC LLC CHARLESTON CHEMICAL PLANT
5598 VIRGINIA AVE NORTH CHARLESTON SC 29406 0.11118 Screened Out
MEADWESTVACO SOUTH CAROLINA LLC 400 CROSBY RD DERIDDER LA 70634 0.14 Screened OutMETAL COATERS 1150 MARIETTA INDUSTRIAL DR
NEMARIETTA GA 30062 0.291 Screened Out
METAL COATERS 9133 CENTER AVE RANCHO CUCAMONG CA 91730 0.38345 Screened OutMETAL COATERS 951 PRISOCK RD JACKSON MS 39272 4.4805 Screened OutMID-STATES PAINT & CHEMICAL CO 9315 WATSON INDUSTRIAL PARK CRESTWOOD MO 63126 0.1325 Screened OutMIDWEST METAL COATINGS 9 KONZEN CT GRANITE CITY IL 62040 0.51 Screened OutMINUTEMAN INTERNATIONAL MULTI-CLEAN DIV
600 CARDIGAN RD SHOREVIEW MN 55126 0.0585 Screened Out
MISCO PRODUCTS CORP 1048 STINSON DR READING PA 19605 0.25 Screened OutMISSION KLEENSWEEP PRODUCTS INC 2434 BIRKDALE ST LOS ANGELES CA 90031 1.5 Screened OutMITSUBISHI MOTORS NORTH AMERICA INC 100 N MITSUBISHI MOTORWAY NORMAL IL 61761 1.0215 Screened OutMOC PRODUCTS CO INC 12306 MONTAGUE ST PACOIMA CA 91331 0.1275 Screened OutMOMENTIVE SPECIALTY CHEMICALS INC 8600 W 71ST ST BEDFORD PARK IL 60501 1.168 Screened OutMOTOR CASTINGS CO 1323 S 65TH MILWAUKEE WI 53214 1.5915 Screened Out
Page 12 of 19
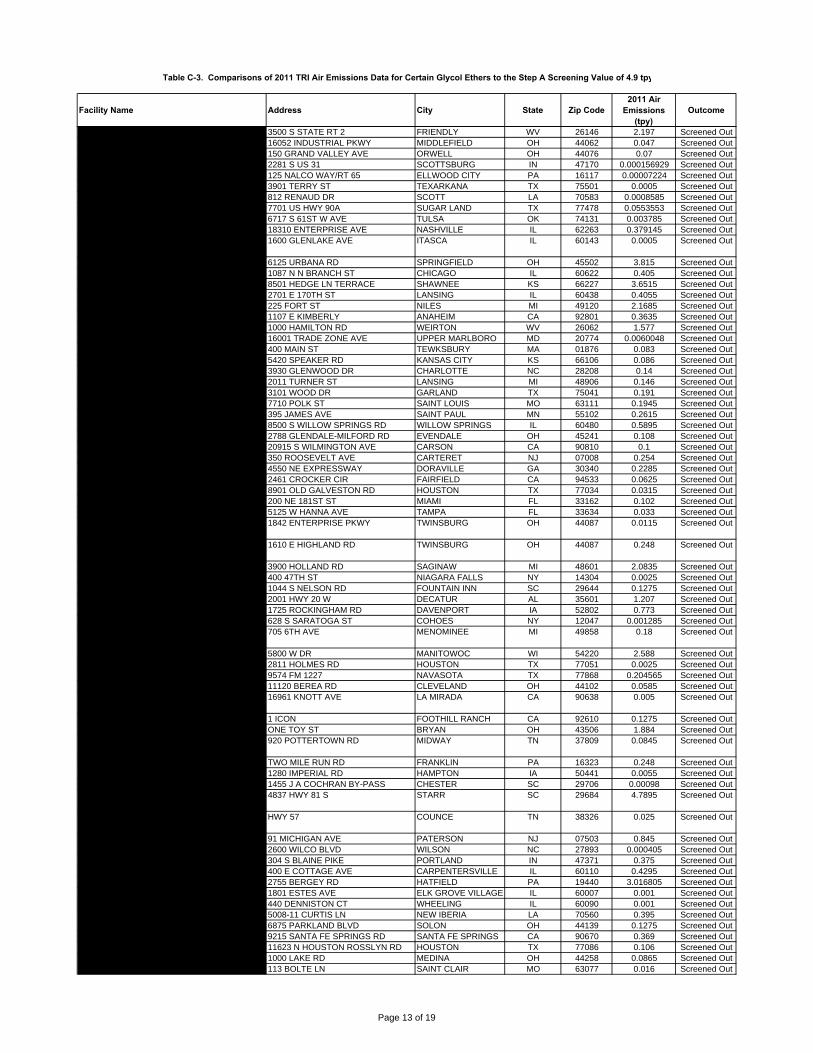
Table C-3. Comparisons of 2011 TRI Air Emissions Data for Certain Glycol Ethers to the Step A Screening Value of 4.9 tpy
Facility Name Address City State Zip Code2011 Air
Emissions (tpy)
Outcome
MPM SILICONES LLC 3500 S STATE RT 2 FRIENDLY WV 26146 2.197 Screened OutMRCG-KRAFTMAID P1 16052 INDUSTRIAL PKWY MIDDLEFIELD OH 44062 0.047 Screened OutMRCG-KRAFTMAID P3 150 GRAND VALLEY AVE ORWELL OH 44076 0.07 Screened OutMULTI-COLOR CORP 2281 S US 31 SCOTTSBURG IN 47170 0.000156929 Screened OutNALCO CO 125 NALCO WAY/RT 65 ELLWOOD CITY PA 16117 0.00007224 Screened OutNALCO CO 3901 TERRY ST TEXARKANA TX 75501 0.0005 Screened OutNALCO CO 812 RENAUD DR SCOTT LA 70583 0.0008585 Screened OutNALCO CO PLANT 106 7701 US HWY 90A SUGAR LAND TX 77478 0.0553553 Screened OutNALCO CO TULSA PLANT 102 6717 S 61ST W AVE TULSA OK 74131 0.003785 Screened OutNASCOTE INDUSTRIES 18310 ENTERPRISE AVE NASHVILLE IL 62263 0.379145 Screened OutNATIONAL INDUSTRIAL COATINGS INC DBA NICOAT INC
1600 GLENLAKE AVE ITASCA IL 60143 0.0005 Screened Out
NAVISTAR INC 6125 URBANA RD SPRINGFIELD OH 45502 3.815 Screened OutNAZDAR CHICAGO 1087 N N BRANCH ST CHICAGO IL 60622 0.405 Screened OutNAZDAR SHAWNEE 8501 HEDGE LN TERRACE SHAWNEE KS 66227 3.6515 Screened OutNB COATINGS INC 2701 E 170TH ST LANSING IL 60438 0.4055 Screened OutNCP COATINGS INC 225 FORT ST NILES MI 49120 2.1685 Screened OutNELCO PRODUCTS INC 1107 E KIMBERLY ANAHEIM CA 92801 0.3635 Screened OutNESTLE PURINA PETCARE 1000 HAMILTON RD WEIRTON WV 26062 1.577 Screened OutNEW DAWN MANUFACTURING CO 16001 TRADE ZONE AVE UPPER MARLBORO MD 20774 0.0060048 Screened OutNEXEO SOLUTIONS LLC 400 MAIN ST TEWKSBURY MA 01876 0.083 Screened OutNEXEO SOLUTIONS LLC 5420 SPEAKER RD KANSAS CITY KS 66106 0.086 Screened OutNEXEO SOLUTIONS LLC 3930 GLENWOOD DR CHARLOTTE NC 28208 0.14 Screened OutNEXEO SOLUTIONS LLC 2011 TURNER ST LANSING MI 48906 0.146 Screened OutNEXEO SOLUTIONS LLC 3101 WOOD DR GARLAND TX 75041 0.191 Screened OutNEXEO SOLUTIONS LLC 7710 POLK ST SAINT LOUIS MO 63111 0.1945 Screened OutNEXEO SOLUTIONS LLC 395 JAMES AVE SAINT PAUL MN 55102 0.2615 Screened OutNEXEO SOLUTIONS LLC 8500 S WILLOW SPRINGS RD WILLOW SPRINGS IL 60480 0.5895 Screened OutNEXEO SOLUTIONS LLC - EVENDALE 2788 GLENDALE-MILFORD RD EVENDALE OH 45241 0.108 Screened OutNEXEO SOLUTIONS LLC CARSON 20915 S WILMINGTON AVE CARSON CA 90810 0.1 Screened OutNEXEO SOLUTIONS LLC CARTERET 350 ROOSEVELT AVE CARTERET NJ 07008 0.254 Screened OutNEXEO SOLUTIONS LLC DORAVILLE 4550 NE EXPRESSWAY DORAVILLE GA 30340 0.2285 Screened OutNEXEO SOLUTIONS LLC FAIRFIELD 2461 CROCKER CIR FAIRFIELD CA 94533 0.0625 Screened OutNEXEO SOLUTIONS LLC HOUSTON 8901 OLD GALVESTON RD HOUSTON TX 77034 0.0315 Screened OutNEXEO SOLUTIONS LLC MIAMI 200 NE 181ST ST MIAMI FL 33162 0.102 Screened OutNEXEO SOLUTIONS LLC TAMPA 5125 W HANNA AVE TAMPA FL 33634 0.033 Screened OutNEXEO SOLUTIONS LLC TWINSBURG ENTERPRISE
1842 ENTERPRISE PKWY TWINSBURG OH 44087 0.0115 Screened Out
NEXEO SOLUTIONS LLC TWINSBURG HIGHLAND
1610 E HIGHLAND RD TWINSBURG OH 44087 0.248 Screened Out
NEXTEER AUTOMOTIVE CORP 3900 HOLLAND RD SAGINAW MI 48601 2.0835 Screened OutNIACET CORP 400 47TH ST NIAGARA FALLS NY 14304 0.0025 Screened OutNICCA USA INC 1044 S NELSON RD FOUNTAIN INN SC 29644 0.1275 Screened OutNICHOLS ALUMINUM ALABAMA INC 2001 HWY 20 W DECATUR AL 35601 1.207 Screened OutNICHOLS ALUMINUM DAVENPORT 1725 ROCKINGHAM RD DAVENPORT IA 52802 0.773 Screened OutNORLITE CORP 628 S SARATOGA ST COHOES NY 12047 0.001285 Screened OutNORTHERN COATINGS & CHEMICAL CO INC 705 6TH AVE MENOMINEE MI 49858 0.18 Screened Out
NORTHERN LABS INC WEST DRIVE 5800 W DR MANITOWOC WI 54220 2.588 Screened OutNOV TUBOSCOPE HOLMES ROAD 2811 HOLMES RD HOUSTON TX 77051 0.0025 Screened OutNOV TUBOSCOPE NAVASOTA 9574 FM 1227 NAVASOTA TX 77868 0.204565 Screened OutNPA COATINGS INC 11120 BEREA RD CLEVELAND OH 44102 0.0585 Screened OutOAKITE PRODUCTS INC (AKA CHEMETALL OAKITE)
16961 KNOTT AVE LA MIRADA CA 90638 0.005 Screened Out
OAKLEY INC 1 ICON FOOTHILL RANCH CA 92610 0.1275 Screened OutOHIO ART CO ONE TOY ST BRYAN OH 43506 1.884 Screened OutOLDCASTLE BUILDING ENVELOPE - TENNESSEE FACILITY
920 POTTERTOWN RD MIDWAY TN 37809 0.0845 Screened Out
OMG AMERICAS TWO MILE RUN RD FRANKLIN PA 16323 0.248 Screened OutOMNIUM 1280 IMPERIAL RD HAMPTON IA 50441 0.0055 Screened OutOMNOVA SOLUTIONS INC 1455 J A COCHRAN BY-PASS CHESTER SC 29706 0.00098 Screened OutOWENS CORNING VETROTEX LLC - ANDERSON SC
4837 HWY 81 S STARR SC 29684 4.7895 Screened Out
PACKAGING CORP OF AMERICA COUNCE MILL
HWY 57 COUNCE TN 38326 0.025 Screened Out
PARISER INDUSTRIES INC 91 MICHIGAN AVE PATERSON NJ 07503 0.845 Screened OutPARKER HANNIFIN TECH SEAL DIV 2600 WILCO BLVD WILSON NC 27893 0.000405 Screened OutPATRIOT PAINT LLC 304 S BLAINE PIKE PORTLAND IN 47371 0.375 Screened OutPCCR USA INC 400 E COTTAGE AVE CARPENTERSVILLE IL 60110 0.4295 Screened OutPENN COLOR INC 2755 BERGEY RD HATFIELD PA 19440 3.016805 Screened OutPENRAY COS INC 1801 ESTES AVE ELK GROVE VILLAGE IL 60007 0.001 Screened OutPENRAY COS INC 440 DENNISTON CT WHEELING IL 60090 0.001 Screened OutPERMA-PIPE OIL & GAS 5008-11 CURTIS LN NEW IBERIA LA 70560 0.395 Screened OutPERMATEX SOLON 6875 PARKLAND BLVD SOLON OH 44139 0.1275 Screened OutPFI INC 9215 SANTA FE SPRINGS RD SANTA FE SPRINGS CA 90670 0.369 Screened OutPILOT CHEMICAL CO 11623 N HOUSTON ROSSLYN RD HOUSTON TX 77086 0.106 Screened OutPLASTI-KOTE INC 1000 LAKE RD MEDINA OH 44258 0.0865 Screened OutPLAZE INC 113 BOLTE LN SAINT CLAIR MO 63077 0.016 Screened Out
Page 13 of 19

Table C-3. Comparisons of 2011 TRI Air Emissions Data for Certain Glycol Ethers to the Step A Screening Value of 4.9 tpy
Facility Name Address City State Zip Code2011 Air
Emissions (tpy)
Outcome
PLAZE INC 1000 INTEGRAM DR PACIFIC MO 63069 0.025 Screened OutPLAZE INC 105 BOLTE LN SAINT CLAIR MO 63077 0.066 Screened OutPOLARTEC LLC 46 STAFFORD ST LAWRENCE MA 01841 0.998 Screened OutPOLYMERIC IMAGING INC 117 E 14TH AVE NORTH KANSAS CITY MO 64116 1.0535 Screened OutPOWER SERVICE PRODUCTS INC 513 PEASTER HWY WEATHERFORD TX 76086 0.25 Screened OutPPG ARCHITECTURAL COATINGS 6804 ENTERPRISE DR LOUISVILLE KY 40214 0.0007 Screened OutPPG ARCHITECTURAL FINISHES EAST POINT 1377 OAKLEIGH DR EAST POINT GA 30344 0.4615 Screened Out
PPG ARCHITECTURAL FINISHES INC 400 S 13TH ST LOUISVILLE KY 40203 0.1765 Screened OutPPG ARCHITECURAL COATINGS HOUSTON 3530 LANG RD HOUSTON TX 77092 0.0065 Screened Out
PPG INDUSTRIES ARCHITECTURAL FINISHES 1886 LYNNBURY WOODS RD DOVER DE 19904 0.0025 Screened Out
PPG INDUSTRIES ARCHITECTURAL FINISHES 1020 OLYMPIC DR BATAVIA IL 60510 0.821 Screened Out
PPG INDUSTRIES INC 500 PITTSBURGH AVE MCCARRAN NV 89434 0.125 Screened OutPPG INDUSTRIES OHIO INC - DELAWARE 760 PITTSBURGH DR DELAWARE OH 43015 0.06872 Screened OutPPG INDUSTRIES OHIO INC (CL) 3800 W 143 ST CLEVELAND OH 44111 1.0425 Screened OutPPG INDUSTRIES OHIO INC CIRCLEVILLE OH 559 PITTSBURGH RD CIRCLEVILLE OH 43113 0.1775 Screened Out
PRC-DESOTO INTERNATIONAL INC 11601 UNITED ST MOJAVE CA 93501 0.016 Screened OutPRECOAT METALS 6754 SANTA BARBARA CT ELKRIDGE MD 21075 0.628695 Screened OutPRECOAT METALS 5888 E COUNTY RD 180 BLYTHEVILLE AR 72315 0.874 Screened OutPRECOAT METALS 3399 DAVEY ALLISON BLVD HUEYTOWN AL 35023 2.5915 Screened OutPRECOAT METALS 4502 FREEDOM WAY WEIRTON WV 26062 2.6315 Screened OutPRECOAT METALS 4301 S SPRING AVE SAINT LOUIS MO 63116 3.355 Screened OutPRECOAT METALS 16402 JACINTOPORT BLVD HOUSTON TX 77015 4.652 Screened OutPREMIER INK SYSTEMS INC 10420 N STATE ST HARRISON OH 45030 0.125 Screened OutPRESTONE PRODUCTS CORP 250 HALLS MILL RD FREEHOLD NJ 07728 0.004 Screened OutPRIDE SOLVENT & CHEMICAL CO OF NY INC 6 LONG ISLAND AVE HOLTSVILLE NY 11742 0.0125 Screened Out
PRIDE SOLVENTS & CHEMICAL CO OF NEW JERSEY
211 RANDOLPH AVE AVENEL NJ 07001 0.0195 Screened Out
PRIOR COATED METALS 2233 26TH ST SW ALLENTOWN PA 18103 0.5515 Screened OutPRO LINE PRINTING ARLINGTON 401 N GREAT SW PKWY ARLINGTON TX 76011 3.266895 Screened OutPROCTER & GAMBLE CO GPDF 5348 VINE ST CINCINNATI OH 45217 0.0065 Screened OutPROCTER & GAMBLE HAIR CARE LLC 2200 LOWER MUSCATINE RD IOWA CITY IA 52240 0.0295 Screened OutPROCTER & GAMBLE MANUFACTURING CO 1900 KANSAS AVE KANSAS CITY KS 66105 0.00611 Screened Out
PROFESSIONAL DISPOSABLES INTERNATIONAL INC
TWO NICE-PAK PARK ORANGEBURG NY 10962 0.129005 Screened Out
PVS NOLWOOD CHEMICALS INC 9000 HUBBELL AVE DETROIT MI 48228 0.005 Screened OutQG LLC 4581 LOWER VALLEY RD ATGLEN PA 19310 0.47 Screened OutQG LLC 420 W INDUSTRIAL AVE EFFINGHAM IL 62401 2.445 Screened OutQG LLC (WAS WORLDCOLOR STILLWATER) 100 W AIRPORT RD STILLWATER OK 74075 2.0405 Screened Out
QG LLC WINCHESTER VIRGINIA 160 CENTURY LN STONEWALL INDUSTRIAL PARK
WINCHESTER VA 22603 4.053425 Screened Out
QUAD GRAPHICS TAUNTON RETAIL 50 JOHN HANCOCK RD TAUNTON MA 02780 1.9616 Screened OutQUAD/GRAPHICS INC 100 DUPLAINVILLE RD THE ROCK GA 30285 2.395 Screened OutQUAD/GRAPHICS INC 555 S 108TH ST WEST ALLIS WI 53214 3.505 Screened OutQUAD/GRAPHICS INC 56 DUPLAINVILLE RD SARATOGA SPRINGS NY 12866 3.8675 Screened OutQUANTUM COATINGS INC 1337 N WOOD BRANCH DR CHARLOTTE NC 28273 0.25 Screened OutQUEST SPECIALTY COATINGS LLC - MENOMONEE FALLS
N92 W14701 ANTHONY AVE MENOMONEE FALLS WI 53051 0.375 Screened Out
QUESTVAPCO CORP 12255 FM 529 HOUSTON TX 77041 0.65 Screened OutR R DONNELLEY & SONS CO DANVILLE DIV 3201 LEBANON RD DANVILLE KY 40422 4.1715 Screened Out
RADIATOR SPECIALTY CO 600 RADIATOR RD INDIAN TRAIL NC 28079 0.146 Screened OutRANBAR ELECTRICAL MATERIALS INC 408 MANOR-HARRISON CITY RD HARRISON CITY PA 15636 0.0065 Screened OutRECKITT BENCKISER 799 RT 206 & HILLSBOROUGH RD HILLSBOROUGH NJ 08844 0.0545 Screened Out
RED SPOT PAINT & VARNISH CO INC 1016 E COLUMBIA ST EVANSVILLE IN 47711 1.047 Screened OutRED SPOT WESTLAND INC 550 S EDWIN ST WESTLAND MI 48186 2.7255 Screened OutREICHHOLD INC 249 ST LOUIS AVE VALLEY PARK MO 63088 0.512645 Screened OutREICHHOLD INC 425 S PACE BLVD PENSACOLA FL 32502 1.7695 Screened OutREICHHOLD INC - AZUSA PLANT 237 S MOTOR AVE AZUSA CA 91702 0.005 Screened OutRENESSENZ LLC JACKSONVILLE 601 CRESTWOOD ST JACKSONVILLE FL 32208 0.0025 Screened OutRESEARCH SOLUTIONS GROUP INC 402 INDUSTRIAL PARK DR PELHAM AL 35124 0.00425 Screened OutRESEARCH SOLUTIONS GROUP INC 133 BAIN DR LA VERGNE TN 37086 0.01117 Screened OutRG STEEL WHEELING LLC BEECH BOTTOM PLANT
2481 RIVER RD WELLSBURG WV 26070 1.4 Screened Out
RHODIA INC 2ND ST & BLUEBALL AVE MARCUS HOOK PA 19061 0.192 Screened OutRHODIA INC 577 BANKHEAD HWY WINDER GA 30680 0.1985 Screened OutRICHARDSAPEX INC 4202-24 MAIN ST PHILADELPHIA PA 19127 0.021111 Screened OutRIKER PRODUCTS INC 4901 STICKNEY AVE TOLEDO OH 43612 0.000945 Screened OutROBROY INDUSTRIES TEXAS LP 1100 US HWY 271 S GILMER TX 75644 0.041 Screened OutROCK TENN CO 2301 S 21ST ST CLINTON IA 52732 0.6065 Screened Out
Page 14 of 19

Table C-3. Comparisons of 2011 TRI Air Emissions Data for Certain Glycol Ethers to the Step A Screening Value of 4.9 tpy
Facility Name Address City State Zip Code2011 Air
Emissions (tpy)
Outcome
ROCKLINE INDUSTRIES 1113 MARYLAND AVE SHEBOYGAN WI 53081 0.0995 Screened OutRODDA PAINT CO 6123 N MARINE DR PORTLAND OR 97203 0.442 Screened OutROHM & HAAS CHEMICALS LLC 2401 E PRATT BLVD ELK GROVE VILLAGE IL 60007 0.0015 Screened OutROHM & HAAS CHEMICALS LLC 200 RT 413 BRISTOL PA 19007 0.2424 Screened OutROHM & HAAS ELECTRONIC MATERIA LS LLC 455 FOREST ST MARLBOROUGH MA 01752 0.005 Screened Out
ROLLEX CORP 800 CHASE AVE ELK GROVE VILLAGE IL 60007 0.2235 Screened OutROPPE CORP 1602 N UNION ST FOSTORIA OH 44830 2.8505 Screened OutRR DONNELLEY 100 QUALITY CT CHARLESTOWN IN 47111 2.103 Screened OutRR DONNELLEY & SONS CO 60 SECURITY DR AVON CT 06001 1.5765 Screened OutRR DONNELLEY & SONS CO 6821 E COUNTY RD 1100 N MATTOON IL 61938 2.1105 Screened OutRR DONNELLEY / PINEVILLE 10519 INDUSTRIAL DR PINEVILLE NC 28134 1.9455 Screened OutRR DONNELLEY / VON HOFFMANN CORP 321 WILSON DR JEFFERSON CITY MO 65109 1.82586 Screened OutRR DONNELLEY BARABOO DIV 1300 SAUK AVE BARABOO WI 53913 4.422 Screened OutRR DONNELLEY LOS ANGELES MANUFACTURING
19681 PACIFIC GATEWAY DR TORRANCE CA 90502 2.433 Screened Out
RR DONNELLEY STRASBURG DIV ONE SHENANDOAH VALLEY DR STRASBURG VA 22657 3.14 Screened OutRR DONNELLEY-WETMORE PLANT 1645 W SAM HOUSTON PKWY N HOUSTON TX 77043 4.7265 Screened OutRR STREET & CO INC 2353 S BLUE ISLAND AVE CHICAGO IL 60608 0.1275 Screened OutRRD MAPLE GROVE 7401 KILMER LN MAPLE GROVE MN 55369 4.038 Screened OutRUDD CO INC 1141 NW 50TH ST SEATTLE WA 98107 0.205 Screened OutRUSTOLEUM CORP 7850 OHIO RIVER RD LESAGE WV 25537 0.0135 Screened OutRUST-OLEUM CORP 8105 95TH ST PLEASANT PRAIRIE WI 53158 0.75 Screened OutRUST-OLEUM CORP IN MD 16410 INDUSTRIAL LN WILLIAMSPORT MD 21795 0.271 Screened OutRYCOLINE PRODUCTS LLC 5540 NW HWY CHICAGO IL 60630 1.194 Screened OutSACRAMENTO- CAMPBELL SOUP SUPPLY CO 6200 FRANKLIN BLVD SACRAMENTO CA 95824 0.125 Screened Out
SAFETY-KLEEN SYSTEMS INC 130 A FRONTAGE RD LEXINGTON SC 29073 0.125 Screened OutSANFORD LP LIQUID MANUFACTURING & TECHNOLOGY CENTER
831 VOLUNTEER PKWY MANCHESTER TN 37355 0.3775 Screened Out
SAPA EXTRUDER INC 2905 OLD OAKWOOD RD GAINESVILLE GA 30504 2.317 Screened OutSAPA EXTRUSIONS INC 2500 ALUMAX RD YANKTON SD 57078 2.4011901 Screened OutSAPA INC - COATINGS DIVSION 5325 NE SKYPORT WAY PORTLAND OR 97218 1.71267935 Screened OutSARTOMER USA LLC 601 TIGHTSQUEEZE INDUSTRIAL
RDCHATHAM VA 24531 0.005 Screened Out
SARTOMER USA LLC 610 S BOLMAR ST WEST CHESTER PA 19382 0.005 Screened OutSASOL NORTH AMERICA INC LAKE CHARLES CHEMICAL COMPLEX
2201 OLD SPANISH TRAIL WESTLAKE LA 70669 0.4905 Screened Out
SC JOHNSON & SON INC WAXDALE FACILITY 8311 16TH ST STURTEVANT WI 53177 0.5 Screened Out
SCHNEIDER ELECTRIC 1990 SANDIFER BLVD SENECA SC 29678 2.35 Screened OutSDC TECHNOLOGIES INC 45 PARKER IRVINE CA 92618 0.001 Screened OutSENOX CORP 227 S TOWN E BLVD MESQUITE TX 75149 1.963 Screened OutSERIGRAPH INC 3801 E DECORAH RD WEST BEND WI 53095 0.206 Screened OutSEWELL PRODUCTS OF FLORIDA LLC 909 MAGNOLIA AVE AUBURNDALE FL 33823 0.398 Screened OutSEYMOUR OF SYCAMORE INC 917 CROSBY AVE SYCAMORE IL 60178 0.6485 Screened OutSHEBOYGAN PAINT CO 608 CANAL ST CEDARTOWN GA 30125 1.3205 Screened OutSHERWIN-WILLIAMS CO 2150 W SAND LAKE RD ORLANDO FL 32809 0.0015 Screened OutSHERWIN-WILLIAMS CO 26300 FARGO AVE BEDFORD HEIGHTS OH 44146 0.002 Screened OutSHERWIN-WILLIAMS CO 14 INDUSTRIAL PARK FLORA IL 62839 0.0035 Screened OutSHERWIN-WILLIAMS CO 404 E MALLORY AVE MEMPHIS TN 38109 0.0065 Screened OutSHERWIN-WILLIAMS CO 12401 INDUSTRIAL BLVD VICTORVILLE CA 92392 0.01 Screened OutSHERWIN-WILLIAMS CO 2325 HOLLINS FERRY RD BALTIMORE MD 21230 0.012 Screened OutSHERWIN-WILLIAMS CO 6795 S MAIN ST MORROW GA 30260 0.0145 Screened OutSHERWIN-WILLIAMS CO 2121 NEW WORLD DR COLUMBUS OH 43207 0.0215 Screened OutSHERWIN-WILLIAMS CO 1025 HOWARD ST GREENSBORO NC 27403 0.0265 Screened OutSHERWIN-WILLIAMS CO 2802 W MILLER RD GARLAND TX 75041 0.028 Screened OutSHERWIN-WILLIAMS CO 113 STAGE COACH TRAIL GREENSBORO NC 27409 0.049 Screened OutSHERWIN-WILLIAMS CO 630 E 13TH ANDOVER KS 67002 0.0505 Screened OutSHERWIN-WILLIAMS CO 180 CANAL ST TERRE HAUTE IN 47808 0.0635 Screened OutSHERWIN-WILLIAMS CO 636 E 40TH ST HOLLAND MI 49423 0.106 Screened OutSHERWIN-WILLIAMS CO 395 BOGGS LN - S RICHMOND KY 40475 0.342 Screened OutSI GROUP INC 1000 MAIN ST ROTTERDAM JUNCTIO NY 12150 0.02354 Screened OutSICPA SECURINK CORP 8000 RESEARCH WAY SPRINGFIELD VA 22153 0.125 Screened OutSIERRA CORP 11400 W 47TH ST MINNETONKA MN 55343 0.3015 Screened OutSIKA CORP SIKA SARNAFIL DIV 100 DAN RD CANTON MA 02021 0.433 Screened OutSILBOND CORP 9901 SAND CREEK HWY WESTON MI 49289 0.25 Screened OutSILGAN CONTAINERS MANUFACTURING CORP
12130 LYNN AVE S SAVAGE MN 55378 0.575 Screened Out
SILGAN CONTAINERS MANUFACTURING CORP
2200 WILBUR AVE ANTIOCH CA 94509 2.067 Screened Out
SILGAN CONTAINERS MANUFACTURING CORP
8673 LYONS-MARENGO RD LYONS NY 14489 4.034 Screened Out
SILGAN CONTAINERS MANUFACTURING CORP
N90 W14600 COMMERCE DR MENOMONEE FALLS WI 53051 4.2 Screened Out
SILGAN CONTAINERS MANUFACTURING CORP
1400 PLOVER RD PLOVER WI 54467 4.47 Screened Out
SILGAN WHITE CAP CORP 1701 WILLIAMSBURG PIKE RICHMOND IN 47375 0.202 Screened Out
Page 15 of 19

Table C-3. Comparisons of 2011 TRI Air Emissions Data for Certain Glycol Ethers to the Step A Screening Value of 4.9 tpy
Facility Name Address City State Zip Code2011 Air
Emissions (tpy)
Outcome
SILGAN WHITE CAP CORP 350 JAYCEE DR VALMONT INDUSTRIAL PARK
HAZLETON PA 18201 1.8125 Screened Out
SIMONIZ USA INC 201 BOSTON TURNPIKE BOLTON CT 06043 0.0195 Screened OutSINCLAIR WYOMING REFINING CO 100 E LINCOLN AVE SINCLAIR WY 82334 0.001 Screened OutSNAP-ON TOOLS MANUFACTURING CO 2600 US HWY 18 E ALGONA IA 50511 0.1205 Screened OutSONOCO FLEXIBLE PACKAGING 6502 S US HWY 31 EDINBURGH IN 46124 0.2045 Screened OutSONOCO PRODUCTS CO 1854 CENTRAL FLORIDA PKWY ORLANDO FL 32837 0.658 Screened OutSONOCO PRODUCTS CO - PRESIDENTS ISLAND
2755 HARBOR AVE MEMPHIS TN 38113 1.7065 Screened Out
SOUTH FLORIDA MATERIALS CORP DBA VECENERGY-PORT EVERGLADES
1200 SE 32ND ST FT LAUDERDALE FL 33316 0.078 Screened Out
SOUTHERN CLAY PRODUCTS INC 1335 S 13TH ST LOUISVILLE KY 40210 0.1275 Screened OutSOUTHWEST DISTRIBUTING CO 539 S DREW ST MESA AZ 85210 0.006 Screened OutSPARTAN CHEMICAL CO INC 1110 SPARTAN DR MAUMEE OH 43537 0.0675 Screened OutSPECTRUM CUBIC INC 13 MCCONNELL ST SW GRAND RAPIDS MI 49503 0.385 Screened OutSPECTRUM METAL FINISHING 535 BEV RD YOUNGSTOWN OH 44512 0.75 Screened OutSPIRALKOTE FLEXIBLE PACKAGING 1200 CENTRAL FLORIDA PKWY ORLANDO FL 32837 0.941 Screened OutSPRAYLAT CORP 716 S COLUMBUS AVE MOUNT VERNON NY 10550 0.4335 Screened OutSPRAYLAT CORP CA 3465 S LA CIENAGA BLVD LOS ANGELES CA 90016 3.358 Screened OutSPRAYLAT CORP IL 1701 E 122-ND ST CHICAGO IL 60633 0.6265 Screened OutST CHARLES OPERATIONS (TAFT/STAR) UNION CARBIDE CORP
355 LA HWY 3142 (GATE 1) TAFT LA 70057 1.67 Screened Out
STANDARD PAINTS INC 940 S 6TH AVE MANSFIELD TX 76063 0.22855 Screened OutSTEEL DYNAMICS INC 5134 LOOP RD JEFFERSONVILLE IN 47130 1.87 Screened OutSTEELSCAPE 222 W KALAMA RIVER RD KALAMA WA 98625 0.735505 Screened OutSTEELSCAPE INC 7001 ALLISON-BONNET MEMORIAL
DFAIRFIELD AL 35064 0.603375 Screened Out
STEELSCAPE INC RANCHO 11200 ARROW RT RANCHO CUCAMONG CA 91730 0.087635 Screened OutSTOUSE INC 300 NEW CENTURY PKWY NEW CENTURY KS 66031 0.1475 Screened OutSTP PRODUCTS MANUFACTURING CO 477 LEXINGTON AVE PAINESVILLE OH 44077 1.0615 Screened OutSUMTER COATINGS INC 2410 HWY 15S SUMTER SC 29150 0.22 Screened OutSUN CHEMICAL CORP 135 W LAKE ST NORTHLAKE IL 60164 0.003 Screened OutSUN CHEMICAL CORP 3301 HUNTING PARK AVE PHILADELPHIA PA 19132 0.2045 Screened OutSUN CHEMICAL CORP 1380 FORD RD MAUMEE OH 43537 0.966 Screened OutSUN CHEMICAL CORP 2445 PRODUCTION DR SAINT CHARLES IL 60174 1.2085 Screened OutSUPERIOR OIL CO INC 400 W REGENT ST INDIANAPOLIS IN 46225 0.007065 Screened OutSUPERIOR OIL CO INC RECLAIMED ENERGY DIV
1500 WESTERN AVE CONNERSVILLE IN 47331 0.074 Screened Out
SUPERIOR SOLVENTS & CHEMICALS 4211 BRAMERS LN LOUISVILLE KY 40216 0.0035 Screened OutSUPERIOR SOLVENTS & CHEMICALS 320 NORTHPOINTE DR FAIRFIELD OH 45014 0.004085 Screened OutSYNDICATE SYSTEMS INC 402 N MAIN ST MIDDLEBURY IN 46540 0.712 Screened OutSYNGENTA CROP PROTECTION LLC SAINT GABRIEL FACILITY
3905 HWY 75 SAINT GABRIEL LA 70776 0.133 Screened Out
TAIYO AMERICA INC 2675 ANTLER DR CARSON CITY NV 89701 1.1335 Screened OutTAKASAGO INTERNATIONAL CORP (USA) 267 UNION ST NORTHVALE NJ 07647 0.0105 Screened OutTCI COATINGS INC 4501 BRADLEY ST LUBBOCK TX 79415 4.36875 Screened OutTECHNICAL CHEMICAL CO 3327 PIPELINE RD CLEBURNE TX 76033 0.1095 Screened OutTEREX WASHINGTON SOUTH CAMPUS 18700 NE 65TH ST REDMOND WA 98052 4.7679 Screened OutTERNIUM USA INC 2500 RON BEAN BLVD SHREVEPORT LA 71115 0.6705 Screened OutTESORO REFINING & MARKETING CO - MANDAN REFINERY
900 OLD RED TRAIL NE MANDAN ND 58554 1.0505 Screened Out
TEXAS FINISHING CO 1801 SURVEYOR BLVD CARROLLTON TX 75006 1.676 Screened OutTEXAS INSTRUMENTS INC 13500 N CENTRAL EXPRESSWAY DALLAS TX 75243 0.114 Screened OutTEXAS INSTRUMENTS INC 12201 SW FWY MS600 STAFFORD TX 77477 0.1275 Screened OutTHE DIAL CORP A SUBSIDIARY OF HENKEL CONSUMER GOODS
6901 MCKISSOCK AVE SAINT LOUIS MO 63147 0.162 Screened Out
THE DOW CHEMICAL CO 1790 BUILDING MIDLAND MI 48667 2.29 Screened OutTHE DOW CHEMICAL CO - LOUISIANA OPERATIONS
21255 LA HWY 1 S PLAQUEMINE LA 70764 0.396 Screened Out
TITAN COATINGS INC 2025 EXCHANGE PL BESSEMER AL 35023 3.59 Screened OutTMS MANUFACTURING 3555 W 123RD ST ALSIP IL 60803 0.284 Screened OutTNEMEC CO INC 2300 EDGEWATER AVE BALTIMORE MD 21222 0.125 Screened OutTNEMEC CO INC 123 W 23RD AVE NORTH KANSAS CITY MO 64116 0.125 Screened OutTOWER PRODUCTS INC 2703 FREEMANSBURG AVE EASTON PA 18045 0.375 Screened OutTOYO INK AMERICA LLC 2400 N HARVEY MITCHELL PKWY BRYAN TX 77807 0.014 Screened OutTRADEBE TREATMENT & RECYCLING LLC 4343 KENNEDY AVE EAST CHICAGO IN 46312 0.4655 Screened OutTRANS CHEMICAL INC 419 E DE SOTO AVE SAINT LOUIS MO 63147 0.125 Screened OutTRANSTAR AUTOBODY TECHNOLOGIES 2040 HEISERMAN DR BRIGHTON MI 48114 0.00418 Screened OutTRELLEBORG COATED SYSTEMS US INC / GRACE ADVANCED MATERIALS
715 RAILROAD AVE & HWY 74 RUTHERFORDTON NC 28139 0.0055 Screened Out
TRELLEBORG OFFSHORE US RANKIN ROAD FACILITY
1902 RANKIN RD HOUSTON TX 77073 0.5125 Screened Out
TRINKOTE INDUSTRIAL FINISHES INC 1800 PARK PL AVE FORT WORTH TX 76110 1.37545 Screened OutTRUE VALUE MANUFACTURING 201 JANDUS RD CARY IL 60013 0.011 Screened OutTTM PRINTED CIRCUIT GROUP - S TAFFORD DIV
4 OLD MONSON RD STAFFORD CT 06075 3.9505 Screened Out
TTM TECHNOLOGIES INC 234 CASHMAN DR CHIPPEWA FALLS WI 54729 0.793 Screened OutTTM TECHNOLOGIES-SANTA CLARA 407 MATHEW ST SANTA CLARA CA 95050 1.0005 Screened Out
Page 16 of 19
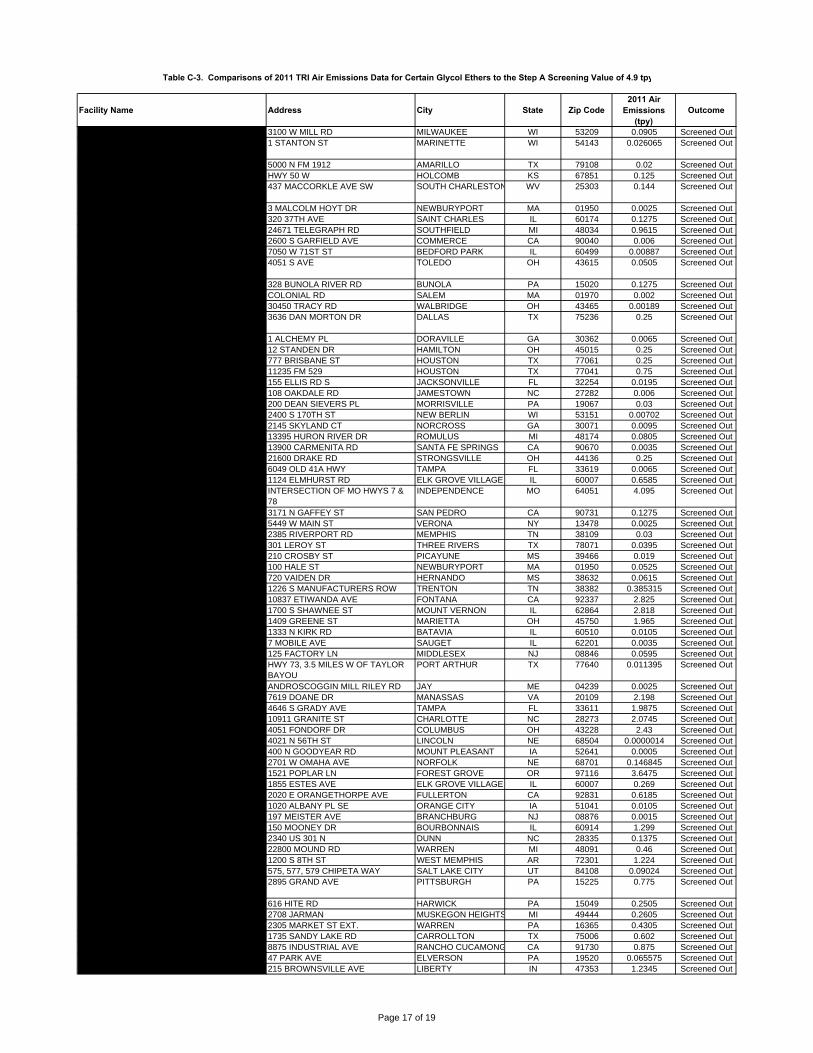
Table C-3. Comparisons of 2011 TRI Air Emissions Data for Certain Glycol Ethers to the Step A Screening Value of 4.9 tpy
Facility Name Address City State Zip Code2011 Air
Emissions (tpy)
Outcome
TWINCO ROMAX 3100 W MILL RD MILWAUKEE WI 53209 0.0905 Screened OutTYCO FIRE SUPPRESSION & BUILDING PRODUCTS
1 STANTON ST MARINETTE WI 54143 0.026065 Screened Out
TYSON FRESH MEATS INC 5000 N FM 1912 AMARILLO TX 79108 0.02 Screened OutTYSON FRESH MEATS INC HWY 50 W HOLCOMB KS 67851 0.125 Screened OutUNION CARBIDE CORP SOUTH CHARLESTON FACILITY
437 MACCORKLE AVE SW SOUTH CHARLESTON WV 25303 0.144 Screened Out
UNION SPECIALTIES INC 3 MALCOLM HOYT DR NEWBURYPORT MA 01950 0.0025 Screened OutUNITED LABORATORIES INC 320 37TH AVE SAINT CHARLES IL 60174 0.1275 Screened OutUNITED PAINT & CHEMICAL 24671 TELEGRAPH RD SOUTHFIELD MI 48034 0.9615 Screened OutUNIVAR USA INC 2600 S GARFIELD AVE COMMERCE CA 90040 0.006 Screened OutUNIVAR USA INC 7050 W 71ST ST BEDFORD PARK IL 60499 0.00887 Screened OutUNIVAR USA INC - TOLEDO SOUTH BRANCH 4051 S AVE TOLEDO OH 43615 0.0505 Screened Out
UNIVAR USA INC - BUNOLA BRANCH 328 BUNOLA RIVER RD BUNOLA PA 15020 0.1275 Screened OutUNIVAR USA INC SALEM BRANCH COLONIAL RD SALEM MA 01970 0.002 Screened OutUNIVAR USA INC - TOLEDO BRANCH 30450 TRACY RD WALBRIDGE OH 43465 0.00189 Screened OutUNIVAR USA INC DALLAS DAN MORTON FACILITY
3636 DAN MORTON DR DALLAS TX 75236 0.25 Screened Out
UNIVAR USA INC DORAVILLE FACILITY 1 ALCHEMY PL DORAVILLE GA 30362 0.0065 Screened OutUNIVAR USA INC HAMILTON BRANCH 12 STANDEN DR HAMILTON OH 45015 0.25 Screened OutUNIVAR USA INC HOUSTON 777 BRISBANE ST HOUSTON TX 77061 0.25 Screened OutUNIVAR USA INC HOUSTON FM 529 11235 FM 529 HOUSTON TX 77041 0.75 Screened OutUNIVAR USA INC JACKSONVILLE FA CILITY 155 ELLIS RD S JACKSONVILLE FL 32254 0.0195 Screened OutUNIVAR USA INC JAMESTOWN FACILITY 108 OAKDALE RD JAMESTOWN NC 27282 0.006 Screened OutUNIVAR USA INC MORRISVILLE BRANCH 200 DEAN SIEVERS PL MORRISVILLE PA 19067 0.03 Screened OutUNIVAR USA INC NEW BERLIN 2400 S 170TH ST NEW BERLIN WI 53151 0.00702 Screened OutUNIVAR USA INC NORCROSS FACILI TY 2145 SKYLAND CT NORCROSS GA 30071 0.0095 Screened OutUNIVAR USA INC ROMULUS BRANCH 13395 HURON RIVER DR ROMULUS MI 48174 0.0805 Screened OutUNIVAR USA INC SANTA FE SPRINGS 13900 CARMENITA RD SANTA FE SPRINGS CA 90670 0.0035 Screened OutUNIVAR USA INC STRONGSVILLE BRANCH 21600 DRAKE RD STRONGSVILLE OH 44136 0.25 Screened OutUNIVAR USA INC TAMPA FACILITY 6049 OLD 41A HWY TAMPA FL 33619 0.0065 Screened OutUNIVERSAL CHEMICALS & COATINGS INC 1124 ELMHURST RD ELK GROVE VILLAGE IL 60007 0.6585 Screened OutUS ARMY LAKE CITY ARMY AMMUNITION PLANT
INTERSECTION OF MO HWYS 7 & 78
INDEPENDENCE MO 64051 4.095 Screened Out
US DOD DFSP SAN PEDRO 3171 N GAFFEY ST SAN PEDRO CA 90731 0.1275 Screened OutUS DOD DFSP VERONA 5449 W MAIN ST VERONA NY 13478 0.0025 Screened OutVALERO REFINING CO - TENNESSEE LLC 2385 RIVERPORT RD MEMPHIS TN 38109 0.03 Screened OutVALERO THREE RIVERS REFINERY 301 LEROY ST THREE RIVERS TX 78071 0.0395 Screened OutVALSPAR REFINISH 210 CROSBY ST PICAYUNE MS 39466 0.019 Screened OutVALSPAR SAMUEL CABOT DIV 100 HALE ST NEWBURYPORT MA 01950 0.0525 Screened OutVALVOLINE 720 VAIDEN DR HERNANDO MS 38632 0.0615 Screened OutVAN CAN CO 1226 S MANUFACTURERS ROW TRENTON TN 38382 0.385315 Screened OutVAN CAN CO 10837 ETIWANDA AVE FONTANA CA 92337 2.825 Screened OutVANEX INC 1700 S SHAWNEE ST MOUNT VERNON IL 62864 2.818 Screened OutVANGUARD PAINTS & FINISHES INC 1409 GREENE ST MARIETTA OH 45750 1.965 Screened OutVARN INTERNATIONAL 1333 N KIRK RD BATAVIA IL 60510 0.0105 Screened OutVEOLIA ES TECHNICAL SOLUTIONS LLC 7 MOBILE AVE SAUGET IL 62201 0.0035 Screened OutVEOLIA ES TECHNICAL SOLUTIONS LLC 125 FACTORY LN MIDDLESEX NJ 08846 0.0595 Screened OutVEOLIA ES TECHNICAL SOLUTIONS LLC PORT ARTHUR FACILITY
HWY 73, 3.5 MILES W OF TAYLOR BAYOU
PORT ARTHUR TX 77640 0.011395 Screened Out
VERSO PAPER HOLDINGS LLC ANDROSCOGGIN MILL RILEY RD JAY ME 04239 0.0025 Screened OutVERTIS 7619 DOANE DR MANASSAS VA 20109 2.198 Screened OutVERTIS COMMUNICATIONS 4646 S GRADY AVE TAMPA FL 33611 1.9875 Screened OutVERTIS COMMUNICATIONS 10911 GRANITE ST CHARLOTTE NC 28273 2.0745 Screened OutVERTIS COMMUNICATIONS 4051 FONDORF DR COLUMBUS OH 43228 2.43 Screened OutVEYANCE TECHNOLOGIES INC 4021 N 56TH ST LINCOLN NE 68504 0.0000014 Screened OutVEYANCE TECHNOLOGIES INC 400 N GOODYEAR RD MOUNT PLEASANT IA 52641 0.0005 Screened OutVEYANCE TECHNOLOGIES INC 2701 W OMAHA AVE NORFOLK NE 68701 0.146845 Screened OutVIASYSTEMS CORP 1521 POPLAR LN FOREST GROVE OR 97116 3.6475 Screened OutVIDEOJET TECHNOLOGIES INC 1855 ESTES AVE ELK GROVE VILLAGE IL 60007 0.269 Screened OutVISTA PAINT CORP 2020 E ORANGETHORPE AVE FULLERTON CA 92831 0.6185 Screened OutVOGEL PAINT & WAX CO INC 1020 ALBANY PL SE ORANGE CITY IA 51041 0.0105 Screened OutVOLTAIX LLC 197 MEISTER AVE BRANCHBURG NJ 08876 0.0015 Screened OutW W HENRY 150 MOONEY DR BOURBONNAIS IL 60914 1.299 Screened OutWARREN OIL CO - NC 2340 US 301 N DUNN NC 28335 0.1375 Screened OutWARREN STAMPING PLANT (PART) 22800 MOUND RD WARREN MI 48091 0.46 Screened OutWARREN UNILUBE INC 1200 S 8TH ST WEST MEMPHIS AR 72301 1.224 Screened OutWATSON LABORATORIES INC 575, 577, 579 CHIPETA WAY SALT LAKE CITY UT 84108 0.09024 Screened OutWATSON STANDARD CO (NEVILLE ISLAND PLANT)
2895 GRAND AVE PITTSBURGH PA 15225 0.775 Screened Out
WATSON STANDARD CO HARWICK PLANT 616 HITE RD HARWICK PA 15049 0.2505 Screened OutWEBB CHEMICAL SERVICE CORP 2708 JARMAN MUSKEGON HEIGHTS MI 49444 0.2605 Screened OutWEST PENN OIL CO,INC130130 2305 MARKET ST EXT. WARREN PA 16365 0.4305 Screened OutWESTERN EXTRUSIONS CORP 1735 SANDY LAKE RD CARROLLTON TX 75006 0.602 Screened OutWESTERN METAL DECORATING CO 8875 INDUSTRIAL AVE RANCHO CUCAMONG CA 91730 0.875 Screened OutWHITFORD CORP 47 PARK AVE ELVERSON PA 19520 0.065575 Screened OutWINSLOW-BROWNING INC 215 BROWNSVILLE AVE LIBERTY IN 47353 1.2345 Screened Out
Page 17 of 19

Table C-3. Comparisons of 2011 TRI Air Emissions Data for Certain Glycol Ethers to the Step A Screening Value of 4.9 tpy
Facility Name Address City State Zip Code2011 Air
Emissions (tpy)
Outcome
WISCONSIN ALUMINUM FOUNDRY CO INC 838 S 16TH ST MANITOWOC WI 54220 0.03505 Screened OutWISMARQ CORP 930 ARMOUR RD OCONOMOWOC WI 53066 0.599 Screened OutWISMARQ CORP 11440 W ADDISON AVE FRANKLIN PARK IL 60131 1.7385 Screened OutWISMARQ VALENCIA LLC 125 MCFANN RD VALENCIA PA 16059 1.1145 Screened OutWM BARR & CO INC 2170 BUOY ST MEMPHIS TN 38113 0.1275 Screened OutWORWAG COATINGS LLC NORTH AMERICA 3420 KOSSUTH ST LAFAYETTE IN 47905 0.6745 Screened Out
WR MEADOWS INC 300 INDUSTRIAL DR HAMPSHIRE IL 60140 0.2525 Screened OutWR MEADOWS OF ARIZONA INC 4220 S SARIVAL RD GOODYEAR AZ 85338 0.1515 Screened OutWYNNEWOOD REFINING CO 906 S POWELL WYNNEWOOD OK 73098 0.0025 Screened OutYENKIN-MAJESTIC PAINT CORPORAT ION 1920 LEONARD AVE COLUMBUS OH 43219 0.25 Screened OutZ TECHNOLOGIES CORP 26500 CAPITOL AVE REDFORD MI 48239 0.0125 Screened OutZEP COMMERCIAL 350 JOE FRANK HARRIS PKWY EMERSON GA 30137 0.019 Screened OutZEP INC 1310 SEABOARD INDUSTRIAL BLVD ATLANTA GA 30318 0.242 Screened Out
ZSCHIMMER & SCHWARZ 70 GA HWY 22 W MILLEDGEVILLE GA 31061 0.3775 Screened Out
Page 18 of 19

Table C-3. Comparisons of 2011 TRI Air Emissions Data for Certain Glycol Ethers to the Step A Screening Value of 4.9 tpy
Facility Name Address City State Zip Code2011 Air
Emissions (tpy)
Outcome
tpy: tons per year
Page 19 of 19
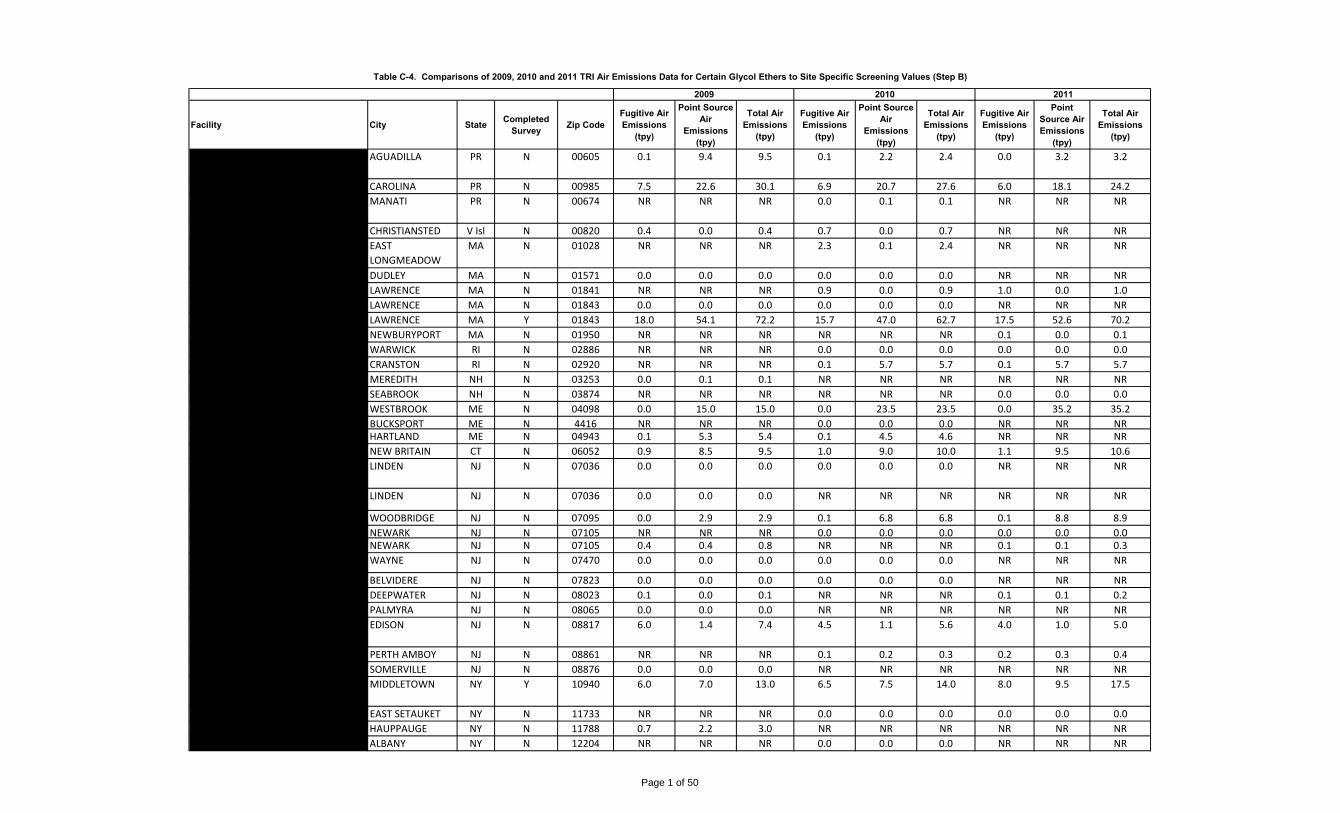
Table C-4. Comparisons of 2009, 2010 and 2011 TRI Air Emissions Data for Certain Glycol Ethers to Site Specific Screening Values (Step B)
2009 2010 2011
Facility City State Completed Survey Zip Code
Fugitive Air Emissions
(tpy)
Point Source Air
Emissions (tpy)
Total Air Emissions
(tpy)
Fugitive Air Emissions
(tpy)
Point Source Air
Emissions (tpy)
Total Air Emissions
(tpy)
Fugitive Air Emissions
(tpy)
Point Source Air Emissions
(tpy)
Total Air Emissions
(tpy)
HEWLETT‐PACKARD CARIBE BV SITE AGUADILLA PR N 00605 0.1 9.4 9.5 0.1 2.2 2.4 0.0 3.2 3.2
CROWN BEVERAGE PACKAGING CAROLINA PR N 00985 7.5 22.6 30.1 6.9 20.7 27.6 6.0 18.1 24.2
DU PONT ELECTRONICS MICROCIRCU
ITS INDUSTRIES LTD
MANATI PR N 00674 NR NR NR 0.0 0.1 0.1 NR NR NR
HOVENSA LLC CHRISTIANSTED V Isl N 00820 0.4 0.0 0.4 0.7 0.0 0.7 NR NR NR
VERTIS INC RNS SPRINGFIELD DIV EAST
LONGMEADOW
MA N 01028 NR NR NR 2.3 0.1 2.4 NR NR NR
SHIELD PACKAGING CO INC DUDLEY MA N 01571 0.0 0.0 0.0 0.0 0.0 0.0 NR NR NR
POLARTEC LLC LAWRENCE MA N 01841 NR NR NR 0.9 0.0 0.9 1.0 0.0 1.0
KEY POLYMER LAWRENCE MA N 01843 0.0 0.0 0.0 0.0 0.0 0.0 NR NR NR
CROWN BEVERAGE PACKAGING LAWRENCE MA Y 01843 18.0 54.1 72.2 15.7 47.0 62.7 17.5 52.6 70.2
VALSPAR SAMUEL CABOT DIV NEWBURYPORT MA N 01950 NR NR NR NR NR NR 0.1 0.0 0.1
MANN DISTRIBUTION WARWICK RI N 02886 NR NR NR 0.0 0.0 0.0 0.0 0.0 0.0
TACO INC ‐ CRANSTON CRANSTON RI N 02920 NR NR NR 0.1 5.7 5.7 0.1 5.7 5.7
EFI / INKWARE MEREDITH NH N 03253 0.0 0.1 0.1 NR NR NR NR NR NR
HENKEL CORP SEABROOK NH N 03874 NR NR NR NR NR NR 0.0 0.0 0.0
S D WARREN CO WESTBROOK ME N 04098 0.0 15.0 15.0 0.0 23.5 23.5 0.0 35.2 35.2
VERSO PAPER BUCKSPORT MILL BUCKSPORT ME N 4416 NR NR NR 0.0 0.0 0.0 NR NR NRPRIME TANNING CO ‐ HARTLAND HARTLAND ME N 04943 0.1 5.3 5.4 0.1 4.5 4.6 NR NR NR
STANLEY WORKS HAND TOOLS DIV NEW BRITAIN CT N 06052 0.9 8.5 9.5 1.0 9.0 10.0 1.1 9.5 10.6
CONOCOPHILLIPS CO TREMLEY POINT
TERMINAL
LINDEN NJ N 07036 0.0 0.0 0.0 0.0 0.0 0.0 NR NR NR
SAFETY‐KLEEN SYSTEMS INC LINDEN NJ N 07036 0.0 0.0 0.0 NR NR NR NR NR NR
MAUSER CORP WOODBRIDGE NJ N 07095 0.0 2.9 2.9 0.1 6.8 6.8 0.1 8.8 8.9
BENJAMIN MOORE & CO ‐ NEWARK NEWARK NJ N 07105 NR NR NR 0.0 0.0 0.0 0.0 0.0 0.0DELEET MERCHANDISING NEWARK NJ N 07105 0.4 0.4 0.8 NR NR NR 0.1 0.1 0.3
ACTEGA RADCURE INC WAYNE NJ N 07470 0.0 0.0 0.0 0.0 0.0 0.0 NR NR NR
BASF CORP BELVIDERE NJ N 07823 0.0 0.0 0.0 0.0 0.0 0.0 NR NR NR
DUPONT CHAMBERS WORKS DEEPWATER NJ N 08023 0.1 0.0 0.1 NR NR NR 0.1 0.1 0.2
CALLAHAN CHEMICAL CO PALMYRA NJ N 08065 0.0 0.0 0.0 NR NR NR NR NR NR
SILGAN CONTAINERS
MANUFACTURING CORP
EDISON NJ N 08817 6.0 1.4 7.4 4.5 1.1 5.6 4.0 1.0 5.0
ENGLERT INC PERTH AMBOY NJ N 08861 NR NR NR 0.1 0.2 0.3 0.2 0.3 0.4
AROMATIC TECHNOLOGIES INC SOMERVILLE NJ N 08876 0.0 0.0 0.0 NR NR NR NR NR NR
BALL METAL BEVERAGE CONTAINER
CORP
MIDDLETOWN NY Y 10940 6.0 7.0 13.0 6.5 7.5 14.0 8.0 9.5 17.5
BASF CORP EAST SETAUKET NY N 11733 NR NR NR 0.0 0.0 0.0 0.0 0.0 0.0
DISC GRAPHICS HAUPPAUGE NY N 11788 0.7 2.2 3.0 NR NR NR NR NR NR
SURPASS CHEMICAL CO INC ALBANY NY N 12204 NR NR NR 0.0 0.0 0.0 NR NR NR
Page 1 of 50

Table C-4. Comparisons of 2009, 2010 and 2011 TRI Air Emissions Data for Certain Glycol Ethers to Site Specific Screening Values (Step B)
2009 2010 2011
Facility City State Completed Survey Zip Code
Fugitive Air Emissions
(tpy)
Point Source Air
Emissions (tpy)
Total Air Emissions
(tpy)
Fugitive Air Emissions
(tpy)
Point Source Air
Emissions (tpy)
Total Air Emissions
(tpy)
Fugitive Air Emissions
(tpy)
Point Source Air Emissions
(tpy)
Total Air Emissions
(tpy)
METAL CONTAINER CORP ‐
NEWBURGH CAN PLANT
NEW WINDSOR NY Y 12553 12.1 34.4 46.5 11.5 30.8 42.3 11.0 29.4 40.4
BALL METAL BEVERAGE CONTAINER
CORP
SARATOGA
SPRINGS
NY Y 12866 3.3 15.0 18.3 3.4 17.0 20.4 3.3 16.0 19.3
QUAD/GRAPHICS INC SARATOGA
SPRINGS
NY N 12866 5.6 0.3 5.9 NR NR NR 3.7 0.2 3.9
FIBERMARK NORTH AMERICA INC LOWVILLE NY N 13367 0.1 5.8 5.9 0.1 5.3 5.4 0.1 4.4 4.4
US DOD DFSP VERONA VERONA NY N 13478 NR NR NR NR NR NR 0.0 0.0 0.0
WHITING DOOR MANUFACTURING
CORP
AKRON NY N 14001 0.0 7.4 7.4 0.0 8.4 8.4 0.0 11.7 11.7
ASHLAND DISTRIBUTION TONAWANDA NY N 14150 NR NR NR 0.0 0.0 0.0 NR NR NR
SENECA FOODS CORP CAN PLANT MARION NY N 14505 0.0 6.1 6.1 0.0 6.7 6.7 0.0 5.4 5.4
HAMMER PACKAGING CORP WEST HENRIETTA NY N 14586 0.0 15.1 15.1 0.0 6.8 6.8 0.0 8.3 8.3
TRI VULCRAFT OF NEW YORK INC CHEMUNG NY N 14825 4.5 5.8 10.3 5.1 7.1 12.2 4.0 6.5 10.5
UNIVAR USA INC ‐ BUNOLA BRANC H BUNOLA PA N 15020 NR NR NR 0.0 0.0 0.0 0.1 0.0 0.1
USS ‐ CLAIRTON PLANT CLAIRTON PA N 15025 5.5 0.0 5.5 14.5 0.0 14.5 41.0 0.0 41.0
CLEARWATER INTERNATIONAL LLC LEETSDALE PA N 15056 0.0 0.0 0.0 NR NR NR 0.0 0.0 0.0
SEQUA COATINGS CORP PRECOAT
METALS DIV
MC KEESPORT PA N 15132 0.2 0.1 0.3 NR NR NR NR NR NR
PPG INDUSTRIES,INC‐SPRINGDALE
COMPLEX
SPRINGDALE PA N 15144 5.5 0.0 5.5 5.2 0.1 5.3 5.8 0.1 5.8
ALLEGHENY PETROLEUM PRODUCTS
CO
WILMERDING PA N 15148 0.0 0.1 0.1 0.0 0.1 0.1 NR NR NR
BEDFORD MATERIALS CO INC MANNS CHOICE PA N 15550 1.3 11.3 12.6 1.4 12.7 14.1 1.4 12.8 14.2
NALCO CO ELLWOOD CITY PA N 16117 NR NR NR 0.0 0.0 0.0 0.0 0.0 0.0
JAMESTOWN COATING
TECHNOLOGIES
JAMESTOWN PA N 16134 0.2 0.0 0.2 NR NR NR 0.2 0.0 0.2
INTERSTATE CHEMICAL CO INC HERMITAGE PA N 16148 NR NR NR 0.0 0.0 0.0 0.0 0.0 0.0
BERENFIELD CONTAINERS INC CLARENDON PA N 16313 0.1 8.3 8.4 0.1 6.7 6.7 0.1 4.3 4.4
FRANKLIN INVESTMENT CORP FRANKLIN PA N 16323 10.7 0.0 10.7 11.6 0.0 11.6 8.5 0.0 8.5
ZURN INDUSTRIES LLC ERIE PA N 16502 4.7 0.0 4.7 NR NR NR NR NR NR
AMES TRUE TEMPER INC HARRISBURG PA N 17104 NR NR NR 1.1 20.6 21.6 1.4 26.2 27.6
CROWN FOOD PACKAGING HANOVER PA N 17331 2.9 8.6 11.4 3.4 10.1 13.5 1.3 3.9 5.2
NEW YORK WIRE HANOVER PA N 17331 0.0 26.0 26.0 0.0 24.2 24.2 0.0 28.0 28.0
AMERICAN COLOR GRAPHICS INC YORK PA N 17404 2.1 0.2 2.3 NR NR NR NR NR NR
CP CONVERTERS INC YORK PA N 17402 NR NR NR 1.2 0.0 1.2 1.0 0.0 1.0
RR DONNELLEY LANCASTER WEST LANCASTER PA N 17601 6.7 0.4 7.1 4.6 0.3 4.9 8.5 0.6 9.1
RR DONNELLEY LANCASTER EAST LANCASTER PA N 17601 5.3 0.4 5.7 6.2 0.4 6.6 7.4 0.5 7.9
Page 2 of 50

Table C-4. Comparisons of 2009, 2010 and 2011 TRI Air Emissions Data for Certain Glycol Ethers to Site Specific Screening Values (Step B)
2009 2010 2011
Facility City State Completed Survey Zip Code
Fugitive Air Emissions
(tpy)
Point Source Air
Emissions (tpy)
Total Air Emissions
(tpy)
Fugitive Air Emissions
(tpy)
Point Source Air
Emissions (tpy)
Total Air Emissions
(tpy)
Fugitive Air Emissions
(tpy)
Point Source Air Emissions
(tpy)
Total Air Emissions
(tpy)
ARMSTRONG WORLD INDUSTRIES
LANCASTER PLANT
LANCASTER PA N 17603 0.9 0.4 1.3 NR NR NR NR NR NR
BEHR PROCESS CORP ALLENTOWN ALLENTOWN PA N 18106 0.0 0.0 0.1 0.0 0.0 0.0 NR NR NR
MASCO RETAIL CABINET GROUP
SAYRE PENNSYLVANIA PLANT
SAYRE PA N 18840 NR NR NR 0.0 0.3 0.3 NR NR NR
DUPONT TOWANDA PLANT TOWANDA PA N 18848 NR NR NR NR NR NR 0.3 2.0 2.3
CLEVELAND STEEL CONTAINER CORP QUAKERTOWN PA N 18951 NR NR NR 0.0 2.0 2.0 0.0 4.0 4.1
SUPERPAC INC SOUTHAMPTON PA N 18966 NR NR NR NR NR NR 0.0 7.5 7.6
GREIF PACKAGING LLC WARMINSTER PA N 18974 0.4 0.7 1.1 2.1 1.5 3.6 3.1 3.0 6.0
GEORGE S COYNE CHEMICAL CO INC CROYDON PA N 19021 0.1 0.0 0.1 NR NR NR NR NR NR
UNIVAR USA INC MORRISVILLE
BRANCH
MORRISVILLE PA N 19067 0.0 0.0 0.0 NR NR NR 0.0 0.0 0.0
CARDONE INDUSTRIES PHILADELPHIA PA N 19120 2.0 8.1 10.1 1.4 5.6 6.9 0.8 3.8 4.7
SUN CHEMICAL CORP PHILADELPHIA PA N 19132 NR NR NR 0.0 0.2 0.2 0.0 0.2 0.2
CAN CORP OF AMERICA INC BLANDON PA N 19510 3.2 9.6 12.8 2.7 7.2 9.9 1.7 4.9 6.6
HIRSH INDUSTRIES INC DOVER DE N 19904 0.0 6.5 6.5 0.0 4.0 4.0 0.0 2.6 2.6
INDEPENDENT CAN CO BELCAMP MD N 21017 NR NR NR NR NR NR 0.0 1.5 1.5
CROWN FOOD PACKAGING BALTIMORE MD N 21221 8.5 25.5 34.0 8.5 25.5 34.1 8.6 25.9 34.5
TNEMEC CO INC BALTIMORE MD N 21222 NR NR NR 0.0 0.1 0.1 0.0 0.1 0.1
RUST‐OLEUM CORP IN MD WILLIAMSPORT MD N 21795 NR NR NR 0.0 0.0 0.0 0.1 0.2 0.3
PHOENIX COLOR CORP HAGERSTOWN MD N 21742 NR NR NR 11.0 0.0 11.0 8.5 0.0 8.5
VERTIS MANASSAS VA N 20109 NR NR NR 2.0 0.1 2.1 2.1 0.1 2.2
CARRY‐ON TRAILER CORP MONTROSS VA N 22520 NR NR NR 0.0 4.2 4.2 0.0 3.9 3.9
QG LLC WINCHESTER VIRGINIA WINCHESTER VA N 22603 3.2 0.1 3.4 5.5 0.3 5.7 3.9 0.2 4.1
DUPONT FRONT ROYAL PLANT FRONT ROYAL VA N 22630 0.0 0.2 0.2 NR NR NR 0.0 0.0 0.0
FISHER SCIENTIFIC INTERNATIONAL
MTN DIAGNOSTICS PLANT
MIDDLETOWN VA N 22645 0.0 0.0 0.0 NR NR NR 0.0 0.0 0.0
RR DONNELLEY HARRISONBURG VA Y 22802 36.1 4.3 40.4 38.8 3.6 42.4 45.2 3.1 48.3
MERCK SHARP & DOHME CORP ELKTON VI N 22827 0.7 0.8 1.5 0.2 0.2 0.4 NR NR NR
SOLITE LLC ARVONIA VI N 23004 0.0 0.0 0.0 NR NR NR NR NR NR
BALL METAL BEVERAGE CONTAINER
CORP
WILLIAMSBURG VA Y 23185 27.0 140.0 167.0 28.5 150.0 178.5 28.0 145.0 173.0
CADMUS SPECIALTY PUBLICATIONS RICHMOND VI N 23228 NR NR NR 2.2 0.1 2.3 NR NR NR
BOEHRINGER INGELHEIM CHEMICALS
INC
PETERSBURG VA N 23805 0.0 0.1 0.1 NR NR NR 0.0 0.0 0.0
VOLVO TRUCKS NORTH AMERICA DUBLIN VI N 24084 NR NR NR 2.2 2.4 4.6 NR NR NR
Page 3 of 50

Table C-4. Comparisons of 2009, 2010 and 2011 TRI Air Emissions Data for Certain Glycol Ethers to Site Specific Screening Values (Step B)
2009 2010 2011
Facility City State Completed Survey Zip Code
Fugitive Air Emissions
(tpy)
Point Source Air
Emissions (tpy)
Total Air Emissions
(tpy)
Fugitive Air Emissions
(tpy)
Point Source Air
Emissions (tpy)
Total Air Emissions
(tpy)
Fugitive Air Emissions
(tpy)
Point Source Air Emissions
(tpy)
Total Air Emissions
(tpy)
NEW MILLENNIUM BUILDING
SYSTEMS
SALEM VI N 24153 5.3 0.0 5.3 NR NR NR NR NR NR
VAUGHAN‐BASSETT FURNITURE CO
GALAX
GALAX VA N 24333 NR NR NR NR NR NR 0.7 4.2 5.0
ROYAL MOULDINGS LTD; MARION
VIRGINIA
MARION VA N 24354 0.4 9.2 9.6 0.7 13.1 13.8 0.4 8.5 8.9
GROTTOES PLASTICS PLANT GROTTOES VI N 24441 0.0 0.0 0.1 NR NR NR NR NR NR
DAVIS‐FROST INC LYNCHBURG VA N 24506 NR NR NR 0.1 0.0 0.1 0.2 0.0 0.2
BALL METAL FOOD CONTAINER CORP WEIRTON WV N 26062 25.5 11.5 37.0 14.5 8.0 22.5 10.0 3.3 13.3
CROWN CORK & SEAL CO (USA) INC
CROWN CLOSURE DIV
WEIRTON WV Y 26062 37.9 63.3 101.1 36.0 60.1 96.1 34.5 57.7 92.2
PRECOAT METALS WEIRTON WV N 26062 0.0 5.7 5.7 0.0 7.2 7.2 0.0 2.6 2.6
JELD‐WEN CRAIGSVILLE WV N 26205 NR NR NR 0.1 2.9 3.0 NR NR NR
REXAM BEVERAGE CAN CO RE:
WINSTON SALEM PLANT
WINSTON‐SALEM NC Y 27107 28.3 143.9 172.2 31.2 157.6 188.8 25.7 110.5 136.2
APOLLO CHEMICAL BURLINGTON NC N 27215 0.1 0.0 0.1 0.2 0.0 0.2 NR NR NR
ENGINEERED POLYMER SOLUTIONS
INC D/B/A VALSPAR COATINGS
HIGH POINT NC N 27261 0.1 0.3 0.3 NR NR NR NR NR NR
THOMAS BUILT BUSES INC HIGH POINT NC N 27263 NR NR NR 0.0 17.9 17.9 0.0 16.0 16.0
UNIVAR USA INC JAMESTOWN
FACILITY
JAMESTOWN NC N 27282 NR NR NR NR NR NR 0.0 0.0 0.0
MEADWESTVACO CONSUMER
PACKAGING GROUP LLC
MEBANE NC N 27302 11.3 0.0 11.3 NR NR NR 2.9 0.0 2.9
BALL METAL BEVERAGE CONTAINER
CORP
REIDSVILLE NC Y 27320 12.0 65.0 77.0 14.5 80.0 94.5 17.0 85.0 102.0
CREE INC DURHAM NC N 27703 1.3 4.2 5.5 0.0 6.6 6.6 0.0 0.1 0.1
AIR SYSTEM COMPONENTS LP TARBORO NC N 27886 0.2 14.8 14.9 0.2 16.6 16.8 0.2 16.4 16.5
PARKER HANNIFIN TECH SEAL DIV WILSON NC N 27893 NR NR NR 0.0 0.0 0.0 0.0 0.0 0.0
WIX FILTRATION CORP ‐ ALLEN PLANT GASTONIA NC N 28052 0.0 7.1 7.1 0.0 7.2 7.2 0.0 6.0 6.0
BERENFIELD CONTAINERS SE LTD HARRISBURG NC N 28075 0.0 6.7 6.7 0.0 31.5 31.5 0.0 5.4 5.4
CLARIANT CORP ‐ MOUNT HOLLY
WEST PLANT
MOUNT HOLLY NC N 28120 0.0 0.1 0.1 0.0 0.1 0.1 NR NR NR
QUANTUM COATINGS INC CHARLOTTE NC N 28273 0.1 0.1 0.3 NR NR NR 0.1 0.1 0.3
COMMERCIAL MERCHANDISING CORP CHARLOTTE NC N 28273 NR NR NR NR NR NR 0.3 0.3 0.6
DUPONT FAYETTEVILLE PLANT FAYETTEVILLE NC N 28306 NR NR NR 0.2 0.0 0.2 NR NR NR
SILGAN CAN CO MAXTON NC N 28364 3.0 6.2 9.1 3.2 7.0 10.2 3.1 6.7 9.8
AVERY DENNISON ‐ IBMD LENOIR LENOIR NC N 28645 3.7 1.6 5.3 5.7 1.3 7.0 4.7 1.1 5.7
Page 4 of 50

Table C-4. Comparisons of 2009, 2010 and 2011 TRI Air Emissions Data for Certain Glycol Ethers to Site Specific Screening Values (Step B)
2009 2010 2011
Facility City State Completed Survey Zip Code
Fugitive Air Emissions
(tpy)
Point Source Air
Emissions (tpy)
Total Air Emissions
(tpy)
Fugitive Air Emissions
(tpy)
Point Source Air
Emissions (tpy)
Total Air Emissions
(tpy)
Fugitive Air Emissions
(tpy)
Point Source Air Emissions
(tpy)
Total Air Emissions
(tpy)
ENGINEERED POLYMER SOLUTIONS
INC D/B/A VALSPAR COATINGS
STATESVILLE NC N 28625 0.1 0.1 0.2 NR NR NR NR NR NR
REXAM BEVERAGE CAN CO RE:
BISHOPVILLE SC FACILITY
BISHOPVILLE SC Y 29010 14.5 82.0 96.5 14.5 82.2 96.8 13.4 75.9 89.3
HOLCIM (US) INC HOLLY HILL PLANT HOLLY HILL SC N 29059 NR NR NR NR NR NR 0.0 0.1 0.1
SAFETY‐KLEEN SYSTEMS INC LEXINGTON SC N 29073 0.0 2.2 2.2 0.0 9.7 9.7 0.0 0.1 0.1
HUSQVARNA CONSUMER OUTDOOR
PRODUCTS
ORANGEBURG SC N 29116 0.1 5.5 5.6 0.1 6.4 6.6 0.1 6.5 6.6
HENKEL ENOREE SC N 29335 0.0 0.0 0.0 NR NR NR NR NR NR
NUCOR CORP VULCRAFT DIV FLORENCE SC N 29501 8.5 0.9 9.4 8.9 0.8 9.8 11.0 1.3 12.2
CROWN BEVERAGE PACKAGING CHERAW SC N 29520 19.6 2.5 22.1 21.4 2.7 24.1 21.2 2.7 23.9
AVX CORP CONWAY CONWAY SC N 29526 0.9 1.1 2.0 NR NR NR NR NR NR
AVX CORP MYRTLE BEACH MYRTLE BEACH SC Y 29577 7.2 2.1 9.4 3.4 2.5 5.9 1.7 1.0 2.7
DIVERSIFIED COATING SYSTEMS INC GREENVILLE SC N 29605 NR NR NR 0.0 0.3 0.3 0.1 0.3 0.4
OWENS CORNING VETROTEX LLC STARR SC N 29684 0.5 4.8 5.4 0.7 5.9 6.6 0.5 4.3 4.8
FUJIFILM MANUFACTURING USA INC GREENWOOD SC N 29649 NR NR NR NR NR NR 0.0 1.6 1.6
BMW MANUFACTURING CO LLC GREER SC Y 29651 3.5 67.1 70.6 1.8 89.4 91.2 2.5 150.0 152.5
COGNIS CORP MAULDIN PLANT MAULDIN SC N 29662 0.0 0.0 0.1 0.0 0.0 0.0 NR NR NR
SCHNEIDER ELECTRIC SENECA SC N 29678 NR NR NR NR NR NR 0.0 2.4 2.4
OMNOVA SOLUTIONS INC CHESTER SC N 29706 NR NR NR 0.0 0.0 0.0 0.0 0.0 0.0
AGY AIKEN LLC AIKEN SC N 29801 3.0 0.9 3.9 10.0 3.1 13.1 12.2 2.3 14.5
DECOSTAR INDUSTRIES INC CARROLLTON GA N 30117 0.1 1.3 1.4 NR NR NR 0.1 1.3 1.4
BALL CONTAINER LLC ROME CAN
PLANT
ROME GA Y 30161 34.5 15.0 49.5 33.5 22.0 55.5 31.0 13.5 44.5
HB FULLER COVINGTON GA N 30014 0.4 0.3 0.7 0.6 0.3 0.9 NR NR NR
BEHR PROCESS CORP ATLANTA MC DONOUGH GA N 30253 NR NR NR NR NR NR 0.3 0.0 0.3
ECOLAB INC MC DONOUGH GA N 30253 0.0 0.0 0.1 0.0 0.0 0.1 NR NR NR
ECOLAB INC MC DONOUGH GA N 30253 NR NR NR NR NR NR 0.0 0.0 0.0
BRIGGS & STRATTON POWER
PRODUCTS MCDONOUGH
OPERATIONS
MC DONOUGH GA N 30253 NR NR NR 0.0 6.7 6.7 0.0 9.0 9.0
TOPPAN INTERAMERICA INC MC DONOUGH GA N 30253 0.0 8.7 8.7 0.0 13.7 13.7 0.0 11.2 11.2
QUAD/GRAPHICS INC THE ROCK GA N 30285 NR NR NR NR NR NR 2.3 0.1 2.4
FLINT GROUP NORTH AMERICA ATLANTA GA N 30339 0.1 0.1 0.2 0.1 0.1 0.2 NR NR NR
UNIVAR USA INC DORAVILLE FACILITY DORAVILLE GA N 30362 NR NR NR NR NR NR 0.0 0.0 0.0
CARRY‐ON TRAILER CORP LAVONIA GA N 30553 NR NR NR 0.0 11.2 11.2 0.0 17.3 17.3
POWER PARTNERS INC ATHENS GA N 30607 0.0 10.8 10.8 0.0 2.4 2.4 0.0 5.2 5.2
Page 5 of 50

Table C-4. Comparisons of 2009, 2010 and 2011 TRI Air Emissions Data for Certain Glycol Ethers to Site Specific Screening Values (Step B)
2009 2010 2011
Facility City State Completed Survey Zip Code
Fugitive Air Emissions
(tpy)
Point Source Air
Emissions (tpy)
Total Air Emissions
(tpy)
Fugitive Air Emissions
(tpy)
Point Source Air
Emissions (tpy)
Total Air Emissions
(tpy)
Fugitive Air Emissions
(tpy)
Point Source Air Emissions
(tpy)
Total Air Emissions
(tpy)
BEAULIEU OF AMERICA PLANT 560‐
MODEL
DALTON GA N 30721 0.0 1.1 1.1 0.0 1.1 1.1 NR NR NR
FIBRO CHEM LLC DALTON GA N 30720 0.1 0.0 0.1 NR NR NR NR NR NR
YKK AP AMERICA INC DUBLIN GA N 31021 9.5 0.4 9.9 9.3 0.3 9.6 9.0 0.4 9.4
ZSCHIMMER & SCHWARZ MILLEDGEVILLE GA N 31061 NR NR NR 0.0 0.4 0.4 0.0 0.4 0.4
U.S. AIR FORCE ROBINS AFB GA ROBINS AFB GA N 31098 1.6 0.9 2.5 2.4 0.4 2.8 NR NR NR
BWAY CORP HOMERVILLE GA N 31634 19.2 0.4 19.6 37.1 8.9 46.0 6.0 1.8 7.8
KIA MOTORS MANUFACTURING OF
GEORGIA
WEST POINT GA N 31833 NR NR NR 0.1 2.7 2.7 0.1 4.9 5.0
COMPLEMENTARY COATINGS CORP EDGEWATER FL N 32132 1.6 0.0 1.6 NR NR NR NR NR NR
METAL CONTAINER CORP ‐
JACKSONVILLE CAN PLANT
JACKSONVILLE FL N 32254 6.9 54.6 61.4 7.0 28.0 35.0 6.5 19.2 25.6
RENESSENZ LLC JACKSONVILLE JACKSONVILLE FL N 32208 NR NR NR NR NR NR 0.0 0.0 0.0
U.S. NAVY NAVAL AIR STATION
JACKSONVILLE
JACKSONVILLE FL N 32212 NR NR NR 0.1 0.0 0.1 NR NR NR
UNIVAR USA INC JACKSONVILLE FA
CILITY
JACKSONVILLE FL N 32254 NR NR NR 0.0 0.0 0.0 0.0 0.0 0.0
CROWN FOOD PACKAGING WINTER GARDEN FL N 34787 1.3 4.4 5.8 NR NR NR NR NR NR
SPIRALKOTE FLEXIBLE PACKAGING ORLANDO FL N 32837 NR NR NR 0.0 1.2 1.2 0.0 0.9 0.9
SOUTH FLORIDA MATERIALS CORP
DBA VECENERGY‐PORT EVERGLADES
FT LAUDERDALE FL N 33316 NR NR NR NR NR NR 0.1 0.0 0.1
METAL INDUSTRIES INC ‐ BUSHNELL BUSHNELL FL N 33513 0.1 15.7 15.8 0.1 14.8 14.9 0.1 10.6 10.7
BALL METAL BEVERAGE CONTAINER
CORP
TAMPA FL N 33617 11.5 15.5 27.0 9.0 15.0 24.0 8.0 9.0 17.0
UNIVAR USA INC TAMPA FACILITY TAMPA FL N 33619 NR NR NR 0.0 0.0 0.0 0.0 0.0 0.0
VERTIS COMMUNICATIONS TAMPA FL N 33611 NR NR NR 1.8 0.2 1.9 1.8 0.2 2.0
GSP MARKETING TECHNOLOGIES CLEARWATER FL N 33760 0.4 0.0 0.4 NR NR NR NR NR NR
HEXION SPECIALTY CHEMICALS INC LAKELAND FL N 33801 9.3 0.0 9.3 8.4 0.0 8.4 8.4 0.0 8.4KEYMARK CORP OF FLORIDA LAKELAND FL N 33810 0.5 9.4 9.8 0.6 11.8 12.4 0.5 8.5 9.0
SEWELL PRODUCTS OF FLORIDA LLC AUBURNDALE FL N 33823 NR NR NR NR NR NR 0.4 0.0 0.4
ONESOURCE COIL COATERS CLEARWATER FL N 33760 NR NR NR 0.0 0.1 0.1 NR NR NR
DYCO PAINTS INC CLEARWATER FL N 33760 0.0 0.1 0.1 0.0 0.2 0.2 NR NR NR
M&B HANGERS LEEDS AL N 35094 2.4 9.6 12.0 2.7 10.9 13.7 2.7 10.8 13.5
HONDA MANUFACTURING OF
ALABAMA LLC
LINCOLN AL N 35096 0.2 16.6 16.8 0.5 23.5 24.0 0.5 24.8 25.3
AKZO NOBEL COATINGS INC BIRMINGHAM AL N 35234 11.1 0.2 11.3 9.8 0.1 9.9 12.2 0.2 12.4
ASHLAND DISTRIBUTION BIRMINGHAM AL N 35234 0.3 0.0 0.3 0.4 0.0 0.4 NR NR NR
Page 6 of 50

Table C-4. Comparisons of 2009, 2010 and 2011 TRI Air Emissions Data for Certain Glycol Ethers to Site Specific Screening Values (Step B)
2009 2010 2011
Facility City State Completed Survey Zip Code
Fugitive Air Emissions
(tpy)
Point Source Air
Emissions (tpy)
Total Air Emissions
(tpy)
Fugitive Air Emissions
(tpy)
Point Source Air
Emissions (tpy)
Total Air Emissions
(tpy)
Fugitive Air Emissions
(tpy)
Point Source Air Emissions
(tpy)
Total Air Emissions
(tpy)
MICHELIN NORTH AMERICA INC TUSCALOOSA AL N 35401 0.0 0.0 0.0 0.0 0.0 0.0 NR NR NR
RECTICEL INTERIORS NORTH AMERICA
LLC
TUSCALOOSA AL N 35401 0.0 0.0 0.0 0.0 0.0 0.0 NR NR NR
MERCEDES‐BENZ US INTERNATIONAL
INC
VANCE AL N 35490 2.3 9.9 12.2 0.4 25.6 25.9 0.5 27.8 28.3
3M CO ‐ GUIN GUIN AL N 35563 0.0 9.5 9.5 0.0 12.8 12.8 NR NR NR
3M CO ‐ GUIN GUIN AL N 35563 NR NR NR NR NR NR 0.0 12.5 12.5
ITW SEXTON INC DECATUR AL N 35603 NR NR NR NR NR NR 1.0 18.3 19.3
HART & COOLEY INC HUNTSVILLE AL N 35811 0.9 13.4 14.3 0.8 12.8 13.6 0.6 7.9 8.5
MUELLER CO ALBERTVILLE AL N 35950 6.9 6.9 13.8 NR NR NR NR NR NR
NUCOR CORP VULCRAFT DIV FORT PAYNE AL N 35967 5.1 1.8 6.9 6.1 3.6 9.7 3.7 2.7 6.3
FLINT GROUP NORTH AMERICA CORP ANNISTON AL N 36207 0.3 0.3 0.5 0.2 0.2 0.4 NR NR NR
DUNBARTON CORP REDIFRAME DIV DOTHAN AL N 36303 NR NR NR NR NR NR 0.0 5.3 5.3
RUSKIN CO GENEVA AL N 36340 0.0 4.5 4.5 0.0 5.1 5.1 0.1 12.7 12.8
INTERNATIONAL PAPER PINE HILL MILL PINE HILL AL N 36769 NR NR NR NR NR NR 0.1 0.0 0.1
STATE INDUSTRIES INC ASHLAND CITY TN N 37015 NR NR NR 0.1 10.3 10.4 0.1 9.3 9.4
WORLDCOLOR CLARKSVILLE TN N 37040 2.4 0.1 2.5 3.8 0.6 4.4 NR NR NR
SANFORD LP SHELBYVILLE TN N 37160 0.1 2.2 2.4 NR NR NR NR NR NR
NISSAN NA INC SMYRNA
MANUFACTURING PLANT
SMYRNA TN N 37167 1.4 31.9 33.3 1.3 34.3 35.6 0.0 30.7 30.7
GM SPRING HILL MANUFACTURING SPRING HILL TN N 37174 0.2 18.0 18.2 0.0 3.3 3.3 NR NR NR
QUAD GRAPHICS NASHVILLE NASHVILLE TN N 37207 NR NR NR 0.2 0.0 0.2 6.4 0.7 7.1
ASHLAND DISTRIBUTION NASHVILLE TN N 37209 0.2 0.0 0.3 NR NR NR NR NR NR
NASHVILLE WIRE PRODUCTS NASHVILLE TN N 37218 0.7 6.5 7.2 1.7 15.0 16.7 16.5 1.9 18.4
MAYTAG CORP CLEVELAND COOKING
PRODUCTS PLANT 1
CLEVELAND TN N 37311 0.0 8.6 8.6 0.0 6.3 6.3 0.0 6.3 6.3
LA‐Z‐BOY TENNESSEE DAYTON TN N 37321 0.0 7.8 7.8 0.0 8.6 8.6 0.0 6.6 6.6
BATESVILLE MANUFACTURING INC MANCHESTER TN N 37355 1.1 20.7 21.8 1.0 19.3 20.3 1.7 32.5 34.2
SANFORD LP LIQUID
MANUFACTURING & TECHNOLOGY
CENTER
MANCHESTER TN N 37355 NR NR NR 0.1 0.1 0.3 0.0 0.4 0.4
ALSTOM POWER INC CHATTANOOGA
BOILERS
CHATTANOOGA TN N 37402 13.8 0.0 13.8 16.7 0.0 16.7 23.9 0.0 23.9
VOLKSWAGEN GROUP OF AMERICA
CHATTANOOGA OPERATIONS LLC
CHATTANOOGA TN N 37416 NR NR NR NR NR NR 0.0 11.0 11.0
STAR BUILDING SYSTEMS ELIZABETHTON TN N 37643 0.0 1.0 1.0 NR NR NR NR NR NR
Page 7 of 50

Table C-4. Comparisons of 2009, 2010 and 2011 TRI Air Emissions Data for Certain Glycol Ethers to Site Specific Screening Values (Step B)
2009 2010 2011
Facility City State Completed Survey Zip Code
Fugitive Air Emissions
(tpy)
Point Source Air
Emissions (tpy)
Total Air Emissions
(tpy)
Fugitive Air Emissions
(tpy)
Point Source Air
Emissions (tpy)
Total Air Emissions
(tpy)
Fugitive Air Emissions
(tpy)
Point Source Air Emissions
(tpy)
Total Air Emissions
(tpy)
ARMSTRONG HARDWOOD FLOORING
CO
ONEIDA TN N 37841 0.0 6.6 6.6 0.0 5.2 5.2 0.0 4.7 4.7
VESTAL MANUFACTURING
ENTERPRISES INC
SWEETWATER TN N 37874 10.7 0.0 10.7 12.2 0.0 12.2 13.1 0.0 13.1
ROHM & HAAS CHEMICALS LLC
KNOXVILLE SITE
KNOXVILLE TN N 37921 0.0 0.0 0.0 NR NR NR NR NR NR
TEKNOR APEX TENNESSEE CO (AKA
HAYWOOD CO)
BROWNSVILLE TN N 38012 NR NR NR NR NR NR 0.0 6.7 6.7
EXCEL POLYMERS LLC DYERSBURG TN N 38024 0.0 0.0 0.0 0.0 0.0 0.0 NR NR NR
WORLDCOLOR ‐ DYERSBURG DIV DYERSBURG TN N 38024 6.3 0.1 6.4 1.4 0.1 1.5 NR NR NR
JOHNSON BRYCE INC MEMPHIS TN N 38109 NR NR NR 0.0 0.0 0.0 NR NR NR
VALERO REFINING CO ‐ TENNESSEE
LLC
MEMPHIS TN N 38109 NR NR NR 0.0 0.0 0.0 0.0 0.0 0.0
ASHLAND DISTRIBUTION MEMPHIS TN N 38113 0.1 0.0 0.1 0.1 0.0 0.1 NR NR NR
SONOCO PHOENIX ‐ PRESIDENTS
ISLAND
MEMPHIS TN N 38113 0.0 6.8 6.8 0.0 3.1 3.1 0.0 1.7 1.7
W M BARR & CO MEMPHIS TN N 38113 0.0 0.1 0.1 NR NR NR NR NR NR
BRYCE CO LLC MEMPHIS TN N 38118 0.0 0.0 0.0 0.0 0.1 0.1 NR NR NR
UNIVAR USA INC MEMPHIS MEMPHIS TN N 38118 0.0 0.0 0.0 NR NR NR NR NR NR
WM BARR & CO INC MEMPHIS TN N 38113 NR NR NR 0.0 0.1 0.1 0.0 0.1 0.1
GOODYEAR TIRE & RUBBER CO UNION CITY TN N 38261 0.0 0.0 0.0 NR NR NR NR NR NR
KOHLER CO UNION CITY TN N 38261 NR NR NR NR NR NR 0.5 4.8 5.3
CECO DOOR PRODUCTS MILAN TN N 38358 5.3 5.3 10.6 10.1 10.1 20.2 8.4 8.4 16.8
VAN CAN CO TRENTON TN N 38382 NR NR NR NR NR NR 0.0 0.4 0.4
CROWN BEVERAGE PACKAGING BATESVILLE MS N 38606 22.5 2.7 25.3 19.6 2.9 22.5 19.3 2.9 22.2
KAWNEER CO INC HERNANDO MS N 38632 0.2 2.0 2.2 NR NR NR NR NR NR
VALVOLINE HERNANDO MS N 38632 NR NR NR NR NR NR 0.0 0.0 0.1
REXAM BEVERAGE CAN CO OLIVE
BRANCH FACILITY
OLIVE BRANCH MS Y 38654 19.6 68.4 88.1 20.6 56.3 76.8 18.8 63.5 82.3
QUEBECOR WORLD OLIVE BRANCH MS N 38654 0.4 3.7 4.1 NR NR NR NR NR NR
SHERWIN‐WILLIAMS CO OLIVE BRANCH MS N 38654 0.0 0.0 0.0 NR NR NR NR NR NR
HUNTER DOUGLAS TUPELO CENTER SHANNON MS N 38868 0.3 5.5 5.8 0.3 5.9 6.2 0.3 5.9 6.2
NISSAN NORTH AMERICA INC CANTON
MS
CANTON MS N 39046 2.0 24.6 26.6 2.5 3.8 6.4 7.6 2.0 9.6
ANDERSON TULLY LUMBER CO
WALTERSVILLE LUMBER MILL
VICKSBURG MS N 39181 NR NR NR 10.4 0.0 10.4 14.1 0.0 14.1
METAL COATERS JACKSON MS N 39272 0.0 5.1 5.1 0.0 4.0 4.0 0.0 4.5 4.5
PRECOAT METALS JACKSON MS N 39272 12.3 1.3 13.6 10.1 0.9 11.0 9.9 1.0 10.9
ESCO CORP NEWTON MS N 39345 6.3 0.0 6.3 8.6 0.0 8.6 9.6 0.0 9.6
CHEVRON PRODUCTS CO
PASCAGOULA REFINERY
PASCAGOULA MS N 39581 NR NR NR 0.1 0.0 0.1 NR NR NR
Page 8 of 50

Table C-4. Comparisons of 2009, 2010 and 2011 TRI Air Emissions Data for Certain Glycol Ethers to Site Specific Screening Values (Step B)
2009 2010 2011
Facility City State Completed Survey Zip Code
Fugitive Air Emissions
(tpy)
Point Source Air
Emissions (tpy)
Total Air Emissions
(tpy)
Fugitive Air Emissions
(tpy)
Point Source Air
Emissions (tpy)
Total Air Emissions
(tpy)
Fugitive Air Emissions
(tpy)
Point Source Air Emissions
(tpy)
Total Air Emissions
(tpy)
INOAC PACKAGING GROUP BARDSTOWN KY N 40004 0.0 0.0 0.0 NR NR NR NR NR NR
KELLEY TECHNICAL COATINGS INC LOUISVILLE KY N 40210 NR NR NR NR NR NR 0.4 0.0 0.4
ASHLAND DISTRIBUTION LOUISVILLE KY N 40211 0.1 0.0 0.1 NR NR NR NR NR NR
FORD LOUISVILLE ASSEMBLY LOUISVILLE KY N 40213 0.1 12.0 12.1 0.2 1.6 1.8 NR NR NR
KELLEY TECHNICAL COATINGS INC LOUISVILLE KY N 40210 NR NR NR NR NR NR 1.3 0.0 1.3
FORD MOTOR CO KENTUCKY TRUCK
PLANT
LOUISVILLE KY Y 40241 0.9 32.5 33.4 2.4 33.0 35.4 3.3 41.0 44.3
TOYOTA MOTOR MANUFACTURING
KENTUCKY INC
GEORGETOWN KY N 40324 0.1 5.4 5.5 0.4 12.3 12.7 0.2 9.2 9.4
MODINE MANUFACTURING CO INC HARRODSBURG KY N 40330 1.2 10.8 12.0 NR NR NR NR NR NR
GUARDIAN AUTOMOTIVE ‐
MOREHEAD PLANT
MOREHEAD KY N 40351 0.0 0.2 0.2 NR NR NR NR NR NR
CENTRAL MOTOR WHEEL OF AMERICA
(DBA CMWA)
PARIS KY N 40361 0.0 0.1 0.1 0.0 0.1 0.1 NR NR NR
HITACHI AUTOMOTIVE SYSTEMS
AMERICAS INC‐BEREA KY
BEREA KY N 40403 0.2 11.1 11.3 0.3 16.1 16.5 0.1 14.7 14.8
SQUARE D CO LEXINGTON KY N 40511 0.0 9.0 9.0 0.0 9.5 9.5 0.1 9.0 9.1
GREIF PACKAGING LLC FLORENCE KY N 41042 1.4 26.2 27.5 1.7 33.2 34.9 3.5 31.3 34.7
MAGNI INDUSTRIES INC INDEPENDENCE KY N 41051 NR NR NR 0.1 0.1 0.3 NR NR NR
AIR PRODUCTS & CHEMICALS INC CALVERT CITY KY N 42029 NR NR NR 0.0 0.0 0.0 NR NR NR
TRAD NA INC HOPKINSVILLE KY N 42240 0.0 5.1 5.1 0.0 0.5 0.5 NR NR NR
LOGAN ALUMINUM INC RUSSELLVILLE KY N 42276 0.0 5.5 5.5 0.0 5.4 5.4 0.0 4.9 4.9
PRECOAT METALS HAWESVILLE KY N 42348 0.0 1.0 1.0 0.0 0.6 0.6 0.0 5.2 5.2
ECOLAB HEBRON OH N 43025 0.0 0.0 0.0 NR NR NR NR NR NR
HONDA OF AMERICA
MANUFACTURING INC
MARYSVILLE OH N 43040 10.1 34.8 44.9 3.8 38.5 42.3 2.7 37.5 40.2
JOHNSON WELDED PRODUCTS INC URBANA OH N 43078 0.0 14.1 14.1 0.0 14.2 14.2 NR NR NR
BALL CONTAINER LLC ‐ COLUMBUS
CAN PLANT
COLUMBUS OH Y 43213 20.0 50.0 70.0 11.5 65.0 76.5 12.0 70.0 82.0
WHIRLPOOL CORP MARION D IVISION MARION OH Y 43302 0.1 55.8 55.8 0.1 57.2 57.2 0.1 51.4 51.5
HONDA OF AMERICA
MANUFACTURING INC
EAST LIBERTY OH N 43319 2.0 27.5 29.5 2.2 45.0 47.2 2.3 36.0 38.3
WHIRLPOOL CORP ‐ CLYDE DIV CLYDE OH N 43410 1.1 34.3 35.4 0.7 22.6 23.4 NR NR NR
REXAM BEVERAGE CAN CO RE:
FREMONT PLANT
FREMONT OH Y 43420 17.9 102.2 120.1 15.9 90.4 106.3 19.0 107.9 127.0
ELECTROPRIME INC ROSSFORD OH N 43460 0.0 6.0 6.0 0.0 7.4 7.4 0.0 7.8 7.8
SILGAN CAN CO NAPOLEON OH N 43545 2.4 6.6 9.0 2.3 6.0 8.3 5.4 7.4 12.7
REXAM BEVERAGE CAN CO RE:
WHITEHOUSE PLANT
WHITEHOUSE OH Y 43571 16.5 31.6 48.1 23.2 44.6 67.8 24.9 51.5 76.3
Page 9 of 50

Table C-4. Comparisons of 2009, 2010 and 2011 TRI Air Emissions Data for Certain Glycol Ethers to Site Specific Screening Values (Step B)
2009 2010 2011
Facility City State Completed Survey Zip Code
Fugitive Air Emissions
(tpy)
Point Source Air
Emissions (tpy)
Total Air Emissions
(tpy)
Fugitive Air Emissions
(tpy)
Point Source Air
Emissions (tpy)
Total Air Emissions
(tpy)
Fugitive Air Emissions
(tpy)
Point Source Air Emissions
(tpy)
Total Air Emissions
(tpy)
DECORATIVE PANELS INTERNATIONA L TOLEDO OH N 43607 7.6 0.0 7.6 13.3 0.0 13.3 13.1 0.0 13.1
MAGNA STEYR NORTH AMERICA TOLEDO OH N 43608 3.0 21.0 24.0 4.7 33.0 37.7 NR NR NR
DAIMLERCHRYSLER CORP TOLEDO
ASSEMBLY PLANT
TOLEDO OH N 43612 0.4 0.9 1.3 0.5 1.1 1.6 2.1 14.5 16.6
CROWN FOOD PACKAGING TOLEDO OH N 43612 2.8 8.4 11.2 3.5 10.4 13.8 3.2 9.5 12.7
AK STEEL CORP ‐ ZANESVI LLE WORKS ZANESVILLE OH N 43701 0.0 2.5 2.5 0.0 4.7 4.7 0.0 6.0 6.0
INTERNATIONAL PAINT LLC BEREA OH N 44017 NR NR NR 0.0 0.0 0.0 0.0 0.0 0.0
EXCEL POLYMERS LLC BURTON OH N 44021 NR NR NR 0.0 0.0 0.0 0.0 0.0 0.0
SCOT LABORATORIES CHAGRIN FALLS OH N 44023 0.0 0.0 0.0 NR NR NR NR NR NR
GOLD KEY PROCESSING INC MIDDLEFIELD OH N 44062 NR NR NR 0.1 0.0 0.1 NR NR NR
NORTH COAST CONTAINER CORP CLEVELAND OH N 44105 0.0 16.1 16.1 0.0 21.2 21.2 0.0 17.3 17.3
NPA COATINGS INC CLEVELAND OH N 44102 NR NR NR NR NR NR 0.0 0.1 0.1
UNIVAR USA INC STRONGSVILLE OH N 44136 NR NR NR 0.0 0.0 0.0 0.1 0.1 0.3
FERRO CORP WALTON HILLS
OPERATIONS
WALTON HILLS OH N 44146 NR NR NR 0.0 0.0 0.0 0.0 0.0 0.0
GOJO INDUSTRIES INC CUYAHOGA FALLS OH N 44223 NR NR NR 0.0 0.0 0.0 0.0 0.0 0.0
HESS PRINT SOLUTIONS BRIMFIELD OH N 44240 9.0 0.0 9.0 NR NR NR 5.0 0.0 5.0
PLASTI‐KOTE INC MEDINA OH N 44258 NR NR NR 0.0 0.0 0.0 0.1 0.0 0.1
3M CO ‐ MEDINA MEDINA OH N 44256 NR NR NR NR NR NR 0.0 0.1 0.2
HARWICK STANDARD DISTRIBUTION
CORP
AKRON OH N 44305 NR NR NR 0.0 0.0 0.0 0.0 0.0 0.0
CANFIELD METAL COATING CORP CANFIELD OH N 44406 0.0 1.1 1.1 NR NR NR 0.0 2.0 2.0
GENERAL MOTORS CORP LORDSTOWN
COMPLEX
LORDSTOWN OH N 44481 12.0 0.2 12.2 3.2 0.8 3.9 4.0 1.1 5.0
TECNOCAP LLC WARREN OH N 44483 2.1 3.7 5.8 1.6 5.7 7.3 1.6 5.8 7.4
NOVELIS CORP WARREN OH N 44483 4.7 11.3 15.9 3.5 8.6 12.1 4.6 10.4 15.0
MAHONING PAINT CORP YOUNGSTOWN OH N 44502 0.0 0.0 0.0 NR NR NR NR NR NR
EPCO EXTRUSION PAINTING CO BOARDMAN OH N 44512 0.8 8.4 9.2 NR NR NR NR NR NR
SPECTRUM METAL FINISHING YOUNGSTOWN OH N 44512 0.4 18.1 18.4 0.3 16.2 16.5 0.4 0.4 0.8
GE WATER & PROCESS TECHNOLOGIES NEW
PHILADELPHIA
OH N 44663 NR NR NR 0.0 0.0 0.0 0.0 0.0 0.0
ARTIFLEX MANUFACTURING LLC
GERSTCO DIV WOOSTER
WOOSTER OH N 44691 0.3 10.5 10.8 0.4 13.4 13.8 0.4 13.0 13.4
MAYFLOWER VEHICLE SYSTEMS INC
NORWALK FACILITY
NORWALK OH N 44857 0.0 10.0 10.0 NR NR NR NR NR NR
AMERICAN COLORS INC DISPERSION
PLANT SANDUSKY OHIO
SANDUSKY OH N 44870 NR NR NR 0.1 0.0 0.1 NR NR NR
Page 10 of 50

Table C-4. Comparisons of 2009, 2010 and 2011 TRI Air Emissions Data for Certain Glycol Ethers to Site Specific Screening Values (Step B)
2009 2010 2011
Facility City State Completed Survey Zip Code
Fugitive Air Emissions
(tpy)
Point Source Air
Emissions (tpy)
Total Air Emissions
(tpy)
Fugitive Air Emissions
(tpy)
Point Source Air
Emissions (tpy)
Total Air Emissions
(tpy)
Fugitive Air Emissions
(tpy)
Point Source Air Emissions
(tpy)
Total Air Emissions
(tpy)
RR DONNELLEY & SONS CO WILLARD OH N 44890 6.1 2.4 8.4 7.5 2.4 9.9 6.9 1.9 8.7
NEWMAN TECHNOLOGY INC MANSFIELD OH N 44903 NR NR NR 0.0 0.0 0.0 NR NR NR
FLINT GROUP NORTH AMERICA CORP LEBANON OH N 45036 NR NR NR 0.6 0.0 0.6 0.6 0.0 0.6
WORLDCOLOR LEBANON DIV LEBANON OH N 45036 2.9 0.4 3.4 3.1 0.1 3.2 NR NR NR
BERENFIELD CONTAINERS INC MASON MASON OH N 45040 0.4 7.5 7.9 0.1 11.7 11.8 0.1 12.6 12.7
PROCTER & GAMBLE CO GPDF CINCINNATI OH N 45217 NR NR NR NR NR NR 0.0 0.0 0.0
HB FULLER CO BLUE ASH OH N 45242 0.5 0.0 0.5 NR NR NR NR NR NR
INGERSOLL‐RAND CO STEELCRAFT DIV CINCINNATI OH N 45242 2.5 7.9 10.5 5.7 19.9 25.6 7.5 25.0 32.5
UNIVAR USA INC‐ CINCINNATI OH
BRANCH
CINCINNATI OH N 45246 0.0 0.0 0.0 0.0 0.0 0.0 NR NR NR
ALCOA HOME EXTERIORS INC SIDNEY OH N 45365 0.7 4.0 4.6 0.8 4.2 5.0 0.7 11.5 12.2
AMERICAN TRIM LLC SIDNEY OH N 45365 0.0 11.2 11.2 0.0 12.7 12.7 0.0 11.9 11.9
NAVISTAR INC SPRINGFIELD OH N 45502 0.6 5.0 5.6 0.6 5.5 6.1 0.4 3.4 3.8
MASCO RETAIL CABINET GROUP LLC WAVERLY OH N 45690 0.0 0.4 0.4 0.0 1.2 1.2 NR NR NR
BALL METAL BEVERAGE CONTAINER
CORP
FINDLAY OH Y 45840 24.5 130.0 154.5 25.0 130.0 155.0 25.5 135.0 160.5
WHIRLPOOL CORP FINDLAY DIV FINDLAY OH N 45840 2.3 20.6 22.8 2.2 20.1 22.4 2.2 19.4 21.5
J&M MANUFACTURING CO INC FORT RECOVERY OH N 45846 0.0 1.7 1.7 NR NR NR NR NR NR
LAFARGE NA (INCLUDING SYSTECH
ENV CORP)
PAULDING OH N 45879 NR NR NR 0.0 0.0 0.0 NR NR NR
AAP ST MARYS CORP SAINT MARYS OH N 45885 0.0 4.7 4.7 0.0 6.7 6.7 0.0 7.5 7.5
DSM NEORESINS INC FRANKFORT IN N 46041 0.0 0.0 0.0 NR NR NR NR NR NR
CROWN EQUIPMENT CORP GREENCASTLE IN N 46135 0.0 3.1 3.1 NR NR NR 1.4 5.4 6.8
PRECOAT METALS GREENFIELD IN N 46140 0.0 18.3 18.4 0.0 24.3 24.3 0.0 7.8 7.8
CAR CARE PACKAGING LLC INDIANAPOLIS IN N 46203 0.0 0.0 0.0 NR NR NR NR NR NR
IVC INDUSTRIAL COATINGS INC INDIANAPOLIS IN N 46218 0.3 1.2 1.5 0.2 0.9 1.1 NR NR NR
UNIVAR USA INC ‐ INDIANAPOLIS INDIANAPOLIS IN N 46219 0.0 0.0 0.0 0.0 0.0 0.0 NR NR NR
MARATHON PETROLEUM CO ‐
SPEEDWAY IN TERMINAL
INDIANAPOLIS IN N 46222 NR NR NR 0.0 0.0 0.0 0.0 0.0 0.0
ENGINEERED POLYMER SOLUTIONS
INC D/B/A VALSPAR COATINGS
INDIANAPOLIS IN N 46225 0.0 0.0 0.0 0.0 0.0 0.0 NR NR NR
DYNALOY LLC INDIANAPOLIS IN N 46226 0.0 0.0 0.0 0.0 0.0 0.0 NR NR NR
UNIVAR USA INC INDIANAPOLIS WEST
BRANCH
INDIANAPOLIS IN N 46268 0.0 0.0 0.0 NR NR NR NR NR NR
TRADEBE TREATMENT & RECYCLING
LLC
EAST CHICAGO IN N 46312 NR NR NR NR NR NR 0.5 0.0 0.5
Page 11 of 50

Table C-4. Comparisons of 2009, 2010 and 2011 TRI Air Emissions Data for Certain Glycol Ethers to Site Specific Screening Values (Step B)
2009 2010 2011
Facility City State Completed Survey Zip Code
Fugitive Air Emissions
(tpy)
Point Source Air
Emissions (tpy)
Total Air Emissions
(tpy)
Fugitive Air Emissions
(tpy)
Point Source Air
Emissions (tpy)
Total Air Emissions
(tpy)
Fugitive Air Emissions
(tpy)
Point Source Air Emissions
(tpy)
Total Air Emissions
(tpy)
SILGAN CONTAINERS
MANUFACTURING CORP
HAMMOND IN N 46320 0.0 6.0 6.0 0.0 6.3 6.3 0.0 5.9 5.9
PRECOAT METALS LA PORTE IN N 46350 0.0 5.0 5.0 0.0 7.7 7.7 0.0 6.9 6.9
SILGAN CONTAINERS
MANUFACTURING CORP
LA PORTE IN Y 46350 12.5 54.5 67.0 12.9 55.5 68.4 12.2 53.2 65.4
AVERY DENNISON PFD SCHERERVILLE IN N 46375 0.1 0.0 0.1 0.0 0.0 0.0 NR NR NR
BP PRODUCTS NORTH AMERICA
WHITING
WHITING IN N 46394 NR NR NR 0.0 0.0 0.0 0.0 0.0 0.0
ET PRODUCTS CO INC BREMEN IN N 46506 0.0 0.3 0.3 0.0 0.3 0.3 NR NR NR
MASTERBRAND CABINETS INC GOSHEN IN N 46526 NR NR NR NR NR NR 0.0 4.2 4.2
MIDDLEBURY HARDWOOD PRODUCTS MIDDLEBURY IN N 46540 NR NR NR 0.0 3.2 3.2 0.0 5.4 5.4
AM GENERAL LLC MISHAWAKA IN N 46545 NR NR NR 0.0 8.2 8.2 NR NR NR
WARSAW CHEMICAL CO INC WARSAW IN N 46580 0.0 0.0 0.1 0.0 0.0 0.1 NR NR NR
BIOLAB INC ASHLEY IN N 46705 NR NR NR 0.0 0.0 0.0 NR NR NR
STEEL DYNAMICS INC BUTLER IN N 46721 0.0 0.0 0.0 0.0 0.0 0.0 NR NR NR
THERMA‐TRU CORP BUTLER IN N 46721 0.0 31.0 31.0 0.0 29.8 29.8 0.0 24.4 24.4
GM TRUCK GROUP FORT WAYNE
ASSEMBLY
ROANOKE IN N 46783 0.5 7.0 7.5 0.7 11.5 12.2 0.7 14.5 15.2
NUCOR VULCRAFT GROUP SAINT JOE
DIV
SAINT JOE IN N 46785 4.2 1.7 5.9 3.6 2.8 6.4 2.9 5.4 8.2
AURORA CASKET CO INC AURORA IN N 47001 0.0 107.6 107.6 0.0 68.2 68.2 NR NR NR
BATESVILLE MANUFACTURING INC ‐
DOLL PLANT
BATESVILLE IN N 47006 0.2 3.3 3.5 0.3 5.0 5.3 0.3 5.1 5.4
ENKEI AMERICA INC COLUMBUS IN N 47201 0.0 5.3 5.3 0.0 7.0 7.0 0.0 6.0 6.0
PATRIOT PAINT LLC PORTLAND IN N 47371 NR NR NR 0.4 0.0 0.4 0.4 0.0 0.4
GEA BPO LLC BLOOMINGTON IN N 47404 0.0 11.0 11.0 0.0 11.0 11.0 0.0 6.5 6.5
ASHLEY INDUSTRIAL MOLDING INC ASHLEY IN N 46705 0.5 4.4 4.8 1.1 9.1 10.1 0.6 5.4 6.0
SABIC INNOVATIVE PLASTICS MT
VERNON LLC
MOUNT VERNON IN N 47620 2.7 1.7 4.4 1.3 0.8 2.1 3.2 2.1 5.3
ALCOA INC ‐ WARRICK OPERATIONS NEWBURGH IN N 47629 0.0 14.5 14.5 0.0 7.0 7.0 0.0 8.5 8.5
TOYOTA MOTOR MANUFACTURING
INDIANA INC
PRINCETON IN N 47670 9.8 6.3 16.1 10.3 13.8 24.2 12.6 5.4 18.0
SILGAN WHITE CAP CORP EVANSVILLE IN N 47710 1.9 6.8 8.7 11.2 2.8 13.9 11.7 3.7 15.4
IVC INDUSTRIAL COATINGS INC BRAZIL IN N 47834 NR NR NR 0.1 0.3 0.4 0.6 2.3 2.9
SUBARU OF INDIANA AUTOMOTIVE
INC
LAFAYETTE IN N 47905 0.2 21.9 22.1 0.4 35.3 35.7 0.3 29.3 29.6
CROWN BEVERAGE PACKAGING CRAWFORDSVILLE IN N 47933 10.0 3.7 13.8 13.8 5.2 19.0 15.7 5.9 21.6
Page 12 of 50

Table C-4. Comparisons of 2009, 2010 and 2011 TRI Air Emissions Data for Certain Glycol Ethers to Site Specific Screening Values (Step B)
2009 2010 2011
Facility City State Completed Survey Zip Code
Fugitive Air Emissions
(tpy)
Point Source Air
Emissions (tpy)
Total Air Emissions
(tpy)
Fugitive Air Emissions
(tpy)
Point Source Air
Emissions (tpy)
Total Air Emissions
(tpy)
Fugitive Air Emissions
(tpy)
Point Source Air Emissions
(tpy)
Total Air Emissions
(tpy)
RR DONNELLEY CRAWFORDSVILLE CRAWFORDSVILLE IN N 47933 5.1 4.8 9.9 6.8 0.3 7.1 6.3 0.3 6.6
BON L MANUFACTURING CO KENTLAND IN N 47951 0.3 3.1 3.4 NR NR NR NR NR NR
BALL METAL BEVERAGE CONTAINER
CORP
MONTICELLO IN N 47960 26.0 10.0 36.0 12.5 16.0 28.5 14.5 18.5 33.0
MASTER GUARD CORP VEEDERSBURG IN N 47987 0.0 2.3 2.4 NR NR NR NR NR NR
GM ORION ASSEMBLY CENTER LAKE ORION MI N 48359 6.5 0.8 7.3 NR NR NR 0.9 0.9 1.8
KAY AUTOMOTIVE GRAPHICS LAKE ORION MI N 48359 NR NR NR NR NR NR 0.0 2.2 2.2
PONTIAC ASSEMBLY CENTER PONTIAC MI N 48341 0.3 3.1 3.4 NR NR NR NR NR NR
HOWARD FINISHING LLC MADISON
HEIGHTS
MI N 48071 0.0 7.4 7.4 0.0 11.8 11.8 0.0 12.4 12.4
CURTIS METAL FINISHING CO STERLING HEIGHTS MI N 48313 2.0 0.8 2.9 3.2 1.3 4.5 4.4 1.8 6.2
NJT ENTERPRISES LLC STERLING HEIGHTS MI N 48314 0.0 0.8 0.8 NR NR NR NR NR NR
CHRYSLER WARREN TRUCK ASSEMBLY
PLANT (PART)
WARREN MI N 48091 6.0 0.7 6.7 5.5 0.4 5.9 8.5 0.2 8.7
WAYNE DISPOSAL INC BELLEVILLE MI N 48111 NR NR NR 0.0 0.0 0.0 NR NR NR
FORD MOTOR CO DEARBORN TRUCK
PLANT
DEARBORN MI Y 48121 3.8 85.0 88.8 1.5 65.0 66.5 1.2 65.0 66.2
AUTOALLIANCE INTERNATIONAL INC FLAT ROCK MI N 48134 0.0 12.6 12.6 0.5 4.8 5.3 0.2 4.7 4.9
UNIVAR USA INC ROMULUS BRANCH ROMULUS MI N 48174 NR NR NR 0.0 0.0 0.0 0.0 0.0 0.1
AUTOMOTIVE COMPONENTS
HOLDINGS LLC SALINE PLANT
SALINE MI N 48176 NR NR NR NR NR NR 0.1 3.5 3.6
FORD MOTOR COMPANY‐WAYNE
ASSEMBLY
WAYNE MI N 48184 0.1 8.5 8.6 0.1 11.0 11.1 NR NR NR
FORD MOTOR CO MICHIGAN
ASSEMBLY PLANT
WAYNE MI N 48184 0.0 0.0 0.0 0.0 0.3 0.3 0.1 6.0 6.1
AMERICAN JETWAY CORP WAYNE MI N 48184 NR NR NR 0.1 0.0 0.1 0.1 0.0 0.1
AJAX METAL PROCESSING INC DETROIT MI N 48207 NR NR NR 0.0 5.4 5.4 0.0 7.4 7.4
CHRYSLER JEFFERSON NORTH
ASSEMBLY PLANT
DETROIT MI N 48215 6.5 20.0 26.5 4.1 31.5 35.6 6.0 50.0 56.0
PVS NOLWOOD CHEMICALS INC DETROIT MI N 48228 NR NR NR 0.0 0.0 0.0 0.0 0.0 0.0
Z TECHNOLOGIES CORP REDFORD MI N 48239 NR NR NR NR NR NR 0.0 0.0 0.0
MT ELLIOTT TOOL & DIE
MANUFACTURING (PART)
DETROIT MI N 48234 0.1 0.0 0.1 NR NR NR NR NR NR
GM LLC POWERTRAIN FLINT ENGINE
OPERATIONS
FLINT MI N 48552 0.3 35.5 35.8 0.5 24.5 25.0 0.7 25.5 26.2
Page 13 of 50

Table C-4. Comparisons of 2009, 2010 and 2011 TRI Air Emissions Data for Certain Glycol Ethers to Site Specific Screening Values (Step B)
2009 2010 2011
Facility City State Completed Survey Zip Code
Fugitive Air Emissions
(tpy)
Point Source Air
Emissions (tpy)
Total Air Emissions
(tpy)
Fugitive Air Emissions
(tpy)
Point Source Air
Emissions (tpy)
Total Air Emissions
(tpy)
Fugitive Air Emissions
(tpy)
Point Source Air Emissions
(tpy)
Total Air Emissions
(tpy)
GENERAL MOTORS LANSING DELTA
TOWNSHIP
LANSING MI N 48917 0.2 8.5 8.7 0.5 23.0 23.5 0.6 24.0 24.6
GMVM‐LANSING GRAND RIVER
ASSEMBLY
LANSING MI N 48921 3.6 3.1 6.7 3.5 4.1 7.6 2.6 3.2 5.8
GRAPHIC PACKAGING INTERNATIONAL
INC
KALAMAZOO MI N 49007 NR NR NR NR NR NR 0.0 8.6 8.6
DEXTER CHASSIS GROUP PLANT 55 WHITE PIGEON MI N 49099 0.0 18.3 18.3 0.0 26.3 26.3 0.0 16.1 16.1
CHEMETALL US INC JACKSON MI N 49203 NR NR NR 0.0 0.0 0.0 0.0 0.0 0.0
ANDERSON DEVELOPMENT CO ADRIAN MI N 49221 NR NR NR NR NR NR 0.0 0.0 0.0
HELEN,INC DBA ENVIRONMENTAL
COATINGS,INC
CALEDONIA MI N 49316 0.2 0.1 0.3 NR NR NR NR NR NR
BRADFORD WHITE CORP MIDDLEVILLE MI N 49333 0.0 5.8 5.8 0.0 6.3 6.3 0.0 7.1 7.1
MAGNA MIRRORS CORP ‐ NEWAYGO NEWAYGO MI N 49337 NR NR NR 1.1 2.7 3.8 1.5 1.2 2.7
WEBB CHEMICAL SERVICE CORP MUSKEGON
HEIGHTS
MI N 49444 NR NR NR 0.1 0.0 0.1 0.3 0.0 0.3
SPECTRUM CUBIC INC GRAND RAPIDS MI N 49503 NR NR NR NR NR NR 0.0 0.4 0.4
AVON AUTOMOTIVE PLANT 1 CADILLAC MI N 49601 NR NR NR NR NR NR 0.1 0.0 0.1
JOHN DEERE DES MOINES WORKS ANKENY IA N 50023 NR NR NR 0.0 7.0 7.0 0.0 21.2 21.2
3M CO ‐ KNOXVILLE KNOXVILLE IA N 50138 0.0 0.0 0.0 NR NR NR NR NR NR
PELLA CORP PELLA IA N 50219 0.1 14.4 14.6 0.1 20.3 20.4 0.1 19.4 19.5
SILGAN CONTAINERS MANUFACTURIN
G CORP
FORT DODGE IA N 50501 NR NR NR 0.0 6.5 6.5 0.0 13.7 13.7
METOKOTE CORP PLANT 15 CEDAR FALLS IA N 50613 0.0 6.0 6.0 0.0 5.7 5.7 NR NR NR
VOGEL PAINT & WAX CO INC ORANGE CITY IA N 51041 NR NR NR 0.0 0.0 0.0 0.0 0.0 0.0
PELLA CORP CARROLL OPERATIONS CARROLL IA N 51401 NR NR NR 0.0 5.1 5.1 0.0 5.6 5.6
CARRY‐ON TRAILER CORP MISSOURI VALLEY IA N 51555 0.0 6.0 6.0 0.0 7.8 7.8 0.0 5.5 5.5
KLINGER PAINT CO INC CEDAR RAPIDS IA N 52404 NR NR NR 0.6 0.0 0.6 NR NR NR
CNH AMERICA LLC BURLINGTON IA N 52601 0.2 5.5 5.7 0.2 8.0 8.2 0.2 11.0 11.2
MONSANTO CO MUSCATINE IA N 52761 0.0 0.0 0.0 0.0 0.0 0.0 NR NR NR
AMERICAN FINISHING RESOURCES INC CHILTON WI N 53014 NR NR NR NR NR NR 6.3 0.0 6.3
WORTHINGTON CYLINDERS WISCONSI
N LLC
CHILTON WI N 53014 0.9 4.3 5.3 0.9 4.9 5.8 0.2 5.0 5.3
BROAN‐NUTONE LLC HARTFORD WI N 53027 0.1 10.6 10.8 0.1 7.6 7.7 0.1 8.7 8.8
QUAD/GRAPHICS INC HARTFORD WI N 53027 12.0 0.4 12.4 13.5 0.4 13.9 11.5 0.4 11.9
JOHN DEERE HORICON WORKS‐DT HORICON WI N 53032 NR NR NR NR NR NR 0.0 5.5 5.5
QUAD/GRAPHICS INC LOMIRA WI N 53048 NR NR NR 2.6 0.3 2.8 4.8 0.5 5.4
Page 14 of 50
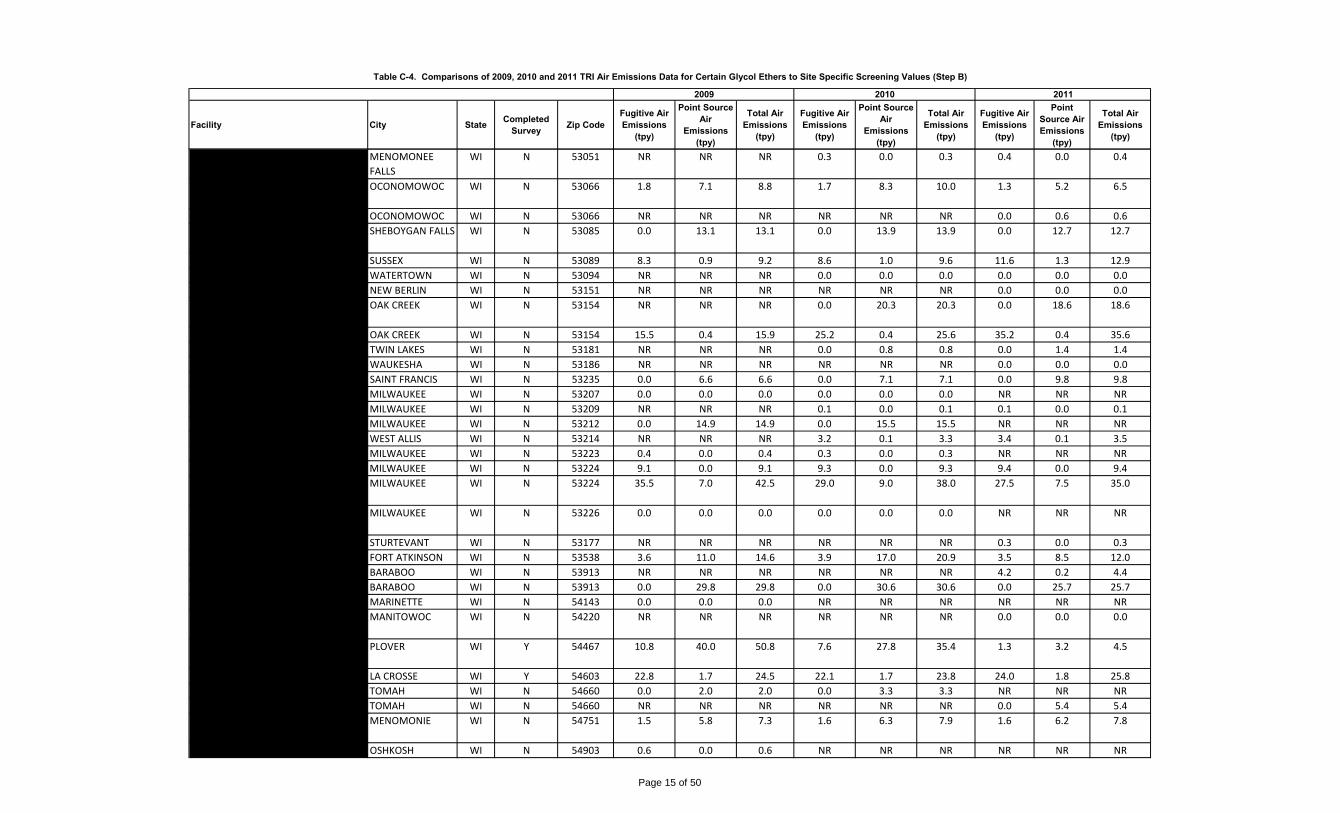
Table C-4. Comparisons of 2009, 2010 and 2011 TRI Air Emissions Data for Certain Glycol Ethers to Site Specific Screening Values (Step B)
2009 2010 2011
Facility City State Completed Survey Zip Code
Fugitive Air Emissions
(tpy)
Point Source Air
Emissions (tpy)
Total Air Emissions
(tpy)
Fugitive Air Emissions
(tpy)
Point Source Air
Emissions (tpy)
Total Air Emissions
(tpy)
Fugitive Air Emissions
(tpy)
Point Source Air Emissions
(tpy)
Total Air Emissions
(tpy)
QUEST SPECIALTY COATINGS LLC ‐
MENOMONEE FALLS
MENOMONEE
FALLS
WI N 53051 NR NR NR 0.3 0.0 0.3 0.4 0.0 0.4
SILGAN CONTAINERS
MANAUFACTURING CORP
OCONOMOWOC WI N 53066 1.8 7.1 8.8 1.7 8.3 10.0 1.3 5.2 6.5
WISMARQ CORP OCONOMOWOC WI N 53066 NR NR NR NR NR NR 0.0 0.6 0.6
BEMIS MANUFACTURING CO PLANT B SHEBOYGAN FALLS WI N 53085 0.0 13.1 13.1 0.0 13.9 13.9 0.0 12.7 12.7
QUAD/GRAPHICS INC SUSSEX WI N 53089 8.3 0.9 9.2 8.6 1.0 9.6 11.6 1.3 12.9
DIVERSEY INC WATERTOWN WI N 53094 NR NR NR 0.0 0.0 0.0 0.0 0.0 0.0
UNIVAR USA INC NEW BERLIN NEW BERLIN WI N 53151 NR NR NR NR NR NR 0.0 0.0 0.0
MID‐AMERICA STEEL DRUM CO IN C OAK CREEK WI N 53154 NR NR NR 0.0 20.3 20.3 0.0 18.6 18.6
PPG INDUSTRIES INC‐OAK CREEK OAK CREEK WI N 53154 15.5 0.4 15.9 25.2 0.4 25.6 35.2 0.4 35.6
FIVE STAR COATINGS GROUP TWIN LAKES WI N 53181 NR NR NR 0.0 0.8 0.8 0.0 1.4 1.4
GACO WESTERN WAUKESHA WI N 53186 NR NR NR NR NR NR 0.0 0.0 0.0
KITZINGER COOPERAGE CORP SAINT FRANCIS WI N 53235 0.0 6.6 6.6 0.0 7.1 7.1 0.0 9.8 9.8
MILPORT ENTERPRISES INC MILWAUKEE WI N 53207 0.0 0.0 0.0 0.0 0.0 0.0 NR NR NR
TWINCO ROMAX MILWAUKEE WI N 53209 NR NR NR 0.1 0.0 0.1 0.1 0.0 0.1
SEIDEL TANNING CORP MILWAUKEE WI N 53212 0.0 14.9 14.9 0.0 15.5 15.5 NR NR NR
QUAD/GRAPHICS INC WEST ALLIS WI N 53214 NR NR NR 3.2 0.1 3.3 3.4 0.1 3.5
MUTI‐PACK LLC MILWAUKEE WI N 53223 0.4 0.0 0.4 0.3 0.0 0.3 NR NR NR
KUBIN‐NICHOLSON CORP MILWAUKEE WI N 53224 9.1 0.0 9.1 9.3 0.0 9.3 9.4 0.0 9.4
BALL METAL BEVERAGE CONTAINER
CORP
MILWAUKEE WI N 53224 35.5 7.0 42.5 29.0 9.0 38.0 27.5 7.5 35.0
FIRST SOURCE WORLDWIDE LLC
MILWAUKEE
MILWAUKEE WI N 53226 0.0 0.0 0.0 0.0 0.0 0.0 NR NR NR
CNH AMERICA LLC STURTEVANT WI N 53177 NR NR NR NR NR NR 0.3 0.0 0.3
BALL CONTAINER LLC FORT ATKINSON WI N 53538 3.6 11.0 14.6 3.9 17.0 20.9 3.5 8.5 12.0
RR DONNELLEY BARABOO DIV BARABOO WI N 53913 NR NR NR NR NR NR 4.2 0.2 4.4
SENECA FOODS CORP BARABOO WI N 53913 0.0 29.8 29.8 0.0 30.6 30.6 0.0 25.7 25.7
CHEMDESIGN PRODUCTS INC MARINETTE WI N 54143 0.0 0.0 0.0 NR NR NR NR NR NR
WISCONSIN ALUMINUM FOUNDRY CO
INC
MANITOWOC WI N 54220 NR NR NR NR NR NR 0.0 0.0 0.0
SILGAN CONTAINERS
MANUFACTURING CORP
PLOVER WI Y 54467 10.8 40.0 50.8 7.6 27.8 35.4 1.3 3.2 4.5
CROWN BEVERAGE PACKAGING LA CROSSE WI Y 54603 22.8 1.7 24.5 22.1 1.7 23.8 24.0 1.8 25.8
TORO CO TOMAH WI N 54660 0.0 2.0 2.0 0.0 3.3 3.3 NR NR NR
TORO CO TOMAH WI N 54660 NR NR NR NR NR NR 0.0 5.4 5.4
SILGAN CONTAINERS
MANUFACTURING CORP
MENOMONIE WI N 54751 1.5 5.8 7.3 1.6 6.3 7.9 1.6 6.2 7.8
MULTICIRCUITS OSHKOSH WI N 54903 0.6 0.0 0.6 NR NR NR NR NR NR
Page 15 of 50

Table C-4. Comparisons of 2009, 2010 and 2011 TRI Air Emissions Data for Certain Glycol Ethers to Site Specific Screening Values (Step B)
2009 2010 2011
Facility City State Completed Survey Zip Code
Fugitive Air Emissions
(tpy)
Point Source Air
Emissions (tpy)
Total Air Emissions
(tpy)
Fugitive Air Emissions
(tpy)
Point Source Air
Emissions (tpy)
Total Air Emissions
(tpy)
Fugitive Air Emissions
(tpy)
Point Source Air Emissions
(tpy)
Total Air Emissions
(tpy)
ALLIANCE INDUSTRIES WAUPACA WAUPACA WI N 54981 0.4 4.0 4.5 0.9 7.7 8.6 1.0 9.4 10.4
UNIVAR USA INC LAKEVILLE LAKEVILLE MN N 55044 0.0 0.0 0.0 0.0 0.0 0.0 NR NR NR
CROWN FOOD PACKAGING OWATONNA MN Y 55060 29.3 87.7 117.1 30.7 91.9 122.6 31.9 95.7 127.6
S B FOOT TANNING CO RED WING MN N 55066 0.0 22.8 22.8 0.0 27.6 27.6 0.0 24.4 24.4
REXAM BEVERAGE CAN CO RE: EVA
STREET ST PAUL MN
SAINT PAUL MN Y 55107 14.0 79.5 93.5 13.4 76.1 89.5 11.8 67.0 78.8
FORD MOTOR CO TWIN CITIES
ASSEMBLY PLANT
SAINT PAUL MN N 55116 0.4 3.0 3.4 0.4 4.2 4.6 0.1 7.0 7.1
FLINT HILLS RESOURCES LP ROSEMOUNT MN N 55068 0.8 0.0 0.8 0.6 0.0 0.6 NR NR NR
EDCO PRODUCTS INC HOPKINS MN N 55343 NR NR NR 0.0 0.0 0.0 0.0 0.0 0.0
RRD MAPLE GROVE MAPLE GROVE MN N 55369 NR NR NR NR NR NR 3.9 0.1 4.0
MEDALLION CABINETRY INC WACONIA MN N 55387 0.0 5.1 5.1 NR NR NR NR NR NR
NORTHLAND ALUMINUM PRODUCTS I
NC
MINNEAPOLIS MN N 55416 NR NR NR NR NR NR 0.0 6.3 6.3
BROWN PRINTING CO WASECA MN N 56093 4.3 0.1 4.3 4.4 0.1 4.5 6.7 0.1 6.8
MID CONTINENT CABINETRY COTTONWOOD MN N 56229 0.5 4.8 5.3 NR NR NR NR NR NR
NAHAN PRINTING INC SAINT CLOUD MN N 56303 4.6 0.1 4.7 7.1 0.3 7.3 5.7 0.2 5.9
SAPA EXTRUSIONS INC YANKTON SD N 57078 0.0 24.4 24.4 0.0 6.3 6.3 0.0 2.4 2.4
BOBCAT CO (MELROE) GWINNER ND N 58040 NR NR NR 0.0 6.0 6.0 NR NR NR
ACME FINISHING CO INC ELK GROVE
VILLAGE
IL N 60007 1.4 5.4 6.8 2.1 8.4 10.4 1.8 7.0 8.8
ROHM & HAAS CHEMICALS LLC ELK GROVE
VILLAGE
IL N 60007 NR NR NR NR NR NR 0.0 0.0 0.0
BECKER SPECIALTY CORP ELK GROVE
VILLAGE
IL N 60007 0.0 0.5 0.5 0.0 0.3 0.3 NR NR NR
IMS ENGINEERED PRODUCTS LLC DES PLAINES IL N 60016 NR NR NR 0.0 0.4 0.4 NR NR NR
GREENWICH INDUSTRIES LP CLARIN
DIV
LAKE BLUFF IL N 60044 0.1 5.0 5.1 NR NR NR NR NR NR
BROWN PRINTING CO WOODSTOCK IL N 60098 4.0 0.1 4.1 3.9 0.1 4.0 6.1 0.1 6.3
GE WATER & PROCESS TECHNOLOGIES ADDISON IL N 60101 NR NR NR 0.0 0.0 0.0 0.0 0.0 0.0
BALL AEROSOL & SPECIALTY
CONTAINER INC
ELGIN IL N 60120 1.7 8.5 10.2 0.9 7.5 8.4 0.4 1.4 1.8
UNIVERSAL CHEMICALS & COATINGS
INC
ELGIN IL N 60123 NR NR NR 0.0 0.2 0.2 NR NR NR
WISMARQ CORP FRANKLIN PARK IL N 60131 NR NR NR NR NR NR 0.0 1.7 1.7
WR MEADOWS INC HAMPSHIRE IL N 60140 NR NR NR NR NR NR 0.3 0.0 0.3
LEHIGH PRESS CADILLAC (DBA LEHIGH
DIRECT DIVISION)
BROADVIEW IL N 60153 2.0 0.1 2.1 NR NR NR NR NR NR
SUN CHEMICAL CORP NORTHLAKE IL N 60164 NR NR NR 0.0 0.0 0.0 0.0 0.0 0.0
SYCAMORE SYSTEMS LLC SYCAMORE IL N 60178 NR NR NR 0.0 10.1 10.1 0.0 6.7 6.7
Page 16 of 50

Table C-4. Comparisons of 2009, 2010 and 2011 TRI Air Emissions Data for Certain Glycol Ethers to Site Specific Screening Values (Step B)
2009 2010 2011
Facility City State Completed Survey Zip Code
Fugitive Air Emissions
(tpy)
Point Source Air
Emissions (tpy)
Total Air Emissions
(tpy)
Fugitive Air Emissions
(tpy)
Point Source Air
Emissions (tpy)
Total Air Emissions
(tpy)
Fugitive Air Emissions
(tpy)
Point Source Air Emissions
(tpy)
Total Air Emissions
(tpy)
SEYMOUR OF SYCAMORE INC SYCAMORE IL N 60178 NR NR NR 0.4 0.1 0.4 0.6 0.1 0.6
KNS COMPANYS INC CAROL STREAM IL N 60188 0.5 2.0 2.5 1.1 4.4 5.5 1.8 7.0 8.8
TMS MANUFACTURING ALSIP IL N 60803 NR NR NR NR NR NR 0.2 0.1 0.3
DOW CHEMICAL JOLIET SITE CHANNAHON IL N 60410 0.0 0.0 0.0 NR NR NR NR NR NR
CHICAGO HEIGHTS STEEL CHICAGO HEIGHTS IL N 60411 6.3 25.1 31.4 7.5 30.0 37.5 7.2 28.7 35.9
ALLIED TUBE & CONDUIT CORP HARVEY IL N 60426 10.0 5.9 15.9 16.1 9.5 25.5 4.3 2.5 6.9
INX INTERNATIONAL INK CO HOMEWOOD IL N 60430 0.0 0.1 0.1 0.0 0.0 0.0 NR NR NR
DOBER CHEMICAL CORP MIDLOTHIAN IL N 60445 0.0 0.0 0.0 0.0 0.0 0.0 NR NR NR
SIGNODE BRIDGEVIEW IL N 60455 0.9 7.6 8.4 1.0 8.6 9.5 0.9 7.5 8.4
UNIVAR USA INC BEDFORD PARK IL N 60499 0.0 0.0 0.1 NR NR NR 0.0 0.0 0.0
UNIVAR USA INC 68TH ST BEDFORD PARK IL N 60501 0.0 0.0 0.0 NR NR NR NR NR NR
CROWN AEROSOL PACKAGING AURORA IL N 60504 7.9 1.0 8.9 7.0 0.8 7.8 5.1 0.7 5.8
CHAMPION PACKAGING &
DISTRIBUTING INC
WOODRIDGE IL N 60517 0.0 0.0 0.0 NR NR NR NR NR NR
LAKESIDE LITHOGRAPHY LLC CHICAGO IL N 60608 1.0 8.8 9.8 1.1 13.2 14.3 2.7 0.6 3.3
EDSAL MANUFACTURING CO INC CHICAGO IL N 60609 0.0 25.7 25.7 0.0 43.1 43.1 0.0 33.9 33.9
REXAM BEVERAGE CAN CO RE :
CHICAGO PLANT
CHICAGO IL Y 60609 13.6 51.7 65.4 14.2 53.8 68.0 6.5 26.6 33.2
CHICAGO STEEL CONTAINER CORP CHICAGO IL N 60623 1.3 5.9 7.2 1.5 9.7 11.2 0.9 9.9 10.8
BWAY CORP CHICAGO IL N 60623 4.4 2.9 7.3 6.8 18.7 25.5 7.2 15.7 23.0
MEYER STEEL DRUM INC CHICAGO IL N 60623 1.1 9.1 10.2 1.2 10.1 11.3 1.4 10.9 12.3
COLOR COMMUNICATIONS INC CHICAGO IL N 60624 1.4 5.3 6.7 0.8 3.8 4.7 1.1 4.4 5.4
SKOLNIK INDUSTRIES CHICAGO IL N 60632 NR NR NR 0.7 5.8 6.5 0.9 7.9 8.8
GREIF PACKAGING LLC ALSIP IL N 60803 1.6 3.9 5.5 2.0 21.3 23.3 4.1 14.6 18.7
CROWN BEVERAGE PACKAGING BRADLEY IL Y 60915 17.1 51.4 68.6 16.0 48.1 64.1 16.2 48.6 64.8
CHRYSLER BELVIDERE ASSEMBLY
PLANT
BELVIDERE IL N 61008 0.1 1.1 1.2 0.8 6.5 7.3 1.2 10.0 11.2
SIGNCRAFT SCREEN PRINT GALENA IL N 61036 NR NR NR NR NR NR 12.2 0.0 12.2
SILGAN CONTAINERS
MANUFACTURING CORP
ROCHELLE IL N 61068 1.8 1.3 3.1 4.4 1.4 5.8 7.3 3.8 11.0
ENGINEERED POLYMER SOLUTIONS
INC D/B/A VALSPAR COATINGS
ROCKFORD IL N 61104 0.0 0.0 0.0 NR NR NR NR NR NR
3M CO ‐ CORDOVA CORDOVA IL N 61242 0.3 0.0 0.3 0.7 0.1 0.8 NR NR NR
3M CO ‐ CORDOVA CORDOVA IL N 61242 NR NR NR NR NR NR 0.4 0.2 0.6
JOHN DEERE HARVESTER WORKS EAST
MOLINE
EAST MOLINE IL N 61244 0.3 6.0 6.3 NR NR NR NR NR NR
TYSON FRESH MEATS INC JOSLIN IL HILLSDALE IL N 61257 0.0 0.0 0.0 0.0 0.0 0.0 NR NR NR
NATIONAL COATINGS INC GALESBURG IL N 61401 NR NR NR 9.2 0.0 9.2 7.4 0.0 7.4
PEORIA DISPOSAL CO #1 PEORIA IL N 61615 NR NR NR 0.8 0.0 0.8 NR NR NR
CNH AMERICA LLC GOODFIELD IL N 61742 NR NR NR 0.1 8.3 8.4 NR NR NR
Page 17 of 50

Table C-4. Comparisons of 2009, 2010 and 2011 TRI Air Emissions Data for Certain Glycol Ethers to Site Specific Screening Values (Step B)
2009 2010 2011
Facility City State Completed Survey Zip Code
Fugitive Air Emissions
(tpy)
Point Source Air
Emissions (tpy)
Total Air Emissions
(tpy)
Fugitive Air Emissions
(tpy)
Point Source Air
Emissions (tpy)
Total Air Emissions
(tpy)
Fugitive Air Emissions
(tpy)
Point Source Air Emissions
(tpy)
Total Air Emissions
(tpy)
CNH AMERICA LLC GOODFIELD IL N 61742 NR NR NR NR NR NR 1.7 15.1 16.7
MASTERBRAND CABINETS INC ARTHUR IL N 61911 0.0 8.3 8.3 NR NR NR NR NR NR
RR DONNELLEY & SONS CO MATTOON IL N 61938 NR NR NR 3.2 0.2 3.5 2.0 0.1 2.1
MIDWEST METAL COATINGS GRANITE CITY IL N 62040 NR NR NR 0.3 0.1 0.4 0.4 0.1 0.5
PRECOAT METALS GRANITE CITY IL N 62040 4.5 1.1 5.6 4.5 1.1 5.6 4.2 1.0 5.3
AFTON CHEMICAL CORP SAUGET IL N 62201 NR NR NR 0.0 0.0 0.0 0.0 0.0 0.0
VEOLIA ES TECHNICAL SOLUTIONS LLC SAUGET IL N 62201 NR NR NR 0.0 0.0 0.0 0.0 0.0 0.0
KNAPHEIDE MANUFACTURING CO QUINCY IL N 62305 0.1 13.0 13.1 0.2 13.4 13.6 0.1 15.9 16.1
QG LLC EFFINGHAM IL N 62401 6.2 0.0 6.2 3.4 0.4 3.8 2.2 0.3 2.4
METAL CONTAINER CORP ‐ ARNOLD
CAN PLANT
ARNOLD MO Y 63010 17.1 27.1 44.2 17.9 28.4 46.3 16.4 25.7 42.0
TRILLA ST LOUIS CORP FENTON MO N 63026 NR NR NR 1.6 8.2 9.8 1.4 8.3 9.6
CHRYSLER ST LOUIS NORTH ASSEMBLY
PLANT
FENTON MO N 63026 5.5 32.0 37.5 NR NR NR NR NR NR
UNIVAR USA INC METRO BLVD MARYLAND
HEIGHTS
MO N 63043 0.1 0.1 0.3 NR NR NR NR NR NR
BUCKEYE INTERNATIONAL INC MARYLAND
HEIGHTS
MO N 63043 0.1 1.8 1.9 NR NR NR 0.1 1.6 1.7
PLAZE INC PACIFIC MO N 63069 NR NR NR NR NR NR 0.0 0.0 0.0
SCHAEFFER MANUFACTURING SAINT LOUIS MO N 63104 4.8 0.0 4.8 5.8 0.0 5.8 6.3 0.0 6.3
U.S. POLYMERS ACCUREZ LLC SAINT LOUIS MO N 63111 0.0 0.0 0.0 0.0 0.0 0.0 NR NR NR
UNIVAR USA INC BERKELEY BERKELEY MO N 63134 0.1 0.1 0.3 0.0 0.0 0.0 NR NR NR
ELANTAS PDG INC SAINT LOUIS MO N 63147 0.0 0.1 0.1 0.0 0.1 0.1 NR NR NR
THE DIAL CORP A SUBSIDIARY OF
HENKEL CONSUMER GOODS
SAINT LOUIS MO N 63147 NR NR NR NR NR NR 0.1 0.1 0.2
SAF‐HOLLAND USA INC WARRENTON MO N 63383 NR NR NR NR NR NR 18.5 2.9 21.5
GENERAL MOTORS WENTZVILLE
ASSEMBLY
WENTZVILLE MO N 63385 0.9 3.7 4.5 1.3 6.0 7.3 1.1 8.0 9.1
GATES CORP POPLAR BLUFF MO N 63901 NR NR NR 0.0 0.0 0.0 0.0 0.0 0.0
US ARMY LAKE CITY ARMY
AMMUNITION PLANT
INDEPENDENCE MO N 64051 1.4 3.3 4.7 1.3 3.9 5.2 1.6 2.5 4.1
FORD MOTOR COMPANY‐‐KANSAS
CITY ASSEMBLY PLANT
CLAYCOMO MO Y 64119 2.3 39.5 41.8 1.5 50.0 51.5 1.6 55.0 56.6
BALL METAL BEVERAGE CONTAINER
CORP
KANSAS CITY MO N 64120 4.2 0.1 4.2 NR NR NR NR NR NR
SILGAN CONTAINERS
MANUFACTURING CORP
SAINT JOSEPH MO N 64504 6.3 2.9 9.2 5.4 3.6 9.0 5.2 3.7 9.0
VON HOFFMANN GRAPHICS INC OWENSVILLE MO N 65066 4.1 1.6 5.8 6.6 1.1 7.7 3.7 1.4 5.1
HUTCHENS INDUSTRIES INC
MANSFIELD FACILITY
MANSFIELD MO N 65704 NR NR NR 0.0 7.5 7.5 NR NR NR
Page 18 of 50
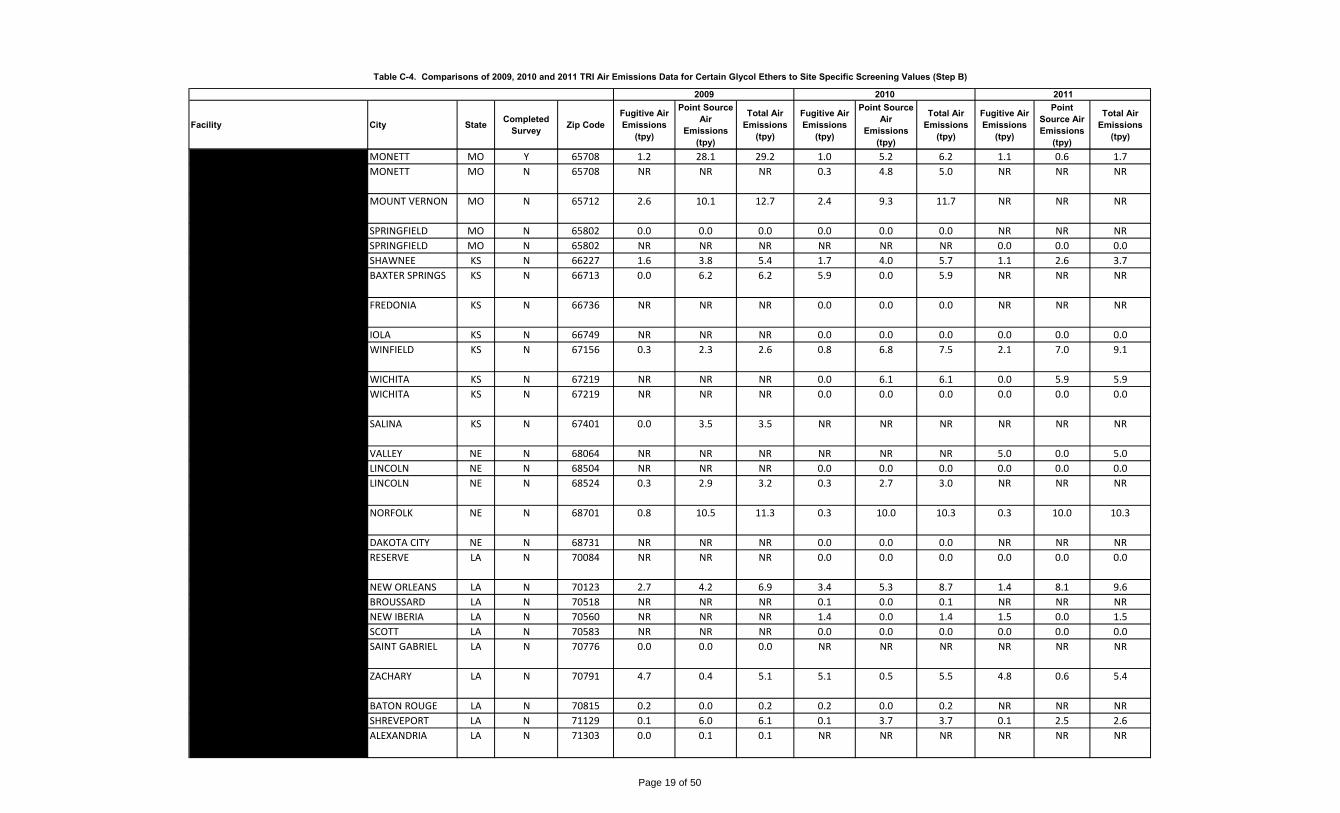
Table C-4. Comparisons of 2009, 2010 and 2011 TRI Air Emissions Data for Certain Glycol Ethers to Site Specific Screening Values (Step B)
2009 2010 2011
Facility City State Completed Survey Zip Code
Fugitive Air Emissions
(tpy)
Point Source Air
Emissions (tpy)
Total Air Emissions
(tpy)
Fugitive Air Emissions
(tpy)
Point Source Air
Emissions (tpy)
Total Air Emissions
(tpy)
Fugitive Air Emissions
(tpy)
Point Source Air Emissions
(tpy)
Total Air Emissions
(tpy)
EFCO CORP MONETT MO Y 65708 1.2 28.1 29.2 1.0 5.2 6.2 1.1 0.6 1.7
HYDRO ALUMINUM NORTH AMERICA
INC
MONETT MO N 65708 NR NR NR 0.3 4.8 5.0 NR NR NR
SILGAN CONTAINERS
MANUFACTURING CORP
MOUNT VERNON MO N 65712 2.6 10.1 12.7 2.4 9.3 11.7 NR NR NR
3M CO ‐ SPRINGFIELD SPRINGFIELD MO N 65802 0.0 0.0 0.0 0.0 0.0 0.0 NR NR NR
3M CO ‐ SPRINGFIELD SPRINGFIELD MO N 65802 NR NR NR NR NR NR 0.0 0.0 0.0
NAZDAR SHAWNEE SHAWNEE KS N 66227 1.6 3.8 5.4 1.7 4.0 5.7 1.1 2.6 3.7
PACKAGING DYNAMICS INC
BAGCRAFT/PAPERCON DIV
BAXTER SPRINGS KS N 66713 0.0 6.2 6.2 5.9 0.0 5.9 NR NR NR
LAFARGE MIDWEST INC (INCLD
SYSTECH ENVIRONMENTAL)
FREDONIA KS N 66736 NR NR NR 0.0 0.0 0.0 NR NR NR
GATES CORP IOLA KS N 66749 NR NR NR 0.0 0.0 0.0 0.0 0.0 0.0
GREIF INDUSTRIAL PACKAGING &
SERVICES
WINFIELD KS N 67156 0.3 2.3 2.6 0.8 6.8 7.5 2.1 7.0 9.1
THE COLEMAN CO INC WICHITA KS N 67219 NR NR NR 0.0 6.1 6.1 0.0 5.9 5.9
CONOCOCPHILLIPS CO WICHITA
TERMINAL
WICHITA KS N 67219 NR NR NR 0.0 0.0 0.0 0.0 0.0 0.0
SCHWAN'S GLOBAL SUPPLY CHAIN ‐
SALINA KS
SALINA KS N 67401 0.0 3.5 3.5 NR NR NR NR NR NR
VALMONT INDUSTRIES INC VALLEY NE N 68064 NR NR NR NR NR NR 5.0 0.0 5.0
VEYANCE TECHNOLOGIES INC LINCOLN NE N 68504 NR NR NR 0.0 0.0 0.0 0.0 0.0 0.0
KAWASAKI MOTORS
MANUFACTURING CORP USA
LINCOLN NE N 68524 0.3 2.9 3.2 0.3 2.7 3.0 NR NR NR
NUCOR CORP ‐ VULCRAFT/NUCOR
COLD FINISH DIV
NORFOLK NE N 68701 0.8 10.5 11.3 0.3 10.0 10.3 0.3 10.0 10.3
TYSON FRESH MEATS INC DAKOTA CITY NE N 68731 NR NR NR 0.0 0.0 0.0 NR NR NR
AIR PRODUCTS PERFORMANCE
MANUFACTURING INC
RESERVE LA N 70084 NR NR NR 0.0 0.0 0.0 0.0 0.0 0.0
GREIF PACKAGING LLC NEW ORLEANS LA N 70123 2.7 4.2 6.9 3.4 5.3 8.7 1.4 8.1 9.6
CHAMPION TECHNOLOGIES INC BROUSSARD LA N 70518 NR NR NR 0.1 0.0 0.1 NR NR NR
BAYOU COS INC NEW IBERIA LA N 70560 NR NR NR 1.4 0.0 1.4 1.5 0.0 1.5
NALCO CO SCOTT LA N 70583 NR NR NR 0.0 0.0 0.0 0.0 0.0 0.0
BRENNTAG SOUTHWEST INC ST
GABRIEL
SAINT GABRIEL LA N 70776 0.0 0.0 0.0 NR NR NR NR NR NR
NOVOLYTE PERFORMANCE
MATERIALS
ZACHARY LA N 70791 4.7 0.4 5.1 5.1 0.5 5.5 4.8 0.6 5.4
ASHLAND DISTRIBUTION CO BATON ROUGE LA N 70815 0.2 0.0 0.2 0.2 0.0 0.2 NR NR NR
GMTG ‐ SHREVEPORT ASSEMBLY SHREVEPORT LA N 71129 0.1 6.0 6.1 0.1 3.7 3.7 0.1 2.5 2.6
UNION TANK CAR ALEXANDRIA
MANUFACTURING FACILITY
ALEXANDRIA LA N 71303 0.0 0.1 0.1 NR NR NR NR NR NR
Page 19 of 50

Table C-4. Comparisons of 2009, 2010 and 2011 TRI Air Emissions Data for Certain Glycol Ethers to Site Specific Screening Values (Step B)
2009 2010 2011
Facility City State Completed Survey Zip Code
Fugitive Air Emissions
(tpy)
Point Source Air
Emissions (tpy)
Total Air Emissions
(tpy)
Fugitive Air Emissions
(tpy)
Point Source Air
Emissions (tpy)
Total Air Emissions
(tpy)
Fugitive Air Emissions
(tpy)
Point Source Air Emissions
(tpy)
Total Air Emissions
(tpy)
BERENFIELD CONTAINERS SW LTD WHITE HALL AR N 71602 0.0 9.9 9.9 0.0 10.1 10.1 0.0 8.5 8.5
WHEELING MACHINE PRODUCTS DIV
PINE BLUFF
PINE BLUFF AR N 71602 NR NR NR 6.5 0.0 6.5 6.0 0.0 6.0
CLEAN HARBORS EL DORADO LLC EL DORADO AR N 71730 0.0 0.0 0.0 0.0 0.0 0.0 NR NR NR
CHAMPION TECHNOLOGIES INC MAGNOLIA AR N 71753 NR NR NR NR NR NR 0.0 0.0 0.0
RINECO BENTON AR N 72015 0.0 0.0 0.0 0.0 0.0 0.0 NR NR NR
BRYCE CO LLC SEARCY AR N 72143 NR NR NR 0.1 0.1 0.3 NR NR NR
MAVERICK TUBE LLC BLYTHEVILLE AR N 72315 NR NR NR NR NR NR 11.2 0.0 11.2
AMERIMAX COATED PRODUCTS HELENA AR N 72342 NR NR NR 0.0 0.3 0.3 0.0 0.2 0.2
QG PRINTING II CORP JONESBORO AR N 72401 NR NR NR NR NR NR 3.6 2.3 5.9
L A DARLING CO ‐ PIGGOTT AR
FACILITY
PIGGOTT AR N 72454 0.2 14.2 14.4 0.2 13.2 13.3 0.1 5.4 5.5
SUPERIOR INDUSTRIES
INTERNATIONAL ARKANSAS LLC
FAYETTEVILLE AR N 72701 NR NR NR 0.0 7.3 7.3 0.0 11.0 11.0
SUPERIOR INDUSTRIES
INTERNATIONAL ARKANSAS LLC
ROGERS AR N 72756 NR NR NR 0.0 6.7 6.7 0.0 12.9 12.9
KAWNEER CO INC SPRINGDALE AR N 72764 4.8 5.3 10.1 3.4 4.8 8.2 4.1 5.9 10.0
GRAPHIC PACKAGING INTERNATIONAL
INC
FORT SMITH AR N 72916 NR NR NR NR NR NR 0.0 13.2 13.2
DEXTER AXLE EL RENO OK N 73036 NR NR NR 0.0 7.4 7.4 0.0 7.5 7.5
GEMINI COATINGS INC EL RENO OK N 73036 NR NR NR 0.4 0.0 0.4 0.2 0.0 0.2
U.S. AIR FORCE TINKER AFB OK TINKER A F B OK N 73145 1.6 4.2 5.8 1.3 6.0 7.3 1.9 3.2 5.1
REXAM BEVERAGE CAN CO
RE:OKLAHOMA CITY PLANT
OKLAHOMA CITY OK Y 73179 5.0 28.5 33.5 NR NR NR NR NR NR
CLEAN HARBORS LONE MOUNTAIN
LLC LONE MOUNTAIN FACILITY
WAYNOKA OK N 73860 NR NR NR NR NR NR 0.0 0.0 0.0
BRENNTAG SOUTHWEST INC SAND
SPRINGS
SAND SPRINGS OK N 74063 NR NR NR 0.0 0.0 0.0 0.0 0.0 0.0
NALCO CO TULSA PLANT 102 TULSA OK N 74131 0.0 0.0 0.0 NR NR NR 0.0 0.0 0.0
BRAINERD CHEMICAL CO INC TULSA OK N 74147 NR NR NR 0.0 0.0 0.0 0.0 0.0 0.0
AIR SYSTEM COMPONENTS LP PONCA CITY OK N 74601 0.2 23.6 23.9 0.2 20.4 20.6 0.2 19.7 19.9
MOBIL CHEMICAL CO SHAWNEE OK N 74804 0.4 23.0 23.4 0.4 21.5 21.9 0.4 18.7 19.1
ELECTRO PLATE CIRCUITRY INC CARROLLTON TX N 75006 NR NR NR 0.0 0.1 0.1 NR NR NR
GLIDDEN CO CARROLLTON TX N 75006 NR NR NR NR NR NR 0.0 0.0 0.0
A BRITE CO GARLAND TX N 75041 NR NR NR NR NR NR 0.0 0.0 0.0
BENJAMIN MOORE & CO ‐ DALLAS MESQUITE TX N 75149 NR NR NR NR NR NR 0.0 0.0 0.0
OLDCASTLE BUILDING ENVELOPE ‐
TEXAS FACILITY
TERRELL TX N 75160 2.8 14.9 17.7 3.2 13.4 16.6 0.0 15.3 15.3
MAGNABLEND INC‐CENTRAL PLANT WAXAHACHIE TX N 75165 0.0 0.0 0.0 0.0 0.0 0.0 NR NR NR
UNITED STATES ALUMINUM CORP WAXAHACHIE TX N 75165 0.4 0.0 0.4 NR NR NR NR NR NR
Page 20 of 50

Table C-4. Comparisons of 2009, 2010 and 2011 TRI Air Emissions Data for Certain Glycol Ethers to Site Specific Screening Values (Step B)
2009 2010 2011
Facility City State Completed Survey Zip Code
Fugitive Air Emissions
(tpy)
Point Source Air
Emissions (tpy)
Total Air Emissions
(tpy)
Fugitive Air Emissions
(tpy)
Point Source Air
Emissions (tpy)
Total Air Emissions
(tpy)
Fugitive Air Emissions
(tpy)
Point Source Air Emissions
(tpy)
Total Air Emissions
(tpy)
INTERNATIONAL EXTRUSION CORP
TEXAS
WAXAHACHIE TX N 75165 0.0 0.2 0.2 NR NR NR NR NR NR
MAXIM INTEGRATED PRODUCTS DALLAS TX N 75244 0.0 0.9 0.9 NR NR NR NR NR NR
SILGAN CAN CO PARIS TX N 75460 4.9 3.2 8.2 4.0 2.9 7.0 3.4 3.2 6.7
ALUMAX MILL PRODUCTS INC TEXARKANA TX N 75501 0.0 0.6 0.6 NR NR NR NR NR NR
BRENNTAG SOUTHWEST INC LONG
VIEW
LONGVIEW TX N 75604 NR NR NR NR NR NR 0.0 0.0 0.0
REXAM BEVERAGE CAN CO LONGVIEW
FACILITY
LONGVIEW TX Y 75604 17.7 49.3 67.0 14.4 43.0 57.5 4.8 47.7 52.5
EASTMAN CHEMICAL CO TEXAS
OPERATIONS
LONGVIEW TX N 75602 12.0 1.8 13.8 12.1 2.5 14.6 12.3 3.1 15.3
ROBROY INDUSTRIES TEXAS LP GILMER TX N 75644 NR NR NR NR NR NR 0.0 0.0 0.0
BAKER PETROLITE KILGORE BLEND
PLANT
KILGORE TX N 75662 NR NR NR 0.0 0.0 0.0 0.0 0.0 0.0
CHAMPION TECHNOLOGIES INC KILGORE TX N 75662 0.2 0.0 0.2 NR NR NR NR NR NR
CHAMPION TECHNOLOGIES INC LONGVIEW TX N 75662 NR NR NR NR NR NR 0.0 0.0 0.0
CLEVELAND STEEL CONTAINER ‐
KILGORE
KILGORE TX N 75662 NR NR NR 0.0 0.1 0.1 0.0 0.1 0.1
NUCOR VULCRAFT GROUP ‐
GRAPELAND DIV
GRAPELAND TX N 75844 0.2 16.3 16.4 0.2 13.3 13.5 4.3 7.9 12.2
SHIELDCOAT TECHNOLOGIES INC (DBA
CYBERSHIELD OF TEXAS)
LUFKIN TX N 75904 7.1 0.0 7.1 8.3 0.0 8.3 NR NR NR
CHAMPION TECHNOLOGIES INC CRESSON TX N 76035 0.1 0.0 0.1 NR NR NR NR NR NR
CHEMGUARD INC MANSFIELD TX N 76063 NR NR NR NR NR NR 0.2 0.1 0.3
BALL METAL BEVERAGE CONTAINER
CORP
FORT WORTH TX N 76140 5.5 7.5 13.0 5.5 8.0 13.5 5.5 7.0 12.5
CARRY‐ON TRAILER CORP MEXIA TX N 76667 NR NR NR 0.0 10.7 10.7 NR NR NR
TEXAS TILE MANUFACTURING LLC HOUSTON TX N 77007 0.0 0.7 0.7 0.0 0.7 0.7 NR NR NR
PRECOAT METALS HOUSTON TX N 77015 4.8 0.3 5.1 4.6 0.3 4.8 4.4 0.2 4.7
NOV TUBOSCOPE WEST LITTLE YORK
COATING
HOUSTON TX N 77041 0.1 1.4 1.5 NR NR NR NR NR NR
UNIVAR USA INC HOUSTON FM 529 HOUSTON TX N 77041 NR NR NR 0.4 0.5 0.9 0.4 0.4 0.8
RR DONNELLEY‐WETMORE PLANT HOUSTON TX N 77043 NR NR NR 4.6 0.0 4.6 4.6 0.1 4.7
BRENNTAG SOUTHWEST INC HOUS
TON
HOUSTON TX N 77047 0.0 0.0 0.0 0.0 0.0 0.0 NR NR NR
KIK (HOUSTON) INC HOUSTON TX N 77054 2.3 0.0 2.3 1.2 0.0 1.2 NR NR NR
INTERCOASTAL PAINT CO INC HOUSTON TX N 77060 NR NR NR NR NR NR 0.0 0.0 0.0
PPG ARCHITECURAL COATINGS
HOUSTON
HOUSTON TX N 77092 NR NR NR 0.0 0.0 0.0 0.0 0.0 0.0
Page 21 of 50

Table C-4. Comparisons of 2009, 2010 and 2011 TRI Air Emissions Data for Certain Glycol Ethers to Site Specific Screening Values (Step B)
2009 2010 2011
Facility City State Completed Survey Zip Code
Fugitive Air Emissions
(tpy)
Point Source Air
Emissions (tpy)
Total Air Emissions
(tpy)
Fugitive Air Emissions
(tpy)
Point Source Air
Emissions (tpy)
Total Air Emissions
(tpy)
Fugitive Air Emissions
(tpy)
Point Source Air Emissions
(tpy)
Total Air Emissions
(tpy)
MAVERICK TUBE LLC DBA
TENARISCONROE
CONROE TX N 77301 NR NR NR 0.4 10.1 10.6 1.0 6.0 6.9
BALL METAL BEVERAGE CONTAINER
CORP
CONROE TX N 77303 14.0 4.6 18.6 14.0 4.6 18.6 13.0 4.2 17.2
CROWN BEVERAGE PACKAGING CONROE TX N 77303 29.3 4.8 34.1 30.8 5.0 35.9 27.6 4.5 32.1
AMERICAN COATINGS INC TOMBALL TX N 77375 0.0 0.0 0.0 0.0 0.0 0.0 NR NR NR
CROWN BEVERAGE PACKAGING SUGAR LAND TX N 77478 28.0 4.2 32.2 28.1 4.2 32.3 27.4 4.1 31.5
NALCO CO PLANT 106 SUGAR LAND TX N 77478 NR NR NR NR NR NR 0.1 0.0 0.1
MEMC PASADENA INC PASADENA TX N 77503 12.7 8.0 20.7 12.8 8.8 21.6 15.0 8.8 23.8
EQUISTAR CHEMICALS BAYPORT
CHEMICALS PLANT
PASADENA TX N 77507 6.8 0.0 6.8 6.7 0.7 7.4 5.1 0.2 5.2
CHEMICALS INC BAYTOWN TX N 77520 0.1 0.0 0.1 0.1 0.0 0.1 NR NR NR
KMCO CROSBY PLANT CROSBY TX N 77532 NR NR NR NR NR NR 0.1 0.1 0.3
DELTA HOUSTON DEER PARK TX N 77536 0.0 0.0 0.0 0.1 0.0 0.1 NR NR NR
CLEAN HARBORS DEER PARK LLC LA PORTE TX N 77571 NR NR NR 0.0 0.0 0.0 NR NR NR
CHAMPION TECHNOLOGIES INC FRESNO TX N 77545 NR NR NR 0.0 0.0 0.0 0.0 0.0 0.0
GREIF PACKAGING LLC LA PORTE TX N 77571 4.1 0.1 4.2 1.7 0.5 2.1 4.5 0.5 5.0
GREIF INDUSTRIAL PACKAGING &
SERVICES LLC
LA PORTE TX N 77571 0.6 0.0 0.6 NR NR NR NR NR NR
MARATHON PETROLEUM CO LLC TEXAS CITY TX N 77590 NR NR NR 0.0 0.0 0.0 NR NR NR
INVISTA SARL ‐ ORANGE SITE ORANGE TX N 77630 NR NR NR 0.1 0.0 0.1 0.0 0.1 0.1
ISP SYNTHETIC ELASTOMERS LP PORT NECHES TX N 77651 NR NR NR 0.0 0.1 0.1 0.0 0.1 0.1
TOYO INK AMERICA LLC BRYAN TX N 77807 NR NR NR NR NR NR 0.0 0.0 0.0
NOV TUBOSCOPE NAVASOTA NAVASOTA TX N 77868 0.8 0.3 1.1 4.9 0.5 5.4 0.1 0.1 0.2
UNION CARBIDE CORP SEADRIFT
PLANT
SEADRIFT TX N 77983 13.9 3.1 17.0 13.9 3.5 17.5 14.2 3.5 17.7
CLEARWATER INTERNATIONAL LLC ELMENDORF TX N 78112 0.0 0.0 0.0 NR NR NR NR NR NR
TOYOTA MOTOR MANUFACTURING
TEX AS INC
SAN ANTONIO TX N 78264 5.2 3.4 8.6 2.4 0.4 2.8 6.8 3.1 9.9
US ECOLOGY TEXAS INC ROBSTOWN TX N 78380 0.0 0.0 0.0 NR NR NR NR NR NR
CHAMPION TECHNOLOGIES INC CORPUS CHRISTI TX N 78405 0.1 0.0 0.1 0.1 0.0 0.1 NR NR NR
TYSON FRESH MEATS INC AMARILLO TX N 79108 0.1 0.0 0.1 NR NR NR 0.0 0.0 0.0
CATALYST OILFIELD SERVICES LLC GARDENDALE TX N 79758 NR NR NR NR NR NR 1.4 0.0 1.4
CHAMPION TECHNOLOGIES INC ODESSA TX N 79762 NR NR NR 0.2 0.0 0.2 0.3 0.0 0.3
UNIVAR USA INC HOUSTON HOUSTON TX N 77061 0.0 0.0 0.0 NR NR NR 0.1 0.1 0.3
NALCO CO ‐ ODESSA PLANT 114 ODESSA TX N 79765 0.0 0.1 0.1 NR NR NR NR NR NR
KBP COIL COATERS INC DENVER CO N 80216 0.0 0.0 0.0 0.0 0.0 0.0 NR NR NR
UNIVAR USA INC DENVER DENVER CO N 80216 0.0 0.0 0.0 0.0 0.0 0.0 NR NR NR
ROCKY MOUNTAIN METAL
CONTAINER
GOLDEN CO N 80401 30.5 6.0 36.5 29.5 6.0 35.5 26.5 7.0 33.5
Page 22 of 50

Table C-4. Comparisons of 2009, 2010 and 2011 TRI Air Emissions Data for Certain Glycol Ethers to Site Specific Screening Values (Step B)
2009 2010 2011
Facility City State Completed Survey Zip Code
Fugitive Air Emissions
(tpy)
Point Source Air
Emissions (tpy)
Total Air Emissions
(tpy)
Fugitive Air Emissions
(tpy)
Point Source Air
Emissions (tpy)
Total Air Emissions
(tpy)
Fugitive Air Emissions
(tpy)
Point Source Air Emissions
(tpy)
Total Air Emissions
(tpy)
BALL METAL BEVERAGE CONTAINER
CORP
GOLDEN CO N 80403 21.0 10.5 31.5 19.5 9.5 29.0 20.0 11.5 31.5
CIRCLE GRAPHICS INC LONGMONT CO N 80501 3.1 1.9 5.0 3.0 1.9 4.9 3.3 1.7 5.0
METAL CONTAINER CORPORTION ‐
WINDSOR CAN PLANT
WINDSOR CO Y 80550 15.1 42.4 57.5 14.9 40.1 55.0 14.5 39.7 54.3
DPIX LLC COLORADO
SPRINGS
CO N 80916 NR NR NR 0.3 0.1 0.5 0.5 0.2 0.6
COORSTEK GRAND JUNCTION CO N 81505 NR NR NR NR NR NR 0.0 4.8 4.8
SINCLAIR WYOMING REFINING CO SINCLAIR WY N 82334 0.0 0.0 0.0 NR NR NR 0.0 0.0 0.0
CROWN BEVERAGE PACKAGING WORLAND WY N 82401 11.1 33.4 44.5 12.8 38.3 51.1 13.3 40.0 53.3
ASHLAND DISTRIBUTION CO CLEARFIELD UT N 84016 0.0 0.0 0.0 0.0 0.0 0.0 NR NR NR
U.S. AIR FORCE OGDEN AIR LOGISTICS
CENTER
HILL AFB UT N 84056 0.9 0.7 1.6 NR NR NR NR NR NR
TTM TECHNOLOGIES INC LOGAN UT N 84321 0.1 1.1 1.2 0.4 3.9 4.3 0.6 5.3 5.9
REXAM BEVERAGE CAN CO PHOENIX
FACILITY
PHOENIX AZ Y 85043 5.2 34.4 39.6 5.2 33.0 38.2 5.7 36.2 41.9
PROCLEAN OF ARIZONA INC PHOENIX AZ N 85043 0.0 0.1 0.1 NR NR NR NR NR NR
SOUTHWEST DISTRIBUTING CO MESA AZ N 85210 NR NR NR 0.0 0.0 0.0 0.0 0.0 0.0
ASHLAND INC ‐ CHANDLER CHANDLER AZ N 85226 0.1 0.0 0.2 NR NR NR NR NR NR
WR MEADOWS OF ARIZONA INC GOODYEAR AZ N 85338 NR NR NR NR NR NR 0.2 0.0 0.2
US MARINE CORPS AIR STATION YUMA YUMA AZ N 85369 0.1 0.0 0.1 NR NR NR NR NR NR
SHERWIN‐WILLIAMS CO FERNLEY NV N 89408 0.0 0.0 0.0 0.0 0.0 0.0 NR NR NR
CARRY‐ON TRAILER CORP WINNEMUCCA NV N 89445 NR NR NR 0.0 7.5 7.5 0.0 5.0 5.0
PRO LINE PRINTING / RR DONNELLEY RENO NV N 89512 1.5 0.2 1.7 1.8 0.0 1.8 NR NR NR
ENGINEERED POLYMER SOLUTIONS
INC
CITY OF
COMMERCE
CA N 90040 0.0 0.0 0.0 NR NR NR 0.0 0.0 0.0
NORMAN FOX & CO VERNON CA N 90058 0.0 0.0 0.0 NR NR NR NR NR NR
HEXION SPECIALTY CHEMICALS INC LYNWOOD CA N 90262 0.0 0.0 0.0 NR NR NR NR NR NR
BALL METAL BEVERAGE CONTAINER
CORP
TORRANCE CA N 90503 31.0 2.7 33.7 29.0 3.0 32.0 16.0 0.7 16.7
EXXONMOBIL OIL CORP ‐ TORRANCE
REFINERY
TORRANCE CA N 90509 NR NR NR 0.1 0.0 0.1 0.0 0.0 0.0
OAKITE PRODUCTS INC (AKA
CHEMETALL OAKITE)
LA MIRADA CA N 90638 NR NR NR NR NR NR 0.0 0.0 0.0
TREND OFFSET PRINTING SERVICES
INC
LOS ALAMITOS CA N 90720 1.8 0.1 1.9 NR NR NR NR NR NR
ARDAGH METAL PACKAGING USA INC TERMINAL ISLAND CA N 90731 6.2 0.6 6.7 4.1 0.4 4.5 3.8 0.4 4.2
Page 23 of 50

Table C-4. Comparisons of 2009, 2010 and 2011 TRI Air Emissions Data for Certain Glycol Ethers to Site Specific Screening Values (Step B)
2009 2010 2011
Facility City State Completed Survey Zip Code
Fugitive Air Emissions
(tpy)
Point Source Air
Emissions (tpy)
Total Air Emissions
(tpy)
Fugitive Air Emissions
(tpy)
Point Source Air
Emissions (tpy)
Total Air Emissions
(tpy)
Fugitive Air Emissions
(tpy)
Point Source Air Emissions
(tpy)
Total Air Emissions
(tpy)
US DOD DFSP SAN PEDRO SAN PEDRO CA N 90731 NR NR NR NR NR NR 0.1 0.0 0.1
SANYO SOLAR (USA) LLC CARSON CA N 90745 0.0 8.5 8.5 0.0 7.2 7.2 NR NR NR
WESTERN TUBE & CONDUIT CORP LONG BEACH CA N 90810 NR NR NR 0.0 0.1 0.1 NR NR NR
REXAM BEVERAGE CAN CO
CHATSWORTH FACILITY
CHATSWORTH CA Y 91311 14.3 40.3 54.6 8.9 35.5 44.4 6.4 22.6 29.0
REICHHOLD INC ‐ AZUSA PLANT AZUSA CA N 91702 NR NR NR NR NR NR 0.0 0.0 0.0
WESTERN METAL DECORATING CO RANCHO
CUCAMONGA
CA N 91730 NR NR NR 0.6 0.4 0.9 0.5 0.4 0.9
CARDINAL INDUSTRIAL FINISHES SOUTH EL MONTE CA N 91733 0.0 0.0 0.1 0.0 0.0 0.1 NR NR NR
METAL CONTAINER CORP ‐ MIRA
LOMA CAN PLANT
MIRA LOMA CA N 91752 29.0 3.8 32.8 28.5 3.7 32.3 27.5 3.7 31.2
HENKEL ONTARIO ONTARIO CA N 91761 0.0 0.0 0.0 NR NR NR NR NR NR
MACDERMID PRINTING SOLUTIONS SAN MARCOS CA N 92078 0.0 2.1 2.1 NR NR NR 0.0 0.3 0.3
SDC TECHNOLOGIES INC IRVINE CA N 92618 NR NR NR NR NR NR 0.0 0.0 0.0
BEHR PROCESS CORP SANTA ANA CA N 92704 0.0 0.0 0.0 NR NR NR NR NR NR
ARLON INC ADHESIVES & FILMS DIV SANTA ANA CA N 92704 0.0 0.0 0.0 0.0 0.0 0.0 NR NR NR
ARLON GRAPHICS LLC SANTA ANA CA N 92704 NR NR NR NR NR NR 0.1 0.1 0.2
BAKER PETROLITE BAKERSFIELD CA N 93308 0.0 0.0 0.0 0.0 0.0 0.0 NR NR NR
GE WATER & PROCESS TECHNOLOGIES
‐ BAKERSFIELD
BAKERSFIELD CA N 93308 NR NR NR 0.0 0.0 0.0 NR NR NR
KELLY‐MOORE PAINT CO INC SAN CARLOS CA N 94070 0.0 0.0 0.0 0.0 0.0 0.0 NR NR NR
BALL METAL BEVERAGE CONTAINER
CORP
FAIRFIELD CA N 94533 12.5 19.0 31.5 7.5 12.0 19.5 9.0 12.5 21.5
REXAM BEVERAGE CAN CO RE:
FAIRFIELD PLANT
FAIRFIELD CA Y 94533 5.5 8.5 14.0 5.4 3.9 9.4 5.3 3.9 9.2
NEW UNITED MOTOR
MANUFACTURING INC
FREMONT CA N 94538 29.7 7.4 37.1 14.6 0.0 14.6 NR NR NR
UNIVAR USA INC ‐ SAN JOSE SAN JOSE CA N 95131 0.0 0.0 0.0 0.0 0.0 0.0 NR NR NR
ECOLAB INC SAN JOSE CA N 95133 0.0 0.0 0.0 NR NR NR NR NR NR
GREIF PACKAGING LLC MERCED CA N 95348 6.5 1.1 7.6 4.6 1.3 5.9 0.2 0.7 0.8
BALL METAL FOOD CONTAINER CORP OAKDALE CA N 95361 0.8 4.7 5.4 0.1 3.9 4.0 0.2 3.4 3.6
SILGAN CONTAINER MANUFACTURING
CORP
RIVERBANK CA N 95367 0.2 3.9 4.1 0.3 4.4 4.7 0.6 7.2 7.8
INX DIGITAL INK CO DIXON CA N 95620 4.7 0.0 4.7 5.6 0.0 5.6 4.4 0.0 4.4
HB FULLER ROSEVILLE CA N 95678 0.0 0.3 0.3 NR NR NR NR NR NR
SACRAMENTO‐ CAMPBELL SOUP
SUPPLY CO
SACRAMENTO CA N 95824 NR NR NR NR NR NR 0.1 0.0 0.1
Page 24 of 50

Table C-4. Comparisons of 2009, 2010 and 2011 TRI Air Emissions Data for Certain Glycol Ethers to Site Specific Screening Values (Step B)
2009 2010 2011
Facility City State Completed Survey Zip Code
Fugitive Air Emissions
(tpy)
Point Source Air
Emissions (tpy)
Total Air Emissions
(tpy)
Fugitive Air Emissions
(tpy)
Point Source Air
Emissions (tpy)
Total Air Emissions
(tpy)
Fugitive Air Emissions
(tpy)
Point Source Air Emissions
(tpy)
Total Air Emissions
(tpy)
SILGAN CAN CO SACRAMENTO CA N 95824 4.9 0.4 5.3 5.2 0.9 6.1 4.4 0.6 5.0
ENGINEERED POLYMER SOLUTIONS
INC D/B/A VALSPAR COATINGS
SACRAMENTO CA N 95826 0.0 0.0 0.0 NR NR NR NR NR NR
BALL METAL BEVERAGE CONTAINER
CORP
KAPOLEI HI N 96707 2.2 10.5 12.7 2.3 10.5 12.8 2.0 9.0 11.0
IMPERIAL PAINT CO INC PORTLAND OR N 97210 NR NR NR 0.0 0.1 0.1 0.0 0.1 0.1
UNIVAR USA INC PORTLAND OR N 97210 NR NR NR 0.0 0.0 0.0 NR NR NR
TARR ACQUISITION LLC PORTLAND OR N 97227 0.0 0.0 0.0 0.0 0.0 0.0 NR NR NR
FORMULA CORP AUBURN WA N 98002 NR NR NR 0.1 0.0 0.1 0.1 0.0 0.1
REXAM BEVERAGE CAN CO KENT WA
FACILITY
KENT WA Y 98032 13.2 74.8 88.0 12.5 70.6 83.1 12.4 70.5 82.9
BOEING COMMERCIAL AIRPLANE
GROUP ‐ EVERETT
EVERETT WA N 98204 1.6 14.0 15.6 2.0 9.0 11.0 3.5 17.0 20.5
EMERALD SERVICES INC TACOMA WA N 98421 NR NR NR 0.0 0.0 0.0 0.0 0.0 0.0
CROWN BEVERAGE PACKAGING OLYMPIA WA Y 98501 17.1 51.3 68.4 19.4 58.3 77.7 16.0 48.0 64.0
US DOD USAF JOINT BASE
ELMENDORF‐RICHARDSON
ELMENDORF AFB AK N 99506 NR NR NR 0.0 0.0 0.0 NR NR NR
Page 25 of 50

Table C-4. Comparisons of 2009, 2010 and 2011 TRI Air Emissions Data for Certain Glycol Ethers to Site Specific Screening Values (Step B)
Facility City State Completed Survey Zip Code
HEWLETT‐PACKARD CARIBE BV SITE AGUADILLA PR N 00605
CROWN BEVERAGE PACKAGING CAROLINA PR N 00985
DU PONT ELECTRONICS MICROCIRCU
ITS INDUSTRIES LTD
MANATI PR N 00674
HOVENSA LLC CHRISTIANSTED V Isl N 00820
VERTIS INC RNS SPRINGFIELD DIV EAST
LONGMEADOW
MA N 01028
SHIELD PACKAGING CO INC DUDLEY MA N 01571
POLARTEC LLC LAWRENCE MA N 01841
KEY POLYMER LAWRENCE MA N 01843
CROWN BEVERAGE PACKAGING LAWRENCE MA Y 01843
VALSPAR SAMUEL CABOT DIV NEWBURYPORT MA N 01950
MANN DISTRIBUTION WARWICK RI N 02886
TACO INC ‐ CRANSTON CRANSTON RI N 02920
EFI / INKWARE MEREDITH NH N 03253
HENKEL CORP SEABROOK NH N 03874
S D WARREN CO WESTBROOK ME N 04098
VERSO PAPER BUCKSPORT MILL BUCKSPORT ME N 4416PRIME TANNING CO ‐ HARTLAND HARTLAND ME N 04943
STANLEY WORKS HAND TOOLS DIV NEW BRITAIN CT N 06052
CONOCOPHILLIPS CO TREMLEY POINT
TERMINAL
LINDEN NJ N 07036
SAFETY‐KLEEN SYSTEMS INC LINDEN NJ N 07036
MAUSER CORP WOODBRIDGE NJ N 07095
BENJAMIN MOORE & CO ‐ NEWARK NEWARK NJ N 07105DELEET MERCHANDISING NEWARK NJ N 07105
ACTEGA RADCURE INC WAYNE NJ N 07470
BASF CORP BELVIDERE NJ N 07823
DUPONT CHAMBERS WORKS DEEPWATER NJ N 08023
CALLAHAN CHEMICAL CO PALMYRA NJ N 08065
SILGAN CONTAINERS
MANUFACTURING CORP
EDISON NJ N 08817
ENGLERT INC PERTH AMBOY NJ N 08861
AROMATIC TECHNOLOGIES INC SOMERVILLE NJ N 08876
BALL METAL BEVERAGE CONTAINER
CORP
MIDDLETOWN NY Y 10940
BASF CORP EAST SETAUKET NY N 11733
DISC GRAPHICS HAUPPAUGE NY N 11788
SURPASS CHEMICAL CO INC ALBANY NY N 12204
Minimum Release Height
(m)
Minimum Receptor
Distance (m)
Proportion of Certain Glycol
Ethers Used that are EGBE
2009 Maximum
Impact (mg/m3)
2010 Maximum
Impact (mg/m3)
2011 Maximum
Impact (mg/m3)
2009 Outcome
2010 Outcome
2011 Outcome
Default Default Default0.20 0.05 0.07 Out Out Out
Default Default Default 0.75 0.69 0.60 Out Out Out
Default Default DefaultNR 0.002 NR Out Out Out
Default Default Default 0.01 0.03 NR Out Out Out
Default Default DefaultNR 0.08 NR Out Out Out
Default Default Default 0.00 0.0001 NR Out Out Out
Default Default Default NR 0.03 0.04 Out Out Out
Default Default Default 0.00 0.0003 NR Out Out Out
8.7 34 0.905 4.31 3.75 4.19 Retain Retain Retain
Default Default Default NR NR 0.0019 Out Out Out
Default Default Default NR 0.00004 0.0000 Out Out Out
Default Default Default NR 0.12 0.12 Out Out Out
Default Default Default 0.00 NR NR Out Out Out
Default Default Default NR NR 0.0011 Out Out Out
Default Default Default 0.32 0.50 0.74 Out Out Out
Default Default Default NR 0.00001 NR Out Out Out
Default Default Default 0.12 0.10 NR Out Out Out
Default Default Default 0.21 0.23 0.24 Out Out Out
Default Default Default0.0001 0.0001 NR Out Out Out
Default Default Default 0.00 NR NR Out Out Out
Default Default Default 0.06 0.15 0.19 Out Out Out
Default Default Default NR 0.00004 0.00005 Out Out Out
Default Default Default 0.02 NR 0.01 Out Out Out
Default Default Default 0.0001 0.0001 NR Out Out Out
Default Default Default 0.0004 0.0004 NR Out Out Out
Default Default Default 0.005 NR 0.0048 Out Out Out
Default Default Default 0.0001 NR NR Out Out Out
Default Default Default0.25 0.18 0.17 Out Out Out
Default Default Default NR 0.01 0.01 Out Out Out
Default Default Default 0.00 NR NR Out Out Out
15 122 0.980.24 0.26 0.32 Out Out Out
Default Default Default NR 0.0003 0.0003 Out Out Out
Default Default Default 0.07 NR NR Out Out Out
Default Default Default NR 0.00002 NR Out Out Out
Page 26 of 50

Table C-4. Comparisons of 2009, 2010 and 2011 TRI Air Emissions Data for Certain Glycol Ethers to Site Specific Screening Values (Step B)
Facility City State Completed Survey Zip Code
METAL CONTAINER CORP ‐
NEWBURGH CAN PLANT
NEW WINDSOR NY Y 12553
BALL METAL BEVERAGE CONTAINER
CORP
SARATOGA
SPRINGS
NY Y 12866
QUAD/GRAPHICS INC SARATOGA
SPRINGS
NY N 12866
FIBERMARK NORTH AMERICA INC LOWVILLE NY N 13367
US DOD DFSP VERONA VERONA NY N 13478
WHITING DOOR MANUFACTURING
CORP
AKRON NY N 14001
ASHLAND DISTRIBUTION TONAWANDA NY N 14150
SENECA FOODS CORP CAN PLANT MARION NY N 14505
HAMMER PACKAGING CORP WEST HENRIETTA NY N 14586
TRI VULCRAFT OF NEW YORK INC CHEMUNG NY N 14825
UNIVAR USA INC ‐ BUNOLA BRANC H BUNOLA PA N 15020
USS ‐ CLAIRTON PLANT CLAIRTON PA N 15025
CLEARWATER INTERNATIONAL LLC LEETSDALE PA N 15056
SEQUA COATINGS CORP PRECOAT
METALS DIV
MC KEESPORT PA N 15132
PPG INDUSTRIES,INC‐SPRINGDALE
COMPLEX
SPRINGDALE PA N 15144
ALLEGHENY PETROLEUM PRODUCTS
CO
WILMERDING PA N 15148
BEDFORD MATERIALS CO INC MANNS CHOICE PA N 15550
NALCO CO ELLWOOD CITY PA N 16117
JAMESTOWN COATING
TECHNOLOGIES
JAMESTOWN PA N 16134
INTERSTATE CHEMICAL CO INC HERMITAGE PA N 16148
BERENFIELD CONTAINERS INC CLARENDON PA N 16313
FRANKLIN INVESTMENT CORP FRANKLIN PA N 16323
ZURN INDUSTRIES LLC ERIE PA N 16502
AMES TRUE TEMPER INC HARRISBURG PA N 17104
CROWN FOOD PACKAGING HANOVER PA N 17331
NEW YORK WIRE HANOVER PA N 17331
AMERICAN COLOR GRAPHICS INC YORK PA N 17404
CP CONVERTERS INC YORK PA N 17402
RR DONNELLEY LANCASTER WEST LANCASTER PA N 17601
RR DONNELLEY LANCASTER EAST LANCASTER PA N 17601
Minimum Release Height
(m)
Minimum Receptor
Distance (m)
Proportion of Certain Glycol
Ethers Used that are EGBE
2009 Maximum
Impact (mg/m3)
2010 Maximum
Impact (mg/m3)
2011 Maximum
Impact (mg/m3)
2009 Outcome
2010 Outcome
2011 Outcome
12.192 73.152 0.871.01 0.93 0.89 Out Out Out
20 66 10.19 0.20 0.19 Out Out Out
Default Default Default0.21 NR 0.14 Out Out Out
Default Default Default 0.12 0.11 0.10 Out Out Out
Default Default Default NR NR 0.0001 Out Out Out
Default Default Default0.16 0.18 0.25 Out Out Out
Default Default Default NR 0.0001 NR Out Out Out
Default Default Default 0.13 0.14 0.11 Out Out Out
Default Default Default0.32 0.14 0.17 Out Out Out
Default Default Default 0.29 0.33 0.28 Out Out Out
Default Default DefaultNR 0.0002 0.0046 Out Out Out
Default Default Default 0.20 0.52 1.48 Out Out Out
Default Default Default 0.00 NR 0.0002 Out Out Out
Default Default Default0.01 NR NR Out Out Out
Default Default Default0.20 0.19 0.21 Out Out Out
Default Default Default0.003 0.0023 NR Out Out Out
Default Default Default 0.28 0.32 0.32 Out Out Out
Default Default Default NR 0.0000 0.0000 Out Out Out
Default Default Default0.01 NR 0.01 Out Out Out
Default Default Default NR 0.0003 0.0003 Out Out Out
Default Default Default 0.18 0.14 0.10 Out Out Out
Default Default Default 0.39 0.42 0.31 Out Out Out
Default Default Default 0.17 NR NR Out Out Out
Default Default Default NR 0.47 0.60 Out Out Out
Default Default Default 0.28 0.34 0.13 Out Out Out
Default Default Default 0.55 0.51 0.59 Out Out Out
Default Default Default 0.08 NR NR Out Out Out
Default Default Default NR 0.04 0.04 Out Out Out
Default Default Default 0.25 0.17 0.32 Out Out Out
Default Default Default 0.20 0.23 0.28 Out Out Out
Page 27 of 50

Table C-4. Comparisons of 2009, 2010 and 2011 TRI Air Emissions Data for Certain Glycol Ethers to Site Specific Screening Values (Step B)
Facility City State Completed Survey Zip Code
ARMSTRONG WORLD INDUSTRIES
LANCASTER PLANT
LANCASTER PA N 17603
BEHR PROCESS CORP ALLENTOWN ALLENTOWN PA N 18106
MASCO RETAIL CABINET GROUP
SAYRE PENNSYLVANIA PLANT
SAYRE PA N 18840
DUPONT TOWANDA PLANT TOWANDA PA N 18848
CLEVELAND STEEL CONTAINER CORP QUAKERTOWN PA N 18951
SUPERPAC INC SOUTHAMPTON PA N 18966
GREIF PACKAGING LLC WARMINSTER PA N 18974
GEORGE S COYNE CHEMICAL CO INC CROYDON PA N 19021
UNIVAR USA INC MORRISVILLE
BRANCH
MORRISVILLE PA N 19067
CARDONE INDUSTRIES PHILADELPHIA PA N 19120
SUN CHEMICAL CORP PHILADELPHIA PA N 19132
CAN CORP OF AMERICA INC BLANDON PA N 19510
HIRSH INDUSTRIES INC DOVER DE N 19904
INDEPENDENT CAN CO BELCAMP MD N 21017
CROWN FOOD PACKAGING BALTIMORE MD N 21221
TNEMEC CO INC BALTIMORE MD N 21222
RUST‐OLEUM CORP IN MD WILLIAMSPORT MD N 21795
PHOENIX COLOR CORP HAGERSTOWN MD N 21742
VERTIS MANASSAS VA N 20109
CARRY‐ON TRAILER CORP MONTROSS VA N 22520
QG LLC WINCHESTER VIRGINIA WINCHESTER VA N 22603
DUPONT FRONT ROYAL PLANT FRONT ROYAL VA N 22630
FISHER SCIENTIFIC INTERNATIONAL
MTN DIAGNOSTICS PLANT
MIDDLETOWN VA N 22645
RR DONNELLEY HARRISONBURG VA Y 22802
MERCK SHARP & DOHME CORP ELKTON VI N 22827
SOLITE LLC ARVONIA VI N 23004
BALL METAL BEVERAGE CONTAINER
CORP
WILLIAMSBURG VA Y 23185
CADMUS SPECIALTY PUBLICATIONS RICHMOND VI N 23228
BOEHRINGER INGELHEIM CHEMICALS
INC
PETERSBURG VA N 23805
VOLVO TRUCKS NORTH AMERICA DUBLIN VI N 24084
Minimum Release Height
(m)
Minimum Receptor
Distance (m)
Proportion of Certain Glycol
Ethers Used that are EGBE
2009 Maximum
Impact (mg/m3)
2010 Maximum
Impact (mg/m3)
2011 Maximum
Impact (mg/m3)
2009 Outcome
2010 Outcome
2011 Outcome
Default Default Default0.04 NR NR Out Out Out
Default Default Default 0.002 0.0005 NR Out Out Out
Default Default DefaultNR 0.0055 NR Out Out Out
Default Default Default NR NR 0.05 Out Out Out
Default Default DefaultNR 0.04 0.09 Out Out Out
Default Default Default NR NR 0.16 Out Out Out
Default Default Default 0.03 0.11 0.17 Out Out Out
Default Default Default0.0046 NR NR Out Out Out
Default Default Default0.0001 NR 0.0008 Out Out Out
Default Default Default 0.24 0.17 0.11 Out Out Out
Default Default Default NR 0.0055 0.0048 Out Out Out
Default Default Default 0.32 0.25 0.16 Out Out Out
Default Default Default 0.14 0.08 0.06 Out Out Out
Default Default Default NR NR 0.03 Out Out Out
Default Default Default 0.84 0.85 0.86 Out Out Out
Default Default Default NR 0.0019 0.0026 Out Out Out
Default Default Default NR 0.0005 0.01 Out Out Out
Default Default Default NR 0.40 0.31 Out Out Out
Default Default Default NR 0.07 0.08 Out Out Out
Default Default Default NR 0.09 0.08 Out Out Out
Default Default Default 0.12 0.20 0.14 Out Out Out
Default Default Default 0.0036 NR 0.00 Out Out Out
Default Default Default
0.0004 NR 0.00005 Out Out Out
11.2 45 Default 1.56 1.65 1.90 Out Retain Retain
Default Default Default 0.04 0.01 NR Out Out Out
Default Default Default 0.00001 NR NR Out Out Out
13.1318 96 0.96563.79 4.05 3.93 Retain Retain Retain
Default Default DefaultNR 0.08 NR Out Out Out
Default Default Default0.002 NR 0.0001 Out Out Out
Default Default Default NR 0.13 NR Out Out Out
Page 28 of 50

Table C-4. Comparisons of 2009, 2010 and 2011 TRI Air Emissions Data for Certain Glycol Ethers to Site Specific Screening Values (Step B)
Facility City State Completed Survey Zip Code
NEW MILLENNIUM BUILDING
SYSTEMS
SALEM VI N 24153
VAUGHAN‐BASSETT FURNITURE CO
GALAX
GALAX VA N 24333
ROYAL MOULDINGS LTD; MARION
VIRGINIA
MARION VA N 24354
GROTTOES PLASTICS PLANT GROTTOES VI N 24441
DAVIS‐FROST INC LYNCHBURG VA N 24506
BALL METAL FOOD CONTAINER CORP WEIRTON WV N 26062
CROWN CORK & SEAL CO (USA) INC
CROWN CLOSURE DIV
WEIRTON WV Y 26062
PRECOAT METALS WEIRTON WV N 26062
JELD‐WEN CRAIGSVILLE WV N 26205
REXAM BEVERAGE CAN CO RE:
WINSTON SALEM PLANT
WINSTON‐SALEM NC Y 27107
APOLLO CHEMICAL BURLINGTON NC N 27215
ENGINEERED POLYMER SOLUTIONS
INC D/B/A VALSPAR COATINGS
HIGH POINT NC N 27261
THOMAS BUILT BUSES INC HIGH POINT NC N 27263
UNIVAR USA INC JAMESTOWN
FACILITY
JAMESTOWN NC N 27282
MEADWESTVACO CONSUMER
PACKAGING GROUP LLC
MEBANE NC N 27302
BALL METAL BEVERAGE CONTAINER
CORP
REIDSVILLE NC Y 27320
CREE INC DURHAM NC N 27703
AIR SYSTEM COMPONENTS LP TARBORO NC N 27886
PARKER HANNIFIN TECH SEAL DIV WILSON NC N 27893
WIX FILTRATION CORP ‐ ALLEN PLANT GASTONIA NC N 28052
BERENFIELD CONTAINERS SE LTD HARRISBURG NC N 28075
CLARIANT CORP ‐ MOUNT HOLLY
WEST PLANT
MOUNT HOLLY NC N 28120
QUANTUM COATINGS INC CHARLOTTE NC N 28273
COMMERCIAL MERCHANDISING CORP CHARLOTTE NC N 28273
DUPONT FAYETTEVILLE PLANT FAYETTEVILLE NC N 28306
SILGAN CAN CO MAXTON NC N 28364
AVERY DENNISON ‐ IBMD LENOIR LENOIR NC N 28645
Minimum Release Height
(m)
Minimum Receptor
Distance (m)
Proportion of Certain Glycol
Ethers Used that are EGBE
2009 Maximum
Impact (mg/m3)
2010 Maximum
Impact (mg/m3)
2011 Maximum
Impact (mg/m3)
2009 Outcome
2010 Outcome
2011 Outcome
Default Default Default0.19 NR NR Out Out Out
Default Default DefaultNR NR 0.12 Out Out Out
Default Default Default0.21 0.30 0.20 Out Out Out
Default Default Default 0.0016 NR NR Out Out Out
Default Default Default NR 0.0051 0.01 Out Out Out
Default Default Default1.16 0.69 0.43 Out Out Out
11 12 16.59 6.26 6.01 Retain Retain Retain
Default Default Default 0.12 0.15 0.06 Out Out Out
Default Default Default NR 0.07 NR Out Out Out
14 75 0.953.86 4.23 3.10 Retain Retain Retain
Default Default Default 0.0051 0.01 NR Out Out Out
Default Default Default0.01 NR NR Out Out Out
Default Default Default NR 0.38 0.34 Out Out Out
Default Default DefaultNR NR 0.0002 Out Out Out
Default Default Default0.41 NR 0.11 Out Out Out
16 137 11.18 1.45 1.58 Out Out Out
Default Default Default 0.14 0.14 0.0026 Out Out Out
Default Default Default 0.32 0.36 0.35 Out Out Out
Default Default Default NR 0.0000 0.00 Out Out Out
Default Default Default0.15 0.15 0.13 Out Out Out
Default Default Default 0.14 0.66 0.11 Out Out Out
Default Default Default0.0011 0.0012 NR Out Out Out
Default Default Default 0.01 NR 0.01 Out Out Out
Default Default DefaultNR NR 0.02 Out Out Out
Default Default Default NR 0.01 NR Out Out Out
Default Default Default 0.24 0.26 0.25 Out Out Out
Default Default Default 0.17 0.23 0.19 Out Out Out
Page 29 of 50

Table C-4. Comparisons of 2009, 2010 and 2011 TRI Air Emissions Data for Certain Glycol Ethers to Site Specific Screening Values (Step B)
Facility City State Completed Survey Zip Code
ENGINEERED POLYMER SOLUTIONS
INC D/B/A VALSPAR COATINGS
STATESVILLE NC N 28625
REXAM BEVERAGE CAN CO RE:
BISHOPVILLE SC FACILITY
BISHOPVILLE SC Y 29010
HOLCIM (US) INC HOLLY HILL PLANT HOLLY HILL SC N 29059
SAFETY‐KLEEN SYSTEMS INC LEXINGTON SC N 29073
HUSQVARNA CONSUMER OUTDOOR
PRODUCTS
ORANGEBURG SC N 29116
HENKEL ENOREE SC N 29335
NUCOR CORP VULCRAFT DIV FLORENCE SC N 29501
CROWN BEVERAGE PACKAGING CHERAW SC N 29520
AVX CORP CONWAY CONWAY SC N 29526
AVX CORP MYRTLE BEACH MYRTLE BEACH SC Y 29577
DIVERSIFIED COATING SYSTEMS INC GREENVILLE SC N 29605
OWENS CORNING VETROTEX LLC STARR SC N 29684
FUJIFILM MANUFACTURING USA INC GREENWOOD SC N 29649
BMW MANUFACTURING CO LLC GREER SC Y 29651
COGNIS CORP MAULDIN PLANT MAULDIN SC N 29662
SCHNEIDER ELECTRIC SENECA SC N 29678
OMNOVA SOLUTIONS INC CHESTER SC N 29706
AGY AIKEN LLC AIKEN SC N 29801
DECOSTAR INDUSTRIES INC CARROLLTON GA N 30117
BALL CONTAINER LLC ROME CAN
PLANT
ROME GA Y 30161
HB FULLER COVINGTON GA N 30014
BEHR PROCESS CORP ATLANTA MC DONOUGH GA N 30253
ECOLAB INC MC DONOUGH GA N 30253
ECOLAB INC MC DONOUGH GA N 30253
BRIGGS & STRATTON POWER
PRODUCTS MCDONOUGH
OPERATIONS
MC DONOUGH GA N 30253
TOPPAN INTERAMERICA INC MC DONOUGH GA N 30253
QUAD/GRAPHICS INC THE ROCK GA N 30285
FLINT GROUP NORTH AMERICA ATLANTA GA N 30339
UNIVAR USA INC DORAVILLE FACILITY DORAVILLE GA N 30362
CARRY‐ON TRAILER CORP LAVONIA GA N 30553
POWER PARTNERS INC ATHENS GA N 30607
Minimum Release Height
(m)
Minimum Receptor
Distance (m)
Proportion of Certain Glycol
Ethers Used that are EGBE
2009 Maximum
Impact (mg/m3)
2010 Maximum
Impact (mg/m3)
2011 Maximum
Impact (mg/m3)
2009 Outcome
2010 Outcome
2011 Outcome
Default Default Default0.00 NR NR Out Out Out
11.5824 11 0.99874.11 4.13 3.81 Retain Retain Retain
Default Default DefaultNR NR 0.00 Out Out Out
Default Default Default 0.05 0.21 0.00 Out Out Out
Default Default Default0.12 0.14 0.14 Out Out Out
Default Default Default 0.00 NR NR Out Out Out
Default Default Default 0.33 0.34 0.42 Out Out Out
Default Default Default 0.76 0.83 0.82 Out Out Out
Default Default Default 0.05 NR NR Out Out Out
5.5 38.099998 0.75 0.34 0.24 0.11 Out Out Out
Default Default DefaultNR 0.0072 0.01 Out Out Out
Default Default Default 0.12 0.15 0.11 Out Out Out
Default Default DefaultNR NR 0.03 Out Out Out
18.3 270 0.88 0.47 0.59 0.98 Out Out Out
Default Default Default 0.0019 0.0004 NR Out Out Out
Default Default Default NR NR 0.05 Out Out Out
Default Default Default NR 0.00003 0.00004 Out Out Out
Default Default Default 0.13 0.43 0.49 Out Out Out
Default Default Default 0.03 NR 0.03 Out Out Out
12.192 54.864 0.861.34 1.44 1.21 Out Out Out
Default Default Default 0.02 0.03 NR Out Out Out
Default Default Default NR NR 0.01 Out Out Out
Default Default Default 0.0015 0.0013 NR Out Out Out
Default Default Default NR NR 0.0010 Out Out Out
Default Default Default
NR 0.14 0.19 Out Out Out
Default Default Default 0.18 0.29 0.24 Out Out Out
Default Default Default NR NR 0.08 Out Out Out
Default Default Default 0.01 0.0060 NR Out Out Out
Default Default DefaultNR NR 0.0002 Out Out Out
Default Default Default NR 0.24 0.37 Out Out Out
Default Default Default 0.23 0.05 0.11 Out Out Out
Page 30 of 50

Table C-4. Comparisons of 2009, 2010 and 2011 TRI Air Emissions Data for Certain Glycol Ethers to Site Specific Screening Values (Step B)
Facility City State Completed Survey Zip Code
BEAULIEU OF AMERICA PLANT 560‐
MODEL
DALTON GA N 30721
FIBRO CHEM LLC DALTON GA N 30720
YKK AP AMERICA INC DUBLIN GA N 31021
ZSCHIMMER & SCHWARZ MILLEDGEVILLE GA N 31061
U.S. AIR FORCE ROBINS AFB GA ROBINS AFB GA N 31098
BWAY CORP HOMERVILLE GA N 31634
KIA MOTORS MANUFACTURING OF
GEORGIA
WEST POINT GA N 31833
COMPLEMENTARY COATINGS CORP EDGEWATER FL N 32132
METAL CONTAINER CORP ‐
JACKSONVILLE CAN PLANT
JACKSONVILLE FL N 32254
RENESSENZ LLC JACKSONVILLE JACKSONVILLE FL N 32208
U.S. NAVY NAVAL AIR STATION
JACKSONVILLE
JACKSONVILLE FL N 32212
UNIVAR USA INC JACKSONVILLE FA
CILITY
JACKSONVILLE FL N 32254
CROWN FOOD PACKAGING WINTER GARDEN FL N 34787
SPIRALKOTE FLEXIBLE PACKAGING ORLANDO FL N 32837
SOUTH FLORIDA MATERIALS CORP
DBA VECENERGY‐PORT EVERGLADES
FT LAUDERDALE FL N 33316
METAL INDUSTRIES INC ‐ BUSHNELL BUSHNELL FL N 33513
BALL METAL BEVERAGE CONTAINER
CORP
TAMPA FL N 33617
UNIVAR USA INC TAMPA FACILITY TAMPA FL N 33619
VERTIS COMMUNICATIONS TAMPA FL N 33611
GSP MARKETING TECHNOLOGIES CLEARWATER FL N 33760
HEXION SPECIALTY CHEMICALS INC LAKELAND FL N 33801KEYMARK CORP OF FLORIDA LAKELAND FL N 33810
SEWELL PRODUCTS OF FLORIDA LLC AUBURNDALE FL N 33823
ONESOURCE COIL COATERS CLEARWATER FL N 33760
DYCO PAINTS INC CLEARWATER FL N 33760
M&B HANGERS LEEDS AL N 35094
HONDA MANUFACTURING OF
ALABAMA LLC
LINCOLN AL N 35096
AKZO NOBEL COATINGS INC BIRMINGHAM AL N 35234
ASHLAND DISTRIBUTION BIRMINGHAM AL N 35234
Minimum Release Height
(m)
Minimum Receptor
Distance (m)
Proportion of Certain Glycol
Ethers Used that are EGBE
2009 Maximum
Impact (mg/m3)
2010 Maximum
Impact (mg/m3)
2011 Maximum
Impact (mg/m3)
2009 Outcome
2010 Outcome
2011 Outcome
Default Default Default0.02 0.02 NR Out Out Out
Default Default Default 0.00 NR NR Out Out Out
Default Default Default 0.35 0.34 0.33 Out Out Out
Default Default Default NR 0.01 0.01 Out Out Out
Default Default Default 0.08 0.10 NR Out Out Out
Default Default Default 0.70 1.53 0.25 Out Out Out
Default Default DefaultNR 0.06 0.11 Out Out Out
Default Default Default0.06 NR NR Out Out Out
Default Default Default1.40 0.84 0.64 Out Out Out
Default Default Default NR NR 0.00 Out Out Out
Default Default DefaultNR 0.00 NR Out Out Out
Default Default DefaultNR 0.00 0.00 Out Out Out
Default Default Default 0.14 NR NR Out Out Out
Default Default Default NR 0.03 0.02 Out Out Out
Default Default Default
NR NR 0.00 Out Out Out
Default Default Default0.33 0.31 0.23 Out Out Out
Default Default Default0.74 0.64 0.48 Out Out Out
Default Default Default NR 0.00 0.00 Out Out Out
Default Default Default NR 0.07 0.07 Out Out Out
Default Default Default 0.01 NR NR Out Out Out
Default Default Default 0.34 0.30 0.30 Out Out Out
Default Default Default 0.22 0.27 0.20 Out Out Out
Default Default DefaultNR NR 0.01 Out Out Out
Default Default Default NR 0.0027 NR Out Out Out
Default Default Default 0.003 0.0050 NR Out Out Out
Default Default Default 0.29 0.33 0.32 Out Out Out
Default Default Default0.36 0.51 0.54 Out Out Out
Default Default Default 0.41 0.36 0.44 Out Out Out
Default Default Default 0.01 0.01 NR Out Out Out
Page 31 of 50

Table C-4. Comparisons of 2009, 2010 and 2011 TRI Air Emissions Data for Certain Glycol Ethers to Site Specific Screening Values (Step B)
Facility City State Completed Survey Zip Code
MICHELIN NORTH AMERICA INC TUSCALOOSA AL N 35401
RECTICEL INTERIORS NORTH AMERICA
LLC
TUSCALOOSA AL N 35401
MERCEDES‐BENZ US INTERNATIONAL
INC
VANCE AL N 35490
3M CO ‐ GUIN GUIN AL N 35563
3M CO ‐ GUIN GUIN AL N 35563
ITW SEXTON INC DECATUR AL N 35603
HART & COOLEY INC HUNTSVILLE AL N 35811
MUELLER CO ALBERTVILLE AL N 35950
NUCOR CORP VULCRAFT DIV FORT PAYNE AL N 35967
FLINT GROUP NORTH AMERICA CORP ANNISTON AL N 36207
DUNBARTON CORP REDIFRAME DIV DOTHAN AL N 36303
RUSKIN CO GENEVA AL N 36340
INTERNATIONAL PAPER PINE HILL MILL PINE HILL AL N 36769
STATE INDUSTRIES INC ASHLAND CITY TN N 37015
WORLDCOLOR CLARKSVILLE TN N 37040
SANFORD LP SHELBYVILLE TN N 37160
NISSAN NA INC SMYRNA
MANUFACTURING PLANT
SMYRNA TN N 37167
GM SPRING HILL MANUFACTURING SPRING HILL TN N 37174
QUAD GRAPHICS NASHVILLE NASHVILLE TN N 37207
ASHLAND DISTRIBUTION NASHVILLE TN N 37209
NASHVILLE WIRE PRODUCTS NASHVILLE TN N 37218
MAYTAG CORP CLEVELAND COOKING
PRODUCTS PLANT 1
CLEVELAND TN N 37311
LA‐Z‐BOY TENNESSEE DAYTON TN N 37321
BATESVILLE MANUFACTURING INC MANCHESTER TN N 37355
SANFORD LP LIQUID
MANUFACTURING & TECHNOLOGY
CENTER
MANCHESTER TN N 37355
ALSTOM POWER INC CHATTANOOGA
BOILERS
CHATTANOOGA TN N 37402
VOLKSWAGEN GROUP OF AMERICA
CHATTANOOGA OPERATIONS LLC
CHATTANOOGA TN N 37416
STAR BUILDING SYSTEMS ELIZABETHTON TN N 37643
Minimum Release Height
(m)
Minimum Receptor
Distance (m)
Proportion of Certain Glycol
Ethers Used that are EGBE
2009 Maximum
Impact (mg/m3)
2010 Maximum
Impact (mg/m3)
2011 Maximum
Impact (mg/m3)
2009 Outcome
2010 Outcome
2011 Outcome
Default Default Default 0.00 0.00 NR Out Out Out
Default Default Default0.00 0.00 NR Out Out Out
Default Default Default0.29 0.55 0.60 Out Out Out
Default Default Default 0.20 0.27 NR Out Out Out
Default Default Default NR NR 0.26 Out Out Out
Default Default Default NR NR 0.42 Out Out Out
Default Default Default 0.31 0.30 0.19 Out Out Out
Default Default Default 0.39 NR NR Out Out Out
Default Default Default 0.22 0.30 0.19 Out Out Out
Default Default Default0.02 0.01 NR Out Out Out
Default Default DefaultNR NR 0.11 Out Out Out
Default Default Default 0.10 0.11 0.27 Out Out Out
Default Default DefaultNR NR 0.00 Out Out Out
Default Default Default NR 0.22 0.20 Out Out Out
Default Default Default 0.09 0.15 NR Out Out Out
Default Default Default 0.05 NR NR Out Out Out
Default Default Default0.72 0.77 0.65 Out Out Out
Default Default Default 0.39 0.07 NR Out Out Out
Default Default Default NR 0.01 0.25 Out Out Out
Default Default Default 0.01 NR NR Out Out Out
Default Default Default 0.16 0.38 0.63 Out Out Out
Default Default Default0.18 0.13 0.13 Out Out Out
Default Default Default 0.17 0.18 0.14 Out Out Out
Default Default Default 0.48 0.44 0.75 Out Out Out
Default Default Default
NR 0.01 0.01 Out Out Out
Default Default Default0.50 0.60 0.86 Out Out Out
Default Default Default
NR NR 0.23 Out Out Out
Default Default Default 0.02 NR NR Out Out Out
Page 32 of 50

Table C-4. Comparisons of 2009, 2010 and 2011 TRI Air Emissions Data for Certain Glycol Ethers to Site Specific Screening Values (Step B)
Facility City State Completed Survey Zip Code
ARMSTRONG HARDWOOD FLOORING
CO
ONEIDA TN N 37841
VESTAL MANUFACTURING
ENTERPRISES INC
SWEETWATER TN N 37874
ROHM & HAAS CHEMICALS LLC
KNOXVILLE SITE
KNOXVILLE TN N 37921
TEKNOR APEX TENNESSEE CO (AKA
HAYWOOD CO)
BROWNSVILLE TN N 38012
EXCEL POLYMERS LLC DYERSBURG TN N 38024
WORLDCOLOR ‐ DYERSBURG DIV DYERSBURG TN N 38024
JOHNSON BRYCE INC MEMPHIS TN N 38109
VALERO REFINING CO ‐ TENNESSEE
LLC
MEMPHIS TN N 38109
ASHLAND DISTRIBUTION MEMPHIS TN N 38113
SONOCO PHOENIX ‐ PRESIDENTS
ISLAND
MEMPHIS TN N 38113
W M BARR & CO MEMPHIS TN N 38113
BRYCE CO LLC MEMPHIS TN N 38118
UNIVAR USA INC MEMPHIS MEMPHIS TN N 38118
WM BARR & CO INC MEMPHIS TN N 38113
GOODYEAR TIRE & RUBBER CO UNION CITY TN N 38261
KOHLER CO UNION CITY TN N 38261
CECO DOOR PRODUCTS MILAN TN N 38358
VAN CAN CO TRENTON TN N 38382
CROWN BEVERAGE PACKAGING BATESVILLE MS N 38606
KAWNEER CO INC HERNANDO MS N 38632
VALVOLINE HERNANDO MS N 38632
REXAM BEVERAGE CAN CO OLIVE
BRANCH FACILITY
OLIVE BRANCH MS Y 38654
QUEBECOR WORLD OLIVE BRANCH MS N 38654
SHERWIN‐WILLIAMS CO OLIVE BRANCH MS N 38654
HUNTER DOUGLAS TUPELO CENTER SHANNON MS N 38868
NISSAN NORTH AMERICA INC CANTON
MS
CANTON MS N 39046
ANDERSON TULLY LUMBER CO
WALTERSVILLE LUMBER MILL
VICKSBURG MS N 39181
METAL COATERS JACKSON MS N 39272
PRECOAT METALS JACKSON MS N 39272
ESCO CORP NEWTON MS N 39345
CHEVRON PRODUCTS CO
PASCAGOULA REFINERY
PASCAGOULA MS N 39581
Minimum Release Height
(m)
Minimum Receptor
Distance (m)
Proportion of Certain Glycol
Ethers Used that are EGBE
2009 Maximum
Impact (mg/m3)
2010 Maximum
Impact (mg/m3)
2011 Maximum
Impact (mg/m3)
2009 Outcome
2010 Outcome
2011 Outcome
Default Default Default0.14 0.11 0.10 Out Out Out
Default Default Default0.39 0.44 0.47 Out Out Out
Default Default Default0.00 NR NR Out Out Out
Default Default DefaultNR NR 0.14 Out Out Out
Default Default Default 0.0005 0.0003 NR Out Out Out
Default Default Default 0.23 0.05 NR Out Out Out
Default Default Default NR 0.00 NR Out Out Out
Default Default DefaultNR 0.002 0.00 Out Out Out
Default Default Default 0.005 0.005 NR Out Out Out
Default Default Default0.14 0.07 0.04 Out Out Out
Default Default Default 0.0026 NR NR Out Out Out
Default Default Default 0.00005 0.00 NR Out Out Out
Default Default Default 0.0001 NR NR Out Out Out
Default Default Default NR 0.0026 0.0027 Out Out Out
Default Default Default 0.00001 NR NR Out Out Out
Default Default Default NR NR 0.12 Out Out Out
Default Default Default 0.30 0.58 0.48 Out Out Out
Default Default Default NR NR 0.01 Out Out Out
Default Default Default 0.87 0.77 0.76 Out Out Out
Default Default Default 0.05 NR NR Out Out Out
Default Default Default NR NR 0.00 Out Out Out
12 100 0.951.35 1.22 1.27 Out Out Out
Default Default Default 0.09 NR NR Out Out Out
Default Default Default 0.00 NR NR Out Out Out
Default Default Default 0.13 0.13 0.13 Out Out Out
Default Default Default0.59 0.17 0.32 Out Out Out
Default Default DefaultNR 0.38 0.51 Out Out Out
Default Default Default 0.11 0.08 0.09 Out Out Out
Default Default Default 0.47 0.38 0.38 Out Out Out
Default Default Default 0.23 0.31 0.35 Out Out Out
Default Default DefaultNR 0.00 NR Out Out Out
Page 33 of 50

Table C-4. Comparisons of 2009, 2010 and 2011 TRI Air Emissions Data for Certain Glycol Ethers to Site Specific Screening Values (Step B)
Facility City State Completed Survey Zip Code
INOAC PACKAGING GROUP BARDSTOWN KY N 40004
KELLEY TECHNICAL COATINGS INC LOUISVILLE KY N 40210
ASHLAND DISTRIBUTION LOUISVILLE KY N 40211
FORD LOUISVILLE ASSEMBLY LOUISVILLE KY N 40213
KELLEY TECHNICAL COATINGS INC LOUISVILLE KY N 40210
FORD MOTOR CO KENTUCKY TRUCK
PLANT
LOUISVILLE KY Y 40241
TOYOTA MOTOR MANUFACTURING
KENTUCKY INC
GEORGETOWN KY N 40324
MODINE MANUFACTURING CO INC HARRODSBURG KY N 40330
GUARDIAN AUTOMOTIVE ‐
MOREHEAD PLANT
MOREHEAD KY N 40351
CENTRAL MOTOR WHEEL OF AMERICA
(DBA CMWA)
PARIS KY N 40361
HITACHI AUTOMOTIVE SYSTEMS
AMERICAS INC‐BEREA KY
BEREA KY N 40403
SQUARE D CO LEXINGTON KY N 40511
GREIF PACKAGING LLC FLORENCE KY N 41042
MAGNI INDUSTRIES INC INDEPENDENCE KY N 41051
AIR PRODUCTS & CHEMICALS INC CALVERT CITY KY N 42029
TRAD NA INC HOPKINSVILLE KY N 42240
LOGAN ALUMINUM INC RUSSELLVILLE KY N 42276
PRECOAT METALS HAWESVILLE KY N 42348
ECOLAB HEBRON OH N 43025
HONDA OF AMERICA
MANUFACTURING INC
MARYSVILLE OH N 43040
JOHNSON WELDED PRODUCTS INC URBANA OH N 43078
BALL CONTAINER LLC ‐ COLUMBUS
CAN PLANT
COLUMBUS OH Y 43213
WHIRLPOOL CORP MARION D IVISION MARION OH Y 43302
HONDA OF AMERICA
MANUFACTURING INC
EAST LIBERTY OH N 43319
WHIRLPOOL CORP ‐ CLYDE DIV CLYDE OH N 43410
REXAM BEVERAGE CAN CO RE:
FREMONT PLANT
FREMONT OH Y 43420
ELECTROPRIME INC ROSSFORD OH N 43460
SILGAN CAN CO NAPOLEON OH N 43545
REXAM BEVERAGE CAN CO RE:
WHITEHOUSE PLANT
WHITEHOUSE OH Y 43571
Minimum Release Height
(m)
Minimum Receptor
Distance (m)
Proportion of Certain Glycol
Ethers Used that are EGBE
2009 Maximum
Impact (mg/m3)
2010 Maximum
Impact (mg/m3)
2011 Maximum
Impact (mg/m3)
2009 Outcome
2010 Outcome
2011 Outcome
Default Default Default 0.00 NR NR Out Out Out
Default Default Default NR NR 0.02 Out Out Out
Default Default Default 0.00 NR NR Out Out Out
Default Default Default 0.26 0.04 NR Out Out Out
Default Default Default NR NR 0.05 Out Out Out
Default Default 0.790.57 0.62 0.78 Out Out Out
Default Default Default0.12 0.27 0.20 Out Out Out
Default Default Default 0.27 NR NR Out Out Out
Default Default Default0.004 NR NR Out Out Out
Default Default Default0.00 0.003 NR Out Out Out
Default Default Default0.24 0.35 0.31 Out Out Out
Default Default Default 0.19 0.20 0.19 Out Out Out
Default Default Default 0.60 0.76 0.78 Out Out Out
Default Default Default NR 0.01 NR Out Out Out
Default Default Default NR 0.001 NR Out Out Out
Default Default Default 0.11 0.01 NR Out Out Out
Default Default Default 0.12 0.11 0.10 Out Out Out
Default Default Default 0.02 0.01 0.11 Out Out Out
Default Default Default 0.00 NR NR Out Out Out
Default Default Default1.10 0.95 0.89 Out Out Out
Default Default Default 0.30 0.30 NR Out Out Out
13.52 37 0.9952.02 2.04 2.18 Retain Retain Retain
12.2 95 11.18 1.21 1.09 Out Out Out
Default Default Default0.65 1.03 0.84 Out Out Out
Default Default Default 0.76 0.50 NR Out Out Out
20 55 0.971.07 0.95 1.14 Out Out Out
Default Default Default 0.13 0.16 0.16 Out Out Out
Default Default Default 0.23 0.21 0.35 Out Out Out
15 200 0.990.45 0.63 0.70 Out Out Out
Page 34 of 50

Table C-4. Comparisons of 2009, 2010 and 2011 TRI Air Emissions Data for Certain Glycol Ethers to Site Specific Screening Values (Step B)
Facility City State Completed Survey Zip Code
DECORATIVE PANELS INTERNATIONA L TOLEDO OH N 43607
MAGNA STEYR NORTH AMERICA TOLEDO OH N 43608
DAIMLERCHRYSLER CORP TOLEDO
ASSEMBLY PLANT
TOLEDO OH N 43612
CROWN FOOD PACKAGING TOLEDO OH N 43612
AK STEEL CORP ‐ ZANESVI LLE WORKS ZANESVILLE OH N 43701
INTERNATIONAL PAINT LLC BEREA OH N 44017
EXCEL POLYMERS LLC BURTON OH N 44021
SCOT LABORATORIES CHAGRIN FALLS OH N 44023
GOLD KEY PROCESSING INC MIDDLEFIELD OH N 44062
NORTH COAST CONTAINER CORP CLEVELAND OH N 44105
NPA COATINGS INC CLEVELAND OH N 44102
UNIVAR USA INC STRONGSVILLE OH N 44136
FERRO CORP WALTON HILLS
OPERATIONS
WALTON HILLS OH N 44146
GOJO INDUSTRIES INC CUYAHOGA FALLS OH N 44223
HESS PRINT SOLUTIONS BRIMFIELD OH N 44240
PLASTI‐KOTE INC MEDINA OH N 44258
3M CO ‐ MEDINA MEDINA OH N 44256
HARWICK STANDARD DISTRIBUTION
CORP
AKRON OH N 44305
CANFIELD METAL COATING CORP CANFIELD OH N 44406
GENERAL MOTORS CORP LORDSTOWN
COMPLEX
LORDSTOWN OH N 44481
TECNOCAP LLC WARREN OH N 44483
NOVELIS CORP WARREN OH N 44483
MAHONING PAINT CORP YOUNGSTOWN OH N 44502
EPCO EXTRUSION PAINTING CO BOARDMAN OH N 44512
SPECTRUM METAL FINISHING YOUNGSTOWN OH N 44512
GE WATER & PROCESS TECHNOLOGIES NEW
PHILADELPHIA
OH N 44663
ARTIFLEX MANUFACTURING LLC
GERSTCO DIV WOOSTER
WOOSTER OH N 44691
MAYFLOWER VEHICLE SYSTEMS INC
NORWALK FACILITY
NORWALK OH N 44857
AMERICAN COLORS INC DISPERSION
PLANT SANDUSKY OHIO
SANDUSKY OH N 44870
Minimum Release Height
(m)
Minimum Receptor
Distance (m)
Proportion of Certain Glycol
Ethers Used that are EGBE
2009 Maximum
Impact (mg/m3)
2010 Maximum
Impact (mg/m3)
2011 Maximum
Impact (mg/m3)
2009 Outcome
2010 Outcome
2011 Outcome
Default Default Default0.27 0.48 0.47 Out Out Out
Default Default Default 0.55 0.86 NR Out Out Out
Default Default Default0.03 0.04 0.38 Out Out Out
Default Default Default 0.28 0.34 0.32 Out Out Out
Default Default Default0.05 0.10 0.13 Out Out Out
Default Default Default NR 0.0001 0.0001 Out Out Out
Default Default Default NR 0.0004 0.0004 Out Out Out
Default Default Default 0.0001 NR NR Out Out Out
Default Default Default NR 0.0045 NR Out Out Out
Default Default Default 0.34 0.45 0.37 Out Out Out
Default Default Default NR NR 0.00 Out Out Out
Default Default Default NR 0.0005 0.01 Out Out Out
Default Default DefaultNR 0.0001 0.0001 Out Out Out
Default Default DefaultNR 0.0001 0.0001 Out Out Out
Default Default Default 0.33 NR 0.18 Out Out Out
Default Default Default NR 0.0003 0.003 Out Out Out
Default Default Default NR NR 0.004 Out Out Out
Default Default DefaultNR 0.00002 0.0001 Out Out Out
Default Default Default 0.02 NR 0.04 Out Out Out
Default Default Default0.44 0.13 0.16 Out Out Out
Default Default Default 0.15 0.18 0.18 Out Out Out
Default Default Default 0.41 0.31 0.38 Out Out Out
Default Default Default 0.00 NR NR Out Out Out
Default Default Default 0.21 NR NR Out Out Out
Default Default Default 0.39 0.35 0.02 Out Out Out
Default Default DefaultNR 0.0001 0.0001 Out Out Out
Default Default Default0.23 0.30 0.29 Out Out Out
Default Default Default0.21 NR NR Out Out Out
Default Default Default
NR 0.0045 NR Out Out Out
Page 35 of 50

Table C-4. Comparisons of 2009, 2010 and 2011 TRI Air Emissions Data for Certain Glycol Ethers to Site Specific Screening Values (Step B)
Facility City State Completed Survey Zip Code
RR DONNELLEY & SONS CO WILLARD OH N 44890
NEWMAN TECHNOLOGY INC MANSFIELD OH N 44903
FLINT GROUP NORTH AMERICA CORP LEBANON OH N 45036
WORLDCOLOR LEBANON DIV LEBANON OH N 45036
BERENFIELD CONTAINERS INC MASON MASON OH N 45040
PROCTER & GAMBLE CO GPDF CINCINNATI OH N 45217
HB FULLER CO BLUE ASH OH N 45242
INGERSOLL‐RAND CO STEELCRAFT DIV CINCINNATI OH N 45242
UNIVAR USA INC‐ CINCINNATI OH
BRANCH
CINCINNATI OH N 45246
ALCOA HOME EXTERIORS INC SIDNEY OH N 45365
AMERICAN TRIM LLC SIDNEY OH N 45365
NAVISTAR INC SPRINGFIELD OH N 45502
MASCO RETAIL CABINET GROUP LLC WAVERLY OH N 45690
BALL METAL BEVERAGE CONTAINER
CORP
FINDLAY OH Y 45840
WHIRLPOOL CORP FINDLAY DIV FINDLAY OH N 45840
J&M MANUFACTURING CO INC FORT RECOVERY OH N 45846
LAFARGE NA (INCLUDING SYSTECH
ENV CORP)
PAULDING OH N 45879
AAP ST MARYS CORP SAINT MARYS OH N 45885
DSM NEORESINS INC FRANKFORT IN N 46041
CROWN EQUIPMENT CORP GREENCASTLE IN N 46135
PRECOAT METALS GREENFIELD IN N 46140
CAR CARE PACKAGING LLC INDIANAPOLIS IN N 46203
IVC INDUSTRIAL COATINGS INC INDIANAPOLIS IN N 46218
UNIVAR USA INC ‐ INDIANAPOLIS INDIANAPOLIS IN N 46219
MARATHON PETROLEUM CO ‐
SPEEDWAY IN TERMINAL
INDIANAPOLIS IN N 46222
ENGINEERED POLYMER SOLUTIONS
INC D/B/A VALSPAR COATINGS
INDIANAPOLIS IN N 46225
DYNALOY LLC INDIANAPOLIS IN N 46226
UNIVAR USA INC INDIANAPOLIS WEST
BRANCH
INDIANAPOLIS IN N 46268
TRADEBE TREATMENT & RECYCLING
LLC
EAST CHICAGO IN N 46312
Minimum Release Height
(m)
Minimum Receptor
Distance (m)
Proportion of Certain Glycol
Ethers Used that are EGBE
2009 Maximum
Impact (mg/m3)
2010 Maximum
Impact (mg/m3)
2011 Maximum
Impact (mg/m3)
2009 Outcome
2010 Outcome
2011 Outcome
Default Default Default 0.27 0.32 0.29 Out Out Out
Default Default Default NR 0.00005 NR Out Out Out
Default Default DefaultNR 0.02 0.02 Out Out Out
Default Default Default 0.12 0.11 NR Out Out Out
Default Default Default0.17 0.25 0.27 Out Out Out
Default Default Default NR NR 0.0002 Out Out Out
Default Default Default 0.02 NR NR Out Out Out
Default Default Default0.26 0.63 0.80 Out Out Out
Default Default Default0.00006 0.0001 NR Out Out Out
Default Default Default 0.11 0.12 0.27 Out Out Out
Default Default Default 0.24 0.27 0.25 Out Out Out
Default Default Default 0.13 0.14 0.09 Out Out Out
Default Default Default0.01 0.02 NR Out Out Out
14.1732 89 13.63 3.65 3.77 Retain Retain Retain
Default Default Default 0.52 0.51 0.49 Out Out Out
Default Default Default 0.04 NR NR Out Out Out
Default Default DefaultNR 0.00002 NR Out Out Out
Default Default Default 0.10 0.14 0.16 Out Out Out
Default Default Default 0.00 NR NR Out Out Out
Default Default Default 0.07 NR 0.16 Out Out Out
Default Default Default 0.39 0.51 0.17 Out Out Out
Default Default Default 0.0001 NR NR Out Out Out
Default Default Default 0.04 0.03 NR Out Out Out
Default Default Default 0.0008 0.0004 NR Out Out Out
Default Default DefaultNR 0.0003 0.0001 Out Out Out
Default Default Default0.0001 0.0010 NR Out Out Out
Default Default Default 0.0002 0.00 NR Out Out Out
Default Default Default0.0003 NR NR Out Out Out
Default Default DefaultNR NR 0.02 Out Out Out
Page 36 of 50

Table C-4. Comparisons of 2009, 2010 and 2011 TRI Air Emissions Data for Certain Glycol Ethers to Site Specific Screening Values (Step B)
Facility City State Completed Survey Zip Code
SILGAN CONTAINERS
MANUFACTURING CORP
HAMMOND IN N 46320
PRECOAT METALS LA PORTE IN N 46350
SILGAN CONTAINERS
MANUFACTURING CORP
LA PORTE IN Y 46350
AVERY DENNISON PFD SCHERERVILLE IN N 46375
BP PRODUCTS NORTH AMERICA
WHITING
WHITING IN N 46394
ET PRODUCTS CO INC BREMEN IN N 46506
MASTERBRAND CABINETS INC GOSHEN IN N 46526
MIDDLEBURY HARDWOOD PRODUCTS MIDDLEBURY IN N 46540
AM GENERAL LLC MISHAWAKA IN N 46545
WARSAW CHEMICAL CO INC WARSAW IN N 46580
BIOLAB INC ASHLEY IN N 46705
STEEL DYNAMICS INC BUTLER IN N 46721
THERMA‐TRU CORP BUTLER IN N 46721
GM TRUCK GROUP FORT WAYNE
ASSEMBLY
ROANOKE IN N 46783
NUCOR VULCRAFT GROUP SAINT JOE
DIV
SAINT JOE IN N 46785
AURORA CASKET CO INC AURORA IN N 47001
BATESVILLE MANUFACTURING INC ‐
DOLL PLANT
BATESVILLE IN N 47006
ENKEI AMERICA INC COLUMBUS IN N 47201
PATRIOT PAINT LLC PORTLAND IN N 47371
GEA BPO LLC BLOOMINGTON IN N 47404
ASHLEY INDUSTRIAL MOLDING INC ASHLEY IN N 46705
SABIC INNOVATIVE PLASTICS MT
VERNON LLC
MOUNT VERNON IN N 47620
ALCOA INC ‐ WARRICK OPERATIONS NEWBURGH IN N 47629
TOYOTA MOTOR MANUFACTURING
INDIANA INC
PRINCETON IN N 47670
SILGAN WHITE CAP CORP EVANSVILLE IN N 47710
IVC INDUSTRIAL COATINGS INC BRAZIL IN N 47834
SUBARU OF INDIANA AUTOMOTIVE
INC
LAFAYETTE IN N 47905
CROWN BEVERAGE PACKAGING CRAWFORDSVILLE IN N 47933
Minimum Release Height
(m)
Minimum Receptor
Distance (m)
Proportion of Certain Glycol
Ethers Used that are EGBE
2009 Maximum
Impact (mg/m3)
2010 Maximum
Impact (mg/m3)
2011 Maximum
Impact (mg/m3)
2009 Outcome
2010 Outcome
2011 Outcome
Default Default Default0.13 0.13 0.12 Out Out Out
Default Default Default 0.11 0.16 0.15 Out Out Out
12.19 32.22 11.83 1.87 1.79 Retain Retain Retain
Default Default Default 0.002 0.0006 NR Out Out Out
Default Default DefaultNR 0.0002 0.00002 Out Out Out
Default Default Default 0.006 0.006 NR Out Out Out
Default Default Default NR NR 0.09 Out Out Out
Default Default DefaultNR 0.07 0.11 Out Out Out
Default Default Default NR 0.17 NR Out Out Out
Default Default Default 0.002 0.002 NR Out Out Out
Default Default Default NR 0.0001 NR Out Out Out
Default Default Default 0.0004 0.0004 NR Out Out Out
Default Default Default 0.65 0.63 0.51 Out Out Out
Default Default Default0.16 0.27 0.33 Out Out Out
Default Default Default0.19 0.19 0.22 Out Out Out
Default Default Default 2.27 1.44 NR Retain Out Out
Default Default Default0.08 0.12 0.12 Out Out Out
Default Default Default 0.11 0.15 0.13 Out Out Out
Default Default Default NR 0.01 0.01 Out Out Out
Default Default Default 0.23 0.23 0.14 Out Out Out
Default Default Default 0.11 0.23 0.14 Out Out Out
Default Default Default0.13 0.06 0.16 Out Out Out
Default Default Default0.31 0.15 0.18 Out Out Out
Default Default Default0.49 0.67 0.57 Out Out Out
Default Default Default 0.21 0.46 0.50 Out Out Out
Default Default Default NR 0.01 0.07 Out Out Out
Default Default Default0.47 0.76 0.63 Out Out Out
Default Default Default0.44 0.61 0.69 Out Out Out
Page 37 of 50

Table C-4. Comparisons of 2009, 2010 and 2011 TRI Air Emissions Data for Certain Glycol Ethers to Site Specific Screening Values (Step B)
Facility City State Completed Survey Zip Code
RR DONNELLEY CRAWFORDSVILLE CRAWFORDSVILLE IN N 47933
BON L MANUFACTURING CO KENTLAND IN N 47951
BALL METAL BEVERAGE CONTAINER
CORP
MONTICELLO IN N 47960
MASTER GUARD CORP VEEDERSBURG IN N 47987
GM ORION ASSEMBLY CENTER LAKE ORION MI N 48359
KAY AUTOMOTIVE GRAPHICS LAKE ORION MI N 48359
PONTIAC ASSEMBLY CENTER PONTIAC MI N 48341
HOWARD FINISHING LLC MADISON
HEIGHTS
MI N 48071
CURTIS METAL FINISHING CO STERLING HEIGHTS MI N 48313
NJT ENTERPRISES LLC STERLING HEIGHTS MI N 48314
CHRYSLER WARREN TRUCK ASSEMBLY
PLANT (PART)
WARREN MI N 48091
WAYNE DISPOSAL INC BELLEVILLE MI N 48111
FORD MOTOR CO DEARBORN TRUCK
PLANT
DEARBORN MI Y 48121
AUTOALLIANCE INTERNATIONAL INC FLAT ROCK MI N 48134
UNIVAR USA INC ROMULUS BRANCH ROMULUS MI N 48174
AUTOMOTIVE COMPONENTS
HOLDINGS LLC SALINE PLANT
SALINE MI N 48176
FORD MOTOR COMPANY‐WAYNE
ASSEMBLY
WAYNE MI N 48184
FORD MOTOR CO MICHIGAN
ASSEMBLY PLANT
WAYNE MI N 48184
AMERICAN JETWAY CORP WAYNE MI N 48184
AJAX METAL PROCESSING INC DETROIT MI N 48207
CHRYSLER JEFFERSON NORTH
ASSEMBLY PLANT
DETROIT MI N 48215
PVS NOLWOOD CHEMICALS INC DETROIT MI N 48228
Z TECHNOLOGIES CORP REDFORD MI N 48239
MT ELLIOTT TOOL & DIE
MANUFACTURING (PART)
DETROIT MI N 48234
GM LLC POWERTRAIN FLINT ENGINE
OPERATIONS
FLINT MI N 48552
Minimum Release Height
(m)
Minimum Receptor
Distance (m)
Proportion of Certain Glycol
Ethers Used that are EGBE
2009 Maximum
Impact (mg/m3)
2010 Maximum
Impact (mg/m3)
2011 Maximum
Impact (mg/m3)
2009 Outcome
2010 Outcome
2011 Outcome
Default Default Default0.29 0.25 0.23 Out Out Out
Default Default Default 0.08 NR NR Out Out Out
Default Default Default1.15 0.79 0.91 Out Out Out
Default Default Default 0.05 NR NR Out Out Out
Default Default Default 0.25 NR 0.05 Out Out Out
Default Default Default NR NR 0.05 Out Out Out
Default Default Default 0.08 NR NR Out Out Out
Default Default Default0.16 0.25 0.26 Out Out Out
Default Default Default0.09 0.14 0.20 Out Out Out
Default Default Default0.02 NR NR Out Out Out
Default Default Default0.23 0.21 0.31 Out Out Out
Default Default Default NR 0.0001 NR Out Out Out
21.32926829 Default 0.970.51 0.34 0.33 Out Out Out
Default Default Default0.27 0.12 0.11 Out Out Out
Default Default DefaultNR 0.0010 0.0022 Out Out Out
Default Default DefaultNR NR 0.08 Out Out Out
Default Default Default0.18 0.24 NR Out Out Out
Default Default Default0.00 0.0064 0.13 Out Out Out
Default Default Default NR 0.005 0.005 Out Out Out
Default Default Default NR 0.11 0.16 Out Out Out
Default Default Default0.66 0.81 1.27 Out Out Out
Default Default Default NR 0.0001 0.0001 Out Out Out
Default Default Default NR NR 0.0003 Out Out Out
Default Default Default0.01 NR NR Out Out Out
Default Default Default0.76 0.53 0.56 Out Out Out
Page 38 of 50

Table C-4. Comparisons of 2009, 2010 and 2011 TRI Air Emissions Data for Certain Glycol Ethers to Site Specific Screening Values (Step B)
Facility City State Completed Survey Zip Code
GENERAL MOTORS LANSING DELTA
TOWNSHIP
LANSING MI N 48917
GMVM‐LANSING GRAND RIVER
ASSEMBLY
LANSING MI N 48921
GRAPHIC PACKAGING INTERNATIONAL
INC
KALAMAZOO MI N 49007
DEXTER CHASSIS GROUP PLANT 55 WHITE PIGEON MI N 49099
CHEMETALL US INC JACKSON MI N 49203
ANDERSON DEVELOPMENT CO ADRIAN MI N 49221
HELEN,INC DBA ENVIRONMENTAL
COATINGS,INC
CALEDONIA MI N 49316
BRADFORD WHITE CORP MIDDLEVILLE MI N 49333
MAGNA MIRRORS CORP ‐ NEWAYGO NEWAYGO MI N 49337
WEBB CHEMICAL SERVICE CORP MUSKEGON
HEIGHTS
MI N 49444
SPECTRUM CUBIC INC GRAND RAPIDS MI N 49503
AVON AUTOMOTIVE PLANT 1 CADILLAC MI N 49601
JOHN DEERE DES MOINES WORKS ANKENY IA N 50023
3M CO ‐ KNOXVILLE KNOXVILLE IA N 50138
PELLA CORP PELLA IA N 50219
SILGAN CONTAINERS MANUFACTURIN
G CORP
FORT DODGE IA N 50501
METOKOTE CORP PLANT 15 CEDAR FALLS IA N 50613
VOGEL PAINT & WAX CO INC ORANGE CITY IA N 51041
PELLA CORP CARROLL OPERATIONS CARROLL IA N 51401
CARRY‐ON TRAILER CORP MISSOURI VALLEY IA N 51555
KLINGER PAINT CO INC CEDAR RAPIDS IA N 52404
CNH AMERICA LLC BURLINGTON IA N 52601
MONSANTO CO MUSCATINE IA N 52761
AMERICAN FINISHING RESOURCES INC CHILTON WI N 53014
WORTHINGTON CYLINDERS WISCONSI
N LLC
CHILTON WI N 53014
BROAN‐NUTONE LLC HARTFORD WI N 53027
QUAD/GRAPHICS INC HARTFORD WI N 53027
JOHN DEERE HORICON WORKS‐DT HORICON WI N 53032
QUAD/GRAPHICS INC LOMIRA WI N 53048
Minimum Release Height
(m)
Minimum Receptor
Distance (m)
Proportion of Certain Glycol
Ethers Used that are EGBE
2009 Maximum
Impact (mg/m3)
2010 Maximum
Impact (mg/m3)
2011 Maximum
Impact (mg/m3)
2009 Outcome
2010 Outcome
2011 Outcome
Default Default Default0.19 0.50 0.53 Out Out Out
Default Default Default0.19 0.21 0.16 Out Out Out
Default Default DefaultNR NR 0.18 Out Out Out
Default Default Default 0.39 0.56 0.34 Out Out Out
Default Default Default NR 0.000004 0.000004 Out Out Out
Default Default Default NR NR 0.00014 Out Out Out
Default Default Default0.01 NR NR Out Out Out
Default Default Default 0.12 0.13 0.15 Out Out Out
Default Default DefaultNR 0.10 0.08 Out Out Out
Default Default DefaultNR 0.0029 0.01 Out Out Out
Default Default Default NR NR 0.01 Out Out Out
Default Default Default NR NR 0.0045 Out Out Out
Default Default Default NR 0.15 0.45 Out Out Out
Default Default Default 0.00 NR NR Out Out Out
Default Default Default 0.31 0.43 0.41 Out Out Out
Default Default DefaultNR 0.14 0.29 Out Out Out
Default Default Default 0.13 0.12 NR Out Out Out
Default Default Default NR 0.00 0.00 Out Out Out
Default Default DefaultNR 0.11 0.12 Out Out Out
Default Default Default0.13 0.17 0.12 Out Out Out
Default Default Default NR 0.02 NR Out Out Out
Default Default Default 0.12 0.18 0.24 Out Out Out
Default Default Default 0.00 0.00002 NR Out Out Out
Default Default DefaultNR NR 0.23 Out Out Out
Default Default Default0.13 0.14 0.11 Out Out Out
Default Default Default 0.23 0.16 0.19 Out Out Out
Default Default Default 0.44 0.50 0.42 Out Out Out
Default Default Default NR NR 0.12 Out Out Out
Default Default Default NR 0.10 0.19 Out Out Out
Page 39 of 50
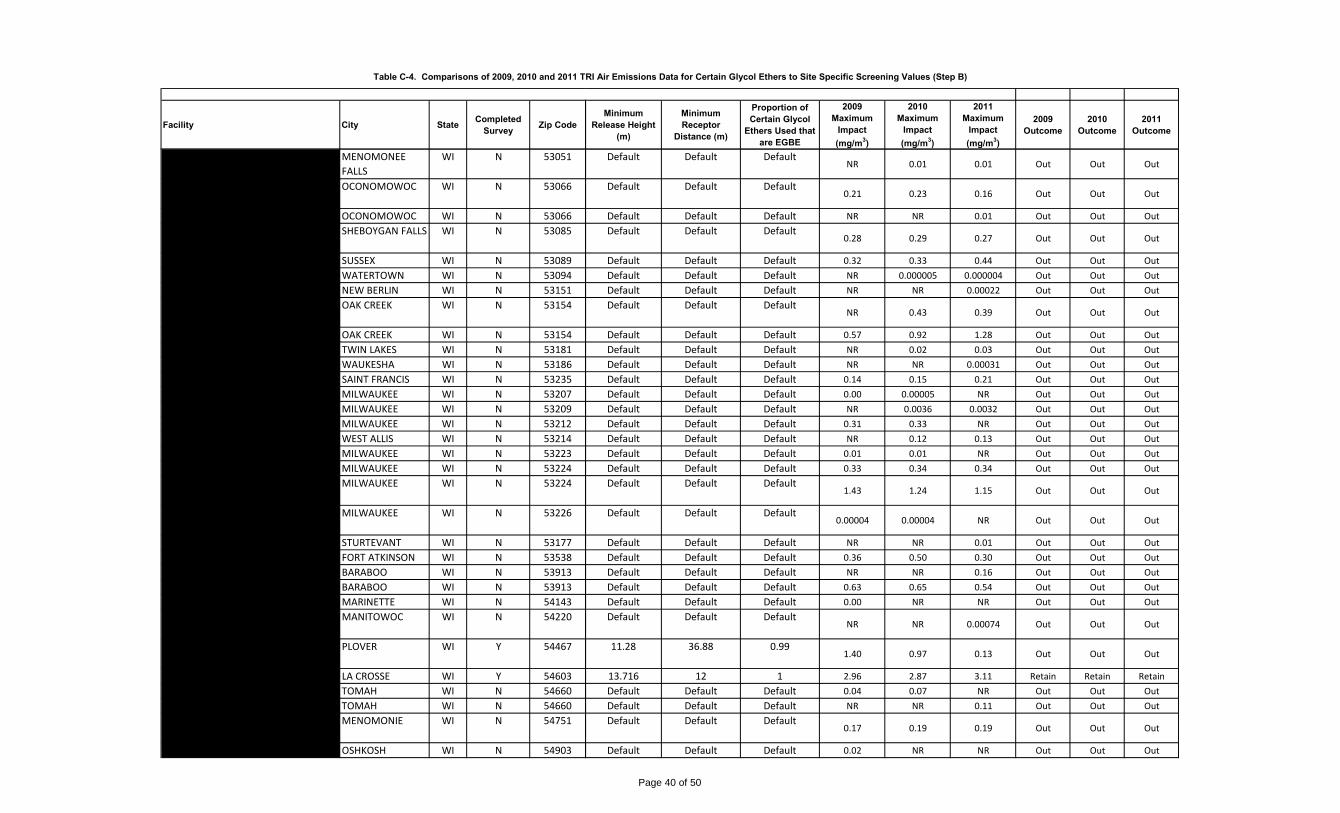
Table C-4. Comparisons of 2009, 2010 and 2011 TRI Air Emissions Data for Certain Glycol Ethers to Site Specific Screening Values (Step B)
Facility City State Completed Survey Zip Code
QUEST SPECIALTY COATINGS LLC ‐
MENOMONEE FALLS
MENOMONEE
FALLS
WI N 53051
SILGAN CONTAINERS
MANAUFACTURING CORP
OCONOMOWOC WI N 53066
WISMARQ CORP OCONOMOWOC WI N 53066
BEMIS MANUFACTURING CO PLANT B SHEBOYGAN FALLS WI N 53085
QUAD/GRAPHICS INC SUSSEX WI N 53089
DIVERSEY INC WATERTOWN WI N 53094
UNIVAR USA INC NEW BERLIN NEW BERLIN WI N 53151
MID‐AMERICA STEEL DRUM CO IN C OAK CREEK WI N 53154
PPG INDUSTRIES INC‐OAK CREEK OAK CREEK WI N 53154
FIVE STAR COATINGS GROUP TWIN LAKES WI N 53181
GACO WESTERN WAUKESHA WI N 53186
KITZINGER COOPERAGE CORP SAINT FRANCIS WI N 53235
MILPORT ENTERPRISES INC MILWAUKEE WI N 53207
TWINCO ROMAX MILWAUKEE WI N 53209
SEIDEL TANNING CORP MILWAUKEE WI N 53212
QUAD/GRAPHICS INC WEST ALLIS WI N 53214
MUTI‐PACK LLC MILWAUKEE WI N 53223
KUBIN‐NICHOLSON CORP MILWAUKEE WI N 53224
BALL METAL BEVERAGE CONTAINER
CORP
MILWAUKEE WI N 53224
FIRST SOURCE WORLDWIDE LLC
MILWAUKEE
MILWAUKEE WI N 53226
CNH AMERICA LLC STURTEVANT WI N 53177
BALL CONTAINER LLC FORT ATKINSON WI N 53538
RR DONNELLEY BARABOO DIV BARABOO WI N 53913
SENECA FOODS CORP BARABOO WI N 53913
CHEMDESIGN PRODUCTS INC MARINETTE WI N 54143
WISCONSIN ALUMINUM FOUNDRY CO
INC
MANITOWOC WI N 54220
SILGAN CONTAINERS
MANUFACTURING CORP
PLOVER WI Y 54467
CROWN BEVERAGE PACKAGING LA CROSSE WI Y 54603
TORO CO TOMAH WI N 54660
TORO CO TOMAH WI N 54660
SILGAN CONTAINERS
MANUFACTURING CORP
MENOMONIE WI N 54751
MULTICIRCUITS OSHKOSH WI N 54903
Minimum Release Height
(m)
Minimum Receptor
Distance (m)
Proportion of Certain Glycol
Ethers Used that are EGBE
2009 Maximum
Impact (mg/m3)
2010 Maximum
Impact (mg/m3)
2011 Maximum
Impact (mg/m3)
2009 Outcome
2010 Outcome
2011 Outcome
Default Default DefaultNR 0.01 0.01 Out Out Out
Default Default Default0.21 0.23 0.16 Out Out Out
Default Default Default NR NR 0.01 Out Out Out
Default Default Default0.28 0.29 0.27 Out Out Out
Default Default Default 0.32 0.33 0.44 Out Out Out
Default Default Default NR 0.000005 0.000004 Out Out Out
Default Default Default NR NR 0.00022 Out Out Out
Default Default DefaultNR 0.43 0.39 Out Out Out
Default Default Default 0.57 0.92 1.28 Out Out Out
Default Default Default NR 0.02 0.03 Out Out Out
Default Default Default NR NR 0.00031 Out Out Out
Default Default Default 0.14 0.15 0.21 Out Out Out
Default Default Default 0.00 0.00005 NR Out Out Out
Default Default Default NR 0.0036 0.0032 Out Out Out
Default Default Default 0.31 0.33 NR Out Out Out
Default Default Default NR 0.12 0.13 Out Out Out
Default Default Default 0.01 0.01 NR Out Out Out
Default Default Default 0.33 0.34 0.34 Out Out Out
Default Default Default1.43 1.24 1.15 Out Out Out
Default Default Default0.00004 0.00004 NR Out Out Out
Default Default Default NR NR 0.01 Out Out Out
Default Default Default 0.36 0.50 0.30 Out Out Out
Default Default Default NR NR 0.16 Out Out Out
Default Default Default 0.63 0.65 0.54 Out Out Out
Default Default Default 0.00 NR NR Out Out Out
Default Default DefaultNR NR 0.00074 Out Out Out
11.28 36.88 0.991.40 0.97 0.13 Out Out Out
13.716 12 1 2.96 2.87 3.11 Retain Retain Retain
Default Default Default 0.04 0.07 NR Out Out Out
Default Default Default NR NR 0.11 Out Out Out
Default Default Default0.17 0.19 0.19 Out Out Out
Default Default Default 0.02 NR NR Out Out Out
Page 40 of 50

Table C-4. Comparisons of 2009, 2010 and 2011 TRI Air Emissions Data for Certain Glycol Ethers to Site Specific Screening Values (Step B)
Facility City State Completed Survey Zip Code
ALLIANCE INDUSTRIES WAUPACA WAUPACA WI N 54981
UNIVAR USA INC LAKEVILLE LAKEVILLE MN N 55044
CROWN FOOD PACKAGING OWATONNA MN Y 55060
S B FOOT TANNING CO RED WING MN N 55066
REXAM BEVERAGE CAN CO RE: EVA
STREET ST PAUL MN
SAINT PAUL MN Y 55107
FORD MOTOR CO TWIN CITIES
ASSEMBLY PLANT
SAINT PAUL MN N 55116
FLINT HILLS RESOURCES LP ROSEMOUNT MN N 55068
EDCO PRODUCTS INC HOPKINS MN N 55343
RRD MAPLE GROVE MAPLE GROVE MN N 55369
MEDALLION CABINETRY INC WACONIA MN N 55387
NORTHLAND ALUMINUM PRODUCTS I
NC
MINNEAPOLIS MN N 55416
BROWN PRINTING CO WASECA MN N 56093
MID CONTINENT CABINETRY COTTONWOOD MN N 56229
NAHAN PRINTING INC SAINT CLOUD MN N 56303
SAPA EXTRUSIONS INC YANKTON SD N 57078
BOBCAT CO (MELROE) GWINNER ND N 58040
ACME FINISHING CO INC ELK GROVE
VILLAGE
IL N 60007
ROHM & HAAS CHEMICALS LLC ELK GROVE
VILLAGE
IL N 60007
BECKER SPECIALTY CORP ELK GROVE
VILLAGE
IL N 60007
IMS ENGINEERED PRODUCTS LLC DES PLAINES IL N 60016
GREENWICH INDUSTRIES LP CLARIN
DIV
LAKE BLUFF IL N 60044
BROWN PRINTING CO WOODSTOCK IL N 60098
GE WATER & PROCESS TECHNOLOGIES ADDISON IL N 60101
BALL AEROSOL & SPECIALTY
CONTAINER INC
ELGIN IL N 60120
UNIVERSAL CHEMICALS & COATINGS
INC
ELGIN IL N 60123
WISMARQ CORP FRANKLIN PARK IL N 60131
WR MEADOWS INC HAMPSHIRE IL N 60140
LEHIGH PRESS CADILLAC (DBA LEHIGH
DIRECT DIVISION)
BROADVIEW IL N 60153
SUN CHEMICAL CORP NORTHLAKE IL N 60164
SYCAMORE SYSTEMS LLC SYCAMORE IL N 60178
Minimum Release Height
(m)
Minimum Receptor
Distance (m)
Proportion of Certain Glycol
Ethers Used that are EGBE
2009 Maximum
Impact (mg/m3)
2010 Maximum
Impact (mg/m3)
2011 Maximum
Impact (mg/m3)
2009 Outcome
2010 Outcome
2011 Outcome
Default Default Default 0.10 0.19 0.24 Out Out Out
Default Default Default 0.0001 0.0001 NR Out Out Out
17.98 70.7 0.99 2.88 3.02 3.14 Retain Retain Retain
Default Default Default 0.48 0.58 0.51 Out Out Out
15 120 0.951.36 1.30 1.15 Out Out Out
Default Default Default0.08 0.10 0.15 Out Out Out
Default Default Default 0.03 0.02 NR Out Out Out
Default Default Default NR 0.0001 0.00009 Out Out Out
Default Default Default NR NR 0.14 Out Out Out
Default Default Default 0.11 NR NR Out Out Out
Default Default DefaultNR NR 0.13 Out Out Out
Default Default Default 0.16 0.16 0.24 Out Out Out
Default Default Default 0.12 NR NR Out Out Out
Default Default Default 0.17 0.26 0.21 Out Out Out
Default Default Default 0.52 0.13 0.05 Out Out Out
Default Default Default NR 0.13 NR Out Out Out
Default Default Default0.16 0.25 0.21 Out Out Out
Default Default DefaultNR NR 0.00003 Out Out Out
Default Default Default0.01 0.01 NR Out Out Out
Default Default Default NR 0.01 NR Out Out Out
Default Default Default0.11 NR NR Out Out Out
Default Default Default 0.15 0.14 0.22 Out Out Out
Default Default DefaultNR 0.0001 0.0001 Out Out Out
Default Default Default0.24 0.19 0.05 Out Out Out
Default Default DefaultNR 0.00 NR Out Out Out
Default Default Default NR NR 0.04 Out Out Out
Default Default Default NR NR 0.01 Out Out Out
Default Default Default0.07 NR NR Out Out Out
Default Default Default NR 0.0006 0.0001 Out Out Out
Default Default Default NR 0.21 0.14 Out Out Out
Page 41 of 50

Table C-4. Comparisons of 2009, 2010 and 2011 TRI Air Emissions Data for Certain Glycol Ethers to Site Specific Screening Values (Step B)
Facility City State Completed Survey Zip Code
SEYMOUR OF SYCAMORE INC SYCAMORE IL N 60178
KNS COMPANYS INC CAROL STREAM IL N 60188
TMS MANUFACTURING ALSIP IL N 60803
DOW CHEMICAL JOLIET SITE CHANNAHON IL N 60410
CHICAGO HEIGHTS STEEL CHICAGO HEIGHTS IL N 60411
ALLIED TUBE & CONDUIT CORP HARVEY IL N 60426
INX INTERNATIONAL INK CO HOMEWOOD IL N 60430
DOBER CHEMICAL CORP MIDLOTHIAN IL N 60445
SIGNODE BRIDGEVIEW IL N 60455
UNIVAR USA INC BEDFORD PARK IL N 60499
UNIVAR USA INC 68TH ST BEDFORD PARK IL N 60501
CROWN AEROSOL PACKAGING AURORA IL N 60504
CHAMPION PACKAGING &
DISTRIBUTING INC
WOODRIDGE IL N 60517
LAKESIDE LITHOGRAPHY LLC CHICAGO IL N 60608
EDSAL MANUFACTURING CO INC CHICAGO IL N 60609
REXAM BEVERAGE CAN CO RE :
CHICAGO PLANT
CHICAGO IL Y 60609
CHICAGO STEEL CONTAINER CORP CHICAGO IL N 60623
BWAY CORP CHICAGO IL N 60623
MEYER STEEL DRUM INC CHICAGO IL N 60623
COLOR COMMUNICATIONS INC CHICAGO IL N 60624
SKOLNIK INDUSTRIES CHICAGO IL N 60632
GREIF PACKAGING LLC ALSIP IL N 60803
CROWN BEVERAGE PACKAGING BRADLEY IL Y 60915
CHRYSLER BELVIDERE ASSEMBLY
PLANT
BELVIDERE IL N 61008
SIGNCRAFT SCREEN PRINT GALENA IL N 61036
SILGAN CONTAINERS
MANUFACTURING CORP
ROCHELLE IL N 61068
ENGINEERED POLYMER SOLUTIONS
INC D/B/A VALSPAR COATINGS
ROCKFORD IL N 61104
3M CO ‐ CORDOVA CORDOVA IL N 61242
3M CO ‐ CORDOVA CORDOVA IL N 61242
JOHN DEERE HARVESTER WORKS EAST
MOLINE
EAST MOLINE IL N 61244
TYSON FRESH MEATS INC JOSLIN IL HILLSDALE IL N 61257
NATIONAL COATINGS INC GALESBURG IL N 61401
PEORIA DISPOSAL CO #1 PEORIA IL N 61615
CNH AMERICA LLC GOODFIELD IL N 61742
Minimum Release Height
(m)
Minimum Receptor
Distance (m)
Proportion of Certain Glycol
Ethers Used that are EGBE
2009 Maximum
Impact (mg/m3)
2010 Maximum
Impact (mg/m3)
2011 Maximum
Impact (mg/m3)
2009 Outcome
2010 Outcome
2011 Outcome
Default Default Default NR 0.01 0.02 Out Out Out
Default Default Default 0.06 0.13 0.21 Out Out Out
Default Default Default NR NR 0.01 Out Out Out
Default Default Default 0.0001 NR NR Out Out Out
Default Default Default0.76 0.90 0.86 Out Out Out
Default Default Default 0.49 0.78 0.21 Out Out Out
Default Default Default 0.003 0.0002 NR Out Out Out
Default Default Default 0.0001 0.0001 NR Out Out Out
Default Default Default 0.19 0.21 0.19 Out Out Out
Default Default Default 0.002 NR 0.0003 Out Out Out
Default Default Default 0.0006 NR NR Out Out Out
Default Default Default 0.31 0.27 0.20 Out Out Out
Default Default Default0.0001 NR NR Out Out Out
Default Default Default 0.22 0.32 0.11 Out Out Out
Default Default Default 0.54 0.91 0.72 Out Out Out
12.192 19 0.93682.97 3.10 1.47 Retain Retain Out
Default Default Default 0.17 0.26 0.24 Out Out Out
Default Default Default 0.22 0.64 0.59 Out Out Out
Default Default Default 0.23 0.26 0.28 Out Out Out
Default Default Default 0.16 0.11 0.13 Out Out Out
Default Default Default NR 0.15 0.20 Out Out Out
Default Default Default 0.14 0.52 0.46 Out Out Out
15.24 18.71 0.88 3.18 2.97 3.01 Retain Retain Retain
Default Default Default0.03 0.17 0.25 Out Out Out
Default Default Default NR NR 0.44 Out Out Out
Default Default Default0.09 0.19 0.34 Out Out Out
Default Default Default0.00 NR NR Out Out Out
Default Default Default 0.01 0.03 NR Out Out Out
Default Default Default NR NR 0.02 Out Out Out
Default Default Default0.14 NR NR Out Out Out
Default Default Default 0.0005 0.0006 NR Out Out Out
Default Default Default NR 0.33 0.27 Out Out Out
Default Default Default NR 0.03 NR Out Out Out
Default Default Default NR 0.18 NR Out Out Out
Page 42 of 50

Table C-4. Comparisons of 2009, 2010 and 2011 TRI Air Emissions Data for Certain Glycol Ethers to Site Specific Screening Values (Step B)
Facility City State Completed Survey Zip Code
CNH AMERICA LLC GOODFIELD IL N 61742
MASTERBRAND CABINETS INC ARTHUR IL N 61911
RR DONNELLEY & SONS CO MATTOON IL N 61938
MIDWEST METAL COATINGS GRANITE CITY IL N 62040
PRECOAT METALS GRANITE CITY IL N 62040
AFTON CHEMICAL CORP SAUGET IL N 62201
VEOLIA ES TECHNICAL SOLUTIONS LLC SAUGET IL N 62201
KNAPHEIDE MANUFACTURING CO QUINCY IL N 62305
QG LLC EFFINGHAM IL N 62401
METAL CONTAINER CORP ‐ ARNOLD
CAN PLANT
ARNOLD MO Y 63010
TRILLA ST LOUIS CORP FENTON MO N 63026
CHRYSLER ST LOUIS NORTH ASSEMBLY
PLANT
FENTON MO N 63026
UNIVAR USA INC METRO BLVD MARYLAND
HEIGHTS
MO N 63043
BUCKEYE INTERNATIONAL INC MARYLAND
HEIGHTS
MO N 63043
PLAZE INC PACIFIC MO N 63069
SCHAEFFER MANUFACTURING SAINT LOUIS MO N 63104
U.S. POLYMERS ACCUREZ LLC SAINT LOUIS MO N 63111
UNIVAR USA INC BERKELEY BERKELEY MO N 63134
ELANTAS PDG INC SAINT LOUIS MO N 63147
THE DIAL CORP A SUBSIDIARY OF
HENKEL CONSUMER GOODS
SAINT LOUIS MO N 63147
SAF‐HOLLAND USA INC WARRENTON MO N 63383
GENERAL MOTORS WENTZVILLE
ASSEMBLY
WENTZVILLE MO N 63385
GATES CORP POPLAR BLUFF MO N 63901
US ARMY LAKE CITY ARMY
AMMUNITION PLANT
INDEPENDENCE MO N 64051
FORD MOTOR COMPANY‐‐KANSAS
CITY ASSEMBLY PLANT
CLAYCOMO MO Y 64119
BALL METAL BEVERAGE CONTAINER
CORP
KANSAS CITY MO N 64120
SILGAN CONTAINERS
MANUFACTURING CORP
SAINT JOSEPH MO N 64504
VON HOFFMANN GRAPHICS INC OWENSVILLE MO N 65066
HUTCHENS INDUSTRIES INC
MANSFIELD FACILITY
MANSFIELD MO N 65704
Minimum Release Height
(m)
Minimum Receptor
Distance (m)
Proportion of Certain Glycol
Ethers Used that are EGBE
2009 Maximum
Impact (mg/m3)
2010 Maximum
Impact (mg/m3)
2011 Maximum
Impact (mg/m3)
2009 Outcome
2010 Outcome
2011 Outcome
Default Default Default NR NR 0.38 Out Out Out
Default Default Default 0.17 NR NR Out Out Out
Default Default Default NR 0.12 0.07 Out Out Out
Default Default Default NR 0.01 0.02 Out Out Out
Default Default Default 0.18 0.19 0.17 Out Out Out
Default Default Default NR 0.0005 0.0005 Out Out Out
Default Default DefaultNR 0.0001 0.0001 Out Out Out
Default Default Default 0.28 0.29 0.34 Out Out Out
Default Default Default 0.22 0.13 0.08 Out Out Out
12.192 68.58 0.80.95 1.00 0.91 Out Out Out
Default Default Default NR 0.23 0.22 Out Out Out
Default Default Default0.87 NR NR Out Out Out
Default Default Default0.01 NR NR Out Out Out
Default Default Default0.04 NR 0.04 Out Out Out
Default Default Default NR NR 0.0009 Out Out Out
Default Default Default 0.18 0.21 0.23 Out Out Out
Default Default Default 0.0004 0.0002 NR Out Out Out
Default Default Default 0.01 0.0011 NR Out Out Out
Default Default Default 0.00 0.0027 NR Out Out Out
Default Default DefaultNR NR 0.0046 Out Out Out
Default Default Default NR NR 0.73 Out Out Out
Default Default Default0.11 0.17 0.21 Out Out Out
Default Default Default NR 0.00001 0.00002 Out Out Out
Default Default Default0.12 0.13 0.11 Out Out Out
Default Default 0.570.52 0.63 0.69 Out Out Out
Default Default Default0.15 NR NR Out Out Out
Default Default Default0.29 0.27 0.27 Out Out Out
Default Default Default 0.18 0.26 0.16 Out Out Out
Default Default DefaultNR 0.16 NR Out Out Out
Page 43 of 50

Table C-4. Comparisons of 2009, 2010 and 2011 TRI Air Emissions Data for Certain Glycol Ethers to Site Specific Screening Values (Step B)
Facility City State Completed Survey Zip Code
EFCO CORP MONETT MO Y 65708
HYDRO ALUMINUM NORTH AMERICA
INC
MONETT MO N 65708
SILGAN CONTAINERS
MANUFACTURING CORP
MOUNT VERNON MO N 65712
3M CO ‐ SPRINGFIELD SPRINGFIELD MO N 65802
3M CO ‐ SPRINGFIELD SPRINGFIELD MO N 65802
NAZDAR SHAWNEE SHAWNEE KS N 66227
PACKAGING DYNAMICS INC
BAGCRAFT/PAPERCON DIV
BAXTER SPRINGS KS N 66713
LAFARGE MIDWEST INC (INCLD
SYSTECH ENVIRONMENTAL)
FREDONIA KS N 66736
GATES CORP IOLA KS N 66749
GREIF INDUSTRIAL PACKAGING &
SERVICES
WINFIELD KS N 67156
THE COLEMAN CO INC WICHITA KS N 67219
CONOCOCPHILLIPS CO WICHITA
TERMINAL
WICHITA KS N 67219
SCHWAN'S GLOBAL SUPPLY CHAIN ‐
SALINA KS
SALINA KS N 67401
VALMONT INDUSTRIES INC VALLEY NE N 68064
VEYANCE TECHNOLOGIES INC LINCOLN NE N 68504
KAWASAKI MOTORS
MANUFACTURING CORP USA
LINCOLN NE N 68524
NUCOR CORP ‐ VULCRAFT/NUCOR
COLD FINISH DIV
NORFOLK NE N 68701
TYSON FRESH MEATS INC DAKOTA CITY NE N 68731
AIR PRODUCTS PERFORMANCE
MANUFACTURING INC
RESERVE LA N 70084
GREIF PACKAGING LLC NEW ORLEANS LA N 70123
CHAMPION TECHNOLOGIES INC BROUSSARD LA N 70518
BAYOU COS INC NEW IBERIA LA N 70560
NALCO CO SCOTT LA N 70583
BRENNTAG SOUTHWEST INC ST
GABRIEL
SAINT GABRIEL LA N 70776
NOVOLYTE PERFORMANCE
MATERIALS
ZACHARY LA N 70791
ASHLAND DISTRIBUTION CO BATON ROUGE LA N 70815
GMTG ‐ SHREVEPORT ASSEMBLY SHREVEPORT LA N 71129
UNION TANK CAR ALEXANDRIA
MANUFACTURING FACILITY
ALEXANDRIA LA N 71303
Minimum Release Height
(m)
Minimum Receptor
Distance (m)
Proportion of Certain Glycol
Ethers Used that are EGBE
2009 Maximum
Impact (mg/m3)
2010 Maximum
Impact (mg/m3)
2011 Maximum
Impact (mg/m3)
2009 Outcome
2010 Outcome
2011 Outcome
6.096 3.048 0.11 0.31 0.07 0.02 Out Out Out
Default Default DefaultNR 0.11 NR Out Out Out
Default Default Default0.31 0.28 NR Out Out Out
Default Default Default 0.0004 0.0004 NR Out Out Out
Default Default Default NR NR 0.0004 Out Out Out
Default Default Default 0.14 0.15 0.09 Out Out Out
Default Default Default0.13 0.21 NR Out Out Out
Default Default DefaultNR 0.0002 NR Out Out Out
Default Default Default NR 0.00005 0.00006 Out Out Out
Default Default Default0.06 0.17 0.22 Out Out Out
Default Default Default NR 0.13 0.12 Out Out Out
Default Default DefaultNR 0.00012 0.00014 Out Out Out
Default Default Default0.07 NR NR Out Out Out
Default Default Default NR NR 0.18 Out Out Out
Default Default Default NR 0.0000000003 0.00000005 Out Out Out
Default Default Default0.07 0.07 NR Out Out Out
Default Default Default0.25 0.22 0.22 Out Out Out
Default Default Default NR 0.00 NR Out Out Out
Default Default DefaultNR 0.00000004 0.00000005 Out Out Out
Default Default Default 0.18 0.23 0.22 Out Out Out
Default Default Default NR 0.003 NR Out Out Out
Default Default Default NR 0.05 0.05 Out Out Out
Default Default Default NR 0.000007 0.000023 Out Out Out
Default Default Default0.00 NR NR Out Out Out
Default Default Default0.18 0.19 0.18 Out Out Out
Default Default Default 0.01 0.01 NR Out Out Out
Default Default Default 0.13 0.08 0.06 Out Out Out
Default Default Default0.00 NR NR Out Out Out
Page 44 of 50

Table C-4. Comparisons of 2009, 2010 and 2011 TRI Air Emissions Data for Certain Glycol Ethers to Site Specific Screening Values (Step B)
Facility City State Completed Survey Zip Code
BERENFIELD CONTAINERS SW LTD WHITE HALL AR N 71602
WHEELING MACHINE PRODUCTS DIV
PINE BLUFF
PINE BLUFF AR N 71602
CLEAN HARBORS EL DORADO LLC EL DORADO AR N 71730
CHAMPION TECHNOLOGIES INC MAGNOLIA AR N 71753
RINECO BENTON AR N 72015
BRYCE CO LLC SEARCY AR N 72143
MAVERICK TUBE LLC BLYTHEVILLE AR N 72315
AMERIMAX COATED PRODUCTS HELENA AR N 72342
QG PRINTING II CORP JONESBORO AR N 72401
L A DARLING CO ‐ PIGGOTT AR
FACILITY
PIGGOTT AR N 72454
SUPERIOR INDUSTRIES
INTERNATIONAL ARKANSAS LLC
FAYETTEVILLE AR N 72701
SUPERIOR INDUSTRIES
INTERNATIONAL ARKANSAS LLC
ROGERS AR N 72756
KAWNEER CO INC SPRINGDALE AR N 72764
GRAPHIC PACKAGING INTERNATIONAL
INC
FORT SMITH AR N 72916
DEXTER AXLE EL RENO OK N 73036
GEMINI COATINGS INC EL RENO OK N 73036
U.S. AIR FORCE TINKER AFB OK TINKER A F B OK N 73145
REXAM BEVERAGE CAN CO
RE:OKLAHOMA CITY PLANT
OKLAHOMA CITY OK Y 73179
CLEAN HARBORS LONE MOUNTAIN
LLC LONE MOUNTAIN FACILITY
WAYNOKA OK N 73860
BRENNTAG SOUTHWEST INC SAND
SPRINGS
SAND SPRINGS OK N 74063
NALCO CO TULSA PLANT 102 TULSA OK N 74131
BRAINERD CHEMICAL CO INC TULSA OK N 74147
AIR SYSTEM COMPONENTS LP PONCA CITY OK N 74601
MOBIL CHEMICAL CO SHAWNEE OK N 74804
ELECTRO PLATE CIRCUITRY INC CARROLLTON TX N 75006
GLIDDEN CO CARROLLTON TX N 75006
A BRITE CO GARLAND TX N 75041
BENJAMIN MOORE & CO ‐ DALLAS MESQUITE TX N 75149
OLDCASTLE BUILDING ENVELOPE ‐
TEXAS FACILITY
TERRELL TX N 75160
MAGNABLEND INC‐CENTRAL PLANT WAXAHACHIE TX N 75165
UNITED STATES ALUMINUM CORP WAXAHACHIE TX N 75165
Minimum Release Height
(m)
Minimum Receptor
Distance (m)
Proportion of Certain Glycol
Ethers Used that are EGBE
2009 Maximum
Impact (mg/m3)
2010 Maximum
Impact (mg/m3)
2011 Maximum
Impact (mg/m3)
2009 Outcome
2010 Outcome
2011 Outcome
Default Default Default 0.21 0.21 0.18 Out Out Out
Default Default DefaultNR 0.23 0.22 Out Out Out
Default Default Default 0.00 0.00021 NR Out Out Out
Default Default Default NR NR 0.00152 Out Out Out
Default Default Default 0.00 0.0018 NR Out Out Out
Default Default Default NR 0.01 NR Out Out Out
Default Default Default NR NR 0.40 Out Out Out
Default Default Default NR 0.0065 0.0032 Out Out Out
Default Default Default NR NR 0.18 Out Out Out
Default Default Default0.31 0.28 0.12 Out Out Out
Default Default DefaultNR 0.15 0.23 Out Out Out
Default Default DefaultNR 0.14 0.27 Out Out Out
Default Default Default 0.28 0.22 0.27 Out Out Out
Default Default DefaultNR NR 0.28 Out Out Out
Default Default Default NR 0.16 0.16 Out Out Out
Default Default Default NR 0.01 0.01 Out Out Out
Default Default Default 0.15 0.17 0.14 Out Out Out
13 100 0.850.44 NR NR Out Out Out
Default Default DefaultNR NR 0.00005 Out Out Out
Default Default DefaultNR 0.0011 0.0011 Out Out Out
Default Default Default 0.0002 NR 0.00009 Out Out Out
Default Default Default NR 0.00005 0.00005 Out Out Out
Default Default Default 0.51 0.44 0.42 Out Out Out
Default Default Default 0.50 0.47 0.41 Out Out Out
Default Default Default NR 0.00273 NR Out Out Out
Default Default Default NR NR 0.000006 Out Out Out
Default Default Default NR NR 0.00009 Out Out Out
Default Default Default NR NR 0.00005 Out Out Out
Default Default Default0.41 0.40 0.32 Out Out Out
Default Default Default0.00009 0.00009 NR Out Out Out
Default Default Default 0.01 NR NR Out Out Out
Page 45 of 50

Table C-4. Comparisons of 2009, 2010 and 2011 TRI Air Emissions Data for Certain Glycol Ethers to Site Specific Screening Values (Step B)
Facility City State Completed Survey Zip Code
INTERNATIONAL EXTRUSION CORP
TEXAS
WAXAHACHIE TX N 75165
MAXIM INTEGRATED PRODUCTS DALLAS TX N 75244
SILGAN CAN CO PARIS TX N 75460
ALUMAX MILL PRODUCTS INC TEXARKANA TX N 75501
BRENNTAG SOUTHWEST INC LONG
VIEW
LONGVIEW TX N 75604
REXAM BEVERAGE CAN CO LONGVIEW
FACILITY
LONGVIEW TX Y 75604
EASTMAN CHEMICAL CO TEXAS
OPERATIONS
LONGVIEW TX N 75602
ROBROY INDUSTRIES TEXAS LP GILMER TX N 75644
BAKER PETROLITE KILGORE BLEND
PLANT
KILGORE TX N 75662
CHAMPION TECHNOLOGIES INC KILGORE TX N 75662
CHAMPION TECHNOLOGIES INC LONGVIEW TX N 75662
CLEVELAND STEEL CONTAINER ‐
KILGORE
KILGORE TX N 75662
NUCOR VULCRAFT GROUP ‐
GRAPELAND DIV
GRAPELAND TX N 75844
SHIELDCOAT TECHNOLOGIES INC (DBA
CYBERSHIELD OF TEXAS)
LUFKIN TX N 75904
CHAMPION TECHNOLOGIES INC CRESSON TX N 76035
CHEMGUARD INC MANSFIELD TX N 76063
BALL METAL BEVERAGE CONTAINER
CORP
FORT WORTH TX N 76140
CARRY‐ON TRAILER CORP MEXIA TX N 76667
TEXAS TILE MANUFACTURING LLC HOUSTON TX N 77007
PRECOAT METALS HOUSTON TX N 77015
NOV TUBOSCOPE WEST LITTLE YORK
COATING
HOUSTON TX N 77041
UNIVAR USA INC HOUSTON FM 529 HOUSTON TX N 77041
RR DONNELLEY‐WETMORE PLANT HOUSTON TX N 77043
BRENNTAG SOUTHWEST INC HOUS
TON
HOUSTON TX N 77047
KIK (HOUSTON) INC HOUSTON TX N 77054
INTERCOASTAL PAINT CO INC HOUSTON TX N 77060
PPG ARCHITECURAL COATINGS
HOUSTON
HOUSTON TX N 77092
Minimum Release Height
(m)
Minimum Receptor
Distance (m)
Proportion of Certain Glycol
Ethers Used that are EGBE
2009 Maximum
Impact (mg/m3)
2010 Maximum
Impact (mg/m3)
2011 Maximum
Impact (mg/m3)
2009 Outcome
2010 Outcome
2011 Outcome
Default Default Default0.0045 NR NR Out Out Out
Default Default Default 0.02 NR NR Out Out Out
Default Default Default 0.25 0.21 0.19 Out Out Out
Default Default Default 0.01 NR NR Out Out Out
Default Default DefaultNR NR 0.0008 Out Out Out
18 80 0.911.53 1.30 1.07 Out Out Out
Default Default Default0.47 0.49 0.51 Out Out Out
Default Default Default NR NR 0.0009 Out Out Out
Default Default DefaultNR 0.0000020 0.000009 Out Out Out
Default Default Default 0.01 NR NR Out Out Out
Default Default Default NR NR 0.00 Out Out Out
Default Default DefaultNR 0.0012 0.0012 Out Out Out
Default Default Default0.35 0.29 0.32 Out Out Out
Default Default Default0.26 0.30 NR Out Out Out
Default Default Default 0.0029 NR NR Out Out Out
Default Default Default NR NR 0.01 Out Out Out
Default Default Default0.36 0.37 0.35 Out Out Out
Default Default Default NR 0.23 NR Out Out Out
Default Default Default 0.02 0.01 NR Out Out Out
Default Default Default 0.18 0.17 0.16 Out Out Out
Default Default Default0.03 NR NR Out Out Out
Default Default DefaultNR 0.02 0.02 Out Out Out
Default Default Default NR 0.17 0.17 Out Out Out
Default Default Default0.0011 0.0007 NR Out Out Out
Default Default Default 0.08 0.04 NR Out Out Out
Default Default Default NR NR 0.00 Out Out Out
Default Default DefaultNR 0.0001 0.0002 Out Out Out
Page 46 of 50

Table C-4. Comparisons of 2009, 2010 and 2011 TRI Air Emissions Data for Certain Glycol Ethers to Site Specific Screening Values (Step B)
Facility City State Completed Survey Zip Code
MAVERICK TUBE LLC DBA
TENARISCONROE
CONROE TX N 77301
BALL METAL BEVERAGE CONTAINER
CORP
CONROE TX N 77303
CROWN BEVERAGE PACKAGING CONROE TX N 77303
AMERICAN COATINGS INC TOMBALL TX N 77375
CROWN BEVERAGE PACKAGING SUGAR LAND TX N 77478
NALCO CO PLANT 106 SUGAR LAND TX N 77478
MEMC PASADENA INC PASADENA TX N 77503
EQUISTAR CHEMICALS BAYPORT
CHEMICALS PLANT
PASADENA TX N 77507
CHEMICALS INC BAYTOWN TX N 77520
KMCO CROSBY PLANT CROSBY TX N 77532
DELTA HOUSTON DEER PARK TX N 77536
CLEAN HARBORS DEER PARK LLC LA PORTE TX N 77571
CHAMPION TECHNOLOGIES INC FRESNO TX N 77545
GREIF PACKAGING LLC LA PORTE TX N 77571
GREIF INDUSTRIAL PACKAGING &
SERVICES LLC
LA PORTE TX N 77571
MARATHON PETROLEUM CO LLC TEXAS CITY TX N 77590
INVISTA SARL ‐ ORANGE SITE ORANGE TX N 77630
ISP SYNTHETIC ELASTOMERS LP PORT NECHES TX N 77651
TOYO INK AMERICA LLC BRYAN TX N 77807
NOV TUBOSCOPE NAVASOTA NAVASOTA TX N 77868
UNION CARBIDE CORP SEADRIFT
PLANT
SEADRIFT TX N 77983
CLEARWATER INTERNATIONAL LLC ELMENDORF TX N 78112
TOYOTA MOTOR MANUFACTURING
TEX AS INC
SAN ANTONIO TX N 78264
US ECOLOGY TEXAS INC ROBSTOWN TX N 78380
CHAMPION TECHNOLOGIES INC CORPUS CHRISTI TX N 78405
TYSON FRESH MEATS INC AMARILLO TX N 79108
CATALYST OILFIELD SERVICES LLC GARDENDALE TX N 79758
CHAMPION TECHNOLOGIES INC ODESSA TX N 79762
UNIVAR USA INC HOUSTON HOUSTON TX N 77061
NALCO CO ‐ ODESSA PLANT 114 ODESSA TX N 79765
KBP COIL COATERS INC DENVER CO N 80216
UNIVAR USA INC DENVER DENVER CO N 80216
ROCKY MOUNTAIN METAL
CONTAINER
GOLDEN CO N 80401
Minimum Release Height
(m)
Minimum Receptor
Distance (m)
Proportion of Certain Glycol
Ethers Used that are EGBE
2009 Maximum
Impact (mg/m3)
2010 Maximum
Impact (mg/m3)
2011 Maximum
Impact (mg/m3)
2009 Outcome
2010 Outcome
2011 Outcome
Default Default DefaultNR 0.23 0.16 Out Out Out
Default Default Default0.60 0.60 0.56 Out Out Out
Default Default Default 1.16 1.22 1.09 Out Out Out
Default Default Default 0.0012 0.0008 NR Out Out Out
Default Default Default 1.10 1.10 1.08 Out Out Out
Default Default Default NR NR 0.0020 Out Out Out
Default Default Default 0.63 0.65 0.73 Out Out Out
Default Default Default0.24 0.26 0.19 Out Out Out
Default Default Default 0.0046 0.0046 NR Out Out Out
Default Default Default NR NR 0.01 Out Out Out
Default Default Default 0.00005 0.0046 NR Out Out Out
Default Default Default NR 0.00004 NR Out Out Out
Default Default Default NR 0.0018 0.0016 Out Out Out
Default Default Default 0.15 0.07 0.17 Out Out Out
Default Default Default0.02 NR NR Out Out Out
Default Default Default NR 0.0002 NR Out Out Out
Default Default Default NR 0.0045 0.0026 Out Out Out
Default Default Default NR 0.0028 0.0028 Out Out Out
Default Default Default NR NR 0.0004 Out Out Out
Default Default Default 0.04 0.19 0.0059 Out Out Out
Default Default Default0.57 0.58 0.59 Out Out Out
Default Default Default 0.00006 NR NR Out Out Out
Default Default Default0.26 0.10 0.31 Out Out Out
Default Default Default 0.0001 NR NR Out Out Out
Default Default Default 0.0029 0.002 NR Out Out Out
Default Default Default 0.0025 NR 0.0007 Out Out Out
Default Default Default NR NR 0.05 Out Out Out
Default Default Default NR 0.01 0.01 Out Out Out
Default Default Default 0.0001 NR 0.01 Out Out Out
Default Default Default 0.0026 NR NR Out Out Out
Default Default Default 0.0009 0.00047 NR Out Out Out
Default Default Default 0.0001 0.00010 NR Out Out Out
Default Default Default1.23 1.19 1.10 Out Out Out
Page 47 of 50
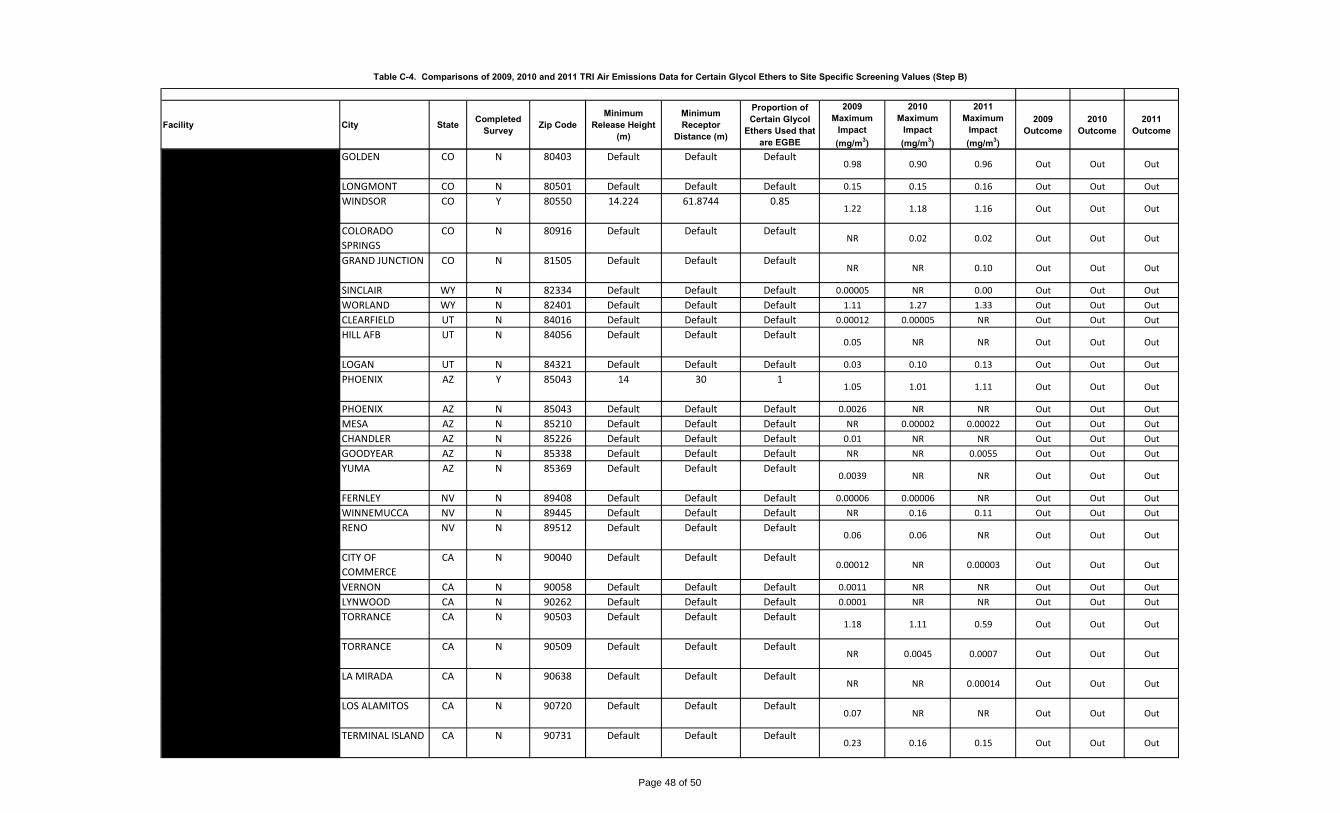
Table C-4. Comparisons of 2009, 2010 and 2011 TRI Air Emissions Data for Certain Glycol Ethers to Site Specific Screening Values (Step B)
Facility City State Completed Survey Zip Code
BALL METAL BEVERAGE CONTAINER
CORP
GOLDEN CO N 80403
CIRCLE GRAPHICS INC LONGMONT CO N 80501
METAL CONTAINER CORPORTION ‐
WINDSOR CAN PLANT
WINDSOR CO Y 80550
DPIX LLC COLORADO
SPRINGS
CO N 80916
COORSTEK GRAND JUNCTION CO N 81505
SINCLAIR WYOMING REFINING CO SINCLAIR WY N 82334
CROWN BEVERAGE PACKAGING WORLAND WY N 82401
ASHLAND DISTRIBUTION CO CLEARFIELD UT N 84016
U.S. AIR FORCE OGDEN AIR LOGISTICS
CENTER
HILL AFB UT N 84056
TTM TECHNOLOGIES INC LOGAN UT N 84321
REXAM BEVERAGE CAN CO PHOENIX
FACILITY
PHOENIX AZ Y 85043
PROCLEAN OF ARIZONA INC PHOENIX AZ N 85043
SOUTHWEST DISTRIBUTING CO MESA AZ N 85210
ASHLAND INC ‐ CHANDLER CHANDLER AZ N 85226
WR MEADOWS OF ARIZONA INC GOODYEAR AZ N 85338
US MARINE CORPS AIR STATION YUMA YUMA AZ N 85369
SHERWIN‐WILLIAMS CO FERNLEY NV N 89408
CARRY‐ON TRAILER CORP WINNEMUCCA NV N 89445
PRO LINE PRINTING / RR DONNELLEY RENO NV N 89512
ENGINEERED POLYMER SOLUTIONS
INC
CITY OF
COMMERCE
CA N 90040
NORMAN FOX & CO VERNON CA N 90058
HEXION SPECIALTY CHEMICALS INC LYNWOOD CA N 90262
BALL METAL BEVERAGE CONTAINER
CORP
TORRANCE CA N 90503
EXXONMOBIL OIL CORP ‐ TORRANCE
REFINERY
TORRANCE CA N 90509
OAKITE PRODUCTS INC (AKA
CHEMETALL OAKITE)
LA MIRADA CA N 90638
TREND OFFSET PRINTING SERVICES
INC
LOS ALAMITOS CA N 90720
ARDAGH METAL PACKAGING USA INC TERMINAL ISLAND CA N 90731
Minimum Release Height
(m)
Minimum Receptor
Distance (m)
Proportion of Certain Glycol
Ethers Used that are EGBE
2009 Maximum
Impact (mg/m3)
2010 Maximum
Impact (mg/m3)
2011 Maximum
Impact (mg/m3)
2009 Outcome
2010 Outcome
2011 Outcome
Default Default Default0.98 0.90 0.96 Out Out Out
Default Default Default 0.15 0.15 0.16 Out Out Out
14.224 61.8744 0.851.22 1.18 1.16 Out Out Out
Default Default DefaultNR 0.02 0.02 Out Out Out
Default Default DefaultNR NR 0.10 Out Out Out
Default Default Default 0.00005 NR 0.00 Out Out Out
Default Default Default 1.11 1.27 1.33 Out Out Out
Default Default Default 0.00012 0.00005 NR Out Out Out
Default Default Default0.05 NR NR Out Out Out
Default Default Default 0.03 0.10 0.13 Out Out Out
14 30 11.05 1.01 1.11 Out Out Out
Default Default Default 0.0026 NR NR Out Out Out
Default Default Default NR 0.00002 0.00022 Out Out Out
Default Default Default 0.01 NR NR Out Out Out
Default Default Default NR NR 0.0055 Out Out Out
Default Default Default0.0039 NR NR Out Out Out
Default Default Default 0.00006 0.00006 NR Out Out Out
Default Default Default NR 0.16 0.11 Out Out Out
Default Default Default0.06 0.06 NR Out Out Out
Default Default Default0.00012 NR 0.00003 Out Out Out
Default Default Default 0.0011 NR NR Out Out Out
Default Default Default 0.0001 NR NR Out Out Out
Default Default Default1.18 1.11 0.59 Out Out Out
Default Default DefaultNR 0.0045 0.0007 Out Out Out
Default Default DefaultNR NR 0.00014 Out Out Out
Default Default Default0.07 NR NR Out Out Out
Default Default Default0.23 0.16 0.15 Out Out Out
Page 48 of 50

Table C-4. Comparisons of 2009, 2010 and 2011 TRI Air Emissions Data for Certain Glycol Ethers to Site Specific Screening Values (Step B)
Facility City State Completed Survey Zip Code
US DOD DFSP SAN PEDRO SAN PEDRO CA N 90731
SANYO SOLAR (USA) LLC CARSON CA N 90745
WESTERN TUBE & CONDUIT CORP LONG BEACH CA N 90810
REXAM BEVERAGE CAN CO
CHATSWORTH FACILITY
CHATSWORTH CA Y 91311
REICHHOLD INC ‐ AZUSA PLANT AZUSA CA N 91702
WESTERN METAL DECORATING CO RANCHO
CUCAMONGA
CA N 91730
CARDINAL INDUSTRIAL FINISHES SOUTH EL MONTE CA N 91733
METAL CONTAINER CORP ‐ MIRA
LOMA CAN PLANT
MIRA LOMA CA N 91752
HENKEL ONTARIO ONTARIO CA N 91761
MACDERMID PRINTING SOLUTIONS SAN MARCOS CA N 92078
SDC TECHNOLOGIES INC IRVINE CA N 92618
BEHR PROCESS CORP SANTA ANA CA N 92704
ARLON INC ADHESIVES & FILMS DIV SANTA ANA CA N 92704
ARLON GRAPHICS LLC SANTA ANA CA N 92704
BAKER PETROLITE BAKERSFIELD CA N 93308
GE WATER & PROCESS TECHNOLOGIES
‐ BAKERSFIELD
BAKERSFIELD CA N 93308
KELLY‐MOORE PAINT CO INC SAN CARLOS CA N 94070
BALL METAL BEVERAGE CONTAINER
CORP
FAIRFIELD CA N 94533
REXAM BEVERAGE CAN CO RE:
FAIRFIELD PLANT
FAIRFIELD CA Y 94533
NEW UNITED MOTOR
MANUFACTURING INC
FREMONT CA N 94538
UNIVAR USA INC ‐ SAN JOSE SAN JOSE CA N 95131
ECOLAB INC SAN JOSE CA N 95133
GREIF PACKAGING LLC MERCED CA N 95348
BALL METAL FOOD CONTAINER CORP OAKDALE CA N 95361
SILGAN CONTAINER MANUFACTURING
CORP
RIVERBANK CA N 95367
INX DIGITAL INK CO DIXON CA N 95620
HB FULLER ROSEVILLE CA N 95678
SACRAMENTO‐ CAMPBELL SOUP
SUPPLY CO
SACRAMENTO CA N 95824
Minimum Release Height
(m)
Minimum Receptor
Distance (m)
Proportion of Certain Glycol
Ethers Used that are EGBE
2009 Maximum
Impact (mg/m3)
2010 Maximum
Impact (mg/m3)
2011 Maximum
Impact (mg/m3)
2009 Outcome
2010 Outcome
2011 Outcome
Default Default Default NR NR 0.0046 Out Out Out
Default Default Default 0.18 0.15 NR Out Out Out
Default Default Default NR 0.0027 NR Out Out Out
15 30 0.981.53 1.20 0.79 Out Out Out
Default Default Default NR NR 0.0001 Out Out Out
Default Default DefaultNR 0.03 0.03 Out Out Out
Default Default Default0.0021 0.0021 NR Out Out Out
Default Default Default1.13 1.11 1.07 Out Out Out
Default Default Default 0.00021 NR NR Out Out Out
Default Default Default0.04 NR 0.0055 Out Out Out
Default Default Default NR NR 0.00003 Out Out Out
Default Default Default 0.00 NR NR Out Out Out
Default Default Default0.00035 0.00047 NR Out Out Out
Default Default Default NR NR 0.01 Out Out Out
Default Default Default 0.00010 0.00012 NR Out Out Out
Default Default DefaultNR 0.00014 NR Out Out Out
Default Default Default 0.00003 0.00003 NR Out Out Out
Default Default Default0.85 0.52 0.59 Out Out Out
15 50 0.980.37 0.27 0.27 Out Out Out
Default Default Default1.23 0.53 NR Out Out Out
Default Default Default 0.0002 0.0003 NR Out Out Out
Default Default Default 0.0007 NR NR Out Out Out
Default Default Default 0.26 0.19 0.02 Out Out Out
Default Default Default0.13 0.09 0.08 Out Out Out
Default Default Default0.09 0.10 0.17 Out Out Out
Default Default Default 0.17 0.20 0.16 Out Out Out
Default Default Default 0.0057 NR NR Out Out Out
Default Default DefaultNR NR 0.0045 Out Out Out
Page 49 of 50

Table C-4. Comparisons of 2009, 2010 and 2011 TRI Air Emissions Data for Certain Glycol Ethers to Site Specific Screening Values (Step B)
Facility City State Completed Survey Zip Code
SILGAN CAN CO SACRAMENTO CA N 95824
ENGINEERED POLYMER SOLUTIONS
INC D/B/A VALSPAR COATINGS
SACRAMENTO CA N 95826
BALL METAL BEVERAGE CONTAINER
CORP
KAPOLEI HI N 96707
IMPERIAL PAINT CO INC PORTLAND OR N 97210
UNIVAR USA INC PORTLAND OR N 97210
TARR ACQUISITION LLC PORTLAND OR N 97227
FORMULA CORP AUBURN WA N 98002
REXAM BEVERAGE CAN CO KENT WA
FACILITY
KENT WA Y 98032
BOEING COMMERCIAL AIRPLANE
GROUP ‐ EVERETT
EVERETT WA N 98204
EMERALD SERVICES INC TACOMA WA N 98421
CROWN BEVERAGE PACKAGING OLYMPIA WA Y 98501
US DOD USAF JOINT BASE
ELMENDORF‐RICHARDSON
ELMENDORF AFB AK N 99506
Minimum Release Height
(m)
Minimum Receptor
Distance (m)
Proportion of Certain Glycol
Ethers Used that are EGBE
2009 Maximum
Impact (mg/m3)
2010 Maximum
Impact (mg/m3)
2011 Maximum
Impact (mg/m3)
2009 Outcome
2010 Outcome
2011 Outcome
Default Default Default 0.18 0.21 0.17 Out Out Out
Default Default Default0.000011 NR NR Out Out Out
Default Default Default0.30 0.30 0.26 Out Out Out
Default Default Default NR 0.00160 0.00134 Out Out Out
Default Default Default NR 0.00009 NR Out Out Out
Default Default Default 0.00029 0.00007 NR Out Out Out
Default Default Default NR 0.0045 0.0045 Out Out Out
13.19784 29 0.99873.75 3.54 3.54 Retain Retain Retain
Default Default Default0.35 0.26 0.48 Out Out Out
Default Default Default NR 0.0000001 0.0000002 Out Out Out
12.8 44.63 0.94 1.83 2.07 1.71 Retain Retain Retain
Default Default DefaultNR 0.00023 NR Out Out Out
NR: no emissions reportedY: survey completedN: survey not completedtpy: tons per yearDefault: Because site-specific survey not completed, assumed point source type, emissions height of 5 m, distance to fenceline of 20 m and all report
mg/m3: concentration of EGBE in air (milligrams per cubic meter) at fencelineEGBE: ethylene glycol monobutyl etherm: meterTRI: Toxics Release Inventory
Page 50 of 50

APPENDIX D
Outcome of Long-Term Tiered Modeling in Support of Uncertainty Analysis
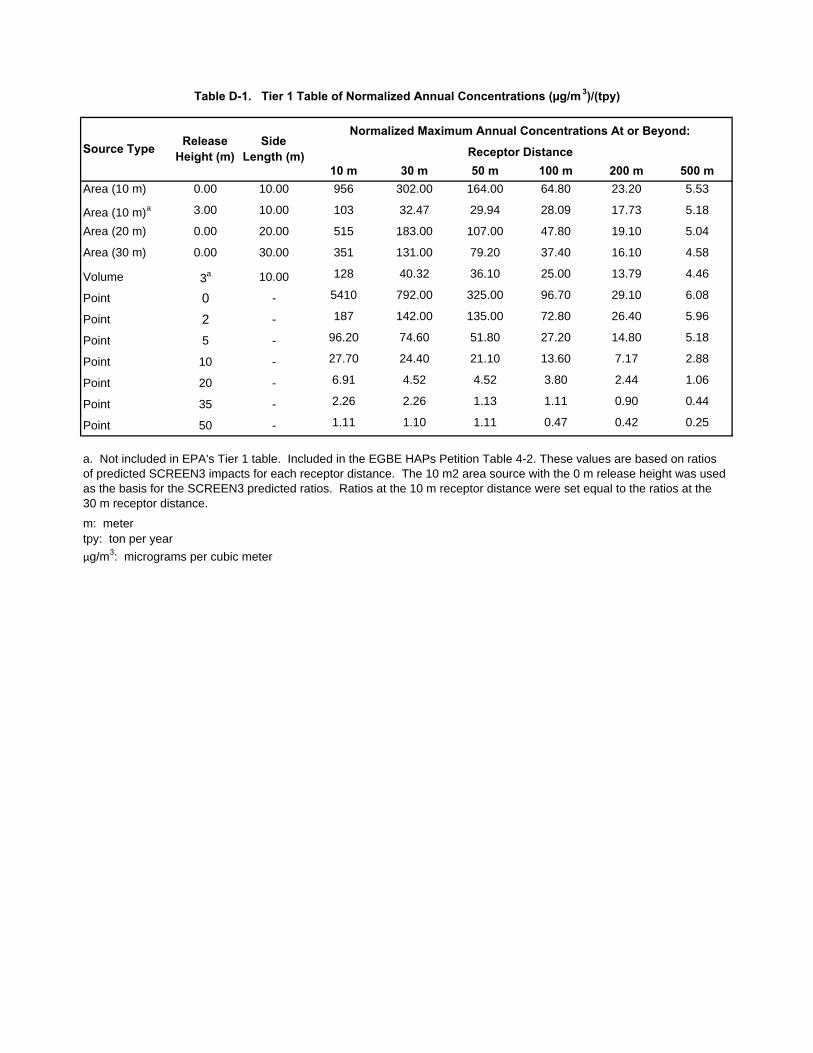
Table D-1. Tier 1 Table of Normalized Annual Concentrations (µg/m 3)/(tpy)
Receptor Distance10 m 30 m 50 m 100 m 200 m 500 m
Area (10 m) 0.00 10.00 956 302.00 164.00 64.80 23.20 5.53
Area (10 m)a 3.00 10.00 103 32.47 29.94 28.09 17.73 5.18
Area (20 m) 0.00 20.00 515 183.00 107.00 47.80 19.10 5.04
Area (30 m) 0.00 30.00 351 131.00 79.20 37.40 16.10 4.58
Volume 3a 10.00 128 40.32 36.10 25.00 13.79 4.46
Point 0 - 5410 792.00 325.00 96.70 29.10 6.08
Point 2 - 187 142.00 135.00 72.80 26.40 5.96
Point 5 - 96.20 74.60 51.80 27.20 14.80 5.18
Point 10 - 27.70 24.40 21.10 13.60 7.17 2.88
Point 20 - 6.91 4.52 4.52 3.80 2.44 1.06
Point 35 - 2.26 2.26 1.13 1.11 0.90 0.44
Point 50 - 1.11 1.10 1.11 0.47 0.42 0.25
m: metertpy: ton per year
µg/m3: micrograms per cubic meter
Source Type Release Height (m)
Side Length (m)
Normalized Maximum Annual Concentrations At or Beyond:
a. Not included in EPA's Tier 1 table. Included in the EGBE HAPs Petition Table 4-2. These values are based on ratiosof predicted SCREEN3 impacts for each receptor distance. The 10 m2 area source with the 0 m release height was used as the basis for the SCREEN3 predicted ratios. Ratios at the 10 m receptor distance were set equal to the ratios at the 30 m receptor distance.

Table D-2. Tier 1 Sensitivity Analysis Long-Term Modeling Parameters and Individual Source Results at Selected Facilities
2009 2010 2011
Facility Name Source ID Release Height (m)
Volume Source
Length of Side (m)
Distance to Nearest Receptor
(m)
Physical Fence (Y/N)
EPA Tier 1 Table: Normalized
Maximum Annual Conc.
(µg/m3)/(tpy)
Proportion EGBE of Certain
Glycol Ethers
TRI Emissions
(tpy)
Maximum Annual Tier I EGBE Conc.
(µg/m3)
TRI Emissions
(tpy)
Maximum Annual Tier I EGBE Conc.
(µg/m3)
TRI Emissions
(tpy)
Maximum Annual Tier I EGBE Conc.
(µg/m3)
Ball Metal Beverage Container Corp- Findlay Stack 1 16.6 - 89 Y 21.10 1.00 130.0 2,743 130.0 2,743 135.0 2,848.50Ball Metal Beverage Container Corp- Findlay Stack 2 16.6 - 91 Y 21.10 1.00 130.0 2,743 130.0 2,743 135.0 2,848.50Ball Metal Beverage Container Corp- Findlay Stack 3 19.8 - 89 Y 21.10 1.00 130.0 2,743 130.0 2,743 135.0 2,848.50Ball Metal Beverage Container Corp- Findlay Stack 4 19.8 - 100 Y 13.60 1.00 130.0 1,768 130.0 1,768 135.0 1,836.00Ball Metal Beverage Container Corp- Findlay Stack 5 14.2 - 127 Y 13.60 1.00 130.0 1,768 130.0 1,768 135.0 1,836.00Ball Metal Beverage Container Corp- Findlay Stack 6 21.2 - 108 Y 3.80 1.00 130.0 494 130.0 494 135.0 513.00Ball Metal Beverage Container Corp- Findlay Stack 7 21.6 - 135 Y 3.80 1.00 130.0 494 130.0 494 135.0 513.00Ball Metal Beverage Container Corp- Findlay Stack 8 20.4 - 105 Y 3.80 1.00 130.0 494 130.0 494 135.0 513.00Ball Metal Beverage Container Corp- Findlay Stack 9 20.7 - 100 Y 3.80 1.00 130.0 494 130.0 494 135.0 513.00Ball Metal Beverage Container Corp- Findlay Fugitive 6.9 10 84 Y 36.10 1.00 24.5 884 25.0 903 25.5 920.58Ball Container LLC - Columbus Stack 1 21.5 - 58 N 4.52 1.00 50.0 225 65.0 292 70.0 314.82Ball Container LLC - Columbus Stack 2 21.8 - 61 N 4.52 1.00 50.0 225 65.0 292 70.0 314.82Ball Container LLC - Columbus Stack 3 25.9 - 62 N 4.52 1.00 50.0 225 65.0 292 70.0 314.82Ball Container LLC - Columbus Stack 4 15.9 - 68 N 21.10 1.00 50.0 1,050 65.0 1,365 70.0 1,469.62Ball Container LLC - Columbus Stack 5 13.5 - 57 N 21.10 1.00 50.0 1,050 65.0 1,365 70.0 1,469.62Ball Container LLC - Columbus Stack 6 13.5 - 68 N 21.10 1.00 50.0 1,050 65.0 1,365 70.0 1,469.62Ball Container LLC - Columbus Stack 7 21.5 - 65 N 4.52 1.00 50.0 225 65.0 292 70.0 314.82Ball Container LLC - Columbus Stack 8 21.8 - 70 N 4.52 1.00 50.0 225 65.0 292 70.0 314.82Ball Container LLC - Columbus Stack 9 25.9 - 69 N 4.52 1.00 50.0 225 65.0 292 70.0 314.82Ball Container LLC - Columbus Stack 10 25.9 - 60 N 4.52 1.00 50.0 225 65.0 292 70.0 314.82Ball Container LLC - Columbus Stack 11 13.5 - 68 N 21.10 1.00 50.0 1,050 65.0 1,365 70.0 1,469.62Ball Container LLC - Columbus Stack 12 13.5 - 68 N 21.10 1.00 50.0 1,050 65.0 1,365 70.0 1,469.62Ball Container LLC - Columbus Stack 13 25.9 - 59 N 4.52 1.00 50.0 225 65.0 292 70.0 314.82Ball Container LLC - Columbus Stack 14 21.8 - 55 N 4.52 1.00 50.0 225 65.0 292 70.0 314.82Ball Container LLC - Columbus Stack 15 25.9 - 52 N 4.52 1.00 50.0 225 65.0 292 70.0 314.82Ball Container LLC - Columbus Stack 16 25.9 - 48 N 4.52 1.00 50.0 225 65.0 292 70.0 314.82Ball Container LLC - Columbus Stack 17 13.5 - 58 N 21.10 1.00 50.0 1,050 65.0 1,365 70.0 1,469.62Ball Container LLC - Columbus Stack 18 13.5 - 57 N 21.10 1.00 50.0 1,050 65.0 1,365 70.0 1,469.62Ball Container LLC - Columbus Stack 19 21.5 - 37 N 4.52 1.00 50.0 225 65.0 292 70.0 314.82Ball Container LLC - Columbus Stack 20 25.9 - 49 N 4.52 1.00 50.0 225 65.0 292 70.0 314.82Ball Container LLC - Columbus Stack 21 21.8 - 45 N 4.52 1.00 50.0 225 65.0 292 70.0 314.82Ball Container LLC - Columbus Stack 22 25.9 - 43 N 4.52 1.00 50.0 225 65.0 292 70.0 314.82Ball Container LLC - Columbus Stack 23 15.8 - 53 N 21.10 1.00 50.0 1,050 65.0 1,365 70.0 1,469.62Ball Container LLC - Columbus Fugitive 5.8 10 50 N 36.10 1.00 20.0 718 11.5 413 12.0 431.05Ball Metal Food Container Corp- Williamsburg Stack 1 18.5 - 147 Y 13.60 0.97 140.0 1,839 150.0 1,970 145.0 1,904.16Ball Metal Food Container Corp- Williamsburg Stack 2 18.9 - 127 Y 13.60 0.97 140.0 1,839 150.0 1,970 145.0 1,904.16Ball Metal Food Container Corp- Williamsburg Stack 3 15.5 - 102 Y 13.60 0.97 140.0 1,839 150.0 1,970 145.0 1,904.16Ball Metal Food Container Corp- Williamsburg Stack 4 15.2 - 102 Y 13.60 0.97 140.0 1,839 150.0 1,970 145.0 1,904.16Ball Metal Food Container Corp- Williamsburg Stack 5 13.1 - 98 Y 21.10 0.97 140.0 2,852 150.0 3,056 145.0 2,954.25Ball Metal Food Container Corp- Williamsburg Stack 6 13.1 - 96 Y 21.10 0.97 140.0 2,852 150.0 3,056 145.0 2,954.25Ball Metal Food Container Corp- Williamsburg Stack 7 18.5 - 140 Y 13.60 0.97 140.0 1,839 150.0 1,970 145.0 1,904.16Ball Metal Food Container Corp- Williamsburg Stack 8 18.4 - 145 Y 13.60 0.97 140.0 1,839 150.0 1,970 145.0 1,904.16Ball Metal Food Container Corp- Williamsburg Stack 9 18.3 - 122 Y 13.60 0.97 140.0 1,839 150.0 1,970 145.0 1,904.16Ball Metal Food Container Corp- Williamsburg Stack 10 18.6 - 118 Y 13.60 0.97 140.0 1,839 150.0 1,970 145.0 1,904.16Ball Metal Food Container Corp- Williamsburg Stack 11 18.3 - 103 Y 13.60 0.97 140.0 1,839 150.0 1,970 145.0 1,904.16
Page 1 of 4
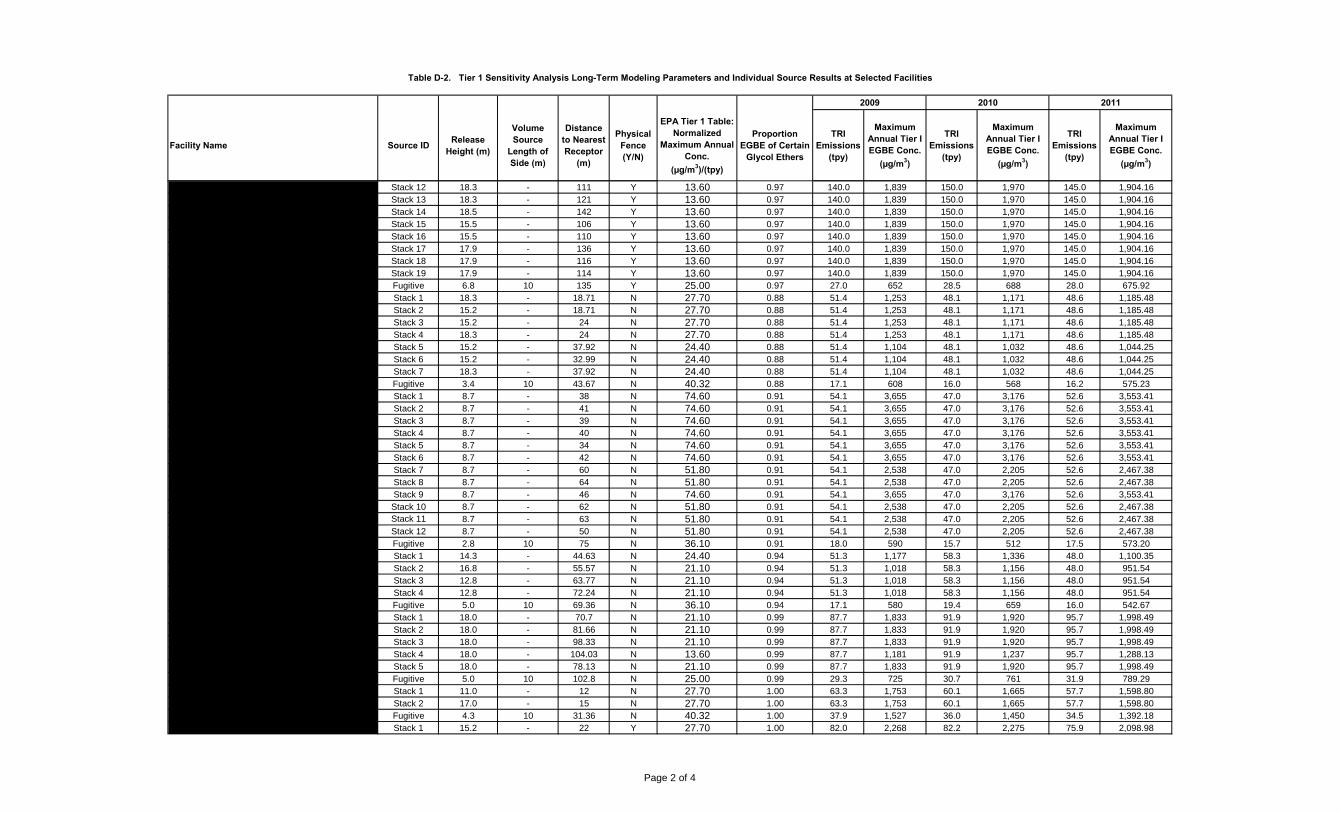
Table D-2. Tier 1 Sensitivity Analysis Long-Term Modeling Parameters and Individual Source Results at Selected Facilities
2009 2010 2011
Facility Name Source ID Release Height (m)
Volume Source
Length of Side (m)
Distance to Nearest Receptor
(m)
Physical Fence (Y/N)
EPA Tier 1 Table: Normalized
Maximum Annual Conc.
(µg/m3)/(tpy)
Proportion EGBE of Certain
Glycol Ethers
TRI Emissions
(tpy)
Maximum Annual Tier I EGBE Conc.
(µg/m3)
TRI Emissions
(tpy)
Maximum Annual Tier I EGBE Conc.
(µg/m3)
TRI Emissions
(tpy)
Maximum Annual Tier I EGBE Conc.
(µg/m3)
Ball Metal Food Container Corp- Williamsburg Stack 12 18.3 - 111 Y 13.60 0.97 140.0 1,839 150.0 1,970 145.0 1,904.16Ball Metal Food Container Corp- Williamsburg Stack 13 18.3 - 121 Y 13.60 0.97 140.0 1,839 150.0 1,970 145.0 1,904.16Ball Metal Food Container Corp- Williamsburg Stack 14 18.5 - 142 Y 13.60 0.97 140.0 1,839 150.0 1,970 145.0 1,904.16Ball Metal Food Container Corp- Williamsburg Stack 15 15.5 - 106 Y 13.60 0.97 140.0 1,839 150.0 1,970 145.0 1,904.16Ball Metal Food Container Corp- Williamsburg Stack 16 15.5 - 110 Y 13.60 0.97 140.0 1,839 150.0 1,970 145.0 1,904.16Ball Metal Food Container Corp- Williamsburg Stack 17 17.9 - 136 Y 13.60 0.97 140.0 1,839 150.0 1,970 145.0 1,904.16Ball Metal Food Container Corp- Williamsburg Stack 18 17.9 - 116 Y 13.60 0.97 140.0 1,839 150.0 1,970 145.0 1,904.16Ball Metal Food Container Corp- Williamsburg Stack 19 17.9 - 114 Y 13.60 0.97 140.0 1,839 150.0 1,970 145.0 1,904.16Ball Metal Food Container Corp- Williamsburg Fugitive 6.8 10 135 Y 25.00 0.97 27.0 652 28.5 688 28.0 675.92Crown Beverage Packaging - Bradley Stack 1 18.3 - 18.71 N 27.70 0.88 51.4 1,253 48.1 1,171 48.6 1,185.48Crown Beverage Packaging - Bradley Stack 2 15.2 - 18.71 N 27.70 0.88 51.4 1,253 48.1 1,171 48.6 1,185.48Crown Beverage Packaging - Bradley Stack 3 15.2 - 24 N 27.70 0.88 51.4 1,253 48.1 1,171 48.6 1,185.48Crown Beverage Packaging - Bradley Stack 4 18.3 - 24 N 27.70 0.88 51.4 1,253 48.1 1,171 48.6 1,185.48Crown Beverage Packaging - Bradley Stack 5 15.2 - 37.92 N 24.40 0.88 51.4 1,104 48.1 1,032 48.6 1,044.25Crown Beverage Packaging - Bradley Stack 6 15.2 - 32.99 N 24.40 0.88 51.4 1,104 48.1 1,032 48.6 1,044.25Crown Beverage Packaging - Bradley Stack 7 18.3 - 37.92 N 24.40 0.88 51.4 1,104 48.1 1,032 48.6 1,044.25Crown Beverage Packaging - Bradley Fugitive 3.4 10 43.67 N 40.32 0.88 17.1 608 16.0 568 16.2 575.23Crown Beverage Packaging - Lawrence Stack 1 8.7 - 38 N 74.60 0.91 54.1 3,655 47.0 3,176 52.6 3,553.41Crown Beverage Packaging - Lawrence Stack 2 8.7 - 41 N 74.60 0.91 54.1 3,655 47.0 3,176 52.6 3,553.41Crown Beverage Packaging - Lawrence Stack 3 8.7 - 39 N 74.60 0.91 54.1 3,655 47.0 3,176 52.6 3,553.41Crown Beverage Packaging - Lawrence Stack 4 8.7 - 40 N 74.60 0.91 54.1 3,655 47.0 3,176 52.6 3,553.41Crown Beverage Packaging - Lawrence Stack 5 8.7 - 34 N 74.60 0.91 54.1 3,655 47.0 3,176 52.6 3,553.41Crown Beverage Packaging - Lawrence Stack 6 8.7 - 42 N 74.60 0.91 54.1 3,655 47.0 3,176 52.6 3,553.41Crown Beverage Packaging - Lawrence Stack 7 8.7 - 60 N 51.80 0.91 54.1 2,538 47.0 2,205 52.6 2,467.38Crown Beverage Packaging - Lawrence Stack 8 8.7 - 64 N 51.80 0.91 54.1 2,538 47.0 2,205 52.6 2,467.38Crown Beverage Packaging - Lawrence Stack 9 8.7 - 46 N 74.60 0.91 54.1 3,655 47.0 3,176 52.6 3,553.41Crown Beverage Packaging - Lawrence Stack 10 8.7 - 62 N 51.80 0.91 54.1 2,538 47.0 2,205 52.6 2,467.38Crown Beverage Packaging - Lawrence Stack 11 8.7 - 63 N 51.80 0.91 54.1 2,538 47.0 2,205 52.6 2,467.38Crown Beverage Packaging - Lawrence Stack 12 8.7 - 50 N 51.80 0.91 54.1 2,538 47.0 2,205 52.6 2,467.38Crown Beverage Packaging - Lawrence Fugitive 2.8 10 75 N 36.10 0.91 18.0 590 15.7 512 17.5 573.20Crown Beverage Packaging - Olympia Stack 1 14.3 - 44.63 N 24.40 0.94 51.3 1,177 58.3 1,336 48.0 1,100.35Crown Beverage Packaging - Olympia Stack 2 16.8 - 55.57 N 21.10 0.94 51.3 1,018 58.3 1,156 48.0 951.54Crown Beverage Packaging - Olympia Stack 3 12.8 - 63.77 N 21.10 0.94 51.3 1,018 58.3 1,156 48.0 951.54Crown Beverage Packaging - Olympia Stack 4 12.8 - 72.24 N 21.10 0.94 51.3 1,018 58.3 1,156 48.0 951.54Crown Beverage Packaging - Olympia Fugitive 5.0 10 69.36 N 36.10 0.94 17.1 580 19.4 659 16.0 542.67Crown Food Packaging - Owatonna Stack 1 18.0 - 70.7 N 21.10 0.99 87.7 1,833 91.9 1,920 95.7 1,998.49Crown Food Packaging - Owatonna Stack 2 18.0 - 81.66 N 21.10 0.99 87.7 1,833 91.9 1,920 95.7 1,998.49Crown Food Packaging - Owatonna Stack 3 18.0 - 98.33 N 21.10 0.99 87.7 1,833 91.9 1,920 95.7 1,998.49Crown Food Packaging - Owatonna Stack 4 18.0 - 104.03 N 13.60 0.99 87.7 1,181 91.9 1,237 95.7 1,288.13Crown Food Packaging - Owatonna Stack 5 18.0 - 78.13 N 21.10 0.99 87.7 1,833 91.9 1,920 95.7 1,998.49Crown Food Packaging - Owatonna Fugitive 5.0 10 102.8 N 25.00 0.99 29.3 725 30.7 761 31.9 789.29Crown Cork & Seal Co (USA) - Weirton Stack 1 11.0 - 12 N 27.70 1.00 63.3 1,753 60.1 1,665 57.7 1,598.80Crown Cork & Seal Co (USA) - Weirton Stack 2 17.0 - 15 N 27.70 1.00 63.3 1,753 60.1 1,665 57.7 1,598.80Crown Cork & Seal Co (USA) - Weirton Fugitive 4.3 10 31.36 N 40.32 1.00 37.9 1,527 36.0 1,450 34.5 1,392.18Rexam Beverage Can Company- Bishopville Stack 1 15.2 - 22 Y 27.70 1.00 82.0 2,268 82.2 2,275 75.9 2,098.98
Page 2 of 4

Table D-2. Tier 1 Sensitivity Analysis Long-Term Modeling Parameters and Individual Source Results at Selected Facilities
2009 2010 2011
Facility Name Source ID Release Height (m)
Volume Source
Length of Side (m)
Distance to Nearest Receptor
(m)
Physical Fence (Y/N)
EPA Tier 1 Table: Normalized
Maximum Annual Conc.
(µg/m3)/(tpy)
Proportion EGBE of Certain
Glycol Ethers
TRI Emissions
(tpy)
Maximum Annual Tier I EGBE Conc.
(µg/m3)
TRI Emissions
(tpy)
Maximum Annual Tier I EGBE Conc.
(µg/m3)
TRI Emissions
(tpy)
Maximum Annual Tier I EGBE Conc.
(µg/m3)
Rexam Beverage Can Company- Bishopville Stack 2 15.5 - 43 Y 24.40 1.00 82.0 1,998 82.2 2,004 75.9 1,848.92Rexam Beverage Can Company- Bishopville Stack 3 11.6 - 13 Y 27.70 1.00 82.0 2,268 82.2 2,275 75.9 2,098.98Rexam Beverage Can Company- Bishopville Stack 4 14.0 - 16 Y 27.70 1.00 82.0 2,268 82.2 2,275 75.9 2,098.98Rexam Beverage Can Company- Bishopville Stack 5 14.0 - 19 Y 27.70 1.00 82.0 2,268 82.2 2,275 75.9 2,098.98Rexam Beverage Can Company- Bishopville Stack 6 15.2 - 11 Y 27.70 1.00 82.0 2,268 82.2 2,275 75.9 2,098.98Rexam Beverage Can Company- Bishopville Stack 7 15.2 - 18 Y 27.70 1.00 82.0 2,268 82.2 2,275 75.9 2,098.98Rexam Beverage Can Company- Bishopville Stack 8 15.2 - 23 Y 27.70 1.00 82.0 2,268 82.2 2,275 75.9 2,098.98Rexam Beverage Can Company- Bishopville Fugitive 5.0 10 63 Y 36.10 1.00 14.5 522 14.5 523 13.4 482.62Rexam Beverage Can Company- Kent Stack 1 14.6 - 36 Y 24.40 1.00 74.8 1,822 70.6 1,721 70.5 1,718.06Rexam Beverage Can Company- Kent Stack 2 14.6 - 40 Y 24.40 1.00 74.8 1,822 70.6 1,721 70.5 1,718.06Rexam Beverage Can Company- Kent Stack 3 16.6 - 42 Y 24.40 1.00 74.8 1,822 70.6 1,721 70.5 1,718.06Rexam Beverage Can Company- Kent Stack 4 14.6 - 29 Y 27.70 1.00 74.8 2,068 70.6 1,954 70.5 1,950.42Rexam Beverage Can Company- Kent Stack 5 13.5 - 56 Y 21.10 1.00 74.8 1,576 70.6 1,488 70.5 1,485.70Rexam Beverage Can Company- Kent Stack 6 14.2 - 61 Y 21.10 1.00 74.8 1,576 70.6 1,488 70.5 1,485.70Rexam Beverage Can Company- Kent Stack 7 13.2 - 62 Y 21.10 1.00 74.8 1,576 70.6 1,488 70.5 1,485.70Rexam Beverage Can Company- Kent Stack 8 13.7 - 65 Y 21.10 1.00 74.8 1,576 70.6 1,488 70.5 1,485.70Rexam Beverage Can Company- Kent Stack 9 15.2 - 56 Y 21.10 1.00 74.8 1,576 70.6 1,488 70.5 1,485.70Rexam Beverage Can Company- Kent Stack 10 15.3 - 62 Y 21.10 1.00 74.8 1,576 70.6 1,488 70.5 1,485.70Rexam Beverage Can Company- Kent Stack 11 15.3 - 65 Y 21.10 1.00 74.8 1,576 70.6 1,488 70.5 1,485.70Rexam Beverage Can Company- Kent Stack 12 15.3 - 60 Y 21.10 1.00 74.8 1,576 70.6 1,488 70.5 1,485.70Rexam Beverage Can Company- Kent Fugitive 3.7 10 64 Y 36.10 1.00 13.2 476 12.5 449 12.4 448.59Silgan Containers Manufacturing Corp- LaPorte Stack 1 12.2 - 37.8 N 24.40 1.00 54.5 1,330 55.5 1,354 53.2 1,298.85Silgan Containers Manufacturing Corp- LaPorte Stack 2 12.2 - 32.22 N 24.40 1.00 54.5 1,330 55.5 1,354 53.2 1,298.85Silgan Containers Manufacturing Corp- LaPorte Stack 3 13.4 - 41.76 N 24.40 1.00 54.5 1,330 55.5 1,354 53.2 1,298.85Silgan Containers Manufacturing Corp- LaPorte Stack 4 13.4 - 41.76 N 24.40 1.00 54.5 1,330 55.5 1,354 53.2 1,298.85Silgan Containers Manufacturing Corp- LaPorte Stack 5 13.4 - 45.11 N 24.40 1.00 54.5 1,330 55.5 1,354 53.2 1,298.85Silgan Containers Manufacturing Corp- LaPorte Stack 7 12.2 - 41.45 N 24.40 1.00 54.5 1,330 55.5 1,354 53.2 1,298.85Silgan Containers Manufacturing Corp- LaPorte Stack 8 12.2 - 32.61 N 24.40 1.00 54.5 1,330 55.5 1,354 53.2 1,298.85Silgan Containers Manufacturing Corp- LaPorte Stack 9 12.2 - 49.07 N 24.40 1.00 54.5 1,330 55.5 1,354 53.2 1,298.85Silgan Containers Manufacturing Corp- LaPorte Stack 10 12.8 - 53.95 N 21.10 1.00 54.5 1,150 55.5 1,171 53.2 1,123.18Silgan Containers Manufacturing Corp- LaPorte Stack 11 12.2 - 56.39 N 21.10 1.00 54.5 1,150 55.5 1,171 53.2 1,123.18Silgan Containers Manufacturing Corp- LaPorte Stack 12 12.2 - 44.2 N 24.40 1.00 54.5 1,330 55.5 1,354 53.2 1,298.85Silgan Containers Manufacturing Corp- LaPorte Fugitive 3.0 10 59 N 36.10 1.00 12.5 451 12.9 464 12.2 440.11Rexam Beverage Can Company- Chicago Stack 1 13.1 - 30 Y 24.40 0.94 51.7 1,183 53.8 1,230 26.6 609.15Rexam Beverage Can Company- Chicago Stack 2 12.6 - 38 Y 24.40 0.94 51.7 1,183 53.8 1,230 26.6 609.15Rexam Beverage Can Company- Chicago Stack 3 13.2 - 44 Y 24.40 0.94 51.7 1,183 53.8 1,230 26.6 609.15Rexam Beverage Can Company- Chicago Stack 4 12.2 - 19 Y 27.70 0.94 51.7 1,342 53.8 1,396 26.6 691.54Rexam Beverage Can Company- Chicago Stack 5 12.8 - 23 Y 27.70 0.94 51.7 1,342 53.8 1,396 26.6 691.54Rexam Beverage Can Company- Chicago Stack 6 13.7 - 31 Y 24.40 0.94 51.7 1,183 53.8 1,230 26.6 609.15Rexam Beverage Can Company- Chicago Stack 7 14.0 - 26 Y 27.70 0.94 51.7 1,342 53.8 1,396 26.6 691.54Rexam Beverage Can Company- Chicago Stack 8 14.0 - 34 Y 24.40 0.94 51.7 1,183 53.8 1,230 26.6 609.15Rexam Beverage Can Company- Chicago Stack 9 15.2 - 41 Y 24.40 0.94 51.7 1,183 53.8 1,230 26.6 609.15Rexam Beverage Can Company- Chicago Fugitive 4.3 10 46 Y 40.32 0.94 13.6 515 14.2 537 6.5 246.36Crown Beverage Packaging - Lacrosse Stack 1 13.7 - 12 N 27.70 1.00 1.7 47 1.7 46 1.8 49.82Crown Beverage Packaging - Lacrosse Fugitive 3.0 10 70 N 36.10 1.00 22.8 824 22.1 799 24.0 865.65
Page 3 of 4

Table D-2. Tier 1 Sensitivity Analysis Long-Term Modeling Parameters and Individual Source Results at Selected Facilities
2009 2010 2011
Facility Name Source ID Release Height (m)
Volume Source
Length of Side (m)
Distance to Nearest Receptor
(m)
Physical Fence (Y/N)
EPA Tier 1 Table: Normalized
Maximum Annual Conc.
(µg/m3)/(tpy)
Proportion EGBE of Certain
Glycol Ethers
TRI Emissions
(tpy)
Maximum Annual Tier I EGBE Conc.
(µg/m3)
TRI Emissions
(tpy)
Maximum Annual Tier I EGBE Conc.
(µg/m3)
TRI Emissions
(tpy)
Maximum Annual Tier I EGBE Conc.
(µg/m3)
RR Donnelley-Harrisonburg Point 11.2 - 45 Unknown 24.40 1.00 4.3 104 3.6 87 3.1 74.69RR Donnelley-Harrisonburg Fugitive 3.1 10 210 Unknown 13.79 1.00 36.1 498 38.8 535 45.2 623.50Rexam Beverage Can Company- Winston-Sale Stacks 1-10 14.0 - 75 Unknown 21.10 0.95 143.9 2,885 157.6 3,158 110.5 2,214.11Rexam Beverage Can Company- Winston-Sale Fugitive 3.0 10 91.7 Unknown 36.10 0.95 28.3 971 31.2 1,071 25.7 881.96
Page 4 of 4

Table D-3. Tier 1 Sensitivity Analysis Long-Term Modeling Summary for Selected Facilities
2009 TRI 2010 TRI 2011 TRI
Maximum Annual Tier I EGBE Conc.
(µg/m3)
Long-Term HQ
(combined)
Maximum Annual Tier I EGBE Conc.
(µg/m3)
Long-Term HQ
(combined)
Maximum Annual Tier I EGBE Conc.
(µg/m3)
Long-Term HQ
(combined)
Crown Beverage Packaging - Lawrence Point 3654.7 3176.1 3553.4
Volume 589.5 512.3 573.2
RR Donnelley-Harrisonburg Point 104.4 87.5 74.7
Volume 498.5 535.1 623.5
Ball Metal Food Container Corp- Williamsburg Point 2852.4 3056.1 2954.3
Volume 651.8 688.0 675.9
Crown Cork & Seal Co (USA) - Weirton Point 1753.1 1665.4 1598.8
Volume 1526.5 1450.2 1392.2
Rexam Beverage Can Company- Winston-Salem Point 2885.0 3158.4 2214.1
Volume 971.0 1070.7 882.0
Rexam Beverage Can Company- Bishopville Point 2268.3 2275.3 2099.0
Volume 521.7 523.3 482.6
Ball Container LLC - Columbus Point 1049.7 1364.6 1469.6
Volume 718.4 413.1 431.0
Ball Metal Beverage Container Corp- Findlay Point 2743.0 2743.0 2848.5
Volume 884.5 902.5 920.6
Silgan Containers Manufacturing Corp- LaPorte Point 1329.8 1354.2 1298.8
Volume 451.3 463.9 440.1
Crown Beverage Packaging - Lacrosse Point 47.4 46.0 49.8
Volume 823.6 799.2 865.6
Crown Food Packaging - Owatonna Point 1833.0 1919.7 1998.5
Volume 725.5 761.0 789.3
Rexam Beverage Can Company- Chicago Point 1342.4 1395.9 691.5
Volume 515.3 536.8 246.4
Crown Beverage Packaging - Bradley Point 1253.3 1171.5 1185.5
Volume 608.1 568.4 575.2
Rexam Beverage Can Company- Kent Point 2068.4 1953.6 1950.4
Volume 475.7 449.3 448.6
Crown Beverage Packaging - Olympia Point 1177.4 1336.4 1100.4
Volume 579.7 659.1 542.7
Bold text indicates an HQ greater than 1EGBE: ethylene glycol monobutyl etherHQ: hazard quotientRfC: reference concentrationTRI: Toxics Release Inventory
µg/m3: micrograms per cubic meter
Hazard quotient (HQ) equals the sum of the maximum annual average concentration for fugitive/volume source emissions and point source emissions, at or beyond
the fence line, is compared to an RfC for EGBE of 1,600 µg/m3.
2
1
2
1
1
1
2
1
0.6
2
0.6
2
1
1
3
0.4
2
2
2
22
1
2
1
0.5
1
1
1
0.5
2
1
1
2
0.4
2
2
3
Site Name Source Type
2
3
0.4
2
2
2
2
1

Facility Name Stack Stack ID Alternative Stack ID
Release Height (m)
Stack Inside Diameter (m)
Stack Exit Gas Velocity
(m/s)
Stack Temperature
(K)
2009 TRI Emission Rate (g/s)a
2010 TRI Emission Rate (g/s)a
2011 TRI Emission Rate (g/s)a
Worst case annual average
unit emission rate concentrationb
(µg/m3) (1g/s)
Ball Container LLC - Columbus Stack 1 L1-IBO-Hot 21.49 0.686 9.64 349.8 1.431 1.860 2.004 59.41Ball Container LLC - Columbus Stack 2 L1-ISS 21.79 0.405 11.70 298.0 1.431 1.860 2.004 165.81Ball Container LLC - Columbus Stack 3 L1-PO1-Hot 25.91 0.381 19.16 374.8 1.431 1.860 2.004 61.09Ball Container LLC - Columbus Stack 4 L1-PO2-Hot 15.85 0.405 20.70 374.8 1.431 1.860 2.004 72.90Ball Container LLC - Columbus Stack 5 L1-PR-11 13.52 0.399 10.18 298.0 1.431 1.860 2.004 195.17Ball Container LLC - Columbus Stack 6 L1-PR-12 13.52 0.399 10.18 298.0 1.431 1.860 2.004 202.66Ball Container LLC - Columbus Stack 7 L2-IBO-Hot 21.49 0.686 2.71 349.8 1.431 1.860 2.004 140.47Ball Container LLC - Columbus Stack 8 L2-ISS 21.79 0.405 11.70 298.0 1.431 1.860 2.004 156.61Ball Container LLC - Columbus Stack 9 L2-PO1-Hot 25.91 0.393 19.19 374.8 1.431 1.860 2.004 59.16Ball Container LLC - Columbus Stack 10 L2-PO2-Hot 25.91 0.381 15.63 374.8 1.431 1.860 2.004 83.54Ball Container LLC - Columbus Stack 11 L2-PR-21 13.52 0.399 10.18 298.0 1.431 1.860 2.004 204.17Ball Container LLC - Columbus Stack 12 L2-PR-22 13.52 0.399 10.18 298.0 1.431 1.860 2.004 211.88Ball Container LLC - Columbus Stack 13 L3-IBO-Hot 25.91 0.686 7.59 349.8 1.431 1.860 2.004 88.27Ball Container LLC - Columbus Stack 14 L3-ISS 21.79 0.405 11.70 298.0 1.431 1.860 2.004 151.97Ball Container LLC - Columbus Stack 15 L3-PO1-Hot 25.91 0.381 17.20 374.8 1.431 1.860 2.004 77.60Ball Container LLC - Columbus Stack 16 L3-PO2-Hot 25.91 0.393 14.71 374.8 1.431 1.860 2.004 83.30Ball Container LLC - Columbus Stack 17 L3-PR-31 13.52 0.399 10.18 298.0 1.431 1.860 2.004 210.52Ball Container LLC - Columbus Stack 18 L3-PR-32 13.52 0.399 10.18 298.0 1.431 1.860 2.004 196.63Ball Container LLC - Columbus Stack 19 L4-BCO-Hot 21.49 0.393 17.23 453.2 1.431 1.860 2.004 62.85Ball Container LLC - Columbus Stack 20 L4-IBO-Hot 25.91 0.381 32.32 349.8 1.431 1.860 2.004 56.94Ball Container LLC - Columbus Stack 21 L4-ISS 21.79 0.405 7.31 298.0 1.431 1.860 2.004 172.87Ball Container LLC - Columbus Stack 22 L4-PO-Hot 25.91 0.686 5.00 374.8 1.431 1.860 2.004 85.12Ball Container LLC - Columbus Stack 23 L4-PR-41 15.75 1.119 1.30 298.0 1.431 1.860 2.004 284.49Ball Metal Beverage Container Corp- Findlay Stack 1 B_PO11 PO11 16.61 0.457 7.00 510.9 3.740 3.740 3.883 49.10Ball Metal Beverage Container Corp- Findlay Stack 2 B_PO12 PO12 16.61 0.305 29.07 510.9 3.740 3.740 3.883 32.25Ball Metal Beverage Container Corp- Findlay Stack 3 B_PO21 PO21 19.81 0.457 9.79 499.8 3.740 3.740 3.883 19.29Ball Metal Beverage Container Corp- Findlay Stack 4 B_PO22 PO22 19.81 0.457 11.32 488.7 3.740 3.740 3.883 18.31Ball Metal Beverage Container Corp- Findlay Stack 5 B_IBO11 IBO11 14.17 0.610 11.62 477.6 3.740 3.740 3.883 27.00Ball Metal Beverage Container Corp- Findlay Stack 6 B_IBO21B IBO21-B 21.18 0.610 3.98 477.6 3.740 3.740 3.883 21.02Ball Metal Beverage Container Corp- Findlay Stack 7 B_IBO31 IBO31 21.64 0.864 5.12 494.3 3.740 3.740 3.883 11.49Ball Metal Beverage Container Corp- Findlay Stack 8 B_WCO31 WashCoat Ov 20.42 0.813 2.58 510.9 3.740 3.740 3.883 18.91Ball Metal Beverage Container Corp- Findlay Stack 9 B_BH Baghouse 20.73 0.330 37.48 294.3 3.740 3.740 3.883 22.86Ball Metal Food Container Corp- Williamsburg Stack 1 PO2 S019 18.47 0.406 13.53 402.0 3.889 4.167 4.028 27.18Ball Metal Food Container Corp- Williamsburg Stack 2 PO3 S006 18.87 0.406 12.25 365.9 3.889 4.167 4.028 39.52Ball Metal Food Container Corp- Williamsburg Stack 3 PO4Z1 S035 15.54 0.483 6.77 402.6 3.889 4.167 4.028 88.33Ball Metal Food Container Corp- Williamsburg Stack 4 PO4Z2 S036 15.16 0.483 9.49 395.9 3.889 4.167 4.028 77.59
Table D-4. Tier 2 Modeling Stack Parameters and Individual Source Results at Individual Facilities
Page 1 of 4

Facility Name Stack Stack ID Alternative Stack ID
Release Height (m)
Stack Inside Diameter (m)
Stack Exit Gas Velocity
(m/s)
Stack Temperature
(K)
2009 TRI Emission Rate (g/s)a
2010 TRI Emission Rate (g/s)a
2011 TRI Emission Rate (g/s)a
Worst case annual average
unit emission rate concentrationb
(µg/m3) (1g/s)
Table D-4. Tier 2 Modeling Stack Parameters and Individual Source Results at Individual Facilities
Ball Metal Food Container Corp- Williamsburg Stack 5 PO5Z1 S037 13.13 0.483 9.63 369.8 3.889 4.167 4.028 85.53Ball Metal Food Container Corp- Williamsburg Stack 6 PO5Z2 S038 13.13 0.483 8.84 380.9 3.889 4.167 4.028 79.85Ball Metal Food Container Corp- Williamsburg Stack 7 IBO2Z1 S021 18.52 0.406 7.60 362.6 3.889 4.167 4.028 46.41Ball Metal Food Container Corp- Williamsburg Stack 8 IBO2Z2 S020 18.42 0.508 6.60 382.6 3.889 4.167 4.028 36.78Ball Metal Food Container Corp- Williamsburg Stack 9 IBO3Z1 S011 18.34 0.406 6.06 322.6 3.889 4.167 4.028 80.16Ball Metal Food Container Corp- Williamsburg Stack 10 IBO3Z2 S010 18.59 0.508 7.29 389.3 3.889 4.167 4.028 37.88Ball Metal Food Container Corp- Williamsburg Stack 11 IBO4/5Z1 S027 18.31 0.406 2.85 356.5 3.889 4.167 4.028 129.63Ball Metal Food Container Corp- Williamsburg Stack 12 IBO4/5Z2 S028 18.29 0.508 5.13 384.8 3.889 4.167 4.028 59.16Ball Metal Food Container Corp- Williamsburg Stack 13 IBO4/5Z3 S039 18.34 0.406 13.05 373.7 3.889 4.167 4.028 38.05Ball Metal Food Container Corp- Williamsburg Stack 14 BCPOL2 S016 18.47 0.406 13.01 391.5 3.889 4.167 4.028 30.40Ball Metal Food Container Corp- Williamsburg Stack 15 BCPOL4Z1 S033 15.54 0.483 9.00 355.9 3.889 4.167 4.028 91.25Ball Metal Food Container Corp- Williamsburg Stack 16 BCPOL4Z2 S034 15.54 0.483 10.22 382.0 3.889 4.167 4.028 74.95Ball Metal Food Container Corp- Williamsburg Stack 17 ICEXH02 S024 17.86 0.305 11.26 293.2 3.889 4.167 4.028 78.39Ball Metal Food Container Corp- Williamsburg Stack 18 ICEXH03 S023 17.86 0.305 11.89 295.9 3.889 4.167 4.028 85.78Ball Metal Food Container Corp- Williamsburg Stack 19 ICEXH045 S022 17.86 0.406 8.61 295.9 3.889 4.167 4.028 89.46Crown Beverage Packaging - Bradley Stack 1 IBO IBO (Can Line 18.29 0.305 10.20 459.8 1.302 1.217 1.231 114.57Crown Beverage Packaging - Bradley Stack 2 Ross Ross (Can Lin 15.24 0.305 16.72 422.6 1.302 1.217 1.231 103.34Crown Beverage Packaging - Bradley Stack 3 IBO IBO (Can Line 15.24 0.305 9.51 459.8 1.302 1.217 1.231 132.80Crown Beverage Packaging - Bradley Stack 4 Ross Ross (Can Lin 18.29 0.305 16.72 422.6 1.302 1.217 1.231 92.75Crown Beverage Packaging - Bradley Stack 5 IBO IBO (Can Line 15.24 0.305 10.20 459.8 1.302 1.217 1.231 155.87Crown Beverage Packaging - Bradley Stack 6 Ross Ross (Can Lin 15.24 0.305 16.72 422.6 1.302 1.217 1.231 131.89Crown Beverage Packaging - Bradley Stack 7 Ross Ross (Can Lin 18.29 0.305 16.72 422.6 1.302 1.217 1.231 118.04Crown Beverage Packaging - Olympia Stack 1 IBO #1A 14.33 0.710 3.97 460.9 1.388 1.576 1.297 62.08Crown Beverage Packaging - Olympia Stack 2 IBO #2C 16.76 1.067 7.98 316.5 1.388 1.576 1.297 93.81Crown Beverage Packaging - Olympia Stack 3 LSM #1A 12.80 0.280 8.32 294.3 1.388 1.576 1.297 294.50Crown Beverage Packaging - Olympia Stack 4 LSM #2A 12.80 0.280 6.91 294.3 1.388 1.576 1.297 310.14Crown Beverage Packaging - Lawrence Stack 1 LSM2 8.53 0.457 1.42 449.8 1.409 1.225 1.370 281.40Crown Beverage Packaging - Lawrence Stack 2 L1PO 8.53 0.457 2.10 291.5 1.409 1.225 1.370 817.14Crown Beverage Packaging - Lawrence Stack 3 IBO1 8.53 0.457 3.31 533.2 1.409 1.225 1.370 187.50Crown Beverage Packaging - Lawrence Stack 4 LSM1 8.53 0.457 1.18 449.8 1.409 1.225 1.370 365.71Crown Beverage Packaging - Lawrence Stack 5 L1V1 8.53 0.457 3.42 291.5 1.409 1.225 1.370 764.54Crown Beverage Packaging - Lawrence Stack 6 IBO3 8.53 0.457 10.25 291.5 1.409 1.225 1.370 317.95Crown Beverage Packaging - Lawrence Stack 7 L3S 8.53 0.457 1.18 449.8 1.409 1.225 1.370 254.13Crown Beverage Packaging - Lawrence Stack 8 L3VI 8.53 0.457 3.42 291.5 1.409 1.225 1.370 537.98Crown Beverage Packaging - Lawrence Stack 9 IBO4 8.53 0.457 8.52 291.5 1.409 1.225 1.370 437.56Crown Beverage Packaging - Lawrence Stack 10 L4S 8.53 0.457 1.42 449.8 1.409 1.225 1.370 250.24
Page 2 of 4

Facility Name Stack Stack ID Alternative Stack ID
Release Height (m)
Stack Inside Diameter (m)
Stack Exit Gas Velocity
(m/s)
Stack Temperature
(K)
2009 TRI Emission Rate (g/s)a
2010 TRI Emission Rate (g/s)a
2011 TRI Emission Rate (g/s)a
Worst case annual average
unit emission rate concentrationb
(µg/m3) (1g/s)
Table D-4. Tier 2 Modeling Stack Parameters and Individual Source Results at Individual Facilities
Crown Beverage Packaging - Lawrence Stack 11 L3PO 8.53 0.457 3.42 291.5 1.409 1.225 1.370 533.91Crown Beverage Packaging - Lawrence Stack 12 IBO2 8.53 0.457 3.68 533.2 1.409 1.225 1.370 151.60Crown Cork & Seal Co (USA) - Weirton Stack 1 TO-1 11.00 1.219 16.17 659.2 1.821 1.730 1.660 19.68Crown Cork & Seal Co (USA) - Weirton Stack 2 TO-2 17.00 0.597 13.49 773.2 1.821 1.730 1.660 33.64Crown Food Packaging - Owatonna Stack 1 EU-001 17.98 0.311 31.08 310.9 2.499 2.617 2.725 93.44Crown Food Packaging - Owatonna Stack 2 EU-003 17.98 0.311 18.65 394.3 2.499 2.617 2.725 82.12Crown Food Packaging - Owatonna Stack 3 EU-005 17.98 0.311 18.65 394.3 2.499 2.617 2.725 80.28Crown Food Packaging - Owatonna Stack 4 EU-007 17.98 0.311 31.08 449.8 2.499 2.617 2.725 55.63Crown Food Packaging - Owatonna Stack 5 EU-008 17.98 0.311 31.08 449.8 2.499 2.617 2.725 52.29Rexam Beverage Can Company- Bishopville Stack 1 SV4 Printer Oven S 15.24 0.457 6.10 422.0 2.356 2.363 2.180 98.65Rexam Beverage Can Company- Bishopville Stack 2 SV5 Printer Oven S 15.54 0.396 6.10 422.0 2.356 2.363 2.180 102.13Rexam Beverage Can Company- Bishopville Stack 3 SV 6 Inside Spray M 11.58 0.610 3.96 294.3 2.356 2.363 2.180 363.01Rexam Beverage Can Company- Bishopville Stack 4 SV 7 Inside Spray M 14.02 0.610 3.96 294.3 2.356 2.363 2.180 295.01Rexam Beverage Can Company- Bishopville Stack 5 SV 8 Inside Spray M 14.02 0.610 3.96 294.3 2.356 2.363 2.180 294.17Rexam Beverage Can Company- Bishopville Stack 6 SV9 Inside Bake O 15.24 0.762 4.88 422.0 2.356 2.363 2.180 59.82Rexam Beverage Can Company- Bishopville Stack 7 SV10 Inside Bake O 15.24 0.762 4.88 422.0 2.356 2.363 2.180 60.45Rexam Beverage Can Company- Bishopville Stack 8 SV11 Inside Bake O 15.24 0.762 4.88 422.0 2.356 2.363 2.180 59.70Rexam Beverage Can Company- Chicago Stack 1 REX_SV21 Printer Oven S 13.11 0.396 9.58 366.5 1.394 1.450 0.718 165.67Rexam Beverage Can Company- Chicago Stack 2 REX_SV22 Printer Oven S 12.65 0.396 9.57 366.5 1.394 1.450 0.718 175.24Rexam Beverage Can Company- Chicago Stack 3 REX_SV23 Base Coater P 13.17 0.396 9.57 366.5 1.394 1.450 0.718 190.89Rexam Beverage Can Company- Chicago Stack 4 RED_SV31 Inside Spray M 12.19 1.097 2.50 294.3 1.394 1.450 0.718 321.15Rexam Beverage Can Company- Chicago Stack 5 REX_SV32 Inside Spray M 12.80 1.189 2.13 294.3 1.394 1.450 0.718 376.82Rexam Beverage Can Company- Chicago Stack 6 REX_SV33 Inside Spray M 13.72 0.914 3.59 294.3 1.394 1.450 0.718 305.07Rexam Beverage Can Company- Chicago Stack 7 REX_SV41 Inside Bake O 14.02 0.762 8.07 449.8 1.394 1.450 0.718 71.92Rexam Beverage Can Company- Chicago Stack 8 REX_SV42 Inside Bake O 14.02 0.823 6.92 449.8 1.394 1.450 0.718 69.03Rexam Beverage Can Company- Chicago Stack 9 REX_RTO Regenerative 15.24 1.158 7.61 488.7 1.394 1.450 0.718 42.09Rexam Beverage Can Company- Kent Stack 1 SV7A Printer Pin Ov 14.63 0.558 4.83 422.0 2.148 2.029 2.026 129.19Rexam Beverage Can Company- Kent Stack 2 SV7B Printer Pin Ov 14.63 0.558 4.83 444.3 2.148 2.029 2.026 153.09Rexam Beverage Can Company- Kent Stack 3 SV7C Printer Pin Ov 16.61 0.914 1.80 397.0 2.148 2.029 2.026 152.01Rexam Beverage Can Company- Kent Stack 4 SV7D Printer Pin Ov 14.63 0.610 4.04 399.8 2.148 2.029 2.026 131.78Rexam Beverage Can Company- Kent Stack 5 SV8A Inside Spray M 13.50 0.838 2.14 299.8 2.148 2.029 2.026 472.44Rexam Beverage Can Company- Kent Stack 6 SV8B Inside Spray M 14.17 0.838 2.14 299.8 2.148 2.029 2.026 413.91Rexam Beverage Can Company- Kent Stack 7 SV8C Inside Spray M 13.20 0.850 2.08 299.8 2.148 2.029 2.026 481.59Rexam Beverage Can Company- Kent Stack 8 SV8D Inside Spray M 13.72 0.838 2.14 299.8 2.148 2.029 2.026 453.99Rexam Beverage Can Company- Kent Stack 9 SV9A Inside Bake O 15.24 0.762 3.62 358.2 2.148 2.029 2.026 167.40Rexam Beverage Can Company- Kent Stack 10 SV9B Inside Bake O 15.33 0.762 3.62 360.9 2.148 2.029 2.026 152.46
Page 3 of 4

Facility Name Stack Stack ID Alternative Stack ID
Release Height (m)
Stack Inside Diameter (m)
Stack Exit Gas Velocity
(m/s)
Stack Temperature
(K)
2009 TRI Emission Rate (g/s)a
2010 TRI Emission Rate (g/s)a
2011 TRI Emission Rate (g/s)a
Worst case annual average
unit emission rate concentrationb
(µg/m3) (1g/s)
Table D-4. Tier 2 Modeling Stack Parameters and Individual Source Results at Individual Facilities
Rexam Beverage Can Company- Kent Stack 11 SV9C Inside Bake O 15.33 0.762 3.62 366.5 2.148 2.029 2.026 152.35Rexam Beverage Can Company- Kent Stack 12 SV9D Inside Bake O 15.33 0.762 3.62 360.9 2.148 2.029 2.026 172.04Rexam Beverage Can Company- Salem Stack 1 Stack1 14.00 6.096 0.46 394.3 3.933 4.306 3.019 55.33Rexam Beverage Can Company- Salem Stack 2 Stack2 14.00 6.096 0.46 394.3 3.933 4.306 3.019 67.54Rexam Beverage Can Company- Salem Stack 3 Stack3 14.00 6.096 0.46 394.3 3.933 4.306 3.019 70.24Rexam Beverage Can Company- Salem Stack 4 Stack4 14.00 6.096 0.46 394.3 3.933 4.306 3.019 58.47Rexam Beverage Can Company- Salem Stack 5 Stack5 14.00 6.096 0.46 394.3 3.933 4.306 3.019 54.25Silgan Containers Manufacturing Corp- LaPorte Stack 1 C11 L1Roll1 15.80 0.719 17.42 477.6 1.568 1.597 1.531 27.42Silgan Containers Manufacturing Corp- LaPorte Stack 2 C12 L1Roll2 15.80 0.719 7.37 477.6 1.568 1.597 1.531 55.07Silgan Containers Manufacturing Corp- LaPorte Stack 3 C13 L1IS1 17.11 0.905 5.13 477.6 1.568 1.597 1.531 44.89Silgan Containers Manufacturing Corp- LaPorte Stack 4 C14 L1IS2 17.11 0.905 5.13 477.6 1.568 1.597 1.531 45.44Silgan Containers Manufacturing Corp- LaPorte Stack 5 C15 L1IS3 17.11 0.905 12.32 477.6 1.568 1.597 1.531 23.93Silgan Containers Manufacturing Corp- LaPorte Stack 6 C16 L1IS4 17.11 0.914 10.78 477.6 1.568 1.597 1.531 26.33Silgan Containers Manufacturing Corp- LaPorte Stack 7 C21 L2Roll1 15.80 0.719 17.42 477.6 1.568 1.597 1.531 28.58Silgan Containers Manufacturing Corp- LaPorte Stack 8 C22 L2Roll2 15.80 0.719 7.37 477.6 1.568 1.597 1.531 49.54Silgan Containers Manufacturing Corp- LaPorte Stack 9 C23 L2IS1 16.46 0.799 9.42 477.6 1.568 1.597 1.531 35.83Silgan Containers Manufacturing Corp- LaPorte Stack 10 C24 L2IS2 16.78 0.799 18.85 477.6 1.568 1.597 1.531 25.58Silgan Containers Manufacturing Corp- LaPorte Stack 11 S1 IS_1_Over_Fu 16.00 0.695 12.44 294.3 1.568 1.597 1.531 132.66Silgan Containers Manufacturing Corp- LaPorte Stack 12 S2 IS_2_Over_Fu 16.13 0.362 45.87 294.3 1.568 1.597 1.531 69.78
a. All point EGBE emissions were conservatively assumed to exhaust through each stack for AERSCREEN modeling.The emission rate for each source is calculated from the TRI reported stack emissions of Certain Glycol Ethers as follows:
EGBE Emission Rate (g/s) = Stack TRI Emissions of Certain Glycol Ethers (tpy) x % EGBE x 254 (conversion factor) ÷ 8,760 (hrs/yr) The calculated emission rate assumes EGBE emissions occur continuously 8,760 hours per year.b. Worst case annual average unit emission rate concentration in (µg/m3) (1g/s) assumes stack emission rate of 1 g/s.
It is obtained by multiplying worst-case 1-hr average unit emission rate concentration by a factor of 0.1, in accordance with EPA's AERSCREEN guidance Tier 2 annual concentration for a stack is obtained by multiplying the unit emission rate concentration by Tier 2 stack emission rate (in g/s) for a given TRI year
The maximum point source unit emission rate impact (considering all point sources for a facility) is shown in bolded text.
g/s: grams per secondK: degrees Kelvinm: meterm/s: meters per second
µg/m3: micrograms per cubic metertpy: ton per yearTRI: Toxic Release Inventory
Page 4 of 4

Site Name Source TypeVolume Release
Height (m) b
Volume Intial Lateral
Dimension (m) c
Volume Intial Vertical
Dimension (m) d
2009 TRI Emission Rate
(g/s)e
2010 TRI Emission Rate
(g/s)e
2011 TRI Emission Rate
(g/s)e
Worst case fugitive annual average unit emission rate
concentrationf (µg/m3) (1g/s)
Ball Container LLC - Columbus Volume 12.420 22.790 5.777 0.572 0.32916 0.34347 86.09Ball Metal Beverage Container Corp- Findlay Volume 12.420 11.230 5.780 0.705 0.71917 0.73355 131.53Ball Metal Food Container Corp- Williamsburg Volume 14.630 13.730 6.805 0.750 0.79165 0.77776 52.37Crown Beverage Packaging - Bradley Volume 7.315 19.850 3.402 0.434 0.40553 0.41038 184.57Crown Beverage Packaging - Olympia Volume 10.670 24.820 4.962 0.462 0.52520 0.43242 93.98Crown Beverage Packaging - Lawrence Volume 6.096 27.300 2.835 0.470 0.40825 0.45675 95.61Crown Cork & Seal Co (USA) - Weirton Volume 9.144 14.120 4.253 1.089 1.03458 0.99320 198.76Crown Food Packaging - Owatonna Volume 10.670 30.710 4.962 0.835 0.87561 0.90821 82.09Rexam Beverage Can Company- Bishopville Volume 10.670 28.840 4.962 0.416 0.41699 0.38457 87.58Rexam Beverage Can Company- Chicago Volume 9.144 20.930 4.253 0.368 0.38295 0.17576 108.26Rexam Beverage Can Company- Kent Volume 7.925 24.550 3.686 0.379 0.35802 0.35745 129.65Rexam Beverage Can Company- Salem Volume 7.000 27.240 3.250 0.774 0.85314 0.70277 111.01Silgan Containers Manufacturing Corp- LaPorte Volume 12.192 20.698 5.670 0.360 0.36965 0.35069 104.77
a. Fugitive releases of EGBE are reported to occur through the building's roof vents in the productionarea of the facility building where stacks emitting EGBE are located. Fugitive emissions from the roofvents are modeled as a single volume source.
b. The volume source release height is taken to be at the release height of fugitive emissions;it is set to be equal to the roof height of the process building
c. Per EPA's AERMOD guidance, the volume source initial lateral dimension is taken to be the length of the side ofthe volume divided by 4.3.
d. Per EPA's AERMOD guidance, the volume source initial vertical dimension is taken to be theheight of the volume source (roof height) divided by 2.15.
e. The emission rate for each source is calculated from the TRI reported fugitive emissions of Certain Glycol Ethers as follows:EGBE Emission Rate (g/s) = Fugitive TRI Emissions of Certain Glycol Ethers (tpy) x % EGBE x 254 (conversion factor) ÷ 8,760 (hrs/yr)The calculated emission rate assumes EGBE emissions occur continuously 8,760 hours per year.
f. Worst case annual average unit emission rate concentration in (µg/m3) (1g/s) assumes fugitive emission rate of 1 g/s.Tier 2 annual concentration for a fugitive volume is obtained by multiplying the unit emission rate concentration
by Tier 2 fugitive emission rate (in g/s) for a given TRI yearg/s: grams per secondhrs/yr: hours per yearm: metertpy: ton per yearTRI: Toxic Release Inventory
Table D-5. Tier 2 Modeling Fugitive Volume Parameters and Results at Individual Facilities

Table D-6. Tier 2 Modeling Stack Parameters and Individual Source Results in Clusters
Facility Name Stack Stack ID Alternative Stack ID Release Height (m)
Stack Inside Diameter (m)
Stack Exit Gas Velocity (m/s)
Stack Temperature (K)
2009 TRI Emission Rate
(g/s)a
2010 TRI Emission Rate (g/s)a
2011 TRI Emission Rate
(g/s)a
Worst case annual average unit emission
rate concentrationb
(µg/m3) (1g/s)
Rexam Beverage Can Company- Chicago Stack 1 REX_SV21 Printer Oven Stack # 1 – SV 21 13.11 0.396 9.58 366.5 1.394 1.450 0.718 165.67
Rexam Beverage Can Company- Chicago Stack 1 REX_SV22 Printer Oven Stack # 2 – SV 22 12.65 0.396 9.57 366.5 1.394 1.450 0.718 175.24
Rexam Beverage Can Company- Chicago Stack 1 REX_SV23 Base Coater Pin Oven Stack # 3 – SV 23 13.17 0.396 9.57 366.5 1.394 1.450 0.718 190.89
Rexam Beverage Can Company- Chicago Stack 4 RED_SV31 Inside Spray Machines Bank 1 – SV 31 12.19 1.097 2.50 294.3 1.394 1.450 0.718 321.15
Rexam Beverage Can Company- Chicago Stack 5 REX_SV32 Inside Spray Machines Bank 2 – SV 32 12.80 1.189 2.13 294.3 1.394 1.450 0.718 376.82Rexam Beverage Can Company- Chicago Stack 6 REX_SV33 Inside Spray Machines Bank 2 – SV 33 13.72 0.914 3.59 294.3 1.394 1.450 0.718 305.07
Rexam Beverage Can Company- Chicago Stack 7 REX_SV41 Inside Bake Oven Stack # 1 – SV 41 14.02 0.762 8.07 449.8 1.394 1.450 0.718 71.92
Rexam Beverage Can Company- Chicago Stack 8 REX_SV42 Inside Bake Oven Stack # 2 – SV 42 14.02 0.823 6.92 449.8 1.394 1.450 0.718 69.03
Rexam Beverage Can Company- Chicago Stack 9 REX_RTO Regenerative Thermal Oxidizer Stack 15.24 1.158 7.61 488.7 1.394 1.450 0.718 42.09Edsal Manufacturing Co Inc- Chicago Stack1 N/A 3960*** 9.75 0.396 2.74 294.3 0.740 1.241 0.976 460.83
Ball Metal Beverage Container Corp- Findlay Stack 1 B_PO11 PO11 16.61 0.457 7.00 510.9 3.740 3.740 3.883 49.10Ball Metal Beverage Container Corp- Findlay Stack 2 B_PO12 PO12 16.61 0.305 29.07 510.9 3.740 3.740 3.883 32.25
Ball Metal Beverage Container Corp- Findlay Stack 3 B_PO21 PO21 19.81 0.457 9.79 499.8 3.740 3.740 3.883 19.29
Ball Metal Beverage Container Corp- Findlay Stack 4 B_PO22 PO22 19.81 0.457 11.32 488.7 3.740 3.740 3.883 18.31
Ball Metal Beverage Container Corp- Findlay Stack 5 B_IBO11 IBO11 14.17 0.610 11.62 477.6 3.740 3.740 3.883 27.00
Ball Metal Beverage Container Corp- Findlay Stack 6 B_IBO21B IBO21-B 21.18 0.610 3.98 477.6 3.740 3.740 3.883 21.02
Ball Metal Beverage Container Corp- Findlay Stack 7 B_IBO31 IBO31 21.64 0.864 5.12 494.3 3.740 3.740 3.883 11.49
Ball Metal Beverage Container Corp- Findlay Stack 8 B_WCO31 WashCoat Oven31 20.42 0.813 2.58 510.9 3.740 3.740 3.883 18.91
Ball Metal Beverage Container Corp- Findlay Stack 9 B_BH Baghouse 20.73 0.330 37.48 294.3 3.740 3.740 3.883 22.86
Whirlpool Corp Findlay Div- Findlay Stack 1 Stk_2 8194**** 12.19 0.305 0.39 327.6 0.591 0.579 0.557 287.86
Silgan Containers Manufacturing Corp- LaPorte Stack 1 C11 L1Roll1 15.80 0.719 17.42 477.6 1.568 1.597 1.531 27.42
Silgan Containers Manufacturing Corp- LaPorte Stack 2 C12 L1Roll2 15.80 0.719 7.37 477.6 1.568 1.597 1.531 55.07
Silgan Containers Manufacturing Corp- LaPorte Stack 3 C13 L1IS1 17.11 0.905 5.13 477.6 1.568 1.597 1.531 44.89
Silgan Containers Manufacturing Corp- LaPorte Stack 4 C14 L1IS2 17.11 0.905 5.13 477.6 1.568 1.597 1.531 45.44
Silgan Containers Manufacturing Corp- LaPorte Stack 5 C15 L1IS3 17.11 0.905 12.32 477.6 1.568 1.597 1.531 23.93
Silgan Containers Manufacturing Corp- LaPorte Stack 6 C16 L1IS4 17.11 0.914 10.78 477.6 1.568 1.597 1.531 26.33
Silgan Containers Manufacturing Corp- LaPorte Stack 7 C21 L2Roll1 15.80 0.719 17.42 477.6 1.568 1.597 1.531 28.58
Silgan Containers Manufacturing Corp- LaPorte Stack 8 C22 L2Roll2 15.80 0.719 7.37 477.6 1.568 1.597 1.531 49.54
Silgan Containers Manufacturing Corp- LaPorte Stack 9 C23 L2IS1 16.46 0.799 9.42 477.6 1.568 1.597 1.531 35.83
Silgan Containers Manufacturing Corp- LaPorte Stack 10 C24 L2IS2 16.78 0.799 18.85 477.6 1.568 1.597 1.531 25.58
Silgan Containers Manufacturing Corp- LaPorte Stack 11 S1 IS_1_Over_Fug 16.00 0.695 12.44 294.3 1.568 1.597 1.531 132.66Silgan Containers Manufacturing Corp- LaPorte Stack 12 S2 IS_2_Over_Fug 16.13 0.362 45.87 294.3 1.568 1.597 1.531 69.78
Roll Coater- La Porte Stack 1 Stk_2 not used 9.14 0.914 3.23 505.4 0.145 0.222 0.199 101.81
Ball Metal Food Container Corp- Weirton Stack 1 0001 0001 (Bldg 5G) 12.80 2.070 8.41 405.9 0.231 0.161 0.066 15.46
Ball Metal Food Container Corp- Weirton Stack 2 TO-1 TO-1 (Bldg 5D) 11.58 1.220 7.80 488.2 0.231 0.161 0.066 31.62
Ball Metal Food Container Corp- Weirton Stack 3 TO-2 TO-2 (Bldg 5D) 10.67 0.670 6.86 704.3 0.231 0.161 0.066 46.93
Ball Metal Food Container Corp- Weirton Stack 4 0003 0003 (Bldg 5D) 10.05 0.640 1.66 649.8 0.231 0.161 0.066 92.82Crown Cork & Seal Co (USA) - Weirton Stack 1 TO-1 11.00 1.219 16.17 659.2 1.821 1.730 1.660 19.68
Crown Cork & Seal Co (USA) - Weirton Stack 2 TO-2 17.00 0.597 13.49 773.2 1.821 1.730 1.660 33.64Ardagh Metal Packaging USA Inc- Weirton Stack 1 Coater #1 12.50 0.610 31.01 824.8 0.031 0.032 0.006 17.65
Ardagh Metal Packaging USA Inc- Weirton Stack 2 Coater #2 14.33 0.610 9.15 783.2 0.031 0.032 0.006 31.19Ardagh Metal Packaging USA Inc- Weirton Stack 3 Coater #3 12.50 0.457 22.27 760.9 0.031 0.032 0.006 23.90
Ardagh Metal Packaging USA Inc- Weirton Stack 4 Coater #4 12.19 0.457 15.45 745.4 0.031 0.032 0.006 26.08
Roll Coater- Weirton Stack 1 No stack parameters available. All emissions (stack + fugitives) modeled as a volume
Page 1 of 2

Table D-6. Tier 2 Modeling Stack Parameters and Individual Source Results in Clusters
Facility Name Stack Stack ID Alternative Stack ID Release Height (m)
Stack Inside Diameter (m)
Stack Exit Gas Velocity (m/s)
Stack Temperature (K)
2009 TRI Emission Rate
(g/s)a
2010 TRI Emission Rate (g/s)a
2011 TRI Emission Rate
(g/s)a
Worst case annual average unit emission
rate concentrationb
(µg/m3) (1g/s)
Ball Metal Beverage Container Corp- Reidsville Stack 1 PO1 15.95 0.508 4.32 479.0 1.812 2.230 2.369 76.93
Ball Metal Beverage Container Corp- Reidsville Stack 2 PO2 16.31 0.508 4.28 465.0 1.812 2.230 2.369 89.85
Ball Metal Beverage Container Corp- Reidsville Stack 3 PO3 16.08 0.508 6.14 458.0 1.812 2.230 2.369 82.55
Ball Metal Beverage Container Corp- Reidsville Stack 4 IBO1 16.00 0.457 12.15 473.0 1.812 2.230 2.369 53.74
Ball Metal Beverage Container Corp- Reidsville Stack 5 IBO2 16.00 0.457 7.11 475.0 1.812 2.230 2.369 69.59
Ball Metal Beverage Container Corp- Reidsville Stack 6 IBO3 16.00 0.457 13.17 474.0 1.812 2.230 2.369 60.47
Ball Metal Beverage Container Corp- Reidsville Stack 7 Printer 1 15.95 0.508 0.50 298.0 1.812 2.230 2.369 303.39Ball Metal Beverage Container Corp- Reidsville Stack 8 Printer 2 15.90 0.508 0.50 298.0 1.812 2.230 2.369 258.17
Ball Metal Beverage Container Corp- Reidsville Stack 9 Printer 3 16.08 0.508 0.50 298.0 1.812 2.230 2.369 278.44
Ball Metal Beverage Container Corp- Reidsville Stack 10 Spray line 1 14.94 0.381 6.39 298.0 1.812 2.230 2.369 193.05
Ball Metal Beverage Container Corp- Reidsville Stack 11 Spray line 2 14.99 0.381 7.28 298.0 1.812 2.230 2.369 194.68
Ball Metal Beverage Container Corp- Reidsville Stack 12 Spray line 3 14.99 0.381 8.74 298.0 1.812 2.230 2.369 210.93
Dystar LP- Reidsville Stack 1 Stk_2 11.64 0.432 5.44 370.9 0.0004 0.0004 0.0004 178.83
a. All point EGBE emissions were conservatively assumed to exhaust through each stack for AERSCREEN modeling.
The emission rate for each source is calculated from the TRI reported stack emissions of Certain Glycol Ethers as follows:
EGBE Emission Rate (g/s) = Stack TRI Emissions of Certain Glycol Ethers (tpy) x % EGBE x 254 (conversion factor) ÷ 8,760 (hrs/yr)
The calculated emission rate assumes EGBE emissions occur continuously 8,760 hours per year.
b. Worst case annual average unit emission rate concentration in (µg/m3) (1g/s) assumes stack emission rate of 1 g/s.
It is obtained by multiplying worst-case 1-hr average unit emission rate concentration by a factor of 0.1, in accordance with EPA's AERSCREEN guidance
Tier 2 annual concentration for a stack is obtained by multiplying the unit emission rate concentration by Tier 2 stack emission rate (in g/s) for a given TRI yearThe maximum point source unit emission rate impact (considering all point sources for a facility) is shown in bolded text.
g/s: grams per second
K: degrees Kelvin
m: meter
m/s: meters per second
µg/m3: micrograms per cubic metertpy: ton per year
TRI: Toxic Regulatory Index
Page 2 of 2
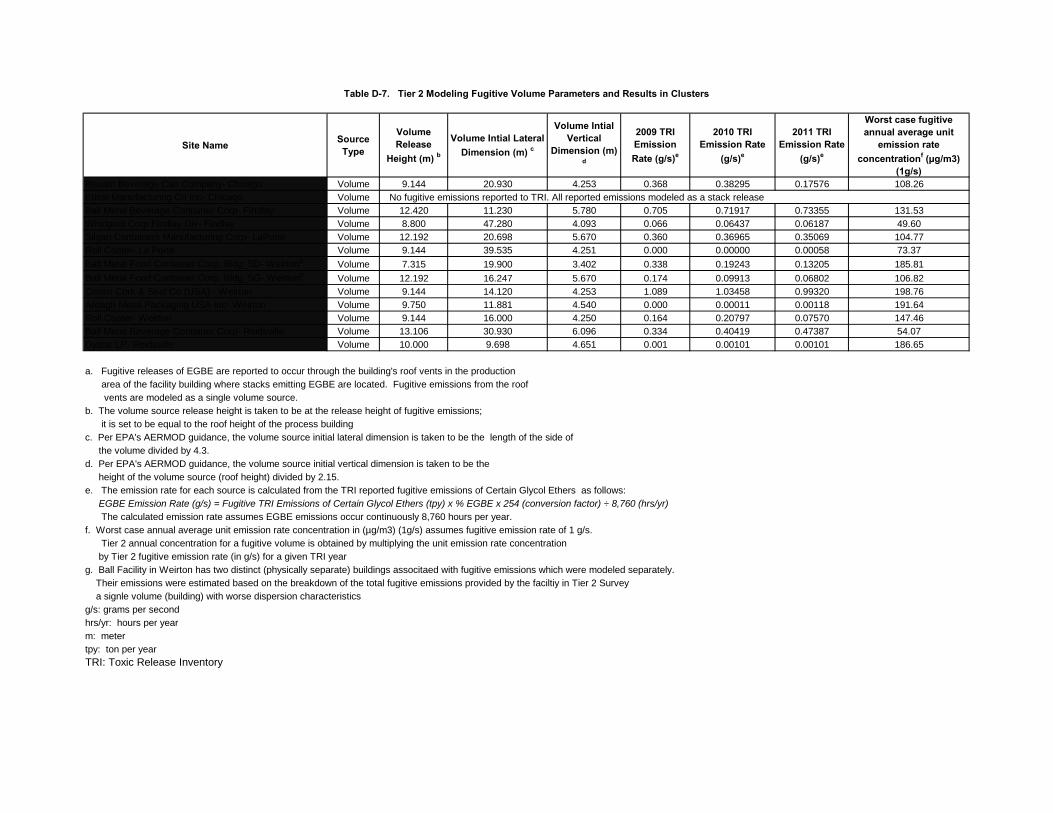
Table D-7. Tier 2 Modeling Fugitive Volume Parameters and Results in Clusters
Site Name Source Type
Volume Release
Height (m) bVolume Intial Lateral
Dimension (m) c
Volume Intial Vertical
Dimension (m) d
2009 TRI Emission Rate (g/s)e
2010 TRI Emission Rate
(g/s)e
2011 TRI Emission Rate
(g/s)e
Worst case fugitive annual average unit
emission rate concentrationf (µg/m3)
(1g/s)Rexam Beverage Can Company- Chicago Volume 9.144 20.930 4.253 0.368 0.38295 0.17576 108.26Edsal Manufacturing Co Inc- Chicago Volume No fugitive emissions reported to TRI. All reported emissions modeled as a stack releaseBall Metal Beverage Container Corp- Findlay Volume 12.420 11.230 5.780 0.705 0.71917 0.73355 131.53Whirlpool Corp Findlay Div- Findlay Volume 8.800 47.280 4.093 0.066 0.06437 0.06187 49.60Silgan Containers Manufacturing Corp- LaPorte Volume 12.192 20.698 5.670 0.360 0.36965 0.35069 104.77Roll Coater- La Porte Volume 9.144 39.535 4.251 0.000 0.00000 0.00058 73.37
Ball Metal Food Container Corp, Bldg_5D- Weirtong Volume 7.315 19.900 3.402 0.338 0.19243 0.13205 185.81
Ball Metal Food Container Corp, Bldg_5G- Weirtong Volume 12.192 16.247 5.670 0.174 0.09913 0.06802 106.82Crown Cork & Seal Co (USA) - Weirton Volume 9.144 14.120 4.253 1.089 1.03458 0.99320 198.76Ardagh Metal Packaging USA Inc- Weirton Volume 9.750 11.881 4.540 0.000 0.00011 0.00118 191.64Roll Coater- Weirton Volume 9.144 16.000 4.250 0.164 0.20797 0.07570 147.46Ball Metal Beverage Container Corp- Reidsville Volume 13.106 30.930 6.096 0.334 0.40419 0.47387 54.07Dystar LP- Reidsville Volume 10.000 9.698 4.651 0.001 0.00101 0.00101 186.65
a. Fugitive releases of EGBE are reported to occur through the building's roof vents in the productionarea of the facility building where stacks emitting EGBE are located. Fugitive emissions from the roofvents are modeled as a single volume source.
b. The volume source release height is taken to be at the release height of fugitive emissions;it is set to be equal to the roof height of the process building
c. Per EPA's AERMOD guidance, the volume source initial lateral dimension is taken to be the length of the side ofthe volume divided by 4.3.
d. Per EPA's AERMOD guidance, the volume source initial vertical dimension is taken to be theheight of the volume source (roof height) divided by 2.15.
e. The emission rate for each source is calculated from the TRI reported fugitive emissions of Certain Glycol Ethers as follows:EGBE Emission Rate (g/s) = Fugitive TRI Emissions of Certain Glycol Ethers (tpy) x % EGBE x 254 (conversion factor) ÷ 8,760 (hrs/yr)The calculated emission rate assumes EGBE emissions occur continuously 8,760 hours per year.
f. Worst case annual average unit emission rate concentration in (µg/m3) (1g/s) assumes fugitive emission rate of 1 g/s.Tier 2 annual concentration for a fugitive volume is obtained by multiplying the unit emission rate concentration
by Tier 2 fugitive emission rate (in g/s) for a given TRI yearg. Ball Facility in Weirton has two distinct (physically separate) buildings associtaed with fugitive emissions which were modeled separately.
Their emissions were estimated based on the breakdown of the total fugitive emissions provided by the faciltiy in Tier 2 Survey a signle volume (building) with worse dispersion characteristics
g/s: grams per secondhrs/yr: hours per yearm: metertpy: ton per yearTRI: Toxic Release Inventory

Facility Name Stack Stack ID Alternative Stack ID Release Height (m)
Stack Inside Diameter (m)
Stack Exit Gas Velocity (m/s)
Stack Temperature
(K)
2009 TRI Emission Rate
(g/s)a
2010 TRI Emission Rate
(g/s)a
2011 TRI Emission Rate
(g/s)a
Crown Beverage Packaging - Lawrence Stack 1 LSM2 8.530 0.457 2.103 291.483 0.1174 0.1021 0.1142Crown Beverage Packaging - Lawrence Stack 2 L1PO 8.530 0.457 3.312 533.150 0.1174 0.1021 0.1142Crown Beverage Packaging - Lawrence Stack 3 IBO1 8.530 0.457 1.183 449.817 0.1174 0.1021 0.1142Crown Beverage Packaging - Lawrence Stack 4 LSM1 8.530 0.457 3.417 291.483 0.1174 0.1021 0.1142Crown Beverage Packaging - Lawrence Stack 5 L1V1 8.530 0.457 10.252 291.483 0.1174 0.1021 0.1142Crown Beverage Packaging - Lawrence Stack 6 IBO3 8.530 0.457 1.183 449.817 0.1174 0.1021 0.1142Crown Beverage Packaging - Lawrence Stack 7 L3S 8.530 0.457 3.417 291.483 0.1174 0.1021 0.1142Crown Beverage Packaging - Lawrence Stack 8 L3VI 8.530 0.457 8.517 291.483 0.1174 0.1021 0.1142Crown Beverage Packaging - Lawrence Stack 9 IBO4 8.530 0.457 1.419 449.817 0.1174 0.1021 0.1142Crown Beverage Packaging - Lawrence Stack 10 L4S 8.530 0.457 3.417 291.483 0.1174 0.1021 0.1142Crown Beverage Packaging - Lawrence Stack 11 L3PO 8.530 0.457 3.680 533.150 0.1174 0.1021 0.1142Crown Beverage Packaging - Lawrence Stack 12 IBO2 8.530 0.457 1.183 449.817 0.1174 0.1021 0.1142Crown Beverage Packaging - Lacrosse Stack 1 S30 13.720 0.966 9.546 422.000 0.049 0.0454 0.0491Crown Cork & Seal Co (USA) - Weirton Stack 1 TO-1 11.000 1.219 16.149 659.150 0.7724 0.7337 0.7044Crown Cork & Seal Co (USA) - Weirton Stack 2 TO-2 17.000 0.597 13.492 773.150 1.0482 0.9958 0.9560Rexam Beverage Can Company- Bishopville Stack 1 SV4 Printer Oven Stack # 1 – SV4 15.200 0.460 6.100 422.000 0.2197 0.2204 0.2033Rexam Beverage Can Company- Bishopville Stack 2 SV5 Printer Oven Stack # 2 – SV5 15.500 0.400 6.100 422.000 0.2197 0.2204 0.2033Rexam Beverage Can Company- Bishopville Stack 3 SV 6 Inside Spray Machines Bank 1 – SV 6 11.600 0.610 3.960 294.000 0.0958 0.0961 0.0886Rexam Beverage Can Company- Bishopville Stack 4 SV 7 Inside Spray Machines Bank 2 – SV 7 14.000 0.610 3.960 294.000 0.0958 0.0961 0.0886Rexam Beverage Can Company- Bishopville Stack 5 SV 8 Inside Spray Machines Bank 3 – SV 8 14.000 0.610 3.960 294.000 0.0958 0.0961 0.0886Rexam Beverage Can Company- Bishopville Stack 6 SV9 Inside Bake Oven Stack # 1 – SV9 15.200 0.760 4.880 422.000 0.5430 0.5447 0.5025Rexam Beverage Can Company- Bishopville Stack 7 SV10 Inside Bake Oven Stack # 2 – SV10 15.200 0.760 4.880 422.000 0.5430 0.5447 0.5025Rexam Beverage Can Company- Bishopville Stack 8 SV11 Inside Bake Oven Stack # 3 – SV11 15.200 0.760 4.880 422.000 0.5430 0.5447 0.5025Rexam Beverage Can Company- Chicago Stack 1 REX_SV21 Printer Oven Stack # 1 – SV 21 13.106 0.396 9.580 366.500 0.1446 0.1504 0.0745Rexam Beverage Can Company- Chicago Stack 1 REX_SV22 Printer Oven Stack # 2 – SV 22 12.649 0.396 9.568 366.500 0.1446 0.1504 0.0745Rexam Beverage Can Company- Chicago Stack 1 REX_SV23 Base Coater Pin Oven Stack # 3 – SV 23 13.167 0.396 9.568 366.500 0.0014 0.0015 0.0007Rexam Beverage Can Company- Chicago Stack 4 RED_SV31 Inside Spray Machines Bank 1 – SV 31 12.192 1.097 2.495 294.261 0.0708 0.0736 0.0365Rexam Beverage Can Company- Chicago Stack 5 REX_SV32 Inside Spray Machines Bank 2 – SV 32 12.802 1.189 2.126 294.261 0.0708 0.0736 0.0365Rexam Beverage Can Company- Chicago Stack 6 REX_SV33 Inside Spray Machines Bank 2 – SV 33 13.716 0.914 3.593 294.261 0.0185 0.0192 0.0095Rexam Beverage Can Company- Chicago Stack 7 REX_SV41 Inside Bake Oven Stack # 1 – SV 41 14.021 0.762 8.072 449.817 0.4020 0.4180 0.2071Rexam Beverage Can Company- Chicago Stack 8 REX_SV42 Inside Bake Oven Stack # 2 – SV 42 14.021 0.823 6.921 449.817 0.4020 0.4180 0.2071Rexam Beverage Can Company- Chicago Stack 9 REX_RTO Regenerative Thermal Oxidizer Stack 15.240 1.158 7.615 488.706 0.1395 0.1450 0.0718Rexam Beverage Can Company- Kent Stack 1 SV7A Printer Pin Oven Stack 1 – SV 7A 14.630 0.558 4.828 422.039 0.1459 0.1378 0.1376Rexam Beverage Can Company- Kent Stack 2 SV7B Printer Pin Oven Stack 2 – SV 7B 14.630 0.558 4.828 444.261 0.1459 0.1378 0.1376Rexam Beverage Can Company- Kent Stack 3 SV7C Printer Pin Oven Stack 3 – SV 7C 16.612 0.914 1.797 397.039 0.1459 0.1378 0.1376Rexam Beverage Can Company- Kent Stack 4 SV7D Printer Pin Oven Stack 4 – SV 7D 14.630 0.610 4.043 399.817 0.1459 0.1378 0.1376Rexam Beverage Can Company- Kent Stack 5 SV8A Inside Spray Machines Bank 1 – SV 8A 13.503 0.838 2.138 299.817 0.0587 0.0554 0.0553Rexam Beverage Can Company- Kent Stack 6 SV8B Inside Spray Machines Bank 2 – SV 8B 14.173 0.838 2.138 299.817 0.0587 0.0554 0.0553Rexam Beverage Can Company- Kent Stack 7 SV8C Inside Spray Machines Bank 3 – SV 8C 13.198 0.850 2.079 299.817 0.0587 0.0554 0.0553Rexam Beverage Can Company- Kent Stack 8 SV8D Inside Spray Machines Bank 4 – SV 8D 13.716 0.838 2.138 299.817 0.0587 0.0554 0.0553Rexam Beverage Can Company- Kent Stack 9 SV9A Inside Bake Oven Stack # 1 – SV 9A 15.240 0.762 3.622 358.150 0.3325 0.3140 0.3135
Table D-8. Tier 3 Modeling Stack Parameters at Individual Facilities
Page 1 of 2

Facility Name Stack Stack ID Alternative Stack ID Release Height (m)
Stack Inside Diameter (m)
Stack Exit Gas Velocity (m/s)
Stack Temperature
(K)
2009 TRI Emission Rate
(g/s)a
2010 TRI Emission Rate
(g/s)a
2011 TRI Emission Rate
(g/s)a
Table D-8. Tier 3 Modeling Stack Parameters at Individual Facilities
Rexam Beverage Can Company- Kent Stack 10 SV9B Inside Bake Oven Stack # 2 – SV 9B 15.331 0.762 3.622 360.928 0.3325 0.3140 0.3135Rexam Beverage Can Company- Kent Stack 11 SV9C Inside Bake Oven Stack # 3 – SV 9C 15.331 0.762 3.622 366.483 0.3325 0.3140 0.3135Rexam Beverage Can Company- Kent Stack 12 SV9D Inside Bake Oven Stack # 4 – SV 9D 15.331 0.762 3.622 360.928 0.3325 0.3140 0.3135Rexam Beverage Can Company - Winston Salem Stack 1 WS1 14.000 0.457 6.096 394.261 3.9333 4.3060 3.0186Rexam Beverage Can Company - Winston Salem Stack 2 WS2 14.000 0.457 6.096 394.261 3.9333 4.3060 3.0186Rexam Beverage Can Company - Winston Salem Stack 3 WS3 14.000 0.457 6.096 394.261 3.9333 4.3060 3.0186Rexam Beverage Can Company - Winston Salem Stack 4 WS4 14.000 0.457 6.096 394.261 3.9333 4.3060 3.0186Rexam Beverage Can Company - Winston Salem Stack 5 WS5 14.000 0.457 6.096 394.261 3.9333 4.3060 3.0186
a. Individual stack emissions were based on total TRI Stack emissions and actual breakdown of EGBE emissions among individual stacksThe emission rate for each source is calculated from the TRI reported stack emissions of Certain Glycol Ethers as follows:
EGBE Emission Rate (g/s) = Stack TRI Emissions of Certain Glycol Ethers (tpy) x % EGBE x 254 (conversion factor) ÷ 8,760 (hrs/yr) x Stack_fractionThe calculated emission rate assumes EGBE emissions occur continuously 8,760 hours per year.Stack_fraction represents the percent of the total TRI stack emissions emitted through the individual stack
g/s: grams per secondK: degrees Kelvinm: meterm/s: meters per second
µg/m3: micrograms per cubic metertpy: ton per yearTRI: Toxic Release Inventory
Page 2 of 2

Table D-9. Tier 3 Modeling Fugitive Volume Parameters and Results at Individual Facilities
Site Name Source TypeVolume Release
Height (m) bVolume Intial
Lateral Dimension (m) c
Volume Intial Vertical
Dimension (m) d
2009 TRI Emission Rate
(g/s)e
2010 TRI Emission Rate
(g/s)e
2011 TRI Emission Rate
(g/s)e
Crown Beverage Packaging - Lawrence Volume 6.096 27.310 2.840 0.470 0.40825 0.45675
Crown Cork & Seal Co (USA) - Weirton Volume 9.144 14.120 4.253 1.089 1.03458 0.99320
Rexam Beverage Can Company- Bishopville Volume 10.668 28.840 4.960 0.416 0.41699 0.38457
Rexam Beverage Can Company- Chicago Volume 9.144 20.900 4.253 0.368 0.38295 0.17576
Rexam Beverage Can Company- Kent Volume 7.920 24.558 3.686 0.379 0.35802 0.35745
Rexam Beverage Can Company - Winston Salem Volume 7.000 27.242 3.250 0.774 0.85314 0.70277
a. Fugitive releases of EGBE are reported to occur through the building's roof vents in the productionarea of the facility building where stacks emitting EGBE are located. Fugitive emissions from the roofvents are modeled as a single volume source.
b. The volume source release height is taken to be at the release height of fugitive emissions;it is set to be equal to the roof height of the process building
c. Per EPA's AERMOD guidance, the volume source initial lateral dimension is taken to be the length of the side ofthe volume divided by 4.3.
d. Per EPA's AERMOD guidance, the volume source initial vertical dimension is taken to be theheight of the volume source (roof height) divided by 2.15.
e. The emission rate for each source is calculated from the TRI reported fugitive emissions of Certain Glycol Ethers as follows:EGBE Emission Rate (g/s) = Fugitive TRI Emissions of Certain Glycol Ethers (tpy) x % EGBE x 254 (conversion factor) ÷ 8,760 (hrs/yr)The calculated emission rate assumes EGBE emissions occur continuously 8,760 hours per year.
g/s: grams per secondhrs/yr: hours per yearm: metertpy: ton per yearTRI: Toxic Release Inventory

Facility Name Stack Stack ID Alternative Stack ID Release Height (m)
Stack Inside Diameter (m)
Stack Exit Gas Velocity (m/s)
Stack Temperature (K)
2009 TRI Emission Rate
(g/s)a
2010 TRI Emission Rate
(g/s)a
2011 TRI Emission Rate
(g/s)a
Rexam Beverage Can Company- Chicago Stack 1 REX_SV21 Printer Oven Stack # 1 – SV 21 13.100 0.396 9.580 366.500 0.1446 0.1504 0.0745Rexam Beverage Can Company- Chicago Stack 1 REX_SV22 Printer Oven Stack # 2 – SV 22 12.649 0.396 9.568 366.500 0.1446 0.1504 0.0745Rexam Beverage Can Company- Chicago Stack 1 REX_SV23 Base Coater Pin Oven Stack # 3 – SV 23 13.167 0.396 9.568 366.500 0.0014 0.0015 0.0007Rexam Beverage Can Company- Chicago Stack 4 RED_SV31 Inside Spray Machines Bank 1 – SV 31 12.192 1.097 2.495 294.261 0.0708 0.0736 0.0365Rexam Beverage Can Company- Chicago Stack 5 REX_SV32 Inside Spray Machines Bank 2 – SV 32 12.802 1.189 2.126 294.261 0.0708 0.0736 0.0365Rexam Beverage Can Company- Chicago Stack 6 REX_SV33 Inside Spray Machines Bank 2 – SV 33 13.716 0.914 3.593 294.261 0.0185 0.0192 0.0095Rexam Beverage Can Company- Chicago Stack 7 REX_SV41 Inside Bake Oven Stack # 1 – SV 41 14.021 0.762 8.072 449.817 0.4020 0.4180 0.2071Rexam Beverage Can Company- Chicago Stack 8 REX_SV42 Inside Bake Oven Stack # 2 – SV 42 14.021 0.823 6.921 449.817 0.4020 0.4180 0.2071Rexam Beverage Can Company- Chicago Stack 9 REX_RTO Regenerative Thermal Oxidizer Stack 15.240 1.158 7.615 488.706 0.1395 0.1450 0.0718Edsal Manufacturing Co Inc- Chicago Stack1 N/A 3960*** 9.144 0.396 2.743 294.260 0.7404 1.2411 0.9764Ball Metal Food Container Corp- Weirton Stack 1 BA5G_P1 0001 (Bldg 5G) 12.802 2.070 8.414 405.930 0.1278 0.0889 0.0367Ball Metal Food Container Corp- Weirton Stack 1 BA5D_PT1 TO-1 (Bldg 5D) 11.580 1.220 7.796 488.150 0.0406 0.0282 0.0116Ball Metal Food Container Corp- Weirton Stack 1 BA5D_PT2 TO-2 (Bldg 5D) 10.670 0.670 6.860 704.300 0.0203 0.0141 0.0058Ball Metal Food Container Corp- Weirton Stack 4 BA5D_P3 0003 (Bldg 5D) 10.050 0.640 1.659 649.800 0.0426 0.0296 0.0122Crown Cork & Seal Co (USA) - Weirton Stack 1 CR_PTO1 TO-1 11.000 1.219 16.149 659.150 0.7724 0.7337 0.7044Crown Cork & Seal Co (USA) - Weirton Stack 2 CR_PTO2 TO-2 17.000 0.597 13.492 773.150 1.0482 0.9958 0.9560Ardagh Metal Packaging USA Inc- Weirton Stack 1 AR_PC1 Coater #1 12.497 0.610 31.008 824.820 0.0084 0.0086 0.0017Ardagh Metal Packaging USA Inc- Weirton Stack 2 AR_PC2 Coater #2 14.330 0.610 9.147 783.150 0.0072 0.0074 0.0015Ardagh Metal Packaging USA Inc- Weirton Stack 3 AR_PC3 Coater #3 12.497 0.457 22.269 760.930 0.0066 0.0068 0.0014Ardagh Metal Packaging USA Inc- Weirton Stack 4 AR_PC4 Coater #4 12.190 0.457 15.447 745.370 0.0087 0.0089 0.0018Roll Coater- Weirton Stack 1 No stack parameters available. All emissions (stack + fugitives) modeled as a volume
a. Individual stack emissions were based on total TRI Stack emissions and actual breakdown of EGBE emissions among individual stacksThe emission rate for each source is calculated from the TRI reported stack emissions of Certain Glycol Ethers as follows:
EGBE Emission Rate (g/s) = Stack TRI Emissions of Certain Glycol Ethers (tpy) x % EGBE x 254 (conversion factor) ÷ 8,760 (hrs/yr) x Stack_fractionThe calculated emission rate assumes EGBE emissions occur continuously 8,760 hours per year.Stack_fraction represents the percent of the total TRI stack emissions emitted through the individual stack
g/s: grams per secondK: degrees Kelvinm: meterm/s: meters per second
µg/m3: micrograms per cubic metertpy: ton per yearTRI: Toxic Release Inventory
Table D-10. Tier 3 Modeling Stack Parameters and Individual Source Results in Clusters

Site Name Source TypeVolume Release Height
(m) bVolume Intial Lateral
Dimension (m) c
Volume Intial Vertical Dimension
(m) d
2009 TRI Emission Rate (g/s)e
2010 TRI Emission Rate (g/s)e
2011 TRI Emission Rate (g/s)e
Rexam Beverage Can Company- Chicago Volume 9.144 20.900 4.253 0.368 0.38295 0.17576Edsal Manufacturing Co Inc- Chicago Volume No fugitive emissions reported to TRI. All reported emissions modeled as a stack release
Ball Metal Food Container Corp, Bldg_5D- Weirtong Volume 7.315 19.900 3.402 0.338 0.19246 0.13205
Ball Metal Food Container Corp, Bldg_5G- Weirtong Volume 12.192 16.247 5.670 0.174 0.09914 0.06802
Crown Cork & Seal Co (USA) - Weirton Volume 9.144 14.120 4.253 1.089 1.03458 0.99320
Ardagh Metal Packaging USA Inc- Weirton Volume 9.750 11.881 4.540 0.000 0.00011 0.00118
Roll Coater- Weirton Volume 9.144 26.700 4.250 0.164 0.20800 0.07570
a. Fugitive releases of EGBE are reported to occur through the building's roof vents in the production
area of the facility building where stacks emitting EGBE are located. Fugitive emissions from the roof
vents are modeled as a single volume source.
b. The volume source release height is taken to be at the release height of fugitive emissions;
it is set to be equal to the roof height of the process building
c. Per EPA's AERMOD guidance, the volume source initial lateral dimension is taken to be the length of the side of
the volume divided by 4.3.
d. Per EPA's AERMOD guidance, the volume source initial vertical dimension is taken to be the
height of the volume source (roof height) divided by 2.15.
e. The emission rate for each source is calculated from the TRI reported fugitive emissions of Certain Glycol Ethers as follows:
EGBE Emission Rate (g/s) = Fugitive TRI Emissions of Certain Glycol Ethers (tpy) x % EGBE x 254 (conversion factor) ÷ 8,760 (hrs/yr)
The calculated emission rate assumes EGBE emissions occur continuously 8,760 hours per year.
g. Ball Facility in Weirton has two distinct (physically separate) buildings associtaed with fugitive emissions which were modeled separately.
Their emissions were estimated based on the breakdown of the total fugitive emissions provided by the faciltiy in Tier 2 Survey
g/s: grams per second
hrs/yr: hours per year
m: meter
tpy: ton per year
TRI: Toxic Release Inventory
Table D-11. Tier 3 Modeling Fugitive Volume Parameters and Results in Clusters
APPENDIX E
Outcome of Short-Term Tiered Modeling
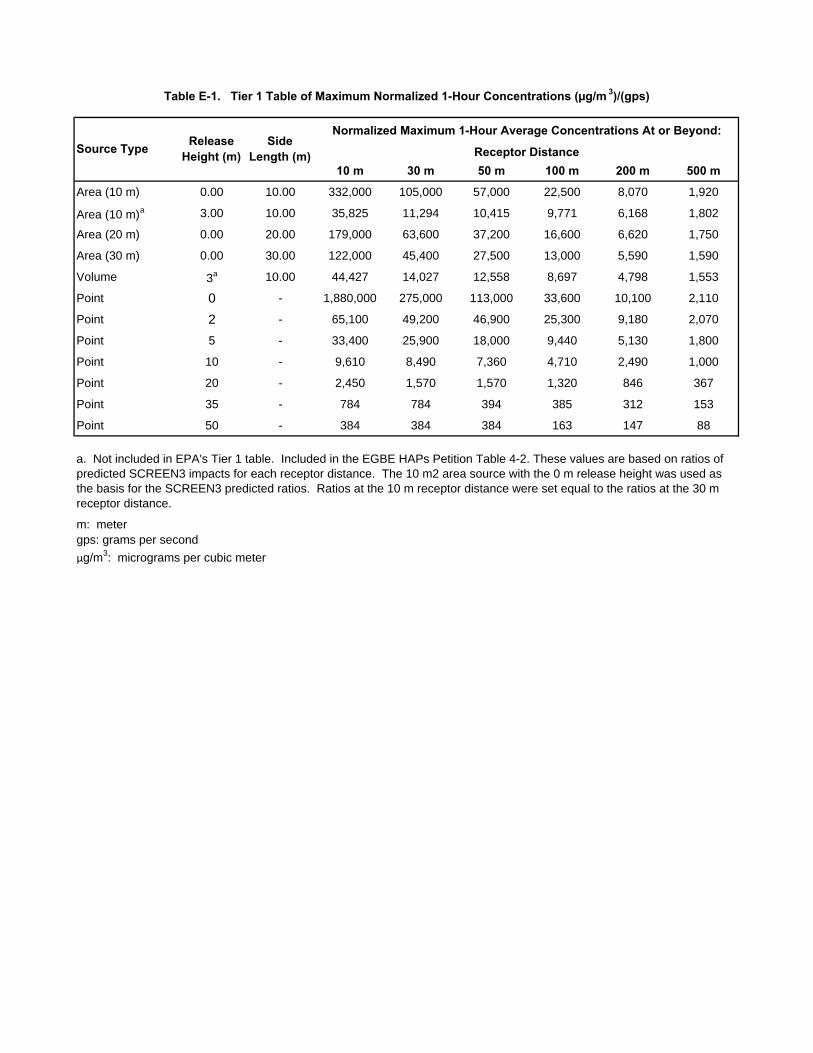
Table E-1. Tier 1 Table of Maximum Normalized 1-Hour Concentrations (µg/m 3)/(gps)
Normalized Maximum 1-Hour Average Concentrations At or Beyond:
Receptor Distance10 m 30 m 50 m 100 m 200 m 500 m
Area (10 m) 0.00 10.00 332,000 105,000 57,000 22,500 8,070 1,920
Area (10 m)a 3.00 10.00 35,825 11,294 10,415 9,771 6,168 1,802
Area (20 m) 0.00 20.00 179,000 63,600 37,200 16,600 6,620 1,750
Area (30 m) 0.00 30.00 122,000 45,400 27,500 13,000 5,590 1,590
Volume 3a 10.00 44,427 14,027 12,558 8,697 4,798 1,553
Point 0 - 1,880,000 275,000 113,000 33,600 10,100 2,110
Point 2 - 65,100 49,200 46,900 25,300 9,180 2,070
Point 5 - 33,400 25,900 18,000 9,440 5,130 1,800
Point 10 - 9,610 8,490 7,360 4,710 2,490 1,000
Point 20 - 2,450 1,570 1,570 1,320 846 367
Point 35 - 784 784 394 385 312 153
Point 50 - 384 384 384 163 147 88
m: metergps: grams per second
µg/m3: micrograms per cubic meter
Source Type Release Height (m)
Side Length (m)
a. Not included in EPA's Tier 1 table. Included in the EGBE HAPs Petition Table 4-2. These values are based on ratios ofpredicted SCREEN3 impacts for each receptor distance. The 10 m2 area source with the 0 m release height was used as the basis for the SCREEN3 predicted ratios. Ratios at the 10 m receptor distance were set equal to the ratios at the 30 m receptor distance.

Table E-2. Tier 1 Short-Term Modeling Parameters and Individual Source Results at Selected Facilities for Short-Term Exposures
2009 2010 2011
Facility Name Source ID Release Height (m)
Volume Source Length
of Side (m)
Distance to Nearest Receptor
(m)
Physical Fence (Y/N)
Tier 1 Table: Normalized Maximum
1-Hour Average Conc. (µg/m3)/(gps)
Proportion EGBE of Certain Glycol Ethers
TRI Emissions
(gps)
Maximum 1-Hour Average Tier I EGBE
Conc. (µg/m3)
TRI Emissions
(gps)
Maximum 1-Hour Average Tier I EGBE
Conc. (µg/m3)
TRI Emissions
(gps)
Maximum 1-Hour Average Tier I EGBE
Conc. (µg/m3)
Ball Metal Beverage Container Corp- Findlay Stack 1 16.6116 - 89 Y 7360.00 1.00 16.4 120,555 16.4 120,555 17.0 125,191.49Ball Metal Beverage Container Corp- Findlay Stack 2 16.6116 - 91 Y 7360.00 1.00 16.4 120,555 16.4 120,555 17.0 125,191.49Ball Metal Beverage Container Corp- Findlay Stack 3 19.812 - 89 Y 7360.00 1.00 16.4 120,555 16.4 120,555 17.0 125,191.49Ball Metal Beverage Container Corp- Findlay Stack 4 19.812 - 100 Y 4710.00 1.00 16.4 77,148 16.4 77,148 17.0 80,115.75Ball Metal Beverage Container Corp- Findlay Stack 5 14.1732 - 127 Y 4710.00 1.00 16.4 77,148 16.4 77,148 17.0 80,115.75Ball Metal Beverage Container Corp- Findlay Stack 6 21.1836 - 108 Y 1320.00 1.00 16.4 21,621 16.4 21,621 17.0 22,452.82Ball Metal Beverage Container Corp- Findlay Stack 7 21.6408 - 135 Y 1320.00 1.00 16.4 21,621 16.4 21,621 17.0 22,452.82Ball Metal Beverage Container Corp- Findlay Stack 8 20.4216 - 105 Y 1320.00 1.00 16.4 21,621 16.4 21,621 17.0 22,452.82Ball Metal Beverage Container Corp- Findlay Stack 9 20.7264 - 100 Y 1320.00 1.00 16.4 21,621 16.4 21,621 17.0 22,452.82Ball Metal Beverage Container Corp- Findlay Fugitive 6.911162791 10 84 Y 12558.23 1.00 3.1 38,767 3.1 39,558 3.2 40,348.92Ball Container LLC - Columbus Stack 1 21.49 - 58 N 1570.00 1.00 6.3 9,841 8.2 12,794 8.8 13,777.93Ball Container LLC - Columbus Stack 2 21.79 - 61 N 1570.00 1.00 6.3 9,841 8.2 12,794 8.8 13,777.93Ball Container LLC - Columbus Stack 3 25.91 - 62 N 1570.00 1.00 6.3 9,841 8.2 12,794 8.8 13,777.93Ball Container LLC - Columbus Stack 4 15.85 - 68 N 7360.00 1.00 6.3 46,135 8.2 59,976 8.8 64,589.53Ball Container LLC - Columbus Stack 5 13.52 - 57 N 7360.00 1.00 6.3 46,135 8.2 59,976 8.8 64,589.53Ball Container LLC - Columbus Stack 6 13.52 - 68 N 7360.00 1.00 6.3 46,135 8.2 59,976 8.8 64,589.53Ball Container LLC - Columbus Stack 7 21.49 - 65 N 1570.00 1.00 6.3 9,841 8.2 12,794 8.8 13,777.93Ball Container LLC - Columbus Stack 8 21.79 - 70 N 1570.00 1.00 6.3 9,841 8.2 12,794 8.8 13,777.93Ball Container LLC - Columbus Stack 9 25.91 - 69 N 1570.00 1.00 6.3 9,841 8.2 12,794 8.8 13,777.93Ball Container LLC - Columbus Stack 10 25.91 - 60 N 1570.00 1.00 6.3 9,841 8.2 12,794 8.8 13,777.93Ball Container LLC - Columbus Stack 11 13.52 - 68 N 7360.00 1.00 6.3 46,135 8.2 59,976 8.8 64,589.53Ball Container LLC - Columbus Stack 12 13.52 - 68 N 7360.00 1.00 6.3 46,135 8.2 59,976 8.8 64,589.53Ball Container LLC - Columbus Stack 13 25.91 - 59 N 1570.00 1.00 6.3 9,841 8.2 12,794 8.8 13,777.93Ball Container LLC - Columbus Stack 14 21.79 - 55 N 1570.00 1.00 6.3 9,841 8.2 12,794 8.8 13,777.93Ball Container LLC - Columbus Stack 15 25.91 - 52 N 1570.00 1.00 6.3 9,841 8.2 12,794 8.8 13,777.93Ball Container LLC - Columbus Stack 16 25.91 - 48 N 1570.00 1.00 6.3 9,841 8.2 12,794 8.8 13,777.93Ball Container LLC - Columbus Stack 17 13.52 - 58 N 7360.00 1.00 6.3 46,135 8.2 59,976 8.8 64,589.53Ball Container LLC - Columbus Stack 18 13.52 - 57 N 7360.00 1.00 6.3 46,135 8.2 59,976 8.8 64,589.53Ball Container LLC - Columbus Stack 19 21.49 - 37 N 1570.00 1.00 6.3 9,841 8.2 12,794 8.8 13,777.93Ball Container LLC - Columbus Stack 20 25.91 - 49 N 1570.00 1.00 6.3 9,841 8.2 12,794 8.8 13,777.93Ball Container LLC - Columbus Stack 21 21.79 - 45 N 1570.00 1.00 6.3 9,841 8.2 12,794 8.8 13,777.93Ball Container LLC - Columbus Stack 22 25.91 - 43 N 1570.00 1.00 6.3 9,841 8.2 12,794 8.8 13,777.93Ball Container LLC - Columbus Stack 23 15.75 - 53 N 7360.00 1.00 6.3 46,135 8.2 59,976 8.8 64,589.53Ball Container LLC - Columbus Fugitive 5.777023256 10 50 N 12558.23 1.00 2.5 31,488 1.4 18,106 1.5 18,892.79Ball Metal Food Container Corp- Williamsburg Stack 1 18.4658 - 147 Y 4710.00 0.97 17.6 80,225 18.9 85,955 18.3 83,090.12Ball Metal Food Container Corp- Williamsburg Stack 2 18.8722 - 127 Y 4710.00 0.97 17.6 80,225 18.9 85,955 18.3 83,090.12Ball Metal Food Container Corp- Williamsburg Stack 3 15.5448 - 102 Y 4710.00 0.97 17.6 80,225 18.9 85,955 18.3 83,090.12Ball Metal Food Container Corp- Williamsburg Stack 4 15.1638 - 102 Y 4710.00 0.97 17.6 80,225 18.9 85,955 18.3 83,090.12Ball Metal Food Container Corp- Williamsburg Stack 5 13.1318 - 98 Y 7360.00 0.97 17.6 125,362 18.9 134,317 18.3 129,839.34Ball Metal Food Container Corp- Williamsburg Stack 6 13.1318 - 96 Y 7360.00 0.97 17.6 125,362 18.9 134,317 18.3 129,839.34Ball Metal Food Container Corp- Williamsburg Stack 7 18.5166 - 140 Y 4710.00 0.97 17.6 80,225 18.9 85,955 18.3 83,090.12Ball Metal Food Container Corp- Williamsburg Stack 8 18.415 - 145 Y 4710.00 0.97 17.6 80,225 18.9 85,955 18.3 83,090.12Ball Metal Food Container Corp- Williamsburg Stack 9 18.3388 - 122 Y 4710.00 0.97 17.6 80,225 18.9 85,955 18.3 83,090.12Ball Metal Food Container Corp- Williamsburg Stack 10 18.5928 - 118 Y 4710.00 0.97 17.6 80,225 18.9 85,955 18.3 83,090.12Ball Metal Food Container Corp- Williamsburg Stack 11 18.3134 - 103 Y 4710.00 0.97 17.6 80,225 18.9 85,955 18.3 83,090.12Ball Metal Food Container Corp- Williamsburg Stack 12 18.288 - 111 Y 4710.00 0.97 17.6 80,225 18.9 85,955 18.3 83,090.12
Page 1 of 4
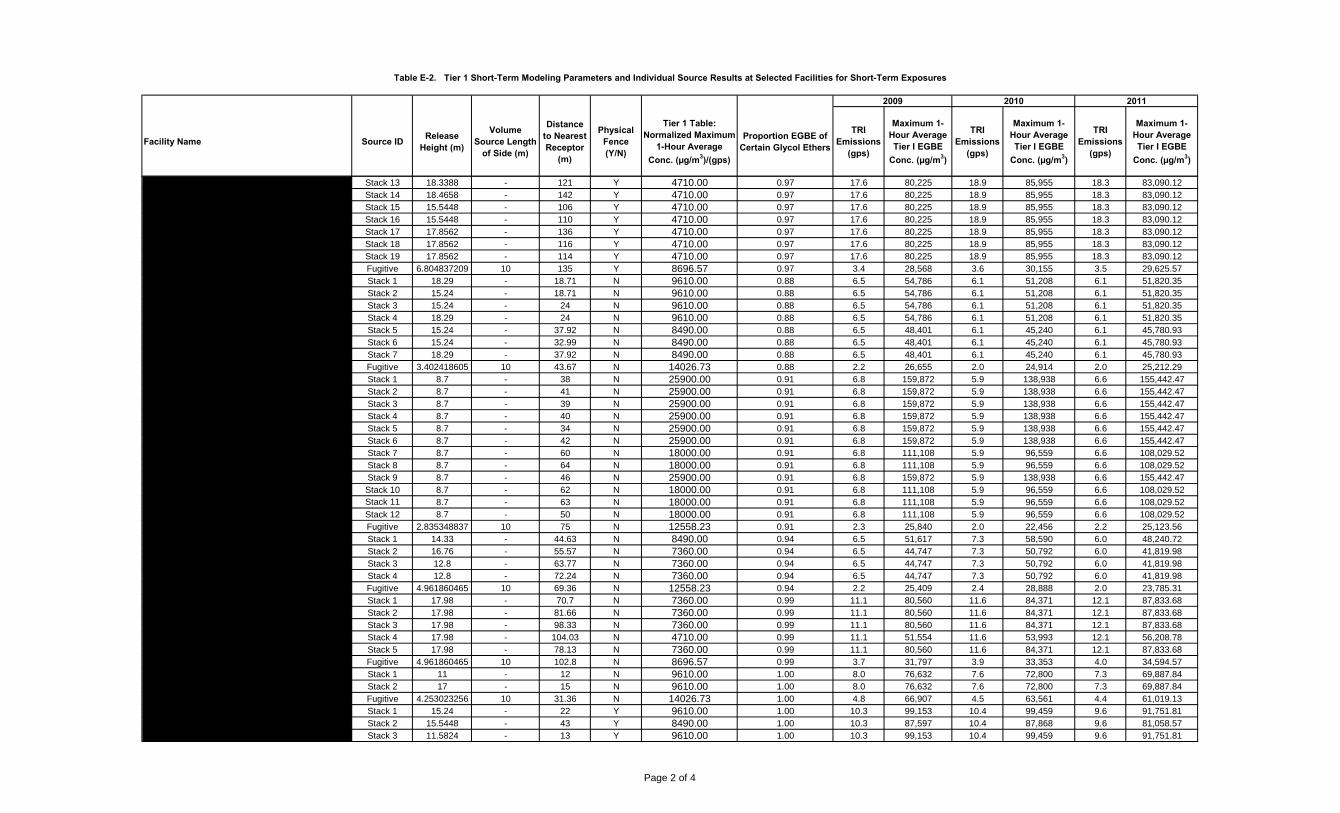
Table E-2. Tier 1 Short-Term Modeling Parameters and Individual Source Results at Selected Facilities for Short-Term Exposures
2009 2010 2011
Facility Name Source ID Release Height (m)
Volume Source Length
of Side (m)
Distance to Nearest Receptor
(m)
Physical Fence (Y/N)
Tier 1 Table: Normalized Maximum
1-Hour Average Conc. (µg/m3)/(gps)
Proportion EGBE of Certain Glycol Ethers
TRI Emissions
(gps)
Maximum 1-Hour Average Tier I EGBE
Conc. (µg/m3)
TRI Emissions
(gps)
Maximum 1-Hour Average Tier I EGBE
Conc. (µg/m3)
TRI Emissions
(gps)
Maximum 1-Hour Average Tier I EGBE
Conc. (µg/m3)
Ball Metal Food Container Corp- Williamsburg Stack 13 18.3388 - 121 Y 4710.00 0.97 17.6 80,225 18.9 85,955 18.3 83,090.12Ball Metal Food Container Corp- Williamsburg Stack 14 18.4658 - 142 Y 4710.00 0.97 17.6 80,225 18.9 85,955 18.3 83,090.12Ball Metal Food Container Corp- Williamsburg Stack 15 15.5448 - 106 Y 4710.00 0.97 17.6 80,225 18.9 85,955 18.3 83,090.12Ball Metal Food Container Corp- Williamsburg Stack 16 15.5448 - 110 Y 4710.00 0.97 17.6 80,225 18.9 85,955 18.3 83,090.12Ball Metal Food Container Corp- Williamsburg Stack 17 17.8562 - 136 Y 4710.00 0.97 17.6 80,225 18.9 85,955 18.3 83,090.12Ball Metal Food Container Corp- Williamsburg Stack 18 17.8562 - 116 Y 4710.00 0.97 17.6 80,225 18.9 85,955 18.3 83,090.12Ball Metal Food Container Corp- Williamsburg Stack 19 17.8562 - 114 Y 4710.00 0.97 17.6 80,225 18.9 85,955 18.3 83,090.12Ball Metal Food Container Corp- Williamsburg Fugitive 6.804837209 10 135 Y 8696.57 0.97 3.4 28,568 3.6 30,155 3.5 29,625.57Crown Beverage Packaging - Bradley Stack 1 18.29 - 18.71 N 9610.00 0.88 6.5 54,786 6.1 51,208 6.1 51,820.35Crown Beverage Packaging - Bradley Stack 2 15.24 - 18.71 N 9610.00 0.88 6.5 54,786 6.1 51,208 6.1 51,820.35Crown Beverage Packaging - Bradley Stack 3 15.24 - 24 N 9610.00 0.88 6.5 54,786 6.1 51,208 6.1 51,820.35Crown Beverage Packaging - Bradley Stack 4 18.29 - 24 N 9610.00 0.88 6.5 54,786 6.1 51,208 6.1 51,820.35Crown Beverage Packaging - Bradley Stack 5 15.24 - 37.92 N 8490.00 0.88 6.5 48,401 6.1 45,240 6.1 45,780.93Crown Beverage Packaging - Bradley Stack 6 15.24 - 32.99 N 8490.00 0.88 6.5 48,401 6.1 45,240 6.1 45,780.93Crown Beverage Packaging - Bradley Stack 7 18.29 - 37.92 N 8490.00 0.88 6.5 48,401 6.1 45,240 6.1 45,780.93Crown Beverage Packaging - Bradley Fugitive 3.402418605 10 43.67 N 14026.73 0.88 2.2 26,655 2.0 24,914 2.0 25,212.29Crown Beverage Packaging - Lawrence Stack 1 8.7 - 38 N 25900.00 0.91 6.8 159,872 5.9 138,938 6.6 155,442.47Crown Beverage Packaging - Lawrence Stack 2 8.7 - 41 N 25900.00 0.91 6.8 159,872 5.9 138,938 6.6 155,442.47Crown Beverage Packaging - Lawrence Stack 3 8.7 - 39 N 25900.00 0.91 6.8 159,872 5.9 138,938 6.6 155,442.47Crown Beverage Packaging - Lawrence Stack 4 8.7 - 40 N 25900.00 0.91 6.8 159,872 5.9 138,938 6.6 155,442.47Crown Beverage Packaging - Lawrence Stack 5 8.7 - 34 N 25900.00 0.91 6.8 159,872 5.9 138,938 6.6 155,442.47Crown Beverage Packaging - Lawrence Stack 6 8.7 - 42 N 25900.00 0.91 6.8 159,872 5.9 138,938 6.6 155,442.47Crown Beverage Packaging - Lawrence Stack 7 8.7 - 60 N 18000.00 0.91 6.8 111,108 5.9 96,559 6.6 108,029.52Crown Beverage Packaging - Lawrence Stack 8 8.7 - 64 N 18000.00 0.91 6.8 111,108 5.9 96,559 6.6 108,029.52Crown Beverage Packaging - Lawrence Stack 9 8.7 - 46 N 25900.00 0.91 6.8 159,872 5.9 138,938 6.6 155,442.47Crown Beverage Packaging - Lawrence Stack 10 8.7 - 62 N 18000.00 0.91 6.8 111,108 5.9 96,559 6.6 108,029.52Crown Beverage Packaging - Lawrence Stack 11 8.7 - 63 N 18000.00 0.91 6.8 111,108 5.9 96,559 6.6 108,029.52Crown Beverage Packaging - Lawrence Stack 12 8.7 - 50 N 18000.00 0.91 6.8 111,108 5.9 96,559 6.6 108,029.52Crown Beverage Packaging - Lawrence Fugitive 2.835348837 10 75 N 12558.23 0.91 2.3 25,840 2.0 22,456 2.2 25,123.56Crown Beverage Packaging - Olympia Stack 1 14.33 - 44.63 N 8490.00 0.94 6.5 51,617 7.3 58,590 6.0 48,240.72Crown Beverage Packaging - Olympia Stack 2 16.76 - 55.57 N 7360.00 0.94 6.5 44,747 7.3 50,792 6.0 41,819.98Crown Beverage Packaging - Olympia Stack 3 12.8 - 63.77 N 7360.00 0.94 6.5 44,747 7.3 50,792 6.0 41,819.98Crown Beverage Packaging - Olympia Stack 4 12.8 - 72.24 N 7360.00 0.94 6.5 44,747 7.3 50,792 6.0 41,819.98Crown Beverage Packaging - Olympia Fugitive 4.961860465 10 69.36 N 12558.23 0.94 2.2 25,409 2.4 28,888 2.0 23,785.31Crown Food Packaging - Owatonna Stack 1 17.98 - 70.7 N 7360.00 0.99 11.1 80,560 11.6 84,371 12.1 87,833.68Crown Food Packaging - Owatonna Stack 2 17.98 - 81.66 N 7360.00 0.99 11.1 80,560 11.6 84,371 12.1 87,833.68Crown Food Packaging - Owatonna Stack 3 17.98 - 98.33 N 7360.00 0.99 11.1 80,560 11.6 84,371 12.1 87,833.68Crown Food Packaging - Owatonna Stack 4 17.98 - 104.03 N 4710.00 0.99 11.1 51,554 11.6 53,993 12.1 56,208.78Crown Food Packaging - Owatonna Stack 5 17.98 - 78.13 N 7360.00 0.99 11.1 80,560 11.6 84,371 12.1 87,833.68Crown Food Packaging - Owatonna Fugitive 4.961860465 10 102.8 N 8696.57 0.99 3.7 31,797 3.9 33,353 4.0 34,594.57Crown Cork & Seal Co (USA) - Weirton Stack 1 11 - 12 N 9610.00 1.00 8.0 76,632 7.6 72,800 7.3 69,887.84Crown Cork & Seal Co (USA) - Weirton Stack 2 17 - 15 N 9610.00 1.00 8.0 76,632 7.6 72,800 7.3 69,887.84Crown Cork & Seal Co (USA) - Weirton Fugitive 4.253023256 10 31.36 N 14026.73 1.00 4.8 66,907 4.5 63,561 4.4 61,019.13Rexam Beverage Can Company- Bishopville Stack 1 15.24 - 22 Y 9610.00 1.00 10.3 99,153 10.4 99,459 9.6 91,751.81Rexam Beverage Can Company- Bishopville Stack 2 15.5448 - 43 Y 8490.00 1.00 10.3 87,597 10.4 87,868 9.6 81,058.57Rexam Beverage Can Company- Bishopville Stack 3 11.5824 - 13 Y 9610.00 1.00 10.3 99,153 10.4 99,459 9.6 91,751.81
Page 2 of 4

Table E-2. Tier 1 Short-Term Modeling Parameters and Individual Source Results at Selected Facilities for Short-Term Exposures
2009 2010 2011
Facility Name Source ID Release Height (m)
Volume Source Length
of Side (m)
Distance to Nearest Receptor
(m)
Physical Fence (Y/N)
Tier 1 Table: Normalized Maximum
1-Hour Average Conc. (µg/m3)/(gps)
Proportion EGBE of Certain Glycol Ethers
TRI Emissions
(gps)
Maximum 1-Hour Average Tier I EGBE
Conc. (µg/m3)
TRI Emissions
(gps)
Maximum 1-Hour Average Tier I EGBE
Conc. (µg/m3)
TRI Emissions
(gps)
Maximum 1-Hour Average Tier I EGBE
Conc. (µg/m3)
Rexam Beverage Can Company- Bishopville Stack 4 14.0208 - 16 Y 9610.00 1.00 10.3 99,153 10.4 99,459 9.6 91,751.81Rexam Beverage Can Company- Bishopville Stack 5 14.0208 - 19 Y 9610.00 1.00 10.3 99,153 10.4 99,459 9.6 91,751.81Rexam Beverage Can Company- Bishopville Stack 6 15.24 - 11 Y 9610.00 1.00 10.3 99,153 10.4 99,459 9.6 91,751.81Rexam Beverage Can Company- Bishopville Stack 7 15.24 - 18 Y 9610.00 1.00 10.3 99,153 10.4 99,459 9.6 91,751.81Rexam Beverage Can Company- Bishopville Stack 8 15.24 - 23 Y 9610.00 1.00 10.3 99,153 10.4 99,459 9.6 91,751.81Rexam Beverage Can Company- Bishopville Fugitive 4.961860465 10 63 Y 12558.23 1.00 1.8 22,865 1.8 22,937 1.7 21,153.27Rexam Beverage Can Company- Kent Stack 1 14.6304 - 36 Y 8490.00 1.00 9.4 79,876 8.9 75,444 8.9 75,321.63Rexam Beverage Can Company- Kent Stack 2 14.6304 - 40 Y 8490.00 1.00 9.4 79,876 8.9 75,444 8.9 75,321.63Rexam Beverage Can Company- Kent Stack 3 16.6116 - 42 Y 8490.00 1.00 9.4 79,876 8.9 75,444 8.9 75,321.63Rexam Beverage Can Company- Kent Stack 4 14.6304 - 29 Y 9610.00 1.00 9.4 90,414 8.9 85,397 8.9 85,258.05Rexam Beverage Can Company- Kent Stack 5 13.50264 - 56 Y 7360.00 1.00 9.4 69,245 8.9 65,403 8.9 65,296.49Rexam Beverage Can Company- Kent Stack 6 14.1732 - 61 Y 7360.00 1.00 9.4 69,245 8.9 65,403 8.9 65,296.49Rexam Beverage Can Company- Kent Stack 7 13.19784 - 62 Y 7360.00 1.00 9.4 69,245 8.9 65,403 8.9 65,296.49Rexam Beverage Can Company- Kent Stack 8 13.716 - 65 Y 7360.00 1.00 9.4 69,245 8.9 65,403 8.9 65,296.49Rexam Beverage Can Company- Kent Stack 9 15.24 - 56 Y 7360.00 1.00 9.4 69,245 8.9 65,403 8.9 65,296.49Rexam Beverage Can Company- Kent Stack 10 15.33144 - 62 Y 7360.00 1.00 9.4 69,245 8.9 65,403 8.9 65,296.49Rexam Beverage Can Company- Kent Stack 11 15.33144 - 65 Y 7360.00 1.00 9.4 69,245 8.9 65,403 8.9 65,296.49Rexam Beverage Can Company- Kent Stack 12 15.33144 - 60 Y 7360.00 1.00 9.4 69,245 8.9 65,403 8.9 65,296.49Rexam Beverage Can Company- Kent Fugitive 3.685953488 10 64 Y 12558.23 1.00 1.7 20,851 1.6 19,693 1.6 19,661.51Silgan Containers Manufacturing Corp- LaPorte Stack 1 12.19 - 37.8 N 8490.00 1.00 6.9 58,300 7.0 59,370 6.7 56,942.90Silgan Containers Manufacturing Corp- LaPorte Stack 2 12.19 - 32.22 N 8490.00 1.00 6.9 58,300 7.0 59,370 6.7 56,942.90Silgan Containers Manufacturing Corp- LaPorte Stack 3 13.41 - 41.76 N 8490.00 1.00 6.9 58,300 7.0 59,370 6.7 56,942.90Silgan Containers Manufacturing Corp- LaPorte Stack 4 13.41 - 41.76 N 8490.00 1.00 6.9 58,300 7.0 59,370 6.7 56,942.90Silgan Containers Manufacturing Corp- LaPorte Stack 5 13.41 - 45.11 N 8490.00 1.00 6.9 58,300 7.0 59,370 6.7 56,942.90Silgan Containers Manufacturing Corp- LaPorte Stack 7 12.19 - 41.45 N 8490.00 1.00 6.9 58,300 7.0 59,370 6.7 56,942.90Silgan Containers Manufacturing Corp- LaPorte Stack 8 12.19 - 32.61 N 8490.00 1.00 6.9 58,300 7.0 59,370 6.7 56,942.90Silgan Containers Manufacturing Corp- LaPorte Stack 9 12.19 - 49.07 N 8490.00 1.00 6.9 58,300 7.0 59,370 6.7 56,942.90Silgan Containers Manufacturing Corp- LaPorte Stack 10 12.8 - 53.95 N 7360.00 1.00 6.9 50,540 7.0 51,468 6.7 49,363.93Silgan Containers Manufacturing Corp- LaPorte Stack 11 12.19 - 56.39 N 7360.00 1.00 6.9 50,540 7.0 51,468 6.7 49,363.93Silgan Containers Manufacturing Corp- LaPorte Stack 12 12.19 - 44.2 N 8490.00 1.00 6.9 58,300 7.0 59,370 6.7 56,942.90Silgan Containers Manufacturing Corp- LaPorte Fugitive 3 10 59 N 12558.23 1.00 1.6 19,779 1.6 20,333 1.5 19,289.95Rexam Beverage Can Company- Chicago Stack 1 13.1064 - 30 Y 8490.00 0.94 6.5 51,842 6.8 53,908 3.4 26,705.88Rexam Beverage Can Company- Chicago Stack 2 12.6492 - 38 Y 8490.00 0.94 6.5 51,842 6.8 53,908 3.4 26,705.88Rexam Beverage Can Company- Chicago Stack 3 13.16736 - 44 Y 8490.00 0.94 6.5 51,842 6.8 53,908 3.4 26,705.88Rexam Beverage Can Company- Chicago Stack 4 12.192 - 19 Y 9610.00 0.94 6.5 58,681 6.8 61,020 3.4 30,228.91Rexam Beverage Can Company- Chicago Stack 5 12.8016 - 23 Y 9610.00 0.94 6.5 58,681 6.8 61,020 3.4 30,228.91Rexam Beverage Can Company- Chicago Stack 6 13.716 - 31 Y 8490.00 0.94 6.5 51,842 6.8 53,908 3.4 26,705.88Rexam Beverage Can Company- Chicago Stack 7 14.0208 - 26 Y 9610.00 0.94 6.5 58,681 6.8 61,020 3.4 30,228.91Rexam Beverage Can Company- Chicago Stack 8 14.0208 - 34 Y 8490.00 0.94 6.5 51,842 6.8 53,908 3.4 26,705.88Rexam Beverage Can Company- Chicago Stack 9 15.24 - 41 Y 8490.00 0.94 6.5 51,842 6.8 53,908 3.4 26,705.88Rexam Beverage Can Company- Chicago Fugitive 4.253023256 10 46 Y 14026.73 0.94 1.7 22,587 1.8 23,528 0.8 10,798.10Crown Beverage Packaging - Lacrosse Stack 1 13.716 - 12 N 9610.00 1.00 0.2 2,072 0.2 2,011 0.2 2,177.69Crown Beverage Packaging - Lacrosse Fugitive 3 10 70 N 12558.23 1.00 2.9 36,100 2.8 35,030 3.0 37,941.43RR Donnelley-Harrisonburg Point 11.17 - 45 Unknown 8490.00 1.00 0.5 4,575 0.5 3,835 0.4 3,274.42RR Donnelley-Harrisonburg Fugitive 3.05 10 210 Unknown 4798.11 1.00 4.6 21,848 4.9 23,455 5.7 27,327.85Rexam Beverage Can Company- Winston-Sale Stacks 1-10 14 - 75 Unknown 7360.00 0.95 18.1 126,798 19.9 138,812 13.9 97,310.09
Page 3 of 4

Table E-2. Tier 1 Short-Term Modeling Parameters and Individual Source Results at Selected Facilities for Short-Term Exposures
2009 2010 2011
Facility Name Source ID Release Height (m)
Volume Source Length
of Side (m)
Distance to Nearest Receptor
(m)
Physical Fence (Y/N)
Tier 1 Table: Normalized Maximum
1-Hour Average Conc. (µg/m3)/(gps)
Proportion EGBE of Certain Glycol Ethers
TRI Emissions
(gps)
Maximum 1-Hour Average Tier I EGBE
Conc. (µg/m3)
TRI Emissions
(gps)
Maximum 1-Hour Average Tier I EGBE
Conc. (µg/m3)
TRI Emissions
(gps)
Maximum 1-Hour Average Tier I EGBE
Conc. (µg/m3)
Rexam Beverage Can Company- Winston-Sale Fugitive 3 10 91.7 Unknown 12558.23 0.95 3.6 42,558 3.9 46,927 3.2 38,656.16
Page 4 of 4
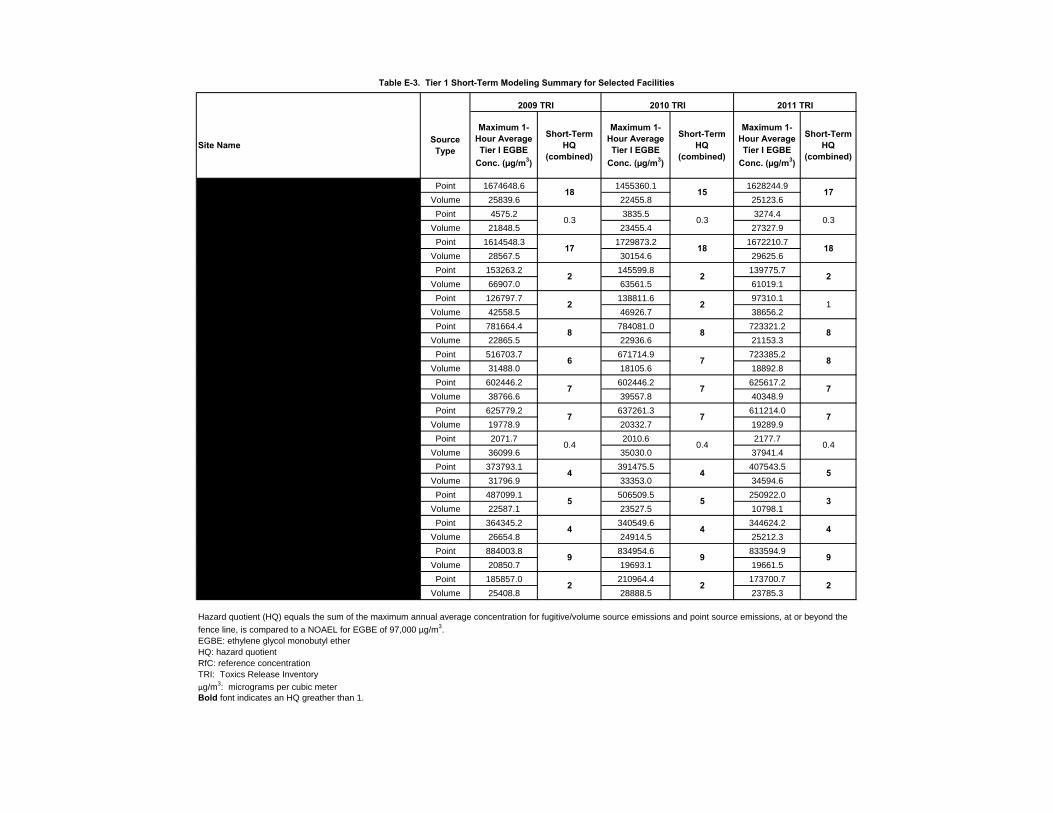
Table E-3. Tier 1 Short-Term Modeling Summary for Selected Facilities
2009 TRI 2010 TRI 2011 TRI
Site Name Source Type
Maximum 1-Hour Average Tier I EGBE
Conc. (µg/m3)
Short-Term HQ
(combined)
Maximum 1-Hour Average Tier I EGBE
Conc. (µg/m3)
Short-Term HQ
(combined)
Maximum 1-Hour Average Tier I EGBE
Conc. (µg/m3)
Short-Term HQ
(combined)
Crown Beverage Packaging - Lawrence Point 1674648.6 1455360.1 1628244.9
Volume 25839.6 22455.8 25123.6
RR Donnelley-Harrisonburg Point 4575.2 3835.5 3274.4
Volume 21848.5 23455.4 27327.9
Ball Metal Food Container Corp- Williamsburg Point 1614548.3 1729873.2 1672210.7
Volume 28567.5 30154.6 29625.6
Crown Cork & Seal Co (USA) - Weirton Point 153263.2 145599.8 139775.7
Volume 66907.0 63561.5 61019.1
Rexam Beverage Can Company- Winston-Salem Point 126797.7 138811.6 97310.1
Volume 42558.5 46926.7 38656.2
Rexam Beverage Can Company- Bishopville Point 781664.4 784081.0 723321.2
Volume 22865.5 22936.6 21153.3
Ball Container LLC - Columbus Point 516703.7 671714.9 723385.2
Volume 31488.0 18105.6 18892.8
Ball Metal Beverage Container Corp- Findlay Point 602446.2 602446.2 625617.2
Volume 38766.6 39557.8 40348.9
Silgan Containers Manufacturing Corp- LaPorte Point 625779.2 637261.3 611214.0
Volume 19778.9 20332.7 19289.9
Crown Beverage Packaging - Lacrosse Point 2071.7 2010.6 2177.7
Volume 36099.6 35030.0 37941.4
Crown Food Packaging - Owatonna Point 373793.1 391475.5 407543.5
Volume 31796.9 33353.0 34594.6
Rexam Beverage Can Company- Chicago Point 487099.1 506509.5 250922.0
Volume 22587.1 23527.5 10798.1
Crown Beverage Packaging - Bradley Point 364345.2 340549.6 344624.2
Volume 26654.8 24914.5 25212.3
Rexam Beverage Can Company- Kent Point 884003.8 834954.6 833594.9
Volume 20850.7 19693.1 19661.5
Crown Beverage Packaging - Olympia Point 185857.0 210964.4 173700.7
Volume 25408.8 28888.5 23785.3
EGBE: ethylene glycol monobutyl etherHQ: hazard quotientRfC: reference concentrationTRI: Toxics Release Inventory
µg/m3: micrograms per cubic meterBold font indicates an HQ greather than 1.
9
2
9
2
9
2
15
0.3
4
8
7
7
0.4
5
3
8
7
7
7
0.4
17
0.3
18
2
1
18
0.3
17
2
2
Hazard quotient (HQ) equals the sum of the maximum annual average concentration for fugitive/volume source emissions and point source emissions, at or beyond the
fence line, is compared to a NOAEL for EGBE of 97,000 µg/m3.
18
2
2
7
8
6
7
0.4
4
5
4
4
5
4
8
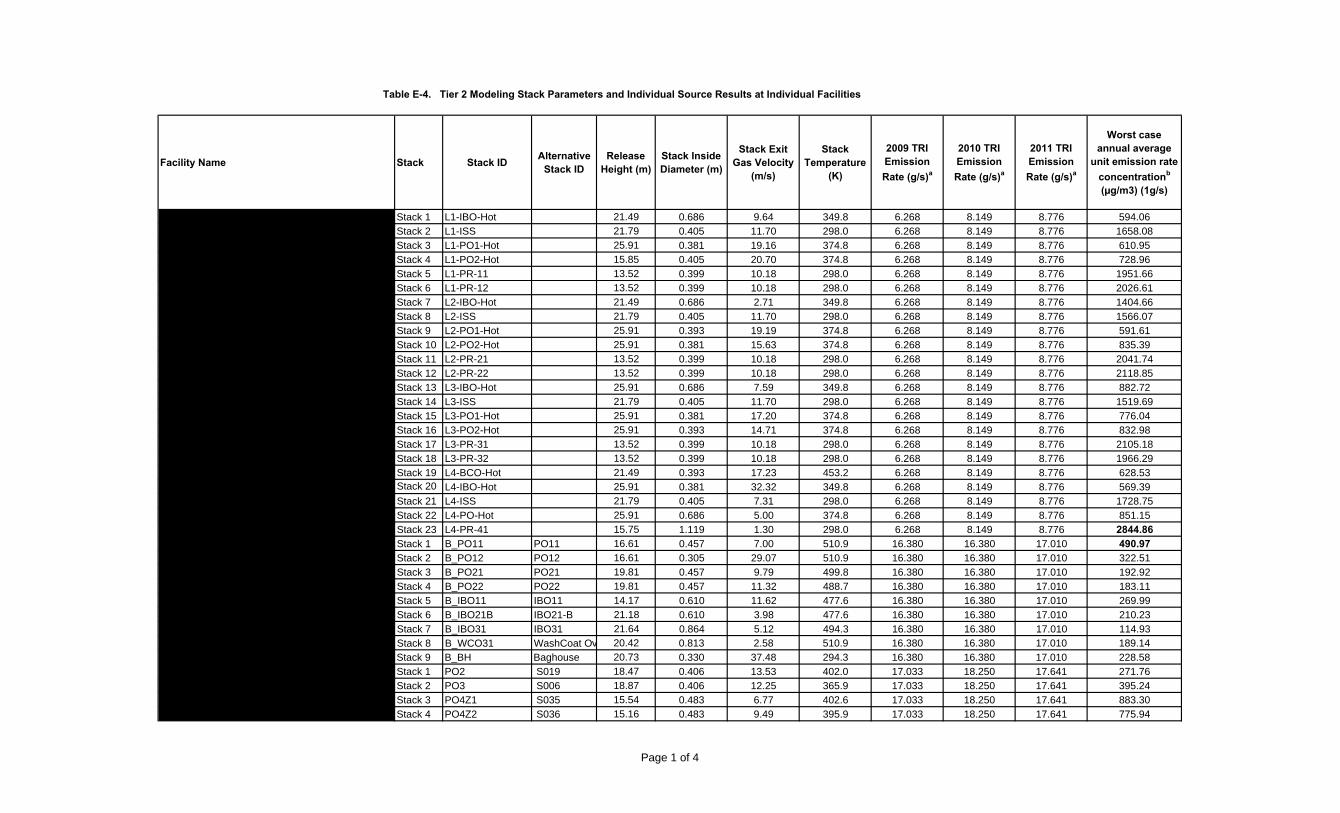
Facility Name Stack Stack ID Alternative Stack ID
Release Height (m)
Stack Inside Diameter (m)
Stack Exit Gas Velocity
(m/s)
Stack Temperature
(K)
2009 TRI Emission Rate (g/s)a
2010 TRI Emission Rate (g/s)a
2011 TRI Emission Rate (g/s)a
Worst case annual average
unit emission rate concentrationb
(µg/m3) (1g/s)
Ball Container LLC - Columbus Stack 1 L1-IBO-Hot 21.49 0.686 9.64 349.8 6.268 8.149 8.776 594.06Ball Container LLC - Columbus Stack 2 L1-ISS 21.79 0.405 11.70 298.0 6.268 8.149 8.776 1658.08Ball Container LLC - Columbus Stack 3 L1-PO1-Hot 25.91 0.381 19.16 374.8 6.268 8.149 8.776 610.95Ball Container LLC - Columbus Stack 4 L1-PO2-Hot 15.85 0.405 20.70 374.8 6.268 8.149 8.776 728.96Ball Container LLC - Columbus Stack 5 L1-PR-11 13.52 0.399 10.18 298.0 6.268 8.149 8.776 1951.66Ball Container LLC - Columbus Stack 6 L1-PR-12 13.52 0.399 10.18 298.0 6.268 8.149 8.776 2026.61Ball Container LLC - Columbus Stack 7 L2-IBO-Hot 21.49 0.686 2.71 349.8 6.268 8.149 8.776 1404.66Ball Container LLC - Columbus Stack 8 L2-ISS 21.79 0.405 11.70 298.0 6.268 8.149 8.776 1566.07Ball Container LLC - Columbus Stack 9 L2-PO1-Hot 25.91 0.393 19.19 374.8 6.268 8.149 8.776 591.61Ball Container LLC - Columbus Stack 10 L2-PO2-Hot 25.91 0.381 15.63 374.8 6.268 8.149 8.776 835.39Ball Container LLC - Columbus Stack 11 L2-PR-21 13.52 0.399 10.18 298.0 6.268 8.149 8.776 2041.74Ball Container LLC - Columbus Stack 12 L2-PR-22 13.52 0.399 10.18 298.0 6.268 8.149 8.776 2118.85Ball Container LLC - Columbus Stack 13 L3-IBO-Hot 25.91 0.686 7.59 349.8 6.268 8.149 8.776 882.72Ball Container LLC - Columbus Stack 14 L3-ISS 21.79 0.405 11.70 298.0 6.268 8.149 8.776 1519.69Ball Container LLC - Columbus Stack 15 L3-PO1-Hot 25.91 0.381 17.20 374.8 6.268 8.149 8.776 776.04Ball Container LLC - Columbus Stack 16 L3-PO2-Hot 25.91 0.393 14.71 374.8 6.268 8.149 8.776 832.98Ball Container LLC - Columbus Stack 17 L3-PR-31 13.52 0.399 10.18 298.0 6.268 8.149 8.776 2105.18Ball Container LLC - Columbus Stack 18 L3-PR-32 13.52 0.399 10.18 298.0 6.268 8.149 8.776 1966.29Ball Container LLC - Columbus Stack 19 L4-BCO-Hot 21.49 0.393 17.23 453.2 6.268 8.149 8.776 628.53Ball Container LLC - Columbus Stack 20 L4-IBO-Hot 25.91 0.381 32.32 349.8 6.268 8.149 8.776 569.39Ball Container LLC - Columbus Stack 21 L4-ISS 21.79 0.405 7.31 298.0 6.268 8.149 8.776 1728.75Ball Container LLC - Columbus Stack 22 L4-PO-Hot 25.91 0.686 5.00 374.8 6.268 8.149 8.776 851.15Ball Container LLC - Columbus Stack 23 L4-PR-41 15.75 1.119 1.30 298.0 6.268 8.149 8.776 2844.86Ball Metal Beverage Container Corp- Findlay Stack 1 B_PO11 PO11 16.61 0.457 7.00 510.9 16.380 16.380 17.010 490.97Ball Metal Beverage Container Corp- Findlay Stack 2 B_PO12 PO12 16.61 0.305 29.07 510.9 16.380 16.380 17.010 322.51Ball Metal Beverage Container Corp- Findlay Stack 3 B_PO21 PO21 19.81 0.457 9.79 499.8 16.380 16.380 17.010 192.92Ball Metal Beverage Container Corp- Findlay Stack 4 B_PO22 PO22 19.81 0.457 11.32 488.7 16.380 16.380 17.010 183.11Ball Metal Beverage Container Corp- Findlay Stack 5 B_IBO11 IBO11 14.17 0.610 11.62 477.6 16.380 16.380 17.010 269.99Ball Metal Beverage Container Corp- Findlay Stack 6 B_IBO21B IBO21-B 21.18 0.610 3.98 477.6 16.380 16.380 17.010 210.23Ball Metal Beverage Container Corp- Findlay Stack 7 B_IBO31 IBO31 21.64 0.864 5.12 494.3 16.380 16.380 17.010 114.93Ball Metal Beverage Container Corp- Findlay Stack 8 B_WCO31 WashCoat Ov 20.42 0.813 2.58 510.9 16.380 16.380 17.010 189.14Ball Metal Beverage Container Corp- Findlay Stack 9 B_BH Baghouse 20.73 0.330 37.48 294.3 16.380 16.380 17.010 228.58Ball Metal Food Container Corp- Williamsburg Stack 1 PO2 S019 18.47 0.406 13.53 402.0 17.033 18.250 17.641 271.76Ball Metal Food Container Corp- Williamsburg Stack 2 PO3 S006 18.87 0.406 12.25 365.9 17.033 18.250 17.641 395.24Ball Metal Food Container Corp- Williamsburg Stack 3 PO4Z1 S035 15.54 0.483 6.77 402.6 17.033 18.250 17.641 883.30Ball Metal Food Container Corp- Williamsburg Stack 4 PO4Z2 S036 15.16 0.483 9.49 395.9 17.033 18.250 17.641 775.94
Table E-4. Tier 2 Modeling Stack Parameters and Individual Source Results at Individual Facilities
Page 1 of 4
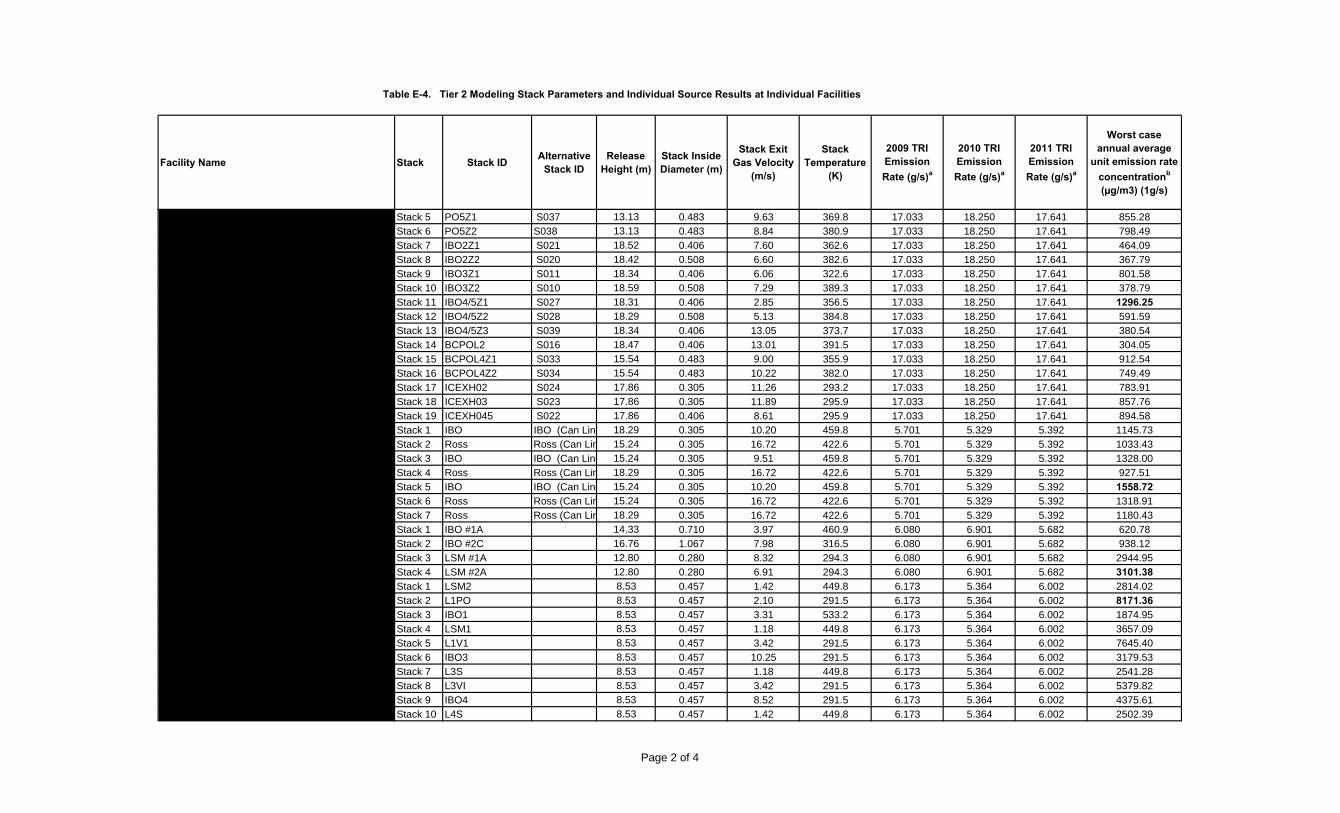
Facility Name Stack Stack ID Alternative Stack ID
Release Height (m)
Stack Inside Diameter (m)
Stack Exit Gas Velocity
(m/s)
Stack Temperature
(K)
2009 TRI Emission Rate (g/s)a
2010 TRI Emission Rate (g/s)a
2011 TRI Emission Rate (g/s)a
Worst case annual average
unit emission rate concentrationb
(µg/m3) (1g/s)
Table E-4. Tier 2 Modeling Stack Parameters and Individual Source Results at Individual Facilities
Ball Metal Food Container Corp- Williamsburg Stack 5 PO5Z1 S037 13.13 0.483 9.63 369.8 17.033 18.250 17.641 855.28Ball Metal Food Container Corp- Williamsburg Stack 6 PO5Z2 S038 13.13 0.483 8.84 380.9 17.033 18.250 17.641 798.49Ball Metal Food Container Corp- Williamsburg Stack 7 IBO2Z1 S021 18.52 0.406 7.60 362.6 17.033 18.250 17.641 464.09Ball Metal Food Container Corp- Williamsburg Stack 8 IBO2Z2 S020 18.42 0.508 6.60 382.6 17.033 18.250 17.641 367.79Ball Metal Food Container Corp- Williamsburg Stack 9 IBO3Z1 S011 18.34 0.406 6.06 322.6 17.033 18.250 17.641 801.58Ball Metal Food Container Corp- Williamsburg Stack 10 IBO3Z2 S010 18.59 0.508 7.29 389.3 17.033 18.250 17.641 378.79Ball Metal Food Container Corp- Williamsburg Stack 11 IBO4/5Z1 S027 18.31 0.406 2.85 356.5 17.033 18.250 17.641 1296.25Ball Metal Food Container Corp- Williamsburg Stack 12 IBO4/5Z2 S028 18.29 0.508 5.13 384.8 17.033 18.250 17.641 591.59Ball Metal Food Container Corp- Williamsburg Stack 13 IBO4/5Z3 S039 18.34 0.406 13.05 373.7 17.033 18.250 17.641 380.54Ball Metal Food Container Corp- Williamsburg Stack 14 BCPOL2 S016 18.47 0.406 13.01 391.5 17.033 18.250 17.641 304.05Ball Metal Food Container Corp- Williamsburg Stack 15 BCPOL4Z1 S033 15.54 0.483 9.00 355.9 17.033 18.250 17.641 912.54Ball Metal Food Container Corp- Williamsburg Stack 16 BCPOL4Z2 S034 15.54 0.483 10.22 382.0 17.033 18.250 17.641 749.49Ball Metal Food Container Corp- Williamsburg Stack 17 ICEXH02 S024 17.86 0.305 11.26 293.2 17.033 18.250 17.641 783.91Ball Metal Food Container Corp- Williamsburg Stack 18 ICEXH03 S023 17.86 0.305 11.89 295.9 17.033 18.250 17.641 857.76Ball Metal Food Container Corp- Williamsburg Stack 19 ICEXH045 S022 17.86 0.406 8.61 295.9 17.033 18.250 17.641 894.58Crown Beverage Packaging - Bradley Stack 1 IBO IBO (Can Line 18.29 0.305 10.20 459.8 5.701 5.329 5.392 1145.73Crown Beverage Packaging - Bradley Stack 2 Ross Ross (Can Lin 15.24 0.305 16.72 422.6 5.701 5.329 5.392 1033.43Crown Beverage Packaging - Bradley Stack 3 IBO IBO (Can Line 15.24 0.305 9.51 459.8 5.701 5.329 5.392 1328.00Crown Beverage Packaging - Bradley Stack 4 Ross Ross (Can Lin 18.29 0.305 16.72 422.6 5.701 5.329 5.392 927.51Crown Beverage Packaging - Bradley Stack 5 IBO IBO (Can Line 15.24 0.305 10.20 459.8 5.701 5.329 5.392 1558.72Crown Beverage Packaging - Bradley Stack 6 Ross Ross (Can Lin 15.24 0.305 16.72 422.6 5.701 5.329 5.392 1318.91Crown Beverage Packaging - Bradley Stack 7 Ross Ross (Can Lin 18.29 0.305 16.72 422.6 5.701 5.329 5.392 1180.43Crown Beverage Packaging - Olympia Stack 1 IBO #1A 14.33 0.710 3.97 460.9 6.080 6.901 5.682 620.78Crown Beverage Packaging - Olympia Stack 2 IBO #2C 16.76 1.067 7.98 316.5 6.080 6.901 5.682 938.12Crown Beverage Packaging - Olympia Stack 3 LSM #1A 12.80 0.280 8.32 294.3 6.080 6.901 5.682 2944.95Crown Beverage Packaging - Olympia Stack 4 LSM #2A 12.80 0.280 6.91 294.3 6.080 6.901 5.682 3101.38Crown Beverage Packaging - Lawrence Stack 1 LSM2 8.53 0.457 1.42 449.8 6.173 5.364 6.002 2814.02Crown Beverage Packaging - Lawrence Stack 2 L1PO 8.53 0.457 2.10 291.5 6.173 5.364 6.002 8171.36Crown Beverage Packaging - Lawrence Stack 3 IBO1 8.53 0.457 3.31 533.2 6.173 5.364 6.002 1874.95Crown Beverage Packaging - Lawrence Stack 4 LSM1 8.53 0.457 1.18 449.8 6.173 5.364 6.002 3657.09Crown Beverage Packaging - Lawrence Stack 5 L1V1 8.53 0.457 3.42 291.5 6.173 5.364 6.002 7645.40Crown Beverage Packaging - Lawrence Stack 6 IBO3 8.53 0.457 10.25 291.5 6.173 5.364 6.002 3179.53Crown Beverage Packaging - Lawrence Stack 7 L3S 8.53 0.457 1.18 449.8 6.173 5.364 6.002 2541.28Crown Beverage Packaging - Lawrence Stack 8 L3VI 8.53 0.457 3.42 291.5 6.173 5.364 6.002 5379.82Crown Beverage Packaging - Lawrence Stack 9 IBO4 8.53 0.457 8.52 291.5 6.173 5.364 6.002 4375.61Crown Beverage Packaging - Lawrence Stack 10 L4S 8.53 0.457 1.42 449.8 6.173 5.364 6.002 2502.39
Page 2 of 4

Facility Name Stack Stack ID Alternative Stack ID
Release Height (m)
Stack Inside Diameter (m)
Stack Exit Gas Velocity
(m/s)
Stack Temperature
(K)
2009 TRI Emission Rate (g/s)a
2010 TRI Emission Rate (g/s)a
2011 TRI Emission Rate (g/s)a
Worst case annual average
unit emission rate concentrationb
(µg/m3) (1g/s)
Table E-4. Tier 2 Modeling Stack Parameters and Individual Source Results at Individual Facilities
Crown Beverage Packaging - Lawrence Stack 11 L3PO 8.53 0.457 3.42 291.5 6.173 5.364 6.002 5339.13Crown Beverage Packaging - Lawrence Stack 12 IBO2 8.53 0.457 3.68 533.2 6.173 5.364 6.002 1515.96Crown Cork & Seal Co (USA) - Weirton Stack 1 TO-1 11.00 1.219 16.17 659.2 7.974 7.575 7.272 196.82Crown Cork & Seal Co (USA) - Weirton Stack 2 TO-2 17.00 0.597 13.49 773.2 7.974 7.575 7.272 336.36Crown Food Packaging - Owatonna Stack 1 EU-001 17.98 0.311 31.08 310.9 10.946 11.463 11.934 934.36Crown Food Packaging - Owatonna Stack 2 EU-003 17.98 0.311 18.65 394.3 10.946 11.463 11.934 821.21Crown Food Packaging - Owatonna Stack 3 EU-005 17.98 0.311 18.65 394.3 10.946 11.463 11.934 802.77Crown Food Packaging - Owatonna Stack 4 EU-007 17.98 0.311 31.08 449.8 10.946 11.463 11.934 556.34Crown Food Packaging - Owatonna Stack 5 EU-008 17.98 0.311 31.08 449.8 10.946 11.463 11.934 522.95Rexam Beverage Can Company- Bishopville Stack 1 SV4 Printer Oven S 15.24 0.457 6.10 422.0 10.318 10.350 9.548 986.47Rexam Beverage Can Company- Bishopville Stack 2 SV5 Printer Oven S 15.54 0.396 6.10 422.0 10.318 10.350 9.548 1021.25Rexam Beverage Can Company- Bishopville Stack 3 SV 6 Inside Spray M 11.58 0.610 3.96 294.3 10.318 10.350 9.548 3630.15Rexam Beverage Can Company- Bishopville Stack 4 SV 7 Inside Spray M 14.02 0.610 3.96 294.3 10.318 10.350 9.548 2950.11Rexam Beverage Can Company- Bishopville Stack 5 SV 8 Inside Spray M 14.02 0.610 3.96 294.3 10.318 10.350 9.548 2941.73Rexam Beverage Can Company- Bishopville Stack 6 SV9 Inside Bake O 15.24 0.762 4.88 422.0 10.318 10.350 9.548 598.16Rexam Beverage Can Company- Bishopville Stack 7 SV10 Inside Bake O 15.24 0.762 4.88 422.0 10.318 10.350 9.548 604.47Rexam Beverage Can Company- Bishopville Stack 8 SV11 Inside Bake O 15.24 0.762 4.88 422.0 10.318 10.350 9.548 597.03Rexam Beverage Can Company- Chicago Stack 1 REX_SV21 Printer Oven S 13.11 0.396 9.58 366.5 6.106 6.350 3.146 1656.67Rexam Beverage Can Company- Chicago Stack 2 REX_SV22 Printer Oven S 12.65 0.396 9.57 366.5 6.106 6.350 3.146 1752.38Rexam Beverage Can Company- Chicago Stack 3 REX_SV23 Base Coater P 13.17 0.396 9.57 366.5 6.106 6.350 3.146 1908.85Rexam Beverage Can Company- Chicago Stack 4 RED_SV31 Inside Spray M 12.19 1.097 2.50 294.3 6.106 6.350 3.146 3211.46Rexam Beverage Can Company- Chicago Stack 5 REX_SV32 Inside Spray M 12.80 1.189 2.13 294.3 6.106 6.350 3.146 3768.25Rexam Beverage Can Company- Chicago Stack 6 REX_SV33 Inside Spray M 13.72 0.914 3.59 294.3 6.106 6.350 3.146 3050.71Rexam Beverage Can Company- Chicago Stack 7 REX_SV41 Inside Bake O 14.02 0.762 8.07 449.8 6.106 6.350 3.146 719.15Rexam Beverage Can Company- Chicago Stack 8 REX_SV42 Inside Bake O 14.02 0.823 6.92 449.8 6.106 6.350 3.146 690.34Rexam Beverage Can Company- Chicago Stack 9 REX_RTO Regenerative 15.24 1.158 7.61 488.7 6.106 6.350 3.146 420.86Rexam Beverage Can Company- Kent Stack 1 SV7A Printer Pin Ov 14.63 0.558 4.83 422.0 9.408 8.886 8.872 1291.94Rexam Beverage Can Company- Kent Stack 2 SV7B Printer Pin Ov 14.63 0.558 4.83 444.3 9.408 8.886 8.872 1530.94Rexam Beverage Can Company- Kent Stack 3 SV7C Printer Pin Ov 16.61 0.914 1.80 397.0 9.408 8.886 8.872 1520.13Rexam Beverage Can Company- Kent Stack 4 SV7D Printer Pin Ov 14.63 0.610 4.04 399.8 9.408 8.886 8.872 1317.77Rexam Beverage Can Company- Kent Stack 5 SV8A Inside Spray M 13.50 0.838 2.14 299.8 9.408 8.886 8.872 4724.42Rexam Beverage Can Company- Kent Stack 6 SV8B Inside Spray M 14.17 0.838 2.14 299.8 9.408 8.886 8.872 4139.12Rexam Beverage Can Company- Kent Stack 7 SV8C Inside Spray M 13.20 0.850 2.08 299.8 9.408 8.886 8.872 4815.86Rexam Beverage Can Company- Kent Stack 8 SV8D Inside Spray M 13.72 0.838 2.14 299.8 9.408 8.886 8.872 4539.85Rexam Beverage Can Company- Kent Stack 9 SV9A Inside Bake O 15.24 0.762 3.62 358.2 9.408 8.886 8.872 1674.02Rexam Beverage Can Company- Kent Stack 10 SV9B Inside Bake O 15.33 0.762 3.62 360.9 9.408 8.886 8.872 1524.62
Page 3 of 4
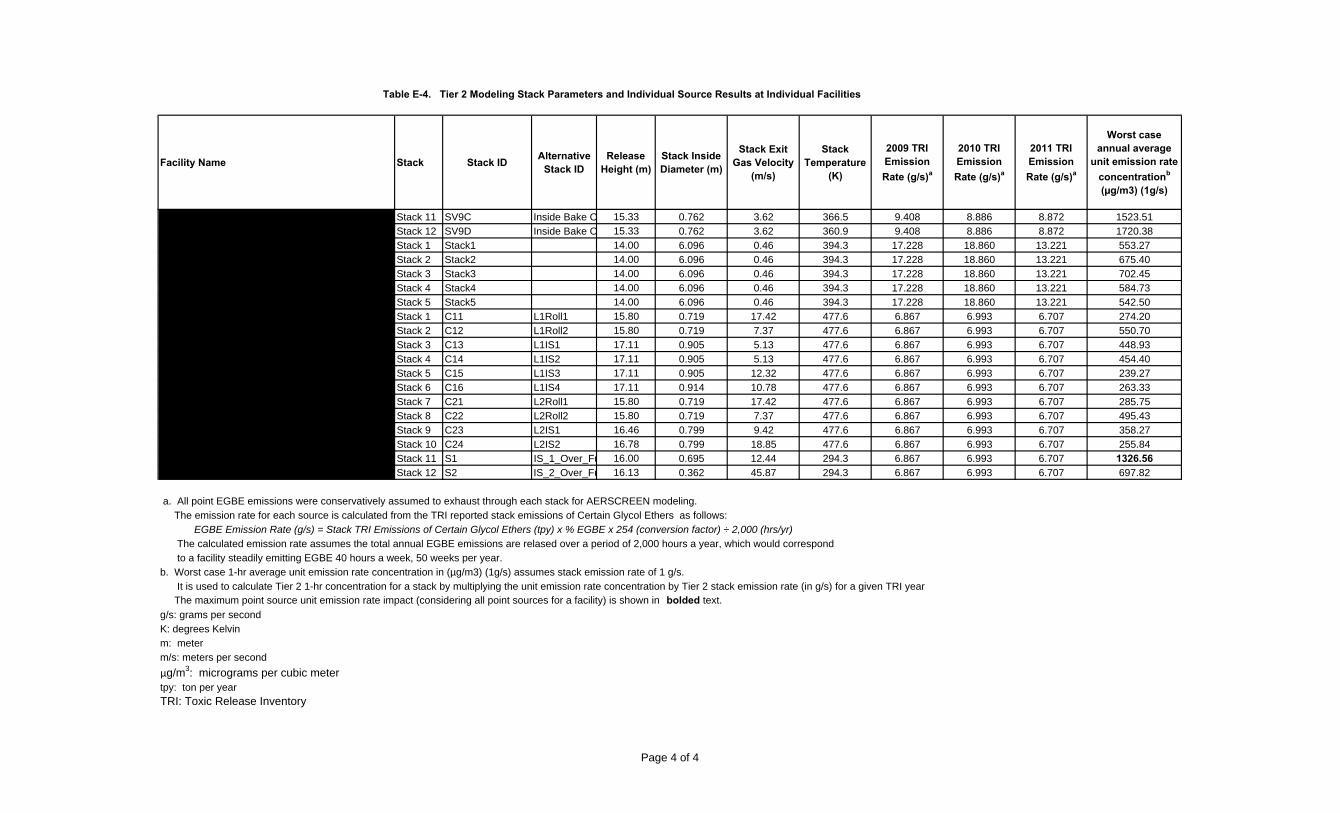
Facility Name Stack Stack ID Alternative Stack ID
Release Height (m)
Stack Inside Diameter (m)
Stack Exit Gas Velocity
(m/s)
Stack Temperature
(K)
2009 TRI Emission Rate (g/s)a
2010 TRI Emission Rate (g/s)a
2011 TRI Emission Rate (g/s)a
Worst case annual average
unit emission rate concentrationb
(µg/m3) (1g/s)
Table E-4. Tier 2 Modeling Stack Parameters and Individual Source Results at Individual Facilities
Rexam Beverage Can Company- Kent Stack 11 SV9C Inside Bake O 15.33 0.762 3.62 366.5 9.408 8.886 8.872 1523.51Rexam Beverage Can Company- Kent Stack 12 SV9D Inside Bake O 15.33 0.762 3.62 360.9 9.408 8.886 8.872 1720.38Rexam Beverage Can Company- Salem Stack 1 Stack1 14.00 6.096 0.46 394.3 17.228 18.860 13.221 553.27Rexam Beverage Can Company- Salem Stack 2 Stack2 14.00 6.096 0.46 394.3 17.228 18.860 13.221 675.40Rexam Beverage Can Company- Salem Stack 3 Stack3 14.00 6.096 0.46 394.3 17.228 18.860 13.221 702.45Rexam Beverage Can Company- Salem Stack 4 Stack4 14.00 6.096 0.46 394.3 17.228 18.860 13.221 584.73Rexam Beverage Can Company- Salem Stack 5 Stack5 14.00 6.096 0.46 394.3 17.228 18.860 13.221 542.50Silgan Containers Manufacturing Corp- LaPorte Stack 1 C11 L1Roll1 15.80 0.719 17.42 477.6 6.867 6.993 6.707 274.20Silgan Containers Manufacturing Corp- LaPorte Stack 2 C12 L1Roll2 15.80 0.719 7.37 477.6 6.867 6.993 6.707 550.70Silgan Containers Manufacturing Corp- LaPorte Stack 3 C13 L1IS1 17.11 0.905 5.13 477.6 6.867 6.993 6.707 448.93Silgan Containers Manufacturing Corp- LaPorte Stack 4 C14 L1IS2 17.11 0.905 5.13 477.6 6.867 6.993 6.707 454.40Silgan Containers Manufacturing Corp- LaPorte Stack 5 C15 L1IS3 17.11 0.905 12.32 477.6 6.867 6.993 6.707 239.27Silgan Containers Manufacturing Corp- LaPorte Stack 6 C16 L1IS4 17.11 0.914 10.78 477.6 6.867 6.993 6.707 263.33Silgan Containers Manufacturing Corp- LaPorte Stack 7 C21 L2Roll1 15.80 0.719 17.42 477.6 6.867 6.993 6.707 285.75Silgan Containers Manufacturing Corp- LaPorte Stack 8 C22 L2Roll2 15.80 0.719 7.37 477.6 6.867 6.993 6.707 495.43Silgan Containers Manufacturing Corp- LaPorte Stack 9 C23 L2IS1 16.46 0.799 9.42 477.6 6.867 6.993 6.707 358.27Silgan Containers Manufacturing Corp- LaPorte Stack 10 C24 L2IS2 16.78 0.799 18.85 477.6 6.867 6.993 6.707 255.84Silgan Containers Manufacturing Corp- LaPorte Stack 11 S1 IS_1_Over_Fu 16.00 0.695 12.44 294.3 6.867 6.993 6.707 1326.56Silgan Containers Manufacturing Corp- LaPorte Stack 12 S2 IS_2_Over_Fu 16.13 0.362 45.87 294.3 6.867 6.993 6.707 697.82
a. All point EGBE emissions were conservatively assumed to exhaust through each stack for AERSCREEN modeling.The emission rate for each source is calculated from the TRI reported stack emissions of Certain Glycol Ethers as follows:
EGBE Emission Rate (g/s) = Stack TRI Emissions of Certain Glycol Ethers (tpy) x % EGBE x 254 (conversion factor) ÷ 2,000 (hrs/yr)The calculated emission rate assumes the total annual EGBE emissions are relased over a period of 2,000 hours a year, which would correspondto a facility steadily emitting EGBE 40 hours a week, 50 weeks per year.
b. Worst case 1-hr average unit emission rate concentration in (µg/m3) (1g/s) assumes stack emission rate of 1 g/s.It is used to calculate Tier 2 1-hr concentration for a stack by multiplying the unit emission rate concentration by Tier 2 stack emission rate (in g/s) for a given TRI yearThe maximum point source unit emission rate impact (considering all point sources for a facility) is shown in bolded text.
g/s: grams per secondK: degrees Kelvinm: meterm/s: meters per second
µg/m3: micrograms per cubic metertpy: ton per yearTRI: Toxic Release Inventory
Page 4 of 4
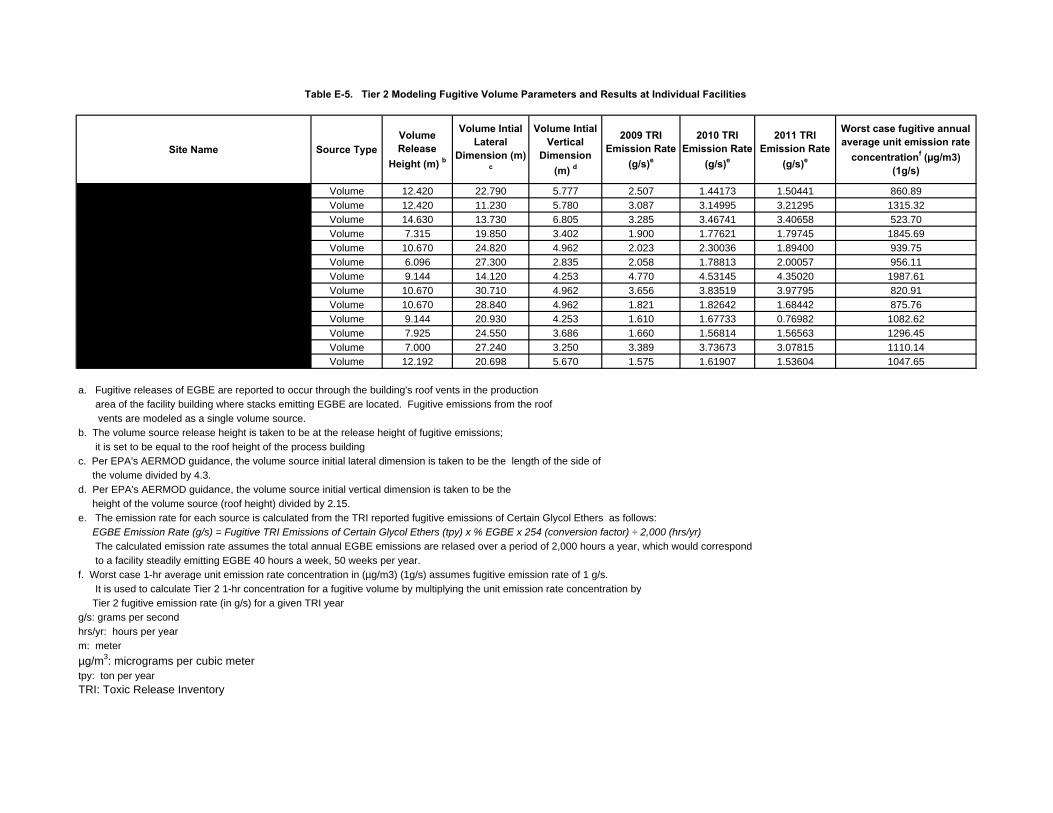
Site Name Source TypeVolume Release
Height (m) b
Volume Intial Lateral
Dimension (m) c
Volume Intial Vertical
Dimension (m) d
2009 TRI Emission Rate
(g/s)e
2010 TRI Emission Rate
(g/s)e
2011 TRI Emission Rate
(g/s)e
Worst case fugitive annual average unit emission rate
concentrationf (µg/m3) (1g/s)
Ball Container LLC - Columbus Volume 12.420 22.790 5.777 2.507 1.44173 1.50441 860.89Ball Metal Beverage Container Corp- Findlay Volume 12.420 11.230 5.780 3.087 3.14995 3.21295 1315.32Ball Metal Food Container Corp- Williamsburg Volume 14.630 13.730 6.805 3.285 3.46741 3.40658 523.70Crown Beverage Packaging - Bradley Volume 7.315 19.850 3.402 1.900 1.77621 1.79745 1845.69Crown Beverage Packaging - Olympia Volume 10.670 24.820 4.962 2.023 2.30036 1.89400 939.75Crown Beverage Packaging - Lawrence Volume 6.096 27.300 2.835 2.058 1.78813 2.00057 956.11Crown Cork & Seal Co (USA) - Weirton Volume 9.144 14.120 4.253 4.770 4.53145 4.35020 1987.61Crown Food Packaging - Owatonna Volume 10.670 30.710 4.962 3.656 3.83519 3.97795 820.91Rexam Beverage Can Company- Bishopville Volume 10.670 28.840 4.962 1.821 1.82642 1.68442 875.76Rexam Beverage Can Company- Chicago Volume 9.144 20.930 4.253 1.610 1.67733 0.76982 1082.62Rexam Beverage Can Company- Kent Volume 7.925 24.550 3.686 1.660 1.56814 1.56563 1296.45Rexam Beverage Can Company- Salem Volume 7.000 27.240 3.250 3.389 3.73673 3.07815 1110.14Silgan Containers Manufacturing Corp- LaPorte Volume 12.192 20.698 5.670 1.575 1.61907 1.53604 1047.65
a. Fugitive releases of EGBE are reported to occur through the building's roof vents in the productionarea of the facility building where stacks emitting EGBE are located. Fugitive emissions from the roofvents are modeled as a single volume source.
b. The volume source release height is taken to be at the release height of fugitive emissions;it is set to be equal to the roof height of the process building
c. Per EPA's AERMOD guidance, the volume source initial lateral dimension is taken to be the length of the side ofthe volume divided by 4.3.
d. Per EPA's AERMOD guidance, the volume source initial vertical dimension is taken to be theheight of the volume source (roof height) divided by 2.15.
e. The emission rate for each source is calculated from the TRI reported fugitive emissions of Certain Glycol Ethers as follows:EGBE Emission Rate (g/s) = Fugitive TRI Emissions of Certain Glycol Ethers (tpy) x % EGBE x 254 (conversion factor) ÷ 2,000 (hrs/yr)The calculated emission rate assumes the total annual EGBE emissions are relased over a period of 2,000 hours a year, which would correspondto a facility steadily emitting EGBE 40 hours a week, 50 weeks per year.
f. Worst case 1-hr average unit emission rate concentration in (µg/m3) (1g/s) assumes fugitive emission rate of 1 g/s.It is used to calculate Tier 2 1-hr concentration for a fugitive volume by multiplying the unit emission rate concentration by
Tier 2 fugitive emission rate (in g/s) for a given TRI yearg/s: grams per secondhrs/yr: hours per yearm: meter
µg/m3: micrograms per cubic metertpy: ton per yearTRI: Toxic Release Inventory
Table E-5. Tier 2 Modeling Fugitive Volume Parameters and Results at Individual Facilities
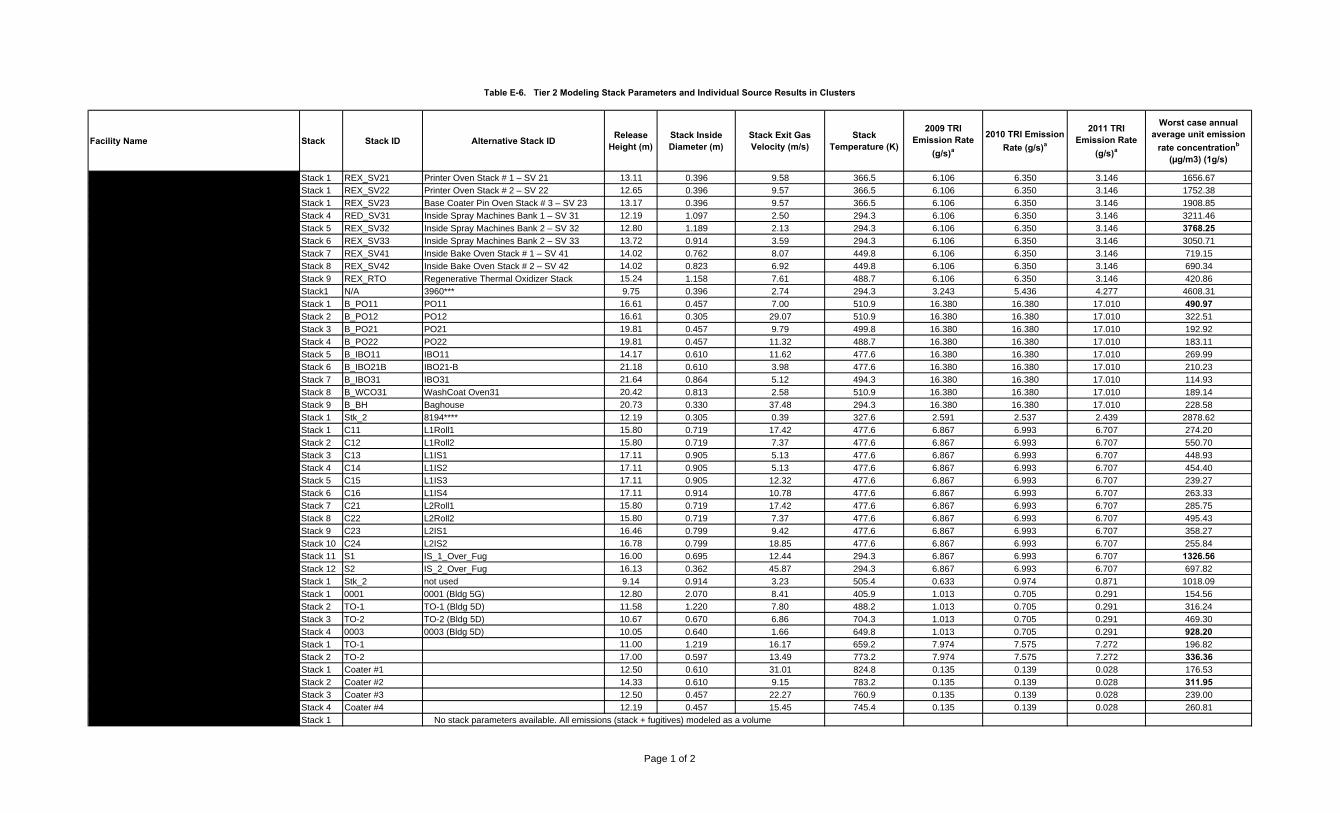
Table E-6. Tier 2 Modeling Stack Parameters and Individual Source Results in Clusters
Facility Name Stack Stack ID Alternative Stack ID Release Height (m)
Stack Inside Diameter (m)
Stack Exit Gas Velocity (m/s)
Stack Temperature (K)
2009 TRI Emission Rate
(g/s)a
2010 TRI Emission Rate (g/s)a
2011 TRI Emission Rate
(g/s)a
Worst case annual average unit emission
rate concentrationb
(µg/m3) (1g/s)
Rexam Beverage Can Company- Chicago Stack 1 REX_SV21 Printer Oven Stack # 1 – SV 21 13.11 0.396 9.58 366.5 6.106 6.350 3.146 1656.67
Rexam Beverage Can Company- Chicago Stack 1 REX_SV22 Printer Oven Stack # 2 – SV 22 12.65 0.396 9.57 366.5 6.106 6.350 3.146 1752.38
Rexam Beverage Can Company- Chicago Stack 1 REX_SV23 Base Coater Pin Oven Stack # 3 – SV 23 13.17 0.396 9.57 366.5 6.106 6.350 3.146 1908.85
Rexam Beverage Can Company- Chicago Stack 4 RED_SV31 Inside Spray Machines Bank 1 – SV 31 12.19 1.097 2.50 294.3 6.106 6.350 3.146 3211.46
Rexam Beverage Can Company- Chicago Stack 5 REX_SV32 Inside Spray Machines Bank 2 – SV 32 12.80 1.189 2.13 294.3 6.106 6.350 3.146 3768.25Rexam Beverage Can Company- Chicago Stack 6 REX_SV33 Inside Spray Machines Bank 2 – SV 33 13.72 0.914 3.59 294.3 6.106 6.350 3.146 3050.71
Rexam Beverage Can Company- Chicago Stack 7 REX_SV41 Inside Bake Oven Stack # 1 – SV 41 14.02 0.762 8.07 449.8 6.106 6.350 3.146 719.15
Rexam Beverage Can Company- Chicago Stack 8 REX_SV42 Inside Bake Oven Stack # 2 – SV 42 14.02 0.823 6.92 449.8 6.106 6.350 3.146 690.34
Rexam Beverage Can Company- Chicago Stack 9 REX_RTO Regenerative Thermal Oxidizer Stack 15.24 1.158 7.61 488.7 6.106 6.350 3.146 420.86Edsal Manufacturing Co Inc- Chicago Stack1 N/A 3960*** 9.75 0.396 2.74 294.3 3.243 5.436 4.277 4608.31
Ball Metal Beverage Container Corp- Findlay Stack 1 B_PO11 PO11 16.61 0.457 7.00 510.9 16.380 16.380 17.010 490.97Ball Metal Beverage Container Corp- Findlay Stack 2 B_PO12 PO12 16.61 0.305 29.07 510.9 16.380 16.380 17.010 322.51
Ball Metal Beverage Container Corp- Findlay Stack 3 B_PO21 PO21 19.81 0.457 9.79 499.8 16.380 16.380 17.010 192.92
Ball Metal Beverage Container Corp- Findlay Stack 4 B_PO22 PO22 19.81 0.457 11.32 488.7 16.380 16.380 17.010 183.11
Ball Metal Beverage Container Corp- Findlay Stack 5 B_IBO11 IBO11 14.17 0.610 11.62 477.6 16.380 16.380 17.010 269.99
Ball Metal Beverage Container Corp- Findlay Stack 6 B_IBO21B IBO21-B 21.18 0.610 3.98 477.6 16.380 16.380 17.010 210.23
Ball Metal Beverage Container Corp- Findlay Stack 7 B_IBO31 IBO31 21.64 0.864 5.12 494.3 16.380 16.380 17.010 114.93
Ball Metal Beverage Container Corp- Findlay Stack 8 B_WCO31 WashCoat Oven31 20.42 0.813 2.58 510.9 16.380 16.380 17.010 189.14
Ball Metal Beverage Container Corp- Findlay Stack 9 B_BH Baghouse 20.73 0.330 37.48 294.3 16.380 16.380 17.010 228.58
Whirlpool Corp Findlay Div- Findlay Stack 1 Stk_2 8194**** 12.19 0.305 0.39 327.6 2.591 2.537 2.439 2878.62
Silgan Containers Manufacturing Corp- LaPorte Stack 1 C11 L1Roll1 15.80 0.719 17.42 477.6 6.867 6.993 6.707 274.20
Silgan Containers Manufacturing Corp- LaPorte Stack 2 C12 L1Roll2 15.80 0.719 7.37 477.6 6.867 6.993 6.707 550.70
Silgan Containers Manufacturing Corp- LaPorte Stack 3 C13 L1IS1 17.11 0.905 5.13 477.6 6.867 6.993 6.707 448.93
Silgan Containers Manufacturing Corp- LaPorte Stack 4 C14 L1IS2 17.11 0.905 5.13 477.6 6.867 6.993 6.707 454.40
Silgan Containers Manufacturing Corp- LaPorte Stack 5 C15 L1IS3 17.11 0.905 12.32 477.6 6.867 6.993 6.707 239.27
Silgan Containers Manufacturing Corp- LaPorte Stack 6 C16 L1IS4 17.11 0.914 10.78 477.6 6.867 6.993 6.707 263.33
Silgan Containers Manufacturing Corp- LaPorte Stack 7 C21 L2Roll1 15.80 0.719 17.42 477.6 6.867 6.993 6.707 285.75
Silgan Containers Manufacturing Corp- LaPorte Stack 8 C22 L2Roll2 15.80 0.719 7.37 477.6 6.867 6.993 6.707 495.43
Silgan Containers Manufacturing Corp- LaPorte Stack 9 C23 L2IS1 16.46 0.799 9.42 477.6 6.867 6.993 6.707 358.27
Silgan Containers Manufacturing Corp- LaPorte Stack 10 C24 L2IS2 16.78 0.799 18.85 477.6 6.867 6.993 6.707 255.84
Silgan Containers Manufacturing Corp- LaPorte Stack 11 S1 IS_1_Over_Fug 16.00 0.695 12.44 294.3 6.867 6.993 6.707 1326.56Silgan Containers Manufacturing Corp- LaPorte Stack 12 S2 IS_2_Over_Fug 16.13 0.362 45.87 294.3 6.867 6.993 6.707 697.82
Roll Coater- La Porte Stack 1 Stk_2 not used 9.14 0.914 3.23 505.4 0.633 0.974 0.871 1018.09
Ball Metal Food Container Corp- Weirton Stack 1 0001 0001 (Bldg 5G) 12.80 2.070 8.41 405.9 1.013 0.705 0.291 154.56
Ball Metal Food Container Corp- Weirton Stack 2 TO-1 TO-1 (Bldg 5D) 11.58 1.220 7.80 488.2 1.013 0.705 0.291 316.24
Ball Metal Food Container Corp- Weirton Stack 3 TO-2 TO-2 (Bldg 5D) 10.67 0.670 6.86 704.3 1.013 0.705 0.291 469.30
Ball Metal Food Container Corp- Weirton Stack 4 0003 0003 (Bldg 5D) 10.05 0.640 1.66 649.8 1.013 0.705 0.291 928.20Crown Cork & Seal Co (USA) - Weirton Stack 1 TO-1 11.00 1.219 16.17 659.2 7.974 7.575 7.272 196.82
Crown Cork & Seal Co (USA) - Weirton Stack 2 TO-2 17.00 0.597 13.49 773.2 7.974 7.575 7.272 336.36Ardagh Metal Packaging USA Inc- Weirton Stack 1 Coater #1 12.50 0.610 31.01 824.8 0.135 0.139 0.028 176.53
Ardagh Metal Packaging USA Inc- Weirton Stack 2 Coater #2 14.33 0.610 9.15 783.2 0.135 0.139 0.028 311.95Ardagh Metal Packaging USA Inc- Weirton Stack 3 Coater #3 12.50 0.457 22.27 760.9 0.135 0.139 0.028 239.00
Ardagh Metal Packaging USA Inc- Weirton Stack 4 Coater #4 12.19 0.457 15.45 745.4 0.135 0.139 0.028 260.81
Roll Coater- Weirton Stack 1 No stack parameters available. All emissions (stack + fugitives) modeled as a volume
Page 1 of 2

Table E-6. Tier 2 Modeling Stack Parameters and Individual Source Results in Clusters
Facility Name Stack Stack ID Alternative Stack ID Release Height (m)
Stack Inside Diameter (m)
Stack Exit Gas Velocity (m/s)
Stack Temperature (K)
2009 TRI Emission Rate
(g/s)a
2010 TRI Emission Rate (g/s)a
2011 TRI Emission Rate
(g/s)a
Worst case annual average unit emission
rate concentrationb
(µg/m3) (1g/s)
Ball Metal Beverage Container Corp- Reidsville Stack 1 PO1 15.95 0.508 4.32 479.0 7.936 9.767 10.378 769.29
Ball Metal Beverage Container Corp- Reidsville Stack 2 PO2 16.31 0.508 4.28 465.0 7.936 9.767 10.378 898.51
Ball Metal Beverage Container Corp- Reidsville Stack 3 PO3 16.08 0.508 6.14 458.0 7.936 9.767 10.378 825.45
Ball Metal Beverage Container Corp- Reidsville Stack 4 IBO1 16.00 0.457 12.15 473.0 7.936 9.767 10.378 537.42
Ball Metal Beverage Container Corp- Reidsville Stack 5 IBO2 16.00 0.457 7.11 475.0 7.936 9.767 10.378 695.90
Ball Metal Beverage Container Corp- Reidsville Stack 6 IBO3 16.00 0.457 13.17 474.0 7.936 9.767 10.378 604.66
Ball Metal Beverage Container Corp- Reidsville Stack 7 Printer 1 15.95 0.508 0.50 298.0 7.936 9.767 10.378 3033.94Ball Metal Beverage Container Corp- Reidsville Stack 8 Printer 2 15.90 0.508 0.50 298.0 7.936 9.767 10.378 2581.65
Ball Metal Beverage Container Corp- Reidsville Stack 9 Printer 3 16.08 0.508 0.50 298.0 7.936 9.767 10.378 2784.36
Ball Metal Beverage Container Corp- Reidsville Stack 10 Spray line 1 14.94 0.381 6.39 298.0 7.936 9.767 10.378 1930.54
Ball Metal Beverage Container Corp- Reidsville Stack 11 Spray line 2 14.99 0.381 7.28 298.0 7.936 9.767 10.378 1946.81
Ball Metal Beverage Container Corp- Reidsville Stack 12 Spray line 3 14.99 0.381 8.74 298.0 7.936 9.767 10.378 2109.27
Dystar LP- Reidsville Stack 1 Stk_2 11.64 0.432 5.44 370.9 0.0019 0.0019 0.0019 1788.26
a. All point EGBE emissions were conservatively assumed to exhaust through each stack for AERSCREEN modeling.
The emission rate for each source is calculated from the TRI reported stack emissions of Certain Glycol Ethers as follows:
EGBE Emission Rate (g/s) = Stack TRI Emissions of Certain Glycol Ethers (tpy) x % EGBE x 254 (conversion factor) ÷ 2,000 (hrs/yr)
The calculated emission rate assumes the total annual EGBE emissions are relased over a period of 2,000 hours a year, which would correspond
to a facility steadily emitting EGBE 40 hours a week, 50 weeks per year.
b. Worst case 1-hr average unit emission rate concentration in (µg/m3) (1g/s) assumes stack emission rate of 1 g/s.
It is used to calculate Tier 2 1-hr concentration for a stack by multiplying the unit emission rate concentration by Tier 2 stack emission rate (in g/s) for a given TRI yearThe maximum point source unit emission rate impact (considering all point sources for a facility) is shown in bolded text.
g/s: grams per second
K: degrees Kelvin
m: meter
m/s: meters per second
µg/m3: micrograms per cubic metertpy: ton per year
TRI: Toxic Release Inventory
Page 2 of 2

Table E-7. Tier 2 Modeling Fugitive Volume Parameters and Results in Clusters
Site Name Source Type
Volume Release
Height (m) bVolume Intial Lateral
Dimension (m) c
Volume Intial Vertical
Dimension (m) d
2009 TRI Emission Rate (g/s)e
2010 TRI Emission Rate
(g/s)e
2011 TRI Emission Rate
(g/s)e
Worst case fugitive annual average unit
emission rate concentrationf (µg/m3)
(1g/s)Rexam Beverage Can Company- Chicago Volume 9.144 20.930 4.253 1.610 1.67733 0.76982 1082.62Edsal Manufacturing Co Inc- Chicago Volume No fugitive emissions reported to TRI. All reported emissions modeled as a stack releaseBall Metal Beverage Container Corp- Findlay Volume 12.420 11.230 5.780 3.087 3.14995 3.21295 1315.32Whirlpool Corp Findlay Div- Findlay Volume 8.800 47.280 4.093 0.288 0.28192 0.27101 495.99Silgan Containers Manufacturing Corp- LaPorte Volume 12.192 20.698 5.670 1.575 1.61907 1.53604 1047.65Roll Coater- La Porte Volume 9.144 39.535 4.251 0.000 0.00000 0.00252 733.69
Ball Metal Food Container Corp, Bldg_5D- Weirtong Volume 7.315 19.900 3.402 1.482 0.84285 0.57837 1858.10
Ball Metal Food Container Corp, Bldg_5G- Weirtong Volume 12.192 16.247 5.670 0.764 0.43420 0.29795 1068.24Crown Cork & Seal Co (USA) - Weirton Volume 9.144 14.120 4.253 4.770 4.53145 4.35020 1987.61Ardagh Metal Packaging USA Inc- Weirton Volume 9.750 11.881 4.540 0.000 0.00048 0.00517 1916.41Roll Coater- Weirton Volume 9.144 16.000 4.250 0.716 0.91090 0.33156 1474.64Ball Metal Beverage Container Corp- Reidsville Volume 13.106 30.930 6.096 1.465 1.77033 2.07556 540.72Dystar LP- Reidsville Volume 10.000 9.698 4.651 0.004 0.00441 0.00441 1866.55
a. Fugitive releases of EGBE are reported to occur through the building's roof vents in the productionarea of the facility building where stacks emitting EGBE are located. Fugitive emissions from the roofvents are modeled as a single volume source.
b. The volume source release height is taken to be at the release height of fugitive emissions;it is set to be equal to the roof height of the process building
c. Per EPA's AERMOD guidance, the volume source initial lateral dimension is taken to be the length of the side ofthe volume divided by 4.3.
d. Per EPA's AERMOD guidance, the volume source initial vertical dimension is taken to be theheight of the volume source (roof height) divided by 2.15.
e. The emission rate for each source is calculated from the TRI reported fugitive emissions of Certain Glycol Ethers as follows:EGBE Emission Rate (g/s) = Fugitive TRI Emissions of Certain Glycol Ethers (tpy) x % EGBE x 254 (conversion factor) ÷ 2,000 (hrs/yr)The calculated emission rate assumes the total annual EGBE emissions are relased over a period of 2,000 hours a year, which would correspondto a facility steadily emitting EGBE 40 hours a week, 50 weeks per year.
f. Worst case 1-hr average unit emission rate concentration in (µg/m3) (1g/s) assumes fugitive emission rate of 1 g/s.It is used to calculate Tier 2 1-hr concentration for a fugitive volume by multiplying the unit emission rate concentration by
Tier 2 fugitive emission rate (in g/s) for a given TRI yearg. Ball Facility in Weirton has two distinct (physically separate) buildings associtaed with fugitive emissions which were modeled separately.
Their emissions were estimated based on the breakdown of the total fugitive emissions provided by the faciltiy in Tier 2 SurveyThe maximum impact from fugitive sources for that facility is obtained by summing maximum impacts of the two volume sources.
g/s: grams per secondhrs/yr: hours per yearm: metertpy: ton per yearTRI: Toxic Release Inventory
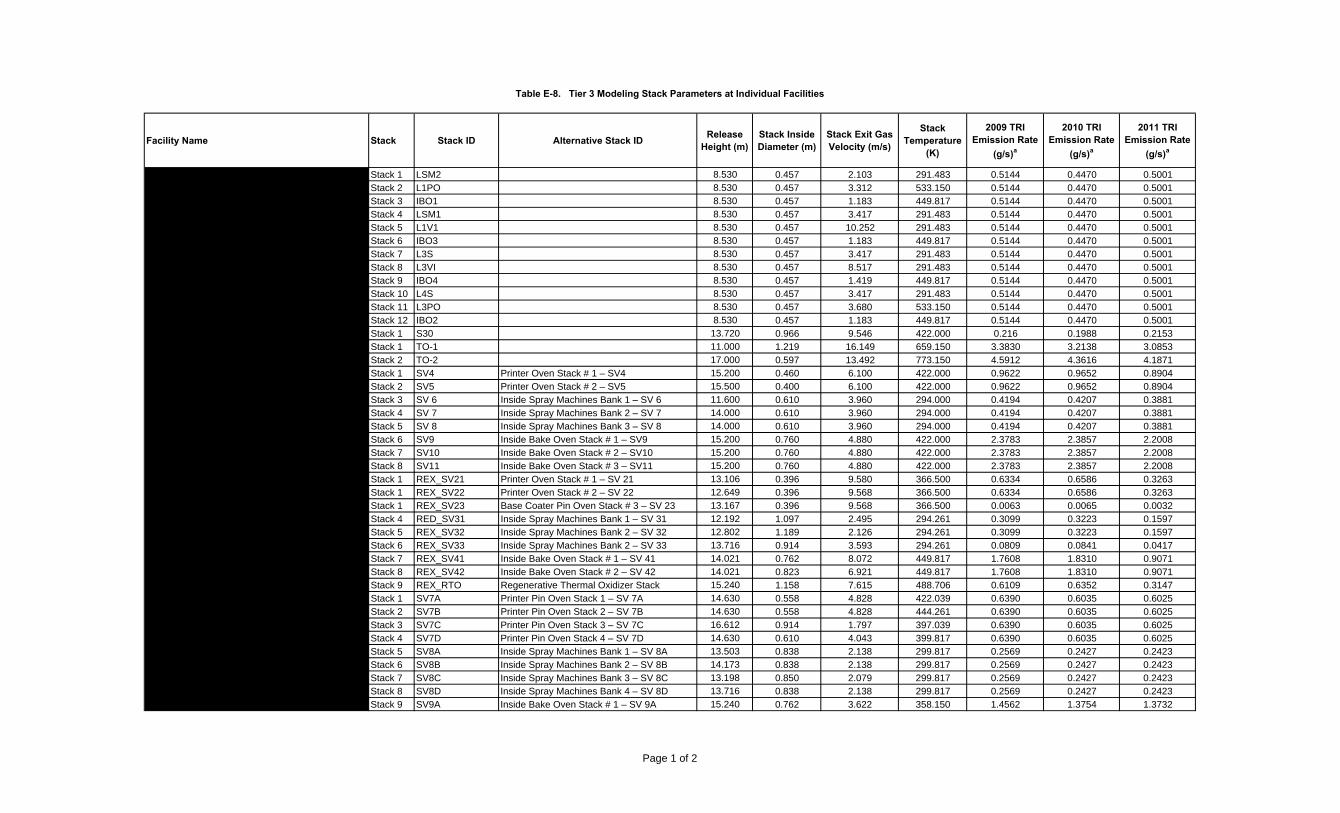
Facility Name Stack Stack ID Alternative Stack ID Release Height (m)
Stack Inside Diameter (m)
Stack Exit Gas Velocity (m/s)
Stack Temperature
(K)
2009 TRI Emission Rate
(g/s)a
2010 TRI Emission Rate
(g/s)a
2011 TRI Emission Rate
(g/s)a
Crown Beverage Packaging - Lawrence Stack 1 LSM2 8.530 0.457 2.103 291.483 0.5144 0.4470 0.5001Crown Beverage Packaging - Lawrence Stack 2 L1PO 8.530 0.457 3.312 533.150 0.5144 0.4470 0.5001Crown Beverage Packaging - Lawrence Stack 3 IBO1 8.530 0.457 1.183 449.817 0.5144 0.4470 0.5001Crown Beverage Packaging - Lawrence Stack 4 LSM1 8.530 0.457 3.417 291.483 0.5144 0.4470 0.5001Crown Beverage Packaging - Lawrence Stack 5 L1V1 8.530 0.457 10.252 291.483 0.5144 0.4470 0.5001Crown Beverage Packaging - Lawrence Stack 6 IBO3 8.530 0.457 1.183 449.817 0.5144 0.4470 0.5001Crown Beverage Packaging - Lawrence Stack 7 L3S 8.530 0.457 3.417 291.483 0.5144 0.4470 0.5001Crown Beverage Packaging - Lawrence Stack 8 L3VI 8.530 0.457 8.517 291.483 0.5144 0.4470 0.5001Crown Beverage Packaging - Lawrence Stack 9 IBO4 8.530 0.457 1.419 449.817 0.5144 0.4470 0.5001Crown Beverage Packaging - Lawrence Stack 10 L4S 8.530 0.457 3.417 291.483 0.5144 0.4470 0.5001Crown Beverage Packaging - Lawrence Stack 11 L3PO 8.530 0.457 3.680 533.150 0.5144 0.4470 0.5001Crown Beverage Packaging - Lawrence Stack 12 IBO2 8.530 0.457 1.183 449.817 0.5144 0.4470 0.5001Crown Beverage Packaging - Lacrosse Stack 1 S30 13.720 0.966 9.546 422.000 0.216 0.1988 0.2153Crown Cork & Seal Co (USA) - Weirton Stack 1 TO-1 11.000 1.219 16.149 659.150 3.3830 3.2138 3.0853Crown Cork & Seal Co (USA) - Weirton Stack 2 TO-2 17.000 0.597 13.492 773.150 4.5912 4.3616 4.1871Rexam Beverage Can Company- Bishopville Stack 1 SV4 Printer Oven Stack # 1 – SV4 15.200 0.460 6.100 422.000 0.9622 0.9652 0.8904Rexam Beverage Can Company- Bishopville Stack 2 SV5 Printer Oven Stack # 2 – SV5 15.500 0.400 6.100 422.000 0.9622 0.9652 0.8904Rexam Beverage Can Company- Bishopville Stack 3 SV 6 Inside Spray Machines Bank 1 – SV 6 11.600 0.610 3.960 294.000 0.4194 0.4207 0.3881Rexam Beverage Can Company- Bishopville Stack 4 SV 7 Inside Spray Machines Bank 2 – SV 7 14.000 0.610 3.960 294.000 0.4194 0.4207 0.3881Rexam Beverage Can Company- Bishopville Stack 5 SV 8 Inside Spray Machines Bank 3 – SV 8 14.000 0.610 3.960 294.000 0.4194 0.4207 0.3881Rexam Beverage Can Company- Bishopville Stack 6 SV9 Inside Bake Oven Stack # 1 – SV9 15.200 0.760 4.880 422.000 2.3783 2.3857 2.2008Rexam Beverage Can Company- Bishopville Stack 7 SV10 Inside Bake Oven Stack # 2 – SV10 15.200 0.760 4.880 422.000 2.3783 2.3857 2.2008Rexam Beverage Can Company- Bishopville Stack 8 SV11 Inside Bake Oven Stack # 3 – SV11 15.200 0.760 4.880 422.000 2.3783 2.3857 2.2008Rexam Beverage Can Company- Chicago Stack 1 REX_SV21 Printer Oven Stack # 1 – SV 21 13.106 0.396 9.580 366.500 0.6334 0.6586 0.3263Rexam Beverage Can Company- Chicago Stack 1 REX_SV22 Printer Oven Stack # 2 – SV 22 12.649 0.396 9.568 366.500 0.6334 0.6586 0.3263Rexam Beverage Can Company- Chicago Stack 1 REX_SV23 Base Coater Pin Oven Stack # 3 – SV 23 13.167 0.396 9.568 366.500 0.0063 0.0065 0.0032Rexam Beverage Can Company- Chicago Stack 4 RED_SV31 Inside Spray Machines Bank 1 – SV 31 12.192 1.097 2.495 294.261 0.3099 0.3223 0.1597Rexam Beverage Can Company- Chicago Stack 5 REX_SV32 Inside Spray Machines Bank 2 – SV 32 12.802 1.189 2.126 294.261 0.3099 0.3223 0.1597Rexam Beverage Can Company- Chicago Stack 6 REX_SV33 Inside Spray Machines Bank 2 – SV 33 13.716 0.914 3.593 294.261 0.0809 0.0841 0.0417Rexam Beverage Can Company- Chicago Stack 7 REX_SV41 Inside Bake Oven Stack # 1 – SV 41 14.021 0.762 8.072 449.817 1.7608 1.8310 0.9071Rexam Beverage Can Company- Chicago Stack 8 REX_SV42 Inside Bake Oven Stack # 2 – SV 42 14.021 0.823 6.921 449.817 1.7608 1.8310 0.9071Rexam Beverage Can Company- Chicago Stack 9 REX_RTO Regenerative Thermal Oxidizer Stack 15.240 1.158 7.615 488.706 0.6109 0.6352 0.3147Rexam Beverage Can Company- Kent Stack 1 SV7A Printer Pin Oven Stack 1 – SV 7A 14.630 0.558 4.828 422.039 0.6390 0.6035 0.6025Rexam Beverage Can Company- Kent Stack 2 SV7B Printer Pin Oven Stack 2 – SV 7B 14.630 0.558 4.828 444.261 0.6390 0.6035 0.6025Rexam Beverage Can Company- Kent Stack 3 SV7C Printer Pin Oven Stack 3 – SV 7C 16.612 0.914 1.797 397.039 0.6390 0.6035 0.6025Rexam Beverage Can Company- Kent Stack 4 SV7D Printer Pin Oven Stack 4 – SV 7D 14.630 0.610 4.043 399.817 0.6390 0.6035 0.6025Rexam Beverage Can Company- Kent Stack 5 SV8A Inside Spray Machines Bank 1 – SV 8A 13.503 0.838 2.138 299.817 0.2569 0.2427 0.2423Rexam Beverage Can Company- Kent Stack 6 SV8B Inside Spray Machines Bank 2 – SV 8B 14.173 0.838 2.138 299.817 0.2569 0.2427 0.2423Rexam Beverage Can Company- Kent Stack 7 SV8C Inside Spray Machines Bank 3 – SV 8C 13.198 0.850 2.079 299.817 0.2569 0.2427 0.2423Rexam Beverage Can Company- Kent Stack 8 SV8D Inside Spray Machines Bank 4 – SV 8D 13.716 0.838 2.138 299.817 0.2569 0.2427 0.2423Rexam Beverage Can Company- Kent Stack 9 SV9A Inside Bake Oven Stack # 1 – SV 9A 15.240 0.762 3.622 358.150 1.4562 1.3754 1.3732
Table E-8. Tier 3 Modeling Stack Parameters at Individual Facilities
Page 1 of 2

Facility Name Stack Stack ID Alternative Stack ID Release Height (m)
Stack Inside Diameter (m)
Stack Exit Gas Velocity (m/s)
Stack Temperature
(K)
2009 TRI Emission Rate
(g/s)a
2010 TRI Emission Rate
(g/s)a
2011 TRI Emission Rate
(g/s)a
Table E-8. Tier 3 Modeling Stack Parameters at Individual Facilities
Rexam Beverage Can Company- Kent Stack 10 SV9B Inside Bake Oven Stack # 2 – SV 9B 15.331 0.762 3.622 360.928 1.4562 1.3754 1.3732Rexam Beverage Can Company- Kent Stack 11 SV9C Inside Bake Oven Stack # 3 – SV 9C 15.331 0.762 3.622 366.483 1.4562 1.3754 1.3732Rexam Beverage Can Company- Kent Stack 12 SV9D Inside Bake Oven Stack # 4 – SV 9D 15.331 0.762 3.622 360.928 1.4562 1.3754 1.3732Rexam Beverage Can Company - Winston Salem Stack 1 WS1 14.000 0.457 6.096 394.261 17.2280 18.8603 13.2215Rexam Beverage Can Company - Winston Salem Stack 2 WS2 14.000 0.457 6.096 394.261 17.2280 18.8603 13.2215Rexam Beverage Can Company - Winston Salem Stack 3 WS3 14.000 0.457 6.096 394.261 17.2280 18.8603 13.2215Rexam Beverage Can Company - Winston Salem Stack 4 WS4 14.000 0.457 6.096 394.261 17.2280 18.8603 13.2215Rexam Beverage Can Company - Winston Salem Stack 5 WS5 14.000 0.457 6.096 394.261 17.2280 18.8603 13.2215
a. Individual stack emissions were based on total TRI Stack emissions and actual breakdown of EGBE emissions among individual stacksThe emission rate for each source is calculated from the TRI reported stack emissions of Certain Glycol Ethers as follows:
EGBE Emission Rate (g/s) = Stack TRI Emissions of Certain Glycol Ethers (tpy) x % EGBE x 254 (conversion factor) ÷ 2,000 (hrs/yr) x Stack_fractionThe calculated emission rate assumes the total annual EGBE emissions are relased over a period of 2,000 hours a year, which would correspondto a facility steadily emitting EGBE 40 hours a week, 50 weeks per year.Stack_fraction represents the percent of the total TRI stack emissions emitted through the individual stack
g/s: grams per secondK: degrees Kelvinm: meterm/s: meters per second
µg/m3: micrograms per cubic metertpy: ton per yearTRI: Toxic Release Inventory
Page 2 of 2

Table E-9. Tier 3 Modeling Fugitive Volume Parameters and Results at Individual Facilities
Site Name Source TypeVolume Release
Height (m) bVolume Intial
Lateral Dimension (m) c
Volume Intial Vertical
Dimension (m) d
2009 TRI Emission Rate
(g/s)e
2010 TRI Emission Rate
(g/s)e
2011 TRI Emission Rate
(g/s)e
Crown Beverage Packaging - Lawrence Volume 6.096 27.310 2.840 2.058 1.78813 2.00057
Crown Cork & Seal Co (USA) - Weirton Volume 9.144 14.120 4.253 4.770 4.53145 4.35020
Rexam Beverage Can Company- Bishopville Volume 10.668 28.840 4.960 1.821 1.82642 1.68442
Rexam Beverage Can Company- Chicago Volume 9.144 20.900 4.253 1.610 1.67733 0.76982
Rexam Beverage Can Company- Kent Volume 7.920 24.558 3.686 1.660 1.56814 1.56563
Rexam Beverage Can Company - Winston Salem Volume 7.000 27.242 3.250 3.389 3.73675 3.07813
a. Fugitive releases of EGBE are reported to occur through the building's roof vents in the productionarea of the facility building where stacks emitting EGBE are located. Fugitive emissions from the roofvents are modeled as a single volume source.
b. The volume source release height is taken to be at the release height of fugitive emissions;it is set to be equal to the roof height of the process building
c. Per EPA's AERMOD guidance, the volume source initial lateral dimension is taken to be the length of the side ofthe volume divided by 4.3.
d. Per EPA's AERMOD guidance, the volume source initial vertical dimension is taken to be theheight of the volume source (roof height) divided by 2.15.
e. The emission rate for each source is calculated from the TRI reported fugitive emissions of Certain Glycol Ethers as follows:EGBE Emission Rate (g/s) = Fugitive TRI Emissions of Certain Glycol Ethers (tpy) x % EGBE x 254 (conversion factor) ÷ 2,000 (hrs/yr)The calculated emission rate assumes the total annual EGBE emissions are relased over a period of 2,000 hours a year, which would correspondto a facility steadily emitting EGBE 40 hours a week, 50 weeks per year.
g/s: grams per secondhrs/yr: hours per yearm: metertpy: ton per yearTRI: Toxic Release Inventory

Facility Name Stack Stack ID Alternative Stack ID Release Height (m)
Stack Inside Diameter (m)
Stack Exit Gas Velocity (m/s)
Stack Temperature (K)
2009 TRI Emission Rate
(g/s)a
2010 TRI Emission Rate
(g/s)a
2011 TRI Emission Rate
(g/s)a
Rexam Beverage Can Company- Chicago Stack 1 REX_SV21 Printer Oven Stack # 1 – SV 21 13.100 0.396 9.580 366.500 0.6334 0.6586 0.3263Rexam Beverage Can Company- Chicago Stack 1 REX_SV22 Printer Oven Stack # 2 – SV 22 12.649 0.396 9.568 366.500 0.6334 0.6586 0.3263Rexam Beverage Can Company- Chicago Stack 1 REX_SV23 Base Coater Pin Oven Stack # 3 – SV 23 13.167 0.396 9.568 366.500 0.0063 0.0065 0.0032Rexam Beverage Can Company- Chicago Stack 4 RED_SV31 Inside Spray Machines Bank 1 – SV 31 12.192 1.097 2.495 294.261 0.3099 0.3223 0.1597Rexam Beverage Can Company- Chicago Stack 5 REX_SV32 Inside Spray Machines Bank 2 – SV 32 12.802 1.189 2.126 294.261 0.3099 0.3223 0.1597Rexam Beverage Can Company- Chicago Stack 6 REX_SV33 Inside Spray Machines Bank 2 – SV 33 13.716 0.914 3.593 294.261 0.0809 0.0841 0.0417Rexam Beverage Can Company- Chicago Stack 7 REX_SV41 Inside Bake Oven Stack # 1 – SV 41 14.021 0.762 8.072 449.817 1.7608 1.8310 0.9071Rexam Beverage Can Company- Chicago Stack 8 REX_SV42 Inside Bake Oven Stack # 2 – SV 42 14.021 0.823 6.921 449.817 1.7608 1.8310 0.9071Rexam Beverage Can Company- Chicago Stack 9 REX_RTO Regenerative Thermal Oxidizer Stack 15.240 1.158 7.615 488.706 0.6109 0.6352 0.3147Edsal Manufacturing Co Inc- Chicago Stack1 N/A 3960*** 9.144 0.396 2.743 294.260 3.2430 5.4361 4.2767Ball Metal Food Container Corp- Weirton Stack 1 BA5G_P1 0001 (Bldg 5G) 12.802 2.070 8.414 405.930 0.5597 0.3894 0.1606Ball Metal Food Container Corp- Weirton Stack 1 BA5D_PT1 TO-1 (Bldg 5D) 11.580 1.220 7.796 488.150 0.1777 0.1236 0.0510Ball Metal Food Container Corp- Weirton Stack 1 BA5D_PT2 TO-2 (Bldg 5D) 10.670 0.670 6.860 704.300 0.0888 0.0618 0.0255Ball Metal Food Container Corp- Weirton Stack 4 BA5D_P3 0003 (Bldg 5D) 10.050 0.640 1.659 649.800 0.1866 0.1298 0.0535Crown Cork & Seal Co (USA) - Weirton Stack 1 CR_PTO1 TO-1 11.000 1.219 16.149 659.150 3.3830 3.2138 3.0853Crown Cork & Seal Co (USA) - Weirton Stack 2 CR_PTO2 TO-2 17.000 0.597 13.492 773.150 4.5912 4.3616 4.1871Ardagh Metal Packaging USA Inc- Weirton Stack 1 AR_PC1 Coater #1 12.497 0.610 31.008 824.820 0.0366 0.0377 0.0076Ardagh Metal Packaging USA Inc- Weirton Stack 2 AR_PC2 Coater #2 14.330 0.610 9.147 783.150 0.0314 0.0323 0.0065Ardagh Metal Packaging USA Inc- Weirton Stack 3 AR_PC3 Coater #3 12.497 0.457 22.269 760.930 0.0288 0.0297 0.0060Ardagh Metal Packaging USA Inc- Weirton Stack 4 AR_PC4 Coater #4 12.190 0.457 15.447 745.370 0.0379 0.0391 0.0078Roll Coater- Weirton Stack 1 No stack parameters available. All emissions (stack + fugitives) modeled as a volume
a. Individual stack emissions were based on total TRI Stack emissions and actual breakdown of EGBE emissions among individual stacksThe emission rate for each source is calculated from the TRI reported stack emissions of Certain Glycol Ethers as follows:
EGBE Emission Rate (g/s) = Stack TRI Emissions of Certain Glycol Ethers (tpy) x % EGBE x 254 (conversion factor) ÷ 2,000 (hrs/yr) x Stack_fractionThe calculated emission rate assumes the total annual EGBE emissions are relased over a period of 2,000 hours a year, which would correspondto a facility steadily emitting EGBE 40 hours a week, 50 weeks per year.Stack_fraction represents the percent of the total TRI stack emissions emitted through the individual stack
g/s: grams per secondK: degrees Kelvinm: meterm/s: meters per second
µg/m3: micrograms per cubic meterTRI: Toxic Release Inventory
Table E-10. Tier 3 Modeling Stack Parameters and Individual Source Results in Clusters
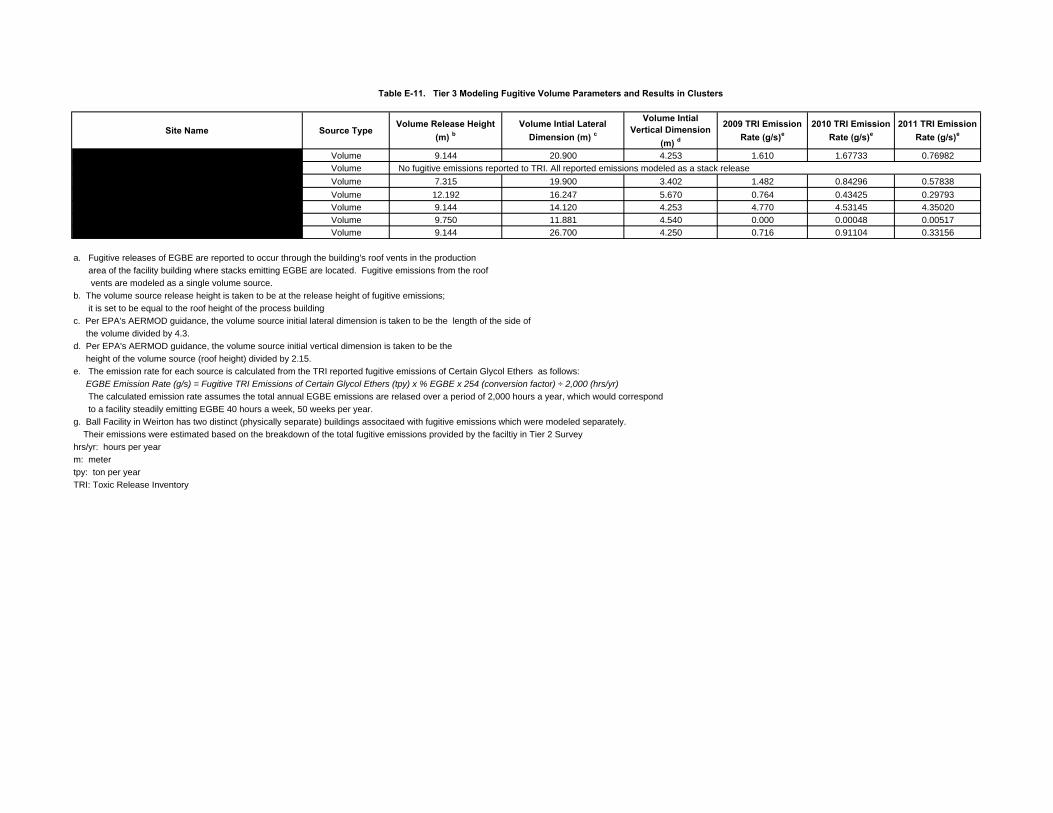
Site Name Source TypeVolume Release Height
(m) bVolume Intial Lateral
Dimension (m) c
Volume Intial Vertical Dimension
(m) d
2009 TRI Emission Rate (g/s)e
2010 TRI Emission Rate (g/s)e
2011 TRI Emission Rate (g/s)e
Rexam Beverage Can Company- Chicago Volume 9.144 20.900 4.253 1.610 1.67733 0.76982Edsal Manufacturing Co Inc- Chicago Volume No fugitive emissions reported to TRI. All reported emissions modeled as a stack release
Ball Metal Food Container Corp, Bldg_5D- Weirtong Volume 7.315 19.900 3.402 1.482 0.84296 0.57838
Ball Metal Food Container Corp, Bldg_5G- Weirtong Volume 12.192 16.247 5.670 0.764 0.43425 0.29793
Crown Cork & Seal Co (USA) - Weirton Volume 9.144 14.120 4.253 4.770 4.53145 4.35020
Ardagh Metal Packaging USA Inc- Weirton Volume 9.750 11.881 4.540 0.000 0.00048 0.00517
Roll Coater- Weirton Volume 9.144 26.700 4.250 0.716 0.91104 0.33156
a. Fugitive releases of EGBE are reported to occur through the building's roof vents in the production
area of the facility building where stacks emitting EGBE are located. Fugitive emissions from the roof
vents are modeled as a single volume source.
b. The volume source release height is taken to be at the release height of fugitive emissions;
it is set to be equal to the roof height of the process building
c. Per EPA's AERMOD guidance, the volume source initial lateral dimension is taken to be the length of the side of
the volume divided by 4.3.
d. Per EPA's AERMOD guidance, the volume source initial vertical dimension is taken to be the
height of the volume source (roof height) divided by 2.15.
e. The emission rate for each source is calculated from the TRI reported fugitive emissions of Certain Glycol Ethers as follows:
EGBE Emission Rate (g/s) = Fugitive TRI Emissions of Certain Glycol Ethers (tpy) x % EGBE x 254 (conversion factor) ÷ 2,000 (hrs/yr)
The calculated emission rate assumes the total annual EGBE emissions are relased over a period of 2,000 hours a year, which would correspond
to a facility steadily emitting EGBE 40 hours a week, 50 weeks per year.
g. Ball Facility in Weirton has two distinct (physically separate) buildings associtaed with fugitive emissions which were modeled separately.
Their emissions were estimated based on the breakdown of the total fugitive emissions provided by the faciltiy in Tier 2 Survey
hrs/yr: hours per year
m: meter
tpy: ton per year
TRI: Toxic Release Inventory
Table E-11. Tier 3 Modeling Fugitive Volume Parameters and Results in Clusters

APPENDIX F
Tier 2 and Tier 3 Modeling Output Files (CDROM)
Related Documents