Peterborough Utilities Commission Annual Drinking Water Report 2018

Welcome message from author
This document is posted to help you gain knowledge. Please leave a comment to let me know what you think about it! Share it to your friends and learn new things together.
Transcript
Peterborough
Utilities
Commission
Annual Drinking Water Report
2018

2018 Annual Drinking Water Report
2018 COMMISSION
Mayor Daryl Bennett............................... Chair Councillor Lesley Parnell ........................ Vice-Chair Councillor Gary Baldwin ......................... Commissioner Councillor Dave Haacke ......................... Commissioner Councillor Don Vassiliadis ...................... Commissioner
2018 RIVERVIEW PARK & ZOO ADVISORY COMMITTEE
Name of Volunteer Date Appointed Wally Davidson Lifetime Member Mike Kirkpatrick January 2016 Janet Lafortune January 2018 Dennis Carter-Edwards January 2018 Paul Hartung January 2018
On the Cover The newly designed and built Greencrest Booster Pumping Station, which is located at 1227 Sherbooke Street West, was commissioned in 2018 Questions or comments Please contact us either by mail, phone or email. PUG Services Corp. 1867 Ashburnham Drive, Peterborough, ON K9L 1P8 705-748-9300, ext. 1258 Patricia Skopelianos, Water Quality Assurance Manager [email protected]

2018 Annual Drinking Water Report
Inside this Report
INTRODUCTION ............................................................................................................. 1
DRINKING WATER PROCESS DESCRIPTION ............................................................. 1
Source Water ............................................................................................................... 1
Treatment Plant Operations ......................................................................................... 1
Reservoirs, Elevated Tanks, Water Booster Pumping Stations ................................ 2
Water Distribution......................................................................................................... 2
Water Main Replacement.......................................................................................... 2
New Water Main Installation ..................................................................................... 3
Water Service Replacement ..................................................................................... 3
Water Main Rehabilitation ......................................................................................... 3
SUMMARY OF INSPECTION & COMPLIANCE ............................................................. 3
Ministry of Environment Conservation & Parks Inspection ........................................... 3
Adverse Water Quality Incidents .................................................................................. 3
WATER FLOWS ............................................................................................................. 4
Permit to Take Water ................................................................................................... 4
Treated Water Production ............................................................................................ 4
WATER QUALITY RESULTS ......................................................................................... 5
Chlorine Residual ......................................................................................................... 5
Turbidity ....................................................................................................................... 5
E coli ............................................................................................................................ 6
Total Coliform ............................................................................................................... 6
Inorganic Parameters ................................................................................................... 7
Organic Parameters ..................................................................................................... 7
Trihalomethanes -THM ................................................................................................ 8
Haloacetic Acid ............................................................................................................ 9
Sodium ......................................................................................................................... 9
Lead ............................................................................................................................. 9
Summary Report .......................................................................................................... 9
Taste and Odour ........................................................................................................ 10
CHEMICAL CONSUMPTION ........................................................................................ 11
Chlorine ...................................................................................................................... 12
Hydrofluorosilicic Acid (Fluoride) ................................................................................ 12
Sodium Silicate .......................................................................................................... 12
Aluminium Sulphate (Alum) ........................................................................................ 12
DRINKING WATER QUALITY MANAGEMENT SYSTEM ............................................ 13
Water Treatment Plant ............................................................................................... 13
Water Distribution....................................................................................................... 13
2018 Annual Drinking Water Report
CAPITAL WORKS SUMMARY ..................................................................................... 13
Water Treatment Plant Capital Upgrades .................................................................. 13
IMPACT OF CLIMATE EVENT ..................................................................................... 13
PILOT PLANT ............................................................................................................... 14
Ozone and Advanced Oxidation ................................................................................. 14
Chloramination ........................................................................................................... 14
Corrosion Control ....................................................................................................... 15
CUSTOMER SERVICE ................................................................................................. 15
Customer Calls ........................................................................................................... 15
Tours .......................................................................................................................... 15
Water Rates ............................................................................................................... 16
RIVERVIEW PARK & ZOO ........................................................................................... 18
Park Operation & Facilities ......................................................................................... 18
Zoo Operations & Facilities ........................................................................................ 18
Capital Program ......................................................................................................... 19
Revenue Contributions ............................................................................................... 19
Zoo Animal Collection ................................................................................................ 20
Conservation & Education .......................................................................................... 20
Research .................................................................................................................... 21
Special Events ........................................................................................................... 21
Staff & Volunteers ...................................................................................................... 21
APPENDIX A – FINANCIAL STATEMENT ................................................................... 22
APPENDIX B – ABBREVIATIONS ................................................................................ 37

2018 Annual Drinking Water Report
P a g e | 1
Introduction All Peterborough Utilities Commission facilities are managed and operated under contract by PUG Services Corp. (PUG). The Water Utility section of PUG includes the following operating departments:
Water Treatment Plant
Water Distribution
Riverview Park and Zoo
Drinking Water Process Description Source Water The source of raw (untreated) water for Peterborough’s drinking water is the Otonabee River. The Otonabee River water is of good quality and can be described as a moderately coloured water of low turbidity. The river water temperature ranges from 0°C (winter) to approximately 26°C (summer). The raw river water is what we call a surface water supply, which means that it is considered to be an unprotected source.
Accordingly, we assume that raw water always requires full treatment at the Peterborough Water Treatment Plant to make it drinkable or potable.
The river water quality is monitored by staff at the plant as well as the Otonabee Region Conservation Authority (ORCA) and the Peterborough Health Unit (beaches only).
The watershed is protected by planning and approvals processes through the City of Peterborough and ORCA. Since 1998, ORCA has monitored water quality in the Otonabee watershed under the Watershed 2000 Program and the Provincial Water Quality Monitoring Network. Peterborough Utilities continued its participation in the Source Water Protection Committee in 2018. Treatment Plant Operations The plant is located at 1230 Water Street North, Peterborough, adjacent to the Riverview Park & Zoo. The plant was initially built in 1922 and expanded in 1952, 1965, 1995 and 2016. The conventional treatment process includes coagulation, flocculation, sedimentation, filtration and chlorine disinfection and a process waste treatment facility to dewater the backwash sludge.
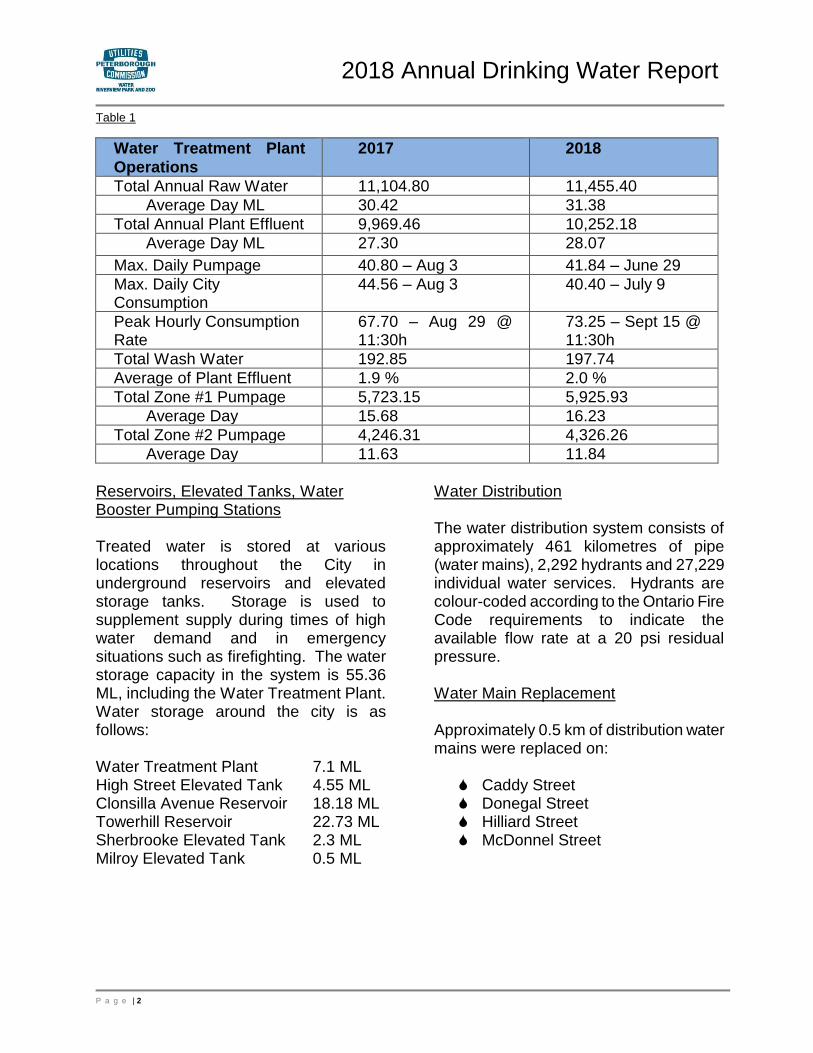
Total raw water processed in 2018 was 11,455.40 megalitres (ML), this is an average of 31.38 ML daily (Table 1). The maximum daily pumpage of 41.84 ML, occurred on June 29th, was a 2.5% increase from the maximum daily value (40.80 ML) recorded on August 3rd, 2017.
2018 Annual Drinking Water Report
P a g e | 2
Table 1
Water Treatment Plant
Operations
2017 2018
Total Annual Raw Water 11,104.80 11,455.40
Average Day ML 30.42 31.38
Total Annual Plant Effluent 9,969.46 10,252.18
Average Day ML 27.30 28.07
Max. Daily Pumpage 40.80 – Aug 3 41.84 – June 29
Max. Daily City Consumption
44.56 – Aug 3 40.40 – July 9
Peak Hourly Consumption Rate
67.70 – Aug 29 @ 11:30h
73.25 – Sept 15 @ 11:30h
Total Wash Water 192.85 197.74
Average of Plant Effluent 1.9 % 2.0 %
Total Zone #1 Pumpage 5,723.15 5,925.93
Average Day 15.68 16.23
Total Zone #2 Pumpage 4,246.31 4,326.26
Average Day 11.63 11.84
Reservoirs, Elevated Tanks, Water Booster Pumping Stations Treated water is stored at various locations throughout the City in underground reservoirs and elevated storage tanks. Storage is used to supplement supply during times of high water demand and in emergency situations such as firefighting. The water storage capacity in the system is 55.36 ML, including the Water Treatment Plant. Water storage around the city is as follows: Water Treatment Plant 7.1 ML High Street Elevated Tank 4.55 ML Clonsilla Avenue Reservoir 18.18 ML Towerhill Reservoir 22.73 ML Sherbrooke Elevated Tank 2.3 ML Milroy Elevated Tank 0.5 ML
Water Distribution The water distribution system consists of approximately 461 kilometres of pipe (water mains), 2,292 hydrants and 27,229 individual water services. Hydrants are colour-coded according to the Ontario Fire Code requirements to indicate the available flow rate at a 20 psi residual pressure. Water Main Replacement Approximately 0.5 km of distribution water mains were replaced on:
Caddy Street Donegal Street Hilliard Street McDonnel Street
2018 Annual Drinking Water Report
P a g e | 3
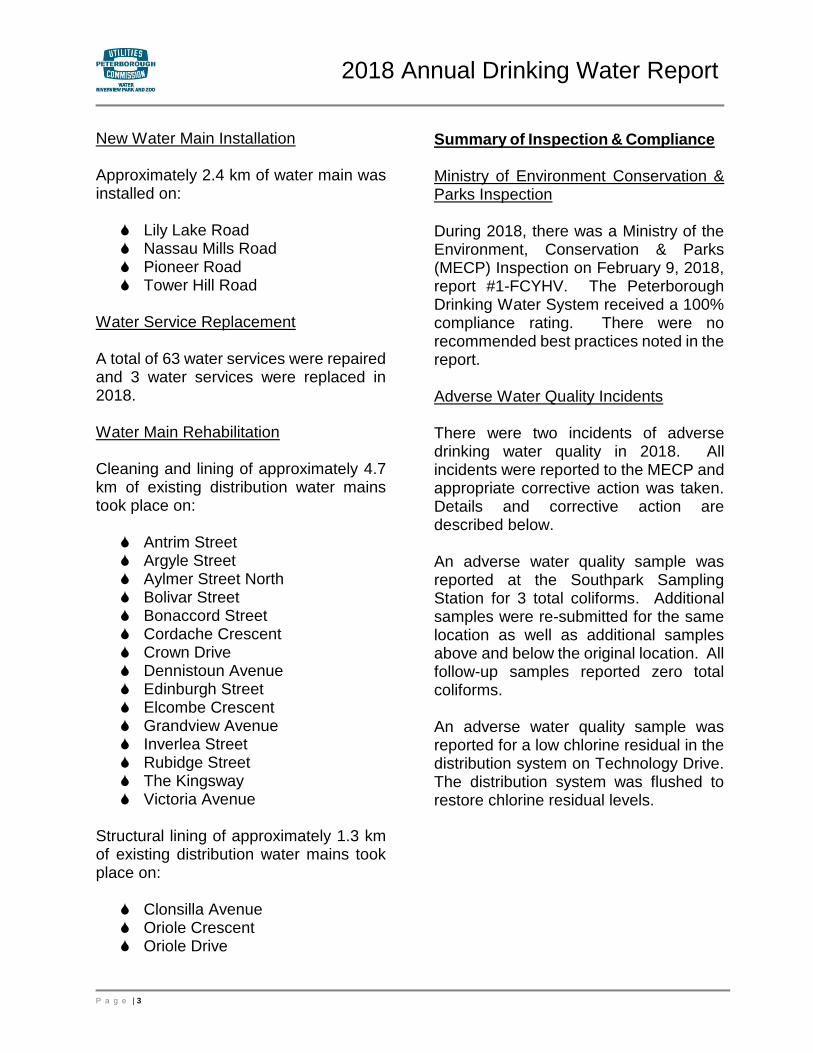
New Water Main Installation Approximately 2.4 km of water main was installed on:
Lily Lake Road Nassau Mills Road Pioneer Road Tower Hill Road
Water Service Replacement A total of 63 water services were repaired and 3 water services were replaced in 2018. Water Main Rehabilitation Cleaning and lining of approximately 4.7 km of existing distribution water mains took place on:
Antrim Street Argyle Street Aylmer Street North Bolivar Street Bonaccord Street Cordache Crescent Crown Drive Dennistoun Avenue Edinburgh Street Elcombe Crescent Grandview Avenue Inverlea Street Rubidge Street The Kingsway Victoria Avenue
Structural lining of approximately 1.3 km of existing distribution water mains took place on:
Clonsilla Avenue Oriole Crescent Oriole Drive
Summary of Inspection & Compliance Ministry of Environment Conservation & Parks Inspection During 2018, there was a Ministry of the Environment, Conservation & Parks (MECP) Inspection on February 9, 2018, report #1-FCYHV. The Peterborough Drinking Water System received a 100% compliance rating. There were no recommended best practices noted in the report. Adverse Water Quality Incidents There were two incidents of adverse drinking water quality in 2018. All incidents were reported to the MECP and appropriate corrective action was taken. Details and corrective action are described below. An adverse water quality sample was reported at the Southpark Sampling Station for 3 total coliforms. Additional samples were re-submitted for the same location as well as additional samples above and below the original location. All follow-up samples reported zero total coliforms. An adverse water quality sample was reported for a low chlorine residual in the distribution system on Technology Drive. The distribution system was flushed to restore chlorine residual levels.

2018 Annual Drinking Water Report
P a g e | 4
Water Flows Permit to Take Water The Ontario Water Resources Act, Regulation 387/05 authorized Peterborough Utilities Commission in accordance with Permit to Take Water, 5167-9BVR6A the withdrawal of 190.68 ML per day. Under this Regulation we are required to report the daily water taking annually by March 31 each year. In 2018, there were no instances of water taking in excess of this daily limit. The total volume of water pumped into the Water Treatment Plant was 11,455.40 megalitres (ML), this is an average of 31.38 ML daily.
Treated Water Production The Water Treatment Plant produced 10,252.18 megalitres (ML) in 2018, this is an average of 28.07 ML daily (Table 1). Historically the highest water consumption recorded was in 1980 (18,621.20 ML). Peterborough Utilities meters water usage and the majority of water usage in 2018 was by industrial, institutional and large commercial users. There was a certain amount of water used for distribution system maintenance in order to maintain the water quality in the distribution system.
Figure 1
10,252.18
10000
11000
12000
13000
14000
15000
16000
17000
18000
19000
Meg
ali
tres
Treated Water Production

2018 Annual Drinking Water Report
P a g e | 5
Water Quality Results No known health-related water quality guidelines for inorganic (Table 2) and organic (Table 3) parameters were exceeded in 2018 in Peterborough’s drinking water. In order to ensure that Peterborough’s water is safe to drink; water quality is carefully monitored and subject to constant surveillance. In addition to continuous monitoring of turbidity, chlorine, fluoride and pH levels at the Water Treatment Plant, thousands of water samples are taken each year for chemical, physical and microbiological tests. These tests are carried out on water samples before and after treatment as well as on samples collected from different points in the water distribution system. A total of approximately 20,000 individual tests were performed on Water Treatment Plant and water distribution samples in 2018. Approximately 13,000 individual tests were performed in the Water Treatment Plant Laboratory and approximately 6,000 microbiological and chemical tests were performed by Peterborough Environmental Protection Laboratory and SGS Lakefield Research Limited. Results of the laboratory testing continue to confirm that the Peterborough Water Treatment Plant produces good quality water and this quality is maintained throughout the water distribution system to the customer’s tap. O. Reg. 169/03 contains the Ontario Drinking Water Quality Standards (ODWQS). The purpose of the Province’s ODWQS is to establish parameter limits to protect public health.
An exceedance of any parameter would result in an adverse water quality event with notification to the Medical Officer of Health and the MECP. Appropriate corrective action would have to be initiated to address the adverse incident. Chlorine Residual The Peterborough Water Treatment Plant uses chlorine for disinfection against viruses and bacteria in accordance with O. Reg. 170/03. Sample results reported under Schedule 7 for plant effluent were 0.63 -2.66 mg/L. Turbidity The average raw water turbidity in 2018 was 0.48 NTU; average during 2017 was 0.44 NTU. The monthly raw water turbidity peak occurred in August at 0.66 NTU as shown in Figure 2. The past 20-year average raw water turbidity was 0.57 NTU and treated water turbidity was 0.09 NTU. The zebra mussel population in the river could also be a contributing factor for the cyclical increase and decreases in raw water turbidity. Raw water turbidity has slowly dropped since 2008. The performance criteria for filtered water is 0.30 NTU for 95% of the time, without exceeding 1.0 NTU. The average filtered water turbidity was 0.04 NTU for 2018 and in 2017 was 0.05 NTU. Filters are taken off-line when the turbidity reaches 0.15 NTU. The 2018 average treated water turbidity was measured at 0.08 NTU.

2018 Annual Drinking Water Report
P a g e | 6
Figure 2
0
0.1
0.2
0.3
0.4
0.5
0.6
0.7
Tu
rbid
ity (
NT
U)
Month
Average Monthly Turbidity 2018
Raw Water Plant Effluent Average Settled
Microbiological Standards Testing E coli During 2018, a total of 233 E. coli samples were analyzed from the Otonabee River (at the WTP intake) to assist in determining the source of fecal contamination within our source water. Monthly values ranged from 0 to 120 Colony Forming Units (CFU) per litre. A total of 1478 E. coli samples were analyzed from the plant effluent and distribution system. In 2018, there were no instances where E coli was detected in the potable drinking water.
Total Coliform The MECP guidelines for clostridium perfringens is to have all samples collected from the plant effluent to be zero CFU per litre of water sampled. While the MECP does not require this parameter to be tested, the bacteria is analyzed as an indicator of treatment efficiency for protection from parasitic protozoan giardia and cryptosporidium.

2018 Annual Drinking Water Report
P a g e | 7
Inorganic Parameters Table 2
Schedule 23 2018 Results MAC
Antimony mg/L <0.00002 0.006 Arsenic mg/L <0.00002 0.025 Barium mg/L 0.0237 1.0 Boron mg/L 0.017 5.0 Cadmium mg/L 0.000004 0.005 Chromium mg/L 0.00008 0.05 Mercury mg/L <0.00001 0.001 Selenium mg/L 0.00004 0.01 Uranium mg/L 0.00003 0.02
Organic Parameters Table 3
Schedule 24 2018 Results MAC
Alachlor mg/L <0.00002 0.005 Atrazine + N-dealkylated metabolites
mg/L <0.00001 0.005
Azinphos-methyl mg/L <0.00005 0.02 Benzene mg/L <0.00032 0.005 Benzo(a)pyrene mg/L <0.000004 0.00001 Bromoxynil mg/L <0.00033 0.005 Carbaryl mg/L <0.00005 0.09 Carbofuran mg/L <0.00001 0.09 Carbon Tetrachloride mg/L <0.00016 0.005 Chlorpyrifos mg/L <0.00002 0.09 Diazinon mg/L <0.00002 0.02 Dicamba mg/L <0.0002 0.12 1,2-Dichlorobenzene mg/L <0.00041 0.2 1,4-Dichlorobenzene mg/L <0.00036 0.005 1,2-Dichloroethane mg/L <0.00035 0.005 1,1-Dichloroethylene (vinylidene chloride)
mg/L <0.00033 0.014
Dichloromethane mg/L <0.00035 0.05 2,4-Dichlorophenol mg/L <0.00015 0.9 2,4-Dichlorophenoxy acetic acid (2,4-D)
mg/L <0.00019 0.1
Diclofop-methyl mg/L <0.0004 0.009 Dimethoate mg/L <0.00003 0.02 Diquat mg/L <0.001 0.07 Diuron mg/L <0.00003 0.15 Glyphosate mg/L <0.001 1

2018 Annual Drinking Water Report
P a g e | 8
Schedule 24 2018 Results MAC
Malathion mg/L <0.00002 0.19 2-Methyl-4-chlorophenoxyacetic acid
mg/L <0.00012 0.00012
Metolachlor mg/L <0.00001 0.05 Metribuzin mg/L <0.00002 0.08 Monochlorobenzene mg/L <0.0003 0.08 Paraquat mg/L <0.001 0.01 Pentachlorophenol mg/L <0.00015 0.06 Phorate mg/L <0.00001 0.002 Picloram mg/L <0.001 0.19 Polychlorinated Biphenyls (PCB)
mg/L <0.00004 0.003
Prometryne mg/L <0.00003 0.001 Simazine mg/L <0.00001 0.01 Terbufos mg/L <0.00001 0.001 Tetrachloroethylene (perchloroethylene)
mg/L <0.00035 0.03
2,3,4,6-Tetrachlorophenol mg/L <0.0002 0.1 Triallate mg/L <0.0001 0.23 Trichloroethylene mg/L <0.00044 0.005 2,4,6-Trichlorophenol mg/L <0.00025 0.005 Trifluralin mg/L <0.00002 0.045 Vinyl Chloride mg/L <0.00017 0.002
Trihalomethanes -THM In Ontario, the Ministry of the Environment Conservation & Parks MAC for total THM’s (total concentration of chloroform, bromoform, bromodichloromethane and dibromochloromethane) are set to 100
g/L (annual average) for the distribution system. According to O. Reg. 170/03, distribution THM samples must be collected and analyzed quarterly. Trihalomethanes (THM’s) are formed as a by-product when chlorine is used to disinfect water for drinking. The presence of organic materials along with the use of chlorine in the water treatment process can contribute to the formation of disinfection by-products. The THM’s may have adverse health effects at high concentrations and many governments
set limits on the amount permissible in drinking water. The THM average values found leaving the Water Treatment Plant during 2018
was 39 g/L. The past 10-year average
plant effluent has been 43 g/L. Distribution levels are always found to be higher than those leaving the Water Treatment Plant since THM’s continue to form as the water travels through the distribution piping system. During 2018, one distribution location was selected to assist in determining areas of the city where THM’s may be highest. The annual average 2018 THM value in the
distribution system was 77 g/L (Figure 3). The average THM value during 2017 was
78 g/L. The 10-year average of distribution THM concentration was found
to be 76 g/L.

2018 Annual Drinking Water Report
P a g e | 9
Figure 3
0
20
40
60
80
100
120
1st Quarter 2nd Quarter 3rd Quarter 4th Quarter
TH
M (
ug
/L)
2018 Total Trihalomethanes
Plant Effluent Distribution (Spillsbury S.S.)
Haloacetic Acid HAA’s are another group of chemicals that are formed as disinfection by-products similar to trihalomethanes (THM). The 2018 average treated water HAA was
36.6 g/L and the average distribution
sample was found to be 69.6 g/L. O Reg. 170/03 was amended to include HAAs in 2020. The regulatory limit for distribution
samples will be 80 g/L; therefore, the Peterborough Drinking Water would maintain compliance to this upcoming legislative change. Sodium Sodium is not part of Schedule 23 or 24 but is required to be tested at least once every five (5) years. It has been sampled every year and was found to be below the ODWS aesthetic objective of 200 mg/L. In 2018, the sodium result was found to be 10.6 mg/L (was 8.68 mg/L in 2017). The local MOH must be notified when the sodium concentration exceeds 20 mg/L so that this information may be passed on to local physicians.
Lead Lead sampling is required under O. Reg. 170/03, schedule 15.1. Peterborough requires 8 distribution samples to be collected and analyzed for lead, pH and alkalinity plus two non-residential samples every sampling period. Peterborough is required to sample any residential house in the city that requests sampling for the same parameters mentioned above. Summary Report The summary of water delivered as per O. Reg. 170/03 Schedule 22 in 2018 is in Table 4.

2018 Annual Drinking Water Report
P a g e | 10
Table 4
Month
Average Day (M3/d)
Maximum Day (M3/d)
Peak Flows (L/m)
January 26,260 27,714 19,246
February 25,588 30,050 20,868
March 25,031 27,082 18,807
April 25,303 27,603 19,169
May 28,792 33,755 23,441
June 32,855 41,838 29,054
July 34,099 39,597 27,498
August 32,665 38,131 26,480
September 30,121 33,743 23,433
October 26,350 28,831 20,022
November 25,288 28,337 19,678
December 24,503 30,490 21,174
Rated Capacity ---- 104.00 ----
Approved Flowrate ---- 190.68 132,743 L/m
Taste and Odour
During 2018, the primary source of taste and odour in our raw water was from the naturally occurring compounds geosmin (name derived from the Greek ‘earth’ and ‘smell’) and 2-MIB (2-methylisoborneol). These compounds are monitored as a precursor to taste and odour complaints (earthy/musty) of the water and are not a health concern. They can be detected by humans at very low levels (less than
10g/L). The bacteria actinomycetes, zebra mussels and some species of algae can produce geosmin and 2-MIB, though all of the contributing organisms are not known. Observations have shown that when we have greater zebra mussel and/or algae populations we experience higher amounts of geosmin and 2-MIB. Previous annual data indicates that geosmin and 2-MIB would hit peaks at the same time during the summer months. There is usually a large peak near the end of the summer when the water temperature is highest and sunlight hours are high. The concentration peaks for
both taste and odour causing compounds occurred approximately August to November. Geosmin is thought to originate higher in the water column and produce an earthy odour. The average raw water value
during 2018 was 5.8 g/L and the average
plant treated water was 6.8 g/L (Figure 4). The 2-MIB is produced in the sediment or benthic layer and gives off a musty odour. 2-MIB can reproduce well when sunlight can penetrate down to the bottom of lakes and streams. The average raw water
value during 2018 was 2.1 g/L and the
average plant effluent was 2.4 g/L (Figure 5). The reduction of geosmin and 2-MIB due to water treatment processes (coagulation, sedimentation, filtration and chlorination) was negligible. Both geosmin and 2-MIB compounds resist oxidation (disinfection) and are difficult to remove by conventional water treatment processes.

2018 Annual Drinking Water Report
P a g e | 11
Figure 4
0
2
4
6
8
10
12
14
Geo
sm
in (
ng
/L)
Month
2018 Average Monthly Geosmin
Raw Water Plant Effluent
Figure 5
0
5
10
15
2-M
eth
yli
sob
orn
eo
l (n
g/L
)
Month
2018 Average Monthly 2-Methylisoborneol (2-MIB)
Raw Water Plant Effluent
Chemical Consumption Table 5
Chemical Use 2017 2018
Total Chlorine 36,337 kg 40,422 kg
Average Dosage 1.27 mg/L 1.23 mg/L
Total Aluminum Sulphate 802,010 L 807,321 L
Average Dosage 47.3 mg/L 46.1 mg/L
Total Hydrofluosilicic Acid 11,827 L 24,298 L
Average Dosage 0.62 mg/L 0.67 mg/L
Total BW46M Sodium Silicate
124,451L 21,071
Average Dosage 6.7 mg/L 7.4 mg/L
2018 Annual Drinking Water Report
P a g e | 12
Chlorine The average dose of chlorine for 2018 was 1.23 mg/L (Table 5). This value fluctuates throughout the year as higher doses of primary chlorine are required during the summer months because it takes more chlorine to disinfect the water when the water is warmer. Chlorine is also added into the treated water before it leaves the WTP. This secondary chlorine is added to help maintain the chlorine residual throughout the distribution system to comply with the Ontario Drinking Water Standards (ODWS). Zebra mussel control for the Water Treatment Plant included adding approximately 0.5 mg/L of chlorine into the Water Treatment Plant intakes from May to October. The addition of zebra mussel chlorine is dosed only during the months when there are warmer water temperatures (usually when water temperature is above 12°C). This is when the zebra mussels will colonize on surfaces such as the intake pipe walls. Hydrofluorosilicic Acid (Fluoride) Hydrofluorosilicic acid (fluoride) was added to the treated water to attain a combined concentration (target value) of 0.70 mg/L. Fluoride is added to the water depending on the total concentration required in the treated water and also the concentration of the raw water. The average dosage of fluoride added to the water in 2018 was approximately 0.62 mg/L (Table 5). The average treated water fluoride residual was 0.65 mg/L. The average fluoride concentration found in the raw water (natural fluoride) during 2018 was 0.12 mg/L.
Sodium Silicate Sodium silicate (BW46) is normally added to the plant effluent for corrosion control within the distribution system as well as plant effluent pH adjustment. The use of chlorine and aluminium sulphate (alum) during the water treatment process lowers the pH level causing the water to be slightly acidic (corrosive). The addition of BW46 increases the pH to a more acceptable value of 7.1. The addition of BW46 contributes to the total silica level found in the water. The level of silica in the distribution system is monitored monthly. Silica levels throughout the distribution system generally ranged between 2.0 mg/L and 14.0 mg/L with an annual average of 5.1 mg/L. Aluminium Sulphate (Alum) Aluminium Sulphate (Alum) is used as our primary coagulant causing particles (silt, sand, algae, and bacteria) to coagulate or ‘clump’ to form a floc, which can settle in the sedimentation basins. The water is further treated by filtration. Alum was added to the water during 2018 at an average rate of 46.1 mg/L (Table 5). The average alum dosage during 2017 was 47.3 mg/L. Aluminium residual found in the WTP treated water can be a by-product of the addition of alum. The average treated water Aluminium residual for 2017 was 0.026 mg/L the Operational Guideline for Aluminium is 0.1 mg/L.

2018 Annual Drinking Water Report
P a g e | 13
Drinking Water Quality Management
System On October 30, 2006, the finalized standard was issued on the Environmental Bill of Rights Registry. The purpose of this Standard is to assist owners and operating authorities in the effective management and operation of their municipal residential drinking water systems. This Standard outlines requirements for a Quality Management System (QMS) to ensure high quality drinking water. In the development of a QMS, the Operating Authority must create an Operational Plan; this document will define the QMS and will be subject to external audits for accreditation. Staff developed and implemented a QMS specific to the Peterborough municipal water system, which received full scope accreditation in June 2011. The Peterborough Drinking Water System maintained accreditation to the Drinking Water Quality Management Standard (DWQMS). In advance of the on-site verification audit an internal audit was conducted in September 2018. The internal audit found four opportunities for improvement and no corrective action that all were corrected before the external audit. The external audit, conducted in October 2018 described that the management system was well documented and continues to be effective. Water Treatment Plant Annual maintenance was conducted at the Water Treatment Plant, Water Street Pumphouse, reservoirs, elevated tanks and booster pumping stations. Two of the pad mount transformers that feed primary
power to the Water Treatment Plant via Utility #1 and Utility #2 failed and required replacing. Water Distribution Annual water distribution review and maintenance programs are necessary to ensure the safe delivery of drinking water in Peterborough. These programs include:
Valve maintenance Hydrant maintenance Dead end flushing Service post repair
Capital Works Summary Water Treatment Plant Capital Upgrades The major capital project of replacing Greenhill underground Pumping Station with Greencrest above ground Pumping Station was completed and the station was fully commissioned by the end of October.
Impact of Climate Event The temperature during June, July and August averaged approximately 17.5°C. 21.8°C and is considered to be slightly above normal summertime temperature according to published values from Environment Canada (normal data 1981 – 2010). The summer months in 2018 were hotter than normal with 24 days where temperatures were higher than 30°C. Rainfall totals for the three summer months of June, July and August was 234.7 mm, this is considered to be normal rainfall values for the three summer months.

2018 Annual Drinking Water Report
P a g e | 14
Pilot Plant The Peterborough Water Treatment Plant has conducted pilot-scale studies in an effort to optimize production, improve water quality, and investigate next-generation treatment technologies. A 5000:1 scale-model version of the main treatment facility, the pilot plant includes processes such as coagulation, tapered mixing, flocculation, settling and filtration . In addition to conventional water treatment studies, ozone and advanced oxidation applications have been investigated. The primary objectives using the ozone pilot were to determine if ozone, advanced oxidation, and biofiltration will enhance our water quality and provide operational flexibility as an integral component of our multi-barrier approach to water treatment.
In 2018, chloramination studies were initiated to evaluate the formation of monochloramines as a secondary disinfectant. Chloramination studies were conducted to investigate water treatment techniques that will improve water quality, mitigate taste and odour compounds, while still using our existing infrastructure. Our primary objectives were to focus on the reduction of disinfection by-product (DBP) formation and increased stability of secondary disinfectant in our distribution. In order to evaluate our current corrosion control program, distribution pipe-loop systems were designed and installed in order to simulate worst-case premise plumbing conditions (Figure 7). The pipe-loop systems were installed to evaluate treatment technologies on distribution corrosion and assess alternative corrosion inhibitors.
Ozone and Advanced Oxidation Our current studies focused on optimizing ozone dose and integration into full-scale applications as a next generation technology. Previous research at our facility has shown the effectiveness of ozone, advanced oxidation, and biofiltration in the removal of DBP precursors and taste and odour compounds, geosmin and 2-methylisoborneol. In 2018, the ozone residual was reduced from 0.5 mg/L to 0.1 mg/L prior to filtration in an effort to reduce operational costs and streamline integration with our water treatment facility. The reduced ozone dose was shown to be effective in the amelioration of trihalomethanes (THMs) and haloacetic acids (HAAs) by 30% and 40%, respectively. Ozone applied pre-filtration was also shown to improve filter performance, reduce natural organic matter, and decrease our chlorine demand. Chloramination
The application of chloramination as a secondary disinfectant was investigated in an effort to improve water quality through the mitigation of DBP formation. Simulated distribution studies were performed to replicate residence time in our distribution system. Water quality analysis was completed for DBP formation, monochloramine stability, and the formation of nitrates and nitrites. The primary uncertainties were if chloramination would reduce DBP formation of THMs and HAAs, or subsequently cause an increase in nitrogen-based DBP formation, including nitrosodimethylamine (NDMA).

2018 Annual Drinking Water Report
P a g e | 15
Our simulated distribution studies showed that monochloramine formation provided increased stability as a secondary disinfectant in our distribution system. Increased stability of a secondary disinfectant has the potential to improve water quality aesthetics, mitigate taste and odour complaints, and reduce operational costs. Chloramination resulted in a 30% reduction in THMs and a 42% reduction in HAA formation. The formation of NDMA, nitrites, and nitrates remained well below regulatory guidelines.
Corrosion Control Pipe-loop systems were monitored in the distribution in order to simulate worst-case premise plumbing conditions. Our current corrosion inhibitor, sodium silicate, was shown to be effective in mitigating lead release through increased pH and not through silicate lining of pipes. Current studies are examining alternative chemicals to increase pH and alkalinity to mitigate potential lead release in premise plumbing in an effort to reduce corrosion and enhance public health.
Customer Service Customer Calls Customer concerns relating to water are tracked by WTP staff and logged using computer software. Some questions and concerns that were asked from our WTP staff were related to taste and odour, colour, hardness, general water quality, information on water treatment, sampling, operations, and questions to assist with school projects on water treatment. In 2018, staff responded to a total of 26 inquiries, this was an increase of 8% from 2017. The 26 inquiries were related to the following concerns; 38% of customer concern calls were relating to colour (usually rusty coloured water), 4% were relating to particulate matter, a total of 50% relating to taste & odour, and 8% relating to bacteriological concerns (Figure 5).
In every inquiry regarding bacteriological issues, the water was tested for bacteria and none was found. A further breakdown of the 13 taste and odour complaints revealed the following: 7 concerns were for an earthy musty odour, 2 concerns were for a chlorine taste and odour, and 4 concerns were for various other taste and odours, from metallic to medicinal. Tours Tours have been an important part of public education at the Peterborough Water Treatment Plant. Over 273 people had a tour of the Water Treatment Plant process during 2018 (over 2,611 people in the last 10 years).
2018 Annual Drinking Water Report
P a g e | 16
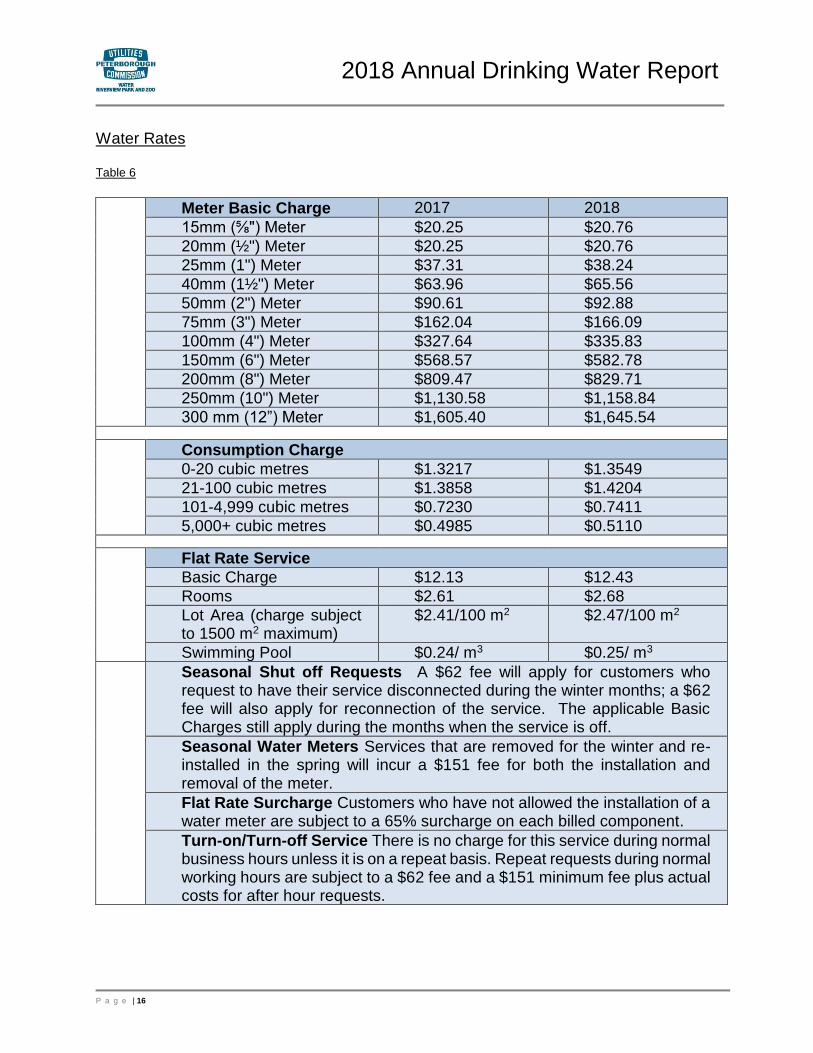
Water Rates Table 6
Meter Basic Charge 2017 2018
15mm (⅝") Meter $20.25 $20.76
20mm (½") Meter $20.25 $20.76
25mm (1") Meter $37.31 $38.24
40mm (1½") Meter $63.96 $65.56
50mm (2") Meter $90.61 $92.88
75mm (3") Meter $162.04 $166.09
100mm (4") Meter $327.64 $335.83
150mm (6") Meter $568.57 $582.78
200mm (8") Meter $809.47 $829.71
250mm (10") Meter $1,130.58 $1,158.84
300 mm (12”) Meter $1,605.40 $1,645.54
Consumption Charge
0-20 cubic metres $1.3217 $1.3549
21-100 cubic metres $1.3858 $1.4204
101-4,999 cubic metres $0.7230 $0.7411
5,000+ cubic metres $0.4985 $0.5110
Flat Rate Service
Basic Charge $12.13 $12.43
Rooms $2.61 $2.68
Lot Area (charge subject to 1500 m2 maximum)
$2.41/100 m2 $2.47/100 m2
Swimming Pool $0.24/ m3 $0.25/ m3
Seasonal Shut off Requests A $62 fee will apply for customers who request to have their service disconnected during the winter months; a $62 fee will also apply for reconnection of the service. The applicable Basic Charges still apply during the months when the service is off.
Seasonal Water Meters Services that are removed for the winter and re-installed in the spring will incur a $151 fee for both the installation and removal of the meter.
Flat Rate Surcharge Customers who have not allowed the installation of a water meter are subject to a 65% surcharge on each billed component.
Turn-on/Turn-off Service There is no charge for this service during normal business hours unless it is on a repeat basis. Repeat requests during normal working hours are subject to a $62 fee and a $151 minimum fee plus actual costs for after hour requests.

2018 Annual Drinking Water Report
P a g e | 17
Table 7
Number of Customer Accounts 2018
Metered Flat Rate
Residential 25,964 122
Industrial, Institutional, Commercial & Multi- Residential
2,134 140
Woodland Acres 1 0
28,099 262
Total 28,361
Figure 5

2018 Annual Drinking Water Report
P a g e | 18
Riverview Park & Zoo In 2018 Riverview Park and Zoo was open and operating during regular hours (8:30 AM – dusk) from January 1st to December 31st. Attendance was somewhat hit and miss and thought to be lower than normal due to the rainy start to the summer with total annual attendance estimated at more than 333,000 visitors. Ongoing improvements to the facilities and equipment continued in 2018 and included upgrades to several animal exhibits, accessibility upgrades, a new dental unit for the Animal Health Centre and continuation of the rehabilitation of the miniature train rail bed. The zoo’s animal collection saw many changes in 2018 with the deaths of some of our older animals as well as new acquisitions. Deaths included a red-rumped agouti, our oldest reindeer, a Gouldi’s monkey, a serval, and our older Sichuan takin, “Quentin”. New animals included two domestic yaks, a new young male Sichuan Takin, two woodland caribou, and the hatching of a red-billed hornbill chick.
Park Operation & Facilities The miniature train ride opened for Victoria Day weekend. The ride ran daily (weather permitting) from May 18th until September 22nd. Ridership was good with an estimated 67,000 train riders in 2018.
The Kiwanis Club of Peterborough operated the Snack bar again in 2018 daily from May through September 4th and on weekends in the fall until Thanksgiving Day. Snack bar profits remained high for the third year in a row. Proceeds from the snack bar were shared between the Park and Zoo and the Kiwanis Club of Peterborough. Zoo Operations & Facilities Regular and emergency veterinary care was provided by consulting veterinarian Dr. John Sallaway throughout 2018. Park and Zoo animal care staff worked with Dr. Sallaway throughout the year to provide planned animal health care to the animals in our collection. Animals were examined and/or treated as part of their health care program. This included physical exams, surgery, numerous vaccinations/ treatments, blood samples, the trimming of many hooves/claws/beaks/tusks, dentistry and dental cleaning. In 2018, there were 5 births and 14 deaths of animals during the year. Post mortems were performed on those animals that had died in an attempt to determine cause of
2018 Annual Drinking Water Report
P a g e | 19
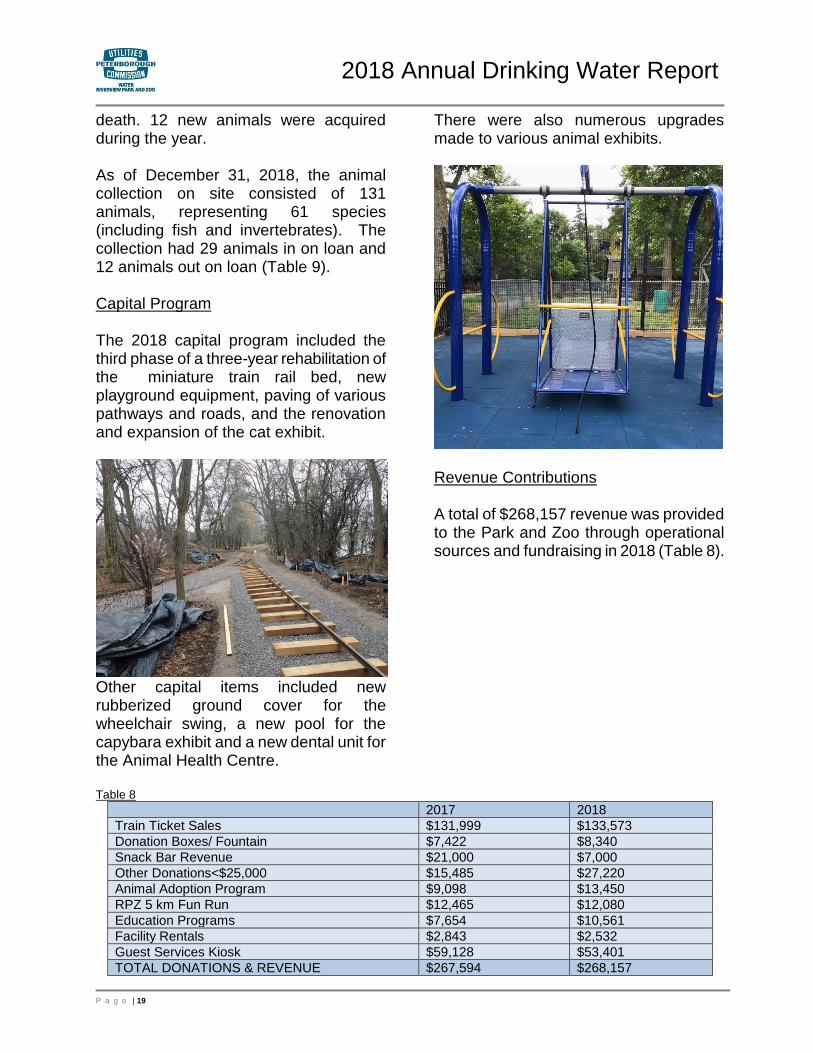
death. 12 new animals were acquired during the year. As of December 31, 2018, the animal collection on site consisted of 131 animals, representing 61 species (including fish and invertebrates). The collection had 29 animals in on loan and 12 animals out on loan (Table 9). Capital Program The 2018 capital program included the third phase of a three-year rehabilitation of the miniature train rail bed, new playground equipment, paving of various pathways and roads, and the renovation and expansion of the cat exhibit.
Other capital items included new rubberized ground cover for the wheelchair swing, a new pool for the capybara exhibit and a new dental unit for the Animal Health Centre. Table 8
There were also numerous upgrades made to various animal exhibits.
Revenue Contributions A total of $268,157 revenue was provided to the Park and Zoo through operational sources and fundraising in 2018 (Table 8).
2017 2018
Train Ticket Sales $131,999 $133,573
Donation Boxes/ Fountain $7,422 $8,340
Snack Bar Revenue $21,000 $7,000
Other Donations<$25,000 $15,485 $27,220
Animal Adoption Program $9,098 $13,450
RPZ 5 km Fun Run $12,465 $12,080
Education Programs $7,654 $10,561
Facility Rentals $2,843 $2,532
Guest Services Kiosk $59,128 $53,401
TOTAL DONATIONS & REVENUE $267,594 $268,157

2018 Annual Drinking Water Report
P a g e | 20
Zoo Animal Collection Table 9
Ja
nu
ary
1,
20
18
Bir
th/
Hath
cin
gs
Dea
ths
Acq
uis
itio
ns
Dis
po
sitio
n
Dece
mb
er
31
,
20
18
# ANIMALS OWNED ON SITE 106 6 18 131 123 102
# ANIMALS IN ON LOAN 31 0 1 3 0 29
# ANIMALS OUT ON LOAN 8 0 2 0 0 12
Conservation & Education The 2018 education program continued to grow and benefited from strong support from our volunteers and our partnership with the School of Education at Trent University. Last year’s program included Educators with roving “touch-tables”, public speaking engagements, “behind–the-scenes” tours, the parent & tot “Zoo Crew” program, formal guided tours, our "Zoo Academy" and "Zoo Trek" half-day curriculum-based day sessions as well as the new Turtle Trek joint-facility program developed in partnership with the Ontario Turtle Conservation Centre. The Park and Zoo also collaborated with Otonabee Conservation to deliver the renowned Bondar Challenge education program at Riverview and the Warsaw Caves Conservation Area. Developed by The Roberta Bondar Foundation, the Bondar Challenge is a unique experiential program that helps children make a connection to nature through the art of photography. Other programming included the “Meet the Keeper” sessions, custom sessions for visiting groups, sleepover programs for Brownies/Scouts, the Homeschool Spelling Bee, and our seasonal conservation exhibit. In 2018, the “Community of Conservation” exhibit featured contributions from several local
conservation organizations including Camp Kawartha, Peterborough Green Up, Otonabee Conservation, the Ontario Turtle Conservation Centre, Peterborough Distribution Inc., etc. and included a series of conservation events/activities. In 2018, the Park and Zoo’s conservation program included cooperative projects with the Otonabee Region Conservation authority as well as supporting the Ontario Turtle Conservation Centre’s conservation work by donating heat lamp bulbs, turtle feed (smelt) and equipment. The Park and Zoo also participated in the Association of Zoos and Aquariums (AZA) Stud Book for red-necked wallaby, Sichuan takin and bobcat. We also participated in the African red-billed hornbill, Goeldi’s monkey, meerkat and squirrel monkey AZA Species Survival Plans, the Emu and Brazilian agouti Population Management Plans. We were also instrumental in the “rescue” of 133 tropical fish that required care and rehoming following the death of a local private collector. Park and Zoo staff worked closely with staff from Kawartha Aquariums, the OSPCA, and Peterborough Humane Society to move the fish, ten aquariums and all of the associated equipment, etc. to the Park and Zoo. We then provided care for the fish until we arranged placement for them at CAZA-Accredited facilities.

2018 Annual Drinking Water Report
P a g e | 21
Research In 2018 the Park and Zoo participated in the Ontario Turtle Conservation Centre’s Blanding’s Turtle research project as well as hosting research projects by university biology and conservation biology students. Special Events The following events were hosted at the Riverview Park & Zoo:
17th Annual Peterborough Children’s Water Festival,
Eight musical groups performed in the 2018 summer season at the Gazebo,
The 9th annual 5 km Fun Run with the Animals, raising $10,000 for the Zoo.
Hosting the Rotary Spelling Bee
Staff & Volunteers As of December 2018, permanent staff included 1 Manager and Curator, 1 Supervisor, 1 Groundskeeper, 1 Animal Care Tech., 3 Zookeepers and 1 Park & Zoo Maintenance.
From May to August a total of 18 seasonal student employees assisted with Park and Zoo operations. Student employee positions included 3 zookeepers, 1 zoo maintenance worker, 2 public educators, 2 Guest Services representatives, 2 park maintenance workers, 4 horticulture/ groundskeeping workers and 4 train operators. A total of 5 student employees worked part-time hours starting in September. The students operated Guest Services on weekends until Thanksgiving, assisted with workload in the park until the end of October, and assisted zoo staff on weekends for the remainder of the calendar year. The Park and Zoo hosted five college/university student placements over the year as well as two high school co-op placement students. In 2018 the Volunteer Program continued to have strong support with a total of 28 volunteers assisting with our education program, and the operation of our seasonal conservation exhibit.

2018 Annual Drinking Water Report
P a g e | 22
Appendix A – Financial Statement

2018 Annual Drinking Water Report
P a g e | 23

2018 Annual Drinking Water Report
P a g e | 24

2018 Annual Drinking Water Report
P a g e | 25
2018 Annual Drinking Water Report
P a g e | 26

2018 Annual Drinking Water Report
P a g e | 27
2018 Annual Drinking Water Report
P a g e | 28

2018 Annual Drinking Water Report
P a g e | 29
2018 Annual Drinking Water Report
P a g e | 30

2018 Annual Drinking Water Report
P a g e | 31
2018 Annual Drinking Water Report
P a g e | 32
2018 Annual Drinking Water Report
P a g e | 33

2018 Annual Drinking Water Report
P a g e | 34

2018 Annual Drinking Water Report
P a g e | 35

2018 Annual Drinking Water Report
P a g e | 36
2018 Annual Drinking Water Report
P a g e | 37
Appendix B – Abbreviations
2-MIB 2-methlisoborneol
CFU Colony Forming Unit
COD Chemical Oxidization Demand
CTS Calcium Thiosulphate
DBP Disinfection by-product
DWQMS Drinking Water Quality Standard
DWRG Drinking Water Research Group
EDC Endocrine disrupting compounds
HAA Haloacetic Acid
KM Kilometers
L/m Litres per Minute
m2 Square Meters
m3 Cubic Meters
MAC Maximum Acceptable Concentration
mg/L Milligram per Litre
ML Megalitres
MECP Ministry of Environment & Climate Change
MOH Medical Officer of Health
g/L Nanogram per Litre
NTU Nephelometric Turbidity Unit
ODWQS Ontario Drinking Water Quality Standards
ORCA Otonabee Region Conservation Authority
ORP Oxidative Reduction Potential
PACL Polyaluminum Hydroxychloride
PUC Peterborough Utilities Commission
PUG Peterborough Utilities Services Inc.
RP& Z Riverview Park & Zoo
STS Sodium thiosulphate
THM Trihalomethane
TOC Total Organic Carbon
µg/L Microgram per Litre
UVA Ultra Violet Absorbance
WTP Water Treatment Plant

2018 Annual Drinking Water Report
Related Documents


