Peter Brandt authored one of the most authoritative books ever written on the subject of trading with classical chart patterns (now out of print and hard to find). He was also one of Commodity Corporation's most successful trading advisors during the late 1980s. The following is Peter Brandt's presentation from the MTA's 1989 Annual Seminar in Naples, Florida (exact date unknown). Daniel L. Chesler October 2004

Welcome message from author
This document is posted to help you gain knowledge. Please leave a comment to let me know what you think about it! Share it to your friends and learn new things together.
Transcript
Peter Brandt authored one of the most authoritative books ever written on the subject of trading
with classical chart patterns (now out of print and hard to find). He was also one of Commodity
Corporation's most successful trading advisors during the late 1980s. The following is Peter
Brandt's presentation from the MTA's 1989 Annual Seminar in Naples, Florida (exact date
unknown).
Daniel L. Chesler October 2004

"CLASSICAL CHARTING PRINCIPLE"
"AN EDWARDS AND MAGEE' APPROACH TO TRADING FUTURES MARKETS”
I have been trading futures markets for about 15 years. For 13
of these years, my primary method of trading has been Edwards and
Magee chart patterns.
Today I am going to talk about how I use Edwards and Magee to
trade the futures markets, and for those of you familiar with
E&M as trading practitioners, I will share some experiences I
have had with a trading technique based on chart formations.
First, let me say that from the standpoint of analysis, I am
probably as pure an E&M trader as is possible. For the most
part, all of my analysis is limited to basic formation identifi-
cation. I do not follow the Elliot Wave Theory or Gann. I do
not follow fundamentals or monitor such things as oscillators,
relative strength, advance/decline or stochastics. Nor do I pay
a whole lot of attention to open interest or volume (with one
exception which I will comment on later). The only tool that I
use in trading outside chart patterns is a 13-day moving ave-
rage. That I use to provide me with some sort of handle on
trend.
so, with these preliminaries aside, let's get down to business,
and to basics.

When many of us think of classical charting prjnciples -- of H&S,
triangles, gaps, support and resistance, trendlines and the like,
we think of John Magee and Robert Edwards and their 1948 book
"Technical Analysis of Stock Trends". The reality is that it was
through marriage that John Magee became knowledgable on classical
charting.
In the early 1900's, the FinancialEditor of Forbes was a guy by the
name of Richard W. Schabacker, Schabacker was a financial journalist,
but he was also an ardent student of the markets. He observed
that the markets did not always act in concert with what the funda-
mental events seemed to dictate. He concluded that there had to
be something else besides fundamentals that drove the markets and
spent the remainder of his life searching for answers.
His conclusion was that:
1, Major market moves were (and are)
engineered by large trading interests.
2. That these trading interests did not
necessarily act as a single group,
nor were they always aware of each
other's identity. But they were
operating with similar minds and
motivatior.
7

3. That major price mark-ups and mark-
downs were almost always preceded
by the "right" people doing the
"right" things. In other words,
major moves required preparation.
4. That by graphing prices and volume,
the activities of large interests
could be detected.
From a more practical trading standpoint, Schabacker came to sev-
eral conclusions:
1. That any given market, at any given
time, was either in a sustained trend
or moving up and moving down without
any real price progress (what we call
today a trading range or consolidation).
2, That during the periods of consolidation,
prices, when plotted on a graph, tended
to form recognizable geometric configurations.
3. That depending on the exact geometric pattern
formed, the direction and magnitude of the
next sustained trend could be determined with
above average confidence.
?lT.A JOURXiL/?lAY 1989

While Schabackcr published several books on investing in the stock
market, none of these books dealt with his work on classical
charting techniques.
John Magee married Schabacker 's daughter and became owner of all
Schabacher's notes. That is the origin of the Edwards and Magee
book.
Without any additional comments at this time,
figurations identified by Schabacker include:
Consolidation Patterns
Head and Shoulders
Rounding (Common) Turn
Symmetrical Triangle
Right Angle Triangle
Broadening Triangle
Diamond
Wedge
Double Top/Bottom
"M" and "W" Patterns
Horn
Drooping/Accelerating Pattern
those geometric con-
Trend Patterns
Gaps
Flags
Pennants
Channel
Double Channel
Cradle
Trendlines

Of course, this is a very simplified list. In his unpublished
manuscripts, Schabacher discussed many variations, nuances,
conditions and exceptions to charting techniques.
Now, before I proceed to discuss exactly what I look for in
charts, I want to make some very, very important points on the
use of charts.
1, Charting is more of an art than science.
Successful chart interpretation takes time,
study and effort.
2, Charts can be misread, much in the same way
as a Wave Count can be prostituted.
3. Charting is a trading tool, not a means
for price forecasting. People who use
chart books to make grand economic fore-
casts are in dangerous territory. Charts
should be used for timing trading maneuvers,
not for formulating fundamental opinions.
4, Even the most well-defined and seemingly
perfect chart pattern is subject to failure.
10 .YTA JOL?F3~/.blhY 1989

5. Not every market, all of the time! can
be understood using classical chart
principles. The real danger is trying
to fit a chart interpretation to all
markets all of the time. More often
than not, a given market will defy clas-
sical charting principles.
6. It is very easy to over analyze a chart.
The temptation for a novice chartist is
to keep studying a chart until something
is made of it. The mentality is one of . . .
"there has got to be something on this chart
and I have to find it". My experience is that
chart patterns pop off the page; that legit-
imate chart patterns will find us. We don't
need to find them. My rule is that if I have
to spend over 15 seconds on a chart, it is
time to turn the page.
These six points are extremely important, and should never be under-
stated.
I maintain daily, weekly and monthly bar charts and closing price
charts on 24 markets. I do not chart livestock, OJ, Coffee, Oats,
11

Lumber, and some of the stock indexes. Wherever possible, my
preference is to use cash market charts, for instance, the DOW,
NY Composite Index and all of the currency markets.
My own personal trading is broken down into two categories.
These are:
1. Every pattern trading. Recognizable patterns are appearing
constantly. These may consist of such things as 2 or 3 week
head and shoulders or triangle, a 5 or 6 week trendline, an 8
week double bottom or a 6 week wedge. My experience is that on
average, a given market will provide about 12 to 15 recognizable
classical chart patterns per year of some degree.
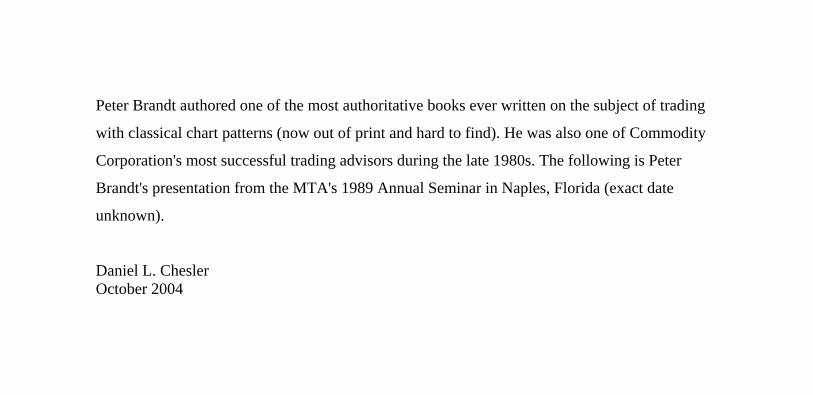
The following graph of Soybean Oil, which I find to be an excel-
lent classical charting market, demonstrates my point.
Here we find a series of 10 recognizable classical chart develop-
ments over a period of 8 l/2 months (from mid-July, 1988 through
late March, 1989). There were actually 3 other patterns I had
drawn in Bean Oil during this time period, but I did not want to
clutter the graph any more than it was.
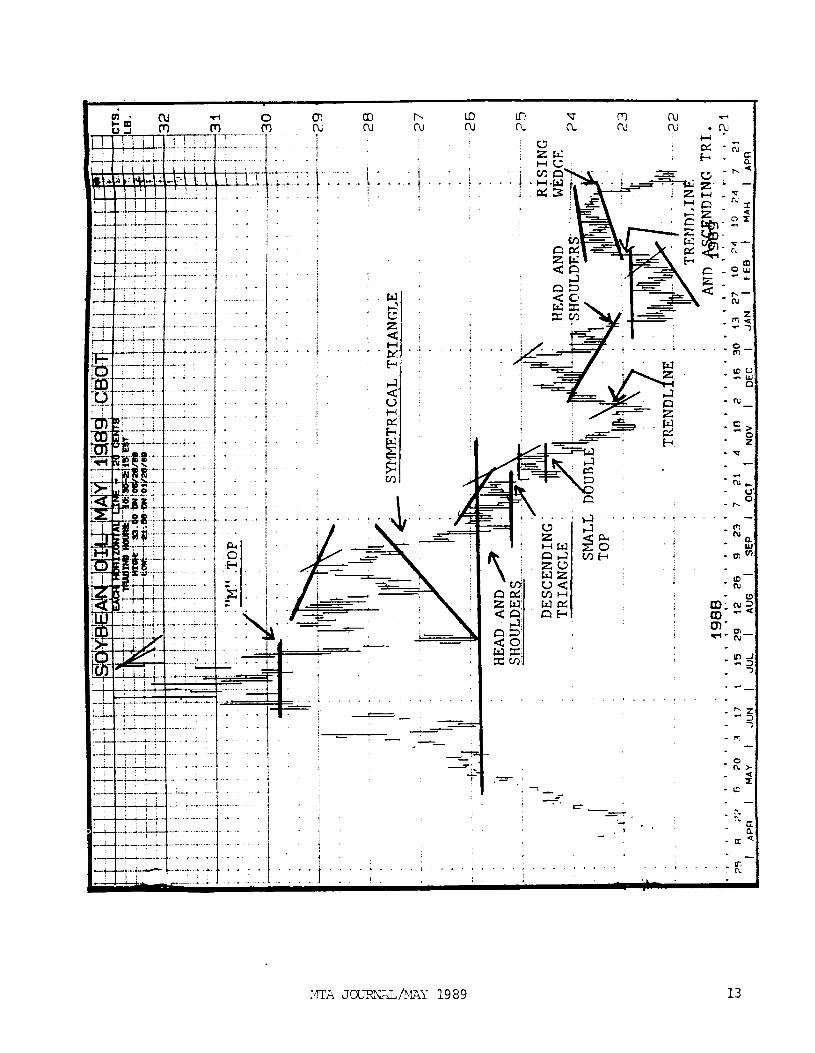
Also in the handout book available, I include a graph on the
Swiss Franc and Crude Oil.
12
CD ru
m RI 1 i
I f .T’- ‘-’
.._.
-J-+-T -CL.-.
.
.
_ .
* .
.
. .
.
.
- . .
. .
_ .
. .
.
.
.
.
. . _ .
’ . I * ; - 11..
. .
. . . ! . . - : .
. . . . i
/
. . . , . . . * , . ! &. * ..J f A -=-: = _A :- -
+-fy?$ i ]L -. _
. -i, . - M
L -f=,
iq- _’ L ,.._.._..... .,
-- =
‘- ,- -- 7 --
-.
.- 2
_ . - -
__ . -.
. ‘.
_ ._ . . . . . . . . .._
. .
. .
. . I
. .
13
_^_.._ ___. .-. ..-..
TWIN& IlOWS
. ..- -. -.... -. . _ _ - . _ _ . _ . _ _.
r , _ . _ ._._ - . 1.. .;.-;
_. _..- ‘._ _______ _____, _ . .._ -- _..__ ____ ,............-. ---- .- _- -...---..--.-c- C_I---...-_
. . .
-_.
. . . . .
TBLAN.GLE. e! t .! ‘..: .._._..__.__ -._--. _. _____ I
- _ .._ _._ +.--,--.- ;
- . _ -Illi 11 _ ; _ _ ._ .._ ..__._; ; /
1988 . . . . . . . . .._ -2. I . , . , , , , . . 1 3 1 1 . . , .t . .~. ,.. T .f.._._.T ._, _T T--T------- . . . . . . . . . . . . . . . . . * * 12
6 20 3 17 ! 15 29 12 26 9 23 7 21 4 18 2 16 30 13 27 10 24 10 24 7 21
, MAY 1 JUN t JJ, 1 AUG 1 SEP 1 OCT 1 NOV t DEC 1 JAN 1 FEB i MAR I APR I
14
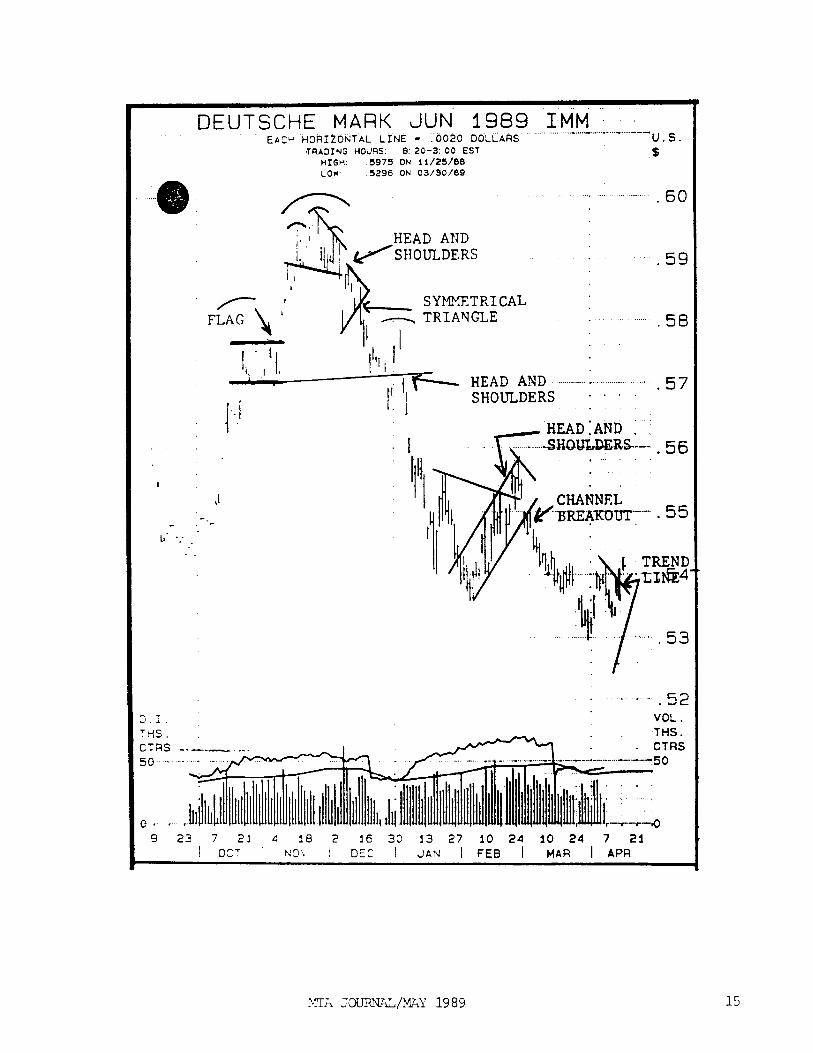
DEUTSCHE MARK JUN 1989 IMM. ‘. EAPP HORItONTAL LINE - .b020 DOLiAhS
. . ..__....~__._.._....~.....~ . ..- U.S.
TRADING HO@X: 8: 20-3: 00 EST d HIGH: .5973 ON ii/25/00
LOW 5290 ON 03/30/09 .. ....... . 60
.’ .59
F-, HEAD AND __..._.___ : .._._..........__. . 57 SHOULDERS * * .
._. ._ _ . 52 =i.:. VOL.
. THS. . CTRS
I 9 23 7 OCT 21 4 N3\ la 2 I I 1 DEC 16 30 1 JAN 13 27 1 FEB 10 24 1 IO MAR 24 1 7 APR 21
15

So that is one part of my personal trading: taking action on
every identifiable pattern development, regardless of its
magnitude or implied price move.
The general rules I follow in this trading program include:
1. I assume the position at the break-out
point. I do not anticipate the break-out.
2. If a market closes back within the
boundaries of a completed pattern, I cover.
3. If I am out $300 a contract, I cover.
4. I take profits at the objective.
As a general rule, I trade one contract of each signal per $50,000
in capital. I do not pay attention to Relative Strength or
Stochastics or contrary opinion or volume or open interest.
One comment on volume. Volume is more important in stocks than
in commodities, In stocks, volume can always be compared to
a known constant -- the float. In commodities, we create open
interest regardless of a fixed supply, and therefore, volume has
to be treated differently.
16

In this portion of my trading, I will usually trade between
25 to 35 signals per month. When I wrote this 'speech in April,
I took a look at the previous 3 months. Out of 91 trades,
there were 31 profits or 34%. That means that 66% of the trades
were losers. But further, the net bottom line profit for all
91 trades was represented by only 4 trades. Less than 5% of the
trades put in the bottom line.
More importantly, I am sure I would not have been able to predict
which 5% it would have been before the fact.
And that is why I don't like to have market opinions.
positions, yes. But market opinions, no.
Market
I mentioned that this approach is only one of two I use in trading.
And it is the least important of the two.
2. Major Market Moves. I believe that the real compensation in
the markets does not come from trading positions, but by holding
positions,
The other part of my trading is an all out concentration toward
identifying the really big move.
My experience is that there are between 10 and 25 really sizable
price moves in futures each year.
NTA JOUR@,.L/r\"L;Y 1989 17

I define the ingredients of these moves with the following:
1. E&M measured move objective of $3 to 5,000
per contract.
2. Major chart development on the daily chart.
3. Technical significance on the weekly and/
or monthly price chart.
Let's take a look at the past 12 months to identify this type of
situation in retrospect, and then look at the current markets
to see if we have any situations currently taking form.
I will only cover a couple of examples. A more complete listing
is in my handout materials.
GOLD - In January, 1988 two things happend in Gold. On the weekly
chart, a major trendline was penetrated. On the daily chart, a
massive rectangle was completed. Notice how a symmetrical triangle
launched the major breakout, Often in a major move, a pattern will
develop just prior to the launch.
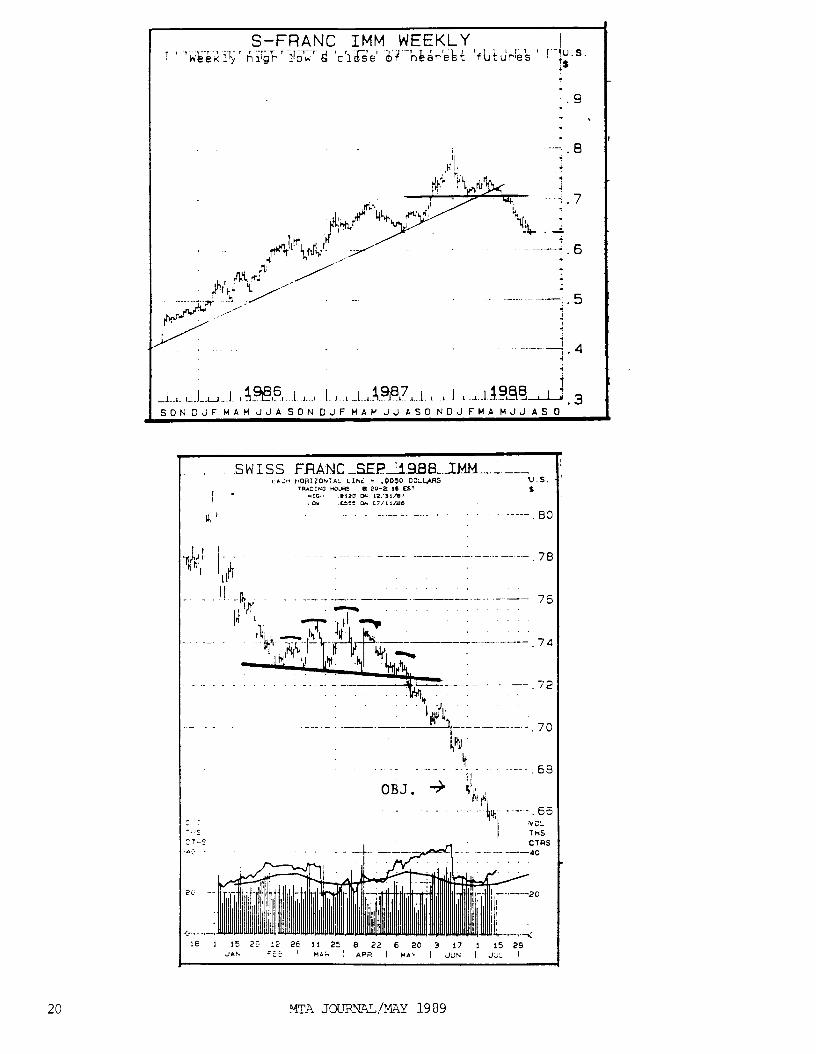
SWISS FRANC - In May, 1988 the Swiss completed a complex continuation
head and shoulders pattern. At the same time, the major trendline
from the 1985 low was being penetrated.
18 -PITA JOU3TZL/MAY 1989

--___-. - GOLD COb$X, W,EEKLY H.L.C. T-TI-. - -.-- , .
__-.---. - --- -_----.. .
.--A-. 4425
‘325
Y ---- - 1.4
L,. ,..l_..,~.l. I WF, i 1 I I 1 L .-.I. 1 W?.., I L L I L A.1 v3LL-J , 3 SONDJFHAHJJASONDJFHAb’JJASONDJFHAMJJASO
5.. -.-, :E 1 15 25 :7 26 1, 25 8 22 6 20 3 17 1 15 29
JAk =:i. 1 n.4; ’ IPR I WPI’ 1 JU’. 1 JLI, 1
20
PORK. .BECCIES-..CME .-wEEKrui
-I eklyl high idw klclode of nebrest f&i?
i Pi ___ - ___ -.__ -. __~ _____ ..____- ._... - .---+ ;g
f 4
.- .-..-. . .- -;6 e -
:5
_.___ ..__ _ ̂ _._ - . . . . -.. -. .
.
I 1 1. .1-l P!R ,. 1.12 ASONOJFHAMJJASONOJFHAMJJASO
21

___--.- ..--.--A _-.-, 15 .
22
II ’
__ ._
---
--.
-.
I CRB FUTURES PRICE INDEX (!99!=100) _.__- -. ~----‘--:-ig;L:y ‘*;p 1c.d 0 ..05e’ . .r-.. -_ .” ; . .--7., .1-r-&
-.. -j210
: - ----;2oc
1
23

KANSAS CITY WHEAT WEEKLY ----. . . .._ .-... ---.-~.. - _-_-_ We e k 1, n 1 g h 10 w -6Fj d Se”- iFiiG r’e’5--Fbei u<e 5
.-. __-_- ___-. -. .-.-.-_ ..-..- -
.---
--,+----- 3oc
-. ‘7
I- . q:
.~-- -.--._~. -.- _ __ ______- 260
24
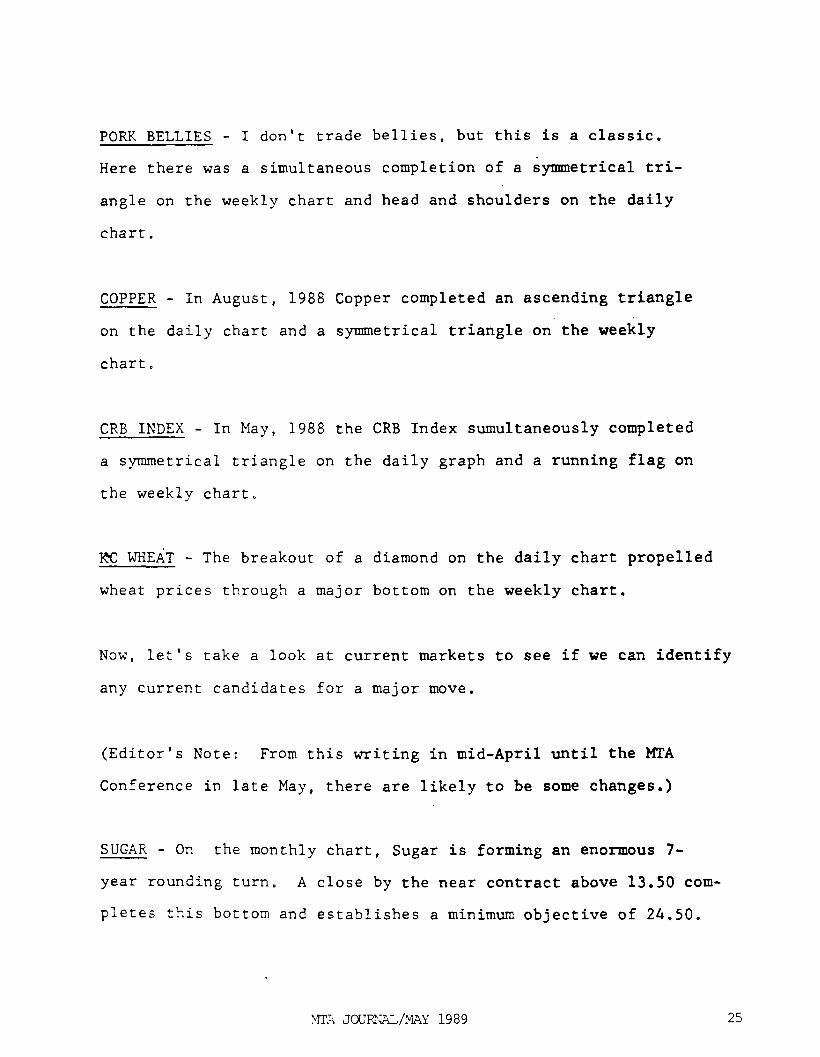
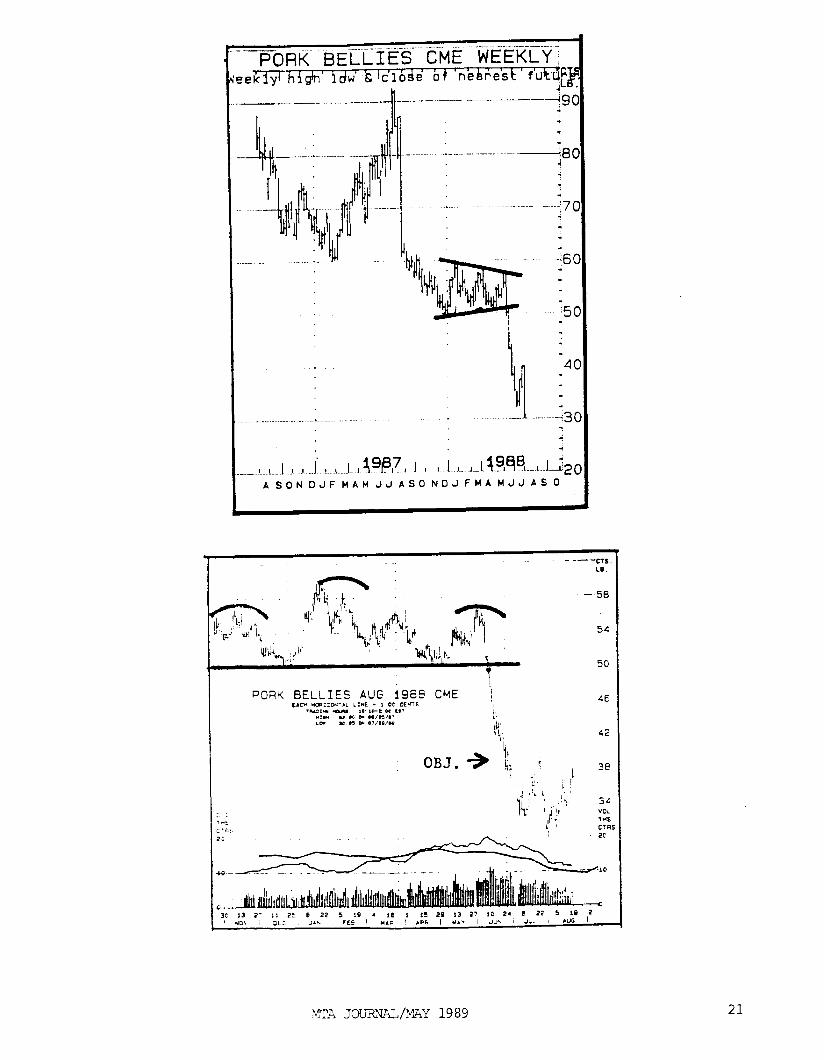
PORK BELLIES - I don't trade bellies, but this is a classic.
Here there was a simultaneous completion of a symmetrical tri-
angle on the weekly chart and head and shoulders on the daily
chart.
COPPER - In August, 1988 Copper completed an ascending triangle
on the daily chart and a symmetrical triangle on the weekly
chart.
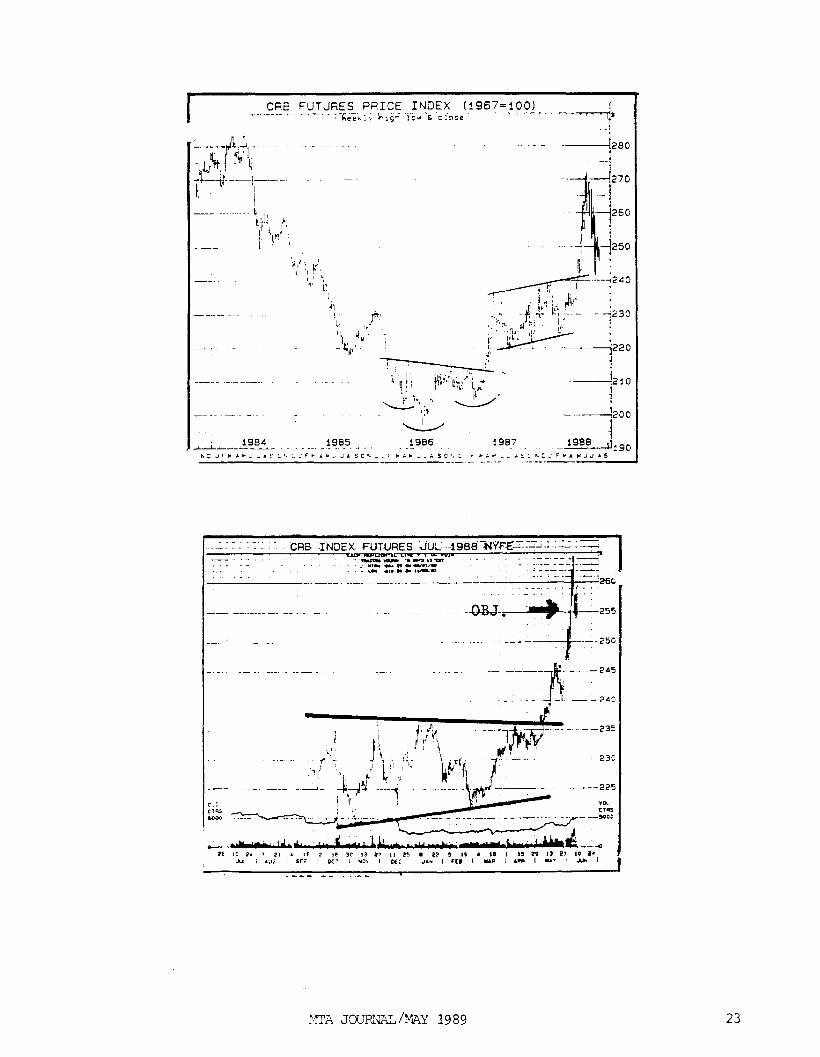
CRB INDEX - In May, 1988 the CRB Index sumultaneously completed
a symmetrical triangle on the daily graph and a running flag on
the weekly chart.
IX WHEdT - The breakout of a diamond on the daily chart propelled
wheat prices through a major bottom on the weekly chart.
Now, let's take a look at current markets to see if we can identify
any current candidates for a major move.
(Editor's Note: From this writing in mid-April until the MTA
Conference in late May, there are likely to be some changes.)
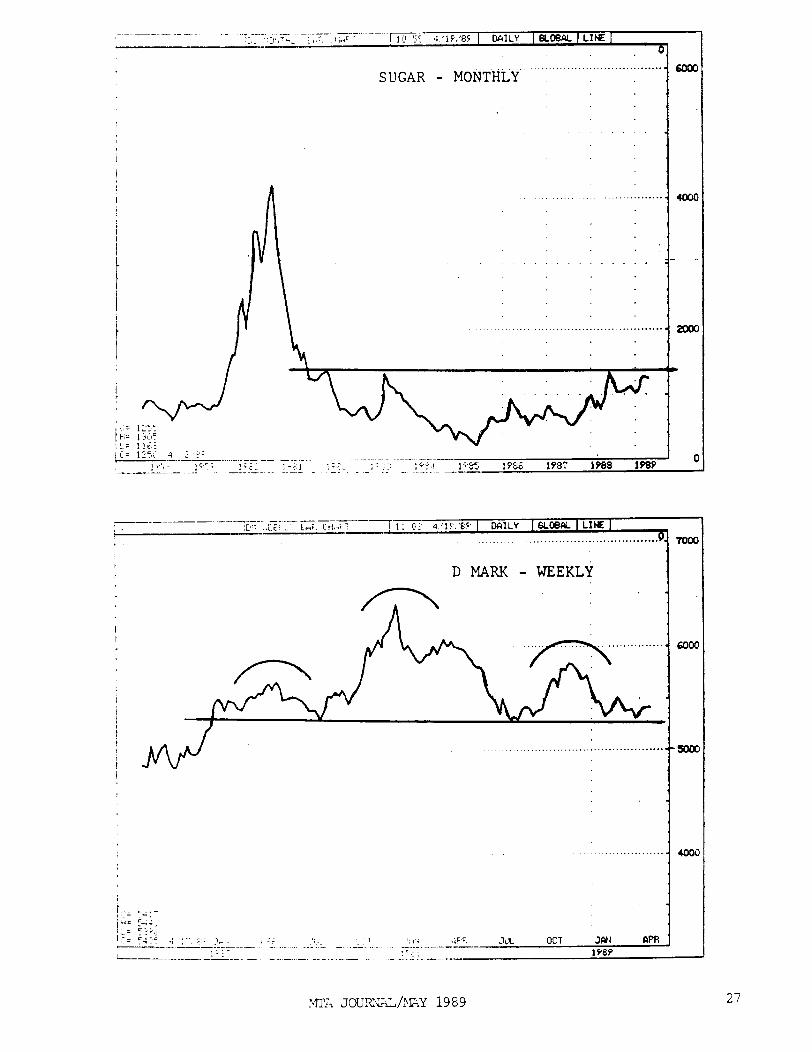
SUGAR - On the monthly chart, Sugar is forming an enormous 7-
year rounding turn. A close by the near contract above 13.50 com-
pletes this bottom and establishes a minimum objective of 24.50.
25

CRB INDEX - On both the daily and weekly charts, the CRB is ex-
hibiting a possible 7-month head and shoulders top pattern with
a target of 218. Note that the monthly CRB chart displays a pos-
sible multi-year top.
SOYBEAN OIL - The daily and weekly charts display a head and
shoulders formation.
D-MARK - The weekly closing price graph shows a multi-year head
and shoulders top. The objective, if completed, is 40.00.
I want to thank you very much for listening. I have brought with
me a handout booklet containing my presentation and other pertinent
materials. But I only have a limited supply. So, if I run out of
the handout, please give me your business card and I will send you
a package.
26
i-.-. _-.- .-- I:,-;-. j,,;T _ ._ _--.. - -...-- -- -
! ,.r -ii*: ’ / 111 ‘j,E ‘i.‘lP.‘BF I nGILY I GLOBAL I LICQ I
0
/ ,... ,........_.............................. SUGAR - MOtiTHLY
. . .
; ____ ---_. --~-,-. - ----- --_--- , ,L . ! ; I L L.-F. C&S I 1 : 01 J.~l?.‘W ] WILY I GLOBAL I LIM I 4
DMARK - WEEKLY
. . . . . . .
/ u= :..i; , IL= 532,: I-= y,q:’ .: ‘-“I: ,-.
-L-.--I----- / .:- .‘, i. ‘,,r:
_. .._. - .---. GPF, JLL OCT JRl4 &PI3 -___.--.--- !--------~.I:i-~-. _
. c ,1 : 1989 _.__ -. ___... ..- -L.-.--..
27

- - .
, : . . >,$. 1: ; ._ - __._.. --.
.’ : ,
. , ! ‘. ‘.r’I . . - _-A- J ffiILY I bLoBaL ) l
0)
CRB INDEX - WEEKLY I
I. . . . . . . . . . . . . . . . . . . . . . . . . . . . . . . . . . j
.d;
24ooo
.
22OOC
2ooDo , * :.: IYEY I
cm INDEX - DAILY 'CASH .: ;..
:i . .:.
.-;
I
; I
.,..... . . . . .._..................... -2
2soot
28

COMMODITY RESEARCH BUREALI FUT@E$ PRICE INDEX ! I I I I I iDI
- --
(1967=100) -.. --- a10
I .~. - ml
t - .-.. ¶60
HEAD--- i 850
L.S.
I _---- I -H SO0 R.S.
--- ----+---+/I60
160
140
29

SOYBEAN OIL - WEEKLY ,,‘I I I I I i l/j
: : . . . . . . . . .._................. .
,I, .h: 1 I . .
II .._. _. I ,i
1$1 i .; . . . . . .._.......................... -2LKy) :. ,1 jj/ I ‘11 cm - ],’ yjj,, ; IlJ ‘1: -- 2
1 I III11 ,I - :d . - ~ ._...............................
25 E 22 6 20 3 17 1 15 29 12 26 9 23 7 21 4 10 2 16 30 13 27 10 24 10 24 7 21- : APa 1 MAY ’ JUri 1 JUL t AUG 1 SEP 1 DC1 1 NOV t DEC 1 JAN 1 FEB 1 MAR I APR

As an advisor, the hotline service of his newsletter, THE FACTOR, has been profitable every year since its inception in 1981 and consistently rates toward the top of the CTCR rankings.
As a money manager since late 1984, Mr. Brandt's composite managed futures account program is up 154% through December, 1988.
Ft'A JOUFNAL/MAY 1989 31
Related Documents
![[Clarinet Institute] Brandt, Victor - 34 Studiesxclarinst.net/s/Solo/[Clarinet_Institute] Brandt... · 2014. 4. 23. · Title [Clarinet_Institute] Brandt, Victor - 34 Studiesx.pdf](https://static.cupdf.com/doc/110x72/61339c56dfd10f4dd73b3331/clarinet-institute-brandt-victor-34-clarinetinstitute-brandt-2014-4.jpg)