PML/PR-39/2011 Pesticide Residues in Imported Fruits and Vegetables INVESTIGATORS Dr. Sapna Johnson Mr. Ramakant Sahu Mrs Poornima Saxena ADVISORS Prof. (Dr.) H. B. Mathur Prof. (Dr.) H. C. Agarwal DATE December 2011 CENTRE FOR SCIENCE AND ENVIRONMENT 41, TUGHLAKABAD INSTITUTIONAL AREA, NEW DELHI –110062 PH: 91-11-2995 6110/5124/6394/6399 FAX: 91-11-2995 5879 EMAIL: [email protected] WEBSITE: www.cseindia.org POLLUTION MONITORING LABORATORY INDIA HABITAT CENTER, CORE-6A, FOURTH FLOOR LODHI ROAD, NEW DELHI – 110003

Welcome message from author
This document is posted to help you gain knowledge. Please leave a comment to let me know what you think about it! Share it to your friends and learn new things together.
Transcript

PML/PR-39/2011
Pesticide Residues in Imported Fruits and Vegetables
INVESTIGATORS
Dr. Sapna Johnson
Mr. Ramakant Sahu
Mrs Poornima Saxena
ADVISORS
Prof. (Dr.) H. B. Mathur
Prof. (Dr.) H. C. Agarwal
DATE
December 2011
CENTRE FOR SCIENCE AND ENVIRONMENT
41, TUGHLAKABAD INSTITUTIONAL AREA, NEW DELHI –110062
PH: 91-11-2995 6110/5124/6394/6399
FAX: 91-11-2995 5879 EMAIL: [email protected]
WEBSITE: www.cseindia.org
POLLUTION MONITORING LABORATORY
INDIA HABITAT CENTER, CORE-6A, FOURTH FLOOR
LODHI ROAD, NEW DELHI – 110003
1. POLLUTION MONITORING LABORATORY OF CSE
The Centre for Science and Environment (CSE), a non-governmental organization based in New Delhi,
has set up the Pollution Monitoring Laboratory (PML) to monitor environmental pollution. PML is an ISO
9001:2000 certified laboratory accredited by SWISO, CH-5610, Wohlen, Switzerland, conducting
Pollution Monitoring and Scientific Studies on Environmental Samples. The Lab has highly qualified and
experienced staff that exercise Analytical Quality Control (AQC) and meticulously follow what is called
Good Laboratory Practices (GLP). It is equipped with most sophisticated state-of-the-art equipments for
monitoring and analysis of air, water and food contamination, including Gas Chromatograph with Mass
Detector (GC-MS), Gas Chromatograph (GC) with ECD, NPD, FID and other detectors, High
Performance Liquid Chromatograph (HPLC), Atomic Absorption Spectrometer (AAS), UV-VIS
Spectrophotometer, Mercury Analyzer, Respirable Dust Sampler etc. Its main aim is to undertake
scientific studies to generate public awareness about food, water and air contamination. It provides
scientific services at nominal cost to communities that cannot obtain scientific evidence against polluters
in their area. This is an effort to use science to achieve ecological security.
2. INTRODUCTION
In many agriculture areas, pesticides are used intensely. In these areas, fruits and vegetables are very
important, and therefore acaricides, insecticides, fungicides, and herbicides are applied on the
agriculture areas. Many different types of pesticides are used extensively, leading to the contamination of
pesticide residues in fruits and vegetables. Pyrethroid, organophosphorus and carbamate residues are
frequently detected in fruit and vegetable crops Fruit and vegetables usually receive direct application of
pesticides in the field or in post-harvest treatment and may retain a proportion as residues in or on the
edible portion delivered to the consumer [1]. Therefore, public concern about the contamination of food
by pesticides has been increasing over the past years due to the uncertainty about the adverse effect of
those residues may pose over a long-time exposure. The toxicity of most pesticides and the consumption
of raw fruit and vegetables reinforce the concern for contamination of these food substances over other
foods [2] . As a result, levels of pesticides in different food item are regulated by international and
national organizations in order to protect human health [3]. That is for the protection of the public against
the toxic effects of pesticides, regulatory agencies in many countries have established standards
specifying the residue levels of each pesticide in various foodstuffs. At an international level, the WHO, in
conjunction with the FAO, has been convening Joint FAO/WHO Meetings on Pesticide Residues
annually since 1961. [4].Almost every country either imports or exports food. Most countries do both [5].
According to the WorldHealth Organization (WHO), food consumption consists on average for 30%
(based on mass) of fruit and vegetables, and fruit andvegetables are the most frequently consumed food
group (WHO,2003).

Given the potential risk of pesticides for public health, the use of pesticides in agriculture is subjected to
constant monitoring. The surveillance focuses on the proper use of pesticides in terms of authorization
and registration (application rates and pre-harvested intervals), and on compliance with maximum residue
limits or MRLs. Although the surveillance output (detection frequency percentage of samples exceeding
the MRL) gives a good indication,it lacks the information necessary for a proper interpretation
andobjectification in terms of food safety. To evaluate the safety of
.A total of 7,905 samples of domestically produced food and imported food from 102 countries were
analyzed for pesticide residues in FY 2004. No residues were found in 58.6 % of domestic and 66.4 % of
import samples analyzed under FDA's regulatory monitoring approach in 2004. Violative residue levels
were found in 1.8 % of domestic and 5.5% of import samples. The findings for 2004 demonstrated that
pesticide residue levels in foods are generally well below EPA tolerances, corroborating results
presented in earlier reports FDA also collected and analyzed 476 domestic and 102 import animal feed
samples for pesticides. No residues were found in 74.4 % of the domestic feed samples and 78.4 % of
the import feed samples.( FDA Pesticide Program Residue Monitoring 2004-2006 March 16, 2011)
A total number of 11,610 samples of nine different commodities (oranges, mandarins, pears, potatoes,
carrots, cucumbers, spinach, beans without pods, and rice) were taken in the 2008 EU coordinated
pesticide monitoring programme. These samples analysed for 78 pesticides .2.2% of the samples
exceeded the MRL, while the percentage of samples with measurable residues above the quantification
level, but at or below the MRL, was 35.7%. In 62.1% of the samples no residues were detected. The
overall MRL exceedance rate was comparable with the previous year rate (2.3%). It is noted that the
percentage of samples without measurable residues increased from 52.7% in 2007 to 62.1% in 2008.
The highest percentage of samples exceeding the MRL was identified for spinach (6.2%) followed by
oranges (3.0%), rice (2.4%), cucumbers (2.1%), mandarins (2.0%), carrots (1.8%), pears (1.6%), beans
without pods (0.8%) and potatoes (0.5%).(EFSA,2008)
http://www.efsa.europa.eu/en/efsajournal/pub/1646.htm
As fruit and vegetables are mainly consumed raw or semi-processed, it is expected that they contain
higher pesticide residue levels compared to other food groups of plant origin, such as bread and other
foodstuffs based on cereal processing. In addition, it is well known that animal products are less
contaminated by currently registered agricultural pesticides. Pesticide residues can sometims exceed the
safe limits precrbed, therefore PML tested imported Fruits and Vegetable samples from different countries
US, Australia , New Zea Land Thailand, Italy France for the presence of organochlorine pesticides
residue(14), organophosphorus pesticide(11), synthetic pyrethroids(4) and carbamates(2) which could be
contaminated with pesticide residues. 16 different types of n fruits and vegetable samples obtained from
local food marketsof Delhi were investigated. 35b major types of pesticides( oragonochlorines,
pyrethroids,organophosphorus , and carbamates were analysed by standard methodology using gas
chromatography

3. Review of Literature
Fruits and Vegetables:
India is the second largest producer of vegetables after China, and accounts for 13.4% of world
production. Surveys carried out by institutions spread throughout the country indicate that 50-70% of
vegetables are contaminated with insecticide residues. Madan et al (1996) reported the presence of
monocrotophos, quinalphos, BHC isomers, DDT analogues and endosulfan in cauliflower, cabbage and
pea peel samples collected from different fields, located in the vicinity of Hissar, Haryana. Among all the
samples, only one sample of cabbage contained 0.23mg/kg of monocrotophos which was above the
MRL (0.2 mg/kg). In another study (Gupta et al., 1998), out of 27 samples of bottle gourd, 4 showed
monocrotophos residues in the range of 0.18-0.67 mg/kg, 3 samples were contaminated with fenvalerate,
2 each with endosulfan and phosphamidon and one each with HCH and DDVP. Cauliflower samples
were found contaminated with monocrotophos (0.12-1.5 g/gm), quinalphos (0.15-0.6 g/gm), dimethoate
(0.05-0.2 g/gm), chlorpyriphos (0.15 g/gm), fenvalerate (0.08-2.5 g/gm), endosulfan (0.05-2.5 g/gm)
and HCH (0.03-2.1 g/gm). Out of the 13 samples analysed, 4 samples showed monocrotophos residues
in the range of 0.2-1.17 g/gm, 4 samples showed endosulfan residues in the range of 0.04-3.0 g/gm. In
a study, done by Sanghi and Tewari (2001), it was clear that malathion was the most abundantly used
organophosphate pesticide for both fruits and vegetables. Higher concentration of malathion was found in
vegetables (0.024-3.74 mg/kg) compared to that of fruits (0.43-2.32 mg/kg). Residues of DDT, DDE,
BHC, dimethoate, endosulfan and ethion were also detected in a few samples. Presence of pesticide
residues in fruits and vegetables were also reported from Islamabad, Pakistan (Tahir et al., 2001).
Dimethoate was present in the quantity of 0.032mg/kg in apple, 0.110mg/kg in banana, 0.004mg/kg in
brinjal, 1.80mg/kg in cauliflower and 0.13mg/kg in arvi, fenvalerate 0.010mg/kg in apple and chlorpyriphos
0.004 mg/kg in brinjal.
Over 27,000 food samples were tested, and most were found to be within the established U.S. legal limits
for pesticides on those foods. The foods found to have the highest levels of pesticide residues were
domestic and imported peaches, grapes, apples, pears and spinach; U.S.-grown green beans; and U.S.-
grown winter squash, both fresh and frozen. Of these, peaches and frozen winter squash had the highest
residue quantities, about 10-fold higher than the other "high scores" according to the study. Foods with
the lowest levels of pesticide residues were frozen/canned corn, milk, U.S. orange juice, U.S. broccoli,
bananas and canned peaches. Slightly higher, but still within legal limits, were frozen/canned sweet peas,
U.S. and imported apple juice, Mexican frozen winter squash, Canadian tomatoes, Brazilian orange juice
and U.S. wheat. U.S.-grown foods were just as likely to contain harmful pesticide residues as foods from
other countries. In fact, 11 of the 12 highest residue scores were found on U.S. grown foods, according to
the study. An apple grown in the United States was found to typically contain residues of four pesticides,
and one sample of spinach was found to have residues of 14 different pesticides. In general though, the
analysts noted that just a handful of chemicals accounted for most of the toxicity loading in crops.

According to EFSA a total, more than 67,000 samples of nearly 300 different types of food were analysed
for pesticide residues by national competent authorities. 97.4% of the samples complied with the legal
maximum residue levels (MRLs) of pesticides. .It was concluded that the long-term exposure of
consumers did not raise health concerns. The short-term exposure assessment revealed that for 77 food
samples analysed the acute reference dose (ARfD) might have been exceeded if the pertinent food was
consumed in high amounts.(EFSA,2011)
Monitoring of vegetables and fruits from various sources in Thailand to determine pesticide residues
showed that about 37 percent of 10 types of vegetables (365 samples) were contaminated with
organophosphorus insecticide residues. Residue of 20, 12, 7, 6, 6, 5, 5, 4, 3, and 2 insecticides were
found in kale, cabbage, cowpeas, cauliflower, brassica, cucumber, impomoea, baby corn, tomato and
mushroom subsequently. Most of the residue levels were within the range of Codex maximum residue
level (MRL), About 19.7 percent, 10 percent, 6 percent and 2 percent of analysed samples of kale,
cowpea, impomoea and mushroom subsequently having residues exceed Codex MRL. About 73 percent
of tangerine samples (70) were contaminated with pesticide residues, which were dimethoate, malathion,
monocrotophos and methyl parathion. Monocrotophos was found in about 16 percent of total samples
and about 10 percent of samples having residues exceed Codex MRL (0.2 ppm). For grape, 139
samples from 156 samples were found pesticide residues, i.e. captan, dimethoate, methomyl and
monocrotophos. Monocrotophos was detected in 75 percent of analysed samples and 26 percent of
samples having residue level above Codex MRL( Technical Conference of Agricultural Toxic Substances
Division, Chonburi (Thailand), 23-25 Aug 1995)
.4. MATERIALS AND METHODS
4.1. Sampling methodology
All the fruits and vegetable samples were collected randomly from the markets. All 16 samples were
extracted and analyzed for the 14 organochlorines and 4 synthetic pyrethroides by GC ECD and for 11
organophosphorus pesticides and 2 carbamates by GC NPD.
4.2. Equipments
Gas Chromatographs used for pesticide residue analysis were Finnigan Polaris Qion trap GC/MSn),
Thermoquest-Trace GC with 63
Ni selective Electron-Capture Detector with advanced software
(Chromcard-32 bit Ver 1.06 October 98) and Nucon –GC- 5765 series equipped with Nitrogen
Phosphorus Detector. GC columns employed were capillary column, DB DB- 5 - 5% diphenyl, 95%
dimethyl polysiloxane(30m x 0.25mm x 0.25 m) J & W. Heating mantles, Soxhlet assembly, Rotatory
evaporator (Buchi type) and a 10-l syringe from Hamilton Co. were employed.
4.3. Solvents and Glassware
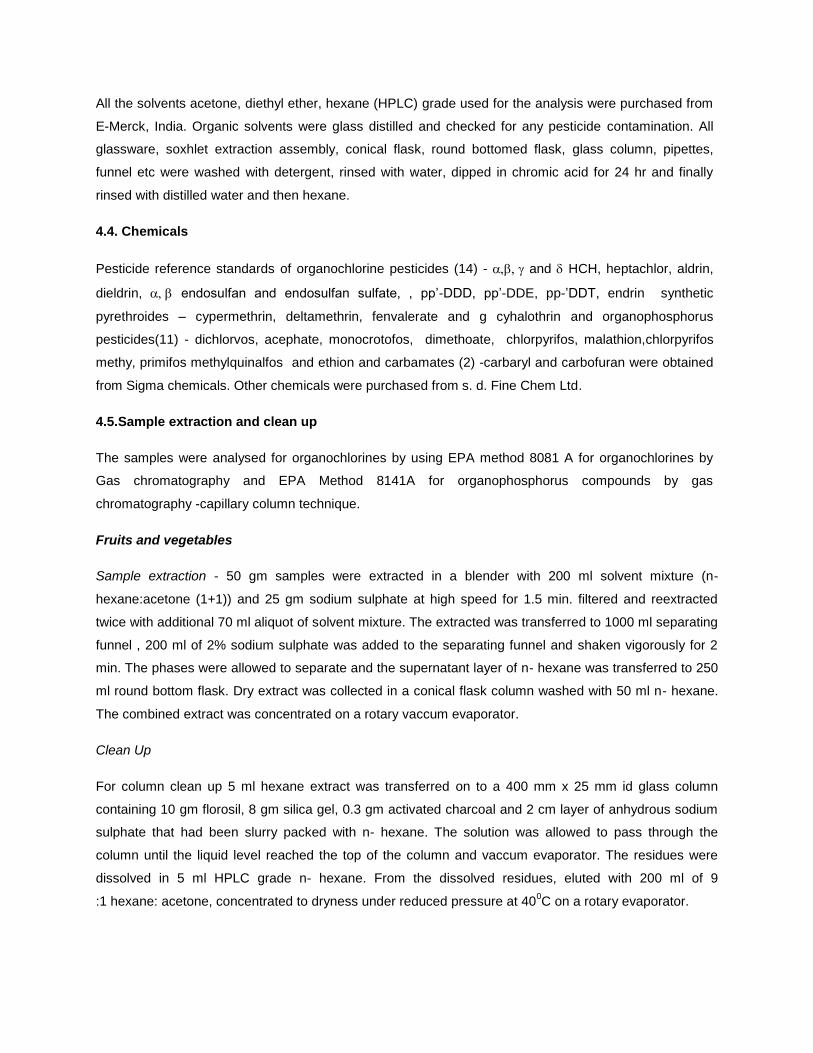
All the solvents acetone, diethyl ether, hexane (HPLC) grade used for the analysis were purchased from
E-Merck, India. Organic solvents were glass distilled and checked for any pesticide contamination. All
glassware, soxhlet extraction assembly, conical flask, round bottomed flask, glass column, pipettes,
funnel etc were washed with detergent, rinsed with water, dipped in chromic acid for 24 hr and finally
rinsed with distilled water and then hexane.
4.4. Chemicals
Pesticide reference standards of organochlorine pesticides (14) - and HCH, heptachlor, aldrin,
dieldrin, endosulfan and endosulfan sulfate, , pp’-DDD, pp’-DDE, pp-’DDT, endrin synthetic
pyrethroides – cypermethrin, deltamethrin, fenvalerate and g cyhalothrin and organophosphorus
pesticides(11) - dichlorvos, acephate, monocrotofos, dimethoate, chlorpyrifos, malathion,chlorpyrifos
methy, primifos methylquinalfos and ethion and carbamates (2) -carbaryl and carbofuran were obtained
from Sigma chemicals. Other chemicals were purchased from s. d. Fine Chem Ltd.
4.5.Sample extraction and clean up
The samples were analysed for organochlorines by using EPA method 8081 A for organochlorines by
Gas chromatography and EPA Method 8141A for organophosphorus compounds by gas
chromatography -capillary column technique.
Fruits and vegetables
Sample extraction - 50 gm samples were extracted in a blender with 200 ml solvent mixture (n-
hexane:acetone (1+1)) and 25 gm sodium sulphate at high speed for 1.5 min. filtered and reextracted
twice with additional 70 ml aliquot of solvent mixture. The extracted was transferred to 1000 ml separating
funnel , 200 ml of 2% sodium sulphate was added to the separating funnel and shaken vigorously for 2
min. The phases were allowed to separate and the supernatant layer of n- hexane was transferred to 250
ml round bottom flask. Dry extract was collected in a conical flask column washed with 50 ml n- hexane.
The combined extract was concentrated on a rotary vaccum evaporator.
Clean Up
For column clean up 5 ml hexane extract was transferred on to a 400 mm x 25 mm id glass column
containing 10 gm florosil, 8 gm silica gel, 0.3 gm activated charcoal and 2 cm layer of anhydrous sodium
sulphate that had been slurry packed with n- hexane. The solution was allowed to pass through the
column until the liquid level reached the top of the column and vaccum evaporator. The residues were
dissolved in 5 ml HPLC grade n- hexane. From the dissolved residues, eluted with 200 ml of 9
:1 hexane: acetone, concentrated to dryness under reduced pressure at 400C on a rotary evaporator.

Juices
Extraction Methodology: Juice sample were shaken well and filtered through Whatman filter paper
no.1.pH of the samples were checked and it was found to be acidic, pH of all the samples was
neutralised by using 0.1 N NaOH. After filtration, 50 ml of sample was taken in a 1 L capacity separatory
funnel and diluted with 50ml of water and 20 ml of saturated sodium chloride solution was added. The
water sample was partitioned with 100 ml of methylene chloride (thrice) by shaking the separatory funnel
vigorously for 2-3 min releasing the pressure intermittently. The layers were allowed to separate. The
three extracts of methylene chloride layers were combined and passed through anhydrous sodium sulfate
and concentrated to about 1-2 ml using rotary vacuum evaporator. Again 10 ml methylene chloride was
added for adsorption chromatography
Clean up: Clean up was done by EPA Method 3620B- Florosil clean up by column chromatography.
Florisil was activated at 1300 C overnight and cooled in a dessicator before use. Weight of florosil taken
was predetermined by calibration using lauric acid. 20g florosil was packed in a 30cm length and 12 mm
ID glass chromatographic column and anhydrous sodium sulfate was added to the top of the florosil
column (1-2 cm) . The column was pre-eluted with hexane and discarded. Transferred the extract to the
column and eluted with 6% diethyl ether in hexane (200ml), 15% diethyl ether in hexane (200ml), 50%
diethyl ether in hexane(200ml) and finally with diethyl ether (200ml). Eluent was collected and
evaporated to dryness. Final samples were prepared in 2ml hexane (HPLC grade) and analyzed by GC-
ECD for organochlorines and GC equipped with NPD for organophosphorus pesticides.
4.6. Sample Analysis
Calibration of GC system
GC system was calibrated using external standard technique.
Stock standard solution (1000mg/L): Individual stock solutions were prepared by weighing appropriate
amounts of active ingredients in a brown bottle with a Teflon-lined screw cap and dissolving the weighed
standard in HPLC grade hexane. The resulting concentration was corrected for the stated purity if purity
was less than 96%. Stock standard solution was used to prepare primary dilution standards.
Composite stock standard solution- Appropriate volume of each individual stock solution was taken in a
volumetric flask and mixed to obtain composite stock standard solution.
Calibration standard- was prepared at different concentrations by dilution of the composite stock
standard solution with hexane, corresponding to the expected range of concentrations found in samples
and it was used to calibrate (retention time, area count) the instrument response with respect to analyte
concentration.

For Organochlorine and Synthetic Pyrethroides pesticides
Organochlorines and Synthertic Pyrethroides were analysed by Gas Chromatograph (Thermoquest-
Trace GC) with the 63
Ni selective electron-capture detector. The capillary column used was DB- 1701
with carrier and makeup gas as nitrogen with a 1 ml/min and 540 ml/min-flow rate respectively
employing the split less mode. 1.0l of the final extract (2ml) was injected at a temperature of 2500 C.
The oven temperature was kept at 1200C with a hold time of 1 minute, then from 120
0C to 205
0 C at a
rate of 250 C/minute with a hold time of 1 minute , then from 200 to 250
0C at a rate of 2
0 C / minute with
a hold time of 1min and finally from 250 0 C to 290
0 C at 5
0 /minute with a hold time of 5 minute. The
total run length was 45.90minutes. The detector was maintained at 3000C. Peak identification was
performed by the GC software (Chromcard-32 bit Ver 1.06 October 98) calibration table set up with a
relative retention time window of 0.65%.
For Organophosphorus and Carbamate pesticides
Organophosphorus and Carbamates pesticides were analysed by Gas Chromatograph (Thermoquest-
Trace GC). The capillary column used was DB- 5 . The carrier gas and the makeup gas was nitrogen
with a 1.0 ml/min and 15-ml/min-flow rate respectively, hydrogen at 2.3 ml/min and air at 60 ml/min
respectively employing the split less mode. 2.0l of the final extract was injected at a temperature of
2700 C. The oven temperature was kept at 120
0C with a hold time of 1 minute, then from 120
0C to 205
0
C at a rate of 50 C/minute with a hold time of 1 minute then from 205 to 225
0C at a rate of 2
0 C / minute
with a hold time of 1 min and finally from 225 0 C to 260
0 C at 5
0 /minute with a hold time of 5 minute
The total run length was 34.50 minutes. The detector was maintained at 300 0C and Source Current at
2.800 A.
Linearity checks
Gas chromatograph equipped with ECD and NPD were checked for linearity. Instrumental limit of
detection for GC- ECD was 0.01 ng/ml for organochlorines and 0.1 ng/ml for organophosphorus
pesticides.
Laboratory Reagent Blank

An aliquot of reagent grade water was treated exactly as a sample including exposure to all glassware,
equipments, solvents, and reagents used with the sample matrix. No analyte peak was detected in
laboratory reagent blank.
Laboratory fortified blank
An aliquot of reagent grade water to which known amount of pesticides were added in the laboratory in
ppb range was analysed exactly like the sample. The recovery of the pesticides over the background
values obtained from unfortified samples was more than 80 per cent for all the pesticides.
Laboratory fortified sample matrix
An aliquot of sample matrix was prepared to which known quantities of the pesticides were added in the
laboratory in ppb range. This laboratory fortified matrix was analyzed exactly like the sample.15-25% of
the samples (minimum) were fortified with a known concentration of pesticides and percent recovery was
calculated. Extraction and clean up was done as mentioned and the recovery of the pesticides over the
background values obtained from unfortified samples were more than 80 per cent. Standard deviation
and coefficient of variation were less than 10 indicating repeatability of the method. All calculations were
done as described in US EPA method and the amount of residues in samples was obtained in mg/kg
(ppm) of infant food.
4.7 Confirmation
GC-MS
The presence of pesticide residues detected in the samples by GC-ECD and GC-NPD were confirmed
by GC-MS, Model Finnigan Polaris Q Ion trap GC/MSn with EI ionization (70eV), in SIM mode. The
sample and standards were injected using a programmable temperature injector (PTV) with a cold
The capillary column used was DB- 5MS with carrier and makeup gas
as nitrogen with a 1 ml/min and 50 ml/min-flow rate respectively employing the split less mode. 1.0l of
the final extract (2ml) was injected at a temperature of 2500 C. The oven temperature was kept at 120
0C
with a hold time of 1 minute, then from 1200C to 205
0 C at a rate of 25
0 C/minute with a hold time of 1
minute , then from 200 to 2500C at a rate of 2
0 C / minute with a hold time of 1min and finally from 250
0
C to 290 0 C at 5
0 /minute with a hold time of 5 minute keeping the Ion source at 275
0C; Multiplier:1100
Volts; AGC:50 , 3 microscan; Default : Tune parameters: Autotune Tune File. Full Scan :50 650 m/z,
SIM: Exact Mass +/- 0.1 amu.
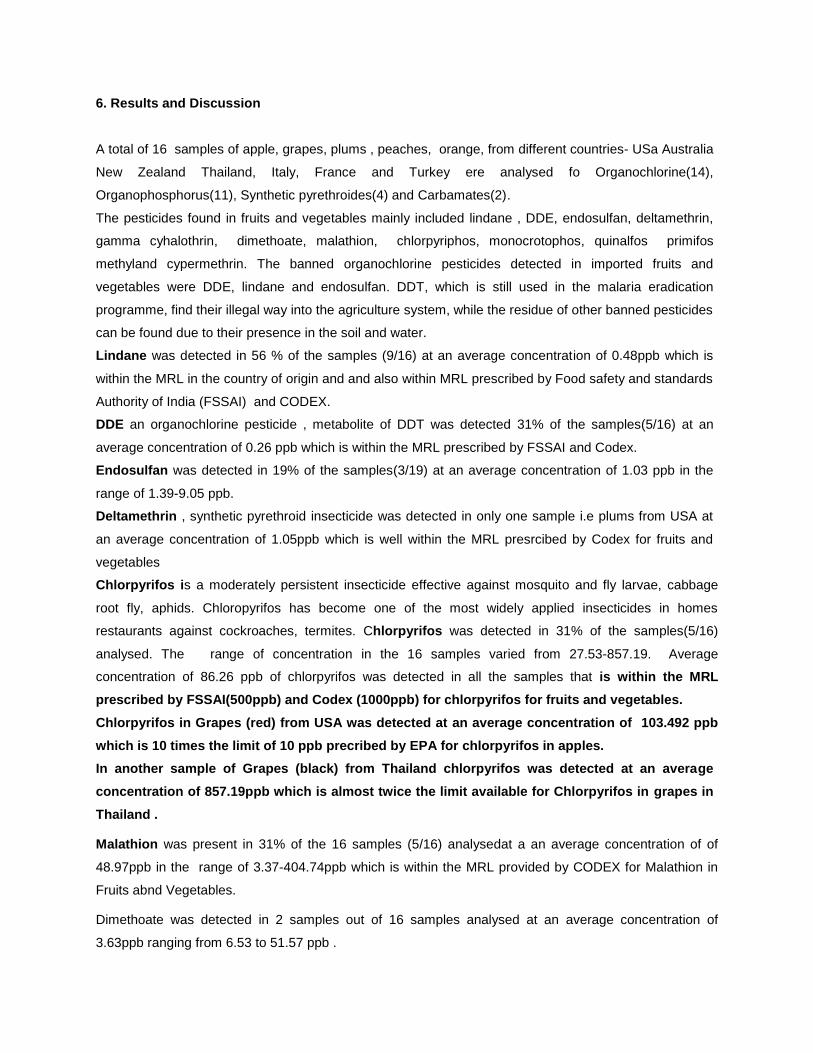
6. Results and Discussion
A total of 16 samples of apple, grapes, plums , peaches, orange, from different countries- USa Australia
New Zealand Thailand, Italy, France and Turkey ere analysed fo Organochlorine(14),
Organophosphorus(11), Synthetic pyrethroides(4) and Carbamates(2).
The pesticides found in fruits and vegetables mainly included lindane , DDE, endosulfan, deltamethrin,
gamma cyhalothrin, dimethoate, malathion, chlorpyriphos, monocrotophos, quinalfos primifos
methyland cypermethrin. The banned organochlorine pesticides detected in imported fruits and
vegetables were DDE, lindane and endosulfan. DDT, which is still used in the malaria eradication
programme, find their illegal way into the agriculture system, while the residue of other banned pesticides
can be found due to their presence in the soil and water.
Lindane was detected in 56 % of the samples (9/16) at an average concentration of 0.48ppb which is
within the MRL in the country of origin and and also within MRL prescribed by Food safety and standards
Authority of India (FSSAI) and CODEX.
DDE an organochlorine pesticide , metabolite of DDT was detected 31% of the samples(5/16) at an
average concentration of 0.26 ppb which is within the MRL prescribed by FSSAI and Codex.
Endosulfan was detected in 19% of the samples(3/19) at an average concentration of 1.03 ppb in the
range of 1.39-9.05 ppb.
Deltamethrin , synthetic pyrethroid insecticide was detected in only one sample i.e plums from USA at
an average concentration of 1.05ppb which is well within the MRL presrcibed by Codex for fruits and
vegetables
Chlorpyrifos is a moderately persistent insecticide effective against mosquito and fly larvae, cabbage
root fly, aphids. Chloropyrifos has become one of the most widely applied insecticides in homes
restaurants against cockroaches, termites. Chlorpyrifos was detected in 31% of the samples(5/16)
analysed. The range of concentration in the 16 samples varied from 27.53-857.19. Average
concentration of 86.26 ppb of chlorpyrifos was detected in all the samples that is within the MRL
prescribed by FSSAI(500ppb) and Codex (1000ppb) for chlorpyrifos for fruits and vegetables.
Chlorpyrifos in Grapes (red) from USA was detected at an average concentration of 103.492 ppb
which is 10 times the limit of 10 ppb precribed by EPA for chlorpyrifos in apples.
In another sample of Grapes (black) from Thailand chlorpyrifos was detected at an average
concentration of 857.19ppb which is almost twice the limit available for Chlorpyrifos in grapes in
Thailand .
Malathion was present in 31% of the 16 samples (5/16) analysedat a an average concentration of of
48.97ppb in the range of 3.37-404.74ppb which is within the MRL provided by CODEX for Malathion in
Fruits abnd Vegetables.
Dimethoate was detected in 2 samples out of 16 samples analysed at an average concentration of
3.63ppb ranging from 6.53 to 51.57 ppb .

Monocrotofos was detected in 3 out of the 16 samples analyzed at an average concentration of 60.55 ppb
ranging from 19.74-819.21ppb. Highest concentration of monocrotofos was detected in Plum from
Australia .There is no MRL for monocrotofos in fruits and vegetables.
Quinalfos was detected in 25 percent of the samples at an average concentration of 8.68ppb.
Primifos –methyl was detected in only 3 sample at an average concentration of 1.68 ppb in the range of
9.71-16.11ppb.
Ethion was detected in 2 out of 13 samples at an average concentration of 7.6975 ppb.
Carbaryl was detected in 5 samples out of 16 samples at an average concentration of 86.77ppb in the
range of 45.16-950.64ppb which is within the MRL given by CODEX(5000ppb) for fruits nd Vegetables.
Carbofuran was detected in only 2 out 16 samples . at an average concentration of 22.1059ppb . Highest
concentration was detected in Peaches imported from Australia.
7. CONCLUSIONS
31 pesticides belonging to 4 different classes -Organochlorines (14), Synthetic pyrethroides (4)
Organophosphorus (11) and Carbamates (2) pesticides were analysed in 16 imported fruit and
vegetable samples. Multiple residues (i.e. single samples which contain residues of more than one
pesticide were detected in imported fruits and vegetables samples available in the Delhi market. The
highest concentration of total pesticides was detected in grapes from thailand i.e 2230.61 ppb (2.23ppm)
, followed by plums from Australia (1424.29 ppb)and then peaches from Australia(794.16ppb). Among
the different classes of pesticides detected highest residues were detected of Organophosphorus
pesticides (217.46ppb) followed by Carbamates (108.88ppb), then Organochlorine (4.026ppb) and finally
the synthetic pyrethroides (0.1496ppb). 87.5% of the imported fruits and vegetables were
compliant with the national and international regulations only 12.5% of the
samples that is 2 grape samples (one from US and one from Thailand) violated
the national regulations for chlorpyrifos but were within the MRL set by CODEX.
Out of the 31 pesticides analysed only Chlorpyrifos was found to be above MRL set for the pesticide in
the country from where imported. Other pesticides detected were compliant with national and
international regulations governing the presence of pesticide residues in agricultural produce. Multiple
residues in one sample can result from the application of different types of pesticides to protect the crop
against different pests, diseases or other threats having an impact on the quality or yield of crops, from
mixing of lots with different treatments, contaminations, but also from practices which do not respect the
principles of good plant protection practice. It should be noted that the presence of pesticides, even an
exceedance of an MRL, does not imply that this is a food safety concern. To ascertain the latter
exposure assessments are required.
8. References

[1] Maria, H. W. M.C.; Regina, T. M. C.; Jaı´za, L. M.; Shirley ; Ka´tia M. P. M. Extractionand Clean-Up
Method for the Determination of Twenty Organochlorine PesticideResidues in Tomatoes by GLC-ECD. J.
High. Resol. Chromatogr.1999, 22, 619–622.
[2] Jos´e, L. T; Consuelo, S´.B; Beatriz, A.; Lorena G.Analysis of pesticide Residues in Juice and
beverage, Crit. Rev. in anal. chem. 2004, 34.
[3] Flemming, H. F. Analysis of Residues of Seven Pesticides in Some Fruits andVegetables by Means of
High Pressure Liquid Chromatography. J. F. Bergm.Vertag.1981, 173, 95-98.
[4] Krbic, B. S. Organochlorine and organophosphate pesticide residues in wheat varietiesfrom Serbia. F.
Addi. and Contam. 2007,24: 695–703.
[5] Carl, F. Varian Chromatography Systems. GC/MS/MS Analysis for PesticideResidues in Agricultural
Products. GC-MS 40,0595.
[6] WHO Regional Office for Africa. International, Regional, Subregional and NationalCooperation in Food
Safety in Africa. FAO/WHO Regional Conference on Food Safetyfor Africa. Harare, Zimbabwe.2005.

Table 1 Organochlorines in imported fruits and vegetables in Fruits and vegetables
Organochlorines
S.No Code No.
Food Item Country a-HCH b-HCH
g-HCH d-HCH t-HCH DDE
DDD DDT t-DDT a-
endo b-
endo Endosulfan sulfate
t-endo Total Ocs
1 001 Grapes Red USA 0.00 0.49 0.00 0.00 0.49 0.30 0.00 0(50) 0.30 0.00 0.00 0.00 0.00 0.79
2 011 Plum USA 0.00 0.00 0.34 0.00 0.34 2.19 0.00 0(200) 2.19 0.00 9.05 0(2000) 9.05 11.59
3 012 Pear USA 0.00 0.00
0.8106(NA)
0.11 0.11 0.35 0.00 0(100) 0.35 0.00 0.00 0(2000) 0.00
1.28
4 005 Peach Australia 0.00 3.05
0.723(2000)
0.00 3.05 0.00 0.00 0(1000) 0.00 0.00 0.00 0.00 0.00
3.77
5 006 Plum Australia 0.00 0.07 0(500) 0.00 0.07 0.00 0.00 0(1000) 0.00 0.00 0.00 0.00 0.00 0.07
6 008 Mandarin Australia 0.00 0.00
0.1053(500)
0.00 0.00 0.00 0.00 0(1000) 0.00 0.00 0.00 0.00 0.00
0.11
7 010 Apple
New Zea Land
0.00 0.00 2.40 1.22 3.62 0.00 0.00 0.00 0.00 0.00 0.00 0.00 0.00
3.62
8 002 Grapes Black Thailand 0.00 1.28 0.64 0.00 1.93 0.00 0.00 0(100) 0.00 0.00 0.00 0.00
0.00 1.93
9 007 Mini Orange Thailand 0.00 0.00 0.00 0.00 0.00 0.00 0.00 0.00 0.00 0.00 0.00 0.00 0.00 0.00
10 013 Guava Thailand 0.00 0.00 0.89 1.34 2.22 0.92 0.71 0.00 1.62 0.00 0.00 0.00 0.00 3.84
11 014 Dragon Fruit Thailand 0.00 0.00 1.05 0.99 2.04 0.44 0.00 0.00 0.44 0.99 0.39 0.00 1.39 3.87
12 015 Snow peas Thailand 0.00 0.00 0.00 0.69 0.69 0.00 0.00 0.00 0.00 0.00 0.00 0.00 0.00 0.69
13 016 Asparagus Thailand 0.00 0.31 0.00 0.29 0.60 0.00 0.00 6.28(100) 0.00 0.00 0.00 0.00 0.00 6.88
14 009 Kiwi Italy 0.00
19.88
and 0.00 19.88 0.00 0.00 0.00 0.00 0.00 5.96 0.00 5.96
26.56
15 003 Apple France 0.00 0.00 0.00 0.00 0.00 0.00 0.00 0.00 0.00 0.00 0.00 0.00 0.00 0.00
16 004 Apricot Turkey 0.00 0.00 0.00 0.00 0.00 0.00 0.00 0.00 0.00 0.00 0.00 0.00 0.00 0.00
Juices
17 017 Real Mixed Fruit India 0.00 0.00 0.00 0.00 0.00 0.00 0.00 0.00 0.00 0.00 0.00 0.00 0.00 0.00
18 018 Real Grape India 0.00 0.00 0.00 0.00 0.00 0.00 0.00 0.00 0.00 0.00 0.00 0.00 0.00 0.00
19 019 Real Orange India 0.00 0.00 0.00 0.00 0.00 0.00 0.00 0.00 0.00 0.00 0.00 0.00 0.00 0.00
20 020
Tropicana Mixed Fruit
India 0.00 0.00 0.00 0.00 0.00 0.00 0.00 0.00 0.00 0.00 0.00 0.00 0.00
0.00
21 021
Tropicana Grapes
India 0.00 0.00 0.00
0.00 0.00 0.00 0.00 0.00 0.00 0.00 0.00 0.00 0.00
0.00
22 022 Onjus Grapes India 0.00 0.00 0.00 0.00 0.00 0.00 0.00 0.00 0.00 0.00 0.00 0.00 0.00 0.00
MEAN 0.00 1.57 0.48 0.29 2.34 0.26 0.04 0.39 0.70 0.06 0.96 0.00 1.02 4.06
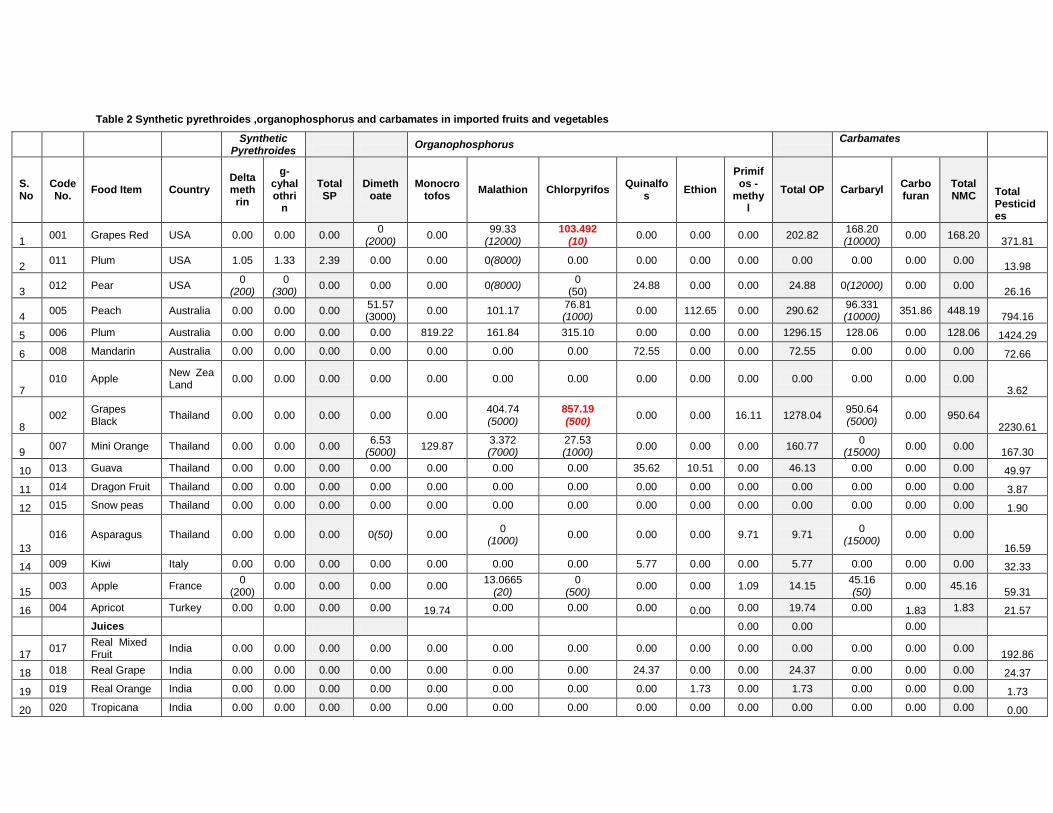
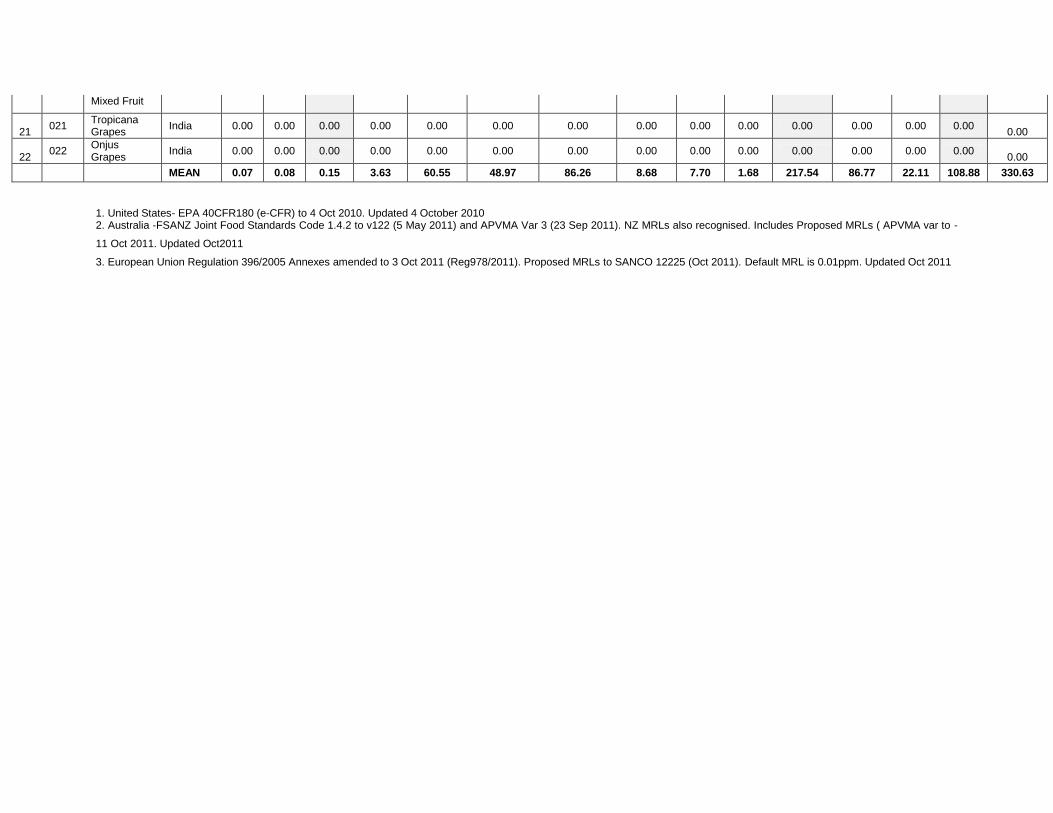
Table 2 Synthetic pyrethroides ,organophosphorus and carbamates in imported fruits and vegetables
Synthetic Pyrethroides
Organophosphorus
Carbamates
S.No
Code No.
Food Item Country Deltamethrin
g- cyhalothri
n
Total SP
Dimethoate
Monocrotofos
Malathion Chlorpyrifos Quinalfo
s Ethion
Primifos -
methyl
Total OP Carbaryl Carbofuran
Total NMC Total
Pesticides
1 001 Grapes Red USA 0.00 0.00 0.00
0 (2000)
0.00 99.33
(12000) 103.492
(10) 0.00 0.00 0.00 202.82
168.20 (10000)
0.00 168.20 371.81
2 011 Plum USA 1.05 1.33 2.39 0.00 0.00 0(8000) 0.00 0.00 0.00 0.00 0.00 0.00 0.00 0.00
13.98
3 012 Pear USA
0 (200)
0 (300)
0.00 0.00 0.00 0(8000) 0
(50) 24.88 0.00 0.00 24.88 0(12000) 0.00 0.00
26.16
4 005 Peach Australia 0.00 0.00 0.00
51.57 (3000)
0.00 101.17 76.81 (1000)
0.00 112.65 0.00 290.62 96.331 (10000)
351.86 448.19 794.16
5 006 Plum Australia 0.00 0.00 0.00 0.00 819.22 161.84 315.10 0.00 0.00 0.00 1296.15 128.06 0.00 128.06 1424.29
6 008 Mandarin Australia 0.00 0.00 0.00 0.00 0.00 0.00 0.00 72.55 0.00 0.00 72.55 0.00 0.00 0.00 72.66
7 010 Apple
New Zea Land
0.00 0.00 0.00 0.00 0.00 0.00 0.00 0.00 0.00 0.00 0.00 0.00 0.00 0.00 3.62
8 002
Grapes Black
Thailand 0.00 0.00 0.00 0.00 0.00 404.74 (5000)
857.19 (500)
0.00 0.00 16.11 1278.04 950.64 (5000)
0.00 950.64 2230.61
9 007 Mini Orange Thailand 0.00 0.00 0.00
6.53 (5000)
129.87 3.372 (7000)
27.53 (1000)
0.00 0.00 0.00 160.77 0
(15000) 0.00 0.00
167.30
10 013 Guava Thailand 0.00 0.00 0.00 0.00 0.00 0.00 0.00 35.62 10.51 0.00 46.13 0.00 0.00 0.00 49.97
11 014 Dragon Fruit Thailand 0.00 0.00 0.00 0.00 0.00 0.00 0.00 0.00 0.00 0.00 0.00 0.00 0.00 0.00 3.87
12 015 Snow peas Thailand 0.00 0.00 0.00 0.00 0.00 0.00 0.00 0.00 0.00 0.00 0.00 0.00 0.00 0.00 1.90
13
016 Asparagus Thailand 0.00 0.00 0.00 0(50) 0.00 0
(1000) 0.00 0.00 0.00 9.71 9.71
0 (15000)
0.00 0.00
16.59
14 009 Kiwi Italy 0.00 0.00 0.00 0.00 0.00 0.00 0.00 5.77 0.00 0.00 5.77 0.00 0.00 0.00 32.33
15 003 Apple France
0 (200)
0.00 0.00 0.00 0.00 13.0665
(20) 0
(500) 0.00 0.00 1.09 14.15
45.16 (50)
0.00 45.16 59.31
16 004 Apricot Turkey 0.00 0.00 0.00 0.00 19.74 0.00 0.00 0.00 0.00 0.00 19.74 0.00 1.83 1.83 21.57
Juices 0.00 0.00 0.00
17 017
Real Mixed Fruit
India 0.00 0.00 0.00 0.00 0.00 0.00 0.00 0.00 0.00 0.00 0.00 0.00 0.00 0.00 192.86
18 018 Real Grape India 0.00 0.00 0.00 0.00 0.00 0.00 0.00 24.37 0.00 0.00 24.37 0.00 0.00 0.00 24.37
19 019 Real Orange India 0.00 0.00 0.00 0.00 0.00 0.00 0.00 0.00 1.73 0.00 1.73 0.00 0.00 0.00 1.73
20 020 Tropicana India 0.00 0.00 0.00 0.00 0.00 0.00 0.00 0.00 0.00 0.00 0.00 0.00 0.00 0.00 0.00
Mixed Fruit
21 021
Tropicana Grapes
India 0.00 0.00 0.00 0.00 0.00 0.00 0.00 0.00 0.00 0.00 0.00 0.00 0.00 0.00 0.00
22 022
Onjus Grapes
India 0.00 0.00 0.00 0.00 0.00 0.00 0.00 0.00 0.00 0.00 0.00 0.00 0.00 0.00 0.00
MEAN 0.07 0.08 0.15 3.63 60.55 48.97 86.26 8.68 7.70 1.68 217.54 86.77 22.11 108.88 330.63
1. United States- EPA 40CFR180 (e-CFR) to 4 Oct 2010. Updated 4 October 2010 2. Australia -FSANZ Joint Food Standards Code 1.4.2 to v122 (5 May 2011) and APVMA Var 3 (23 Sep 2011). NZ MRLs also recognised. Includes Proposed MRLs ( APVMA var to -
11 Oct 2011. Updated Oct2011
3. European Union Regulation 396/2005 Annexes amended to 3 Oct 2011 (Reg978/2011). Proposed MRLs to SANCO 12225 (Oct 2011). Default MRL is 0.01ppm. Updated Oct 2011

Table 3. Pesticide residues detected in Imported fruits and vegetables
S.No. Pesticide
No of Samples
No of samples in which residues detected
Percentage in which residues detected (%) Mean Range(ppb)
MRL -1 FSSAI (ppb)
MRL - 2 Codex (ppb)
1 Lindane 16 9 56 0.48 0.11-2.40 100 500
2 DDE 16 5 31 0.26 0.30-2.19 3500
3 Endosulfan 16 3 19 1.03 1.39-9.05
4 deltamethrin 16 1 6 0.07 0-1.05 50
5 Gamma cyhalothrin 16 1 6 0.08 0-1.34
6 Dimethoate 16 2 13 3.63 6.53-51.57 2000 1000
7 Monocrotofos 16 3 19 60.55 19.74-819.21
8 Malathion 16 6 38 48.97 3.37-404.74 8000
9 Chlorpyrifos 16 5 31 86.26 27.53-857.19 500 1000
10 Quinalfos 16 4 25 8.68 5.77-72.55
11 Primifos -methyl 16 3 19 1.68 9.71-16.11
12 Ethion 16 2 13 7.70 10.51-112.65
13 Carbaryl 16 5 31 86.77 45.16-950.64 5000
14 carbofuran 16 2 13 22.11 1.83-351.86
1. FSSAI Food Safety and Standards Regulations 2010 (2-15015/30/2010-FSSAI October 2010) - Part 8.3. PFA (2nd Amendm) GSR 264 of 30 Mar 2011. Updated July 2011
2.Codex Codex Alimentarius to CAC34 July 2011 (CCPR REP11/PR). Updated Aug 2011


Related Documents