Pest and Pesticide Use Assessment and Use and Care of Personal Protective Equipment for Grape Production in New York State for 1993 Mary S. Partridge Charlotte Coffman William G. Smith Donald A. Rutz Pesticide Management Education Program and The Department of Textiles & Apparel Cornell University Ithaca, NY 14853-0901 Funded By The National Agricultural Pesticide Impact Assessment Program United States Department of Agriculture

Welcome message from author
This document is posted to help you gain knowledge. Please leave a comment to let me know what you think about it! Share it to your friends and learn new things together.
Transcript

Pest and Pesticide Use Assessment and Use and Careof Personal Protective Equipment for Grape
Production in New York State for 1993
Mary S. PartridgeCharlotte CoffmanWilliam G. SmithDonald A. Rutz
Pesticide Management Education Programand
The Department of Textiles & ApparelCornell University
Ithaca, NY 14853-0901
Funded ByThe National Agricultural Pesticide Impact Assessment Program
United States Department of Agriculture

ACKNOWLEDGMENTS
The authors gratefully acknowledge the help of the following people withoutwhom this report could not have been completed: Linda Aures, Tom Davenport, EricHarrington, Debbie Kalaf, Jim Kamas, Joe Kovach, Donna Kowalski, Dave Peterson,Tim Weigle, Alice Wise, and especially the growers who took the time to attendmeetings and fill out the surveys.
ii

SECTION ONE:
PEST AND PESTICIDE USE ASSESSMENT

2
INTRODUCTION
The overall assessment and effectiveness of pest control techniques for grapeproduction systems are an ongoing process for scientists at Cornell's College ofAgriculture and Life Sciences. Not only must the specifics of pest dynamics and pestinduced losses be assessed, but the more general problem of designing andimplementing appropriate pest management systems for grower acceptance must beaddressed as well.
New York has approximately 32,500 acres of grapes. It is a national leader infruit production, ranking third behind California and Washington in total grapeproduction. Significant grape acreage is concentrated in ten counties located in fourregions: Western New York, the Finger Lakes region, Long Island, and the HudsonRiver Valley (Figure 1).
Figure 1: New York counties with major grape production
The value of the 1993 New York State grape crop was estimated at $26.5 milliondollars with 118,000 tons of grapes (all varieties) being produced. Average yield wasestimated at 3.6 tons/acre (New York State Agricultural Statistics Service, 1993 AnnualSummary).
Programs attempting to address the issues surrounding pesticides have a criticalneed to obtain use information about those chemicals being applied in the grapeproductions systems in New York State. Downy mildew, a serious disease of grapes, iscurrently controlled by the use of one of three fungicide complexes--captan, EBDCfungicides, or copper. Although reregistered by the Environmental Protection Agency(EPA), captan has been suspended from use by all juice processors in New York.Some wineries are also reluctant to use captan because of its poor public image. EBDCfungicides, such as maneb and mancozeb, have been reregistered by the EPA but mostjuice processors continue to restrict their use to the prebloom period in spite of a 66-day

3
preharvest interval (PHI).Because all processors in New York apply these restrictions regarding captan
and the EBDCs, growers do not have the option of selling their crop to less restrictiveprocessors. Furthermore, unless the recent ruling by the Ninth Circuit Court of Appealsin California against EPA's interpretation of the Delaney Clause is reversed, or newlegislation is passed, the registration of captan and the EBDC fungicides for processedgrapes will be canceled.
Further developments affecting the grape industry in New York are:
• Resistance of powdery mildew to benomyl (Benlate) has become widespread.• There is confirmed resistance of powdery mildew to triadimefon (Bayleton) in
some vineyards.• Karathane, an excellent material for powdery mildew was not reregistered.• Fungicides available for black rot control after bloom are limited. These
include the sterol inhibiting fungicides Bayleton and Nova. Also, ferbam(carbamate) is restricted to one post bloom application in New York due tolabel interpretation.
• The major grape variety, Concord (grown primarily in Western New York) ishighly susceptible to phytotoxicity from the use of sulfur and moderatelysensitive to copper, thus making these choices for powdery mildew controlless attractive.
• On Long Island, pesticides used to control grape insect and disease pests areharmful to naturally occurring predators of European red mite (ERM), whichhave the ability to keep ERM in check. Thus, by controlling one pest, anotherpest problem is being created.
• There are only two miticides registered for use. One miticide is no longerbeing used in many wine growing regions due to pest resistance. The secondmiticide is expensive. This means growers use mainly the cheaper material,which will drastically increase the rate at which resistance develops. This willsoon leave growers with only one, very expensive option.
Due to the aforementioned problems facing the grape industry, it is essential tocompile not only pesticide use data, but also all pest management practices currentlyemployed by grape producers. This report contains such a compilation. Thisinformation should aid policy makers, researchers, extension specialists and industrypersonnel in evaluating pesticide use patterns, current pest management strategies,and the economic impacts of regulatory actions on specific pesticides. Funding for thisproject was provided by the National Agricultural Pesticide Impact Assessment Program(NAPIAP), United States Department of Agriculture.

4
OBJECTIVES
To obtain the following information for grape production systems in New York State:
A. Acres planted
B. Average yield
C. Contract, processor and restriction information
D. For each pest type (weed, insect and disease) affecting crop
1. Chemical used for control
a) Formulation
b) Who applied
c) Acres treated
d) Number of treatments
e) Application site
2. Time of application
3. Target pest(s)
4. Cost comparison of chemicals
E. Alternative Control Measures: cultural, biological, no treatment
F. Potential yield changes from alternatives
G. Cost per acre
1. Chemical control
2. Non-chemical control
H. Calibration of equipment
1. Frequency
2. Method
I. Basis for application, and recommendation of pesticides
J. Storage of pesticides
K. Disposal
1. Rinsate
2. Unwanted/unused pesticides
3. Empty pesticide containers

5
PROJECT DESIGN, IMPLEMENTATION AND ANALYSIS
Questionnaires were developed from previous NAPIAP and other surveys thathad been conducted in New York State. The first drafts were reviewed by grapespecialists, IPM specialists, extension agents and grape processors for comment andcritique. Final survey forms were printed and duplicated (see Appendix for survey formsamples) based on input from these groups.
Letters were sent to grape processors, specialists and extension agentsexplaining the project and requesting assistance in the implementation of the survey. Aone hour pesticide applicator training presentation on EPA's "Special Review" process,and personal protective equipment (PPE) use (see section two of this report) was givenprior to the completion of the survey questionnaire. In order to attract growers to themeetings, two recertification credits were given to all those who participated. Threemeetings were set up: one on Long Island, and two which covered the Finger Lakesregion. A mailing list was used to send surveys to Western New York grape growers.Response was approximately 25%.
Once data were collected, database management files were developed usingFileMaker Pro 2.0 for compilation and analysis of the data. This report contains datapertaining to the objectives stated previously.
Certain words and/or terms used throughout this paper are defined below:
• Active ingredient (AI) - The portion of the pesticide product which controls thepest. All quantities and application rates are reported in pounds of activeingredient.
• Acres treated - The area treated with a pesticide one or more times.• Number of applications - Number of times a pesticide was applied to acres
treated.• Times applied - Average number of applications, weighted by acres treated.• Acre treatments - "Acres treated" multiplied by "times applied."• Record - One survey complete with all responses within that survey
(synonymous with one grower or one grape producer).• Response - One entry within a record (survey). Since there can be more than
one response to certain questions, the distinction between records andresponses is important.
• Product name/trade name - The name designated for a chemical by acompany. Similar formulations can have different product/trade names.
• Fungicides - Materials that control diseases.• Herbicides - Materials that control weeds.• Insecticides - Materials that control insects. Miticides, materials that control
mites, are included in this category.• Tank mixes - Two or more pesticides mixed in the same spray tank by the
grower and applied together. In this survey pesticides mixed together wereonly considered tank mixes if they were two different types - a fungicide andinsecticide mixed together, rather than two or more of the same type ofpesticide mixed together.
7
Results and Discussion

8
DEMOGRAPHICS
The total 1993 acreage of the 137 vineyards sampled was 7,291 acres (22% oftotal NY grape acreage) with only 251.4 acres nonbearing (Table 1). The Finger Lakesregion produced 1,838 acres (88.8%) of grapes for wine, 227 acres (11.0%) for juiceand 5 acres (0.2%) of table grapes. In Western New York, 97.6% of the 3,603 acresreported were in juice production, 1.8% were for wine and 0.4% were for table grapes.All of the Long Island grape production was for wine. The average yield for wine grapeswas 4.3 tons/acre, 5.2 tons/acre for juice, and 4.5 tons/acre for table grapes.
Table 1: Demographics of grape vineyards in New York in 1993 Region Average # of growers
# of Bearing Non-bearing yield reportingGrape type records acreage acreage (tons) yield
Western New York (Chautauqua, Erie, Niagara Counties)
Juice 86 3,518.7 175.2 5.2 84Wine 4 66.0 0.0 2.5 3Table 3 14.5 0.0 4.5 2Totals 93 3,599.2 175.2 5.1 89
Finger Lakes (Cayuga, Ontario, Schuyler, Seneca, Steuben, Yates Counties)Juice 4 226.5 10.5 5.7 3Wine 33 3,037.9 53.2 4.7 29Table 1 5.0 0.0 NS 0Totals 38 3,269.4 63.7 4.8 32
Long Island (Suffolk County)Wine 6 171.0 12.5 2.6 6Totals 6 171.0 12.5 2.6 6
Total Juice 90 3,745.2 185.5 5.2 87Total Wine 43 3,274.9 65.9 4.3 38Total Table 4 19.5 0.0 4.5 2TOTAL 137 7,039.6 251.4 4.9 127 NS = not specified
One hundred and thirteen growers (81.9%) indicated they were under contractwith a processor (Table 2). Ninety-one (80.5%) of those under contract indicated therewere pesticide restrictions placed on them by the processor. Table 3 summarizes thoserestrictions. Although answers varied, over half of the growers indicated that captan usewas not allowed, and that EBDCs could not be used after bloom.

9
Table 2: Contracts and restrictions for grape growers in NY for 1993 Under contract? # of % of
With whom? records records No 25 18.1Yes 113 81.9
National Grape Cooperative 60 53.1Westfield Grower's Cooperative 20 17.7Canandaigua Wine Co. 13 11.5Cliffstar 5 4.4Coca Cola Foods 3 2.7Royal Wine Company 3 2.7Seneca Foods 2 1.8Taylor Wine Company 2 1.8Not specified 2 1.8Fall Bright the Winemakers Shoppe 1 0.9Mogen David 1 0.9Red Wing 1 0.9
Table 3: Restrictions placed on grape growers in NY for 1993 (91 records)
# of % ofgrowers records
with withWhat restrictions are placed on growers? restrictions restictions No EBDC use after bloom 57 62.6No captan 49 53.8No Alar 19 20.9Not specified 10 11.0Only use approved products 9 9.9No parathion 7 7.7No Roundup after bloom 3 3.3No Benlate 2 2.2No 2,4-D 1 1.1Several 1 1.1Must follow label requirements 1 1.1Do not use any restricted material before harvest 1 1.1Only use pesticides in Cornell Recommends 1 1.1Do not remember 1 1.1

10
HERBICIDE USE
One hundred and twenty-five (91.2%) growers made 341 herbicide applicationsto 92.9% of the vineyard acres in 1993, for an average of 2.7 applications per grower(Table 4). The percent of growers using herbicides in Western New York, the FingerLakes and Long Island was approximately the same (93.5%, 86.8% and 83.3%,respectively). Growers in Western New York applied herbicides to 96.6% of theiracreage, 89.7% in the Finger Lakes and 76.6% on Long Island.
Table 4: NY grape growers using herbicides in 1993
# of growers # of Acreageusing # of applications receiving
Region herbicides applications per grower herbicides Western 87 238 2.7 3,478.2Finger Lakes 33 88 2.7 2,932.4Long Island 5 15 3.0 131.0
Total 125 341 2.7 6,541.6
Table 5 summarizes who applied the herbicides to grapes in 1993. Ninety-eightpercent of herbicide applications were made by the grower, or his/her employee. Thetype of application equipment used most often was a boom sprayer (84.5%, Table 6).All herbicide applications were ground applications.
Table 5: Who applied herbicides to NY grape crop in 1993 Who applied # of applications % of applications Grower/employee 335 98.2Custom applicator 6 1.8
Table 6: Equipment used to apply herbicides to NY grape crop in 1993 Type of equipment # of applications % of applications Boom sprayer 288 84.5Not specified 26 7.6Air-blast sprayer 12 3.5Hand-held sprayer 10 2.9Piston-pump sprayer 5 1.5
Table 7 summarizes the herbicides used by grape growers in 1993. A total of34,015.42 lbs of herbicide active ingredients were applied to 6,541.6 acres of vineyardsurveyed in 1993. The active ingredient used most often was diuron (applied by 72.8%of growers using herbicides). It was applied to 244.84 acres an average of 1.2 times ata rate of 9.0 or 9.6 lbs active ingredient per acre, for a total of 20,389.49 lbs diuronapplied to the survey area.

11
Table 7: Herbicide use on NY grape crop in 1993 (all regions)
RateTotal AI per Total
Active Ingredient # of acres Times Acre acre lbs AITrade Name records treated a/ appliedb/ treatments (lb) c/ applied
diuron 91 20,389.49
Direx & Karmex 4L 13 244.84 1.2 293.81 9.0 2,644.29Direx 80DF, Diuron
80WDG & Karmex DF 78 1,848.46 1.0 1,848.46 9.6 17,745.20glyphosate 89 4,120.26
Roundup 89 3,092.23 1.3 4,120.26 1.0 4,120.26simazine 65 7,571.69
Princep Caliber 90 29 476.10 1.0 476.10 4.77 2,271.00Princep 4L, 80W, &
Simazine 80W 30 643.81 1.0 643.81 4.8 3,090.29Sim-trol & Simazine 4L 6 460.50 1.2 552.6 4.0 2,210.40
paraquat 54 1,532.45Gramoxone Extra 54 1,451.69 1.1 1,634.61 0.94 1,532.45
oryzalin 5 306.23Surflan A.S. 5 51.04 1.0 51.04 6.0 306.23
norflurazon 4 95.30Solicam DF 4 24.25 1.0 24.25 3.93 95.30
Total 34,015.42 a/ When under-trellis applications were made, acres treated are based on width of spray band and
distance between vineyard rows.b/ Average, weighted by acres treated.c/ Based on high label rates
Figure 2 illustrates the pounds of herbicide active ingredients applied to the 1993grape crop in each region. Long Island growers did not use diuron or norflurazon, andFinger Lakes growers used neither oryzalin nor norflurazon.
10000800060004000200000
Western
Finger Lakes
Long Island
diuron
glyphosate
norflurazon
oryazlin
paraquat
simazine
Figure 2: Pounds of herbicide AIs applied to 1993 grape crop by region in NY
lbs active ingredient

12
Pounds of herbicide active ingredients applied per acre in each region are shownin Figure 3. Long Island growers treated 131 acres with 558.54 lbs (AI) of herbicides(4.3 lbs AI/A); Finger Lakes growers applied 15,790.23 lbs to 2,932.4 acres (5.4 lbsAI/A), and Western New York growers used 18,380.51 lbs (AI) of herbicides on 3,478.2acres of vineyard (5.3 lbs AI/A).
Western
Finger Lakes
Long Island
1086420lbs herbicide AIs/A
Figure 3: Pounds of herbicide AIs applied per acre in NY in 1993
regi
on
Herbicide applications were made both pre- and post- weed emergence almostequally (Table 8). The most common site of application of herbicides was "under thetrellis" (69.8%, Table 9).
Table 8: Timing of application of herbicides on NY grape crop in 1993
# of % ofTime of Application applications applications Preemergence 169 49.6Postemergence 172 50.4
Table 9: Site of application of herbicides on NY grape crop in 1993
# of % ofSite of application applications applications Under the trellis 238 69.8Between the row 53 15.5Spot treatment 50 14.7
Table 10 indicates the frequency of herbicide applications for weed pests.Annual grass and annual broadleaf weeds accounted for 59.8% and 57.2% of herbicideapplications, respectively, to vineyards in 1993. Broadleaf weeds (both annual andperennial) were targeted more often on Long Island, while annual weeds (both broadleafand grasses) were targeted more often in the Finger Lakes and Western New York.There was no chemical suckering control indicated on Long Island (Figure 4). A costcomparison of herbicides used in vineyards is shown in Table 11.

13
Table 10: Frequency of herbicide applications for target pests of grapes in NY in 1993
# of % ofWeed pest applications applications Annual grass 204 59.8Annual broadleaf 195 57.2Perennial broadleaf 170 49.9Perennial grass 170 49.9Biennial weeds 129 37.8Chemical suckering 36 10.6Not specified 65 19.1
80706050403020100
Western
Finger Lakes
Long Island
Figure 4: Frequency of herbicide applications for target pests of grapes by region in NY in 1993
Annual broadleaf
Perennial broadleaf
Annual grass
Perennial grass
Biennial weeds
Chemical suckering
Not specified
number of applications
Table 11: Cost comparison of herbicides used in grape production
Maximum Median Cost per Avg. #Active rate/A cost/lb acre per of times Total
Herbicide ingredient (lbs of AI) of AI a/ application applied cost Karmex 4L diuron 9.0 $5.06 $45.54 1.2 $54.65Karmex DF diuron 9.6 5.06 48.48 1.0 48.58Roundup glyphosate 1.0 12.50 12.50 1.3 16.25Princep Cal 90 simazine 4.77 3.50 16.70 1.0 16.70Princep 4L simazine 4.8 3.00 14.40 1.0 14.40Princep 80W simazine 4.8 3.50 16.80 1.0 16.80Gramoxone Extra paraquat 0.938 7.84 7.35 1.1 8.09Surflan A.S. oryzalin 6.0 16.16 96.96 1.0 96.96Solicam DF norflurazon 3.93 19.00 74.67 1.0 74.67 a/ Price obtained from AGCHEMPRICE Current U.S.A. Prices of Non-Fertilizer Agricultural ChemicalsApril 1992. Published by DPRA Incorporated. Costs may not reflect 1994 prices, and may vary.

14
INSECTICIDE USE
Seventy-two (52.6%) growers made 136 insecticide applications to 43.5% of thevineyard acres in 1993. An average of 1.9 applications were made per grower (Table12). Long Island growers, who applied insecticides to 83.0% of grape acreage, madeconsiderably more applications than Finger Lakes or Western New York growers.Vineyards in the Fingers Lakes and Western New York received insecticide treatmentson 29.8% and 54.4% of acreage, respectively.
Table 12: NY grape growers using insecticides in 1993
# of growers Avg. # of Acreageusing # of applications receiving
Region insecticides applications per grower herbicides Western 50 90 1.8 1,960.5Finger Lakes 17 30 1.8 975.0Long Island 5 16 3.2 142.0
Total 72 136 1.9 3,077.5
Table 13 summarizes who applied insecticides to grapes in 1993. Ninety-eightand one-half percent of insecticide applications were made by the grower/employee.The majority of applications (94.1%, Table 14) were foliar and applied with an air-blastsprayer (84.6%, Table 15).
Table 13: Who applied insecticides to NY grape crop in 1993
# of % ofWho applied applications applications Grower/employee 134 98.5Custom applicator 2 1.5
Table 14: Type of coverage of insecticides on NY grape crop in 1993
# of % ofType of coverage applications applications Foliar 128 94.1Border/spot 5 3.7Not specified 3 2.2
Table 15: Equipment used to apply insecticides to NY grape crop in 1993
# of % ofType of equipment applications applications Air-blast sprayer 115 84.6Boom sprayer 17 12.5Helicopter 1 0.7Not specified 3 2.2

15
Table 16 summarizes the insecticides used by grape growers in 1993. A total of9,204.97 lbs of insecticide active ingredients were applied to 3,077.5 acres of vineyardsurveyed in 1993. The active ingredient used most often was carbaryl (applied by95.8% of growers using insecticides). It was applied to 2,460.1 acres, an average of 1.7times at a rate of 2.0 lbs active ingredient per acre, for a total of 8,364.34 lbs carbarylapplied to the survey area.
Table 16: Insecticide use on NY grape crop in 1993
Total Rate TotalActive Ingredient # of acres Times Acre AI per lbs AI
Trade name records sprayed applied treatments acre applied carbaryl 69 8,364.34
Carbaryl & Sevin 69 2,460.1 1.7 4,182.17 2.0 8,364.34methyl parathion 8 388.00
Penncap-M 8 170.0 1.1 194.00 2.0 388.00dicofol 5 169.63
Kelthane 35 2 50.0 1.3 65.00 1.225 79.63Kelthane 50 3 72.0 1.0 72.00 1.25 90.00
azinphos-methyl 3 95.00Guthion WP 3 55.0 1.7 95.00 1.0 95.00
phosmet 3 153.00Imidan 50-WP 3 67.0 1.5 102.00 1.5 153.00
fenbutatin-oxide 1 35.00Vendex 50WP 1 28.0 1.0 28.0 1.25 35.00
Total 9,204.97
Figure 5 illustrates the pounds of insecticide active ingredients applied to the1993 grape crop in each region. Long Island growers were the only growers whoapplied dicofol, fenbutatin-oxide or phosmet, while Western New York growers were theonly ones to apply azinphos-methyl.
60005000400030002000100000
carbaryl
methyl parathion
dicofol
phosmet
azinphos-methyl
fenbutatin-oxide
Western
Finger Lakes
Long Island
Figure 5: Pounds of insecticide AIs applied to 1993 grape crop by regionlbs active ingredient

16
Pounds of insecticide active ingredients applied per acre in each region is shownin Figure 6. Long Island vineyards carried the greatest insecticide load - 545.83 lbs (AI)of insecticides to 142.0 acres (3.8 lbs AI/A). Western New York growers applied6,445.10 lbs of insecticide active ingredients to 1,960.5 acres (3.3 lbs AI/A), and 975.0Finger Lakes acres were treated with 2,575.20 lbs (2.6 lbs AI/A).
regi
onWestern
Finger Lakes
Long Island
43210lbs insecticide AI/A
Figure 6: Pounds of fungicide AIs applied per acre in NY in 1993
Insecticide applications were applied most frequently as a midsummer spray(36.0%), followed by second postbloom and first postbloom sprays (25.0% and 19.9%respectively, Table 17). Long Island growers applied insecticides as first and secondpostbloom and midsummer sprays only, while Western New York growers appliedinsecticides at all stages except bud swell and 1 inch shoot growth (Figure 7).
Table 17: Timing of insecticide application on NY grape crop in 1993
# of % ofTime of Application applications applications Bud swell 1 0.71" shoot growth 1 0.73-5" shoot growth 2 1.510-12" shoot growth 9 6.6Prebloom 9 6.6Trace bloom 2 1.51st postbloom spray 27 19.92nd postbloom spray 34 25.0Midsummer spray 49 36.0Postharvest 2 1.5

17
0
10
20
30
40
50
carbaryldicofol
phosmetfenbutatin-oxide
carbaryl
methyl parathion
azinphos-methyl
# of
app
licat
ions
Long Island
Western
budswell
1" shootgrowth
3-5"shootgrowth
10-12"shootgrowth
prebloom 1stpost
bloom
2ndpost
bloom
midsummer
postharvest
Figure 7: Number of insecticide applications at variousstages of vineyard growth in NY in 1993
carbaryl
methyl parathionFinger Lakes
Table 18 indicates the frequency of insecticide applications for insect pests.Applications made for both grape berry moth and leafhoppers were most common(56.6%), followed by applications to control the Japanese flea beetle (43.4%). A similarpattern was followed in Western New York and the Finger Lakes, but on Long Island,the most common target pest was the European red mite which received 43.8% of allinsecticide applications there (Figure 8).
Table 18: Frequency of insecticide applications for target pests of grapes in NY in 1993
# of % ofInsect pest applications applications Grape berry moth and Leafhopper together 77 56.6Japanese beetle 59 43.4Grape flea beetle 25 18.4Grape berry moth 24 17.6Leafhopper 14 10.3Grape cane girdler 11 8.1Climbing cutworm 8 5.9European red mite 7 5.1Not specified 7 5.1Grape rootworm 5 3.7Grape cane gallmaker 2 1.5Rose chafer 2 1.5Leafrollers 2 1.5

18
0
10
20
30
40
50
60
WesternFinger LakesLong Island
# of
app
licat
ions
Grapeberry moth
and leaf-hopper
Grapeberrymoth
Grapeflea
beetle
Clim
bing
cutw
orm
Eur
opea
nre
d m
ite
Graperootworm
Rosechafer
Japa
nese
beet
le
Leaf
hopp
er
Gra
pe c
ane
gird
ler
Gra
pe c
ane
gallm
aker
Leaf
rolle
rs
Figure 8: Frequency of insecticide applications for target pests on grapes in NY in 1993
A cost comparison of insecticides used on vineyards is shown in Table 19.
Table 19: Cost comparison of insecticides used in grape production
Maximum Median Cost per Avg. #Active rate/A cost/lb acre per of times Total
Insecticide ingredient (lbs of AI) of AI a/ application applied cost Guthion WP azinphos-methyl 1.0 $12.60 $12.60 1.7 $21.42Sevin 50W carbaryl 2.0 5.50 11.00 1.7 18.70Sevin 80S carbaryl 2.0 5.00 10.00 1.7 17.00Kelthane 35 dicofol 1.225 17.71 21.69 1.3 28.20Vendex 50WP fenbutatin-oxide 1.25 36.43 45.54 1.0 45.54Penncap-M methyl parathion 2.0 10.50 21.00 1.1 23.10Imidan 50-WP phosmet 1.5 5.80 8.70 1.5 13.05 a/ Price obtained from AGCHEMPRICE Current U.S.A. Prices of Non-Fertilizer Agricultural Chemicals
April 1992. Published by DPRA Incorporated. Costs may not reflect 1994 prices, and may vary.

19
FUNGICIDE USE
One hundred and thirty (94.9%) growers made 927 fungicide applications to89.4% of the vineyard acres in 1993, for an average of 7.1 applications per grower(Table 20). Western New York growers made considerably less applications per grower(4.3), than growers in the Finger Lakes and Long Island (12.3 and 18.2, respectively).However, percent of acreage treated was approximately the same (Western New York -97.5%, Finger Lakes - 99.3% and Long Island - 100%).
Table 20: NY grape growers using fungicides in 1993
# of growers Acreageusing # of # applications receiving
Region fungicides applications per grower fungicides Western 88 375 4.3 3,508.2Finger Lakes 36 443 12.3 3,247.4Long Island 6 109 18.2 171.0
Total 130 927 7.1 6,926.6
All of the fungicide applications were made by the grower/employee in 1993.Eighty-five percent were made with an air-blast sprayer (Table 21), and all were foliarapplications.
Table 21: Equipment used to apply fungicides to NY grape crop in 1993
# of % ofType of equipment applications applications Air-blast sprayer 792 85.4Boom sprayer 107 11.5Hand-held sprayer 6 0.6Not specified 22 2.4
Table 22 summarizes the fungicides used by grape growers in 1993. A total of123,725.6 lbs of fungicide active ingredients were applied to 6,926.6 acres of vineyardsurveyed. The active ingredient used most often was mancozeb (applied by 72.3% ofgrowers using fungicides). A total of 40,280 lbs mancozeb was applied to 4,696vineyard acres. Although used by only 37.7% of growers, the amount of sulfur appliedto New York vineyards (55,827 lbs) was even greater than the amount of mancozeb.
Figure 9 illustrates the pounds of the eight most widely used fungicide activeingredients applied in each region. The majority of sulfur (89.4%), mancozeb (70.5%),and captan (85.6%) was applied in the Finger Lakes. Long Island growers did not usemyclobutanil or fenarimol, and they used extremely small amounts of triadimefon (7.4%)and mancozeb (6.5%).

20
Table 22: Fungicide use on NY grape crop in 1993 (all regions)
Total Rate TotalActive Ingredient # of acres Times Acre AI per lbs AI
Trade name records sprayed applied treatments acre applied mancozeb 94 40,280.02
Dithane DF, Manzate 200DF, & Penncozeb DF 51 1,702.5 2.2 3,745.50 3.0 11,236.50
Dithane M-45, Mancozeb80W, & Penncozeb 41 2,893.5 3.1 8,969.85 3.2 28,703.52
Mancozeb 4L 2 100.0 1.0 100.0 3.4 340.00myclobutanil 76 1,063.07
Nova 40W 76 4,062.0 2.1 8,504.55 0.125 1,063.07sulfur 49 55,827.23
Micro Flo Sulfur 3 75.2 6.0 450.20 6.0 2,701.20Microthiol Special 2 53.0 3.8 203.00 8.0 1,624.00Super Six LiquidSulfur 7 95.4 3.7 356.67 1.5 535.01Thiolux 2 56.0 2.5 140.00 4.8 672.00Wettable Sulfur 35 2,417.7 4.5 10,933.70 4.6 50,295.02
triadimefon 47 690.79Bayleton 47 2,171.0 1.7 3,684.20 0.188 690.79
ferbam 47 3,654.51Carbamate WDG 47 1,508.5 1.6 2,404.28 1.52 3,654.51
fenarimol 41 168.14Rubigan E.C. 41 1,994.8 1.8 3,592.80 0.047 168.14
maneb 29 11,523.34Maneb 80 8 542.0 2.8 1,536.50 3.2 4,916.80Manex II 21 1,261.5 1.5 1,943.10 3.4 6,606.54
captan 25 5,142.54Captan 50-WP, 80-WP,
& Captec 4L 25 1,353.3 1.9 2,571.27 2.0 5,142.54copper hydroxide 19 809.90
Kocide 101 10 482.5 1.0 482.50 1.0 482.50Kocide DF 9 409.3 1.0 409.25 0.8 327.40
copper oxychloridesulfate 19 1,773.00C-O-C-S WDG 19 721.5 1.2 886.50 2.0 1,773.00
iprodione 15 545.50Rovral 15 357.0 1.5 545.50 1.0 545.50
maneb and dinocap 6 1,718.08Dikar 6 470.0 1.2 560.00 3.07 1,718.08
copper sulfate 4 268.18Basicop 4 253.0 1.0 253.00 1.06 268.18
benomyl 4 66.00Benlate 4 88.0 1.0 88.00 0.75 66.00
copper 3 130.47Tenn-Cop 5E 3 46.1 1.0 46.39 2.81 130.47
metalaxyl & copper 3 25.20hydroxideRidomil/Copper 70W 3 18.0 1.0 18.00 1.4 25.20
metalaxyl 1 34.00Ridomil 2E 1 17.0 1.0 17.00 2.0 34.00
dinocap 1 5.63Karathane LC 1 7.5 1.0 7.50 0.75 5.63
Total 123,725.60

21
captan fenarimol ferbam mancozeb maneb myclobutanil sulfur triadimefon0
10000
20000
30000
40000
50000
Western
Finger Lakes
Long Islandlb
s ac
tive
ingr
edie
nt
Figure 9: Pounds of fungicide AIs applied to 1993 grape crop by region in NY
Pounds of fungicide active ingredients applied per acre in each region is shownin Figure 10. As with insecticides, Long Island vineyards carried the greatest fungicideload, applying 8,254.5 lbs (AI) to 171 acres (48.3 lbs AI/A). The Finger Lakes growersapplied 91,617.95 lbs of fungicide active ingredients to 3,247.4 acres (28.2 lbs AI/A),and the vineyards surveyed in Western New York carried a fungicide load of only 6.8 lbsAI/A (23,695.35 lbs {AI} applied to 3,508.2 acres).
50403020100lbs fungicide AIs/A
Figure 10: Pounds of fungicide AIs applied per acre in NY in 1993
Western
Finger Lakes
Long Island
Reg
ion
Fungicide applications were applied most frequently as a midsummer spray(22.0%), followed by prebloom sprays (19.5%, Table 23). All three regions followed thissame pattern. Figure 11 illustrates fungicide applications at different stages of vineyarddevelopment. Where EBDCs were not used for juice grapes after first bloom (generallyin Western New York), myclobutanil and triadimefon became popular.

22
Table 23: Timing of application of fungicides on NY grape crop for 1993
# of % ofTime of Application applications applications Bud swell 12 1.31" shoot growth 44 4.73-5" shoot growth 89 9.610-12" shoot growth 110 11.9Prebloom 177 19.5Trace bloom 19 2.01st postbloom spray 147 15.92nd postbloom spray 120 12.9Midsummer spray 204 22.0Postharvest 4 0.4
sulfur
# of
app
licat
ions
Western
Finger Lakes
Long Island
0
5
10
15
20
25
30
35
mancozeb Western
Finger Lakes
Long Island
bud
swel
l
1" s
hoot
gro
wth
3-5"
sho
ot g
row
th
10-1
2" s
hoot
gro
wth
preb
loom
trac
e bl
oom
1st
post
bloo
m
2nd
post
bloo
m
mid
sum
mer
triadimefon
# of
app
licat
ions
0
5
10
15
20
25
30
35
Western
Finger Lakes
Long Island
po
sth
arv
est
bud
swel
l
1" s
hoot
gro
wth
3-5"
sho
ot g
row
th
10-1
2" s
hoot
gro
wth
preb
loom
trac
e bl
oom
1st
post
bloo
m
2nd
post
bloo
m
mid
sum
mer
myclobutanil
Western
Finger Lakes
Long Island
po
sth
arv
est
Figure 11: Number of fungicide applications at different stages of vineyard development in NY in1993

23
Table 24 indicates the frequency of fungicide applications for disease pests.Fungicides were applied most often for powdery mildew and black rot (72.0% and68.6% respectively), followed by downy mildew (52.5%). Finger Lakes growers appliedfungicides for the previously mentioned pests in that same order, while Western NewYork growers applied for black rot most often (76%). Long Island growers appliedfungicides for all three of the above diseases and for Phomopsis Cane and Leaf Spotwith the same frequency (Figure 12). A cost comparison of fungicides used onvineyards is shown in Table 25.
Table 24: Frequency of fungicide applications for target pests of grapes
# of % ofDisease pest applications applications Powdery mildew 667 72.0Black rot 636 68.6Downy mildew 487 52.5Phomopsis Cane and Leaf Spot 246 26.5Botrytis bunch rot 65 7.0Not specified 48 5.2
1009080706050403020100
Powdery mildew
Black rot
Downy mildew
Phomopsis cane and leaf spot
Botrytis bunch rot
Western
Finger Lakes
Long Island
% of fungicide applicationsFigure 12: Frequency of fungicide applications for target pests of grapes in NY in 1993

24
Table 25: Cost comparison of fungicides used in grape production
Maximum Median Cost per Avg. #Active rate/A cost/lb acre per of times Total
Fungicide ingredient (lbs of AI) of AI a/ application applied cost Benlate benomyl 0.75 $30.90 $23.18 1.0 $23.18Captan 50-WP captan 2.0 4.12 8.24 1.9 15.66Rovral iprodione 1.0 37.50 37.50 1.5 56.25Dithane DF mancozeb 3.0 3.60 10.80 2.2 23.76Dithane M-45 mancozeb 3.2 3.40 10.88 3.1 33.73Manzate 200DF mancozeb 3.0 2.20 6.60 2.2 14.52Ridomil 2E metalaxyl 2.0 71.00 142.00 1.0 142.00Wettable Sulfur sulfur 4.6 0.16 0.74 4.5 3.31Bayleton triadimefon 0.18 92.00 16.42 1.7 27.92 a/ Price obtained from AGCHEMPRICE Current U.S.A. Prices of Non-Fertilizer Agricultural Chemicals
April 1992. Published by DPRA Incorporated. Costs may not reflect 1994 prices, and may vary.

25
TANK MIX USE
Fifty-three (38.7%) growers made tank mix (combination of insecticide andfungicide) applications to 35.2% of the vineyard acres surveyed in 1993. An average of1.8 tank mix applications were made per grower (Table 26). Growers in all threeregions made approximately the same number of applications, but growers on LongIsland treated a greater percentage of vineyard acres: 79.8% vs. 41.4% for WesternNew York and 26.0% for the Finger Lakes region.
Table 26: NY grape growers using tank mixes in 1993
# of growers Avg. # of Acreageusing # of applications receiving
Region tank mixes applications per grower tank mixes Western 36 60 1.6 1,488.3Finger Lakes 12 25 2.1 853.5Long Island 5 8 1.6 136.5
Total 53 93 1.8 2,478.3
All of the tank mix applications were made by the grower/employee and werefoliar applications. The type of equipment used most often to apply tank mixes was anair-blast sprayer (72.0%, Table 27).
Table 27: Equipment used to apply tank mixes to NY grape crop in 1993
# of % ofType of equipment applications applications Air-blast sprayer 67 72.0Boom sprayer 18 19.4Hand-held sprayer 3 3.2Not specified 5 5.4
Table 28 summarizes the tank mixes used by grape growers in 1993. Thecombination of carbaryl and myclobutanil (Sevin and Nova) was the most common tankmix. Seventeen growers (32% of those using tank mixes) applied Sevin/Nova on 662.6acres, an average of 1.3 times for a total of 1,830.4 lbs AI applied. Carbaryl was theinsecticide active ingredient used most often in tank mixes, and myclobutanil was thefungicide AI used most often in tank mixes.

26
Table 28: Tank mix use on NY grape crop in 1993 (all regions)
Total Rate TotalActive Ingredient # of acres Times Acre AI per lbs AI
Trade name records sprayed applied treatments acre applied azinphos-methyl & captan
Guthion, Captan 1 6.0 1.0 6.00 3.0 18.00azinphos-methyl & triadimefon
Guthion, Bayleton 1 1.5 1.0 1.50 2.19 3.28captan & carbaryl
Captan, Sevin 2 21.5 1.0 21.50 4.0 86.00captan, carbaryl, & benomyl
Captan, Sevin, Benlate 1 6.0 2.0 12.00 4.75 57.00captan, carbaryl, dicofol & triadimefon
Captan, Sevin,Kelthane, Bayleton 1 50.0 1.0 50.00 5.44 271.88
captan, carbaryl & myclobutanilCaptan, Sevin, Nova 2 100.0 1.0 100.00 4.13 412.50
captan, carbaryl & triadimefonCaptan, Sevin,
Bayleton 2 40.3 1.0 40.25 4.19 168.55captan, triadimefon & dicofol
Captan, Bayleton,Kelthane 1 10.0 1.0 10.00 3.39 33.88
captan, triadimefon & fenbutatin-oxideCaptan, Bayleton,
Vendex 1 28.0 1.0 28.00 3.44 96.25captan, triadimefon, phosmet
Captan, Bayleton,Imidan 1 28.0 1.0 28.00 3.69 103.25
carbaryl, dicofol, ferbam & sulfurSevin, Kelthane,
Carbamate, LiquidSulfur 1 29.0 1.0 29.00 6.27 181.83
carbaryl & fenarimolSevin, Rubigan 1 45.0 1.0 45.00 2.05 92.11
carbaryl, fenarimol & ferbamSevin, Rubigan,
Carbamate 2 126.0 1.0 126.00 3.57 449.42carbaryl, fenarimol & mancozeb
Sevin, Rubigan, Dithane/Penncozeb/Mancozeb 5 338.0 1.3 439.40 5.25 2,305.53
carbaryl, fenarimol & manebSevin, Rubigan, Maneb 1 9.5 1.0 9.50 5.25 49.84
carbaryl & ferbamSevin, Carbamate 1 105.0 1.0 105.00 3.52 369.60
carbaryl, ferbam & myclobutanilSevin, Carbamate, Nova 3 32.0 1.0 32.00 3.65 116.64
carbaryl, ferbam, myclobutanil & sulfurSevin, Carbamate, Nova,
Wettable Sulfur 1 2.0 1.0 2.00 8.25 16.49carbaryl, ferbam & triadimefon
Sevin, Carbamate,Bayleton 1 10.0 1.0 10.00 4.19 41.88
carbaryl & mancozebSevin, Penncozeb 1 40.0 1.0 40.00 5.00 200.00
carbaryl, mancozeb & myclobutanilSevin, Dithane, Nova 2 45.0 1.9 85.50 5.33 455.29
carbaryl, mancozeb, myclobutanil & sulfurSevin, Dithane, Nova, Sulfur 1 50.0 1.0 50.00 9.925 496.25
(con't next page)

27
Table 28: Tank mix use on NY grape crop in 1993 (continued)
Total Rate TotalActive Ingredient. # of acres Times Acre AI per lbs AI
Trade name records sprayed applied treatments acre applied carbaryl, mancozeb & sulfur
Sevin, Dithane/PenncozebMicro Flo/WettableSulfur 2 57.0 1.0 57.00 10.58 603.20
carbaryl, mancozeb & triadimefonSevin, Penncozeb,
Bayleton 1 45.0 2.0 90.00 5.19 466.88carbaryl, maneb, & sulfur
Sevin, Manex, Sulfur 1 17.0 1.0 17.00 10.00 170.00carbaryl, methyl parathion & triadimefon
Sevin, Penncap-M,Bayleton 1 10.0 1.0 10.00 4.19 41.88
carbaryl & myclobutanilSevin, Nova 17 662.6 1.3 861.38 2.13 1,830.43
carbaryl & triadimefonSevin, Bayleton 2 30.0 3.5 104.00 2.19 227.50
carbaryl, triadimefon & manebSevin, Bayleton, Maneb 1 290.0 2.0 580.00 5.39 3,124.75
dinocap, ferbam & methyl parathionKarathane, Carbamate,
Penncap-M 2 65.4 1.0 65.40 4.27 279.26fenarimol, ferbam & methyl parathion
Rubigan, Carbamate,Penncap-M 2 71.5 1.0 71.50 3.57 255.03
fenarimol & methyl parathionRubigan, Penncap-M 1 130.0 1.0 130.00 2.05 266.08
ferbam, methyl parathion & myclobutanilCarbamate, Penncap-M,
Nova 1 37.0 1.0 37.00 3.65 134.87mancozeb & methyl parathion
Penncozeb, Penncap-M 1 12.0 3.0 36.00 5.20 187.20mancozeb, methyl parathion & sulfur
Manzate, Penncap-M,Sulfur 1 5.0 1.0 5.00 9.60 48.00
methyl parathion & myclobutanilPenncap-M, Nova 5 244.25 1.4 344.25 2.13 731.53
Total 14,392.08
Figure 13 illustrates the pounds of tank mix active ingredients applied per acre ineach region. Although more tank mixes were used in Western New York than in theFinger Lakes or Long Island, Western New York vineyards received a considerablysmaller pesticide load (4.0 lbs/A for Western New York vs. 9.3 and 10.7 lbs/A for theFinger Lakes and Long Island, respectively). This is due, in part, to the fact that almostall tank mixes in Western New York used myclobutanil (low rate of active ingredient peracre), while tank mixes in the Finger Lakes and on Long Island used more products withhigher active ingredient rates per acre (mancozeb and sulfur).

28
Western
Finger Lakes
Long Island
151050lbs tank mix AI/A
Figure 13: Pounds of tank mix AIs applied per acre in NY in 1993
regi
on
Tank mix applications were applied most often as midsummer sprays (39.7%,Table 29), followed by first and second postbloom sprays. Twenty-five percent of themidsummer applications and one-third of the first and second postbloom sprays weretank mixes of Nova and Sevin.
Table 29: Timing of application of tank mixes on NY grape crop in 1993
# of % ofTime of Application applications applications Bud swell 0 0.01" shoot growth 2 2.23-5" shoot growth 2 2.210-12" shoot growth 1 1.1Prebloom 11 11.8Trace bloom 0 0.01st postbloom spray 20 21.52nd postbloom spray 21 22.6Midsummer spray 36 38.7Postharvest 0 0.0
Table 30 indicates the frequency of tank mix applications for insect and diseasepests. Tank mixes were applied most often for leafhopper (74.2%), grape berry moth(72.0%), black rot (87.1%) and powdery mildew (87.1%). Fifty-one applications (54.8%)were made for all four of the above. Only eight of the grape berry moth and ten of theleafhopper applications were made without targeting both insect pests. Only six blackrot and powdery mildew applications were made without targeting both diseases.

29
Table 30: Frequency of tank mix applications for target pests of grapes (all regions) in NY in 1993
# of % of # of % ofInsect pest appl. appl. Disease pest appl. appl. Leafhopper 69 74.2 Black rot 81 87.1Grape berry moth 67 72.0 Powdery mildew 81 87.1Japanese beetle 44 47.3 Downy mildew 55 59.1Grape flea beetle 17 18.3 Phomopsis caneGrape cane girdler 13 14.0 and leaf spots 29 31.2Grape cane gallmaker 11 11.8 Botrytis bunch rot 9 9.7Not specified 8 8.6 Not specified 4 4.3Climbing cutworm 5 5.4Grape rootworm 5 5.4European red mite 3 3.2Rose chafer 2 2.1Thrips 1 1.1
Figure 14 illustrates the frequency of tank mix use for target pests by region.Western New York growers were the only ones who targeted thrips, rose chafers andbotrytis bunch rot. Long Island growers targeted Japanese beetle and European redmite most often. All tank mix applications on Long Island that targeted Japanese beetlewere also used for powdery and downy mildew, as well as black rot. Forty-four of the46 tank mix applications that targeted grape berry moth in Western New York alsotargeted black rot and powdery mildew. Twenty-one of the 22 tank mix applicationstargeting downy mildew in the Finger Lakes also targeted leafhoppers.
% of applications
100806040200
Leafhopper
Grape berry moth
Japanese beetleGrape flea beetle
Grape cane girdler
Grape cane gallmaker
Climbing cutworm
Grape rootworm
European red miteRose chafer
Thrips
Western
Finger Lakes
Long Island
Inse
ct
100806040200
% of applications
Western
Finger Lakes
Long Island
Black rot
Powdery mildew
Downy mildew
Phomopsis cane and leaf spots
Botrytis bunch rot
Dis
ease
Figure 14: Frequency of tank mix applications for target pests of grapes by region in NY in 1993

30
MISCELLANEOUS
The cost of chemical pest control is illustrated in Table 31. The most commonamount spent on chemical pest control, not including the response "over $250" wherethe actual amount was unspecified, was $51 - 150 (10.9%) followed by $151 - 250(8.7%). It is unclear from the answers whether or not growers read the questioncorrectly, since it asked for a per acre cost, and many of these answers appear to beextremely high.
Table 31: Cost of chemical pest control per acre for NY grape crop in 1993
# of % ofCost records records $0 1 0.7$11-50 2 1.4$51-150 15 10.9$151-250 12 8.7Over $250 (amount not specified) 26 18.8$251-500 8 5.8$501-750 6 4.3$751-1,000 8 5.8$1,000-1,500 12 8.7$1,501-2,000 2 1.4$2,001-3,000 9 6.5$3,001-5,000 9 6.5$5,001-7,500 4 2.9$7,501-10,000 8 5.8$10,001-25,000 3 2.2$28,000 1 0.7$90,000 1 0.7Don't know 2 1.4Not specified 8 5.8
Nonchemical pest control cost was $0 (58.0%, Table 32). It is unclear whatgrowers considered nonchemical control when answering this question, but some of thecomments on the surveys indicated the following: leaf removal, hedging, bird controland hydraulic grape hoe. There is, however, a cost attached to nonchemical methodswhich include man hours and equipment costs.
Table 32: Cost of nonchemical pest control per acre for NY grape crop in 1993
# of % ofCost records records $0 80 58.0Less than $10 1 0.7$11-50 11 8.0$51-150 6 4.4$151-250 9 6.5Over $250 (amount not specified) 7 5.1$251-750 3 2.1$751-2000 4 2.8Not specified 14 10.1Don't know 2 1.4

31
Forty three and one-half percent of the growers surveyed indicated that theycalibrated their application equipment once per season (Table 33). Approximately one-third calibrated before each application. The most common method of calibratingequipment was the "known area method" (spray water on a measured acre and thencalculate how many gallons of water were used) (38.4%, Table 34).
Table 33: Frequency of calibration of equipment for NY grape crop in 1993
# of % ofFrequency of calibration records records Once per season 60 43.5Before each application 41 29.7Two to three times a season 29 21.0At the time of equipment purchase 2 1.4At the time of equipment purchase and once a season 2 1.4Not specified 2 1.4Before each application & two to three times a season 1 0.7Every two to three years 1 0.7
Table 34: How NY grape growers calibrated their equipment in 1993
# of % ofMethod of calibration records records Gallons of water/acre 53 38.4Nozzle output (quart jar method) 23 16.7Gallons of water/acre, speed of equipment 18 13.0According to manual 14 10.1Not specified 11 8.0Acres covered over time 3 2.2Gallons of water /acre and nozzle output 3 2.2Othera/ 13 9.4 a/Other includes: "adjust pressure as the acre is sprayed", "experimentation", "feet X mph X psi", "land
speed and pressure", "make sure everything works properly", "not easily", "person who services sprayerdoes it", "replace tee jets and maintain proper pressure", "stopwatch distance" and "the right way".
Growers were asked to select one of the following choices releated to applyingpesticides in their vineyard in 1993: "spray schedule", "presence of pest" or "IPMprogram." The results are shown in Table 35. Almost half of the growers indicated theyused a spray schedule that was recommended by Extension (Table 36). There weremany comments on this question indicating that growers felt the question was difficult toanswer:
• "I really use a spray schedule integrated with IPM, that's why I only applied 3 or 4sprays this year."
• "I feel a spray schedule takes into account IPM."• "This is a bad question--to do the best conscientious job, one does all three."• "For grape berry moth, I scout, but this is minor compared to a schedule for weeds
and diseases."• "I use presence of pest, including disease pressure/presence from pervious year."

32
Table 35: Basis for application of pesticides on NY grape crop in 1993
# of % ofBasis for application records records Spray schedule 63 45.7Presence of pest 36 26.1IPM program 30 21.7All three 4 2.9Presence of pest and spray schedule 2 1.4Not specified 2 1.4Presence of pest and IPM program 1 0.7
Table 36: Recommendation of spray schedule on NY grape crop in 1993
# of % ofWho recommends schedule records records Extension system 24 34.8Extension system and myself 11 15.9Myself 10 14.5Extension system and pesticide dealer 4 5.8Extension system and processor 4 5.8Processor 4 5.8Various combinations of above 12 17.4
Tables 37, 38 and 39 show the spray schedules used by growers who indicatedthat they used a spray schedule to apply pesticides in 1993. Thirty-seven Western NewYork growers, 25 Finger Lakes growers and two Long Island growers used sprayschedules. Herbicide sprays consisted of a preemergent spray of either diuron orsimazine (Table 37) in Western New York and the Finger Lakes, oryzalin or simazine onLong Island, and a postemergent spray of glyphosate or paraquat. Western New Yorkand Finger Lakes growers also used glyphosate for spot treatments. Eight percent ofWestern New York growers and 16% of Finger Lakes growers who said they used aspray schedule in 1993 did not use any herbicides.
Table 37: Herbicide spray schedule used by NY grape growers in 1993
Western Finger Lakes Long Island
% growers % growers % growersTiming AI using AI using AI using Pre- diuron 67.5 diuron 60.0 oryzalin 50.0
emergeence simazine 40.5 simazine 48.0 simazine 50.0glyphosate 8.0 paraquat 4.0norflurazon 5.4
Post- glyphosate 67.6 paraquat 64.0 glyphosate 100.0emergence paraquat 24.3 glyphosate 48.0 paraquat 50.0
diuron 13.5 simazine 8.0simazine 2.7norflurazon 2.7
Spot treatment glyphosate 24.3 glyphosate 32.0paraquat 2.7 paraquat 20.0
simazine 4.0

33
Insecticide sprays in Western New York and the Finger Lakes consisted of aprebloom (includes bud swell through prebloom) spray(s) of carbaryl, a postbloom(includes first and second postbloom sprays) spray(s) of carbaryl, and a midsummerspray(s) of carbaryl. Forty-three percent of Western New York growers and 60% ofFinger Lakes growers using spray schedules did not use insecticides alone on their1993 grape crop. Long Island growers using a spray schedule did not apply a prebloomspray, applied dicofol postbloom, and carbaryl midsummer (Table 38).
Table 38: Insecticide spray schedule used by NY grape growers in 1993
Western Finger Lakes Long Island
% growers % growers % growersTiming AI using AI using AI using Prebloom carbaryl 18.9 carbaryl 20.0 none used
methyl methylparathion 2.7 parathion 4.0
Postbloom carbaryl 72.0 carbaryl 24.0 dicofol 100.0methyl methyl phosmet 50.0
parathion 2.7 parathion 8.0azinphos-
methyl 2.7Midsummer carbaryl 37.9 carbaryl 12.0 carbaryl 100.0
azinphos- methyl dicofol 50.0methyl 5.4 parathion 4.0
phosmet 50.0
The most common prebloom fungicide sprays for all three regions weremancozeb and/or sulfur for those growers who used a spray schedule (Table 39). Thepostbloom sprays in Western New York were myclobutanil, while mancozeb and sulfurwere applied in the Finger Lakes region. Long Island growers applied captan andtriadimefon. Midsummer copper applications were most common in Western New York,sulfur and captan in the Finger Lakes and captan, copper, iprodione and sulfur on LongIsland. Eight percent of Western New York and Finger Lakes growers who used sprayschedules, did not apply fungicides (not including fungicides in tank mixes) to their 1993grape crop.
34
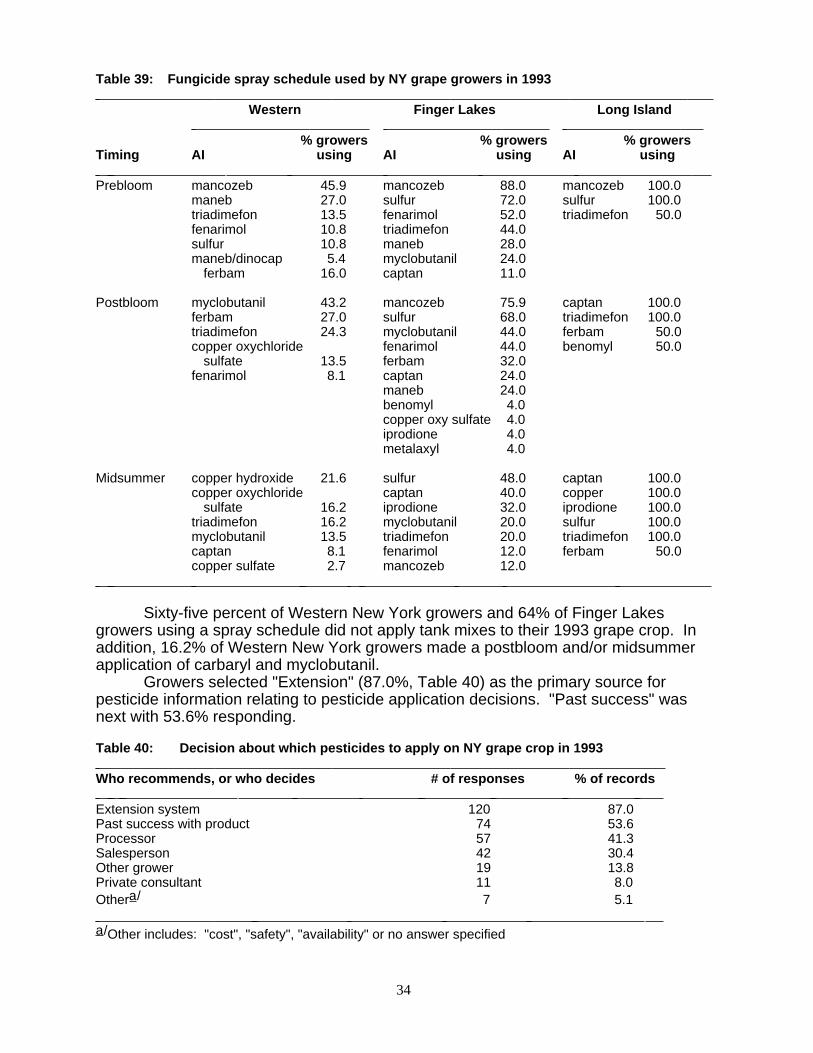
Table 39: Fungicide spray schedule used by NY grape growers in 1993
Western Finger Lakes Long Island
% growers % growers % growersTiming AI using AI using AI using Prebloom mancozeb 45.9 mancozeb 88.0 mancozeb 100.0
maneb 27.0 sulfur 72.0 sulfur 100.0triadimefon 13.5 fenarimol 52.0 triadimefon 50.0fenarimol 10.8 triadimefon 44.0sulfur 10.8 maneb 28.0maneb/dinocap 5.4 myclobutanil 24.0
ferbam 16.0 captan 11.0
Postbloom myclobutanil 43.2 mancozeb 75.9 captan 100.0ferbam 27.0 sulfur 68.0 triadimefon 100.0triadimefon 24.3 myclobutanil 44.0 ferbam 50.0copper oxychloride fenarimol 44.0 benomyl 50.0
sulfate 13.5 ferbam 32.0fenarimol 8.1 captan 24.0
maneb 24.0benomyl 4.0copper oxy sulfate 4.0iprodione 4.0metalaxyl 4.0
Midsummer copper hydroxide 21.6 sulfur 48.0 captan 100.0copper oxychloride captan 40.0 copper 100.0
sulfate 16.2 iprodione 32.0 iprodione 100.0triadimefon 16.2 myclobutanil 20.0 sulfur 100.0myclobutanil 13.5 triadimefon 20.0 triadimefon 100.0captan 8.1 fenarimol 12.0 ferbam 50.0copper sulfate 2.7 mancozeb 12.0
Sixty-five percent of Western New York growers and 64% of Finger Lakesgrowers using a spray schedule did not apply tank mixes to their 1993 grape crop. Inaddition, 16.2% of Western New York growers made a postbloom and/or midsummerapplication of carbaryl and myclobutanil.
Growers selected "Extension" (87.0%, Table 40) as the primary source forpesticide information relating to pesticide application decisions. "Past success" wasnext with 53.6% responding.
Table 40: Decision about which pesticides to apply on NY grape crop in 1993 Who recommends, or who decides # of responses % of records Extension system 120 87.0Past success with product 74 53.6Processor 57 41.3Salesperson 42 30.4Other grower 19 13.8Private consultant 11 8.0Othera/ 7 5.1 a/Other includes: "cost", "safety", "availability" or no answer specified

35
The most common alternative method used by grape growers to control pestproblems in the vineyard in 1993 was mowing (82.6%, Table 41). Over half the growersused pruning (to remove infected or infested growth) and cultivation as alternativemethods. Figure 15 illustrates alternative methods used by region. Long Islandgrowers indicated pruning was used most often followed by row orientation and thenmowing. Western New York growers pruned more often, while Finger Lakes growersmulched at greater frequency.
Table 41: Alternative methods used to control grape pests in NY in 1993
# of % ofAlternative method responses records Mowing 114 82.6Pruning to remove infected or infested growth 76 55.1Cultivation 74 53.6Burn/bury/remove infected plants/berries 36 26.1Rows oriented to promote good air circulation 26 18.8Cover crop 25 18.1Mulching 25 18.1Othera/ 13 9.4Do not use 5 3.6Baited traps 1 0.7 a/Other includes: "leaf removal in fruit zone", "bird netting", "shoot thinning", "summer pruning", "canopy
management", "grub hoe", "do not know", "mating disruption", "encouraging insect eating birds to nestaround vineyard"
mow
ing
prun
ing
cultiv
atio
n
burn
/bur
y/re
mov
e
orien
t row
s
cove
r cro
p
mul
chin
g
do n
ot u
se
0
20
40
60
80
100Western
Finger Lakes
Long Island
% o
f gro
wer
s
Figure 15: Alternative methods used to control grape pests in NY in 1993
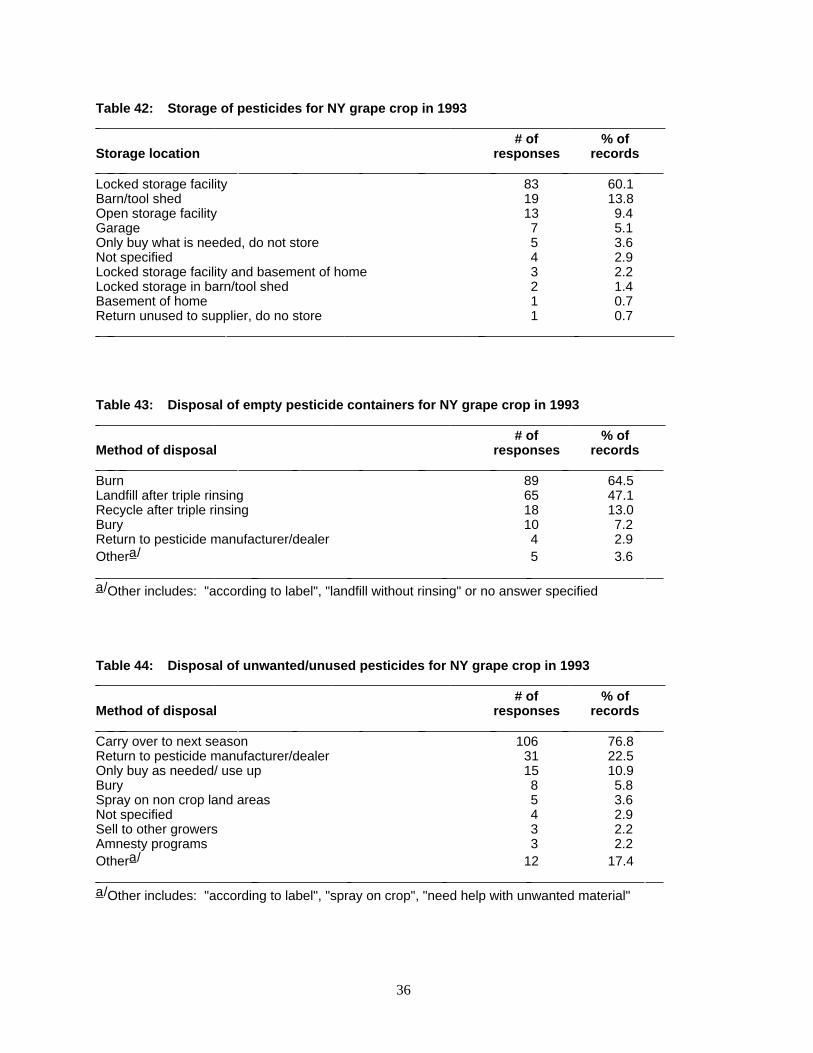
Respondents indicated that pesticides were stored in a locked storage facility(60.1%, Table 42). Empty containers were burned (64.5%) or sent to the landfill aftertriple rinsing (47.1%, Table 43). Unwanted or unused pesticides were carried over tothe next season (76.8%, Table 44) and rinsate was disposed of by spraying it back intothe vineyard (48.1%, Table 45).
36
Table 42: Storage of pesticides for NY grape crop in 1993
# of % ofStorage location responses records Locked storage facility 83 60.1Barn/tool shed 19 13.8Open storage facility 13 9.4Garage 7 5.1Only buy what is needed, do not store 5 3.6Not specified 4 2.9Locked storage facility and basement of home 3 2.2Locked storage in barn/tool shed 2 1.4Basement of home 1 0.7Return unused to supplier, do no store 1 0.7
Table 43: Disposal of empty pesticide containers for NY grape crop in 1993
# of % ofMethod of disposal responses records Burn 89 64.5Landfill after triple rinsing 65 47.1Recycle after triple rinsing 18 13.0Bury 10 7.2Return to pesticide manufacturer/dealer 4 2.9Othera/ 5 3.6 a/Other includes: "according to label", "landfill without rinsing" or no answer specified
Table 44: Disposal of unwanted/unused pesticides for NY grape crop in 1993
# of % ofMethod of disposal responses records Carry over to next season 106 76.8Return to pesticide manufacturer/dealer 31 22.5Only buy as needed/ use up 15 10.9Bury 8 5.8Spray on non crop land areas 5 3.6Not specified 4 2.9Sell to other growers 3 2.2Amnesty programs 3 2.2Othera/ 12 17.4 a/Other includes: "according to label", "spray on crop", "need help with unwanted material"

37
Table 45: Disposal of rinsate for NY grape crop in 1993
# of % ofMethod of rinsate disposal records records Spray back into vineyard 66 48.1Not specified 30 21.7Dump on ground 11 8.0Spray on non-crop field 8 5.8Othera/ 8 5.8Spray on border rows 6 4.3Burn 4 2.9Do not know 3 2.2Spray on crops 2 1.4 a/Other includes: "according to label", "burn and bury", "daily removal", "empty sprayer is filled with water
and detergent and used to wash the equipment off", "landfill", "safely", "trash removal", "wash withwater 3 times and dispose"

38
CONCLUSIONS
In 1979, Fluke, Marsh and Osteen conducted a grape production pesticide usesurvey in New York and Pennsylvania, covering 39,270 acres. Grape growers treated95% of the vineyard acreage surveyed with pesticides; Finger Lakes growers treated99% and growers in Pennsylvania and Western New York treated 93% (Fluke, Marshand Osteen, 1982). In 1993, growers treated an average of 68% of vineyard acreagesurveyed; Finger Lakes growers treated an average of 61%, Western New York growerstreated an average of 73% and growers on Long Island treated an average of 85% withpesticides. This is a considerable reduction since 1979, especially in the Finger Lakes.On average, in 1979, each grower applied 10.6 lbs (AI) of pesticides per acre; in 1993that number decreased to 8.4 lbs AI/A.
In 1979, approximately 38% of acre-treatments were mixes of fungicides andinsecticides. Applications of tank mixes dropped considerably in 1993, where only 5%of acre-treatments were mixes. This shows that growers are more aware of integratedpest management (IPM) practices, as IPM is trying to separate insecticide and fungicideapplications. In Western New York where 8.4% of acre-treatments were tank mixes,grape berry moth phenology used was to time pesticide applications. With IPM, theprebloom spray is eliminated, and future sprays are dependent on risk and scouting,allowing fungicides to be sprayed on a preventive basis (at 3 inch shoot growth), ratherthan corrective basis. In the Finger Lakes region, where only 3.4% of acre-treatmentswere tank mixes, diseases are more of a concern and growers used to routinely add aninsecticide with their fungicide applications. With IPM, insecticide applications shouldbe based on both risk assessment and scouting. The sharp decrease in tank mixapplications in both areas indicates grower acceptance of IPM practices.
As in 1979, fungicides were the most used group of pesticides. Benomyl, captanand folpet were most widely used in 1979, while mancozeb, myclobutanil and sulfurwere most common in 1993. That 78,000 lbs of captan were applied in 1979, and only5,100 lbs were applied in 1993 is indicative of the fact that many processors discouragethe use of captan. As in 1979, the primary diseases were black rot and powderymildew.
Insecticide applications in 1979 consisted most commonly of carbaryl andparathion, but there were at least ten different insecticide active ingredients used. In1993, carbaryl was used most often, but there were only six different AIs used. Theprimary pests are still grape berry moth and leafhopper. Herbicide use has remainedthe same, with diuron being used most often.
Data collection from 1987-1989 on 1,660 acres of grapes in New York showedthat fungicides accounted for 63% of total pesticide use, insecticides accounted for 22%and herbicides accounted for 15% (Long Range Plan for Grapes). In 1993, fungicidesaccounted for 74 %, insecticides for 6% and herbicides for 20%. This is consistent withnational trends observed by the National Center for Food and Agricultural Policy(Gianessi and Anderson). It has been estimated that IPM techniques for grapes canreduce insecticide use by 50-70%. Since insecticide use as a percent of total pesticideuse decreased by 75% since 1989, it is apparent that New York growers are using IPMtechniques, at least for insect control.
In 1979, spray schedules determined pesticide use on 91.5% of vineyard acres(Fluke, Marsh and Osteen, 1982), while in 1993 spray schedules determined only54.8% of pesticide use. As was evidenced by comments stated previously, many of theschedules took IPM practices and presence of pest into account. In addition, only 3% ofvineyard acres were under an IPM program in 1979 versus 20% in 1993.
For cultural weed control, 95% of vineyard acreage was mowed in order to chopprunings and control growth between rows in 1979. In 1993, 85% was mowed. This is

39
also consistent with IPM practices. IPM is trying to move away from mowing because itis not as cost effective or as good at reducing competition as a low volume applicationof Roundup. Use of propane weed burners in the row can be as effective for newlyemerged weed seedling control as paraquat if undertaken at the proper time and underoptimum conditions (Pool 1992-1993). Use of propane burners could greatly reduce theneed for mechanical cultivation, reduce the negative impacts of cultivation and improvethe overall weed control program without affecting grape yields. The propane weedburner is still in the research/demonstration stage, and has not yet been made availableto growers.
The use of cover crops and/or cultivation for between the row weed control hasbeen shown to be effective against weeds, but have been associated with low yieldcomponents, while mulch tends to increase cluster and berry weights (Pool, 1992-1993). Cover crops and mulching were both used by 18% of growers surveyed on 24%and 39% of vineyard acreage, respectively. Cultivation was used by 54% of growers on60% of the acreage. However, growers surveyed who used mulch reported an averageyield of 4.4 tons/acre while those who cultivated and/or used cover crops reported anaverage yield of 4.8 tons/acre.
It is estimated that yield per acre in New York would decrease by 59% with nopesticide use and 21% if pesticide applications were decreased by one-half (Knutson,1993). Because of the greater presence of diseased berries, hand harvesting would benecessary to select disease-free clusters of Concord grapes for processing. Estimatedcosts without the use of pesticides would thus increase markedly by about $150 peracre. According to Knutson, with zero pesticide use, the estimated cash cost perpound for Concord grapes would increase from $0.08 per pound to $0.192. However,with a 50% reduction in application, the cash cost would increase from $0.08 per poundto only $0.094.
Without herbicides, yields would be reduced by an estimated 12%, while cost peracre would increase by approximately $100 (Knutson, 1993). Under 50% herbicidereduction, yields would decrease by 5% while costs would increase by $50 per acre.According to Knutson, without fungicides, there would be a 37 percent reduction in yield,while decreasing fungicide use by one-half would reduce yield by 12%. Without the useof insecticides, yields would decrease by 10% and reducing insecticide applications byone-half would cause a yield loss of 4 percent.
In this survey, only one grower did not use pesticides in 1993. This growerreported yield of juice grapes at 4 tons/acre, a 20% reduction from the average reportedyield for all growers surveyed. Eleven growers did not use herbicides; they reported anaverage yield of 4.5 tons/acre (10% reduction). All growers, other than the one who didnot use pesticides, reported using a fungicide (includes fungicides in tank mixes).Twenty-two growers indicated insecticides were not used in 1993. These growersreported an average yield of 4.9 tons/acre: no change from those who usedinsecticides. Many variables are associated with yield (i.e. cultural practices, croppinghistrory, climate, etc.), thus comparisons made of yields of growers not using pesticidesmust be assessed with that in mind.

40
SECTION TWO:
USE AND CARE OF PERSONAL PROTECTIVEEQUIPMENT

41
INTRODUCTION
Many pesticide handlers are unaware of the hazards of pesticide exposure, anduninformed about the type of personal protective equipment (PPE) that should be worn.The health risks for these workers extend beyond the workplace when pesticide-contaminated clothing is worn into the home, or when it is washed with the familylaundry. With the advent of the Environmental Protection Agency's (EPA) revisedWorker Protection Standard (WPS), due to go into complete effect January 1, 1995, it isimportant to assess growers' current practices and attitudes regarding work clothing andPPE for pesticide applications.
Growers' attitudes toward protection have the greatest influence on behavior(Stone, et. al., 1989). Those who hold the highest protection beliefs are most likely totake action when (or before) WPS goes into complete effect. This report containscurrent practices and attitudes held by grape growers/employees in New York State.This information should aid researchers, extension specialists and clothing/equipmentmanufacturers in evaluating grower concerns and practices regarding PPE foreducational and manufacturing purposes. Financial assistance for this portion of thisproject was also received from the USDA-ES Regional Project NC-170.

42
OBJECTIVES
To obtain the following information for grape growers in New York State:
A. Frequency of use of work clothing
B. Frequency of use of PPE
C. Material of outer clothing
D. Use of PPE when mixing pesticides
E. Laundering
1. Length of time outer clothing is worn
2. Facilities
3. Procedures
F. Frequency of replacement of work clothing
G. Limited-use or disposable garments
1. Length of time worn
2. Disposal method
H. Storage of PPE
I. Frequency of replacement of chemically resistant gloves
J. Label requirements (for PPE)
1. Are they met?
2. If "no", why not?
K. Resources to learn about PPE
L. Proportion of applications made from enclosed cab
M. Acute or short term symptoms associated with overexposure to pesticides
1. Frequency of occurrence
2. Was medical help sought?
3. Did particular products cause these?
N. Chronic or long-term health problems
O. Applicator training programs
1. Sponsors
2. Grower/employee preferences
All of the above are discussed (where applicable) with pesticides used from section one.

43
PROJECT DESIGN, IMPLEMENTATION AND ANALYSIS
The survey was adapted from previous PPE surveys conducted in other states(Stone, et al., 1989 and Stone, et al., 1992). The first drafts were reviewed by grapespecialists, textiles and apparel specialists, and others for content and accuracy. Acopy of the final survey form can be found in the appendix.
The survey was implemented at the same time as the pest and pesticide usesurvey described previously. All surveys were coded so they could be identified with thepesticide use surveys. Employees who filled out a clothing survey may not have filledout a pest and pesticide use survey if their employer or other employees had alreadycompleted one. Therefore, there are more clothing survey results than pest andpesticide use survey results, but they all encompass the same number of vineyards. Inthis section, the term "grower" can mean grower or employee.
Certain words and/or terms used throughout this paper are defined below:
• Work clothing - Garments growers have in their closet for everyday wear.They might be worn for pesticide work if the label does not require any specialprotection, they might be required by the label, or they might be worn under aprotective garment.
• Personal protective equipment (PPE) - Garments that are worn specifically toprotect from pesticides or pesticide residues.
• Coveralls - One or two-piece garment that covers, at a minimum, the entirebody except the hands, feet, and head.
• Woven coveralls - Coveralls made of woven fabric of cotton or cotton/polyesterand worn as the outer garment, but not over work clothes.
• Woven coveralls over work clothes - Cotton or cotton/polyester coveralls wornas the outer garment, but over other work clothes.
• Insulated coveralls - Padded coveralls for warmth.• Nonwoven coveralls (limited-use or disposable) - Coveralls made from fabric
that is made by bonding fibrous webs. Examples are: Tyvek®, Kleenguard®,and Comfort Gard ®
• Chemically-resistant coveralls - One or two-piece coveralls of plastic or rubber,or of fabrics coated with plastic or rubber. Examples are: PVC, Saranex-coated, Tyvek, or rainsuits which are nylon fabric with PVC coating.
• Barrier laminate - Lightweight laminate that resists permeation from a widerange of chemicals. Examples are: Silver Shield® and 4-H®.

44
Results and Discussion

45
WORK CLOTHING AND PERSONAL PROTECTIVE EQUIPMENT
One hundred and forty-nine growers completed surveys corresponding to the 137surveys on pest and pesticide use assessment. At least three quarters of the grapegrowers "nearly always" wore an undershirt/T-shirt, undershorts/long johns, jeans/worktrousers, socks and leather shoes when working with pesticides (Table 46). Exposureto pesticides through the skin decreases with more layers of clothing. Most growerswore undershirts and undershorts. Just over half reported "nearly always" wearing along-sleeve shirt, while 32% wore one "occasionally, depending on the weather", and11% indicated it "depended on the pesticide" that they were using. Work coats orjackets were worn "occasionally depending on the weather" (68.2%).
Table 46: Frequency of use of work clothes by NY grape growers when working with pesticides
Wear WearNearly occasionally: occasionally: Rarely oralways weather pesticide never Notwear dependent dependent wear specified
# of % of # of % of # of % of # of % of # of % of
Type of clothing resp. growers resp. growers resp. growers resp. growers resp. growers Undershirt/T-shirt 112 75.7 22 14.9 0 0.0 12 8.1 2 1.4Undershorts/long johns 115 77.7 20 13.5 0 0.0 9 6.1 3 2.0Jeans/Work trousers 144 97.3 3 2.0 0 0.0 1 0.7 0 0.0Overalls 14 9.5 61 41.2 9 6.1 47 31.8 18 12.2Long-sleeved shirt 82 55.4 48 32.4 16 10.8 3 2.0 2 1.4Short-sleeved shirt 22 14.9 55 37.2 11 7.4 34 23.0 27 18.2Baseball-style cap 103 69.6 11 7.4 4 2.7 22 14.9 8 5.4Straw hat 5 3.4 16 10.8 0 0.0 100 67.6 28 18.9Socks 144 97.3 1 0.7 0 0.0 0 0.0 4 2.7Leather shoes 121 81.8 14 9.5 1 0.7 6 4.1 7 4.7Canvas shoes 7 4.7 23 15.5 3 2.0 91 61.5 26 17.6Woven coveralls 12 8.1 50 33.8 17 11.5 53 35.8 18 12.2Insulated coveralls 1 0.7 66 44.6 3 3.0 52 35.1 27 18.2Work coat or jacket 12 8.1 101 68.2 4 2.7 13 8.8 29 19.6Cotton/canvas gloves 16 10.8 57 38.5 14 9.5 41 27.7 20 13.5Leather gloves 23 15.5 61 41.2 10 6.8 36 24.3 19 12.8Wide brimmed canvas hat 1 0.7Earmuffs 1 0.7
Leather shoes were "nearly always" worn by 81.8% of growers. Although leathermay resist dust penetration, dust can sift into the inside, spray can be absorbed, anddecontamination is a problem. The same is true of leather gloves, which were worn"nearly always" by 15.5% of growers, and occasionally, depending on the weather by68.2%. Baseball-style caps (worn "nearly always" by 69.6% of growers) may keep thesun out of the eyes, and allow ventilation, but they do not provide a good barrier topesticides. In addition, contaminated caps can be a source of continued exposure asthey are worn for many occasions, but rarely washed. Straw hats were "rarely or neverworn" (67.6%).
Exposure studies have shown hands to be the area of greatest exposure (Lavy,et al., 1983). The use of chemically-resistant gloves will reduce this exposure. Sixty-two percent of growers reported "nearly always" wearing chemically-resistant gloves,and 29.7% wore them "occasionally depending on the pesticide" (Table 47). Of thegrowers who wore chemically-resistant gloves "depending on the weather", "rarely ornever", or indicated they were "unnecessary for the kinds of pesticides they applied",30% used Gramoxone Extra and/or Dithane, and 35% used Mancozeb, wettable sulfur,captan and/or Rubigan. These pesticides specifically state on the label to wearchemically-resistant gloves.

46
Table 47: Frequency of use of protective equipment by NY grape growers when working with pesticides
Wear Wear UnecessaryNearly occasionally: occasionally: Rarely or for kinds ofalways weather pesticide never pesticideswear dependent dependent wear I apply
# of % of # of % of # of % of # of % of # of % of
Type of equipment resp. growers resp. growers resp. growers resp. growers resp. growers Chem.-resistant gloves 91 61.5 6 4.1 44 29.7 6 4.1 2 1.4Rubber boots 42 28.4 30 20.3 40 27.0 23 15.5 2 1.4Woven coveralls over
work clothes 16 10.8 44 29.7 20 13.5 46 31.1 5 3.4Nonwoven coveralls (limited
use or disposable) 23 15.5 6 4.1 20 13.5 68 45.9 10 6.8Chemical-resistant
(laminated) coveralls 31 20.9 4 2.7 28 18.9 58 39.2 13 8.8Chem.-resistant apron 8 5.4 3 2.0 19 12.8 80 54.1 14 9.5Plastic/rubber hat 12 8.1 1 0.7 25 16.9 81 54.7 15 10.1Hard hat 3 2.0 3 2.0 4 2.7 99 66.9 19 12.8Chemical cartridge
respirator 68 45.9 4 2.7 43 29.1 18 12.2 9 6.1Dust/mist respirator 28 18.9 6 4.1 19 12.8 67 45.3 13 8.8Goggles 22 14.9 11 7.4 42 28.4 47 31.8 7 4.7Safety glasses 53 35.8 5 3.4 15 10.1 59 39.9 7 4.7Face shield 7 4.7 5 3.4 23 15.5 76 51.4 16 10.8Power air purifying helmet 1 0.7Eye glasses 1 0.7
Chemical cartridge, or dust/mist respirators were "nearly always" worn by 64.8%of the growers, and goggles, safety glasses, or a face shield were "nearly always" wornby 56.4% of growers. This is consistent with usage of chemicals requiring this type ofprotection. For example, Roundup, which requires goggles, face shield or safetyglasses, was used by 61% of growers. All other chemicals requiring this protectionwere used by less than 61% of growers.
Rubber boots were "nearly always" worn by one-third of the growers, whileanother third wore them "occasionally depending on the pesticide." Twenty percent ofthe remaining growers used Gramoxone Extra, which requires the use of waterprooffootwear. Almost all of the growers either "nearly always" wore, or wore "occasionallydepending on the pesticide", some form of coverall (i.e. woven over work clothes,limited-use or disposable, or chemically resistant). The material of outer clothing wornmost often by grape growers was cotton/polyester blend (31.5%), followed by water-proof rubber/plastic (27.5%, Table 48).
Table 48: Material of outer clothing most often worn by NY grape growers
# of % ofMaterial growers growers Cotton/polyester blend 47 31.5Water-proof rubber/plastic (rain gear) 41 27.5Limited-use or disposable (Tyvek, Comfort-Gard,
Kleenguard) 33 22.1Cotton 23 15.4Not specified 3 2.0Do not know 2 1.3
The labels of many of the pesticides used by grape growers state that certainPPE must be worn when mixing or loading the concentrated product. Figure 16 showswhat protective equipment was worn by growers when mixing pesticides, and whatpercent of growers used chemicals that require that equipment.

47
0
20
40
60
80
100
growers using at least one chemical requiring PPE
growers using equipment required%
of u
se
chemicallyresistantgloves
chemicalcartridgeor dust/mistrespirator
chemicallyresistant,limited-use,or wovencoveralls
rubberboots
goggles,faceshield orsafetyglasses
chemicallyresistant apron
plastic/rubber, orhard hat
Figure 16: NY growers using PPE versus growers using chemicals requiring PPE
In almost all cases, the percent of growers that wore the protective equipmentwas less than the percent of growers who used chemicals that require the equipment.For example, 47.3% of growers used at least one chemical where the label states thatwaterproof shoe coverings are required when mixing or loading. However, only 29.5%of growers indicated they wore rubber boots when mixing pesticides. The twoexceptions to this were chemical cartridge, or dust/mist respirator, and chemically-resistant, limited-use/disposable, or woven (over work clothes) coveralls. In both cases,almost twice as many growers used the equipment as used the chemicals requiring theequipment.
In addition to the protective equipment listed in the survey, growers indicated thatthey wore a long-sleeved shirt (6.0% of growers), jeans and leather boots (both 3.4%),cotton gloves (2.7%), socks (2.0%), undershirt (1.3%), overalls, shoes and leathergloves (all 0.7%) when mixing pesticides. Not only are these items not consideredprotective equipment by EPA, but some - such as leather boots/gloves - create pesticidedecontamination problems. Some growers may have been confused by terminologybecause, although long-sleeved shirts and jeans are considered to be work clothing (notPPE), some labels do require their use. Four growers indicated they wore no protectiveequipment when mixing even though three of them used Gramoxone Extra (veryrestrictive on PPE), and three used mancozeb (chemical-resistant gloves and apron,and goggles or a face shield required).

48
The Gramoxone Extra label reads:
When pouring, loading, or mixing concentrate, wear:• NIOSH/MSHA approved pesticide respirator• Disposable suit/coveralls or long-sleeved shirt and pants• Full face shield• Mid-forearm waterproof gloves• Waterproof apron and footwear
Table 49 shows what PPE was worn by growers when mixing Gramoxone Extra. Atbest, 73.1% of growers are in compliance with at least one item on the label (chemicalcartridge respirator). Only 3.8% wore a face shield, but up to 68.3% may have used afull-face respirator instead. No PPE was worn by 5.8% when mixing.
Table 49: Protective equipment worn when mixing pesticides by NY grape growers who usedGramoxone Extra (52 records)
# of % of
Protective equipment growers growers Chemical cartridge, or dust/mist respirator 38 73.1Chemically resistant gloves 32 61.5Chemically resistant or nonwoven coveralls, or
coveralls worn over work clothes 31 59.6Rubber boots 16 30.8Chemically resistant apron 8 15.4Goggles 7 13.5None 3 5.8Face shield 2 3.8Plastic/rubber hat 2 3.8
LAUNDERING
Proper management of clothing worn while working with pesticides can help tominimize pesticide exposure. According to the Department of Textiles and Apparel, thefollowing rules should be used when washing clothing worn while applying pesticides:
• All clothing worn while handling or applying pesticides is contaminated• Wear chemical-resistant gloves when handling highly contaminated clothing,
wash hands immediately after handling others.• Wash clothing daily• Hang garment outdoors to dry• Prerinse or presoak• Pretreat heavily soiled garments• Wash separately from family wash• Wash only a few items at a time• Use highest water level• Use hot water• Use longest wash time• Use heavy-duty detergent• Line dry to avoid contaminating dryer• After washing - run machine through a complete cycle with detergent.• Rewash contaminated garments two or three times before reuse for more
complete pesticide removal

49
Table 50 shows the number of hours grape growers wore refurbishable workclothing before laundering. Although there were many answers to this question, itappears that at least 90% of the growers washed their work clothing daily, asrecommended.
Eighty-six percent of growers use the family washer, but wash contaminatedclothing separately from family laundry (Table 51). Table 52 shows the steps taken tolaunder clothes worn when working with pesticides. Forty-one percent presoaked orprerinsed, 77.9% washed in hot or warm water and 58.4% line-dried their clothingoutdoors. A commendable 24.2% recognized that washing more than once before line-drying removed more pesticides. Several growers indicated that they took no specialsteps because they used Tyvek, or a rainsuit over their clothes. Between 10 and 20%of growers did not answer one or more of these questions. It is impossible to knowwhether they did not answer because they did not do that procedure, or because theydid not know whether or not it was done.
Table 50: Number of hours NY grape growers wore refurbishable work clothes before laundering
# of % ofNumber of hours growers growers One 1 0.7Two 2 1.3Two and one half 1 0.7Three 4 2.7Four 4 2.7Four and one half 2 1.3Five 4 2.7Six 10 6.7Seven 8 5.4Seven and one half 1 0.7Eight 66 44.3Nine 8 5.4Ten 4 2.7Eleven 1 0.7Twelve 5 3.4Fourteen 1 0.7Sixteen 4 2.7Eighteen 1 0.7Twenty-four 2 1.3Thirty-two 1 0.7Not specified 10 6.7Launder after each spray 3 2.0Do not know 2 1.3Depends on materials and exposure 2 1.3One day 2 1.3
Average number of hours: 8.3

50
Table 51: Facilities used by NY grape growers to launder clothes that were worn when workingwith pesticides
# of % of
Facility responses growers Family washer, but in a separate load
from family clothes 128 85.9Family washer with family clothes 9 6.0Grower's special facilities reserved for laundry
of pesticide-soiled clothing 7 4.7Coin operated laundromat 4 2.7Not specified 4 2.7Do not know 3 2.0A commercial laundry service 2 1.3Hose suit off with garden hose, then scrub it 1 0.7
Table 52: Frequency of steps taken by NY grape growers to launder clothes that were worn whenworking with pesticides
Yes No Do not know
# of % of # of % of # of % of
Laundering step resp. growers resp. growers resp. growers Presoak or rinse before
washing with detergent 61 40.9 48 32.2 11 7.4Wash in hot or warm
rather than cold 116 77.9 9 6.0 10 6.7Wash more than once
before drying 36 24.2 69 46.3 13 8.7Line-dry outdoors 87 58.4 36 24.2 8 5.4
REPLACEMENT OF WORK CLOTHING AND DISPOSABLE GARMENTS
Replacement of work clothing occurred most often when the clothing wore out(75.8%, Table 53). One-quarter of the growers gave more than one answer to thisquestion. These were usually combined with "if contaminated by pesticide spill."
Table 53: Frequency of replacement of work clothing by NY grape growers
# of % ofReplacement frequency responses growers When it wears out 113 75.8If contaminated by pesticide spill 46 30.9Annually 18 12.1Seasonally 15 10.1Not specified 5 3.4As required/needed 3 2.0Two times a year 2 1.3Depends on article 1 0.7Do not know 1 0.7

51
Of the 70 growers who indicated they used disposable garments, one-thirddiscarded them after eight hours (Table 54). However, the average length of timedisposable garments were worn before discarding was 17.4 hours, which indicates thatgrowers removed them after spraying, stored them, and reused them. One growerindicated that he/she wore them as long as 200 hours. According to the EPA, the U.S.Department of Agriculture - Extension Service (USDA-ES) and PPE manufacturers,nonwoven (limited-use or disposable) coveralls are designed to be disposed of afteruse. Most are intended to be worn for only one workday's exposure period (8 hours).The instructions for some coated nonwoven suits may permit them to be worn morethan once if each period of use is short, if the inside of the garment is not contaminated,and they do not get much pesticide on them.
Table 54: Number of hours NY grape growers wear disposable garments before discarding
% of growers# of who wear
Number of hours growers disposable garments Two 2 2.9Four 3 4.3Five 2 2.9Six 3 4.3Seven 1 1.4Eight 23 32.9Eight and one half 1 1.4Nine 2 2.9Ten 3 4.3Eleven 1 1.4Twelve 6 8.6Thirteen 1 1.4Sixteen 1 1.4Twenty 2 2.9Twenty-four 2 2.9Thirty-two 1 1.4Forty 1 1.4Forty-eight 2 2.9Sixty 2 2.9Eighty 1 1.4Two hundred 1 1.4One day 4 5.7Every day that we spray 2 2.9Until they wear out 2 2.9Do not know 1 1.4
Average number of hours: 17.4
Over half of the growers who wore disposable garments, burned them (Table 55).One-third sent them to the landfill. Many of those who used the landfill also indicatedthat they rinsed the garment three times, and sealed it in a plastic bag first.

52
Table 55: How NY grape growers discard of disposable garments (70 records)
% of growers# of who wear
Method of disposal growers disposable garments Burn 36 51.4Landfill 24 34.3Not specified 5 7.1Burn or landfill 3 4.3Bury 1 1.4According to pesticide label 1 1.4
STORAGE OF PPE AND REPLACEMENT OF CHEMICALLY-RESISTANT GLOVES
Respirators and eyewear should be stored where they are protected from dust,sunlight, extreme temperatures, excessive moisture, pesticides and other chemicals. Azip-closable sturdy plastic bag works well for storage (EPA, USDA-ES pamphlets). Onlyone grower indicated that protective equipment was stored in plastic bags (Table 56).However, that was not one of the choices for the question, so others may have storedthem in plastic bags within the area(s) indicated. Approximately one-quarter of thegrowers stored protective equipment in a pesticide storage area. As stated previously,PPE should be stored away from pesticides.
Table 56: Where protective equipment is stored by NY grape growers between wearings
# of % ofStorage facility responses growers In pesticide storage area 35 23.5In dressing/changing area with no shower 33 22.1At home 28 18.8With other clothing items at work 28 18.8Barn/shop 16 10.7Storage area away from clothing and pesticides 7 4.7In dressing/changing area with a shower 6 4.0Not specified 6 4.0In vehicle 5 3.4In plastic bags 1 0.7In a locked cabinet 1 0.7
Chemically-resistant (reusable) gloves should be inspected before use for signsof wear or abrasion (EPA, USDA-ES pamphlets). If they show any sign of wear, theyshould be discarded. Even if there are no signs of wear, reusable chemically-resistantgloves should be replaced regularly since residues that cannot be detected may remainin the material even after washing and adequate airing. A good rule of thumb is todispose of gloves that have been worn for about one week of work. Because handprotection is the most important concern for pesticide handlers, glove replacement is ahigh priority. Over half of the growers replaced chemically-resistant gloves "when a leakwas detectable" and/or they appeared worn out (Table 57). About 15% of growers gavetwo answers to this question: "seasonally", and "when a leak is detectable". It appearsthat growers are not replacing their gloves often enough, as only 3.4% indicatedreplacing them weekly.
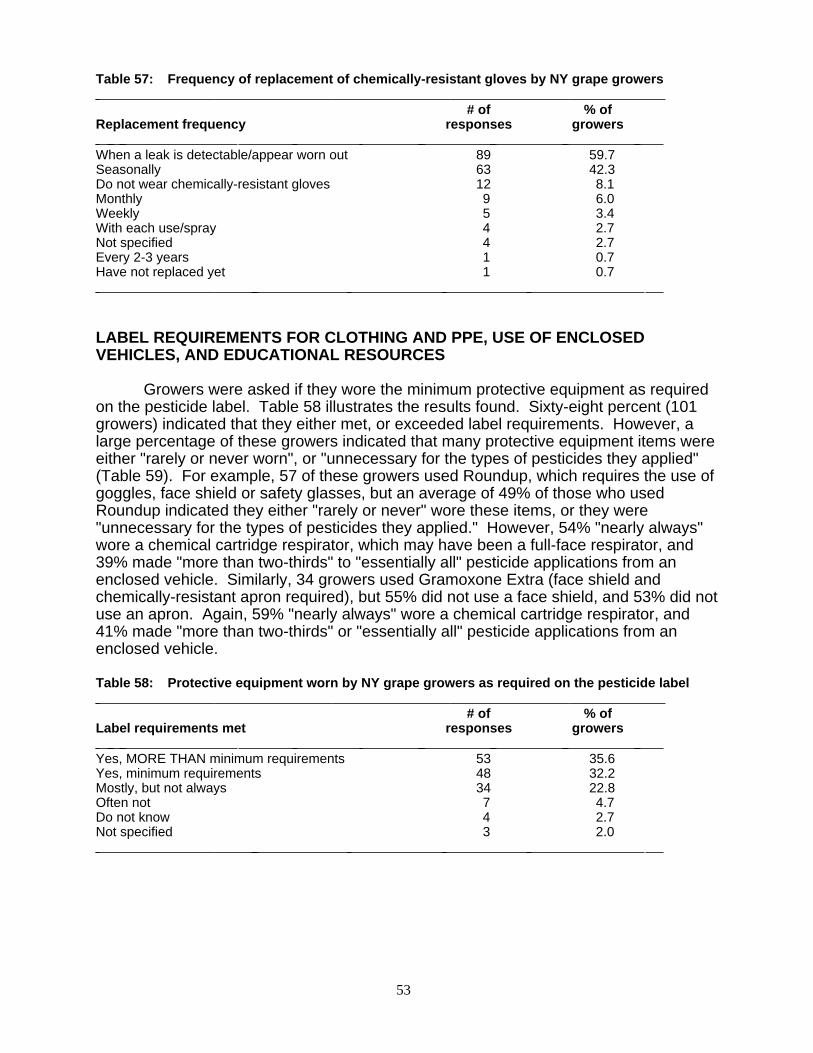
53
Table 57: Frequency of replacement of chemically-resistant gloves by NY grape growers
# of % ofReplacement frequency responses growers When a leak is detectable/appear worn out 89 59.7Seasonally 63 42.3Do not wear chemically-resistant gloves 12 8.1Monthly 9 6.0Weekly 5 3.4With each use/spray 4 2.7Not specified 4 2.7Every 2-3 years 1 0.7Have not replaced yet 1 0.7
LABEL REQUIREMENTS FOR CLOTHING AND PPE, USE OF ENCLOSEDVEHICLES, AND EDUCATIONAL RESOURCES
Growers were asked if they wore the minimum protective equipment as requiredon the pesticide label. Table 58 illustrates the results found. Sixty-eight percent (101growers) indicated that they either met, or exceeded label requirements. However, alarge percentage of these growers indicated that many protective equipment items wereeither "rarely or never worn", or "unnecessary for the types of pesticides they applied"(Table 59). For example, 57 of these growers used Roundup, which requires the use ofgoggles, face shield or safety glasses, but an average of 49% of those who usedRoundup indicated they either "rarely or never" wore these items, or they were"unnecessary for the types of pesticides they applied." However, 54% "nearly always"wore a chemical cartridge respirator, which may have been a full-face respirator, and39% made "more than two-thirds" to "essentially all" pesticide applications from anenclosed vehicle. Similarly, 34 growers used Gramoxone Extra (face shield andchemically-resistant apron required), but 55% did not use a face shield, and 53% did notuse an apron. Again, 59% "nearly always" wore a chemical cartridge respirator, and41% made "more than two-thirds" or "essentially all" pesticide applications from anenclosed vehicle.
Table 58: Protective equipment worn by NY grape growers as required on the pesticide label
# of % ofLabel requirements met responses growers Yes, MORE THAN minimum requirements 53 35.6Yes, minimum requirements 48 32.2Mostly, but not always 34 22.8Often not 7 4.7Do not know 4 2.7Not specified 3 2.0

54
Table 59: Protective equipment rarely or never worn, or considered unnecessary by NY grapegrowers who indicated they wore minimum or exceeded minimum requirements onpesticide labels
Unnecessary
Rarely or for kinds ofnever pesticideswear I apply
% of % of
Type of clothing growers growers Chemically-resistant gloves 1.0 2.0Rubber boots 10.0 1.0Woven coveralls over work clothes 33.0 5.0Nonwoven coveralls (limited use or disposable) 40.0 9.0Chemically-resistant (laminated) coveralls 29.0 11.0Chemically-resistant apron 44.0 11.0Plastic/rubber hat 48.0 12.0Hard hat 63.0 15.0Chemical cartridge respirator 5.0 9.0Dust/mist respirator 41.0 13.0Goggles 29.0 6.0Safety glasses 30.0 6.0Face shield 45.0 14.0
The remaining 48 growers, who did not always wear minimum labelrequirements, indicated that the reason was primarily because protective equipment istoo hot (64.6%, Table 60). Many indicated that the trouble of using protectiveequipment prompted them to purchase tractors with enclosed cabs. Research hasshown that dermal exposure to the applicator in an enclosed tractor cab during groundboom application is one-sixth the exposure to the applicator conducting similaroperations with an open tractor cab (Lunchick, et al, 1988). This same researchshowed exposure to be thirtyfold less when airblast applications were made in enclosedvehicles versus open vehicles. Twenty-eight percent of growers made "essentially all"of their pesticide applications from an enclosed cab (Table 61). However, they did notindicate whether or not they kept required equipment in the cab as directed on labels.
Table 60: Reasons why protective equipment worn by NY grape growers does NOT meetminimum requirements (48 records)
% of growers
# of who do not meetReason responses label requirements Protective equipment is too hot 31 64.6Protective equipment restricts movements 10 20.8Not specified 6 12.5Minimum requirements are too strict 5 10.4Protective equipment is too expensive 4 8.3Use a spray-safe cab 4 8.3Protective equipment is uncomfortable 1 2.0It is unnecessary for chemicals I use 1 2.0Not always sure of requirements 1 2.0Do not use any protective equipment 1 2.0

55
Table 61: Proportion of pesticide applications made from an enclosed vehicle in 1993
# of % ofProportion of pesticide applications growers growers None 89 59.7Essentially all 41 27.5More than two-thirds 11 7.4One-third to two-thirds 3 2.0Less than one-third 2 1.3Not specified 3 2.0
Many growers who indicated they met or exceeded label requirements also feltcompelled to answer the question about reasons why they may not always wearprotective equipment. Sixty-nine percent said it was too hot, 17% said requirementswere too strict, 10% indicated protective equipment restricted their movements, and 7%said it was too expensive.
When asked what three resources grape growers would most likely use to learnabout protective equipment, they chose "fact sheets" (67.1%), "exhibit" (47.7%) and "kitof sample protective equipment" (41.6%, Table 62).
Table 62: Resources NY grape growers would most likely use to learn about protectiveequipment
# of % of
Resource responses growers Fact sheets 100 67.1Exhibit 71 47.7Kit of sample protective equipment 62 41.6PAT manual 44 29.5Videotape 34 22.8Telephone hot line 20 13.4Media (TV, radio, newspaper) 17 11.4Slide set 6 4.0Computer program 3 2.0

56
SHORT- AND LONG-TERM HEALTH PROBLEMS ASSOCIATED WITHOVEREXPOSURE TO PESTICIDES
There are many short-term or acute symptoms associated with overexposure topesticides. The most common complaint was eye irritation (19.5%), followed byheadache (18.1%, Table 63). However, very few short-term symptoms wereexperienced in 1993. An average of 94% of growers never experienced any of the 11symptoms listed. Five of the growers indicated they had experienced some of thesymptoms, but were more inclined to blame them on heat stress from protectiveequipment than overexposure to pesticides.
Table 63: Acute or short term symptoms associated with overexposure to pesticides felt to be related to handlingor applyingpesticides by grape growers in the past crop year
2 to 3 4 to 5 5 times
Never Once times times or more # of % of # of % of # of % of # of % of # of % of
Symptom resp. growers resp. growers resp. growers resp. growers resp. growers Excessive fatigue 140 94.0 4 2.7 5 3.4 0 0.0 0 0.0Headache 122 81.9 10 6.7 16 10.7 1 0.7 0 0.0Dizziness 144 96.6 4 2.7 1 0.7 0 0.0 0 0.0Eye irritation 120 80.5 11 7.4 12 8.1 2 1.3 3 2.0Skin irritation 133 89.3 8 5.4 7 4.7 0 0.0 2 1.3Nausea 143 96.0 3 2.0 2 1.3 1 0.7 0 0.0Diarrhea 148 99.3 0 0.0 0 0.0 1 0.7 0 0.0General weakness 144 96.6 3 2.0 2 1.3 0 0.0 0 0.0Chest discomfort 148 99.3 1 0.7 0 0.0 0 0.0 0 0.0Heat fatigue 148 99.3 0 0.0 1 0.7 0 0.0 0 0.0Allergic reactions 148 99.3 0 0.0 1 0.7 0 0.0 0 0.0
Of the 11 symptoms, medical help was sought by growers for only three. Table64 shows that those symptoms were headache, dizziness and nausea. Only one of thegrowers who experienced each of these symptoms sought medical attention.
Table 64: Was medical attention sought for symptoms felt by NY grape growers in 1993?
Yes No
% of growersexperiencing
Symptom symptoms Headache (n=27) 3.7 96.3Dizziness (n=5) 20.0 80.0Nausea (n=6) 16.7 83.3
When asked if any particular chemical caused these acute or short-termsymptoms, 23.2% of growers who had experienced at least one symptom, one or moretimes, said "yes, a particular trade name caused this" (Table 65). Nine of those growersindicated that sulfur, alone or with some other chemical, caused the problem, basicallybecause the fine powder can bother the eyes.
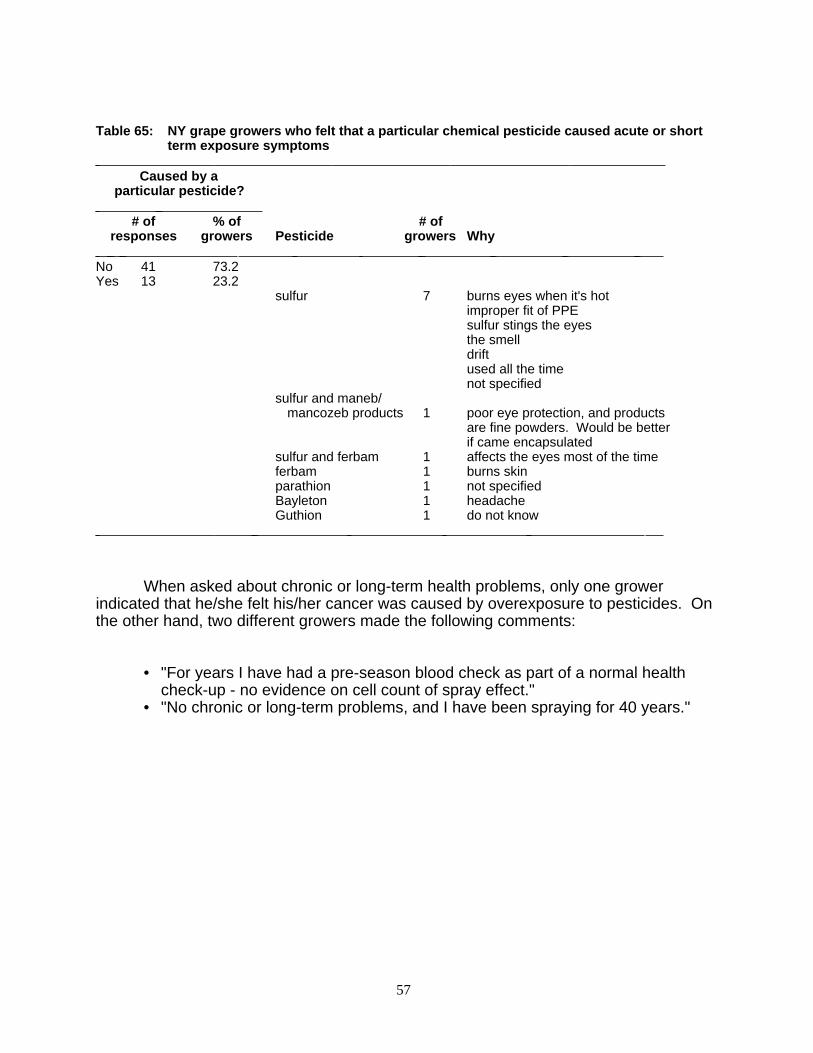
57
Table 65: NY grape growers who felt that a particular chemical pesticide caused acute or shortterm exposure symptoms
Caused by a
particular pesticide?
# of % of # ofresponses growers Pesticide growers Why
No 41 73.2Yes 13 23.2
sulfur 7 burns eyes when it's hotimproper fit of PPEsulfur stings the eyesthe smelldriftused all the timenot specified
sulfur and maneb/mancozeb products 1 poor eye protection, and products
are fine powders. Would be better if came encapsulated
sulfur and ferbam 1 affects the eyes most of the timeferbam 1 burns skinparathion 1 not specifiedBayleton 1 headacheGuthion 1 do not know
When asked about chronic or long-term health problems, only one growerindicated that he/she felt his/her cancer was caused by overexposure to pesticides. Onthe other hand, two different growers made the following comments:
• "For years I have had a pre-season blood check as part of a normal healthcheck-up - no evidence on cell count of spray effect."
• "No chronic or long-term problems, and I have been spraying for 40 years."

58
APPLICATOR TRAINING PROGRAMS
Grape growers indicated that the Extension service, followed by the chemicalcompany/dealer was most likely to sponsor the educational programs they attended(89.3%, 61.1% respectively, Table 66). They also indicated that they prefer the trainingsession format for pesticide training (63.1%, Table 67).
Table 66: Sponsors of applicator certification and continuing education programs attended byNY grape growersa/
Yes No Do not recall
# of % of # of % of # of % of
Sponsor responses growers responses growers responses growers Employer 20 13.4 123 82.6 1 0.7Grape processors/buyers 37 24.8 104 69.8 3 2.0Extension service 133 89.3 11 7.4 0 0.0Chemical company/dealer 91 61.1 52 34.9 1 0.7Grape grower's association 44 29.5 96 64.4 4 2.7 a/Five surveys gave no response at all to any of the above questions
Table 67: Educational format preferred by NY grape growers for pesticide training
# of % ofFormat responses growers Training session 94 63.1Self study 50 33.6Study group 40 26.8Conference 12 8.1Satellite downlink 10 6.7

59
CONCLUSIONS
New York State grape growers appear to be wearing PPE when working withpesticides. However, many seem to wear what they think they need, rather than what isrequired on the pesticide label. Comparisons to other surveys are difficult due to thedifferent climates, pesticides, crops, equipment, regional attitudes, etc., but somerelationships between these data and those of a 1992 Iowa State University study(Stone, et.al., 1992) may be useful. The percent of New York grape growers "nearlyalways" wearing an undershirt, a long-sleeved shirt, and/or a work coat or jacket wasapproximately twice that of Iowa commercial agriculture applicators. The percent of NYgrape growers "nearly always" wearing a chemical cartridge respirator was nine timesthat of Iowa applicators. However, 20% more Iowa respondents "nearly always" worechemically resistant gloves, and 9% more wore goggles or a face shield (safety glasseswere not in the Iowa survey). The latter statistic may be misleading as persons wearingfull-face respirators would not need other eye protection.
New York growers, in general, seem to be following correct launderingprocedures. Refurbishable clothing is laundered daily, separate from family clothing,prerinsed, washed in hot water, and line-dried. A relatively large percentage are evenwashing clothing more than once before drying. The Iowa study showed approximatelythe same results.
Disposable garments are being worn too long by approximately one-third of NewYork growers surveyed before they are being discarded; half of them are being burned.Although reusable PPE is being stored by 23.5% of New York growers in their pesticidestorage area, it is a 15% decrease from Iowa, where 38% of applicators stored theirPPE in a pesticide storage area. Also, in Iowa, 40% stored protective gear in theirvehicle where it would be subject to extreme temperatures. Only 3% of New Yorkgrowers used their vehicle as a storage area.
Replacement of chemically-resistant gloves by New York growers wasinfrequent. Only 3.4% replaced them weekly, as recommended, whereas 18% replacedthem weekly in Iowa. It is possible though, that some growers spend no more than 40hours (1 week equivalent) each growing season handling pesticides. Both Iowaapplicators and New York growers replaced them when a leak was detectable with thesame frequency.
Label compliance was reported at the same frequency in New York as in Iowa,but as discussed previously, it appears that New Yorkers falsely believe that they aremeeting the requirements. As indicated by one of the growers, "I do not always knowwhat the requirements are". Confusion exists as to location and exact meaning of PPEinformation on old labels. The revised WPS should correct this problem as new labelsbecome available.
Grape growers demonstrated an interest in learning about protective equipmentthrough tangible resources such as exhibits and kits of sample PPE. They attendprograms sponsored by Extension, and prefer a training session format.
All short-term symptoms associated with overexposure to pesticides were felt atleast once by at least one grape grower in New York. However, many times it wasattributed more to heat stress than pesticides. All of the symptoms were experiencedmore often by Iowa applicators. In both New York and Iowa, very few respondentssought medical help for the symptoms.
It appears that New York grape growers are concerned about, and willing tocomply with regulations related to the use and care of PPE. Unfortunately, many seemto be unformed or uncertain, confirming the need for good educational programs onPPE.

APPENDIX

REFERENCES
1. AgChemPrice. Current U.S.A. Prices of Non-Fertilizer Agricultural Chemicals.April 1992.
2. A Long-Range Plan for the New York State Integrated Pest Management Program:A Crop Protection Strategy that Emphasizes Alternatives to Current PesticidePractices. May 1992. New York State Integrated Pest Management Programat Cornell University in conjunction with The New York State Department ofAgriculture and Markets. pp. 148-161.
3. Commercial Pesticide Applicator Program. Summer 1992. Iowa State University,University Extension
4. Environmental Protection Agency and United States Department of Agriculture -Extension Service. Protection for Pesticide Handlers pamphlets "Brush up onCovering Up":a. Avoiding Heat Stressb. Choosing Chemical-Resistant PPEc. Clothing Layers for Added Protectiond. Coveralls, Gloves and Other Skin Protectione. Inspecting, Maintaining, and Replacing PPEf. Protective Eyewearg. Respirators
5. Fluke, W.J., Cleveland Marsh and Craig Osteen. Pesticide Use on Grapes in NewYork and Pennsylvania, 1979. USDA Economics and Statistics Service Staffreport # AGES820107, January 1982.
6. Gianessi, Leonard P. and James Earl Anderson. Pesticide Use Trends in U.S.Agriculture, 1979 - 1992. National Center for Food and Agricultural PolicyDiscussion Paper PS-93-1. October 1993.
7. Lavy, T.L., J.D. Mattice and R.R. Flynn. Field studies monitoring worker exposureto pesticides. In: K.G. Seymour (Ed.), Pesticide Formulations and ApplicationSystems. pp. 60-74. American Society for Testing and Material. Philadelphia,PA, 1983.
8. Knutson, Ronald D., Charles R. Hall, Edward G. Smith, Samuel D. Cotner andJohn W. Miller. Economic Impacts of Reduced Pesticide Use on Fruits andVegetables. Texas A & M University. September 1993.
9. New York State Agricultural Statistics. 1993 Annual Summary.
11. Pool, R.M., C.M. Becker, S.P. Falk, D.M. Gadoury, D.G. Riegel, A.N. Lakso, J.A.Robinson, T. Henik-Kling, T.E. Martinson, G.B. White, Frank DesJardins andD.V. Petersen. Whole Farm Impact of Converting Conventionally ManagedEastern Vineyard to Organic Management Practices. Cornell University.Report for period: 15 December, 1992 - 1 December, 1993.

12. Stone, Janis, Donna Branson, Cherilyn Nelson, Wanda Olson, Margaret Ruckerand Ann Slocum. Use and Care of Clothing Worn for Pesticide Application: AFive-State Survey Report. North Central Regional Research Publication No.318. June 1989.
13. Stone, J., S. Padgitt, and W. Wintersteen. Commercial Pesticide ApplicatorProgram: Survey of applicator attitudes, safety precautions, and healthexperiences. Preliminary Findings. Iowa State University, Ames, Iowa, 1992.
Related Documents