03 2021 ISSN 2308-7250 PES PHYSICAL EDUCATION OF STUDENTS PHYSICAL EDUCATION OF STUDENTS PES The journal represents original scientific researches of scientists from the East-European region. The Journal welcomes articles on different aspects of physical education, sports and health of students which cover scientific researches in the related fields, such as biomechanics, kinesiology, medicine, psychology, sociology, technologies of sports equipment, research in training, selection, physical efficiency, as well as health preservation and other interdisciplinary perspectives. In general, the editors express hope that the journal “Physical Education of Students” contributes to information exchange to combine efforts of the researchers from the East-European region to solve common problems in health promotion of students, development of physical culture and sports in higher educational institutions. 2 308725 020210 3 0

Welcome message from author
This document is posted to help you gain knowledge. Please leave a comment to let me know what you think about it! Share it to your friends and learn new things together.
Transcript
ФИЗИЧЕСКОЕВОСПИТАНИЕ СТУДЕНТОВ
032021
ISSN 2308-7250
PESPHYSICAL
EDUCATIONOF STUDENTS
Журнал освещает статьи по актуальным проблемам:
формирования, восстановления, укрепления
и сохранения здоровья студентов, физической
реабилитации и рекреации, лечебной
и оздоровительной физической культуры,
физического воспитания
и спорта. В нем также отражены средства
физической культуры, ее формы и методы,
основные принципы здоровьесберегающих технологий и
профилактики заболеваний.
Материалы журнала представляют теоретический и
практический интерес для аспирантов, студентов,
докторантов, тренеров, спортсменов, преподавателей
учебных заведений, учителей средних школ и научных
работников.
PHYSICALEDUCATION OF STUDENTSPES
The journal represents original scientific researches of
scientists from the East-European region.
The Journal welcomes articles on different aspects of physical
education, sports and health of students which cover scientific
researches in the related fields, such as biomechanics,
kinesiology, medicine, psychology, sociology, technologies of
sports equipment, research in training, selection, physical
efficiency, as well as health preservation and other
interdisciplinary perspectives.
In general, the editors express hope that the
journal “Physical Education of Students”
contributes to information exchange to
combine efforts of the researchers
from the East-European region to
solve common problems in
health promotion of students,
development of physical
culture and sports in
higher educational
institutions.
ISSN 23087250
2 308725 020210 30
2021
03
133
© Iermakov S.S., 2021
Indexing:
PHYSICAL EDUCATION OF STUDENTS
2021
03Key title: Physical education of students
Abbreviated key title: Phys. educ. stud.
ISSN 2308-7250 (English ed. online)
Founders: Iermakov Sergii Sidorovich (Ukraine); (Doctor of Sciences in Pedagogy, professor, Department of Physical Education, Kharkov National Pedagogical University).
Certificate to registration: KB 21884-11784P 21.12.2015.
Address of editorial office:
P.O.Box 11135, Kharkov-68, 61068, Ukraine.
Tel. +38 099 430 69 22
e-mail: [email protected]
Frequency - 6 numbers in a year.
http://www.sportedu.org.ua
Journal is ratified Ministry of Education
and Science of Ukraine (online):
physical education and sport: (11.07.2019, № 975, “A” - 24.00.01, 24.00.02, 24.00.03; 017); (13.03.2017, № 374).
pedagogical sciences: (07.05.2019, № 612, “A” - 13.00.02; 011, 014); (22.12.2016, № 1604).
Web of Science Core Collection
[Emerging Sources Citation Index (ESCI)]
https://mjl.clarivate.com/home
DOAJ (Directory of Open Access Journals)
http://www.doaj.org
ERIH PLUS (The European Reference Index for the Humanities and the Social Sciences)
https://dbh.nsd.uib.no
WorldCat
http://www.worldcat.org
Open Science Directory (EBSCO information services)
http://www.opensciencedirectory.net
PBN (Polish Scholarly Bibliography)
https://pbn.nauka.gov.pl/core/#/home
Scilit - http://www.scilit.net
OpenAIRE - https://www.openarchives.org/
Dimensions - https://app.dimensions.ai/discover/publication
Open Ukrainian Citation Index (OUCI)
https://ouci.dntb.gov.ua/en/editions/3lDkV60E/
MIAR - http://miar.ub.edu/issn/2308-7250
BASE (Bielefeld Academic Search Engine)
http://www.base-search.net
Google Scholar
http://scholar.google.com.ua
Academic Journals Database
http://journaldatabase.org
V.I.Vernadskiy National Library of Ukraine
http://www.nbuv.gov.ua
Researchgate
https://www.researchgate.net/journal/2075-5279_Physical_Education_of_Students
Hinari Access to Research for Health
http://extranet.who.int/hinari/en/journals.php
PKP Index
http://index.pkp.sfu.ca/index.php/browse/index/2236
134
PHYSICAL EDUCATION OF STUDENTS
EDITORIAL BOARD
Editor-in-chief:
Sergii S. Iermakov Doctor of Sciences in Pedagogy, Professor:
Kharkov National Pedagogical University (Kharkov, Ukraine).
Deputy Editor:
Wladyslaw Jagiello Doctor of Sciences in Physical Education and Sport, professor, Gdansk University of
Physical Education and Sport (Gdansk, Poland).
Editorial Board:
Marek Sawczuk Doctor of Biological Sciences, Gdansk University of Physical Education and Sport (Gdansk,
Poland).Michael Chia PhD, Professor, Faculty of Phisical Education and Sports, National Institute of Education
Nanyang Technological University (Singapore)Marc Lochbaum Professor, Ph.D., Department of Kinesiology and Sport Management, Texas Tech
University (Lubbock, USA)Romualdas
Malinauskas
Doctor of Pedagogical Sciences, Professor, Lithuanian Academy of Physical Education
(Kaunas, Lithuania)Agnieszka
Maciejewska-Skrendo
Doctor of Biological Sciences, Faculty of Physical Education and Health Promotion,
University of Szczecin (Szczecin, Poland).Tatiana S. Yermakova Doctor of Pedagogical Sciences, Kharkov State Academy of Design and Fine Arts (Kharkov,
Ukraine).Oleg M. Khudolii Doctor of Sciences in Physical Education and Sport, Professor, Kharkov National
Pedagogical University (Kharkov, Ukraine)Zhanneta L. Kozina Doctor of Sciences in Physical Education and Sport, Professor, Private University of
Environmental Sciences (Radom, Poland)Olga V. Ivashchenko Doctor of Pedagogical Sciences, Associate Professor, H. S. Skovoroda Kharkiv National
Pedagogical University, Ukraine (Kharkov, Ukraine)Mykola O. Nosko Doctor of Pedagogical Sciences, Professor, National Pedagogical University (Chernigov,
Ukraine)Mourad Fathloun Ph.D. Physical Education and Sport, Research Unit Evaluation and Analysis of Factors
Influencing Sport Performance (Kef, Tunisia)Bahman Mirzaei Professor of exercise physiology, Department Exercise Physiology University of Guilan
(Rasht, Iran)Ratko Pavlović Ph.D., Full prof., Faculty of Physical Education and Sport, University of East Sarajevo
(Sarajevo, Bosnia and Herzegovina-Republic of Srpska)Vladimir Potop Doctor of Sciences in Physical Education and Sport, Professor, Ecological University of
Bucharest (Bucharest, Romania)Fedor I. Sobyanin Doctor of Pedagogical Sciences, Professor, West Kazakhstan Innovation and Technological
University (Uralsk, Republic of Kazakhstan).Javier Cachón-Zagalaz Doctor of Sciences in Physical Education and Sport. Department of Didactics of Musical
Expression, University of Jaén (Jaén, Spain)Jorge Alberto Ramirez
Torrealba
Ph. D. (Physical Education and Sport), Pedagogical University (Maracay, Venezuela)
2021
03
135
CONTENTS
Mateusz Tomanek, Andrzej Lis. Physical activity in the context of the COVID-19 pandemic: Research profiling and mapping ......................................................................................................................................................................................... 136
Sevilay Kaplan, Ali Osman Kivrak. The effect of acute dehydration on agility, quickness and balance performance in elite wrestlers ........................................................................................................................................................ 149
Yusuf Soylu. The psychophysiological effects of the COVID-19 quarantine in the college students ........................ 158Izzet Kirkaya, Celil Kaçoğlu, Beyza Şenol. Reliability and concurrent validity of Iphone® level application for
measuring lower limb active flexion and extension range of motions in physical education students ............. 164Javad Mahdiabadi. The effect of 8 weeks moderate-intensity continuous training on central hemodynamics
and VO2max in non-athlete male ..................................................................................................................................................... 172Recep Aydin, Gülfem Ersöz, Ali Özkan. The relationship of some factors affecting dynamic-static balance
and proprioceptive sense in elite wrestlers* ...............................................................................................................................................................................................................................178
Abdullah Arguz, Abdelkader Guebli, Nurtekin Erkmen, Samet Aktaş, Madani Reguieg, Yusuf Er. Biomechanical analysis of accuracy penalties-kicking performance for Turkish Soccer players: Group-based analysis without goalkeeper ................................................................................................................................ 189
Inna N. Ovsyannikova, Konstantin G. Tomilin, Yulia A. Tumasyan, Yulia A. Vasilkovskaya, Lyudmila V. Malygina. Game method to increase students’ motivation to engage in elective disciplines in physical culture and sports ............................................................................................................................................................................... 197
Information: ................................................................................................................................................................................................... 205
136
PHYSICAL EDUCATION OF STUDENTS
Physical activity in the context of the COVID-19 pandemic: Research profiling and mappingMateusz TomanekCDE, Andrzej LisABCD
Faculty of Economic Sciences and Management, Nicolaus Copernicus University in Toruń, Poland
Authors contribution: A – Study design; B – Data collection; C – Bibliometric analysis; D – Manuscript preparation; E – Funds collection
AbstractBackground and Study Aim
The aim of the study is to profile and map the scientific output in research on physical activity in the COVID-19 context. The study makes an attempt to response to the three following questions: (1) What are the leading contributors (countries, research institutions, authors and source titles) to research production in the field? (2) What are the core references? (3) What are the leading thematic areas / research fronts?
Material and Methods
We used the Scopus database as a source of bibliometric data for the research sampling process and employed a combination of bibliometric methods, including research profiling and selected science mapping methods, i.e. co-word analysis and direct citation analysis, in order to achieve the aim of the study and provide responses to the study questions. Science mapping processes were supported with VOSviewer software.
Results: Research profiling indicates that the main contributors to scientific output on physical activity in the COVID-19 context are scholars and research institutions from countries, which have been heavily affected by the pandemic such as: the United States, the United Kingdom, Italy, Spain, Brazil. Certainly, the reports from China, which was the first nation to suffer from COVID-19 and associated epidemic restrictions, constitute an important input, too. The core references in research on physical activity in the COVID-19 context may be grouped into three categories aimed at: (1) investigating the consequences of pandemic restrictions on physical activity, (2) analysing the outcomes of physical activity for other variables, and (3) providing recommendations for practising home-based physical activity during COVID-19 confinement. Science mapping of the research field conceptual structure indicates the following thematic areas / research fronts in research on physical activity in the COVID-19 context: (1) ‘pandemic and its outcomes’, (2) ‘physical activity during self-isolation’, (3) ‘health behaviour’, (4) ‘food habits’, (5) ‘mental health’, (6) ‘adults and the pandemic’.
Conclusions: The study contributes to development of physical activity theory by profiling and mapping research conducted in the context of the COVID-19 pandemic. Through mapping the scientific output, the paper points out the leading contributors and core references, and makes an attempt to identify leading thematic areas / research fronts. Discovering the main signposts may be useful for all the researchers planning and designing research within the field. Moreover, mapping research fronts indicates them the topics attracting attention of the academia and potential research gaps.
Keywords: physical activity, COVID-19, bibliometrics, research profiling, science mapping.
Introduction1
There is no doubt that 2020 will be remembered as the year of the COVID-19 pandemic. At the outbreak of the pandemic, the lack of sufficient information about threats and possible counter-measures against the virus deepened the feeling of uncertainty. In consequence, the responses to the increase in the number of infection cases varied across the countries. Lockdown restrictions ranged from closing hotels, restaurants or schools to imposing home isolation and travel restrictions [1, 2]. Simultaneously, scholars around the world started investigating social, economic and health consequences of the pandemic and lockdown. The impact of the spreading pandemic and associated restrictions on physical activity seems to be one of the emerging streams of COVID-19 related research. For instance, Tison et al. (2020) [3] measured the changes in the average daily step count between February and June 2020 in 187 countries observing both a sharp decrease in
© Mateusz Tomanek, Andrzej Lis, 2021 doi:10.15561/20755279.2021.0301
REVIEW ARTICLE
physical activity and significant regional differences. In addition to the studies focusing on direct consequences of the pandemic confinement on the physical activity intensity, some other related themes have been explored e.g. medical benefits of physical activity during the pandemic discussed by Dwyer et al. (2020) [4] or the role of social media, as a substitute of sport, for physical activity analysed by Hayes (2020) [5]. Nevertheless, in spite of the growing number of publications, the variety of themes, streams and aspects in the research field has not been mapped from the bibliometric perspective, so far.
Thus, the aim of the study is to profile and map the scientific output in research on physical activity in the COVID-19 context. The study makes an attempt to response to the three following questions: (1) What are the leading contributors (countries, research institutions, authors and source titles) to research production in the field? (2) What are the core references? (3) What are the leading thematic areas / research fronts? In the remainder of the paper, firstly, data sampling and research
2021
03
137
methodology are explained. Secondly, the findings of general publication profiling and thematic profiling are presented. Thirdly, the key contributors, the core references and the leading thematic areas in research on physical activity in the COVID-19 context are explored and discussed.
Material and MethodsData Sources and Research SampleWe used the Scopus database as a source of
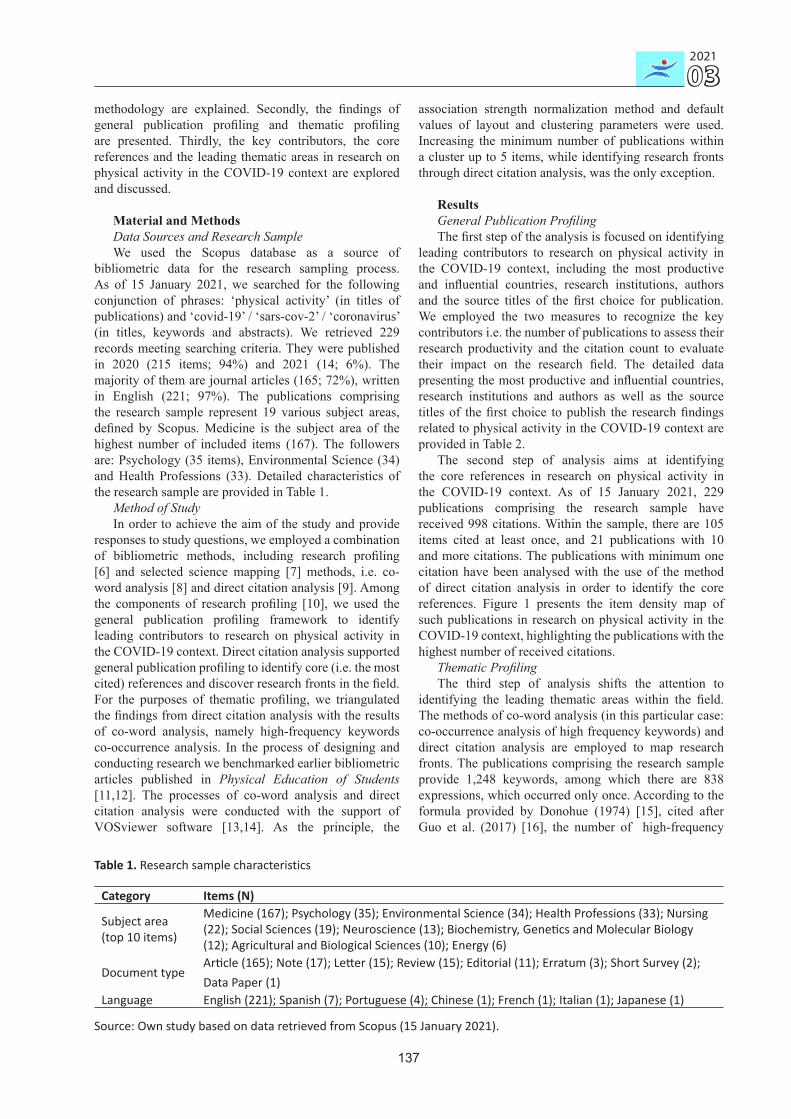
bibliometric data for the research sampling process. As of 15 January 2021, we searched for the following conjunction of phrases: ‘physical activity’ (in titles of publications) and ‘covid-19’ / ‘sars-cov-2’ / ‘coronavirus’ (in titles, keywords and abstracts). We retrieved 229 records meeting searching criteria. They were published in 2020 (215 items; 94%) and 2021 (14; 6%). The majority of them are journal articles (165; 72%), written in English (221; 97%). The publications comprising the research sample represent 19 various subject areas, defined by Scopus. Medicine is the subject area of the highest number of included items (167). The followers are: Psychology (35 items), Environmental Science (34) and Health Professions (33). Detailed characteristics of the research sample are provided in Table 1.
Method of StudyIn order to achieve the aim of the study and provide
responses to study questions, we employed a combination of bibliometric methods, including research profiling [6] and selected science mapping [7] methods, i.e. co-word analysis [8] and direct citation analysis [9]. Among the components of research profiling [10], we used the general publication profiling framework to identify leading contributors to research on physical activity in the COVID-19 context. Direct citation analysis supported general publication profiling to identify core (i.e. the most cited) references and discover research fronts in the field. For the purposes of thematic profiling, we triangulated the findings from direct citation analysis with the results of co-word analysis, namely high-frequency keywords co-occurrence analysis. In the process of designing and conducting research we benchmarked earlier bibliometric articles published in Physical Education of Students [11,12]. The processes of co-word analysis and direct citation analysis were conducted with the support of VOSviewer software [13,14]. As the principle, the
association strength normalization method and default values of layout and clustering parameters were used. Increasing the minimum number of publications within a cluster up to 5 items, while identifying research fronts through direct citation analysis, was the only exception.
Results General Publication ProfilingThe first step of the analysis is focused on identifying
leading contributors to research on physical activity in the COVID-19 context, including the most productive and influential countries, research institutions, authors and the source titles of the first choice for publication. We employed the two measures to recognize the key contributors i.e. the number of publications to assess their research productivity and the citation count to evaluate their impact on the research field. The detailed data presenting the most productive and influential countries, research institutions and authors as well as the source titles of the first choice to publish the research findings related to physical activity in the COVID-19 context are provided in Table 2.
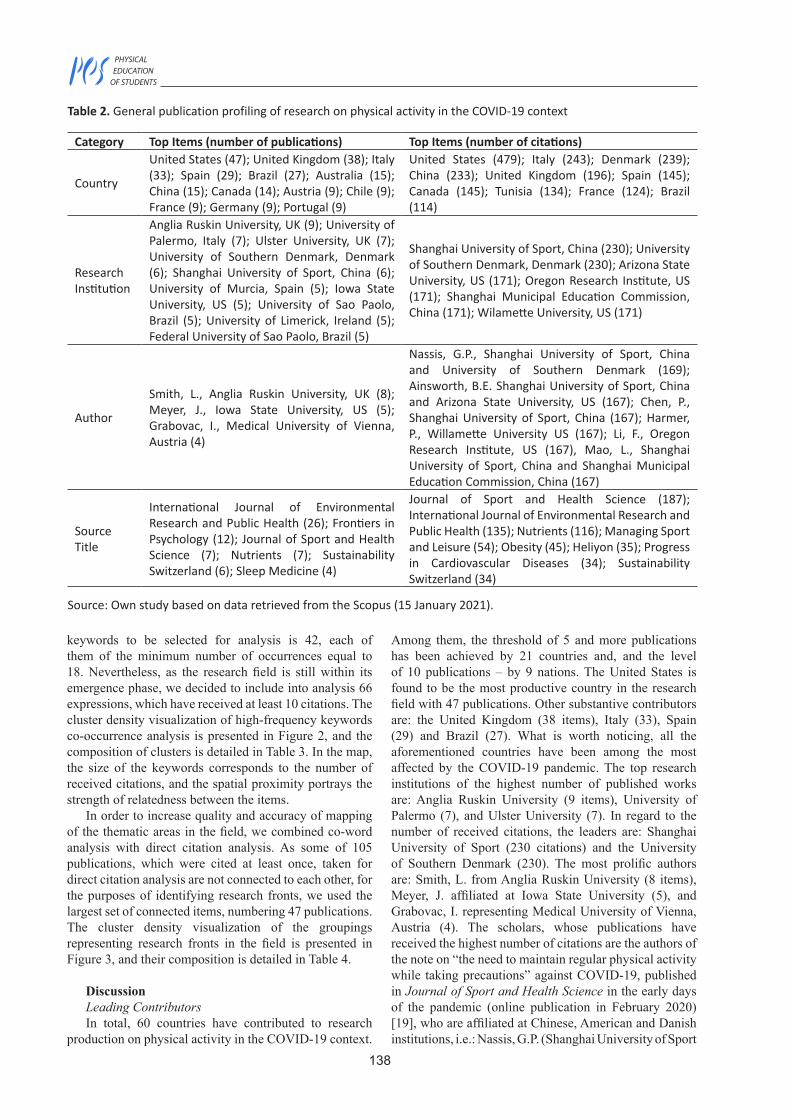
The second step of analysis aims at identifying the core references in research on physical activity in the COVID-19 context. As of 15 January 2021, 229 publications comprising the research sample have received 998 citations. Within the sample, there are 105 items cited at least once, and 21 publications with 10 and more citations. The publications with minimum one citation have been analysed with the use of the method of direct citation analysis in order to identify the core references. Figure 1 presents the item density map of such publications in research on physical activity in the COVID-19 context, highlighting the publications with the highest number of received citations.
Thematic ProfilingThe third step of analysis shifts the attention to
identifying the leading thematic areas within the field. The methods of co-word analysis (in this particular case: co-occurrence analysis of high frequency keywords) and direct citation analysis are employed to map research fronts. The publications comprising the research sample provide 1,248 keywords, among which there are 838 expressions, which occurred only once. According to the formula provided by Donohue (1974) [15], cited after Guo et al. (2017) [16], the number of high-frequency
Table 1. Research sample characteristics
Category Items (N)
Subject area (top 10 items)
Medicine (167); Psychology (35); Environmental Science (34); Health Professions (33); Nursing (22); Social Sciences (19); Neuroscience (13); Biochemistry, Genetics and Molecular Biology (12); Agricultural and Biological Sciences (10); Energy (6)
Document typeArticle (165); Note (17); Letter (15); Review (15); Editorial (11); Erratum (3); Short Survey (2);Data Paper (1)
Language English (221); Spanish (7); Portuguese (4); Chinese (1); French (1); Italian (1); Japanese (1)
Source: Own study based on data retrieved from Scopus (15 January 2021).
138
PHYSICAL EDUCATION OF STUDENTS
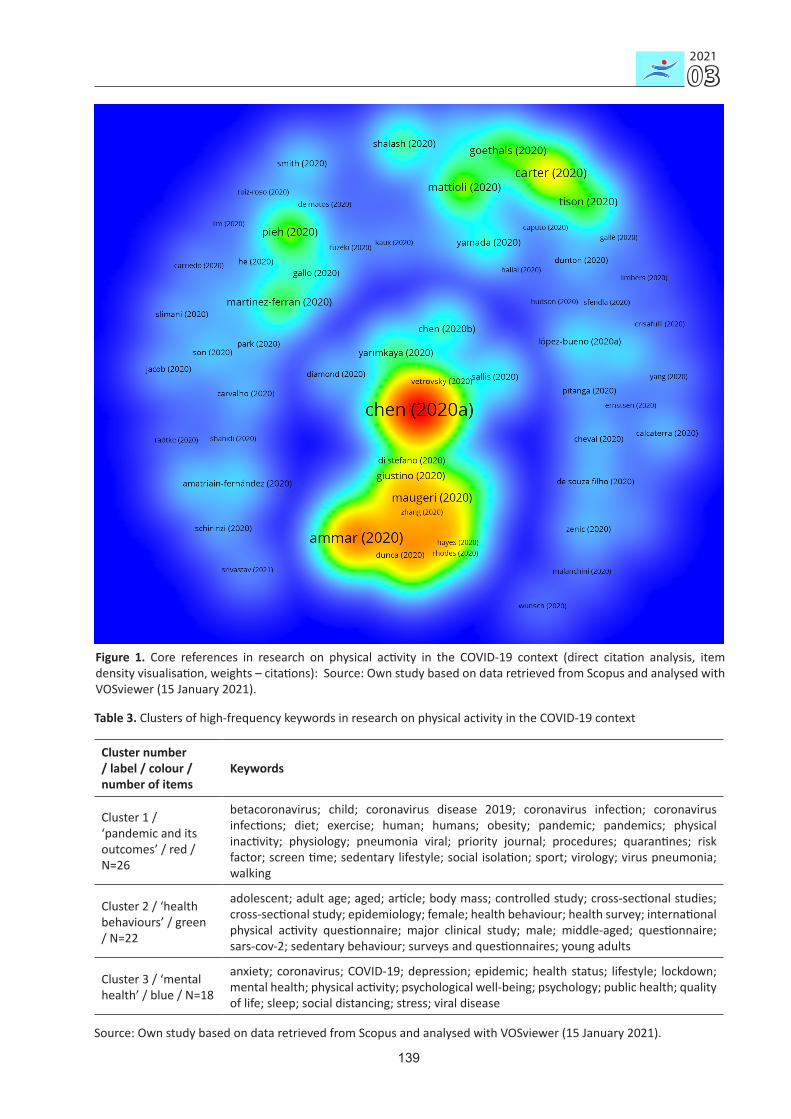
keywords to be selected for analysis is 42, each of them of the minimum number of occurrences equal to 18. Nevertheless, as the research field is still within its emergence phase, we decided to include into analysis 66 expressions, which have received at least 10 citations. The cluster density visualization of high-frequency keywords co-occurrence analysis is presented in Figure 2, and the composition of clusters is detailed in Table 3. In the map, the size of the keywords corresponds to the number of received citations, and the spatial proximity portrays the strength of relatedness between the items.
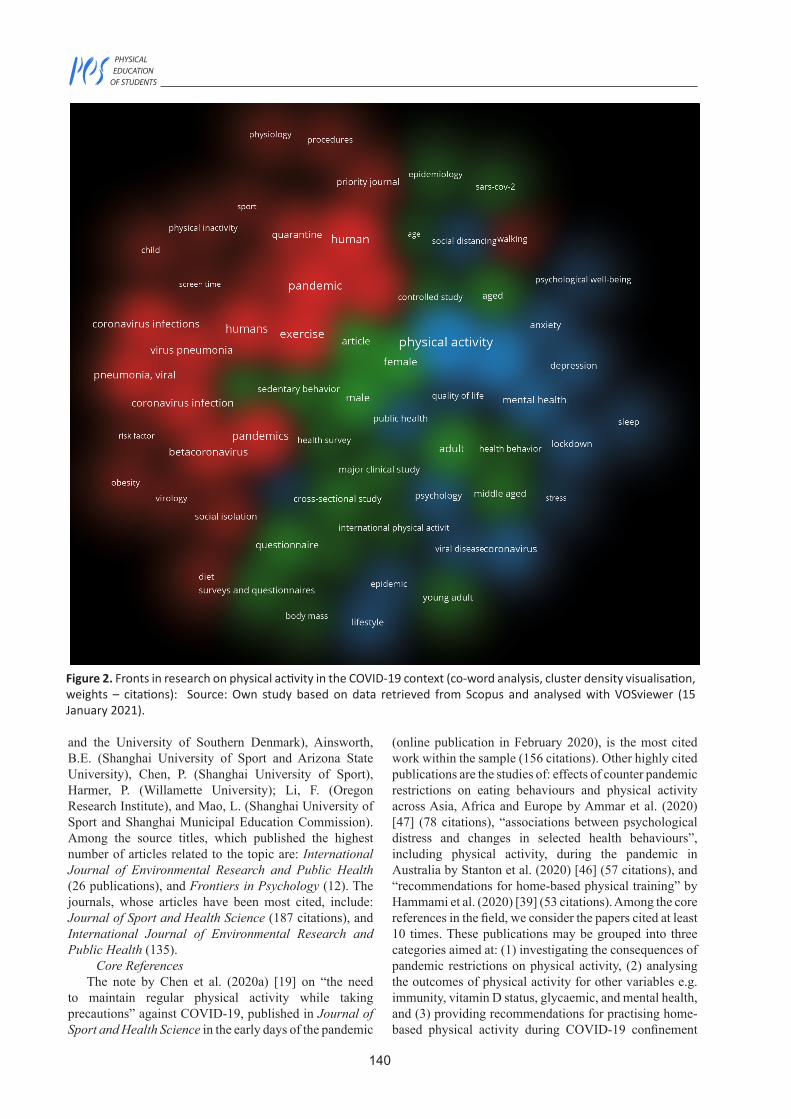
In order to increase quality and accuracy of mapping of the thematic areas in the field, we combined co-word analysis with direct citation analysis. As some of 105 publications, which were cited at least once, taken for direct citation analysis are not connected to each other, for the purposes of identifying research fronts, we used the largest set of connected items, numbering 47 publications. The cluster density visualization of the groupings representing research fronts in the field is presented in Figure 3, and their composition is detailed in Table 4.
DiscussionLeading ContributorsIn total, 60 countries have contributed to research
production on physical activity in the COVID-19 context.
Among them, the threshold of 5 and more publications has been achieved by 21 countries and, and the level of 10 publications – by 9 nations. The United States is found to be the most productive country in the research field with 47 publications. Other substantive contributors are: the United Kingdom (38 items), Italy (33), Spain (29) and Brazil (27). What is worth noticing, all the aforementioned countries have been among the most affected by the COVID-19 pandemic. The top research institutions of the highest number of published works are: Anglia Ruskin University (9 items), University of Palermo (7), and Ulster University (7). In regard to the number of received citations, the leaders are: Shanghai University of Sport (230 citations) and the University of Southern Denmark (230). The most prolific authors are: Smith, L. from Anglia Ruskin University (8 items), Meyer, J. affiliated at Iowa State University (5), and Grabovac, I. representing Medical University of Vienna, Austria (4). The scholars, whose publications have received the highest number of citations are the authors of the note on “the need to maintain regular physical activity while taking precautions” against COVID-19, published in Journal of Sport and Health Science in the early days of the pandemic (online publication in February 2020) [19], who are affiliated at Chinese, American and Danish institutions, i.e.: Nassis, G.P. (Shanghai University of Sport
Table 2. General publication profiling of research on physical activity in the COVID-19 context
Category Top Items (number of publications) Top Items (number of citations)
Country
United States (47); United Kingdom (38); Italy (33); Spain (29); Brazil (27); Australia (15); China (15); Canada (14); Austria (9); Chile (9); France (9); Germany (9); Portugal (9)
United States (479); Italy (243); Denmark (239); China (233); United Kingdom (196); Spain (145); Canada (145); Tunisia (134); France (124); Brazil (114)
Research Institution
Anglia Ruskin University, UK (9); University of Palermo, Italy (7); Ulster University, UK (7); University of Southern Denmark, Denmark (6); Shanghai University of Sport, China (6); University of Murcia, Spain (5); Iowa State University, US (5); University of Sao Paolo, Brazil (5); University of Limerick, Ireland (5); Federal University of Sao Paolo, Brazil (5)
Shanghai University of Sport, China (230); University of Southern Denmark, Denmark (230); Arizona State University, US (171); Oregon Research Institute, US (171); Shanghai Municipal Education Commission, China (171); Wilamette University, US (171)
Author
Smith, L., Anglia Ruskin University, UK (8); Meyer, J., Iowa State University, US (5); Grabovac, I., Medical University of Vienna, Austria (4)
Nassis, G.P., Shanghai University of Sport, China and University of Southern Denmark (169); Ainsworth, B.E. Shanghai University of Sport, China and Arizona State University, US (167); Chen, P., Shanghai University of Sport, China (167); Harmer, P., Willamette University US (167); Li, F., Oregon Research Institute, US (167), Mao, L., Shanghai University of Sport, China and Shanghai Municipal Education Commission, China (167)
Source Title
International Journal of Environmental Research and Public Health (26); Frontiers in Psychology (12); Journal of Sport and Health Science (7); Nutrients (7); Sustainability Switzerland (6); Sleep Medicine (4)
Journal of Sport and Health Science (187); International Journal of Environmental Research and Public Health (135); Nutrients (116); Managing Sport and Leisure (54); Obesity (45); Heliyon (35); Progress in Cardiovascular Diseases (34); Sustainability Switzerland (34)
Source: Own study based on data retrieved from the Scopus (15 January 2021).
2021
03
139
Figure 1. Core references in research on physical activity in the COVID-19 context (direct citation analysis, item density visualisation, weights – citations): Source: Own study based on data retrieved from Scopus and analysed with VOSviewer (15 January 2021).
Table 3. Clusters of high-frequency keywords in research on physical activity in the COVID-19 context
Cluster number / label / colour / number of items
Keywords
Cluster 1 / ‘pandemic and its outcomes’ / red / N=26
betacoronavirus; child; coronavirus disease 2019; coronavirus infection; coronavirus infections; diet; exercise; human; humans; obesity; pandemic; pandemics; physical inactivity; physiology; pneumonia viral; priority journal; procedures; quarantines; risk factor; screen time; sedentary lifestyle; social isolation; sport; virology; virus pneumonia; walking
Cluster 2 / ‘health behaviours’ / green / N=22
adolescent; adult age; aged; article; body mass; controlled study; cross-sectional studies; cross-sectional study; epidemiology; female; health behaviour; health survey; international physical activity questionnaire; major clinical study; male; middle-aged; questionnaire; sars-cov-2; sedentary behaviour; surveys and questionnaires; young adults
Cluster 3 / ‘mental health’ / blue / N=18
anxiety; coronavirus; COVID-19; depression; epidemic; health status; lifestyle; lockdown; mental health; physical activity; psychological well-being; psychology; public health; quality of life; sleep; social distancing; stress; viral disease
Source: Own study based on data retrieved from Scopus and analysed with VOSviewer (15 January 2021).
140
PHYSICAL EDUCATION OF STUDENTS
Figure 2. Fronts in research on physical activity in the COVID-19 context (co-word analysis, cluster density visualisation, weights – citations): Source: Own study based on data retrieved from Scopus and analysed with VOSviewer (15 January 2021).
and the University of Southern Denmark), Ainsworth, B.E. (Shanghai University of Sport and Arizona State University), Chen, P. (Shanghai University of Sport), Harmer, P. (Willamette University); Li, F. (Oregon Research Institute), and Mao, L. (Shanghai University of Sport and Shanghai Municipal Education Commission). Among the source titles, which published the highest number of articles related to the topic are: International Journal of Environmental Research and Public Health (26 publications), and Frontiers in Psychology (12). The journals, whose articles have been most cited, include: Journal of Sport and Health Science (187 citations), and International Journal of Environmental Research and Public Health (135).
Core ReferencesThe note by Chen et al. (2020a) [19] on “the need
to maintain regular physical activity while taking precautions” against COVID-19, published in Journal of Sport and Health Science in the early days of the pandemic
(online publication in February 2020), is the most cited work within the sample (156 citations). Other highly cited publications are the studies of: effects of counter pandemic restrictions on eating behaviours and physical activity across Asia, Africa and Europe by Ammar et al. (2020) [47] (78 citations), “associations between psychological distress and changes in selected health behaviours”, including physical activity, during the pandemic in Australia by Stanton et al. (2020) [46] (57 citations), and “recommendations for home-based physical training” by Hammami et al. (2020) [39] (53 citations). Among the core references in the field, we consider the papers cited at least 10 times. These publications may be grouped into three categories aimed at: (1) investigating the consequences of pandemic restrictions on physical activity, (2) analysing the outcomes of physical activity for other variables e.g. immunity, vitamin D status, glycaemic, and mental health, and (3) providing recommendations for practising home-based physical activity during COVID-19 confinement
2021
03
141
Table 4. Clusters of core references in research on physical activity in the COVID-19 context
Cluster number / label / colour / number of items
References
Cluster 1 / ‘physical activity during self-isolation’ / red / N=20
Callow et al. (2020) [17]; Castañeda-Babarro et al. (2020) [18]; Chen et al. (2020a) [19]; Chen et al. (2020b) [20]; Chirico et al. (2020) [21]; Di Sebastiano et al. (2020) [22]; Diamond and Waite (2020) [23]; Esentürk (2020) [24]; Fröberg (2020) [25]; Hemphil et al. (2020) [26]; Jurak et al. (2020) [27]; Kaushal et al. (2020) [28]; Qi et al. (2020) [29]; Qin et al. (2020) [30]; Rosales et al. (2020) [31]; Sallis et al. (2020) [32]; Sekulic et al. (2020) [33]; Tornese et al. (2020) [34]; Vetrovsky et al. (2020) [35]; Yarımkaya and Esentürk (2020) [36]
Cluster 2 / ‘mental health’/ green / N=11
Antunes et al. (2020) [37]; Dunca et al. (2020) [38]; Hammami et al. (2020) [39]; Hayes (2020) [5]; Karuc et al. (2020) [40]; Laddu et al. (2020) [41]; Ng (2020) [42]; Nigro et al. (2020) [43]; Rhodes et al. (2020) [44]; Rogers et al. (2020) [45]; Stanton et al. (2020) [46]
Cluster 3 / ‘food habits’ / blue / N=8
Ammar et al. (2020) [47]; Lesser and Nienhuis (2020) [48]; López-Bueno (2020) [49]; Reyes-Olavarria (2020) et al. [50]; Romero-Blanco et al. (2020) [51]; Ruíz-Roso et al. (2020) [52]; Schuch et al. (2020) [53]; Sánchez-Sánchez et al. (2020) [54]
Cluster 4 / ‘adults and the pandemic’/ green / N=8
Aubertin-Leheudre and Rolland (2020) [55]; Di Stefano et al. (2020) [56]; Dwyer et al. (2020) [4]; Giustino et al. (2020) [57]; Katewongsa et al. (2020) [58]; Maugeri et al. (2020) [59]; Suzuki et al. (2020) [60]; Zhang et al. (2020) [61]
Source: Own study based on data retrieved from Scopus and analysed with VOSviewer (15 January 2021).
Figure 3. Fronts in research on physical activity in the COVID-19 context (direct citation analysis, cluster density visualisation, weights – citations): Source: Own study based on data retrieved from Scopus and analysed with VOSviewer (15 January 2021).
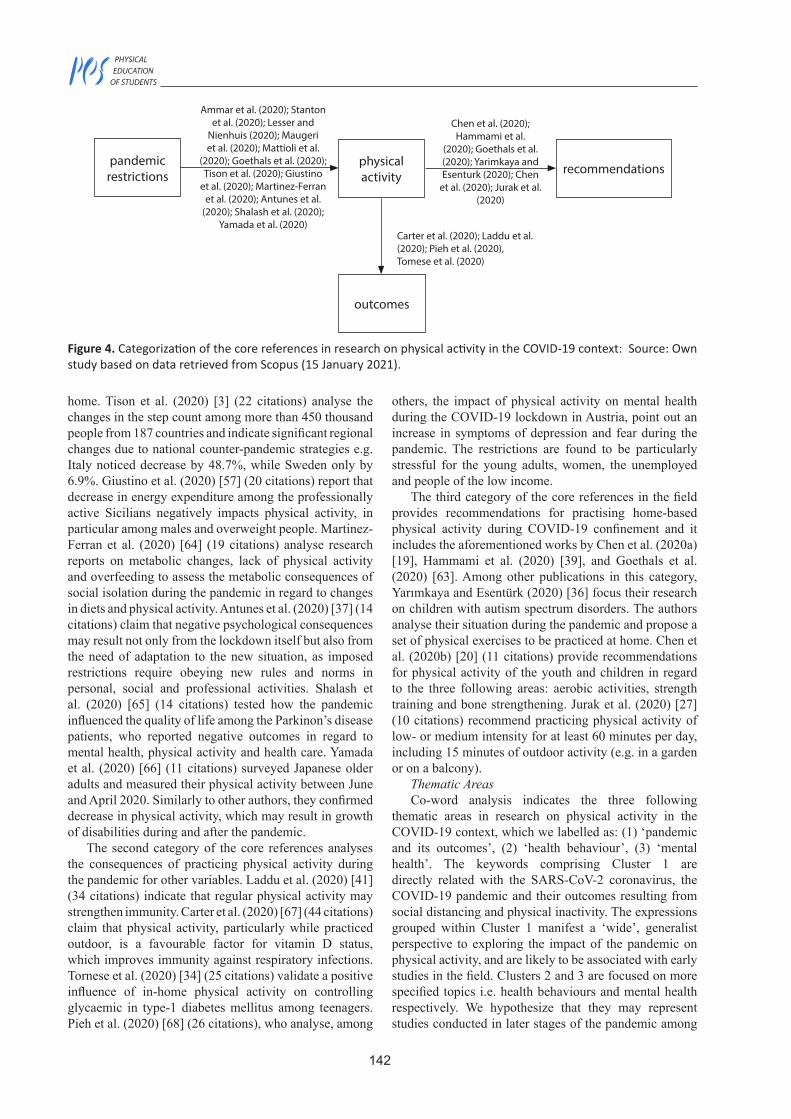
(cf. Figure 4).The first category of the core references is focused on
the consequences of pandemic restrictions on physical activity and it comprises the already mentioned studies by Ammar et al. (2020) [47] and Stanton et al. (2020) [46]. Among other publications, Lesser and Nienhuis (2020) [48] (38 citations) present the findings of their research conducted in April and May 2020, on the impact of social distancing and closing of sport facilities on physical activity and well-being of Canadians. The Italian study of Maugeri et al. (2020) [59] (35 citations) proves that home
isolation resulted in decrease in weekly energy expenditure associated with physical activity in all age categories, and particularly among men. Mattioli et al. (2020) [62] (27 citations) point out that stress and depression caused by home confinement result in unhealthy diet behaviours and less intensive physical activity. In their qualitative study, Goethals et al. (2020) [63] (23 citations) assess the impact of quarantine on physical activity of the elderly living in France and the authors recommend to enhance physical activity of senior citizens through providing them with a set of simple exercises to be practiced individually at
142
PHYSICAL EDUCATION OF STUDENTS
home. Tison et al. (2020) [3] (22 citations) analyse the changes in the step count among more than 450 thousand people from 187 countries and indicate significant regional changes due to national counter-pandemic strategies e.g. Italy noticed decrease by 48.7%, while Sweden only by 6.9%. Giustino et al. (2020) [57] (20 citations) report that decrease in energy expenditure among the professionally active Sicilians negatively impacts physical activity, in particular among males and overweight people. Martinez-Ferran et al. (2020) [64] (19 citations) analyse research reports on metabolic changes, lack of physical activity and overfeeding to assess the metabolic consequences of social isolation during the pandemic in regard to changes in diets and physical activity. Antunes et al. (2020) [37] (14 citations) claim that negative psychological consequences may result not only from the lockdown itself but also from the need of adaptation to the new situation, as imposed restrictions require obeying new rules and norms in personal, social and professional activities. Shalash et al. (2020) [65] (14 citations) tested how the pandemic influenced the quality of life among the Parkinon’s disease patients, who reported negative outcomes in regard to mental health, physical activity and health care. Yamada et al. (2020) [66] (11 citations) surveyed Japanese older adults and measured their physical activity between June and April 2020. Similarly to other authors, they confirmed decrease in physical activity, which may result in growth of disabilities during and after the pandemic.
The second category of the core references analyses the consequences of practicing physical activity during the pandemic for other variables. Laddu et al. (2020) [41] (34 citations) indicate that regular physical activity may strengthen immunity. Carter et al. (2020) [67] (44 citations) claim that physical activity, particularly while practiced outdoor, is a favourable factor for vitamin D status, which improves immunity against respiratory infections. Tornese et al. (2020) [34] (25 citations) validate a positive influence of in-home physical activity on controlling glycaemic in type-1 diabetes mellitus among teenagers. Pieh et al. (2020) [68] (26 citations), who analyse, among
others, the impact of physical activity on mental health during the COVID-19 lockdown in Austria, point out an increase in symptoms of depression and fear during the pandemic. The restrictions are found to be particularly stressful for the young adults, women, the unemployed and people of the low income.
The third category of the core references in the field provides recommendations for practising home-based physical activity during COVID-19 confinement and it includes the aforementioned works by Chen et al. (2020a) [19], Hammami et al. (2020) [39], and Goethals et al. (2020) [63]. Among other publications in this category, Yarımkaya and Esentürk (2020) [36] focus their research on children with autism spectrum disorders. The authors analyse their situation during the pandemic and propose a set of physical exercises to be practiced at home. Chen et al. (2020b) [20] (11 citations) provide recommendations for physical activity of the youth and children in regard to the three following areas: aerobic activities, strength training and bone strengthening. Jurak et al. (2020) [27] (10 citations) recommend practicing physical activity of low- or medium intensity for at least 60 minutes per day, including 15 minutes of outdoor activity (e.g. in a garden or on a balcony).
Thematic AreasCo-word analysis indicates the three following
thematic areas in research on physical activity in the COVID-19 context, which we labelled as: (1) ‘pandemic and its outcomes’, (2) ‘health behaviour’, (3) ‘mental health’. The keywords comprising Cluster 1 are directly related with the SARS-CoV-2 coronavirus, the COVID-19 pandemic and their outcomes resulting from social distancing and physical inactivity. The expressions grouped within Cluster 1 manifest a ‘wide’, generalist perspective to exploring the impact of the pandemic on physical activity, and are likely to be associated with early studies in the field. Clusters 2 and 3 are focused on more specified topics i.e. health behaviours and mental health respectively. We hypothesize that they may represent studies conducted in later stages of the pandemic among
Figure 4. Categorization of the core references in research on physical activity in the COVID-19 context: Source: Own study based on data retrieved from Scopus (15 January 2021).
pandemic restrictions
Ammar et al. (2020); Stanton et al. (2020); Lesser and
Nienhuis (2020); Maugeri et al. (2020); Mattioli et al.
(2020); Goethals et al. (2020); Tison et al. (2020); Giustino
et al. (2020); Martinez-Ferran et al. (2020); Antunes et al.
(2020); Shalash et al. (2020); Yamada et al. (2020)
Chen et al. (2020); Hammami et al.
(2020); Goethals et al. (2020); Yarimkaya and Esenturk (2020); Chen
et al. (2020); Jurak et al. (2020)
Carter et al. (2020); Laddu et al. (2020); Pieh et al. (2020), Tomese et al. (2020)
physical activity
outcomes
recommendations

2021
03
143
the enlarging population of those who recovered from COVID-19 or suffered from social distancing and lockdown restrictions.
The results of direct citation analysis point out the four clusters of publications focused on the following themes: (1) ‘physical activity during self-isolation’, (2) ‘mental health’, (3) ‘food habits’, (4) ‘adults and the pandemic’. Cluster 1, labelled as ‘physical activity during self-isolation’, includes papers published mainly in health science journals. In their communique issued in February 2020, Chen et al. (2020a) [19] list possible areas of research on the impact of COVID-19 on physical activity and outcomes. For instance, they notice that prolonged periods of self-isolation at home may result in lowering the intensity of physical activity, feeling of fear and depression, which consequently may lead to a wide range of chronic diseases. Cluster 1 includes papers disseminating the findings from research on the scope of physical activity. For instance, Di Sebastiano et al. (2020) [22] measured, with the use of ParticipACTION application, the level of physical activity before and after imposing social distancing restrictions in Canada. Chirico et al. (2020) [21] conducted a similar study among the population of Italy. Kaushal et al. (2020) [28] investigated how the access to the sport equipment at home influenced decisions made by Americans to participate in physical activity.
Cluster 2, consisting of 11 publications, concentrates on the issues of ‘mental health’. To mention a few examples, Antunes et al. (2020) [37] claim that negative psychological consequences may result not only from the lockdown itself but also from the need of adaptation to the new situation, as imposed restrictions require obeying new rules and norms in personal, social and professional activities. Dunca et al. (2020) [38] conducted the online questionnaire survey among American twins in order to investigate the relationship between perceived change of physical activity and mental health in the context of the COVID-19 pandemic. Stanton et al. (2020) [46] analyse the association between psychological stress and changes in health behaviours of Australians. Their study encompasses such aspects as: depression, fear, stress, physical activity, sleep, alcohol consumption and smoking.
Food habits are the theme of Cluster 3. Sánchez-Sánchez et al. (2020) [54] investigate food habits of Spanish population before and during COVID-19. They notice that Mediterranean diet slight gains some popularity in the pandemic, while a rise in consumption of ‘unhealthy’ food (alcohol, snacks, sweets) is noticed. Ammar et al. (2020) [47] suggest that quarantine may be considered as a factor increasing the risk of consuming low quality food. They observe that confined people consume more unhealthy food comparing to the period before the COVID-19 outbreak. What is interesting, their study indicates simultaneously a slight decrease in binge drinking during the pandemic. A high level of consumption of processed food in the pandemic in Italy, Spain and Latin America is reported by Ruíz-Roso et al.
(2020) [52]. It is worth noticing that highly-processed food consumption is typical of poor societies as this kind of food is usually relatively cheap.
Cluster 4, labelled as ‘adults and the pandemic’, presents the findings of the studies, which take into account the age factor. The interest in the elderly may be observed in research conducted by Suzuki et al. (2020) [60], who investigate how restrictions in public health influence physical activity, subjective well-being and health-related quality of life. Aubertin-Leheudre and Rolland (2020) [55] indicate the need to remember about physical activity of the elderly and offering them simple physical exercises to be practiced at home. Giustino et al. (2020) [57], who studied the professionally active Sicilians, report that decrease in energy expenditure negatively impacts physical activity, in particular among males and overweight people. The research conducted in Thailand shows a similar fall in physical activity. Katewongsa et al. (2020) [58] claims that such a situation may result from a lower priority given to promotion of health lifestyle, while in the early weeks of the pandemic the efforts were concentrated on countering the spread of the coronavirus.
An interesting tendency is observed in regard to research methodologies employed to study the issues of physical activity in the context of the COVID-19 pandemic. Before the pandemic outbreak, papers published in journals representing the disciplines of medicine, health science or sport studies were characterized by the employment of sophisticated quantitative methods and techniques. During the pandemic, the shift from quantitative to qualitative research is noticed. Laboratory experiments were replaced by online questionnaire surveys based on subjective responses of informants. Thus, due to social distancing, the use of online applications to monitor physical activity may be recommended to support data collection in order to objectively asses the level of physical activity.
ConclusionsIn response to the first research question, we have
identified the leading contributors (countries, research institutions, authors and source titles) to research on physical activity in the COVID-19 context. The countries, which have contributed with the highest number of publications are: the United States, the United Kingdom, Italy, Spain and Brazil. All the aforementioned countries have been among the most affected by the COVID-19 pandemic. A similar tendency is observed among the research institutions with the highest number of published works or received citations – they mainly represent China (Shanghai University of Sport, Shanghai Municipal Education Commission), where the outbreak of COVID-19 happened or the countries, which heavily suffered from the pandemic e.g. the United States (Arizona State University, Iowa State University, Oregon Research Institute, Wilamette University), the United Kingdom (Anglia Ruskin University, Ulster University), Italy (University of Palermo), Spain (University of Murcia), Brazil (University of Sao Paolo, Federal University of
144
PHYSICAL EDUCATION OF STUDENTS
Sao Paolo). Lee Smith from Anglia Ruskin University, who published 8 articles, is recognized as the most prolific author. The scholars, whose publications have received the highest number of citations are the authors of the note on “the need to maintain regular physical activity while taking precautions” against COVID-19 published in the early days of the pandemic in February 2020 [19]. The leading journals publishing research on physical activity in the COVID-19 context are: International Journal of Environmental Research and Public Health (by number of published articles) and Journal of Sport and Health Science (by the number of received citations).
In response to the second research question, we have identified and explored the core references in research on physical activity in the COVID-19 context. The aforementioned note by Chen et al. (2020a) [19] on “the need to maintain regular physical activity while taking precautions” against COVID-19 is the most cited work within the sample. The identified core references may be grouped into three categories aimed at: (1) investigating the consequences of pandemic restrictions on physical activity, (2) analysing the outcomes of physical activity for other variables e.g. immunity, vitamin D status, glycaemic, and mental health, and (3) providing recommendations for practising home-based physical activity during COVID-19 confinement.
In response to the third research question, we have identified and explored the leading thematic areas / research fronts in research on physical activity in the COVID-19 context. The three following areas have been mapped with the use of co-word analysis of high-frequency keywords: (1) ‘pandemic and its outcomes’, (2) ‘health behaviour’, (3) ‘mental health’. The results of direct citation analysis indicate the four clusters of publications focused on the following themes: (1) ‘physical activity during self-isolation’, (2) ‘mental health’, (3) ‘food habits’, (4) ‘adults and the pandemic’.
The study contributes to development of physical activity theory by profiling and mapping research conducted in the context of the COVID-19 pandemic. Through mapping the scientific output, it points out the key contributors and core references, and makes an attempt to identify leading thematic areas / research fronts. Discovering the main signposts may be useful for all the researchers planning and designing research within the field. Moreover, mapping research fronts indicates them the topics attracting attention of the academia and potential research gaps.
Discussing the research findings, there is a need to consider limitations of the study and indicate the lines of effort for further research. Firstly, methodological limitations should be mentioned. We have tried to triangulate research methods to ensure an appropriate level of objectivity. In our study we employed both co-word analysis and direct citation analysis to identify and explore research fronts in the field. Among citation analysis methods, direct citation is known as effective in discovering emerging fronts [69]. Nevertheless, in the future, following the development of the research field,
the replication of this part of the study is recommend with the use of other citation analysis methods, which show a higher level of accuracy in mapping science [70] such as: bibliographic coupling and co-citation analysis. These two methods could be also used to triangulate the mapping of the intellectual structure of the research field and discovering the most influential publications. Secondly, limitations regarding the research sampling process should be unveiled. Although Scopus is a recognized source of high quality bibliometric data, it may omit some important publications, especially those published in languages other than English. Moreover, due to the novelty of the research field the number of items taken for analysis (N=229) is relatively small for bibliometric studies. Thus, we recommend to replicate the study as the field becomes more developed and to use other sources of bibliometric data for the research sampling process.
Highlights• The publications on physical activity in the
COVID-19 context represent 19 various subject areas, defined by Scopus. Medicine is the subject area of the highest number of included items. The followers among subject areas are: Psychology, Environmental Science and Health Professions.
• The countries, which have contributed with the highest number of publications are: the United States, the United Kingdom, Italy, Spain and Brazil. All the aforementioned countries have been among the most affected by the COVID-19 pandemic.
• The top research institutions of the highest number of published works are: Anglia Ruskin University, University of Palermo, and Ulster University. In regard to the number of received citations, the leaders are: Shanghai University of Sport and the University of Southern Denmark.
• The leading journals publishing research on physical activity in the COVID-19 context are: International Journal of Environmental Research and Public Health (by number of published articles) and Journal of Sport and Health Science (by the number of received citations).
• The note by Chen et al. (2020a) [19] on “the need to maintain regular physical activity while taking precautions” against COVID-19, published in Journal of Sport and Health Science in the early days of the pandemic (online publication in February 2020), is the most cited work within the sample.
• The core references in research on physical activity in the COVID-19 context may be grouped into three categories aimed at: (1) investigating the consequences of pandemic restrictions on physical activity, (2) analysing the outcomes of physical activity for other variables e.g. immunity, vitamin D status, glycaemic, and mental health, and (3) providing recommendations for practising home-based physical activity during COVID-19 confinement.
• Science mapping of the research field conceptual structure indicates the following thematic areas /
2021
03
145
research fronts in research on physical activity in the COVID-19 context: (1) ‘pandemic and its outcomes’, (2) ‘physical activity during self-isolation’, (3) ‘health behaviour’, (4) ‘food habits’, (5) ‘mental health’, (6) ‘adults and the pandemic’.
Conflicts of InterestThe authors declare no conflict of interest.
References1. Punn NS, Sonbhadra SK, Agarwal S. Monitoring
COVID-19 social distancing with person detection and tracking via fine-tuned YOLO v3 and Deepsort techniques 2020. arXiv:2005.01385
2. de Matos DG, Aidar FJ, de Almeida-Neto PF, Moreira OC, de Souza RF, Marçal AC, et al. The impact of measures recommended by the government to limit the spread of coronavirus (COVID-19) on physical activity levels, quality of life, and mental health of Brazilians. Sustain, 2020;12:art. 9072. https://doi.org/10.3390/su12219072
3. Tison GH, Avram R, Kuhar P, Abreau S, Marcus GM, Pletcher MJ, et al. Worldwide effect of COVID-19 on physical activity: A descriptive study. Ann Intern Med, 2020;173:767–70. https://doi.org/10.7326/M20-2665
4. Dwyer MJ, Pasini M, De Dominicis S, Righi E. Physical activity: Benefits and challenges during the COVID-19 pandemic. Scand J Med Sci Sport, 2020;30:1291–4. https://doi.org/10.1111/sms.13710
5. Hayes M. Social media and inspiring physical activity during COVID-19 and beyond. Manag Sport Leis, 2020:1–8. https://doi.org/10.1080/23750472.2020.1794939
6. Porter AL, Kongthon A, Lu J-CC. Research profiling: Improving the literature review. Scientometrics, 2002;53:351–70. https://doi.org/10.1023/A:1014873029258
7. Zupic I, Čater T. Bibliometric methods in management and organization. Organ Res Methods 2015;18:429–72. https://doi.org/10.1177/1094428114562629
8. He Q. Knowledge discovery through co-word analysis. Libr Trends, 1999;48:133–59.
9. Smith LC. Citation analysis. Libr Trends, 1981;30:83–106.
10. Martinez H, Jaime A, Camacho J. Relative absorptive capacity: A research profiling. Scientometrics, 2012;92:657–74. https://doi.org/10.1007/s11192-012-0652-6
11. Tomanek M, Lis A. Managing information on the physical education research field: Bibliometric analysis. Phys Educ Students, 2020;24:213–26. https://doi.org/10.15561/20755279.2020.0404
12. Lis A, Tomanek M. Mapping the intellectual and conceptual structure of physical education research: Direct citation analysis. Phys Educ Students, 2021;25(2):67-84. https://doi.org/10.15561/20755279.2021.0201
13. van Eck NJ, Waltman L. Software survey: VOSviewer, a computer program for bibliometric mapping. Scientometrics, 2010;84:523–38.
https://doi.org/10.1007/s11192-009-0146-314. van Eck NJ, Waltman L. VOSviewer Manual. 2020.15. Donohue JC. Understanding Scientific Literature: A
Bibliometric Approach. Cambridge: MIT Press; 1974.16. Guo D, Chen H, Long R, Lu H, Long Q. A co-word
analysis of organizational constraints for maintaining sustainability. Sustainability, 2017;9:art. 1928. https://doi.org/10.3390/su9101928
17. Callow DD, Arnold-Nedimala NA, Jordan LS, Pena GS, Won J, Woodard JL, et al. The mental health benefits of physical activity in older adults survive the COVID-19 pandemic. Am J Geriatr Psychiatry, 2020;28:1046–57. https://doi.org/10.1016/j.jagp.2020.06.024
18. Castañeda-Babarro A, Coca A, Arbillaga-Etxarri A, Gutiérrez-Santamaría B. Physical activity change during COVID-19 confinement. Int J Environ Res Public Health, 2020;17:1–10. https://doi.org/10.3390/ijerph17186878
19. Chen P, Mao L, Nassis GP, Harmer P, Ainsworth BE, Li F. Coronavirus disease (COVID-19): The need to maintain regular physical activity while taking precautions. J Sport Heal Sci, 2020;9:103–4. https://doi.org/10.1016/j.jshs.2020.02.001
20. Chen P, Mao L, Nassis GP, Harmer P, Ainsworth BE, Li F. Returning Chinese school-aged children and adolescents to physical activity in the wake of COVID-19: Actions and precautions: COVID-19 and school physical activity. J Sport Heal Sci, 2020;9:322–4. https://doi.org/10.1016/j.jshs.2020.04.003
21. Chirico A, Lucidi F, Galli F, Giancamilli F, Vitale J, Borghi S, et al. COVID-19 Outbreak and Physical Activity in the Italian Population: A Cross-Sectional Analysis of the Underlying Psychosocial Mechanisms. Front Psychol, 2020;11:2100. https://doi.org/10.3389/fpsyg.2020.02100
22. Di Sebastiano KM, Chulak-Bozzer T, Vanderloo LM, Faulkner G. Don’t Walk So Close to Me: Physical Distancing and Adult Physical Activity in Canada. Front Psychol, 2020;11:1895. https://doi.org/10.3389/fpsyg.2020.01895
23. Diamond R, Waite F. Physical activity in a pandemic: A new treatment target for psychological therapy. Psychol Psychother Theory Res Pract, 2021;94:357–64. https://doi.org/10.1111/papt.12294
24. Esentürk OK. Parents’ perceptions on physical activity for their children with autism spectrum disorders during the novel Coronavirus outbreak. International Journal of Developmental Disabilities, 2020:1–12. https://doi.org/10.1080/20473869.2020.1769333
25. Fröberg A. The COVID-19 pandemic: The importance of physical activity among faculty members. Journal of American College Health, 2020:1–4. https://doi.org/10.1080/07448481.2020.1817037
26. Hemphill NM, Kuan MTY, Harris KC. Reduced physical activity during COVID-19
146
PHYSICAL EDUCATION OF STUDENTS
pandemic in children with congenital heart disease. Can J Cardiol, 2020;36:1130–4. https://doi.org/10.1016/j.cjca.2020.04.038
27. Jurak G, Morrison SA, Leskošek B, Kovač M, Hadžić V, Vodičar J, et al. Physical activity recommendations during the coronavirus disease-2019 virus outbreak. J Sport Heal Sci, 2020;9:325–7. https://doi.org/10.1016/j.jshs.2020.05.003
28. Kaushal N, Keith NC, Aguiñaga S, Hagger MS. Social cognition and socioecological predictors of home-based physical activity intentions, planning, and habits during the COVID-19 pandemic. Behav Sci (Basel), 2020;10:art. 133. https://doi.org/10.3390/bs10090133
29. Qi M, Li P, Moyle W, Weeks B, Jones C. Physical activity, health-related quality of life, and stress among the Chinese adult population during the COVID-19 pandemic. Int J Environ Res Public Health, 2020;17:1–10. https://doi.org/10.3390/ijerph17186494
30. Qin F, Song Y, Nassis GP, Zhao L, Dong Y, Zhao C, et al. Physical activity, screen time, and emotional well-being during the 2019 novel coronavirus outbreak in China. Int J Environ Res Public Health, 2020;17:1–16. https://doi.org/10.3390/ijerph17145170
31. Rosales CK, Erazo PV, Valderrama JF, González JB, Terneus DH, Stagno RU, et al. Sport COVID-19 orientations: Recommendations for return to physical activity and sports in children and adolescents. Rev Chil Pediatr, 2020;91:1–16. https://doi.org/10.32641/rchped.vi91i7.2782
32. Sallis JF, Adlakha D, Oyeyemi A, Salvo D. An international physical activity and public health research agenda to inform coronavirus disease-2019 policies and practices. J Sport Heal Sci, 2020;9:328–34. https://doi.org/10.1016/j.jshs.2020.05.005
33. Sekulic D, Blazevic M, Gilic B, Kvesic I, Zenic N. Prospective analysis of levels and correlates of physical activity during COVID-19 pandemic and imposed rules of social distancing; gender specific study among adolescents from Southern Croatia. Sustain, 2020;12:art. 4072. https://doi.org/10.3390/SU12104072
34. Tornese G, Ceconi V, Monasta L, Carletti C, Faleschini E, Barbi E. Glycemic control in type 1 diabetes mellitus during COVID-19 quarantine and the role of in-home physical activity. Diabetes Technol Ther, 2020;22:462–7. https://doi.org/10.1089/dia.2020.0169
35. Vetrovsky T, Frybova T, Gant I, Semerad M, Cimler R, Bunc V, et al. The detrimental effect of COVID-19 nationwide quarantine on accelerometer-assessed physical activity of heart failure patients. ESC Hear Fail, 2020;7:2093–7. https://doi.org/10.1002/ehf2.12916
36. Yarımkaya E, Esentürk OK. Promoting physical activity for children with autism spectrum disorders during Coronavirus outbreak: benefits, strategies, and examples. International Journal of Developmental Disabilities 2020:1–6. https://doi.org/10.1080/20473869.2020.1756115
37. Antunes R, Frontini R, Amaro N, Salvador R, Matos R, Morouço P, et al. Exploring lifestyle habits, physical activity, anxiety and basic psychological needs in a sample of Portuguese adults during COVID-19. Int J Environ Res Public Health, 2020;17:1–13. https://doi.org/10.3390/ijerph17124360
38. Dunca GE, Aver AR, Seto E, Tsang S. Perceived change in physical activity levels and mental health during COVID-19: Findings among adult twin pairs. PLoS One, 2020;15. https://doi.org/10.1371/journal.pone.0237695
39. Hammami A, Harrabi B, Mohr M, Krustrup P. Physical activity and coronavirus disease 2019 (COVID-19): specific recommendations for home-based physical training. Managing Sport and Leisure, 2020:1–6. https://doi.org/10.1080/23750472.2020.1757494
40. Karuc J, Sorić M, Radman I, Mišigoj-Duraković M. Moderators of change in physical activity levels during restrictions due to COVID-19 pandemic in young urban adults. Sustain, 2020;12:art. 6392. https://doi.org/10.3390/SU12166392
41. Laddu DR, Lavie CJ, Phillips SA, Arena R. Physical activity for immunity protection: Inoculating populations with healthy living medicine in preparation for the next pandemic. Progress in Cardiovascular Diseases, 2021;64:102–4. https://doi.org/10.1016/j.pcad.2020.04.006
42. Ng K. Adapted physical activity through COVID-19. Eur J Adapt Phys Act 2020;13:1–3. https://doi.org/10.5507/EUJ.2020.003
43. Nigro E, Polito R, Alfieri A, Mancini A, Imperlini E, Elce A, et al. Molecular mechanisms involved in the positive effects of physical activity on coping with COVID-19. Eur J Appl Physiol, 2020;120:2569–82. https://doi.org/10.1007/s00421-020-04484-5
44. Rhodes RE, Liu S, Lithopoulos A, Zhang CQ, Garcia-Barrera MA. Correlates of perceived physical activity transitions during the COVID-19 pandemic among Canadian adults. Appl Psychol Heal Well-Being, 2020;12:1157–82. https://doi.org/10.1111/aphw.12236
45. Rogers NT, Waterlow NR, Brindle H, Enria L, Eggo RM, Lees S, et al. Behavioral Change Towards Reduced Intensity Physical Activity Is Disproportionately Prevalent Among Adults With Serious Health Issues or Self-Perception of High Risk During the UK COVID-19 Lockdown. Front Public Health, 2020;8:575091. https://doi.org/10.3389/fpubh.2020.575091
46. Stanton R, To QG, Khalesi S, Williams SL, Alley SJ, Thwaite TL, et al. Depression, anxiety and stress during COVID-19: Associations with changes in physical activity, sleep, tobacco and alcohol use in Australian adults. Int J Environ Res Public Health, 2020;17:1–13. https://doi.org/10.3390/ijerph17114065
47. Ammar A, Brach M, Trabelsi K, Chtourou H, Boukhris O, Masmoudi L, et al. Effects of COVID-19 Home Confinement on Eating Behaviour and Physical Activity: Results of the ECLB-COVID19 International Online Survey. Nutrients, 2020;12:1583. https://doi.org/10.3390/nu12061583
2021
03
147
48. Lesser IA, Nienhuis CP. The Impact of COVID-19 on Physical Activity Behavior and Well-Being of Canadians. IJERPH 2020;17:3899. https://doi.org/10.3390/ijerph17113899
49. López-Bueno R, Calatayud J, Andersen LL, Balsalobre-Fernández C, Casaña J, Casajús JA, et al. Immediate Impact of the COVID-19 Confinement on Physical Activity Levels in Spanish Adults. Sustainability, 2020;12:5708. https://doi.org/10.3390/su12145708
50. Reyes-Olavarría D, Latorre-Román PÁ, Guzmán-Guzmán IP, Jerez-Mayorga D, Caamaño-Navarrete F, Delgado-Floody P. Positive and negative changes in food habits, physical activity patterns, and weight status during COVID-19 confinement: Associated factors in the Chilean population. Int J Environ Res Public Health, 2020;17:1–14. https://doi.org/10.3390/ijerph17155431
51. Romero-Blanco C, Rodríguez-Almagro J, Onieva-Zafra MD, Parra-Fernández ML, Prado-Laguna MDC, Hernández-Martínez A. Physical activity and sedentary lifestyle in university students: Changes during confinement due to the COVID-19 pandemic. Int J Environ Res Public Health, 2020;17:1–13. https://doi.org/10.3390/ijerph17186567
52. Ruíz-Roso MB, de Carvalho Padilha P, Matilla-Escalante DC, Brun P, Ulloa N, Acevedo-Correa D, et al. Changes of physical activity and ultra-processed food consumption in adolescents from different countries during COVID-19 pandemic: An observational study. Nutrients, 2020;12:2289. https://doi.org/10.3390/nu12082289
53. Schuch FB, Bulzing RA, Meyer J, Vancampfort D, Firth J, Stubbs B, et al. Associations of moderate to vigorous physical activity and sedentary behavior with depressive and anxiety symptoms in self-isolating people during the COVID-19 pandemic: A cross-sectional survey in Brazil. Psychiatry Res, 2020;292:113339. https://doi.org/10.1016/j.psychres.2020.113339
54. Sánchez-Sánchez E, Ramírez-Vargas G, Avellaneda-López Y, Orellana-Pecino JI, García-Marín E, Díaz-Jimenez J. Eating habits and physical activity of the Spanish population during the COVID-19 pandemic period. Nutrients, 2020;12:1–12. https://doi.org/10.3390/nu12092826
55. Aubertin-Leheudre M, Rolland Y. The importance of physical activity to care for frail older adults during the COVID-19 pandemic. J Am Med Dir Assoc, 2020;21:973–6. https://doi.org/10.1016/j.jamda.2020.04.022
56. Di Stefano V, Battaglia G, Giustino V, Gagliardo A, D’Aleo M, Giannini O, et al. Significant reduction of physical activity in patients with neuromuscular disease during COVID-19 pandemic: the long-term consequences of quarantine. J Neurol, 2021;268:20–6. https://doi.org/10.1007/s00415-020-10064-6
57. Giustino V, Parroco AM, Gennaro A, Musumeci G, Palma A, Battaglia G. Physical Activity Levels and Related Energy Expenditure during COVID-19 Quarantine among the Sicilian Active Population: A Cross-Sectional
Online Survey Study. Sustainability, 2020;12:4356. https://doi.org/10.3390/su12114356
58. Katewongsa P, Widyastari DA, Saonuam P, Haemathulin N, Wongsingha N. The effects of the COVID-19 pandemic on the physical activity of the Thai population: Evidence from Thailand’s Surveillance on Physical Activity 2020. Journal of Sport and Health Science, 2021;10:341–8. https://doi.org/10.1016/j.jshs.2020.10.001
59. Maugeri G, Castrogiovanni P, Battaglia G, Pippi R, D’Agata V, Palma A, et al. The impact of physical activity on psychological health during Covid-19 pandemic in Italy. Heliyon 2020;6:e04315. https://doi.org/10.1016/j.heliyon.2020.e04315
60. Suzuki Y, Maeda N, Hirado D, Shirakawa T, Urabe Y. Physical activity changes and its risk factors among community-dwelling Japanese older adults during the COVID-19 epidemic: Associations with subjective well-being and health-related quality of life. Int J Environ Res Public Health, 2020;17:1–12. https://doi.org/10.3390/ijerph17186591
61. Zhang X, Zhu W, Kang S, Qiu L, Lu Z, Sun Y. Association between physical activity and mood states of children and adolescents in social isolation during the COVID-19 epidemic. Int J Environ Res Public Health, 2020;17:1–12. https://doi.org/10.3390/ijerph17207666
62. Mattioli A V., Sciomer S, Cocchi C, Maffei S, Gallina S. Quarantine during COVID-19 outbreak: Changes in diet and physical activity increase the risk of cardiovascular disease. Nutr Metab Cardiovasc Dis, 2020;30:1409–17. https://doi.org/10.1016/j.numecd.2020.05.020
63. Goethals L, Barth N, Guyot J, Hupin D, Celarier T, Bongue B. Impact of Home Quarantine on Physical Activity Among Older Adults Living at Home During the COVID-19 Pandemic: Qualitative Interview Study. JMIR Aging, 2020;3:e19007. https://doi.org/10.2196/19007
64. Martinez-Ferran M, de la Guía-Galipienso F, Sanchis-Gomar F, Pareja-Galeano H. Metabolic Impacts of Confinement during the COVID-19 Pandemic Due to Modified Diet and Physical Activity Habits. Nutrients, 2020;12:1549. https://doi.org/10.3390/nu12061549
65. Shalash A, Roushdy T, Essam M, Fathy M, Dawood NL, Abushady EM, et al. Mental health, physical activity, and quality of life in Parkinson’s disease during COVID-19 pandemic. Mov Disord, 2020;35:1097–9. https://doi.org/10.1002/mds.28134
66. Yamada M, Kimura Y, Ishiyama D, Otobe Y, Suzuki M, Koyama S, et al. Effect of the COVID-19 Epidemic on Physical Activity in Community-Dwelling Older Adults in Japan: A Cross-Sectional Online Survey. J Nutr Health Aging, 2020;24:948–50. https://doi.org/10.1007/s12603-020-1424-2
67. Carter SJ, Baranauskas MN, Fly AD. Considerations for obesity, vitamin D, and physical activity amid the COVID-19 pandemic. Obesity, 2020;28:1176–7. https://doi.org/10.1002/oby.22838
68. Pieh C, Budimir S, Probst T. The effect of age, gender, income, work, and physical activity on mental health during coronavirus disease (COVID-19) lockdown in Austria.
148
PHYSICAL EDUCATION OF STUDENTS
Information about the authors:
Mateusz Tomanek; (Corresponding Author); https://orcid.org/0000-0002-9527-2513; [email protected]; Faculty of Economic Sciences and Management, Nicolaus Copernicus University; ul. Gagarina 13a, 87-100, Toruń, Poland.
Andrzej Lis; https://orcid.org/0000-0003-4080-4137; [email protected]; Faculty of Economic Sciences and Management, Nicolaus Copernicus University; ul. Gagarina 13a, 87-100, Toruń, Poland.
Cite this article as: Tomanek M, Lis A. Physical activity in the context of the COVID-19 pandemic: Research profiling and mapping. Physical Education of Students, 2021;25(3):136–148. https://doi.org/10.15561/20755279.2021.0301
This is an Open Access article distributed under the terms of the Creative Commons Attribution License, which permits unrestricted use, distribution, and reproduction in any medium, provided the original work is properly cited http://creativecommons.org/licenses/by/4.0/deed.en
Received: 27.02.2021Accepted: 10.04.2021; Published: 30.06.2021
Journal of Psychosomatic Research, 2020;136:110186. https://doi.org/10.1016/j.jpsychores.2020.110186
69. Shibata N, Kajikawa Y, Takeda Y, Matsushima K. Detecting emerging research fronts based on topological measures in citation networks of scientific
publications. Technovation, 2008;28:758–75. https://doi.org/10.1016/j.technovation.2008.03.009
70. Boyack KW, Klavans R. Co-citation analysis, bibliographic coupling, and direct citation: Which citation approach represents the research front most accurately? J Am Soc Inf Sci Technol, 2010;61:2389–404. https://doi.org/10.1002/asi.21419
2021
03
149
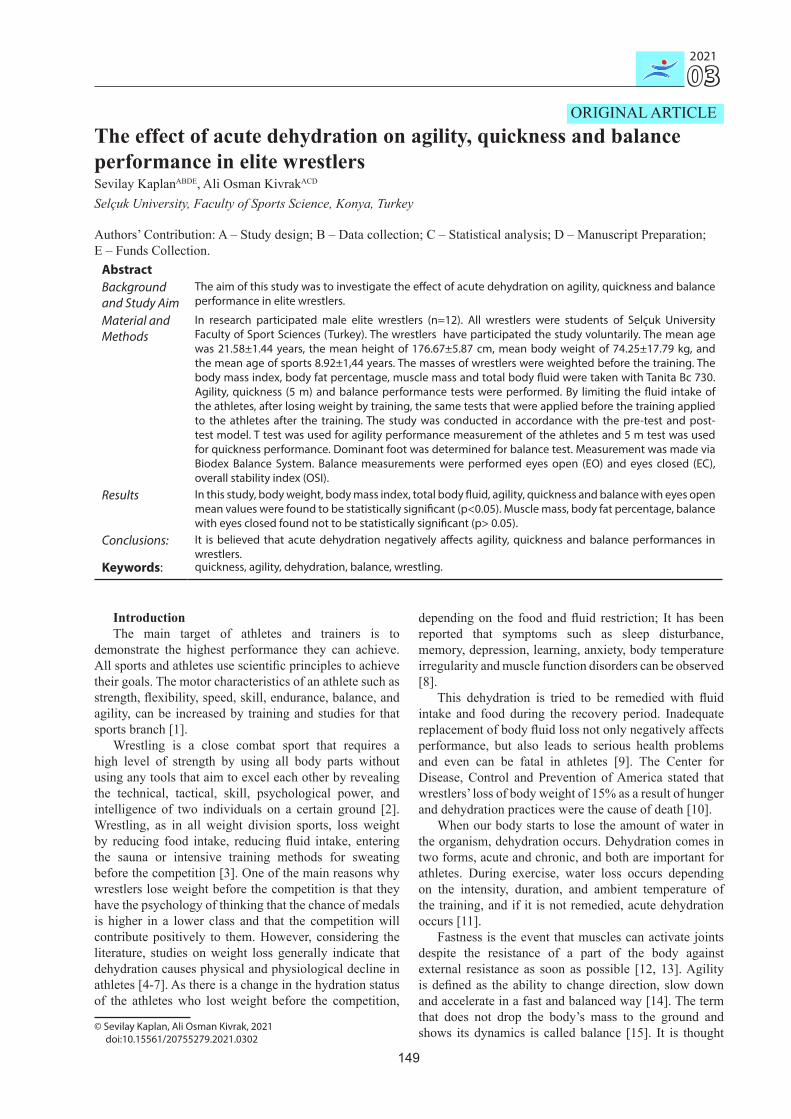
The effect of acute dehydration on agility, quickness and balance performance in elite wrestlersSevilay KaplanABDE, Ali Osman KivrakACD
Selçuk University, Faculty of Sports Science, Konya, Turkey
Authors’ Contribution: A – Study design; B – Data collection; C – Statistical analysis; D – Manuscript Preparation; E – Funds Collection.
AbstractBackground and Study Aim
The aim of this study was to investigate the effect of acute dehydration on agility, quickness and balance performance in elite wrestlers.
Material and Methods
In research participated male elite wrestlers (n=12). All wrestlers were students of Selçuk University Faculty of Sport Sciences (Turkey). The wrestlers have participated the study voluntarily. The mean age was 21.58±1.44 years, the mean height of 176.67±5.87 cm, mean body weight of 74.25±17.79 kg, and the mean age of sports 8.92±1,44 years. The masses of wrestlers were weighted before the training. The body mass index, body fat percentage, muscle mass and total body fluid were taken with Tanita Bc 730. Agility, quickness (5 m) and balance performance tests were performed. By limiting the fluid intake of the athletes, after losing weight by training, the same tests that were applied before the training applied to the athletes after the training. The study was conducted in accordance with the pre-test and post-test model. T test was used for agility performance measurement of the athletes and 5 m test was used for quickness performance. Dominant foot was determined for balance test. Measurement was made via Biodex Balance System. Balance measurements were performed eyes open (EO) and eyes closed (EC), overall stability index (OSI).
Results In this study, body weight, body mass index, total body fluid, agility, quickness and balance with eyes open mean values were found to be statistically significant (p<0.05). Muscle mass, body fat percentage, balance with eyes closed found not to be statistically significant (p> 0.05).
Conclusions: It is believed that acute dehydration negatively affects agility, quickness and balance performances in wrestlers.
Keywords: quickness, agility, dehydration, balance, wrestling.
Introduction1
The main target of athletes and trainers is to demonstrate the highest performance they can achieve. All sports and athletes use scientific principles to achieve their goals. The motor characteristics of an athlete such as strength, flexibility, speed, skill, endurance, balance, and agility, can be increased by training and studies for that sports branch [1].
Wrestling is a close combat sport that requires a high level of strength by using all body parts without using any tools that aim to excel each other by revealing the technical, tactical, skill, psychological power, and intelligence of two individuals on a certain ground [2]. Wrestling, as in all weight division sports, loss weight by reducing food intake, reducing fluid intake, entering the sauna or intensive training methods for sweating before the competition [3]. One of the main reasons why wrestlers lose weight before the competition is that they have the psychology of thinking that the chance of medals is higher in a lower class and that the competition will contribute positively to them. However, considering the literature, studies on weight loss generally indicate that dehydration causes physical and physiological decline in athletes [4-7]. As there is a change in the hydration status of the athletes who lost weight before the competition,
© Sevilay Kaplan, Ali Osman Kivrak, 2021 doi:10.15561/20755279.2021.0302
depending on the food and fluid restriction; It has been reported that symptoms such as sleep disturbance, memory, depression, learning, anxiety, body temperature irregularity and muscle function disorders can be observed [8].
This dehydration is tried to be remedied with fluid intake and food during the recovery period. Inadequate replacement of body fluid loss not only negatively affects performance, but also leads to serious health problems and even can be fatal in athletes [9]. The Center for Disease, Control and Prevention of America stated that wrestlers’ loss of body weight of 15% as a result of hunger and dehydration practices were the cause of death [10].
When our body starts to lose the amount of water in the organism, dehydration occurs. Dehydration comes in two forms, acute and chronic, and both are important for athletes. During exercise, water loss occurs depending on the intensity, duration, and ambient temperature of the training, and if it is not remedied, acute dehydration occurs [11].
Fastness is the event that muscles can activate joints despite the resistance of a part of the body against external resistance as soon as possible [12, 13]. Agility is defined as the ability to change direction, slow down and accelerate in a fast and balanced way [14]. The term that does not drop the body’s mass to the ground and shows its dynamics is called balance [15]. It is thought
ORIGINAL ARTICLE

150
PHYSICAL EDUCATION OF STUDENTS
that dehydration in the body may affect the performance in weight division sports and studies in this matter are insufficient. Unlike other acute dehydration studies, this study is important for athletes and trainers to examine the effect of fluid loss on performance before and after intense training.
In this study, it is aimed to investigate the effect of acute dehydration on agility, quickness and balance performance in elite wrestlers.
Material and MethodsParticipants A total of 12 elite wrestlers participated, who are
participants in national and international competitions studying at the Faculty of Sport Sciences of Selçuk University, with an average age of 21.58 ± 1.44 years, an average height of 176.67 ± 5.87 cm, and a sports age of 8.92 ± 1.44 years. Before the study, the athletes who participated in the study voluntarily were informed in detail about the risks that may be encountered in the study and about the study, and the voluntary consent form was read and signed by athletes. In the formation of the research group, it was determined that the subjects did not have any injury period or had not experienced any injury that would affect their performance recently.
Research DesignAfter taking the height measurement of the wrestlers
participating in the research, the weight is weighed before the 1st measurement; Body mass index, body fat percentage, muscle mass and total body fluid were taken with Tanita BC 730 and performance tests (agility, quickness, and balance) were applied. Then, by limiting the fluid intake of the athletes, after losing weight by training, the same tests that were applied before the training applied to the athletes after the training. These tests were applied in the performance measurement laboratory of the sports science faculty. This study was conducted in accordance with the non-invasive clinical research ethics committee decision of Selçuk University, Faculty of Sport Sciences, numbered 41 and dated 11.04.2019.
Height MeasurementThe height of the subjects was determined by using a
0.01 mm precision height gauge with bare feet and only shorts on top.
Body Weight, Body Fat and Muscle Ratio and Total Fluid Distribution Measurement
Measurements were made with Tanita Bc 730 body composition device twice in total, the first measurement and the second measurement. Care has been taken to ensure that the device is on a flat and rigid ground. During the measurement, the athletes preferred to be with bare feet and clothes that would not affect the weight. In order to ensure that the two legs are open at equal distance on the device and the weight is given equally on each foot, the body is directed to an upright point with eyes directed forward. After the command is given to person on the device in anatomical posture, the person did not move in any way and was warned to observe commands. Body weight in kilograms (kg), body fat percentage (%),
body muscle percentage (%) and total fluid distribution as a percentage (%) were automatically recorded by the device. The amount of fluid lost during training is calculated by the following formula [16]:
Dehydration percentage = [(pre-training body weight - post-training body weight) × 100] / pre-training body weight.
Body Mass Index (BMI)The following formula was used to determine the
body mass index [17, 18]. Body Mass Index (BMI) = Body Weight (kg) / Height
(m)²Training Program (tabl. 1).Test ProtocolT Agility Test The 3 cones were placed in the same line, 4.57 meters
apart. The test includes a 9.14 meters fast forward run, 4.57 meters side slide to the left, 9.14 meters side slide to the right, 4.57 meters side slide left, 9.14 meters backward run. The athlete took a standing position on the A cone at the starting point. Before starting to run at the starting point, the athletes were instructed to take a forward leaning stance of at least 3 seconds. No swaying or similar movements were allowed. After holding this position for at least 3 seconds, the athlete ran and touched the cone B at a distance of 9.14 meters in the middle from the starting point at maximum speed, and then went quickly to the left cone C with a sliding step and touched the cone at a distance of 4.57 meters with his hand. Then, the athlete went quickly with a right shift step, touched the D cone at a distance of 9.14 meters, quickly ran to the B cone in the middle with the slide step, and then backed quickly to the starting point, and completed the test. The agility performance of the athletes was measured with a photocell placed at the starting point, with a single gated start and end sensor. 3 trial rights were given for each athlete. The athletes were allowed 3 minutes of rest between each run. By writing the measurement results in seconds, the best time obtained in three trials was recorded [1, 19, 20].
Quickness TestThe visual and auditory quickness performances of the
athletes were evaluated at a distance of 5 meters. For the visual quickness performance, the trainer lowers the flag in his hand 10 meters away from the athlete and starts the value at the 5 m distance was recorded in seconds with the stopwatch. For the auditory quickness performance, the athlete was asked to start with the whistle of the trainer in the standing position and the degree was recorded in seconds. In the starting position, the athlete is not allowed to step by coming behind the position. 3 trial rights were given for each athlete and the best measurement was recorded. Between each run, the athletes were given 3 minutes of rest [19, 21, 22].
Balance TestBiodex Balance System (Biodex Balance System,
BBS, Biodex Medical Systems Inc, Shirley, NY) was used for balance measurements of the subjects. System has a movable balance platform with 360° joint range of motion, the surface of which can tilt up to 20°.
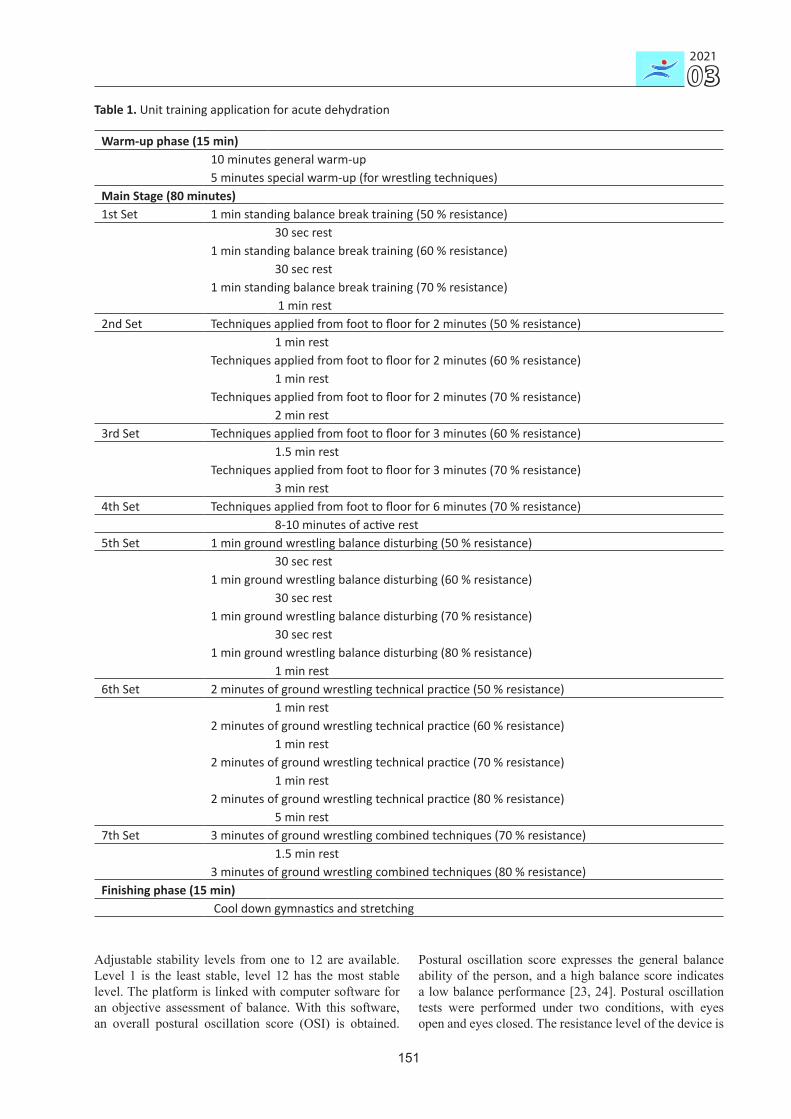
2021
03
151
Adjustable stability levels from one to 12 are available. Level 1 is the least stable, level 12 has the most stable level. The platform is linked with computer software for an objective assessment of balance. With this software, an overall postural oscillation score (OSI) is obtained.
Postural oscillation score expresses the general balance ability of the person, and a high balance score indicates a low balance performance [23, 24]. Postural oscillation tests were performed under two conditions, with eyes open and eyes closed. The resistance level of the device is
Table 1. Unit training application for acute dehydration
Warm-up phase (15 min)10 minutes general warm-up5 minutes special warm-up (for wrestling techniques)
Main Stage (80 minutes)1st Set 1 min standing balance break training (50 % resistance)
30 sec rest1 min standing balance break training (60 % resistance)
30 sec rest1 min standing balance break training (70 % resistance)
1 min rest2nd Set Techniques applied from foot to floor for 2 minutes (50 % resistance)
1 min restTechniques applied from foot to floor for 2 minutes (60 % resistance)
1 min restTechniques applied from foot to floor for 2 minutes (70 % resistance)
2 min rest3rd Set Techniques applied from foot to floor for 3 minutes (60 % resistance)
1.5 min restTechniques applied from foot to floor for 3 minutes (70 % resistance)
3 min rest4th Set Techniques applied from foot to floor for 6 minutes (70 % resistance)
8-10 minutes of active rest5th Set 1 min ground wrestling balance disturbing (50 % resistance)
30 sec rest1 min ground wrestling balance disturbing (60 % resistance)
30 sec rest1 min ground wrestling balance disturbing (70 % resistance)
30 sec rest1 min ground wrestling balance disturbing (80 % resistance)
1 min rest6th Set 2 minutes of ground wrestling technical practice (50 % resistance)
1 min rest2 minutes of ground wrestling technical practice (60 % resistance)
1 min rest2 minutes of ground wrestling technical practice (70 % resistance)
1 min rest2 minutes of ground wrestling technical practice (80 % resistance)
5 min rest7th Set 3 minutes of ground wrestling combined techniques (70 % resistance)
1.5 min rest3 minutes of ground wrestling combined techniques (80 % resistance)
Finishing phase (15 min) Cool down gymnastics and stretching
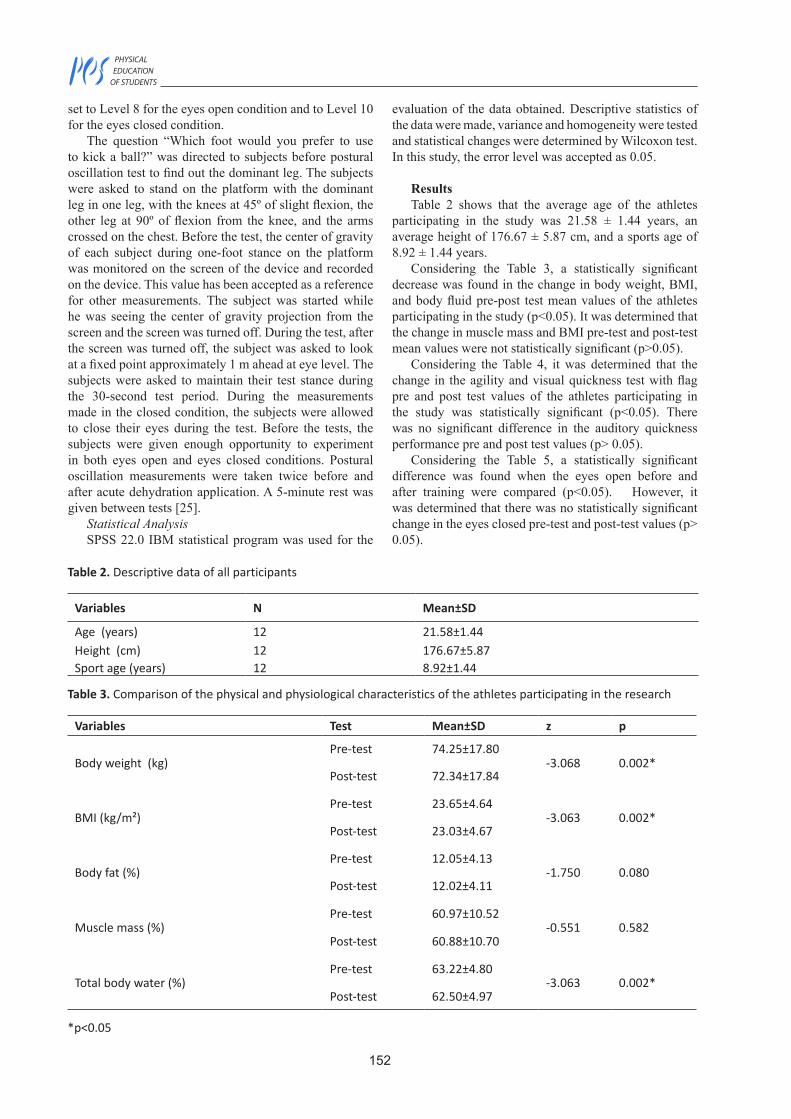
152
PHYSICAL EDUCATION OF STUDENTS
set to Level 8 for the eyes open condition and to Level 10 for the eyes closed condition.
The question “Which foot would you prefer to use to kick a ball?” was directed to subjects before postural oscillation test to find out the dominant leg. The subjects were asked to stand on the platform with the dominant leg in one leg, with the knees at 45º of slight flexion, the other leg at 90º of flexion from the knee, and the arms crossed on the chest. Before the test, the center of gravity of each subject during one-foot stance on the platform was monitored on the screen of the device and recorded on the device. This value has been accepted as a reference for other measurements. The subject was started while he was seeing the center of gravity projection from the screen and the screen was turned off. During the test, after the screen was turned off, the subject was asked to look at a fixed point approximately 1 m ahead at eye level. The subjects were asked to maintain their test stance during the 30-second test period. During the measurements made in the closed condition, the subjects were allowed to close their eyes during the test. Before the tests, the subjects were given enough opportunity to experiment in both eyes open and eyes closed conditions. Postural oscillation measurements were taken twice before and after acute dehydration application. A 5-minute rest was given between tests [25].
Statistical AnalysisSPSS 22.0 IBM statistical program was used for the
evaluation of the data obtained. Descriptive statistics of the data were made, variance and homogeneity were tested and statistical changes were determined by Wilcoxon test. In this study, the error level was accepted as 0.05.
ResultsTable 2 shows that the average age of the athletes
participating in the study was 21.58 ± 1.44 years, an average height of 176.67 ± 5.87 cm, and a sports age of 8.92 ± 1.44 years.
Considering the Table 3, a statistically significant decrease was found in the change in body weight, BMI, and body fluid pre-post test mean values of the athletes participating in the study (p<0.05). It was determined that the change in muscle mass and BMI pre-test and post-test mean values were not statistically significant (p>0.05).
Considering the Table 4, it was determined that the change in the agility and visual quickness test with flag pre and post test values of the athletes participating in the study was statistically significant (p<0.05). There was no significant difference in the auditory quickness performance pre and post test values (p> 0.05).
Considering the Table 5, a statistically significant difference was found when the eyes open before and after training were compared (p<0.05). However, it was determined that there was no statistically significant change in the eyes closed pre-test and post-test values (p> 0.05).
Table 2. Descriptive data of all participants
Variables N Mean±SD
Age (years) 12 21.58±1.44Height (cm) 12 176.67±5.87Sport age (years) 12 8.92±1.44
Table 3. Comparison of the physical and physiological characteristics of the athletes participating in the research
Variables Test Mean±SD z p
Body weight (kg)Pre-test 74.25±17.80
-3.068 0.002*Post-test 72.34±17.84
BMI (kg/m²)Pre-test 23.65±4.64
-3.063 0.002*Post-test 23.03±4.67
Body fat (%)Pre-test 12.05±4.13
-1.750 0.080Post-test 12.02±4.11
Muscle mass (%)Pre-test 60.97±10.52
-0.551 0.582Post-test 60.88±10.70
Total body water (%)Pre-test 63.22±4.80
-3.063 0.002*Post-test 62.50±4.97
*p<0.05
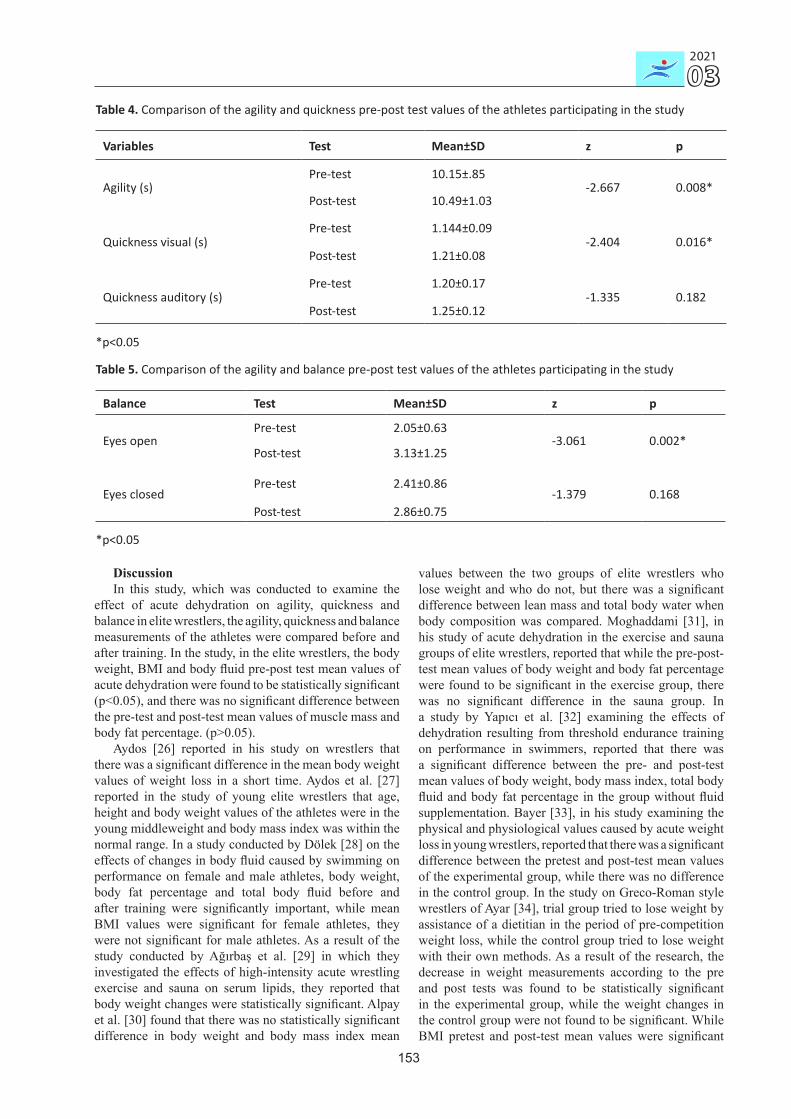
2021
03
153
DiscussionIn this study, which was conducted to examine the
effect of acute dehydration on agility, quickness and balance in elite wrestlers, the agility, quickness and balance measurements of the athletes were compared before and after training. In the study, in the elite wrestlers, the body weight, BMI and body fluid pre-post test mean values of acute dehydration were found to be statistically significant (p<0.05), and there was no significant difference between the pre-test and post-test mean values of muscle mass and body fat percentage. (p>0.05).
Aydos [26] reported in his study on wrestlers that there was a significant difference in the mean body weight values of weight loss in a short time. Aydos et al. [27] reported in the study of young elite wrestlers that age, height and body weight values of the athletes were in the young middleweight and body mass index was within the normal range. In a study conducted by Dölek [28] on the effects of changes in body fluid caused by swimming on performance on female and male athletes, body weight, body fat percentage and total body fluid before and after training were significantly important, while mean BMI values were significant for female athletes, they were not significant for male athletes. As a result of the study conducted by Ağırbaş et al. [29] in which they investigated the effects of high-intensity acute wrestling exercise and sauna on serum lipids, they reported that body weight changes were statistically significant. Alpay et al. [30] found that there was no statistically significant difference in body weight and body mass index mean
values between the two groups of elite wrestlers who lose weight and who do not, but there was a significant difference between lean mass and total body water when body composition was compared. Moghaddami [31], in his study of acute dehydration in the exercise and sauna groups of elite wrestlers, reported that while the pre-post-test mean values of body weight and body fat percentage were found to be significant in the exercise group, there was no significant difference in the sauna group. In a study by Yapıcı et al. [32] examining the effects of dehydration resulting from threshold endurance training on performance in swimmers, reported that there was a significant difference between the pre- and post-test mean values of body weight, body mass index, total body fluid and body fat percentage in the group without fluid supplementation. Bayer [33], in his study examining the physical and physiological values caused by acute weight loss in young wrestlers, reported that there was a significant difference between the pretest and post-test mean values of the experimental group, while there was no difference in the control group. In the study on Greco-Roman style wrestlers of Ayar [34], trial group tried to lose weight by assistance of a dietitian in the period of pre-competition weight loss, while the control group tried to lose weight with their own methods. As a result of the research, the decrease in weight measurements according to the pre and post tests was found to be statistically significant in the experimental group, while the weight changes in the control group were not found to be significant. While BMI pretest and post-test mean values were significant
Table 4. Comparison of the agility and quickness pre-post test values of the athletes participating in the study
Variables Test Mean±SD z p
Agility (s)Pre-test 10.15±.85
-2.667 0.008*Post-test 10.49±1.03
Quickness visual (s)Pre-test 1.144±0.09
-2.404 0.016*Post-test 1.21±0.08
Quickness auditory (s)Pre-test 1.20±0.17
-1.335 0.182Post-test 1.25±0.12
*p<0.05
Table 5. Comparison of the agility and balance pre-post test values of the athletes participating in the study
Balance Test Mean±SD z p
Eyes openPre-test 2.05±0.63
-3.061 0.002*Post-test 3.13±1.25
Eyes closedPre-test 2.41±0.86
-1.379 0.168Post-test 2.86±0.75
*p<0.05
154
PHYSICAL EDUCATION OF STUDENTS
in both groups, Body fat ratio values were statistically significant in the experimental group, the changes in the percentage of body fat in the control group were not found to be significant. Şahin [35] used the skinfold device measurement method to determine the body fat ratio of wrestlers before and after acute weight loss in his study on university wrestlers. With this method, the skin fold thicknesses of eight standard areas of the body were measured before and after weight loss. According to the results, it was reported that the subjects who lost weight had a decrease in the final test fat ratios. In the study conducted by Yoon [36], most of wrestlers stated that they want to keep their body fat ratio to a minimum, and therefore, generally, wrestlers believe that having a low-fat percentage would be advantageous. Today, body fat percentage is seen to be an important factor in achieving optimal efficiency and physical performance, as well as being one of the health criteria [37]. Bağatır [38] investigated the effect of short-term fluid loss on performance in university level wrestlers and 10 wrestlers lost 3% body weight using sauna method and 10 wrestler using training method. As a result of the study, it was found that there was no significant difference between the groups in the mean values of body weight and body fat percentage. Türkyılmaz [39] in his study investigating the effect of short-term weight loss on anaerobic performance and reaction time under tournament conditions in elite wrestlers; Athletes were asked to lose 5% of their body weight within 48 hours; while total body fluid and muscle mass were found to be significant, percentage of body fat was not found to be statistically significant as result of the study. Considering these studies conducted, it is thought that the results are similar to our study and that the reason for the different results is due to factors such as the difference in training method, age, height, gender and training age.
In this study, while agility and visual quickness pre-post test average values of acute dehydration were statistically significant on elite wrestlers, there was no statistically significant difference between the average values of auditory quickness. Aydos [26] applied the standing long jump and standing vertical jump tests to examine the effect of dehydration on the rapid strength performance in his study in which he examined the effect of weight loss in a short time on strength and endurance in wrestlers. At the end of the study, he reported that the pre-test and post-test mean values were at the level of 0.05 significance and found that this effect continued to decrease after recovery. Akyüz [40], in his study titled the effect of rapid weight loss on physical physiological and biochemical parameters in elite wrestlers, reported that that there was a significant difference between body weight and reaction left auditory values before and after weight loss, and reported that there was no difference between pre-post test right-left visual and reaction right auditory values Şahin [41], in his study investigating the effect of acute weight loss on performance of wrestlers in the developmental age, determined in the results of 11-16 years old male athletes competing in the category
of little and stars that after losing 4% weight through training, the visual and auditory stimulus reaction time is the first measurement and the second measurement is the average. Found that there is a significant difference between the values. Bağatır [38], in his study examining the effect of short-term fluid loss on performance in university-level wrestlers, reported that there was no significant difference between the measurements in the mean values of the standing long jump, vertical jump test, both visual and auditory reaction tests. Bayer [33], in his study investigating the effect of acute dehydration in young wrestlers studying in high school, reported that he founded a statistically significant difference between the agility pre-test and post-test mean values of the experimental group, however there was no significant difference in the control group. Türkyılmaz [39] found that there is no significant difference in the effects of weight loss on performance in wrestlers in terms of visual and auditory reaction times.
In our study, while acute dehydration eyes open balance mean values were statistically significant before and after training, no significant difference was found between pre-post test mean values of eyes closed. Erkmen et al. [42] in their study on 17 active athletes, investigated the effect on balance performance before and after training and recovery period by using the Biodex Balance System balance device where the subjects were at 3-day intervals, by dehydrated on the 1st day the hydration with sports drink on the 2nd day, and the hydration with water on the 3rd day. As a result of the study, it was determined that OSI scores were significantly higher before and after exercise in the dehydration condition with eyes open and eyes closed. They reported that there was no significant difference between the values obtained after a 20-minute recovery after exercise and pre-exercise values. The findings of the study conducted by Derave et al. [43] indicate that the balance performance decreases immediately after the exercise applied without fluid administration and balance recovery occurs after 20 minutes. However, McKinney et al. [44] applied an exercise protocol on the treadmill to create dehydration in subjects in a study in which postural oscillation was measured with the Balance Error Scoring System (BESS). This exercise protocol was continued until the body weight loss rate reached 3%, the exercise lasted approximately 75-120 minutes depending on the sweat loss, postural oscillation measurements were repeated after a 20-minute recovery period after exercise in order to eliminate the effects of fatigue. As a result of the study, they stated that dehydration induced by exercise decreased balance performance after a 20-minute recovery period. Gauchard et al. [45] reported that subjects who take fluid after 45 minutes of exercise had higher balance performance than those who did not drink fluids. Bayer [33] used the flamingo test to evaluate the balance performance before and after training in his study investigating the effect of acute dehydration in young wrestlers, while the average values of the dehydrated group were found to be significant, no difference was observed in the non-dehydrated control group. Judelson

2021
03
155
et al. [46] investigated the physiological effects of weight loss and its effect on performance in amateur wrestlers. According to results of the study, they reported that 6% weight loss of the total body weight before the two-day freestyle wrestling tournament significantly decreased the lower body strength of the wrestlers as the tournament progressed. Studies have found that when fluid loss is in the range of 3-4%, both aerobic and anaerobic performance are affected, but anaerobic performance is affected more [47, 48, 49, 50]. In other studies, conducted on wrestlers, Alderman et al. [51] 5.27 kg, Brito et al. [52] 7.25 kg, Oppliger et al. [53] reported that 5.3 kg weight loss occurred in short periods of time. In these studies, it was reported that there were higher amounts of weight loss compared to the results of the research. The reason for this can be shown that wrestlers try to cause weight loss with traditional methods and do not apply an adequate and balanced nutrition program. Too much weight loss in a short time puts wrestlers at risk in terms of performance and health.
ConclusionsIt is thought that the acute dehydration training applied
in this study affected the average values of body weight, body mass index, total body fluid, agility, visual quickness and balance with eyes open, whereas it did not affect muscle mass, body fat percentage, auditory quickness and balance performances with eyes closed. It can be said that one unit of high intensity training causes a decrease in body fluid and consequently, athletes have difficulty in maintaining the position of the body. Considering this situation, it is thought that trainers should include balance and direction-changing exercises in their exercises, and fluid supplements should be provided during the training.
AcknowledgmentsThis study was written by abridging Sevilay
KAPLAN’s Selçuk University Institute of Health Sciences, Department of Coaching Education master’s thesis. The authors sincerely thank the subjects, who participated in this study and contributed to the realization of this study. This research received no funding.
Conflicts of Interest The authors declare no conflict of interest.
References1. Kızılet A, Atılan O, Erdemir I. The effect of the different
strength training on quickness and jumping abilities of basketball players between 12 and 14 age group. Journal of Physical Education and Sport Sciences, 2010; 12 (2): 44–57.
2. Arslan C. Wrestler’s Guide-I. Uğur Offset Printing, İzmir; 1984.
3. Ağaoğlu SA, Kalkavan A, Taşmektepligil Y. Weight problems and solutions in wrestlers. Ondokuz Mayis University Journal of Education Faculty, 1997; 10 (1): 384–9.
4. Kostelnik SB, Rockwell MS, Davy KP, Hedrick VE, Thomas DT, Davy BM. Evaluation of Pragmatic Methods to Rapidly Assess Habitual Beverage Intake and Hydration Status in US Collegiate Athletes. International Journal of Sport Nutrition and Exercise Metabolism. 2021;31(2):115–124. https://doi.org/10.1123/ijsnem.2020-0125
5. Isik O, Yildirim I, Ersoz Y, Koca HB, Dogan I, Ulutas E. Monitoring of pre-competition dehydration-induced skeletal muscle damage and inflammation levels among elite wrestlers. Journal of Back and Musculoskeletal Rehabilitation. 2018;31(3):533–540. https://doi.org/10.3233/bmr-170955
6. Moghaddami A, Gerek Z, Karimiasl A, Nozohouri H. Evaluation of acute dehydration impacts on elite wrestlers’ single-leg takedown technique by 3D motion analysis. Med Sport. 2018;71(1):1–10. https://doi.org/10.23736/s0025-7826.17.02977-5
7. Işık O, Cicioglu HI. Dehydration, skeletal muscle damage and inflammation before the competitions among the elite wrestlers. Journal of Physical Therapy Science, 2016; 28: 162–8. https://doi.org/10.1589/jpts.28.162
8. Işık Ö, Gökdemir K, Bastık C, Yıldırım İ, Doğan İ. A study on elite wrestlers weight loss and depression. Nigde University Journal of Physical Education and Sport Sciences, 2013; 7: 216–23.
9. Hawley J, Burke L. Peak performance training and nutritional strategies for sport, 1998; 3: 283–91.
10. Oppliger RA, Bartok C. Hydration testing
of athletes. Sports Med, 2002; 32: 952–71. https://doi.org/10.2165/00007256-200232150-00001
11. Casa DJ, Clarkson PM, Roberts WO. American college of sports medicine roundtable on hydration and physical activity consensus statement. Curr Sports Med, 2005; 4: 115–27. https://doi.org/10.1007/s11932-005-0055-z
12. Yüksel C. Training in speed and hurdles. Ankara: Bağırgan Publishing House; 2002.
13. Osipov AY, Guralev VM, Kudryavtsev MD, Kamoza TL, Kuzmin VA. Development of the ability to maintain body balance in dynamic conditions in beginning sambo wrestlers aged 11-12. Human Sport Medicine. 2018;18(4):88–94. https://doi.org/10.14529/hsm180413
14. Reilly T, Williams AM. Introduction to science and soccer. In Science and Soccer; 2003.
15. Okubo J, Watanabe I, Takeya T, Baron JB. Influence of foot position and visual field condition in the examination for equilibrium function and sway of centre of gravity in normal persons. Agressologie, 1979; 20: 127–32.
16. Armstrong LE. Performing in extreme environments. 1 st ed. London: Blackwell’s; 2000.
17. Petri C, Mascherini G, Bini V, Anania G, Cal P, Toncelli L, et al. Integrated total body composition versus Body Mass Index in young athletes. Minerva Pediatrica. 2020;72(3):163–169. https://doi.org/10.23736/s0026-4946.16.04439-x
18. Mendez-Cornejo J, Gomez-Campos R, Carrasco-Lopez S, Urzua-Alul L, Cossio-Bolanos M. Applicability of the Body Mass Index and Weight Index in young athletes participating in the University Selection of Chile. Revista Espanola De Nutricion Humana Y Dietetica. 2019;23(2):76–82. https://doi.org/10.14306/renhyd.23.2.625
19. Pauole K, Madole K, Garhammer J, Lacourse M, Rozenek R. Reliability and validity of the T-test as a measure of agility, leg power, and leg speed in college-aged men and women. J. Strength Cond Res, 2000; 14: 443–50. https://doi.org/10.1519/00124278-200011000-00012
20. Bloomfield J, Polman R, Odonoghue P, Mcnaughton L. Effective speed and agility conditioning
156
PHYSICAL EDUCATION OF STUDENTS
methodology for random intermittent dynamic type sports. J. Strength Cond. Res, 2007; 21: 1093–100. https://doi.org/10.1519/00124278-200711000-00020
21. Taşkın C. The effect of an eight-week proprioception training programme on agility, quickness, and acceleration [Doctorate Thesis]. Elazığ: Fırat University Institute of Health Sciences; 2013.
22. Taşkın M. Effect of anaerobic power on quickness and agility [Doctorate Thesis]. Kütahya: Dumlupınar University Institute of Health Sciences; 2016.
23. Ayik HM, Griffin MJ. Postural Stability When Walking and Exposed to Mediolateral Oscillatory Motion: Effect of Oscillation Waveform. Journal of Applied Biomechanics. 2019;35(2):131–139. https://doi.org/10.1123/jab.2017-0352
24. Hinman M. Factors affecting reliability of the biodex balance system: a summary of four Studies. J of Sport Rehabilitation, 2000; 9: 240–52. https://doi.org/10.1123/jsr.9.3.240
25. Erkmen N, Taşkın H, Kaplan T, Sanioǧlu A. The effect of fatiguing exercise on balance performance as measured by the balance error scoring system. Isokinetics and Exercise Science, 2009; 17: 121–7. https://doi.org/10.3233/IES-2009-0343
26. Aydos L. Effects of rapid weight loss on strength and endurance of elite wrestlers. Gazi Journal of Physical Education and Sport Sciences, 1996; 4: 17–26.
27. Aydos L, Taş M, Akyüz M, Uzun A. Investigation of the relationship between strength and some anthropometric parameters in young elite wrestlers. Journal of Physical Education and Sport Sciences, 2009; 11: 1–10.
28. Ertaş Dölek B. Effects of the changes, due to swimming, in the body water balance on swimming performance [Doctorate Thesis]. Ankara: Gazi University Institute of Health Sciences; 2010.
29. Ağırbaş Ö, Ağgön E, Uçan İ, Kıyıcı F. Effect of high intensity acute wresting exercise and sauna on serum lipids. Journal of Sports Medicine, 2012; 47: 49–57.
30. Alpay CB, Ersöz Y, Karagöz Ş, Oskoueı MM. Comparison of weight loss, body composition, and some mineral levels before the competition in elite wrestlers International Journal of Science Culture and Sport (IntJSCS), 2015; 4: 338–48. https://doi.org/10.14486/IJSCS395
31. Moghaddami A. A study and comparison on biomechanical aspects of acute dehydration (exercise- sauna) of elite wrestlers [Doctorate Thesis]. Erzurum: Atatürk University Institute of Health Sciences; 2016.
32. Yapıcı A, Kavruk H. Çelik E. Effects of dehydration on performance and body hydration level as a result of threshold endurance training (end-2) in swimmers. International Journal of Cultural and Social Studies (IntJCSS), 2017; 3: 373–81.
33. Bayer MA. Investigation of physical and physiological values of acute weight loss in young wrestlers studying in high school [Master thesis]. Bartın: Bartın University Institute of Educational Sciences; 2018.
34. Ayar M. The effect of nutrition program on body composition, strength and mood profile of elite grecoroman wrestlers for weight loss in pre-competition period [Master thesis]. İstanbul: Marmara University Institute of Health Science; 2018.
35. Şahin İ. The effect of short time losing weight and effect of performance and motoric factors in wrestlers [Master thesis]. Niğde: Niğde University Institute of Social Sciences; 2000.
36. Yoon J. Physiological profiles of elite senior
wrestlers. Sports Medicine, 2002; 32: 225–33. https://doi.org/10.2165/00007256-200232040-00002
37. Zorba E. Body structure measurement methods and dealing with obesity. Istanbul: Morpa Publishing; 2006.
38. Bağatır E. The effect of liguid loss to the performance of the wrestlers at universities [Master thesis]. Aksaray: Aksaray University Institute of Social Sciences; 2013.
39. Türkyılmaz R. Investigation of the effect of short-term body weight loss on elite wrestlers on anaerobic performance and reaction time in tournament conditions [Master thesis]. Bolu: Bolu Abant İzzet Baysal University Institute of Health Sciences; 2019.
40. Akyüz M. Effects of rapid weight loss on physical, physiological and biochemical parameters in elite wrestlers. [Doctorate Thesis]. Ankara: Gazi University Institute of Health Sciences; 2009.
41. Şahin H. The effect of acute weight loss on performance of the wrestlers at the growth age [Master thesis]. Kayseri: Erciyes University Institute of Health Sciences; 2011.
42. Erkmen N, Taskın H, Kaplan T, Sanioğlu A. Balance performance and recovery after exercise with water intake, sport drink intake and no fluid. Journal of Exercise Science and Fitness, 2010; 8: 105–12. https://doi.org/10.1016/S1728-869X(10)60016-0
43. Derave W, Clercq DD, Bouckaert J, Pannier JL. The influence of exercise and dehidration on postural stability, Ergonomics, 1998; 41: 782–9. https://doi.org/10.1080/001401398186630
44. McKinney JL, Eberman LE, Cleary MA, Lopez R, Sandler D. Effects of dehidrasyon on balance as measured by the balance error scoring system, Proceeding of the Fourth Annual Colege of Education Research Conference, 2005; 30: 80–5.
45. Gauchard GC, Gangloff P, Vouriot A, Mallié JP, Perrin PP. Effects of exercise- induced fatigue with and without hydration on static postural control in adult human subjects. Int J Neurosci, 2002; 112: 1191–206. https://doi.org/10.1080/00207450290026157
46. Judelson DA, Maresh CM, Yamamoto LM, Farrell MJ, Armstrong LE, Kraemer WJ, Volek JS, Spiering BA, Casa DJ, Anderson JM. Effect of hydration state on resistance exercise-induced endocrine markers of anabolism, catabolism, and metabolism. Journal of Applied Physiology, 2008; 105: 816–24. https://doi.org/10.1152/japplphysiol.01010.2007
47. Webster S, Rutt R, Weltman A. Physiological effects of a weight loss regimen practiced by college wrestlers. Medicine and Science in Sports and Exercise journal, 1990; 22: 229–34.
48. Cesur B, Sanioglu A. The investigation of the weight loss methods and effects on the elite U23 wrestlers. Progress in Nutrition. 2020;22:88–93. https://doi.org/10.23751/pn.v22i1-S.9793
49. Moghaddami A, Gerek Z, Karimiasl A, Nozohouri H. Evaluation of acute dehydration impacts on elite wrestlers’ single-leg takedown technique by 3D motion analysis. Med Sport. 2018;71(1):1–10. https://doi.org/10.23736/s0025-7826.17.02977-5
50. Kondo E, Sagayama H, Yamada Y, Shiose K, Osawa T, Motonaga K, et al. Energy Deficit Required for Rapid Weight Loss in Elite Collegiate Wrestlers. Nutrients. 2018;10(5). https://doi.org/10.3390/nu10050536
51. Alderman B, Landers DM, Carlson J, Scott JR. Factors related to rapid weight loss practices among international-style wrestlers. Medicine and Science in Sports and Exercise, 2004; 36: 249–52.
2021
03
157
https://doi.org/10.1249/01.MSS.0000113668.03443.6652. Brito CJ, Roas AF, Brito IS, Marins JC, Cordova C,
Franchini E. Methods of body mass reduction by combat sport athletes. International Journal of Sport Nutritio and Exercise Metabolism, 2012; 22: 89–97.
https://doi.org/10.1123/ijsnem.22.2.8953. Oppliger RA, Case HS, Horswill CA, Landry GL, Shelter
AC. ACSM Position Stand: Weight Loss in Wrestlers. Medicine & Science in Sports & Exercise, 1996;28:135–8. https://doi.org/10.1097/00005768-199610000-00049
Information about the authors:
Sevilay Kaplan; Doctorate Student; https://orcid.org/0000-0001-9420-049X; [email protected]; Faculty of Sports Science, Selçuk University; Konya, 42130, Turkey.
Ali Osman KIVRAK; (Corresponding Author); https://orcid.org/0000-0003-4699-0401; [email protected]; Faculty of Sports Science, Selçuk University; Konya, 42130, Turkey.
Cite this article as: Kaplan S, Kivrak AO. The effect of acute dehydration on agility, quickness and balance performance in elite wrestlers. Physical Education of Students, 2021;25(3):149–157. https://doi.org/10.15561/20755279.2021.0302
This is an Open Access article distributed under the terms of the Creative Commons Attribution License, which permits unrestricted use, distribution, and reproduction in any medium, provided the original work is properly cited http://creativecommons.org/licenses/by/4.0/deed.en
Received: 12.04.2021Accepted: 27.05.2021; Published: 30.06.2021

158
PHYSICAL EDUCATION OF STUDENTS
ORIGINAL ARTICLE
The psychophysiological effects of the COVID-19 quarantine in the college studentsYusuf SoyluABCDE
Faculty of Sport Sciences, Tokat Gaziosmanpasa University, Turkey
Authors’ Contribution: A – Study design; B – Data collection; C – Statistical analysis; D – Manuscript Preparation; E – Funds Collection.
AbstractBackground and Study Aim
A global pandemic affected by COVID-19 resulted in restrictions to daily routines, including recreation activities, social skills, and academic and health quality of college students. This study aimed to evaluate the psychophysiological effect of coronavirus quarantine on physical activity and its’ relationship between sleep quality, mood states and musculoskeletal pain in college students.
Material and Methods
A total of 392 (male = 150; female = 242; age = 22.9±5.5) college students completed an online survey. The International Physical Activity Questionnaire-Short Form (IPAQ-SF), the Brunel Mood Scale, the Pittsburgh Sleep Quality Index (PSQI) and the Visual Analogue Scale for musculoskeletal pain (MSP) were used in this study.
Results Total physical activity significantly correlation with PSQI (p < 0.05, r = -.103), fatigue (p < 0.01, r = -.344), depression (p < 0.01, r = -.258), angry (p < 0.01, r = -.210), vigour (p < 0.01, r = -.344), neck and shoulder, upper and lower back (p < 0.01, r = -.225), neck and shoulder correlation (p < 0.01, r = -.230), upper and lower back (p < 0.01, r = -.209). Furthermore, a positive correlation was shown between PSQI and negative moods and a negative correlation with positive mood.
Conclusions: During quarantine, decreased physical activity was associated with higher negative mood states and poor sleep quality and more MSP. The COVID-19 quarantine has considerably affected mental health-related crisis consists of desperation, self-consciousness and deficiency of physical capabilities in young adults, especially in college students.
Keywords: COVID-19, physical activity, sleep quality, mood, musculoskeletal pain
Introduction1
COVID-19 is a mortal disaster that is spreading human to human infectious disease all over the world. The pandemic of the coronavirus tried to control taking precautions such as mask, social distance [1]. However, increased death rate in many countries created a solution to the transmission of the virus with various restrictions including travelling, closing the school and home confinement [2]. Not only these restrictions prevent infecting coronavirus, but also negatively affected public health decreasing physical activity level [3] and attending sports organizations [4]. Physical activity and nutrition linked to the immune system and its relationship provide to prevent COVID-19 as all viral disease [5, 6]. Thus, coronavirus might lead to changing levels of physical activity, related to psychophysiological responses, mood states, sleep quality and musculoskeletal pain during the lockdown.
Health is the most important factors in the quality of life and it is possible that improving physical fitness components [7]. Restrictions of outdoor activities in some countries could make a difficult to enhance the level of physical activity [1]. Therefore, these restrictions negatively were composed to a potential risk for physical fitness, infections and critical immunologic and cardiopulmonary [8, 9], depression [10] and obesity [11].
© Yusuf Soylu, 2021 doi:10.15561/20755279.2021.0303
Restrictions of physical and social activities may cause negative mood states to consist of stress, tension, anxiety, sleep disorder, physiological stress in quarantine [12, 13]. Conversely, physical activity positively affected health-related physical parameters and well-being and increasing well-being in college students [14, 15].
Previous studies [14, 16] shown a significant reduction in physical activity behaviour and participation among college students in low-, middle- and high-income countries. Physical activity could avoid harmful effect on mental health, stress, anxiety to college students [17, 18]. Considering, physical education classes, transportation, social activities provide higher physical activity, COVID-19 may reveal many problems to college students. According to American College Health Association [19] reported, COVID-19 imposed mental health challenges, clarifying stress, depression and anxiety which is important factors of academic achievement. Similarly, physical activity might use a tool coping with mental health problems during COVID-19 [20]. Given the evidence presenting coronavirus higher impact physical inactivity and would mediating effect mental health psychological and physical disorder. Taken together, the aim of this study investigates the relationship between physical activity and psychophysiological (mood state, sleep quality) and physical effects (MSP) in college students.
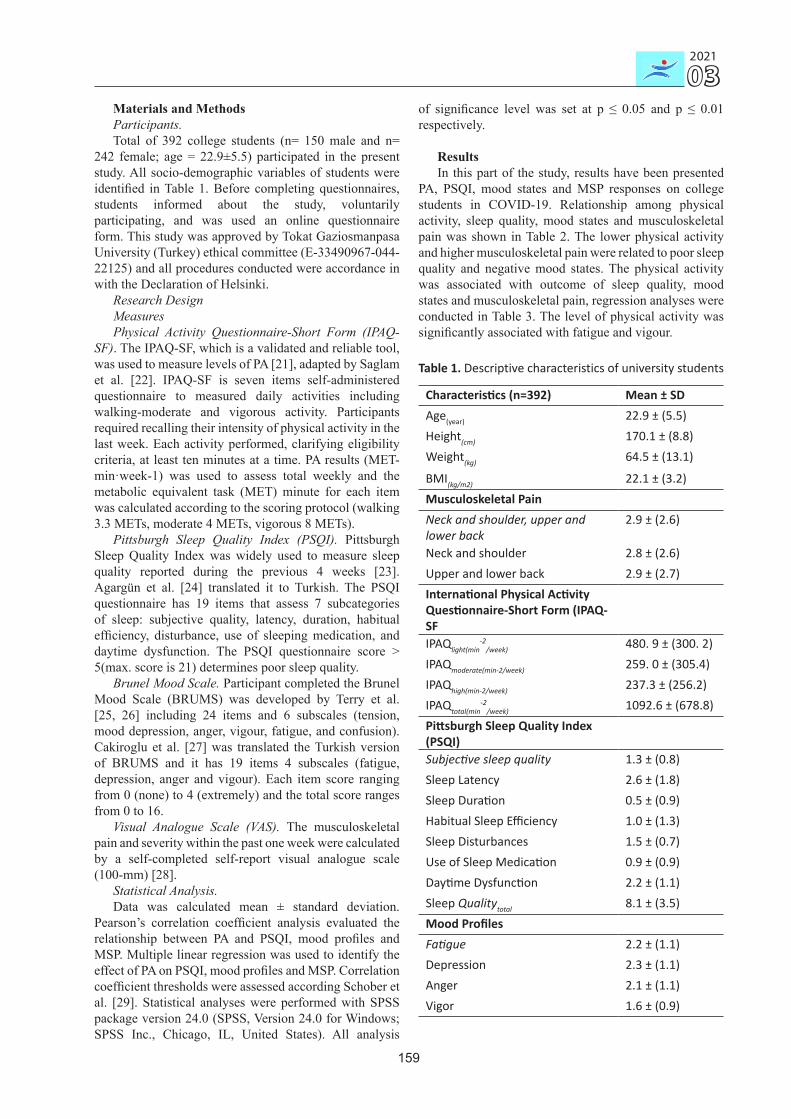
2021
03
159
Materials and MethodsParticipants.Total of 392 college students (n= 150 male and n=
242 female; age = 22.9±5.5) participated in the present study. All socio-demographic variables of students were identified in Table 1. Before completing questionnaires, students informed about the study, voluntarily participating, and was used an online questionnaire form. This study was approved by Tokat Gaziosmanpasa University (Turkey) ethical committee (E-33490967-044-22125) and all procedures conducted were accordance in with the Declaration of Helsinki.
Research DesignMeasuresPhysical Activity Questionnaire-Short Form (IPAQ-
SF). The IPAQ-SF, which is a validated and reliable tool, was used to measure levels of PA [21], adapted by Saglam et al. [22]. IPAQ-SF is seven items self-administered questionnaire to measured daily activities including walking-moderate and vigorous activity. Participants required recalling their intensity of physical activity in the last week. Each activity performed, clarifying eligibility criteria, at least ten minutes at a time. PA results (MET-min·week-1) was used to assess total weekly and the metabolic equivalent task (MET) minute for each item was calculated according to the scoring protocol (walking 3.3 METs, moderate 4 METs, vigorous 8 METs).
Pittsburgh Sleep Quality Index (PSQI). Pittsburgh Sleep Quality Index was widely used to measure sleep quality reported during the previous 4 weeks [23]. Agargün et al. [24] translated it to Turkish. The PSQI questionnaire has 19 items that assess 7 subcategories of sleep: subjective quality, latency, duration, habitual efficiency, disturbance, use of sleeping medication, and daytime dysfunction. The PSQI questionnaire score > 5(max. score is 21) determines poor sleep quality.
Brunel Mood Scale. Participant completed the Brunel Mood Scale (BRUMS) was developed by Terry et al. [25, 26] including 24 items and 6 subscales (tension, mood depression, anger, vigour, fatigue, and confusion). Cakiroglu et al. [27] was translated the Turkish version of BRUMS and it has 19 items 4 subscales (fatigue, depression, anger and vigour). Each item score ranging from 0 (none) to 4 (extremely) and the total score ranges from 0 to 16.
Visual Analogue Scale (VAS). The musculoskeletal pain and severity within the past one week were calculated by a self-completed self-report visual analogue scale (100-mm) [28].
Statistical Analysis.Data was calculated mean ± standard deviation.
Pearson’s correlation coefficient analysis evaluated the relationship between PA and PSQI, mood profiles and MSP. Multiple linear regression was used to identify the effect of PA on PSQI, mood profiles and MSP. Correlation coefficient thresholds were assessed according Schober et al. [29]. Statistical analyses were performed with SPSS package version 24.0 (SPSS, Version 24.0 for Windows; SPSS Inc., Chicago, IL, United States). All analysis
of significance level was set at p ≤ 0.05 and p ≤ 0.01 respectively.
ResultsIn this part of the study, results have been presented
PA, PSQI, mood states and MSP responses on college students in COVID-19. Relationship among physical activity, sleep quality, mood states and musculoskeletal pain was shown in Table 2. The lower physical activity and higher musculoskeletal pain were related to poor sleep quality and negative mood states. The physical activity was associated with outcome of sleep quality, mood states and musculoskeletal pain, regression analyses were conducted in Table 3. The level of physical activity was significantly associated with fatigue and vigour.
Table 1. Descriptive characteristics of university students
Characteristics (n=392) Mean ± SDAge(year) 22.9 ± (5.5)Height(cm) 170.1 ± (8.8)Weight(kg) 64.5 ± (13.1)
BMI(kg/m2) 22.1 ± (3.2)Musculoskeletal PainNeck and shoulder, upper and lower back
2.9 ± (2.6)
Neck and shoulder 2.8 ± (2.6)Upper and lower back 2.9 ± (2.7)International Physical Activity Questionnaire-Short Form (IPAQ-SFIPAQlight(min
-2/week) 480. 9 ± (300. 2)
IPAQmoderate(min-2/week) 259. 0 ± (305.4)IPAQhigh(min-2/week) 237.3 ± (256.2)IPAQtotal(min
-2/week) 1092.6 ± (678.8)
Pittsburgh Sleep Quality Index (PSQI)Subjective sleep quality 1.3 ± (0.8)Sleep Latency 2.6 ± (1.8)Sleep Duration 0.5 ± (0.9)Habitual Sleep Efficiency 1.0 ± (1.3)Sleep Disturbances 1.5 ± (0.7)Use of Sleep Medication 0.9 ± (0.9)Daytime Dysfunction 2.2 ± (1.1)Sleep Qualitytotal 8.1 ± (3.5)Mood ProfilesFatigue 2.2 ± (1.1)Depression 2.3 ± (1.1)Anger 2.1 ± (1.1)Vigor 1.6 ± (0.9)
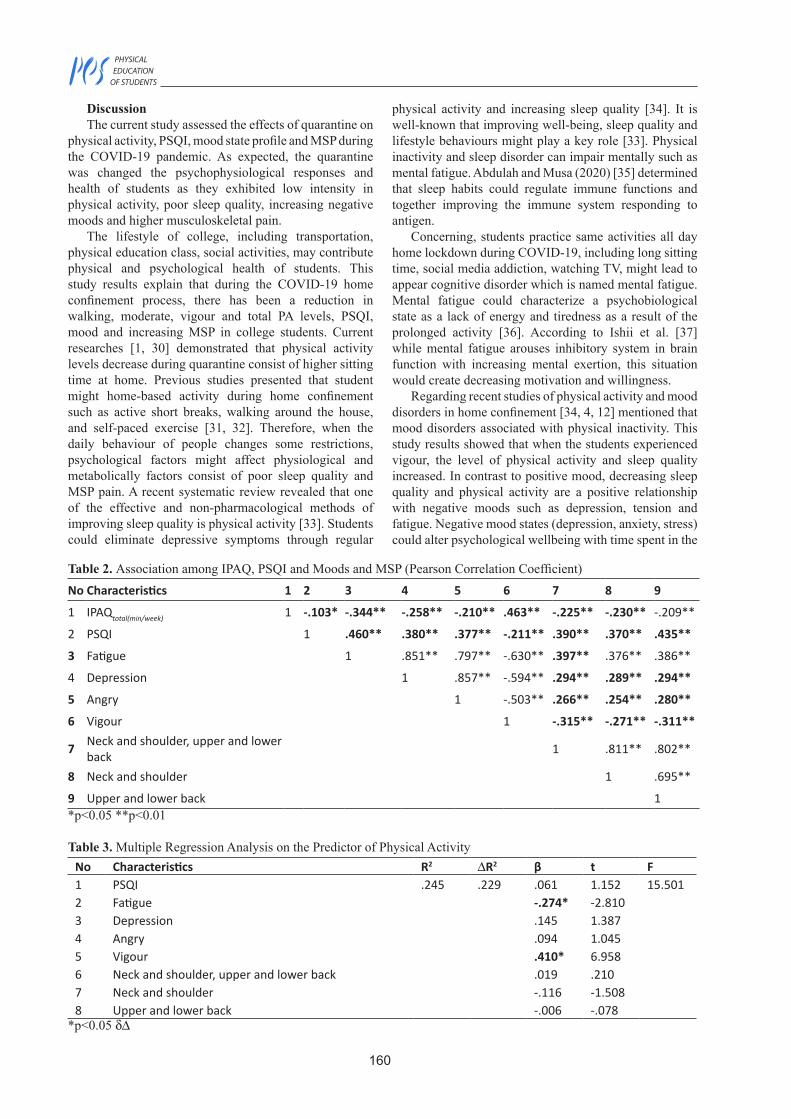
160
PHYSICAL EDUCATION OF STUDENTS
DiscussionThe current study assessed the effects of quarantine on
physical activity, PSQI, mood state profile and MSP during the COVID-19 pandemic. As expected, the quarantine was changed the psychophysiological responses and health of students as they exhibited low intensity in physical activity, poor sleep quality, increasing negative moods and higher musculoskeletal pain.
The lifestyle of college, including transportation, physical education class, social activities, may contribute physical and psychological health of students. This study results explain that during the COVID-19 home confinement process, there has been a reduction in walking, moderate, vigour and total PA levels, PSQI, mood and increasing MSP in college students. Current researches [1, 30] demonstrated that physical activity levels decrease during quarantine consist of higher sitting time at home. Previous studies presented that student might home-based activity during home confinement such as active short breaks, walking around the house, and self-paced exercise [31, 32]. Therefore, when the daily behaviour of people changes some restrictions, psychological factors might affect physiological and metabolically factors consist of poor sleep quality and MSP pain. A recent systematic review revealed that one of the effective and non-pharmacological methods of improving sleep quality is physical activity [33]. Students could eliminate depressive symptoms through regular
physical activity and increasing sleep quality [34]. It is well-known that improving well-being, sleep quality and lifestyle behaviours might play a key role [33]. Physical inactivity and sleep disorder can impair mentally such as mental fatigue. Abdulah and Musa (2020) [35] determined that sleep habits could regulate immune functions and together improving the immune system responding to antigen.
Concerning, students practice same activities all day home lockdown during COVID-19, including long sitting time, social media addiction, watching TV, might lead to appear cognitive disorder which is named mental fatigue. Mental fatigue could characterize a psychobiological state as a lack of energy and tiredness as a result of the prolonged activity [36]. According to Ishii et al. [37] while mental fatigue arouses inhibitory system in brain function with increasing mental exertion, this situation would create decreasing motivation and willingness.
Regarding recent studies of physical activity and mood disorders in home confinement [34, 4, 12] mentioned that mood disorders associated with physical inactivity. This study results showed that when the students experienced vigour, the level of physical activity and sleep quality increased. In contrast to positive mood, decreasing sleep quality and physical activity are a positive relationship with negative moods such as depression, tension and fatigue. Negative mood states (depression, anxiety, stress) could alter psychological wellbeing with time spent in the
Table 2. Association among IPAQ, PSQI and Moods and MSP (Pearson Correlation Coefficient)No Characteristics 1 2 3 4 5 6 7 8 9
1 IPAQtotal(min/week) 1 -.103* -.344** -.258** -.210** .463** -.225** -.230** -.209**
2 PSQI 1 .460** .380** .377** -.211** .390** .370** .435**
3 Fatigue 1 .851** .797** -.630** .397** .376** .386**
4 Depression 1 .857** -.594** .294** .289** .294**
5 Angry 1 -.503** .266** .254** .280**
6 Vigour 1 -.315** -.271** -.311**
7 Neck and shoulder, upper and lower back 1 .811** .802**
8 Neck and shoulder 1 .695**
9 Upper and lower back 1*p<0.05 **p<0.01
Table 3. Multiple Regression Analysis on the Predictor of Physical ActivityNo Characteristics R2 DR2 β t F1 PSQI .245 .229 .061 1.152 15.5012 Fatigue -.274* -2.8103 Depression .145 1.3874 Angry .094 1.0455 Vigour .410* 6.9586 Neck and shoulder, upper and lower back .019 .2107 Neck and shoulder -.116 -1.5088 Upper and lower back -.006 -.078
*p<0.05 dD
2021
03
161
quarantine [4]. Physiology of mood, including serotonin, dopamine and adrenaline, linked to play an active role in the psychological and behavioural process that is these neurotransmitters related to activating happiness, pleasure and regulating mood and energy [38, 39]. Lack of physical activity might occur deterioration of the physiological process during the lockdown. However, students would have difficulties regulating emotions, which causes poor physical and mental health.
Results of musculoskeletal pain examined levels of pain significantly increased with physical inactivity, irregulating mood state and sleep. Students would spend their times sitting activities such as video-game, using smartphone and watching TV during home confinement. In the literature previous studies showing that prolonged static activities, including sitting and screen-based activities may increase the risk of neck and shoulder pain, upper and lower back pain risk [40, 41].
ConclusionIn conclusion, not only physical activity is a key
component of physical and psychological well-being
daily routines of students but also unexpected times such as COVID-19. The current study presented that while physical activity is a positive relationship between positive mood states, negative relationship with quality of sleep and MSP. COVID-19 process highlighted that student might not ready against unexpected disease and disorder, the face of many negative outcomes. Further studies interested in examining the relationship between physical activity and the stress of academic success, hopelessness in the light of future anxiety in COVID-19.
AcknowledgementsThis study was written by abridging Yusuf Soylu. No
grants or financial aids were taken in this Project.
Financial supportThere is no financial support.
Conflict of interestThe authors declare no conflict of interest
References 1. Papaspanos N. Effects of COVID-19 Home
Confinement on Eating Behaviour and Physical Activity: Results of the ECLB-COVID19 International Online Survey. Komp Nutr Diet, 2021;1:19–21. https://doi.org/10.1159/000512852
2. Parnell D, Widdop P, Bond A, Wilson R. COVID-19, networks and sport. Managing Sport and Leisure, 2020:1–7. https://doi.org/10.1080/23750472.2020.1750100
3. Hossain MM, Sultana A, Purohit N. Mental health outcomes of quarantine and isolation for infection prevention: A systematic umbrella review of the global evidence. Epidemiol Health, 2020:e2020038. https://doi.org/10.4178/epih.e2020038
4. Turgut M, Soylu Y, Metin SN. Physical activity, night eating, and mood state profiles of athletes during the COVID-19 pandemic. Progr Nutr, 2020;22(2-S):e2020019. https://doi.org/10.23751/pn.v22i2-S.10567
5. Li X, Geng M, Peng Y, Meng L, Lu S. Molecular immune pathogenesis and diagnosis of COVID-19. Journal of Pharmaceutical Analysis, 2020;10:102–8. https://doi.org/10.1016/j.jpha.2020.03.001
6. Ravalli S, Musumeci G. Coronavirus Outbreak in Italy: Physiological Benefits of Home-Based Exercise During Pandemic. J Funct Morphol Kinesiol. 2020;5:31. https://doi.org/10.3390/jfmk5020031
7. Bize R, Johnson JA, Plotnikoff RC. Physical activity level and health-related quality of life in the general adult population: A systematic review. Preventive Medicine, 2007;45:401–15. https://doi.org/10.1016/j.ypmed.2007.07.017
8. Bloch W, Halle M, Steinacker J. Sport in Zeiten von Corona [Sport in times of Corona]. Dtsch Z Sportmed, 2020;71:83–4. (In German). https://doi.org/10.5960/dzsm.2020.432
9. Steinacker J, Bloch W, Halle H, Mayer F, Meyer T, Hirschmüller A, et al. Fact Sheet: Health Situation for Athletes in the Current Coronavirus Pandemic (SARS-CoV-2 / COVID-19). Dtsch Z Sportmed, 2020;71:85–6. https://doi.org/10.5960/dzsm.2020.431
10. Rebar AL, Stanton R, Geard D, Short C, Duncan MJ, Vandelanotte C. A meta-meta-analysis of the effect of physical activity on depression and anxiety in non-clinical adult populations. Health Psychology Review, 2015;9:366–78. https://doi.org/10.1080/17437199.2015.1022901
11. Wanner M, Richard A, Martin B, Faeh D, Rohrmann S. Associations between self-reported and objectively measured physical activity, sedentary behavior and overweight/obesity in NHANES 2003–2006. Int J Obes, 2017;41:186–93. https://doi.org/10.1038/ijo.2016.168
12. Asmundson GJG, Paluszek MM, Landry CA, Rachor GS, McKay D, Taylor S. Do pre-existing anxiety-related and mood disorders differentially impact COVID-19 stress responses and coping? Journal of Anxiety Disorders, 2020;74:102271. https://doi.org/10.1016/j.janxdis.2020.102271
13. Hammami A, Harrabi B, Mohr M, Krustrup P. Physical activity and coronavirus disease 2019 (COVID-19): specific recommendations for home-based physical training. Managing Sport and Leisure, 2020:1–6. https://doi.org/10.1080/23750472.2020.1757494
14. Wang J. The association between physical fitness and physical activity among Chinese college students. Journal of American College Health, 2019;67:602–9. https://doi.org/10.1080/07448481.2018.1515747
15. Warburton DER, Bredin SSD. Reflections on Physical Activity and Health: What Should We Recommend? Canadian Journal of Cardiology, 2016;32:495–504. https://doi.org/10.1016/j.cjca.2016.01.024
16. Wang C, Chen P, Zhuang J. Validity and Reliability of International Physical Activity Questionnaire–Short Form in Chinese Youth. Research Quarterly for Exercise and Sport, 2013;84:S80–6. https://doi.org/10.1080/02701367.2013.850991
17. Physical Activity Guidelines Advisory Committee. 2018 Physical Activity Guidelines Advisory Committee Scientific Report. Washington, DC: U.S. Department of Health and Human Services; 2018.
18. Hill MD, Gibson A-M, Wagerman SA, Flores ED, Kelly LA. The effects of aerobic and resistance exercise on state anxiety
162
PHYSICAL EDUCATION OF STUDENTS
and cognitive function. Science & Sports, 2019;34:216–21. https://doi.org/10.1016/j.scispo.2018.09.004
19. American College Health Association. American College Health Association-National College Health Assessment II: Reference Group Executive Summary Spring 2019. Silver Spring, MD: American College Health Association; 2019.
20. Maher JP, Hevel DJ, Reifsteck EJ, Drollette ES. Physical activity is positively associated with college students’ positive affect regardless of stressful life events during the COVID-19 pandemic. Psychology of Sport and Exercise, 2021;52:101826. https://doi.org/10.1016/j.psychsport.2020.101826
21. Craig CL, Marshall AL, Sjöström M, Bauman AE, Booth ML, Ainsworth BE, et al. International Physical Activity Questionnaire: 12-Country Reliability and Validity. Medicine & Science in Sports & Exercise, 2003;35:1381–95. https://doi.org/10.1249/01.MSS.0000078924.61453.FB
22. Saglam M, Arikan H, Savci S, Inal-Ince D, Bosnak-Guclu M, Karabulut E, et al. International Physical Activity Questionnaire: Reliability and Validity of the Turkish Version. Percept Mot Skills, 2010;111:278–84. https://doi.org/10.2466/06.08.PMS.111.4.278-284
23. Buysse DJ, Reynolds CF, Monk TH, Berman SR, Kupfer DJ. The Pittsburgh sleep quality index: A new instrument for psychiatric practice and research. Psychiatry Research, 1989;28:193–213. https://doi.org/10.1016/0165-1781(89)90047-4
24. Agargün YM, Kara H, Anlar Ö. Pittsburgh Uyku Kalitesi İndeksinin geçerlilik ve güvenirliğI [Validity and reliability of the Pittsburgh Sleep Quality Index]. Turk Psikiyatri Dergisi, 1996. 7(2): 107–111. (In Turkish).
25. Terry PC, Lane AM, Fogarty GJ. Construct validity of the Profile of Mood States — Adolescents for use with adults. Psychology of Sport and Exercise, 2003;4:125–39. https://doi.org/10.1016/S1469-0292(01)00035-8
26. Terry PC, Lane AM, Lane HJ, Keohane L. Development and validation of a mood measure for adolescents. Journal of Sports Sciences 1999;17:861–72. https://doi.org/10.1080/026404199365425
27. Cakiroglu AA, Demir E, Guclu M. The Validity and Reliability Study of the Brunel Mood Scale with the Adult Athletes (Turkish Adaptation). Int. J. Appl. Exerc. Physiol. 2020. 9(10):126–40.
28. Bijur PE, Silver W, Gallagher EJ. Reliability of the Visual Analog Scale for Measurement of Acute Pain. Acad Emergency Med, 2001;8:1153–7. https://doi.org/10.1111/j.1553-2712.2001.tb01132.x
29. Schober P, Boer C, Schwarte LA. Correlation Coefficients: Appropriate Use and Interpretation. Anesthesia & Analgesia, 2018;126:1763–8. https://doi.org/10.1213/ANE.0000000000002864
30. Orgilés M, Morales A, Delvecchio E, Mazzeschi C, Espada JP. Immediate Psychological Effects of the COVID-19 Quarantine in Youth From Italy and Spain. Front Psychol 2020;11:579038. https://doi.org/10.3389/fpsyg.2020.579038
31. Garcia M, Custodio E. Home quarantine - based rhythmic exercises: new fitness assessment and intervention in teaching physical education. Physical Education of Students. 2021;25(1):51–7. https://doi.org/10.15561/20755279.2021.0107
32. Ricci F, Izzicupo P, Moscucci F, Sciomer S, Maffei S, Di Baldassarre A, et al. Recommendations for Physical Inactivity and Sedentary Behavior During the Coronavirus Disease (COVID-19) Pandemic. Front Public Health, 2020;8:199. https://doi.org/10.3389/fpubh.2020.00199
33. Wang F, Boros S. The effect of physical activity on sleep quality: a systematic review. European Journal of Physiotherapy, 2021;23:11–8. https://doi.org/10.1080/21679169.2019.1623314
34. Cahuas A, He Z, Zhang Z, Chen W. Relationship of physical activity and sleep with depression in college students. Journal of American College Health, 2020;68:557–64. https://doi.org/10.1080/07448481.2019.1583653
35. Abdulah DM, Musa DH. Insomnia and stress of physicians during COVID-19 outbreak. Sleep Medicine: X, 2020;2:100017. https://doi.org/10.1016/j.sleepx.2020.100017
36. Boksem MAS, Tops M. Mental fatigue: Costs and benefits. Brain Research Reviews, 2008;59:125–39. https://doi.org/10.1016/j.brainresrev.2008.07.001
37. Ishii A, Tanaka M, Watanabe Y. Neural mechanisms of mental fatigue. Reviews in the Neurosciences, 2014;25(4): 469-479. https://doi.org/10.1515/revneuro-2014-0028
38. Dalley JW, Roiser JP. Dopamine, serotonin and impulsivity. Neuroscience, 2012;215:42–58. https://doi.org/10.1016/j.neuroscience.2012.03.065
39. Kringelbach ML, Berridge KC. Towards a functional neuroanatomy of pleasure and happiness. Trends in Cognitive Sciences, 2009;13:479–87. https://doi.org/10.1016/j.tics.2009.08.006
40. Todd AI, Bennett AI, Christie CJ. Physical implications of prolonged sitting in a confined posture-a literature review. Ergonomics SA: Journal of the Ergonomics Society of South Africa, 2007. 19(2): 7–21.
41. Myrtveit SM, Sivertsen B, Skogen JC, Frostholm L, Stormark KM, Hysing M. Adolescent Neck and Shoulder Pain—The Association With Depression, Physical Activity, Screen-Based Activities, and Use of Health Care Services. Journal of Adolescent Health, 2014;55:366–72. https://doi.org/10.1016/j.jadohealth.2014.02.016
2021
03
163
Information about the author:
Yusuf Soylu; https://orcid.org/0000-0003-0609-0601; [email protected]; Faculty of Sport Sciences, Tokat Gaziosmanpasa University; Tokat, Turkey.
Cite this article as: Soylu Y. The psychophysiological effects of the COVID-19 quarantine in the college students. Physical Education of Students, 2021;25(3):158–163. https://doi.org/10.15561/20755279.2021.0303
This is an Open Access article distributed under the terms of the Creative Commons Attribution License, which permits unrestricted use, distribution, and reproduction in any medium, provided the original work is properly cited http://creativecommons.org/licenses/by/4.0/deed.en
Received: 12.04.2021Accepted: 27.05.2021; Published: 30.06.2021
164
PHYSICAL EDUCATION OF STUDENTS
ORIGINAL ARTICLE
Reliability and concurrent validity of Iphone® level application for measuring lower limb active flexion and extension range of motions in physical education studentsIzzet Kirkaya1ACDE, Celil Kaçoğlu2ABCDE, Beyza Şenol3ABDE
1Faculty of Sport Sciences, Department of Coaching Education, Yozgat Bozok University, Yozgat, Turkey2Faculty of Sport Sciences, Department of Coaching Education, Eskişehir Technical University, Eskişehir, Turkey 3Trakya University, Department of Physical Education and Sport, Institute of Health Sciences, Edirne, Turkey
Authors’ Contribution: A – Study design; B – Data collection; C – Statistical analysis; D – Manuscript Preparation; E – Funds Collection.
AbstractBackground and Study Aim
The aim of this study was to analyse reliability and validity of accelerometer-based Iphone® Level application for measuring lower extremity active flexion and extension joint range of motion.
Material and Methods
Thirty physically healthy students enrolled in sport sciences (11 males, 19 females, 21.2±1.5 years, Body mass 64.4±10.0 kg, Height 1.68±0.8 m, Fat percentage 21.2±7.8 %, 22.5±2.6 kg/m2) participated in the measurements of hip, knee, and ankle joint range of motion twice through Universal goniometer and Iphone® Level applications. The same experienced measurer carried out blind study of plantarflexion, dorsiflexion and knee flexion/extension, hip flexion/extension joint range of motion three times for each measurement methods and the other researcher recorded the results. For simultaneous validity analysis Pearson coefficient of correlation was used to decide the level of adaptation between the two intraclass correlation coefficient and Cronbach’s alpha values. Bland-Altman graphics were utilized for level of agreement between these two different methods.
Results The results of Pearson coefficient of correlation analysis revealed a positive correlation between the measurement values of joint range of motion performed through Universal goniometer and Level App (r2 = 0.44-0.94, p <0.05). Bland-Altman graphics showed a good agreement among Cronbach Alpha values and intraclass correlation coefficient in the confidence range of %95, and universal goniometers and Level App application.
Conclusions: The results of this study revealed that goniometric measurements using Iphone® Level App is a good reliable method for measuring lower extremity active range of motion compared to universal goniometer.
Keywords: joint motion, goniometry, smartphone applications, validity
Introduction1
In the 21st century, technological developments have appeared in many areas of usage, including the world of sports. Increase in the use of technology in the world of sports has led to developments including online application, smart TVs, and mobile phones [1].
Technological advancements in branches and different areas in the world of sports have become a part of sport and are seen as solution-oriented assistants by both amateur and professional athletes [2]. With the introduction of sports to human life, various applications have been used for physical activities in daily life [3]. To understand the capacity of movement and evaluate it, functionality of the structures supplying the movement should be known. Thanks to advancing technology, measurement of movements in activities has become easier and joint range of motion (ROM) known as capacity of movement has come into prominence. ROM is known as joint arc originating towards one or more joints [4]. Functionality in amount of joint ROM is directly proportional with attendance in daily life activities [5].
In clinical and scientific research, the most common angle meter is universal goniometers (UG) for the © Izzet Kirkaya, Celil Kaçoğlu, Beyza Şenol, 2021
doi:10.15561/20755279.2021.0304
measurement of joint ROM. UG is the most common one due to its ease of use, attainableness, cost, and reliability [6]. Despite its common use, it might reveal inconsistent measurements since in hinge type joint such as knee and elbow cannot be marked properly [7]. Moreover, stabilization of the joint is difficult because hands are used during the measurement, which contributes to increased failure rate [5]. In addition, lack of experience and knowledge in positioning the joints may increase the failure rate. To minimize the failure rate in UG using smart phones is at the forefront. Nowadays smart phones have been equipped with many applications such as accelerometer, manometer, and gyroscope [8]. While applications are providing joint ROM measurements to be easier and faster day by day, usage, portability, and data collection also get easier.
Clinicians and scientific research have stated that UG ais supposed to give clearer results owing to reliability and validity of smart phones in measuring joint ROM. Research has compared UGs and smart phone applications. For example, Cox, et al., [9] stated in their research that Clinometer application can be a valid alternative for ankle plantar and dorsal flexion. Milanese, et al., [10] indicated that in knee flexion, KGA and UGs are both reliable and

2021
03
165
valid for measurement. In addition, Romeo-Franco, et al., [11] found that MyProprioception application is able to be used for different joint motions in knee and ankle. Charlton, et al., [12] stated that smart phone applications are suitable for usage in different range of motion of hip. Keogh, et al., [7] mentioned that smart phone applications for different joint range of motion measurement can be observed and utilized. In the light of information in the literature, the main aim of this study is to analyse interclass reliability and concurrent validity of level application on Iphone® smart phones with universal goniometer for active joint range of motion.
Material and MethodsParticipants.Prior to data collection, power analysis using Power
Analysis and Sample Size (PASS, Version 2021, NCSS, Kaysville, Utah, USA) programs. was conducted to determine the minimum number of participants, before When Alpha (α) value is determined as 0.05, power value (1-β) is 0.95, the confidence level of agreements (LoA) is 0.9, the confidence level of the confidence intervals about the LoAs is 0,9, the number of participants is appointed as 31. Rate of waste was considered as 10 % and the study included 34 participants. During the research, four of the participants dropped out of the study of their own accord with various reasons. Eventually 30 students (11 males, 19 females 21.2±1.5 years, Body mass 64.4±10.0 kg, Height 1.68±0.8 m, Fat percentage 21.2±7.8 %, 22.5±2.6 kg/m2) who were picked with convenience sampling method among Sport Sciences Faculty students who are physically active and heathy between 18-24 ages participated in this cross-sectional method comparison research and completed whole study successfully.
Participants who were male or female and aged between 18 and 21years, who could perform lower extremity joint range of motion movements successfully, and who signed the consent form were included in the study. Before the data collection, participants were informed about the aims and the methods of the research and informed volunteer consent form was signed by all the participants. This research was carried out in accordance with the Declaration of Helsinki. The ethical approval was received from Eskişehir Technical University, Science and Engineering Sciences Medical Research and Publication Ethics Committee (Date: 30.04.2019, Protocol no: 10874).
Procedure.Measurements were performed in the Laboratory of
Human Performance in Eskişehir Technical University Sport Sciences Faculty. Blind goniometric measurements were taken by one of the two researchers (CK&BŞ) in a random order. Measurements were performed three times for each joint motion of all participants and in every measurement the other researcher who did not perform the measurement recorded the results by reading it on the screen of the smart phone or UG indicator. In every measurement these procedures were repeated. These three measurements were averaged and recorded for the
analysis [13, 14].The professional measurer has the experience of
using both UG and smart phone application in the joint ROM measurement. Added to that, approximately 10 days before the research protocol testing and adaptation measurements about both UG and Level application were applied for both the researchers and the participants [10]. Test positions and procedures were the same in both measurement techniques. The measurements were taken unilaterally from participants’ dominant side (2 left side and 28 right side). Participants first performed pedalling without any load for 3-4 minutes. Following that, for 2-3 minutes they did standard warm up session which include mobilization and dynamic extension movements to avoid the possibility of muscle strain in lower extremity. The joint range of motion measurement was implemented in a row as follows: plantar and dorsal flexion, knee extension, hip flexion in supine position; and knee flexion, and hip extension in prone position. All measurements were done in the same sessions. The first measurements of the participants were performed using UG and then they had a break for at least 10 minutes. The second measurements were taken using Level applications. After each measurement, the positions of the participants were repeated.
Participants’ lower extremity maximal active joint range of motion was measured with a 12inch plastic standard UG which has 2 arms moving 3600 (Baseline®, Model 12-1000, Chattanooga Group Inc, Hixson, Tennessee, USA) (Fig.1) and with Level application (IPhone 8®, IOS 13.1, Apple Inc., Cupertino, CA, USA) level application (App Store; (https://apps.apple.com/tr/app/%C3%B6l%C3%A7%C3%BCm/id1383426740?l=tr) with 10 sensitivity. This application is able to calculate the angle with 10 sensitivity between two segments with a working principle like a gravity-based digital inclinometer by using Iphone’ s interior accelerometer sensor and indicate the result on the screen digitally (Fig.2).
The measurements using Iphone® were taken by holding the phone from long edges of short edges touching the participants’ skin [10]. Neither goniometer nor Level application needed calibration. All the measurements were performed in the afternoons and similar time periods in November, 2019.
Figure 1. Universal Goniometer
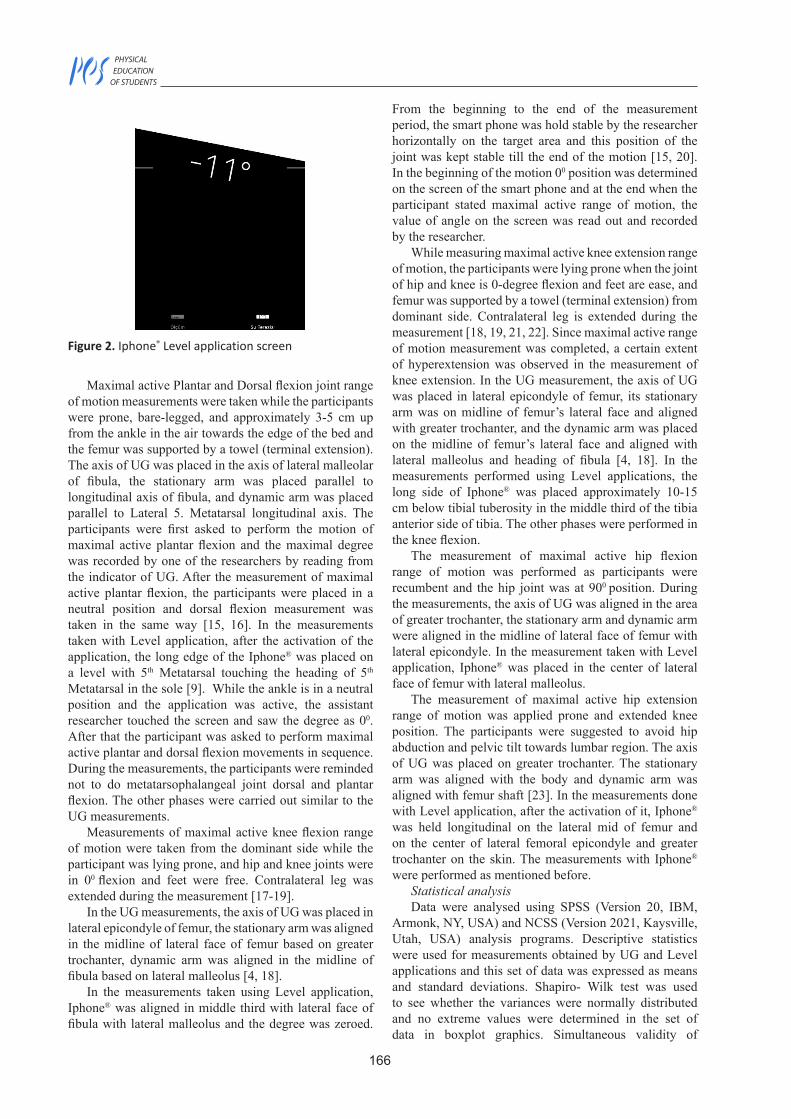
166
PHYSICAL EDUCATION OF STUDENTS
Figure 2. Iphone® Level application screen
Maximal active Plantar and Dorsal flexion joint range of motion measurements were taken while the participants were prone, bare-legged, and approximately 3-5 cm up from the ankle in the air towards the edge of the bed and the femur was supported by a towel (terminal extension). The axis of UG was placed in the axis of lateral malleolar of fibula, the stationary arm was placed parallel to longitudinal axis of fibula, and dynamic arm was placed parallel to Lateral 5. Metatarsal longitudinal axis. The participants were first asked to perform the motion of maximal active plantar flexion and the maximal degree was recorded by one of the researchers by reading from the indicator of UG. After the measurement of maximal active plantar flexion, the participants were placed in a neutral position and dorsal flexion measurement was taken in the same way [15, 16]. In the measurements taken with Level application, after the activation of the application, the long edge of the Iphone® was placed on a level with 5th Metatarsal touching the heading of 5th Metatarsal in the sole [9]. While the ankle is in a neutral position and the application was active, the assistant researcher touched the screen and saw the degree as 00. After that the participant was asked to perform maximal active plantar and dorsal flexion movements in sequence. During the measurements, the participants were reminded not to do metatarsophalangeal joint dorsal and plantar flexion. The other phases were carried out similar to the UG measurements.
Measurements of maximal active knee flexion range of motion were taken from the dominant side while the participant was lying prone, and hip and knee joints were in 00 flexion and feet were free. Contralateral leg was extended during the measurement [17-19].
In the UG measurements, the axis of UG was placed in lateral epicondyle of femur, the stationary arm was aligned in the midline of lateral face of femur based on greater trochanter, dynamic arm was aligned in the midline of fibula based on lateral malleolus [4, 18].
In the measurements taken using Level application, Iphone® was aligned in middle third with lateral face of fibula with lateral malleolus and the degree was zeroed.
From the beginning to the end of the measurement period, the smart phone was hold stable by the researcher horizontally on the target area and this position of the joint was kept stable till the end of the motion [15, 20]. In the beginning of the motion 00 position was determined on the screen of the smart phone and at the end when the participant stated maximal active range of motion, the value of angle on the screen was read out and recorded by the researcher.
While measuring maximal active knee extension range of motion, the participants were lying prone when the joint of hip and knee is 0-degree flexion and feet are ease, and femur was supported by a towel (terminal extension) from dominant side. Contralateral leg is extended during the measurement [18, 19, 21, 22]. Since maximal active range of motion measurement was completed, a certain extent of hyperextension was observed in the measurement of knee extension. In the UG measurement, the axis of UG was placed in lateral epicondyle of femur, its stationary arm was on midline of femur’s lateral face and aligned with greater trochanter, and the dynamic arm was placed on the midline of femur’s lateral face and aligned with lateral malleolus and heading of fibula [4, 18]. In the measurements performed using Level applications, the long side of Iphone® was placed approximately 10-15 cm below tibial tuberosity in the middle third of the tibia anterior side of tibia. The other phases were performed in the knee flexion.
The measurement of maximal active hip flexion range of motion was performed as participants were recumbent and the hip joint was at 900 position. During the measurements, the axis of UG was aligned in the area of greater trochanter, the stationary arm and dynamic arm were aligned in the midline of lateral face of femur with lateral epicondyle. In the measurement taken with Level application, Iphone® was placed in the center of lateral face of femur with lateral malleolus.
The measurement of maximal active hip extension range of motion was applied prone and extended knee position. The participants were suggested to avoid hip abduction and pelvic tilt towards lumbar region. The axis of UG was placed on greater trochanter. The stationary arm was aligned with the body and dynamic arm was aligned with femur shaft [23]. In the measurements done with Level application, after the activation of it, Iphone® was held longitudinal on the lateral mid of femur and on the center of lateral femoral epicondyle and greater trochanter on the skin. The measurements with Iphone® were performed as mentioned before.
Statistical analysis Data were analysed using SPSS (Version 20, IBM,
Armonk, NY, USA) and NCSS (Version 2021, Kaysville, Utah, USA) analysis programs. Descriptive statistics were used for measurements obtained by UG and Level applications and this set of data was expressed as means and standard deviations. Shapiro- Wilk test was used to see whether the variances were normally distributed and no extreme values were determined in the set of data in boxplot graphics. Simultaneous validity of
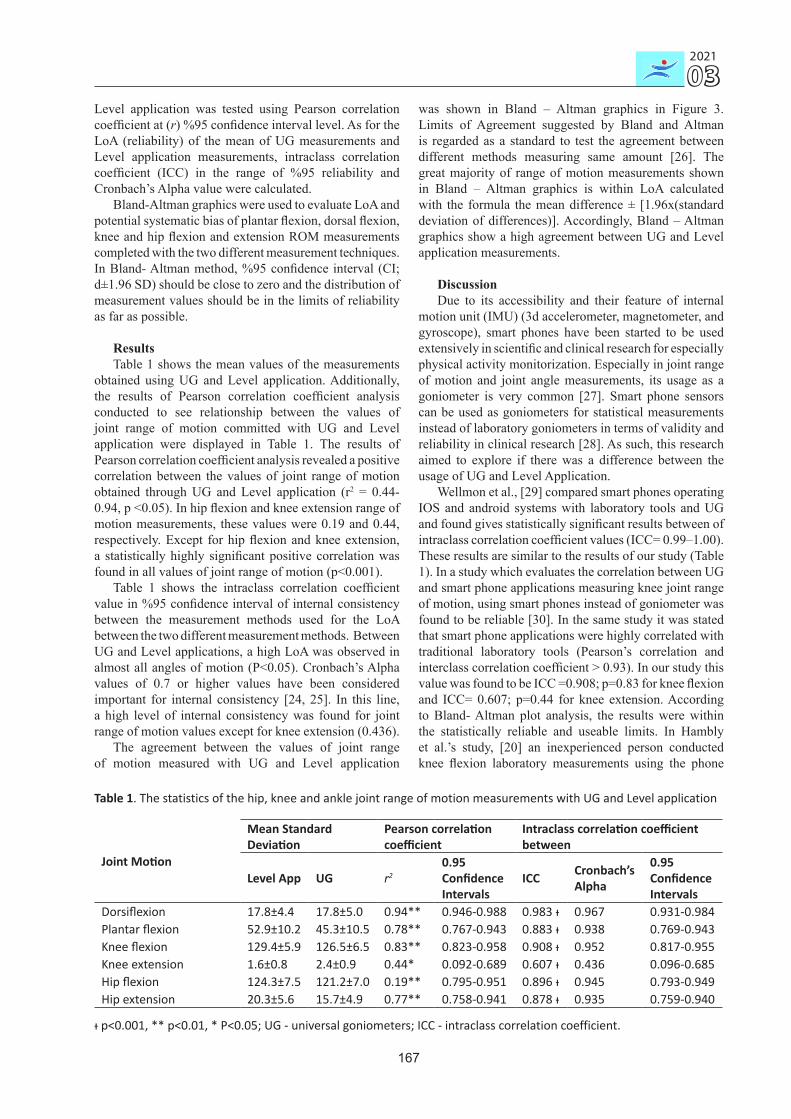
2021
03
167
Level application was tested using Pearson correlation coefficient at (r) %95 confidence interval level. As for the LoA (reliability) of the mean of UG measurements and Level application measurements, intraclass correlation coefficient (ICC) in the range of %95 reliability and Cronbach’s Alpha value were calculated.
Bland-Altman graphics were used to evaluate LoA and potential systematic bias of plantar flexion, dorsal flexion, knee and hip flexion and extension ROM measurements completed with the two different measurement techniques. In Bland- Altman method, %95 confidence interval (CI; d±1.96 SD) should be close to zero and the distribution of measurement values should be in the limits of reliability as far as possible.
ResultsTable 1 shows the mean values of the measurements
obtained using UG and Level application. Additionally, the results of Pearson correlation coefficient analysis conducted to see relationship between the values of joint range of motion committed with UG and Level application were displayed in Table 1. The results of Pearson correlation coefficient analysis revealed a positive correlation between the values of joint range of motion obtained through UG and Level application (r2 = 0.44-0.94, p <0.05). In hip flexion and knee extension range of motion measurements, these values were 0.19 and 0.44, respectively. Except for hip flexion and knee extension, a statistically highly significant positive correlation was found in all values of joint range of motion (p<0.001).
Table 1 shows the intraclass correlation coefficient value in %95 confidence interval of internal consistency between the measurement methods used for the LoA between the two different measurement methods. Between UG and Level applications, a high LoA was observed in almost all angles of motion (P<0.05). Cronbach’s Alpha values of 0.7 or higher values have been considered important for internal consistency [24, 25]. In this line, a high level of internal consistency was found for joint range of motion values except for knee extension (0.436).
The agreement between the values of joint range of motion measured with UG and Level application
was shown in Bland – Altman graphics in Figure 3. Limits of Agreement suggested by Bland and Altman is regarded as a standard to test the agreement between different methods measuring same amount [26]. The great majority of range of motion measurements shown in Bland – Altman graphics is within LoA calculated with the formula the mean difference ± [1.96x(standard deviation of differences)]. Accordingly, Bland – Altman graphics show a high agreement between UG and Level application measurements.
Discussion Due to its accessibility and their feature of internal
motion unit (IMU) (3d accelerometer, magnetometer, and gyroscope), smart phones have been started to be used extensively in scientific and clinical research for especially physical activity monitorization. Especially in joint range of motion and joint angle measurements, its usage as a goniometer is very common [27]. Smart phone sensors can be used as goniometers for statistical measurements instead of laboratory goniometers in terms of validity and reliability in clinical research [28]. As such, this research aimed to explore if there was a difference between the usage of UG and Level Application.
Wellmon et al., [29] compared smart phones operating IOS and android systems with laboratory tools and UG and found gives statistically significant results between of intraclass correlation coefficient values (ICC= 0.99–1.00). These results are similar to the results of our study (Table 1). In a study which evaluates the correlation between UG and smart phone applications measuring knee joint range of motion, using smart phones instead of goniometer was found to be reliable [30]. In the same study it was stated that smart phone applications were highly correlated with traditional laboratory tools (Pearson’s correlation and interclass correlation coefficient > 0.93). In our study this value was found to be ICC =0.908; p=0.83 for knee flexion and ICC= 0.607; p=0.44 for knee extension. According to Bland- Altman plot analysis, the results were within the statistically reliable and useable limits. In Hambly et al.’s study, [20] an inexperienced person conducted knee flexion laboratory measurements using the phone
Table 1. The statistics of the hip, knee and ankle joint range of motion measurements with UG and Level application
Joint Motion
Mean Standard Deviation
Pearson correlation coefficient
Intraclass correlation coefficient between
Level App UG r20.95 Confidence Intervals
ICC Cronbach’s Alpha
0.95 Confidence Intervals
Dorsiflexion 17.8±4.4 17.8±5.0 0.94** 0.946-0.988 0.983 ᵻ 0.967 0.931-0.984Plantar flexion 52.9±10.2 45.3±10.5 0.78** 0.767-0.943 0.883 ᵻ 0.938 0.769-0.943Knee flexion 129.4±5.9 126.5±6.5 0.83** 0.823-0.958 0.908 ᵻ 0.952 0.817-0.955Knee extension 1.6±0.8 2.4±0.9 0.44* 0.092-0.689 0.607 ᵻ 0.436 0.096-0.685Hip flexion 124.3±7.5 121.2±7.0 0.19** 0.795-0.951 0.896 ᵻ 0.945 0.793-0.949Hip extension 20.3±5.6 15.7±4.9 0.77** 0.758-0.941 0.878 ᵻ 0.935 0.759-0.940
ᵻ p<0.001, ** p<0.01, * P<0.05; UG - universal goniometers; ICC - intraclass correlation coefficient.
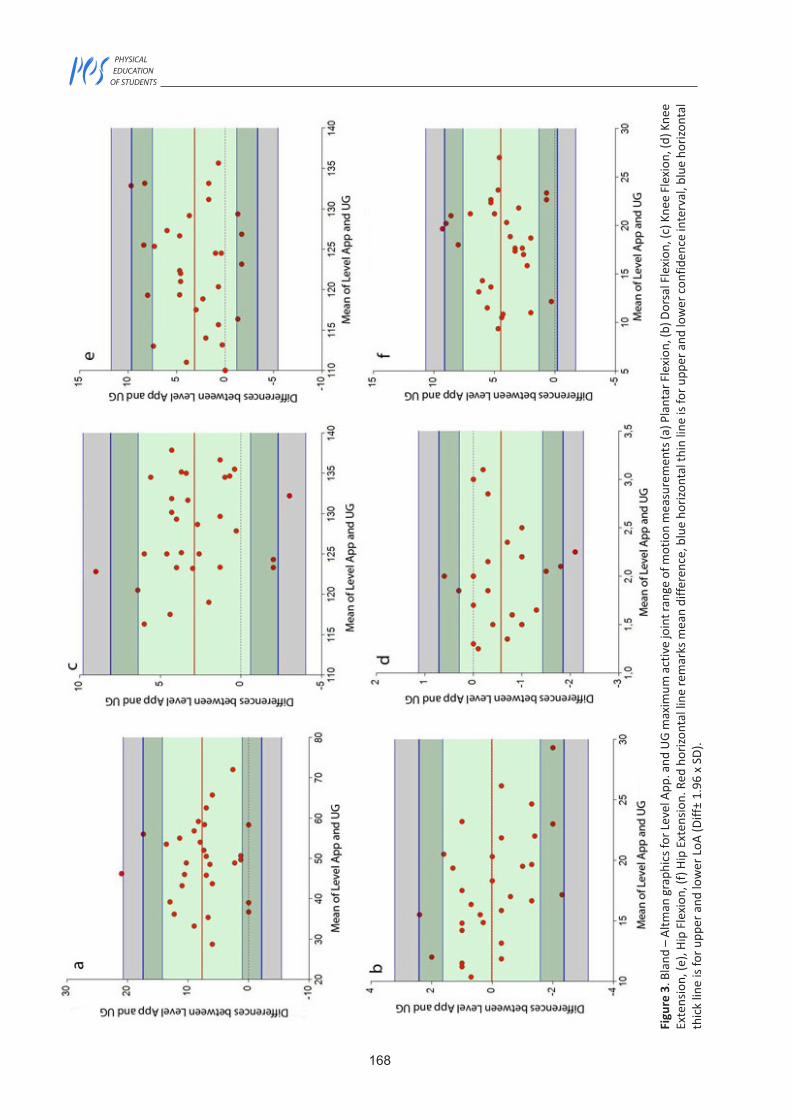
168
PHYSICAL EDUCATION OF STUDENTS
Figu
re 3
. Bla
nd –
Altm
an g
raph
ics f
or Le
vel A
pp. a
nd U
G m
axim
um a
ctiv
e jo
int r
ange
of m
otio
n m
easu
rem
ents
(a) P
lant
ar F
lexi
on, (
b) D
orsa
l Fle
xion
, (c)
Kne
e Fl
exio
n, (d
) Kne
e Ex
tens
ion,
(e),
Hip
Flex
ion,
(f) H
ip E
xten
sion.
Red
hor
izont
al li
ne re
mar
ks m
ean
diffe
renc
e, b
lue
horiz
onta
l thi
n lin
e is
for u
pper
and
low
er co
nfid
ence
inte
rval
, blu
e ho
rizon
tal
thic
k lin
e is
for u
pper
and
low
er L
oA (D
iff±
1.96
x S
D).
2021
03
169
and found a statistically significant correlation between laboratory goniometer and the smart phone application (r=0.932; p<0.01).
In their study which compared digital goniometer and smart phone applications in lower extremity measurements, Mohammad et al., [31] found ICC values for hip flexion, knee flexion, ankle dorsiflexion and ankle plantar flexion as 0.93, 0.93, 0.52 and 0.57, respectively. These results showed similarity with our study. Statistically significant but low level of correlations were found in hip and ankle measurements. While performing camera-based goniometers analysis several problems such as alignment of the camera to the joint or difficulty of placing the camera on smaller joints, however; these problems were not experienced with smart phone IMU sensors [32]. In another research in which ankle joint ROM was measured using IMU sensors, ICC for dorsiflexion was found to be 0.91 and ICC for plantar flexion was 0.82 [15]. In our study these values were found to be 0.98 and 0.88, respectively. Especially these values are considered higher compared to the results of studies conducted on dorsiflexion. The main reason of this can be attributed to the position during dorsiflexion or the application to be used [15, 33, 34]. In our study statistical methods were preferred to determine joint ROM and angles of joint. Camera- based applications can be used for dynamic motions. While Milani et al., [27] stated that camera- based applications might result better for dynamic motions, if the smart phone applications
are updated, a new verification analysis needed to be performed by the application developer not only to affirm individually change but also to determine the capacity and the effect of this change on the whole software system.
Even though the results of the research show validity for UG and Level application, it has limitations. First, in ICC method only intra-class correlation was used. For the future studies inter-class correlation should also be added. In addition to passive motions, future research should investigate dynamic motions. Moreover, except for sagittal plane, different plane motions should be added.
ConclusionAs a conclusion statistically significant results
for Dorsiflexion, Plantar flexion, knee flexion, knee extension, hip flexion and hip extension were obtained. In light of these results, Level app can be used instead of UG in clinical studies.
HighlightsThis research was endorsed by Eskişehir Technical
University Scientific research projects. Project Number: 20ADP165.
Conflicts of InterestThe authors declare that they have no conflict of
interest.
References1. Şimşek A, Devecioğlu S. Spor Endüstrisinde Yeni
Teknolojilerin Görünümü. [Appearance of New Technologies in Sports Industry] Uluslararası Beden Eğitimi Spor Rekreasyon ve Dans Dergisi, 2018;1(1):20–36–49. (Turkish). https://doi.org/10.29228/ispes.1.559
2. Özen G, Güllü M, Uğraş S. Beden Eğitimi Öğretmenlerinin Beden Eğitimi Ders İçi ve Dışı Etkinliklerinde Teknolojik Araç ve Gereçlerin Kullanımı İle İlgili Görüşleri. [Physical Education and Sport Teachers’ Views on The Use of Technological Tools and Equipment in Physical Education Lesson and Extracurricular Activities] Gaziantep Üniversitesi Spor Bilimleri Dergisi, 2016; 1(1):24–37. (Turkish).
3. Ekmekçi A, Ekmekçi R, İrmiş A. Küreselleşme ve Spor Endüstrisi. [Globalization and The Sports Industry] Pamukkale Spor Bilimleri Dergisi, 2013;4(1):91–117. (Turkish).
4. Norkin CC, White DJ. Measurement of Joint Motion: A Guide To Goniometry. FA Davis; 2016.
5. Keleş E, Şimşek E, Salmanı M, Şimşek TT, Angın S, Yakut Y. Eklem Hareket Açıklığı Ölçümünde Kullanılan İki Akıllı Telefon Uygulamasının Uygulayıcı İçi ve Uygulayıcılar Arası Güvenirliğinin İncelenmesi [Examining inter and intra-rater reliability of two smartphones applications used in measuring joint range of motion. J Exerc Ther Rehabil. 2016;3(1):21–29. (Turkish).
6. Furness J, Schram B, Cox AJ, Anderson SL, Keogh J. Reliability and concurrent validity of the iPhone® Compass application to measure thoracic rotation range of motion (ROM) in healthy participants. PeerJ. 2018;6:e4431. https://doi.org/10.7717/peerj.4431
7. Keogh JWL, Cox A, Anderson S, Liew B, Olsen A, Schram B, et al. Reliability and validity of clinically accessible
smartphone applications to measure joint range of motion: A systematic review. PLoS One. 2019;14(5):e0215806. https://doi.org/10.1371/journal.pone.0215806
8. Pourahmadi MR, Bagheri R, Taghipour M, Takamjani IE, Sarrafzadeh J, Mohseni-Bandpei MA. A new iPhone application for measuring active craniocervical range of motion in patients with non-specific neck pain: A reliability and validity study. Spine J. 2018;18(3):447–57. https://doi.org/10.1016/j.spinee.2017.08.229
9. Cox RW, Martinez RE, Baker RT, Warren L. Validity of A Smartphone Application for Measuring Ankle Plantar Flexion. J Sport Rehabil, 2018;27(3). https://doi.org/10.1123/jsr.2017-0143
10. Milanese S, Gordon S, Buettner P, Flavell C, Ruston S, Coe D, et al. Reliability and concurrent validity of knee angle measurement: smart phone app versus universal goniometer used by experienced and novice clinicians. Man Ther. 2014;19(6):569–74. https://doi.org/10.1016/j.math.2014.05.009
11. Romero-Franco N, Jiménez-Reyes P, González-Hernández JM, Fernández-Domínguez JC. Assessing the concurrent validity and reliability of an iPhone application for the measurement of range of motion and joint position sense in knee and ankle joints of young adults. Phys Ther Sport. 2020;44:136–42. https://doi.org/10.1016/j.ptsp.2020.05.003
12. Charlton PC, Mentiplay BF, Pua Y-H, Clark RA. Reliability and concurrent validity of a Smartphone, bubble inclinometer and motion analysis system for measurement of hip joint range of motion. J Sci Med Sport. 2015;18(3):262–7. https://doi.org/10.1016/j.jsams.2014.04.008
13. Boone DC, Azen SP, Lin CM, Spence C, Baron C, Lee L. Reliability of goniometric measurements. Physical therapy, 1978;58(11):1355-1360.
170
PHYSICAL EDUCATION OF STUDENTS
https://doi.org/10.1093/ptj/58.11.135514. Pourahmadi MR, Taghipour M, Jannati E, Mohseni-Bandpei
MA, Takamjani IE, Rajabzadeh F. Reliability and validity of an iPhone® application for the measurement of lumbar spine flexion and extension range of motion. PeerJ. 2016;4:2355. https://doi.org/ 10.7717/peerj.2355
15. Alawna MA, Unver BH, Yuksel EO. The reliability of a smartphone goniometer application compared with a traditional goniometer for measuring ankle joint range of motion. J Am Podiatr Med Assoc. 2019;109(1):22–9. https://doi.org/10.7547/16-128
16. Wang KY, Hussaini SH, Teasdall RD, Gwam CU, Scott AT. Smartphone applications for assessing ankle range of motion in clinical practice. Foot Ankle Orthop. 2019;4(3):247301141987477. https://doi.org/10.1177/2473011419874779
17. Peeler J, Anderson JE. Reliability of the Ely’s test for assessing rectus femoris muscle flexibility and joint range of motion. J Orthop Res. 2008;26(6):793–9. https://doi.org/ 10.1002/jor.20556
18. Reese NB, Bandy WD. Joint range of motion and muscle length testing-E-book. Elsevier Health Sciences; 2016.
19. Tzalach A, Lifshitz L, Yaniv M, Kurz I, Kalichman L. The correlation between knee flexion lower range of motion and Osgood-schlatter’s syndrome among adolescent soccer players. Br J Med Med Res. 2016;11(2):1–10. https://doi.org/10.9734/BJMMR/2016/20753
20. Hambly K, Sibley R, Ockendon M. Level of agreement between a novel smartphone application and a long arm goniometer for the assessment of maximum active knee flexion by an inexperienced tester. Int J Physiother Rehabil, 2012; 2:1.
21. Clarkson HM. Musculoskeletal Assessment: Joint Motion and Muscle Testing (Musculoskeletal Assessment). 3nd ed. Philadelphia, Lippincott Williams and Wilkins; 2013.
22. Peeler J, Anderson JE. Reliability of the Ely’s test for assessing rectus femoris muscle flexibility and joint range of motion. J Orthop Res, 2008;26:793–9. https://doi.org/10.1002/jor.20556
23. Roach S, San Juan JG, Suprak DN, Lyda M. Concurrent validity of digital inclinometer and universal goniometer in assessing passive hip mobility in healthy subjects. Int J Sports Phys Ther. 2013;8(5):680–8.
24. DeVellis RF. Scale development: Theory and applications. 2nd edition. Contemp Sociol.; 2003.
25. Kline RB. Principles and practice of structural equation modeling, 2nd edition. New York: Guildford Publication; 2005.
26. Zou GY. Confidence interval estimation for the Bland-Altman limits of agreement with multiple observations per individual. Stat Methods Med Res. 2013;22(6):630–42. https://doi.org/10.1177/0962280211402548
27. Milani P, Coccetta CA, Rabini A, Sciarra T, Massazza G, Ferriero G. Mobile Smartphone Applications for Body Position Measurement in Rehabilitation: A Review of Goniometric Tools. PM&R, 2014;6:1038–43. https://doi.org/10.1016/j.pmrj.2014.05.003
28. Mourcou Q, Fleury A, Franco C, Klopcic F, Vuillerme N. Performance evaluation of smartphone inertial sensors measurement for range of motion. Sensors (Basel). 2015;15(9):23168–87. https://doi.org/10.3390/s150923168
29. Wellmon RH, Gulick DT, Paterson ML, Gulick CN. Validity and reliability of 2 goniometric mobile apps: Device, application, and examiner factors. J Sport Rehabil. 2016;25(4):371–9. https://doi.org/10.1123/jsr.2015-0041
30. Dos Santos RA, Derhon V, Brandalize M, Brandalize D, Rossi LP. Evaluation of knee range of motion: Correlation between measurements using a universal goniometer and a smartphone goniometric application. J Bodyw Mov Ther. 2017;21(3):699–703. https://doi.org/10.1016/j.jbmt.2016.11.008
31. Mohammad WS, Elattar FF, Elsais WM, AlDajah SO. Validity and Reliability of a Smartphone and Digital Inclinometer in Measuring the Lower Extremity Joints Range of Motion. Montenegrin Journal of Sports Science and Medicine, 2021:10(2):10. https://doi.org/10.26773/mjssm.210907
32. Otter SJ, Agalliu B, Baer N, Hales G, Harvey K, James K, et al. The reliability of a smartphone goniometer application compared with a traditional goniometer for measuring first metatarsophalangeal joint dorsiflexion. J Foot Ankle Res. 2015;8(1):30. https://doi.org/10.1186/s13047-015-0088-3
33. Vohralik SL, Bowen AR, Burns J, Hiller CE, Nightingale EJ. Reliability and validity of a smartphone app to measure joint range. Am J Phys Med Rehabil. 2015;94(4):325–30. https://doi.org/10.1097/phm.0000000000000221
34. Meislin MA, Wagner ER, Shin AY. A comparison of elbow range of motion measurements: Smartphone-based digital photography versus goniometric measurements. J Hand Surg Am. 2016;41(4):510-515. https://doi.org/10.1016/j.jhsa.2016.01.006
2021
03
171
Information about the authors:
Izzet Kırkaya; (Corresponding author); https://orcid.org/0000-0002-0468-8434; [email protected]; Faculty of Sport Sciences, Department of Coaching Education, Yozgat Bozok University; Yozgat, Turkey.
Celil Kaçoğlu; https://orcid.org/0000-0002-1817-5234; [email protected]; Faculty of Sport Sciences, Department of Coaching Education, Eskişehir Technical University; Eskişehir, Turkey.
Beyza Şenol; https://orcid.org/0000-0003-3206-882X; [email protected]; Department of Physical Education and Sport, Institute of Health Sciences, Trakya University; Edirne, Turkey.
Cite this article as: Kirkaya I, Kaçoğlu C, Şenol B. Reliability and concurrent validity of Iphone® level application for measuring lower limb active flexion and extension range of motions in physical education students. Physical Education of Students, 2021;25(3):164–171. https://doi.org/10.15561/20755279.2021.0304
This is an Open Access article distributed under the terms of the Creative Commons Attribution License, which permits unrestricted use, distribution, and reproduction in any medium, provided the original work is properly cited http://creativecommons.org/licenses/by/4.0/deed.en
Received: 12.04.2021Accepted: 16.06.2021; Published: 30.06.2021
172
PHYSICAL EDUCATION OF STUDENTS
The effect of 8 weeks moderate-intensity continuous training on central hemodynamics and VO2max in non-athlete male Javad MahdiabadiABCDE
Toos Institute of Higher Education, Mashhad, Iran
Authors’ Contribution: A – Study Design, B – Data Collection, C – Statistical Analysis, D – Manuscript Preparation, E – Funds Collection
AbstractBackground and Study Aim
Aerobic exercise improves fitness and quality of life and decreases mortality rate. Existence study determined the central hemodynamic adaptation after 8 weeks moderate-intensity continuous countryside jogging in non-athlete male.
Material and Methods
Twenty-four untrained healthy male students (aged 20-22 years) volunteered and randomly divided into two groups: continuous training (CTG; n=12) and control (CG; n=12). Training program was countryside jogging for 45 min at 65-70% of Maximum Heart Rate (MHR), 3 days/week for 8-weeks performed. The CG group remained sedentary during the study period. Maximal oxygen consumption (VO2max) obtained using the step-test. Standard medical method impedance cardiograph was performed for hemodynamic parameters, during resting and after step-test conditions, before and after the study period.
Results Using t-test, after eight weeks: the resting heart rate (HR) in CTG group significantly decreased (P≤0.05). The systolic blood pressure (SBP) in CTG group decreased significantly at rest and after workload (P≤0.05). The diastolic blood pressure (DBP) did not change in both groups (P>0.05). The stroke volume (SV) increased significantly in CTG group at rest and after workload (P≤0.05). The cardiac output (CO) did not change in both groups (P>0.05). The cardiac output (CO) did not change in both groups (P>0.05). The VO2max absolute and relative increased significantly in CTG group (P≤0.05). Significant difference between groups in SBP, SV, SVR and VO2max (absolute and relative) (P≤0.05).
Conclusions: 8 weeks moderate-intensity continuous countryside jogging can improve the cardiac function and VO2max in selected healthy male. The regular exercise of aerobic with moderate intensity causes positive developments in systolic and diastolic blood pressures.
Keywords: heart rate, stroke volume, systemic vascular resistance, jogging, maximal oxygen consumption
Introduction1
Reduce cardiovascular risk as a result of regular physical activity [1]. Many researches have reported that endurance training increases cardiac systolic function reserve [2]. Studies confirm that the health benefits of endurance training and people try to establish it as a part of daily life [3, 4]. Aerobic trainings as a kind of workload program advised for health improvement and prevention for many cardiovascular diseases specially prevent or delay the development of hypertension (systolic blood pressure (SBP) > 140 mm Hg and diastolic blood pressure (DBP) > 90 mm Hg) [5, 6]. They refer to all trainings that involving major muscle groups and improve oxygen consumption. Many methods of aerobic training are available like walking, jogging, running, cycling and others [7-9]. Recent studies confirm that aerobic exercise would result in clinically significant reduction in blood pressure [7]. BP change during the aerobic training may relate to variations in underlying physiological adaptive processes (e.g., neural, hormonal, and local vasodilator substances) [10, 11].
Effect of regular exercise on Hemodynamic – specifically, changes in cardiac output (CO) and peripheral vascular resistance due to exercise, it depends on sporting disciplines. Exercise can be separated into two types
© Javad Mahdiabadi, 2021 doi:10.15561/20755279.2021.0305
ORIGINAL ARTICLE
with defining hemodynamic differences. Isotonic type, as endurance exercise increased in CO with normal or reduced peripheral vascular resistance. This type of exercise primarily represents a volume challenge for the heart, which affects all four chambers, specially increased left ventricular chamber size, with an increase in wall thickness caused by volume overload (eccentric left ventricular hypertrophy). In contrast, isometric exercise, as strength training, leads to increased peripheral vascular resistance, and normal or only little increased CO. The increase in peripheral resistance causes momentary but potentially marked systolic hypertension and left ventricular afterload. Athletes involved in mainly static or isometric exercise develop increased left ventricular wall thickness, with no change in left ventricular chamber size (concentric left ventricular hypertrophy) [12, 13].
The CO is altered by regulating both heart rate (HR) and stroke volume (SV) [14]. Regular exercise and physical activity cause a reduction in resting heart rate (RHR) [15, 16]. Cramer et al. [15] found a significant reduction in heart rate through yoga of 6.59 bpm in in healthy participants. In another studies Huang G, Shi et al. [17] showed that endurance training causes RHR reductions of 8.4% in older individuals. Furthermore, a decrease in RHR at quiet status was found after tai chi exercise in healthy adults in the research of Zheng Li et al. [18].
2021
03
173
The increase in maximal heart rate (MHR) is responsible for enhancement of the CO during exercise, and peak HR is a basically limiting factor of peak exercise capacity in healthy people. Maximal HR does not increase with training. In contrast, with prolonged physical training increases in stroke volume (SV) at rest and during exercise [19]. The initial increase in SV during training is as a result of an improved systolic and diastolic function as indicated by a raise in venous return and a stronger myocardial contractility. Additional research by Slordahl et al. [20] demonstrated that high intensity aerobic training at 90-95% of maximal oxygen consumption (VO2max) increased left ventricle heart mass by 12% and cardiac contractility by 13%, which is comparable to cardiovascular changes observed in continuous aerobic exercise. LV filling pressures and diastolic LV distension increase at the onset of exercise causing stretch-activation of myofibers according to the Frank-Starling mechanism and subsequently an increase in SV [21]. Findings about the CO help to develop physiological responses and mechanisms of adaptation due to the physical training, sedentary lifestyle and chronic disease [22].
Maximal oxygen consumption (VO2max) is considered the uppermost ability of the body to consume, distribute and utilize oxygen for energy production. It is commonly called maximal aerobic capacity and is a good predictor of exercise performance. Improvements in cardiovascular function will increase one’s VO2max. Daussin et al. [23] measured VO2max responses among men and women who participated in an 8-week interval and a continuous cardiovascular training program. VO2max increases in the interval group (15%) and in the continuous group (9%). Several study reported that the 4 × 4-min high-intensity interval training approach has been shown to be more effective than moderate exercise training for improving maximal oxygen uptake (VO2max) in both healthy subjects and patient groups [24-26]. Improving cardiovascular function and increasing VO2max are major goals of patients that suffer from cardiovascular disease [27].
Many people who want to do sports practice in different exercises. But what kind of cardiovascular exercise more effective than it is important to clearly specify. The aim of this study determined the central hemodynamic adaptation after 8 weeks moderate-intensity continuous countryside jogging in non-athlete male.
Material and methodsParticipants. The study was performed on 24 non-athletic
healthy male students aged from 18-22 years. Selected participants were randomly divided into two groups as continuous training group (CTG; n=12) and control group (CG; n=12). They did not attend regularly sports activities (more than one hour per week), before this study. The criterion for cardiovascular health was the data obtained from the questionnaire devised by the researcher. Before the initiation to participate in the study, all subjects were informed of the process and filled out the medical sport questionnaire and the соnsent form.
Research Design.Training programme. Training program was designed including a
45-minutes countryside continuous jogging with 65-70% of the maximum heart rate (MHR), three times a week for eight weeks. Training session was of 65min duration and consisted of warm-up (10min), main program (45min) and cold-down (10 min). All the training sessions were supervised by the researcher. The control group remained sedentary during the study period.
Complex «Impecard-M ТU RB14563250. 017-96. » was used to study central hemodynamics (HR, SV, CO, SVR) with application of standard medical method of tetra polar chest reography (impedance cardiograph).
Blood pressure (BP) were recorded in the sitting position. BP at rest was obtained from the right arm was resting on a table with the elbow in a flexed position by manually using mechanical aneroid sphygmomanometer and a quality stethoscope (MDF ® Calibra Professional Aneroid Sphygmomanometer and Stethoscope). The resting heart rate (HR) was recorded by 60-s count, maximum heart rate was determined by the formula:
HRmax
= 220 − age.Step-test uses as a 40 cm high step bench. Subjects
try with a step frequency of 22.5 steps per minute under the metronome for 6 minutes. Aerobic capacity was expressed as estimated maximal oxygen consumption (VO2max), obtained using the step-test and the Astrand-Ryhming nomogram from the steady state heart rate (HR) and workload [28].
Statistical analysis. SPSS 19.0 packet program. Means and standard
deviation were calculated with this program. Test of normality for the data’s were made by Kolmogorov-Smirnov test. And then parametric tests applied. The evaluation inside the group was made by Paired Samples-t test, and evaluations between-group differences in baseline values and intervention induced changes were tested by independent-t test. Statistical significance was accepted as and p ≤ 0.05.
ResultsGeneral features and demographic characteristics
of the participants are summarized in Table 1. Values of central hemodynamic variables participants are summarized in Table 2. After eight weeks the resting heart rate (HR) in the CTG significantly decreased (P≤0.05). The systolic blood pressure (SBP) in CTG decreased significantly at rest and after workload (P≤0.05). The diastolic blood pressure did not change in both groups (P>0.05). The systemic vascular resistance (SVR) in both groups did not change (P>0.05). The stroke volume (SV) increased significantly in CTG at rest and after workload (P≤0.05). The cardiac output (CO) did not change in both groups (P>0.05). The VO2max absolute and relative increased significantly in CTG (P≤0.05).
Significant difference observed between groups in SBP, SV, SVR and VO2max absolute and relative (P≤0.05).
174
PHYSICAL EDUCATION OF STUDENTS
DiscussionHypertension is the most important risk factor for
cardiovascular morbidity and mortality [29] and it is also known that increased resting heart rate is an independent risk factor associated with cardiovascular fatality [30]. In addition, increased heart rate may also increase atherosclerosis, cardiac ischemia, cardiac hypertrophy and heart failure [31, 32]. Studies showed that the patients with high-normal blood pressure (systolic blood pressure 130-139 mmHg, diastolic blood pressure 85-89 mmHg, or both) were twice as likely to have a cardiovascular disease risk compared to those at low levels [33, 34, 35]. Liu S et al. [36] reported significantly decrease in SBP and DBP after acute and chronic exercise. In our study SBP decreased from 125.0±8.7 to 115.7±4.1 mmHg at rest and decreased from 143.6±5.9 to 135.0±8.4 at workload (step-test) in training group significantly, along with decrease in DBP, but there was no significant mode. It was also observed that systolic and diastolic blood pressures of CTG were closed to cardiovascular disease risk before training, but at the end of the study there was a positive improvement indicating that subjects in exercise group were away from the risk of cardiovascular disease. It can be argued that the regular exercise of aerobic with moderate intensity causes positive developments in systolic and diastolic blood
pressures [37, 38]. Jennings et al. [39] and Whelton et al. [40] reported that higher exercise more than five times per week and >60 min did not produce a greater reduction in BP in hypertensive patients compared with three to four times per week and 30–60 min. The relation of long term training intensity to BP reductions is unclear, with some authors observing more change with an intensity >70% VO2max [41], whereas another sees no intensity effect [11]. Nevertheless, the time course of the resting BP change allowed us to verify that the greatest BP reduction was achieved at the end of the 8 weeks of training [36].
Duncker and Bache, [42] reported that during physical activity increase in HR is highest of myocardial oxygen consumption is responsible. In the present study, HR decreased significantly at rest. It is consonant with research of Rodrigues et al. [43] and Chaudhary et al. [44]. SV increased at rest and workload. Trilk et al. [45] demonstrated that interval training improved cardiac function by reducing HR and increasing SV. After 8 weeks continuous training the CO showed no significantly increase. In result of endurance training is eccentric reformation change on heart. It is highlight with increase the internal dimension and a reason of the large left ventricular volume, and high SV [46, 47]. In addition, in the CTG was shown an increase in SV with a decrease
Table 1. General characteristics of the subjects
Variables Training group Control group
Age (year) 18.4 ± 0.7 18.9±0.6Height (cm) 175.7 ± 5.4 173.2±5.3Weight (kg) 71.3 ± 5.1 72.6±4.5
Table 2. Values of central hemodynamic variables in the training and control groups
VariablesGroups Continuous training Control
Status Pre (0 wks.) Post (8 wks.) Pre (0 wks.) Post (8 wks.)
SBP, mmHg
Rest 125.0±8.7 115.7±4,1*,** 121.6±2.8 120.0±5.7Step-test 143.6±5.9 135.0±8.4* 145.0±9.8 142.0±10.3
DBP, mmHg
Rest 83.7±10.0 77.8±5.6 80.5±8.5 77.3±4.8Step-test 79.3±11.8 76.5±6.2 82.6±2.9 75.1±7.5
HR, beats.min-1
Rest 73.2±6.0 65.0±5.3* 71.3±7.5 68.3±5.4Step-test 127.0±10.5 120.9±7.1 124.2±20.7 125.0±24.2
SV, ml
Rest 85.5±7.5 102.5±10.1* 93.5±10.9 96.3±14.2Step-test 83.5±17.3 101.5±6.1* 92.9±14.6 91.8±24.1
CO, l.min-1
Rest 6.2±1.8 7.6±2.2 6.6±1.4 6.5±0.9Step-test 10.6±2.9 12.2±1.7 11.5±1.9 11.4±1.6
SVR, dynes⋅sec⋅cm5
Rest 961.3± 143.0 863.1±107.8** 1072.2±145.3 1056.7±128.2Step-test 925.3±135.0 850.7±112.0** 1026.9±126.3 1032.5±127.8
VO2max absolute,l.min-1
Step-test 4.1±0.6 4.7±0.5*,** 3.6±1.1 3.7±0.7
VO2max relative, ml.kg-1.min-1 Step-test 52.6±8.8 62.9±6.3*,** 48.1±10.9 51.4±11.5
Note: Significantly different from beginning at statistical level: * in groups, ** between groups – P≤0.05
2021
03
175
in heart rate. This mechanism was shown as the result that might maintain a stable resting CO. It can be said, increasing SV is maintained with decreasing heart rate, and conversely. Also, regular exercise makes the flow of the venous blood, thus increasing the amount of blood returning to the heart, which increases CO [48].
Mean arterial blood pressure increases in result of dynamic exercise. Increase in mean arterial pressure results from an increase in CO and decrease in total peripheral resistance [49, 50]. The long term exercise–associated BP reduction is mainly due to decreased total peripheral resistant that is not met by an increase in CO [8]. The mechanism in which exercises have effect on blood pressure is different depending on intensity, time, and training types, but it is known that decreasing blood pressure happens due to decreasing activity of sympathetic nervous system and decreasing the peripheral resistance [51]. That confirmed with decrease in SVP at rest and after step-test. After 8-weeks the SVP in CGT was significantly less than control group.
VO2max is accepted as a demonstration of cardiovascular health and cardiopulmonary fitness [52]. One of the aims of our study was to increase VO2max by applying moderate-intensity continuous programs at 65-70% in addition, improving left ventricular cardiac parameters (CO & SV) [54]. At the end of the study, there was a positive increase in VO2max (absolute and relative) in CTG (at rest and after workload) and resulting in positive improvements in SV. For this reason, we can say that regular exercises on young
male in training group benefit cardiorespiratory fitness and primary and another protection of cardiovascular diseases [54]. Mazurek K et al. [55] reported significantly increase in VO2max absolute and VO2max related in college females after interval and continuous aerobic training. Tjonna et al. [56] showed the intensive endurance training significantly improves VO2max after 10-week of training in healthy men. After 8-weeks VO2max in CGT was significantly higher than CG.
In response to aerobic training, the body reacts by increased oxygen uptake, HR, CO, initial peak and then plateau in SV. Peripheral vascular resistance is reduced and SBP progressively increases along with a decreased DBP [57]. It is consistent with the result of our study in terms of step-test.
ConclusionThe result of this study demonstrated that a positive
effect through moderate-intensity continuous countryside jogging on VO2max and cardiac function. Also, the exercise duration (45 min) and intensity (65-70% VO2max) prescribed in this study were expected to yield the optimal BP reduction as well as improvement in aerobic power especially for sedentary people.
Conflicts of InterestThe author declare that they have no conflict of
interest.
References1. Li J, Siegrist J. Physical activity and risk of cardiovascular
disease: a meta-analysis of prospective cohort studies. Int J Environ Res Public Health, 2012; 9: 391–407. https://doi.org/10.3390/ijerph9020391
2. Otsuki T, Maeda S, Iemitsu M, Saito Y, Tanimura Y, Ajisaka R, et al. Systemic arterial compliance, systemic vascular resistance, and effective arterial elastance during exercise in endurance-trained men. Am J Physiol Regul Integr Comp Physiol, 2008; 295: R228–R235. https://doi.org/10.1152/ajpregu.00009.2008
3. Hottenrott K, Ludyga S, Schulze S. Effects of High Intensity Training and Continuous Endurance Training on Aerobic Capacity and Body Composition in Recreationally Active Runners. J Sports Sci Med, 2012; 11(3): 483–488.
4. Reimers CD, Knapp G, Reimers AK. Does Physical Activity Increase Life Expectancy? A Review of the Literature. Journal of Aging Research, 2012;2012:1–9. https://doi.org/10.1155/2012/243958
5. Chobanian AV, Bakris GL, Black HR, Cushman WC, Green LA, Izzo JL, et al. Seventh Report of the Joint National Committee on Prevention, Detection, Evaluation, and Treatment of High Blood Pressure. Hypertension, 2003;42:1206–52. https://doi.org/10.1161/01.HYP.0000107251.49515.c2
6. Cornelissen VA, Fagard RH. Effects of endurance training on blood pressure, blood pressure–regulating mechanisms, and cardiovascular risk factors. Hypertension, 2005; 46(4): 667–675. https://doi.org/10.1161/01.HYP.0000184225.05629.51
7. Punia S, Kulandaivelan S, Singh V, Punia V. Effect of Aerobic Exercise Training on Blood Pressure in Indians:
Systematic Review. Int J Chronic Dis, 2016; (2):1–8. https://doi.org/10.1155/2016/1370148
8. Cornelissen VA, Smart NA. Exercise training for blood pressure: a systematic review and meta-analysis. Journal of the American Heart Association, 2013; 2(1): e004473. https://doi.org/10.1161/JAHA.112.004473
9. Sagelv EH, Hammer T, Hamsund T, Rognmo K, Pettersen SA, Pedersen S. High Intensity Long Interval Sets Provides Similar Enjoyment as Continuous Moderate Intensity Exercise. The Tromsø Exercise Enjoyment Study. Front Psychol, 2019; 10:1788. https://doi.org/10.3389/fpsyg.2019.01788
10. Halliwill JR. Mechanisms and clinical implications of post-exercise hypotension in humans. Exerc Sport Sci Rev, 2001; 29(2): 65–70.
11. MacDonald JR. Potential causes, mechanisms, and implications of post exercise hypotension. J Hum Hypertens, 2002; 16(4): 225–236. https://doi.org/10.1038/sj.jhh.1001377
12. Horn P, Ostadal P, Ostadal B. Rowing Increases Stroke Volume and Cardiac Output to a Greater Extent Than Cycling. Physiol Res, 2015; 64: 203–207. https://doi.org/10.33549/physiolres.932853
13. Lakin R, Notarius C, Thomas S, Goodman J. Effects of moderate-intensity aerobic cycling and swim exercise on post-exertional blood pressure in healthy young untrained and triathlon-trained men and women. Clinical Science, 2013; 125(12): 543–553. https://doi.org/10.1042/CS20120508
14. Kobe J, Mishra N, Arya VK, Al-Moustadi W, Nates W, Kumar B. Cardiac output monitoring: Technology
176
PHYSICAL EDUCATION OF STUDENTS
and choice. Ann Card Anaesth, 2019; 22(1): 6–17. https://doi.org/10.4103/aca.ACA_41_18
15. Cramer H, Lauche R, Haller H, Steckhan N, Michalsen A, Dobos G. Effects of yoga on cardiovascular disease risk factors: A systematic review and meta-analysis. Int J Cardiol, 2014; 173: 170–183.
16. Hartaigh BO, Gill TM, Shah I, Hughes AD, Deanfield JE, Kuh D, et al. Association between resting heart rate across the life course and all-cause mortality: Longitudinal findings from the Medical Research Council (MRC) National Survey of Health and Development (NSHD). J Epidemiol Community Health, 2014; 68: 883–889.
17. Huang G, Shi X, Davis-Brezette JA, Osness WH. Resting heart rate changes after endurance training in older adults: A meta-analysis. Med Sci Sports Exerc, 2005; 37: 1381–1386.
18. Zheng G, Li S, Huang M, Liu F, Tao J, Chen L. The effect of Tai Chi training on cardiorespiratory fitness in healthy adults: A systematic review and meta-analysis. PLoS ONE, 2015; 10: e0117360. https://doi.org/10.1371/journal.pone.0117360
19. Baggish AL. The athlete’s heart. In: Ostadal B, and Dhalla NS, editors. Cardiac adaptation. Advances in Biochemistry in Health and Disease. New York: Springer Science and Business Media; 2013.
20. Slørdahl SA, Madslien, VO, Støylen A, Kjos A, Helgerud J, Wisløff U. Atrioventricular plane displacement in untrained and trained females. Medicine and Science in Sports and Exercise, 2004; 36(11): 1871–1875. https://doi.org/10.1249/01.MSS.0000145444.01292.3D
21. Ochsner G, Wilhelm MJ, Amacher R, Petrou A, Cesarovic N, Staufert S, et al. In Vivo Evaluation of Physiologic Control Algorithms for Left Ventricular Assist Devices Based on Left Ventricular Volume or Pressure. ASAIO J, 2017; 63(5): 568–577. https://doi.org/10.1097/MAT.0000000000000533
22. Warburton DE, Gledhill N, Jamnik VK, Krip B, Card N. Induced hypervolemia, cardiac function, VO2max, and performance of elite cyclists. Med Sci Sports Exerc, 1999; 31: 800–808. https://doi.org/10.1097/00005768-199906000-00007
23. Daussin FN, Zoll J, Dufour SP, Ponsot E, Lonsdorfer-Wolf E, Doutreleau S, et al. Effect of interval versus continuous training on cardiorespiratory and mitochondrial functions: relationship to aerobic performance improvements in sedentary subjects. American Journal of Physiology-Regulatory, Integrative and Comparative Physiology 2008;295:R264–72. https://doi.org/10.1152/ajpregu.00875.2007
24. Helgerud J, Høydal K, Wang E, Karlsen T, Berg P, Bjerkaas M, et al. Aerobic high-intensity intervals improve VO2max more than moderate training. Med Sci Sports Exerc, 2007; 39(4): 665–671. https://doi.org/10.1249/mss.0b013e3180304570
25. Rognmo Ø, Hetland E, Helgerud J, Hoff J, Slørdahl SA. High intensity aerobic interval exercise is superior to moderate intensity exercise for increasing aerobic capacity in patients with coronary artery disease. Eur J Cardiovasc Prev Rehabil, 2004; 11(3): 216–22. https://doi.org/10.1097/01.hjr.0000131677.96762.0c
26. Wisløff U, Støylen A, Loennechen JP, Bruvold M, Rognmo O, Haram PM, et al. Superior cardiovascular effect of aerobic interval training versus moderate continuous training in heart failure patients: a randomized study. Circulation, 2007; 115(24): 3086–3094. https://doi.org/10.1161/CIRCULATIONAHA.106.675041
27. Bartels MN, Bourne GW, Dwyer JH. High-intensity exercise for patients in cardiac rehabilitation after myocardial infarction. Physical Medicine and Rehabilitation, 2010; 2(2):
151–155.28. Vilarinho R, Caneiras C, Mesquita Montes A. Measurement
properties of step tests for exercise capacity in COPD: A systematic review. Clin Rehabil, 2020;35:578–588. https://doi.org/10.1177/0269215520968054
29. Kearney PM, Whelton M, Reynolds K, Muntner P, Whelton PK, He J. Global burden of hypertension: analysis of worldwide data Lancet, 2005; 365(9455): 217–223. https://doi.org/10.1016/S0140-6736(05)17741-1
30. Brito Díaz B, Alemán Sánchez JJ, Cabrera de León A. Frecuencia cardiaca en reposo y enfermedad cardiovascular [Resting heart rate and cardiovascular disease]. Med Clin (Barc), 2014; 143(1): 34–8. (In Spanish). https://doi.org/10.1016/j.medcli.2013.05.034
31. Palatini P. Heart rate as an independent risk factor for cardiovascular disease: current evidence and basic mechanisms. Drugs, 2007; 67(2):3–13. https://doi.org/10.2165/00003495-200767002-00002
32. Zhang GQ, Zhan W. Heart rate, lifespan, and mortality risk Ageing. Res Rev, 2009; 8(1): 52–60. https://doi.org/10.1016/j.arr.2008.10.001
33. Vasan RS, Larson MG, Leip EP, Evans JC, O’Donnell CJ, Kannel WB, et al. Impact of high-normal blood pressure on the risk of cardiovascular disease. N Engl J Med, 2001; 345(18): 1291–7. https://doi.org/10.1056/NEJMoa003417
34. Ridker PM, Pradhan A, MacFadyen JG, Libby P, Glynn RJ. Cardiovascular benefits and diabetes risks of statin therapy in primary prevention: an analysis from the JUPITER trial. Lancet, 2012; 380(9841): 565–571. https://doi.org/10.1016/S0140-6736(12)61190-8
35. Rossow L, Yan H, Fahs CA, Ranadive SM, Agiovlasitis S, Wilund KR, et al. Postexercise Hypotension in an Endurance-Trained Population of Men and Women Following High-Intensity Interval and Steady-State Cycling. American Journal of Hypertension, 2010; 23(4): 358–367. https://doi.org/10.1038/ajh.2009.269
36. Liu S, Goodman J, Nolan R, Lacombe S, Thomas SG. Blood Pressure Responses to Acute and Chronic Exercise Are Related in Prehypertension. Med Sci Sports Exerc, 2012; 44(9): 1644–1652. https://doi.org/10.1249/MSS.0b013e31825408fb
37. Sillanpää E, Häkkinen A, Punnonen K, Häkkinen K, Laaksonen DE. Effects of strength and endurance training on metabolic risk factors in healthy 40-65-year-old men. Scand J Med Sci Sports, 2009; 19(6): 885–895. https://doi.org/10.1111/j.1600-0838.2008.00849.x
38. Fagard RH. Exercise characteristics and the blood pressure response to dynamic physical training. Med Sci Sports Exerc, 2001; 33(6): 484–92. https://doi.org/10.1097/00005768-200106001-00018
39. Jennings GL, Deakin G, Korner P, Meredith I, Kingwell B, Nelson L. What is the dose–response relationship between exercise training and blood pressure? Ann Med, 2009; 23(3): 313–318. https://doi.org/10.3109/07853899109148066
40. Whelton SP, Chin A, Xin X, He J. Effect of aerobic exercise on blood pressure: a meta-analysis of randomized, controlled trials. Ann Intern Med, 2002; 136: 493–503. https://doi.org/10.7326/0003-4819-136-7-200204020-00006
41. Hagberg JM, Park JJ, Brown MD. The role of exercise training in the treatment of hypertension: an update. Sports Med, 2000; 30(3): 193–206. https://doi.org/10.2165/00007256-200030030-00004
42. Duncker D J, Bache R J. Regulation of Coronary Blood Flow During Exercise. Physiological Reviews, 2008; 88(3): 1009–1086.
2021
03
177
https://doi.org/10.1152/physrev.00045.200643. Rodrigues AC, de Melo Costa J, Alves GB, Ferreira
da Silva D, Picard MH, Andrade JL, et al. (2006). Left ventricular function after exercise training in young men. Am J Cardiol, 2006; 97(7): 1089–92. https://doi.org/10.1016/j.amjcard.2005.10.055
44. Chaudhary S, Kang MK, Sandhu JS. The effects of aerobic versus resistance training on cardiovascular fitness in obese sedentary females. Asian J Sports Med, 2010; 1(4): 177–184. https://doi.org /10.5812/asjsm.34835
45. Trilk JL, Singhal A, Bigelman KA, Cureton KJ. Effect of sprint interval training on circulatory function during exercise in sedentary, overweight/obese women. European journal of applied physiology, 2011; 111: 1591–7. https://doi.org/10.1007/s00421-010-1777-z
46. Maron BJ, Pelliccia A. The heart of trained athletes: cardiac remodeling and the risks of sports, including sudden death. Circulation, 2006; 114: 1633–1644. https://doi.org/10.1161/CIRCULATIONAHA.106.613562
47. Paterick TE, Gordon T,Spiegel D. Echocardiography: profiling of the athlete’s heart. J Am Soc Echocardiogr, 2014; 27: 940–948. https://doi.org/10.1016/j.echo.2014.06.008
48. Hoogsteen J, Hoogeveen A, Schaffers H, Wijn PF, van Hemel NM, van der Wall EE. Myocardial adaptation in different endurance sports: an echocardiographic study. Int J Cardiovasc Imaging, 2004; 20: 19–26. https://doi.org/10.1023/B:CAIM.0000013160.79903.19
49. da Nobrega AC. The subacute effects of exercise: concept, characteristics, and clinical implications. Exerc Sport Sci Rev, 2005; 33: 84–87. https://doi.org/10.1097/00003677-200504000-00005
50. Ridker PM. On evolutionary biology, inflammation, infection, and the causes of atherosclerosis. Circulation, 2002; 105: 2–4. https://doi.org/10.1161/circ.105.1.2
51. Cavalcante MA, Bombig MT, Luna Filho B, Carvalho AC, Paola AA, Póvoa R. Quality of life of hypertensive patients treated at an outpatient clinic. Arq Bras Cardiol, 2007; 89: 245–250. https://doi.org/10.1590/s0066-782x2007001600006
52. Doijad VP, Kample P, Surdi AD. Effect of Yogic exercises on aerobic capacity (VO2 max). Int J Recent Trends Sci Technol, 2013; 6(3): 119–121. https://doi.org/10.5958/j.2320-608X.1.2.010
53. Karavirta L, Häkkinen K, Kauhanen A, Arija-Blázquez A, Sillanpää E, Rinkinen N, et al. Individual responses to combined endurance and strength training in older adults. Med Sci Sports Exercises, 2011; 43(3): 484–490. https://doi.org/10.1249/mss.0b013e3181f1bf0d
54. Lavie CJ, Church TS, Milani RV, Earnest CP, et al. Impact of physical activity, cardiorespiratory fitness, and exercise training on markers of inflammation. J Cardiopulm Rehabil Prev, 2011; 31(3): 137–145. https://doi.org/10.1097/HCR.0b013e3182122827
55. Mazurek K, Krawczyk K, Zmijewski P, Norkowski H, Czajkowska A. Effects of aerobic interval training versus continuous moderate exercise programme on aerobic and anaerobic capacity, somatic features and blood lipid profile in collegate females. Annals of Agricultural and Environmental Medicine, 2014; 21: 844–849. https://doi.org/10.5604/12321966.1129949
56. Tjonna AE, Leinan IM, Bartnes AT, Jenssen BM, Gibala MJ, et al. Low- and High-Volume of Intensive Endurance Training Significantly Improves Maximal Oxygen Uptake after 10-Weeks of Training in Healthy Men. PLoS ONE, 2013; 8(5): e65382. https://doi.org/10.1371/journal.pone.0065382
57. Meka N, Katragadda S, Cherian B, Arora RR. Endurance exercise and resistance training in cardiovascular disease. Therapeutic Advances in Cardiovascular Disease, 2008; 2(2): 115–121. https://doi.org/10.1177/1753944708089701
Information about the author:
Javad Mahdiabadi; Assistant Professor in Exercise Physiology; https://orcid.org/0000-0002-2442-3206; [email protected]; Toos Institute of Higher Education, Mashhad, Iran.
Cite this article as: Mahdiabadi J. The effect of 8 weeks moderate-intensity continuous training on central hemodynamics and VO2max in non-athlete male. Physical Education of Students, 2021;25(3):172–177. https://doi.org/10.15561/20755279.2021.0305
This is an Open Access article distributed under the terms of the Creative Commons Attribution License, which permits unrestricted use, distribution, and reproduction in any medium, provided the original work is properly cited http://creativecommons.org/licenses/by/4.0/deed.en
Received: 12.05.2021Accepted: 18.06.2021; Published: 30.06.2021
178
PHYSICAL EDUCATION OF STUDENTS
The relationship of some factors affecting dynamic-static balance and proprioceptive sense in elite wrestlers*
Recep Aydin1ABCDE, Gülfem Ersöz2ADE, Ali Özkan1ACD
1Faculty of Sport Sciences, Bartin University, Turkey2Faculty of Sport Sciences, Ankara University, Turkey
Authors’ contributions: A – Study design; B – Data collection; C – Statistical analysis; D – Manuscript Preparation; E – Funds Collection.
AbstractBackground and Study Aim
The aim of this study is to identify and correlate some factors that are thought to affect the dynamic-static balance and proprioceptive senses of elite level wrestlers.
Material and Methods
Descriptive statistics of a total of 13 volunteer elite freestyle wrestlers were determined after body weights, height, WAnT, active-squat jump tests, proprioceptive sense measurements, static and dynamic balance test measurements were taken. Then, the relationship test with the values obtained from static-dynamic balance and proprioceptive sense measurements, the Wingate anaerobic power test (WAnT) and vertical jump (active-squat) was examined.
Results As a result of Pearson Products Moment Relationship analyses, a significant relationship was found between static balance measurements and, WAnT anaerobic performance measurements, anaerobic performance measurements obtained from jumping, lower extremity isoinertial strength imbalance measurements (p>0.05). In addition, a significant relationship was found between dynamic balance measurements and WAnT anaerobic performance measurements (p>0.05). In addition, a significant relationship was found between proprioceptive joint angle deviation values and WAnT anaerobic performance measurements, anaerobic performance measurements obtained from jumping, and lower extremity isoinertial strength imbalance measurements (p>0.05).
Conclusions: In conclusion, as the findings of the study, the determining factors of the balance and angular error rates differ in the left and right legs of wrestlers. Especially, in order to minimize left leg balance and angular errors, training modules that increase proprioceptive performance should be applied to athletes.
Keywords: proprioception, dynamic balance, static balance, wrestling, male
Introduction1
In order for the individual to maintain proper motor control, two different senses must work effectively. The sense of balance and vision in the inner ear constitute these senses. Preserving posture together with balance is not a passive fixation, but it is accepted as an active state that includes proprioceptive feedback processes [1]. As the ability to maintain the position, it regulates the proprioceptive sensory, vision and vestibular sensory organs, which provides the coordination between muscle contractions in the lower extremities in balancing the body and significantly affects all activities of daily life. In addition, the relationship between proprioceptive sense and sense of vision emerges as an important factor to control postural sway in static balance [2].
The proprioceptive system, which modulates muscle tone and activity, controls the load applied to bones, joints, tendons and ligaments. These loads are then converted into molecular signals by mechanosensors placed inside tissues. Thus, both growth and stability of the body are regulated [3]. According to some researchers, joint position sense is defined as a specialized model of tactile sense, which is defined in a wide range and includes neuromuscular control [4], while other scientists define proprioception as being aware of position or movement,
© Recep Aydin, Gülfem Ersöz, Ali Özkan, 2021 doi:10.15561/20755279.2021.0306
ORIGINAL ARTICLE
that is, “afferent input”. The afferent information required for fine tuning of motor control works fine on motor control, and this is provided by visual, vestibular and somatosensory receptors [5]. In addition, proprioception is examined in two subgroups as static and dynamic proprioception. While static proprioception means the conscious perception of the orientation of different extremities in the body with respect to one another; the speed and kinesthesia of the sense of movement is called dynamic proprioception. The knowledge of dynamic and static proprioception is attributed to the awareness of the angular movements in all joints applied in all planes and the ratios of the differences in these situations [6]. Kinesthesia, which includes the dynamic component of proprioception, defined as the sense of speed and joint motion, contains mechanoreceptors that give neromuscular abilities to athletes for each joint movement and joint sense [7]. Sensory receptors of proprioception in the skin, muscles, joints, ligaments and tendons continuous monitoring of changes in muscle length, joint angle changes of the other corresponding joint that implements the motion, and the forces generated during muscle contraction are of critical importance to the fulfilment of motor tasks. Proprioceptive sensory neurons (PSN) interpret and respond through spinal circuits. The paths to the brain encode this information and transmit it to the central nervous system [8, 9].
2021
03
179
Proprioceptive mechanosensors are responsible for the continuous regulation of skeletal muscle length and tension to coordinate motor control [9]. Known and most important ones are specific sensory receptors known as muscle spindles (MS) and Golgi tendon organs (GTO), as axons that extend to the periphery from PSN cell bodies localized in the dorsal root ganglia (DRG) [10]. Among all mechanosensors, the two dominant types are considered as the muscle spindle and the Golgi tendon organ. These mechanosensors differ in morphology, location, measured input, effect and other properties [11-13]. Common to both mechanosensor is that they perceive the biomechanical environment and that special sensory afferent information quickly initiates a neural response in the fibers. As a result, muscle spindles and GTOs modulate local muscle tension, and have the ability to create reflex bridges [14].
Postural performance is defined as the ability to minimize postural sway [15]. In other words, it is accepted as an umbrella term that includes the act of maintaining, regaining or restoring a balance state during any postural balance or activity [16]. In addition to playing a role in sport-specific postural control, balance is also known to play a fundamental role in many athletic activities. Although the relationship between balance and performance is limited, it can contribute to high performance [17, 18]. Factors that change the responses of postural control are sensory information obtained from the somato sensory, visual, and vestibular systems. In addition, it includes motor responses that affect the quality and safety of performance during athletic performance, such as routine functional movements, coordination, range of motion (ROM), high intensity exercises [19] power values [20, 21] vertical protection of the center of mass (COM) of the body on the base of support (BOS) [17]. In order to have an optimal balance, three afferent information must be provided. These are proprioception, vision, and vestibular system [22].
Wrestling is one of the oldest competitive sports in the world as a high-intensity sport that requires regional power and whole-body power [23-26]. While athletes exhibit these skills on the mat, they apply many physical and affective characteristics such as strength, endurance, flexibility, balance, agility, strategy to the opponent during the match, in transforming the skill into points. As these characteristics are being exhibited, the skills enter into a systematic cycle, as successive and alike. During the match, this cycle is provided with conscious and unconscious feelings, awareness of movement, balance and postural control. This is reflected in the central nervous system as neural cumulative input and draws attention to the importance of proprioception in wrestling [27, 28].
Purpose: In this context, our study was conducted to determine the relationship between lower extremity strength imbalances and anaerobic performance, which are thought to affect the dynamic-static balance and proprioceptive senses obtained from elite level wrestlers.
Material and MethodsParticipantsIn the study, 13 national male athlete students (24.23
± 2.01 years; 172.84 ± 8.08 cm; 80.67 ± 23.31 kg) who were educated at Bartın University Faculty of Sport Sciences and actively participated in wrestling training have participated voluntarily. The approval of Ankara University Faculty of Medicine Clinical Research Ethics Committee was obtained for the study to be implemented.
Research DesignIn the research, there were athletes who competed
as licensed athletes in wrestling for the last 5 years and participated in training at least 4 days a week. Athletes who competed in wrestling as freestyle athletes and represented Turkey in the A classification category participated. A randomized single-blind experimental study design with no control group was used in the study.
Anthropometric Measurement ToolsHeight and body weight measurements were taken
with scales integrated with SECA brand stadiometer. The precision of the device is ±0.01 mm and ±0.1 kg.
Anaerobic power and Capacity Measurement ToolsWhen determining anaerobic performance, Monark
894 branded Wingate Anaerobic Power Test (WAnT) was used. Participants were subjected to a 30-second test period by applying 75g of external resistance per body weight. In addition, as another method, squat jump and active jump tests were applied on the Lafayette-VertiMetric branded electronic jumpmeter.
Proprioception MeasurementFor proprioceptive measurements, Baseline Digital
Absolute+Axis 180˚ goniometer was used. In order to provide stability in the knee joint and to prevent any angular error, the digital goniometer is mounted on the Wicromed brand angle adjustable knee brace. Joint Position Sense (JPS) method, one of the proprioceptive measurement methods, was applied to the participants on double leg [29]. While determining the target angles, the knee joint positions during the skills used by the athletes in wrestling sport were examined and the close values, 90o, 105o, 120o were determined as target angle.
Static and Dynamic Balance Measurement Static and dynamic balance measurements were
performed using Pro-Kin Tecnobody, PK200 branded device. Among the static balance data, the parameters of each participant’s static balance scores were recorded. These parameters were determined as FBSD: back and forth sway, MLSD: left and right sway, ACOPY: pressure point to y-axis, ACOPX: pressure point to x-axis. The parameters among the dynamic balance data were determined as PL: total sway, AGP: mean sway velocity in the field, AP: mean degree of sway to the front and back, ML: mean degree of sway to the left and right. On the dynamic balance device, the balance scores of double leg with eyes open, dominant legs with eyes open and nondominant legs with eyes open were recorded.
Isometric Force Distribution MeasurementsIsometric force distribution measurements were
performed on the DESMOTEC D. device as the force
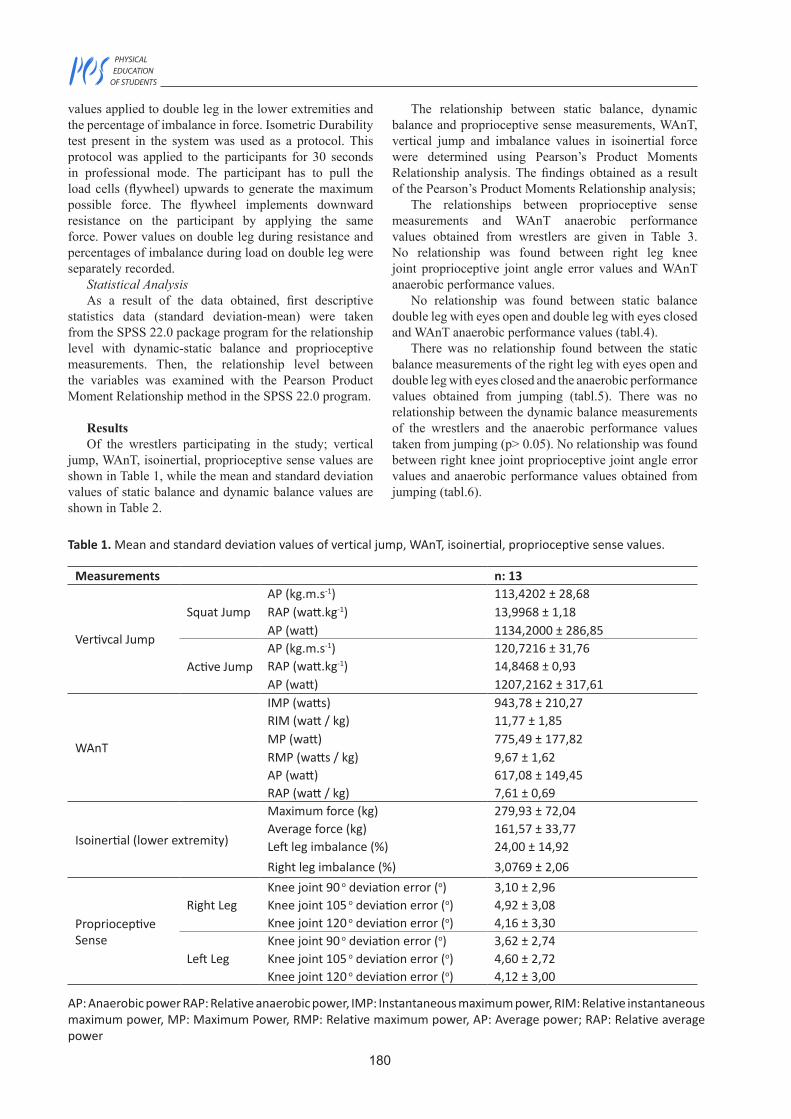
180
PHYSICAL EDUCATION OF STUDENTS
values applied to double leg in the lower extremities and the percentage of imbalance in force. Isometric Durability test present in the system was used as a protocol. This protocol was applied to the participants for 30 seconds in professional mode. The participant has to pull the load cells (flywheel) upwards to generate the maximum possible force. The flywheel implements downward resistance on the participant by applying the same force. Power values on double leg during resistance and percentages of imbalance during load on double leg were separately recorded.
Statistical AnalysisAs a result of the data obtained, first descriptive
statistics data (standard deviation-mean) were taken from the SPSS 22.0 package program for the relationship level with dynamic-static balance and proprioceptive measurements. Then, the relationship level between the variables was examined with the Pearson Product Moment Relationship method in the SPSS 22.0 program.
ResultsOf the wrestlers participating in the study; vertical
jump, WAnT, isoinertial, proprioceptive sense values are shown in Table 1, while the mean and standard deviation values of static balance and dynamic balance values are shown in Table 2.
The relationship between static balance, dynamic balance and proprioceptive sense measurements, WAnT, vertical jump and imbalance values in isoinertial force were determined using Pearson’s Product Moments Relationship analysis. The findings obtained as a result of the Pearson’s Product Moments Relationship analysis;
The relationships between proprioceptive sense measurements and WAnT anaerobic performance values obtained from wrestlers are given in Table 3. No relationship was found between right leg knee joint proprioceptive joint angle error values and WAnT anaerobic performance values.
No relationship was found between static balance double leg with eyes open and double leg with eyes closed and WAnT anaerobic performance values (tabl.4).
There was no relationship found between the static balance measurements of the right leg with eyes open and double leg with eyes closed and the anaerobic performance values obtained from jumping (tabl.5). There was no relationship between the dynamic balance measurements of the wrestlers and the anaerobic performance values taken from jumping (p> 0.05). No relationship was found between right knee joint proprioceptive joint angle error values and anaerobic performance values obtained from jumping (tabl.6).
Table 1. Mean and standard deviation values of vertical jump, WAnT, isoinertial, proprioceptive sense values.
Measurements n: 13
Vertivcal Jump
Squat JumpAP (kg.m.s-1) 113,4202 ± 28,68RAP (watt.kg-1) 13,9968 ± 1,18AP (watt) 1134,2000 ± 286,85
Active JumpAP (kg.m.s-1) 120,7216 ± 31,76RAP (watt.kg-1) 14,8468 ± 0,93AP (watt) 1207,2162 ± 317,61
WAnT
IMP (watts) 943,78 ± 210,27RIM (watt / kg) 11,77 ± 1,85MP (watt) 775,49 ± 177,82RMP (watts / kg) 9,67 ± 1,62AP (watt) 617,08 ± 149,45RAP (watt / kg) 7,61 ± 0,69
Isoinertial (lower extremity)
Maximum force (kg) 279,93 ± 72,04Average force (kg) 161,57 ± 33,77Left leg imbalance (%) 24,00 ± 14,92Right leg imbalance (%) 3,0769 ± 2,06
Proprioceptive Sense
Right LegKnee joint 90 o deviation error (o) 3,10 ± 2,96Knee joint 105 o deviation error (o) 4,92 ± 3,08Knee joint 120 o deviation error (o) 4,16 ± 3,30
Left LegKnee joint 90 o deviation error (o) 3,62 ± 2,74Knee joint 105 o deviation error (o) 4,60 ± 2,72Knee joint 120 o deviation error (o) 4,12 ± 3,00
AP: Anaerobic power RAP: Relative anaerobic power, IMP: Instantaneous maximum power, RIM: Relative instantaneous maximum power, MP: Maximum Power, RMP: Relative maximum power, AP: Average power; RAP: Relative average power
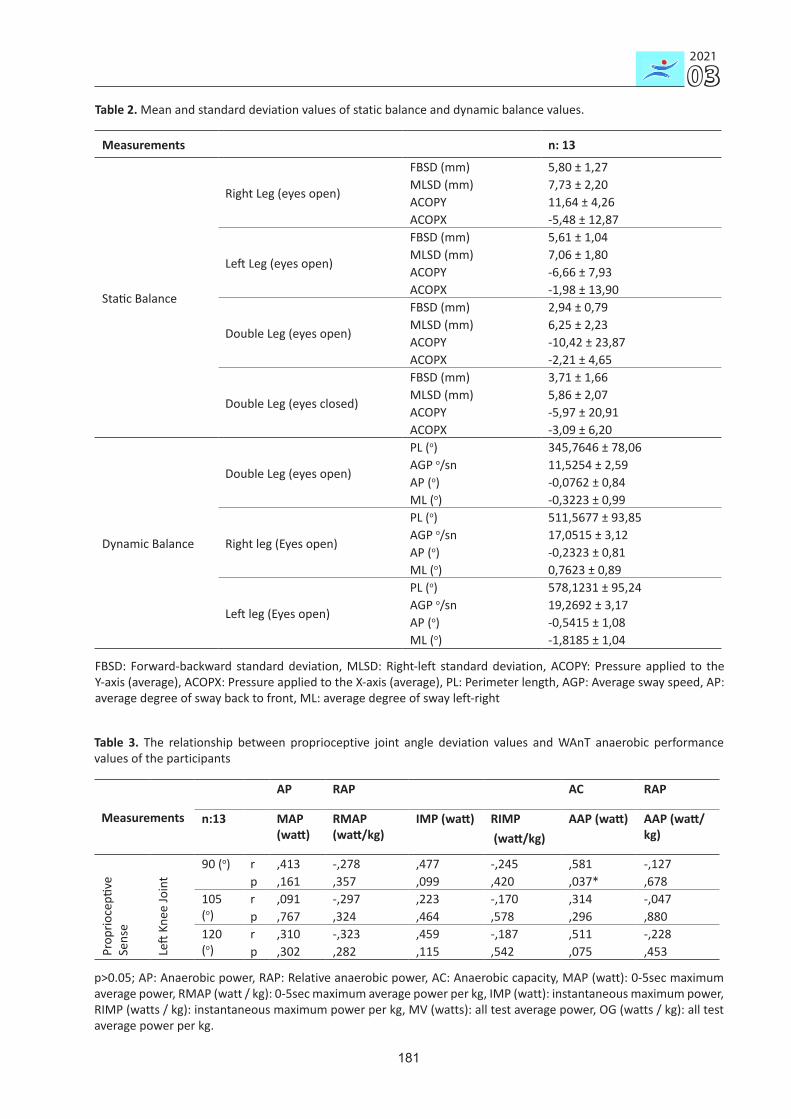
2021
03
181
Table 2. Mean and standard deviation values of static balance and dynamic balance values.
Measurements n: 13
Static Balance
Right Leg (eyes open)
FBSD (mm) 5,80 ± 1,27MLSD (mm) 7,73 ± 2,20ACOPY 11,64 ± 4,26ACOPX -5,48 ± 12,87
Left Leg (eyes open)
FBSD (mm) 5,61 ± 1,04MLSD (mm) 7,06 ± 1,80ACOPY -6,66 ± 7,93ACOPX -1,98 ± 13,90
Double Leg (eyes open)
FBSD (mm) 2,94 ± 0,79MLSD (mm) 6,25 ± 2,23ACOPY -10,42 ± 23,87ACOPX -2,21 ± 4,65
Double Leg (eyes closed)
FBSD (mm) 3,71 ± 1,66MLSD (mm) 5,86 ± 2,07ACOPY -5,97 ± 20,91ACOPX -3,09 ± 6,20
Dynamic Balance
Double Leg (eyes open)
PL (o) 345,7646 ± 78,06AGP o/sn 11,5254 ± 2,59AP (o) -0,0762 ± 0,84ML (o) -0,3223 ± 0,99
Right leg (Eyes open)
PL (o) 511,5677 ± 93,85AGP o/sn 17,0515 ± 3,12AP (o) -0,2323 ± 0,81ML (o) 0,7623 ± 0,89
Left leg (Eyes open)
PL (o) 578,1231 ± 95,24AGP o/sn 19,2692 ± 3,17AP (o) -0,5415 ± 1,08ML (o) -1,8185 ± 1,04
FBSD: Forward-backward standard deviation, MLSD: Right-left standard deviation, ACOPY: Pressure applied to the Y-axis (average), ACOPX: Pressure applied to the X-axis (average), PL: Perimeter length, AGP: Average sway speed, AP: average degree of sway back to front, ML: average degree of sway left-right
Table 3. The relationship between proprioceptive joint angle deviation values and WAnT anaerobic performance values of the participants
Measurements
AP RAP AC RAP
n:13 MAP (watt)
RMAP (watt/kg)
IMP (watt) RIMP (watt/kg)
AAP (watt) AAP (watt/kg)
Prop
rioce
ptive
Se
nse
Left
Knee
Join
t
90 (o) r ,413 -,278 ,477 -,245 ,581 -,127p ,161 ,357 ,099 ,420 ,037* ,678
105 (o)
r ,091 -,297 ,223 -,170 ,314 -,047p ,767 ,324 ,464 ,578 ,296 ,880
120 (o)
r ,310 -,323 ,459 -,187 ,511 -,228p ,302 ,282 ,115 ,542 ,075 ,453
p>0.05; AP: Anaerobic power, RAP: Relative anaerobic power, AC: Anaerobic capacity, MAP (watt): 0-5sec maximum average power, RMAP (watt / kg): 0-5sec maximum average power per kg, IMP (watt): instantaneous maximum power, RIMP (watts / kg): instantaneous maximum power per kg, MV (watts): all test average power, OG (watts / kg): all test average power per kg.
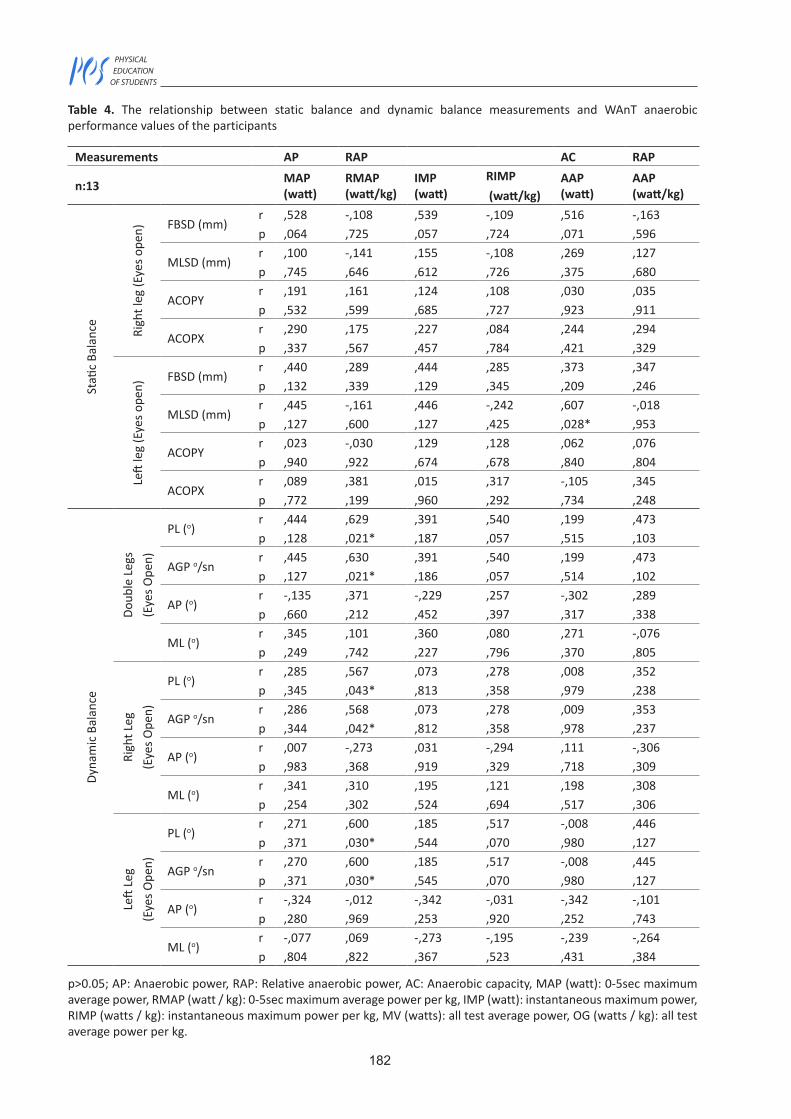
182
PHYSICAL EDUCATION OF STUDENTS
Table 4. The relationship between static balance and dynamic balance measurements and WAnT anaerobic performance values of the participants
Measurements AP RAP AC RAP
n:13 MAP (watt)
RMAP (watt/kg)
IMP (watt)
RIMP (watt/kg)
AAP (watt)
AAP (watt/kg)
Stati
c Ba
lanc
e
Righ
t leg
(Eye
s ope
n) FBSD (mm)r ,528 -,108 ,539 -,109 ,516 -,163p ,064 ,725 ,057 ,724 ,071 ,596
MLSD (mm)r ,100 -,141 ,155 -,108 ,269 ,127p ,745 ,646 ,612 ,726 ,375 ,680
ACOPYr ,191 ,161 ,124 ,108 ,030 ,035p ,532 ,599 ,685 ,727 ,923 ,911
ACOPXr ,290 ,175 ,227 ,084 ,244 ,294p ,337 ,567 ,457 ,784 ,421 ,329
Left
leg
(Eye
s ope
n)
FBSD (mm)r ,440 ,289 ,444 ,285 ,373 ,347p ,132 ,339 ,129 ,345 ,209 ,246
MLSD (mm)r ,445 -,161 ,446 -,242 ,607 -,018p ,127 ,600 ,127 ,425 ,028* ,953
ACOPYr ,023 -,030 ,129 ,128 ,062 ,076p ,940 ,922 ,674 ,678 ,840 ,804
ACOPXr ,089 ,381 ,015 ,317 -,105 ,345p ,772 ,199 ,960 ,292 ,734 ,248
Dyna
mic
Bal
ance
Doub
le L
egs
(Eye
s Ope
n)
PL (o)r ,444 ,629 ,391 ,540 ,199 ,473p ,128 ,021* ,187 ,057 ,515 ,103
AGP o/snr ,445 ,630 ,391 ,540 ,199 ,473p ,127 ,021* ,186 ,057 ,514 ,102
AP (o)r -,135 ,371 -,229 ,257 -,302 ,289p ,660 ,212 ,452 ,397 ,317 ,338
ML (o)r ,345 ,101 ,360 ,080 ,271 -,076p ,249 ,742 ,227 ,796 ,370 ,805
Righ
t Leg
(E
yes O
pen)
PL (o)r ,285 ,567 ,073 ,278 ,008 ,352p ,345 ,043* ,813 ,358 ,979 ,238
AGP o/snr ,286 ,568 ,073 ,278 ,009 ,353p ,344 ,042* ,812 ,358 ,978 ,237
AP (o)r ,007 -,273 ,031 -,294 ,111 -,306p ,983 ,368 ,919 ,329 ,718 ,309
ML (o)r ,341 ,310 ,195 ,121 ,198 ,308p ,254 ,302 ,524 ,694 ,517 ,306
Left
Leg
(Eye
s Ope
n)
PL (o)r ,271 ,600 ,185 ,517 -,008 ,446p ,371 ,030* ,544 ,070 ,980 ,127
AGP o/snr ,270 ,600 ,185 ,517 -,008 ,445p ,371 ,030* ,545 ,070 ,980 ,127
AP (o)r -,324 -,012 -,342 -,031 -,342 -,101p ,280 ,969 ,253 ,920 ,252 ,743
ML (o)r -,077 ,069 -,273 -,195 -,239 -,264p ,804 ,822 ,367 ,523 ,431 ,384
p>0.05; AP: Anaerobic power, RAP: Relative anaerobic power, AC: Anaerobic capacity, MAP (watt): 0-5sec maximum average power, RMAP (watt / kg): 0-5sec maximum average power per kg, IMP (watt): instantaneous maximum power, RIMP (watts / kg): instantaneous maximum power per kg, MV (watts): all test average power, OG (watts / kg): all test average power per kg.
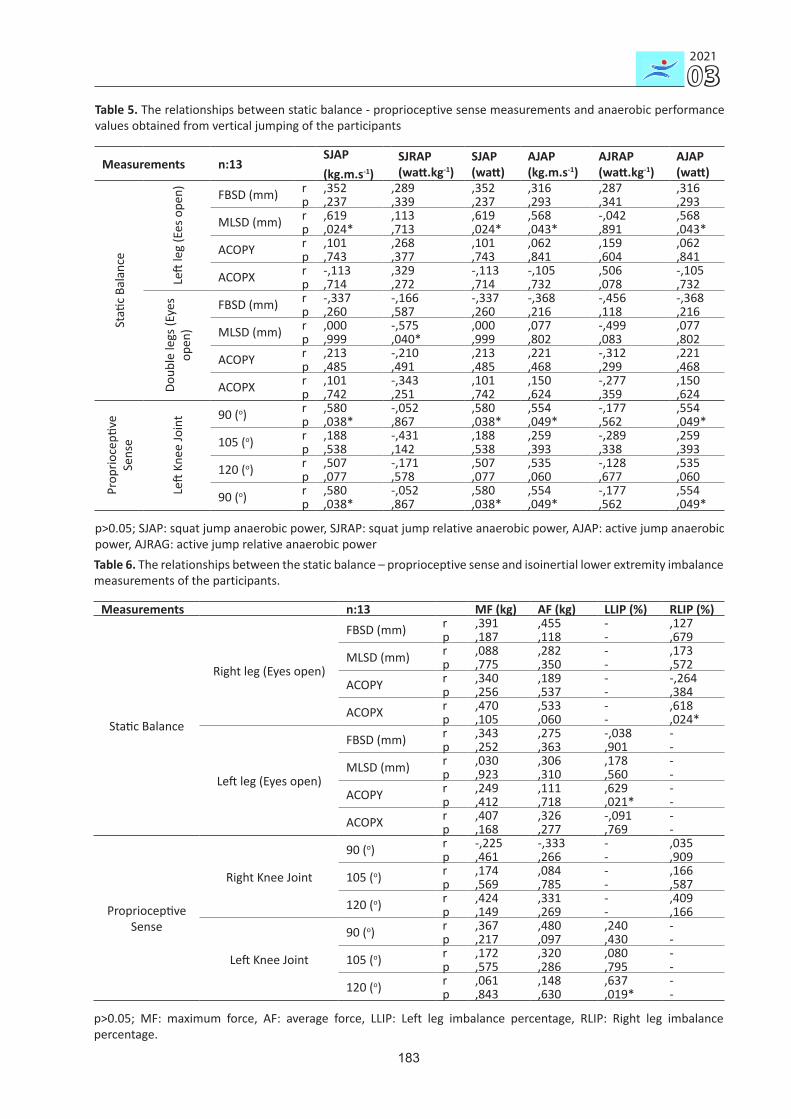
2021
03
183
Table 5. The relationships between static balance - proprioceptive sense measurements and anaerobic performance values obtained from vertical jumping of the participants
Measurements n:13SJAP(kg.m.s-1)
SJRAP (watt.kg-1)
SJAP (watt)
AJAP (kg.m.s-1)
AJRAP (watt.kg-1)
AJAP (watt)
Stati
c Ba
lanc
e
Left
leg
(Ees
ope
n) FBSD (mm) r ,352 ,289 ,352 ,316 ,287 ,316p ,237 ,339 ,237 ,293 ,341 ,293
MLSD (mm) r ,619 ,113 ,619 ,568 -,042 ,568p ,024* ,713 ,024* ,043* ,891 ,043*
ACOPY r ,101 ,268 ,101 ,062 ,159 ,062p ,743 ,377 ,743 ,841 ,604 ,841
ACOPX r -,113 ,329 -,113 -,105 ,506 -,105p ,714 ,272 ,714 ,732 ,078 ,732
Doub
le le
gs (E
yes
open
)
FBSD (mm) r -,337 -,166 -,337 -,368 -,456 -,368p ,260 ,587 ,260 ,216 ,118 ,216
MLSD (mm) r ,000 -,575 ,000 ,077 -,499 ,077p ,999 ,040* ,999 ,802 ,083 ,802
ACOPY r ,213 -,210 ,213 ,221 -,312 ,221p ,485 ,491 ,485 ,468 ,299 ,468
ACOPX r ,101 -,343 ,101 ,150 -,277 ,150p ,742 ,251 ,742 ,624 ,359 ,624
Prop
rioce
ptive
Se
nse
Left
Knee
Join
t 90 (o) r ,580 -,052 ,580 ,554 -,177 ,554p ,038* ,867 ,038* ,049* ,562 ,049*
105 (o) r ,188 -,431 ,188 ,259 -,289 ,259p ,538 ,142 ,538 ,393 ,338 ,393
120 (o) r ,507 -,171 ,507 ,535 -,128 ,535p ,077 ,578 ,077 ,060 ,677 ,060
90 (o) r ,580 -,052 ,580 ,554 -,177 ,554p ,038* ,867 ,038* ,049* ,562 ,049*
p>0.05; SJAP: squat jump anaerobic power, SJRAP: squat jump relative anaerobic power, AJAP: active jump anaerobic power, AJRAG: active jump relative anaerobic power Table 6. The relationships between the static balance – proprioceptive sense and isoinertial lower extremity imbalance measurements of the participants.
Measurements n:13 MF (kg) AF (kg) LLIP (%) RLIP (%)
Static Balance
Right leg (Eyes open)
FBSD (mm) r ,391 ,455 - ,127p ,187 ,118 - ,679
MLSD (mm) r ,088 ,282 - ,173p ,775 ,350 - ,572
ACOPY r ,340 ,189 - -,264p ,256 ,537 - ,384
ACOPX r ,470 ,533 - ,618p ,105 ,060 - ,024*
Left leg (Eyes open)
FBSD (mm) r ,343 ,275 -,038 -p ,252 ,363 ,901 -
MLSD (mm) r ,030 ,306 ,178 -p ,923 ,310 ,560 -
ACOPY r ,249 ,111 ,629 -p ,412 ,718 ,021* -
ACOPX r ,407 ,326 -,091 -p ,168 ,277 ,769 -
Proprioceptive Sense
Right Knee Joint
90 (o) r -,225 -,333 - ,035p ,461 ,266 - ,909
105 (o) r ,174 ,084 - ,166p ,569 ,785 - ,587
120 (o) r ,424 ,331 - ,409p ,149 ,269 - ,166
Left Knee Joint
90 (o) r ,367 ,480 ,240 -p ,217 ,097 ,430 -
105 (o) r ,172 ,320 ,080 -p ,575 ,286 ,795 -
120 (o) r ,061 ,148 ,637 -p ,843 ,630 ,019* -
p>0.05; MF: maximum force, AF: average force, LLIP: Left leg imbalance percentage, RLIP: Right leg imbalance percentage.

184
PHYSICAL EDUCATION OF STUDENTS
No relationship was found between static balance with double leg with eyes open and double leg with eyes closed and lower extremity isoinertial force imbalance measurements. No relationship was found between wrestlers’ dynamic balance and lower extremity isoinertial force imbalance measurements.
No relationship was found between right knee joint proprioceptive joint angle error values and lower extremity isoinertial force imbalance measurements.
Discussion According to the findings obtained, it is seen that the
mean values of the wrestlers participating in the study have normal values are similar to the literature [30-32].
In static balance, statistically better results were obtained from the means, in favor of the balance measurements with eyes open, between the balance measurements with double leg with eyes open, and the balance measurements with double leg with the eyes closed (Table 2). The degree of sway of the left leg in static balance suggests that this may be related to the mass and volume of the muscles in the thigh and their inter-synergy. When dynamic balance measurements are considered, right leg dynamic balance measurements show statistically more positive results than left leg dynamic balance measurements. Double leg dynamic balance measurements show better scores than both single leg balance measurements (Table 2).
Isoinertial balance parameter distributions were examined on the condition of generating eccentric force after an equal amount of concentric force by means of a flywheel system. While athletes applied maximum force (279.93 ± 72.04kg) and applied average force (161.57 ± 33.77kg), their left leg imbalance percentages were determined as 24.00 ± 14.92%, and right leg imbalance percentages were determined as 3.07 ± 2.06%. As can be understood here, the force on both knee joints exhibits a great imbalance in the percentage force distribution in the left leg. Besides, the test yielded results that prove that the dominant leg is the right leg with percentages of imbalance in force (Table 1). As in the studies on the balance values of wrestlers with auditory special needs [33, 34] in the literature, the results of the studies with the participation of normal wrestlers [35, 36] are similar to the findings of this study. As the “sway” states in the balance parameters move away from the zero (0) point, it leads the athlete to imbalance. So much so that this situation is seen as determinant in both static and dynamic balance. However, it is seen that the anthropometric values of the athletes affect the balance scores [37], and it is also seen that balance studies in different branches are stimulated through different proprioceptive channels [38, 17]. In addition, it has been found that in the balance parameters applied on different surfaces, defense sports such as taekwondo have more single leg sways [39]. This situation is similarly observed in studies conducted in different branches [40]. Contrary to all these results, there are also studies in the literature stating that anthropometric properties may not be considered as descriptive in balance
tests and additional research may be required for this [41].The ability of individuals to do a work for balance
performance is not only based on muscle strength, aerobic capacity, but may also be related to the explosive power generation of leg extensors [42-44] hamstring/quadriceps ratio. In case of imbalance, the most important risk factors are muscle strength applied to the knee joint, hip extensors-flexors, and lateral postural balance situation [45,46]. When the anaerobic results are examined at the level of means (Table 1), it is in line with the literature when considering the athletes of being at national level and at the level of training [47-49]. In some studies, it is seen that it has lower maximum, minimum and mean power values than our study in terms of training status and age criteria [50]. In the study examining the anaerobic performance values of different style wrestlers, it is seen that in the wingate lower extremity anaerobic performance test, Greco-Roman style has higher values than freestyle in all variables [51]. There are similarities between the anaerobic performance values of freestyle and Greco-Roman style athletes and the values of the athletes in our study, except for the maximum anaerobic power and fatigue index values.
High number of muscles, muscle mass and muscle fibers that make up the leg area indicate that the force generated by the muscle may be higher [52, 53]. In this respect, the fact that the dominant legs of the wrestling athletes in our group are right legs, and the other leg is lighter while maintaining balance on the mat may provide an advantage. Thus, less load will be placed on the body during balance, and athletes can be made to use their left leg as a limb to demonstrate their strategies.
On the other hand, deep ventilation resulting from anaerobic acidosis (lactic acid accumulation) caused by intense vigorous exercise also increases body release [54, 55]. It is known that affect postural control by causing proprioceptive stimulation, vestibular and visual inputs cause nerve muscle fatigue after vigorous exercise, central and affective weaknesses and cardio-respiratory changes [56-58].
In previous studies on the sense of joint position, traumas in the knee joint in general and the differences in the patient’s return process were examined. Some of these studies included elderly individuals [59-61], young sedentary individuals [62], the relationship between the fall risks of elderly groups and pain syndromes [63-65], patients with knee osteoarthritis [66], the differences in the sense of joint position of the groups with and without athletes, and the position sense within the sports branches [67-69]. In our study, the smaller the angular error value and the closer to the taught degree (90o-105o-120o) in proprioceptive measurements taken using the Joint Position Sense (JPS) method (Table 1), the better the awareness of the limbs. The better the awareness of the joint position, the more effective it will be in practicing the skill and positioning against the opponent in the match and turning this into points. Results showed that right leg values showed better results in 90 degree angular error than left leg 90 degree angular error. In 105 degrees and
2021
03
185
120 degrees angular errors, it is seen that the angular error of the left leg is better than the angular errors of the right leg (Table 1). In this situation the posture of the wrestlers, the angular awareness of the support legs, their habits while applying the skill can cause angular errors. In addition, it is known that their weight values may be negatively correlated with the sense of position [70]. Obese individuals [71] and having a higher body mass index causes loss of joint stability and impaired proprioception [72]. However, attention has been drawn to the relationship between anaerobic exercise and muscle strength and proprioceptive sense [52], and it has been observed that the knee joint recovered within 30 minutes after the exercise and returned to its former sensory values at the end of 24 hours [73]. When we look at this acute effect, it is seen that as the anaerobic load increases, the proprioception senses are negatively affected [74]. In the results seen in our study, as the anaerobic capacity increases, the angular errors at 90 degrees increase, which
supports this situation. So much so that besides strength training for muscle strengthening, proprioceptive specific exercises are seen as the most effective method to improve proprioceptive accuracy [75]. PNF (proprioceptive neuromuscular facilitation) method can be given as an example and widely used technique [76-78].
ConclusionAs a conclusion, the determining factors of the balance
and angular error rates in the left leg and right leg of the wrestlers differ. Performance enhancing training modules should be applied on left leg balance and angular errors. These training modules should include methods that increase the effectiveness of proprioceptive receptors in muscles, tendons and joints.
Conflict of interestThe authors declare no conflict of interest.
References1. İnal S. Sports Biomechanics Basic Principles. Ankara: Nobel
Bookstore; 2004 (In Turkish).2. Yong MS, Lee YS. Effect of ankle proprioceptive exercise
on static and dynamic balance in normal adults. Journal of Physical Therapy Science, 2017; 29(2): 242– 244. https://doi.org/10.1589/jpts.29.242
3. Blecher R, Heinemann-Yerushalmi L, Assaraf E, Konstantin N, Chapman JR, Cope TC, et al. New functions for the proprioceptive system in skeletal biology. Philosophical Transactions of the Royal Society B: Biological Sciences, 2018; 373(1759): 20170327. https://doi.org/10.1098/rstb.2017.0327
4. Lephart SM, Pincicivero DM, Rozzi SL. Proprioception of the ankle and knee. Sports Medicine, 1998; 25(3): 55– 149. https://doi.org/10.2165/00007256-199825030-00002
5. Ergen E, Ülkar B, Eraslan A. Review: Proprioception and Coordination. Turkish Journal of Sports Medicine, 2007; 42(2): 57–83 (In Turkish).
6. Guyton A, Hall JE, Çavuşoğlu H, Yeğen BÇ, Aydın Z. Medical Physiology. Nobel Bookstore; 2007. (In Turkish).
7. Rozzi S, Lephart SM, Fu FH. Effects of muscular fatigue on knee joint laxity and neuromuscular characteristics of male and female athletes. Journal of Athletic Training, 1999; 34(2): 106.
8. Pierrot-Deseilligny E, Burke D. The Circuitry of the Human Spinal Cord: Its Role in Motor Control and Movement Disorders. Cambridge: Cambridge University Press; 2005. https://doi.org/10.1017/CBO9780511545047
9. Windhorst U. Muscle Proprioceptive Feedback and Spinal Networks. Brain Research Bulletin. 2007; 73: 155–202. https://doi.org/10.1016/j.brainresbull.2007.03.010
10. Sonner MJ, Walters MC, Ladle DR. Analysis of Proprioceptive Sensory Innervation of the Mouse Soleus: A Whole-Mount Muscle Approach. PLoS ONE, 2017;12:e0170751. https://doi.org/10.1371/journal.pone.0170751.
11. Granit R. The functional role of the muscle spindles-facts and hypotheses. Brain: a journal of neurology, 1975; 98(4): 531–556. https://doi.org/10.1093/brain/98.4.531
12. Maier A. Development and regeneration of muscle spindles in mammals and birds. Int. J. Dev. Biol, 1997; 41: 1–17.
13. Moore JC. The Golgi tendon organ: a review and update. American Journal of Occupational Therapy, 1984; 38(4), 227–236. https://doi.org/10.5014/ajot.38.4.227
14. Proske U, Gandevia SS. The proprioceptive senses: their roles in signaling body shape, body position and movement, and muscle force. Physiological Reviews, 2012; 92(4): 1651–1697. https://doi.org/10.1152/physrev.00048.2011
15. Paillard T, Costes-Salon C, Lafont C, Dupui P. Are there differences in postural regulation according to the level of competition in judoists? Br J Sports Med, 2002; 36: 304–5. https://doi.org/10.1136/bjsm.36.4.304
16. Pallock A, Durward B, Rowe P, Paul J. What is balance? Clinical Rehabilitation, 2000; 14(4): 402–406. https://doi.org/10.1191/0269215500cr342oa
17. Hrysomallis C. Balance abilities and athletic performances. Sports Medicine, 2011; 41: 221– 232. https://doi.org/10.2165/11538560-000000000-00000
18. Alderton AK, Morıtz U, Moe-Nılssen R. Force plate and accelerometer measures for evaluating the effect of muscle fatigue on postural control during one legged stance. Physiother Res Int, 2003; 8: 187–199. https://doi.org/10.1002/pri.289
19. Erkmen N, Suveren S, Göktepe AS. Effects of Exercise Continued Until Anaerobic Threshold on Balance Performance in Male Basketball Players. J Hum Kinet, 2012; 33: 73–79. https://doi.org/10.2478/v10078-012-0046-0
20. Grigg P. Peripheral neural mechanisms in proprioception. Sport Rehab, 1994; 3: 2–17. https://doi.org/10.1123/jsr.3.1.2
21. Palmieri RM, Ingersoll CD, Stone MB, Krause BA. Center-of-.pressure parameters used in the assessment of postural control. Journal of Sports and Rehabilitation, 2002; 11: 51–66. https://doi.org/10.1123/jsr.11.1.51
22. Hammamı R, Behm DG, Chtara M, Othman AB, Chaouachı A. Comparison of static balance and the role of vision in elite athletes. Journal of Human Kinetics, 2014; 41(1): 33–41. https://doi.org/10.2478/hukin-2014-0030
23. Zaccagnı L. Anthropometric characteristics and body composition of Italian national wrestlers. European Journal of Sport Science, 2012; 12(2): 145–151. https://doi.org/10.1080/17461391.2010.545838
186
PHYSICAL EDUCATION OF STUDENTS
24. Lopez-Gullon JM. Physical fitness differences between freestyle and Greco-Roman elite wrestlers. Arch. Budo, 2011; 7: 217–225.
25. Vardar SA. The relationship between body composition and anaerobic performance of elite young wrestlers. J. Sports Sci. Med. 2007; 6: 34–38.
26. Mcguıgan MR, Wınchester JB, Erıckson T. The importance of isometric maximum strength in college wrestlers. J. Sports Sci. Med. 2006; 5: 108–113.
27. Hıemstra LA, Lo IK, Fowler PJ. Effect of fatigue on knee proprioception: implications for dynamic stabilization. J Orthop Sports Phys Ther, 2001; 31: 598–605. https://doi.org/10.2519/jospt.2001.31.10.598
28. Rıbeıro F, Olıveıra J. Aging effects on joint proprioception: the role of physical activity in proprioception preservation. Eur Rev Aging Phys Act, 2007; 4: 71–6. https://doi.org/10.1007/s11556-007-0026-x
29. Fortier S, Basset FA. The effects of exercise on limb proprioceptive signals. Journal of electromyography and kinesiology, 2012; 22(6): 795–802. https://doi.org/10.1016/j.jelekin.2012.04.001
30. Ramırez-Velez R, Argothyd R, Meneses-Echavez JF, Sanchez-Puccını MB, Lopez-Alban CA, Cohen DD. Anthropometric characteristics and physical performance of colombian elite male wrestlers. Asian Journal of Sports Medicine, 2014; 5(4). https://doi.org/10.5812/asjsm.23810
31. Mırzaeı B, Curby DG, Barbas I, Lotfı N. Anthropometric and physical fitness traits of four-time World Greco-Roman wrestling champion in relation to national norms: A case study. Journal of Human Sport & Exercıse, 2011; 6(2):406–413. https://doi.org/10.4100/jhse.2011.62.21
32. Koç H, Aydos L. Compare the Reaction Times of Turkish National Team Wrestlers. European Journal of Physical Education and Sport Science. 2018; 4(2).
33. Coşkun B, Unlu G, Golshaeı B, Koçak S, Kirazcı S. Comparison of the static and dynamic balance between normal-hearing and hearing-impaired wrestlers. Montenegrin Journal of Sports Science and Medicine, 2019; 8(1): 11–16. https://doi.org/10.26773/mjssm.190302
34. Alpay CB, Işık Ö. Comparison of body components and balance levels among hearing-impaired wrestlers and healthy wrestlers. Acta Kinesiologica, 2017; 11(1): 79–84.
35. Basar S, Duzgun I, Guzel Na, Cıcıoğlu I, Çelık B. Differences in strength, flexibility and stability in freestyle and Greco-Roman wrestlers. Journal of Back and Musculoskeletal Rehabilitation, 2014; 27(3): 321–330. https://doi.org/10.3233/BMR-130451
36. Polat SC, Cetın E, Yarım I, Bulgay C, Cıcıoglu HI. Effect of ballistic warm-up on isokinetic strength, balance, agility, flexibility and speed in elite freestyle wrestlers. Sport Mont, 2018; 16(3): 85–89. https://doi.org/10.26773/smj.181015
37. Çatal Ç. Investigation of the relationship between anthropometric characteristics and balance performance in athletes in different branches. Amasya: Amasya University Press; 2019. (In Turkish).
38. Perrın P, Devıterne D, Hugel F, Perrot C. Judo, better than dance, develops sensorimotors adaptabilities involved in balance control. Gait & Posture, 2002; 15: 187–194. https://doi.org/10.1016/S0966-6362(01)00149-7
39. Negahban H, Aryan N, Mazaheri M, Norasteh AA, Sanjari MA. Effect of expertise in shooting and Taekwondo on bipedal and unipedal postural control isolated or concurrent with a reaction-time task. Gait & posture, 2013; 38(2), 226–230. https://doi.org/10.1016/j.gaitpost.2012.11.016
40. Bahadoran R, Ghasemzadeh Y, Soleımanı T. Investıgatıng lower lımb strength and statıc balance ın elıte gymnasts and wrestlers wıth non-athletes. 30 International Conference on Biomechanics in Sports, 2012; 276–279.
41. Moeın E, Movaseghı F. Relationship between some anthropometric indices with dynamic and static balance in sedentary female college students. Turkish Journal of Sport and Exercise, 2016; 18(1): 45–49. https://doi.org/10.15314/tjse.65406
42. Ilmarınen J. Job design for the aged with regard to decline in their maximal capacity: Part I–Guidelines for the practioner. Int J Ind Ergon, 1992; 10: 53–65. https://doi.org/10.1016/0169-8141(92)90048-5
43. Landers K, Hunter G, Wetzteın C, Bamman M, Weınsteır R. The interrelationship among muscle mass, strength and the ability to perform physical tasks of daily living in younger and older women. J Gerontol Ser A Biol Sci Med Sci, 2001; 56A(10): B443– B448. https://doi.org/10.1093/gerona/56.10.B443
44. Rantanen T. Muscle strength, disability and mortality. Scand J Med Sci Sports, 2003; 13: 3–8. https://doi.org/10.1034/j.1600-0838.2003.00298.x
45. Horak FB. Mechanistic and physiological aspects postural orientation and equilibrium: what do we need to know about neural control of balance to prevent falls. Age Ageing, 2006; 35(S2): 7–11. https://doi.org/10.1093/ageing/afl077
46. Orr R, Raymond J, Sıngh MF. Efficacy of progressive resistance training on balance performance in older adults: a systematic review of randomized controlled trials. Sports Med, 2008; 38(4): 317–343. https://doi.org/10.2165/00007256-200838040-00004
47. Gıerczuk D, Hübner-Woznıak E, Dlugolecka B. Influence of training on anaerobic power and capacity of upper and lower limbs in young greco-roman wrestlers. Biology of Sport, 2012; 29(3): 235. https://doi.org/10.5604/20831862.1003449
48. Farzad B, Gharakhanlou R, Agha-Alınejad H, Curby DG, Bayatı M, Bahramınejad M, Mäestu J. Physiological and performance changes from the addition of a sprint interval program to wrestling training. The Journal of Strength & Conditioning Research, 2011; 25(9): 2392–2399. https://doi.org/10.1519/JSC.0b013e3181fb4a33
49. Zorba E, Özkan A, Akyüz M, Harmancı H, Taş M, Şenel Ö. The relationship of leg volume and leg mass with anaerobic performance and knee strength in wrestlers. Uluslararası İnsan Bilim Dergisi, 2010; 7(1): 83–96. (In Turkish).
50. Saç A, Taşmektepligil MY. Evaluatıon of the results of three dıfferent anaerobıc power tests obtaıned by measurıng dıfferent sport groups. Journal of Sports and Performance Researches, 2011; 2(1): 5–12. (In Turkish).
51. Kılınç F, Özen, G. Comparison of Anaerobic Power Values and Heart Rate in Elite Freestyle and Greco-Roman Wrestlers. Inonu University Journal of Physical Education and Sport Sciences, 2015; 2(2): 21–34. (In Turkish).
52. Wang H, Jı Z, Jıang G, Lıu W, Jıao X. Relationship among proprioception, muscle strength, and balance. Journal of Physical Therapy Science, 2016; 28(12): 3468–3472. https://doi.org/10.1589/jpts.28.3468
53. Özkan, A, Sarol, H. Relatıonshıp Between Body Composıtıon, Leg Volume, Leg Mass, Anaerobıc Performance And Knee Strength In Clımbers]. Spormetre Beden Eğitimi ve Spor Bilimleri Dergisi, 2008; 6(4), 175–181. (In Turkish). https://doi.org/10.1501/Sporm_0000000108
54. Hunter IW, Kearney RE. Respiratory components of human
2021
03
187
postural sway. Neuroscience Letters, 1981; 25(2): 155–159. https://doi.org/10.1016/0304-3940(81)90324-4
55. Sakelları V, Bronsteın AM, Corna S, Hammon CA, Jones S, Wolsley CJ. The effects of hyperventilation on postural control mechanisms. Brain, 1997; 120(9): 1659–1673. https://doi.org/10.1093/brain/120.9.1659
56. Şimşek D, Ertan H. Postural kontrol ve spor: kassal yorgunluk ve postural kontrol ilişkisi. Spormetre Beden Eğitimi ve Spor Bilimleri Dergisi, 2011; 9(4): 119–124. (In Turkish) . https://doi.org/10.1501/Sporm_0000000208
57. Schneıders AG, Sullıvan SJ, Handcock P, Gray A, Mccrory PR. Sports concussion assessment: the effect of exercise on dynamic and static balance. Scandinavian Journal of Medicine & Science in Sports, 2012; 22(1): 85–90. https://doi.org/10.1111/j.1600-0838.2010.01141.x
58. Bove M, Brunorı A, Cogo C, Faellı E, Ruggerı P. Effects of a fatiguing treadmill exercise on body balance. Gait & Posture, 2005; 21: 121. https://doi.org/10.1016/S0966-6362(05)80397-2
59. Granıto RN, Aveıro MC, Renno ACM, Oıshı J, Drıusso. Comparison of thoracic kyphosis degree, trunk muscle strength and joint position sense among healthy and osteoporotic elderly women: a cross-sectional preliminary study. Archives of Gerontology and Geriatrics, 2012; 54(2): e199–e202. https://doi.org/10.1016/j.archger.2011.05.012
60. Rıbeıro F, Mot J, Olıveıra J. Effect of exercise-induced fatigue on position sense of the knee in the elderly. European Journal of Applied Physiology, 2007; 99(4): 379–385. https://doi.org/10.1007/s00421-006-0357-8
61. Goble DJ, Coxon JP, Wenderoth N, Van Impe A, Swınnen SP. Proprioceptive sensibility in the elderly: degeneration, functional consequences and plastic-adaptive processes. Neuroscience & Biobehavioral Reviews, 2009; 33(3): 271–278. https://doi.org/10.1016/j.neubiorev.2008.08.012
62. Hosp S, Bottonı G, Heınrıch D, Kofler P, Hasler M, Nachbauer W. A pilot study of the effect of Kinesiology tape on knee proprioception after physical activity in healthy women. Journal of Science and Medicine in Sport, 2015; 18(6): 709–713. https://doi.org/10.1016/j.jsams.2014.09.004
63. Şekeröz S. Effects of Chronıc Neck Paın on Balance, Joınt Posıtıon Sense, Head Posture and Flexor Muscle Endurance in Elderly. Denizli: Pamukkale University Press; 2018. (In Turkish).
64. Topal Y. Investigation of the Relationship Between Balance Parameters and Functional Performance and Joint Position Sense in Patients with Knee Osteoarthritis. Ankara: Haccettepe University Press; 2018. (In Turkish).
65. Bayramlar K, Halıs S. Comparison of the joint position sense in transtibial amputees with and without phantom limb pain. Fizyoterapi Rehabilitasyon, 2008; 19(2): 85–91. (In Turkish).
66. Vıthoulka I, Beneka A, Mallıou P, Aggelousıs N, Karatsolıs K, Dıamantopoulos K. The effects of Kinesio-Taping® on quadriceps strength during isokinetic exercise in healthy non athlete women. Isokinet Exerc Sci, 2010; 18(1): 1–6. https://doi.org/10.3233/IES-2010-0352
67. Eıls E, Schröter R, Schröder M, Gerss J, Rosenbaum D. Multistation proprioceptive exercise program prevents ankle injuries in basketball. Medicine & Science in Sports & Exercise, 2010; 42(11): 2098–2105. https://doi.org/10.1249/MSS.0b013e3181e03667
68. Daneshjoo A, Mokhtar AH, Rahnama N, Yusof A. The effects of comprehensive warm-up programs on proprioception, static and dynamic balance on male soccer players. PloS ONE, 2012; 7(12): 51568. https://doi.org/10.1371/journal.pone.0051568
69. Arslan F, Erkmen N, Taşkın H, Sallı A, Ismet CG. Ankle joint position sense in male Taekwondo athletes after wobble board training. Orıgınal Artıcle, 2011; 197–201.
70. Moravvejı H, Ghanbarı A, Kamalı F. Proprioception of knee joint in atheletes and non atheletes obese. Global J Health Sci, 2017; 9: 286–293. https://doi.org/10.5539/gjhs.v9n2p286
71. Wang L, Lı JX, Xu DQ, Hong YL. Proprioception of ankle and knee joints in obese boys and nonobese boys. Medical Science Monitor, 2008; 14(3): 129–135.
72. Peltola EK, Lındahl J, Hıetaranta H, Koskınen SK. Knee dislocation in overweight patients. American Journal of Roentgenology, 2009; 192(1): 101–106. https://doi.org/10.2214/AJR.07.3593
73. Romero-Franco N, Martínez-López EJ, Hıta-Contreras F, Lomas-Vega R, Martínez-Amat A. Short-term effects of anaerobic lactic exercise on knee proprioception of track and field athletes. Isokinetics and Exercise Science, 2014; 22(3): 205–210. https://doi.org/10.3233/IES-140540
74. Göktepe M, Çakır E, Göktepe MM, Şenel Ö. Effect of maximal anaerobic loading on lower extremity proprioceptive sense in soccer players. Journal of Education and Training Studies, 2019; 7(2): 163–168. https://doi.org/10.11114/jets.v7i2.3768
75. Knoop J, Steultjens M, Van Der Leeden M, Van Der Esch M, Thorstensson C, Roorda L, et. al.. Proprioception in knee osteoarthritis: A narrative review. Osteoarthritis and Cartilage, 2011; 19(4): 381–388. https://doi.org/10.1016/j.joca.2011.01.003
76. Ganesh DP. Effect of proprioceptive training on select motor fitness and skill performance variables of hockey players. Indıa: Pondıcherry Unıversıty Press; 2012.
77. Sılva GCE, Sılveıra A, Novaes J, Dı Ması F, Conceıção M, Dantas E. Acute effects of static and proprioceptive neuromuscular facilitation stretching on sprint performance in male swimmers. Med Sport, 2014; 67: 119–28.
78. Göktepe MM, Günay M. The effects of proprioceptive exercise programme given to female footballers their on balance, proprioceptive sense and functional performance. Journal of Human Sciences, 2019; 16(4), 1051–1070. https://doi.org/10.14687/jhs.v16i4.5824
*This entire article has been produced from the doctoral thesis (Ankara University, Health Sciences Institute, TURKEY).
188
PHYSICAL EDUCATION OF STUDENTS
Information about the authors:
Recep Aydın; (Corresponding author); https://orcid.org/0000-0001-8755-226X; [email protected]; Bartin University; Bartın, Turkey.
Gülfem Ersöz; https://orcid.org/0000-0001-8813-3032; [email protected]; Ankara University; Ankara, Turkey.
Ali Özkan; https://orcid.org/0000-0002-2859-2824; [email protected]; Bartin University, Bartın, Turkey.
Cite this article as: Aydin R, Ersöz G, Özkan A.The relationship of some factors affecting dynamic-static balance and proprioceptive sense in elite wrestlers. Physical Education of Students, 2021;25(3):178–188. https://doi.org/10.15561/20755279.2021.0306
This is an Open Access article distributed under the terms of the Creative Commons Attribution License, which permits unrestricted use, distribution, and reproduction in any medium, provided the original work is properly cited http://creativecommons.org/licenses/by/4.0/deed.en
Received: 12.05.2021Accepted: 19.06.2021; Published: 30.06.2021
2021
03
189
Biomechanical analysis of accuracy penalties-kicking performance for Turkish Soccer players: Group-based analysis without goalkeeperAbdullah Arguz1ABE, Abdelkader Guebli2ABCDE, Nurtekin Erkmen3ABE, Samet Aktaş4AB, Madani Reguieg5ADE, Yusuf Er6AD
1 School of Physical Education and Sports, Karamanoğlu Mehmetbey University, Karaman, Turkey2 APSSEH Laboratory, Institute of Physical Education and Sports, Hassiba Benbouali University of Chlef, Algeria3 Faculty of Sports Sciences, Selçuk University of Konya, Turkey4 School of Physical Education and Sports, Batman University, Batman, Turkey5 SMAH Laboratory, Institute of Physical Education and Sports, Abdelhamid Ibn Badiss University of Mostaganem, Algeria6 School of Applied Sciences Recreation Management, Karamanoğlu Mehmetbey University, Karaman, Turkey
Authors’ Contribution: A – Study Design, B – Data Collection, C – Statistical Analysis, D – Manuscript Preparation, E – Funds Collection
AbstractBackground and Study Aim
It is stated that kinetic performance factors are important in the successful execution of accurate kick-penalties, thus, its offer excellent performance despite a substantial kinetic method change in their implementation. The aim of the study is to biomechanical analysis of accuracy penalties-kicking performance for Turkish soccer players.
Material and Methods
The study group consisted 15 male students of Turkish Regional Amateur League players (Age: 21.08± 1.56 years old). Two video cameras placed at optical axes X&Y filmed penalty-kick performance of the subjects. we analysed the best three scores by video analysis Dartfish 9.0 software. Standard statistical methods were used for the calculation of mean±SD. the Statistical significance at p<.05 for Pearson product—moment correlations.
Results Accurate penalty-kicks showed significant positive relationship of knee Pi angle value in backswing, ball Contact phases, trunk angle value in ball contact with the accuracy at p<.01. Significant negative relationship of inclination_body angle value, time of foot contact at p<.01, and distance pivot foot&ball value at p<.05 in the follow-through phase.
Conclusions: Such knowledge should aid in clarify the relationships between variables of penalty kicking during The performance phases and accuracy. the present preliminary investigation of accurate penalty-kicks performance indicates Support-leg characteristics demonstrated in knee angle values an important factor in Backswing, Ball Contact phases with the accuracy of penalty kicking. also, the Foot Contact time and Inclination_Body angle in that.
Keywords: biomechanics, kicking, penalty, accurate, soccer.
Introduction1
Soccer is one type of sports game [1]. Today, soccer is becoming very popular throughout the world [2, 3]. It is a ball sport with many demands on the basic technical and tactical skills of the individual player [4], namely dribbling techniques, kicking techniques, and passing techniques [5]. The soccer kick is considered the most powerful of the playing techniques [6, 7]. There are many factors that influence the success of a ball kick, but the three dominant factors to consider are accuracy, strength, and swing [8, 9].
In a most studies [10–13], soccer kicks is accounted the important actions in the game, but a powerful kick is not always a successful one because accuracy has a bearing on a kick’s success for goal scoring. Seeing the importance of the accuracy of ball kicking in soccer games, research is needed to improve the performance of soccer players when shooting the ball [14]. Especially the penalty kick, as the probability to score on a penalty kick © Abdullah Arguz, Abdelkader Guebli, Nurtekin Erkmen,
Samet Aktaş, Madani Reguieg, Yusuf Er, 2021 doi:10.15561/20755279.2021.0307
ORIGINAL ARTICLE
in soccer is about 80% [15], the importance of penalty kicks is underpinned by the fact that the average number of goals in professional soccer is about 2.5–2.7 [15, 16].
In the following decades, penalty shootout has become the standard tie-breaking procedure in knockout tournaments [17]. Therefore, variations of kick penalties performance become an important factor as a football player [18]. Since most penalties are predicted successful, the player taking the kick is usually under great mental pressure [19], especially facing a goalkeeper who is might be known to be good, when a penalty miss could mean the immediate loss of the match. According to the current rulebook of soccer, laws of the game 2019/20, “when competition rules require a winning team after a drawn match or home-and-away tie, the only permitted procedures to determine the winning team are: (a) away goals rule; (b) two equal periods of extra time not exceeding 15 minutes each; (c) kicks from the penalty mark” [5]. Thus, research examining accuracy in penalty-kicking in other tasks is also in constant development [20–22]. Penalty shootouts performance have inspired
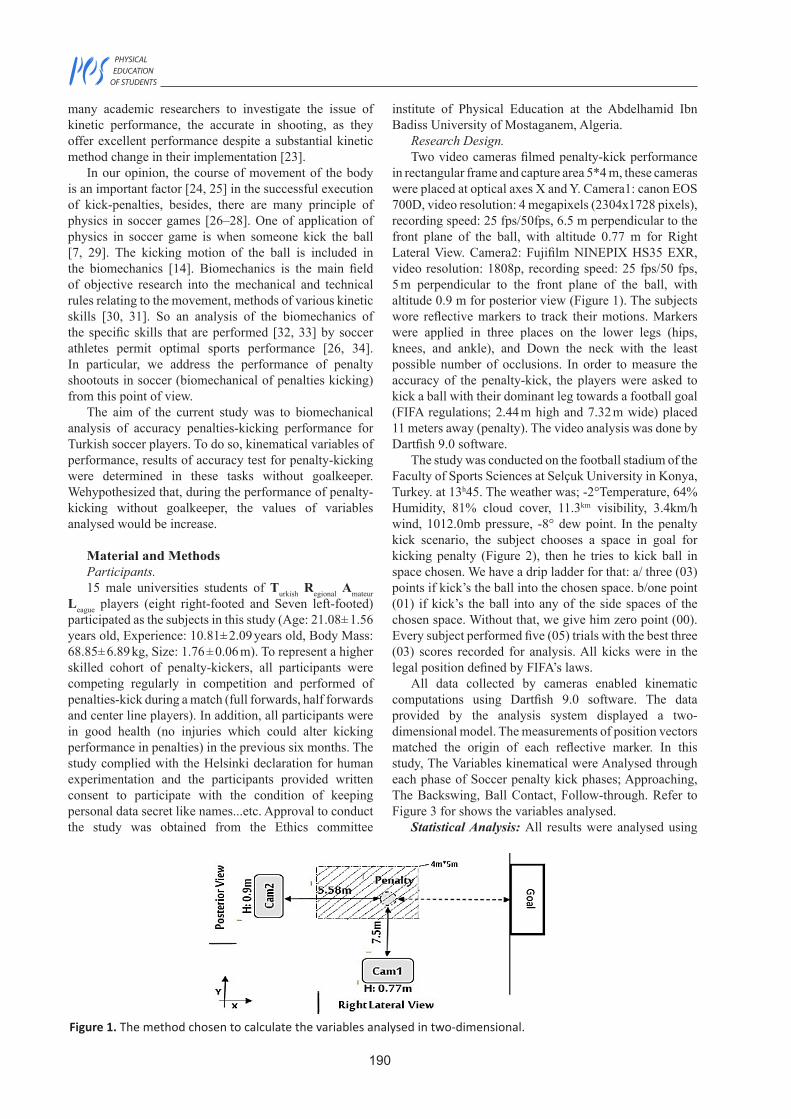
190
PHYSICAL EDUCATION OF STUDENTS
many academic researchers to investigate the issue of kinetic performance, the accurate in shooting, as they offer excellent performance despite a substantial kinetic method change in their implementation [23].
In our opinion, the course of movement of the body is an important factor [24, 25] in the successful execution of kick-penalties, besides, there are many principle of physics in soccer games [26–28]. One of application of physics in soccer game is when someone kick the ball [7, 29]. The kicking motion of the ball is included in the biomechanics [14]. Biomechanics is the main field of objective research into the mechanical and technical rules relating to the movement, methods of various kinetic skills [30, 31]. So an analysis of the biomechanics of the specific skills that are performed [32, 33] by soccer athletes permit optimal sports performance [26, 34]. In particular, we address the performance of penalty shootouts in soccer (biomechanical of penalties kicking) from this point of view.
The aim of the current study was to biomechanical analysis of accuracy penalties-kicking performance for Turkish soccer players. To do so, kinematical variables of performance, results of accuracy test for penalty-kicking were determined in these tasks without goalkeeper. Wehypothesized that, during the performance of penalty-kicking without goalkeeper, the values of variables analysed would be increase.
Material and MethodsParticipants.15 male universities students of Turkish Regional Amateur
League players (eight right-footed and Seven left-footed) participated as the subjects in this study (Age: 21.08± 1.56 years old, Experience: 10.81± 2.09 years old, Body Mass: 68.85± 6.89 kg, Size: 1.76 ± 0.06 m). To represent a higher skilled cohort of penalty-kickers, all participants were competing regularly in competition and performed of penalties-kick during a match (full forwards, half forwards and center line players). In addition, all participants were in good health (no injuries which could alter kicking performance in penalties) in the previous six months. The study complied with the Helsinki declaration for human experimentation and the participants provided written consent to participate with the condition of keeping personal data secret like names...etc. Approval to conduct the study was obtained from the Ethics committee
institute of Physical Education at the Abdelhamid Ibn Badiss University of Mostaganem, Algeria.
Research Design.Two video cameras filmed penalty-kick performance
in rectangular frame and capture area 5*4 m, these cameras were placed at optical axes X and Y. Camera1: canon EOS 700D, video resolution: 4 megapixels (2304x1728 pixels), recording speed: 25 fps/50fps, 6.5 m perpendicular to the front plane of the ball, with altitude 0.77 m for Right Lateral View. Camera2: Fujifilm NINEPIX HS35 EXR, video resolution: 1808p, recording speed: 25 fps/50 fps, 5 m perpendicular to the front plane of the ball, with altitude 0.9 m for posterior view (Figure 1). The subjects wore reflective markers to track their motions. Markers were applied in three places on the lower legs (hips, knees, and ankle), and Down the neck with the least possible number of occlusions. In order to measure the accuracy of the penalty-kick, the players were asked to kick a ball with their dominant leg towards a football goal (FIFA regulations; 2.44 m high and 7.32 m wide) placed 11 meters away (penalty). The video analysis was done by Dartfish 9.0 software.
The study was conducted on the football stadium of the Faculty of Sports Sciences at Selçuk University in Konya, Turkey. at 13h45. The weather was; -2°Temperature, 64% Humidity, 81% cloud cover, 11.3km visibility, 3.4km/h wind, 1012.0mb pressure, -8° dew point. In the penalty kick scenario, the subject chooses a space in goal for kicking penalty (Figure 2), then he tries to kick ball in space chosen. We have a drip ladder for that: a/ three (03) points if kick’s the ball into the chosen space. b/one point (01) if kick’s the ball into any of the side spaces of the chosen space. Without that, we give him zero point (00). Every subject performed five (05) trials with the best three (03) scores recorded for analysis. All kicks were in the legal position defined by FIFA’s laws.
All data collected by cameras enabled kinematic computations using Dartfish 9.0 software. The data provided by the analysis system displayed a two-dimensional model. The measurements of position vectors matched the origin of each reflective marker. In this study, The Variables kinematical were Analysed through each phase of Soccer penalty kick phases; Approaching, The Backswing, Ball Contact, Follow-through. Refer to Figure 3 for shows the variables analysed.
Statistical Analysis: All results were analysed using
Figure 1. The method chosen to calculate the variables analysed in two-dimensional.
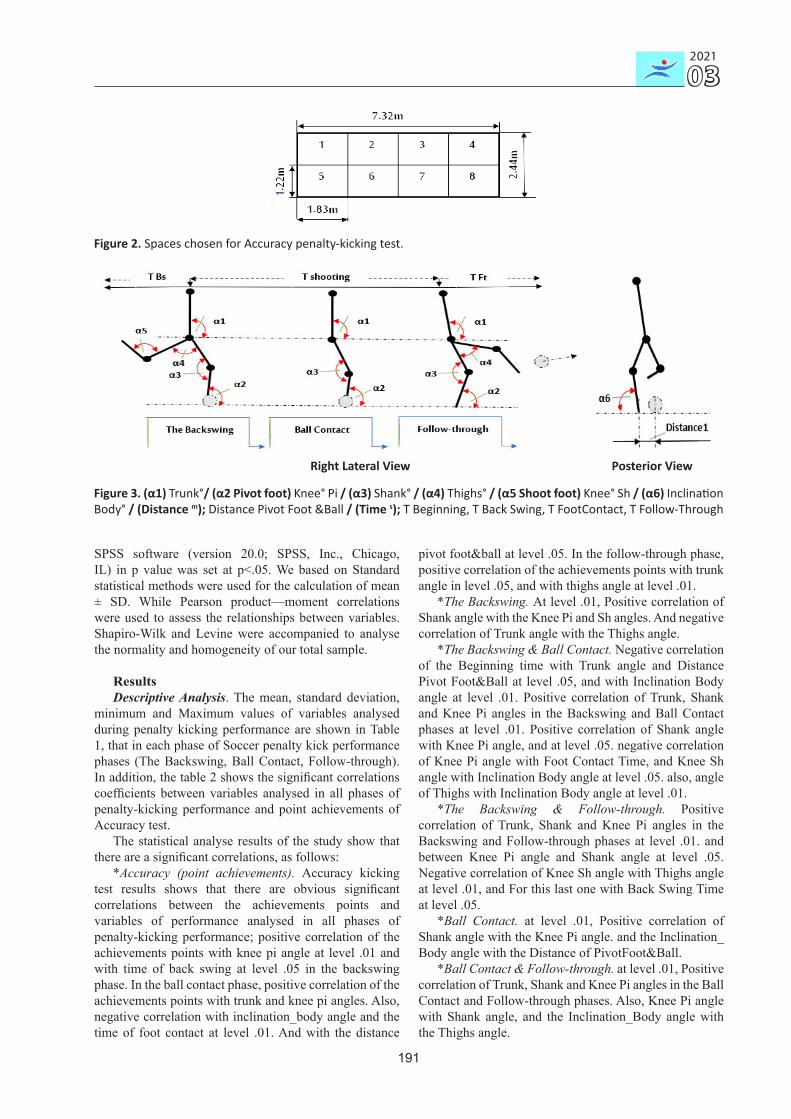
2021
03
191
SPSS software (version 20.0; SPSS, Inc., Chicago, IL) in p value was set at p<.05. We based on Standard statistical methods were used for the calculation of mean ± SD. While Pearson product—moment correlations were used to assess the relationships between variables. Shapiro-Wilk and Levine were accompanied to analyse the normality and homogeneity of our total sample.
ResultsDescriptive Analysis. The mean, standard deviation,
minimum and Maximum values of variables analysed during penalty kicking performance are shown in Table 1, that in each phase of Soccer penalty kick performance phases (The Backswing, Ball Contact, Follow-through). In addition, the table 2 shows the significant correlations coefficients between variables analysed in all phases of penalty-kicking performance and point achievements of Accuracy test.
The statistical analyse results of the study show that there are a significant correlations, as follows:
*Accuracy (point achievements). Accuracy kicking test results shows that there are obvious significant correlations between the achievements points and variables of performance analysed in all phases of penalty-kicking performance; positive correlation of the achievements points with knee pi angle at level .01 and with time of back swing at level .05 in the backswing phase. In the ball contact phase, positive correlation of the achievements points with trunk and knee pi angles. Also, negative correlation with inclination_body angle and the time of foot contact at level .01. And with the distance
pivot foot&ball at level .05. In the follow-through phase, positive correlation of the achievements points with trunk angle in level .05, and with thighs angle at level .01.
*The Backswing. At level .01, Positive correlation of Shank angle with the Knee Pi and Sh angles. And negative correlation of Trunk angle with the Thighs angle.
*The Backswing & Ball Contact. Negative correlation of the Beginning time with Trunk angle and Distance Pivot Foot&Ball at level .05, and with Inclination Body angle at level .01. Positive correlation of Trunk, Shank and Knee Pi angles in the Backswing and Ball Contact phases at level .01. Positive correlation of Shank angle with Knee Pi angle, and at level .05. negative correlation of Knee Pi angle with Foot Contact Time, and Knee Sh angle with Inclination Body angle at level .05. also, angle of Thighs with Inclination Body angle at level .01.
*The Backswing & Follow-through. Positive correlation of Trunk, Shank and Knee Pi angles in the Backswing and Follow-through phases at level .01. and between Knee Pi angle and Shank angle at level .05. Negative correlation of Knee Sh angle with Thighs angle at level .01, and For this last one with Back Swing Time at level .05.
*Ball Contact. at level .01, Positive correlation of Shank angle with the Knee Pi angle. and the Inclination_Body angle with the Distance of PivotFoot&Ball.
*Ball Contact & Follow-through. at level .01, Positive correlation of Trunk, Shank and Knee Pi angles in the Ball Contact and Follow-through phases. Also, Knee Pi angle with Shank angle, and the Inclination_Body angle with the Thighs angle.
Figure 2. Spaces chosen for Accuracy penalty-kicking test.
Right Lateral View Posterior View
Figure 3. (α1) Trunk°/ (α2 Pivot foot) Knee° Pi / (α3) Shank° / (α4) Thighs° / (α5 Shoot foot) Knee° Sh / (α6) Inclination Body° / (Distance m); Distance Pivot Foot &Ball / (Time s); T Beginning, T Back Swing, T FootContact, T Follow-Through
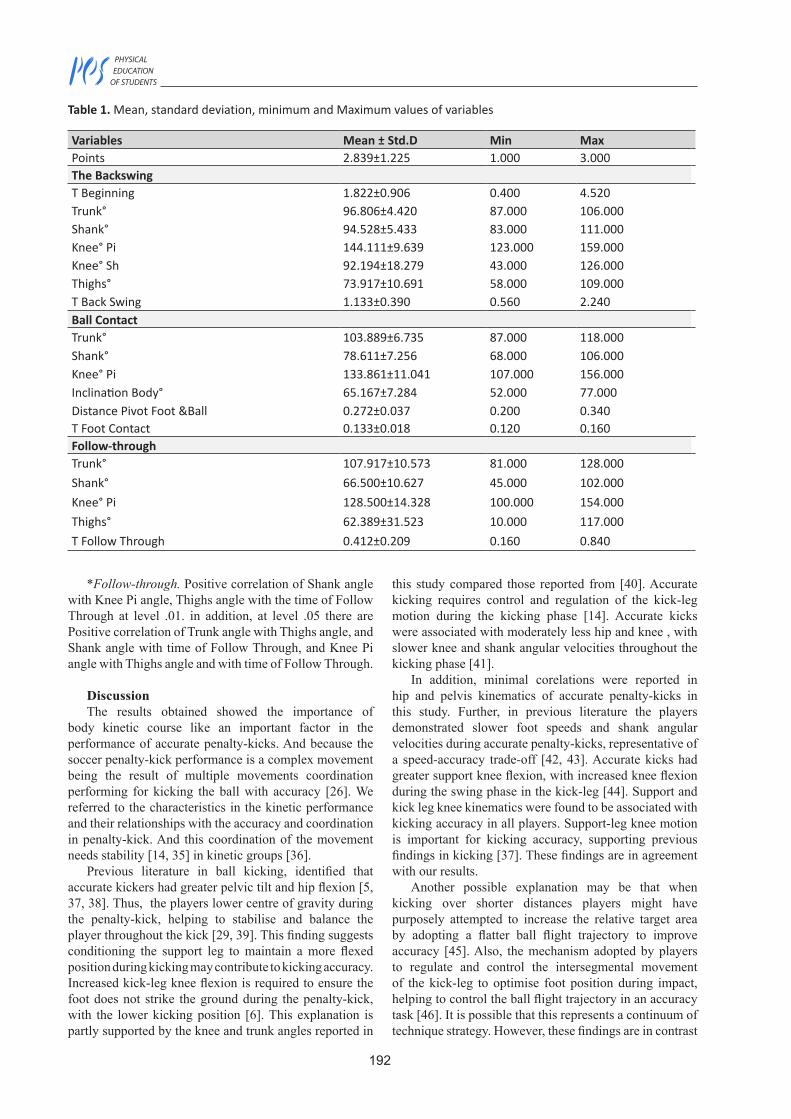
192
PHYSICAL EDUCATION OF STUDENTS
Table 1. Mean, standard deviation, minimum and Maximum values of variables
Variables Mean ± Std.D Min MaxPoints 2.839±1.225 1.000 3.000The BackswingT Beginning 1.822±0.906 0.400 4.520Trunk° 96.806±4.420 87.000 106.000Shank° 94.528±5.433 83.000 111.000Knee° Pi 144.111±9.639 123.000 159.000Knee° Sh 92.194±18.279 43.000 126.000Thighs° 73.917±10.691 58.000 109.000T Back Swing 1.133±0.390 0.560 2.240Ball ContactTrunk° 103.889±6.735 87.000 118.000Shank° 78.611±7.256 68.000 106.000Knee° Pi 133.861±11.041 107.000 156.000Inclination Body° 65.167±7.284 52.000 77.000Distance Pivot Foot &Ball 0.272±0.037 0.200 0.340T Foot Contact 0.133±0.018 0.120 0.160Follow-throughTrunk° 107.917±10.573 81.000 128.000Shank° 66.500±10.627 45.000 102.000Knee° Pi 128.500±14.328 100.000 154.000Thighs° 62.389±31.523 10.000 117.000T Follow Through 0.412±0.209 0.160 0.840
*Follow-through. Positive correlation of Shank angle with Knee Pi angle, Thighs angle with the time of Follow Through at level .01. in addition, at level .05 there are Positive correlation of Trunk angle with Thighs angle, and Shank angle with time of Follow Through, and Knee Pi angle with Thighs angle and with time of Follow Through.
DiscussionThe results obtained showed the importance of
body kinetic course like an important factor in the performance of accurate penalty-kicks. And because the soccer penalty-kick performance is a complex movement being the result of multiple movements coordination performing for kicking the ball with accuracy [26]. We referred to the characteristics in the kinetic performance and their relationships with the accuracy and coordination in penalty-kick. And this coordination of the movement needs stability [14, 35] in kinetic groups [36].
Previous literature in ball kicking, identified that accurate kickers had greater pelvic tilt and hip flexion [5, 37, 38]. Thus, the players lower centre of gravity during the penalty-kick, helping to stabilise and balance the player throughout the kick [29, 39]. This finding suggests conditioning the support leg to maintain a more flexed position during kicking may contribute to kicking accuracy. Increased kick-leg knee flexion is required to ensure the foot does not strike the ground during the penalty-kick, with the lower kicking position [6]. This explanation is partly supported by the knee and trunk angles reported in
this study compared those reported from [40]. Accurate kicking requires control and regulation of the kick-leg motion during the kicking phase [14]. Accurate kicks were associated with moderately less hip and knee , with slower knee and shank angular velocities throughout the kicking phase [41].
In addition, minimal corelations were reported in hip and pelvis kinematics of accurate penalty-kicks in this study. Further, in previous literature the players demonstrated slower foot speeds and shank angular velocities during accurate penalty-kicks, representative of a speed-accuracy trade-off [42, 43]. Accurate kicks had greater support knee flexion, with increased knee flexion during the swing phase in the kick-leg [44]. Support and kick leg knee kinematics were found to be associated with kicking accuracy in all players. Support-leg knee motion is important for kicking accuracy, supporting previous findings in kicking [37]. These findings are in agreement with our results.
Another possible explanation may be that when kicking over shorter distances players might have purposely attempted to increase the relative target area by adopting a flatter ball flight trajectory to improve accuracy [45]. Also, the mechanism adopted by players to regulate and control the intersegmental movement of the kick-leg to optimise foot position during impact, helping to control the ball flight trajectory in an accuracy task [46]. It is possible that this represents a continuum of technique strategy. However, these findings are in contrast
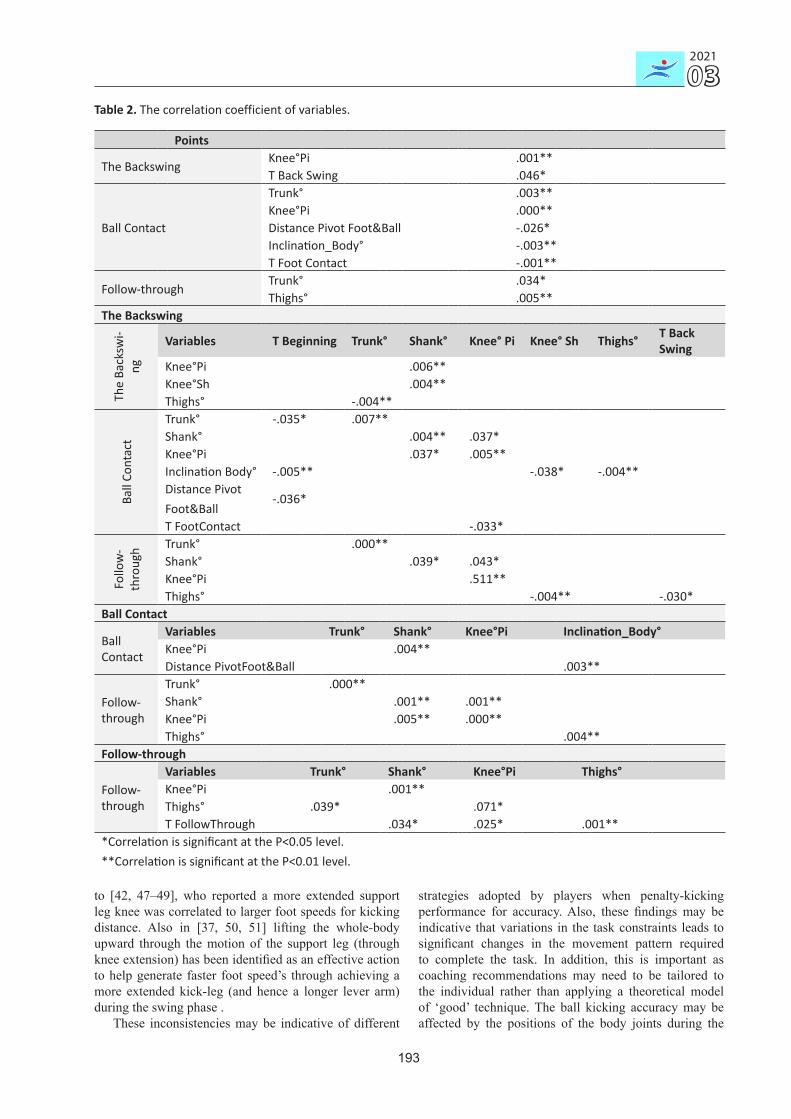
2021
03
193
to [42, 47–49], who reported a more extended support leg knee was correlated to larger foot speeds for kicking distance. Also in [37, 50, 51] lifting the whole-body upward through the motion of the support leg (through knee extension) has been identified as an effective action to help generate faster foot speed’s through achieving a more extended kick-leg (and hence a longer lever arm) during the swing phase .
These inconsistencies may be indicative of different
strategies adopted by players when penalty-kicking performance for accuracy. Also, these findings may be indicative that variations in the task constraints leads to significant changes in the movement pattern required to complete the task. In addition, this is important as coaching recommendations may need to be tailored to the individual rather than applying a theoretical model of ‘good’ technique. The ball kicking accuracy may be affected by the positions of the body joints during the
Table 2. The correlation coefficient of variables.
Points
The BackswingKnee°Pi .001**T Back Swing .046*
Ball Contact
Trunk° .003**Knee°Pi .000**Distance Pivot Foot&Ball -.026*Inclination_Body° -.003**T Foot Contact -.001**
Follow-throughTrunk° .034*Thighs° .005**
The Backswing
The
Back
swi-
ng
Variables T Beginning Trunk° Shank° Knee° Pi Knee° Sh Thighs° T Back Swing
Knee°Pi .006**Knee°Sh .004**Thighs° -.004**
Ball
Cont
act
Trunk° -.035* .007**Shank° .004** .037*Knee°Pi .037* .005**Inclination Body° -.005** -.038* -.004**Distance PivotFoot&Ball
-.036*
T FootContact -.033*
Follo
w-
thro
ugh Trunk° .000**
Shank° .039* .043*Knee°Pi .511**Thighs° -.004** -.030*
Ball Contact
Ball Contact
Variables Trunk° Shank° Knee°Pi Inclination_Body°Knee°Pi .004**Distance PivotFoot&Ball .003**
Follow-through
Trunk° .000**Shank° .001** .001**Knee°Pi .005** .000**Thighs° .004**
Follow-through
Follow-through
Variables Trunk° Shank° Knee°Pi Thighs°Knee°Pi .001**Thighs° .039* .071*T FollowThrough .034* .025* .001**
*Correlation is significant at the P<0.05 level.**Correlation is significant at the P<0.01 level.
194
PHYSICAL EDUCATION OF STUDENTS
performance. Thus, we recommend our coaches to focus on the biomechanical details during penalty-kicking performance, in order to achieve accuracy in kicking and goal. As well as a group-based analysis, supporting previous work in rugby goal-kicking. Future work with a larger samples should examine if differences exist for technical method in penalty-kicks performance, and to determine if results can be generalised or whether accuracy are made dependent on kinetic performance the penalty-kick.
ConclusionThe present preliminary investigation indicates where
the use of kinematical analysis technology was effective in clarifications the relationships between variables analysed during penalty kicking phases (backswing, ball contact and follow-through) and accuracy. Support-leg characteristics demonstrated in knee angle values a significant positive relationship in backswing, ball contact phases with the accuracy of penalty kicking. Also, angle values of trunk in ball contact and follow-through phases. Accurate kicks demonstrated lower hip and knee flexion. At the end of follow through, and it is an important factor. During the ball contact phase, accurate penalty-kicks were associated with foot contact time and inclination_body angle. Also, with thighs angle in follow-through phase. In addition, a number of substantial linear relationships
were reported between technical parameters analysed and accuracy. Many factors of movement course of the body were found to interact with accurate penalty-kicking, ranging from a backswing phase, ball contact, kick-leg swing motion, through to the end of follow through. Also, our results showed, the gradual decrease in the knee angle of the support-leg during the performance phases 144.11°, 133.86°, 128.50° in succession, and this indicates a decrease in the path of the body gravity center during the performance. This decrease is offset by a gradual increase in trunk angle during the performance 96.806°, 103.889°, 107.917°. Where it was confined between 81°and 128°. The researchers attribute this to the increase in the inclination body angle , as this may be in order to increase the accuracy degree in penalty-kicking on the sides of goal. The ball kicking accuracy may be affected by the positions of the body joints during the performance. Thus, we recommend our coaches to focus on the biomechanical details during penalty-kicking performance, in order to achieve accuracy in kicking and goal.
Acknowledgments The authors would like to thank the players who took
part in the study for their participation.
Conflict of Interests The authors have no conflict of interests to declare.
References1. Mohammad HK, Mohammad KS, Mokhtar M, Mohammad
Z, Fateh Z. Which training improves the ability tocontrol and manipulate the ball within the goalkeeperin football? Eur J Phys Educ Sport Sci 2016;2016.https://doi.org/10.46827/ejpe.v0i0.119
2. Barbieri FA, Gobbi LTB, Santiago PRP, Cunha SA.Performance comparisons of the kicking of stationary androlling balls in a futsal context. Sports Biomech, 2010;9:1–15. https://doi.org/10.1080/14763141003690211
3. Zerf M. Main Goalkeeper versus his Substitute: whichcriteria limit the traditional method of selecting the potentialgoalkeepers? Pamukkale J Sport Sci, 2018;9:11–22.
4. Tunçel A, HarbiLi E, Aritan S. Futbolda Penaltı VuruşununKinematiği: Kaleci Faktörünün Etkisi [Kinematics of PenaltyKick in Football: The Effect of the Goalkeeper Factor]. SporBilimleri Dergisi Hacettepe Üniversitesi 2019. (In Turkish).https://doi.org/10.17644/sbd.445220
5. Blair S, Robertson S, Duthie G, Ball K. Biomechanics ofaccurate and inaccurate goal-kicking in Australian football:Group-based analysis. Plos One, 2020;15:e0241969.https://doi.org/10.1371/journal.pone.0241969
6. Kellis E, Katis A. Biomechanical Characteristics andDeterminants of Instep Soccer Kick. J Sports Sci Med,2007;6:154–65.
7. Noguchi T, Demura S, Nagasawa Y. Relationship BetweenBall Kick Velocity and Leg Strength: A Comparison Between Soccer Players and other Athletes. Adv Phys Educ, 2012;2:95–8. https://doi.org/10.4236/ape.2012.23017
8. Bray K, Kerwin D. Modelling the flight of a soccerball in a direct free kick. J Sports Sci, 2003;21:75–85.https://doi.org/10.1080/0264041031000070994
9. Goktepe A, Karabork H, Ak E, Cıçek S, Korkusuz F. Futbolda Penaltı Atışının Kinematik Analizi [Kinematic Analysis ofPenalty Kick in Football]. Selçuk Üniversitesi MühendisBilim Ve Teknol Derg 2008;23:45–8. (In Turkish).
10. Coloma G. Penalty Kicks in Soccer: AnAlternative Methodology for Testing Mixed-Strategy Equilibria. J Sports Econ, 2007;8:530–45.https://doi.org/10.1177/1527002506289648
11. Lees A, Nolan L. The biomechanics of soccer: Areview. Journal of Sports Sciences, 1998;16:211–34.https://doi.org/10.1080/026404198366740
12. Rahnama N, Reilly T, Lees A. Injury riskassociated with playing actions during competitivesoccer. Br J Sports Med, 2002;36:354–9.https://doi.org/10.1136/bjsm.36.5.354
13. Reilly T. Science and Soccer. Routledge;2003. https://doi.org/10.4324/9780203417553
14. Hennı AB, Bouabdellah S, Mouissi F, Abdelkader G. Thekinematical analysis of static and dynamic balance variablesand their relationships with the accuracy shooting insoccer players U16. Int J Sport Exerc Train Sci – IJSETS,2020;6:97–104.
15. Bar-Eli M, Azar OH, Ritov I, Keidar-Levin Y, ScheinG. Action bias among elite soccer goalkeepers: Thecase of penalty kicks. J Econ Psychol, 2007;28:606–21.https://doi.org/10.1016/j.joep.2006.12.001
16. Baumann F, Friehe T, Wedow M. General Abilityand Specialization: Evidence From PenaltyKicks in Soccer. J Sports Econ, 2011;12:81–105.https://doi.org/10.1177/1527002510371194
17. Avugos S, Azar OH, Sher E, Gavish N, Bar-EliM. The Right-Oriented Bias in Soccer Penalty
2021
03
195
Shootouts. J Behav Exp Econ, 2020;89:101546. https://doi.org/10.1016/j.socec.2020.101546
18. Csato L. A fairer penalty shootout design in soccer; 2018.19. Jordet G. Why do English players fail in soccer penalty
shootouts? A study of team status, self-regulation, and choking under pressure. J Sports Sci, 2009;27:97–106. https://doi.org/10.1080/02640410802509144
20. Csato L, Petróczy D. A comprehensive analysis of soccer penalty shootout designs. arXiv:2004.09225, 2020.
21. Jordet G, Hartman E, Visscher C, Lemmink KAPM. Kicks from the penalty mark in soccer: The roles of stress, skill, and fatigue for kick outcomes. J Sports Sci, 2007;25:121–9. https://doi.org/10.1080/02640410600624020
22. Lubis J. Anticipation of Penalty Kick to a Goal Keeper. Asian Soc Sci, 2014;10:p55. https://doi.org/10.5539/ass.v10n5p55
23. Del Giudice PES. Modeling football penalty shootouts: how improving individual performance affects team performance and the fairness of the ABAB sequence. Int J Sport Health Sci, 2019;13:240–5.
24. Abdelkader G, Madanı R, Bouabdellah S. Kinematical variables analysis of shot-put activity in para athletics (class F32/33) and their relationships with digital level achievement. Int J Sport Exerc Train Sci, 2020;6:65–72. https://doi.org/10.18826/useeabd.709944
25. Guebli Abdelkader, Reguieg Madani, Sbaa Bouabdellah. Impact Of The Collision And Push Angles On The Phases Hop, Step And Jump In The Triple Jump And Their Relationship To The Stage Of Take-Off. Eur J Phys Educ Sport Sci, 2018;4:183–9. https://doi.org/10.5281/ZENODO.1221435
26. Clarys J, Reilly T, Stibbe A. Science and Football II. Taylor & Francis; 2003. https://doi.org/10.4324/9780203474235
27. Hay J. The biomechanics of sports techniques. Prentice-Hall; 1978.
28. Shan G, Zhang X, Wan B, Yu D, Wilde B, Visentin P. Biomechanics of coaching maximal instep soccer kick for practitioners. Interdiscip Sci Rev, 2019;44:12–20. https://doi.org/10.1080/03080188.2018.1534359
29. Goktepe A. KInematic analysis of penalty kick in soccer. J. Fac.Eng.Arch. Selcuk Univ., 2008;23(3):45–49.
30. Zerf Mohammed, Mokkedes Moulay Idriss, Bengoua Ali, Bendahmane Med Nasreddin, Guebli Abd-el-Kader. The Impact of the Techniques and Tactics Appropriate by the Athletes in Phase Triple Jump and Their Relationships with the Finale Results. J Sports Sci, 2015;3. https://doi.org/10.17265/2332-7839/2015.04.004
31. Guebli A, Reguieg M, Sba B, Erkmen N, Holanda FJ de. The Modern Technology to Stimulate and Improve Sports Performance for the Paralympic Athletes. J Phys Act Sport Soc Educ Heath 2020;3:66–74. https://www.asjp.cerist.dz/en/article/128311
32. Abdelkader G, Madani R, Bouabdellah S. Impact of the collision and push angles on the phases hop, step and jump in the triple jump and their relationship to the stage of take-off. Eur J Phys Educ Sport Sci, 2018;4.
33. Benelguemar H, Bouabdellah S, Mouissi F. The kinematical analysis of blocking skill in volleyball and their relationships with the explosive force of lower limbs. Int J Sport Exerc Train Sci – IJSETS, 2020;6:73–9. https://doi.org/10.18826/useeabd.731462
34. Caspersen CJ, Powell KE, Christenson GM. Physical activity, exercise, and physical fitness: definitions and distinctions for health-related research. Public Health Rep Wash DC 1974,
1985;100:126–31.35. Guebli A, Bessenouci HAI, Regiueg M. The Compounds
of Some Variables Kinematics in the Phases of Triple Jump and Their Relationships with the Finale Results-An analytical study of the elements of the Algerian elite team. J Phys Act Sport Soc Educ Health 2018;1:25–31. https://www.asjp.cerist.dz/en/article/67719
36. Dalton K, Guillon M, Naroo SA. An Analysis of Penalty Kicks in Elite Football Post 1997. Int J Sports Sci Coach, 2015;10:815–27. https://doi.org/10.1260/1747-9541.10.5.815
37. Ball K. Loading and performance of the support leg in kicking. J Sci Med Sport, 2013;16:455–9. https://doi.org/10.1016/j.jsams.2012.10.008
38. Dichiera A, Webster KE, Kuilboer L, Morris ME, Bach TM, Feller JA. Kinematic patterns associated with accuracy of the drop punt kick in Australian Football. J Sci Med Sport, 2006;9:292–8. https://doi.org/10.1016/j.jsams.2006.06.007
39. Johansen BT, Erikstad MK. A Preliminary Analysis of the Importance of Distance, Angle, and Insight When Soccer Referees Make Penalty Decisions. Front Sports Act Living, 2021;2: 595703. https://doi.org/10.3389/fspor.2020.595703
40. Blair S, Duthie G, Robertson S, Ball K. Biomechanics of goal-kicking accuracy in australian football using an inertial measurement system. ISBS Proc Arch, 2017;35.
41. Atiyat K, Fattah O. The Effect of Fatigue on Accuracy and Some Kinematic Variables for Penalty Kick Among First Club Football players in Northern Palestine. An-Najah University Journal for Research - B (Humanities), 2021;35(8):30–37.
42. Dörge HC, Andersen TB, SØrensen H, Simonsen EB. Biomechanical differences in soccer kicking with the preferred and the non-preferred leg. J Sports Sci, 2002;20:293–9. https://doi.org/10.1080/026404102753576062
43. Rađa A, Kuvačić G, De Giorgio A, Sellami M, Ardigò LP, Bragazzi NL, et al. The ball kicking speed: A new, efficient performance indicator in youth soccer. PloS One, 2019;14:e0217101. https://doi.org/10.1371/journal.pone.0217101
44. Hart NH, Nimphius S, Spiteri T, Cochrane JL, Newton RU. Relationship between Leg Mass, Leg Composition and Foot Velocity on Kicking Accuracy in Australian Football. J Sports Sci Med, 2016;15:344–51.
45. Peacock J, Ball K, Taylor S. The impact phase of drop punt kicking for maximal distance and accuracy. J Sports Sci, 2017;35:2289–96. https://doi.org/10.1080/02640414.2016.1266015
46. De Giorgio A, Sellami M, Kuvacic G, Lawrence G, Padulo J, Mingardi M, et al. Enhancing motor learning of young soccer players through preventing an internal focus of attention: The effect of shoes colour. PLoS ONE, 2018;13. https://doi.org/10.1371/journal.pone.0200689
47. Andersen TB. Collisions in soccer kicking. Sports Eng, 1999;2:121–5. https://doi.org/10.1046/j.1460-2687.1999.00015.x
48. Lees A, Asai T, Andersen TB, Nunome H, Sterzing T. The biomechanics of kicking in soccer: A review. J Sports Sci, 2010;28:805–17. https://doi.org/10.1080/02640414.2010.481305
49. Reilly T, Williams AM, Nevill A, Franks A. A multidisciplinary approach to talent identification in soccer. J Sports Sci, 2000;18:695–702. https://doi.org/10.1080/02640410050120078
50. Augustus S, Mundy P, Smith N. Support leg action can
196
PHYSICAL EDUCATION OF STUDENTS
contribute to maximal instep soccer kick performance: an intervention study. J Sports Sci, 2017;35:89–98. https://doi.org/10.1080/02640414.2016.1156728
51. Inoue K, Nunome H, Sterzing T, Shinkai H, Ikegami Y. Dynamics of the support leg in soccer instep kicking. J Sports Sci, 2014;32:1023–32. https://doi.org/10.1080/02640414.2014.886126
Information about the authors:
Abdullah Arguz; https://orcid.org/0000-0002-0616-2735; [email protected]; School of Physical Education and Sports, Karamanoğlu Mehmetbey University, Karaman, Turkey.
Abdelkader Guebli; (Corresponding author); https://orcid.org/0000-0001-5314-4903; [email protected]; APSSEH Laboratory, Institute of Physical Education and Sports, Hassiba Benbouali University of Chlef, Algeria.
Nurtekin Erkmen; https://orcid.org/0000-0002-5220-887X; [email protected]; Faculty of Sports Sciences, Selçuk University of Konya, Turkey.
Samet Aktaş; https://orcid.org/0000-0001-6857-2599; [email protected]; School of Physical Education and Sports, Batman University, Batman, Turkey.
Madani Reguieg; https://orcid.org/0000-0002-8090-0257; [email protected]; SMAH Laboratory, Institute of Physical Education and Sports, Abdelhamid Ibn Badiss University of Mostaganem, Algeria.
Yusuf Er; https://orcid.org/0000-0002-6490-4880; [email protected]; School of Applied Sciences Recreation Managemen, Karamanoğlu Mehmetbey University, Karaman, Turkey.
Cite this article as: Arguz A, Guebli A, Erkmen N, Aktaş S, Reguieg M, Er Y. Biomechanical analysis of accuracy penalties-kicking performance for Turkish Soccer players: Group-based analysis without goalkeeper. Physical Education of Students, 2021;25(3):189–196. https://doi.org/10.15561/20755279.2021.0307
This is an Open Access article distributed under the terms of the Creative Commons Attribution License, which permits unrestricted use, distribution, and reproduction in any medium, provided the original work is properly cited http://creativecommons.org/licenses/by/4.0/deed.en
Received: 12.04.2021Accepted: 27.05.2021; Published: 30.06.2021
2021
03
197
Game method to increase students’ motivation to engage in elective disciplines in physical culture and sportsInna N. OvsyannikovaABDE, Konstantin G. TomilinABCDE, Yulia A. TumasyanBDE, Yulia A. VasilkovskayaBDE, Lyudmila V. MalyginaBDE
Sochi State University, Sochi, Russia
Authors’ Contribution: A – Study design; B – Data collection; C – Statistical analysis; D – Manuscript Preparation; E – Fund Collection
AbstractBackground and Study Aim
A serious problem when using the play method in training sessions is the regulation of physical activity. For students with poor health, high emotionality of classes and intense rivalry between teams can lead to undesirable consequences for health. Purpose of the research: assessment of the effectiveness of the game method to increase the motivation of students to engage in elective disciplines in physical culture and sports.
Material and Methods
The study involved first-year students of Sochi State University (Russia) (n=25), with different experience in physical culture and sports. The training sessions (6 hours a week) lasted two academic semesters (9 months) and included outdoor games. A daily «scan» of the current functional state of the students was carried out by heart rate, express scales («Emotional excitement and physical fatigue» and «Well-being-Activity-Mood»). The indicators of general physical fitness of students were registered. The results were analyzed in Microsoft Excel 2010 computer programs. The significance of the change was determined by the Wilcoxon test using the significance level р<0.05.
Results The use of a large number of outdoor games and relay games in the classroom contributed to the increase of students’ motivation to engage in elective disciplines in physical culture and sports. Which led to almost 100 % of class attendance and improved agility, flexibility and endurance indicators among students (p<0.05). There was a decrease in the indicator in the test «pulling up on a high bar» among young men (p<0.05).
Conclusions: The study showed new prospects for using the game method in the classroom not only with homogeneous groups of students, but also with students with different levels of physical fitness and health. By manipulating the composition of the playing teams, each of the participants was regularly provided with strong and varied emotions. That increased the interest in students attending classes. The use of the «Express-control» system for the current functional state of the trainees (primarily for students with weakened health) ensured prompt correction of the intensity of physical activity.
Keywords: students, outdoor games, relay games, class classification, express control, functional state, physical fitness.
Introduction1
A person in the process of his life goes through certain stages of development [1], on the overcoming of which his further well-being and health largely depends. The most critical phase is the end of adolescence, which coincides with the admission of a young person to a higher education institution. At this stage, students become independent and responsible for their own lives, especially if they are far from the parental home [2].
The World Health Organization (WHO) has repeatedly emphasized the need for sufficient physical activity for the health of today’s youth [3, 4]. Its certain level contributes to physiological and psychological resistance to stress [5] and mental health [6, 7].
At present, there is a decrease in the attention of society to the physical education of young people, both in Europe [8–10] and America [11-13], and in Russia [14, 15]. Experts point to the need to increase the level of physical condition and motor activity of students by increasing the number of physical culture lessons [16] with a weekly motor regime exceeding 4-6 hours [17-20]. © Inna N. Ovsyannikova, Konstantin G. Tomilin, Yulia A. Tumasyan,
Yulia A. Vasilkovskaya, Lyudmila V. Malygina, 2021 doi:10.15561/20755279.2021.0308
ORIGINAL ARTICLE
It is advisable to stimulate physical activity by increasing the motivation of students to independent motor activity [21-23].
A significant positive factor can be the use of modern pedagogical technologies and new types of physical activity in the activities of the university. The implementation will allow attracting students to regular physical education and sports classes. To form in them a value attitude towards a healthy lifestyle [24]. Adaptation of high technologies of sports training to the needs and conditions of physical education of young people is perspective. And also the use of the «activity approach» in the process of teaching and upbringing, with a change in the relationship between the participants in the pedagogical process. The authoritarian pedagogy should be replaced by the pedagogy of cooperation [25].
Outdoor games are an effective means of increasing youth motivation for physical activity. Scientific researches of Russian scientists reveal the peculiarities of the use of outdoor games in folk traditions [26-31], in classes with schoolchildren and students [32-34] and sports training [35-37]. The authors note that the use of the game method allows you to diversify the relationship
198
PHYSICAL EDUCATION OF STUDENTS
between those involved (colleagues and rivals), and the application of the rules contributes to the development of moral and ethical standards of behavior. The unpredictable development of the game requires the participants to show initiative and creativity in order to achieve success.
For students of the academic group with disabilities, you can choose feasible roles in outdoor games, which allows you to include in the classroom all, without exception, those present [38]. During training sessions, students are taught to change the content of outdoor games for their further use in various conditions of the resort (on the water, on a sandy beach, etc.) [39, 40].
The use of informal sports and game-oriented classes will intensify physical activity in comparison with traditional forms of physical culture in universities, both for students with good physical training, as well as for people with weakened health [41–43]. However, there is a concern that coordinated and physically prepared students will dominate the game-oriented classes, leading to the passivity of other participants in the class. Forming in them an inferiority complex and a decrease in interest in classes.
A serious problem when playing games can be the lack of rationing of physical activity. That, for students with poor health, with high emotionality of classes, and acute rivalry between teams, can lead to undesirable consequences.
It should be noted that students studying in the Sochi region are in a special natural and climatic zone of Russia and in a year-round entertainment and recreational atmosphere. The mastery by students of a large number of outdoor games provides an opportunity to use this experience during outdoor activities with relatives and friends. And also in his future career, applying this experience at corporate events.
At the same time, the population of the Sochi region is historically different in mentality, traditions, ways of earning and resting from the inhabitants of other regions of the South of Russia. This is due to the atmosphere of a constant holiday and a large number of entertainment events for the guests of the resort. Sochi youth, accustomed to this atmosphere, are less interested in physical culture and sports, compared to youth in other regions of Russia. What determines the relevance of our research.
Purpose of the research: assessment of the effectiveness of the game method in increasing the motivation of students to engage in elective disciplines in physical culture and sports.
Materials and MethodsParticipants. The research involved first-year students of Sochi
State University (n=25), studying in the profile «Service of engineering systems of hotel and tourist complexes and sports facilities» (10 boys and 15 girls). The formation of the contingent of the subjects took place in a random way: the students were of the same training group, with different experience in physical culture and sports. Among them there are two former highly qualified athletes who have
been engaged in rhythmic gymnastics for 7-10 years, 4 people – young men who are fond of football and strength training equipment. And also 4 students who did not go in for physical education at school for health reasons. The approval of Sochi State University (Russia) Ethics Committee was obtained for the study to be implemented. All procedures conducted were accordance in with the Declaration of Helsinki.
Research Design.The main part was held with more than 7 dozen
outdoor games taken from collections of Russian and Western European folk outdoor games and relay games. Preference was given to games that could be used in the conditions of the water resort [40, 44, 45]. For the convenience of teachers, they were presented in the classification of play-oriented classes (Table 1).
In the classroom, the composition of the playing teams was manipulated so that the students’ activities were conducted in different conditions, allowing everyone to feel strong emotions, both from victories and from defeats.
The final part (exercises for strength, flexibility; the simplest exercises from yoga and qigong), with a summary of the lesson, a survey of well-being and a task for self-fulfillment. Duration of classes per week – 6 academic hours.
Particular attention was paid to monitoring the current functional state of the trainees. This is due to the complex relationship between heart rate and subjective perception of load in play [45]. Therefore, we made an attempt to use the technologies of current control of members of the USSR / Russian national teams [46] and tourists at water resorts [47].
Such diagnostics, if possible, should be carried out repeatedly during the lesson, and monitor the condition of the trainees when they perform physical activities. The methodological principle «Obtaining the maximum of information with a minimum of recorded indicators» is used, and the introduction of a multi-level control system:
Level 1 – visual methods of monitoring the state and behavior of a student;
Level 2 – a survey of those in poor health (if necessary) about their health, degree of physical fatigue, mood, etc.;
Level 3 – diagnostics of the current functional state of the body by registering the pulse (resting heart rate, etc.);
Level 4 – diagnostics (if necessary) of individual systems of the human body using the simplest, hardware-based express methods (heart rate dynamics after exercise, blood pressure measurement, etc.);
Level 5 – in some cases, examination of a student using modern instrumental techniques in a sports dispensary, polyclinic or diagnostic center [46, 47].
In our classes, we used daily express scales of visual control of the level of emotional arousal and the degree of physical fatigue of the trainees (Table 2).
If necessary, the subjective feelings of students about their health were specified – «Express-health-activity-mood» (Table 3).
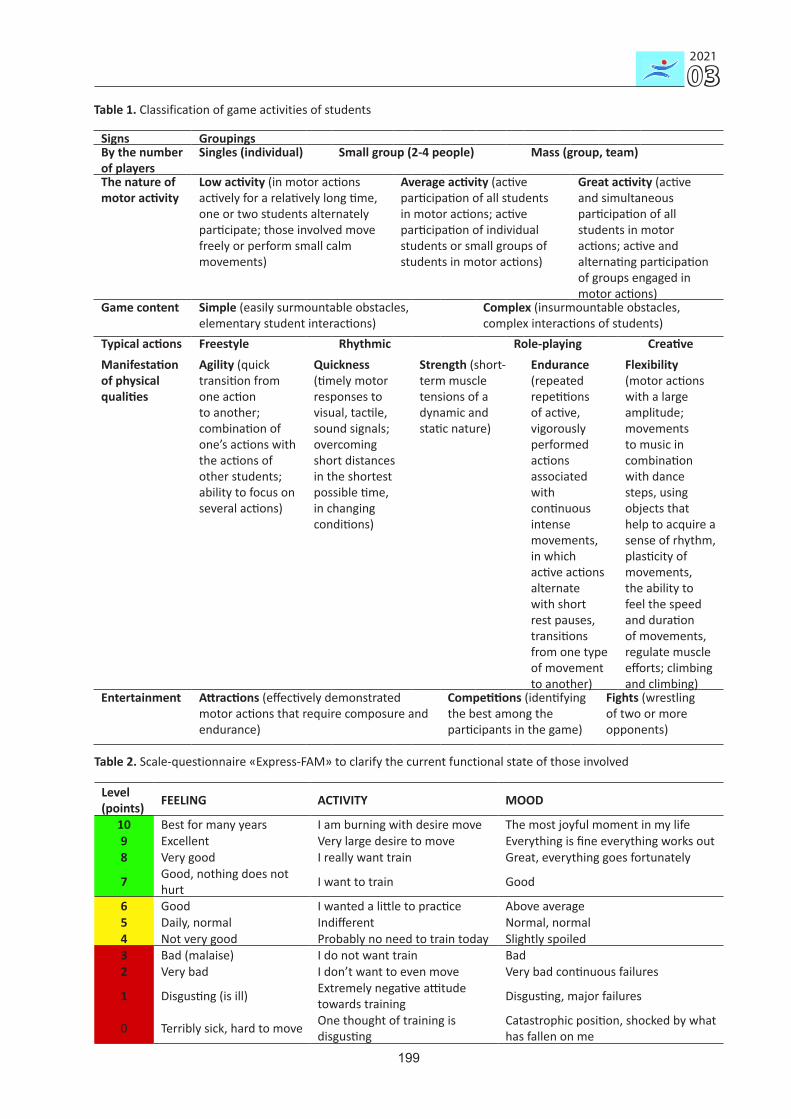
2021
03
199
Table 1. Classification of game activities of students
Signs GroupingsBy the number of players
Singles (individual) Small group (2-4 people) Mass (group, team)
The nature of motor activity
Low activity (in motor actions actively for a relatively long time, one or two students alternately participate; those involved move freely or perform small calm movements)
Average activity (active participation of all students in motor actions; active participation of individual students or small groups of students in motor actions)
Great activity (active and simultaneous participation of all students in motor actions; active and alternating participation of groups engaged in motor actions)
Game content Simple (easily surmountable obstacles, elementary student interactions)
Complex (insurmountable obstacles, complex interactions of students)
Typical actions Freestyle Rhythmic Role-playing CreativeManifestation of physical qualities
Agility (quick transition from one action to another; combination of one’s actions with the actions of other students; ability to focus on several actions)
Quickness (timely motor responses to visual, tactile, sound signals; overcoming short distances in the shortest possible time, in changing conditions)
Strength (short-term muscle tensions of a dynamic and static nature)
Endurance (repeated repetitions of active, vigorously performed actions associated with continuous intense movements, in which active actions alternate with short rest pauses, transitions from one type of movement to another)
Flexibility (motor actions with a large amplitude; movements to music in combination with dance steps, using objects that help to acquire a sense of rhythm, plasticity of movements, the ability to feel the speed and duration of movements, regulate muscle efforts; climbing and climbing)
Entertainment Attractions (effectively demonstrated motor actions that require composure and endurance)
Competitions (identifying the best among the participants in the game)
Fights (wrestling of two or more opponents)
Table 2. Scale-questionnaire «Express-FAM» to clarify the current functional state of those involved
Level (points) FEELING ACTIVITY MOOD
10 Best for many years I am burning with desire move The most joyful moment in my life9 Excellent Very large desire to move Everything is fine everything works out8 Very good I really want train Great, everything goes fortunately
7 Good, nothing does not hurt I want to train Good
6 Good I wanted a little to practice Above average5 Daily, normal Indifferent Normal, normal4 Not very good Probably no need to train today Slightly spoiled3 Bad (malaise) I do not want train Bad2 Very bad I don’t want to even move Very bad continuous failures
1 Disgusting (is ill) Extremely negative attitude towards training Disgusting, major failures
0 Terribly sick, hard to move One thought of training is disgusting
Catastrophic position, shocked by what has fallen on me
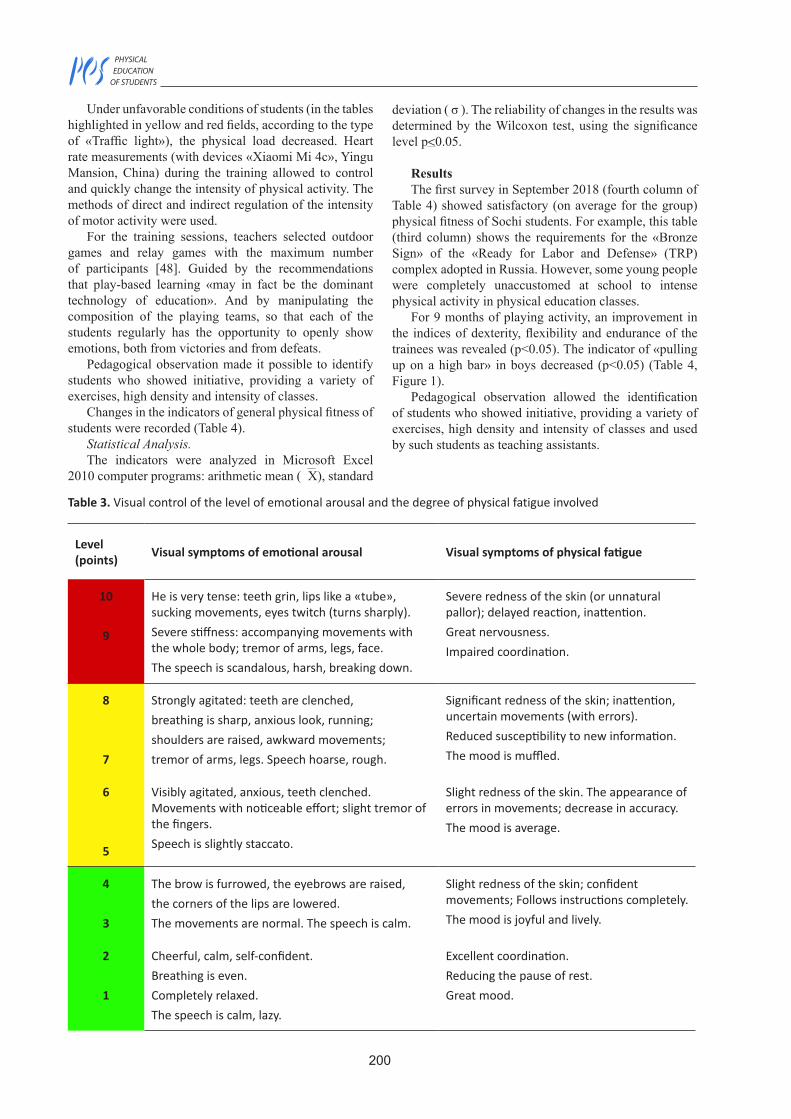
200
PHYSICAL EDUCATION OF STUDENTS
Table 3. Visual control of the level of emotional arousal and the degree of physical fatigue involved
Level (points) Visual symptoms of emotional arousal Visual symptoms of physical fatigue
10
9
He is very tense: teeth grin, lips like a «tube», sucking movements, eyes twitch (turns sharply).Severe stiffness: accompanying movements with the whole body; tremor of arms, legs, face.The speech is scandalous, harsh, breaking down.
Severe redness of the skin (or unnatural pallor); delayed reaction, inattention.Great nervousness.Impaired coordination.
8
7
Strongly agitated: teeth are clenched, breathing is sharp, anxious look, running; shoulders are raised, awkward movements; tremor of arms, legs. Speech hoarse, rough.
Significant redness of the skin; inattention, uncertain movements (with errors). Reduced susceptibility to new information.The mood is muffled.
6
5
Visibly agitated, anxious, teeth clenched. Movements with noticeable effort; slight tremor of the fingers.Speech is slightly staccato.
Slight redness of the skin. The appearance of errors in movements; decrease in accuracy.The mood is average.
4
3
The brow is furrowed, the eyebrows are raised, the corners of the lips are lowered.The movements are normal. The speech is calm.
Slight redness of the skin; confident movements; Follows instructions completely.The mood is joyful and lively.
2
1
Cheerful, calm, self-confident. Breathing is even.Completely relaxed.The speech is calm, lazy.
Excellent coordination.Reducing the pause of rest.Great mood.
Under unfavorable conditions of students (in the tables highlighted in yellow and red fields, according to the type of «Traffic light»), the physical load decreased. Heart rate measurements (with devices «Xiaomi Mi 4c», Yingu Mansion, China) during the training allowed to control and quickly change the intensity of physical activity. The methods of direct and indirect regulation of the intensity of motor activity were used.
For the training sessions, teachers selected outdoor games and relay games with the maximum number of participants [48]. Guided by the recommendations that play-based learning «may in fact be the dominant technology of education». And by manipulating the composition of the playing teams, so that each of the students regularly has the opportunity to openly show emotions, both from victories and from defeats.
Pedagogical observation made it possible to identify students who showed initiative, providing a variety of exercises, high density and intensity of classes.
Changes in the indicators of general physical fitness of students were recorded (Table 4).
Statistical Analysis.The indicators were analyzed in Microsoft Excel
2010 computer programs: arithmetic mean (`X), standard
deviation ( σ ). The reliability of changes in the results was determined by the Wilcoxon test, using the significance level p<0.05.
ResultsThe first survey in September 2018 (fourth column of
Table 4) showed satisfactory (on average for the group) physical fitness of Sochi students. For example, this table (third column) shows the requirements for the «Bronze Sign» of the «Ready for Labor and Defense» (TRP) complex adopted in Russia. However, some young people were completely unaccustomed at school to intense physical activity in physical education classes.
For 9 months of playing activity, an improvement in the indices of dexterity, flexibility and endurance of the trainees was revealed (p<0.05). The indicator of «pulling up on a high bar» in boys decreased (p<0.05) (Table 4, Figure 1).
Pedagogical observation allowed the identification of students who showed initiative, providing a variety of exercises, high density and intensity of classes and used by such students as teaching assistants.
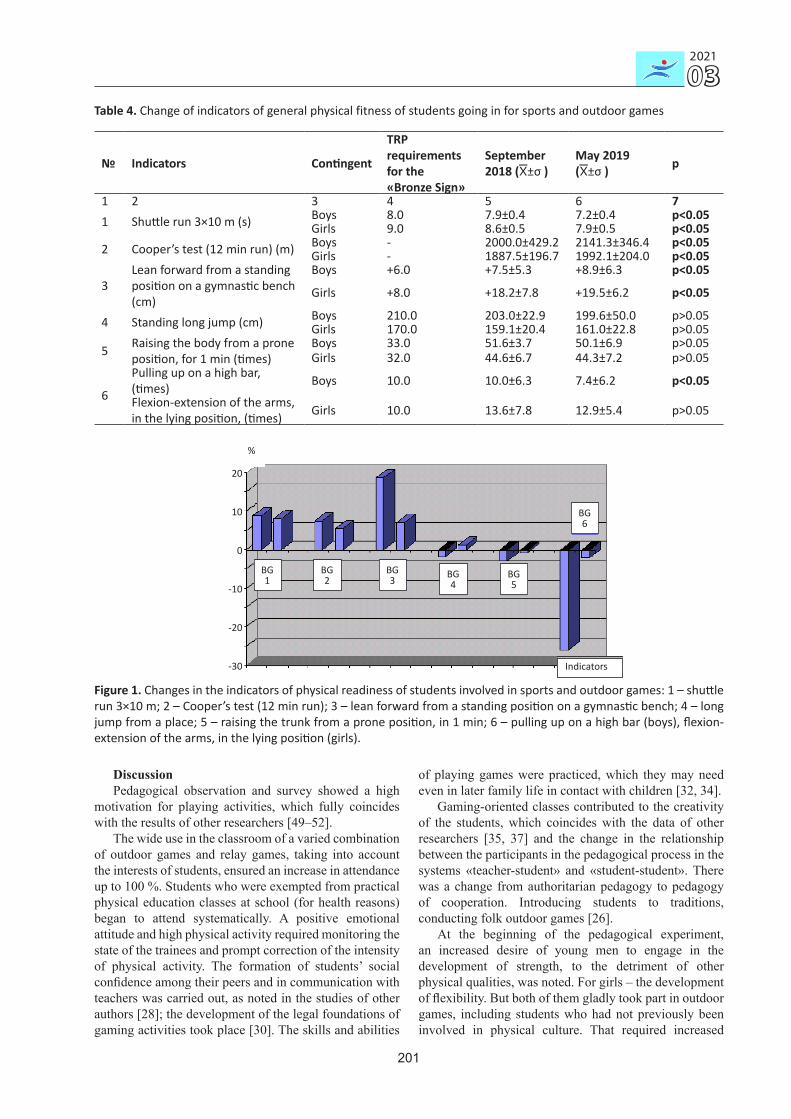
2021
03
201
Table 4. Change of indicators of general physical fitness of students going in for sports and outdoor games
№ Indicators Contingent
TRP requirements for the «Bronze Sign»
September 2018 (±σ )
May 2019 (±σ ) p
1 2 3 4 5 6 71 Shuttle run 3×10 m (s) Boys 8.0 7.9±0.4 7.2±0.4 p<0.05
Girls 9.0 8.6±0.5 7.9±0.5 p<0.052 Cooper’s test (12 min run) (m) Boys - 2000.0±429.2 2141.3±346.4 p<0.05
Girls - 1887.5±196.7 1992.1±204.0 p<0.05
3Lean forward from a standing position on a gymnastic bench (cm)
Boys +6.0 +7.5±5.3 +8.9±6.3 p<0.05
Girls +8.0 +18.2±7.8 +19.5±6.2 p<0.05
4 Standing long jump (cm) Boys 210.0 203.0±22.9 199.6±50.0 p>0.05Girls 170.0 159.1±20.4 161.0±22.8 p>0.05
5 Raising the body from a prone position, for 1 min (times)
Boys 33.0 51.6±3.7 50.1±6.9 p>0.05Girls 32.0 44.6±6.7 44.3±7.2 p>0.05
6
Pulling up on a high bar, (times) Boys 10.0 10.0±6.3 7.4±6.2 p<0.05
Flexion-extension of the arms, in the lying position, (times) Girls 10.0 13.6±7.8 12.9±5.4 p>0.05
Figure 1. Changes in the indicators of physical readiness of students involved in sports and outdoor games: 1 – shuttle run 3×10 m; 2 – Cooper’s test (12 min run); 3 – lean forward from a standing position on a gymnastic bench; 4 – long jump from a place; 5 – raising the trunk from a prone position, in 1 min; 6 – pulling up on a high bar (boys), flexion-extension of the arms, in the lying position (girls).
DiscussionPedagogical observation and survey showed a high
motivation for playing activities, which fully coincides with the results of other researchers [49–52].
The wide use in the classroom of a varied combination of outdoor games and relay games, taking into account the interests of students, ensured an increase in attendance up to 100 %. Students who were exempted from practical physical education classes at school (for health reasons) began to attend systematically. A positive emotional attitude and high physical activity required monitoring the state of the trainees and prompt correction of the intensity of physical activity. The formation of students’ social confidence among their peers and in communication with teachers was carried out, as noted in the studies of other authors [28]; the development of the legal foundations of gaming activities took place [30]. The skills and abilities
of playing games were practiced, which they may need even in later family life in contact with children [32, 34].
Gaming-oriented classes contributed to the creativity of the students, which coincides with the data of other researchers [35, 37] and the change in the relationship between the participants in the pedagogical process in the systems «teacher-student» and «student-student». There was a change from authoritarian pedagogy to pedagogy of cooperation. Introducing students to traditions, conducting folk outdoor games [26].
At the beginning of the pedagogical experiment, an increased desire of young men to engage in the development of strength, to the detriment of other physical qualities, was noted. For girls – the development of flexibility. But both of them gladly took part in outdoor games, including students who had not previously been involved in physical culture. That required increased
Indicators
BG1
BG3
BG2 BG
4BG5
BG6
20
10
0
-10
-20
-30
%
202
PHYSICAL EDUCATION OF STUDENTS
attention of teachers to this group and regular use of the express control system of their current functional state.
The studies have proved the high efficiency of the game method in increasing the motivation of Sochi students to engage in elective disciplines in physical culture and sports. That, with the manipulation of the composition of the involved teams, and in combination with the use of the «Express control» system for the current functional state of students (for the operative correction of the intensity of physical influences), provided adequate physical activity in the group, both for well-trained athletes and persons with weakened health.
The lack of modern inventory and equipment of the gym and the small amount of time allotted in the curriculum for classes in elective disciplines in physical culture and sports did not allow to achieve the desired improvement in all indicators of physical fitness in full.
Conclusion The study showed new prospects for using the game
method in the classroom not only with homogeneous groups of students, but also with people with different levels of physical fitness and health. By manipulating the composition of the playing teams, each of the participants
was regularly provided with strong and varied emotions. That increased the interest in students attending classes. The use of the «Express-control» system for the current functional state of the trainees (primarily for persons with weakened health) ensured prompt correction of the intensity of physical activity.
Since long-term pedagogical observations have revealed a tendency towards a gradual decrease in the motivation of Sochi students to engage in physical culture and sports, as they move to senior courses of study (change of interests, search for a partner for family relations, employment, etc.), it would be interesting to implement long-term pedagogical observations of students of this group during their studies at the university. To assess the impact on participants in this group of quarantine measures during the coronavirus pandemic. To study the weekly physical activity, and the use of the arsenal of outdoor games learned in the classroom during picnics in nature with relatives and friends.
Conflicts of interestThe authors of the article declare that there is no
conflict of interest.
References 1. Semenyuk LM. Reader on developmental psychology.
[Internet]. Moscow: Institute of Practical Psychology; 1996. (In Russian). [updated 21 Jun 15; cited 2019 April 5]. Available from: http://pedlib.ru/Books/1/0374/index.shtml
2. Assaf I, Brieteh F, Tfaily M, El-Baida M, Kadry S, Balusamy B. Students university healthy lifestyle practice: quantitative analysis. Health Inf Sci Syst, 2019;7:7. https://doi.org/10.1007/s13755-019-0068-2
3. World Health Organization. Regional Office for Europe. Physical activity strategy for the WHO European Region 2016-2025. World Health Organization. Regional Office for Europe. 2016. [Updated June 25, 2019; cited April 27, 2021]. Available from: https://apps.who.int/iris/handle/10665/329416
4. O’Donovan G, Blazevich AJ, Boreham C, Cooper AR, Crack H, Ekelund U. et al. The ABC of physical activity for health: a consensus statement from British Association of Sport and Exercise Science. Journal of Sport Science. 2010; 28 (6): 573–591 https://doi.org/10.1080/02640411003671212
5. Gerber M, Ludyga S, Mukke M, College F, Brand S, Puhse U. Low vigorous physical activity is associated with increased reactivity of the adrenal cortex to psychosocial stress in students with high perception of stress. Psychoneuroendocrinology. 2017; 80: 104–113. https://doi.org/10.1016/j.psyneuen.2017.03.004
6. Ghrouz AK, Noohu MM, Manzar MD, Spence DW, BaHammam AS, Pandi-Perumal SR. Physical activity and sleep quality in relation to the mental health of college students. Sleep and Breathing. 2019; 23(2): 627–634. https://doi.org/10.1007/s11325-019-01780-z
7. Weatherson K, Gierc M, Patte K, Qian W, Leatherdale S, Faulkner G. Complete mental health status and associations with physical activity, screen time, and sleep in youth. Mental Health and Physical Activity, 2020;19:100354. https://doi.org/10.1016/j.mhpa.2020.100354
8. Coppinger T, Milton K, Murtagh E, Harrington D, Johansen D, Seghers J, et al. Global Matrix 3.0 physical activity report card for children and youth: a comparison across Europe. Public Health. 2020;187:150–156. https://doi.org/10.1016/j.puhe.2020.07.025
9. Cristi-Montero C, Chillon P, Labayen I, Casajus JA, Gonzalez-Gross M, Vanhelst J, et al. Cardiometabolic risk through an integrative classification combining physical activity and sedentary behavior in European adolescents: HELENA study. Journal of Sport and Health Science. 2019;8(1):55–62. https://doi.org/10.1016/j.jshs.2018.03.004
10. Uher I, Bukova A. Interrelationship between Exercise and Diseases in young people: Review study. Physical Activity Review. 2018; 6: 203–212. https://doi.org/10.16926/par.2018.06.25
11. Thomas AM, Beaudry KM, Gammage KL, Klentrou P, Josse AR. Physical Activity, Sport Participation, and Perceived Barriers to Engagement in First-Year Canadian University Students. Journal of Physical Activity & Health. 2019; 16(6): 437–446. https://doi.org/10.1123/jpah.2018-0198
12. Cardinal BJ, Sorensen SD, Cardinal MK. Historical Perspective and Current Status of the Physical Education Graduation Requirement at American 4-Year Colleges and Universities. Res Q Exerc Sport. 2012; 83(4): 503–512. https://doi.org/10.1080/02701367.2012.10599139
13. Schuch FB, Vancampfort D, Firth J, Rosenbaum S, Ward PB, Silva ES, et al. Physical Activity and Incident Depression: A Meta-Analysis of Prospective Cohort Studies. American Journal of Psychiatry. 2018;175(7):631–648. https://doi.org/10.1176/appi.ajp.2018.17111194
14. Zvyagintsev MV, Karpova TV, Sauer NG. Analysis of physical fitness of first-year students of the Novokuznetsk branch-institute of Kemerovo State University. Scientific Notes of the University P.F. Lesgaft. 2020; 1(179): 143–147. (In Russian). https://doi.org/10.34835/issn.2308-1961.2020.143-148
15. Enchenko IV, Egorova NM. Comparative analysis of the physical activity level in europe and russian

2021
03
203
federation. Human Sport Medicine. 2020;20(4):103–110. https://doi.org/10.14529/hsm200412
16. Vorona V, Kylyk N, Litvinenko V, Ratov A., Lazorenko S. The level of physical condition of students of various faculties of the pedagogical university. International Journal of Applied Exercise Physiology. 2019; 8 (3): 153–158. https://doi.org/10.26655/IJAEP.2019.9.19
17. de la Vega R, Jimenez-Castuera R, Leyton-Roman M. Impact of Weekly Physical Activity on Stress Response: An Experimental Study. Frontiers in Psychology. 2021;11. https://doi.org/10.3389/fpsyg.2020.608217
18. Rundle AG, Chen Y, Quinn JW, Rahai N, Bartley K, Mooney SJ, et al. Development of a Neighborhood Walkability Index for Studying Neighborhood Physical Activity Contexts in Communities across the US over the Past Three Decades. Journal of Urban Health-Bulletin of the New York Academy of Medicine. 2019;96(4):583–590. https://doi.org/10.1007/s11524-019-00370-4
19. Sáez I, Solabarrieta J, Rubio I. Motivation for Physical Activity in University Students and Its Relation with Gender, Amount of Activities, and Sport Satisfaction. Sustainability 2021;13:3183. https://doi.org/10.3390/su13063183
20. Shoesmith A, Hall A, Hope K, Sutherland R, Hodder RK, Trost SG, et al. Associations between in-school-hours physical activity and child health-related quality of life: A cross-sectional study in a sample of Australian primary school children. Preventive Medicine Reports. 2020;20. https://doi.org/10.1016/j.pmedr.2020.101179
21. Fraile-Garcia J, Tejero-Gonzalez CM, Esteban-Cornejo I, Veiga OL. Association between enjoyment, motor self-efficacy, physical activity and academic performance in physical education. Retos-Nuevas Tendencias En Educacion Fisica Deporte Y Recreacion. 2019(36):58–63. https://doi.org/10.47197/retos.v36i36.63035
22. Gu XL, Chen YL, Jackson AW, Zhang T. Impact of a pedometer-based goal-setting intervention onchildren’s motivation, motor competence, and physical activity in physical education. Physical Education and Sport Pedagogy. 2018;23(1):54–65. https://doi.org/10.1080/17408989.2017.1341475
23. Yli-Piipari S, Grasten A, Huhtiniemi M, Salin K, Seppala S, Hakonen H, et al. Predictive Strength of Physical Education-Centered Physical Literacy Indicators on Physical Activity. Journal of Teaching in Physical Education. 2021;40(2):303–311. https://doi.org/10.1123/jtpe.2019-0144
24. Kuzmina OI, Lebedinsky VYu, Shvachun OA. Modern technologies of pedagogical influence and new types of physical activity in health preservation of student youth. Theory and Practice of Physical Culture. 2020; 1: 14–16.
25. Lubysheva LI. Physical and sports culture: content, relationships and dissociation. Theory and Practice of Physical Culture. 2002; 3: 11–14.
26. Abrashina IV. Russian folk outdoor games as a means of developing moral behavior in the learning process [Cand. Diss]. St. Petersburg; 2005. (In Russian).
27. Voldina TV. Game as an element of traditional culture of the Ob Ugrians (outdoor games with pebbles and sticks: comparative analysis). Vestnik Ugrovedeniya-Bulletin of Ugric Studies. 2018;8(3):503–524. https://doi.org/10.30624/2220-4156-2018-8-3-503-524
28. Gzhemskaya NKh. Pedagogical conditions for the realization of social functions of physical culture based on the use of outdoor games [Cand. Diss]. Naberezhnye Chelny; 2006. (In Russian).
29. Azizbaev SS. Historical information on the development of Kyrgyz traditional games and competitions. Tomsk Journal of Linguistics and Anthropology. 2020(2):97–105. https://doi.org/10.23951/2307-6119-2020-2-97-105
30. Nizhnikh IK. Formation of the foundations of legal culture in senior adolescents of the risk group by means of play activities [Cand. Diss]. Moscow; 2014. (In Russian).
31. Bochaver AA, Korzun AN, Polivanova KN. Outdoor Pastimes of Children and Teenagers. Psychology The Journal of the Higher School of Economics. 2017;14(3):470–490.
32. Zayachuk TV. Formation of creative abilities of students of pedagogical universities means of choreography and movement games. Uchenye zapiski universiteta imeni PF Lesgafta 2007. (In Russian). https://doi.org/10.5930/issn.1994-4683.2007.06.28.p31-3
33. Morgachev OV, Khramtsov PI. Hygienic characteristics of a physically active lifestyle of primary school children of different gender. Population Health and Life Environment. 2020(8):26–30. https://doi.org/10.35627/2219-5238/2020-329-8-26-30
34. Zulkarnayev TR, Agafonov A, Kazak AA, Khisamiev II, Povargo EA, Zulkarnaeva AT. Hygienic assessment of hemodynamic parameters of schoolchildren and students with different motor activity level. Population Health and Life Environment. 2019(2):19–25.
35. Bauer OP. Outdoor and sports games in the professional training of specialists in physical culture of preschoolers [Cand. Diss]. St. Petersburg; 2005. (In Russian).
36. Akaneeva EA. The Influence of Physical Education With the Use of Karate on the Physical Development of Children Aged 6 to 7. Tomsk State University Journal. 2020(455):152–156. https://doi.org/10.17223/15617793/455/21
37. Golubeva VV. Outdoor games in the system of training coaches for cyclic sports [Cand. Diss]. Moscow; 1997. (In Russian).
38. Kovaleva MV. The method of using mobile and elements of sports games in the classroom with students of special medical groups with disabilities of the cardiovascular system [Cand. Diss]. Shuya; 2012. (In Russian).
39. Ovsyannikova IN. The content and organization of physical education of university students based on the use of beach handball means [Cand. Diss]. Krasnodar; 2008. (In Russian).
40. Tomilin KG, Ovsyannikova IN. Game types of recreation at spa resorts [Internet]. Saratov: IPR Media; 2019. [updated 2021 Jun 15; cited 2021 May 5]. (In Russian). Available from: http://www.iprbookshop.ru/83823.html
41. Jones GJ, Carlton T, Hyun M, Kanters M, Bocarro J. Assessing the contribution of informal sport to leisure-time physical activity: a new perspective on social innovation. Managing Sport & Leisure. 2020; 25(3): 161–174. https://doi.org/10.1080/23750472.2019.1620627
42. Milanović Z, Pantelić S, Čović N, Sporiš G, Mohr M, Krustrup P. Broad-spectrum physical fitness benefits of recreational football: a systematic review and meta-analysis. Br J Sports Med. 2019; 53(15): 926–939. https://doi.org/10.1136/bjsports-2017-097885
43. Hartman CL, Barcelona RJ, Trauntvein NE, Hall SL. Well-being and leisure-time physical activity psychosocial factors predict physical activity among university students. Leisure Studies. 2020;39(1):156–164. https://doi.org/10.1080/02614367.2019.1670722
44. Zheleznov NN, Ponomarev VV, Levitskaya AN, Zheleznova EN. Fitness football in physical education of female students of the university. Physical Culture: Upbringing, Education, Training. 2021; 1: 25–27.
204
PHYSICAL EDUCATION OF STUDENTS
45. Ovsyannikova IN, Tomilin KG, Vasilkovskaya YuA, Laktionova EG, Malygina LV. «Game method» in the classroom of elective disciplines in physical culture and sports. Scientific Notes of the P.F. Lesgaft. 2020; 11(189): 378–384.
46. Tomilin KG, Mikhailova TV, Kuznetsova MM. Sailing: A Yearly Training Cycle for Qualified Riders: A Study Guide. St. Petersburg: Lan; 2020. (In Russian).
47. Tomilin KG. Management of recreational activities at spa resorts. Saratov: IPR Media; 2019. (In Russian).
48. Ovsyannikova IN. Signs, components and classifications of play types of recreation. Bulletin of the Sochi State University of Tourism and Resort Business. 2011. 2(16). 159–161. (In Russian).
49. Di Battista R, Robazza C, Ruiz MC, Bertollo M, Vitali F, Bortoli L. The student’s intention to engage in physical activity in their free time: the interaction of the climate associated with tasks, satisfaction of competence needs
and psychobiosocial states in physical education. European Physical Education Review. 2019; 25(3): 761–777. https://doi.org/10.1177/1356336X18770665
50. Dao Chan Tuk. The effect of physical activity on the biological age parameters of women from 17 to 18 years old. Journal of Sports Medicine and Therapy. 2018; 3: 75–79. https://doi.org/10.29328/journal.jsmt.1001030
51. Tomilin KG. Motivation and interests of Sochi youth involved in physical culture and sports. In: 2nd All-Russian Scientific and Practical Conference «Physical Education and Student Sports through the Eyes of Students», Kazan, November 24-27, 2016, Kazan; 2016. P. 226–229. (In Russian).
52. Tomilin KG. Optimization of physical culture lessons based on studying the interests of students. In: All-Russian scientific-practical conference «Motor activity. Sport. Personality». Yoshkar-Ola, December 13-14, 2018, Yoshkar-Ola, 2019. P. 105–108. (In Russian).
Information about the authors:
Inna N. Ovsyannikova; Candidate of Pedagogical Sciences, Associate Professor; https://orcid.org/0000-0001-8011-9420; [email protected]; Sochi State University; Sochi, Russia.
Konstantin G. Tomilin; (Corresponding Author); candidate of pedagogical sciences, associate professor; https://orcid.org/0000-0002-9496-696X; [email protected]; Sochi State University, Sochi, Russia.
Yulia A. Tumasyan; Candidate of Pedagogical Sciences, Associate Professor; https://orcid.org/0000-0002-9477-7202; [email protected]; Sochi State University; Sochi, Russia.
Yulia A. Vasilkovskaya; Candidate of Pedagogical Sciences, Associate Professor; https://orcid.org/0000-0001-8264-4157; [email protected]; Sochi State University; Sochi, Russia.
Lyudmila V. Malygina; Candidate of Pedagogical Sciences, Associate Professor; https://orcid.org/0000-0003-2388-2547; [email protected]; Sochi State University; Sochi, Russia.
Cite this article as: Ovsyannikova IN, Tomilin KG, Tumasyan YA, Vasilkovskaya YA, Malygina LV. Game method to increase students’ motivation to engage in elective disciplines in physical culture and sports. Physical Education of Students, 2021;25(3):197–204. https://doi.org/10.15561/20755279.2021.0308
This is an Open Access article distributed under the terms of the Creative Commons Attribution License, which permits unrestricted use, distribution, and reproduction in any medium, provided the original work is properly cited http://creativecommons.org/licenses/by/4.0/deed.en
Received: 12.05.2021Accepted: 23.06.2021; Published: 30.06.2021
2021
03
205
SUBMISSION OF MANUSCRIPTS (For more detailed information see http://www.sportedu.org.ua/index.php/PES/pages/view/trebovaniya-e)
Structure of article:- title of an article;- surname, full first name and patronymic;- full name of organization (place of work or study);- annotation in three language (Russian, Ukrainian, English). The scope of the annotation is to be 800-1000 symbols. Annotation must contain translate of surname, full first name and patronymic of authors, in Ukrainian (Russian) and English. Structure of annotation: aim, material, result. For authors from Russia, the translation in the Ukrainian language makes editorial board.- Key words for the three languages: ( 1-2 lines of words. Do not use word combinations).- Introduction (statement of a problem; analysis of the last researches and publications of this theme; to single out the open problem in the research article).- Connection of the article with important scientific programs or practical tasks.- Aim, tasks, material and methods.- Results of the research (description of the main research material with full substantiation of the derived scientific results).- Findings.- Perspectives of future researches in this direction.- Bibliographic references (more than 20) should be making up according to standard form.
REVIEW PROCEDURE FOR MANUSCRIPTS (For more detailed information see http://www.sportedu.org.ua/index.php/PES/pages/view/recenzirovaniye-e)All manuscripts submitted for publication must go through the review process.
TREATMENT OF MANUSCRIPTS (For more detailed information see http://www.sportedu.org.ua/index.php/PES/pages/view/rassmotreniye-e)Manuscripts are assessed by the Editorial Board within 1 month.The Journal will acknowledge receipt of a manuscript within 2 days.
EDITORIAL ETHICS (For more detailed information see http://www.sportedu.org.ua/index.php/PES/pages/view/ethics-e)The journal is committed to a high standard of editorial ethics.Editorial board is used the principles of ethics of scientific publications upon recommendations of International Committee of Medical Journal Editors.Conflicts of interests of persons who have direct or indirect relation to the publication of an article or any information that the article consist are settled according to the law of Ukraine in the field of intellectual property.
CONTACT INFORMATIONbox 11135, Kharkov-68, 61068, Ukrainephone. +38 099 430 69 22http://www.sportpedu.org.uae-mail: [email protected]
Information: Sponsors, Partners, Sponsorship:
• Olympic Academy of Ukraine
• Ukrainian Academy of Sciences.
SCIENTIFIC EDITION (journal)
Physical Education of Students, 2021;25(3)
Editorial to the publisher department KSPU:certificate DK №860 20.03.2002.--------------------------------------------------------------------------------designer - Iermakov S.editing - Yermakova T. administrator of sites - Iermakov S. designer cover - Bogoslavets A.———————————————————————passed for printing 30.06.2021Format A4. PRINTHOUSE (B02 № 248 750, 13.09.2007). 61002, Kharkov, Girshman, 16a.
Related Documents