Testimony of Mark Zandi Chief Economist, Moody’s Analytics Before the House Budget Committee "Perspectives on the Economy" July 1, 2010 The economy has made enormous progress since early 2009. A year and half ago the global financial system was on the brink of collapse and the economy was engulfed in the Great Recession, the worst downturn since the Great Depression. Real GDP was plunging at an annual rate of more than 6%, and monthly job losses were averaging close to 750,000. Today, the financial system is operating much more normally, real GDP is advancing at a nearly 3% pace, and monthly job growth—excluding temporary hiring for the 2010 census—is nearly 125,000. This dramatic turnaround is largely due to the aggressive and unprecedented response of monetary and fiscal policy. The Federal Reserve Board has implemented an effective zero interest rate policy and made a wide range of efforts to support the flow of credit throughout the financial system. The Treasury Department has required the nation’s largest bank holding companies to conduct public stress tests. The FDIC has increased deposit insurance limits and guaranteed the issuance of bank debt. Congress and the Bush administration passed the Troubled Asset Relief Program, creating a fund that was ultimately used to support the banking system, the auto industry, and the housing market. And under both the Bush and Obama administrations, Congress passed a series of fiscal stimulus efforts ranging from expanded benefits for unemployed workers to aid for state and local governments to tax cuts for businesses and households. While the effectiveness of any individual aspect of the policy response can be debated, there is no question that the overall policy response has been very successful. Despite the enormous economic progress, the economy is not yet out of the woods. Unemployment is stuck near double digits, and the current rate of job growth is barely sufficient to forestall further increases in unemployment as population and the labor force grow. Though stock prices have rallied and house prices are more stable, household nest eggs have been significantly diminished. Confidence also remains fragile: Consumers and small businesses feel better than they did a year ago but no better than in the depths of past recessions. The recovery thus remains vulnerable if anything further goes wrong, and there is plenty to be nervous about, including skittish businesses that are reluctant to hire and cannot get credit, the ongoing foreclosure crisis, budget problems plaguing state and local governments, and most recently, the pernicious European debt crisis. With the recovery so fragile, policymakers must not end support for the economy too quickly. While odds are that the recovery will remain intact and steadily gain traction, if the economy were to backtrack into recession, there would be no effective policy response. The Federal Reserve could restart its credit easing efforts, but it is not clear that any resulting decline in long-term interest rates would provide a meaningful boost to the economy. Fixed mortgage rates are already near record lows, and the housing market is still struggling. A renewed recession would also cause the yawning federal budget deficit to balloon, making it difficult for policymakers to add a further fiscal stimulus without triggering much higher interest rates. Fortunately, the Federal Reserve is signaling it is likely to hold to its zero interest rate policy at least through the remainder of this year. With nearly double-digit unemployment, low and still-weakening inflation, and low and stable inflation expectations, there is no impetus for raising interest rates any time soon. However, fiscal policymakers appear increasingly unlikely to provide an additional stimulus. Legislation to extend emergency unemployment insurance benefits through the end of this year and provide further financial aid to hard-pressed state and local governments in fiscal 2011 has failed in Congress.

Welcome message from author
This document is posted to help you gain knowledge. Please leave a comment to let me know what you think about it! Share it to your friends and learn new things together.
Transcript

Testimony of Mark Zandi Chief Economist, Moody’s Analytics
Before the House Budget Committee
"Perspectives on the Economy"
July 1, 2010
The economy has made enormous progress since early 2009. A year and half ago the global financial system was on the brink of collapse and the economy was engulfed in the Great Recession, the worst downturn since the Great Depression. Real GDP was plunging at an annual rate of more than 6%, and monthly job losses were averaging close to 750,000. Today, the financial system is operating much more normally, real GDP is advancing at a nearly 3% pace, and monthly job growth—excluding temporary hiring for the 2010 census—is nearly 125,000.
This dramatic turnaround is largely due to the aggressive and unprecedented response of monetary and fiscal policy. The Federal Reserve Board has implemented an effective zero interest rate policy and made a wide range of efforts to support the flow of credit throughout the financial system. The Treasury Department has required the nation’s largest bank holding companies to conduct public stress tests. The FDIC has increased deposit insurance limits and guaranteed the issuance of bank debt. Congress and the Bush administration passed the Troubled Asset Relief Program, creating a fund that was ultimately used to support the banking system, the auto industry, and the housing market. And under both the Bush and Obama administrations, Congress passed a series of fiscal stimulus efforts ranging from expanded benefits for unemployed workers to aid for state and local governments to tax cuts for businesses and households. While the effectiveness of any individual aspect of the policy response can be debated, there is no question that the overall policy response has been very successful.
Despite the enormous economic progress, the economy is not yet out of the woods. Unemployment is stuck near double digits, and the current rate of job growth is barely sufficient to forestall further increases in unemployment as population and the labor force grow. Though stock prices have rallied and house prices are more stable, household nest eggs have been significantly diminished. Confidence also remains fragile: Consumers and small businesses feel better than they did a year ago but no better than in the depths of past recessions. The recovery thus remains vulnerable if anything further goes wrong, and there is plenty to be nervous about, including skittish businesses that are reluctant to hire and cannot get credit, the ongoing foreclosure crisis, budget problems plaguing state and local governments, and most recently, the pernicious European debt crisis.
With the recovery so fragile, policymakers must not end support for the economy too quickly. While odds are that the recovery will remain intact and steadily gain traction, if the economy were to backtrack into recession, there would be no effective policy response. The Federal Reserve could restart its credit easing efforts, but it is not clear that any resulting decline in long-term interest rates would provide a meaningful boost to the economy. Fixed mortgage rates are already near record lows, and the housing market is still struggling. A renewed recession would also cause the yawning federal budget deficit to balloon, making it difficult for policymakers to add a further fiscal stimulus without triggering much higher interest rates.
Fortunately, the Federal Reserve is signaling it is likely to hold to its zero interest rate policy at least through the remainder of this year. With nearly double-digit unemployment, low and still-weakening inflation, and low and stable inflation expectations, there is no impetus for raising interest rates any time soon. However, fiscal policymakers appear increasingly unlikely to provide an additional stimulus. Legislation to extend emergency unemployment insurance benefits through the end of this year and provide further financial aid to hard-pressed state and local governments in fiscal 2011 has failed in Congress.

-800
-600
-400
-200
0
200
400
600
07 08 09 10
The Economic Recovery Is Gaining Traction Monthly payroll employment change, ths
Consistent monthly job growth of over 150,000 will be necessary to reduce unemployment
Census workers
Many lawmakers worry that an additional stimulus will add to the nation’s serious fiscal problems. This is a reasonable concern that must be addressed before too long or global investors will balk at buying our debt, as they are now doing with countries in Europe. It would be ideal if Congress funded an additional stimulus through spending offsets or additional taxes—not this year or even next, but when the economy is in full swing. A larger near-term federal deficit is not an economic problem, given the current deleveraging by the private sector and exceptionally low interest rates, particularly if we make up for it with greater fiscal discipline in coming years.
Paying for it, however, should not be a precondition for Congress to provide more financial help to unemployed workers, strapped states and municipalities, and small businesses looking to expand. This stimulus will help ensure the recovery gains traction as expected, a precondition for addressing our long-term fiscal challenges. Odds are that the economy will not fall back into recession even if Congress fails to help further, but the odds of a double dip are still much too high to gamble. Until the economy is expanding solidly, federal policymakers should not risk reducing their support. Economic recovery
The economic recovery is one year old.i
Coming after the Great Recession—the deepest and longest downturn since the Great Depression—the recovery has in some respects been surprisingly strong. Real GDP is estimated to have grown more than 3% during this period, and some 500,000 jobs have been added in the private sector since the beginning of this year (see Chart 1). Unemployment, which surged during the recession, has been essentially unchanged since the recovery began.
The sources of economic growth have become more diverse over the past year. Consumer spending has been solid, business investment in equipment and software is sturdy, and export growth could even be characterized as strong. The downdraft in housing construction that led the economy into recession is largely over, and even commercial construction appears to be approaching a bottom.
Corporate profits have made a stunning rebound over the past year, rising more than 30% as businesses significantly raised productivity while reducing cost structures.ii
The revival in demand for goods and services has fallen straight to their bottom lines. Historically, rising corporate profits have led to increased investment and hiring within six to 12 months as businesses responded to better earnings by seeking growth opportunities (see Chart 2).

-30
-20
-10
0
10
20
30
40
50
-5 -4 -3 -2 -1 0 1 2 3 4 5 6
70 75 80 85 90 95 00 05
Profits Surge; Jobs Should Follow
Sources: BLS, BEA
Profit growth lagged 3 qtrs (R)
Job growth % change yr ago (L)
Business cycle status of the nation’s metropolitan areas
Source: Moody’s Analytics
Recovery Moderating recession
Economic Recovery Broadens
Indeed, the recovery has steadily broadened across industries and regions in recent months. The demographically sensitive healthcare and educational services industries added to payrolls throughout the recession, supported by demographic trends and government spending. Manufacturing began to revive at the end of last year, led by a pickup in technology and auto production, and more recently, distribution and transportation have expanded. Retailers and leisure and hospitality companies are also growing, and professional services and some financial services businesses also appear set to add to their payrolls.
Across the country, approximately two-thirds of the nation’s nearly 400 metropolitan area economies are now recovering (see Chart 3).iii
For context, at the depths of the recession, all but a handful of metro areas were in decline. The strongest recoveries to date have been in the Midwest and South, driven by the revival in manufacturing and distribution, and in technology centers. Those regions still in recession are mainly those where the housing bust and foreclosure crisis are most severe, including parts of Florida and the Mountain West and the Central Valley of California.
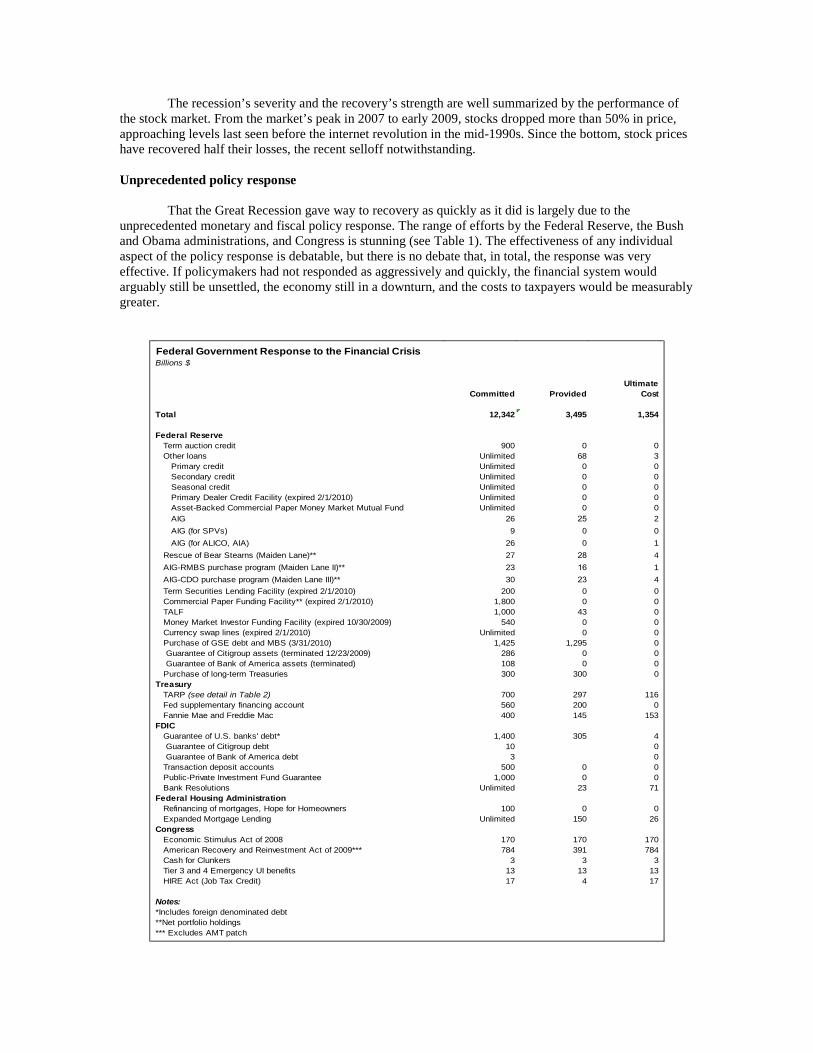
Federal Government Response to the Financial CrisisBillions $
UltimateCommitted Provided Cost
Total 12,342 3,495 1,354
Federal ReserveTerm auction credit 900 0 0Other loans Unlimited 68 3
Primary credit Unlimited 0 0Secondary credit Unlimited 0 0Seasonal credit Unlimited 0 0Primary Dealer Credit Facility (expired 2/1/2010) Unlimited 0 0Asset-Backed Commercial Paper Money Market Mutual Fund Unlimited 0 0AIG 26 25 2AIG (for SPVs) 9 0 0AIG (for ALICO, AIA) 26 0 1
Rescue of Bear Stearns (Maiden Lane)** 27 28 4AIG-RMBS purchase program (Maiden Lane II)** 23 16 1AIG-CDO purchase program (Maiden Lane III)** 30 23 4Term Securities Lending Facility (expired 2/1/2010) 200 0 0Commercial Paper Funding Facility** (expired 2/1/2010) 1,800 0 0TALF 1,000 43 0Money Market Investor Funding Facility (expired 10/30/2009) 540 0 0Currency swap lines (expired 2/1/2010) Unlimited 0 0Purchase of GSE debt and MBS (3/31/2010) 1,425 1,295 0 Guarantee of Citigroup assets (terminated 12/23/2009) 286 0 0 Guarantee of Bank of America assets (terminated) 108 0 0Purchase of long-term Treasuries 300 300 0
TreasuryTARP (see detail in Table 2) 700 297 116Fed supplementary financing account 560 200 0Fannie Mae and Freddie Mac 400 145 153
FDICGuarantee of U.S. banks' debt* 1,400 305 4
Guarantee of Citigroup debt 10 0 Guarantee of Bank of America debt 3 0
Transaction deposit accounts 500 0 0Public-Private Investment Fund Guarantee 1,000 0 0Bank Resolutions Unlimited 23 71
Federal Housing AdministrationRefinancing of mortgages, Hope for Homeowners 100 0 0Expanded Mortgage Lending Unlimited 150 26
CongressEconomic Stimulus Act of 2008 170 170 170American Recovery and Reinvestment Act of 2009*** 784 391 784Cash for Clunkers 3 3 3Tier 3 and 4 Emergency UI benefits 13 13 13HIRE Act (Job Tax Credit) 17 4 17
Notes:*Includes foreign denominated debt**Net portfolio holdings*** Excludes AMT patch
The recession’s severity and the recovery’s strength are well summarized by the performance of the stock market. From the market’s peak in 2007 to early 2009, stocks dropped more than 50% in price, approaching levels last seen before the internet revolution in the mid-1990s. Since the bottom, stock prices have recovered half their losses, the recent selloff notwithstanding. Unprecedented policy response
That the Great Recession gave way to recovery as quickly as it did is largely due to the unprecedented monetary and fiscal policy response. The range of efforts by the Federal Reserve, the Bush and Obama administrations, and Congress is stunning (see Table 1). The effectiveness of any individual aspect of the policy response is debatable, but there is no debate that, in total, the response was very effective. If policymakers had not responded as aggressively and quickly, the financial system would arguably still be unsettled, the economy still in a downturn, and the costs to taxpayers would be measurably greater.

0.0 0.5 1.0 1.5 2.0 2.5 3.0 3.5 4.0 4.5 5.0
07 08 09
Bear Stearns hedge funds liquidate
TARP fails to pass Congress
Lehman failure
Bear Stearns collapse
No TARP asset purchases
Bank stress tests
Fannie/Freddie takeover
Bank funding problems
Sources: Federal Reserve Board, Moody’s Analytics
Difference between 3-mo Libor and Treasury bill yields Policymakers Stabilize the Financial System
Broadly, the policy response involved first stabilizing the global financial system and then jump-starting economic growth. The financial crises that took hold beginning in the spring of 2007 with the failure of broker-dealer Bear Stearns had spiraled into a financial panic by the fall of 2008 with the federal government’s takeover of Fannie Mae and Freddie Mac and the Lehman Brothers bankruptcy. The turmoil created in the financial system is evident in the difference between Libor—the interest rate banks charge for borrowing and lending to each other—and Treasury yields (see Chart 4).iv
At the height of the panic, the three-month Libor-Treasury spread was an astounding 450 basis points; the globe's largest banks were afraid to lend to each other.
The Federal Reserve took a number of extraordinary steps to quell the financial panic. In late 2007, the Fed established the first of what would be a half dozen credit facilities to provide liquidity to a range of financial institutions and financial markets.v
The Fed also aggressively lowered interest rates throughout 2008, adopting a zero interest rate policy by year’s end, and engaged in credit easing throughout much of 2009 and in early 2010, purchasing Treasury bonds and Fannie Mae and Freddie Mac mortgage securities in an effort to bring down mortgage and other long-term interest rates.
Despite the Fed’s efforts, the financial system remained in turmoil. The FDIC increased deposit insurance limits to stem potential bank runs and provided guarantees to ensure that banks could continue to borrow in capital markets. Congress and the Treasury also established the Troubled Asset Relief Program in the fall of 2008 to shore up the financial system (see Table 2).vi
TARP was used in part to fund the Capital Purchase Program, which provided much-needed capital to a large part of the nation’s banking system. While the bank bailout has been very unpopular, it was essential and has proven very successful. More than half the banks that received TARP funds have already repaid them, and it is likely taxpayers will ultimately see a profit on their investment.

TARP Funds Billions $
UltimateProvided Completed Cost
Total 554 580 116
CPP (Financial institutions) 208 205 -16Less: Tarp Repayments 136
Homeowner Affordability and Stability Plan 50 40 50AIG 70 70 45Citi (TIP) 20 RepaidBank of America (TIP) 20 RepaidCiti debt guarantee 5 RepaidFederal Reserve ( TALF) 55 20 0GMAC 13 13 4GM 50 48 20GM (for GMAC) 1 1Chrysler 13 13 8Chrysler Financial (loan 1/16) RepaidPublic-Private Investment Fund 30 30 1SBA loan purchase 15 >1 0Auto suppliers 5 3.5 3.5
Sources: Federal Reserve, Treasury, FDIC, FHA, Moody's Economy.com
Perhaps the key to ending the financial panic was the bank stress testing that took place in the
spring of 2009. The Treasury and Federal Reserve required the nation's 19 largest bank holding companies to stress their balance sheets to determine their losses if the economy suffered a downturn on par with the Great Depression, and then show they had sufficient capital to withstand such a setback, raising more if necessary. The results of the stress tests were made public and, combined with the capital raising that went on, fully restored confidence in the banking system. The Libor-Treasury spread narrowed back to where it had been prior to the crisis. The fiscal stimulus
The effort to end the recession and jump-start recovery has been built around a series of fiscal stimulus measures.vii Tax rebate checks were mailed to lower- and middle-income households in the spring of 2008, the American Restoration and Recovery Act was passed in early 2009, and several small stimulus measures became law in late 2009 and early 2010.viii
In all, close to $1 trillion will eventually be distributed through temporary tax cuts and increased government spending. The stimulus has done what it was supposed to do: end the recession and spur recovery. It is no coincidence the Great Recession ended last summer, when the ARRA was providing its maximum economic benefit.
The fiscal stimulus encompassed a wide array of tax cuts and government spending. Providing additional unemployment insurance benefits for workers who use up their regular 26 weeks of benefits produces the most economic activity per federal dollar spent (see Table 3). Without this extra help, laid-off workers and their families have little choice but to slash spending. The impact on consumer confidence cannot be underestimated. Financial aid to strapped state and local governments also provides a significant multiplier, forestalling government and private sector job cuts and tax increases that would be necessary in most states to meet constitutional balanced-budget requirements.

Fiscal Stimulus Bang for the BuckSource: Moody's Analytics
Bang for the Buck
Tax CutsNonrefundable Lump-Sum Tax Rebate 1.01Refundable Lump-Sum Tax Rebate 1.22
Temporary Tax CutsPayroll Tax Holiday 1.24Job Tax Credit 1.30Across the Board Tax Cut 1.02Accelerated Depreciation 0.25Loss Carryback 0.22Housing Tax Credit 0.90
Permanent Tax CutsExtend Alternative Minimum Tax Patch 0.51Make Bush Income Tax Cuts Permanent 0.32Make Dividend and Capital Gains Tax Cuts Permanent 0.37Cut in Corporate Tax Rate 0.32
Spending IncreasesExtending Unemployment Insurance Benefits 1.61Temporary Federal Financing of Work-Share Programs 1.69Temporary Increase in Food Stamps 1.74General Aid to State Governments 1.41Increased Infrastructure Spending 1.57Low Income Home Energy Assistance Program (LIHEAP) 1.13
Note: The bang for the buck is estimated by the one-year dollar change in GDP for a given dollar reduction in federal tax revenue or increase in spending.
The stimulus program has been criticized on a number of grounds. Charges that the government
took too long to distribute its stimulus funds are largely misplaced (see Table 4). What matters for economic growth is the pace of stimulus spending, which surged from nothing at the start of 2009 to over $90 billion in the second quarter. That is a big change in a short period and is why the economy began to grow again by the third quarter. Infrastructure spending funded by the stimulus was slow to get started, partly because of safeguards against funding unproductive or politically driven projects. Infrastructure projects are now gearing up and will be particularly helpful in supporting growth during the second half of this year, when the economy can still benefit from it.

Ameri
can Re
cover
y and
Reinv
estme
nt Ac
t Spe
ndou
t$ b
ilHis
torica
l data
throu
gh Ju
ne 20
10200
9201
0Av
ailab
le Pa
id-ou
tJa
nFe
bMa
rAp
rMay
Jun
JulA
ugSe
pOc
tNov
Dec
Jan
Feb
Mar
AprM
ayJu
n200
9q12
009q2
2009q
32009
q4201
0q12
010q2
Infras
tructu
re an
d othe
r spe
nding
147.2
56.0
0.00.0
0.00.0
1.53.7
1.73.2
4.33.8
3.94.7
2.85.5
5.86.1
4.14.9
0.05.2
9.212.
414.
115.
1Tra
ditiona
l Infras
tructu
re37.
814.
00.0
0.00.0
0.00.2
0.20.8
1.20.7
1.81.5
1.40.6
1.21.1
1.31.1
1.00.0
0.42.6
4.62.9
3.4Tra
nsfers
to sta
te an
d loc
al go
vernm
ents
174.3
119.3
0.03.4
6.65.8
9.48.4
8.28.0
8.48.2
8.07.7
2.87.3
7.07.1
5.67.4
10.0
23.5
24.6
23.9
17.2
20.2
Medic
aid87.
368.
70.0
3.46.6
5.44.8
4.74.5
4.34.3
4.14.3
4.12.5
3.92.6
2.72.1
4.410.
014.
913.
112.
69.0
9.3Ed
ucation
87.0
50.6
0.00.0
0.00.3
4.63.7
3.73.7
4.14.1
3.73.6
0.33.4
4.44.4
3.53.0
0.08.7
11.5
11.4
8.210.
9Tra
nsfers
to pe
rsons
112.4
104.4
0.00.0
0.86.1
17.5
7.66.1
6.46.4
6.46.7
6.76.6
6.56.2
6.16.3
1.80.8
31.2
18.9
19.8
19.4
14.3
Socia
l Secu
rity13.
113.
10.0
0.00.0
0.011.
61.5
0.00.0
0.00.0
0.00.0
0.00.0
0.00.0
0.00.0
0.013.
10.0
0.00.0
0.0Un
emplo
yment
assis
tance
65.7
61.4
0.00.0
0.04.1
4.14.1
4.14.5
4.54.5
4.84.8
4.74.6
4.34.2
4.4-0.
10.0
12.2
13.1
14.1
13.6
8.5Fo
od sta
mps
9.69.6
0.00.0
0.00.6
0.60.6
0.60.6
0.60.6
0.60.6
0.60.6
0.60.6
0.60.6
0.01.9
1.91.9
1.91.9
Cobra
Paym
ents
24.0
20.4
0.00.0
0.81.4
1.31.4
1.41.3
1.31.3
1.31.3
1.31.3
1.31.3
1.31.3
0.84.1
3.93.8
3.93.9
Tax c
uts112
.0111
.40.0
0.02.3
4.13.9
22.7
4.23.9
25.8
3.33.5
5.35.7
5.75.7
5.25.1
5.02.3
30.7
33.9
12.1
17.1
15.3
Busin
esses
& othe
r tax in
centive
s40.
040.
00.0
0.00.0
0.00.0
18.0
0.00.0
22.0
0.00.0
0.00.0
0.00.0
0.00.0
0.00.0
18.0
22.0
0.00.0
0.0Ind
ividual
s excl
uding
increa
se in A
MT ex
emptio
n72.
071.
40.0
0.02.3
4.13.9
4.74.2
3.93.8
3.33.5
5.35.7
5.75.7
5.25.1
5.02.3
12.7
11.9
12.1
17.1
15.3
Total
545.9
391.1
0.03.4
9.716.
032.
342.
420.
221.
544.
921.
722.
124.
518.
025.
024.
824.
621.
119.
113.
190.
786.
568.
367.
864.
8
Sourc
es: Tr
easury
, Join
t Com
mittee
on Ta
xation
, Reco
very.g
ov, Mo
ody's A
nalytic
s

50
52
54
56
58
60
62
64
66
9.5
10.0
10.5
11.0
07 08 09
Disposable income (L)
Sources: BEA, FRB, Moody’s Analytics
Consumer spending (L)
Household wealth (R)
Temporary Tax Cuts Support Consumer Spending $ tril
Disposable income ex rebates
Arguments that the temporary tax cuts included in various stimulus measures have not supported
consumer spending are incorrect. This is best seen in the 2008 tax rebates. While these rebates significantly lifted after-tax income in the period, consumer spending did not follow, at least not immediately. The reason lay in the income caps on the rebates, which meant higher-income households did not receive them. Because of rapidly falling stock and house prices, these same households were saving significantly more and spending less (see Chart 5). The saving rate for households in the top quintile of the income distribution surged from close to nothing in early 2007 to well into the double digits by early 2008. Lower- and middle-income households did spend a significant part of the rebates they received, but the sharp pullback by higher-income households significantly diluted the impact of the tax cut on overall spending.
Critics who argue that the ARRA failed since it did not keep unemployment below 8%, as the Obama administration projected it would when lobbying to get the legislation through Congress, are wrong. Unemployment was already above 8% in February 2009, when the legislation was passed; administration economists did not know that at the time, because of lags in the data and the rapid rise in unemployment that was occurring. They, like most private forecasters, including Moody’s Analytics, misjudged how serious the downturn had already become. If anything, this suggests the stimulus provided in the ARRA was not large enough.
How much the fiscal stimulus has helped the economy cannot be determined through an accounting exercise. Washington's statisticians cannot canvas the country and pick out which jobs have been created or saved by the stimulus and which have not. The best tools available involve statistical analysis that is subject to a range of uncertainties. But although the exact number of jobs that would have been lost without the fiscal stimulus will never be known, it is clear that this number is significant. Research by Moody’s Analytics and others, such as the Congressional Budget Office, suggests that without ARRA, at least 2 million fewer jobs would exist today and the unemployment rate would be closer to 11% (see Table 5).ix

Forec
ast C
ompa
rison
: Bas
eline
vs. N
o ARR
A stim
ulus s
cena
rioSo
urces
: BEA
, BLS
, Moo
dy's
Analy
tics
2009
Q120
09Q2
2009
Q320
09Q4
2010
Q120
10Q2
2010
Q320
10Q4
2011
Q120
11Q2
2011
Q320
11Q4
2009
2010
2011
Real
GDP
(05$ b
il, SA
AR)
Scen
ario (
no A
RRA
stimu
lus)
12,91
2.612
,795.7
12,76
3.612
,868.6
12,92
3.613
,001.7
13,08
0.813
,180.4
13,33
5.813
,542.3
13,73
6.213
,922.6
12,83
5.113
,046.6
13,63
4.2
annu
alize
d % ch
ange
-6.8
-3.6
-1.0
3.31.7
2.42.5
3.14.8
6.35.9
5.5-3.
61.6
4.5
Real
GDP
(05$ b
il, SA
AR)
Base
line (
with A
RRA
stimu
lus)
12,92
5.412
,901.5
12,97
3.013
,149.5
13,24
8.213
,346.7
13,43
0.313
,522.0
13,65
4.813
,826.4
13,99
9.214
,180.5
12,98
7.413
,386.8
13,91
5.2
annu
alize
d % ch
ange
-6.4
-0.7
2.25.6
3.03.0
2.52.8
4.05.1
5.15.3
-2.4
3.13.9
Payro
ll Emp
loyme
nt (m
il, SA
)Sc
enari
o (no
ARR
A sti
mulus
)13
2.813
0.612
9.112
8.212
7.812
8.112
8.012
8.312
8.812
9.713
0.813
2.013
0.212
8.013
0.3
annu
alize
d % ch
ange
-6.5
-6.3
-4.6
-2.8
-1.1
0.9-0.
31.0
1.43.0
3.53.6
-4.8
-1.6
1.8
Payro
ll Emp
loyme
nt (m
il, SA
)Ba
selin
e (wit
h ARR
A sti
mulus
)13
2.813
1.113
0.112
9.612
9.713
0.313
0.513
0.813
1.213
1.813
2.613
3.513
0.913
0.313
2.3
annu
alize
d % ch
ange
-6.4
-5.0
-3.1
-1.3
0.22.0
0.60.9
1.31.8
2.32.7
-4.3
-0.4
1.5
Unem
ploym
ent R
ate (%
)Sc
enari
o (no
ARR
A sti
mulus
)8.2
9.510
.010
.710
.611
.011
.511
.611
.511
.310
.69.8
9.611
.210
.8Un
emplo
ymen
t Rate
(%)
Base
line (
with A
RRA
stimu
lus)
8.29.3
9.610
.09.7
9.810
.010
.110
.19.8
9.38.8
9.39.9
9.5
CPI (I
ndex
, 198
2-84=
100,
SA)
Scen
ario (
no A
RRA
stimu
lus)
213.2
214.1
214.9
215.2
215.5
215.7
215.8
216.2
216.8
218.1
219.9
221.9
214.3
215.8
219.1
an
nuali
zed %
chan
ge-2.
31.8
1.50.6
0.40.5
0.20.8
1.02.4
3.43.7
-0.4
0.71.6
CPI (I
ndex
, 198
2-84=
100,
SA)
Base
line (
with A
RRA
stimu
lus)
212.5
213.5
215.4
216.8
217.6
218.1
218.7
219.5
220.7
222.1
223.8
225.5
214.5
218.5
223.0
an
nuali
zed %
chan
ge-2.
21.9
3.72.6
1.50.8
1.21.6
2.12.6
3.23.1
-0.3
1.82.1

3,500
4,000
4,500
5,000
5,500
6,000
05 06 07 08 09 10
Recovery Remains Fragile as Hiring Is Dormant
Source: Bureau of Labor Statistics
Number of monthly hires, ths, SA
Layoffs have abated, but hiring has yet to revive, and quits remain extraordinarily low
These estimates are not an idle academic exercise. Whether the ARRA and other fiscal stimulus
measures are deemed successful will influence how policymakers respond if the recovery does not take root, or worse, if the economy slides back into recession. Although a double-dip downturn remains less than likely, the recovery remains fragile and vulnerable to a number of threats. No help wanted Especially worrisome is the reluctance of businesses to increase hiring. Layoffs have abated, which has allowed job growth to resume, but hiring remains moribund. Prior to the recession, well over 5 million workers were being hired throughout the economy each month (see Chart 6). Hiring slid during the downturn, since hitting bottom in early 2009; since then, it has remained near 4 million per month. Until hiring revives substantially, job growth will not be sufficient to meaningfully reduce unemployment, which at close to 10%, poses a significant risk to the recovery.x
Hiring remains soft across most industries and firms of all sizes, but particularly among very small businesses (those with up to four employees) and very big ones (those with more than 1,000 employees).xi
Given the large number of workers in small businesses, about half the decline in job creation has been among firms with fewer than 100 employees. About a fourth occurred among firms with between 100 and 1,000 employees, and the remaining fourth happened at firms with more than 1,000 employees.
The principal impediment to hiring at smaller businesses appears to be a lack of credit. Bank lenders remain cautious in their underwriting: According to the Federal Reserve's senior loan officer survey, banks are no longer tightening small-business lending standards, but those standards remain exceptionally tight (see Chart 7).xii This is evident in the credit data, as commercial and industrial loans outstanding continue to fall rapidly and the number of bank credit cards has plummeted by nearly 100 million, or 25%, since peaking in mid-2008.xiii
Most of these loans are to large businesses, and the credit cards are to consumers, but small businesses rely heavily on loans and credit cards to finance their activities.

-40
-20
0
20
40
60
80
0
2
4
6
8
10
12
14
16
86 88 90 92 94 96 98 00 02 04 06 08 10
% of small businesses saying its tough to get credit (L) Net % of SCOs tightening underwriting (R )
Small Businesses Struggle to Get Credit
Sources: NFIB, Federal Reserve Board
It is unlikely that credit conditions for small businesses will improve soon. Hundreds of the small banks so important to small business lending, particularly in smaller communities, have failed or will fail in the next couple of years. More than 700 banks are now on the FDIC's troubled list; in many cases, defaulting commercial mortgage loans are overwhelming banks' capital. Credit card lenders also continue to adjust to new legislation and regulation. Small business borrowers are also being hampered by weak housing and commercial real estate prices. Real estate is often used by small business owners as collateral for borrowing. With the value of that collateral less certain, lenders are less willing to make loans. Credit is not the chief impediment to job creation at large businesses—the corporate bond and commercial paper markets are functioning well. The larger problem there is uncertainty about government policy. Washington is arguably changing the legal and regulatory landscape more than at any time since the Great Depression, enacting reforms to healthcare, energy, financial regulation and tax policy. All of these policy changes are important and should be carefully considered, but until businesses figure out what each means for them, they are likely to hold back decisions on hiring and expansion.xiv
Uncertainty and indecision among business executives cannot be discounted as a reason for the poor job market. Business surveys broadly show sentiment has improved since early in the year but remains extraordinarily fragile (see Chart 8).xv
Many businesses suffered near-death experiences in the past year, and those memories remain fresh. Managers must also wonder whether recent pickups in demand will prove temporary. The massive monetary and fiscal stimulus and an inventory swing have clearly contributed to the turnaround, but these are not long-lasting sources of demand growth. Executives are plagued by the thought of what happens if they build it and no one comes. Until that question fades, many will neither build nor hire.

80
85
90
95
100
105
110
86 88 90 92 94 96 98 00 02 04 06 08 10
Businesses Remain Very Anxious
Source: NFIB
Small business confidence index, 1986=100
Consumer confidence similarly remains very weak; larger businesses are a bit more upbeat
0 500
1,000 1,500 2,000 2,500 3,000 3,500 4,000 4,500
00 01 02 03 04 05 06 07 08 09 10
90 days and over delinquent In foreclosure
Foreclosure Crisis Continues First mortgage loans, ths
Sources: Equifax, Moody’s Analytics
Strategic defaults, in which the homeowner can reasonably afford their mortgage payment but defaults anyway, are now over 20% of defaults.
Foreclosure crisis
The foreclosure crisis and chance of further house price declines remain threats to the recovery. At the end of May, there were 2.8 million mortgage loans at some stage of the foreclosure process and an additional 1.6 million loans 90 days or more past due and thus headed toward foreclosure (see Chart 9).xvi
Fully 9% of the 49 million first-mortgage loans outstanding are in deep trouble.

-150
-100
-50
0
50
100
05 06 07 08 09 10
Gaping State and Local Govt. Budget Hole
Source: Moody’s Analytics
State and local government budget shortfall, $ bil, annualized
State government budget shortfall is an estimated nearly $50 billion, and local government shortfall is closer to $40 billion.
The glut of loans in the foreclosure pipeline is due in large part to delays in the process created by the Obama administration's loan modification plan. The Home Affordable Mortgage Plan is a complicated arrangement that has only recently been fully implemented. Mortgage servicers have delayed pushing loans through foreclosure until they know which homeowners qualify for the plan. A drop in foreclosure sales, along with stronger nondistressed home sales due to the first-time homebuyer tax credit and lower fixed mortgage rates resulting from the Federal Reserve's credit easing efforts, have resulted in more stable house prices over the past year.
This is about to change. Foreclosures and short sales are expected to increase as mortgage servicers push loans that cannot be modified through the process to a sale. The number of loans receiving permanent modifications to date through HAMP—close to 350,000—has been disappointing, while the number of homeowners going into new trial modifications slowed sharply this spring.xvii
Changes to the HAMP announced earlier this year to provide greater incentives for modifications that include principal reductions should make the program more effective, but the changes come too late to forestall greater foreclosure and short sales in coming months. With nondistressed home sales already weakened by the recent end of the tax credit, house prices will likely decline further during the second half of this year and early next. Nationwide, house prices have already fallen nearly 30% from their peak four years ago, according the national Case-Shiller house price index.
Nothing works well in the economy when house prices are falling; as household wealth erodes, consumers lose the ability and willingness to spend, and the financial system loses the ability and willingness to extend credit. The recovery will not gain traction until the foreclosure crisis ends and house prices fully stabilize. State and municipal budget shortfalls The recovery is also threatened by massive shortfalls in most state and municipal budgets. This is forcing increasingly large job cuts, budget reductions, and tax increases. There is no dispute that state and local governments are struggling with epic budget shortfalls. The aggregate deficit likely for fiscal 2011, which begins in July in most states, is over $90 billion (see Chart 10). Fiscal difficulties in California, Illinois and New York are receiving the most attention, but similar problems plague most states and municipalities from coast to coast.
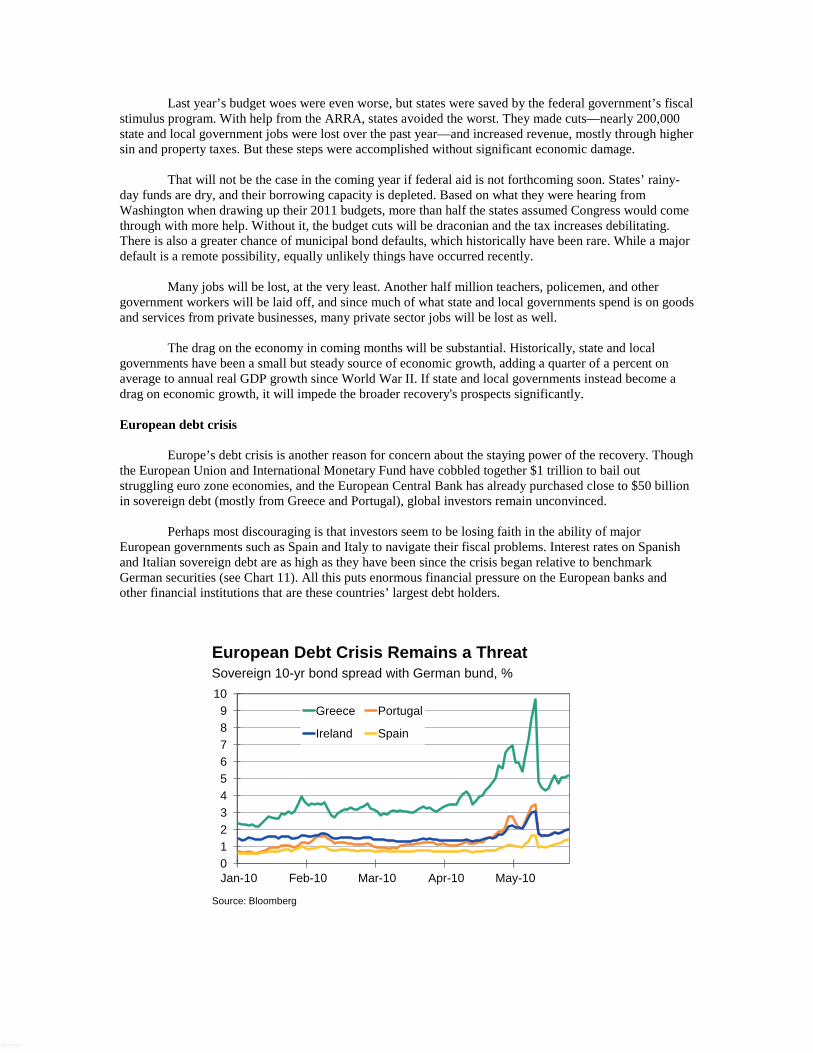
0 1 2 3 4 5 6 7 8 9
10
Jan-10 Feb-10 Mar-10 Apr-10 May-10
Greece Portugal
Ireland Spain
European Debt Crisis Remains a Threat
Source: Bloomberg
Sovereign 10-yr bond spread with German bund, %
Last year’s budget woes were even worse, but states were saved by the federal government’s fiscal stimulus program. With help from the ARRA, states avoided the worst. They made cuts—nearly 200,000 state and local government jobs were lost over the past year—and increased revenue, mostly through higher sin and property taxes. But these steps were accomplished without significant economic damage.
That will not be the case in the coming year if federal aid is not forthcoming soon. States’ rainy-day funds are dry, and their borrowing capacity is depleted. Based on what they were hearing from Washington when drawing up their 2011 budgets, more than half the states assumed Congress would come through with more help. Without it, the budget cuts will be draconian and the tax increases debilitating. There is also a greater chance of municipal bond defaults, which historically have been rare. While a major default is a remote possibility, equally unlikely things have occurred recently.
Many jobs will be lost, at the very least. Another half million teachers, policemen, and other government workers will be laid off, and since much of what state and local governments spend is on goods and services from private businesses, many private sector jobs will be lost as well.
The drag on the economy in coming months will be substantial. Historically, state and local governments have been a small but steady source of economic growth, adding a quarter of a percent on average to annual real GDP growth since World War II. If state and local governments instead become a drag on economic growth, it will impede the broader recovery's prospects significantly. European debt crisis
Europe’s debt crisis is another reason for concern about the staying power of the recovery. Though the European Union and International Monetary Fund have cobbled together $1 trillion to bail out struggling euro zone economies, and the European Central Bank has already purchased close to $50 billion in sovereign debt (mostly from Greece and Portugal), global investors remain unconvinced.
Perhaps most discouraging is that investors seem to be losing faith in the ability of major European governments such as Spain and Italy to navigate their fiscal problems. Interest rates on Spanish and Italian sovereign debt are as high as they have been since the crisis began relative to benchmark German securities (see Chart 11). All this puts enormous financial pressure on the European banks and other financial institutions that are these countries’ largest debt holders.

Even if the financial turmoil ends soon, it is difficult to see how Europe will avoid sliding back into recession. The European economy was barely growing before recent events, and that was mostly because of the temporary policy stimulus and an end to massive inventory liquidation by manufacturers. As Europe’s strained financial system tightens credit further and governments impose fiscal restraint, the economy will suffer.
European policymakers thus need to do more to settle financial markets and limit the economic damage. Most importantly, nations need to offer credible plans to restore fiscal stability—and then show they are following through. So far so good; the Greeks, Portuguese and Spaniards appear to be doing just this. The British also recently put forth a budget that credibly addresses that nation’s fiscal problems, at least on paper.
The ECB and Bank of England will not be able to begin normalizing interest rates soon; thus, both the euro and the British pound will continue their recent slides. It would not be surprising to see the euro approach one-for-one parity with the U.S. dollar by year’s end and for the pound to reach quarter-century lows. There are also meaningful odds that the ECB will have to increase its sovereign debt purchases and not sterilize those purchases as it has been doing, thus allowing interest rates to fall even closer to zero. Further credit easing by the Bank of England is also a possibility.
Assuming Europe’s policy response is sufficient to soon calm financial markets, the fallout on the U.S. economy should be manageable. A weak European economy and a stronger dollar will have a negative effect on U.S. exports. This impact should be small, however, as Europe accounts for about a fifth of total U.S. exports, and exports in turn make up less than a tenth of U.S. GDP. The debt crisis also brings some economic positives for the U.S., including lower prices for oil and other commodities and, in particular, lower interest rates. Long-term rates have fallen significantly, given global investors’ flight to quality into U.S. Treasury bonds and Fannie and Freddie mortgage securities; fixed mortgage rates are now near record lows.
However, just how badly the U.S. economy is damaged by the European debt crisis will depend largely on the stock market. Stock prices are off 10% to 15% since the crisis began; not much more than a garden-variety correction, particularly following a year of strong gains. The drop thus far does not make anyone feel good, but it will not change consumers’ spending behavior or businesses’ hiring decisions too much.
Yet the market’s recent turmoil shows why the European debt crisis is such a serious threat: Further stock price declines could do significant damage to the U.S. psyche and economy. Spending by high-income households is particularly sensitive to the markets’ ups and downs. The saving rate for households in the top fifth of the income distribution—a group that accounts for about 60% of consumer spending—surged during the recession, as higher-income households saw their nest eggs erode. The stock market’s rally over the past year came as a huge relief, pushing these households’ saving rates back to prerecession levels. The market’s current travails have surely put this group on edge again. Continued policy support
Given the sizable threats to the fragile recovery and the difficulty of dealing with another slide into recession, it is important for policymakers to continue to provide substantial support to the economy. The Federal Reserve is signaling it will not begin to raise rates soon.xviii
The Fed will likely continue to pursue its zero interest rate policy until unemployment moves definitively lower, which is not expected until next spring at the earliest.
If the recovery were to falter, the Fed could resume its credit easing efforts, but the economic benefit of this would be limited. Long-term interest rates are already extraordinarily low, and even if they fall further, it is unclear how much this would help to revive home sales, consumer purchases of cars and other durable goods, and business investment. Moreover, banks would presumably tighten underwriting standards in such a scenario, restricting the availability of credit at any interest rate.

-2
-1
0
1
2
3
4
09 10 11
The Boost From ARRA Will Soon Fade
Source: Moody’s Analytics
Contribution to real GDP growth, %
The limits of monetary policy to further support the recovery put added pressure on fiscal policymakers, particularly since the effect of the fiscal stimulus in place is beginning to fade (see Chart 12). By late this year, the stimulus will begin to decline in earnest, becoming a meaningful drag on growth by early 2011.
With this context, it would seem prudent for fiscal policymakers to provide some additional
stimulus. I would recommend a total of $80 billion, including $45 in additional funding for emergency UI benefits through the end of 2010, $30 billion to states to meet their Medicaid obligations through fiscal 2011—this would allow them to redirect their resources and forestall the worst of the coming budget cuts and tax increases—and $5 billion to finance additional small business lending.
If policymakers provide additional funds this summer similar to my recommendation, the odds of a double-dip recession in the next year will remain no more than one in four.xix
If policymakers provide no further stimulus, the odds will rise to one in three. Thus, even if policymakers fail to provide an additional fiscal stimulus, the recovery should remain intact and eventually evolve into a self-sustaining expansion, but the odds are uncomfortably high that it will not.
Given this, fiscal policymakers should also consider scaling back and phasing in the tax increases due to start in 2011 under current law. Personal marginal tax rates and capital gains and dividend income tax rates are set to rise back to where they were a decade ago.xx
Any tax increases would be counterproductive until the economy is consistently expanding at a strong enough rate to significantly lower unemployment.
Federal deficit concerns
Fiscal policymakers are rightfully worried about providing an additional stimulus, given the nation’s large budget deficits and daunting fiscal outlook. The federal budget deficit ballooned to $1.4 trillion in fiscal 2009, equal to a record 10% of GDP, and this year’s deficit is expected to be a similar $1.4 trillion. Even President Obama’s budget, presented earlier this year, does not result in a fiscally sustainable deficit at any point during its 10-year outlook.xxi
This very poor fiscal situation reflects the ultimate expected price tag of the financial crisis and recession of more than $2.15 trillion.xxii This includes $1.35 trillion in direct costs— approximately $1 trillion in federal fiscal stimulus spending and $350 billion to support various institutions and markets, less

0
20
40
60
80
100
120
1790 1815 1840 1865 1890 1915 1940 1965 1990 2015
Sources: Treasury, Moody’s Analytics
The average federal debt-to-GDP ratio since WWII is 40%
Policymakers Must Change This Outlook Federal debt-to-GDP ratio
what the government will recoup in future asset sales. The loss of tax revenues and the growth of unemployment and other income support programs will cost the Treasury another $800 billion.
Even after the costs associated with the financial crisis abate, without significant changes to tax and government spending policy the budget outlook is bleak. This is largely due to the rising expected costs of the entitlement programs, despite the passage of healthcare reform. The nation's federal debt-to-GDP ratio is projected to increase to almost 85% a decade from now, double the approximately 40% that prevailed prior to the current financial crisis and the highest ratio since World War II (see Chart 13).
The need to make fundamental changes to government spending and tax policy is thus much more intense in the wake of the financial crisis and recession. Unless policymakers credibly address these issues soon, a future fiscal crisis will likely result in higher interest rates, lower stock prices, a weaker U.S. dollar, and ultimately lower living standards.
As such, it would be desirable for fiscal policymakers to pay for any additional stimulus with spending offsets and tax increases. Doing so this year or next would dilute or neutralize any economic benefit from the stimulus, but it should be placed high on the legislative agenda as soon as the economy is in full swing, most likely beginning in 2012. Making such a commitment now would send a strong signal to global investors that policymakers are serious about addressing the nation’s fiscal problems. This would make it easier for policymakers to run a larger deficit in the coming year to fund the stimulus without causing long-term interest rates to rise and crowding out private investment.
That said, fully paying for the recommended additional stimulus should not be a necessary condition for providing it. Policymakers have some latitude to run a larger deficit in the coming year, given the ongoing global flight to quality into U.S. government debt and, more importantly, given deleveraging by the private sector. Households, businesses and financial institutions are reducing their debt outstanding so rapidly that total credit demand is still declining despite enormous borrowing by federal, state and municipal governments (see Chart 14). With still-moribund private credit demand, there is little prospect that providing a deficit-financed stimulus in the coming year will result in higher interest rates.

-2,000
-1,000
0
1,000
2,000
3,000
4,000
5,000
6,000
50 60 70 80 90 00
No Credit Growth
Sources: Federal Reserve Board, Moody’s Analytics
Total domestic credit growth, $ bil
Deleveraging by households, nonfinancial businesses and financial institutions is greater than government borrowing.
Conclusions
The economy has come a long way since the end of the Great Recession. Job growth has resumed in earnest, stock prices are up strongly, and house prices have largely stabilized. That the recovery is a year old is testimonial to the unprecedented and ultimately successful monetary and fiscal policy response. If policymakers had not acted as aggressively, the economy would still very likely be in recession.
However, there still is no free lunch. The government response was extraordinarily costly and effectively pulled the nation’s fiscal problems forward by a full decade. Policymakers have little choice but to soon deal with the nation’s byzantine tax structure and ballooning entitlement programs. It is thus understandable that many policymakers are reticent to heed calls to provide even more fiscal stimulus, lest they make these fiscal problems even more severe.
Indeed, if policymakers ignore these calls, the recovery will in all likelihood not devolve into recession. The next six to 12 months will be uncomfortable as the recovery struggles to gain traction, but a full-fledged expansion should take hold by this time next year. Policymakers would be taking a significant gamble, however. Given the still-fragile recovery and the clear threats remaining, it is not difficult to construct scenarios in which the economy backtracks into recession. Once back in recession, moreover, it is not clear how the economy would get out, at least not for a long time or before millions more lose their livelihoods. The nation’s fiscal problems would then be completely intractable.
Prudent economic risk management strongly argues that policymakers should err on the side of providing too much near-term fiscal stimulus rather than too little.

i The National Bureau of Economic Research, the official arbiter of the U.S. business cycle, has yet to determine when the recession ended. The widespread consensus among economists is that the recovery began sometime during the summer of 2009. ii Nonfarm business productivity rose 6.1% in the year ending in the first quarter of 2010. Only in two other periods since World War II has productivity growth been stronger. It is not unusual for productivity to surge early in recoveries, but the recent gains are noteworthy. iii Moody’s Analytics determines where each state and metropolitan area is in its business cycle based on a methodology similar to that used by the NBER in determining the national business cycle. iv The difference between Libor and Treasury yields is only known as the TED spread. v The new credit facilities include the Term Auction Facility, the Term Securities Loan Facility, the Term Asset-Backed Securities Loan Facility, the Commercial Paper Funding Facility, the Money Market Investor Funding Facility, and currency swap lines. vi The success and failures of the TARP fund are discussed in "Taking Stock: Independent Views on TARP's Effectiveness," Mark Zandi, testimony before the TARP Commission, November 19, 2009. vii Other key policy measures include the auto industry bailout early in 2009 and the ongoing effort to encourage foreclosure mitigation, both of which have been funded by TARP monies. viii This includes, among other things, the cash for clunkers tax incentive in the fall of 2009, the extension and expansion of the housing tax credit through mid-2010, the passage of a job tax credit through year-end 2010, and extensions of emergency UI benefits through June 2010. ix The CBO’s estimates of the economic impact of ARRA can be found at http://www.cbo.gov/ftpdocs/115xx/doc11525/05-25-ARRA.pdf . x The underemployment rate, which also includes those working part-time for economic reasons and discouraged workers, is closer to 17%. This is the highest underemployment rate on record dating back to World War II as constructed by Moody’s Analytics. xi This analysis is based on data from the BLS business employment dynamics survey. xii The Fed asks respondents whether they have tightened their underwriting or increased their loan spreads in the last quarter. Recent responses indicate that fewer lenders are tightening further, but there is no indication they have eased after the extreme tightening that occurred this time last year. xiii It is difficult to disentangle the impact of credit standards and weaker demand on credit outstanding, but suffice it to say, standards have arguably never been as stringent. xiv The potential of policy to affect job creation is amplified by the ability of large firms to shift activities overseas. Despite big productivity gains and lower labor costs in the U.S., costs and market opportunities in emerging economies are growing in attractiveness. xv The National Federation of Independent Business survey of small businesses, the Conference Board survey and Business Roundtable surveys of large businesses, and the Moody's Economy.com weekly global business survey all roughly show this. xvi This is based on a 5% random sample of all the credit files in the country maintained by the credit bureau Equifax. xvii In the HAMP program, homeowners are initially put into trial modifications, during which they must remain current on their modified loans. After three months of timely payments, the modification is made permanent. It is important to note that private mortgage servicers are also implementing modification plans that are as significant as HAMP in terms of the number of loans being modified. xviii This is evident in the statement from the late June meeting of the FOMC in which policymakers stated their intent to keep interest rates “exceptionally low for an extended period.” The consensus interpretation of this within the financial system is that the Fed is committing to not raising rates for at least six months. xix These are subjective odds to provide the reader with a general sense of my assessment of the risks of a double-dip recession. xx The tax cuts were implemented as part of the Economic Growth and Tax Relief and Reconciliation Act of 2001. xxi A fiscally sustainable deficit-to-GDP ratio—consistent with a stable debt-to-GDP—is no more than 3%. xxii This is equal to nearly 15% of GDP. For historical context, the savings and loan crisis in the early 1990s cost taxpayers some $350 billion in today's dollars—$275 billion in direct costs and $75 billion due to the associated recession. That was equal to almost 6% of GDP at that time.
Related Documents


