PERSPECTIVES ON FISCAL FEDERALISM Edited by Richard M. Bird François Vaillancourt WBI LEARNING RESOURCES SERIES 35628 Public Disclosure Authorized Public Disclosure Authorized Public Disclosure Authorized Public Disclosure Authorized Public Disclosure Authorized Public Disclosure Authorized Public Disclosure Authorized Public Disclosure Authorized

Welcome message from author
This document is posted to help you gain knowledge. Please leave a comment to let me know what you think about it! Share it to your friends and learn new things together.
Transcript
PERSPECTIVES ON FISCAL FEDERALISM
Edited by
Richard M. Bird
François Vaillancourt
W B I L E A R N I N G R E S O U R C E S S E R I E S
35628
Pub
lic D
iscl
osur
e A
utho
rized
Pub
lic D
iscl
osur
e A
utho
rized
Pub
lic D
iscl
osur
e A
utho
rized
Pub
lic D
iscl
osur
e A
utho
rized
Pub
lic D
iscl
osur
e A
utho
rized
Pub
lic D
iscl
osur
e A
utho
rized
Pub
lic D
iscl
osur
e A
utho
rized
Pub
lic D
iscl
osur
e A
utho
rized
Other Titles from the World Bank Institute
India and the Knowledge Economy: Leveraging Strengths and Opportunities2005. ISBN: 0-8213-6207-0. SKU: 16207
Intergovernmental Finance in Hungary: A Decade of Experience 1990–20002005. ISBN: 0-8213-6051-5. SKU: 16051
Intergovernmental Fiscal Relations in Central and Eastern Europe: A Sourcebook and Reference Guide2005. ISBN: 0-8213-5705-0. SKU: 15705
Reducing Poverty on a Global Scale: Learning and Innovating for Development—Findings from the ShanghaiGlobal Learning Initiative2005. ISBN: 0-8213-6362-X. SKU: 16362
Beyond Economic Growth: Meeting the Challenges of Global Development (2nd edition)2004. ISBN: 0-8213-5933-9. SKU: 15933
Building State Capacity in Africa2004. ISBN: 0-8213-6000-0. SKU: 16000
Granting and Renegotiating Infrastructure Concessions: Doing It Right2004. ISBN: 0-8213-5792-1. SKU: 15792
Leadership and Innovation in Subnational Government: Case Studies from Latin America2004. ISBN: 0-8213-5707-7. SKU: 15707
Subnational Data Requirements for Fiscal Decentralization: Case Studies from Central and Eastern Europe2004. ISBN: 0-8213-5699-2. SKU: 15699
The Right to Tell: The Role of Mass Media in Economic Development2002. ISBN: 0-8213-5203-2. SKU: 15203
China and the Knowledge Economy: Seizing the 21st Century 2001. ISBN: 0-8213-5005-6. SKU: 15005
Economic Analysis of Investment Operations: Analytical Tools and Practical Applications2001. ISBN: 0-8213-4850-7. SKU: 14850
Perspectives on Fiscal Federalism
Edited by Richard M. Bird and François Vaillancourt
The World BankWashington, DC
WBI LEARNING RESOURCES SERIES
©2006 The International Bank for Reconstruction and Development / The World Bank1818 H Street NWWashington DC 20433Telephone: 202-473-1000Internet: www.worldbank.orgE-mail: [email protected]
All rights reserved
1 2 3 4 5 10 09 08 07 06
This volume is a product of the staff of the International Bank for Reconstruction and Development /The World Bank. The findings, interpretations, and conclusions expressed in this volume do not neces-sarily reflect the views of the Executive Directors of The World Bank or the governments they represent.
The World Bank does not guarantee the accuracy of the data included in this work. The boundaries,colors, denominations, and other information shown on any map in this work do not imply any judge-ment on the part of The World Bank concerning the legal status of any territory or the endorsement oracceptance of such boundaries.
Rights and PermissionsThe material in this publication is copyrighted. Copying and/or transmitting portions or all of this workwithout permission may be a violation of applicable law. The International Bank for Reconstruction andDevelopment / The World Bank encourages dissemination of its work and will normally grant permis-sion to reproduce portions of the work promptly.
For permission to photocopy or reprint any part of this work, please send a request with completeinformation to the Copyright Clearance Center Inc., 222 Rosewood Drive, Danvers, MA 01923, USA; telephone: 978-750-8400; fax: 978-750-4470; Internet: www.copyright.com.
All other queries on rights and licenses, including subsidiary rights, should be addressed to the Office of the Publisher, The World Bank, 1818 H Street NW, Washington, DC 20433, USA; fax: 202-522-2422; e-mail: [email protected].
ISBN-10: 0-8213-6555-XISBN-13: 978-0-8213-6555-7eISBN: 978-0-8213-6556-4DOI: 10.1596/978-0-8213-6555-7
Library of Congress Cataloging-in-Publication Data
Perspectives on fiscal federalism / edited by Richard M. Bird, François Vaillancourt. p. cm. – (WBI learning resources series)
Includes bibliographical references.ISBN-13: 978-0-8213-6556-4ISBN-10: 0-8213-6556-8ISBN-13: 978-0-8213-6555-7ISBN-10: 0-8213-6555-X
1. Intergovernmental fiscal relations. 2. Local finance. 3. Revenue. I. Bird, RichardMiller, 1938- II. Vaillancourt, François. III. World Bank. IV. Series.
HJ197.P38 2006336--dc22
2005057899
Contents
Foreword vPreface viContributors x
1. Introduction and Summary 1
Part I. The Structure of Intergovernmental Finance 132. Revenues and Expenditures in an Intergovernmental Framework 15
Jorge Martinez-Vazquez, Charles McLure, and François Vaillancourt
3. Budgeting, Financial Management, and Financial Markets in an Intergovernmental Context 35François Vaillancourt
4. The Structures and Conduct of Intergovernmental Relations 57 Ronald H. Neumann and T. Russell Robinson
5. Fiscal Flows, Fiscal Balance, and Fiscal Sustainability 81Richard M. Bird
Part II. The Provision of Services 996. Fiscal Aspects of Alternative Methods of Governing Large Metropolitan Areas 101
Enid Slack
7. Providing Public Services in Remote Areas 123Harry Kitchen and Enid Slack
8. Local Government Enterprises 141Harry Kitchen
Part III. Revenues 1759. Local and Regional Revenues: Realities and Prospects 177
Richard M. Bird
10. Alternative Approaches to Taxing Land and Property 197Enid Slack
11. Local Business Taxes 225Richard M. Bird
12. Fiscal Federalism and the Taxation of Nonrenewable Resources 247Kenneth J. McKenzie
iii

v
Foreword
When Russia declared its independence from the Soviet Union in 1991, an era of reforms waslaunched throughout Central and Eastern Europe and Central Asia to make the transition fromcommand to market systems (economic decentralization). Key among these reforms has beenthe process of decentralizing the governance of the socialist state—the devolution of fiscal pow-ers and responsibilities from central to local governments and the creation of a functioning fed-eral state. Indeed, the World Bank’s World Development Report on Entering the 21st Century(1990–2000) concluded that such localization is, along with globalization, one of the two forcesthat now shape the world in which development policy is defined and implemented. Since theearly 1990s, the World Bank Institute has supported this change process through the sustaineddelivery of courses and seminars.
As noted in the preface to this volume, there are few countries where the success of fiscalreform is as important as it is in Russia; and few countries have as much to offer as does Canadain terms of lessons to be learned about sustainable federalism. To facilitate this exchange ofknowledge, in 2001 the World Bank Institute (WBI) joined with the Russian Ministry of Financeand the Canadian International Development Agency (CIDA) to develop a Russian languagecourse on Intergovernmental Fiscal Relations and Local Financial Management to help preparefuture trainers in all seven Okrugs (Administrative Regions) build the capacity to design a suc-cessful decentralization strategy. The course was organized by WBI’s Migara De Silva in coop-eration with Dr. Alexei Lavrov of the Russian Ministry of Finance and Guillaume Legros ofCIDA. The course materials on Canada were developed by Professors Richard Bird (Universityof Toronto) and Francois Vaillancourt (University of Montreal), who worked with the team ofexperts who have contributed chapters to this book.
Perspectives on Fiscal Federalism adds to the existing series of WBI publications on intergov-ernmental fiscal relations, complements the core course which is now fully managed and deliv-ered by our Russian counterparts, and further strengthens the knowledge partnership amongCanada, Russia, and the World Bank.
Frannie A. LéautierVice PresidentWorld Bank Institute
vi
Preface
Extensive political and fiscal decentralization is underway worldwide, from China to Cambo-dia, India to Indonesia, and Sudan to Sierra Leone. But nowhere has it been more dramaticallyevidenced than by the collapse of the Soviet Union. Moreover, because the world needs an eco-nomically robust and decentralized postcommunist system, there are few countries where thesuccess of federalism is more important than it is in Russia. And, few countries have as much tooffer in terms of knowledge about federalism than does Canada.
Russia is a country that has a huge potential for global and regional economic power, yetthat has a remarkably poor record of performance. Today’s Russia has a population four and ahalf times that of Canada, but a GDP half its size. The United Nations Human DevelopmentIndex assigns Canada a ranking of .95 (1.00 is the maximum), making it 4th in the world out of171 countries, while Russia comes in at .80, making it 57th. Similar comparisons can be madebetween Russia and several other states that, for the 45 years following the end of World War IIwere also under the rule of the former Soviet Union. Thus, comparisons between Russia andCroatia, the Czech Republic, Estonia, Hungary, Latvia, Lithuania, Poland, and the SlovakRepublic tell a similar, albeit less dramatic, story of Russia’s falling behind. While there are sev-eral reasons for this disappointing record, recent empirical work suggests that the failure todecentralize fiscally is one of them.
At the time of its independence in 1991, it was generally accepted that some form of fed-eralism was the only political system that would fit the size and diversity of Russia; how-ever, the recent consolidation of power under the government of President Vladmir Putinhas cast doubt on the extent (or maybe just the pace) of this commitment. Whatever the pres-ent degree of commitment or the pace, it is clear that for Russia to realize its economic,social, and political potential there must be a functional and appropriate system of intergov-ernmental fiscal relations.
Drawing on Canada, this book is about what is functional and appropriate. Recognizingthere is no one “correct” model for, or path to, a well-designed intergovernmental fiscal systemand that many dissimilarities exist between the two countries, it is also true that Russia andCanada have many similarities and that there are lessons to be shared.
The dissimilarities include those of culture, history, and the markedly different systems ofgovernance that the two countries have operated under over the past century. Although bothRussia and Canada are ethnically and linguistically mixed, naturally rich in resources, andhighly diverse in their geographic character as well as in their urban vs. rural profiles, Russia ismuch more fractionalized in each of these categories. And then there is the matter of sheer size:Canada spans 6 time zones while Russia spans 11. Another big difference is time: Canada’s fed-eral experience spans nearly 14 decades, whereas the new Russian experiment is a scant 14years old.
In 139 years, citizens have time to change a system. The Canadian Constitution Act of 1867contained 147 articles, many of which have been repealed, overridden, or otherwise modifiedin some manner. As the editors of this volume point out, although Canada is far from havingthe conceptually ideal structure of federalism, it has nevertheless done many things “right”with respect to the central vs. subnational fiscal relationship. Of course, just what Canada’s fed-eralism looks like in its 15th decade will be different from that of its 14th; however, the basicsystem will remain in place. Indeed, the flexibility to adjust to new circumstances, economic,
Preface vii
demographic, technological, and political, is one of the great merits of a robust federal systemsuch as Canada’s.
Russia, however, does not have 14 decades to work it all out. The future is arriving muchmore rapidly in the first decade of the 21st century than it did in the mid-19th (the law of com-pound economic growth attests to that), and in an era of market globalization and the growingglobal desire of people for self-determination and devolution of governmental power, the pres-sure is on for Russia to exploit more fully its full potential. However, as part of its post- Sovietlegacy, Russia is grappling with how to decentralize fiscal power at the same time that its pub-lic sector is striving to retain many attributes of a heavily centralized state. The result is a gapbetween the goal of initiating a well-designed federal system as expressed in its 1993 Constitu-tion, and the reality whereby the division of powers remains obscure, with fiscal relationssometimes confrontational and chaotic.
So, the differences matter. But so do the similarities. And here is where there is a great dealof common ground. The similarities are of two types: there are institutional similarities andsimilarities pertaining to knowledge. Institutionally, there are two common elements. The firstis that, in the case of both Russia and Canada, part of the impetus behind the “new” federalistdiscussion (one in the 1860s, the other in the 1990s) was to devise a system that recognized thelegitimate interests of different regions in a geographically expansive country and at the sametime needed to establish the intergovernmental competence of the central (“federal”) govern-ment. Thus, Canadian politics focused on addressing the divergent interests of both upper(anglophone) and lower (francophone) Canada. Russia has a similar starting point of divergentregions, such as those of north and west vs. south and east of the Ural Mountains. And, just asdid Canada in its beginnings, Russia has a need to become intergovernmental in a manner thataffirms the primacy of central law.
The second common institutional feature is that, for both countries, the question of “whitherfederalism” has been at the historic core of the process whereby the nation defines the scopeand character of its collective actions. This is true even though the content of that discussionhas been vastly different. For Canada, one could characterize the content as a fiscal “magnifi-cent obsession.” For Russia, it has oftentimes (at least before 1991) been a “perverse obsession.”But in both cases it has been a fiscal obsession.
For the Canadian “founding fathers” who participated in three constitutional conven-tions between 1864 and 1867, federalism was about a combination of national survival andidentity, and the hard, cold political give and take between upper and lower Canada. Under-pinning both was an urgency to avoid the violence of the then ongoing Civil War in theUnited States, which served as a signal to many that the U.S. “bottom-up” model was a fail-ure. And so it has gone since 1867, with the Canadian notions—and practice—of federalismserving as a flexible vehicle for subsequently accommodating matters such as the interestsof western province demands for powers over land and natural resources (granted in 1930),the equal status of the French and English languages in New Brunswick (1993), permittingQuébec to organize school boards along linguistic lines (1997), and creation of the new Terri-tory of Nunavut (1999). Indeed, there is a Canadian saying (at least among the federalismcrowd) that whatever social issue may arise in Canada, the correct response is “Is it good orbad for the federal system?”
The same robustness of the federalism debate characterizes the history of the RussianSoviet Federative Socialist Republic (1924–1991) and the Russian Federation (1991–present).With 11 time zones, fractionalization, and rich vs. very poor regions, federalism matters.However, Russia’s history provides few good lessons in federalism. The fiscal structureenvisioned by Vladmir Lenin was a transitory federal system that would serve as the “sureststep” to a centralized socialist state. Joseph V. Stalin similarly argued that federalism in Rus-sia was merely a transition to a centralized union, and that to think of Canada (which he
viii Preface
specifically cited in a 1918 interview with Pravda) as having a stable system was “an infatu-ation.” The result: citizen desire for autonomy was supplanted by autocracy, and pluralismby plutocracy. However, in December 1991, the Soviet concept of federalism as a “free feder-ation of people in equal rights” (USSR Constitution of 1924) gave way to the concept of “ademocratic federal rule of law . . . whereby the people of the Russian Federation shall exer-cise their power directly and also through organs of state power and local self-government”(Constitution of the Russian Federation, 1993).
Editors Richard Bird and François Vaillancourt have identified three areas in which theCanadian experience informs the policy and implementation challenges that Russia faces inmaking its new federalism work: the structure of intergovernmental finance, provision ofservices, and revenue mobilization. In their introduction, the editors provide a detailedoverview of the contents of each of the 11 supporting chapters; that discussion is not repeatedhere. What is useful here is to note how these chapters fit Canadian–Russian knowledge shar-ing. To summarize:
STRUCTURE OF INTERGOVERNMENTAL FINANCE. Both countries have understood from thestart that in order for there to be a strong subnational system of finance, the central authoritymust have the capacity to be intergovernmental. Thus, as the first chapters explain, Canada hasexpenditure and revenue assignment largely “right” in its federal-provincial relationship. Rec-ognizing that a well-designed intergovernmental structure it not just about assignment, butalso about how to manage and implement that assignment, the book proceeds to addresses thepractical areas of budgeting and public financial management, the necessary institutionalframework for the conduct of intergovernmental relations, and how to bring all this informa-tion together into a sustainable set of central-subnational relationships through a system of fis-cal planning, measurement, and monitoring.
PROVISION OF SERVICES. Having established the structural underpinnings for an intergov-ernmental system, the next two sections turn to the economist’s raison d’être for fiscal decen-tralization: the promise of efficiency gains that can be exploited once there are local varia-tions in preferences and costs of local public services. The first section turns to theexpenditure side of the intergovernmental budget, addressing three topics where the Cana-dian experience is particularly relevant to the emerging federalism dialogue. The first twotopics focus on questions of jurisdictional size and degree of population concentration—thatis, on the choices of implementing service delivery in a metropolitan agglomeration (cityregions such as Toronto, Vancouver, and Halifax) vs. rural areas (including regions such asthe Yukon, Northwest Territories, and Nunavut). Together the two chapters, metropolitanand rural, weave a single story of when to use tools such as one- vs. two-tier governmentalstructures and alternative forms of intragovernmental cooperation, and of how the urban vs.rural framework frames the choice of tax handles. The discussion on service delivery is thenrounded out by a focus on the role of local governmental enterprises. A special merit of thegovernment enterprise chapter is that it moves from first addressing the important ques-tions of the role and rationale for local government enterprises to providing a framework forevaluating their governance.
REVENUES. The provision of services is only one side of the intergovernmental budget equa-tion and the efficiency argument for decentralization. The other is that, at the margin, the taxdecision to provide decentralized public services must be local. This is true even though thereremains a clear role for transfers from “senior” governments. But for the efficiency goal to berealized there must be clarity in the subnational authority’s power to levy “own” revenues.And, with respect to revenue policy and practice, Canada has much to offer. Accordingly, this

section addresses issues ranging from the principles and practice of the conventional—forexample, user charges and the variants of real estate taxation_to two less conventional localtaxes, personal income tax surcharges (piggybacking) and provincial destination-based value-added taxes. Again, as is true throughout this book, the discussion is not what Russia “should”do but, rather, how to think about its options from an operational perspective.
Robert D. EbelSenior Fellow Tax Policy Center, Urban InstituteDistrict of ColumbiaUnited States
Preface ix
x
Contributors
Richard M. Bird is professor emeritus of economics, adjunct professor of business economics,and codirector of the International Tax Program at the Joseph L. Rotman School of Manage-ment of the University of Toronto. He has been a visiting scholar at a number of overseas uni-versities, and has frequently been a consultant to the World Bank, the International MonetaryFund, the Canadian federal government, and other national and international organizations.In addition to numerous publications on tax and federal finance issues in Canada, Bird haswritten extensively on the fiscal problems of developing and transition countries and on com-parative public finance in general.
Harry Kitchen is a full professor in the Department of Economics, Trent University, Peterbor-ough, Ontario. He has published extensively in the field of local public finance, especially inrelation to Canada. He has carried out numerous consultancies in this area and, in particular,has been involved in issues of local government mergers and restructuring.
Kenneth J. McKenzie is a full professor in the Department of Economics, University of Cal-gary, Alberta. Specializing in public economics with an emphasis on taxation and politicaleconomy, McKenzie has acted as an adviser to governments and institutions at the interna-tional, federal, and provincial levels. He was appointed to the Taxation and Finance Commit-tee of the Alberta Economic Development Authority and was a member of the Alberta Busi-ness Tax Review Committee in 2000.
Ronald H. Neumann is the director of intergovernmental finance in the Finance Departmentof Manitoba. Since 1998 he has also served as a consultant to the Financial and Fiscal Commis-sion of South Africa. He has participated in projects related to transfer payment formulas andthe conduct of intergovernmental fiscal relations in Russia and in China.
T. Russell Robinson was assistant deputy minister for federal-provincial relations in theCanadian federal Department of Finance (1986–93) and deputy secretary to the Cabinet in theIntergovernmental Affairs section (1993–95). As a public policy consultant since 1995, he hasparticipated in projects in China, Mongolia, Russia, and Vietnam dealing with policy reformareas that include intergovernmental arrangements and structures.
Enid Slack is president of Enid Slack Consulting, Inc. Slack is an economic consultant special-izing in municipal, education, and intergovernmental finance. She was a special adviser to theGreater Toronto Area Task Force, a member of the Who Does What Panel in Ontario, and amember of the City of Toronto’s Business Reference Group on tax policy. Her clients in Canadaand abroad include municipal, provincial, territorial, and federal governments; governmentcommissions; school boards; and private companies. Slack has published numerous books andarticles on local government finance.
François Vaillancourt is a full professor in the Economics Department and a fellow of the Eco-nomics Research Center, Université de Montréal. He has published extensively in the area ofpublic policy, especially on federalism, human resources, and taxation issues. He has acted asa consultant for various bodies, such as the Canadian International Development Agency, theEconomic Council of Canada, Finance Canada and Finance Québec, Statistics Canada, theUnited Nations Development Programme, and the World Bank.
1Introduction and Summary
Richard M. Bird and François Vaillancourt
This book deals with a wide range of questions relating to intergovernmental finance aroundthe world. While we do not purport to provide a comprehensive treatment of all the issues thatarise in this context—even for Canada, the country of most of the authors, or for Russia, thecountry for which earlier versions of these materials were prepared—some chapters coverimportant new ground, and the book as a whole should prove useful to scholars and policy-makers everywhere who are concerned with intergovernmental and local finance issues.
The coverage and contents of any book largely reflect its origins. The original impetus forthis book arose from several years of experience with the Intergovernmental Finance Coursethe World Bank Institute (WBI) offered to developing and transition countries.1 In part becauseof the short duration of the course, it could not adequately cover a number of issues critical inmany countries. Thus one factor that led us to prepare this book was the desire to provide morecomplete coverage of some important subjects in the field. Coincidentally, the Canadian Inter-national Development Agency expressed interest in working with Canadian scholars and WBIto develop and present a course on intergovernmental finance developed specifically for thecomplex and evolving situation in the Russian Federation and drawing, to the extent possible,on experience with these issues in Canada. As we were the principal Canadian scholarsinvolved with the WBI course, we were charged with the task of pulling together pertinentpapers, and we also took the opportunity to attempt to fill some of the gaps in the existingcourse.
The 11 substantive chapters in this book arose from this project. They were prepared almostentirely by Canadian scholars and policymakers drawing in large part on their experience withthese issues in Canada, although all also had some relevant experience in the developing andtransition countries. Some chapters were initially intended to assist Russian policy analysts andpolicymakers in areas of special concern in Russia, such as property taxation, natural resourcestaxation, and the provision of services to remote areas. However, as many other countries mustalso grapple with similar problems, this material should be of interest to a much wider audi-ence. In addition, to help fill some gaps in the materials available for analysts and policymak-ers everywhere with respect to certain aspects of intergovernmental finance, chapters were pre-pared on a number of other subjects: local business taxation, local business enterprises, financesof metropolitan areas, fiscal flows, and federal-regional relations. Finally, in the course of adapt-ing the WBI course materials for Russia, we realized that some revision and extension of sev-eral of the core materials was also desirable. The result was the chapters on tax and expendi-ture assignment, budgetary policy, and local and regional revenues.
The three parts of this book are not, however, organized in terms of its varied origins, butin terms of three basic issues that arise with respect to intergovernmental finance in general:the structure and functioning of the intergovernmental finance system, the provision ofservices, and revenues. The balance of this introduction provides a brief overview of the key
1
1. The current version of this course may be found at http://www.worldbank.org/wbi/publicfinance/decentralization/coursemodule.htm.
issues in fiscal federalism in general and then summarizes the key points of each of the sub-sequent chapters.
Key Issues in Fiscal Federalism
Six questions arise with respect to intergovernmental finance in any country (this frameworkand some of the discussion in this section are taken from Bird forthcoming). The first five focuson content as follows:
• The question of expenditure assignment: Who should do what?• The question of revenue assignment: Who should levy what taxes? • The question of vertical imbalance: How should any imbalance between the revenues
and expenditures of subnational governments be resolved?• The question of horizontal imbalance or equalization: To what extent should fiscal insti-
tutions attempt to adjust for differences in needs and capacities between different gov-ernment units at the same level of government?
• The question of access to capital markets: What, if any, rules should exist with respect tosubnational borrowing?
The sixth question concerns the process by which these questions are answered, that is, theinstitutional framework within which the technical and political problems of fiscal federalismare resolved.
Each of the six questions must be analyzed taking the specific circumstances of each countryinto account. For example, the relevant policy objectives for a particular country may includenot only the classic goals of efficiency (allocation), equity (distribution), and stabilization, butalso achieving economic growth, preserving a regional balance, and maintaining nationalintegrity and political stability. Moreover, in the case of transition countries such as Russia,additional important objectives may include developing market-facilitating institutional andreal infrastructure (property rights, rule of law, transportation networks, and so on). Not onlymay some of these objectives conflict in theory and practice, but important differences oftenexist between local and central perceptions of the weights that should be attached to them.Moreover, intergovernmental fiscal policies have to take both political constraints and eco-nomic constraints into account. Finally, the fiscal institutions in place in any country reflect theresults of an accretionary process of policies over time, and the inertia inherent in such institu-tions must not be underestimated when policy changes are contemplated or initiated. To under-stand, let alone to resolve, the intergovernmental fiscal puzzle therefore requires substantialinstitutional as well as analytical knowledge.
That said, the basic requirement for efficient and effective subnational government may besummarized as the “matching principle.” Ideally, to the extent possible, for any type of publicservices, benefit areas (such as school catchment areas or areas serviced by public transit)should be matched with financing areas (fees or taxes used to finance the relevant service), asin the benefit model of local finance. In addition, expenditure responsibilities should bematched with revenue resources. Most important, revenue capacities should be matched withpolitical accountability.
The basic rule of efficient expenditure assignment is to assign each function to the lowest levelof government consistent with its efficient performance, an approach that the European Unionrefers to as subsidiarity. The economic literature expresses much the same idea in the so-calleddecentralization theorem. So long as local variations in tastes and costs exist, carrying out publicsector activities in as decentralized a fashion as possible clearly has potential efficiency gains.Local decisionmakers should decide what services are to be provided, to whom, and in whatquantity and quality, and—an important point—local taxpayers should pay for the services pro-vided. Scarce public funds should, of course, be managed as efficiently and used as effectively as
2 Introduction and Summary
possible. Both financial honesty and political accountability require budgeting and financial pro-cedures to be properly established and implemented. Budgeting, financial reporting, and audit-ing should be comprehensive, comprehensible, comparable, verifiable, and public.
In relation to revenues, a completely subnational tax may be defined as one that subnationalgovernments assess, determine the rates for, and collect, and one whose proceeds accrue to sub-national governments. In the real world, however, many taxes may possess only one or two ofthese characteristics, and who “owns” them may be unclear. We suggest two basic principlesfor assigning revenues to subnational governments. First, own source revenues should ideallybe sufficient to enable at least the richest subnational governments to finance all locally pro-vided services that primarily benefit local residents from their own resources. Second, to theextent possible, subnational revenues should be collected only from local residents and shouldpreferably be related to the benefits they receive from local services. Establishing a clear con-nection between those who make decisions about local taxes, those who pay such taxes, andthose who benefit from them is critical for sound intergovernmental policy.
Regardless of the revenue sources made available to subnational governments, if they donot have the capacity to finance services at adequate levels, if externalities are associated withthe services in question, or if a country wishes to take inter-regional differences in needs intoaccount, transfers are needed. A well-designed system of intergovernmental transfersinevitably constitutes an essential component of any decentralization strategy. Three key fac-tors in the design of intergovernmental fiscal transfers are the size of the pool available for dis-tribution, the basis for distributing transfers, and the conditionality attached to transfers. Threepossible ways to determine how much money is to be distributed through intergovernmentalfiscal transfers are
• As a fixed proportion of central government revenues or some other “macro” basis, forexample, as a percentage of gross domestic product
• On an ad hoc basis, that is, in the same way as any other budgetary expenditure • On a formula-driven basis, for instance, as a proportion of specific local expenditures or
in relation to some general characteristics of the recipient jurisdictions.
With respect to subnational borrowing, inappropriate subnational borrowing generallyreflects basic, underlying inadequacies with respect to the intergovernmental fiscal system.Once that system has been corrected by means of such measures as reassigning revenues, andperhaps expenditures; revising the transfer system; introducing transparent, timely, and reli-able reporting systems; and establishing a stable, accepted, periodic review process, the prob-lem of unsustainable subnational borrowing should largely be solved. Until then, however, cer-tain specific rules and limits may have to be put in place to reduce the likelihood of undesirableoutcomes. Essentially, only two basic ex ante limits on subnational borrowing seem to be neces-sary. First, borrowing should be permitted only for investment purposes, a restriction that maynot always be easy to enforce in the absence of strictly segregated and meaningful capital budg-ets. Second, explicit national approval should be required for borrowing abroad.
In the long run, unless subnational governments are able to save themselves from fiscalcrises by drawing on their taxing powers, their only options are bankruptcy or bailouts. The fis-cal root of this problem is the limited taxing power available to subnational governments thatare expected and required to carry out a much wider range of functions than they can financeon their own without extensive reliance on central support, either directly through transfers or,less desirably, indirectly through bailouts The political root of the problem, however, lies in thecontinuing expectation by all players—citizens, subnational and national politicians, andlenders—that, in the end, the central government will come to the rescue. So long as centralactions, ex post, reinforce this expectation, ex ante administrative controls on borrowing, suchas requiring prior central government approval or limiting debt service to a certain proportionof current revenues, may have to remain in place.
Richard M. Bird and François Vaillancourt 3
Good fiscal federalism outcomes are likely to occur only when a good institutional frame-work is available within which to discuss and resolve the inevitable problems. In general, weargue as follows:
• Transparency is needed for good fiscal management. • Good fiscal management is needed if a decentralized political structure is to work rela-
tively effectively and efficiently. • Some sort of specialized agency (or agencies) is needed to perform such functions as
providing good, relevant, and timely analysis of intergovernmental fiscal relations;training good analysts; facilitating and encouraging productive technical exchangesbetween and within governments; and providing neutral, competent input into publicdiscussions of intergovernmental fiscal and financial policy.
Such intangible, but critical, institutional factors will, in the end, play a vitally important role inmaking decentralization work in any country.
Because all countries are different, and because no federal country is exactly like any otherfederal country, international comparisons of federal financial arrangements are both difficultto make and hard to interpret once made. In Canada, for example, the two worlds of federal-provincial and provincial-local fiscal relations are almost totally different in most relevantrespects, and the federal government has little direct interaction with local governments (Birdand Chen 1998). In contrast, in Russia not only does the federal government’s role extend muchmore deeply into the local government sector, but governments at all levels remain deeplyinvolved in what would be considered private sector activities in most other countries.Nonetheless, despite the difficulties of comparing one country with another, considering theexperience of one country in light of the experiences of other countries can be useful, includingboth their successes and their failures. Such comparisons, explicit and implicit, underlie thepapers in this volume.
The Structure of Intergovernmental Finance
Part I of this book contains four chapters covering important issues related to the general set-ting of intergovernmental finance in any country, that is, assignment, budgeting, institutional,and measurement issues.
Assignment
Chapter 2, by Jorge Martinez-Vazquez, Charles McLure, and Francois Vaillançourt, sets thestage for the rest of the volume by considering the key issues related to the nature of govern-ment intervention and decentralization, the assignment of responsibilities, the assignment ofrevenues, and the sequencing of such assignment. Several important points emerge from thisdiscussion.
Governments have three main ways to intervene in the economy: spending (including taxexpenditures), taxing, and regulation. All three should be clearly assigned to appropriate levelsof government. While expenditure and taxes have been discussed extensively in this context,regulation must not be forgotten, because regulation can mandate private agents to carry outtasks that would otherwise be carried out by governments and would therefore require budg-etary or tax expenditures. Indeed, in modern federations, regulatory powers are sometimesfound at the very center of intergovernmental relations. In Canada, for example, one of the keyintergovernmental issues arises from a continuing push by the private sector, which wants tohave the power to regulate securities moved from the provinces and territories to the federallevel (Vaillancourt and Bird 2002).
4 Introduction and Summary
More generally, exactly what one means by decentralization must be clear. The term can beseen as encompassing the following three distinct types of behavior:
• Deconcentration: giving regional or local offices of the central government decision-making power previously held in the central offices in the capital
• Delegation: making a subnational government responsible for carrying out a function forwhich the central government retains responsibility
• Devolution: transferring responsibilities from the central government to subnationalgovernments.
When economists talk about decentralization, they usually mean devolution, but when govern-ments decentralize they are often really deconcentrating or delegating rather than devolvingresponsibility. Because what a government is trying to do affects how it should be done, beingclear about the real objectives of decentralization is critical.
In all cases, the first fundamental step in designing a system of intergovernmental fiscalrelations should be a clear assignment of functional responsibilities among different levels ofgovernment. Instability and controversy have often resulted in practice when the law is silentor unclear about the competencies (responsibilities) of different levels of government. Theassignment of responsibilities should be guided by a concern for efficiency, with particularattention to matching the service area with the level of government.
Another important point concerns tax assignment. For fiscal decentralization to be a reality,subnational governments must control their own sources of revenue, because if they lack inde-pendent sources of revenue, they are likely to be under the financial thumb of the central gov-ernment. Of course, increasing tax autonomy may result in increased tax competition, but, aschapter 2 notes, this is not necessarily a bad thing.
Thus stable and meaningful decentralization requires both an unambiguous and well-defined assignment of responsibilities among the different levels of government and sufficientbudgetary, regulatory, and tax autonomy to carry out the assigned responsibilities at each levelof government. Moreover, getting the sequence right is important. In particular, assigning rev-enues in the absence of a clear assignment of responsibilities is to put the cart before the horse.Unfortunately, undue focus on the revenue side of decentralization and neglect of the need fora clear assignment of expenditure responsibilities has characterized decentralization in manytransition countries and has invariably resulted in relatively poor outcomes.
Money Management
Even if every government obtains the right amount of money from the right sources, for it tosucceed it must manage its funds properly. Thus chapter 3, by Vaillancourt, addresses a set ofmundane, but nonetheless critical, issues that discussions of intergovernmental finance haveall too often neglected, that is, accounting concepts, the role and preparation of budgets, thestructure of capital markets, bond issuance, and credit rating processes.
Accountability is the key to good government, and good accounting, budgetary, and finan-cial documents are necessary for three types of accountability: administrative accountability,both internal and external; economic accountability to attain the greatest level of efficiency pos-sible and provide taxpayers with value for money; and political accountability, which allowscitizens to assess the performance of their elected politicians. In this regard, an understandingthat, for example, bookkeeping conventions matter, is critical. For instance, single-entry book-keeping on a cash basis, which is common in many developing countries, particularly at thesubnational level, means that expenses and revenues are entered in one column with a positivevalue for revenues and a negative value for expenses. With this system proper budgeting isobviously difficult, because expenses and revenues are intermingled and cancel each other out
Richard M. Bird and François Vaillancourt 5
and arrears do not show up in the accounting system. In contrast, double-entry bookkeepingon an accrual basis has two columns, one for revenues and one for expenses. This form ofrecording transactions allows the production of an expenses and revenues statement, which isone of the two basic documents of modern accounting (the other is the balance sheet).
Of course, everyone recognizes that budgets are key legal, managerial, and political doc-uments. Budgetary choices affect the well-being not only of today’s citizens, but also oftomorrow’s. Thus, as chapter 3 discusses, carefully thinking through not only the form andcontent of the final budgetary document but also the process used to establish the budget isimportant.
Despite the potential problems with subnational borrowing alluded to earlier, access tofinancial markets through borrowing is important for subnational governments (and theirenterprises), because it allows them to allocate the costs of capital expenditures appropriatelyover the lifetime of a project so that those who benefit from it pay for it, rather than requiringunduly high saving by current generations to finance infrastructure that their descendantswill enjoy. Thus chapter 3 also discusses some critical aspects of subnational access to capitalmarkets.
Institutional Framework
Chapter 4, by Ronald Neumann and Russell Robinson, focuses on the institutional frameworkneeded to make a federation work. Of course, each federation will organize its intergovern-mental relations differently depending on its constitutional and legal framework, on its history,on the role of political parties (regional or national in scope), and so on. Nonetheless, presum-ably the aim is always to make the federation work. To do so, it needs to accomplish a numberof tasks and develop institutions to ensure that that the tasks are carried out in an appropriateand timely way.
A first task is to identify the issues to be discussed. Such issues may be broad and general,for example, whether there is a fiscal disequilibrium, or narrow and technical, for instance, howto measure a given tax base for equalization purposes. A second, and particularly crucial, taskis to develop relevant and accepted common statistical information. One possibility may be aspecialized intergovernmental agency; another may be an independent statistical agency. Untilgovernments and other interested parties, such as beneficiaries of public spending, are familiarwith and generally agree on the facts (which does not, of course, imply agreement on theirinterpretation), developing policy options is difficult, let alone reaching either consensus, or atleast informed dissent. A third task is the critical one of policy adoption, implementation,administration, and coordination. The appropriate institutional way in which to achieve thesevarious objectives may, as chapter 4 discusses, vary from one policy to another.
A final important task discussed in chapter 4 is how to achieve accountability. While chap-ter 3 discussed how to obtain the meaningful financial numbers needed for accountability,chapter 4 raises some broader questions about how to use these and other numbers to ensurethat the system is working correctly and that people get what they want and what they are pay-ing for. A current Canadian example illustrates this problem. The federal government, whichtransfers substantial funds to provinces intended, at least loosely, to finance health costs, hasestablished a health council to which the various provincial governments, which actually do allthe direct spending on health (including much from their own resources) would report infor-mation in a uniform fashion that lends itself to comparison and assessment. Most large provin-cial governments have resisted, arguing that they are accountable to their citizens through thepolitical process and that this proposal represents unwarranted federal interference. Issuessuch as this come up all the time, in all decentralized systems, and need to be resolved bymeans of some appropriate institutional framework.
6 Introduction and Summary
Fiscal Measurement
The final chapter in part I, chapter 5 by Richard Bird, turns to a different question that appearsto arise in different ways in most decentralized systems, and certainly in most federal states.How can one measure how well the federal fiscal system is working? The literature offers threeapproaches to this question: fiscal flows, fiscal balance, and fiscal sustainability. Chapter 5 sug-gests that each of these concepts is fraught with conceptual and practical problems and must behandled with great care.
Inter-regional fiscal flows refer to the amount of federal taxes collected in a region and theamount of spending done in a region. Such numbers are difficult to obtain and hard to inter-pret. Taxes are not necessarily paid by the residents of the region in which they are collected,for example, consider customs duties collected in a port city but paid by all the consumers ofthe relevant goods. Similarly, the residents of a region through which a highway passes do notnecessarily receive benefits equal to the value of their share of that highway. Even if fiscalflows are properly measured—taking the real incidence of taxes and spending into account—what a surplus or deficit means is far from clear. If a country has a progressive tax system, forexample, and more rich people live in one region than in the others, then there will appear tobe a fiscal flow out of that region. Is the implication that taxes should be paid back to thatregion?
Fiscal imbalance may be vertical, that is, between levels of government, with typically thecentral government having excess revenues and the other levels having deficiencies, or hori-zontal, that is between governments at a given level. While widely used, these measures too aredubious. Vertical fiscal imbalance, for example, is often calculated based on assumptions aboutrequired expenditures and feasible taxes, and all such calculations are obviously subject to chal-lenge and more useful in political debate than for analytical purposes.
Despite the problems with many of the common measures outlined in chapter 5, attemptingto produce relevant indicators is obviously important to permit the evaluation and appraisal offiscal federalism structures and policies. Fortunately, though again difficult both to measureand to interpret, the fiscal sustainability approach appears to be the least flawed way to assesshow well structured, and hence how sustainable, a federal system may be. Thus the chaptersuggests that future work should concentrate on improving this aspect of fiscal measurementin decentralized government systems.
The Provision of Services
Part II of the book contains three chapters related to the provision of public services. Thesechapters shift the focus from federal-regional relations to the local level of government, wheremany services are actually delivered. The emphasis is not on the characteristics of particularservices, important though that consideration may be in practice, but on the institutionalstructure that delivers services at the local level. Chapters 6 and 7 discuss the issue from twodistinct, but important, perspectives: first that of a large metropolitan area and then that of asmall remote area. The first question is how best to resolve the fundamental assignment issuesraised in chapter 2 in these two completely different sets of circumstances. The second, related,but distinct, issue is how best to structure local government institutions to deliver local serv-ices in these two extreme cases. While some overlap between these two chapters is inevitablebecause the questions raised and the factors to be taken into consideration are essentially thesame, the answers are quite different, demonstrating the inevitable context specificity of pol-icy in this area. The final chapter in this part, chapter 8, focuses on a different question,namely, the appropriate role and structure of local government enterprises in providing pub-lic services.
Richard M. Bird and François Vaillancourt 7
Providing Public Services in Large Metropolitan Areas
Chapter 6, by Enid Slack, examines large metropolitan areas. The levels and types of local gov-ernment expenditures in large metropolitan areas differ from expenditures in other areasbecause of the size of the population; the large number of people living in close proximity,which creates agglomeration economies; and the presence of a heterogeneous population interms of social and economic circumstances, and often in terms of ethnicity, birthplace, ormother tongue.
Unfortunately, economies of scale are often not important in this context, so the result ishigher spending per capita even on services provided in smaller areas, but fortunately, metro-politan areas not only spend more, they can tax more. They generally have a larger, more diver-sified tax base than smaller areas. Not only can they more easily levy their own taxes, they oftenhave greater fiscal autonomy than other areas. Because they can finance many of the servicesresidents and business demand out of own sources of revenue, large cities generally need torely less on grants from senior levels of government than other areas, though, of course, metro-politan area politicians, like those everywhere, prefer to secure less politically painful grants(or so-called shared taxes) than to raise more tax revenue.
The extent to which taxes reflect the benefits received in the way of local services is deter-mined largely by the governing structure of the metropolitan area, which also affects the abilityof large metropolitan areas to share the costs of local government in a fair and efficient way. Theoptimal design for the government structure depends on the importance of such factors aseconomies of scale, externalities, and equity, which favor large government units, versus localresponsiveness, access, and accountability, which point toward smaller government units.
To attain good allocative outcomes, some form of structure encompassing the entire area ofthe city is needed to address problems of a regionwide nature, such as fiscal disparities andexternalities. The form such a regional structure takes will vary with local circumstances, whichmay sometimes suggest a unified (one-tier) metropolitan government and sometimes a feder-ated (two-tier) structure.
A one-tier structure is simpler and more transparent than a two-tier structure, and thuswould appear to enhance political and fiscal accountability. Two-tier structures are more com-plex and may result in duplication, overlap, and confusion among citizens as to who does whatand who pays for it. However, a two-tier structure may achieve greater efficiency than a morecentralized one-tier structure is likely to attain. Desirable economies of scale and scope can berealized at the upper tier level, while at the same time the lower tier permits more responsive-ness to local variations in preferences. Voluntary intermunicipal agreements about the provi-sion of services may work in a few cases, but cannot replace the need for an effective institutionto facilitate, encourage, and require the necessary degree of regional cooperation.
Providing Services in Remote Areas
By contrast, as chapter 7 by Harry Kitchen and Slack notes, local governments in remote areasoften lack the financial, human, and technological means to provide more than basic services toa sparse and dispersed population, particularly outside the regional hub. Financing these serv-ices is more difficult in remote areas because of a combination of low tax bases (low propertyvalues, little economic activity) and high unit costs of services (because economies of scale arelow and transportation costs high). As a result, transfers inevitably represent a higher share ofrevenues for local governments in such areas.
Chapter 7 argues that in these circumstances, the most appropriate local government struc-ture is a single–tier structure. Two-tier structures, special districts, and intermunicipal agree-ments such as those discussed in chapter 6 are unlikely to work well because of a lack ofcontiguous government. Even though central governments should not intervene by directly
8 Introduction and Summary
providing services as this reduces accountability, they can and should use grants to achieve thedesired level of services. No matter how the lily is gilded, however, in the end the dispersion ofresidents and the relatively low levels of public resources and services available in remote areasmean that local governments are unlikely to play a large role in remote areas. (As chapter 12notes, however, matters may be completely different if such areas are blessed with highly val-ued natural resources.)
Local Government Enterprises
In the final chapter of part II, chapter 8, Kitchen raises four key issues. The first, and most basic,is why do local government enterprises exist at all? Noting that many reasons that make noeconomic sense often account for their existence, including adhering to legal requirements andtraditions, creating jobs, avoiding controls or revenue sharing with central governments, andhiding revenues, chapter 8 argues that only sensible reason is when providing services throughthis organizational structure is more efficient than the alternatives.
Even if, in principle, an enterprise can be more efficient, however, this gain is not achievedcostlessly. The removal of enterprise decisions from general politics may mean that theybecome subject, in a nontransparent way, to special politics. Coordination between enterprisesand local governments and the sharing of common resources may prove troublesome. More-over, accountability is clearly weakened in most cases. Chapter 8 argues that enterprise per-formance should be closely monitored using appropriate indicators, noting that alternativemeans of service delivery include contracting out, franchises, or public-private partnership ofvarious kinds.
An issue that turns out to be surprisingly complex in practice is how to set enterprises’prices. Various possibilities exist, such as average cost pricing, multipart pricing, and so on. Theappropriate method will vary from service to service, and is often not simply technically com-plex, but politically important. For both reasons, an important question is whether and how toregulate enterprises’ prices.
Finally, should local government enterprises earn profits and should their revenues be ear-marked? In principle, chapter 8 suggests that the answer is that enterprises should be expectedto earn a normal rate of return on capital and that the extent to which earmarking is appropri-ate depends on the type of enterprise. Taxes should be paid if the enterprise competes with pri-vate firms.
Revenues
In the end, discussions about fiscal federal issues often come down to where the money comesfrom. Part III contains four chapters about revenue matters. The first provides an overview andthe last three deal with specific tax questions that are generally important in a regional or localcontext.
Local and Regional Revenues
Chapter 9, by Bird, reviews the entire field of possible regional and local revenues. The theoryof fiscal federalism prescribes that subnational governments taxes should be easy to administerlocally, should be imposed solely (or mainly) on local residents, and should not create problemsof harmonization or competition between governments. Essentially only property taxes, taxeson vehicles, and user charges and fees meet these conditions. Local governments may indeedbe able to finance purely local services through property taxes and user fees on residents, butregional governments responsible for social services cannot rely solely on such a narrow fiscalbase. Chapter 9 argues that a good subnational tax system should provide sufficient revenue
Richard M. Bird and François Vaillancourt 9
for the richest subnational units to be essentially autonomous and should impose fiscal respon-sibility at the margin on all subnational governments.
The chapter then reviews various revenue sources from this perspective, noting that the firstrule of subnational finance should be wherever possible, charge. If properly designed, usercharges (service fees, public prices, and specific benefit taxes) help ensure that citizens valuewhat the public sector supplies, at least at marginal cost, and promote economic efficiency byproviding demand information to public sector suppliers. In addition, a low-rate, uniformproperty tax has an important role to play in financing local governments along with otherland-based taxes, for example, betterment levies and special assessments. Excise taxes may alsoplay a role in financing subnational governments, particularly automotive and fuel taxes,although more in large urban areas than in poor rural areas.
Turning to less conventional local taxes, supplementary (piggybacked) local income taxesare another good possibility, especially at the regional and metropolitan government level.Such taxes would be visible, and hence in principle would satisfy the criteria of political respon-sibility and accountability. Unfortunately, a good local income tax is only possible when thereis a good national income tax, and few developing or transition countries have such taxes. Pay-roll taxes are another possibility. They have the merit of being both easily administrable, at leastwhen imposed on large enterprises, and relatively productive at relatively low rates. However,such taxes are a barrier to employment in the modern sector and compete with social securitysystems. To the extent that payroll taxes can be made effective on a regional basis, so can flat-rate personal income taxes, which, in practice, are probably levied on much the same base with-out the bias against employment inherent in payroll taxes.
General sales taxes are often the answer to the search for a regional revenue source that iseconomically respectable, administratively viable, and reasonably elastic. Retail sales taxes area nonreproducing breed confined to parts of North America. General turnover taxes are inap-propriate, because they tax a significant number of intermediate business activities and oftencreate a variety of totally unenforceable distinctions between activities. The sales tax of choiceis now the value added tax (VAT), so the issue is how best to design and implement a subna-tional VAT. While Canada has demonstrated that this can be done, whether such a system canwork satisfactorily in developing and transition countries remains unclear (Bird and Gendron2001). This chapter also briefly discuss a variant form of VAT, the so-called business value tax,which is taken up in more detail in chapter 11.
Property Taxes
In many countries, property taxes are the mainstay of local finance. In many others, local gov-ernments are frequently urged to make more use of such taxes. Chapter 10, by Slack, sets outalterative approaches to taxing land and property in some detail (for an extended treatment,see Bird and Slack forthcoming). The chapter argues that a property tax can be best viewed as ahighly visible benefit tax. It therefore makes for good accountability and is a good source ofautonomous revenues for local governments, provided they can set the rate themselves.
The chapter discusses many aspects of property taxes in some detail. It notes, for example,that the key problem to developing a successful property tax in many countries is the difficultyof establishing ownership of the land and the structures on that land, but contends that this cangenerally be overcome to a considerable extent. Exemptions for certain types of properties, suchas churches and schools, and favorable treatment for other types of properties, particularlyowner occupied single family dwellings, complicate administration and are hard to justify,because the use of local services does not vary in proportion to the more or less favorable treat-ment of such properties. Regular updates of property tax bases, for instance, assessed values,are important to ensure fairness, revenue elasticity, and sensible allocative outcomes. Finally,harking back to an issue touched on in chapter 3, chapter 10 notes that special assessments, land
10 Introduction and Summary
value increment taxes, and exactions (lot levies, development charges) can play useful, if lim-ited, roles in financing local infrastructure investment in some circumstances.
Business Taxes
Economists tend to argue that regional and local governments should not tax business as such,but governments always want to do so. Recognizing that regional and local governments areno different than central governments in this respect, chapter 11, by Bird, notes that local andregional taxes on business and capital are indeed likely to be economically costly, and that themobility of the tax base (and income shifting across boundaries) make it difficult for small gov-ernments to enforce such taxes. Moreover, to the extent they can be “exported,” local businesstaxes reduce accountability and weaken the hard budget constraint needed to ensure thatdecentralized public sector decisions are efficient, because they weaken the link between pay-ment and benefits.
Nonetheless, as chapter 11 notes, taxing businesses can be both efficient and equitable to theextent that businesses derive benefits from general local spending, although political factorsoften mean that the level of business taxes is higher than the level of benefits received. In prac-tice, the local and regional business taxes found around the world take many forms: corporateincome taxes, taxes on internal trade, gross receipts taxes, fixed or proportional taxes that varyby type of business and location, local sales taxes, nonresidential real property taxes, and a vari-ety of licenses and fees unrelated to public services. Most of these taxes are not equitable,almost none are neutral, all accentuate disparities between localities, most lend themselves totax exporting, and most are costly to administer. However, such taxes are clearly politicallyacceptable, they provide an important, and relatively elastic source of revenue, and they areoften one of the few ways in which local governments have any degree of fiscal autonomy.
Given these conflicting realities, chapter 11 concludes that what is needed to improve thesituation is essentially a move toward a more strictly benefit system of business licenses andfees for smaller local governments and toward a more neutral and uniform variety of VAT,imposed on an income-origin basis, for large local governments and regional governments (seeBird and McKenzie 2001 for a detailed proposal for such a tax at the regional level).
Natural Resource Taxes
In many countries, natural resource taxation has become a critical issue in fiscal federalism. Inaddition to Canada and Russia, other significant examples include countries as disparate asColombia, Indonesia, and Sudan. Chapter 12, by Kenneth McKenzie, does not purport to pro-vide a thorough review of this exceptionally complex and controversial area, but sets out a pos-sible general framework within which to approach the question of who should get how muchfrom taxing nonrenewable natural resources like oil.
The key characteristics of such resources are that their total supply is inherently limited andthat they tend to be unevenly distributed across geographic regions. The first characteristic gen-erates a scarcity rent, while the second means that this rent is concentrated in specific areas. Inprinciple, if resources are located in one region of a multiregion federation and if the govern-ment of that region can tax them, one result will be to induce inefficient migration from otherregions, because residents from those regions will want to benefit from the lower taxes, higherexpenditures, or both provided by the lucky regional government. For this reason, an efficiencyargument favors having such resource rents collected centrally.
However, the rents to be collected centrally should be net of the costs of providing publicservices and the infrastructure to extract the resources and net of the externalities (pollution,damage to infrastructure, and so on) associated with resource extraction, if any. Moreover, espe-cially if secession is a credible option, resource-rich states may need to be permitted to maintain
Richard M. Bird and François Vaillancourt 11
a significant share of the rents generated by natural resources within their boundaries so thatthey agree to remain part of the federation. Doing so need not make other states worse off, aspresumably all can share in the surplus resulting from the continuation of the federation; thissurplus results from gains from trade and economies of scale.
Turning to how to tax natural resources, chapter 12 notes that the breakdown of extractiontime is a key parameter, because it determines the intergenerational allocation of the incomeobtained from the resource stock. Firms will choose to extract resources according to a timepath that maximizes their profits in present value terms. Because severance taxes—perhaps themost common form of local tax—encourage the postponement of production, while royalties(gross or net) have an uncertain impact on this choice, the best choice for a local or regional taxwould appear to be a property tax. Such a tax, provided it is levied on the present value of theremaining resources net of extraction costs, is similar to a so-called resource rent tax, and henceis neutral with respect to extraction decisions.
References
Bird, Richard M. Forthcoming. “Fiscal Federalism in Russia: A Canadian Perspective.” PublicFinance and Management.
Bird, Richard M., and Duanjie Chen. 1998. “Federal Finance and Fiscal Federalism: The TwoWorlds of Canadian Public Finance.” Canadian Public Administration 43(1): 51–74.
Bird, Richard M., and Pierre-Pascal Gendron. 2001. “VATs in Federal Countries: InternationalExperience and Emerging Possibilities.” Bulletin for International Fiscal Documentation 55(7):293–309.
Bird, Richard M., and Kenneth J. McKenzie. 2001. Taxing Business: A Provincial Affair? Com-mentary no. 154. Toronto: C. D. Howe Institute.
Bird, Richard M., and Enid Slack. 2004. International Handbook on Land and Property Taxation.Cheltenham, U.K.: Edward Elgar.
Vaillancourt, François, and Richard M. Bird. 2002. “Changing With the Times: Success, Failure,and Inertia in Canadian Federal Arrangements, 1945–2002.” Paper no. 151. Stanford: CA:Stanford Center for International Development. http://credpr.stanford.edu/publications/abstracts.html#151.
12 Introduction and Summary
Part IThe Structure of
Intergovernmental Finance

2Revenues and Expenditures in an Intergovernmental Framework
Jorge Martinez-Vazquez, Charles McLure, and François Vaillancourt
Countries throughout the world are increasingly recognizing the benefits of fiscal decentral-ization. If done properly, decentralization allows people to have a greater influence ongovernment decisions that affect their lives (see, for example, Bird and Vaillancourt 1998 fordeveloping countries; Bird, Ebel, and Wallich 1995 on countries in transition from socialism;Litvack, Ahmad, and Bird 1998 for a review of World Bank experience with decentralization ina variety of countries). Even if decentralization is primarily adopted for such political reasonsas assuaging separatist tendencies in certain regions, it may also improve the welfare of thepopulation.
This chapter examines general principles of federalism, how expenditure responsibilitiesshould be allocated across levels of government; how taxes should be assigned to various lev-els of government; and how transfers, if necessary (and they almost always are), can bedesigned.1 Before doing this, however, distinguishing among the different varieties of decen-tralization is important to ensure that the concept is well understood. There are three com-monly used meanings of decentralization as follows:
• Deconcentration: gives regional or local offices of the central government decisionmak-ing power that was previously held by the central government’s offices in the capitalwithin parameters specified by the central government.
• Delegation: makes a subnational government responsible for delivering services forwhich the central government retains responsibility.
• Devolution: transfers responsibilities for service delivery from the central government tosubnational governments.
When economists talk about decentralization, they usually mean devolution; however, whengovernments decentralize they are often really deconcentrating or delegating rather thandevolving responsibility.
Principles for Dividing Revenue Responsibilities and Revenue Sources
Two classic contributions to the literature focus on the division of revenue responsibilities andrevenue sources: the seminal work by Musgrave (1959) and the refinements by Oates (1972).Musgrave (1959) suggests that, for conceptual purposes, the activities of government should beseparated into three functions or branches: macroeconomic stabilization, income redistribution,and resource allocation. The stabilization branch is to ensure the achievement of high employ-ment and price stability, the distribution branch is to achieve an equitable distribution ofincome, and the allocation branch is to make sure that resources are used efficiently. Which
15
Section two of this document draws on “Tax Assignment and Subnational Fiscal Autonomy” Bulletin forInternational Fiscal Documentation 54(12):626–635, 2000 by Charles McLure. We thank the InternationalBureau of Fiscal Documentation for granting us permission to use this material.
1. Borrowing is not addressed here, as it is discussed at length in chapter 3 in this volume.
level of government, central or subnational, should perform each function is the question ofinterest here.2
The stabilization function—the maintenance of high employment and price stability—isordinarily assigned to the central government for two reasons.3 First, subnational governmentscommonly cannot have much of an effect on macroeconomic conditions within their bound-aries, because most of the effects of macroeconomic policy attempted by subnational govern-ments will leak out of their jurisdiction. Second, subnational governments have no power toprint money and often have limited power to borrow money, thus they often have difficulty inengaging in the deficit financing that is frequently required to implement expansionary policy.
This perspective neglects two points, however. First, subnational governments may beresponsible for activities that lend themselves more easily to countercyclical spending than thenational government. For example, varying road expenditures—a subnational activity inCanada and the United States, for example—according to macroeconomic needs is easier thanvarying spending on military airplanes, a national responsibility. Second, second-tier govern-ments in some countries (Canada, the United States) set some labor standards, such as rules onthe length of the warning period for mass layoffs and the amount of severance pay when lay-offs occur. The requirements thus set may reduce the amplitude of employment cycles, but atthe expense of employment levels.4
Subnational governments are also usually limited on the revenue side. The taxes commonlythought to have the most powerful stabilizing effects are the corporate income tax and the pro-gressive individual income tax.5 The former is considered stabilizing because profits fluctuatemore than general economic conditions,6 and the latter because of the stabilizing effects of grad-uated rates (including tax-free amounts). This suggests that these two taxes should be assignedto the central government.
The distribution function is primarily assigned to the central level of government, becausesubnational attempts at redistribution may not succeed and are likely to distort the geographicallocation of economic resources. Progressive taxation intended to “soak the rich” may driveout capital and high-income individuals. If this occurs, taxation that appears to be progressivemay actually be regressive.7
16 Revenues and Expenditures in an Intergovernmental Framework
2. The term subnational is used to describe all levels of government below the national level. Secondtier is used for the highest level of subnational government, for example, the states of Australia, Brazil, andthe United States; the provinces of Argentina and Canada; the lander of Germany; and the oblasts of the for-mer Soviet Union. Local is used for all governments below the second tier.
3. Sewell (1996) suggests that there may be more latitude for subnational stabilization policy than inMusgrave’s view.
4. Differences in policies across subnational governments on the use of factors of productions willalso affect the impact of national stabilization policies
5. Progressive taxation takes a percentage of income that rises as income rises; regressive taxationtakes a percentage that falls; proportionate taxation takes the same fraction of income at all income levels.
6. Specific provisions of the corporate income tax, such as depreciation rates, can also be varied toencourage private investment in a given time period. Such incentives were common in Canada in the1960s and 1970s.
7. The contrary problem occurs on the expenditure side. Transfer payments by subnational govern-ments are likely to attract the poor, which may discourage the use of such policies. Sewell (1996) reviewsevidence that subnational governments do, indeed, engage in income redistribution. In Musgrave’s three-branch system, only transfers and taxes would be used to modify the distribution of income; other typesof expenditure policies would not be used. While tax policy can “level down,” it cannot reduce poverty or“level up”; that must be done on the expenditure side (refundable tax credits are transfers and thus expen-ditures). If implementation problems prevent the use of transfers, as is common in developing countries,using expenditure policy related, for example, to health and education, may be appropriate for reducingpoverty. Considerations discussed by Sewell (1996) suggest that, while these policies may best be imple-mented locally, they should be financed nationally.

The explanation just presented relies heavily on the mobility of factors of production, and ofpeople in particular. The internal mobility of labor varies between countries according to thestrength of family ties, culture, and tradition. If the borders of subnational jurisdictions coin-cide with those of ethnic, linguistic, or religious groupings, then redistributive policies carriedout at that level are less likely to induce migration. This is observed in Canada, with Quebecbeing a high-tax, second-tier jurisdiction, but with the lowest out-migration rate of all theprovinces because the majority (80 percent) of its population is French speaking, while theCanadian labor markets outside Quebec are English speaking. Also in some countries, the lim-ited availability of housing and poorly developed housing markets limit mobility. Under thesecircumstances, subnational policies may have more latitude to redistribute income than in theMusgrave model.
So far the discussion has been about policies to modify the current distribution of income,given the characteristics of the members of a society. In a longer-term perspective, what mattersare the policies that determine these characteristics. In this respect, education policies, and inparticular, equal opportunities for all, may be what matter the most for the intertemporal evo-lution of inequalities. Such policies are often, at least in part, within the domain of subnationalgovernments, but national standards may be required to achieve the desired results.8
The third function of governments is efficient allocation of resources, which is where subna-tional governments can play their most important role. Musgrave (1959) argues that the poli-cies of subnational branches of governments should be permitted to differ to reflect the prefer-ences of their residents. The decentralization of taxing and spending power allows subnationalgovernments to tailor schemes that match the demands of their constituency. This ultimatelyincreases efficiency, because local governments have better information about their residents’needs than the central government. Because of their size and proximity to citizens, subnationalgovernments may also be less subject to capture by various established groups, such as bureau-crats or unions.
Oates (1972) puts forward four criteria to assign specific roles to specific levels of govern-ment as follows:
• Economies of scale will vary across goods and services. Economies of scale are signifi-cant in broadcasting, for example, where the unit cost per viewer drops by half whenthe number of viewers of a given program doubles, but negligible in the provision ofindividualized health services such as surgical treatment. The existence of significanteconomies of scale constitutes an argument for a higher level of government to providea particular good or service.
• Heterogeneity of preferences and of circumstances also matters. Groups living in differ-ent parts of a country may display strong heterogeneity of preferences or may be facedwith different environments in terms of climate or topography. They may therefore pre-fer or may need different amounts (more or less) of services, a different quality of serv-ice (for a given amount), or a different language for delivering public services. Decen-tralization is appropriate if these groups are separated by borders that match those ofareas with differentiated preferences or circumstances.
• The presence of externalities, negative or positive, has an impact. If some of the activi-ties of one government at a given level have important external effects on the individu-als or businesses located in other jurisdictions or on other governments at the same or adifferent level, then these activities should be more centralized, or at a minimum theactions of lower-level authorities should be well coordinated.
Jorge Martinez-Vazquez, Charles McLure, and François Vaillancourt 17
8. National standards can result from either a central government decision if the constitutional andlegal framework permits or from an agreement among subnational governments.
• Emulation, also referred to as competition, which helps increase or introduce best prac-tices in government, requires at least two, and probably more, units involved in a givenactivity. This is an argument for decentralizing government activities.
Assignment of Responsibilities
The first fundamental step in the design of a system of intergovernmental fiscal relationsshould be a clear assignment of functional responsibilities among different levels of govern-ment. Instability and controversy in the practice of decentralized systems have resulted inmany cases where the law is silent or unclear about the competencies, or responsibilities, of dif-ferent levels of government. Governments have two main ways to carry out their responsibili-ties: spending, including tax expenditures, and regulation, and these powers should be clearlyassigned to appropriate levels of government. Regulation should not be forgotten, becausethese two approaches are both complements and substitutes. For example, regulation can man-date private agents to carry out tasks that the government would otherwise carry out andwould therefore require public spending. For instance, requiring households or firms to recyclemakes them spend time and money on this activity while reducing the landfill costs incurredby the government. The use of regulation to impose costs on individuals or firms cannot be jus-tified solely on the basis that it reduces government spending, or worse, that it hides the coststo society of government decisions. It can be appropriate if the private sector’s productioncosts, including the regulatory burden costs, are lower than the public provision cost, given thatthose that create the social costs will bear them.9
In some countries, subnational governments are given autonomy to formulate budgets andto spend their funds any way they want, but the central government determines revenues andthe overall budget levels of subnational governments. In most cases, the main revenue sourcesare taxes whose base and rates are set centrally and that are often collected centrally. As a result,subnational governments have little or no access to tax expenditures or tax incentives toachieve their policy objectives. Similarly, their access to regulatory power is also oftenrestricted. Regional and local governments may have autonomously elected legislatures, but inmany cases the central government continues to appoint the heads of executive agencies. Suchinstitutional confusion has resulted in some countries having an unwieldy mix of deconcentra-tion and devolution of government activities.
The efficient provision of government services requires that the government satisfy taxpay-ers’ needs and preferences as well as possible. This is best achieved by the subsidiarity princi-ple.10 One aspect of this principle is that responsibility for the provision of services should be atthe lowest level of government compatible with the size of the benefit area associated withthose services. For example, the benefit area for sanitation service (garbage removal) is the localcommunity, but for air traffic control, the benefit area is the entire national territory, or even asupranational one, such as the European Community.
18 Revenues and Expenditures in an Intergovernmental Framework
9. Governments need to be extremely careful in relation to their use of regulation, because it could turninto something akin to unfunded mandates, where the central government requires the provision of a goodor service by another level of government, but does not provide the funds to cover the cost of doing so.
10. This is put forward as a key principle in the proposed European constitution (Article I-9). TheEuropean Parliament set forth the following definition on November 5, 2003 (http://www.europarl.eu.int/factsheets/1_2_2_en.htm):
The general aim of the principle of subsidiarity is to guarantee a degree of independence for a lowerauthority in relation to a higher body or for a local authority in respect of a central authority. It there-fore involves the sharing of powers between several levels of authority, a principle which forms theinstitutional basis for federal States. When applied in a Community context, the principle means thatthe Member States remain responsible for areas which they are capable of managing more effectivelythemselves, while the Community is given those powers which the Member States cannot dischargesatisfactorily.
Leaving the supply of public services with wider benefit areas to smaller units of govern-ment is likely to result in the inefficient underprovision of services, with taxpayers unwilling topay for services provided to others. An example is a tertiary public hospital providing regionalservices that is financed solely by a single municipality.
Efficiency may also be enhanced if governments can use regulatory instruments to mandateprivate provision, as in the following examples:
• A local government responsible for parking issues may find that mandating that newbuildings be built with an adequate number of parking spaces is less costly than havingto build and operate public parking facilities, while at the same time ensuring that thoseresponsible for the demand for additional parking bear the costs of providing it.
• A second-tier government responsible for watershed management may prefer regulat-ing discharges from various privately operated treatment facilities to building a largerwater treatment plant or sewer system. The regulatory approach also ensures that pol-luters provide the required treatment services.11
The application of the principles put forward by Oates and of the subsidiarity principleguides the assignment of responsibilities to different levels of government, but does not alwaysyield an unequivocal answer. Some public services, for example, primary education and pri-mary health services, may be of a local nature by the size of their benefit area; however, becauseof their relevance for welfare and income redistribution, they may also be considered a respon-sibility of the central government. Thus talking about the best assignment of expenditureresponsibilities in any absolute sense is not meaningful. What is considered the best assignmentis likely to change over time with changes in costs and technological constraints that affect theproduction of publicly provided goods and services, changes in the preferences and humancapital endowments of individuals, and changes in the relative endowments of the regions of acountry. For example:
• The increased capability of computers to handle large datasets, coupled with thereduced cost of transmitting information across the Internet and greater labor mobility,may mean that welfare supervision, which is often a local responsibility because localauthorities know their clients best, could now be regional or national.
• The increased mobility of labor between regions of a country or the need to accommo-date a larger flow of international immigrants that need to become familiar with theirnew country may mean that the school curriculum in some topics now needs to be setnationally.
Nonetheless, at any given moment, having a clear, concrete assignment of expenditureresponsibilities among the various assignments—preferably one that could be considered opti-mal—is necessary. Failure to have such a transparent, concrete assignment may lead to instabil-ity in intergovernmental relations and to inefficient provision of public services.
In centralized systems, the lack of a clear assignment of expenditure responsibilities may beless important in practical terms. For example, in the former Soviet Union, because all govern-ment budgets were integrated with the federal budget, subnational governments could counton additional resources when they faced an unexpected shortfall. As unitary systems becomemore decentralized, however, and especially for federal systems, the failure to establish a clearassignment of expenditure responsibilities for each government level can become a source ofconflict between the central and subnational governments and can lead to an inefficient (andoften insufficient) provision of key public services. If treasury functions (tax collection and
Jorge Martinez-Vazquez, Charles McLure, and François Vaillancourt 19
11. Even though a pollution rights market would generally be preferable, this would be difficult toimplement in lower-income countries given the extent of their institutional capacity.
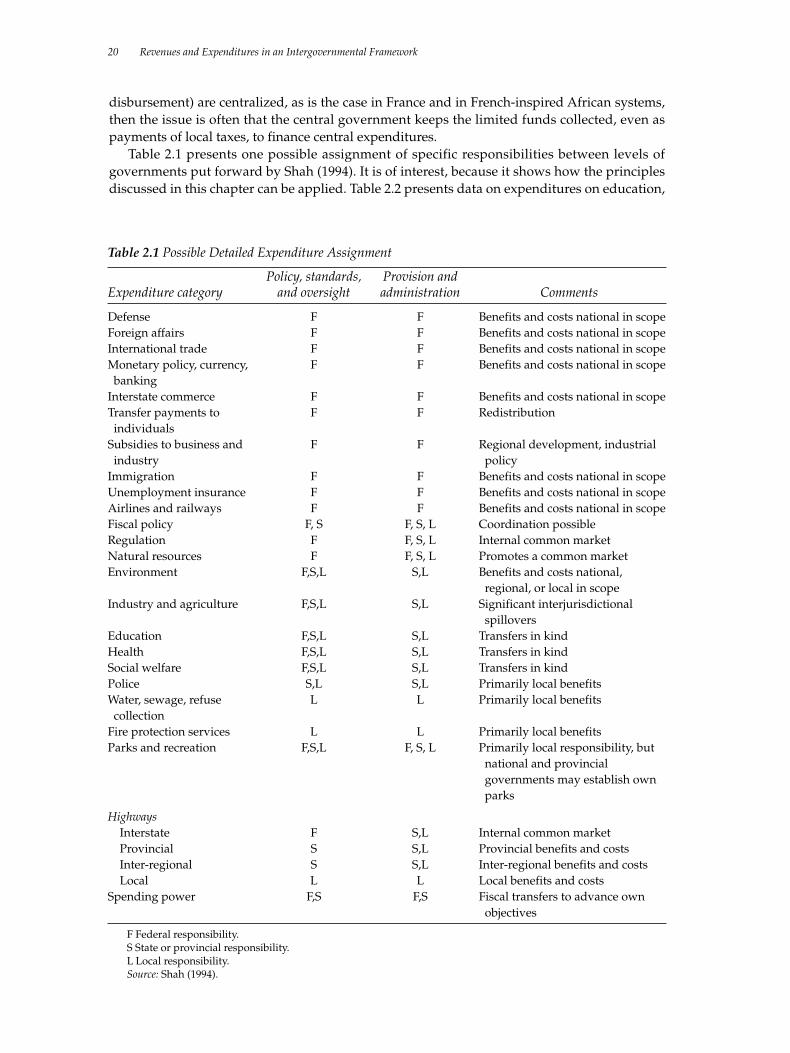
disbursement) are centralized, as is the case in France and in French-inspired African systems,then the issue is often that the central government keeps the limited funds collected, even aspayments of local taxes, to finance central expenditures.
Table 2.1 presents one possible assignment of specific responsibilities between levels ofgovernments put forward by Shah (1994). It is of interest, because it shows how the principlesdiscussed in this chapter can be applied. Table 2.2 presents data on expenditures on education,
20 Revenues and Expenditures in an Intergovernmental Framework
Table 2.1 Possible Detailed Expenditure Assignment
Policy, standards, Provision and Expenditure category and oversight administration Comments
Defense F F Benefits and costs national in scopeForeign affairs F F Benefits and costs national in scopeInternational trade F F Benefits and costs national in scopeMonetary policy, currency, F F Benefits and costs national in scopebanking
Interstate commerce F F Benefits and costs national in scopeTransfer payments to F F Redistributionindividuals
Subsidies to business and F F Regional development, industrialindustry policy
Immigration F F Benefits and costs national in scopeUnemployment insurance F F Benefits and costs national in scopeAirlines and railways F F Benefits and costs national in scopeFiscal policy F, S F, S, L Coordination possibleRegulation F F, S, L Internal common marketNatural resources F F, S, L Promotes a common marketEnvironment F,S,L S,L Benefits and costs national,
regional, or local in scopeIndustry and agriculture F,S,L S,L Significant interjurisdictional
spilloversEducation F,S,L S,L Transfers in kindHealth F,S,L S,L Transfers in kindSocial welfare F,S,L S,L Transfers in kindPolice S,L S,L Primarily local benefitsWater, sewage, refuse L L Primarily local benefitscollection
Fire protection services L L Primarily local benefitsParks and recreation F,S,L F, S, L Primarily local responsibility, but
national and provincial governments may establish own parks
HighwaysInterstate F S,L Internal common marketProvincial S S,L Provincial benefits and costsInter-regional S S,L Inter-regional benefits and costsLocal L L Local benefits and costs
Spending power F,S F,S Fiscal transfers to advance own objectives
F Federal responsibility.S State or provincial responsibility.L Local responsibility.Source: Shah (1994).
health, and social welfare by different levels of government for selected countries and years. Itshows the great diversity in the assignment of responsibilities for public spending acrosscountries.
Tax Assignment
If fiscal decentralization is to be a reality, subnational governments must control their ownsources of revenue. Subnational governments that lack independent sources of revenue cannever truly enjoy fiscal autonomy, because they may be—and probably are—under the finan-cial thumb of the central government. Therefore important questions are which revenuesources can and should be assigned to subnational levels of government and how these assign-ments will be carried out. This is commonly referred to as the tax assignment problem.12 It isclosely related to the expenditure problem, both because of the importance, at least in princi-ple, of benefit taxation in the finances of subnational government, and because of the need toensure that subnational governments have revenues that are adequate to finance the expendi-tures assigned to them.
To the extent possible, services the government provides should be financed by user chargesand fees. This is both fair and efficient in the sense of encouraging responsible use of thenation’s economic resources. User charges, fees, and taxes related to the benefits of publicspending are likely to be regressive or, at most, proportionate to income. They are unlikely toreduce inequality in the pretax distribution of income.13
Where strict compliance with benefit finance is infeasible because of the difficulty or unde-sirability of exclusion from the benefits of public spending, the principle is, nonetheless,instructive. For both equity and efficiency, tax payments should reflect the costs and benefits ofpublic services to the extent possible. Among the examples of benefit-related taxes are thoselevied on motor vehicles and motor fuels and used to construct and maintain roads. Such taxescan also be used to reduce congestion, pollution, or both when set to take both the direct valueof the service provided to the user and these social costs into account.
Each level of government should be assigned taxes that are related to the benefits derivedfrom spending them. Thus the proper assignment of taxes that are related to benefits dependson the assignment of responsibilities and expenditures. A rational assignment of taxing powershelps each level of government control its fiscal destiny. In particular, it permits choice in thelevel of public spending by governments at each level. Subnational governments must haveenough own revenues to finance the services they provide. If a subnational government legis-lates and collects its own taxes, protected by meaningful constitutional safeguards of its rightto do so, it clearly has a source of own revenues. Even if such a government must rely on grantsfrom a higher-level government, it may reasonably be considered to have adequate own rev-enues, provided the grants are determined in an objective way and are guaranteed by the con-stitution or by long-standing legislation. By comparison, own revenues may not exist in anyreal sense if grants are made at the sole discretion of the higher government, perhaps on an adhoc, arbitrary, and unpredictable basis, and even well into the fiscal year and subject to renego-tiation. Between these extremes lies a variety of arrangements that provide more or less
Jorge Martinez-Vazquez, Charles McLure, and François Vaillancourt 21
12. Musgrave (1983) asks, “Who Should Tax, Where, and What?” The tax assignment problem is partof a larger set of questions that can be referred to as the revenue assignment problem. The latter includesthe design of intergovernmental grants and the framework for borrowing by subnational governments.
13. This statement is incomplete if the benefits of public spending, as well as tax burdens, are consid-ered. Taxes related closely to marginal benefits may finance expenditures that involve substantial infra-marginal benefits. These inframarginal benefits may be of special value to low-income families. Obviousexamples include the provision of safe drinking water. Many consumers would probably consider them-selves better off if they had access to safe water, even if they had to pay for it. The problem is often access,not cost.
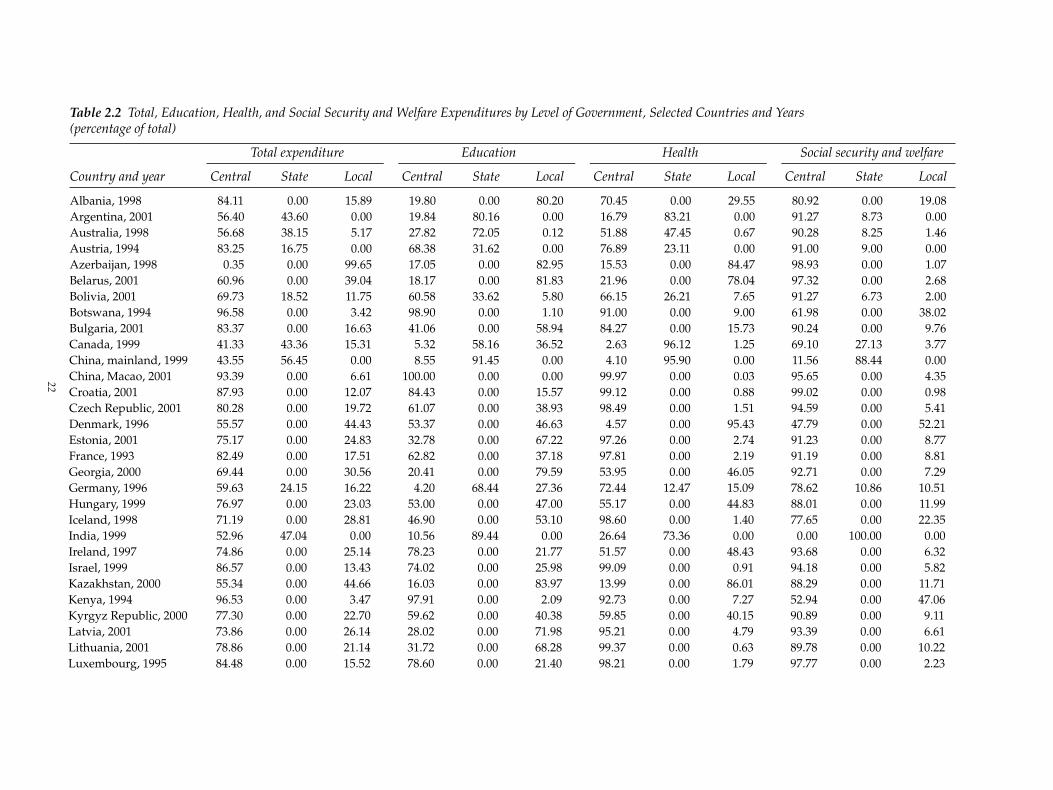
Table 2.2 Total, Education, Health, and Social Security and Welfare Expenditures by Level of Government, Selected Countries and Years (percentage of total)
Total expenditure Education Health Social security and welfare
Country and year Central State Local Central State Local Central State Local Central State Local
Albania, 1998 84.11 0.00 15.89 19.80 0.00 80.20 70.45 0.00 29.55 80.92 0.00 19.08Argentina, 2001 56.40 43.60 0.00 19.84 80.16 0.00 16.79 83.21 0.00 91.27 8.73 0.00Australia, 1998 56.68 38.15 5.17 27.82 72.05 0.12 51.88 47.45 0.67 90.28 8.25 1.46Austria, 1994 83.25 16.75 0.00 68.38 31.62 0.00 76.89 23.11 0.00 91.00 9.00 0.00Azerbaijan, 1998 0.35 0.00 99.65 17.05 0.00 82.95 15.53 0.00 84.47 98.93 0.00 1.07Belarus, 2001 60.96 0.00 39.04 18.17 0.00 81.83 21.96 0.00 78.04 97.32 0.00 2.68Bolivia, 2001 69.73 18.52 11.75 60.58 33.62 5.80 66.15 26.21 7.65 91.27 6.73 2.00Botswana, 1994 96.58 0.00 3.42 98.90 0.00 1.10 91.00 0.00 9.00 61.98 0.00 38.02Bulgaria, 2001 83.37 0.00 16.63 41.06 0.00 58.94 84.27 0.00 15.73 90.24 0.00 9.76Canada, 1999 41.33 43.36 15.31 5.32 58.16 36.52 2.63 96.12 1.25 69.10 27.13 3.77China, mainland, 1999 43.55 56.45 0.00 8.55 91.45 0.00 4.10 95.90 0.00 11.56 88.44 0.00China, Macao, 2001 93.39 0.00 6.61 100.00 0.00 0.00 99.97 0.00 0.03 95.65 0.00 4.35Croatia, 2001 87.93 0.00 12.07 84.43 0.00 15.57 99.12 0.00 0.88 99.02 0.00 0.98Czech Republic, 2001 80.28 0.00 19.72 61.07 0.00 38.93 98.49 0.00 1.51 94.59 0.00 5.41Denmark, 1996 55.57 0.00 44.43 53.37 0.00 46.63 4.57 0.00 95.43 47.79 0.00 52.21Estonia, 2001 75.17 0.00 24.83 32.78 0.00 67.22 97.26 0.00 2.74 91.23 0.00 8.77France, 1993 82.49 0.00 17.51 62.82 0.00 37.18 97.81 0.00 2.19 91.19 0.00 8.81Georgia, 2000 69.44 0.00 30.56 20.41 0.00 79.59 53.95 0.00 46.05 92.71 0.00 7.29Germany, 1996 59.63 24.15 16.22 4.20 68.44 27.36 72.44 12.47 15.09 78.62 10.86 10.51Hungary, 1999 76.97 0.00 23.03 53.00 0.00 47.00 55.17 0.00 44.83 88.01 0.00 11.99Iceland, 1998 71.19 0.00 28.81 46.90 0.00 53.10 98.60 0.00 1.40 77.65 0.00 22.35India, 1999 52.96 47.04 0.00 10.56 89.44 0.00 26.64 73.36 0.00 0.00 100.00 0.00Ireland, 1997 74.86 0.00 25.14 78.23 0.00 21.77 51.57 0.00 48.43 93.68 0.00 6.32Israel, 1999 86.57 0.00 13.43 74.02 0.00 25.98 99.09 0.00 0.91 94.18 0.00 5.82Kazakhstan, 2000 55.34 0.00 44.66 16.03 0.00 83.97 13.99 0.00 86.01 88.29 0.00 11.71Kenya, 1994 96.53 0.00 3.47 97.91 0.00 2.09 92.73 0.00 7.27 52.94 0.00 47.06Kyrgyz Republic, 2000 77.30 0.00 22.70 59.62 0.00 40.38 59.85 0.00 40.15 90.89 0.00 9.11Latvia, 2001 73.86 0.00 26.14 28.02 0.00 71.98 95.21 0.00 4.79 93.39 0.00 6.61Lithuania, 2001 78.86 0.00 21.14 31.72 0.00 68.28 99.37 0.00 0.63 89.78 0.00 10.22Luxembourg, 1995 84.48 0.00 15.52 78.60 0.00 21.40 98.21 0.00 1.79 97.77 0.00 2.23
22
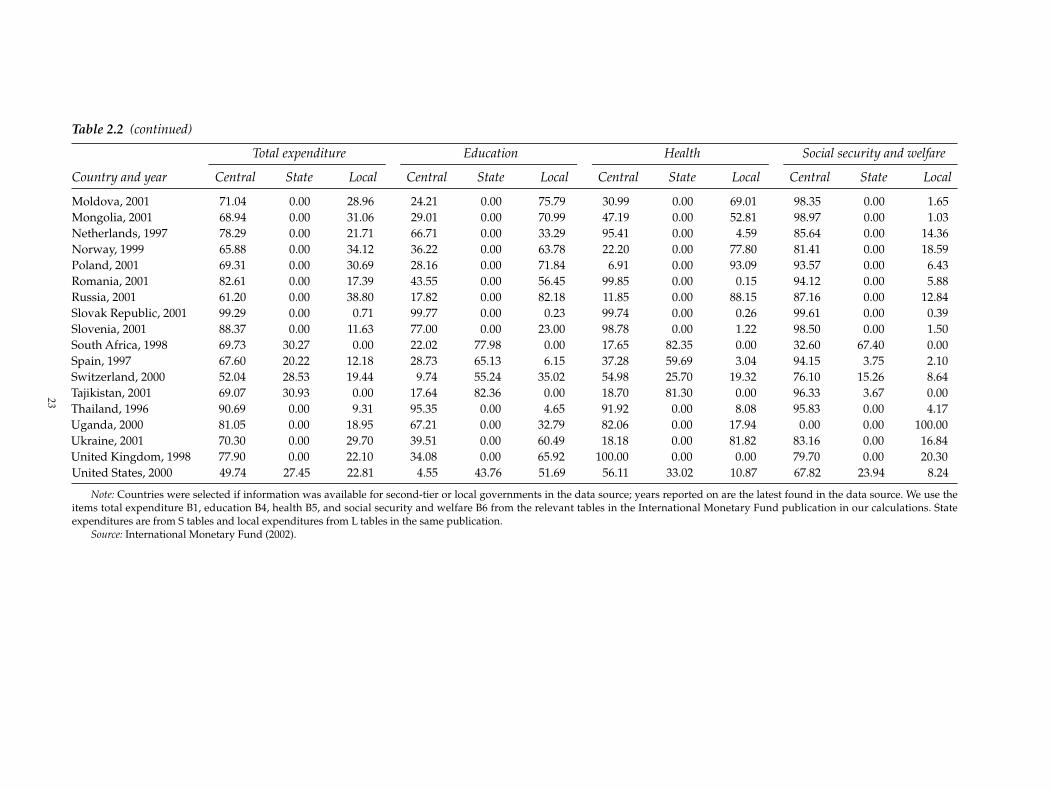
Table 2.2 (continued)
Total expenditure Education Health Social security and welfare
Country and year Central State Local Central State Local Central State Local Central State Local
Moldova, 2001 71.04 0.00 28.96 24.21 0.00 75.79 30.99 0.00 69.01 98.35 0.00 1.65Mongolia, 2001 68.94 0.00 31.06 29.01 0.00 70.99 47.19 0.00 52.81 98.97 0.00 1.03Netherlands, 1997 78.29 0.00 21.71 66.71 0.00 33.29 95.41 0.00 4.59 85.64 0.00 14.36Norway, 1999 65.88 0.00 34.12 36.22 0.00 63.78 22.20 0.00 77.80 81.41 0.00 18.59Poland, 2001 69.31 0.00 30.69 28.16 0.00 71.84 6.91 0.00 93.09 93.57 0.00 6.43Romania, 2001 82.61 0.00 17.39 43.55 0.00 56.45 99.85 0.00 0.15 94.12 0.00 5.88Russia, 2001 61.20 0.00 38.80 17.82 0.00 82.18 11.85 0.00 88.15 87.16 0.00 12.84Slovak Republic, 2001 99.29 0.00 0.71 99.77 0.00 0.23 99.74 0.00 0.26 99.61 0.00 0.39Slovenia, 2001 88.37 0.00 11.63 77.00 0.00 23.00 98.78 0.00 1.22 98.50 0.00 1.50South Africa, 1998 69.73 30.27 0.00 22.02 77.98 0.00 17.65 82.35 0.00 32.60 67.40 0.00Spain, 1997 67.60 20.22 12.18 28.73 65.13 6.15 37.28 59.69 3.04 94.15 3.75 2.10Switzerland, 2000 52.04 28.53 19.44 9.74 55.24 35.02 54.98 25.70 19.32 76.10 15.26 8.64Tajikistan, 2001 69.07 30.93 0.00 17.64 82.36 0.00 18.70 81.30 0.00 96.33 3.67 0.00Thailand, 1996 90.69 0.00 9.31 95.35 0.00 4.65 91.92 0.00 8.08 95.83 0.00 4.17Uganda, 2000 81.05 0.00 18.95 67.21 0.00 32.79 82.06 0.00 17.94 0.00 0.00 100.00Ukraine, 2001 70.30 0.00 29.70 39.51 0.00 60.49 18.18 0.00 81.82 83.16 0.00 16.84United Kingdom, 1998 77.90 0.00 22.10 34.08 0.00 65.92 100.00 0.00 0.00 79.70 0.00 20.30United States, 2000 49.74 27.45 22.81 4.55 43.76 51.69 56.11 33.02 10.87 67.82 23.94 8.24
Note: Countries were selected if information was available for second-tier or local governments in the data source; years reported on are the latest found in the data source. We use theitems total expenditure B1, education B4, health B5, and social security and welfare B6 from the relevant tables in the International Monetary Fund publication in our calculations. Stateexpenditures are from S tables and local expenditures from L tables in the same publication.
Source: International Monetary Fund (2002).
23
complete subnational ownership of revenues. Tax surcharges collected by higher-level govern-ments might be seen as own revenues if there is no substantial risk that the higher-level gov-ernment collecting the revenues will not remit them to the subnational government.
Even if subnational governments have own revenues, they may be unable to influence theamount of revenue they receive. This is true, for example, if the central government sharesrevenues from certain taxes with subnational governments.14 By comparison, if subnationalgovernments legislate and implement their own taxes, or even if they are allowed to imposesurcharges on the taxes levied by the central government at rates they choose, they can influ-ence the amount of revenues they receive, and thus, at the margin, control their revenues. Thisdistinction is crucial, because subnational governments must be assigned marginal sources ofown revenues, that is, revenues with a level they can control, if they are to be truly autonomous.Only by choosing to pay higher or lower taxes can residents of subnational jurisdictions choosethe level of public services they want.
An important prerequisite for the exercise of subnational fiscal autonomy is therefore theability to choose statutory tax rates.15 A given tax should be assigned to the lowest level ofgovernment that can implement it (or for which it can be implemented) and for which it is notinappropriate. This is the application of subsidiarity to taxation. The notion of subsidiarity intaxation was introduced to the European Union with the Maastricht Treaty amendments to theTreaty of Rome (Article 3B). Subsidiarity requires member states to determine their own fiscalpolicies unless those policies have negative spillover effects on the entire Union. The Commis-sion of the European Communities (1991, p. 7) explained that subsidiarity requires that “Mem-ber States should remain free to determine their tax arrangements, except where these wouldlead to major distortions.” Compliance with this principle is important to minimize the ten-dency toward vertical imbalance that exists because subnational governments have difficultyimplementing many taxes, but higher levels of government can implement almost any tax thata lower level of government can implement.
Tax competition can protect citizens from the rapaciousness of politicians and bureaucrats.It helps ensure that taxpayers are getting what they pay for and that the composition of gov-ernment spending, as well as the level, is appropriate.16
Many services that governments provide, including those subnational governments pro-vide, can be described as producing generalized benefits, or benefits that cannot be closelyrelated to taxes on the beneficiaries. Although generalized benefits may not be conducive to theuse of charges and fees, or even taxes closely related to benefits, such as taxes on motor trans-port, they can be related in a general way to taxes paid. Thus, for example, the general benefitsof government spending may be loosely related to income or to private consumption. Unlessthere is some reason to believe that benefits rise more or less rapidly than income or consump-tion, relying on flat-rate taxes on income or consumption to finance such services may be rea-sonable. At the subnational level, if people do not work where they live (or if they do not invest
24 Revenues and Expenditures in an Intergovernmental Framework
14. In such a case, these are own revenues but not marginal revenues of subnational governments15. An issue here is why statutory and not effective tax rates. Effective tax rates would vary if subna-
tional governments could alter deductions, exemptions, and so on, but this would mean changing the baseand not the rates. This would increase the complexity of the system and the compliance costs of firms oper-ating in multiple jurisdictions.
16. Brennan and Buchanan (1983) provide a strong argument for tax competition (see also McLure1986). This is only part of the story, although an important part. Because those who enjoy public goodscannot be excluded from enjoying the benefits, they have little incentive to reveal their preferences for suchgoods. There is thus a tendency to underprovide public goods that tax competition might aggravate (seeGordon 1983 for a theoretical analysis of the inefficiencies that can result from decentralization, includingtax competition). Benefit taxation helps to combat this source of market failure (Wildasin 1986). Tax com-petition makes it difficult for subnational governments to tax mobile factors—capital and highly educatedor skilled labor—and therefore to engage in progressive taxation.

their savings where they live), one must ascertain whether production or consumption (incomeearned or income spent) is the better measure of generalized benefits.
If the benefits of public spending are more closely related to production or the earning ofincome than to consumption or the spending of income, origin-based taxes on value added andpayroll taxes levied where employment occurs would be superior to destination-based valueadded taxes (VATs), retail sales taxes, and residence-based income taxes as measures of benefitsreceived.
A priori reasoning suggests that consumption (the spending of income) is probably moreclosely related to the benefits of public spending than is production (the earning of income). Forexample, education is usually provided where people live, not where they work, and the sametends to be true for health care. The implications of this reasoning concerning generalized ben-efits of public services for the problem of tax assignment are clear. In principle, residence-basedincome taxes are probably superior to employment-based payroll taxes, and destination (con-sumption)-based sales taxes are better than origin (production)-based ones.
A variety of approaches to assigning revenues to subnational governments can be distin-guished. These approaches differ in the degree of fiscal autonomy they provide subnationalgovernments, the ease of compliance and administration, the fairness and neutrality they arelikely to produce, and the degree of interjurisdictional redistribution they can accommodate.Four aspects of revenue assignment can be distinguished: (a) which level of governmentchooses the taxes from which subnational governments receive revenues, (b) which leveldefines the tax bases, (c) which level sets the tax rates, and (d) which level administers the taxes.
From the viewpoint of subnational fiscal sovereignty, the capacity to set rates is clearly themost important of these, and also the most efficient. The choice of rates is what allows subna-tional governments to choose the level of public services while minimizing the compliancecosts associated with collecting the required revenues. Subnational governments clearly cannotbe allowed total discretion in the choice of the taxes they will levy, for example, they should notbe allowed to levy import duties on international trade or trade between subnational jurisdic-tions or to impose taxes likely to be exported in large part. Excessive subnational latitude in thechoice of tax bases and in tax administration can create unacceptable complexity and adminis-trative burdens, as well as inequities and distortions in the allocation of resources.
A first approach, independent subnational legislation and administration, provides subna-tional governments with the most fiscal autonomy. Under this approach, subnational govern-ments choose the taxes they levy, define the tax bases, set the tax rates, and administer thetaxes.17 This is the approach followed in Canada, Switzerland, and the United States. Becausethey are subject only to general constitutional limitations (for example, due process and nonin-terference with inter-regional and international commerce) and almost no statutory limitations,the provinces, cantons, or states can do virtually anything they want in these four areas. Car-ried to the extreme, this approach is vulnerable to inconsistency, duplication of effort, andexcessive complexity of compliance and administration. These problems can occur if differentjurisdictions choose radically different taxes (for example, if some levy retail sales taxes, butothers levy VATs as is the case in Canada), define their tax bases in different ways (as in the caseof state corporate income taxes and retail sales taxes in the United States), or administer thesame taxes in different ways. Inequities and economic distortions can also occur if the tax sys-tems of various subnational governments do not mesh, resulting in gaps or overlaps in taxa-tion. Within limits, these problems—which differ in importance from tax to tax—can andshould be tolerated in the interest of gaining the benefits of decentralized government. Seriouscomplexities, inequities, and distortions should be avoided, however. This objective can be
Jorge Martinez-Vazquez, Charles McLure, and François Vaillancourt 25
17. Subnational constitutions or laws may limit any of these, but self-imposed restrictions in the con-stitutions of subnational governments differ from restrictions imposed from above by law or as part of anational constitution.

achieved without greatly compromising the fiscal autonomy of subnational governmentsthrough intergovernmental compacts among subnational governments or the imposition ofuniform ground rules by a higher level of government, for example, rules governing the defini-tion and division of the corporate income tax base.
A second approach is subnational surcharges, which provide most of the important fiscalautonomy of independent subnational legislation and administration. Under this approach, ahigher level of government defines the tax base and collects both its own tax and surchargesset by subnational governments. This approach ideally avoids the problems that occur whendifferent subnational jurisdictions define the tax base in conflicting ways, use different appor-tionment formulas, and administer the tax in different ways. Because of their power to setsurcharge rates, subnational governments retain the most important attribute of fiscal sover-eignty in the tax field. The ability to define the tax base and administer taxes is much lessimportant.
There is no reason, in principle, why the tax rate of the central government cannot be zerofor a particular tax. In such a case the central government would simply administer the tax ofsubnational governments, thereby ensuring uniformity and avoiding duplication of effort. Aproblem does exist, though, with providing incentives for the central government to collect atax that it does not keep and, indeed, of trusting it not to keep the revenues it ostensibly collectsfor subnational governments. These problems exist in any system of surcharges. Surchargesshould, of course, be limited to that portion of the tax base reasonably deemed to arise in, or beattributed to, the taxing jurisdiction. Subnational surcharges appear to be the most appropriatemeans of providing subnational governments with their own marginal revenues in countrieswhere administrative resources are scarce. For example, even though three Canadian provinces(among the four largest and wealthiest) collect their own corporate income taxes, others rely onthe federal government. In both cases, tax bases and apportionment formulas are the same.
A third approach, tax sharing, is generally much less attractive than subnational surcharges.Under this approach subnational governments receive fixed fractions of revenues from particu-lar national taxes originating within their boundaries. The sharing rates are usually uniformacross jurisdictions, though not across taxes. As with surcharges, formulas may be needed todetermine the deemed origin of tax revenues. In many countries the data needed to share rev-enues may not exist or may be unreliable. This approach severely restricts subnational govern-ments’ fiscal autonomy. Individual subnational governments have autonomy over how tospend a given amount of revenue, but not the power to alter the amount of revenue they receivefrom shared taxes. They therefore cannot control the level of public spending. Although all sub-national governments, acting as a group, can attempt to influence their share of revenues fromthese taxes, no subnational government, acting unilaterally, can hope to do so.
Table 2.3 presents one possible detailed tax assignment put forward by Shah (1994), andtable 2.4 shows the distribution of tax revenues for three taxes (income, property, and goodsand services) by level of government for countries selected using the same criterion as for table2.2. As was the case for table 2.2, it reveals a large amount of diversity across countries.
Transfers
A system of tax assignment designed in accord with the principles outlined previously mayproduce vertical imbalance in the revenues available to various levels of government or hori-zontal fiscal disparities among governments at a given level. Vertical fiscal imbalance is likelybecause many of the taxes that, from a conceptual point of view, are appropriately assigned tosubnational governments cannot easily be administered in a way that implements this assign-ment. Finding taxes that can be implemented in a way that provides subnational governmentswith marginal sources of own revenues is especially difficult. The likelihood of vertical fiscalimbalance explains the earlier emphasis on subsidiarity in taxation.
26 Revenues and Expenditures in an Intergovernmental Framework
Jorge Martinez-Vazquez, Charles McLure, and François Vaillancourt 27
Even if tax assignment follows the principles outlined here, horizontal fiscal disparities arelikely unless taxable capacity is evenly distributed across subnational jurisdictions. Unequal fis-cal capacity generally occurs where income levels are quite different. Inequalities in income lev-els make it difficult for poor jurisdictions to collect as much tax revenue from income and salestaxes as their more affluent counterparts. Disparities between regions have a number of causes(Dafflon and Vaillancourt 2003), such as differences in opportunities for economic growth,impossibility of attaining a sufficient threshold of production capacity because of populationsize or density, and higher costs of producing and delivering local public services because ofgeographical conditions. Particular combinations of industrial structures and tax assignmentscan create or aggravate horizontal disparities. The assignment of taxes on important and geo-graphically concentrated natural resources to subnational governments is perhaps the mostobvious example of this. The assignment of the corporate income tax to subnational govern-ments can also aggravate these disparities, especially if the tax base is apportioned primarilyon the basis of origin-related factors, such as payrolls and property. Where tax assignment doesnot follow the principles outlined earlier, horizontal disparities may be even worse. The assign-ment of all or a share of excise taxes, customs duties, or VAT on imports to the jurisdictionwhere production or importation occurs instead of the jurisdiction of consumption is perhapsthe most obvious example of a worsened situation.
Thus in many countries, taxes reasonably assigned to subnational governments will proba-bly be inadequate to finance the provision of services assigned to those governments or willresult in horizontal fiscal disparities. If so, using grants from higher-level governments to com-pensate for vertical fiscal imbalance or to offset horizontal fiscal disparities may be desirable.Grants intended to offset vertical imbalance or horizontal disparities should provide inframar-ginal funding for subnational governments so as not to affect the marginal decisions of thosegovernments regarding the choice between public and private spending. Grants may be appro-priate because of interjurisdictional spillovers of benefits of services provided by subnationalgovernments. By their nature, these types of grant should be designed to change the terms onwhich private income can be exchanged for public services characterized by spillovers and,indeed, the terms of the trade-off between these and other public expenditures.
Subnational governments should not be penalized for raising additional revenues with areduction in grants. Some favor including provisions in grants that reward a greater subna-tional tax effort. This policy is unattractive unless there are reasons to believe that the choices ofsubnational governments are being artificially constrained to suboptimal levels. Even then,removing the obstacles seems more appropriate than rewarding the tax effort.
From the grantor’s perspective, usually the national government, grants are an expense thatshould be limited and controlled. From the recipient’s perspective, for example, subnationalgovernments, they are revenues that should be maximized. Open-ended grants, where thegrantor will pay whatever is appropriate, (for instance, 50 percent of expenses, which aredecided by the recipients, are thus dangerous from the grantor’s perspective. Grantors will pre-fer close-ended grants, with a total maximum amount to be paid in any given time period. Sucha set amount is a block grant if it is not linked directly to spending.
Grantors prefer tied (or conditional) grants, because they link the amount received to achange in behavior, such as spending more on the relevant item. From recipients’ perspective,the greater the freedom to spend as they wish, the better a grant, and thus they prefer untied(unconditional) grants. Governments should seek to avoid formulas that will create unfavorableoutcomes, such as encouraging capital spending in place of maintaining existing equipment.
The design of a grant requires that the following two fundamental issues be settled:
• The total amount of the transfers that are to be made, that is, how much money in total thenational government will transfer to subnational governments. This is referred to as the verti-cal distribution, because it goes from one level of government to the one below, or as theprimary distribution, because it is done first. Related to this issue is how this transfer
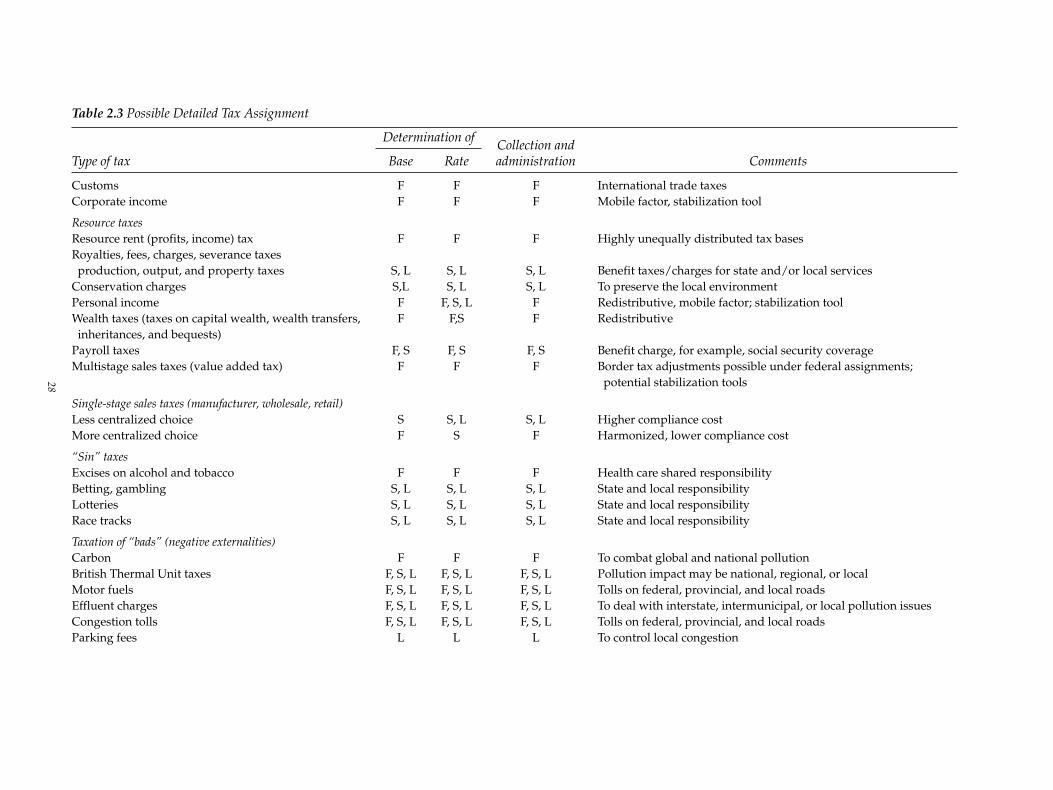
Table 2.3 Possible Detailed Tax Assignment
Determination ofCollection and
Type of tax Base Rate administration Comments
Customs F F F International trade taxesCorporate income F F F Mobile factor, stabilization tool
Resource taxesResource rent (profits, income) tax F F F Highly unequally distributed tax basesRoyalties, fees, charges, severance taxesproduction, output, and property taxes S, L S, L S, L Benefit taxes/charges for state and/or local services
Conservation charges S,L S, L S, L To preserve the local environmentPersonal income F F, S, L F Redistributive, mobile factor; stabilization toolWealth taxes (taxes on capital wealth, wealth transfers, F F,S F Redistributive inheritances, and bequests)
Payroll taxes F, S F, S F, S Benefit charge, for example, social security coverageMultistage sales taxes (value added tax) F F F Border tax adjustments possible under federal assignments;
potential stabilization tools
Single-stage sales taxes (manufacturer, wholesale, retail)Less centralized choice S S, L S, L Higher compliance costMore centralized choice F S F Harmonized, lower compliance cost
“Sin” taxesExcises on alcohol and tobacco F F F Health care shared responsibility Betting, gambling S, L S, L S, L State and local responsibilityLotteries S, L S, L S, L State and local responsibilityRace tracks S, L S, L S, L State and local responsibility
Taxation of “bads” (negative externalities)Carbon F F F To combat global and national pollutionBritish Thermal Unit taxes F, S, L F, S, L F, S, L Pollution impact may be national, regional, or localMotor fuels F, S, L F, S, L F, S, L Tolls on federal, provincial, and local roadsEffluent charges F, S, L F, S, L F, S, L To deal with interstate, intermunicipal, or local pollution issuesCongestion tolls F, S, L F, S, L F, S, L Tolls on federal, provincial, and local roadsParking fees L L L To control local congestion
28
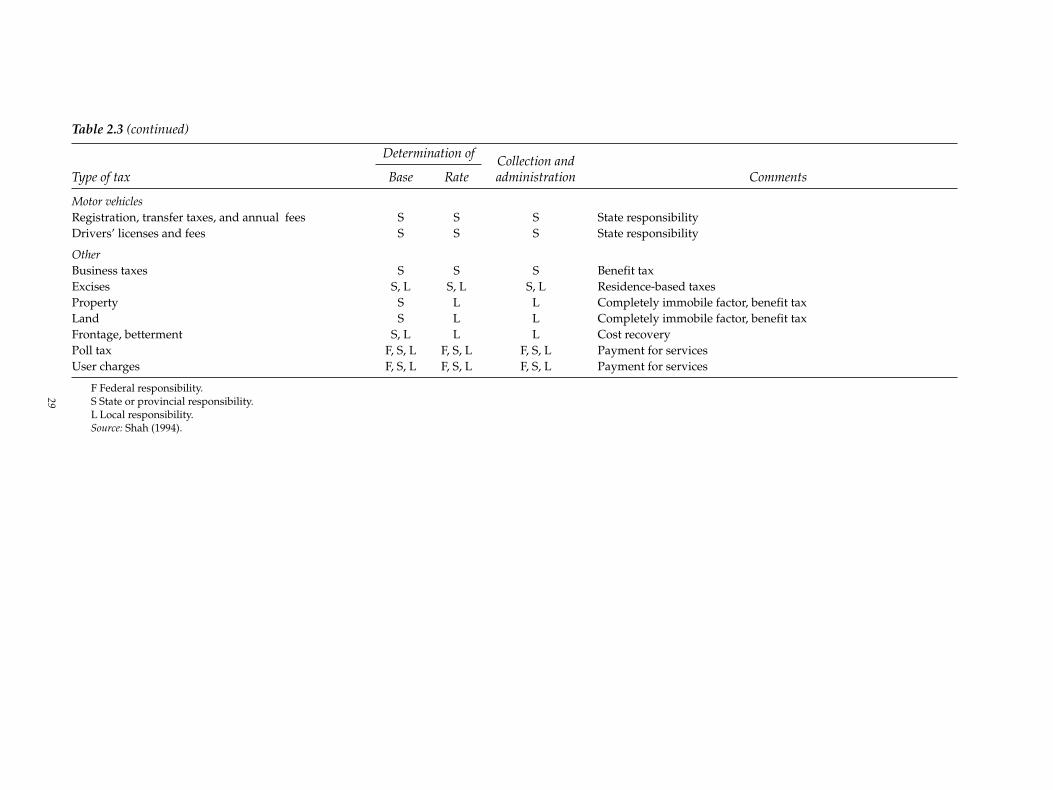
Table 2.3 (continued)
Determination ofCollection and
Type of tax Base Rate administration Comments
Motor vehiclesRegistration, transfer taxes, and annual fees S S S State responsibilityDrivers’ licenses and fees S S S State responsibility
Other Business taxes S S S Benefit tax Excises S, L S, L S, L Residence-based taxesProperty S L L Completely immobile factor, benefit taxLand S L L Completely immobile factor, benefit taxFrontage, betterment S, L L L Cost recoveryPoll tax F, S, L F, S, L F, S, L Payment for servicesUser charges F, S, L F, S, L F, S, L Payment for services
F Federal responsibility.S State or provincial responsibility. L Local responsibility.Source: Shah (1994).
29
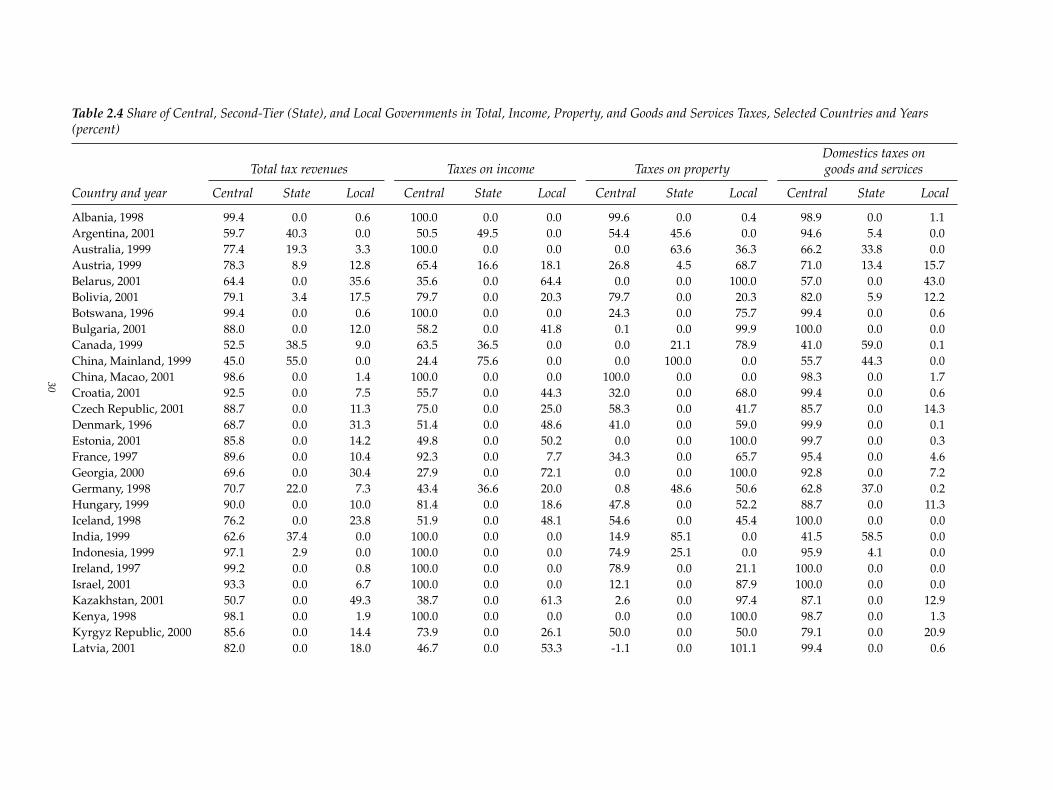
Table 2.4 Share of Central, Second-Tier (State), and Local Governments in Total, Income, Property, and Goods and Services Taxes, Selected Countries and Years (percent)
Domestics taxes onTotal tax revenues Taxes on income Taxes on property goods and services
Country and year Central State Local Central State Local Central State Local Central State Local
Albania, 1998 99.4 0.0 0.6 100.0 0.0 0.0 99.6 0.0 0.4 98.9 0.0 1.1Argentina, 2001 59.7 40.3 0.0 50.5 49.5 0.0 54.4 45.6 0.0 94.6 5.4 0.0Australia, 1999 77.4 19.3 3.3 100.0 0.0 0.0 0.0 63.6 36.3 66.2 33.8 0.0Austria, 1999 78.3 8.9 12.8 65.4 16.6 18.1 26.8 4.5 68.7 71.0 13.4 15.7Belarus, 2001 64.4 0.0 35.6 35.6 0.0 64.4 0.0 0.0 100.0 57.0 0.0 43.0Bolivia, 2001 79.1 3.4 17.5 79.7 0.0 20.3 79.7 0.0 20.3 82.0 5.9 12.2Botswana, 1996 99.4 0.0 0.6 100.0 0.0 0.0 24.3 0.0 75.7 99.4 0.0 0.6Bulgaria, 2001 88.0 0.0 12.0 58.2 0.0 41.8 0.1 0.0 99.9 100.0 0.0 0.0Canada, 1999 52.5 38.5 9.0 63.5 36.5 0.0 0.0 21.1 78.9 41.0 59.0 0.1China, Mainland, 1999 45.0 55.0 0.0 24.4 75.6 0.0 0.0 100.0 0.0 55.7 44.3 0.0China, Macao, 2001 98.6 0.0 1.4 100.0 0.0 0.0 100.0 0.0 0.0 98.3 0.0 1.7Croatia, 2001 92.5 0.0 7.5 55.7 0.0 44.3 32.0 0.0 68.0 99.4 0.0 0.6Czech Republic, 2001 88.7 0.0 11.3 75.0 0.0 25.0 58.3 0.0 41.7 85.7 0.0 14.3Denmark, 1996 68.7 0.0 31.3 51.4 0.0 48.6 41.0 0.0 59.0 99.9 0.0 0.1Estonia, 2001 85.8 0.0 14.2 49.8 0.0 50.2 0.0 0.0 100.0 99.7 0.0 0.3France, 1997 89.6 0.0 10.4 92.3 0.0 7.7 34.3 0.0 65.7 95.4 0.0 4.6Georgia, 2000 69.6 0.0 30.4 27.9 0.0 72.1 0.0 0.0 100.0 92.8 0.0 7.2Germany, 1998 70.7 22.0 7.3 43.4 36.6 20.0 0.8 48.6 50.6 62.8 37.0 0.2Hungary, 1999 90.0 0.0 10.0 81.4 0.0 18.6 47.8 0.0 52.2 88.7 0.0 11.3Iceland, 1998 76.2 0.0 23.8 51.9 0.0 48.1 54.6 0.0 45.4 100.0 0.0 0.0India, 1999 62.6 37.4 0.0 100.0 0.0 0.0 14.9 85.1 0.0 41.5 58.5 0.0Indonesia, 1999 97.1 2.9 0.0 100.0 0.0 0.0 74.9 25.1 0.0 95.9 4.1 0.0Ireland, 1997 99.2 0.0 0.8 100.0 0.0 0.0 78.9 0.0 21.1 100.0 0.0 0.0Israel, 2001 93.3 0.0 6.7 100.0 0.0 0.0 12.1 0.0 87.9 100.0 0.0 0.0Kazakhstan, 2001 50.7 0.0 49.3 38.7 0.0 61.3 2.6 0.0 97.4 87.1 0.0 12.9Kenya, 1998 98.1 0.0 1.9 100.0 0.0 0.0 0.0 0.0 100.0 98.7 0.0 1.3Kyrgyz Republic, 2000 85.6 0.0 14.4 73.9 0.0 26.1 50.0 0.0 50.0 79.1 0.0 20.9Latvia, 2001 82.0 0.0 18.0 46.7 0.0 53.3 -1.1 0.0 101.1 99.4 0.0 0.6
30
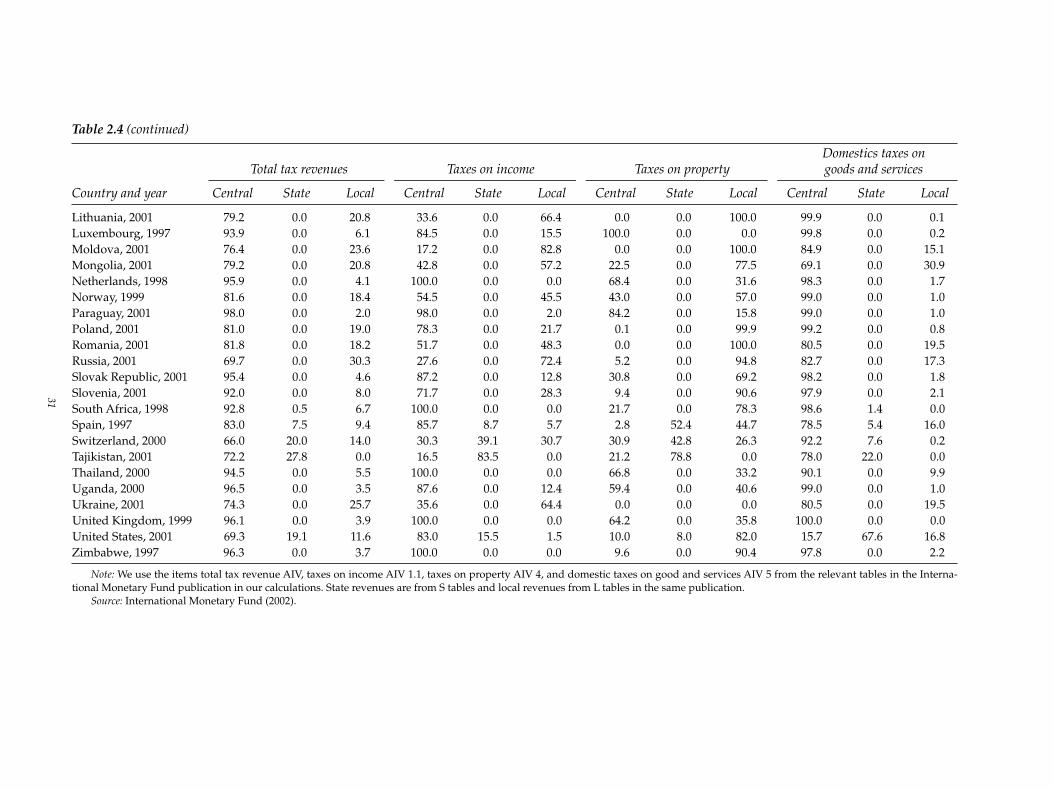
31
Table 2.4 (continued)
Domestics taxes onTotal tax revenues Taxes on income Taxes on property goods and services
Country and year Central State Local Central State Local Central State Local Central State Local
Lithuania, 2001 79.2 0.0 20.8 33.6 0.0 66.4 0.0 0.0 100.0 99.9 0.0 0.1Luxembourg, 1997 93.9 0.0 6.1 84.5 0.0 15.5 100.0 0.0 0.0 99.8 0.0 0.2Moldova, 2001 76.4 0.0 23.6 17.2 0.0 82.8 0.0 0.0 100.0 84.9 0.0 15.1Mongolia, 2001 79.2 0.0 20.8 42.8 0.0 57.2 22.5 0.0 77.5 69.1 0.0 30.9Netherlands, 1998 95.9 0.0 4.1 100.0 0.0 0.0 68.4 0.0 31.6 98.3 0.0 1.7Norway, 1999 81.6 0.0 18.4 54.5 0.0 45.5 43.0 0.0 57.0 99.0 0.0 1.0Paraguay, 2001 98.0 0.0 2.0 98.0 0.0 2.0 84.2 0.0 15.8 99.0 0.0 1.0Poland, 2001 81.0 0.0 19.0 78.3 0.0 21.7 0.1 0.0 99.9 99.2 0.0 0.8Romania, 2001 81.8 0.0 18.2 51.7 0.0 48.3 0.0 0.0 100.0 80.5 0.0 19.5Russia, 2001 69.7 0.0 30.3 27.6 0.0 72.4 5.2 0.0 94.8 82.7 0.0 17.3Slovak Republic, 2001 95.4 0.0 4.6 87.2 0.0 12.8 30.8 0.0 69.2 98.2 0.0 1.8Slovenia, 2001 92.0 0.0 8.0 71.7 0.0 28.3 9.4 0.0 90.6 97.9 0.0 2.1South Africa, 1998 92.8 0.5 6.7 100.0 0.0 0.0 21.7 0.0 78.3 98.6 1.4 0.0Spain, 1997 83.0 7.5 9.4 85.7 8.7 5.7 2.8 52.4 44.7 78.5 5.4 16.0Switzerland, 2000 66.0 20.0 14.0 30.3 39.1 30.7 30.9 42.8 26.3 92.2 7.6 0.2Tajikistan, 2001 72.2 27.8 0.0 16.5 83.5 0.0 21.2 78.8 0.0 78.0 22.0 0.0Thailand, 2000 94.5 0.0 5.5 100.0 0.0 0.0 66.8 0.0 33.2 90.1 0.0 9.9Uganda, 2000 96.5 0.0 3.5 87.6 0.0 12.4 59.4 0.0 40.6 99.0 0.0 1.0Ukraine, 2001 74.3 0.0 25.7 35.6 0.0 64.4 0.0 0.0 0.0 80.5 0.0 19.5United Kingdom, 1999 96.1 0.0 3.9 100.0 0.0 0.0 64.2 0.0 35.8 100.0 0.0 0.0United States, 2001 69.3 19.1 11.6 83.0 15.5 1.5 10.0 8.0 82.0 15.7 67.6 16.8Zimbabwe, 1997 96.3 0.0 3.7 100.0 0.0 0.0 9.6 0.0 90.4 97.8 0.0 2.2
Note: We use the items total tax revenue AIV, taxes on income AIV 1.1, taxes on property AIV 4, and domestic taxes on good and services AIV 5 from the relevant tables in the Interna-tional Monetary Fund publication in our calculations. State revenues are from S tables and local revenues from L tables in the same publication.
Source: International Monetary Fund (2002).

will be funded and according to which decision procedure. Several answers are possi-ble, each with its advantages and disadvantages, namely:
• The amount is financed out of the general resources of the paying unit and estab-lished in its annual budget. This is a flexible solution, changeable from one year tothe next, but it has two defects: first, recipient governments are not sure that theywill receive a real (nominal is meaningless if inflation is present) comparableamount from one year to another, which renders planning difficult; and second,annual budgetary debates are subject to ad hoc political arrangements.
• The exact calculation of the amount is explicitly stated in the constitution or in a law.It may be formulated as a percentage of total expenditures; of total revenues; or ofone, but preferably several, specific tax sources used at the central level. Using onlyone tax source and allocating a high percentage of revenues from it to transfers mayresult in the central government not collecting it as vigorously as if it kept 100 per-cent of revenues as discussed earlier. This solution has two advantages. First, with aspecific legal foundation, the political debate on the size of transfers takes placewhen the constitution is amended or the law is passed, and not on an annual basis.Second, it avoids important variations in the amounts available if the amount isdependent on a sufficiently large basis. A variant of this is that the amount can be setinitially and then indexed, and the indexing formula can take one or more of the fol-lowing factors into account: inflation (overall or of specific items such as medicationor road materials), population growth (overall or of specific age groups such asschool-age children), gross domestic product growth, growth of specific taxes (suchas gasoline-related taxes or VAT), and so on.
• If a specific tax or set of taxes is used, this can create fluctuations in the revenuesavailable for sharing. This problem can be partially solved by setting up a fundfueled with these taxes. This can smooth transfer payments by leaving part of theamounts in the fund in good years to be used in bad ones. This intertemporal stabi-lization is what distinguishes this option from the preceding one.
• The amount to be provided to each recipient. This is referred to as the horizontal distribu-tion, because it is between recipients at the same level of government. It is also calledthe secondary distribution, because it follows after the primary one. Transfer schemesrequire that the amount each jurisdiction will receive be determined by an appropriateformula. This will vary according to the purpose of the grant. If grants are made tostimulate the production by particular subnational entities of specific public servicesthat generate positive externalities, then the central government may want to use indi-cators linked to the benefits outside populations receive, such as their size. If grants aremade to alleviate vertical fiscal disequilibrium (absent horizontal equilibrium), thenneed as measured by such indicators as population, specific populations, topography,or urban density may be appropriate. Finally, in the case of grants aimed at alleviatinghorizontal disequilibrium, equalization, revenue capacity, and needs may all be takeninto account. Jurisdictions with higher than average capacity should receive less (paymore); jurisdictions with lower than average capacity should receive more (pay less). Itis generally accepted that explicit revenue equalization, if any, takes into account somefiscal or financial capacity indicator. Extra funding for governments facing additionalcharges caused by socio-demographic challenges, their geographic location, or bothwould necessitate some form of cost equalization
Conclusion
The success of decentralization often depends both on the sequencing of policy changes andthe nature of the policies adopted. With respect to the first point, this is true both when a given
32 Revenues and Expenditures in an Intergovernmental Framework

state is moving from a more to a less centralized system and when an already decentralizedstate is modifying its institutional arrangements. In general, one aspect of the intergovernmen-tal arrangements cannot be changed without addressing the other arrangements. For example,in the 1990s, some countries in Latin America made the mistake of assigning revenues to sub-national governments and putting transfers in place before the central government decidedwhat functional competencies would be transferred from the central government to subna-tional governments. The result was a weak decentralized system and a fiscally overburdenedcentral government. Switzerland, which since 2000 has begun a re-examination of intergovern-mental financial arrangements, is simultaneously clarifying the assignment of responsibilitiesand the financial transfer system (Dafflon and Perritaz 2002).
Stable and meaningful decentralization requires an unambiguous and well-defined assign-ment of responsibilities among the different levels of government. The assignment of responsi-bilities must take into account the principle of subsidiary, and thus differences in economies ofscale, preferences, and objective conditions and the importance of externalities. Autonomymust be real and not simply formal. This requires fiscal autonomy on the part of subnationalgovernments, and thus the ability to vary statutory tax rates. Because varying tax rates withoutinducing taxpayers to take steps that would minimize their tax burdens might be difficult, gov-ernments should rely as heavily as possible on fees, charges, and taxes that can be linked closelyto the benefits of public services. Finally, transfer systems should be designed carefully to avoidundesirable behavior by recipient governments, such as a reduction in tax effort or skewedspending, while ensuring that they have the necessary resources to provide the desired level ofpublic services.
References
Bird, Richard M., and François Vaillancourt, eds. 1998. Fiscal Decentralization in DevelopingCountries. Cambridge, U.K.: Cambridge University Press
Bird, Richard M., Robert D. Ebel, and Christine I. Wallich, eds. 1995. Decentralization of theSocialist State: Intergovernmental Finance in Transition Economies. Washington, D.C.: WorldBank.
Brennan, Geoffrey, and James Buchanan. 1983. “Normative Tax Theory for a Federal Polity:Some Public Choice Preliminaries.” In Charles E. McLure, Jr., ed., Tax Assignment in FederalCountries. Canberra: Centre for Research on Federal Financial Relations.
Commission of the European Communities. 1991. “Removal of Tax Obstacles to the Cross-Frontier Activities of Companies.” Bulletin of the European Communities (Supplement 4/91).
Dafflon, Bernard, and Steve Perritaz. 2002. “Federal-Cantonal Equalisation in Switzerland: AnOverview of the Present System and Reform in Progress.” Working Paper no. 356. Univer-sity of Fribourg, BENEFRI Centre for Studies in Public Sector Economics, Fribourg,Switzerland.
Dafflon, Bernard, and François Vaillancourt. 2003. “Problems of Equalization in Federal Coun-tries.” In R. Blidenbacher and A. Koller, eds., Federalism in a Changing World: Learning fromEach Other. Montreal: McGill Queens University Press.
Gordon, Roger H. 1983. “An Optimal Taxation Approach to Fiscal Federalism.” In Charles E.McLure, Jr., ed., Tax Assignment in Federal Countries. Canberra: Centre for Research on Fed-eral Financial Relations.
International Monetary Fund. 2002. Government Finance Statistics Yearbook 2002. Washington, D.C.
Litvack, Jennie, Junaid Ahmad, and Richard Bird. 1998. Rethinking Decentralization in Develop-ing Countries. Washington, D.C.: World Bank.
Jorge Martinez-Vazquez, Charles McLure, and François Vaillancourt 33
McLure, Charles. 1986. “Tax Competition: Is What’s Good for the Private Goose also Good forthe Public Gander?” National Tax Journal 39(3): 341–48.
_____. 2000. “Tax Assignment and Subnational Fiscal Autonomy.” Bulletin for International Fis-cal Documentation 54(12): 626–35.
Musgrave, Richard A. 1959. The Theory of Public Finance. New York: McGraw Hill.
_____. 1983. “Who Should Tax, Where, and What?” In Charles E. McLure, Jr., ed., Tax Assign-ment in Federal Countries. Canberra: Centre for Research on Federal Financial Relations.
Oates, Wallace E. 1972. Fiscal Federalism. New York: Harcourt Brace Jovanovich.
Sewell, David O. 1996. “‘The Dangers of Decentralization’ According to Prud’homme: SomeFurther Aspects.” World Bank Research Observer 11(1): 143–50.
Shah, Anwar. 1994. The Reform of Intergovernmental Fiscal Relations in Developing and EmergingCountries. Policy and Research Series no. 23. Washington, D.C.: World Bank.
Wildasin, David E. 1986. “Interstate Tax Competition: A Comment.” National Tax Journal 39(3):353–56.
34 Revenues and Expenditures in an Intergovernmental Framework
3Budgeting, Financial Management, and Financial Markets in an Intergovernmental Context
François Vaillancourt
This chapter discusses the concepts of budgeting, financial management, and the financial mar-ket at the subnational level. It is designed to increase readers’ knowledge and understanding ofthe major financing issues facing subnational governments (SNGs), such as oblasts in Russia orcities. After a brief description of the links between financial management and markets, thechapter is divided into five sections that cover accounting, the budget process, the capital mar-ket, bond issues, and credit rating.
Financial Management and Markets
This section begins by presenting how financial management and budgeting contributes toaccountability. It then turns to the relationship with markets.
Financial Management and Budgeting
Financial management and budgeting refers to the whole set of activities by which the inten-tions of managers and politicians, expressed through a variety of means such as strategic plans,become operational. For plans to materialize, top decisionmakers must understand the relevantfinancial and budgetary information. This information is key to the concept of accountability,that is, the notion that managers and elected decisionmakers are responsible for their actionsand that citizens require them to account for their actions. Accountability has three key dimen-sions: administrative, economic, and political.
ADMINISTRATIVE ACCOUNTABILITY. This type of accountability requires making available thenecessary information to allow
• Adequate internal management controls to be established• Supervisory bodies, such as ministries of the interior or of municipal affairs, to carry out
their tasks• Outside auditors, public as well as private, to not only certify that the financial reports
of an SNG represent its true spending, but to ascertain the presence or absence of anycorruption as well.
ECONOMIC ACCOUNTABILITY. This type of accountability requires making the necessaryinformation available to allow decisions to be made in a manner that ensures resources are allo-cated with the greatest level of efficiency possible and that taxpayers are provided with the bestservices possible. This pursuit of value for money is made easier if the accounting tools (suchas analytical accounting) used help establish the true cost of a service and provide informationuseful for making decisions, such as whether or not a service should be privatized.
35

POLITICAL ACCOUNTABILITY. This type of accountability requires making sufficient informa-tion available to citizens to allow them to assess the performance of their elected politicians andto decide whether or not to re-elect them.
Financial Markets
Financial markets are the set of institutions, such as stock markets, and agents, such as banks,financial cooperatives, and foreign exchange brokers, found in varying degrees and combina-tions in every country worldwide. These institutions carry out various financial transactions.SNGs commonly make use of such institutions to borrow funds for capital expenditures.1
Although the specific organization and structure of such institutions will vary from country tocountry, the technical vocabulary of finance—maturity, yield, coupon, and so on—is used uni-formly. Because public sector managers and politicians who must deal with financial marketsoften do not have a good understanding of this vocabulary, a discussion of these terms followslater in this chapter.
The Link between Financial Management and Capital Markets
Proper financial management is a prerequisite to accessing financial markets. Lenders demandhigh-quality financial information and well-managed finances before they will lend. In addi-tion, some information required to access financial markets is the same as that needed forproper financial management. There is thus a natural link between these two topics.
Accounting Concepts
This section introduces several important basic accounting concepts: single- and double-entrybookkeeping, accrual and cash accounting, and balance sheets.
Bookkeeping
Bookkeeping refers to the operation of entering financial information (revenues and expenses)into a ledger book. Although this activity may seem innocuous—and even unimportant—it isthe basis for all accounting because accountants use the information thus recorded to preparefinancial statements. There are two types of bookkeeping: single-entry bookkeeping anddouble-entry bookkeeping.
SINGLE-ENTRY BOOKKEEPING. This type of bookkeeping requires that expenses and revenuesare entered in one column, using a positive value for revenues and a negative value forexpenses. The disadvantage of single-entry bookkeeping is that at the end of the year there isno way to ascertain revenues or expenses, only the difference between the two. Table 3.1 showsa situation where an SNG is in the same financial situation at the end of the period as at thebeginning, yet expenses were incurred and revenues received.
Table 3.1 also shows a limitation of single-entry bookkeeping: the difficulty of doing properbudgeting because expenses and revenues are intermingled and cancel each other out.Although financial administrators using single-entry bookkeeping may maintain other docu-ments that allow them to prepare the relevant financial statements, this obviously requiresadditional work. Moreover, in countries where accounting conventions (sometimes establishedby law) require the use of single-entry bookkeeping, supervisory authorities do not verify these
36 Budgeting, Financial Management, and Financial Markets in an Intergovernmental Context
1. Capital expenditure is spending on investments that have a long life span, such as roads or sewers.It is seldom sensible—and often impossible—to finance such expenditures out of current revenues.
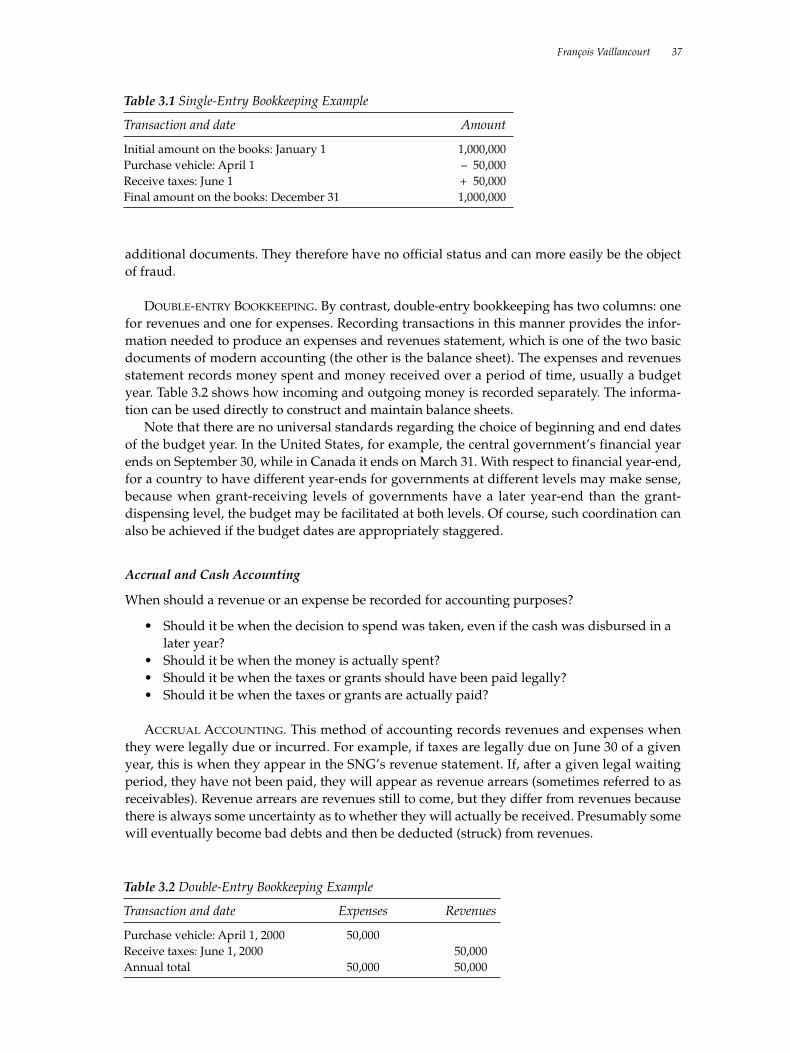
additional documents. They therefore have no official status and can more easily be the objectof fraud.
DOUBLE-ENTRY BOOKKEEPING. By contrast, double-entry bookkeeping has two columns: onefor revenues and one for expenses. Recording transactions in this manner provides the infor-mation needed to produce an expenses and revenues statement, which is one of the two basicdocuments of modern accounting (the other is the balance sheet). The expenses and revenuesstatement records money spent and money received over a period of time, usually a budgetyear. Table 3.2 shows how incoming and outgoing money is recorded separately. The informa-tion can be used directly to construct and maintain balance sheets.
Note that there are no universal standards regarding the choice of beginning and end datesof the budget year. In the United States, for example, the central government’s financial yearends on September 30, while in Canada it ends on March 31. With respect to financial year-end,for a country to have different year-ends for governments at different levels may make sense,because when grant-receiving levels of governments have a later year-end than the grant-dispensing level, the budget may be facilitated at both levels. Of course, such coordination canalso be achieved if the budget dates are appropriately staggered.
Accrual and Cash Accounting
When should a revenue or an expense be recorded for accounting purposes?
• Should it be when the decision to spend was taken, even if the cash was disbursed in alater year?
• Should it be when the money is actually spent? • Should it be when the taxes or grants should have been paid legally? • Should it be when the taxes or grants are actually paid?
ACCRUAL ACCOUNTING. This method of accounting records revenues and expenses whenthey were legally due or incurred. For example, if taxes are legally due on June 30 of a givenyear, this is when they appear in the SNG’s revenue statement. If, after a given legal waitingperiod, they have not been paid, they will appear as revenue arrears (sometimes referred to asreceivables). Revenue arrears are revenues still to come, but they differ from revenues becausethere is always some uncertainty as to whether they will actually be received. Presumably somewill eventually become bad debts and then be deducted (struck) from revenues.
François Vaillancourt 37
Table 3.1 Single-Entry Bookkeeping Example
Transaction and date Amount
Initial amount on the books: January 1 1,000,000Purchase vehicle: April 1 – 50,000Receive taxes: June 1 + 50,000Final amount on the books: December 31 1,000,000
Table 3.2 Double-Entry Bookkeeping Example
Transaction and date Expenses Revenues
Purchase vehicle: April 1, 2000 50,000Receive taxes: June 1, 2000 50,000Annual total 50,000 50,000

Similarly, if a supplier is due a payment on a certain date, this is recorded as a payment on thatdate. If the supplier is not paid on time, then the due payment becomes expense arrears (some-times known as payables). Some payment arrears are due to contractual disputes about theamount to be paid or the quality of the work, and others may reflect cash management issues.
CASH ACCOUNTING. This method of accounting waits for the money to be received or spentbefore recording it in the SNG’s books.
DIFFERENCES BETWEEN CASH AND ACCRUAL ACCOUNTING. The most important differencebetween cash and accrual accounting is in the treatment of arrears. In the following example,the SNG owes 100,000 to the national electricity utility for May, which is payable in June, but itdoes not pay. At the same time the central government owes the SNG a monthly transfer of50,000 on the first of each month, but the SNG does not receive it. Tables 3.3 and 3.4 show howthis is recorded using the two different accounting methods.
Note the difference between the two tables with regard to the bottom line. Cash accountingprovides no information about amounts in arrears. Accrual accounting identifies this informa-tion under the items payables and receivables. This information can be extremely important ifsignificant amounts of money are involved.
Balance Sheets
Balance sheets are the second key accounting document (the revenues and expenses statementwas the first). The balance sheet describes, at a given point in time (usually the end of the finan-cial year) both assets (financial as well as nonfinancial) and liabilities (what is owed to others).
Balance sheets measure the wealth of the SNG or regional government at a given point intime. Such wealth includes
• Financial assets, such as bank deposits, cash in hand, and amounts to be collected• Nonfinancial assets, such as buildings, land, and equipment.
38 Budgeting, Financial Management, and Financial Markets in an Intergovernmental Context
Table 3.3 Monthly Statement of Revenues and Expenses Using the Cash Accounting Method
Transaction and date Expenses Revenues
Taxes: June 1 to 30, 2000 500,000Salaries: June 15, 2000 250,000Electricity: June 10, 2000 0 Transfer from central government: June 1, 2000 0 Cash recorded 250,000 500,000
Table 3.4 Monthly Statement of Revenues and Expenses Using the Accrual Accounting Method
Transaction and date Expenses Revenues
Taxes : June 1 to 30, 2000 500,000Salaries: June 15, 2000 250,000Electricity: June 10, 2000 (payables) 100,000 Transfer from central government: June 1, 2000(receivables) 50,000
Total accruals recorded 350,000 550,000

For equipment, one must assign a value to old assets purchased in the past. Assigning avalue can be done either by using what the asset would sell for in a given year—which is calledthe current value—or by using accounting rules that depreciate (assign a value) to an asset overtime. For example, it is common to assume that a building will last 50 years. As a result, a build-ing that cost 1,000 15 years ago will be assigned a depreciated value of 700 this year and 600 5years from now. Specific rules depend on a country’s accounting practices. If inflation is impor-tant (and, as is usual, there is no indexing for inflation), then the nominal value of assets mayincrease with the passage of time. The value of an asset may also depend on the regulatoryenvironment. For instance, a public school located on a beachfront lot is worth less if the landcan only be used for a school than if it might instead be used for a hotel.
The Budget Process
The budget is a document that outlines how resources will be used.
Why Budget?
Every SNG administration needs an effective budgeting process for legal, administrative, andpolitical reasons.
LEGAL. In most countries the legal environment of SNGs requires that a budget be preparedannually. In many countries a supervisory body such as the ministry of municipal affairs or theministry of the interior, must approve the budget.
MANAGERIAL. Effective financial administration requires that each specific activity, such asroad maintenance, computer purchases, dogcatchers’ salaries, and other items, must beassigned a specific budget amount for a given year. Assigning budget amounts for each activityprovides a control mechanism to ensure that any specific spending request by an employeeconforms with the choices of the SNG as a whole. Thus if a roads manager wants to order a tonof gravel costing 100,000 and no such amount appears in the budget, the purchasing depart-ment can refuse to authorize this spending by referring to an official expression of the SNGstrategy as concretized in the budget. The budget is therefore a crucial tool for ensuring thateach department head—all of whom would naturally like to have more resources for theirdepartments—is constrained to spend within the assigned means.
POLITICAL. Budgets allow voters to ascertain whether politicians are carrying out theirpromises to cut back on one kind of spending or to increase another. Budgets therefore play akey role in ensuring a transparent administration. The budget represents how politicians spendthe resources entrusted to them by citizens. Budgetary choices affect the well-being not only oftoday’s citizens, but also of tomorrow’s. Budgets often involve borrowing or building infra-structure. Both these activities have a long-term impact because they affect the resources avail-able to provide services in future years (when any loans taken to build infrastructure will haveto be paid). For this reason, it is important to scrutinize not only the final budgetary document,but also the process used to establish the budget.
Establishing Spending Priorities
The most demanding aspect of preparing a budget is establishing spending priorities. Theimportance of this aspect of preparing a budget depends in large part on the degree of freedomthat an SNG has to determine expenditure. The following paragraphs discuss the factors thatinfluence an SNG’s degree of freedom. Although some or all of these factors may restrict thefreedom of an SNG’s budgetary choices, most SNGs will nonetheless have at least some
François Vaillancourt 39
flexibility. Most notably, they can vary current spending to some extent and, at least in someinstances, they can borrow for capital spending.
PAST CHOICES. Previous budgetary decisions, such as a decision to borrow, have a signifi-cant impact on the current budget. For example, a loan taken out to build a bridge in 2000 maytake 20 years to repay. Repayments, of course, come out of current revenues, but in addition,new employees may have to be hired to maintain the bridge. Both these expenses must be keptup over time, the first to ensure that the SNG retains access to capital markets, because lendersdo not appreciate nonrepayment of loans, and the second to ensure that the bridge remainsfunctional and that the service for which funds were borrowed is indeed offered. A new admin-istration elected in 2002 may not have built the bridge, but it is nonetheless faced with the factthat paying for and operating the bridge takes away resources that it would have preferred touse elsewhere.
EMPLOYMENT CHOICES. The SNG government may have too many employees. This may bethe result of the changing nature of work, the introduction of new technologies that reduce theneed for employees, or a change in the services being provided. Reducing the number ofemployees may be difficult because of the strength of their unions, for political reasons, orbecause the civil service law states that hiring is for life. Such surplus employees may not bestrictly needed, but they are all too often a spending item that cannot be reduced. The SNG hasfewer spending choices to make because it has fewer uncommitted resources.
LEGAL FRAMEWORK. Country legislation may mandate the SNG to carry out specific expen-ditures according to national standards or requirements. For example, SNGs may be requiredto offer civil registry services (such as births, deaths, identification cards) regardless of theirpopulation size, or they may have to build roads according to standards set nationally. If suchrequirements are not accompanied by resources—a situation often referred to as unfundedmandates—then the SNG again has less revenue available to spend as it might wish.
RESOURCES. Some SNGs are so poor that they simply have no choices to make regardingspending. In such cases more fundamental issues might be raised, such as the possibility ofmerging with a richer neighbor.
Preparing a Budget
Budget preparation ideally involves four stages: ascertaining the priorities of the population,preparing the budget document, approving the budget, and spending the budget.
ASCERTAINING THE PRIORITIES OF THE POPULATION. Governments exist for people, not theother way around. In principle, therefore, the first and most important thing is to establish whatpeople really want. Although various mechanisms may be used to determine what the peoplewant, in the end they all require asking people for their opinions and genuinely listening totheir views. One option might be to request written submissions from various bodies (such asnongovernmental organizations, business associations, unions, neighborhood councils, and soon), through advertisements in newspapers, or through the Internet. These submissions shouldthen be examined carefully.
Another option is to hold public meetings in various parts of the SNG, inviting residents tovoice their opinions about how the budget should be spent.2 The SNG council or the council’s
40 Budgeting, Financial Management, and Financial Markets in an Intergovernmental Context
2. Such meetings may be easier to arrange in cities than in rural areas, because the latter have scat-tered populations. However, attendance and interest may sometimes be higher and more representative inareas with smaller populations.
budget committee can organize such meetings. Officials can then summarize the proposals gen-erated from these meetings and carefully consider their feasibility.
As discussed previously, some spending choices may bind budget decisions in future years.For this reason, it may be appropriate to organize one type of public input system for currentspending choices and another for capital spending, that is, for long-term investments such asbridges. This might allow more time and resources to be devoted to making proper choices forlong-term decisions. As capital spending should be planned on a multiyear basis (three to fiveyears) to ensure coherence and complementarity, planning public consultations around thesetimelines may be useful.
Some may be surprised by our emphasis on the need to consult voters on budgets,because presumably the public has elected politicians to make such decisions. If politiciansare elected for a long term, however, then even if they faithfully carry out their promises,these may no longer represent the need of their electorate by the midterm of their mandate.For example, they may have promised when elected in 1998 to a six-year mandate to equipall libraries with a new encyclopedia by 2004, but by 2002 the best way to help children is togive them access to the Internet rather than to an encyclopedia. Should politicians be held toa now wasteful promise, or should they be able to modify their means of action after consult-ing with the public?
More important, no representative system is perfect. In an election with more than two can-didates, politicians may be elected with far fewer than 50 percent of the vote and may not havegood informal contacts with the supporters of their opponents. First-past-the-pole electoral sys-tems with no proportional representation will not ensure that the losing side is represented onthe SNG council. Regular public consultations give them access to the opinions of the wholecommunity and more legitimacy. Of course, as noted previously, such consultations must bemore than an opportunity to explain choices already made. Politicians must allow variousopinions to be heard.
PREPARING THE BUDGET DOCUMENT. In theory, each budget is unique and could be preparedwithout consideration of all previous budgets. In practice, this is not done for several reasonsas follows:
• Past budgets contain information about voter preferences and about the trade-offsachieved at the political level in preparing that budget. Ignoring this information wouldbe inefficient.
• Past budgets, as already mentioned, have often created commitments that cannot beeasily changed from one year to the next. To neglect them means that the budget willnot be workable. For example, if an SNG subsidizes sports clubs to carry out activitiesfor the benefit of all children, to suddenly change this policy, even if legally the subsidyis renewed annually, will create ill-will and mistrust.
• Generally only a few experts, such as the SNG administrator and the chair of thefinance committee, are really knowledgeable about budget preparation. An examinationof past budgets can help other SNG councilors to better contribute to the debate.
However, there is also some danger in using existing budgets as a template for preparingnew budgets. Expenditures that were once useful but have now lost their relevance may, forexample, be again included in the budget. To avoid this situation, each area of expenditureshould, in principle, be subject to a more in-depth analysis on a rotating basis (perhaps everyfive years). Another way to achieve the same goal is to use so-called sunset clauses, which statethat a program will end unless it is explicitly renewed after a given time interval.
The people who actually prepare the first draft of the budget will vary according to practiceand to capacities. Whether done by council committee or by officials, the exercise typicallyrequires the following steps:
François Vaillancourt 41

• Forecast revenues. The expected amount of revenue (income) must be determined. Themost basic forecast is to use revenues from the current year, often increased by a growthfactor. This approach is not unreasonable if tax rates, tax bases, and compliance behav-ior have not changed, but it can hide key facts. For example, deterioration in tax compli-ance can be hidden by an increase in the tax base. It is thus preferable to forecast poten-tial revenues using information on forecasted bases and planned rates to calculateexplicitly what is legally collectable, and then to use information on tax compliance toforecast what the revenues are likely to be. The practice encountered in some countriesof making forecasts based on perfect compliance, unchanged over time, even in the faceof evidence that this is not observed should be avoided.
—For example, revenues in the past year from daily parking permits were 100,000resulting from 10,000 permits at 10 each. A survey by outside experts shows that15,000 permits should have been sold, but 5,000 users of parking spaces simply didnot pay. If the SNG doubles the rate to 20 per day, can it forecast revenues at 200,000,or should it assume that evasion will increase, say from a third to a half, so that only7,500 users are paying 20, yielding revenue of 150,000?
—Revenues from intergovernmental transfers may be more difficult to forecast, becausethe formula used to calculate them will often use information not available to theSNG. Ideally, the provincial or national government will provide a forecast. If thisinformation is not forthcoming, in view of the importance of transfer revenue inmany countries, SNGs (at least the larger ones) may want to acquire the necessaryexpertise to forecast these revenues.
• Forecast expenditures. Using past expenditures to forecast next year’s expenditures isdangerous for a number of reasons:
—Salaries usually increase from year to year according to a set of rules (collective agree-ment, indexing, matching other civil servants, central government decisions).
—Debt repayments are made according to another set of parameters (nature of borrow-ing, amount outstanding).
—Other expenses respond to still other forces (natural disasters, energy price changes,age of equipment, and amount of deferred maintenance).
It is therefore better to forecast each type of expenditure explicitly with the aim of hav-ing the most accurate estimate possible. For example:
—For salaries, use data on the number of employees by salary level and multiply it bythe proper salary.
—For debt, calculate the amount outstanding to be repaid and the interest paymentowed with the help of financial advisers (if this information is not provided by thelender directly).
—For other expenses use estimates of quantities required (for example, liters of motorfuel) and prices to calculate the more important ones.
• Prepare a capital spending plan and, in many cases, a borrowing plan. As mentioned earlier,as a rule borrowing (the action of obtaining funds now in exchange for a pledge to paythat amount and interest on it in the future ) is required to finance investment. To bor-row in financial markets, an SNG must prepare financial forecasts for the borrowingperiod, often in collaboration with a lending agency.
Forecasts of revenues, expenditures, and borrowing can be prepared taking into account theresults of the consultation process described previously. Indeed, in more sophisticated consul-tations, preliminary forecasts might be used as the basis of the consultation process and finalforecasts prepared after discussion and debate.
42 Budgeting, Financial Management, and Financial Markets in an Intergovernmental Context
APPROVING THE BUDGET. Once the budget has been prepared, it must be legally approved.Approval is usually done by a formal vote of the SNG council that typically must be held by agiven date. In many countries SNG budgets are not official until the ministry responsible forSNGs has given its approval, which may be done either at the regional level (governorate orsubgovernorate) or in the central ministry’s offices.
SPENDING THE BUDGET. Once the budget has been approved, the SNG in theory has themeans to spend as it sees fit. In practice, however, it may need to obtain approval from a centralgovernment office, such as the treasurer’s office, to either contract for the provision of goodsand services or to pay for such provision.
This second aspect raises the issue of who controls access to funds. In a number of countriesSNGs, even the largest ones, do not have free access to their own funds. Such funds may bedeposited in central government offices, and the authorization of a central government officialis required before funds can be disbursed. In this situation, the temptation for the central gov-ernment to use these funds as a source of liquidity may sometimes be strong, to the detrimentof rational SNG financial planning and spending.
Capital Markets
The nature of capital markets varies from country to country depending on the legal frame-work and the degree of economic progress of each country. The capital market consists of theset of institutions by which the savings of savers are made available to borrowers and investorswho, in exchange, agree to remunerate these savings with some payment such as an interestpayment or a dividend payment. This section considers the subset of the financial markets thatmakes savings available to SNGs, and is therefore restricted to one financial transaction: a loan.In addition, the section focuses on one financial instrument: bonds, and does not address suchaspects of capital markets as options, indexes, and stocks, because they are not relevant to SNGfinances.
The Institutions of the SNG Capital Market
A country’s SNG capital market (SCM) can vary from nonexistent to extremely diverse.
NONEXISTENT SCMS. A country may not have an SCM. In this case SNGs are formally for-bidden from borrowing. Thus the only funds available to an SNG to finance a large investmentin this situation are any savings it may have, perhaps complemented by national grants (whichcan be national savings made available to the SNG). In this case a relevant financial issue relatesto what the SNG can earn on its savings. If SNG savings are kept in the national central bank orin the ministry of finance’s national treasury with no interest paid, then saving for long periodsusually makes no sense because inflation will reduce the value of these savings.
SNG BANK SCMS. When a country has a SNG bank, SCM SNGs can borrow, but must do sofrom a monopoly public agency that specializes in lending to SNGs. The state-owned, special-ized SNG bank borrows from the national or international capital markets and relends to theSNGs. Its loans are usually guaranteed by the central government, either explicitly or throughthe use of the supervisory power of the central government. The public SNG lender will ensurethat the borrower’s annual budget includes the appropriate amount for loan repayment.
Advocates of such specialized SNG banks have argued that these banks can provide a widerange of services to SNGs. Not only can they provide financing, but they can also develop closerelationships with their SNG clients, helping them with budget management, capital planning,and the like. Others have argued that while these may be useful services, they end up being
François Vaillancourt 43
paid for, as the bank charges above market rates of interest because these services must befinanced. Nevertheless, such banks can often borrow from the market at lower rates than smallSNGs. Such banks may sometimes be an appropriate step in helping SNGs access SCMs, butthey should not be the final or only solution.
NATIONAL SCMS. If a country has national SCMs, SNGs are free to borrow from any nationalfinancial institution, such as private banks, pension funds, insurance firms, and so on, but theyare prohibited by law from borrowing in foreign currency, and perhaps from abroad in localcurrency (an unlikely case). Some private sector firms are likely to develop some expertise inthis area. SNG lending differs from private sector lending in that SNG assets are more difficultto seize and sell in cases of nonpayment.
NATIONAL AND INTERNATIONAL SCMS. Finally, in countries that have national SCMs andalso allow access to international SCMs, SNGs can access any financial institution, even thoseabroad. In general SNGs have access to international lenders only if they are large in financialterms, because international lenders are interested in transactions of a minimum size to coverthe extra costs and risks associated with dealing with a foreign SNG.
Use of the SCM
Assuming an SNG has access to some SCM, why should it want to borrow funds from theSCM? One reason is simply because SNGs face numerous critical needs, ranging from provid-ing emergency shelter for the homeless and poverty relief to the poor to improving education,social services, roads, and potable water supplies. The specific demands on budgets are a func-tion of both the extent of needs in the area and of the allocation of responsibilities among thedifferent levels of government. Thus while in one country an SNG may face tremendous finan-cial demands related to water systems, in other countries that responsibility may rest with theregional, or even the national, government.
SNGs must distinguish among needs and financing requirements. Many critical servicesrequire recurring operating expenditures year after year. For example:
• Subsidies for the routine provision of health care for elderly citizens can be expected torepresent a relatively constant expenditure, with some variation as demographicschange.
• Funds required to hire SNG police or to maintain the SNG hall remain similar from yearto year, increasing gradually as the jurisdiction grows and as its resources permit.
Operating expenditures are not the only kind of expenditures required to satisfy the needsof citizens, however. Capital expenditures (investment in infrastructure) are also needed. Theseexpenditures tend to be large in financial terms, that is account for a large part of an annualbudget, and are usually nondivisible, that is, they must be paid as a whole. The financialdemands of such investments tend to exceed the resources of SNG governments in any partic-ular year. For example:
• Construction of a major roadway will require a huge amount of resources, but that needwill stop once the roadway is built. Indeed, if the project is structured as a toll road, itmight even begin to generate self-supporting revenues.
• Construction of a water treatment plant could, if paid for in a single-year budget, repre-sent 100 percent or more of the entire budget. Clearly SNGs do not want to cut 100 per-cent of their other expenditures or raise tax revenues dramatically to cover such a one-time expense.
Even though capital investments involve significant expenditure in a short period of time,they also create assets that are both long-lived and often have the potential to generate
44 Budgeting, Financial Management, and Financial Markets in an Intergovernmental Context
revenues. Thus, if maintained in good condition, the water treatment plant might continueoperating and generating revenues from user fees for say at least 30 years. Knowing that suchprojects can produce the funds to pay them back, investors may be more willing to lend money.
Capital expenditures, with their long lives and large size, raise different financial equityissues for governments than operating expenses, namely:
• If a water treatment plant is going to serve the community for 30 years, does imposingthe entire burden of paying for its construction on today’s taxpayers make sense?
• If the plant is going to generate revenues during that period, should today’s taxpayersbear all the burden of construction while tomorrow’s taxpayers get the benefits of thenew revenues?
The reverse reasoning applies to the financing of current expenditures using borrowedresources. Borrowing to finance expenditures that will only benefit taxpayers in a given year,such as road cleaning, fireworks displays, or other short-lived expenditures, is not appropriate(equitable), because borrowing means that other taxpayers end up paying for the service.
Capital expenses and operating expenses affect an SNG’s budget very differently. For thisreason, developing separate capital budgets generally makes sense to. However, to work well,capital budgets need to be derived from a coordinated capital improvement or investment plan.The capital plan should drive the capital budget rather than the other way around.
Capital Improvement Plans
A capital improvement plan is a strategic program for funding needed capital improvementsthat
• Looks comprehensively at capital needs• Prioritizes those needs to identify specific worthy projects• Considers different funding sources for each project and evaluates their advantages and
disadvantages • Develops approved capital budget expenditures for each year that take into account the
SNG’s borrowing capacity as established for a reasonable time period, such as 5 or 10years.
Developing a capital improvement plan offers numerous practical benefits. It requires thegovernment to define its needs and priorities, to establish criteria for judging among needs, andto make sure its proposed projects are coordinated with available resources and broader gov-ernment policies. This process can help rationalize and increase the transparency of govern-ment decisionmaking and build public support for the agreed on projects. Such a plan shouldproduce investments that are well integrated and provide better services than unplanned capi-tal spending of the same amount.
One of the most difficult steps in the process is determining how to set priorities among dif-ferent capital needs. Another challenge is to identify projects that meet those priorities. Becauseno government has unlimited resources, the prioritization process is extremely important tohighlight those projects with a real prospect of going forward. To make such decisions the SNGhas to consider the following difficult questions:
• What is its strategic vision?• What are its long-term development needs and goals?• When can various projects be completed?• What are the interrelationships among different projects?
Separating the initial decision to support a project from the decision about how to fund itis important, because a variety of funding approaches may exist for any given project. Aproject considered solely as a package, for example, a proposal to issue bonds to support the
François Vaillancourt 45
construction of a sports stadium, may end up pairing a good project with a bad financingmechanism, or vice versa.
Borrowing in the SCM: Terminology and Activities
Even if borrowing appears to make the most sense, the type of borrowing that is most appro-priate needs to be considered carefully. For example, the simplest way to proceed might be toborrow from a local or national bank (public or private, monopoly or not) through a loan agree-ment. An SNG, for example, would simply take out a loan through a bank. An alternativemethod would be to issue bonds in either the domestic or international capital markets. Annu-ities are yet another option.
BONDS. A bond is a document indicating the issuer’s obligation to repay a specified princi-pal amount on a specific certain date (the maturity date), together with interest at a stated rateor according to a formula for determining that rate. A bond represents a promise by the issuer,for our purposes, an SNG, to pay back the bondholder—the people or institutions that pur-chase the bond—the principal plus a specified interest rate at given intervals, whether quar-terly or annually. Although a loan agreement essentially has the same features as a bond, abond has additional features that are different from those of a bank loan. A loan is with a spe-cific financial institution (or group of institutions, in which case the group is referred to as asyndicate and the loan as a syndicated loan), while bonds are issued at large in the SCM andcan be held by various institutions and by individuals. In technical terms, the principal beingborrowed is often referred to as the par value of the bond, and the interest rate is referred to asthe coupon rate. (The coupon rate derived its name because a bond traditionally had—and insome cases still does have—a detachable coupon that specifies the amount of interest payableat a specific date and place and is presented to the issuer’s paying agent for payment.) Couponpayments are typically made twice a year in the United States and annually in the Europeanmarket. The maturity date is the date on which all the principal and interest has been paid. Insome cases all the principal is to be paid on that date, while in others some of the principal willhave been paid before.
ANNUITIES. One technique used to pay a debt is to pay an annuity. This is an amount paidannually and calculated in such a way that with the last payment the debt is extinguished. Theamount is made up of both interest payment and capital (principal) payment, with the propor-tion of interest decreasing over time and that of capital increasing (this is the same method gen-erally used to pay off a mortgage on a private home except that the payments on mortgages areat least monthly, if not more frequent).
ADVANTAGES OF USING BONDS. The main argument that can be made for issuing bondsrather than borrowing from banks is that they allow a longer maturity (that is, a longer periodbefore the capital is due to be paid off) than bank loans. Longer maturity debt helps to mini-mize the budget risk and contributes to the financial stability of SNGs because they create amore certain stream of expenses.
In addition, a bond is usually issued at a fixed coupon rate, whereas the interest rate on bankloans can vary over time. Bond markets may also provide cheaper sources of financing thandomestic bank loans. However, if they intend to use bond markets, SNGs need to be aware ofcertain risk factors to ensure proper financial management, namely:
• Fixed and variable interest rates. Bond issues can be structured to pay interest at a ratefixed over the life of the bond. In other words, the coupon will be a constant specifiedpercentage of the par value, paid on a regular basis. Under a floating or variable rateinterest structure, the interest is not fixed until maturity, but is determined periodically,
46 Budgeting, Financial Management, and Financial Markets in an Intergovernmental Context
based on some specified formula, such as X percent above the prime or the central bankdiscount rate. The benefit of this structure for an issuer (that is, the borrower) is thatfloating rates are typically lower than a fixed rate at the time of issuance. However, theissuer runs the risk that the market rate will change unfavorably( increase) during thelife of the issue, thereby increasing required interest payments to the bondholders. Thismakes it more difficult for issuers to budget with certainty for debt service paymentsover time.
• Foreign and domestic bonds. Although interest rates may be lower for bonds denominatedin foreign currency than for local debt, the former require the borrower to bear the for-eign currency risk. This means that if the currency of the borrowing country loses value(depreciates) with respect to the currency in which the bond is labeled, the borrowerwill have to pay more. This is illustrated in box 3.1.
REPAYMENT GUARANTEES. There are three kinds of repayment guarantees associated withthree kinds of bonds: general obligation bonds, project bonds, and dedicated revenue bonds.
• General obligation bonds. For this type of bond, repayment is guaranteed by the “full faithand credit” of the issuing government. This means that the full taxing authority of theissuer is pledged to pay back the bonds. This can be a secure pledge if the issuer hasboth the capacity and the willingness to raise taxes as needed. In some circumstancesbonds are secured by a physical asset, such as land, that acts as collateral for repayment.In the event that the SNG does not make a debt service payment, title to the land istransferred to the bondholders and the land is sold to repay the outstanding obligation.The strength of the general obligation pledge is also affected by the SNG’s perceivedwillingness to raise taxes, cut spending, or take other steps necessary to ensure thatbondholders will be paid back on time and in full.
• Project revenue bonds. Unlike general obligation bonds, project revenue bonds are notbacked by the full faith and credit of the issuer, but are secured only by the expectedstream of revenue from the project being financed. For example, bonds to build an
François Vaillancourt 47
Box 3.1 How Foreign Currency Risks Come Into Play
The following is a four-step example of the risk of borrowing in foreign exchange:
• An SNG borrows US$50 million by means of a bond issuance. The exchange rate at that time isRub 10 for US$1. The SNG therefore obtains Rub 500 million to build infrastructure.
• Ten years later, when the principal is due, the ruble has lost value and the exchange rate is nowRub 20 to US$1. The SNG must therefore spend Rub 1 billion to acquire the US$50 million to berepaid.
• If the coupon rate for borrowing in U.S. dollars on the international SCM was 10 percent insteadof the 15 percent that the SNG would have had to pay on the domestic SCM, it would have real-ized savings of Rub 25 million per year (500 x 0.10 – 500 x 0.15 = –25) from borrowing on theinternational SCM, or Rub 250 million for the full 10 years that the bond is outstanding, assum-ing that the exchange rate remained unchanged until the capital had to be paid back. Because ofthe change in the exchange rate, however, the SNG faces a net loss of Rub 250 million, the differ-ence between the Rub 500 million extra required to purchase the US$50 million and the savingsin interest payments over the period of Rub 250 million. If the domestic rate had been 25 percentinstead of 15 percent, then there would have been a gain of Rub 250 million. (Of course the num-bers mentioned in this example ignore a number of potentially relevant factors, such as the infla-tion rate over the period, the effects of inflation on revenues and expenditures, and the earningsfrom the interest saved.)
• Exchange loss risk is minimized when a project earns foreign exchange in the borrowing cur-rency. For example, a utility could borrow U.S. dollars to build a hydroelectric dam in Canada tosell power to the United States paid for in U. S. dollars.
electric utility might be backed by the anticipated revenues that the utility will collectfrom user charges as electricity is distributed. The issuer may be an SNG or some sort ofpublic authority, such as a water authority, that is independent of the government.
• Dedicated revenue bonds. Under this structure, bond repayments are guaranteed by a par-ticular revenue stream, which is unrelated to the project being financed and is held in atrust type of arrangement to ensure repayment. For example, a bond may be backed bythe pledge of funds from intergovernmental transfers that the SNG is due to receive, orby specific tax revenues, such as a liquor, sales, or gas tax.
When bonds are backed by a dedicated revenue stream two main concerns arise. First, howcertain is it that the specified revenue stream will be sufficient to meet debt payment obliga-tions and that it will continue at that level for the life of the bond? For example, if intergovern-mental transfers from the national government are being pledged, investors will have questionsabout the intergovernmental transfer system. Second, how stringent is the trust fund mecha-nism under which these revenues are segregated? For example, will the revenues first go intoSNG coffers and then be transferred to a bank for deposit into a special trust? Or will the rev-enues go directly to the bank without ever passing through the government’s hands?
ISSUING AT A DISCOUNT OR A PREMIUM. Bonds may be issued at, above, or below parvalue. Bonds issued below par value are said to be sold at a discount. The issuer collectsproceeds from the sale below the total of the par value of all bonds issued, but pledges topay back the total value at par. This approach allows an issuer to offer the bonds at a lowercoupon rate.
Bonds issued at a premium are sold above par value. In this instance the coupon rate ishigher than it would be if bonds were issued at par. The main reason why a borrower wouldnot issue a bond at par value is because investors (those who purchase the bonds) ask them todo so, usually for tax reasons, for example, there may be a withholding tax on coupon pay-ments or differential treatment of capital gains income and interest income, with more favor-able treatment of capital gains (the difference between an asset’s purchase price and resaleprice).
The Bond Issuance Process
The issuance of debt in the domestic or international capital markets, whether in the form ofgeneral obligation, project revenue, or dedicated revenue bonds, is accomplished through acomplex process involving a wide variety of players. While the story of every bond issue issomewhat different, most issues demonstrate several general trends.
Key Players Involved in Bond Issuance
A thorough understanding of the process of bond issuance requires familiarity with the keyplayers involved, and understanding that responsibilities may vary somewhat based on thetype of bond issue and that the method of sale is important. Because underwriters and finan-cial advisers have common expertise in some areas, for example, their responsibilities mayoverlap. Furthermore, the precise outline of different players’ roles will be determined both bythe expertise of the issuing SNG and by the complexity of the bond itself. Even though the def-initions are fluid, it is still possible to describe the core responsibilities of each player in theprocess.
FINANCIAL ADVISERS. Issuers, particularly those new to the bond market, often choose to relyon financial advisers to guide them through a bond issue. Financial advisers become involved
48 Budgeting, Financial Management, and Financial Markets in an Intergovernmental Context
with the issuer’s administration early in the process and may help them develop a capital planand accounting practices. Their roles may include assisting the issuer to
• Assess borrowing capacity and project revenue flow estimates from specific projects• Develop a long-term borrowing program, not simply the single bond transaction• Devise policies for debt management, cash management, and improved credit condition • Develop a credit rating strategy.
The issuer should make sure that the financial adviser does not have any conflict of interestin the sale of the bonds and is interested in the SNG’s long-term financial health. A conflict ofinterest arises when the adviser to the bond issuer is the same entity that sells the bonds toinvestors. The underwriter or investment bank often plays both roles in order to better under-stand the needs of both the SNG and the investor community.
CONSULTANTS. A number of consultants or consulting engineers may also be hired early inthe process for project revenue or dedicated revenue bonds. While the consultants’ responsibil-ities can be shaped however the issuer desires, consultants are generally used to provide tech-nical advice regarding the feasibility of specific projects to be funded by bond issues.
UNDERWRITERS. The underwriter’s basic function in a bond offering is to purchase bondsfrom the issuer and resell them to investors. In the vast majority of cases the underwriter com-mits to purchasing the bonds, whether or not it can sell them on the market. This risk spursunderwriters to price bonds carefully and to create syndicates with other firms.
Most underwriters are investment banks, securities firms, or commercial banks. Whateverthe nature of the offering, the underwriter will have a great deal of influence over its ultimatesuccess. The role of the underwriter, like that of the financial adviser, varies with the type ofoffering. In a competitive sale, an issuer publishes notice of the offering and underwriters pres-ent the issuer with firm bids for the right to underwrite the issue.
In a negotiated sale an underwriter is typically involved earlier in the process, assisting theissuer with structuring the offering. In this type of arrangement, underwriters negotiatedirectly with the issuer regarding the size of the spread, which is the underwriter’s compensa-tion (that is, the smallest difference between what the underwriter will raise in the market andwhat the underwriter will remit to the SNG).
INSTITUTIONAL AND RETAIL INVESTORS. Institutional and retail investors are a major con-stituency in bond markets at various stages of development. Both groups of investors share sev-eral broad concerns when investing in SNG bonds. The primary risks investors face are marketrisk and credit risk. Market risk refers to the risk that interest rates will go up, leaving aninvestor with bonds paying an interest rate that is below the market rate. Credit risk refers tothe risk that the credit rating of an issuer will fall over time. If the risk that an issuer will beunable to meet its payment obligations on the bond increases, the price of the bond will drop.
RATING AGENCIES. Rating agencies evaluate an issuer’s ability to repay its debt obligationsand rate this ability by reviewing various criteria for different types of bonds. Bonds are ratedin recognized categories (AAA, AA, and so on), and these ratings are made available toinvestors. Rating agencies have tremendous influence over the success of SNG bond issues,because investors use these agencies, especially when considering new issuers.
Key Stages in the Bond Issuance Process
In addition to knowing about the players, potential issuers should also be aware of the keystages in the process of issuing bonds. Here again there are differences based on the specific
François Vaillancourt 49
bond issue and the market in which money is being borrowed. Other differences are based onthe customs of each market. Given the differences among the systems, there is no single seriesof stages. What follows, therefore, is a general description that must be tailored to differentapproaches and markets.
MAKING PRELIMINARY DECISIONS. Issuers need to undertake a substantial capital planningprocess before deciding whether to issue debt in the form of bonds. The issuer will need to con-sider its outstanding debt and how any new issues will affect its existing debt policies. If itdecides to issue a bond, then the issuer, perhaps with the assistance of a financial adviser orconsultant, must choose which type of bond to issue.
STRUCTURING THE BIDDING PROCESS. Once an SNG decides to issue bonds, it will normallyengage the services of a financial adviser (or team of advisers and consultants). Among theirfirst tasks will be to select an underwriter. There are two principal methods of soliciting bidsfrom underwriters: competitive sales and negotiated sales.
• In a competitive sale the issuer structures the issue, with assistance from a financialadviser; advertises it; solicits bids from underwriting firms that submit bids based ontheir evaluation of the chance of successfully placing the bond with investors; andselects the bid with the lowest spread. The principal advantage of a competitive sale isthat it increases the possibility that the issuer will receive the lowest available price foran underwriter’s services. The process is transparent in nature, and the selection of aparticular underwriter is easily justifiable because the lowest price wins. However,competitive bids may not be as universally advantageous as they may seem at firstglance.
• In a negotiated sale an issuer negotiates pricing directly with an underwriting firm. Thistypically takes place relatively early in the process. A negotiated sale optimizes theissuer’s ability to take advantage of rapidly changing market conditions. Using a nego-tiated sale, the underwriter is involved much earlier in the process and assists the bor-rower in structuring the issue. A negotiated sale may be particularly beneficial to a newissuer, because it allows the underwriter to make presale marketing efforts to waryinvestors on the issuer’s behalf. Finally, an underwriter’s early involvement in a negoti-ated sale may save some of the costs of a financial adviser. Issuers in developing coun-tries may find that engaging underwriting firms in a competitive bidding process is dif-ficult, particularly for international issues. Underwriters, especially when not involvedin the structuring process, are hesitant to commit themselves to the purchase of anentire issue of bonds from SNGs without established credit. For such issuers the debatebetween a competitive and negotiated bidding process may therefore be entirely aca-demic. By establishing a credit history through a negotiated sale process, issuers maygain the option of entertaining competitive bids for subsequent issues.
STRUCTURING THE ISSUE. Decisions made during the bidding process will affect the structureof the issue. With a competitive bidding process, the key structural matters will need to beresolved with the financial adviser before underwriters can bid. Under a negotiated salearrangement, the underwriter will be able to play a major role in the structuring decisions withthe issuer.
Sometime during this process, a marketing “road show” may be undertaken to key finan-cial centers to tell the borrower’s story and ascertain investor concerns and demand. Investorresponses can then be factored into the structure decisions. Financial advisers can also preparea preliminary structure for the competitive or negotiated process and allow the underwriters tosuggest changes or refinements to their proposals. Rating agencies may play a role in structur-ing if the issuer is trying to achieve a certain rating grade.
50 Budgeting, Financial Management, and Financial Markets in an Intergovernmental Context
While the number of decisions in structuring the issue is almost infinite, the following areespecially important:
• Type of issue. A key decision is whether the bond issue will represent a general obliga-tion or whether it will be backed by project or other dedicated revenues. This determi-nation drives many other decisions, including the market’s eagerness to purchase thedebt, the types of information rating agencies require, and the types of legal documentsneeded.
• Sizing the issue. The size of an issue will depend primarily on an issuer’s particularneeds. If it is issuing bonds to finance a particular project, the costs of the project mustbe budgeted in order to size the bond issue. If the issuer’s goal is to refinance existingdebt, the size of the existing debt will help determine the size of the issue. Regardless ofthe reason for a bond issue, an issuer may have to cover a number of costs with pro-ceeds from bond sales, for example, pay the expenses of the issue, such as fees for bondcounsel and financial advisers; fund a debt service reserve fund; pay interest on bondsecurity; and fund other forms of credit enhancement.
• Determining final maturity. A bond’s maturity date is based primarily on the issuer’sfinancial condition, market conditions, and type of project being financed. If an issue isused to finance an infrastructure project, the final maturity of the debt should be tai-lored to the expected life of the completed project. If, for example, bonds are issued tofinance a highway expected to last for 40 years, the final maturity may be at any timewithin 40 years. If, however, a fleet of police cars is being purchased that is expected tolast seven years, the maturity should not be longer than seven years.
The market generally does not want issuers to be paying for projects when they are nolonger in use. Issuers should also avoid using long-term bonds to finance a continuing operat-ing deficit. For most SNGs in developing countries, issuing a bond for the expected life of theasset is not generally possible. International and domestic capital markets for issuers are toovolatile and underdeveloped to allow for bond tenders to match the life of the assets beingfinanced. Nevertheless, as these markets develop, issuers may increasingly be able to offerlonger-term bonds for their infrastructure projects.
OBTAINING A CREDIT RATING. The financial adviser and/or underwriter generally play asubstantial role in helping the issuer through the credit rating process. The credit rating agencywill need information about the structure of the issue in order to rate the particular issue.
PREPARING THE DOCUMENTS. Decisions regarding bidding and structure also shape thepreparation of bond documents, in which the financial adviser, underwriter, and bond counselall play a role.
UNDERTAKING MARKETING AND DISTRIBUTION. While sovereign governments often go totheir domestic capital market based on set auction dates, such as treasury bill auctions, SNGs ingeneral often have more flexibility in timing their offering based on market conditions. Duringthis phase the underwriters actually sell the bonds to investors.
SETTING THE CLOSING DATE AND UNDERTAKING ONGOING ACTIVITIES. The closing date is thetime at which the issue is officially considered closed, meaning that underwriters are responsi-ble for purchasing any bonds that have not been sold to investors by that date. After the clos-ing, accounts among the syndicated members are balanced.
Even after the issue is closed, however, activities continue. The trustee remains responsiblefor protecting the interests of the bondholders, while the required interest payments must bemade regularly, often through the paying agent. In addition, the credit rating agencies will
François Vaillancourt 51
continue to assess the issue throughout its life. If an active secondary market exists, then theclosing of the issue is merely the prelude to perhaps years of continued trading of the bonds.
Credit Ratings
This section discusses credit ratings, why they are important, and how the credit rating processworks.
A credit rating assesses an issuer’s future ability to pay back, on time and in full, the moniesowed to the investors who buy the bonds. Receiving a favorable credit rating is important toissuers for the following two key reasons:
• Many investors will refuse to buy bonds if they are not rated, and in some cases the cen-tral government may not even permit an SNG to sell unrated bonds.
• The rating serves as a critical determinant of the interest rate an SNG will have to pay toissue debt in the capital markets. The riskier the credit rating agencies think the issuer’sability to make debt service payments, the higher the interest rate.
Who Determines the Credit Rating?
A credit rating is an independent opinion on a borrower’s future ability, legal obligation, andmoral commitment to meet its financial obligations of interest and principal, in full, and in atimely manner. Credit ratings are not
• Recommendations to buy, sell, or hold a security• Opinions about the general quality of a government or statements about the quality of
life in a community• Opinions about the correctness of a government’s policy decisions.
A credit rating is determined by a credit rating agency, an independent appraiser of defaultrisk associated with bond issues. With the growth of free market economies and the privatiza-tion of state-owned companies, rating agencies are increasingly used internationally. The fourbest known firms are Moody’s Investors Service, Standard & Poor’s, Duff & Phelps Credit Rat-ing Company, and Fitch IBCA, Inc.
In some circumstances, credit ratings are performed not just by credit rating agencies, butalso by national governments or quasi-governmental agencies in order to give the marketgreater faith in the issuer’s repayment ability. The national government needs to considerwhether the market will see such a rating as an implicit national guarantee of the debt issue,something that it may not want to give.
Why Are Credit Ratings Important?
Credit ratings are important from both the investor’s and issuer’s perspectives. Ratings pro-vide information to the investment community and facilitate investors’ access to debt offerings.They also have an effect on the costs of both buying and selling debt. This occurs because creditratings indicate a level of default risk, which is the central factor for pricing bonds. High creditratings indicate low default risk and therefore decrease the cost of borrowing. Low ratings, anindicator of higher default risk, increase the issuer’s interest cost. Credit ratings are intended toequip investors with a consistent measure of credit, which provides reliable comparisons ofdebt and debt-like instruments in the capital markets. Usually the better the rating, the lessinterest an issuer will have to pay when it issues bonds.
In addition to influencing the interest rate issuers will pay to issue bonds, credit ratings canaffect current and future debt offerings and other government behavior. For example, ratingscan
52 Budgeting, Financial Management, and Financial Markets in an Intergovernmental Context
• Expand the number of investors available, as these investors understand the risks asso-ciated with the securities being offered
• Make debt more attractive to a wide range of investors, both domestic and foreign• Provide a form of free publicity about SNG financial performance and make it politi-
cally easier for SNG officials to institute financial management techniques that couldimprove future ratings
• Influence government policies directly, because officials may avoid certain policies thatmight lower SNG credit ratings in the future.
Note that a credit rating can be useful even without borrowing, as argued in box 3.2.
How Does the Credit Rating Process Work?
The rating process involves several sequential steps. International rating agencies generally fol-low the rating process described here. Domestic rating agencies may use somewhat differentprocedures for conducting ratings.
CREDIT PRESENTATION. The rating agency, whose revenue comes from issuers and investors,begins the process by sending a rating team for a credit presentation. A credit presentation isthe issuer’s opportunity to describe the issue and make its case for a good rating. In addition tomaking an oral presentation, issuers often provide a written presentation with backgroundmaterials (some of which are often provided prior to the rating team’s visit). The informationprovided differs in accordance with the type of bond being issued, but frequently includes suchitems as
• Background and history of the issuer• Official statement of the issuer• Proposed terms and legal covenants for the issue• Nature of existing bond issues, if any• Five years of audited financial statements and annual reports and operating and capital
budgets• Summary of operating and statistical trends.
SITE VISIT. As part of its review, the rating agency visits the SNG or regional government andmeets with senior officials to discuss economic and budget trends as well as any factors affect-ing credit quality.
RATING COMMITTEE. Once the analysis is complete, the lead analyst from the rating teamconvenes an internal rating committee to discuss and debate the entity’s credit quality and
François Vaillancourt 53
Box 3.2 The Role of Credit Rating without Borrowing Requests
After undergoing a capital planning process, an SNG may decide not to borrow. Nevertheless, it maywant to employ a credit rating agency to issue a credit rating. A credit rating that is independent ofimmediate borrowing needs can serve the following purposes:
• It can alert the SNG to potential investor concerns, which it can then deal with through strategicplanning initiatives and can result in an improved credit rating when the SNG does want to bor-row.
• It can get the word out among investors that a particular SNG is “testing the waters.” • It can help influence government policies directly. For example, officials may avoid certain poli-
cies that might lower the SNG’s credit rating in the future.
determine its rating. Once the rating has been determined, the rating team contacts the issuerto report its decision.
OPPORTUNITY TO APPEAL. At this point the issuer is given the opportunity to appeal by pre-senting new or additional information that could lead to a change in the rating. If the issuer dis-agrees with the rating, the rating is not published and remains confidential. If the issuer acceptsthe rating, the capital markets are informed by means of a press release. If there is reason toreassess a previously issued rating, changes will be announced in a similar manner.
ONGOING REVIEW. The rating agency will expect to receive regular financial updates fromthe issuer and, in most cases, will visit the issuer annually. The rating agency reserves the rightto upgrade or downgrade the rating based on new credit developments, such as
• Material changes in rating factors• Significant change in the issuer or the project’s financial position• Shift in sovereign or subnational policy that will alter the credit profile• Substantial economic downturn without sufficient governmental response.
What Criteria Are Analyzed in Determining Credit Ratings for Individual Issuers and Bond Issues?
The criteria analyzed to determine individual issuers’ credit ratings vary according to the typeof bond.
GENERAL OBLIGATION BONDS. There are four broad criteria for this type of bond.
• Economic base, diversity, and growth. A diverse economy with no dominant employer anda healthy blend of manufacturing, agriculture, services, trade, natural resource process-ing, and government jobs is a positive credit factor. Dependence on a few primaryemployment segments in an economy makes the borrower more vulnerable to eco-nomic shocks and recessions. In addition, analysts look at how well developed privatesector employment is compared with public sector employment. Economic prosperityand demographics are significant credit considerations. The competitiveness of localindustries, infrastructure capacity, and the conduciveness of the environment to privatesector investment and economic growth are other important factors.
• Analysis of outstanding debt. Debt analysis indicates what type of debt is owed, what themoney has been borrowed for, and what has been pledged to repay the debt. For SNGs,their debt burden is measured by certain debt ratios, such as total outstanding debt topopulation and property valuation, as well as debt service to financial balances and rev-enues.
• Financial operations, revenue, and expenditure flexibility. Financial analysis begins with anexamination of the issuer’s financial statements. Balance sheets, income statements, andaudits (if available), which display cash balances, intergovernmental borrowing, andcurrent and long-term assets and liabilities, are fundamental to the credit rating process.Incomplete information will inhibit the credit rating.
• The government’s administrative structure, legal factors, and political dynamics. Rating agen-cies must assess the regulatory and legal structures of the country’s executive and leg-islative branches of government; the services provided by the central government, stateenterprises, and administrative agencies; and the relationships among the central gov-ernment and its SNGs to help determine the issuer’s willingness to pay. In addition, rat-ing agencies must consider the intergovernmental system’s political and administrativestability and supportiveness. Part of this analysis will include consideration of the
54 Budgeting, Financial Management, and Financial Markets in an Intergovernmental Context
structure of intergovernmental transfers and the likelihood that such transfers will con-tinue at current rates.
PROJECT REVENUE BONDS. The criteria for analyzing project revenue bonds are similar to thegeneral obligation criteria, with two key differences. These differences can lead to the sameissuer having different credit ratings for its general obligation debt and project revenue debt.
• Debt service for revenue bonds comes from the user fees generated by the project. Theissuer does not pledge general revenues for debt service. Therefore, the key focus ofcredit analysis is not the issuer’s financial stability, but the financial health of the projectthat will generate the revenues.
• Unlike general obligation debt, which generally has no bond covenants beyond theissuer’s general pledge to service the debt, revenue bonds have a series of covenantsdealing with such items as project maintenance, establishment of operating reserve anddebt service reserve funds, debt service coverage levels, rate covenants, and additionalbond issuance covenants. The legal strength and enforceability of these covenants has adirect impact on the issue’s rating.
DEDICATED REVENUE BONDS. Rating agencies analyze criteria comparable to general obliga-tion debt when determining a revenue bond rating. In general, agencies focus on four criteria:
• Economic feasibility of the project • Credit risks during the project’s development • Efficient management and long-term economic health of the project • Bond covenants in the context of the country’s legal and policy framework.
What Are the Challenges Facing Emerging Markets?
Rating agencies have acknowledged particular concerns and challenges in rating emergingmarket SNG and regional debt. These challenges, which arise from the political, economic, andsocial pressures to which emerging markets are subject, include the following:
• Unpredictable legal and regulatory frameworks• Risky debt profile• Financial data that are not independently audited• Burdens imposed by publicly-owned companies• Shifting intergovernmental political and fiscal relationships• Incomplete demographic data• Inflation effects• Enormous infrastructure needs• Uncollected taxes and user fees.
Conclusion
The main points those concerned with SNG budgeting and finance should be aware of are thefollowing. First, good financial information is necessary for both budgeting and borrowingactivities and is derived from accounting information. Accounting conventions matter whenmeasuring the financial health of an SNG. Even nonspecialists should be aware of the choicesmade in this matter (accrual or cash bookkeeping and so on). Second, the budget is one of themost important documents produced annually by a SNG. It is therefore crucial that it reflectsresidents’ needs and the means available to satisfy them. Third, capital assets, such as sewersand roads, should be financed by all those who will benefit from them. Because these assets are
François Vaillancourt 55

long lived, borrowing to finance them is appropriate. Fourth, borrowing is done on the finan-cial markets. The features of these markets vary among countries, both in terms of the institu-tions (banks, brokers, and so forth) and in terms of loan agreements (bonds, interest rates, roleof credit ratings, and so on). The underlying economic rationale for borrowing and lending,however, remains the same. The amount borrowed must be used to finance capital assets andmust be repaid on time.
56 Budgeting, Financial Management, and Financial Markets in an Intergovernmental Context

4The Structures and Conduct of Intergovernmental Relations
Ronald H. Neumann and T. Russell Robinson
Federalism is a complex form of government that Canada, Russia, and a number of other coun-tries have adopted. Such an approach helps countries achieve a politically acceptable andsustainable balance between national goals (including economic efficiency, social equity, andbeneficial international relations) and the responsibilities and preferences of subnationalregions and governments, often in the context of ethnic and cultural diversity. A related moti-vation, consistent with federalism although not confined to federal structures alone, is thewidespread (although not universal) belief that decentralization can improve government effi-ciency and strengthen democratic practices (Martinez-Vasquez and Boex 2001).
Constitutions partly determine how federations function, as do laws that describe anddelineate divisions of power and responsibility and sometimes prescribe elements of intergov-ernmental machinery and procedures. However, much also depends on the multitude of lessformal structures and processes and on the conduct of the people who participate in them.
Martinez-Vasquez and Boex (2001) suggest explicitly that the Russian Federation required awell-functioning system of intergovernmental relations for Russia to meet its goals. This state-ment may be applicable to any federation. In his wide-ranging comparative analysis, Watts(1999a, p. 118) notes, “All federations have required intergovernmental processes and institu-tions to facilitate consultation and collaboration between their governments in the unavoidableareas of overlapping jurisdiction.” Virtually all federations have found it necessary to build sys-tems of intergovernmental collaboration, which sometimes include explicit and detailed rulesand commitments and require high levels of policy understanding and professional compe-tence from all participants. In this way, the intergovernmental structures in federations—including the various divisions of roles and responsibilities and the procedures for handlingoverlapping jurisdictions and common interests—represent a framework and regulatoryregime for mediating conflicts, negotiating common goals, and collaborating on policy devel-opment, and even on program design and administration.
While specific mechanisms and procedures need to be tailored to each country’s circum-stances, there appears to be a significant set of common underlying structures, processes, andcompetencies for effective policymaking and public administration in federations. This chapterelaborates on such issues by examining a range of mechanisms and procedures by which gov-ernments in a federation conduct their affairs and pursue their responsibilities. In doing so, thechapter draws on specific examples from the content and conduct of Canadian intergovern-mental relations (especially fiscal federalism) since World War II.
Benefits from Differentiation and Common Understandings
One advantage of a federal form of government is that it should, in principle, allow for a greaterdegree of differentiation than a unitary state through more formal decentralization of publicsector policies, program design, and delivery. This differentiation is often useful when con-stituent parts of the federation have substantively different needs, tastes, or capacities. These
57
differences arise because of the make-up of the constituent parts of the federation. The coun-try’s economic, fiscal, and social circumstances and conventions; the historical development ofits constitutional and legal systems; different interpretations of appropriate principles govern-ing roles for central, regional, and local governments; political considerations; and a host ofother factors all come into play. Each of these factors can change over time, and the resultingformula of intergovernmental relations will similarly need to adapt. The participants in inter-governmental systems must have a good understanding of these differences and changes,along with an awareness of the areas in which a common perspective and solid consensusexists.
In a unitary state, the central government might face a constant stream of choices to balancethese factors, each resulting in some degree of contention, whether the decision is to imposestandard practice or to attempt different solutions for each set of circumstances. In a federalstate the machinery of intergovernmental relations must provide options for addressing keycommon objectives while respecting the diversity within the federation.
A second advantage of decentralized activity is that it fosters the potential to address simi-lar needs in different ways. This experimentation can lead to the development of new and bet-ter methods, healthy competition, and the confirmation of best practices (Breton 1990; Ostrom1987).
However, a federal form of government also has potential disadvantages. More questionsarise during the decisionmaking process, and jurisdictional “rights” of constituent govern-ments can make issue resolution and clear decisions more complex and time consuming. Thesuccessful resolution of these matters may be essential to the efficiency of the state, and indeedto its very survival, should the constituent parts of a federation retain a degree of sovereignty.
Flexible Frameworks to Accommodate Variety and Change
Establishing an appropriate constitutional and legal framework is essential to the maximiza-tion of the value of a federal form of government. Noted scholars such as Bird (1986) and Bird,Ebel, and Wallich (1995) discuss in detail the principles and best practices for developing thisframework, incorporating such matters as expenditure responsibilities and revenue assign-ments between and among national, regional, and local levels of government. However, a fed-eral constitution, which balances various interests in the country, is likely to be difficult tochange. For this reason, and because there are few absolutes in relation to principles and bestpractices, constitutions and legal frameworks usually provide parameters within which a widedegree of operational flexibility is practiced. Australia, Canada, and South Africa provideexamples of such operational flexibility. There are no cookie cutter approaches to the designand operation of a federal state. Each state is likely to be unique and, furthermore, each is likelyto evolve over time.
Intergovernmental relations are especially important for the operation of federal systemsthat can adapt, change, and remain flexible. Constitutional provisions, particularly for theassignment of expenditure and regulatory responsibilities, may have been made many decadesago (in Canada, for example, they date back to the 1860s) and do not always match contempo-rary needs. However, federal constitutions are by design difficult to amend. Thus policymakersuse intergovernmental relations, including fiscal arrangements, to allow governments toachieve change more easily and less permanently. Central, regional, and local governmentscooperate when dealing with naturally concurrent or overlapping responsibilities, such as envi-ronmental protection; coordinating local and national aspects of a policy area, such as economicdevelopment; and providing national frameworks for programs delivered by subnational gov-ernments, such as social programs (see, for example, Watts 1999b; Wright 1998).
Federations that are particularly complex and diverse have broad parameters for opera-tional activity and face the need or potential for change must have intergovernmental processes
58 The Structures and Conduct of Intergovernmental Relations
that garner the benefits of the federal form of government while minimizing the potential forserious conflict (see Watts 1999a, chapter 5).
Intergovernmental Processes that Apply to Virtually all Policy Areas and Ministries
The conduct and structures of intergovernmental relations in a federation typically applyacross the wide range of public sector responsibilities. Variations of these structures, processes,and practices develop among the major government ministries in which all levels of govern-ment have a role. Thus sectors and ministries of health, environment, energy, education, eco-nomic development, social protection, and so on will each develop mechanisms and patternsfor the conduct of intergovernmental relations covering the range of functions outlined in thischapter (Watts 1999a).
In Canada, virtually all ministries have their own family of intergovernmental mechanisms,and they have developed their own practices of cooperation and collaboration between the fed-eral and provincial (or territorial) levels.1 Although many of the concepts and functions arecommon across ministries, roles and structures vary for a variety of reasons. These include thediffering roles and responsibilities of each level of government in various program areas, suchas social services, housing, and energy (see, for example, Dupre 1985; Kernaghan and Siegal1995; McRoberts 1985; Simeon 1979). This chapter uses finance ministry functions to provideexamples of intergovernmental processes, focusing on the Canadian experience with fiscal rela-tions.
Fiscal Federalism’s Core Issues
Bird (2000) poses five questions that arise with respect to intergovernmental finance in anycountry, namely:
• Who does what? This refers to the assignment of expenditure responsibilities across lev-els of government.
• Who levies what taxes? This refers to the assignment of revenue capacity.• How is any vertical imbalance addressed? A vertical imbalance exists when the expen-
diture responsibilities and the revenue capacities of subnational governments are notwell matched.
• How are any horizontal imbalances addressed? A horizontal imbalance exists when dif-ferent units of the same order of government, with similar expenditure responsibilities,have significantly differing fiscal capacities.
• What, if any, rules exist with respect to subnational borrowing?
Bird then adds a sixth question: what is the institutional framework whereby decisions aremade and the technical and political problems of fiscal federalism resolved? Intergovernmentalfiscal relations must have in place appropriate processes to deal with these fundamental ques-tions whenever the answers cannot be found within the legal and constitutional framework.This is because a need may arise for interpreting or elaborating existing policies or for respond-ing to changing conditions; contingencies, including external shocks; or new opportunities andchallenges.
Ronald H. Neumann and T. Russell Robinson 59
1. Canada’s 10 provinces derive their basic powers and responsibilities from the Canadian Constitu-tion, whereas federal legislation created the three northern territories. Although the territories are muchmore financially dependent on the federal government than are provinces, and are supported by means ofa different fiscal formula, they have taxing powers and expenditure responsibilities similar to those ofprovinces. As such, the territorial governments participate in virtually all intergovernmental processes asindependent jurisdictions. Thus in Canada (and in this chapter) references to intergovernmental opera-tions include the territories.
The remainder of this chapter discusses intergovernmental processes in the public fiscalarea; intergovernmental machinery; examples from Canada and Russia; and a possible mecha-nism for evaluating the system with respect to needs, practice, and support for intergovern-mental processes.
Functions of Intergovernmental Structures
Several factors determine how each federal system organizes itself for intergovernmental rela-tions and the degree to which such mechanisms are formal and institutionalized or informaland ad hoc. The first factor is the degree of separation of powers in the federation, that is,whether the executive branch dominates intergovernmental relations as it does in Canada, orwhether the legislative branch also plays an important role, as in the U.S. system (Watts 1989).The second factor is whether the legislative powers of the constituent governments are heldconcurrent with those of the central government, in which case broad cooperative schemes willbe required to prevent centralization of policy, as in Australia. Alternatively, the constituentgovernments may have exclusive powers, enabling them to resist or avoid cooperative schemes(Painter 1998). The third factor is the value that society places on the degree of governmentalcompetition versus cooperation. In Germany, for example, cooperation is seen as relativelyimportant, and therefore intergovernmental relations are heavily institutionalized, whereas inthe United States, where competition is valued, relations are more ad hoc. Finally, the fourthfactor is the number of units in a federation. The smaller the number of units, the easier andmore efficient it is to pursue ad hoc and informal bargaining of all governments as a group,because all the leaders can meet in a relatively small room, as with Australia and Canada. Thisis more difficult where the number of units is larger, as with Russia and the United States.
In any case, the structures of intergovernmental relations, whether explicitly as in Canada,or perhaps more informally in more recently-developing federations whose institutions are stillbeing formed (perhaps including Russia), will normally carry out a number of activities thatmay be classified into several broad functional areas.
Identification of Issues and Priorities for Intergovernmental Attention
Federations respond both to central priorities and to regional and local priorities. The nationalgovernment should have the ability to protect the common national interest and may promotethe maintenance of national standards, where appropriate. Regions, in addition to having theability to manage the areas within their own legal and constitutional competency, should beable to bring national attention to matters that may require the financial assistance or coordina-tion of national or other regional and local governments. Bringing together these interests andcompetencies will likely raise a variety of matters that, though not necessarily unique to feder-ations, must be addressed in patterns unique to the federal form of government.
To elaborate, one could consider the list of questions raised by Bird. Are there program andother expenditure responsibilities that might be new or might be desirably shifted to anotherorder of government? Should tax assignment be changed? Must the total tax burden or the totaltax burden on a particular segment of the population or a particular sector of the economy bechanged and does this require coordinated action? In cases in which tax fields are shared, is thesharing appropriate? Are national standards with respect to public programs necessary orappropriate and, if so, will they be established by the national government or through coordi-nated action of all, or perhaps only a majority, of regional and local governments? Are therevertical or horizontal fiscal imbalances that need to be addressed? Must there be new rules orcoordination with respect to borrowing?
If this identification function is not performed adequately, the intergovernmental system willbe forced to deal with many matters simultaneously without sufficient focus to successfully
60 The Structures and Conduct of Intergovernmental Relations
address major challenges. It may be more responsive to immediate concerns than to any longer-term vision. The vital issues can be trivialized, while the importance of other issues is exaggerated.Achieving agreement on priorities—or adjustments to ongoing priorities—will not always be easy,but it is almost always worth the effort, and it can improve the prospects for progress and ultimateagreement.
Development and Analysis of Relevant Information
Data of acceptable quality are essential to the conduct and refinement of intergovernmental fis-cal relations. The data must be accurate, current, appropriate, and sufficiently comprehensivefor the purpose and must be accepted as such by the users (McEwin 2000). The developmentand use of a respected and independent statistical agency has proven to be a valuable tool inmany federations, ensuring that needed data are prepared and accepted for policy develop-ment and administrative purposes. In this context, there should be an effective working rela-tionship and consultative arrangements between the statistical agencies at the regional level (ifthey exist) and the central statistical agency, as well as a mechanism for information exchangeand joint statistical planning and analysis among the finance officials of the governments in afederation.
In several federations, such as Australia, Canada, and South Africa, statistical agencies havebeen given the authority to develop the data underlying the calculation of federal transfer pay-ments. In some federations, Nigeria, for example, available data are in dispute and thereforeare not useful for administrative purposes. In Russia the data are less disputatious, but are notsufficiently current to capture the dimensions of a rapidly changing economy.
Whenever the facts are in question, the discussion of solutions to problems is jeopardized.Even when the facts are agreed on, separate interpretations can lead to support for different,even conflicting, positions. However, further joint analysis of the data can often lead to broaderand more deeply shared perspectives on issues. Thus intergovernmental processes should havethe capacity not only to receive data and analytical conclusions, but also to work toward a com-mon and accepted interpretation of the data.
Necessary information may not be limited to economic and fiscal data. “Soft data”regarding political preferences; administrative capabilities; and the results of the monitor-ing, evaluation, and accountability exercises are examples of the range of other data require-ments necessary for the analytical work underlying good, evidence-based decisionmaking.
Development of Policy, Administrative, and Technical Options
All governments require a competent cadre of administrative players who can take informa-tion; apply it to selected issues; and develop the policy, administrative, and technical optionsavailable to address a variety of issues. Knowledge of principles and best practices, practicalexperience, and professional objectivity are often the key characteristics of competent analysts.
Most often this type of expertise is concentrated in the national government. However,when it comes to the total number of competent staff or to experts on particular sectors of pub-lic finance—such as subnational program and expenditure responsibilities or revenue issueswith respect to natural resources unequally distributed in regions of the country—more expert-ise may be available in the subnational governments. What seems to work most effectively isthe development over time of “trust ties” among professional public servants across govern-ments, creating good working relationships at the bureaucratic level (Dupre 1985).
It is important for intergovernmental processes to be able to access and consider the analy-sis and synthesis into options produced by policy development experts. Those experts may belocated in the national or subnational levels of government—or even in the nongovernmentalor quasi-governmental spheres, providing the system is open to such sources, as it is in Russia.
Ronald H. Neumann and T. Russell Robinson 61
Sufficient capacity within each level of government to understand, engage in, and challenge theanalytical work will increase effectiveness. Without a capacity for critical analysis, federal sys-tems may become mired in uninformed debates (Pollard 1986).
Even though the ultimate responsibility for the national interest may often reside at the fed-eral level, participants in regional and local governments should have a good understanding ofnational policies and priorities, even when these policies and priorities may appear to be inconflict with local or regional preferences. Only then will maintaining a balanced dialoguebetween different levels of government be possible along with resisting the natural attitude of“them versus us,” which can undermine productive intergovernmental processes.
Development of Consensus
Frequently in the conduct of intergovernmental fiscal relations, various camps will come to dif-ferent conclusions about the best course of action. Relative power may play the decisive role inthese situations; however, techniques are available for building consensus. As noted previously,making an appropriate forum for dialogue available and ensuring that the data and analysisare understood can be useful, particularly if the group members have become familiar with oneanother’s perspectives.
The forum for resolution of intergovernmental fiscal issues should respect rules of success-ful negotiations, including
• The development of an appropriate agenda• The role of the chair• The establishment of deadlines• The use of smaller and/or more focused working groups on subissues.
The introduction of outside facilitation, mediation, or conciliation may be considered,although such techniques are used infrequently. McRoberts (1985) provides a useful perspec-tive on different approaches taken to resolve outstanding issues in the Canadian federation,including multilateralism, bilateralism, and unilateralism. When consensus is not achievedthough structured processes, the balancing of political interests, establishment of alliances,trade-offs involving other issues, and other more political approaches are the common vehiclesfor maintaining viable intergovernmental relations, or at least for reducing antagonisms.2
Policy Adoption and Implementation
Officials must make decisions at the appropriate level in the governmental hierarchy. Technicalmatters may be resolved at lower levels, but policy must have political approval. Fiscalarrangements are frequently among the most important and contentious issues that the politi-cal system addresses. The intergovernmental machinery must be structured to enable the polit-ical approval process to function effectively.
Analytically based briefing material is an essential ingredient of the successful conduct ofintergovernmental relations. In countries such as Canada and South Africa, forums of both offi-cials and ministers strive to use common briefing materials that provide
• Background information and data that clearly and concisely provide the analyticalframework
62 The Structures and Conduct of Intergovernmental Relations
2. For a broad conceptual framework drawing on public choice theory, see Ostrom (1990). Ostrom’swork is mainly rooted in the American experience. For a discussion more relevant to Australia see Painter(1998), and for Canada see Sproule-Jones (1993).
• A succinct summary of the options • The short- and longer-term consequences of the options• A recommendation from staffers or a supporting body • Strategies for implementation if the policy recommendations are accepted.
The material must be considered in an appropriate forum. This may consist of a meeting ofheads of state of the federation, ministers of finance, perhaps others.
Processes that are overly cumbersome risk delay and may even jeopardize a plan of action.Strategies that assist the political process in reaching decisions in Canada include the follow-ing:
• The assignment of tasks with specific terms of reference and deadlines from political toadministrative levels.
• A hierarchical system descending from the political level through senior officials tocommittees of technicians within the bureaucracy, with each level mimicking, or at leastcapable of representing, the various configurations of national and regional or localinterests. Officials at each level attempt to focus their efforts toward the specific needsof the political decisionmakers, to the extent those are clear, or to identify and clarifythose needs if there is ambiguity (which is often the case).
• The ability to resort to common briefing books rather than referencing separate materi-als developed by each jurisdiction. Although separate briefings will inevitably stilloccur, the structure of separate briefings will more likely focus on the degree of consen-sus that appears to be emerging and the differences of the specific jurisdiction from theconsensus.
• Regular meetings that familiarize the players with each others’ usual positions and per-spectives and allow routine business to be concluded. In addition, the players shouldhave the flexibility to meet when required to address urgent or exceptional business.
Administration and Coordination
Intergovernmental fiscal relations require a significant degree of coordinated activity. To movefrom policy to funding to actual program implementation, the role of each of the levels of gov-ernment should be clear and accepted. Sometimes, by virtue of the constitutional or legalframework, the authority to take action is shared.
Even though bilateral action may suffice, a federation usually benefits from the creation offorums to guide and monitor the implementation of policy. Such forums may also assist in thedevelopment of appropriate rules and regulations under which policy is implemented. Stan-dards may be set, but the boundaries may be more sensitive to regional considerations. Forexample, consider the regulations required for the provision of welfare in a poor, rural regioncompared with provision in a city. The overall policy objective of providing basic food, shelter,and clothing may be the same in the two settings, but the form of assistance provided, and itscost and delivery structure, may be substantially different. The development of a financing for-mula must consider these factors, and a common understanding of the necessity for specificelements within the formula reduces the potential for conflict. Experimentation and differenti-ation may be important benefits of the decentralized, federal system of governance. Sharingbest practices helps to spread the benefits.
In some federal systems, such as Australia, Canada, and Germany, as well as the EuropeanUnion, governments have developed (to varying degrees) intergovernmental machinery thatenables them to make more substantive, collective decisions. This co-decision capacity—espe-cially as seen in the European Union—requires intergovernmental councils to take bindingvotes in order to get past the lowest common denominator results of consensus rules. Even ifsuch votes are not always taken, the ability to take them changes the behavior of the parties;
Ronald H. Neumann and T. Russell Robinson 63
one holdout cannot prevent forward movement by the rest. The European Union, which has noother form of central decisionmaking, uses such co-decision mechanisms routinely. In the moreestablished federations co-decision is more restrained (especially in Canada) and confined to afew areas of public policy (Brown 2002).
Transparency and Accountability
In a democracy, transparency and political accountability to the electorate foster good gover-nance. In a federation, however, even if information on monitoring, evaluation, and relatedactivities is available to the media and the public, the lines are often blurred about who isaccountable (for delivery or funding, for example) and to whom the reporting of informationshould be directed. Shared responsibilities among levels of government and conditionsattached to shared-cost programs or to intergovernmental transfer payments can add to the dif-ficulty of achieving public understanding and political accountability.
By way of example, national governments typically provide transfer payments to offset ver-tical and horizontal fiscal imbalances. The reasons for these imbalances within federations arerooted in the efficient distribution of taxation powers—which may not coincide with desirabledistribution of spending responsibilities—and the need for the national government to makepayments to address horizontal disparities (for example, to even out fiscal capacities betweenricher and poorer regions). In such circumstances, the national government will transfer fundsto subnational governments. It will often seek considerable information from the recipient gov-ernments about program delivery, administration, and financial outlays to hold the subnationalgovernments accountable for their performance.
Experience in established federations suggest that, as federal states develop modern gover-nance practices, it may become appropriate to limit national accountability to the issues ofwhether program funding is adequate and whether it is effectively distributed. Regionalauthorities, responsible to their own electorate, can be held accountable for efficient and effec-tive delivery of services. Of course when governments agree to conditions or performancecommitments, or when national authorities threaten or impose penalties to enforce nationalstandards, the national government often must be held at least partially accountable for pro-gram delivery and performance, if only because it is accountable to the electorate for the exer-cise of federal authority and the expenditure of federal funds.
In the context of contemporary Canadian political culture in which citizens, the media, andvarious organized social interests are much less deferential of governments than they oncewere, many observers have criticized intergovernmental relations on democratic grounds(Brock 1995; Dupre 1985; Smiley 1979). This criticism came to the fore during constitutionalnegotiations in the 1980s and 1990s, when the federal and provincial premiers were perceivedas reaching deals behind closed doors on issues related to broad Canadian values and identitywithout adequate legislative scrutiny and public debate. The secrecy and suspected collusionof “executive federalism” became a liability and helped to turn public opinion against the pro-posed constitutional reforms.
The public and media usually seem to be less concerned about more routine, technical inter-governmental issues and discussions, even if the latter are closed to the public. Some wouldargue that governments are supposed to handle details competently, without continuousrecourse to public debate. However, it is difficult to predict when a specific or apparently minorintergovernmental issue may assume a higher profile, with democracy issues (includingaccountability and transparency concerns) once again being raised by a critical media and pub-lic. Government officials and their political masters always face the challenge of finding anacceptable balance between the comfort, and sometimes the efficiency, of inside deliberationsand the need for public input, understanding, and support.
64 The Structures and Conduct of Intergovernmental Relations
In Canada, the Auditor General’s Office has written about these challenges of accountabilityin collaborative federal systems (Desautels 1999). In this complex environment many observers,including the auditor general, have identified key elements associated with strong accountabil-ity, including
• Clear and agreed-on expectations• Clear roles and responsibilities• Balanced expectations and capacities• Transparency and credible reporting• Reasonable review, program evaluation, and audit• Ongoing scrutiny of intergovernmental arrangements by legislative committees• Public hearings on major intergovernmental agreements prior to their completion.
Public debate is sometimes poorly informed about complex issues, and the simplistic solu-tions that are often presented in the popular media can create false expectations and unman-ageable political pressures. Enabling independent researchers and arms-length organizationsto obtain government data and to analyze it against the backdrop of adopted goals and policiescan help provide greater credibility to the policy development process generally, and to inter-governmental policy activity specifically.
Thus public understanding and debate can be enhanced by a greater flow of facts and analy-sis from respected private, academic, and government organizations that have a credible struc-ture and history. Modern democratic governments are increasingly seeking to make the policyprocess more accessible and transparent to outside organizations and the public at large. Theultimate benefit is government decisions that are better understood and ultimately better sup-ported through democratic political processes than would be the case with more closed, or evensecretive, decisionmaking processes.
Issue Resolution
After a course of action has been approved and adopted, disputes may still arise—and theyoften do. In some cases the administrative, evaluative, and accountability functions will func-tion well, with the result that a subsequent cycle, beginning with the identification of issues tobe addressed, will automatically unfold.
In other cases resorting to a third party, be it a political, judicial, or other type of forum formediation, conciliation, or arbitration, may be necessary. A third party should be used only as alast resort, however, because its use can imply a failure to agree through the normal processes.Most intergovernmental issues are fundamentally of a political, rather than judicial, nature andrequire negotiated compromise and agreement. Effective governance of a federation will bedemonstrated by political resolution of intergovernmental conflicts, at both bureaucratic andpolitical levels. Thus appeals to an outside authority such as the courts should be avoided whenpossible.
Other typically Canadian devices that have frequently been used to achieve and sustainintergovernmental agreement or joint action—in other words, to avoid the occurrence of dis-putes in the first place—have included the following
• Having a co-decision by qualified majority vote that is binding on all parties, as dis-cussed previously, such as the rules for the Canada Pension Plan (CPP)
• Allowing a party to opt out or opt in under certain specified circumstances• Allowing one specific party to go its own way if its nonparticipation does not affect the
other parties, such as the province of Quebec’s handling of university funding (Kennett1998).
Ronald H. Neumann and T. Russell Robinson 65

Establishment of Intergovernmental Machinery
Usually the mechanisms and structures to carry out the functions just outlined are the result ofboth formal and informal arrangements. The myriad of combinations used in federationsaround the world may reflect the need for certainty and continuity, for flexibility, or for differ-ing combinations of both. These may evolve, responding to changing pressures and subject tointergovernmental negotiations and mutual agreement. However, structures may also be deter-mined, at least in part, by constitutions; international obligations, such as treaties; and othermore formal influences and requirements.
Constitutional Provisions
National constitutions often specify revenue and expenditure assignments, but they some-times do so with a degree of flexibility or a lack of clarity. Constitutions generally do not insti-tutionalize elements of intergovernmental machinery, though some countries have extensiveconstitutional intergovernmental provisions. For example, South Africa has a relatively recentconstitution that
• Establishes rules for revenue and expenditure assignment and borrowing• Sets out government operational objectives through the provisions of the justiciable Bill
of Rights• Provides that the National Council of Provinces, which consists of provincial and local
government representatives, has oversight in relation to particular pieces of legislationthat concern intergovernmental arrangements
• Proclaims a commitment to cooperative governance• Provides for a financial and fiscal commission to advise the national parliament, provin-
cial legislatures, and local governments on intergovernmental fiscal arrangements• Provides for (while simultaneously discouraging) access to the Constitutional Court for
dispute settlement.3
Usually a nation has to manage its intergovernmental relations with less explicit guidance—letalone instruction— from its constitution.
Some nations can alter their constitutional arrangements more easily and frequently thanothers. In Canada, constitutional change is difficult, and therefore rare. For example, constitu-tional changes were approved in 1951 and in 1964 to allow the development of old-age securityprograms. One part of the system, which administers old-age security pensions and guaran-teed income supplements for low-income elderly Canadians, now falls completely under theaegis of the federal government. Another part, the CPP, a wage-based contributory program, isadministered nationally, but both federal and provincial ministers provide policy stewardship.Even the government of the province of Quebec participates, while administering the QuebecPension Plan (QPP) apart from, but in a generally harmonized fashion with, the CPP. Tax har-monization has allowed for the third part of the pension system, in the form of tax-supportedemployer-employee and private retirement plans, to be developed in a similar fashion acrossCanada.
Legislative Arrangements
Legislation can be used to add new elements to the fiscal machinery. For example, the creationof statistical and monitoring agencies and their roles may be formalized through legislation, asAustralia and Canada have done.
66 The Structures and Conduct of Intergovernmental Relations
3. For more about the South African provisions see Financial and Fiscal Commission (2000).
Legislators may also pass bills to develop intergovernmental arrangements. Such bills com-monly include rules of procedure or the establishment of committees to manage prescribedmatters or provide advice about them. South Africa’s parliament passed legislation to establishboth the Budget Council and Budget Forum. The council discusses transfer payments, fiscalcoordination, and other related issues with respect to provinces; the forum discusses local gov-ernment issues. Both are only advisory bodies to the national minister of finance, and both haveministerial representation from the national and provincial governments. The Budget Forumalso has local government representatives. Both the council and the forum have establishedcommittees of officials that parallel the ministerial body in composition, but these committeesare not provided for within the legislation.
The national government may promulgate legislation even when the national and subna-tional governments are not in a hierarchical relationship; however broad acceptance by inde-pendent constituent bodies is necessary to make the arrangement work well. Legislation ismore readily altered than constitutional provisions, and may indeed be easier to change thanarrangements resulting from agreements. Of all the federations, the German model is the mostformalized. State governments administer almost all federal legislation. To ensure that admin-istrative realities are taken into account in the federal lawmaking process, the upper house ofthe federal parliament—the Bundesrat, which is composed entirely of delegates of state gov-ernments—must approve all federal laws.
Intergovernmental Agreements
Intergovernmental agreements, which typically are used to implement funding and other pol-icy decisions, may also be used to establish intergovernmental arrangements for the perform-ance of a variety of functions. These include consultation on identifying issues; preparation ofcommon data and policy option papers; coordination, administration, and monitoring ofissues; and the establishment of rules of procedure.
Proceeding with agreements that do not have the full and active support of participants isless likely to produce satisfactory, well-functioning machinery. In Canada the 1998 Social UnionFramework Agreement attempted to establish a system to manage federal involvement in cer-tain areas of provincial jurisdiction; however, without the full participation of the province ofQuebec or the sustained commitment of the national government, the agreement’s potentialhas not yet been fulfilled (Lazar 2000; Mendelsohn and McLean 2000).
Established Forums
An intergovernmental political body or a group of officials may carry out one or more of thekinds of activities reviewed earlier on either a one-time or regular, continuing basis. When thesebodies are established on a longer-term basis, the accumulation of knowledge and experiencecan ease the burden on the agencies administering the affected programs. More longstandingarrangements may encourage clarity about the mandate, clear rules of participation, estab-lished patterns of working arrangements, ability to foster greater participation, and mentoringof new participants; however, such longer-term structures may or may not be open to newmandates, more effective working arrangements, or other new approaches and ideas that aregenerated externally. As in other areas of public administration, regular public reporting andmandated periodic reviews can help offset these risks, while retaining the benefits of sustainedexpertise and continuity.
Government-Funded Agencies
Governments frequently find that funding an outside agency rather than carrying out an activ-ity through a government department is expeditious. Perhaps Russia does this more commonly
Ronald H. Neumann and T. Russell Robinson 67
than other countries, although Canada and other federations provide many examples. Oftensuch arrangements can build in greater real or perceived independence. An outside agencymay be more flexible and able to bring in expertise on a short-term project. The agency may alsobe able to develop a governance structure that is supportive and reflects the intergovernmentalmilieu in which it operates.
In Canada both federal and provincial governments have experimented with a variety ofgovernment-funded agencies. In the 1960s and 1970s the Economic Council of Canada playedan influential role by providing information and analysis and shaping debates, but the Cana-dian government ceased funding it in the late 1980s as part of a wide-ranging, cost-cuttingbudget review. Some controversy also existed about the council’s analysis of the politically sen-sitive issue of Quebec separatism. This serves as a reminder of the balance that must be struckbetween the independence of such agencies and the roles they are expected to play. It also illus-trates the potential vulnerability of agencies that rely on only one source of financial support.The provincial government of Ontario also sponsored the Ontario Economic Council, whichfunctioned for several years until the sole source of funding ceased.
The provinces have a longstanding Council of Ministers of Education, with its own secre-tariat, which has had some success in maintaining a more cohesive education policy across thecountry than might otherwise have occurred with 10 independent provincial jurisdictions incharge of education policy. Recently, the federal government established the Canadian Institutefor Health Information to monitor developments in the health care system, which is adminis-tered by the provinces. The institute is a federal creation, but its role is to advise both levels ofgovernment.
Pursuant to intergovernmental discussions and agreement, the federal government createdthe Canadian Food Inspection Agency as a joint body that brings together pertinent aspects ofboth federal and provincial activity—involving several ministries at each level of govern-ment—in a cooperative effort to reduce overlap and duplication, clarify roles, and improve theefficiency of the multifaceted food inspection system across the country. Currently Canada hasfew such jointly sponsored and financed organizations. However desirable these organizationsmay be in concept, they are complex to set up and manage because of the need to span a widerange of governmental interdependencies, both across jurisdictions and across ministrieswithin governments, as in the food inspection area.
Nongovernmental Organizations and Ad Hoc Activity
In North America private, academic, and service organizations frequently play a significantpolicy development and monitoring role with respect to intergovernmental relations and otherimportant issues. They are often invited into the government process of decisionmaking andmanagement. They may or may not accept some government funding, but interpersonal rela-tionships between nongovernmental organizations and government agency officials are fre-quently close.
Specific issues may trigger new organizational activity and sometimes will generate thedevelopment of coalitions of stakeholders. Such activity may extend beyond the usual lob-bying efforts centered around individual concerns. This ad hoc activity, often with mediacoverage, has on occasion generated significant pressure in relation to the development andmanagement of intergovernmental relations in Canada.
Like other countries, Canada has hundreds of large and small organizations and interestgroups that seek to influence both federal and provincial governments. Coalitions of taxpayersform because of concerns about tax structures and distribution, representatives of health careproviders urge their preferences on health ministers, associations of universities and collegespress the federal government to increase research funding and provincial governments to
68 The Structures and Conduct of Intergovernmental Relations
improve facilities and increase support for faculty and students, and so on. In relation to suchinput from interest groups Shultz (1977, p. 394)) concludes:
Given the significance of intergovernmental negotiations to policy processes, and conse-quently the political fortunes of the participants, interest group participation is not with-out its costs. Although the federal system does provide many access points, groups whoexploit them run the risk of being embroiled in intergovernmental conflicts, of beingcaught, as it were, in the vise of federalism.
Despite these complexities—and perhaps partly in response to the challenges they imply—advocacy groups have become more ubiquitous and sophisticated, and they help stimulatepublic debate across the spectrum of government activity. Governments are increasinglyobliged to respond, both in private consultations and in public discourse with such organiza-tions. This increasingly open interaction takes time and effort on the part of policymakers, andit requires governments at all levels to build these interactions into their policymakingprocesses, including intergovernmental processes.
Political Party Processes
In many federations, party policies strongly influence intergovernmental relations. In theUnited States, for example, the Democratic and Republican political parties operate at bothnational and state levels, with significant linkages between them. In others, such as Canada, therelationships are weaker. Thus the debate on the appropriate role of the federal and provincialgovernments may be a side issue (as is currently the case of the federal Liberal government) ormay be central to the policies of the party (as with the Bloc Quebecois, a party of parliamentar-ians from Quebec, that advocates the separation of that province from Canada).
In countries where one party has control of both national and most subnational govern-ments, such as the African National Congress in South Africa, internal party processes can oftenplay a significant role in managing intergovernmental issues. In Germany and the United Statesthe political parties are integrated at the federal and state levels, that is, the same party exists atboth levels, but with different branches. In Canada the party system has evolved to the pointwhere it is not integrated, and the provincial party systems are quite separate from the federalsystem. Thus party linkages play less of a role in integrating the system. In other federationswith coalition governments, the alliances struck could entail power sharing, the introduction ofbargaining over the conduct of intergovernmental relations, or both.
The more the electoral fortunes of competing political parties ebb and flow so that govern-ments or coalitions change frequently, the greater the need for independent, professional civilservants who maintain the processes of communication, interaction, and operational coordi-nation across levels of government. In a sense, the expertise and continuity of intergovern-mental relations at the level of civil servants permits more variable political change across afederation. Put another way, frequent changes in political leadership, especially at the regionalor provincial levels where many governments may face elections at variable times, can createconsiderable disruption to intergovernmental policy development and cooperative manage-ment without the anchor of well-functioning processes maintained at the staff level.
Judicial Processes
When constituent governments resort to the courts, it is usually on matters of interpretation oflaws. Courts rarely overturn nationally legislated decisions, with exceptions related to theapplication of rights or transgression of constitutional provisions. Governments in Canada,depending on the soundness of their legal advice, have tended to use the option of going to
Ronald H. Neumann and T. Russell Robinson 69
court as one among a variety of strategic instruments to achieve their goals. Nonetheless, courtstend to impose winner-take-all solutions, often with longer-term consequences in terms of con-stitutional balance. Thus Canadian governments will normally choose negotiated solutions ifconditions permit. Court systems are often structured differently in different federations, whichin turn probably influences attitudes toward and uses of them by governments as well as bycitizens and organizations.
Fiscal Federalism Mechanisms in Canada
Canada has a well-developed set of intergovernmental institutions and arrangements that wasbuilt during the 20th century, especially during the second half of the century (after World War II),as government roles grew generally and subnational governments took on increasingly importantroles. An examination of the institutions and processes as they relate to key functions in maintain-ing federal fiscal arrangements in Canada is useful, but note that intergovernmental relations onfinancial issues, although important, may not always be typical of intergovernmental relationsacross the board in Canada. They are more routine, more technical, probably more professionallyoriented, and less overtly political than other areas of intergovernmental cooperation and conflict.
Information
Two specific institutional arrangements for the development and provision of information anddata in Canada provide critical underpinnings for the work of government generally and forfiscal federalism issues specifically, namely: Statistics Canada and the federal-provincial Com-mittee on Economic and Fiscal Data.
STATISTICS CANADA. Statistics Canada is a federal government agency with an internationalreputation for providing accurate and unbiased demographic, economic, and fiscal data. Thatreputation has been built on specific legal and institutional characteristics and policy norms,including
• A specific statutory basis for the statistical agency• An executive director (with deputy minister status) who has control over the agency’s
budget and other matters • The maintenance of autonomy over the statistical system, including data collection, sys-
tem design, and data dissemination • An adherence to internationally recognized scientific norms in data gathering and pres-
entation• A data gathering system that protects individual and corporate privacy and confiden-
tiality• A tradition of transparent decisionmaking• A separate public profile• A nonpolitical objectivity in relation to who has access to data, which is available to all
the governments in the federation based on the provisions of the 2001 Federal-Provincial Fiscal Arrangements Regulations.
In general, Statistics Canada data are essential for economic and fiscal management. Morespecifically, the chief statistician of Canada plays an important role in determining federaltransfer payments to provinces. Under section 2 of the 1985 Federal-Provincial Fiscal Arrange-ments Act, the chief statistician has the authority to determine the populations of the provincesand territories for the calculation of transfer payments and to determine their gross domesticproducts for use in establishing escalator provisions. In the regulations accompanying the act,the chief statistician must present a certificate setting out data related to provincial revenues to
70 The Structures and Conduct of Intergovernmental Relations
be equalized, including population and gross domestic product figures, prior to a final compu-tation being made with respect to the Fiscal Equalization Program. By meeting these informa-tion needs, Statistics Canada’s independence is crucial in reducing or avoiding potential con-flict between the provinces and the federal government.
COMMITTEE ON ECONOMIC AND FISCAL DATA. The federal-provincial Committee on Eco-nomic and Fiscal Data meets twice a year and plays a useful role in ensuring that the frame-work for collecting and analyzing data is applied on a consistent basis across Canada. Forexample, its financial management system of accounts provides a system that takes disparatepublic accounts data of the federal and provincial governments and transforms them into amore comparable set of statistics. The committee also plays a role in projecting economic andfiscal results based on budgets and other information.
Technical and Policy Options
Federal and provincial finance departments maintain a number of joint committees to producetechnical analyses and policy options with respect to fiscal arrangements. These include the Fis-cal Arrangements Committee, which includes the Technical Committee on Transfers; the Taxa-tion Committee; the CPP/QPP Committee; and the senior committee of deputy ministers,which is called the Continuing Committee of Officials.
FISCAL ARRANGEMENTS COMMITTEE. The Fiscal Arrangements Committee is composed ofassistant deputy ministers from the federal government and all the provinces and territoriesand generally meets twice a year. Most participants enjoy direct access to their ministers anddeputy ministers and can therefore present their governments’ positions during discussions.Their task is to develop policy options for ministerial decisions with respect to major issuesinvolving the Equalization Program, as well as the Canada Health and Social Transfer Programand other major transfer programs. They draw on the expertise of the Technical Committee,and some members participate in the meetings of both committees.
Issues that the Fiscal Arrangements Committee addresses include basic methodologies to beused for the distribution of transfers; adequacy and affordability issues that translate into stan-dards, floors, ceilings and other parameters; and contentious technical issues that the TransfersCommittee does not resolve. The Fiscal Arrangements Committee develops options that areusually considered by ministers, although some vetting might occur by deputy ministersthrough the Continuing Committee of Officials.
TECHNICAL COMMITTEE ON TRANSFERS. The Technical Committee’s primary responsibility isto consider the detailed operations of the Canadian Equalization Program. It meets approxi-mately four times a year and circulates documents between meetings. Members discuss themethodology for the Equalization Program and, in particular, the modeling of the representa-tive tax system. Therefore they must bring to the forum in-depth knowledge of the provincialtax bases and techniques for developing proxy or melded bases, necessary when provincial taxregimes have different profiles.
The national government has the largest staff involved in this work and generally preparesinitial discussion papers; however, the provincial members frequently prepare alternative dis-cussion papers or work with their federal counterparts to develop the discussion papers. Allcommittee members participate in the consideration of these papers. Their specialized knowl-edge and expertise is concentrated within the committee, therefore the committee’s decisionswith respect to these technical aspects are rarely challenged.
The Technical Committee addresses administrative issues, such as payment schedules,when necessary. It provides guidance and advice to the more senior Fiscal Arrangements
Ronald H. Neumann and T. Russell Robinson 71
Committee regarding the effects or impacts of adopting different methodologies and standardsand other issues requiring policy decisions.
TAXATION COMMITTEE. The Taxation Committee discusses issues of tax policy, administra-tion, and harmonization. As many tax fields (income taxes, sales taxes, various commodity-based taxes, and so on) are shared between the national and subnational governments inCanada, the actions of one can have a significant effect on another. The national Canada Cus-toms and Revenue Agency collects personal and corporate income taxes on behalf of mostprovinces, although three large provinces administer their own corporate income tax and Que-bec administers its own personal income tax.
In the 1990s the Taxation Committee assisted in the transition of the federal manufacturerssales tax into a value added tax, named the goods and services tax. Federal leaders hopedprovinces would join them and create a Canada-wide, harmonized sales tax by integrating theirprovincial retail sales taxes into a more comprehensive goods and services tax. Because ofadministrative and policy differences, however, only three Atlantic provinces joined the federalgovernment in a harmonized sales tax. The federal government administers this tax. In Quebecthe provincial government administers the harmonized sales tax system. Ontario and three ofthe four western provinces levying general sales taxes (Alberta has no such tax) did not chooseto join in the harmonized system.
Effective tax administration requires some coordinated action between governments. TheTaxation Committee addresses issues of tax sharing, tax evasion though loopholes, and smug-gling with the objective of helping to achieve coherent and mutually compatible tax actions bythe two orders of government. As with the Fiscal Arrangements Committee, the recommenda-tions of the Taxation Committee are generally submitted directly to ministers for their deci-sions, with the Deputy Ministers’ Committee participating somewhat more actively in this areathan with Fiscal Arrangements Committee issues.
CPP/QPP COMMITTEE. Constitutional changes transferred the administration of old-agesecurity programs—which had been an exclusively provincial jurisdiction—from the provincesto the federal government. Nevertheless, the subsequent legislation establishing the CPP pro-vided for joint policy administration by the two levels of government. Quebec maintained itsown pension plan, the QPP, but it has consistently harmonized rates and benefits, though notinvestment policy, with the CPP. Ministers created the CPP/QPP Committee to make recom-mendations with respect to rates, benefits, and other administrative policy matters. Recentlythe independent CPP Investment Board was created, with a process allowing for provincialinput into the federal appointment of board members. Recommendations of the CPP/QPPCommittee are also directed to the federal-provincial meetings of ministers. As noted previ-ously, a co-decision rule under legislation establishing the CPP means that major features of theplan may be changed only with a qualified majority of the parties. In this case, there must beagreement from the federal parliament plus 7 of the 10 provinces, which must make up at leasthalf of the Canadian population. The CPP/QPP Committee is the main formal forum for theexchange of views and provides an indication of how each government might vote on any pro-posed changes.
CONTINUING COMMITTEE OF OFFICIALS. The deputy ministers of finance from the federal,provincial, and territorial governments form the Continuing Committee of Officials. The com-mittee receives the reports and recommendations of the economic and fiscal data committees,the Fiscal Arrangements Committee, the Taxation Committee, and the CPP/QPP Committee.In the past, the Continuing Committee of Officials played a significant role in resolving issuesarising in any of the aforementioned committees. In recent years, however, its primary role hasbeen to prepare for meetings of ministers by establishing the agenda, rehearsing the positions
72 The Structures and Conduct of Intergovernmental Relations

to be taken into the meetings, and providing ministers with necessary information with respectto options, recommendations, and the positions of other jurisdictions. This work ensures thatthe limited time of ministerial meetings is used in the most productive fashion.
A recent development in the transfers area has been the holding of one-day workshopsinvolving both officials and invited academic experts who present and discuss papers relat-ing to the policy interests of the Continuing Committee of Officials. The committee thenholds its regular meeting without the outside academics or other guests present, perhaps onthe next day. This allows government officials to hear from the experts and debate issueswithout prejudice to the positions they might adopt inside their committee, while the aca-demics gain a better appreciation of the current issues and priorities being examined insidegovernment.
FUNCTIONING OF THE COMMITTEES AND SUBCOMMITTEES. The foregoing committees and sub-committees typically carry out their work behind closed doors. In contrast to the more openU.S. congressional committee processes, they are not part of the public policy dialogue amongcitizens, outside organizations, the media, and the government. However, they have access to,and are informed by, outside expertise from universities, private agencies, think tanks, andother organizations. The committees review the work of these groups, participate with them inpublic workshops and conferences, and sometimes consult with them on specific issues.
Political Forums and Decisions
The administration of Canada’s major fiscal arrangements is generally the responsibility of theministers of finance, who also deal with fiscal policy coordination and discuss monetary issues.However, with respect to major changes or new programs, first ministers (the prime ministerand provincial and territorial premiers) may also be involved.
FEDERAL, PROVINCIAL, AND TERRITORIAL MINISTERS MEETINGS. Federal, provincial, and terri-torial ministers of finance traditionally met twice a year, and more frequently if major changesto programs were under consideration, but in recent years they have met less frequently. Thismay be because the 1990s became a period of severe fiscal restraint by most governments, andthis included significant reductions in federal transfers to provinces. Relationships becamestrained, and political posturing over these cutbacks created a more difficult environment formeetings at the ministerial, and thus also the deputy minister, level. Recent improvements inthe federal budget have resulted in some recovery of transfers, although not to the extentdemanded by provinces. Under these conditions one might expect—or at least hope for—areturn to more “normal” relations, with ministers and deputies resuming their former rhythmof more frequent and collegial meetings.
Traditionally, ministerial meetings held well in advance of the federal budget (normallyannounced each year in February) have been viewed as opportunities for provincial and terri-torial governments to influence federal budgetary decisions. Provincial budgets have usuallyfollowed the federal one, and they are often influenced by the federal budget and any consulta-tive meetings that preceded it. Similarly, meetings after the passage of all budgets are regardedas opportunities to take stock of the aggregate set of decisions and the evolving state of theeconomy in preparation for the next budget cycle.
Officials at these meetings may address the options and recommendations arising from thework of the Technical, Fiscal Arrangements, Taxation, and CPP/QPP committees. Finance min-isters attempt to reach consensus, although in most instances the final decisions lie with the fed-eral minister of finance and the national government. Thus the ministerial meetings serve forthe most part as an exchange of information and an attempt to coordinate broad policy goals orpersuade others of a course of action. However individual governments almost always make
Ronald H. Neumann and T. Russell Robinson 73
final fiscal decisions in the context of provincial budget statements made in their own legisla-tures (or in parliament in the case of the federal government).
SEPARATE PROVINCIAL AND TERRITORIAL MINISTERS MEETINGS. In recent years provincial andterritorial ministers of finance have begun to meet frequently with each other. In the early 1990swestern finance ministers also began to meet separately and prepare annual public reports onissues of common concern. These reports soon had an impact on the national agenda. After thisdevelopment, the Atlantic provinces began to assert their interests as a block. More recentlystill, the provincial finance ministers have undertaken studies and arrived at consensus posi-tions to be taken to the federal-provincial forum.
MEETINGS OF FIRST MINISTERS. First ministers also maintain their own ongoing forums, butthese have typically been less frequent and more ad hoc than the finance ministers’ meetings.Their agendas and frequency depend on the political will and priorities of the prime minister.Some recent Canadian prime ministers, such as Brian Mulroney (1984–93), preferred intensiveuse of first ministers’ meetings. Others, such as the current Prime Minister Jean Chretien, preferto meet premiers in more informal circumstances or bilaterally. In addition to an irregular pat-tern of meetings involving all first ministers, annual premiers’ conferences and regional pre-miers’ conferences involve only the provinces and territories.
Each jurisdiction has an intergovernmental affairs office. In the provinces, this office is oftenwithin the office of the premier; in the federal government it is part of the Privy Council Office,which serves both the prime minister and a federal minister for intergovernmental affairs. Thefirst ministers’ meetings and the intergovernmental affairs offices deal with all matters of coor-dination of activity between the levels of government and among the provinces.
In 2000 federal improvements to funding for provincial social programs were offered by theprime minister at a first ministers’ meeting, rather than by the federal finance minister, who hadnot met his colleagues except on a regional or bilateral basis in more than a year. Perhaps thiswas partly a reflection of the fact that the finance minister had become the bearer of bad newsduring the earlier fiscal restraint period, whereas the first minister was allowed the luxury ofpresenting good news. Whatever the case, this serves as an example that the availability of bothfirst minister and finance minister forums provides useful flexibility in handling major—andsometimes contentious—issues of national importance.
ROYAL COMMISSIONS. The establishment of royal commissions by the federal governmentand the issuing of white or green papers on policy issues by federal or provincial governmentsare occasionally used to generate broad public policy debates. One major example was a recentmultiyear royal commission on aboriginal affairs, and another, more recent, example concernedCanada’s health care system, conducted by a former provincial premier, Roy Romanow ofSaskatchewan.
Administration
The amounts and flows of funds resulting from intergovernmental fiscal arrangements inCanada are primarily formula driven. With excellent, reliable data from Statistics Canada,administrative issues have focused largely on estimations and timing. Advance payments forthe Equalization Program, for example, rely on federal estimates of the coming year’s revenues,based on economic and demographic forecasts. Adjustments are made when revised data,based on actual results and for up to a three-year extension period, become available. The sameprocess of advance payments based on federal estimates, with adjustments for actual collec-tions, applies to personal and corporate income taxes administered by the federal governmenton behalf of the provinces. These retroactive adjustments can be quite large, and they may have
74 The Structures and Conduct of Intergovernmental Relations
a somewhat destabilizing impact with either positive or negative surprises for provincial gov-ernment financing. This has been an issue for intergovernmental discussion from time to time.
Another issue, which may fall into the administration category, is the treatment of tax roomceded by the federal government to provinces 25 years ago. (Tax room refers to tax reductionsenacted by one government, with the idea that the other government could step in and increaseits tax, that is, take up the “room” created by the reductions while preserving the same total taxburden as before.) Both levels of government claim credit for these revenues as part of theirsupport for health care, postsecondary education, and other social programs. The federal gov-ernment argues that its tax reduction was an agreed form of a federal de facto contribution tosupport the designated program areas, while the provinces claim that they are now raising therevenues as part of their own tax system. This lack of clarity—and conflicting political claims—creates some confusion, so that public understanding of who is responsible and accountable forwhat is sometimes blurred. Perhaps this provides a reminder that in any federation, clear infor-mation and public understanding are a challenge. The potential for ambiguity is always pres-ent, underlining the need to nurture an informed electorate.
Government-Funded Agencies
The government recently transformed the federal Department of National Revenue, whichfocuses on customs administration and tax collection, into an independent corporation.Renamed the Canada Customs and Revenue Agency, it has more flexibility than under the pre-vious tax collection agreements to collect revenues for both the federal and provincial govern-ments in accordance with provinces’ increasingly independent tax policies and preferences.
Nongovernmental Agencies
Canada also has a significant number of private, academic, and social agencies that are influen-tial in developing technical and policy options in the area of intergovernmental arrangements,including fiscal arrangements. Many of these institutes, such as the Institute of Intergovern-mental Relations at Queen’s University, the Economics Association of Canada, and theSaskatchewan Institute for Public Policy, are based in the academic community. Privatelyfinanced institutes, such as the C. D. Howe Institute, the Caledon Institute, the Fraser Institute,the Atlantic Institute for Market Studies, and the Canada West Foundation, may be national orregional in their perspective.
Grassroots Associations
Another interesting category of entity, which may be gaining in importance, is what might bereferred to as grassroots or bottom-up associations. Such organizations include associations ofmunicipal governments and school boards at the provincial or national levels and social plan-ning councils. Should Canada mimic the worldwide trend toward a growing assignment ofresponsibilities to local governments, these associations may become increasingly influential.
The Russian Context: Center-Regional Fiscal Relations in Transition
Russia is still going through a period of transition in its center-regional fiscal relations. Officialscontinue to define expenditure responsibilities and make changes in the assignment of revenuesources. These changes in turn have required changes to the nation’s Equalization Program andcompensation fund to address vertical and horizontal fiscal imbalances. Each of these changesis being made as the country’s fiscal circumstances begin to improve. As Martinez-Vasquez andBoex (2001) note, a rapid pace of transition and reform is being planned and implemented. This
Ronald H. Neumann and T. Russell Robinson 75
is apparently being managed by a cadre of officials in the national capital who have goodknowledge of fiscal federalism principles and practices. These individuals work in both the for-mal government sector and in various high-quality institutes. However, they face a dauntingchallenge in trying to address the issues of intergovernmental fiscal relations in this vast coun-try with its many and diverse regional and local governments. Moreover, it is clear that not allthe regions match their expertise.
The establishment of seven federal districts and the appointment of presidential representa-tives to these districts by President Vladimir Putin add a new element to center-regional rela-tions. Nevertheless, districts’ legal status and roles are still somewhat vague and may be evolv-ing (Avtonomov 2001).
As Russia proceeds through this period of transition, its center-regional fiscal relations maybe shaped to a large degree by its emerging fiscal circumstances. If recent history is any guide,constitutional, legislative, and other less formal arrangements will continue to evolve. Theinstitutional framework must be developed and professional bureaucratic capacities nurturedat both the national and subnational levels if the advantages of decentralization are to be real-ized.
Checklists and “Audits” as Evaluation and Planning Tools
This chapter has outlined a range of functions for intergovernmental institutions: develop-ment of issues; information gathering and analysis; preparation of technical and policyoptions; policy adoption and implementation; and coordination of tasks related to administra-tion, monitoring, evaluation, and ensuring accountability. These tasks may be fulfilled by anumber of intergovernmental institutions established by the constitution, legislation, agree-ments, or less formal means. There is no one best structure for all federations, but once all theconstituent parts of the system have been set up, the job of managing federal fiscal arrange-ments must be carried out effectively and efficiently, and supportive mechanisms and expert-ise are essential.
Obtaining a full view of how a system functions in a federation may be difficult. To assist inan examination of a federal system, an intergovernmental audit could be useful. The auditwould involve a review of the component parts of the system. It could also yield an assessmentas to how well each of the functions is performed, bearing in mind that different people willhave different perspectives concerning the system. In particular, there may well be differencesbetween the perspectives of those in the regions and those working in the national government,as well as between those outside the formal government structure and those inside it. The dis-cussion of such differences is a healthy step toward strengthening the intergovernmentalprocesses.
No unique best system exists. The importance of doing an audit and discussing the resultsis to identify how constituent parts of the system might be added, strengthened, restructured,or made to fit with other parts more effectively to better address identified needs. In particular,there could be some potential to compensate for a deficiency in one area—be it constitutionalvagueness, the lack of legislation, political discord, an inadequate civil service, or some otherweakness—by using any other part of the available system. For example, a strong politicalforum, legislation, or agreements might satisfy certain needs of the system. Quasi or non-governmental organizations might be equipped to do some of the data gathering, analysis, anddevelopment of policy options that elsewhere are done within national or subnational govern-ments. It may not matter which part of the system carries out the function as long as the workis being done capably and is feeding into and from the rest of the intergovernmental system.The audit should determine whether the existing structure is up to doing the job or if functionsneed to be shifted, supplemented, or in other ways strengthened.
76 The Structures and Conduct of Intergovernmental Relations
Conclusion
Federations are complex and each is unique. The systems for conducting intergovernmental fis-cal relations must reflect such complexity and diversity. Dupre (1985, p. 1) examined the Cana-dian system for the MacDonald Royal Commission and wrote that “federal-provincial relationshave become so varied and complex that they defy generalization.” However, officials in everysystem need to perform a range of common or “generic” functions, as described in this chapter.Many elements of a complete system may already exist, including institutions and expertise,and these can be drawn upon to help build or strengthen new structures.
There are no absolute prescriptions for the conduct of intergovernmental relations. How-ever, assessing the role and effectiveness of the entire system against the list of tasks that mustbe accomplished could suggest areas that need to be strengthened and potential avenues forfilling in gaps in the development, implementation, and administration of policy.
Canada’s system of intergovernmental relations has evolved over a long period. With thepossible exception of the year after World War II, when Canada’s social programs grew rapidly,the pace of change in Canada has been much more gradual than that occurring today in Russia.The processes of policymaking in this changing environment may be as important to the cohe-sion of the nation as the content. A well-functioning system of intergovernmental relations willbe staffed with competent participants, working with a common set of information, withinknown processes and structures.
Continuity of people and their efforts, mutual respect, and shared experiences create theteamwork to pursue the development of policy in an effective federal system. The gradualbuilding up of working practices, along with expertise in all governments, is critical for the suc-cessful implementation of government mandates and policies. Clarifying those mandates anddesigning good policy constitute only one side of the good governance coin. Equally importantand necessary for success are well-designed and well-attended structures and processes bywhich policies are interpreted, programs administered, disputes settled, and tensions resolved,competently and peacefully. In a federation, all levels of government must participate.
References
Avtonomov, Alexei. 2001. “Putin’s Presidential Representatives: One Year Later.” Federations:What’s New in Federalism Worldwide. 1(4).
Bird, Richard A. 1986. Federal Finance in Comparative Perspective. Toronto: Canadian Tax Foun-dation.
———. 2000. A Perspective on Fiscal Federalism in Russia. Toronto: C. D. Howe Institute.
Bird, Richard M., Robert D. Ebel, and Christine I Wallich, eds. 1995. Decentralization of theSocialist State: Intergovernmental Finance and Transition Economies. Washington, D.C.: WorldBank.
Breton, Albert. 1990. Centralization, Decentralization and Intergovernmental Competition.Kingston, Ontario: Queen’s University, Institute of Intergovernmental Relations.
Brock, Kathy. 1995. “The End of Executive Federalism?” In F. Rocher and Miriam Smith, eds.,New Trends in Canadian Federalism. Peterborough, Ontario: Broadview Press.
Brown, Douglas, M. 2002. Market Rules: Economic Union Reform and Intergovernmental Policy-Making in Australia and Canada. Montreal: McGill-Queen’s University Press.
Desautels, L. Dennis. 1999. “Accountability for Alternative Service-Delivery Arrangements inthe Federal Government: Some Consequences of Sharing the Business of Government.” In
Ronald H. Neumann and T. Russell Robinson 77
Susan Delacourt and Donald G. Lenihan, eds., Collaborative Government: Is There a CanadianWay? Toronto: Institute of Public Administration.
Dupre, Stefan J. 1985. “Reflections on the Workability of Executive Federalism.” In RichardSimeon, ed., Intergovernmental Relations. Toronto: University of Toronto Press.
Financial and Fiscal Commission. 2000. Recommendations for 2001. Halfway House, SouthAfrica.
Kennett, Steven A. 1998. Securing the Social Union: A Comment on the Decentralized Approach.Kingston, Ontario: Queen’s University, Institute of Intergovernmental Relations.
Kernaghan, Kenneth, and David Siegel. 1995. Public Administration in Canada, 5th ed. Toronto:Nelson.
Lazar, Harvey. 2000. “The Social Union Framework Agreement and the Future of Fiscal Feder-alism.” In Harvey Lazar, ed., Canada: The State of the Federation 1999/2000: Toward a New Mis-sion Statement for Canadian Fiscal Federalism. Kingston, Ontario: Queen’s University, Insti-tute of Intergovernmental Relations.
Martinez-Vasquez, Jorge, and Jameson Boex. 2001. Russia’s Transition to a New Federalism.Washington, D.C.: World Bank.
McEwin, Marion. 2000. “Improving the International Statistical System.” Occasional Paper.Academy of the Social Sciences in Australia, Canberra.
McRoberts, Kenneth. 1985. “Unilateralism, Bilateralism, and Multilateralism: Approaches toCanadian Federalism.” In R. Simeon, ed., Intergovernmental Relations. Research Studies ofthe Royal Commission on the Economic Union and Development Prospects for Canada,vol. 63. Toronto: University of Toronto Press.
Mendelsohn, M., and John McLean. 2000. “SUFA’s Double Vision: Citizen Engagement andIntergovernmental Collaboration.” Policy Options 21(3): 43–5.
Ostrom, Elinor. 1990. Governing the Commons: The Evolution of Institutions of Collective Action.Cambridge, U.K.: Cambridge University Press.
Ostrom, Vincent. 1987. The Political Theory of the Compound Republic: Designing the AmericanExperiment. Lincoln, Neb.: University of Nebraska Press.
Painter, Martin. 1998. Collaborative Federalism: Economic Reform in Australia in the 1990s. Mel-bourne: MacMillan.
Pollard, Bruce. 1986. Managing the Interface: Intergovernmental Affairs Agencies in Canada.Kingston, Ontario: Queen’s University, Institute of Intergovernmental Relations.
Shultz, Richard. 1977. “Interest Groups and Intergovernmental Negotiations: Caught in theVice of Federalism.” In J. Peter Meekison, ed., Canadian Federalism: Myth or Reality, 3rd ed.Toronto: Methuen Publications.
Simeon, Richard, ed. 1979. Confrontation and Collaboration: Intergovernmental Relations in CanadaToday. Toronto: Institute of Public Administration.
Smiley, Donald V. 1979. “An Outsider’s Observations of Federal-Provincial Relations AmongConsenting Adults.” In Richard Simeon, ed., Confrontation and Collaboration: Intergovernmen-tal Relations in Canada Today. Toronto: Institute of Public Administration.
Sproule-Jones, Mark. 1993. Governments at Work: Canadian Parliamentary Federalism and Its Pub-lic Policy Effects. Toronto: University of Toronto Press.
78 The Structures and Conduct of Intergovernmental Relations

Watts, Ronald L. 1989. Executive Federalism: A Comparative Analysis. Kingston, Ontario: Queen’sUniversity, Institute of Intergovernmental Relations.
———. 1999a. Comparing Federal Systems. Kingston, Ontario: McGill-Queen’s University Press.
———. 1999b. The Spending Power in Federal Systems: A Comparative Study. Kingston, Ontario:Queens University, Institute of Intergovernmental Relations.
Wright, Deil S. 1998. “Federalism, Intergovernmental Relations and Intergovernmental Man-agement: The Origins, Emergence, and Maturity of Three Concepts across Two Centuriesor Organized Power by Area and Function.” In J. Rabin, ed., Handbook on Public Administra-tion. New York: Marcel Dekker.
Ronald H. Neumann and T. Russell Robinson 79

5Fiscal Flows, Fiscal Balance, and Fiscal Sustainability
Richard M. Bird
The search for fiscal indicators to provide a shorthand, and preferably quantitative, picture ofthe size, direction, and nature of intergovernmental finance—and ideally some guidance for pol-icy designed to improve outcomes—appears to be endless. For example, fiscal balance and fiscalsustainability are terms commonly heard in discussions of intergovernmental fiscal relations.These concepts sound like good things, and policymakers or analysts often suggest policies thatare intended to achieve them. Fiscal flows are perhaps less prominent in policy discussions, butthis notion too is often very much in the minds of some of those engaged in such discussions.Indeed, in practice much of the discussion of both fiscal balance and fiscal sustainability oftenreduces to assertions about the current and projected future course of fiscal flows. The aim ofthis chapter is to provide an overview of the uses and limits of these three approaches to meas-uring and interpreting the problems and progress of fiscal decentralization.
The next section argues that measuring fiscal flows is conceptually difficult, inherently sub-ject to considerable political bias, and, in any case, is of surprisingly little use or relevance indetermining good policy. I then go on to argue that the notion of fiscal balance is also seldomclearly defined; that it often seems to be confused with other, and quite separable, policy objec-tives; and that it is of surprisingly little analytical or policy relevance. In contrast, I note in thefollowing section that fiscal sustainability can have a clear analytical meaning, and that ifdefined properly this concept can provide a useful, if limited, guideline or framework for pol-icy. Unfortunately, even good fiscal sustainability analysis does not take us far along the roadof analyzing and understanding intergovernmental fiscal relations. Thus in the concluding sec-tion I suggest that, while much can and should be done to improve the quantitative picture ofintergovernmental fiscal relations, as a rule careful institutional and empirical analysis seemsmore necessary than such broad indicators, however carefully calculated, if we are to discoverand fully understand the situation (for an illustration of the complexities involved even inindustrial federal countries see Bird and Tarasov 2002).
Although some points in this chapter are illustrated by reference to particular countries, thechapter makes no attempt either to provide a full analysis of all the measures mentioned in thischapter for any one country or to provide comparable measures within or across countries. Itsaim is less to tell analysts or policymakers what they should do to measure, say, fiscal balance,than to argue that looking to such simple quantitative indicators to reveal the directions ofneeded policies is inherently futile. Instead, much more specific institutional analyses focusedon real policy goals and real policy problems are generally needed.
Fiscal Flows
Regional fiscal flows are usually intended to measure the redistribution of income amongregions that results from tax and expenditure policies. In these terms, a region experiences afavorable fiscal flow if its income (in reality the income of its residents) is raised more by theimpact of government spending than it is reduced by the taxes borne in the region. The mostextensive discussion in English of intergovernmental finance in Russia (Lavrov and Makushkin2001), for example, is concerned almost entirely with the analysis of inter-regional fiscal flows.
81
The data presented in this study are interesting, and the study as a whole is an important con-tribution. Much the same can be said of a detailed study of flows at the subregional level in theLeningrad region (Bahl and others 1999). Similar studies have also been carried out in othercountries from time to time, for example, see Advisory Commission on IntergovernmentalRelations (1980) for the United States, Bird (1984) for Colombia, and Leslie and Simeon (1977)for Canada.
Fiscal flow data are not easy to obtain, and often require substantial effort to construct.1 Itis thus perhaps understandable that once the hard work of estimating such flows has beenaccomplished, basing policy conclusions on them is tempting. The temptation to do so should,however, be resisted, because such numbers, though generally well used descriptively in thestudies cited, can, unless care is taken, be highly misleading as a guide to policy. The balanceof this section explains why this is so (portions of this section draw on an earlier discussion ofsome of these issues in Bird 1984, appendix II).
Analyzing Geographic Incidence
Fiscal flow analysis essentially has two levels of problems: conceptual and practical. Eventhough the task of measuring the size of regional fiscal flows might seem to be simple andstraightforward, serious conceptual problems in the exercise and critical gaps in the databaseare common. As a rule, for instance, such analysis assumes, often implicitly, that taxes collectedwithin a territory are paid by the residents of that territory. This assumption is often wrong. Forexample:
• Port cities do not pay—in the only economically meaningful sense of reduced privateincomes for their residents—customs duties that are collected on shipments in transit toinland destinations.
• Those who live near a distillery that ships most of its product outside the jurisdiction donot pay the taxes the distillery remits to the government.
• Citizens of the region in which a company’s headquarters is located do not pay all thetaxes that company pays.
Tax incidence analysis is no doubt an arcane and arguable art, but its intricacies and inher-ent problems cannot be simply neglected, as is too often the case in flow analysis. Moreover, thedata needed to trace the real inter-regional effects of product (and perhaps factor) taxes are sel-dom, if ever, available, largely because good data on cross-border flows of either products orfactors within national boundaries are seldom available.
Similarly, on the expenditure side it should not simply be asserted that expenditures thattake place in a particular geographic area actually benefit the residents of that area. For exam-ple:
• Are all the benefits (as measured by the cost of the project) of an interstate highwayreceived by those who live beside the road?
• Do the benefits of expenditures on public sector activities accrue to those who receiveincomes as a result (such as teachers) or to those who receive the services provided (inthis case students)?
• Are the “benefits” received by the factors of production employed by the governmentonly short run and those received by the presumed ultimate beneficiaries long run?
82 Fiscal Flows, Fiscal Balance, and Fiscal Sustainability
1. In many countries, even industrial countries, such information is often impossible to obtain belowthe level of intermediate (regional) governments. In the 1970s, for example, I worked for a trilevel com-mission on public finance in Canada that labored in vain for more than a year to carry out an acceptablefiscal flow analysis at the local level.
• What is the time frame of the analysis? • Are benefits equal to costs?2
• How does one allocate the benefits of public goods?
Such questions generally do not have easy or obvious answers and are even harder toanswer in a regional context. A region is, in effect, a small, open economy that has extensiveeconomic linkages with other regions. The central government may, for example, spend exten-sively in a certain region (directly or through transfers), but the effects of that expenditure maybe felt throughout the economy as a result of the network of inter-regional trade and factorflows. Reliable data on such flows are rare. Even worse, spillovers from region to region of bothexpenditures (the factor incomes paid out, for example) and benefits (the services provided)may take place. Such spillovers are diffuse, complex, and difficult to measure even in principle,let alone in practice.
Such problems do not mean that measuring geographic incidence is impossible in principleor practice, but they do imply that doing so meaningfully requires more detailed data than usu-ally exist as well as strong assumptions about issues that are inherently highly uncertain. Onecan certainly assign taxes and expenditures on a regional, or even a local basis, if one is willingto make such assumptions, but there are no universal rules that determine the appropriateassumptions for a particular country and time (for a recent interesting study of the UnitedStates that illustrates both what can be done and what assumptions are needed to do it seeSehili and Martinez-Vazquez 2002). The results of such analyses, even the most careful ones, arethus always suspect to some extent. More important, precisely because of its inherent subjectiv-ity, flow analysis is all too subject to manipulation for political purposes.
To add to the problems, because of data limitations many flow studies, for example, Lavrovand Makushkin (2001), cover only part of the flow of intergovernmental revenues and expendi-tures. While understandable, this approach implicitly assumes that nonincluded flows haveequal per capita effects everywhere, an assumption that is almost certain to be wrong. Ideally,one should also take into account the possibly offsetting regional effects of such “invisible”transfers as those through price controls and subsidies, tax expenditures, and controlled creditallocations (Bird and Chen 1998b), and a variety of nonfiscal public policies, such as regulation.To do so, however, is so difficult a task, even in the most data-rich countries, that apparently noone has ever managed to do it. The picture that even the best fiscal flow analysis paints of real-ity is therefore inevitably partial, and hence inherently flawed to an unknowable extent.
Interpreting Regional Flows
Even in the improbable case that the methodology of a flow study is beyond question, what dothe results mean? Usually, as in the fiscal balance studies discussed in the next section, suchstudies are interpreted as showing that one region is paying too much or too little or receivingtoo much or too little. The usual policy recommendation drawn from such analysis is that thisimbalance should be corrected, usually by allowing the generating regions to keep more ofwhat they produce in terms in revenue. Attractive as such a conclusion may be to those regions,it is illogical. The aggregation of people into territorial units has little to do with the factorsdetermining the allocation of most flows.
Suppose, for example, that each region were joined to one of its neighbors, that absolutelynothing else changed, and that fiscal flows were then re-estimated. The results would, ofcourse, be quite different, generally with less measured inequality in the regional balance ofrevenues and expenditures, even though the reality has not changed. To illustrate, take this
Richard M. Bird 83
2. Even if resources are optimally allocated, which is unlikely in reality, such equality prevails only atthe margin, not in total terms.
example to its limits and unify all territories into one. All regional differences have now beeneliminated because there are no regions, but nothing has changed in reality because, byassumption, all spending and taxing is continuing in exactly the same way as before. Box 4.1reinforces this point.
Despite its many methodological problems, fiscal flow analysis may nonetheless sometimesprovide a useful framework within which to assemble data from diverse and scattered sources(which is essentially what Bahl and others 1999 and Lavrov and Makushkin 2001 do for Rus-sia). From a policy perspective, however, the analysis of fiscal flows appears to be essentially adead end. It is hard to see what one can learn from even the best fiscal flow analysis other thanthat the geographic incidence of taxes and expenditures—assuming one thinks, improbably,that such incidence is known with sufficient certainty—is unlikely to be neatly balanced withinparticular jurisdictional boundaries. Of course, why anyone would expect or want it to be sobalanced is not obvious, which leads us to the next section.
Fiscal Balance
Some degree of fiscal imbalance seems inherent in countries with more than one level of gov-ernment (much of the discussion in this section is based on Bird and Tarasov 2002). As a rule,central governments tend to collect most taxes while state and local governments are oftenresponsible for more expenditures than they can finance from sources of revenue directly undertheir control. The resulting difference between expenditures and own source revenues at differ-ent levels of government is called vertical fiscal imbalance (VFI). At the same time, within eachsubnational level of government invariably some jurisdictions are richer than others. Theresulting difference in the resources available to governments at the same level is called
84 Fiscal Flows, Fiscal Balance, and Fiscal Sustainability
Box 4.1 Balance-Sheet Federalism in Canada
In Canadian political debate adding up all the taxes paid by a region on one side and the transfersand services received on the other side and drawing conclusions from such calculations about whowins and who loses is common. For example, a prominent Alberta academic argued that Albertansare the major net contributors to Canadian federalism and that most other provinces—and by exten-sion the people in them—were “on the take” (Flanagan 2001). Around the same time Quebec’s pre-mier argued that Quebec and its people were on the losing side of the federal fiscal equation, a viewthat the federal minister of intergovernmental affairs strongly rebutted (Dion 2001). (For earlier go-rounds in this fight see Leslie and Simeon 1977.) As argued in the text, however, all such calculationsare inherently theoretical and rely heavily on possibly prejudiced judgments. They often ignore, forexample, upper-level government debt, deficits, and surpluses and also any economic flows ofincome back to the paying jurisdiction. Moreover, even if one believes all the numbers, they do notindicate whether any given person in any jurisdiction is better or worse off.
As no one has any objective measure of such fiscal balance sheets, the reality is that governments(and their opponents) use such numbers mainly for the purpose of scoring political points. In Canadathe result is that people in every province except Ontario—the biggest and richest province—seem tothink they pay more into federalism than they get out. However, if one takes a leap of faith and arguesthat such numbers have meaning, Ontario actually seems to be the biggest net loser in the system,with all other provinces except Alberta being net winners.
Reality is quite different than either of these pictures. As everyone in the same economic situa-tion tends to pay the same taxes to the federal government and receive the same services regardlessof where they live and the federal fiscal system appears on the whole to be mildly redistributiveinterpersonally, the biggest winners are likely to be poor people, of whom, by definition, there arerelatively more in poor provinces, and the biggest losers seem to be rich people, of whom, again bydefinition, there are more in rich provinces. How provinces as such appear to fare reflects mainlyhow this works out in territorial terms given the level and distribution of income in a province rela-tive to the national average. It has little or no independent meaning or policy relevance. Focusing onregional fiscal flows therefore hides rather than reveals the most important distributive outcome ofCanadian fiscal federalism.
horizontal fiscal imbalance (HFI). Each of these concepts carries with it a fair amount of philo-sophical baggage. Each is also difficult to measure in an unambiguous way.
Vertical Fiscal Imbalance
If imbalance is the problem, then balance would seem to be the solution. It is thus not surpris-ing that the concept of VFI—or the fiscal gap (Boadway and Hobson 1993)—is often discussedas though in an ideal governmental structure the own source revenues of each level of govern-ment should be sufficient to finance the expenditures for which it is responsible withoutrecourse to intergovernmental fiscal transfers.3 Vertical fiscal balance, thus understood, seemsto require that each level of government should have separate and independent revenuesources sufficient to finance the expenditures assigned to that level—no more and no less. Inother words, given the assignment of expenditures, revenues should be assigned so that thereis no imbalance between revenues and expenditures at any level of government. Proponents ofthis argument note that if this is not done, a fiscal crisis may ensue (see box 4.2).
In a world in which in many countries the most rapidly expanding expenditure sectors—education and health, for example—have often been assigned to regional (state, provincial)governments, the implication of such analysis is generally taken to be that more revenuesshould be assigned to subnational governments. In Canada, for example, the province of Que-bec has frequently used this interpretation of fiscal balance as an argument for more revenueauthority.4 Among the advantages of such tax separation, in which every level of government“stands on its own bottom,” are that local autonomy and accountability are strengthened andthat the fiscal system is more transparent, with citizens being less confused by overlapping fis-cal jurisdictions as to what they are paying for and to whom.5
Richard M. Bird 85
Box 4.2 How to Create a Fiscal Crisis
A fiscal crisis for any local government occurs when its potential to raise revenues is insufficient tocover the expenditures that it is legally mandated to carry out. If maximum tax revenues are less thanrequired expenditure (less transfers and other revenues), someone who is legally entitled to a claimon the local government loses and crisis ensues. Thus to see if a subnational government faces a crisisall one has to do is (a) calculate the maximum tax revenues, T*, that it can collect with its designatedrevenue structure; (b) calculate the cost of the expenditures, E, that it is legally required to carry out;(c) estimate the transfers to be received from other levels of government, TR; and (d) calculate howmuch the jurisdiction can expect to get from such other revenues as fees, OR. If T* is less than E + TR+ OR, there is a crisis.
Or is there? Obviously the credence one puts in this calculation depends on two things. One is thereliability of the estimates; what is maximum tax revenue, for example? The other is the criticalassumption that no changes in required expenditures are feasible, for example, paying city workersless, reducing pension obligations, negotiating better prices for materials the city buys, or reducingservice levels are all impossible. Only if one assumes that all the terms in the equation are both prop-erly estimated and, more important, that the underlying assumption about the rigidity of the revenueand expenditure possibilities is correct, can one take such an equation as an indicator of crisis.
Source: This note was suggested by reading Inman (1995).
3. This perspective is implicit in Wheare’s (1963, p.93) classic statement that “both general andregional governments must each have under its independent control financial resources sufficient to per-form its exclusive functions.” It is explicit in Hunter (1977), the seminal work on vertical fiscal imbalance.
4. Compare, for example, the Tremblay report of 1954 (Kwavnick 1973, p. 215) with the Seguin Com-mission (2001, p. 4).
5. Another advantage of tax separation might be to make it more difficult for governments to form acartel against citizens, thereby reducing governments’ ability to exploit them unduly (Brennan andBuchanan 1980).
By contrast, there is no reason why governments that are so inclined could not, if theywished, overcome taxpayer confusion and the inadequate attribution of political responsibil-ity without recourse to strict revenue separation. Nor does even strict separation necessarilylead to such benefits. If governments really want citizens to understand what is going on, theycan achieve this end without separate taxes. If they do not, separate taxes alone will do little tohelp matters. Moreover, even the strongest adherents of tax separation at the regional levelsometimes seem strangely reluctant to apply similar reasoning to the local level of govern-ment, where it is surely equally applicable or inapplicable on logical (if not necessarily on con-stitutional) grounds. Finally, and perhaps most important, so long as governments at the samejurisdictional level have different levels of fiscal resources relative to their expenditure respon-sibility, even the most far-reaching attempt to resolve VFI by devolving revenue resources can-not succeed.
To make this last point clearer, it is important to understand that the two concepts of fiscalbalance mentioned earlier—VFI and HFI—cannot be cleanly separated. One way to view VFI,for example, is that it might be thought of as being eliminated, that is, vertical fiscal balance isachieved, when expenditures and revenues (excluding transfers) are balanced for the richestlocal government, measured in terms of its capacity to raise resources on its own (Bird 1993).Even if this goal is achieved, however, fiscal gaps or VFI will, of course, still remain for allpoorer local governments. More commonly, however, such gaps are instead discussed in termsof HFI, that is, as a problem of achieving horizontal fiscal balance within the regional or localgovernment sector rather than vertical balance between levels of government. Regardless ofhow it is defined, whether and to what extent HFI (VFI for poorer jurisdictions under anothername) is considered a problem is a highly political issue in many countries, and especially informally federal countries. Box 4.3 illustrates some of the complexity of the notion of VFI in theCanadian setting.
While intergovernmental fiscal relations in most countries seem closer to those betweenCanada’s provinces and its local governments than those between Canada’s provinces and thefederal government (for an extended discussion of these two very different models of fiscal fed-eralism see Bird and Chen 1998a), vertical fiscal gaps may, in principle, be closed by reducingsubnational expenditures or raising subnational revenues from existing sources, just as centralgovernments may rectify any inverse imbalance or deficit (revenues exceeding expenditures)at the central level by increasing their expenditures or reducing their taxes. Central govern-ments are seldom reluctant to expand their own expenditures or, less commonly, to lower theirtaxes. Often central governments also argue that subnational governments can both spendmore efficiently and increase their fiscal effort. No doubt there is at least as much room forimprovement in these respects at the subnational level in most countries as at the central level.Nonetheless, while each of these paths has been followed to some extent at some time in mostfederal countries, as a rule sufficient mismatch in the revenues and expenditures assigned todifferent levels of government remains so that some balancing role is invariably assigned tointergovernmental fiscal transfers.
Measuring Vertical Fiscal Imbalance
No matter what their stated purpose might be, intergovernmental fiscal transfers are thus oftenintended to help close the fiscal gap, and in any case have that result. Indeed, one way in whichVFI is sometimes measured is simply as the ratio of transfers to subnational expenditures. Thismeasure has the considerable virtue of being easy to calculate. Moreover, if one ignores bor-rowing, it may sometimes provide a useful measure of the actual level of VFI prevailing in acountry in any given year in terms of fiscal flows. However, such a measure tells us nothingabout the extent to which the fundamental concerns about political accountability andeconomic efficiency that presumably underlie the concept of VFI are legitimate. The
86 Fiscal Flows, Fiscal Balance, and Fiscal Sustainability
transfer/expenditure ratio measure does not get to the heart of the matter, because it does nottake into account the extent to which transfers, other subnational revenues, and indeed evensubnational expenditures reflect central or subnational policy decisions.
Recognizing this problem, analysts have developed more refined measures of VFI. Hunter(1974, 1977), for instance, proposed three coefficients of vertical imbalance. Essentially, thesemeasures took into account, to varying degrees, net borrowing by subnational governments,shared taxes, and the degree to which federal transfers were conditional. His intent in con-structing these measures was to define more precisely the extent to which the basic allocationof revenues and expenditures was such that “governments at each level can command thefinancial resources necessary for them to carry out their expenditure responsibilities and to beheld accountable for both spending and taxing decisions” (Mathews 1980, p.10). In otherwords, what Hunter was attempting to do was to distinguish between revenue sources thatwere under federal control and those that were under state control. He did so by assuming inone measure that unconditional transfers did not reduce state autonomy, in another that theydid, and in a third that not only did such transfers (and borrowing) compromise state auton-omy, but so did shared taxes to some extent. Naturally, Hunter’s judgments as to how to assess
Richard M. Bird 87
Box 4.3 The Meaning of VFI in Canada
Consider how VFI might be eliminated, assuming that for some reason vertical balance is viewed asan appropriate or desirable policy goal. First, as just discussed, the assignment of expenditures can betaken as fixed and more revenue-raising powers can be devolved to subnational jurisdictions. Alter-natively, revenue powers may be taken as fixed and some expenditure powers can be reassigned tothe federal (or central) level. In Canada, for example, this is essentially how the gradually expandingsocial security system (unemployment insurance and old-age pensions) was initially dealt with in themiddle of the 20th century (Bryden 1972), through constitutional amendments to “federalize” theseexpenditure functions. Subsequently, the later expansion of education, health, and social welfareexpenditures was dealt with instead by increasing federal transfers to provinces, first in the form ofbroad conditional grants, and then in the form of essentially unconditional grants.
Norrie (2002) recently noted with respect to Canada: “The traditional interpretation of VFI doesnot apply to a federation in which both orders of government have equal access to the main revenuesources and both clearly exercise these powers to achieve economic and social objectives.” His pointis simply that projections of expected provincial and federal budget outcomes over some time periodtell us nothing meaningful about fiscal balance. The distribution of both revenue sources and spend-ing responsibilities in a flexible federation like Canada is therefore, and always has been, essentially amatter of political choice, not something carved in constitutional stone. As fiscal outcomes are notinevitable, but chosen, the ongoing and endless debate on VFI in Canada can largely be seen as noth-ing more than political posturing—part of the process of setting the stage for yet another reshuffle ofexactly who is responsible for what and who pays for it and how (the recent review of tax sharing inCanada during the last 50 years in Vaillancourt and Bird 2002 broadly supports this interpretation).
Canadian cities, however, are not provinces, thus their fiscal futures are indeed largely cast instone that is beyond their ability to cut (Bird and Slack 1993). The traditional concept of VFI thereforeseems to be applicable at the lower level of subnational government even in Canada, and studies thatargue that the fiscal needs of cities (driven largely by demographics) exceed their revenueprospects”(essentially the yields of the real property tax) are not uncommon (Vander Ploeg 2001), butsuch conclusions too are generally overstated. There is no iron law of local expenditure that saysexpenditure must always increase in step with population or with the growth of a particular clientgroup. The alternative of reducing the amount spent per client is always an option. Moreover,although local governments’ ability to raise property taxes may be genuinely limited, there is nothingto prevent provincial governments from, in effect, taking back responsibility for expenditures thatcannot readily be financed from this source. Parenthetically, in Canada there cannot really be a fiscalcrisis (box 4.2) at the local level simply because local governments are strictly held to balanced budg-ets; however, local levels can nonetheless face a sustainability crisis in the sense that the required bal-ance is achieved only by reducing expenditures to below maintenance levels or by raising taxes sohigh that the tax base is chased away (for further discussion see Slack and Bird 2003).
such autonomy could be questioned, and soon were, for example, by Thimmaiah (1976).Nonetheless, despite its inherent subjectivity the literature still uses variants of Hunter’sapproach (see, for example, Bird and Tarasov 2002; Rezk 1998).
The defects of this approach are both conceptual and empirical. Conceptually, focusing onactual deficits and surpluses at different levels of government is a limited approach to the broadproblem of VFI, however the data are manipulated. Hettich and Winer (1983), for instance,argue that ideally one needs a more logically consistent approach related to such fundamentalconcerns as maximizing social welfare. A less ambitious refinement would be to focus not onactual budget balances, but on structural budget balances, that is, the balances inherent in cur-rent expenditure and tax policies at each level of government. A recent Canadian study byMatier, Wu, and Jackson (2001), for example, first projects expenditures and revenues at eachlevel of government under various demographic and economic assumptions, and then consid-ers the extent to which the fiscal positions of each level are sustainable in the framework of anintertemporal budget constraint. Under this approach VFI exists if one level has room to reducetaxes or increase spending while satisfying its intertemporal constraint while another levelwould have to increase taxes or reduce spending to do so. The results of this more formalapproach seem to be extremely sensitive to both model specification and empirical assump-tions, and hence are unlikely to be accepted by all.6
In any case, undertaking such an ambitious dynamic analysis is seldom feasible in devel-oping or transition countries. Even if one works only with historical data, one must be awareof important differences in the real significance of numbers purporting to measure the samething in different countries, or even in the same country at different times. For example, sharedtaxes are an important source of subnational revenue in many countries. In some instances,however, such taxes may simply be central taxes, a share of which flows to subnational gov-ernments through a distribution formula, as is the case with VAT in Germany. Such tax shar-ing is in reality just an intergovernmental transfer in other guise. In other instances, so-calledshared taxes may actually be subnational in the sense that the subnational governments set thetax rates even though the central government collects the taxes, as with most provincial per-sonal income taxes in Canada. Thus those interpreting statistical comparisons must considerprecisely how such data are recorded in statistical sources as well as the meaning of the meas-ures provided. As Ebel and Yilmaz (2003) and the Organisation for Economic Co-operationand Development (1999) demonstrate, measures of fiscal decentralization and the interpreta-tion of those measures are highly sensitive to assumptions about whether and to what extenteach level of government controls state and local taxes. All measures of VFI based on interna-tionally comparable fiscal data are thus invariably questionable to some extent.
Horizontal and Vertical Fiscal Imbalance
I noted earlier that HFI might be interpreted as the VFI that is “left over” when the VFI prob-lem of revenue-expenditure imbalance is solved for the richest subnational government. As arule, however, HFI is discussed in different terms than VFI, and indeed, close consideration ofHFI raises serious questions about the meaning of VFI as that term is usually discussed. Essen-tially, VFI is generally measured in terms of the actual gap between subnational expendituresand subnational own source revenues available to finance those expenditures.
If horizontal fiscal balance is interpreted in the same gap-filling sense as vertical fiscal bal-ance, the implication is that sufficient transfers are needed to equalize revenues (includingtransfers) and the actual expenditures of each subnational government. Such fiscal dentistry, as
88 Fiscal Flows, Fiscal Balance, and Fiscal Sustainability
6. This approach, in contrast to that which Quebec’s Seguin Commission (2001) used, yields the resultthat Canada has no VFI. It is perhaps not entirely coincidental that the authors are employed by Canada’sFederal Department of Finance.
Rao and Chelliah (1991) refer to this approach, clearly makes no sense. Equalizing the actualoutlays of subnational governments in per capita terms (raising all to the level of the richestsubnational government) in effect ignores differences in local preferences, and hence one of themain rationales for decentralization in the first place. It also ignores local differences in needs,costs, and own revenue-raising capacity. Equalizing actual outlays would discourage both sub-national revenue-raising efforts and subnational expenditure restraint, because under this sys-tem those with the highest expenditures and the lowest taxes would get the largest transfers.
Such problems are well recognized, but what seems to be noted less often is that just as anytransfer, no matter what its rationale may be, helps resolve the VFI problem, so any transfer—even one intended purely to close the gap—may have adverse incentive effects on subnationalfiscal decisions. The appropriate incentive design of transfers, no matter what their statedrationale may be, is therefore a critical element in intergovernmental fiscal relations in anycountry.
Equalization and Balance
Three different topics are often confused when HFI, or equalization as it is often labeled, is dis-cussed. First, many writers, especially in the United States—perhaps not coincidentally theonly federal country that has no general equalization transfers—often discuss the equityaspects of intergovernmental transfers as though the principal objective of such transfers is toreduce disparities in per capita incomes in different regions (see, for example, Oakland 1994).Inter-regional equity is not interpersonal equity, however, and keeping the two concerns dis-tinct is important (for further discussion of the distinction between interpersonal and inter-regional transfer objectives see Bird and Rodriguez 1999; Rao and Das-Gupta 1995). Sometimestransfers to poor regions may help poor people and sometimes they may not. If the principalobjective of policy is to alleviate poverty, intergovernmental transfers are unlikely to be eitherthe most appropriate or the most efficient way to achieve this aim. Nonetheless, such transfershave their own rationales and should not be judged solely or primarily in terms of their effectson individuals at different income levels.
Second, much public discussion of intergovernmental transfers focuses on the relationshipbetween such transfers and regional disparity. While generally ill-defined, regional disparity isoften interpreted in such a way that the supposed objective of transfers is to reduce such dispar-ity, whether understood in terms of differences in per capita income between states or localities orin terms of differential regional growth rates, unemployment rates, or some other economic vari-able (Bird 1966 discusses the many facets of regional balance as a policy objective). Reducing suchregional disparities may not always be a sensible policy objective, but naturally countries are freeto attempt to do so if they wish, and they may use intergovernmental transfers as a policy instru-ment in any such attempt (Bird 1982 compares such transfers to other policy instruments, such astax expenditures and direct expenditures). Thus finding that an important indicator of need intransfer formulas is some measure of the level of economic well-being in recipient regions, suchas per capita regional income, is not uncommon. Basing intergovernmental transfers solely onsuch concerns, however, may produce undesirable economic incentives. Moreover, as with thecase of viewing interpersonal equity as a policy objective, it is important to distinguish the aim ofreducing regional disparity from the narrow concept of fiscal equalization between governmentincome (or spending) that seems most directly relevant to transfer design.
Equalization transfers in the third sense just mentioned, namely, those intended to equalizegovernment income, may have two distinct rationales. The first is to provide the necessaryunderpinning for decentralization in general (and, as discussed later, for matching transfers)by equalizing the fiscal capacity of territorial entities to some level, thereby putting all closer tothe same footing with respect to incentives. A second rationale might be to provide sufficientresources to enable all local governments, even the smallest and poorest, to provide a basic
Richard M. Bird 89
package of local services.7 From a purely economic point of view, the second of these objectivesmay appear to make little sense. Often, however, small rural areas are simply unable to provideany significant local services without such transfers.8
In part to avoid the disincentive problem noted earlier, most countries with systems of for-mal equalization transfers avoid revenue pooling, and generally aim either to equalize localgovernments’ capacity to provide a certain level of public services or to equalize local govern-ments’ actual performance of this level of service (Bird and Smart 2002). The performance crite-rion, which adjusts the transfer received in accordance with the perceived need for the aidedservice (and which may also allow for cost differentials) is often more attractive to central gov-ernments, because the level of service funded is then determined centrally, and transfers can bemade conditional on the provision of that level of service. Unfortunately, unless adequateadjustment is made for differential fiscal capacity, once again the government that tries leastwill receive the most.
In contrast, under capacity equalization, which is more applicable to federal settings inwhich subnational governments have constitutional expenditure and revenue responsibilities,the aim is to provide each local government with sufficient funds (own source revenues plustransfers) to deliver a centrally predetermined level of services (differentials in the cost of pro-viding services may or may not be taken into account). Transfers are based on a measure of eachjurisdiction’s potential revenue-raising capacity, such as assessed values for property taxes ormeasured tax bases for other taxes, and not on actual revenues. As long as revenue capacity ismeasured accurately, which is seldom an easy task in practice, such transfers will create no dis-incentive for local governments to raise revenues, because at the margin the local governmentstill bears full fiscal responsibility for expenditure and taxing decisions, essentially becausetransfers are lump sum (inframarginal) in nature.
Full equalization (as defined earlier in the sense of closing all gaps) will be achieved only ifthe standard revenue-raising capacity that the grant is intended to provide is set at the level ofthe richest local government. In most countries, budgetary constraints lead to lower standards,such as the average revenue-raising capacity of local governments. In such cases, localities withbelow average capacities obviously remain disadvantaged.9 As even this brief discussion sug-gests, HFI is clearly a much more complex concept than VFI. Correspondingly, it is even moredifficult to measure satisfactorily (for an interesting recent discussion of many of the relevantissues in the U.S. context see Chernick and Reschovsky 2000).
Thus even though fiscal balance analysis is not quite the analytical dead end that fiscal flowanalysis generally is, for the most part it too is a relatively unproductive diversion from the realpolicy questions facing analysts in relation to intergovernmental fiscal relations. Perhaps thereal answer lies in fiscal sustainability analysis?
Fiscal Sustainability
Sustainability, like balance, sounds good. At the very least unsustainability clearly seems tobe not only undesirable, but, well, unsustainable (this section draws on an earlier, broader
90 Fiscal Flows, Fiscal Balance, and Fiscal Sustainability
7. The objective of providing similar public services regardless of location may conflict with the desir-ability of migration from less (privately) productive to more productive locations. This subject has beendiscussed extensively, if not conclusively, in the literature and is not considered further here.
8. Note that this lack of local resources need not necessarily imply a lack of local capacity to make andimplement suitable expenditure decisions (see, for example, Fiszbein 1997).
9. An exception is when the positive transfers required to bring those below the average up to theaverage are financed by negative transfers from those above the average (as in the finanzausgleich of Ger-many and the similar system in Denmark and the Baltic states). Such transparent “Robin Hood” policiesare inevitably controversial. More generally, the effects of any grant system are obviously determined inpart by how the grants are financed (Musgrave 1961).
discussion of fiscal indicators in Bird and Banta 2000). Like fiscal balance, however, fiscal sus-tainability is a term of art, not science. What it means depends largely on the interests andobjectives of those who use it. How it is measured also depends on the information available.Sustainability may be assessed in terms of such structural factors as laws and institutions.Alternatively, and more plausibly, sustainability may be determined by the attainment of par-ticular performance criteria, such as the reduction of deficits, or both structural and perform-ance factors may be considered. Some factors taken into account may be quantifiable, othersmay be descriptive, and still others may reflect subjective judgment.
An obvious interpretation of fiscal sustainability, for instance, is simply that a governmentshould cover public expenditures out of its own revenues, for example, reducing its dependenceon transfers if it is a subnational government, on foreign assistance if it is a national government,or on borrowing regardless of its level.10 According to this simple definition, sustainability hasthree distinct quantifiable aspects: the level of taxes, the level of expenditures, and the differencebetween the two (the deficit), with the main relevant indicator of performance being the deficit.An example of this approach is the well-known Maastricht criteria for countries wishing to jointhe European Monetary Union: a budget deficit not exceeding 3 percent of gross domestic prod-uct (GDP) and a public debt level not exceeding 60 percent of GDP. McKenzie (2001) provides auseful simulation exercise showing how this approach can be used to illuminate some aspects ofsubnational finance (however, note the comment in box 4.2 on one possible limitation of thisapproach to sustainability at the local level, at least in some countries).
Even with this simple approach, however, in principle two distinct dimensions need to beconsidered: the static dimension (the relationship between levels) and the dynamic dimension(the relationship between growth rates). Suppose, for example, that the elasticity of publicexpenditures is unity, so that a 1 percent increase in GDP leads to a 1 percent increase in expen-ditures. If the budget were initially in deficit, fiscal sustainability would then require an elastic-ity of revenues that is greater than unity. However, if, for example, revenues depend largely ona VAT, the elasticity of which is unlikely to exceed unity over any prolonged period, then theonly way to remove the initial deficit and achieve sustainability in the sense used here may beto reduce the size of the public sector relative to GDP (for an analysis along these lines see Bird1989).
Focusing on such simple, quantifiable, budgetary measures can sometimes be an appealingand useful initial approach to the sustainability issue, but it is unlikely to prove fully satisfac-tory as a guide to policy for several reasons. First, the numbers available may not be either theright ones or the best ones.11 Second, they may not be comprehensive (on the importance ofextrabudgetary funds in Russia see, for instance, World Bank 1996b). Third, they may not be
Richard M. Bird 91
10. A variant, common in the literature on public debt, is to compare the actual deficit with the esti-mated sustainable deficit that would maintain a constant debt-to-gross domestic product ratio (for likelyrates of growth, real interest, and inflation). A useful way to approach the question of how to move fromtheory to numbers in approaching the sustainability issue is to consider three quite distinct papers on thissubject produced by the International Monetary Fund: Chalk (2002), Hemming and Petrie (2000), andHorne (1991). Reviewing these papers emanating from the world’s leading institution charged with assess-ing the sustainability of national fiscal policies is impossible without concluding first, that the resultsappear to be very dependent on theoretical assumptions that often seem to be arguable, and second, thatwe still have a long way to go before we can use simple quantitative measures with much confidence, evenat the national level. A review of some recent literature on appraising the creditworthiness (equivalent tosustainability) of subnational governments (for example, Fitch Ratings, Ltd. 2001; Moody’s Investors Ser-vice 1998; World Bank 1996b) similarly suggests the continued importance of informed judgment oversimple numerical measures.
11. Questions may be raised about, for example, the comprehensiveness of budgets and the appropri-ate measurement of deficits, particularly in transition countries in which the proliferation of such devicesas mutual settlements, tax offsets, and the like make interpretation of the public sector’s real fiscal situa-tion difficult.
comparable over time or across jurisdictions, particularly internationally.12 Finally, changes inbudgetary outcomes may reflect not internal change and effort, but largely fortuitous externalevents. As different jurisdictions start in different initial positions, similar changes in outcomemeasures may mean completely different things.
Thus indicators of a government’s relative degree of fiscal sustainability need to extendbeyond outcomes to take into account both initial conditions and processes and structures. Todo so satisfactorily requires establishing meaningful links between structures and processes—for example, the existence of a tax code, a functional organization of tax administration, or asingle treasury ledger system—and the relevant outcomes to demonstrate that such outcomesare truly the result of the adoption of such policies and not simply reflections of exogenousinfluences. Such a task is far beyond the scope of our current knowledge. At best we maybelieve, from experience or theory, that a particular institution may be conducive to better out-comes. As an example, international experience may suggest that countries that systematicallyreview and codify their tax systems are, on average, likely to do better over time than countriesthat do not, or theory may suggest that subnational governments subject to a hard budget con-straint are more likely to tax and spend sensibly (Bird 2001).13
Initial Conditions
The policy choices governments make and the effects of those choices depend in part on initialconditions. A country, region, or locality that has few human or natural resources; no priorexperience with an independent fiscal institutional structure; and also faces internal or externalarmed conflict is clearly completely different from a rich country, region, or locality with astrong tradition of independence that faces no serious disturbances. A country with a hugeexternal debt, a large fiscal deficit, and raging inflation at the moment the transition processbegins is not readily comparable with a country that faces none of these problems. Ideally, suchcontextual or environmental factors—ranging from the degree of public acceptance of the gov-ernment’s legitimacy to the extent of the development of the financial infrastructure—shouldbe taken into account in assessing the efforts made and the success achieved (Bagchi, Bird, andDas Gupta 1995 develop this point with respect to tax administration).
Effort and success are therefore inherently relative concepts in the sense that both must beassessed in light of the scope and scale of the problems facing the country in question. For thisreason, different indicators at different levels of detail may be appropriate for different jurisdic-tions, depending on such factors as the degree of development of the market economy, the extentto which the jurisdiction is engaged in fiscal reform as opposed to what may be called fiscaldevelopment (that is, the extent to which it has moved from changing the old to implementingthe new), and perhaps also the level of outside technical and financial assistance it has received.
To illustrate, differences in levels of income and wealth are obviously relevant in assessingfiscal performance. It takes more effort for a poor country to raise an additional percentagepoint of GDP in taxes than for a rich country (Bird 1976). Similarly, the well-known convergencehypothesis suggests that increasing its growth rate may be easier for a country with below aver-age growth performance than for one with above average performance. Another illustrationrelates to investor perceptions. With respect to foreign investment, for instance, as in politics,perception often is reality. If investors see a country as risky, the country pays the price in terms
92 Fiscal Flows, Fiscal Balance, and Fiscal Sustainability
12. The importance of, for instance, tax offsets in transition countries has varied considerably fromcountry to country, and within any one country may change sharply from year to year.
13. For an interesting recent look at the sustainability issue in the broader environmental context seeStavins, Wagner, and Wagner (2002), who separate the problem into two components: the economic prob-lem of dynamic efficiency and the political problem of intergenerational equity. One could conceive of asimilar approach to the problem of public sector sustainability.
of receiving less investment than it otherwise would and paying more for what it gets. Differ-ent perceived degrees of riskiness may therefore affect measured fiscal performance.
Performance Assessment
The nature of the problems a particular jurisdiction faces—the initial conditions—thus influ-ence its performance. So, of course, may the institutional measures taken to deal with them. Inother words, does the jurisdiction have a sustained, high-level commitment to change? Is therea coherent strategy for change? Without both a genuine desire to make changes and a well-developed plan for change, efforts at change are unlikely to prove either coherent or successful.The critical question to be considered here, however, is how to assess the extent to which a juris-diction has achieved success.
Performance is a function both of exogenous conditions and institutional factors (includingcapacity). Unfortunately, many conceivable indicators measure inputs, not the policy outputs thatare of ultimate concern. Some outputs, such as tax revenue, may easily be quantified. Other out-puts may be more subjective, for example, what is the public’s perception of the fairness of the taxsystem, and hence, perhaps, its long-term sustainability? On the whole, the fiscal indicators thatmay be assembled in practice in most countries almost inevitably constitute an extremely mixedbag. Aggregating or averaging such heterogeneous indicators meaningfully may be difficult, andsometimes not really possible, even with respect to any one area. As a rule, what analysts usuallydo, for example, in most bond rating analyses (see, for example, Fitch Ratings, Ltd. 2001; Moody’sInvestors Service 1998; World Bank 1996a), is little more than the pre-analytic step of collecting aseries of indicators that, taken together, help profile some relevant aspect of the area.
To illustrate with respect to pension reform—a key component of the long-term fiscal sus-tainability issue in many countries—such indicators may be clustered under four headings: thesystem’s structure, its viability, administrative issues, and other issues. The sustainability ofpension systems may then be assessed either in terms of static short-run measures, such as pen-sion payments to GDP ratios, or in light of longer-term measures, such as the present value offuture commitments. Box 4.4 provides another example with respect to taxation (both the pen-sion and tax cases are developed in more detail in Bird and Banta 2000, and Das-Gupta 2002discusses the latter).
Richard M. Bird 93
Box 4.4 Tax Indicators in New Zealand
As an example of the use and limits of quantitative measurement, consider what is perhaps thesimplest case, the measurement of how well a jurisdiction does in collecting taxes. New Zealandrecently made a notable attempt to assess its tax performance, estimating the optimal tax level andstructure from the perspective both of maximizing economic growth and minimizing tax evasion(Caragata 1998). The conclusion was that tax levels mattered much more with respect to the attain-ment of these objectives than did tax mix, and that the prevailing level of taxation in New Zealand (37percent of GDP in 1997) was much higher than the optimal level of at most 25 percent. This studyunderlines the importance of the sheer size of the tax share in appraising tax policy performance.Moreover, it suggests that success in increasing taxes, even if such increases seem necessary to copewith deficit problems, may well be a two-edged sword, relieving short-run fiscal pressures at the costof long-run damage both to real economic growth and to the growth of the “official” economy.
The change in tax revenues compared with the change in GDP over the same period (tax buoy-ancy) may be the single most meaningful measure of tax effort in the absence of reliable measures oftax potential. A more refined measure might also encompass some measure of revenue stability, suchas the coefficient of variation of the annual buoyancy measure. An additional measure that would beuseful to assess the predictability and reliability of budgets would be to compare actual revenue out-comes with the amounts initially budgeted. Similar comparisons of the accuracy of budgeting could,of course, also be calculated for the expenditure side. Even the best figures must sometimes be inter-preted with care, however. For example, what does high buoyancy mean when growth is negative?

Raising taxes is undoubtedly hard. Unfortunately, spending hard-won fiscal proceeds sensi-bly and well seems to be at least as difficult in most developing and transition countries. Thusassessing expenditure performance at the subnational level is at least as important as assessingtax performance. In addition to comprehensiveness, perhaps the key factor in appraising budg-etary policy in any country is discipline. As recent empirical studies in a variety of countrieshave suggested, budgetary institutions may have important effects on fiscal outcomes (Alesinaand Perotti 1995). Important factors include the legitimacy, predictability, honesty, and effec-tiveness of the budgetary process and the related issues of the existence of a coherent strategy,for example, the budget’s relationship to the macroeconomic policy framework through acoherent medium-term expenditure plan and the capacity of budgetary institutions in both theexecutive and legislative branches of government to analyze and implement policy (Camposand Pradhan 1996). As in the case of taxes, a well-grounded appraisal of fiscal sustainabilitytherefore has to extend well beyond simple numbers to a thorough understanding of the sus-tainability of the institutional framework underlying the numbers.
Conclusion
Regardless of how carefully one assembles any set of fiscal indicators, at best the results consti-tute raw material for interpretative analysis. Fiscal indicators, such as those discussed in thischapter, may be compared with the information that consumer magazines assemble withrespect to automobiles. Some of the indicators reported describe various mechanical and otherfeatures of the different vehicles, others report the results of specified performance tests, andstill others report the subjective judgments of selected experts with respect to the vehicles’ qual-ity and general appeal. What the editors deem to be the best buy in terms of a particularlyweighted set of criteria may also be indicated. In the end, however, readers must draw theirown conclusions from all the information presented.
Even the best indicators are not, and cannot be, a substitute for analysis. Numbers are pow-erful. Good numbers, properly used, may illuminate reality and may not only permit meaning-ful assessment of certain aspects of performance, but may also suggest new and promising linesof inquiry. Measurement and quantification have long been essential ingredients in the devel-opment and application of scientific thought. Unfortunately, even good numbers may be mis-understood and misinterpreted, and bad numbers may all too easily pass for good among thosewho do not take the time to understand what the numbers can and do measure, and, equallyimportant, what they cannot show. However, just because the unwary might cut themselveswith sharp tools is no reason not to sharpen one’s analytical tools as best as possible. Only care-ful study and appreciation of what can be measured, and with what degree of reliability, willadvance knowledge of the world and how it works.
Therefore despite the inherent limitations and risks, attempting to develop meaningful andcomparable fiscal indicators is worthwhile, particularly with respect to sustainability. Even thebest such indicators will never provide a certain or clear guideline telling any country what todo, but they may, if done well, be helpful in understanding how a country or a subnational gov-ernment is doing relative to others in roughly similar circumstances. Providing a base caseagainst which to assess performance is no mean achievement in the complex and ongoing taskof assessing how well particular governments are doing.
References
The word processed describes informally reproduced works that may not be commonly avail-able through libraries.
Advisory Commission on Intergovernmental Relations. 1980. Regional Growth: Flows of FederalFunds, 1952–76: A Commission Report. Washington, D.C.
94 Fiscal Flows, Fiscal Balance, and Fiscal Sustainability
Alesina, Alberto, and Robert Perotti. 1995. “Budget Deficits and Budget Institutions.” WorkingPaper no. 5556. National Bureau of Economic Research, Cambridge, Massachusetts.
Bagchi, Amaresh, Richard M. Bird, and Arindam Das-Gupta. 1995. “An Economic Approach toTax Administration Reform.” Discussion Paper no. 3. University of Toronto, Faculty ofManagement, International Centre for Tax Studies, Toronto.
Bahl, Roy W., and others. 1999. “Intergovernmental Fiscal Relations in Leningrad Region.”Working Paper no. 99-2. International Studies Program, Andrew Young School of PublicPolicy, Georgia State University, Atlanta, Georgia.
Bird, Richard M. 1966. “Tax-Subsidy Policies for Regional Development.” National Tax Journal19(2): 113–24.
_____. 1976. “Assessing Tax Performance in Developing Countries: A Critical Review of theLiterature.” Finanzarchiv 34(2): 234–55.
_____. 1982. “Expenditure Policy and Regional Development.” Rivista di diritto finaziario escienze delle finanze 41(December): 483–503.
_____. 1984. Intergovernmental Finance in Colombia: Final Report of the Mission on Intergovernmen-tal Finance. Cambridge, Massachusetts: Harvard Law School International Tax Program.
_____. 1989. “Taxation in Papua New Guinea: Backwards to the Future?” World Development17(August): 1145–57.
_____. 1993. “Threading the Fiscal Labyrinth: Some Issues in Fiscal Decentralization.” NationalTax Journal 46(2): 207–27.
_____. 2001. Intergovernmental Fiscal Relations in Latin America: Policy Design and Policy Out-comes. Washington, D.C.: Inter-American Development Bank, Sustainable DevelopmentDepartment.
Bird, Richard M., and Susan Banta. 2000. “Fiscal Sustainability and Fiscal Indicators.” In A.Shapleigh, F. Andic, and S. Banta, eds., Transition Economies and Fiscal Reforms. Proceedings ofthe Conference on Central and Eastern Europe and the New Independent States, Istanbul, June1999. Washington, D.C.: U.S. Agency for International Development.
Bird, Richard M., and Duanjie Chen. 1998a. “Federal Finance and Fiscal Federalism: The TwoWorlds of Canadian Public Finance.” Canadian Public Administration 41(1): 51–74.
_____. 1998b. “Intergovernmental Fiscal Relations in China in International Perspective.” InDonald J. S. Brean, ed., Taxation in Modern China. New York: Routledge.
Bird, Richard M., and Edgard Rodriguez. 1999. “Decentralization and Poverty Alleviation:International Experience and the Philippines.” Public Administration and Development 19:299–319.
Bird, Richard M., and Enid Slack. 1993. Urban Public Finance in Canada, 2nd ed. Toronto: JohnWiley.
Bird, Richard M., and Michael Smart. 2002. “Intergovernmental Fiscal Transfers: Lessons fromInternational Experience.” World Development 30(6): 899–912.
Bird, Richard M., and Andrey V. Tarasov. 2002. “Closing the Gap: Fiscal Imbalances and Inter-governmental Transfers in Developed Federations.” Working Paper no. 02-02. InternationalStudies Program, Andrew Young School of Policy Studies, Georgia State University,Atlanta, Georgia.
Boadway, Robin W., and Paul Hobson. 1993. Intergovernmental Finance in Canada. Toronto:Canadian Tax Foundation.
Richard M. Bird 95
96 Fiscal Flows, Fiscal Balance, and Fiscal Sustainability
Brennan, Geoffrey, and James M. Buchanan. 1980. The Power to Tax. Cambridge, U.K.: Cam-bridge University Press.
Bryden, W. Kenneth. 1972. Old Age Pensions and Policy Making in Canada. Montreal: McGill-Queen’s University Press.
Campos, Edward, and Sanjay Pradhan. 1996. “Budgetary Institutions and Expenditure Out-comes.” Policy Research Working Paper no. 1646. World Bank, Washington, D.C.
Caragata, Patrick J. 1998. The Economic and Compliance Costs of Taxation: A Report on the Health ofthe Tax System in New Zealand. Boston: Kluwer Academic Publishers.
Chalk, Nigel A. 2002. “Structural Balances and All That: Which Indicators to Use in AssessingFiscal Policy.” Working Paper no. 02/101. International Monetary Fund, Washington, D.C.
Chernick, Howard, and Andrew Reschovsky. 2000. “The Long-Run Fiscal Health of CentralCities: The Impact of Devolution.” State Tax Notes, November 27, pp. 1445–56.
Das-Gupta, Arindam. 2002. “Central Tax and Administrative Reform in the 1990s: An Assess-ment.” In M. Govinda Rao, ed., Development, Poverty, and Fiscal Policy: Decentralization ofInstitutions. New Delhi: Oxford University Press.
Dion, Stephane. 2001. “Tell the Truth, Bernard.” The Globe and Mail (Toronto), March 15, p. A15.
Ebel, Robert D., and Serdar Yilmaz. 2003. “On the Measurement and Impact of Fiscal Decen-tralization.” In James Alm and Jorge Martinez-Vazquez, eds., Public Finance in Developingand Transitional Countries. Cheltenham, U.K.: Edward Elgar.
Fiszbein, Ariel. 1997. “Emergence of Local Capacity: Lessons from Colombia.” World Develop-ment 25: 1029–43.
Fitch Ratings, Ltd. 2001. International Public Finance Special Report: Examining CanadianProvinces. New York.
Flanagan, Tom. 2001. “Why Canada Is a Kleptocracy.” National Post, February 6, p. A14.
Hemming, Richard, and Murray Petrie. 2000. “A Framework for Assessing Fiscal Vulnerabil-ity.” Working Paper no. 00/52. International Monetary Fund, Washington, D.C.
Hettich, Walter, and Stanley Winer. 1983. “Vertical Imbalance in the Fiscal Systems of FederalStates.” Working Paper no. 56-82-83. Carnegie-Mellon University, Graduate School ofIndustrial Administration, Pittsburg, Pennsylvania.
Horne, Jocelyn. 1991. “Indicators of Fiscal Sustainability.” Working Paper no. 91/5. Interna-tional Monetary Fund, Washington, D.C.
Hunter, J. S. H. 1974. “Vertical Intergovernmental Financial Imbalance: A Framework for Eval-uation.” Finanzarchiv 32: 481–92.
_____. 1977. Federalism and Fiscal Balance. Canberra: Australian National University Centre forResearch on Federal Financial Relations.
Inman, Robert P. 1995. “How to Have a Fiscal Crisis: Lessons from Philadelphia.” AmericanEconomic Review, Papers and Proceedings 85(2): 378–83.
Kwavnick, David, ed. 1973. The Tremblay Report. Toronto: McClelland and Stewart.
Lavrov, Alexei M., and Alexei G. Makushkin. 2001. The Fiscal Structure of the Russian Federation:Financial Flows between the Center and the Regions. Armonk, New York: M. E. Sharpe.
Leslie, Peter, and Richard Simeon. 1977. “The Battle of the Balance Sheets.” In Richard Simeon,ed., Must Canada Fail? Montreal, Canada: McGill-Queen’s University Press.
Richard M. Bird 97
Mathews, Russell. 1980. Revenue Sharing in Federal Systems. Canberra: Australian National Uni-versity, Centre for Research on Federal Financial Relations.
Matier, Chris, Lisa Wu, and Harriet Jackson. 2001. “Analyzing VFI in a Framework of FiscalSustainability.” Paper presented to the Canadian Economic Association, June.
McKenzie, Kenneth M. 2001. “A Note on the Sustainability of Fiscal Policy in SubnationalGovernments.” World Bank Institute, Washington, D.C. Processed.
Moody’s Investors Service. 1998. Subnational Governments: A Rating Agency Perspective. New York.
Musgrave, Richard A. 1961. “Approaches to a Fiscal Theory of Political Federalism.” In PublicFinances: Needs, Sources, and Utilization. Princeton, New Jersey: Princeton University Press.
Norrie, Kenneth. 2002. “On Fiscal Balance in the Canadian Federation.” In Robert D. Brown,ed., Canadian Conundrum: Views from the Clifford Clark Visiting Economists. Toronto: C. D.Howe Institute.
Oakland, William H. 1994. “Fiscal Equalization: An Empty Box?” National Tax Journal 47(1):199–209.
Organisation for Economic Co-operation and Development. 1999. Taxing Powers of State andLocal Governments. Paris.
Rao, M. Govinda, and Raja J. Chelliah. 1991. Survey of Research on Fiscal Federalism. New Delhi:National Institute of Public Finance and Policy.
Rao, M. Govinda, and Arindam Das-Gupta. 1995. “Intergovernmental Transfers and PovertyAlleviation.” Environment and Policy C: Government and Policy 13(1): 1–23.
Rezk, Ernesto. 1998. “Argentina: Fiscal Federalism and Decentralization.” In Richard M. Birdand Francois Vaillancourt, eds., Fiscal Decentralization in Developing Countries. Cambridge,U.K.: Cambridge University Press.
Seguin Commission on Fiscal Imbalance. 2001. Fiscal Imbalance: Problems and Issues. Quebec.
Sehili, Saloua, and Jorge Martinez-Vazquez. 2002. “Fiscal Incidence at the Regional Level.”Andrew Young School of Policy Studies, Georgia State University, Atlanta, Georgia. Draft.
Slack, Enid, and Richard M. Bird. 2003. “Fiscal Sustainability in the GTA.” Paper prepared forthe Neptis Foundation. Toronto.
Stavins, Robert N., Alexander F. Wagner, and Gernot Wagner. 2002. “Interpreting Sustainabil-ity in Economic Terms: Dynamic Efficiency Plus Intergenerational Equity.” FacultyResearch Working Paper no. RWP 02-018. Harvard University, John F. Kennedy School ofGovernment, Cambridge, Massachusetts.
Thimmaiah, G. 1976. “Vertical Intergovernmental Financial Balance: A Restatement.” Finan-zarchiv 34: 497–508.
Vaillancourt, Francois, and Richard M. Bird. 2002. “Changing with the Times: Success, Failure,and Inertia in Canadian Federal Arrangements, 1945–2002.” Federalism Project. StanfordUniversity, Palo Alto, Calif.
Vander Ploeg, Casey. 2001. Dollars and Sense: Big City Finances in the West. Western Cities Dis-cussion Paper. Calgary, Canada: Canada West Foundation.
Wheare, Kenneth C. 1963. Federal Government. 4th ed. London: Oxford University Press.
World Bank. 1996a. Argentina Provincial Finances Study: Selected Issues in Fiscal Federalism, vol.II, Technical Annexes. Report no. 15487-AR. Washington, D.C.
_____. 1996b. Fiscal Management in Russia. Washington, D.C.


Part IIThe Provision of Services

6Fiscal Aspects of Alternative Methods of Governing Large Metropolitan Areas
Enid Slack
Large metropolitan areas or city-regions differ from other urban or rural areas in large partbecause of the size of their populations and because of the concentration of population withinthe metropolitan area.1 These differences are reflected both in the magnitude and complexityof the expenditures that local governments in metropolitan areas are required to make onmunicipal services and in their ability to pay for them. The type of governing structure in alarge metropolitan area will have an effect on the efficiency with which local governments pro-vide services and on the ability to share the costs throughout the entire region in a fair and effi-cient way. The governing structure also has an effect on citizens’ access to local decisionmak-ing and the government’s accountability for the expenditure and taxing decisions it makes.
This chapter reviews the fiscal aspects of the various ways to organize government struc-ture in large metropolitan areas or city-regions. First, it reviews local government expendituresin metropolitan areas and describes how the size of these areas affects the nature and magni-tude of expenditures. Next the chapter details the revenue sources of large metropolitan areasand how the size of the municipality affects these sources. The third section sets out the criteriafor designing a government structure that will be used to evaluate alternative governancemodels. These include efficiency, equity, and accountability. The chapter then presents andevaluates alternative government structures used in city-regions around the world. The finalpart of the chapter sets out conclusions.
This discussion of governing structures in metropolitan areas shows that different structureshave worked in different places at different times. Thus generalizing from the examples providedis difficult, because no one model stands out. The appropriate governing structure in any onemunicipality will depend on its specific characteristics: the nature of the services it provides, therevenue sources available to it, the size and location of the municipality, the size of the municipal-ity relative to the state or province or the country as a whole, the nature of intergovernmental rela-tions, the history of cooperation with neighboring municipalities, and other factors.
Local Government Expenditures in Large Metropolitan Areas
In terms of economic theory, the major role of local governments is to provide goods and serv-ices within a particular geographic area to residents who are willing to pay for them.2 If the
101
1. The term city-region generally refers to a defined urban center with smaller adjacent urban andrural areas.
2. The literature on fiscal federalism assigns three roles to government: stabilization, income redistri-bution, and resource allocation. Stabilization policy is generally not an appropriate function of local gov-ernments because they do not have access to monetary policy, and because capital and labor flow freelyacross local jurisdictions. In the case of redistribution, local efforts to address income disparities will likelyresult in the movement of high-income groups to low-tax areas and low-income groups to high-tax areas.Nevertheless, local governments do engage in redistribution through the act of taxing and spending. SeeBird and Slack (1993) for a discussion of the role of local government.
benefits of particular services are confined to local jurisdictions and the actions of one munici-pality have no effect on other municipalities, service provision will be efficient because the mixand level of services can vary according to local preferences. Some observers argue that localofficials are in a better position to respond to local tastes and preferences than central govern-ment officials. Local governments generally have expenditure responsibilities for a wide rangeof services: roads and transit, water and sewer services, police and fire protection, garbage col-lection and disposal, recreation and culture, land use planning, and social services. However,this provision of local services does not mean that the municipality has to produce the goodsand services itself. Rather, the role of local government is to make decisions about which serv-ices to provide and how to provide them. Municipalities could, for example, contract out serv-ice delivery to another government or to the private sector. As noted in Osborne and Gaebler(1992), local governments need to concentrate more on “steering” (policymaking) and less on“rowing” (service delivery).
This theory of the role of local governments does not distinguish among large metropolitanareas, intermediate-size cities, or towns and villages, yet making that distinction is important.According to Burki, Perry, and Dillinger (1999, p. 24): “A structure that fails to distinguishbetween major metropolitan areas and small villages makes it difficult to clearly define thefunctional responsibilities of local government.” If all local governments are assigned the sameresponsibilities, the assignment is likely to reflect only that which the smallest municipalitiescan provide. Governments in large metropolitan areas may need to provide more and differentservices than governments in smaller urban areas, and they may have greater capacity to do so.
The magnitude and complexity of local government expenditures in large metropolitanareas differ from expenditures in smaller urban or rural areas because of the sheer size of thepopulation in metropolitan areas (generally more than 1 million people), the high degree ofconcentration of population, and the presence of a heterogeneous population in terms of socialand economic circumstances (Freire 2001; Nowlan 1994).
People and businesses are attracted to large metropolitan areas because they provide manyof the benefits of close proximity, known as agglomeration economies. These benefits includeface-to-face interaction, availability of business services, accessibility to a large skilled laborforce, and accessibility to transportation and communications networks. Large metropolitanareas are able to achieve the critical mass required to attract and support high degrees of spe-cialization: specialized labor, knowledge, businesses, services, infrastructure, institutions, andmedia. At the same time, large metropolitan areas attract low-income individuals and house-holds that seek employment opportunities and can take advantage of a wider range of morespecialized social services than are usually available in smaller municipalities.
Local governments in large metropolitan areas must provide a sophisticated transportationand communications network and services such as parks, recreational facilities, and culturalinstitutions that yield a high quality of life. The high concentration of special needs within largemetropolitan areas also requires higher expenditures on social services, low-income housing,and public health. Expenditures per household in large metropolitan areas are therefore gener-ally higher than in other municipalities. Large metropolitan areas tend to make expenditureson a wider range of services than do smaller cities and rural areas. For example, smaller citiesmay not have a public transit system because the urban densities are not sufficient for a transitsystem to be economically viable. Cultural facilities, such as opera houses and art galleries, areunlikely to be provided in smaller urban areas because they require a minimum size to makeprovision possible. Furthermore, people from outside the metropolitan area make use of thecultural facilities as well as other services, such as social services.
Opportunities may exist for lower expenditures per capita for metropolitan services to theextent that the local government can take advantage of economies of scale in service provision.Economies of scale occur when the per unit cost of producing a particular service decreases asthe quantity of the service provided increases. Empirical evidence on the existence of
102 Fiscal Aspects of Alternative Methods of Governing Large Metropolitan Areas
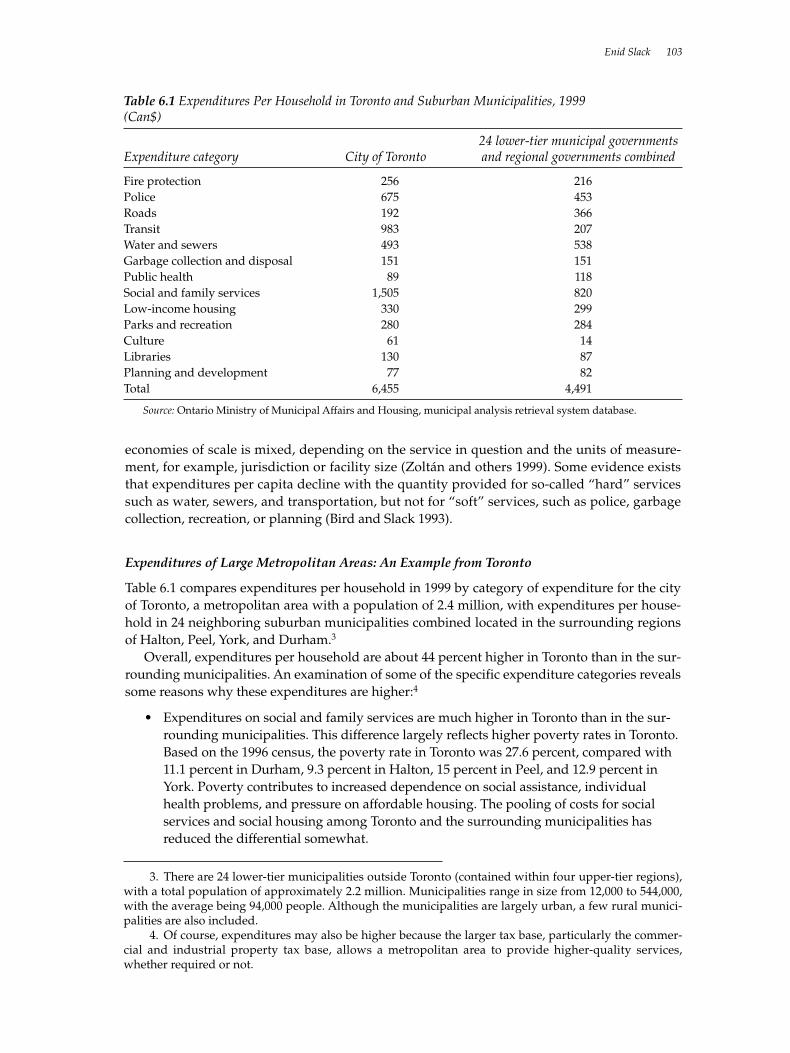
Enid Slack 103
economies of scale is mixed, depending on the service in question and the units of measure-ment, for example, jurisdiction or facility size (Zoltán and others 1999). Some evidence existsthat expenditures per capita decline with the quantity provided for so-called “hard” servicessuch as water, sewers, and transportation, but not for “soft” services, such as police, garbagecollection, recreation, or planning (Bird and Slack 1993).
Expenditures of Large Metropolitan Areas: An Example from Toronto
Table 6.1 compares expenditures per household in 1999 by category of expenditure for the cityof Toronto, a metropolitan area with a population of 2.4 million, with expenditures per house-hold in 24 neighboring suburban municipalities combined located in the surrounding regionsof Halton, Peel, York, and Durham.3
Overall, expenditures per household are about 44 percent higher in Toronto than in the sur-rounding municipalities. An examination of some of the specific expenditure categories revealssome reasons why these expenditures are higher:4
• Expenditures on social and family services are much higher in Toronto than in the sur-rounding municipalities. This difference largely reflects higher poverty rates in Toronto.Based on the 1996 census, the poverty rate in Toronto was 27.6 percent, compared with11.1 percent in Durham, 9.3 percent in Halton, 15 percent in Peel, and 12.9 percent inYork. Poverty contributes to increased dependence on social assistance, individualhealth problems, and pressure on affordable housing. The pooling of costs for socialservices and social housing among Toronto and the surrounding municipalities hasreduced the differential somewhat.
Table 6.1 Expenditures Per Household in Toronto and Suburban Municipalities, 1999 (Can$)
24 lower-tier municipal governments Expenditure category City of Toronto and regional governments combined
Fire protection 256 216Police 675 453Roads 192 366Transit 983 207Water and sewers 493 538Garbage collection and disposal 151 151Public health 89 118Social and family services 1,505 820Low-income housing 330 299Parks and recreation 280 284Culture 61 14Libraries 130 87Planning and development 77 82Total 6,455 4,491
Source: Ontario Ministry of Municipal Affairs and Housing, municipal analysis retrieval system database.
3. There are 24 lower-tier municipalities outside Toronto (contained within four upper-tier regions),with a total population of approximately 2.2 million. Municipalities range in size from 12,000 to 544,000,with the average being 94,000 people. Although the municipalities are largely urban, a few rural munici-palities are also included.
4. Of course, expenditures may also be higher because the larger tax base, particularly the commer-cial and industrial property tax base, allows a metropolitan area to provide higher-quality services,whether required or not.
• Transit expenditures per household are much higher in Toronto. Toronto operates anintegrated transit system with subways, light rail lines, streetcars, and an extensive busnetwork. This system absorbs significant numbers of commuters on a daily basis.Expenditures on roads, however, are higher in the suburban municipalities wherereliance on automobile use is much greater.
• Expenditures on policing are higher in Toronto. This reflects the higher crime rates of alarge metropolitan area with a large, diverse population and a higher incidence ofpoverty. It also reflects the need for more specialization in police services.
• Expenditures on culture are higher in Toronto in part because it has the necessary sizerequired for such facilities to be viable and in part because people come from outsidethe city and from outside the region to use these cultural facilities.
• Expenditures per household on fire protection are somewhat higher in Toronto. Fireprotection is more costly to provide in large metropolitan areas with much higher pop-ulation densities and greater concentrations of high-rise office buildings. These charac-teristics of large metropolitan areas require specialized training and equipment andfull-time firefighters. A smaller urban or rural area may be able to rely on a volunteerfire department.
Expenditure Assignment in Large Metropolitan Areas
As noted, the characteristics of large metropolitan areas mean that the level and complexity oflocal government expenditures will be different than for other types of urban or rural areas.Furthermore, in addition to providing goods and services, local governments have to managethe local environment, structure land use to promote efficiency, and use financial tools in a waythat promotes efficiency.
For these reasons, distinguishing among different types of municipalities in terms of expen-diture assignment is important (Burki, Perry, and Dillinger 1999). For example, the Germanstructure distinguishes among governments of different sizes, giving broader responsibilitiesto “city-states” such as Berlin, Bremen, and Hamburg and allowing other large municipalitiesto assume the responsibilities of counties (Burki, Perry, and Dillinger 1999).
Large metropolitan areas can and should be responsible for a wide range of municipal serv-ices, including hard services such as water, sewers, and transportation and soft services such aspublic health and some social services. To provide this wide range of services, however, theyneed appropriate revenue sources and governing structures.
Financing Options
Although the expenditure requirements are greater for local governments in large metropolitanareas, these local governments also have greater capacity to finance these expenditures. Thetypes of revenue sources assigned to local governments in metropolitan areas should reflect thenature and level of services they provide and their ability to levy taxes. In particular, large met-ropolitan areas have greater fiscal autonomy than other urban or rural areas. This meansgreater responsibility for local services and greater ability to levy their own taxes and collecttheir own revenues (Bird 1984).
The sources of revenue available to and used by local governments include user charges;taxes such as property, income, and fuel taxes; and intergovernmental transfers.
User Charges
The efficient provision of goods and services requires local governments to charge directly forservices wherever possible. Charges should be levied on those who receive the benefits from
104 Fiscal Aspects of Alternative Methods of Governing Large Metropolitan Areas

services wherever the government can identify such beneficiaries. User fees allow residents andbusinesses to know how much they are paying for the services that they receive from local gov-ernments. Based on the services provided and the costs incurred, residents and businesses cantherefore make efficient decisions about how much to consume. User charges are appropriatefor services such as water and public transit, because benefits are confined largely to individualconsumers.
User fees are appropriate for large metropolitan areas, not only because they result in anefficient use of services, but also because they can potentially lead to efficient land use. If mar-ginal cost pricing is used as the basis to charge for services, consumers of services that are faraway from existing services would have to pay higher fees, while consumers of services thatare closer would pay lower fees. However, if governments charged an average cost, consumersin outlying areas, where costs are relatively higher, would pay less than the marginal cost of theservice and would therefore receive a subsidy. At the same time, consumers in the central, high-density area would be paying more than the marginal cost of the service, in effect subsidizingthe use of services by others.
Taxes
Where user charges cannot be used because the benefits of a particular service are not confinedto individual consumers, but are confined within the municipal boundary, for example, polic-ing, taxes that are borne by local residents are appropriate. These include property taxes andlocal income taxes. These taxes allow individuals to express their demand for services wherebenefits are consumed collectively.
In large metropolitan areas, the tax base is generally larger than in other urban or rural areasbecause of higher property values and a larger commercial and industrial presence in themunicipality. A greater opportunity exists to share the costs of municipal services over a widertax base in a metropolitan area, but this requires some form of governing structure encompass-ing the entire area or an intermunicipal agreement to share taxes.
PROPERTY TAXES. The property tax has an important role to play in funding local needs formunicipalities of all sizes. It is the main source of revenue in 5 of the 27 Organisation for Eco-nomic Co-operation and Development countries (Australia, Canada, Ireland, New Zealand,and the United Kingdom), where it accounts for more than 90 percent of local tax revenue(OECD 2000).
The property tax is appropriate for financing local services for at least two reasons: first, realproperty is immovable, that is, it is unable to shift location in response to the tax. Second, a con-nection exists between the types of services funded at the local level and the benefit to propertyvalues. The property tax is like a benefit tax because it approximates the benefits received fromlocal services. Residential property taxes, in particular, are appropriate to fund local govern-ments because they are borne by local residents. Those who enjoy the benefits from services arerequired to pay for them.
The nonresidential property tax may be less appropriate for financing local governmentexpenditures, because property owners may in part export this type of tax to residents of otherjurisdictions who are consumers of the products or services produced in those properties. Taxexporting reduces accountability, because those bearing the burden of the tax are not the sameas those enjoying the benefits. Thus an incentive exists on the part of local residents to demandgreater expenditures, because some of the cost is borne by others. For this reason, restricting theuse of nonresidential property taxes may be necessary.
Large metropolitan areas tend to have a larger proportion of commercial and industrialproperty than smaller urban areas because of the extent of economic activity. A largercommercial-industrial tax base permits local governments to make greater expenditures than
Enid Slack 105
smaller municipalities for reasons previously noted. Because of the ability to export these taxes,restrictions may also be needed in metropolitan areas.
INCOME TAXES. Income taxes represent the most important source of local tax revenues in 13of the 27 Organisation for Economic Co-operation and Development countries including, forexample, Belgium, the Czech Republic, Denmark, Finland, Norway, Sweden, and Switzerland(OECD 2000).
A strong case can be made for a local income tax (piggybacked onto the national tax) to sup-plement property taxes for large metropolitan areas. This source of revenue is justifiable on thegrounds that governments in large metropolitan areas are increasingly required to addressissues of poverty, crime, land use planning, regional transportation, and other regionwideneeds (Nowlan 1994). To the extent that large metropolitan areas must provide social services,for example, an income tax is more appropriate than a property tax because it is more closelyrelated to ability to pay. Furthermore, because mobility across jurisdictions in response to taxdifferentials will be lower for a larger geographic area, large metropolitan areas may be able totake advantage of tax sources such as income taxes. Finally, an income tax would permit localgovernments to be less dependent on grants from the central government (Bird 2001).
Another justification for income taxes for large metropolitan areas is on benefit grounds(Nowlan 1994). Some observers argue that the residential property tax is tied to the consump-tion of housing rather than the consumption of public goods. This means that the tax is a bene-fits tax only to the extent that housing consumption and local goods consumption are highlycorrelated across different households (Thirsk 1982). In large metropolitan areas with a hetero-geneous population, income is more likely to be highly correlated with consumption of publicservices than with property value. This finding suggests that a municipal income tax may actmore as a benefits tax than a property tax in large metropolitan areas. This argument onlyapplies to large heterogeneous areas and not to municipalities where a strong relationshipexists between income and property values. The choice between income and property taxes isless significant where housing values and income levels vary less.
Large metropolitan areas should be permitted to levy their own tax rates to ensure that theyhave fiscal autonomy. Even within metropolitan areas, however, a need to piggyback onto cen-tral government income taxes may exist. Piggybacking would significantly reduce the cost ofadministration.
FUEL TAXES. Governments levy municipal fuel taxes in many American jurisdictions and ina few of the larger Canadian municipalities, including Calgary, Edmonton, Montreal, Vancou-ver, and Victoria. Those cities that do levy a fuel tax generally piggyback onto state or provin-cial fuel taxes. The main reason is that the administrative costs of levying their own tax wouldbe prohibitive. The revenues generated from these taxes are often earmarked for local roadsand transit services in those cities, and, in some cases, these revenues are intended to replacepreviously provided provincial grants for these services.
A user charge on road users that reflects the marginal social cost of road use would result inan efficient use of the road. A share of the fuel tax for cities is not exactly the same as a direct usercharge in the sense that it would not reflect the marginal social cost, but the fuel tax is nonethe-less a benefits-based tax (Slack 2002). A municipal fuel tax is most appropriate for large metro-politan areas that have transit systems that would benefit from a dedicated source of revenue.
Intergovernmental Transfers
Transfers from senior levels of government are another source of revenue for local govern-ments. The rationales for transfers include fiscal gap, externalities, and equity. In the case oflarge metropolitan areas, however, transfers may not be necessary. To reduce or eliminate the
106 Fiscal Aspects of Alternative Methods of Governing Large Metropolitan Areas
dependence of large metropolitan areas on intergovernmental transfers, governments mayneed to take other actions, such as assigning different revenue sources to large metropolitanareas than to other urban and rural areas and designing an appropriate governing structure.
FISCAL GAP. A fiscal imbalance exists when municipalities have inadequate revenues to meettheir expenditure needs. Fiscal imbalance occurs at the local level essentially because local rev-enue sources tend to grow more slowly than income over time, while local expenditures tendto grow more quickly. Even though large metropolitan areas tend to have greater revenues thansmaller cities, “few countries permit local governments to levy taxes capable of yielding suffi-cient revenue to meet expanding local needs” (Bird 2001).
Senior levels of government can address fiscal imbalance by increasing the sources of rev-enue at the local level or by reducing expenditure responsibilities. For example, if senior levelsof government were to take over the funding of some services, then the local fiscal imbalancewould be reduced. Alternatively, senior levels of government could allow local governments toraise revenues from additional tax sources. In particular, large metropolitan areas could begiven access to more revenue sources, leaving unconditional grants for the smaller urban areas.Governing structure at the local level will also affect the size of the tax base and the capacity ofa local government to meet expenditure requirements.
EXTERNALITIES. Where a service spills over municipal boundaries as, for example, in the caseof regional highways, that service will receive an underallocation of resources, because themunicipality providing the service bases its expenditure decisions only on the benefits cap-tured within its jurisdiction. The municipality would not take account of the benefits to thoseoutside the jurisdiction.
One way to provide an incentive to allocate more resources to the service generating theexternality is a transfer from a senior level of government. The type of transfer appropriate foraddressing externalities is a conditional matching grant (Bird and Slack 1993). It should be con-ditional in that it has to be spent on the service that generates the externality. It should bematching to reflect the extent of the externality. For example, if 50 percent of the benefits ofhighway expenditures spill over existing municipal boundaries, the matching rate should be 50percent.
In the case of large metropolitan areas, externalities can be internalized within the jurisdic-tion if its boundaries are designed to reflect all the users of the service. For those services thatgenerate externalities beyond the borders of the metropolitan area, providing a transfer maystill be appropriate. These services may include, for example, education and health.
EQUITY. Some municipalities are unable to provide an adequate level of service at reasonabletax rates (Bird and Slack 1993). This may occur for three reasons: the costs of services may be toohigh, the need for services may be too high, and the tax base may be too small. Under these cir-cumstances, an equalization grant is appropriate. The formula for a grant of this type reflects dif-ferent per capita expenditures and different-sized tax bases in different municipalities.
The extent to which large metropolitan areas need equalization grants is unclear. In terms ofthe formula, a large metropolitan area generally does not qualify for equalization based on thesize of its tax base because it is generally larger than the tax base of a smaller urban area. Asnoted earlier, the presence of economic activity and higher densities of residential, commercial,and industrial development all contribute to a larger tax base. On the expenditure side, how-ever, the costs of services and the need for services may be higher than in other urban areas.5 If
Enid Slack 107
5. The cost of services in remote areas tends to be even higher than in large metropolitan areas, how-ever, because of higher transportation costs (greater distances), higher heating costs (climatic conditions),and so on.
the equalization formula were to capture the higher costs, large metropolitan areas may be in aposition to receive equalization grants.
Another way to achieve equity is to design the governing structure so that it covers theentire metropolitan area. By combining rich communities and poor communities, equalizationcan take place at least within the metropolitan area.
Borrowing
Borrowing is not a source of revenue, but is included here to show the differences in the abilityof large metropolitan areas and other municipalities to access capital markets to finance capitalexpenditures. Local governments are generally not permitted to borrow to meet operatingexpenditure requirements. They are permitted to borrow to make capital expenditures, how-ever. Where the benefits of a capital investment, for example, the construction of a water treat-ment plant, are enjoyed over a long period, say 25 years, paying for the project at least in partby borrowing may be fair and efficient. The stream of benefits matches the stream of coststhrough the payment of debt charges.
Local access to capital markets may be restricted, however, especially in developing coun-tries (Bird 2001). Smaller municipalities, for example, may require a financing authority or stateor provincial body to borrow on their behalf or to pool the borrowing requirements of severalmunicipalities to reduce borrowing costs.
A municipality’s bond rating largely dictates the rate of interest (and other features) neces-sary to make bonds marketable. This rating involves a detailed assessment of a municipality’scapacity to bear debt and its capacity to raise revenue under normal and depressed economiccircumstances. Generally the size of the municipality is negatively correlated with the interestrate attached to the debt instrument. This means that smaller local governments generally payhigher servicing costs than larger local governments.
Large metropolitan areas tend to have more access to bond markets than smaller municipal-ities, and debenture borrowing is therefore more prevalent in larger municipalities (and munic-ipalities with higher bond ratings) than in small municipalities.
Design of Local Government Structure
Government structure should be designed to ensure that the local government provides theservices that individuals and businesses want in a cost-effective manner. The main objective ofdesigning the optimal government structure is usually to maximize the welfare of individuals.The welfare of individuals depends, at least in part, on the satisfaction they receive from localpublic goods and services. The optimal level of government is that which provides the desiredlevel of local public goods and services at the least cost. Within this general framework, gov-ernments can use several criteria to design government structure: subsidiarity and localresponsiveness, economies of scale, externalities, equity, access, and accountability.
Subsidiarity Principle and Local Responsiveness
The efficient provision of services requires that the level of government closest to the individ-ual citizen carry out the decisionmaking. This is known as the subsidiarity principle and isneeded for the efficient allocation of resources, accountability, and responsiveness.6 As long as
108 Fiscal Aspects of Alternative Methods of Governing Large Metropolitan Areas
6. The Treaty of the European Union in 1992 originally included the subsidiarity principle in the con-text of the division of powers and responsibilities between European governmental bodies and their mem-ber countries. Governments have also applied the principle to the role and structure of government at alllevels (Barnett 1997).
local differences in tastes and costs exist, efficiency can clearly be gained from delivering serv-ices at the local level.
Higher levels of government should only take over expenditure responsibilities if they candemonstrate that they can carry out the function more efficiently than the lower level. With fewexceptions, such as national defense and services that involve redistribution, almost all publicservices should be provided at the local level with local policymakers making decisions aboutwhat services to provide, how much to provide, and who should pay for them.
Public choice theory argues that small-scale, fragmented local governments have specialadvantages for local democracy because they maintain a quasi market. The proliferation ofsmall government units in a metropolitan area results in competition among them. Tiebout(1956), for example, suggested that people vote with their feet, meaning that they move to thejurisdiction with the tax and expenditure package that most closely resembles what they want.7
This competition benefits citizens through increased efficiency in service delivery or throughfinding the municipality that has the basket of goods and services that most closely meets theirtastes (Boyne 1992). A large urban government will be less efficient in meeting the demands ofits residents because it will tend to provide a uniform level of public services to people whohave different preferences for those services.
Economies of Scale
Economies of scale occur where the per unit cost of producing a particular service falls as thequantity of the service provided increases. However, using economies of scale as a criterion fordesigning government structure has problems. First, each urban service will likely achieve thelowest per unit cost at a different scale of production. For example, the optimal size of govern-ment may be different for fire services than for waste management. These differences mean thatdrawing boundaries for general-purpose local governments can be extremely difficult.
Second, the jurisdiction that provides the service is not necessarily the one that consumes it.If consumers are located in adjacent jurisdictions, then the producing jurisdiction could selloutput to them. The producing jurisdiction could benefit from economies of scale in productionwithout having to be part of a larger jurisdiction, that is, without requiring the larger popula-tion to be located within its own boundaries. A larger government jurisdiction is not necessar-ily required to achieve economies of scale because the demand and supply of local governmentservices can be separated; economies of scale can be achieved even in a fragmented system.
Even if large government units can reap economies of scale for hard services, however, otherways are available to achieve these economies without having to create large jurisdictions. Fur-thermore, some evidence points to the higher costs from larger government units because ofproblems delivering services to remote areas within large jurisdictions or because of “bureau-cratic congestion” (Boyne 1992, p. 336).
Externalities
The provision of some services results in externalities (spillovers) whereby the benefits (orcosts) of a specific service in one local government jurisdiction spill over onto residents ofanother jurisdiction. One way to remove the resulting inefficiency is to design governmentjurisdictions large enough so that all of the benefits from a particular public service are enjoyedwithin the boundaries of that jurisdiction. Such boundary readjustments would internalize the
Enid Slack 109
7. The Tiebout model assumes, among other characteristics, a large number of small, homogeneouslocal governments. Criticisms of the Tiebout model suggest that mobility has a cost that makes this adjust-ment less than automatic, that it excludes any discussion of externalities, and that it does not consider thatpeople will vote other than with their feet.
externalities, and those who benefit from the service will pay for it. As with economies of scale,however, the optimal size of a jurisdiction will be different for different services. Furthermore,the optimal jurisdiction from the point of view of internalizing externalities may conflict withthe optimal size required to achieve economies of scale. Other ways to address externalitiesinclude provincial grants and coordination among municipalities.
Equity
Equity arguments are at least as important as efficiency arguments in designing governmentstructure. Local government fragmentation means that some communities are likely to be richand some poor. In these circumstances, the rich communities will have a more adequate taxbase with which to provide services and may not have great demands for services, such as edu-cation or social services. However, the poor communities may require more services but haveonly a small tax base on which to levy taxes. The more municipalities within a metropolitanarea, the greater this problem will be. One solution is to consolidate two or more areas into onejurisdiction, in effect taxing the rich municipalities and using some of the proceeds to subsidizethe poor municipalities. An alternative approach is to shift the redistributive function to a sen-ior level of government, or for the senior level of government to provide equalization transfers.
Access and Accountability
The access and accountability criteria suggest that citizens should have access to local govern-ment so that they can influence government policy. This is done through public meetings,hearings, elections, and direct contacts with officials (Bish 2001). Smaller government unitscan provide the average citizen with greater access to local decisions: “As the levels of consol-idation and concentration in the local government system rise, so the capacity of the public tomonitor policy makers’ behavior falls” (Boyne 1992, p. 338). The larger the local government,the more likely that special interest groups will dominate citizen participation (Bish 2001).
Accountability is closely related to access: the more accessible politicians are to their con-stituents, the more easily they can be held accountable for their actions. A more fragmented sys-tem of local governments should increase public scrutiny and accountability and result in lowerservice costs. Accountability requires a link between expenditure and revenue decisions: thebody making the decisions about how much to spend should be responsible for raising a largeportion of the revenues it requires. “The costs of local decisions should be fully borne by thosewho make them” (Bird 2001, p. 117). If no accountability exists in decisionmaking, decision-makers have no incentive to allocate resources efficiently across the competing services. Localgovernments must also be accountable to the central government to the extent that they receivetransfers from it.
Governance Models
This section reviews four models—one-tier governments, two-tier governments, voluntarycooperation (including intermunicipal agreements), and special purpose districts and presentsthe advantages and disadvantages of each. Case studies from North American jurisdictionsprovide examples of how these models work in practice.
One-Tier Model
Under the one-tier model of urban governance, a single local government is responsible forproviding the full range of local services and has a geographic boundary that covers the entire
110 Fiscal Aspects of Alternative Methods of Governing Large Metropolitan Areas
urban area. Large single-tier governments have generally been formed by amalgamation(merger of two or more lower-tier municipalities within an existing region) or by annexation(appropriation of a portion of a municipality by an adjacent municipality). Because only onelevel of government provides all municipal services, allocating expenditures among levels oflocal government (as in the two-tier model) is not necessary. In addition, only one political bodymakes taxing and spending decisions. One-tier governments can provide a wide range of serv-ices. These can be financed by a variety of user fees and tax sources that would be levied acrossthe metropolitan area in the same way that the upper-tier municipality would finance servicesin the two-tier model.
One-tier cities can mean that the government provides uniform services throughout themetropolitan area, but this is not necessarily the case. Particularly where the amalgamation ofseveral municipalities has created the one-tier municipality, maintaining the differential serv-ices and service levels that existed in different parts of the city-region prior to the creation ofone tier is an option. For example, rural residents will not necessarily receive all the servicesavailable to urban residents.
For services financed by user fees, those who benefit from a service pay directly for it. Whereproperty taxes finance services, special area rating can be used for those services where benefi-ciaries are restricted to specific areas. For example, if garbage collection is only provided in theurban parts of the municipality, then a special area rate for garbage would be levied on urbanresidents. All residents would pay the same general property tax rate; those in urban areaswould pay both the general rate and the special area rate.8
In short, because services are not necessarily standardized across the new municipality, taxrates should also not be standardized. However, an opposing argument holds that one of thereasons for amalgamation is to create one jurisdiction that encompasses the entire city-regionand that differences in service delivery and tax rates should not be maintained past a short tran-sition period.
The main advantages cited for one-tier governments include better service coordination,clearer accountability, more streamlined decisionmaking, and greater efficiency (Boyne 1992).Furthermore, the funding of the provision of services is fair, because a wider tax base shares thecosts of services that benefit taxpayers across the region. The larger taxable capacity of the one-tier government increases its ability to borrow and to recover capital and operating costs fromuser fees (Bahl and Linn 1992).
The advantages of better service coordination, streamlined decisionmaking, and fundingfairness are undisputed. From an efficiency perspective, municipal amalgamations have thepotential to internalize externalities. For example, rural residents outside the original munici-pal boundary would now pay for the urban services that they use.9 Large one-tier governmentscan also take advantage of economies of scale in service provision.
However, some observers debate the success of a large one-tier government in achievingaccountability and efficiency in terms of cost savings. In terms of accountability, some arguethat a large-scale one-tier government reduces access and accountability because the jurisdic-tion becomes too large and bureaucratic. In some cases, community committees are establishedto address local issues, or satellite offices are distributed across the municipality where people
Enid Slack 111
8. Special area rating has also been used to ensure that differences in reserves and debt of the con-stituent municipalities are reflected in their tax rates.
9. Municipal restructuring is only the first step in linking taxes to service benefits by ensuring thatthe beneficiaries are located within the jurisdiction providing the services. The second step is to identifythe benefits received by residents and to tax residents accordingly. For example, while charging rural resi-dents for their use of urban services such as recreation facilities and libraries is fair, charging them forgarbage collection if they do not receive it is unfair (Vojnovic 2000).
can pay tax bills, apply for building permits, and so on.10 These committees and satellite officesprobably increase accessibility, but their effect on accountability is unclear. Furthermore, theyremove any potential cost savings that might result from a larger government unit.
In terms of efficiency, evidence from municipal amalgamations suggests that cost savingsare elusive (Slack 2000). Duplication of services tends to decrease when several municipalitiesare amalgamated, in particular, the number of politicians and bureaucrats decreases. However,a tendency for expenditure increases also exists when municipalities with different service lev-els and different wage scales merge.
As an example, when the fire departments of several municipalities are amalgamated, elim-inating a number of fire chiefs, and maybe some deputy fire chiefs, is possible. Eliminatingthese positions will produce some cost savings. However, thousands of firefighters in the newlyamalgamated municipality will now all be doing the same job, working for the sameemployer—the newly created city—and will want to be paid comparable salaries and benefits.Thus a tendency exists for salaries and benefits to equalize up to the highest-expendituremunicipality. Although amalgamation presents potential cost savings, the harmonization ofwages and salaries will likely outweigh the savings.11
Similarly, amalgamations result in the harmonization of service levels across the newmunicipality, and again these will equalize up to the highest service level enjoyed before theamalgamation (Slack 2000). The harmonization of service levels will also increase costs. Thesehigher costs are not necessarily a bad thing. If some municipalities cannot afford to provide anadequate level of service because they do not have adequate resources, amalgamation allowsthem to provide a comparable level of service as that in other municipalities in the region. Suchan amalgamation increases equity within the region.
A review of the empirical evidence in the United States on fragmented versus consolidatedlocal governments concludes that lower spending is a feature of fragmented local governmentsystems, while consolidated structures are associated with higher spending (Boyne 1992).12 Onereason is that amalgamation tends to reduce competition among municipalities because thegovernment has less incentive to be concerned with efficiency and less incentive to be respon-sive to local needs. The lack of competition reduces efficiency in the delivery of services andresults in higher costs. Boxes 6.1 and 6.2 provide examples of the one-tier model.
Two-Tier Model
The two-tier model consists of an upper-tier governing body, usually region, district, or metro-politan area, encompassing a fairly large geographic area and lower-tier or area municipalities,including cities, towns, villages, townships, and so forth. The upper tier provides regionwide
112 Fiscal Aspects of Alternative Methods of Governing Large Metropolitan Areas
10. In 1971 the city of Winnipeg and its 12 area municipalities were amalgamated to form a single city.Even with its residents’ advisory groups, observers felt that the city lacked responsiveness and accounta-bility. These groups were subsequently abolished (Sancton 2000; Smith 1995). Montreal presents anotherexample of amalgamation. The provincial government decided to merge the city of Montreal, with a pop-ulation of 1 million, and 27 other municipalities on the island of Montreal, with a total population of800,000, which took effect January 1, 2002. The new city was divided into 27 boroughs, each responsiblefor local services such as garbage collection, swimming pools, snow clearing, and libraries. Nine of the bor-oughs are located in the central city where no boroughs existed previously. Thus even though residents ofthe former suburbs lose control over some municipal services, residents of the former city of Montreal gainmore autonomy.
11. Service delivery costs could also be reduced without changing government boundaries, for exam-ple, through the involvement of the private sector in municipal service delivery and the provision of serv-ices by one municipality to other municipalities.
12. Sancton (1996) reviewed municipal consolidations in three Canadian provinces and concluded thatthe evidence does not support the view that consolidations result in cost savings.
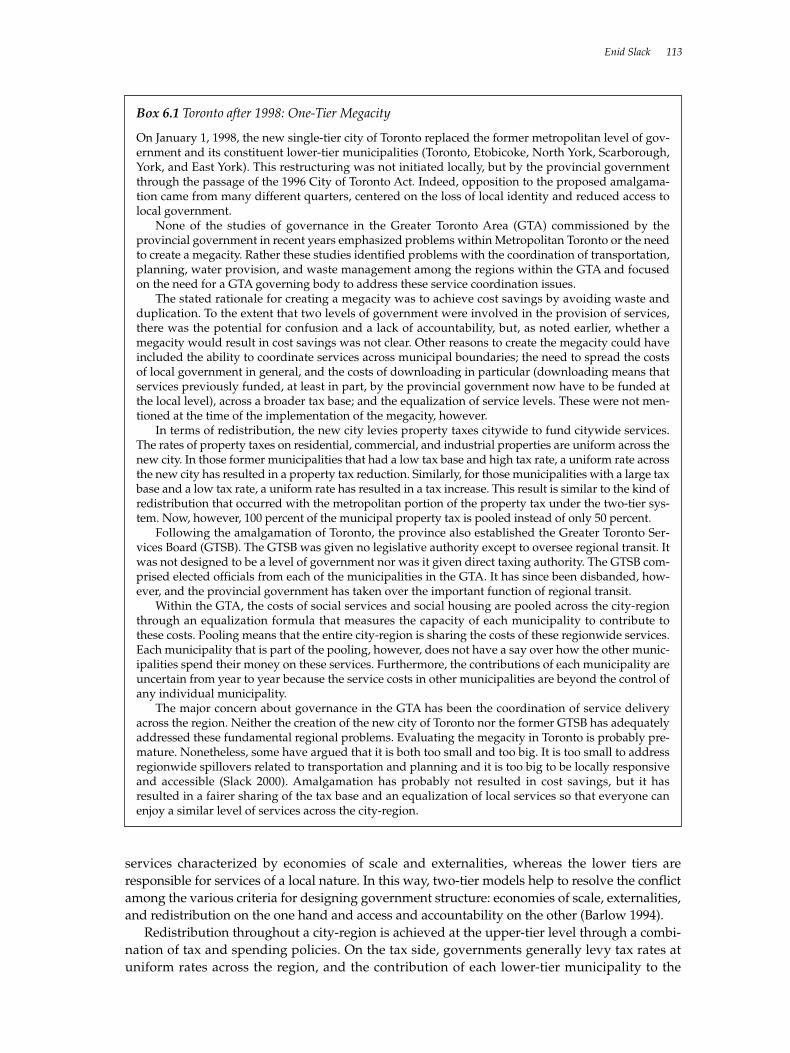
services characterized by economies of scale and externalities, whereas the lower tiers areresponsible for services of a local nature. In this way, two-tier models help to resolve the conflictamong the various criteria for designing government structure: economies of scale, externalities,and redistribution on the one hand and access and accountability on the other (Barlow 1994).
Redistribution throughout a city-region is achieved at the upper-tier level through a combi-nation of tax and spending policies. On the tax side, governments generally levy tax rates atuniform rates across the region, and the contribution of each lower-tier municipality to the
Enid Slack 113
Box 6.1 Toronto after 1998: One-Tier Megacity
On January 1, 1998, the new single-tier city of Toronto replaced the former metropolitan level of gov-ernment and its constituent lower-tier municipalities (Toronto, Etobicoke, North York, Scarborough,York, and East York). This restructuring was not initiated locally, but by the provincial governmentthrough the passage of the 1996 City of Toronto Act. Indeed, opposition to the proposed amalgama-tion came from many different quarters, centered on the loss of local identity and reduced access tolocal government.
None of the studies of governance in the Greater Toronto Area (GTA) commissioned by theprovincial government in recent years emphasized problems within Metropolitan Toronto or the needto create a megacity. Rather these studies identified problems with the coordination of transportation,planning, water provision, and waste management among the regions within the GTA and focusedon the need for a GTA governing body to address these service coordination issues.
The stated rationale for creating a megacity was to achieve cost savings by avoiding waste andduplication. To the extent that two levels of government were involved in the provision of services,there was the potential for confusion and a lack of accountability, but, as noted earlier, whether amegacity would result in cost savings was not clear. Other reasons to create the megacity could haveincluded the ability to coordinate services across municipal boundaries; the need to spread the costsof local government in general, and the costs of downloading in particular (downloading means thatservices previously funded, at least in part, by the provincial government now have to be funded atthe local level), across a broader tax base; and the equalization of service levels. These were not men-tioned at the time of the implementation of the megacity, however.
In terms of redistribution, the new city levies property taxes citywide to fund citywide services.The rates of property taxes on residential, commercial, and industrial properties are uniform across thenew city. In those former municipalities that had a low tax base and high tax rate, a uniform rate acrossthe new city has resulted in a property tax reduction. Similarly, for those municipalities with a large taxbase and a low tax rate, a uniform rate has resulted in a tax increase. This result is similar to the kind ofredistribution that occurred with the metropolitan portion of the property tax under the two-tier sys-tem. Now, however, 100 percent of the municipal property tax is pooled instead of only 50 percent.
Following the amalgamation of Toronto, the province also established the Greater Toronto Ser-vices Board (GTSB). The GTSB was given no legislative authority except to oversee regional transit. Itwas not designed to be a level of government nor was it given direct taxing authority. The GTSB com-prised elected officials from each of the municipalities in the GTA. It has since been disbanded, how-ever, and the provincial government has taken over the important function of regional transit.
Within the GTA, the costs of social services and social housing are pooled across the city-regionthrough an equalization formula that measures the capacity of each municipality to contribute tothese costs. Pooling means that the entire city-region is sharing the costs of these regionwide services.Each municipality that is part of the pooling, however, does not have a say over how the other munic-ipalities spend their money on these services. Furthermore, the contributions of each municipality areuncertain from year to year because the service costs in other municipalities are beyond the control ofany individual municipality.
The major concern about governance in the GTA has been the coordination of service deliveryacross the region. Neither the creation of the new city of Toronto nor the former GTSB has adequatelyaddressed these fundamental regional problems. Evaluating the megacity in Toronto is probably pre-mature. Nonetheless, some have argued that it is both too small and too big. It is too small to addressregionwide spillovers related to transportation and planning and it is too big to be locally responsiveand accessible (Slack 2000). Amalgamation has probably not resulted in cost savings, but it hasresulted in a fairer sharing of the tax base and an equalization of local services so that everyone canenjoy a similar level of services across the city-region.
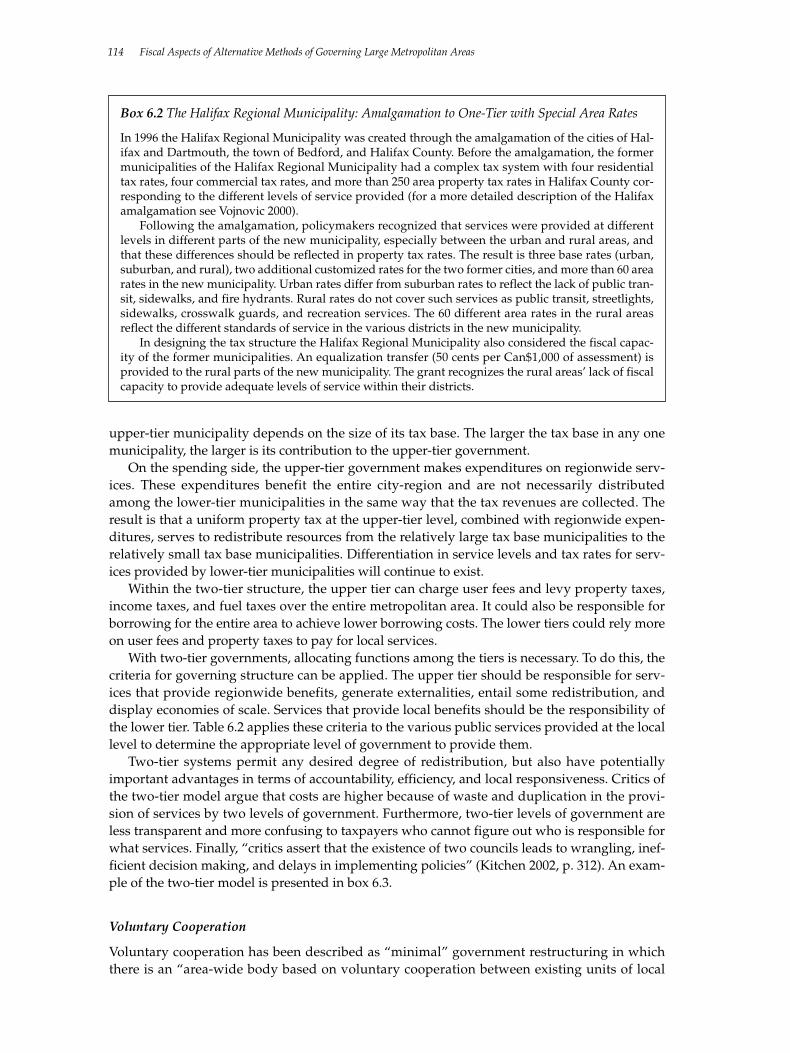
upper-tier municipality depends on the size of its tax base. The larger the tax base in any onemunicipality, the larger is its contribution to the upper-tier government.
On the spending side, the upper-tier government makes expenditures on regionwide serv-ices. These expenditures benefit the entire city-region and are not necessarily distributedamong the lower-tier municipalities in the same way that the tax revenues are collected. Theresult is that a uniform property tax at the upper-tier level, combined with regionwide expen-ditures, serves to redistribute resources from the relatively large tax base municipalities to therelatively small tax base municipalities. Differentiation in service levels and tax rates for serv-ices provided by lower-tier municipalities will continue to exist.
Within the two-tier structure, the upper tier can charge user fees and levy property taxes,income taxes, and fuel taxes over the entire metropolitan area. It could also be responsible forborrowing for the entire area to achieve lower borrowing costs. The lower tiers could rely moreon user fees and property taxes to pay for local services.
With two-tier governments, allocating functions among the tiers is necessary. To do this, thecriteria for governing structure can be applied. The upper tier should be responsible for serv-ices that provide regionwide benefits, generate externalities, entail some redistribution, anddisplay economies of scale. Services that provide local benefits should be the responsibility ofthe lower tier. Table 6.2 applies these criteria to the various public services provided at the locallevel to determine the appropriate level of government to provide them.
Two-tier systems permit any desired degree of redistribution, but also have potentiallyimportant advantages in terms of accountability, efficiency, and local responsiveness. Critics ofthe two-tier model argue that costs are higher because of waste and duplication in the provi-sion of services by two levels of government. Furthermore, two-tier levels of government areless transparent and more confusing to taxpayers who cannot figure out who is responsible forwhat services. Finally, “critics assert that the existence of two councils leads to wrangling, inef-ficient decision making, and delays in implementing policies” (Kitchen 2002, p. 312). An exam-ple of the two-tier model is presented in box 6.3.
Voluntary Cooperation
Voluntary cooperation has been described as “minimal” government restructuring in whichthere is an “area-wide body based on voluntary cooperation between existing units of local
114 Fiscal Aspects of Alternative Methods of Governing Large Metropolitan Areas
Box 6.2 The Halifax Regional Municipality: Amalgamation to One-Tier with Special Area Rates
In 1996 the Halifax Regional Municipality was created through the amalgamation of the cities of Hal-ifax and Dartmouth, the town of Bedford, and Halifax County. Before the amalgamation, the formermunicipalities of the Halifax Regional Municipality had a complex tax system with four residentialtax rates, four commercial tax rates, and more than 250 area property tax rates in Halifax County cor-responding to the different levels of service provided (for a more detailed description of the Halifaxamalgamation see Vojnovic 2000).
Following the amalgamation, policymakers recognized that services were provided at differentlevels in different parts of the new municipality, especially between the urban and rural areas, andthat these differences should be reflected in property tax rates. The result is three base rates (urban,suburban, and rural), two additional customized rates for the two former cities, and more than 60 arearates in the new municipality. Urban rates differ from suburban rates to reflect the lack of public tran-sit, sidewalks, and fire hydrants. Rural rates do not cover such services as public transit, streetlights,sidewalks, crosswalk guards, and recreation services. The 60 different area rates in the rural areasreflect the different standards of service in the various districts in the new municipality.
In designing the tax structure the Halifax Regional Municipality also considered the fiscal capac-ity of the former municipalities. An equalization transfer (50 cents per Can$1,000 of assessment) isprovided to the rural parts of the new municipality. The grant recognizes the rural areas’ lack of fiscalcapacity to provide adequate levels of service within their districts.
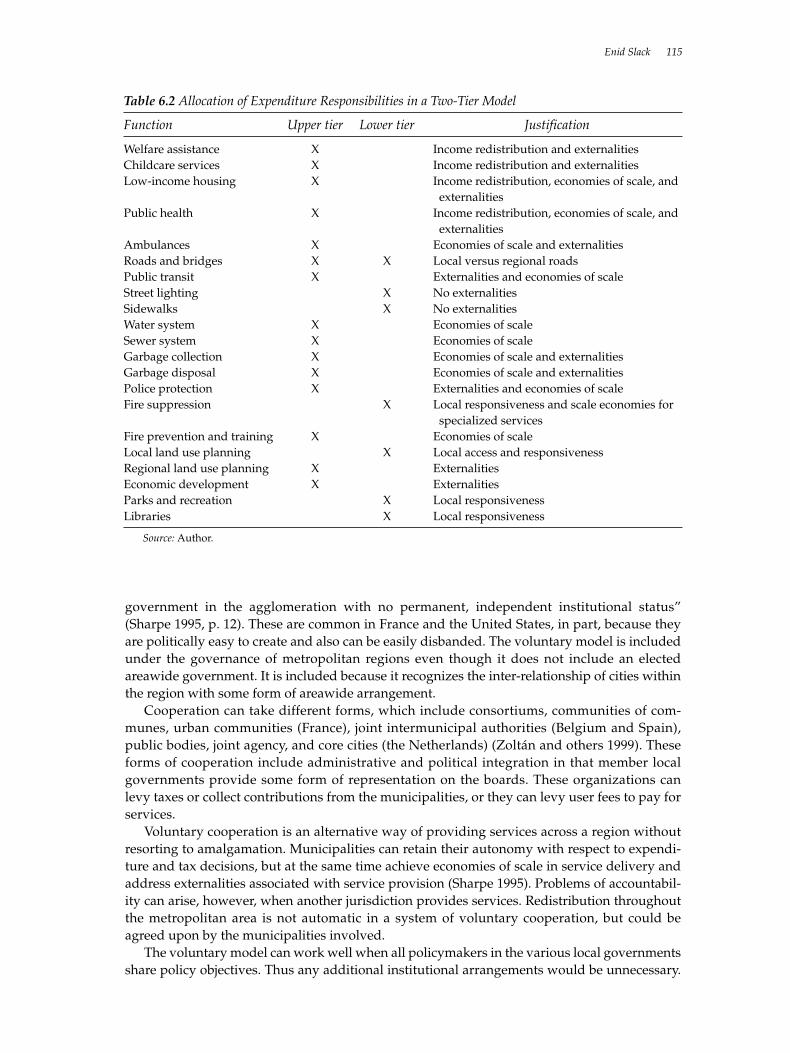
government in the agglomeration with no permanent, independent institutional status”(Sharpe 1995, p. 12). These are common in France and the United States, in part, because theyare politically easy to create and also can be easily disbanded. The voluntary model is includedunder the governance of metropolitan regions even though it does not include an electedareawide government. It is included because it recognizes the inter-relationship of cities withinthe region with some form of areawide arrangement.
Cooperation can take different forms, which include consortiums, communities of com-munes, urban communities (France), joint intermunicipal authorities (Belgium and Spain),public bodies, joint agency, and core cities (the Netherlands) (Zoltán and others 1999). Theseforms of cooperation include administrative and political integration in that member localgovernments provide some form of representation on the boards. These organizations canlevy taxes or collect contributions from the municipalities, or they can levy user fees to pay forservices.
Voluntary cooperation is an alternative way of providing services across a region withoutresorting to amalgamation. Municipalities can retain their autonomy with respect to expendi-ture and tax decisions, but at the same time achieve economies of scale in service delivery andaddress externalities associated with service provision (Sharpe 1995). Problems of accountabil-ity can arise, however, when another jurisdiction provides services. Redistribution throughoutthe metropolitan area is not automatic in a system of voluntary cooperation, but could beagreed upon by the municipalities involved.
The voluntary model can work well when all policymakers in the various local governmentsshare policy objectives. Thus any additional institutional arrangements would be unnecessary.
Enid Slack 115
Table 6.2 Allocation of Expenditure Responsibilities in a Two-Tier Model
Function Upper tier Lower tier Justification
Welfare assistance X Income redistribution and externalitiesChildcare services X Income redistribution and externalitiesLow-income housing X Income redistribution, economies of scale, and
externalitiesPublic health X Income redistribution, economies of scale, and
externalitiesAmbulances X Economies of scale and externalitiesRoads and bridges X X Local versus regional roadsPublic transit X Externalities and economies of scaleStreet lighting X No externalitiesSidewalks X No externalitiesWater system X Economies of scaleSewer system X Economies of scaleGarbage collection X Economies of scale and externalitiesGarbage disposal X Economies of scale and externalitiesPolice protection X Externalities and economies of scaleFire suppression X Local responsiveness and scale economies for
specialized servicesFire prevention and training X Economies of scaleLocal land use planning X Local access and responsivenessRegional land use planning X ExternalitiesEconomic development X ExternalitiesParks and recreation X Local responsivenessLibraries X Local responsiveness
Source: Author.
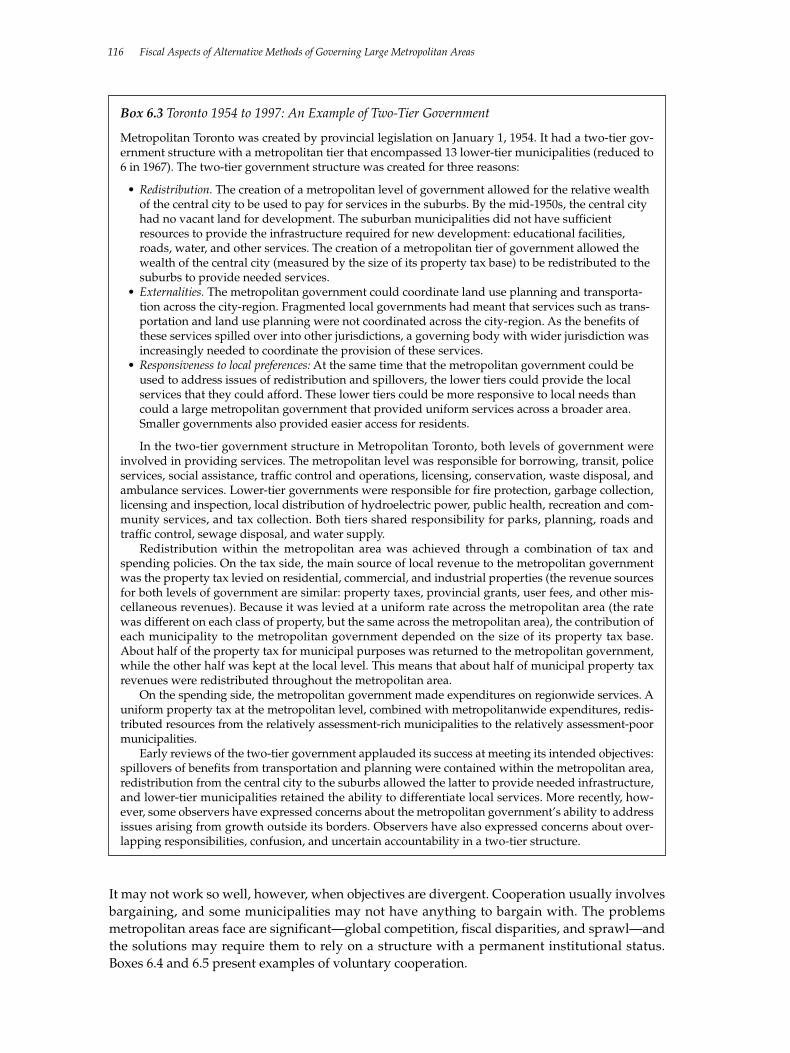
It may not work so well, however, when objectives are divergent. Cooperation usually involvesbargaining, and some municipalities may not have anything to bargain with. The problemsmetropolitan areas face are significant—global competition, fiscal disparities, and sprawl—andthe solutions may require them to rely on a structure with a permanent institutional status.Boxes 6.4 and 6.5 present examples of voluntary cooperation.
116 Fiscal Aspects of Alternative Methods of Governing Large Metropolitan Areas
Box 6.3 Toronto 1954 to 1997: An Example of Two-Tier Government
Metropolitan Toronto was created by provincial legislation on January 1, 1954. It had a two-tier gov-ernment structure with a metropolitan tier that encompassed 13 lower-tier municipalities (reduced to6 in 1967). The two-tier government structure was created for three reasons:
• Redistribution. The creation of a metropolitan level of government allowed for the relative wealthof the central city to be used to pay for services in the suburbs. By the mid-1950s, the central cityhad no vacant land for development. The suburban municipalities did not have sufficientresources to provide the infrastructure required for new development: educational facilities,roads, water, and other services. The creation of a metropolitan tier of government allowed thewealth of the central city (measured by the size of its property tax base) to be redistributed to thesuburbs to provide needed services.
• Externalities. The metropolitan government could coordinate land use planning and transporta-tion across the city-region. Fragmented local governments had meant that services such as trans-portation and land use planning were not coordinated across the city-region. As the benefits ofthese services spilled over into other jurisdictions, a governing body with wider jurisdiction wasincreasingly needed to coordinate the provision of these services.
• Responsiveness to local preferences: At the same time that the metropolitan government could beused to address issues of redistribution and spillovers, the lower tiers could provide the localservices that they could afford. These lower tiers could be more responsive to local needs thancould a large metropolitan government that provided uniform services across a broader area.Smaller governments also provided easier access for residents.
In the two-tier government structure in Metropolitan Toronto, both levels of government wereinvolved in providing services. The metropolitan level was responsible for borrowing, transit, policeservices, social assistance, traffic control and operations, licensing, conservation, waste disposal, andambulance services. Lower-tier governments were responsible for fire protection, garbage collection,licensing and inspection, local distribution of hydroelectric power, public health, recreation and com-munity services, and tax collection. Both tiers shared responsibility for parks, planning, roads andtraffic control, sewage disposal, and water supply.
Redistribution within the metropolitan area was achieved through a combination of tax andspending policies. On the tax side, the main source of local revenue to the metropolitan governmentwas the property tax levied on residential, commercial, and industrial properties (the revenue sourcesfor both levels of government are similar: property taxes, provincial grants, user fees, and other mis-cellaneous revenues). Because it was levied at a uniform rate across the metropolitan area (the ratewas different on each class of property, but the same across the metropolitan area), the contribution ofeach municipality to the metropolitan government depended on the size of its property tax base.About half of the property tax for municipal purposes was returned to the metropolitan government,while the other half was kept at the local level. This means that about half of municipal property taxrevenues were redistributed throughout the metropolitan area.
On the spending side, the metropolitan government made expenditures on regionwide services. Auniform property tax at the metropolitan level, combined with metropolitanwide expenditures, redis-tributed resources from the relatively assessment-rich municipalities to the relatively assessment-poormunicipalities.
Early reviews of the two-tier government applauded its success at meeting its intended objectives:spillovers of benefits from transportation and planning were contained within the metropolitan area,redistribution from the central city to the suburbs allowed the latter to provide needed infrastructure,and lower-tier municipalities retained the ability to differentiate local services. More recently, how-ever, some observers have expressed concerns about the metropolitan government’s ability to addressissues arising from growth outside its borders. Observers have also expressed concerns about over-lapping responsibilities, confusion, and uncertain accountability in a two-tier structure.
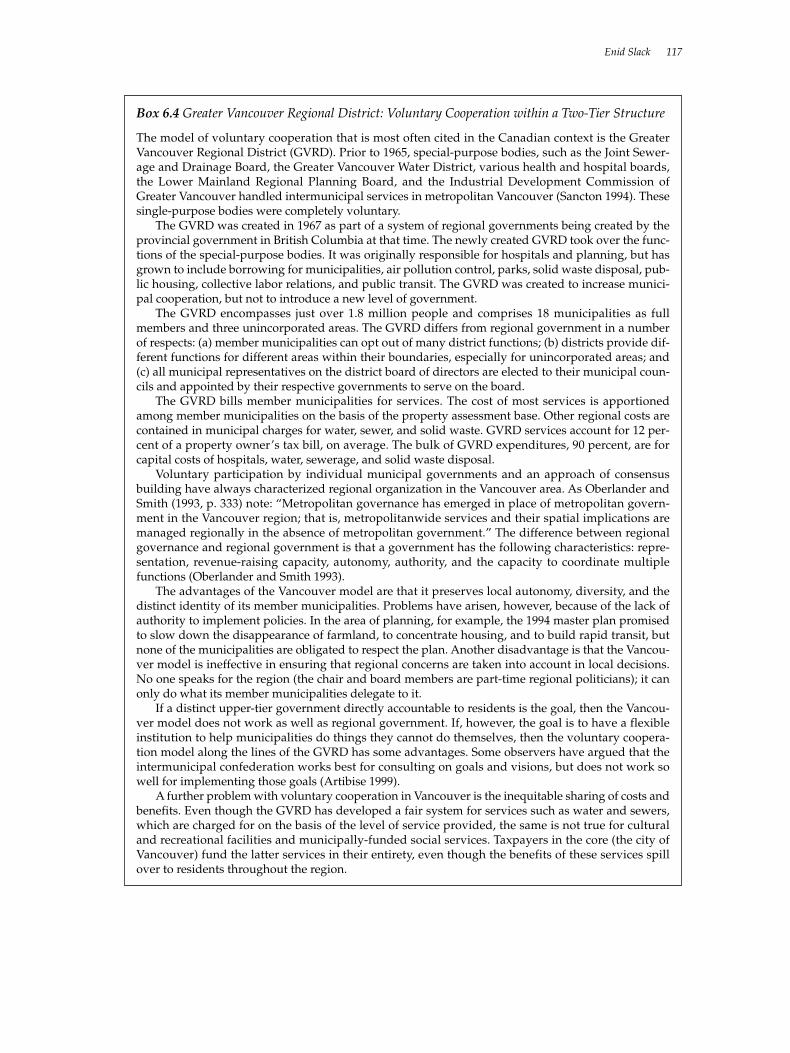
Enid Slack 117
Box 6.4 Greater Vancouver Regional District: Voluntary Cooperation within a Two-Tier Structure
The model of voluntary cooperation that is most often cited in the Canadian context is the GreaterVancouver Regional District (GVRD). Prior to 1965, special-purpose bodies, such as the Joint Sewer-age and Drainage Board, the Greater Vancouver Water District, various health and hospital boards,the Lower Mainland Regional Planning Board, and the Industrial Development Commission ofGreater Vancouver handled intermunicipal services in metropolitan Vancouver (Sancton 1994). Thesesingle-purpose bodies were completely voluntary.
The GVRD was created in 1967 as part of a system of regional governments being created by theprovincial government in British Columbia at that time. The newly created GVRD took over the func-tions of the special-purpose bodies. It was originally responsible for hospitals and planning, but hasgrown to include borrowing for municipalities, air pollution control, parks, solid waste disposal, pub-lic housing, collective labor relations, and public transit. The GVRD was created to increase munici-pal cooperation, but not to introduce a new level of government.
The GVRD encompasses just over 1.8 million people and comprises 18 municipalities as fullmembers and three unincorporated areas. The GVRD differs from regional government in a numberof respects: (a) member municipalities can opt out of many district functions; (b) districts provide dif-ferent functions for different areas within their boundaries, especially for unincorporated areas; and(c) all municipal representatives on the district board of directors are elected to their municipal coun-cils and appointed by their respective governments to serve on the board.
The GVRD bills member municipalities for services. The cost of most services is apportionedamong member municipalities on the basis of the property assessment base. Other regional costs arecontained in municipal charges for water, sewer, and solid waste. GVRD services account for 12 per-cent of a property owner’s tax bill, on average. The bulk of GVRD expenditures, 90 percent, are forcapital costs of hospitals, water, sewerage, and solid waste disposal.
Voluntary participation by individual municipal governments and an approach of consensusbuilding have always characterized regional organization in the Vancouver area. As Oberlander andSmith (1993, p. 333) note: “Metropolitan governance has emerged in place of metropolitan govern-ment in the Vancouver region; that is, metropolitanwide services and their spatial implications aremanaged regionally in the absence of metropolitan government.” The difference between regionalgovernance and regional government is that a government has the following characteristics: repre-sentation, revenue-raising capacity, autonomy, authority, and the capacity to coordinate multiplefunctions (Oberlander and Smith 1993).
The advantages of the Vancouver model are that it preserves local autonomy, diversity, and thedistinct identity of its member municipalities. Problems have arisen, however, because of the lack ofauthority to implement policies. In the area of planning, for example, the 1994 master plan promisedto slow down the disappearance of farmland, to concentrate housing, and to build rapid transit, butnone of the municipalities are obligated to respect the plan. Another disadvantage is that the Vancou-ver model is ineffective in ensuring that regional concerns are taken into account in local decisions.No one speaks for the region (the chair and board members are part-time regional politicians); it canonly do what its member municipalities delegate to it.
If a distinct upper-tier government directly accountable to residents is the goal, then the Vancou-ver model does not work as well as regional government. If, however, the goal is to have a flexibleinstitution to help municipalities do things they cannot do themselves, then the voluntary coopera-tion model along the lines of the GVRD has some advantages. Some observers have argued that theintermunicipal confederation works best for consulting on goals and visions, but does not work sowell for implementing those goals (Artibise 1999).
A further problem with voluntary cooperation in Vancouver is the inequitable sharing of costs andbenefits. Even though the GVRD has developed a fair system for services such as water and sewers,which are charged for on the basis of the level of service provided, the same is not true for culturaland recreational facilities and municipally-funded social services. Taxpayers in the core (the city ofVancouver) fund the latter services in their entirety, even though the benefits of these services spillover to residents throughout the region.
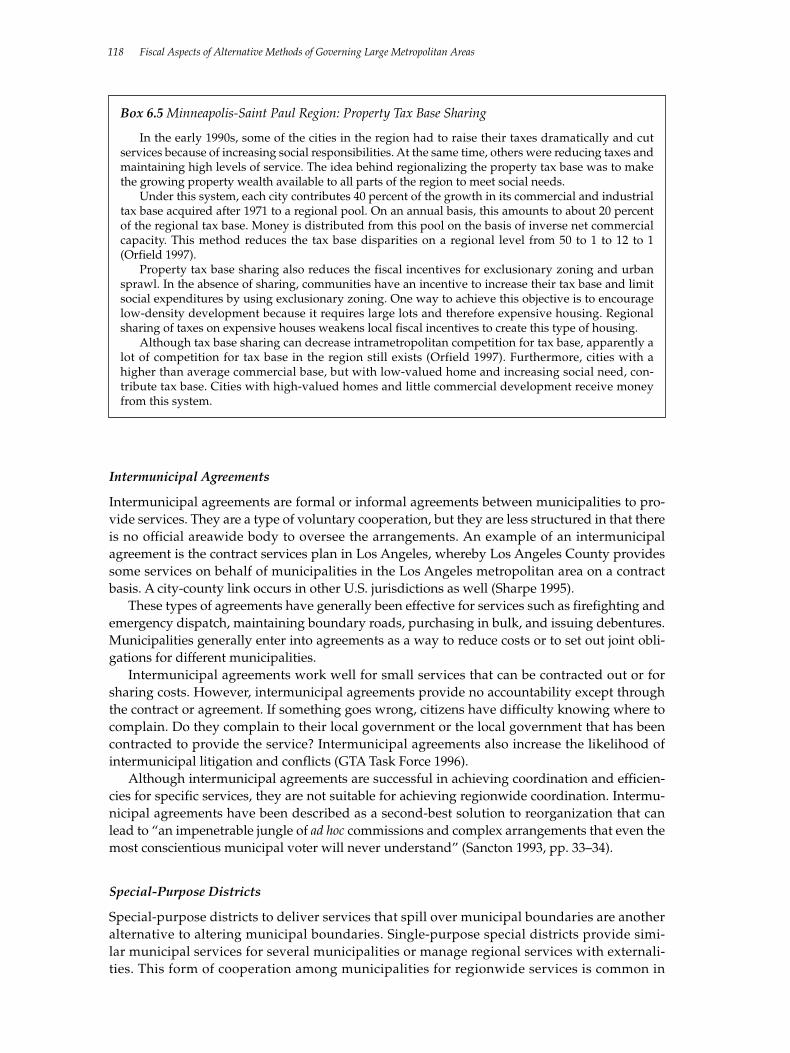
Intermunicipal Agreements
Intermunicipal agreements are formal or informal agreements between municipalities to pro-vide services. They are a type of voluntary cooperation, but they are less structured in that thereis no official areawide body to oversee the arrangements. An example of an intermunicipalagreement is the contract services plan in Los Angeles, whereby Los Angeles County providessome services on behalf of municipalities in the Los Angeles metropolitan area on a contractbasis. A city-county link occurs in other U.S. jurisdictions as well (Sharpe 1995).
These types of agreements have generally been effective for services such as firefighting andemergency dispatch, maintaining boundary roads, purchasing in bulk, and issuing debentures.Municipalities generally enter into agreements as a way to reduce costs or to set out joint obli-gations for different municipalities.
Intermunicipal agreements work well for small services that can be contracted out or forsharing costs. However, intermunicipal agreements provide no accountability except throughthe contract or agreement. If something goes wrong, citizens have difficulty knowing where tocomplain. Do they complain to their local government or the local government that has beencontracted to provide the service? Intermunicipal agreements also increase the likelihood ofintermunicipal litigation and conflicts (GTA Task Force 1996).
Although intermunicipal agreements are successful in achieving coordination and efficien-cies for specific services, they are not suitable for achieving regionwide coordination. Intermu-nicipal agreements have been described as a second-best solution to reorganization that canlead to “an impenetrable jungle of ad hoc commissions and complex arrangements that even themost conscientious municipal voter will never understand” (Sancton 1993, pp. 33–34).
Special-Purpose Districts
Special-purpose districts to deliver services that spill over municipal boundaries are anotheralternative to altering municipal boundaries. Single-purpose special districts provide simi-lar municipal services for several municipalities or manage regional services with externali-ties. This form of cooperation among municipalities for regionwide services is common in
118 Fiscal Aspects of Alternative Methods of Governing Large Metropolitan Areas
Box 6.5 Minneapolis-Saint Paul Region: Property Tax Base Sharing
In the early 1990s, some of the cities in the region had to raise their taxes dramatically and cutservices because of increasing social responsibilities. At the same time, others were reducing taxes andmaintaining high levels of service. The idea behind regionalizing the property tax base was to makethe growing property wealth available to all parts of the region to meet social needs.
Under this system, each city contributes 40 percent of the growth in its commercial and industrialtax base acquired after 1971 to a regional pool. On an annual basis, this amounts to about 20 percentof the regional tax base. Money is distributed from this pool on the basis of inverse net commercialcapacity. This method reduces the tax base disparities on a regional level from 50 to 1 to 12 to 1(Orfield 1997).
Property tax base sharing also reduces the fiscal incentives for exclusionary zoning and urbansprawl. In the absence of sharing, communities have an incentive to increase their tax base and limitsocial expenditures by using exclusionary zoning. One way to achieve this objective is to encouragelow-density development because it requires large lots and therefore expensive housing. Regionalsharing of taxes on expensive houses weakens local fiscal incentives to create this type of housing.
Although tax base sharing can decrease intrametropolitan competition for tax base, apparently alot of competition for tax base in the region still exists (Orfield 1997). Furthermore, cities with ahigher than average commercial base, but with low-valued home and increasing social need, con-tribute tax base. Cities with high-valued homes and little commercial development receive moneyfrom this system.
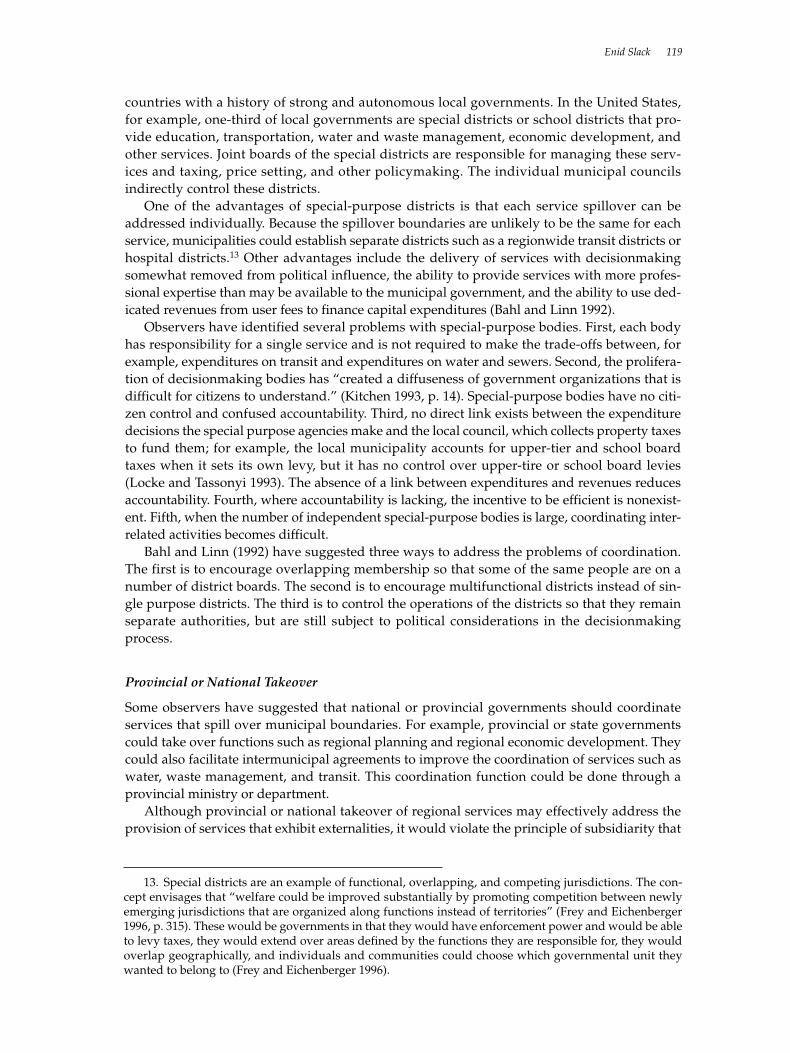
countries with a history of strong and autonomous local governments. In the United States,for example, one-third of local governments are special districts or school districts that pro-vide education, transportation, water and waste management, economic development, andother services. Joint boards of the special districts are responsible for managing these serv-ices and taxing, price setting, and other policymaking. The individual municipal councilsindirectly control these districts.
One of the advantages of special-purpose districts is that each service spillover can beaddressed individually. Because the spillover boundaries are unlikely to be the same for eachservice, municipalities could establish separate districts such as a regionwide transit districts orhospital districts.13 Other advantages include the delivery of services with decisionmakingsomewhat removed from political influence, the ability to provide services with more profes-sional expertise than may be available to the municipal government, and the ability to use ded-icated revenues from user fees to finance capital expenditures (Bahl and Linn 1992).
Observers have identified several problems with special-purpose bodies. First, each bodyhas responsibility for a single service and is not required to make the trade-offs between, forexample, expenditures on transit and expenditures on water and sewers. Second, the prolifera-tion of decisionmaking bodies has “created a diffuseness of government organizations that isdifficult for citizens to understand.” (Kitchen 1993, p. 14). Special-purpose bodies have no citi-zen control and confused accountability. Third, no direct link exists between the expendituredecisions the special purpose agencies make and the local council, which collects property taxesto fund them; for example, the local municipality accounts for upper-tier and school boardtaxes when it sets its own levy, but it has no control over upper-tire or school board levies(Locke and Tassonyi 1993). The absence of a link between expenditures and revenues reducesaccountability. Fourth, where accountability is lacking, the incentive to be efficient is nonexist-ent. Fifth, when the number of independent special-purpose bodies is large, coordinating inter-related activities becomes difficult.
Bahl and Linn (1992) have suggested three ways to address the problems of coordination.The first is to encourage overlapping membership so that some of the same people are on anumber of district boards. The second is to encourage multifunctional districts instead of sin-gle purpose districts. The third is to control the operations of the districts so that they remainseparate authorities, but are still subject to political considerations in the decisionmakingprocess.
Provincial or National Takeover
Some observers have suggested that national or provincial governments should coordinateservices that spill over municipal boundaries. For example, provincial or state governmentscould take over functions such as regional planning and regional economic development. Theycould also facilitate intermunicipal agreements to improve the coordination of services such aswater, waste management, and transit. This coordination function could be done through aprovincial ministry or department.
Although provincial or national takeover of regional services may effectively address theprovision of services that exhibit externalities, it would violate the principle of subsidiarity that
Enid Slack 119
13. Special districts are an example of functional, overlapping, and competing jurisdictions. The con-cept envisages that “welfare could be improved substantially by promoting competition between newlyemerging jurisdictions that are organized along functions instead of territories” (Frey and Eichenberger1996, p. 315). These would be governments in that they would have enforcement power and would be ableto levy taxes, they would extend over areas defined by the functions they are responsible for, they wouldoverlap geographically, and individuals and communities could choose which governmental unit theywanted to belong to (Frey and Eichenberger 1996).
suggests that services are more efficiently and effectively delivered by the level of governmentclosest to citizens. Based on this principle, regional coordination would be more effective andmore accountable than provincial coordination.
Concluding Comments on Governing Large Metropolitan Areas
The size, concentration, and composition of the population of large metropolitan areas makesuch areas different from other urban or rural areas. From a fiscal perspective, these factorsmean that these areas may have greater needs than other municipalities (although their costsmay be lower) and greater ability to levy taxes. For this reason, granting them more fiscalautonomy—the ability to make expenditure decisions and set tax rates—than other urban areasmay be appropriate. Large metropolitan areas will also be able to rely less on transfers fromsenior levels of government.
The governing structure of large metropolitan areas will affect their ability to provide serv-ices and raise revenues in a fair and efficient way. However, determining the best model ofgovernance for large metropolitan areas is difficult. Out of the wide variety of existing metro-politan government structures “no model stands out as clearly superior in all respects”(McMillan 1997, p. 39). Application of the criteria for designing government structure to thevarious models presented, however, suggests the following:
• Some form of regional structure that encompasses the entire city-region is needed toaddress problems of a regionwide nature, such as fiscal disparities among municipal-ities and problems associated with externalities in service provision. Although theneed for a regional structure is clear, the form it takes will vary with local circum-stances. Intermunicipal agreements for the provision of services are effective for asmall number of services, but do not provide a solution to the need for regionalcooperation.
• A one-tier structure is simpler to understand and more transparent than a two-tierstructure. For that reason, it appears to enhance political and fiscal accountability. Two-tier structures, however, are inherently more complex and may result in undesirableduplication, overlap, and general confusion among citizens as to who is responsible forwhat and who is paying for it.
• Municipalities can achieve redistribution within a one-tier or a two-tier structure. In aone-tier structure with uniform tax rates across the city-region, all taxes are madeavailable for redistribution. In a one-tier structure with special area rates or in a two-tier structure, less than 100 percent of tax revenues will be available for redistribution.
• A two-tier structure may achieve greater efficiency than a more centralized one-tierstructure is likely to achieve. Desirable economies of scale can be realized at theupper-tier level, while the lower tier permits more responsiveness to local variationsin preferences and maintains the close link between local financing and spendingdecisions.
• Where local autonomy is paramount and where policymakers in various local govern-ments share objectives, voluntary cooperation can work. It works less well when objec-tives differ among local governments and when it comes time to implement thoseobjectives.
City-regions face a number of fiscal and other challenges, unique to large metropolitanareas. What works best in terms of governing structure in particular circumstances depends onpolicy priorities, the scope and type of local responsibilities, the instruments of local finance,and the degree and nature of central-provincial presence in the metropolitan area in terms ofservice provision and financial support. “Any attempt to define one ideal size of a city-regionor one ideal form of governance would be doomed to failure” (Sancton 2000, p. 7).
120 Fiscal Aspects of Alternative Methods of Governing Large Metropolitan Areas
References
Artibise, Alan F. J. 1999. “Regional Governance without Regional Government: The Strengthsand Weaknesses of the Greater Vancouver Regional District.” Report prepared for theRegional Municipality of Ottawa-Carleton, Ottawa.
Bahl, Roy, and Johannes Linn. 1992. Urban Public Finance in Developing Countries. New York:Oxford University Press.
Barlow, Max. 1994. “Centralization and Decentralization in the Governing of Cities and Metro-politan Regions.” In Robert J. Bennett, ed., Local Government and Market Decentralization:Experiences in Industrialized, Developing, and Former Eastern Bloc Countries. Tokyo: UnitedNations University Press.
Barnett, Richard, R. 1997. “Subsidiarity, Enabling Government, and Local Governance.” InPaul A. R. Hobson and France St-Hilaire, eds., Urban Governance and Finance: A Question ofWho Does What. Montreal: Institute for Research on Public Policy.
Bird, Richard, M. 1984. “Intergovernmental Finance in Colombia.” Final report of the missionon intergovernmental finance. Cambridge, Mass.: Harvard University Law School.
_____. 2001. “Setting the Stage: Municipal and Intergovernmental Finance.” In Mila Freire andRichard Stren, eds., The Challenge of Urban Government: Policies and Practices. Washington,D.C.: World Bank Institute.
Bird, Richard, and Enid Slack. 1993. Urban Public Finance in Canada, 2nd ed. Toronto: John Wiley.
Bish, Robert L. 2001. Local Government Amalgamations: Discredited 19th Century Ideals Alive in the21st. Toronto: C. D. Howe Institute.
Boyne, George. 1992. “Local Government Structure and Performance: Lessons from America?”Public Administration 70(Autumn): 338–57.
Burki, Shahid Javed, Guillermo E. Perry, and William Dillinger. 1999. Beyond the Center: Decen-tralizing the State. Washington, D.C.: World Bank.
Freire, Mila. 2001. “Introduction.” In Mila Freire and Richard Stren, eds., The Challenge of UrbanGovernment: Policies and Practices. Washington, D.C.: World Bank Institute.
Frey, Bruno, and Reiner Eichenberger. 1996. “FOJC: Competitive Governments for Europe.”International Review of Law and Economics 16(3): 315–27.
GTA (Greater Toronto Area) Task Force. 1996. Greater Toronto. Toronto.
Kitchen, Harry. 1993. “Efficient Delivery of Local Government Services.” Discussion Paper no.93–15. Queen’s University, School of Policy Studies, Government and Competitiveness Pro-ject, Kingston, Ontario.
_____. 2002. Municipal Revenue and Expenditure Issues in Canada. Toronto: Canadian Tax Foun-dation.
Locke, Wade, and Almos Tassonyi. 1993. “Shared Tax Bases and Local Public ExpenditureDecisions.” Canadian Tax Journal 41(5): 941–57.
McMillan, Melville. 1997. “Taxation and Expenditure Patterns in Major City-Regions: An Inter-national Perspective and Lessons for Canada.” In Paul A.R. Hobson and France St-Hilaire,eds., Urban Governance and Finance: A Question of Who Does What. Montreal: Institute forResearch on Public Policy.
Nowlan, David, 1994. “Local Taxation as an Instrument of Policy.” In Frances Frisken, ed., TheChanging Canadian Metropolis: A Public Policy Perspective, vol. 2. Berkeley, Calif.: Institute ofGovernmental Studies Press.
Enid Slack 121

Oberlander, H. Peter, and Patrick J. Smith. 1993. “Governing Metropolitan Vancouver:Regional Intergovernmental Relations in British Columbia.” In Donald N. Rothblatt andAndrew Sancton, eds., Metropolitan Governance: American/Canadian Intergovernmental Per-spectives. Berkeley, California: University of California, Institute for Governmental Studies.
OECD (Organisation for Economic Co-operation and Development). 2000. Revenue Statistics1965-1999. Paris.
Orfield, Myron. 1997. Metropolitics: A Regional Agenda for Community and Stability. Washington,D.C and Cambridge, Mass..: The Brookings Institution and Lincoln Institute of Land Policy.
Osborne, David, and Ted Gaebler. 1992. Reinventing Government—How the Entrepreneurial SpiritIs Transforming the Public Sector. Reading, Mass.: Addison-Wesley.
Sancton, Andrew. 1993. “Local Government Reorganization in Canada since 1975.” Intergov-ernmental Committee on Urban and Regional Research, Toronto.
_____. 1994. Governing Canada’s City-Regions: Adapting Form to Function. Montreal: Institute forResearch on Public Policy.
_____. 1996. “Reducing Costs by Consolidating Municipalities: New Brunswick, Nova Scotia,and Ontario.” Canadian Public Administration 39(3): 267–89.
_____. 2000. Merger Mania: An Assault on Local Government. Westmount, Quebec: Price-Patterson.
Sharpe, L. J., ed. 1995. “The Future of Metropolitan Government.” In The Government of WorldCities: The Future of the Metro Model. Chichester, U.K.: John Wiley.
Slack, Enid. 2000. “A Preliminary Assessment of the New City of Toronto.” Canadian Journal ofRegional Science 23(1): 13–29.
_____. 2002. Municipal Finance and the Pattern of Urban Growth. C. D. Howe Institute Commen-tary no. 160. Toronto: C. D. Howe Institute.
Smith, Patrick J. 1995. “Governing Metropolitan Change: Public Policy and Governance inCanada’s City Regions.” In James Lightbody, ed., Canadian Metropolitics: Governing OurCities. Toronto: Copp Clark.
Thirsk, Wayne. 1982. “Political Sensitivity Versus Economic Sensibility: A Tale of Two PropertyTaxes.” In Wayne Thirsk and John Whalley, eds., Tax Policy Options in the 1980s. Toronto:Canadian Tax Foundation.
Tiebout, Charles. 1956. “A Pure Theory of Local Government Expenditures.” Journal of PoliticalEconomy 64(October): 416–24.
Vojnovic, Igor. 2000. “Municipal Consolidation, Regional Planning, and Fiscal Accountability:The Recent Experience in Two Maritime Provinces.” Canadian Journal of Regional Science23(1): 49–72.
Zoltán, Hermann, M. Tamás Horváth, Gábor Péteri, and Gábor Ungvári. 1999. Allocation ofLocal Government Functions: Criteria and Conditions—Analysis and Policy Proposals for Hun-gary. Washington, D.C.: Fiscal Decentralization Initiative for Central and Eastern Europe.
122 Fiscal Aspects of Alternative Methods of Governing Large Metropolitan Areas
7Providing Public Services in Remote Areas
Harry Kitchen and Enid Slack
Governing remote areas raises different issues than governing urban areas because of the smallsize of the population, the lack of concentration of population, and the high cost of living. Thesecharacteristics mean that expenditures per capita are often much higher in remote areas than inurban areas. At the same time, the fiscal base tends to be smaller, because property is not pri-vately owned and levels of employment and income are low. Governance of remote areas raisesquestions about local governments’ ability to deliver services and the role of senior levels ofgovernment in funding and delivering local services. It also raises a more fundamental ques-tion of whether or not settlements in remote areas should be subsidized by senior levels of gov-ernment.
The purpose of this chapter is to review ways to provide services in remote areas. The firstsection outlines the characteristics of remote areas and raises issues pertaining to the role oflocal government. The second section reviews local government expenditures in remote com-munities and indicates how the characteristics of these areas affect the nature and magnitude ofexpenditures. The third section looks at the revenue sources of remote areas and how they areaffected by the size and remoteness of these communities. The fourth section presents and eval-uates alternative government structures that can be used in remote areas, such as two-tier struc-tures, one-tier structures, intermunicipal agreements, and special-purpose districts, and the roleof senior levels of government.
Characteristics of Remote Areas
Although small or remote areas do not have universal characteristics, some common themescan be found (Dougherty, Klase, and Song 1999). Remote areas are characterized by geographicisolation and low population density. Communities tend to be sparsely populated, and the dis-tance between them is considerable. In addition, they are generally noncontiguous. Often thesecommunities have no publicly provided overland transportation system, such as roads and rail.Most municipalities in remote areas are subject to harsher climatic conditions than those livingin the more populated and urbanized parts of the country. Many of these communities havehigher unemployment rates because of fewer job opportunities and greater dependence onsocial service programs. As the second and third sections will show, the combination of thesefactors contributes to higher per capita costs of public services and a smaller tax base.
In some instances, remote communities are not organized into local government units and arecalled unincorporated areas. Any municipal functions that are required are generally providedby departments of senior levels of government, such as departments of regional affairs, trans-portation, natural resources, the environment, and so forth, in return for a small tax payment.
In some remote communities, municipal institutions have been slow to form because thecommunities were built and operated as company towns. In these cases municipal services areprovided by the companies for their employees. This phenomenon has been common in Rus-sia, where enterprises have provided services to their employees and their families that else-where are provided by local governments. For example, as Wallich (1994, p. 39) states: “Enter-prises build and support hospitals, construct and maintain housing, build and run
123
kindergartens and preschools, and make ‘voluntary donations’ toward financing public trans-port and to extrabudgetary funds of subnational governments.” Although the extent to whichthe funding of services by enterprises varies across Russia, almost all social expenditures aremade by enterprises in single-enterprise company towns.
Wallich (1994) identifies some of the problems with this practice. First, it is a form of hiddentaxation, because enterprises are providing services rather than paying taxes and user fees forpublicly provided services. Second, the provision of public services in this way does not allowlocal residents to reveal their preferences. Third, expenditures on public services place a bur-den on enterprises and put them at a disadvantage in the market economy. To the extent thatthese services are considered to be fringe benefits that are necessary to attract labor, however,the first and third points may be less relevant. In the sparsely settled areas of several countries(for example, Australia and Canada), communities are often characterized by a dual economy.On the one hand, the relatively stable native population is engaged for the most part in eitherlow-wage occupations in line with their generally low skill and educational levels, are engagedin low-paying traditional occupations (hunting and trapping, for example), are engaged insome combination of these activities, or are unemployed. On the other hand, a highly mobilenonnative population is employed in remote communities whether they are full-time residents(like most government employees) or transitory workers (for instance, in mining and construc-tion). In both cases, the highly mobile populations are well paid because of the nature of theiroccupations (skill and educational levels) and as compensation for enduring harsh living con-ditions. The concentration of income at the upper and lower ends of the income scale is thedirect consequence of an economy characterized by a dual labor market.
Municipal governments in remote areas have generally been confined to population centers.Historically, communities in remote areas were established for a number of reasons. Some werebased on a particular industry, such as mining, forestry, agriculture, fishing, or oil; some wereregional service centers that provided a range of private and public services to the surroundingpopulation; some were centers of indigenous peoples; and some were created for national secu-rity reasons. The existence of communities in remote areas today reflects these historical rea-sons even though, in some cases, they are no longer valid. For example, companies may haveshut down, regional service centers may have moved, and national security in remote areasmay no longer be an issue.
People continue to live in these communities, however. The issue is not whether they shouldcontinue to live there, but whether they should be subsidized. If a town loses the economicbasis for its existence and no viable alternatives are available, continuing to subsidize theseareas is not in the economic interests of senior levels of government (Graham 1963). These sub-sidies may prevent ghost towns from occurring, but they distort the allocation of resources.Although economic arguments would support the abandonment of these communities, politi-cal realities may keep them alive.
Local Government in Remote Areas
In terms of economic theory, the major role assigned to local governments is to provide goodsand services within a particular geographic area to residents who are willing to pay for them(see Bird and Slack 1993, p. 16, for a discussion of the role of local government). If the benefitsof particular services are confined to local jurisdictions (the actions of one municipality have noeffect on other municipalities), efficiency is enhanced, because the mix and level of services canvary according to local preferences. The provision of local services does not mean that munici-palities have to produce the goods and services themselves, however. Rather, the role of localgovernment is to make decisions about which services to provide and how to provide them.Municipalities could, for example, contract out service delivery to another government or tothe private sector (see Osborne and Gaebler 1992).
124 Providing Public Services in Remote Areas
A strong local government is one that is efficient and effective in service delivery, on the onehand, and accountable and responsive to its citizens on the other. Municipalities have to besmall enough to provide access and large enough to be able to support a wide range of servicesin an efficient and effective way. If the municipality is too small and remote to deliver serviceseffectively, however, political access is meaningless. In particular, municipalities need an ade-quate tax base and qualified personnel.
Some small municipalities do not have a large enough tax base to be economically viable. Inparticular, they often cannot finance major capital expenditures, such as road graders and fireequipment. Their limited debt capacity further inhibits their ability to make capital expendi-tures. Because the size of the population is small, these municipalities cannot take advantage ofeconomies of scale in service provision. Furthermore, their remoteness prevents them from tak-ing advantage of economies of scale by contracting out services to neighboring municipalitiesor to the private sector. As a result, small communities in remote areas tend to concentrate onproviding a few basic services (Dougherty, Klase, and Song 1999).
Inadequate resources also mean that small and remote communities may face administra-tive difficulties, because they are unable to find suitably qualified full-time staff. These commu-nities have limited training opportunities to develop and maintain qualified personnel(Dougherty, Klase, and Song 1999). Some municipalities operate with a part-time staff; othersoperate with a staff that is required to have a wide range of expertise because specialization isvirtually impossible (Kurlyandskaya, Nikolayenko, and Golovanova 2001). The lack of quali-fied staff limits elected officials’ ability to respond to their constituents’ needs (ConsultationCommittee to the Minister of Municipal Affairs 1989). Some of these problems may be over-come, however, by contracting out to other governments or the private sector or by sharingexpertise among municipalities. Technology can also improve efficiency and provide easyaccess to needed expertise.
In terms of access and accountability, the lack of mobility of large segments of the popula-tion in remote communities brings into question the role of local government. If residents arenot mobile, they are unlikely to respond to taxes and expenditures by moving to other commu-nities. To the extent that the efficiency of local government relies on it being responsive to localcitizens, its role in remote areas is less significant than in urban areas (see Litvack, Ahmad, andBird 1998 for a discussion of the limitations of “voice” and “exit” in smaller municipalities andrural areas in developing countries where mobility is limited).
Local Government Expenditures in Remote Areas
The role of local government in remote areas tends to be much weaker than in urban areas.Because of the vast distances involved, services such as police and fire protection are limited,garbage collection is non-existent, and land use planning is often performed by a senior level ofgovernment. Local services mainly comprise roads, sewer and water, garbage disposal, socialservices, and recreation. With respect to water and sewers in rural areas, public health consid-erations require that governments regulate and monitor the quality of water from private sys-tems. With respect to garbage disposal, a need also exists to ensure that garbage is transportedto landfill sites.
To illustrate the differences between per capita expenditures in remote areas and more pop-ulated areas, table 7.1 compares population density and per capita costs of providing govern-ment services in Canada’s three northern territories, Yukon, Northwest Territories, andNunavut, with the rest of Canada. This comparison is made for municipalities alone and for theconsolidated territorial/municipal sector. Municipal expenditures per capita indicate the levelof spending made by municipalities alone. Consolidated municipal/territorial expendituresindicate the level of spending by both sectors combined. The latter measure is appropriatewhere service responsibility is split between two levels of government. For example, social
Harry Kitchen and Enid Slack 125
services are a territorial responsibility in the Yukon and are split between the municipal and ter-ritorial sector in the Northwest Territories and Nunavut.
Table 7.1 shows clearly that the population density is much lower in these remote territoriesthan in the rest of Canada, and also that variation is considerable across the territories. The vari-ation in population density accounts for a considerable portion of the variation in per capitaexpenditures. For the municipal sector alone, the following differences are noted with respectto expenditures per capita:
• Municipal spending on all services is considerably higher in remote areas than in therest of Canada. Municipal spending is 41 percent higher in the Yukon, 173 percenthigher in the Northwest Territories, and 171 percent higher in Nunavut.
• General government expenditures are considerably higher in the north than in the restof Canada. This can be attributed to municipalities’ small size and their inability to takeadvantage of economies of scale in administration.
• Fire and police expenditures are lower in the north, primarily because fire protectionequipment is much less sophisticated than in more urban areas. In addition, the northdoes not have any high-rise buildings and has a relatively small geographical area tocover. The response time cannot compare with that in urban areas because of the dis-tances involved, and the north does not have externalities, because the properties are sofar apart. Policing is almost always the responsibility of a senior level of governmentbecause of economies of scale associated with the policing.
• Expenditures on roads, water, and sewers are higher in the north because of the harshclimatic conditions and terrain (tundra).
• Expenditures on recreation and culture are considerably higher in the north. Almostevery municipality has an ice arena and a variety of recreational programs.
When consolidated territorial/municipal per capita expenditures are compared for theremote areas with the rest of Canada, the following are noted:
• Municipal/territorial spending on all services is substantially higher in remote areas:129 percent higher in the Yukon, 188 percent higher in the Northwest Territories, and224 percent higher in Nunavut.
• Administration expenditures are considerably higher in remote areas by a factor ofclose to 10 or more.
• Expenditures on fire, police, transportation, water, sewers, solid waste, housing, andrecreation are significantly higher in remote areas.
• Spending on education, health, and social services significantly exceeds that in morepopulated and urban areas.
Local Revenues in Remote Areas
Under the benefit model of local government finance, charges should be levied to pay for serv-ices, wherever possible. Where user charges cannot be used because the benefits of a particularservice are not confined to individual consumers, but are confined within the municipalboundary, taxes that are borne by local residents are considered to be appropriate. These taxesallow individuals to express their demand for services where benefits are consumed collec-tively.
As noted earlier, expenditures per capita are generally higher in remote areas than in otherlocal communities. Indeed, they can even be higher in remote areas than in large metropolitanareas. Unlike large metropolitan areas, however, remote areas do not generally have sufficientcapacity to finance these expenditures. To the extent that local governments in remote commu-nities are responsible for delivering services, however, the local governments require some local
126 Providing Public Services in Remote Areas
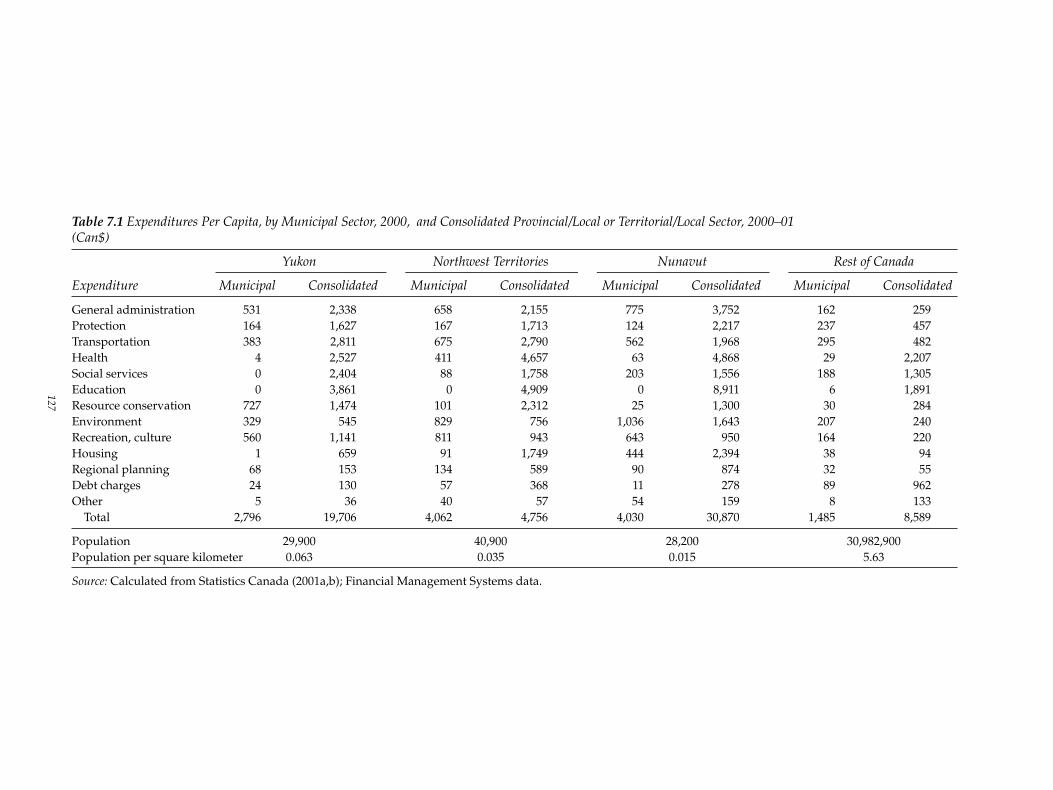
Table 7.1 Expenditures Per Capita, by Municipal Sector, 2000, and Consolidated Provincial/Local or Territorial/Local Sector, 2000–01 (Can$)
Yukon Northwest Territories Nunavut Rest of Canada
Expenditure Municipal Consolidated Municipal Consolidated Municipal Consolidated Municipal Consolidated
General administration 531 2,338 658 2,155 775 3,752 162 259Protection 164 1,627 167 1,713 124 2,217 237 457Transportation 383 2,811 675 2,790 562 1,968 295 482Health 4 2,527 411 4,657 63 4,868 29 2,207Social services 0 2,404 88 1,758 203 1,556 188 1,305Education 0 3,861 0 4,909 0 8,911 6 1,891Resource conservation 727 1,474 101 2,312 25 1,300 30 284Environment 329 545 829 756 1,036 1,643 207 240Recreation, culture 560 1,141 811 943 643 950 164 220Housing 1 659 91 1,749 444 2,394 38 94Regional planning 68 153 134 589 90 874 32 55Debt charges 24 130 57 368 11 278 89 962Other 5 36 40 57 54 159 8 133
Total 2,796 19,706 4,062 4,756 4,030 30,870 1,485 8,589
Population 29,900 40,900 28,200 30,982,900Population per square kilometer 0.063 0.035 0.015 5.63
Source: Calculated from Statistics Canada (2001a,b); Financial Management Systems data.
127
taxing authority to reinforce local autonomy and to promote accountability. Local governmentsin remote areas should therefore have access to revenue sources that can be exploited locally,and they should be encouraged to exploit them as much as possible. As Bird and Slack (1991, p.84) state: “Unless local governments are given some degrees of freedom, including the freedomto make mistakes for which they are accountable, the development of responsible and respon-sive local government will remain an unattainable mirage.” In theory, the sources of revenueavailable to local governments in remote areas are the same as local governments elsewhere.These include user fees, taxes (property, income, sales, fuel, and possibly poll taxes), and inter-governmental transfers. In reality, however, the characteristics of the tax base in remote areasrestricts the use of many of these revenue sources, and the high cost of services means that userfees are less likely to cover the full cost of service provision.
User Fees
User fees recover at least a portion, if not all, of the costs of some services, such as water andsewers, in remote areas. Although reliance on these fees varies across remote communities, theproportion of total local revenues attributed to user fees is higher in two of three territories(Northwest Territories and Nunavut) than in the rest of Canada. This difference may be attrib-uted to the higher cost of services for which user fees are charged in remote areas.
Charging user fees has many advantages. First, they promote efficiency in the consumptionof goods and services. Users know how much it costs to provide services and can make aninformed choice about how much to consume. When consumers do not know the cost, they arelikely to consume more or less than what is efficient. Second, user fees allow the government toknow the quantity and quality of goods and services that people want. Without direct charg-ing, citizens do not have a mechanism (except for voting every few years) to register theirdemand for local goods and services. Third, user fees satisfy the equity principle when equityis based on benefits received. All individuals pay an amount that reflects the additional benefitthey receive from a unit of the good or service.
Wherever possible, user fees should reflect the marginal cost of providing the service. Aproblem with charging the marginal cost in remote areas, however, is that costs can be signifi-cantly higher than in other communities. For example, the marginal cost of supplying water topeople in remote areas is much higher than in urban areas. If the marginal cost is charged, somepeople might not be able to pay it and would likely leave these communities if they are not sub-sidized. In other words, charging a fee that reflects the true marginal cost of providing servicesto remote areas could reduce the number of people living there.
Subsidies provide an incentive to consume more water than is efficient. Furthermore, subsi-dies for water would benefit both low-income and high-income people. Although subsidizingthe cost of services in remote areas is unlikely to result in an efficient level of service, it maynevertheless be justified to meet other objectives, for example, regional development, security,and so forth.
A problem with charging for services in remote areas concerns the cost of administration.Determining the appropriate amount of the charge and enforcing it can both be costly. If theadministrative costs exceed the revenues collected, user charges may not be worthwhile.
User fees are appropriate for recreational services in urban areas, but may be less appropri-ate in remote areas. In remote areas externalities are associated with arenas and recreation cen-ters, because the benefits of these services extend beyond the users of the facilities. One couldargue, for example, that arenas and recreation centers provide a social service to the commu-nity, especially for youth, because remote communities have few alternatives. If full-cost pric-ing is charged, those who would use the facility might otherwise engage in less socially accept-able activities. In other words, significant external benefits call for at least some subsidization.Similarly, user fees for garbage (solid waste) disposal may act as a disincentive for using the
128 Providing Public Services in Remote Areas
service and may encourage individuals to dispose of their garbage on land outside the munici-pal boundary.
Taxes
Taxes borne by local residents might include property taxes; local income taxes; consumption-based taxes, such as sales and fuel taxes; and poll taxes.
PROPERTY TAXES. As table 7.2 shows, property taxes represent almost 54 percent of total rev-enues of local governments for Canada as a whole. They only account for 5 percent in Nunavut,however, and 13.6 percent in the Northwest Territories. Property taxes are 44 percent of localgovernment revenues in the Yukon. In some other countries with remote areas, property taxesare not important. For example, they are not used in Sweden and are used only minimally inFinland and Norway (Organisation for Economic Co-operation and Development 2000).
A tax on property is a good tax for municipalities. The tax base is immobile because onlypeople move, so taxing property is relatively efficient. In addition, a local tax on all properties,owned or rented, is desirable to promote local autonomy, accountability, and fairness. If dis-crepancies exist in the size of the tax base across local communities in remote areas, these maybe handled through an equalization grant.
Even though one could argue that local governments should be granted taxing authority tomeet their expenditure requirements, some communities have difficulty levying a property tax,because the tax base is limited relative to local needs. One reason is the lack of private owner-ship of properties in remote areas, resulting in few properties to tax. Furthermore, the value ofproperties in remote communities tends to be much lower than the value in urban areas, and isoften lower than the cost of construction. In Eastern European countries, where the market forhousing is just developing in cities, assessing market value for properties in remote areas maybe impossible. For this reason an alternative assessment base may be required. One possibilitycould include assessment on the basis of unit value, such as unit size and lot size (for a discus-sion of unit value assessment see Slack, LaFaver, and Shpak 1998).The proportion of propertytax revenues levied on agricultural land, forests, mines, and pipelines is likely to be higher inremote areas than in urban areas. The nature of these properties requires different tax treatmentthan other commercial and industrial properties. For example, agricultural land and forests areoften valued at current use rather than highest and best use, tax rates are often lower than forother properties, and in some countries farm properties and forests are exempt from propertytaxation altogether (Slack 2001a). Mines and minerals are generally exempt except for surfaceland and office buildings not connected with the mining operation. Mineral resources are usu-ally taxed on the basis of profits, acreage, or assessment of mineral values (Kitchen 1992).Pipelines are usually assessed on the basis of pipe length and diameter.
Pipeline properties, unlike other commercial and industrial properties, have extensive lin-ear networks that are not specific to any one municipality. Pipelines pass through urban areas,rural areas, and remote areas, and they receive limited services. Unlike the other special prop-erties mentioned, pipelines have less of a link to the communities they traverse, so the munici-pal level does not have any accountability for the taxes levied.
For properties owned by senior levels of government in remote communities, as elsewhere,payments in lieu of taxes are required from the senior level of government to pay for local serv-ices. Failure to make these payments means that these properties receive services without pay-ing for them, which puts senior government properties at an advantage compared with othercommercial and industrial properties. Furthermore, the costs of these services will have to bepicked up by other properties through higher taxes.
The levying of property taxes by municipal governments in remote areas does not mean thatmunicipalities need to determine the assessment base. Assessment can be expensive and could
Harry Kitchen and Enid Slack 129

Table 7.2 Revenues Per Capita, by Municipal Sector, 2000, and Consolidated Provincial/Local or Territorial/Local Sector, 2000–01 (Can$)
Yukon Northwest Territories Nunavut Rest of Canada
Revenue source Municipal Consolidated Municipal Consolidated Municipal Consolidated Municipal Consolidated
Own source revenue 1,079 5,140 2,058 10,755 1,323 5,146 1,193 7,929Income taxes 0 1,396 0 4,054 0 636 0 2,201Consumption taxes 0 669 0 924 0 404 0 1,520Property and related taxes 688 760 568 953 197 311 776 1,335Other taxes 18 189 23 250 5 61 18 506Contributions to social
insurance 0 202 0 394 0 224 0 262User fees 310 825 1,342 2,804 1,091 2,062 308 937Investment income 54 1,040 105 730 25 339 73 959Other revenues 11 59 20 649 5 1,109 17 141
Total grants 504 13,439 2,104 14,243 2,537 21,208 255 1,021Unconditional grants 313 11,065 341 11,627 262 19,439 38 810Conditional grants 192 2,374 1,762 2,616 2,275 1,849 217 211
Federal 2 — 12 — 10 — 11 —Provincial 190 — 1,751 — 2,265 — 206 —
Averages of all revenues 1,583 18,583 4,162 24,996 3,861 26,434 1,448 8,949
— Not available.Source: Calculated from Statistics Canada (2001a,b); Financial Management Systems data.
130

be the responsibility of a senior level of government, as it is in Canada and many other coun-tries. A further advantage of centralizing the assessment function comes from the implementa-tion of uniform assessment practices across all municipalities. Uniformity establishes a levelplaying field and permits municipalities to set their own tax rates to meet their financial andeconomic objectives.
In unincorporated communities in countries where property taxes are used, the propertytaxes have to be administered by a senior level of government because there is no local govern-ment. Tax proceeds are used to finance a portion of the costs of the limited number of services,for example, landfill sites and local roads, that are provided to residents of these areas.
INCOME TAXES. A potential source of revenue for local governments in remote areas is anincome tax. For each local government in these areas to levy its own income tax would be fartoo costly; at most they could piggyback onto the income tax base of a senior level of govern-ment. Rates may be uniform across all municipalities, or they could vary by municipality. Uni-form rates do not permit the same degree of local autonomy as locally determined rates.
Income taxes are the most important source of local tax revenue in a number of countrieswith remote communities. For example, income taxes account for 100 percent of all local taxrevenue in Sweden, 96 percent of all local tax revenue in Finland, and 90 percent in Norway.Australia and Canada, other countries with many remote municipalities, do not use localincome taxes at all (Organisation for Economic Co-operation and Development 2000).
While local income taxes have advantages in large metropolitan areas (Slack 2001b), someof these advantages disappear in remote communities, where problems exist in relation to theprevalence of a dual economy and more frequent worker mobility. In remote communities,many high-income workers are employed in seasonal occupations. They live in the communityduring the work season and relocate to urban and less remote areas in the off-season. The impo-sition of an income tax by a remote municipality becomes problematic if the tax is based onplace of permanent residency, as it is in many countries. The municipality where the workersearned their incomes and benefited from municipally provided services for part of the yearwould not receive any tax revenue from them. A further impediment to levying income taxes inremote areas in developing countries arises from administrative and compliance problems(McClure 2001). Individuals in these countries have a history of never filing income tax returns.Furthermore, reliance on local income tax revenues to fund municipal services permits lower-income individuals with no income tax liability to use these services at no cost. This creates thepotential for overconsumption and waste in the provision of public services.
One possible solution might be to implement a payroll tax on all employers and self-employed residents of the municipality, with the municipality retaining the tax revenue. This,however, also poses problems. The tax base would exclude higher-income individuals who usemunicipal services, but who are not in the labor force because they are retired or voluntarilyunemployed. Because the tax base would be smaller than the income tax base, tax rates wouldhave to be higher to generate the same amount of tax revenue.
When local property taxes are compared with local income taxes for remote communities,the former are likely to produce a closer link between taxes paid by individuals and the use ofmunicipal services funded by these taxes. The closer this link, the greater the likelihood thatsome degree of local autonomy, accountability, and efficiency will be achieved in service provi-sion. This view is often not shared by individuals who purchase rural properties for vacationuse and argue that they receive fewer services and should therefore pay lower taxes than per-manent residents. Although this argument may have some merit on the basis of benefitsreceived, it is less defensible on the basis of ability to pay.
CONSUMPTION-BASED TAXES. This section considers two consumption-based taxes: a generalsales tax and a municipal fuel tax.
Harry Kitchen and Enid Slack 131
Some countries permit municipalities to tax businesses, for example, tourism facilities,through a crude gross receipts or categorical lump-sum tax. This section only looks at taxes onconsumers. Reliance on a municipal sales tax tends not to be prevalent in countries with manyremote areas, although it is used in several countries with relatively few communities in remoteareas (Organisation for Economic Co-Operation and Development 2000). As with the incometax, the most feasible option for a general sales tax would be to piggyback onto the sales tax ofa more senior level of government. The tax rate could be uniform across all municipalities, or itcould be determined locally, with the latter providing more local autonomy than the former.
The rationale for a municipal sales tax in remote areas may be stronger than for a municipalincome tax, mainly because the sales tax base is less mobile. Consumers in one municipality areunlikely to shop elsewhere to avoid the tax or tax differential because of distance and travelcosts. Furthermore, the tax collects revenue from high-income and low-income earners andfrom permanent residents and visitors alike. As long as this revenue is used to fund local serv-ices, a somewhat closer link may be formed between the consumers of local public services andpayment for these services than exists under a local income tax. This link, however, is not likelyto be as close as it would be under a property tax.
Some Canadian and U.S. municipalities levy municipal fuel taxes (Slack 2001b). Generallythese taxes are piggybacked onto state or provincial fuel taxes, because the administrative costsof a local tax would be prohibitive. The greatest amount of local autonomy would be achievedwhere municipalities were permitted to set their own tax rate. The revenues generated fromthese taxes are often earmarked for local roads and transit services.
Because the vast majority of roads in remote communities do not extend beyond the bound-aries of the community, a tax on fuel could be viewed as a tax on residents and businesses thatbenefit from the local road system. The tax would increase local autonomy and be fair in termsof the benefits received principle. In addition, it might be more acceptable politically if the rev-enues are earmarked for funding local roads.
Those who support earmarking do so because it creates a link between the cost of a programand the tax rate necessary to fund it. Opponents argue that it can lead to rigidity in budgetarydecisions and overspending, because of unwillingness to periodically review the relative bene-fits of spending on the earmarked service. Nevertheless, political acceptance of earmarkedtaxes for roads in remote areas may be higher if funded from a local fuel tax than from the gen-eral property tax or some other tax.
A potential disadvantage of a local fuel tax in remote areas is the increased cost of fuel thatmight result from higher taxes. Fuel costs are already considerably higher than in more urbanareas, and an additional tax would likely raise them even further. Higher fuel taxes may serveto discourage businesses from locating in remote areas, although business location decisions inmany of these communities are unlikely to depend on the price of fuel. Businesses are therebecause of a specific resource (mining, oil, or logging) or because they serve the local market(delivery of oil to homes, building construction, or operation of the few stores that serve thecommunity). Distance from markets and cost of production, in reality, are simply too high toinduce other firms or businesses to move to these areas.
POLL TAXES. The poll tax (or head tax) is a tax of a specific value that is imposed on eachindividual. It bears no direct relationship to property values, nor is it based on any concept ofability to pay. The local tax base is directly dependent on the number of residents in the com-munity, usually adult residents only. A poll tax is considered to be the most efficient tax thatlocal governments could adopt, because it is a fixed charge on all eligible taxpayers. Because apoll tax does not change the relative price of consumption or other types of activities, it doesnot provide an incentive for individuals to alter their behavior to reduce the tax.
Local government in the United Kingdom levied a poll tax (known as the communitycharge) for a short time, but it was replaced by a property tax (council tax) in 1993 (King 1988).
132 Providing Public Services in Remote Areas
The poll tax was extremely unpopular, because it was seen as regressive, that is, born relativelymore heavily by low-income households than high-income households, and because it wascostly to administer. Unlike property, which is highly visible and in a fixed location, individualtaxpayers were able to escape full reporting of the total number of taxable occupants.
Although the poll tax may not be appropriate in large urban areas for the reasons previouslynoted, it may have some merit in remote areas. The lack of a sizable income, sales, or propertytax base combined with the importance of having some local taxing authority and accountabil-ity might justify a poll tax in remote communities. Furthermore, it may be more difficult toescape full reporting in a small community.
Intergovernmental Transfers
Communities in remote areas generally rely more heavily on federal and provincial or statetransfers than do communities in urban areas. In Canada, for example, municipalities on aver-age receive 18 percent of their revenues from provincial grants (see table 7.2). This compareswith 32 percent in the Yukon, 51 percent in the Northwest Territories, and 66 percent inNunavut. The following paragraphs provide three economic justifications for intergovernmen-tal transfers: the fiscal gap, externalities, and equity.
FISCAL GAP. When municipalities have inadequate revenues to meet their expenditureneeds, they are suffering from a fiscal imbalance or fiscal gap. Fiscal imbalance occurs at thelocal level essentially because local revenue sources tend to grow more slowly than incomeover time, but local expenditures tend to grow more quickly. This is true in remote areas in thesame way as in urban areas.
Fiscal imbalance can be addressed by increasing the sources of revenue at the local level orby reducing expenditure responsibilities. While large metropolitan areas could be given accessto more revenue sources (Slack 2001b), this is unlikely to work as well for remote communities.Some increases in user fees and property taxes or poll taxes may be appropriate, as argued pre-viously, but this is unlikely to be sufficient to eliminate the fiscal gap. This means either that thecentral government will either have to take over functions from the local governments or willhave to provide unconditional grants. Grants to reduce or eliminate the fiscal gap would beunconditional in the sense that local governments could spend the funds on any function or usethem to reduce taxes. In other words, the trade-off between expenditures and taxes and amongdifferent types of expenditures would remain with the local government.
EXTERNALITIES. Another rationale for central government transfers is externalities. Whereservices spill over municipal boundaries, an underallocation of resources to that service willoccur, because the municipality providing the services would base its expenditure decisionsonly on the benefits captured within its jurisdiction. It would not take into account the benefitsto those outside the jurisdiction (Slack 2001b). One way to provide an incentive to allocate moreresources to the service generating the externality is a conditional, matching transfer from asenior level of government. It should be conditional in that it has to be spent on the service thatgenerates the externality; it should be matching to reflect the extent of the externality. Thisrationale for central government transfers is not as applicable to remote areas as it is for urbanareas. By definition, remote communities are isolated, and any spillover of service benefits toother jurisdictions is unlikely to occur. They are simply too far away to enjoy the benefits.
EQUITY. Some municipalities are unable to provide an adequate level of service at reason-able tax rates (Bird and Slack 1993). This may occur for three reasons: the costs of services maybe higher, the need for services may be higher, and the tax base may be smaller. These three rea-sons are all relevant in remote areas.
Harry Kitchen and Enid Slack 133
Under these circumstances, an equalization grant, which reflects both the fiscal capacity ofthe municipality and its expenditure needs, is appropriate. The definition and measurement ofthese two components presents a challenge, however. The formula must be designed in a waythat does not discourage municipalities from collecting own source revenues or from findingother ways of balancing their revenues and expenditures (Martinez-Vazquez and Boex 2001),such as amalgamating communities, establishment of service boards to share costs, and so forth.
Perhaps the best national to subnational (municipal) grant equalization scheme is the oneused in Australia. In each state or territory, calculations are made for both standard expendi-tures and revenues. Standard expenditures are calculated for each of 20 municipal functions bytaking the product of the following (Commonwealth Grants Commission 2001):
• The council’s relevant unit of need (such as population, number of households served,kilometers of roads
• The standard cost per unit of need (usually the average cost of that service or functionwithin the state)
• A discount factor (total expenditure on the function discounted by revenue receivedfrom specific grants and certain other sources)
• A disability factor, which compensates the council for factors beyond its control, such associoeconomic profile, possibly expressed as a percentage of the state average, physicalterrain, or isolation
Within this basic framework, state to state differences may exist in the following:
• Measurement of disability factors• Extent to which socioeconomic characteristics are emphasized and measured• Degree of community isolation or remoteness that is recognized• Number of qualitative factors included in measuring a particular service• Weighting applied to improvements in local governments’ management practices and
structural reform
Standardized revenue for each municipality is obtained by multiplying the municipal taxbase (property assessment) by the average (or implied) rate across all municipalities in the state.The difference between estimated expenditure needs and revenue potential is the basis fordetermining the municipality’s share of equalization funds. The available funds, however, aregenerally less than the amount required to achieve full equalization.
In Australia, the Northern Territory, which contains the majority of remote areas and a highproportion of the aboriginal population, is included in the overall national government equal-ization formula. Higher expenditures of remote areas are recognized and compensated for inthe equalization formula through the use of disability factors. For the Northern Territory, fewercategories of expenditures involve redistribution. Two categories—general administration andtransportation—account for 90 percent of the total redistribution. One of the disability factorsreflects the proportion of the population comprising aboriginal people. In the Northern Terri-tory, the aboriginal factor accounts for one-third of the funds that are redistributed.
In Canada, the federal government provides equalization grants to the provinces and terri-tories, which in turn use their own formulas to distribute funds to local governments. The fed-eral grant to the territories is based on a different formula than the grant to the provinces. Box7.1 compares these two formulas.
Design of Government Structure
A variety of options may be considered for structuring municipal government in municipalitiesin remote areas. These include two tier, single tier for all services, intermunicipal agreements,
134 Providing Public Services in Remote Areas
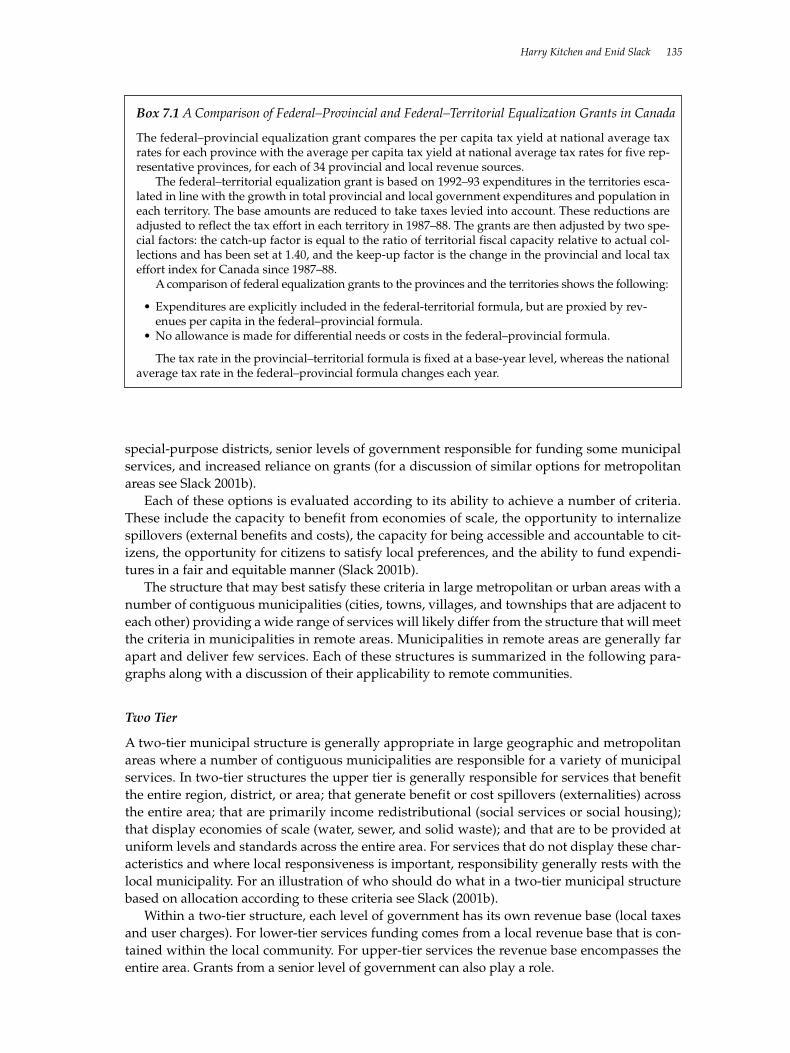
special-purpose districts, senior levels of government responsible for funding some municipalservices, and increased reliance on grants (for a discussion of similar options for metropolitanareas see Slack 2001b).
Each of these options is evaluated according to its ability to achieve a number of criteria.These include the capacity to benefit from economies of scale, the opportunity to internalizespillovers (external benefits and costs), the capacity for being accessible and accountable to cit-izens, the opportunity for citizens to satisfy local preferences, and the ability to fund expendi-tures in a fair and equitable manner (Slack 2001b).
The structure that may best satisfy these criteria in large metropolitan or urban areas with anumber of contiguous municipalities (cities, towns, villages, and townships that are adjacent toeach other) providing a wide range of services will likely differ from the structure that will meetthe criteria in municipalities in remote areas. Municipalities in remote areas are generally farapart and deliver few services. Each of these structures is summarized in the following para-graphs along with a discussion of their applicability to remote communities.
Two Tier
A two-tier municipal structure is generally appropriate in large geographic and metropolitanareas where a number of contiguous municipalities are responsible for a variety of municipalservices. In two-tier structures the upper tier is generally responsible for services that benefitthe entire region, district, or area; that generate benefit or cost spillovers (externalities) acrossthe entire area; that are primarily income redistributional (social services or social housing);that display economies of scale (water, sewer, and solid waste); and that are to be provided atuniform levels and standards across the entire area. For services that do not display these char-acteristics and where local responsiveness is important, responsibility generally rests with thelocal municipality. For an illustration of who should do what in a two-tier municipal structurebased on allocation according to these criteria see Slack (2001b).
Within a two-tier structure, each level of government has its own revenue base (local taxesand user charges). For lower-tier services funding comes from a local revenue base that is con-tained within the local community. For upper-tier services the revenue base encompasses theentire area. Grants from a senior level of government can also play a role.
Harry Kitchen and Enid Slack 135
Box 7.1 A Comparison of Federal–Provincial and Federal–Territorial Equalization Grants in Canada
The federal–provincial equalization grant compares the per capita tax yield at national average taxrates for each province with the average per capita tax yield at national average tax rates for five rep-resentative provinces, for each of 34 provincial and local revenue sources.
The federal–territorial equalization grant is based on 1992–93 expenditures in the territories esca-lated in line with the growth in total provincial and local government expenditures and population ineach territory. The base amounts are reduced to take taxes levied into account. These reductions areadjusted to reflect the tax effort in each territory in 1987–88. The grants are then adjusted by two spe-cial factors: the catch-up factor is equal to the ratio of territorial fiscal capacity relative to actual col-lections and has been set at 1.40, and the keep-up factor is the change in the provincial and local taxeffort index for Canada since 1987–88.
A comparison of federal equalization grants to the provinces and the territories shows the following:
• Expenditures are explicitly included in the federal-territorial formula, but are proxied by rev-enues per capita in the federal–provincial formula.
• No allowance is made for differential needs or costs in the federal–provincial formula.
The tax rate in the provincial–territorial formula is fixed at a base-year level, whereas the nationalaverage tax rate in the federal–provincial formula changes each year.
In remote areas where municipalities are isolated from each other, distances are such thatthe benefits or costs of services provided by one municipality are unlikely to spill over intoadjacent municipalities. Similarly, distances between municipalities and their isolation fromeach other prevent them from benefiting from economies of scale in the provision of serviceswhose costs per unit decline as the number of residents served increases. Hence the rationalefor a two-tier structure at the municipal level in remote areas is far less compelling than it is forlarger metropolitan areas.
Single Tier
In a single-tier structure only one level of municipal government is responsible for all munici-pal services. Almost every country has a number of single-tier municipalities. Some exist inlarge metropolitan areas and some exist in small, isolated communities. Although a single tieris one of a number of potentially viable options for large metropolitan or urban areas, it isalmost certain to be the only feasible one for municipalities in remote areas. These municipali-ties are generally small and isolated from each other. This means that there are no externalitiesfrom services they provide and that they cannot benefit from economies of scale. Hence there isno apparent role for an upper-tier level of municipal government.
What differentiates large metropolitan or urban areas from small, rural, and isolated munic-ipalities in remote areas is the fiscal impact of their expenditure responsibilities. For example,higher per unit costs of service delivery are generally observed in the latter (see table 7.1). Inaddition, these municipalities almost always have a smaller and less diversified revenue basefrom which they can raise locally generated revenues. This combination of higher per unit costsand lower fiscal capacity raises the question of whether or not ways exist within this single-tierstructure for providing local services in a less costly fashion or whether they should be fundeddifferently than in larger metropolitan areas. The following subsections discuss some of theseoptions.
Intermunicipal Agreements
An intermunicipal agreement exists when one municipality agrees contractually to buy a serv-ice from another municipality, generally an adjacent municipality. These agreements may existfor a variety of services, but are most common for water provision, fire and police protection,and maintenance of roads (snowplowing in particular). They are used more frequently insmall municipalities (villages and townships, for example) than in large municipalities (citiesand towns). The rationale for entering an agreement is almost always cost savings. Buying theservice from an adjacent municipality is deemed to be less costly than for the municipality toprovide it on its own, because the local municipality can achieve benefits from economies ofscale.
Although these agreements have been used for a long time in many smaller, contiguousmunicipalities, they are unlikely to work or be appropriate where municipalities, such as thosein remote areas, are isolated from each other. A municipality is unlikely to benefit from buyingservices from other municipalities where distances between them are large.
Special-Purpose Districts
In areas with a number of contiguous municipalities, some countries use special-purpose dis-tricts to provide a range of services for each municipality within the district. Although special-purpose districts are not common in Russia, some examples exist, such as a specialized medicalcenter in the Gatchina raion of the Leningrad oblast that provides services to more than onemunicipality (Kurlyandskaya, Nikolayenko, and Golovanova 2001).
136 Providing Public Services in Remote Areas
Service responsibilities of special-purpose districts generally include those that generateexternalities, benefit from economies of scale, are income redistributional, and for whichdistrict-wide uniform standards are important. Where special-purpose districts exist, theyplay the same role and perform the same functions as an upper-tier level of municipal gov-ernment in a two-tier structure. Special-purpose districts are less formal in terms of govern-ing structure, however, because they generally have a board with members appointed fromthe different municipal councils. Even in metropolitan areas, issues of accountability existaround special districts. For reasons that are similar to the rejection of a two-tier structurefor noncontiguous municipalities in remote areas, special-purpose districts are also rejectedas being inappropriate and ineffective.
Role for Senior Levels of Government
Given that municipalities in remote areas are unable to take advantage of economies of scale inservice provision, and given their smaller and less diversified tax base, one option is that seniorlevels of government provide local services instead of municipalities. Although this optioncould reduce local taxes and user fees, it would seriously hinder accountability, because therewould be no direct link between individual consumption of a service and payment for it. Whenindividuals receive a service for which they are not taxed or charged a fee, an incentive existsfor them to consume more than they would if they paid for it. For example, in rural communi-ties in Ontario, policing was provided by the provincial government at no charge until 1998.Failure to charge for policing provided an incentive to overuse the service.
The provision of services by a senior level of government raises concerns about local respon-siveness. It may be less appropriate for a senior level of government to provide services becauseit is further removed from local residents. This makes determining the quality and quantity ofoutput to provide in each municipality difficult. Senior levels of government are likely to be lessresponsive and less accountable to local residents than a local government.
Grants
Another option is for senior levels of government to provide grant assistance to communitiesin remote areas and have the municipalities deliver and fund local services themselves. If serv-ice provision is considerably more expensive (as shown in table 7.1, for example) and consider-ably higher levels of financial assistance are required (as shown in table 7.2), a question existsabout the use of national or provincial/state resources to foster communities artificially inremote areas. The issue is not whether taxpayers in remote communities should be excludedfrom paying for municipal services. Clearly, they should pay at least some of the costs of serv-ices if accountability, fairness, and efficiency are to be achieved. An important issue is whethercommunities that cannot survive in the absence of disproportionate senior government fund-ing (when compared with other urban areas) should exist at all.
Arguments can be made for and against government subsidization of remote areas. If amunicipality in a remote area is essential for the provision of an important public service, suchas national security, the public good benefit of this service and the externalities associated withit may justify higher grant assistance from senior levels of government to keep these communi-ties viable. If the existence of municipalities in remote areas does not provide public good ben-efits, there may be less justification for large subsidies to these communities. For example, inthe case of a company town where the municipality’s existence is vital to the company’s suc-cess, justification for grant funding is less obvious.
The argument against subsidizing remote areas is based on efficiency. Reliance on grantfunding reduces the incentive for residents of these municipalities to leave and move to areaswhere with greater employment and educational opportunities. If national economic efficiency
Harry Kitchen and Enid Slack 137
is an important objective, encouraging mobility of labor out of remote areas may be moreappropriate than providing subsidies that encourage them to stay. That is not to say that theyshould not remain in these communities, but rather that there is no economic justification forhigher subsidies. Politics sometimes leads to a different conclusion, however, because peopleform emotional attachments to communities and politicians are reluctant to move them, eventhough the long-term costs are high.
References
Bird, Richard M., and Enid Slack. 1991. “Financing Local Government in OECD Countries:The Role of Local Taxes and User Charges.” In Jeffrey Owens and Giorgio Panella, eds.,Local Government: An International Perspective. Amsterdam: North Holland.
_____. 1993. Urban Public Finance in Canada, 2nd ed. Toronto: John Wiley.
Commonwealth Grants Commission. 2001. Report on State Revenue Sharing Relativities. Can-berra.
Consultation Committee to the Minister of Municipal Affairs. 1989. County Government inOntario. Toronto.
Dougherty, Michael John, Kenneth A. Klase, and Soo Geun Song. 1999. “The Needs and Finan-cial Problems of Small and Rural Localities: The Case of West Virginia.” Public Budgetingand Finance 19(3): 17–22.
Graham, John, F. 1963. Fiscal Adjustment and Economic Development: A Case Study of Nova Scotia.Toronto: University of Toronto Press.
King, David, N. 1988. “Accountability and Equity in British Local Finance—The Poll Tax.” Dis-cussion Papers in Economics, Finance, and Investment. University of Stirling, Stirling, Scot-land.
Kitchen, Harry. 1992. Property Taxation in Canada. Toronto: Canadian Tax Foundation.
Kurlyandskaya, Galina, Yelena Nikolayenko, and Natalia Golovanova. 2001. “Local Govern-ments in the Russian Federation.” Paper prepared for the Local Government and PublicService Reform Initiative/Open Society Institute. Budapest.
Litvack, Jennie, Junaid Ahmad, and Richard Bird. 1998. Rethinking Decentralization in Develop-ing Countries. Washington, D.C.: Word Bank.
Martinez-Vazquez, Jorge, and Jameson Boex. 2001. Russia’s Transition to a New Federalism.Washington, D.C.: World Bank.
McClure, Charles, E., Jr. 2001. “The Tax Assignment Problem: Ruminations on How Theoryand Practice Depend on History.” National Tax Journal LIV(2): 339–63.
Organisation for Economic Co-operation and Development. 2000. Revenue Statistics 1965–1999.Paris.
Osborne, David, and Ted Gaebler. 1992. Reinventing Government—How the Entrepreneurial SpiritIs Transforming the Public Sector. Reading, Massachusetts: Addison-Wesley.
Slack, Enid. 2001a. “Alternative Approaches to Taxing Land and Real Property.” Washington,D.C.: World Bank.
_____. 2001b. Fiscal Aspects of Governing Large Metropolitan Areas. Washington, D.C.: WorldBank.
138 Providing Public Services in Remote Areas

Slack, Enid, John LaFaver, and Ihor Shpak. 1998. “Property Tax in Ukraine: Third Attempt.”Budget and Fiscal Review (Fiscal Analysis Office, Verkhovna Rada) (Second Quarter): 32–45.
Statistics Canada. 2001a. “CANSIM II, table 051-0001.” Ottawa. Data provided on request.
_____. 2001b. “Natural Resources Canada, GeoAccess Division.” Ottawa. Data provided onrequest.
Wallich, Christine I. 1994. “Intergovernmental Fiscal Relations: Setting the Stage.” In ChristineI. Wallich, ed., Russia and the Challenge of Fiscal Federalism. Washington, D. C.: World Bank.
Harry Kitchen and Enid Slack 139

8Local Government Enterprises
Harry Kitchen
Local governments in many countries, but especially in developing countries, rely on a rangeof local government enterprises to finance a variety of public sector services. Nowhere is thismore apparent than in Russia, where historically, Russia’s state enterprises have financed manyexpenditures that the public sector shoulders in more market-based economies, for example,schools, hospitals, roads, and sanitation (Wallich 1994b). Of the 12,261 municipalities in Russia,4,714 own municipal enterprises (Kurlyandskaya, Nikolayenko, and Golovanova 2001). Thispreponderance of enterprises raises a number of issues in relation to whether they should existand their governance, structure, and control. This chapter attempts to address some of theseconcerns.
The chapter draws in part on experience in Canada and other countries. The discussion isorganized in three main sections. The next section considers the possible role of local govern-ment enterprises and how the activity of such enterprises should be evaluated. The chapterthen considers the difficult issue of the appropriate structure and control of local governmententerprises, with special attention to financial aspects. Finally, the last section reviews the con-trol of local enterprise expenditures and discusses alternative ways that local government serv-ices may be delivered other than directly by local governments or by enterprises owned bylocal governments.
The Role of Local Government Enterprises
Before local government enterprises are evaluated as a vehicle for financing and deliveringlocal public services, a number of issues should be considered. In particular, what is a local gov-ernment enterprise? Why do countries use local government enterprises? And finally, do localgovernment enterprises have a unique role to play?
What Is a Local Government Enterprise?
While no single and uniform definition of what constitutes a local government enterprise isavailable, generally such enterprises are responsible for providing marketable goods or serv-ices for which they can charge a fee or a price per unit. This explains, at least in part, why localgovernment enterprises are often responsible for electricity, water, sewers, and public transit,while locally elected councils are responsible for local streets and roads, street lighting, side-walks, fire fighting, and neighborhoods parks, that is, services for which specific fees or perunit charges cannot be imposed.
Each public enterprise operates as a separate business entity, sometimes independent of thelocally elected council and sometimes under some kind of governing control by or affiliationwith the locally elected council. Each enterprise tends to be responsible for only one service.Each also usually has its own independent or quasi-independent (from the local council) gov-erning body that is responsible for all policies affecting the enterprise. Each has its ownaccounting and financial system, frequently has its own workforce and capital equipment, andis responsible for monitoring and reporting on its own activities.
141
Local government responsibility, by comparison, covers a range of public services for whichfees or prices are not used. Local streets and roads, street lighting, fire fighting and the policeforce, and neighborhood parks are almost always funded from local taxes, grants, and otherlocally generated revenues. Local government staff share in the provision of all services, that is,each of these services uses a common staff and equipment complement. For example, account-ing, auditing and legal services, municipal employees, and capital equipment are shared acrossa number of services. A locally elected council is responsible for making policy decisions for allservices, including the trade-off between spending on one rather than another.
In New Zealand, Europe, and North America local government enterprises are responsiblefor relatively few local services. Furthermore, they generally provide almost all such services inan environment that lacks alternatives and competitors. Such services often include electricity,telephone services, water and sewers, municipal airports, and low-income housing. In othercountries, by contrast, local government enterprises are responsible for many more services,some of which may compete with the private sector. For example, Russian subnational govern-ments have long looked to state enterprises to finance many essential services. Estimates indi-cate that in 1992 40 percent of subnational budgetary outlays came from enterprises’ contribu-tions (Martinez-Vazquez 1994). In most one-company towns the percentage was much higher,sometimes reaching almost 100 percent. Revenues from local enterprises are important at thesubnational level in Russia because they help finance basic services that might not be funded ifleft to the local tax base (Bahl and Wallich 1995). Bird (1984) reports a similarly importantrevenue-generating role for local government enterprises in Colombia. In short, the range ofgoods and services local government enterprises provide is vast and diversified, has been forsome time, and likely will continue to be in the future.
Local government enterprises may be separated into those that operate in an environmentlacking competitors and those that compete openly with the private sector. For the former, theonly supplier is a public sector monopolist. For example, municipal water and sewers are theresponsibility of one agency, a separate utility or business enterprise, sometimes under thedirect governance of the municipality and sometimes under the governance structure of aspecial-purpose board or commission that tends to have characteristics similar to those of a sep-arate business entity. Similarly, electricity is the responsibility of a single agency, as is publictransit and so on. Furthermore, services with high infrastructure costs, such as water, sewers,and electricity, have characteristics of a natural monopolist, of which their predominant charac-teristic for analytical purposes here is that they exhibit decreasing per unit costs over the entirerange of output, that is, they exhibit economies of scale. Other services, such as public transit,may not benefit from economies of scale over their entire output, that is, they are not naturalmonopolists, but they are, nevertheless, provided in a protected setting. In short, there is nocompetition for many of these services (electricity, water, and sewers) and limited and indirectcompetition for others (automobiles competing with public transit).
For publicly provided goods or services that compete with the private sector, the questionarises whether the public sector should be involved at all. No solid economic rationale for pub-lic sector provision exists, though their provision has been defended on the basis of generatingrevenue for local governments. In Russia examples include public sector involvement in bak-eries, paint shops, flower shops, sports clubs, mushroom growing, and handicraft businesses(Kurlyandskaya, Nikolayenko, and Golovanova 2001).
Why Do Countries Use Local Government Enterprises?
Defenders have put forward a variety of arguments for using local government enterprises forspecific services. First, in some countries or regions within countries, legislated requirementsstipulate that a separate enterprise must be responsible for providing specific services, gener-ally under a governing structure referred to as a commission, board, or utility. This is the case
142 Local Government Enterprises
for municipal electricity distribution in Ontario, Canada, where either a private corporation ora municipally appointed board of directors operating at arms length and independent of thelocal council makes all policy decisions (see box 8.1).
Second, where local governments are free to choose their governing structures for the provi-sion of local goods and services, tradition often plays a role in relying on separate enterprises.The view is that it has always been done this way and there is no reason to change.
Third, local government enterprises have been defended on the grounds that appointed orelected officials governing single-purpose enterprises will make better decisions than directlyelected municipal politicians who must make decisions, choices, and trade-offs over a vastrange of local government functions. A single-purpose governing council, the argument goes,is more likely to consist of experts, and therefore be able to make better decisions than locallyelected politicians and government officials who have heavy workloads and insufficient timeto plan, administer, and oversee all governing functions. Those who support this view assertthat financially independent public utilities are generally well run, honest, and efficient andallege that politically controlled utilities are markedly worse in each of these respects and likelyto be run at a financial loss.
Fourth, some countries use enterprises as a way of escaping rigid controls by a senior levelof government that apply to what and how local governments spend, whom they employ forwhat, how much they pay them, which revenues they can access, on what terms they may bor-row, and so on.
Fifth, those countries where senior levels of government share in local tax revenues, but donot share in revenues generated by local enterprises, may prefer local government enterprises(Martinez-Vazquez and Boex 2001).
Sixth, some countries may use local government enterprises to provide employment.Seventh, many politicians and residents perceive local government enterprises as more effi-
cient and accountable than other municipally provided services that are not sold for specificfees or prices, because they are run more like a business, that is, they deliver a product, sell it,retain the revenue, and cover all their costs.
Harry Kitchen 143
Box 8.1 Governance of Municipal Electrical Utilities, Ontario, Canada
In 2000, the provincial government in Ontario introduced legislation deregulating the provision andsale of hydroelectricity. For municipalities, this legislation required each of them to adopt one of thefollowing options. The municipality could
• Sell its electrical utility to a private sector firm. Municipalities that sell their electrical utility to a pri-vate sector firm (the city of Cornwall is the only example of this so far) can use the proceeds forany purpose they wish. Private sector corporations operate under legislation and laws applicableto the private sector. This means that in the absence of a specific contractual agreement betweenthe municipality and the private sector, the private sector operates entirely independently of thelocal council. However, the provincially appointed Ontario Energy Board must approve each rateincrease.
• Sell or lease its electrical utility to another municipality or a provincial public sector agency. The implica-tions of this are similar to selling to the private sector. Public sector responsibility for electricityprovision is not, however, subject to the same freedom of information requirements applied toother public sector institutions.
• Retain ownership of the electrical utility. This is by far the most frequently chosen option. Legisla-tion mandates that a board of directors appointed by the municipal council must govern the util-ity. This board has the power to make decisions independently and at arms length from localcouncils. The utility may be run as a nonprofit agency or the local council may require it to pay adividend (rate of return) to the municipality. As with the other options, the Ontario Energy Boardmust improve rate increases. This, in turn, affects the rate of return paid to the municipality. Theutility is not subject to the same freedom of information requirements applied to other publicsector institutions.
Finally, some local politicians and administrators prefer local government enterprisesbecause fewer citizens complain about revenues generated from the sale of goods and servicesby what they perceive as a business enterprise than about local governments increasing localtaxes to raise the same amount of money. More bluntly, setting up a local business enterpriseand selling a good or service to raise revenues seems to be more acceptable politically than rais-ing local taxes. Municipal governments may prefer generating revenues from the sale of goodsand services by local government enterprises if the municipal governments face legislatedrequirements against their ability to raise taxes.
What Are the Criteria for Evaluating Local Government Enterprises?
The role of local government enterprises and how they should be structured should be evalu-ated based on the following criteria: allocative or economic efficiency, accountability, trans-parency, and ease of administration. Issues of fairness are important, but of little relevance inthis discussion. Fairness is associated with how specific services are funded—benefits receivedarguments (for a discussion of the benefit model of local finance see Bird 1993; Kitchen 2000b)—or with income distribution issues—ability to pay arguments (for a discussion of income redis-tribution and how to handle it see Boadway and Kitchen 1999, chapter 8)—and not with theenterprise or local government responsible for the service.
EFFICIENCY. The local public sector achieves efficiency when all service responsibilities areorganized and allocated so that society gets the greatest possible gain from the use of allresources at its disposal. In other words, if reliance on local government enterprises leads to theuse of fewer resources than would be required if the same service were provided directly bylocal government, then for a local enterprise to provide the service would be more allocativelyefficient because society would be better off collectively.1 If, by contrast, the existence of one ormore enterprises provides barriers or impediments to efficient local public sector decisionmak-ing and leads to a greater use (wastage) of resources, local enterprises could be deemed to mis-allocate resources and to be more costly to society collectively.
ACCOUNTABILITY. In the provision of local public sector services, accountability is achievedwhen the customer or taxpayer is able to identify who is responsible for what and is able to linkthe governing unit responsible for the service directly to its funding. Where there is only onegoverning unit, taxpayers know who is responsible for what and whom to contact if they wishto have an impact on decisionmaking. Where there are a number of local governing unitsresponsible for a diverse range of services, customers or taxpayers may become confused andnot know who is responsible for what and how to influence decisionmakers.
TRANSPARENCY. Transparency is achieved when taxpayers have access to information anddecisionmaking forums so that they know what is happening and can judge whether it isappropriate. Vehicles or instruments for enhancing transparency should include legislation thatrequires public sector decisionmakers to consult with and report to the public annually on
144 Local Government Enterprises
1. Economic efficiency is more than technical efficiency: the latter is a necessary but insufficient con-dition for economic efficiency. Technical efficiency exists when a producing unit (firm, government, com-mission) operates in such a way that securing any additional output is impossible given the availableinputs (labor, material, capital) and level of technology. In other words, technical efficiency is achievedwhen the output per unit of input is maximized or the cost per unit of output is minimized. Note that thisdoes not concern whether one good or service generates more or fewer net benefits than another good orservice. It simply concentrates on the efficient employment of inputs in the production of a specific goodor service. Finally, as the level of technology advances, a technically efficient production process leads toincreased output with the same inputs.
planned activities, enforcement of regulations by officers, and purchase of inputs through con-tractual arrangements with internal staff or the private sector. A possible vehicle or instrumentcould include an annual publication of local public sector performance measures, thereby pro-viding local residents with information for making intermunicipal efficiency and effectivenesscomparisons. All this is intended to mitigate the risk of corruption by making informationstatutorily available and by ensuring that all public policy decisions are made in an open andtransparent manner (see International Monetary Fund 2001).
EASE OF ADMINISTRATION. Ease of administration is an extension of the efficiency andaccountability criteria. The easiest system to administer is one that is not confusing and doesnot require an unnecessary amount of time and effort for consultations, correspondence, andmeetings to reach decisions.
Do Local Government Enterprises Have a Unique Role to Play?
Do local government enterprises perform a unique role or offer something that improves localpublic sector governance, decisionmaking, and funding responsibilities? The foregoing criteriamay shed some light on this question. The best and most socially desirable governing structureis achieved when locally elected councilors have decisionmaking responsibility for all localgoods and services regardless of how they are delivered (for a discussion of the importance ofdistinguishing between decisionmaking for governance and service delivery see Batley 2001;Kolderie 1986; Osborne and Gaebler 1992; Ostrom, Schroeder, and Wynne 1993; Savas 1987;World Bank 1994; Wunsch 1991). Perhaps this is best illustrated by pointing out a variety ofproblems—real and potential—that frequently emerge when local government enterprises areresponsible for some local public sector decisionmaking. For example, if a local governmententerprise can make policy decisions and has funding control over specific goods and services,and if it operates independently or semi-independently of the locally elected council that isresponsible for a range of other goods and services, there are fewer incentives and it is lesslikely that local public sector efficiency, transparency, and accountability will be achieved.Indeed, the potential for problems of this sort exists in the newly created governing structurefor municipal electricity in Ontario (box 8.1). In addition, if additional resources and time arewasted on reaching agreements and coordinating policies between these competing governingunits, the system will be more expensive to administer than it should be.
As noted earlier, support for local government enterprises rests, at least in part, on the asser-tion that individuals appointed or elected to an enterprise’s governing board can govern moreefficiently and effectively than locally elected politicians who are responsible for a range oflocal public sector goods and services. These services, the argument goes, must be kept freefrom political interference. This approach to municipal government as basically corrupt andunrepresentative of consumer demands, however, is a poor principle upon which to organizemunicipal service responsibility.
Furthermore, arguments supporting removal from politics seem to be an attempt to substi-tute special politics for general politics or to withdraw from the struggle to change the commu-nity’s political decisions. If politics is understood in the pejorative sense of partisan or personalpatronage and influence, the independence of local government enterprises does not guaranteefreedom from spoils, but rather opens possibilities for their own methods of self-enrichment.Technical specialists in many functions and their respective supporting groups of citizens maybelieve that their function is so important to the general welfare and the methods involved sotechnical that their objectives can be accomplished only if they are protected against interfer-ence by nonprofessionals (Bird 1980). In a democracy, however, practical politics involves com-promise in the decisionmaking process. Experts and special interest groups should be availablefor advice on such decisionmaking, but they need not be responsible for policy. In cases inwhich an activity’s proponents find the existing political situation distasteful, they should resist
Harry Kitchen 145

the tempting alternative of avoiding involvement in favor of seeking basic political improve-ments.
Another dubious contention by advocates of local government enterprises is their assertionthat funding specific goods and services from user fees or prices is more businesslike, andtherefore preferable, if conducted by an independent or semi-independent business enterpriserather than if funded in the same manner but under the governance of a locally elected council.Such an argument overlooks the essentially political nature of decisionmaking with regard tomany services supported in whole or in part by user charges or public sector prices. There is noreason why a user-supported service cannot be operated on a businesslike and self-sustainedbasis under a department at city hall.
The existence of a number of independent and semi-independent enterprises complicateslocal government to the point where citizens cannot understand its structure or determine whois responsible for what. The weakening of municipal councils by removing some responsibili-ties, combined with citizens’ inability of to understand government (who is responsible forwhat), results in a loss of accountability, a lack of transparency, and a reduced public interest inlocal government. As the municipal organization becomes more diffuse it becomes less accessi-ble to political control. Also the agencies into which local government is fragmented are oftenonly indirectly responsible to the public, particularly if its members are appointed. Fragmenta-tion of government into separate enterprises further complicates the problems of administra-tive integration and coordination.
Bringing all governance and policymaking decisions for local enterprises under local coun-cil governing responsibility (day-to-day management should be left to the managers regardlessof the governing structure) may be criticized, however, because local politicians in some coun-tries apparently use these enterprises as places of employment for relatives, friends, andcronies. Some have suggested that if governing responsibilities for enterprise operations wereleft with local enterprises, these potentially inefficient and unfair employment practices couldbe minimized; however, this might not be true for at least two reasons. First, there is nothinginherent in the governing structure of either a local government enterprise or local counciloperation to suggest that either agency is more or less susceptible to this type of employmentabuse. Second, where this is a problem, its resolution should involve the implementation of fair,effective, and transparent employment policies that prevent this kind of nepotistic behavior.
Many local government enterprises enjoy considerable autonomy and financial independ-ence. Indeed, they tend to become little governments in themselves with the inherent charac-teristic that they are independent and in no way subordinate to the elected municipal politi-cians. This can lead to an environment over which taxpayers have little control, and one that istherefore politically inefficient. For those that are funded partially by grants or local taxes, thereis often no direct link between the policymaking body (the body making the expenditure deci-sions) and revenues (local taxes) that are collected by municipal councils and must be used tofund the agencies. Whenever expenditure and revenue decisions such as these are made inde-pendently, the system is likely to be less accountable or transparent and unable to allocate itsresources efficiently across all competing municipal services (for a discussion of the importanceof this link between revenues and expenditures see Bossons, Kitchen, and Slack 1993). Thosethat are fully funded from sales of their output are more likely to become independent and bemore removed from the governing decisions of local councils.
When a large number of independent, single-purpose enterprises exists, coordinating inter-related activities is difficult, and in some instances impossible (Kitchen 1989, chapters 8 and 9).Attempts by locally elected politicians to provide services are frequently thwarted or mademore difficult because of decisions made by these independent enterprises over which thepoliticians have little, if any, control. For example, actions taken by electrical utilities, water andsewer utilities, or public transit authorities may conflict with the local council’s overall plan-ning effort (Tindal and Tindal 1988).
146 Local Government Enterprises
This institutional structure, which may be referred to as a localized monopoly, creates apotential impediment for pursuing competitive forces if municipal councils are prevented frommaking all decisions affecting the local municipality in the most accountable, transparent, andefficient manner. This may happen when a municipality defers all decisions over spending andfunding until a local government enterprise has determined its level of spending and funding.For example, a decision by a separate water utility enterprise to replace or rehabilitate a waterline or sewer main may affect a municipality’s timing for resurfacing or improving a local roador street. This, in turn, may affect both the timing and choice of competing alternatives wherebythe municipality allocates its resources to other municipal services.2 Similarly, if a decision by alocal enterprise to borrow in order to finance the rehabilitation or provision of new capitalinfrastructure crowds out or inhibits the local council’s ability to borrow for other capital proj-ects, perhaps because of debt limits, then resources are not allocated efficiently.
In general, where municipal councils are directly responsible for a service pressures for pub-lic accountability (Kitchen 1975) and political responsibility are greater. Greater public account-ability, in turn, leads to greater pressure to reduce costs (Kitchen 1976a),3 improve efficiency,and justify expenditure increases. When compared with governance under a municipal coun-cil, most enterprises are free from the limelight of major municipal elections, and consequentlyare further removed from these important political pressures. The elections of commissioners,where elections rather than appointments occur, are generally dull affairs that go virtuallyunnoticed by the public and often result in acclamations. Voter apathy develops in municipalelections, but the general desire to control costs at city hall extends to all departments, whereassuch pressure is less frequently exerted on a separate enterprise. Partly for this reason, manygoverning boards for local enterprises slip into “rubber stamp syndrome” and allow many pol-icy decisions to stem from dominant, technically competent managers.
Connected with the idea of political accountability is the financial flexibility available toeach type of organization. A sufficient degree of political leverage and direct accountability tothe public must be maintained over the governance of local public services, otherwise theseorganizations are strongly tempted to try unwarranted expansion or to invest in new resourcesto an extent far out of line with investment in other municipal functions. Municipal counciloperations appear to satisfy such a condition much more than separate enterprise operations,and the latter’s financial freedom may permit greater indulgence in empire building (Kitchen1975) and wasted expenditures.
An important source of economies available to operations run by municipal councils andoften not available to single-purpose enterprises comes from the opportunity for certain per-sonnel, facilities, and capital equipment to be engaged in multiple functions. Some of theseeconomies are as follows. First, council-operated services may share office space at city hall,whereas separate enterprises are generally established in separate buildings. Second, a munic-ipally governed service easily shares administrative and operational tasks with other depart-ments at city hall, for example, accounting and legal services, whereas separate enterpriseoperations tend to set up their own administrative and operational facilities. Economies of
Harry Kitchen 147
2. Information gathered from interviews with municipal officials in Ontario. Similar results havebeen observed for school board (Tassonyi and Locke 1994) and police spending (Knapton 1993) in Ontario(both are under governing structures that are independent of municipal councils), where expenditure deci-sions and ensuing property tax requirements for these two independent local bodies frequently crowd outmunicipal expenditures over which the municipal council has control. Kitchen (2002, chapter 11) arguesthat crowding out occurs because municipal councils are reluctant to raise property taxes to cover munici-pal expenditures and incur the wrath of local citizens if the expenditure decisions of school boards andpolice boards have resulted in higher property taxes for their specific services.
3. The results of this study indicated that the cost of supplying water through a separate water utilityor enterprise was significantly higher than the costs of supplying it through a department directly respon-sible to the municipal council.
scale and cost savings are less likely to be achieved in the latter structure than in the formerstructure. Third, opportunities exist for pooling capital equipment and labor in city-governedoperations. This permits a reduction in idle hours for capital and labor through the opportunityto transfer personnel and equipment to different functions as the need arises. As with many ofits departments, city hall can achieve economies of scale in the use of unspecialized personneland equipment. This source of savings is more important for smaller than for larger municipal-ities, because the smaller-scale operations are much more likely to encounter indivisibilities incapital and labor inputs. Local government enterprises, by contrast, tend to acquire a separatecomplement of labor and equipment, and as a rule these inputs are not used for other munici-pal government functions. In many instances, especially for capital equipment, there is consid-erable down time and lack of use of some of the capital equipment (see Kitchen 1975, and for amore recent illustration and discussion see Armstrong and Kitchen 1997).
Thus the economic and political arguments in support of independent and autonomous orsemi-independent and semi-autonomous local government enterprises are generally weak.Local government enterprises do not appear to contribute anything that is unique. Their exis-tence creates or has the potential to create decisionmaking problems and unnecessary costs forboth local governments and local residents. Eliminating local government enterprises shouldimprove the extent to which local public sector efficiency, accountability, and transparencycould be improved. It would certainly remove the confusion about who is responsible for whatand allow local councils to set priorities and weigh and consider the trade-offs necessary inmaking decisions on the relative merits of spending on water and sewer systems versus roadsversus public transit and so on.
All this assumes, of course, that we are operating in a first-best world and that the currentdecisionmaking structures can be changed. Unfortunately, this may not be possible for manyenterprises and in many countries. Local government enterprises are solidly entrenched in localpublic sector services, and they will continue to be used even though they have declined inimportance in some countries over the past decade,4 largely because of the types of decision-making problems described earlier.
Governance, Structure, and Control of Local Government Enterprises
The remainder of this chapter therefore takes a different slant and accepts the likelihood thatlocal government enterprises will continue to be responsible for a range of local goods andservices for some time and in many countries. In particular, the discussion concentrates on poli-cies designed to improve the efficiency, accountability, and transparency of the local govern-ment sector without unnecessarily increasing its administrative costs.
How Should Local Government Enterprises Be Governed?
The governance of local government enterprises depends on local views regarding the separa-tion of politics or governance from management.5 The governance structure refers to the politi-cal body responsible for making all policy decisions. It does not refer to the day-to-day man-agement of local government or its enterprises and it does not refer to service delivery, becausethis may be handled in a variety of ways. As a major objective of the local government sectorshould be to design an overall governance structure that, in principle and as closely as possible
148 Local Government Enterprises
4. In Ontario, reliance on utility commissions (local enterprises) for water provision declined from112 separate utilities in 1990, to 41 in 2000, and 15 in 2001 (Sancton and Janik 2001, table 3).
5. In New Zealand, for example, legislation mandates that the policymaking responsibilities ofelected municipal councils must be “decoupled” from day-to-day management of the authority (Pallot2001).
in practice, meets the criteria described earlier, it is best achieved if a democratically electedlocal council retains all local public sector decisionmaking powers. In effect, a local enterpriseshould be governed by the same body that governs city hall. This would create an environmentwhere it would be easier to coordinate all municipal services and functions and would mini-mize instances where the policies of local enterprises conflict with the policies of local councils.In principle, a system whereby local councils are responsible for making decisions about theappropriate trade-offs to be made in relation to all local expenditures reduces the possibilitiesof conflict between local enterprises seeking to promote their own special interests and themunicipality attempting to hold the line on taxes, restricting expenditures, or altering expendi-ture choices among those services over which it does have substantial control.
Putting all municipal public policy decisionmaking powers, including those that are politi-cally sensitive and those that are not as politically sensitive, under council control shouldimprove local accountability and responsiveness to the taxpaying public (Municipality of Met-ropolitan Toronto 1988; Stenning and Landau 1988). An independent enterprise in charge of abasic service, such as water, sewers, electricity, and so on, that can set its own rates or prices,determine its own policies, and formulate and approve its long-range plans has considerablecontrol over a number of other municipal services; how a community is governed; and howand where it develops residentially, commercially, and industrially.
How Should Prices Be Set?
Given that services traditionally provided by local government enterprises or their substitutes(separate business units under local council responsibility) tend to have many characteristicsassociated with private goods except that they are generally provided in a monopolistic envi-ronment, the pricing structure should reflect the specific circumstances under which each serv-ice is supplied. Allocative efficiency, fairness, and accountability in the provision of enterpriseservices are generally achieved if the fee or price per unit equals the extra cost of producing thelast unit. This is the well-known marginal cost pricing principle for public sector goods andservices. While this principle is straightforward in theory, its application is considerably moredifficult and almost always requires modification. For example, municipal officials frequentlycannot determine marginal costs. Even where they can do so, problems arise in setting priceswhen economies of scale are present, when capacity constraints exist, when demand differs atpeak and nonpeak periods, when second-best considerations are prevalent, and when external-ities exist (for more detail see Bird 2001; Bird and Tsiopoulos 1997; Kitchen 1997, 2002). Theoptions for achieving marginal cost pricing are described briefly in the following paragraphs.To satisfy the criteria for efficiency and accountability, one or more of the following types ofpricing should be implemented. The actual choice will depend on the characteristics of the spe-cific good or service and the circumstances under which it is provided.
AVERAGE COST PRICING. Either the inability to calculate marginal cost or the likelihood thatfinancial losses will result where marginal cost can be calculated has led to considerable relianceon average cost pricing. Average cost pricing (total cost divided by the units of output equalsprice) is relatively easy to calculate, especially if only financial costs are considered, as is usuallythe case. Average cost pricing, however, produces some important differences when comparedwith marginal cost pricing. If average cost is declining (marginal cost is lower than average cost),too little of the good is provided (in the allocative efficiency sense) and the price is too high. Ifaverage cost is rising (marginal cost is above average cost), too much of the output is producedand the price is too low. In either case, an inefficient level of output results. Average cost willonly generate the efficient level of output if marginal and average costs are constant (the sameregardless of the level of output). Despite potential efficiency deficiencies, average cost pricing isthe most common structure for funding many municipal services that rely on prices or fees.
Harry Kitchen 149
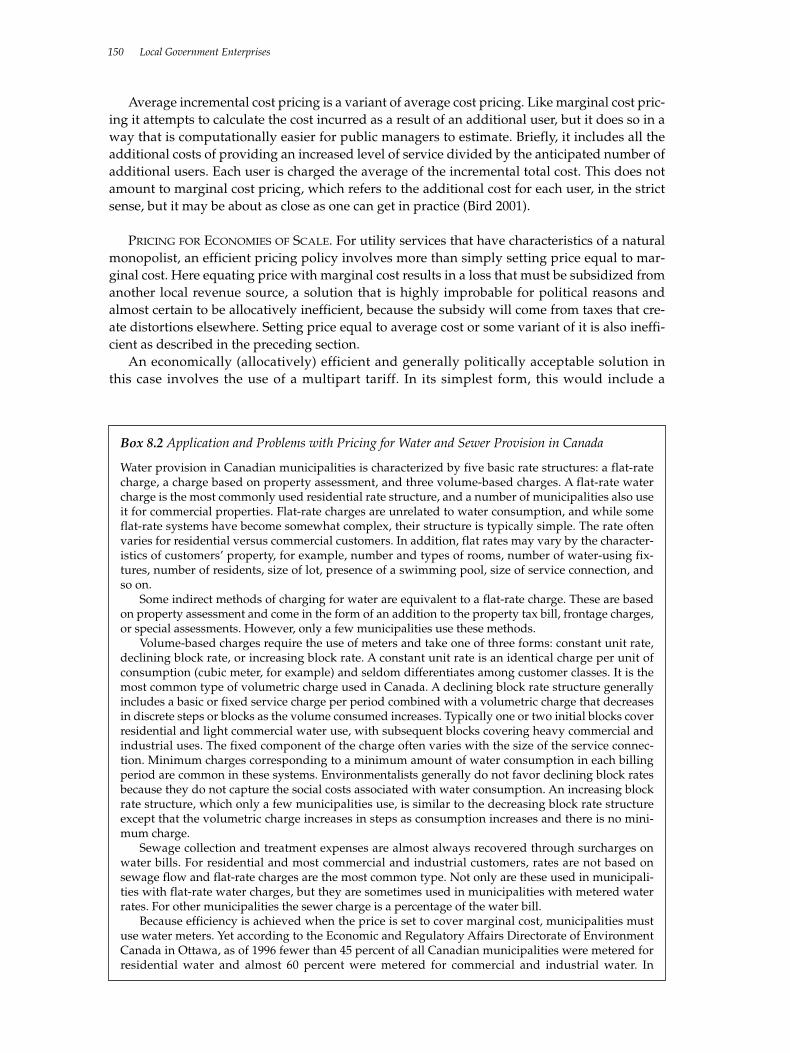
Average incremental cost pricing is a variant of average cost pricing. Like marginal cost pric-ing it attempts to calculate the cost incurred as a result of an additional user, but it does so in away that is computationally easier for public managers to estimate. Briefly, it includes all theadditional costs of providing an increased level of service divided by the anticipated number ofadditional users. Each user is charged the average of the incremental total cost. This does notamount to marginal cost pricing, which refers to the additional cost for each user, in the strictsense, but it may be about as close as one can get in practice (Bird 2001).
PRICING FOR ECONOMIES OF SCALE. For utility services that have characteristics of a naturalmonopolist, an efficient pricing policy involves more than simply setting price equal to mar-ginal cost. Here equating price with marginal cost results in a loss that must be subsidized fromanother local revenue source, a solution that is highly improbable for political reasons andalmost certain to be allocatively inefficient, because the subsidy will come from taxes that cre-ate distortions elsewhere. Setting price equal to average cost or some variant of it is also ineffi-cient as described in the preceding section.
An economically (allocatively) efficient and generally politically acceptable solution inthis case involves the use of a multipart tariff. In its simplest form, this would include a
150 Local Government Enterprises
Box 8.2 Application and Problems with Pricing for Water and Sewer Provision in Canada
Water provision in Canadian municipalities is characterized by five basic rate structures: a flat-ratecharge, a charge based on property assessment, and three volume-based charges. A flat-rate watercharge is the most commonly used residential rate structure, and a number of municipalities also useit for commercial properties. Flat-rate charges are unrelated to water consumption, and while someflat-rate systems have become somewhat complex, their structure is typically simple. The rate oftenvaries for residential versus commercial customers. In addition, flat rates may vary by the character-istics of customers’ property, for example, number and types of rooms, number of water-using fix-tures, number of residents, size of lot, presence of a swimming pool, size of service connection, andso on.
Some indirect methods of charging for water are equivalent to a flat-rate charge. These are basedon property assessment and come in the form of an addition to the property tax bill, frontage charges,or special assessments. However, only a few municipalities use these methods.
Volume-based charges require the use of meters and take one of three forms: constant unit rate,declining block rate, or increasing block rate. A constant unit rate is an identical charge per unit ofconsumption (cubic meter, for example) and seldom differentiates among customer classes. It is themost common type of volumetric charge used in Canada. A declining block rate structure generallyincludes a basic or fixed service charge per period combined with a volumetric charge that decreasesin discrete steps or blocks as the volume consumed increases. Typically one or two initial blocks coverresidential and light commercial water use, with subsequent blocks covering heavy commercial andindustrial uses. The fixed component of the charge often varies with the size of the service connec-tion. Minimum charges corresponding to a minimum amount of water consumption in each billingperiod are common in these systems. Environmentalists generally do not favor declining block ratesbecause they do not capture the social costs associated with water consumption. An increasing blockrate structure, which only a few municipalities use, is similar to the decreasing block rate structureexcept that the volumetric charge increases in steps as consumption increases and there is no mini-mum charge.
Sewage collection and treatment expenses are almost always recovered through surcharges onwater bills. For residential and most commercial and industrial customers, rates are not based onsewage flow and flat-rate charges are the most common type. Not only are these used in municipali-ties with flat-rate water charges, but they are sometimes used in municipalities with metered waterrates. For other municipalities the sewer charge is a percentage of the water bill.
Because efficiency is achieved when the price is set to cover marginal cost, municipalities mustuse water meters. Yet according to the Economic and Regulatory Affairs Directorate of EnvironmentCanada in Ottawa, as of 1996 fewer than 45 percent of all Canadian municipalities were metered forresidential water and almost 60 percent were metered for commercial and industrial water. In
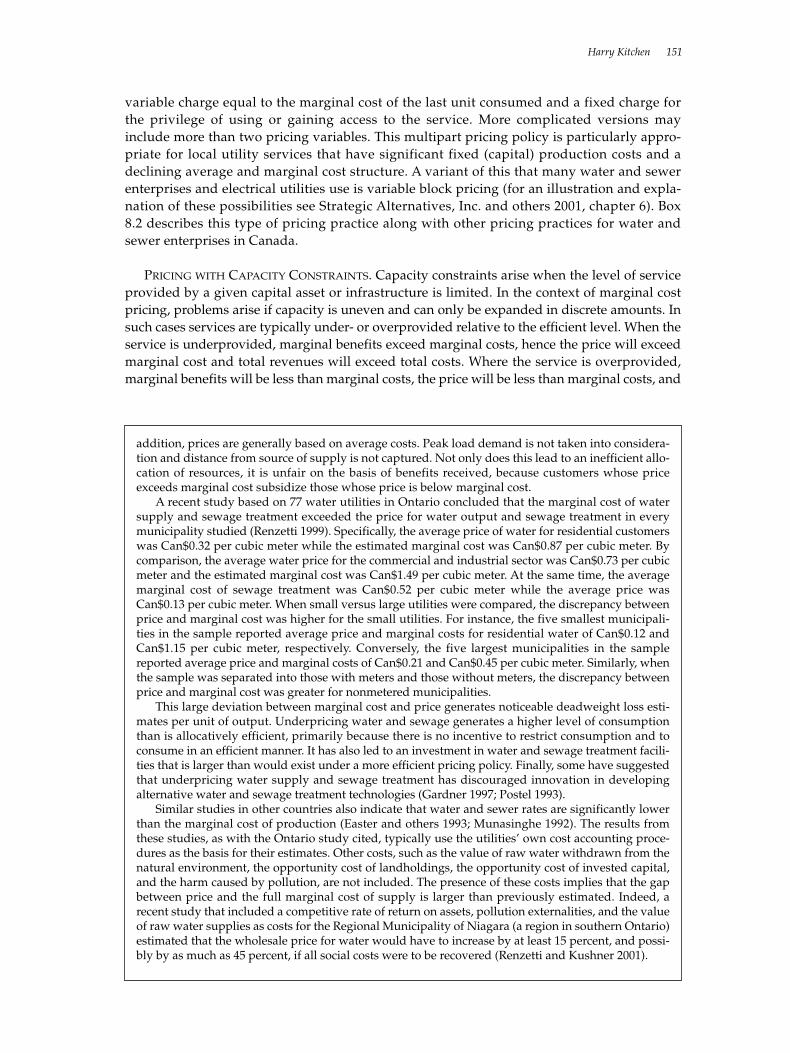
variable charge equal to the marginal cost of the last unit consumed and a fixed charge forthe privilege of using or gaining access to the service. More complicated versions mayinclude more than two pricing variables. This multipart pricing policy is particularly appro-priate for local utility services that have significant fixed (capital) production costs and adeclining average and marginal cost structure. A variant of this that many water and sewerenterprises and electrical utilities use is variable block pricing (for an illustration and expla-nation of these possibilities see Strategic Alternatives, Inc. and others 2001, chapter 6). Box8.2 describes this type of pricing practice along with other pricing practices for water andsewer enterprises in Canada.
PRICING WITH CAPACITY CONSTRAINTS. Capacity constraints arise when the level of serviceprovided by a given capital asset or infrastructure is limited. In the context of marginal costpricing, problems arise if capacity is uneven and can only be expanded in discrete amounts. Insuch cases services are typically under- or overprovided relative to the efficient level. When theservice is underprovided, marginal benefits exceed marginal costs, hence the price will exceedmarginal cost and total revenues will exceed total costs. Where the service is overprovided,marginal benefits will be less than marginal costs, the price will be less than marginal costs, and
Harry Kitchen 151
addition, prices are generally based on average costs. Peak load demand is not taken into considera-tion and distance from source of supply is not captured. Not only does this lead to an inefficient allo-cation of resources, it is unfair on the basis of benefits received, because customers whose priceexceeds marginal cost subsidize those whose price is below marginal cost.
A recent study based on 77 water utilities in Ontario concluded that the marginal cost of watersupply and sewage treatment exceeded the price for water output and sewage treatment in everymunicipality studied (Renzetti 1999). Specifically, the average price of water for residential customerswas Can$0.32 per cubic meter while the estimated marginal cost was Can$0.87 per cubic meter. Bycomparison, the average water price for the commercial and industrial sector was Can$0.73 per cubicmeter and the estimated marginal cost was Can$1.49 per cubic meter. At the same time, the averagemarginal cost of sewage treatment was Can$0.52 per cubic meter while the average price wasCan$0.13 per cubic meter. When small versus large utilities were compared, the discrepancy betweenprice and marginal cost was higher for the small utilities. For instance, the five smallest municipali-ties in the sample reported average price and marginal costs for residential water of Can$0.12 andCan$1.15 per cubic meter, respectively. Conversely, the five largest municipalities in the samplereported average price and marginal costs of Can$0.21 and Can$0.45 per cubic meter. Similarly, whenthe sample was separated into those with meters and those without meters, the discrepancy betweenprice and marginal cost was greater for nonmetered municipalities.
This large deviation between marginal cost and price generates noticeable deadweight loss esti-mates per unit of output. Underpricing water and sewage generates a higher level of consumptionthan is allocatively efficient, primarily because there is no incentive to restrict consumption and toconsume in an efficient manner. It has also led to an investment in water and sewage treatment facili-ties that is larger than would exist under a more efficient pricing policy. Finally, some have suggestedthat underpricing water supply and sewage treatment has discouraged innovation in developingalternative water and sewage treatment technologies (Gardner 1997; Postel 1993).
Similar studies in other countries also indicate that water and sewer rates are significantly lowerthan the marginal cost of production (Easter and others 1993; Munasinghe 1992). The results fromthese studies, as with the Ontario study cited, typically use the utilities’ own cost accounting proce-dures as the basis for their estimates. Other costs, such as the value of raw water withdrawn from thenatural environment, the opportunity cost of landholdings, the opportunity cost of invested capital,and the harm caused by pollution, are not included. The presence of these costs implies that the gapbetween price and the full marginal cost of supply is larger than previously estimated. Indeed, arecent study that included a competitive rate of return on assets, pollution externalities, and the valueof raw water supplies as costs for the Regional Municipality of Niagara (a region in southern Ontario)estimated that the wholesale price for water would have to increase by at least 15 percent, and possi-bly by as much as 45 percent, if all social costs were to be recovered (Renzetti and Kushner 2001).
total revenues will be less than total costs. The decision as to the size of facility is therefore onefor benefit-cost analysis.
In the presence of capacity constraints, an efficient pricing policy will result in revenuesexceeding costs for a facility that is too small—the project is self-financing—whereas for a facil-ity that is too large, supplementary financing beyond revenues from sales will be required, per-haps some kind of fixed charge such as noted earlier.
PRICING DURING PEAK PERIODS. A further issue revolves around the pricing of services dur-ing peak and off-peak periods of demand. Efficient pricing may call for higher fees during peakperiods and lower fees during off-peak periods. This arises because peak demand strainscapacity and only lasts for part of the demand cycle. Marginal benefit to peak users only occursover a portion of the demand cycle, whereas the marginal cost of capacity expansion is incurredover the entire demand cycle, which means that the marginal benefits to peak users exceed theirmarginal costs. In addition, as off-peak users gain no additional benefit from capacity expan-sion, peak users should shoulder all the additional capacity costs. In other words, the off-peakprice should be set equal to marginal operating costs, while the peak price should be set equalto the sum of marginal capacity and operating costs.
PRICING AND DISTANCE FROM THE SOURCE OF SUPPLY. If distance from the source of supplyaffects marginal cost and if the price is not differentiated to reflect this, users with lower mar-ginal costs subsidize users with higher marginal costs. If this subsidy is capitalized into landvalues (this is an empirical question, and some uncertainty exists as to the extent of capital-ization), then those properties furthest from the source will be priced higher than would oth-erwise be the case. One way to handle this is to impose zone charges or differential fees oncustomers in areas where the costs of servicing are higher because of their distance from thesource.
PRICING AND SECOND-BEST CONSIDERATIONS. Second-best considerations arise in the pres-ence of inefficient pricing policies (prices set at levels other than marginal social cost) elsewherein the system. Such is the case, for instance, when a municipality implements a price for a par-ticular service, say public transit or buses, while other services that are considered substitutes,such as urban expressways or roads, are not subjected to a specific charge. Here road andexpressway users pay nothing per trip other than their vehicle operating costs, while transitusers are charged for each trip. In this instance efficiency gains can be achieved if price is setbelow marginal cost in the controllable sector (public transit), and if this results in an increaseduse of transit services and a decreased use of roads and expressways (uncontrollable sector).This pricing solution is known as second best (Boadway 1997).
Should Prices Be Regulated?
There are two opposing views on whether or not prices or user fees charged by local govern-ment enterprises should be regulated. Those who oppose the regulation of prices suggest thatconcerns about price increases by local monopoly enterprises may be no different than concernsabout tax increases. In democratically elected local councils where all decisionmaking responsi-bilities rest with the local council, taxpayers have the ultimate control or power in that theyhave the opportunity to vote the politicians out of office at the next elections. Furthermore, ifcost efficiency in service provision, and hence control of prices, is the objective, this is likely tobe achieved by introducing competitive elements in the production and delivery of each publicgood and service.
In contrast, those who support price regulation contend that it is necessary to protect con-sumers from inefficient and unfair price increases where decisions about service responsibilityand funding are made in an environment that lacks competition. Setting up a regulatory system
152 Local Government Enterprises

is a complex task, however. When should prices be regulated? Who should regulate them?How should they be regulated?
WHEN SHOULD PRICES BE REGULATED? Current practice in many countries is inconsistent inrelation to local price regulation. For example, prices are regulated for specific local govern-ment enterprises in some countries (electricity, for instance), but not for other enterprises in thesame countries (water and sewer, public transit). The rationale behind this differential treat-ment is far from clear. The practice appears to be based on tradition and what is done elsewhererather than on any solid economic rationale. Presumably, the case for price regulation isstrongest in instances where competitive pressures both in terms of decisionmaking (lack ofopportunity for the local council to make decisions on the trade-offs for all local goods andservices) and production or delivery are weakest, such as in noncontestable markets.
WHO SHOULD REGULATE PRICES? Should regulation be the responsibility of the local council,of an independent body set up by the local council, of a senior level of government, or of a sep-arate agency set up by a senior level of government? If it is a local council responsibility, theadvantages of this have been noted already. If it is a separate independent body set up by thelocal council, it has the potential to take on a life of its own and create the kinds of problemsthat tend to be created by special-purpose bodies (Kitchen 1993). Similar concerns arise if it is abody set up by a senior level of government or if it is a senior level of government itself. Ineither case, a senior level of government has considerable control over the behavior of localgovernments that may restrict their ability to be independent and autonomous governing unitsworking in the best interests of their local citizens. Of these possible options, the creation of anindependent regulatory body operating at arms length from all levels of government, withexperts appointed jointly by local and senior levels of government and fully versed in financial,budgetary, and operational details, may best serve local citizens.
HOW SHOULD PRICES BE REGULATED? What is the benchmark or criterion that should be usedto determine the appropriate price? Should it be based on the financial or economic costs of theenterprise in each municipality? Should it be based on a defined standard of service for allmunicipalities, and if so, what standard? These are not easy questions to answer.
In general, price regulatory schemes have two common prototypes: rate of return and pricecap regulation (Szalai 2001). Where rate of return is used, the regulator defines a fair and rea-sonable profit level and the company has the opportunity to increase the price to the pointwhere it reaches its maximum profit level. Because reasonable profit is counted as a percentageof the asset base, the company has an incentive to overinvest to increase its asset base, andhence its profit. Further concerns with this regulatory pricing scheme exist because it does notdepend on costs, and hence the enterprise has little incentive to be efficient and vigilant in con-trolling costs. Monitoring of this price would require regulators to check the usefulness of allinvestments so that unnecessary ones could be dropped from the asset base—a formidable task.
Price cap regulatory schemes concentrate on creating incentives for the enterprise toincrease efficiency. This scheme adjusts the regulated price each year by the rate of inflationminus the rate of the expected efficiency gain. If the company reduces its costs through techno-logical innovation or production efficiencies, it earns extra profits. If it does not, it incurs adeficit. A major difficulty with this scheme is establishing a measure of efficiency. The practicehas been to compare relevant performance indicators for an enterprise with similar indicatorsfrom enterprises in other municipalities or to take the average for all similar enterprises withina country adjusted for geography and other factors that affect cost. The difference between anenterprise and the comparator group may be referred to as the efficiency deficit (gap). Where adeficit arises, it is not always expected to be corrected immediately. It may take a few years,with a condition that a specific percentage of the deficit be removed each year. For example, thewater regulator in the United Kingdom requires that less efficient companies close 50 percent
Harry Kitchen 153

of the gap yearly. Again, to be effective and efficient such regulation requires a high degree ofknowledge and competence on the part of the regulator.
Where the costs are less than expected under price cap regulation, the enterprise will yieldunexpectedly high profits. One solution in such a case is to give each customer a refund at theend of the fiscal year equal to that customer’s share of the profit, which could be referred to asa patronage dividend. Another possibility, although less preferable economically because itwould reward those customers who did not consume the service in the year when the profitwas earned, would be to use the profits to reduce prices in the following year.
Should Local Government Enterprises Earn Profits?
Perhaps this discussion should start by asking what is meant by profit. Here profit is defined asthe difference between annual operating revenues and annual operating costs. Annual operat-ing revenues come from the sale of goods or services provided by the enterprise. Annual costsshould include all financial or explicit costs and all implicit or opportunity costs. Financial costsinclude wages, materials, insurance, utilities, and bank interest on borrowed money, andopportunity costs include the annual costs of asset replacement (depreciation) and a normalprofit defined as the opportunity cost associated with putting resources into this enterpriserather than into a viable alternative.
In some countries, it is common practice for a local government enterprise to generate aprofit and for the enterprise to transfer this profit to the local government so that the latter canuse it to fund a range of municipal services. This raises an important question. Should profitgeneration be an objective of a local government enterprise? If a municipality relies on user feesor charges and local taxes to fund a range of municipal services, what is the rationale for over-charging consumers of goods and services provided by enterprises and undercharging taxpay-ers for services funded from local taxes? In principle, there is no solid rationale why local tax-payers should be subsidized from revenues generated by selling a specific good or service orwhy the users of a specific good or service should be subsidized by local taxpayers. Thisencourages citizens to overconsume subsidized services and underconsume the overpriced orovertaxed services.
While one could argue that profit maximization should not be an objective of a public enter-prise, so that monopoly (as opposed to normal) profits should not arise, this is not to say thatallocative efficiency and cost minimization should not be objectives. Clearly they should be.This is where implementation of expenditure controls and monitoring activities such as thosediscussed later are critical.
Should Revenues Be Earmarked?
If local government enterprises earn profits, especially above normal profits (greater than thecost of capital), what should be done with such profits? Should they be earmarked or not? (Foran extensive discussion and analysis of earmarking, including reference to Russia, see Bird1997.) Earmarking occurs when specific revenues are set aside for funding certain goods orservices, for example, earmarking exists if the costs of providing a specific good or service arefunded by revenues generated from the sale of that good or service. Earmarking can be effi-cient, accountable, and fair for local public sector services that resemble privately suppliedservices in that each taxpayer’s consumption can be recorded, the extra cost of providing theservice can be measured, and correct prices or user fees can be charged. Earmarking can also bea disaster when it channels funds into activities that do not have high public priorities.
Earmarking is supported for a number of reasons. First, when there is a close link betweenthe cost of a good or service and the revenue that funds it. This permits residents to associatethe benefits received as reflected in the price paid with the costs of providing the good or
154 Local Government Enterprises
service and to decide for themselves whether the good or service is worth the price or fee. Thisin turn leads to a greater likelihood of achieving efficiency and accountability in local serviceprovision.
Second, earmarking is likely to improve local decisionmakers’ motivation and efficiency. Iffunds are not earmarked, surplus revenues from the sale of goods and services could be usedto lower local tax rates. This may discourage management from improving efficiency andreducing costs, because excess revenues would go elsewhere. It could also discourage the intro-duction of innovative techniques and future investment that could lead to cost savings and effi-ciencies.
Third, there is no solid economic reason why local taxpayers should be subsidized from rev-enues generated by selling a specific good or service or why the users of a specific good or serv-ice should be subsidized by local taxpayers. Such cross-subsidization may lead to undesirabledistortions and a departure from efficient and accountable pricing and investment practices.
Fourth, this type of cross-subsidization is almost certain to lead to a great deal of unplannedand implicit income redistribution, much of which would be unacceptable if it were madeexplicit (Bird 1976). More specifically, when consumers of specific goods and services are subsi-dized by local taxpayers or vice versa, lower-income individuals all too frequently subsidizehigher-income individuals. Indeed, this has been observed in both rich and poor countries, forexample, Bird (1997) notes that flat-rate water charges favor households with large lawns towater and multiple vehicles to wash.
Fifth, as generating local revenues by raising user fees or public prices is often more politi-cally palatable than raising local taxes, failure to earmark these fees provides an incentive forthe governing body to generate excess revenues and use them to fund services that ought to befunded from local taxes or grants (Kitchen 2000a). If governing bodies responsible for localservice rely properly on user fees or prices, local taxes, and grants, one opportunity for abuse ofpower by such governing bodies may be removed.
Sixth, rational earmarking is fair because consumers pay for identifiable services they useand no one either receives a service without paying for it or pays without receiving it. Properlydesigned user fees should therefore be earmarked for use by the enterprise producing the serv-ice. However, to the extent that such fees are used to levy a tax (in the form of a monopolyprofit) on service users, such profits should flow into general revenues and not be earmarkedeither for the enterprise or for other specific uses.
Thus good earmarking can be beneficial, but all too often it can be criticized, because it canshield expenditure programs from the critical assessment that budgetary authorities might oth-erwise impose. Even though criticism may be muted as long as proper expenditure controlsand monitoring practices are in place, it arises, at least in part, because of the absence of goodfinancial practices that leads to much earmarking in the first place.
How Should Capital Investments Be Financed?
Local enterprises generally finance their capital expenditures from current operating revenues(user charges), capital reserves, borrowing, and more recently, public-private partnershipsbecause of the potential opportunities for gaining access to new sources of revenue. Borrowingis generally favored as a way to fund large capital infrastructure projects where the beneficiar-ies of the asset can be identified and prices or fees can be charged for the goods or services pro-vided (for arguments for and against borrowing see Peterson 2001). Borrowing in this instancesatisfies the benefits-based model of local public finance, because those who benefit from thefacility (the users over the next few years) pay for it. Furthermore, the practice of earmarkingrevenues has much to offer when there is a strong benefit link between the payment of an ear-marked fee or price and the use of revenues to finance capital expenditures. In these instances,local preferences can be reflected in the level and quality of service provided. Fairness is
Harry Kitchen 155
achieved as long as the projects’ beneficiaries pay for it. Optimal and efficient investment deci-sions will ensue as long as the price or fee charged is efficient and fair. In short, the “interde-pendence of pricing and investment decisions, and the potentially important role of earmark-ing in linking revenues and expenditures deserves careful consideration when it comes tofinancing local infrastructure” (Bird 1994, p. 20).
The arguments against borrowing and in support of pay-as-you-go financing from currentrevenue sources include the savings in annual interest costs (available for spending on otherprojects), the creation of debt capacity for more important projects in the near future, and theavoidance of the situation whereby future users have no say in the issuance of debt yet arerequired to pay for projects approved by those in power today. These criticisms of borrowing,however, essentially ignore the benefits-based principles of funding local public services.
The way in which an enterprise raises long-term capital funds through borrowing can affectits cost of raising money. If the local government enterprise issues its own debt, then its trans-action, interest, and administration costs are almost certain to be higher than if it raised thesame debt through a provincial, state, or regional borrowing body. Furthermore, this borrow-ing authority might include other public sector bodies, such as municipalities, local schools,and hospitals, in which case the enterprise could borrow from the authority, which would totalup all requests for funds and issue long-term debentures against itself. When it received theproceeds from the sale of these debentures, it could disburse the funds to the requesting partic-ipants under a loan agreement.
The advantages of pooling municipal debt through a regional authority can be substantial.Administration costs would be lower, because one contract with an underwriter could be sub-stituted for separate contracts between each borrower and debt issuer. Transaction costs couldbe reduced, because an authority would be prepared to issue debentures more frequently thanwould an enterprise on its own. This is important when capital markets are volatile and con-siderable savings may be incurred by being able to take advantage of lower interest rates.Because of its size a large borrowing authority can exercise greater flexibility over issue termsand offer lower interest costs to participants (Gilbert and Pike 1998).
Should Local Government Enterprises Pay Taxes?
The issue of whether a local government enterprise should pay taxes is more complicated thanwhether private sector firms should pay taxes. While arguments for taxing the latter are fairlyclear (Boadway and Kitchen 1999, chapters 4 and 7), arguments for taxing the former are morecomplicated. To illustrate, if local enterprises are responsible for goods and services that localgovernments would otherwise be responsible for, then arguments for taxing them may be nodifferent than arguments for taxing a municipality. Otherwise taxing enterprises with the taxrevenues going to municipal governments means that some public services are taxed while oth-ers (those provided by the municipal council) are not. Such differential treatment can lead todistortions and income distribution consequences identical to those discussed earlier. If, how-ever, local enterprises provide goods and services that compete with the private sector, the casefor taxation is the same in both cases.6
Controlling Enterprise Behavior
Where local government enterprises exist, local governments should control them. One approachis through expenditure controls, such as the implementation of appropriate budgeting, reporting,
156 Local Government Enterprises
6. Note that there is never a case for nonpayment of bills by or to local enterprises. All too often, localgovernments do not pay their electricity bills and local electricity enterprises reciprocate by not payingtheir taxes or not paying dividends to local governments.
and accounting practices and the adoption of performance measures. A quite different approachmay be to consider alternative ways of delivering certain services.
Budgets
Local enterprise budgets should be designed to achieve the following objectives (Solano andBrams 1996): (a) to provide for the maintenance of financial control, (b) to provide informa-tion essential for efficient management decisions, and (c) to improve program and financialplanning.
In practice, local enterprise budgets tend to be input oriented as opposed to goal or outputoriented and far from ideal. Input-based budgets are almost always based on incrementalism,for example, last year’s line-by-line expenditure item plus 2 or 3 percent. Budgets of this typeare deficient, because they lack a mechanism for assessing benefits from existing expenditures.They lead to a narrow and cumbersome financial management system characterized by paper-work, detail, duplication, complexity, and inflexibility. They lack the information necessary forproper planning and efficient management of local enterprise activities. Finally, the informa-tion provided is frequently incomprehensible to all but the most sophisticated readers.
To facilitate policymaking and managerial decisions, budgets should be designed to reflectboth past and projected expenditures on outputs (rather than inputs) or goals achieved or to beachieved. This may be a tall order, yet one that is necessary if operational efficiencies are to beachieved. Such identification of expenditures on outputs involves the establishment of work-loads or targets, for example, the policy decision may be to achieve a 5 percent reduction inwater line breaks at an average cost of X person-hours per incident, or the aim may be for allgarbage to be collected with a minimum amount of inconvenience to all residents at an averagecost of $Y per ton. Similar targets may involve a reduction in per capita fire losses of a fixed per-centage at an average cost of $Z per alarm or the completion of road maintenance that ensuressmooth riding at a cost of $K per kilometer.
Establishing targets or workloads permits decisions to be made on the basis of both costs(efficiency) and some measure of returns (effectiveness). Budgets should be built around thekind of work to be undertaken in the next fiscal year and beyond, expenditures required, andrevenues tapped. Workload targets should include the scheduling of work, the development ofan organizational structure, and the procedures to achieve the proposed plans (Solano andBrams 1996). Any local government or local government enterprise should also consider alter-native methods of achieving the volume of work to be undertaken. Decisionmakers shouldundertake impact studies and cost-benefit analysis of all options before a path of action is cho-sen.
Once such targets or objectives have been established, the task of achieving these objectivesbegins. Workloads or targets must be defined in quantifiable terms. Such quantificationrequires data on both inputs and outputs, because it is the ratio of inputs to outputs that definesthe target to be achieved.
Workload and other performance indicators should be measured, established, and moni-tored periodically to make certain that targets are adhered to and that justifiable changes arebeing incorporated into the budget. Periodic reporting also provides a basis for evaluatingimprovements or discovering deviations that must be corrected. These deviations might existbecause of unplanned inflationary cost pressures, inadequate financial controls, unrealisticrevenue or expenditure estimates, and/or foolish management decisions. Once decisionmak-ers have determined the basis for the deviation, enterprise managers should either alter thetargets or adjust their operations to achieve the previously stated objective. Finally, an inde-pendent audit by a firm or individual(s) not employed directly by the enterprise is necessaryto guarantee that the enterprise has achieved its objectives or goals in an effective and efficientmanner.
Harry Kitchen 157
Accounting and Reporting
The focus of accounting and reporting is to document, classify, and summarize transactions sothat users of financial reports can understand and evaluate the operations of municipal enter-prises (Holder 1996). Enterprises must fulfill a number of financial management functions tomeet these objectives. Accounting systems are needed to record revenues and expenditures in away that permits comparisons between budgets and actual figures. Financial audits are neededto determine whether the financial statements provide an accurate and reasonable picture ofthe financial position and activities for the reporting period. The financial audit must bedesigned to detect deficiencies in the system of internal financial control, failures to complywith accounting principles and standards or with reporting requirements of a senior level ofgovernment, and instances of errors or the misappropriation of funds. As financial audits focuson financial statements, they do not address the issues of efficient resource utilization and theachievement of performance standards, which are reviewed by means of management and per-formance audits or special audits, such as an environmental audit.
Accounting information should be presented in a way that satisfies a number of users. Onegroup includes constituents, creditors, suppliers, and others engaged in business transactionswith the enterprise. This group is external to the operation and generally lacks any effectivecontrol over the type of financial information available. Information on performance measureswould be particularly useful. This would permit an intermunicipal and intramunicipal com-parison of enterprises’ unit costs, efficiency, and effectiveness of service provision. This groupwould also benefit greatly from information on such things as the impact of current capital proj-ects on future operating budgets; the enterprise’s ability to draw on future resources; and theimpact of inflation on future expenditures, and hence on revenues to be collected.
A second group of users includes all individuals involved in the enterprise’s managerial andadministrative functions. Specifically, it includes policymakers, managers, and administrators.The financial information needs of these users are more comprehensive. In addition to the fore-going, they require cost estimates for alternative ways of achieving specific goals. Cost-benefitanalyses of proposed and existing ways of providing services, forecasts of current and capitalexpenditures, and the impact these will have on current and future revenues are important.
Fund accounting is particularly appropriate for local government enterprises. It featuresself-balancing, double-entry accounts from which a balance sheet and statement of operationscan be prepared. The fund basis of accounting recognizes that most assets are not fungible—that is, they are not available for purposes other than those budgeted—and that data on budg-eting compliance are an important part of an enterprise’s stewardship responsibility. Fundaccounting and reporting is necessary to control resources so they are used for their designatedpurpose and to demonstrate compliance with legal and budgeting constraints (Holder 1996).
Cash, accrual, and modified accrual accounting are the three possible accounting bases thatmay be used. Cash accounting involves recording expenditures and revenues when funds areactually disbursed or received. Accrual accounting records transactions when they occurregardless of when expenditures are made or funds received. For example, the cash expendi-ture to finance an investment in a fixed asset may take place within one year, but the associatedexpenses reported in the financial statement of operations takes the form of annual deprecia-tion charges incurred over the life of the asset. As depreciation is a charge that is used to recoverthe original cost of an asset and associates the annual flow of benefits with costs, interpretingdepreciation as a charge to cover replacement costs is incorrect, because this would entail dou-ble counting. Moreover, the cost of asset maintenance and repair is recovered directly as anexpense.
Modified accrual accounting is somewhat different. It adopts the same principles andapproach as accrual accounting except that depreciation and return on capital are not includedas costs. Instead, interest costs and principal repayments on debt are recovered directly in theyear in which they are due through revenues the enterprise generates. Modified accrual
158 Local Government Enterprises
accounting often generates revenue in excess of expected operating, maintenance, and debtservice costs, resulting in operating surpluses that are transferred to a capital fund to financeongoing investments or into reserves or reserve funds to finance planned future investments.Because principal repayments are recovered directly each year as chargeable expenses, enter-prises are less likely to face cash flow problems. Capital finance does not therefore depend onthe flow of funds from a depreciation charge and a return on equity
The adoption of accrual or modified accrual accounting does not suggest that absolutelyevery revenue source or expenditure item be accrued. For extremely small revenue and expen-diture items, a simple recording on a cash basis along with a proper notation of the approachfollowed may be sufficient.
Interest in full accrual-based accounting is generally motivated by concerns about the stateof aging infrastructure and a lack of reliable information that could be used to evaluate this con-cern. In New Zealand, the 1996 Local Government Amendment Act requires local governmentsto adopt fixed asset accounting and to prepare and approve a long-term financial strategy everythree years, thereby providing long-term financial and asset management plans (Pallot 2001).Under the act, depreciation charges are estimated and funded through locally generated rev-enues. The depreciation charge provides an estimate of the decline in the service potential ofassets, while its funding assures that users of the service pay its real cost (1999 report to parlia-ment by the Office of the Controller and Auditor General of New Zealand). Currently, localauthorities are allowed to use the long-run average cost of asset renewals as an alternative todepreciation charges. To make this approach work, local authorities must develop a 20-yearcapital plan. In the case of long-life assets, the 20-year plan has not provided a realistic estimateof the average annual renewal cost. Conversely, where a realistic depreciation charge is set andfunded, local authorities have complained that extremely large reserve funds will accumulatelong before they are needed.
Accounting reforms in the United States are similar (International City/County Manage-ment Association 2000). The requirement for full accrual accounting by local government wasestablished by the U.S. Government Accounting Standards Board, which concluded that report-ing information on infrastructure assets is essential for assessing municipalities’ financial posi-tion and changes in their financial position and for reporting the costs of programs or functions(Johnson and Bean 1999). Governments may choose to report expenses for repairing and main-taining infrastructure instead of depreciation expenses for that infrastructure if they managethe infrastructure using a suitable asset management system, including an assessment of theassets’ physical condition every three years, and if they establish a minimum condition levelfor those assets and demonstrate that they are maintaining those assets at or above that condi-tion through appropriate investments (Government Accounting Standards Board 2001; Pattonand Wardlow 1999).
Asset management figures prominently in both the New Zealand and U.S. approaches. InNew Zealand it is mandatory, and in the United States it is mandatory so long as depreciationis not charged for infrastructure. As a source of information on the condition of infrastructure,asset management planning goes well beyond fixed asset accounting, because it requires anassessment of the physical condition of the infrastructure and includes a strategy and financingplan for asset maintenance and replacement.
Performance Measures
Performance measurement is relatively new for public goods and services, although the impor-tance of performance measures has been widely recognized for some time (Hatry 1999). If cor-rectly set, a performance measure records the output of, rather than the input to, municipalspending on specific programs or services As an example, table 8.1 describes performancemeasures used in Ontario.
Harry Kitchen 159
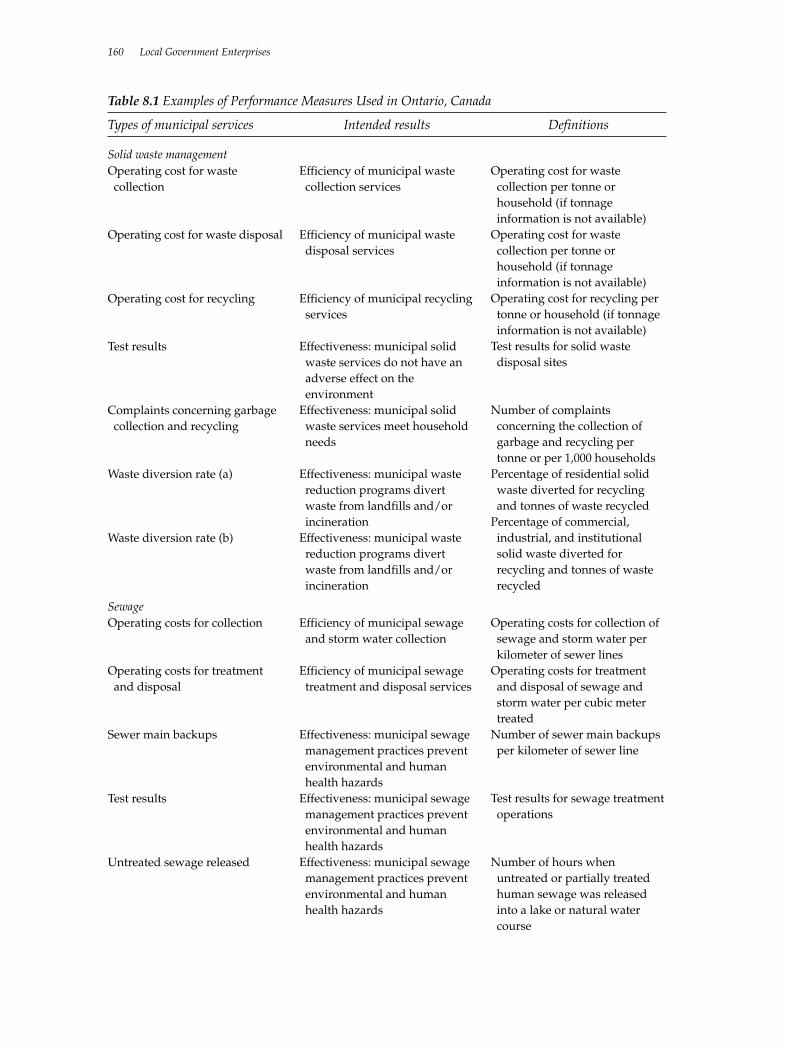
160 Local Government Enterprises
Operating cost for wastecollection
Operating cost for waste disposal
Operating cost for recycling
Test results
Complaints concerning garbagecollection and recycling
Waste diversion rate (a)
Waste diversion rate (b)
Efficiency of municipal wastecollection services
Efficiency of municipal wastedisposal services
Efficiency of municipal recyclingservices
Effectiveness: municipal solidwaste services do not have anadverse effect on theenvironment
Effectiveness: municipal solidwaste services meet householdneeds
Effectiveness: municipal wastereduction programs divertwaste from landfills and/orincineration
Effectiveness: municipal wastereduction programs divertwaste from landfills and/orincineration
Operating cost for wastecollection per tonne orhousehold (if tonnageinformation is not available)
Operating cost for wastecollection per tonne orhousehold (if tonnageinformation is not available)
Operating cost for recycling pertonne or household (if tonnageinformation is not available)
Test results for solid wastedisposal sites
Number of complaintsconcerning the collection ofgarbage and recycling pertonne or per 1,000 households
Percentage of residential solidwaste diverted for recyclingand tonnes of waste recycled
Percentage of commercial,industrial, and institutionalsolid waste diverted forrecycling and tonnes of wasterecycled
Operating costs for collection
Operating costs for treatmentand disposal
Sewer main backups
Test results
Untreated sewage released
Efficiency of municipal sewageand storm water collection
Efficiency of municipal sewagetreatment and disposal services
Effectiveness: municipal sewagemanagement practices preventenvironmental and humanhealth hazards
Effectiveness: municipal sewagemanagement practices preventenvironmental and humanhealth hazards
Effectiveness: municipal sewagemanagement practices preventenvironmental and humanhealth hazards
Operating costs for collection ofsewage and storm water perkilometer of sewer lines
Operating costs for treatmentand disposal of sewage andstorm water per cubic metertreated
Number of sewer main backupsper kilometer of sewer line
Test results for sewage treatmentoperations
Number of hours whenuntreated or partially treatedhuman sewage was releasedinto a lake or natural watercourse
Table 8.1 Examples of Performance Measures Used in Ontario, Canada
Types of municipal services Intended results Definitions
Solid waste management
Sewage
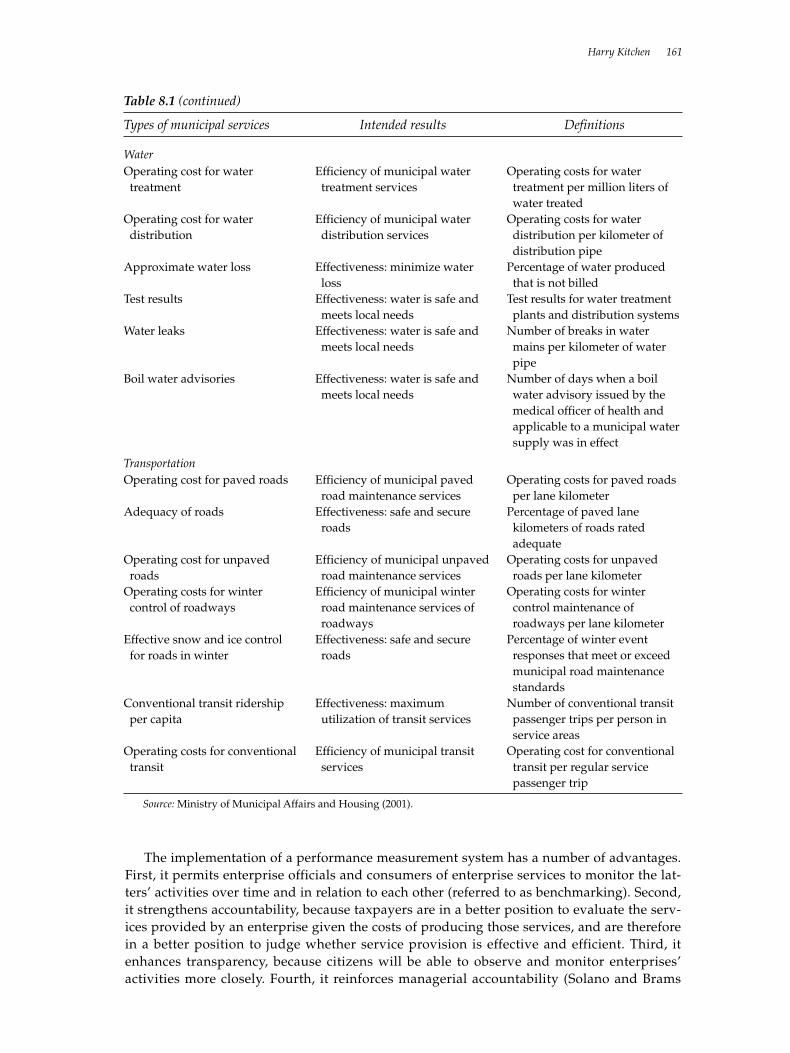
The implementation of a performance measurement system has a number of advantages.First, it permits enterprise officials and consumers of enterprise services to monitor the lat-ters’ activities over time and in relation to each other (referred to as benchmarking). Second,it strengthens accountability, because taxpayers are in a better position to evaluate the serv-ices provided by an enterprise given the costs of producing those services, and are thereforein a better position to judge whether service provision is effective and efficient. Third, itenhances transparency, because citizens will be able to observe and monitor enterprises’activities more closely. Fourth, it reinforces managerial accountability (Solano and Brams
Harry Kitchen 161
Operating cost for watertreatment
Operating cost for waterdistribution
Approximate water loss
Test results
Water leaks
Boil water advisories
Efficiency of municipal watertreatment services
Efficiency of municipal waterdistribution services
Effectiveness: minimize waterloss
Effectiveness: water is safe andmeets local needs
Effectiveness: water is safe andmeets local needs
Effectiveness: water is safe andmeets local needs
Operating costs for watertreatment per million liters ofwater treated
Operating costs for waterdistribution per kilometer ofdistribution pipe
Percentage of water producedthat is not billed
Test results for water treatmentplants and distribution systems
Number of breaks in watermains per kilometer of waterpipe
Number of days when a boilwater advisory issued by themedical officer of health andapplicable to a municipal watersupply was in effect
Table 8.1 (continued)
Types of municipal services Intended results Definitions
Water
Operating cost for paved roads
Adequacy of roads
Operating cost for unpavedroads
Operating costs for wintercontrol of roadways
Effective snow and ice controlfor roads in winter
Conventional transit ridershipper capita
Operating costs for conventionaltransit
Efficiency of municipal pavedroad maintenance services
Effectiveness: safe and secureroads
Efficiency of municipal unpavedroad maintenance services
Efficiency of municipal winterroad maintenance services ofroadways
Effectiveness: safe and secureroads
Effectiveness: maximumutilization of transit services
Efficiency of municipal transitservices
Operating costs for paved roadsper lane kilometer
Percentage of paved lanekilometers of roads ratedadequate
Operating costs for unpavedroads per lane kilometer
Operating costs for wintercontrol maintenance ofroadways per lane kilometer
Percentage of winter eventresponses that meet or exceedmunicipal road maintenancestandards
Number of conventional transitpassenger trips per person inservice areas
Operating cost for conventionaltransit per regular servicepassenger trip
Transportation
Source: Ministry of Municipal Affairs and Housing (2001).
1996) and often provides an incentive to stimulate staff creativity and productivity. Finally, ithelps enterprises develop budgets based on realistic economic costs and benefits rather thanon historical patterns.
Performance measures are also used to determine the effectiveness of service delivery. Effec-tiveness measures the extent to which an activity contributes to the achievement of stated goals,objectives, or targets. For example, an activity such as building a road may be efficient in termsof cost per kilometer, but its effectiveness will depend on the road’s usefulness in providingconvenient, safe, and economic vehicular transportation. When a direct evaluation of the bene-fits arising from local services is impossible, the demand for services subject to quality stan-dards could be measured using surveys, studies of local economic conditions, reports on thenumber of applications, requests or complaints received, expert evaluations of specific needs,and so on. In this way, a measure of the value of the service provided can be estimated.
As noted earlier, not only are performance measures now required for all municipalities andtheir agencies in the province of Ontario, Canada, and all local governments in New Zealand,municipalities and their enterprises are required to report the results to their taxpayers (Min-istry of Municipal Affairs and Housing 2001; Pallot (2001). While this information is intendedto improve efficiency and productivity in the provision of each local service, it should be linkedto the budgetary process. The tighter financial environment facing local enterprises every-where, along with the greater pressure for public accountability, should provide an incentivefor them to clearly outline their budgetary targets, goals, or objectives and to relate these to per-formance measures. At the same time, enterprises should employ cost-benefit analysis to eval-uate alternative means of achieving their stated objectives to determine those that yield thegreatest returns given revenue constraints.
Monitoring
In order to monitor enterprises’ behavior, a senior level of government must mandate budget-ing, accounting, and reporting requirements. In addition, requirements that enterprises reportall budgetary information, the extent to which they met budgetary goals, and informationabout performance measures to local citizens on an annual basis should improve the efficiency,accountability, and transparency of enterprise activities. This reporting could take a variety offorms, including mailings to all residents included with property tax and/or utility bills,notices in local newspapers, and postings on the municipality’s Web site.
Service Delivery
So far the discussion of local government enterprises has concentrated on governance and man-agerial issues rather than on actual service delivery. Instead of relying on local governmententerprises to deliver specific public services, municipalities can choose the private sector astheir delivery agent while retaining all ownership rights through contractual arrangements thatspell out the terms and conditions for delivery, including quantity, quality, frequency, standardsto be met, and so on. Indeed, Wallich (1994a) suggests that with competitive markets beingintroduced in Russia, all governments and their agencies stand to realize significant cost sav-ings by privatizing service delivery in some form or other without relinquishing governingresponsibilities.
As discussed in the following subsections, private sector delivery could take the form ofcontracting out, franchising out, or public-private partnerships.
CONTRACTING OUT. Local authorities in the United Kingdom are now required to enter intocompetitive tendering for the provision of municipal services. Recent legislation in NewZealand has had a significant impact on the way services are provided, but it does not go as far
162 Local Government Enterprises
as the United Kingdom in requiring mandatory competitive tendering. In New Zealand, deliv-ery exclusively by local council departments declined from 70 percent in 1989 to 26 percent in1994, while delivery by business units rose from 2 to 18 percent (Department of Internal Affairs1994). Business units delivered the core services of water supply, sewage systems, storm waterremoval, and drainage in more than 50 percent of the councils surveyed, and most councils thatprovided legal services, refuse collection, and refuse disposal and engaged in commercialforestry used external providers (Pallot 2001).
The current trend is to advocate privatization of local public services, primarily throughcontracting out, on the basis of a number of claimed efficiency advantages. In essence, propo-nents of contracting out allege that the use of competitive tendering improves the competitiveenvironment and leads to lower per unit operating costs for the delivery agent. Contractors facepositive incentives to be efficient and negative sanctions if they are not. Note that contractingout need not apply only to contracting out to the private sector. Indeed, it could equally applyto enterprises and governments that contract with each other and with nonprofit and voluntaryorganizations as well (Bish 1986).
Contracts are typically awarded on a competitive tendering system whereby the lowest bid-der is normally chosen. In addition, some jurisdictions have adopted a policy whereby regions,counties, or cities are subdivided and contracts are tendered for a number of subregions orareas for those services where economies of scale do not exist. The purpose of this is to encour-age smaller firms to bid on contracts and in some cases to permit municipal crews to competewith the private sector in securing a contract. Such action provides a stimulus for increasedcompetition, ultimately promoting cost savings and greater efficiency, as has occurred in someU.S. cities (Goldsmith 1997, 1998).
The most successful contracts tend to be those based on outputs that can be measured (solidwaste, recycling, and so on), primarily because monitoring the quality of the output is easier. Inaddition, writing contracts in terms of outputs rather than inputs leaves contractors free toorganize their operations to attain output goals or targets in the most efficient way possible(Bish 1986).
Many local government politicians and administrators who are not strong advocates of con-tracting out have argued that service quality is inevitably lower in the private sector. This con-cern has led to suggestions that a monitoring system be established to ensure that quality ismaintained at an acceptable level. However, public sector monitoring is unlikely to be any moreeffective or efficient than a policy of competitive tendering for service delivery on a relativelyfrequent basis, for example, annually, biennially, or every three years. Tendering can createincentives for a firm to maintain quality if it wants the contracting agency to consider renewingits contract at the time of rebidding.
Most of the empirical work on contracting out suggests that per unit operating costs arelower in privately run operations. While the bulk of these studies have been completed in theUnited States and Europe (Borcherding, Pommerehne, and Schneider 1982; Hike 1992), similarstudies have been conducted elsewhere. In New Zealand, for example, cost savings from con-tracting out reportedly range from 45 to 60 percent in the case of refuse collection in the city ofDunedin to 15 to 30 percent for other services in Dunedin and the city of Christchurch (Dou-glas 1994; Williamson 1994). A number of Canadian studies on a variety of services (solid wastecollection, recycling and garbage disposal, public transit operations, and electrical utility main-tenance) are also available that provide similar results (see table 8.2). Investigators haveobtained similar results in an examination of private sector involvement in three urban services(waste collection, water, and electricity supply) in developing countries (Batley 2001).
These studies conclude that most of the efficiency gains from contracting out have resultedfrom increased scope for competition rather than from the fact that a private contractor pro-vided the service (Bish 2001; Donahue 1989; Johnson 1988). In addition, the results suggest thatwhere economies of scale are not prevalent, the creation of delivery zones creates a more
Harry Kitchen 163
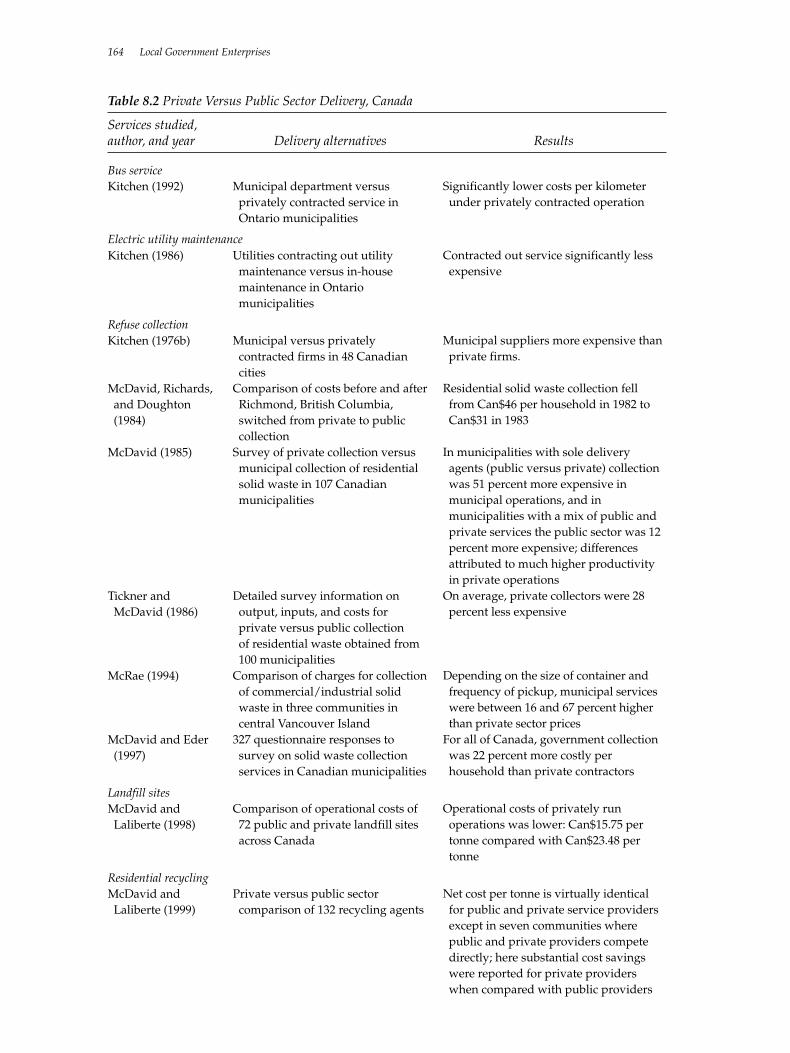
164 Local Government Enterprises
Table 8.2 Private Versus Public Sector Delivery, Canada
Services studied, author, and year Delivery alternatives Results
Bus service Kitchen (1992)
Kitchen (1986)
Refuse collectionKitchen (1976b)
McDavid, Richards,and Doughton(1984)
McDavid (1985)
Tickner andMcDavid (1986)
McRae (1994)
McDavid and Eder(1997)
Landfill sitesMcDavid andLaliberte (1998)
Residential recyclingMcDavid andLaliberte (1999)
Municipal department versusprivately contracted service inOntario municipalities
Utilities contracting out utilitymaintenance versus in-housemaintenance in Ontariomunicipalities
Municipal versus privatelycontracted firms in 48 Canadiancities
Comparison of costs before and afterRichmond, British Columbia,switched from private to publiccollection
Survey of private collection versusmunicipal collection of residentialsolid waste in 107 Canadianmunicipalities
Detailed survey information onoutput, inputs, and costs for private versus public collection of residential waste obtained from100 municipalities
Comparison of charges for collectionof commercial/industrial solidwaste in three communities incentral Vancouver Island
327 questionnaire responses tosurvey on solid waste collectionservices in Canadian municipalities
Comparison of operational costs of72 public and private landfill sitesacross Canada
Private versus public sectorcomparison of 132 recycling agents
Significantly lower costs per kilometerunder privately contracted operation
Contracted out service significantly lessexpensive
Municipal suppliers more expensive thanprivate firms.
Residential solid waste collection fellfrom Can$46 per household in 1982 toCan$31 in 1983
In municipalities with sole deliveryagents (public versus private) collectionwas 51 percent more expensive inmunicipal operations, and inmunicipalities with a mix of public andprivate services the public sector was 12percent more expensive; differencesattributed to much higher productivityin private operations
On average, private collectors were 28percent less expensive
Depending on the size of container andfrequency of pickup, municipal serviceswere between 16 and 67 percent higherthan private sector prices
For all of Canada, government collectionwas 22 percent more costly perhousehold than private contractors
Operational costs of privately runoperations was lower: Can$15.75 pertonne compared with Can$23.48 pertonne
Net cost per tonne is virtually identicalfor public and private service providersexcept in seven communities wherepublic and private providers competedirectly; here substantial cost savingswere reported for private providerswhen compared with public providers
Electric utility maintenance

competitive environment than exists when there is only a single delivery agent for an entiremunicipality (Bartone 2001). Introducing or increasing rivalry, however, may not be possiblewithout the existence of some private ownership. In other words, some degree of privatizationthrough contracting out may be a necessary, but insufficient, condition for substantial perform-ance improvements (Vickers and Yarrow 1991). For a recent and practical example of the impor-tance of competition see the discussion in box 8.3.
Although most of the studies have concentrated on contracting out individual services,some U.S. cities have experience with contracting out most of their service responsibilities.These cities have formed the Association of Contract Cities and are mainly concentrated in Cal-ifornia. This group has generated a highly competitive local service environment with a vastnetwork of producers and contract arrangements. Cities buy and sell to one another, and pri-vate firms compete actively among themselves and with government producers for contracts(Bish 1986, 1997). One empirical analysis of these contract cities indicated that they receivedservices at lower cost than the noncontract cities in Los Angeles County (Deacon 1979).
While many municipalities have apparently achieved cost reductions from increased com-petition, unions are generally opposed to contracting out (Canadian Union of Public Employ-ees 1985). In particular, they are concerned about their members losing jobs and the extent towhich contracting out would undermine the union, fragment the workforce, side-step provi-sions of collective agreements, and reduce labor costs with resultant profit-taking opportuni-ties for businesses (Cassidy 1994). In addition, cost savings and increased efficiencies noted inthe empirical studies have not been universally accepted by a few critics, because they allegethat some important cost items have been excluded. In particular, critics have argued thatcontracting out results in additional costs because of the time and money spent on drafting,
Harry Kitchen 165
Box 8.3 The Impact of Competition
Recent experience in pricing for garbage in Clinton, a small town in southwest Ontario, provides anexample of the importance of competition in affecting costs, and hence the price or tax paid. Nearly adecade ago, the town implemented a per bag charge for garbage collection. The initial impact, as inmost jurisdictions that have implemented “pay-as-you-throw” garbage collection, was that the num-ber of garbage bags households put out declined by roughly 50 percent, while the weight of theirgarbage fell by about 25 percent. Households reduced their garbage collection charges by packinggarbage bags fuller and tighter, but they also began recycling more of their bottles, cans, cardboard,plastic, and newspapers.
The initial charge for the pay-as-you-throw program was Can$2 per bag. Residents had to buystickers from the town hall and affix them to their garbage bags. Shortly after this started, an enter-prising resident figured he could make a profit by collecting town garbage for only Can$1 per bag aslong as he had access to the town’s landfill site on the same terms as everyone else. The town was notpleased with this challenge to its monopoly. It tried several ways to thwart this entrepreneurial effort,but to no avail. Finally the simple threat of market competition forced the town to lower its charges toonly Can$1 per bag, the same fee the private collection service charged.
In 2000 town officials realized that they had more important uses for some of their employees thancollecting garbage and announced that Clinton was terminating its garbage collection service, andthat residents would be obliged either to take their garbage to the landfill site themselves at a cost ofapproximately Can$15 per load or to hire a private contractor to collect their garbage. Within a fewweeks three different private collection services surfaced. One firm offered garbage tags for an intro-ductory price of only 80¢, another offered its tags for 90¢, and the existing private service promised todonate 5 percent of its revenues to the local hockey program. Prices for garbage collection services fellas each firm courted new customers. Furthermore, residents no longer had to go to the town hall tobuy garbage tags during town hall business hours. The competing collection services arranged forlocal convenience stores to be their outlets, and even offered to bring tags to the homes of residentswho could not get to the store. While this is a small-town story, it illustrates the importance of compe-tition in affecting the costs of providing a service and the price charged for it.
Source: Palmer (2001).
negotiating, and monitoring contracts (for a discussion of contract design and efficient moni-toring systems see David 1988); the contractees’ costs for training and overseeing contractors’employees to ensure productivity; and the costs incurred in laying off employees after theirservices have been contracted out (Sauter, Weisman, and Percy 1988).
FRANCHISING OUT. A franchise may exist when a private firm provides a service to residentswithin a specific geographic area and when the supplier is paid directly by the service recipi-ents. Franchises may be exclusive (one producer) or nonexclusive (many producers).
If an exclusive franchise provides the service, then prices will likely have to be regulated.Further regulations may be imposed to guarantee that the franchise adheres to quality stan-dards or performance measures and that all consumers within the specific area served by thefranchise have access to the service if they pay for it. For exclusive franchises that are largelycapital intensive, not tendered on a frequent basis, and not subject to competitive forces (suchas water and wastewater), adherence to performance standards along with carefully drawn upcontracts spelling out the terms and conditions of the agreement are essential. For services thatare not capital intensive, refuse collection, for example, frequent tendering for the right to pro-vide the service should help maintain the necessary competitive forces to ensure high-qualityand low-cost services.
For services provided by nonexclusive franchises, price regulation and monitoring activitiesare less likely to be necessary. The attractiveness of this organizational structure is mainly afunction of the number of firms involved, and hence the degree of competition created. Thelarger the number of firms, the greater the competitive environment and thus the greater theincentive for improved efficiency, lower costs, and good quality services.
A possible problem with franchise operations is that some users, such as low-income fami-lies, may discontinue the consumption of certain services if they view the price of the serviceas being too high. This has occurred, primarily in smaller communities, where solid waste col-lection has been privatized and franchised. Not only could this be unsanitary and imposeexternalities on those who pay, it could lead to lower-quality service and/or greater costs forexisting users if economies of scale disappear. Use of a franchise operation in place of con-tracting out may therefore be undesirable on efficiency grounds, especially for services wherenegative externalities might be created because individuals choose not to use the service.
Where franchises are considered, a franchise agreement between the local council and thesupplier is critical, because it is the core legal document by which both parties are bound andwhich can be enforced. This agreement should include the following:
• The terms of payment for a franchise fee• The principles and practices to follow in setting prices• The standards and performance measures that the franchise is to meet• A list and description of all financial and performance reports that the franchise is to
provide on a regular basis to the local council and the public• Procedures to follow in renegotiating standards and conditions in the agreement• The conditions for the return of any capital assets whose ownership is retained by the
local council at the end of the agreement period.
PUBLIC-PRIVATE PARTNERSHIPS. Relatively recent developments in the financing of municipalinfrastructure involve public-private partnerships, particularly for services with substantialcapital or infrastructure costs. Indeed, 85 percent of government respondents to a survey by theCanadian Council for Public-Private Partnerships noted that their governments were increas-ing their reliance on public-private partnerships (Martin 2001). Szalai (2001) notes similartrends in many other countries. This kind of partnership can take different forms, including pri-vate involvement in project initiation or planning, construction, operation, ownership, and
166 Local Government Enterprises
financing. These public-private partnerships are a form of contracting out and involve thedirect participation of one sector in a venture controlled by the other sector (for more informa-tion see Slack (1996). Both partners contribute funds or services in exchange for certain rightsor future income.
Public-private partnerships can take the following forms:
• Operate: the private sector operates the facility for a fee. The public sector retainsresponsibility for capital costs.
• Lease or purchase and operate: the private firm leases or purchases the facility from thepublic sector, operates the facility, and charges user fees.
• Lease or purchase, build, and operate: this option is similar to the previous one except thatthe private sector firm is required to build or develop a new facility or enlarge or reno-vate an existing facility and then operate it for a number of years.
• Build: this is a turnkey partnership in which the private sector is paid a fixed fee tobuild a facility according to government specifications and turns the facility over to thepublic sector when it has been completed.
• Build, operate, and transfer: the private sector develops and builds the required infrastruc-ture, operates the facility for some specified period of time, and then transfers it back tothe government.
• Build and operate: the private sector builds and operates the facility and is responsible forcapital financing. The public sector regulates and controls the operation.
• Build and transfer: the private sector builds the infrastructure and then transfers owner-ship to the public sector.
The way in which the risks of partnerships are shared will depend on their structure (for amore detailed discussed see Martin 2001; Tassonyi 1997). Public-private partnerships havethree main benefits. First, private sector capital may be viewed as a way of gaining new sourcesof capital, freeing up municipal resources, reducing current debt, and increasing debt capacity(De Luca 1997). The opportunity to gain new sources of capital is especially important wheremodernization of decrepit and crumbling infrastructure is necessary (Huang 2001). Reliance onprivate sector financing means that the private sector must incur all associated risks (see table8.3 for possible types of risks). The greater the risk, the greater the rate of return expected. Theprivate sector may also be concerned that the government could change the rules of the gamein midstream because of changes in regulation or in the political climate or that the public sec-tor may terminate contractual arrangements without having to compensate private sector par-ticipants.
Second, public-private partnerships enable the public sector to draw on the private sector’sexperience and skill to minimize costs. This may be more important to smaller municipalitiesthat may have greater difficulty in attracting the necessary expertise.
Third, private sector involvement tends to lead to more innovative and efficient operationsthan if the public sector provides the service on its own (Probyn 1997).
As with most options, private sector involvement also entails some disadvantages. First,there may be some uncertainty that the private sector will be able to carry its role through tocompletion. Second, the public sector faces a potential loss of control to the private sector.Third, there may be a trade-off of up-front capital costs for future operating costs, for example,this could happen if the private sector’s annual cost of financing a municipal project is greaterthan if the public sector financed it (De Luca 1997; Probyn 1997). Finally, private sector financ-ing may include government financial or credit backing, thereby continuing to impose a poten-tial burden on the public sector.
Experience with public-private partnerships in Canada suggests that most have producedcost savings for the public sector (table 8.4). Experience with public-private partnerships hasled to the identification of a number of issues. One issue relates to the respective roles of the
Harry Kitchen 167
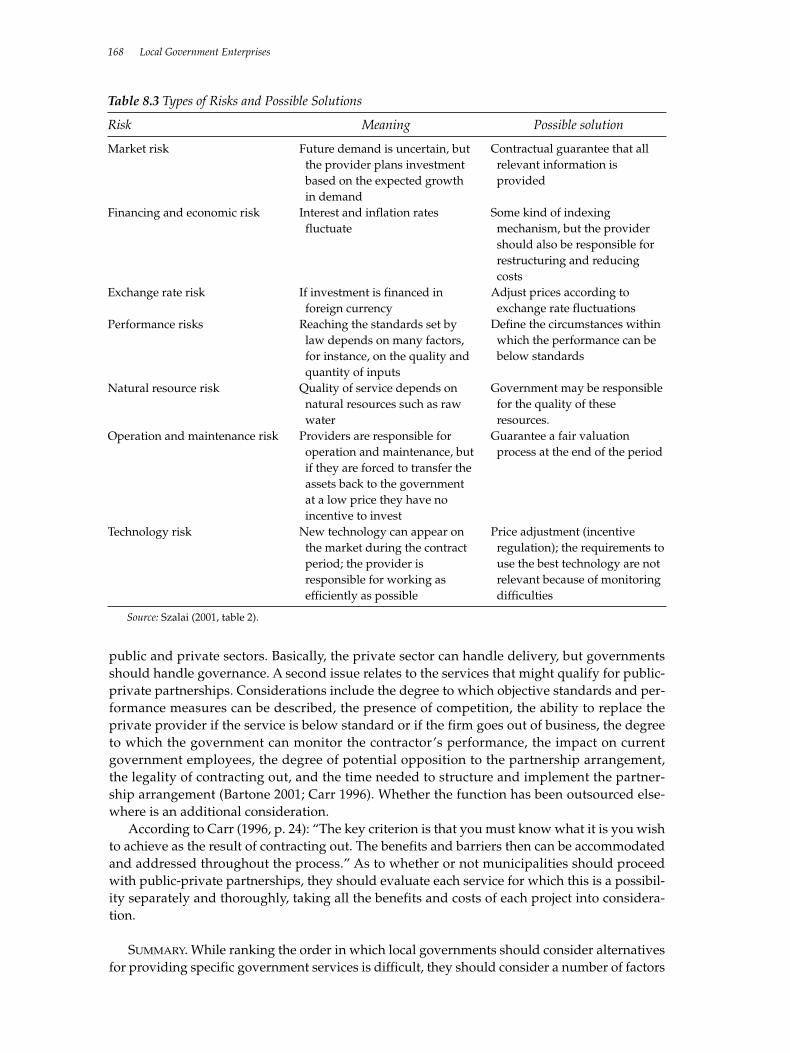
public and private sectors. Basically, the private sector can handle delivery, but governmentsshould handle governance. A second issue relates to the services that might qualify for public-private partnerships. Considerations include the degree to which objective standards and per-formance measures can be described, the presence of competition, the ability to replace theprivate provider if the service is below standard or if the firm goes out of business, the degreeto which the government can monitor the contractor’s performance, the impact on currentgovernment employees, the degree of potential opposition to the partnership arrangement,the legality of contracting out, and the time needed to structure and implement the partner-ship arrangement (Bartone 2001; Carr 1996). Whether the function has been outsourced else-where is an additional consideration.
According to Carr (1996, p. 24): “The key criterion is that you must know what it is you wishto achieve as the result of contracting out. The benefits and barriers then can be accommodatedand addressed throughout the process.” As to whether or not municipalities should proceedwith public-private partnerships, they should evaluate each service for which this is a possibil-ity separately and thoroughly, taking all the benefits and costs of each project into considera-tion.
SUMMARY. While ranking the order in which local governments should consider alternativesfor providing specific government services is difficult, they should consider a number of factors
168 Local Government Enterprises
Table 8.3 Types of Risks and Possible Solutions
Risk Meaning Possible solution
Source: Szalai (2001, table 2).
Market risk
Financing and economic risk
Exchange rate risk
Performance risks
Natural resource risk
Operation and maintenance risk
Technology risk
Future demand is uncertain, butthe provider plans investmentbased on the expected growthin demand
Interest and inflation ratesfluctuate
If investment is financed inforeign currency
Reaching the standards set bylaw depends on many factors,for instance, on the quality andquantity of inputs
Quality of service depends onnatural resources such as rawwater
Providers are responsible foroperation and maintenance, butif they are forced to transfer theassets back to the governmentat a low price they have noincentive to invest
New technology can appear onthe market during the contractperiod; the provider isresponsible for working asefficiently as possible
Contractual guarantee that allrelevant information isprovided
Some kind of indexingmechanism, but the providershould also be responsible forrestructuring and reducingcosts
Adjust prices according toexchange rate fluctuations
Define the circumstances withinwhich the performance can bebelow standards
Government may be responsiblefor the quality of theseresources.
Guarantee a fair valuationprocess at the end of the period
Price adjustment (incentiveregulation); the requirements touse the best technology are notrelevant because of monitoringdifficulties
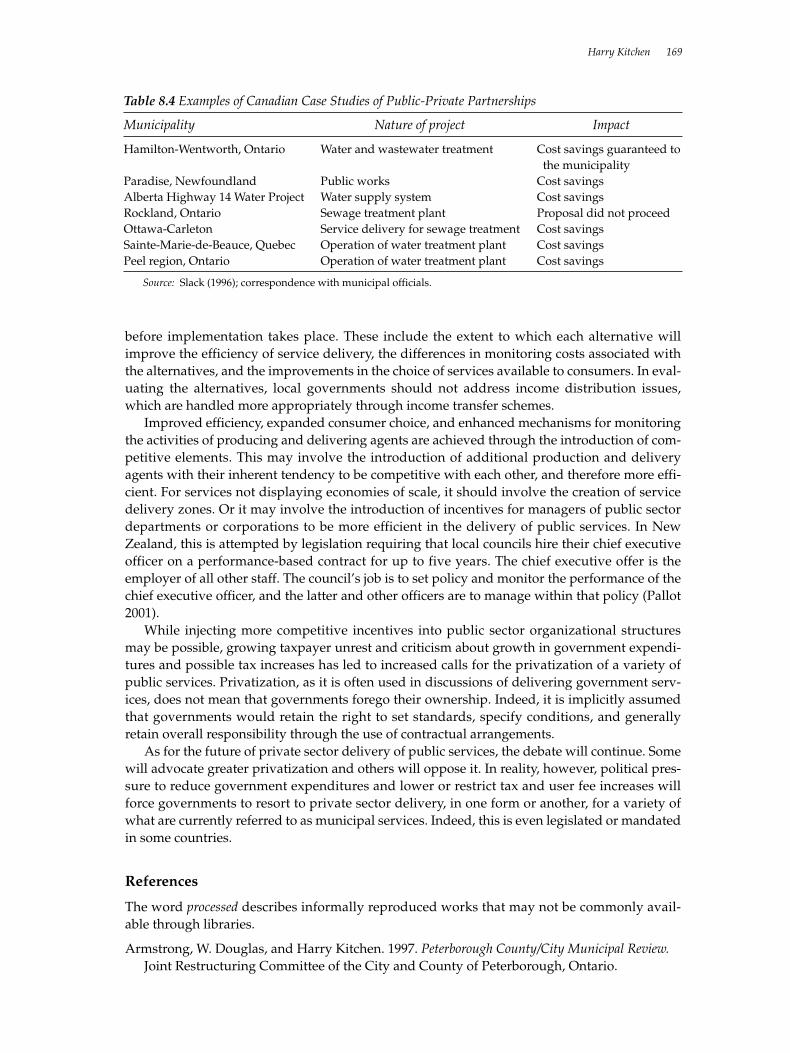
before implementation takes place. These include the extent to which each alternative willimprove the efficiency of service delivery, the differences in monitoring costs associated withthe alternatives, and the improvements in the choice of services available to consumers. In eval-uating the alternatives, local governments should not address income distribution issues,which are handled more appropriately through income transfer schemes.
Improved efficiency, expanded consumer choice, and enhanced mechanisms for monitoringthe activities of producing and delivering agents are achieved through the introduction of com-petitive elements. This may involve the introduction of additional production and deliveryagents with their inherent tendency to be competitive with each other, and therefore more effi-cient. For services not displaying economies of scale, it should involve the creation of servicedelivery zones. Or it may involve the introduction of incentives for managers of public sectordepartments or corporations to be more efficient in the delivery of public services. In NewZealand, this is attempted by legislation requiring that local councils hire their chief executiveofficer on a performance-based contract for up to five years. The chief executive offer is theemployer of all other staff. The council’s job is to set policy and monitor the performance of thechief executive officer, and the latter and other officers are to manage within that policy (Pallot2001).
While injecting more competitive incentives into public sector organizational structuresmay be possible, growing taxpayer unrest and criticism about growth in government expendi-tures and possible tax increases has led to increased calls for the privatization of a variety ofpublic services. Privatization, as it is often used in discussions of delivering government serv-ices, does not mean that governments forego their ownership. Indeed, it is implicitly assumedthat governments would retain the right to set standards, specify conditions, and generallyretain overall responsibility through the use of contractual arrangements.
As for the future of private sector delivery of public services, the debate will continue. Somewill advocate greater privatization and others will oppose it. In reality, however, political pres-sure to reduce government expenditures and lower or restrict tax and user fee increases willforce governments to resort to private sector delivery, in one form or another, for a variety ofwhat are currently referred to as municipal services. Indeed, this is even legislated or mandatedin some countries.
References
The word processed describes informally reproduced works that may not be commonly avail-able through libraries.
Armstrong, W. Douglas, and Harry Kitchen. 1997. Peterborough County/City Municipal Review.Joint Restructuring Committee of the City and County of Peterborough, Ontario.
Harry Kitchen 169
Table 8.4 Examples of Canadian Case Studies of Public-Private Partnerships
Municipality Nature of project Impact
Hamilton-Wentworth, Ontario Water and wastewater treatment Cost savings guaranteed to the municipality
Paradise, Newfoundland Public works Cost savingsAlberta Highway 14 Water Project Water supply system Cost savingsRockland, Ontario Sewage treatment plant Proposal did not proceedOttawa-Carleton Service delivery for sewage treatment Cost savingsSainte-Marie-de-Beauce, Quebec Operation of water treatment plant Cost savingsPeel region, Ontario Operation of water treatment plant Cost savings
Source: Slack (1996); correspondence with municipal officials.
Bahl, Roy, and Christine I. Wallich. 1995. “Intergovernmental Fiscal Relations in the RussianFederation.” In Richard M. Bird, Robert D. Ebel, and Christine I. Wallich, eds., Decentraliza-tion of the Socialist State. Washington, D.C.: World Bank.
Bartone, Carl R. 2001. “The Role of the Private Sector in Municipal Solid Waste Service Deliv-ery in Developing Countries: Keys to Success.” In Mila Freire and Richard Stren, eds., TheChallenge of Urban Government: Policies and Practices. Washington, D.C.: World Bank.
Batley, Richard. 2001. “Public-Private Partnerships for Urban Services.” In Mila Freire andRichard Stren, eds., The Challenge of Urban Government: Policies and Practices. Washington,D.C.: World Bank.
Bird, Richard M. 1976. Charging for Public Services: A New Look at an Old Idea. Toronto: CanadianTax Foundation.
_____. 1980. Central-Local Fiscal Relations and the Provision of Urban Public Services. Canberra:Australian National University, Centre for Research on Federal Financial Relations.
_____. 1984. Intergovernmental Finance in Colombia. Cambridge, Massachusetts: Harvard LawSchool, International Tax Program.
_____. 1993. “Threading the Fiscal Labyrinth: Some Issues in Fiscal Decentralization.” NationalTax Journal XLVI(2): 207–27.
_____. 1994. Decentralizing Infrastructure: For Good or Ill? Policy Research Working Paper no.1258. Washington, D.C.: World Bank.
_____. 1997. “Analysis of Earmarked Taxes.” Tax Notes International 14(25): 2096–2116.
_____. 2001. “User Charges in Local Government Finance.” In Mila Freire and Richard Stren,eds., The Challenge of Urban Government: Policies and Practices. Washington, D.C.: WorldBank.
Bird, Richard M., and Thomas Tsiopoulos. 1997. “User Charges for Public Services: Potentialand Problems.” Canadian Tax Journal 45(1): 35–37.
Bish, Robert L. 1986. “Improving Productivity in the Government Sector: The Role of Contract-ing Out.” In David Laidler, research coordinator, Responses to Economic Change. Studies ofthe Royal Commission on the Economic Union and Development Prospects for Canada,vol. 27, pp. 203–37. Toronto: University of Toronto Press.
_____. 1997. “California Contract Cities.” Policy Brief. Winnipeg, Manitoba: Frontier Centre forPublic Policy.
_____. 2001 “Local Government Amalgamations: Discredited 19th-Century Ideals Alive in the21st.” C. D. Howe Institute Commentary, no. 150. Toronto: C. D. Howe Institute.
Boadway, Robin. “Public Economics and the Theory of Public Policy.” 1997. Canadian Journal ofEconomics 30 (4):753–772.
Boadway, Robin, and Harry Kitchen. 1999. Canadian Tax Policy, 3rd ed. Toronto: Canadian TaxFoundation.
Borcherding, T. E., W. Pommerehne, and F. Schneider. 1982. “Comparing the Efficiency of Pri-vate and Public Provision: The Evidence from Five Countries.” Nationalokonomie, Journal ofEconomics 42(Supplement 2): 127–56.
Bossons, John, Harry Kitchen, and Enid Slack. 1993. “Local Government Finance: Principlesand Issues.” Ontario Fair Tax Commission, Toronto.
Canadian Union of Public Employees. 1985. “Contracting Out: It’s a Trend CUPE Must Con-tinue to Oppose.” Facts 7: 14–15.
170 Local Government Enterprises
Carr, Glenna. 1996. “Promoting Entrepreneurial Municipalities.” Background paper for theGreater Toronto Area Task Force. Toronto.
Cassidy, Gordon. 1994. Contracting Out. Discussion Paper no. 94-06. Kingston, Ontario:Queen’s University, School of Policy Studies.
David, T. 1988. Privatization in America. Washington, D.C.: International City ManagementAssociation.
Deacon, R. T. 1979. “The Expenditure Effects of Alternative Public Supply Institutions.” PublicChoice 34(3–4): 381–97.
De Luca, L,. ed. 1997. Labour and Social Dimensions of Privatization and Restructuring—PublicUtilities, Water, Gas, Electricity: Part II Europe. Geneva: International Labour Organization,Interdepartmental Action Program on Privatization, Restructuring, and Economic Democ-racy.
Department of Internal Affairs. 1994. Territorial Authority Service Delivery 1993–1994. Welling-ton, New Zealand.
Donahue, John. 1989. The Privatization Decision: Public Ends, Private Means. New York: BasicBooks.
Douglas, M. 1994. “New Zealand Paths to Competitive Tendering.” In Introducing CompetitiveTendering in Local Government in Australia. Melbourne: Royal Melbourne Institute of Tech-nology, Department of Management, Foundation for Local Government Education andDevelopment Fund.
Easter, K.W., G. Feder, G. Le Moigne, and A. Duda. 1993. Water Resources Management. PolicyPaper. Washington, D.C.: World Bank.
Gardner, G. 1997. Recycling Organic Waste. Paper no. 135. Washington, D.C.: Worldwatch Insti-tute.
Gilbert, M., and R. Pike. 1998. “Financing Local Government Debt in Canada: Pooled VersusStand-Alone Issues—An Empirical Study.” Canadian Public Administration 41(4): 529–52.
Goldsmith, Stephen. 1997. “Can Business Really Do Business with Government? The AnswerIs Yes, Just Ask the Mayor of Indianapolis.” Harvard Business Review (May–June): 110–21.
_____. 1998. “Smaller Government Prescriptions for Big City Problems.” Fraser Forum (Septem-ber): 6–15.
Government Accounting Standards Board. 2001. New Rules for Reporting Infrastructure Informa-tion Enacted for State and Local Governments. Available on:http://www.rutgers.edu/Accounting/raw/gasb/repmodel/infrastructure.html.
Hatry, Harry. 1999. Performance Measurement. Washington: D.C.: Urban Institute Press.
Hike, John. 1992. Competition in Government Financed Services. Westport, Conn.: Quorum Books.
Holder, William W. 1996. “Financial Accounting, Reporting, and Auditing.” In J. RichardAronson and Eli Schwartz, eds., Management Policies in Local Government Finance, 4th ed.Washington, D.C.: International City Management Association.
Huang, Mel. 2001. “From Monopolies to Markets: Privatizing Public Utilities in the BalticStates.” Local Government Brief: Quarterly Journal of Local Government and Public ServiceReform Initiative (Budapest) (Fall): 1–3, 6–12.
International City/County Management Association. 2000. GASB: What It Means for You. Ser-vice Report 332(12). Washington, D.C.
Harry Kitchen 171
International Monetary Fund. 2001. Code of Good Practices on Fiscal Transparency. Washington,D.C.
Johnson, Christopher, ed. 1988. Privatization and Ownership. London: Lloyds Bank Review.
Johnson, L. E., and D. R. Bean. 1999. “GASB Statement No. 34: The Dawn of a New Govern-mental Financial Reporting Model.” CPA Journal 69(12): 14–24.
Kitchen, Harry. 1975. “Some Organizational Implications of Providing an Urban Service: TheCase of Water.” Canadian Public Administration (Summer): 18(2): 297–308.
_____. 1976a. “A Statistical Estimation of an Operating Cost Function for Municipal Water Pro-vision.” Journal of Urban Analysis (January): 5(1): 56–76.
_____. 1976b. “A Statistical Estimation of an Operating Cost Function for Municipal RefuseCollection.” Public Finance Quarterly (January): 4(1): 56–76.
_____. 1986 Local Government Enterprise in Canada. Discussion Paper no. 300. Ottawa: EconomicCouncil of Canada.
_____. 1989. Report and Recommendations: A Review of Regional Government in Niagara. Toronto:Queen’s Printer for Ontario.
_____. 1992. “Urban Transit Provision in Ontario: A Public/Private Sector Cost Comparison.”Public Finance Quarterly 20(1): 114–28.
_____. 1993. Efficiency Delivery of Local Government Services. Discussion Paper no. 93-15.Kingston, Ontario: Queens University, School of Policy Studies.
_____. 1997. “Pricing of Local Government Services.” In Paul A. R. Hobson and France St-Hilaire, eds., Urban Governance and Finance: A Question of Who Does What. Montreal: Insti-tute for Research on Public Policy.
_____. 2000a. “Municipal Finance in a New Fiscal Environment.” C. D. Howe Institute Commen-tary, no. 147. Toronto: C. D. Howe Institute.
_____. 2000b. “Provinces and Municipalities, Universities, Schools, and Hospitals: RecentTrends and Funding Issues.” In Harvey Lazar, ed., Canada: The State of the Federation1999/2000. Kingston, Ontario: Queen’s University, Institute of Intergovernmental Affairs.
_____. 2002. Municipal Revenue and Expenditure Issues in Canada. Toronto: Canadian Tax Foun-dation.
Knapton, David. 1993. “Police Commissions: Do They Crowd Out Other Municipal Expendi-tures?” Honors economics essay, Trent University, Economics Department, Peterborough,Ontario.
Kolderie, T. 1986. “Two Different Concepts of Privatization.” Public Administration Review46(2): 285–91.
Kurlyandskaya, Galina, Yelena Nikolayenko, and Natalia Golovanova. 2001. “Local Govern-ments in the Russian Federation.” Open Society Institute, Local Government and PublicService Reform Initiative, Budapest.
Martin, Stephen. 2001. “Public-Private Partnerships: An Effective Tool for Providing BestValue.” Paper presented at the Insight Information conference on Managing the New Reali-ties of Municipal Amalgamation, February 13–14, Toronto.
Martinez-Vazquez, Jorge. 1994. “Budgeting in the Russian Federation.” World Bank, Europeand Central Asia Department, Washington, D.C. Draft.
Martinez-Vazquez, Jorge, and Jameson Boex. 2001. Russia’s Transition to a New Federalism.Washington, D.C.: World Bank.
172 Local Government Enterprises
McDavid, James. 1985. “The Canadian Experience With Privatizing Residential Solid WasteCollection Services.” Public Administration Review: 45(4): 602–08.
McDavid, James, and K. Anthony Eder. 1997. The Efficiency of Residential Solid Waste CollectionServices in Canada: The National Survey Report. Victoria, British Columbia: University of Vic-toria, School of Public Administration, Local Government Institute.
McDavid, James, and Verna Laliberte 1998. The Efficiency of Canadian Solid Waste Landfills:National Survey Report. Victoria, British Columbia: University of Victoria, School of PublicAdministration, Local Government Institute.
_____. 1999. The Efficiency of Residential Recycling Services in Canadian Local Governments:National Survey Report. Victoria, British Columbia: University of Victoria, School of PublicAdministration, Local Government Institute.
McDavid, James, P. L. Richards, and B. E. Doughton. 1984. “Privatization of Residential SolidWaste Collection in Richmond, British Columbia.” University of Victoria, School of PublicAdministration, Victoria, British Columbia. Processed.
McRae, James J. 1994. Efficient Production of Solid Waste Services by Municipal Governments. Dis-cussion Paper no. 94-11. Kingston, Ontario: Queen’s University, School of Policy Studies.
Ministry of Municipal Affairs and Housing. 2001. Municipal Performance Measurement Program.Ontario: Government of Ontario.
Munasinghe, M. 1992. Water Supply and Environmental Management: Developing World Applica-tions. Studies in Water Policy and Management. Boulder, Colorado: Westview Press.
Municipality of Metropolitan Toronto. 1988. “First Report of the Subcommittee on Special Pur-pose Bodies.” Toronto, Ontario. Processed.
Osborne, David, and Ted Gaebler. 1992. Reinventing Government: How the Entrepreneurial SpiritIs Transferring the Public Sector. Reading, Massachusetts: Addison Wesley.
Ostrom, E., L. Schroeder, and S. Wynne. 1993. Institutional Incentives and Sustainable Develop-ment: Infrastructure Policies in Perspective. Bolder, Colorado: Westview.
Pallot, June. 2001. “Local Government Reform in New Zealand: Options for Public Manage-ment as Governance.” Available on http://www.willamette.org/ipmn/test/papers/pallot.htm.
Palmer, John. 2001. “Clinton Garbage: Pay as You Throw.” University of Western Ontario, Lon-don, Ontario. Processed.
Patton, T. K., and P. S. Wardlow. 1999. “Why Infrastructure Reporting?” GASB Action Report,vol. 16, no. 5. Available on:http://www.rutgers.edu/Accounting/raw/gasb/repmodel/viewpoints.html.
Peterson, J. E. 2001. Subnational Debt, Borrowing Process, and Creditworthiness. Washington, D.C.:World Bank Institute.
Postel, S. 1993. “Facing Water Scarcity.” In L. Brown, ed., The State of the World. New York: W.W. Norton.
Probyn, S. 1997. “Public-Private Partnerships on the Way to Nowhere.” Financial Post, April 16,p. B-5.
Renzetti, Steven. 1999. “Municipal Water Supply and Sewage Treatment: Costs, Prices, andDistortions.” Canadian Journal of Economics 32(3): 688–704.
Renzetti, Steven, and Joseph Kushner. 2001. “The Underpricing of Water Supply and SewageTreatment.” Brock University, Economics Department, St. Catharine’s, Ontario. Processed.
Harry Kitchen 173
Sancton, Andrew, and Teresa Janik. 2001. “Provincial-Local Relations and Drinking Water inOntario.” Issue paper commissioned by the Walkerton Inquiry.
Sauter, R. W., R. D. Weisman, and R. W. Percy. 1988. “Union View: Subcontracting the Work ofUnion Members in the Public Sector.” Labor Law Journal 39(8): 487–96.
Savas, E. S. 1987. Privatization: The Key to Better Government. Chatham, New Jersey: ChathamHouse.
Slack, Enid. 1996. Financing Infrastructure: Evaluation of Existing Research and Information Gaps.Ottawa: Central Mortgage and Housing Corporation.
Solano, Paul L., and Marvin A. Brams. 1996. “Budgeting.” In J. Richard Aronson and EliSchwartz, eds., Management Policies in Local Government Finance, 4th ed. Washington, D.C.:International City Management Association.
Stenning, Philip, and Tammy Landau. 1988. The Niagara Regional Board of Commissioners ofPolice: Its Role and Accountability. Background study. Niagara Region Review Commission,Niagara Falls, Ontario.
Strategic Alternatives Inc., Michael Fortin, Enid Slack, Mike Loudon, and Harry Kitchen. 2001.“Financing Water Infrastructure.” Issue Paper no. 14. Commissioned by the WalkertonInquiry, Toronto.
Szalai, Akos. 2001. “New Models of Privatizing Public Utilities: Highlights of Reform in Post-Soviet Countries.” Local Government Brief: Quarterly Journal of Local Government and PublicService Reform Initiative (Budapest) (Fall): 18–24.
Tassonyi, Almos. 1997. “Financing Infrastructure in Canada’s City-Regions” In Paul A. R. Hob-son and France St-Hilaire, eds., Urban Governance and Finance: A Question of Who Does What.Montreal: Institute for Research on Public Policy.
Tassonyi, Almos, and Wade Locke. 1994. “Shared Tax Bases and Local Public ExpenditureDecisions.” Canadian Tax Journal 41(5): 941–57.
Tickner, Glen, and James McDavid. 1986. “Effects of Scale and Market Structure on the Costsof Residential Solid Waste Collection in Canadian Cities. Public Finance Quarterly 14(4):371–93.
Tindal, C. R., and S. Nobes Tindal. 1988. Local Government in Canada. Toronto: McGraw-HillRyerson.
Vickers, John, and George Yarrow. 1991. “Economic Perspectives on Privatization.” Journal ofEconomic Perspectives 5(2): 111–32.
Wallich, Christine I. 1994a. “Intergovernmental Fiscal Relations: Setting the Stage” In ChristineI. Wallich, ed., Russia and the Challenge of Fiscal Federalism. Washington, D.C.: World Bank.
_____. 1994b. “Russia’s Dilemma.” In Christine Wallich, ed., Russia and the Challenge of FiscalFederalism. Washington, D.C.: World Bank.
Williamson, J. 1994. “The Christchurch Case Study on Competitive Tendering.” In IntroducingCompetitive Tendering in Local Government in Australia. Melbourne: Royal Melbourne Insti-tute of Technology, Department of Management, Foundation for Local Government Educa-tion and Development Fund.
World Bank. 1994. World Development Report 1994: Infrastructure for Development. New York:Oxford University Press.
Wunsch, J. S. 1991. “Institutional Analysis and Decentralization: Developing an AnalyticalFramework for Effective Third World Administration Reform.” Public Administration andDevelopment 11(5): 431–52.
174 Local Government Enterprises

Part IIIRevenues


9Local and Regional Revenues: Realities and Prospects
Richard M. Bird
The traditional theory of fiscal federalism prescribes a limited tax base for subnational govern-ments. According to the theory, the only good local taxes are those that are easy to administerlocally, are imposed solely (or mainly) on local residents, and do not raise problems of harmo-nization or competition between subnational—local or regional—governments or between sub-national and national governments. (For the classic tax assignment arguments see Musgrave1983 and for a recent restatement see McLure 1999.) The only major revenue source that usuallypasses these stringent tests is the property tax, with perhaps a secondary role for taxes on vehi-cles and user charges and fees. As central governments are in any case generally reluctant toprovide subnational governments with access to more lucrative sales or income taxes, that tra-ditional theory has become conventional wisdom is not surprising. Almost everywhere, centralgovernments and experts alike therefore urge subnational governments to make more use ofproperty taxes and user charges and criticize them when they do not do so enthusiastically.
Up to a point, this view has much to recommend it. Unfortunately, that point falls short ofthe task facing subnational governments in many countries for a number of reasons. First, theconventional case for user charges and property taxes is somewhat flawed. Property taxes, forexample, are often costly and difficult to administer well, and such problems are greatly exac-erbated as the tax burden increases. Moreover, political realities mean that increases in prop-erty taxes are often concentrated primarily on those nonresidential properties that most readilypermit tax exporting, that is, the shifting of taxes to nonresidents, thereby undercutting one ofthe principal arguments for local use of property taxes in the first place.
Second, even a well-administered local property tax cannot finance major social expendi-tures (education, health, social assistance) except perhaps to a limited extent in the richest, andusually largest, communities (user charges should be used only with caution in such socialareas; see Bird 1976). Because, to the extent possible, governments should finance the servicesthey provide from their own revenues, either local governments that depend on property taxesare essentially confined to providing local services (street cleaning, refuse removal, and thelike), or they are inevitably heavily dependent on transfers from higher levels of government.This pattern persists even in the industrial countries.1
Third, the conventional argument does not take adequately into account the existence inmany countries of important regional or intermediate levels of government, especially thesegovernments’ often major role in financing social expenditures. Local governments may to aconsiderable extent be able to finance purely local services through property taxes and user fees
177
This is a substantially revised and updated version of a paper originally prepared for the 1999 AnnualWorld Bank Conference on Development in Latin America and the Caribbean and subsequently publishedin Burki and Perry (2000).
1. Relatively few industrial countries have significant local property taxes. In most countries of theOrganisation for Economic Co-operation and Development, to the extent that local governments are notdependent on national transfers, they either impose significant direct taxes on business or levy surchargeson national income taxes (Bird and Slack 1991). Bahl (2002) shows that property taxes are even less impor-tant in developing and transition countries.
on residents. Regional governments responsible for social services, however, cannot rely solelyon this narrow base for financial support. The conventional approach to tax assignment has tra-ditionally held that the best additional source of finance for regional governments is retail salestaxes. Such taxes are usually assumed to fall mainly on residents, a desirable feature of a sub-national tax. In reality, most retail sales taxes, even in industrial countries, fall to a considerableextent on business inputs. For example, one Canadian study found that between a third and ahalf of the retail sales tax base in different provinces consisted of such inputs (Kuo, McGirr, andPoddar 1988).2 Moreover, as Canada and the United States have long demonstrated, retail salestaxes can be administered at the regional level, at least in industrial countries, although thiscannot simply be carried over to developing countries, which have universally found thatadministering such taxes is impossible, even at the national level.
Given the recent moves toward decentralization in many countries (Litvack, Ahmad, andBird 1998) and the frequently expressed concerns about the resulting strain on intergovernmen-tal fiscal relations and the possibility of irresponsible behavior by subnational governmentsexpressed by authors such as Tanzi (1996), some rethinking of the appropriate revenue struc-ture for regional and local governments seems to be needed.
Both theory and international experience suggest that governments are more likely to spendresponsibly the more they are responsible for raising the revenues they spend. While intergov-ernmental transfers will obviously always have an important role, especially in countries withwide regional economic disparities, in principle, there seems to be no reason why at least thewealthier regions, for example, large urban areas, should not be able to raise and spend most oftheir budgets themselves. Thus there are good reasons to strengthen subnational tax regimes.The balance of this chapter reviews the various sources usually considered for this purpose.
An important implication of strengthening subnational own revenues should first be noted,however. The resources accruing to different states or provinces will obviously differ greatlydepending on their access to the tax base in question. While in principle, transfer systems canbe adjusted as desired to prevent unduly penalizing poor regions, the extent to which suchadjustments will actually be made is always country specific—compare, for example, the casesof Canada versus the United States and Germany versus Switzerland (Bird 1986)—and theincentive effects of transfer design need to be considered with care (Bird and Smart 2002).
Multitiered governments work best when taxes and the benefits of public spending are asclosely related as possible, that is, when citizen-voter-consumers residing in a particular politi-cal jurisdiction both pay for what they get from the public sector and get what they pay for, orin other words, when they benefit from the expenditures financed by the taxes they pay. Obvi-ously when citizens reside in several overlapping jurisdictions (local, regional, national), thisso-called principle of fiscal equivalence (Olson 1969) suggests that they should pay taxes toeach level corresponding to the benefits they receive from each jurisdiction.
In this framework, the only rationale for intergovernmental transfers is to restore this equiv-alence, for example, by providing a compensatory payment when some benefits flow from onejurisdiction to another or when some taxes levied by one jurisdiction are actually paid by peo-ple residing in another jurisdiction. Such transfers would, of course, be horizontal, betweenregions or municipalities, and not between levels of government. In addition, however, consid-erations of administrative efficiency and feasibility may require that higher or lower levels ofgovernment impose certain taxes or make certain expenditures, even when doing so is notappropriate on equivalence grounds. The vertical intergovernmental fiscal transfers found inmost countries are motivated largely by this consideration. However, if, as suggested here,more adequate subnational taxes are made available, this fiscal gap (Boadway and Hobson1993) argument for transfers disappears with respect to richer jurisdictions, because the richer
178 Local and Regional Revenues: Realities and Prospects
2. The situation in the United States appears to be broadly similar (Ring 1999).
units of government at subnational levels should be essentially self-sufficient. Any grants fromhigher levels of government that are made to the poorer subnational units for reasons ofregional equalization should be clearly inframarginal, so that, as McLure (1999) notes, all sub-national governments, rich and poor alike, will face the full marginal tax price of the spendingdecisions for which they are responsible. Only in this way can the hard budget constraint criti-cal to good intergovernmental fiscal and financial policy be achieved (see Bird 2001 for moredetail and Rodden, Eskeland, and Litvack 2003 for a useful recent review of experience withhard budget constraints in a variety of countries).
Therefore good subnational taxes should, in principle, satisfy two main criteria. First, theyshould provide sufficient revenue for the richest subnational units to be essentially fiscallyautonomous. Of course this objective does not preclude intergovernmental fiscal transfers notonly to achieve the usual spillover objectives, but also, in some circumstances, to ensure theadequate provision of certain services to national standards (for a suggested design for such asystem in Colombia, for instance, see Bird and Fiszbein 1998). Second, good subnational taxesshould clearly impose fiscal responsibility at the margin on subnational governments. The sim-plest and probably best way to achieve this goal is by allowing those governments to establishtheir own tax rates with respect to at least some major taxes.
The most immediate issue facing many large countries is undoubtedly the need to developa satisfactory revenue base for regional governments, that is, one for which those governmentsare politically responsible. One possibility is to permit regional surcharges on personal incometaxes. Another potentially promising approach may be to establish subnational value addedtaxes (VATs). Such taxes work well in Canada (Bird and Gendron 1998), and implementingthem in some circumstances may be feasible even in countries with less well-developed taxadministrations.
The following sections review the major tax sources experts usually suggest for local andregional governments in developing countries, more or less in order of preference.
User Charges
Perhaps the most obvious, and in many ways the most sensible, recommendation with respectto revenue at any level of government is that governments should employ appropriate usercharges whenever possible. From an economic point of view local, and to some extent regional,governments may be viewed as firms delivering packages of local public services to residents.As with any economic activity, people should want what they deliver enough to be willing topay for it. From this perspective, the first rule of subnational finance should therefore be: wher-ever possible, charge. While officials are likely to view user charges solely as a potential addi-tional source of revenue, their main economic value derives from ensuring that citizens valuewhat the public sector supplies, at least at its marginal cost. In addition, user charges promoteeconomic efficiency by providing demand information to public sector suppliers. This effi-ciency objective is particularly important at the subnational level, because the main economicrationale for subnational government in the first place is to improve efficiency. Whenever pos-sible, local governments should charge for local public services properly rather than givingthem away.
Most countries have at least the following three types of user charges:
• Service fees. These include such items as license fees (marriage, business, dog, vehicle,and so on) and various small charges local governments levy for performing specificservices—registering this or providing a copy of that—for identifiable individuals orbusinesses. In effect, such fees constitute cost reimbursement from the private to thepublic sector. Charging people for something they are required by law to do may notalways be sensible, however, for example, if the benefit of registration is general and the
Richard M. Bird 179
cost is specific, but on the whole there is seldom much harm, or much revenue, inrecovering the cost of providing the service in question. Note, however, that imposingunnecessary regulatory requirements, whether accompanied by a fee or not, may resultin considerable harm, both by imposing additional obstacles to and costs on new busi-ness activities and by providing more opportunities for corrupt practices.
• Public prices. These consist of the revenues local governments receive from the sale ofprivate goods and services other than from service fees. All sales of locally-providedservices to identifiable private agents—from public utility charges, to admissioncharges, to recreation facilities—fall under this general heading. In principle, local gov-ernments should set such prices at the competitive private level, with no tax or subsidyelement included, unless doing so is the most efficient way of achieving public policygoals. The best approach is to account for the tax subsidy element separately.
• Specific benefit taxes. Such revenues are distinct from service fees and public pricesbecause they do not arise from the provision or sale of a specific good or service to anidentifiable private agent. Unlike prices that those who obtain services voluntarily pay,but like fees that people must pay for services that are legally required, taxes are com-pulsory. Nonetheless, specific benefit taxes are, at least in theory, related in some way tobenefits that specific taxpayers receive, in contrast to such general benefit taxes as fueltaxes levied on road users as a class or local general business or property taxes viewedas a price paid for local collective goods. Examples of specific benefit taxes aboundunder many different names: special assessments, land value increment taxes, improve-ment taxes, front footage levies, supplementary property taxes related to the provisionof sewers or street lighting, development exactions and charges, delineation levies, andso on. Most such charges are imposed either on the assessed value of real property oron some characteristic of that property such as its area, its frontage, or its location.
The importance of user charges is greater in principle than the relatively small amounts ofmoney that most countries collect from this source. The appropriate policy in setting usercharges is simply to charge the correct price. Only then will local governments provide the cor-rect amounts and types of service to the right people, that is, those willing to pay for them. Suchuser charges should be levied wherever feasible to ensure that scarce public resources are usedas efficiently as possible. Critics often suggest that equity considerations mitigate against usercharges. Although in principle the incidence of user charges is no more relevant than the ulti-mate incidence of the price of something someone obtains from the private sector, a number ofstudies in different countries suggest that in many instances the distributive consequences ofcharging for local public services may even be progressive (Bird and Miller 1989). The rich, forexample, use more water—for washing cars, watering lawns, filling swimming pools, and soon—than the poor. In any case, attempting to rectify fundamental distribution problems byinefficiently pricing scarce local resources is almost always a bad idea that results in little, if any,improvement in equity and a high price in efficiency terms.
Most countries make much less use of charging at the local level than seems to be desirable,and many of the charges they do levy are poorly designed from an efficiency point of view. Theprovince of San Juan, Argentina, for example, levies a wide range of charges for an enormousnumber of specific services rendered by the judiciary, the registry of commerce, the registry ofreal property, the inspection of juridical persons, the civil registry, the mining department, thetransport directorate, the bus station, the local transport enterprises, the police, the irrigationdepartment, the general administration, and even the tax department. Many of these chargesprobably cost more to administer than they yield and are little more than nuisance levies thatimpede normal transactions, while none of the rates imposed appear to be based on anyrational principle.
Thus even though the rational use of user charges in subnational finance has a number ofadvantages, finding much rationality in the systems in use in most jurisdictions is hard.
180 Local and Regional Revenues: Realities and Prospects
Probably 90 percent of the levies now existing in San Juan, and in all likelihood in manyother subnational governments throughout the world, could be abolished with little loss inrevenue and some gain in efficiency. The remaining 10 percent probably need to be revisedto accord with appropriate charging policy.
In most countries user charges are seldom employed to the extent that is both possible anddesirable, and those charges that do exist are seldom well designed, and consequently rarelyproduce any significant economic benefits. Even in the industrial countries, designing andimplementing good user charges is often surprisingly difficult, and as a rule even good chargesare not popular with either administrators or citizens (for further discussion of the theory andpractice of user charges, with extensive examples from Canada, see Bird and Tsiopoulos 1997).In short, user charges are a good idea in principle, but one that appears to be surprisingly diffi-cult to implement well in practice. Such charges therefore seem unlikely to provide anythingclose to adequate finance for subnational activities in any country.
Property Taxes
As already mentioned, for decades, local governments have been told that the only appropriategeneral tax source for them is the real property tax. A property tax is indeed an excellent localtax.3 Unfortunately, such advice is often not helpful in the circumstances of many countries.Land and buildings cannot easily run away and hide from tax officials, but nonetheless, astandard, market value property tax can be sometimes difficult and costly to administer well.Valuation is an art, not a science, and the determination of the tax base offers much room fordiscretion and argument. Moreover, even though the assessment and collection of propertytaxes can and should be improved in most developing and transition countries, administeringthis tax equitably is difficult in a rapidly changing environment, and increasing revenues fromthis source very much or quickly is always hard.4
Despite such problems, however, a low-rate, uniform property tax almost always has animportant role to play in financing local governments in most countries, especially in ruralareas, in which land is often the only possible tax base (see Bird 1974). Moreover, other land-based subnational taxes, for example, betterment levies, and even transfer taxes, are both feasi-ble and, within limits, desirable in certain circumstances (for further discussion of such leviessee Bird and Slack 2002). In general, however, subnational governments in most countries willdo well if they can finance “hard” (property-related) services, such as local roads and refuseremoval and disposal out of property taxes. If such governments are expected to play any sig-nificant role in financing “soft” services (education, health), as a rule they will need to haveaccess to more elastic revenue sources.
The current state of land and property taxes in most countries leaves much to be desired,and countries usually can and should collect more local revenue from this source. InArgentina, for example, a few years ago regulations imposed maximum property tax rates,differentiated by rural and urban locations, and further decreed that the tax base could in nocase exceed 80 percent of market value. The maximum nominal rates that can be establishedare little more than 1 percent of market value. The nominal property tax rates currently in forcein most of Argentina are well below these limits, and the effective rates are even lower giventhe high degree of undervaluation of even those properties recorded on the rolls (see, for
Richard M. Bird 181
3. One important economic argument for local property taxation is as a sort of generalized usercharge financing activities that benefit local residents. See Netzer (1973) and Vickrey (1963) for the classicarguments for the property tax as a user charge. For a modern view see Fischel (2001).
4. As with the other condensed reviews of alternative subnational revenue sources in this chapter,such statements may appear to be unsupported assertions. For the most part, however, they are groundedin decades of experience and dozens of specific examples; see, for example, Bird and Slack (2002) and thereferences cited therein.
example, the data on undervaluation in the cities of Santa Fé, Mendoza, and Buenos Airesreported in World Bank 1996). Moreover, the structure of the tax is, as a rule, too complicated,economically perverse, and basically unenforceable. In the province of San Juan, for instance,urban properties are taxed at nominal rates from 0.55 to 0.75 percent depending on their fiscalvalue, rural properties are subject to a similar scale ranging from 0.9 to 1.3 percent, and vacantland is allegedly taxed at 3 percent. Every aspect of this tax is both structurally wrong andunduly complicates administration. Progressive rates make no sense (Bird 1974), nor does dif-ferentiating between different classes of property or penalizing vacant land through high taxrates (Bird and Slack 2002).
Countries can and should do much to strengthen such deficient property taxes. Ideally thetax should be simplified and applied uniformly. Cadastral maps should be updated; valuationsshould be made more consistently and at regular intervals; and better use should be made offlows of information from property registries, local building license authorities, public utilities,and the like. As Dillinger (1991) argues, from a revenue perspective, in upgrading propertytaxes most attention should be paid to improving collection and enforcement rather than thetechnically more costly (and less immediately productive in terms of revenue) mapping andsurveying of the traditional cadastral approach.
Property taxes are not easy to administer well, however, especially in countries where infla-tion is endemic, and they are never politically popular, perhaps because of their visibility aswell as a certain inherent arbitrariness in the process of assigning values to individual proper-ties. Even in the most sophisticated countries, local property taxes can seldom yield enough tofinance local services. No industrial country that depends significantly on property taxes forlocal fiscal resources has a local government sector that accounts for more than 10 percent oftotal public spending (Bird and Slack 1991). Despite substantial efforts in some countries andconsiderable foreign assistance, property taxes seldom account for more than 20 percent of localcurrent revenues—or less than 1 percent of total public spending—in developing countries(Bird 1995).
In short, even though the property tax is a useful, even a necessary, source of local revenue,in most countries it cannot easily provide sufficient resources to finance a significant expansionof local public services. Indeed, many countries have often been hard-pressed to maintain eventhe currently low relative importance of property tax revenues in the face of varying price lev-els and political difficulties.
One reason for widespread resistance to the property tax is simply its visibility. Taxpayersusually have to pay it directly in periodic lump-sum payments. Taxpayers who pay taxesdirectly to the government tend to be more aware of the size of their tax bills than those whosetake-home pay is reduced by weekly or monthly tax deductions or those who pay smallamounts of tax on each purchase. The need to make such large periodic payments may increasegovernments’ accountability and responsibility, but it also greatly increases taxpayers’ sensitiv-ity to even nominal increases in taxes.
The inelasticity of the property tax has a similar effect. As the base of this tax does notincrease automatically over time, the periodic nominal increases in property tax bills needed tomaintain real revenues when price levels rise require increased tax rates. In terms of politicalaccountability, the need to confront people with the cost of government represents a virtue ofthe property tax; however, the downside, at least from the government’s point of view, is theheightened visibility of nominal tax increases and the accompanying political resistance.
Finally, property taxes finance such services as roads and garbage collection. The quantityand quality of these services (or their absence) is thus readily linked to the property tax. Whenpotholes develop in their street, taxpayers are understandably quick to question the taxes thatsupposedly finance street repair. Again, the very features that make the property tax a goodsource of local government revenue in principle make it especially vulnerable to political resist-ance in practice.
182 Local and Regional Revenues: Realities and Prospects
Other problems result from property tax administration. As a rule, property is supposed tobe assessed on the basis of its market value, usually defined as the price struck between a will-ing buyer and a willing seller in an arm’s-length transaction. Substantial technical efforts aretherefore needed before much revenue can be expected from property taxes. Even in countrieswith well-developed property tax systems, discrepancies arise between assessed values andmarket values within classes of property, between classes of property, and across municipali-ties for both political and technical reasons (Bird and Slack 1993). As taxpayers can easilycompare their property taxes with those of similar properties in their neighborhoods, such dis-crepancies lead both to specific assessment appeals and to general pressure for tax relief.
For such reasons, experience around the world suggests that the political costs of relying onproperty taxes are so high that no government with access to “cheaper” sources of finance willwillingly increase property taxes. That academics tend to be fonder of recommending increaseduse of the property tax than politicians are of actually doing so is thus not surprising.
If property taxes are to become a relatively more attractive source of local finance, and iflocal decisionmakers are to confront the true economic and political costs of their decisions,central governments must curtail politically cheaper sources of finance such as unconditionalintergovernmental transfers, which local governments can spend as they wish, and access totaxes on business, which local governments can export to a substantial degree. Even if they suc-ceed in doing so, a number of other policy reforms are also needed to turn the property tax intoa responsive instrument of local fiscal policy. First, local governments must be allowed to settheir own tax rates. Few developing or transition countries currently give local governmentsmuch freedom in this respect. Second, the tax base must be maintained adequately. In countrieswith inflation some form of index adjustment may be advisable. In other countries the assess-ing agency must sometimes be provided with direct financial incentives to keep the tax baseup-to-date. Finally, a series of procedural reforms is often needed to improve collection effi-ciency, valuation accuracy, and coverage of the potential tax base. None of these steps is easy,but countries that want to have local governments that are both responsive and responsiblemust follow this hard road.
Property tax revenues are low in many developing and transition economies, in partbecause of the way in which the tax is administered. The coverage of the tax is not compre-hensive, assessments and nominal tax rates are low, and collection rates are also often low.Low tax rates are sometimes imposed by higher-level governments and sometimes by localgovernments themselves, which find rate increases in this most visible of taxes difficult to sellpolitically.
Simply raising the legal tax rate would seldom be appropriate, however, because it wouldplace the burden of the increase on “those few individuals whose properties are on the tax rolls,accurately valued, and from whom taxes are actually collected” (Dillinger 1991). Increasednominal rates are likely to be acceptable only along with improvements in tax administration,such as more comprehensive coverage, better assessments, more frequent assessment revalua-tions, and enforced penalties for late payment. In general, revenues from this source are higherif the property tax is based on the value of land and buildings instead of just on land, if exemp-tions are few and no particular property classes are given favorable treatment, and if the scopefor local tax competition is limited.
Despite its problems, the property tax remains the predominant option for raising localrevenues in most developing and transition countries. The potential yield of land and prop-erty taxes is unlikely to be huge, revenues from this source will not be very elastic, andadministrative costs are substantial. Nonetheless, an expanded property tax is both a logicaland a desirable objective for many countries, particularly those in which local governmentsare expected to play an increasing role in allocating public sector resources. Nevertheless, sig-nificant additional revenues from this source can seldom be expected in the short run, andeven though property taxes are often relatively more important in smaller communities, most
Richard M. Bird 183
additional revenues will likely be found in, and accrue to, the larger urban areas. A goodproperty tax is a good thing, but it is seldom enough to do the whole job.
Excise Taxes
The property tax is undoubtedly the pre-eminent local tax. Taxes that might be considered asregional sources of funds include excises, payroll taxes, corporate income taxes, personalincome taxes, retail sales taxes, and VATs. McLure (1997) suggests that excise taxes are a poten-tially significant source of regional revenue largely on administrative and efficiency grounds.He argues that such taxes are both easy for regional governments to administer and lend them-selves to regionally-differentiated rate determination. Moreover, in terms of efficiency, suchtaxes, applied on a destination basis, should have little distortionary effect. Finally, a generalbenefit argument can be made for some regional excises, for example, on alcohol and tobaccoto the extent that regional governments are responsible for health expenditures and on vehiclesand fuel to the extent they are responsible for roads.
All these arguments have some validity, although in some instances the case is weak. Thebenefit case for “sin” taxes, for example, is weak in general (Bird 1998), and imposing region-ally differential taxes without serious distortions, as well as substantial administrative andcompliance costs and dangers of evasion, is not always easy, as demonstrated by Canada’srecent experiences with cross-border smuggling and provincial tobacco taxes (Bird, Perry, andWilson 1998). Indeed, even though countries such as Canada and the United States derive a sig-nificant proportion of regional government revenues from excises, tying regional finances tosuch inelastic levies when the pressure on those finances for the most part comes from elasticexpenditure demands for health and education does not seem particularly desirable. Such amismatch of revenue and expenditure elasticity is a serious problem in Colombia, for example,where regional governments’ revenues depend largely on excise taxes (Acosta and Bird 2003).
The strongest economic and administrative case for regional excises is with respect tovehicle-related taxes (Bahl and Linn 1992). The most important tax on automobiles from a rev-enue perspective is the fuel tax, which is also the simplest and cheapest form of automotive tax-ation from an administrative perspective. Fuel taxes can be levied at the regional level. Differentregions could impose different tax rates if they chose to do so, subject to the constraint that theywould probably not be able to differ much from the rates imposed by their neighbors given themobility of the tax base. Administratively, differential regional fuel taxes could easily beimposed at the refinery or wholesale level, with the refiner or wholesaler acting as the collectionagent for the regional governments and remitting taxes in accordance with fuel shipments.
Fuel taxes are also related to road usage and to such external effects of vehicles as accidents,pollution, and congestion, although not in any precise way. To the extent that automotive taxa-tion is intended to price either the use of publicly provided services or externalities, fuel taxesare at best a crude instrument. Toll roads and an appropriate set of annual automobile anddriver license fees can serve this benefit tax function much better. For example, these fees mightbe based on such features as vehicles’ age and engine size (older and larger cars generally con-tribute more to pollution), location of vehicle (cars in cities add more to pollution and to con-gestion), driver records (20 percent of drivers are responsible for 80 percent of accidents), andvehicles’ axle weight (heavier vehicles do exponentially more damage to roads and requireroads that are more costly to build).
To the extent that policymakers wish to achieve some redistributional goal through automo-tive taxation, a national excise tax at the time of initial sale is the best way to achieve this. Incontrast, the situation in Argentina, in which every province levies an array of annual taxes thatvary with vehicles’ year and model, apparently in an attempt to levy a progressive tax, makeslittle sense. In San Juan province, where it takes three newspaper-sized pages to set out thedetails of vehicle tax rates, the tax is imposed at a rate of 3 percent on automobiles, but the
184 Local and Regional Revenues: Realities and Prospects
values to which this rate is applied vary with vehicles’ make, model, age, and weight. Thisapproach is administratively complex and costly, is not related in any consistent way to any dis-tributional objective, unduly penalizes newer and more efficient vehicles, and does not pricepublic services or externalities in any meaningful way. As with most provincial taxes andcharges in Argentina, the automobile tax suffers from undue refinement in terms of finediscrimination between similar bases. The result is arbitrary differentiation with consequenteconomic distortion and considerable leeway for administrative and compliance slippage. Acommendable desire to make fine distinctions for social purposes may underlie this complexsystem, but the reality is that such complexity makes the system both economically undesirableand impossible to administer properly.
Subnational taxation of automobiles is fundamentally a good idea, but requires carefulstudy of the appropriate design of any automobile tax system (Smith 1991). Most countriescould raise more revenue and achieve better economic effects through a revised system of auto-motive taxation. Subnational revenues could be boosted still further by giving regions access tothe fuel tax, perhaps through regionally determined surcharges. Indeed, automotive and fueltaxation appear to be the only commonly available subnational revenue sources that shoulddemonstrate more than unitary income elasticity, thereby matching this aspect of some of thekey services (education, health) for which regional, and sometimes perhaps local, governmentsare increasingly responsible in many countries. Nonetheless, even when fully exploited auto-mobile taxation alone seems unlikely to do the job of financing social services such as educa-tion and health to any significant degree. Moreover, as with most of the tax sources discussedin the following sections, fuel and vehicle taxes are much greater potential revenue sources inlarge urban areas than in poor rural areas. Consequently, to the extent that regional financesrely on such levies, regional fiscal inequalities are likely to be exacerbated unless they are offsetby an adequate system of equalization transfers.
Personal Income Taxes
Because property taxes can only be pushed so far and user charges and taxes on vehicles andfuels seem unlikely to be extremely productive in most regions, if countries wish their subna-tional governments to have more own source revenues, either to expand the size of subnationalactivities or to make subnational governments more self-reliant, experience in countries of theOrganisation for Economic Co-operation and Development points to supplementary (piggy-backed) local income taxes (Bird and Slack 1991). Like the property tax, such a tax would be vis-ible and would therefore satisfy the criteria of political responsibility and accountability. Manysuch taxes exist in the industrial countries, as follows:
• The Nordic countries are among the few in which subnational governments have largeexpenditure roles and are largely fiscally autonomous. It is no coincidence that the bestknown examples of local income taxes are in those same countries (Soderstrom 1991).These local income taxes are levied at a flat, locally-established rate on the same taxbase as the national income tax and are collected by the central government.
• In Belgium, and until recently in most Canadian provinces, the local surcharge is leviedas a percentage of the national tax liability rather than the national tax base. A similarsystem exists in Switzerland, where most cantons—the intermediate level of govern-ment—allow local governments to levy surcharges at locally-established rates on thecantonal income taxes, which as with most U.S. state income taxes are not harmonizedwith the federal income tax (Bird 1986).
• Japan has a unique system of local income taxation. Corporations are subjected to amunicipal tax assessed largely on the basis of national corporate taxes paid in the previ-ous year, with the tax base being allocated to different jurisdictions in proportion to the
Richard M. Bird 185
number of employees. In addition, corporations are subject to a progressive municipalenterprise tax based directly on income. When this enterprise tax is applied to individu-als operating businesses, its rate varies with the category of business activity (like thelocal professional tax in France). Individuals are also subject to both a progressive localincome tax levied on the same base as the national income tax and a poll tax (like theformer British community charge) levied at a nationally determined per capita rate thatvaries with the size of the municipality. Only the latter is levied on nonresidents work-ing in the municipality. All these taxes are assessed and collected locally.
Even though developing countries have occasionally levied local income taxes (Bahl andLinn 1992), they are not common. In contrast, in many transition economies subnational gov-ernments have been assigned significant shares of income tax revenues. For example, in Russiaat one time a few years ago subnational governments received all personal income tax rev-enues, in Bulgaria they received 50 percent, in Poland 30 percent, and in Hungary 25 percent(Bird, Ebel, and Wallich 1995). In none of these countries, however, did local governments haveany freedom in establishing the tax rate. In such cases the resulting distribution of revenues istherefore closer to an intergovernmental fiscal transfer based on locally collected national taxrevenues than a truly local source of revenue. If local governments are not politically responsi-ble for the revenues they receive, such revenues should not be viewed as local taxes (Ebel andYilmaz 2003). In contrast, locally determined surcharges are clearly local own taxes in that localgovernments are accountable for both imposing the taxes and spending the revenues.
One reason local governments have seldom been given access to income taxes in the indus-trial countries is because of central governments’ reliance on this source of revenue. In thedeveloping countries even central governments often have trouble collecting much from theincome tax. Shome (1999), for example, depicts the weak, and weakening, state of personalincome taxes in a number of Latin American countries. In most developing and transition coun-tries, no quick fix for subnational revenues is likely to be available from this quarter given thecombination of weak personal income taxes at the central level, the apparent difficulty ofstrengthening these taxes in the near future, and the general reluctance of central governmentsto share productive taxes with local governments.
Nonetheless, several developing and transition countries, such as Hungary and SouthAfrica, have recently proposed local surcharges on a central personal income tax (Bird, Wallich,and Peteri 1995), and others have recently favorably reviewed this revenue source (see, forexample, McLure 1999). Most countries should therefore explore further the possibility ofimposing regional, and in some instances perhaps even local, surcharges on personal incometaxes, but subnational revenues from this source are unlikely to be significant in the near future.
Payroll Taxes
Payroll taxes have been important sources of regional government finance in Australia and, toa considerably lesser degree, in some other countries such as Mexico and South Africa. Suchtaxes have several advantages and at least two disadvantages. Their advantages are that theyare easily administrable, at least when imposed on large enterprises, and relatively productiveat relatively low rates. Their disadvantages are, first, that they act as a tax barrier to employ-ment in the modern sector and introduce distortions into the factor mix decision (Bird 1992),and second, that in most countries the payroll tax basis is already heavily exploited to financethe central government’s social security systems. Note that some countries use the payroll taxbase for many additional purposes (see, for example, the discussion of the Colombian systemin Alm and López-Castaño 2002).
To the extent that payroll taxes can be made effective on a regional basis, so can flat-rate per-sonal income taxes, which are likely to be levied on much the same base without the factor bias
186 Local and Regional Revenues: Realities and Prospects
inherent in payroll taxes. Moreover, again in principle if not as clearly in practice, subnationalpersonal income taxes can more easily be levied on a destination (resident) than origin(employment) basis (Bird and Wallich 1992), an important factor in considering the potentialdistortionary aspects of subnational factor taxes. Thus on the whole, in economic terms, sur-charges on a nationally uniform personal income tax base would seem to be a more appropri-ate way for subnational governments to tax wages in most developing and transition countriesthan payroll taxes. In administrative terms, however, a payroll tax, levied as a final tax on pay-rolls at the enterprise level, is undoubtedly simpler, unless the so-called personal income tax isitself levied in much the same way on total wages and salaries at the enterprise level and is notaggregated with other forms of income on an individual basis.
General Consumption Taxes
In many countries the search for a regional revenue source that is economically significant,administratively viable, and reasonably elastic comes down to a general sales tax. Given thedisadvantages of the taxes already discussed, the only “big” tax that remains—apart from busi-ness taxes as discussed in the next section—is the general sales tax.
The general sales tax now found in most countries is a VAT. According to Ebrill and others(2001), 123 countries had a VAT in 2001. The future of the retail sales tax, once favored as aregional tax (Musgrave 1983), and still in place in most U.S. states, now seems dim; however,the dominance of the VAT poses a serious problem for the finance of regional governments.Most tax analysts consider independent, subnational VATs to be either infeasible or undesirablefor a number of reasons (Bird 1993a). Some emphasize high administrative and compliancecosts. Others stress the possible loss of macroeconomic control and central governments’ gen-eral reluctance to share the sales tax base. Still others emphasize the problems arising fromcross-border (interstate) trade, arguing that if levied on an origin basis, subnational VATs aredistortionary, and if levied on a destination basis, they are unworkable.5
Critics generally took Brazil’s experience as supportive of this negative appraisal. Brazil wasthe first country to introduce a fully fledged VAT (Guérard 1973). Indeed, Brazil liked the ideaof a VAT so much that it introduced not one VAT but several, one for the federal governmentand one for each of the state governments. The central government levies the federal VAT onindustry and the states levy state VATs on agriculture, industry, and many services. Brazil’senthusiastic adoption of this new tax soon resulted in a series of complex technical and admin-istrative problems with respect to how to apply different VATs in different states (although allare levied at a uniform rate) in addition to a federal VAT. Over the years these problems werepartly resolved in various, ultimately unsatisfactory, ways, for example, the overlap in taxeswas reduced by confining the federal VAT essentially to the manufacturing stage. In part, theproblems were simply ignored, perhaps because the resulting distortions in resource allocationseemed unimportant compared with those resulting from inflation. In part the issue wasfudged by means of various unsatisfactory administrative fixes, such as introducing some bor-der controls between states (for further discussion see Purohit 1994; Shome and Spahn 1996).Not surprisingly, the resulting patchwork has become increasingly unsatisfactory, and sales taxreform has again risen high on Brazil’s fiscal agenda in recent years, although as yet no reformhas proved possible (Varsano 2000).
Fear of difficulties similar to those encountered in Brazil has perhaps been one reason whyneighboring Argentina has delayed desirable sales tax reforms following a 1993 federal-provincial agreement that required the abolition of provincial gross receipts taxes and their
Richard M. Bird 187
5. Poddar (1990), in the most thorough early discussion of this issue, demonstrates that the destina-tion base is technically feasible, although the particular approach he discusses seems unlikely to work wellin developing countries.
replacement by a retail sales tax by 1996 (World Bank 1996). Even though the process was post-poned, the ensuing debate led to proposals from the most important province, Buenos Aires,for a provincial-level VAT and to considerable discussion on the advantages and disadvantagesof this approach.
The major revenue source of Argentine provinces has long been an antiquated gross receiptstax levied at various rates on different activities and an even more antiquated stamp tax. In SanJuan province, for example, the basic rate of the gross receipts tax was 3 percent, with rates of0.83 percent on fuel production; 1.67 percent on fuel sales; 2 percent on construction; 4 percenton tourist services and certain financial activities; 5 percent on certain other financial activities,lotteries and gaming, sales of tobacco, and advertising agencies; 10 percent on pubs, nightclubs, and similar activities; and 15 percent on electronic games, pool, cabarets, and places thatrent rooms by the hour. In addition, minimum fixed taxes were established for certain activi-ties, including cabarets, parking lots per space (depending on the size of the space), and placesrented by the hour (depending on the rate they charge).
This gross receipts tax provides an excellent illustration of what is wrong with provincialconsumption taxes in Argentina and similar taxes found in other countries. It taxes a significantnumber of intermediate business activities, such as fuel, construction, advertising, insurance,and finance; it creates a variety of unenforceable distinctions between disfavored activities,ranging from cabarets versus night clubs to the sizes of parking spaces; and it imposes ridicu-lous rates on the latter activities. Such provisions may make legislators feel good, but they cre-ate a nightmare for tax administrators and serve no useful economic or social purpose.
Thus the requirement of the 1993 federal-provincial agreement that the gross receipts tax bechanged to a retail sales tax is quite understandable. Indeed, Argentina took some steps in thisdirection. By 1995, for example, taxes on primary production had been eliminated completelyin 6 of the 24 provinces and reduced to rates of 1 percent or less in most of the rest, while the taxon industry had generally been lowered to 1.5 percent (compared with the general rates of 2.5percent on wholesale trade and roughly 3.5 percent on retail trade and services). From the pointof view of reducing the economic distortion caused by the tax system, the need to complete thereforms and replace the antiquated taxes with a more modern retail sales tax seemed obvious.From the point of view of strengthening provincial revenues, however, the effects of replacingthe existing stamp and gross receipts tax seemed less obviously desirable to most provincialgovernments. Estimates of the revenue-neutral rate of a retail sales tax ranged from 3.5 percentto 10 percent. Adding a retail sales tax at these rates to the then existing federal VAT of 21 per-cent was clearly not a politically attractive alternative.
Some commentators, such as Gómez Sabaini and Gaggero (1997), suggested that imposingeither independent provincial VATs or a more uniform joint federal-provincial VAT, subject toan overall 20 percent rate limit, would be better. They indicated that such subnational VATscould be imposed like any national VAT essentially on a destination basis, with the problem ofinterprovincial sales dealt with by allocating revenues in accordance with macroeconomic con-sumption indicators. Such an approach would clearly be more feasible with the joint version ofthe tax and would resemble the so-called harmonized sales tax in force in three small Canadianprovinces (Bird and Gendron 1998). It would also require a high degree of agreement betweenthe federal and various provincial governments. In contrast, the compensating VAT (CVAT)proposal discussed briefly later requires less agreement and affords more provincial revenueautonomy.
The only functioning, destination-based, subnational VAT now in existence is that in theprovince of Quebec in Canada (Bird and Gendron 1998). The Quebec sales tax and the federalVAT (known as the goods and services tax) constitute a dual VAT system with none of the prob-lems usually associated with such systems. The respective governments set the rates of the twotaxes quite independently. The tax bases are also determined independently, although they areessentially the same. Since the beginning a single administration, the Quebec Department of
188 Local and Regional Revenues: Realities and Prospects
Revenue, has collected both taxes. Taxes on interprovincial sales from one business to anotherare handled through a deferred payment system similar to that applied with respect to salesbetween member countries in the European Union. Exports from Quebec, whether to anotherprovince or another country, are zero rated. Imports into the province from other provinces orfrom abroad are taxable, but the tax is assessed on interprovincial imports only when there is asale by a registered trader to an unregistered trader or consumer in the province. Although spe-cial regimes apply to automobiles and a few other cases, in general no attempt is made to col-lect tax on interprovincial purchases made directly by final consumers.
What makes this system work, Bird and Gendron (1998) argue, is the existence of the over-riding federal goods and services tax as an enforcement mechanism. In effect, the existence of afederal sales tax on a more or less uniform base provides some control over interjurisdictionalsales for purposes of both provincial and federal taxes. Reportedly the system is working quitewell.
Thus Canada has demonstrated that with good tax administration operating a VAT at thesubnational level on a destination basis is feasible, at least for large regional governments. Inprinciple, it is immaterial whether there are two separate administrations or one, or if there isone, which level operates it. A single central administration and a common base, as in Canada’spersonal income tax system, is probably most efficient, but this degree of convergence is notessential. What seems to be critical is either a unified audit or a high level of informationexchange. Most important, from the perspective of improving accountability each taxing gov-ernment should be able to determine its own VAT rate independently.
What is the alternative for countries with no realistic prospect of “good” tax administrationat the subnational level in the near future? As Varsano (2000) demonstrates, a promisingapproach is to impose what is in effect a supplemental central VAT, which McLure (2000) labelsthe CVAT. This approach has the major virtue of protecting revenues when tax administration(at all levels of government) is far from well developed. Specifically, it reduces the risk thathouseholds and unregistered traders in any state can dodge state VAT by pretending to be reg-istered traders located in other states.
To implement this kind of CVAT (see Bird and Gendron 2001), states would zero rate notonly international, but also interstate sales, but the latter would be subject to the central CVAT(as well as the central VAT). Domestic sales would therefore be subject to central VAT and eitherstate VAT or central CVAT. There would be no need for any state to deal explicitly with anyother state nor, generally, would there be any need for interstate clearing of tax credits.6 Regis-tered purchasers in the other state would be able to credit CVAT against central VAT. Theresults of this procedure are twofold. First, the central government, which first levies CVAT andthen credits it, would gain no net revenue from it (it could receive some kind of fee for its serv-ices as in Canada). Second, the state VAT applied to resale by the purchaser would be that ofthe destination state. In other words, the results are exactly the same as in the goods and serv-ices tax and Quebec sales tax case described earlier: a destination, subnational VAT is applied,but the CVAT now acts to protect state revenues from some obvious frauds. This approachappears to make subnational VATs potentially feasible, at least in large countries in which stateshave major expenditure roles, the VAT is the principal source of actual and potential revenue,and tax administration is not up to Canadian standards.
As Bird and Gendron (2001) note in a review of experience around the world, however,the debate on how best to design and implement a subnational VAT is far from settled. Thefinal answer may turn out to be, as might be expected, that different contexts call for different
Richard M. Bird 189
6. This assumes that the state VAT rates are lower than the central rate. If, as in Brazil, the state ratesare substantially higher, there might be some residual need for a clearing house, though on an aggregate,not transaction basis, but this would not seem to be a difficult problem if there is central administration ofstate VATs.
solutions. What a country can, should, and will do depends on many factors, including itstrade patterns, the location and size of the country and its subnational jurisdictions, the rela-tive importance of business to business versus business to consumer transactions in the taxbase, the quality of administration, the degree of trust and feasible coordination, the desirefor local autonomy, the tolerance for asymmetry, the offsetting nature of equalization, theextent and nature of revenue shifts, and the existing sales tax structure. The road to feasiblesubnational VATs may be long and winding in many countries, but the longest journey startswith a single step, and with respect to subnational VATs, a few countries such as Brazil andCanada are already much further down this path than a few steps.
Business Taxes
Most countries have regional and local business taxes in such forms as corporate income taxes,capital taxes, nonresidential property taxes; such ancient levies as octroi and patente; and vari-ous forms of industry and commerce taxes. Whether or not an economic case for such taxesexists, the political realities of governing in a democratic society are such that virtually any sub-national government will wish to impose such a tax. Subnational business taxes are not onlywidespread, they are also generally popular with officials and citizens alike for at least two rea-sons. First, they often produce substantial revenue, and they also tend to be much more elasticthan, for example, property taxes. Second, as no one is quite sure of the incidence of such taxes,assuming or asserting that they are paid by someone other than local residents is easy.
As a rule, experts have tended to look at the distortions and problems arising from suchtaxes, advised against them, and moved on to other topics (see, for example, McLure 1994). Aslocal business taxes are likely to continue to exist no matter what economists may say, animportant consideration is whether the problem is with the very idea of subnational govern-ments taxing business or rather with the way in which they now generally do so.
The economic case for local business taxation is simply as a form of generalized benefit tax.Such benefit taxes are essential to the attainment of efficiency. Where possible, specific publicservices benefiting specific business enterprises should be paid for by appropriate user charges,as argued earlier, but where recouping the marginal cost of cost-reducing public sector outlaysthrough user charges is not feasible, some form of broadly–based, general levy on businessactivity may well be warranted. Finding any support along these lines for taxing any one inputis difficult, however, whether labor (payroll tax) or capital (corporate income tax). Instead, whatthis line of reasoning suggests is that a broadly based levy neutral to factor mix should beimposed, such as a tax on value added.
As discussed in chapter 11, the most appropriate form of VAT for this purpose would appearto be a value added income tax or a VAT levied on the basis of income (production, origin)rather than on consumption (destination). A business value tax (BVT) would improve subna-tional tax systems in several ways. First, it would be more neutral than most existing local busi-ness taxes, which often discriminate against certain forms of investment. Second, it wouldprobably be less susceptible to base erosion. Third, it should be more sensitive to cyclical reali-ties than most other forms of business tax. All these advantages would apply even if the rate ofthe BVT were set to produce the same revenue as existing business taxes. Of course, if the ratewere set to more or less match the benefits received basis suggested earlier, it would generallybe lower, and the tax would have the additional important advantages of eliminating inefficientspillovers and encouraging more responsible and accountable subnational governments. Aswith the subnational VAT, while many technical issues need further thought and discussion,moving toward a local business tax of the BVT type as, for example, Italy did recently (Bor-dignon, Gianni, and Panteghini 2001) would clearly be a substantial improvement in manycountries.
190 Local and Regional Revenues: Realities and Prospects
Alternatively, in some countries simply rationalizing the existing set of (often presumptive)levies imposed on business may prove simpler administratively and almost equally beneficialeconomically, as discussed in more detail in chapter 11. As shown there, local business taxa-tion is characterized by great variety around the world. Some countries rely mainly on taxeson profits and property, some on various forms of sales taxation, and some on a variety of spe-cific charges and fees. Few existing local taxes on business are equitable; almost none are neu-tral; most accentuate rather than reduce disparities between localities, giving most to thosewho have most; most also lend themselves to tax exporting, thereby violating the correspon-dence principle that those who pay should be those who benefit; and all too many are costly toadminister, especially taking into account the cost of compliance and the facility with whichthe tax can serve as the basis for corrupt transactions. Nevertheless, local business taxes thrivearound the world because they score highly on some of the other criteria. For example, busi-ness taxes are highly politically acceptable; provide an important, and relatively elastic, sourceof revenue, particularly for larger cities; and in many countries, despite defects in design andexecution, provide one of the few ways in which local governments have any degree of fiscalautonomy.
The question is therefore to what extent the virtues of local business taxation can be realizedwhile minimizing such vices as economic distortions and administrative costs. While the lowrates of most such taxes dampen these problems, a more systematic approach to the problem isthe BVT. Note, however that that no form of local business taxation can overcome certain fun-damental problems. First, any tax on business will obviously give more revenues to those whohave more tax base. It will therefore accentuate fiscal disparities among regions and localities.Second, although one of the advantages of local business taxation is that it is politically accept-able, this “virtue” is inescapably accompanied by two potential vices: the weakening of the cor-respondence principle and a consequent increase in the lack of clarity about the equity of localtaxation. The first of these weaknesses is much more important. Although most local businesstaxes are probably somewhat regressive, the equity of local taxation is, in general, a less impor-tant question than some think. Indeed, as noted earlier, from many perspectives local govern-ments can be viewed as entities that provide services to residents, and the appropriate equityperspective is the benefit principle rather than the ability to pay principle (Bird 1993b).
Conclusion
Table 9.1 summarizes many of the arguments of this chapter. The general approach this chapterhas taken in relation to subnational taxation in developing and transition countries is based onthree simple principles: (a) more attention should be paid to matching expenditure and revenueneeds, (b) more effort should be made to ensure that all governments bear significant responsi-bility at the margin for financing the expenditures for which they are politically responsible,and (c) subnational taxes should not unduly distort the allocation of resources.
If regional governments have significant expenditure responsibilities, in most countries theyare apparently only able to satisfy these criteria through a surcharge on personal income tax ora surcharge on VAT. Few developing countries have sufficiently robust central income taxes tooffer much hope that subnational governments will soon be able to derive much revenue fromthis source. A potentially promising alternative answer for subnational revenues, at least in thelarger countries, particularly those with federal features, may better rely on the VAT.
A second feature of subnational taxation that this chapter has emphasized is the importanceof developing a less harmful form of subnational business taxation. Most forms of local andregional business taxes found in developing countries introduce serious economic distortionsin a variety of ways. Nonetheless, there is an economic (benefit) case for some regional andlocal taxation of business and local leaders often face an overwhelming political need to impose
Richard M. Bird 191

Table 9.1 A Preliminary Evaluation of Local Revenues
Personal Business Criterion User charges (R) Property tax (L) Excises (R) income tax (R) Payroll tax (R) Sales tax (R) taxes (L, R)
Revenue adequacy Yes, for some Yes, for general Unlikely to Unlikely Yes, if industrial Yes Not likelyactivities; not in local suffice areageneral government
Revenue buoyancy No Not much Varies Yes Yes Yes May be adequate
Correspondence of Excellent if Fair if properly Not high Not high Depends on Depends on Depends onpayers and well designed done employment mobility designbeneficiaries pattern
Local accountability Excellent Low Not good unless Low (depends on If have rate May be Usually lowrate set regionally rate discretion) discretion adequate
Administrative cost Sometimes high Fairly high Low Reasonable if Not high Moderate Sometimes highimposed as a regional surcharge
Compliance costs Irrelevant, in Vary, but not high Low as a rule Medium Not high Moderate Often highprinciple
Latitude for Low Moderate Low Probably high in Low Moderate Highcorruption most countries
Political acceptability Not high in most Moderate High in some Low High Perhaps Highcountries instances
Distortionary impact None Moderate Can be low Moderate Not too high Moderate Usually highProgressivity Irrelevant Possibly Regressive in Largely unknown Not very No Usually
general, except unknownfuel
Reduces regional May do so to No No No No No Nodisparities some extent
L Local. R Regional. Source: Author.
192
such taxes. One approach to this problem might be to introduce another form of value addedtax such as the BVT.
Suppose that a given country accepted both these proposals for subnational revenue reform.The result would then be a family of VATs, with a standard invoice credit, destination principle,consumption type of VAT imposed at the central government level, similar VATs imposed atvarying rates on the same base by regional governments, and a BVT levied on all VAT regis-trants by regional governments, and perhaps even larger local governments, at relatively uni-form rates. In addition, all levels of government should apply appropriate user charges; someexcise taxes, particularly those related to vehicles, might be appropriate at the regional level; astrong case exists for more effective local property taxation in most developing countries, espe-cially of residential property; and the central government may continue to levy both a corpo-rate and a progressive personal income tax, perhaps with regional governments imposing flat-rate personal income taxes on the same base if they so choose.
Even major reforms along these lines would not solve all the problems of establishing soundand workable subnational tax regimes in developing and transition countries. Such reformswould, however, would at least move matters in the right direction.
References
The word processed describes informally reproduced works that may not be commonly avail-able through libraries.
Acosta, Olga Lucia, and Richard M. Bird. 2003. “The Dilemma of Decentralization in Colom-bia.” Mision de Ingresos, Bogota, Colombia. Processed.
Alm, James, and Hugo López-Castaño. 2002. “Payroll Taxes in Colombia.” Mision de Ingresos,Bogota, Colombia. Processed.
Bahl, Roy. 2002. “The Property Tax in Developing Countries: Where Are We in 2002?” LandLines (newsletter, Lincoln Institute of Land Policy, Cambridge, Mass.).
Bahl, Roy W., and Johannes Linn. 1992. Urban Public Finance in Developing Countries. New York:Oxford University Press.
Bird, Richard M. 1974. Taxing Agricultural Land in Developing Countries. Cambridge, Mass.: Har-vard University Press.
_____. 1976. Charging for Public Services. Toronto: Canadian Tax Foundation.
_____. 1986. Federal Finance in Comparative Perspective. Toronto: Canadian Tax Foundation.
_____. 1992. Tax Policy and Economic Development. Baltimore, Md.: Johns Hopkins UniversityPress.
_____. 1993a. “Federal-Provincial Taxation in Turbulent Times.” Canadian Public Administration36(Winter): 479–96.
_____. 1993b. “Threading the Fiscal Labyrinth: Some Issues in Fiscal Decentralization.”National Tax Journal 46(2): 207–27.
_____. 1995. Local Finance: Problems, Perspectives, and Possibilities. Major Report no. 31. Toronto:University of Toronto, Centre for Urban and Community Studies.
_____. 1998. “Analysis of Earmarked Taxes.” Tax Notes International, June 23, pp. 2095–2116.
_____. 2000. “Rethinking Subnational Taxes: A New Look at Tax Assignment.” Tax Notes Inter-national 20(19): 2069–96.
Richard M. Bird 193
_____. 2001. Intergovernmental Fiscal Relations in Latin America: Policy Designs and Policy Out-comes. Washington, D.C.: Inter-American Development Bank, Sustainable DevelopmentDepartment.
Bird, Richard M., and Ariel Fiszbein. 1998. “The Central Role of Central Government in Decen-tralization: Colombia.” In Richard M. Bird and Francois Vaillancourt, eds., Fiscal Decentral-ization in Developing Countries. Cambridge, U.K.: Cambridge University Press.
Bird, Richard M., and Pierre-Pascal Gendron. 1998. “Dual VATs and Cross-Border Trade: TwoProblems, One Solution?” International Tax and Public Finance 5(3): 429–42.
_____. 2001. “VATs in Federal Countries: International Experience and Emerging Possibilities.”Bulletin for International Fiscal Documentation 55(7): 293–309.
Bird, Richard M., and Barbara D. Miller. 1989. “Taxation, Pricing, and the Poor,” In Richard M.Bird and Susan Horton, eds., Government Policy and the Poor in Developing Countries.Toronto: University of Toronto Press.
Bird, Richard M., and Enid Slack. 1991. “Financing Local Government in OECD Countries:The Role of Taxes and User Charges.” In Jeffrey Owens and Giorgio Panella, eds., LocalGovernment: An International Perspective. Amsterdam: North-Holland.
_____. 1993. Urban Public Finance in Canada. Toronto: John Wiley.
_____. 2002. “Land and Property Taxation around the World: A Review.” Journal of Property TaxAssessment and Administration 7(3): 31–67.
Bird, Richard M., and Michael Smart. 2002. “Intergovernmental Fiscal Transfers: Lessons fromInternational Experience.” World Development 30(6): 899–912.
Bird, Richard M., and Thomas Tsiopoulos. 1997. “User Charges for Public Services: Potentialsand Problems.” Canadian Tax Journal 45(1): 25–86.
Bird, Richard M., and Christine Wallich. 1992. “Financing Local Government in Hungary.”Working Paper no. WPS 869. World Bank, Washington, D.C.
_____. 1993. “Fiscal Decentralization and Intergovernmental Relations in TransitionEconomies.” Working Paper no. WPS1122. World Bank, Washington, D.C.
Bird, Richard M., Robert Ebel, and Christine Wallich, eds. 1995. Decentralization of the SocialistState. Washington, D.C.: World Bank.
Bird, Richard M., Christine I. Wallich, and Gabor Peteri. 1995. “Financing Local Governmentin Hungary,” in Richard M. Bird, Robert Ebel, and Christine Wallich, eds., Decentralizationof the Socialist State. Washington, D.C: World Bank.
Bird, Richard M., David Perry, and Thomas A. Wilson. 1998. “Canada.” In Ken Messere, ed.,The Tax System of Industrialised Countries. London: Oxford University Press.
Boadway, Robin W., and Paul A. Hobson. 1993. Intergovernmental Finance in Canada. Toronto:Canadian Tax Foundation.
Bordignon, Massimo, Silvia Gianni, and Paolo Panteghini. 2001. “Reforming Business Taxa-tion: Lessons from Italy?” International Tax and Public Finance 8: 191–210.
Burki, Shahid Javed, Florence Eid, Maria Emilia Freire, Victor Vergara, and Guillermo E. Perry.2000. Annual World Bank Conference on Development in Latin America and theCaribbean: 1999 Proceedings. Washington, D.C: World Bank.
Dillinger, William. 1991. Urban Property Tax Reform: Guidelines and Recommendations. Washing-ton, D.C.: World Bank.
194 Local and Regional Revenues: Realities and Prospects
Ebel, Robert, and Serdar Yilmaz. 2003. “Fiscal Decentralization: Is It Happening? How Do WeKnow?” In James Alm and Jorge Martinez-Vazquez, eds., Public Finance in Developing Coun-tries. Cheltenham, U.K.: Edward Elgar.
Ebrill, Liam, Michael Keen, Jean-Paul Bodin, and Victoria Summers. 2001. The Modern VAT.Washington, D.C.: International Monetary Fund.
Fischel, William. 2001 “Homevoters, Muncipal Corporate Governance, and the Benefit of theProperty Tax,” National Tax Journal, 54(1): 157–73.
Gómez Sabaini, Juan Carlos, and Jorge Gaggero. 1997. “Lineamientos para una Reforma delSistema Tributario Argentino.” No. T-37. Inter-American Center for Tax Studies, BuenosAires. Processed.
Guérard, Michele. 1973. “The Brazilian State Value-Added Tax.” International Monetary FundStaff Papers 20: 118–69.
Kuo, C.-Y., T. McGirr, and S. Poddar. 1988. “Measuring the Non-Neutralities of Sales andExcise Tax in Canada.” Canadian Tax Journal 36(3): 655–70.
Litvack, Jennie, Junaid Ahmad, and Richard M. Bird. 1998. Rethinking Decentralization. Wash-ington, D.C.: World Bank.
McLure, Charles E., Jr. 1994. “The Tax Assignment Problem: Ends, Means, and Constraints.”Australian Tax Forum 11: 153–83.
_____. 1997. “Topics in the Theory of Revenue Assignment: Gaps, Traps, and Nuances.” InMario J. Blejer and Teresa Ter-minassian, eds., Macroeconomic Dimensions of Public Finance.London: Routledge.
_____. 1999. “The Tax Assignment Problem: Conceptual and Administrative Considerations inAchieving Subnational Fiscal Autonomy.” Paper presented and the seminar on Intergov-ernmental Fiscal Relations and Local Financial Management, February 24–March 5,National Economic and Social Development Board of the Royal Thai Government andWorld Bank, Chiang Mai, Thailand.
_____. 2000. “Implementing Subnational VATs on Internal Trade: The Compensating VAT(CVAT).” International Tax and Public Finance 7(6): 723–40.
Musgrave, Richard A. 1983. “Who Should Tax, Where and What?” In Charles E. McLure, Jr.,ed., Tax Assignment in Federal Countries. Canberra: Australian National University, Centrefor Research on Federal Financial Relations.
Netzer, Dick. 1973. The Property Tax. Washington, D.C.: The Brookings Institution.
Olson, Mancur. 1969. “The Principle of ‘Fiscal Equivalence’: The Division of Responsibilitiesamong Different Levels of Government.” American Economic Review 59: 479–87.
Poddar, Satya. 1990. “Options for a VAT at the State Level.” In M. Gillis, C. S. Shoup, and G.Sicat, eds., Value Added Taxation in Developing Countries. Washington, D.C.: World Bank.
Purohit, Mahesh C. 1994. “Value Added Tax in Brazil.” Working Paper. National Institute ofPublic Finance and Policy, New Delhi.
Ring, Raymond J. Jr. 1999. “Consumers’ Share and Producers’ Share of the General Sales Tax.”National Tax Journal 52 (1): 79-90.
Rodden, Jonathan, Gunnar Eskeland, and Jennie Litvack, eds. 2003. Decentralization and HardBudget Constraints. Cambridge, Mass.: MIT Press.
Shome, Parthasarathi. 1999. “Taxation in Latin America: Structural Trends and Impact of Admin-istration.” Working Paper no. WP/99/19. International Monetary Fund, Washington, D.C.
Richard M. Bird 195
Shome, Parthasarathi, and Bernd Spahn. 1996. “Brazil: Fiscal Federalism and Value Added TaxReform.” Working Paper no. 11. National Institute of Public Finance and Policy, New Delhi
Smith, Roger S. 1991. “Motor Vehicle Taxation.” In Roy W. Bahl, ed., The Jamaican Tax Reform.Cambridge, Mass.: Lincoln Institute of Land Policy.
Soderstrom, Lars. 1991. “Fiscal Federalism: The Nordic Countries’ Style.” In RemyPrud’homme, ed., Public Finance with Several Levels of Government. The Hague/Koenigstein:Foundation Journal Public Finance.
Tanzi, Vito. 1996. “Fiscal Federalism and Decentralization: A Review of Some Efficiency andMacroeconomic Aspects.” In Michael Bruno and Boris Pleskovic, eds., Annual World BankConference on Development Economics 1995. Washington, D.C.: World Bank.
Varsano, Ricardo. 2000. “Subnational Taxation and Treatment of Interstate Trade in Brazil:Problems and a Proposed Solution.” In S. J. Burki and G. E. Perry, eds., Decentralization andAccountability of the Public Sector. Washington, D.C.: World Bank.
Vickrey, William. 1963. “General and Specific Financing of Urban Services.” In HowardSchaller, ed., Public Economic Decisions in the Urban Community. Washington, D.C.:Resources for the Future.
World Bank. 1996. Argentina: Provincial Finances. Washington, D.C.
196 Local and Regional Revenues: Realities and Prospects
10Alternative Approaches to Taxing Land and Real Property
Enid Slack
Almost all local governments worldwide rely, at least to some extent, on property taxation.Dependence on property taxes as a source of local government revenue has varied over timeand across jurisdictions depending on the expenditure responsibilities assigned to local gov-ernments and the other revenues available to them, such as intergovernmental transfers, userfees, and income and sales taxes. In many countries local governments also levy other land-based taxes, such as land value increment taxes, land transfer taxes, and developmentcharges.
This chapter reviews elements of property taxes and other land-based taxes at the locallevel. A standard list of criteria for evaluating taxes provides the background to the discussionsof property taxes and other land-based taxes that follow. These criteria include
• Fairness based on benefits received: taxes should be related to the benefits received fromgovernment expenditures.
• Fairness based on ability to pay: taxes should be related to the ability to pay taxes. Hori-zontal equity requires that taxes be similar for those with similar ability to pay. Verticalequity requires that taxpayers with greater ability pay relatively greater taxes.1
• Neutrality: taxes should not distort economic behavior, including people’s decisionsabout where to live and work and what improvements to make to their property. Nega-tive side effects should be minimized.
• Accountability: taxes should be designed in ways that are clear to taxpayers, so that poli-cymakers can be made accountable to the taxpayers for the cost of government.
• Ease of administration: taxes should be fairly easy to administer. The simpler the system,the easier it will be to administer.
Achieving all these principles at the same time is often difficult, so governments have to makechoices. For example, a tax system that is designed to be equitable may not be simple toadminister.
Taxing Real Property
The property tax is historically associated with local government, in part because real propertyis immovable, that is, it is unable to shift location in response to the tax. Although a change in
197
1. This criterion raises definitional questions with regard to the measure of ability to pay. Ability topay has been measured by income (current income in some cases and permanent income in others), prop-erty value, and wealth. For a discussion of different measures of ability to pay property taxes see Kitchen(1992).
property tax may be capitalized into property values in a particular community,2 and in thelong run may affect where people locate, these effects are of a smaller magnitude than thosethat would occur with income and sales taxes at the local level.
Another reason why property taxes are appropriate as a source of revenue for local govern-ments is the connection between the types of services funded at the local level and the benefitto property values. Fischel (2000), for example, has argued that the property tax is like a benefittax, because taxes approximate the benefits received from local services. Under these circum-stances, the property tax promotes efficient public decisions, because taxpayers will supportthose measures for which the benefits exceed the taxes. Both the benefits derived from localservices (for example, good schools, access to roads and transit, and so on) and the taxes arecapitalized into property values. Because taxpayers are willing to pay more for better servicesand lower tax rates, this translates into higher property values. A competing view sees theproperty tax as a tax on capital. For example, Zodrow (2000) argues that the property tax resultsin distortions in the housing market and in local fiscal decisions. According to this view, theproperty tax (based on market value) discourages building and results in the underutilizationof land. The amount of capital per unit of land is less than what is economically efficient. Bothof these approaches have some validity. The property tax is not purely a benefits tax, becausehomeowners who improve their houses will face higher taxes and will therefore be discouragedfrom doing so. At the same time, the benefits and costs of local programs are reflected in localproperty values.
Characteristics of the Real Property Tax
The following characteristics of the property tax differentiate it from other taxes:
• Visibility: the property tax is a highly visible tax. Unlike the income tax, for example, theproperty tax is not withheld at source. Rather, taxpayers generally have to pay itdirectly in periodic lump-sum payments. This means that taxpayers tend to be muchmore aware of the property taxes they pay.3 The property tax also finances services thatare highly visible, such as roads, garbage collection, snow removal, and neighborhoodparks. Visibility is desirable from a decisionmaking perspective, because it makes tax-payers aware of the costs of local public services. This awareness enhances accountabil-ity. The ability to raise property taxes (or to reform the tax), however, is more con-strained than with other taxes.
• Inelasticity: the base of the property tax does not increase automatically over time,because property values respond more slowly to annual changes in economic activity
198 Alternative Approaches to Taxing Land and Real Property
2. Property taxes are capitalized into the value of a property if, other things being equal, a higherproperty tax results in a lower property value. Because property owners pay property taxes each year, esti-mating the present value of the property tax payments is necessary. The present value of a future flow isthe amount that someone would pay today in exchange for receiving that flow in the future. The presentvalue of US$1 to be received next year is 1/(1+i), where i is the discount rate (the return on an investmentother than housing). The present value of a dollar received in two years is 1/(1+i)2 and so on. The presentvalue of avoiding property taxes every year from now until the expected lifetime of the house is Σ1/(1+i)n,which is closely approximated by 1/i. For example, consider two houses, A and B, identical except for theproperty taxes. The annual property taxes on house A are $1,000 higher than on house B. Suppose that thediscount rate is 5 percent. The present value of the stream of future property taxes would thus beUS$20,000 (that is 1,000/0.05) higher on house A than on house B. Property taxes would be fully capital-ized if the market value of house A were US$20,000 less than house B. Anything less than US$20,000 wouldmean that the property taxes were only partially capitalized.
3. In some cases, however, mortgage institutions include property tax payments with monthly mort-gage payments. This reduces the visibility of the property tax for taxpayers who pay their taxes along withtheir mortgage payments.
than incomes. Furthermore, few jurisdictions update property values for taxation pur-poses on an annual basis. This means that to maintain property tax revenues in realterms or to raise property tax revenues, taxing authorities have to increase the rate ofthe tax. As with visibility, inelasticity leads to greater accountability (taxing authoritieshave to increase the tax rate to increase tax revenues), but it also leads to greater tax-payer resistance.
• Local autonomy: usually only local governments levy the property tax. This means that itcan be an important instrument of local autonomy, because property taxes do not com-pete with taxes the central government levies. To ensure local autonomy, however, taxrates must be set locally and not by a senior level of government. Some local govern-ment revenues are linked to taxes at other levels of government. For example, owners ofmultiresidential, commercial, and industrial properties can write off their propertytaxes against income for income tax purposes. In the United States, homeowners canalso write off property taxes against income. User charges, however, cannot be writtenoff against income, and are therefore not linked to income taxes at other levels of gov-ernment. This difference might bias the choice of revenues at the local level in favor ofthose that can reduce taxpayers’ income tax liability.
• Favorable treatment of single-family, owner-occupied, residential property: the property taxcommonly favors single-family, owner-occupied, residential properties over apartmentsand commercial and industrial properties in most North American jurisdictions. Simi-larly, in most transition economies, enterprises tend to pay higher property taxes thanindividuals (Malme and Youngman 2000). Favorable treatment of single-family residen-tial properties is achieved in three ways. First, the assessment system deliberatelyunderassesses single-family residential property compared with apartments and com-mercial and industrial property of comparable value. Many jurisdictions have legislatedlower tax rates on single-family residential property. Second, governments often pro-vide property tax relief measures to residential property owners (and in some cases totenants) in the form of tax credits, homeowner grants, or tax deferrals. These measuresare not generally available to nonresidential properties. At the same time, this differen-tial treatment does not necessarily reflect the differential use of services by differentproperty types.4
Property Identification
Several steps are involved in the process of taxing real property: identifying the propertiesbeing taxed, preparing an assessment roll that contains a description of the property and theamount of assessment, setting the tax rate or series of rates, issuing tax bills, responding toassessment appeals, collecting taxes, and addressing arrears. This chapter focuses on propertyidentification, assessment, and tax rates. For information on the other steps in the process seeDillinger (1992).
The first step in levying a property tax is to identify ownership and assemble a complete listof properties. A fiscal cadastre requires the following for each property: a description, a defini-tion of its boundaries (using cadastral maps), a notation of ownership, and the value of landand improvements. The preparation of cadastral maps is an essential element of property iden-tification. Establishing a complete inventory of all properties and assigning a unique propertyidentification number to each parcel is necessary to permit the tracking of all parcels. Propertyidentifiers also allow for the linking of assessment, billing, and property transfer records.
Enid Slack 199
4. Some observers have suggested that nonresidential properties use fewer services than residentialproperties, but pay more in taxes. For example, users of nonresidential property often provide their owngarbage collection, security, and fire protection (Kitchen and Slack 1993).
The process of property identification is often more difficult in developing countries andtransition economies. Dillinger (1992) and Malme and Youngman (2000) present examples ofsome of the types of problems that have occurred, which include the nonexistence of base mapsfor property identification, the absence of data on property ownership because of disputedownership, the incomplete information on improvements, and the poor sharing of informationon building permits. Further problems include land and building records being maintainedseparately by different agencies and not linked, tax records being identified by taxpayer andnot by property, records being considered secret, and official prices not being true indicators ofmarket value.
Property identification requires that existing information on properties within the jurisdic-tion be updated and made consistent. Information that needs to be collected for each propertyincludes, for example, the assessment roll number of the property, the address, the owner(s) ofthe property, the area in square meters, the age of the unit, and a description of any renova-tions.5 Jurisdictions must report the information collected in a consistent way and establish aprocess for updating it on an annual basis (Slack, LaFaver, and Shpak 1998).
Composition of the Assessment Base
The property tax is levied on residential, commercial, and industrial properties. The base of thetax is the assessed value of real property. Some properties in all countries are exempt from theproperty tax base. Exemptions may be based on ownership, such as government-owned prop-erty; on the use of the property, such as properties used for charitable purposes; or on the basisof the characteristics of the owner or occupier; such as age or disability (Youngman and Malme1994).
Although the use of exemptions varies widely, some properties are exempt in most jurisdic-tions. For example, property owned and occupied by the government is generally exempt fromproperty taxes. Other property types that are often exempt include colleges and universities,churches and cemeteries, public hospitals, charitable institutions, public roads, parks, schools,libraries, foreign embassies, and property owned by international organizations.
Governments often make payments in lieu of taxes. These payments are generally negoti-ated between governments and are often much less than the property taxes would be. InCanada, for example, the federal government, and not the taxing authority, determines the val-ues and rates to be used for the payment in lieu calculation.
Critics have questioned exemptions and payments in lieu of taxes on a number of grounds.First, to the extent that people working in government buildings or institutions use municipalservices just as workers do in other buildings, they should be taxed (Bahl and Linn 1992). Sec-ond, the differential treatment means that owners or managers in payment in lieu or taxedproperties face higher costs than owners or managers of exempt properties. This differentialwill have implications for economic competition among businesses and between businessesand the government (Kitchen and Vaillancourt 1990). Third, differential tax treatment affectslocation decisions, choices about what activities to undertake, and other economic decisions.Fourth, exemptions narrow the tax base and thereby increase the taxes on the remaining tax-payers. Fifth, the proportion of tax-exempt properties varies by municipality, thereby creatingdisproportionate tax burdens across communities.
A case may exist for favoring certain property holders, such as churches and charitableorganizations, to encourage their presence in the local community. If such a case can be made for
200 Alternative Approaches to Taxing Land and Real Property
5. The cost of collecting the information could be added to the tax bill. In Ontario, Canada, for exam-ple, a corporation representing municipalities in the province performs the assessment function. The costof the assessment function is passed on to municipalities, which add this cost onto tax bills.
preferential treatment, then some argue that these organizations should be rewarded directlywith a grant rather than on the basis of their property holdings (Kitchen 1992). Unlike a propertytax exemption, a grant is open and subject to review by elected representatives. If exemptionsare to be continued, all exempt property should be assessed in the same way as other propertiesso that the value of the exemption is known. Furthermore, payments in lieu of taxes should bebased on the assessed value and should reflect the taxes that could have been collected.
Assessment Systems
Two general assessment methodologies are used for property taxation: area-based assessmentand value-based assessment (for a review of the characteristics of property tax systems aroundthe world see McCluskey 1999; Youngman and Malme 1994).
AREA-BASED ASSESSMENT. Under an area-based assessment system, the tax jurisdiction leviesa charge per square meter of land area, per square meter of building, or some combination ofthe two. Where both measures of area are included, the assessment of the property is the sumof an assessment rate per square meter multiplied by the size of the land parcel and an assess-ment rate per square meter multiplied by the size of the building. Assessment rates can be thesame for land and buildings or they can be different. For example, if a policy existed to encour-age development, a lower assessment rate could apply to buildings.
A strict per unit assessment results in a tax liability that is directly related to the area of theland and buildings. With unit value assessment, the assessment rate per square foot is adjustedto reflect location, quality of the structure, or other factors. Market value has an indirect influ-ence on the assessment base through the application of adjustment factors. For example, theassessment rate per square meter might be adjusted to reflect the location of the propertywithin a particular zone in the city. Even though the specific location of the property within thezone is not taken into account, properties in different zones will have different values.
The adjustment factors derive from average values for groups of properties within eachzone and do not reflect the characteristics of each individual property. When the groups aredefined narrowly enough, however, unit value begins to approximate market value. For exam-ple, a zone could be defined anywhere from an entire city to specific neighborhoods to proper-ties on one side of a street.
Unit value assessment is used in Israel and until recently was used in Rotterdam in theNetherlands. Governments in transition economies also use it, because the absence of matureproperty markets makes determining market value difficult. A study of property taxes ineconomies in transition by Malme and Youngman (2000) indicates that with the exception ofEstonia, the countries studied—Armenia, the Czech Republic, Poland, the Russian Federation,and Slovakia—levy taxes on an area basis. In the Czech Republic, for example, tax jurisdictionsassess land and tax it on the basis of land area and assess buildings and tax them on the basis offloor space. The assessment of land and buildings is adjusted by factors that reflect location andland use, but these differentials do not reflect market data.6 The major tax base influence is loca-tion, and urban areas have higher assessed values than rural areas.
In Estonia, the area-based system has been adapted to reflect actual market influences. Theland tax combines an area-based pricing system with market evidence on location, quality, anduse. These values were originally determined using survey data. With the development of thereal estate market, these values have been able to reflect market information.
Enid Slack 201
6. Market value assessment has been under discussion in the Czech Republic since 1993. The govern-ment is considering moving in the direction of market value assessment by incorporating ad valorem ele-ments into the area-based system using information on approximate pricing for location and types of usegathered by the real estate industry (see Bryson and Cornia 2000).
In Tunisia, the rental tax requires communes to use national values for covered squaremeters to establish the rental tax roll. The values set by presidential decree vary from D 2 to D 8per square meter, depending on the size of the house and the neighborhood.7 The communesapply four tax rates on an area basis. Areas are classified according to the availability of sixservices: garbage collection, street lighting, paved roadway, paved sidewalk, sanitary sewers,and rain water sewers. The tax rate is set at 8 percent for one to two services, 10 percent forthree to four services, 12 percent for five to six services, and 14 percent for additional servicesor better quality services.
VALUE-BASED ASSESSMENT. Value-based assessments use market value (including site valueassessment), rental value, and self-assessment. Market value is defined as the price that wouldbe struck between a willing buyer and a willing seller in an arm’s-length transaction. Marketvalue assessment estimates the value that the market places on individual properties. The fol-lowing are three methods used to estimate market value:
• The comparable sales approach looks at valid sales of properties similar to the propertybeing assessed. Assessors use it when the market is active and similar properties arebeing sold.
• The depreciated cost approach values the property by estimating the land value as if itwere vacant and adding the cost of replacing the buildings and other improvements tothat value. Assessors use the depreciated cost approach when the property is relativelynew, no comparable sales exist, and the improvements are relatively unique. They alsouse the cost approach to assess industrial properties.
• The income approach uses the assessor’s estimate of the potential gross rental incomethe property could produce and deducts operating expenditures. The assessor then con-verts the resulting annual net operating income to a capital value using a capitalizationrate. Assessors mainly use this approach for properties with actual rental income.
Canadian and American municipalities generally use some form of market value assess-ment. Variations of market value to address property tax volatility can be found in Californiaand the United Kingdom. In California, assessors update the property assessment to reflectmarket value only at the time of sale. After that, assessment is frozen and increased annually bya 2 percent inflation factor. The stated advantage of time of resale assessment is that propertytaxes are stable and predictable over time. The disadvantage is that assessors will assess simi-larly valued properties differently depending on whether or not the properties have been soldrecently. This difference violates the principle of horizontal equity (fairness based on ability topay for comparable properties).
In 1993 the U.K. government implemented the council tax to replace the community charge(poll tax).8 The Valuation Office Agency, which is part of the Department of Inland Revenue of
202 Alternative Approaches to Taxing Land and Real Property
7. Two main sources of own revenues exist in Tunisia: direct taxes and indirect taxes and fees (includ-ing market fees). Direct taxes comprise mainly the rental tax, the business tax, the hotel tax, an electricitytax, and the tax on unbuilt land. The rental tax and the business tax each account for about 40 percent ofdirect tax revenue (Vaillancourt 1998).
8. The community charge in the United Kingdom was a poll tax of a specific dollar value applied toeach adult. The local tax base therefore depended solely on the number of residents in the community.Economists consider a poll tax to be the most efficient tax that local governments can adopt, because it isa fixed charge on all eligible taxpayers. Because a poll tax does not change the relative price of consump-tion or other types of activities, it does not provide an incentive for individuals to alter their behavior toreduce the tax. The community charge was unpopular in the United Kingdom, however, because it wasperceived as regressive (borne relatively more heavily by low-income households than high-incomehouseholds), and because it was costly to administer. Unlike property that is highly visible and in a fixedlocation, individual taxpayers can escape full reporting of the total number of taxable occupants (seeKing 1988).
the central government, assessed the value of homes. The agency placed each property on a val-uation list in one of eight valuation bands. The value assigned to each property only indicatesthe valuation band and not the actual value of the property. Tax rates vary among differentbands according to proportions laid out in statute. In particular, higher rates apply to proper-ties with higher band values.
The value for each dwelling is based on its market value, which is an estimate of the saleprice on April 1, 1991, and takes into account any significant changes that have occurred sincethat time, such as an extension to the property. The government did not intend to revalue alldwellings in the future, which means that any change in value because of a change in houseprices has generally not affected the banding. Individual properties could be rebanded onlyunder two circumstances. First, if the local area changes for the worse, all homes in the areamay be placed into a lower band. Second, if a house is expanded it will be rebanded only afterit is sold. If a home decreases in value because part of it is demolished, it may be rebandedimmediately.
By assigning properties to broad categories rather than assigning a taxable value to eachone, the council tax achieves simplicity and stability at the price of accuracy. Furthermore,because the council tax uses an estimate of market value at a particular point in time (April 1,1991) and then freezes assessments for the foreseeable future, it has the same implications asany out-of-date assessment system, namely, inequities will increase over time. The governmentrecognizes this problem and has proposed a reassessment in 2007.
Site value taxation is a special case of market value taxation where only the land portion ofthe property is taxed; the assessment base excludes any improvements to the land. George firstproposed the method in 1879, which gave rise to the single tax movement in the United Statesin the 1890s. Land is sometimes taxed directly. In other cases, market value taxes are levied, butthey exempt improvements or tax them at a lower rate. Site value assessment has been used inparts of Australia and in Jamaica, Kenya, New Zealand, and South Africa.
The main advantage of site value taxes is their potential for improving the efficiency of landuse. Site value, in principle, taxes the location rents (the returns from a particular locationregardless of the improvements to the site). If improvements are not taxed, the owner has anincentive to develop the land to its most profitable use. Compared with a property tax that dis-courages investment in property, a site value tax will encourage building and improvements.
Assuming land is in fixed supply (the supply of land offered for development is unrespon-sive to price changes), the tax falls on landowners and cannot be shifted to others. Increased sitevalue taxes will be capitalized into lower property values. Because landowners bear propor-tionately more of the tax than in the case of a property tax, the tax should be more progressive(borne relatively more heavily by high-income taxpayers than low-income taxpayers).
The use of site value taxation has two potential disadvantages. The first relates to the admin-istration of the tax. Accurate land valuation presents a challenge to assessors, because urbanreal estate sales combine the value of land and improvements. Site value requires the assessorto subtract the value of the improvements from the property value to derive an assessed valuefor the land. Some authors have argued, however, that valuation of land is probably easier thanvaluation of property (Netzer 1998). Rather than assessing the property value and subtractingthe value of improvements, site values per square meter could be estimated from sales anddemolition records. Although this debate has not been resolved in the literature, Bahl (1998) hasargued that valuing land separately may be more of a problem in industrial countries than indeveloping countries, where separate assessment of land and improvements takes place any-way. Where a uniform tax rate exists and taxpayers can only appeal the total value, however,the division between the two components becomes arbitrary.
The second disadvantage concerns the potential revenues that can be collected using a sitevalue tax. Because the tax base is considerably smaller than the value of land and improve-ments combined, site value taxation can only produce comparable revenues at high tax rates.Bahl (1998) notes that levying a lower property tax rate on land and improvements is politically
Enid Slack 203
easier than levying a higher tax rate on the land portion only. Under the rental value (or annualvalue) approach, property is assessed according to an estimate of rental value or net rent. Onerationale for using rental value is that taxes are paid from income (a flow) rather than fromwealth (a stock), and thus taxing the net rental value of real property is appropriate. In theory,however, no difference should exist between a tax on market value and a tax on rental value(see box 10.1). When a property is put to its highest and best use and this is expected to con-tinue, rental value will bear a predictable relationship to market value: the discounted netstream of net rental payments is approximately equal to market value.
This relationship does not always hold, however. Most assessors tend to assess rental valueon the basis of current use, and thus a difference exists between market value and rental value.A property that is underutilized would be assessed much lower under rental value than undermarket value. Furthermore, gross rents are often used rather than net rents that build in anallowance for maintenance expenditures, insurance costs, and other expenses.
The use of rental value assessment has some problems. First, estimating rental value is diffi-cult when rent control is in place. Controlled or subsidized rents cannot be directly used toassess market rents unless most properties are rent controlled. Second, vacant land causes prob-lems. Because vacant land is not taxable under a tax based on rental value in current use, anincentive exists for low return uses over high return uses and to withhold rental propertiesfrom the market altogether.9 If governments do not tax vacant properties, the tax has to behigher on occupied properties to yield the same amount of revenue. These higher taxes dis-courage investment.
In terms of tax administration, using rental value poses further difficulties (Netzer 1966).First, rental value is difficult to estimate, because little information is available on the annualrents of comparable properties for unique commercial and industrial properties such as steelmills, for example. Second, calculating net rents is difficult, because the distribution of expenses
204 Alternative Approaches to Taxing Land and Real Property
Box 10.1 Equivalence between Rental Value and Market Value Property Taxes
The following shows the equivalence between a tax on rental value and a tax on market value. Thisequivalence is important if moving from one tax base to the other and if private investors are familiarwith one system when the other is being used.
Tax Rates
Tax rates are usually expressed in terms of a given amount per 100 units of value, such as US$2 perUS$100 of taxable value. The term “mill rate” refers to the rate per 1,000 units. In this example, themill rate would be US$20.
Tax Bases
Rental value and market value are linked, because in well-functioning markets a relationship existsbetween the returns to various types of investments. Thus if one can earn 10 percent interest on aninvestment such as a bond, then the rental value of a property worth US$100,000 should be US$10,000(100,000 x 0.1), neglecting maintenance, repair, and risk. Otherwise, investors should either sell prop-erties (if the return is less) or buy properties (if the return is more).
This means that the tax rates in the two systems can be compared. A tax rate of 2 percent on prop-erty value is equivalent to a tax rate of 20 percent on rental value, because a property worthUS$100,000 will (a) have a property tax burden of US$2,000; (b) rent for US$10,000; and (c) conse-quently have a rental tax burden of US$2,000 if the rate is 20 percent on rental value.
Source: Based on Vaillancourt and Renneberg (2000).
9. As noted previously, if rental value were based on highest and best use, then vacant land would betaxable; the value would have to be estimated on the basis of other properties. Even if rental value werebased on current use, assigning a nonzero value to vacant land might be possible.
between landlords and tenants differs for different properties. Third, assessors may not haveaccess to rental income information, because rental income is not always in the public domainin the same way as sales prices.
Rental value assessment is used in several countries, including France, India, and Morocco.In India, which has rent controls, the assessed value is not related to the market value becauseit is tied to the controlled rent. Revaluation is also irrelevant, because the rent control sets themaximum assessment.
Self-assessments require property owners to place an assessed value on their own property.In Turkey, for example, property owners are required to file property declarations with the tax-ing authority every three years and when a property changes ownership or when a building isconstructed or improved (Dillinger 1992). Owners must also provide information on location,use, measurements, and characteristics of land and buildings. Based on these characteristicsand price factors provided by the taxing authority, owners are required to calculate their prop-erty value. If their estimate is below the minimum value, they pay a penalty if the property islater sold for more than the estimated value. Turkey relies on field audits and tax clearances toenforce compliance. When owners sell their properties, they are required to obtain clearancefrom the tax authority before submitting their applications to the registrar of deeds. While thissystem is effective for properties that are being sold, it does not affect properties that are not.
In some countries, Taiwan (China), for example, the taxing authority has the right to buy theproperty at the assessed value (see Dillinger 1992). A system where the taxing authority can buythe property will only be credible if it can and will buy property, but this right has rarely beenexercised, partly because of the political impossibility of large-scale purchases of residences.
Another similar proposal is that people should assess their own properties and then maketheir assessments public (Tanzi 2001). Anyone who wanted to buy a property at a price thatexceeded the declared price by some margin, such as 40 percent, could make an offer. If theowner refused the offer, the bid plus a penalty would become the new assessment.
Self-assessment does not require an assessment staff, and it appears to be easy to implement.To minimize the problems associated with self-assessment, however, the government has to beprepared to obtain expert assessments of individual properties in cases where it believes theself-assessment is inaccurate. Expert assessments significantly increase the cost of collecting thetax.
Self-assessment can lead to inaccurate estimates of property values, and there is a tendencyto underestimate the value of the property. Self-assessment violates the principle of fairness onthe basis of ability to pay, because people with comparable properties will not necessarily paycomparable taxes. Generally lower-valued properties have a lower rate of underestimationthan higher-valued properties, making this assessment approach regressive (taxes are relativelyhigher on low-valued properties). Underestimation also erodes the size of the tax base. Further-more, the potential exists for self-dealing and fraud, for example, if non-arm’s length transac-tions determine values.
Table 10.1 summarizes the different assessment methodologies and presents examples ofwhere they are used. Note that in a number of countries taxing authorities have a choice of taxbase. For example, in New Zealand the site value system is the most popular among localauthorities, but they can also use rental value, market value, and, in a few instances, land area.
COMPARISON OF AREA-BASED AND VALUE-BASED ASSESSMENT. Where possible, experts gener-ally regard market value as a better tax base. First, the benefits from services are more closelyreflected in property values than in the size of the property. For example, properties close totransit systems or parks enjoy higher property values. The benefits from these services are notreflected in the dimensions of the property, but rather in the value of the property. Even forthose services where benefits may relate more closely to property dimensions (such as side-walks and street lighting, for example), front footage, rather than lot size or building size, is
Enid Slack 205
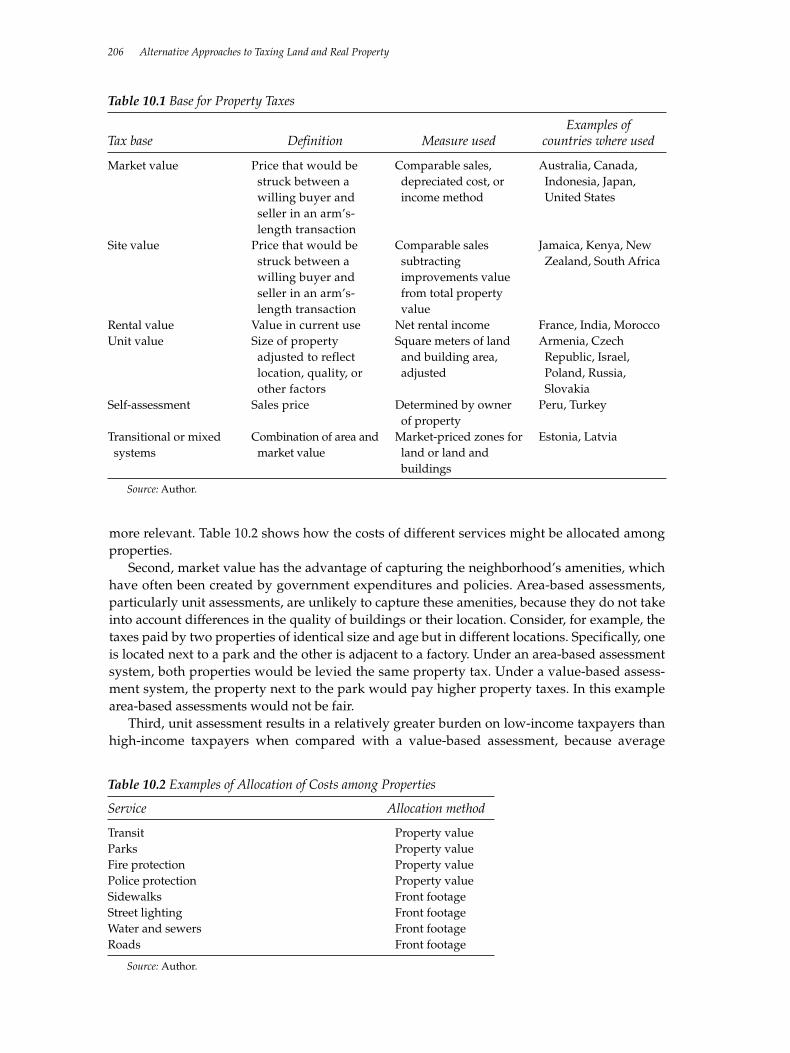
more relevant. Table 10.2 shows how the costs of different services might be allocated amongproperties.
Second, market value has the advantage of capturing the neighborhood’s amenities, whichhave often been created by government expenditures and policies. Area-based assessments,particularly unit assessments, are unlikely to capture these amenities, because they do not takeinto account differences in the quality of buildings or their location. Consider, for example, thetaxes paid by two properties of identical size and age but in different locations. Specifically, oneis located next to a park and the other is adjacent to a factory. Under an area-based assessmentsystem, both properties would be levied the same property tax. Under a value-based assess-ment system, the property next to the park would pay higher property taxes. In this examplearea-based assessments would not be fair.
Third, unit assessment results in a relatively greater burden on low-income taxpayers thanhigh-income taxpayers when compared with a value-based assessment, because average
206 Alternative Approaches to Taxing Land and Real Property
Table 10.1 Base for Property Taxes
Examples ofTax base Definition Measure used countries where used
Source: Author.
Market value
Site value
Rental valueUnit value
Self-assessment
Transitional or mixedsystems
Price that would bestruck between awilling buyer andseller in an arm’s-length transaction
Price that would bestruck between awilling buyer andseller in an arm’s-length transaction
Value in current useSize of propertyadjusted to reflectlocation, quality, orother factors
Sales price
Combination of area andmarket value
Comparable sales,depreciated cost, orincome method
Comparable salessubtractingimprovements valuefrom total propertyvalue
Net rental incomeSquare meters of landand building area,adjusted
Determined by ownerof property
Market-priced zones forland or land andbuildings
Australia, Canada,Indonesia, Japan,United States
Jamaica, Kenya, NewZealand, South Africa
France, India, MoroccoArmenia, CzechRepublic, Israel,Poland, Russia,Slovakia
Peru, Turkey
Estonia, Latvia
Table 10.2 Examples of Allocation of Costs among Properties
Service Allocation method
Transit Property valueParks Property valueFire protection Property valuePolice protection Property valueSidewalks Front footageStreet lighting Front footageWater and sewers Front footageRoads Front footage
Source: Author.
household incomes in high-value neighborhoods are higher than in low-value neighborhoods.A tax on square footage taxes all properties that are the same size the same amount whetherthey are in high-income or low-income neighborhoods. Similarly, older houses in a bad state ofrepair but with a large floor area will pay relatively higher taxes.
Furthermore, if a relatively poor neighborhood becomes richer, no relative tax changewould occur. A tax system that fails to take account of changes in relative values over time willresult in inequities among houses. If one value per square foot is chosen for all single-familyhomes, for example, and the relative property values change over time as some locationsbecome more desirable, then over a period of years, if the value per square foot is not changed,inequities in the assessment system will result (Bird and Slack 1993).
One of the stated advantages of unit value assessment is that property taxes based on it tendto be less volatile than under market value assessment, because they do not change when prop-erty values change. In any event, unit value assessment can easily evolve into a market valuesystem by defining zones more narrowly over time.
Some experts have also argued that unit value assessment is easier to understand andcheaper to administer than value-based assessment. This is particularly true where the realestate market is not well developed. Although unit value may be easier to administer for single-family residential properties, using it for multiresidential rental, residential condominium,commercial, and industrial properties is difficult. One problem is what to include for tax pur-poses. For example, one question is whether spaces such as atrium floors, servicing shafts, andelevator spaces should be taxed even though they have no revenue-producing space. Issuesarise about whether to include structural elements, such as decorative beams that project out-side the glass line, as is the case with some office towers. A second problem is how to allocateshared facilities, such as common entrances, halls, exits, aisles, atriums, or malls, between own-ers and tenants. For example, common areas can be shared on the basis of the size of each unitrelative to the total, the rent charged to each unit, or some other measure. A third problem inmarket economies has been the tendency toward the proliferation of multipliers that areapplied to the area of improved property to reflect the relative differences in value. In theNetherlands, for example, the system became so complex that it was abandoned (Youngmanand Malme 1994).
NEED FOR A UNIFORM ASSESSMENT SYSTEM. Whichever assessment method is used, fair prop-erty taxes have to be based on assessments that are uniform within each jurisdiction. In thisway, taxpayers share the costs of local government fairly. Furthermore, because the propertyassessment base is sometimes used as the measure of fiscal capacity for equalization grantsfrom senior levels of government, as is the case in Morocco, the assessment base needs to beuniform across jurisdictions.
Uniform assessment systems are easier to achieve where the assessment function is central-ized. Strauss and Sullivan (1998), for example, found that the use of county rather than localassessors resulted in more uniform residential assessments in U.S. jurisdictions. Furthermore,to the extent that economies of scale exist in the assessment function, these are more likely to beachieved at the central government level (Sjoquist and Walker 1999). When assessment is per-formed at the local level, an incentive exists to undervalue properties to increase the equaliza-tion grant.
Much of the criticism of the property tax stems from a lack of credibility in the fairness ofthe assessment base. Fair and productive property taxes require periodic revaluation to reflectchanges in the market. Frequent valuations maintain the legitimacy of the tax and reduce therisk of sudden, dramatic shifts in tax burdens caused by large increases in assessed values. Forthese reasons the valuation cycle needs to be fairly short.
Many countries use a three- to five-year cycle, and in some cases they index values in theintervening years using a price index (Bell 1999). In a market in which property values are
Enid Slack 207
changing, a shorter time frame for re-assessments would obviously be better for reflecting cur-rent market conditions. Indexing is not as good as re-assessment, because property valueschange at a different rate in different neighborhoods and for different property characteristics.Fairness is not achieved when property assessments are merely increased by a common factoron an annual basis. Indexing can be used, however, where financial resources are insufficient tocarry out regular reassessments. Indexing over a three- to five-year period that reflects relativeprice changes among locations and property markets can ameliorate taxpayers’ discomfortwith large assessment changes and improve information about market trends for assessmentadministrators.
Tax Rates
To determine the tax liability, the assessed value is multiplied by the tax rate. Given the size ofthe tax base, the tax rate determines how much revenue the property tax will generate. In mostNorth American jurisdictions, local governments first determine their expenditure require-ments. They then subtract nonproperty tax revenues available to them, for example, intergov-ernmental transfers, user fees, and other revenues, from their expenditure requirements todetermine how much they need to raise from property tax revenues. The resulting property taxrequirements are divided by the taxable assessment to determine the property tax rate.
By contrast, in many transition economies, the national government sets the rates for prop-erty taxes. Two exceptions are Estonia and Poland, where municipalities are allowed to deter-mine tax rates within fixed limits (Malme and Youngman 2000). In Poland local governmentsdetermine the tax rates on land and buildings through the annual budgetary process, but thecentral government sets upper and lower limits.
To be a truly local tax, local governments must set tax rates. If a local government is to makeefficient fiscal decisions, it needs to weigh the benefits of the proposed services with the costsof providing them. If local governments do not finance these services themselves, then the linkbetween expenditures and revenues is lost and the choice of services will not be based on theircost. Setting tax rates at the local level places accountability for tax decisions at the local level.Local determination of tax rates is particularly important where a senior level of governmentdetermines the tax base.
Local tax rates may have to be set within limits, however, to avoid distortions. A minimumtax rate may be needed to avoid distorting tax competition. For example, richer local govern-ments may choose to lower tax rates to attract more business. A maximum rate may be neededto prevent distorting tax exporting, whereby local governments levy higher tax rates on indus-tries for which nonresidents will bear the ultimate tax burden (for a discussion of tax exportingsee Boadway and Kitchen 1999).
Local governments may levy a series of rates that differ by property class. Property tax ratescan also vary according to the services received. For example, in some jurisdictions a generaltax rate applies across the city and a special area rate or additional surcharge applies in thoseparts of the city that receive services provided only to them, for example, garbage collection,street lighting, or transit. Special area rates, which are earmarked for services in those locations,approximate a benefit charge.
Variable tax rates are different tax rates for different classes of property, for example, resi-dential, commercial, and industrial. Generally where variable tax rates apply, properties areassessed at a uniform ratio (100 percent or less) of market value. Another way to differentiateamong property classes is through a classification-based assessment system. Under this system,tax jurisdictions differentiate classifications or types of property according to ratios of assessedvalue, but apply a uniform tax rate. In terms of accountability, variable tax rates would be morevisible and easier to understand for taxpayers than a classified assessment system. This systemgives local governments the power to manage the distribution of the tax burden across various
208 Alternative Approaches to Taxing Land and Real Property
property classes within their jurisdiction in addition to determining the size of the overall taxburden on taxpayers.
Variable tax rates may be justified on a number of grounds as follows:
• On the basis of fairness with respect to benefits received, some could argue that the ben-efits from local public services are different for different property classes. In particular, acase can be made on benefit grounds for taxing nonresidential properties at a lower ratethan residential properties.
• On efficiency (neutrality) grounds, some have argued that property taxes should beheavier on those components of the tax base that are least elastic in supply. Becausebusiness capital tends to be more mobile than residential capital, efficiency argumentslead to the conclusion that business property should be taxed more lightly than residen-tial property. In reality, however, tax jurisdictions generally apply lower rates to resi-dential properties.
• On the basis that higher property taxes on buildings tend to slow development and thatlower taxes speed up development, a municipal policy to develop some neighborhoodsinstead of others would call for differential taxes in different locations as well as for dif-ferent property classes. In this case variable tax rates are used to deliberately distortdecisions to achieve certain land use objectives.
Taxation of Nonresidential Property
Nonresidential properties include a wide variety of property uses, including commercial usessuch as offices, banks, retail outlets, restaurants, and hotels; industrial uses such as mines, man-ufacturing plants, and shipyards; and special uses such as pipelines and railway rights-of-way.As noted earlier, effective property tax rates (property taxes relative to market value) are gener-ally higher on nonresidential properties than on residential properties. As also noted, thehigher taxation of nonresidential properties cannot be justified on the basis of benefits receivedor on efficiency grounds. Notwithstanding all the reasons for taxing nonresidential property ata lower rate than residential property, most jurisdictions do the opposite. Local governmentstend to favor residential properties largely on political grounds: residential homeowners votein elections.
The ability of nonresidential property owners to export property taxes to residents of otherjurisdictions may require limits on the local government’s ability to determine tax rates on thisclass of property. At least to some extent, the consumers of the products or services produced innonresidential properties bear the burden of nonresidential property taxes. To the extent thatthe product or service is exported outside the jurisdiction, consumers in other jurisdictions maybear part of the tax. Tax exporting is inequitable, because the same benefits of local expendi-tures require different tax prices in different jurisdictions depending on the degree of export-ing. It tends to induce inefficient, additional local expenditures to the benefit of local residentswho may not be willing to bear the cost of such expenditures themselves. Finally, tax exportingdoes not enable accountability, because those bearing the burden of the tax are not the same asthose enjoying the benefits.
Within the category of nonresidential properties, linear properties, such as railway rights-of-way and gas pipelines, present unique challenges. Unlike other commercial and industrialproperties, these properties have extensive linear networks that are not specific to any one munic-ipality. They pass through urban and rural areas and areas where no people live. They receivelimited services. Because they have no links to the communities they traverse, no accountabilityexists at the municipal level for the taxes levied. Indeed, the tax revenues that accrue to munici-palities along the route are simply windfall revenues for which no services are provided. Forthese types of properties, a province-wide or nationwide tax rate may be appropriate.
Enid Slack 209
Taxation of Farm Properties
Tax jurisdictions usually favor farm properties in the property tax system as part of a more gen-eral policy of protecting farmland. A common way to favor farm properties is through assess-ment. Rather than using market value to assess farms, which reflects the highest and best use,farms are often assessed at their value in current use. This means that the value of a farm isdetermined by its selling price if it were to continue to be used as a farm. Alternative uses of thefarm, or its speculative value, are not considered in the determination of value.
Many Canadian and New Zealand jurisdictions use value in current use for farmland. InOntario, Canada, tax rates on farmland pending development can be phased in over stages. Thetriggers for tax increases are when the land is used solely for farm purposes but has been regis-tered for subdivision, and when the land is used solely for farm purposes but a building permithas been issued. In New Zealand, if the highest and best use exceeds current use, tax jurisdic-tions record both values. The difference between the taxes as assessed on the two values maybe postponed until the land is sold or no longer used for farming.
Other ways of favoring farm properties include providing exemptions for part or all of thefarm property, lowering tax rates on farms, or providing farm tax rebates. Tax jurisdictions givefull exemptions in Cyprus and Ireland, for example, whereas they provide partial exemptionsin Jamaica and the Netherlands. Lower tax rates apply in Ontario, where the farm tax rate andthe rate for managed forests are legislated to be 25 percent of the residential tax rate. Lowerrates replaced the earlier system of farm tax rebates in Ontario.
Incidence of the Property Tax
The statutory incidence of the tax (the taxpayers legally liable to pay the tax) is not necessarilythe same as the economic incidence (the taxpayers who bear the final burden of the tax) (for areview of the incidence of the property tax see Bird and Slack 1993). The reason for the differ-ence is that those who are liable for the tax can shift the burden onto others by altering theirbehavior. For example, the tax may be levied on an apartment owner (statutory incidence), butthe final burden may be borne by the renter (economic incidence), because the owner passesthe tax onto the renter as part of the rent.
The two views of property tax incidence are the “old” view and the “new” view. Accordingto the old or traditional view of property tax incidence, the tax is divided into a tax on land anda tax on improvements. Because the supply of land is fixed, it follows that the landowner bearsthe tax on the land component. Because the quantity of land supplied cannot be reduced, thelandowner cannot shift the burden onto others. However, because the supply of structures canbe altered through investment decisions, the portion of the tax that falls on structures may beshifted forward onto the consumers of the services provided by the structures. For rented resi-dential property, this means the tax can be shifted onto tenants; for nonresidential property thetax can be shifted to consumers of the goods and services produced by commerce and industry.For owner-occupied properties, owners bear the entire tax on structures in proportion to theirimputed housing expenditures. If the supply of structures is perfectly elastic in the long run, allthe tax can be shifted forward to tenants and consumers.
The new view of property tax incidence takes a different perspective on the property tax.The old view provides a partial equilibrium approach to property tax incidence and concernsthe incidence of a property tax change in a particular city. The new view provides a generalequilibrium approach and concerns the differential incidence of property taxes in general.
Under the new view, the initial assumption is that the property tax can be, in the firstinstance, viewed as being imposed at a uniform rate on all forms of property.10 Although the
210 Alternative Approaches to Taxing Land and Real Property
10. Note that the new view does not differentiate between residential and nonresidential property.
effective tax rate varies by jurisdiction and type of property, an “average” tax rate on all prop-erty determines the incidence of the property tax system as a whole. The tax in any one juris-diction is thus an average plus a differential.
The property tax under the new view is similar to a general tax on land and capital. If thetotal supply of land and capital is fixed, and certain other assumptions are made, the tax willsimply lower the rate of return to capital and land and no tax shifting will take place. The bur-den of the tax will be in proportion to the ownership of land and capital.
In reality, the property tax is not a uniform tax on all forms of capital. A good deal of the cap-ital stock is exempt from this tax and wide variations also exist in the effective tax rate becauseof type of capital and taxing jurisdiction. Differences exist in the composition of the tax base,exemptions, assessment methodology, rates, and other characteristics of the tax. These varia-tions give rise to “excise tax effects.”
The differential portion of taxes on land in fixed supply will, for example, tend to be capital-ized, while the differential taxes on reproducible capital will lead to movements of capitalamong industries and jurisdictions so as to tend to offset these differentials and ensure thatinvestors obtain similar after-tax returns on all investments. Over time, jurisdictions with aboveaverage property tax rates will suffer a decrease in local capital stock. The migration of capitalout of the high-tax jurisdictions will be followed by the migration of other mobile resources,such as skilled labor, to the low-tax jurisdictions. The result is that the tax in the high-tax areaswill be borne by the least mobile factors: unskilled workers, consumers who face higher pricesfor goods and services, owners of businesses that cannot move to other locations, and landowners. The opposite situation will occur in the low-tax jurisdictions.
In summary, the old view assumes the net return to capital is fixed and thus can only beapplied to the analysis of a property tax in an individual municipality. It concludes that theproperty tax is regressive, that is, low-income taxpayers bear relatively more of the tax. Thenew view explicitly looks at the effect of a property tax system in the whole economy andassumes that the supply of capital in the economy is fixed. It concludes that the tax is progres-sive, borne relatively more heavily by high-income taxpayers.
Property Tax Relief Measures
Notwithstanding the lack of agreement on whether the property tax is progressive or regres-sive, most jurisdictions have implemented property tax relief measures to reduce the perceivedburden on low-income taxpayers. Some property tax relief measures are designed to reduce theburden of property taxes on residential taxpayers in specific circumstances; other measures areprovided indirectly through the tax system, for example, differential tax rates provide relief tosome property classes such as residential and farm categories, and taxable assessment is some-times calculated at different percentages of assessed value for different types of properties.
Relief measures vary according to a number of factors: characteristics of the property (resi-dential versus nonresidential), characteristics of the beneficiaries (for example, owners versusrenters, income, age), and the extent to which these measures are permanent or transitory.Because most relief schemes apply to residential property, table 10.3 summarizes the character-istics of residential property tax relief programs. Relief programs include tax credits; deferrals;grants; exemptions; special relief schemes for poor taxpayers such as reductions, cancellations,and refunds; and assessment credits.
PROPERTY TAX CREDITS. The property tax credit is designed to alleviate the perceived regres-sivity of the property tax by relating the amount of the credit to personal income. The tax creditis based on the amount of property taxes paid (or a portion of the rent for renters) and theincome of the taxpayer. The credit is subtracted from the personal income taxes payable and isusually refundable. This means that if the property tax liability exceeds the income taxes
Enid Slack 211

payable, the government pays a refund to the taxpayer. These credits are progressive in inci-dence, especially if they are refundable, because they provide greater benefits to low-incomehouseholds than to high-income households.
Property tax credits can, however, result in liquidity problems for low-income taxpayers,because they are required to pay property taxes throughout the year but do not receive thecredit until they file their income taxes the following year. Furthermore, taxpayers are unlikelyto make the connection between the property taxes they pay and the tax credit, in part becauseof the delay in receiving the credit, but also because a senior level of government administersthe credits.
TAX DEFERRALS. Under a deferral scheme, property owners are permitted to defer some orall of their property taxes. Either the local government or a senior level of government recoversthe amount. The outstanding amount becomes a lien against the property and is payable whenthe property is transferred. It is a deferral of taxes and not a tax rebate. In some cases, an inter-est charge (often below the market rate of interest) applies to the taxes deferred. Property taxdeferral programs are generally restricted to elderly and disabled property taxpayers. They canbe especially useful in addressing the cash flow problems of seniors who are asset rich butincome poor.11
Although good economic arguments exist for using tax deferral schemes, they are not par-ticularly popular among taxpayers. The take-up rate is low “largely owing to the strong attach-ment of the old to their homes and to their desire to leave them unencumbered for their heirs”(Bird and Slack 1978, p. 98).
GRANTS. Some municipalities or senior levels of government provide grants to eligiblehomeowners or renters. The grant may be the same amount for all taxpayers; it may be
212 Alternative Approaches to Taxing Land and Real Property
Table 10.3 Residential Property Tax Relief Measures
Characteristics of beneficiaries
Owners or Based Permanent orProgram renters on income Other characteristics transitory
Property tax credit
Tax deferral
Grants
Exemptions
Reductions and/or cancellations and/or refunds
Assessment credits
Owners and/or renters
Owners
Owners and/orrenters
Owners or renters
Owners or tenants
Owners
Yes
No
Sometimes
Sometimes
Yes
No
n.a.
Elderly and/or disabled
Sometimes restricted to the elderly or those on social assistance
Sometimes restricted to the elderly
Poverty or illness
n.a.
Permanent
Until time of property transfer
Usually permanent
Permanent
Usually for one year; need to apply
Permanent
n.a. Not applicable. Source: Author.
11. Tax deferrals should not be expanded to include the non-elderly, because the loans would be out-standing for a much longer time, and it would be necessary to determine eligibility for a referral to ensurea reasonable number of beneficiaries.
restricted to only some recipients, for example, the elderly or those on social assistance; or itmay vary inversely with income. The advantage of a grant scheme over a tax credit scheme isthat tax jurisdictions can link it more directly to the property tax liability; the taxpayer canreceive the grant in time to pay the property tax. A grant scheme can also be more directly tar-geted to those in need, especially in smaller communities where hardship cases are easily iden-tified.
EXEMPTIONS. An exemption removes specific properties from the tax base. Exemptionsare similar to grants that completely offset the tax liability. If an exemption is only availableto a class of taxpayers, such as elderly taxpayers, it will not necessarily be based on abilityto pay.
REDUCTIONS, CANCELLATIONS, AND REFUNDS. Some municipalities may refund, cancel, orreduce taxes in special cases of poverty or illness. The benefit of these programs usually onlyapplies for one year, and taxpayers have to re-apply in subsequent years. These programs, likegrants, work best in smaller communities where hardship cases are easily identified.
ASSESSMENT CREDITS. Assessment credits mean the removal of a fixed amount from the mar-ket value assessment of each residential property. The municipal council determines the fixedamount. Because the amount is the same for all properties, the scheme turns the property taxinto a progressive tax. The assessment results in a smaller tax base overall. This means that toraise an equivalent amount of tax, higher tax rates are required. For those with relatively lowproperty values, the effect of the assessment exemption would outweigh the effect of anincreased tax rate. Thus they would benefit from lower property taxes. For those with relativelyhigh property values, the tax rate increase would outweigh the effect of the assessment exemp-tion, and they would pay higher taxes.
The assessment credit is based only on property values and not on property owners’ abilityto pay the tax. The credit would be based on ability to pay only to the extent that property val-ues and incomes are highly correlated. For example, the elderly living in high-valued homesbut with low incomes would gain little benefit.
COMBINED PROPERTY TAX RELIEF OPTIONS. Some municipalities provide more than one typeof property tax relief. For example, property tax credits may be combined with tax deferrals forthe elderly. Reductions, cancellations, or refunds may be needed for specific hardship caseseven where tax jurisdictions use other relief schemes.
Land-Based Revenue Systems
In addition to the property tax, other forms of land-based revenues used by local governmentsinclude the following:
• Special assessments: property taxes for specific capital facilities in specific neighborhoods • Land value increment taxes: taxes on increases in land value as a result of a proposed capi-
tal investments• Land transfer taxes: taxes on the value of properties at the time of sale• Development charges: taxes on developers to pay for the infrastructure required to
develop land parcels.
With the exception of land transfer taxes, local governments generally use these land-basedrevenues to finance infrastructure, whereas they use property taxes mostly for operating expen-ditures (though sometimes they allocate portions to capital expenditures).
Enid Slack 213
Special Assessments
Special assessments, which are also known as local improvement charges, are compulsorycharges imposed on residential, commercial, and industrial properties to pay for additions orimprovements to existing capital facilities that border on those properties. They are most oftenused for capital expenditures to pave or repave streets, install or replace water mains or sewers,construct sidewalks, install street lighting, and so on. Although the magnitude of the charge isbased on a particular capital expenditure in a particular year, the costs may be spread over anumber of years.
The most common base for special assessments is the front footage of those properties thatabut the capital works in question, but the charges can also be levied on the basis of lot size,assessed value of property, or zone. Special assessments are not as efficient as user fees, becausethe charge is not directly related to the use of the service, but they do approximate benefit taxesmore closely than the property tax. Many public works increase the value of nearby land, pro-viding a financial benefit to the owners. With a special assessment, the municipality constructsthe works and then recoups the cost through a special assessment on the properties that directlybenefit from the government expenditure.
In theory, the apportionment of capital costs to benefiting property owners should reflectthe value of the additional benefits that each property receives, where the value is measured bythe increase in property value. For example, a water main on a residential street would pre-sumably make that street relatively more desirable. For a given supply of residential propertieson that street, the resulting increase in demand would increase prices. Thus, all other thingsbeing equal, the benefit of the water main would be reflected in property values. In reality, how-ever, isolating the effect of one capital expenditure from other influences on property values isdifficult. For this reason, measures such as front footage and lot size are often used rather thanassessed value.
Although Boadway and Kitchen (1999) note that special assessments do not generally con-tribute a large amount of money to municipal revenues in countries like Canada where they areused, they are an important way of financing local improvement projects. This is because thecosts of the projects financed in this way are allocated on the basis of the benefits received fromthe infrastructure.
Local governments in Poland have the option of levying an “adjacency” fee to recover partof the costs of infrastructure investment, for example, street lights or sidewalks. When a publicinvestment increases the value of adjacent property, the local government can levy a specialassessment within three years after making the improvements. The cost for an individual prop-erty cannot exceed 50 percent of the increase in value attributable to the improvements. Prop-erty owners can pay in annual installments for a period not exceeding 10 years (Malme andBrzeski 2000).
Land Value Increment Taxes
Governments levy land value increment taxes to capture the increment in land value attributa-ble to public efforts rather than to the landowner’s own actions. These taxes are also known asland value capture taxes, betterment levies, and valorization taxes. Although land value incre-ment taxes have had a long history in a number of Latin American countries, they are still notwidely used around the world.
This form of taxation has generally been proposed in situations where a municipality is con-templating a major infrastructure investment such as a new subway. Other examples where aland value increment tax could be used include schools, parks, conservation areas, and anyother public investment that increases the value of adjacent land. The unearned increments canbe captured indirectly through conversion into taxes or fees or directly through on-siteimprovements that benefit the community at large (Smolka and Furtado 2001).
214 Alternative Approaches to Taxing Land and Real Property

A large investment of this nature requires a capital outlay of billions of dollars immediately,but the benefits will not be enjoyed for several years. The tax is designed so that the costsincurred during the current period are shared among future beneficiaries. This involves identi-fying the beneficiaries and the benefits they will receive and estimating the present value ofthose future benefits.
In terms of future benefits, the local government will enjoy increased property tax revenues;the benefits to the private sector can be described in terms of potential profits. Increaseddemand for development along the subway line, for example, will permit property owners toincrease rents. Furthermore, zoning changes often accompany investment in infrastructure:increased densities permitted along the subway line, for example, will result in increased landvalues.
The decision of the public sector to construct major infrastructure results in a windfall gainto owners of property nearby. For example, a subway increases demand for housing and officeson properties located near it. Given normal demand and supply conditions, the increaseddemand results in higher prices being charged for these properties. Through no efforts on thepart of the property owners, the value of their property increases. Rather, the efforts of the localgovernment cause these values to increase. A land value capture tax is a way for the public sec-tor to tax some or all of the windfall gain that it has created. However, isolating the change inproperty value arising from the public investment in infrastructure from other market forcesthat affect land prices does pose some difficulties. To some extent, the increased densities andincreased land values will be reflected in property tax revenues if market value assessment isthe base of the tax.
A review of valorization taxes in Colombia suggests that a number of elements are requiredfor the implementation of this tax to be successful (Bird 1992). One particularly important ele-ment is the linking of taxes to benefits: “The valorization tax over the long run must haveapproached a benefit basis in fact as well as belief” (Bird 1992, p. 165). In the case of the subwayexample, the tax is specifically levied to pay for a subway line. Although earmarking of taxesalong these lines is often criticized, earmarking the revenues of a land value increment tax canwork if the tax rate is changed regularly to reflect revenue needs.12 A land value increment taxcreates an incentive to examine the prospective benefits from projects more closely than mightotherwise be done.
Those who criticize the fairness of the tax argue that land value increment taxes reduce thescope of income redistribution through taxation. This problem is lessened, however, to theextent that the income from these taxes finances specific projects, and as such does not consti-tute the main source of revenues to local governments.
In terms of tax administration, land value increment taxes have some advantages. Enforce-ment is somewhat easier than with a general property tax, because the tax is collected in largeamounts from a relatively small number of taxpayers. Poor administration, however, can alsolead to criticisms of the tax if, for example, projects financed by tax revenues are not on sched-ule or if the tax is calculated to be greater than the increase in property values.
Land value increment taxes are similar to site value taxes in that they both tax location rents,or the returns from a particular location regardless of the improvements to the site. In the caseof land value increment taxes, only the portion of the increased value that is a direct result ofthe public investment is taxed. Site value taxes, by contrast, also tax increases in site values thatmay arise for other reasons, such as unique locational advantages. This means that the poten-tial revenue from a site value tax is greater than from a land value increment tax.
The land value increment tax, like site value taxes but unlike property taxes, does not penal-ize the development of unimproved land. It will tend to encourage more intensive uses of land
Enid Slack 215
12. Earmarking is sometimes criticized for limiting budgeting flexibility, which results in insufficientrevenues for some activities and too much for others.
by making it less profitable for landowners to withhold land for speculative purposes. Thelandowner will either realize the opportunity cost of holding the land vacant by putting it tomore profitable use or will sell it to someone who will. The land value increment tax is likely tobe more effective in increasing the intensity of land use than site value taxes, however, becauseit is a large tax assessed over a short period of time.
Land increment taxes can also be compared with a capital gains tax on property. Many coun-tries tax capital gains from the sale of property, though capital gains on a principal residenceare exempt in Australia and Canada, and a portion of the gains on a primary residence areexempt in the United States. Tax jurisdictions levy the tax on the increase in value between theacquisition price and the sale price of the property. The tax rate may depend on the length ofthe holding period. One of the main differences between capital gains taxes and land valueincrement taxes is that the latter tries to isolate only the increase in value arising from a publicinvestment, whereas a capital gains tax is levied on all the gains regardless of their source. Acapital gains tax on the land portion only would tax the increment in land value and notimprovements to the property, but would not isolate the increase in land value arising from apublic investment. Furthermore, payment of a capital gains tax generally takes place when theincrement is realized by sale. Neither site value taxes nor capital gains taxes are designed toprovide the public investments that will lead to the increment in land value.
A type of land value increment tax commonly used for urban revitalization in U.S. cities istax increment financing (TIF). TIF legislation exists in 40 U.S. states, and the United Kingdomuses a similar program in local jurisdictions. TIFs have been applied to downtown areas thatneed revitalization, brownfield remediation,13 and to pay for deteriorating infrastructure (fora review of TIFs see Anderson 1990; Wassmer 1994). Under a TIF, the city government definesa district for renewal and freezes the annual property tax revenue accruing to all taxingauthorities within the district, including the municipality, the county, school boards, and soon, at prerevitalization levels. These are known as the base level property taxes. For a periodof time, generally between 15 and 35 years, all or some portion of the incremental tax gener-ated beyond the base level accrues to the redevelopment agency to be used for the redevelop-ment. After the TIF period expires, tax revenues from the expanded assessment base againflow through the taxing authorities. Based on these TIFs, the local government (or the privatesector) can borrow funds to pay for the infrastructure. TIF revenues are used to pay back theborrowed funds.
The idea behind a TIF is that investment in infrastructure or redevelopment will result inincreased tax revenues for the TIF district. For example, property owners may benefit from amore appropriate or a more affordable site. Under this scheme, the tax authorities do not taxproperty owners at a different rate than other city landowners. Rather, property owners con-tinue to pay the taxes on the assessment base, but the local government dedicates the incre-mental taxes to redevelopment or to infrastructure investment. If the TIF achieves the resultspredicted, no direct transfer of funds from the government takes place, nor does any transfer oftax dollars from one business subsidize another business.
Critics of TIFs point to several problems, however. TIFs may not be able to generate the pre-dicted tax revenues, and the resulting lack of funds could threaten efforts to revitalize the des-ignated area. Some have argued that TIFs may merely accelerate development that would have
216 Alternative Approaches to Taxing Land and Real Property
13. Brownfields are urban sites that are underutilized, often vacant, and sometimes contaminated.Because of their proximity to downtown areas where infrastructure is generally in place, brownfields holda great deal of potential for redevelopment. The realization of this potential is hindered, however, by thecleanup costs of contaminated land and the costs of upgrading or replacing existing but older infrastruc-ture. In many cases, traditional sources of private financing are hesitant to invest in brownfield sitesbecause of the risks associated with their redevelopment. Although there is the potential for futurerewards, these lands often remain unused because of a lack of up-front redevelopment financing.
occurred anyway. Other taxing authorities, such as school boards, resent that their propertytaxes are frozen when they are experiencing growth in demand as a result of the revitalization.Finally, TIFs have been criticized for targeting funds to a designated area at the expense of areason the periphery of the TIF district or at the expense of overall municipal growth.
Land Transfer Taxes
Tax authorities levy land transfer taxes at the time of sale of a property and usually calculatethem as a percentage of the value of the property transferred. The tax, which must be paidbefore the transfer is registered, is like a sales tax payable by the purchaser and is calculated asa percentage of the purchase price. A number of variations on land transfer taxes exist. Forexample, the tax rate sometimes increases with the value of the property; in some cases, taxesare higher on nonresidents.
Many countries impose transfer taxes. In Australia, Japan, Sweden, and the United King-dom they are known as stamp duties. The following summarizes the use of land transfer taxesin four transition economies (Malme and Youngman 2000):
• In Armenia the real property transfer tax is a percentage of the declared value or officialprice, whichever is greater.
• In Estonia real property transfers are subject to a transfer fee, which is calculated as arate times the value. The rate is a fixed amount for properties over a certain amount,and a sliding scale exists for properties of lower value.
• In Poland three transfer taxes or fees are levied on the property value: stamp duty,notarial fee, and title registration fee. Both the stamp duty and the notarial fee are leviedat a percentage of the reported sales price. The Land Title Registry collects a fee, whichis a percentage of the reported price, to record the new ownership title.
• In Slovakia the value of the base for the transfer tax is specified by a price decree of theMinistry of Finance. When property is transferred, administrators can choose the higherof the reported sales price or the assessed price. The assessment is done by appraisers.
Central and local governments can levy land transfer taxes. When levied at the local leveltax rates have to be fairly low to avoid distortions (people moving in response to the tax). Whenrates are set low, however, the administrative costs at the local level end up being high relativeto the amount of revenues collected.14
The revenues generated from a land transfer tax depend on activity in the real estate mar-ket. As land values rise and activity in the market grows, the yield of the tax will increase. A lullin the real estate market, however, will result in a lower yield from a land transfer tax. Landtransfer taxes discourage full reporting of transaction amounts and thus reduce the reliabilityof this source of data for property tax administration (Bahl 1998).
The purchaser pays the land transfer tax to the government. In terms of incidence, individu-als have little ability to pass on the tax, although consideration of the tax may lower the price abuyer is willing to pay for property. Because the tax is usually small, however, the effect onprice is not likely to be significant. In the case of businesses, the tax is a capital cost that is likelyto be recovered over time through higher prices for goods and services.
Although the tax is probably borne more by high-income people, the value of homes rela-tive to income tends to decrease as incomes increase. This means that the land transfer tax isregressive relative to income for those who pay the tax. In cases where the tax rate is higher on
Enid Slack 217
14. To the extent that the collection of land transfer taxes provides an opportunity to collect otherunpaid taxes on the property being transferred, the administrative burden as a percentage of the total taxrevenues may be lower.
portions over a certain value, the tax would be less regressive. In terms of benefits receivedfrom the tax, governments generally bestow few benefits on property purchases that are notalready picked up by user fees charged by the land titles or land registry office.
An example of a particular type of land transfer tax was the land speculation tax in Ontario,Canada. This was a provincial tax imposed in 1974 to tax gains realized on the disposition ofreal property, including buildings and fixtures. The purpose of the land speculation tax was torestrain the rate of increase of land and housing prices by curtailing speculation and to recovera major share of windfall gains from land speculation for the public. The tax rate of 20 percentapplied to all realized capital gains with some exceptions. These exceptions included principalresidences; developed industrial or commercial properties; properties sold to the government;properties that were substantially improved by building a new structure or renovating an exist-ing structure; residential investment properties owned by transferors for at least 10 years thatcontained structures worth at least 40 percent of the total value; farm properties owned bytransferors for at least 10 years; and properties that which were included in a registered plan ofsubdivision and had been wholly or partially serviced by the transferor.
Smith’s (1976) study of the effect of the land speculation tax showed that while the taxcaused a temporary reduction in the price of houses, it left the upward trend in house pricesunaffected. Furthermore, the study found that a land speculation tax tends to increase concen-tration in the construction industry and in the ownership of residential investment properties,and thereby tends to reduce competition in the industry. It also encourages the deterioration ofresidential investment properties and reduces the availability of funds for investment in realproperty.
Finally, the tax requires a considerable bureaucracy to administer it and may not generatesufficient revenues to cover the administrative costs. In the extreme, if the tax did eliminatespeculation, no tax revenues would accrue at all. In the Ontario example, the tax eliminatedmost of the taxable transactions, with the result that revenues were small and probably lessthan the administrative costs and other foregone tax revenues, such as land transfer, income,and capital gains taxes. The provincial government eventually eliminated the tax.
Development Charges
Local governments levy development charges (also known as exactions and lot levies) ondevelopers in North American jurisdictions to cover the growth-related capital costs associatedwith new development, or in some cases redevelopment. These charges provide revenues fromthe private sector to municipalities to finance infrastructure needs arising from growth (for areview of the application of development charges by municipalities across Canada see Slack1994). Municipalities generally levy development charges for officially mandated programsand have to use the funds collected to pay for the infrastructure made necessary by the devel-opment.15 Before municipalities levied development charges, they paid for infrastructure out ofproperty tax revenues, user fees, intergovernmental transfers, reserves, and borrowing. Devel-opment charges require the private sector to pay for the capital costs imposed on municipali-ties resulting from development. The main rationale for development charges is simply thatgrowth should pay for itself and not be a burden on existing taxpayers. The involvement of theprivate sector enables the provision of needed infrastructure when government funding is con-strained.
218 Alternative Approaches to Taxing Land and Real Property
15. Municipalities in Canada have, historically, required developers to provide or pay for on-site serv-ices, such as streets, street lighting, sidewalks, and other public facilities within a subdivision. Morerecently, municipalities have extended the responsibility to developers to pay for the off-site costs associ-ated with new development. Although most municipalities specify the on-site costs that developers mustcover, not all municipalities make developers pay for the off-site costs. Development charges only apply tothe off-site costs.
Development charges are usually structured according to a set of rules so that they cannotbe negotiated. For example, local governments in Ontario are required to calculate the need forthe services to be financed by development charges where the need for services depends on theforecasted growth over the next 10 years and the existence of excess capacity. Local govern-ments have to specify future capital expenditures by category of expenditure and determinewhat portion of these expenditures is growth related. The calculation of the developmentcharge cannot be based on a level of service that exceeds the average level of service providedin the municipality over the last 10 years. Municipalities are also required to estimate the effectof their capital expenditures on future operating expenditures to determine if these costs can bepaid for out of local revenues such as property taxes and user fees.16
In terms of the geographic application of the development charge, a municipality can (a)charge all developments in the municipality for all services, (b) charge part of the municipalityfor all services, (c) charge different amounts in different municipal service areas to reflect dif-ferent costs, or (d) levy a uniform charge across the municipality plus charges for specific serv-ices in specific areas.
Other formal or informal exactions on the developer exist that are part of the subdivisionapproval process, but are not strictly development charges. These include, for example, landdedications that require the developer to set aside land for roads, other public works, andschool sites, or for environmental reasons; parkland dedications that require a portion of theland used for development to be set aside for parkland or the developer to make a cash pay-ment in lieu of parkland; density bonusing whereby developers are granted higher densitiesthan are permitted by planning regulations in return for meeting conditions such as providingday care, preserving an historic building, and so on; connection fees to permit developers tobuy into existing water and sewer facilities; and oversizing provisions (sometimes called front-end financing) that require developers to provide more infrastructure than is required for theirdevelopment. In some cases the municipality agrees to recover part of the costs on behalf of thedeveloper from future benefiting owners.
DEVELOPMENT CHARGES AND LAND USE. Development charges can be a useful tool inencouraging efficient land use and infrastructure use. To be efficient, however, jurisdictionsmust structure charges to reflect the true costs of providing public services. Area-specificcharges allow municipalities to vary the charge by area of the city according to the differentinfrastructure costs imposed on the city by each area. The costs of services may vary by area,because the distance of each development from major facilities may be different, infrastructuremay already exist in some areas, and service standards differ (Tomalty and Skaburskis 1997).Whatever the reason for the differential costs, efficient land use requires that developments thatimpose higher infrastructure costs on the city pay higher development charges than develop-ments that impose lower costs.
If the development charge reflects the full private and social costs and benefits of the devel-opment, then developers will make efficient choices about where to locate their development.The charge is similar to a price for services rendered. In the absence of a development charge,the developer considers only the costs and benefits of alternative locations and does not con-sider the effect of the development on the municipality’s costs of providing services.
Because the cost of services varies by the type and location of development, an efficientdevelopment charge would have to vary by these characteristics of the development. For exam-ple, developments located close to existing services should pay less than those farther away.
Enid Slack 219
16. The estimated capital costs have to be reduced by an amount that reflects a municipality’s excesscapacity and by an amount that reflects the benefit to existing development. Furthermore, legislationrequires that the capital costs be reduced by 10 percent for infrastructure other than water supply, waste-water, storm water drainage, services related to highways and electrical power, and police and fire protec-tion services.
Alternatively, a uniform charge levied across the city, regardless of variations in the actual costof providing services, would provide an incentive to develop farther away from existing serv-ices. A development charge that is the same amount per unit regardless of where the unit islocated will not reflect the true costs of the development to the municipality and will not leadto efficient development decisions. When urban form and density are not fully factored into thedevelopment charge, a market distortion occurs, and inefficient allocation of resources is oftenthe result. A uniform charge subsidizes inefficient uses of land, and developments that incurlower costs end up subsidizing developments that impose higher costs.
INCIDENCE OF DEVELOPMENT CHARGES. A number of studies have investigated the issue ofwho bears the burden of development charges (for a review see Slack 1994). The developer paysthe charge generally at the time of subdivision approval or issuance of the building permit or atthe time of subdivision construction. As with the property tax, the economic incidence of thecharge is not necessarily the same as the statutory incidence. The charge may ultimately beborne by new homebuyers, the predevelopment landowner, the developer or builder, or somecombination of these players.
The incidence of development charges depends on the uniformity of the charge withinhousing markets, the demand and supply conditions in the market for new housing, and thedeveloper’s awareness of the charge and its magnitude before undertaking the development.
A uniform charge is one that is comparable across a particular housing market. With a uni-form charge, the degree to which developers will pass it onto new homebuyers or back ontolandowners depends on the demand and supply conditions in the housing market. In the longrun most experts believe that demand for housing is price inelastic and that the supply of hous-ing is elastic. On the demand side, this means that new homebuyers are relatively insensitive toprice: if prices increase, the demand for housing will fall only slightly. On the supply side, anelastic supply means that development is responsive to price changes. The combination ofinelastic demand and elastic supply means that a uniform charge is likely to be shifted forwardonto new homebuyers.
If market conditions do not permit the developer to pass the charge forward onto the newhomebuyer, then the developer will not develop the land. The price of land will fall, and theburden of the charge will be borne by the owner of the land at the time the charge was imposed.Thus the timing of the charge also influences who bears the burden. Even if the developer bearspart of the burden in the short run, the developer is unlikely to bear the burden in the long run.Increased demand for housing in the future will cause prices to rise to the point where pro-ceeding with the development is profitable. In the long term the burden will be shifted forwardonto the new homebuyer.
Where the charge is nonuniform within the same housing market, for the developer to passthe charge forward onto the new homebuyer will be more difficult because competitors innearby locations with lower development charges will not raise their house prices by as much.Where the charge cannot be passed forward, the developer will develop less land, and the priceof land will come down. The landowner will bear the differential at the time the charge is antic-ipated. In the long term, when increased demand for housing results in an increase in the priceof housing, the developer will be able to pass the charge forward onto the new homebuyer.
In summary, the development charge is likely to be passed forward onto the new home-buyer, if not in the short term, then certainly in the long term. With respect to rental housing,property owners are likely to pass the charge onto tenants. The analysis of who bears the bur-den of development charges on commercial and industrial property is similar: the charge islikely to be passed forward onto the consumers and producers of services provided by theseproperties in the same way that the residential charge is passed onto new homebuyers.
EFFECT OF DEVELOPMENT CHARGES ON EXISTING VERSUS NEW RESIDENTS. One of the mainadvantages of development charges is that growth pays for itself and does not create a burden
220 Alternative Approaches to Taxing Land and Real Property
for existing residents. The previous discussion of who bears the burden of the developmentcharge notes that the price of new housing would increase. The price of existing housing willalso increase as a result of the levying of development charges because new housing and exist-ing housing are reasonable substitutes. This means that owners of existing housing will enjoy awindfall gain as a result of the higher prices of their houses.
In comparing new and existing residents, two further points can be made. First, to the extentthat property taxes and user fees paid by new residents are used to help defray the debt costsassociated with existing infrastructure or to finance present or future capital expenditures, forexample, where replacement costs of existing infrastructure are charged to existing residentsthrough property taxes or user fees, new residents are paying not only for their own facilitiesbut also for those of previous and future generations. Second, to the extent that infrastructurebeing enjoyed by existing residents was financed in large part by previous generations of tax-payers, a move from tax revenues to development charges on new residents means that exist-ing residents enjoy a windfall gain. Their services were paid for, in part, by previous genera-tions, and they are not required to pay for future generations.
DEVELOPMENT CHARGES AND ACCOUNTABILITY. Where developers pass the developmentcharge onto the new homebuyer, problems of accountability may arise. New homebuyers paythe charge before moving into the neighborhood, that is, before they are voters. In the case ofproperty taxation, voters can register their opposition to high taxes at election time. In the caseof development charges, those who pay them are not voters at the time the government leviesthe charges and cannot register their opposition.
DEVELOPMENT CHARGES AND BORROWING COSTS. In the absence of development charges, citiesgenerally borrow funds to pay for infrastructure and pass the costs of the infrastructure (plus theborrowing costs) onto taxpayers through the property tax. With development charges, the devel-oper pays the charge up-front using borrowed funds or equity and then passes these costs ontoresidents.17 In theory, in the absence of interest rate differentials, a new homebuyer should beindifferent between a development charge financed over the mortgage period and annual prop-erty tax payments. In reality, however, homebuyers face borrowing constraints. An addition tothe purchase price of the house, resulting, for example, from a development charge, may meanthat a new homebuyer facing a borrowing constraint can no longer purchase the house.
One of the differences between levying development charges and levying property taxes topay for capital costs relates to who borrows funds. In the case of the development charge,developers and new homebuyers borrow funds; in the case of the property tax, the city borrowsfunds. If cities can borrow more cheaply than new homebuyers and more cheaply than devel-opers, then development charges may be less efficient than municipal borrowing to financeinfrastructure.
References
Anderson, John. 1990. “Tax Increment Financing: Municipal Adoption and Growth.” NationalTax Journal 43(2): 155–64.
Bahl, Roy. 1998. “Land Taxes Versus Property Taxes in Developing and Transition Countries.”In Dick Netzer, ed., Land Value Taxation: Can It and Will It Work Today? Cambridge, Massa-chusetts: Lincoln Institute of Land Policy.
Bahl, Roy, and Johannes Linn. 1992. Urban Finance in Developing Countries. Cambridge, U.K.:Oxford University Press.
Enid Slack 221
17. Municipalities can generally include borrowing costs in the development charge.

Bell, Michael. 1999. “An Optimal Property Tax: Concepts and Practices.” World Bank, Inter-governmental Fiscal Relations and Local Financial Management Department, Washington,D.C.
Bird, Richard, M. 1992. Tax Policy and Economic Development. Baltimore, Maryland: The JohnsHopkins University Press.
Bird, Richard, M., and Enid Slack. 1978. Residential Property Tax Relief Measures in Ontario.Toronto: University of Toronto Press.
_____. 1993. Urban Public Finance in Canada, 2nd ed. Toronto: John Wiley.
Boadway, Robin, W., and Harry M. Kitchen. 1999. “Canadian Tax Paper No. 103.” In CanadianTax Policy, 3rd ed. Toronto: Canadian Tax Foundation.
Bryson, Phillip, and Gary Cornia. 2000. “Taxes on Real Property in the Czech Republic.” InJane H. Malme and Joan M. Youngman, eds., Case Studies. Washington, D.C.: World Bank.
Dillinger, William. 1992. Urban Property Tax Reform Guidelines and Recommendations. Washing-ton, D.C.: World Bank, Urban Management Program.
Fischel, William A. 2000. “Homevoters, Municipal Corporate Governance, and the BenefitView of the Property Tax.” National Tax Journal LIV(1): 157–73.
George, Henry. 1879, reprinted 1979. Progress and Poverty. New York: Robert SchalkenbachFoundation.
King, David, N. 1988. “Accountability and Equity in British Local Finance—The Poll Tax.” Dis-cussion Papers in Economics, Finance, and Investment, University of Stirling, Stirling, Scot-land.
Kitchen, Harry. 1992. Property Taxation in Canada. Toronto: Canadian Tax Foundation.
Kitchen, Harry, and Enid Slack. 1993. Business Property Taxation. Kingston, Ontario: Queen’sUniversity.
Kitchen, Harry, and François Vaillancourt. 1990. “The Federal Grants-in-Lieu of Property TaxesProgram: An Assessment.” Canadian Tax Journal 38(4): 928–36.
Malme, Jane H., and W. Jan Brzeski. 2000. “Property Tax Developments in Poland.” In Jane H.Malme and Joan M. Youngman, eds., Case Studies. Washington, D.C.: World Bank.
Malme, Jane H., and Joan M. Youngman, eds. 2000. “The Development of Property Taxation inEconomies in Transition.” In Case Studies. Washington, D.C.: World Bank.
McCluskey, William, ed. 1999. Property Tax: An International Comparative Review. Aldershot,U.K.: Ashgate Publishing.
Netzer, Dick. 1966. Economics of the Property Tax. Washington, D.C.: The Brookings Institution.
_____. 1998. “The Relevance and Feasibility of Land Value Taxation in the Rich Countries.” InDick Netzer, ed., Land Value Taxation: Can It and Will It Work Today? Cambridge, Massachu-setts: Lincoln Institute of Land Policy.
Sjoquist, David L., and Mary B. Walker. 1999. “Economies of Scale in Property Tax Assess-ment.” National Tax Journal 52(2): 207–20.
Slack, Enid. 1994. “Development Charges in Canadian Municipalities: An Analysis.” Reportcommissioned by the Intergovernmental Committee on Urban and Regional Research,Toronto.
Slack, Enid, John LaFaver, and Ihor Shpak. 1998. “Property Tax in Ukraine: Third Attempt.”Budget and Fiscal Review (Fiscal Analysis Office, Verkhovna Rada) (2): 32–45.
222 Alternative Approaches to Taxing Land and Real Property
Smith, Larry. 1976. “The Ontario Land Speculation Tax: An Analysis of an Unearned Incre-ment Land Tax.” Land Economics 52(1): 1–12.
Smolka, Martin, and Fernanda Furtado. 2001. “Lessons from the Latin American Experiencewith Value Capture. Land Lines (newsletter of the Lincoln Institute of Land Policy, Cam-bridge, Mass.) 13(4): 5–7.
Strauss, Robert P., and Sean R. Sullivan. 1998. “The Political Economy of the Property Tax:Assessor Authority and Assessment Uniformity.” State Tax Notes 15(December 21): 1603–10.
Tanzi, Vito. 2001. “Pitfalls on the Road to Fiscal Decentralization.” Working Paper no. 19.Carnegie Endowment for International Peace, Washington, D.C.
Tomalty, Ray, and Andrejs Skaburskis. 1997. “Negotiating Development Charges in Ontario:Average Cost Versus Marginal Cost Pricing of Services.” Urban Studies 34(12): 1987–2002.
Vaillancourt, François. 1998. “Local Government Finance in Tunisia: A Note.” World Bank,Washington, D.C.
Vaillancourt, François, and R. Renneberg. 2000. “Revenue Sources of Cities.” Urban and CityManagement Program, World Bank Institute, Washington, D.C.
Wassmer, Robert. 1994. “Can Local Incentives Alter a Metro City’s Economic Development?”Urban Studies 31(18): 1251–78.
Youngman, Joan, and Jane Malme. 1994. An International Survey of Taxes on Land and Buildings.Netherlands: Kluwer Law and Taxation Publishers.
Zodrow, George R. 2000. “The Property Tax as a Capital Tax: A Room with Three Views.”National Tax Journal LIV(1): 139–56.
Enid Slack 223

11Local Business Taxes
Richard M. Bird
Cynics have sometimes said that economists cannot agree about anything, but many econo-mists do agree on one important issue: while collecting many taxes through businesses isclearly convenient, there is little justification for taxing business as such. In the end, all taxeshave an economic impact on people. Policy has little to gain and potentially much to lose byconfusing the issue and pretending to tax companies and not people. Hiding who really paysthe bills is not a good way to ensure accountable public sector decisions.
In addition, most forms of business taxation tend to impose economic costs by distortingdecisions on such matters as the decision to incorporate, the debt-equity ratio, and the dividendpolicy along with where and how much to invest. Business taxes may also impose significantcosts and barriers to the expansion of new and small firms. These arguments may sometimes beoverstated, for example, when the untaxed allocation of resources is clearly distorted by monop-oly or externalities. On the whole, however, they are sufficiently well founded to persuade manyeconomists that, based on efficiency grounds, taxes on corporations in particular have fewadvantages, and much the same can be said for business taxes in general. Moreover, the eco-nomic case against such taxes seems even stronger at the local level than at the national level.
The virtual unanimity of professional economic advice on this issue is more than matched,however, by the unanimity with which governments at all levels appear to ignore it and imposesuch taxes. They do so for many reasons, some specious, some perhaps justifiable in certain cir-cumstances, and some more compelling. Indeed, contrary to the conventional economic wis-dom, there are often good reasons why in many instances local governments should indeedimpose some form of taxation on businesses operating within their jurisdictions (for an argu-ment supporting national corporation income taxes for quite different reasons see Bird 2002).
In addition to the case for and against business taxes, this chapter also discusses the difficultpractical question of just how local governments should tax business. It then describes the sur-prisingly broad panorama of local business taxes found around the world by looking at prac-tices in a number of countries. Next it turns to the evaluation of local business taxes, and thendescribes the two most promising forms of local business taxation. The chapter finishes with abrief conclusion.
The Costs of Local Business Taxation
Most economic costs that arise from taxing businesses grow in proportion with the mobility ofcapital. Capital is generally more mobile within than between countries.1 The argument that
225
I am grateful to François Vaillancourt for helpful comments on an earlier draft.1. Helliwell and McKitrick (1999), for example, show that interprovincial capital mobility is much
higher than international mobility in Canada, with the correlation between savings and investment forindividual provinces being statistically indistinguishable from zero. As Dahlby (2000) shows, however,one must be cautious in interpreting correlations between saving and investment as reflecting capitalmobility. In a simple endogenous growth model for a small, open economy, for example, a higher savingsrate results in more investment in human capital, and because human capital is complementary to physi-cal capital, it also results in an increase in the investment rate.
taxes on business are economically distorting would therefore seem to be even stronger withrespect to local business taxes. The basic tax competition model (Wilson 1999) implies that localcompetition for a tax base may lead to an inefficiently low tax rate on capital, and hence a cor-respondingly low level of public goods provision. The idea behind this result is simple. If thetotal amount of capital in a country is fixed, but capital is mobile between regions and the coun-try has only two regions, then an outflow of capital from one region is, of course, an inflow tothe other. An increase in the tax on capital in one region thus creates a positive externality inthe other region, because the outflow of capital benefits the residents of the other region.Because each regional government is assumed to be concerned only with the welfare of its ownresidents, it will not take this external effect into account when setting its tax rates. Both regionswill therefore set their tax rates—and therefore their levels of public goods provision—ineffi-ciently low. In this model, local tax competition produces a “race to the bottom” and businesstaxes are more likely to be set too low than too high in efficiency terms.
From some perspectives, however, competition that keeps local taxes on businesses down isa good thing rather than a bad thing. One example is the so-called commitment problem. Asgovernments with limited political lives cannot commit credibly not to increase taxes in thefuture on investments once made, fewer investments will be made (Kehoe 1989). Competitionthat tends to keep local tax rates down may therefore lead to increased private investment, andhence, presumably, to a higher growth rate.
Similarly, the public choice model suggests that in the absence of tax competition gov-ernments may tend to be inefficiently large (Edwards and Keen 1996). To some extent localgovernments can often “export” taxes by shifting the tax burden to nonresidents, for exam-ple, by taxing nonresident owners. In such cases not only will local business taxes tend to beinefficiently high, but by severing the connection between those who are taxed and thosewho benefit from the services financed by taxes, local business taxation may also reducelocal accountability.
In the real world, of course, the degree and nature of competition for capital between gov-ernments are generally even more complicated than the most complex formal analysis sug-gests. No regional or local government is an island in economic terms. Each is affected by whathappens outside its borders and, especially in the case of the larger localities, the actions of eachin turn will exert some influence on the constraints facing others. Tax competition matters.
Thus on balance, local and regional taxes on business capital seem likely to be economicallycostly. The international and intranational mobility of the tax base, the ease with which busi-nesses can shift income across boundaries, and the difficulty that small governments may havein enforcing taxes in such circumstances all point in the same direction. However, determiningexactly how costly such taxes are is not easy. It depends on many things that are difficult tomeasure, such as the effect of taxes on economic growth and investment and the size of theassociated distortions in the allocation of capital. Yet despite the measurement difficulty, con-sensus in the literature appears to be growing that taxes on business capital tend both todepress investment and to affect location decisions (see, for example, Chirinko, Fazzari, andMeyer 1999; Cummins, Hassett, and Hubbard 1998; Devereux and Griffith 1998). Even thoughthe precise importance of such effects in any country is hard to determine, Whalley (1997) con-cludes that most studies estimated the efficiency cost of national taxes on capital to be in theneighborhood of 0.75 to 1 percent of gross domestic product (GDP). Such numbers may seemsmall, but they persist from year to year, and hence imply a substantial cumulative effect ongrowth and well-being. At the subnational level, as local economies are generally more openthan national economies, such costs would presumably be even greater.
Thus theory, empirical evidence, and common sense all suggest that in most circumstanceskeeping local and regional taxes on business, especially taxes impinging on capital investment,as low as possible makes economic sense. Such taxes depress investment and distort economicdecisions and reduce economic output, and hence the potential standard of living Moreover, by
226 Local Business Taxes
breaking the connection between those who pay taxes and those who benefit from the expendi-tures financed, they reduce local accountability and thereby weaken the critical hard budgetconstraint needed to ensure that decentralized public sector decisions are efficient (Bird 2001a).
The Case for Local Business Taxes
Despite the argument set out in the previous section, virtually every country does havesome form of local business taxation. As least three arguments support local taxes on business:an efficiency argument, an equity argument, and a political argument.
In economic terms, the most convincing case for taxing business derives from one of the old-est principles of taxation, the benefit principle. To the extent that particular public activitiesresult in particular firms receiving identifiable, cost-reducing benefits, those firms can andshould be charged for the costs incurred in providing such benefits. Thus whenever feasible,direct user charges should be applied to businesses just as to any other direct beneficiary (Birdand Tsiopoulos 1997). For example, if business waste is more toxic and therefore more costly toremove and dispose of than household waste, an additional charge on those businesses impos-ing the additional cost is clearly warranted. Similarly, if large trucks impose heavier costs onroads and highways in terms of wear and tear, they should be charged accordingly.
In addition to services the public sector provides directly to identifiable private firms, forwhich it can and should levy user charges, a significant fraction of general public expenditure,particularly at the local government level, directly benefits businesses. In the case of Canada,for instance, Kitchen and Slack (1993) estimate that, on average, close to 40 percent of the none-ducation municipal expenditures in eight Ontario cities benefited commercial and industrialactivities (though the share was less than 20 percent if education were taken into account). Sim-ilarly, Oakland and Testa (1995) estimate the business share of U.S. state and local expenditures,including those on education, to be 13 percent. Even though both these studies assume thatbusiness receives no benefits from educational expenditures, both nonetheless conclude thatthe taxes levied on business actually constitute a higher share of the taxes levied by the respec-tive governments than the benefits received by business. A solid efficiency case can therefore bemade for levying some form of generalized benefit tax on business to cover such unattributablebenefits to productive activities.2
Indeed, such benefit taxation has both an efficiency and an equity rationale. It is efficientbecause it ensures that, assuming local taxes are freely chosen by local people, someone is will-ing to pay an amount at least equal to the marginal cost of providing a particular service. At thesame time, it is equitable in the sense that it is fair for everyone, whether rich or poor, to pay thesame price for services received, whether from the public sector (refuse removal, for example)or from a private seller (such as bread or clothing).
From an efficiency perspective, levying taxes on firms and individuals that benefit frompublic services is economically necessary. Doing so will, for example, minimize the horizontalspillovers that would otherwise arise from such expenditures (Mintz and Tulkens 1986). Asnoted earlier, if local governments impose nonbenefit taxes that are paid by nonresidents ratherthan residents, local governments are likely to spend more than they should in terms of effi-cient resource allocation. The size of government will then be excessive, because through taxexportation nonresidents (who do not vote in the jurisdiction) pay for services enjoyed by resi-dents. An additional horizontal spillover arises from competition for the tax base. In this case,
Richard M. Bird 227
2. Feehan (1998), who argues that much government spending produces services that enhance firms’productive capacities, provides an interesting theoretical rationale for such a tax under certain conditions.As Bird (2002) notes, this benefit argument for imposing “tax-prices” in the form of a generalized businessbenefit tax should not be confused with some of the less tenable versions of the benefit rationale for taxingcorporations that can be found in the literature.
however, a jurisdiction may choose tax levels that are too low for fear of losing the tax base toother jurisdictions. Whether the result of local fiscal competition is too much or too little localspending in aggregate, however, in either case the efficient allocation of resources is distorted.To avoid this outcome taxes should, where possible, be allocated in accordance with a reason-able measure of benefits received. In many countries local and regional taxes levied on businessmay already be higher than can be justified on such efficiency arguments. This situation reflectsthe obvious political feasibility—perhaps even the political necessity (Sorensen 1995)—of tax-ing business. Often taxing business heavily is as politically attractive as it is economically unde-sirable, both because of the common belief that the rich pay such taxes and the real possibilitythat nonresidents may do so.
Moreover, there also seems to be a widespread belief that jurisdictions in which economicactivities take place are in some sense entitled to part of the proceeds, regardless of whether theservices provided by their governments contribute anything to production or whether any ofthe output is consumed within the jurisdiction. The common conflicts between central andregional governments over natural resource revenues, for example, arise at least in part fromsuch deeply held, if seldom articulated, beliefs.3 This entitlement principle can be extended toencompass business taxes more generally. Of course, the extent to which one accepts this argu-ment may rest largely on personal preference and the prevailing local interpretation of history.Nevertheless, when combined with the benefit argument, some version of the entitlement con-cept appears to constitute the strongest logical case in support of local taxes on business.
Many politicians, and indeed the public in most countries, sometimes seem to think thatbusiness taxes, especially those on large corporations, are not among the worst, but rather thebest, of all taxes. One naive version of this argument is that because corporations are separatelegal persons and some of them have a lot of money, they must have substantial ability to paytaxes and should therefore do so. Popular as such arguments are, they are clearly fallacious.Only people, not things, can pay taxes in the sense of having their private, real incomesdecreased. Indeed, a major problem with most business taxes—though also one of their politi-cal attractions—is that no one can be certain who is actually paying them. The burden of corpo-rate taxes may fall on workers, landowners, equity owners, consumers, or some combinationthereof, and assessing exactly how the burden is likely to be distributed is surprisingly difficult(Whalley 1997).
Taxation is as much a political as an economic phenomenon, however. Governments goagainst popular perceptions of who should pay, how much, and in what way at their peril. Ifdespite strong economic arguments to the contrary popular feelings are that businesses in gen-eral, and large corporations in particular, should pay taxes much larger than can possibly bejustified on benefit grounds, then any government that wishes to stay in power has to bow tothese wishes, at least to some extent.4 If the political cost of raising taxes from corporations islow, even if the economic cost is high, imposing such taxes may be perfectly rational. From agovernment perspective, both costs are real, and the optimal tax policy will equate total (eco-nomic and political) costs at the margin with total benefits (Gillespie 1991; Hettich and Winer1999).
228 Local Business Taxes
3. McLure (2000) articulates the entitlement principle in the international context. It is equally observ-able at the subnational level in most countries, especially with respect to resource taxes (McLure andMieszkowski 1983). This last aspect is also discussed in the chapter by McKenzie in this volume. This argu-ment should, of course, be distinguished from the case for adequate compensatory payments to local resi-dents for, say, environmental damage caused by mining or similar activities.
4. As the Ontario Fair Tax Commission (1993, p. 399) put it, “For many of those who appeared at ourhearings, declining revenue shares from corporate income and capital taxation stood as a symbol ofincreasing unfairness in our overall system of taxation.” This symbolic aspect of taxation is developed inBird (1991).
Corporate income taxes and other taxes on business may therefore be economically irra-tional, but nonetheless make perfect sense from the perspective of political economy. Whentaxes induce significant economic distortions, as most forms of business taxation do, the associ-ated costs in terms of output forgone, even though usually hidden from public and politicaleyes, should in principle be explicitly weighed against possible political benefits resulting fromgreater public acceptability. Nonetheless, the political realities of governing, certainly in demo-cratic countries, seem to be such that governments will impose business taxes whatever econo-mists may say (Pola 1991).
Under the circumstances, it is perhaps as well that some arguments support such taxes to alimited extent. For example, in some instances local business taxes may provide the only signif-icant source of elasticity in local revenues, and may therefore be a critical source of finance forexpanding local infrastructure and service needs. Moreover, despite the danger that businesstaxes may reduce accountability by severing the connection between payers and beneficiaries,in some cases local business taxes may play a critical role in improving accountability in thesense that they are sometimes the only revenues over which local governments have any sig-nificant discretionary authority and for which they may therefore be held accountable.
Just how well local taxes on business serve any of these purposes in practice will dependlargely on how they are structured and administered. The more important question is thereforenot whether countries impose local and regional taxes on business, but how they shouldimpose them.
Local Business Taxation Around the World
Many forms of local and regional business taxation exist. Among the most common are corpo-rate or enterprise income taxes, taxes on internal trade (such as octroi), gross receipts taxes, fixedor proportional taxes that vary by type of business and location (such as patente), local salestaxes (which often fall to a considerable extent on intermediate business activities rather thanon final consumers), and nonresidential real property taxes. A variety of licenses and fees unre-lated to any services provided by the public sector may also be imposed. Some countriesimpose several of these forms of business tax at the same level of government, some impose dif-ferent types of taxes at different levels, and some impose different taxes on different sizes andtypes of business.
Unfortunately, information on the precise characteristics of such taxes, the variations fromjurisdiction to jurisdiction within countries, the administration of such taxes, and the taxes’ eco-nomic effects is sporadic and incomplete. This section simply summarizes some aspects ofsome taxes in some countries. The aim is not to provide a full picture of the situation in anycountry, but rather to illustrate something of the variety and complexity of local business taxes.5
Canada
Canada’s provinces impose corporate income taxes, capital taxes, and payroll taxes on busi-nesses.6 In addition, about half of the 10 provinces impose retail sales taxes that derive one-third or more of their revenues from taxing business capital investment and intermediateactivities (Kuo, McGirr, and Poddar 1988). Four provinces impose conventional consumervalue added taxes (VATs)—invoice-credit, destination basis levies—that do not tax either
Richard M. Bird 229
5. The text discusses formal taxes. As Prud’homme (1992) notes in a case study of Zaire, many infor-mal local taxes are also imposed on business in many developing countries, ranging from simple theft andextortion by local officials to systems of requisitions and contributions that are virtually formalized.
6. Capital taxes are usually especially heavy on financial enterprises (McQuillan and Cochrane 1996).On provincial payroll taxes see Dahlby (1993).
investment or intermediate activities (Bird and Gendron 1998). In total, these taxes constitutea substantial burden on capital investment and on production in general. Bird and McKenzie(2001) estimate that in some provinces such taxes are twice as high as in others on manufac-turing investment and are generally much higher on investment in the labor-intensive servicesector than in manufacturing.
In addition to these provincial business taxes, Canadian municipalities impose the largestproperty taxes in the world (as a share of GDP), and about half of the yield from this tax comesfrom taxes on commercial and industrial property. In some instances, such property is explic-itly subject to higher rates. In many cases, it is assessed at higher ratios of market value. Thirsk(1982) argues that the property tax’s heavy dependence on the business tax base is one reasonwhy the property tax, so often seen as the main accountability link between local spending andtaxing decisions, is actually one of the main ways in which this link is severed.
United States
Subnational business taxation in the United States is similar to that in Canada. Most statesimpose corporate income taxes, most also impose retail sales taxes that fall to a considerableextent on business (Ring 1999), and most local governments rely heavily on nonresidentialproperty taxes. State business taxation probably has more distorting effects than in Canada fortwo reasons. First, unlike Canada, which has a uniform formula for apportioning the tax basebetween provinces, the definition of the taxable corporate base differs substantially in differentstates.7 Second, no U.S. states have followed the path some Canadian provinces have taken andeliminated the business element of sales taxes by moving to a consumption type of VAT. Twostates, however, have experimented with an income type of VAT.
Michigan first introduced a modified income type of VAT, the business activities tax, in 1953(Ebel 1972). Even though Michigan abolished the business activities tax in 1967, the single busi-ness tax, introduced in 1976, was similar (Brazer 1977). The single business tax was basically amodified VAT computed through the addition method and measured on the income side as thesum of payments to labor and capital, but with a number of important deductions and limitsthat moved it closer to a consumption base (Advisory Commission on Intergovernmental Rela-tions 1978).
Originally intended to replace the state corporate income tax and some other taxes on busi-ness, proponents considered the main virtues of the single business tax to be increased revenuestability and the extension of taxation to noncorporate forms of business. Of course opponentssaw both of these virtues as vices, and businesses, especially small businesses, bitterly resentedpaying the single business tax when there would be no corporate income tax liability. Inresponse to these pressures, and no doubt to the usual tendency of tax bases to erode over timeand become more complex, (the single business tax came to be excessively complex and unpop-ular (Kenyon 1996). Thus in 1999, when Michigan once again drew back from its pioneeringattempt to introduce a state VAT and decided to phase out the 2.3 percent tax over the next 22years, beginning with reductions to 2.2 percent in 1999 and 2.1 percent in 2000, this was not acomplete surprise. In 2001, however, under budgetary pressure, the state decided to maintainthe rate of the single business tax at 1.9 percent, but to phase it out by the end of 2009 (Hines2002).
The second attempt at a state VAT in the United States is much more recent. In 1993 NewHampshire introduced the business enterprise tax, which differed from Michigan’s single busi-ness tax in a number of important respects. First, the base of the business enterprise tax is essen-tially net income (Kenyon 1996). Second, the tax is levied at a much lower rate, 0.25 percent,
230 Local Business Taxes
7. A huge literature is available on the workings, and defects of state corporate income taxes in theunited States. A classic assessment is McLure (1981). For a more positive perspective see McIntyre (2002).
compared with Michigan’s current rate of 2.3 percent. Third, unlike Michigan, the businessenterprise tax did not replace the corporate income tax in New Hampshire, but was insteadseen as a complement to it. Despite these differences, the two taxes are also alike in some impor-tant respects. Both are levied on value added by the addition method, and both were intendedto provide a more stable, efficient, and simple source of state revenues. Kenyon (1996) arguesthat the business enterprise tax has indeed increased stability, that it is less distorting than anincreased corporate income tax would have been, and that it is relatively simple.
The main technical problem encountered with income-type, origin-based, state VATs con-cerns their application to multistate or multinational businesses. Michigan, for example, usedthe same apportionment rule for the corporate income tax, an equally weighted three-factorallocation formula (payroll, profits, and sales in the state), ignoring the illogic of usingdestination-based sales in this tax base. Recent moves in many states to double-weight suchsales in the formula would accentuate this problem. By contrast, even though New Hampshire,unlike Michigan, actually has a corporate income tax, it does not use the same apportionmentrule for the business enterprise tax, but instead applies different factors to each element of thetax base, thereby substantially complicating what is otherwise a simple tax. Such problemswould be greatly simplified if, as in Canada, a simple, uniform, apportionment formula wereapplied throughout the country.
Germany
The grandfather of all value added local business taxes is probably the German trade tax orgewerbesteuer (this account is based largely on Bennett and Krebs 1988). As originally conceived,this tax was levied on the income of all factors of production, although not in a uniform fash-ion, but as is so often the way with fiscal institutions, over the years the scope of the tax basehas been substantially eroded. For example, the payroll component of the base was abolishedin 1980, and since 1984, 50 percent of interest on long-term debts has been deducted from thebase. This not only creates an incentive to use more debt financing (Gropp 2002), but alsoreduces the relatively logical initial coherence of the tax. Moreover, in practice the tax has essen-tially been removed from all but larger enterprises.
Even though local authorities still have considerable discretion with respect to tax rates,base changes decreed from higher levels of government have substantially reduced localauthorities’ revenue autonomy. Thus most local governments’ apparent support of a 1982 fed-eral proposal to introduce an explicit local VAT at an estimated rate of about 3 percent on top ofthe federal VAT is not surprising. The tax was to be imposed on a net income origin basis andcollected by the addition method, that is, on the sum of payroll, interest, rents, and net profits.In the end, however, this proposal failed largely—as in the Michigan case—because of businessopposition to paying taxes when firms had no profits. Currently the Commission for Reform ofMunicipal Finances is once again considering possible revisions of the gewerbesteuer. Report-edly one reason for doing so is because the trade tax is considered to be overly dependent oneconomic cycles.
Larger cities generally impose higher rates. Recent analysis suggests that this may reflect thegreater market power and urban externalities found in larger population centers, and hencetheir lesser concern with attracting mobile capital. At the same time, the rates imposed in onearea are clearly affected by those imposed in neighboring jurisdictions (Buettner 1999, 2001).
Italy
Italy has a particularly interesting approach to the problem of how best to tax local business. In1998 a regional income tax levied essentially on business income at a rate of about 16 percent, atax on dividend distributions by corporations, a small net worth tax, and payroll contributions
Richard M. Bird 231
levied to finance a national health scheme were all replaced by a new business tax, the impostaregionala sulle activita produttive or regional tax on productive activity (IRAP) (Dell’Anese 1997;Maisto 1997). This was part of a broader reform of business taxation (see Bordignon, Gianni,and Panteghini 2001).The IRAP is essentially a net income type of VAT on an origin basis. Mostfirms, including all types of business and self-employed activities, are subject to the IRAP at arate of 4.25 percent, although regional governments can levy an additional percentage point ifthey so choose.
The IRAP appears to be the closest approximation to a good local business tax that nowexists. The tax base is calculated annually by a direct subtraction method as the differencebetween gross receipts (sales revenues) and the cost of intermediate goods and services (pur-chases from other firms plus depreciation), with specific rules for different types of financialinstitutions. Neither wages and salaries nor interest payments are deductible from the tax base.Outlays for capital goods are deducted in accordance with normal income tax depreciationschedules. Revenues are allocated among regions in proportion to labor costs incurred in eachregion. This tax now finances about a quarter of all regional spending in Italy.
A recent assessment of the IRAP stressed its neutrality with respect to both choice of organi-zational form and between equity and debt financing, regardless of the source of finance, butnoted that it probably, on balance, favored capital over labor, because tax depreciation exceededeconomic depreciation (Bordignon, Gianni, and Panteghini 2001). Its proponents saw the majorvirtue of this regional tax as being that it permitted a significant reduction of taxes on profits,and hence brought Italian profits taxes closer to those in other European Union (EU) countries.In addition, the U.S. Internal Revenue Service has agreed that a portion of the IRAP would becreditable for U.S. income tax purposes (Smith and Gann 1998), which on its face would appearto be a factor encouraging other countries to adopt this form of tax. The national government’srecent decision to eliminate this tax, beginning with the exclusion of 20 percent of labor costsfrom the base in 2003, thus seems to be unfortunate. Because, as Keen (2003) notes, the govern-ment’s reasons for doing this are not clear, and because how this essential source of regionalfinance will be replaced is also unclear, this move does not appear to augur well for the futureof rational business taxation in Italy.
Other European Union Countries
The United Kingdom does not impose real estate tax (council tax) on enterprises, but Denmarkand Ireland impose real estate taxes only on enterprises. As Messere (1993) reports that taxeson business constituted as much as 71 percent of total property taxes in Austria, 65 percent inIceland, 60 percent in Germany, 50 percent in Finland, and 32 percent in France, the problem ofpossible tax exporting noted earlier with respect to Canada is hardly unique to that country.
Several EU countries in addition to Germany and Italy impose special local taxes on busi-ness in addition to the property tax. France, for example, has a local tax that is essentially onpayroll and fixed assets; Belgium has one that is based on the number of people employed and“motive power” (or the power output of machinery); Portugal taxes on profits; and Spain onthe number of people employed as well as on such other factors as area, sector of activity, andpower usage.
Hungary
In 1998 Hungarian local governments collected 86 percent of their own source revenuesfrom a local business tax introduced in 1990 with a maximum rate of only 0.3 percent, but ona base consisting of gross sales. In addition, a small communal tax at a fixed amount (Ft2,000) per employee is levied on the basis of the average number of employees of businesses
232 Local Business Taxes
with permanent establishments in the municipality.8 The business tax, which Szalai andTassonyi (2002) refer to as “the curiosity of the Hungarian local taxation system,” is levied at alocally-determined rate of up to a maximum of 2 percent on a base that seems to be essentiallyvalue added (sales revenue, excluding VAT, less the cost of goods sold, materials costs, and thecost of subcontractors). If a taxpayer has permanent commercial activities in more than onejurisdiction, the base is divided. Smaller taxpayers (those with a turnover of less than Ft 100million) may choose to divide it either by the proportion of net assets or personnel payments,and larger taxpayers have to use the weighted average of these two factors.
This tax is much more important in larger than in smaller localities. On a per capita basis,for example, revenues are 27 times greater in Budapest than in villages and eight to nine timesgreater than in towns (OECD 2000). Most localities do not appear to carry out any seriousaudits of tax returns. A recent assessment by Szalai and Tassonyi (2002) notes that this tax isexpensive to administer, because the base is calculated on a different basis to the corporateincome tax, and that it is also economically inefficient and has likely engendered tax competi-tion (for example, localities can grant exemptions), tax exporting, and tax avoidance and hasreduced accountability. Nonetheless, the business tax has unquestionably been the mainstay oflocal taxation in Hungary since its inception.
Ukraine
Like other transition countries, Ukraine has for some time been wrestling with the problem ofhow to tax small business. Recently it introduced a simplified system consisting of fixed ratesimposed on different activities carried out by sole proprietorships plus a 10 percent sales tax ongross sales by enterprises or alternatively, enterprises can opt for a 6 percent sales tax plus VATat 20 percent. Although a share of the enterprise taxes imposed under this system goes to localgovernments, this part of the new system is clearly a national tax.9 However, local councils notonly receive all the revenues from the tax on individuals engaged in business, but can also varythe rate of the low simplified tax on individuals engaged in a variety of business activitieswithin fairly narrow limits (between approximately US$50 to US$500 a year). This levy isimposed in addition to a related system of local business taxation (the so-called patent) thatimposes similar patent fees ranging from US$50 to US$250 annually on individuals engaged intrading. Such levies may not amount to much in terms of revenue, but they are nonetheless sig-nificant in terms of local accountability, because local governments have more discretion inapplying them than they do with respect to other sources of revenue.
The current system has been under review for some time and seems likely to be changedsoon. A proposal introduced in late 2002, for example, introduced a single corporate tax at 5percent on small and medium enterprises, although it would also require them to pay both VATand social security contributions. As yet, however, how the system will be changed, if at all, isfar from clear, and views about its virtues and problems vary widely. On one side, the Depart-ment for Economic Development of Entrepreneurship (2002) has argued that the simplified sys-tem has been a major success in terms of promoting small and medium businesses, because ithas greatly reduced the complexity of the tax system with which such businesses must grapple.Moreover, the department’s report suggests that for most firms the result of adopting what is
Richard M. Bird 233
8. Like many countries, Hungary also makes it easy for local governments to impose special taxes onnonresidents, specifically tourists, in the form of a tax of Ft 300 per person per night (for a review oftourism taxes see Bird 1992). Many countries also have special local taxes on entertainment of varioussorts. As with tourist taxes, such taxes appear to be politically highly acceptable
9. A similar national levy is imposed, at low rates varying by types of land, on agriculture, with ashare going to local budgets. For a description of the Ukrainian system see World Bank (2002).
essentially a fixed tax system has been to greatly increase the number of people in the formaltax system, and hence has increased tax revenues. By contrast, the State Tax Administrationconsiders the simplified system to be ineffective. Its reported solution is simply to exempt smallbusinesses from tax completely (Lungu 2002). At the same time, the World Bank (2002) hasexpressed considerable reservations about the whole system, suggesting that over time it mayerode the entire tax system because of the incentives it gives firms to masquerade as small andthe obvious difficulty facing the tax administration in uncovering the truth. Although the cur-rent discussion focuses largely on national tax issues, how these issues are finally resolved hasserious implications for the future of local business taxation.10
Japan
In Japan, both regional (prefectural) and municipal governments levy taxes not only on prop-erty, but also on both personal and enterprise incomes. Corporations, for example, are subjectto a municipal tax assessed on the basis of the national corporation tax paid the previous year,with the tax base being allocated among jurisdictions in proportion to the number of employ-ees. This tax is both assessed and collected locally. The same is true of the business fixed assetstax, which is imposed not only on land and buildings, but also on business assets that aredepreciable for income tax purposes. Although the assessment of this tax is local, a uniform sys-tem of assessment is applied throughout the country. Local governments must impose at least astandard tax rate of 1.4 percent of taxable value, but if they wish can increase the rate up to 2.1percent. About 10 percent of municipalities impose higher rates (Kitazato 2002). In addition tothis municipal tax, prefectures can levy a separate tax on certain assets held by larger busi-nesses.
Beginning in April 2004, the local tax imposed on corporations with capital of more than¥100 million (31,000 out of 2.5 million corporations) will be altered to include both a valueadded component and a capital component. The value added tax base will be the sum of wages,net interest paid, net rents paid, and taxable income (profits) and the capital tax base will con-sist of paid-in capital (amounts invested) plus capital surplus. The larger corporations subjectto this new tax will continue to be subject to local business tax based on their taxable income(profits), but at a reduced rate (maximum of 7.2 percent, compared with the normal maximumof 9.6 percent for the local enterprise tax). In addition, however, these larger corporations willnow be taxed at a rate of 0.48 percent on value added and an additional 0.2 percent on capital.The purpose of this new system is essentially to reduce the sensitivity of local tax revenues toeconomic fluctuations, thereby insulating local finances to some extent from the effects ofJapan’s continuing recession.
South Asia
In India the most striking form of local business taxation is octroi, in effect a local customs dutyon goods entering a locality, that is enforced by physical inspection at the “border.” For exam-ple, in 2002 the state of Uttar Pradesh reportedly had 105 border check posts. The rates of octroivary widely from place to place, and also by product. It is generally levied as a percentage ofvalue. Much of the revenue—more than 40 percent in Gujarat according to Rao (1984)—comesfrom taxing intermediate and capital goods.
234 Local Business Taxes
10. Other countries emerging from the former Soviet Union seem to have encountered similar difficul-ties in working out how best to tax small business. At one point, for example, legislation intended to sim-plify small business taxation in both the Kyrgyz Republic and Russia required such businesses to calculatetax liabilities using both the simplified system and the standard system.
Octroi is supposed to be collected only from goods that are destined for use in the taxing local-ity. Those responsible for goods that are passing through are supposed to get a transit passexempting them, although in some cases they are charged octroi in any case and have to seekreimbursement on proof of exit. (In Nepal, where octroi is also levied, Zimmerman 1998 notes thatsuch reimbursement is rarely forthcoming.) Others have noted that in many instances octroiamounts to a tax on exports. Octroi obstructs the free movement of trade within the country andis often assessed and collected in an arbitrary, costly, and corrupt fashion. To illustrate the scale ofthe problem, at one time the state of Maharasthra had as many as 10,000 local octroi check posts.The costs of collection in the state of Karnataka were estimated to be high, varying between 6 and18 percent of collections. As Purohit (1998, p. 39) notes with respect to the corruption within thesystem: “A facilitation fee is considered as the way of life when there is an octroi post.”
Octroi is thus complex and nontransparent, has induced cascading, has encouraged verticalintegration, and has greatly increased transport costs. According to Das-Gupta (2002), borderprocedures take between an hour and several days at the state level, implying economic costsof more than 1 percent of GDP and perhaps much more. For all these reasons, even thoughoctroi is both the most important and most buoyant source of local own revenue, especially inurban areas, Rao (1984) has characterized octroi as “obnoxious, vexatious, wasteful and distort-ing.” Indeed, almost everyone who has looked at how this tax works appears to agree thatNapoleon did the right thing when he abolished similar levies in France 200 years ago. SomeIndian states have abolished octroi and others are considering abolishing it. Nevertheless, in1999 this form of tax still existed in at least six states, though sometimes in the form of an “entrytax” (essentially a sort of customs duty imposed by the state rather than the local government)as in West Bengal. Karnataka abolished octroi in 1979—197 of the state’s 226 municipalities hadbeen levying the tax—but again replaced it with a state entry tax on a similar base. At the timeoctroi was abolished, it accounted for 40 percent of the revenue of Bangalore (the capital of Kar-nataka) and up to 60 percent of the revenue of other urban areas in the state. The so-called octroicompensation grant introduced to make up for this loss did not demonstrate the same buoy-ancy (or responsiveness to local wishes) as the old tax, and by the late 1990s the need for localrevenues, particularly in urban areas, led the state to consider reintroducing the octroi (Rao1998). Indeed, Das-Gupta’s (2002) study of the border check posts used to enforce octroi andentry tax suggests that in the absence of other appropriate subnational taxes and competent taxadministration, even such costly and distorting tax enforcement techniques as check posts maybe better than the available alternatives.
Octroi is also, or has been, important elsewhere in South Asia. For example, Zimmerman(1998) reports that 87 percent of local revenue in Nepal came from octroi. German TechnicalCooperation (1999) notes that octroi in Nepal is supposed to be replaced by a local developmentfee to be levied by customs as a 1.5 percent tax on imports and distributed to municipalities bythe central government. In Bangladesh octroi was abolished and replaced by a central grantthat turned out to be a much less productive, reliable, and elastic source of revenue. In Pakistanurban local governments collected octroi until 1999, at which time it was replaced by a transferbased on 2.5 percent of general sales tax revenue.
Brazil
Local business taxes have a long history in Brazil, dating back to the early 19th century (Silveira1989). The current tax, the imposto sobre servicios or tax on services (ISS), established in 1966, islevied on the gross receipts of independent professionals and firms in the service sector,although some important services, such as communications, finance, and transport, areexcluded. Originally, some 79 specific services were subject to the tax, but this number has beenextended over time. The municipality in which the service is provided levies the tax. Initially,national law limited both the base and the rates of the ISS, but in recent years local governments
Richard M. Bird 235
have had full rate autonomy within the maximum rate fixed by federal law. The applicationand enforcement of this tax varies widely around the country, with the more developed citiesgenerally collecting relatively more. In Brazil as a whole, the ISS yielded 0.57 percent of GDP in2001, or almost 2 percent of total taxes collected, compared with 0.45 percent for the propertytax, the other main source of local tax revenue (Wiesner 2002). Silveira (1989) suggests that eventhough the incidence of the tax is probably regressive and its effects on economic efficiency arequestionable, to some extent these defects are not as bad as they seem, because the tax extendsinto the informal sector in a way that state and federal taxes do not. The existence of a large sec-tor of the economy that is effectively not subject to direct taxation substantially influencesassessments of the effects of different fiscal instruments on equity. For example, the real pro-gressivity of a nominally progressive personal income tax that mainly affects wage earners, andwhich many high-income recipients seem to escape, may be low. Thus in countries like Brazil,an indirect tax on the service sector such as the ISS may in the end be as or more progressive asthis sort of income tax.
Other Latin American Countries
Many other countries in Latin America have special local taxes on business. These taxes taketwo main forms: taxes on gross receipts or some form of patente (fixed tax). Argentina, for exam-ple, has a provincial tax on gross receipts at rates ranging from 1 to 12 percent. Nicaragua has a1 percent tax on gross receipts. In Colombia the rate of the gross receipts tax (industria y comer-cio) ranges from 0.2 to 1 percent. In practice, these taxes are usually levied on an annual basis,that is, at a fixed amount calculated as the tax rate multiplied by the estimated tax base for theprevious year, often as estimated by the taxpayer. Much of the revenue from such taxes oftencomes from a few sectors such as financial enterprises. The second common form of local busi-ness tax in Latin America is some form of tax on wealth, often called a patente. Chile, for exam-ple, imposes this tax at rates of 2.5 or 5 percent depending on the enterprise’s estimated netwealth. Ecuador imposes a similar tax at a rate of 1 percent.
South Africa
An interesting local tax imposed in South Africa is the regional services council levy (Bahl andSolomon 2000). Like many local taxes around the world this tax, imposed mainly in urbanareas, is levied at rates and on a base established by the central government. In Capetown, forexample, it accounts for about one-third of revenues. The regional services council levy has twocomponents: two-thirds of the revenue comes from a flat tax imposed on gross sales and thebalance comes from a similar tax on payrolls.11 Bahl and Solomon’s (2000) study criticizesalmost every aspect of this tax, but somewhat paradoxically concludes that the combination ofits low rates and its weak administration probably made it more or less acceptable. The tax’sfuture is currently the subject of considerable discussion in South Africa.
Kenya
Kenya has recently undertaken a major reform of its local business tax system. The major localtaxes levied specifically on business take the form of license fees. Such fees or charges, found invarious forms in many countries, are in principle intended to serve both regulatory and rev-enue purposes—although these two objectives often conflict. Sometimes they are levied as flat
236 Local Business Taxes
11. As mentioned earlier, Canadian provinces, like Australian and Mexican states, can also levy taxeson payrolls. While some portion of such taxes undoubtedly falls on business, at least in the short run, as arule economists think such taxes are borne largely by workers in the long run. In the Canadian case, forexample, Dahlby (1993) estimates that workers bear two-thirds of the tax.
lump-sum charges; sometimes as charges that vary by the type, size, and location of the busi-ness; and sometimes as a proportion of sales, turnover, or income. As Kelly and Devas (2001)note, the latter approach is likely the best, but it is also the most complex to administer and themost likely to lead to problems of competition, not only between localities, but between levelsof government, because higher-level governments generally already impose taxes on sales andincome. For this reason, the 1999 Kenyan reform followed the second path, establishing amatrix of fixed charges that vary with business type and size.
Policymakers considered the previous form of license fees out-of-date, burdensome to busi-ness, and conducive to corruption. To reduce these problems the reform introduced the singlebusiness permit system. This system was intended to achieve several purposes: (a) to reducecompliance costs by streamlining business licensing procedures and eliminating multiplelicensing of the same business, (b) to establish a more rational rate structure, and (c) to allowlocal authorities to exercise some discretion over rates by choosing from a range of permittedrate schedules. Under the previous system, fees had varied from place to place on a completelydiscretionary basis, and they had also varied from business to business with no apparentrationale. The result was that in one town the fee for a butcher might be twice that for a bakerwhile the opposite was true in the next town. To reduce such unnecessary distortions the newschedules classify businesses into easily distinguishable broad categories, for example, tradersoperating in the open are taxed differently than those in temporary structures, and the latter inturn are distinguished from those with premises in permanent buildings. Traders are then fur-ther classified by number of employees and size of premises. Local rates are set by choosing alocal base-level value, for example, K Sh 100, and then applying the established relative rate fac-tors, which range from 2 for, say, small informal traders, to 100 for such enterprises as large,five-star hotels or manufacturers employing more than 50 people. Localities can choose fromamong 16 base levels. The system is apparently working well.
Francophone Africa
As in most African countries formerly ruled by France, the major form of local business tax inCôte d’Ivoire is the patente, a differentiated set of fixed taxes that vary by type, size, and loca-tion of a business. This tax, based on a pre-independence French tax, produces substantial rev-enue for local governments, for instance, about one-third of total revenues in Abijdan, but it isnot particularly elastic, in part because the tax schedules are not indexed, and hence the effec-tive rate falls with inflation (World Bank 1989). The tax is based in part on fixed amounts dif-ferentiated by type of activity, number of employees, and so on and in part takes the form of aproperty tax based on the rental value of premises. A similar tax exists in Morocco, where sixtax rates are applied to several hundred categories of businesses classified by rental value,type of business, and nature and quantity of inputs used (Vaillancourt 1998). For example, adentist’s office is taxed at different rates depending on the number of chairs. In contrast, inTunisia the business tax is levied at a rate of one-fifth of 1 percent on gross business income(up to a maximum). A problem with this tax is that businesses do not provide a breakdown oftheir activities by locality, so that cities with head offices obtain most revenues. To deal withthis problem, in 1997 revenues were allocated on the basis of the square meters of premisesused. In both countries, as is common in francophone Africa, all tax rates are set nationally. Inprinciple, the patente is simple to administer because it is based on visible indicators such assize of premises, type of business, and number of employees.12 In practice, however, it is
Richard M. Bird 237
12. Note that this resembles the structure of some forms of imputed and presumptive national taxes.Other such taxes amount to gross receipts taxes. For a recent review of such taxes see Wallace (2002). Thesimilarity between presumptive taxation and many of the issues arising with respect to local businesstaxes, for example, the extent to which such taxes really tax the indicators (number of employees, size ofpremises), deserves more attention.
cumbersome because of its complex structure, the need to update the taxpayer register eachyear, and the fragmentation of administration between several different agencies. Even thoughit is a local tax in the sense that all the revenues go to the local government, the patente is actu-ally administered by the central government. The patente is supplemented in most countriesthat have it by other, less important, forms of local business taxation, such as a tax on smallcrafts people and traders and professional and business license fees. The latter are also oftendifferentiated by activity, for example, they are higher for businesses selling alcohol.
Appraisal of Local Business Taxes
As the previous section illustrates, local business taxation is characterized by great variety.Some countries rely mainly on taxes on profits and property, some on various forms of salestaxation, some on a range of specific charges and fees. How can one appraise this diverse vari-ety of levies? As table 11.1 suggests, a number of criteria can be used for this purpose. Eventhough the entries in the table are essentially subjective, it is hard to avoid concluding that mostlocal taxes on business do not score well in terms of many criteria. Few such taxes are equitable;almost none are neutral; all accentuate rather than reduce disparities between localities, givingmost to those who have most; most lend themselves to tax exporting, thereby violating the cor-respondence principle that those who pay should be those who benefit; and most are costly toadminister, especially if the costs of compliance and the facility with which the tax can serve asthe basis for corrupt transactions are taken into account.
Nevertheless, local business taxes thrive around the world precisely because many of themscore highly on some of the other criteria. Such taxes are, for example, highly politically accept-able, in part because no one knows who really pays them, but many people think someone elsedoes. Local business taxes also provide an important, and relatively elastic, source of revenue,particularly for larger cities. Finally, in many countries local business taxes, defective as theyoften are in design and execution, provide one of the few ways in which local governmentshave any degree of fiscal autonomy.13
The question is therefore to what extent countries can realize the virtues of local businesstaxation—essentially revenues and autonomy—while minimizing such vices as economic dis-tortions, high administrative costs, and lack of adherence to the correspondence principle.While the low rates of most such taxes dampen these problems, the next section describes twopossible approaches to local business taxation aimed at minimizing the problems, one prima-rily for the local level and one primarily for the regional level of subnational government.
No matter how well designed, however, no form of local business taxation can overcometwo fundamental problems. First, any tax on business will obviously give more revenues tothose jurisdictions that have a greater tax base. It will therefore accentuate fiscal disparitiesamong regions and localities, and partly to offset this effect, many countries have introducedsome equalization component in intergovernmental transfers (see Bird and Smart 2002). Sec-ond, even though one of the virtues of local business taxation is that it is politically acceptable,this virtue is almost inescapably accompanied by two potential vices: some weakening of thecorrespondence principle and a consequent increase in the lack of clarity about the equity oflocal taxation.
The first of these weaknesses is much more important, although in principle it is simple toovercome by introducing clear political responsibility for the taxes imposed at the local level,for example, by allowing local governments some degree of discretion with respect to tax rates.Even when central governments collect taxes on bases those governments determine, political
238 Local Business Taxes
13. Note that table 11.1 does not consider user charges, which are almost always the most desirableway for local governments to raise revenue (see Bird 2001b).
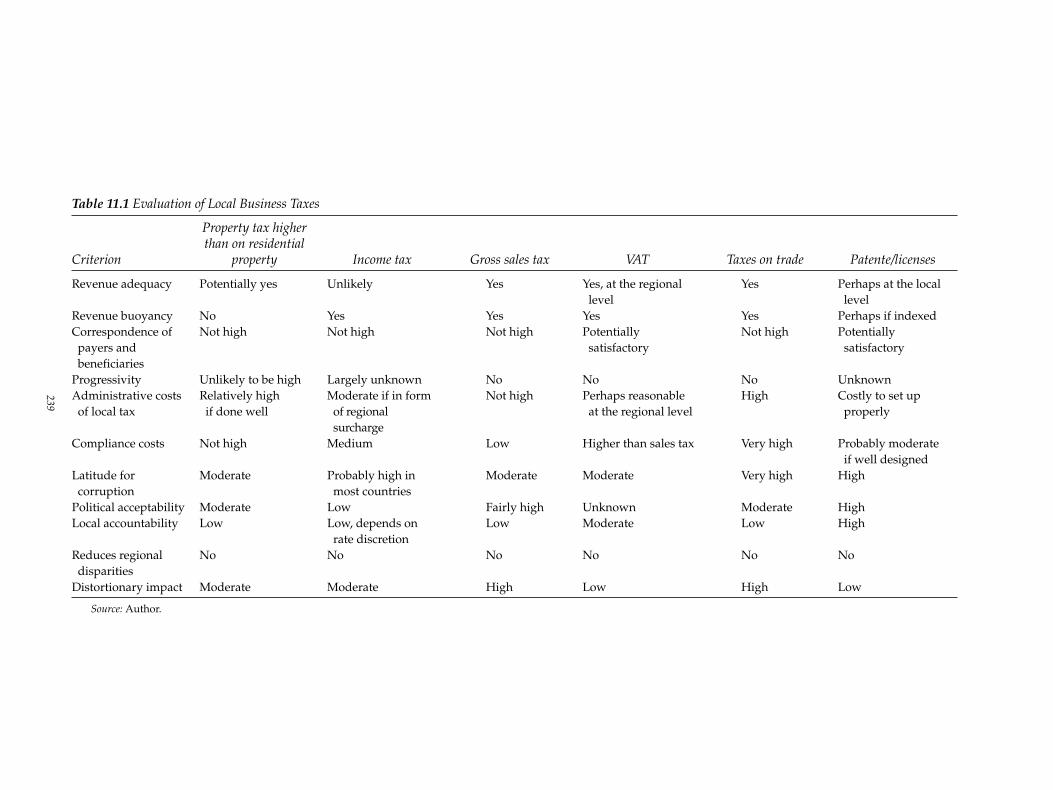
Table 11.1 Evaluation of Local Business Taxes
Property tax higherthan on residential
Criterion property Income tax Gross sales tax VAT Taxes on trade Patente/licenses
Revenue adequacy Potentially yes Unlikely Yes Yes, at the regional Yes Perhaps at the local level level
Revenue buoyancy No Yes Yes Yes Yes Perhaps if indexedCorrespondence of Not high Not high Not high Potentially Not high Potentially payers and satisfactory satisfactorybeneficiaries
Progressivity Unlikely to be high Largely unknown No No No UnknownAdministrative costs Relatively high Moderate if in form Not high Perhaps reasonable High Costly to set up
of local tax if done well of regional at the regional level properlysurcharge
Compliance costs Not high Medium Low Higher than sales tax Very high Probably moderate if well designed
Latitude for Moderate Probably high in Moderate Moderate Very high Highcorruption most countries
Political acceptability Moderate Low Fairly high Unknown Moderate HighLocal accountability Low Low, depends on Low Moderate Low High
rate discretionReduces regional No No No No No Nodisparities
Distortionary impact Moderate Moderate High Low High Low
Source: Author.
239
accountability can be achieved so long as the subnational government that receives and spendsthe revenues is clearly responsible to its citizens for setting the tax rates. In some instances, localrate discretion may need to be limited, however, especially with respect to business taxes. Toreduce tax exporting and maintain the correspondence principle, imposing a maximum ratemay be desirable. At the same time, however, when differences in the tax base from locality tolocality are large, as is usually the case with business taxes, imposing a minimum rate might beadvisable to restrict the ease with which areas with larger tax bases may be able to attract thetax base from other areas by imposing lower tax rates.
As for the second weakness, even though most local business taxes are somewhat regres-sive, the equity of local taxation is much less important than some people think. From manyperspectives, local governments can be considered as entities that provide services to residents,so that the appropriate equity perspective is the benefit principle rather than the ability to payprinciple, as argued in detail elsewhere (Bird 1993). Even from the latter perspective, the equityissue may be addressed by means of two different approaches. The first approach considers thedetails of the relative treatment, in law and in practice, of the tax burdens imposed on taxpay-ers in the same and different economic circumstances. The second approach focuses on theoverall effects of taxation on people’s income and well-being. Economists tend to take the sec-ond approach, while much popular discussion of taxation takes the first approach.
The policy implications of these two different ways of approaching the equity of taxationcan differ. Focusing on the implications for equity of details of particular taxes tends to result inproposals to alter the rates and structures of particular taxes. Such proposals, even though theymight improve horizontal and vertical equity within the limited group actually subject to thefull legal burden of the tax in question, may at the same time actually exacerbate broaderinequity. From the perspective of social and economic inequality, what matters in the end is theoverall impact of the budgetary system on the distribution of wealth and income. The preciseincidence of specific local government taxes seldom is important in this context, and exces-sively complicating the system in terms of economic, administrative, and compliance costs inan attempt to achieve miniscule, if any, gains in equity terms would be a mistake.
Two Approaches to Local Business Taxation
Many countries have at least two levels of subnational government, one at the regional leveland one at the local level. Each of these levels may wish to impose taxes on business, but thebest way to do so may differ. Local governments, particularly the smaller ones, have feweravenues for such taxation open to them than larger regional governments. While countries’ cir-cumstances vary, describing two ideal approaches to subnational business taxation may be use-ful, one applicable to smaller, lower-level, local governments and one more suitable for largerregional (or metropolitan area) governments.
The smaller the government, the more closely it is likely to adhere to the benefit model men-tioned earlier; therefore the ideal form of business taxation for local governments would appearto be a system that is as benefit related as possible. In addition to imposing properly designeduser charges, such governments might therefore consider a system of business licenses like thatrecently introduced in Kenya (Kelly and Devas 2001). In some instances supplementing, or per-haps even replacing, such a system with a low-rate gross receipts levy, such as that in Tunisia(Vaillancourt 1998), might be desirable.
The advantage of the Kenyan system is that it is based on objective evidence, that is, infor-mation that should be readily visible to tax assessors. The disadvantage is that the need fordirect contact between assessors and taxpayers opens the process to corruption. Another disad-vantage is that such taxes often tend to become irrationally differentiated between differentactivities and businesses of different sizes, again opening the door to complexity and corrup-tion. The advantage of the Tunisian system is that it is less distortionary, because it is not a tax
240 Local Business Taxes
on specific inputs, but it is essentially self-assessed, and hence open to evasion. Low-rate taxeson gross receipts may also give rise to problems of interjurisdictional apportionment and may,like the business license approach, sometimes evolve into highly differentiated, and in all like-lihood distorting, systems. Either approach may be acceptable at relatively low rates, anddetermining which path, if either, is best for any specific country requires careful study andassessment.
In contrast, at the regional level, and perhaps also for larger metropolitan local govern-ments, in theory the best form of business taxation is a broadly based levy neutral to factor mix,such as a tax on value added. As Sullivan (1965) points out, the original concept of the VAT wasas a business benefit tax. The most appropriate form of VAT for this purpose is a value addedincome tax or a VAT based on income rather than the usual consumption VAT, as set out in, forexample, Ebrill and others (2001).14
Businesses add value by combining labor and capital with other purchased inputs. Thevalue added by labor is the cost of labor (wages and salaries), while the value added by capitalis the cost of capital (both debt and equity). The base of the local business tax that Bird andMintz (2000) call the business value tax (BVT) consists of revenues, less purchases of currentinputs except labor, less depreciation allowances. From an administrative perspective, such atax base could be calculated in two ways. The first is simply to add back the appropriateamounts of interest and wages to the base of a business income tax as usually calculated. Thesecond is to impose a payroll tax and an appropriate tax on capital, and the easiest way to dothis in most countries is to tax the same base as a VAT.15
Compared with a conventional VAT, a BVT has two important distinguishing features. First,it is a tax on income, not consumption, that is, it is imposed on profits as well as wages or, toput it another way, on investment as well as consumption.16 Second, as a tax on productionrather than on consumption, it is imposed on an origin rather than a destination basis, andthereby taxes exports but not imports.
As a replacement for many existing local and regional business taxes, which in effect taxcapital to a substantial extent, an income-based BVT would improve the tax system in at leasttwo ways. First, such a tax would be more neutral than income and capital taxes, which dis-criminate against capital investment. Second, a BVT would be less susceptible to base erosion.The tax rate would be lower and the base larger and unaffected by the degree of debt financing.Economic distortion costs would therefore be lower. Taxes of the BVT type are sometimes criti-cized (as in the case of the German and Michigan taxes discussed earlier), because they do notsufficiently resemble income taxes in that they have to be paid whether a company makes prof-its or not, but this is precisely one reason why they are much more efficient taxes. Moreover, tothe extent that the rationale for taxing business rests on benefit or entitlement grounds, a BVTis more equitable than an income tax.
Even though the efficiency gains from switching to a BVT at the local or regional level maybe substantial in principle, many countries would face difficulties in implementing such a
Richard M. Bird 241
14. Many analysts in the United States have reached a similar conclusion. For two recent examples seeEbel (2000) and Papke (2000).
15. Although the two approaches are effectively identical for a fully taxpaying firm, they may differfor nontaxpaying firms depending on the nature of loss offsetting. Under the second approach all firmswill pay taxes regardless of their profitability. Under the first approach firms could be in a loss positionand therefore not pay the BVT in a particular year.
16. Note that if capital is expensed rather than depreciated, the business value tax becomes aconsumption-based rather than income-based tax. Financial income would not be included in the tax baseand interest on borrowed funds would not be deductible. A special regime would therefore be necessarywith respect to financial institutions and insurance companies, because most of their value added wouldnot be included in the tax base. Presumably countries would need to levy a combination of capital andpayroll taxes on this sector, as Israel does for its VAT, for example.
proposal, for instance, in relation to resolving the numerous detailed definitional issues. Forlow-rate local business taxes the need for such adjustments is reduced, and any rules intro-duced for these purposes could be highly simplified.
An important coordination issue needs to be resolved, however. Ideally, the tax base shouldbe identical everywhere to facilitate compliance with and administration of the BVT. Even if itis, the allocation formula for business value added must also be determined. Businesses thatoperate in only one region (province, state) or one locality (municipality, district) would betaxed solely by that jurisdiction. In principle, value added earned in more than one jurisdictionwould need to be allocated according to formula weights based on such factors as payroll, sales(on an origin basis), capital, or some combination thereof (see Gordon 1986 for a discussion ofthis apportionment problem with state origin-based VATs). As Smith (1998) documents in thecase of provincial business taxes in Canada, negotiations about who gets what tax base arenever easy, but they can be successful. Indeed, as Bird and McKenzie (2001) argue in relation tothe Canadian case, while a number of difficult points have to decided in designing a BVT, noneof them seem to be unsolvable in either principle or practice. Moreover, as the status quo seemsto be increasingly unsatisfactory in many countries, adequate solutions may perhaps be foundmore readily with the BVT than by tinkering further with the existing imperfect taxes.
In any case, subnational governments around the world do, and probably always will, taxbusiness. Doing so through a BVT is less distorting than through most other possible local busi-ness taxes and it deserves consideration for this reason.
Conclusion
Local business taxes, like the weather, are always with us and always a matter for discussion,and often dissatisfaction. Unlike the weather, however, we can do more than deplore unfortu-nate outcomes. Both the design and the implementation of local business taxation can be sub-stantially improved in most countries. This chapter has suggested two broad approachestoward improving local business taxation: developing a more strictly benefit system of busi-ness licenses and fees on the one hand, and developing a more neutral, uniform variety of VAT,the BVT, on the other hand. As table 11.1 suggests, neither approach is without flaws, buttogether or separately they appear more likely to yield satisfactory results than the many otherforms of local and regional business taxation now found around the world.
References
The word processed describes informally reproduced works that may not be commonly avail-able through libraries.
Advisory Commission on Intergovernmental Relations. 1978. The Michigan Single Business Tax.Washington, D.C.
Bahl, Roy, and David Solomon. 2000. “The Regional Services Council Levy: Evaluation andReform Options.” Georgia State University, Atlanta.
Bennett, Robert, and Gunter Krebs, eds. 1988. Local Business Taxes in Britain and Germany.Baden-Baden, Germany: Nomos Verlagsgesellschaft.
Bird, Richard M. 1991. “Tax Structure and the Growth of Government.” In Lorraine Eden, ed.,Retrospectives on Public Finance. Durham, North Carolina: Duke University Press.
_____. 1992. “Taxing Tourism in Developing Countries.” World Development 20(August):1145–58.
_____. 1993. “Threading the Fiscal Labyrinth: Some Issues in Fiscal Decentralization.” NationalTax Journal 46(June): 207–27.
242 Local Business Taxes
_____. 2001a. Intergovernmental Fiscal Relations in Latin America: Policy Designs and Policy Out-comes. Washington, D.C.: Inter-American Development Bank, Sustainable DevelopmentDepartment.
_____. 2001b. “User Charges in Local Government Finance.” In Richard Stren and MariaEmilia Freire, eds., The Challenge of Urban Government. Washington, D.C.: World Bank Insti-tute.
_____. 2002. “Why Tax Corporations?” Bulletin for International Fiscal Documentation 56(5):194–203.
Bird, Richard M., and Pierre-Pascal Gendron. 1998. “Dual VATs and Cross-Border Trade: TwoProblems, One Solution?” International Tax and Public Finance 5(3): 429–42.
Bird, Richard M., and Kenneth J. McKenzie. 2001. Taxing Business: A Provincial Affair? Com-mentary no. 154. Toronto: C. D. Howe Institute.
Bird, Richard M., and Jack M. Mintz. 2000. “Tax Assignment in Canada: A Modest Proposal.”In Harvey Lazar, ed., Canada: The State and the Federation 1999/2000. Toward a Mission State-ment for Canadian Fiscal Federalism. Kingston, Ontario: Institute of Intergovernmental Rela-tions.
Bird, Richard M., and Michael Smart. 2002. “Intergovernmental Fiscal Transfers: InternationalLessons for Developing Countries.” World Development 30(6): 899–912.
Bird, Richard M., and Thomas Tsiopoulos. 1997. “User Charges for Public Services: Potentialsand Problems.” Canadian Tax Journal., 45(1): 25–86.
Bordignon, Massimo, Silvia Gianni, and Paolo Panteghini. 2001. “Reforming Business Taxa-tion: Lessons from Italy?” International Tax and Public Finance 8(2): 191–210.
Brazer, Harvey E. 1977. “Michigan’s Single Business Tax: Theory and Background.” In StanleyJ. Bowers, ed., Proceedings of the 69th Annual Conference on Taxation. Louisville, Ky.: NationalTax Association and Tax Institute of America.
Buettner, Thiess. 1999. “Determinants of Tax Rates in Local Capital Income Taxation: A Theo-retical Model and Evidence from Germany.” Working Paper no. 194. Center for EconomicStudies and Ifo Institute for Economic Research, Munich.
_____. 2001. “Local Business Taxation and Competition for Capital: The Choice of the TaxRate” Working Paper no. 440, Center for Economic Studies and Ifo Institute for EconomicResearch, Munich.
Chirinko, Robert, Steven Fazzari, and Andrew Meyer. 1999. “How Responsive Is BusinessCapital Formation to Its User Cost? An Exploration with Micro Data.” Journal of Public Eco-nomics 74: 53–80.
Cummins, Jason, Kevin Hassett, and Glenn Hubbard. 1998. “Tax Reforms and Investment: ACross-Country Comparison.” Journal of Public Economics 62: 237–73.
Dahlby, Bev. 1993. “Payroll Taxes.” In Alan Maslove, ed., Taxing Business. Toronto: Universityof Toronto Press.
_____. 2000. Tax Reform and Economic Growth in Alberta. Calgary, Alberta: Canada West Founda-tion.
Das-Gupta, Arindam. 2002. “Internal Fiscal Barriers in India: Check Posts.” Indiraa GandhiInstitute of Development Research, Mumbai, India. Processed.
Dell’Anese, Luca. 1997. “Italy Introduces New Regional Tax.” Tax Notes International, Novem-ber 17, pp. 1589–90.
Richard M. Bird 243
Department for Economic Development of Entrepreneurship. 2002. Simplified Taxation Regimes:Application Practices and Development Trends. Kyiv, Ukraine.
Devereux, Michael, and Rachel Griffith. 1998. “Taxes and Location of Production: Evidencefrom a Panel of U.S. Multinationals.” Journal of Public Economics 68: 335–67.
Ebel, Robert D. 1972. The Michigan Business Activities Tax. East Lansing, Michigan: MichiganState University, School of Business Administration, Division of Research.
_____. 2000. “Robert Ebel on Tax Reform, Federalism, and Sound Tax Policy.” State Tax Notes,May 29, pp. 1877–79.
Ebrill, Liam, Michael Keen, Jean-Paul Bodin, and Victoria Summers 2001. The Modern VAT.Washington, D.C.: International Monetary Fund.
Edwards, J. S. S., and Michael Keen. 1996. “Tax Competition and Leviathan.” European Eco-nomic Review 40: 113–40.
Feehan, James P. 1998. “Public Investment: Optimal Provision of Hicksian Public Inputs.”Canadian Journal of Economics 31: 693–707.
German Technical Cooperation. 1999. Urban Development through Local Efforts. Kathmandu,Nepal.
Gillespie, W. Irwin. 1991. Tax, Borrow, and Spend. Ottawa: Carleton University Press.
Gordon, Roger H. 1986. “A Critical Look at Formula Apportionment.” In Final Report of theMinnesota Tax Study Commission. St. Paul, Minnesota: Butterworths.
Gropp, Reint E. 2002. “Local Taxes and Capital Structure Choice.” International Tax and PublicFinance 9(1): 51–71.
Helliwell, John, and Ross McKitrick. 1999. “Comparing Capital Mobility Across Provincial andNational Borders.” Canadian Journal of Economics 32(5): 1164–73.
Hettich, Walter, and Stanley Winer. 1999. Democratic Choice and Taxation Cambridge, U.K.:Cambridge University Press.
Hines, James R., Jr. 2002. “Michigan’s Flirtation with the Single Business Tax.” University ofMichigan, Ann Arbor, Mich. Processed.
Keen, Michael. 2003. “Tax Reform in Italy.” Tax Notes International, February 17, pp. 665–82.
Kehoe, Patrick. 1989. “Policy Cooperation among Benevolent Governments May Be Undesir-able.” Review of Economic Studies 56: 289–96.
Kelly, Roy, and Nick Devas. 2001. “Regulation or Revenues? An Analysis of Local BusinessLicensing, with a Case Study of the Single Business Permit in Kenya.” Public Administrationand Development., 21: 381–91.
Kenyon, Daphne. 1996. “A New State VAT? Lessons from New Hampshire.” State Tax Notes,December 2, pp. 1605–15.
Kitazato, Toshiaki. 2002. “Japanese Fixed Property Tax.” Paper prepared for the World Bank,Washington, D.C. Processed.
Kitchen, Harry, and Enid Slack. 1993. “Business Property Taxation.” Government and Com-petitiveness Paper no. 93–24, Queen’s University, School of Policy Studies, Kingston,Ontario.
Kuo, C. Y., T. McGirr, and S. Poddar. 1988. “Measuring the Non-Neutralities of Sales andExcise Tax in Canada.” Canadian Tax Journal., 36(3): 655–70.
244 Local Business Taxes
Lungu, Iurie. 2002. “Official Proposes Exempting Small Businesses from Tax.” Tax Notes Inter-national October 21, pp: 246.
Maisto, Guglielmo. 1997. “Italy Introduces Regional Tax on Productive Activities.” Tax NotesInternational, March 31, pp. 1029–31.
McIntyre, Michael J. 2002. “Thoughts on the Future of the State Corporate Income Tax.” StateTax Notes, September 23, pp. 931–47.
McLure, Charles E., Jr. 1981. “The Elusive Incidence of the Corporate Income Tax: The StateCase.” Public Finance Quarterly 9(October): 395–413.
_____. 2000. “Source-Based Taxation and Alternatives to the Concept of Permanent Establish-ment.” In 2000 World Tax Conference Report. Toronto: Canadian Tax Foundation.
McLure, Charles E., Jr., and Peter Mieszkowski, eds. 1983. Fiscal Federalism and the Taxation ofNatural Resources. Lexington, Massachusetts: Lexington Books.
McQuillan, Peter E., and E. Cal Cochrane. 1996. “Capital Tax Issues.” Working Paper no. 96–8.Department of Finance, Technical Committee on Business Taxation, Ottawa.
Messere, Ken. 1993. Tax Policy in OECD Countries. Amsterdam: IBFD Publications.
Mintz, Jack M., and Henry Tulkens. 1986. “Commodity Tax Competition between MemberStates of a Federation: Equilibrium and Efficiency.” Journal of Public Economics 29: 133–72.
Oakland, William H., and William A. Testa. 1995. “Community Development-Fiscal Interac-tions: Theory and Evidence from the Chicago Area.” Working Paper Series. FederalReserve Bank of Chicago, Research Department, Chicago.
OECD (Organisation for Economic Co-operation and Development). 2000. Economic Surveys—Hungary. Paris.
Ontario Fair Tax Commission. 1993. Fair Taxation in a Changing World. Toronto: University ofToronto Press.
Papke, James A. 2000. “Rethinking Local Business Taxation: Substituting a State Value AddedTax for the Local Ad Valorem Tax on Business Personal Property.” State Tax Notes, February28, pp. 669–82.
Pola, Giancarlo, ed. 1991. Local Business Taxation: An International Comparison Milan, Italy: Vitae Pensiero.
Prud’homme, Remy. 1992. “Informal Local Taxation in Developing Countries.” Environmentand Planning C: Government and Policy 10(1): 1–17.
Purohit, Mahesh C. 1998. “Recalling Octroi and Its Implications: A Case of Karnataka.” In M.N. Rao, ed., Octroi: Pros and Cons. Bangalore, India: AIUD Trust.
Rao, M. Govinda. 1984. Entry Tax as an Alternative to Octroi. New Delhi: National Institute ofPublic Finance and Policy.
Rao, M. Nageswara, ed. 1998. Octroi: Pros and Cons. Bangalore, India: Asia Institute of UrbanDevelopment.
Ring, Raymond J. 1999. “Consumers’ Share and Producers’ Share of the General Sales Tax.”National Tax Journal 52(1): 81–92.
Silveira, Ricardo. 1989. “The Local Tax on Services in Brazil” Working Paper no. 7. WorldBank, Policy Planning and Research Staff, Urban Development Division, Washington, D.C.
Smith, Ernest H. 1998. Federal-Provincial Tax Sharing and Centralized Tax Collection in Canada.Toronto: Canadian Tax Foundation.
Richard M. Bird 245

Smith, Paul A., and Jennifer Gann. 1998. “U.S. IRS to Allow Partial Credit for New ItalianLocal Tax.” Tax Notes International, April 13, pp. 1114–15.
Sorensen, Peter Birch. 1995. “Changing Views of the Corporate Income Tax.” National Tax Jour-nal., 48(2): 279–94.
Sullivan, Clara K. 1965. The Tax on Value Added. New York: Columbia University Press.
Szalai, Akos, and Almos T. Tassonyi. 2002. “Value-Based Property Taxation: Options for Hun-gary.” Toronto. Processed.
Thirsk, Wayne R. 1982. “Political Sensitivity Versus Economic Sensibility: A Tale of Two Prop-erty Taxes.” In Wayne R. Thirsk and John Whalley, eds., Tax Policy Options in the 1980s.Toronto: Canadian Tax Foundation.
Vaillancourt, François. 1998. “”Morocco and Tunisia: Financing Local Governments: TheImpact on Infrastructure Finance.” In Richard M . Bird and François Vaillancourt, eds., Fis-cal Decentralization in Developing Countries. Cambridge, U.K.: Cambridge University Press.
Wallace, Sally. 2002. “Imputed and Presumptive Taxes: International Experiences and Lessonsfor Russia.” Working Paper no. 02–03. Georgia State University, Andrew Young School ofPublic Policy, International Studies Program, Atlanta.
Whalley, John. 1997. “Efficiency Considerations in Business Tax Reform.” Working Paper no.97–08. Department of Finance, Technical Committee on Business Taxation, Ottawa.
Wiesner, Eduardo. 2002. “Bank Lending for Subnational Development: The Policy and Institu-tional Challenges.” Inter-American Development Bank, Office of Evaluation and Over-sight, Washington, D.C. Processed.
Wilson, John. 1999. “Theories of Tax Competition.” National Tax Journal 52(2): 269–304.
World Bank. 1989. “The Administration of the Patente in the Côte d’Ivoire.” Washington, D.C.
_____. 2002. “Ukraine: Tax Policy and Administration.” Washington, D.C. Processed.
Zimmerman, Horst. 1998. Strengthening Local Government Finance: Principles of Fiscal Decentral-ization and Nepal Case Study. Escheim, Germany: German Technical Cooperation.
246 Local Business Taxes
12Fiscal Federalism and the Taxation of Nonrenewable Resources
Kenneth J. McKenzie
This chapter discusses selected issues that arise in connection with the taxation of nonrenew-able resources from a fiscal federalism perspective. There are at least two reasons for singlingout exhaustible resources for special attention in this regard. Both of them relate to the essenceof nonrenewable resources in that they are inherently limited in total supply and they tend tobe distributed unevenly across geographical regions.
The fact that exhaustible resources are fixed in total supply suggests that they have thepotential to generate economic rent. Economists are familiar with the concept of economic rent,but noneconomists often view it with some suspicion. However, this notion is vital to under-standing the taxation of nonrenewable resources.
Economic rent is simply the return to a resource that is fixed in total supply. It is measuredas the difference between the gross revenues received from selling the resource and the eco-nomic cost of extracting it. The economic cost of extracting a resource is equal to the opportu-nity cost of the inputs employed in the extraction. The opportunity cost of an input is the returnthat is forgone by using the input to produce the resource rather than employing the input insome other activity. For some inputs the opportunity cost is relatively easy to measure. Forexample, the opportunity cost of labor employed in the production of a natural resource con-sists simply of the wages paid to the workers. In a reasonably well-functioning labor market,these wages reflect the need to pay the workers a reasonable salary to keep them away fromalternative occupations and uses of their time, and perhaps an amount needed to compensatethem for difficult working conditions associated with the extraction of natural resources.
The opportunity cost of other inputs is more difficult to measure. For example, one of themore important opportunity costs in the capital-intensive resource sector is the return requiredon the capital employed in the extraction of the resource. That capital could be employed insome other activity or location, and could generate income accordingly. To attract it to the natu-ral resource sector in a particular location, the capital must generate a return that is at least ashigh as the return that the capital could earn if employed in some other activity, or location,with a similar risk profile. That forgone return, plus any decline in the value of the capital dueto physical depreciation and/or changes in its price, is the opportunity cost of capital employedin the resource sector.
Economic rent consists of the revenues generated from the resource in excess of the oppor-tunity cost of the labor, capital, and other inputs employed in its extraction. Economists areinterested in the economic rent generated by a nonrenewable resource for two reasons.
The first reason is motivated by pure tax policy considerations. There are both efficiencyand equity reasons for imposing taxes on the economic rent generated by the extraction ofnonrenewable resources. From an efficiency perspective, the existence of rent enables tax rev-enue to be raised in an efficient, or nondistortionary, manner. Because economic rent repre-sents compensation in excess of the costs required to bring the resource into production, thegovernment may claim a portion of those rents without inhibiting or distorting the produc-tion of the resource. Taxes on pure economic rents are said to be economically neutral or
247
nondistortionary. Neutral taxes are generally desirable because, in the absence of other dis-tortions in the marketplace, taxes that distort economic decisions impose real costs on theeconomy by providing an incentive for firms and individuals to alter their choices and effortsin an inefficient manner. Tax policy analysts often assume that the government faces thedilemma of choosing between “heavy taxes,” which raise significant revenue but areextremely distortive, and “light taxes,” which are nondistortive but generate little revenue.The presence of economic rent offers a way out of this dilemma, at least partly, because sig-nificant revenue can be raised in a neutral manner.
Taxing economic rent is also compelling from an equity perspective. Because the economicrent of a nonrenewable resource is equal to its value after all necessary costs have been recov-ered, there are strong grounds for the government to claim at least a portion of that rent onbehalf of the community. Because governments typically rely, at least to some extent, on privatecompanies to help exploit the resource, taxes are an obvious way to extract this value (pricecontrols and regulations are others). There are no reasons—economic, moral, ethical, or other-wise—why economic rent should accrue exclusively to the shareholders (as the owners of cap-ital) or to the workers of the companies that extract the resources. Remember that rent accruesonly after the owners of the companies and their workers have been compensated for theirefforts in accordance with market prices that reflect the relative scarcity of the inputs used toproduce the resource.
Much research on the taxation of natural resources has focused on the extent to which dif-ferent types of taxes approximate nondistortionary taxes on economic rent. To the extent thatthey do not, the emphasis has been on what types of distortions the various types of taxes mayintroduce.
The second reason that economists are interested in resource rent concerns how that rent isallocated among different governments. Given that, as discussed previously, there are good taxpolicy reasons for the government to claim a portion of the rent generated by nonrenewableresources on behalf of the community, the question of which government and which commu-nity—local, state, or national—naturally arises. Exploring this question involves the study offiscal federalism.
Two related concepts are relevant in this regard. The first concerns the degree of fiscaldecentralization, or the extent to which various levels of government have the power to levytaxes on the rents generated by nonrenewable resources. A key question relates to the implica-tions of assigning the ability to levy taxes on a resource to the subnational government (state orprovincial) rather than the national (federal) government, and vice versa. The fact that nonre-newable resources tend to be concentrated in specific geographical regions within a countrygives rise to the second issue: revenue sharing. Aside from the question of which level of gov-ernment is responsible for initially imposing taxes on the nonrenewable resource is the ques-tion of how those resource rents should be shared, not only between levels of government, butbetween governments at the same level.
This suggests the need to consider the role of revenues from resource taxation within thecontext of intergovernmental transfers through an equalization system or other such mecha-nism. Although this chapter does not directly address the role of resource revenues in this con-nection, the idea of sharing economic rents arising from natural resources across jurisdictionspermeates much of the discussion that follows.
The intent of this chapter is not to provide a survey of various approaches to the taxation ofnatural resources in various countries. This type of survey has been done many times by prac-titioners with specific expertise in the area (see, for example, Kemp 1994; Otto 2000). Nor is theintent to provide a survey of the literature in fiscal federalism applied to emerging capitalisteconomies. This topic too has received significant attention elsewhere (see, for example, Boad-way, Roberts and Shah 1994; Shah 1994). Rather, this chapter focuses on a few key issues relatedto natural resource taxation within a federation and illustrates how some simple economic
248 Fiscal Federalism and the Taxation of Nonrenewable Resources
concepts can shed light on those issues. The level of analysis is intended to provide individualswith only a little formal training in economics a sense of the fundamental insights economicanalysis can add to an understanding of natural resource taxation in a fiscal federalism context.The remainder of this chapter is structured as follows: The next section emphasizes tax policyissues, temporarily setting aside issues related to fiscal federalism and the distribution ofresource tax revenue. This condensed discussion sets up the analysis in the second section. Thethird section reviews some of the international experience regarding the allocation of tax pow-ers associated with natural resources.
Resource Taxation
The bulk of research on the economics of resource taxation focuses on the extent to which vari-ous types of taxes approximate taxes on economic rent. This preoccupation with the distor-tionary effects of resource taxes does not necessarily imply a belief that tax neutrality is alwaysa desirable policy objective, but a recognition that neutrality is the boundary between policiesthat encourage some type of activities and policies that discourage them. Governments maywell have reasons to intervene in private markets for exhaustible resources on efficiencygrounds if the economy exhibits other distortions that the government is seeking to correct.
For example, resource extraction may proceed too rapidly because of common propertyproblems or too slowly if markets are not competitive. Extraction paths for the resource maynot be optimal from a social perspective, and firms may undertake too much or too little pro-cessing of the raw natural resource if the government’s social discount rate and firms’ privatediscount rate differ. There may also be environmental externalities (such as pollution), or infor-mational spillovers associated with natural resources exploration and development activities.For all these reasons, and others, the government may seek to undertake corrective actionsusing the tax system. Nonetheless, if economists are to make meaningful policy prescriptions,an understanding of the characteristics of the neutral boundary is important.
Nonrenewable resources tend to be subject to a myriad of special taxes, much more so thanother sectors. The taxes typically levied on the resource industry may be classified as follows:
• Severance taxes, levied on a per unit basis either on the amount of the raw resourceextracted or on the amount of processed or refined material produced
• Gross royalties, determined as a percentage of gross sales • Net royalties, similar to gross royalties but allowing for the deduction of selected costs• Income taxes, similar to net royalties, but allowing for the deduction of more costs
based on a broader notion of profits earned by the firm• Resource rent taxes, levied on the present value of the resource• Property taxes and various franchise and license fees.
These taxes can distort, to varying degrees, all sorts of decisions regarding the exploitation anddevelopment of nonrenewable resources, including
• The time profile of extraction• The exploration and development decision• The choice of factor mix and production structure, including the relative use of labor,
capital, and energy in the mix of nonresource inputs• The degree of processing of the resource once it is extracted• The choice of the optimal cutoff grade and intertemporal grade selection profile.
This chapter focuses on how selected taxes distort perhaps the most fundamental decisionregarding the natural resource: the extraction decision.
The time profile of extraction is fundamental, because this is what determines the intergen-erational allocation of the returns to the resource stock. For pedagogical purposes, and to focus
Kenneth J. McKenzie 249
the discussion squarely on the timing decision, consider the following simple state of affairs. Asingle firm has the right to exploit a fixed, known deposit of a resource of homogenous qualitythat requires no processing beyond extraction and that can be extracted at a constant per unitcost. In this overly simplistic case, the firm will exhaust the entire reserve and the only decisioninvolves the rate at which it should extract the reserves. Despite its obvious limitations andabstractions, this simple model generates some illuminating insights.
Assume, for example, that the resource in question is oil. The assumption is that the firmwill choose an extraction path for the oil that will maximize the present discounted value of theprofits generated from the oil reservoir. To do this, the firm will choose a time profile for extract-ing the resource that follows a simple rule: it will allocate the extraction of the oil over time sothat the present value of the profits generated by the extraction of one more barrel of oil, dis-counted back to the current period, is the same over all periods. To see that this decision ruleconstitutes the optimal, value-maximizing, extraction policy for the firm, consider a situationwhere this is not the case: assume that the present value of extracting an additional barrel of oilnext year is greater than the present value of extracting that barrel this year. In this case, thefirm could increase the present value of its profits by delaying production and shifting theextraction of the barrel of oil from this year to next year. Only when the firm has chosen a timeprofile in which the present value of the profits on the extraction of an additional barrel of oil isthe same in all time periods can it no longer increase the present value of the profits from theoil reservoir by undertaking this sort of intertemporal reallocation. This simple rule is key tounderstanding how various types of taxes may distort the extraction profile by either speedingup or slowing down the rate of extraction.
Consider the imposition of some sort of tax on the production of oil from the reservoir. Thepre- and post-tax extraction paths will be the same (and therefore the tax will be nondistor-tionary or neutral) only if the present value of the tax levied on the production of an incremen-tal barrel of oil is the same in all periods. This requires the rate of increase in the tax levied onan additional barrel of oil to be equal to the rate at which the firm discounts profits back to thecurrent time period. If the tax on an additional barrel of oil increases at a rate that is higher thanthe firm’s discount rate, the tax will increase in present value terms over time, and producerswill have an incentive to accelerate extraction to lower the present value of their tax payments.They will move extraction from the future to the present to lower the present value of their taxpayments. The opposite is true if the tax on an incremental unit increases at a rate that is lessthan the firm’s discount rate; in that case extraction is delayed.
What is the firm’s discount rate? In simple terms, it is the rate of return that the firm couldearn by investing the proceeds from the extracted resource elsewhere. In simple models withno risk or uncertainty and no other market failures, the discount rate is simply equal to theinterest rate. However, in more complicated and realistic models, the interest rate must beadjusted to reflect risk, and perhaps other market imperfections.
Based on this reasoning, the following subsections assess the impact of various types oftaxes on the extraction decision.
Severance taxes are levied at a constant dollar amount per unit of output, for example, US$Xper barrel. The amount of tax collected per barrel is the same in every period, and the tax actsjust like a constant dollar reduction in the price of the oil. This means that the rate of increase inthe tax on an incremental barrel of oil is zero. Using the reasoning outlined earlier, the presentvalue of the tax declines over time, and the firm can lower the present value of the severancetaxes it pays by reallocating extraction from the present to the future. Thus per unit severancetaxes tilt the extraction profile from the present to the future by providing an incentive for firmsto delay extraction.
Gross royalties are determined as a constant percentage of gross revenue. The discountedafter tax price of a barrel of oil is reduced by the same proportion in each period, which meansthat the rate of increase in the tax on an incremental barrel of oil is equal to the rate of increase
250 Fiscal Federalism and the Taxation of Nonrenewable Resources
in the price of oil. Thus if the growth rate in the oil price is greater than the firm’s discount rate,the present value of the royalties is increasing over time, and the firm will accelerate extraction.If the price is increasing at a rate that is less than the interest rate, the present value of the tax ona per barrel basis is declining over time, and the firm will have an incentive to delay extractionto avoid paying the tax. Thus gross royalties cause firms to accelerate, delay, or leave extractionunchanged according to whether the growth rate in the price of the resource is greater than, lessthan, or equal to the interest rate. Of course, in reality, sometimes the price of oil increases at arate that is greater than the interest rate, and at other times the price increases at a rate that isless than the interest rate. Moreover, the growth rate in the price is not known with certainty,but rather is risky or uncertain. Thus the key comparison is between the expected rate ofgrowth in the price of oil and the risk-adjusted discount rate facing the firm. Regarding theimpact on the extraction path, gross royalties have the same effect as production sharing con-tracts, whereby the government claims some portion of the resource extracted by the privateenterprise.
Property taxes are levied on the assessed value of the resource property. Ideally, propertytaxes should be levied on the present value of the remaining reserves net of the extraction costs,which correctly reflects the opportunity cost of the inputs used in the extraction decision. Thisis equal to the market value of the resource at any point in time. In these cases the property taxis equivalent to a resource rent tax and will not distort the extraction path. However, in prac-tice, the present value of reserves may be difficult for the government to measure. Therefore, analternative form of assessment is often used that is frequently based on the cumulative amountof the resource extracted. The cumulative amount is easier to measure than the present value ofreserves. When the assessment is performed using cumulative measures, the property tax isnegatively related to the amount of the resource extracted. In other words, the more of theresource that is extracted, the lower the tax base. The tendency is therefore for property taxes toact as a subsidy to rapid extraction, providing an incentive to increase extraction now anddecrease it in the future.
Net royalties or profit taxes differ from gross royalties because they allow certain costs to bededucted from gross revenues in the determination of the tax liability. Net royalties and profittaxes differ from each other with regard to the nature and scope of the costs allowed as deduc-tions. Net royalties typically allow the deduction of current extraction costs only; they do notallow a deduction for the capital costs associated with extraction. Because extraction costs areassumed to be constant over time in our example, a net royalty acts like a gross royalty andincreases, decreases, or leaves unchanged the rate of extraction as the growth rate in the priceof oil is greater than, less than, or the same as the rate at which the firm discounts the profitsfrom the reservoir.
A profits tax also allows some form of deduction for the capital costs associated withresource extraction. The nature of this deduction determines the impact on the extraction deci-sion. For example, if the deduction reflects the true opportunity cost of capital employed inresource extraction, then the net profits tax is a tax on economic rent with no impact on theextraction profile. As mentioned earlier, the true opportunity cost of capital reflects both itsdepreciation over time and the rate of return it could earn if employed in an alternative activityor location. A profits tax that properly accounts for the opportunity cost of all the inputs is neu-tral with respect to the extraction decision, because in the long run average profits mustincrease at the rate of return required by shareholders. As this is also the rate used to discountfuture profits, taxes on profits will increase at the firm’s discount rate in the long run. In thiscase the present value of the taxes paid on an extra barrel of oil extracted is constant over timeand the firm has no incentive to alter its extraction path for tax reasons.
Tax policy analysts sometimes argue that a depletion allowance is required under a profitstax to account for the decrease in the value of the reservoir as oil is extracted. Governmentsoften grant two kinds of depletion allowances as a deduction against income under a profits
Kenneth J. McKenzie 251
tax. Percentage depletion allowances are equal to some constant percentage of gross revenue.Cost depletion allowances are a constant per unit deduction based on the amount of theresource extracted. As long as the size of the initial reservoir is fixed and known, there is noneed to grant a depletion allowance to ensure neutrality. In this case percentage depletionallowances act just like a negative gross royalty, while cost depletion allowances act like a neg-ative severance tax, with precisely the opposite effects on the extraction path. When the size ofthe initial reserve is not fixed, but depends on the firm’s exploration and development efforts,an income tax does require a depletion allowance to be neutral. The depletion allowance isneeded because there are now two decisions that the firm must make: how big the initialreserve should be (in other words, how much exploration effort to undertake) and how fast toextract it. What is required for neutrality along both these dimensions is a depletion allowancethat grows at a rate equal to the difference between the rate of growth in the market price of oiland the rate at which the firm discounts its profits.
Resource rent taxes are levied on the present value of the resource, net of all extraction costs.Because these taxes are intended to be levied explicitly on economic rent, if designed properlythey have no impact on the extraction decision. However, measuring the net present value ofthe resource is not always straightforward. As such, two approaches to implementing aresource rent tax are employed in practice. One is to levy a cash flow tax, which is equivalent toa tax on economic rent in present value terms. A cash flow tax allows all the costs associatedwith extraction, both current and capital, to be deducted immediately. In the case of capitalcosts, the entire purchase price of capital is deducted when incurred, and there is no need toprovide subsequent deductions for depreciation of the forgone rate of return on the capital. Tobe neutral, a pure cash flow tax must be fully refundable. This means that in the early stages ofthe project, when the firm has little revenue and its capital expenditures may be quite large, itreceives a tax refund from the government equal to the size of the negative cash flow times thetax rate.
Another way to levy a resource rent tax—which skirts the necessity of the government hav-ing to issue refunds in the early stages of the project—is to allow the firm to fully recover all thecosts associated with its initial investment in the resource, including the forgone rate of return,before levying a net royalty tax. In this situation, the firm pays no taxes and receives no refundfor several years at the beginning of a resource project, and pays a net royalty tax only after therate of return on the project reaches a level equal to the firm’s discount rate. One way to imple-ment this approach is to carry the negative cash flows from the early stages of a nonrenewableresource development forward for deduction against future positive cash flows. These nega-tive cash flows are carried forward at the firm’s discount rate.
Note that for practical purposes, the foregoing discussion was limited in relation to thetypes of taxes and distortions it could include. However, the analysis does elucidate the needfor each government to carefully consider the tax design and the implications for the decisionsof the firms involved in the extraction decision when designing a tax system intended to obtaina share of the rent generated by a nonrenewable resource.
Resource Taxation and Fiscal Federalism
This section explores how revenues from the taxation of the economic rents from naturalresources may be distributed across governments and jurisdictions. The conventional economicwisdom in this regard is that the taxation of natural resources should be centralized with thenational—as opposed to state—government. This section sets out an economic model or argu-ment for centralization, which will make the case on both efficiency and equity grounds. Thisfundamental result is then qualified along both economic and political dimensions, whichimply that exclusive central control may not be completely desirable and that there may be atleast some role for state governments in the area of resource taxation.
252 Fiscal Federalism and the Taxation of Nonrenewable Resources

The Simple Case for Centralization
As stated before, a defining characteristic of natural resources is that endowments tend to beunevenly distributed across geographical regions. This situation creates problems when thegeographical boundaries that demarcate the distribution of those resources coincide, or liewithin, the political boundaries that define the subnational governments or states.
Consider a simple case of a federation with just two states, A and B. State A is endowed witha natural resource, for example, oil, which generates economic rents, while state B is not. Thestate government in both states is responsible for delivering a set of local public goods andservices that only benefits the residents of the state in question. In other words, there are nospillovers between states in the provision of these local public goods. Assume also that the pop-ulation in the entire country is fixed, coincides with the working population, is perfectly mobilebetween the two states, and is able to migrate between them costlessly. Assume also that migra-tion decisions are based solely on economic considerations, such as the wages individuals canearn in each state. Finally, assume that the residents of each state are fully informed about thelevel of local public goods and services and the taxes required to finance them, not only in theirown state, but in the other state as well.
Similar to the example used in the previous section illustrating the economic implications ofdifferent types of resource taxes on the extraction decision, this example is vastly oversimpli-fied. Nonetheless, it is useful in illustrating important points that carry over into more complex,and more realistic, environments.
To begin, consider a situation where state A, the state endowed with oil, does not imposeany taxes on the rents generated by the natural resource. Instead imagine that both statesfinance the provision of their local public goods exclusively with benefit taxes. Benefit taxes aretaxes equal to the economic benefit provided to residents by the public goods and services. Inpractice, these taxes may be approximated by user fees or similar charges. Although the use ofbenefit taxes is obviously restricted in practice to public goods that are excludable, in the sensethat only those who pay for the goods receive the benefits—although many public goods are infact nonexcludable—the idea of benefit taxes serves a useful pedagogical purpose. When pub-lic goods are financed exclusively by benefit taxes, taxpayers receive no excess benefit, or sur-plus, from the public goods provided by the government over and above the amount they haveto pay for them. In the jargon of economics, the net fiscal benefit associated with the provisionand financing of public services with benefit taxes is zero. The net fiscal benefit refers to thevalue of the pubic goods and services to the citizens in excess of the taxes they pay to receivethem.
The fact that the net fiscal benefit in each of the states is zero under this hypothetical sce-nario suggests that the residents of either state will have no reason to migrate to the other stateto access the public goods the other state offers. No matter where citizens choose to live, theypay an amount equal to the value of the public goods and services to them, earning no surplus.This means that the allocation of residents across the two states will be independent of fiscalconsiderations, and will be determined purely by economic considerations, particularly by thewages individuals can earn by living in each state.1 The equilibrium in this initial scenario isillustrated in figure 12.1.
The horizontal axis in figure 12.1 measures the population size of the entire country. Anypoint along this axis represents an allocation of the population between the two states. Movingalong the horizontal axis to the right from the left-hand origin, labeled OA, signifies a realloca-tion of the population away from state B and toward state A, while moving to the left from theright-hand origin, labeled OB, is a reallocation in the opposite direction. For example, consider
Kenneth J. McKenzie 253
1. For the allocation of workers across the two states to be independent of fiscal considerations, theonly requirement is a zero net fiscal benefit in each state.
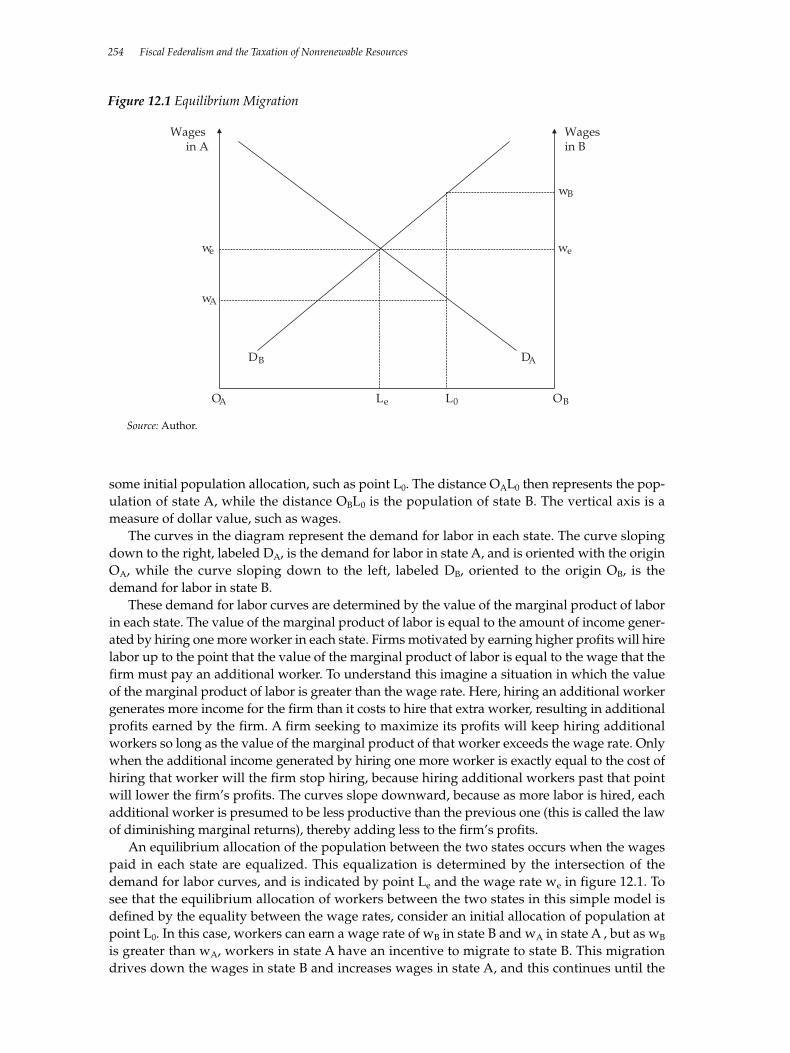
some initial population allocation, such as point L0. The distance OAL0 then represents the pop-ulation of state A, while the distance OBL0 is the population of state B. The vertical axis is ameasure of dollar value, such as wages.
The curves in the diagram represent the demand for labor in each state. The curve slopingdown to the right, labeled DA, is the demand for labor in state A, and is oriented with the originOA, while the curve sloping down to the left, labeled DB, oriented to the origin OB, is thedemand for labor in state B.
These demand for labor curves are determined by the value of the marginal product of laborin each state. The value of the marginal product of labor is equal to the amount of income gener-ated by hiring one more worker in each state. Firms motivated by earning higher profits will hirelabor up to the point that the value of the marginal product of labor is equal to the wage that thefirm must pay an additional worker. To understand this imagine a situation in which the valueof the marginal product of labor is greater than the wage rate. Here, hiring an additional workergenerates more income for the firm than it costs to hire that extra worker, resulting in additionalprofits earned by the firm. A firm seeking to maximize its profits will keep hiring additionalworkers so long as the value of the marginal product of that worker exceeds the wage rate. Onlywhen the additional income generated by hiring one more worker is exactly equal to the cost ofhiring that worker will the firm stop hiring, because hiring additional workers past that pointwill lower the firm’s profits. The curves slope downward, because as more labor is hired, eachadditional worker is presumed to be less productive than the previous one (this is called the lawof diminishing marginal returns), thereby adding less to the firm’s profits.
An equilibrium allocation of the population between the two states occurs when the wagespaid in each state are equalized. This equalization is determined by the intersection of thedemand for labor curves, and is indicated by point Le and the wage rate we in figure 12.1. Tosee that the equilibrium allocation of workers between the two states in this simple model isdefined by the equality between the wage rates, consider an initial allocation of population atpoint L0. In this case, workers can earn a wage rate of wB in state B and wA in state A , but as wB
is greater than wA, workers in state A have an incentive to migrate to state B. This migrationdrives down the wages in state B and increases wages in state A, and this continues until the
254 Fiscal Federalism and the Taxation of Nonrenewable Resources
Figure 12.1 Equilibrium Migration
OA OBLe L0
we
Wages in A
Wages in B
we
wA
wB
DB DA
Source: Author.
wage rates in the two states are equalized, after which there is no longer an incentive for work-ers to migrate from one state to another. At this point, an equilibrium has been achieved.
As mentioned earlier, because the net fiscal benefit associated with the provision of localpublic goods in each state in this initial situation is presumed to be zero, workers migrate fromone state to the other only in response to wage differentials, and not in response to higher pub-lic services or lower taxes. When this is the case, the equality of wages also means that the valueof the marginal product of labor is equal in the two states. This situation means that it is notpossible to increase the total amount of income generated in the entire country by allocatinglabor from one state to another. In this situation, the allocation of labor between the two statesis said to be economically efficient, in the sense that any other allocation will result in lowernational income. To further visualize this situation, remember that labor will be hired up to thepoint that the value of the marginal product is equal to the wage rate, and consider again thealternative allocation associated with L0. At L0 wB = VMPLB > VMPLA = wA, where VMPLi
stands for the value of the marginal product of labor in state i, and i = A,B. Thus, at L0, thereduction in income from losing one worker in state A is less than the increase in income fromgaining one worker in state B, and total income generated in the country can be increased bytaking one worker from state A and moving this worker to state B. This type of increase innational income resulting from moving workers from one state to the other can take place forall allocations of labor between the two states except that given by Le, where wA = VMPLA =VMPLB = wB. Thus in the absence of differences in net fiscal benefits between the two states,migration ensures an efficient, income-maximizing allocation of workers between states.
Remember, however, that state A is fortunate enough to be endowed with oil reserves thatgenerate economic rent. Say the total rent generated by those reserves is equal to an amount RA.As discussed earlier, these rents are earned over and above the opportunity cost of extractingthe resource, and thus represent the excess value of the resource over and above the wages paidto the workers and the return to the owners of capital involved in the extraction. State A canimpose taxes on these rents without discouraging or distorting the production of the resource(including the time profile, as discussed earlier). State A can use the resulting tax revenue toeither enhance the public goods and services it currently offers or to lower the taxes currentlypaid by its residents (or some combination of the two). In either case, the presence of this rentand the revenue it gives rise to generate a positive net fiscal benefit to the residents of state A.In other words, the value of the publicly provided goods and services that residents of state Anow receive exceeds the amount they have to pay for them. The value of that benefit, on a percapita basis, is RA/LA, where LA is the population of state A. The positive net fiscal benefit instate A created by these rents means that individuals in state B now have an incentive to moveto state A to access that benefit. The reason for this is that because the net fiscal benefit in stateB is still zero (because of its use of benefit taxes), the economic benefit that workers receive fromliving in state B is determined solely by the wage rate in state B, wB. By contrast, the economicbenefit that workers receive from living in state A is determined by the sum of the wage rateand the (now positive) net fiscal benefit in state A, or wA + RA/LA. Workers will move betweenstates until the economic benefit of living in each state is equalized. In the presence of a positivenet fiscal benefit in state A, the equilibrium allocation of the population between the two stateswill thus be determined by the condition wA + RA/LA = wB, which is illustrated in figure 12.2.
The original equilibrium from figure 12.1, with a population allocation of Le and wages ineach state equalized at we, is reproduced in figure 12.2. The effect of the positive net fiscal ben-efit financed by taxing the economic rents generated by the oil reserves in state A is illustratedby shifting the labor demand curve in state A from DA up to the right to DA + RA/LA. This is thelabor demand curve augmented by the net fiscal benefit associated with the resource rents. Theequilibrium allocation of workers between the two states is determined by the intersection ofthis augmented labor demand curve in state A with the labor demand curve in state B, generat-ing a population allocation given by point Lf. The presence of a positive net fiscal benefit in
Kenneth J. McKenzie 255
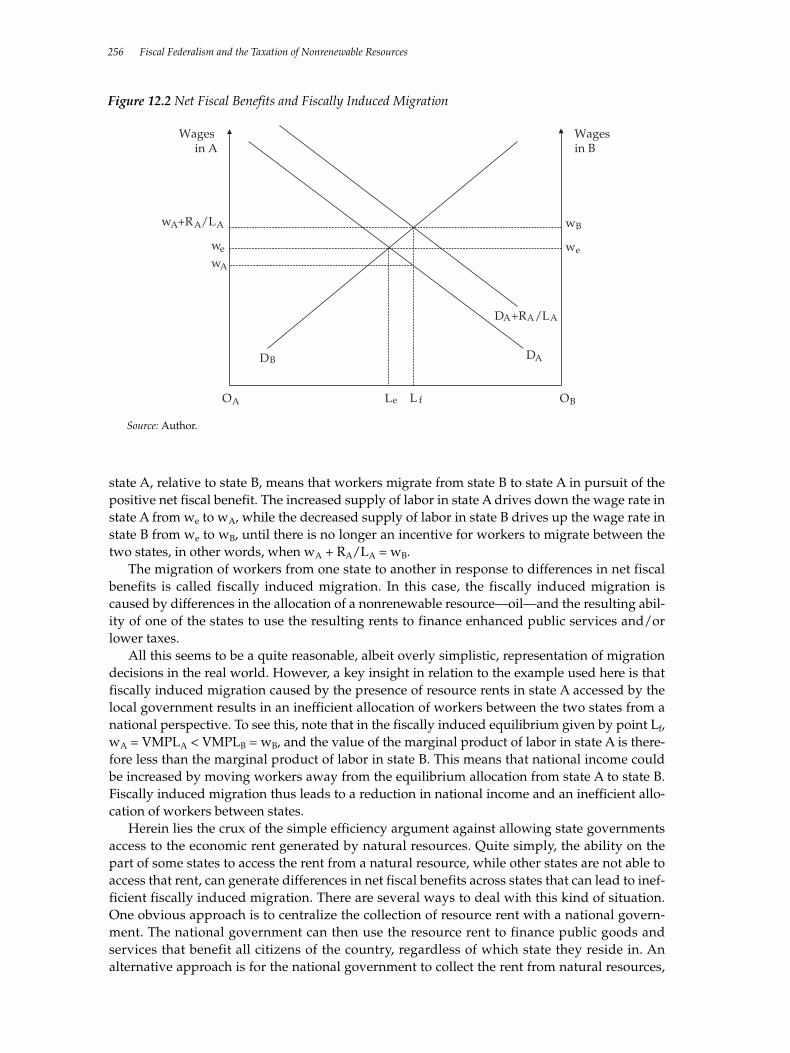
state A, relative to state B, means that workers migrate from state B to state A in pursuit of thepositive net fiscal benefit. The increased supply of labor in state A drives down the wage rate instate A from we to wA, while the decreased supply of labor in state B drives up the wage rate instate B from we to wB, until there is no longer an incentive for workers to migrate between thetwo states, in other words, when wA + RA/LA = wB.
The migration of workers from one state to another in response to differences in net fiscalbenefits is called fiscally induced migration. In this case, the fiscally induced migration iscaused by differences in the allocation of a nonrenewable resource—oil—and the resulting abil-ity of one of the states to use the resulting rents to finance enhanced public services and/orlower taxes.
All this seems to be a quite reasonable, albeit overly simplistic, representation of migrationdecisions in the real world. However, a key insight in relation to the example used here is thatfiscally induced migration caused by the presence of resource rents in state A accessed by thelocal government results in an inefficient allocation of workers between the two states from anational perspective. To see this, note that in the fiscally induced equilibrium given by point Lf,wA = VMPLA < VMPLB = wB, and the value of the marginal product of labor in state A is there-fore less than the marginal product of labor in state B. This means that national income couldbe increased by moving workers away from the equilibrium allocation from state A to state B.Fiscally induced migration thus leads to a reduction in national income and an inefficient allo-cation of workers between states.
Herein lies the crux of the simple efficiency argument against allowing state governmentsaccess to the economic rent generated by natural resources. Quite simply, the ability on thepart of some states to access the rent from a natural resource, while other states are not able toaccess that rent, can generate differences in net fiscal benefits across states that can lead to inef-ficient fiscally induced migration. There are several ways to deal with this kind of situation.One obvious approach is to centralize the collection of resource rent with a national govern-ment. The national government can then use the resource rent to finance public goods andservices that benefit all citizens of the country, regardless of which state they reside in. Analternative approach is for the national government to collect the rent from natural resources,
256 Fiscal Federalism and the Taxation of Nonrenewable Resources
Figure 12.2 Net Fiscal Benefits and Fiscally Induced Migration
OA OBLe
we we
DB DA
DA+RA/LA
L f
wA+RA/LA wB
wA
Wages in A
Wages in B
Source: Author.
but then share the rent on an equal per capita basis with all the state governments via a systemof intergovernmental transfers. Yet another approach would be to include resource rent in anequalization system that seeks to equalize fiscal capacity and net fiscal benefits across stategovernments (see chapter 2 in this volume). Regardless of the approach, the possibility of fis-cally induced migration associated with local government access to resource rent provides acompelling efficiency argument in favor of a strong central government presence in the area ofresource taxation.
A theoretical case in favor of centralization of the taxation of natural resources may also bemade on equity grounds. An important concept underlying the analysis of equity considerationsrelated to public policy is the idea of ability to pay. The ability to pay approach to the analysis ofequity says quite simply that the amount that individuals pay (in taxes or otherwise) for publicgoods and services should somehow be related to their ability to pay for those goods and serv-ices. Ability to pay may be measured in several ways, but for the purposes of this chapter think ofit simply as income. The principle of horizontal equity then says that individuals with the sameability to pay should pay the same amount for the public goods and services that they receive.For this reason, horizontal equity is often referred to simply as the equal treatment of equals.
The presence of unequally distributed resource endowments, and the associated rent, acrossstates suggests that the principle of horizontal equity will be violated on a national level if localgovernments are able to access the rent generated by the natural resources, even if there is nopossibility for migration between states. To visualize this possibility, consider the discrepancybetween the net fiscal benefits associated with public goods in states A and B, as described pre-viously. An individual living in state A who has the same ability to pay (in other words, thesame income) as an individual living in state B will pay less for the same level of public goodprovision (or the same for a higher level of public good provision). This violates the principleof horizontal equity. If the collection and/or distribution of resource rent is centralized with thenational government, differences in net fiscal benefits between states caused by discrepanciesin the endowment of natural resources is eliminated, and horizontal equity may be maintained.
Qualification I: The Economic Environment
The previous example was based on a very simple and stylized set of assumptions about theeconomic environment. For example, the efficiency argument for the centralization of taxingpower over natural resources relied on an assumption of perfect labor mobility across states. Inpractice, this assumption does not hold, and to the extent that labor is not perfectly mobileacross states, the efficiency argument for central control is obviously reduced. However, themodel still identifies the pressures that may exist in the presence of local government controlover resource rent taxes. Moreover, some evidence in other countries indicates that individualsdo indeed base their migration decisions on differences in net fiscal benefits across states, atleast in part (Winer and Day 1994). These pressures are the basis for the conventional economicwisdom suggesting that the central government can play a prominent role in the taxation ofnatural resources.
Several elements can be added to the economic environment that could soften the argumentthat the central government should have exclusive jurisdiction over the taxation of naturalresources. This section focuses on two such elements in a nontechnical manner.
The first consideration involves the provision of services and infrastructure by state andlocal governments in support of the exploitation of natural resources. Taxes and other chargeslevied on natural resources might be considered compensation for the costs associated with theprovision of this infrastructure.
A related idea involves the presence of negative externalities associated with the produc-tion and development of the natural resource. For example, the development of naturalresources is often associated with negative environmental impacts. These negative environ-
Kenneth J. McKenzie 257
mental impacts tend to be concentrated locally, within state boundaries. The presence of thesenegative environmental impacts suggests that state governments may have a role in monitor-ing and regulating activities related to the production of the natural resource, for instance, byimposing environmental standards and regulations. Similar to other infrastructure providedby state and local governments, the costs associated with this regulatory activity need to befinanced in some way, and a natural candidate would be the rents generated from the exploita-tion of the natural resource.
State compensation for costs associated with infrastructure and regulatory activity relatedto natural resources can take many forms. One is to allow state governments to impose taxes orother levies on the companies involved in exploiting the resource. Another possibility is toretain the central government’s dominance in the taxation of the resource, but to allocate someof the rents generated by the resource to the state government.
A related issue concerns the costs imposed by the negative environmental externality itself.The presence of these environmental externalities may suggest an argument for lowering therate of extraction of the resource below that determined by the private market. The introduc-tion of this chapter alludes to this possibility in connection with the importance of establishinga neutral boundary. As discussed in the previous section on the economic effects of resourcetaxes, taxes can affect many decisions related to the production of the natural resource, includ-ing the time profile of extraction. If the government with jurisdiction over the taxation of thenatural resource does not fully internalize, or take account of, the negative externalities associ-ated with the extraction of the resource, then it may not properly implement a tax systemdesigned to generate an appropriate time profile, that is, one that reflects the negative environ-mental externalities associated with the extraction of the natural resource. To the extent that thecentral government does not properly internalize negative local environmental externalitiesassociated with resource extraction, the result will not be socially optimal. This suggests thatthe state government has a role in imposing taxes designed to reflect the negative externality,perhaps by slowing down the rate of extraction of the resource. An obvious candidate for thistype of tax is a state-level severance tax that tilts the time profile of resource extraction from thepresent to the future.
The second consideration that modifies the argument for exclusive central government con-trol over resource taxation concerns the very existence of the positive net fiscal benefits arisingfrom the taxation of resource rents. The simple model presented previously presumed that thevalue of the net fiscal benefit was simply equal to the per capita rents generated by the naturalresource. This may not be the case in practice if the supply curve for the local goods and serv-ices provided by the state government is upward sloping. If this is the case, as the stateendowed with the natural resource (state A in the previous example) expands its provision oflocal public goods and services, the per unit cost of providing those goods and servicesincreases. This means that the per unit cost of providing government goods and services instate A will be greater than the cost in state B. In the extreme case, this cost differential may beenough to dissipate the net fiscal benefit in state A altogether, in which case both the equity andefficiency arguments in favor of centralization cease to hold. Although the extreme case isunlikely in practice, it does suggest that the net fiscal benefit arising from the natural resourceendowment in state A may be lower than suggested by simply measuring the per capita eco-nomic rent generated by the resource. If the net fiscal benefit is lower, the efficiency cost ofallowing state government control over the taxation of the natural resource may be lower thanmight be expected as well.
Qualification II: The Political Environment
The model discussed previously, or variations of it, is often used to justify the dominant, if notexclusive, role of the central government in natural resource taxation on economic grounds.
258 Fiscal Federalism and the Taxation of Nonrenewable Resources
Despite this conventional economic wisdom, precisely the opposite seems to be the case inmany, if not most, federal countries. For example, while Canada’s national government has avirtually unrestricted ability to levy taxes on all activities, including natural resources, the own-ership of natural resources is constitutionally enshrined with the provincial (state) govern-ments, which impose royalties and other types of special taxes on their natural resources. Thissituation is not at all uncommon in many federalist countries.
The phrase “political considerations” is often invoked to explain public policies that seem togo against conventional economic wisdom, and in the case of the taxation of natural resourcesthe phrase seems to be particularly apt. Yet as an explanation, political considerations areclearly unsatisfactory. The political and constitutional history of each federation is unique, anda single theory cannot adequately encompass all cases. However, employing some conceptsfrom cooperative game theory in economics can shed some light on the way that political con-siderations might influence the allocation of the rents from natural resource taxation acrossgovernments in a generic sense.2 To do this consider the following economic benefits that amember state or jurisdiction may derive from being part of a federation:
• Some economies of scale may be realized in the provision of public goods on anational basis. An example of this might be the provision of national defense,whereby the per capita cost of providing the service declines as the size of the feder-ation increases.
• Something akin to insurance benefits can come from belonging to the federation. Thesebenefits arise from risk pooling in a federation where business cycles are not perfectlycorrelated across regions. This introduces some stability in to the provision of publicgoods and services and/or taxes that might not exist in a unitary state. Indeed, this maybe particularly relevant in the area of natural resource taxation, because revenue fromsuch taxes tends to be quite volatile.
• States within a federation typically share, at least to some extent, a common set of laws,regulations, language, and culture. This situation facilitates trade and lowers the trans-action costs associated with this trade.
• Collection of some taxes, including resource taxes, by a national government may pre-vent the type of inefficient, fiscally-induced migration between jurisdictions discussedearlier (presuming labor mobility between independent states).
Of course, economic costs are also associated with being part of a federation. These costsinvolve the loss of autonomy a region incurs because some of the tax and spending policiesimposed on its citizens originate with the central government. If the policy preferences of aregion or state do not coincide with the preferences of the nation as a whole, the resulting out-come can impose real economic costs on the state’s citizens.
Whether or not a particular state is a net beneficiary from belonging to a federation, in eco-nomic terms, depends on whether or not the benefits of federation are greater than the costs.Before getting into the economic analysis of political considerations, let us assume that beingpart of the federation is indeed beneficial to all the states that belong to it. The revealed prefer-ence argument for this assertion is simple: if this were not the case, a state would not choose tobe a member of the federation. Again, this situation is overly simplistic because federations areformed—or not—on the basis of other aspects such as the cultural and political history of theregions in question, and not just on the basis of economic considerations. Moreover, regionstypically cannot decide to simply join or leave a federation arbitrarily. While these considera-tions are obviously important, what matters for the purposes of this discussion is the simple
Kenneth J. McKenzie 259
2. The technical literature contains vast amounts of information on bargaining in economics. Thischapter does not attempt to discuss this literature.
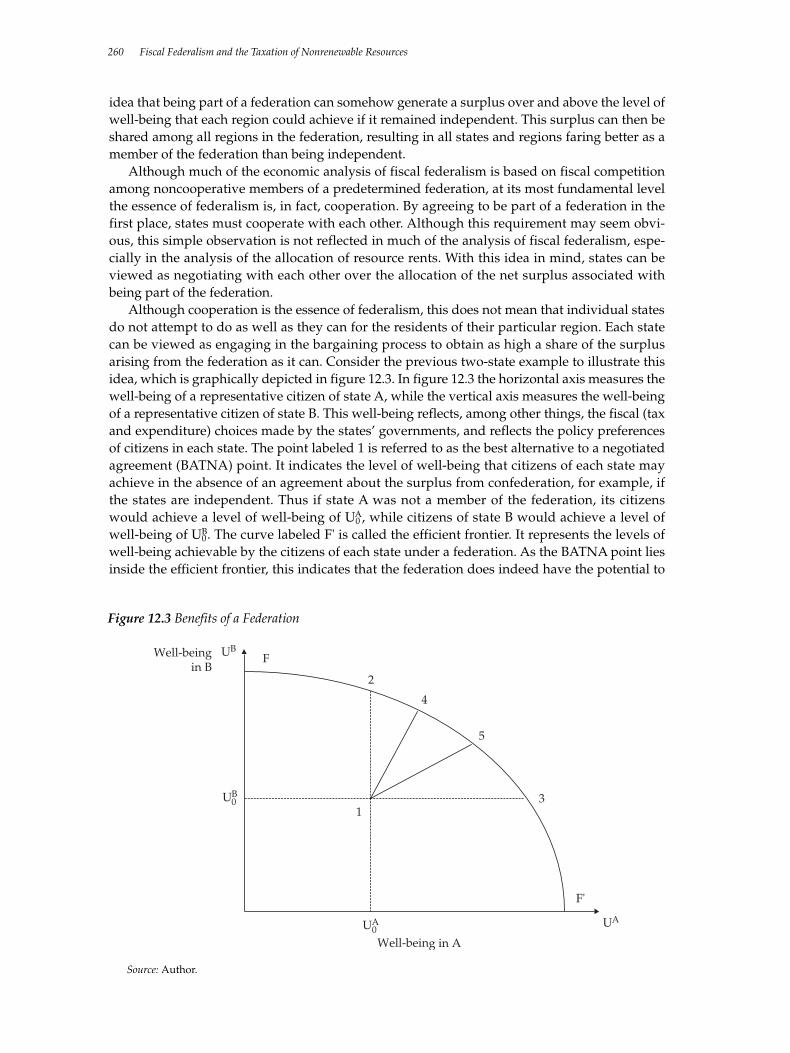
idea that being part of a federation can somehow generate a surplus over and above the level ofwell-being that each region could achieve if it remained independent. This surplus can then beshared among all regions in the federation, resulting in all states and regions faring better as amember of the federation than being independent.
Although much of the economic analysis of fiscal federalism is based on fiscal competitionamong noncooperative members of a predetermined federation, at its most fundamental levelthe essence of federalism is, in fact, cooperation. By agreeing to be part of a federation in thefirst place, states must cooperate with each other. Although this requirement may seem obvi-ous, this simple observation is not reflected in much of the analysis of fiscal federalism, espe-cially in the analysis of the allocation of resource rents. With this idea in mind, states can beviewed as negotiating with each other over the allocation of the net surplus associated withbeing part of the federation.
Although cooperation is the essence of federalism, this does not mean that individual statesdo not attempt to do as well as they can for the residents of their particular region. Each statecan be viewed as engaging in the bargaining process to obtain as high a share of the surplusarising from the federation as it can. Consider the previous two-state example to illustrate thisidea, which is graphically depicted in figure 12.3. In figure 12.3 the horizontal axis measures thewell-being of a representative citizen of state A, while the vertical axis measures the well-beingof a representative citizen of state B. This well-being reflects, among other things, the fiscal (taxand expenditure) choices made by the states’ governments, and reflects the policy preferencesof citizens in each state. The point labeled 1 is referred to as the best alternative to a negotiatedagreement (BATNA) point. It indicates the level of well-being that citizens of each state mayachieve in the absence of an agreement about the surplus from confederation, for example, ifthe states are independent. Thus if state A was not a member of the federation, its citizenswould achieve a level of well-being of U0
A, while citizens of state B would achieve a level ofwell-being of U0
B. The curve labeled F' is called the efficient frontier. It represents the levels ofwell-being achievable by the citizens of each state under a federation. As the BATNA point liesinside the efficient frontier, this indicates that the federation does indeed have the potential to
260 Fiscal Federalism and the Taxation of Nonrenewable Resources
Figure 12.3 Benefits of a Federation
UB
UA
F
F'
1
UA0
UB0
2
3
4
5
Well-beingin B
Well-being in A
Source: Author.
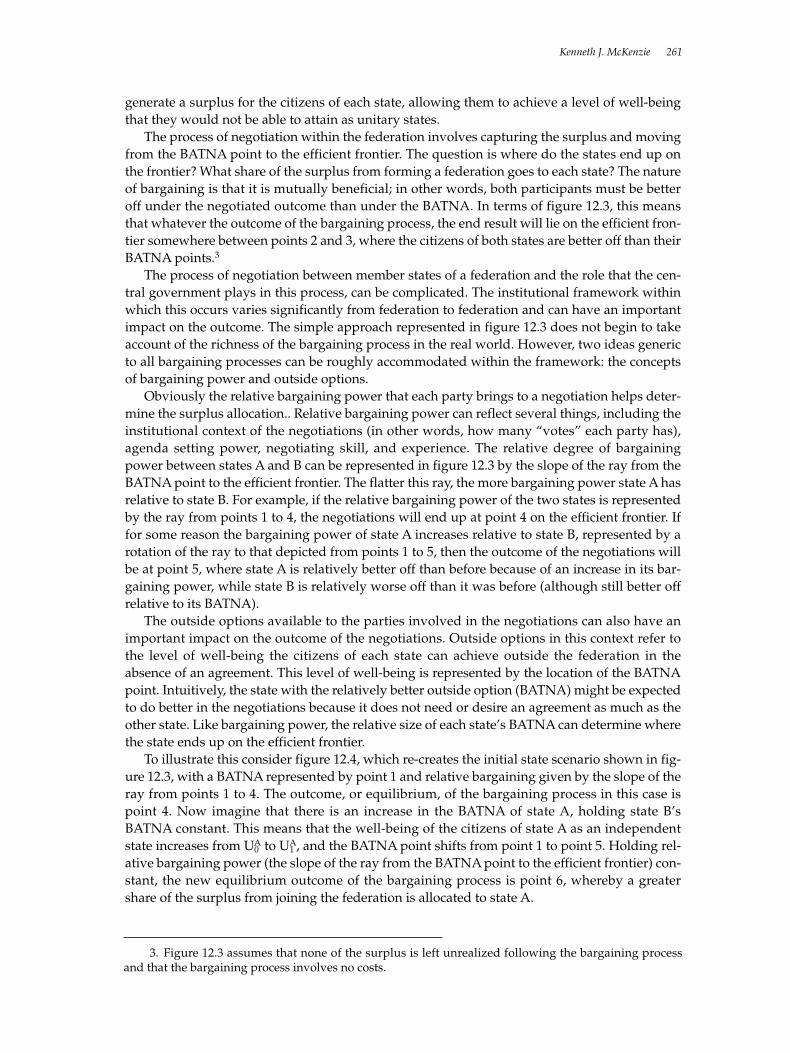
generate a surplus for the citizens of each state, allowing them to achieve a level of well-beingthat they would not be able to attain as unitary states.
The process of negotiation within the federation involves capturing the surplus and movingfrom the BATNA point to the efficient frontier. The question is where do the states end up onthe frontier? What share of the surplus from forming a federation goes to each state? The natureof bargaining is that it is mutually beneficial; in other words, both participants must be betteroff under the negotiated outcome than under the BATNA. In terms of figure 12.3, this meansthat whatever the outcome of the bargaining process, the end result will lie on the efficient fron-tier somewhere between points 2 and 3, where the citizens of both states are better off than theirBATNA points.3
The process of negotiation between member states of a federation and the role that the cen-tral government plays in this process, can be complicated. The institutional framework withinwhich this occurs varies significantly from federation to federation and can have an importantimpact on the outcome. The simple approach represented in figure 12.3 does not begin to takeaccount of the richness of the bargaining process in the real world. However, two ideas genericto all bargaining processes can be roughly accommodated within the framework: the conceptsof bargaining power and outside options.
Obviously the relative bargaining power that each party brings to a negotiation helps deter-mine the surplus allocation.. Relative bargaining power can reflect several things, including theinstitutional context of the negotiations (in other words, how many “votes” each party has),agenda setting power, negotiating skill, and experience. The relative degree of bargainingpower between states A and B can be represented in figure 12.3 by the slope of the ray from theBATNA point to the efficient frontier. The flatter this ray, the more bargaining power state A hasrelative to state B. For example, if the relative bargaining power of the two states is representedby the ray from points 1 to 4, the negotiations will end up at point 4 on the efficient frontier. Iffor some reason the bargaining power of state A increases relative to state B, represented by arotation of the ray to that depicted from points 1 to 5, then the outcome of the negotiations willbe at point 5, where state A is relatively better off than before because of an increase in its bar-gaining power, while state B is relatively worse off than it was before (although still better offrelative to its BATNA).
The outside options available to the parties involved in the negotiations can also have animportant impact on the outcome of the negotiations. Outside options in this context refer tothe level of well-being the citizens of each state can achieve outside the federation in theabsence of an agreement. This level of well-being is represented by the location of the BATNApoint. Intuitively, the state with the relatively better outside option (BATNA) might be expectedto do better in the negotiations because it does not need or desire an agreement as much as theother state. Like bargaining power, the relative size of each state’s BATNA can determine wherethe state ends up on the efficient frontier.
To illustrate this consider figure 12.4, which re-creates the initial state scenario shown in fig-ure 12.3, with a BATNA represented by point 1 and relative bargaining given by the slope of theray from points 1 to 4. The outcome, or equilibrium, of the bargaining process in this case ispoint 4. Now imagine that there is an increase in the BATNA of state A, holding state B’sBATNA constant. This means that the well-being of the citizens of state A as an independentstate increases from U0
A to U1A, and the BATNA point shifts from point 1 to point 5. Holding rel-
ative bargaining power (the slope of the ray from the BATNA point to the efficient frontier) con-stant, the new equilibrium outcome of the bargaining process is point 6, whereby a greatershare of the surplus from joining the federation is allocated to state A.
Kenneth J. McKenzie 261
3. Figure 12.3 assumes that none of the surplus is left unrealized following the bargaining processand that the bargaining process involves no costs.
Thus the relative strength of the two states outside the federation helps determine the allo-cation of the surplus within the federation. The more attractive a state’s outside options—inother words, its economic prospects outside the federation—the greater the share of the surplusfrom participating in confederation.
This insight can be applied to an analysis of the allocation of resource rents across states.Imagine, as before, that the resource rents arise from a natural resource, oil, located in state A.Now imagine a process whereby state A and state B bargain about the allocation of those rents,as well as about other aspects of fiscal policy within the federation. State B can be viewed as theother state within a two-country federation or as a national government representing the otherstates in the federation that are not endowed with the natural resource. Either way, even withits endowment of natural resources, state A can still benefit from being part of the federationfor the reasons discussed earlier. However, its endowment of natural resources, and the associ-ated economic rents, can be thought of as increasing state A’s BATNA relative to the other statesin the federation. As illustrated in figure 12.4, the bargaining process will allocate a greatershare of the benefits of confederation to state A than would otherwise be the case. One obviousway to achieve this is to allow state A to maintain a greater share of the resource rents arisingfrom its endowment of the natural resource. Political considerations, at least in the ratherabstract and imprecise way modeled here, can therefore act to constrain the economic consider-ations, which suggests that resource rents should be collected by the central government andshared among all states of the federation by the provision of a national public good, by inter-governmental transfers, or by an equalization system. In simple terms, the analysis suggeststhat resource-rich states may need to be permitted to maintain a significant share of the rentgenerated by natural resources within their boundary in order to remain part of the federation.Doing so would allow all states within the federation to share in the surplus resulting from con-federation.
Even though the foregoing analysis was framed in terms of a stark outside option associatedwith withdrawing from (or not joining) the federation, similar reasoning applies to outsideoptions and BATNA points that are less stark. For example, even if withdrawing from the
262 Fiscal Federalism and the Taxation of Nonrenewable Resources
Figure 12.4 Change in BATNA
F
F'
1
2
3
4
6
5
UAUA0 UA
1
UB
UB0
Well-beingin B
Well-being in A
Source: Author.
federation is not a viable and credible option for a resource-rich state, there are still variousdegrees of cooperation among states within the context of federalism that may be available toeach state. Cooperation can include a variety of activities, from participating in the harmoniza-tion of tax and spending programs across states to facilitating the collection of taxes (includingresource taxes) by the central government. Canada again offers an informative example in thisregard. Several areas of governance are constitutionally under the responsibility of Canadianprovinces, but have been abdicated in large part to the national government. These include theprovision of the government pension plan, the collection of personal income taxes, provincialpolicing, and some aspects of health care policy. Although the important national presence inthese and other areas obviously contributes to the harmony and synchronization of the result-ing programs, the provinces can, if they so choose, withdraw from the federal programs and setup their own alternatives. Indeed, the province of Quebec has chosen to do just that on manyfronts. The point is that Canadian provinces can choose to be more or less cooperative with eachother and with the national government within the context of the existing federation.
Regardless of the precise form of the outside option available to the states involved in thenegotiating process, either directly or indirectly via a national government, if the endowmentof the natural resource increases the relative attractiveness of the outside option available toresource-rich states, then political considerations suggest the need for these states to retainsome sort of interest in the rent generated by their endowment of natural resources. This is con-sistent with the observation that many federalist countries in the real world do in fact allocate agood deal of the share of natural resource rents to originating state governments by assigningthem taxing power.
International Experience
This chapter does not provide an in-depth overview of the international experience with regardto various approaches to either resource taxation or to the allocation of taxing powers acrosslevels of governments. Nonetheless, briefly discussing some aspects of the international experi-ence is useful. Table 12.1 lists several types of taxes that are levied on natural resources inselected countries and indicates whether or not the tax is under national, state, or local govern-ment authority.
The table indicates that national governments are heavily involved in the taxation of naturalresources in all the countries, and in virtually every tax field. The exceptions to nationalinvolvement are in the area of sales and excise taxes on equipment and services purchased bynatural resource companies and property taxes. The former is due primarily to the lack of salesand excise taxes imposed at the national level in general, while the latter reflects a tendency toleave property taxes to state and local governments. Along with property taxes, the most com-mon involvement by state or local governments in the taxation of natural resources is via theimposition of a mineral royalty or severance tax and land fees.
The involvement of state and local governments in property and land taxes may be justifiedby referring to some of the economic qualifications offered in the previous section, whichargued that to the extent that state governments provide infrastructure that is beneficial to thenatural resource sector, the state government should be compensated for it. Property and land-based taxes are natural candidates for this compensation.
Although the tendency of several state-level governments in table 12.1 to have authorityover royalties and severance taxes may also be justified on these grounds—in other words, ascompensation for environmental damage—such charges are in most cases more likelyexplained by political and constitutional considerations. As discussed earlier, resource-richstates may need to retain some share of the tax revenue collected from natural resources inorder to maintain cooperation within the federation. Royalties and severance taxes levied bystate governments are one way to do this.
Kenneth J. McKenzie 263
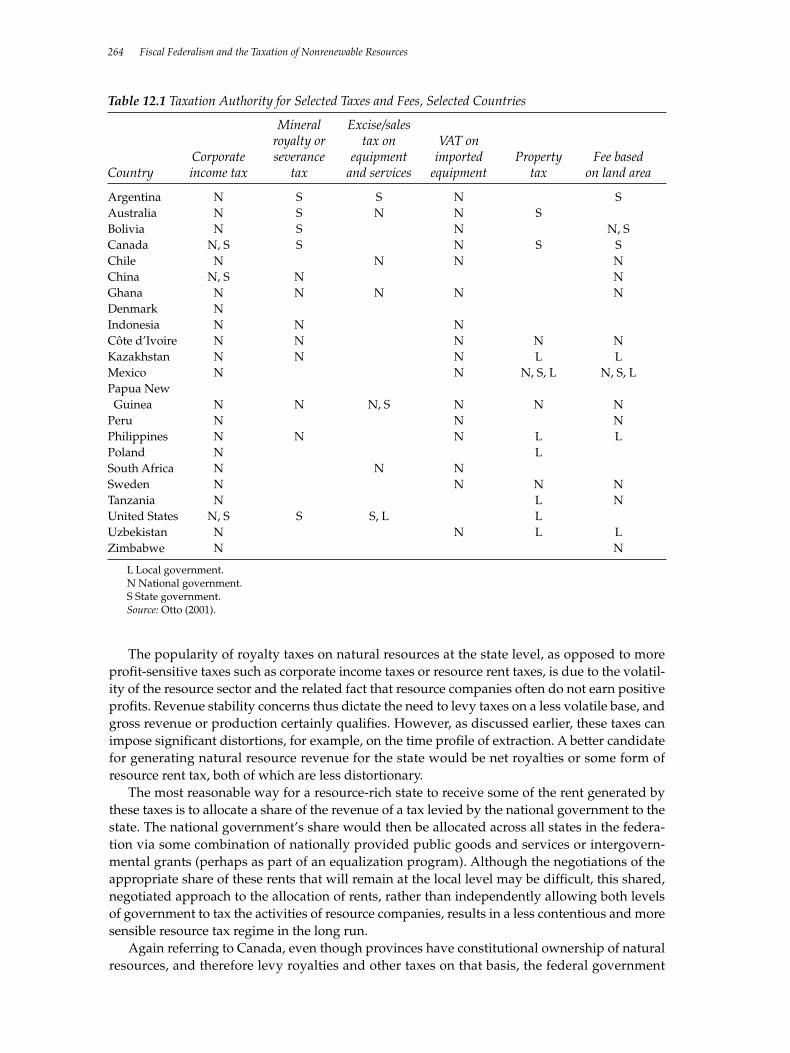
The popularity of royalty taxes on natural resources at the state level, as opposed to moreprofit-sensitive taxes such as corporate income taxes or resource rent taxes, is due to the volatil-ity of the resource sector and the related fact that resource companies often do not earn positiveprofits. Revenue stability concerns thus dictate the need to levy taxes on a less volatile base, andgross revenue or production certainly qualifies. However, as discussed earlier, these taxes canimpose significant distortions, for example, on the time profile of extraction. A better candidatefor generating natural resource revenue for the state would be net royalties or some form ofresource rent tax, both of which are less distortionary.
The most reasonable way for a resource-rich state to receive some of the rent generated bythese taxes is to allocate a share of the revenue of a tax levied by the national government to thestate. The national government’s share would then be allocated across all states in the federa-tion via some combination of nationally provided public goods and services or intergovern-mental grants (perhaps as part of an equalization program). Although the negotiations of theappropriate share of these rents that will remain at the local level may be difficult, this shared,negotiated approach to the allocation of rents, rather than independently allowing both levelsof government to tax the activities of resource companies, results in a less contentious and moresensible resource tax regime in the long run.
Again referring to Canada, even though provinces have constitutional ownership of naturalresources, and therefore levy royalties and other taxes on that basis, the federal government
264 Fiscal Federalism and the Taxation of Nonrenewable Resources
Table 12.1 Taxation Authority for Selected Taxes and Fees, Selected Countries
Mineral Excise/salesroyalty or tax on VAT on
Corporate severance equipment imported Property Fee basedCountry income tax tax and services equipment tax on land area
Argentina N S S N SAustralia N S N N SBolivia N S N N, SCanada N, S S N S SChile N N N NChina N, S N NGhana N N N N NDenmark NIndonesia N N NCôte d’Ivoire N N N N NKazakhstan N N N L LMexico N N N, S, L N, S, LPapua New Guinea N N N, S N N N
Peru N N NPhilippines N N N L LPoland N LSouth Africa N N NSweden N N N NTanzania N L NUnited States N, S S S, L LUzbekistan N N L LZimbabwe N N
L Local government.N National government.S State government.Source: Otto (2001).
has, at various times, levied special taxes on the resource sector. This shared jurisdictionapproach, as opposed to sharing the proceeds from a resource levy, has not only resulted in agood deal of acrimony, but in heavy taxation of the natural resources sector, in particular, theoil and gas sectors (see, for example, Boadway and McKenzie 1989; Boadway, McKenzie, andMintz 1990).
References
The word processed describes informally reproduced works that may not be commonly avail-able through libraries.
Boadway, Robin, and Kenneth McKenzie 1989. “The Economic Impact of Tax Reform on theResource Sector.” In J. Mintz and J. Whalley, eds., The Economic Impacts of Tax Reform. Cana-dian Tax Paper no. 84. Toronto: Canadian Tax Foundation.
Boadway, Robin, Kenneth McKenzie, and Jack Mintz. 1990. Federal and Provincial Taxation of theCanadian Mining Industry: Impact and Implication for Reform. Kingston, Ontario: Queen’sCentre for Resource Studies.
Boadway, Robin, Sandra Roberts, and Anwar Shah. 1994. The Reform of Fiscal Systems in Devel-oping Countries: A Federalism Perspective. Washington, D.C.: World Bank.
Kemp, Alexander G. 1994. “International Petroleum Taxation in the 1990s.” Energy Journal(Special Issue: The Changing World Petroleum Market): 291–309.
Otto, James L. 2000. “Mining Taxation in Developing Countries.” United Nations Conferenceon Trade and Development, Geneva. Processed.
_____. 2001. “Fiscal Decentralization and Mining Taxation.” World Bank, Mining Department,Washington, D.C. Processed.
Shah, Anwar. 1994. The Reform of Intergovernmental Fiscal Relations in Emerging and DevelopingMarket Economies. Washington D.C.: World Bank.
Winer, Stanley and Kathleen Day. 1999. “Internal Migration and Public Policy: An Introductionto the Issues and Review of Empirical Research on Canada” in Alan Maslove, ed., Issues inthe Taxation of Individuals. Toronto: University of Toronto Press.
Kenneth J. McKenzie 265


0-8213-6555-X
T H E W O R L D B A N K
1818 H Street, N.W.Washington, D.C. 20433, U.S.A.
Telephone: 202 473 1000Facsimile: 202 477 6391Internet: www.worldbank.orgE-mail: [email protected]
World Bank Institute
The World Bank Institute (WBI)develops capacity in World Bankclient countries through courses andseminars, policy advice, diagnostictools, and other products andservices to help countries achievetheir development goals. Throughtraditional face-to-face and distancelearning methods, WBI and itspartners around the world work withpolicymakers, technical experts,business and community leaders,and civil society stakeholders tofoster the kinds of analytical andnetworking skills that supporteffective socioeconomic programsand policymaking. The Institutecollaborates with World Bankoperations staff on high prioritythemes including humandevelopment, poverty reduction andeconomic management,environmentally and sociallysustainable development, and financeand private sector development.
Related Documents