Perspective: Tipping the scales - search for drifting constants from molecular spectra Paul Jansen, Hendrick L. Bethlem, and Wim Ubachs Department of Physics and Astronomy, LaserLaB, VU University Amsterdam, De Boelelaan 1081, 1081 HV Amsterdam, The Netherlands (Dated: 6 December 2013) Transitions in atoms and molecules provide an ideal test ground for constraining or detecting a possible variation of the fundamental constants of nature. In this Perspective, we review molecular species that are of specific interest in the search for a drifting proton-to-electron mass ratio μ. In particular, we outline the procedures that are used to calculate the sensitivity coefficients for transitions in these molecules and discuss current searches. These methods have led to a rate of change in μ bounded to 6 × 10 -14 /yr from a laboratory experiment performed in the present epoch. On a cosmological time scale the variation is limited to |Δμ/μ| < 10 -5 for look-back times of 10-12 billion years and to |Δμ/μ| < 10 -7 for look-back times of 7 billion years. The last result, obtained from high-redshift observation of methanol, translates into ˙ μ/μ = (1.4 ± 1.4) × 10 -17 /yr if a linear rate of change is assumed. I. INTRODUCTION The fine-structure constant, α ≈ 1/137, which deter- mines the overall strength of the electromagnetic force, and the proton-to-electron mass ratio, μ = m p /m e ≈ 1836, which relates the strengths of the forces in the strong sector to those in the electro-weak sector 1 , are the only two dimensionless parameters that are required for the description of the gross structure of atomic and molecular systems 2 . The values of these two constants ensure that protons are stable, that a large number of heavy elements could form in the late evolution stage of stars, and that complex molecules based on carbon chemistry exist 3 . If these constants would have had only slightly different values, even by fractions of a percent, our Universe would have looked entirely different. The question whether this fine tuning is coincidental or if the constants can be derived from a – yet unknown – theory beyond the Standard Model of physics, is regarded as one of the deepest mysteries in science. One solution to this enigma may be that the values of the fundamental con- stants of nature may vary in time, or may obtain different values in distinct parts of the (multi)-Universe. Searches for drifting constants are motivated by this perspective. Theories that predict spatial-temporal variations of α and μ can be divided into three classes. The first class comprises a special type of quantum field theories that permit variation of the coupling strengths. Bekenstein postulated a scalar field for the permittivity of free space; this quintessential field then compensates the energy bal- ance in varying α scenarios to accommodate energy con- servation as a minimum requirement for a theory 4 . Based on this concept various forms of dilaton theories with coupling to the electromagnetic part of the Lagrangian were devised, combined with cosmological models for the evolution of matter (including dark matter) and dark en- ergy under the assumptions of General Relativity. Such scenarios provide a natural explanation for variation of fundamental constants over cosmic history, i.e., as a func- tion of red-shift parameter z. The variation will freeze out under conditions, where the dark energy content has taken over from the matter content in the Universe, a sit- uation that has been reached almost completely 5 . These theories provide a rationale for searches of drifting con- stants at large look-back times toward the origin of the Universe, even if laboratory experiments in the modern epoch were to rule out such variations. The second class of theories connects drifting constants to the existence of high order dimensions as postulated in many versions of modern string theory 6 . Kaluza-Klein theories, first devised in the 1920s, showed that formulations of elec- tromagnetism in higher dimensions resulted in different effective values of α, after compactification to the four observed dimensions. Finally, the third class of theories, known as Chameleon scenarios, postulate that additional scalar fields acquire mass depending on the local matter density 7 . Experimental searches for temporal variation of fun- damental constants were put firmly on the agenda of contemporary physics by the ground-breaking study by Webb et al. 8 An indication of a varying α was detected by comparing metal absorptions at high redshift with corresponding transitions that were measured in the lab- oratory. As the observed transitions have in general a different dependence on α, a variation manifests itself as a frequency shift of a certain line with respect to an- other. This is the basis of the Many-Multiplet-Method for probing a varying fine structure constant. 9 The find- ings triggered numerous laboratory tests that compare transitions measured in different atoms and molecules over the course of a few years and thus probe a much shorter time scale for drifting constants. In later work, Webb and co-workers found indication for a spatial vari- ation of α in terms of a dipole across the Universe. 10,11 Spectroscopy provides a search ground for probing drifts in both α and μ. While electronic transitions, in- cluding spin-orbit interactions, are sensitive to α, vibra- tional, rotational and tunneling modes in molecules are sensitive to μ. Hyperfine effects, such as in the Cs-atomic arXiv:submit/0863887 [physics.chem-ph] 6 Dec 2013

Welcome message from author
This document is posted to help you gain knowledge. Please leave a comment to let me know what you think about it! Share it to your friends and learn new things together.
Transcript

Perspective: Tipping the scales - search for drifting constants from molecularspectra
Paul Jansen, Hendrick L. Bethlem, and Wim UbachsDepartment of Physics and Astronomy, LaserLaB, VU University Amsterdam, De Boelelaan 1081,1081 HV Amsterdam, The Netherlands
(Dated: 6 December 2013)
Transitions in atoms and molecules provide an ideal test ground for constraining or detecting a possiblevariation of the fundamental constants of nature. In this Perspective, we review molecular species that areof specific interest in the search for a drifting proton-to-electron mass ratio µ. In particular, we outlinethe procedures that are used to calculate the sensitivity coefficients for transitions in these molecules anddiscuss current searches. These methods have led to a rate of change in µ bounded to 6 × 10⁻¹⁴/yr froma laboratory experiment performed in the present epoch. On a cosmological time scale the variation islimited to |∆µ/µ| < 10−5 for look-back times of 10-12 billion years and to |∆µ/µ| < 10−7 for look-backtimes of 7 billion years. The last result, obtained from high-redshift observation of methanol, translates intoµ/µ = (1.4± 1.4)× 10−17/yr if a linear rate of change is assumed.
I. INTRODUCTION
The fine-structure constant, α ≈ 1/137, which deter-mines the overall strength of the electromagnetic force,and the proton-to-electron mass ratio, µ = mp/me ≈1836, which relates the strengths of the forces in thestrong sector to those in the electro-weak sector1, arethe only two dimensionless parameters that are requiredfor the description of the gross structure of atomic andmolecular systems2. The values of these two constantsensure that protons are stable, that a large number ofheavy elements could form in the late evolution stageof stars, and that complex molecules based on carbonchemistry exist3. If these constants would have had onlyslightly different values, even by fractions of a percent,our Universe would have looked entirely different. Thequestion whether this fine tuning is coincidental or if theconstants can be derived from a – yet unknown – theorybeyond the Standard Model of physics, is regarded as oneof the deepest mysteries in science. One solution to thisenigma may be that the values of the fundamental con-stants of nature may vary in time, or may obtain differentvalues in distinct parts of the (multi)-Universe. Searchesfor drifting constants are motivated by this perspective.
Theories that predict spatial-temporal variations of αand µ can be divided into three classes. The first classcomprises a special type of quantum field theories thatpermit variation of the coupling strengths. Bekensteinpostulated a scalar field for the permittivity of free space;this quintessential field then compensates the energy bal-ance in varying α scenarios to accommodate energy con-servation as a minimum requirement for a theory4. Basedon this concept various forms of dilaton theories withcoupling to the electromagnetic part of the Lagrangianwere devised, combined with cosmological models for theevolution of matter (including dark matter) and dark en-ergy under the assumptions of General Relativity. Suchscenarios provide a natural explanation for variation offundamental constants over cosmic history, i.e., as a func-
tion of red-shift parameter z. The variation will freezeout under conditions, where the dark energy content hastaken over from the matter content in the Universe, a sit-uation that has been reached almost completely5. Thesetheories provide a rationale for searches of drifting con-stants at large look-back times toward the origin of theUniverse, even if laboratory experiments in the modernepoch were to rule out such variations. The second classof theories connects drifting constants to the existenceof high order dimensions as postulated in many versionsof modern string theory6. Kaluza-Klein theories, firstdevised in the 1920s, showed that formulations of elec-tromagnetism in higher dimensions resulted in differenteffective values of α, after compactification to the fourobserved dimensions. Finally, the third class of theories,known as Chameleon scenarios, postulate that additionalscalar fields acquire mass depending on the local matterdensity7.
Experimental searches for temporal variation of fun-damental constants were put firmly on the agenda ofcontemporary physics by the ground-breaking study byWebb et al.8 An indication of a varying α was detectedby comparing metal absorptions at high redshift withcorresponding transitions that were measured in the lab-oratory. As the observed transitions have in general adifferent dependence on α, a variation manifests itself asa frequency shift of a certain line with respect to an-other. This is the basis of the Many-Multiplet-Methodfor probing a varying fine structure constant.9 The find-ings triggered numerous laboratory tests that comparetransitions measured in different atoms and moleculesover the course of a few years and thus probe a muchshorter time scale for drifting constants. In later work,Webb and co-workers found indication for a spatial vari-ation of α in terms of a dipole across the Universe.10,11
Spectroscopy provides a search ground for probingdrifts in both α and µ. While electronic transitions, in-cluding spin-orbit interactions, are sensitive to α, vibra-tional, rotational and tunneling modes in molecules aresensitive to µ. Hyperfine effects, such as in the Cs-atomic
arX
iv:s
ubm
it/08
6388
7 [
phys
ics.
chem
-ph]
6 D
ec 2
013

2
clock12,13 and the 21-cm line of atomic hydrogen14, de-pend on both α and µ, as do Λ-doublet transitions inmolecules15. The same holds for combined high-redshiftobservations of a rotational transition in CO and a finestructure transition in atomic carbon,16 placing a tightconstraint on the variation of the combination α2µ at aredshift as high as z = 5.2. Within the framework ofGrand Unification schemes theories have been developedthat relate drifts in µ and α via
∆µ
µ= R
∆α
α(1)
where the proportionality constant R should be large,on the order of 20 − 40, even though its sign is notpredicted.1,17 This would imply that µ is a more sensitivetest ground than α when searching for varying constants.
The sensitivity of a spectroscopic experiment searchingfor a temporal variation of µ (and similarly for α) can beexpressed as
(∂µ
∂t
)/µ =
(∂ν
ν
)/(Kµ∆t) , (2)
assuming a linear drift. Here (∂µ/∂t)/µ is the fractionalrate of change of µ, ∂ν/ν is the fractional frequency pre-cision of the measurement, Kµ is the inherent sensitivityof a transition to a variation of µ, and ∆t is the timeinterval that is probed in the experiment. For a sensitivetest, one needs transitions that are observed with a goodsignal to noise and narrow linewidth, and that exhibithigh Kµ. In order to detect a possible variation of µ atleast two transitions possessing a different sensitivity arerequired.
Note that, for detecting a variation of µ, it is not nec-essary to actually determine its value. In fact, in mostcases this is impossible, since the exact relation betweenthe value of µ and the observed molecular transitions isnot known. Only for the most simple systems such as H+
2
and HD+, recently it became feasible to directly extractinformation on the value of µ from spectroscopic mea-surements18,19. So far, the numerical value of the proton-electron mass ratio, µ = 1836.15267245 (75), is knownat a fractional accuracy of 4.1 × 10⁻¹⁰ and included inCODATA20,21, while constraints on the fractional changeof µ are below 10−14/yr, as will be discussed in this pa-per.
The most stringent independent test of the time vari-ation of µ in the current epoch was set by comparing vi-brational transitions in SF6 with a cesium fountain overthe course of two years. The SF6 transitions were mea-sured with a fractional accuracy of ∼10−14 and have asensitivity of Kµ = − 1
2 , whereas the sensitivity coeffi-
cient of the Cs transition is Kµ ≈ −112,13, resulting in alimit on the variation of ∆µ/µ of 5.6× 10⁻¹⁴/yr.22
In order to improve the constraints – or to detecta time-variation – attention has shifted to molecularspecies that possess transitions with greatly enhanced
sensitivity coefficients. Unfortunately, the transitionsthat have an enhanced sensitivity are often rather ex-otic, i.e., transitions involving highly exited levels in com-plex molecules that pose considerable challenges to ex-perimentalists and are difficult or impossible to observein galaxies at high red-shift. Nevertheless, a number ofpromising systems have been identified that might leadto competitive laboratory and astrophysical tests in thenear future.
In this Perspective we review the current status oflaboratory and astrophysical tests on a possible time-variation of µ. In particular we outline the procedures fordetermining the sensitivity coefficients for the differentmolecular species. Reviews on the topic of varying con-stants were presented by Uzan23, approaching the sub-ject from a perspective of fundamental physics, and byKozlov and Levshakov24, approaching the topic from amolecular spectroscopy perspective.
II. DEFINITION OF SENSITIVITY COEFFICIENTS
The induced frequency shift of a certain transition asa result of a drifting constant is – at least to first order– proportional to the fractional change in α and µ andis characterized by its sensitivity coefficients Kα and Kµ
via
∆ν
ν= Kα
∆α
α+Kµ
∆µ
µ, (3)
where ∆ν/ν = (νobs − ν0)/ν0 is the fractional changein the frequency of the transition and ∆µ/µ = (µobs −µ0)/µ0 is the fractional change in µ, both with respectto their current-day values. From Eq. (3) we can derivean expression for Kµ (and similarly for Kα)
Kµ =µ
Ee − Eg
(dEedµ− dEg
dµ
), (4)
where Eg and Ee refer to the energy of the ground andexcited state, respectively. Note that the concept of aground state may be extended to any lower state in atransition, even if this corresponds to a metastable stateor a short-lived excited state in a molecule. This defini-tion of Kµ yields opposite signs to that used in Refs. [25–27].
Although electronic transitions in atoms are sensitiveto α, they are relatively immune to a variation of µ.For instance, the frequency of the radiation emitted by ahydrogen-like element with nuclear charge Ze and massnumber A in a transition between levels a and b is givenby
νab = Z2µred
meR∞
(1
n2a
− 1
n2b
), (5)

3
where µred = Ampme/(Amp + me) and R∞ is the Ryd-berg constant. In order to find the sensitivity coefficientsof these transitions we apply Eq. (4) and obtain
Kµ =1
1 +Aµ, (6)
resulting in sensitivity coefficients of 5.4 × 10⁻⁴ for thetransitions of the Lyman series in atomic hydrogen (A =1).
Let us now turn to transitions in molecules. Within theframework of the Born-Oppenheimer approximation, thetotal energy of a molecule is given by a sum of uncoupledenergy contributions, hence, we may rewrite Eq. (4) as
Kµ ≈∑iK
iµ∆Ei∑
i ∆Ei, (7)
where the summation index i runs over the different en-ergy contributions, such as electronic, vibrational, androtational energy. It is generally assumed that theneutron-to-electron mass ratio follows the same behav-ior as the proton-to-electron mass ratio and no effectsdepending on quark structure persist28. Under this as-sumption all baryonic matter may be treated equally andµ is proportional to the mass of the molecule. Hence,from the well-known isotopic scaling relations we findKelµ = 0, Kvib
µ = − 12 , and Krot
µ = −1.The inverse dependence of the sensitivity coefficient
on the transition frequency suggests that Kµ is enhancedfor near-degenerate transitions, i.e., when the differentenergy contributions in the denominator of Eq. (7)cancel each other. This enhancement is proportional tothe energy that is being cancelled and to the differencein the sensitivity coefficients of the energy terms. Sincein general Eel Evib Erot, cancellations betweenelectronic, vibrational and rotational energies areunexpected. Nevertheless, transitions with enhancedsensitivity due to a cancellation of vibrational andelectronic energies have been identified in Cs2
29 andNH+30. Whereas cancellations between electronicand vibrational energies are purely coincidental, near-degeneracies occur as a rule in more complex moleculessuch as molecular radicals or poly-atomic molecules.These molecules have additional energy contributionsthat are comparable in magnitude to rotational andvibrational energies and exhibit a different functionaldependence on µ. For instance, molecules in electronicstates with non-zero electronic angular momentum havefine-structure splittings that are comparable to vibra-tional splittings in heavy molecules31 and to rotationalsplittings in light molecules32. Likewise, molecules thatpossess nuclear spin have hyperfine splittings that canbe comparable to rotational splittings33. In polyatomicmolecules, splittings due to classically-forbidden large-amplitude motions, such as inversion34–36 or internalrotation24,37, can be comparable to rotational splittings.
Finally, the Renner-Teller splitting, that originatesfrom the interaction between electronic and vibrationalangular momenta in linear polyatomic molecules, can becomparable to rovibrational splittings38.
As discussed in the introduction, the sensitivity ofa test depends both on the sensitivity coefficient andthe fractional precision of the measured transition (seeEq. (2). For enhancements originating from cancellationsbetween different modes of energy the sensitivity scales asthe inverse frequency i.e., when two energy terms in thenumerator of Eq. (4) are very similar the sensitivity co-efficient becomes large while the transition frequency be-comes small. The resolution of astrophysical observationsare usually limited by Doppler broadening which impliesthat the fractional precision, δν/ν, is independent of thefrequency. Thus, for astrophysical tests the advantageof low frequency transitions with enhanced sensitivity isevident. For laboratory tests, the motivation for choos-ing low frequency transitions is less obvious. Due to theadvances in frequency comb and optical clock techniques,the fractional precision of optical transitions has becomesuperior to those in the microwave domain.39,40 It wastherefore argued by Zelevinsky et al.41 and others, thatthe best strategy for testing the time-variation of funda-mental constants is to measure an as large as possibleenergy interval and accept the rather limited sensitivitycoefficient that is associated with it. It may be true thatoptical clocks have a better fractional accuracy but mi-crowave measurements still have a smaller absolute un-certainty. For instance, the most accurate optical clockbased on a transition in Al+ at 267 nm (1.12 PHz) hasa fractional accuracy of 2.3 × 10⁻¹⁷, which correspondsto an absolute uncertainty of 27 mHz42, while the mostaccurate microwave clock, based on a transition in Ce-sium at 9.2 GHz has a fractional accuracy of 2 × 10⁻¹⁶
corresponding to an absolute uncertainty of 2 µHz43. Itthus make sense to measure transitions in the microwaveregion, but only if favorable enhancement schemes areavailable. An additional advantage is that, in some well-chosen cases, transitions with opposite sensitivity coeffi-cients can be used to eliminate systematic effects.
The remainder of this paper can be divided into twoparts. In the first part, consisting of Secs. III A and III B,the use of diatomic molecules in studies of a time-varyingµ is discussed. In particular, Sec. III A reviews the cal-culation of sensitivity coefficients for rovibronic transi-tions in molecular hydrogen and carbon monoxide anddescribes how these transitions are used to constrain tem-poral variation of µ on a cosmological time scale. Sec-tion III B shows that the different mass dependence ofrotational and spin-orbit constants results in ‘accidental’degeneracies for specific transitions. The second part ofthe paper consists of Secs. IV A to IV C and discussesthe use of polyatomic molecules, in particular those thatpossess a classically-forbidden tunneling motion.

4
III. TESTING THE TIME INDEPENDENCE OF µUSING DIATOMIC MOLECULES
A. Transitions in molecular hydrogen and carbonmonoxide
Molecular hydrogen has been the target species ofchoice for µ variation searches on a cosmological timescale, in particular at higher redshifts (z > 2). The wave-lengths of the Lyman and Werner absorption lines in H2
and HD can be detected in high-redshifted interstellarclouds and galaxies in the line of sight of quasars and maybe compared with accurate measurements of the sametransitions performed in laboratories on earth. WhileThompson proposed using high-redshift H2 lines as asearch ground for a varying proton-electron mass ratio44,Varshalovich and Levshakov first calculated Kµ sensitiv-ity coefficients for the H2 molecule45. Later updated val-ues for sensitivity coefficients of H2 were obtained in asemi-empirical fashion, based on newly established spec-troscopic data25,26, and via ab initio calculations.46
In the semi-empirical approach, rovibrational level en-ergies of the relevant electronic states are fitted to a Dun-ham expansion47
E(ν, J) =∑
k,l
Ykl(ν + 1
2
)k [J (J + 1)− Λ2
]l, (8)
where Λ is the projection of the orbital angular momen-tum on the molecular axis, i.e., Λ = 0 and 1 for Σ andΠ states, respectively, and Ykl are the fitting parame-ters. The advantage of the Dunham representation ofmolecular states is that the coefficients scale to first or-der as Ykl ∝ µ
l−k/2red , with µred the reduced mass of the
molecule26,47. The coefficients from the Dunham expan-sion can thus be used to determine the sensitivity coeffi-cients through
dE
dµ=∑
k,l
dYkldµ
(ν + 1
2
)k [J (J + 1)− Λ2
]l,
withdYkldµ≈ −Ykl
µ
(l +
k
2
). (9)
By inserting Eqs. (8) and (9) into Eq. (4), sensitivitycoefficients are obtained within the Born-Oppenheimerapproximation. The mass dependence of the potentialminima of ground and excited states is partly accountedfor by including the adiabatic correction. Neglecting thedependence on the nuclear potential, its effect is approx-imated to that of the normal mass shift or Bohr shift48,RH/R∞ = mp/(mp + me), on the levels of an electron
bound to an H+2 core, due to the finite mass of the latter
∆Ead = − ∆E∞2(µ+ 1)
= −∆E(µ)
2µ+ 1, (10)
where ∆Eµ is the difference of the empirical Y00 values ofthe (deperturbed) B1Σ+
u or C1Πu state and the X1Σ+g
ground state. The mass dependence of Eq. (10) intro-duces an additional term that should be included in theparenthesis of Eq. (4) representing the adiabatic correc-tion
d
dµ∆Ead = −∆Ead
µ+ 1. (11)
In order to account for nonadiabatic interaction, mix-ing between different electronic states should be included.In Refs. [25,26] a model is adopted in which the multi-dimensional problem is approximated by incorporatingonly the interaction of the dominant electronic states.The values for the resulting interaction matrix elementsare obtained from a fit to the experimental data. Thisprocedure provides both the deperturbed level energies towhich the Dunham coefficients are fitted, as well as thesuperposition coefficients of the mixed states, ci. Thesensitivity coefficients for the perturbed states are givenby
Kµ =∑
i
c2iKiµ, (12)
where i = 0 refers to the state under considerationand Ki
µ are the sensitivity coefficients of the perturb-ing states. In particular for some levels where a stronginteraction between B 1Σ+
u and C 1Πu states occurs thenon-adiabatic interaction contributes significantly to thevalues of Kµ.
The procedures, following this semi-empirical (SE)procedure outlined in the above, yield Kµ coefficientsfor the Lyman lines (in the B 1Σ+
u - X 1Σ+g system)
and Werner lines (in the C 1Πu - X 1Σ+g system) in
the range (-0.05, +0.02). These results agree withvalues obtained from ab initio calculations (AI) within∆Kµ = KAI
µ − KSEµ < 3 × 10⁻⁴, so at the 1% level,
providing confidence that a reliable set of sensitivitycoefficients for H2 is available. For the HD moleculea set of Kµ coefficients was obtained via ab initiocalculations.50
A full set of accurate laboratory wavelengths was ob-tained in spectroscopic studies with the Amsterdam nar-rowband extreme ultraviolet (XUV) laser setup. Coher-ent and tunable radiation at wavelengths 92 − 112 nmis produced starting from a Nd:VO4-pumped continu-ous wave (CW) ring dye laser, subsequent pulse ampli-fication in a three-stage traveling-wave pulsed dye am-plifier, frequency doubling in a KDP-crystal to produceUV-light, and third harmonic generation in a pulsed jetof Xe gas51. The spectroscopy of the strong dipole al-lowed transitions in the Lyman bands and Werner bandswas performed in a configuration with a collimated beamof H2 molecules perpendicularly crossing the overlapping

5
94849.0 94849.5 94850.0 94850.5
wavenumber (cm-1)
HDB – X(4,0) R(0)
105.4295105.4300105.4305105.4310
wavelength (nm)
*
FIG. 1. Representative high-resolution spectrum. Record-ing of the R(0) line in the B − X(4, 0) band of HD (upper)with etalon markers (lower) and an I2-saturation spectrum(middle) for calibration. The line marked with an asterisk(*) is the a2 hyperfine component of the B − X(8, 4)R(49)transition line in I2 at 15 808.13518 cm−1 used as an absolutereference49. Note that the I2 and etalon spectra are takenat the fundamental, whereas the XUV axis shown is the 6thharmonic.
XUV and UV beams via the method of 1 + 1 resonance-enhanced photo-ionization. Calibration of the absolutefrequency scale in the XUV was established via com-parison of the CW-output of the ring laser with on-linerecording of saturated absorption lines of I2 and fringesof a Fabry-Perot interferometer, which was stabilizedagainst of HeNe laser. Wavelength uncertainties, for themajor part related to residual Doppler effects, AC-Starkinduced effects and frequency chirp in the pulsed dye am-plifier, as well as to statistical effects, were carefully ad-dressed leading to calibrated transition frequencies of theLyman and Werner band lines in the range 92−112 nm atan absolute accuracy of 0.004 cm−1 or 0.000004 nm, cor-responding to a relative accuracy of 5×10⁻⁸. A detaileddescription of the experimental procedures and of the re-sults is given in a sequence of papers52–54. Similar investi-gations of the XUV-laser spectrum of HD were performedin view of the fact that HD lines were also observed inhigh-redshift spectra towards quasar sources55,56.
Additional spectroscopic studies of H2 were performedassessing the level energies in these excited states inan indirect manner, thereby verifying and even improv-ing the transition frequencies in the Lyman and Wernerbands57,58. The data set of laboratory wavelengths ob-tained for both H2 and HD, has reached an accuracythat can be considered exact for the purpose of compar-ison with quasar data, where accuracies are never betterthan 10−7. A typical recording of an HD lines is shownin Fig. 1. A full listing of all relevant parameters on thelaboratory absorption spectrum of H2 and HD, includinginformation on the intensities, is made available in digital
3098 3100 3102 3104
3098 3100 3102 3104
0
1
0
1
Nor
mal
ized
Flux
W0Q3 L7R0 L7R1 W0R5 L7P1W0P3
L7R2 W0Q4
Wavelength ( )A
W0Q3 L7R0 L7R1 W0R5 L7P1W0P3
L7R2 W0Q4
UVE
S-VLT
HIRES-Keck
FIG. 2. Comparison between the spectrum of Q2123-005 inthe 3097−3106 A range observed with HIRES-Keck59 (upperpanel) and UVES-VLT60 (lower panel). For both panels, fitsto the molecular hydrogen lines are shown as the solid greenlines and their velocity components are indicated by the tickmarks that are shown above the spectrum. Tick marks in-dicating the positions of Lyman-α lines and Fe II lines areshown with a slight offset. H2 spectral line identifications areshown at the bottom. Residuals from the fit are shown abovethe observed spectra.
form in the supplementary material of Ref. [56].High quality data on high redshift absorbing systems,
in terms of signal-to-noise (S/N) and resolution, is avail-able only for a limited number of objects. In viewof the transparency window of the earth’s atmosphere(λ > 300 nm) absorbing systems at z > 2 will reveal asufficient number of lines to perform a ∆µ/µ constrain-ing analysis. The systems observed and analyzed so farare: Q0347-383 at zabs = 3.02, Q0405-443 at zabs = 2.59,Q0528-250 at zabs = 2.81, Q2123-005 at zabs = 2.05, andQ2348-011 at zabs = 2.42. Note that the objects denotedby ”Q” are background quasars, which in most studies fo-cusing on H2 spectra are considered as background lightsources, and are indicated by their approximate right as-cension (in hours, minutes and seconds) as a first coor-dinate and by their declination (in degrees, arcminutesand arcseconds, north with ”+” and south with ”-”) asa second coordinate. Hence Q0347-383 refers to a brightquasar located at RA =03:49:43.64 and dec =-38:10:30.6in so-called J2000 coordinates (the slight discrepanciesin numbers relate to the fact that most quasars were dis-covered some 30 years ago, in the epoch when the B1950coordinate system was in use; hence they derive theirnames from the older, shifted coordinate frame). Thesecoordinates imply that Q0347-383 is observable duringnight-time observations in October and a few months be-fore and after. This quasar source is known to be locatedat zemis = 3.21 from a Lyman-α intensity peak in itsemission spectrum, while the absorbing galaxy contain-ing one or more clouds with H2 is at zabs = 3.02. From
6
the analysis of the redshifted H2 spectrum a 7-digit ac-curacy value for the redshift is obtained, in the case ofQ0347-383 zabs = 3.024 899 0(12)25. Such an accuratedetermination of zabs is required for the µ-variation anal-ysis, since it sets the exact value of the Doppler shift ofthe absorbing cloud.
Relevant parameters for the analysis are the H2 col-umn density, which should be sufficient to yield ab-sorption of at least the lowest J-levels, hence N(H2)> 1014 cm−2 and lower than 1019 cm−2 to avoid fullsaturation of the lines, and the brightness of the back-ground quasar which should produce a high S/N in areasonable amount of observing time. The absorbingsystem toward Q2123-005 has the favorable conditionthat the magnitude of the quasar background source(Rmag = 15.8) is the brightest of all H2 bearing systemsobserved so far. This system has been observed from boththe Very Large Telescope (Paranal, Chile), equipped withthe Ultraviolet-Visible Echelle Spectrometer (UVES) andwith the Keck Telescope (Hawaii, USA) equipped withthe HIRES spectrometer. For a comparison of observedspectra see Fig. 2. The results from the analyses are∆µ/µ = (5.6 ± 5.5stat ± 2.9syst) × 10−6 for the Keckspectrum59 and ∆µ/µ = (8.5 ± 3.6stat ± 2.2syst) × 10−6
for the VLT spectrum60, are tightly constraining and ingood agreement with each other. This result eases con-cerns on systematic effects associated with each of theinstruments. Brightness of the other background quasarsis typically Rmag = 17.5, while Q2348-011 is the weakestwith Rmag = 18.3. The latter only delivered a poor con-straint for reasons of low brightness and from a seconddamped-Lyman absorber taking away many H2 lines byits Lyman cutoff61.
Since the number of suitable H2 absorber systems athigh redshift is rather limited, additional schemes are re-quired to improve the current constraint on µ variation atredshifts z > 1. Recent observations of vacuum ultravi-olet transitions in carbon monoxide at high redshift64–67
make CO a promising target species for probing varia-tion of µ. An additional advantage of the CO A − Xbands is that its wavelengths range from 130 − 154 nm,that is, at lower wavelengths than Lyman-α, so that theCO spectral features in typical quasar spectra will falloutside the region of the so-called Lyman-α forest (pro-vided that the emission redshift of the quasar zem is nottoo far from the redshift zabs of the intervening galaxyexhibiting the molecular absorption). The occurrence ofthe Lyman-forest lines is a major obstacle in the searchfor µ variation via molecular hydrogen lines.
In order to prepare for a µ-variation analysis, accuratelaboratory measurements on the A − X system of COwere performed, using laser-based excitation and Fourier-transform absorption spectroscopy27, yielding transitionfrequencies at an accuracy better than ∆λ/λ = 3×10⁻⁷.Also a calculation of Kµ sensitivity coefficients was per-formed, which required a detailed analysis of the struc-ture of the A1Π state of CO and its perturbation by anumber of nearby lying singlet and triplet states.68
B. Near-degeneracies in diatomic radicals
In the previous section we discussed sensitivity coeffi-cients for transitions in diatomics with closed-shell elec-tronic states, that is, molecules that have zero electronicorbital angular momentum.
Let us now turn to diatomic open-shell molecules in a2Π electronic state that have a nonzero projection of or-bital angular momentum along the molecular axis. Theoverall angular momentum J depends on the coupling be-tween the orbital angular momentum L, the spin angularmomentum S, and the rotational angular momentum R.Depending on the energy scales that are associated withthese momenta, the coupling between the vectors is de-scribed by the different Hund’s cases.
When only rotation and spin-orbit coupling are con-sidered, the Hamiltonian matrix for a 2Π electronic statein a Hund’s case (a) basis is given by69
(12A+Bz −B
√z
−B√z − 1
2A+B (z + 2)
),
with z =(J + 1
2
)2 − 1 (13)
where A and B refer to the spin-orbit and rotationalconstant, respectively. For a given value of J , the lowerenergy level is labelled as F1 and the upper as F2. Theeigenfunctions of the Hamiltonian matrix (13) are
|F2〉 = aJ | 32 〉 − bJ |12 〉 and |F1〉 = bJ | 32 〉+ aJ | 12 〉 , (14)
where
a2J =
X + (A− 2B)
2X, and b2J =
X − (A− 2B)
2X, (15)
and
X =√
(A− 2B)2 + 4B2z. (16)
It is instructive to analyze the sensitivity coefficientsof transitions within these molecules as a function ofA/B. These transitions can be divided into two cate-gories; transitions within a spin-orbit manifold and tran-sitions between adjacent spin-orbit manifolds. In thelimit of large |A/B|, transitions within a Ω manifold be-come purely rotational having Kµ = −1, while transi-tions between different Ω manifolds, become purely elec-tronic, and therefore have Kµ = 0. When A ∼ Bz, thespin-orbit manifolds become mixed and the sensitivity ofthe different types of transitions lies between 0 and -162.Three distinct situations, illustrated for a single transi-tion in the left-hand side of Fig. 3, can be identified; (i)When A = 0 all transitions have a sensitivity coefficientof −1. (ii) When A = 2B, aJ = bJ = 1/
√2 and the spin-
orbit manifolds are completely mixed. This also resultsin sensitivity coefficients of Kµ = −1. (iii) Finally, whenA = 4B, the levels F1(J) and F2(J−1) are degenerate for
7
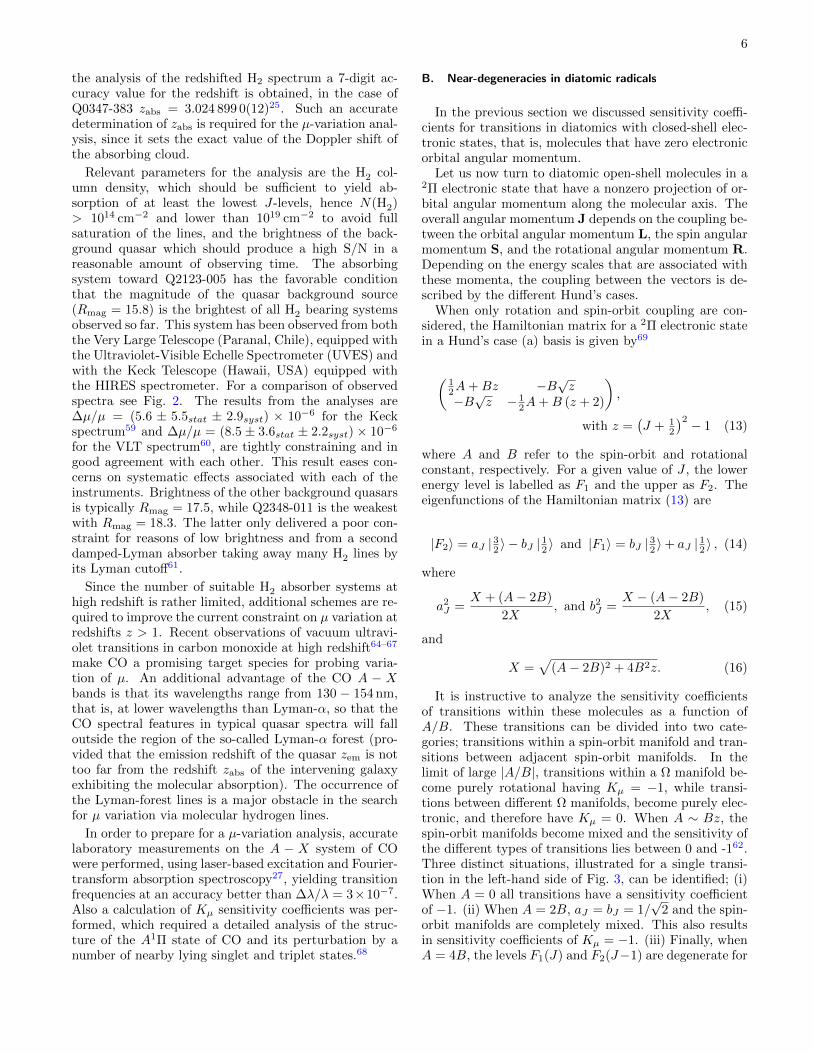
JΩ’ = 80 → 61– – p
-20 -10 0 10A/B
-15
-10
-5
0
5
10
K μ
24 25 26 27 28A/B
-400
-200
0
200
K μ
OD OH CH CD 13C16O12C16O 13C18O
JΩ’ = 3/21/2 → 5/23/2
JΩ’ = 80 → 61+ + p
FIG. 3. Sensitivity coefficients Kµ as a function of A/B for JΩ′ = 3/21/2 → 5/23/2 transitions in diatomic molecules in a2Π electronic state, calculated using Eq. (13) (left panel, after de Nijs et al.62) and JpΩ′ = 8±0 → 6±1 transitions in the a3Πstate of several CO isotopologues (right panel). The crosses indicate sensitivity coefficients that were calculated while takinghigher-order contributions to the Hamiltonian into account62,63.
CO
inverted
0 5 10 15 20
1/2 11/2 21/2 31/2J
-80
-60
-40
-20
0
20
40
60
80
A/B CH
CF
SiH
SiC
CD
SH
OD
normal
NO
2Π
3Π
OHa)
c)
c)
a)
b)
b)
a) 3Π : F2(J + 2) → F3(J)b) 2Π : F1(J + 2) → F2(J)c) 3Π : F1(J + 2) → F2(J)
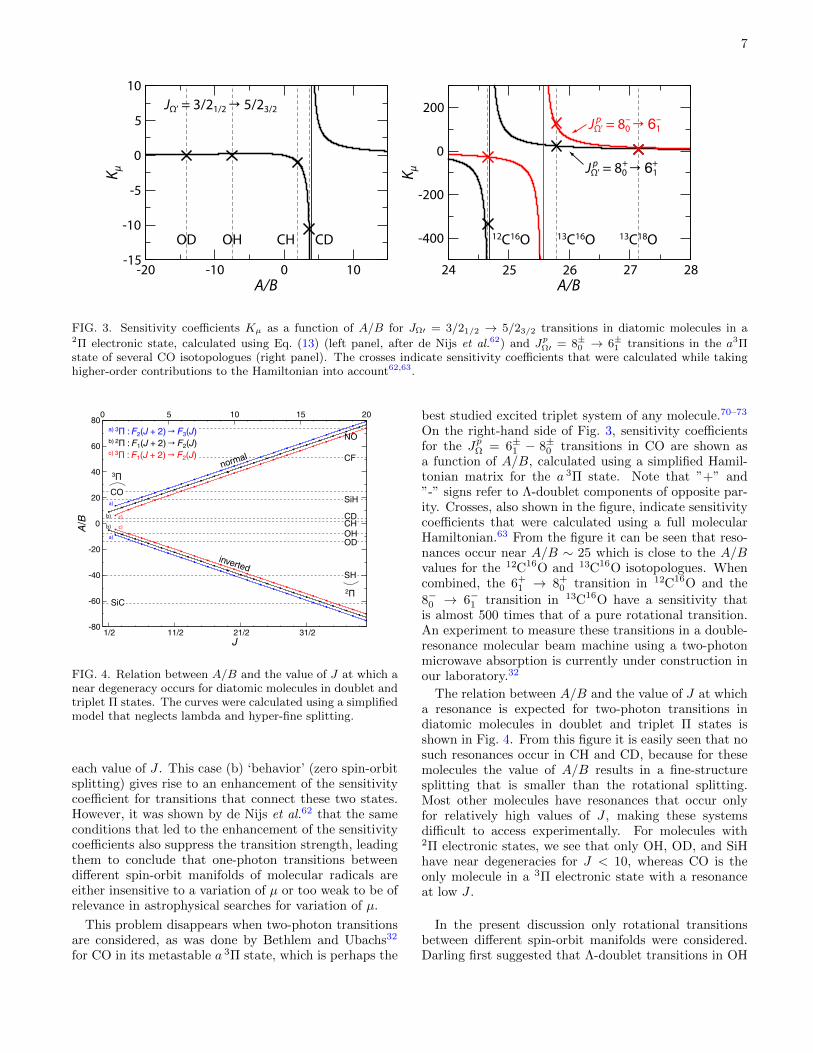
FIG. 4. Relation between A/B and the value of J at which anear degeneracy occurs for diatomic molecules in doublet andtriplet Π states. The curves were calculated using a simplifiedmodel that neglects lambda and hyper-fine splitting.
each value of J . This case (b) ‘behavior’ (zero spin-orbitsplitting) gives rise to an enhancement of the sensitivitycoefficient for transitions that connect these two states.However, it was shown by de Nijs et al.62 that the sameconditions that led to the enhancement of the sensitivitycoefficients also suppress the transition strength, leadingthem to conclude that one-photon transitions betweendifferent spin-orbit manifolds of molecular radicals areeither insensitive to a variation of µ or too weak to be ofrelevance in astrophysical searches for variation of µ.
This problem disappears when two-photon transitionsare considered, as was done by Bethlem and Ubachs32
for CO in its metastable a 3Π state, which is perhaps the
best studied excited triplet system of any molecule.70–73
On the right-hand side of Fig. 3, sensitivity coefficientsfor the JpΩ = 6±1 − 8±0 transitions in CO are shown asa function of A/B, calculated using a simplified Hamil-tonian matrix for the a 3Π state. Note that ”+” and”-” signs refer to Λ-doublet components of opposite par-ity. Crosses, also shown in the figure, indicate sensitivitycoefficients that were calculated using a full molecularHamiltonian.63 From the figure it can be seen that reso-nances occur near A/B ∼ 25 which is close to the A/Bvalues for the 12C16O and 13C16O isotopologues. Whencombined, the 6+
1 → 8+0 transition in 12C16O and the
8−0 → 6−1 transition in 13C16O have a sensitivity thatis almost 500 times that of a pure rotational transition.An experiment to measure these transitions in a double-resonance molecular beam machine using a two-photonmicrowave absorption is currently under construction inour laboratory.32
The relation between A/B and the value of J at whicha resonance is expected for two-photon transitions indiatomic molecules in doublet and triplet Π states isshown in Fig. 4. From this figure it is easily seen that nosuch resonances occur in CH and CD, because for thesemolecules the value of A/B results in a fine-structuresplitting that is smaller than the rotational splitting.Most other molecules have resonances that occur onlyfor relatively high values of J , making these systemsdifficult to access experimentally. For molecules with2Π electronic states, we see that only OH, OD, and SiHhave near degeneracies for J < 10, whereas CO is theonly molecule in a 3Π electronic state with a resonanceat low J .
In the present discussion only rotational transitionsbetween different spin-orbit manifolds were considered.Darling first suggested that Λ-doublet transitions in OH

8
could serve as a probe for a time-variation of α and µ.74
These transitions were measured at high accuracy in aStark-decelerated molecular beam by Hudson et al.75 Itwas shown by Kozlov15 that Λ-doublet transitions in par-ticular rotational levels of OH and CH have an enhancedsensitivity for µ-variation, as a result of an inversion ofthe Λ-doublet ordering. For OH the largest enhancementoccurs in the J = 9/2 of the Ω = 3/2 manifold whichlies 220 cm−1 above the ground-state and gives rise toKµ ∼ 103. For CH the largest enhancements occur inthe J = 3/2 of the Ω = 3/2, which lies only 18 cm−1
above the ground state, however, the enhancement is onthe order of 10. Recently, Truppe et al.76 used Ramsey’sseparated zone oscillatory field technique to measure the3.3 and 0.7 GHz Λ-doublet transitions in CH with rela-tive accuracies of 9×10⁻¹⁰ and 3×10⁻⁸, respectively. Bycomparing their line positions with astronomical obser-vations of CH (and OH) from sources in the local galaxy,they were able to constrain µ-dependence on matter den-sity effects (chameleon scenario) at ∆µ/µ < 2.2× 10⁻⁷.
IV. LARGE AMPLITUDE MOTION IN POLYATOMICMOLECULES
A. Tunneling inversion
In its electronic ground state, the ammonia moleculehas the form of a regular pyramid, whose apex is formedby the nitrogen atom, while the base consists of an equi-lateral triangle formed by the three hydrogen atoms.Classically, the lowest vibrational states possess insuf-ficient energy to allow the nitrogen atom to be found inthe plane of the hydrogen atoms, as can be seen fromthe potential energy curve in Fig. 5. If the barrier be-tween the two potential wells were of infinite height, thetwo wells would be totally disconnected and each energyeigenvalue of the system would be doubly degenerate.However, as the barrier is finite, quantum-mechanicaltunneling of the nitrogen atom through the plane of thehydrogen atoms couples the two wells. This tunnelingmotion lifts the degeneracy, and the energy levels aresplit into doublets. The tunneling through the barrierwith a height of 2023 cm−1 is responsible for an energysplitting of 0.8 cm−1 and 36 cm−1 in the ground vibra-tional and first excited vibrational states, respectively.These energies are much smaller than the energy corre-sponding to the normal vibrational motion in a singlewell (ν0 = 950 cm−1), since the inversion of the moleculeis severely hindered by the presence of the potential bar-rier.
An analytical expression for the inversion frequencyhas been calculated by Dennison and Uhlenbeck77, whoused the Wentzel-Kramers-Brillouin approximation toobtain
s0
s
2023 cm-1
inversionsplitting
0.8 cm-1νinv = 0
1
45
6
7
23
3
ν2 = 0
1
2
35.7 cm-1
284.7 cm-1
511.4 cm-1
502.0 cm-1
629.4 cm-1
931.6 cm-1
-s0
FIG. 5. Potential energy curve and lowest vibrational energylevels for the electronic ground state of NH3 as a functionof the distance between the nitrogen atom and the plane ofthe hydrogen atoms, s. The classical turning points for theground vibrational state, ±s0, are indicated as well. Due totunneling through the potential barrier each vibrational levelis split in a symmetric and antisymmetric component.
ωinv =ω0
πe−G, with
G =1
~
∫ s0
−s0[2µred (U(z)− E)]
12 ds, (17)
with ω0 the energy of the vibration in one of the potentialminima and E the total vibrational energy.
Townes and Schawlow already noted that “if the re-duced mass is increased by a factor of 2, such as wouldbe roughly done by changing from NH3 to ND3, νinv de-
creases by e6(√
2−1) or a factor of 11.”78. Van Veldhovenet al.34 and Flambaum and Kozlov35 pointed out thatthe strong dependence of the inversion splitting on thereduced mass of the ammonia molecule can be exploitedto probe a variation of µ.
To a first approximation the Gamow factor, G, is pro-
portional to µ1/2red and the µ dependence of Eq. (17) can
be expressed through
νinv =a0√µred
e−a1√µred , (18)
where a0 and a1 are fitting constants. The sensitivitycoefficient for the inversion frequency is thus given by
K invµ = − 1
2a1√µred − 1
2 . (19)
From a fit through the inversion frequencies of the dif-ferent isotopologues of ammonia we find a0 = 68 and88 THz amu1/2 and a1 = 4.7 and 3.9 amu1/2 for theν2 = 0 and ν2 = 1 inversion modes, respectively. For14NH3, this results in sensitivity coefficients K inv
µ = −4.2and −3.6.
Alternatively, an expression for the sensitivity coeffi-cients may be obtained from the derivative of Eq. (17).By explicitly taking the µ dependence of the vibrational
9
43–
33–
33+
43+
42–
32–
22–
32+
42+
22+
41–
31–
21–
40+
30+
20+
00+
31+
41+
21+
11–
11+10
+
40+
30+
20+
10+
1200
1100
1000
200
100
0 00+
41±
22±21
±
±31
±11
43±
±33
42±
±32
ΔE = 23.8 GHz
ΔE = 140 GHz
ΔE = 2.885 GHz
ΔE = 1071 GHz
ener
gy (c
m-1
)
ν2 = 0
ν2 = 1
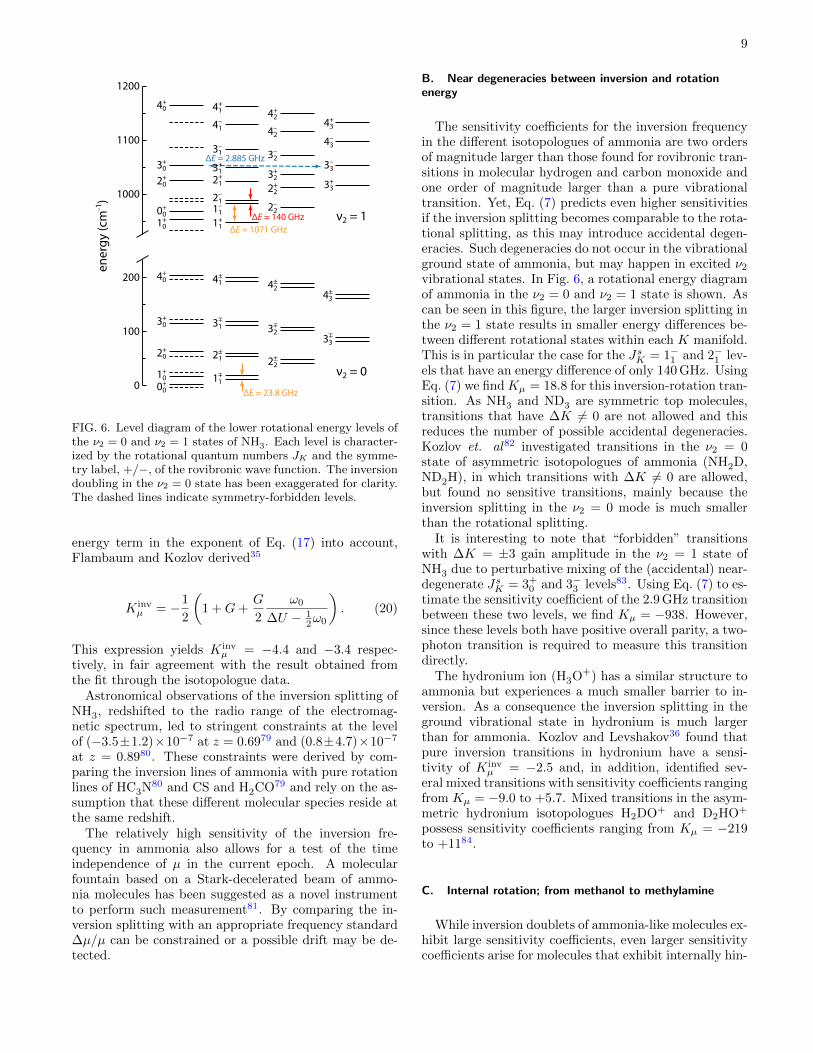
FIG. 6. Level diagram of the lower rotational energy levels ofthe ν2 = 0 and ν2 = 1 states of NH3. Each level is character-ized by the rotational quantum numbers JK and the symme-try label, +/−, of the rovibronic wave function. The inversiondoubling in the ν2 = 0 state has been exaggerated for clarity.The dashed lines indicate symmetry-forbidden levels.
energy term in the exponent of Eq. (17) into account,Flambaum and Kozlov derived35
K invµ = −1
2
(1 +G+
G
2
ω0
∆U − 12ω0
). (20)
This expression yields K invµ = −4.4 and −3.4 respec-
tively, in fair agreement with the result obtained fromthe fit through the isotopologue data.
Astronomical observations of the inversion splitting ofNH3, redshifted to the radio range of the electromag-netic spectrum, led to stringent constraints at the levelof (−3.5±1.2)×10−7 at z = 0.6979 and (0.8±4.7)×10−7
at z = 0.8980. These constraints were derived by com-paring the inversion lines of ammonia with pure rotationlines of HC3N80 and CS and H2CO79 and rely on the as-sumption that these different molecular species reside atthe same redshift.
The relatively high sensitivity of the inversion fre-quency in ammonia also allows for a test of the timeindependence of µ in the current epoch. A molecularfountain based on a Stark-decelerated beam of ammo-nia molecules has been suggested as a novel instrumentto perform such measurement81. By comparing the in-version splitting with an appropriate frequency standard∆µ/µ can be constrained or a possible drift may be de-tected.
B. Near degeneracies between inversion and rotationenergy
The sensitivity coefficients for the inversion frequencyin the different isotopologues of ammonia are two ordersof magnitude larger than those found for rovibronic tran-sitions in molecular hydrogen and carbon monoxide andone order of magnitude larger than a pure vibrationaltransition. Yet, Eq. (7) predicts even higher sensitivitiesif the inversion splitting becomes comparable to the rota-tional splitting, as this may introduce accidental degen-eracies. Such degeneracies do not occur in the vibrationalground state of ammonia, but may happen in excited ν2
vibrational states. In Fig. 6, a rotational energy diagramof ammonia in the ν2 = 0 and ν2 = 1 state is shown. Ascan be seen in this figure, the larger inversion splitting inthe ν2 = 1 state results in smaller energy differences be-tween different rotational states within each K manifold.This is in particular the case for the JsK = 1−1 and 2−1 lev-els that have an energy difference of only 140 GHz. UsingEq. (7) we findKµ = 18.8 for this inversion-rotation tran-sition. As NH3 and ND3 are symmetric top molecules,transitions that have ∆K 6= 0 are not allowed and thisreduces the number of possible accidental degeneracies.Kozlov et. al82 investigated transitions in the ν2 = 0state of asymmetric isotopologues of ammonia (NH2D,ND2H), in which transitions with ∆K 6= 0 are allowed,but found no sensitive transitions, mainly because theinversion splitting in the ν2 = 0 mode is much smallerthan the rotational splitting.
It is interesting to note that “forbidden” transitionswith ∆K = ±3 gain amplitude in the ν2 = 1 state ofNH3 due to perturbative mixing of the (accidental) near-degenerate JsK = 3+
0 and 3−3 levels83. Using Eq. (7) to es-timate the sensitivity coefficient of the 2.9 GHz transitionbetween these two levels, we find Kµ = −938. However,since these levels both have positive overall parity, a two-photon transition is required to measure this transitiondirectly.
The hydronium ion (H3O+) has a similar structure toammonia but experiences a much smaller barrier to in-version. As a consequence the inversion splitting in theground vibrational state in hydronium is much largerthan for ammonia. Kozlov and Levshakov36 found thatpure inversion transitions in hydronium have a sensi-tivity of K inv
µ = −2.5 and, in addition, identified sev-eral mixed transitions with sensitivity coefficients rangingfrom Kµ = −9.0 to +5.7. Mixed transitions in the asym-metric hydronium isotopologues H2DO+ and D2HO+
possess sensitivity coefficients ranging from Kµ = −219to +1184.
C. Internal rotation; from methanol to methylamine
While inversion doublets of ammonia-like molecules ex-hibit large sensitivity coefficients, even larger sensitivitycoefficients arise for molecules that exhibit internally hin-

10
0 π/3 2π/3 π 4π/3 5π/3 2πTorsional angle γ (rad)
0
100
200
300
400
Ener
gy (c
m-1
)
νt = 0
V
133.173
139.388
139.416143.924
E2A+A-E1
E1A∓E2
a
bc
νt = 1
FIG. 7. Variation of the potential energy of methanol withthe relative rotation of the OH group with respect to theCH3 group and a schematic representation of the molecule.Shown are the J = 1, |K| = 1 energies of the lowest torsion-vibrational levels.
dered rotation, in which one part of a molecule rotateswith respect to the remainder. This is another exampleof a classically-forbidden tunneling motion that is fre-quently encountered in polyatomic molecules. This sub-ject of the interaction between such hindered rotation,also referred to as torsion, and its quantum mechanicaldescription has been investigated since the 1950s.85–90
In this section we outline the procedure for obtainingthe sensitivity coefficients in internal rotor moleculescontaining a C3v symmetry group and show that aparticular combination of molecular parameters can beidentified that results in the highest sensitivity coef-ficients. The fact that methanol possesses transitionswith enhanced sensitivity coefficients was discoveredindependently by Jansen et al.37 and by Levshakov etal.91
One of the simplest molecules that exhibits hinderedinternal rotation is methanol (CH3OH). Methanol,schematically depicted on the right-hand side of Fig. 7,consists of a methyl group (CH3) with a hydroxyl group(OH) attached. The overall rotation of the molecule isdescribed by three rotational constants A, B, and C,associated with the moments of inertia Ia, Ib, and Ic, re-spectively, along the three principal axes of the molecule.The total angular momentum of the molecule is given bythe quantum number J , while the projection of J ontothe molecule fixed axis is given by K.
In addition to the overall rotation, the flexible CObond allows the methyl group to rotate with respect tothe hydroxyl group, denoted by the relative angle γ. Thisinternal rotation is not free but hindered by a threefoldpotential barrier,92 shown on the left-hand side of Fig. 7,with minima and maxima that correspond to the stag-gered and eclipsed configuration of the molecule, respec-tively. The vibrational levels in this well are denoted byνt.
When we neglect the slight asymmetry of the moleculeas well as higher-order terms in the potential and cen-trifugal distortions, the lowest-order Hamiltonian can be
written as
H =1
2
P 2a
Ia+
1
2
P 2b
Ib+
1
2
P 2c
Ic+
1
2
1
Iredp2γ +
1
2V3(1− cos 3γ),
with Ired =Ia1Ia2
Ia. (21)
The first three terms describe the overall rotation aroundthe a, b and c axis, respectively. The fourth term de-scribes the internal rotation around the a axis, with Iredthe reduced moment of inertia along the a-axis, Ia2 themoment of inertia of the methyl group along its own sym-metry axis and Ia1 the part of Ia that is attributed to theOH group; Ia1 = Ia − Ia2. Note that in the derivation ofEq. (21) an axis transformation was applied in order toremove the coupling between internal and overall rota-tion. The fifth term is the lowest order term arising fromthe torsional potential. If the potential were infinitelyhigh, the threefold barrier would result in three separateharmonic potentials, whereas the absence of the poten-tial barrier would result in doubly degenerate free-rotorenergy levels. In the case of a finite barrier, quantum-mechanical tunneling mixes the levels in different wellsof the potential. As a result, each rotational level issplit into three levels of different torsional symmetry, la-beled as A, E1, or E2. Following Lees90, E1 and E2-symmetries are labeled by the sign of K; i.e, levels withE1-symmetry are denoted by a positive K-value, whereaslevels with E2-symmetry are denoted by a negative K-value. For K 6= 0, A levels are further split into +/−components by molecular asymmetry. For K = 0, onlysingle E and A+ levels exist.
The splitting between the different symmetry levels isrelated to the tunneling frequency between the differenttorsional potential wells and is therefore very sensitive tothe reduced moment of inertia, similar to the inversionof the ammonia molecule. It was shown by Jansen etal.37,93 that a pure torsional transition in methanol hasa sensitivity coefficient of Kµ = −2.5. However, puretorsional transitions are forbidden, since they possess adifferent torsional symmetry. Sensitivity coefficients forallowed transitions in methanol and other internal rotormolecules can be obtained by calculating the level ener-gies as a function of µ and taking the numerical deriva-tive, in accordance with Eq. (4). This can be achieved byscaling the different parameters in the molecular Hamil-tonian according to their µ dependence. The physicalinterpretation of the lowest-order constants is straight-forward and the scaling relations can be derived unam-biguously. Higher order parameters pose a problem sincetheir physical interpretation is not always clear. Jansenet al.37,93 derived the scaling relations for these higher-order constants by considering them as effective prod-ucts of lower-order torsional and rotational operators.Ilyushin et al. showed that the scaling of the higher orderconstants only contributes marginally to the sensitivitycoefficient of a transition.94

11
Relative Velocity (km s-1)
0
-0.1
Line
-to-
Cont
inuu
mRa
tio (%
)
Kμ = -33
120600-60-120
3-1 20 E
FIG. 8. Observed spectrum of the 3−1−20E methanol transi-tion observed in the gravitational lensed object PKS1830-211with the Effelsberg radio telescope.98
Jansen et al.37,93 employed the state-of-the art effec-tive Hamiltonian that is implemented in the belgi code95
together with a set of 119 molecular parameters.96,97
Similar calculations were performed by Levshakov etal. using a simpler model containing only six molecularparameters.91 The two results are in excellent agreementand sensitivity coefficients for transitions in methanolrange from −42 for the 51 → 60A
+ transition at 6.6 GHzto +53 for the 52 → 43A
+ transition at 10.0 GHz.
The large number of both positive and negative sen-sitivity coefficients makes methanol a preferred targetsystem for probing a possible variation of µ, since thismakes it possible to test variation of µ using transitionsin a single molecular species, thereby avoiding the manysystematic effects that plague tests that are based oncomparing transitions in different molecules. Followingthe recent detection of methanol in the gravitationallylensed object PKS1830-211 (PKS referring to the Parkescatalog of celestial objects, with 1830 and -211 referringto RA and dec coordinates as for quasars; the PKS1830-211 system is a radio-loud quasar at zemis = 2.51) in anabsorbing galaxy at a redshift of zabs = 0.8999, Bagdon-aite et al.98 used four transitions that were observed inthis system using the 100m radio telescope in Effelsbergto constrain ∆µ/µ at (0.0 ± 1.0) × 10−7 at a look-backtime of 7 billion years. A spectrum of the 3−1 − 20Emethanol line, the line with the largest sensitivity to µ-variation observed at high redshift, is shown in Fig. 8.
The enhancements discussed in methanol, generally oc-cur in any molecule that contains an internal rotor withC3v symmetry. Jansen et. al constructed a simple modelthat predicts whether a molecule with such C3v group islikely to have large sensitivity coefficients.37 This ”toy”model decomposes the energy of the molecule into a purerotational and a pure torsional part, cf. Eq. (7). The ro-tational part is approximated by the well-known expres-sion for the rotational energy levels of a slightly asym-metric top
f(s)sin
π 3ρ)
10.8
0.6
0.4
0.2
ρ = 0
s = 4V3/9F0 5 10 15 20 25 30 35
-0.8
-0.6
-0.4
-0.2
0
0.2
0.4
met
hyl f
orm
ate
acet
alde
hyde
acet
ic a
cid
met
hyl m
erca
ptan
met
hano
l
acet
amid
e
larg
e K
µla
rge K
µ
FIG. 9. The product f(s) sin(π3ρ)
which is a measure of themaximum value of Kµ (see text). Also shown are data pointsfor molecules containing a internal rotor with C3v symmetryfor which the sensitivity coefficients have been calculated.
Erot(J,K) =1
2(B + C) J (J + 1) +
(A− B + C
2
)K2,
(22)with A, B, and C the rotational constants along the a,b, and c axis of the molecule, respectively. The torsionalenergy contribution is approximated by a Fourier expan-sion as86
Etors(K) = F
[a0 + a1 cos
2π
3(ρK + σ)
], (23)
where F ' 12~
2I−1red is the constant of the internal rota-
tion, ρ ' Ia2/Ia is a dimensionless constant reflectingthe coupling between internal and overall rotation, andσ = 0,±1 is a constant relating to the torsional sym-metry. The expansion coefficients a0 and a1 depend onthe shape of the torsional potential. Since we are mainlyinterested in the torsional energy difference, a0 cancels,and a1 is obtained from
a1 = A1sB1e−C1
√s, (24)
with A1 = −5.296, B1 = 1.111, and C1 = 2.12093. Thedimensionless parameter s = 4V3/9F , with V3 the heightof the barrier, is a measure of the effective potential.The sensitivity of a pure torsional transition is givenby Ktors
µ = (B1 − 1) − 12C1√s. Inserting the different
terms in Eq. (7) reveals that the sensitivity coefficientof a transition is roughly proportional to f(s) sin
(π3 ρ),
with f(s) = −2a1
(Ktorsµ + 1
). This function is plotted
in Fig. 9 for several values of ρ. The curves can beregarded as the maximum sensitivity one may hopeto find in a molecule with a certain F and transitionenergy hν. The maximum sensitivity peaks at s = 4 and
12
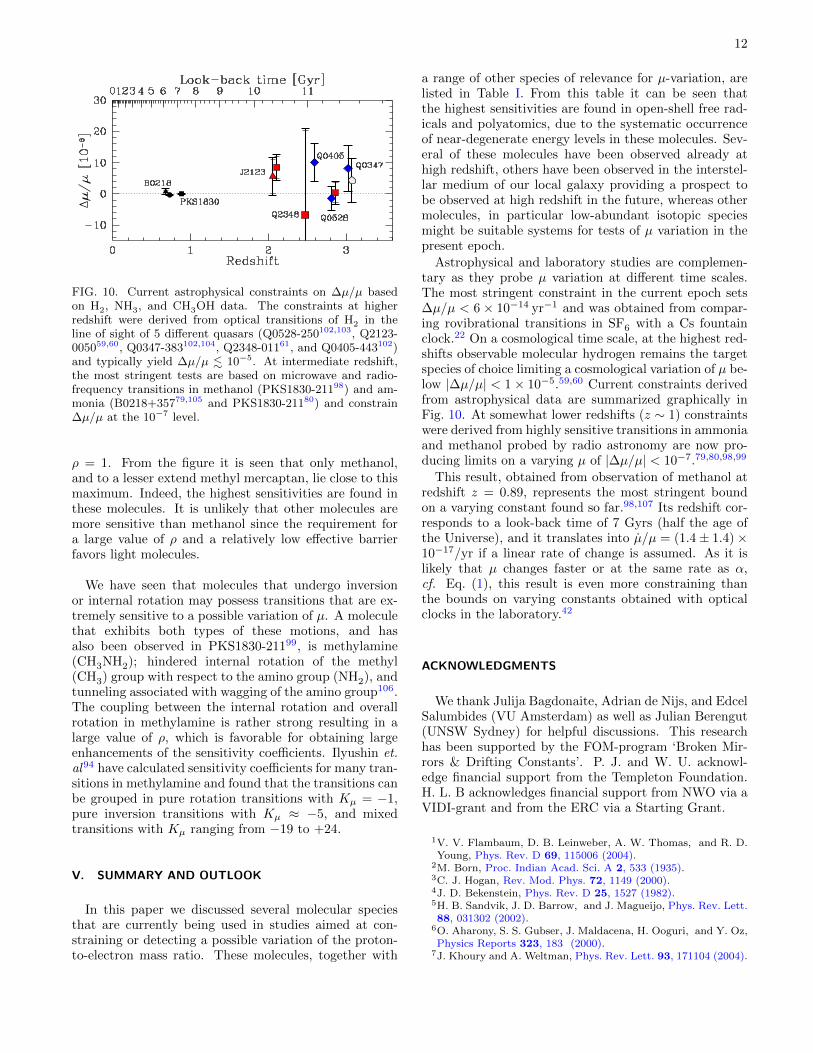
FIG. 10. Current astrophysical constraints on ∆µ/µ basedon H2, NH3, and CH3OH data. The constraints at higherredshift were derived from optical transitions of H2 in theline of sight of 5 different quasars (Q0528-250102,103, Q2123-005059,60, Q0347-383102,104, Q2348-01161, and Q0405-443102)and typically yield ∆µ/µ . 10−5. At intermediate redshift,the most stringent tests are based on microwave and radio-frequency transitions in methanol (PKS1830-21198) and am-monia (B0218+35779,105 and PKS1830-21180) and constrain∆µ/µ at the 10−7 level.
ρ = 1. From the figure it is seen that only methanol,and to a lesser extend methyl mercaptan, lie close to thismaximum. Indeed, the highest sensitivities are found inthese molecules. It is unlikely that other molecules aremore sensitive than methanol since the requirement fora large value of ρ and a relatively low effective barrierfavors light molecules.
We have seen that molecules that undergo inversionor internal rotation may possess transitions that are ex-tremely sensitive to a possible variation of µ. A moleculethat exhibits both types of these motions, and hasalso been observed in PKS1830-21199, is methylamine(CH3NH2); hindered internal rotation of the methyl(CH3) group with respect to the amino group (NH2), andtunneling associated with wagging of the amino group106.The coupling between the internal rotation and overallrotation in methylamine is rather strong resulting in alarge value of ρ, which is favorable for obtaining largeenhancements of the sensitivity coefficients. Ilyushin et.al94 have calculated sensitivity coefficients for many tran-sitions in methylamine and found that the transitions canbe grouped in pure rotation transitions with Kµ = −1,pure inversion transitions with Kµ ≈ −5, and mixedtransitions with Kµ ranging from −19 to +24.
V. SUMMARY AND OUTLOOK
In this paper we discussed several molecular speciesthat are currently being used in studies aimed at con-straining or detecting a possible variation of the proton-to-electron mass ratio. These molecules, together with
a range of other species of relevance for µ-variation, arelisted in Table I. From this table it can be seen thatthe highest sensitivities are found in open-shell free rad-icals and polyatomics, due to the systematic occurrenceof near-degenerate energy levels in these molecules. Sev-eral of these molecules have been observed already athigh redshift, others have been observed in the interstel-lar medium of our local galaxy providing a prospect tobe observed at high redshift in the future, whereas othermolecules, in particular low-abundant isotopic speciesmight be suitable systems for tests of µ variation in thepresent epoch.
Astrophysical and laboratory studies are complemen-tary as they probe µ variation at different time scales.The most stringent constraint in the current epoch sets∆µ/µ < 6× 10⁻¹⁴ yr−1 and was obtained from compar-ing rovibrational transitions in SF6 with a Cs fountainclock.22 On a cosmological time scale, at the highest red-shifts observable molecular hydrogen remains the targetspecies of choice limiting a cosmological variation of µ be-low |∆µ/µ| < 1× 10−5.59,60 Current constraints derivedfrom astrophysical data are summarized graphically inFig. 10. At somewhat lower redshifts (z ∼ 1) constraintswere derived from highly sensitive transitions in ammoniaand methanol probed by radio astronomy are now pro-ducing limits on a varying µ of |∆µ/µ| < 10−7.79,80,98,99
This result, obtained from observation of methanol atredshift z = 0.89, represents the most stringent boundon a varying constant found so far.98,107 Its redshift cor-responds to a look-back time of 7 Gyrs (half the age ofthe Universe), and it translates into µ/µ = (1.4± 1.4)×10−17/yr if a linear rate of change is assumed. As it islikely that µ changes faster or at the same rate as α,cf. Eq. (1), this result is even more constraining thanthe bounds on varying constants obtained with opticalclocks in the laboratory.42
ACKNOWLEDGMENTS
We thank Julija Bagdonaite, Adrian de Nijs, and EdcelSalumbides (VU Amsterdam) as well as Julian Berengut(UNSW Sydney) for helpful discussions. This researchhas been supported by the FOM-program ‘Broken Mir-rors & Drifting Constants’. P. J. and W. U. acknowl-edge financial support from the Templeton Foundation.H. L. B acknowledges financial support from NWO via aVIDI-grant and from the ERC via a Starting Grant.
1V. V. Flambaum, D. B. Leinweber, A. W. Thomas, and R. D.Young, Phys. Rev. D 69, 115006 (2004).
2M. Born, Proc. Indian Acad. Sci. A 2, 533 (1935).3C. J. Hogan, Rev. Mod. Phys. 72, 1149 (2000).4J. D. Bekenstein, Phys. Rev. D 25, 1527 (1982).5H. B. Sandvik, J. D. Barrow, and J. Magueijo, Phys. Rev. Lett.88, 031302 (2002).
6O. Aharony, S. S. Gubser, J. Maldacena, H. Ooguri, and Y. Oz,Physics Reports 323, 183 (2000).
7J. Khoury and A. Weltman, Phys. Rev. Lett. 93, 171104 (2004).

13
TABLE I. Selection of diatomic and polyatomic molecules that are used or have been proposed to probe a possible variation ofµ. The second and third columns list the relevant electronic state and the different types of energies involved in the transitions,while the fourth and fifth column give the range of sensitivities and corresponding bibliographical references.
electronic state origin Kµ Ref.
Diatomic molecules
H2 B1Σ+u ← X1Σ+
g /C1Πu ← X1Σ+
g Eel/Evib −0.054 < Kµ < +0.019 [26,46]
HD B1Σ+u ← X1Σ+
g /C1Πu ← X1Σ+
g Eel/Evib −0.052 < Kµ < +0.012 [56]
CH X2Π Efs/Erot/EΛ −6.2 < Kµ < +2.7 [15,62]
CD X2Π Efs/Erot/EΛ −67 < Kµ < +18 [62]
OH X2Π Efs/Erot/EΛ −460 < Kµ < −0.50 [15]
NO X2Π Efs/Erot/EΛ −38.9 < Kµ < +6.81 [15]
LiO X2Π Efs/Erot/EΛ −4.24 < Kµ < −0.95 [15]
NH+ a4Σ− ← X2Π (ν = 0, 1) Eel/Erot −185.8 < Kµ < +126.9 [30]
CO A1Π← X1Σ+ Eel/Evib −0.071 < Kµ < +0.003 [27]
a3Π Efs/Erot −334 < Kµ < +128 [32,63]
Polyatomic molecules
NH3 X Einv −4.2 [35]
ND3 X Einv −5.6 [34]
NH2D/ND2H X Einv/Erot −1.54 < Kµ < +0.10 [82]
H3O+ X Einv −2.5 [36]
X Einv/Erot −9.0 < Kµ < +5.7 [36]
H2DO+/D2HO+ X Einv/Erot −219 < Kµ < +11.0 [84]
H2O2 X Einv/Erot −36.5 < Kµ < +13.0 [100]
CH3OH X Etors/Erot −88 < Kµ < +330 [37,91,93]
CH3SH X Etors/Erot −14.8 < Kµ < +12.2 [101]
CH3COH X Etors/Erot −3.7 < Kµ < −0.5 [93]
CH3CONH2 X Etors/Erot −1.34 < Kµ < +0.06 [93]
HCOOCH3 X Etors/Erot −1.07 < Kµ < −0.03 [93]
CH3COOH X Etors/Erot −1.36 < Kµ < −0.27 [93]
l-C3H X2Π ERT/Evib/Erot −19 < Kµ < +742 [38]
CH3NH2 X Einv/Etors/Erot −19 < Kµ < +24 [94]
8J. K. Webb, V. V. Flambaum, C. W. Churchill, M. J. Drinkwa-ter, and J. D. Barrow, Phys. Rev. Lett. 82, 884 (1999).
9V. A. Dzuba, V. V. Flambaum, and J. K. Webb, Phys. Rev.Lett. 82, 888 (1999).
10J. K. Webb, J. A. King, M. T. Murphy, V. V. Flambaum, R. F.Carswell, and M. B. Bainbridge, Phys. Rev. Lett. 107, 191101(2011).
11J. A. King, J. K. Webb, M. T. Murphy, V. V. Flambaum, R. F.Carswell, M. B. Bainbridge, M. R. Wilczynska, and F. E. Koch,Mon. Not. Roy. Astron. Soc. 422, 3370 (2012).
12V. V. Flambaum and A. F. Tedesco, Phys. Rev. C 73, 055501(2006).
13J. C. Berengut, V. V. Flambaum, and E. M. Kava, Phys. Rev.A 84, 042510 (2011).
14P. Tzanavaris, J. K. Webb, M. T. Murphy, V. V. Flambaum,and S. J. Curran, Phys. Rev. Lett. 95, 041301 (2005).
15M. G. Kozlov, Phys. Rev. A 80, 022118 (2009).16S. A. Levshakov, F. Combes, F. Boone, I. I. Agafonova,
D. Reimers, and M. G. Kozlov, Astron. Astroph. 540, L9(2012).
17X. Calmet and H. Fritsch, Eur. Phys. J. C 24, 639 (2002).18S. Schiller and V. Korobov, Phys. Rev. A 71, 032505 (2005).19V. I. Korobov and Z.-X. Zhong, Phys. Rev. A 86, 044501 (2012).20P. Mohr, B. N. Taylor, and D. B. Newell, Rev. Mod. Phys. 41,
043109 (2012).21 Note that spectroscopic transitions in molecules probe the iner-
tial or kinematic mass, as it enters in the Schrodinger equation,rather than a gravitational mass.
22A. Shelkovnikov, R. J. Butcher, C. Chardonnet, and A. Amy-Klein, Phys. Rev. Lett. 100, 150801 (2008).
23J.-P. Uzan, Rev. Mod. Phys. 75, 403 (2003), and referencestherein.
24M. G. Kozlov and S. A. Levshakov, Ann. Phys. (Berlin) 525,
452 (2013).25E. Reinhold, R. Buning, U. Hollenstein, A. Ivanchik, P. Petit-
jean, and W. Ubachs, Phys. Rev. Lett. 96, 151101 (2006).26W. Ubachs, R. Buning, K. S. E. Eikema, and E. Reinhold, J.
Mol. Spectrosc. 241, 155 (2007).27E. J. Salumbides, M. L. Niu, J. Bagdonaite, N. de Oliveira,
D. Joyeux, L. Nahon, and W. Ubachs, Phys. Rev. A 86, 022510(2012).
28T. Dent, J. Cosmol. Astropart. Phys. 2007, 013 (2007).29D. DeMille, S. Sainis, J. Sage, T. Bergeman, S. Kotochigova,
and E. Tiesinga, Phys. Rev. Lett. 100, 043202 (2008).30K. Beloy, M. G. Kozlov, A. Borschevsky, A. W. Hauser, V. V.
Flambaum, and P. Schwerdtfeger, Phys. Rev. A 83, 062514(2011).
31V. V. Flambaum and M. G. Kozlov, Phys. Rev. Lett. 99, 150801(2007).
32H. L. Bethlem and W. Ubachs, Faraday Discuss. 142, 25 (2009).33V. V. Flambaum, Phys. Rev. A 73, 034101 (2006).34J. van Veldhoven, J. Kupper, H. L. Bethlem, B. Sartakov,
A. J. A. van Roij, and G. Meijer, Eur. Phys. J. D 31, 337(2004).
35V. V. Flambaum and M. G. Kozlov, Phys. Rev. Lett. 98, 240801(2007).
36M. G. Kozlov and S. A. Levshakov, Astrophys. J. 726, 65 (2011).37P. Jansen, L.-H. Xu, I. Kleiner, W. Ubachs, and H. L. Bethlem,
Phys. Rev. Lett. 106, 100801 (2011).38M. G. Kozlov, Phys. Rev. A 87, 032104 (2013).39C. W. Chou, D. B. Hume, J. C. J. Koelemeij, D. J. Wineland,
and T. Rosenband, Phys. Rev. Lett. 104, 070802 (2010).40T. L. Nicholson, M. J. Martin, J. R. Williams, B. J. Bloom,
M. Bishof, M. D. Swallows, S. L. Campbell, and J. Ye, Phys.Rev. Lett. 109, 230801 (2012).
41T. Zelevinsky, S. Kotochigova, and J. Ye, Phys. Rev. Lett. 100,

14
043201 (2008).42T. Rosenband, D. B. Hume, P. O. Schmidt, C. W. Chou, A. Br-
usch, L. Lorini, W. H. Oskay, R. E. Drullinger, T. M. Fortier,J. E. Stalnaker, S. A. Diddams, W. C. Swann, N. R. Newbury,W. M. Itano, D. J. Wineland, and J. C. Bergquist, Science 319,1808 (2008).
43S. Bize, P. Laurent, M. Abgrall, H. Marion, I. Maksimovic,L. Cacciapuoti, J. Grunert, C. Vian, F. P. Dos Santos, P. Rosen-busch, P. Lemonde, G. Santarelli, P. Wolf, A. Clairon, A. Luiten,M. Tobar, and C. Salomon, J. Phys. B 38, S449 (2005).
44R. I. Thompson, Astrophys. Lett. 16, 3 (1975).45D. Varshalovich and S. Levshakov, JETP Lett. 58, 231 (1993).46V. Meshkov, A. Stolyarov, A. Ivanchik, and D. Varshalovich,
JETP Lett. 83, 303 (2006).47J. L. Dunham, Phys. Rev. 41, 721 (1932).48N. Bohr, Nature 92, 231 (1913).49S. C. Xu, R. van Dierendonck, W. Hogervorst, and W. Ubachs,
J. Mol. Spectrosc. 201, 256 (2000).50T. I. Ivanov, G. D. Dickenson, M. Roudjane, N. De Oliveira,
D. Joyeux, L. Nahon, W.-U. L. Tchang-Brillet, and W. Ubachs,Mol. Phys. 108, 771 (2010).
51W. Ubachs, K. S. E. Eikema, W. Hogervorst, and P. C. Cac-ciani, J. Opt. Soc. Am. B 14, 2469 (1997).
52J. Philip, J. P. Sprengers, T. Pielage, C. A. de Lange,W. Ubachs, and E. Reinhold, Can. J. Chem. 82, 713 (2004).
53J. Philip, J. Sprengers, P. Cacciani, C. de Lange, andW. Ubachs, Appl. Phys. B 78, 737 (2004).
54T. I. Ivanov, M. O. Vieitez, C. A. de Lange, and W. Ubachs,J. Phys. B 41, 035702 (2008).
55U. Hollenstein, E. Reinhold, C. A. de Lange, and W. Ubachs,J. Phys. B 39, L195 (2006).
56T. I. Ivanov, M. Roudjane, M. O. Vieitez, C. A. de Lange, W.-U. L. Tchang-Brillet, and W. Ubachs, Phys. Rev. Lett. 100,093007 (2008).
57E. J. Salumbides, D. Bailly, A. Khramov, A. L. Wolf, K. S. E.Eikema, M. Vervloet, and W. Ubachs, Phys. Rev. Lett. 101,223001 (2008).
58D. Bailly, E. Salumbides, M. Vervloet, and W. Ubachs, Mol.Phys. 108, 827 (2010).
59A. L. Malec, R. Buning, M. T. Murphy, N. Milutinovic, S. L.Ellison, J. X. Prochaska, L. Kaper, J. Tumlinson, R. F. Carswell,and W. Ubachs, Mon. Not. R. Astron Soc. 403, 1541 (2010).
60F. van Weerdenburg, M. T. Murphy, A. L. Malec, L. Kaper,and W. Ubachs, Phys. Rev. Lett. 106, 180802 (2011).
61J. Bagdonaite, M. T. Murphy, L. Kaper, and W. Ubachs, Mon.Not. R. Astron. Soc. 421, 419 (2012).
62A. J. de Nijs, W. Ubachs, and H. L. Bethlem, Phys. Rev. A 86,032501 (2012).
63A. J. de Nijs, E. J. Salumbides, K. S. E. Eikema, W. Ubachs,and H. L. Bethlem, Phys. Rev. A 84, 052509 (2011).
64R. Srianand, P. Noterdaeme, C. Ledoux, and P. Petitjean, As-tron. Astrophys. 482, L39 (2008).
65P. Noterdaeme, C. Ledoux, R. Srianand, P. Petitjean, andS. Lopez, Astron. Astrophys. 503, 765 (2009).
66P. Noterdaeme, P. Petitjean, C. Ledoux, S. Lopez, R. Srianand,and S. D. Vergani, Astron. Astrophys. 523, A80 (2010).
67P. Noterdaeme, P. Petitjean, R. Srianand, C. Ledoux, andS. Lopez, Astron. Astrophys. 526, L7 (2011).
68M. Niu, E. J. Salumbides, D. Zhao, N. De Oliveira, D. Joyeux,L. Nahon, R. W. Field, and W. Ubachs, Mol. Phys. 111, 2163(2013).
69J. Brown and A. Carrington, Rotational Spectroscopy of Di-atomic Molecules (Cambridge University Press, 2003).
70R. S. Freund and W. Klemperer, J. Chem. Phys. 43, 2422(1965).
71B. G. Wicke, R. W. Field, and W. Klemperer, J. Chem. Phys.56, 5758 (1972).
72R. J. Saykally, T. A. Dixon, T. G. Anderson, P. G. Szanto, andR. C. Woods, J. Chem. Phys. 87, 6412 (1987).
73S. Yamamoto and S. Saito, J. Chem. Phys. 89, 1936 (1965).74J. Darling, Phys. Rev. Lett. 91, 011301 (2003).75E. R. Hudson, H. J. Lewandowski, B. C. Sawyer, and J. Ye,
Phys. Rev. Lett. 96, 143004 (2006).76S. Truppe, R. J. Hendricks, S. K. Tokunaga, H. J. Lewandowski,
M. G. Kozlov, C. Henkel, E. A. Hinds, and M. R. Tarbutt,Nature Comm. 4, 2600 (2013).
77D. M. Dennison and G. E. Uhlenbeck, Phys. Rev. 41, 313 (1932).78C. H. Townes and A. L. Schawlow, Microwave Spectroscopy
(Dover Publications, 1975).79N. Kanekar, Astroph. J. Lett. 728, L12 (2011).80C. Henkel, K. M. Menten, M. T. Murphy, N. Jethava, V. V.
Flambaum, J. A. Braatz, S. Muller, J. Ott, and R. Q. Mao,Astron. Astrophys. 500, 725 (2009).
81H. L. Bethlem, M. Kajita, B. Sartakov, G. Meijer, andW. Ubachs, Eur. Phys. J. Spec. Top. 163, 55 (2008).
82M. G. Kozlov, A. V. Lapinov, and S. A. Levshakov, J. Phys. B43, 074003 (2010).
83D. Laughton, S. Freund, and T. Oka, J. Mol. Spectrosc. 62,263 (1976).
84M. G. Kozlov, S. G. Porsev, and D. Reimers, Phys. Rev. A 83,052123 (2011).
85D. Kivelson, J. Chem. Phys. 22, 1733 (1954).86C. C. Lin and J. D. Swalen, Rev. Mod. Phys. 31, 841 (1959).87D. R. Herschbach, J. Chem. Phys. 31, 91 (1959).88B. Kirtman, J. Chem. Phys. 37, 2516 (1962).89R. M. Lees and J. B. Baker, J. Chem. Phys. 48, 5299 (1968).90R. M. Lees, Astrophys. J. 184, 763 (1973).91S. A. Levshakov, M. G. Kozlov, and D. Reimers, Astrophys. J.738, 26 (2011).
92J. D. Swalen, J. Chem. Phys. 23, 1739 (1955).93P. Jansen, I. Kleiner, L.-H. Xu, W. Ubachs, and H. L. Bethlem,
Phys. Rev. A 84, 062505 (2011).94V. V. Ilyushin, P. Jansen, M. G. Kozlov, S. A. Levshakov,
I. Kleiner, W. Ubachs, and H. L. Bethlem, Phys. Rev. A 85,032505 (2012).
95J. T. Hougen, I. Kleiner, and M. Godefroid, J. Mol. Spec-trosc. 163, 559 (1994), (program available through: http:
//www.ifpan.edu.pl/~kisiel/introt/introt.htm#belgi).96L. H. Xu, R. M. Lees, and J. T. Hougen, J. Chem. Phys. 110,
3835 (1999).97L. H. Xu, J. Fisher, R. M. Lees, H. Y. Shi, J. T. Hougen, J. C.
Pearson, B. J. Drouin, G. A. Blake, and R. Braakman, J. Mol.Spectrosc. 251, 305 (2008), and references therein.
98J. Bagdonaite, P. Jansen, C. Henkel, H. L. Bethlem, K. M.Menten, and W. Ubachs, Science 339, 46 (2013).
99S. Muller, A. Beelen, M. Guelin, S. Aalto, J. H. Black,F. Combes, S. Curran, P. Theule, and S. Longmore, Astron.Astrophys. 535, A103 (2011).
100M. G. Kozlov, Phys. Rev. A 84, 042120 (2011).101P. Jansen, L.-H. Xu, I. Kleiner, H. L. Bethlem, and W. Ubachs,
Phys. Rev. A 87, 052509 (2013).102J. A. King, J. K. Webb, M. T. Murphy, and R. F. Carswell,
Phys. Rev. Lett. 101, 251304 (2008).103J. A. King, M. T. Murphy, W. Ubachs, and J. K. Webb, Mon.
Not. R. Astron. Soc. 417, 3010 (2011).104M. Wendt and P. Molaro, Astron. Astrophys. 541, A69 (2012).105M. T. Murphy, V. V. Flambaum, S. Muller, and C. Henkel,
Science 320, 1611 (2008).106M. Tsuboi, A. Y. Hirakawa, T. Ino, T. Sasaki, and K. Tama-
gake, J. Chem. Phys. 41, 2721 (1964).107J. Bagdonaite, M. Dapra, P. Jansen, H. L. Bethlem, W. Ubachs,
S. Muller, C. Henkel, and K. M. Menten, Phys. Rev. Lett. 111,231101 (2013).
Related Documents