Persons with an HIV Diagnosis in Hillsborough County, Florida, 2019 7,412 persons with an HIV diagnosis, living in Hillsborough County, year-end 2019 285 persons received an HIV diagnosis in Hillsborough County in 2019 139 persons received an AIDS diagnosis in Hillsborough County in 2019 Persons who received an HIV diagnosis in Hillsborough County in 2019 by mode of HIV exposure Female Heterosexual Contact Female Injection Drug Use (IDU) MMSC/IDU 70% 14% 8% 1% 2% The age group with the highest proportion of persons who received an HIV diagnosis in Hillsborough County in 2019 was 20–29 30–39 40–49 50+ 20–29 13–19 6% 18% 15% 27% 33% Black persons represented the highest proportion of persons who received an HIV diagnosis in Hillsborough County in 2019 44% 26% 26% In Hillsborough County, males were more likely to receive an HIV diagnosis than females in 2019 Male n=233 Female n=52 Male Heterosexual Contact 7,412 persons with an HIV diagnosis living in Hillsborough County, year-end 2019 Other 3% Male-to-Male Sexual Contact (MMSC) Male IDU 4% Black Hispanic/Latinx White 18% 82% Unless otherwise noted, White and Black persons are non-Hispanic/Latinx. “Other” includes Asian/Pacific Islanders, American Indians/Native Alaskans and mixed races. MMSC, MMSC/IDU and heterosexual data excludes transgender persons

Welcome message from author
This document is posted to help you gain knowledge. Please leave a comment to let me know what you think about it! Share it to your friends and learn new things together.
Transcript
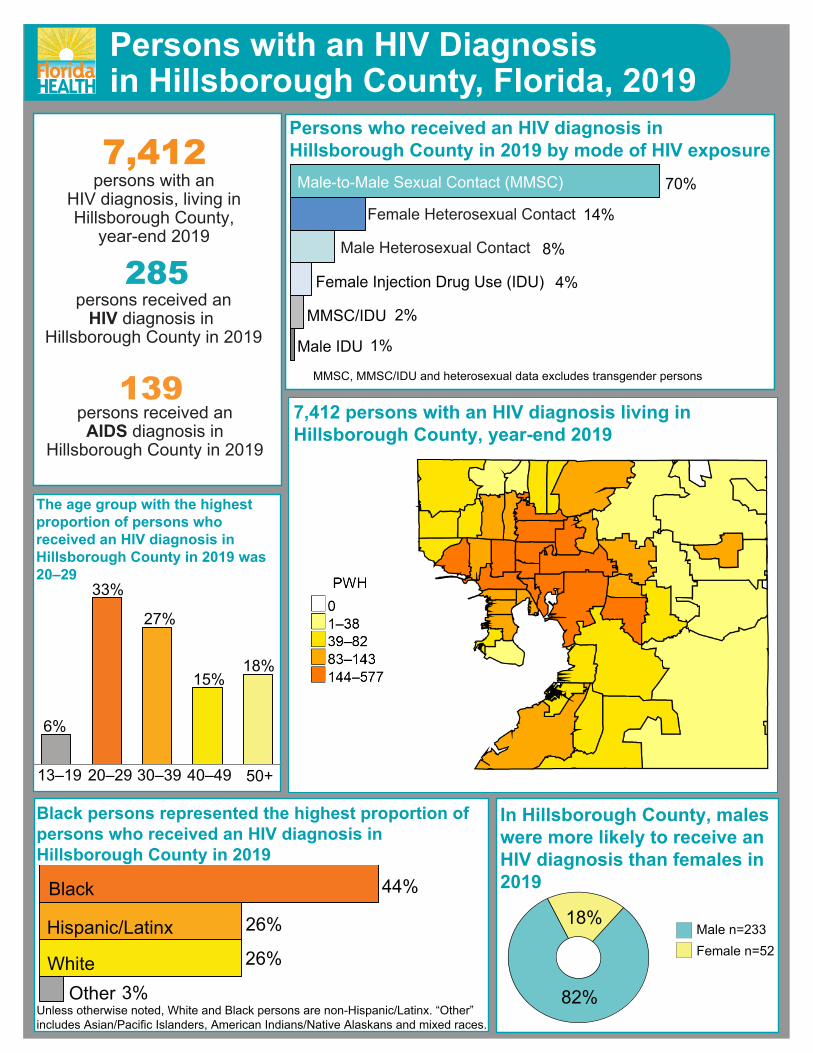
Persons with an HIV Diagnosisin Hillsborough County, Florida, 2019
7,412persons with an
HIV diagnosis, living in Hillsborough County,
year-end 2019
285persons received an
HIV diagnosis in Hillsborough County in 2019
139 persons received an AIDS diagnosis in
Hillsborough County in 2019
Persons who received an HIV diagnosis in Hillsborough County in 2019 by mode of HIV exposure
Female Heterosexual Contact
Female Injection Drug Use (IDU)
MMSC/IDU
70%
14%
8%
1%
2%
The age group with the highest proportion of persons who received an HIV diagnosis in Hillsborough County in 2019 was 20–29
30–39 40–49 50+ 20–29 13–19
6%
18% 15%
27%
33%
Black persons represented the highest proportion of persons who received an HIV diagnosis in Hillsborough County in 2019
44%
26%
26%
In Hillsborough County, males were more likely to receive an HIV diagnosis than females in 2019
Male n=233Female n=52
Male Heterosexual Contact
7,412 persons with an HIV diagnosis living in Hillsborough County, year-end 2019
Other 3%
Male-to-Male Sexual Contact (MMSC)
Male IDU
4%
Black
Hispanic/Latinx
White
18%
82% Unless otherwise noted, White and Black persons are non-Hispanic/Latinx. “Other” includes Asian/Pacific Islanders, American Indians/Native Alaskans and mixed races.
MMSC, MMSC/IDU and heterosexual data excludes transgender persons
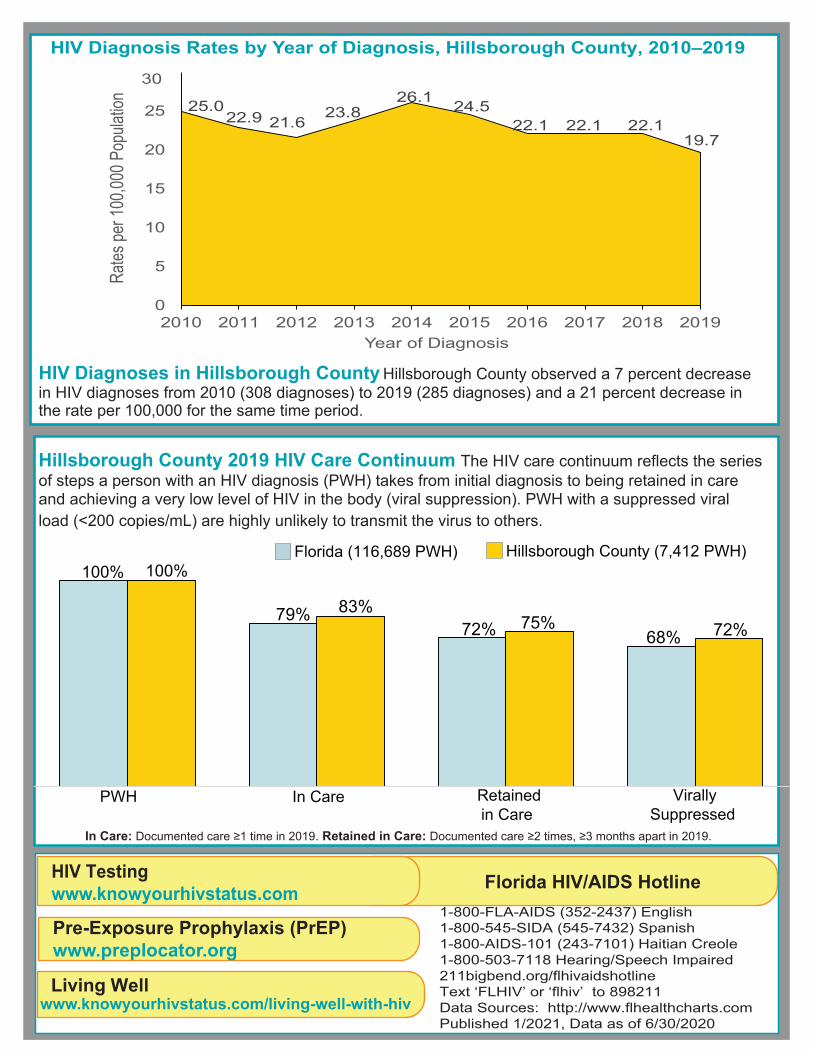
In Care: Documented care ≥1 time in 2019. Retained in Care: Documented care ≥2 times, ≥3 months apart in 2019.
Hillsborough County 2019 HIV Care Continuum The HIV care continuum reflects the series of steps a person with an HIV diagnosis (PWH) takes from initial diagnosis to being retained in care and achieving a very low level of HIV in the body (viral suppression). PWH with a suppressed viral load (<200 copies/mL) are highly unlikely to transmit the virus to others.
PWH In Care Retainedin Care
VirallySuppressed
83% 79% 72% 75%
68%
100% 100%
72%
Florida (116,689 PWH) Hillsborough County (7,412 PWH)
HIV Diagnosis Rates by Year of Diagnosis, Hillsborough County, 2010–2019
HIV Diagnoses in Hillsborough County Hillsborough County observed a 7 percent decrease in HIV diagnoses from 2010 (308 diagnoses) to 2019 (285 diagnoses) and a 21 percent decrease in the rate per 100,000 for the same time period.
HIV Testingwww.knowyourhivstatus.com
Pre-Exposure Prophylaxis (PrEP)www.preplocator.org
Living Wellwww.knowyourhivstatus.com/living-well-with-hiv
Florida HIV/AIDS Hotline
25.022.9 21.6
23.826.1 24.5
22.1 22.1 22.119.7
0
5
10
15
20
25
30
2010 2011 2012 2013 2014 2015 2016 2017 2018 2019
Rates
per 1
00,00
0 Pop
ulatio
n
Year of Diagnosis
1-800-FLA-AIDS (352-2437) English1-800-545-SIDA (545-7432) Spanish1-800-AIDS-101 (243-7101) Haitian Creole1-800-503-7118 Hearing/Speech Impaired211bigbend.org/flhivaidshotlineText ‘FLHIV’ or ‘flhiv’ to 898211Data Sources: http://www.flhealthcharts.comPublished 1/2021, Data as of 6/30/2020
Related Documents