ORIGINAL RESEARCH Open Access Personalized predictive lung dosimetry by technetium-99m macroaggregated albumin SPECT/CT for yttrium-90 radioembolization Yung Hsiang Kao 1,2* , Butch M Magsombol 1 , Ying Toh 1 , Kiang Hiong Tay 3 , Pierce KH Chow 4,5,6 , Anthony SW Goh 1 and David CE Ng 1 Abstract Background: For yttrium-90 ( 90 Y) radioembolization, the common practice of assuming a standard 1,000-g lung mass for predictive dosimetry is fundamentally incongruent with the modern philosophy of personalized medicine. We recently developed a technique of personalized predictive lung dosimetry using technetium-99m ( 99m Tc) macroaggregated albumin (MAA) single photon emission computed tomography with integrated CT (SPECT/CT) of the lung as part of our routine dosimetric protocol for 90 Y radioembolization. Its rationales are the technical superiority of SPECT/CT over planar scintigraphy, ease and convenience of lung auto-segmentation CT densitovolumetry, and dosimetric advantage of patient-specific lung parenchyma masses. Methods: This is a retrospective study of our pulmonary clinical outcomes and comparison of lung dosimetric accuracy and precision by 99m Tc MAA SPECT/CT versus conventional planar methodology. 90 Y resin microspheres (SIR-Spheres) were used for radioembolization. Diagnostic CT densitovolumetry was used as a reference for lung parenchyma mass. Pulmonary outcomes were based on follow-up diagnostic CT chest or X-ray. Results: Thirty patients were analyzed. The mean lung parenchyma mass of our Southeast Asian cohort was 822 ± 103 g standard deviation (95% confidence interval 785 to 859 g). Patient-specific lung parenchyma mass estimation by CT densitovolumetry on 99m Tc MAA SPECT/CT is accurate (bias -21.7 g) and moderately precise (95% limits of agreement -194.6 to +151.2 g). Lung mean radiation absorbed doses calculated by 99m Tc MAA SPECT/CT and planar methodology are both accurate (bias <0.5 Gy), but 99m Tc MAA SPECT/CT offers better precision over planar methodology (95% limits of agreement -1.76 to +2.40 Gy versus -3.48 to +3.31 Gy, respectively). None developed radiomicrosphere pneumonitis when treated up to a lung mean radiation absorbed dose of 18 Gy at a median follow-up of 4.4 months. Conclusions: Personalized predictive lung dosimetry by 99m Tc MAA SPECT/CT is clinically feasible, safe, and more precise than conventional planar methodology for 90 Y radioembolization radiation planning. Keywords: Yttrium-90 radioembolization; Selective internal radiation therapy; Partition model; Technetium-99m macroaggregated albumin SPECT/CT; CT lung densitovolumetry; Lung mass * Correspondence: [email protected] 1 Department of Nuclear Medicine and PET, Singapore General Hospital, Outram Road, Singapore 169608, Singapore 2 Department of Nuclear Medicine, Austin Hospital, Level 1, Harold Stokes Building, 145 Studley Rd, Melbourne, Victoria 3084, Australia Full list of author information is available at the end of the article © 2014 Kao et al.; licensee Springer. This is an Open Access article distributed under the terms of the Creative Commons Attribution License (http://creativecommons.org/licenses/by/4.0), which permits unrestricted use, distribution, and reproduction in any medium, provided the original work is properly credited. Kao et al. EJNMMI Research 2014, 4:33 http://www.ejnmmires.com/content/4/1/33

Welcome message from author
This document is posted to help you gain knowledge. Please leave a comment to let me know what you think about it! Share it to your friends and learn new things together.
Transcript

Kao et al. EJNMMI Research 2014, 4:33http://www.ejnmmires.com/content/4/1/33
ORIGINAL RESEARCH Open Access
Personalized predictive lung dosimetry bytechnetium-99m macroaggregated albuminSPECT/CT for yttrium-90 radioembolizationYung Hsiang Kao1,2*, Butch M Magsombol1, Ying Toh1, Kiang Hiong Tay3, Pierce KH Chow4,5,6, Anthony SW Goh1
and David CE Ng1
Abstract
Background: For yttrium-90 (90Y) radioembolization, the common practice of assuming a standard 1,000-g lungmass for predictive dosimetry is fundamentally incongruent with the modern philosophy of personalized medicine.We recently developed a technique of personalized predictive lung dosimetry using technetium-99m (99mTc)macroaggregated albumin (MAA) single photon emission computed tomography with integrated CT (SPECT/CT)of the lung as part of our routine dosimetric protocol for 90Y radioembolization. Its rationales are the technicalsuperiority of SPECT/CT over planar scintigraphy, ease and convenience of lung auto-segmentation CT densitovolumetry,and dosimetric advantage of patient-specific lung parenchyma masses.
Methods: This is a retrospective study of our pulmonary clinical outcomes and comparison of lung dosimetric accuracyand precision by 99mTc MAA SPECT/CT versus conventional planar methodology. 90Y resin microspheres (SIR-Spheres)were used for radioembolization. Diagnostic CT densitovolumetry was used as a reference for lung parenchyma mass.Pulmonary outcomes were based on follow-up diagnostic CT chest or X-ray.
Results: Thirty patients were analyzed. The mean lung parenchyma mass of our Southeast Asian cohort was 822 ± 103 gstandard deviation (95% confidence interval 785 to 859 g). Patient-specific lung parenchyma mass estimation byCT densitovolumetry on 99mTc MAA SPECT/CT is accurate (bias −21.7 g) and moderately precise (95% limits ofagreement −194.6 to +151.2 g). Lung mean radiation absorbed doses calculated by 99mTc MAA SPECT/CT and planarmethodology are both accurate (bias <0.5 Gy), but 99mTc MAA SPECT/CT offers better precision over planar methodology(95% limits of agreement −1.76 to +2.40 Gy versus −3.48 to +3.31 Gy, respectively). None developed radiomicrospherepneumonitis when treated up to a lung mean radiation absorbed dose of 18 Gy at a median follow-up of 4.4 months.
Conclusions: Personalized predictive lung dosimetry by 99mTc MAA SPECT/CT is clinically feasible, safe, and more precisethan conventional planar methodology for 90Y radioembolization radiation planning.
Keywords: Yttrium-90 radioembolization; Selective internal radiation therapy; Partition model; Technetium-99mmacroaggregated albumin SPECT/CT; CT lung densitovolumetry; Lung mass
* Correspondence: [email protected] of Nuclear Medicine and PET, Singapore General Hospital,Outram Road, Singapore 169608, Singapore2Department of Nuclear Medicine, Austin Hospital, Level 1, Harold StokesBuilding, 145 Studley Rd, Melbourne, Victoria 3084, AustraliaFull list of author information is available at the end of the article
© 2014 Kao et al.; licensee Springer. This is an Open Access article distributed under the terms of the Creative CommonsAttribution License (http://creativecommons.org/licenses/by/4.0), which permits unrestricted use, distribution, and reproductionin any medium, provided the original work is properly credited.

Table 1 Types of CT scanners
Maker Model Number
GE LightSpeed VCTa 11
Philips iCT 256 4
Siemens SOMATOM Definition 8
Siemens SOMATOM Sensation 1
Toshiba Aquilion 4
Toshiba Aquilion ONE 2aReconstructed at 5-mm slice thickness.
Kao et al. EJNMMI Research 2014, 4:33 Page 2 of 12http://www.ejnmmires.com/content/4/1/33
BackgroundRadioembolization (RE) is intra-arterial brachytherapyusing yttrium-90 (90Y) resin (SIR-Spheres®, Sirtex MedicalLimited, North Sydney, New South Wales, Australia)or glass (TheraSphere®, BTG, Ottawa, Ontario, Canada)microspheres for the treatment of inoperable liver ma-lignancies. Radiomicrosphere pneumonitis is a knowncomplication due to hepatopulmonary shunting of 90Ymicrospheres from arteriovenous shunts within targethepatic arterial territories [1-3]. The severity of radio-microsphere lung injury depends on the extent of hepa-topulmonary shunting, the radiation absorbed dose, andits pulmonary biodistribution [2,4,5].For 90Y resin microspheres, the ‘partition model’ is the
simplest method of predictive dosimetry to personalizethe intended radiation absorbed doses to tumor andnon-tumorous liver and lung based on 99mTc macroag-gregated albumin (MAA) scintigraphy [6,7]. For lungdosimetry, a standard mass of 1,000 g is often assumed[8] - an assumption which risks under- or overestimationof the lung radiation absorbed dose depending on patientsize, pre-existing chronic lung disease, prior lung surgeryor irradiation, lung shunt fraction (LSF), or injected 90Yactivity. In the modern era of personalized medicine, thereis a clinical need to shift away from assumed massesand to embrace patient-specific lung mass estimates forpredictive dosimetry in 90Y RE.For years, CT densitometry has been used by pulmo-
nologists to evaluate lung parenchymal diseases such asemphysema [9]. Its premise is the approximate linearrelationship between radiographic density, expressed inCT numbers (Hounsfield Unit, HU) and physical density(g/cm3) within the range of lung parenchyma [10]. Thislinear relationship was found to be consistent across awide variety of CT scanners [11]. Hence, lung auto-segmentation CT densitovolumetry provides a simple,rapid, and convenient way of patient-specific lung par-enchyma mass estimation.We previously showed that 99mTc MAA single photon
emission computed tomography with integrated CT(SPECT/CT) of the liver can improve the safety andeffectiveness of 90Y resin microsphere RE [12]. This isdue its ability for attenuation and scatter correction of99mTc MAA activity and for volumetric assessment oftarget arterial territories to improve partition modeling.The next logical step was to expand 99mTc MAA SPECT/CT dosimetry from the abdomen into the lung.On the basis of the technical superiority of SPECT/CT
over planar scintigraphy, ease and convenience of lungauto-segmentation CT densitovolumetry, and dosimetricadvantage of using patient-specific lung parenchymamasses, we recently implemented 99mTc MAA SPECT/CTof the lung into our routine dosimetric protocol, inaddition to that of the abdomen [12]. This is a retro-
spective report of our clinical outcomes, with a detailedcomparison of lung dosimetric accuracy and precision bySPECT/CT versus conventional planar methodology.
MethodsInstitutional review board approval was obtained for theconduct, waiver of informed consent, and publication ofthis retrospective study (CIRB 2010/781/C, SingHealth,Singapore). This study has been performed in accordancewith the ethical standards laid down in the 1964 Declar-ation of Helsinki and its later amendments. Personalizedpredictive lung dosimetry by 99mTc MAA SPECT/CT wasrecently integrated into our earlier protocol for liverdosimetry [12]. Our current protocol is now a single, fullySPECT/CT, seamless workflow from the lung to abdomen.For quality assurance of LSF calculation, conventionalplanar scintigraphy was also performed for each patient.90Y resin microspheres (SIR-Spheres®, Sirtex MedicalLimited, North Sydney, New South Wales, Australia)were used for RE.Patients were eligible for this study if they have a pre-
RE diagnostic CT chest and follow-up chest imaging atany time in the post-RE period. The follow-up chestimaging may either be a diagnostic CT or chest X-ray,and its purpose was to assess for any radiological featuressuggestive of radiomicrosphere pneumonitis. If both mo-dalities were available, a diagnostic CT was favored over achest X-ray. Patients enrolled in ongoing RE clinical trialswere excluded.
Imaging and reconstruction protocolsPre-RE diagnostic CT chests were performed on sixscanner types across our institution (Table 1). All diag-nostic CT chests were acquired with inspiration andbreath-holding, intravenous contrast, and tube voltage120 kVp; milliamp seconds (mAs) varied widely. Allimages were reconstructed at 3-mm slice thickness,except for one scanner which was at 5 mm. Lungauto-segmentation was performed on images recon-structed using soft tissue kernels and 512 × 512 matrix;the images reconstructed using lung kernels were notused for auto-segmentation. Reconstructed fields-of-view ranged from 30 to 45 mm.
Kao et al. EJNMMI Research 2014, 4:33 Page 3 of 12http://www.ejnmmires.com/content/4/1/33
All scintigraphy was performed on a Philips PrecedenceSPECT/CT scanner (Philips Healthcare, Eindhoven, TheNetherlands), which has a dual-head gamma camera inte-grated with a 16-slice multi-detector CT. All scintigraphywere performed within 1 h of 99mTc MAA injection. Forplanar imaging, anterior and posterior images of the lungand liver were acquired over 120 s each and matrix size256 × 256. Attenuation and scatter correction was notperformed for planar images.For SPECT acquisition, 128 frames (20 s per frame,
angle step of 3°) were acquired over 360° with a 128 × 128matrix using a low-energy, high-resolution collimator atphotopeak 140 ± 10% keV. All patients were imaged fromthe lung apex to inferior liver edge, covering one or twobed positions depending on the combined lengths of thelung and liver. SPECT images were reconstructed usingAstonish software (Philips Healthcare, Eindhoven, TheNetherlands), which is an iterative 3D-ordered subsetexpectation maximization (3D-OSEM) algorithm incorp-orating corrections for resolution recovery, attenuation,and scatter correction based on the CT attenuation map,three iterations eight subsets and no filters. Non-contrast-enhanced CT was acquired at free breathing at 120 kVpand 50 mAs. CT images were reconstructed using a softtissue kernel at 3-mm slice thickness, reconstructed field-of-view 60 cm and matrix size 512 × 512.
Phantom evaluation of CT densitometryAn approximately linear relationship between CT numbersand physical density has been shown to be valid for CTnumbers ≤0 HU [11,13], where 0 HU is the CT numberof water. For quality assurance, CT densitometry wasperformed on a 1-L water phantom scanned on ourSPECT/CT using the same CT settings as for 99mTcMAA SPECT/CT. Its results were compared to anexpected water physical density of 1 g/cm3. A largevolume-of-interest (VOI) was drawn within the waterphantom to obtain its mean CT number, and the physicaldensity (g/cm3) was calculated as [10,14,15]:
Physical density ¼ Mean CT number þ 10001000
ð1Þ
As we had no access to suitable lung phantoms, ourCT numbers closer to that of lung density were notassessed. For the purposes of this study, it was assumedthat the CT phantom results reported by Cheng et al.[11] were applicable to our SPECT/CT scanner.
Lung CT densitovolumetryLung CT densitovolumetry for both diagnostic CT andSPECT/CT was performed by auto-segmentation usingOsiriX software version 5.6 (Pixmeo, Geneva, Switzerland).The aim was to obtain a reasonable estimate of the patient-
specific lung parenchyma mass for dosimetry, conceptuallysuperior to the standard 1,000 g assumption. It was not ouraim to obtain a patient's true lung parenchyma mass, whichremains unknown. Lung parenchyma masses derived bydiagnostic CT were used as a reference for comparisonagainst that derived by SPECT/CT.On diagnostic CT, the entire left and right lung paren-
chyma were auto-segmented slice by slice from apex tocostophrenic recesses using a two-dimensional trans-axialgrowing algorithm. The lower threshold CT number wasfixed at −1,000 HU, while the upper threshold was visuallyadjusted between −150 and −600 HU to obtain the bestsegmentation result for each slice. Each trans-axial region-of-interest (ROI) was visually reviewed and manuallyrefined if necessary. The intent was to include all lungparenchyma and to exclude large hilar vessels, proximalbronchial tree, trachea, and large parenchymal scars, inaccordance with external beam radiotherapy conventions[16]. Trans-axial ROIs for the left and right lungs wereinterpolated separately to compute their respective volumesand mean CT numbers. The latter was applied intoEquation 1 to calculate the approximate lung meandensities (g/cm3) for the left and right lungs. The patient-specific lung parenchyma mass was calculated from theproduct of its volume and lung mean density for both theleft and right lungs.On SPECT/CT, lung CT densitovolumetry was per-
formed in a similar manner but with a slight differenceto ROI margins. Prior to the implementation of ourcurrent dosimetric protocol, we conducted an internalpilot study to assess the technical feasibility of lung CTdensitovolumetry by SPECT/CT. We observed that forSPECT/CT to obtain lung parenchyma mass estimatescomparable to that by diagnostic CT for the same patient,the SPECT/CT ROI margins should be slightly moregenerous than that of diagnostic CT. This is achievedby including a thin sliver of pleura within its margins notexceeding 1 mm in thickness (Figure 1), which we believeto be related to differences in lung expansion betweenan inspiratory breath-hold diagnostic CT versus free-breathing SPECT/CT. We also observed that dependentatelectasis was more common in SPECT/CT (Figure 1).This was likely due to a combination of free-breathingCT acquisition and prolonged lying in the supine pos-ition from exploratory angiography to SPECT/CT. OurSPECT/CT ROIs were adjusted to include all regions ofdependent atelectasis. At our institution, an experiencedoperator can complete the entire lung segmentationprocess within 20 min, including manual refinements.
Lung shunt fraction calculationLSFs for both planar scintigraphy and SPECT/CT werecalculated by conventional formularism [3,8] and expressedas percentages:

LSF ¼ Total lung countsTotal lung counts þ Total counts within all target hepatic arterial territories
ð2Þ
Kao et al. EJNMMI Research 2014, 4:33 Page 4 of 12http://www.ejnmmires.com/content/4/1/33
Planar image analysis was performed using PhilipsExtended Brilliance Workspace Nuclear Medicine soft-ware version 2.0 (Philips Healthcare, Eindhoven, TheNetherlands). Planar ROIs were contoured over the leftand right lungs and the liver, excluding the mediastinum.Simple background activity correction was performedusing a method similar to that described by Jha et al. [17].Scatter correction was not performed to be consistentwith conventional methodology [3,8]. Both anterior andposterior images were contoured to obtain geometricmeans of lung and liver counts.SPECT/CT acquired at free breathing is known to
cause mis-registration of 99mTc MAA activity from theliver dome into both lung bases (Figure 2), overestimating
Figure 1 Technical considerations in region-of-interest (ROI) delineatiparenchyma margins (A). Our SPECT/CT ROI technique requires the inclusiona tendency to over-include the left mediastinal border (red triangles) (B). Dueof the same patient performed a week apart show dependent atelectasis on
the LSF [18]. To overcome this problem, Yu et al. recentlyproposed using either the left lung only or to exclude thelung regions near the diaphragms [18]. Neither solutionis ideal, as the pulmonary biodistribution of 90Y micro-spheres may be asymmetrical between both sides of thelung and also within each lung. We chose the lattermethod of excluding the lung regions near the diaphragmsfor our protocol.The cranio-caudal displacement of the diaphragm apex
during free breathing was measured by Kolar et al. tobe 2.73 ± 1.02 cm (mean ± standard deviation) [19]. Weempirically chose a figure of 1.5 cm above the apex ofboth diaphragms as the trans-axial cut-off level, belowwhich all lung SPECT counts were excluded from all
on. On diagnostic CT, auto-segmented ROIs should closely match lungof a very thin sliver of pleura within its margins (blue arrows), but this hasto differences in CT scan technique, diagnostic CT (C) and SPECT/CT (D)SPECT/CT (D, blue arrows) but not on diagnostic CT (C).

Figure 2 Example of 99mTc MAA SPECT/CT mis-registration at the right diaphragm due to free breathing. This is depicted in coronalviews of SPECT/CT lung window (A), SPECT (B), and SPECT/CT soft tissue window (C). Horizontal dashed lines indicate the mis-registration extent.
Kao et al. EJNMMI Research 2014, 4:33 Page 5 of 12http://www.ejnmmires.com/content/4/1/33
dosimetric analysis, i.e., ‘exclusion zone’ (Figure 3). Depend-ing on the relative positions of the diaphragm apices atthe time of CT, the exclusion zone cut-offs for both lungsmay not always be at the same trans-axial level (Figure 3).Due to variable in vivo breakdown of 99mTc MAA, back-
ground activity may be present due to free pertechnetatewithin the blood pool and soft tissue, in addition toscatter. On SPECT/CT, simple lung background activitycorrection was performed by first estimating the back-ground count density (counts/cm3) using a long cylindricalVOI placed along the left erector spinae muscle in theposterior abdomen. The lung background counts abovethe exclusion zone were calculated as the product ofthe background count density and the lung parenchymatissue volume above the exclusion zone. The lungparenchyma tissue volume (not to be confused with CTlung volume) was estimated as follows: lung parenchymamass above exclusion zone/1.04, where 1.04 g/cm3 isthe assumed physical density of general soft tissue (not
Figure 3 Overview of lung count quantification. Horizontal dashedlines indicate the trans-axial cut-off levels for bilateral exclusion zones,1.5 cm above each diaphragm apex. Background-corrected total lungcounts were calculated from the lung mean count density above theexclusion zones.
be confused with lung mean density estimated fromEquation 1). The lung background counts above theexclusion zone were subtracted accordingly to obtain thebackground-corrected lung counts above the exclusionzone. This was further divided by the CT lung volumeabove the exclusion zone to obtain the background-corrected lung mean count density (counts/cm3), whichwe assumed to be representative of the entire lung. Thebackground-corrected counts for the entire lung werecalculated as the product of the background-correctedlung mean count density and the total CT lung volumeon SPECT/CT. To complete the LSF denominator ofEquation 2, background-corrected counts of all targethepatic arterial territories were obtained as previouslydescribed for liver SPECT/CT dosimetry [12].
Lung mean absorbed dose calculationBy Medical Internal Radiation Dose (MIRD) formularism,the lung mean radiation absorbed dose, Dmean, expressedin gray (Gy), was calculated as follows:
Lung mean dose ¼ 49:67� LSF� Total injected activityLung parenchyma mass
ð3Þ
where 49.67 is the absorbed dose coefficient of 1 GBq of90Y uniformly distributed throughout 1 kg of tissue [6],LSF is in its original dimensionless ratio, activity in GBqand mass in kilogram. 90Y resin microspheres were used,and all cases were planned by partition modeling [12].Our dosimetric limit for the intended lung mean dose is25 Gy for a single RE [8]. The use of SPECT-based voxeldosimetry to derive dose-volume histograms was notexplored in this study.For the purposes of this study, the ‘reference Dmean’
(i.e., gold standard) for each patient was assumed to bebest approximated by a combination of SPECT/CT LSFand lung parenchyma mass derived by diagnostic CTdensitovolumetry. ‘Planar methodology’ refers to conven-tional Dmean calculation based on planar LSF and the
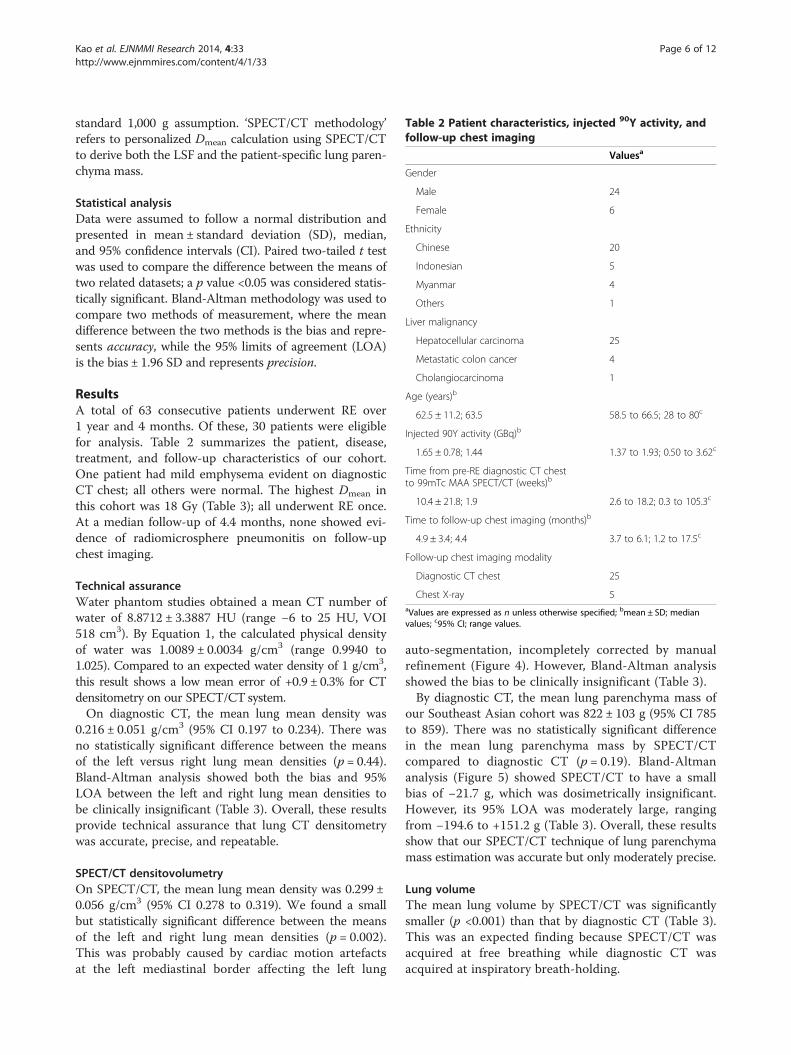
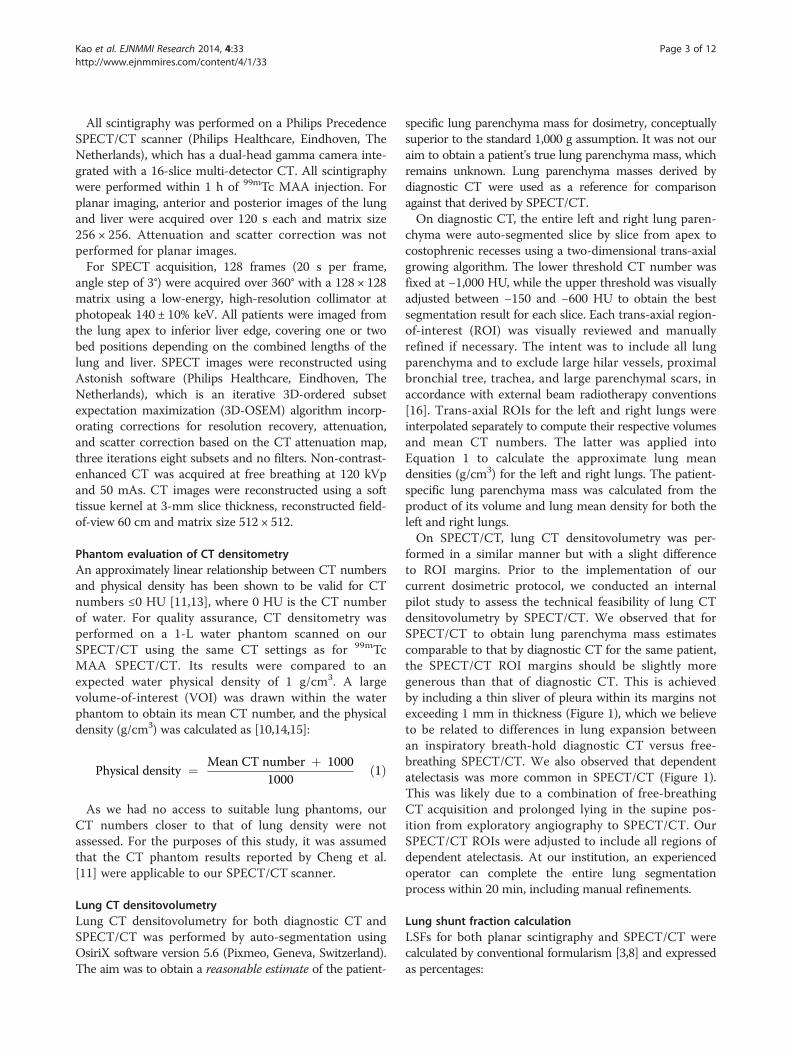
Table 2 Patient characteristics, injected 90Y activity, andfollow-up chest imaging
Valuesa
Gender
Male 24
Female 6
Ethnicity
Chinese 20
Indonesian 5
Myanmar 4
Others 1
Liver malignancy
Hepatocellular carcinoma 25
Metastatic colon cancer 4
Cholangiocarcinoma 1
Age (years)b
62.5 ± 11.2; 63.5 58.5 to 66.5; 28 to 80c
Injected 90Y activity (GBq)b
1.65 ± 0.78; 1.44 1.37 to 1.93; 0.50 to 3.62c
Time from pre-RE diagnostic CT chestto 99mTc MAA SPECT/CT (weeks)b
10.4 ± 21.8; 1.9 2.6 to 18.2; 0.3 to 105.3c
Time to follow-up chest imaging (months)b
4.9 ± 3.4; 4.4 3.7 to 6.1; 1.2 to 17.5c
Follow-up chest imaging modality
Diagnostic CT chest 25
Chest X-ray 5aValues are expressed as n unless otherwise specified; bmean ± SD; medianvalues; c95% CI; range values.
Kao et al. EJNMMI Research 2014, 4:33 Page 6 of 12http://www.ejnmmires.com/content/4/1/33
standard 1,000 g assumption. ‘SPECT/CT methodology’refers to personalized Dmean calculation using SPECT/CTto derive both the LSF and the patient-specific lung paren-chyma mass.
Statistical analysisData were assumed to follow a normal distribution andpresented in mean ± standard deviation (SD), median,and 95% confidence intervals (CI). Paired two-tailed t testwas used to compare the difference between the means oftwo related datasets; a p value <0.05 was considered statis-tically significant. Bland-Altman methodology was used tocompare two methods of measurement, where the meandifference between the two methods is the bias and repre-sents accuracy, while the 95% limits of agreement (LOA)is the bias ± 1.96 SD and represents precision.
ResultsA total of 63 consecutive patients underwent RE over1 year and 4 months. Of these, 30 patients were eligiblefor analysis. Table 2 summarizes the patient, disease,treatment, and follow-up characteristics of our cohort.One patient had mild emphysema evident on diagnosticCT chest; all others were normal. The highest Dmean inthis cohort was 18 Gy (Table 3); all underwent RE once.At a median follow-up of 4.4 months, none showed evi-dence of radiomicrosphere pneumonitis on follow-upchest imaging.
Technical assuranceWater phantom studies obtained a mean CT number ofwater of 8.8712 ± 3.3887 HU (range −6 to 25 HU, VOI518 cm3). By Equation 1, the calculated physical densityof water was 1.0089 ± 0.0034 g/cm3 (range 0.9940 to1.025). Compared to an expected water density of 1 g/cm3,this result shows a low mean error of +0.9 ± 0.3% for CTdensitometry on our SPECT/CT system.On diagnostic CT, the mean lung mean density was
0.216 ± 0.051 g/cm3 (95% CI 0.197 to 0.234). There wasno statistically significant difference between the meansof the left versus right lung mean densities (p = 0.44).Bland-Altman analysis showed both the bias and 95%LOA between the left and right lung mean densities tobe clinically insignificant (Table 3). Overall, these resultsprovide technical assurance that lung CT densitometrywas accurate, precise, and repeatable.
SPECT/CT densitovolumetryOn SPECT/CT, the mean lung mean density was 0.299 ±0.056 g/cm3 (95% CI 0.278 to 0.319). We found a smallbut statistically significant difference between the meansof the left and right lung mean densities (p = 0.002).This was probably caused by cardiac motion artefactsat the left mediastinal border affecting the left lung
auto-segmentation, incompletely corrected by manualrefinement (Figure 4). However, Bland-Altman analysisshowed the bias to be clinically insignificant (Table 3).By diagnostic CT, the mean lung parenchyma mass of
our Southeast Asian cohort was 822 ± 103 g (95% CI 785to 859). There was no statistically significant differencein the mean lung parenchyma mass by SPECT/CTcompared to diagnostic CT (p = 0.19). Bland-Altmananalysis (Figure 5) showed SPECT/CT to have a smallbias of −21.7 g, which was dosimetrically insignificant.However, its 95% LOA was moderately large, rangingfrom −194.6 to +151.2 g (Table 3). Overall, these resultsshow that our SPECT/CT technique of lung parenchymamass estimation was accurate but only moderately precise.
Lung volumeThe mean lung volume by SPECT/CT was significantlysmaller (p <0.001) than that by diagnostic CT (Table 3).This was an expected finding because SPECT/CT wasacquired at free breathing while diagnostic CT wasacquired at inspiratory breath-holding.

Table 3 Lung quantification results
Item Mean ± SD; median; 95% CI; range t test Bias ± SD; 95% LOA
Lung mean density (g/cm3)
Diagnostic CT
Right lung 0.215 ± 0.049; 0.201; 0.197 to 0.232; 0.121 to 0.376
Left lung, compared to right 0.217 ± 0.054; 0.201; 0.197 to 0.236; 0.128 to 0.383 p = 0.44 +0.0019 ± 0.0131;−0.0239 to +0.0276
Mean of both lungs 0.216 ± 0.051; 0.206; 0.197 to 0.234; 0.125 to 0.379
SPECT/CT
Right lung 0.291 ± 0.051; 0.289; 0.273 to 0.309; 0.180 to 0.410
Left lung, compared to right 0.306 ± 0.064; 0.310; 0.273 to 0.309; 0.161 to 0.442 p = 0.002 +0.0152 ± 0.0243;−0.0324 to +0.0628
Mean of both lungs, compared to diagnostic CT 0.299 ± 0.056; 0.298; 0.278 to 0.319; 0.171 to 0.417 p <0.001
Lung parenchyma mass (g)
Diagnostic CT
All patients 822 ± 103; 809; 785 to 859; 621 to 1,107
Male 828 ± 114; 823; 783 to 874; 621 to 1,107
Female 795 ± 19; 801; 780 to 811; 764 to 812
SPECT/CT
All patients, compared to diagnostic CT 788 ± 110; 736; 748 to 827; 624 to 1,045 p = 0.19 −21.7 ± 88.2; −194.6 to +151.2
Lung volume (cm3)
Diagnostic CT 3,967 ± 798; 4,049; 3,682 to 4,253; 2,142 to 5,634
SPECT/CT, compared to diagnostic CT 2,749 ± 744; 2,530; 483 to 3,015; 1,698 to 5,199 p <0.001
Lung shunt fraction (%)
SPECT/CT 5.96 ± 4.59; 4.97; 4.32 to 7.61; 0.98 to 21.71
Planar, compared to SPECT/CT 7.36 ± 4.96; 6.03; 5.58 to 9.14; 2.20 to 25.26 p <0.001 +1.40 ± 1.60; −1.73 to +4.52
Lung Dmean (Gy)
Reference Dmean 6.16 ± 5.24; 3.64; 4.28 to 8.03; 0.76 to 17.52
Planar, compared to reference 6.07 ± 4.51; 4.75; 4.46 to 7.68; 1.00 to 16.02 p = 0.78 −0.09 ± 1.73; −3.48 to +3.31
SPECT/CT, compared to reference 6.48 ± 5.51; 4.06; 4.51 to 8.45; 0.85 to 18.87 p = 0.11 +0.32 ± 1.06; −1.76 to +2.40
Planar, compared to SPECT/CT p = 0.27 −0.41 ± 2.00; −4.32 to +3.50
Kao et al. EJNMMI Research 2014, 4:33 Page 7 of 12http://www.ejnmmires.com/content/4/1/33
Lung shunt fractionThere was a small but statistically significant differencebetween the mean LSFs by planar scintigraphy andSPECT/CT (p <0.001). Bland-Altman analysis (Figure 6)showed planar LSFs to have a small bias of +1.4% com-pared to SPECT/CT (Table 3).
Lung mean absorbed doseTo reiterate, the reference Dmean (i.e., gold standard) foreach patient was assumed to be best approximated by acombination of SPECT/CT LSF and lung parenchymamass derived by diagnostic CT densitovolumetry. By thisdefinition, we found no statistically significant differencesbetween the mean Dmean estimated by either planar orSPECT/CT methodology, when each was respectivelycompared to the mean reference Dmean (p >0.05). Bland-Altman analysis (Figure 7) showed both planar andSPECT/CT methodologies to have biases of <0.5 Gy when
each was respectively compared to reference Dmean, whichis dosimetrically acceptable. However, 95% LOA forSPECT/CT was smaller than that for planar methodology(95% LOA −1.76 to +2.40 Gy versus −3.48 to +3.31 Gy, re-spectively) (Table 3). Overall, these results show that lungdosimetry by planar and SPECT/CT methodologies areboth accurate, but SPECT/CT offers better precision. Theresults also show the small but statistically significant LSFover-estimation by planar scintigraphy to be dosimetricallyinsignificant in the context of Dmean.When the mean Dmean by planar methodology was
directly compared to that by SPECT/CT methodology,we found no statistically significant difference betweenthe two methods (p = 0.27). Bland-Altman analysis showedplanar methodology to have a small bias of −0.41 Gy com-pared to SPECT/CT, which was dosimetrically insignificant.However, its 95% LOA was moderately large, rangingbetween −4.32 and +3.5 Gy. Overall, these results suggest

Figure 4 Cardiac motion artefacts on SPECT/CT. Cardiac motion artefacts were frequently observed at the left mediastinal border (arrows)(A), often leading to auto-segmentation errors (red contour line) (B) requiring manual correction.
Figure 5 Bland-Altman plot of lung CT densitovolumetry parenchyma masses by SPECT/CT versus diagnostic CT. Horizontal dashed linesindicate the bias and 95% LOA.
Kao et al. EJNMMI Research 2014, 4:33 Page 8 of 12http://www.ejnmmires.com/content/4/1/33
Figure 6 Bland-Altman plot of LSFs by planar scintigraphy versus SPECT/CT. Horizontal dashed lines indicate the bias and 95% LOA.
Kao et al. EJNMMI Research 2014, 4:33 Page 9 of 12http://www.ejnmmires.com/content/4/1/33
moderate disagreement between planar and SPECT/CTmethodologies for Dmean calculation and, therefore, shouldnot be used interchangeably (Table 3).
DiscussionSafe and effective partition modeling relies on the accur-ate input of dosimetric parameters such as tissue masses,tumor-to-normal liver ratio and LSF. We previouslyshowed that 99mTc MAA SPECT/CT of the abdomen canimprove partition modeling for the liver [12]. As an exten-sion of our earlier work, this study clinically validates99mTc MAA SPECT/CT for personalized predictive lungdosimetry and has provided initial data on its safety,accuracy, and precision.Our lung CT densitovolumetry results are in keeping
with the literature. Rosenblum et al. found the whole-lungmean CT number among 19 subjects under inspiratorybreath-holding to be −802 ± 34 HU and among 44 sub-jects under free breathing to be −734 ± 58 HU [14]. Thesefigures translate into a mean lung mean density of0.198 ± 0.034 g/cm3 (95% CI 0.182 to 0.214) by inspira-tory breath-hold CT and 0.266 ± 0.058 g/cm3 (95% CI0.249 to 0.283) by free-breathing CT, comparable toour results. Our study has also found planar LSFs to be
slightly overestimated as compared to SPECT/CT LSFs.This observation was consistent with the literature andmay be explained by the lack of attenuation and scattercorrection in planar scintigraphy [18,20-22].Our study has shown conventional planar methodology,
with its assumption of a standard 1,000 g lung mass, to bedosimetrically accurate, affirming its strong history of clin-ical safety. However, we found planar methodology to beless precise than SPECT/CT methodology. While our datashows planar methodology to be accurate when analyzedacross a cohort, its relative imprecision risks dosimetricuncertainty for patients who fall beyond populationnorms. Examples are patients with extremes of height,pre-existing chronic lung disease (e.g., emphysema,interstitial lung disease), undergone prior lung surgeryor irradiation. Such patients should not be assumed tohave ‘standard’ lung masses or lung parenchymal radio-biology and will benefit from personalized predictivelung dosimetry. Its clinical impact is greatest under theparadigm of partition modeling, which relies heavily ondosimetric accuracy and precision for the safe escal-ation of intended tumor absorbed doses. Furthermore,we have found the mean lung parenchyma mass of ourSoutheast Asian cohort to be nearly always less than

Figure 7 Combined Bland-Altman plots of lung mean doses by planar and SPECT/CT methodologies. Planar (red diamonds) and SPECT/CT(blue circles) methodologies were each respectively compared to the reference Dmean. Fine red and coarse blue horizontal dashed lines indicate thebias and 95% LOA for planar and SPECT/CT methodologies, respectively.
Kao et al. EJNMMI Research 2014, 4:33 Page 10 of 12http://www.ejnmmires.com/content/4/1/33
1,000 g. Ultimately, planar methodology is undesirable froma dosimetric perspective because its assumption of a stand-ard 1,000 g lung mass is fundamentally incongruent withthe modern era of personalized medicine.We found planar methodology to have a dosimetrically
insignificant bias of −0.41 Gy compared to SPECT/CTmethodology for Dmean calculation. However, its 95% LOAwas moderately large (−4.32 to +3.5 Gy) and thereforethese two methods cannot be regarded as dosimetricallyequivalent. This means that a choice of either methodwould not be expected to significantly affect lung dos-imetry in patients of average anthropometry but maysignificantly impact those who fall beyond populationnorms. Although correlations exist across a populationbetween lung parenchyma mass and physical parameterssuch as age, body weight, or height, modern personalizedmedicine encourages clinicians to pursue patient-specificmeasurements for individualized therapeutic guidance.Therefore, we advocate SPECT/CT methodology to beroutinely used for lung predictive dosimetry and adviseagainst using planar and SPECT/CT methodologiesinterchangeably for Dmean calculation.
SPECT/CT methodology overcomes most of the tech-nical limitations of planar methodology and also enablesCT densitovolumetry for patient-specific lung parenchy-mal mass estimation. On the technical issue of SPECT/CT mis-registration due to free breathing, this problemsimilarly affects planar scintigraphy and therefore shouldnot be regarded as a comparative disadvantage. On thecontrary, SPECT/CT can partially overcome this problemusing the technique outlined in this report. Respiratory-gated 99mTc MAA SPECT/CT is a promising solutionwhich warrants investigation.Although our SPECT/CT technique for patient-specific
lung parenchyma mass estimation was shown to beaccurate, it was only moderately precise. Lung CT den-sitovolumetry may be affected by many physiologicaland technical factors such as the phase of respiration[14], variations in pulmonary blood flow [15], intravenouscontrast, CT reconstruction [23], and ROI delineationmethods. Further research is necessary to improve itsprecision on SPECT/CT. However, it is important toreiterate that our aim was not to derive a patient's truelung parenchyma mass, which remains unknown, but
Kao et al. EJNMMI Research 2014, 4:33 Page 11 of 12http://www.ejnmmires.com/content/4/1/33
its reasonable estimate. To this end, we believe ourSPECT/CT methodology has served its purpose well.A limitation of our study was the lack of a true gold
standard for Dmean for clinical validation of our SPECT/CT methodology. 99mTc MAA is an imperfect surrogatefor 90Y resin microspheres due to slightly dissimilarphysical properties [24]. It is also theoretically possiblefor LSFs to dynamically change during RE due to pro-gressive microembolization. Therefore, LSFs simulatedby 99mTc MAA only give an estimate of the true post-RELSF. The relative contribution to errors in Dmean due tobiophysical and technical inaccuracies from 99mTc MAAand scintigraphic methods are beyond the scope of thisstudy, However, we believe 99mTc MAA SPECT/CT to befeasible for personalized predictive lung dosimetry untilsuperseded by better simulation microspheres (e.g.,fluorine-18 resin microspheres [25]) or imaging modal-ities (e.g., respiratory-gated 90Y PET/CT [26]). Anotherlimitation of our study was the assumption of normal dis-tribution for our data for statistical tests of significance.We believe this assumption to be reasonably valid for oursample size of 30 patients.We have clinically validated our SPECT/CT method-
ology up to Dmean 18 Gy without radiomicrospherepulmonary toxicity. This study has also provided earlydata on the statistical limits of dosimetric uncertaintyfor Dmean planned by 99mTc MAA, represented by thebias and LOA. This statistical data may guide person-alized predictive lung dosimetry in a manner similarto that recently described for the liver [27].
ConclusionsPatient-specific lung parenchyma mass estimation by CTdensitovolumetry on 99mTc MAA SPECT/CT is accurateand moderately precise. Lung mean radiation absorbeddoses calculated by 99mTc MAA SPECT/CT is accurateand offers better precision than planar methodology. Anintegrated, seamless, and personalized dosimetric work-flow by 99mTc MAA SPECT/CT from lung to abdomenis clinically feasible and safe.
Competing interestsYHK, KHT, PKHC, and ASWG received research funding from Sirtex MedicalSingapore. PKHC and ASWG receive honoraria from Sirtex Medical Singapore. Thisstudy was partially funded by a research grant from Sirtex Medical Singapore.
Authors' contributionsYHK, BMM, YT, ASWG, and DCEN were involved in study design, implementation,data collection, data analysis, and manuscript preparation. KHT and PKHC wereinvolved in radioembolization, clinical care, and manuscript preparation. Allauthors read and approved the final manuscript.
AcknowledgementsWe thank the following individuals for contributing to this study: NadiaChandra, Research Coordinator, Department of Nuclear Medicine and PET,Singapore General Hospital; Doreen Lau Ai Hui and Dr Kei Pin Lin,Department of Diagnostic Radiology, Singapore General Hospital. This studywas partially funded by a research grant from Sirtex Medical Singapore.
Author details1Department of Nuclear Medicine and PET, Singapore General Hospital,Outram Road, Singapore 169608, Singapore. 2Department of NuclearMedicine, Austin Hospital, Level 1, Harold Stokes Building, 145 Studley Rd,Melbourne, Victoria 3084, Australia. 3Department of Diagnostic Radiology,Singapore General Hospital, Outram Road, Singapore 169608, Singapore.4Department of General Surgery, Singapore General Hospital, Outram Road,Singapore 169608, Singapore. 5Department of Surgical Oncology, NationalCancer Centre Singapore, 11 Hospital Drive, Singapore 169610, Singapore.6Office of Clinical Sciences, Duke-National University of Singapore GraduateMedical School, 8 College Rd, Singapore 169857, Singapore.
Received: 28 March 2014 Accepted: 11 June 2014
References1. Lin M: Radiation pneumonitis caused by yttrium-90 microspheres:
radiologic findings. AJR Am J Roentgenol 1994, 162:1300–1302.2. Leung TW, Lau WY, Ho SK, Ward SC, Chow JH, Chan MS, Metreweli C,
Johnson PJ, Li AK: Radiation pneumonitis after selective internal radiationtreatment with intraarterial 90yttrium microspheres for inoperablehepatic tumors. Int J Radiat Oncol Biol Phys 1995, 33:919–924.
3. Ho S, Lau WY, Leung WT, Chan M, Chan KW, Johnson PJ, Li AK:Arteriovenous shunts in patients with hepatic tumors. J Nucl Med 1997,38:1201–1205.
4. Salem R, Parikh P, Atassi B, Lewandowski RJ, Ryu RK, Sato KT, Gates VL,Ibrahim S, Mulcahy MF, Kulik L, Liu DM, Riaz A, Omary RA, Kennedy AS:Incidence of radiation pneumonitis after hepatic intra-arterial radiotherapywith yttrium-90 microspheres assuming uniform lung distribution. Am JClin Oncol 2008, 31:431–438.
5. Wright CL, Werner JD, Tran JM, Gates VL, Rikabi AA, Shah MH, Salem R:Radiation pneumonitis following yttrium-90 radioembolization: casereport and literature review. J Vasc Interv Radiol 2012, 23:669–674.
6. Ho S, Lau WY, Leung TW, Chan M, Ngar YK, Johnson PJ, Li AK: Partitionmodel for estimating radiation doses from yttrium-90 microspheres intreating hepatic tumours. Eur J Nucl Med 1996, 23:947–952.
7. Ho S, Lau WY, Leung TW, Chan M, Johnson PJ, Li AK: Clinical evaluationof the partition model for estimating radiation doses from yttrium-90microspheres in the treatment of hepatic cancer. Eur J Nucl Med 1997,24:293–298.
8. Sirtex Medical Limited: SIR-Spheres package insert (CR1507). In NorthSydney, NSW, Australia: Sirtex Medical Limited; 2012.
9. Guenard H, Diallo MH, Laurent F, Vergeret J: Lung density and lung massin emphysema. Chest 1992, 102:198–203.
10. Mull RT: Mass estimates by computed tomography: physical density fromCT numbers. AJR Am J Roentgenol 1984, 143:1101–1104.
11. Cheng CW, Zhao L, Wolanski M, Zhao Q, James J, Dikeman K, Mills M, Li M,Srivastava SP, Lu XQ, Das IJ: Comparison of tissue characterization curvesfor different CT scanners: implication in proton therapy treatmentplanning. Transl Cancer Res 2012, 1:236–246.
12. Kao YH, Hock Tan AE, Burgmans MC, Irani FG, Khoo LS, Gong Lo RH,Tay KH, Tan BS, Hoe Chow PK, Eng Ng DC, Whatt Goh AS: Image-guidedpersonalized predictive dosimetry by artery-specific SPECT/CT partitionmodeling for safe and effective 90Y radioembolization. J Nucl Med 2012,53:559–566.
13. Saw CB, Loper A, Komanduri K, Combine T, Huq S, Scicutella C:Determination of CT-to-density conversion relationship for image-basedtreatment planning systems. Med Dosim 2005, 30:145–148.
14. Rosenblum LJ, Mauceri RA, Wellenstein DE, Thomas FD, Bassano DA, RaaschBN, Chamberlain CC, Heitzman ER: Density patterns in the normal lung asdetermined by computed tomography. Radiology 1980, 137:409–416.
15. Drummond GB: Computed tomography and pulmonary measurements.Br J Anaesth 1998, 80:665–671.
16. Kong FM, Ritter T, Quint DJ, Senan S, Gaspar LE, Komaki RU, Hurkmans CW,Timmerman R, Bezjak A, Bradley JD, Movsas B, Marsh L, Okunieff P, Choy H,Curran WJ Jr: Consideration of dose limits for organs at risk of thoracicradiotherapy: atlas for lung, proximal bronchial tree, esophagus, spinal cord,ribs, and brachial plexus. Int J Radiat Oncol Biol Phys 2011, 81:1442–1457.
17. Jha AK, Zade AA, Rangarajan V, Purandare N, Shah SA, Agrawal A, KulkarniSS, Shetty N: Comparative analysis of hepatopulmonary shunt obtainedfrom pretherapy 99mTc MAA scintigraphy and post-therapy 90Y

Kao et al. EJNMMI Research 2014, 4:33 Page 12 of 12http://www.ejnmmires.com/content/4/1/33
Bremsstrahlung imaging in 90Y microsphere therapy. Nucl Med Commun2012, 33:486–490.
18. Yu N, Srinivas SM, Difilippo FP, Shrikanthan S, Levitin A, McLennan G, SpainJ, Xia P, Wilkinson A: Lung dose calculation with SPECT/CT for yttrium-90radioembolization of liver cancer. Int J Radiat Oncol Biol Phys 2013,85:834–839.
19. Kolar P, Neuwirth J, Sanda J, Suchanek V, Svata Z, Volejnik J, Pivec M:Analysis of diaphragm movement during tidal breathing and during itsactivation while breath holding using MRI synchronized with spirometry.Physiol Res 2009, 58:383–392.
20. Giammarile F, Bodei L, Chiesa C, Flux G, Forrer F, Kraeber-Bodere F, Brans B,Lambert B, Konijnenberg M, Borson-Chazot F, Tennvall J, Luster M, Therapy,Oncology and Dosimetry Committees: EANM procedure guideline forthe treatment of liver cancer and liver metastases with intra-arterialradioactive compounds. Eur J Nucl Med Mol Imaging 2011, 38:1393–1406.
21. O'Doherty J, Scuffham J, Hinton P: The importance of scatter correction forthe assessment of lung shunting prior to yttrium-90 radioembolizationtherapy. Nucl Med Commun 2011, 32:628–634.
22. Chiesa C, Maccauro M, Romito R, Spreafico C, Pellizzari S, Negri A, Sposito C,Morosi C, Civelli E, Lanocita R, Camerini T, Bampo C, Bhoori S, Seregni E,Marchianò A, Mazzaferro V, Bombardieri E: Need, feasibility and convenienceof dosimetric treatment planning in liver selective internal radiationtherapy with (90)Y microspheres: the experience of the National TumorInstitute of Milan. Q J Nucl Med Mol Imaging 2011, 55:168–197.
23. Busse N, Erwin W, Pan T: Effect of CT acquisition parameters on alung-mass estimation algorithm. J Nucl Med 2013, 54(Suppl 2):214.
24. Van de Wiele C, Maes A, Brugman E, D'Asseler Y, De Spiegeleer B, Mees G,Stellamans K: SIRT of liver metastases: physiological andpathophysiological considerations. Eur J Nucl Med Mol Imaging 2012,39:1646–1655.
25. Selwyn RG, Avila-Rodriguez MA, Converse AK, Hampel JA, Jaskowiak CJ,McDermott JC, Warner TF, Nickles RJ, Thomadsen BR: 18 F-labeled resinmicrospheres as surrogates for 90Y resin microspheres used in thetreatment of hepatic tumors: a radiolabeling and PET validation study.Phys Med Biol 2007, 52:7397–7408.
26. Mamawan MD, Ong SC, Senupe JM: Post-90Y radioembolization PET/CTscan with respiratory gating using time-of-flight reconstruction. J NuclMed Technol 2013, 41:42.
27. Kao YH: A clinical dosimetric perspective uncovers new evidence andoffers new insight in favor of 99mTc macroaggregated albumin forpredictive dosimetry in 90Y resin microsphere radioembolization. J NuclMed 2013, 54:2191–2192.
doi:10.1186/s13550-014-0033-7Cite this article as: Kao et al.: Personalized predictive lung dosimetry bytechnetium-99m macroaggregated albumin SPECT/CT for yttrium-90radioembolization. EJNMMI Research 2014 4:33.
Submit your manuscript to a journal and benefi t from:
7 Convenient online submission
7 Rigorous peer review
7 Immediate publication on acceptance
7 Open access: articles freely available online
7 High visibility within the fi eld
7 Retaining the copyright to your article
Submit your next manuscript at 7 springeropen.com
Related Documents