Volume 2, Issue 3 (2014) ISSN: 2320-9038 ____________________________________________________ Page 253 Guru Journal of Behavioral and Social Sciences Personality Orientation and Meaning in Life of College Students in relation to Certain Demographic Variables Manikandan, K* & Sreeja, G** *Associate Professor, Department of Psychology, University of Calicut, Kerala, India **MSc Applied Psychology, Department of Psychology, University of Calicut, Kerala, India Received: 2 Aug 2014 Revised: 8 Aug 2014 Accepted: 12 Aug 2014 Keywords: Career counseling, Holland’s theory, Meaning in Life, Personality Orientation Abstract Career and vocational counseling has significant role in today’s educational scenario. Many numbers of students are approaching career counselors to find out the right course they have to pursue in their academic endower. Holland, a pioneer in career psychology has laid a strong foundation to this field and reported the personality orientations of difference careers. Based on this theory, this study conducted among college students with two objectives in mind. The instruments used in this study were Vocational Preference Inventory (VPI) and Meaning in Life Questionnaire. There were 221 undergraduate students both males and females participated in the study. Results revealed that no significant relationship between meaning in life and personality orientations; there exist significant difference on personality orientation and meaning in life with regard to sex, stream of study and year of study. © 2014 Guru Journal of Behavioral and Social Sciences Vocational and career counseling is primarily concerned with the nature of rewarding career paths in the context of individuals' different patterns of interests and abilities. The systematic assessment of vocational interests can be traced to 1927 when Strong first published the Strong Vocational Interest Bank for Men and 1934 when Kuder first introduced the Kuder Preference Record (Walsh & Osipow, 1986). Holland suggested that the choice of an occupation is an expression of personality and that interests are therefore personality inventories. He developed research instruments like Vocational Preference Inventory and Self-Directed Search for measuring the interest and personality types. Holland's theory is based on the fact that career choice is an expression of one's personality and members of an occupation may have similar personalities and similar histories. Accordingly he assumed that individuals can be described in terms six personality types namely 1) Realistic, 2) Investigative, 3) Artistic, 4) Social, 5) Enterprising and 6) Conventional. He also proposed five more dimensions, namely, Self Control, Masculinity-Feminity, Status, Infrequency and Acquiescence which can be assessed using vocational Preference Inventory (VPI). These types of personality classification may be considered as model of vocational preferences. Each personality type has a characteristic set of attitudes and skills to use in response to problems encountered in the environment and each encompasses preferences for vocational and leisure activities, life goals and values, beliefs about oneself, and problem solving style. An individual is rarely a single pure type; rather, individuals more likely to be a combination of several types, with one type that is dominant and other types that are secondary. Meaning in life is defined as, the extent to which people make sense of, or see significance in their lives, accompanied by the degree to which they perceive themselves to have purpose, mission or over-arching aim in life (Steger, 2006). Those who report high levels of presence of meaning in life are generally more satisfied with their lives and less distressed than those who report low levels. Many studies suggest that meaning in life positively affects health (Debats, Drost, & Hansen, 1995), resistance to stress (Chamberlain & Zika, 1988), and life Guru Journal of Behavioral and Social Sciences Volume 2 Issue 3 (July – Sept, 2014) ISSN: 2320-9038 www.gjbss.org

Welcome message from author
This document is posted to help you gain knowledge. Please leave a comment to let me know what you think about it! Share it to your friends and learn new things together.
Transcript
Volume 2, Issue 3 (2014) ISSN: 2320-9038
____________________________________________________ Page 253 Guru Journal of Behavioral and Social Sciences
Personality Orientation and Meaning in Life of College Students in relation
to Certain Demographic Variables Manikandan, K* & Sreeja, G** *Associate Professor, Department of Psychology, University of Calicut, Kerala, India
**MSc Applied Psychology, Department of Psychology, University of Calicut, Kerala, India Received: 2 Aug 2014
Revised: 8 Aug 2014
Accepted: 12 Aug 2014
Keywords:
Career counseling, Holland’s
theory, Meaning in Life,
Personality Orientation
Abstract
Career and vocational counseling has significant role in today’s educational scenario. Many
numbers of students are approaching career counselors to find out the right course they have to
pursue in their academic endower. Holland, a pioneer in career psychology has laid a strong
foundation to this field and reported the personality orientations of difference careers. Based on
this theory, this study conducted among college students with two objectives in mind. The
instruments used in this study were Vocational Preference Inventory (VPI) and Meaning in Life
Questionnaire. There were 221 undergraduate students both males and females participated in
the study. Results revealed that no significant relationship between meaning in life and
personality orientations; there exist significant difference on personality orientation and meaning
in life with regard to sex, stream of study and year of study.
© 2014 Guru Journal of Behavioral and Social Sciences
Vocational and career counseling is primarily concerned with the nature of rewarding career paths in the context of individuals' different patterns of interests and abilities. The systematic assessment of vocational interests can be traced to 1927 when Strong first published the Strong Vocational Interest Bank for Men and 1934 when Kuder first introduced the Kuder Preference Record (Walsh & Osipow, 1986). Holland suggested that the choice of an occupation is an expression of personality and that interests are therefore personality inventories. He developed research instruments like Vocational Preference Inventory and Self-Directed Search for measuring the interest and personality types. Holland's theory is based on the fact that career choice is an expression of one's personality and members of an occupation may have similar personalities and similar histories. Accordingly he assumed that individuals can be described in terms six personality types namely 1) Realistic, 2) Investigative, 3) Artistic, 4) Social, 5) Enterprising and 6) Conventional. He also proposed five more dimensions, namely, Self Control, Masculinity-Feminity, Status, Infrequency and Acquiescence which can be assessed using vocational Preference Inventory (VPI).
These types of personality classification may be considered as model of vocational preferences. Each personality type has a characteristic set of attitudes and skills to use in response to problems encountered in the environment and each encompasses preferences for vocational and leisure activities, life goals and values, beliefs about oneself, and problem solving style. An individual is rarely a single pure type; rather, individuals more likely to be a combination of several types, with one type that is dominant and other types that are secondary.
Meaning in life is defined as, the extent to which people make sense of, or see significance in their lives, accompanied by the degree to which they perceive themselves to have purpose, mission or over-arching aim in life (Steger, 2006). Those who report high levels of presence of meaning in life are generally more satisfied with their lives and less distressed than those who report low levels. Many studies suggest that meaning in life positively affects health (Debats, Drost, & Hansen, 1995), resistance to stress (Chamberlain & Zika, 1988), and life
Guru Journal of Behavioral and Social Sciences
Volume 2 Issue 3 (July – Sept, 2014)
ISSN: 2320-9038 www.gjbss.org
Volume 2, Issue 3 (2014) ISSN: 2320-9038
_______________________________________________________________________________________________________
______________________________________________ Page Guru Journal of Behavioral and Social Sciences
254
satisfaction. Several researchers have reaffirmed the connection between meaning in life and well-being (King, Hicks, Krull, & Del-Gaiso, 2006).
One of our main concerns is making our life meaningful. In fact, our every action is part of our effort to make the life meaningful. Some might have developed a clear sense of purpose of life and others at the same time will be in search of finding what makes their life meaningful. The difference between presence and search of meaning may be obvious in one’s choices, decisions, preferences etc. Vocational preference is an important aspect in one’s life. The presence and search for meaning may differently influence one’s vocational preferences and presence of meaning will lead to the preference of some category of jobs and search for meaning will lead to the preference for other category of jobs. Thus, much basic research remains necessary to understand relationship between meaning in life dimensions and vocational preference. At the same time we should study more about how meaning in life and vocational preference are influenced by demographics as it was only a few research were
carried out.
Vocation is, in one sense, one’s way of life. It has a tremendous impact on one’s life through its influence on his/her social status, interpersonal relations, recreational activities etc. Hence vocational preference becomes an important aspect in one’s life. According to Holland, one’s vocational preference can reveal the underlying personality dimensions. Here comes the
significance of assessing the vocational preference of students. Through it, we can gain insight into the personality characteristics possessed by them which attract to a particular category of jobs and thereby gain some information about their career aptitudes. Students who choose professional course after their higher secondary are somewhat regarded as job oriented. But the vocational preferences and career orientations of students studying traditional degree courses are somewhat less clear. It is interesting to find that whether they prefer career that are consistent with their subject of study, whether the students studying a particular subject are characterized by a personality dimension etc.
Objectives
1. To find out the correlation between meaning in life and personality orientation.
2. To know the influence of demographics on personality orientations and meaning in life.
Hypotheses
1. There will be significant positive correlation between meaning in life and personality orientation.
2. There exists significant difference between males and females on personality orientation and meaning in life.
3. There exists significant difference between arts and science students on personality orientation and meaning in life.
4. There exists significant difference among year of study personality orientation and meaning in life.
Participants
The participants selected for the study consists of 221 undergraduate college students who belong to different subjects of study and different years of study. They were selected from four colleges from Kozhikode and Malapuram districts of Kerala, India. Among the total participants, 137 (62%) were females and 84 (38%) were males. Among them, 179 (81%) were from nuclear family and 42 (19%) were from joint family. Regarding religion 131 (59.3%) were Hindus, 73 (33%) Muslims and 17 (7.7%) were Christians. When considering the year of study, 49 (22.2%) were first year students, 94 (42.5%) second year and 78 (35.3%) were third (final) year students. In the case of stream of study, 162 (73.3%) were Arts students and, 59 (26.7%) were
Volume 2, Issue 3 (2014) ISSN: 2320-9038
_______________________________________________________________________________________________________
______________________________________________ Page Guru Journal of Behavioral and Social Sciences
255
Science students. Among the total 221 participants, 62(28.1%) were Economics students, 37(16.7%) Physics, 42(19%) History, 34(15.4%) Malayalam, 6(2.7%) Zoology, 16(7.2%) English, 8(3.6%) Chemistry, 9(4.1%) Hindi, and 7(3.2%) were Mathematics students. The participant’s age ranges from 17 to 20 years.
Instruments
1. Vocational Preference Inventory (VPI): Vocational Preference Inventory developed by Holland (1968) was used for measuring personality of the subjects. It consists of 160 occupational titles. The response categories are ‘Y’ for ‘Yes’ and ‘N’ for ‘No’. Participants are also allowed to make ‘Neutral’ responses by making no responses to the concerned occupational title. The internal consistency (KR 20) of the VPI scales for a sample of females ranges from .42 to .91, and for males .53 to .91. The test -retest reliability of the VPI is also established in various sample like adult women (ranges from .58 to .84), College freshmen (one year - .65 to .86). Holland (1968) reported similar retest reliabilities for the interest scales (range of 0.54 to 0.80 with a median of 0.71) for samples of junior college students (62 men and 53 women) for a 3 month interval. The concurrent or predictive validity of the VPI interest scales are equal to or exceed the concurrent or predictive validities of other interest scales.
2. Meaning in Life Questionnaire: Meaning in Life Questionnaire was developed by Steger, Frazier, Oishi, and Kaler (2006). The Meaning in Life Questionnaire assesses two dimensions of meaning in life using 10 items rated on a seven-point scale from “Absolutely True” to “Absolutely Untrue.” The MLQ takes about 5 minutes to complete. The alpha coefficients for the target self-reports on the MLQ–P and MLQ–S were .81 and .84 during Time 1, respectively, and .86 and .92 during Time 2, representing good
internal consistency. One-month test–retest stability coefficients were good (.70 for the MLQ–P, .73 for the MLQ–S). The authors of the questionnaire reported the convergent validity also.
3. Personal Informational Schedule: To collect information regarding demographic variables such as sex, stream of study, subject of study, religion, etc., was gathered using
personal information schedule.
Procedure
The investigators sought prior appointment from the Principals of the colleges and discussed about the purpose and importance of the study. Then the Principal directed the advisors of each class and they arranged a favorable environment for the data collection. The instruments were administered to the selected sample after giving proper instructions. Assurance was given to the participants that the information gathered from him/ her should be used only for research purpose and identity would be kept confidential. Then the instrumented were collected back and scored according to the scoring scheme provided by the manual. The score obtained by each subject on different variables under study along with the socio demographic variables are coded and entered into a spread sheet for further statistical
treatments.
Results and Discussion
To know how the vocational preference of the participants is related with their meaning in life, the Pearson product moment correlation was calculated and the results are presented in table 1.
Volume 2, Issue 3 (2014) ISSN: 2320-9038
_______________________________________________________________________________________________________
______________________________________________ Page Guru Journal of Behavioral and Social Sciences
256
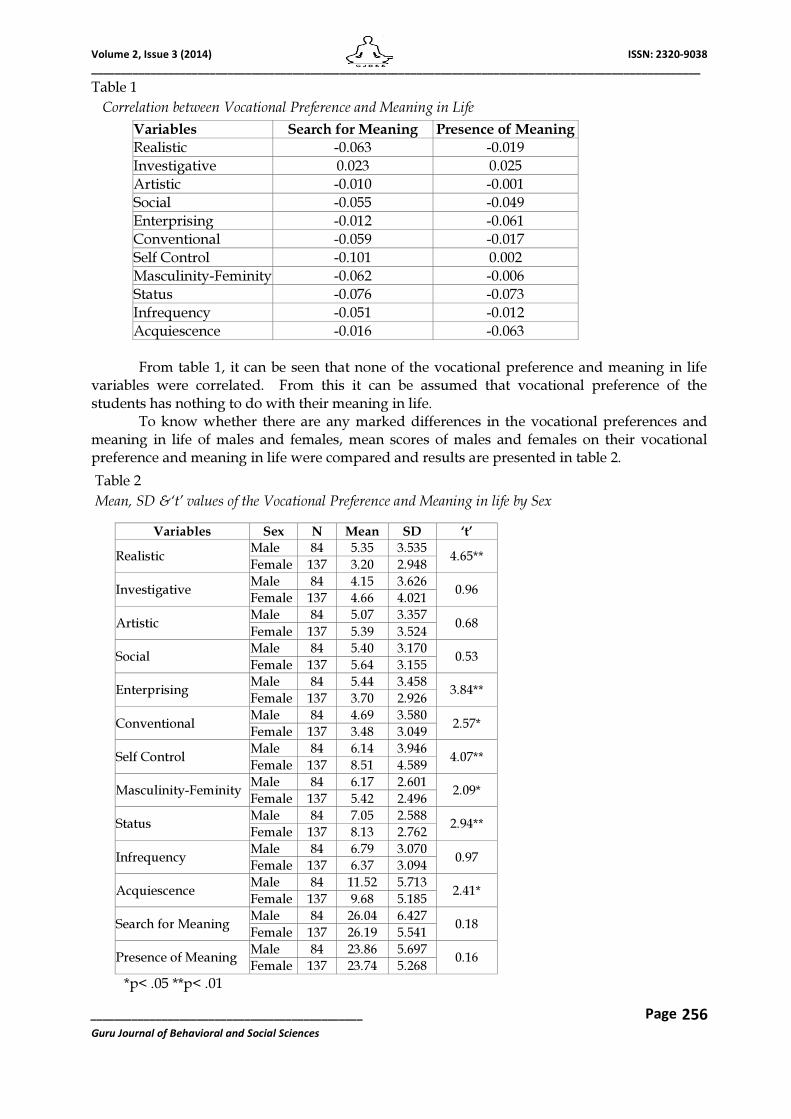
Table 1
Correlation between Vocational Preference and Meaning in Life
Variables Search for Meaning Presence of Meaning
Realistic -0.063 -0.019
Investigative 0.023 0.025
Artistic -0.010 -0.001
Social -0.055 -0.049
Enterprising -0.012 -0.061
Conventional -0.059 -0.017
Self Control -0.101 0.002
Masculinity-Feminity -0.062 -0.006
Status -0.076 -0.073
Infrequency -0.051 -0.012
Acquiescence -0.016 -0.063
From table 1, it can be seen that none of the vocational preference and meaning in life
variables were correlated. From this it can be assumed that vocational preference of the
students has nothing to do with their meaning in life. To know whether there are any marked differences in the vocational preferences and meaning in life of males and females, mean scores of males and females on their vocational preference and meaning in life were compared and results are presented in table 2.
Table 2
Mean, SD &‘t’ values of the Vocational Preference and Meaning in life by Sex
Variables Sex N Mean SD ‘t’
Realistic Male 84 5.35 3.535
4.65** Female 137 3.20 2.948
Investigative Male 84 4.15 3.626
0.96 Female 137 4.66 4.021
Artistic Male 84 5.07 3.357
0.68 Female 137 5.39 3.524
Social Male 84 5.40 3.170
0.53 Female 137 5.64 3.155
Enterprising Male 84 5.44 3.458
3.84** Female 137 3.70 2.926
Conventional Male 84 4.69 3.580
2.57* Female 137 3.48 3.049
Self Control Male 84 6.14 3.946
4.07** Female 137 8.51 4.589
Masculinity-Feminity Male 84 6.17 2.601
2.09* Female 137 5.42 2.496
Status Male 84 7.05 2.588
2.94** Female 137 8.13 2.762
Infrequency Male 84 6.79 3.070
0.97 Female 137 6.37 3.094
Acquiescence Male 84 11.52 5.713
2.41* Female 137 9.68 5.185
Search for Meaning Male 84 26.04 6.427
0.18 Female 137 26.19 5.541
Presence of Meaning Male 84 23.86 5.697
0.16 Female 137 23.74 5.268
*p< .05 **p< .01
Volume 2, Issue 3 (2014) ISSN: 2320-9038
_______________________________________________________________________________________________________
______________________________________________ Page Guru Journal of Behavioral and Social Sciences
257
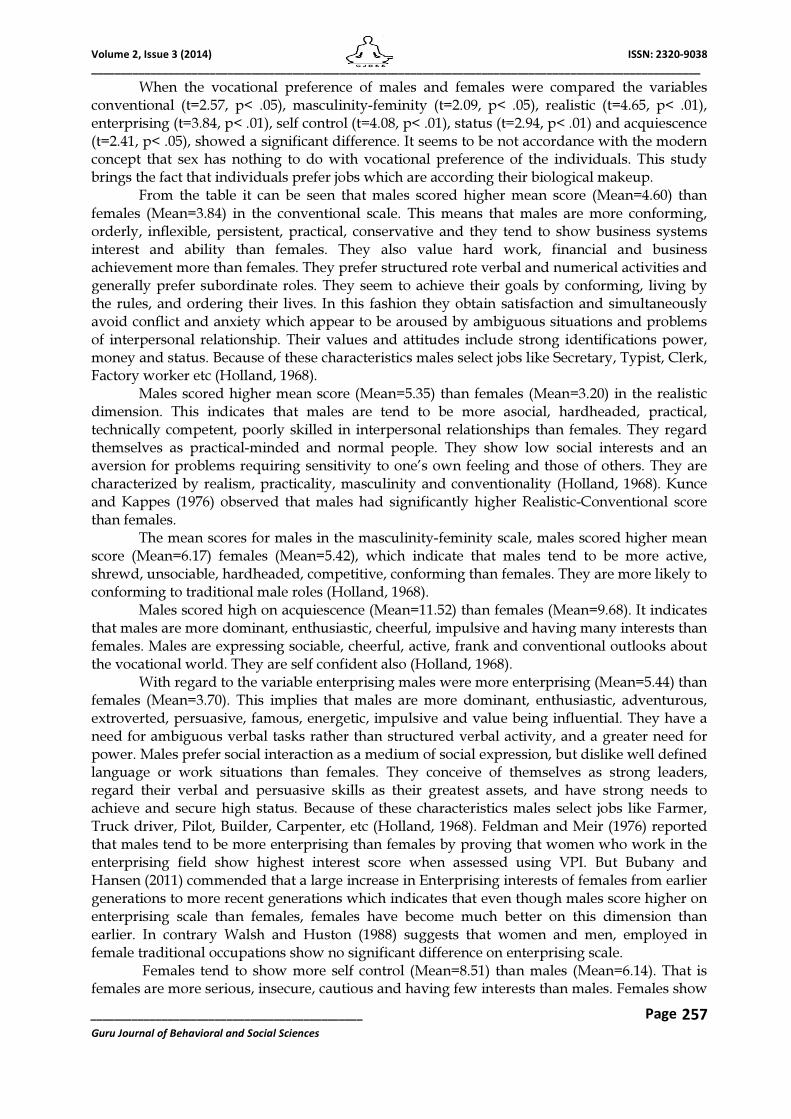
When the vocational preference of males and females were compared the variables conventional (t=2.57, p< .05), masculinity-feminity (t=2.09, p< .05), realistic (t=4.65, p< .01), enterprising (t=3.84, p< .01), self control (t=4.08, p< .01), status (t=2.94, p< .01) and acquiescence (t=2.41, p< .05), showed a significant difference. It seems to be not accordance with the modern concept that sex has nothing to do with vocational preference of the individuals. This study brings the fact that individuals prefer jobs which are according their biological makeup. From the table it can be seen that males scored higher mean score (Mean=4.60) than
females (Mean=3.84) in the conventional scale. This means that males are more conforming, orderly, inflexible, persistent, practical, conservative and they tend to show business systems interest and ability than females. They also value hard work, financial and business achievement more than females. They prefer structured rote verbal and numerical activities and generally prefer subordinate roles. They seem to achieve their goals by conforming, living by the rules, and ordering their lives. In this fashion they obtain satisfaction and simultaneously avoid conflict and anxiety which appear to be aroused by ambiguous situations and problems of interpersonal relationship. Their values and attitudes include strong identifications power, money and status. Because of these characteristics males select jobs like Secretary, Typist, Clerk, Factory worker etc (Holland, 1968). Males scored higher mean score (Mean=5.35) than females (Mean=3.20) in the realistic dimension. This indicates that males are tend to be more asocial, hardheaded, practical, technically competent, poorly skilled in interpersonal relationships than females. They regard themselves as practical-minded and normal people. They show low social interests and an aversion for problems requiring sensitivity to one’s own feeling and those of others. They are characterized by realism, practicality, masculinity and conventionality (Holland, 1968). Kunce and Kappes (1976) observed that males had significantly higher Realistic-Conventional score than females. The mean scores for males in the masculinity-feminity scale, males scored higher mean score (Mean=6.17) females (Mean=5.42), which indicate that males tend to be more active, shrewd, unsociable, hardheaded, competitive, conforming than females. They are more likely to conforming to traditional male roles (Holland, 1968). Males scored high on acquiescence (Mean=11.52) than females (Mean=9.68). It indicates that males are more dominant, enthusiastic, cheerful, impulsive and having many interests than females. Males are expressing sociable, cheerful, active, frank and conventional outlooks about the vocational world. They are self confident also (Holland, 1968). With regard to the variable enterprising males were more enterprising (Mean=5.44) than females (Mean=3.70). This implies that males are more dominant, enthusiastic, adventurous, extroverted, persuasive, famous, energetic, impulsive and value being influential. They have a need for ambiguous verbal tasks rather than structured verbal activity, and a greater need for power. Males prefer social interaction as a medium of social expression, but dislike well defined language or work situations than females. They conceive of themselves as strong leaders, regard their verbal and persuasive skills as their greatest assets, and have strong needs to achieve and secure high status. Because of these characteristics males select jobs like Farmer, Truck driver, Pilot, Builder, Carpenter, etc (Holland, 1968). Feldman and Meir (1976) reported that males tend to be more enterprising than females by proving that women who work in the enterprising field show highest interest score when assessed using VPI. But Bubany and Hansen (2011) commended that a large increase in Enterprising interests of females from earlier generations to more recent generations which indicates that even though males score higher on enterprising scale than females, females have become much better on this dimension than
earlier. In contrary Walsh and Huston (1988) suggests that women and men, employed in female traditional occupations show no significant difference on enterprising scale. Females tend to show more self control (Mean=8.51) than males (Mean=6.14). That is females are more serious, insecure, cautious and having few interests than males. Females show
Volume 2, Issue 3 (2014) ISSN: 2320-9038
_______________________________________________________________________________________________________
______________________________________________ Page Guru Journal of Behavioral and Social Sciences
258
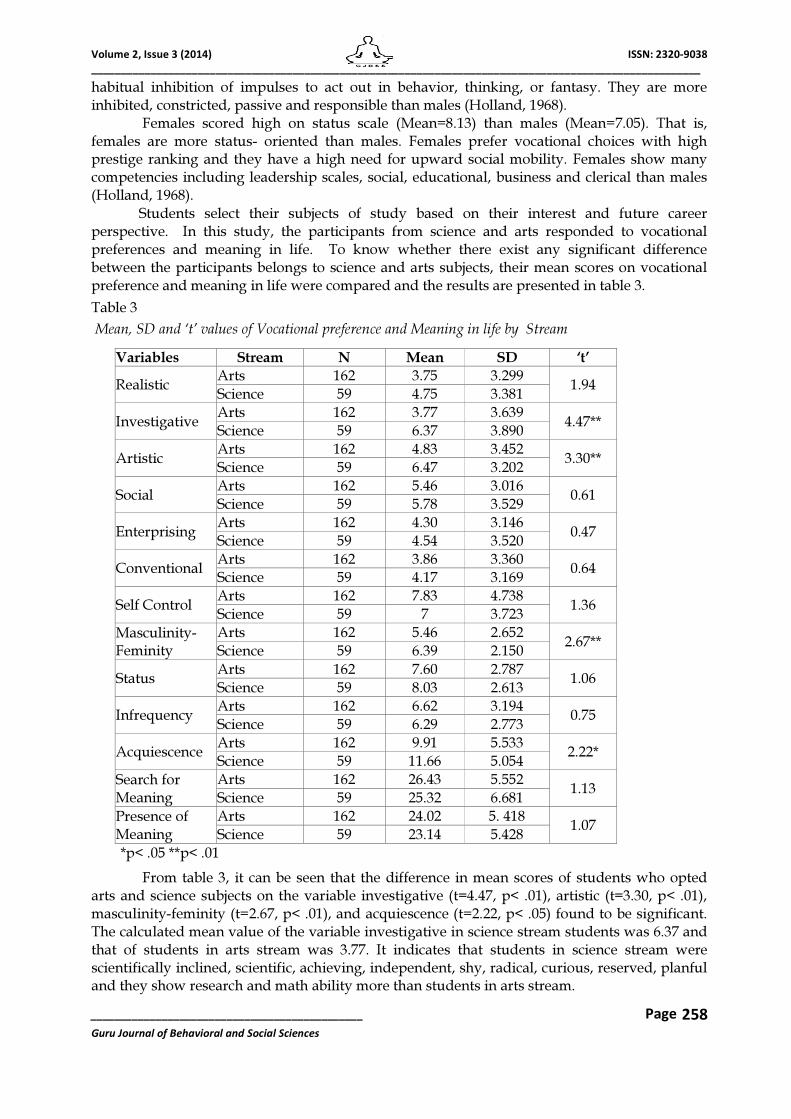
habitual inhibition of impulses to act out in behavior, thinking, or fantasy. They are more inhibited, constricted, passive and responsible than males (Holland, 1968). Females scored high on status scale (Mean=8.13) than males (Mean=7.05). That is, females are more status- oriented than males. Females prefer vocational choices with high prestige ranking and they have a high need for upward social mobility. Females show many competencies including leadership scales, social, educational, business and clerical than males (Holland, 1968).
Students select their subjects of study based on their interest and future career perspective. In this study, the participants from science and arts responded to vocational preferences and meaning in life. To know whether there exist any significant difference between the participants belongs to science and arts subjects, their mean scores on vocational preference and meaning in life were compared and the results are presented in table 3.
Table 3
Mean, SD and ‘t’ values of Vocational preference and Meaning in life by Stream
Variables Stream N Mean SD ‘t’
Realistic Arts 162 3.75 3.299
1.94 Science 59 4.75 3.381
Investigative Arts 162 3.77 3.639
4.47** Science 59 6.37 3.890
Artistic Arts 162 4.83 3.452
3.30** Science 59 6.47 3.202
Social Arts 162 5.46 3.016
0.61 Science 59 5.78 3.529
Enterprising Arts 162 4.30 3.146
0.47 Science 59 4.54 3.520
Conventional Arts 162 3.86 3.360
0.64 Science 59 4.17 3.169
Self Control Arts 162 7.83 4.738
1.36 Science 59 7 3.723
Masculinity-Feminity
Arts 162 5.46 2.652 2.67**
Science 59 6.39 2.150
Status Arts 162 7.60 2.787
1.06 Science 59 8.03 2.613
Infrequency Arts 162 6.62 3.194
0.75 Science 59 6.29 2.773
Acquiescence Arts 162 9.91 5.533
2.22* Science 59 11.66 5.054
Search for Meaning
Arts 162 26.43 5.552 1.13
Science 59 25.32 6.681
Presence of Meaning
Arts 162 24.02 5. 418 1.07
Science 59 23.14 5.428
*p< .05 **p< .01
From table 3, it can be seen that the difference in mean scores of students who opted arts and science subjects on the variable investigative (t=4.47, p< .01), artistic (t=3.30, p< .01), masculinity-feminity (t=2.67, p< .01), and acquiescence (t=2.22, p< .05) found to be significant. The calculated mean value of the variable investigative in science stream students was 6.37 and that of students in arts stream was 3.77. It indicates that students in science stream were scientifically inclined, scientific, achieving, independent, shy, radical, curious, reserved, planful and they show research and math ability more than students in arts stream.
Volume 2, Issue 3 (2014) ISSN: 2320-9038
_______________________________________________________________________________________________________
______________________________________________ Page Guru Journal of Behavioral and Social Sciences
259
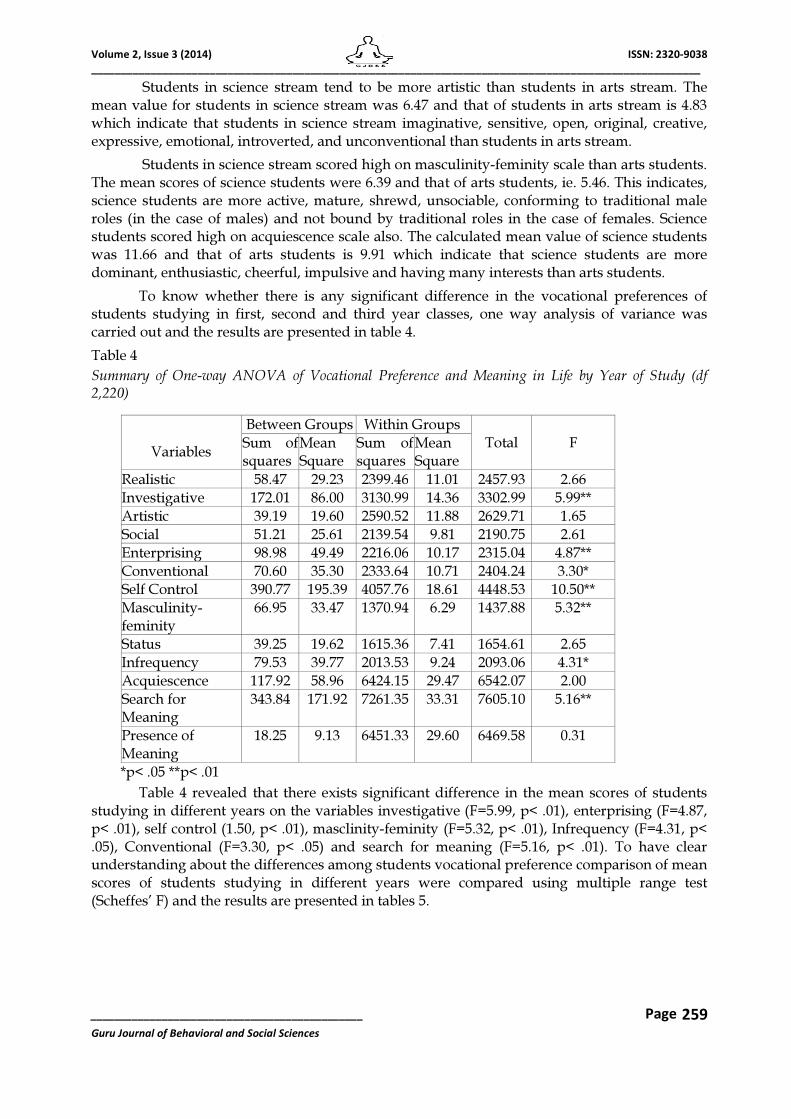
Students in science stream tend to be more artistic than students in arts stream. The mean value for students in science stream was 6.47 and that of students in arts stream is 4.83 which indicate that students in science stream imaginative, sensitive, open, original, creative, expressive, emotional, introverted, and unconventional than students in arts stream.
Students in science stream scored high on masculinity-feminity scale than arts students. The mean scores of science students were 6.39 and that of arts students, ie. 5.46. This indicates, science students are more active, mature, shrewd, unsociable, conforming to traditional male roles (in the case of males) and not bound by traditional roles in the case of females. Science students scored high on acquiescence scale also. The calculated mean value of science students was 11.66 and that of arts students is 9.91 which indicate that science students are more dominant, enthusiastic, cheerful, impulsive and having many interests than arts students.
To know whether there is any significant difference in the vocational preferences of students studying in first, second and third year classes, one way analysis of variance was carried out and the results are presented in table 4.
Table 4
Summary of One-way ANOVA of Vocational Preference and Meaning in Life by Year of Study (df 2,220)
Variables
Between Groups Within Groups
Total F Sum of squares
Mean Square
Sum of squares
Mean Square
Realistic 58.47 29.23 2399.46 11.01 2457.93 2.66
Investigative 172.01 86.00 3130.99 14.36 3302.99 5.99**
Artistic 39.19 19.60 2590.52 11.88 2629.71 1.65
Social 51.21 25.61 2139.54 9.81 2190.75 2.61
Enterprising 98.98 49.49 2216.06 10.17 2315.04 4.87**
Conventional 70.60 35.30 2333.64 10.71 2404.24 3.30*
Self Control 390.77 195.39 4057.76 18.61 4448.53 10.50**
Masculinity- feminity
66.95 33.47 1370.94 6.29 1437.88 5.32**
Status 39.25 19.62 1615.36 7.41 1654.61 2.65
Infrequency 79.53 39.77 2013.53 9.24 2093.06 4.31*
Acquiescence 117.92 58.96 6424.15 29.47 6542.07 2.00
Search for Meaning
343.84 171.92 7261.35 33.31 7605.10 5.16**
Presence of Meaning
18.25 9.13 6451.33 29.60 6469.58 0.31
*p< .05 **p< .01
Table 4 revealed that there exists significant difference in the mean scores of students studying in different years on the variables investigative (F=5.99, p< .01), enterprising (F=4.87, p< .01), self control (1.50, p< .01), masclinity-feminity (F=5.32, p< .01), Infrequency (F=4.31, p< .05), Conventional (F=3.30, p< .05) and search for meaning (F=5.16, p< .01). To have clear understanding about the differences among students vocational preference comparison of mean scores of students studying in different years were compared using multiple range test (Scheffes’ F) and the results are presented in tables 5.
Volume 2, Issue 3 (2014) ISSN: 2320-9038
_______________________________________________________________________________________________________
______________________________________________ Page Guru Journal of Behavioral and Social Sciences
260
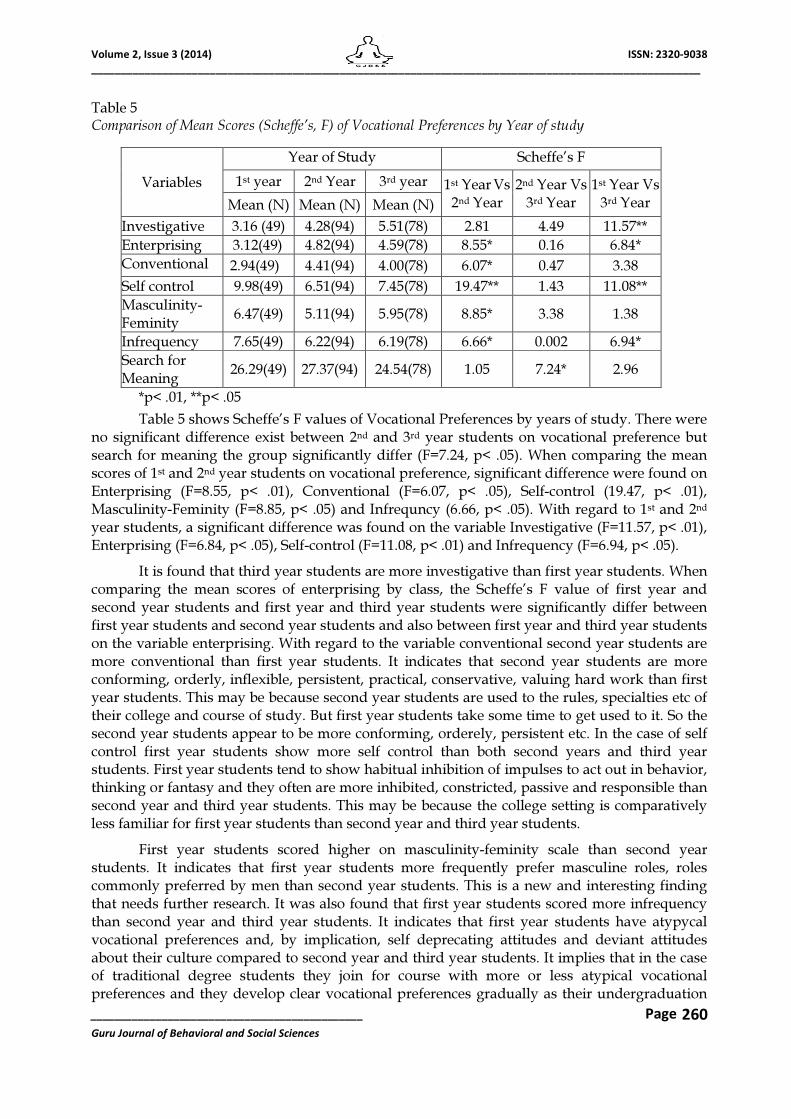
Table 5 Comparison of Mean Scores (Scheffe’s, F) of Vocational Preferences by Year of study
Variables
Year of Study Scheffe’s F
1st year 2nd Year 3rd year 1st Year Vs 2nd Year
2nd Year Vs 3rd Year
1st Year Vs 3rd Year Mean (N) Mean (N) Mean (N)
Investigative 3.16 (49) 4.28(94) 5.51(78) 2.81 4.49 11.57**
Enterprising 3.12(49) 4.82(94) 4.59(78) 8.55* 0.16 6.84*
Conventional 2.94(49) 4.41(94) 4.00(78) 6.07* 0.47 3.38
Self control 9.98(49) 6.51(94) 7.45(78) 19.47** 1.43 11.08**
Masculinity-Feminity
6.47(49) 5.11(94) 5.95(78) 8.85* 3.38 1.38
Infrequency 7.65(49) 6.22(94) 6.19(78) 6.66* 0.002 6.94*
Search for Meaning
26.29(49) 27.37(94) 24.54(78) 1.05 7.24* 2.96
*p< .01, **p< .05
Table 5 shows Scheffe’s F values of Vocational Preferences by years of study. There were no significant difference exist between 2nd and 3rd year students on vocational preference but search for meaning the group significantly differ (F=7.24, p< .05). When comparing the mean scores of 1st and 2nd year students on vocational preference, significant difference were found on Enterprising (F=8.55, p< .01), Conventional (F=6.07, p< .05), Self-control (19.47, p< .01), Masculinity-Feminity (F=8.85, p< .05) and Infrequncy (6.66, p< .05). With regard to 1st and 2nd year students, a significant difference was found on the variable Investigative (F=11.57, p< .01), Enterprising (F=6.84, p< .05), Self-control (F=11.08, p< .01) and Infrequency (F=6.94, p< .05).
It is found that third year students are more investigative than first year students. When comparing the mean scores of enterprising by class, the Scheffe’s F value of first year and second year students and first year and third year students were significantly differ between first year students and second year students and also between first year and third year students on the variable enterprising. With regard to the variable conventional second year students are more conventional than first year students. It indicates that second year students are more conforming, orderly, inflexible, persistent, practical, conservative, valuing hard work than first year students. This may be because second year students are used to the rules, specialties etc of their college and course of study. But first year students take some time to get used to it. So the second year students appear to be more conforming, orderely, persistent etc. In the case of self control first year students show more self control than both second years and third year students. First year students tend to show habitual inhibition of impulses to act out in behavior, thinking or fantasy and they often are more inhibited, constricted, passive and responsible than second year and third year students. This may be because the college setting is comparatively less familiar for first year students than second year and third year students.
First year students scored higher on masculinity-feminity scale than second year students. It indicates that first year students more frequently prefer masculine roles, roles commonly preferred by men than second year students. This is a new and interesting finding that needs further research. It was also found that first year students scored more infrequency than second year and third year students. It indicates that first year students have atypycal vocational preferences and, by implication, self deprecating attitudes and deviant attitudes about their culture compared to second year and third year students. It implies that in the case of traditional degree students they join for course with more or less atypical vocational preferences and they develop clear vocational preferences gradually as their undergraduation
Volume 2, Issue 3 (2014) ISSN: 2320-9038
_______________________________________________________________________________________________________
______________________________________________ Page Guru Journal of Behavioral and Social Sciences
261
progresses. With regard to the variable search for meaning, second year students has higher mean score than third year students. It indicates that third year students are in the last year of their course; so the chance for finding the purpose of life, future plans etc are more. But second year students are facing the middle part of their course of study. So they might not have acquired as much knowledge as the third year students at the same time will have more knowledge than the first years. That is, their position at the midpoint prompts them to acquire fullness.
Conclusion
Vocation is one’s way of life. It has a tremendous impact on one’s life through its influence on his/her social status, interpersonal relations, recreational activities etc. Hence vocational preference becomes an important aspect in one’s life. The study aimed to find out the correlation between meaning in life and vocational preference and to know the influence of demographics on vocational preference and meaning in life. Analysis of the collected information revealed that there is no significant relationship between meaning in life and vocational preference. This result brought the fact that vocational preference of the students has nothing to do with their meaning in life. When the participants vocational preferences were compared by their sex, out of 11 factors only in seven dimensions they significantly differ. In the same way stream of study and year of study was also compared. Result revealed that in many dimension there was considerable differences. These results has significant role in career and vocational counseling.
References
Bubany, S. T., & Hansen, J. C. (2011). Birth cohort change in the vocational interests of female and male college students. Journal of Vocational Behavior, 78, 59–67.
Chamberlain, K., & Zika, S. (1988) Religiosity, Life Meaning and Well-being: Some Relationships in a sample of Women. Journal for the Scientific Study of Religion, 27 (3), 411-420.
Debats, D. L., Drost, J., & Hansen, P. (1995). Experiences of meaning in life: A combined qualitative and quantitative approach. British Journal of Psychology, 86, 359–376.
Feldman, S., & Meir, E. (1976). Measuring women’s interests using Holland’s vocational
classification, Journal of Vocational Behavior, 9(3), 345-353.
Holland, J. L. (1968). ACT guidance profile manual. Iowa City: The American College Testing Program.
Holland, J. L. (1985). VPI: Professional Manual. USA: Psychological Assessment Resources, Inc. (PAR).
Holland, J. L. (1985a). Making Vocational Choices: A Theory of Personality types and work environments. Englewood Cliffs, NJ: Prentice-Hall.
Holland, J. L. (1985b). Professional Manual of the Self- Directed Search. Odessa, FL: Psychological Assessment Resources.
Holland, J. L. (1997). Making Vocational Choices: A Theory of Vocational Personalities and work environments (3rd ed). Odessa, FL: Psychological Assessment Resources.
King, L. A., Hicks, J. A., Krul, J. L., & Del-Gaiso, A. K. (2006). Positive affect and the experience of meaning in life. Journal of Personality and social Psychology, 90(1), 179-196.
Kunce, J. T., & Kappes, B. M. (1976). The vocational preference inventory scores and environmental preferences. Journal of Vocational Behavior, 9, 363-366.
Steger, M. F. (2006b). An illustration of issues in factor extraction and Identification dimensionality in psychological assessment data, Journal of Personality Assessment, 86, 263–272.
Volume 2, Issue 3 (2014) ISSN: 2320-9038
_______________________________________________________________________________________________________
______________________________________________ Page Guru Journal of Behavioral and Social Sciences
262
Steger, M. F. (2006a). The Pursuit of Meaningfulness in Life. In S. J. Lopez (Ed), Handbook of Positive Psychology (2nd ed). Oxford, UK: Oxford University Press.
Steger, M. F., & Frazier, P. (2006). The Meaning in Life Questionnaire: Assessing the Presence of and Search for Meaning in Life. Journal of Counseling Psychology, 53, 80- 93.
Steger, M. F., Frazier, P., Oishi, S., & Kaler, M. (2006). The Meaning in Life Questionnaire: Assessing the presence and search for meaning in life. Journal of Counseling Psychology, 53, 80- 93.
Steger, M. F., Mann, J., Michels, P., & Cooper, T. (2009). Meaning in Life, anxiety, depression, and general health among smoking cessation patients. Journal of Psychosomatic Research, 67, 353- 358.
Walsh, W., & Osipow, S. (1986). Advances in vocational psychology, Vol 1: The assessment of interests. Hillsdale, NJ: Erlbaum.
Related Documents