Dr Lisa Methven : Dept Food & Nutritional Sciences © University of Reading 2008 www.reading.ac.uk Department of Food and Nutritional Sciences 20 June 2016 Personalised Sensory: Considerations of Age & Genetics Dr Lisa Methven Sensory Science Centre; University of Reading

Welcome message from author
This document is posted to help you gain knowledge. Please leave a comment to let me know what you think about it! Share it to your friends and learn new things together.
Transcript

Dr Lisa Methven : Dept Food & Nutritional Sciences© University of Reading 2008 www.reading.ac.uk
Department of Food and Nutritional Sciences
20 June 2016
Personalised Sensory: Considerations of Age & Genetics
Dr Lisa MethvenSensory Science Centre; University of Reading

Dr Lisa Methven : Dept Food & Nutritional Sciences
Questions to Consider…
• How big & relevant are differences in Sensory Perception?
• How much do our screened “Expert Panelists” differ in
sensitivity?
• Do they represent consumers?
• Should we be screening panellists on genotype?
• Will genotype become a factor we consider in consumer
testing?
• If we target products of a certain group, should our sensory
profiling panel represent the groups’ sensitivities?
2

Dr Lisa Methven : Dept Food & Nutritional Sciences
How big & relevant are differencesin Sensory Perception?
3
• Is it all about Supertasters & Non-tasters ?
– But if so, what are these groups really ?
• Is it just the Bitter genotype that matters ?!
• What about differences in other basics tastes?
• What about differences in aroma perception ?
Dr Lisa Methven : Dept Food & Nutritional Sciences
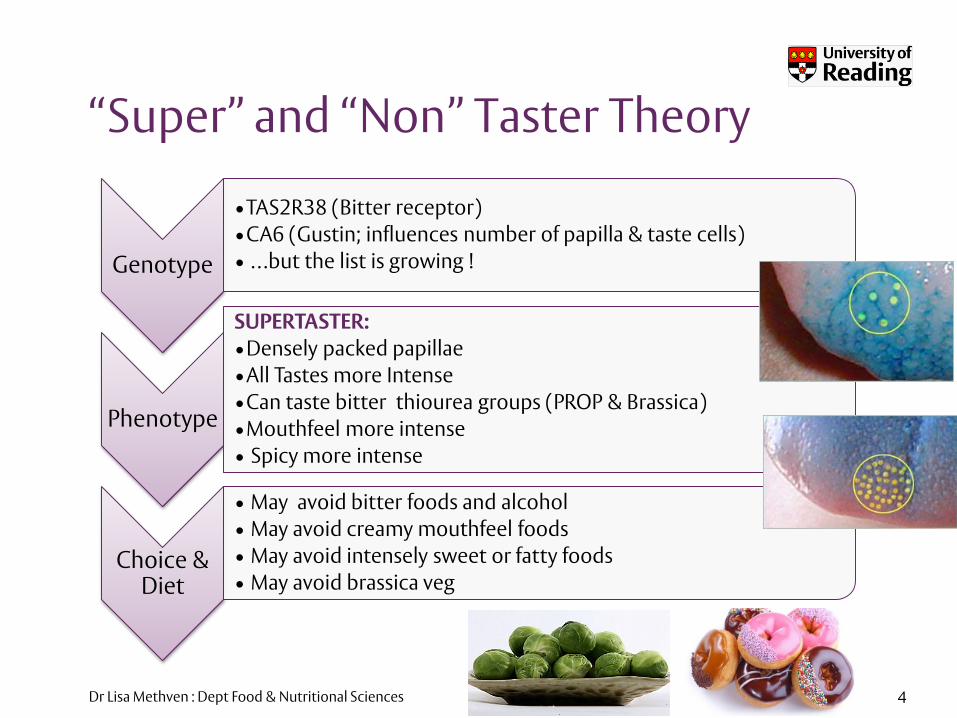
“Super” and “Non” Taster Theory
4
Genotype
•TAS2R38 (Bitter receptor)
•CA6 (Gustin; influences number of papilla & taste cells)
• …but the list is growing !
Phenotype
SUPERTASTER:
•Densely packed papillae
•All Tastes more Intense
•Can taste bitter thiourea groups (PROP & Brassica)
•Mouthfeel more intense
• Spicy more intense
Choice & Diet
• May avoid bitter foods and alcohol
• May avoid creamy mouthfeel foods
• May avoid intensely sweet or fatty foods
• May avoid brassica veg
Dr Lisa Methven : Dept Food & Nutritional Sciences
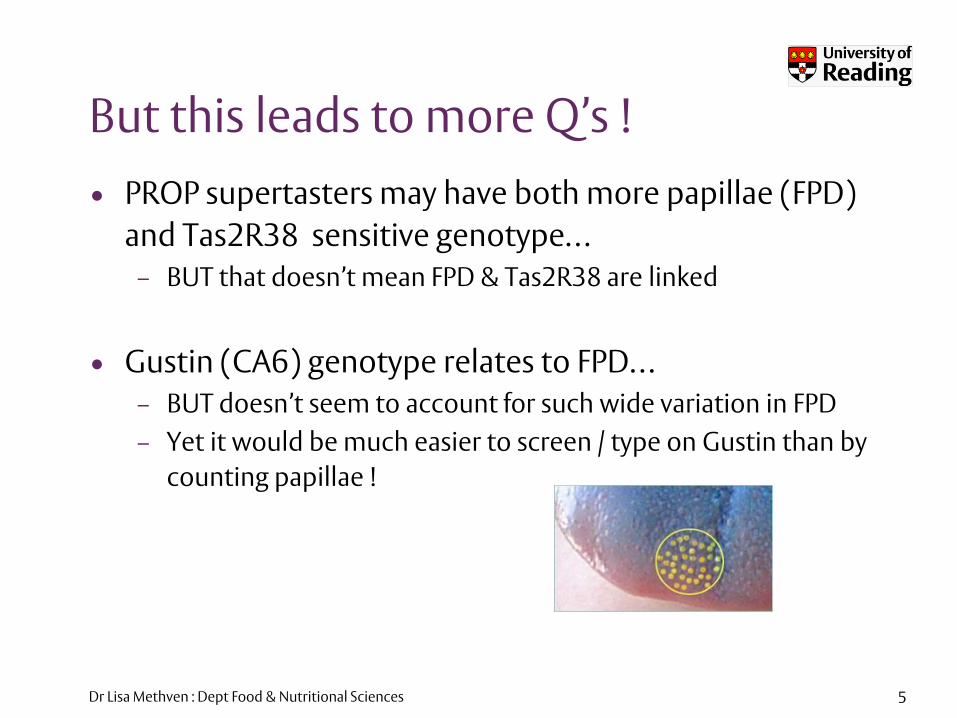
But this leads to more Q’s !
• PROP supertasters may have both more papillae (FPD)
and Tas2R38 sensitive genotype…
– BUT that doesn’t mean FPD & Tas2R38 are linked
• Gustin (CA6) genotype relates to FPD…
– BUT doesn’t seem to account for such wide variation in FPD
– Yet it would be much easier to screen / type on Gustin than by
counting papillae !
5
Dr Lisa Methven : Dept Food & Nutritional Sciences
Bitter Taste Sensitivity
6
Dr Lisa Methven : Dept Food & Nutritional Sciences
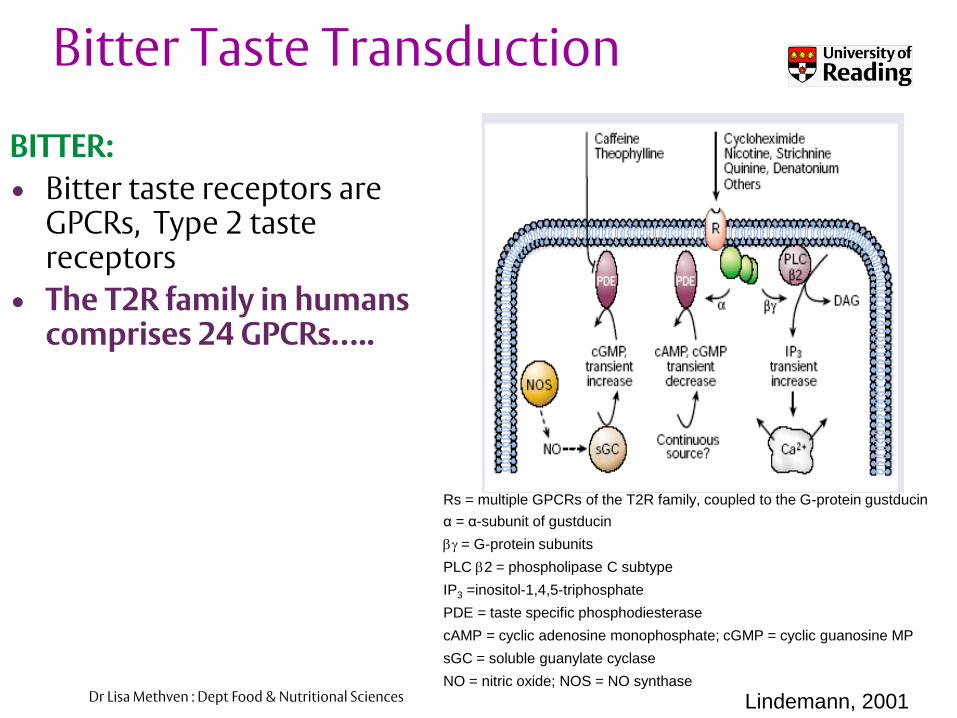
Bitter Taste Transduction
BITTER:
• Bitter taste receptors are GPCRs, Type 2 taste receptors
• The T2R family in humans comprises 24 GPCRs…..
Rs = multiple GPCRs of the T2R family, coupled to the G-protein gustducin
α = α-subunit of gustducin
= G-protein subunits
PLC 2 = phospholipase C subtype
IP3 =inositol-1,4,5-triphosphate
PDE = taste specific phosphodiesterase
cAMP = cyclic adenosine monophosphate; cGMP = cyclic guanosine MP
sGC = soluble guanylate cyclase
NO = nitric oxide; NOS = NO synthase
Lindemann, 2001
Dr Lisa Methven : Dept Food & Nutritional Sciences
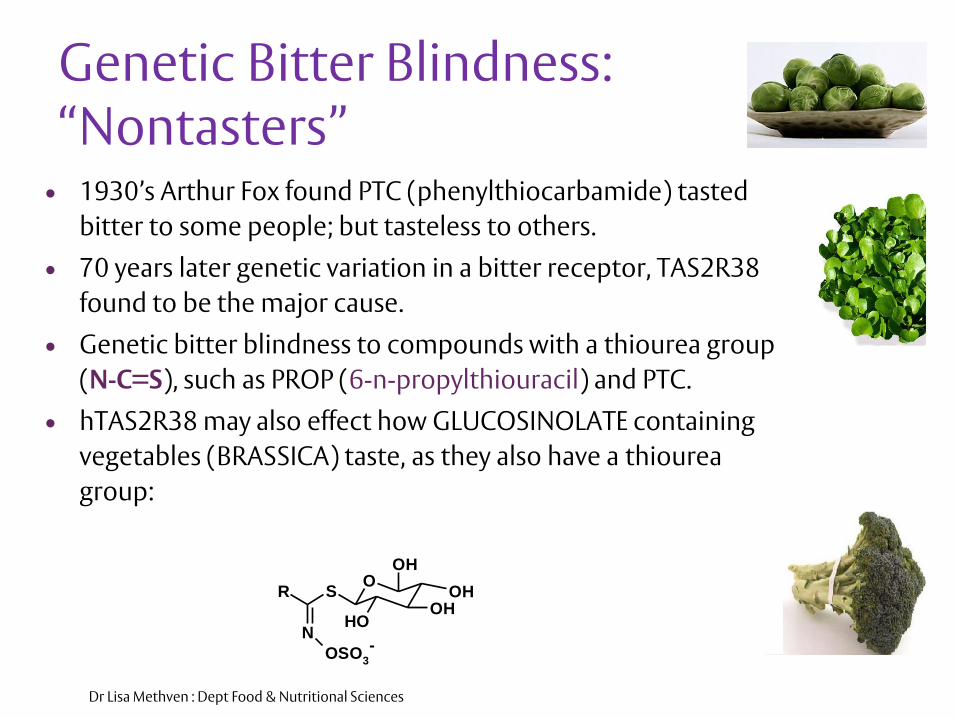
• 1930’s Arthur Fox found PTC (phenylthiocarbamide) tasted
bitter to some people; but tasteless to others.
• 70 years later genetic variation in a bitter receptor, TAS2R38
found to be the major cause.
• Genetic bitter blindness to compounds with a thiourea group
(N-C=S), such as PROP (6-n-propylthiouracil) and PTC.
• hTAS2R38 may also effect how GLUCOSINOLATE containing
vegetables (BRASSICA) taste, as they also have a thiourea
group:
Genetic Bitter Blindness: “Nontasters”
OR
N
OSO3
SOH
OH
OH
OH
-
Dr Lisa Methven : Dept Food & Nutritional Sciences
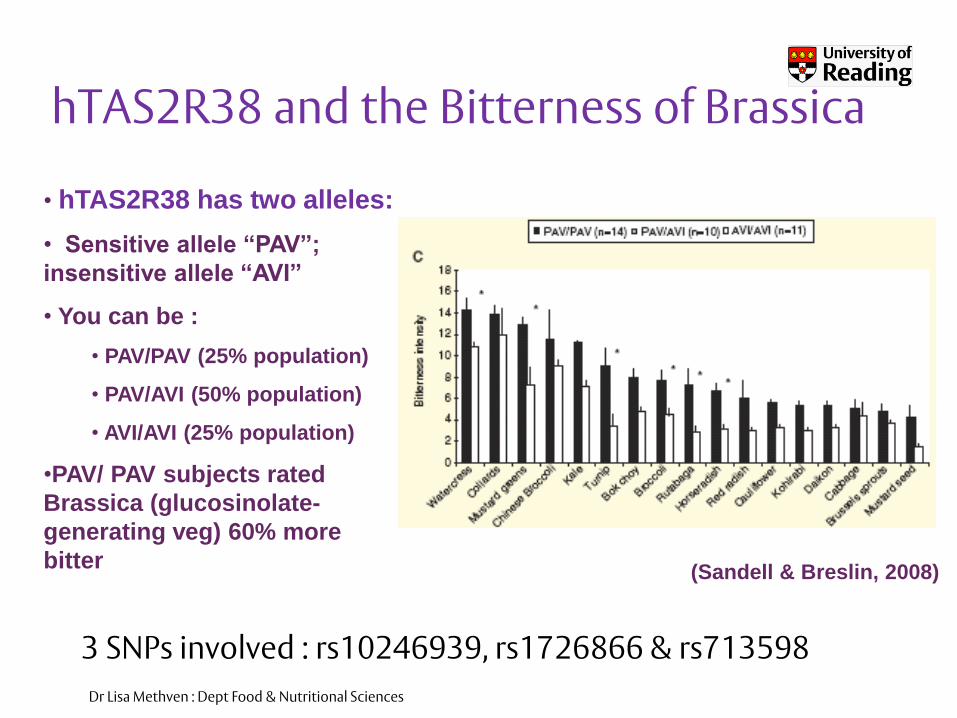
hTAS2R38 and the Bitterness of Brassica
• hTAS2R38 has two alleles:
• Sensitive allele “PAV”;
insensitive allele “AVI”
• You can be :
• PAV/PAV (25% population)
• PAV/AVI (50% population)
• AVI/AVI (25% population)
•PAV/ PAV subjects rated
Brassica (glucosinolate-
generating veg) 60% more
bitter(Sandell & Breslin, 2008)
3 SNPs involved : rs10246939, rs1726866 & rs713598
Dr Lisa Methven : Dept Food & Nutritional Sciences 10
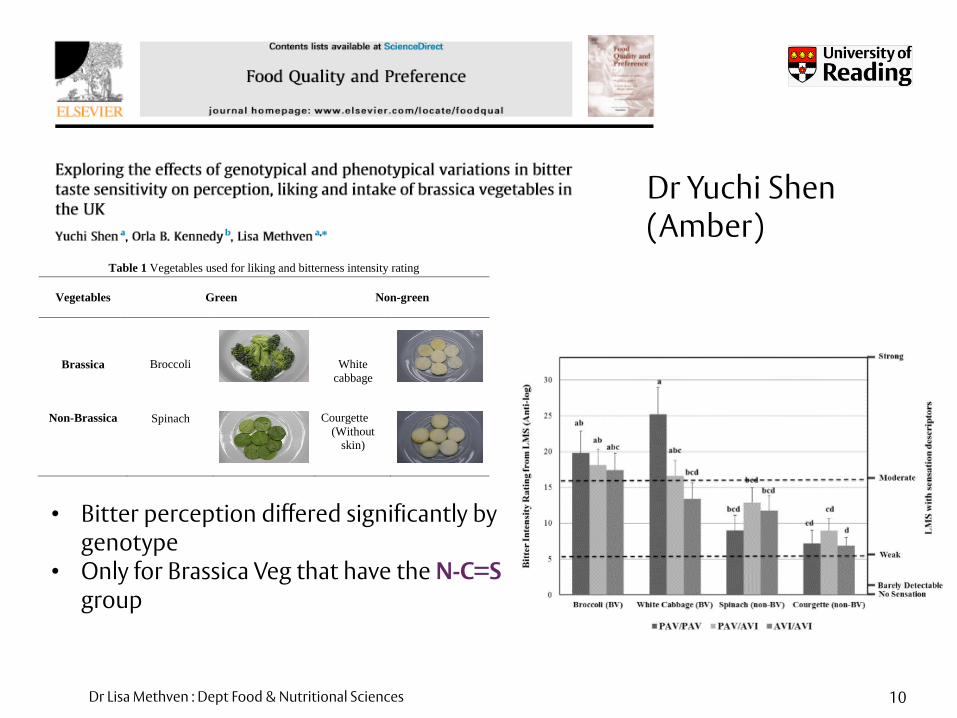
Table 1 Vegetables used for liking and bitterness intensity rating
Vegetables Green Non-green
Brassica
Broccoli
White
cabbage
Non-Brassica
Spinach
Courgette
(Without
skin)
• Bitter perception differed significantly by genotype
• Only for Brassica Veg that have the N-C=S group
Dr Yuchi Shen (Amber)
Dr Lisa Methven : Dept Food & Nutritional Sciences
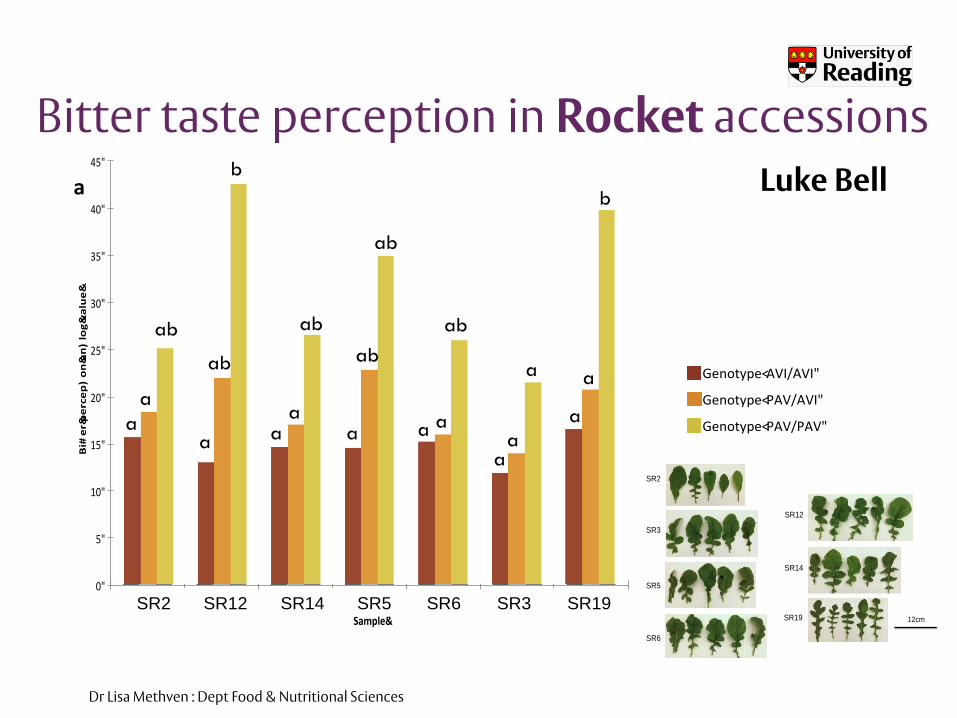
Bitter taste perception in Rocket accessions
0"
5"
10"
15"
20"
25"
30"
35"
40"
45"
CGN"24247" ERU"140" ERU"154" ERU"16" ERU"18" Elsoms" HRIGRU"8346"
Bi#er&percep)on&an)log&value&
Sample&SR2 SR3 SR5 SR6 SR12 SR14 SR19
a a a
a a a a a a a
a
a a ab ab
ab ab ab
ab
b
b a
0"
5"
10"
15"
20"
25"
30"
35"
CGN"24247" ERU"140" ERU"154" ERU"16" ERU"18" Elsoms" HRIGRU"8346"
Pepperiness(percep*on(an*log(value(
Sample(
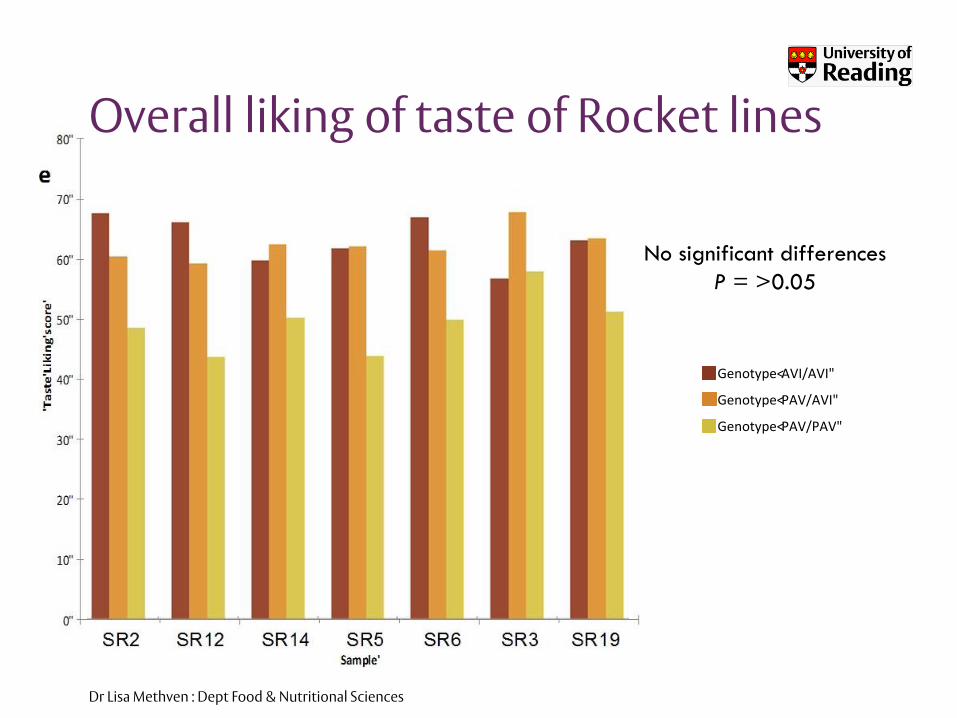
Genotype<AVI/AVI"
Genotype<PAV/AVI"
Genotype<PAV/PAV"
SR2 SR3 SR5 SR6 SR12 SR14 SR19
a a
ab ab ab
ab
ab ab ab ab ab
ab ab
b
b b b
b
b b b d
a
ab
b
a
a aa
a a a
aa
a
a
aab
ab
ab
ab
ab
b
SR2
SR3
SR5
SR6
SR12
SR14
SR19 12cm
SR2
SR3
SR5
SR6
SR12
SR14
SR19 12cm
Luke Bell
Dr Lisa Methven : Dept Food & Nutritional Sciences
Overall liking of taste of Rocket lines
No significant differences
P = >0.05
0"
5"
10"
15"
20"
25"
30"
35"
40"
45"
CGN"24247" ERU"140" ERU"154" ERU"16" ERU"18" Elsoms" HRIGRU"8346"
Bi#er&percep)on&an)log&value&
Sample&SR2 SR3 SR5 SR6 SR12 SR14 SR19
a a a
a a a a a a a
a
a a ab ab
ab ab ab
ab
b
b a
0"
5"
10"
15"
20"
25"
30"
35"
CGN"24247" ERU"140" ERU"154" ERU"16" ERU"18" Elsoms" HRIGRU"8346"
Pepperiness(percep*on(an*log(value(
Sample(
Genotype<AVI/AVI"
Genotype<PAV/AVI"
Genotype<PAV/PAV"
SR2 SR3 SR5 SR6 SR12 SR14 SR19
a a
ab ab ab
ab
ab ab ab ab ab
ab ab
b
b b b
b
b b b d
a
ab
b
a
a aa
a a a
aa
a
a
aab
ab
ab
ab
ab
b
Dr Lisa Methven : Dept Food & Nutritional Sciences
So, Should our Sensory Panel all be Tas2R38 PAV/PAV ?
13
• Most panels are screened for genetic bitter blindness
• So, they can taste bitterness in Brassica Veg
• BUT, if less sensitive to bitterness can you pick out other differences that the bitter sensitive panelist cannot ?
Dr Lisa Methven : Dept Food & Nutritional Sciences
Sweet Taste Sensitivity
14
Dr Lisa Methven : Dept Food & Nutritional Sciences
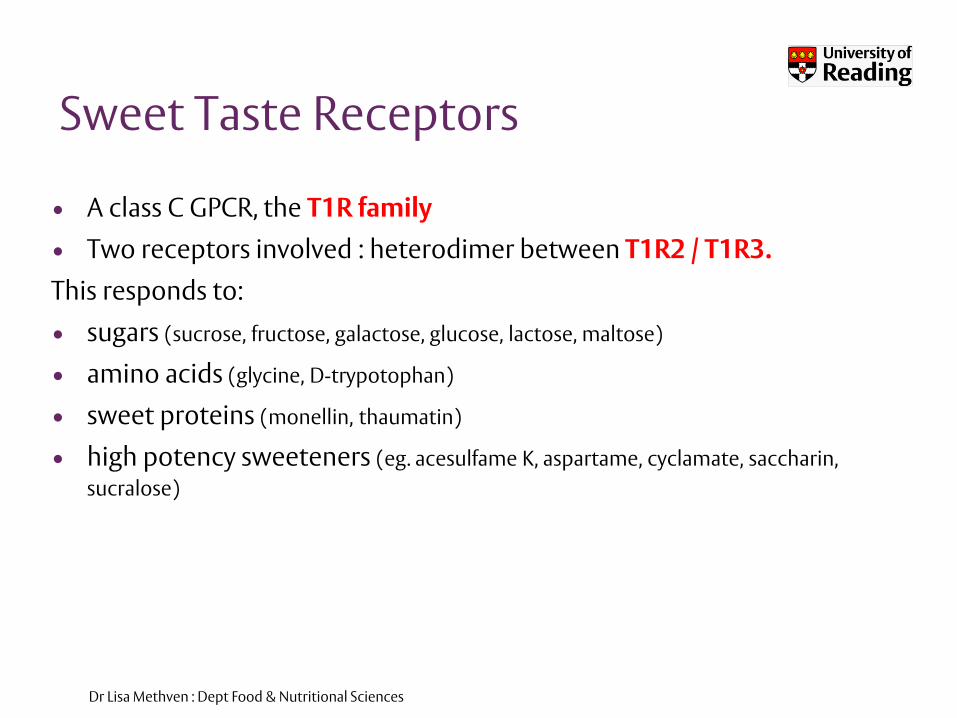
Sweet Taste Receptors
• A class C GPCR, the T1R family
• Two receptors involved : heterodimer between T1R2 / T1R3.
This responds to:
• sugars (sucrose, fructose, galactose, glucose, lactose, maltose)
• amino acids (glycine, D-trypotophan)
• sweet proteins (monellin, thaumatin)
• high potency sweeteners (eg. acesulfame K, aspartame, cyclamate, saccharin,
sucralose)
Dr Lisa Methven : Dept Food & Nutritional Sciences
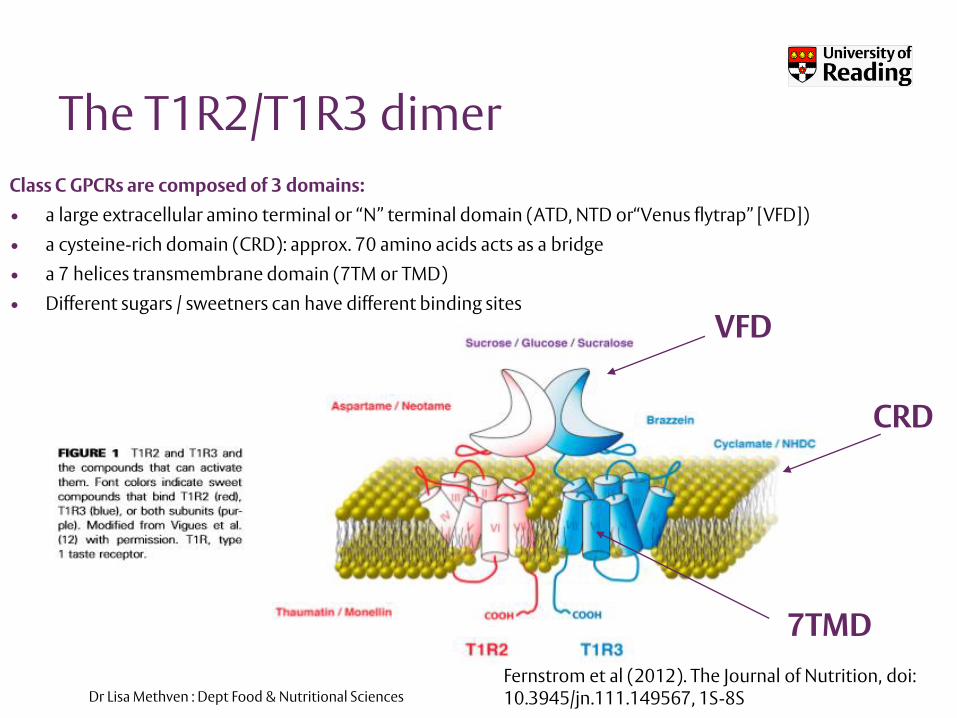
The T1R2/T1R3 dimer
Class C GPCRs are composed of 3 domains:
• a large extracellular amino terminal or “N” terminal domain (ATD, NTD or“Venus flytrap” [VFD])
• a cysteine-rich domain (CRD): approx. 70 amino acids acts as a bridge
• a 7 helices transmembrane domain (7TM or TMD)
• Different sugars / sweetners can have different binding sites
Fernstrom et al (2012). The Journal of Nutrition, doi: 10.3945/jn.111.149567, 1S-8S
VFD
CRD
7TMD
Dr Lisa Methven : Dept Food & Nutritional Sciences
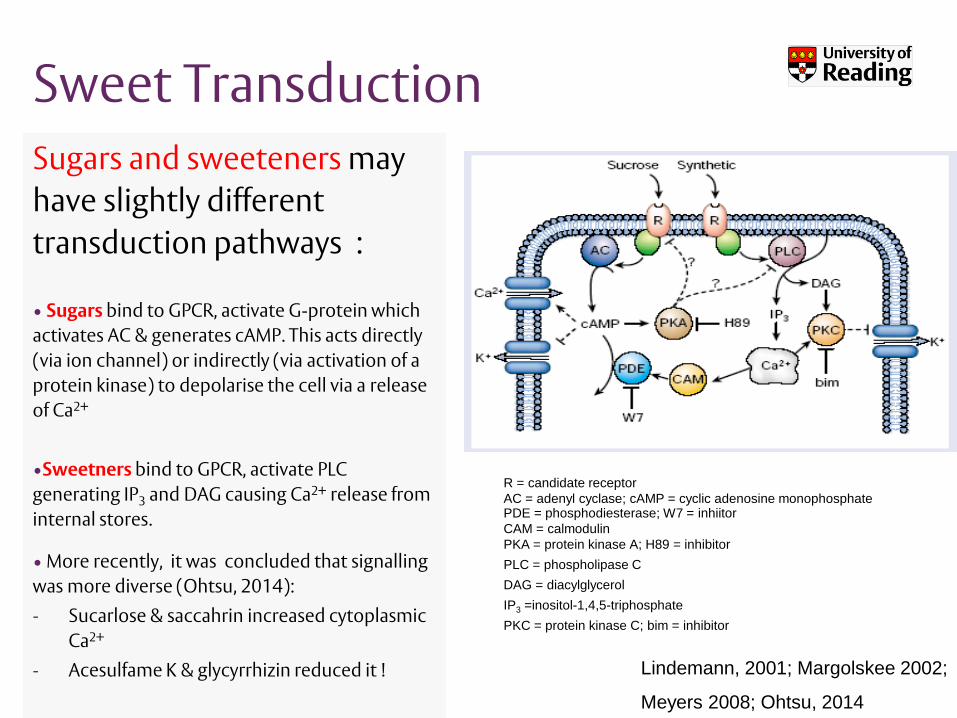
Sweet Transduction
Sugars and sweeteners may
have slightly different
transduction pathways :
• Sugars bind to GPCR, activate G-protein which
activates AC & generates cAMP. This acts directly
(via ion channel) or indirectly (via activation of a
protein kinase) to depolarise the cell via a release
of Ca2+
•Sweetners bind to GPCR, activate PLC
generating IP3 and DAG causing Ca2+ release from
internal stores.
• More recently, it was concluded that signalling
was more diverse (Ohtsu, 2014):
- Sucarlose & saccahrin increased cytoplasmic
Ca2+
- Acesulfame K & glycyrrhizin reduced it !
R = candidate receptor
AC = adenyl cyclase; cAMP = cyclic adenosine monophosphatePDE = phosphodiesterase; W7 = inhiitor
CAM = calmodulin
PKA = protein kinase A; H89 = inhibitor
PLC = phospholipase C
DAG = diacylglycerol
IP3 =inositol-1,4,5-triphosphate
PKC = protein kinase C; bim = inhibitor
Lindemann, 2001; Margolskee 2002;
Meyers 2008; Ohtsu, 2014
Dr Lisa Methven : Dept Food & Nutritional Sciences
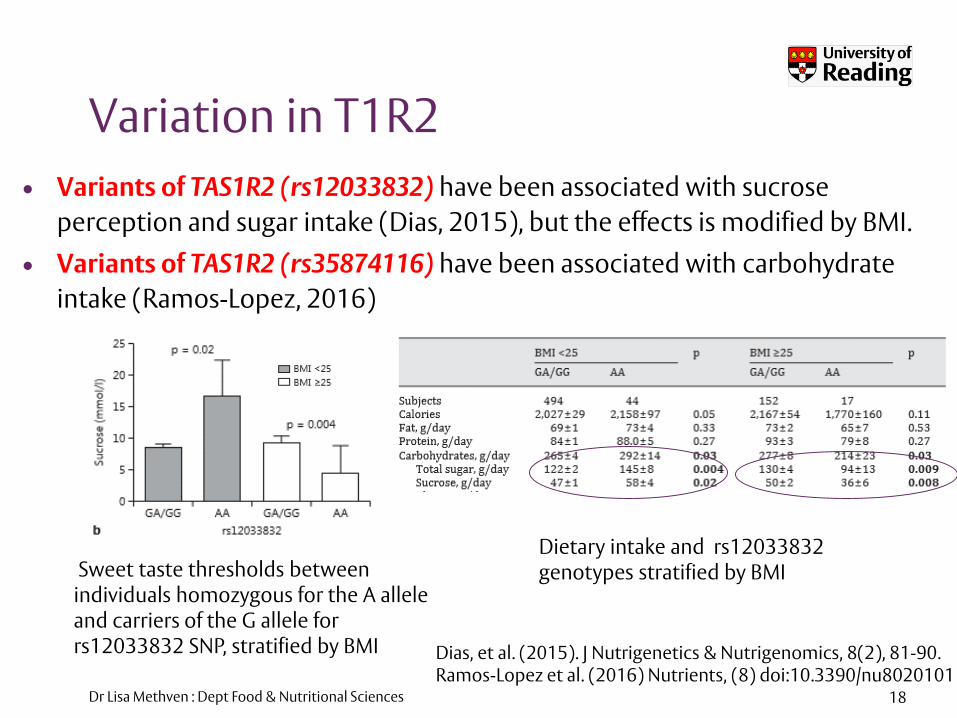
Variation in T1R2
• Variants of TAS1R2 (rs12033832) have been associated with sucrose
perception and sugar intake (Dias, 2015), but the effects is modified by BMI.
• Variants of TAS1R2 (rs35874116) have been associated with carbohydrate
intake (Ramos-Lopez, 2016)
18
Dias, et al. (2015). J Nutrigenetics & Nutrigenomics, 8(2), 81-90.Ramos-Lopez et al. (2016) Nutrients, (8) doi:10.3390/nu8020101
Sweet taste thresholds between individuals homozygous for the A allele and carriers of the G allele for rs12033832 SNP, stratified by BMI
Dietary intake and rs12033832 genotypes stratified by BMI
Dr Lisa Methven : Dept Food & Nutritional Sciences
0
10
20
30
40
50
60
70
80
90
3 6 12 24 36
Lik
ing
of
Sw
ee
t T
ast
e (
0-1
00
)
Sucrose concentration in water (% w/v)
SD
SL
***
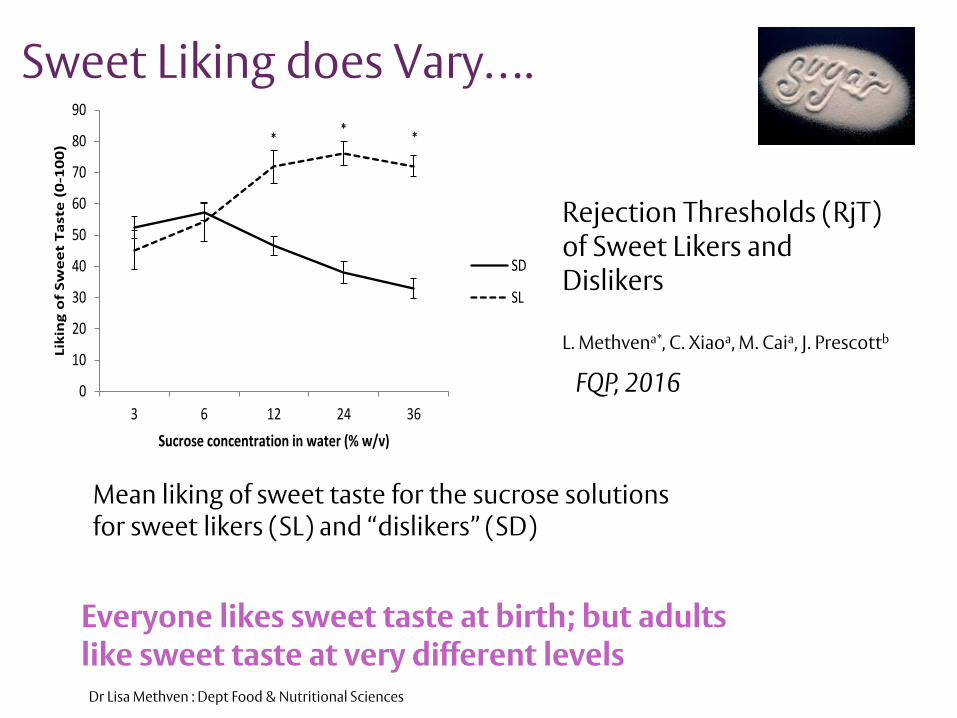
Mean liking of sweet taste for the sucrose solutions for sweet likers (SL) and “dislikers” (SD)
Rejection Thresholds (RjT) of Sweet Likers and Dislikers
L. Methvena*, C. Xiaoa, M. Caia, J. Prescottb
FQP, 2016
Everyone likes sweet taste at birth; but adults like sweet taste at very different levels
Sweet Liking does Vary….

Dr Lisa Methven : Dept Food & Nutritional Sciences
0.6
0.8
1.0
1.2
1.4
1.6
1.8
2.0
1.5 2.0 2.5 3.0
Log 10
Perc
eive
d Sw
eetn
ess
Inte
nsity
(LM
S sc
ale)
Log10 Sucrose Concentration (g/L)
SD & jelly
SL & jelly
SD & juice
SL & juice
Sweetness intensity as a function of sucrose concentration (Log-Log data) in orange juice and jelly
• Matrix effects perception of sweetness• SL & SD significantly different: BUT differences very small
Sweet Perception in Orange Juice

Dr Lisa Methven : Dept Food & Nutritional Sciences
So, Should we screen out TAS1R2(rs12033832) AA genotype?
21
• Certainly not enough evidence to suggest this yet…and would we then have to screen on BMI as well ?
• Is screening out on genotype ethical ?• Would screening out on BMI be ethical ?
Dr Lisa Methven : Dept Food & Nutritional Sciences
Oleogustus : The Taste of fat
22
Xirui Zhou (Sherrie)
Dr Lisa Methven : Dept Food & Nutritional Sciences
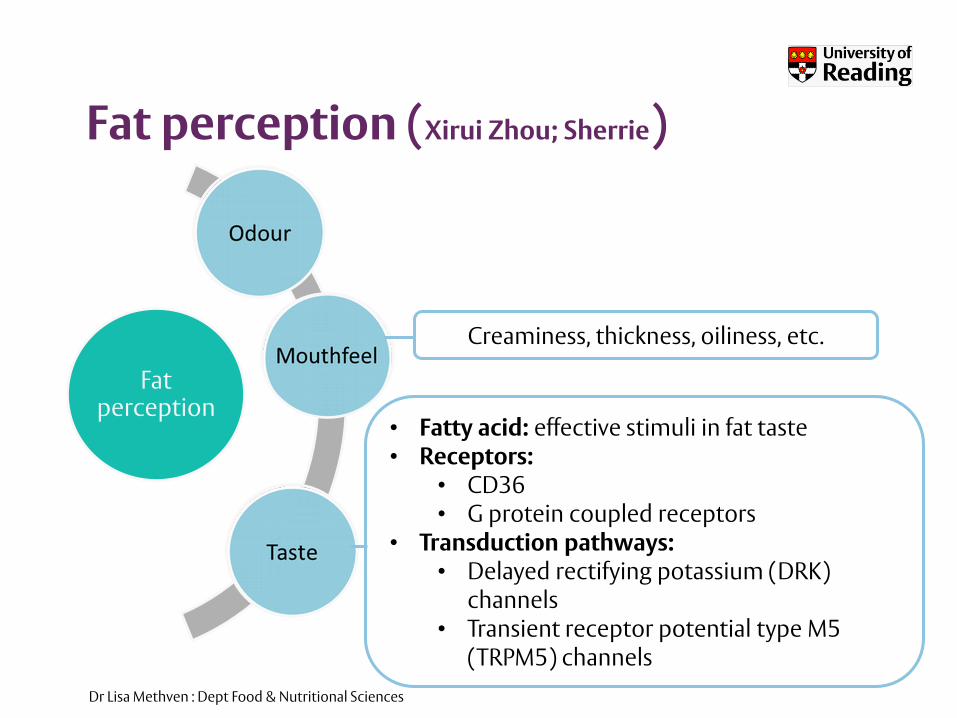
Fat perception (Xirui Zhou; Sherrie)
Fat perception
• Fatty acid: effective stimuli in fat taste• Receptors:
• CD36 • G protein coupled receptors
• Transduction pathways: • Delayed rectifying potassium (DRK)
channels• Transient receptor potential type M5
(TRPM5) channels
Creaminess, thickness, oiliness, etc.

Dr Lisa Methven : Dept Food & Nutritional Sciences
Fat Sensitivity (Fatty acid sensitivity)
Individuals have different sensitivities
to oleic acid1,2
Subjects with low sensitivity
Higher energy/fat intake 1,2
Higher BMI 1,2
Subjects with high sensitivity
Stronger ability to distinguish added oil contents in samples 1,2
Based on current studies1,2,
1 Stewart et al. (2010). Br J Nutr, 104(1), 145-152.2 Stewart, Newman, & Keast. (2011). Clin Nutr, 30(6), 838-844.3 Mounayar, et al. (2013). Chem Percep, 6, 118-126.4 Voigt, et al. (2014). J Lip Res, 55, 870–882.5 Melis et al, (2015). Nutrients, 7(3), 2068-2084.6 Mrizak et al, (2015). Br J Nutr, 1-8.
Potential factors causing these individual difference in fat sensitivity• Differences in lipase activity 3,4
• Different CD36 genotypes at rs1761667 5,6
• Other – e.g. differences in expression of receptors
Dr Lisa Methven : Dept Food & Nutritional Sciences
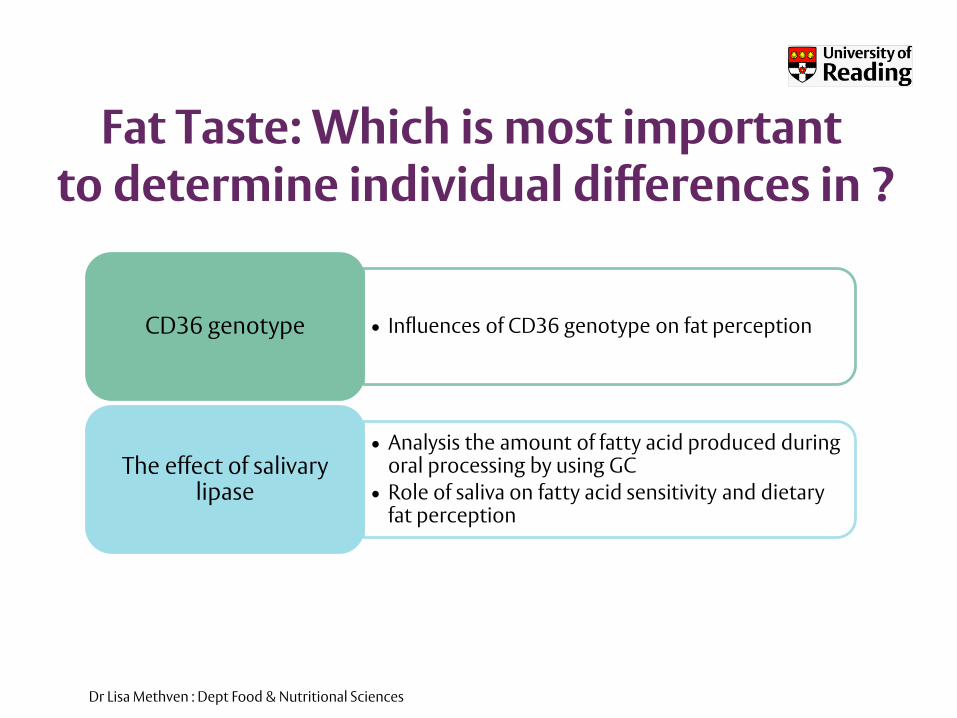
Fat Taste: Which is most important to determine individual differences in ?
• Influences of CD36 genotype on fat perceptionCD36 genotype
• Analysis the amount of fatty acid produced during oral processing by using GC
• Role of saliva on fatty acid sensitivity and dietary fat perception
The effect of salivary lipase

Dr Lisa Methven : Dept Food & Nutritional Sciences
So, Should we screen for fatty acid thresholds?
26
• Levels of free fatty acids in foods very low• But some people producing them in mouth
• We don’t know how relevant it is yet.

Dr Lisa Methven : Dept Food & Nutritional Sciences
Olfactory Receptor Variations
• Anosmia’s to certain aroma’s well known: genetic causes under
investigation
• Hasin et al (2008) concluded there are many OR variants
• OR5A1 (rs6591536) – variants lead to differences in β-ionone perception (Jaeger, 2014).
– either perceived as pleasant floral or sour/sharp.
• OR2J3 (rs28757581) – ability to detect “grassy/green” odour of 3-hexen-1-ol (McRae, 2012).

Dr Lisa Methven : Dept Food & Nutritional Sciences
In the future, could we screen for OR genotype rather than ability to identify a large array of aroma compounds?
28

Dr Lisa Methven : Dept Food & Nutritional Sciences 29
How does taste change with age?
• We cannot recruit (or dismiss) panel on basis of age, only on ability.
• Taste does deteriorate with age but it is gradual and individual
• Meta-analysis of 23
studies
• Consensus was that
taste detection
thresholds increased
with age (p<0.001)
across all taste
modalities.
Identification thresholds
higher for older adults in
17 out of 18 studies.
16 out of 25 studies
reported perception of
taste intensity at
supra-threshold levels
to be significantly
lower for older adults,
Methven, Allen, Withers & Gosney (2012) Ageing and Taste. Proceeding of the Nutrition Society, 71 (4): 556-65
Dr Lisa Methven : Dept Food & Nutritional Sciences 30
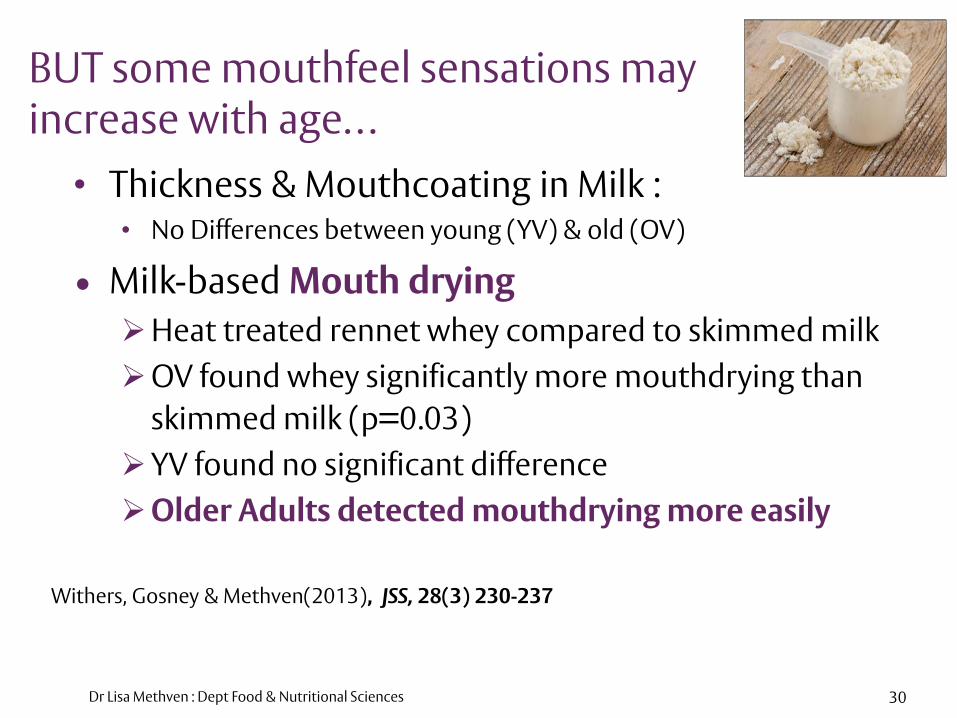
BUT some mouthfeel sensations may increase with age…
Withers, Gosney & Methven(2013), JSS, 28(3) 230-237
• Thickness & Mouthcoating in Milk :• No Differences between young (YV) & old (OV)
• Milk-based Mouth drying
Heat treated rennet whey compared to skimmed milk
OV found whey significantly more mouthdrying than
skimmed milk (p=0.03)
YV found no significant difference
Older Adults detected mouthdrying more easily

Dr Lisa Methven : Dept Food & Nutritional Sciences
So, should we recruit older as well as younger sensory panels?
31
Raija-Liisa Heiniö runs a trained seniors panel at VTT
Dr Lisa Methven : Dept Food & Nutritional Sciences
Conclusions of Personalised Sensory:
• Taste differences are not as simple as super & non taster
• There are a number of different genotypes contributing
• We have more aroma receptors than taste, and OR
variants may be vast
• What is “average”, what is a “screened expert” & how
relevant are they ??
32

Dr Lisa Methven : Dept Food & Nutritional Sciences
Acknowledgements Our Volunteers Dr Yuchi Shen (Amber) Xirui Zhou (Sherrie) Luke Bell
Dr Caroline Withers
Project Students
MMR Sensory panel
33
Thank you
Related Documents