Personal Independence Payment: Official Statistics, GB Published: 18 th March 2015 Frequency: Quarterly Coverage: Great Britain Theme: People and Places Issued by: Information Exploitation and Security Directorate Department for Work and Pensions Telephone: Press Office: 0203 267 5129 Website: http://www.gov.uk/dwp Statistician: Steve Watkins Information Exploitation and Security Directorate Department for Work and Pensions [email protected] Next publication: June 2015 If you have any comments or suggestions regarding this publication, please contact DWP via [email protected]. ISBN: 978-1-78425-187-1 Introduction From 8 th April 2013 DWP started to replace Disability Living Allowance (DLA) for people aged 16-64, with Personal Independence Payment (PIP). On 8 th April 2013, PIP was introduced as a controlled start, for new claims from people living in a limited geographic area in the North West and part of the North East of England. On 10 th June 2013, PIP was introduced for new claims for the remaining parts of Great Britain. From 28 th October 2013, DWP started to invite DLA claimants living in certain areas to claim PIP – for additional information on roll out see the notes section. These are the fourth set of official statistics to be released on PIP. The statistics have been developed using guidelines set out by the UK Statistics Authority, and as new official statistics undergoing evaluation they have accordingly been badged as being experimental statistics. Users are invited to comment on the development and relevancy of these statistics at this stage. The Department is publishing PIP clearance times and outstanding times statistics for the first time as part of this release 1

Welcome message from author
This document is posted to help you gain knowledge. Please leave a comment to let me know what you think about it! Share it to your friends and learn new things together.
Transcript

Personal Independence Payment: Official Statistics, GB
Published: 18th March 2015 Frequency: Quarterly Coverage: Great Britain Theme: People and Places
Issued by: Information Exploitation and Security Directorate Department for Work and Pensions Telephone: Press Office: 0203 267 5129 Website: http://www.gov.uk/dwp Statistician: Steve Watkins Information Exploitation and Security Directorate Department for Work and Pensions [email protected] Next publication: June 2015 If you have any comments or suggestions regarding this publication, please contact DWP via [email protected]. ISBN: 978-1-78425-187-1
Introduction From 8th April 2013 DWP started to replace Disability Living Allowance (DLA) for people aged 16-64, with Personal Independence Payment (PIP). On 8th April 2013, PIP was introduced as a controlled start, for new claims from people living in a limited geographic area in the North West and part of the North East of England. On 10th June 2013, PIP was introduced for new claims for the remaining parts of Great Britain. From 28th October 2013, DWP started to invite DLA claimants living in certain areas to claim PIP – for additional information on roll out see the notes section. These are the fourth set of official statistics to be released on PIP. The statistics have been developed using guidelines set out by the UK Statistics Authority, and as new official statistics undergoing evaluation they have accordingly been badged as being experimental statistics. Users are invited to comment on the development and relevancy of these statistics at this stage.
The Department is publishing PIP clearance times and outstanding times statistics for the first time as part of this release
1
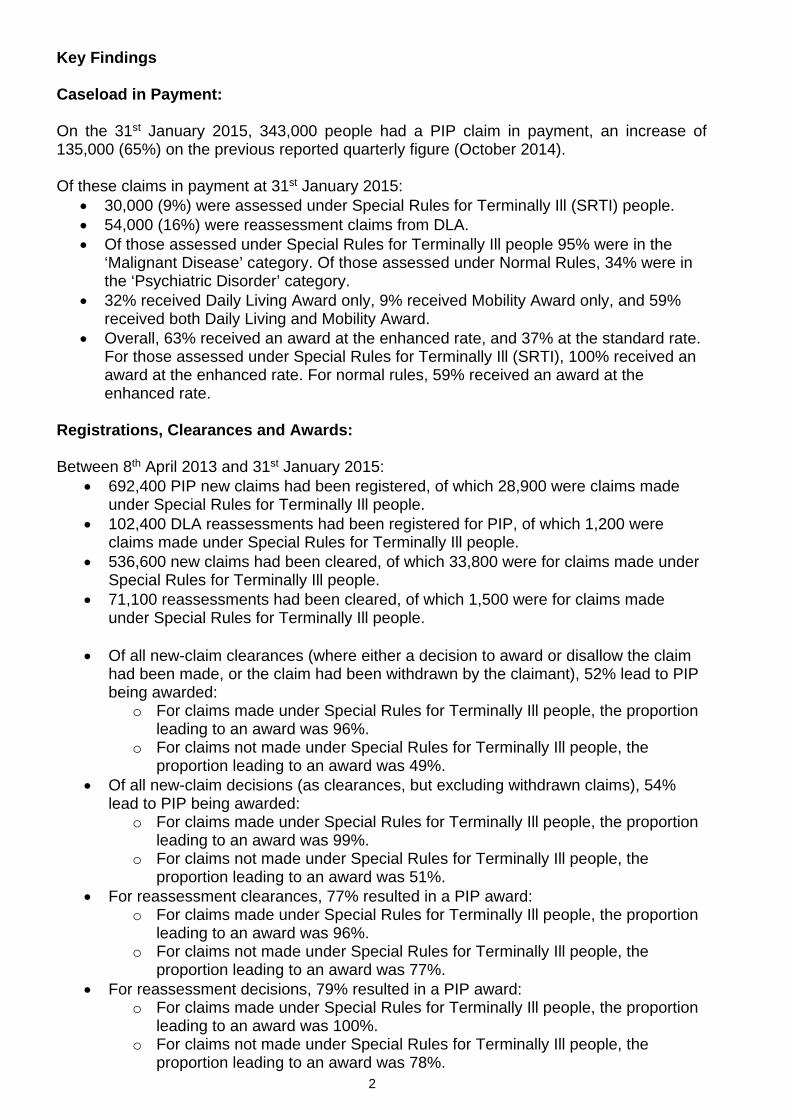
Key Findings Caseload in Payment: On the 31st January 2015, 343,000 people had a PIP claim in payment, an increase of 135,000 (65%) on the previous reported quarterly figure (October 2014). Of these claims in payment at 31st January 2015:
• 30,000 (9%) were assessed under Special Rules for Terminally Ill (SRTI) people. • 54,000 (16%) were reassessment claims from DLA. • Of those assessed under Special Rules for Terminally Ill people 95% were in the
‘Malignant Disease’ category. Of those assessed under Normal Rules, 34% were in the ‘Psychiatric Disorder’ category.
• 32% received Daily Living Award only, 9% received Mobility Award only, and 59% received both Daily Living and Mobility Award.
• Overall, 63% received an award at the enhanced rate, and 37% at the standard rate. For those assessed under Special Rules for Terminally Ill (SRTI), 100% received an award at the enhanced rate. For normal rules, 59% received an award at the enhanced rate.
Registrations, Clearances and Awards: Between 8th April 2013 and 31st January 2015:
• 692,400 PIP new claims had been registered, of which 28,900 were claims made under Special Rules for Terminally Ill people.
• 102,400 DLA reassessments had been registered for PIP, of which 1,200 were claims made under Special Rules for Terminally Ill people.
• 536,600 new claims had been cleared, of which 33,800 were for claims made under Special Rules for Terminally Ill people.
• 71,100 reassessments had been cleared, of which 1,500 were for claims made under Special Rules for Terminally Ill people.
• Of all new-claim clearances (where either a decision to award or disallow the claim
had been made, or the claim had been withdrawn by the claimant), 52% lead to PIP being awarded:
o For claims made under Special Rules for Terminally Ill people, the proportion leading to an award was 96%.
o For claims not made under Special Rules for Terminally Ill people, the proportion leading to an award was 49%.
• Of all new-claim decisions (as clearances, but excluding withdrawn claims), 54% lead to PIP being awarded:
o For claims made under Special Rules for Terminally Ill people, the proportion leading to an award was 99%.
o For claims not made under Special Rules for Terminally Ill people, the proportion leading to an award was 51%.
• For reassessment clearances, 77% resulted in a PIP award: o For claims made under Special Rules for Terminally Ill people, the proportion
leading to an award was 96%. o For claims not made under Special Rules for Terminally Ill people, the
proportion leading to an award was 77%. • For reassessment decisions, 79% resulted in a PIP award:
o For claims made under Special Rules for Terminally Ill people, the proportion leading to an award was 100%.
o For claims not made under Special Rules for Terminally Ill people, the proportion leading to an award was 78%.
2

Average Actual Clearance Times (median); In January 2015, of those claims cleared, the average PIP new claim normal rules claim took;
• 20 weeks from the point of registration to a decision made on the claim • 14 weeks from the point of referral to the assessment providers to a decision made
on the claim • 12 weeks for an assessment.
In January 2015, of those claims cleared, the average PIP reassessment normal rules claim took;
• 18 weeks from the point of registration to a decision made on the claim • 13 weeks from the point of referral to the assessment providers to a decision made
on the claim • 8 weeks for an assessment.
In January 2015, of those claims cleared, the average PIP special rules claim took; • 7 working days from the point of registration to a decision made on the claim (new
claims) • 8 working days from the point of registration to a decision made on the claim
(reassessments). Average Actual Outstanding Times (median); In January 2015, of those claims outstanding, the average PIP new claim normal rules claim had taken;
• 13 weeks from the point of registration • 15 weeks from the point of referral to the assessment providers • 15 weeks for an assessment.
In January 2015, of those claims outstanding, the average PIP reassessment normal rules claim had taken;
• 10 weeks from the point of registration • 11 weeks from the point of referral to the assessment providers • 11 weeks for an assessment.
Note, the individual parts of the claimant journey average times will not sum to the end to end claimant journey average times. This is because each measure is based on the median clearance/outstanding time of cases cleared/outstanding at that stage, whilst the end to end measure is based on the median clearance/outstanding time for all cleared/outstanding cases. As the size and distributions of clearance/outstanding times for the individual stages will vary, the sum of the individual medians will not total the end to end median. Furthermore for this reason, we may also see an individual part of the claimant journey (e.g. assessment provider stage) having a longer average time than the end to end average time.
3

In this Summary This Summary contains Official Statistics on PIP caseload, registrations, clearances and awards for both new claims and claims made by those with an existing claim for Disability Living Allowance (known as Reassessments). Monthly caseload refers to the number of PIP claims in payment at the end of the reporting month. The monthly caseload will not include claims that are backdated for an earlier period and so will not be subject to retrospection. These claims will be included from the month they are paid. Caseload is further broken down by:
• Geography- Region, Local Authority and Parliamentary Constituency • Assessment status- Special Rules for Terminally Ill people, Mobility Award Level,
Daily Living Award Level • Primary disability category / sub category • Age • Gender • Reassessment indicator
Caseload statistics are available as both ready-made tables and as bespoke tables within Stat-Xplore. More information on Stat-Xplore can be accessed here: https://stat-xplore.dwp.gov.uk/ Supplementary data on;
• registrations, clearances and awards, including information by Parliamentary Constituency, Local Authority and Government Office Region;
• clearance times and outstanding times (Great Britain) are available in excel format https://www.gov.uk/government/statistics/personal-independence-payment-april-2013-to-january-2015 Further PIP Statistics A full suite of PIP statistics plus further detailed information on PIP can be accessed here: https://www.gov.uk/government/collections/personal-independence-payment-statistics
4

Table of Contents 1. PIP Caseload Statistics and commentary 6
1.1. Time series: Caseload by Terminally Ill Rules Indicator 6 1.2 January 2015: Caseload by award level, claim type and disability category 7 1.3 January 2015: Special Rules for Terminally Ill by award level, claim type and disability category 8 1.4 January 2015: Normal Rules by award level, claim type and disability category 9 1.5: January 2015: caseload : Reassessment claim s from Disability Living Allowance 10
2. PIP Registrations, Clearances and Awards: Statistics and commentary 11
2A. PIP Registrations, by month of registration 12 2B. PIP Clearances, by month of clearance 13 2Ci. PIP Award Rates, by month of clearance – New Claims 14 2Cii. PIP Award Rates, by month of clearance – Reassessments 15
3. PIP Clearance Times and Outstanding Times: Statistics and commentary 16 3Ai. PIP Average Actual Clearance Times - New Claims (Normal Rules) 17 3Aii. PIP Average Actual Clearance Times - Reassessments (Normal Rules) 18 3Bi. PIP Average Actual Clearance Times - New Claims (Special Rules) 19 3Bii. PIP Average Actual Clearance Times - Reassessments (Special Rules) 20 3Ci. PIP Average Actual Outstanding Times - New Claims (Normal Rules) 21 3Cii. PIP Average Actual Outstanding Times - Reassessments (Normal Rules) 22
4. Notes 23
5

Section 1: PIP Caseload Statistics and commentary The statistics covered in this section cover the period 8th April 2013 to 31st January 2015. The data has been sourced from PIP Computer System claimant records. The data should be seen as provisional data subject to revision. ** Further breakdowns are available for some of the charts below in Stat-Xplore – where available, click on link to explore further, or go directly to the Stat-Xplore visualisation page at: https://sv.stat-xplore.dwp.gov.uk/views/** 1.1: Time series: Caseload by Terminally Ill Rules Indicator
0
50,000
100,000
150,000
200,000
250,000
300,000
350,000
400,000
Apr-1
3
May
-13
Jun-
13
Jul-1
3
Aug-
13
Sep-
13
Oct
-13
Nov
-13
Dec
-13
Jan-
14
Feb-
14
Mar
-14
Apr-1
4
May
-14
Jun-
14
Jul-1
4
Aug-
14
Sep-
14
Oct
-14
Nov
-14
Dec
-14
Jan-
15
SRTI Non SRTI Reassessed Claims
Source: PIP Computer System claimant records
Key messages
Chart 1.1 shows a time series of the number of PIP claims in payment that were assessed under Special Rules for Terminally Ill people (SRTI). SRTI are covered by Special Rules, a fast tracked claiming process which, among other provisions, exempt them from completing the additional information form or attending a face-to-face assessment. Whether a claim is made under SRTI has been determined at the point of registration. At 31st January 2015, there were 342,800 PIP claims in payment. • Of these, 30,000 (9%) were assessed under
SRTI. 312,800 claims (91%) were in payment that were not assessed under SRTI.
• 54,400 (16%) were reassessment claims from DLA.
6

1.2: January 2015 Caseload by award level, claim type and disability category Chart 1.2a - by award level
Enhanced Rate Standard Rate
Chart 1.2b - by claim type
Mobility Only Daily Living Only Both
Chart 1.2c – by disability category
0 20,000 40,000 60,000 80,000 100,000 120,000
Psychiatric disorders
Musculoskeletal disease (general)
Musculoskeletal disease (regional)
Malignant disease
Neurological disease
Respiratory disease
Cardiovascular disease
Other
Source: PIP Computer System claimant records
Key messages
At 31st January 2015 there were 342,800 PIP claims in payment. • 215,300 (63%) received an award at the
enhanced rate, including 97,000 (28%) who received the highest level of award, i.e. both enhanced daily living and enhanced mobility
• 127,500 (37%) were receiving the standard rate.
• 202,300 (59%) were receiving both the
mobility and daily living components. 32% were receiving daily living only and 9% receiving mobility only.
The primary disability condition of the claimant is reported at disability category and subcategory level. Further breakdowns are available via - Stat Xplore • 106,100 (31%) of all PIP claimants were
recorded with ‘Psychiatric disorders’, including ‘Mixed anxiety and depressive disorders’ and ‘Mood disorders’.
• 60,100 (18%) were recorded with ‘Musculoskeletal disease (general)’ including ‘Osteoarthritis’.
7

1.3: January 2015 caseload - Special Rules for Terminally Ill People Chart 1.3a – by Special Rules indicator
Special Rules Normal Rules
Chart 1.3b - by award level
Enhanced Rate
Standard Rate
Chart 1.3c - by claim type
Mobility Only
Daily LivingOnlyBoth
Chart 1.3d – by disability category
0 5,000 10,000 15,000 20,000 25,000 30,000 35,000
Malignant disease
Neurological disease
Respiratory disease
Diseases of the liver, gallbladder, biliary tract
Cardiovascular disease
Others
Source: PIP Computer System claimant records
Key messages
At 31st January 2015, 30,000 claims (9% of the total caseload) were assessed under Special Rules for Terminally Ill (STRI). • 100% received an award at the enhanced
rate, all at the highest level of award, i.e. both enhanced daily living and enhanced mobility.
• 100% were receiving both the mobility and
daily living components. • 28,700 (95%) were recorded in “Malignant
disease’ disability category, including ‘Cancers of the gastrointestinal tract’ and ‘Cancers of the respiratory tract’.
8
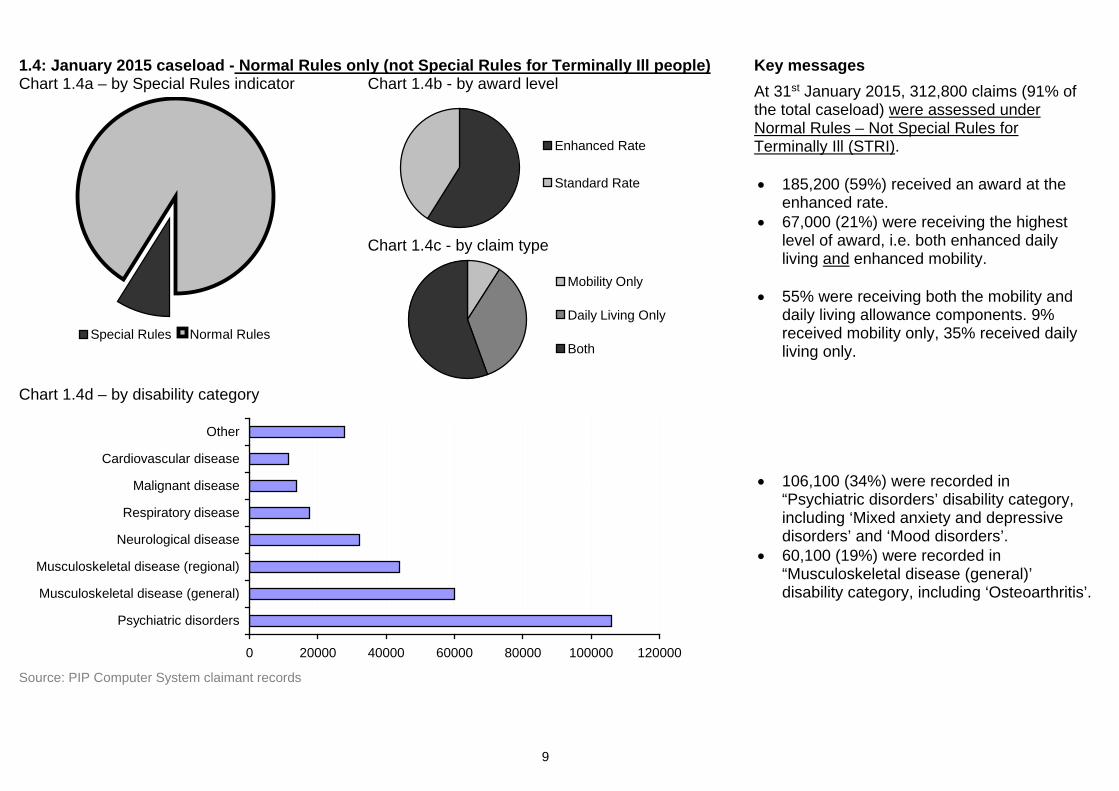
1.4: January 2015 caseload - Normal Rules only (not Special Rules for Terminally Ill people) Chart 1.4a – by Special Rules indicator
Special Rules Normal Rules
Chart 1.4b - by award level
Enhanced Rate
Standard Rate
Chart 1.4c - by claim type
Mobility Only
Daily Living Only
Both
Chart 1.4d – by disability category
0 20000 40000 60000 80000 100000 120000
Psychiatric disorders
Musculoskeletal disease (general)
Musculoskeletal disease (regional)
Neurological disease
Respiratory disease
Malignant disease
Cardiovascular disease
Other
Source: PIP Computer System claimant records
Key messages
At 31st January 2015, 312,800 claims (91% of the total caseload) were assessed under Normal Rules – Not Special Rules for Terminally Ill (STRI). • 185,200 (59%) received an award at the
enhanced rate. • 67,000 (21%) were receiving the highest
level of award, i.e. both enhanced daily living and enhanced mobility.
• 55% were receiving both the mobility and
daily living allowance components. 9% received mobility only, 35% received daily living only.
• 106,100 (34%) were recorded in
“Psychiatric disorders’ disability category, including ‘Mixed anxiety and depressive disorders’ and ‘Mood disorders’.
• 60,100 (19%) were recorded in “Musculoskeletal disease (general)’ disability category, including ‘Osteoarthritis’.
9

1.5: January 2015 caseload – Reassessment claim s from Disability Living Allowance Chart 1.5a - Reassessment claims from DLA by Local Authority
Source: PIP Computer System claimant records
Disability Living Allowance reassessment roll out From 28th October 2013, DWP started to invite DLA claimants living in Wales, East Midlands, West Midlands and East Anglia to claim PIP (see Notes for more details) : Structured roll out to other postcodes areas has since followed - Most DLA recipients will start to be invited to claim PIP from October 2015 Key messages
At 31st January 2015, 54,000 claims were reassessment claims from DLA (16% of the total caseload) • 39,600 (73%) received an award at the
enhanced rate. • 19,400 (36%) were receiving the highest
level of award, i.e. both enhanced daily living and enhanced mobility.
Interactive map Further statistics on the PIP caseload showing information at Local Authority level are also available via an interactive map. . Please click here to access the interactive version
10

Section 2: PIP Registrations, Clearances and Awards: Statistics and commentary The statistics covered in this section cover the period 8th April 2013 to 31st January 2015, for PIP new claims and claims made by those with an existing claim for Disability Living Allowance, known as Reassessments. The time series presented in these tables reflect volumes and proportions during the early stages of implementation of PIP and may not represent longer-term trends. The data should be seen as provisional data subject to revision. The data is subject to some minor retrospection. When a claim is first registered, it is assumed to be a new claim unless there is evidence to suggest that is it a reassessment. If evidence is presented between registration and clearance, the claim will then show as a reassessment clearance and will move from being a new claim registration to a reassessment registration. Also, it should be noted that some claims may not be marked as claims under Special Rules for Terminally Ill people (SRTI) at the point of registration but become a SRTI claim prior to the point of clearance, and vice versa. This may lead to the figures showing fewer SRTI registrations than clearances. Supplementary data on registrations, clearances and awards, including information by Parliamentary Constituency, Local Authority and Government Office Region are available in excel format https://www.gov.uk/government/statistics/personal-independence-payment-april-2013-to-january-2015.
11

2A: PIP Registrations, by month of registration
Normal Rules SRTI All Normal Rules SRTI All
Apr-13 3,000 200 3,100 0 0 0May-13 4,800 200 5,000 0 0 0Jun-13 23,000 900 23,800 0 0 0Jul-13 34,200 1,500 35,700 0 0 0Aug-13 30,600 1,300 31,900 0 0 0Sep-13 33,700 1,300 35,000 0 0 0Oct-13 35,500 1,500 37,100 100 - 100Nov-13 32,600 1,400 34,000 3,600 - 3,600Dec-13 21,700 1,200 22,800 4,900 - 4,900Jan-14 37,900 1,500 39,500 7,200 100 7,300Feb-14 35,600 1,300 36,900 5,800 100 5,800Mar-14 36,300 1,600 37,900 7,700 100 7,800Apr-14 32,600 1,400 34,000 7,100 100 7,200May-14 32,400 1,400 33,800 7,700 100 7,800Jun-14 32,900 1,500 34,400 7,100 100 7,200Jul-14 34,900 1,600 36,500 7,100 100 7,200Aug-14 31,600 1,400 33,000 5,300 100 5,400Sep-14 36,800 1,700 38,500 7,300 100 7,400Oct-14 35,800 1,700 37,400 7,000 100 7,100Nov-14 31,900 1,500 33,300 7,200 100 7,300Dec-14 24,400 1,400 25,800 7,000 100 7,100Jan-15 41,300 1,700 42,900 8,800 100 9,000
Total 663,400 28,900 692,400 101,200 1,200 102,400
New Claims Reassessments
Key messages By the end of January 2015, 692,400 new claims to PIP had been registered. Of these, 28,900 had been registered under SRTI, and 663,400 under normal-rules (i.e. non-SRTI claims). Looking at new claims only, since July 2013, the volume of claims under SRTI had been relatively stable at around 1,600 per month. In most months between 30,000 and 40,000 new claims were registered though there were noticeable dips in December 2013 and December 2014. The months with the most new claims were January 2014 and January 2015 (39,500 and 42,900 respectively). Between October 2013 - January 2015, there were 102,400 PIP claims registered from claimants with an existing DLA claim. The number of reassessment claims each month peaked at 9,000 in January 2015. Information on registrations at Parliamentary Constituency, Local Authority and Government Regional Office level are available in excel format https://www.gov.uk/government/statistics/personal-independence-payment-april-2013-to-january-2015
Source: PIP Computer System claimant records Notes: 1. Figures have been rounded to the nearest 100. Components may not sum to totals due to rounding. 2. The status of claims as 'normal rules' or 'SRTI' is shown as at the point of registration. 3. Definition of Registration: The claimant has completed the initial PIP claim process, either by phone or, in exceptional circumstances, via a paper form. 4. Some claims may not be marked SRTI at the point of registration but become a SRTI claim at the point of clearance, and vice versa. This could lead to figures showing more SRTI clearances than registrations. 5. '-' Less than 50 claims in this category. 6. Revisions have been made to the totals that were previously published on 17th December 2014 due to a change in how we assign claims as new and reassessment. 7. Great Britain only.
12

2B: PIP Clearances, by month of clearance
0
10,000
20,000
30,000
40,000
50,000
60,000
70,000
80,000
90,000
Apr-13
May-13
Jun-13
Jul-13
Aug-13
Sep-13
Oct-13
Nov-13
Dec-13
Jan-14
Feb-14
Mar-14
Apr-14
May-14
Jun-14
Jul-14
Aug-14
Sep-14
Oct-14
Nov-14
Dec-14
Jan-15
Non SRTI
SRTI
Key messages In total, to the end of January 2015, there had been 607,700 clearances, of which around 35,300 were SRTI claims and 572,500 normal-rules claims. 536,600 of the total clearances were for new claims and 71,100 for DLA reassessment claims. On average 16,000 claims were being cleared each month between November 2013 and May 2014. In the months between May 2014 and June 2014 nearly 20,000 more claims were cleared. This increased dramatically again, by more than 19,000 claims, between July 2014 and August 2014. Between August 2014 and October 2014, on average 58,000 claims were being cleared per month. The average number of clearances rose again between November 2014 and January 2015 to 75,000 per month. Since September 2013, clearances of SRTI claims have remained stable at around 1,900 claims a month. Information on clearances at Parliamentary Constituency, Local Authority and Government Regional Office level are available in excel format https://www.gov.uk/government/statistics/personal-independence-payment-april-2013-to-january-2015
Source: PIP Computer System claimant records Notes: 1. Figures have been rounded to the nearest 100. Components may not sum to totals due to rounding. 2. The status of claims as 'normal rules' or 'SRTI' is shown as at the point of clearance. 3. Total clearances include Decisions (comprising Awards and Disallowances) and Withdrawals and reflect outcomes prior to any reconsideration and appeal action. 4. Definition of Award: The Department has made the decision to award PIP. 5. Definition of Disallowance: The Department has made the decision not to award PIP. 6. Definition of Withdrawal: The claimant has withdrawn the claim prior to a decision being made. 7. Some claims may not be marked SRTI at the point of registration but become a SRTI claim at the point of clearance, and vice versa. This could lead to figures showing more SRTI clearances than registrations. 8. '-' Less than 50 claims in this category. 9. Revisions have been made to the totals that were previously published on 17th December 2014 due to a change in how we assign claims as new and reassessment. 10. Great Britain only. 13

2Ci: PIP Award Rates, by month of clearance – New Claims
Normal Rules SRTI All Normal Rules SRTI All
Apr-13 7% 93% 52% # 100% 91%May-13 48% 97% 80% 76% 100% 94%Jun-13 26% 96% 61% 52% 100% 83%Jul-13 26% 96% 62% 53% 100% 85%Aug-13 21% 96% 47% 27% 100% 56%Sep-13 26% 95% 47% 32% 99% 55%Oct-13 35% 96% 47% 40% 99% 53%Nov-13 32% 95% 41% 35% 98% 44%Dec-13 38% 94% 44% 40% 98% 47%Jan-14 48% 95% 54% 53% 99% 58%Feb-14 59% 97% 65% 65% 100% 71%Mar-14 62% 97% 66% 67% 100% 71%Apr-14 61% 97% 65% 65% 100% 69%May-14 61% 96% 65% 66% 99% 69%Jun-14 30% 95% 33% 31% 98% 35%Jul-14 49% 94% 51% 51% 98% 53%Aug-14 53% 96% 54% 54% 98% 56%Sep-14 47% 96% 49% 49% 98% 51%Oct-14 51% 97% 53% 53% 99% 55%Nov-14 52% 97% 53% 53% 99% 54%Dec-14 51% 97% 53% 53% 99% 54%Jan-15 51% 96% 52% 52% 98% 53%
Total 49% 96% 52% 51% 99% 54%
Excluding withdrawn claimsIncluding withdrawn claims
Key Messages Of all new claims cleared by the end of January 2015, 52% led to an award. For SRTI claims only, 96% resulted in an award, while for normal-rules new claims, 49% of those cleared had lead to an award. When looking only at decisions made on new claims (i.e. excluding claims that had been withdrawn by the claimant), 54% were awarded PIP. Likewise, 99% of SRTI decisions and 51% of normal-rules decisions resulted in an award. Information on award rates for new claim by Parliamentary Constituency, Local Authority and Government Regional Office level are available in excel format https://www.gov.uk/government/statistics/personal-independence-payment-april-2013-to-january-2015 Note: Between January 2014 – May 2014, an IT issue within the PIP computer system meant that the award rate artificially increased. Likewise, the resolution of the issue in June 2014 caused a reduction in the award rate. The total award rates, however, are an accurate reflection of outcomes up to January 2015.
Source: PIP Computer System claimant records Notes: 1. The status of claims as 'normal rules' or 'SRTI' is shown as at the point of clearance. 2. Clearances include Decisions (comprising Awards and Disallowances) and Withdrawals and reflect outcomes prior to any reconsideration and appeal action. 3. Definition of Award: The Department has made the decision to award PIP. 4. Definition of Disallowance: The Department has made the decision not to award PIP. 5. Definition of Withdrawal: The claimant has withdrawn the claim prior to a decision being made. 6. '#' Less than 10 claims made in this category. 7. Revisions have been made to the totals that were previously published on 17th December 2014 due to a change in how we assign claims as new and reassessment. 8. Great Britain only.
14

2Cii: PIP Award Rates, by month of clearance – Reassessments
Normal Rules SRTI All Normal Rules SRTI All
Oct-13 # ~ # ~ ~ ~Nov-13 0% # 15% # # #Dec-13 0% 91% 36% # 100% 74%Jan-14 8% 96% 30% 17% 99% 52%Feb-14 34% 98% 58% 58% 100% 79%Mar-14 80% 97% 84% 88% 100% 92%Apr-14 76% 98% 78% 80% 100% 83%May-14 75% 92% 76% 78% 100% 80%Jun-14 69% 87% 70% 73% 98% 75%Jul-14 74% 97% 76% 77% 98% 79%Aug-14 78% 95% 78% 79% 100% 79%Sep-14 78% 99% 78% 79% 100% 79%Oct-14 77% 98% 77% 78% 99% 79%Nov-14 79% 96% 79% 80% 100% 80%Dec-14 78% 99% 78% 79% 100% 79%Jan-15 77% 96% 77% 78% 100% 78%
Total 77% 96% 77% 78% 100% 79%
Excluding withdrawn claimsIncluding withdrawn claims
Key Messages Overall, 77% of reassessments cleared resulted in an award. Looking at normal-rules claims, by the end of January 2015, 77% of clearances had led to an award. Likewise, 96% of all SRTI clearances resulted in an award. When looking only at decisions made on reassessments (i.e. excluding claims that had been withdrawn by the claimant), 79% were awarded PIP. Likewise, 100% of SRTI decisions and 78% of normal-rules decisions resulted in an award.
Source: PIP Computer System claimant records Notes: 1. The status of claims as 'normal rules' or ‘SRTI' is shown as at the point of clearance. 2. Clearances include Decisions (comprising Awards and Disallowances) and Withdrawals. 3. Definition of Award: The Department has made the decision to award PIP. 4. Definition of Disallowance: The Department has made the decision not to award PIP. 5. Definition of Withdrawal: The claimant has withdrawn the claim prior to a decision being made. 6. '~' No claims made in this category. 7. '#' Less than 10 claims made in this category. 8. Figures reflect outcomes prior to any Mandatory Reconsideration or Appeal action. 9. Great Britain only.
Source: PIP Computer System claimant records Notes: 1. The status of claims as 'normal rules' or 'SRTI' is shown as at the point of clearance. 2. Clearances include Decisions (comprising Awards and Disallowances) and Withdrawals and reflect outcomes prior to any reconsideration and appeal action. 3. Definition of Award: The Department has made the decision to award PIP. 4. Definition of Disallowance: The Department has made the decision not to award PIP. 5. Definition of Withdrawal: The claimant has withdrawn the claim prior to a decision being made. 6. '#' Less than 10 claims made in this category. 7. '~' No claims made in this category. 8. Revisions have been made to the totals that were previously published on 17th December 2014 due to a change in how we assign claims as new and reassessment. 9. Great Britain only.
15

Section 3: PIP Clearance Times and Outstanding Times: Statistics and commentary The statistics covered in this section cover the period 8th April 2013 to 31st January 2015, for PIP new claims and claims made by those with an existing claim for Disability Living Allowance, known as Reassessments. Average Actual Clearance Times (AACT) represent the average clearance time of claims cleared within that calendar month. Average Actual Outstanding Times (AAOT) represent the average outstanding time of claims outstanding within that calendar month, i.e. we check the queues for claimants that were outstanding on the last day of each month and measure how long they have been in that queue. Charts 3Ai and 3Aii show AACT, in weeks:
• for each of the main PIP processing stages individually; • for the time from referral to the assessment providers through to the DWP decision; • for the time from the registration of the claim through to the DWP decision.
Charts 3Bi and 3Bii show AACT, in working days:
• for each of the main PIP processing stages individually; • for the time from the registration of the claim through to the DWP decision.
Charts 3Ci and 3Cii show AAOT, in weeks (normal rules only):
• for each of the main PIP processing stages individually; • for the time from referral to the assessment providers through to the DWP decision. • for the time from the registration of the claim through to the DWP decision.
Special rules AAOTs are not given due to small numbers. All average actual times are based on the median measure. The median time represents the middle value if you are to order all the times within our distribution from lowest value to highest value. The median is being presented instead of the mean, as the mean measure is affected by outlying cases (e.g. cases were the person has been hard to reach due to being in prison, hospital, failed to attend on numerous occasions). Note, the individual parts of the claimant journey average times will not sum to the end to end claimant journey average times. This is because each measure is based on the median clearance/outstanding time of cases cleared/outstanding at that stage, whilst the end to end measure is based on the median clearance/outstanding time for all cleared/outstanding cases. As the size and distributions of clearance/outstanding times for the individual stages will vary, the sum of the individual medians will not total the end to end median. Furthermore for this reason, we may also see an individual part of the claimant journey (e.g. assessment provider stage) having a longer average time than the end to end average time. The time series presented in these charts reflect average times during the early stages of implementation of PIP and may not represent longer-term trends. The data should be seen as provisional data subject to revision. The data is subject to some minor retrospection, as explained in section 2. Supplementary data tables on clearance times and outstanding times (Great Britain), including more detailed footnotes, are available in excel format.
16

3Ai: PIP Average Actual Clearance Times (Median) – New Claims Normal Rules
PIP New Claims Normal Rules: Average Actual Clearance Times (Median in Weeks) For Each Stage of the Claimant Journey
0
5
10
15
20
25
30
35
40
45
Apr-13
May-13
Jun-1
3Ju
l-13
Aug-13
Sep-13
Oct-13
Nov-13
Dec-13
Jan-1
4
Feb-14Mar-1
4Apr-1
4
May-14
Jun-1
4Ju
l-14
Aug-14
Sep-14
Oct-14
Nov-14
Dec-14
Jan-1
5
Month of clearance/latest event
Num
ber o
f wee
ks
Registration to issue of Part 2 Issue of Part 2 to return of Part 2Referral to AP to return from AP Return from AP to DWP decisionRegistration to DWP decision (end to end) Referral to AP to DWP decision (end to end)
Key Messages
Key Messages In January 2015, of those claims cleared, the average PIP new claim normal rules claim took:
• 20 weeks from the point of registration to a decision made on the claim
• 14 weeks from the point of referral to the assessment providers to a decision made on the claim
• 12 weeks for an assessment. The above times are less than half what they were in July 2014 (41 weeks, 35 weeks and 29 weeks respectively), showing end to end and assessment provider clearance times are reducing. The claimant took on average 4 weeks to return their Part2 form (January 2015). The DWP took on average 1 week to make the final decision (January 2015). Note, the purple line within the chart represents how long a claim has taken since the claimant returned the Part 2, compared to the time taken for the entire process, including time where the claimant is completing the form, which is represented by the black line.
Source: PIP Computer System claimant records Notes: 1. Figures have been rounded to the nearest whole number of weeks. 2. The status of claims as 'normal rules' and 'new claim/reassessment' is shown as at the point of issue of the Part2/referral to the AP/return from the AP/DWP decision, in accordance with the measure. It is possible for claims to transition between normal/special rules and new claims/reassessments during the course of the claimant journey. 3. Figures represent the average clearance time of claims cleared within that calendar month. 5. The assessment provider clearance time data published today are slightly different to those previously given within an ad hoc statistical release on 28th January 2015. This is because the measure published in the ad hoc included all claims that were no longer outstanding with the assessment providers and hence included claims that have been withdrawn by the claimant during this phase or claims that have been returned to DWP without a report and disallowed due to failure to attend without good reason. The above measure does not include such claims. 4. Great Britain only. 17

3Aii: PIP Average Actual Clearance Times (Median) – Reassessments Normal Rules
PIP Reassessed Claims Normal Rules: Average Actual Clearance Times (Median in Weeks) For Each Stage of the Claimant Journey
0
5
10
15
20
25
30
35
40
45
Dec-13
Jan-1
4
Feb-14
Mar-14
Apr-14
May-14
Jun-1
4Ju
l-14
Aug-14
Sep-14
Oct-14
Nov-14
Dec-14
Jan-1
5
Month of clearance/latest event
Num
ber o
f wee
ks
Registration to issue of Part 2 Issue of Part 2 to return of Part 2Referral to AP to return from AP Return from AP to DWP decisionRegistration to DWP decision (end to end) Referral to AP to DWP decision (end to end)
Key Messages In January 2015, of those claims cleared, the average PIP reassessments normal rules claim took:
• 18 weeks from the point of registration to a decision made on the claim
• 13 weeks from the point of referral to the assessment providers to a decision made on the claim
• 8 weeks for an assessment. The above times are an improvement compared to times for September 2014 (32 weeks, 27 weeks and 21 weeks respectively), showing end to end and assessment provider times are reducing. The claimant took on average 4 weeks to return their Part2 form (January 2015). The DWP took on average 4 weeks to make the final decision (January 2015). Note, the purple line within the chart represents how long a claim has taken since the claimant returned the Part 2, compared to the time taken for the entire process, including time where the claimant is completing the form, which is represented by the black line.
Source: PIP Computer System claimant records Notes: 1. Figures have been rounded to the nearest whole number of weeks. 2. The status of claims as 'normal rules' and 'new claim/reassessment' is shown as at the point of issue of the Part2/referral to the AP/return from the AP/DWP decision, in accordance with the measure. It is possible for claims to transition between normal/special rules and new claims/reassessments during the course of the claimant journey. 3. Figures represent the average clearance time of claims cleared within that calendar month. 4. Great Britain only.
18

3Bi: PIP Average Actual Clearance Times (Median) – New Claims Special Rules PIP New Claims Special Rules: Average Actual Clearance Times
(Median in working days)
0
2
4
6
8
10
12
14
16
18
20
Apr-13
May-13
Jun-1
3Ju
l-13
Aug-13
Sep-13
Oct-13
Nov-13
Dec-13
Jan-1
4
Feb-14Mar-1
4Apr-1
4
May-14
Jun-1
4Ju
l-14
Aug-14
Sep-14
Oct-14
Nov-14
Dec-14
Jan-1
5
Month of clearance/latest event
Num
ber o
f wor
king
day
s
Registration to referral to the AP Referral to AP to return from APReturn from AP to DWP decision Registration to DWP decision (end to end)
Key Messages In January 2015, of those claims cleared, the average PIP new claims special rules claim took:
• 7 working days from the point of registration to a decision made on the claim
Of the 7 working days, the claim is:
• awaiting referral to the assessment providers on 5 of those days (i.e. awaiting receipt of the DS1500)
• with the assessment providers for 1 day • with the DWP decision maker for 1 day.
The average times have been gradually reducing since the introduction of PIP in April 2013, mainly driven by a reduction in the DWP decision stage average time (from 6 days at its peak to 1 day).
Source: PIP Computer System claimant records Notes: 1. Figures have been rounded to the nearest working day, i.e. Monday to Friday (including bank holidays). 2. The status of claims as 'special rules' and 'new claim/reassessment' is shown as at the point of referral to the AP/return from the AP/DWP decision, in accordance with the measure. It is possible for claims to transition between normal/special rules and new claims/reassessments during the course of the claimant journey. 3. Figures represent the average clearance time of claims cleared within that calendar month. 4. Great Britain only.
19

3Bii: PIP Average Actual Clearance Times (Median) – Reassessments Special Rules
PIP Reassessed Claims Special Rules: Average Actual Clearance Times (Median in working days)
0
2
4
6
8
10
12
14
16
18
20
Nov-13
Dec-13
Jan-1
4
Feb-14
Mar-14
Apr-14
May-14
Jun-1
4Ju
l-14
Aug-14
Sep-14
Oct-14
Nov-14
Dec-14
Jan-1
5
Month of clearance/latest event
Num
ber o
f wor
king
day
s
Registration to referral to the AP Referral to AP to return from APReturn from AP to DWP decision Registration to DWP decision (end to end)
Key Messages In January 2015, of those claims cleared, the average PIP reassessments special rules claim took:
• 8 working days from the point of registration to a decision made on the claim
Of the 8 working days, the claim is:
• awaiting referral to the assessment providers on 3 of those days (i.e. awaiting receipt of the DS1500)
• with the assessment providers for 1 day • with the DWP decision maker for 3 days.
Source: PIP Computer System claimant records Notes: 1. Figures have been rounded to the nearest working day, i.e. Monday to Friday (including bank holidays). 2. The status of claims as 'special rules' and 'new claim/reassessment' is shown as at the point of referral to the AP/return from the AP/DWP decision, in accordance with the measure. It is possible for claims to transition between normal/special rules and new claims/reassessments during the course of the claimant journey. 3. Figures represent the average clearance time of claims cleared within that calendar month. 4. Great Britain only.
20

3Ci: PIP Average Actual Outstanding Times (Median) – New Claims Normal Rules
PIP New Claims Normal Rules: Average Actual Outstanding Times (Median in weeks) For Each Stage of the Claimant Journey
0
5
10
15
20
25
Apr-13
May-13
Jun-1
3Ju
l-13
Aug-13
Sep-13
Oct-13
Nov-13
Dec-13
Jan-1
4
Feb-14
Mar-14
Apr-14
May-14
Jun-1
4Ju
l-14
Aug-14
Sep-14
Oct-14
Nov-14
Dec-14
Jan-1
5
Month at which the claim is outstanding
Num
ber o
f wee
ks
Registration to issue of Part 2 Issue of Part 2 to return of Part 2Referral to AP to return from AP Return from AP to DWP decisionRegistration to latest event (end to end) Referral to AP to latest event (end to end)
Key Messages In January 2015, of those claims outstanding, the average PIP new claim normal rules claim had taken:
• 13 weeks from the point of registration • 15 weeks from the point of referral to the
assessment providers • 15 weeks for an assessment.
The above times have been falling since July 2014 when they were 20 weeks, 18 weeks and 16 weeks respectively, showing end to end and assessment provider outstanding times are improving. As explained in the section 3 introduction, the individual parts of the claimant journey average outstanding times will not sum to the end to end average outstanding times. This is because each measure is based on the median outstanding time of cases outstanding at that stage, whilst the end to end measure is based on the median outstanding time for all outstanding cases. As the size and distributions of outstanding times for the individual stages will vary, the sum of the individual medians will not total the end to end median. Furthermore for this reason, we can also see an individual part of the claimant journey (e.g. assessment provider stage) having a longer average time than the end to end average time.
Source: PIP Computer System claimant records Notes: 1. Figures have been rounded to the nearest whole number of weeks. 2. The status of claims as 'normal rules' and 'new claim/reassessment' is the most recent know status for each claim. It is possible for claims to transition between normal/special rules and new claims/reassessments during the course of the claimant journey. 3. Figures represent the average outstanding time of claims outstanding within that calendar month, i.e. we check the queues for claimants that were outstanding on the last day of each month and measure how long they have been in that queue. 4. Great Britain only.
21

3Cii: PIP Average Actual Outstanding Times (Median) – Reassessment Normal Rules
PIP Reassessed Claims Normal Rules: Average Actual Outstanding Times (Median in weeks) For Each Stage of the Claimant Journey
0
5
10
15
20
25
Oct-13
Nov-13
Dec-13
Jan-1
4
Feb-14
Mar-14
Apr-14
May-14
Jun-1
4Ju
l-14
Aug-14
Sep-14
Oct-14
Nov-14
Dec-14
Jan-1
5
Month at which the claim is outstanding
Num
ber o
f wee
ks
Registration to issue of Part 2 Issue of Part 2 to return of Part 2Referral to AP to return from AP Return from AP to DWP decisionRegistration to latest event (end to end) Referral to AP to latest event (end to end)
Key Messages In January 2015, of those claims outstanding, the average PIP reassessment normal rules claim had taken:
• 10 weeks from the point of registration • 11 weeks from the point of referral to the
assessment providers • 11 weeks for an assessment.
The above times have been falling since September 2014 when they were 18 weeks, 15 weeks and 14 weeks respectively, showing end to end and assessment provider outstanding times are improving. As explained in the section 3 introduction, the individual parts of the claimant journey average outstanding times will not sum to the end to end average outstanding times. This is because each measure is based on the median outstanding time of cases outstanding at that stage, whilst the end to end measure is based on the median outstanding time for all outstanding cases. As the size and distributions of outstanding times for the individual stages will vary, the sum of the individual medians will not total the end to end median. Furthermore for this reason, we can also see an individual part of the claimant journey (e.g. assessment provider stage) having a longer average time than the end to end average time.
Source: PIP Computer System claimant records Notes: 1. Figures have been rounded to the nearest whole number of weeks. 2. The status of claims as 'normal rules' and 'new claim/reassessment' is the most recent know status for each claim. It is possible for claims to transition between normal/special rules and new claims/reassessments during the course of the claimant journey. 3. Figures represent the average outstanding time of claims outstanding within that calendar month, i.e. we check the queues for claimants that were outstanding on the last day of each month and measure how long they have been in that queue. 4. Great Britain only.
22

Section 4: Notes Data Quality PIP payment statistics exclude a small number of successful claims that are not in payment (because, for example, initial payment has been suspended for hospitalisation or other reasons), prior to any PIP payment – but will include a small number of cases where a payment has been made but subsequently been suspended temporarily. As the data available for PIP evolves over time, the methodology used and definitions may develop also. Users of these statistics are asked to note the status as experimental official statistics and that subsequent releases may include revisions to the time series already released.
Note - Due to a change in the way the reassessment marker is derived within the source data, the new claims/reassessment statistics in this release (March 2015) may differ slightly to previously published data.
Disability Living Allowance reassessment roll out From 28th October 2013, DWP started to invite DLA claimants living in Wales, East Midlands, West Midlands and East Anglia to claim PIP if:
• DWP received information about a change in care or mobility needs and the claimant’s fixed term award was due to expire
• children turned 16 years old (unless they have been awarded DLA under the Special Rules for Terminally Ill people) or;
• the claimant could choose to claim PIP instead of their DLA. Structured roll out to other postcodes areas has since followed - Most DLA recipients will start to be invited to claim PIP from October 2015 Code of Practice for Official Statistics In developing PIP Statistics, DWP has acted in accordance with the Code of Practice and supporting Principles. DWP policy statements DWP would like to hear your views on our statistical publications. If you use any of our statistics publications, we would be interested in hearing what you use them for and how well they meet your requirements. Please email DWP at [email protected]. If you would like to receive occasional e-mails from DWP to directly inform you of documents seeking the views of users, please email [email protected] giving details of the DWP publications you use. Other National and Official Statistics issued by the Department for Work and Pensions Details of other National and Official Statistics produced by the Department for Work and Pensions can be found on the DWP website at the following links:
23

• A list of Tabulation Tools: https://www.gov.uk/government/organisations/department-for-
work-pensions/series/dwp-statistics-tabulation-tool; • A schedule of statistical releases over the next 12 months and a list of the most recent
releases: https://www.gov.uk/government/organisations/department-for-work-pensions/about/statistics ;
• In accordance with the Code of Practice for Official Statistics, all DWP National Statistics are also announced via the UK Statistics Authority publication hub at: http://www.statistics.gov.uk/hub/statistics-producers/publications/index.html?newquery=*&source-agency=Work+and+Pensions&pagetype=release-landing-page'
In addition, users can find links to DWP additional statistical analyses that have not been included in our standard publications at https://www.gov.uk/government/organisations/department-for-work-pensions/series/ad-hoc-statistical-publications-list Revisions The Department’s policy statement describes more generally how DWP will handle revisions https://www.gov.uk/government/publications/policy-statement-on-the-revision-of-dwp-statistics
24
Related Documents