PERSONAL AND ENVIRONMENTAL HYGIENE SURVEY (DENGUE FEVER & SARS) Main Report Commissioned by Central Health Education Unit Department of Health April 2004 Copyright of this survey report is held by the Department of Health

Welcome message from author
This document is posted to help you gain knowledge. Please leave a comment to let me know what you think about it! Share it to your friends and learn new things together.
Transcript

PERSONAL AND ENVIRONMENTAL HYGIENE SURVEY (DENGUE FEVER & SARS)
Main Report
Commissioned by
Central Health Education Unit Department of Health
April 2004
Copyright of this survey report is held by the Department of Health

1
Table of Contents Table of Contents 1 Executive Summary 2 Chapter 1 Introduction 8 Background Objectives Chapter 2 Research Methodology 10 Target Respondents Sampling Method Data Collection Method Questionnaire Design Pilot Study Sampling Result Data Processing and Analysis Chapter 3 Findings of the Survey 13 Demographic Information Dengue Fever SARS Environmental Hygiene Chapter 4 Demographic Breakdowns of the Results 48 Dengue Fever SARS Environmental Hygiene
Chapter 5 Models of Factors Influencing the Practice of Preventive 74 Measures
Dengue Fever SARS Chapter 6 Conclusion and Recommendations 81 Conclusion Limitations Recommendations Appendix A Survey Questionnaire (not included in the main report) i
Appendix B Frequency Tables (not included in the main report) xxxii

2
Executive Summary Introduction The Department of Health (DH) commissioned the Social Sciences Research Centre (SSRC), the University of Hong Kong, to conduct a survey on personal and environmental hygiene. The objectives of this survey are: a) to examine public awareness of the health campaigns for prevention of dengue
fever and SARS; b) to examine public knowledge of and attitude towards preventive measures for
dengue fever and SARS; c) to monitor public practices of preventive measures for dengue fever and SARS;
and d) to identify factors influencing the adoption of these preventive measures. Research Methodology The survey was conducted by telephone interviews. A bilingual questionnaire with 68 coded questions was used to collect the data. Telephone numbers were selected by random sampling using the SSRC’s Computer-Aided Telephone Interview (CATI) system. Eligible respondents were individuals aged 12 years or above who had their birthday most recently and were at home at the time of the interview. The fieldwork was carried out from December 1 to December 30, 2003. A total of 3163successfully completed interviews were conducted and the response rate was 71.2%. Data analyses were performed by using SPSS for Windows version 11.5. Statistical testing was applied to study sub-group differences and factors associated withpreventive measures.
Key Findings of the Survey A slight difference in gender, marital status, education level, and occupation was detected between the sample and the 2001 Population Census data. Over half of the respondents were females (56.3%) and single (50.2%). About three-fifths (63.8%) had education up to secondary school level and one-fifth (23.3%) had tertiary level or above. The working group composed 44.1% of the sample. The largest group of respondents were from the $10,000-$19,999 household income group (29.6%),followed by the $20,000-$29,999 household income group (20.7%).
Section 1 Dengue Fever Knowledge of dengue fever Many respondents in this survey had good (31.9%) or fair (59.6%) knowledge of dengue fever. Nearly all of the respondents (95.8%) correctly identified mosquito bites as the transmission route for dengue fever. Many respondents (85.6%) knew that travelling to tropical and subtropical areas would be most likely to catch dengue fever. Suffering from high fever for 3 to 5 days was recognized by 85.8% of the

3
respondents as a symptom of dengue fever, followed by severe headache (44.2%), pain behind the eyes (24.6%), and skin rash (23.8%). Many respondents stated that preventing mosquitoes from breeding (84.4%) and preventing mosquito bites (64.0%) are effective preventive measures against dengue fever. Half of the respondents (49.5%) wrongly believed that there is a vaccine for dengue fever. 62.2% of the respondents knew that there would be a fine for allowing mosquitoes or insects to breed in stagnant water. Attitude towards dengue fever The majority of respondents (90.2%) did not agree that the consequences of mosquito bites were not serious and preventive measures were not necessary. Risk perception of dengue fever Respondents’ perceived likelihood of catching dengue fever outside Hong Kong was slightly higher than that in Hong Kong. While 89.8% of the respondents said that they would be likely or very likely to contract dengue fever when travelling aboard, 84.5% said that they would be likely or very likely to catch the disease in Hong Kong. A high proportion of respondents (92.6%) believed that it would be likely or very likely for them to survive the illness if they caught dengue fever. Practice for dengue fever prevention Many respondents had carried out dengue fever preventive measures in the past three months. 96.3% of the respondents put refuse that could accumulate stagnant water into a litter bin. 85.4% of the respondents kept all drains free from blockage. 67.0% covered all water containers, water storage tanks or wells properly. 65.6% changed water for flowers or plants at least once a week and 60.7% removed stagnant water under flower or plant containers. Actions frequently taken by respondents to prevent mosquito bites included wearing long-sleeved clothing and trousers (65.5%) and avoiding scrubby areas (59.6%). Applying mosquito repellent to exposed parts of the body (42.6%) and installing mosquito nets in non-air-conditioned rooms (18.0%) were less commonly practised by the respondents. The main reason for not taking preventive measures against dengue fever was that respondents thought that it was not necessary to carry out preventive measures. Other reasons cited by respondents for such hindrance included “no mosquito”, “no such habit”, and “too busy”. Awareness of dengue fever prevention information Nearly all of the respondents (97.0%) were aware of dengue fever prevention information in the past three months. Many of them usually obtained such information through television (TV) advertisements/Announcement of Public Interest (63.7%), TV news (54.7%), and newspapers (42.0%). Among the 5.5% of the respondents who obtained dengue fever prevention information through websites,
43.9% visited the website of the Department of Health. Opinion about Government’s efforts in providing dengue fever prevention information Three-fifths (60.1%) of the respondents were satisfied with the Government’s efforts in providing dengue fever prevention information, whilst 6.0% were dissatisfied. The main areas of dissatisfaction cited by respondents were “insufficient advertisements” and “news and information on dengue fever were not well covered or clear”.
Section 2 SARS Knowledge of SARS The results indicate that respondents’ knowledge of SARS was good, with 66.3% of the respondents having good knowledge and 29.5% having fair knowledge. SARS is transmitted by respiratory droplets. Many respondents (72.0%) correctly identified this as the transmission route for SARS. When respondents were asked about the symptoms of SARS, 92.8% of the respondents named fever as a SARS symptom, followed by cough (60.5%), shortness of breath (57.5%), and headache (44.2%). Respondents stated that a mask should be worn when one is having symptoms of respiratory tract infection (88.1%), visiting the sick in hospitals (83.4%), having had close contact with SARS patients (75.8%), and taking care of patients with respiratory infection symptoms (75.8%). Over three quarters of the respondents knew that the surgical mask and N95 mask are effective in preventing SARS. Risk perception of SARS Over half of the respondents (52.8%) perceived that it would be likely or very likely for them to catch SARS. However, most of the respondents (78.7%) were confident that they would survive the illness if they caught SARS. Practice for SARS prevention Most of the respondents had carried out preventive measures to prevent SARS in the past three days. Preventive measures frequently taken by the respondents included covering the mouth and nose when coughing and sneezing (94.3%), washing hands after coughing, sneezing, or nose cleaning (89.3%), using liquid soap when washing hands (89.2%), avoiding using public towels (82.8%), and washing hands after touching public objects (70.0%). Other preventive measures often practised at home included keeping toilets clean and working properly (99.1%), maintaining good indoor ventilation (98.0%), making liquid soap always available for washing hands (96.1%), and cleaning home everyday (70.9%). Using serving utensils when having meals with others (45.9%) and eating with family (20.9%) were less frequently practised by the respondents. Only 9.2% of the respondents reported wearing a mask in the past three days.
4

5
The reasons for not taking preventive measures for SARS prevention were that respondents believed that it was unnecessary and too troublesome to do so. Another reason was that they did not have such habit. Perception of changes in hygiene conditions after the SARS outbreak Many respondents reported an improvement in their personal hygiene (61.6%), home hygiene (56.8%), and the environmental hygiene of Hong Kong (80.0%) after the SARS outbreak. Awareness of SARS prevention information The Government’s efforts in disseminating SARS prevention information have been successful. Almost all of the respondents (97.7%) were aware of the information about SARS prevention in the past six months. Respondents usually obtained such information through TV advertisements/Announcement of Public Interest (64.8%), TV news (64.0%), and newspaper (52.7%). Among the 9.9% of the respondents who learned about SARS prevention information through websites, 51.3% visited the website of the Department of Health. Opinion about Government’s efforts in providing SARS prevention information About two-thirds (64.0%) of the respondents were satisfied with the information provided by the Government on SARS prevention and 7.1% were dissatisfied. The main areas of dissatisfaction cited by respondents were “news and information on SARS were not well covered or clear”, “the Government was not responsive to the issue”, and “insufficient advertisement”. Section 3 Environmental Hygiene Information on environmental hygiene The majority of respondents (89.9%) knew that the fixed penalty for littering in Hong Kong is $1,500. More than half of the respondents (51.4%) said that the whole community should be responsible for maintaining a hygienic environment. 43.0% and 19.4% of the respondents said that it was an individual’s and the Government’s responsibility respectively. Some important factors identified by respondents about maintaining and improving good hygiene in residential buildings were households’ concern (38.4%), good personal hygiene (36.9%) and good building management (36.8%). A quarter (24.6%) of the respondents reported that they had cooperated with their neighbours to improve the hygiene of the public areas near their homes.

6
Demographic Breakdowns of the Results The results found that good knowledge of dengue fever and SARS was associated with higher education level and household income. Working individuals, students, and those who were single had better knowledge of dengue fever and SARS. Females’ knowledge of SARS was also better than males. Females were more likely to think that mosquito bites are serious and preventive measures should be taken. More males perceived that they were likely or very likely to survive the illness if they caught dengue fever. More males also perceived that they would be likely or very likely to catch SARS and to survive the illness. Perceived likelihood of catching and surviving these two communicable diseases was associated with education level, occupation, and household income. Females and married persons took more preventive measures against dengue fever and SARS. The practice of many dengue fever preventive measures was associated with higher education level and household income. But the pattern was different for SARS preventive practices. People who were less educated and who had lower household income generally carry out more precautionary actions to prevent SARS. Working individuals and students were more likely to carry out dengue fever preventive measures, whilst non-working individuals were more likely to carry out SARS preventive measures. Awareness of dengue fever and SARS prevention information was associated with higher education level and household income. Working individuals’ and students’ awareness was better than non-working respondents’. Those who were single were more likely to be aware of SARS prevention information. Age and occupation were associated with respondents’ satisfaction level with the Government’s efforts in providing dengue fever prevention information, whereas age, gender, marital status, and occupation were associated with respondents’ satisfaction level with SARS prevention information. Factors Influencing the Practice of Preventive Measures Logistic regression modelling was used to examine the factors of some of the preventive practices of dengue fever and SARS. Occupation was a significant determinant of the practice of wearing long-sleeved clothing and trousers. Gender, marital status, knowledge and risk perception of dengue fever were significant factors influencing the use of mosquito repellent to exposed parts of the body. Marital status and household income were determinants of installing mosquito nets in non-air-conditioned rooms. Gender, education level, and household income were factors associated with the practice of avoiding scrubby areas. Gender, education level, and household income were factors influencing the use of serving utensils when having meals with others. Gender, marital status, and household income were significant determinants of the practice of washing hands

7
after touching public objects. Marital status, education level, and occupation were factors in determining the practice of cleaning home everyday. Conclusion and Recommendations The Government has been successful in the public health education campaigns as shown by the public’s good knowledge, awareness, and practice of preventive measures of dengue fever and SARS. This can be attributed to information and health guidelines on these diseases disseminated to the public. The majority of people are satisfied with the Government’s efforts and they realize that maintaining a hygienic environment cannot be achieved without the effort of the whole community. Comparing the present survey results with the findings of the previous survey on dengue fever conducted in 2002, it shows that there is an improvement in people’s awareness, knowledge, attitude, and behaviour in relation to dengue fever prevention. Dengue fever and SARS are emerging communicable diseases which are potentially life-threatening. It is important to maintain good personal and environmental hygiene in order to prevent the outbreak of these diseases. With the knowledge of the public’s practice of preventive measures and factors influencing their decisions in taking those precautionary actions, the Government will be able to evaluate the effectiveness of its work and to improve its public health education based on the needs of the public. The Government may need to put more emphasis on promoting the less commonly practised dengue fever and SARS preventive measures. Moreover, the Government has to educate working individuals and students about the importance of taking SARS preventive measures because they are less likely to carry out SARS preventive practices. Their good practice is important to prevent the spread of SARS since they are exposed to many people and different environments. Making health information easier to understand and more accessible can help increase the public’s knowledge and awareness. Arranging more community cleaning activities in estate can also increase people’s awareness that keeping a clean and healthy environment requires cooperation from everyone. This may also help people to turn it into a routine practice. Maintaining a hygienic environment does not depend solely on the Government. Effective disease prevention and control cannot be achieved without the cooperation of the community.

8
Chapter 1 Introduction Background Dengue fever Dengue fever is an acute viral disease. It is transmitted through Aedes egypti and Aedes albopictus mosquito bites. Aedes mosquitoes bite during the daytime, especially two hours after sunrise and a few hours before sunset. Person-to-person spread is not a mode of transmission for dengue fever. The incubation period ranges from 3 to 14 days. An infected individual may develop high fever, severe headache, muscle and joint pain, pain behind the eye, nausea, vomiting and skin rash. In severe cases, dengue fever may progress to dengue haemorrhagic fever and the patient may suffer from bleeding, shock, or even death. The importation of dengue fever from neighbouring countries and the increased density of Aedes albopictus mosquitoes have made Hong Kong susceptible to a local spread of dengue fever. SARS SARS is a viral respiratory infection caused by a coronavirus. The disease is transmitted through close person-to-person contact via respiratory droplets of an infected individual when he/she coughs or sneezes. It may be spread when a person touches a surface or object contaminated with infectious droplets and then touches his/her mouth, nose, or eyes. The incubation period for SARS ranges from 2 to 7 days. Symptoms of SARS include high fever (38oC or above), malaise, chills, headache, rigors, muscle pain, and diarrhoea. After a few days, symptoms of lower respiratory tract infection may follow, including cough without sputum and difficulty in breathing. WHO considered Hong Kong as one of the hardest cities in which to contain SARS because of its high population density and fluid boundaries with neighbouring areas. Moreover, SARS is an emerging communicable disease. Without prior knowledge, prompt diagnosis and treatment are difficult since SARS virus does not behave like other members in the coronavirus family. However, with the efforts of the Government, healthcare sector and the community, SARS was successfully controlled. WHO removed Hong Kong from the list of areas with recent local transmission on June 23, 2003 after the last reported case was isolated on June 2, 2003. Prevention Dengue fever and SARS are potentially life-threatening diseases but they can be prevented by taking certain preventive and control measures. The Government of the Hong Kong Special Administrative Region takes disease control and public health issues seriously. It brings together forces from different sources, emphasizing that the cooperation of the Government, healthcare sector, and the community is important to combat the outbreak of these communicable diseases.

9
Surveillance, port and border control, quarantine directives, public education, risk communication, and community prevention are some of the important public health measures for infectious disease control and prevention. The Government has been disseminating information and health guidelines on dengue fever and SARS to the public. In this regard, the Department of Health (DH) has a major role in providing expert health advice and assuring the quality of information flow to the public. In order to prevent the spread of these communicable diseases to people locally and globally, the importance of preventive measures, especially good personal and environmental hygienic practices, cannot be overemphasized. While health messages have been disseminated through a multitude of channels, DH identifies the need to assess the public’s knowledge, awareness, risk perception, attitude and actual practice so as to evaluate the impact of its work and to improve the quality of its output. The DH has commissioned the Social Sciences Research Centre (SSRC) of the University of Hong Kong to conduct this research. Objectives The objectives of this survey are: a) to examine public awareness of the health campaigns for prevention of dengue fever
and SARS; b) to examine public knowledge of and attitude towards preventive measures for
dengue fever and SARS; c) to monitor public practices of preventive measures for dengue fever and SARS; and d) to identify factors influencing the adoption of these preventive measures.
10
Chapter 2 Research Methodology This chapter describes the methodology used in designing and conducting the survey. Target Respondents
Sampling Method
Data Collection Method
Questionnaire Design
The survey covered the land-based non-institution population of Hong Kong. Eligible respondents were the people in each household aged 12 years or above. Respondents must be English, Cantonese, or Putonghua speakers.
A random sample of residential telephone numbers was drawn from the SSRCComputer Aided Telephone Interview (CATI) system. These residential numbers werederived from 2003 English residential telephone directory. They were generated bydropping the last digit of those directory numbers, removing duplicates, adding all 10 possible final digits, and randomizing order. This ensured coverage of unlisted andnew numbers. Modified “Last Birthday” method was employed in the selection of respondents. From each household contacted, the person aged 12 years old or above who had his/herbirthday most recently and was at home at the time of the telephone interview wasselected as the eligible respondent. This was to minimize the over-representation of housewives and the elderly in the sample.
The survey was conducted by telephone interviews during December 1, 2003 to December 30, 2003. The fieldwork covered weekdays and weekends to ensure that the sample was representative of all households. All telephone calls were made between 4:00 p.m. and 10:00 p.m. All interviews were conducted by experienced interviewers fluent in Cantonese, Mandarin and English using CATI workstations. All SSRC interviewers were trained in a standardized approach prior to the commencement of the survey. Respondents were informed about the nature and the purpose of the survey. Anonymity and confidentiality of information provided were guaranteed. Their right to refuse or withdraw from the interview at any time during the process was clearly explained before each interview was started.
A bilingual (Chinese and English) questionnaire with 68 coded questions was designed for this survey1. The questionnaire covered the following areas:
1 Some questions on dengue fever in this present survey were based on the DH survey on dengue fever in 2002 and some questions on SARS (Q18, Q22, Q23, Q24, Q26, Q28, Q30, Q32, Q33, Q35, Q37, Q38, Q39, Q40, Q41, Q42, Q43, Q44, Q46, Q47, and Q56 of the present survey) were extracted from the SARS Questionnaire developed by the Department of Community Medicine, Faculty of Medicine, the University of Hong Kong, with modification. New questions were added to the questionnaire to meet
11
a) awareness of health education on preventive measures of dengue fever and SARS; b) knowledge about dengue fever and SARS, and their prevention; c) attitude towards preventive measures of dengue fever and SARS; d) practice of personal and environmental hygiene in relation to the prevention of
dengue fever and SARS; e) perception of facilitating factors of and barriers against good hygienic practice; f) perception of risk of contracting dengue fever and SARS; and g) demographic information: age, gender, education, occupation, type of housing,
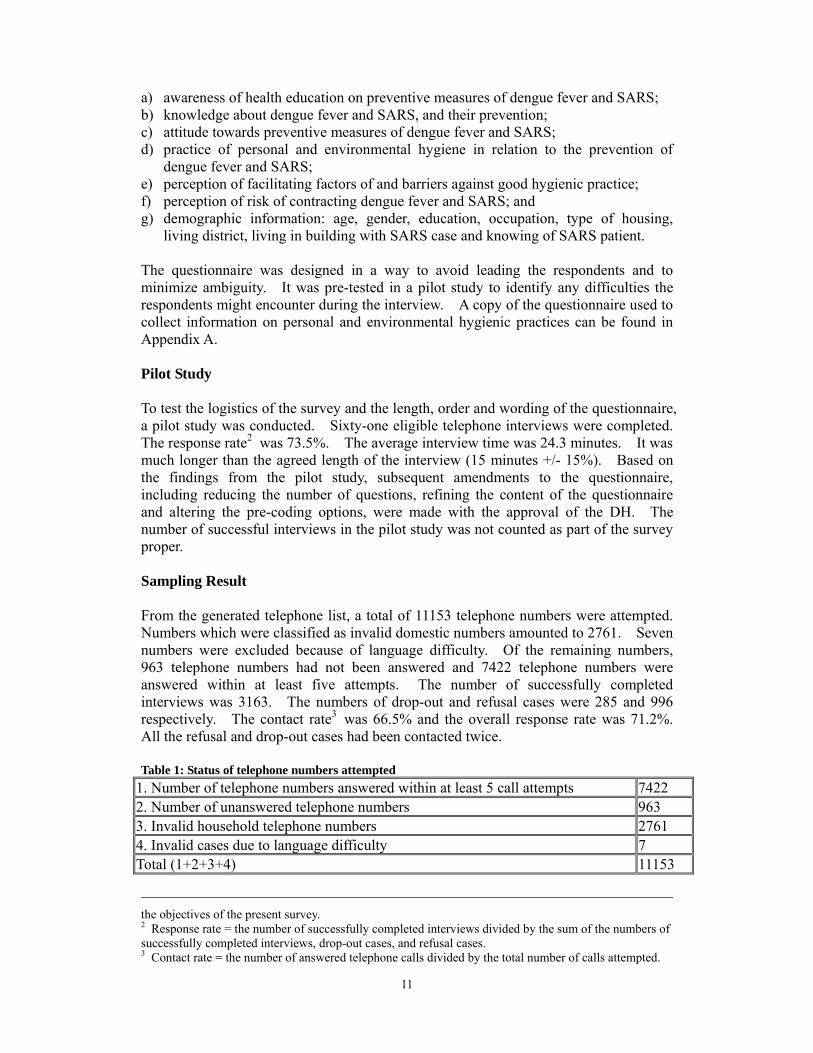
living district, living in building with SARS case and knowing of SARS patient. The questionnaire was designed in a way to avoid leading the respondents and to minimize ambiguity. It was pre-tested in a pilot study to identify any difficulties the respondents might encounter during the interview. A copy of the questionnaire used to collect information on personal and environmental hygienic practices can be found in Appendix A. Pilot Study To test the logistics of the survey and the length, order and wording of the questionnaire, a pilot study was conducted. Sixty-one eligible telephone interviews were completed. The response rate2 was 73.5%. The average interview time was 24.3 minutes. It was much longer than the agreed length of the interview (15 minutes +/- 15%). Based on the findings from the pilot study, subsequent amendments to the questionnaire, including reducing the number of questions, refining the content of the questionnaire and altering the pre-coding options, were made with the approval of the DH. The number of successful interviews in the pilot study was not counted as part of the survey proper. Sampling Result From the generated telephone list, a total of 11153 telephone numbers were attempted. Numbers which were classified as invalid domestic numbers amounted to 2761. Seven numbers were excluded because of language difficulty. Of the remaining numbers, 963 telephone numbers had not been answered and 7422 telephone numbers were answered within at least five attempts. The number of successfully completed interviews was 3163. The numbers of drop-out and refusal cases were 285 and 996 respectively. The contact rate3 was 66.5% and the overall response rate was 71.2%. All the refusal and drop-out cases had been contacted twice. Table 1: Status of telephone numbers attempted
1. Number of telephone numbers answered within at least 5 call attempts 7422 2. Number of unanswered telephone numbers 963 3. Invalid household telephone numbers 2761 4. Invalid cases due to language difficulty 7 Total (1+2+3+4) 11153
the objectives of the present survey. 2 Response rate = the number of successfully completed interviews divided by the sum of the numbers of successfully completed interviews, drop-out cases, and refusal cases. 3 Contact rate = the number of answered telephone calls divided by the total number of calls attempted.

12
Table 2: Composition of answered telephone numbers 1. Number of successful telephone numbers 3163 2. Number of drop-out telephone numbers 285 3. Number of refusal telephone numbers 996 4. Number of telephone numbers with respondents not available to answer the call 2978 Total (1+2+3+4) 7422 The sampling error at a 95% confidence interval was 1.7%4. This means that we have 95% confidence that the population proportion falls within the sample proportion plus or minus 1.7%. For example, 90.2% of respondents in the sample agreed that mosquito bite was a serious issue and preventive measures should be taken. The 95% confidence interval of the estimated population proportion that agreed to the above statement would be 90.2% ±1.7%, that is, between 88.5% and 91.9%. Data Processing and Analysis All the descriptive statistics were reported in percentages. Statistical testing was applied to study sub-group differences. Associations between selected demographic information and response of selected questions were examined. For dengue fever, four logistic regression analyses were conducted to identify factors associated with respondents’ practice of preventive measures. Another three logistic regression analyses were run to find out the determinants of SARS prevention practices. To facilitate analysis, some of the variables were re-grouped in binary format or into a smaller number of categories. Different re-grouping criteria were set for different analyses to meet the need of this survey. Details of these rearrangements are discussed in the corresponding chapters. The statistical software, SPSS for Windows version 11.5, was used to perform all statistical analyses. Where there was a test for significance, it was run at 5% significance level (2-tailed). Some of descriptive figures might not add up to 100% because of rounding up of figures.
4 As the population proportion is unknown, 0.5 is put into the formula of the sampling error to produce the most conservative estimation of the sampling error. Therefore 0.017 (or 1.7%) is equal to 1.96 x {square root of [((0.5)(0.5))/(3163)]}.
13
Chapter 3 Findings of the Survey This chapter of the report presents a descriptive analysis of the survey findings in the following aspects:
Section 1 Demographic Information 1. Background of respondents Section 2 Dengue Fever 1. Respondents’ knowledge of dengue fe2. Respondents’ attitude towards dengue 3. Respondents’ risk perception of dengu4. Respondents’ practice for dengue feve5. Respondents’ awareness of dengue fev6. Respondents’ opinion about Govern
prevention information Section 3 SARS 1. Respondents’ knowledge of SARS 2. Respondents’ knowledge of SARS pati3. Respondents’ risk perception of SARS4. Respondents’ practice for SARS preve5. Respondents’ practice if they had had 6. Respondents’ perception of changes in7. Respondents’ awareness of SARS prev8. Respondents’ opinion about Governm
information Section 4 Environmental Hygiene 1. Information on environmental hygiene
ver fever e fever r prevention er prevention information ment’s efforts in providing dengue fever
ents ntion contact with SARS patients hygiene conditions after the SARS outbreak ention information ent’s efforts in providing SARS prevention

14
Section 1 Demographic Information This section briefly describes the characteristics of respondents in this survey. Table 3.1.1-1 is a detailed presentation of each demographic variable+. The 2001 Population Census statistics from the Census and Statistics Department are included for reference. 3.1.1 Background of respondents
Table 3.1.1-1: Personal information of respondents
This Survey
(%)
2001 Population
Census (%)
ThisSurvey
(%)
2001 Population
Census (%)
enderG #Marital status
emale f 56.3 51.5 never married 47.0 31.9male 43.7 48.5 now married 49.7 59.4 widowed 1.7 6.0Age divorced/separated 1.5 2.7
2-14 1 9.0 4.5
5-24 1 25.3 15.7 Education level# 5-34 2 17.2 18.9 no schooling/ kindergarten 2.1 8.45-44 3 22.1 23.3 primary 10.8 20.55-54 4 15.2 16.4 lower secondary (F.1-F.3) 23.0 18.9 5-64 5 6.3 8.6 upper secondary (F.4-F.5) 33.1 26.3 ≥65 4.7 12.7 matriculation 7.7 9.4 tertiary (non-degree) 6.9 3.7 tertiary (degree) or above 16.4 12.7
#ccupationO anagers and m
dministratorsa rofessionals pssociate professioa nals lerks cervice workers ans d hop sales workers s
raft and related wc orkers lant and machinep perators and asseo mblers lementary occupe ations killed agriculturas l and ishery workers anf d ccupations not clo assified elf-employed s
8.2 16.9 9.7 22.8
20.1
5.1
7.0 7.0
3.1 (2.0) ^
10.7 5.5
15.3 16.3
15.0
9.9
7.3 19.5
0.3 /
Occupation#
students housewives retired unemployed
Working indoors/outdoors
indoors outdoors
not fixed
(27.2)^ (17.2)^
(6.4)^
(5.1)^
70.3 15.9
13.8
/ / / /
/ /
/
ears livingY in Hong Place of birth ongK
< 7 years 4.8 14.9 Hong Kong 73.1 59.7 ≥ 7 years 95.2 85.1 other places 26.9 40.3

15
Living district Living district Hong Kong Island 7.7 19.9 New Territories East 42.2 24.7Wan Chai 0.4 2.5 Sai Kung 9.6 4.9 Eastern 3.4 9.2 Shatin 15.9 9.4Central and Western 1.6 3.9 North 7.8 4.5 Southern 2.3 4.3 Tai Po 6.3 4.6
Islands 2.6 1.3
Kowloon 21.4 30.2 New Territories West 28.5 25.2Kwun Tong 6.9 8.4 Tsuen Wan 3.6 4.1 Kowloon City 4.4 5.7 Kwai Tsing 6.4 7.1 Wong Tai Sin 4.9 6.6 Tuen Mun 9.4 7.3 Yau Tsim Mong 1.8 4.2 Yuen Long 9.1 6.7 Sham Shui Po 3.4 5.3
Housing type Housing type public housing 34.5 31.0 village houses 7.6 6.0 Housing Authority/ Society subsidized saleflats 17.7 15.9 staff quarter 0.9 1.1private residential flats 38.1 44.0 others 1.0 0.7 temporary quarter 0.1 1.2
Household income Household income<$2000 3.5 3.2 $15,000-$19,999 11.8 12.8$2,000-$3,999 2.1 4.8 $20,000-$24,999 14.0 10.9$4,000-$5,999 3.2 4.5 $25,000-$29,999 6.7 7.8$6,000-$7,999 4.2 5.7 $30,000-$39,999 12.7 10.7$8,000-$9,999 5.7 5.9 $40,000-$59,999 10.9 9.6$10,000-$14,999 17.8 15.5 ≥$60,000 7.4 8.7
All the missing data were not included in the table. Detailed descriptive statistics for these questions (Q58 to Q68) can be
found in Appendix B. # In 2001 Population Census, percentages of marital status, education level, and occupation were based on the population aged 15 and over.
^Because students, housewives, retired, and unemployed were not classified as the working population and self-employed was not a category classified in 2001 Population Census, percentages reported in brackets for these groups were derived from the survey sample (3163 respondents).
Gender There were more female respondents than male respondents in the survey. Female respondents comprised 56.3% of the sample and the remaining 43.7% were males. Age In terms of age, the largest group in the sample was respondents aged 35-44 (22.1%), followed by respondents aged 25-34 (17.2%). For the purpose of comparison with the 2001 Population Census statistics, respondents in age groups 15-17 and 18-24 were regrouped into one age group and it contained 25.3% of the sample altogether.
+
16
Marital status There were slightly more married respondents (49.7%) than the “never married” respondents (47.0%) in the sample. 1.7% and 1.5% of the respondents were widowed and divorced/separated respectively. Education level Many of the respondents were of a secondary education level. 33.1% were of an upper secondary education level and 23.0% were of a lower secondary education level. Only 7.7% of respondents received education up to matriculation level. The sample comprised 23.3% of the respondents who had tertiary level or above. Occupation The job categories used in the survey follow the classification of the Census and Statistics Department. The three most common occupations among the respondents were clerks (22.8%), service and shop sales workers (20.1%), and professionals (16.9%). Of the respondents in the sample, 27.2% were students. The non-working group included housewives (17.2%), the retired (6.4%) and the unemployed (5.1%), which took up 28.7% of the sample. Percentages shown in brackets in table 3.1.1-1 were derived from the actual sample of this present survey and they were not scaled for the comparison with the 2001 Population Census statistics because the Census does not include self-employed, students, housewives, retired and unemployed in the occupation classification. Among those who were working5, 70.3% were working indoors and 15.9% were working outdoors. 13.8% reported that they worked both indoors and outdoors. Years living in Hong Kong and place of birth Survey results indicated that 95.2% of the respondents had lived in Hong Kong for seven years or more and 73.1% of the respondents were born in Hong Kong. Living district The percentages of respondents living on Hong Kong Island and in Kowloon were 7.7% and 21.4% respectively. Most of the respondents lived in the New Territories. They comprised 70.7% of the sample. Housing type More than one-third (38.1%) of the respondents lived in private residential flats. Another one-third (34.5%) lived in public housing. The remaining were living in Housing Authority/Society subsidized sale flats (17.7%), village houses (7.6%), and other types of housing (2.0% in total). Household income The most common category was a monthly household income of $10,000-$14,999 (17.8%), followed by the $20,000-$24,999 household income group (14.0%) and the $30,000-$39,999 household income group (12.7%). 5 The sample size for this question (Q63) was 1426 because students, housewives, retired, and unemployed were excluded since they were not classified as the working population.
17
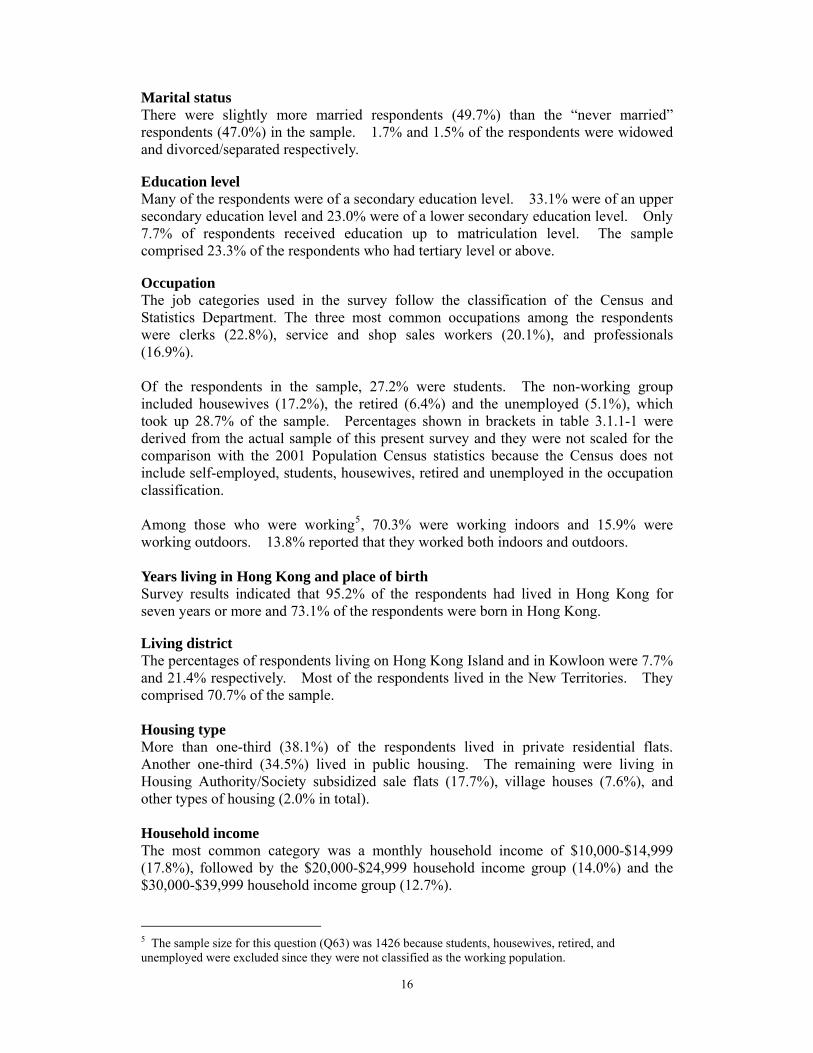
Section 2 Dengue Fever In this section, respondents’ responses in different areas of dengue fever are presented. 3.2.1 Respondents’ knowledge of dengue fever Four questions were included to explore respondents’ knowledge of dengue fever. Each correct response is presented as a shaded bar with two asterisks (**) beside its label. Transmission route for dengue fever Figure 3.2.1-1 shows respondents’ knowledge of the transmission route for dengue fever. It indicates that 95.8% of the respondents correctly identified that dengue fever is spread by mosquito bites. Other incorrect options, including person to person transmission and faecal-oral route, were chosen by not more than 5.0% of the respondents. Fig. 3.2.1-1: Transmission route for dengue fever
95.8%
1.9% 1.0% 1.3%0%
10%
20%
30%
40%
50%
60%
70%
80%
90%
100%
**mosquito bites person to person faecal-oral route don't know
(Base = 3163)
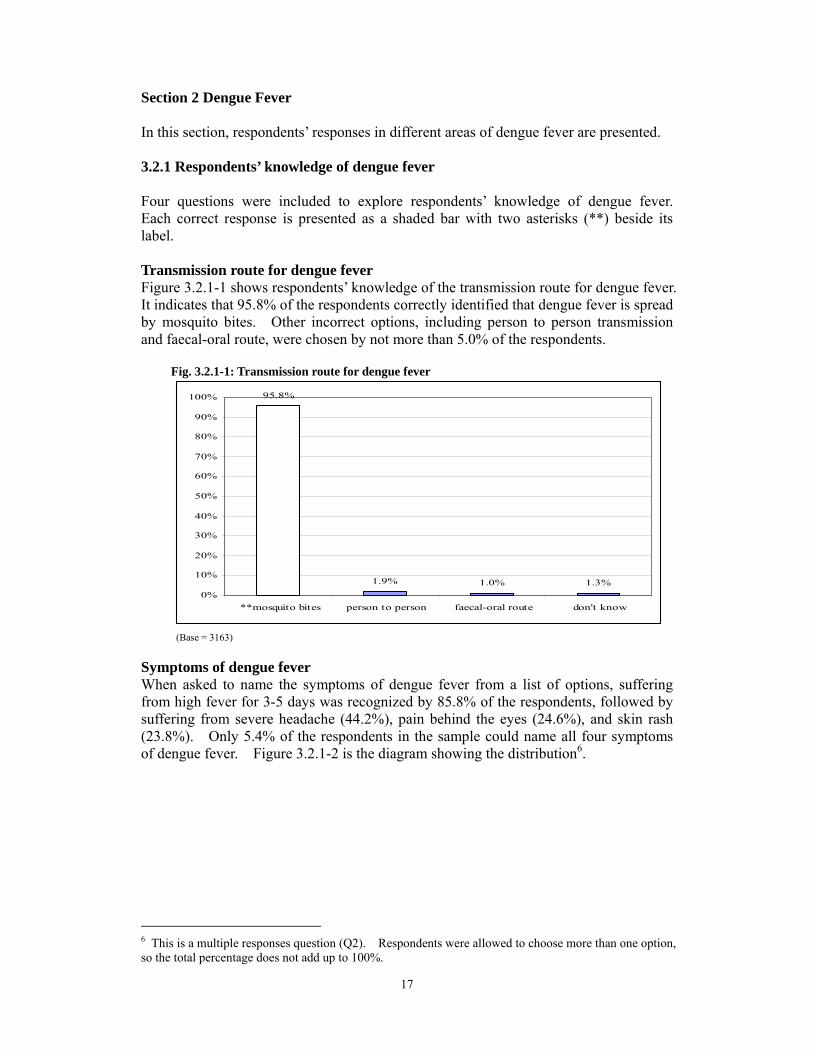
Symptoms of dengue fever When asked to name the symptoms of dengue fever from a list of options, suffering from high fever for 3-5 days was recognized by 85.8% of the respondents, followed by suffering from severe headache (44.2%), pain behind the eyes (24.6%), and skin rash (23.8%). Only 5.4% of the respondents in the sample could name all four symptoms of dengue fever. Figure 3.2.1-2 is the diagram showing the distribution6.
6 This is a multiple responses question (Q2). Respondents were allowed to choose more than one option, so the total percentage does not add up to 100%.
18
Fig. 3.2.1-2 Symptoms of dengue fever
85.8%
44.2%
24.6% 23.8%
4.3% 5.4%
0%10%20%30%40%50%60%70%80%90%
100%
**high feverfor 3-5 days
**severeheadache
**painbehind the
eyes
**skin rash don't know all correct
##All correct = respondents who correctly identified all the correct responses for this multiple responses question. (Base = 3163)
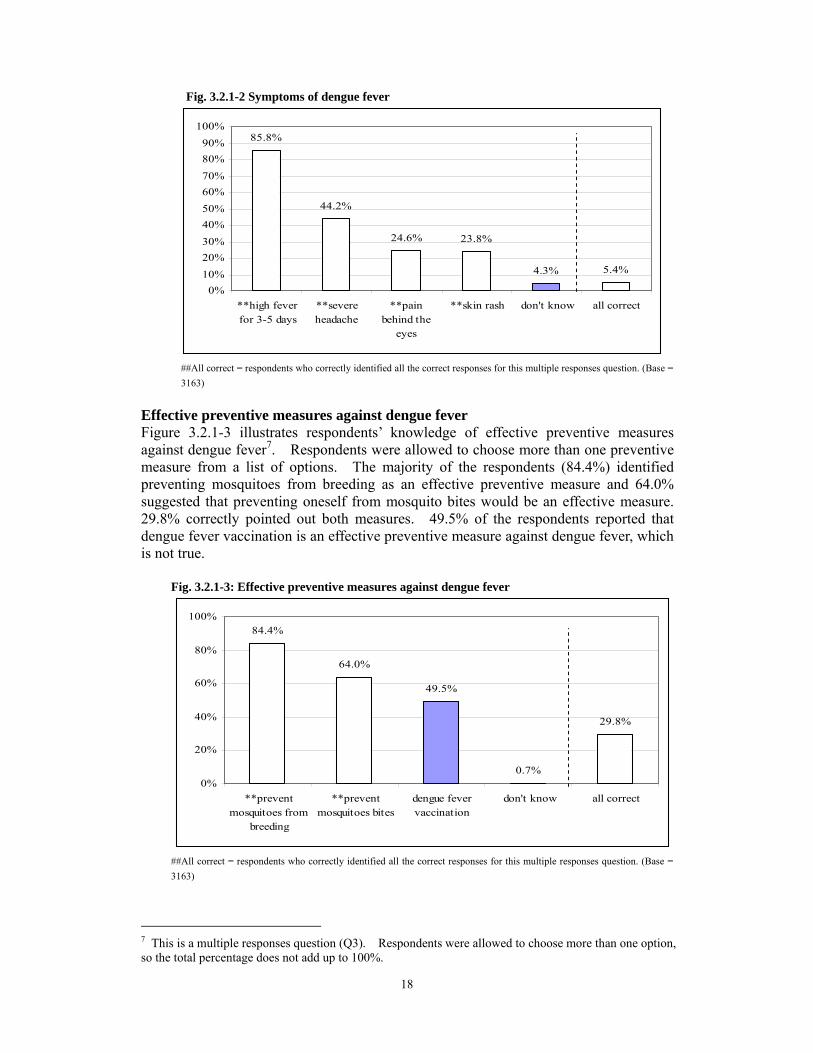
Effective preventive measures against dengue fever Figure 3.2.1-3 illustrates respondents’ knowledge of effectiv
7e preventive measures
against dengue fever . Respondents were allowed to choose more than one preventive measure from a list of options. The majority of the respondents (84.4%) identified preventing mosquitoes from breeding as an effective preventive measure and 64.0% suggested that preventing oneself from mosquito bites would be an effective measure. 29.8% correctly pointed out both measures. 49.5% of the respondents reported that dengue fever vaccination is an effective preventive measure against dengue fever, which is not true. Fig. 3.2.1-3: Effective preventive measures against dengue fever
84.4%
64.0%
49.5%
0.7%
29.8%
0%
20%
40%
60%
80%
100%
**preventmosquitoes from
breeding
**preventmosquitoes bites
dengue fevervaccination
don't know all correct
##All correct = respondents who correctly identified all the correct responses for this multiple responses question. (Base = 3163)
7 This is a multiple responses question (Q3). Respondents were allowed to choose more than one option, so the total percentage does not add up to 100%.

Penalty for allowing mosquitoes or insects to breed in stagnant water From Figure 3.2.1-4, we can see that 32.2% of the respondents thought that allowing mosquitoes or insects to breed in stagnant water would only be punished by verbalwarning but not a fine. 62.2% of the respondents knew that there would be a fine.
Fig. 3.2.1-4: Do you think the following statement is true? “According to the law of theHKSAR, those who allow mosquitoes or insects to breed in stagnant water will only bepunished by verbal warning but not by a fine.”
32.2%
62.2%
5.5%
0%
10%
20%
30%
40%
50%
60%
70%
true **false don't know
(Base = 3163) Areas most likely to catch dengue fever when travelling Figure 3.2.1-5 reveals respondents’ knowledge of areas most likely to contract dengue fever when travelling8. 85.6% correctly said that those travelling to tropical and subtropical areas were most likely to catch dengue fever. 33.2% of respondents thought that people travelling in temperate areas were most likely to catch this disease. Only 1.9% identified polar areas as susceptible places to catch dengue fever.
Fig. 3.2.1-5: In which of the following areas are you most likely to catch dengue fever when travelling?
85.6%
33.2%
1.9% 0.6%0%
10%
20%
30%
40%
50%
60%
70%
80%
90%
**tropical & subtropicalareas
temperate areas polar areas don't know
This is a multiple responses question. (Base = 3163)
19
8 This is a multiple responses question (Q8). Respondents were allowed to choose more than one option, so the total percentage does not add up to 100%.
20
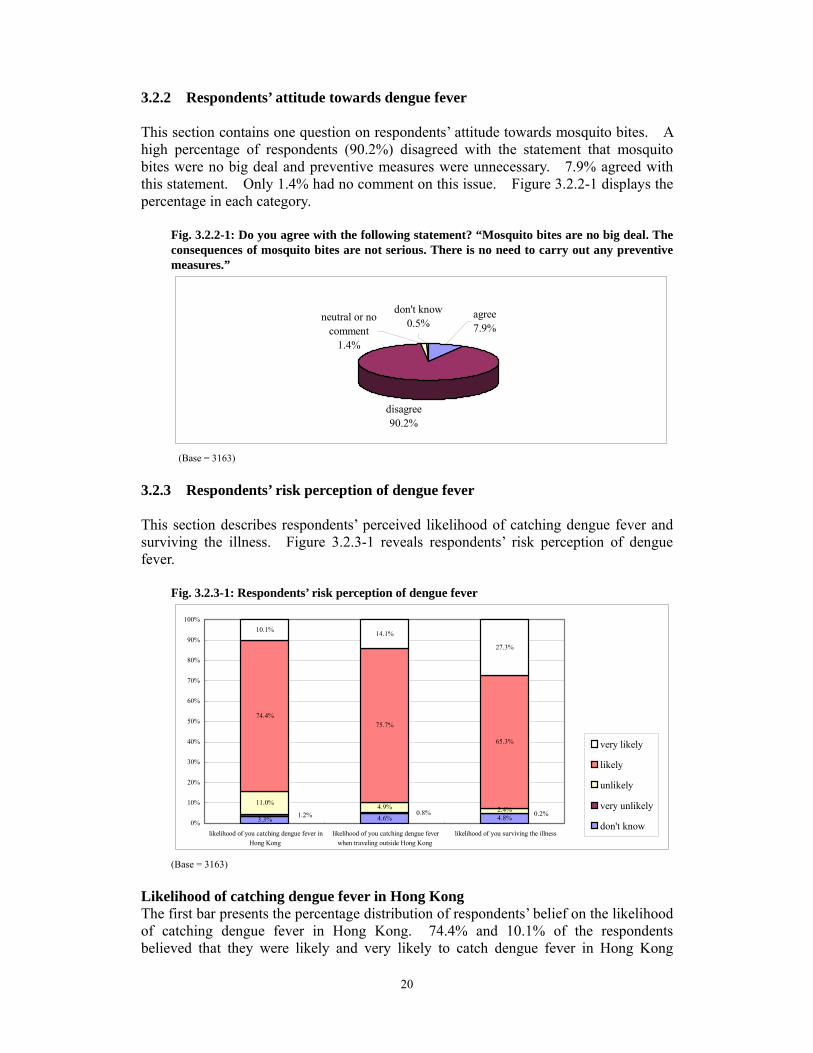
3.2.2 Respondents’ attitude towards dengue fever This section contains one question on respondents’ attitude towards mosquito bites. A high percentage of respondents (90.2%) disagreed with the statement that mosquito bites were no big deal and preventive measures were unnecessary. 7.9% agreed with this statement. Only 1.4% had no comment on this issue. Figure 3.2.2-1 displays the percentage in each category.
Fig. 3.2.2-1: Do you agree with the following statement? “Mosquito bites are no big deal. The consequences of mosquito bites are not serious. There is no need to carry out any preventive measures.”
disagree90.2%
neutral or nocomment
1.4%
don't know0.5%
agree7.9%
(Base = 3163)
This section describes respondents’ perceived likelihood of catching dengue fever and surviving the illness. Figure 3.2.3-1 reveals respondents’ risk perception of dengue fever.
Fig. 3.2.3-1: Respondents’ risk perception of dengue fever
3.2.3 Respondents’ risk perception of dengue fever
3.3% 4.6% 4.8%
11.0% 4.9%
74.4%75.7%
65.3%
10.1% 14.1%
27.3%
0.8%1.2% 0.2%2.4%
0%
10%
20%
30%
40%
50%
60%
70%
80%
90%
100%
likelihood of you catching dengue fever inHong Kong
likelihood of you catching dengue feverwhen traveling outside Hong Kong
likelihood of you surviving the illness
very likely
likely
unlikely
very unlikely
don't know
(Base = 3163)
Likelihood of catching dengue fever in Hong Kong The first bar presents the percentage distribution of respondents’ belief on the likelihood of catching dengue fever in Hong Kong. 74.4% and 10.1% of the respondents believed that they were likely and very likely to catch dengue fever in Hong Kong
21
respectively. Only about 1.0% of respondents went into the other extreme. About 11.0% thought that they were unlikely to be infected by dengue fever in Hong Kong.
Likelihood of catching dengue fever when travelling abroad Similar to the previous question, many respondents thought that they were likely or very likely (75.7% and 14.1%, respectively) to catch dengue fever when travelling abroad. Only very few respondents thought that it was unlikely (4.9%) or very unlikely (0.8%) to catch dengue fever outside Hong Kong.
Likelihood of surviving the illness When asked if they caught dengue fever, what would be the likelihood of surviving the illness, 65.3% and 27.3% of the respondents believed that they would be likely or very likely to survive the illness respectively. Only 0.2% of the respondents thought that they were unlikely to survive once they got the disease. 4.8% reported that it was very unlikely for them to survive the illness.
3.2.4 Respondents’ practice for dengue fever prevention
In this section, respondents’ practice for dengue fever prevention in the past three months is examined. The option “not applicable” for each preventive measure means that such practice does not apply to the respondents. For example, if respondents answered “not applicable” to the question, “Did you change water for flowers or plants at least once a week?” (3.2.4-2), that means that those respondents did not have any plants that needed watering. Therefore, they were not asked the reasons for not doing such practice in the survey. The percentages shown for practice hindrances were based on the respondents who did not carry out the practice.
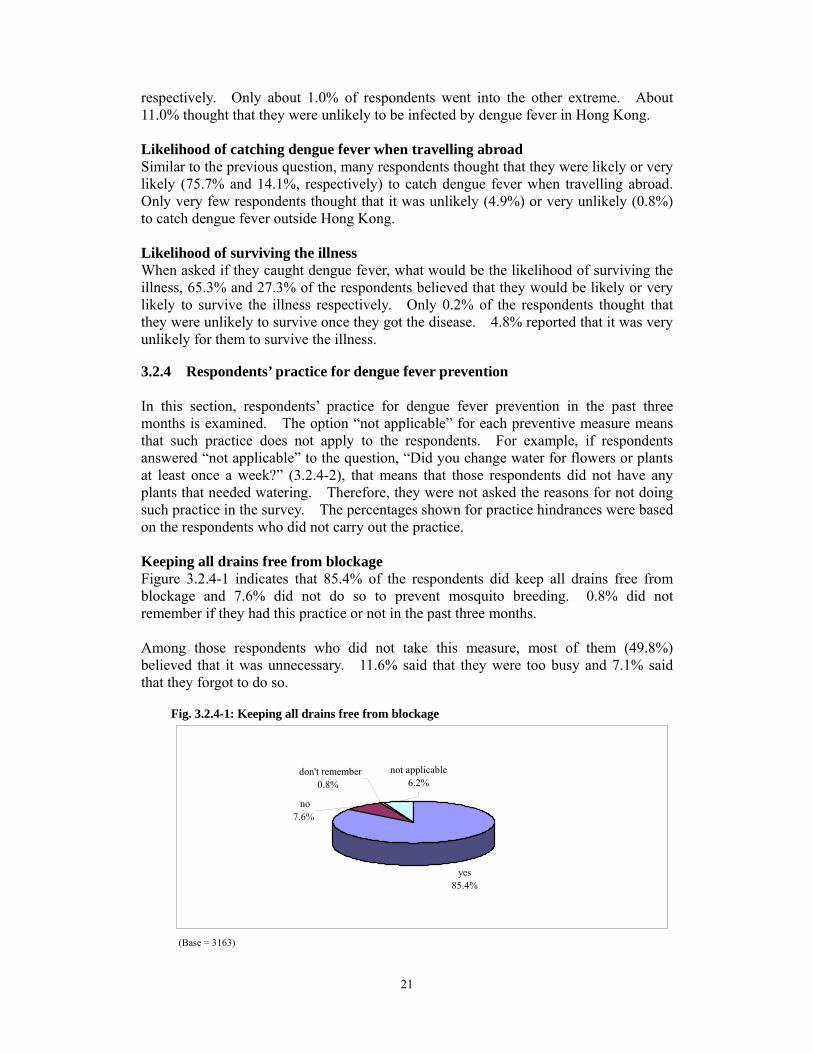
Keeping all drains free from blockage Figure 3.2.4-1 indicates that 85.4% of the respondents did keep all drains free from blockage and 7.6% did not do so to prevent mosquito breeding. 0.8% did not remember if they had this practice or not in the past three months.
Among those respondents who did not take this measure, most of them (49.8%) believed that it was unnecessary. 11.6% said that they were too busy and 7.1% said that they forgot to do so.
Fig. 3.2.4-1: Keeping all drains free from blockage
yes85.4%
not applicable6.2%
no7.6%
don't remember0.8%
(Base = 3163)
22
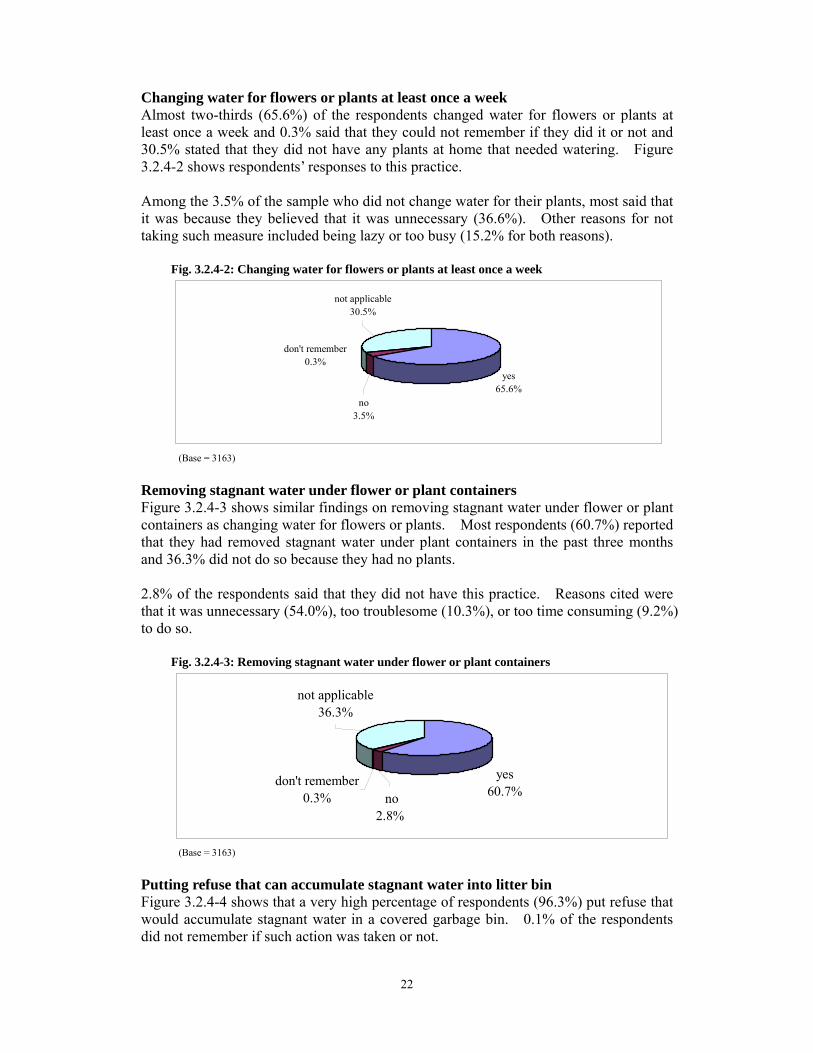
Changing water for flowers or plants at least once a week Almost two-thirds (65.6%) of the respondents changed water for flowers or plants at least once a week and 0.3% said that they could not remember if they did it or not and 30.5% stated that they did not have any plants at home that needed watering. Figure 3.2.4-2 shows respondents’ responses to this practice. Among the 3.5% of the sample who did not change water for their plants, most said that it was because they believed that it was unnecessary (36.6%). Other reasons for not taking such measure included being lazy or too busy (15.2% for both reasons). Fig. 3.2.4-2: Changing water for flowers or plants at least once a week
yes65.6%
no3.5%
don't remember0.3%
not applicable30.5%
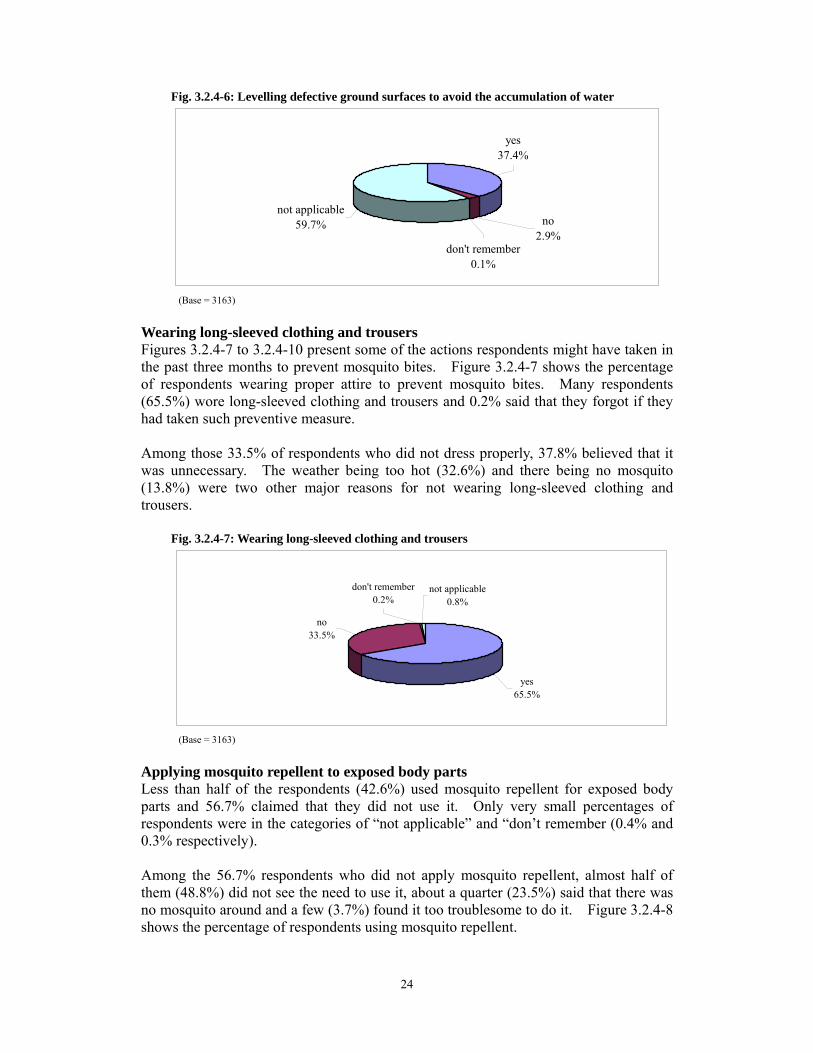
(Base = 3163) Removing stagnant water under flower or plant containers Figure 3.2.4-3 shows similar findings on removing stagnant water under flower or plant containers as changing water for flowers or plants. Most respondents (60.7%) reported that they had removed stagnant water under plant containers in the past three months and 36.3% did not do so because they had no plants. 2.8% of the respondents said that they did not have this practice. Reasons cited were that it was unnecessary (54.0%), too troublesome (10.3%), or too time consuming (9.2%) to do so. Fig. 3.2.4-3: Removing stagnant water under flower or plant containers
yes60.7%
don't remember0.3% no
2.8%
not applicable36.3%
(Base = 3163) Putting refuse that can accumulate stagnant water into litter bin Figure 3.2.4-4 shows that a very high percentage of respondents (96.3%) put refuse that would accumulate stagnant water in a covered garbage bin. 0.1% of the respondents did not remember if such action was taken or not.

23
Among those who did not practice it (1.6%), 36.0% thought that it was unnecessary and 14.0% said that it was too troublesome to take such measure. Some respondents claimed that they were too busy or too lazy (each comprised 14.0% of those who did not do it) to do so. Fig. 3.2.4-4: Putting refuse that can accumulate stagnant water into litter bin
yes96.3%
no1.6%
not applicable2.1%
don't remember0.1%
(Base = 3163) Having all water containers tightly covered Many respondents (67.0%) in the sample reported that they covered all water containers, water storage tanks or wells properly (Figure 3.2.4-5). 31.1% said that this practice did not apply to them and 0.2% claimed that they did not remember if this measure had been taken in the past three months. Among the 1.7% who did not cover all the water containers properly, most thought that it was unnecessary (43.6%). Being lazy (10.9%) and having forgotten (12.7%) to do so were two other hindrances for not taking this preventive measure against mosquito breeding. Fig. 3.2.4-5: Having all water containers, water storage tanks or well covered tightly
yes67.0%
no1.7%
don't remember0.2%
not applicable31.1%
(Base = 3163)
Levelling defective ground surfaces Figure 3.2.4-6 shows that this practice was not applicable to many respondents in the sample (59.7%). 37.4% did level defective ground surfaces to avoid the accumulation of stagnant water.
2.9% stated that they did not have such practice. 51.6% of them claimed that it was unnecessary to do so. Others said they were too busy (15.4%) or that they did not do so because they had no materials to level the defective ground surfaces (12.1%).
24
Fig. 3.2.4-6: Levelling defective ground surfaces to avoid the accumulation of water
not applicable59.7% no
2.9%don't remember
0.1%
yes37.4%
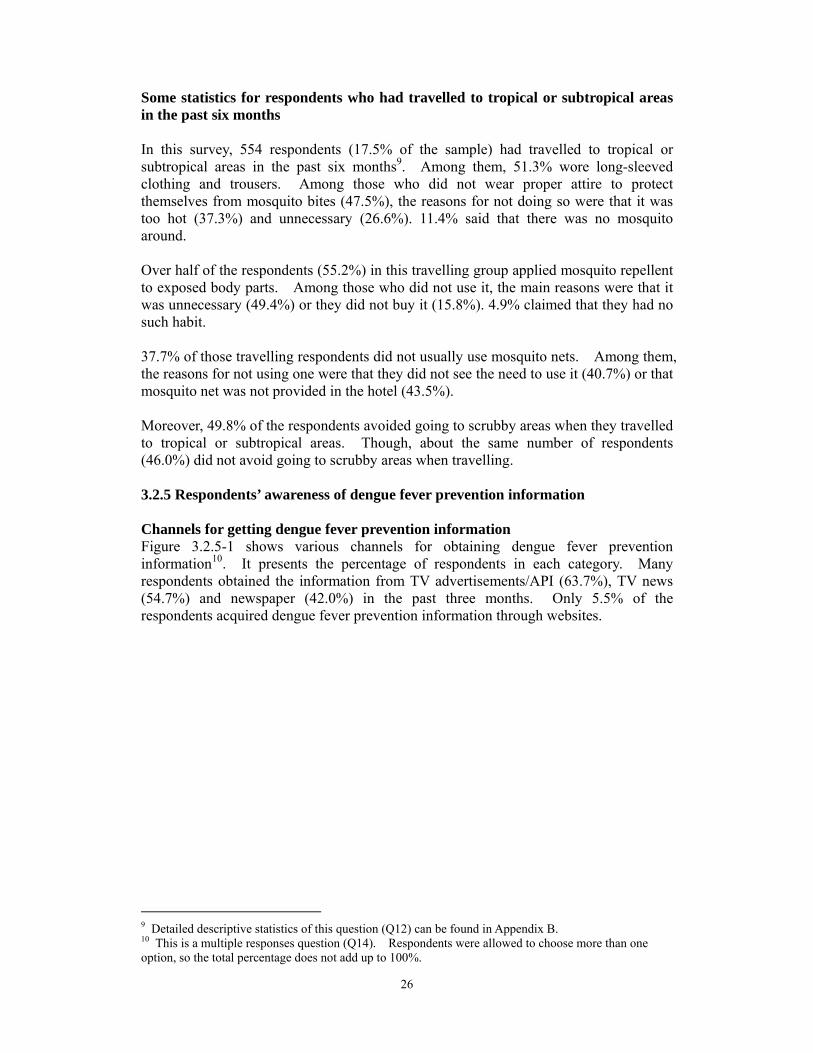
(Base = 3163) Wearing long-sleeved clothing and trousers Figures 3.2.4-7 to 3.2.4-10 present some of the actions respondents might have taken in the past three months to prevent mosquito bites. Figure 3.2.4-7 shows the percentage of respondents wearing proper attire to prevent mosquito bites. Many respondents(65.5%) wore long-sleeved clothing and trousers and 0.2% said that they forgot if they had taken such preventive measure.
Among those 33.5% of respondents who did not dress properly, 37.8% believed that it was unnecessary. The weather being too hot (32.6%) and there being no mosquito(13.8%) were two other major reasons for not wearing long-sleeved clothing andtrousers.
Fig. 3.2.4-7: Wearing long-sleeved clothing and trousers
yes65.5%
not applicable0.8%
don't remember0.2%
no33.5%
(Base = 3163)
Applying mosquito repellent to exposed body parts Less than half of the respondents (42.6%) used mosquito repellent for exposed body parts and 56.7% claimed that they did not use it. Only very small percentages of respondents were in the categories of “not applicable” and “don’t remember (0.4% and 0.3% respectively).
Among the 56.7% respondents who did not apply mosquito repellent, almost half of them (48.8%) did not see the need to use it, about a quarter (23.5%) said that there was no mosquito around and a few (3.7%) found it too troublesome to do it. Figure 3.2.4-8 shows the percentage of respondents using mosquito repellent.

25
Fig. 3.2.4-8: Applying mosquito repellent to exposed body parts
yes42.6%
no56.7%
not applicable0.4%don't remember
0.3%
(Base = 3163) Installing mosquito nets in non-air-conditioned rooms Figure 3.2.4-9 indicates that two-thirds (66.3%) of the respondents did not use mosquito nets in non-air-conditioned rooms. Only 18.0% of the respondents installed mosquito nets.
The reasons for not installing mosquito nets were similar to those for not wearing long-sleeved clothing and trousers, that is, “not necessary” (42.8%), “no mosquito” (28.8%), and “no such habit” (4.5%).
Fig. 3.2.4-9: Installing mosquito nets in non-air-conditioned rooms
yes18.0%
not applicable15.5%
don't remember0.2%
no66.3%
(Base = 3163) Avoiding scrubby areas As shown in Figure 3.2.4-10, 59.6% of the respondents avoided going to scrubby areas but 37.8% did not do so.
Fig. 3.2.4-10: Avoiding scrubby areas
yes59.6%
no37.8%
don't remember0.2%
not applicable2.4%
(Base = 3163)
26
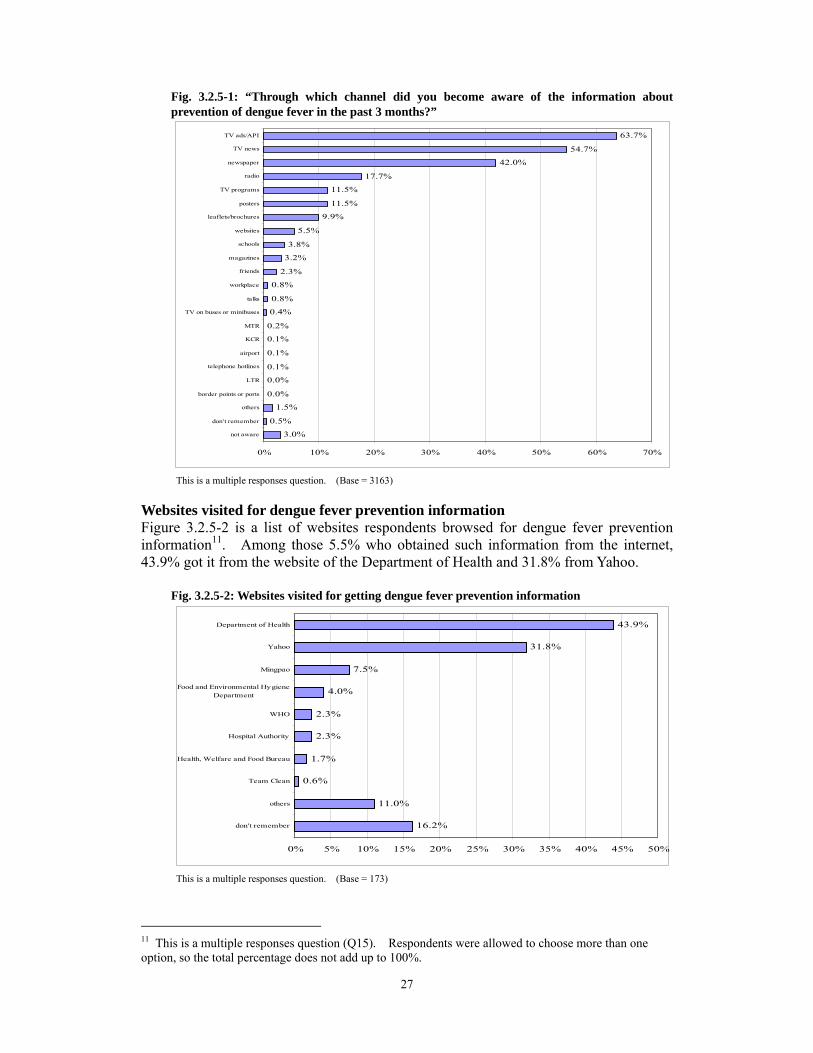
Some statistics for respondents who had travelled to tropical or subtropical areas in the past six months In this survey, 554 respondents (17.5% of the sample) had travelled to tropical or subtropical areas in the past six months9. Among them, 51.3% wore long-sleeved clothing and trousers. Among those who did not wear proper attire to protect themselves from mosquito bites (47.5%), the reasons for not doing so were that it was too hot (37.3%) and unnecessary (26.6%). 11.4% said that there was no mosquito around. Over half of the respondents (55.2%) in this travelling group applied mosquito repellent to exposed body parts. Among those who did not use it, the main reasons were that it was unnecessary (49.4%) or they did not buy it (15.8%). 4.9% claimed that they had no such habit. 37.7% of those travelling respondents did not usually use mosquito nets. Among them, the reasons for not using one were that they did not see the need to use it (40.7%) or that mosquito net was not provided in the hotel (43.5%). Moreover, 49.8% of the respondents avoided going to scrubby areas when they travelled to tropical or subtropical areas. Though, about the same number of respondents (46.0%) did not avoid going to scrubby areas when travelling. 3.2.5 Respondents’ awareness of dengue fever prevention information Channels for getting dengue fever prevention information Figure 3.2.5-1 shows various channels for obtaining dengue fever prevention information10. It presents the percentage of respondents in each category. Many respondents obtained the information from TV advertisements/API (63.7%), TV news (54.7%) and newspaper (42.0%) in the past three months. Only 5.5% of the respondents acquired dengue fever prevention information through websites.
9 Detailed descriptive statistics of this question (Q12) can be found in Appendix B. 10 This is a multiple responses question (Q14). Respondents were allowed to choose more than one option, so the total percentage does not add up to 100%.
27
Fig. 3.2.5-1: “Through which channel did you become aware of the information about prevention of dengue fever in the past 3 months?”
3.0%
0.5%
1.5%
0.0%
0.0%
0.1%
0.1%
0.1%
0.2%
0.4%
0.8%
0.8%
2.3%
3.2%
3.8%
5.5%
9.9%
11.5%
11.5%
17.7%
42.0%
54.7%
63.7%
0% 10% 20% 30% 40% 50% 60% 70%
not aware
don't remember
others
border points or ports
LTR
telephone hotlines
airport
KCR
MTR
TV on buses or minibuses
talks
workplace
friends
magazines
schools
websites
leaflets/brochures
posters
TV programs
radio
newspaper
TV news
TV ads/API
This is a multiple responses question. (Base = 3163)
Websites visited for dengue fever prevention information Figure 3.2.5-2 is a list of websites respondents browsed for dengue fever prevention information11. Among those 5.5% who obtained such information from the internet, 43.9% got it from the website of the Department of Health and 31.8% from Yahoo. Fig. 3.2.5-2: Websites visited for getting dengue fever prevention information
16.2%
11.0%
0.6%
1.7%
2.3%
2.3%
4.0%
7.5%
31.8%
43.9%
0% 5% 10% 15% 20% 25% 30% 35% 40% 45% 50%
don't remember
others
Team Clean
Health, Welfare and Food Bureau
Hospital Authority
WHO
Food and Environmental HygieneDepartment
Mingpao
Yahoo
Department of Health
This is a multiple responses question. (Base = 173)
11 This is a multiple responses question (Q15). Respondents were allowed to choose more than one option, so the total percentage does not add up to 100%.
28
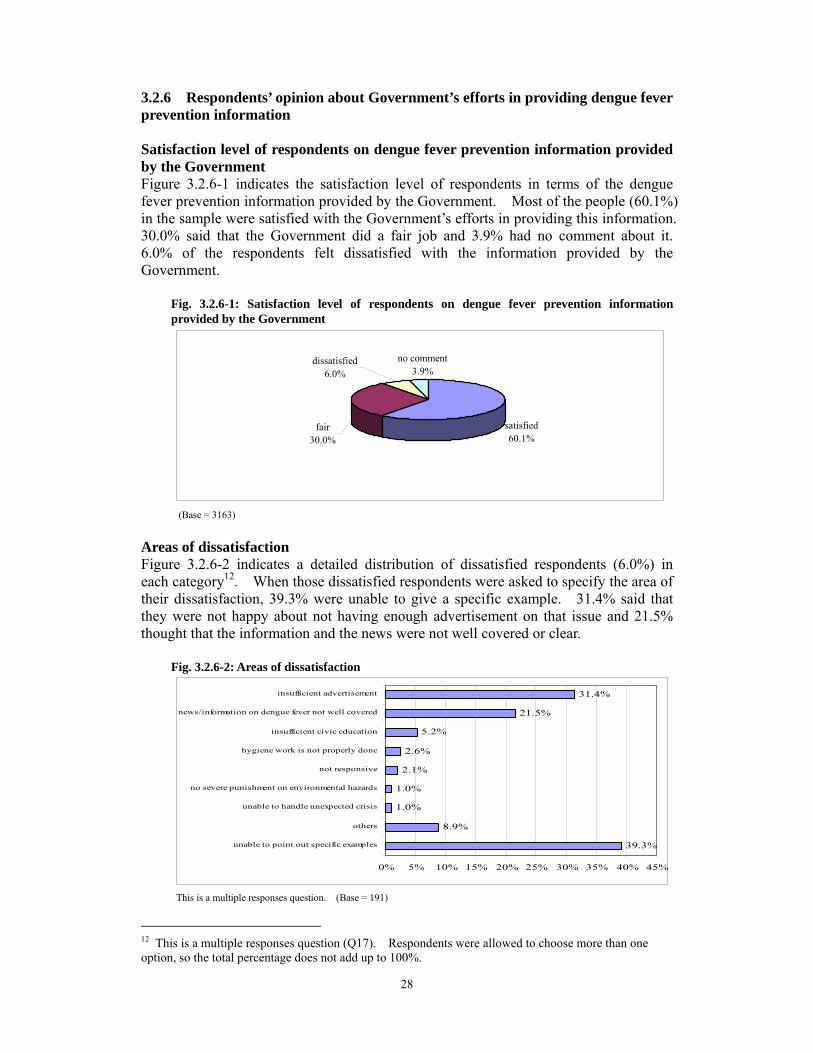
3.2.6 Respondents’ opinion about Government’s efforts in providing dengue fever prevention information Satisfaction level of respondents on dengue fever prevention information provided by the Government Figure 3.2.6-1 indicates the satisfaction level of respondents in terms of the dengue fever prevention information provided by the Government. Most of the people (60.1%) in the sample were satisfied with the Government’s efforts in providing this information. 30.0% said that the Government did a fair job and 3.9% had no comment about it. 6.0% of the respondents felt dissatisfied with the information provided by the Government.
Fig. 3.2.6-1: Satisfaction level of respondents on dengue fever prevention information provided by the Government
satisfied60.1%
no comment3.9%
dissatisfied6.0%
fair30.0%
(Base = 3163)
Areas of dissatisfaction Figure 3.2.6-2 indicates a detailed distribution of dissatisfied respondents (6.0%) in each category12. When those dissatisfied respondents were asked to specify the area of their dissatisfaction, 39.3% were unable to give a specific example. 31.4% said that they were not happy about not having enough advertisement on that issue and 21.5% thought that the information and the news were not well covered or clear.
Fig. 3.2.6-2: Areas of dissatisfaction
39.3%
8.9%
1.0%
1.0%
2.1%
2.6%
5.2%
21.5%
31.4%
0% 5% 10% 15% 20% 25% 30% 35% 40% 45%
unable to point out specific examples
others
unable to handle unexpected crisis
no severe punishment on environmental hazards
not responsive
hygiene work is not properly done
insufficient civic education
news/information on dengue fever not well covered
insufficient advertisement
This is a multiple responses question. (Base = 191)
12 This is a multiple responses question (Q17). Respondents were allowed to choose more than one option, so the total percentage does not add up to 100%.

29
Section 3 SARS Respondents’ responses on different areas of SARS are presented in this section. 3.3.1 Respondents’ knowledge of SARS There are four questions on respondents’ knowledge of SARS. Each is presented as a shaded bar with two asterisks (**) marked beside its label. Transmission route for SARS Figure 3.3.1-1 shows respondents’ knowledge of the SARS transmission route. It reveals that 72.0% of the respondents correctly identified respiratory droplets as the route for transmitting SARS. Over one-fifth (22.3%) of the respondents said that SARS was transmitted by air. Only 3.1% named the faecal-oral route as the transmission route of SARS. Fig. 3.3.1-1: Transmission route for SARS
72.0%
22.3%
3.1% 2.7%
0%
10%
20%
30%
40%
50%
60%
70%
80%
** respiratory droplets air faecal-oral route Don't know
Symptoms of SARS Figure 3.3.1-2 shows the percentage of respondents who identified symptoms of SARS13. Respondents were allowed to choose more than one symptom from the given list. 92.8% recognized febrile illness (38oC or above) as a symptom of SARS. 60.5% and 57.5% of respondents pointed out cough and shortness of breath as SARS symptoms respectively. Headache was the correct symptom least identified and only 44.2% of the respondents named it correctly. A quarter (25.0%) of the respondents could correctly point out all four options as symptoms of SARS.
(Base = 3163)
13 This is a multiple responses question (Q19). Respondents were allowed to choose more than one option, so the total percentage does not add up to 100%.

30
Fig. 3.3.1-2: Symptoms of SARS
92.8%
44.2%
60.5% 57.5%
1.2%
25.0%
0%10%20%30%40%50%60%70%80%90%
100%
**fever(38℃ orabove)
**headache **cough **shortnessof breath
don't know all correct
##All correct = respondents who correctly identified all the correct responses for this multiple responses question. (Base = 3163)
Situations where a mask should be worn Respondents said that one should wear a mask when having symptoms of respiratory tract infection (88.1%) and when visiting the sick in hospitals (83.4%). Other prominent situations respondents named included having had close contact with SARS patients (75.8%), taking care of patients with respiratory infection symptoms (75.8%), and preparing or serving food (35.5%). Figure 3.3.1-3 shows the percentage distribution14. Fig. 3.3.1-3: Situations where a mask should be worn
88.1%
75.8% 75.8%
83.4%
35.5%
7.8%
3.5% 2.9%5.7%
0.8% 0.7% 0.2% 1.7% 0.6%
0%
10%
20%
30%
40%
50%
60%
70%
80%
90%
100%
**when having
symptoms of
respiratory
tract infection
*having had
close contact
with SARS
patients
*when taking
care of patients
with respiratory
infection symp
*when visiting
the sick in
hospitals
when preparing
or serving food
when going to
crowded area
when going to
public area
SARS peak
period
when sick when cleaning
home
when going to
air-con place
dirty places others don't know
This is a multiple responses question. (Base = 3163)
14 This is a multiple responses question (Q20). Respondents were allowed to choose more than one option, so the total percentage does not add up to 100%.
31
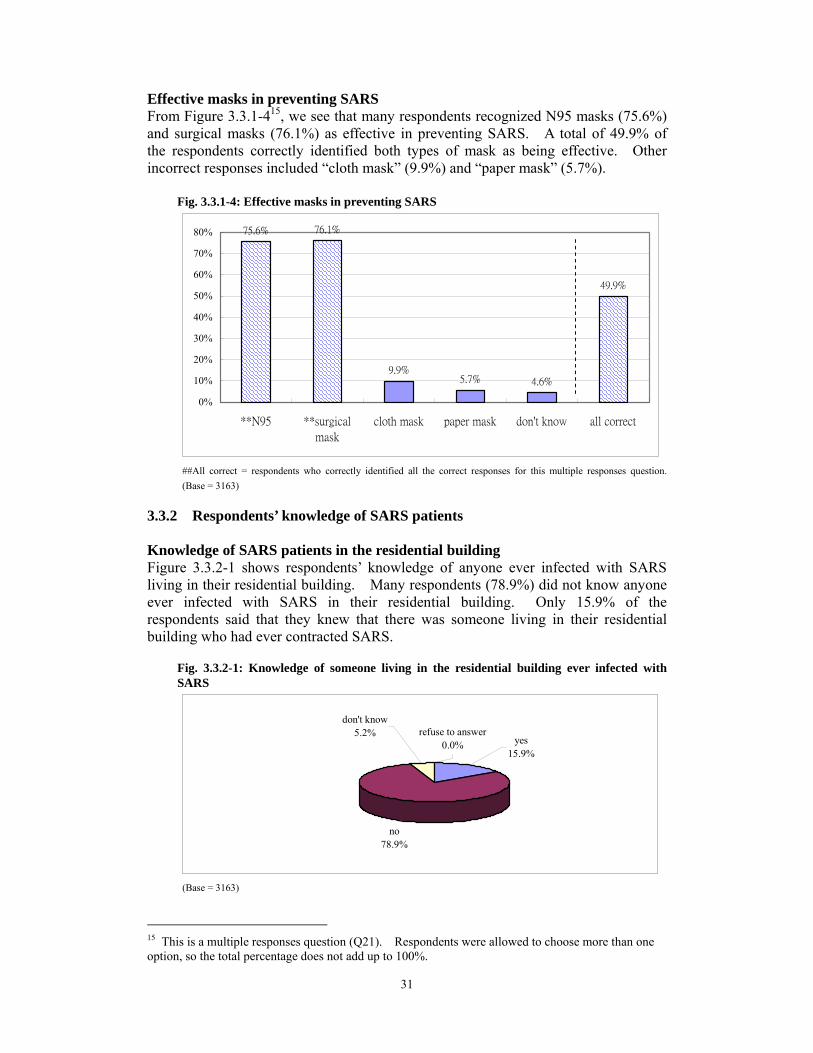
Effective masks in preventing SARS From Figure 3.3.1-415, we see that many respondents recognized N95 masks (75.6%) and surgical masks (76.1%) as effective in preventing SARS. A total of 49.9% of the respondents correctly identified both types of mask as being effective. Other incorrect responses included “cloth mask” (9.9%) and “paper mask” (5.7%).
Fig. 3.3.1-4: Effective masks in preventing SARS
75.6% 76.1%
9.9%5.7% 4.6%
49.9%
0%
10%
20%
30%
40%
50%
60%
70%
80%
**N95 **surgical
mask
cloth mask paper mask don't know all correct
##All correct = respondents who correctly identified all the correct responses for this multiple responses question. (Base = 3163)
3.3.2 Respondents’ knowledge of SARS patients Knowledge of SARS patients in the residential building Figure 3.3.2-1 shows respondents’ knowledge of anyone ever infected with SARS living in their residential building. Many respondents (78.9%) did not know anyone ever infected with SARS in their residential building. Only 15.9% of the respondents said that they knew that there was someone living in their residential building who had ever contracted SARS.
Fig. 3.3.2-1: Knowledge of someone living in the residential building ever infected with SARS
no78.9%
refuse to answer0.0% yes
15.9%
don't know5.2%
(Base = 3163)
15 This is a multiple responses question (Q21). Respondents were allowed to choose more than one option, so the total percentage does not add up to 100%.

32
Knowledge of SARS patient Figure 3.3.2-2 presents respondents’ personal knowledge of anyone ever infected with SARS. 92.2% did not know anyone ever infected with SARS and 7.2% knew someone who had contracted SARS previously.
Fig. 3.3.2-2: Knowledge of someone ever infected with SARS
yesdon't know 7.2%
0.6%
no92.2%
(Base = 3163)
3.3.3 Respondents’ risk perception of SARS This section describes respondents’ views on the likelihood of catching SARS and surviving SARS (Figure 3.3.3-1). 25.6% and 7.0% of the respondents said that it was unlikely and very unlikely for them to contract SARS respectively. 50.0% of the sample thought that it was likely for them to catch SARS and 2.8% believed that they were very likely to be infected by this disease. But 65.4% claimed that they were likely to survive the disease and 13.3% said it was very likely for them to survive. Fig. 3.3.3-1: Respondents’ risk perception of SARS
100% 2.8%13.3%90%
80%50.0%70%
60%65.4%
50%
40%25.6%
30%
20% 7.0% 6.6%2.5%
10% 14.7% 12.2%0%
likelihood of catching SARS likelihood of you surviving theillness
very likely
likely
unlikely
very unlikely
don't know
(Base = 3163)

33
3.3.4 Respondents’ practice for SARS prevention This section shows respondents’ practice for SARS preventive measures in the past three days. The option, “not applicable”, for each practice means that such practice does not apply to the respondents. For example, if respondents answered “not applicable” to the question, “How often did you cover your mouth and nose when you coughed or sneezed in the past three days?” (3.3.4-1), that means that those respondents did not cough or sneeze during that period. Therefore, they were not asked for the reasons for not doing so. The percentages shown for practice hindrances were based on the respondents who did not carry out the practice. Covering the mouth and nose when coughing or sneezing Most of the respondents (94.3%) covered their mouth and nose when coughing or sneezing at least sometimes while 70.5% of the sample always did so. Only 1.7% did not do it and the reasons were that it was unnecessary (40.7%) and that it was not their usual habit (18.5%). Some said that they forgot to do so (11.1%) when they coughed or sneezed. Figure 3.3.4-1 presents the distribution of respondents having this practice. Fig. 3.3.4-1: Covering the mouth and nose when coughing or sneezing
70.5%
19.4%
4.4%1.7% 0.2%
3.7%
0%
10%
20%
30%
40%
50%
60%
70%
80%
always often sometimes never don't
remember
not
applicable
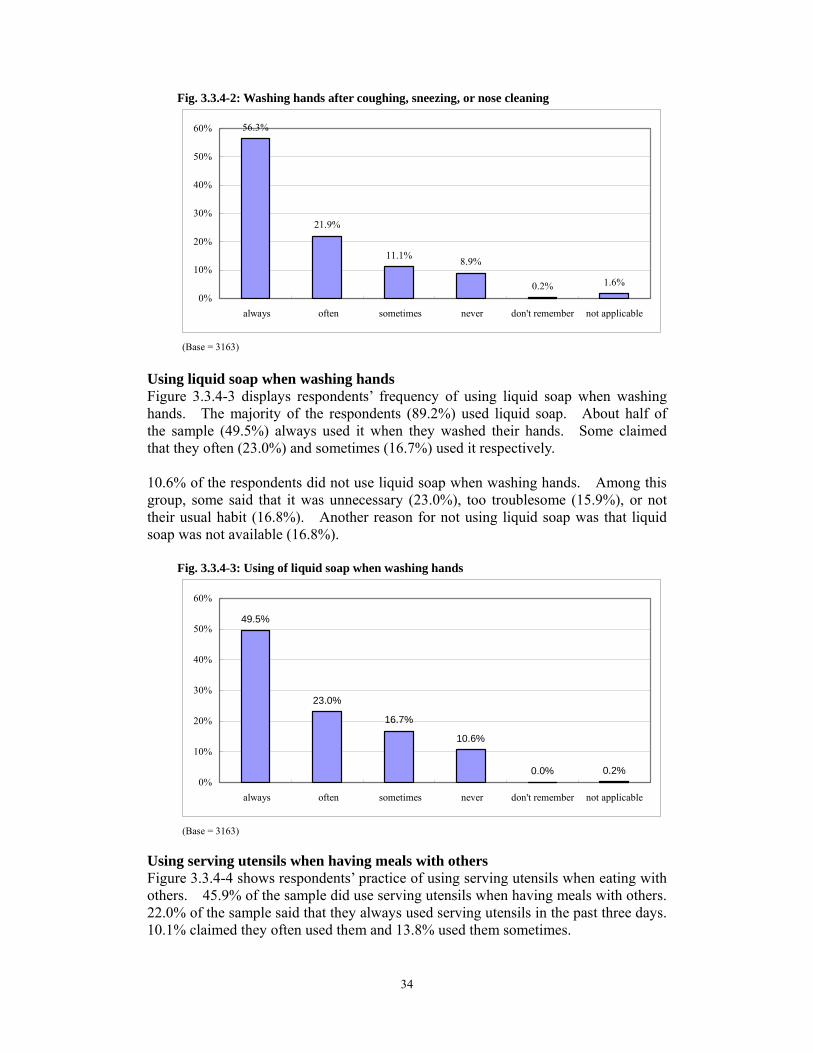
(Base = 3163) Washing hands after coughing, sneezing, or nose cleaning After coughing, sneezing, or cleaning their nose, 56.3% of the respondents alwayswashed their hands. 21.9% often washed their hands and 11.1% did it sometimes.8.9% reported that they did not do so (Figure 3.3.4-2). Among the 8.9% of respondents who did not have this practice, most of them claimed it was inconvenient to wash hands when staying outside (46.6%). Other hindrances included “no such habit” (12.1%), “unnecessary” (11.7%) and “too troublesome”(9.3%).
34
Fig. 3.3.4-2: Washing hands after coughing, sneezing, or nose cleaning
56.3%
21.9%
11.1% 8.9%
0.2% 1.6%0%
10%
20%
30%
40%
50%
60%
always often sometimes never don't remember not applicable
(Base = 3163)
Using liquid soap when washing hands Figure 3.3.4-3 displays respondents’ frequency of using liquid soap when washing hands. The majority of the respondents (89.2%) used liquid soap. About half of the sample (49.5%) always used it when they washed their hands. Some claimed that they often (23.0%) and sometimes (16.7%) used it respectively. 10.6% of the respondents did not use liquid soap when washing hands. Among this group, some said that it was unnecessary (23.0%), too troublesome (15.9%), or not their usual habit (16.8%). Another reason for not using liquid soap was that liquid soap was not available (16.8%). Fig. 3.3.4-3: Using of liquid soap when washing hands
49.5%
23.0%
16.7%
10.6%
0.0% 0.2%0%
10%
20%
30%
40%
50%
60%
always often sometimes never don't remember not applicable
(Base = 3163)
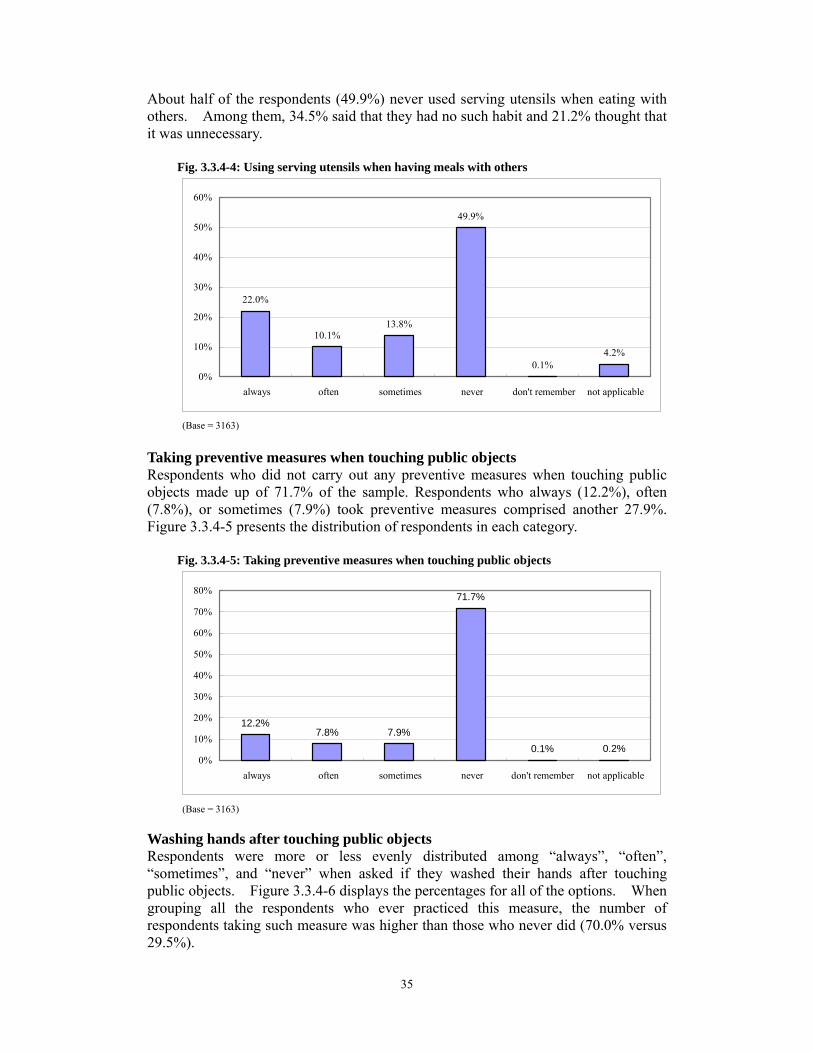
Using serving utensils when having meals with others Figure 3.3.4-4 shows respondents’ practice of using serving utensils when eating with others. 45.9% of the sample did use serving utensils when having meals with others. 22.0% of the sample said that they always used serving utensils in the past three days. 10.1% claimed they often used them and 13.8% used them sometimes.
35
About half of the respondents (49.9%) never used serving utensils when eating with others. Among them, 34.5% said that they had no such habit and 21.2% thought that it was unnecessary. Fig. 3.3.4-4: Using serving utensils when having meals with others
22.0%
10.1%13.8%
49.9%
0.1%4.2%
0%
10%
20%
30%
40%
50%
60%
always often sometimes never don't remember not applicable
(Base = 3163)
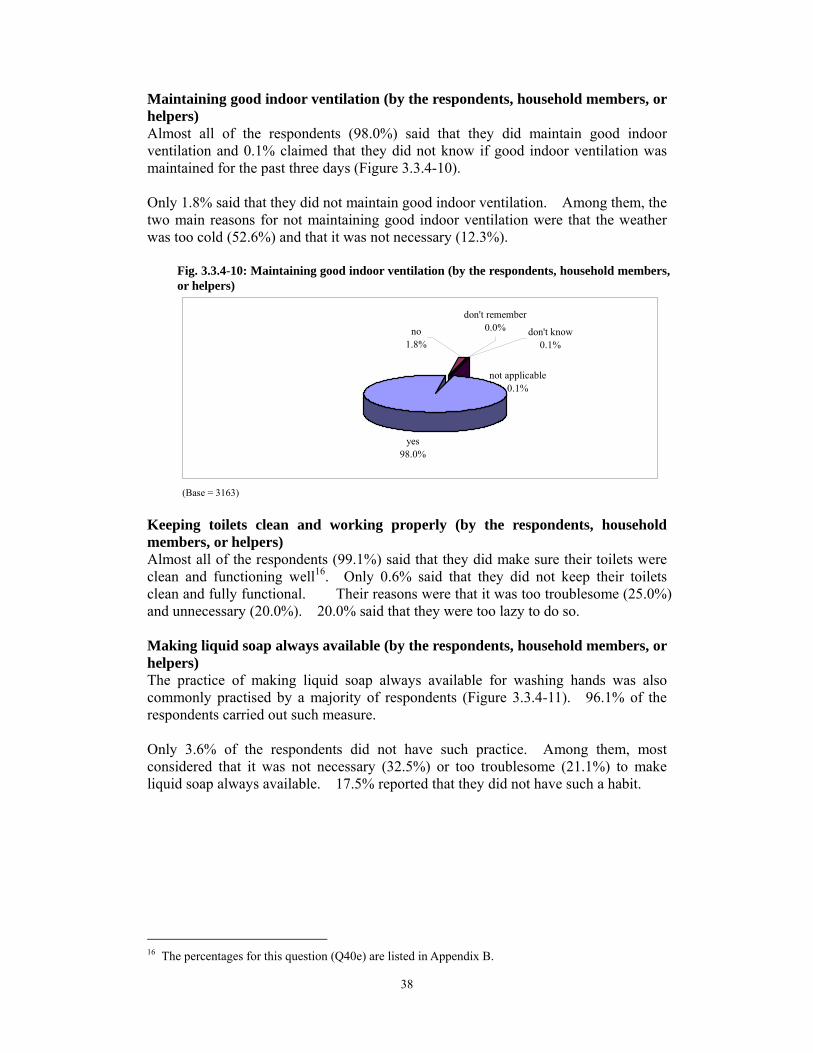
Taking preventive measures when touching public objects Respondents who did not carry out any preventive measures when touching public objects made up of 71.7% of the sample. Respondents who always (12.2%), often (7.8%), or sometimes (7.9%) took preventive measures comprised another 27.9%. Figure 3.3.4-5 presents the distribution of respondents in each category.
Fig. 3.3.4-5: Taking preventive measures when touching public objects
12.2%7.8% 7.9%
71.7%
0.1% 0.2%0%
10%
20%
30%
40%
50%
60%
70%
80%
always often sometimes never don't remember not applicable
(Base = 3163)
Washing hands after touching public objects Respondents were more or less evenly distributed among “always”, “often”,“sometimes”, and “never” when asked if they washed their hands after touching public objects. Figure 3.3.4-6 displays the percentages for all of the options. When grouping all the respondents who ever practiced this measure, the number ofrespondents taking such measure was higher than those who never did (70.0% versus 29.5%).

36
Among those who never washed their hands after touching public objects in the past three days, the most commonly given reason for not doing so was that they believed that it was unnecessary to do so (23.6%). Some respondents claimed that it was too troublesome (14.6%) or too difficult to find a place where they could wash their hands right away (14.5%). Fig. 3.3.4-6: Washing hands after touching public objects in the past 3 days
27.4%
19.2%
23.4%
29.5%
0.2% 0.3%0%
5%
10%
15%
20%
25%
30%
35%
always often sometimes never don't remember not applicable
(Base = 3163)
Avoiding using public towels 73.1% of the respondents always avoided using public towels. 6.8% and 2.9% of the respondents often and sometimes avoided using public towels respectively (Figure 3.3.4-7). Among those who used public towels (5.5%), most of them did not see the need for such avoidance (45.4%). Others felt that it was very convenient to use public towels (14.9%) or that the public towels were clean (14.9%).
Fig. 3.3.4-7: Avoiding using public towels
73.1%
6.8%2.9% 5.5%
0.1%
11.6%
0%
10%
20%
30%
40%
50%
60%
70%
80%
always often sometimes never don't remember not applicable
(Base = 3163)

37
Wearing a mask 90.7% of the respondents did not wear a mask in the past three days and only 9.2% said that they did (Figure 3.3.4-8). Among those who did, most of them wore it in the hospital or clinic (32.7%). Others wore it in the workplace and in public areas (18.2% and 16.4%, respectively). Surgical masks (77.4%) were the most commonly used, followed by N95 masks (8.7%).
Fig. 3.3.4-8: Wearing a mask
3.9% 1.7% 3.6%
90.7%
0.0% 0.1%0%
10%
20%
30%
40%
50%
60%
70%
80%
90%
100%
always often sometimes never don't remember not applicable
(Base = 3163)
Preventive measures taken at home in the past three days by the respondents, household members, or helpers Cleaning home everyday (by the respondents, household members, or helpers) Figure 3.3.4-9 indicates that many respondents (70.9%) cleaned their home everyday as a practice taken to prevent SARS in the past three days. 0.4% said that they did not know if the house was cleaned everyday for the past three days. 28.4% said they did not do so and many of them said that they were too busy (35.2%). Others claimed that they cleaned their home once or twice a week (28.9%). 14.9% considered that there was no need to clean the house everyday. Fig. 3.3.4-9: Cleaning home everyday (by the respondents, household members, or helpers)
yes70.9%
no28.4%
don't know0.4%don't remember
0.0%not applicable
0.2%
(Base = 3163)
38
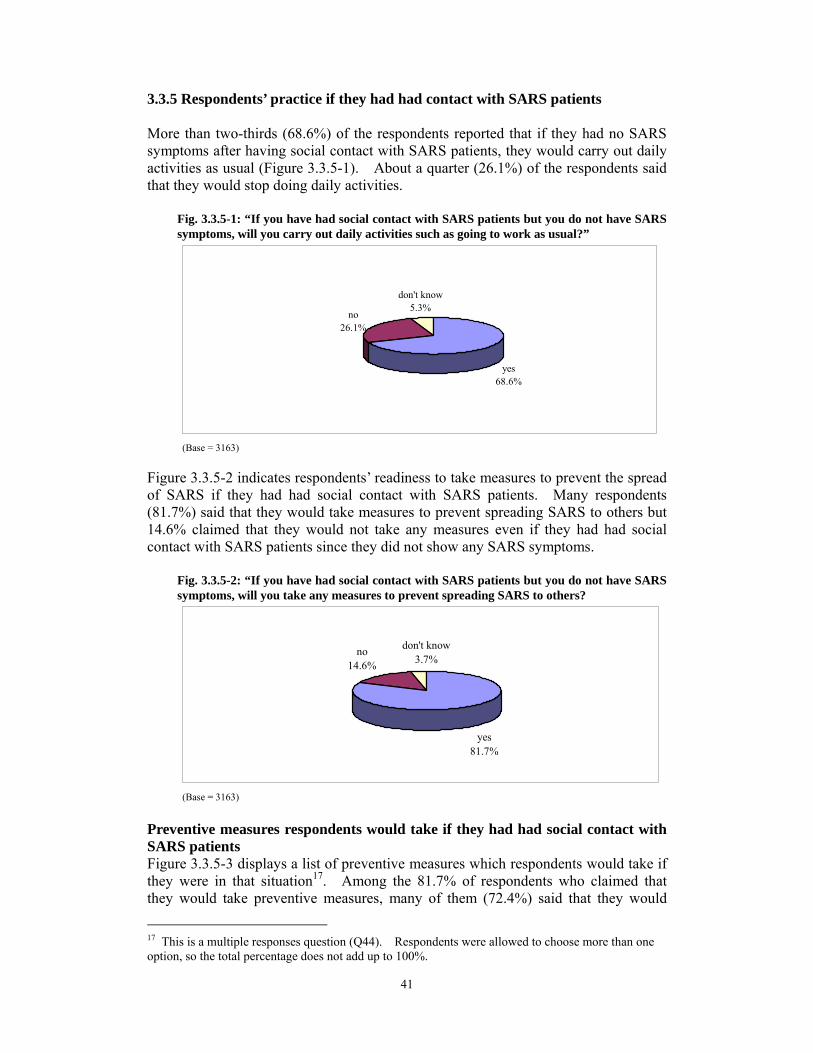
Maintaining good indoor ventilation (by the respondents, household members, or helpers) Almost all of the respondents (98.0%) said that they did maintain good indoor ventilation and 0.1% claimed that they did not know if good indoor ventilation was maintained for the past three days (Figure 3.3.4-10). Only 1.8% said that they did not maintain good indoor ventilation. Among them, the two main reasons for not maintaining good indoor ventilation were that the weather was too cold (52.6%) and that it was not necessary (12.3%).
Fig. 3.3.4-10: Maintaining good indoor ventilation (by the respondents, household membersor helpers)
,
yes98.0%
don't know0.1%
not applicable0.1%
don't remember0.0%no
1.8%
(Base = 3163)
Keeping toilets clean and working properly (by the respondents, household members, or helpers) Almost all of the respondents (99.1%) said that they did make sure their toilets were clean and functioning well16. Only 0.6% said that they did not keep their toilets clean and fully functional. Their reasons were that it was too troublesome (25.0%) and unnecessary (20.0%). 20.0% said that they were too lazy to do so. Making liquid soap always available (by the respondents, household members, or helpers) The practice of making liquid soap always available for washing hands was also commonly practised by a majority of respondents (Figure 3.3.4-11). 96.1% of the respondents carried out such measure. Only 3.6% of the respondents did not have such practice. Among them, most considered that it was not necessary (32.5%) or too troublesome (21.1%) to make liquid soap always available. 17.5% reported that they did not have such a habit.
16 The percentages for this question (Q40e) are listed in Appendix B.

39
Fig. 3.3.4-11: Making liquid soap always available for washing hands (by the respondents, household members, or helpers)
yes96.1%
no3.6% not applicable
0.1%
don't know0.2%
(Base = 3163)
Wearing a mask (by the respondents, household members, or helpers) Figure 3.3.4-12 displays respondents’ practice of wearing a mask. 91.8% said that no one in the household had worn a mask in the last three days. Only 7.8% reported using one. Fig. 3.3.4-12: Wearing a mask (by the respondents, household members, or helpers)
no91.8%
not applicable0.1%
don't know0.2%
don't remember0.0%
yes7.8%
(Base = 3163)
Using serving utensils when having meals with family (by the respondents, household members, or helpers) More than three-quarters (76.6%) of the respondents claimed that they did not use serving utensils when eating with their family and about one-fifth (20.9%) said that serving utensils were used in the past three days (Figure 3.3.4-13). Fig. 3.3.4-13: Using serving utensils when having meals with family
no76.6%
yes20.9%
don't know0.2%
not applicable2.2%
don't remember0.2%
(Base = 3163)

40
Other preventive measures taken at home (by the respondents, householdmembers, or helpers) Figure 3.3.4-14 shows a list of other preventive measures for SARS apart from the ones mentioned above. 53.0% of the respondents took other measures to prevent SARS. Most people changed their clothes right after they returned home (27.9%). The remaining 47.0% respondents said that they did not perform any other measures.
Fig. 3.3.4-14: Other measures taken at home to prevent SARS (by the respondents, household members, or helpers)
47.0% 12.7%
0.1%
0.3%
0.3%
0.5%
1.1%
3.9%
6.1%
27.9%
0% 5% 10% 15% 20% 25% 30% 35% 40% 45% 50%
no
others
exercise frequently
bath right after going back home
clean shoes
maintain good health
prepare mask at home
clean drains
prepare disinfectant
change clothes right after going back home
(Base = 3163)
Other actions taken to prevent SARS The following summarizes the prevalence of some actions which respondents reported to have taken to prevent SARS in the past three days. Percentages of these measures are presented in Figure 3.3.4-15.
Fig. 3.3.4-15: Other actions taken to prevent SARS in the past 3 days
8.9%
68.6%
58.1%
85.2%
80.9%
69.5%
97.8%
12.9%
27.5%
40.3%
13.8%
18.3%
29.8%
2.0%
78.1%0.2%
0.0%
0.5%
0.5%
0.6%
0.4%
0.3%3.6%
1.2%
0.3%
0.3%
0.2%
0.2%
0% 10% 20% 30% 40% 50% 60% 70% 80% 90% 100%
reduce smoking
avoid exposure to second-hand smoking
avoid going to crowded area
have a balanced diet
have adequate rest
do moderate exercise
maintain good indoor ventilation
yes no don't remember not applicable
(Base = 3163)
3.3.5 Respondents’ practice if they had had contact with SARS patients More than two-thirds (68.6%) of the respondents reported that if they had no SARS symptoms after having social contact with SARS patients, they would carry out daily activities as usual (Figure 3.3.5-1). About a quarter (26.1%) of the respondents said that they would stop doing daily activities.
Fig. 3.3.5-1: “If you have had social contact with SARS patients but you do not have SARS symptoms, will you carry out daily activities such as going to work as usual?”
yes68.6%
no26.1%
don't know5.3%
(Base = 3163)
Figure 3.3.5-2 indicates respondents’ readiness to take measures to prevent the spread of SARS if they had had social contact with SARS patients. Many respondents (81.7%) said that they would take measures to prevent spreading SARS to others but 14.6% claimed that they would not take any measures even if they had had social contact with SARS patients since they did not show any SARS symptoms.
Fig. 3.3.5-2: “If you have had social contact with SARS patients but you do not have SARS symptoms, will you take any measures to prevent spreading SARS to others?
don't knowno3.7%14.6%
yes81.7%
(Base = 3163)
Preventive measures respondents would take if they had had social contact with SARS patients Figure 3.3.5-3 displays a list of preventive measures which respondents would take if they were in that situation17. Among the 81.7% of respondents who claimed thatthey would take preventive measures, many of them (72.4%) said that they would
17 This is a multiple responses question (Q44). Respondents were allowed to choose more than ooption, so the total percentage does not add up to 100%.
ne
41

42
wear a mask. Other commonly identified practices included visiting a doctor (30.8%) and self quarantine (23.2%). The two preventive measures least picked by respondents were taking a bath right away (1.5%) and observing personal health (1.7%).
Fig. 3.3.5-3: “What preventive measures would you take?”
6.9%1.5%1.7%2.5%2.6%2.8%
4.4%4.8%5.0%5.4%
7.2%8.2%8.7%9.2%
11.3%13.9%
23.2%30.8%
72.4%
0% 10% 20% 30% 40% 50% 60% 70% 80%
others
bath right after going back home
observe personally health
change clothes right after going back home
observe home hygiene
check body temperature regularly
observe personal hygiene
avoid going to crowded, public area
do not go to work/school
avoid touching public objects
cover the mouth & nose when you sneeze or cough
avoid contact with others
wash hands after sneezing, coughing or cleaning nose
wash hand frequently
use liquid soap to wash hands
use serving utensils when having meals with others
self qurantine
consult doctor
wear a mask
This is a multiple responses question. (Base = 2585)
3.3.6 Respondents’ perception of changes in hygiene conditions after the SARS outbreak Figure 3.3.6-1 shows respondents’ views on the overall change in their personal hygiene, home hygiene, and environmental hygiene in Hong Kong. Generally, there is an improvement in the hygiene condition in all three areas. Fig. 3.3.6-1: Respondents’ perception of changes in hygiene conditions
1.7%0.2%0.3%
37.3% 42.6%
17.5%
0.9%0.4%
0.9%
80.0%
56.8%61.6%
0%10%20%30%40%50%60%70%80%90%
100%
personal hygienecondition after the
SARS outbreak
home hygienecondition after the
SARS outbreak
environment hygieneof Hong Kong afterthe SARS outbreak
better
worse
no change
don't know
(Base = 3163)

43
Personal hygiene The first bar in Figure 3.3.6-1 presents respondents’ perceived change in their personal hygiene. 61.6% reported that their personal hygiene was better after the outbreak of SARS and 37.3% said that there was no change in terms of their practice. Only 0.9% claimed that their personal hygiene was worse than before. Home hygiene After the SARS epidemic, more than half of the respondents (56.8%) had improved their home hygiene. Other respondents (42.6%) maintained the same level of home hygiene as before. Very few respondents (0.4%) said that their home hygiene became worse after the outbreak.
Environmental hygiene of Hong Kong When respondents were asked about the environmental hygiene of Hong Kong after the SARS outbreak, 80.0% believed that it was better and 17.5% of the respondents reported that there was no change. 3.3.7 Respondents’ awareness of SARS prevention information Channels for getting SARS prevention information Figure 3.3.7-1 presents various channels for obtaining SARS prevention information18. In the past six months, the respondents usually obtained such information through TV advertisement/API (64.8%), TV news (64.0%), and newspaper (52.7%). Almost 10.0% of the respondents obtained such information through the internet.
Fig. 3.3.7-1: “Through which channel did you become aware of the information about prevention of SARS in the past 6 months?”
2.3%
0.3%
1.3%
0.1%
0.1%
0.1%
0.4%
0.7%
0.9%
2.0%
6.0%
7.0%
7.1%
9.9%
9.9%
12.7%
23.8%
24.4%
52.7%
64.0%
64.8%
0% 10% 20% 30% 40% 50% 60% 70%
not aware
don't remember
others
border points or ports
telephone hotlines
airport
MTR
TV on buses or minibuses
talks
workplace
schools
magazines
friends
websites
posters
leaflets/brochures
TV programs
radio
newspaper
TV news
TV ads/API
This is a multiple responses question. (Base = 3163)
18 This is a multiple responses question (Q48). Respondents were allowed to choose more than one option, so the total percentage does not add up to 100%.
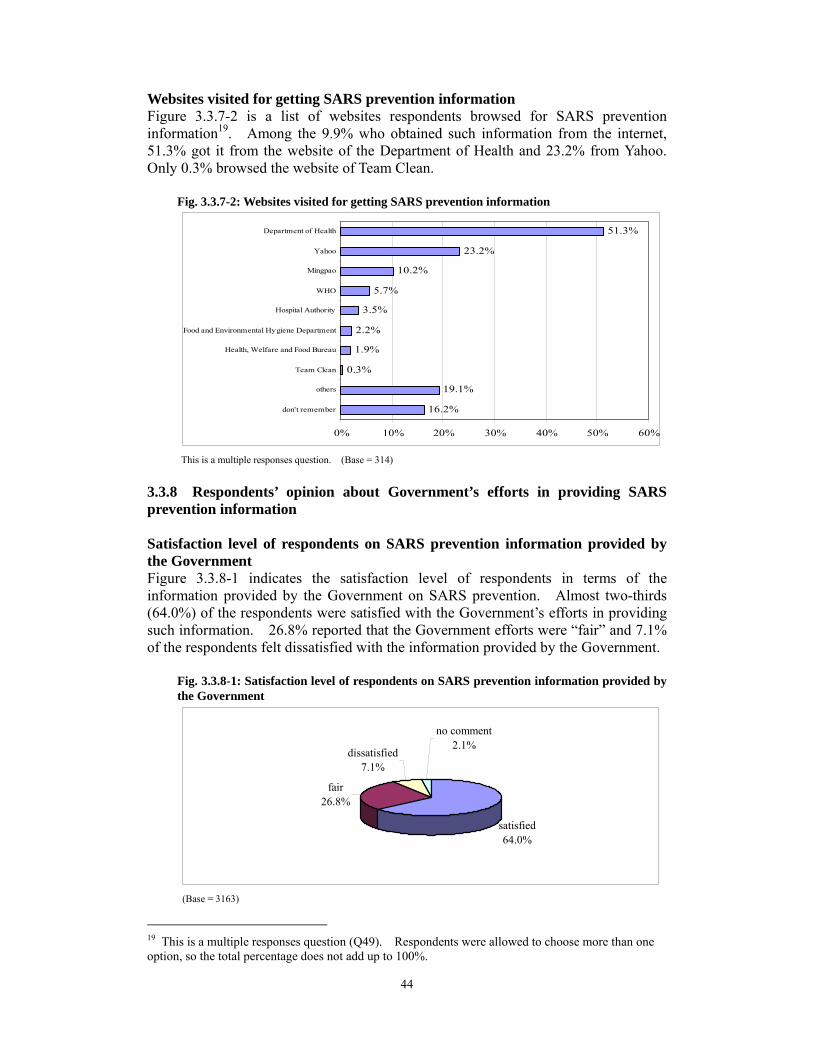
44
Websites visited for getting SARS prevention information Figure 3.3.7-2 is a list of websites respondents browsed for SARS preventioninformation19. Among the 9.9% who obtained such information from the internet, 51.3% got it from the website of the Department of Health and 23.2% from Yahoo. Only 0.3% browsed the website of Team Clean.
Fig. 3.3.7-2: Websites visited for getting SARS prevention information
16.2%
19.1%
0.3%
1.9%
2.2%
3.5%
5.7%
10.2%
23.2%
51.3%
0% 10% 20% 30% 40% 50% 60%
don't remember
others
Team Clean
Health, Welfare and Food Bureau
Food and Environmental Hygiene Department
Hospital Authority
WHO
Mingpao
Yahoo
Department of Health
This is a multiple responses question. (Base = 314)
3.3.8 Respondents’ opinion about Government’s efforts in providing SARS prevention information Satisfaction level of respondents on SARS prevention information provided by the Government Figure 3.3.8-1 indicates the satisfaction level of respondents in terms of theinformation provided by the Government on SARS prevention. Almost two-thirds (64.0%) of the respondents were satisfied with the Government’s efforts in providing such information. 26.8% reported that the Government efforts were “fair” and 7.1% of the respondents felt dissatisfied with the information provided by the Government.
Fig. 3.3.8-1: Satisfaction level of respondents on SARS prevention information provided by the Government
satisfied64.0%
fair26.8%
dissatisfied7.1%
no comment2.1%
(Base = 3163)
19 This is a multiple responses question (Q49). Respondents were allowed to choose more than one option, so the total percentage does not add up to 100%.

45
Areas of dissatisfaction Figure 3.3.8-2 gives a detailed distribution of dissatisfied respondents (7.1%) in each category20. When asked about their dissatisfaction, 26.0% of those dissatisfied respondents were unable to give a specific example. About a quarter (23.8%) said that they were dissatisfied because the information and the news were not well covered or clear. Also, 19.7% said that the Government was not responsive and 16.1% said that there was insufficient advertisement about the issue.
Fig. 3.3.8-2: Areas of dissatisfaction
26.0%
14.8%
0.4%
0.9%
2.2%
2.2%
3.1%
4.9%
5.4%
16.1%
19.7%
23.8%
0% 5% 10% 15% 20% 25% 30%
unable to point out specific examples
others
hygiene work is not properly done
no severe punishment on environmental hazards
unable to handle unexpected crisis
insufficient resources
insufficient civic education
not transparent
cover up details of the epidemic
insufficient advertisement
not responsive
news, information on SARS not well covered
This is a multiple responses question. (Base = 223)
20 This is a multiple responses question (Q51). Respondents were allowed to choose more than one option, so the total percentage does not add up to 100%.

46
Section 4 Environmental Hygiene 3.4.1 Information on environmental hygiene This section on environmental hygiene covers areas on respondents’ knowledge, attitude, and practice. Penalty for littering Figure 3.4.1-1 reveals respondents’ knowledge of the fixed penalty for littering in Hong Kong. The fine for such action is $1,500. 89.9% answered this question correctly and 10.1% of respondents gave incorrect amounts. Fig. 3.4.1-1: Fixed penalty for littering in Hong Kong
**$1,50089.9%
don't know3.0%
$5001.9% $1,000
2.0%$5,0003.2%
(Base = 3163) Responsibility for maintaining a hygienic environment Figure 3.4.1-2 shows respondents’ views on who should be responsible for maintaining a hygienic environment21. 51.4% said that the whole community should be responsible for that. 43.0% and 25.0% said that it was an individual’s responsibility and a citizen’s responsibility respectively. About one-fifth (19.4%) said that the Government should be responsible for maintaining a hygienic environment. Fig. 3.4.1-2: “Who should be responsible for maintaining a hygienic environment?”
0.5%
0.8%
1.0%
1.2%
1.2%
19.4%
25.0%
43.0%
51.4%
0% 10% 20% 30% 40% 50% 60%
don't know
others
media
country
organization
government
citizen
individual
community
This is a multiple responses question. (Base = 3163)
21 This is a multiple responses question (Q55). Respondents were allowed to choose more than one option, so the total percentage does not add up to 100%.
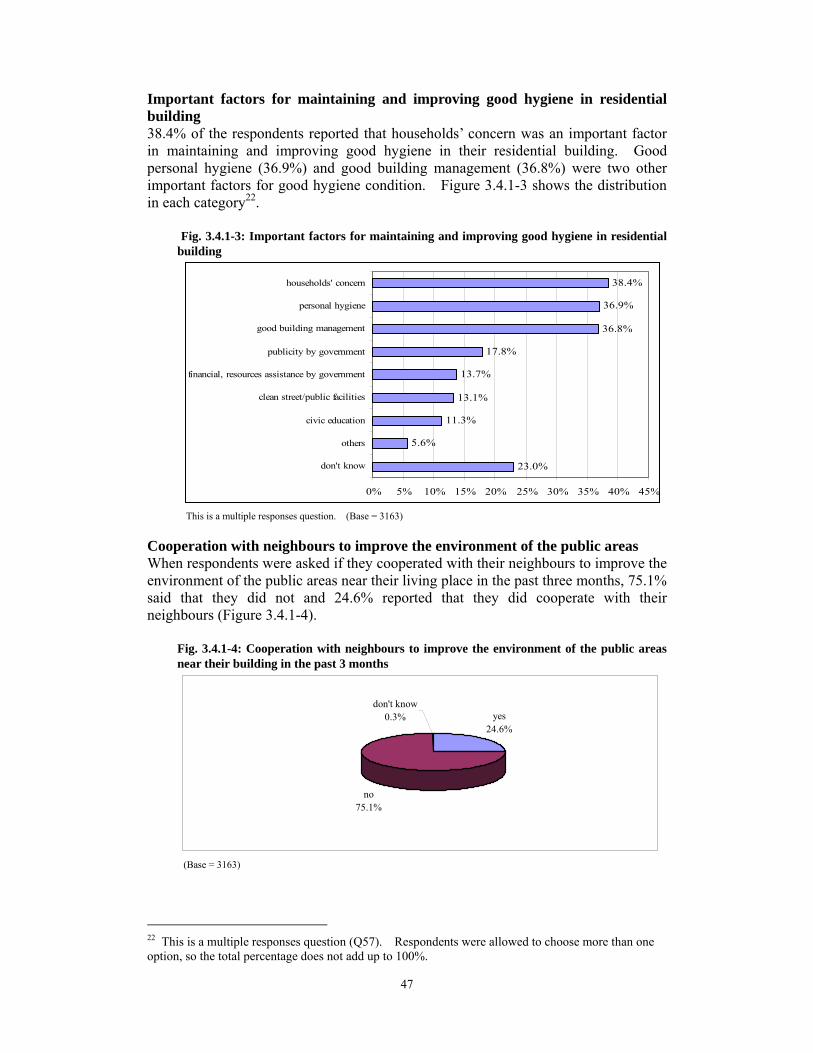
47
Important factors for maintaining and improving good hygiene in residential building 38.4% of the respondents reported that households’ concern was an important factor in maintaining and improving good hygiene in their residential building. Good personal hygiene (36.9%) and good building management (36.8%) were two other important factors for good hygiene condition. Figure 3.4.1-3 shows the distribution in each category22.
Fig. 3.4.1-3: Important factors for maintaining and improving good hygiene in residential building
23.0%
5.6%
11.3%
13.1%
13.7%
17.8%
36.8%
36.9%
38.4%
0% 5% 10% 15% 20% 25% 30% 35% 40% 45%
don't know
others
civic education
clean street/public facilities
financial, resources assistance by government
publicity by government
good building management
personal hygiene
households' concern
This is a multiple responses question. (Base = 3163)
Cooperation with neighbours to improve the environment of the public areas When respondents were asked if they cooperated with their neighbours to improve the environment of the public areas near their living place in the past three months, 75.1% said that they did not and 24.6% reported that they did cooperate with their neighbours (Figure 3.4.1-4).
Fig. 3.4.1-4: Cooperation with neighbours to improve the environment of the public areas near their building in the past 3 months
yes24.6%
no75.1%
don't know0.3%
(Base = 3163)
22 This is a multiple responses question (Q57). Respondents were allowed to choose more than one option, so the total percentage does not add up to 100%.

48
Chapter 4 Demographic Breakdowns of the Results
There are three sections in this chapter, namely dengue fever, SARS, and environmental hygiene. Relationships between respondents’ demographic characteristics, including gender, age, marital status, education level, occupation, household income, and their knowledge, attitude, risk perception, practice, awareness, and opinion are analyzed to see if there are any significant differences by using statistically appropriate tests at 5% significance level. When both variables are nominal, chi-square test is used for testing the significant association. When both variables are ordinal, rank correlation is used. When one variable is nominal and the other variable is ordinal, Kruskal-Wallis test is performed. In order to facilitate the analyses, some of the variables have been regrouped in binary format or into a smaller number of categories (see Table 4.1). Moreover, composite knowledge scores have been computed for the knowledge questions, one for dengue fever and one for SARS. They are calculated by counting the number of responses correctly identified by the respondents on these knowledge questions. “Don’t know”, “don’t remember”, “not applicable”, and “refuse to answer” have been excluded from all the analyses, except for one factor, awareness. This will be explained in detail in the awareness sections for dengue fever and SARS. In the following, only statistically significant results are included. Table 4.1 Re-grouping variables for analysis Type Variables Original levels Re-grouped levels Respondents' background
Gender female female male male
Age 12-14 12-17 15-17 18-24 18-24 25-34 25-34 35-44 35-44 45-54 45-54 55-64 55-64 65 or above 65 or above
Marital status now married now married ver married
now single widowed divorced/separated
Education level no schooling/ kindergarten primary or below primary lower secondary
secondary upper secondary matriculation tertiary (non-degree)
tertiary or above tertiary (degree) or above
ne

49
Occupation managers and administrators
working group
professionals associate professionals self-employed clerks service workers and shop sales workers craft and related workers plant and machine operators and assemblers elementary occupationsskilled agricultural and fishery workers and occupations not classifiable students students housewives
non-working group retired unemployed
Household income
below $2,000
$0-$9,999
$2,000-$3,999 $4,000-$5,999 $6,000-$7,999 $8,000-$9,999 $10,000-$14,999 $10,000-$19,999 $15,000-$19,999 $20,000-$24,999 $20,000-$29,999 $25,000-$29,999 $30,000-$39,999 $30,000-$39,999 $40,000-$59,999 $40,000 or above $60,000 or above
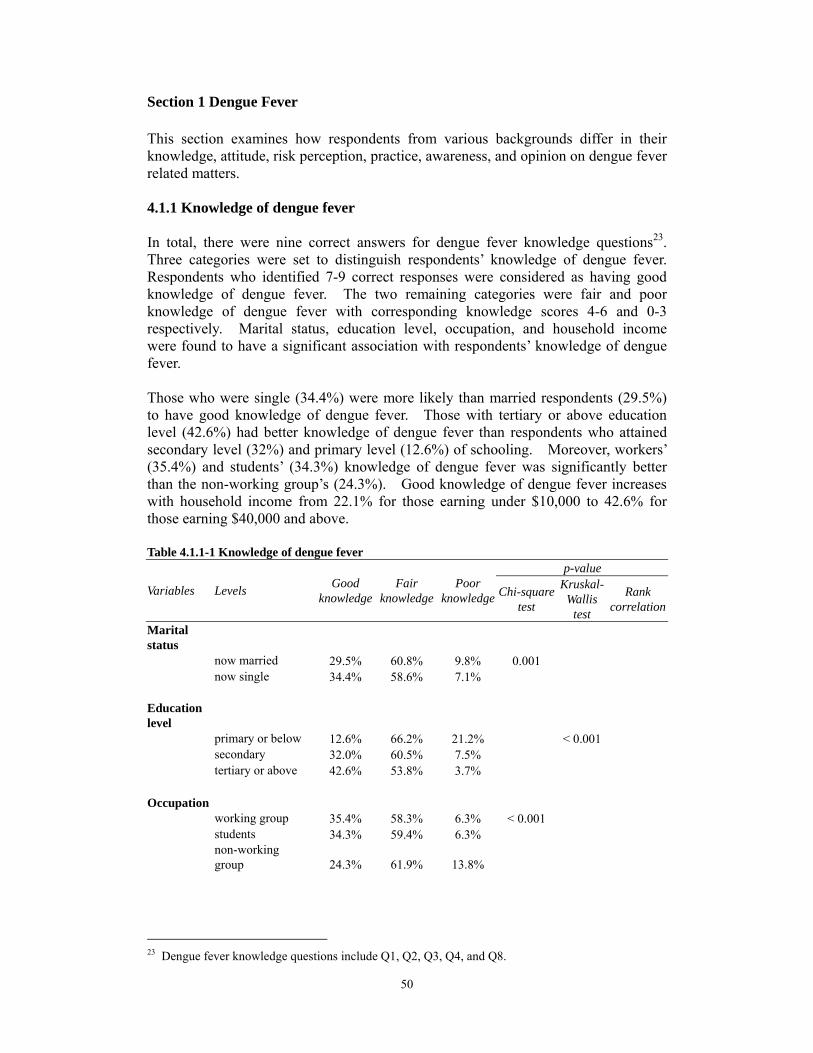
50
Section 1 Dengue Fever This section examines how respondents from various backgrounds differ in their knowledge, attitude, risk perception, practice, awareness, and opinion on dengue fever related matters. 4.1.1 Knowledge of dengue fever In total, there were nine correct answers for dengue fever knowledge questions23. Three categories were set to distinguish respondents’ knowledge of dengue fever. Respondents who identified 7-9 correct responses were considered as having good knowledge of dengue fever. The two remaining categories were fair and poor knowledge of dengue fever with corresponding knowledge scores 4-6 and 0-3 respectively. Marital status, education level, occupation, and household income were found to have a significant association with respondents’ knowledge of dengue fever. Those who were single (34.4%) were more likely than married respondents (29.5%) to have good knowledge of dengue fever. Those with tertiary or above education level (42.6%) had better knowledge of dengue fever than respondents who attained secondary level (32%) and primary level (12.6%) of schooling. Moreover, workers’ (35.4%) and students’ (34.3%) knowledge of dengue fever was significantly better than the non-working group’s (24.3%). Good knowledge of dengue fever increases with household income from 22.1% for those earning under $10,000 to 42.6% for those earning $40,000 and above.
Table 4.1.1-1 Knowledge of dengue fever
Variables Levels Good knowledge
Fair knowledge
p-value Poor
knowledge Chi-squaretest
Kruskal- Wallis
test
Rank correlation
Marital status
now married 29.5% 60.8% 9.8% 0.001 now single 34.4% 58.6% 7.1%
Education level
primary or below 12.6% 66.2% 21.2% < 0.001secondary 32.0% 60.5% 7.5%tertiary or above 42.6% 53.8% 3.7%
Occupationworking group 35.4% 58.3% 6.3% < 0.001students 34.3% 59.4% 6.3%non-working group 24.3% 61.9% 13.8%
23 Dengue fever knowledge questions include Q1, Q2, Q3, Q4, and Q8.

51
Household income
$0-$9,999 22.1% 62.8% 15.1% < 0.001$10,000-$19,999 32.8% 59.0% 8.2%$20,000-$29,999 37.6% 57.8% 4.6%$30,000-$39,999 38.2% 58.1% 3.7%≥ $40,000 42.6% 54.0% 3.4%
4.1.2 Attitude Only gender was found to have a statistically significant association with respondents’ attitude to mosquito bites. Females (92.7%) were more likely than males (87.9%) to disagree that the consequences of mosquito bites were not serious and no preventive measures needed to be taken. Table 4.1.2-1 “Do you agree with the following statement? ‘Mosquito bites are no big deal. The consequences of mosquito bites are not serious. There is no need to carry out any preventive measures.’”
Variable Levels Agree Disagree Neutral or
no comment
p-value
Chi-squaretest
Kruskal- Wallis
test
Rank correlation
Gender female 6.1% 92.7% 1.2% < 0.001 male 10.4% 87.9% 1.7% 4.1.3 Risk perception Likelihood of catching dengue fever in Hong Kong Education, occupation and household income were found to have statistically significant associations with respondents’ perception of the likelihood of catching dengue fever in Hong Kong. More respondents with higher education level (90.4%) thought that they were very likely or likely to catch dengue fever in Hong Kong than those who were less educated (88.4% and 75.0%). More workers (89.7%) and students (88.5%) believed that they were very likely or likely to get dengue fever in Hong Kong than the non-working group (81.8%). More respondents who had household income between $30,000 and $39,999 (93.0%) perceived that they were very likely or likely to catch dengue fever in Hong Kong than their counterparts. Table 4.1.3-1 “What is the likelihood of you catching dengue fever in Hong Kong?”
Variables Levels Very Likely Unlikelylikely
p-value Very
unlikely Chi-squaretest
Kruskal- Wallis
test
Rank correlation
Education levelprimary or below 10.1% 64.9% 22.2% 2.7% 0.001secondary 11.2% 77.2% 10.5% 1.1%tertiary or above 8.4% 82.0% 8.6% 1.0%
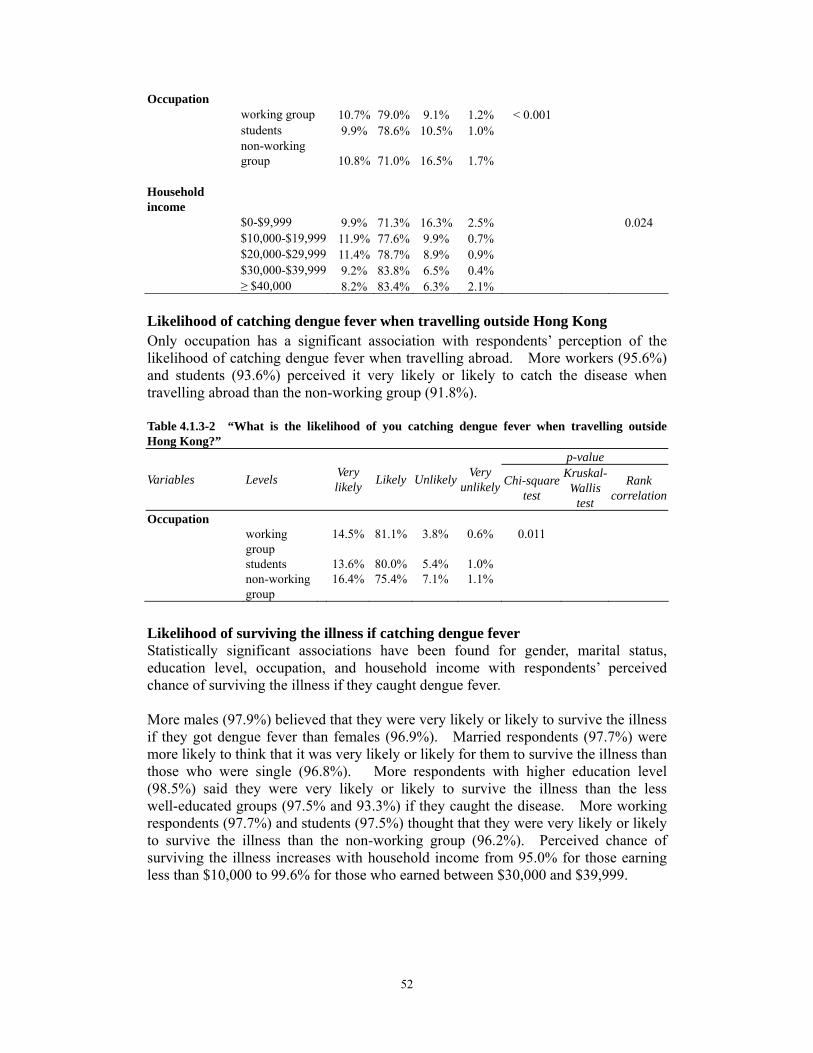
52
Occupation working group 10.7% 79.0% 9.1% 1.2% < 0.001 students 9.9% 78.6% 10.5% 1.0%
non-working group 10.8% 71.0% 16.5% 1.7% Household income $0-$9,999 9.9% 71.3% 16.3% 2.5% 0.024 $10,000-$19,999 11.9% 77.6% 9.9% 0.7% $20,000-$29,999 11.4% 78.7% 8.9% 0.9% $30,000-$39,999 9.2% 83.8% 6.5% 0.4% ≥ $40,000 8.2% 83.4% 6.3% 2.1%
Likelihood of catching dengue fever when travelling outside Hong Kong Only occupation has a significant association with respondents’ perception of the likelihood of catching dengue fever when travelling abroad. More workers (95.6%) and students (93.6%) perceived it very likely or likely to catch the disease when travelling abroad than the non-working group (91.8%). Table 4.1.3-2 “What is the likelihood of you catching dengue fever when travelling outside Hong Kong?”
Variables Levels
Very likely Likely Unlikely
p-value Very
unlikely Chi-squaretest
Kruskal- Wallis
test
Rank correlation
Occupation working 14.5% 81.1% 3.8% 0.6% 0.011
group students 13.6% 0.0%8 5.4% 1.0% non-working 16.4% 5.4%7 7.1% 1.1%
group
Likelihood of surviving the illness if catching dengue fever Statistically significant associations have been found for gender, marital status, education level, occupation, and household income with respondents’ perceived chance of surviving the illness if they caught dengue fever. More males (97.9%) believed that they were very likely or likely to survive the illness if they got dengue fever than females (96.9%). Married respondents (97.7%) were more likely to think that it was very likely or likely for them to survive the illness than those who were single (96.8%). More respondents with higher education level (98.5%) said they were very likely or likely to survive the illness than the less well-educated groups (97.5% and 93.3%) if they caught the disease. More working respondents (97.7%) and students (97.5%) thought that they were very likely or likely to survive the illness than the non-working group (96.2%). Perceived chance of surviving the illness increases with household income from 95.0% for those earning less than $10,000 to 99.6% for those who earned between $30,000 and $39,999.

53
Table 4.1.3-3 “If you caught dengue fever, what would be the likelihood of you surviving the illness?”
p-value
Variables Levels Very likely Likely Unlikely Very
unlikely Chi-squaretest
Kruskal- Wallis
test
Rank correlation
female 25.4% 71.5% 2.9% 0.2% < 0.00 male 32.9% 65.0% 2.1% 0.1%
Marital Status now married 26.4% 71.3% 2.3% 0.1% 0.012 now single 30.8% 66.0% 2.9% 0.3%
Education level primary or 21.2% 72.1% 6.7% 0.0% < 0.001
below secondary 27.9% 69.6% 2.3% 0.2% tertiary or above 33.9% 64.6% 1.3% 0.1%
Occupation working group 29.3% 68.4% 2.1% 0.2% < 0.001 students 32.2% 65.3% 2.3% 0.2% non-working 23.8% 72.4% 3.7% 0.1%
group
Household income $0-$9,999 24.9% 70.1% 4.7% 0.3% 0.001 $10,000-$19,999 29.0% 68.0% 3.0% 0.0% $20,000-$29,999 28.6% 70.0% 1.4% 0.0% $30,000-$39,999 33.3% 66.3% 0.4% 0.0% ≥ $40,000 34.2% 65.2% 0.5% 0.0%
Gender 1
4.1.4 Practice Keeping all drains free from blockage Gender, marital status, and education level all have a significant association with keeping all drains free from blockage. Females (93.4%) were more likely than males (89.7%) to keep all drains free from blockage. More married respondents (96.9%) did this practice than those who were single (86.6%). The lower the educational attainment, the more likely they were to keep all drains free from blockage. Table 4.1.4-1 “Did you keep all drains free from blockage in the past 3 months to prevent mosquito breeding?”
Variables Levels Yes No
p-value
Chi-squaretest
Kruskal- Wallis
test
Rank correlation
Gender female 93.4% 6.6% < 0.001male 89.7% 10.3%
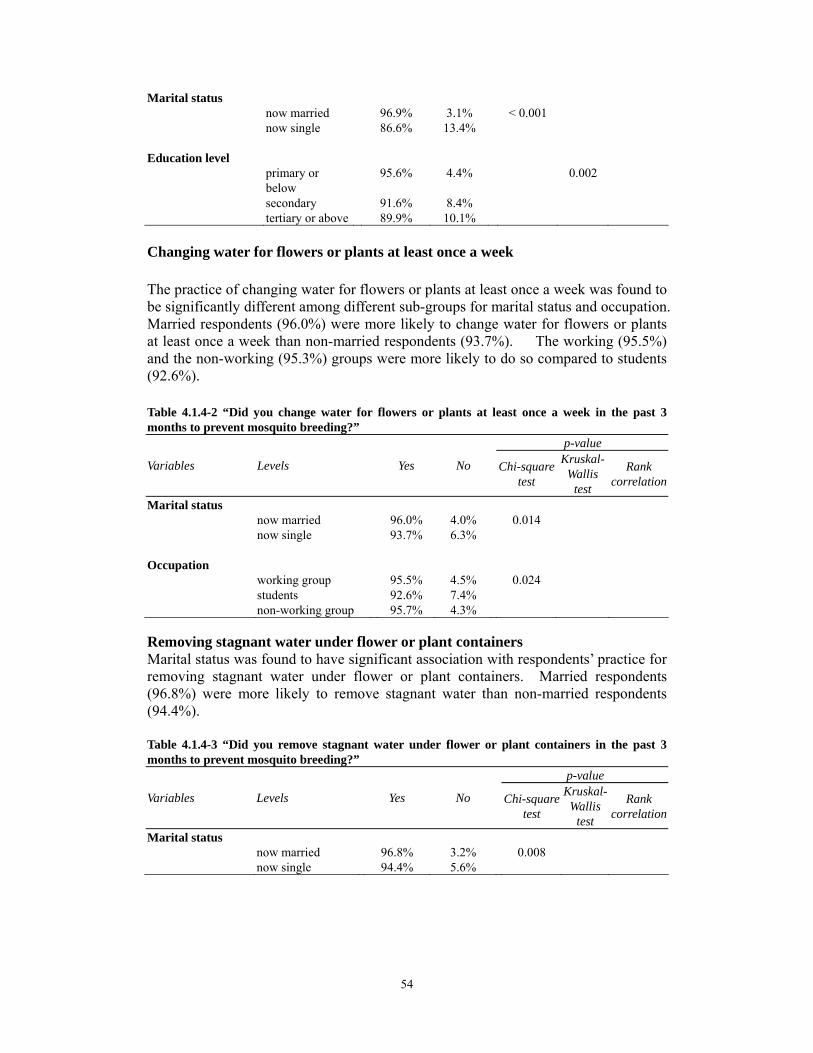
54
Marital status now married 96.9% 3.1% < 0.001 now single 86.6% 13.4% Education level primary or
below 95.6% 4.4% 0.002
secondary tertiary or above
91.6% 89.9%
8.4% 10.1%
Changing water for flowers or plants at least once a week The practice of changing water for flowers or plants at least once a week was found tbe significantly different among different sub-groups for marital status and occupatioMarried respondents (96.0%) were more likely to change water for flowers or plantat least once a week than non-married respondents (93.7%). The working (95.5%and the non-working (95.3%) groups were more likely to do so compared to student(92.6%).
o n. s ) s
Table 4.1.4-2 “Did you change water for flowers or plants at least once a week in the past 3 months to prevent mosquito breeding?”
Variables Levels Yes No
p-value
Chi-squaretest
Kruskal- Wallis
test
Rank correlation
Marital status now married 96.0% 4.0% 0.014 now single 93.7% 6.3% Occupation working group 95.5% 4.5% 0.024 students 92.6% 7.4% non-working group 95.7% 4.3%
Removing stagnant water under flower or plant containers Marital status was found to have significant association with respondents’ practice for removing stagnant water under flower or plant containers. Married respondents (96.8%) were more likely to remove stagnant water than non-married respondents (94.4%). Table 4.1.4-3 “Did you remove stagnant water under flower or plant containers in the past 3 months to prevent mosquito breeding?”
Variables Levels Yes No
p-value Kruskal- Chi-square Rank Wallis test correlationtest
Marital status now married 96.8% 3.2% 0.008now single 94.4% 5.6%

55
Putting refuse such as empty lunch boxes and soft drink cans which can accumulate stagnant water in covered litter bins Marital status and occupation have a significant association with putting refuse which can accumulate stagnant water in covered litter bins. Married respondents (98.9%) tended to do this more often than those who were single (97.9%). Moreover, the working (99.1%) and non-working (98.6%) groups were more likely to have this practice than students (97.1%). Table 4.1.4-4 “Did you put refuse such as empty lunch boxes and soft drink cans which couldaccumulate stagnant water in a covered litter bins in the past 3 months to prevent mosquitobreeding?”
Variables Levels Yes No
p-value Chi-squ
are test
Kruskal-Wallis
test
Rank correlation
Marital status now married 98.9% 1.1% 0.025now single 97.9% 2.1%
Occupation working group 99.1% 0.9% 0.001students 97.1% 2.9%non-working group 98.6% 1.4%
Covering all water containers, water storage tanks or wells tightly Statistically significant associations have been identified for age, marital status, occupation, education level, and household income with respondents’ practice of covering all water containers tightly and properly. Respondents aged 25 to 34 were most likely to cover all water containers, water storage tanks, or wells tightly compared to respondents in other age groups. Married persons (98.8%) tended to do this practice more often than those who were single (96.3%). While the working (98.2%) and non-working (98.3%) groups were more likely to have this practice compared to students (95.6%), better educated people (97.5% and 97.4%) were more likely to cover all water containers tightly than those who were less educated (95.3%). Respondents who had a household income $20,000 or above were most likely to do this than those who earned less than $20,000. Table 4.1.4-5 “Did you cover all water containers, water storage tanks, or wells tightly in the past 3 months to prevent mosquito breeding?”
Variables Levels Yes No
p-value
Chi-squaretest
Kruskal-Wallis
test
Rank correlation
Age 12-17 98.7% 1.3% 0.01118-24 97.0% 3.0%25-34 99.5% 0.5%35-44 97.2% 2.8%45-54 94.6% 5.4%55-64 96.6% 3.4%65 or above 98.2% 1.8%

56
Marital status now married 98.8% 1.2% < 0.001 now single 96.3% 3.7%
Education level
primary or below secondary tertiary or above
95.3% 97.4% 98.5%
4.7% 2.6% 1.5%
0.015
Occupation
working group students
98.2% 95.6%
1.8% 4.4%
0.002
non-working group 98.3% 1.7%
Household income $0-$9,999 95.8% 4.2% 0.005$10,000-$19,999 96.9% 3.1% $20,000-$29,999 98.0% 2.0% $30,000-$39,999 98.9% 1.1% ≥ $40,000 98.9% 1.1%
Levelling defective ground surfaces to avoid accumulation of stagnant water Levelling defective ground surfaces to avoid accumulation of stagnant water wasfound to have a statistically significant association with marital status and occupation.Married respondents (95.9%) were more likely to level defective ground surfaces than non-married respondents (90.3%). Also, more workers (95.8%) did this practicethan students (88.8%) and non-working respondents (92.8%). Table 4.1.4-6 “Did you level defective ground surfaces to avoid accumulation of stagnant water in the past 3 months to prevent mosquito breeding?”
Variables Levels Yes No
p-value
Chi-squaretest
Kruskal- Wallis
test
Rank correlation
Marital status now married 95.9% 4.1% < 0.001 now single 90.3% 9.7%
Occupation working group 95.8% 4.2% < 0.001 students 88.8% 11.2% non-working group 92.8% 7.2%
Wearing long-sleeved clothing and trousers
Statistically significant associations have been identified for marital status and occupation with the practice of wearing long-sleeved clothing and trousers. Those who were single (69.7%) were more likely than married respondents (62.9%) to have this practice. Students (74.8%) were most likely to wear long-sleeved clothing and trousers compared to workers (61.8%) and non-working respondents (65.0%).

57
Table 4.1.4-7 “Did you wear long-sleeved clothing and trousers in the past 3 months to prevent mosquito bites?”
Variables Levels Yes No
p-value
Chi-squaretest
Kruskal- Wallis
test
Rank correlation
Marital status now married 62.9% 37.1% < 0.001 now single 69.7% 30.3% Occupation working group 61.8% 38.2% < 0.001
students 74.8% non-working group 65.0% 35.0% 25.2%
Applying mosquito repellent to exposed parts of the body Gender, marital status, and occupation all have a significant association with applying mosquito repellent to exposed body parts. Females (49.6%) were more likely than males (34.3%) to apply mosquito repellent to exposed body parts. More married respondents (46.0%) carried out this preventive measure than non-married respondents (39.9%). Also, more non-working respondents (47.8%) used mosquito repellent than workers (41.8%) and students (39.9%). Table 4.1.4-8 “Did you apply mosquito repellent to exposed parts of the body in the past 3 months to prevent mosquito bites?”
Variables Levels Yes No
p-value
Chi-squaretest
Kruskal- Wallis
test
Rank correlation
Gender female 49.6% 50.4% < 0.001 male 34.3% 65.7% Marital status now married 46.0% 54.0% 0.00 now single 39 %.9 60.1% Occupation working group 41.8% 58.2% 0.002 students 39.9% 60.1% non-working group 47.8% 52.2%
1
Installing mosquito nets or screens in non-air-conditioned rooms Gender, marital status, and occupation were all found to have a significant association with the practice of installing mosquito nets in non-air-conditioned rooms. Females (23.3%) were more likely than males (18.9%) to take this measure. More married persons (24.3%) installed mosquito nets than non-married respondents (18.7%). Non-working respondents (24.0%) also tended to use mosquito nets more often than workers (21.6%) and students (18.4%).

58
Table 4.1.4-9 “Did you install mosquito nets or screens in non-air-conditioned rooms in the past 3 months to prevent mosquito bites?”
Variables Levels Yes No
p-value
Chi-squaretest
Kruskal- Wallis
test
Rank correlation
Gender female 23.3% 76.7% 0.006 male 18.9% 81.1% Marital status now married 24.3% 75.7% 0.001 now single 18.7% 81.3% Occupation
working group 21.6% 78.4% 0.030students 18.4% 81.6%non-working group 24.0% 76.0%
Avoiding scrubby areas Gender, education level, occupation, and household income all have a significant association with respondents’ avoidance of visiting scrubby areas. More female respondents (64.9%) avoided scrubby places than male respondents (56.4%). Also, less educated respondents (63.9% and 63.7%) were more likely to avoid these places than those who were better educated (52.7%). Non-working respondents (64.5%) and students (64.2%) were significantly different from the working group (57.6%) in avoiding scrubby areas. Respondents who had a household income less than $10,000 were most likely to avoid visiting scrubby areas than their counterparts.
Table 4.1.4-10 “Did you avoid scrubby areas in the past 3 months to prevent mosquito bites?”
Variables Levels Yes No
p-value
Chi-squaretest
Kruskal- Wallis
test
Rank correlation
Gender female 64.9% 35.1% < 0.001male 56.4% 43.6%
Education level primary or below 63.9% 36.1% < 0.001 secondary 63.7% 36.3% tertiary or above 52.7% 47.3%
Occupation working group 57.6% 42.4% 0.001 students 64.2% 35.8%non-working group 64.5% 35.5%

59
Household income $0-$9,999 66.8% %33.2 < 0.001$10,000-$19,999 65.7% 34.3%$20,000-$29,999 59.9% 40.1%$30,000-$39,999 56.6% 43.4%
≥ $40,000 51.5% 48.5%
4.1.5 Awareness of dengue fever prevention information Awareness of dengue fever prevention information was regrouped into a dichotomous variable (Yes/No). All the channels leading to respondents’ awareness were grouped together as respondents becoming aware of such information24. “Don’t remember” was also included in this category although the respondents were unable to recall through which channel such information was obtained. “Not aware of such information” was classified as respondents who were not aware of any dengue fever prevention information in the past three months. Statistical significance was found between respondents’ awareness of dengue fever prevention information and their education level, occupation, and household income. Better educated respondents (98.1%) were more likely to be aware of dengue fever prevention information than less educated respondents (91.9%). Working respondents (97.9%) and students (98.1%) were also significantly better in their awareness of dengue fever prevention information than the non-working group (95.0%). Respondents who earned $40,000 or above (99.2%) were more aware of such information than those earning less than $10,000 (92.3%). Table 4.1.5-1 Awareness of dengue fever prevention information
Variables Levels Yes No
p-value
Chi-squaretest
Kruskal-Wallis
test
Rank correlation
Education level 91.9% 8.1% < 0.001
secondary 97.9% 2.1%tertiary or above 98.1% 1.9%
Occupation working group 97.9% 2.1% < 0.001students 98.1% 1.9%non-working group 95.0% 5.0%
Household income $0-$9,999 92.3% 7.7% < 0.001$10,000-$19,999 98.4% 1.6%$20,000-$29,999 99.1% 0.9%$30,000-$39,999 98.9% 1.1%≥ $40,000 99.2% 0.8%
primary or below
4.1.6 Opinion Satisfaction level of Government’s efforts in providing dengue fever prevention information is associated with age and occupation. Respondents aged 35 to 44 were most satisfied with dengue fever prevention information provided by the Government
24 All the channels for this question (Q14) can be found in Appendix A.
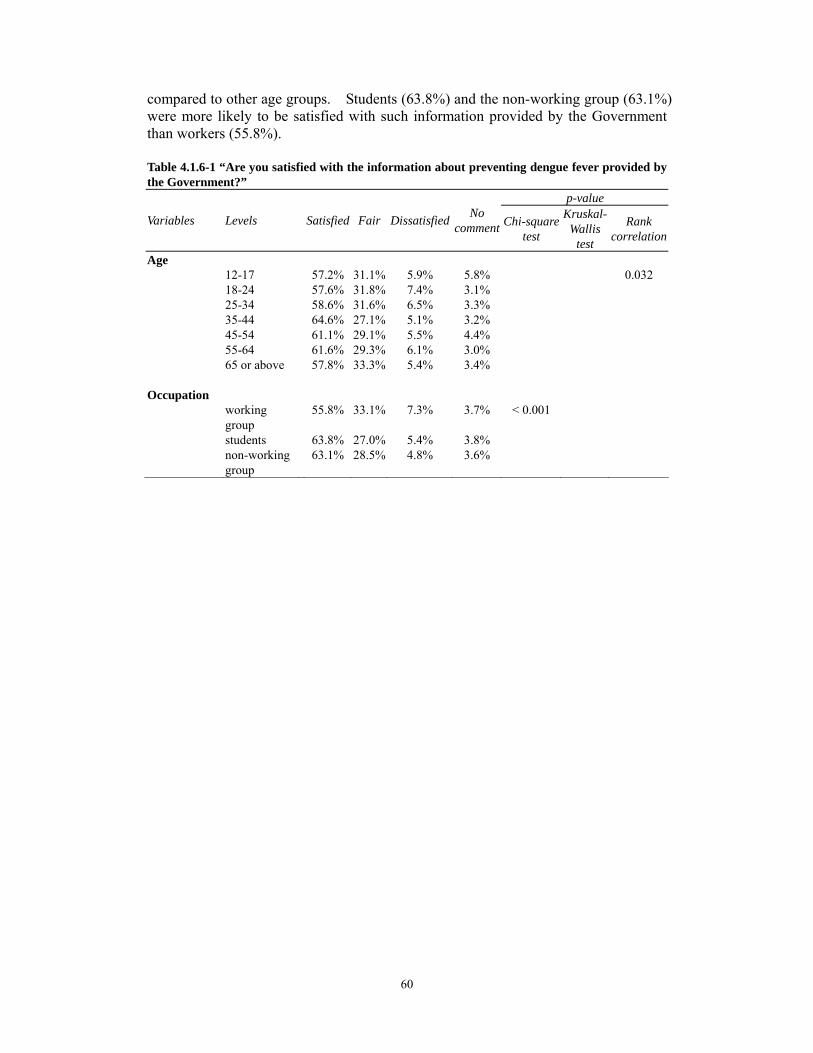
60
compared to other age groups. Students (63.8%) and the non-working group (63.1%) were more likely to be satisfied with such information provided by the Government than workers (55.8%). Table 4.1.6-1 “Are you satisfied with the information about preventing dengue fever provided by the Government?”
Variables Levels Satisfied Fair Dissatisfied No comment Chi-square
test
p-value Kruskal-
Wallis test
Rank correlation
Age 12-17 57.2% 31.1% 5.9% 5.8%
0.032
18-24 57.6% 31.8% 7.4% 3.1%25-34 58.6% 31.6% 6.5% 3.3%35-44 64.6% 27.1% 5.1% 3.2%45-54 61.1% 29.1% 5.5% 4.4%55-64 61.6% 29.3% 6.1% 3.0%65 or above 57.8% 33.3% 5.4% 3.4%
Occupation
working
55.8%
33.1%
7.3%
3.7% < 0.001
group students 63.8% 27.0% 5.4% 3.8%non-working 63.1% 28.5% 4.8% 3.6% group
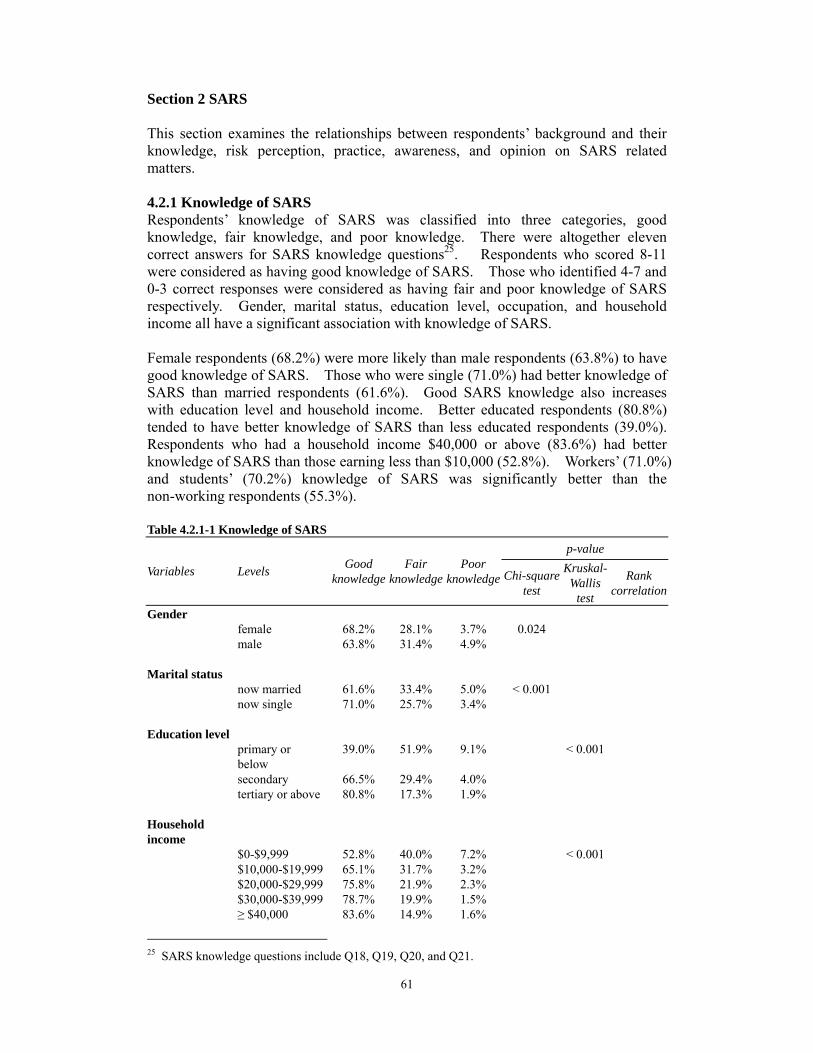
61
Section 2 SARS This section examines the relationships between respondents’ background and their knowledge, risk perception, practice, awareness, and opinion on SARS related matters. 4.2.1 Knowledge of SARS Respondents’ knowledge of SARS was classified into three categories, goodknowledge, fair knowledge, and poor knowledge. There were altogether elevencorrect answers for SARS knowledge questions25. Respondents who scored 8-11were considered as having good knowledge of SARS. Those who identified 4-7 and0-3 correct responses were considered as having fair and poor knowledge of SARSrespectively. Gender, marital status, education level, occupation, and householdincome all have a significant association with knowledge of SARS. Female respondents (68.2%) were more likely than male respondents (63.8%) to havegood knowledge of SARS. Those who were single (71.0%) had better knowledge ofSARS than married respondents (61.6%). Good SARS knowledge also increaseswith education level and household income. Better educated respondents (80.8%)tended to have better knowledge of SARS than less educated respondents (39.0%).Respondents who had a household income $40,000 or above (83.6%) had betterknowledge of SARS than those earning less than $10,000 (52.8%). Workers’ (71.0%and students’ (70.2%) knowledge of SARS was significantly better than thenon-working respondents (55.3%).
)
Table 4.2.1-1 Knowledge of SARS
p-value
Variables Levels Good Fair Poor knowledge knowledge knowledge Chi-square
test
Kruskal- Wallis
test
Rank correlation
Gender female 68.2% 28.1% 3.7% 0.024male 63.8% 31.4% 4.9%
Marital status now married 61.6% 33.4% 5.0% < 0.001 now single 71.0% 25.7% 3.4%
Education level primary or 39.0% 51.9% 9.1% < 0.001below secondary 66.5% 29.4% 4.0%tertiary or above 80.8% 17.3% 1.9%
Household income
$0-$9,999 52.8% 40.0% 7.2% < 0.001$10,000-$19,999 65.1% 31.7% 3.2%$20,000-$29,999 75.8% 21.9% 2.3%$30,000-$39,999 78.7% 19.9% 1.5%≥ $40,000 83.6% 14.9% 1.6%
25 SARS knowledge questions include Q18, Q19, Q20, and Q21.

62
Occupation working groupstudents
71.0%70.2%
25.6%26.5%
3.4%3.3%
< 0.001
non-working 55.3% 38.6% 6.2%group
4.2.2 Risk perception Likelihood of catching SARS Gender, marital status, education level, occupation, and household income were found to have statistically significant associations with respondents’ perception of the likelihood of catching SARS. Males (65.2%) were more likely than females (59.2%) to think that they were very likely or likely to catch SARS. Although both married (58.4%) and non-married (58.5%) respondents believed that they were likely to catch this disease but more married respondents (4.0%) reported that it was very likely for them to catch SARS than non-married respondents (2.7%). Better educated respondents (75.7%) were more likely to think that it was very likely or likely for them to be infected by SARS than their counterparts (58.6% and 46.7%). Working respondents (69.2%) were most likely to think that they were very likely or likely to contract this disease compared to students (57.5%) and non-working respondents (52.7%). Respondents with household income $30,000 or above (72.8% and 72.7%) were more likely than those with lower household income (63.7%, 59.8%, and 54.2%) to think that they were very likely or likely to catch SARS. Table 4.2.2-1 “What is the likelihood of you catching SARS?”
p-value
Variables Levels Very likely Likely Unlikely Very
unlikely Chi-squaretest
Kruskal- Wallis
test
Rank correlation
Gender female 3.1% 56.1% 33.0% 7.8% 0.002 male 3.6% 61.6% 26.3% 8.5% Marital status now married 4.0% 58.4% 30.7% 6.8% 0.025 now single 2.7% 58.5% 29.4% 9.4% Education level primary or 4.2% 42.5% 39.8% 13.5% < 0.001
below secondary 3.4% 55.2% 33.5% 8.0% tertiary or above 2.6% 73.1% 17.6% 6.6% Occupation working group 4.5% 64.7% 24.2% 6.5% < 0.001 students 2.1% 55.4% 33.0% 9.6% non-working 2.4% 50.3% 37.6% 9.7%
group

63
Household income
$0-$9,999 2.7% 51.5% 35.4% 10.4% < 0.001$10,000-$19,999 3.0% 56.8% 31.1% 9.1%$20,000-$29,999 4.6% 59.1% 30.1% 6.2%$30,000-$39,999 5.0% 67.8% 23.0% 4.2%≥ $40,000 1.7% 71.0% 20.5% 6.8%
Likelihood of surviving the illness if catching SARS Statistically significant associations have been identified for gender, education level, occupation, and household income with respondents’ perceived likelihood of surviving the illness if catching SARS. Males (91.9%) were more optimistic than females (87.9%) to think that they were very likely or likely to survive the illness if they caught SARS. Better educated respondents (94.7%) were more likely to believe that it was very likely or likely for them to survive the illness than those who were less well-educated (90% and 76.3%). Workers’ (91.4%) and students’ (90.8%) perceived likelihood of surviving the illness was significantly higher than non-working respondents (84.9%). Perceived likelihood of surviving the illness also increases with household income from 83.9% for those earning less than $10,000 to 94.4% for those earning $40,000 and above.
Table 4.2.2-2 “If you caught SARS, what would be the likelihood of you surviving the illness?”
ariablesV Levels Very Likely Unlikelylikely
p-value Very
unlikely Chi-squaretest
Kruskal- Wallis
test
Rank correlation
enderGfemale 12.9% 75.0% 8.8% 3.3% < 0.001male 17.9% 74.0% 5.9% 2.3%
Education level primary or 14.9% 61.4% 15.5% 8.3% < 0.001 below secondary 15.5% 74.5% 7.5% 2.5%tertiary or above 14.5% 80.2% 3.8% 1.5%
ccupationO working group 16.5% 74.9% 6.4% 2.1% < 0.001 students 14.4% 76.4% 6.9% 2.3%non-working 14.4% 70.5% 10.2% 4.9%group
Household income
$0-$9,999 17.6% 66.3% 12.2% 3.9% 0.025$10,000-$19,999 15.6% 74.3% 7.2% 2.8%$20,000-$29,999 15.5% 77.2% 5.1% 2.3%$30,000-$39,999 16.3% 77.6% 4.5% 1.6%≥ $40,000 15.1% 79.3% 4.3% 1.4%
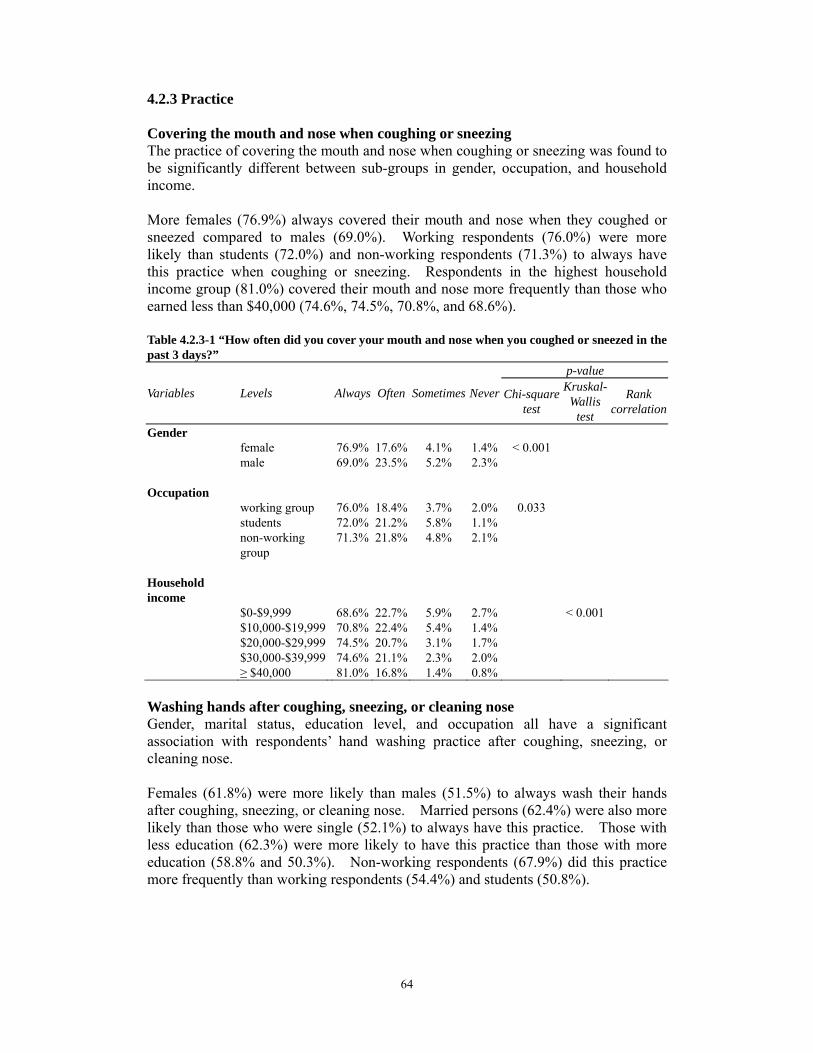
64
4.2.3 Practice Covering the mouth and nose when coughing or sneezing The practice of covering the mouth and nose when coughing or sneezing was found to be significantly different between sub-groups in gender, occupation, and household income. More females (76.9%) always covered their mouth and nose when they coughed or sneezed compared to males (69.0%). Working respondents (76.0%) were more likely than students (72.0%) and non-working respondents (71.3%) to always have this practice when coughing or sneezing. Respondents in the highest household income group (81.0%) covered their mouth and nose more frequently than those who earned less than $40,000 (74.6%, 74.5%, 70.8%, and 68.6%). Table 4.2.3-1 “How often did you cover your mouth and nose when you coughed or sneezed in the past 3 days?”
p-value
Variables Levels Always Often Sometimes Never Chi-squaretest
Kruskal- Wallis
test
Rank correlation
Gender female 76.9% 17.6% 4.1% 1.4% < 0.001 male 69.0% 23.5% 5.2% 2.3% Occupation working group 76.0% 18.4% 3.7% 2.0% 0.033 students 72.0% 21.2% 5.8% 1.1% non-working 71.3% 21.8% 4.8% 2.1%
group Household income $0-$9,999 68.6% 22.7% 5.9% 2.7% < 0.001
$10,000-$19,999 70.8% 22.4% 5.4% 1.4%$20,000-$29,999 74.5% 20.7% 3.1% 1.7%$30,000-$39,999 74.6% 21.1% 2.3% 2.0%≥ $40,000 81.0% 16.8% 1.4% 0.8%
Washing hands after coughing, sneezing, or cleaning nose Gender, marital status, education level, and occupation all have a significant association with respondents’ hand washing practice after coughing, sneezing, or cleaning nose. Females (61.8%) were more likely than males (51.5%) to always wash their hands after coughing, sneezing, or cleaning nose. Married persons (62.4%) were also more likely than those who were single (52.1%) to always have this practice. Those with less education (62.3%) were more likely to have this practice than those with more education (58.8% and 50.3%). Non-working respondents (67.9%) did this practice more frequently than working respondents (54.4%) and students (50.8%).

65
Table 4.2.3-2 “How often did you wash your hands after coughing, sneezing, or cleaning your nose in the past 3 days?”
p-value
Variables Levels Always Often Sometimes Never Chi-squaretest
Kruskal- Wallis
test
Rank correlation
Gender female 61.8% 20.6% 10.3% 7.4% < 0.001 male 51.5% 24.7% 12.6% 11.3% Marital status now married 62.4% 20.5% 10.6% 6.5% < 0.001 now single 52.1% 24.4% 11.9% 11.5% Education level primary or 62.3% 24.6% 10.1% 3.0% < 0.001
below secondary 58.8% 20.8% 11.0% 9.4% tertiary or above 50.3% 25.5% 12.8% 11.4% Occupation working group 54.4% 23.7% 11.9% 10.0% < 0.001
students 50.8% 24.9% 11.8% 12.4%non-working 67.9% 18.0% 9.7% 4.4% group
Using liquid soap when washing hands Gender, marital status, and occupation were all found to have a significant association with the use of liquid soap when washing hands. Females (54.1%) were more likely than males (43.8%) to always use liquid soap when washing their hands. More married respondents (54.7%) always washed their hands with liquid soap than non-married respondents (44.4%). Non-working respondents (57.7%). were most likely to always use liquid soap compared to workers (51.8%) and students (37.3%) Table 4.2.3-3 “How often did you use liquid soap to wash your hands in the past 3 days?”
p-value
Variables Levels Always Often Sometimes Never Chi-squaretest
Kruskal- Wallis
test
Rank correlation
Gender female 54.1% 21.9% 15.3% 8.7% < 0.001 male 43.8% 24.5% 18.6% 13.1% Marital status now married 54.7% 21.5% 15.7% 8.1% < 0.001 now single 44.4% 24.7% 17.9% 13.0% Occupation working grou 51.8% 24.1% 15.4% 8.7% < 0.001
students 37.3% 25.8% 20.7% 16.2%non-working 57.7% 19.0% 14.9% 8.4%
group
p

66
Using serving utensils when having meals with others No statistically significant association was found between respondents’ background and the use of serving utensils when having meals with others in the past three days. Carrying out preventive measures when touching public objects The practice of carrying out preventive measures when touching public objects is significantly associated with gender, marital status, education level, occupation, and household income. Females (14.2%) were more likely than males (9.7%) to always take preventive measures when they touched public objects. More married respondents (15.6%) always carried out preventive measures in such situations than those who were single (8.9%). Respondents who were less educated were more likely to always have this practice than better educated respondents. Non-working respondents (17.3%) were also more likely to always carry out preventive measures when touching public objects than the working group (11.3%) and students (8.9%). Respondents who were in the lowest household income group were most likely to always do this than their counterparts. Table 4.2.3-4 “How often did you carry out preventive measures when you when you touched public objects in the past 3 days?”
Variables Levels Always Often Sometimes Never Chi-squaretest
p-value Kruskal-
Wallis test
Rank correlation
Gender female 14.2% 9.1% 7.7% 69.0% < 0.001 male 9.7% 6.3% 8.1% 75.8% Marital status now married 15.6% 8.8% 7.7% 68.0% < 0.001 now single 8.9% 6.8% 8.2% 76.0% Education level
primary or below 20.1% 10.9% 10.0% 59.0% < 0.001 secondary 11.8% 7.8% 7.4% 73.0% tertiary or above 9.3% 6.0% 8.2% 76.5% Occupation working group 11.3% 7.3% 7.4% 74.0% < 0.001 students 8.9% 6.2% 8.1% 76.8%
non-working group 17.3% 9.9% 8.6% 64.2%
Household income $0-$9,999 18.0% 10.3% 9.8% 62.0% < 0.001 $10,000-$19,999 11.0% 7.7% 6.0% 75.4% $20,000-$29,999 8.3% 7.6% 6.7% 77.4% $30,000-$39,999 7.9% 6.4% 9.7% 76.0% ≥ $40,000 12.0% 5.0% 8.6% 74.4%

67
Washing hands after touching public objects No statistically significant association was found between respondents’ background and the practice of washing hands after touching public objects in the past three days. Avoiding using public towels Respondents’ marital status, occupation, education level, and household income were all found to have a statistically significant association with their avoidance of using public towels. Married respondents (87.2%) were more likely than those who were single (78.5%) to always avoid using public towels. Non-working respondents (87.8%) were most likely to always have this avoidance compared to working respondents (82.9%) and students (76.9%). The lower the educational attainment, the more likely they were to always avoid using public towels. Compared to their counterparts, respondents who had household income between $20,000 and $29,999 were most likely to always avoid using public towels.
Table 4.2.3-5 “How often did you avoid using public towels in the past 3 days?” p-value
Variables Levels Always Often Sometimes Never Chi-square test
Kruskal- Wallis
test
Rank correlation
Marital status now married 87.2% 4.6% 2.4% 5.8% < 0.001 now single 78.5% 10.6% 4.2% 6.7% Occupation working group 82.9% 7.0% 2.7% 7.4% < 0.001 students 76.9% 12.0% 5.1% 6.0% non-working 87.8% 4.7% 2.5% 5.0%
group Education level primary or 87.1% 5.6% 3.1% 4.1% 0.041
below secondary 82.6% 8.0% 3.5% 6.0% tertiary or above 80.8% .9%7 3.2% 8.2% Household income $0-$9,999 81.0% 9.5% 3.1% 6.4% 0.043 $10,000-$19,999 82.6% 8.5% 4.1% 4.9% $20,000-$29,999 87.5% 4.4% 3.1% 5.0% $30,000-$39,999 85.2% 7.0% 0.9% 7.0% ≥ $40,000 81.8% 6.6% 2.6% 9.0%
Wearing a mask Statistically significant associations exist between the use of a mask and respondents’ marital status and occupation. Married respondents (4.6%) tended to use a mask more frequently than those who were single (3.1%). Workers (4.7%) were more likely than students (2.6%) and non-working respondents (3.8%) to always wear a mask.

68
Table 4.2.3-6 “How often did you wear a mask in the past 3 days?” p-value
Variables Levels Always Often Sometimes Never Chi-squaretest
Kruskal- Wallis
test
Rank correlation
Marital status now married 4.6% 2.1% 4.2% 89.1% 0.007 now single 3.1% 1.3% 2.9% 92.7% Occupation
working group 4.7% 2.6% 3.9% 88.8% < 0.001students 2.6% 0.7% 2.5% 94.2%non-working 3.8% 1.1% 4.1% 90.9%group
Cleaning home everyday (by the respondents, household members, or helpers)
Gender, marital status, education level and occupation all have a significantassociation with the practice of cleaning home everyday. Females (73.9%) were more likely than males (68.1%) to clean their home everyday.More married respondents (75.1%) cleaned their home everyday than those who weresingle (67.8%). The practice of this preventive measure is inversely related toeducation level. Less educated respondents (77.9%) were more likely to carry outthis practice than those with more education (73.0% and 63.3%). Non-workingrespondents (78.9%) were most likely to clean their home everyday compared toworkers (65.1%) and students (74.3%).
Table 4.2.3-7 “Did you clean home everyday in the past 3 days?”
p-value
Variables Levels Yes No Chi-squaretest
Kruskal- Wallis
test
Rank correlation
Gender female 73.9% 26.1% < 0.001 male 68.1% 31.9% Marital status now married 75.1% 24.9% < 0.001 now single 67.8% 32.2% Education level primary or below 77.9% 22.1% < 0.001
secondary 73.0% 27.0%tertiary or above 63.3% 36.7%
Occupation working group 65.1% 34.9% < 0.001
students 74.3% 25.7%non-working group 78.9% 21.1%
Maintaining good indoor ventilation (by the respondents, household members, or helpers) No statistical significance was found between respondents’ background and maintaining good indoor ventilation.
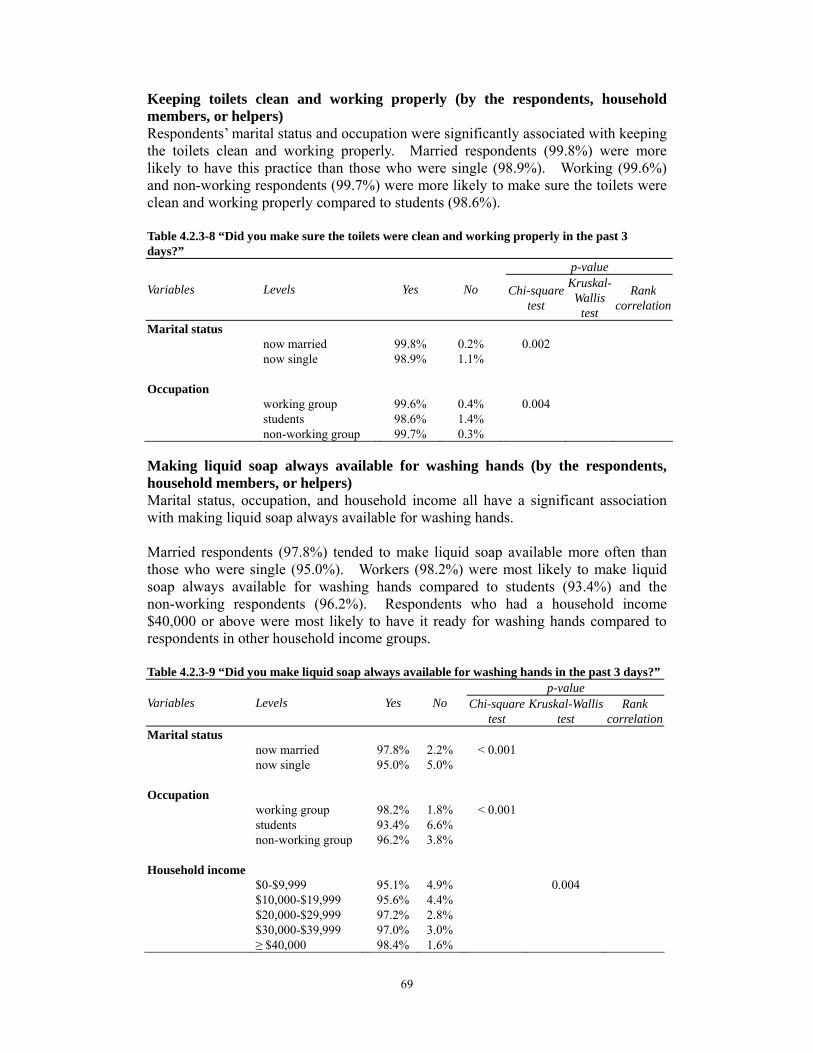
69
Keeping toilets clean and working properly (by the respondents, household members, or helpers) Respondents’ marital status and occupation were significantly associated with keeping the toilets clean and working properly. Married respondents (99.8%) were more likely to have this practice than those who were single (98.9%). Working (99.6%) and non-working respondents (99.7%) were more likely to make sure the toilets were clean and working properly compared to students (98.6%). Table 4.2.3-8 “Did you make sure the toilets were clean and working properly in the past 3 days?”
p-value
Variables Levels Yes No Chi-squaretest
Kruskal- Wallis
test
Rank correlation
Marital status now married 99.8% 0.2% 0.002 now single 98.9% 1.1% Occupation
working group 99.6% 0.4% 0.004students 98.6% 1.4%non-working group 99.7% 0.3%
Making liquid soap always available for washing hands (by the respondents, household members, or helpers) Marital status, occupation, and household income all have a significant association with making liquid soap always available for washing hands. Married respondents (97.8%) tended to make liquid soap available more often than those who were single (95.0%). Workers (98.2%) were most likely to make liquid soap always available for washing hands compared to students (93.4%) and the non-working respondents (96.2%). Respondents who had a household income $40,000 or above were most likely to have it ready for washing hands compared to respondents in other household income groups. Table 4.2.3-9 “Did you make liquid soap always available for washing hands in the past 3 days?”
p-value Variables Levels Yes No Chi-square Kruskal-Wallis Rank
test test correlationMarital status
now married 97.8% 2.2% < 0.001 now single 95.0% 5.0%
Occupation working group 98.2% 1.8% < 0.001 students 93.4% 6.6%non-working group 96.2% 3.8%
Household income $0-$9,999 95.1% 4.9% 0.004$10,000-$19,999 95.6% 4.4%$20,000-$29,999 97.2% 2.8%$30,000-$39,999 97.0% 3.0%≥ $40,000 98.4% 1.6%
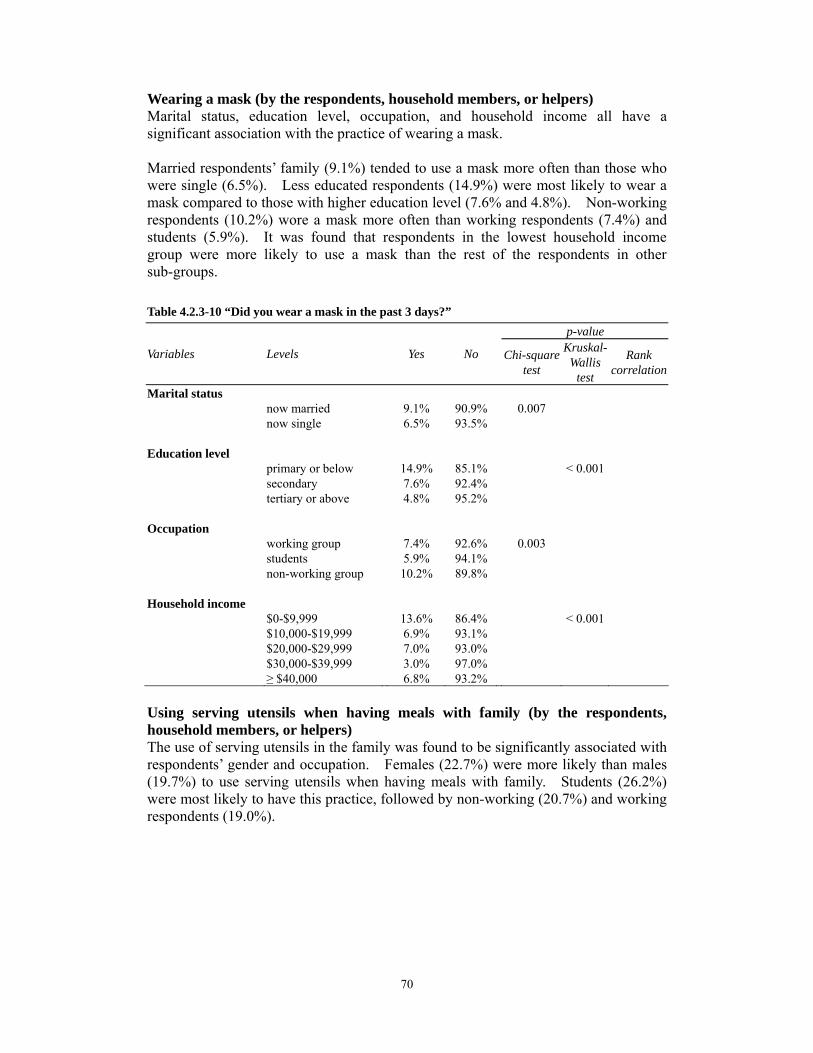
70
Wearing a mask (by the respondents, household members, or helpers)
Marital status, education level, occupation, and household income all have asignificant association with the practice of wearing a mask. Married respondents’ family (9.1%) tended to use a mask more often than those whowere single (6.5%). Less educated respondents (14.9%) were most likely to wear amask compared to those with higher education level (7.6% and 4.8%). Non-workingrespondents (10.2%) wore a mask more often than working respondents (7.4%) andstudents (5.9%). It was found that respondents in the lowest household incomegroup were more likely to use a mask than the rest of the respondents in othersub-groups.
Table 4.2.3-10 “Did you wear a mask in the past 3 days?”
p-value
Variables Levels Yes No Chi-squaretest
Kruskal-Wallis
test
Rank correlation
Marital status now married 9.1% 90.9% 0.007 now single 6.5% 93.5%
Education levelprimary or below 14.9% 85.1% < 0.001 secondary 7.6% 92.4%tertiary or above 4.8% 95.2%
Occupation working group 7.4% 92.6% 0.003 students 5.9% 94.1%non-working group 10.2% 89.8%
Household income $0-$9,999 13.6% 86.4% < 0.001$10,000-$19,999 6.9% 93.1%$20,000-$29,999 7.0% 93.0%$30,000-$39,999 3.0% 97.0%≥ $40,000 6.8% 93.2%
Using serving utensils when having meals with family (by the respondents, household members, or helpers)
The use of serving utensils in the family was found to be significantly associated with respondents’ gender and occupation. Females (22.7%) were more likely than males (19.7%) to use serving utensils when having meals with family. Students (26.2%) were most likely to have this practice, followed by non-working (20.7%) and working respondents (19.0%).

71
Table 4.2.3-11 “Did you use serving utensils when having meals with family in the past 3 days?”
Variables Levels Yes No
p-value Kruskal-Chi-square Rank Wallis test correlationtest
Gender female 22.7% 77.3% 0.045 male 19.7% 80.3% Occupation working group
students19.0% 26.2%
81.0% 73.8%
< 0.001
non-working group 20.7% 79.3%
4.2.4 Awareness of SARS prevention information Awareness of SARS prevention information was regrouped into a dichotomousvariable (Yes/No). All the channels leading to respondents’ awareness were groupedtogether as respondents becoming aware of such information26. “Don’t remember”was also included in this category although respondents were unable to recall throughwhich channel they obtained such information. “Not aware of such information”was classified as respondents who were not aware of any SARS preventioninformation in the past six months. Marital status, education level, occupation and household income all have asignificant association with awareness of SARS prevention information.Respondents who were single (98.5%) were more likely to be aware of SARSprevention information than married respondents (97%). Better educatedrespondents (98.8%) were more aware of such information than those who hadprimary education or below (91.1%). Students’ (99.8%) and working respondents(98.2%) awareness was significantly better than those who were not working (95.1%).Awareness of SARS prevention information also increases with household income.Respondents who had a household income over $10,000 were more aware of suchinformation.
’
Table 4.2.4-1 Awareness of SARS prevention information
p-value Variables Levels Yes No Chi-square Kruskal-Wallis Rank
test test correlationMarital status
now married 97.0% 3.0% 0.009 now single 98.5% 1.5%
Education level primary or below 91.1% 8.9% < 0.001secondary 98.8% 1.2%tertiary or above 98.8% 1.2%
Occupation working group 98.2% 1.8% < 0.001 students 99.8% 0.2%non-working group 95.1% 4.9%
26 All the channels for this question (Q48) can be found in Appendix A.

72
Household income$0-$9,999 93.8% 6.2% < 0.001$10,000-$19,999 98.9% 1.1%$20,000-$29,999 99.3% 0.7%$30,000-$39,999 98.5% 1.5%≥ $40,000 99.2% 0.8%
4.2.5 Opinion Satisfaction level of the Government’s efforts in providing SARS prevention information is associated with age, gender, marital status, and occupation. Respondents aged 55 to 64 were most satisfied with the Government’s efforts in providing SARS prevention information. Males (67%) were more likely than females (61.7%) to be satisfied with such information. Those who were single (69.3%) were also more satisfied than married respondents (59.0%). Students (76.4%) were most satisfied with the SARS prevention information provided by the Government compared to working (58.8%) and non-working (60.5%) respondents. Table 4.2.5-1 “Are you satisfied with the information on preventing SARS provided by the Government?”
Variables Levels Satisfied Fair Dissatisfied No comment
p-value
Chi-squaretest
Kruskal- Wallis
test
Rank correlation
Age 12-17 61.8% 28.4% 7.0% 2.9% 0.03118-24 63.4% 25.6% 8.7% 2.3%25-34 61.7% 28.4% 8.0% 1.9%35-44 65.7% 26.2% 6.4% 1.7%45-54 62.9% 28.8% 6.3% 1.9%55-64 72.7% 20.2% 5.1% 2.0%65 or above 66.0% 25.9% 6.1% 2.0%
Gender female 61.7% 28.9% 7.1% 2.3% 0.014male 67.0% 24.2% 7.0% 1.9%
Marital status now married 59.0% 29.5% 9.2% 2.3% < 0.001 now single 69.3% 24.1% 4.8% 1.8%
Occupation
working 58.8% 30.2% 9.0% 2.0% < 0.001 group students 76.4% 19.6% 3.2% 0.7%non-working 60.5% 28.6% 7.6% 3.3% group

73
Section 3 Environmental Hygiene Cooperation with neighbours to improve the environment of the public areas near the living place is associated with marital status, education level, occupation, and household income. Married respondents (26.4%) were more likely than non-married respondents (22.9%) to cooperate with their neighbours to improve the environment of the public areas near their living place. Less educated respondents (31.4%) tended to carry out this practice more often than those who were better educated (24.9% and 20.1%). Non-working respondents (29.2%) were most likely to cooperate with their neighbours to improve the environment of the public areas near their living place compared to students (24.8%) and the working group (21.6%). Respondents who were in the lowest household income group were more likely to do this than respondents in other subgroups. Table 4.3.1-1 “Did you cooperate with your neighbours to improve the environment of the public areas near your living place in the past 3 months?”
p-value
Variables Levels Yes No Chi-squaretest
Kruskal- Wallis
test
Rank correlation
Marital status now married 26.4% 73.6% 0.024 now single 22.9% 77.1% Education level primary or below 31.4% 68.6% < 0.001 secondary 24.9% 75.1% tertiary or above 20.1% 79.9% Occupation working group 21.6% 78.4% < 0.001 students 24.8% 75.2% non-working group 29.2% 70.8% Household income $0-$9,999 28.8% 71.2% 0.014 $10,000-$19,999 24.7% 75.3% $20,000-$29,999 19.4% 80.6% $30,000-$39,999 19.5% 80.5 ≥ $40,000 23.8% 76.2%
%

74
Chapter 5 Models of Factors Influencing the Practice of Preventive Measures
This chapter examines the factors influencing respondents’ practice of preventive measures for dengue fever and SARS. These factors include selected demographic characteristics27 of respondents, knowledge of dengue fever and SARS information28, attitude29, risk perception30, and awareness31. Four practices of dengue fever and three practices of SARS have been selected for further analyses as they have more than 20% non-compliance and sample sizes large enough for modelling. Logistic regression analysis has been used for identifying the determinants of these practices, adjusting for confounders and estimating the odds ratios (OR). Backward stepwise selection method is used for selecting parsimonious models. In order to run logistic regression analysis, the dependent variable must be in binary format. All of the selected practices are dichotomous except for two practices for SARS prevention which require final re-grouping. Details of this rearrangement will be discussed in the SARS section. Before running logistic regression, statistically appropriate tests32 (with significance level at 5%) have been used to test whether each factor has a significant association with the selected practices. Only those factors with significant results are included in the modelling. Section 1 Dengue Fever For dengue fever, respondents’ background, knowledge, attitude, risk perception, and awareness have been used to predict their practices of wearing long-sleeved clothing and trousers, applying mosquito repellent to exposed parts of the body, installing mosquito nets in non-air-conditioned rooms, and avoiding scrubby areas. Wearing long-sleeved clothing and trousers Marital status (χ2=15.83, df=1, p<0.001) and occupation (χ2=39.88, df=2, p<0.001) were found to be statistically significant on univariate analyses. However, when they were included in the modelling, only occupation remained in the final model (Table 5.1-1). Students were about 1.8 times more likely than working respondents to wear long-sleeved clothing and trousers (students: OR=1.81, 95% C.I.: 1.50-2.19).
27 Selected demographic characteristics are gender (Q58), age (Q59), marital status (Q60), education
level (Q61), occupation (Q62), and household income (Q68). 28 Knowledge questions for dengue fever (Q1, Q2, Q3, Q4, and Q8) and SARS (Q18, Q19, Q20, and
Q21) can be found in Appendix A. 29 Attitude to dengue fever is Q5 of the questionnaire. 30 Risk perception of dengue fever is Q6 of the questionnaire. Risk perception of SARS is Q22 of the
questionnaire. 31 Awareness of dengue fever prevention information is Q14 of the questionnaire. Awareness of
SARS prevention information is Q48 of the questionnaire 32 When both variables are nominal scales, chi-square test will be used.
When one variable is nominal scale and another variable is ordinal scale, Kruskal-Wallis test will be used.
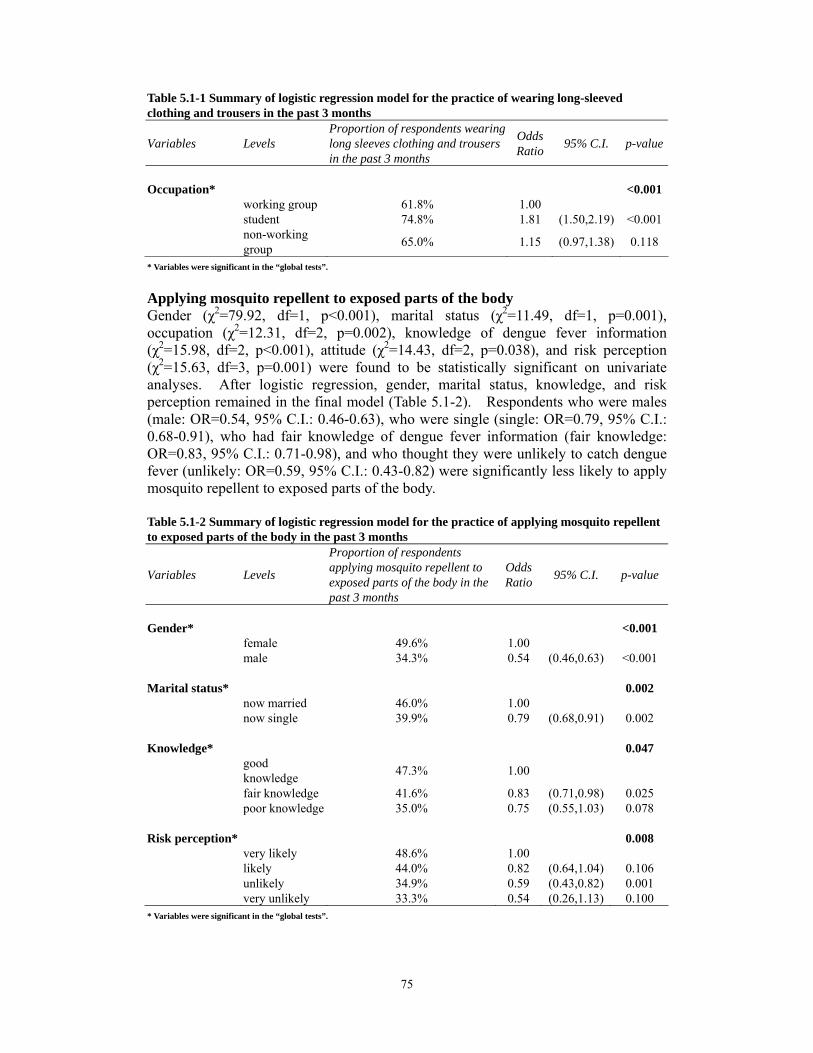
75
Table 5.1-1 Summary of logistic regression model for the practice of wearing long-sleeved clothing and trousers in the past 3 months
Variables LevelsProportion of respondents wearing long sleeves clothing and trousers in the past 3 months
Odds Ratio 95% C.I. p-value
Occupation* <0.001 working group 61.8% 1.00student 74.8% 1.81 (1.50,2.19) <0.001non-working group 65.0% 1.15 (0.97,1.38) 0.118
* Variables were significant in the “global tests”.
Applying mosquito repellent to exposed parts of the body Gender (χ2=79.92, df=1, p<0.001), marital status (χ2=11.49, df=1, p=0.001), occupation (χ2=12.31, df=2, p=0.002), knowledge of dengue fever information (χ2=15.98, df=2, p<0.001), attitude (χ2=14.43, df=2, p=0.038), and risk perception (χ2=15.63, df=3, p=0.001) were found to be statistically significant on univariate analyses. After logistic regression, gender, marital status, knowledge, and risk perception remained in the final model (Table 5.1-2). Respondents who were males (male: OR=0.54, 95% C.I.: 0.46-0.63), who were single (single: OR=0.79, 95% C.I.: 0.68-0.91), who had fair knowledge of dengue fever information (fair knowledge: OR=0.83, 95% C.I.: 0.71-0.98), and who thought they were unlikely to catch dengue fever (unlikely: OR=0.59, 95% C.I.: 0.43-0.82) were significantly less likely to apply mosquito repellent to exposed parts of the body. Table 5.1-2 Summary of logistic regression model for the practice of applying mosquito repellent to exposed parts of the body in the past 3 months
Variables Levels
Proportion of respondents applying mosquito repellent to exposed parts of the body in thepast 3 months
Odds Ratio 95% C.I. p-value
Gender* <0.001 female 49.6% 1.00male 34.3% 0.54 (0.46,0.63) <0.001
Marital status* 0.002 now married 46.0% 1.00now single 39.9% 0.79 (0.68,0.91) 0.002
Knowledge* 0.047 good knowledge 47.3% 1.00
fair knowledge 41.6% 0.83 (0.71,0.98) 0.025poor knowledge 35.0% 0.75 (0.55,1.03) 0.078
Risk perception* 0.008 very likely 48.6% 1.00likely 44.0% 0.82 (0.64,1.04) 0.106unlikely 34.9% 0.59 (0.43,0.82) 0.001very unlikely 33.3% 0.54 (0.26,1.13) 0.100
* Variables were significant in the “global tests”.
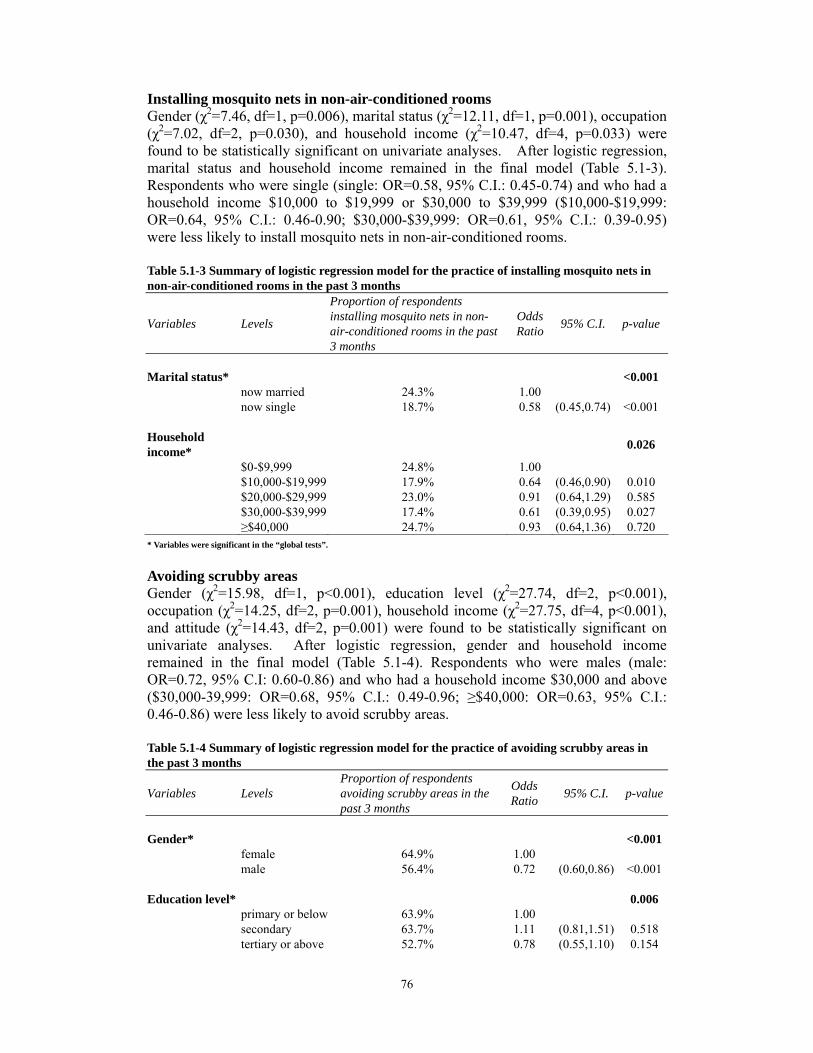
76
Installing mosquito nets in non-air-conditioned rooms Gender (χ2=7.46, df=1, p=0.006), marital status (χ2=12.11, df=1, p=0.001), occupation (χ2=7.02, df=2, p=0.030), and household income (χ2=10.47, df=4, p=0.033) were found to be statistically significant on univariate analyses. After logistic regression, marital status and household income remained in the final model (Table 5.1-3). Respondents who were single (single: OR=0.58, 95% C.I.: 0.45-0.74) and who had a household income $10,000 to $19,999 or $30,000 to $39,999 ($10,000-$19,999: OR=0.64, 95% C.I.: 0.46-0.90; $30,000-$39,999: OR=0.61, 95% C.I.: 0.39-0.95) were less likely to install mosquito nets in non-air-conditioned rooms. Table 5.1-3 Summary of logistic regression model for the practice of installing mosquito nets in non-air-conditioned rooms in the past 3 months
Proportion of respondents
Variables Levels installing mosquito nets in non- air-conditioned rooms in the past
Odds Ratio 95% C.I. p-value
3 months
Marital status* <0.001 now married 24.3% 1.00now single 18.7% 0.58 (0.45,0.74) <0.001
Household income* 0.026
$0-$9,999 24.8% 1.00$10,000-$19,999 17.9% 0.64 (0.46,0.90) 0.010$20,000-$29,999 23.0% 0.91 (0.64,1.29) 0.585$30,000-$39,999 17.4% 0.61 (0.39,0.95) 0.027≥$40,000 24.7% 0.93 (0.64,1.36) 0.720
* Variables were significant in the “global tests”.
Avoiding scrubby areas Gender (χ2=15.98, df=1, p<0.001), education level (χ2=27.74, df=2, p<0.001),occupation (χ2=14.25, df=2, p=0.001), household income (χ2=27.75, df=4, p<0.001), and attitude (χ2=14.43, df=2, p=0.001) were found to be statistically significant onunivariate analyses. After logistic regression, gender and household incomeremained in the final model (Table 5.1-4). Respondents who were males (male:OR=0.72, 95% C.I: 0.60-0.86) and who had a household income $30,000 and above ($30,000-39,999: OR=0.68, 95% C.I.: 0.49-0.96; ≥$40,000: OR=0.63, 95% C.I.:0.46-0.86) were less likely to avoid scrubby areas.
Table 5.1-4 Summary of logistic regression model for the practice of avoiding scrubby areas in the past 3 months
Variables Levels Proportion of respondents avoiding scrubby areas in the past 3 months
Odds Ratio 95% C.I. p-value
Gender* <0.001 female 64.9% 1.00male 56.4% 0.72 (0.60,0.86) <0.001
Education level* 0.006 primary or below 63.9% 1.00secondary 63.7% 1.11 (0.81,1.51) 0.518 tertiary or above 52.7% 0.78 (0.55,1.10) 0.154

77
Household income* 0.009
$0-$9,999 66.8% 1.00
$10,000-$19,999 $20,000-$29,999 $30,000-$39,999
≥$40,000
65.7%59.9%56.6%51.5%
0.97 0.77 0.68 0.63
(0.73,1.28)(0.57,1.04)(0.49,0.96)(0.46,0.86)
0.8120.0930.0290.004
* Variables were significant in the “global tests”.

78
Section 2 SARS For SARS, respondents’ background, knowledge, risk perception, and awareness have been used to predict their practices of using serving utensils when having meals with others, washing hands after touching public objects, and cleaning home everyday. Two practices, using serving utensils when having meals with others and washing hands after touching public objects, have been re-grouped into dichotomous variables. “Always”, “often”, and “sometimes” are grouped together into one category to represent respondents’ action for taking such measures. “Never” is another category, denoting no such measures taken by the respondents.
Using serving utensils when having meals with others Gender (χ2=11.2198, df=1, p=0.001), marital status (χ2=13.40, df=1, p<0.001),education level (χ2=9.76, df=2, p=0.008), occupation (χ2=6.98, df=2, p=0.030), andhousehold income (χ2=46.41, df=4, p<0.001) were found to be statistically significanton univariate analyses. After logistic regression, gender, education level, andhousehold income remained in the final model (Table 5.2-1). Respondents who weremales (male: OR=0.80, 95% C.I.:0.67-0.97) and who had household income between$10,000 and $29,999 ($10,000-$19,999: OR=0.62, 95% C.I: 0.47-0.81;$20,000-$29,999: OR=0.73, 95% C.I.: 0.55-0.99) were less likely to use servingutensils when having meals with others. Respondents of higher education level(tertiary or above: OR=1.50, 95% C.I.: 1.06-2.13) were more likely to take thispreventive measure.
Table 5.2-1 Summary of logistic regression model for the practice of using serving utensils when having meals with others in the past 3 days
Variables Levels
Proportion of respondents using serving utensils when having meals with others in the past 3 days
Odds Ratio 95% C.I. p-value
Gender* 0.019 female 50.6% 1.00male 44.5% 0.80 (0.67,0.97) 0.019
Education level* 0.042 primary or below 49.3% 1.00secondary 45.8% 1.19 (0.88,1.61) 0.270tertiary or above 52.6% 1.50 (1.06,2.13) 0.023
Household income* <0.001
$0-$9,999 49.6% 1.00$10,000-$19,999 38.8% 0.62 (0.47,0.81) <0.001$20,000-$29,999 43.6% 0.73 (0.55,0.99) 0.039$30,000-$39,999 45.1% 0.74 (0.53,1.03) 0.076≥$40,000 60.5% 1.36 (0.99,1.87) 0.057
* Variables were significant in the “global tests”.

79
Washing hands after touching public objects Gender (χ2=45.04, df=1, p<0.001), marital status (χ2=47.70, df=1, p<0.001), education level (χ2=39.26, df=2, p<0.001), occupation (χ2=71.56, df=2, p<0.001), household income (χ2=29.70, df=4, p<0.001), knowledge of SARS information (χ2=15.62, df=2, p<0.001), risk perception (χ2=8.89, df=3, p=0.031), and awareness (χ2=4.23, df=1, p=0.040) were found to be statistically significant on univariate analyses. After logistic regression, gender, marital status, and household income remained in the final model (Table 5.2-2). Respondents who were males (male: OR=0.61, 95% C.I.:0.50-0.75), who were single (single: OR= 0.53, 95% C.I.: 0.43-0.65), and who had a household income $20,000 and above ($20,000-$29,999: OR=0.49, 95% C.I.: 0.35-0.69; $30,000-$39,999: OR=0.49, 95% C.I.: 0.34-0.72; ≥$40,000: OR=0.65, 95% C.I.: 0.45-0.92) were less likely to wash their hands after touching public objects.
Table 5.2-2 Summary of logistic regression model for the practice of washing hands after touching public objects in the past 3 days
Variables Levels Proportion of respondents washing hands after touching public objects in the past 3 days
Odds Ratio 95% C.I. p-value
Gender* <0.001 female 75.1% 1.00male 64.1% 0.61 (0.50,0.75) <0.001
Marital status* <0.001
now married 75.9% 1.00now single 64.6% 0.53 (0.43,0.65) <0.001
Household income* <0.001
$0-$9,999$10,000-$19,999$20,000-$29,999$30,000-$39,999≥$40,000
77.3%71.8%61.7%63.5%67.9%
1.000.840.490.490.65
(0.60,1.17)(0.35,0.69)(0.34,0.72)(0.45,0.92)
0.293<0.001<0.0010.016
* Variables were significant in the “global tests”.
Cleaning home everyday Gender (χ2=12.91, df=1, p<0.001), marital status (χ2=20.72, df=1, p<0.001),education level (χ2=34.25, df=2, p<0.001), occupation (χ2=55.24, df=2, p<0.001), knowledge of SARS information (χ2=6.21, df=2, p=0.044), and risk perception (χ2=14.70, df=3, p=0.002) were found to be statistically significant on univariate analyses. After logistic regression, marital status, education level, and occupation remained in the final model (Table 5.2-3). Respondents who were single (single: OR=0.63, 95% C.I.: 0.51-0.77) and those of higher education level (tertiary or above: OR=0.68, 95% C.I.: 0.48-0.96) were less likely to clean their home everyday. Students (students: OR=1.95, 95% C.I: 1.54-2.46) and non-working respondents (non-working group: OR=1.62, 95% C.I.: 1.28-2.04) were 1.95 and 1.62 times more likely than working respondents to clean their home everyday.
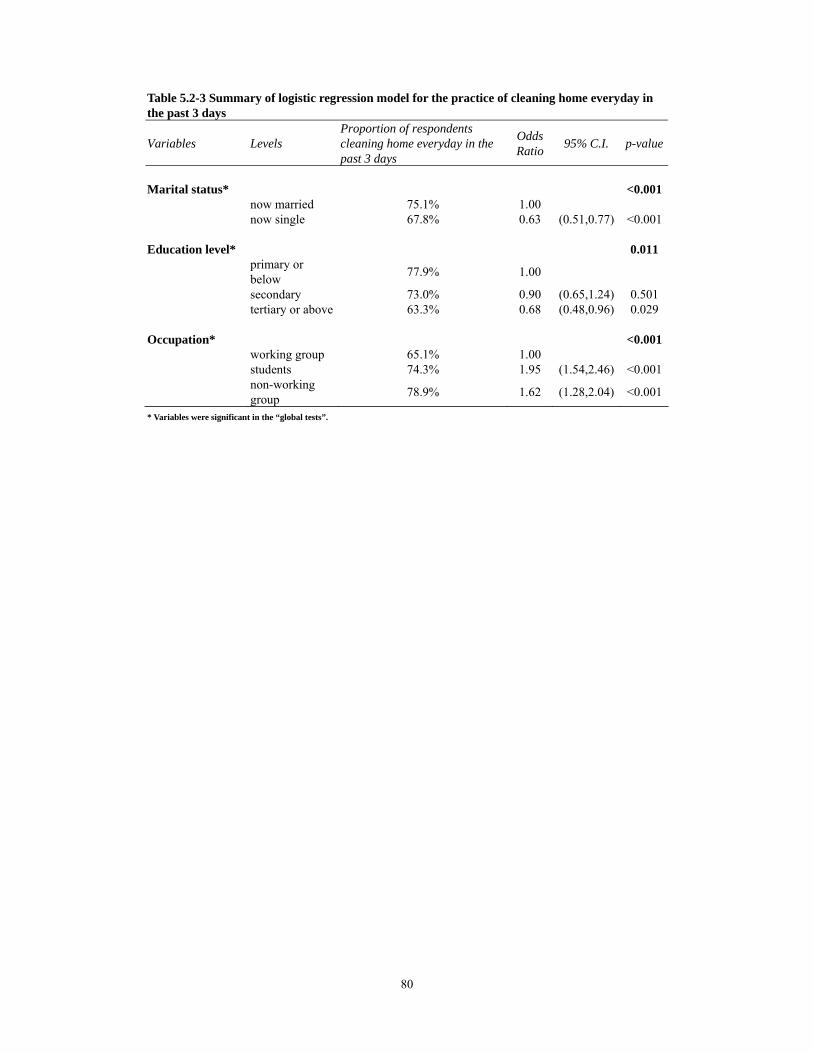
80
Table 5.2-3 Summary of logistic regression model for the practice of cleaning home everyday in the past 3 days
Variables Levels Proportion of respondents cleaning home everyday in the past 3 days
Odds Ratio 95% C.I. p-value
Marital status* <0.001 now married 75.1% 1.00now single 67.8% 0.63 (0.51,0.77) <0.001
Education level* 0.011 primary or below 77.9% 1.00
secondary 73.0% 0.90 (0.65,1.24) 0.501tertiary or above 63.3% 0.68 (0.48,0.96) 0.029
Occupation* <0.001 working group 65.1% 1.00students 74.3% 1.95 (1.54,2.46) <0.001non-working group 78.9% 1.62 (1.28,2.04) <0.001
* Variables were significant in the “global tests”.

81
Chapter 6 Conclusion and Recommendations
This chapter is divided into three parts. The first part covers the significant findings of the survey. The second part identifies several limitations of the study. In the final part, some recommendations are made. Conclusion Section 1 Dengue Fever The survey results indicate that 31.9% and 59.6% of the respondents have good and fair knowledge of dengue fever respectively. Three-fifths carry out some preventive measures against dengue fever in the past three months. Nearly all of the respondents (97.0%) are aware of dengue fever prevention information in the past three months and three-fifths (60.1%) are satisfied with the information provided by the Government. Knowledge of dengue fever, risk perception of catching and surviving the illness, and awareness of dengue fever prevention information increase with education level and household income. The working group and students are significantly better than the non-working group in these four areas. This may be due to the fact that those who are better educated may understand this information more easily than their counterparts because of their better education background. They are also likely to be in the workforce and have higher earning power. Males are more likely to think that mosquito bites are no big deal and that the consequences are not serious. Males are also more likely to think that they can survive the illness if they catch dengue fever than females. Therefore, they are less likely than females to carry out preventive measures for dengue fever.
Females and married persons are more likely to be the ones to take preventive measures against dengue fever. This applies to keeping the drains free from blockage, changing water for flowers and plants, removing stagnant water under plant containers, putting refuse which can accumulate stagnant water in covered litter bins, levelling defective ground surfaces, applying mosquito repellent to exposed parts of the body, installing mosquito nets, and avoiding scrubby areas. This survey also finds that there is no significant difference between working and non-working persons regarding the tendency to change water for flowers, put refuse into covered litter bins, cover all water containers, and level defective ground surfaces. There are a few interesting findings on dengue fever preventive measures. People who are single wear long-sleeved clothing more often than married persons. Students are more likely to wear long-sleeved clothing as well. Students, less educated persons, and those with lower household income are more likely to avoid scrubby areas.
82
Some of the findings in this survey are comparable to the previous dengue fever survey in 2002 (http://www.cheu.gov.hk/eng/professional/index2.htm). Almost all of the respondents (97.0%) in this survey and about three-fifths (61.0%) of the respondents in the previous survey are aware of dengue fever prevention information. While 60.1% of the respondents are found to be satisfied with dengue feverprevention information provided by the Government in the present survey, 53.0% are found to be satisfied with the Government’s efforts in anti-mosquito measures in the previous survey. Half of the respondents (50.5%) in this survey and about two-fifths (43.0%) of the respondents in the previous survey correctly answer that there is no effective vaccine for dengue fever. About three-fifths (62.2%) of the respondents in this survey and one-third (36.0%) in the previous survey know that there is a fine for allowing mosquitoes or insects to breed in stagnant water. This shows that there is an improvement in people’s knowledge of dengue fever. Most of the respondents (90.2%) in this survey and four-fifths (80.0%) in the previous survey disagree that mosquito bites and their consequences are not serious. This shows that there is also an improvement in people’s attitude towards dengue fever. Both surveys indicate that females are more likely to take preventive measures than males. Comparing the findings in these two surveys suggests that more people are now taking preventive measures against dengue fever.
Section 2 SARS The survey results indicate that 66.3% and 29.5% of the respondents have good and fair knowledge of SARS respectively. This may be due to the recent outbreak of SARS and recurring announcements of precautionary measures against the disease. Health advice on SARS and prevention guidelines are made available to thecommunity. Many preventive measures are frequently taken by more thanfour-fifths of the respondents in the past three days. The least commonly practised measures are using serving utensils, wearing a mask, and taking preventive measures when touching public objects. The low practice rate may be due to the fact that there is no immediate threat of SARS outbreak in Hong Kong. Besides, using serving utensils is not a common practice in the Chinese culture since we often share food when eating, especially within the family. Almost all of the respondents (97.7%) are aware of SARS prevention information in the past six months and about two-thirds (64.0%) are satisfied with the information provided by the Government. Many respondents have reported an improvement in their personal (61.6%) and home (56.8%) hygiene, as well as the environmental hygiene of Hong Kong (80.0%) after the SARS outbreak. Knowledge of SARS, risk perception of catching and surviving the illness, and awareness of SARS prevention information increase with education and household income. The working group and students show a similar pattern in these four areas, except that students do not think that they are likely or very likely to catch SARS. People who are better educated are more capable of processing and digesting the information delivered to them. They are also likely to be in the workforce and have higher earning power.

83
More males than females perceive themselves as likely to catch SARS and to survive the illness. Their more common false belief of SARS not being a serious illness may partly explain why they are less likely to take preventive measures against SARS than females.
Females, married persons, less educated individuals, non-working individuals, and those with lower household income are more likely to carry out SARS preventive measures.
After the SARS outbreak, publicity campaigns on SARS prevention by the Government mainly focused on personal hygiene. This survey shows that many preventive measures are sustainable. Hence the Government’s efforts are worthwhile.
Section 3 Environmental Hygiene The majority of the respondents (89.9%) know that the fixed penalty for littering in Hong Kong is $1,500. Over half of the respondents (51.4%) consider that it is the responsibility of the community to maintain a hygienic environment. Households’ concern, good personal hygiene, and good building management are important factors as perceived by the respondents for maintaining and improving good hygiene in residential buildings. A quarter of the respondents have cooperated with their neighbours to improve the hygiene of the public areas near their homes. Limitations 1. The survey sample is slightly biased towards females, non-married individuals,
people with better education, and some of the professions compared to the Population Census data.
2. The use of the modified Last-Birthday method cannot cover people who are always not at home. The response rate of this survey is 71.2%. The characteristics of the non-respondents (28.8%) remain unknown. There is a possibility that they belong to the hard-to-reach population group.
3. The coverage of a household telephone survey may not include all households in the random selection process and lead to a non-contact bias. However, domestic telephone coverage in Hong Kong is already greater than 99.0%.
4. There may be recall bias by the respondents when reporting their past experience in taking preventive measures against dengue fever and SARS, as well as their awareness of prevention information.
5. Another concern of using telephone survey is that the information provided by the respondents cannot be verified. The respondents may deliberately give socially desirable answers during interview.
6. This is a cross-sectional study. The causal or time relationship between various factors cannot be ascertained.

84
Recommendations The general public are generally satisfied with the Government’s efforts in providing dengue fever and SARS prevention information. The information provided has covered many areas, including the nature of and prevention for these diseases. The information flow is not only intended for high risk groups but for people at all levels. Most of the people have been shown to have fair to good knowledge, awareness, and good practices of preventive measures. However, there are some recommendations based on the survey findings which would further enhance the effectiveness and the quality of public health education.
1. Although many respondents have practised preventive measures to prevent the
spread of dengue fever and SARS, some of the practices are carried out by less than one-third of the respondents. For example, installing mosquito nets in non-air-conditioned rooms, using serving utensils when having meals with family, and wearing a mask are found to be the least commonly practised by the general public. The Government may need to put more emphasis on promoting these practices.
2. It has been found that persons of higher education level, students and working
individuals in general have good knowledge and awareness of dengue fever and SARS prevention information. Hence, public health education should put more focus on people who are less educated and unemployed to enrich their knowledge and awareness. Health information should be made easier to understand and more accessible to these target groups. Simple language should be used.Education materials can be made available at community centres, elderly homes, estates management offices, all Government departments, and so on. Delivering this information through the mass media, especially through television, canachieve desirable results as it is the channel where most of the people obtain dengue fever and SARS prevention information.
3. Working individuals and students are less likely to carry out SARS preventive measures even though their knowledge is better than those who are not working. The Government has to educate these two groups of people of the importance of taking preventive measures since they are exposed to many people and different environments. Their good practice can play a crucial role in preventing thespread of SARS.
4. The Government may arrange more community cleaning activities in estates since
people do not have the practice to cooperate with neighbours to improve theenvironment of the public areas near their homes. This can increase people’s awareness of the idea that a clean and healthy environment requires cooperation from everyone. Also, by doing so, they can turn it into a routine practice.
The emergence of dengue fever and SARS brought significant challenges to publichealth. These challenges must be handled carefully. Otherwise, lives may be lostto these highly contagious diseases. Good personal and environmental hygienicpractices and risk communication cannot be overlooked. These must involve thecombined effort of everyone, including the community, healthcare sector, and theGovernment. Knowing these diseases and maintaining good personal and
85
environmental hygiene can play an important role in effective disease prevention. It is important to understand the public’s practice of preventive measures and the factors which may be influencing their decisions in taking those precautionary actions. With such knowledge, the Government is able to evaluate the effectiveness of its work and to provide public health education according to the nature and needs of the public. Moreover, community participation is essential for effective control of dengue fever and SARS. Without community participation, even the best public health education would be futile.
Related Documents


![Dengue Fever/Severe Dengue Fever/Chikungunya Fever · Dengue fever and severe dengue (dengue hemorrhagic fever [DHF] and dengue shock syndrome [DSS]) are caused by any of four closely](https://static.cupdf.com/doc/110x72/5e87bf3e7a86e85d3b149cd7/dengue-feversevere-dengue-feverchikungunya-dengue-fever-and-severe-dengue-dengue.jpg)