Persistent luminescence in MSi 2 O 2 N 2 :Eu phosphors Jonas Botterman, 1,2 Koen Van den Eeckhout, 1,2 Adrie J. J. Bos, 3 Pieter Dorenbos, 3 and Philippe F. Smet 1,2,* 1 LumiLab, Dept. Solid State Sciences, Ghent University, Krijgslaan 281-S1, 9000 Gent, Belgium 2 Center for Nano- and Biophotonics (NB-Photonics), Ghent University, Belgium 3 Delft University of Technology, Faculty of Applied Sciences, 2629 JB Delft, The Netherlands *[email protected] Abstract: In this work we study the persistent luminescence properties of europium-doped alkaline earth silicon oxynitrides (CaSi 2 O 2 N 2 , SrSi 2 O 2 N 2 and BaSi 2 O 2 N 2 ). All compounds show afterglow emission, with an emission spectrum which is similar to the steady state photoluminescence. The afterglow decay time for BaSi 2 O 2 N 2 :Eu and SrSi 2 O 2 N 2 :Eu is about 50 and 100 minutes respectively, while for CaSi 2 O 2 N 2 :Eu the afterglow intensity is very low. Although the persistent luminescence can be induced by ultraviolet light (250-300 nm) in all three phosphors, only for BaSi 2 O 2 N 2 :Eu low energy radiation (350-500 nm) allows filling of the traps responsible for the afterglow. ©2012 Optical Society of America OCIS codes: (160.2900) Optical storage materials; (160.5690) Rare-earth-doped materials; (170.6280) Spectroscopy, fluorescence and luminescence; (160.2540) Fluorescent and luminescent materials; (250.5230) Photoluminescence. References and links 1. K. Van den Eeckhout, P. F. Smet, and D. Poelman, “Persistent luminescence in Eu 2+ -doped compounds: a review,” Materials 3(4), 2536–2566 (2010). 2. T. Matsuzawa, Y. Aoki, N. Takeuchi, and Y. Murayama, “New long phosphorescent phosphor with high brightness, SrAl2O4:Eu 2+ ,Dy 3+ ,” J. Electrochem. Soc. 143(8), 2670–2673 (1996). 3. R. Mueller-Mach, G. Mueller, M. R. Krames, H. A. Höppe, F. Stadler, W. Schnick, T. Juestel, and P. Schmidt, “Highly efficient all-nitride phosphor-converted white light emitting diode,” Phys. Status Solidi A 202(9), 1727– 1732 (2005). 4. R. J. Xie, N. Hirosaki, K. Sakuma, and N. Kimura, “White light-emitting diodes (LEDs) using (oxy) nitride phosphors,” J. Phys. D Appl. Phys. 41(14), 144013 (2008). 5. P. F. Smet, A. B. Parmentier, and D. Poelman, “Selecting conversion phosphors for white light-emitting diodes,” J. Electrochem. Soc. 158(6), R37–R54 (2011). 6. V. Bachmann, C. Ronda, O. Oeckler, W. Schnick, and A. Meijerink, “Color point tuning for (Sr,Ca,Ba)Si2O2N2:Eu 2+ for white light LEDs,” Chem. Mater. 21(2), 316–325 (2009). 7. V. Bachmann, T. Justel, A. Meijerink, C. Ronda, and P. J. Schmidt, “Luminescence properties of SrSi2O2N2 doped with divalent rare earth ions,” J. Lumin. 121(2), 441–449 (2006). 8. M. Y. Wang, X. Zhang, Z. D. Hao, X. G. Ren, Y. S. Luo, H. F. Zhao, X. J. Wang, and J. H. Zhang, “Long-lasting phosphorescence in BaSi2O2N2:Eu 2+ and Ba2SiO4:Eu 2+ phases for x-ray and cathode ray tubes,” J. Electrochem. Soc. 157(2), H178–H181 (2010). 9. A. J. J. Bos, R. M. van Duijvenvoorde, E. van der Kolk, W. Drozdowski, and P. Dorenbos, “Thermoluminescence excitation spectroscopy: A versatile technique to study persistent luminescence phosphors,” J. Lumin. 131(7), 1465–1471 (2011). 10. P. F. Smet, K. Van den Eeckhout, A. J. J. Bos, E. van der Kolk, and P. Dorenbos, “Temperature and wavelength dependent trap filling in M2Si5N8:Eu (M = Ca, Sr, Ba) persistent phosphors,” J. Lumin. 132(3), 682–689 (2012). 11. J. A. Kechele, O. Oeckler, F. Stadler, and W. Schnick, “Structure elucidation of BaSi2O2N2 - A host lattice for rare-earth doped luminescent materials in phosphor-converted (pc)-LEDs,” Solid State Sci. 11(2), 537–543 (2009). 12. O. Oeckler, F. Stadler, T. Rosenthal, and W. Schnick, “Real structure of SrSi2O2N2,” Solid State Sci. 9(2), 205– 212 (2007). 13. H. A. Höppe, F. Stadler, O. Oeckler, and W. Schnick, “Ca[Si2O2N2] - A novel layer silicate,” Angew. Chem. Int. Ed. 43(41), 5540–5542 (2004). #160143 - $15.00 USD Received 20 Dec 2011; revised 23 Feb 2012; accepted 23 Feb 2012; published 27 Feb 2012 (C) 2012 OSA 1 March 2012 / Vol. 2, No. 3 / OPTICAL MATERIALS EXPRESS 341

Welcome message from author
This document is posted to help you gain knowledge. Please leave a comment to let me know what you think about it! Share it to your friends and learn new things together.
Transcript
Persistent luminescence in MSi2O2N2:Eu
phosphors
Jonas Botterman,1,2
Koen Van den Eeckhout,1,2
Adrie J. J. Bos,3 Pieter Dorenbos,
3
and Philippe F. Smet1,2,*
1LumiLab, Dept. Solid State Sciences, Ghent University, Krijgslaan 281-S1, 9000 Gent, Belgium
2Center for Nano- and Biophotonics (NB-Photonics), Ghent University, Belgium 3Delft University of Technology, Faculty of Applied Sciences, 2629 JB Delft, The Netherlands
Abstract: In this work we study the persistent luminescence properties of
europium-doped alkaline earth silicon oxynitrides (CaSi2O2N2, SrSi2O2N2
and BaSi2O2N2). All compounds show afterglow emission, with an emission
spectrum which is similar to the steady state photoluminescence. The
afterglow decay time for BaSi2O2N2:Eu and SrSi2O2N2:Eu is about 50 and
100 minutes respectively, while for CaSi2O2N2:Eu the afterglow intensity is
very low. Although the persistent luminescence can be induced by
ultraviolet light (250-300 nm) in all three phosphors, only for BaSi2O2N2:Eu
low energy radiation (350-500 nm) allows filling of the traps responsible for
the afterglow.
©2012 Optical Society of America
OCIS codes: (160.2900) Optical storage materials; (160.5690) Rare-earth-doped materials;
(170.6280) Spectroscopy, fluorescence and luminescence; (160.2540) Fluorescent and
luminescent materials; (250.5230) Photoluminescence.
References and links
1. K. Van den Eeckhout, P. F. Smet, and D. Poelman, “Persistent luminescence in Eu2+-doped compounds: a
review,” Materials 3(4), 2536–2566 (2010).
2. T. Matsuzawa, Y. Aoki, N. Takeuchi, and Y. Murayama, “New long phosphorescent phosphor with high
brightness, SrAl2O4:Eu2+,Dy3+,” J. Electrochem. Soc. 143(8), 2670–2673 (1996).
3. R. Mueller-Mach, G. Mueller, M. R. Krames, H. A. Höppe, F. Stadler, W. Schnick, T. Juestel, and P. Schmidt,
“Highly efficient all-nitride phosphor-converted white light emitting diode,” Phys. Status Solidi A 202(9), 1727–
1732 (2005).
4. R. J. Xie, N. Hirosaki, K. Sakuma, and N. Kimura, “White light-emitting diodes (LEDs) using (oxy) nitride
phosphors,” J. Phys. D Appl. Phys. 41(14), 144013 (2008).
5. P. F. Smet, A. B. Parmentier, and D. Poelman, “Selecting conversion phosphors for white light-emitting diodes,”
J. Electrochem. Soc. 158(6), R37–R54 (2011).
6. V. Bachmann, C. Ronda, O. Oeckler, W. Schnick, and A. Meijerink, “Color point tuning for
(Sr,Ca,Ba)Si2O2N2:Eu2+ for white light LEDs,” Chem. Mater. 21(2), 316–325 (2009).
7. V. Bachmann, T. Justel, A. Meijerink, C. Ronda, and P. J. Schmidt, “Luminescence properties of SrSi2O2N2
doped with divalent rare earth ions,” J. Lumin. 121(2), 441–449 (2006).
8. M. Y. Wang, X. Zhang, Z. D. Hao, X. G. Ren, Y. S. Luo, H. F. Zhao, X. J. Wang, and J. H. Zhang, “Long-lasting
phosphorescence in BaSi2O2N2:Eu2+ and Ba2SiO4:Eu2+ phases for x-ray and cathode ray tubes,” J. Electrochem.
Soc. 157(2), H178–H181 (2010).
9. A. J. J. Bos, R. M. van Duijvenvoorde, E. van der Kolk, W. Drozdowski, and P. Dorenbos,
“Thermoluminescence excitation spectroscopy: A versatile technique to study persistent luminescence
phosphors,” J. Lumin. 131(7), 1465–1471 (2011).
10. P. F. Smet, K. Van den Eeckhout, A. J. J. Bos, E. van der Kolk, and P. Dorenbos, “Temperature and wavelength
dependent trap filling in M2Si5N8:Eu (M = Ca, Sr, Ba) persistent phosphors,” J. Lumin. 132(3), 682–689 (2012).
11. J. A. Kechele, O. Oeckler, F. Stadler, and W. Schnick, “Structure elucidation of BaSi2O2N2 - A host lattice for
rare-earth doped luminescent materials in phosphor-converted (pc)-LEDs,” Solid State Sci. 11(2), 537–543
(2009).
12. O. Oeckler, F. Stadler, T. Rosenthal, and W. Schnick, “Real structure of SrSi2O2N2,” Solid State Sci. 9(2), 205–
212 (2007).
13. H. A. Höppe, F. Stadler, O. Oeckler, and W. Schnick, “Ca[Si2O2N2] - A novel layer silicate,” Angew. Chem. Int.
Ed. 43(41), 5540–5542 (2004).
#160143 - $15.00 USD Received 20 Dec 2011; revised 23 Feb 2012; accepted 23 Feb 2012; published 27 Feb 2012(C) 2012 OSA 1 March 2012 / Vol. 2, No. 3 / OPTICAL MATERIALS EXPRESS 341
14. F. Stadler, R. Kraut, O. Oeckler, S. Schmid, and W. Schnick, “Synthesis, crystal structure and solid-state NMR
spectroscopic investigation of the oxonitridosilicate BaSi6N8O,” ChemInform 36(43), 1773–1778 (2005).
15. F. Stadler and W. Schnick, “The new layer-silicates Ba3Si6O9N4 and Eu3Si6O9N4,” Z. Anorg. Allg. Chem. 632(6),
949–954 (2006).
16. D. Poelman, N. Avci, and P. F. Smet, “Measured luminance and visual appearance of multi-color persistent
phosphors,” Opt. Express 17(1), 358–364 (2009).
17. K. Van den Eeckhout, P. F. Smet, and D. Poelman, “Luminescent afterglow behavior in the M2Si5N8: Eu family
(M = Ca, Sr, Ba),” Materials 4(6), 980–990 (2011).
18. K. Korthout, K. Van den Eeckhout, J. Botterman, S. Nikitenko, D. Poelman, and P. F. Smet, “Luminescence and
x-ray absorption measurements of persistent SrAl2O4:Eu,Dy powders: Evidence for valence state changes,” Phys.
Rev. B 84(8), 085140 (2011).
1. Introduction
Persistent luminescent materials are able to emit light for a long time after the excitation has
ended (typically minutes to hours). This remarkable ‘afterglow’ of persistent luminescent
materials allows for a wide range of applications from commercial products including watch
dials, luminous paints and glow-in-the-dark gadgets to emergency signage and safety
illumination in public places and medical imaging applications. Currently, europium doped
materials are among the most efficient and most studied persistent phosphors. Other rare-earth
elements are often added to enhance the persistence lifetime. An overview of reported
europium based persistent luminescent materials (and suggested mechanisms) is given by Van
den Eeckhout et al. [1]. SrAl2O4:Eu,Dy is an efficient persistent luminescent material with an
afterglow duration exceeding 30 h. The report on this green emitting phosphor in 1996 by
Matsuzawa et al. [2] marked the start for intensive scientific research on persistent
luminescence.
Europium doped oxynitrides (MSi2O2N2:Eu with M = Ba, Sr, Ca) have recently been
proposed as excellent conversion phosphor materials for white-light-emitting LED
applications based on near ultraviolet (UV) or blue emitting InGaN LEDs. This is not only
because of their strong absorption in the near UV to blue-light region of the light spectrum,
but also for their high quantum efficiency and their good thermal and chemical stability
compared to most oxide and sulfide phosphors [3–5]. BaSi2O2N2:Eu emits blue-green light
and has an emission maximum around 494 nm and a full width at half-maximum (FWHM) for
the emission band of 32 nm. SrSi2O2N2:Eu emits in the green region of the visible light
spectrum. Its emission spectrum is broad (FWHM = 76 nm) with an emission maximum
around 539 nm. CaSi2O2N2:Eu is a green-yellow emitting phosphor with an even broader
emission band (FWHM = 106 nm) with a maximum around 560 nm. The photoluminescent
properties of these oxynitrides were reported in detail by Bachmann et al. [6,7].
Recently, the persistent luminescence of BaSi2O2N2:Eu upon excitation with X-rays has
been briefly reported in the context of application with x-ray and cathode ray tubes [8]. In the
current paper we present a systematic study of the persistent luminescence in the europium
doped oxynitrides (MSi2O2N2:Eu with M = Ba, Sr, Ca). We link these properties to results
from thermoluminescent (TL) spectroscopic studies. Measuring the influence of the excitation
wavelength on the afterglow intensity and duration of persistent luminescence is a lengthy
process, as one should in principle collect a separate decay profile for each excitation
wavelength. Therefore one often uses the integrated TL glow intensity as a measure of the
amount of stored energy in the host lattice upon filling the relevant traps in the material. In the
TL spectroscopic study, presented in this study, TL curves are recorded after exciting the
material with specific wavelengths. By variation of the excitation wavelength, a TL excitation
contour plot can be obtained [9,10], from which the depth of traps inside the material and the
wavelengths suitable to fill traps relevant for the persistent luminescence can be extracted. In
this work we discuss the potential use of europium-doped alkaline earth oxynitrides as
persistent phosphors. Finally, afterglow is often seen as a disadvantage when it comes to
applying the materials in phosphor converted white LEDs where fast luminescence turn-on
and turn-off characteristics are required. We will show that despite the existence of persistent
#160143 - $15.00 USD Received 20 Dec 2011; revised 23 Feb 2012; accepted 23 Feb 2012; published 27 Feb 2012(C) 2012 OSA 1 March 2012 / Vol. 2, No. 3 / OPTICAL MATERIALS EXPRESS 342
luminescence in SrSi2O2N2:Eu and CaSi2O2N2:Eu, these materials can perfectly be used as
conversion phosphor in LEDs.
2. Experimental
MSi2O2N2:Eu powders (with M = Ba, Sr, Ca) were synthesized using a high temperature solid
state reaction. Stoichiometric amounts of starting materials MCO3 (99.95%, Alfa Aesar) and
Si3N4 (α-phase, 99.5%, Alfa Aesar) were weighed and thoroughly mixed in a mortar. In order
to dope with Eu, appropriate amounts of MCO3 were substituted by EuF3 (99.5%, Alfa Aesar).
All powders were prepared with 2 mol% of Eu unless stated otherwise. The obtained mixtures
were put in zirconia crucibles and fired at 1425 °C during 4 h in a horizontal tube furnace
under a flowing atmosphere of forming gas (90% N2, 10% H2). Since the europium ions are
incorporated on divalent lattice sites, and the reaction atmosphere is reducing, europium is
dominantly incorporated into the host lattice as Eu2+
. After cooling in a natural way, the
powders were recuperated from the crucibles and grinded in a mortar.
The crystal structure of the prepared powders was checked by θ-2θ X-ray diffraction
(XRD) measurements (Siemens D5000, CuKα radiation) and compared with literature data
[11–13].
Photoluminescence (PL) excitation and emission spectra were recorded with a steady state
fluorescence spectrometer (Edinburgh Instruments FS920). Luminescence decay
measurements were performed using the Edinburgh spectrometer and a calibrated photometer
(International Light Technologies ILT1700).
Thermoluminescence excitation spectra were obtained on the setup described in detail in
[9,10]. A fiber-coupled grating monochromator in combination with a xenon arc light source
allows to direct monochromatic excitation light towards the sample. Thermoluminescence
glow curves are then collected by a Risø thermoluminescence reader (TL/OSL-DA-15),
equipped with a photomultiplier tube and suitable optical filters. The setup is fully automated
and software controlled, which allows the reproducible collection of thermoluminescence
glow curves for consecutive excitation wavelengths. Typically, a measurement time of 8 h
was needed for the TL excitation contour plots shown in this work. All spectra were corrected
for the wavelength-dependent optical output of the excitation source. TL excitation contour
plots were collected with a heating rate of 5 K/s.
3. Results
3.1 Crystal structure
XRD spectra (Fig. 1) of the BaSi2O2N2:Eu powders showed the structure of the BaSi2O2N2
host lattice [11] with only minor traces of BaSi6ON8 [14] and Ba3Si6O9N4 [15] in some
samples. Substituting a small amount of Ba atoms by Eu atoms in the crystal lattice does not
have a detectable influence on the XRD spectra and thus we assume that for low doping
concentration the crystal structure is unaltered. Also for the synthesis of SrSi2O2N2:Eu and
CaSi2O2N2:Eu we verified that under the used synthesis conditions the desired materials are
obtained with only minor traces of impurities [12,13].
The MSi2O2N2 crystal structures are closely related to each other and consist of layers of
M2+
cations alternating with layers of highly condensed SiON3 tetrahedra. However, small
differences in the relative orientation or positioning of the silicate layers in the different
compounds results in different crystal systems: BaSi2O2N2 is orthorhombic, SrSi2O2N2 is
triclinic and CaSi2O2N2 is monoclinic.
#160143 - $15.00 USD Received 20 Dec 2011; revised 23 Feb 2012; accepted 23 Feb 2012; published 27 Feb 2012(C) 2012 OSA 1 March 2012 / Vol. 2, No. 3 / OPTICAL MATERIALS EXPRESS 343
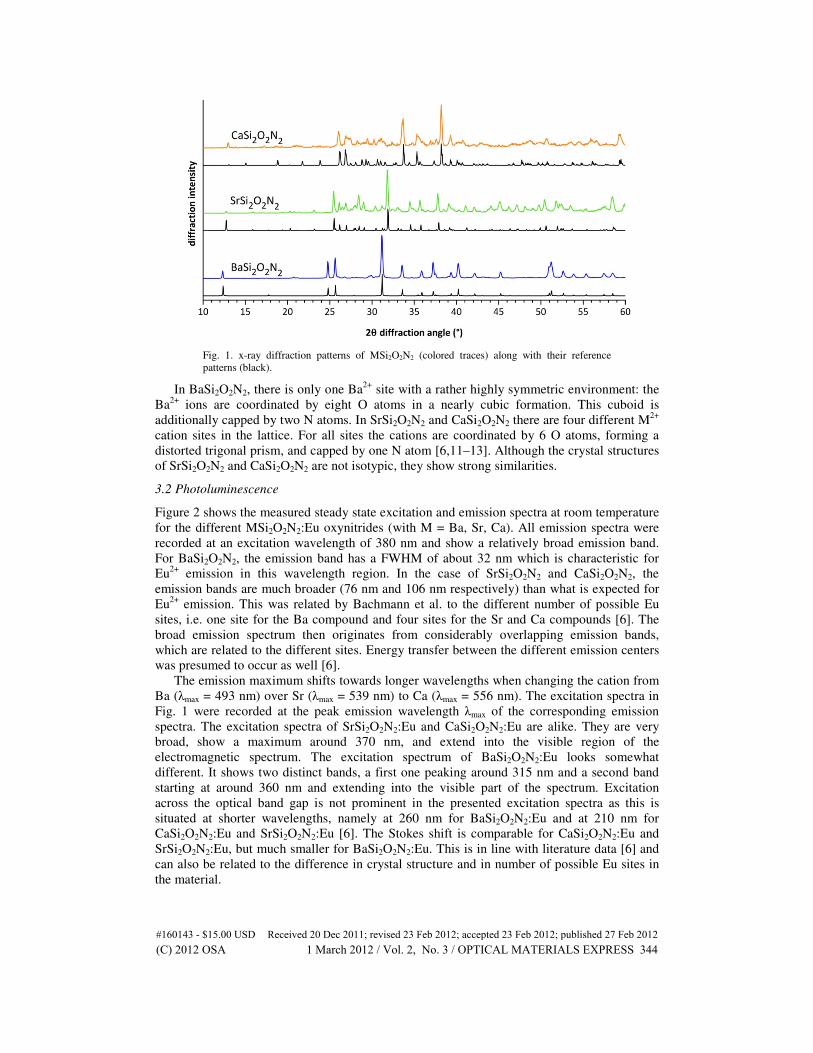
Fig. 1. x-ray diffraction patterns of MSi2O2N2 (colored traces) along with their reference
patterns (black).
In BaSi2O2N2, there is only one Ba2+
site with a rather highly symmetric environment: the
Ba2+
ions are coordinated by eight O atoms in a nearly cubic formation. This cuboid is
additionally capped by two N atoms. In SrSi2O2N2 and CaSi2O2N2 there are four different M2+
cation sites in the lattice. For all sites the cations are coordinated by 6 O atoms, forming a
distorted trigonal prism, and capped by one N atom [6,11–13]. Although the crystal structures
of SrSi2O2N2 and CaSi2O2N2 are not isotypic, they show strong similarities.
3.2 Photoluminescence
Figure 2 shows the measured steady state excitation and emission spectra at room temperature
for the different MSi2O2N2:Eu oxynitrides (with M = Ba, Sr, Ca). All emission spectra were
recorded at an excitation wavelength of 380 nm and show a relatively broad emission band.
For BaSi2O2N2, the emission band has a FWHM of about 32 nm which is characteristic for
Eu2+
emission in this wavelength region. In the case of SrSi2O2N2 and CaSi2O2N2, the
emission bands are much broader (76 nm and 106 nm respectively) than what is expected for
Eu2+
emission. This was related by Bachmann et al. to the different number of possible Eu
sites, i.e. one site for the Ba compound and four sites for the Sr and Ca compounds [6]. The
broad emission spectrum then originates from considerably overlapping emission bands,
which are related to the different sites. Energy transfer between the different emission centers
was presumed to occur as well [6].
The emission maximum shifts towards longer wavelengths when changing the cation from
Ba (λmax = 493 nm) over Sr (λmax = 539 nm) to Ca (λmax = 556 nm). The excitation spectra in
Fig. 1 were recorded at the peak emission wavelength λmax of the corresponding emission
spectra. The excitation spectra of SrSi2O2N2:Eu and CaSi2O2N2:Eu are alike. They are very
broad, show a maximum around 370 nm, and extend into the visible region of the
electromagnetic spectrum. The excitation spectrum of BaSi2O2N2:Eu looks somewhat
different. It shows two distinct bands, a first one peaking around 315 nm and a second band
starting at around 360 nm and extending into the visible part of the spectrum. Excitation
across the optical band gap is not prominent in the presented excitation spectra as this is
situated at shorter wavelengths, namely at 260 nm for BaSi2O2N2:Eu and at 210 nm for
CaSi2O2N2:Eu and SrSi2O2N2:Eu [6]. The Stokes shift is comparable for CaSi2O2N2:Eu and
SrSi2O2N2:Eu, but much smaller for BaSi2O2N2:Eu. This is in line with literature data [6] and
can also be related to the difference in crystal structure and in number of possible Eu sites in
the material.
#160143 - $15.00 USD Received 20 Dec 2011; revised 23 Feb 2012; accepted 23 Feb 2012; published 27 Feb 2012(C) 2012 OSA 1 March 2012 / Vol. 2, No. 3 / OPTICAL MATERIALS EXPRESS 344
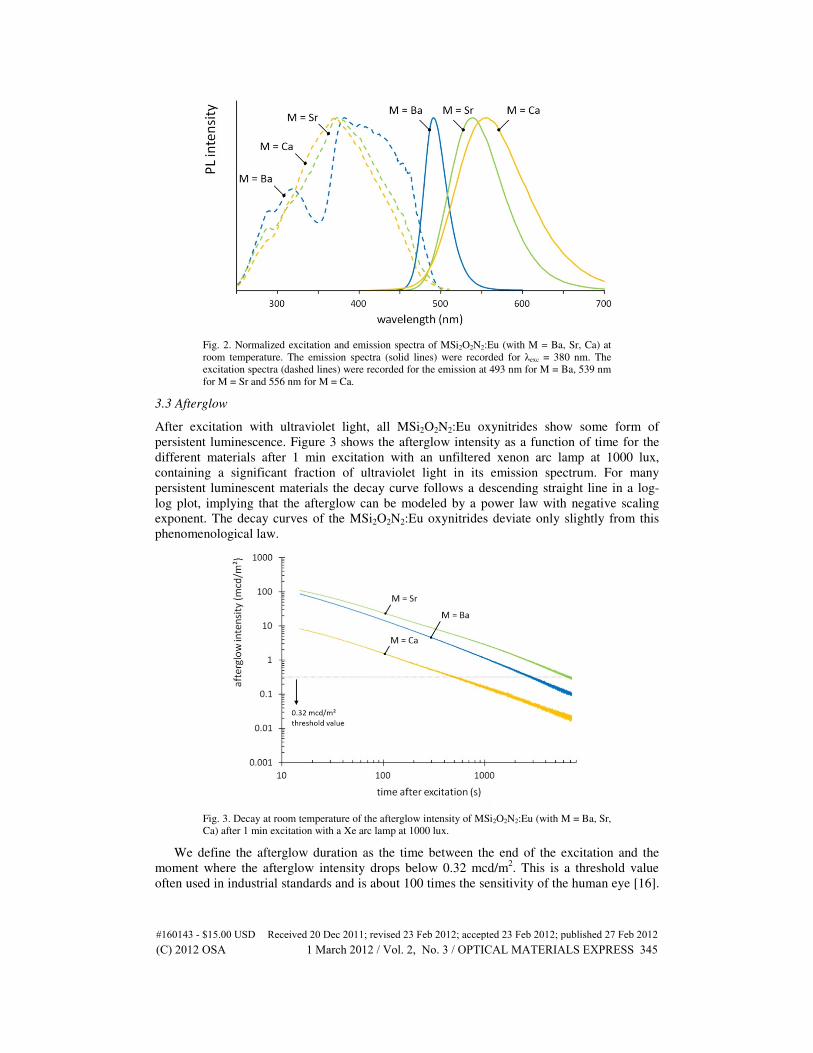
Fig. 2. Normalized excitation and emission spectra of MSi2O2N2:Eu (with M = Ba, Sr, Ca) at
room temperature. The emission spectra (solid lines) were recorded for λexc = 380 nm. The
excitation spectra (dashed lines) were recorded for the emission at 493 nm for M = Ba, 539 nm
for M = Sr and 556 nm for M = Ca.
3.3 Afterglow
After excitation with ultraviolet light, all MSi2O2N2:Eu oxynitrides show some form of
persistent luminescence. Figure 3 shows the afterglow intensity as a function of time for the
different materials after 1 min excitation with an unfiltered xenon arc lamp at 1000 lux,
containing a significant fraction of ultraviolet light in its emission spectrum. For many
persistent luminescent materials the decay curve follows a descending straight line in a log-
log plot, implying that the afterglow can be modeled by a power law with negative scaling
exponent. The decay curves of the MSi2O2N2:Eu oxynitrides deviate only slightly from this
phenomenological law.
Fig. 3. Decay at room temperature of the afterglow intensity of MSi2O2N2:Eu (with M = Ba, Sr,
Ca) after 1 min excitation with a Xe arc lamp at 1000 lux.
We define the afterglow duration as the time between the end of the excitation and the
moment where the afterglow intensity drops below 0.32 mcd/m2. This is a threshold value
often used in industrial standards and is about 100 times the sensitivity of the human eye [16].
#160143 - $15.00 USD Received 20 Dec 2011; revised 23 Feb 2012; accepted 23 Feb 2012; published 27 Feb 2012(C) 2012 OSA 1 March 2012 / Vol. 2, No. 3 / OPTICAL MATERIALS EXPRESS 345
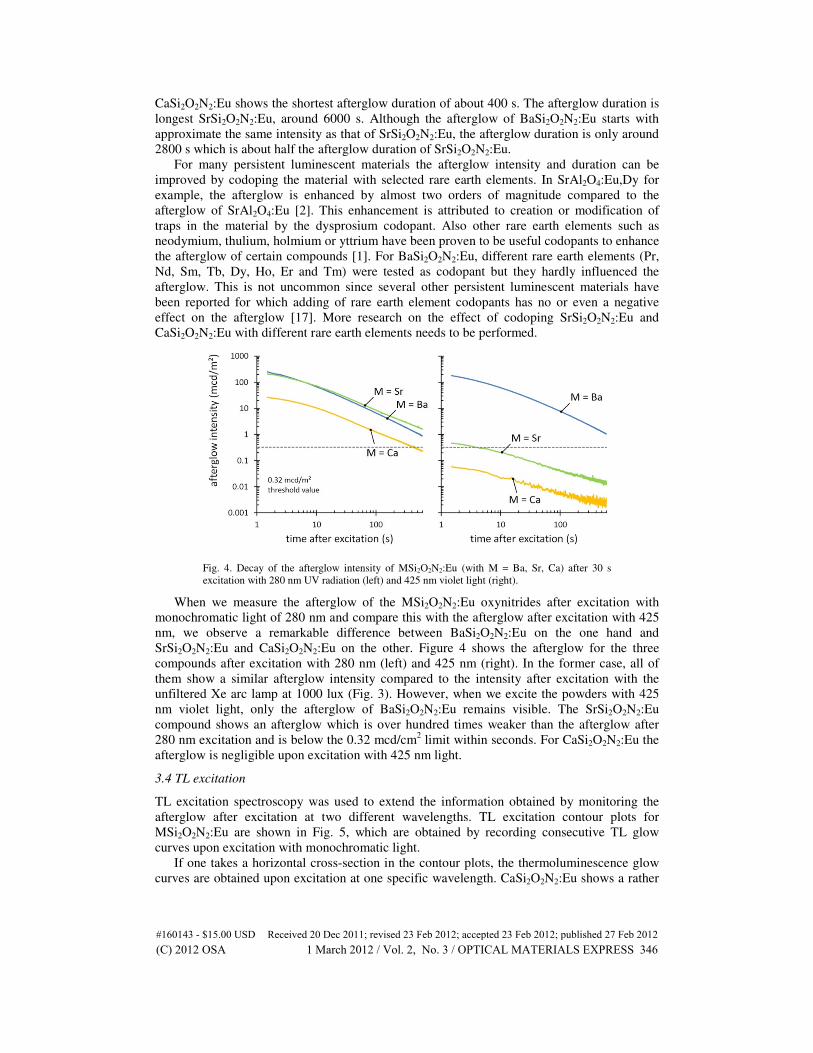
CaSi2O2N2:Eu shows the shortest afterglow duration of about 400 s. The afterglow duration is
longest SrSi2O2N2:Eu, around 6000 s. Although the afterglow of BaSi2O2N2:Eu starts with
approximate the same intensity as that of SrSi2O2N2:Eu, the afterglow duration is only around
2800 s which is about half the afterglow duration of SrSi2O2N2:Eu.
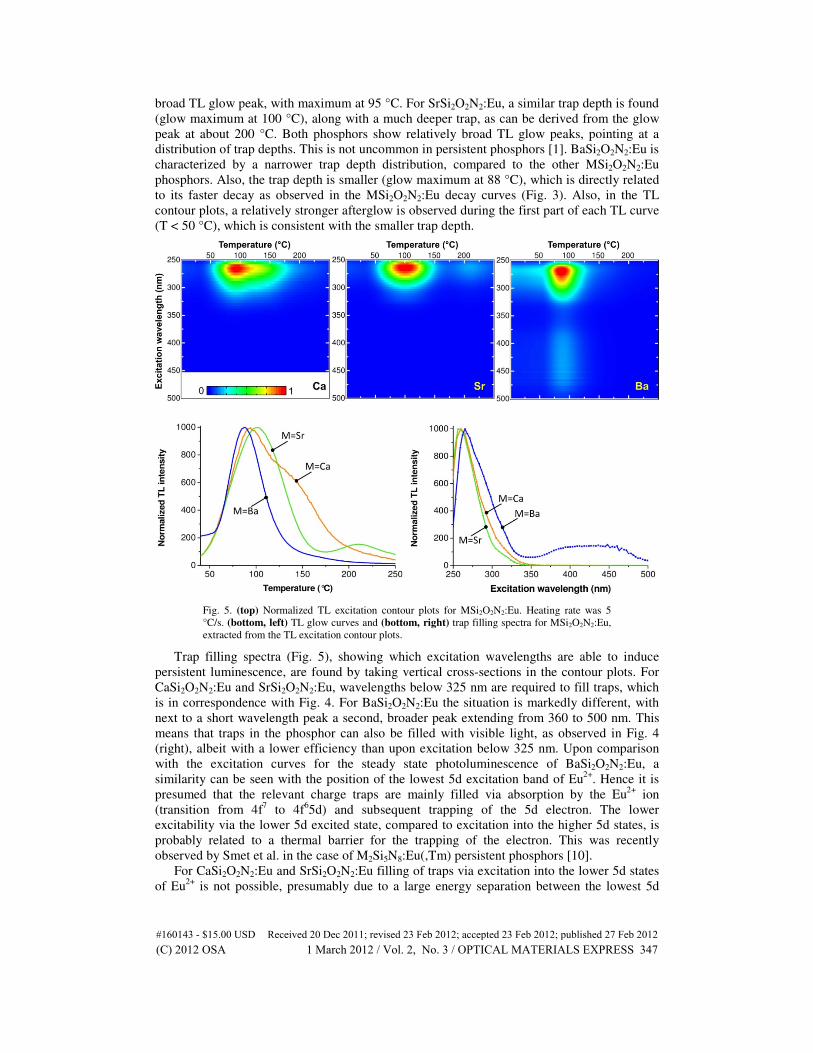
For many persistent luminescent materials the afterglow intensity and duration can be
improved by codoping the material with selected rare earth elements. In SrAl2O4:Eu,Dy for
example, the afterglow is enhanced by almost two orders of magnitude compared to the
afterglow of SrAl2O4:Eu [2]. This enhancement is attributed to creation or modification of
traps in the material by the dysprosium codopant. Also other rare earth elements such as
neodymium, thulium, holmium or yttrium have been proven to be useful codopants to enhance
the afterglow of certain compounds [1]. For BaSi2O2N2:Eu, different rare earth elements (Pr,
Nd, Sm, Tb, Dy, Ho, Er and Tm) were tested as codopant but they hardly influenced the
afterglow. This is not uncommon since several other persistent luminescent materials have
been reported for which adding of rare earth element codopants has no or even a negative
effect on the afterglow [17]. More research on the effect of codoping SrSi2O2N2:Eu and
CaSi2O2N2:Eu with different rare earth elements needs to be performed.
Fig. 4. Decay of the afterglow intensity of MSi2O2N2:Eu (with M = Ba, Sr, Ca) after 30 s
excitation with 280 nm UV radiation (left) and 425 nm violet light (right).
When we measure the afterglow of the MSi2O2N2:Eu oxynitrides after excitation with
monochromatic light of 280 nm and compare this with the afterglow after excitation with 425
nm, we observe a remarkable difference between BaSi2O2N2:Eu on the one hand and
SrSi2O2N2:Eu and CaSi2O2N2:Eu on the other. Figure 4 shows the afterglow for the three
compounds after excitation with 280 nm (left) and 425 nm (right). In the former case, all of
them show a similar afterglow intensity compared to the intensity after excitation with the
unfiltered Xe arc lamp at 1000 lux (Fig. 3). However, when we excite the powders with 425
nm violet light, only the afterglow of BaSi2O2N2:Eu remains visible. The SrSi2O2N2:Eu
compound shows an afterglow which is over hundred times weaker than the afterglow after
280 nm excitation and is below the 0.32 mcd/cm2 limit within seconds. For CaSi2O2N2:Eu the
afterglow is negligible upon excitation with 425 nm light.
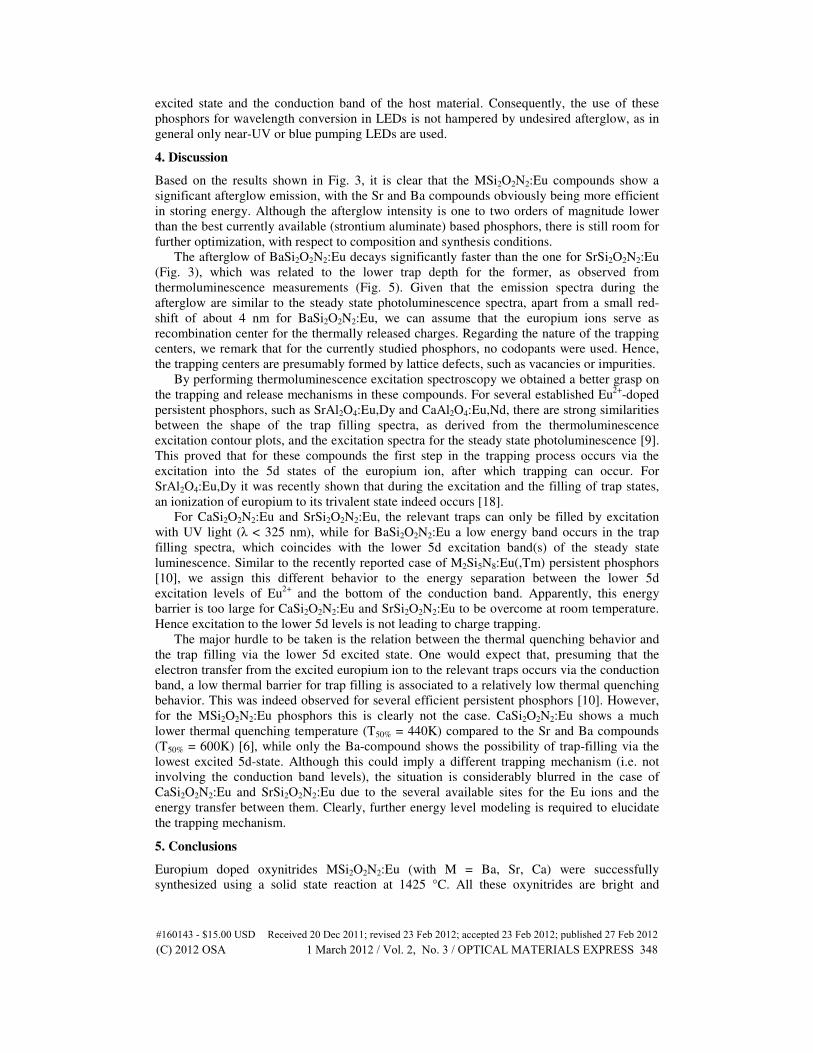
3.4 TL excitation
TL excitation spectroscopy was used to extend the information obtained by monitoring the
afterglow after excitation at two different wavelengths. TL excitation contour plots for
MSi2O2N2:Eu are shown in Fig. 5, which are obtained by recording consecutive TL glow
curves upon excitation with monochromatic light.
If one takes a horizontal cross-section in the contour plots, the thermoluminescence glow
curves are obtained upon excitation at one specific wavelength. CaSi2O2N2:Eu shows a rather
#160143 - $15.00 USD Received 20 Dec 2011; revised 23 Feb 2012; accepted 23 Feb 2012; published 27 Feb 2012(C) 2012 OSA 1 March 2012 / Vol. 2, No. 3 / OPTICAL MATERIALS EXPRESS 346
broad TL glow peak, with maximum at 95 °C. For SrSi2O2N2:Eu, a similar trap depth is found
(glow maximum at 100 °C), along with a much deeper trap, as can be derived from the glow
peak at about 200 °C. Both phosphors show relatively broad TL glow peaks, pointing at a
distribution of trap depths. This is not uncommon in persistent phosphors [1]. BaSi2O2N2:Eu is
characterized by a narrower trap depth distribution, compared to the other MSi2O2N2:Eu
phosphors. Also, the trap depth is smaller (glow maximum at 88 °C), which is directly related
to its faster decay as observed in the MSi2O2N2:Eu decay curves (Fig. 3). Also, in the TL
contour plots, a relatively stronger afterglow is observed during the first part of each TL curve
(T < 50 °C), which is consistent with the smaller trap depth.
Fig. 5. (top) Normalized TL excitation contour plots for MSi2O2N2:Eu. Heating rate was 5
°C/s. (bottom, left) TL glow curves and (bottom, right) trap filling spectra for MSi2O2N2:Eu,
extracted from the TL excitation contour plots.
Trap filling spectra (Fig. 5), showing which excitation wavelengths are able to induce
persistent luminescence, are found by taking vertical cross-sections in the contour plots. For
CaSi2O2N2:Eu and SrSi2O2N2:Eu, wavelengths below 325 nm are required to fill traps, which
is in correspondence with Fig. 4. For BaSi2O2N2:Eu the situation is markedly different, with
next to a short wavelength peak a second, broader peak extending from 360 to 500 nm. This
means that traps in the phosphor can also be filled with visible light, as observed in Fig. 4
(right), albeit with a lower efficiency than upon excitation below 325 nm. Upon comparison
with the excitation curves for the steady state photoluminescence of BaSi2O2N2:Eu, a
similarity can be seen with the position of the lowest 5d excitation band of Eu2+
. Hence it is
presumed that the relevant charge traps are mainly filled via absorption by the Eu2+
ion
(transition from 4f7 to 4f
65d) and subsequent trapping of the 5d electron. The lower
excitability via the lower 5d excited state, compared to excitation into the higher 5d states, is
probably related to a thermal barrier for the trapping of the electron. This was recently
observed by Smet et al. in the case of M2Si5N8:Eu(,Tm) persistent phosphors [10].
For CaSi2O2N2:Eu and SrSi2O2N2:Eu filling of traps via excitation into the lower 5d states
of Eu2+
is not possible, presumably due to a large energy separation between the lowest 5d
#160143 - $15.00 USD Received 20 Dec 2011; revised 23 Feb 2012; accepted 23 Feb 2012; published 27 Feb 2012(C) 2012 OSA 1 March 2012 / Vol. 2, No. 3 / OPTICAL MATERIALS EXPRESS 347
excited state and the conduction band of the host material. Consequently, the use of these
phosphors for wavelength conversion in LEDs is not hampered by undesired afterglow, as in
general only near-UV or blue pumping LEDs are used.
4. Discussion
Based on the results shown in Fig. 3, it is clear that the MSi2O2N2:Eu compounds show a
significant afterglow emission, with the Sr and Ba compounds obviously being more efficient
in storing energy. Although the afterglow intensity is one to two orders of magnitude lower
than the best currently available (strontium aluminate) based phosphors, there is still room for
further optimization, with respect to composition and synthesis conditions.
The afterglow of BaSi2O2N2:Eu decays significantly faster than the one for SrSi2O2N2:Eu
(Fig. 3), which was related to the lower trap depth for the former, as observed from
thermoluminescence measurements (Fig. 5). Given that the emission spectra during the
afterglow are similar to the steady state photoluminescence spectra, apart from a small red-
shift of about 4 nm for BaSi2O2N2:Eu, we can assume that the europium ions serve as
recombination center for the thermally released charges. Regarding the nature of the trapping
centers, we remark that for the currently studied phosphors, no codopants were used. Hence,
the trapping centers are presumably formed by lattice defects, such as vacancies or impurities.
By performing thermoluminescence excitation spectroscopy we obtained a better grasp on
the trapping and release mechanisms in these compounds. For several established Eu2+
-doped
persistent phosphors, such as SrAl2O4:Eu,Dy and CaAl2O4:Eu,Nd, there are strong similarities
between the shape of the trap filling spectra, as derived from the thermoluminescence
excitation contour plots, and the excitation spectra for the steady state photoluminescence [9].
This proved that for these compounds the first step in the trapping process occurs via the
excitation into the 5d states of the europium ion, after which trapping can occur. For
SrAl2O4:Eu,Dy it was recently shown that during the excitation and the filling of trap states,
an ionization of europium to its trivalent state indeed occurs [18].
For CaSi2O2N2:Eu and SrSi2O2N2:Eu, the relevant traps can only be filled by excitation
with UV light (λ < 325 nm), while for BaSi2O2N2:Eu a low energy band occurs in the trap
filling spectra, which coincides with the lower 5d excitation band(s) of the steady state
luminescence. Similar to the recently reported case of M2Si5N8:Eu(,Tm) persistent phosphors
[10], we assign this different behavior to the energy separation between the lower 5d
excitation levels of Eu2+
and the bottom of the conduction band. Apparently, this energy
barrier is too large for CaSi2O2N2:Eu and SrSi2O2N2:Eu to be overcome at room temperature.
Hence excitation to the lower 5d levels is not leading to charge trapping.
The major hurdle to be taken is the relation between the thermal quenching behavior and
the trap filling via the lower 5d excited state. One would expect that, presuming that the
electron transfer from the excited europium ion to the relevant traps occurs via the conduction
band, a low thermal barrier for trap filling is associated to a relatively low thermal quenching
behavior. This was indeed observed for several efficient persistent phosphors [10]. However,
for the MSi2O2N2:Eu phosphors this is clearly not the case. CaSi2O2N2:Eu shows a much
lower thermal quenching temperature (T50% = 440K) compared to the Sr and Ba compounds
(T50% = 600K) [6], while only the Ba-compound shows the possibility of trap-filling via the
lowest excited 5d-state. Although this could imply a different trapping mechanism (i.e. not
involving the conduction band levels), the situation is considerably blurred in the case of
CaSi2O2N2:Eu and SrSi2O2N2:Eu due to the several available sites for the Eu ions and the
energy transfer between them. Clearly, further energy level modeling is required to elucidate
the trapping mechanism.
5. Conclusions
Europium doped oxynitrides MSi2O2N2:Eu (with M = Ba, Sr, Ca) were successfully
synthesized using a solid state reaction at 1425 °C. All these oxynitrides are bright and
#160143 - $15.00 USD Received 20 Dec 2011; revised 23 Feb 2012; accepted 23 Feb 2012; published 27 Feb 2012(C) 2012 OSA 1 March 2012 / Vol. 2, No. 3 / OPTICAL MATERIALS EXPRESS 348
efficient phosphor materials with a broad excitation spectrum and with emission maximum at
493 nm for M = Ba, 539 nm for M = Sr and 556 nm for M = Ca.
All MSi2O2N2:Eu show persistent luminescence upon excitation by UV radiation (λ < 325
nm). The afterglow duration is about 400 s, 2800 s and 6000 s for CaSi2O2N2:Eu,
BaSi2O2N2:Eu and SrSi2O2N2:Eu respectively. Upon excitation with near UV and blue light
(360 nm < λ <500 nm) only BaSi2O2N2:Eu shows persistent luminescence. TL excitation
measurements confirm these findings. Codoping BaSi2O2N2:Eu with various rare earth ions
does not increase the afterglow emission intensity.
Acknowledgments
Jonas Botterman and Koen Van den Eeckhout are Research Assistants for the BOF-UGent.
Philippe F. Smet is indebted to the Fund for Scientific Research - Flanders (FWO-Vlaanderen)
for a Mobility Grant to TU Delft.
#160143 - $15.00 USD Received 20 Dec 2011; revised 23 Feb 2012; accepted 23 Feb 2012; published 27 Feb 2012(C) 2012 OSA 1 March 2012 / Vol. 2, No. 3 / OPTICAL MATERIALS EXPRESS 349
Related Documents


