Montréal Février 2006 © 2006 Wladimir Raymond, Pierre Mohnen, Franz Palm, Sybrand Schim van der Loeff. Tous droits réservés. All rights reserved. Reproduction partielle permise avec citation du document source, incluant la notice ©. Short sections may be quoted without explicit permission, if full credit, including © notice, is given to the source. Série Scientifique Scientific Series 2006s-04 Persistence of Innovation in Dutch Manufacturing: Is it Spurious? Wladimir Raymond, Pierre Mohnen, Franz Palm, Sybrand Schim van der Loeff

Welcome message from author
This document is posted to help you gain knowledge. Please leave a comment to let me know what you think about it! Share it to your friends and learn new things together.
Transcript

Montréal Février 2006
© 2006 Wladimir Raymond, Pierre Mohnen, Franz Palm, Sybrand Schim van der Loeff. Tous droits réservés. All rights reserved. Reproduction partielle permise avec citation du document source, incluant la notice ©. Short sections may be quoted without explicit permission, if full credit, including © notice, is given to the source.
Série Scientifique Scientific Series
2006s-04
Persistence of Innovation in Dutch Manufacturing:
Is it Spurious? Wladimir Raymond, Pierre Mohnen,
Franz Palm, Sybrand Schim van der Loeff
CIRANO
Le CIRANO est un organisme sans but lucratif constitué en vertu de la Loi des compagnies du Québec. Le financement de son infrastructure et de ses activités de recherche provient des cotisations de ses organisations-membres, d’une subvention d’infrastructure du Ministère du Développement économique et régional et de la Recherche, de même que des subventions et mandats obtenus par ses équipes de recherche.
CIRANO is a private non-profit organization incorporated under the Québec Companies Act. Its infrastructure and research activities are funded through fees paid by member organizations, an infrastructure grant from the Ministère du Développement économique et régional et de la Recherche, and grants and research mandates obtained by its research teams.
Les organisations-partenaires / The Partner Organizations PARTENAIRE MAJEUR . Ministère du Développement économique, de l’Innovation et de l’Exportation PARTENAIRES . Alcan inc. . Banque du Canada . Banque Laurentienne du Canada . Banque Nationale du Canada . Banque Royale du Canada . Bell Canada . BMO Groupe financier . Bombardier . Bourse de Montréal . Caisse de dépôt et placement du Québec . Fédération des caisses Desjardins du Québec . GazMétro . Hydro-Québec . Industrie Canada . Ministère des Finances du Québec . Pratt & Whitney Canada . Raymond Chabot Grant Thornton . Ville de Montréal . École Polytechnique de Montréal . HEC Montréal . Université Concordia . Université de Montréal . Université du Québec . Université du Québec à Montréal . Université Laval . Université McGill . Université de Sherbrooke ASSOCIÉ À : . Institut de Finance Mathématique de Montréal (IFM2) . Laboratoires universitaires Bell Canada . Réseau de calcul et de modélisation mathématique [RCM2] . Réseau de centres d’excellence MITACS (Les mathématiques des technologies de l’information et des systèmes complexes)
ISSN 1198-8177
Les cahiers de la série scientifique (CS) visent à rendre accessibles des résultats de recherche effectuée au CIRANO afin de susciter échanges et commentaires. Ces cahiers sont écrits dans le style des publications scientifiques. Les idées et les opinions émises sont sous l’unique responsabilité des auteurs et ne représentent pas nécessairement les positions du CIRANO ou de ses partenaires. This paper presents research carried out at CIRANO and aims at encouraging discussion and comment. The observations and viewpoints expressed are the sole responsibility of the authors. They do not necessarily represent positions of CIRANO or its partners.
Persistence of Innovation in Dutch Manufacturing: Is it Spurious? *
Wladimir Raymond†, Pierre Mohnen‡, Franz Palm§, Sybrand Schim van der Loeff**
Résumé / Abstract Cette étude analyse la persistance et la dynamique de l’innovation dans les entreprises manufacturières néerlandaises à partir des données de trois vagues d’enquêtes communautaires sur l’innovation (ECI), portant sur les périodes 1994-1996, 1996-1998 et 1998-2000. Nous estimons par la méthode du maximum de vraisemblance un modèle tobit de type II dynamique sur données de panel avec effets individuels et traitement explicite des conditions initiales. Nous concluons qu’il n’y a pas de véritable persistance dans le fait d’innover en produits ou en procédés, mais que les observations passées des parts du chiffre d’affaires en produits innovants influencent, quoique faiblement, les données contemporaines de ces parts.
Mots clés : modèle tobit de type II dynamique, données de panel, persistence, innovation
This paper studies the persistence of innovation and the dynamics of innovation output in Dutch manufacturing using firm data from three waves of the Community Innovation Surveys (CIS), pertaining to the periods 1994-1996, 1996-1998, and 1998-2000. We estimate by maximum likelihood a dynamic panel data type 2 tobit model accounting for individual effects and handling the initial conditions problem. We find that there is no evidence of true persistence in achieving technological product or process innovations, while past shares of innovative sales condition, albeit to a small extent, current shares of innovative sales.
Keywords: Dynamic panel data type 2 tobit, innovation, spurious persistence Codes JEL : C33, C34, O31
* The empirical part of this study has been carried out at the Centre for Research of Economic Microdata at Statistics Netherlands. The authors wish to thank Statistics Netherlands, and in particular Bert Diederen, for helping us in accessing and using the Micronoom data set. The views expressed in this paper are solely those of the authors. The authors also wish to thank François Laisney for his helpful comments. The first author acknowledges financial support from METEOR. † University of Maastricht, [email protected] ‡ University of Maastricht, MERIT and CIRANO, MERIT, University of Maastricht, P.O. Box 616 6200 MD Maastricht, The Netherlands; Tel: +31 43 388 3869; Fax: + 31 43 388 4905; [email protected] § University of Maastricht and CESifo fellow, [email protected] ** University of Maastricht, [email protected]
1 Introduction
This paper examines, at the firm level, the dynamics of the innovation process in Dutch
manufacturing using three waves of the Community Innovation Survey (henceforth CIS)
pertaining to the periods 1994-1996, 1996-1998 and 1998-2000. More specifically, we
attempt to answer two questions. First, does being successful in past innovation activities
increase the probability of being successful in current innovation activities? Secondly,
does past innovation output, as measured by the share in total sales of innovative sales,1
generate current innovation output?
The first research question relates to the literature on the persistence of innovation
which, at the micro level, plays an important role in the context of endogenous growth
models (Romer, 1990; Aghion and Howitt, 1992). It also helps to understand industrial
economics phenomena such as the persistence of profitability (Roberts, 2001) and total
factor productivity (TFP) growth (Geroski, 1989). Several theoretical explanations of
the persistence of innovation (at the firm level) exist in the literature. In one approach
the persistence of innovation is explained by the existence of sunk costs: in order to
build and maintain an R&D department, R&D expenditures are regular. In the linear
model of innovation as opposed to the chain-link model a direct relationship between
a firm’s R&D expenditures and its innovations is postulated such that the persistence
of innovation coincides with that of R&D expenditures. A second explanation of the
persistence of innovation pertains to the financial constraints that a firm may face in
funding R&D activities, which makes it dependent on retained earnings as a source of
funds. Innovations that have met a commercial success in the past generate profits that
may be invested in current innovation activities and hence “success breeds success”.
Finally an explanation of the persistence of innovation is given by the learning-by-doing
model. It predicts that the production of innovations is subject to dynamic economies
of scale. In other words, knowledge that has been used to produce past innovations can,
1This study considers products that are new to the firm, not necessarily new to the market.
2

assuming that the depreciation rate of innovative abilities is small, be used to produce
current and even future innovations. In Schumpeterian terms, the three theoretical
explanations of the persistence of innovation can be labeled as “creative accumulation”,
as opposed to “creative destruction”, where the latter term is used to explain the absence
of persistence in innovation activities.
The dynamics of innovation output, investigated by the second research question,
plays a crucial role in understanding the dynamics of firms’ technological performance
(e.g. innovative sales) and economic performance (e.g. profits). Since the empirical work
by Crepon et al. (1998), a great number of empirical studies focus on the relationship
between innovation output and firm performance, the latter variable being measured, for
instance, by sales per employee, value-added per employee, export per employee, growth
rates of sales, total employment growth and so on. The main finding of these studies
is that, regardless of how performance is measured, innovation output positively and
significantly affects firm performance, with the exception of the study by Klomp and
van Leeuwen (2001) that finds a negative but insignificant effect of innovation output on
employment growth.2 For instance, innovation output has a positive and significant effect
on value-added per employee of French firms (Crepon et al., 1998), sales per employee of
German firms (Janz et al., 2003), sales growth of Dutch firms (Klomp and van Leeuwen,
2001), and labor productivity (value-added per employee) growth of Swedish firms (Loof
and Heshmati, 2002a). Loof and Heshmati (2002b) perform a sensitivity analysis using,
besides the previously-mentioned ones, three additional measures of firm performance,
namely, sales margin, profit before and after depreciation (in level and growth rates),
and find the same pattern of positive and significant effect of innovation output on firm
performance. Because of this close relationship between innovation output and firm
performance, the dynamics of the former is expected to explain that of the latter. In
2The relationship between innovation and employment is not a clear-cut one. Empirical studiesidentify both a positive and a negative effect of the former on the latter. The sign of the relationshipdepends, e.g., on the type of the data, the time-period and the level of analysis (firm versus industrylevel) (Pianta, 2004).
3

other words, our second research question can help us address the issue of the persistence
of firm performance (Cefis, 2003b; Cefis and Ciccarelli, 2005).
This study contributes to the empirical literature on innovation in a number of ways.
Firstly, it analyzes persistence using other output measures than patents. Secondly, un-
like the aforementioned empirical studies on firm performance, three waves of the CIS,
pertaining to the Dutch manufacturing sector, are used for the first time to link the per-
sistence of innovation (qualitative) to the dynamics of firms’ technological performance
(quantitative). We estimate a dynamic panel data type 2 tobit model accounting for
unobserved individual effects and handling the initial conditions problem encountered
when estimating dynamic panel data models. The incidence and the intensity of inno-
vation are jointly estimated allowing for a correlation between the processes governing
the introduction of new or significantly improved products and/or processes, and the
generation of innovative sales. We use estimation techniques suggested by Wooldridge
(2005), and generalized in Raymond et al. (2005), and find that being successful in
past innovation activities does not increase the probability of being successful in current
innovation activities, and that past innovation output does condition, albeit to a small
extent, current innovation output.
Section 2 summarizes the findings of the empirical literature on the persistence of
innovation and firm performance. Section 3 presents the model that is estimated in
Section 4. We describe the data used to implement the model in Section 5, present and
discuss estimation results in Section 6, and conclude in Section 7.
2 Literature
This section summarizes the findings of the empirical literature on the persistence of
innovation. Two types of studies are identified according to whether patent or other
data are used (Table 1). We explain the importance of the type of data that are used
4
to measure innovation activities when persistence is analyzed. We also describe the
findings of the rather few empirical studies on the relationship between the persistence
of innovation output and that of firm performance.
2.1 The persistence of innovation
The studies on the persistence of innovation are motivated by testing the Schumpeter
Mark I and II hypotheses. In other words, authors seek to know whether innovation
activities are subject to “creative destruction” or “creative accumulation”. The hypoth-
esis of whether innovation activities are subject to “dynamic economies of scales” is also
tested in these studies. Finally, industry and country differences in the persistence of
innovation are investigated.
2.1.1 Patent data
Innovation activities are captured in these studies by the number of patents that are
either applied for or granted by the European Patent office (henceforth EPO) and the
United States Patents and Trademarks Office (henceforth US PTO). Table 1 shows that,
with the exception of Crepon and Duguet (1997), all the studies on the persistence of
innovation that use patent data conclude more or less alike regardless of the methodology:
there is no clear-cut evidence of strong persistence in innovation activities. In fact, those
studies share a common drawback, namely, the type of data used to analyze persistence.
The limitations of patent data are well-known (Griliches, 1990), and the inability to
obtain unequivocal empirical results using such data is therefore not surprising. Indeed,
in order for a firm to be properly accounted for in a patent data set, it has to be the
first to apply for a patent. Hence, when analyzing the persistence of innovation using
patent data, one is unwittingly analyzing the persistence of “winning the patent race”,
which is unlikely to be strong (Duguet and Monjon, 2002). As a result, other types of
data should be used to investigate the persistence of innovation activities.
5
2.1.2 Major innovation, R&D and CIS data
Major innovation, R&D and CIS data are also used to analyze the persistence of inno-
vation activities. The first type of data yields results that are similar to those of studies
using patent data. Duguet and Monjon (2002) point out that persistence is also likely
to be low when using major innovation data. Indeed, since a major innovation is one
that meets a commercial success, innovators are likely to be innovation or commercial
leaders, which is unlikely to persist over a long period of time. Thus, major innovation
data are as demanding as patent data when analyzing the persistence of innovation. On
the other hand, R&D and CIS data are seen as less demanding as persistence can be
analyzed at the firm level without mentioning the patenting or market leadership status
of the firm. In this case, regardless of the methodology, persistence in innovation activ-
ities is found to be high, whether input measures (Castillejo et al., 2004; Peters, 2005)
or output measures (Duguet and Monjon, 2002) of innovation are used.
2.2 The persistence of innovation output and firm performance
All the empirical studies mentioned in Section 1 on the relationship between innovation
output and firm performance are cross-sectional, whereas this one is based on panel
data.3 Hence, they cannot analyze the dynamics of the innovation process and that
of firm performance. Little is known about the relationship between the dynamics of
innovation and that of firm performance. Two instances of studies that investigate this
relationship are Cefis (2003b) and Cefis and Ciccarelli (2005). Both studies use patent
data and find that persistent innovators have profits that are and remain higher than
those of non-persistent innovators, hence the persistence of innovation and that of firm
performance are closely related to each other.
3To the best of our knowledge, van Leeuwen’s (2002) study is the only one that analyzes the dynam-ics of innovation input (R&D expenditures/total sales) and output (innovative sales/total sales), andlinks innovation output to firm performance. However, his analysis is not done in a “true” panel dataframework in that individual effects are not accounted for.
6
Our study attempts to give a first insight into the dynamics of the innovation process
in Dutch manufacturing using three waves of the CIS. We consider a model of innova-
tive behavior in a “true” dynamic panel data framework, i.e. accounting for unobserved
individual effects and handling the initial conditions problem. We estimate a dynamic
panel data type 2 tobit model, according to Amemiya’s (1984) terminology, which en-
compasses the cross-sectional type 2 tobit model studied by, for instance, Brouwer and
Kleinknecht (1996) and Mairesse and Mohnen (2001). The model is described as follows.
3 Econometric model
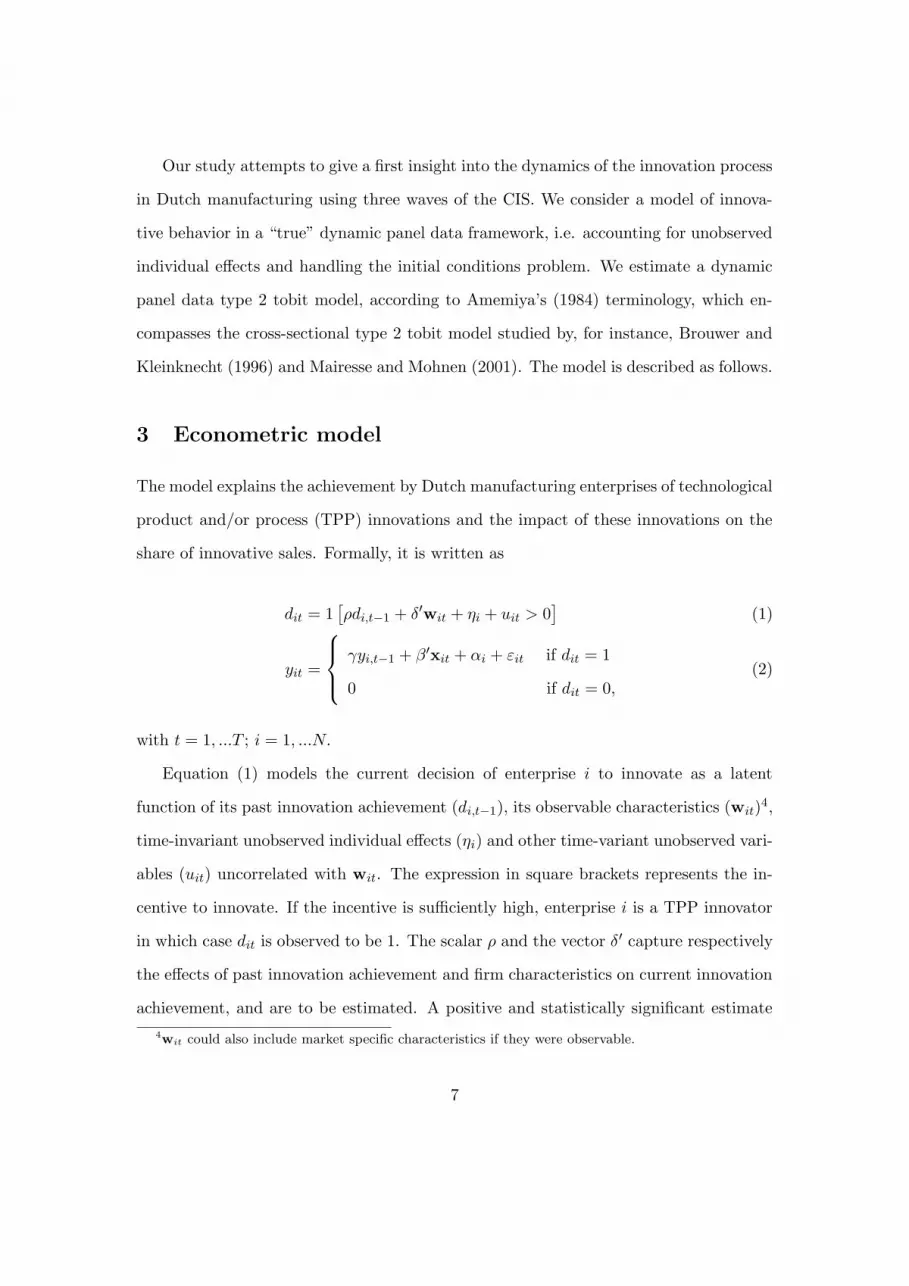
The model explains the achievement by Dutch manufacturing enterprises of technological
product and/or process (TPP) innovations and the impact of these innovations on the
share of innovative sales. Formally, it is written as
dit = 1[
ρdi,t−1 + δ′wit + ηi + uit > 0]
(1)
yit =
γyi,t−1 + β′xit + αi + εit if dit = 1
0 if dit = 0,(2)
with t = 1, ...T ; i = 1, ...N.
Equation (1) models the current decision of enterprise i to innovate as a latent
function of its past innovation achievement (di,t−1), its observable characteristics (wit)4,
time-invariant unobserved individual effects (ηi) and other time-variant unobserved vari-
ables (uit) uncorrelated with wit. The expression in square brackets represents the in-
centive to innovate. If the incentive is sufficiently high, enterprise i is a TPP innovator
in which case dit is observed to be 1. The scalar ρ and the vector δ′ capture respectively
the effects of past innovation achievement and firm characteristics on current innovation
achievement, and are to be estimated. A positive and statistically significant estimate
4wit could also include market specific characteristics if they were observable.
7
of ρ identifies the presence of persistence in innovation which may occur for two rea-
sons, because of state dependence or because of unobserved effects or left-out variables
that are correlated over time (through serially-correlated errors or individual effects).
Heckman (1981a; 1981c) refers to the first phenomenon as true state dependence and
the second one as spurious state dependence. True state dependence states that past
innovation achievement increases positively and significantly the probability of current
innovation achievement (true persistence).5 In order to distinguish it from spurious state
dependence, unobserved effects that are correlated over time and the initial conditions
must be properly accounted for when estimating eq. (1).
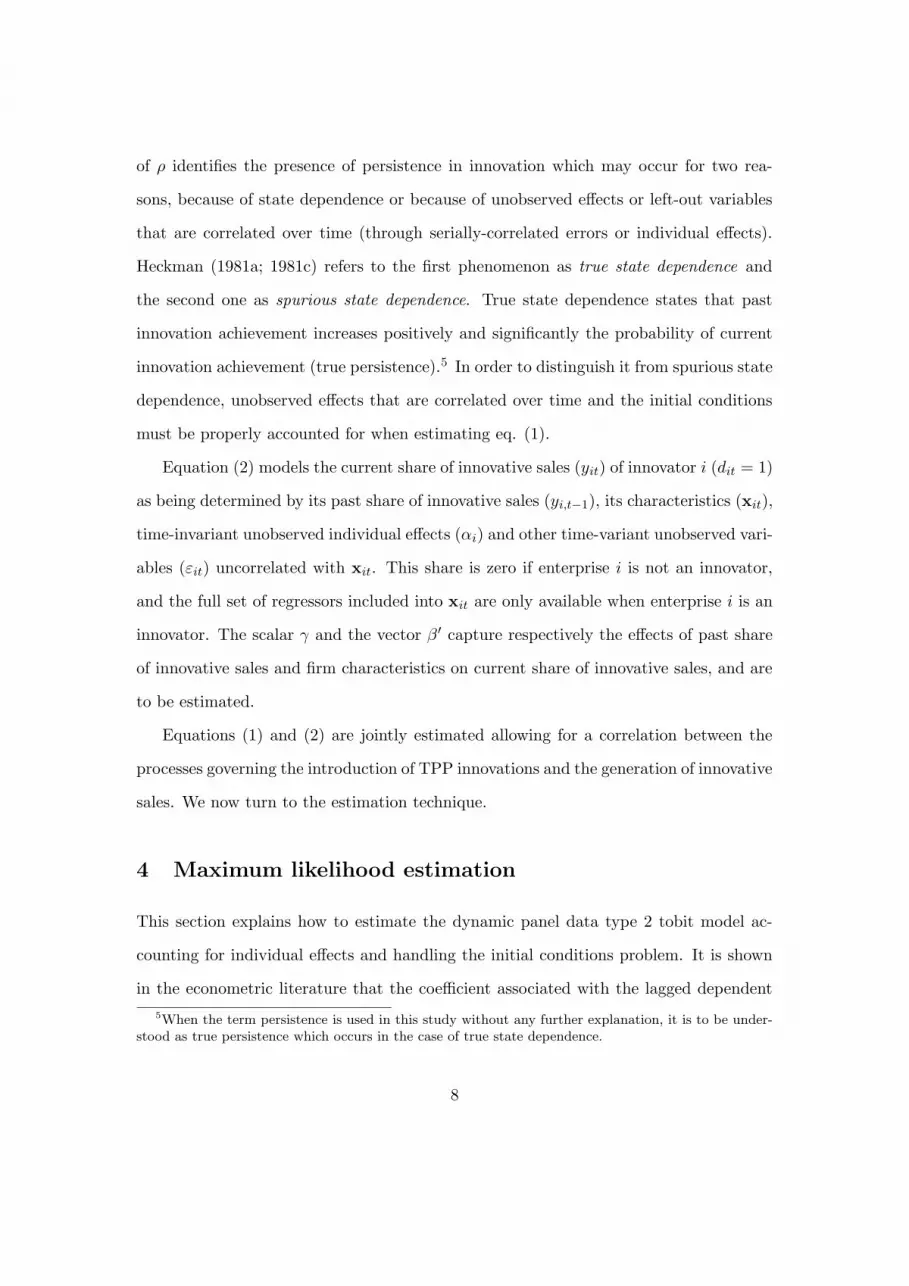
Equation (2) models the current share of innovative sales (yit) of innovator i (dit = 1)
as being determined by its past share of innovative sales (yi,t−1), its characteristics (xit),
time-invariant unobserved individual effects (αi) and other time-variant unobserved vari-
ables (εit) uncorrelated with xit. This share is zero if enterprise i is not an innovator,
and the full set of regressors included into xit are only available when enterprise i is an
innovator. The scalar γ and the vector β ′ capture respectively the effects of past share
of innovative sales and firm characteristics on current share of innovative sales, and are
to be estimated.
Equations (1) and (2) are jointly estimated allowing for a correlation between the
processes governing the introduction of TPP innovations and the generation of innovative
sales. We now turn to the estimation technique.
4 Maximum likelihood estimation
This section explains how to estimate the dynamic panel data type 2 tobit model ac-
counting for individual effects and handling the initial conditions problem. It is shown
in the econometric literature that the coefficient associated with the lagged dependent
5When the term persistence is used in this study without any further explanation, it is to be under-stood as true persistence which occurs in the case of true state dependence.
8

variable can be overestimated if these two problems are not properly accounted for. Es-
timation techniques that properly handle these problems are known in the econometric
literature (Heckman, 1981b; Wooldridge, 2005).
Kyriazidou (2001) suggests a “semi-parametric fixed-effects” approach, i.e. the indi-
vidual effects ηi and αi are assumed to be fixed, and derives moment restrictions (along
the lines of Ahn and Schmidt (1995)) that are exploited to construct two-step GMM-type
estimators. In the first step, the parameters of eq. (1) are consistently estimated, e.g.,
by methods suggested by Honore and Kyriazidou (2000). In the second step, these esti-
mates are used to construct kernel weights that are larger for individuals whose sample
selection effect is small. Under appropriate assumptions, the derived kernel-weighted
GMM estimators are shown to be consistent and asymptotically normal. These esti-
mators, however, cannot be applied in this study because of data limitations. First,
the fixed-effects approach requires data that show a lot of variation over time (within
variation), otherwise they are wiped out when time-differencing. This is hardly the case
in our data since most of the variables are qualitative, and the continuous ones exhibit
little within variation. For instance, the approach does not identify the effects of indus-
try dummies which are assumed to capture technological opportunities. Secondly, the
estimators are effective when the number of time periods is fairly large (T ≥ 4), which is
not the case in our study either. Indeed, the moment equations require time-differencing
resulting in a loss of information in the data, and the remaining information must be
sufficient to estimate the model, which is not feasible when T is too small.
In order to cope with the limitations of our data, we consider an error-components
approach and make distributional assumptions on the individual effects. We “integrate
out” the individual effects and use the Wooldridge (2005) approach of handling the initial
conditions problem. The estimator is described as follows. We assume the individual
9

effects to be correlated with the initial conditions and the regressors, i.e.
ηi = bs0 + bs
1di0 + b′s2 wi + a1i (3)
and
αi = br0 + br
1yi0 + b′r2 xi + a2i, (4)
where w′i = (w′
i1, ...,w′iT ), x′
i = (x′i1, ...,x
′iT ), and bs
0, bs1, b
′s2 , br
0, br1 and b′r
2 are to be esti-
mated.6 The scalars bs1 and br
1 capture the dependence of the individual effects on the ini-
tial conditions. The vectors (a1i, a2i)′ and (uit, εit)
′ are assumed to be independently and
identically (over time and across individuals) normally distributed with means zero and
covariance matrices Ωa1a2=
σ2a1
ρa1a2σa1
σa2
ρa1a2σa1
σa2σ2
a2
and Ωuε =
1 ρuεσε
ρuεσε σ2ε
respectively, and independent of each other. The likelihood function of one individual,
starting from t = 1 and conditional on the regressors and the initial conditions, is written
as
Li =
∫ ∞
−∞
∫ ∞
−∞
T∏
t=1
Lit(yit|di0, di,t−1,wi, yi0, yi,t−1,xi, a1i, a2i)g(a1i, a2i)da1ida2i, (5)
where∏T
t=1 Lit(yit|di0, di,t−1,wi, yi0, yi,t−1,xi, a1i, a2i) and g(a1i, a2i) denote respectively
the likelihood function if the individual effects are treated as fixed, and the bivariate
normal density function of (a1i, a2i)′. Define
Ait = ρdi,t−1 + δ′wit + bs0 + bs
1di0 + b′s2 wi (6)
6The approach considered in equations (3) and (4) allows the individual effects to be correlated withthe regressors. However, because of the lack of variation over time (within variation) in wit and xit, amore restricted approach is considered in this analysis where the individual effects are assumed to becorrelated only with the initial conditions.
10

and
Bit = γyi,t−1 + β′xit + br0 + br
1yi0 + b′r2 xi, (7)
the likelihood function under the fixed-effects assumption is written as
T∏
t=1
Φ [− (Ait + a1i)](1−dit)
[
1
σε
φ
(
yit − Bit − a2i
σε
)
Φ
(
Ait + a1i + ρuε
σε(yit − Bit − a2i)
√
1−ρ2uε
)]dit
.
(8)
The double integral in equation (5) can be approximated by “two-step” Gauss-Hermite
quadrature which states that
∫ ∞
−∞
e−z2
f(z)dz 'M∑
m=1
wmf(am), (9)
where wm and am are respectively the weights and abscissas of the Gauss-Hermite inte-
gration, the tables of which are formulated in mathematical textbooks (e.g. Abramovitz
and Stegun, 1964), and M is the total number of integration points. The larger M , the
more accurate the Gauss-Hermite approximation.
Equation (5) is written as
Li =
∫ ∞
−∞
g(a2i)T∏
t=1
[
1
σε
φ
(
yit − Bit − a2i
σε
)]dit
H(a2i)da2i, (10)
where H(a2i) is written as
∫ ∞
−∞
g(a1i|a2i)T∏
t=1
Φ [− (Ait + a1i)](1−dit)
[
Φ
(
Ait + a1i + ρuε
σε(yit − Bit − a2i)
√
1−ρ2uε
)]dit
da1i.
(11)
In the first step, we approximate equation (11) using eq. (9). In the second step, we
replace the approximation into eq. (10) and apply again eq. (9). The final expression
of the likelihood is written as
11

Li '
√
1 − ρ2a1a2
π
P∑
p=1
wp
T∏
t=1
[
1
σε
φ
(
yit − Bit − apσa2
√
2(1 − ρ2a1a2
)
σε
)]dit
×M∑
m=1
wm
exp[
2ρ2a1a2
apam
]
T∏
t=1
Φ
[
−
(
Ait + amσa1
√
2(1 − ρ2a1a2
)
)](1−dit)
(12)
×Φ
Ait + amσa1
√
2(1 − ρ2a1a2
) + ρuε
σε(yit − Bit − apσa2
√
2(1 − ρ2a1a2
))√
1−ρ2uε
dit
,
where wm , wp , am and ap are respectively the weights and abscissas of the first- and
second-stage Gauss-Hermite integration with M and P being the first- and second-stage
total number of integration points.7 The same number of integration points (P = M)
is used in this study, although P need not be equal to M . Equations (1) and (2)
are correlated through the individual effects (ρa1a26= 0) and the idiosyncratic errors
(ρuε 6= 0), and the “total” correlation between the two equations is calculated as
ρtot =ρa1a2
σa1σa2
+ ρuεσε√
(σ2a1
+ 1)(σ2a2
+ σ2ε )
. (13)
5 Data
To implement the models, we use the same data as in Raymond et al. (2006) collected
by the Centraal Bureau voor de Statistiek (CBS). They stem from three waves of the
Dutch Community Innovation Survey, CIS 2 (1994-1996), CIS 2.5 (1996-1998) and CIS
3 (1998-2000), merged with data from the Production Survey (PS). Only enterprises
in Dutch manufacturing (SBI 15-37) are included in the analysis.8 The population of
interest consists of enterprises with at least ten employees and positive sales at the end
of the period covered by the innovation survey. We consider enterprises that existed in
7Details on the calculation of the double integral can be found in Raymond et al. (2005).8SBI stands for the Dutch standard industrial classification and gives the enterprise economic activity.
12
1994, survived until 2000 and took part in the three innovation surveys, resulting in a
balanced panel of 861 enterprises.
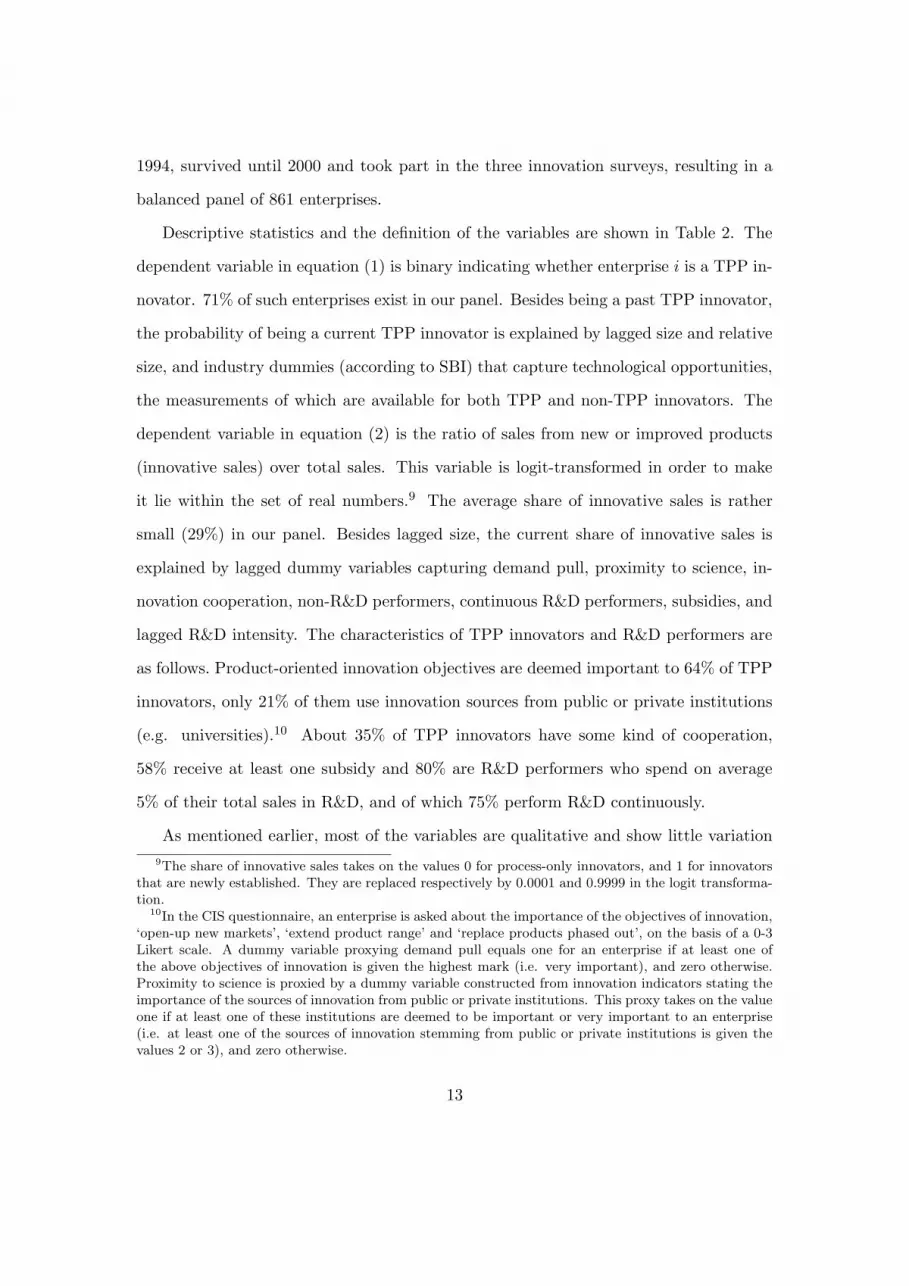
Descriptive statistics and the definition of the variables are shown in Table 2. The
dependent variable in equation (1) is binary indicating whether enterprise i is a TPP in-
novator. 71% of such enterprises exist in our panel. Besides being a past TPP innovator,
the probability of being a current TPP innovator is explained by lagged size and relative
size, and industry dummies (according to SBI) that capture technological opportunities,
the measurements of which are available for both TPP and non-TPP innovators. The
dependent variable in equation (2) is the ratio of sales from new or improved products
(innovative sales) over total sales. This variable is logit-transformed in order to make
it lie within the set of real numbers.9 The average share of innovative sales is rather
small (29%) in our panel. Besides lagged size, the current share of innovative sales is
explained by lagged dummy variables capturing demand pull, proximity to science, in-
novation cooperation, non-R&D performers, continuous R&D performers, subsidies, and
lagged R&D intensity. The characteristics of TPP innovators and R&D performers are
as follows. Product-oriented innovation objectives are deemed important to 64% of TPP
innovators, only 21% of them use innovation sources from public or private institutions
(e.g. universities).10 About 35% of TPP innovators have some kind of cooperation,
58% receive at least one subsidy and 80% are R&D performers who spend on average
5% of their total sales in R&D, and of which 75% perform R&D continuously.
As mentioned earlier, most of the variables are qualitative and show little variation
9The share of innovative sales takes on the values 0 for process-only innovators, and 1 for innovatorsthat are newly established. They are replaced respectively by 0.0001 and 0.9999 in the logit transforma-tion.
10In the CIS questionnaire, an enterprise is asked about the importance of the objectives of innovation,‘open-up new markets’, ‘extend product range’ and ‘replace products phased out’, on the basis of a 0-3Likert scale. A dummy variable proxying demand pull equals one for an enterprise if at least one ofthe above objectives of innovation is given the highest mark (i.e. very important), and zero otherwise.Proximity to science is proxied by a dummy variable constructed from innovation indicators stating theimportance of the sources of innovation from public or private institutions. This proxy takes on the valueone if at least one of these institutions are deemed to be important or very important to an enterprise(i.e. at least one of the sources of innovation stemming from public or private institutions is given thevalues 2 or 3), and zero otherwise.
13
over time. The few continuous variables typically vary more “between” enterprises than
“within” enterprises over time. This is in part due to the rather small number of time
periods (T = 3) of the panel.
Table 3 reports transition probabilities for innovation activities. 63% of non-TPP
innovators and 78% of TPP innovators in CIS 2 remain in their initial state in CIS 3.
The same holds for the two sub-periods. As regards innovation intensity, 73% of the
innovators with below average intensity in CIS 2 remain below average in CIS 2.5 and
CIS 3, and about 70% are always above average. The general pattern in the figures of
Table 3 is that innovation activities are persistent which may occur, as mentioned earlier,
for two reasons namely true and spurious state dependence. In order to distinguish the
former from the latter, we estimate eqs. (1) and (2) using the estimation technique
described in Section 4. We now present the estimation results.
6 Results
By simultaneous estimation of equations (1) and (2) an answer is sought to the two
research questions taken jointly. As product-life cycle and R&D intensity vary across
industries, the persistence of innovation and R&D intensity may be expected to be
industry-specific (Malerba and Orsenigo, 1999; Cefis and Orsenigo, 2001). In first in-
stance, a test was performed on the equality of the industry persistence parameters
(coefficients of the lagged dependent variables) and industry intercepts. The joint null
hypothesis that the industry persistence parameters and the industry intercepts are
equal could not be rejected. In Table 4 the results are presented of the model in which
the industry persistence parameters and industry intercepts are restricted to be equal.
In order to show the importance of accounting for individual effects and handling the
initial conditions problem, we present the estimation results of the dynamic type 2 tobit
model without accounting for individual effects in the first pair of column in Table 4, and
14
those of the same model in which individual effects have been taken into account but the
initial conditions have been assumed exogenous in the second pair of columns. These
results are to be contrasted with the estimates in the third pair of columns resulting
from estimation of the dynamic type 2 tobit model in which both individual effects have
been taken into account and the initial conditions have been treated as endogenous. The
estimation results on the persistence of innovation, i.e. the estimates of the parameters
in equation (1), are presented in the upper part of Table 4 and discussed in subsection
6.1. The estimation results on the dynamics of innovation output, i.e. the estimates of
the parameters in equation (2), are presented in the middle part of Table 4 and discussed
in subsection 6.2. Finally, the outcomes of some sensitivity analyses are reported on in
subsection 6.3.
6.1 The persistence of innovation
No individual effects and individual effects with exogenous initial conditions
The estimation results of the dynamic type 2 tobit model assuming the absence
of individual effects and, alternatively, accounting for individual effects and assuming
the initial conditions to be exogenous are very similar.11 The persistence parameter
is positive and highly significant and lagged size affects positively and significantly the
probability to innovate. As mentioned earlier, the persistence of innovation may be
spurious. The existence of true persistence in innovation may be ascertained by verifying
that, after accounting for individual effects and properly handling the initial conditions
problem, the effect of the lagged dependent variable is, economically and statistically,
relevant.
Individual effects and endogenous initial conditions
11Exogenous initial conditions imply that being successful in achieving TPP innovations at the initialperiod does not affect the probability to innovate later on.
15
Once the two typical problems of individual effects and initial conditions are properly
handled, the hypothesis that the persistence parameter, i.e. the coefficient of the lagged
dependent variable, is equal to zero can no longer be rejected. This result contrasts with
that of Duguet and Monjon (2002) who find strong persistence in achieving TPP innova-
tions in French manufacturing. However, they do not account for individual effects, and
their finding of persistence may well be due to spurious state dependence. Furthermore,
lagged size positively and significantly affects the probability to innovate.
6.2 The dynamics of innovation output
No individual effects and individual effects with exogenous initial conditions
The estimates of the parameters of equation (2) are also similar in the dynamic type
2 tobit model without individual effects and in the model with individual effects and
exogenous initial conditions. The persistence parameter is positive and highly significant.
Furthermore, past R&D intensity, size and demand pull positively affect the current share
of innovative sales and, ceteris paribus, past non-R&D performers are less successful than
past R&D performers.
Individual effects and endogenous initial conditions
The results suggest that, even after accounting for individual effects and handling the
initial conditions problem, the persistence parameter remains significant at 1% level of
significance, suggesting that past innovation output generates in part current innovation
output. As for the other regressors, the results mentioned above remain valid.
Both the model that assumes the absence of individual effects and the one that ac-
counts for individual effects but assumes exogenous initial conditions are rejected using
a likelihood ratio test at 1% level of significance. Hence, the full model is the preferred
one where equations (1) and (2) are jointly estimated allowing for a correlation between
16
the processes governing the introduction of TPP innovations and the generation of in-
novative sales. Both cross-equation individual effects and cross-equation idiosyncratic
parts are found to be correlated and the “total” correlation (eq. (13)) between the two
equations is calculated ex post to be 0.162.
6.3 Robustness analysis
When no correlation is assumed between the decision to be a TPP innovator and the
share of innovative sales, consistent and efficient estimators of the parameters of the
type 2 tobit model may be obtained by separately estimating equations (1) and (2).
We use estimation techniques by Heckman (1981b) and Wooldridge (2005) (eq. (1))
and Anderson and Hsiao (1981; 1982) (eq. (2)). The estimation results from separate
estimations reveal the same pattern: similar to the results in Table 4, persistence in
achieving TPP innovations vanishes when individual effects and the initial conditions
are dealt with, while inertia shows up in the share of innovative sales. Hence, the lack
of persistence in achieving TPP innovations is a rather robust result.
Also the sensitivity of the model to using R&D input rather than output measures
has been investigated. The dynamic type 2 tobit has been estimated using the incidence
of engaging in R&D activities rather than that of being a TPP innovator as dependent
variable in equation (1) and using R&D intensity rather than the share of innovative
sales as dependent variable in equation (2). The results of this analysis show the same
pattern as that of Table 4, with the exception of the probit persistence parameter that
remains significant also in the preferred model accounting for individual effects and the
endogeneity of the initial conditions. More specifically, the magnitude of the persistence
parameters in both equations lessens when accounting for individual effects and assuming
endogenous initial conditions. In this analysis the full model is also shown to be the
preferred one: the restrictions imposed in the model without individual effects on the
one hand, and those imposed in the model with individual effects and exogenous initial
17
conditions, on the other hand, are - as in Table 4 - rejected using a likelihood ratio test.12
7 Conclusion
This study gives first insights into the persistence of innovation and the dynamics of
innovation output in Dutch manufacturing using three waves of the CIS. We answer
the questions jointly by estimating a dynamic type 2 tobit and find that there is no
evidence of persistence in achieving TPP innovations, while past shares of innovative
sales condition, albeit to a small extent, current shares of innovative sales. The lack
of persistence of innovation contrasts with results by Duguet and Monjon (2002) who
find evidence of strong persistence in innovation in French manufacturing. Once the
individual effects and the initial conditions are allowed for, they seem to take over the role
of persistence. This phenomenon is even more plausible when the panel is short because,
the shorter the panel the higher the correlation between the initial conditions (di0) and
the lagged dependent variable (di,t−1). The fact that the same phenomenon does not
take place in the regression equation (eq. (2)) indicates that the lack of persistence
found cannot be attributed only to the shortness of the panel. This issue remains a
topic of future research. The results on the sensitivity of the model to using R&D input
rather than output measures indicate that there is evidence of persistence in engaging in
R&D activities and in the share of R&D expenditures in total sales. The former result
is in accordance with Manez Castillejo et al. (2004) who find evidence of persistence
by Spanish manufacturing firms in engaging in R&D activities, and Peters (2005) who
finds persistence by German manufacturing and services firms in engaging in innovation
activities. Our results suggest that there is evidence of true persistence of innovation
when considered on the input side and spurious persistence when taken on the output
side. The idea is that persistent R&D performers may not be guaranteed to persistently
12The tabulated results of the robustness analysis can be obtained upon request.
18
achieve TPP innovations.
The main caveat of this study is the data we use to implement the model. First, the
panel is rather short (T = 3) which may explain in part the lack of true persistence in
achieving TPP innovations. Secondly, there is one-year overlap between two consecu-
tive waves of the Dutch CIS. Hence, to the extent that respondents answer this survey
consistently, the overlap would tend to bias the results towards persistence in being a
TPP innovator. As no evidence of persistence is found in the preferred model, it may
be concluded that the effect of the overlapping year is not important.
References
Abramovitz, Milton, and Irene Stegun (1964) Handbook of Mathematical Functions with
Formulas, Graphs, and Mathematical Tables (Washington, D.C..: National Bureau
of Standards Applied Mathematics, US Government Printing Office).
Aghion, Philippe, and Peter Howitt (1992) “A Model of Growth Through Creative De-
struction,” Econometrica 60, 323–351.
Ahn, Seung C., and Peter Schmidt (1995) “Efficient Estimation of Models for Dynamic
Panel Data,” Journal of Econometrics 68, 5–27.
Amemiya, Takeshi (1984) “Tobit Models: A Survey,” Journal of Econometrics 24, 3–62.
Anderson, Theodore W., and Cheng Hsiao (1981) “Estimation of Dynamic Models with
Error Components,” Journal of the American Statistical Association 76, 598–606.
(1982) “Formulation and Estimation of Dynamic Models Using Panel Data,” Jour-
nal of Econometrics 18, 47–82.
Brouwer, Eric, and Alfred H. Kleinknecht (1996) “Determinants of Innovation: A Mi-
cro Econometric Analysis of Three Alternative Innovative Output Indicators,” in
19

Alfred H. Kleinknecht (Ed.), Determinants of Innovation: The Message from New
Indicators (London: Macmillan).
Cabagnols, Alexandre, Claudine Gay, and Christian Le Bas (1999) ““How Persistently
do Firms Innovate?” An Evolutionary View. An Empirical Application of Duration
Models.” CNRS Collection Les Cahiers de l’Innovation no. 00001.
Cefis, Elena (2003a) “Is there Persistence in Innovative Activities?,” International Jour-
nal of Industrial Organization 21, 489–515.
(2003b) “Persistence in Innovation and Profitability,” Rivista Internazionale di
Scienze Sociali, 1, 19–37.
Cefis, Elena, and Luigi Orsenigo (2001) “The Persistence of Innovative Activities
A Cross-Countries and Cross-Sectors Comparative Analysis,” Research Policy
30, 1139–1158.
Cefis, Elena, and Matteo Ciccarelli (2005) “Profit Differentials and Innovation,” Eco-
nomics of Innovation and New Technology 14, 43–61.
Crepon, Bruno, and Emmanuel Duguet (1997) “Estimating the Innovation Function from
Patent Numbers: GMM on Count Panel Data,” Journal of Applied Econometrics
12, 243–263.
Crepon, Bruno, Emmanuel Duguet, and Jacques Mairesse (1998) “Research, Innovation,
and Productivity: An Econometric Analysis at the Firms Level.” NBER Working
Paper no. 6696.
Duguet, Emmanuel, and Stephanie Monjon (2002) “Creative Destruction and the Inno-
vative Core: Is Innovation Persistent at the Firm Level?” UCL Discussion Paper
02-07.
20
Geroski, Paul A. (1989) “Entry, Innovation and Productivity Growth,” The Review of
Economics and Statistics 71, 572–578.
Geroski, Paul A., John van Reenen, and Chris F. Walters (1997) “How Persistently do
Firms Innovate?,” Research Policy 26, 33–48.
Griliches, Zvi (1990) “Patent Statistics as Economic Indicators: A Survey,” Journal of
Economic Literature 28, 1661–1707.
Heckman, James J. (1981a) “Heterogeneity and State Dependence,” in S Rosen (Ed.),
Studies in Labor Markets (University of Chicago Press) pp. 91–139.
(1981b) “The Incidental Parameters Problem and the Problem of Initial Conditions
in Estimating a Discrete Time-Discrete Data Stochastic Process,” in Charles F.
Manski, and Daniel McFadden (Eds.), Structural Analysis of Discrete Data with
Econometric Applications (Cambridge, MA: MIT Press) pp. 179–195.
(1981c) “Statistical Models for Discrete Panel Data,” in Charles F. Manski, and
Daniel McFadden (Eds.), Structural Analysis of Discrete Data with Econometric
Applications (Cambridge, MA: MIT Press) pp. 114–178.
Honore, Bo E., and Ekaterini Kyriazidou (2000) “Panel Data Discrete Choice Models
with Lagged Dependent Variables,” Econometrica 69, 839–874.
Janz, Norbert, Hans Loof, and Bettina Peters (2004) “Firm Level Innovation and Pro-
ductivity: Is there a Common Story Across Countries,” Problems and Perspectives
in Management.
Klomp, Luuk, and George van Leeuwen (2001) “Linking Innovation and Firm Perfor-
mance: A New Approach,” International Journal of the Economics of Business
8, 343–364.
21

Kyriazidou, Ekaterini (2001) “Estimation of Dynamic Panel Data Sample Selection Mod-
els,” Reviews of Economic Studies 68, 543–572.
Loof, Hans, and Almas Heshmati (2002a) “Knowledge Capital and Performance Het-
erogeneity: A Firm-Level Innovation Study,” International Journal of Production
Economics 76, 61–85.
(2002b) “On the Relationship between Innovation and Performance: A Sensitivity
Analysis.” SSE/EFI Working Paper Series in Economics and Finance no. 446.
Manez Castillejo, Juan A., Marıa E. Rochina Barrachina, Amparo Sanchis Llopis, and
Juan A. Sanchis Llopis (2004) “A Dynamic Approach to the Decision to Invest in
R&D: The Role of Sunk Costs.” mimeo.
Mairesse, Jacques, and Pierre Mohnen (2001) “To Be or Not To Be Innovative: An Ex-
ercise in Measurement,” STI Review Special Issue on New Science and Technology
Indicators 27, 103–129.
Malerba, Franco, and Luigi Orsenigo (1999) “Technological Entry, Exit and Survival:
an Empirical Analysis of Patent Data,” Research Policy 28, 643–660.
Peters, Bettina (2005) “Persistence of Innovation: Stylised Facts and Panel Data Evi-
dence.” ZEW Discussion Paper, No. 05-81.
Pianta, Mario (2004) “Innovation and Employment,” in Jan Fagerberg, David C Mow-
ery, and Richard R Nelson (Eds.), The Oxford Handbook of Innovation (Oxford
University Press) chapter 21.
Raymond, Wladimir, Pierre Mohnen, Franz Palm, and Sybrand Schim van der Loeff
(2005) “Maximum Likelihood Estimation of Panel Data Sample Selection Models.”
mimeo.
22

(2006) “A Classification of Dutch Manufacturing Based on a Model of Innovation,”
De Economist 154, 1–21.
Roberts, Peter W. (2001) “Innovation and Firm-Level Persistent Profitability: A Schum-
peterian Framework,” Managerial and Decision Economics 22, 239–250.
Romer, Paul M. (1990) “Endogenous Technical Change,” The Journal of Political Econ-
omy 98, S71–S102.
van Leeuwen, George (2002) “Linking Innovation to Productivity Growth Using two
Waves of the Community Innovation Survey.” OECD Science, Technology and
Industry Working Papers, 2002/8, OECD Publishing.
Wooldridge, Jeffrey M. (2005) “Simple Solutions to the Initial Conditions Problem in
Dynamic Nonlinear Panel Data Models with Unobserved Heterogeneity,” Journal
of Applied Econometrics 20, 39–54.
23
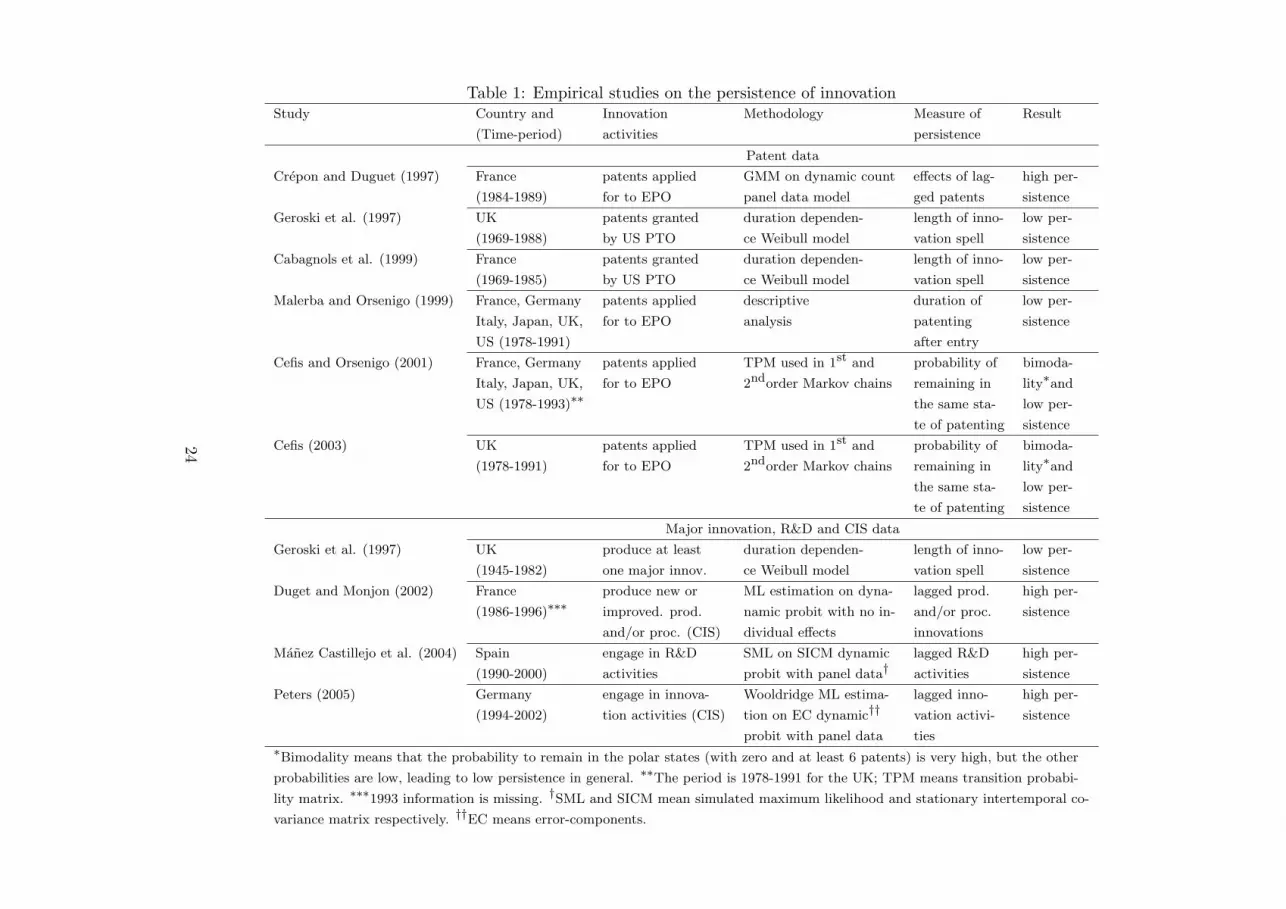
Table 1: Empirical studies on the persistence of innovationStudy Country and Innovation Methodology Measure of Result
(Time-period) activities persistence
Patent data
Crepon and Duguet (1997) France patents applied GMM on dynamic count effects of lag- high per-
(1984-1989) for to EPO panel data model ged patents sistence
Geroski et al. (1997) UK patents granted duration dependen- length of inno- low per-
(1969-1988) by US PTO ce Weibull model vation spell sistence
Cabagnols et al. (1999) France patents granted duration dependen- length of inno- low per-
(1969-1985) by US PTO ce Weibull model vation spell sistence
Malerba and Orsenigo (1999) France, Germany patents applied descriptive duration of low per-
Italy, Japan, UK, for to EPO analysis patenting sistence
US (1978-1991) after entry
Cefis and Orsenigo (2001) France, Germany patents applied TPM used in 1st and probability of bimoda-
Italy, Japan, UK, for to EPO 2ndorder Markov chains remaining in lity∗and
US (1978-1993)∗∗ the same sta- low per-
te of patenting sistence
Cefis (2003) UK patents applied TPM used in 1st and probability of bimoda-
(1978-1991) for to EPO 2ndorder Markov chains remaining in lity∗and
the same sta- low per-
te of patenting sistence
Major innovation, R&D and CIS data
Geroski et al. (1997) UK produce at least duration dependen- length of inno- low per-
(1945-1982) one major innov. ce Weibull model vation spell sistence
Duget and Monjon (2002) France produce new or ML estimation on dyna- lagged prod. high per-
(1986-1996)∗∗∗ improved. prod. namic probit with no in- and/or proc. sistence
and/or proc. (CIS) dividual effects innovations
Manez Castillejo et al. (2004) Spain engage in R&D SML on SICM dynamic lagged R&D high per-
(1990-2000) activities probit with panel data† activities sistence
Peters (2005) Germany engage in innova- Wooldridge ML estima- lagged inno- high per-
(1994-2002) tion activities (CIS) tion on EC dynamic†† vation activi- sistence
probit with panel data ties∗Bimodality means that the probability to remain in the polar states (with zero and at least 6 patents) is very high, but the other
probabilities are low, leading to low persistence in general. ∗∗The period is 1978-1991 for the UK; TPM means transition probabi-
lity matrix. ∗∗∗1993 information is missing. †SML and SICM mean simulated maximum likelihood and stationary intertemporal co-
variance matrix respectively. ††EC means error-components.
24
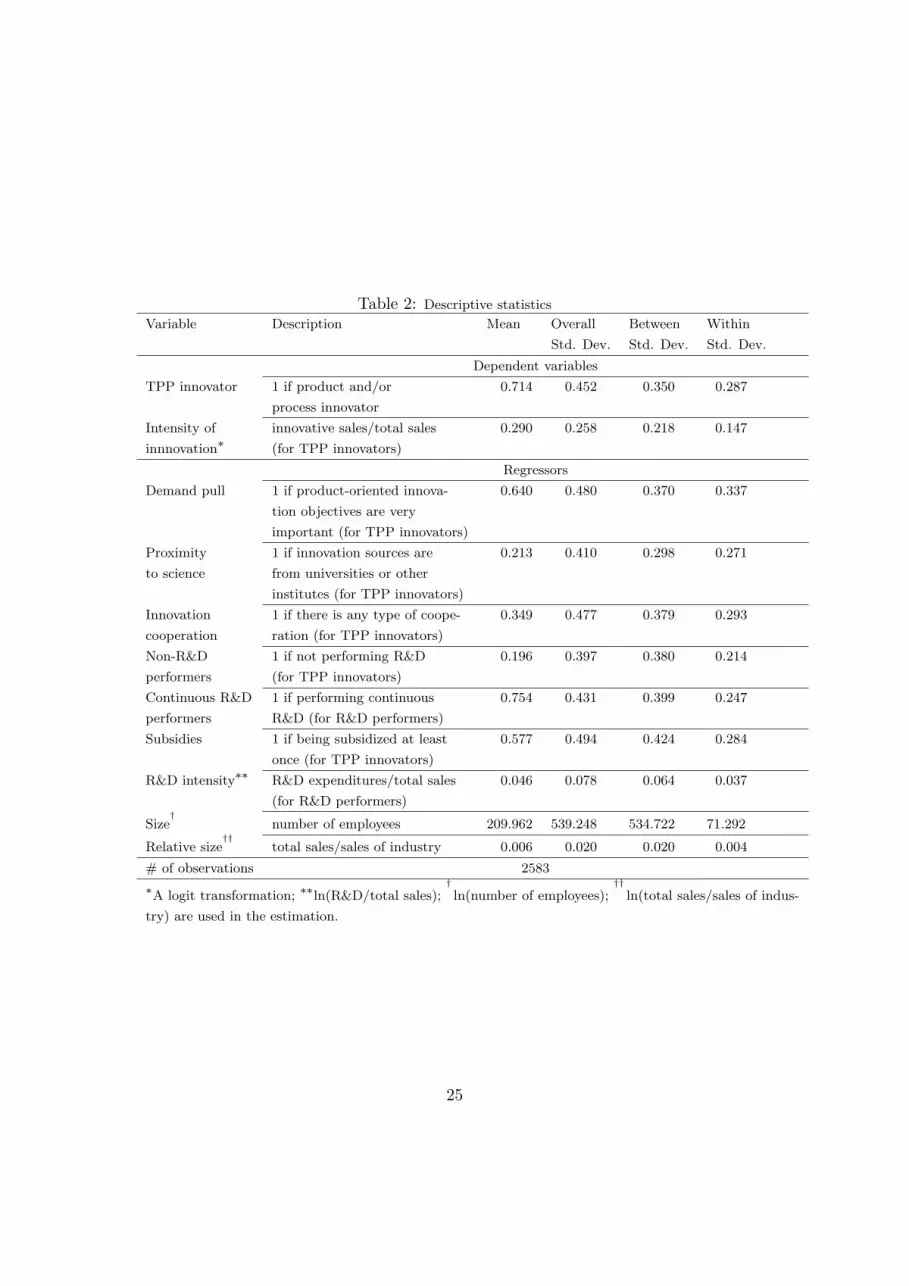
Table 2: Descriptive statistics
Variable Description Mean Overall Between Within
Std. Dev. Std. Dev. Std. Dev.
Dependent variables
TPP innovator 1 if product and/or 0.714 0.452 0.350 0.287
process innovator
Intensity of innovative sales/total sales 0.290 0.258 0.218 0.147
innnovation∗ (for TPP innovators)
Regressors
Demand pull 1 if product-oriented innova- 0.640 0.480 0.370 0.337
tion objectives are very
important (for TPP innovators)
Proximity 1 if innovation sources are 0.213 0.410 0.298 0.271
to science from universities or other
institutes (for TPP innovators)
Innovation 1 if there is any type of coope- 0.349 0.477 0.379 0.293
cooperation ration (for TPP innovators)
Non-R&D 1 if not performing R&D 0.196 0.397 0.380 0.214
performers (for TPP innovators)
Continuous R&D 1 if performing continuous 0.754 0.431 0.399 0.247
performers R&D (for R&D performers)
Subsidies 1 if being subsidized at least 0.577 0.494 0.424 0.284
once (for TPP innovators)
R&D intensity∗∗ R&D expenditures/total sales 0.046 0.078 0.064 0.037
(for R&D performers)
Size†
number of employees 209.962 539.248 534.722 71.292
Relative size††
total sales/sales of industry 0.006 0.020 0.020 0.004
# of observations 2583
∗A logit transformation; ∗∗ln(R&D/total sales);†
ln(number of employees);††
ln(total sales/sales of indus-
try) are used in the estimation.
25

Table 3: Transition probability: persistence in innovation activitiesCIS 3 CIS 3
CIS 2 Non-TPP (%) TPP (%) Total CIS 2.5 Non-TPP (%) TPP (%) Total
Non-TPP 63.16 36.84 228 Non-TPP 64.50 35.50 231
TPP 21.64 78.36 633 TPP 20.95 79.05 630
Total 281 580 861 Total 281 580 861
Innov. intens. in CIS 3 Innov. intens. in CIS 3
CIS 2 Below avg. (%) Above avg. (%) Total CIS 2.5 Below avg. (%) Above avg. (%) Total
Below avg. 73.81 26.19 565 Below avg. 73.01 26.99 552
Above avg. 28.38 71.62 296 Above avg. 31.72 68.28 309
Total 501 360 861 Total 501 360 861
26
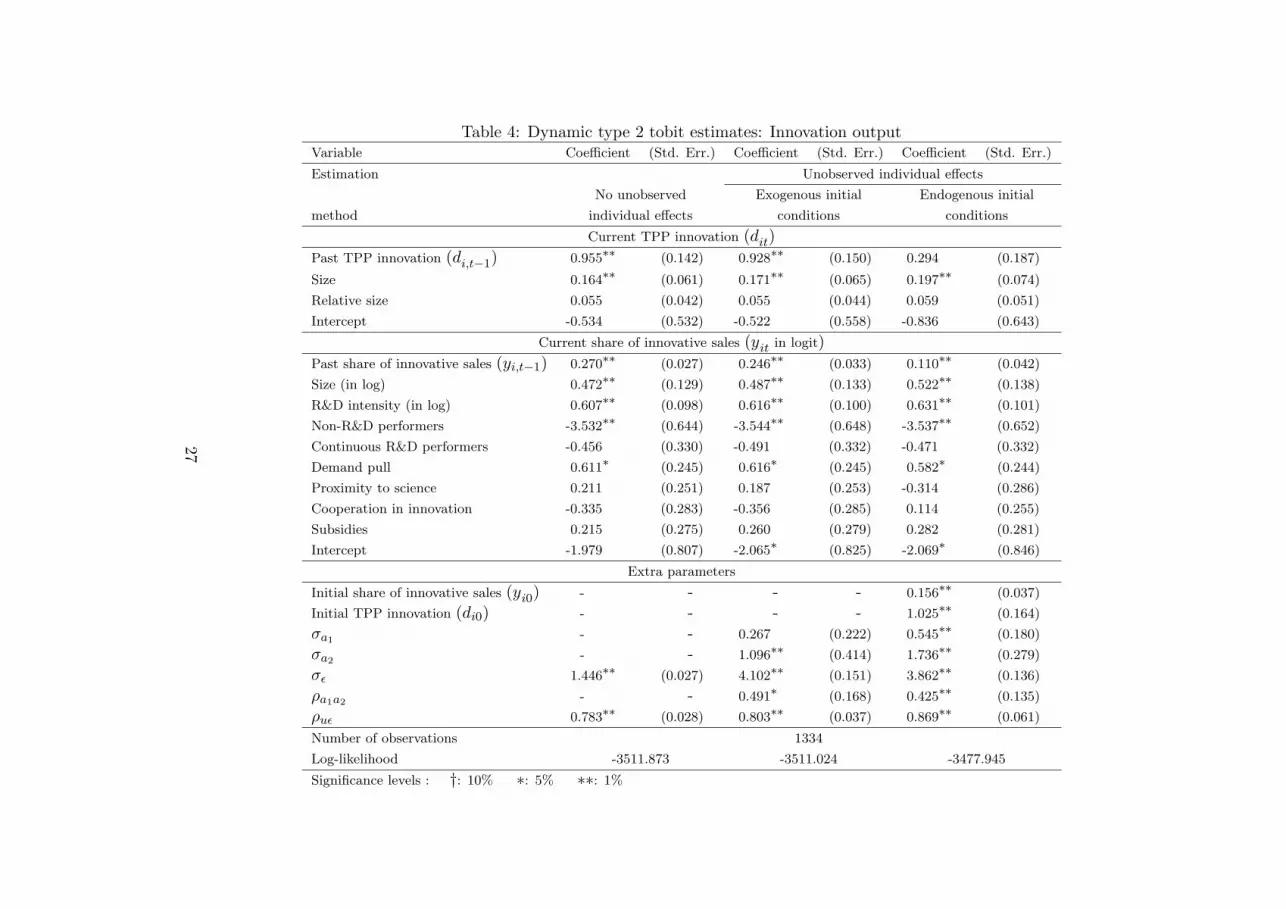
Table 4: Dynamic type 2 tobit estimates: Innovation outputVariable Coefficient (Std. Err.) Coefficient (Std. Err.) Coefficient (Std. Err.)
Estimation Unobserved individual effects
No unobserved Exogenous initial Endogenous initial
method individual effects conditions conditions
Current TPP innovation (dit)
Past TPP innovation (di,t−1) 0.955∗∗ (0.142) 0.928∗∗ (0.150) 0.294 (0.187)
Size 0.164∗∗ (0.061) 0.171∗∗ (0.065) 0.197∗∗ (0.074)
Relative size 0.055 (0.042) 0.055 (0.044) 0.059 (0.051)
Intercept -0.534 (0.532) -0.522 (0.558) -0.836 (0.643)
Current share of innovative sales (yit in logit)
Past share of innovative sales (yi,t−1) 0.270∗∗ (0.027) 0.246∗∗ (0.033) 0.110∗∗ (0.042)
Size (in log) 0.472∗∗ (0.129) 0.487∗∗ (0.133) 0.522∗∗ (0.138)
R&D intensity (in log) 0.607∗∗ (0.098) 0.616∗∗ (0.100) 0.631∗∗ (0.101)
Non-R&D performers -3.532∗∗ (0.644) -3.544∗∗ (0.648) -3.537∗∗ (0.652)
Continuous R&D performers -0.456 (0.330) -0.491 (0.332) -0.471 (0.332)
Demand pull 0.611∗ (0.245) 0.616∗ (0.245) 0.582∗ (0.244)
Proximity to science 0.211 (0.251) 0.187 (0.253) -0.314 (0.286)
Cooperation in innovation -0.335 (0.283) -0.356 (0.285) 0.114 (0.255)
Subsidies 0.215 (0.275) 0.260 (0.279) 0.282 (0.281)
Intercept -1.979 (0.807) -2.065∗ (0.825) -2.069∗ (0.846)
Extra parameters
Initial share of innovative sales (yi0) - - - - 0.156∗∗ (0.037)
Initial TPP innovation (di0) - - - - 1.025∗∗ (0.164)
σa1- - 0.267 (0.222) 0.545∗∗ (0.180)
σa2- - 1.096∗∗ (0.414) 1.736∗∗ (0.279)
σε 1.446∗∗ (0.027) 4.102∗∗ (0.151) 3.862∗∗ (0.136)
ρa1a2- - 0.491∗ (0.168) 0.425∗∗ (0.135)
ρuε 0.783∗∗ (0.028) 0.803∗∗ (0.037) 0.869∗∗ (0.061)
Number of observations 1334
Log-likelihood -3511.873 -3511.024 -3477.945
Significance levels : †: 10% ∗: 5% ∗∗: 1%
27
Related Documents