387480.35 November 25, 2014 Dear Pershing Square Holdings, Ltd. Shareholder: The portfolio of Pershing Square Holdings, Ltd. (“PSH”) outperformed the major market indexes for the third quarter of 2014, year-to-date and since inception as set forth below 1 : The PSH IPO was completed on October 1, 2014 on the Euronext Amsterdam exchange with a capital raise of $2.73 billion from new investors. An additional $212.5 million was raised from existing investors in Pershing Square International, Ltd. who elected to roll over their investments to PSH, and from Pershing Square employees who invested $129 million of additional capital. When combined with existing assets, this capital raise translated into an initial public capital base of more than $6.2 billion. As this is our first letter to the public shareholders of PSH, we thought it would be useful to share how we think about PSH and our long-term goals for the company. Our long-term goal is to compound our capital at a high rate of return while minimizing the risk of permanent loss of capital. While the structure of PSH is that of a closed end fund, we think of PSH as akin to an investment holding company. We expect to continue to concentrate the substantial majority of our capital in about 8 to 12 investments, and estimate that our typical holding period will be long-term, typically four or more years. Our “subsidiaries” are represented by large minority stakes in a handful of public companies. Typically, we are the largest or second largest 1 Past performance is not necessarily indicative of future results. All investments involve risk including the loss of principal. Please see the additional disclaimers and notes to performance results at the end of this letter. 3rd Quarter October Year to Date 2014 2014 2014 Jan 1 - Oct 31 Since Inception Pershing Square Holdings, Ltd. 12/31/12 - 10/31/14 Gross Return 6.4% 1.8% 43.4% 62.1% Net of All Fees 5.3% 1.4% 35.0% 47.9% Indexes (including dividend reinvestment) 12/31/12 - 10/31/14 S&P 500 Index 1.1% 2.4% 11.0% 46.9% Russell 1000 Index 0.7% 2.4% 10.6% 47.2% Dow Jones Industrial Average 1.9% 2.2% 6.8% 38.5%

Welcome message from author
This document is posted to help you gain knowledge. Please leave a comment to let me know what you think about it! Share it to your friends and learn new things together.
Transcript
387480.35
November 25, 2014
Dear Pershing Square Holdings, Ltd. Shareholder:
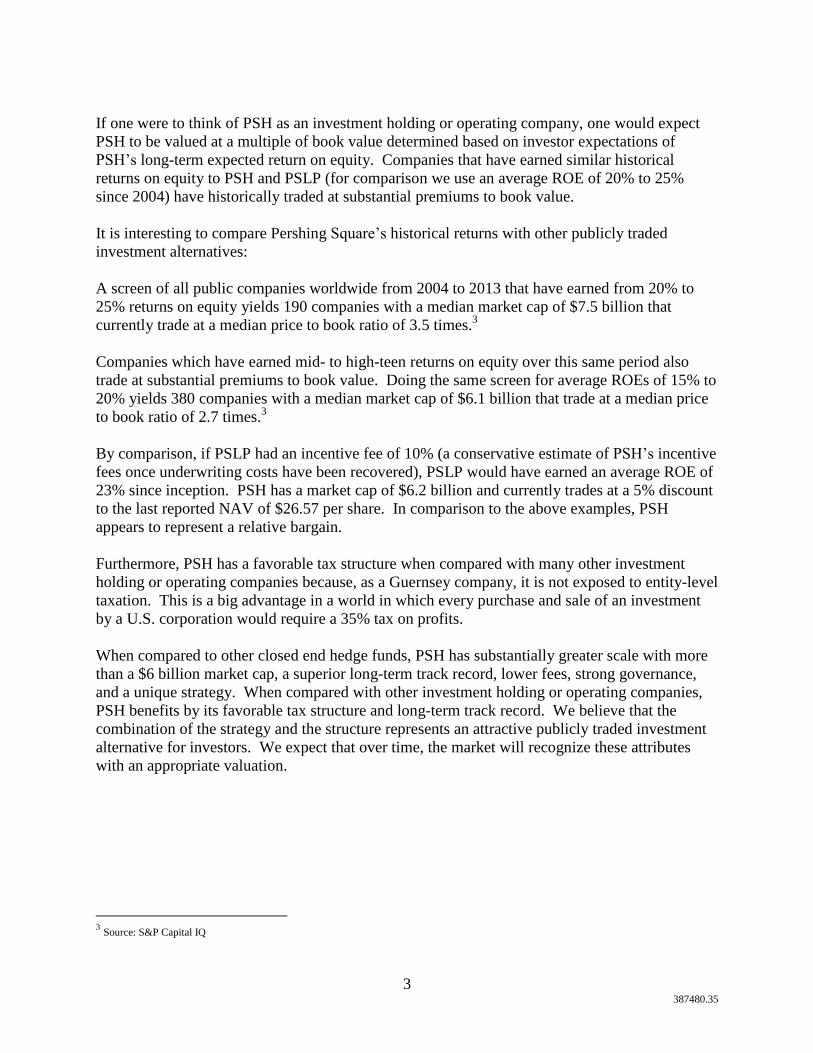
The portfolio of Pershing Square Holdings, Ltd. (“PSH”) outperformed the major market indexes
for the third quarter of 2014, year-to-date and since inception as set forth below1:
The PSH IPO was completed on October 1, 2014 on the Euronext Amsterdam exchange with a
capital raise of $2.73 billion from new investors. An additional $212.5 million was raised from
existing investors in Pershing Square International, Ltd. who elected to roll over their
investments to PSH, and from Pershing Square employees who invested $129 million of
additional capital. When combined with existing assets, this capital raise translated into an initial
public capital base of more than $6.2 billion.
As this is our first letter to the public shareholders of PSH, we thought it would be useful to share
how we think about PSH and our long-term goals for the company. Our long-term goal is to
compound our capital at a high rate of return while minimizing the risk of permanent loss of
capital. While the structure of PSH is that of a closed end fund, we think of PSH as akin to an
investment holding company. We expect to continue to concentrate the substantial majority of
our capital in about 8 to 12 investments, and estimate that our typical holding period will be
long-term, typically four or more years. Our “subsidiaries” are represented by large minority
stakes in a handful of public companies. Typically, we are the largest or second largest
1 Past performance is not necessarily indicative of future results. All investments involve risk including the loss of principal. Please see the
additional disclaimers and notes to performance results at the end of this letter.
3rd Quarter October Year to Date 2014
2014 2014 Jan 1 - Oct 31 Since Inception
Pershing Square Holdings, Ltd. 12/31/12 - 10/31/14
Gross Return 6.4% 1.8% 43.4% 62.1%
Net of All Fees 5.3% 1.4% 35.0% 47.9%
Indexes (including dividend reinvestment) 12/31/12 - 10/31/14
S&P 500 Index 1.1% 2.4% 11.0% 46.9%
Russell 1000 Index 0.7% 2.4% 10.6% 47.2%
Dow Jones Industrial Average 1.9% 2.2% 6.8% 38.5%

2 387480.35
shareholder, may have representation on the board, and, at a minimum, have substantial
influence by virtue of our large stake and active voice.
Our first fund, Pershing Square, L.P. (“PSLP”), began investing capital on January 1st, 2004.
Since inception, PSLP has compounded its capital at 21% per annum. Despite these strong
returns, our open-ended structure has prevented us from investing our capital in an optimal
fashion. While our activist approach to investments has generated large returns on capital,
historically we have deployed, on average, only about two-thirds of our capital in this strategy.
The balance of our funds has been invested in cash and passive value investments, which have
generated minimal returns. Being forced to sell an investment in the middle of an activist
campaign can be damaging to the execution of that investment, and, as a result, we have
historically set aside cash and liquid passive investments to minimize this risk.
By virtue of the permanent capital of PSH and the substantial amount of capital invested by
employees and other affiliates in our open ended funds, approximately 40% of Pershing Square’s
assets under management can now be considered effectively permanent. Over time, the
proportion of permanent capital in our total capital base should grow, as Pershing Square
employees and affiliates are likely to reinvest our profits and a substantial portion of our
incentive fees, net of taxes, in the funds.
We are fortunate in that our open ended capital base is relatively stable compared to most other
investment managers. Our open-ended capital is subject to various commitment periods. The
most common redemption schedule, which represents over 50% of open ended capital, allows
investors to redeem one-eighth of their capital each quarter. The balance of our open-ended
capital is subject to rolling two year, and one-third per year contractual lockups. We expect our
open-ended investor base to be relatively stable because these investors have benefited from the
more than $13.9 billion of profits we have generated over the last nearly 11 years. The
combination of approximately 40% permanent capital with our relatively stable open-ended
capital enables us to invest a greater percentage of our capital in our core activist strategy. With
a greater proportion of our capital in our core strategy, we believe we are well positioned to
achieve our long-term goal of generating high returns while minimizing the risk of permanent
loss of capital.
Over time, we believe that if we continue to generate attractive rates of returns, PSH should trade
at a premium to its NAV or book value (the book value of PSH equals its NAV because we mark
our assets and liabilities to market). While trading at a premium to NAV is not a common
occurrence for most closed end funds, we believe that Pershing Square’s performance history
and PSH’s strategy, scale, liquidity and structure differentiate PSH from the typical closed end
fund. While our corporate form is that of a closed end fund, our approach, governance structure,
and the compensation2 of management are better compared to publicly traded investment holding
or operating companies.
2 The incentive fee of PSH is 16% reduced dollar for dollar by an amount equal to 20% of the incentive fees earned
on other funds managed by Pershing Square Capital Management. Once the offering expense advance has been
repaid, based on current assets under management, we estimate that PSH’s incentive fee will be less than 10% per
annum, a level comparable to that of equity incentives granted to public company managements.
3 387480.35
If one were to think of PSH as an investment holding or operating company, one would expect
PSH to be valued at a multiple of book value determined based on investor expectations of
PSH’s long-term expected return on equity. Companies that have earned similar historical
returns on equity to PSH and PSLP (for comparison we use an average ROE of 20% to 25%
since 2004) have historically traded at substantial premiums to book value.
It is interesting to compare Pershing Square’s historical returns with other publicly traded
investment alternatives:
A screen of all public companies worldwide from 2004 to 2013 that have earned from 20% to
25% returns on equity yields 190 companies with a median market cap of $7.5 billion that
currently trade at a median price to book ratio of 3.5 times.3
Companies which have earned mid- to high-teen returns on equity over this same period also
trade at substantial premiums to book value. Doing the same screen for average ROEs of 15% to
20% yields 380 companies with a median market cap of $6.1 billion that trade at a median price
to book ratio of 2.7 times.3
By comparison, if PSLP had an incentive fee of 10% (a conservative estimate of PSH’s incentive
fees once underwriting costs have been recovered), PSLP would have earned an average ROE of
23% since inception. PSH has a market cap of $6.2 billion and currently trades at a 5% discount
to the last reported NAV of $26.57 per share. In comparison to the above examples, PSH
appears to represent a relative bargain.
Furthermore, PSH has a favorable tax structure when compared with many other investment
holding or operating companies because, as a Guernsey company, it is not exposed to entity-level
taxation. This is a big advantage in a world in which every purchase and sale of an investment
by a U.S. corporation would require a 35% tax on profits.
When compared to other closed end hedge funds, PSH has substantially greater scale with more
than a $6 billion market cap, a superior long-term track record, lower fees, strong governance,
and a unique strategy. When compared with other investment holding or operating companies,
PSH benefits by its favorable tax structure and long-term track record. We believe that the
combination of the strategy and the structure represents an attractive publicly traded investment
alternative for investors. We expect that over time, the market will recognize these attributes
with an appropriate valuation.
3 Source: S&P Capital IQ

4 387480.35
Third Quarter Performance Attribution
Investments that contributed or detracted at least 50 basis points to gross performance are
outlined below.4
Contributors
Canadian Pacific Railway Herbalife Ltd. Allergan, Inc. Burger King Worldwide
3.2% 3.2% 1.8% 0.7%
Fannie Mae Platform Specialty Products Howard Hughes Corp Freddie Mac
(1.1%) (0.7%) (0.6%) (0.6%)
Total 8.9% Total (3.0%)
Portfolio Update
Allergan (AGN)
Third Quarter Share Price Performance: 5.33%5
In September, despite extraordinarily onerous special meeting bylaws and burdensome
information requirements, described by the Chancellor of Delaware’s Court of Chancery as
“quite a horse-choker of a bylaw,” Pershing Square received support from shareholders holding
36% of Allergan shares to call a special meeting, materially exceeding the 25% required
threshold.
On September 16th
, after Pershing Square had sued Allergan to schedule the special meeting,
Allergan settled and entered into a court approved stipulation irrevocably committing the
company to hold the special meeting on December 18th
, and to “take no action, to delay,
postpone, or not hold the Special Meeting.”
In August, Allergan filed a lawsuit in Federal Court in California against Valeant and Pershing
Square for alleged securities fraud and supposed violations of the tender offer rules. In that suit,
Allergan moved for a preliminary injunction, seeking to prevent Pershing Square from voting its
shares at the special meeting.
On November 4th
, the Court in California denied Allergan’s request to enjoin Pershing Square
from voting its shares. At the same time, the Court directed Pershing Square to make certain
clarifying disclosures in connection with our solicitation of proxies.
On November 5th
, the day after the court ruling, Allergan entered into a confidentiality
agreement with Actavis. On November 17th
, Allergan announced a merger with Actavis for cash
4 Past performance is not necessarily indicative of future results. All investments involve risk including the loss of principal. Please see the
additional disclaimers and notes to performance results at the end of this letter. 5 The third quarter share price performance data set out in this letter reflects the change in share price of each given underlying investment from
July 1 through September 30, 2014 (plus any dividends). Share price performance data is provided for illustrative purposes only and is not an
indication of actual returns to the Company over the period or future returns of the Company. Additionally, it should not be assumed that any of
the changes in share prices of the investments listed herein indicate that the investment recommendations or decisions that Pershing Square makes in the future will be profitable or will generate values equal to those of the companies discussed herein.
5 387480.35
and stock. In the transaction, Allergan shareholders will receive $129.22 in cash and 0.3683
shares of Actavis for each share of Allergan. At Actavis’ closing price yesterday of $266.88 per
share, the transaction is valued at $227.51 per Allergan share which compares favorably to our
average acquisition price of $128.14 per share. In light of the Actavis transaction, we have
withdrawn our special meeting request and intend to support the transaction. We shared $344
million of the profits from the transaction with Valeant consistent with our joint venture
agreement.
The transaction is estimated to close in mid-April 2015. There are minimal if any anti-trust
issues, the financing for the transaction is fully committed, and the market has reacted quite
favorably to the deal.
We continue to hold our remaining 26.6 million share stake in Allergan which at current market
value is worth $5.64 billion (as of 11/24/14). The stock currently trades at a $15.70 discount to
the transaction value, about a 19% annualized return assuming a closing in mid-April 2015. This
wide spread is likely due to the large size of the transaction and the underperformance of many
event-driven funds who may be conserving capital for investor redemptions, and are less willing
to deploy capital as the year end approaches. We expect the spread will narrow after the new
year begins.
We recently met with the CEO of Actavis and were impressed with him and his business plan for
the combined company. If we hold the shares until transaction closure, we will receive $3.4
billion in cash and 9.81 million shares of Actavis worth $2.6 billion at current value. We are
currently doing due diligence on Actavis to determine whether we should remain a long-term
holder. Whether or not we choose to hold some or all of our Actavis stake, we will generate
substantial cash from this transaction which will be available for our next investment.
Canadian Pacific (CP)
Third Quarter Share Price Performance: 20.42% [CAD]
Canadian Pacific’s transformation has been nothing short of remarkable. Recent results confirm
the strength of CP’s turnaround. Despite lingering industry-wide congestion challenges, CP
reported third quarter earnings per share of $2.31 which was 26% above prior year levels. On
the strength of these results and the company’s outlook for the fourth quarter, CP maintained its
full-year guidance, which calls for 6% to 7% revenue growth, a 35% or higher operating margin,
and 30% or greater EPS growth. This guidance indicates that the company is on track to reach
its original four-year margin target in just two years, given the rapid pace of the operational
transformation.
CP held an analyst day in early October to outline its revised multi-year plan. The company’s
new four-year targets call for $10 billion of revenue by 2018, representing a 10.5% compound
annual growth rate. According to CP, this impressive revenue growth is driven by the
company’s vastly improved operations, which are enhancing CP's service and reliability to
customers, and allow it to compete profitably for business it could not previously serve with its
historically bloated cost structure.

6 387480.35
We estimate that CP’s announced revenue and margin goals equate to $20 per share in earnings
in 2018 including the impact of projected share repurchases, which is 138% above 2014
analysts’ consensus estimates of $8.41 per share. At the inception of our investment in 2011, CP
earned $3.15 per share. The achievement of $20 per share in earnings would represent more than
a six-fold increase in the earnings power of the business following the proxy contest and Hunter
Harrison’s appointment as CEO.
Air Products and Chemicals, Inc. (APD)
Third Quarter Share Price Performance: 1.81%
Air Products has begun its transformation under its newly appointed CEO Seifi Ghasemi. We
recruited Seifi to the Board of APD because he had over three decades of experience in the
industrial gas and specialty chemical sectors, with a stellar track record of creating value for
shareholders. We believe that Seifi is the ideal leader to transform Air Products, and we applaud
the Board for hiring Seifi as Chairman/CEO and supporting him in his efforts to improve the
company.
Seifi has made a significant impact on the company in his first 120 days. In mid-September, he
disclosed Air Products’ new strategy and goals, stating that the company is now targeting
industry-best performance. Seifi’s plan to improve performance rests on five core principles: 1)
focus on the core, 2) restructure the organization, 3) change the company culture, 4) control
capital / costs, and 5) align rewards. The company plans to increase operating margins from
16% to 23% to achieve performance levels in line with its well-run competitor Praxair. Of this
700 basis points margin improvement, roughly half is expected to come from SG&A reductions,
with the balance expected to come from operational efficiencies and productivity. Air Products
was at the top of the industry two decades ago, and Seifi asserts that there are no structural issues
that should prevent the company from regaining its industry-leading performance.
Fourth quarter results announced in late October were impressive. Fiscal year earnings per share
were 10% above the best quarterly result in the company’s history. For the quarter, revenue
grew by 3%, operating income increased 12%, and EPS increased by 13%. While revenue
growth was modest, operating income growth was impressive, due to significant progress on
costs, with operating margins increasing 130 basis points year-over-year and 190 basis points
sequentially. The company’s 17.6% reported operating margin was the highest in over nine
years. For the first time in four years, margins grew in all of the company’s operating segments,
and overhead declined 7% in the quarter. Management stressed that a substantial portion of the
improvement in results was driven by the company’s renewed focus on costs and efficiency. In
that Seifi's first day on the job, July 1st, coincided with the beginning of the company's quarter,
these improvements are occurring with remarkable rapidity.
In summary, Air Products' transformation has begun in earnest, and early returns are promising.
The company plans to hold an analyst day in late March or early April of next year to provide
further details on its plans for improvement and progress to date. We are encouraged by the
company's significant potential for improvement, and have confidence in Seifi and his team as
they work to reestablish Air Products as the industry leader.
7 387480.35
Herbalife (HLF) Short
Third Quarter Share Price Performance: -32.21%
Recent developments at Herbalife reinforce our short thesis that HLF is an illegal pyramid that
will collapse or otherwise be shut down by regulators. Since Herbalife’s last earnings
announcement, the stock has declined significantly. Herbalife’s third quarter earnings miss and
reduced guidance contributed to Herbalife’s stock price decline to 52-week lows. On November
5th, the stock price continued its decline from a recent high of $55.90 to close at $39.78 – a drop
of nearly 30% in two trading days, on high volume.
On October 23rd, Orion Research, with the assistance of Pershing Square, published an in-depth
article on Herbalife Venezuela (which you can read at http://seekingalpha.com/article/2583335-
through-herbalifes-venezuela-looking-glass-and-back-again). In summary, the article asserts that
Herbalife has realized distorted growth and artificial profits in Venezuela in recent years as inter-
company currency policies have created a mechanism for distributors to circumvent and
arbitrage official local currency controls. In its September 30, 2014 10-Q, Herbalife finally
acknowledged that its use of a 10.7 to 1 bolivar/dollar exchange rate was unrealistic and took an
impairment charge using a 50 to 1 rate at the end of the third quarter. The reduced guidance in
the fourth quarter and fiscal year 2015 is partly a result of the reduced earnings from the change
to a 50 to 1 bolivar/dollar exchange rate, which materially reduces reported revenues and
profitability.
On November 3rd, after the market close, HLF announced third quarter earnings with volume,
sales, earnings and guidance all disappointing expectations. The company also announced
numerous changes to its business model and marketing plan, a stark reversal from previous
assertions that claimed that its business model is beyond reproach. Judging by the poor financial
performance, it appears that even marginal changes in Herbalife’s business practices have made
it materially more difficult for the company to attract new distributors and generate sales.
Underpinning the headline net revenue number was a 2.2% decline in North America and a
14.9% decline in South & Central America. Volume growth (unadjusted for price changes) was
flat overall, with North America down 3.5% and South & Central America down 16.6%. These
markets are among the oldest and, historically, the strongest for the company. While the number
of Sales Leaders (distributors who have achieved certain minimum inventory purchases)
increased (perhaps due in part to reduced qualification standards), the number of non-Sales
Leader members (a leading indicator of future Sales Leaders) declined. Along with weak third-
quarter results, Herbalife reduced earnings and revenue guidelines for the fourth quarter and full
year 2015 to levels meaningfully below expectations.
Herbalife also announced that independent director Leroy Barnes (62 years old) resigned
effective immediately as chair of the Audit Committee and from the board effective February
2015 (without completing his board term). In his place, Herbalife named existing board member
Richard Bermingham as the new chair of the Audit Committee. We find it highly unusual that
Herbalife did not recruit a new board member to chair the Audit Committee, especially since Mr.
Bermingham is also the chair of the Compensation Committee and sits on several other boards.
We consider it to be questionable governance for one person to chair both the Audit and
8 387480.35
Compensation Committees. Of note, Mr. Barnes is the fourth independent director within the
last eight months to resign or decline to be renominated to the Herbalife board.
Herbalife’s total cash is now $678 million (down from $774 million last quarter), of which only
$181 million is held by Herbalife’s parent and its U.S. entities, and is available for debt service,
share repurchases or dividends. Total debt is now $2.025 billion having increased by $1.15
billion from the issuance of convertible bonds to finance a $1.3 billion share repurchase earlier in
the year at prices more than 50% above current levels.
We continue to believe that the expiration of HLF’s $1.15 billion credit facility in 2016 is a
potential catalyst for further stock price declines, as we are skeptical that the company will be
able to access the credit markets in order to refinance or replace this facility.
Year to date, Herbalife’s stock price has declined by almost 50% per share. We believe that
management’s new 2015 guidance fundamentally changes the bull case prospects, both by
reducing the projected earnings power of the company and the price-earnings multiple that
investors will assign to a business in decline.
With the company’s progressively weakening balance sheet, a deteriorating business profile, and
the ongoing and active regulatory investigations (as evidenced by the company’s continuing
material costs to respond to these investigations), we believe that there is limited risk of a
sustained increase in HLF’s stock price from current levels. Given the negative developments in
the quarter, we believe that it will be increasingly difficult for institutional managers to hold (or
initiate) positions in Herbalife.
On October 31st, Herbalife announced that it had entered into a settlement of the class action
lawsuit Bostick v. Herbalife, in which distributors alleged that they had been defrauded in
connection with the Herbalife business opportunity. The company recorded a $17.5 million
legal reserve in the quarter and agreed to make “numerous changes” to its business model. The
settlement reinforces our view that regulators are best suited to shut down or otherwise reform
Herbalife, as private individuals and their counsel will generally settle without compelling the
company to pay fully for its wrongdoing or to require sufficient changes to the business model
which would protect consumers.
Burger King Worldwide (BKW)
Third Quarter Share Price Performance: 9.26%
At the end of August, Burger King announced that it would acquire Tim Hortons, Canada’s
leading quick-service restaurant (QSR) company, for $12 billion. Tim Hortons operates as a
100% franchised business model with approximately 4,500 units. In Canada, where 80% of
THI’s restaurants are located, the company commands a market share of more than 40% of total
QSR traffic and nearly 75% of QSR caffeinated beverages sales.
We believe the acquisition of Tim Hortons will create significant long-term value for Burger
King shareholders as executed by the company’s controlling shareholder, 3G, which has an
extremely strong track record of successful business transformations. In the four years that 3G

9 387480.35
has owned a controlling stake in Burger King, the company has dramatically improved its
operations, reduced its capital intensity, significantly grown its number of restaurants, and put in
place an improved capital structure. We believe the improvements that 3G has enacted at Burger
King will serve as a template to create value in the Tim Hortons transaction. The Tim Hortons
transaction will reset the opportunity to create material value at the combined enterprise. We
look forward to substantial additional value creation over the long term.
Platform Specialty Products (PAH)
Third Quarter Share Price Performance: -10.74%
At the end of October, Platform announced that it would acquire Arysta LifeScience, an
agricultural specialty chemicals company, for $3.5 billion. Arysta sells agricultural chemicals,
such as fungicides, herbicides, insecticides, and biostimulants that protect and enhance growers’
crop yields. The company operates in niche crop markets in more than 100 countries and derives
a high proportion of its sales from fast-growing developing markets. Arysta has a large technical
sales force that has established close relationships with growers around the world and outsources
the manufacturing of the active ingredients in its products, which provides it with the “asset-
light, high-touch” characteristics that Platform seeks for its acquisitions.
Arysta is Platform’s largest acquisition to date and its third acquisition announced this year.
With the acquisition of Arysta, Platform will have built a leading global crop solutions business
that offers a full product portfolio and diversity across crop varieties and geographies. Wayne
Hewitt, who has led Arysta for the last five years and previously spent twenty years at GE, will
join Platform as President and head up the company’s agricultural business. Platform announced
that the acquisition of Arysta is expected to be more than 20% accretive to current year earnings
per share before synergies, and close to 30% accretive including the benefit of cost synergies,
which will be realized over several years.
Platform’s acquisition of Arysta is consistent with our thesis that the company has the
opportunity to invest large amounts of capital at a high rate of return by assembling a collection
of specialty chemicals businesses that can operate more efficiently as part of a larger industry
platform. We purchased $250 million of common stock from Platform in October to help
finance the Arysta acquisition.
Fannie Mae (FNMA) / Freddie Mac (FMCC)
Third Quarter Share Price Performance: FNMA -31.20%; FMCC -31.61%
On September 30th, the U.S. District Court dismissed several lawsuits that sought to enjoin the
net worth sweep, the arrangement whereby Treasury unilaterally amended the 10% dividend rate
on its senior preferred stock to a variable dividend equal to 100% of Fannie and Freddie’s future
earnings and existing net worth. We believe the U.S. District Court ruling will ultimately be
overturned on appeal, and similar lawsuits in other jurisdictions will yield a more favorable
outcome. The adverse court ruling resulted in a large decline in Fannie and Freddie’s respective
share prices, which we used as an opportunity to purchase additional shares in both companies.
We voluntarily withdrew our case in the U.S. District Court and are devoting our legal resources

10 387480.35
to reversing the Federal Government’s improper seizure of common shareholders’ property by
prosecuting our Constitutional takings claims in the U.S. Court of Federal Claims.
In addition to our assertion that the net worth sweep constitutes an unlawful taking under the
U.S. Constitution, we believe that it is an untenable economic arrangement. By stripping Fannie
and Freddie of the earnings that they could otherwise use to build capital, the Treasury is
subjecting the U.S. taxpayer to grave risk during the next economic downturn. We remain
convinced that a reformed Fannie and Freddie is the only credible path to preserving widespread
access to the 30-year, prepayable, fixed-rate mortgage at a reasonable cost. It is therefore
essential that Fannie and Freddie build a sufficient level of capital through the retention of their
earnings so they can continue to perform their vital function to the mortgage markets while
limiting risk to the U.S. taxpayer. A reformed and well-capitalized Fannie and Freddie will
accomplish the important policy objective of providing widespread and affordable access to
mortgage credit for millions of Americans while, at the same time, delivering tremendous
economic value to the U.S. taxpayer through Treasury’s ownership of warrants on 79.9% of
Fannie and Freddie’s common stock.
While we remain confident in the prospects for Fannie and Freddie and believe our investment in
their common shares will ultimately be worth a large multiple of current prices, the litigation is
likely to continue for a protracted period before being resolved, unless the Administration,
Treasury, Congress and other interested parties forge a consensual resolution. In light of the
inherent uncertainty of the situation, our combined investment in the two companies represents
about 3% of our capital at current market values.
Howard Hughes Corp. (HHC)
Third Quarter Share Price Performance: -4.96%
HHC continues to build shareholder value by converting its development stage assets and vacant
land into income-producing real estate and high-rise residential condominiums held for sale. We
have not before seen a real estate company accomplish so much in so little time while
maintaining superbly high quality execution along the way. Credit for this progress belongs to
the extraordinary management team at HHC that is led by CEO David Weinreb and President
Grant Herlitz, and a highly shareholder-oriented, real estate savvy board of directors.
Four years ago on November 10, 2010, HHC became a public company in a spinoff from
General Growth Properties. At the time, there was considerable skepticism about the orphaned
development assets that comprised HHC’s asset base. This was reflected in the company’s share
price which closed at $36.90 that day. Four years later, shareholders have been rewarded with a
four-fold increase in the company’s stock price. HHC continues to work to accelerate value
creation by monetizing its assets and generating recurring income from new developments. Over
time, the intrinsic value of HHC will be easier for investors to assess as the company’s cash
generation from stabilized income-producing assets increases. While management has its hands
full with the existing asset base, there will come a time when management talent can be applied
to new assets. We believe that the HHC “platform” has material value that is also not currently
reflected in the market value of HHC common stock.
11 387480.35
Zoetis, Inc. (ZTS)
On November 11th
, Pershing Square announced an investment in Zoetis, the world leader in
animal healthcare products, alongside Sachem Head Capital. Our collective investment
represents an approximate 10% stake in the company.
Until 2013, Zoetis was a non-core subsidiary of Pfizer, whose primary business is human, not
animal, health. In January 2013, Pfizer completed an initial public offering of a 20% stake in
Zoetis. The separation from Pfizer was completed in June 2013, when Pfizer split-off its
remaining 80% ownership to its shareholders. This separation resulted in the creation of the only
large independent and publicly traded animal health company in the world. The company has a
market capitalization of $22 billion with approximately $4.7 billion of revenue expected this
year.
Zoetis’ business model passes Pershing Square’s high bar for business quality. Zoetis
participates in markets with strong secular growth, driven by global increases in protein
consumption, pet ownership, and the use of medicines to treat pets and livestock. As a result, the
global animal health market has grown at an average of about 4% since 2008 and has
experienced positive volume growth every year since 2003. Historically, Zoetis’ organic growth
has exceeded the industry average. Zoetis’ revenue growth last quarter, currency adjusted, was
10%, above our expectations for long-term future growth.
Zoetis’ product portfolio is highly durable. Unlike many human health businesses, Zoetis’
business model is not based on bringing new products to market to compensate for the loss of
patent exclusivity in its existing portfolio. Despite over 80% of its products lacking patent
protection, generic competition in markets where Zoetis competes is minimal.
A number of factors contribute to the success of branded products in the animal health industry.
One of the most important contributors is the small size of animal health products. Only about
20 products in the industry have sales exceeding $100 million, with the majority of products
having sales significantly below this level. In addition, gross margins of branded animal health
products are lower than branded human health products. This combination of smaller products
and lower gross margins has made it difficult for generic manufacturers to compete in the animal
health market. Other factors that have contributed to the success of branded products include the
lack of third-party payers in the animal health market and the fact that pet veterinarians directly
dispense drugs to their customers.
We believe Zoetis is a scarce asset, similar to our investment in Beam, which was acquired
earlier this year in a large premium transaction. News reports indicate that Pfizer considered
selling Zoetis in late 2012 and that several large, well-capitalized buyers, including Bayer and
Novartis, participated in the sales process. In part because a sale would have triggered large
taxes for Pfizer, Pfizer instead decided to pursue a tax-free split-off of Zoetis to its shareholders.
We look forward to beginning a dialogue with Zoetis’ management and board, as we work
together to maximize value for Zoetis shareholders.

12 387480.35
Transparency
The nature of our investment strategy as an active and concentrated investor principally in North
American companies creates a high degree of transparency about PSH. As an SEC-registered
investment advisor, we are required to make periodic publicly available filings (including
Schedules 13F, 13G, 13D filings) that provide detailed information about the substantial majority
of our portfolio positions. In addition, we provide weekly performance updates and monthly
performance and transparency reports which you can access on the
www.pershingsquareholdings.com website.
From time to time, we will release public presentations on specific investments which provide
detailed insights into our investment thinking. We write quarterly letters and have quarterly
conference calls on which the investment team reviews significant portfolio developments and
answers your questions. Generally, the only material items we don’t discuss are what we are
buying or selling in advance of any regulatory requirement to do so. You can expect that we will
be candid in our reporting to you including detailed discussions of successes and failures.
Please access the PSH web site www.pershingsquareholdings.com to find weekly postings of
NAV, monthly performance and transparency reports, press releases, and letters to investors, as
well as access to our quarterly investor calls and general corporate documents.
Pershing Square Organizational Update
Charles Korn joined the investment team in September of 2014. Charles came to Pershing
Square after spending two years as a Private Equity Associate at Kohlberg Kravis Roberts & Co.
and previously as an analyst at Goldman Sachs. Charles received his B.A from The University
of Western Ontario, Richard Ivey School of Business and was an Ivey Scholar. In October, Bill
Doyle traded in his Senior Advisor status to become an official member of our investment team.
Ryan Belden joined the Shareholder Services team, replacing Lucy Harris who joined the IR
team. Michael Chamberlain joined the accounting team as a controller in November 2014.
Michael began his career at PricewaterhouseCoopers where he was an Assurance Manager in the
Asset Management practice. Michael graduated from the New York University, Leonard N.
Stern School of Business with a B.S. in Finance and Accounting.
Please feel free to contact the Investor Relations team or me if you have questions about any of
the above.
Sincerely,
William A. Ackman

13 387480.35
IMPORTANT NOTICE
Presentation of Performance Results and Other Data
The performance results of PSH shown in this letter are presented on a gross and net-of-fees basis. Gross and net
performances include the reinvestment of all dividends, interest, and capital gains, and reflect the deduction of,
among other things, brokerage commissions and administrative expenses. Net performance reflects the deduction of
management fees and accrued performance fee, if any. All performance provided herein assumes an investor has
been invested in the Company since its inception date. Depending on the timing of a specific investment, net
performance for an individual investor may vary from the net performance stated herein. Performance data for 2014
is estimated and unaudited.
The inception date for PSH is December 31, 2012. The performance data presented on the first page of this letter for
the market indices under “since inception” is calculated from December 31, 2012. The market indices shown on the
first page of this letter have been selected for purposes of comparing the performance of an investment in PSH with
certain well-known, broad-based equity benchmarks. The statistical data regarding the indices has been obtained
from Bloomberg and the returns are calculated assuming all dividends are reinvested. The indices are not subject to
any of the fees or expenses to which the funds are subject. The Company is not restricted to investing in those
securities which comprise any of these indices, its performance may or may not correlate to any of these indices and
it should not be considered a proxy for any of these indices. The volatility of an index may materially differ from the
volatility of a Pershing Square fund. The S&P 500 index is proprietary to and is calculated, distributed and marketed
by S&P Opco, LLC (a subsidiary of S&P Dow Jones Indices LLC), its affiliates and/or its licensors and has been
licensed for use. S&P® and S&P 500®, among other famous marks, are registered trademarks of Standard & Poor's
Financial Services LLC. © 2014 S&P Dow Jones Indices LLC, its affiliates and/or its licensors. All rights reserved.
Pershing Square, L.P.’s net returns for 2004 were calculated net of a $1.5 million (approximately 3.9%) annual
management fee and performance allocation equal to 20% above a 6% hurdle, in accordance with the terms of the
limited partnership agreement of Pershing Square, L.P., which was later amended to provide for a 1.5% annual
management fee and 20% performance allocation effective January 1, 2005. In addition, pursuant to a separate
agreement, in 2004 the sole unaffiliated limited partner paid Pershing Square Capital Management, L.P. (“Pershing
Square”) an additional $840,000 for overhead expenses in connection with services provided unrelated to Pershing
Square, L.P. To the extent such amounts had been included in the management fee charged to the fund, net returns
would have been lower.
The data reflected in the chart on p.3 reflects the gross returns of the positions that contributed at least 50 basis
points to, or detracted at least 50 basis points from, the overall portfolio’s gross performance during Q3. The gross
returns provided herein include the reinvestment of all dividends, interest and capital gains, if any, and reflect the
deduction of, among other things, brokerage commissions and administrative expenses. Returns were calculated
taking into account currency hedges, if any. These gross returns do not reflect deduction of management fees and
accrued performance fee. These returns (and attributions) do not reflect certain other fund expenses (e.g.,
administrative expenses). Inclusion of such fees and expenses would produce lower returns than presented here.
Please refer to the net performance figures presented on page 1 of this letter.
The third quarter share price performance data set out in this letter reflects the change in share price of each given
underlying investment from July 1 through September 30, 2014 (plus any dividends). Share price performance data
is provided for illustrative purposes only and is not an indication of actual returns to the Company over the period or
future returns of the Company. Additionally, it should not be assumed that any of the changes in shares prices of the
investments listed herein indicate that the investment recommendations or decisions that Pershing Square makes in
the future will be profitable or will generate values equal to those of the companies discussed herein.
Limitations of Performance Data
Past performance is not necessarily indicative of future results. All investments involve risk including the loss of
principal. This letter does not constitute a recommendation, an offer to sell or a solicitation of an offer to purchase
any security or investment product.
This letter contains information and analyses relating to all publicly disclosed positions above 50 basis points in the
Company’s portfolio during the period reflected on the first page. Pershing Square may currently or in the future
buy, sell, cover or otherwise change the form of its investment in the companies discussed in this letter for any
reason. Pershing Square hereby disclaims any duty to provide any updates or changes to the information contained
here including, without limitation, the manner or type of any Pershing Square investment.

14 387480.35
Forward-Looking Statements
This letter also contains forward-looking statements, which reflect Pershing Square is views. These forward-looking
statements can be identified by reference to words such as “believe”, “expect”, “potential”, “continue”, “may”,
“will”, “should”, “seek”, “approximately”, “predict”, “intend”, “plan”, “estimate”, “anticipate” or other comparable
words. These forward-looking statements are subject to various risks, uncertainties and assumptions. Accordingly,
there are or will be important factors that could cause actual outcomes or results to differ materially from those
indicated in these statements. Should any assumptions underlying the forward-looking statements contained herein
prove to be incorrect, the actual outcome or results may differ materially from outcomes or results projected in these
statements. None of the Company, Pershing Square or any of their respective affiliates undertakes any obligation to
update or review any forward-looking statement, whether as a result of new information, future developments or
otherwise, except as required by applicable law or regulation.
Risk Factors
Investors in PSH may lose all, or substantially all, of their investment in PSH. Any person acquiring shares in PSH
must be able to bear the risks involved. These include, among other things, the following:
PSH is exposed to a concentration of investments, which could exacerbate volatility and investment risk;
Activist investment strategies may not be successful and may result in significant costs and expenses;
Pershing Square may fail to identify suitable investment opportunities. In addition, the due diligence
performed by Pershing Square before investing may not reveal all relevant facts in connection with an
investment;
While Pershing Square may use litigation in pursuit of activist investment strategies, Pershing Square itself
and PSH may be the subject of litigation or regulatory investigation;
Pershing Square may participate substantially in the affairs of portfolio companies, which may result in
PSH’s inability to purchase or sell the securities of such companies;
PSH may invest in derivative instruments or maintain positions that carry particular risks. Short selling
exposes PSH to the risk of theoretically unlimited losses;
PSH’s non-U.S. currency investments may be affected by fluctuations in currency exchange rates;
Adverse changes affecting the global financial markets and economy may have a material negative impact
on the performance of PSH’s investments;
Changes in laws or regulations, or a failure to comply with any laws and regulations, may adversely affect
PSH’s business, investments and results of operations;
Pershing Square is dependent on William A. Ackman;
PS Holdings Independent Voting Company Limited controls a majority of the voting power of all of PSH’s
shares;
PSH shares may trade at a discount to NAV and their price may fluctuate significantly and potential
investors could lose all or part of their investment;
The ability of potential investors to transfer their PSH shares may be limited by the impact on the liquidity
of the PSH shares resulting from restrictions imposed by ERISA and similar regulations, as well as a 4.75
per cent. ownership limit;
When the lock-up arrangements to which existing shareholders are subject expire, more PSH shares may
become available on the market which could reduce the market price of PSH shares;
PSH is exposed to changes in tax laws or regulations, or their interpretation; and
PSH may invest in United States real property holding corporations which could cause PSH to be subject to
tax under the United States Foreign Investment in Real Property Tax Act.
Related Documents