Data SnapShot Series 1.1 May 2015 DATA SNAPSHOT Perry County

Welcome message from author
This document is posted to help you gain knowledge. Please leave a comment to let me know what you think about it! Share it to your friends and learn new things together.
Transcript

Data SnapShot Series 1.1May 2015
DATA SNAPSHOTPerry County

2
Hometown Collaboration InitiativeThis report has been produced by the Purdue Center for Regional Development as a part of the Indiana Hometown Collaboration Initiative (HCI). HCI is funded, in part, by the Indiana Office of Community and Rural Affairs.

Table of contents
Introduction01Demography02
Economy03Labor Market04

Purpose
About Perry County
01introductio
n

5
Purpose
This document provides information and data about Perry County that can be used to guide local decision-making activities.
The Data SnapShot showcases a variety of demographic, economic and labor market information that local leaders, community organizations and others can use to gain a better perspective on current conditions and opportunities in their county.
To strengthen the value and usability of the information, we showcase the data using a variety of visual tools, such as charts, graphs and tables. In addition, we offer key points about the data as a way of assisting the user with the interpretation of the information presented.
Finally, short takeaway messages are offered at the end of each section in order to highlight some of the more salient findings.
Introduction
section 01

6
About Perry CountyIntroduction
section 01
County Background
Established 1814
CountySeat
Tell City
Area 386 sq. mi.
NeighboringCounties
Breckinridge, KYCrawford, IN
Dubois, INHancock, KY
Meade, KYSpencer, IN
Hoosier National Forest

Population change
Population pyramids
Race
Ethnicity
Educational attainment
Takeaways
02demograp
hy

8
18,899
19,338
19,558 19,2
79
Population change
Components of Population Change, 2000-2013
Total Change -67*
Natural Increase 343
International Migration
77
Domestic Migration
-379
The total population is projected to decrease by 1 percent between 2013 and 2020.
Demography
Sources: STATSIndiana, U.S. Census Bureau – 2000 Decennial Census, 2010 Decennial Census, 2013 Estimates, Estimates of the Components of Resident Population Change
section 02
The county’s total population increased by 3 percent between 2000 and 2013. The major contributor to that expansion was natural increase (births minus deaths over that span of time) with a net growth of 343 persons.
Data on domestic migration (the difference between the number of people moving into the county versus moving out) show that out-migration outpaced in-migration by nearly 380 people. On the other hand, international migration had a net increase of 77, indicating that the county experienced a minor influx of new people from outside the U.S.
Total population projections
2000
2010
2013
2020
*Total change in population differs from the sum of the components due to Census estimation techniques. Residuals (not reported here) make up the difference.

9
0-9
10-19
20-29
30-39
40-49
50-59
60-69
70-79
80+
9 6 3 0 3 6 9
6.0%
5.8%
8.0%
7.6%
7.5%
7.9%
5.9%
3.0%
1.8%
5.8%
5.4%
4.9%
5.3%
5.6%
7.3%
5.8%
3.3%
3.1%
Percent of Total Population
Ag
e C
oh
ort
0-9
10-19
20-29
30-39
40-49
50-59
60-69
70-79
80+
9 6 3 0 3 6 9
6.0%
7.5%
7.5%
8.3%
8.6%
5.9%
3.8%
2.9%
1.3%
5.5%
6.9%
5.3%
6.4%
7.4%
5.7%
4.3%
4.2%
2.6%
Percent of Total Population
Ag
e C
oh
ort
Population pyramidsPopulation pyramids are visual representations of the age distribution of the population by gender.
There are proportionately more males than females in Perry County. Approximately 51.7 % of the population was male in 2000 (9,771 people) and that percent increased to 53.5% (10,467 people) in 2013. The distribution of people across the various age categories changed as well, with a larger share of people shifting into the higher age groupings over the 2000 to 2013 time period.
Demography
Source: U.S. Census Bureau – 2000 Decennial Census and 2013 Annual Population Estimates
section 02
In particular, people 50 and over swelled from 13.9% to 18.6% for males and from 16.8% to 19.5% for females between 2000 and 2013. Individuals of prime working age -- 20-49 years old -- slipped from 24.4% to 23.1% for males and from 19.1% to 15.8% for females. The percent of residents under 20 years of age also declined over the same time period.
Male
Female
20132000
Male
Female
10
White95%
Black
Asian
Native
Two or More Races
White98%
Black
Asian
Native
Two or More Races
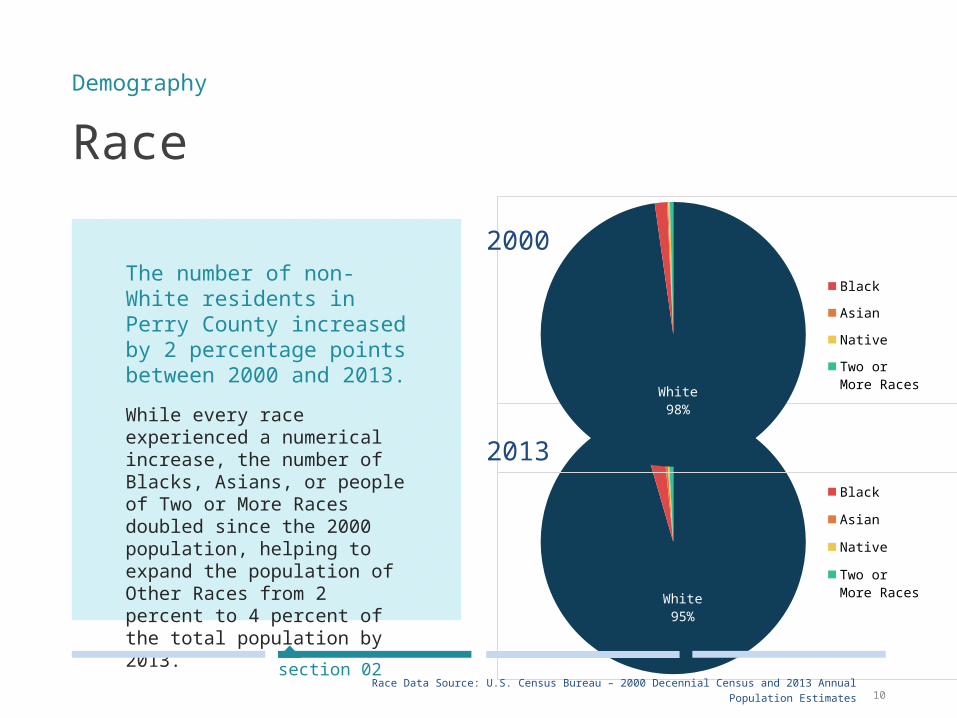
Race
The number of non-White residents in Perry County increased by 2 percentage points between 2000 and 2013.
While every race experienced a numerical increase, the number of Blacks, Asians, or people of Two or More Races doubled since the 2000 population, helping to expand the population of Other Races from 2 percent to 4 percent of the total population by 2013.
Demography
Race Data Source: U.S. Census Bureau – 2000 Decennial Census and 2013 Annual Population Estimates
section 02
2000
2013

11
EthnicityHispanics are individuals of any race whose ancestry are from Mexico, Puerto Rico, Cuba, Spain, the Dominican Republic or any other Spanish-speaking Central or South American country.
There were 133 Hispanics residing in Perry County in 2000. This figure expanded to 246 by 2013, an 85 percent increase.
Despite this increase in the number of Hispanics, they still only represented one percent of the population in 2013.
Demography
Source: U.S. Census Bureau – 2000 Decennial Census and 2013 Annual Population Estimates
section 02
1%
1%
Hispanics - 2000
Hispanics - 2013

12
No High School;
16%
High School;
47%
Some College;
18%
Asso-ciate's Degree;
8%
Bachelor's Degree or More; 11%
No High School;
25%
High School; 45%
Some Col-lege; 15%
Asso-ciate's Degree;
4%
Bachelor's Degree or More; 10%
Educational attainment Perry County had a 5 percentage
point increase in the number of adults (25 and older) with an
associate’s, bachelor’s or graduate degree from 2000 to
2013.
The proportion of adults 25 years of age and older with a high school
education or more improved from 75 percent in 2000 to 84 percent by
2013. Residents with less than a high school education fell by 9
percentage points from 2000 to 2013; however, those with only a
high school degree increased by 2 percentage points to 47 percent in
the same time period.
Adults with a college degree increased from 14 percent in 2000 to
19 percent in 2013. This was due to a 4 percentage point growth in
residents with associate’s degrees (4 percent versus 8 percent), while
adults with a bachelor's degree or more increased from 10 percent to
11 percent, a 1 percentage point growth.
.
Demography
Source: U.S. Census Bureau – 2000 Decennial Census and 2013 ACS
section 02
2000
2013

13
Takeaways The population of Perry County is expected to fall over the next few years, and if past trends hold, that decrease will be due mainly to domestic out-migration (more people moving out of the county for other U.S. locations than moving to the county from other U.S. places).
The gender gap in the county varies across age groupings. For example, the gender imbalance is greatest among persons of prime working age (20-49 years) with men representing a larger share of the population than women. But, females make up a larger percentage of the 70 plus age population.
The population of Perry County is getting older, on average, with a larger percent of the population now being 60 years of age or older. Moreover, a sizable number of people in the 50-59 working age population is nearing retirement age. As such, the percent of men and women of prime working age (20-29, 30-39 and 40-49) continues to decline.
The educational attainment of adults 25 years old and over has improved since 2000, with an impressive decline in the percentage of adults with less than a high school education. At the same time, the proportion of residents with a high school education only remains sizable (at 47 percent). Taking time to assess whether local economic development opportunities might be impeded by the presence of a sizable number of adults with a terminal high school degree may be worthy of attention. While nearly one in five adult residents in the county has an associate’s or a bachelor’s degree or more, this figure is about 14 percentage points lower than that of the state of Indiana for adults 25 plus years of age.
Perry County may wish to assess the job skills of workers with a high school education only. Determining if such skills align with the needs of local businesses and industries – both now and in the future -- may be worth exploring.
Demography
section 02

Establishments
Industries
Occupations
Income and poverty
Takeaways
03economy

15
Establishments
Components of Change for Establishments
Total Change (2000-11) 449
Natural Change (births minus deaths) 435
Net Migration 14
The number of establishments in Perry County increased 55 percent from 2000 to 2011.
The rapid growth of establishments was largely due to natural change. That is, 1,101 establishments were launched in the county between 2000-2011 while 666 closed, resulting in a net gain of 435 establishments. There was a gain of 14 establishments due to net migration.
Economy
Source: National Establishment Time Series (NETS) – 2012 Database
section 03
An establishment is a physical business
location. Branches, standalones and
headquarters are all considered types of
establishments.
Definition of Company Stages
0 12 3
4
Self-employed
2-9 employees
10-99employees
100-499employees
500+employees
Note: The 2011 figures use 2012 data to include all gains and losses over the entire
year. Establishment information was calculated in-house and may differ slightly from publicly available data.

16
Number of establishments by stage/employment category
Economy
Source: National Establishment Time Series (NETS) – 2012 Database
section 03
2000 2011
Stage Establishments Proportion Establishment
s Proportion
Stage 0 239 30% 449 35%
Stage 1 464 57% 703 56%
Stage 2 100 12% 100 8%
Stage 3 11 1% 11 1%
Stage 4 - - -* -
Total 814 100% 1,263 100%
Note: The 2011 figures use 2012 data to include all gains and losses over the entire year.
The NETS Database is derived from the Dun & Bradstreet archival national establishment data, a population of known establishments in the United States that is quality controlled and updated annually. Establishments include both private and public sector business units and range in size from one employee (i.e., sole-proprietors and self-employed) to several thousand employees.*ReferenceUSA indicates one Stage 4 company, however, NETS records this company asa Stage 3 establishment. Additional information is available on the next slide.

17
Top five employers in 2015Economy
Source: ReferenceUSA (Infogroup) and Purdue Extension Community Development Southwest Regional Office
section 03
Establishment Stage
1. Waupaca Foundry Stage 4
2. Branchville CorrectionalFacility
Stage 3
3. Walmart Supercenter Stage 3
4. Perry County Memorial Hospital
Stage 3
5. Accent Marketing Stage 3
The top five employers produce a mix of local and local export goods and services.
Waupaca Foundry in Tell City is the largest establishment-level employer in Perry County.
Both Waupaca Foundry and Accent Marketing produce mainly local export goods and services, while the Branchville Correctional Facility, Walmart Supercenter, and Perry County Memorial Hospital primarily support the local community.
Information on the top five establishments by employment comes from ReferenceUSA. ReferenceUSA is a library database service provided by Infogroup, the company that also supplies the list of major employers for Hoosiers by the Numbers. While both NETS and ReferenceUSA contain establishments, differences in data collection processes result in discrepancies between the two sources. We use NETS for a broad picture of establishments in the county, while ReferenceUSA is used for studying individual establishments.

18
Number of jobs by stage/employment category
Economy
Source: National Establishment Time Series (NETS) – 2012 Database
section 03
2000 2011Stage Jobs* Proportion Jobs* Proportion
Stage 0 239 4% 449 7%
Stage 1 1,729 27% 2,254 32%
Stage 2 2,371 36% 2,376 34%
Stage 3 2,149 33% 1,912 27%
Stage 4 - - - -
Total 6,488 100% 6,991 100%
Note: The 2011 figures use 2012 data to include all gains and losses over the entire year.*Includes both full-time and part-time jobs

19
Amount of sales (2011 dollars) by stage/employment category
Economy
Source: National Establishment Time Series (NETS) – 2012 Database
section 03
2000 2011Stage Sales Proportion Sales Proportion
Stage 0 $26,873,034 3% $28,190,229 4%
Stage 1 $189,127,250 23% $161,337,489 26%
Stage 2 $240,740,609 30% $211,595,242 34%
Stage 3 $353,733,622 44% $222,337,600 36%
Stage 4 - - - -
Total $810,474,516 100% $623,460,560 100%
Note: The 2011 figures use 2012 data to include all gains and losses over the entire year.

20
Manufacturing25.1%
Government18.1%
Retail Trade11.0%
Accommoda-tion & Food
Services7.4%
Health Care & Social Assis-tance5.7%
All Other Industries
32.8%
Top five industries in 201367.2 percent of jobs are tied to one of the top five industries in Perry County.
Manufacturing is the largest industry sector (2,132 jobs). Health Care & Social Assistance is the smallest of the top industry sectors with 481 jobs. Four of these top five industries primarily serve the local population, suggesting that the county’s economy is focused on local services.
Of the top five industries in Perry County, Manufacturing (+26.1 percent) and Accommodation & Food Services (+21.2 percent) gained jobs between 2002 and 2013. The other three top five industries lost jobs over the same time period, with Health Care & Social Assistance losing the most, 9.4 percent.
Economy
Source: Economic Modeling Specialists International (EMSI) – 2014.3 – QCEW Employees, Non-QCEW Employees, Self-Employed, and Extended Proprietors
section 03

21
Industry distribution and changeNAICS Code
Description Jobs 2002
Jobs 2013
Change (2002-2013)
% Change (2002-2013)
Average Total
Earnings 2013
11Agriculture, Forestry, Fishing & Hunting 487 463 -24 -5% $29,364
21Mining, Quarrying, & Oil & Gas Extraction 45 28 -17 -38% $18,580
22 Utilities 57 50 -7 -12% $70,531 23 Construction 413 401 -12 -3% $29,411 31-33 Manufacturing 1,691 2,132 441 26% $64,025 42 Wholesale Trade 90 68 -22 -24% $61,994 44-45 Retail Trade 966 931 -35 -4% $22,281 48-49 Transportation & Warehousing 159 195 36 23% $35,271 51 Information 55 53 -2 -4% $52,129 52 Finance & Insurance 268 307 39 15% $102,761 53 Real Estate & Rental & Leasing 174 331 157 90% $30,850
54Professional, Scientific & Technical Services 149 147 -2 -1% $35,945
55Management of Companies and Enterprises 32 27 -5 -16% $41,964
56 Administrative & Waste Management 231 226 -5 -2% $25,471 61 Educational Services (Private) 15 28 13 87% $13,527 62 Health Care & Social Assistance 531 481 -50 -9% $32,239 71 Arts, Entertainment & Recreation 74 59 -15 -20% $18,735 72 Accommodation and Food Services 520 630 110 21% $14,130
81Other Services (except Public Administration) 474 403 -71 -15% $21,640
90 Government 1,579 1,537 -42 -3% $47,175 99 Unclassified Industry 0 0 0 0% $0 All Total 8,007 8,496 489 6% $42,685
Economy
Source: Economic Modeling Specialists International (EMSI) – 2014.3 – QCEW Employees, Non-QCEW Employees, Self-Employed, and Extended Proprietors
section 03Note: Average total earnings include wages, salaries, supplements and earnings from investments and proprietorships.

22
Industry distribution and change
The largest percentage gains in employment in Perry County occurred in: Real Estate and Rental and
Leasing (+90.2 percent) Educational Service, private
(+86.7 percent)
The largest percentage losses in employment occurred in: Mining, Quarrying, and Oil and
Gas Extraction (-38.7 percent) Wholesale Trade (-24.4
percent)
Economy
Source: Economic Modeling Specialists International (EMSI) – 2014.3 – QCEW Employees, Non-QCEW Employees, Self-Employed, and Extended Proprietors
section 03
Employment Increase
Employment Decrease
Industries with the largest gains and losses in employment numbers between 2002 & 2013:
Manufacturing(+441)
Real Estate(+157)
Accommodation & Food Services
(+110)
Other Services(-71)
Health Care & Social
Assistance(-50)
Government(-42)

23
Production 18.1%
Sales & Re-lated 11.9%
Management*9.3%
Office & Administra-tive Support
8.6%
Food Preparation & Serving Related
7.5%
All Other Occupations
44.5%
Top five occupations in 2013The top five occupations in Perry County represent 55.5 percent of all jobs.
Production (1,542 jobs) is the top occupation in Perry County. Food Preparation & Serving is the smallest of the top five occupations, with 641 jobs. Four of the top five occupations focus on providing local services; however, production occupations are the exception if their manufactured goods are exported to other counties, states, or countries.
Of the five top occupations in Perry County, Production (+26.5 percent), Food Preparation (+19.1 percent), and Sales & Related (+13.0 percent) occupations had the largest percentage increase in jobs from 2002 to 2013. Office & Administrative Support (-12.7 percent) occupations lost the largest proportion of jobs.
Economy
Source: Economic Modeling Specialists International (EMSI) – 2014.3 – QCEW Employees, Non-QCEW Employees, Self-Employed, and Extended Proprietors
section 03*Management occupations include farm managers, so changes in jobs may be related to changes in the number of farm proprietorships.

24
SOC Description Jobs
2002Jobs 2013
Change (2002-2013)
% Change (2002-2013)
Hourly Earnings
201311 Management 794 789 -5 -1% $20.76 13 Business & Financial Operations 247 268 21 9% $28.30 15 Computer & Mathematical 50 48 -2 -4% $25.04 17 Architecture & Engineering 152 147 -5 -3% $32.06 19 Life, Physical & Social Science 33 30 -3 -9% $25.31 21 Community & Social Service 112 86 -26 -23% $18.92 23 Legal 43 36 -7 -16% $30.17 25 Education, Training & Library 239 487 248 104% $17.54
27Arts, Design, Entertainment, Sports & Media 124 108 -16 -13% $17.11
29 Health Care Practitioners & Technical 391 244 -147 -38% $26.80 31 Health Care Support 223 170 -53 -24% $11.59 33 Protective Service 182 140 -42 -23% $16.55 35 Food Preparation & Serving Related 538 641 103 19% $8.91
37Building & Grounds Cleaning Maintenance 219 292 73 33% $9.54
39 Personal Care & Service 316 290 -26 -8% $9.26 41 Sales & Related 897 1,014 117 13% $13.46 43 Office & Administrative Support 837 731 -106 -13% $14.29 45 Farming, Fishing & Forestry 41 61 20 49% $13.01 47 Construction & Extraction 412 393 -19 -5% $15.14 49 Installation, Maintenance & Repair 315 341 26 8% $18.74 51 Production 1,219 1,542 323 26% $16.43 53 Transportation & Material Moving 534 555 21 4% $14.74 55 Military 62 62 0 0% $18.10 99 Unclassified 27 22 -5 -19% $15.76 All Total 8,007 8,496 489 6% $16.24
Occupation distribution and change
Economy
Source: Economic Modeling Specialists International (EMSI) – 2014.3 – QCEW Employees, Non-QCEW Employees, Self-Employed, and Extended Proprietors
section 03

25
Occupation distribution and change
Economy
Source: Economic Modeling Specialists International (EMSI) – 2014.3 – QCEW Employees, Non-QCEW Employees, Self-Employed, and Extended Proprietors
section 03
The largest percentage gains in employment in Perry County occurred in: Education, Training, and
Library (+103.8 percent) Farming, Fishing, and Forestry
(+48.8 percent)
The largest percentage losses in employment occurred in: Health Care Practitioners and
Technical (-37.6 percent) Health Care Support (-23.8
percent)
Occupations with the largest gains and losses in employment numbers between 2002 & 2013:
Production(+323)
Education, Training, &
Library(+248)
Health Care Practitioners
(-147)
Office & Administrative
(-106)
Employment Increase
Employment Decrease

26
Income and poverty
2000 2006 2013
Total Population in Poverty 8.8% 12.3% 14.2%
Minors (up to age 17)in Poverty
10.8% 16.4% 19.4%
Real Median Household Income (2013)*
$49,187 $47,309 $45,722
Real Per Capita Income (2013)* $30,357 $31,788 $32,577
The median household income in Perry County dipped by $3,500 between 2000 and 2013 in real dollars (that is, adjusted for inflation), while average income per person rose by $2,200 in real dollars over the same time period.
The total population in poverty swelled from 8.8 percent to 14.2 percent between 2000 and 2013. The rate for minors was even higher, increasing by nearly nine percentage points over the same period of time.
Economy
Source: U.S. Census Bureau – Small Area Income and Poverty Estimates (SAIPE) and U.S. Bureau of Economic Analysis – Regional Personal Income Summary
section 03
*Real median household income is the middle income value in the county. Half of the county’s households fall above this line and half below. Real per capita personal income is the average income per person in the county.

27
2000
2001
2002
2003
2004
2005
2006
2007
2008
2009
2010
2011
2012
2013
25,000
30,000
35,000
40,000
45,000
50,000
55,000
0
4
8
12
16
20
24
Rea
l Inco
me
(2013 d
olla
rs)
Popula
tion
in P
over
ty (
per
cent)
Median House-hold Income
Minors in Poverty
All Ages in Poverty
Per Capita In-come
Income and povertyMedian household income in Perry County has experienced significant fluctuation over time, showing some improvement since 2012. However, per capita income has been gradually increasing since 2000. Poverty rates for adults and minors have gradually increased since 2000, and the 2013 rates remain high relative to the early 2000s.
Economy
Source: U.S. Census Bureau – Small Area Income and Poverty Estimates (SAIPE) and U.S. Bureau of Economic Analysis – Regional Personal Income Summary
section 03

28
Takeaways Growth in the number of establishments in Perry County occurred in businesses with fewer than 10 employees (the self-employed and Stage 1 enterprises), components of the local economy that are often overlooked but deserve closer attention by local leaders.
While growth in establishments and employment between 2000 and 2011 can be attributed to Stage 0 and Stage 1 enterprises, the number of establishments in Stages 2 and 3 remained unchanged. However, Stage 2 establishments comprise 34 percent of jobs but are only eight percent of establishments. Perry County might consider focusing on economic development efforts that seek to strengthen high-growth Stage 1 and 2 establishments since they employ several people and capture sizable sales.
Real median income has gradually decreased and poverty has increased in Perry County since 2000. As of 2013, poverty rates for minors and the total population had not yet stabilized, and they remain considerably higher than was the case in 2000.
The fluctuations and decline in real median income experienced since 2000 may be tied to employment changes in various industries in the county during that time period. Job losses occurred in both low and high paying industries. While the largest job gains occurred in Manufacturing, with average earnings of $64,000, large job gains also occurred in Accommodation & Food Services with average earnings of only $13,500. The largest job losses between 2000 and 2013 occurred in occupations paying over $25 per hour, while the largest job gains over the same time period were in occupations paying less than $18 per hour.
The ability to capture good paying jobs will depend on the availability of a well-trained and educated workforce, something that may be challenging in light of the smaller percentage of adults in the county with an associate’s degree or higher.
Economy
section 03

Labor force and unemployment
Commuteshed
Laborshed
Workforceinflow/outflow
Takeaways
04labor
market

30
Labor force and unemployment
2002 2013
Labor Force 9,424 9,475
Unemployment Rate 5.2% 7.3%
The number of individuals in the labor force in Perry County has not changed between 2002 and 2013.
The number of individuals in the county’s labor force has remained approximately the same, and with the population increase, the labor force participation rate decreased by three percentage points between 2000 and 2013 to 60 percent. In addition, the unemployment rose by 2 percentage points from 2002 to 2013, indicating that the individuals in the labor force are experiencing more difficulty finding jobs than they were in 2002.
Labor market
Source: U.S. Bureau of Labor Statistics – Local Area Unemployment Statistics (2013 Annual Data Release)
section 04

31
20002001
20022003
20042005
20062007
20082009
20102011
20122013
0
2
4
6
8
10
12
4.5%5.8%
4.5%
10.2%
7.3%
Unem
plo
yment
Rate
(perc
ent)
Unemployment rateUnemployment increased dramatically after 2007, peaking at 10.2 percent in 2009. Since that time, the rate has been on a slow but steady decline, dipping to 7.3 percent by 2013.
Labor market
Source: U.S. Bureau of Labor Statistics – Local Area Unemployment Statistics (2013 Annual Data Release)
section 04

32
Commuteshed
A county’s commuteshed is the geographic area to which its resident labor force travels to work.
Sixty-seven percent of employed residents in Perry County commute to jobs located outside of the county. Dubois County, Indiana, is the biggest destination for residents who work outside of the county.
Twenty-two percent of out-commuters work in counties adjacent to Perry County; however, the second largest work destination outside Perry County is the Evansville metropolitan area (Vanderburgh County), and fifth largest is the Indianapolis metropolitan area (Marion County).
Labor market
Source: U.S. Census Bureau – Longitudinal Employer-Household Dynamics (LEHD)
section 04
6,189
Out-Commuters
3,044
Same Work/Home
Commuters Proportion
Dubois, IN 1,168 12.7%
Vanderburgh, IN
549 5.9%
Spencer, IN 467 5.1%
Hancock, KY 378 4.1%
Marion, IN 304 3.3%

33
Commuteshed in 2011Labor market
section 04
Source: U.S. Census Bureau, OTM, LEHD, PCRD
Seventy percent of Perry County’s working residents are employed in Dubois, Marion, Perry, Posey, Spencer or Vanderburgh Counties in Indiana or Daviess and Hancock Counties in Kentucky. Another 5 percent commute to Gibson, Warrick or Knox County, Indiana. An additional 5 percent travel to jobs in Allen, Crawford, Daviess, Lake or Tippecanoe Counties in Indiana.
Collectively, these 16 counties represent 80 percent of the commuteshed for Perry County.

34
Laborshed
Commuters Proportion
Spencer, IN 499 9.0%
Hancock, IN 311 5.6%
Daviess, IN 243 4.4%
Dubois, IN 157 2.8%
Vanderburgh, IN 142 2.6%
Labor market
Source: U.S. Census Bureau – Longitudinal Employer-Household Dynamics (LEHD)
section 04
2,515
In-Commuters
3,044
Same Work/Home
A county’s laborshed is the geographic area from which it draws employees.
Forty-five percent of individuals working in Perry County commute from another county.
Eighteen percent of in-commuters reside in counties adjacent to Perry County. Spencer County, Indiana, is the biggest source of outside labor for Perry County; however, the fifth largest residential source of laborers outside Perry County is the Evansville metropolitan area (Vanderburgh County).

35
Laborshed in 2011Labor market
section 04
Source: U.S. Census Bureau, OTM, LEHD, PCRD
The bulk (70 percent) of Perry County’s workforce is
drawn from Hancock County, Kentucky, Spencer County, Indiana, and Perry County,
Indiana. Another 5 percent is drawn from Dubois,
Vanderburgh or Warrick Counties in Indiana. An
additional 5 percent comes from Daviess
County, Kentucky.
Combined, the seven counties represent 80
percent of Perry County’s laborshed.

36
Workforce inflow and outflow in 2011
Labor market
section 04
Source: U.S. Census Bureau, OTM, LEHD, PCRD
Perry County has more laborers traveling out of the county for work than into the county for work.
Net commuting is negative, with a loss of 3,674 commuters. The resulting situation is that for every 100 employed residents, Perry County has 60 jobs.
CountProporti
on
Employed in Perry County 5,559 100%
Both employed and living in the county 3,044 55%
Employed in the county but living outside
2,515 45%
Living in Perry County 9,233 100%
Both living and employed in the county
3,044 33%
Living in the county but employed outside
6,189 67%

37
Takeaways
The Great Recession that impacted the U.S. economy between 2007 and 2009 took a major toll on the Perry County’s unemployment rate. While the rate was quite low in 2000, it skyrocketed to over 10 percent by 2009. Recent figures make clear that the unemployment rate has steadily improved since 2009.
Despite the modest increase in the population of Perry County over the past decade or more, the number of individuals in the county’s labor force has remained the same since 2002. The decrease in the labor force participation rate and increase in the unemployment rate between 2002 and 2013 indicates that the Great Recession has likely made it more difficult to find a job in Perry County, leading to a larger proportion of discouraged workers (workers who have given up trying to find a job) in the county.
Approximately 70 percent of Perry County’s residents in the workforce are gainfully employed outside of the county. This represents a tremendous loss of human talent that is unavailable to contribute to the social and economic vitality of the county. It may be worthwhile for local leaders and industries to determine the human capital attributes of workers who commute to jobs outside the county. By so doing, they could be positioned to determine how best to reduce the leakage of educated and skilled workers to surrounding counties. Of course, this will require expansion in the number of good paying jobs that will help keep these workers in their home county.
The laborshed and commuteshed data offer solid evidence of the value of pursuing economic and workforce development on a regional (multi-county) basis.
Labor market
section 04

38
Notes
LAUS (Local Area Unemployment Statistics):LAUS is a U.S. Bureau of Labor Statistics (BLS) program that provides monthly and annual labor force, employment and unemployment data by place of residence at various geographic levels. LAUS utilizes statistical models to estimate data values based on household surveys and employer reports. These estimates are updated annually. Annual county-level LAUS estimates do not include seasonal adjustments.
LEHD (Longitudinal Employer-Household Dynamics):LEHD is a partnership between U.S. Census Bureau and State Department of Workforce Development (DWD) to provide labor market and journey to work data at various geographic levels. LEHD uses Unemployment Insurance earnings data and Quarterly Census of Employment and Wages from DWDs and census administrative records related to individuals and businesses.
NETS (National Establishment Time Series): NETS is an establishment-level database, not a company-level database. This means that each entry is a different physical location, and company-level information must be created by adding the separate establishment components.
OTM (On the Map):OTM, a product of LEHD program, is used in the county snapshot report to develop commuting patterns for a geography from two perspectives: place of residence and place of work. At the highly detailed level of census blocks, some of the data are synthetic to maintain confidentiality of the worker. However, for larger regions mapped at the county level, the commuteshed and laborshed data are fairly reasonable.
OTM includes jobs for a worker employed in the reference as well as previous quarter. Hence, job counts are based on two consecutive quarters (six months) measured at the “beginning of a quarter.” OTM data can differ from commuting patterns developed from state annual income tax returns, which asks a question about “county of residence” and “county of work” on January 1st of the tax-year. OTM can also differ from American Community Survey data, which is based on a sample survey of the resident population.
SAIPE (Small Area Income and Poverty Estimates):SAIPE is a U.S. Census Bureau program that provides annual data estimates of income and poverty statistics at various geographic levels. The estimates are used in the administration of federal and state assistance programs. SAIPE utilizes statistical models to estimate data from sample surveys, census enumerations, and administrative records.

39
Report ContributorsThis report was prepared by the Purdue Center for Regional Development in partnership with Purdue University Extension.
Data AnalysisIndraneel Kumar, Ph.D.Ayoung Kim
Report AuthorsElizabeth DobisBo Beaulieu, Ph.D.
Report DesignTyler Wright

FOR MORE INFORMATION
Purdue Center for Regional Development (PCRD) . . .seeks to pioneer new ideas and strategies that contribute to regional collaboration, innovation and prosperity.
Purdue Extension Community Development (CD) . . . works to strengthen the capacity of local leaders, residents and organizations to work together to develop and sustain strong, vibrant communities.
Please contact
Sara Dzimianski County Extension Educator, Agriculture & Natural Resources812-547-7084 [email protected]
PCRDMann Hall, Suite 266Purdue University
OR
Related Documents