Produced Water Society September 20,2017 - Midland, Texas Permian Basin Produced Water Trends Bill Zartler, CEO Solaris Midstream

Welcome message from author
This document is posted to help you gain knowledge. Please leave a comment to let me know what you think about it! Share it to your friends and learn new things together.
Transcript

Produced Water SocietySeptember 20,2017 - Midland, Texas
Permian Basin Produced Water TrendsBill Zartler, CEO Solaris Midstream

2
Permian Basin Produced Water: a Market in Transition
Solaris has seen 3 consistent trends in water sourcing, transfer, and disposal in the Permian Basin
Water is rapidly transforming into an infrastructure business, both for take-away & completions supply
1
The SWD Market is transitioning to focus on deeper injection intervals to avoid pressurization in shallower zones2
Cost effective water reuse will be the key to maintaining future growth and the competitiveness of the Permian Basin
3
3
Understanding the Permian Basin
The Permian Basin consists of a number of sub-basins with different characteristics
4
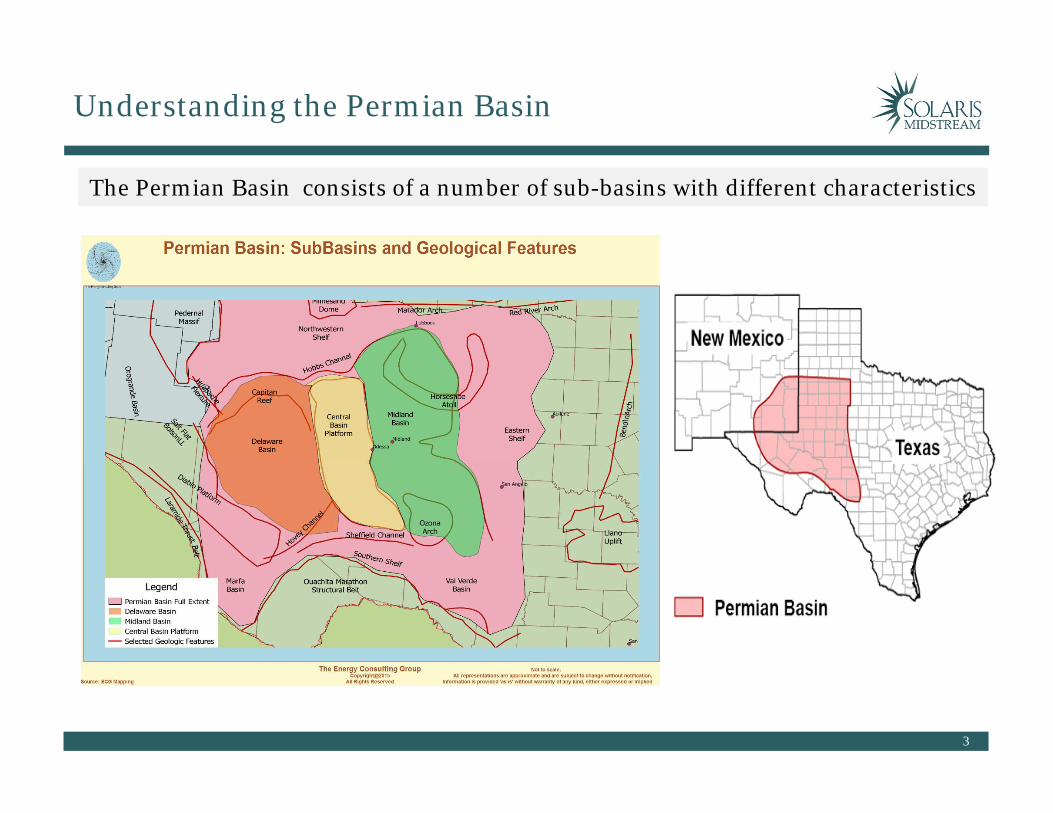
Unique Geology with Stacked Pay Zones
Permian: The gift that keeps giving!

5
Long Life Resource
Horizontal Drilling has been a Game Changer
EIA Production data.
6
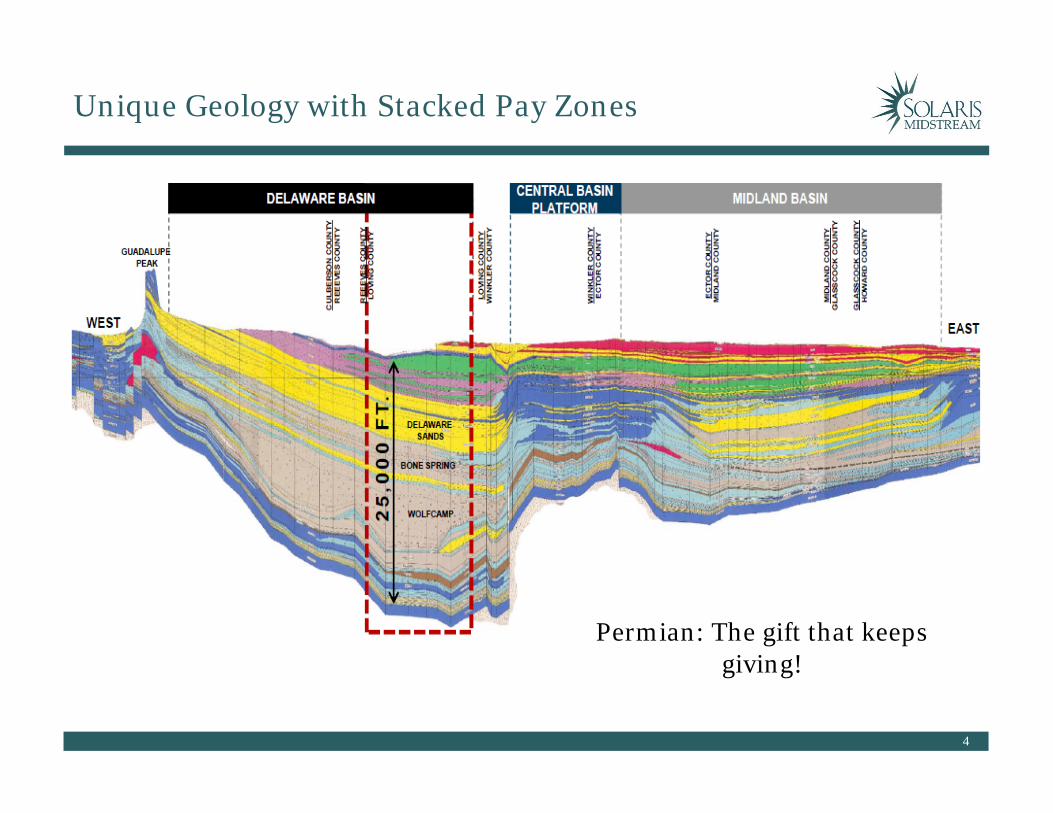
Permian Basin is Now a Global Swing Producer
Wood Mackenzie

7
Increased Rig Count and Increased Production
EIA Drilling Report September 2017

8
Produced Water Volumes are Growing Rapidly
Permian Basin average oil to water ratio is 5.9:1 ~6X higher than Eagle Ford wells. As fields age, the water cuts increase.
CONFIDENTIAL

9
US Crude Oil Production Forecast; Permian Leads
• The EIA projects that the Permian is expected to produce 2.9 million b/d of oil by the end of 2018, about 0.5 million b/d more than est. 2017 production level, nearly 30% of total U.S. crude oil production in 2018. Based on the Permian oil water ratio’s, this is an est. 17 million b/d of produced water and est. 2.95 million b/d more than water produced in June 2017.
• In June 2017, 366 of the 915 onshore rigs in the Lower 48 states were operating in the Permian which constitutes approx. 40% of all operating rigs.

10
Trending Down: Breakeven Prices Across the US

11
Comparative Breakeven Prices for New Wells
Lower commodity prices have forced operational efficiencies, which together with technology improvements have dramatically reduced
breakeven prices

12
Demand for Effective Water Management Growing
• Water use in the Permian has risen six-fold since the start of the shale oil boom,from more than 5 billion gallons (158M/B) in 2011 to almost 30 billion(952M/B) last year
• Energy research firm IHS Market predicts demand will double by the end ofthis year, to 60 billion gallons, and more than triple by 2020, to almost 100billion
• This is a stunning amount of water:• where will the water come from?
• Fresh• Brackish• Reuse
• how will produced water be disposed of cost effectively?• who will develop, fund and operate the infrastructure to support this
growth?
Producers are increasingly concerned and looking for sustainable solutions
Producers are increasingly concerned and looking for sustainable solutions
13
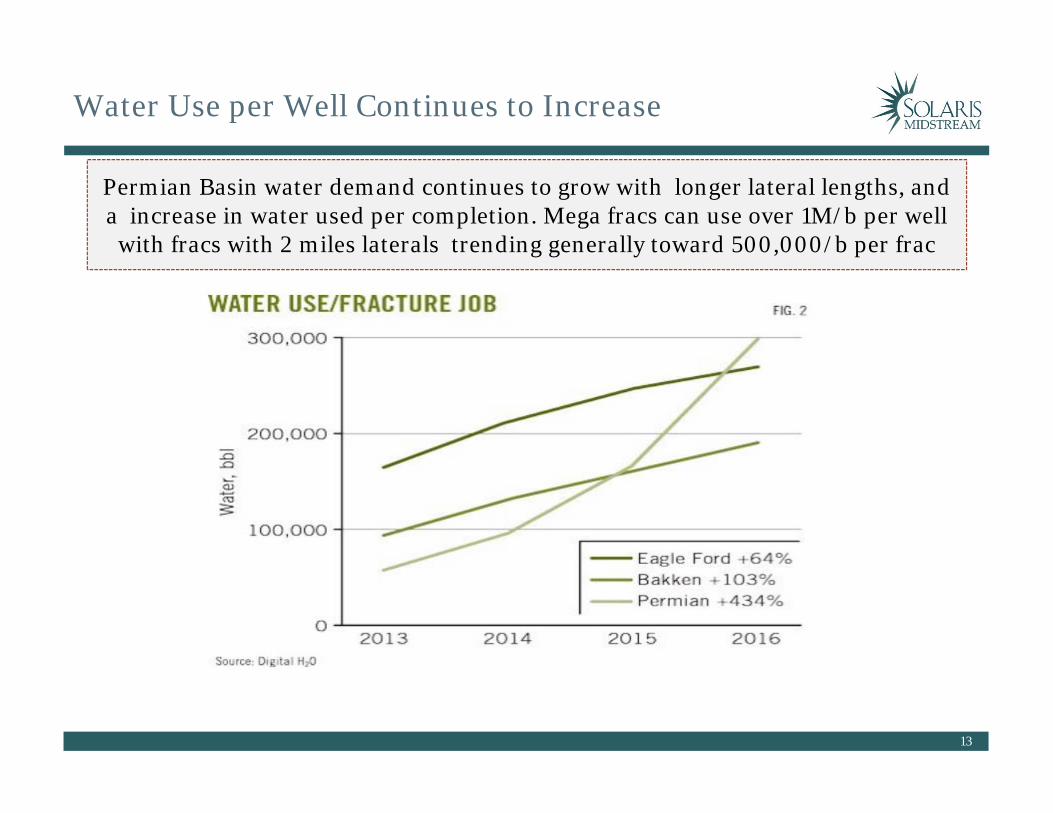
Water Use per Well Continues to Increase
Permian Basin water demand continues to grow with longer lateral lengths, and a increase in water used per completion. Mega fracs can use over 1M/b per well
with fracs with 2 miles laterals trending generally toward 500,000/b per frac

14
Illustrative Water Infrastructure Needs
Example operator has 500,000 gross acres currently producing ~20,000 Boe/d reaching over 130,000 Boe/d by 2021 requiring potentially over $400M in infrastructure investment
Operator requires 300,00-500,000 barrels of sourced water per frac and manages ~ 4-6 barrels of produced water for every barrel of oil produced, presenting a critical logistical and operational challenges
Toda
y20
21
= 20,000 bbl of Oil
= 20,000 bbl/d capacity water disposal well= 20,000 bbl of
Produced Water= 100 Miles of Water Pipeline
Infrastructure
~$500,000 per mile of pipeline ~$5 million per disposal well
Legend
= 10 million bbl of sourced water
Trend One: Water is now an Infrastructure Business

16
Oilfield Water Evolving to an Infrastructure Business
Water as an Oilfield Services Business Water as Midstream Infrastructure
Assets
Water hauling trucks
Saltwater disposal wells
Environmental cleaning facilitiesAssets
Fresh & produced water pipeline infrastructure
Saltwater disposal wells
Treatment & reuse facilities
General Contract
Terms
Primarily call out or ad-hoc
High degree of spot market rates
Operational Conditions
Manual process subject to significant HS&E challenges, including spills, contamination and exposure
Subject to significant truck traffic and weather risk
General Contract
Terms
Infrastructure build-out with dedicated operator acreage and/or volumes
Long-term contractual partnerships between operators and service/infrastructure providers
Operational Conditions
Automated process; data driven operations
Significant reduction in personnel needs
Improved HS&E levels and reduced trucking
Economies of scale for cost structure (CAPEX vs. OPEX)
Capital Markets
Treatment
Viewed as cyclical oilfield services business
Typically does not trade at a premium multiple
Capital Markets
Treatment
MLP qualified income and “bankable”
Long-term contracts and stable cost structure
• Large-scale infrastructure investment required to create reliable & redundant systems that service multiple operators
• Transition from “mom and pop” SWDs & trucks to well-capitalized midstream participants
• Lower capital / higher operating cost higher capital / lower operating cost

17
Water Infrastructure Require Integrated Water Systems
Produced Water Trunk Line
Recycled Water Trunk Line
Fresh/Brackish Water Trunk Line
SWD #1 & Water Recycling Facility
SWD #2 & Water Recycling Facility
SWD #3 & Water Recycling Facility
Fresh/Brackish Water Source Operator D
Operator COperator A
Operator B
Frac Blend
Frac Blend
Frac Blend
Frac Blend

Trend Two: Producers Transitioning to Deeper Injection Intervals
19
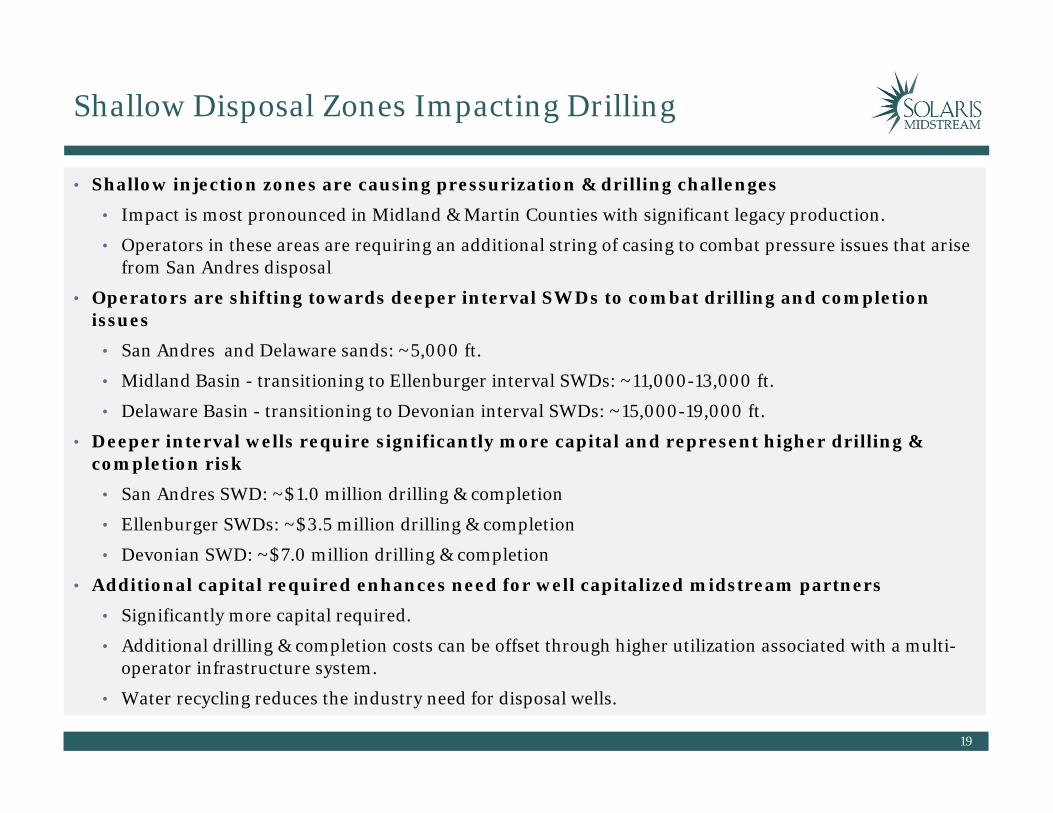
Shallow Disposal Zones Impacting Drilling
• Shallow injection zones are causing pressurization & drilling challenges
• Impact is most pronounced in Midland & Martin Counties with significant legacy production.
• Operators in these areas are requiring an additional string of casing to combat pressure issues that arise from San Andres disposal
• Operators are shifting towards deeper interval SWDs to combat drilling and completion issues
• San Andres and Delaware sands: ~5,000 ft.
• Midland Basin - transitioning to Ellenburger interval SWDs: ~11,000-13,000 ft.
• Delaware Basin - transitioning to Devonian interval SWDs: ~15,000-19,000 ft.
• Deeper interval wells require significantly more capital and represent higher drilling & completion risk
• San Andres SWD: ~$1.0 million drilling & completion
• Ellenburger SWDs: ~$3.5 million drilling & completion
• Devonian SWD: ~$7.0 million drilling & completion
• Additional capital required enhances need for well capitalized midstream partners
• Significantly more capital required.
• Additional drilling & completion costs can be offset through higher utilization associated with a multi-operator infrastructure system.
• Water recycling reduces the industry need for disposal wells.

20
Potential SWD Bottlenecks; Capacity Constraints
As producers push to move to deeper disposal intervals, constraints are already impacting excising shallow disposal wells exacerbating the challenge for
infrastructure to keep up with growth.Permian SWD Available Monthly Volume Capacity July 2017. Digital H2O

Trend Three: Water Reuse is Continuing to Gain Traction
22
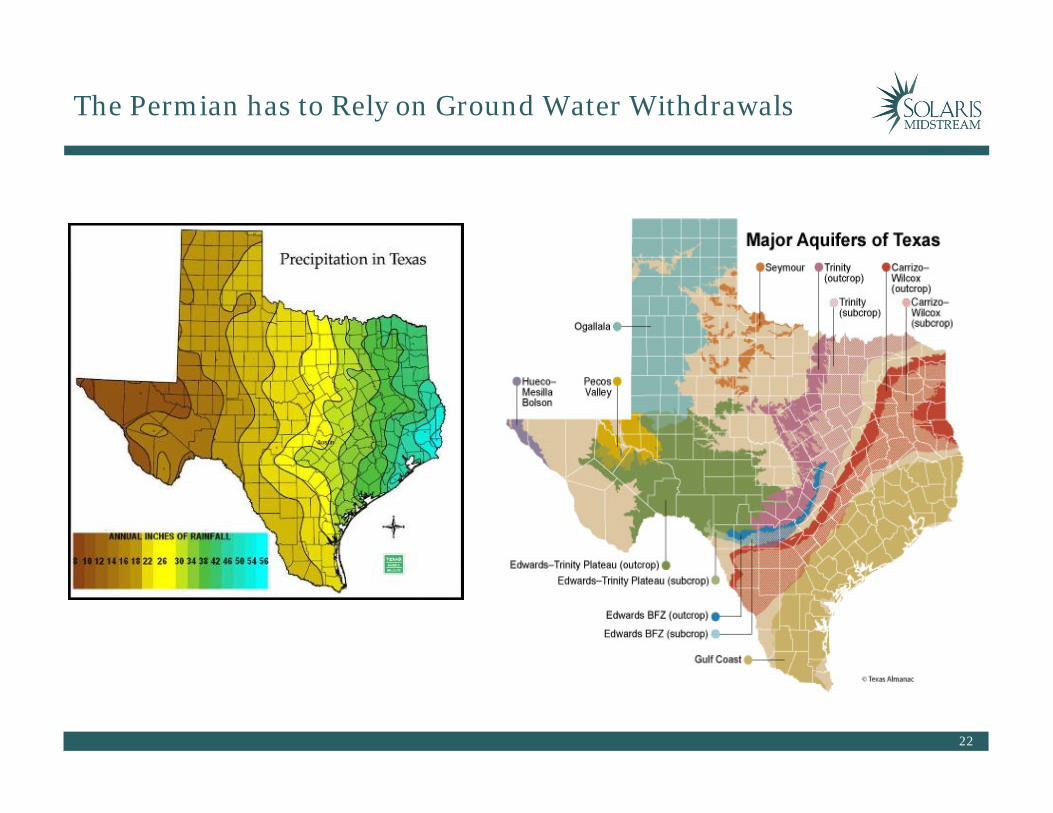
The Permian has to Rely on Ground Water Withdrawals

23
Feasibility of Reuse
24
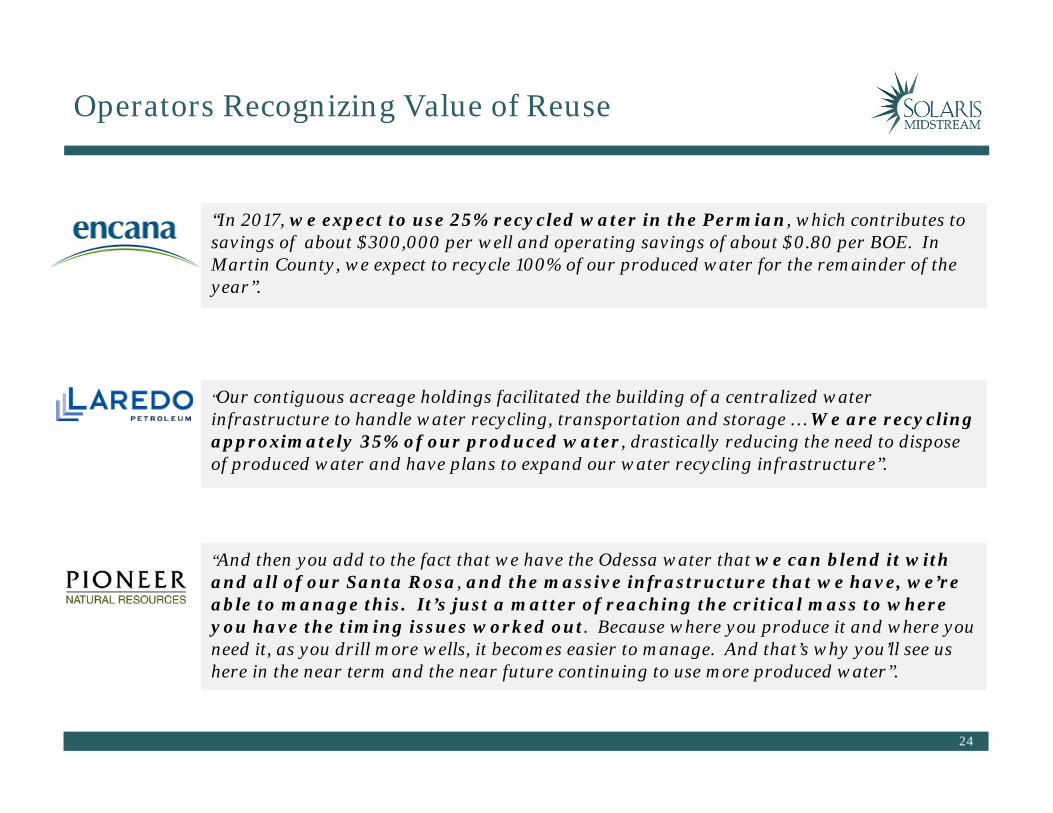
Operators Recognizing Value of Reuse
“In 2017, we expect to use 25% recycled water in the Permian, which contributes to savings of about $300,000 per well and operating savings of about $0.80 per BOE. In Martin County, we expect to recycle 100% of our produced water for the remainder of the year”.
“Our contiguous acreage holdings facilitated the building of a centralized water infrastructure to handle water recycling, transportation and storage … We are recycling approximately 35% of our produced water, drastically reducing the need to dispose of produced water and have plans to expand our water recycling infrastructure”.
“And then you add to the fact that we have the Odessa water that we can blend it with and all of our Santa Rosa, and the massive infrastructure that we have, we’re able to manage this. It’s just a matter of reaching the critical mass to where you have the timing issues worked out. Because where you produce it and where you need it, as you drill more wells, it becomes easier to manage. And that’s why you’ll see us here in the near term and the near future continuing to use more produced water”.
25
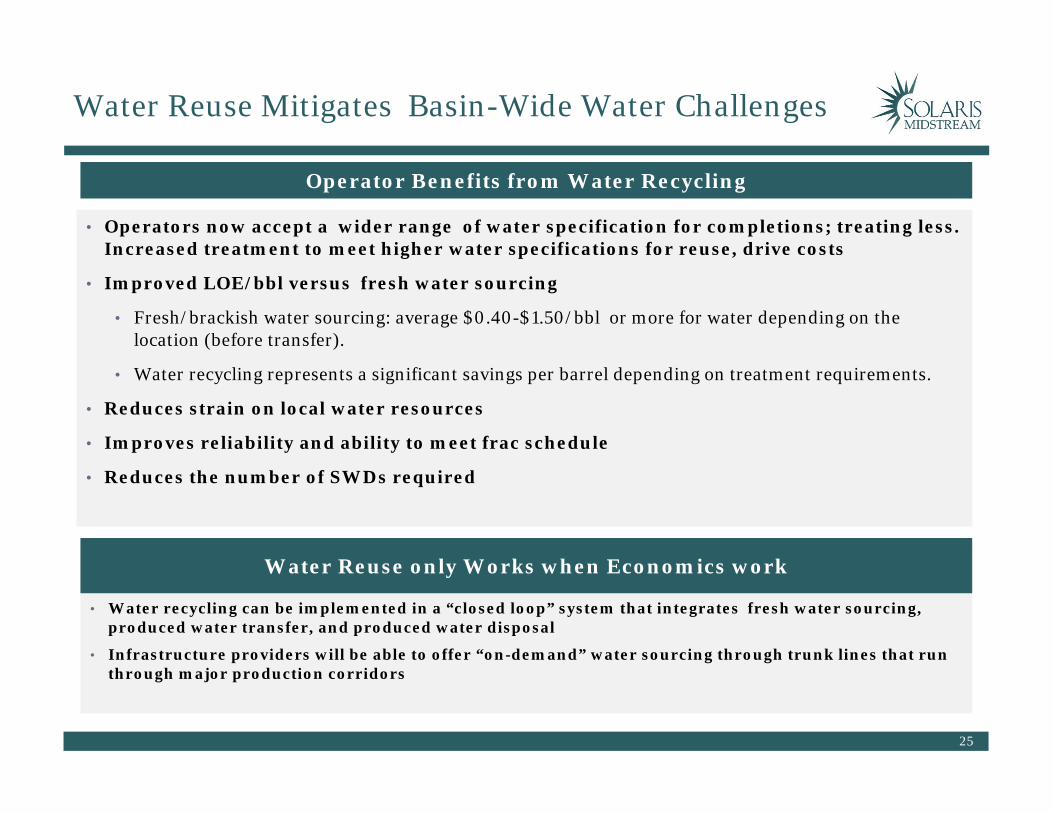
Water Reuse Mitigates Basin-Wide Water Challenges
• Operators now accept a wider range of water specification for completions; treating less. Increased treatment to meet higher water specifications for reuse, drive costs
• Improved LOE/bbl versus fresh water sourcing
• Fresh/brackish water sourcing: average $0.40-$1.50/bbl or more for water depending on the location (before transfer).
• Water recycling represents a significant savings per barrel depending on treatment requirements.
• Reduces strain on local water resources
• Improves reliability and ability to meet frac schedule
• Reduces the number of SWDs required
Operator Benefits from Water Recycling
• Water recycling can be implemented in a “closed loop” system that integrates fresh water sourcing, produced water transfer, and produced water disposal
• Infrastructure providers will be able to offer “on-demand” water sourcing through trunk lines that run through major production corridors
Water Reuse only Works when Economics work

26
Conclusion
• The Permian Basin began a rapid transformation from a declining conventional basinin 2012 to a Super Basin, defined as cumulative production of more than 5 Billion BOE
• One of the fundamental challenges in the Permian is how to manage and fund theinfrastructure needed to support this growth
• Significant increase in water production and demand for source water is a keychallenge, with bottlenecks in SWDs and infrastructure
• Reuse will become integral to managing the water mass balance and can be economicwith changing frac designs
• The big question is who is going to pay for all of the water infrastructure needed tosupport the production growth in the Permian? Single producer systems vs. sharedinfrastructure
• The market needs capitalized Midstream Infrastructure players to cost effectivelydevelop, invest in and operate reliable and safe integrated systems
• In order to succeed, Water Midstream Infrastructure players are going to have to bewell capitalized, understand and stay ahead of the trends and adopt an integratedmodel, balancing disposal and reuse, while delivering multi operator systems
Related Documents