189 Introduction The Longyearbyen CO 2 Lab of Svalbard (Fig. 1), Norway, targets the global aim to reduce the emission of flue gases to the atmosphere (e.g., Lindeberg, 2003; Bachu et al., 2007) by pursuing the vision of a so-called CO 2 -free Svalbard (Sand & Braathen, 2006). Data harvest of the pilot project includes the drilling and full coring of seven deep wells (totalling c. 4500 m of core) with technical logging of cap-rock and potential reservoir units, allowing assessment of properties in reservoir (aquifer) sandstones and impermeable cap-rock units. As pilot- scale CO 2 sequestration projects guide the fundamental understanding of rock properties such as permeability fields and flow patterns, retention capacities and cap- rock integrity (e.g., Korbøl & Kaddour, 1995; Bachu et al., 2007), they allow detailed research into controlling factors that are outside the opportunity of commercial storage projects. Along this line, we present a detailed analysis of permeability patterns in tight sandstones through access to a continuous, fully cored succession that, in sum, offers a unique dataset. We find that variable diagenetic effects render only small parts of the targeted reservoir prone to flow in the rock matrix. The encountered datasets allow a critical assessment of Miniperm instruments as tools for analysis of permeability of tight porous rocks. Many studies of permeability in cataclastic deformation bands or similar fault rocks are based on such measurements (e.g., Antonellini & Aydin, 1994; Tueckmantel et al., 2010; Torabi et al., 2013). Accordingly, the precision of the non-destructive instrument with respect to conventional more costly analysis based on destructive plug drilling is of general interest. Through this study, we are able to show that a calibrated correction function for Miniperm data is required in order to achieve matching results with laboratory plug measurements in tight sandstones. Magnabosco, C., Braathen, A. & Ogata, K.: Permeability model of tight reservoir sandstones combining core-plug and Miniperm analysis of drillcore; Longyearbyen CO 2 Lab, Svalbard. Norwegian Journal of Geology, Vol 94, pp. 189–200. Trondheim 2014, ISSN 029-196X. Permeability measurements in Mesozoic, low-permeability sandstone units within the strata cored in seven drillholes near Longyearbyen, Svalbard, have been analysed to assess the presence of aquifers and their potentials as reservoirs for the storage of carbon dioxide. These targeted sandstones are located in the Upper Triassic–Lower Jurassic De Geerdalen and Knorringfjellet formations, with some permeability found in the Cretaceous Rurikfjellet and Helvetiafjellet formations situated within otherwise impermeable cap-rocks. Permeability and porosity data were acquired from drill plugs, analysed in the laboratory by flooding of H 2 O, He and Hg, and compared with direct measurements collected manually from cores with a Miniperm instrument. The sandstones are tight (<2 mD) due to extensive diagenesis. The two methods produced permeability results of up to one order difference in magnitude; however, when correlated, these methods offer a robust linear relationship that can be applied as a correction function. Detailed mapping of drillcore with Miniperm, corrected by the proposed function, allows analysis of tight reservoir permeability on a very detailed scale, which identify otherwise unrecognised permeable zones. In the analysed reservoir sandstone succession, 2 out of 30 m has recognisable permeability above the threshold of the Miniperm. In the upper part of the reservoir (Knorringfjellet Formation), where data are from three closely spaced wells, the permeability field can be divided into through-going and isolated zones, of which c. 10% is through-going. In the explored Upper Triassic to Cretaceous succession of Central Svalbard, the Knorringfjellet Formation sandstones and conglomerates have the best matrix properties for storage of carbon dioxide. Cara Magnabosco, University Center in Svalbard, Box 156, 9171 Longyearbyen, Norway. Present address: Princeton University, Department of Geosciences, Guyot Hall, 08544 NJ, USA. Alvar Braathen, University Center in Svalbard, Box 156, 9171 Longyearbyen, Norway. Present address: University of Oslo, Department of Geosciences, Box 1047 Blindern, 0316 Oslo, Norway. Kei Ogata, University Center in Svalbard, Box 156, 9171 Longyearbyen, Norway. Dipartimento di Fisica e Scienze della Terra ’Macedonio Melloni’, Università degli Studi di Parma, Campus Universitario – Parco Area delle Scienze 157/A, I–43124 Parma, Italy. E-mail corresponding author (Cara Magnabosco): [email protected] Published December 24. 2014. Cara Magnabosco, Alvar Braathen & Kei Ogata NORWEGIAN JOURNAL OF GEOLOGY Permeability model of tight reservoir sandstones; Longyearbyen CO 2 Lab, Svalbard Permeability model of tight reservoir sandstones combining core-plug and Miniperm analysis of drillcore; Longyearbyen CO 2 Lab, Svalbard

Welcome message from author
This document is posted to help you gain knowledge. Please leave a comment to let me know what you think about it! Share it to your friends and learn new things together.
Transcript
189
Introduction
The Longyearbyen CO2 Lab of Svalbard (Fig. 1), Norway, targets the global aim to reduce the emission of flue gases to the atmosphere (e.g., Lindeberg, 2003; Bachu et al., 2007) by pursuing the vision of a so-called CO2-free Svalbard (Sand & Braathen, 2006). Data harvest of the pilot project includes the drilling and full coring of seven deep wells (totalling c. 4500 m of core) with technical logging of cap-rock and potential reservoir units, allowing assessment of properties in reservoir (aquifer) sandstones and impermeable cap-rock units. As pilot-scale CO2 sequestration projects guide the fundamental understanding of rock properties such as permeability fields and flow patterns, retention capacities and cap-rock integrity (e.g., Korbøl & Kaddour, 1995; Bachu et al., 2007), they allow detailed research into controlling factors that are outside the opportunity of commercial storage projects. Along this line, we present a detailed
analysis of permeability patterns in tight sandstones through access to a continuous, fully cored succession that, in sum, offers a unique dataset. We find that variable diagenetic effects render only small parts of the targeted reservoir prone to flow in the rock matrix.
The encountered datasets allow a critical assessment of Miniperm instruments as tools for analysis of permeability of tight porous rocks. Many studies of permeability in cataclastic deformation bands or similar fault rocks are based on such measurements (e.g., Antonellini & Aydin, 1994; Tueckmantel et al., 2010; Torabi et al., 2013). Accordingly, the precision of the non-destructive instrument with respect to conventional more costly analysis based on destructive plug drilling is of general interest. Through this study, we are able to show that a calibrated correction function for Miniperm data is required in order to achieve matching results with laboratory plug measurements in tight sandstones.
Magnabosco, C., Braathen, A. & Ogata, K.: Permeability model of tight reservoir sandstones combining core-plug and Miniperm analysis of drillcore; Longyearbyen CO2 Lab, Svalbard. Norwegian Journal of Geology, Vol 94, pp. 189–200. Trondheim 2014, ISSN 029-196X.
Permeability measurements in Mesozoic, low-permeability sandstone units within the strata cored in seven drillholes near Longyearbyen, Svalbard, have been analysed to assess the presence of aquifers and their potentials as reservoirs for the storage of carbon dioxide. These targeted sandstones are located in the Upper Triassic–Lower Jurassic De Geerdalen and Knorringfjellet formations, with some permeability found in the Cretaceous Rurikfjellet and Helvetiafjellet formations situated within otherwise impermeable cap-rocks. Permeability and porosity data were acquired from drill plugs, analysed in the laboratory by flooding of H2O, He and Hg, and compared with direct measurements collected manually from cores with a Miniperm instrument. The sandstones are tight (<2 mD) due to extensive diagenesis. The two methods produced permeability results of up to one order difference in magnitude; however, when correlated, these methods offer a robust linear relationship that can be applied as a correction function. Detailed mapping of drillcore with Miniperm, corrected by the proposed function, allows analysis of tight reservoir permeability on a very detailed scale, which identify otherwise unrecognised permeable zones. In the analysed reservoir sandstone succession, 2 out of 30 m has recognisable permeability above the threshold of the Miniperm. In the upper part of the reservoir (Knorringfjellet Formation), where data are from three closely spaced wells, the permeability field can be divided into through-going and isolated zones, of which c. 10% is through-going. In the explored Upper Triassic to Cretaceous succession of Central Svalbard, the Knorringfjellet Formation sandstones and conglomerates have the best matrix properties for storage of carbon dioxide.
Cara Magnabosco, University Center in Svalbard, Box 156, 9171 Longyearbyen, Norway. Present address: Princeton University, Department of Geosciences, Guyot Hall, 08544 NJ, USA. Alvar Braathen, University Center in Svalbard, Box 156, 9171 Longyearbyen, Norway. Present address: University of Oslo, Department of Geosciences, Box 1047 Blindern, 0316 Oslo, Norway. Kei Ogata, University Center in Svalbard, Box 156, 9171 Longyearbyen, Norway. Dipartimento di Fisica e Scienze della Terra ’Macedonio Melloni’, Università degli Studi di Parma, Campus Universitario – Parco Area delle Scienze 157/A, I–43124 Parma, Italy.
E-mail corresponding author (Cara Magnabosco): [email protected]
Published December 24. 2014.
Cara Magnabosco, Alvar Braathen & Kei Ogata
NORWEGIAN JOURNAL OF GEOLOGY Permeability model of tight reservoir sandstones; Longyearbyen CO2 Lab, Svalbard
Permeability model of tight reservoir sandstones combining core-plug and Miniperm analysis of drillcore; Longyearbyen CO2 Lab, Svalbard
190 C. Magnabosco et al.
Regional setting
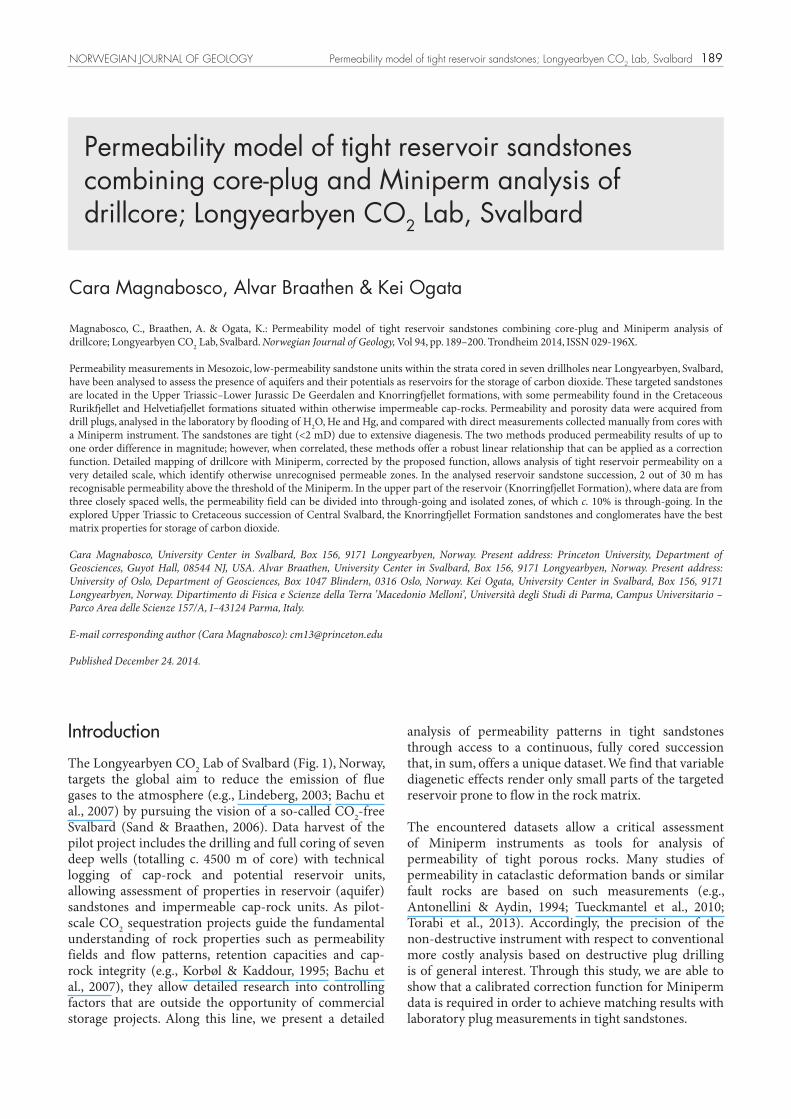
The Longyearbyen settlement of Spitsbergen (Svalbard archipelago, Arctic Norway) is located on the exhumed northwestern part of the Barents Shelf (Fig. 1). A diverse geological record includes: (1) a Caledonian metamorphic basement prior to (2) localised Devonian and Carboniferous extensional basins, and (3) Permian and Mesozoic platform deposition. Subsequent continental breakup by formation of a transform fault between Svalbard and Greenland in the Palaeogene caused fold-thrust belt development with foreland basin formation (e.g., Steel & Worsley, 1984; Nøttvedt et al., 1992; Bergh et al., 1997; Braathen et al., 1999), followed
by transtension leading to a passive continental margin. Of special importance for the Mesozoic reservoirs and cap-rocks shown in Fig. 2 is the burial induced on the Cenozoic foreland basin system, with syn-tectonic deposits reaching a thickness of around 3 km (Manum & Throndsen, 1978). Related burial of underlying Mesozoic sandstones triggered mechanical and chemical compaction that significantly altered the primary properties of both the reservoir sandstones and the cap-rock shales (Mørk, 2013). Further, Cretaceous mafic intrusions into the sedimentary succession allowed additional localised diagenesis (e.g., Senger et al., 2011, 2014a).
Figure 1. (A) Geographic position of the Svalbard archipelago and the western Barents Sea. (B) Simplified geological map of Spitsbergen showing the main tectonostratigraphic units and the principal tectonic structures (modified from Braathen et al., 2012). The red arrow highlights the position of the investigated area. Location marked by red box in (A). (C) Schematic cross-section emphasising the LYB CO2 Lab targeted reservoir/storage unit (modified after Bergh et al., 1997). The cross-section’s path is marked in (B). Abbreviations: BFZ – Billefjorden Fault Zone, LFZ – Lomfjorden Fault Zone, D – Devonian, Ca – Carboniferous, Cp – Permian, Tr – Triassic, JC – Jurassic–Cretaceous.
191NORWEGIAN JOURNAL OF GEOLOGY Permeability model of tight reservoir sandstones; Longyearbyen CO2 Lab, Svalbard
NW SE7 km
m
850
900
950
750
800
700
650
600
550
500
450
400
350
300
250
200
150
100
50
0
M Si vf vcf m c
Dh4TD 969.72
+ + +
m 850
800
750
700
650
600
550
500
450
400
350
300
250
200
150
100
50
0
M Si vf vcf m c
Dh2TD 856.32
Tria
ssic
Janu
sfje
llet S
ubgr
oup
Rur
ikfje
llet
Form
atio
nAg
ardh
fjelle
t Fo
rmat
ion
De
Gee
rdal
enFo
rmat
ion
CarolinefjelletFormation
HelvetiafjelletFormation
Jura
ssic
Cre
tace
ous
Terrain Surface
Permafrostinterval
igne
ous
intru
sion
sWilh
elm
øya
Subg
roup
Adv
entd
alen
Gro
up
Knor
ringf
jellet
Form
ation
Sto
rfjor
den
Sub
grou
p
Kap
p To
scan
a G
roup
100 m
bent
onite
ash
AQ
UIF
ER
AQ
UIT
AR
D
test
ed in
terv
als
wat
er fl
ow
LOTs
Frac
ture
>>
mat
rix fl
owM
atrix
> fr
actu
re fl
owFr
actu
re ≥
mat
rix fl
ow
M Si vf vcf m c
Delta front/inner shelf
Fluvial/Delta
Shelf/Prodelta/ Distal delta-front
Mass-transport deposits
Detachment zone Condensed shallow marine
Deltaic and tidal
Organic/anoxic shelf
AQ
UIF
ER
Dh 5R
700
690
680
670
660
SiM vf f m
Sandstone
c vc Cgl
wavy
drapes
700
690
680
670
SiM vf f m
Sandstone
c vc Cgl
Dh 7A
700
690
680
670
Dh 4m
DeltanesetComposite
Stratigraphic Log(Outcrop)
BrentskardhaugenBed
Slottet Bed
677 m (approx.DH4 depth)
Top Reservoir
SiM vf f m
Sandstone
c vc Cgl
Dh 2
750
740
730
760
ca. 7 km ca. 15 kmm
m
Knor
ring�
ellet
Form
atio
n datum
750
Wilh
elm
øya
Subg
roup
Knor
ringf
jell
fjell
fet
Form
ation 700
Mat
rix >
frac
ture
flow
Mat
rix >
frac
ture
flow
Mat
rix >
frac
ture
flow
Mat
rix >
frac
ture
flow
700
Mat
rix >
frac
ture
flow
Mat
rix >
frac
ture
flow
Mat
rix >
frac
ture
flow
A
B
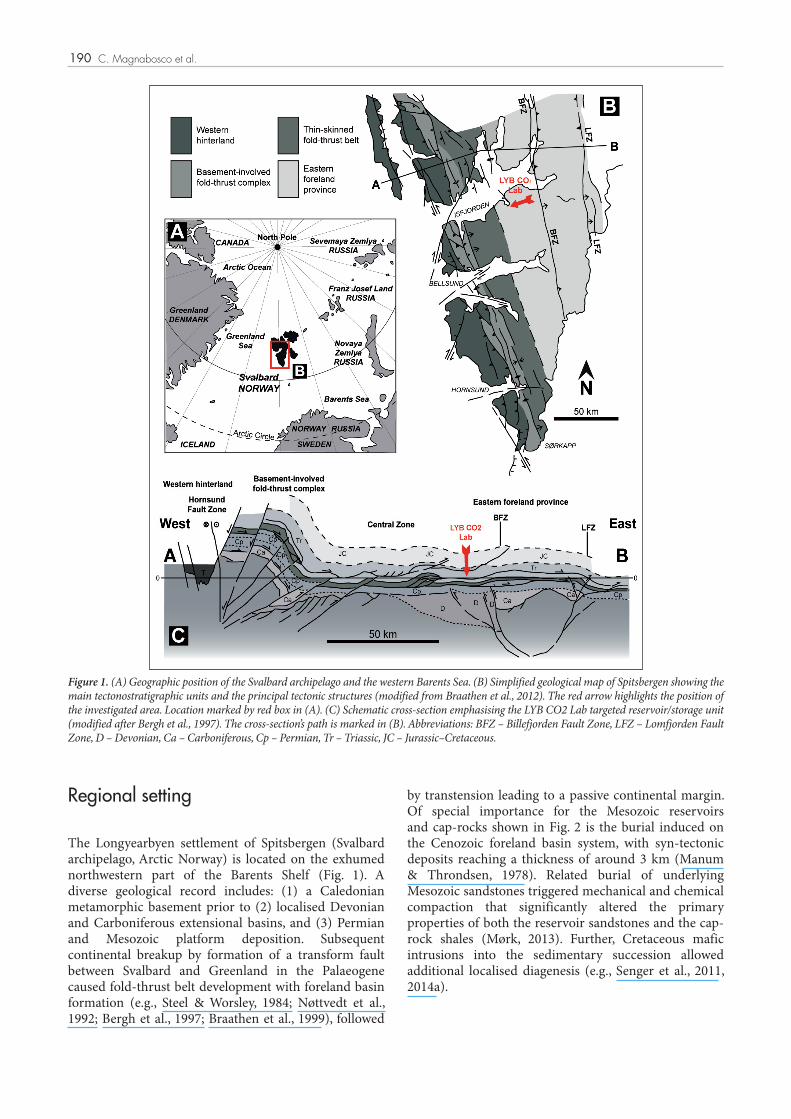
Figure 2. (A) Correlation panel between the two deepest boreholes Dh2 and Dh4. Formations, ages and interpreted depositional elements are repre-sented. Location of the intervals targeted for water flow injection and leak-off tests (i.e., LOTs) are indicated. (B) Detailed representation of the Knorringfjellet Fm. (i.e., Wilhelmøya Subgroup) across the wells at the drill site to the outcrop section.
192 C. Magnabosco et al.
Stratigraphy and propertiesThe generalised stratigraphy based on logs of drillcores from Dh2 and Dh4 of the Longyearbyen CO2 Lab is depicted in Fig. 2 (based on Braathen et al., 2012). The targeted sandstones in the project are those of the Upper Triassic De Geerdalen and the Triassic–Jurassic Knorringfjellet formations, which are overlain by the impermeable Jurassic shales and mudstones of the Agardhfjellet and Rurikfjellet formations. Above this, there is a shallow sandstone aquifer represented by the Cretaceous Helvetiafjellet Formation, followed by the partly impermeable, heterolithic Carolinefjellet Formation. There is also a level of permeable sandstones and conglomerates in the Cretaceous Rurikfjellet Formation in Dh2. These units pinch out and disappear towards Dh4 located c. 7 km away to the E–SE, which suggest that these permeable units have a spatially limited extent.
De Geerdalen Formation
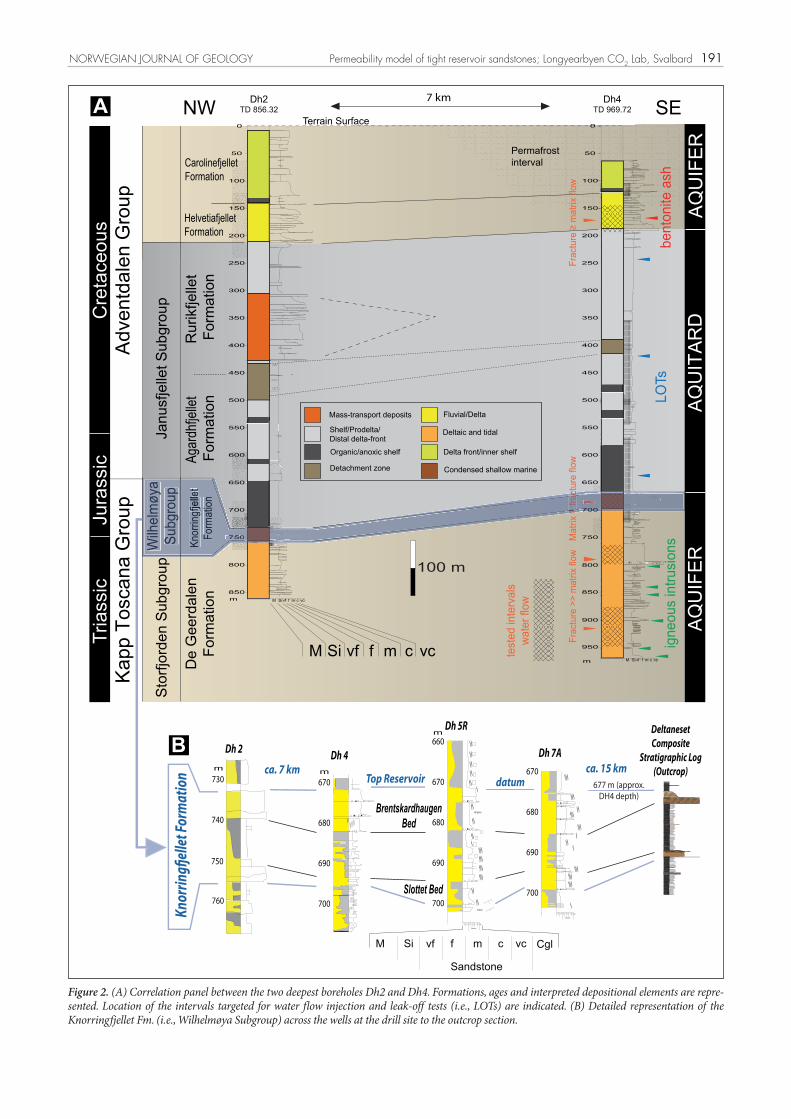
The De Geerdalen Formation (Kapp Toscana Group) of Late Triassic age (Carnian – Norian) reflects marginal marine to paralic deposits of a temperate climatic zone (Mørk et al., 1982), with texturally and compositionally immature sandstones classified as lithic to arkosic arenites (Mørk, 2013) and wackestones (Mørk et al., 1982). Reconstructions based on sedimentary-facies associations are consistent with shallow shelf to deltaic environments (Mørk et al., 1999) composed of barrier bars, lagoons, offshore bars, distal delta progradations and reworked mouth bars (Mørk et al., 1982; Ogata et al., 2012, 2014). The cored succession near Longyearbyen divides into three main intervals; the lower (820–970 m in Dh4) offering thin sandstones interlayered with thicker shales and mudstones and intruded by thin dolerite sills. Above this there is a 20 m-thick sandstone-dominated succession (820–800 m in Dh4), followed by a heterolithic succession of fairly thin-bedded shales, mudstones and sandstones up to the base of the overlying formation. Water injection tests suggest that the sandstone intervals in the De Geerdalen Formation are characterised by linear flow controlled by fractures, with a small or questionable contribution from the rock matrix permeability (Larsen, 2013a, b). This flow pattern is consistent with microtextural observations, showing extensive diagenetic quartz cementation with additional carbonate cement and clay minerals (Mørk, 2013). Extensive feldspar dissolution is also commented on by Worsley (2008) and Mørk (2013). This sandstone diagenesis has reduced the porosity to a range of 3–16%, matched by low permeabilites (<0.2 mD) (Braathen et al., 2012; Farokpoor et al., 2013), as shown in Fig. 3 and further described below.
Knorringfjellet FormationThe Knorringfjellet Formation (Wilhemøya Subgroup) of Late Triassic to Mid Jurassic age (Norian to Bathonian) consists of a condensed shallow-marine to continental succession of conglomerates, sandstones and shales deposited in a temperate climatic zone (Mørk et al., 1982; 1999). An easterly source area likely prevailed (Worsley, 2008). Two significant hiati expressed by phosphatic conglomerates (Slottet and the Brentskardhaugen beds) mark the base and closing stages of the formation, bounding marine shales that grade into coastal or mouth-bar sheet sandstones (Mørk et al., 1982; Braathen et al., 2012; Ogata et al., 2012, 2014). The slow sedimentation rates, high-energy environments and the prevailing reworking produced lag conglomerates and mature sandstones referred to as quartz arenites by Mørk (2013); however, diagenetic chlorite grain coating (obstructing quartz cementation) and feldspar dissolution is widespread. This diagenetic status has produced more porous sandstones than those encountered in the De Geerdalen Formation, as reflected in water injection tests showing semi-radial flow during injection (Larsen, 2013a, b). Porosity estimates are slightly better than at deeper levels, ranging between 6 and 20%, with permeabilites spanning from 0 to 2 mD (Braathen et al., 2012). Noticeably, the top conglomerate (Brentskardhaugen Bed) varies between ten centimetres and some metres in thickness (Fig. 2B) and, in many places, is found to be poorly consolidated both in outcrops and in drillcore. This unit is considered the most permeable of the entire succession (see below).
Agardhfjellet and Rurikfjellet formations
The Cretaceous (Berriasian to Early Barremian) Agardhfjellet and Rurikfjellet formations (Janusfjellet Subgroup, Adventdalen Group) are mostly composed of mudstones, dark shales, siltstones and some sandstones, with facies associations suggesting deposition in open-marine to shelf environments (Dypvik et al.,1991; Mørk et al., 1999). Especially the lower part has a high total organic carbon (TOC), consistent with anoxic conditions, making up a globally recognised source rock. In Dh2, an interval of sandstones and conglomerates interpreted as sedimentary mass-flow deposits sourced in a tentatively northern delta front are evident, as suggested by Rismyr et al. (pers. comm.). Thin sandstones at the same level in Dh4, 7 km towards the east, place constraints on the extent of the deposits, which is clearly limited. This interval of sandstones and conglomerates offers some permeability, as seen in Fig. 3 (for approximately 180–200 m). Otherwise, the Janusfjellet Subgroup with its nearly 450 m-thick succession of impermeable rocks makes up a regional top-seal above deeper reservoirs (Nøttvedt et al., 1992). This is also the case in the subsurface near Longyearbyen. The significant under-pressure recorded in the targeted reservoir supports the good sealing properties of this sub-group (Larsen 2013a, b). This is further verified by leak-off tests (LOT and XLOT) (Braathen et al., 2012; Boholi et al., 2014).
193NORWEGIAN JOURNAL OF GEOLOGY Permeability model of tight reservoir sandstones; Longyearbyen CO2 Lab, Svalbard
Further, slight over-pressure and good total permeability have been constrained by artesian wells in Adventdalen. Microtexturally, the diagenesis, with its bearing on porosity and permeability, is the same for deeper units. However, the basal 10–50 cm-thick fluvial conglomerate overlying the hiatus towards the underlying Rurikfjellet Formation that appears in most drillholes of Adventdalen has been found to be poorly consolidated. This well-sorted unit most likely has a significant matrix permeability.
There is a transitional contact between the continental deposits of the Helvetiafjellet Formation and paralic sandstones of the Carolinefjellet Formation. Above this contact, shallow-marine sandstones are gradually giving way to offshore deposits, with thin hummocky sandstones interlayered with shales. This marine, shaly succession seems to act as a top-seal for the mildly over-pressured brine in the Helvetiafjellet Formation, unless the near-surface, c. 120 m-deep permafrost causes the sealing at this level in Adventdalen.
Helvetiafjellet and Carolinefjellet formations
The Helvetiafjellet Formation (Adventdalen Group) was deposited in the Early Cretaceous (Barremian). This period was influenced by northern regional uplift, sourcing deltaic systems that were withdrawing northward during subsequent sea-level rise, giving way to paralic deposits (Nemec, 1992; Midtkandal & Nystuen, 2009) (Fig. 2). Typical facies include coarse sandstones with subordinate carbonaceous shales and thin coal seams that have been ascribed to delta plain, mouth-bar, barrier-bar and tidal estuary environments (Gjelberg & Steel, 1995). Maher et al. (2004) described the quartz grains as well rounded and identified basaltic lithics that originated from the High Arctic Large Igneous Province (HALIP). Recent age constraints on the HALIP (c. 122–125 Ma; Corfu et al., 2013) verify a close link between this magmatic event and deposition of the Helvetiafjellet Formation (Senger et al., 2014b). On the property side, injection tests show high injectivity dominated by radial flow likely driven by fractures.
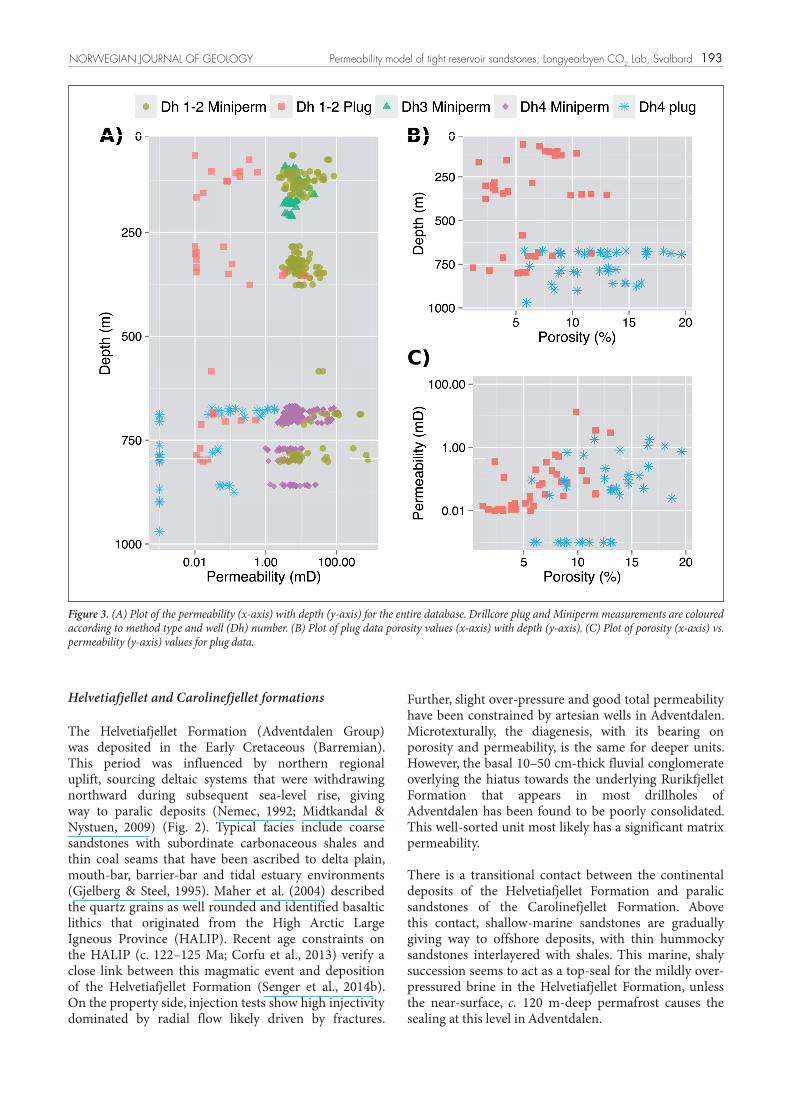
Figure 3. (A) Plot of the permeability (x-axis) with depth (y-axis) for the entire database. Drillcore plug and Miniperm measurements are coloured according to method type and well (Dh) number. (B) Plot of plug data porosity values (x-axis) with depth (y-axis). (C) Plot of porosity (x-axis) vs. permeability (y-axis) values for plug data.

194 C. Magnabosco et al.
Materials and methodsIn this study, we used a combination of permeability and porosity measurements throughout the retrieved drillcores to identify potential zones for CO2 storage. Porosity has several measurable aspects that relate to different pore spaces (Allaby & Allaby, 2003). Total (or Absolute) porosity is the sum of the effective and ineffective porosities, which are based on measurements of interconnected and isolated pores. Permeability is the rate at which a fluid can pass through a porous material (McLane, 1995), and is measured in Darcies (D) or milliDarcies (mD). There is no direct relationship between permeability and porosity applicable to all materials (Bernabe et al., 2003). According to McLane (1995), porosity and permeability are controlled and influenced by the texture, fabric, mean grain size, sorting, grain shape, and grain orientation of the material and will evolve according to the geological processes that they are subjected to. In order to extract or inject fluids or gases, or be utilised as CO2 containment, porosity over 12% and permeabilities greater than a few mD are desirable (Selley, 1985; Torabi et al., 2013).
In this study, a total of 88 plug samples were drilled within sandstone units in the drillcores for laboratory permeability and porosity analyses. The depths at which plugs were taken from Dh1–2 and Dh4 are shown in Fig. 3A, B. Plugs from Dh1–2 were analysed at ResLab (Trondheim, Norway) using He injection for permeability assessments and Hg for net porosity (Braathen et al., 2012). Plugs from Dh4 were analysed at NTNU/SINTEF lab (Trondheim, Norway)
using He porosimetry and brine saturation for porosity measurements and air flow for permeability measurements (Farokpoor et al., 2010, 2013).
Permeability was also measured in Dh1–2, Dh3, and Dh4 using a Miniperm (TinyPerm II; New England Research) instrument, which is a portable air permeameter that measures rock permeability by recovering a vacuum of injected air across rock surfaces. Depending on the instrument, detectable permeabilites in the range of 1 to 1000 mD can be identified. As plugs had been collected from the core prior to this study, special care was made to ensure that the diameter of the core was the minimum distance air would have to travel to relieve the Miniperm’s vacuum instead of the vertical distance to a removed plug. Some operational errors are, however, assumed for exceptionally high permeabilities and ascribed to poor sealing around the nozzle. Another variable influencing the recordings was the temperature of the core during the measurement. This effect is further outlined in the results section.
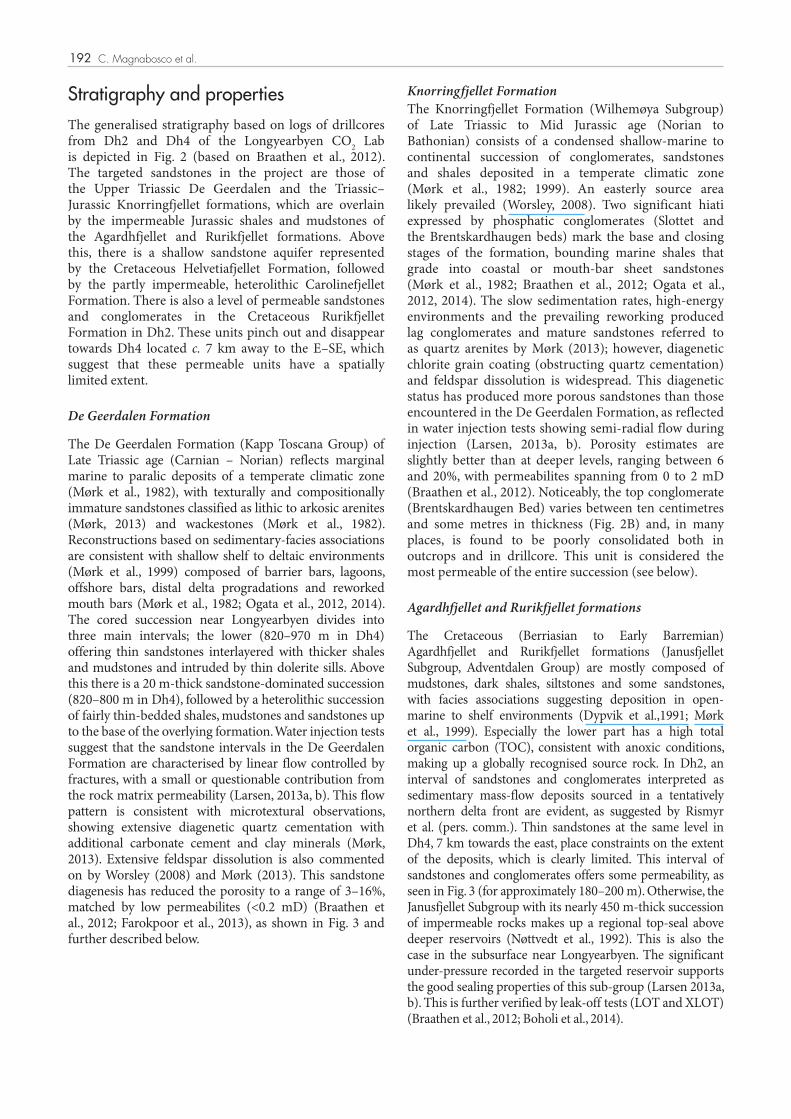
During data collection, the vacuum cylinder of the Miniperm was attached to a retort stand using two clamps (Fig. 4). This apparatus remained intact throughout the period of data collection and functioned as a mechanical arm supporting the instrument. When the control unit screen generated a reading or after a 5-minute period (whichever occurred first), the clamps were loosened and the Miniperm moved vertically up the retort stand breaking the seal between the nozzle and the core. The 5-minute cutoff was selected due to the observation that
Figure 4. Photographs of the TinyPerm instrument. Left: setup for permeability measurements, with a mechanical arm fixing the cylinder on to the drillcore. Right: components of the TinyPerm II instrument, including the vacuum cylinder topped with the handle & plunger, the pressure trans-ducer enclosure (box on cylinder) and the base showing the white-grey nozzle. An electric cable connects the pressure transducer with the micro-processor and control unit (yellow box). The right image is from the TinyPerm II manual.
195NORWEGIAN JOURNAL OF GEOLOGY Permeability model of tight reservoir sandstones; Longyearbyen CO2 Lab, Svalbard
generally between 2% and 13%, but locally yielding 18–20%. Fig. 3B shows that there is mildly increased permeability around 390 m for Dh1 and Dh2 (sandy debris-flow deposits), but the highest values are recorded around 700 m in Dh4, in the Knorringfjellet Formation sandstones.
Regional approach
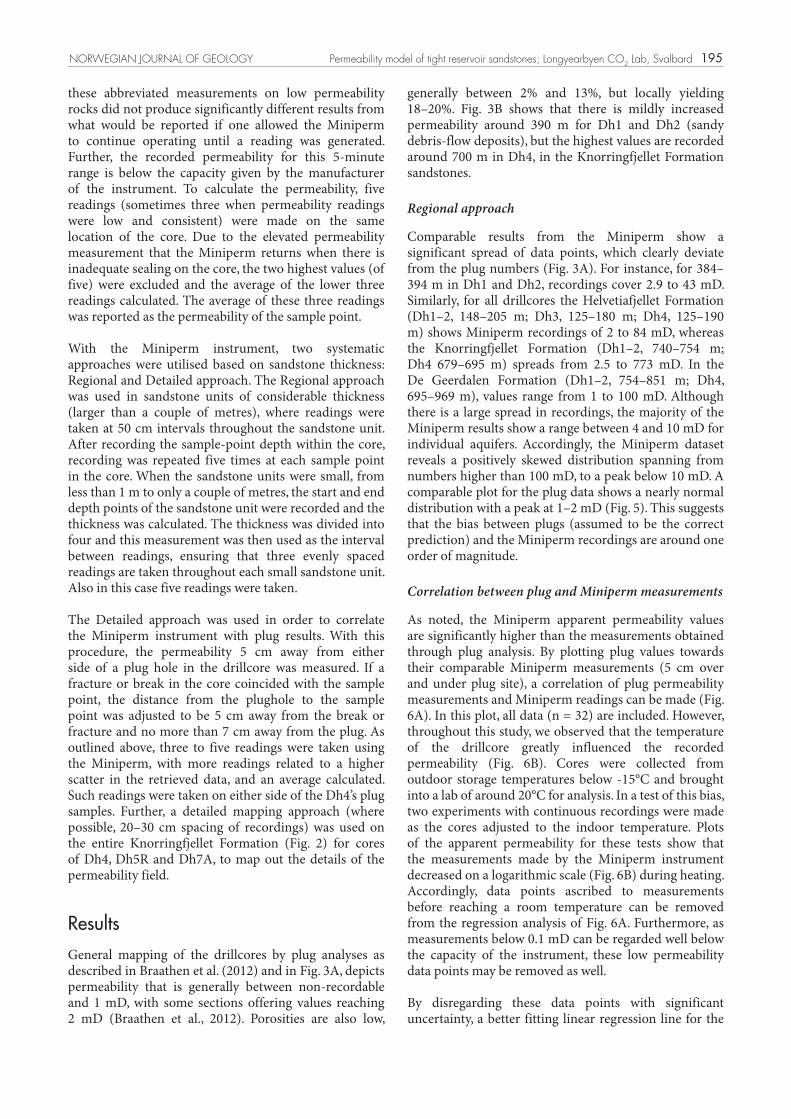
Comparable results from the Miniperm show a significant spread of data points, which clearly deviate from the plug numbers (Fig. 3A). For instance, for 384–394 m in Dh1 and Dh2, recordings cover 2.9 to 43 mD. Similarly, for all drillcores the Helvetiafjellet Formation (Dh1–2, 148–205 m; Dh3, 125–180 m; Dh4, 125–190 m) shows Miniperm recordings of 2 to 84 mD, whereas the Knorringfjellet Formation (Dh1–2, 740–754 m; Dh4 679–695 m) spreads from 2.5 to 773 mD. In the De Geerdalen Formation (Dh1–2, 754–851 m; Dh4, 695–969 m), values range from 1 to 100 mD. Although there is a large spread in recordings, the majority of the Miniperm results show a range between 4 and 10 mD for individual aquifers. Accordingly, the Miniperm dataset reveals a positively skewed distribution spanning from numbers higher than 100 mD, to a peak below 10 mD. A comparable plot for the plug data shows a nearly normal distribution with a peak at 1–2 mD (Fig. 5). This suggests that the bias between plugs (assumed to be the correct prediction) and the Miniperm recordings are around one order of magnitude.
Correlation between plug and Miniperm measurements
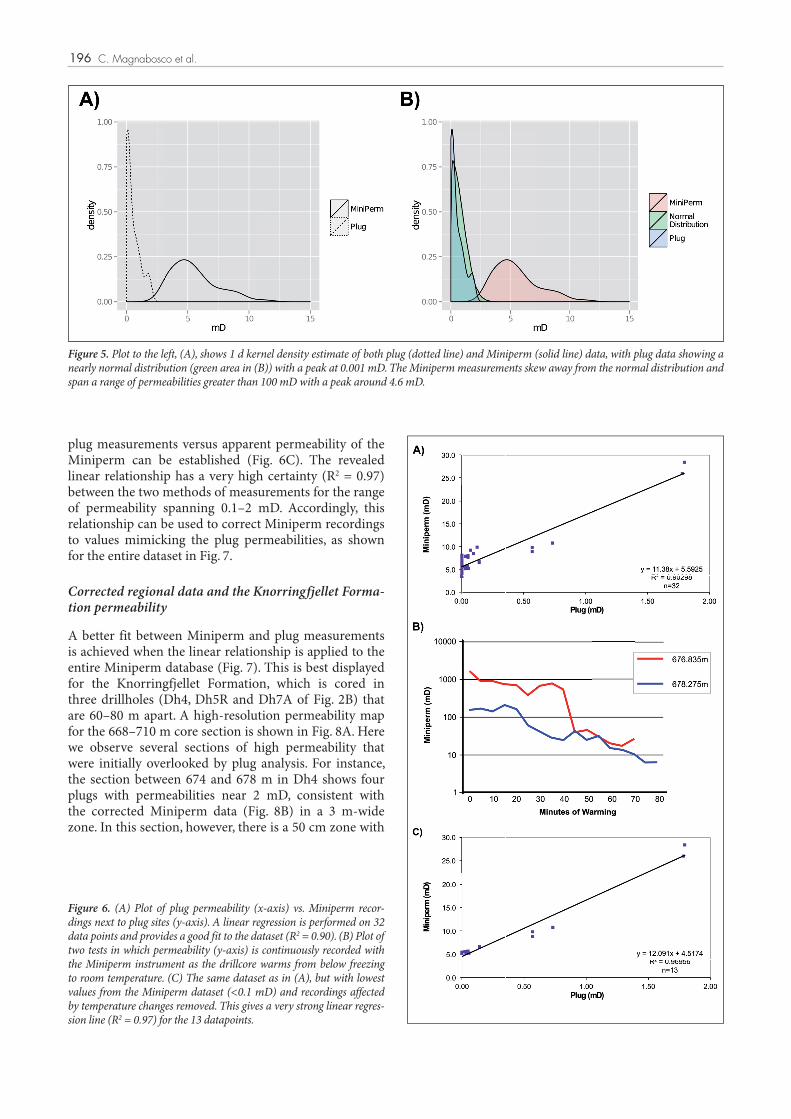
As noted, the Miniperm apparent permeability values are significantly higher than the measurements obtained through plug analysis. By plotting plug values towards their comparable Miniperm measurements (5 cm over and under plug site), a correlation of plug permeability measurements and Miniperm readings can be made (Fig. 6A). In this plot, all data (n = 32) are included. However, throughout this study, we observed that the temperature of the drillcore greatly influenced the recorded permeability (Fig. 6B). Cores were collected from outdoor storage temperatures below -15°C and brought into a lab of around 20°C for analysis. In a test of this bias, two experiments with continuous recordings were made as the cores adjusted to the indoor temperature. Plots of the apparent permeability for these tests show that the measurements made by the Miniperm instrument decreased on a logarithmic scale (Fig. 6B) during heating. Accordingly, data points ascribed to measurements before reaching a room temperature can be removed from the regression analysis of Fig. 6A. Furthermore, as measurements below 0.1 mD can be regarded well below the capacity of the instrument, these low permeability data points may be removed as well.
By disregarding these data points with significant uncertainty, a better fitting linear regression line for the
these abbreviated measurements on low permeability rocks did not produce significantly different results from what would be reported if one allowed the Miniperm to continue operating until a reading was generated. Further, the recorded permeability for this 5-minute range is below the capacity given by the manufacturer of the instrument. To calculate the permeability, five readings (sometimes three when permeability readings were low and consistent) were made on the same location of the core. Due to the elevated permeability measurement that the Miniperm returns when there is inadequate sealing on the core, the two highest values (of five) were excluded and the average of the lower three readings calculated. The average of these three readings was reported as the permeability of the sample point.
With the Miniperm instrument, two systematic approaches were utilised based on sandstone thickness: Regional and Detailed approach. The Regional approach was used in sandstone units of considerable thickness (larger than a couple of metres), where readings were taken at 50 cm intervals throughout the sandstone unit. After recording the sample-point depth within the core, recording was repeated five times at each sample point in the core. When the sandstone units were small, from less than 1 m to only a couple of metres, the start and end depth points of the sandstone unit were recorded and the thickness was calculated. The thickness was divided into four and this measurement was then used as the interval between readings, ensuring that three evenly spaced readings are taken throughout each small sandstone unit. Also in this case five readings were taken.
The Detailed approach was used in order to correlate the Miniperm instrument with plug results. With this procedure, the permeability 5 cm away from either side of a plug hole in the drillcore was measured. If a fracture or break in the core coincided with the sample point, the distance from the plughole to the sample point was adjusted to be 5 cm away from the break or fracture and no more than 7 cm away from the plug. As outlined above, three to five readings were taken using the Miniperm, with more readings related to a higher scatter in the retrieved data, and an average calculated. Such readings were taken on either side of the Dh4’s plug samples. Further, a detailed mapping approach (where possible, 20–30 cm spacing of recordings) was used on the entire Knorringfjellet Formation (Fig. 2) for cores of Dh4, Dh5R and Dh7A, to map out the details of the permeability field.
ResultsGeneral mapping of the drillcores by plug analyses as described in Braathen et al. (2012) and in Fig. 3A, depicts permeability that is generally between non-recordable and 1 mD, with some sections offering values reaching 2 mD (Braathen et al., 2012). Porosities are also low,
196 C. Magnabosco et al.
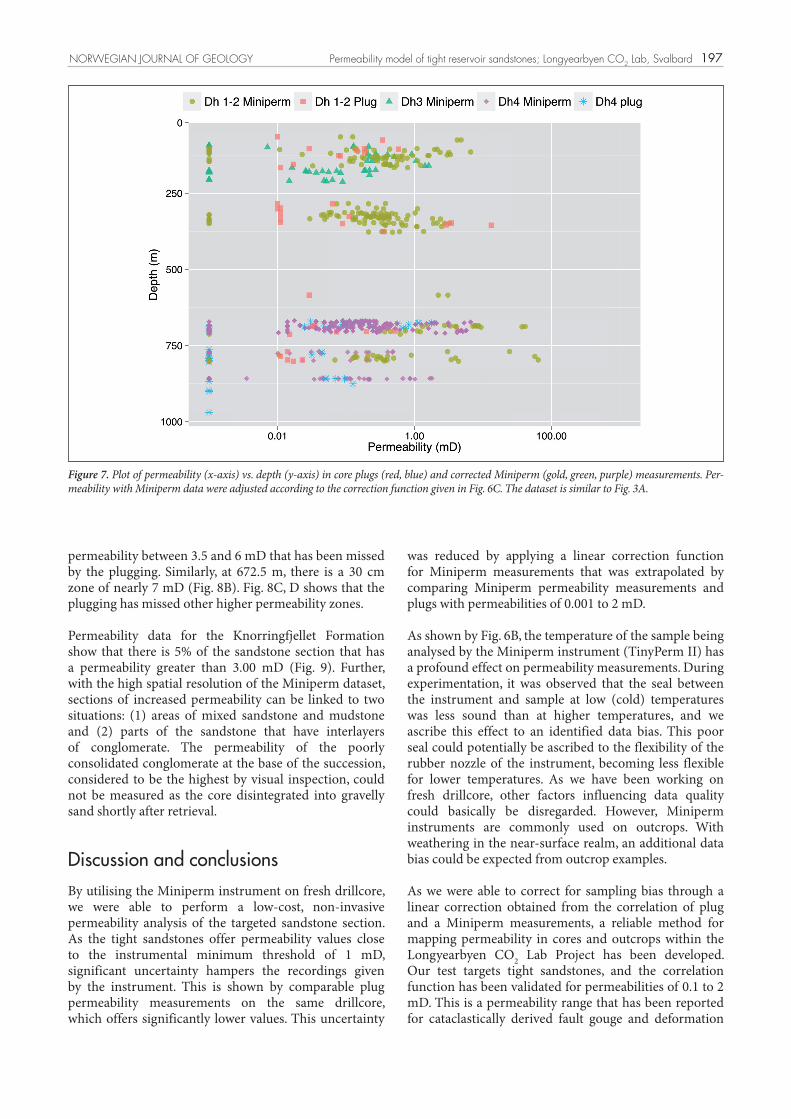
plug measurements versus apparent permeability of the Miniperm can be established (Fig. 6C). The revealed linear relationship has a very high certainty (R2 = 0.97) between the two methods of measurements for the range of permeability spanning 0.1–2 mD. Accordingly, this relationship can be used to correct Miniperm recordings to values mimicking the plug permeabilities, as shown for the entire dataset in Fig. 7.
Corrected regional data and the Knorringfjellet Forma-tion permeability
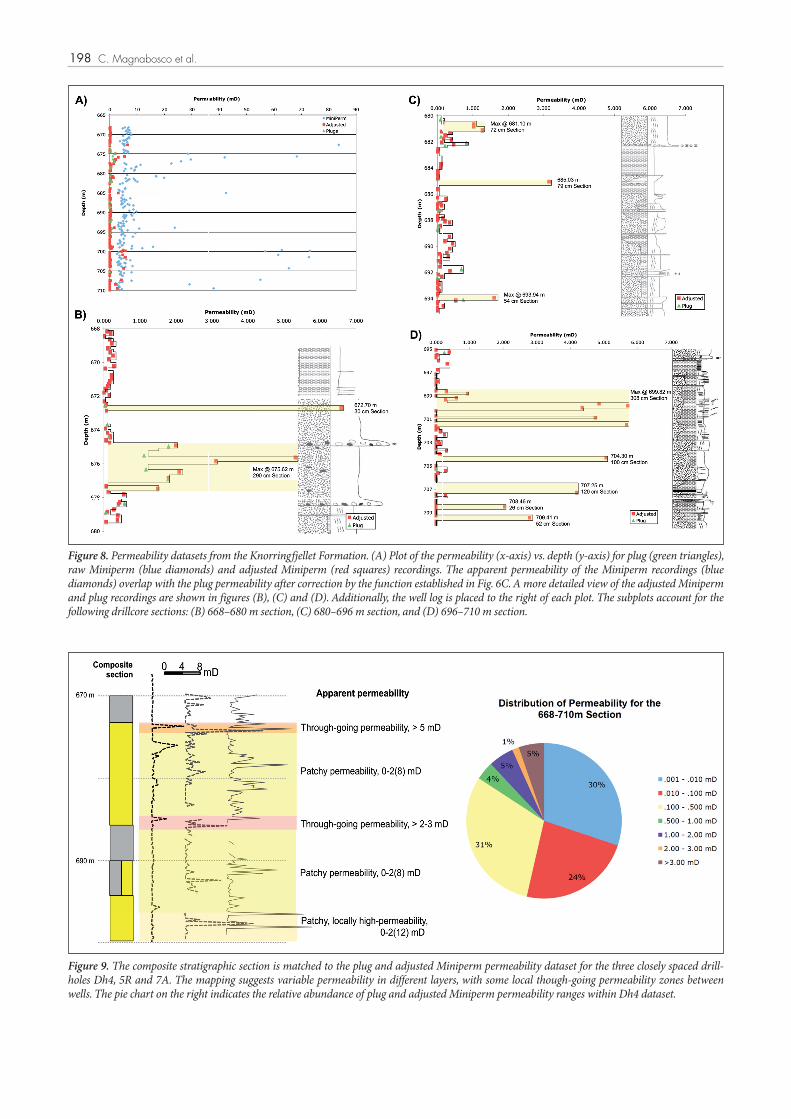
A better fit between Miniperm and plug measurements is achieved when the linear relationship is applied to the entire Miniperm database (Fig. 7). This is best displayed for the Knorringfjellet Formation, which is cored in three drillholes (Dh4, Dh5R and Dh7A of Fig. 2B) that are 60–80 m apart. A high-resolution permeability map for the 668–710 m core section is shown in Fig. 8A. Here we observe several sections of high permeability that were initially overlooked by plug analysis. For instance, the section between 674 and 678 m in Dh4 shows four plugs with permeabilities near 2 mD, consistent with the corrected Miniperm data (Fig. 8B) in a 3 m-wide zone. In this section, however, there is a 50 cm zone with
Figure 5. Plot to the left, (A), shows 1 d kernel density estimate of both plug (dotted line) and Miniperm (solid line) data, with plug data showing a nearly normal distribution (green area in (B)) with a peak at 0.001 mD. The Miniperm measurements skew away from the normal distribution and span a range of permeabilities greater than 100 mD with a peak around 4.6 mD.
Figure 6. (A) Plot of plug permeability (x-axis) vs. Miniperm recor-dings next to plug sites (y-axis). A linear regression is performed on 32 data points and provides a good fit to the dataset (R2 = 0.90). (B) Plot of two tests in which permeability (y-axis) is continuously recorded with the Miniperm instrument as the drillcore warms from below freezing to room temperature. (C) The same dataset as in (A), but with lowest values from the Miniperm dataset (<0.1 mD) and recordings affected by temperature changes removed. This gives a very strong linear regres-sion line (R2 = 0.97) for the 13 datapoints.
197NORWEGIAN JOURNAL OF GEOLOGY Permeability model of tight reservoir sandstones; Longyearbyen CO2 Lab, Svalbard
was reduced by applying a linear correction function for Miniperm measurements that was extrapolated by comparing Miniperm permeability measurements and plugs with permeabilities of 0.001 to 2 mD.
As shown by Fig. 6B, the temperature of the sample being analysed by the Miniperm instrument (TinyPerm II) has a profound effect on permeability measurements. During experimentation, it was observed that the seal between the instrument and sample at low (cold) temperatures was less sound than at higher temperatures, and we ascribe this effect to an identified data bias. This poor seal could potentially be ascribed to the flexibility of the rubber nozzle of the instrument, becoming less flexible for lower temperatures. As we have been working on fresh drillcore, other factors influencing data quality could basically be disregarded. However, Miniperm instruments are commonly used on outcrops. With weathering in the near-surface realm, an additional data bias could be expected from outcrop examples.
As we were able to correct for sampling bias through a linear correction obtained from the correlation of plug and a Miniperm measurements, a reliable method for mapping permeability in cores and outcrops within the Longyearbyen CO2 Lab Project has been developed. Our test targets tight sandstones, and the correlation function has been validated for permeabilities of 0.1 to 2 mD. This is a permeability range that has been reported for cataclastically derived fault gouge and deformation
permeability between 3.5 and 6 mD that has been missed by the plugging. Similarly, at 672.5 m, there is a 30 cm zone of nearly 7 mD (Fig. 8B). Fig. 8C, D shows that the plugging has missed other higher permeability zones.
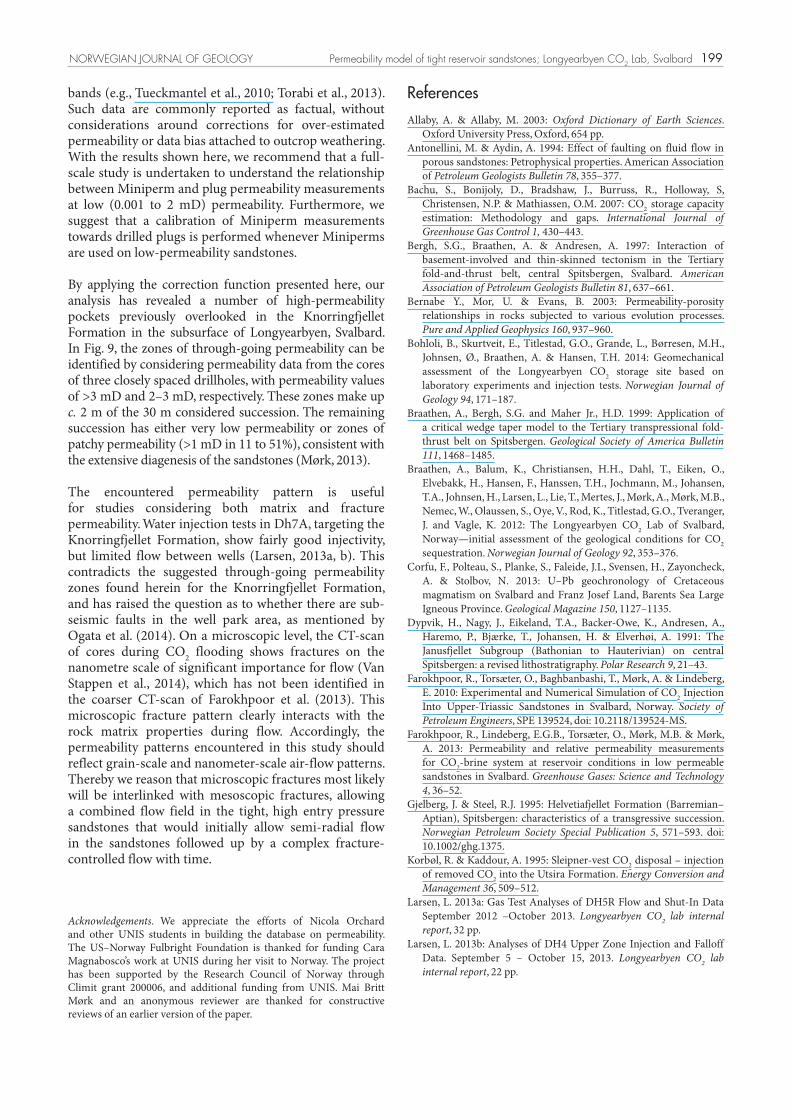
Permeability data for the Knorringfjellet Formation show that there is 5% of the sandstone section that has a permeability greater than 3.00 mD (Fig. 9). Further, with the high spatial resolution of the Miniperm dataset, sections of increased permeability can be linked to two situations: (1) areas of mixed sandstone and mudstone and (2) parts of the sandstone that have interlayers of conglomerate. The permeability of the poorly consolidated conglomerate at the base of the succession, considered to be the highest by visual inspection, could not be measured as the core disintegrated into gravelly sand shortly after retrieval.
Discussion and conclusionsBy utilising the Miniperm instrument on fresh drillcore, we were able to perform a low-cost, non-invasive permeability analysis of the targeted sandstone section. As the tight sandstones offer permeability values close to the instrumental minimum threshold of 1 mD, significant uncertainty hampers the recordings given by the instrument. This is shown by comparable plug permeability measurements on the same drillcore, which offers significantly lower values. This uncertainty
Figure 7. Plot of permeability (x-axis) vs. depth (y-axis) in core plugs (red, blue) and corrected Miniperm (gold, green, purple) measurements. Per-meability with Miniperm data were adjusted according to the correction function given in Fig. 6C. The dataset is similar to Fig. 3A.
198 C. Magnabosco et al.
Figure 8. Permeability datasets from the Knorringfjellet Formation. (A) Plot of the permeability (x-axis) vs. depth (y-axis) for plug (green triangles), raw Miniperm (blue diamonds) and adjusted Miniperm (red squares) recordings. The apparent permeability of the Miniperm recordings (blue diamonds) overlap with the plug permeability after correction by the function established in Fig. 6C. A more detailed view of the adjusted Miniperm and plug recordings are shown in figures (B), (C) and (D). Additionally, the well log is placed to the right of each plot. The subplots account for the following drillcore sections: (B) 668–680 m section, (C) 680–696 m section, and (D) 696–710 m section.
Figure 9. The composite stratigraphic section is matched to the plug and adjusted Miniperm permeability dataset for the three closely spaced drill-holes Dh4, 5R and 7A. The mapping suggests variable permeability in different layers, with some local though-going permeability zones between wells. The pie chart on the right indicates the relative abundance of plug and adjusted Miniperm permeability ranges within Dh4 dataset.
199NORWEGIAN JOURNAL OF GEOLOGY Permeability model of tight reservoir sandstones; Longyearbyen CO2 Lab, Svalbard
References
Allaby, A. & Allaby, M. 2003: Oxford Dictionary of Earth Sciences. Oxford University Press, Oxford, 654 pp.
Antonellini, M. & Aydin, A. 1994: Effect of faulting on fluid flow in porous sandstones: Petrophysical properties. American Association of Petroleum Geologists Bulletin 78, 355–377.
Bachu, S., Bonijoly, D., Bradshaw, J., Burruss, R., Holloway, S, Christensen, N.P. & Mathiassen, O.M. 2007: CO2 storage capacity estimation: Methodology and gaps. International Journal of Greenhouse Gas Control 1, 430–443.
Bergh, S.G., Braathen, A. & Andresen, A. 1997: Interaction of basement-involved and thin-skinned tectonism in the Tertiary fold-and-thrust belt, central Spitsbergen, Svalbard. American Association of Petroleum Geologists Bulletin 81, 637–661.
Bernabe Y., Mor, U. & Evans, B. 2003: Permeability-porosity relationships in rocks subjected to various evolution processes. Pure and Applied Geophysics 160, 937–960.
Bohloli, B., Skurtveit, E., Titlestad, G.O., Grande, L., Børresen, M.H., Johnsen, Ø., Braathen, A. & Hansen, T.H. 2014: Geomechanical assessment of the Longyearbyen CO2 storage site based on laboratory experiments and injection tests. Norwegian Journal of Geology 94, 171–187.
Braathen, A., Bergh, S.G. and Maher Jr., H.D. 1999: Application of a critical wedge taper model to the Tertiary transpressional fold-thrust belt on Spitsbergen. Geological Society of America Bulletin 111, 1468–1485.
Braathen, A., Balum, K., Christiansen, H.H., Dahl, T., Eiken, O., Elvebakk, H., Hansen, F., Hanssen, T.H., Jochmann, M., Johansen, T.A., Johnsen, H., Larsen, L., Lie, T., Mertes, J., Mørk, A., Mørk, M.B., Nemec, W., Olaussen, S., Oye, V., Rod, K., Titlestad, G.O., Tveranger, J. and Vagle, K. 2012: The Longyearbyen CO2 Lab of Svalbard, Norway—initial assessment of the geological conditions for CO2 sequestration. Norwegian Journal of Geology 92, 353–376.
Corfu, F., Polteau, S., Planke, S., Faleide, J.I., Svensen, H., Zayoncheck, A. & Stolbov, N. 2013: U–Pb geochronology of Cretaceous magmatism on Svalbard and Franz Josef Land, Barents Sea Large Igneous Province. Geological Magazine 150, 1127–1135.
Dypvik, H., Nagy, J., Eikeland, T.A., Backer-Owe, K., Andresen, A., Haremo, P., Bjærke, T., Johansen, H. & Elverhøi, A. 1991: The Janusfjellet Subgroup (Bathonian to Hauterivian) on central Spitsbergen: a revised lithostratigraphy. Polar Research 9, 21–43.
Farokhpoor, R., Torsæter, O., Baghbanbashi, T., Mørk, A. & Lindeberg, E. 2010: Experimental and Numerical Simulation of CO2 Injection Into Upper-Triassic Sandstones in Svalbard, Norway. Society of Petroleum Engineers, SPE 139524, doi: 10.2118/139524-MS.
Farokhpoor, R., Lindeberg, E.G.B., Torsæter, O., Mørk, M.B. & Mørk, A. 2013: Permeability and relative permeability measurements for CO2-brine system at reservoir conditions in low permeable sandstones in Svalbard. Greenhouse Gases: Science and Technology 4, 36–52.
Gjelberg, J. & Steel, R.J. 1995: Helvetiafjellet Formation (Barremian–Aptian), Spitsbergen: characteristics of a transgressive succession. Norwegian Petroleum Society Special Publication 5, 571–593. doi: 10.1002/ghg.1375.
Korbøl, R. & Kaddour, A. 1995: Sleipner-vest CO2 disposal – injection of removed CO2 into the Utsira Formation. Energy Conversion and Management 36, 509–512.
Larsen, L. 2013a: Gas Test Analyses of DH5R Flow and Shut-In Data September 2012 –October 2013. Longyearbyen CO2 lab internal report, 32 pp.
Larsen, L. 2013b: Analyses of DH4 Upper Zone Injection and Falloff Data. September 5 – October 15, 2013. Longyearbyen CO2 lab internal report, 22 pp.
bands (e.g., Tueckmantel et al., 2010; Torabi et al., 2013). Such data are commonly reported as factual, without considerations around corrections for over-estimated permeability or data bias attached to outcrop weathering. With the results shown here, we recommend that a full-scale study is undertaken to understand the relationship between Miniperm and plug permeability measurements at low (0.001 to 2 mD) permeability. Furthermore, we suggest that a calibration of Miniperm measurements towards drilled plugs is performed whenever Miniperms are used on low-permeability sandstones.
By applying the correction function presented here, our analysis has revealed a number of high-permeability pockets previously overlooked in the Knorringfjellet Formation in the subsurface of Longyearbyen, Svalbard. In Fig. 9, the zones of through-going permeability can be identified by considering permeability data from the cores of three closely spaced drillholes, with permeability values of >3 mD and 2–3 mD, respectively. These zones make up c. 2 m of the 30 m considered succession. The remaining succession has either very low permeability or zones of patchy permeability (>1 mD in 11 to 51%), consistent with the extensive diagenesis of the sandstones (Mørk, 2013).
The encountered permeability pattern is useful for studies considering both matrix and fracture permeability. Water injection tests in Dh7A, targeting the Knorringfjellet Formation, show fairly good injectivity, but limited flow between wells (Larsen, 2013a, b). This contradicts the suggested through-going permeability zones found herein for the Knorringfjellet Formation, and has raised the question as to whether there are sub-seismic faults in the well park area, as mentioned by Ogata et al. (2014). On a microscopic level, the CT-scan of cores during CO2 flooding shows fractures on the nanometre scale of significant importance for flow (Van Stappen et al., 2014), which has not been identified in the coarser CT-scan of Farokhpoor et al. (2013). This microscopic fracture pattern clearly interacts with the rock matrix properties during flow. Accordingly, the permeability patterns encountered in this study should reflect grain-scale and nanometer-scale air-flow patterns. Thereby we reason that microscopic fractures most likely will be interlinked with mesoscopic fractures, allowing a combined flow field in the tight, high entry pressure sandstones that would initially allow semi-radial flow in the sandstones followed up by a complex fracture-controlled flow with time.
Acknowledgements. We appreciate the efforts of Nicola Orchard and other UNIS students in building the database on permeability. The US–Norway Fulbright Foundation is thanked for funding Cara Magnabosco’s work at UNIS during her visit to Norway. The project has been supported by the Research Council of Norway through Climit grant 200006, and additional funding from UNIS. Mai Britt Mørk and an anonymous reviewer are thanked for constructive reviews of an earlier version of the paper.
200 C. Magnabosco et al.
Lindeberg, E. 2003: The Quality of a CO2 Repository: What is the sufficient retention time of CO2 stored underground? In Gale, J. & Kaya, Y. (eds.): Proceeding of the 6th International Greenhouse Gas Control Technologies vol. 1, 1–4 October 2002, Kyoto, Japan, Elsevier Science Ltd, Amsterdam, pp. 255–260.
Maher Jr., H.D., Hays, T., Shuster, R.D. & Mutrux, J. 2004: Sandstone Petrography of Lower Cretaceous sandstones on Svalbard. Polar Research 23, 147–165.
McLane, M. 1995: Sedimentology. Oxford University Press, New York, 423 pp.
Manum, S.B. & Throndsen, T. 1978: Rank of coal and dispersed organic matter and its geological bearing in the Spitsbergen Tertiary. Norsk Polarinstitutt Årbok 1977, 159–177.
Midtkandal, I. & Nystuen, J.P. 2009: Depositional architecture of a low-gradient ramp shelf in an epicontinental sea: the lower Cretaceous of Svalbard. Basin Research 5, 655−675.
Mørk, A., Knarud, R. & Worsley, D. 1982: Depositional and diagenetic environments of the Triassic and Lower Jurassic succession of Svalbard. Arctic geology and geophysics: Canadian Petroleum Society Geological Memoir 8, 371–398.
Mørk, A., Dallmann, W.K, Dypvik, H., Johannessen, E.P., Larssen, G.B., Nagy, J., Nøttvedt, A., Olaussen, S., Pchelina, T.M. & Worsley, D. 1999: Mesozoic lithostratigraphy. In Dallmann, W.K. (ed.): Lithostratigraphic lexicon of Svalbard. Review and recommendations for nomenclature use. Upper Palaeozoic to Quaternary bedrock. Norsk Polarinstitutt, pp. 127–214.
Mørk, M.B.E. 2013: Diagenesis and quartz cement distribution of low-permeability Upper Triassic–Middle Jurassic reservoir sandstones, Longyearbyen CO2 lab well site in Svalbard, Norway. American Association of Petroleum Geologists Bulletin 97, 577–596.
Nemec, W. 1992: Depositional controls on plant growth and peat accumulation in a braidplain delta environment: Helvetiafjell Formation (Barremian-Aptian), Svalbard. Geological Society of America Special Paper 267, 209–226.
Nøttvedt, A., Livbjerg, F., Midbø, P.S. & Rasmussen, E. 1992: Hydrocarbon potental of the Central Spitsbergen Basin. Norwegian Petroleum Society Special Publication 2, 333–361.
Ogata, K., Senger, K., Braathen, A., Tveranger, J. & Olaussen, S. 2012: The importance of natural fractures in a tight reservoir for potential CO2 storage: a case study of the upper Triassic–middle Jurassic Kapp Toscana Group (Spitsbergen, Arctic Norway). Geological Society of London, Special Publications 374, 21 pp. doi: 0.1144/SP374.9.
Ogata, K., Senger, K., Braathen, A., Tveranger, J., and Olaussen, S. 2014: Fracture systems and meso-scale structural patterns in the reservoir-cap rock succession of the Longyearbyen CO2 Lab project; inplications for geological CO2 sequestration on Svalbard. Norwegian Journal of Geology 94, 121–154.
Sand, G. & Braathen, A. 2006: CO2-fritt Svalbard i 2025? Svalbardposten, 10 November.
Selley, R.C. 1985: Elements of petroleum geology. W. H. Freeman and company, New York, 449 pp.
Senger, K., Roy. S., Ogata, K., Bælum, K., Braathen, A., Noormets, R., Olaussen, S. & Tveranger, J. 2011: Exploring for saucer-shaped igneous intrusions, Svalbard, Spitsbergen. Proceeding paper, 2nd international Geosciences Student Conference, 12–14 July, Kraków, Poland, p. 6.
Senger, K., Roy, S., Braathen, A., Buckley, S., Bælum, K., Gernigon, L., Mjelde, R., Noormets, R., Ogata, K., Olaussen, S., Planke, S., Ruud, B. & Tveranger, J. 2014a: Geometries of igneous intrusions in central Spitsbergen, Svalbard: an integrated study of a magmatic plumbing system with possible implications on CO2 sequestration. Norwegian Journal of Geology 94, 155-169.
Senger, K., Tveranger, J., Ogata, K., Braathen, A., and Planke, S. 2014b: Late Mesozoic magmatism in Svalbard: a review. Earth Science Reviews 139, 123–144, doi: 10.1016/j.earscirev.2014.09.002.
Steel, R.J. & Worsley, D. 1984: Svalbard’s post-Caledonian strata—an atlas of sedimentational patterns and palaeogeographic evolution. In Spencer, A.M. (ed.): Petroleum geology of the North European margin, Springer, pp. 109–135.
Torabi, A., Fossen, H. & Braathen, A. 2013: Insight into petrophysical properties of deformed sandstone reservoirs. American Association of Petroleum Geologists Bulletin 97, 619–637.
Tueckmantel, C., Fisher, Q.J., Knipe, R.J., Lickorish, H. & Khalil, S.M. 2010: Fault seal prediction of seismic-scale normal faults in porous sandstone: A case study from the eastern Gulf of Suez rift, Egypt. Marine and Petroleum Geology 27, 334–350.
Van Stappen, J., De Kock, T., Boone, M., Olaussen, S. & Cnudde, V. 2014: Pore-scale characterization and modelling of the Wilhelmøya Subgroup reservoir section using X-ray micro-CT. Norwegian Journal of Geology 94, 201–215.
Worsley, D. 2008: The post-Caledonian development of Svalbard and the western Barents Sea. Polar Research 27, 298–317.
Related Documents


