Permeability anisotropy induced by the shear displacement of rough fracture walls H. Auradou, 1 G. Drazer, 2 J. P. Hulin, 1 and J. Koplik 2 Received 3 January 2005; revised 3 May 2005; accepted 7 June 2005; published 27 September 2005. [1] The permeability anisotropy that results from a shear displacement ~ u between the complementary self-affine walls of a rough fracture is investigated. Experiments in which a dyed fluid radially injected into a transparent fracture displaces a transparent one are presented. A clear anisotropy is observed in the presence of shear displacements and allows us to estimate the ratio of the permeabilities for flows parallel and perpendicular to ~ u. A simple model which accounts for the development of channels perpendicular to ~ u qualitatively explains these results and predicts a permeability decreasing (increasing) linearly with the variance of the aperture field for flow parallel (perpendicular) to the shear displacement. These predictions are then compared to the results of numerical simulations performed using a lattice Boltzmann technique and to the anisotropies measured in displacement experiments. Citation: Auradou, H., G. Drazer, J. P. Hulin, and J. Koplik (2005), Permeability anisotropy induced by the shear displacement of rough fracture walls, Water Resour. Res., 41, W09423, doi:10.1029/2005WR003938. 1. Introduction [2] Subsurface fluid flow in many low-permeability geo- logical formations occurs primarily through fracture net- works [NAS Committee on Fracture Characterization and Fluid Flow, 1996; Adler and Thovert, 1999; Sahimi, 1995]. In order to model such systems, one needs to understand flow in single fractures, which are the building blocks of the network. Among the many parameters which influence fluid motion at this scale, we focus here on the geometry of the fractures, specifically on the effect of correlations between the roughness of the two opposite walls on the permeability of the fracture. The two surfaces completely match each other, but a shear displacement of one of the surfaces alters these correlations, and previous laboratory measurements demonstrated that it also affects the permeability, through the corresponding variations of the local aperture of the fracture [Plouraboue ´ et al., 2000; Olsson and Brown, 1993]. [3] In related experiments, a higher permeability was measured for flow perpendicular to the shear displacement than parallel to it [Gentier et al., 1997; Yeo et al., 1998], and an indication of such anisotropic permeability was also observed in previous work on self-affine fractures [Drazer and Koplik, 2002]. Numerical computations performed in fractures with anisotropic aperture fields showed a similar behavior in the permeability [Thompson and Brown, 1991]. The purpose of the present paper is to combine experiments, numerical simulations, and analytical arguments to under- stand the permeability anisotropies that are induced by shear displacements of rough fracture walls. [4] A key geometrical feature of the fracture surfaces studied in this work is their statistical scale invariance known as self-affinity [Mandelbrot, 1983; Feder, 1988]. The analysis of the surfaces of both faults and fresh fractures has established that their roughness cannot be described by a finite set of typical wavelength values, but instead is self- affine. A self-affine surface is one that is statistically un- changed under the scaling relation: x ! lx, y ! ly and h(x, y) ! l z h(x, y). ((x, y) are the coordinates in the mean surface plane, h(x, y) is the local height of the surface, and z is known as the Hurst exponent.) The self-affine character of the fracture surfaces has been observed, over a significant range of length scales, in a broad variety of materials and for both natural and man-made fractures [Bouchaud, 2003]. In the case of fractured rocks, such as granite or basalt rocks, the Hurst exponent is found to be z 0.8 ± 0.05 over a broad range of length scales [Bouchaud, 2003], although values near 0.5 are found in other rocks [Boffa et al., 1998]. [5] The key consequence of self-affinity in our context is the following scaling law for the variance of the surface heights: h ~ x þ ~ l h ~ x ðÞ h i 2 ( ) ~ l 2z ; ð1Þ which implies long-range correlations in the height-to- height fluctuations. We shall show that these correlations strongly affect the aperture field of the rough fractures studied in the present work and therefore flow inside them. [6] In both experiments and numerical studies, we shall consider model fractures, made of two complementary self- affine surfaces: two perfectly matching surfaces separated by a distance a 0 in the direction normal to their common mean plane and, in general, subject to a shear displacement ~ u parallel to this mean plane. As pointed out in previous studies [Brown et al., 1986; Plouraboue ´ et al., 1995], the shear displacement introduces a mismatch length between the two perfectly mated surfaces and the self-affine scaling behavior seen in the topography of an individual surface 1 Laboratoire Fluides, Automatique et Syste `mes Thermiques, UMR 7608, CNRS, Universite ´ Paris-Sud XI, Orsay, France. 2 Benjamin Levich Institute and Department of Physics, City College of the City University of New York, New York, New York, USA. Copyright 2005 by the American Geophysical Union. 0043-1397/05/2005WR003938$09.00 W09423 WATER RESOURCES RESEARCH, VOL. 41, W09423, doi:10.1029/2005WR003938, 2005 1 of 10

Welcome message from author
This document is posted to help you gain knowledge. Please leave a comment to let me know what you think about it! Share it to your friends and learn new things together.
Transcript

Permeability anisotropy induced by the shear
displacement of rough fracture walls
H. Auradou,1 G. Drazer,2 J. P. Hulin,1 and J. Koplik2
Received 3 January 2005; revised 3 May 2005; accepted 7 June 2005; published 27 September 2005.
[1] The permeability anisotropy that results from a shear displacement ~u between thecomplementary self-affine walls of a rough fracture is investigated. Experiments in whicha dyed fluid radially injected into a transparent fracture displaces a transparent one arepresented. A clear anisotropy is observed in the presence of shear displacements andallows us to estimate the ratio of the permeabilities for flows parallel and perpendicular to~u. A simple model which accounts for the development of channels perpendicular to ~uqualitatively explains these results and predicts a permeability decreasing (increasing)linearly with the variance of the aperture field for flow parallel (perpendicular) to the sheardisplacement. These predictions are then compared to the results of numerical simulationsperformed using a lattice Boltzmann technique and to the anisotropies measured indisplacement experiments.
Citation: Auradou, H., G. Drazer, J. P. Hulin, and J. Koplik (2005), Permeability anisotropy induced by the shear displacement of
rough fracture walls, Water Resour. Res., 41, W09423, doi:10.1029/2005WR003938.
1. Introduction
[2] Subsurface fluid flow in many low-permeability geo-logical formations occurs primarily through fracture net-works [NAS Committee on Fracture Characterization andFluid Flow, 1996; Adler and Thovert, 1999; Sahimi, 1995].In order to model such systems, one needs to understandflow in single fractures, which are the building blocks of thenetwork. Among the many parameters which influence fluidmotion at this scale, we focus here on the geometry of thefractures, specifically on the effect of correlations betweenthe roughness of the two opposite walls on the permeabilityof the fracture. The two surfaces completely match eachother, but a shear displacement of one of the surfaces altersthese correlations, and previous laboratory measurementsdemonstrated that it also affects the permeability, throughthe corresponding variations of the local aperture of thefracture [Plouraboue et al., 2000; Olsson and Brown,1993].[3] In related experiments, a higher permeability was
measured for flow perpendicular to the shear displacementthan parallel to it [Gentier et al., 1997; Yeo et al., 1998], andan indication of such anisotropic permeability was alsoobserved in previous work on self-affine fractures [Drazerand Koplik, 2002]. Numerical computations performed infractures with anisotropic aperture fields showed a similarbehavior in the permeability [Thompson and Brown, 1991].The purpose of the present paper is to combine experiments,numerical simulations, and analytical arguments to under-stand the permeability anisotropies that are induced by sheardisplacements of rough fracture walls.
[4] A key geometrical feature of the fracture surfacesstudied in this work is their statistical scale invarianceknown as self-affinity [Mandelbrot, 1983; Feder, 1988].The analysis of the surfaces of both faults and fresh fractureshas established that their roughness cannot be described by afinite set of typical wavelength values, but instead is self-affine. A self-affine surface is one that is statistically un-changed under the scaling relation: x ! lx, y ! ly andh(x, y) ! lz h(x, y). ((x, y) are the coordinates in the meansurface plane, h(x, y) is the local height of the surface, and zis known as the Hurst exponent.) The self-affine character ofthe fracture surfaces has been observed, over a significantrange of length scales, in a broad variety of materials and forboth natural and man-made fractures [Bouchaud, 2003]. Inthe case of fractured rocks, such as granite or basalt rocks,the Hurst exponent is found to be z� 0.8 ± 0.05 over a broadrange of length scales [Bouchaud, 2003], although valuesnear 0.5 are found in other rocks [Boffa et al., 1998].[5] The key consequence of self-affinity in our context is
the following scaling law for the variance of the surfaceheights:
h ~xþ~l� �
� h ~xð Þh i2� �
� ~l��� ���2z; ð1Þ
which implies long-range correlations in the height-to-height fluctuations. We shall show that these correlationsstrongly affect the aperture field of the rough fracturesstudied in the present work and therefore flow inside them.[6] In both experiments and numerical studies, we shall
consider model fractures, made of two complementary self-affine surfaces: two perfectly matching surfaces separatedby a distance a0 in the direction normal to their commonmean plane and, in general, subject to a shear displacement~u parallel to this mean plane. As pointed out in previousstudies [Brown et al., 1986; Plouraboue et al., 1995], theshear displacement introduces a mismatch length betweenthe two perfectly mated surfaces and the self-affine scalingbehavior seen in the topography of an individual surface
1Laboratoire Fluides, Automatique et Systemes Thermiques, UMR 7608,CNRS, Universite Paris-Sud XI, Orsay, France.
2Benjamin Levich Institute and Department of Physics, City College ofthe City University of New York, New York, New York, USA.
Copyright 2005 by the American Geophysical Union.0043-1397/05/2005WR003938$09.00
W09423
WATER RESOURCES RESEARCH, VOL. 41, W09423, doi:10.1029/2005WR003938, 2005
1 of 10
will only appear in the aperture field at length scales smallerthan the shear displacement. In all cases, the gap betweensurfaces is large enough so that the two walls do not touch,thereby avoiding the effects of shear-induced dilation of thefracture gap on its permeability.[7] The experiments were performed using transparent
models fabricated from moldings of actual rocks. In theexperiments, a dye is injected radially from a point of thefracture and the anisotropy in the permeability is computedfrom that of the injection patterns. Only the ratio of thehighest and lowest permeabilities can be determined in thisway, but not their absolute values. These experiments aretherefore appropriately complemented by numerical simu-lations which, in addition to the permeability, provide thecomplete flow field. In order to compute the velocity field inthese complex geometries we used the lattice Boltzmanntechnique [Drazer and Koplik, 2000, 2001, 2002; Kim etal., 2003].[8] The paper is organized as follows: in section 2.1 we
describe the experimental procedure used to obtain thetransparent cast of the fractured rock. Also in section 2.1we describe the method used to characterize the roughnessof the fracture walls. In section 2.2 we describe the exper-imental setup and the image analysis method. In section 3we present the experimental results and, in section 4, wediscuss a theoretical analysis of the relation between theaperture field and the observed anisotropy in the permeabil-ity. The scaling laws obtained in this way are then comparedto numerical simulations in sections 5 and 6. Finally, thetheoretical description developed in section 4 is applied tothe experimental data in section 7.
2. Experimental Setup and Procedure
2.1. Model Fracture and Flow Setup
[9] The experiments were performed on transparentmoldings of fractured granite blocks extracted from a quarryin Lanhelin (Britanny). A tensile crack was produced by acompressive force applied on two opposite sharp edgescarved in the middle of two facing sides (the initial blocksize is 25 � 25 � 40 cm3). A silicon rubber molding of oneof the fracture surfaces is then used as a template to producea transparent epoxy casts of the original surface. The epoxycast is in turn used as a template to produce a second siliconrubber molding of a perfectly matching surface (dimension-al deformations during polymerization are much smaller forthe silicon than for the epoxy). This method is in commonuse, and typical reproduction problems are negligible in thepresent type of application [Hakami and Barton, 1990; Yeoet al., 1998; Auradou et al., 2001; Isakov et al., 2001;Kostakis et al., 2003]. The complementary epoxy andrubber surfaces are the walls of the model fracture used inthe present work.[10] Prior to the experiments, 2-D maps of the epoxy
casts of different fractures are obtained by means of a mech-anical profilometer (770 � 760 points), with a 250 mm gridspacing and a 10 mm vertical resolution [Boffa et al., 1998].The difference in height between the highest and the lowestpoints of the surface is ’17 mm and the root mean squaredeviation of the surface heights is ’3.5 mm. As discussedin the introduction, self-affine surfaces have a roughnesswhich does not contain any intrinsic wavelength, and it
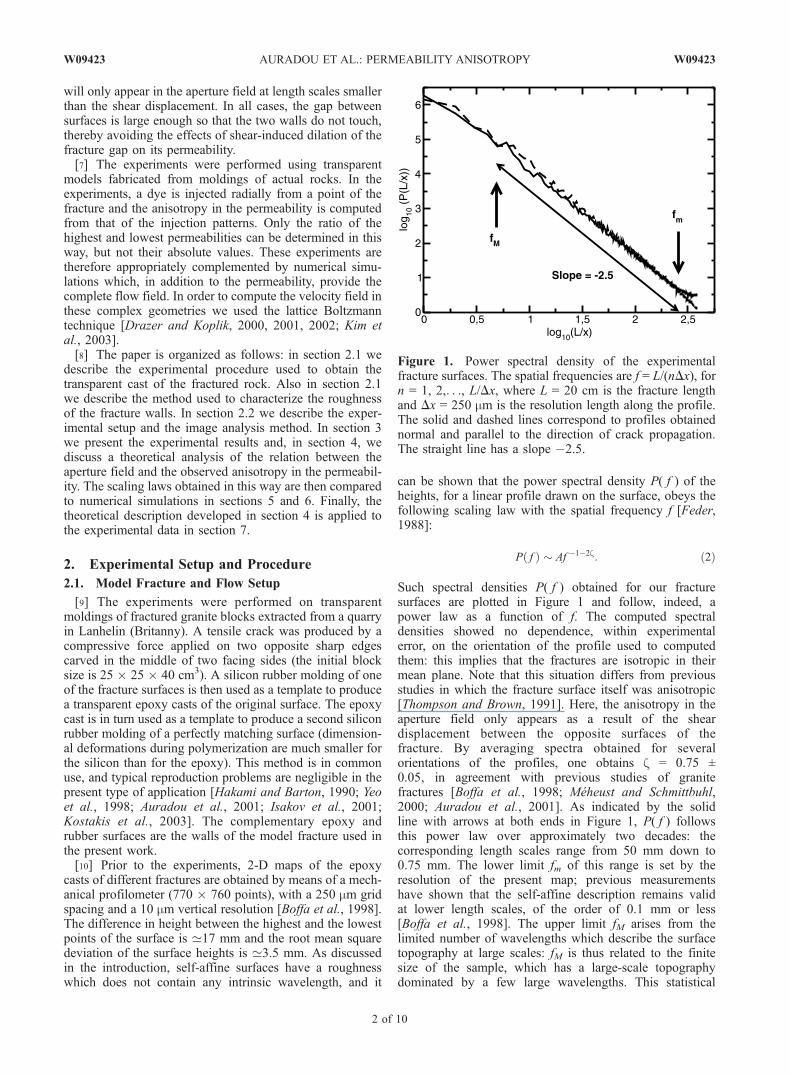
can be shown that the power spectral density P( f ) of theheights, for a linear profile drawn on the surface, obeys thefollowing scaling law with the spatial frequency f [Feder,1988]:
P fð Þ � Af �1�2z: ð2Þ
Such spectral densities P( f ) obtained for our fracturesurfaces are plotted in Figure 1 and follow, indeed, apower law as a function of f. The computed spectraldensities showed no dependence, within experimentalerror, on the orientation of the profile used to computedthem: this implies that the fractures are isotropic in theirmean plane. Note that this situation differs from previousstudies in which the fracture surface itself was anisotropic[Thompson and Brown, 1991]. Here, the anisotropy in theaperture field only appears as a result of the sheardisplacement between the opposite surfaces of thefracture. By averaging spectra obtained for severalorientations of the profiles, one obtains z = 0.75 ±0.05, in agreement with previous studies of granitefractures [Boffa et al., 1998; Meheust and Schmittbuhl,2000; Auradou et al., 2001]. As indicated by the solidline with arrows at both ends in Figure 1, P( f ) followsthis power law over approximately two decades: thecorresponding length scales range from 50 mm down to0.75 mm. The lower limit fm of this range is set by theresolution of the present map; previous measurementshave shown that the self-affine description remains validat lower length scales, of the order of 0.1 mm or less[Boffa et al., 1998]. The upper limit fM arises from thelimited number of wavelengths which describe the surfacetopography at large scales: fM is thus related to the finitesize of the sample, which has a large-scale topographydominated by a few large wavelengths. This statistical
Figure 1. Power spectral density of the experimentalfracture surfaces. The spatial frequencies are f = L/(nDx), forn = 1, 2,. . ., L/Dx, where L = 20 cm is the fracture lengthand Dx = 250 mm is the resolution length along the profile.The solid and dashed lines correspond to profiles obtainednormal and parallel to the direction of crack propagation.The straight line has a slope �2.5.
2 of 10
W09423 AURADOU ET AL.: PERMEABILITY ANISOTROPY W09423

effect usually becomes apparent at length scales greaterthan one fourth of the system size [Meheust andSchmittbuhl, 2000].
2.2. Experimental Procedure and Image Analysis
[11] The objective of the experiments is to analyze flowinside an open fracture by monitoring the radial spreadingof an injected dye. Using a radial injection geometry allowsus to estimate variations of the fracture permeability withthe flow direction from the shape of the invaded zone. Thetwo complementary surfaces are initially brought into fullcontact, with their mean plane (x, y) horizontal. The top(transparent) surface is kept fixed thereafter (see Figure 2for details) and the lower one can be translated whileremaining parallel to its initial orientation. Specifically, itis first displaced downward (�z direction), by a distance a0,to open the fracture, and then laterally in the (x, y) plane tothe desired location. This lateral displacement ~u is smallenough so that the two surfaces do not come in contact. Inorder to ensure an isotropic boundary condition at the outlet,the rubber molding has been cut to a circular shape with itscenter at the injection point.[12] The fracture model is then placed inside a leak tight
basin which is filled with transparent fluid in order tosaturate the model prior to the experiments. Transparentfluid is then injected through a hole in the top surface andflows radially outward. Once a steady flow is reached, adyed fluid is injected through the inlet orifice, and images ofthe invaded region are taken at constant time intervals usinga high resolution cooled 12 bits digital camera. The cell isuniformly illuminated from above by four halogen lampsplaced around the setup and the light reflected by theopaque silicon cast, which corresponds to the bottomsurface of the fracture (see Figure 2), is recorded by thecamera. Each pixel corresponds to a 250 mm � 250 mm area.The fluids used are water-glycerol solutions with 10%glycerol and viscosity 1.288 cP at 20�C [Lide, 1996]. Thedyed solution contains 0.2–0.3 g/L of nigrosine and thedensity of the two fluids is matched by adding an equivalentamount of NaCl to the transparent solution. In order toavoid density differences due to temperature variations thesolutions are stored at the same temperature. In all experi-ments, density differences between the two fluids werealways smaller than 25 10�4 g/cm3 [Lide, 1996] and theflow rate is less than 5 mL/min. The Reynolds number isless than 1 even in the vicinity of the injection.[13] The concentration map of the injected dye is then
determined from the images recorded during the experi-ments, by assuming the validity of Beer-Lambert’s law[Brown et al., 1998; Detwiler et al., 1999, 2000], i.e., thatthe light intensity I(x, y) at any given point (x, y) of theimage varies exponentially with the local aperture a(x, y)and the local concentration c(x, y) according to
I x; yð Þ ¼ I0 x; yð Þ exp �2 m c x; yð Þa x; yð Þð Þ; ð3Þ
where I0(x, y) is the light intensity for a transparent fluid andm is the extinction coefficient. The validity of this relationhas been verified by opening the fracture without introdu-cing a lateral shift so that the local aperture a(x, y) isconstant and equal to the vertical displacement Dz. Thecorresponding light intensity I(x, y) was then determined fordifferent dye concentrations, c0, and different mean
apertures, a0 = Dz. The corresponding results approximatelycollapse into a single curve by plotting the ratio I(x, y)/I0(x,y) as a function of Dz � c0. Moreover, the variation of theabsorbance with Dz � c0 can be approximated, in a loglinear plot, by the linear relationship that follows fromequation (3) with m = 2.9 ± 0.4 m2/g. The previous lineardependence of the absorbance is valid for a(x, y) c0 <0.15 g/m2: The uncertainty on the extinction coefficient mmostly reflects the departure from this linear law and hasbeen previously observed with this experimental technique[Detwiler et al., 1999, 2000]. Then, we can determine thelocal, instantaneous concentration c(x, y, t) during the dis-placement experiments, by also applying equation (3) to theasymptotic concentration inside the fracture:
c x; y; tð Þcf
¼ lnI x; y; tð ÞI0 x; yð Þ
� ,ln
I0 x; yð ÞIf x; yð Þ
� ; ð4Þ
where cf is the asymptotic concentration and If is thecorresponding final light intensity. A typical concentrationmap obtained in this way for an experiment in which thefracture walls are translated relative to each other isdisplayed in Figure 3a. The maximum RMS error was 6%for any location inside the fracture. In addition to theirregularity of the front boundary, already discussed byAuradou et al. [2001] and by Drazer et al. [2004], its globalshape is clearly anisotropic, with a strong elongation in thedirection perpendicular to the shear displacement ~u. Asimilar anisotropy is observed on the aperture field
Figure 2. Schematic view of the experimental setup. Thetop wall is a transparent epoxy cast and has a fixed position.The bottom wall is a silicone replica of the top wall and canbe moved down and laterally. The dyed fluid is injected in aradial, divergent configuration, and it displaces a nondyedfluid which initially saturates the fracture gap. The flowprocess is visualized with a camera set above the fracture.The two controlled lengths are indicated: a0, the meanvertical separation between walls, and ~u, the sheardisplacement vector.
W09423 AURADOU ET AL.: PERMEABILITY ANISOTROPY
3 of 10
W09423
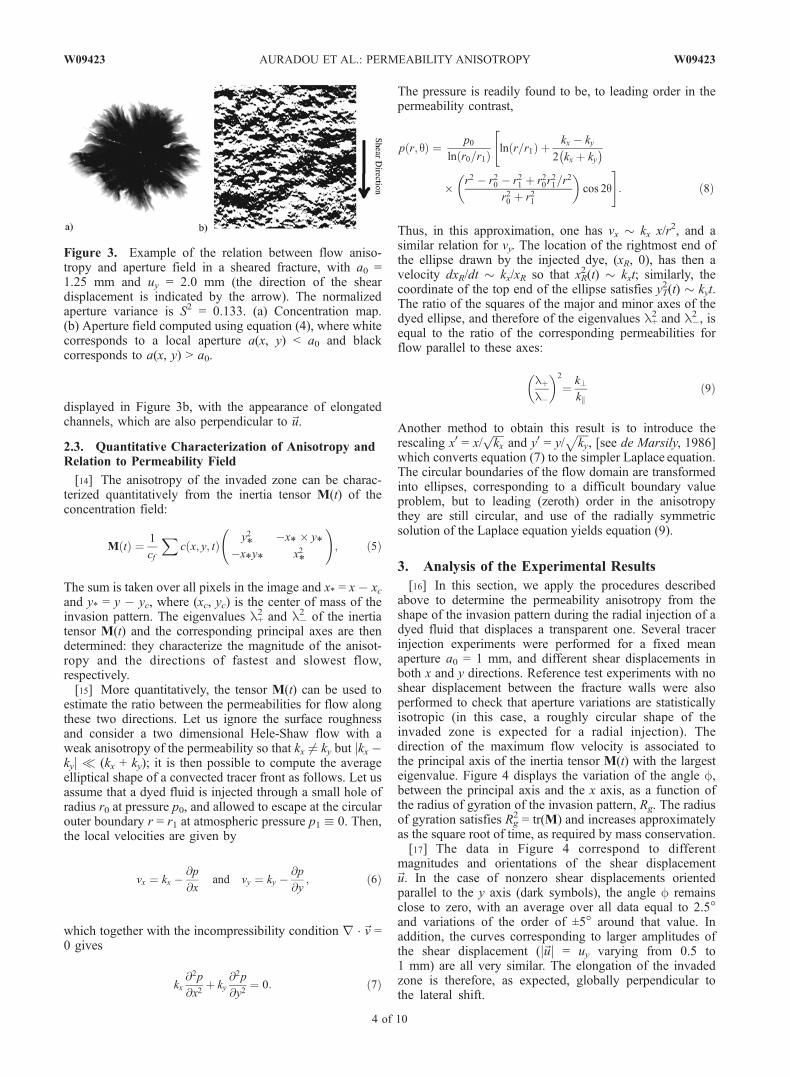
displayed in Figure 3b, with the appearance of elongatedchannels, which are also perpendicular to ~u.
2.3. Quantitative Characterization of Anisotropy andRelation to Permeability Field
[14] The anisotropy of the invaded zone can be charac-terized quantitatively from the inertia tensor M(t) of theconcentration field:
M tð Þ ¼ 1
cf
Xc x; y; tð Þ
y2*
�x* � y*�x*y* x2
*
!; ð5Þ
The sum is taken over all pixels in the image and x* = x � xcand y* = y � yc, where (xc, yc) is the center of mass of theinvasion pattern. The eigenvalues l+
2 and l�2 of the inertia
tensor M(t) and the corresponding principal axes are thendetermined: they characterize the magnitude of the anisot-ropy and the directions of fastest and slowest flow,respectively.[15] More quantitatively, the tensor M(t) can be used to
estimate the ratio between the permeabilities for flow alongthese two directions. Let us ignore the surface roughnessand consider a two dimensional Hele-Shaw flow with aweak anisotropy of the permeability so that kx 6¼ ky but jkx �kyj (kx + ky); it is then possible to compute the averageelliptical shape of a convected tracer front as follows. Let usassume that a dyed fluid is injected through a small hole ofradius r0 at pressure p0, and allowed to escape at the circularouter boundary r = r1 at atmospheric pressure p1 � 0. Then,the local velocities are given by
vx ¼ kx �@p
@xand vy ¼ ky �
@p
@y; ð6Þ
which together with the incompressibility condition r �~v =0 gives
kx@2p
@x2þ ky
@2p
@y2¼ 0: ð7Þ
The pressure is readily found to be, to leading order in thepermeability contrast,
p r; qð Þ ¼ p0
ln r0=r1ð Þ ln r=r1ð Þ þ kx � ky
2 kx þ ky� �
"
� r2 � r20 � r21 þ r20r21=r
2
r20 þ r21
� �cos 2q
#: ð8Þ
Thus, in this approximation, one has vx � kx x/r2, and asimilar relation for vy. The location of the rightmost end ofthe ellipse drawn by the injected dye, (xR, 0), has then avelocity dxR/dt � kx/xR so that xR
2(t) � kxt; similarly, thecoordinate of the top end of the ellipse satisfies yT
2(t) � kyt.The ratio of the squares of the major and minor axes of thedyed ellipse, and therefore of the eigenvalues l+
2 and l�2 , is
equal to the ratio of the corresponding permeabilities forflow parallel to these axes:
lþ
l�
� �2
¼ k?
kkð9Þ
Another method to obtain this result is to introduce therescaling x0 = x/
ffiffiffiffikx
pand y0 = y/
ffiffiffiffiky
p, [see de Marsily, 1986]
which converts equation (7) to the simpler Laplace equation.The circular boundaries of the flow domain are transformedinto ellipses, corresponding to a difficult boundary valueproblem, but to leading (zeroth) order in the anisotropythey are still circular, and use of the radially symmetricsolution of the Laplace equation yields equation (9).
3. Analysis of the Experimental Results
[16] In this section, we apply the procedures describedabove to determine the permeability anisotropy from theshape of the invasion pattern during the radial injection of adyed fluid that displaces a transparent one. Several tracerinjection experiments were performed for a fixed meanaperture a0 = 1 mm, and different shear displacements inboth x and y directions. Reference test experiments with noshear displacement between the fracture walls were alsoperformed to check that aperture variations are statisticallyisotropic (in this case, a roughly circular shape of theinvaded zone is expected for a radial injection). Thedirection of the maximum flow velocity is associated tothe principal axis of the inertia tensor M(t) with the largesteigenvalue. Figure 4 displays the variation of the angle f,between the principal axis and the x axis, as a function ofthe radius of gyration of the invasion pattern, Rg. The radiusof gyration satisfies Rg
2 = tr(M) and increases approximatelyas the square root of time, as required by mass conservation.[17] The data in Figure 4 correspond to different
magnitudes and orientations of the shear displacement~u. In the case of nonzero shear displacements orientedparallel to the y axis (dark symbols), the angle f remainsclose to zero, with an average over all data equal to 2.5�and variations of the order of ±5� around that value. Inaddition, the curves corresponding to larger amplitudes ofthe shear displacement (j~uj = uy varying from 0.5 to1 mm) are all very similar. The elongation of the invadedzone is therefore, as expected, globally perpendicular tothe lateral shift.
Figure 3. Example of the relation between flow aniso-tropy and aperture field in a sheared fracture, with a0 =1.25 mm and uy = 2.0 mm (the direction of the sheardisplacement is indicated by the arrow). The normalizedaperture variance is S2 = 0.133. (a) Concentration map.(b) Aperture field computed using equation (4), where whitecorresponds to a local aperture a(x, y) < a0 and blackcorresponds to a(x, y) > a0.
4 of 10
W09423 AURADOU ET AL.: PERMEABILITY ANISOTROPY W09423

[18] Similar results are obtained for displacements paral-lel to the x axis (open symbols) and at an angle of �45�from it (asterisks). In these cases, f is of the order of 90�and 45�, respectively, indicating again that the invaded zoneis elongated perpendicularly to the displacement. Thisdemonstrates that the flow anisotropy is directly connectedto the lateral shift, with the preferential flow directionoriented at an angle of 90� with respect to the direction ofthe shear displacement: these results also show that theobserved anisotropy does not arise from any intrinsicfeature in the fracture surface itself, but from the sheardisplacement between the surfaces of the fracture.[19] These results are in agreement with qualitative
observations of the aperture fields, such as that presentedin Figure 3: the shear displacement creates ridges in theaperture field, oriented in the perpendicular direction andpartly inhibiting the flow. In the absence of such sheardisplacement we observe, in some cases, a large dispersionof the measured values of f, as expected for a nearlycircular invaded zone for which f is undetermined. In otherexperiments, f takes a better defined value, possibly due toa residual lateral shift.[20] While f indicates the orientation of the anisotropy,
its magnitude is characterized by the ratio of the eigenvaluesof the inertia tensor, l+/l�. The variation of l+/l� with theradius of gyration Rg of the invaded zone is displayed inFigure 5: it can be seen that l+/l� reaches an approximatelyconstant value for Rg > 30 mm, suggesting that the growthof the invaded zone is self-similar. This asymptotic value ofl+/l� represents then a robust parameter allowing tocharacterize the anisotropy of the permeability for a givenorientation and amplitude of the shear displacement.[21] Figure 5b shows that for a fixed amplitude of the
shear displacement the measured value of l+/l�, and
therefore the degree of anisotropy of the permeability,depends, in general, on the direction of the shear displace-ment: e.g., while it is of the order of 1.05 for a displacement~u along the x axis, it reaches 1.15 when ~u is in the ydirection. Note that, on the other hand, when the displace-ment is applied along a given orientation, the ratio l+/l�takes similar values in the positive and negative directions.These fluctuations come from the statistical character of thedistribution of the ridges that alter the flow, which varies,not only from sample to sample, but also with the orienta-tion of the shear displacement in a single fracture. On theother hand, for a given orientation, the variation of l+/l�with the magnitude of the shear displacement is smooth, inagreement with the fact that the location of the main ridgesremains the same as j~uj = u increases. These results on theratio l+/l� can be converted into permeability ratios bymeans of equation (9), which allows then for comparisonswith the numerical simulations discussed below.
4. Theoretical Discussion of the Relation BetweenPermeability Anisotropy and Aperture Field
[22] The self-affine nature of the fracture walls affects theaperture field, and has thus an important influence on fluidflow due to the hydrodynamic boundary conditions imposedthere. Here, we consider two complementary fracture sur-faces with their mean planes parallel and horizontal, whichare separated vertically in order to open the fracture andshifted horizontally to introduce a shear displacement. For avertical separation a0 and shear displacements ux and uy,
Figure 5. Experimental variation of the ratio l+/l� asfunction of the radius of gyration Rg of the invaded zone fora shear displacement ~u oriented along +y and with thefollowing amplitudes: u = 0 (circles), 0.25 mm (squares),0.5 mm (diamonds), 0.75 mm (triangles), and 1 mm(inverted triangles). (b) Variation of l+/l� with Rg for aconstant magnitude of the shear displacement ~u (u =0.75mm) and oriented in the following directions: +x (circles),�x (squares), +y (triangles), and �y (diamonds).
Figure 4. Angle f between the x axis and the direction ofmaximum flow velocity for different shear displacements.The different symbols correspond to a shear displacementparallel to x and u = 0.25 mm (open squares), 0.5 mm (opendiamonds), and 0.75 mm (open triangles); a shear displace-ment parallel to y and u = 0.25 mm (solid squares), 0.5 mm(solid diamonds), 0.75 mm (solid triangles), and 1 mm(pluses); and a shear displacement at �45� with x and u =1 mm (asterisks).
W09423 AURADOU ET AL.: PERMEABILITY ANISOTROPY
5 of 10
W09423
along the x and y directions, respectively, the local apertureis defined as the vertical distance separating the two walls:
a x; yð Þ ¼ h x; yð Þ � h x� ux; y� uy� �
þ a0: ð10Þ
[23] The covariance of the aperture, computed usingequation (1), exhibits two different scaling regimes[Plouraboue et al., 1995]. Specifically, for length scalessmaller than the shear displacement, the aperture field wasshown to have self-affine correlations with exponent z,whereas, for larger length scales, the covariance decreases,corresponding to a loss of the self-affine character of theaperture field.[24] The magnitude of the shear displacement thus rep-
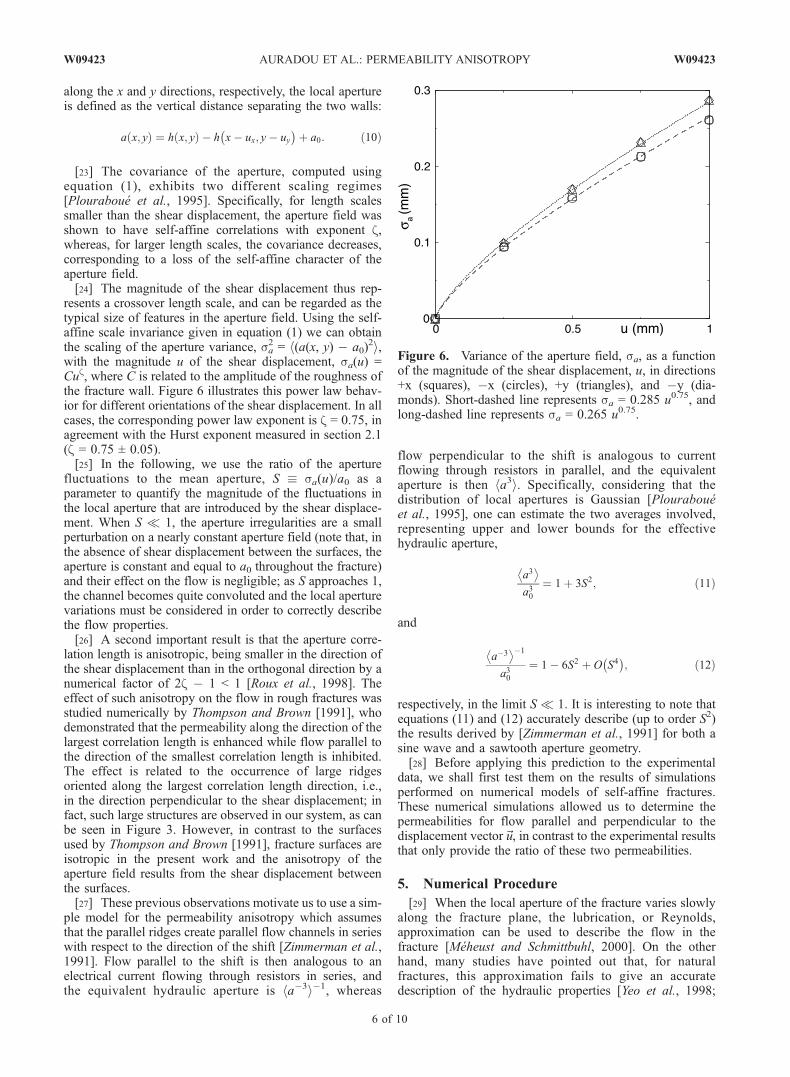
resents a crossover length scale, and can be regarded as thetypical size of features in the aperture field. Using the self-affine scale invariance given in equation (1) we can obtainthe scaling of the aperture variance, sa
2 = h(a(x, y) � a0)2i,
with the magnitude u of the shear displacement, sa(u) =Cuz, where C is related to the amplitude of the roughness ofthe fracture wall. Figure 6 illustrates this power law behav-ior for different orientations of the shear displacement. In allcases, the corresponding power law exponent is z = 0.75, inagreement with the Hurst exponent measured in section 2.1(z = 0.75 ± 0.05).[25] In the following, we use the ratio of the aperture
fluctuations to the mean aperture, S � sa(u)/a0 as aparameter to quantify the magnitude of the fluctuations inthe local aperture that are introduced by the shear displace-ment. When S 1, the aperture irregularities are a smallperturbation on a nearly constant aperture field (note that, inthe absence of shear displacement between the surfaces, theaperture is constant and equal to a0 throughout the fracture)and their effect on the flow is negligible; as S approaches 1,the channel becomes quite convoluted and the local aperturevariations must be considered in order to correctly describethe flow properties.[26] A second important result is that the aperture corre-
lation length is anisotropic, being smaller in the direction ofthe shear displacement than in the orthogonal direction by anumerical factor of 2z � 1 < 1 [Roux et al., 1998]. Theeffect of such anisotropy on the flow in rough fractures wasstudied numerically by Thompson and Brown [1991], whodemonstrated that the permeability along the direction of thelargest correlation length is enhanced while flow parallel tothe direction of the smallest correlation length is inhibited.The effect is related to the occurrence of large ridgesoriented along the largest correlation length direction, i.e.,in the direction perpendicular to the shear displacement; infact, such large structures are observed in our system, as canbe seen in Figure 3. However, in contrast to the surfacesused by Thompson and Brown [1991], fracture surfaces areisotropic in the present work and the anisotropy of theaperture field results from the shear displacement betweenthe surfaces.[27] These previous observations motivate us to use a sim-
ple model for the permeability anisotropy which assumesthat the parallel ridges create parallel flow channels in serieswith respect to the direction of the shift [Zimmerman et al.,1991]. Flow parallel to the shift is then analogous to anelectrical current flowing through resistors in series, andthe equivalent hydraulic aperture is ha�3i�1, whereas
flow perpendicular to the shift is analogous to currentflowing through resistors in parallel, and the equivalentaperture is then ha3i. Specifically, considering that thedistribution of local apertures is Gaussian [Plouraboueet al., 1995], one can estimate the two averages involved,representing upper and lower bounds for the effectivehydraulic aperture,
a3� �a30
¼ 1þ 3S2; ð11Þ
and
a�3� ��1
a30¼ 1� 6S2 þ O S4
� �; ð12Þ
respectively, in the limit S 1. It is interesting to note thatequations (11) and (12) accurately describe (up to order S2)the results derived by [Zimmerman et al., 1991] for both asine wave and a sawtooth aperture geometry.[28] Before applying this prediction to the experimental
data, we shall first test them on the results of simulationsperformed on numerical models of self-affine fractures.These numerical simulations allowed us to determine thepermeabilities for flow parallel and perpendicular to thedisplacement vector~u, in contrast to the experimental resultsthat only provide the ratio of these two permeabilities.
5. Numerical Procedure
[29] When the local aperture of the fracture varies slowlyalong the fracture plane, the lubrication, or Reynolds,approximation can be used to describe the flow in thefracture [Meheust and Schmittbuhl, 2000]. On the otherhand, many studies have pointed out that, for naturalfractures, this approximation fails to give an accuratedescription of the hydraulic properties [Yeo et al., 1998;
Figure 6. Variance of the aperture field, sa, as a functionof the magnitude of the shear displacement, u, in directions+x (squares), �x (circles), +y (triangles), and �y (dia-monds). Short-dashed line represents sa = 0.285 u0.75, andlong-dashed line represents sa = 0.265 u0.75.
6 of 10
W09423 AURADOU ET AL.: PERMEABILITY ANISOTROPY W09423

Nicholl et al., 1999; Dijk and Berkowitz, 1999; Konzuk andKueper, 2004]. In fact, when the roughness of the wallsbecomes sizable compared to the mean fracture aperture,e.g. when the surfaces are close to contact, the lubricationapproximation fails, and a complete description of the flowfield, which accounts for the flow velocity normal to thesurface, is needed [Mourzenko et al., 1995; Drazer andKoplik, 2000]. In this work, we use the lattice Boltzmannmethod to compute the flow field inside the fractures.Previous studies have shown that the lattice Boltzmanntechnique is particularly suitable to investigate flows incomplex geometries [Gutfraind et al., 1995; Gutfraindand Hansen, 1995].[30] First, a self-affine surface is generated numerically,
using a Fourier synthesis method [Drazer and Koplik, 2002],and the fracture pore space is modeled as the region betweenone such surface and a suitably translated replica. In order tomimic the experimental procedure, the two complementarysurfaces are first separated by a fixed distance a0 in thedirection z normal to the mean plane of the fracture. Then, ashear displacement of the upper surface is introduced in the (x,y) plane. The maximum shear displacement investigated ineach direction corresponds to the occurrence of the firstcontact point between the surfaces, and therefore the fractureremains open over its full area. In order to compare thenumerical results to the experiments, both the Hurst exponentand the average magnitude of the surface roughness need tobe matched to their experimental values: the average fluctu-ation in surface height over a distance of 1 mmwas thus set to0.25 mm, and the Hurst exponent zwas set to 0.8. Finally, themean aperture was set to a ’ 1 mm, which is comparable tothat used in the experiments. Using these values, the localheight varies considerably over distances of the order of theaperture size, and computing the complete flow field insidethe fractures is therefore required.[31] In order to capture the three-dimensional character of
the flow field inside the fractures, large cubic lattices, with asmany as 1024� 1024� 20 sites, are used in the simulations,which were then run in parallel using a distributed memorycomputer with over 1000 processors. Hence the latticespacing d corresponds to 0.05 mm (the mean aperture a0 =1 mm corresponds to 20 lattice sites). The Lattice Boltzmannmethod is then used to compute the flow field in the presenceof a pressure gradient and using periodic boundary conditionsin the plane of the surface (see Drazer and Koplik [2002] fordetails of the simulation method). The pressure gradient isapplied either along or perpendicular to the shear displace-ment between surfaces. In addition, and to avoid the possibleeffects of any intrinsic anisotropy in the generation of the self-affine surfaces, the shear displacements are introduced in boththe x and y directions within the mean plane. The Reynoldsnumber in the simulations is Re = Ua/n � a3rrP/12n2 �0.4 < 1 for a = 1 mm. Inertia effects are therefore negligibleand the flow is governed by the linear Stokes equations,whichare invariant under velocity rescaling. Then, by computingthe flow rate, we can obtain the permeability of the fractureand its dependence on the magnitude and orientation of theshear displacement.
6. Analysis of the Numerical Simulations
[32] Numerical simulations are performed in configura-tions reproducing as far as possible those encountered in the
experiments. Several series of computations were performedon self-affine fracture models for different mean apertures(0.5 < a0 < 2.0 mm) and shear-displacements ~u (0 < u <1.6 mm). The displacement~u is oriented along directions xor y in the mean plane of the surfaces and the size of thesimulated fractures is typically 25.6 � 25.6 mm. For givenvalues of a0 and ~u, computations are performed on 10independent realizations in order to estimate the dispersionof the results (only a part of the corresponding data will bedisplayed for clarity, but all data are consistent with thetrends visible on the figures).[33] The variation of the normalized permeabilities, kk/k0
and k?/k0 (where k0 is the isotropic permeability for u = 0, andkk (k?) is the permeability for flow parallel (normal) to theshear displacement), as a function of the normalized aperturevariance S2 are represented on Figure 7, for a constant meanaperture a0 = 1.0 mm, and for different magnitudes of theshear displacement, which is oriented either along the x oralong the y axis. The normalized variance S2 is used as thehorizontal scale since, as already discussed in section 4, it isthe relevant parameter to characterize the dependence of thepermeability on the shear displacement.[34] The main result is the fact that both k?/k0 and kk/k0
vary linearly with S2 but in opposite directions (k?/k0increases with S2 while kk/k0 decreases). Figure 7 alsoshows that a similar behavior is observed for shear displace-ments oriented both parallel to the x and y axes: thisdemonstrates that the permeability anisotropy is inducedby the shear displacement and it is not associated togeometrical anisotropies present before the relative dis-placement of the walls is introduced.
Figure 7. Normalized permeabilities as a function of thenormalized aperture variance S2 from numerical simulationswith variable shear displacements (0 < u < 1.6 mm) and aconstant mean aperture (a0 = 1.0 mm) for two fracturesurface realizations. Open (solid) symbols show perme-ability kk/k0 (k?/k0) parallel (perpendicular) to the sheardisplacement~u. For realization 1, squares show ux 6¼ 0, uy =0, and circles show ux = 0, uy 6¼ 0. For realization 2,diamonds show ux 6¼ 0, uy = 0, and triangles show ux = 0,uy 6¼ 0. Top (bottom) solid line is upper (lower) perme-ability bound from equation (11) (equation (12)).
W09423 AURADOU ET AL.: PERMEABILITY ANISOTROPY
7 of 10
W09423
[35] These linear variations of the permeability qualita-tively agree with the simple model presented in section 4. Infact, in section 4 we estimated the upper and lower boundsfor k?/k0 and kk/k0 with S2 (see equations (11) and (12)).These limiting values are represented by solid lines inFigure 7. As can be seen, the sign and order of magnitudeof these variations are the same as those obtained in thenumerical simulations.[36] Another interesting result is the strong correlation
between the changes in kk/k0 and those in k?/k0: fracturesdisplaying a large reduction of the permeability kk for agiven shear displacement generally also display a significantincrease of k? for the same displacement ~u. This is forinstance the case for the results displayed in Figure 7, whichcorrespond to two different fractures.[37] Finally, other simulations were performed in which
S2 is modified by varying the mean aperture from a0 =2.0 mm to a0 = 0.75 mm, while keeping the shear displace-ment constant, u = 1.5 mm. In this case, the variance S2
increases when the aperture a0 decreases. The variations ofkk/k0 and k?/k0 as a function of S2 for data sets obtained inthis way for three different realizations of the fracture sur-face are plotted in Figure 8. One observes the same generaltrend as in Figure 7 for which a0 is kept constant and u var-ies: namely, kk/k0 decreases and k?/k0 increases or remainsconstant as a0 is reduced and S2 increases. For a givenrealization of the surface, the variations of kk/k0 and k?/k0with S2 are linear and both remain within the bounds set byequations (11) and (12). This confirms that the normalizedaperture variance, S2, is indeed the adequate parameter tocharacterize the disorder in the aperture field introduced bythe shear displacement between the two surfaces.[38] Numerically, 10 independent self-affine surfaces
were used to create aperture fields for different meanapertures and shear displacements. By fitting the averageof the permeabilities over all realizations to a quadraticdependence on S we obtain:
k?k0
� �¼ 0:995þ 1:09S2; ð13Þ
and
kk
k0
� �¼ 0:955� 3:05S2: ð14Þ
Nevertheless, large fluctuations are observed from onerealization to another: for some of them, the flow is onlyweakly perturbed by the wall roughness while, for others, itis strongly distorted and the permeability behaves aspredicted by equations (11) and (12).
7. Comparison Between Experiments andSimulations
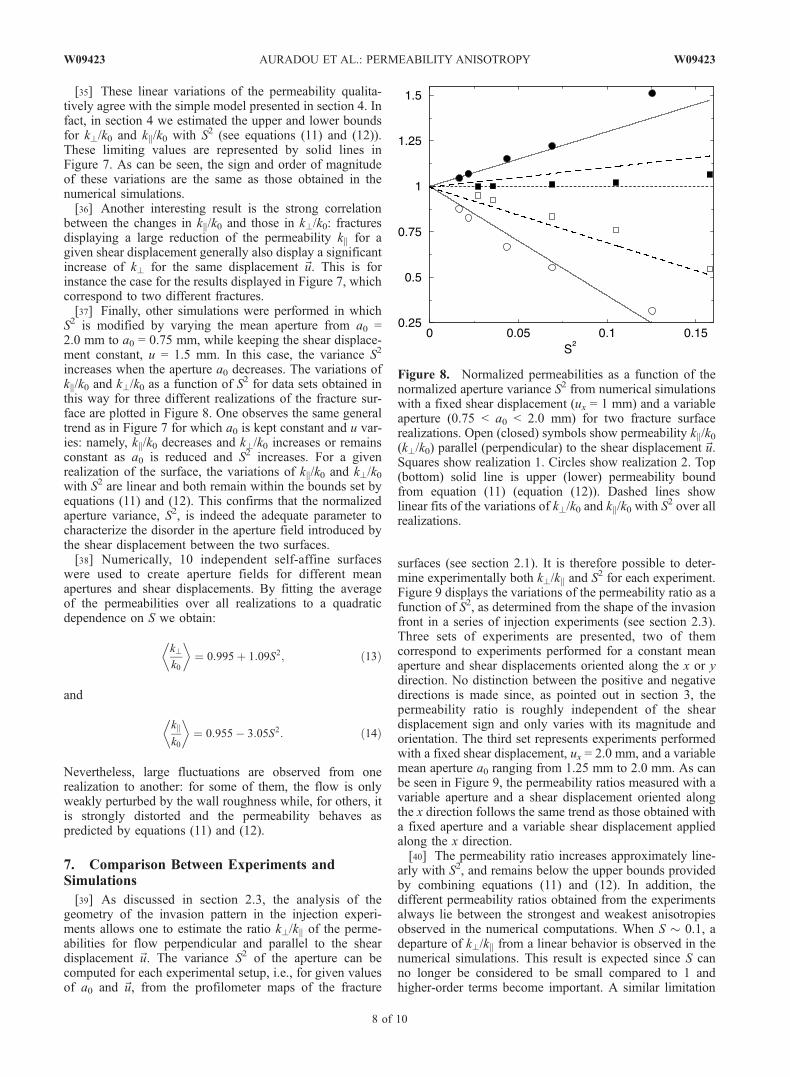
[39] As discussed in section 2.3, the analysis of thegeometry of the invasion pattern in the injection experi-ments allows one to estimate the ratio k?/kk of the perme-abilities for flow perpendicular and parallel to the sheardisplacement ~u. The variance S2 of the aperture can becomputed for each experimental setup, i.e., for given valuesof a0 and ~u, from the profilometer maps of the fracture
surfaces (see section 2.1). It is therefore possible to deter-mine experimentally both k?/kk and S2 for each experiment.Figure 9 displays the variations of the permeability ratio as afunction of S2, as determined from the shape of the invasionfront in a series of injection experiments (see section 2.3).Three sets of experiments are presented, two of themcorrespond to experiments performed for a constant meanaperture and shear displacements oriented along the x or ydirection. No distinction between the positive and negativedirections is made since, as pointed out in section 3, thepermeability ratio is roughly independent of the sheardisplacement sign and only varies with its magnitude andorientation. The third set represents experiments performedwith a fixed shear displacement, ux = 2.0 mm, and a variablemean aperture a0 ranging from 1.25 mm to 2.0 mm. As canbe seen in Figure 9, the permeability ratios measured with avariable aperture and a shear displacement oriented alongthe x direction follows the same trend as those obtained witha fixed aperture and a variable shear displacement appliedalong the x direction.[40] The permeability ratio increases approximately line-
arly with S2, and remains below the upper bounds providedby combining equations (11) and (12). In addition, thedifferent permeability ratios obtained from the experimentsalways lie between the strongest and weakest anisotropiesobserved in the numerical computations. When S � 0.1, adeparture of k?/kk from a linear behavior is observed in thenumerical simulations. This result is expected since S canno longer be considered to be small compared to 1 andhigher-order terms become important. A similar limitation
Figure 8. Normalized permeabilities as a function of thenormalized aperture variance S2 from numerical simulationswith a fixed shear displacement (ux = 1 mm) and a variableaperture (0.75 < a0 < 2.0 mm) for two fracture surfacerealizations. Open (closed) symbols show permeability kk/k0(k?/k0) parallel (perpendicular) to the shear displacement~u.Squares show realization 1. Circles show realization 2. Top(bottom) solid line is upper (lower) permeability boundfrom equation (11) (equation (12)). Dashed lines showlinear fits of the variations of k?/k0 and kk/k0 with S
2 over allrealizations.
8 of 10
W09423 AURADOU ET AL.: PERMEABILITY ANISOTROPY W09423

applies to the experimental results, in that the method usedfor the anisotropy characterization is strictly valid for weakanisotropic permeabilities (see discussion in section 2.3).[41] Finally, we also present in Figure 9 a linear fit to the
experimental data. The strongest effect is observed for ashear displacement in the y direction and a linear regressionindicates a linear increase of k?/kk with S2 with a slope of5.4 ± 0.3. For a shear displacement in the x direction, thepermeability ratio also increases as S2 but with a slope of2.3 ± 0.15.
8. Conclusions
[42] The present study shows, both experimentally andnumerically, that the permeability of a fracture made of twocomplementary surfaces with a shear displacement ~u islower for flow parallel to ~u than perpendicular to it. Moreprecisely, the parallel permeability (kk) decreases signifi-cantly while the perpendicular one (k?) increases or remainsconstant as the magnitude of the shear displacementincreases.[43] Qualitatively, this result appears to be related to the
appearance of preferential channels of larger local apertureoriented perpendicular to ~u: these channels are indeedvisible on aperture images reconstructed from experimental(or numerical) profilometry maps. Assuming such a geo-metrical structure allowed us to develop a simple theoreticalmodel to predict the relation between the permeabilityvariations and the normalized variance S2 of the aperturefield. The permeability for flow parallel (perpendicular) to~uwas then shown to decrease (increase) approximately line-
arly with S2. The absolute magnitude of the variation ispredicted to be two times larger for the parallel flow. Weshowed that these predictions are qualitatively correct andprovide a good estimate for the permeability variations andfor the ratio of the permeabilities perpendicular and parallelto the shear displacement. In particular, both experimentsand numerical simulations exhibit a linear variation of thepermeability ratio with S2, showing that in fact, the varianceS2 is a key parameter of the process. However there is asignificant dispersion in the absolute value of the constantsin these linear relations from one sample to another.[44] Further studies will be needed to understand the
origin of the dispersion of the numerical values of thepermeability variations and uncover the other characteristicgeometrical parameters which may be involved in theprocess (finite size effects may be a limitation, particularlyfor the present simulations). Another important issue forpractical applications is whether an estimation of the aper-ture variance can be obtained, for a given shift~u and meanaperture of the fracture a0, without needing to map the fullsurface of the sample. Mean aperture values used in ourexperiments and simulations are comparable to thosecorresponding to near-surface fractures, but substantiallylarger than for deeper fractures. We have shown, however,that the scaling behavior found for permeability variationsonly depends on the fluctuations of the local aperturenormalized by its mean value, and not on the absolutevalue of the aperture. We therefore expect the same behav-ior for open fractures located far from the surface. Ofcourse, since the stress on the fractures increases with depth,the contact area between opposite surfaces can increasesubstantially with depth, and could modify the analysis.
[45] Acknowledgments. We are indebted to S. Bourles for providingus with the fracture moldings and to G. Chauvin, R. Pidoux, and C. Saurinefor their assistance in the realization of the experimental setup. Computerresources were provided by the National Energy Research ScientificComputing Center. HA and JPH are supported by the CNRS and ANDRAthrough the GdR FORPRO (contribution 2004/20) and the EHDRA(European Hot Dry Rock Association) and PNRH programs. GD and JKare supported by the Geosciences Program of the Office of Basic EnergySciences (U.S. Department of Energy) and by a PSC-CUNY grant. Thiswork was facilitated by a CNRS-NSF Collaborative Research grant.
ReferencesAdler, P. M., and J.-F. Thovert (1999), Fractures and Fracture Networks,Springer, New York.
Auradou, H., J. P. Hulin, and S. Roux (2001), Experimental study of mis-cible displacement fronts in rough self-affine fractures, Phys. Rev. E, 63,066306, doi:10.1103/PhysRevE.63.066306.
Boffa, J. M., C. Allain, and J. P. Hulin (1998), Experimental analysis offracture rugosity in granular and compact rocks, Eur. Phys. J. Appl.Phys., 2, 281–289.
Bouchaud, E. (2003), The morphology of fracture surfaces: A tool forunderstanding crack propagation in complex materials, Surf. Rev. Lett.,10, 797–814, doi:10.1142/S0218625X03005530.
Brown, S. R., R. L. Kranz, and B. P. Bonner (1986), Correlation betweenthe surfaces of natural rock joints, Geophys. Res. Lett., 13, 1430–1433.
Brown, S. R., A. Caprihan, and R. Hardy (1998), Experimental observationof fluid flow channels in a single fracture, J. Geophys. Res., 103(B3),5125–5132.
de Marsily, G. (1986), Quantitative Hydrogeology: Groundwater Hydrol-ogy for Engineers, Elsevier, New York.
Detwiler, R. L., S. E. Pringle, and R. J. Glass (1999), Measurement offracture aperture fields using transmitted light: An evaluation of measure-ment errors and their influence on simulations of flow and transportthrough a single fracture, Water Resour. Res., 35(9), 2605–2617.
Detwiler, R. L., H. Rajaram, and R. J. Glass (2000), Solute transport invariable-aperture fractures: An investigation of the relative importance of
Figure 9. Permeability ratio k?/kk as a function ofnormalized aperture variance S2. Squares, open circles,and solid circles show experimental data; stars and crossesshow numerical data. Squares show ux = 0, uy 6¼ 0. Opencircles show ux 6¼ 0, uy = 0, a0 = 1.0 mm. Solid circles showux = 2.0 mm, 1.25 < a0 < 2 mm. Stars and crosses shownumerical realizations displaying the strongest and theweakest anisotropy, respectively. Short-dashed line showsupper bound for the permeability ratio estimated fromequations (11) and (12). Solid line shows average hk?/kki ofthe permeability ratio over all numerical realizations. Long-dashed lines show linear fits of the experimental data.
W09423 AURADOU ET AL.: PERMEABILITY ANISOTROPY
9 of 10
W09423

Taylor dispersion and macrodispersion, Water Resour. Res., 36, 1161–1625.
Dijk, P. E., and B. Berkowitz (1999), Three-dimensional flow measure-ments in rock fractures, Water Resour. Res., 35, 3955–3959.
Drazer, G., and J. Koplik (2000), Permeability of self-affine rough fractures,Phys. Rev. E, 62, 8076–8085.
Drazer, G., and J. Koplik (2001), Tracer dispersion in two-dimensionalrough fractures, Phys. Rev. E, 63, 056104, doi:10.1103/Phys-RevE.63.056104.
Drazer, G., and J. Koplik (2002), Transport in rough self-affine fractures,Phys. Rev. E, 66, 026303, doi:10.1103/PhysRevE.66.026303.
Drazer, G., H. Auradou, J. Koplik, and J. P. Hulin (2004), Self-affine frontsin self-affine fractures: Large- and small-scale structure, Phys. Rev. Lett.,92, 014501, doi:10.1103/PhysRevLett.92.014501.
Feder, J. (1988), Fractals, Springer, New York.Gentier, S., E. Lamontagne, G. Archambault, and J. Riss (1997), Aniso-tropy of flow in a fracture undergoing shear and its relationship to thedirection of shearing and injection pressure, Int. J. Rock Mech. Min. Sci.,34(3–4), 412, doi:10.1016/S0148-9062(97)00177-0.
Gutfraind, R., and A. Hansen (1995), Study of fracture permeability usinglattice-gas automata, Transp. Porous Media, 18, 131–149.
Gutfraind, R., I. Ippolito, and A. Hansen (1995), Study of tracer dispersionin self-affine fractures using lattice-gas automata, Phys. Fluids, 7, 1938–1948.
Hakami, E., and N. Barton (1990), Aperture measurements and flow ex-periments using transparent replicas of rock joints, in International Sym-posium on Rock Joints, pp. 383–390, A. A. Balkema, Brookfield, Vt.
Isakov, E., S. R. Ogilvie, C. W. Taylor, and P. W. J. Glover (2001), Fluidflow through rough fractures in rocks i: High resolution aperture deter-minations, Earth Planet. Sci. Lett., 191, 267–282.
Kim, I., W. B. Lindquist, and W. B. Durham (2003), Fracture flow simula-tion using a finite-difference lattice Boltzmann method, Phys. Rev. E, 67,046708, doi:10.1103/PhysRevE.67.046708.
Konzuk, J. S., and B. H. Kueper (2004), Evaluation of cubic law basedmodels describing single-phase flow through a rough-walled fracture,Water Resour. Res., 40, W02402, doi:10.1029/2003WR002356.
Kostakis, K., J. P. Harrison, and S. M. Heath (2003), Silicone rubber cast-ings for aperture measurement of rock fractures, Int. J. Rock Mech. Min.Sci., 40, 939–945.
Lide, D. (Ed.) (1996), Handbook of Chemistry and Physics, 63rd ed., CRCPress, Boca Raton, Fla.
Mandelbrot, B. B. (1983), The Fractal Geometry of Nature, W. H. Freeman,New York.
Meheust, Y., and J. Schmittbuhl (2000), Flow enhancement of a roughfracture, Geophys. Res. Lett., 27(18), 2989–2992.
Mourzenko, V., J. F. Thovert, and P. Adler (1995), Permeability of a singlefracture: Validity of the Reynolds equation, J. Phys. II, 5(3–4), 465–482.
NAS Committee on Fracture Characterization and Fluid Flow (1996), RockFractures and Fluid Flow: Contemporary Understanding and Applica-tions, Natl. Acad. Press, Washington, D. C.
Nicholl, M. J., H. Rajaram, R. J. Glass, and R. Detwiler (1999), Saturatedflow in a single fracture: Evaluation of the Reynolds equation in mea-sured aperture fields, Water Resour. Res., 35, 3361–3373.
Olsson, W. A., and S. R. Brown (1993), Hydromechanical response of afracture undergoing compression and shear, Int. J. Rock Mech. Min. Sci.Geomech. Abstr., 30(7), 845–851.
Plouraboue, F., P. Kurowski, J. P. Hulin, S. Roux, and J. Schmittbuhl(1995), Aperture of rough cracks, Phys. Rev. E, 51, 1675–1685.
Plouraboue, F., J. M. Boffa, P. Kurowski, J. P. Hulin, and S. Roux (2000),Experimental study of the transport properties of rough self-affine frac-tures, J. Contam. Hydrol., 46, 295–318.
Roux, S., F. Plouraboue, and J. P. Hulin (1998), Tracer dispersion in roughopen cracks, Transp. Porous Media, 32, 97–116.
Sahimi, M. (1995), Flow and Transport in Porous Media and FracturedRock: From Classical Methods to Modern Approaches, John Wiley,Hoboken, N. J.
Thompson, M. E., and S. R. Brown (1991), The effect of anisotropic sur-face roughness on flow and transport in fractures, J. Geophys. Res., 96,21,923–21,932.
Yeo, I. W., M. H. De Freitas, and R. W. Zimmerman (1998), Effect of sheardisplacement on the aperture and permeability of a rock fracture, Int. J.Rock Mech. Min. Sci., 35(8), 1051–1070.
Zimmerman, R. W., S. Kumar, and G. S. Bodvarsson (1991), Lubrificationtheory analysis of the permeability of rough-walled fractures, Int. J. RockMech. Min. Sci. Geomech. Abstr., 23, 1–30.
����������������������������H. Auradou and J. P. Hulin, Laboratoire Fluides, Automatique et
Systemes Thermiques, UMR 7608, CNRS, Batiment 502, Universite Paris-Sud XI, F-91405 Orsay Cedex, France. ([email protected])
G. Drazer and J. Koplik, Benjamin Levich Institute, City College of theCity University of New York, New York, NY 10031, USA.
10 of 10
W09423 AURADOU ET AL.: PERMEABILITY ANISOTROPY W09423
Related Documents