Welcome message from author
This document is posted to help you gain knowledge. Please leave a comment to let me know what you think about it! Share it to your friends and learn new things together.
Transcript
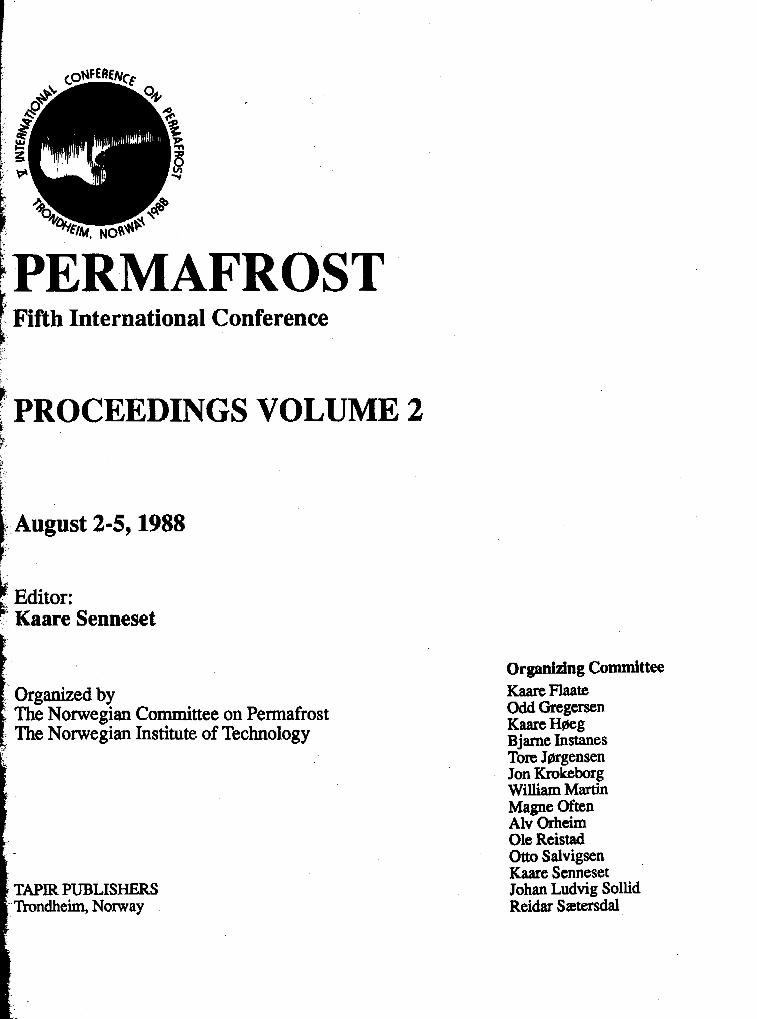
PERMAFR os I T Fifth International Conference
PROCEEDINGS VOLU 'ME 2
Editor: Kaare Senneset
Organized by The Norwegian Committee on Permafrost The Norwegian Institute of Technology
i
' TAPIR PUBLISHERS -%ndheim, Norway
Organizing Committee Kaare Flaate Odd Gregersen KaareH~eg Bjarne Instanes Tore Jfirgensen Jon Krokebrg William Martin Magne Often Alv Orheim Ole Rcistad Otto Salvigsen Kaare Scnneset Johan Ludvig Sollid Reidar S ~ t e r s d a l

0 Tapir Publishers, Trondheim, Norway ISBN 82-5 19-0863-9
Printed in Norway.
CONTENTS VOLUME 1: SCIENCE -
CLIMATE CHANGE AND GEOTHERMAL REGIME
PALEOCLIMATE AND PERMAFROST IN THE MACKENZIE DELTA D . Allen, F. Michel and A. Judge
METEOROLOGICAL CONDITIONS’ INFLUENCE ON THE PERMAFROST GROUND IN SVEAGRUVA, SPITSBERGEN
S. Bakkehoi and C. Bandis
THERMAL CURRENTS OF ACTIVE LAYER IN HORNSUND AREA H . Chmal, J . Klementowski and K. Migala
FREEZING-POINT DEPRESSION AT THE BASE OF ICE-BEARING PERMAFROST ON THE NORTH SLOPE OF ALASKA
T.S. Collett and KJ. Bird
NATURAL GROUND TEMPERATURES IN UPLAND BEDROCK TERRAIN, INTERIOR ALASKA
CM. Collins, RK. Haugen and R A. Kreig
THAWING IN PERMAFROST - SIMULATION AND VERIFICATION M. Ymuz Corapcioglu and S. Panday
SCHEFFERVILLE SNOW-GROUND INTERFACE TEMPERATURES D.T. Desrochers and HB. Granberg
A LONG-TERM PERMAFROST AND CLIMATE MONITORING PROGRAM IN NORTHERN CANADA
DA. Etkin, A . Headley and KJL. Stoker
PERMAFROST-CLlMATIC CHARACTERISTICS OF Different CLASSES M.K. Gmrilowa
LATE QUATERNARY SOLIFLUCTION IN CENTRAL SPITSBERGEN P. Klysz, L. Lindner, L. Marks and L. Wysokinski
GEOMORPHOLOGICAL EFFECTS AND RECENT CLIMATIC RESPONSE OF SNOWPATCHES AND GLACIERS IN THE WESTERN ABISKO MOUNTAINS, SWEDEN
L. Lindh, R. Nyberg and A. Rapp
GAS-HYDRATE ACCUMULATIONS AND PERMAFROST DEVELOPMENT YuF. Makogon
A HYPOTHESIS FOR THE HOLOCENE PERMAFROST EVOLUTION L.N. Maximova and YYe. Romanovsky
DIVISION AND TEMPERATURE CONDITION OF THE LAST GLACIATION IN NORTHERN CHINA
Sun, Jianzhong and Li, Xinguo
33
39
44
50
56
61
67
73
78
84
89
95
102
REGIONAL PERMAFROST
SHORELINE PERMAFROST IN KANGIQSUALUJJUAQ BAY, UNGAVA, Quebec M . Allard, MK. Seguin and Y. Pelletier
PERMAFROST DATA AND INFORMATION: STATUS AND NEEDS R.G. Barry
GEOCRYOLOGICAL MAP OF MONGOLIAN PEOPLE' S REPUBLIC V.V. Baulin, G L . Dubikov, Yu.T. Uvarkin, A L . Chekbvsky, A. Khishigt, S. Dolzhin and R. Buvey-Bator
GEOTECHNICAL AND GEOTHERMAL CONDITIONS OF NEAR-SHORE SEDIMENTS, SOUTHERN BEAUFORST SEA, N o r t h w e s t TERRITORIES, CANADA
SR. Dallimre, P.J. Kutfurst and JAM. Hunter
MASSIVE GROUND ICE ASSOCIATED WITH GLACIOFLUVIAL SEDIMENTS, R i c h a r d s ISLAND, N.W.T., CANADA
SR. Dallimore and SA. Wove
PERMAFROST AGGRADATION ALONG AN EMERGENT COAST, Churchill MANITOBA
L. Dyke
CHARACTERISTICS OF THE MASSIVE GROUND ICE BODY IN THE Western CANADIAN ARCTIC
(Fujinb, Kazuo, Sato, Seiji, Matsuda Kyou, Sasa, Gaichirau, Shimizu, Osamu and Kato, Kikuo
MEASUREMENTS OF ACTIVE LAYER AND PERMAFROST PARAMETERS WITH ELECTRICAL Resistivity SELF POTENTIAL AND INDUCED POLARIZATION
E. Gahe, M. Allard, M.K. Seguin and R. Fortier
THE ALPINE PERMAFROST ZONE OF THE U.S.S.R. A.P. Gorbunov
ON THE SPATIAL DYNAMICS OF SNOWCOVER - PERMAFROST RELATIONSHIPS AT SCHEFFERVILLE
HB. Granberg
PERENNIAL, CHANGES IN NATURAL, COMPLEXES OF CRYOLITHOZONE G.F. Gravis, N.G. Moskalenko and A.V. Pavlov
PERMAFROST AND ITS ALTITUDINAL ZONATION IN N. LAPLAND P.P. Jeckel
A MODEL FOR MAPPING PERMAFROST DISTRIBUTION BASED ON
113
119
123
127
132
138
143
148
154
159
165
170
LANDSCAPE COMPONENT M A P S AND CLIMATIC VARIABLES 176 M.T. Jorgenson and RA. Kreig
PERMAF'ROST SITES IN FINNISH LAPLAND AND THEIR ENVIRONMENT OCCURRENCES DE PERGELISOL EN LAPPONIE FINLANDAISE
L. King and M . Seppali
CRYOGENIC COMPLEXES AS THE BASIS FOR PREDICTION M A P S I.V Klimovsky and SP. Gotovtsev
GLACIAL HISTORY AND PERMAFROST IN THE SVALBARD AREA J.Y. Lundvik,- J . Mangerud and 0. Salvigsen
REGIONAL FACTORS OF PERMAFROST DISTRIBUTION AND THICKNESS, HUDSON BAY COAST, QUEBEC CANADA
R. Levesque M. Allard and M.K. Seguin
PINUS HINGGANENSIS AND PERMAFROST ENVIRONMENT IN THE MT.DA-HINGANLING, NORTHEAST CHINA
Lu, Guowei
NATURAL GEOSYSTEMS OF THE PLAIN CRYOLlTHOZONE E.S. Melnikov
Predicting THE OCCURRENCE OF PERMAFROST IN THE ALASKAN DISCONTINUOUS ZONE WITH SATELLITE DATA
LA. Morrissey
MODERN METHODS OF STATIONARY ENGINEERING - GEOLOGIC INVESTIGATIONS OF CRYOLITIC ZONE
A.V. Pavlov and V.R. Tsibulsky
PETROGRAPHIC CHARACTERISTICS OF MASSIVE GROUND ICE, YUKON COASTAL PLAIN, CANADA
W.H. Pollard and SR. Dallimre
CONTENT OF NORTH AMERICAN CRYOLITHOLOEICAL MAP AJ. Popov and G.E. Rosenbaum
NEW DATA ON PERMAFROST OF KODAR-CHARA-UDOKAN REGION NN. Romanovsky, VN. Zaitsev, S.Yu. Volchenkoc, VP. Volkova and O.M. Lisitsina
MEAN ANNUAL TEMPERATURE OF GROUNDS IN EAST SIBERIA S.A. Zamolotchibva
ALPINE PERMAFROST IN EASTERN NORTH AMERICA: A REVIEW T.W. Schrnidlin
SEASONAL Freezing OF SOILS IN CENTRAL ASIA MOUNTAINS I.V. Seversky and E.V. Seversky
ALPINE PERMAFROST OCCURRENCE AT MT. TAISETSU, CENTRAL HOKKA 0, IN NORTHERN JAPAN Some 1- Toshio, Takahashi, Nobuyuki and Fukuda, Masami
183
189
194
199
205
208
213
218
224
230
233
237
241
247
253
ROCK GLACIERS AND GLACIATION OF THE CENTRAL ASIA MOUNTAINS S.N.Titkov
GEOCRYOGENIC GEOMORPHOLOGY, EAST Flank OF THE ANDES OF MENDOZA, AT 330 S.L.
D. Trombotto
OUTER LIMIT OF PERMAFROST DURING THE LAST GLACIATION IN EAST CHINA
Xu, Shuying, Xu, Defu and Pan, Baotian
THE GEOCRYOLOGICAL MAP OF THE USSR OF 1:2,5OO,OOO SCALE ED. Yershov, KA. Kondratyeva, SA. Zamolotchikova, N.I. Trush and YeN. Dunaeva
THE PERMAFROST ZONE EVOLUTION INDUCED BY DESTRUCTION OF Soil OVEWYING COVER IN THE AMUR NORTH
S.I. Zubolotnik
DISTRIBUTION OF SHALLOW PERMAFROST ON MARS A.P. Zent F.P. Fanale, JR. Salvail and S.E. Postawko
PHYSICS AND CHEMISTRY OF FROZEN GROUND, FROST HEAVE MECHANISM
ON THE METHOD OF CRYOHYDROGEOCHEMICAL INVESTIGATIONS N.P. Anisinwva
Hydrochemistry OF RIVERS IN MOUNTAIN PERMAFROST AT 330 L.S., MENDOZA - ARGENTINA
EM. Buk
FROST LINE BEHAVIOUR AROUND A COOLED CAVITY A.M. Cames-Pintaux and J. Aguirre-Puente
A FROST HEAVE MODEL OF SANDY GRAVEL IN OPEN SYSTEM Chen, XB., Wang, KQ. and He, P,
OBSERVATIONS OF MOISTURE MIGRATION IN FROZEN SOILS DURING THAWING
Cheng, Guohng and E J . Chamberlain
GEOCRYOLOGIC STUDIES AIMED AT NATURE CONSERVATION AB. Chizhov, A.?? Gavrilov and Ye.I. Pizhankova
IRON AND CLAY MINERALS IN PERIGLACIAL ENVIRONMENT T. Chodak
259
263
268
274
278
284
290
294
299
304
308
316
FROZEN SOIL MACRO- AND MICROTEXTURE FORMATION YeM. Chuvilin and O.M. Yazynin
ACOUSTICS AND UNFROZEN WATER CONTENT DETERMINATION M.H. Deschatres, F. Cohen-Tenoudji, J . Aguirre-Puente and B. Khastou
THERMODYNAMICS THEORY FORECASTING FROZEN GROUND Ding, Dewen
PORE SOLUTIONS OF FROZEN GROUND AND ITS PROPERTIES EJ. Dubikov, N.V. Ivarwva and VJ. Akrenov
FORMATION PROBLEM OF THICK ICE STREAKS, ICE SATURATED HORIZONS IN PERMAFROST
G.M. Feldman
FROST HEAVE K.S. Forland T. Forland and S.K. Ratkje
PARAMETRIC EFFECTS IN THE F i l t r a t i o n FREE CONVECTION MODEL FOR P a t t e r n e d GROUND
KJ. Gleason, W. B . Kruntz and N . Caine
HEAT AND MOISTURE TRANSPORT DURING ANNUAL FREEZING AND THAWING
JP. Gosink, K . Kawasaki, T.E. Osterkamp and J. Holty
SUMMER THAWING OF DIFFERENT GROUNDS - AN EMPIRICAL MODEL FOR WESTERN SPITSBERGEN
M . Grzes
OBSERVATIONS ON THE REDISTRIBUTION OF MOISTURE IN THE ACTIVE LAYER AND PERMAFROST
S.A. Harris
A MATHEMATICAL MODEL OF FROST HEAVE IN GRANULAR M a t e r i a l s D. Piper, J.T. Holden and R.H. Jones
ELECTRIC CONDUCTIVITY OF AN ICE CORE OBTAINED FROM MASSIVE GROUND ICE
Horiguchi, Kaoru
PHYSICAL-CHEMICAL TYPES OF CRYOGENESIS VN. Konischm V.V Rogov and SA. Poklonny
TEMPERATURE OF ICE LENS FORMATION IN FREEZING SOILS ,
J.M. Konrad
M i c r o s t r u c t u r e OF FROZEN SOILS EXAMINED BY SEM ;‘Kumai,jMotov , ”. . ,,-./<
CRYOGENIC DEFORMATIONS IN FINE-GRAINED SOILS Yu P. Lebedenko and L.V; Shevchenko
320
324
329
333
339
344
349
355
361
364
370
377
38 1
384
390
396
PROPERTIES OF GEOCHEMICAL FIELDS IN THE PERMAFROST ZONE V . . Makarov
THE DYNAMICS OF SUMMER GROUND THAWING IN THE Kaffioyra PLAIN ( N W SPITSBERGEN)
K . Marcinid, R. Przybylak, W. Szczepanik
A METHOD FOR MEASURING THE RATE OF WATER TRANSPORT DUE TO Temperature GRADIENTS IN UNSATURATED FROZEN SOILS
Nakarw, Yoshisuke and AR. Tice
FILTRATION PROPERTIES OF FROZEN GROUND BA. Olovin
"HERMODIFFUSE ION TRANSFER IN GROUNDS YE. Ostroumov
ELECTROACOUSTIC Effect IN FROZEN SOILS A.S. Pavlov and AD. Frolov
SPATIAL VARIATION IN SEASONAL FROST HEAVE CYCLES E. Perfect R.D. Miller and B. Burton
D i r e c t i o n OF ION MIGRATION DURING COOLING AND FREEZING PROCESSES
Qiu, Guoqing, Sheng, Wenkun, Huang, Cuilan and Zheng, Kaiwen
DYNAMICS OF PERMAFROST Active LAYER - SPITSBERGEN J . Repelewska-Pekalowa and A. Gluza
INVESTIGATION OF ELECTRIC POTENTIALS IN FREEZING DISPERSE SYSTEMS
VP. Romanov
PHYSICO-CHEMICAL NATURE OF CONGELATION STRENGTH B A. Saveliev, V.V. Razumov and VE. Gagarin
HYDROGEOCHEMISTRY OF-KRYOLITHOZONE OF SIBERIAN PLATFORM SL. Schwartsev, VA. Zuev and MB. Bukaty
THE FORMATION OF PEDOGENIC CARBONATES ON SVALBARD: THE INFLUENCE OF COLD TEMPERATURES AND FREEZING
R .S. Sletten
Measurement OF THE UNFROZEN WATER CONTENT OF SOILS: A COMPARISON OF NMR AND TDR METHODS
M.W. Smith and AR. Tice
GENESIS OF ARCTIC BROWN SOILS (PERGELIC CRYOCHREPT) IN SVALBARD
F.C. Ugolini and R.S. Sletten
4 0 1
406
412
418
425
431
436
442
448
454
459
462
467
473
478
OXYGEN ISOTOPIC COMPOSITION OF SOME MASSIVE GROUND ICE LAYERS IN THE NORTH OF WEST SIBERIA
RA. Vaikmae VJ. Solomatin and Y.G. Karpov
OXYGEN ISOTOPE VARIATIONS IN ICE-WEDGES AND MASSIVE ICE YuK. Vasilchuk and V.T. Trofimv
THERMODYNAMIC AND MECHANICAL CONDITIONS WITHIN FROZEN Soils AND THEIR EFFECTS
PJ. Wil l iam
TlME AND SPATIAL Variation OF TEMPERATURE OF ACTIVE LAYER- IN SUMMER ON THE Kaffioyra PLAIN (NW SPITSBERGEN)
G. Wojcik K. Marciniak and R. Prqbylak
Temperature OF A c t i v e LAYER AT BUNGER OASIS IN ANTARCTICA IN SUMMER 1978-79
G. Wdjcik
CHEMICAL WEATHERING IN PERMAFROST REGIONS OF ANTARCTICA: GREAT WALL STATION OF CHINA, CASEY STATION AND DAVIS STATION OF AUSTRALIA Xie, Youyu
WATER MIGRATION IN SATURATED Freezing Soil Xu, Xiaozu, Deng, Youseng, Wang, Jiacheng and Liu, Jiming
EFFECT OF OVER CONSOLIDATION RATIO OF SATURATED SOIL ON FROST HEAVE AND THAW SUBSIDENCE
Yamamcto, H., Ohrai, T. andIzuta, H .
MASS TRANSFER INFROZEN SOILS ED. Yershov, YuP. Lebedenko, VD. Yershov and Ye.M. Chuvilin
STRESS-STRAIN PREDICTION OF FROZEN Retaining STRUCTURES REGARDING THE FROZEN S O L CREW
YuK. Zaretsb, Z.G. Ter-Martirosyan and A.G. Shchobolev
STUDY OF FROZEN SOILS BY GEOPHYSICAL METHODS YuD. Zykov, N.Yu. Rozhdestuenrky and OP. Chervinskaya
484
489
493
499
505
511
516
522
528
533
537
HYDROLOGY, ECOLOGY OF NATURAL AND DISTURBED AREAS
THE OUTFLOW OF WATER IN PERMAFROST ENVIRONMENT - SPITSBERGEN 543
S. Bartoszewski, J . Rodzik and K . Wojciechowski I MODELLING OF AVERAGE Monthly STREAMFLOWS FROM GLACIERIZED BASINS IN ALASKA 546
D. Bjerkelie and R.F. Carlson
PROTECTION OF The ENVIRONMENT IN JAMESON LAND 552 C. Baek-Madsen
SUSPENDED SEDIMENT TRANSPORT IN ARCTIC RIVERS MJ. Clark, A.M. Gurnell and JL. Threlfall
558
THE BUFFERING POTENTIAL OF CARBONATE SOILS IN DISCONTINUOUS
ACIDIFICATION 564 PERMAFROST TERRAIN, AGAINST NATURAL AND MAN-INDUCED
LA. Dredge
PHYSICAL AND CHEMICAL CHARACTERISTICS OF THE A c t i v e LAYER
PICEA MARIANA STAND, FORT NORMAN, N.W.T., CANADA 568 AND NEAR-SURFACE PERMAFROST IN A DISTURBED HOMOGENEOUS
K.E. Evans, G.P. Kershaw and B J . Gallinger
HYDROLOGY AND GEOCHEMISTRY OF A SMALL DRAINAGE BASIN IN UPLAND TUNDRA, NORTHERN ALASKA 574
KR. Everett and B. Ostendorf
ENVIRONMENT P r o t e c t i o n Studies IN PERMAFROST ZONE OF THE USSR 580
NA. Grave
CLASSIFICATION OF GROUND WATER IN PERMAFROST AREAS ON THE QINGHAI-XTZANG PLATEAU, CHINA 583
Guo, Pengfei
Permafrost HYDROLOGY OF A SMALL ARCTIC WATERSHED 590 D L . Kane and L.D. Hinzman
FLOWING WATER EFFECT ON TEMPERATURE IN OUTWASH DEPOSITS 596 A. Karczewski
SALIX ARBUSCLEOIDES ANDERSS, RESPONSE TO DENUDING AND IMPLICATIONS FOR NORTHERN RIGHTS-OF-WAY 599
G.P. Kershaw, B J . Gallinger and L J. Kershaw
ABLATION OF MASSIVE GROUND ICE, MACKENZIE DELTA 605 A.G. Lmkowicz
HYDROGEOLQGICAL FEATURES IN HUOLAHE BASIN OF NORTH DAXINGANLING, NORTHEAST CHINA 61 1
Lira, Fengton and Tu, Guangzhong
SHALLOW OCCURRENCE OF WEDGE ICE: IRRIGATION FEATURES A A. Mandamv and IS. Ugarov
SOIL INFILTRATION AND SNOW-MELT RUN-OFF IN THE MACKENZIE DELTA, N.W.T.
P. Marsh
LATE PLEISTOCENE DISCHARGE OF THE YUKON RIVER OK. Mason and J.E. Beget
INFLUENCE OF WATER PHENOMENA ON Depth OF SOIL THAWING IN OSCAR 11 LAND, NORTHWESTERN S p i t s b e r g e n
C . Pietrucien and R . Skowron
INFLUENCE OF AN ORGANIC MAT ON THE ACTIVE LAYER D.W. Riseborough and CR. Burn
PERENNIAL DISCHARGE OF SUBPERMAFROST GROUNDWATER IN TWO SMALL DRAINAGE BASINS, YUKON, CANADA
R.O. Van Everdingen
WETLAND RUNOFF REGIME IN NORTHERN CANADA Woo, M.K.
STREAMFLOW CHARACTERISTICS OF THE QINGHAI (NORTHERN TIBETAN) PLATEAU
Yang, Zhengniang and Woo, Ming-hm
RATIONAL EXPLOlTATION AND UTILIZATION OF GROUND WATER IN
XINGANLING, NORTHEAST CHINA PERMAFROST REGION OF THE MT.DA-XINGANLING AND MT.XIAO-
Zheng, Qipu
PERIGLACIAL PHENOMENA, GEOCRYOLOGY
GROUNDWATER PROTECTION IN THE PERMAFROST ZONE V.Ye. Afanusenko and V.P. Volkova
MINERO-CRYOGENIC PROCESSES A. L. Ahumada
UPFREEZING IN SORTED CIRCLES, WESTERN SPITSBERGEN S . Prestrud Anderson
TEPHRAS AND SEDIMENTOLOGY OF FROZEN ALASKAN LOESS J.E. Beget
MORPHOLOGICAL FEATURES OF THE ACTIVE ROCK GLACIERS I N THE ITALIAN ALPS AND CLIMATIC CORFSLATIONS
S. Belloni, M. Pemni and C. Smiraglia
615
618
622
628
633
639
644
650
656
659
661
666
672
678
OBSERVATIONS ON NEAR-SURFACE CREEP IN PERMAFROST, EASTERN Melville ISLAND, ARCTIC CANADA 683
L.P. Bennett and HM. French
OBSERVATIONS ON AN ACTIVE LOBATE ROCK GLACIER, SLIMS RIVER VALLEY, ST, ELIAS RANGE, CANADA
W. Blumstengel & SA. Harris
GENERAL MOISTENING OF THE AREA AND INTENSITY OF CRYOGENIC PROCESSES
NF. Bosibv
THERMOKARST LAKES AT MAYO, YUKON TERRITORY, CANADA CR. Burn and M.W. Smith
LOESS AND DEEP THERMOKARST BASINS IN ARCTIC ALASKA L.D. Carter
A FIRST APPROACH TO THE SYSTEMATIC STUDY OF THE ROCK GLACIERS IN THE ITALIAN ALPS
A. Carton, F. Dramis, and C. Smiraglia
GEOCRYOLOGY OF The CENTRAL ANDES AND ROCK GLACIERS A.E. Corte
ROCK GLACIERS IN THE SOURCE REGION OF URUMQI RIVER, MIDDLE TIAN SHAN, CHINA
Cui, Zhijiu and Zhu, Cheng
SEASONAL FROST MOUNDS IN AN EOLIAN SAND SHEET NEAR Sondre Stromfjord W. GREENLAND
J.W.A. D i j h n s
689
695
700
706
712
718
724
728
PINGOS IN ALASKA: A REVIEW 734 0 J. Ferrians, Jr.
REGULARITIES IN FORMING THE DISCONTINUITY OF A CRYOGENIC SERIES 740
S.M. Fotiev
ROCK GLACIER RHEOLOGY A PRELIMINARY ASSESSMENT 744 JR. GiamIino and JD. Vitek
THE USE OF MICROBIOLOGICAL CHARACTERISTICS OF ROCKS IN GEOCRYOLOGY 749
D A. Gilichinsky, G M. Khlebnibva, D.C. Zvyagintsev, D.C. Fetiorov-Davydov and NN. Kudryavtseva
THERMIC OF PERMAFROST ACTIVE LAYER - SPITSBERGEN 754 A. Gluza, J . Repelewska-Pekalowa and K. Dabrowski
SOIL FORMATION PALEOGEOGRAPHIC ASPECTS IN YAKUTIYA S.V. Gubin
AEROPHOTOGRAMMETRICAL MONlTORING OF ROCK GLACIERS W. Haeberli and W. Schmid
SURFACE SOIL DISPLACEMENTS IN SORTED CIRCLES, WESTERN SPITSBERGEN
B. Hallet, S . Prestrud Anderson, C.W. Stubbs and E. Carrington Gregory
MICROMORPHOLOGY AND MICROFABRICS OF SORTED CIRCLES, JOTUNHEIMEN, SOUTHERN NORWAY
C. Harris and JD. Cook
CRYOSTRATIGRAPHTC STUDIES OF PERMAFROST, NORTHWESTERN CANADA
D.E. Harry and H.M. French
THAW LAKE SEDIMENTS AND SEDIMENTARY ENVIRONMENTS D.M. Hopkins and J.G. Kidd
PERIGLACIAL SOIL Structures IN SPITSBERGEN AND IN CENTRAL EUROPA
A . Jahn
CONTINUOUS PERSISTENCE OF THE PERMAFROST ZONE DURING THE QUATERNARY PERIOD
EM. Katasonov
PROBLEM OF INTEGRAL INDEX STABILlTY OF G r o u n d COMPLEX OF PERMAFROST
VP. Kovalbv and P.F. Shvetsov
I C E WEDGE GROWTH IN NEWLY AGGRADING PERMAFROST, WESTERN A r c t i c COAST, CANADA
J . Ross Mackay
HEAT FLOW AND PECULIARlTIES OF CRYOLlTHOZONE IN WESTERN SIBERIA
VP. Melnikov, VN. Devyatkin and Y.P. Bevzenko
MICROTOPOGRAPHIC THERMAL CONTRASTS, NORTHERN ALASKA F.E. Nelson, SJ. Outcalt, K M , Hinkel, D.F. Murray and B.M. Murray
FROST MOUNDS IN K a f f i o y r a AND HERMANSENOYA, NW SPITSBERGEN, AND THEIR ORIGIN
W. Niewiarowski and M . Sinkiewicz
CONTEMPORARY FROSTACITONONDIFFERENTORIENTEDROCKWALLS: AN EXAMPLE FROM THE SWISS JURA MOUNTAINS
A. Pancza and J.-Cl. Ozouf
759
764
770
776
784
790
796
801
805
809
815
819
824
830
GEOCRYOGENIC Slope Caves in The SOUTHERN CASCADES FL. Perez
TRACES OF ICE IN CAVES: Evidence of FORMER PERMAFROST A. Pissart, B. Van Vliet-Lame, C . Ek and E. Juvigne
THE THEORY OF CRYOLITHOGENESfS AJ. Popov
834
840
846 '
ORIGIN OF MASSIVE GROUND ICE ON TUKTOYAKTUR PENINSULA, NORTHWEST Territories CANADA: A REVIEW OF Stratigraphic AND GEOMORPHIC EVIDENCE 850
VA. Rampton
ANDES SLOPE A s y m m e t r y DUE TO Gelifluction , I
856 M.C. Regairaz
THE DEVELOPMENT OF DEPRESSED-CENTRE ICE-WEDGE POLYGONS IN THE N o r t h e r n m o s t UNGAVA PENINSULA, QUEBEC, CANADA 862
M . Seppala, J . Gray and J . Richard
The UPPER HORIZON OF PERMAFROST SOILS 867 Yu L. Shur
FROST SHATTERING OF ROCKS IN The LIGHT OF POROSITY 872 R. Uwinoka and P. Nieminen
FLUVIO-AEOLIAN INTERACTION In A REGION OF CONTINUOUS PERMAFROST
* , 876 J . Vandenberghe and J . Van Huissteden
Regularities OF FORMING SEASONALLY CRYOGENIC GROUND 882 EA. Vtyurina
Observations OF SORTED.CIRCLE A c t i v i t y CENTRAL ALASKA 886 J.C. Walters
Patterned GROUND GEOLOGIC CONTROLS, MENDOZA, ARGENTINA 892 WJ. Wayne I ( ,
LANDSLIDE MOTION IN DISCONTINUOUS PERMAFROST 897 S.C. Wilbur and J.E. Beget
THE CHARACIERISTIC OF CRYOPLANATION LANDFORM IN THE
Zhang, Weixin, Shi, Shengmn, Chen, Fahu and Xu, Shuying I n t e r i o r a r e a OF QINGHAI-XIZANQ PLATEAU , < 903
THE PREDICTION OF PERMAFROST ENERGY STABILITY 906 LA. Zhigarew and 0.Yu. Parmuzina
VOLUME 2: ENGINEERING SITE INVESTIGATIONS AND Terrain ANALYSES,
SUBSEA PERMAFROST
BOREHOLE INVESTIGATIONS OF THE Electrical PROPERTIES OF FROZEN SILT
SA. Arcone and A J. Delaney
PERMAFROST AND Terrain Preliminary MONITORING RESULTS, NORMAN WELLS PIPELINE CANADA
M.M. Burgess
CONTRIBUTION TO THE STUDY OF THE Active LAYER IN THE AREA AROUND CENTRUM LAKE, NORTH EAST GREENLAND
M . Chiron and J.-F. Loubiere
SEASONAL VARIATIONS IN RESISTIVITY AND TEMPERATURE IN Discontinuous PERMAFROST
A. Delaney, P. Sellmann and S. Arcone
PERMAFROST CONDITIONS IN THE SHORE AREA AT SVALBARD 0. Gregersen and T. Eidsmoen
CORE DRILLING THROUGH ROCK GLACIER-PERMAFROST W. Haeberli, J . Huder, H.-R. Keusen, J . Pika and H . Rdthlisberger
REMOTE S e n s i n g LINEAMENT STUDY IN NORTHWESTERN ALASKA Huang, SL, and N. Lozano
THERMAL EVIDENCE FOR AN ACTIVE LAYER ON THE Seabottom OF THE CANADIAN BEAUFORT SEA SHELF
J A. Hunter HA. MacAulay, S.E. Pullan. R.M. Gagne RA. Burns and RL. Good
FOUNDATION CONSIDERATIONS FOR Siting AND DESIGNING THE RED DOG MINE MILL FACILlTES ON PERMAFROST
T.G. Krzavinski, T.A. Hammer and G.G. Booth
ELECTRIC PROSPECting OF INHOMOGENEOUS FROZEN MEDIA V;V: Kuskov
PREDICI'ION OF PERMAFROST THICKNESS BY THE 'TWO POINT" METHOD I.M. Kutasov
910
916
922
927
933
937
943
949
955
961
965
THE USE OF GROUND PROBING RADAR IN THE DESIGN AND MONITORING OF WATER RETAINING EMBANKMENTS INPERMAFROST 97 1
P.T. Lafleche A.S. Judge and JA. Pilon
PEAT FORMATION IN SVALBARD J . Lag
977
PERMAFROST GEOPHYSICAL INVESTIGATION AT THE NEW AIRPORT SITE OF KANGIQSUALUJJUAQ, Northern QUEBEC, CANADA 980
M.K. Seguin, E. Gahe M. Allardand K. Ben-Mibud
D.C. RESISTIVITY ALONG THE COAST AT PRUDHOE BAY, ALASKA 988 P.V. Sellmann, A J. Delaney and SA. Arcone
EM SOUNDINGS FOR MAPPING COMPLEX GEOLOGY IN THE PERMAFROST TERRAIN OF NORTHERN CANADA
AX. Sinhu 994
MAPPING AND ENGINEERING-GEOLQGIC EVALUATION OF KURUMS 1000 AJ. Tyurin, NN. Romanovsky and D.O. Sergqev
Development AND THAWING OF ICE~RICH PERMAFROST AROUND CHILLED PIPELINES MONITORED BY RESISTANCE GAUGES 1004
R.O. Van Everdingen and L.E. Carlson
THE ORIGIN OF PATTERNED GROUNDS IN N.W. SVALBARD 1008 B. Van Vliet-Lanoe
THE STATISTICAL ANALYSIS ON FROST HEAVE OF SOILS IN SEASONALLY FROZEN GROUND AREA 1014
Wang, Jianguo and Xie, Yinqi
DISCONTINUOUS PERMAFROST MAPPING USING THE EM-31 D.S. Washburn and A. Phukan
1018
A DISCUSSION ON MAXIMUM SEASONAL FROST DEPTH OF GROUND 1024 Xu, Ruiqi, Pang, Guoliang and Wang, Bingcheng
PRINCIPLES FOR COMPILING AN ATLAS OF SEASONAL FROST Penetration JILIN, CHINA (1: 2000000) 1026
Zhang, Xing, Li, yinrong and Song, Zhengyuan
GEOTECHNICAL Properties FROST HEAVE PARAMETERS
SEGREGATION FREEZING OBSERVED IN WELDED TUFF BY OPEN SYSTEM FROST HEAVE TEST 1030
Akagawa, Satoshi, Goto, Shigem and Saito, Akira
SOME ASPECTS OF SOILS ENGINEERING PROPERTIES IMPROVEMENT DURING DAM CONSTRUCTION 1036
G.F. Bianov, V . . Makarov and EL. Kadkinu
FROST HEAVE FORCES ON H AND PIPE FOUNDATION PILES 1039 J.S. Buska and J.B. Johnson
THAW Settlement OF FROZEN SUBSOILS IN SEASONAL FROST REGIONS
Cheng, Enyuan and Jiang, Hongiu
TENSILE ADFREEZING STRENGTH BETWEEN SOIL AND FOUNDATION Ding, Jingkang, Lou, Anjin and Yang, Xueqin
Interaction BETWEEN A Laterally LOADED PILE AND FROZEN SOIL L. Domaschuk, L. Fransson and DH. Shields
CHOICE OF P a r a m e t e r s OF IMPACT BREAKAGE OF FROZEN SOILS AND ROCKS
AJ. Fedulov and V . . . Labustin
FROST HEAVE CHARACTERISTICS OF SALINE SOILS AND CANAL DAMAGE
Feng, Ting
MECHANICAL PROPERTIES OF FROZEN SALINE CLAYS T. Furuberg and A.-L. Berggren
DECREASED SHEAR STRENGTH OF A Silty SAND Subjected TO FROST G.P. GiSford
THEORETICAL Froblems OF CRYOGENIC GEOSYSTEM M o d e l l i n g S.E. Grechishchev
USE OF GEOTEXTILES TO MITIGATE FROST HEAVE IN SOILS K . Henry
VOLUME OF FROZEN GROUND STRENGTH TESTING LN. Khrustalev and G.P. Pustovoit
MECHANICAL FROZEN ROCK-FILL PROPERTIES AS SOIL STRUCTURE YaA. Kronik, AN. Gavrilov and VN. Shramkova
A STUDY OF FROST HEAW IN LARGE U-SHAPED CONCRETE CANALS Li, Anguo
FROST HEAVING FORCE ON THE FOUNDATION OF A HEATING BUILDING Liu, Hongxu
FROST HEAVE IN SALINE-SATU'RATED FINE-GRAINED SOILS B.T.D. Lu, ML. Leonard and L. Mahar
EFFECT OF Variable THERMAL PROPERTIES ON FREEZING WITH AN UNFROZEN WATER CONTENT
VJ. Lunardini
DEVELOPMENT AND APPLICATION PRACTICE OF METHODS FOR PRELIMINARY THAWING OF PERMAFROST SOILS IN FOUNDATIONS
E.S. Maksimenko
105 1
1056
1060
1066
1071
1078
1085
1091
1096
1102
1106
1110
1116
1121
1127
1133
SECONDARY CREEP INTERPRETATIONS OF ICE RICH PERMAFROST E.C. McRoberts
PHASE RELAXATION OF THE WATER IN FROZEN GROUND SAMPLES V.P. Melnikov, L.S. Podenko and A.G. Zavodovski
STANDARD METHOD FOR PILE LOAD TESTS IN PERMAFROST R J . Neukirchner
CRYOGENIC HEAVE UNDER FREEZING OF ROCKS VL. Nevecherya
EFFECTIVE LIFE IN CREEP OF FROZEN SOILS KR . Parameswaran
HORIZONTAL FROST HEAVE FORCE ACTING ON THE RETAINING WALL IN SEASONAL Frozen REGIONS
Shui, Tieling and Na, Wenjie
DYNAMIC LOAD EFFECT ON Settlement OF MODEL PILES IN FROZEN SAND
D.L. Stelzer and OB. Andersland
TANGENTIAL FROST-HEAVING FORCE OF THE REINFORCED CONCRETE PILE AND CALCULATION OF PREVENTING IT FROM PULLING UP DUE TO FROST HEAVE
Sun, Yuiiang
BEHAVIOUR OF LONG PILES IN PERMAFROST A . Theriault and B. Ludanyi
INVESTIGATION ON TANGENTIAL FROST HEAVING FORCES Tong, Changiiang, Yu, Chongyun and Sun, Weimin
STRESS-STRAIN BEHAVIOUR OF FROZEN SOILS S.S. Vyalov R.V. Maximyak, VN. Razbegin, M.E. Slepak and A.A. Chapayev
FROST HEAVING FORCES ON FOUNDATIONS IN SEASONALLY FROZEN GROUND
Xu, Shaoxin
ON THE DISTRIBUTION OF FROST HEAVE WITH DEPTH Zhu, Qiang
TRIAXIAL COMPRESSIVE STRENGTH OF FROZEN SOILS UNDER CONSTANT STRAIN RATES
Zhu, Yuanlin and D.L. Carbee
\
Geotechnical ENGINEERING, PIPELINE CONSTRUCTION
1206 LONG TERM Settlement TEST (3 YEARS) FOR CONCRETE PILES IN PERMAFROST
B A. Bredesen, 0. Puschmann and 0. Gregersen
TANGENTIAL FROST HEAVING FORCE ON REINFORCED CONCRETE PILES OFHIGHWAY BRIDGE
Dai, Huimin and Tian, Deting
PERFORMANCE OF TWO EARTHFILL DAMS AT LUPIN, N.W.T S. Dufour and I . Holubec
ROADWAY EMBANKMENTS ON WARM P e r m a f r o s t PROBLEMS AND REMEDIALTREATMENTS
D . Esch
REMEDIAL SOLUTIONS FOR Pipe l ine THAW SETTLEMENT J.E. Ferrell and H . P. Thomas
A FROZEN FOUNDATION ABOVE A TECHNOGENIC TALK I.E. Guryanov
ASSESSMENT OF KEY DESIGN ASPECTS OF A 150 FOOT HIGH EARTH DAM ON WARM PERMAFROST
TA. Humme< T.G. Krzewinski and G.G. Booth
PERMAFROST SLOPE DESIGN FOR A BURIED OIL PIPELINE A J . Hanna and E.C. McRoberts
A METHOD FOR C a l c u l a t i n g THE Minimum BURIED DEPTH OF BUILDING FOUNDATIONS
Jiang, Hongju and Cheng, Enyuan
PROTECTION OF WARM PERMAFROST USING CONTROLLED SUBSIDENCE AT NUNAPITCHUK Airport
E.G. Johnson and G.P. Bradley
THERMAL PERFORMANCE OF A SHALLOW UTILIDOR F.E. Kennedy, G. Phetteplace, N. Humiston and V. Prabhakar
CONSTRUCTION OF HYDROS IN COLD CLIMATE: ACHIEVEMENTS AND PROBLEMS
Ld. Kudoyarov and NF. Krivonogova
1212
1217
1223
1229
1235
1242
1247
1253
1256
1262
1268
STUDY OF SOME GEOTECHNICAL ASPECTS EFFECTING CONSTRUCTION IN GLACIAL REGIONS OF HIMALAYAS 127 1
D.S. Laljii and R.C. Pathak
A SUBGRADE COOLING AND ENERGY RECOVERY SYSTEM EL. Long and E. Yarmak Jr.
1277
LONG TERM PLATE LOAD TESTS ON MARINE CLAY IN SVEA. SVALBARD 1282 T. Lunne and T. Eidsmoen
~Z -
MELIORATION OF SOILS OF CRYOLITHOZONE 0.K Makeev
EMBANKMENT FAILURE FROM CREEP OF PERMAFROST FOUNDATION SOIL
R. McHattie and D. Esch
CONSTRUCTION OF EARTH Structures IN PERMAFROST AREAS BY HYDRAULIC METHODS
P.I. Melnikov, Chang, R.V. G.P. Kuzmin and A.V. Yakovlev
STORAGE TANK FOUNDATION DESIGN, PRUDHOE BAY, ALASKA, U.S.A. B. Nidowicz, D . Bruggers and V. Manikian
STUDIES OF PIPELINE INTERACTION WITH HEAVING SOILS S.Yu. Pamtuzin, A D . Perelimiter and I.Ye. Naidenok
YUKON RIVER BANK STABILIZATION: A CASE STUDY CH. Riddle, J.W. Rooney and S.R. Bredthauer
AIRPORT RUNWAY DEFORMATION AT NOME, ALASKA J.W. Rooney, J.F. Nixon, C.H. Riddle and E.G. Johnson
PHYSICAL MODEL STUDY OF ARCTIC PIPELINE SETTLEMENT T.S. Vinson and A.C. Palmer
BETHEL AIRPORT, CTB PAVEMENT PERFORMANCE ANALYSIS C L . vita, J.W. Rooney and T.S. Vinson
A NEW METHOD FOR PILE TESTING AND DESIGN IN PERMANENTLY-FROZEN GROUNDS
S.S. Vyalov and Yu.S. Mirenburg
CLASSIFICATION OF FROZEN HEAVE OF GROUND FOR HYDRAULIC ENGINEERING IN SEASONAL FROZEN REGIONS
Xie, Yinqi, Wung, Jianguo and Han, Weijun
RETAINING WALL WITH ANCHOR SLABS USING IN COLD REGION Xu, Bomeng and Li, Changlin
THAW STABILIZATION OF ROADWAY EMBANKMENTS J.P. Zarling, W.A. Braley and D.C. Esch
METHOD FOR CALCULATING FROST HEAVE REACTION FORCE IN SEASONAL FROST REGION
Zhou, Youcai
1288
1292
1298
1301
1307
1312
1318
1324
1330
1336
1341
1346
1352
1358
ENGINEERING, -PETROLEUM, -MINING, -MUNICIPAL
COLD-MIX ASPHALT CURING AT LOW Termperatures A N S . Beaty and P.M. Jarrett
PROGNOSIS OF SOIL TEMPERATURE AT THE AREA UNDER CONSTRUCTION
A L . Chekhovskyi
PRESSURE IN RELATION TO FREEZING OF WATER-CONTAINING MASSES IN A CONFINED SPACE
M.M. Dubina
ENVIRONMENT PROTECTION FOR MINING ENTERPRISES IN PERMAFROST REGIONS
EA. Elchaninov
ARCTIC MINING IN PERMAFROST H.M. Giegerich
APPLIED STUDY OF PREVENTING STRUCTURES FROM FROST DAMAGE BY USING DYNAMIC CONSOLIDATION
Han, Huaguang and Euo, Mingzhu
EFFECT OF HEATING ON FROST DEPTH BENEATH FOUNDATIONS OF BUILDING
Hong, Yuping and Jiang, Hongju
PREDICTION OF PERMAFROST THAWING AROUND MINE WORKINGS VYu. Izakson, E.E. Petrov and A.V. Samokhin
EXPERIENCE IN CONSTRUCTION BY STABILIZATION METHOD LN. Khrustalm and V.V. Nikiforov
GEOCRYOLOGICAL STUDIES FOR RAILWAY CONSTRUCTION (STATE, P r i m a r y TASKS)
V.G. Kondratyev AA. Korolyev, MI. Karlinski, E M . Timopheev and PN. Lugovoy
VENTILATED SURFACE FOUNDATIONS ON PERMAFROST SOILS NB. Kutvitskqa and MR. Gokhman
R e s u l t s OF RESEARCHES AND EXPERIENCE OF HYDRAULIC MINING OF FROZEN ROCKS
N.P. Lavrov, G.Z. Perlshtein and V.K. Samyshin
OFFSHORE SEAWATER TREATING PLANT FOR WATERFLOOD PROJECT, PRUDHOE BAY OIL FIELD, ALASKA, U.S.A.
V. Manikian and J.L. Machemehl
1363
1368
1372
1377
1382
1388
1393
1397
1403
1407
1413
1417
1422
DEVELOPING A THAWING MODEL FOR SLUDGE FREEZING BEDS C. J. Martel
ROCK MECHANICS RELATED TO COAL MINING IN PERMAFROST ON SPITZBERGEN
A.M. Myrvang
SETTLEMENTS OF THE FOUNDATIONS ON SEASONALLY Freezing SOILS
V.O. Orlov and V.V. Fwsov
REGULARITIES OF THERMAL AND MECHANICAL INTERACTION BETWEEN C u l v e r t s AND EMBANKMENTS
NA. Peretrukhin and AA. Topekha
Methods OF QUANTITATIVE VALUATION OF REGIONAL HEAT RESOURCES FOR PREPARATION OF PERMAFROST PLACER Deposits TO MINING
G.Z. Perlshtein and V.E. Kapranov
Stability OF ROAD SUBGRADES IN THE NORTH OF WEST SIBERIA A.G. Polmvsky and Yu.M. Lyvovitch
REFLECTION SEISMIC EXPLORATION AND DATA PROCESSING IN COLD REGIONS
F. Parturas
PROBLEMS OF ARCTIC ROAD CONSTRUCTION AND MAINTENANCE IN FINLAND
S. Saarelainen and J. Vaskelainen
SOME ASPECTS OF FREEZING THE ICE PLATFORMS BA. Suveliev and DA. Latalin
SLOPE STABILlTY IN ARCTIC COAL MINES A X . Sinha, M. Sengupta and T.C. Kinney
THE RESISTANCE TO FROST HEAVE OF VARIOUS CONCRETE CANAL LINING
Song, Baoqing, Fan, Xiuting and Sun, Kehan
THE BARROW DIRECT BURY Utilities SYSTEM DESIGN J.E. Thomas, P.E.
COLD CRACKING OF Asphalt PAVEMENT ON HIGHWAY Tian, Deting and Dai, Huimin
AIRPORT Network AND HOUSING CONSTRUCTION PROGRAMMES IN NORTHERN QUEBEC, CANADA
C. Tremblay and G. Dork
FROST DAMAGE OF ENCLOSURE AND ITS MEASURE FOR PREVENTING FROST HAZARD
Wang, Gongshan
APPLICATION OF LIME STABILIZATION ON HIGHWAY PERMAFROST REGION, QINGHAI-XIZANG PLATEAU
Wang, Qing-tu,Wu, Jing-min and Liu, Jian-du
INVESTIGATION AND TREATMENT FOR SLOPE-SLIDING OF RAILWAY CUTTING IN PERMAFROST AREA
Wang, Wenbao
MODEL TEST TO DETERMINE Thawing DEPTH OF EMBANKMENT IN PERMAFROST REGION
Ye, Bayou, Tong, Zhiquan, Lou Anjin and Shang, Jihong
STUDIES ON THE PLASTIC-FILM-ENCLOSED FOUNDATION OF SLUICE GATES AND ITS APPLICATION
Yu, Bofang, Qu, Xiangmin and Jin, Naicui
GEOCRYOLOGICAL BLOCK OF OIL AND GAS PRODUCING AND TRANSPORTING GEOTECHNICAL SYSTEMS
YF. Zakharov, Y.Y. Podborny and GJ. PUSH
1507
1511
1515
1520
1526
1531
BOREHOLE INVESTIGATIONS OF THE ELECTRICAL PROPERTIES OF FROZEN SILT
S.A. Arcone and AJ. Delaney
U.S. Army Cold Regions Research and Engineering Laboratory
SYNOPS I S The d i e l e c t r i c c o n s t a n t and a t t e n u a t i o n r a t e o f short radiowave pulses in f ro- zen Fairbanks s i l t have been measured between boreholes.12 m deep and spaced between 4 . 4 and 1 7 . 6 m . The ranges for volumetr ic ice content and temperature were 4 4 t o 79% and -6.0 ( su r face , ea r ly A p r i l ) t o -0 .7 -C (bottom) respectively. The pulses l as ted approximate ly 30 n s , had a power spec- trum centered near 100 MHz, and were t ransmit ted and r ece ived a t t he same depth. Dielectric cons t an t s were determined from the propagation time delay of the leading edge and there was no s igni f icant d i spers ion . At tenuat ion rates (dB/m) were determined by comparing s ignal levels rece ived be tween d i f fe ren t borehole pa i r s and were adjusted €or geometr ic spreading losses . Con- c u r r e n t b o r e h o l e d c r e s i s t i v i t y measurements allowed estimates of t he s epa ra t e con t r ibu t ions of various loss mechanisms. The r e s u l t s show t h e d i e l e c t r i c c o n s t a n t t o v a r y between 4 . 3 and 7.0 and t o c o r r e l a t e well with the volumetric ice content, but not with temperature Average attenu- a t i o n r a t e s a t any par t icular depth var ied between 1 . 4 and 4.0 dB/m. The lowest values occurred in the sec t ions wi th the h igher i ce conten t . No more than 0 . 8 dB/m could be ascribed to con- duc t ive abso rp t ion l o s ses , sugges t ing t ha t s ca t t e r ing is an important loss mechanism.
INTRODUCTION
Short-pulse radar operat ing between 50 and 500 MHz is of t en u sed fo r exp lo ra t ion i n no r the rn reg ions (e .g . , Annan and Davis, 1 9 7 6 ; Davis e t a l , , 1 9 7 6 ; Arcone and Delaney, 1 9 8 4 ) . The f r eez ing of soil decreases the wave a t t enua - t i on a t t hese f r equenc ie s found i n t he same ma te r i a l s when thawed. Knowledge o f t he e l e c t r i c a l p r o p e r t i e s of f rozen so i l s , which determines wave v e l o c i t y and a t t e n u a t i o n r a t e , is thus e s sen t i a l t o t he i n t e rp re t a t ion o f radar records in northern c l imates .
The e l e c t r i c a l r e s i s t i v i t y p o f f r o z e n s o i l s strongly depends on the mobili ty of charge carr iers a long networks of unfrozen water, given poorly conducting minerals. Complex d i - e l e c t r i c p e r m i t t i v i t y E* depends on t h e rela- t ive p ropor t ions and i n d i v i d u a l p r o p e r t i e s of mine ra l ma t t e r , a i r , ice and unfrozen water (e.g., Hoekstra and Delaney, 1 9 7 4 ; Delaney and Arcone, 1 9 8 4 ) . Grain s ize and temperature he lp de te rmine the amount of unfrozen water , which e x i s t s n e a r p a r t i c l e s u r f a c e s . The water content determines how many channels form (usua l ly a small volumetric percentage is needed t o c o a t a l l soil p a r t i c l e s ) and how many voids can be f i l l ed w i th wa te r o r ice. Temperature mainly determines the percentage of i n t e r s t i t i a l w a t e r t h a t forms i c e ; as temperature decreases below O’C the percentage of unfrozen water d e c r e a s e s ( T i c e e t a l . , 1 9 7 8 ) . E l e c t r i c a l p r o p e r t i e s also depend on frequency, which is con t ro l l ed by s e v e r a l r e l a x a t i o n p r o c e s s e s a l h o e f t , 1 9 7 7 ) . I n t h i s research the bandwidth was suf f ic ien t ly nar row to avoid such dependence.
F ie ld inves t iga t ions of f rozen soil p r o p e r t i e s i n t h e 50- t o 500”Hz range have not been
extensive. Arcone and Delaney (1982a, 1 9 8 4 ) and Delaney and Arcone (1 984) , using f ixed frequency and pulse techniques, have found the d i e l e c t r i c c o n s t a n t E’ t o v a r y between 3 and 12 f o r s i l t between about -2 and -12’C, with volumetr ic ice content varying from 0 t o o v e r 80X. Annan and Davis (1 9 7 6 ) and Annan ( 1 9 7 6 ) have ca l cu la t ed c ’ from s igna l p ropagat ion times for c layey s o i l s with high ice con ten t , and found some va lues l ess than 3 . 2 , t h a t of pure ice . None o f the above works contains d a t a on s igna l a t t enua t ion . Ind i r ec t methods such as modeling or Low f r e q u e n c y r e s i s t i v i t y measurements ( e .g . , Arcone and Delaney, 1982a) can be employed t o e s t i m a t e a t t e n u a t i o n r a t e s .
The ob jec t ive of t h i s r e s e a r c h was to measure i n s i t u t h e d i e l e c t r i c p e r m i t t i v i t y o f f rozen s i l t and t o co r re l a t e va lues w i th soil temperature and ice content. High ice conten t s i l t is common i n i n t e r i o r Alaska. The time delays of pulses transmitted between boreholes a t a s i t e in Fairbanks. Alaska, and a t t enua - t i o n rates ca l cu la t ed from comparisons of s i g n a l loss between d i f f e ren t bo reho le pa i r s were used t o compute t h e r e a l p a r t E ’ of t h e d i e l e c t r i c p e r m i t t i v i t y . Measurements of dc r e s i s t i v i t y a l l o w e d a t t e n u a t i o n mechanisms t o be estimated. The da ta repor ted here a re ’ f rom two y e a r s f o r l a t e March - ea r ly Apr i l when the ground was ent i re ly f rozen .
EQUIPMENT AND DATA PROCESSING
Electromagnetic
A control uni t manufactured by t h e Xadar Company (Elec t romagnet ic Ref lec t ion Prof i l ing System, model 1316) operated a p a i r of bore- hole antennas manufactured by t he GSSI
91 0
Company. The u n i t i s intended €or radar sub- s u r f a c e p r o f i l i n g w i t h t r a n s m i t and r ece ive a n t e n n a s c l o s e t o g e t h e r , b u t may be used with t h e a n t e n n a s a t any s e p a r a t i o n . The p u l s e r e p e t i t i o n f r e q u e n c y was 50 kHz. The s i g n a l s r ece ived a r e s equen t i a l ly s ampled t o conve r t t h e VHF f r equenc ie s t o t he aud io r ange fo r
a1 s can l e n g t h s , ranging from 43 t o 2000 n s . d i g i t a l o r ana log r eco rd ing ove r one of seve r -
The scans were l i n e a r l y s t a c k e d t o r e d u c e i n - cohe ren t no i se and t hen s to red on magnetic tape . An exponen t i a l ga in was app l i ed O V e K t h e f i r s t q u a r t e r of t h e s c a n , a f t e r w h i c h i t remained constant . An ove ra l l sys t em ga in was a l so u sed . Data were later t r a n s f e r r e d t o a computer for playback and g raph ic d i sp l ay .
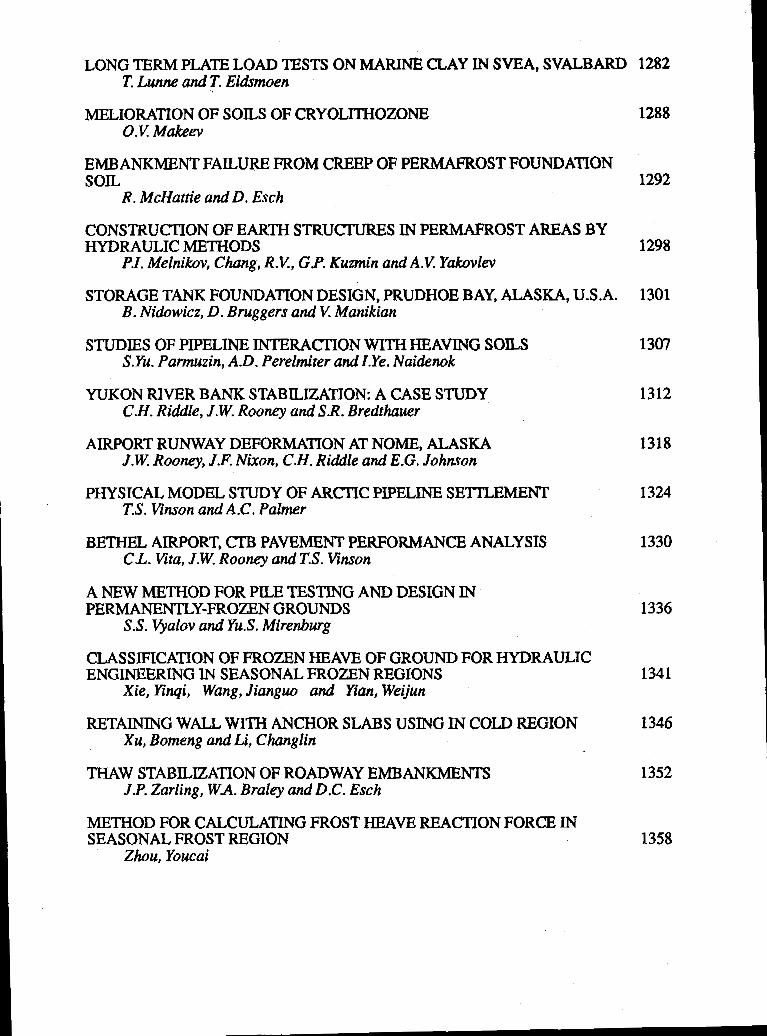
-3b ' Ib 20 io 40 ' 5b ' Time (ns)
Frequency (Hz)
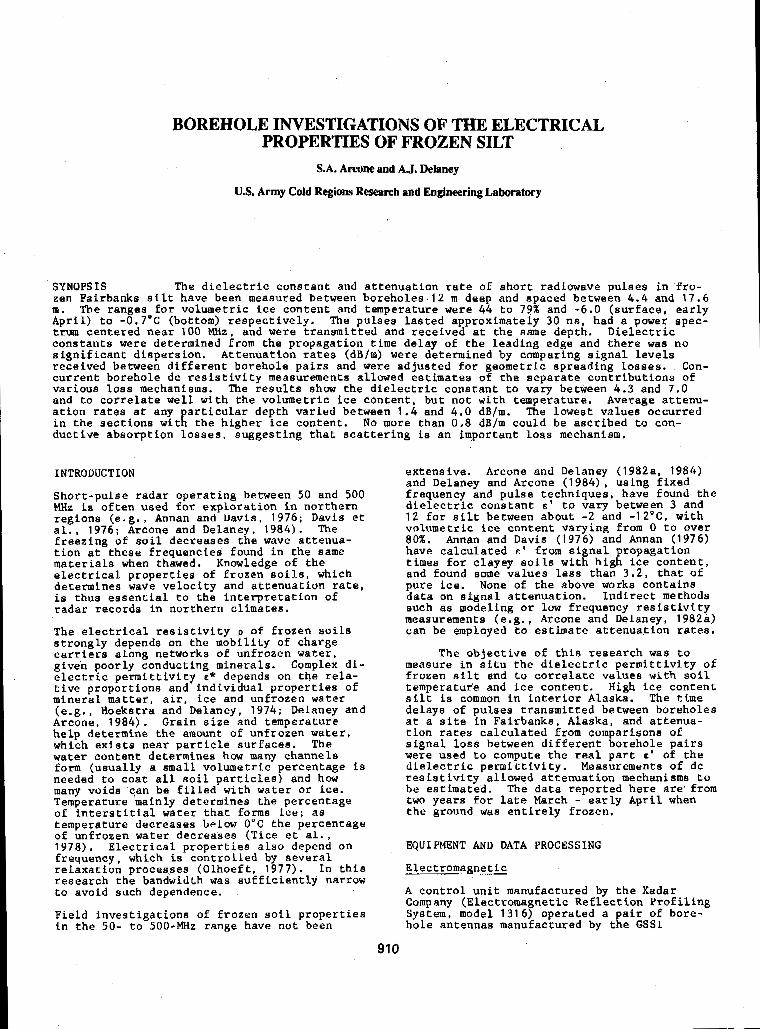
Fig. 1 Typica l t ransmi t ted 'wavele t ( top) and i t s assoc ia ted ampl i tude and phase spec t r a .
A t y p i c a l r a d i a t e d p u l s e s h a p e and i t s a s so - c i a t e d F o u r i e r s p e c t r m are ahown in Figure 1 . Both t ransmit and r ece ive an tennas do no t r a d i a t e u n i f o r m l y in t h e r a d i a l d i r e c t i o n , a l - though pulse shape is mainta ined in a l l d i r e c - t i o n s . Measurements made i n air r e v e a l e d t h a t received ampli tude could vary as much as 2.6 dB, depending on t h e a z i m u t h a l o r i e n t a t i o n o f t he an t ennas . However, t h i s c o u l d c a u s e o n l y
r a t e ( i n dB/m) when d iv ided by the p ropagat ion a small adjustment in the measured a t tenuat ion
ho le s was i n h i b i t e d by the a t t ached ropes and d i s t a n c e s . A n t e n n a o r i e n t a t i o n i n t h e b o r e -
c a b l e s , b u t was imposs ib l e t o de t e rmine as t h e an tennas would r o t a t e when being lowered.
Time de lay was c a l i b r a t e d by r eco rd ing pu l se t ransmissions between antennas separated in air a t measured dis tances . The a b s o l u t e z e r o time r e f e r e n c e f o r any borehole pa i r was determined by f i r s t measuring the t ime delay d i f f e r e n c e t d b e t w e e n a i r t r a n s m i s s i o n s o v e r a d i s t a n c e e q u a l t o t h e b o r e h o l e s p a c i n g , and that between the boreholes (both recordings wi th in 1 minute) a t t h e maximum depth of 11.5 m. The bo reho le s epa ra t ion d iv ided by the
91 1
f r e e s p a c e v e l o c i t y c = 30 cm/ns was then added t o t d t o g ive t he ze ro time r e f r r - ence . This p rocedure f ixed the pos i t ion of t h e a b s o l u t e t i m e r e f e r e n c e on our record ings for both years of measurement. Temperatures r eco rded t h roughou t t he yea r a t 11.5-m depth revea led no seasona l changes , t hus ve r i fy ing an assumption of no d i e l e c t r i c c h a n g e s a t t h e 11.5-m depth . Year ly ca l ibra t ions were r e q u i r e d t o c o m p e n s a t e f o r d r i f t i n t h e z e r o time re fe rence ( approx ima te ly 1 ns /hour) because of c h a n g e s i n d c b i a s l e v e l s w i t h i n t h e c o u r s e o f a day or between years .
S i g n a l a m p l i t u d e c a l i b r a t i o n was determined by the ga in s e t t i ngs and s igna l l eve l r eco rded f o r e a c h t r a n s m i s s i o n . A t t e n u a t i o n r a t e s between a borehole pair were determined by comparing the ampli tudes received between that pair wi th those measured between a c l o s e r r e f e r e n c e p a i r , f o r which t o t a l a t t e n u a t i o n was g e n e r a l l y l ess ; 13 combinat ions of pairs w e r e u t i l i z e d . The r a t e s a r e t h e r e f o r e b a s e d on re la t ive measurements to e l imina te sys tem l o s s e s . A b s o l u t e c a l i b r a t i o n s were impossible because of the unknown va lues of i n i t i a l s i g n a l s t r e n g t h a t t h e a n t e n n a s .
R e s i s t i v i t y
A s t r i n g o f e l e c t r o d e s was a t t a c h e d t o a 3 . 8 - cm-diameter p las t ic (ABS) p ipe and i n s e r t e d darn a separate borehole , which was then back- f i l l e d w i t h wet s i l t and allowed t o r e f r e e z e . The e l ec t rodes were s epa ra t ed by 30 cm and an
the fo rmula fo r a Wenner a r r a y embedded i n a a p p a r e n t r e s i s t i v i t y pa was computed us ing
homogeneous e a r t h
pa = 4na V / I ,
where a is the e l ec t rode spac ing and V and I a re the measured vo l tage and i n j e c t e d c u r r e n t , r e s p e c t i v e l y . The q u a n t i t y Pa is an i n t e - g r a t i o n o v e r a r a d i u s of about 0 .7a and equa l s t h e r e a l r e s i s t i v i t y f o r homogeneous e a r t h . A more complete descr ipt ion of th i s exper iment
a n d p i p e e f f e c t s ) w i t h d a t a f o r 1 2 months is ( inc lud ing d i scuss ions o f con tac t r e s i s t ance
given by Delaney e t a l . ( i n press) .
Temperature
Temperature T was measured a t 30-cm l e v e l s us- ing a thermistor probe s lowly lowered down a s e p a r a t e b o r e h o l e f i l l e d w i t h e t h y l e n e g l y - c o l . The the rmis to r (Omega 400 s e r i e s ) was c a l i b r a t e d t o 0.01 "C. Readings were made on a b a t t e r y - o p e r a t e d v o l t m e t e r a f t e r e q u i l i b r i u m was e s t a b l i s h e d a t e a c h l e v e l . The t h e r m i s t o r was w e i g h t e d t o f a c i l i t a t e l o w e r i n g . An e n t i r e r u n l a s t e d a b o u t 45 minutes .
Electromagnet ic Data Reduct ion
The time de lay and peak amplitude of each pulse t ransmiss ion a l lowed computa t ion o f t he com lex index o f r e f r a c t i o n n* = n ' - in" ( i = Jd) from which E* = E' - i c " = nX2 could be c a l c u l a t e d . Time delays were measured a t t h e lead ing edge of the wavele t and , w i t l i t h e known boreho le s epa ra t ion , de t e rmined n ' . The p o s i t i o n o f the Leading edge was determined v i s u a l l y t o a b o u t f 0.5 n s , which genera l ly
g i v e s a n e r r o r o f l e s s t h a n 0.1 i n E' . The c o n e i s t e n c y i n o s c i l l a t i o n p e r i o d s f o r a l l wavele t s p rec luded the p resence o f d i spers ion a n d t h e p o s s i b i l i t y t h a t l e a d i n g e d g e v e l o c i t i e s w e r e n o t c h a r a c t e r i s t i c of t he s t ronges t : f requency of the wave le t s . on ly t he leading edge could be used because the wavelet 1et)gth and s p e c t t m i n t h e a i r r e f e r e n c e ( c e n t e r e d a t a p p r o x i m a t e l y 140 MHz) was d i f f e r e n t t h a n i n t h e g r o u n d (100 MHz). The a t t e n u a t i o n r a t e 4 (dBfm) was computed by compar ing the peak rece ived s igna l s t rength A, f o r o n e p a i r w i t h t h a t f o r a c l o s e r , r e f e r e n c e h o l e p a i r A . A f t e r a d j u s t i n g t h e r a t i o A P I A I f o r g e o m e t r i c s p r e a d i n g l o s s e s , a is then found from the formula
B - 20 log (A2fA1) f A2 (2)
where AZ i s t h e d i f f e r e n c e i n s e p a r a t i o n between the two borehole pairs. The imaginary p a r t o f t h e r e f r a c t i v e i n d e x i s then
n" = pcf (8 .68.2sf) = 0.055 Rff ( 3 )
where f i s , t h e s t r o n g e s t f r e q u e n c y o f t r a n s - mission ( in hundreds of MHz). The components of . E* a r e t h e n
E ' = 7 2 I ( 4 )
and
E" - 2n'n' ' . (5)
The q u a n t i t y n" proved small enough to a l low E ' = n r 2 t o w i t h i n + 0.04, which is w i t h i n t h e e r r o r o f t h e time measurement.
S igna l a t t enua t ion o the r t han geomet r i c spreading is caused by r e s i s t i v e or d i p o l a r d i s p e t a i o n a l l o s s e s , or sca t t e r ing . De laney and Arcone (1984) have shown t h e d i p o l a r component of E" t o be in the range 0 . 1 - 0 . 2 f o r very h igh ice conten t Fa i rbanks s i l t , which a t 100 MHz, g ives 0 . 4 - 0 . 8 dBfm f o r a n E' = 5. A t t e n u a t i o n r a t e s due t o m a t e r i a l r e s i s t i v i t y p are computed from the formula
$, = 4 . 3 4 i c J e ' b p = 1636foJ; ' . ( 6 )
SITE DESCRIPTION AND PREPARATION
T h e i n v e s t i g a t i o n was conducted a t t he Farmer 's Loop Road tes t f a c i l i t y of USACRREL in Fa i rbanks , Alaska . The s o i l type t o seve r - a l t e n s of meters depth is r e t r a n s p o r t e d e o l i a n s i l t (PmC. 1958) . P rev ious i nves t iga - t ions here (Arcone e t a l . , 1 9 7 8 ; Arcone and Delaney. 1982b3) have r epor t ed va lues fo r ground r e s i s t i v i t y and t h e a c t i v e l a y e r d i e l e c t r i c c o n s t a n t . G e n e r a l l y , v o l u m e t r i c ice con ten t (d i scussed l a t e r ) exceeds 50% and a c t i v e l a y e r d e p t h i s 70-100 cm. An organ ic mat cove r s t he su r f ace . The h ighes t and low- es t ground tempera tures occur in ear ly spr ing and l a t e summer r e s p e c t i v e l y .
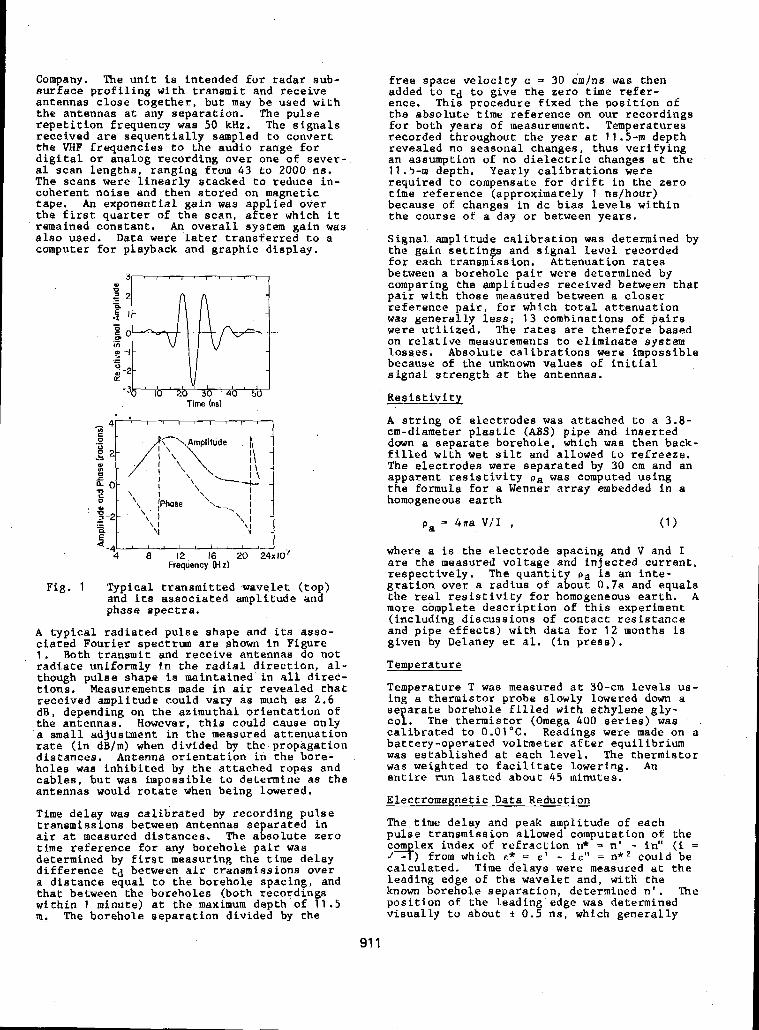
S ix ho le s (F ig . 2 ) were d r i l l e d to approxi - mately 12-m depth and cased wi th 3 - in . (7 .62- cm) d iameter ABS plast ic pipe, capped and sea led a t the bo t tom. Core samples could no t
Access Roud
Fig. 2 Borehole l ayout a t the Farmer ' s Loop Road tes t f a c i l i t y . T and p a r e t h e tempera ture and r e s i s t i v i t y e l e c t r o d e s t r i n g b o r e h o l e s .
be obtained because f reeze-back of the core b a r r e l t o t h e h o l e wall c o n s t a n t l y o c c u r r e d a t t he nea r 0°C tempera ture o f the so i l . Conse- quent ly , only augered cut t ings were obtained from which gravimetr ic water content was measured. Massive ice was no t encoun te red i n any of the ho les .
0.0 H
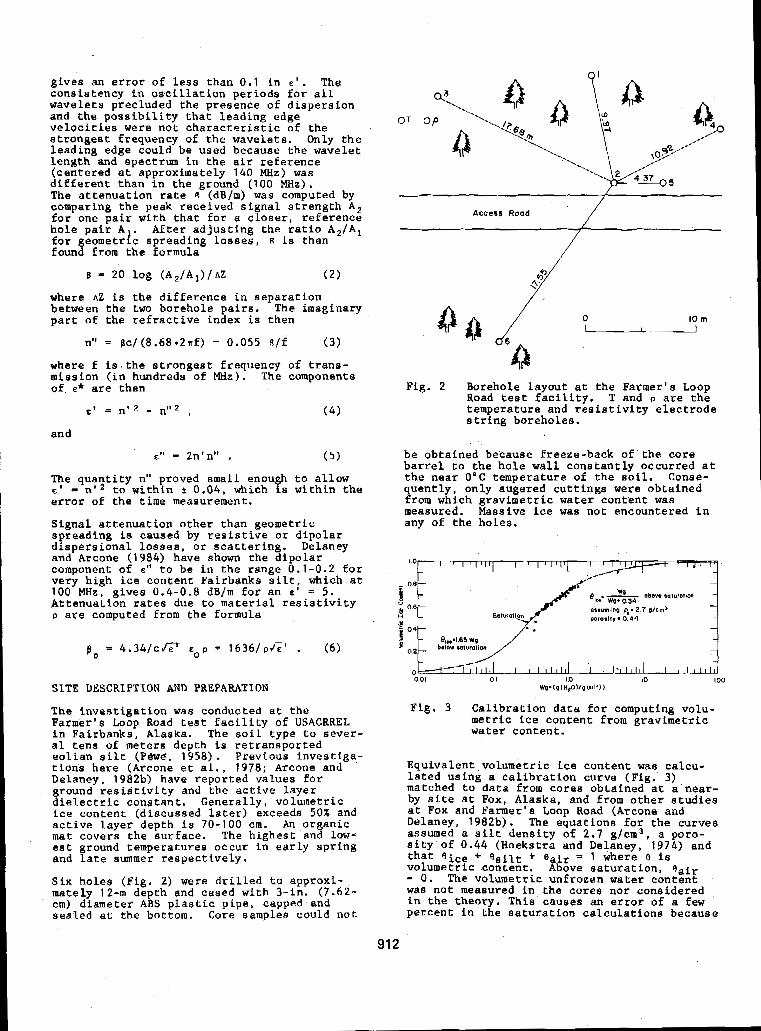
Fig. 3 Cal ib ra t ion da t a fo r comput ing vo lu - metric i ce con ten t f rom g rav ime t r i c wa te r con ten t .
Equiva len t vo lumetr ic ice con ten t was ca lcu- l a t e d u s i n g a ca l . i b ra t ion cu rve (F ig . 3) matched t o d a t a from c o r e s o b t a i n e d a t a'near- by s i t e a t Fox, Alaska. and f rom other s tudies a t Fox and Farmer 's Loop Road (Arcone and Delaney, 1982b). The equa t ions fo r t he cu rves assumed a e i l t d e n s i t y o f 2 . 7 g f c m 3 , a poro- s i t y o f 0 . 4 4 (Hoekstra and Delaney, 1 9 7 4 ) and t h a t Site f Rei1t + Bair = 1 where 8 is volumetr ic conten t . Above s a t u r a t i o n , S a i r = 0. The volumetr ic unf rozen water conten t was not measured in the cores nor cons idered i n t h e t h e o r y . Thie causes an e r r o r o f a few p e r c e n t i n t h e s a t u r a t i o n c a l c u l a t i o n s b e c a u s e
91 2
s e v e r a l grams of unfrozen water can exist per 100 8 of s i l t (T ice e t a l . , 1978) below -0.J C , t he h ighes t t empera tu re encoun te red i n the boreholes .
RESULTS AND DISCUSSION
Pul se t r ansmiss ions were r e c o r d e d a t 1-m depth i n t e r v a l s . The an tennas were r a i s e d s i m u l - taneous ly from a bot tom datum plane es tabl ish- ed by s u r f a c e l e v e l i n g . N i n e b o r e h o l e p a i r s were i n v e s t i g a t e d f o r E' and Figure 4 shows a cy i c a l r e c o r d . The two wides t pa i r s (bore- hoyes 2 t o 6 and 2 t o 3 , Fig . 2) gave l imi ted o r no d i s c e r n i b l e s i g n a l a b o v e t h e n o i s e
3 m be tween each pa i r were severe ly a f fec ted leve l . . Genera l ly , t ransmiss ions in the top
by t h e n o i s e g e n e r a t e d by t h e s e q u e n t i a l
of nearby FM r a d i o s t a t i o n s , a s i s e v i d e n t i n sampling (see Equipment and Data Processing)
F igure 4 . None o f t h e i n t e r - b o r e h o l e p a t h s c rossed a th i rd bo reho le and r a re ly was an e v e n t s e c o n d a r y t o t h e d l r e c t t r a n s m i s s i o n observed for any pa i r bu t the c loses t . The c o r r e l a t i o n s b e t w e e n p r o p a g a t i o n c h a r a c t e r i s - t i cs and i c e c o n t e n t a r e c r e a t e d s t a t i s t i c a l l y because no soil samples were obtained between boreholes .
Cl t I I
Depth (m)
x
Fig . 4 Typica l i n t e r -bo reho le pu l se t r ansmiss ions , i n t h i s ca se be tween ho le s 4 and 5.
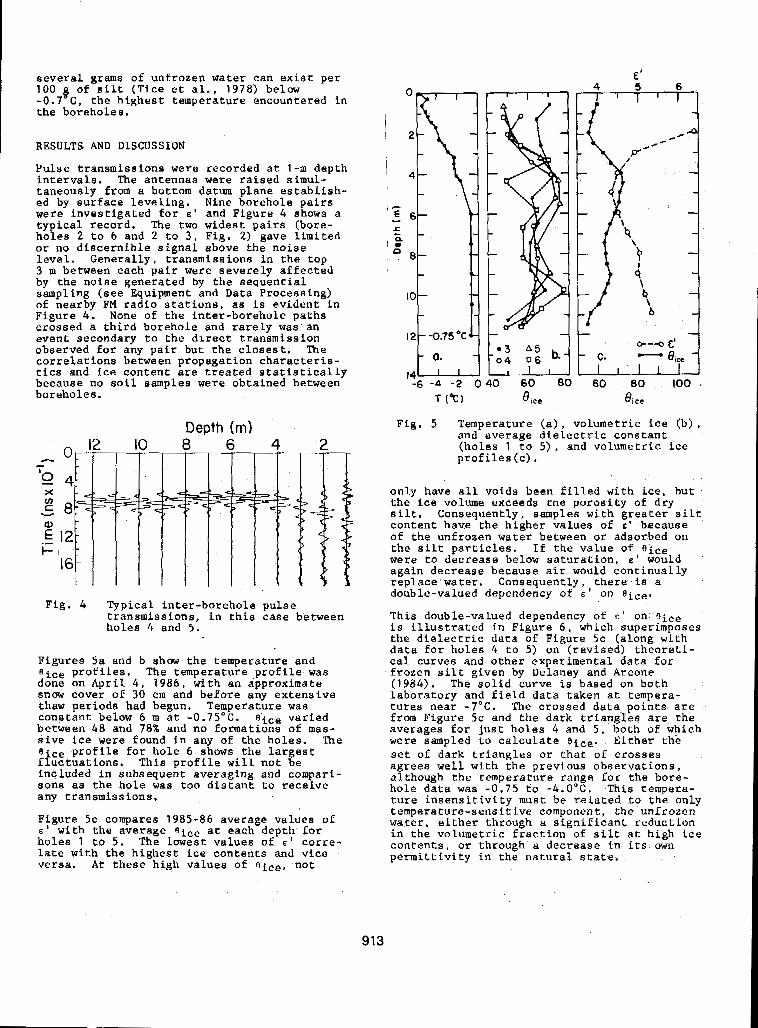
Figures 5a and b show the temperature and e i c e p r o f i l e s . The t e m p e r a t u r e p r o f i l e was done on A p r i l 4 , 1986, with an approximate snow cover of 30 cm and be fo re any ex tens ive thaw periods had begun. Temperature was constant below 6 m a t -0.75'C. ?ice v a r i e d between 48 and 78% and no formations of mas- s i v e i c e were found in any o f t h e h o l e s . The
f l u c t u a t i o n s . T h i s p r o f i l e w i l l no t be e ce p r o f i l e f o r h o l e 6 shows t h e l a r g e s t
inc luded in subsequent averaging and compari- sons as the ho le was t o o d i s t a n t t o r e c e i v e any t r ansmiss ions .
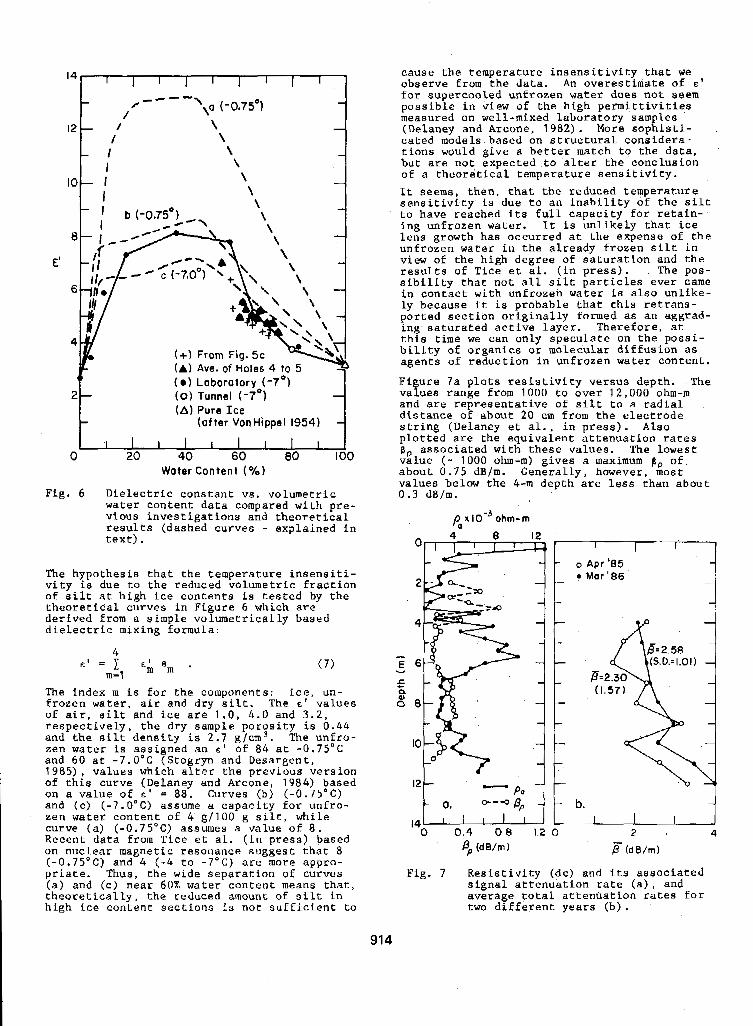
Ffgure 5c compares 1985-86 average values of E with the average A i c e a t each dep th fo r ho le s 1 t o 5. The lowest values of E ' c o r r e - l a t e w i t h t h e h i g h e s t i c e c o n t e n t s and v i c e versa . A t t hese h igh va lues of A i c e , no t
: - E Y
c
19 c
0
E' 4 5 6
Fig . 5 Tempera ture (a ) , vo lumetr ic i ce (b) , and a v e r a g e d i e l e c t r i c c o n s t a n t (ho le s 1 t o 5), and vo lumet r i c i ce p r o f i l e s (c) .
only have a l l v o i d s b e e n f i l l e d w i t h i c e , b u t t h e i c e volume exceeds tne porosi ty of dry s i l t . Consequent ly , samples with gFeater s i l t conten t have the h igher va lues o f E because of the unfrozen water between o r adsorbed on t h e s i l t p a r t i c l e s . I f t h e v a l u e o f , e i c e were to dec rease be low sa tu ra t ion , E wauLd a g a i n d e c r e a s e b e c a u s e a i r would c o n t i n u a l l y r ep lace wa te r . Consequen t ly , t he re is a double-valued dependency o f E ' on @ice.
This double-valued dependency of E ' on i s i l l u s t r a t e d i n F igure 6, which superimposes t h e d i e l e c t r i c d a t a of Figure 5c (a long with d a t a € o r h o l e s 4 t o 5) on ( r e v i s e d ) t h e o r e t i - c a l c u r v e s and o t h e r e x p e r i m e n t a l d a t a f o r f rozen s i l t given by Delaney and Arcone (1984). The s o l i d c u r v e is based on both l a b o r a t o r y a n d f i e l d d a t a t a k e n a t t e m p e r a - t u r e s n e a r -JOG. The c r o s s e d d a t a p o i n t s a r e from Figure 5c and t h e d a r k t r i a n g l e s a r e t h e a v e r a g e s f o r j u s t h o l e s 4 and 5 , both of which were sampled to calculate e i c e . E i t h e r t h e set of d a r k t r i a n g l e s o r t h a t of c ros ses a g r e e s w e l l w i t h t h e p r e v i o u s o b s e r v a t i o n s ,
h o l e d a t a was -0.75 to - 4 . O " C . This temper.a- a l t h o u g h t h e t e m p e r a t u r e r a n g e f o r t h e b o r e -
t u r e i n s e n s i t i v i t y must be r e l a t e d t o t h e o n l y temperature-sensi t ive component , the unfrozen wa te r , e i t he r t h rough a s i g n i f i c a n t r e d u c t i o n i n t h e v o l u m e t r i c f r a c t i o n of s i l t a t h i g h i c e
p e r m i t t i v i t y i n t h e n a t u r a l s t a t e . c o n t e n t s , o r through a d e c r e a s e i n i t s own
913
P ( 0 ) Laboratory ( -7 ' ) ( 0 ) Tunnel (-7') (a) Pure Ice
(a t ter Von Hippel 1954)
0 20 40 60 80 IO0 Water Content ( % I
Fig. 6 D i e l e c t r i c c o n s t a n t v s . v o l u m e t r i c wa te r con ten t da t a compared wi th p re- v i w s i n v e s t i g a t i o n s and t h e o r e t i c a l r e su l t s (dashed cu rves - exp la ined i n t e x t ) .
The h y p o t h e s i s t h a t t h e t e m p e r a t u r e i n s e n s i t i - v i t y is due to t he r educed vo lumet r i c f r ac t ion o f s i l t a t h i g h i c e c o n t e n t s i s t e s t e d by the t h e o r e t i c a l c u r v e s i n F i g u r e 6 which are der fved from a s imple volumetr ical ly based d i e l e c t r i c m i x i n g f o r m u l a :
The index m i s for the components : ice , un- f r o z e n w a t e r , a i r and dry s i l t . The E ' va lues of a i r , s i l t and i c e a r e 1 . 0 , 4.0 and 3.2, r e spec t ive ly , t he d ry s ample po ros i ty is 0.44 and t h e s i l t d e n s i t y i s 2 .1 g/cm3. The unfro- zen water is ass igned an E ' of 8 4 a t -0 .75"C and 60 a t -7 .O 'C (Stogryn and Desargent, 1 9 8 5 ) , va lues wh ich a l t e r t he p rev ious ve r s ion of this curve (Delaney and Arcone, 1984) based on a va lue OE E ' = 88. Curves (b) (-0.75'C) and (c ) ( - 7 . O " C ) assume a capac i ty f o r unf ro- zen water content of 4 g/100 g s i l t , whi le curve (a) (-0.75'C) assumes a value o f 8 . Recent data from T i c e e t a l . ( i n p r e s s ) b a s e d on nuc lear magnet ic resonance nugges t tha t 8 (-0.75'C) and 4 ( - 4 t o - 7 ' C ) a r e more appro- p r i a t e . Thus , t he w ide s epa ra t ion o f curves
t h e o r e t i c a l l y , t h e r e d u c e d amount of s i l t i n (a) and ( c ) nea r 60% water con ten t means t h a t ,
h i g h i c e c o n t e n t s e c t i o n s i s n o t s u f f i c i e n t t o
c a u s e t h e t e m p e r a t u r e i n s e n s i t i v i t y t h a t we observe from t h e d a t a . An overes t imate o f E '
for supercooled unf rozen water does not seem p o s s i b l e i n v iew of the h igh permi t t iv i t ies measured on well-mixed Laboratory samples (Delaney and Arcone, 1982) . More s o p h i s t i - cated models based on s t r u c t u r a l c o n s i d e r a - t i o n s would g ive a b e t t e r m a t c h t o t h e d a t a , b u t a r e n o t e x p e c t e d t o a l t e r t h e c o n c l u s i o n of a t h e o r e t i c a l t e m p e r a t u r e s e n s i t i v i t y . It seems, then. t ha t t he r educed t empera tu re s e n s i t i v i t y is d u e t o a n i n a b i l i t y o f t h e s i l t to have reached i ts € u l l c a p a c i t y f o r r e t a i n - ing unf rozen water . I t is u n l i k e l y t h a t ice lens g rowth has occur red a t the expense of t h e un f rozen wa te r i n t he a l r eady f rozen s i l t i n view of the h igh degree of s a t u r a t i o n and t h e r e s u l t s of T i c e e t a l . ( i n p r e s s ) . The pos- s i b i l i t y t h a t n o t a l l s i l t p a r t i c l e s e v e r came in con tac t w i th un f rozen wa te r i s a l s o u n l i k e - l y because i t is p r o b a b l e t h a t t h i s r e t r a n s - po r t ed s ec t ion o r ig ina l ly fo rmed as an aggrad- i n g s a t u r a t e d a c t i v e l a y e r . T h e r e f o r e , a t t h i s time we can on ly specula te on t h e p o s s i - b i l i t y o f o r g a n i c s o r m o l e c u l a r d i f f u s i o n a s agents o f reduct ion in unf rozen water conten t .
F igu re 7a p l o t s r e s i s t i v i t y v e r s u s d e p t h . The values range from 1000 t o o v e r 1 2 , 0 0 0 ohm-m and a r e r e p r e s e n t a t i v e of s i l t t o a r a d i a l d i s t a n c e of about 20 cm f rom the e l ec t rode s t r ing (Delaney e t a l , , i n p r e s s ) . A l s o p l o t t e d are t h e e q u i v a l e n t a t t e n u a t i o n r a t e s 6, assoc ia t ed w i th t hese va lues . The lowest va lue ( - 1000 ohm-m) g ives a maximum p P of about 0 .75 dB/m. Generally, however, most values below the 4-m depth a re Less than about 0 .3 dB/m.
p, x I0-j ohm-m
0 4 8 I2
2
4
rr
Y E 6
f B S a
IO
14 I 0 0.4 O B 1.2 0 2 . 4
op (d B/m 1 (dB/rn)
Fig. 7 R e s i s t i v i t y ( d c ) and i t s a s s o c i a t e d s i g n a l a t t e n u a t i o n r a t e ( a ) , and a v e r a g e t o t a l a t t e n u a t i o n r a t e s f o r two d i f f e r e n t y e a r s (b) ,
914
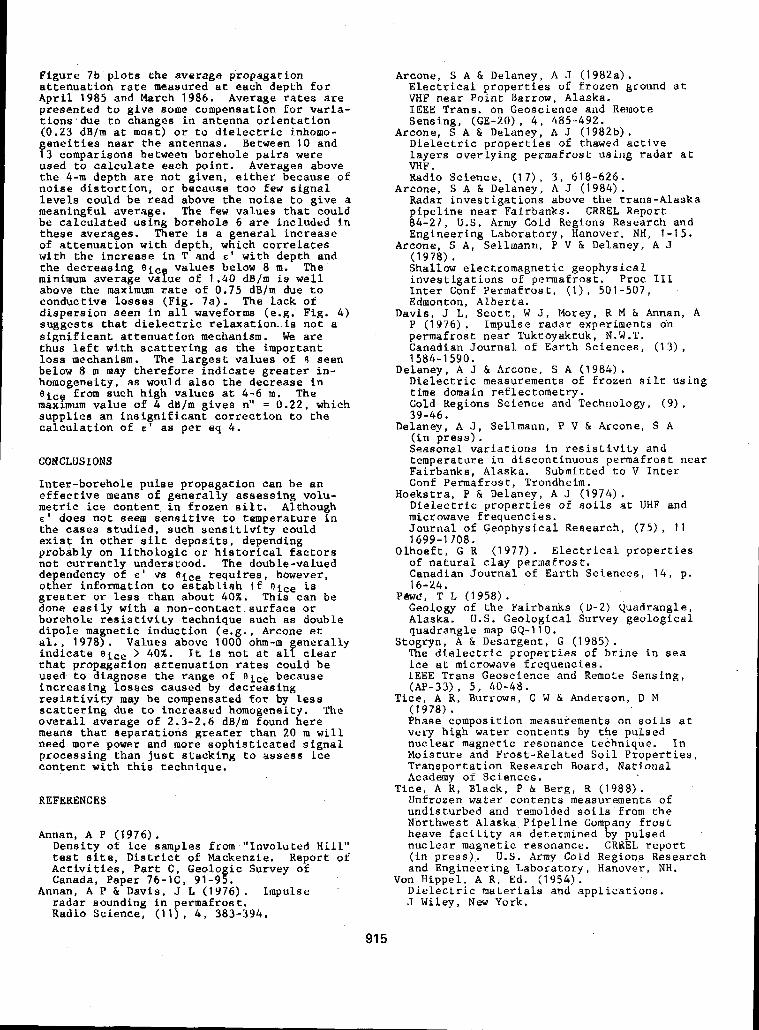
Figure 7b p lo t s t he ave rage p ropaga t ion
A p r i l 1985 and March 1986. Average r a t e s a r e a t t e n u a t i o n r a t e m e a s u r e d a t e a c h d e p t h f o r
p r e s e n t e d t o g i v e some compensation f o r v a r i a - t i o n s , d u e t o changes i n an t enna o r i en ta t ion (0.23 dBJm a t most) o r t o d i e l e c t r i c inhomo- e n e i t i e s n e a r t h e a n t e n n a s . Between 10 and 3 comparisons between borehole pairs were
used to ca lcu la te each po in t . Averages above t h e 4-m dep th a r e no t g iven , e i t he r because of n o i s e d i s t o r t i o n , o r b e c a u s e t o o few s i g n a l leve ls could be read above the no ise to g ive a meaningful average. The few va lues t ha t cou ld be ca l cu la t ed u s ing bo reho le 6 a r e i n c l u d e d i n these averages. There is a g e n e r a l i n c r e a s e o f a t t e n u a t i o n w i t h d e p t h , w h i c h c o r r e l a t e s w i t h t h e i n c r e a s e i n T and E ' with depth and the dec reas ing e i c values below 8 m. The minimum average vafue of 1.40 dB/m i s well above the maximum r a t e of 0.75 dBJm due to conduct ive losses (F ig . 7a) . The lack of d i s p e r s i o n s e e n i n a l l waveforms (e.g. Fig. 4) s u g g e s t s t h a t d i e l e c t r i c r e l a x a t i o n - i s n o t a s i g n i f i c a n t a t t e n u a t i o n mechanism. We a r e thus l e f t w i t h s c a t t e r i n g as the impor tan t loss mechanism. The l a r g e s t v a l u e s o f R seen below 8 rn may t h e r e f o r e i n d i c a t e g r e a t e r i n - homogenei ty , as would a lso the decrease in e i c g from such high values a t 4-6 m. The maximum va lue of 4 dB/m g ives n" = 0.22 , which s u p p l i e s a n i n s i g n i f i c a n t c o r r e c t i o n t o t h e caLcula t ion of E ' a s per eq 4 .
f
CONCLUSIONS
In t e r -bo reho le pu l se propagat ion can be an e f f e c t i v e means o f gene ra l ly a s ses s ing vo lu - m e t r i c i c e c o n t e n t . i n f r o z e n s i l t . Although E ' does not seem s e n s i t i v e t o t e m p e r a c u r e i n t he cases s t u d i e d , s u c h s e n s i t i v i t y c o u l d e x i s v i n o t h e r s i l t depos i t s , depending probably on l i t h o l o g i c o r h i s t o r i c a l f a c t o r s no t cu r ren t ly uyde r s tood . The double-valued dependency of E vs requires , however , o t h e r i n f o r m a t i o n t o e s t a b l i s h i f R i c e is g r e a t e r OK less than about 40%. This can be done ea s i ly w i th a n o n - c o n t a c t s u r f a c e o r bo reho le r e s i s t i v i ty t echn ique such a s doub le dipole magnet ic induct ion (e .g . , Arcone e t a l . , 1978). Values above 1000 ohm-m e n e r a l l y i n d i c a t e e i c e > 40%. I t is n o t a t a l f c l e a r t h a t p r o p a g a t i o n a t t e n u a t i o n r a t e s c o u l d b e used to d iagnose the range of Aice because i n c r e a s i n g losses caused by dec reas ing r e s i s t i v i t y may be compensated for by l e s s sca t te r ing due to increased homogenei ty . The o v e r a l l a v e r a g e of 2.3-2.6 dB/m found here means t h a t s e p a r a t i o n s g r e a t e r t h a n 20 m w i l l need more power and more s o p h i s t i c a t e d s i g n a l p r o c e s s i n g t h a n j u s t s t a c k i n g t o a s s e s s i c e c o n t e n t w i t h t h i s t e c h n i q u e .
REFERENCES
Annan, A P (1976). Densi ty of ice samples from "Involu ted H i l l " tes t s i t e , D i s t r i c t of Mackenzie. Report of A c t i v i t i e s , P a r t C, Geologic Survey of
Annan, A P & Davis , J L (1976) . Impulse Canada, Paper 76-1C, 91-95.
radar sounding in permafros t . Radio Science, (Il), 4 , 383-394.
Arcone, S A & Delaney, A J (1982a) . E L e c t r i c a l p r o p e r t i e s of frozen ground a t VHF near Point Barrow, Alaska.
Sensing, (GE-20) , 4 , 485-492. I E E E Trans. on Geoscience and Remote
D i e l e c t r i c p r o p e r t i e s of thawed a c t i v e
VHF . l a y e r s o v e r l y i n g p e r m a f r o s t u s i n g r a d a r a t
Radio Science, (1 7), 3 , 618-626. Arcone, S A & Delaney, A J (1984) .
Radar inves t iga t ions above t he t r ans -Alaska p i p e l i n e n e a r F a i r b a n k s . CRREL Report 84-27, U.S. Army Cold Regions Research and Engineering Laboratory, Hanover, N H , 1-15.
(1978) . Shal low e lectromagnet ic geophysical
I n t e r Conf Permafros t , ( I ) , 501-507, i n v e s t i g a t i o n s of permafrost . Proc 111
Edmonton, A lbe r t a .
P (1976) , Impulse radar experiments on permafrost: neat Tuktoyaktuk, N.W.T. Canadian Journal of Ea r th Sc i ences , (1 3) ,
Arcone, S A & Delaney, A J (1982b).
Arcone, S A , Sellmann, P V & Delaney, A J
Davis , J L, S c o t t , W J , Morey, R M & Annan, A
1584-1 590. Delaney, A J & Arcone, S A ( 1 984) .
Dielectr ic measurements of f rozen s i l t u s i n g time domain r e f l ec tomet ry . Cold Regions Science and Technology, (9), 39-46.
Delaney, A J , Sellmann, P V & Arcone, S A ( i n p r e s s ) . S e a s o n a l v a r i a t i o n s i n r e s i s t i v i t y a n d
Fairbanks, Alaska. Submitted t o V I n t e r tempera ture in d i scont inuous permafros t near
Conf Permafrost , Trondheim.
D i e l e c t r i c p r o p e r t i e s of soils a t UHF and microwave frequencies.
Hoeks t ra , P & Delaney, A J (1974) .
Journa l o f Geophys ica l Research , (75) , 1 1
O l h o e f t , G R ( 1 9 7 7 ) . E l e c t r i c a l p r o p e r t i e s 1699-1 708.
of n a t u r a l c l a y p e r m a f r o s t . Canadian Journal of Ear th Sc iences , 14 , p. 16-24.
Pew&. T L (1958). Geology of the Fairbanks ( D - 2 ) Quadrangle , Alaska. U . S . Geological Survey geological
ogryn, A & Desargent , G (1 985) . quadrangle map G Q - I 10.
The d i e l e c t r i c p r o p e r t i e s o f b r i n e i n s e a i c e a t microwave frequencies. IEEE Trans Geoscience and Remote Sens ing ,
c e , A R, Burrows, C W & Anderson, D M ( 1 978) . Phase composition measurements on s o i l s a t
(AP-33), 5, 40-46.
very h igh 'wat r r conten ts by the pu lsed nuclear magnet ic resonance technique. In Moisture and Fros t -Rela ted S o i l P r o p e r t i e s , Transportation Research Board, National Academy of Sc iences ,
Unfrozen water contents measurements o f undis turbed and remolded s o i l s from t h e Northwest Alaska Pipeline Company f r o s t h e a v e f a c i l i t y as determined by pulsed nuclear magnetic resonance. CRKEL r e p o r t ( i n press) . U.S. Army Cold Regions Research and Engineering Laboratory, Hanover, NH.
Dielectric m a t e r i a l s and a p p l i c a t i o n s . J Wiley, N e w Pork.
T ice , A R , Black, P & Berg, R (1988) .
Von Hippel , A R , Ed . (1954).
91 5
PERMAFROST AND TERRAIN PRELIMINARY MONITORING RESULTS, - NORMAN WELLS PIPELINE, CANADA
M.M. Burgess
Permafrost Research, Geological Survey of Canada, Energy, Mines and Resources, Ottawa, Canada
SYNOPSIS The 8 6 9 km Norman Wells oil pipeline, owned by Interprovincial Pipe Line (NW) ttd. (IPL). traverses the discontinuous permafrost zone of Northwestern Canada. A fully buried, small diameter ( 3 2 4 mm) line transporting initially chilled oil was designed for operation in the thaw-sensitive terrain along the route. Operation began in April 1985. Monitoring o f the thermal regime at thirteen locations along the route forms a major component of a long term cooperative government-IPL permafrost and terrain research and monitoting program, Observations to the end of March I987 indicate that mean annual pipe tempetatures, which range from O°C to 5 O C , are generally >O°C both within the widespread discontinuous permafrost terrain in the north and the sporadic discontinuous permafrost terrain in the south. Mean annual ground temperatures on the right-of-way (ROW) a.t 1 m depth, several metres from the trench, range from - 2 O to + Q 0 C and are on average 1.5 degrees colder than mean annual pipe temperatures. Mean annual ground temperatures off-ROW a t a depth of 1 m range from - 3 O to +3'C and are on average 1 degree colder than those on-ROW. Maximum surface settlement observed on the ROW at the sites has reached up to 8 0 cm outside the trench area, and over 100 cm in the vicinity of the trench.
INTRODUCTION
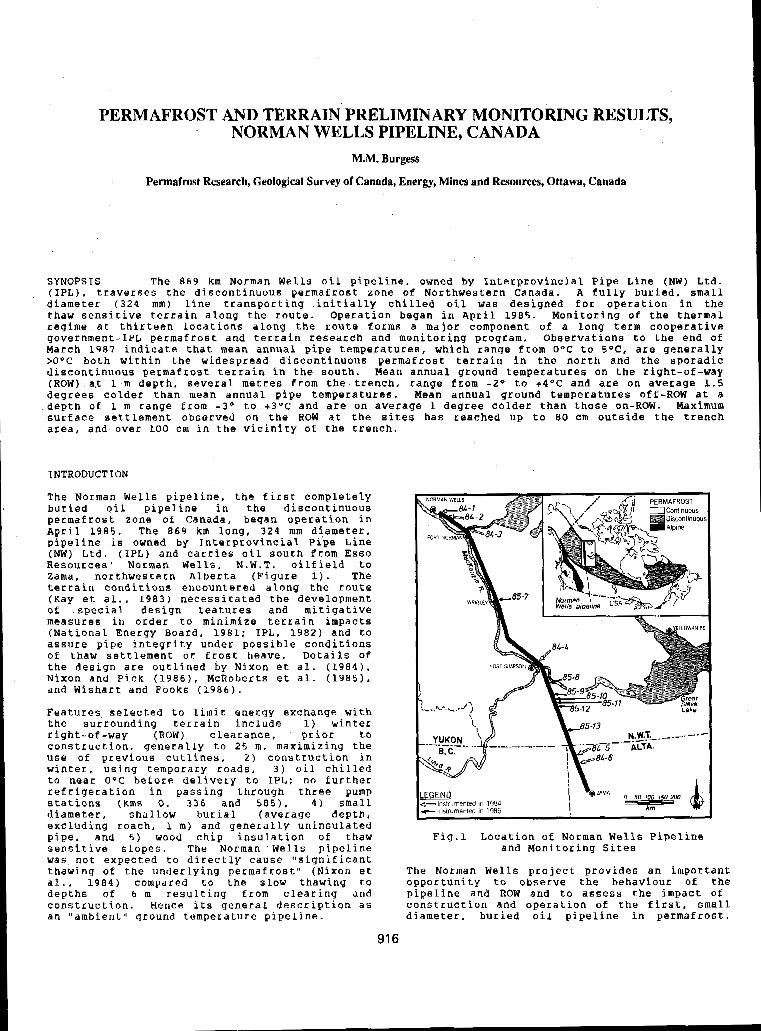
The Norman Wells pipeline. the Eirst completely buried oil pipeline in the discontinuous permafrost zone of Canada. began operation in April 1985. The 8 6 9 km long, 3 2 4 mm diameter, pipeline is owned by Interprovincial Pipe Line (NW) Ltd. (IPL) and carries oil south from Esso Resources' Norman Wells, N.W.T. oilfield to Zama, northwestern Alberta (Figure 1). The terrain conditions encountered along the route (Kay et al.. 1983) necessitated the development of special design features and mitigative measures in order to minimize terrain impacts (National Energy Board, 1981: IPL, 1982) and to assure pipe integrity under possible conditions of thaw settlement or frost heave. Details of the design are outlined by Nixon et al. ( 1 9 8 4 ) . Nixon and Pick (1986). McRoberts et al. (1985). and Wishart and Fooks (1986).
Features selected to limit energy exchange with the surrounding terrain include 1). winter right-of-way (ROW) clearance, p r l o r to construction. generally to 2 5 m. maximizing the use of previous cutlines, 2 ) construction in winter, using temporary roads, 3 ) oil chilled to near O°C before delivery to fPL; no further refrigeration in passing through three pump stations (kms 0. 3 3 6 and 585). 4 ) small diameter, shallow burial (average depth, excluding roach, 1 m) and generally uninsulated pipe, and 5) wood chip insulation of thaw sensitive slopes. The Norman Wells pipeline was not expected to directly cause "significant thawing of the underlying permafrost" (Nixon et dl., 1984) compared to the slow thawing to depths o f 6 m resulting from clearing and construction. Hence its general description a s an "ambient" ground temperature pipeline.
Fig.1 Location o f Norman Wells Pipeline and Monitoring Sites
The Norman Wells project provides an important opportunity to observe the behaviour of the pipeline and ROW and to assess the impact o f construction and operation of the first. small diameter, buried oil pipeline in permafrost.
91 6
This paper discusses observations on 1) the pipe thermal regime. 2) the ground thermal reglme. and 3 ) the surface settlement recorded at 13 joint government and industry monitoring sites from construction t o the end of the second year o f pipeline operation (March 1987).
PERMAFROST AND TERRAIN RESEARCH AND MONITORING
The long term permafrost and terrain research and monitoring (PTRM) program wae established under an Environmental Agreement signed in 1982 between the federal department o f Indian and Northern Affairs (INAC) and IPL. A major component of the PTRM program, developed in
Energy, Mines and Resources (EMR), involves the cooperation with the federal department of
detailed quantification of changes in the ground thermal regime and geomorphic conditions at instrumented sites.
Table I
Site Locations and Descriptions
B 19.3
C 19.6
84-3 Great Bear River A 79.2
B 79.4
85-7 Table nountain A 271.2 8 212.0
84-1 Pump station 1 0.02 Ice-rich silty clay in widespeead permafrost BE-2 Canyon crset (previously cleared cut line from the 1960s)
A 19.0 Level terrain. frozen till with low ice
East-tacing permafrost slope with a 1 m content in widespread permafrost
insulating wood c h i p cover wart-eacing permaftost slope with erosion control berms
(Joint IPL site) Stratigraphically camplex ice-rich alluvial terrace deposits in widespread permafrost Cliff-Cop lacustrine deposits: aeallan veneer
loe-rich lacustrine plain (old seismic line) Icn-rich lacustrine vlain (recent helipad
(joint IPL s i t e ]
olearing at top of north-facing sLape)- C 2 7 1 . 3 Ice-rich lacustrine plain
(unfrozen terrain aftor long frozen stretch) a 478.0 Unfrozen saturated sands ana silt# in duns
84-4 Trail River
hollow B
85-8 Manner's Creek (rapidly changing permafrost conditions) 478.1 Dry Bands and silts in dune crnst
A 557.8 Thin peat, thick (10 m) permafrost B 558.2 Thick peat (2.7 ml. thin ( I m ) permafroet C
85-9 Pump Station 3 583.3 Unfrozen granular soils after frozen section 558.3 Thin peat (1 m). thin (1 m) petmaErosC
85-10 M4ckenzie Highway South a 588.3 Transltion from tecent helipad clearing in
B 588.7 Thin ( 3 n) pe~mafrost with 2 m peat cover
& 6 0 8 . 6 Thin unfrozen pear plateau
A 682.2 Frozen ( 6 o) terrain eurroundinq largo een B 6 8 2 . 1 Frozen ( 6 m) tertain at edge of fen
Unfrozen terrain to
85-12 Jean Marie Creek 85-11 Moraine South 597.4 Thin ( 4 a) Perma1roBt in recent helipad
B 85-13 aadknife Hills
608.7 Thick ice-rich peat plateau: 4 m permaltost
C 182.6 Unfrozen terrain in fen
Ir 783.0 Ice-rich peat ( 3 . 5 m): 15-18 m permafroat 84-5 Petitot Rivar North
B 84-6 Petitot River South
783.3 Very thick icy peat (7 m); 1'2 m permafrost
819.1 Thlck ( 5 D ) ice-rich peat: 7 m permafrost
Rote: All fences. unless otherwise indicated. a r e located io terrain newly cleared for the pipeline Row. site 85-13 is the only site which has not been set up in the "thermal fence" configuration.
Thirteen principal monitoring sites, shown in Figures 1 and briefly described in Table I , were selected to 1) investigate the terrain response t o particular pipeline design features and mitigative measures, including areas of thaw sensitive terrain, frozen/unfrozen interfaces and a wood chip insulated slope, and 2) represent the soil and ground ice conditions along the route. An IPL geotechnical monitoring program involves the instrumentation of 2 6 slopes; 17 with wood chip insulation. Joint industry- government sites emphasize the study of other terrain conditions.
Thermal instrumentation installed at the PTRM sites has been laid out along one mor e "thermal fences". In total there Yr'e 23 fences, each of which typically consists of 5 thermistor sensors placed on the external Wall of the pipe and a series of 4 boreholes. cased with PVC and instrumented with multithermistor cables. Two 5 m cables (10 sensors. 50 cm spacing) are located within a few metres of the pipe. Two 20 m cables contain 11 sensors spaced every 1 m near the surface and every
ROW several metres (4-9) from the pipe. the 2-3 m at depth; one cable is installed on the
other is set in the adjacent terrain off-ROW. The establishment of the thermal fences, the
are described in detail by Burgess et. al. instturnentation and the measurement programs
(1986). Burgess (1987) and Pilon et al. (in prep. ) . Topographic surveys, conducted
movements in the ground surface to an accuracy annually at most' fences, record vertical
of 10 cm over a 20 m x 20 m grid, using 2-3 local benchmarks per site and a 2 m station spacing.
Monthly field trips emphasize the manual
Automatic loggers (SeaData) a l s o installed at 5 acquisition of thermal data for most fences.
fences record ground temperature cable readings several times daily. The monthly data are published regularly as EMR open file reports (Burgess, 1.986 and 1987). Thermal conditions across the ROW are complex especially at sites with different ages and degrees of vegetation removal and of ground surface disturbance. Conditions are dynamic, and may include 1) maintenance activities , 2) stationary or flowing water, 3 ) changing vegetation cover, as well a s 4) variable climatic conditions.
PIPE THERMAL REGIME
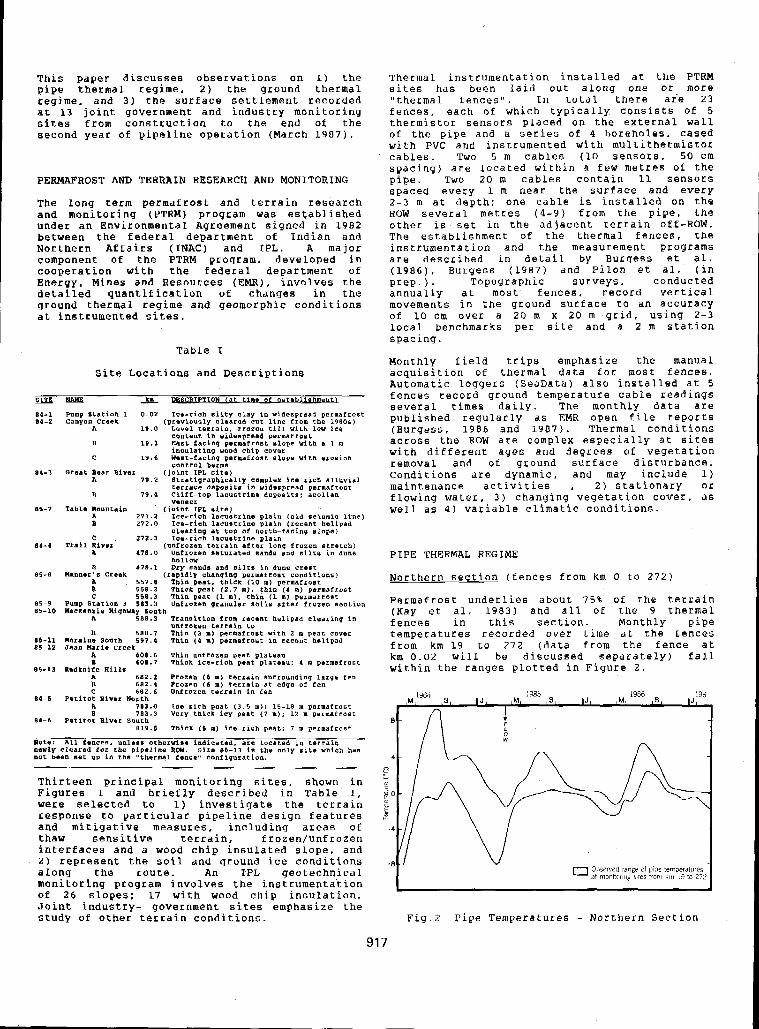
Northern section (fences from km 0 to 272)
Permafrost underlies about 7 5 % of the terrain (Kay et al. 1983) and all of the 9 thermal fences in this section. Monthly pipe temperature6 recorded over time at the fences from km 19 to 272 (data from the fence at km 0 . 0 2 will be discussed separately) fall within the ranges plotted in Figure 2.
Fiq.2 Pipe Temperatures - Northern Section
91 7
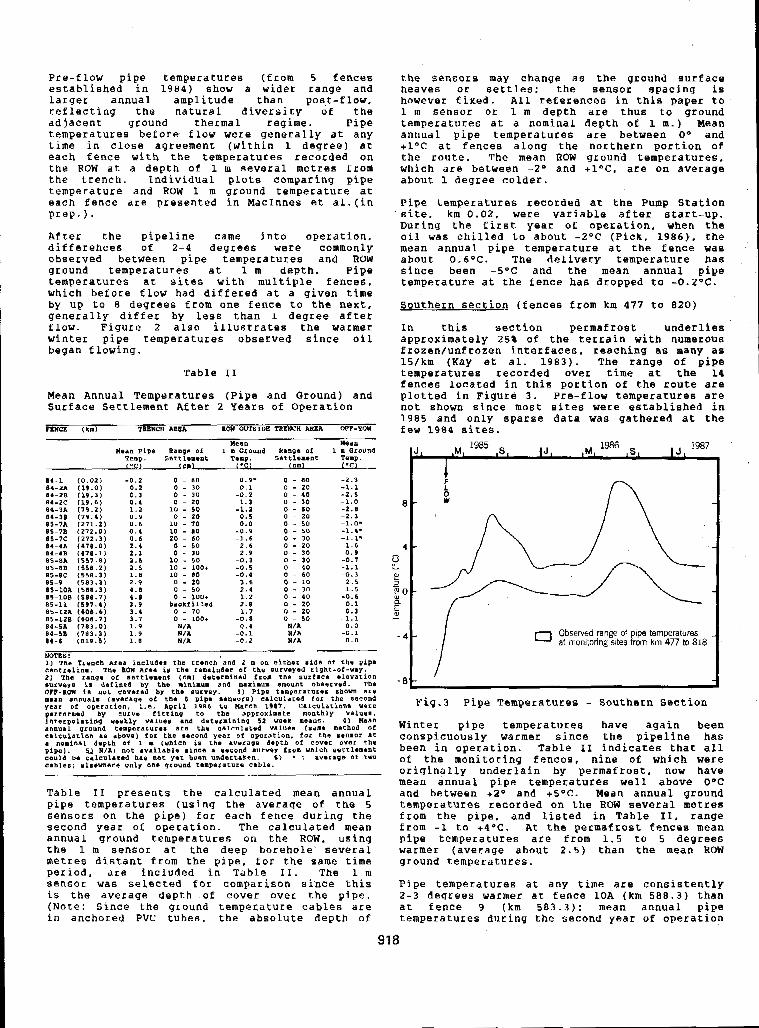
Pre-flow pipe temperatures (from 5 fences established in 1984) show a wider range and larger annual amplitude than post-flow, reflecting the natural diversity of the adjacent ground thermal regime. Pipe temperatures before flow were generally at any time in close agreement (within 1 degree) at each fence with the temperatures recorded on the ROW at a depth of 1 m several metres from the trench. Individual p l o t s comparing pipe temperature and ROW 1 m ground temperature at each fence are presented in MacInnes et al.(in prep.).
After the pipeline came into operation, differehces of 2-4 degKeeS were commonly observed between pipe temperatures and ROW ground temperatures at 1 m depth. Pipe temperatures at sites with multiple fences. which before flow had differed at a given time by up to 8 degrees from one fence to the next, generally differ by less than I degree after flow. Figure 2 also illustrates the warmer winter pipe temperatures observed since o i l began flowing.
Table I 1
Mean Annual Temperatures (Pipe and Ground) and Surface Settlement After 2 Years of Operation
PENCK (km) TRENCH AREA ROV OUTSIDE TRENCH AREA OFF-ROW
Wean Mean Wean Pipe Range of 1 q Ground Range o f 1 m m o u n d
Temp. Settlmment Temp. Settlemmnt Tsmp. (fm) L.C) (em) (*C)
84-1 ( 0 . 0 2 ) - 0 . 2 81-2A (19.0) 0 . 2
0 - 6 0 -0.9- 0 - BO -2.3 0 - 30
84-26 ( 1 9 . 3 ) 0.1 0 . 1 0 - 20 -1.1
81-2C (19.6) 0 . 4 0 - 3 0 - 0 . 2 0 - 40 - 2 . 5 0 - 20
84-3R ( 1 9 . 2 ) 1.2 10 - 50 -1.2 1.3 0 - 30 -1.0
0 - 5 0 - 2 . 8 84-38 ( 7 9 . 4 ) 0 . 9 0 - 20 0 . 5 0 - 20
0 . 0 - 2 . 1
0 - 50 -0 .9
- 1 . o w 0 - 50
-1.6 0 - 3 0 -I. I' -1.1*
85-YA (271.2) 0.6 10 - 7 0 85 -78 ( 2 7 2 . 0 ) 0 .1 10 - 80 8 5 - l f 1 2 7 2 . 3 ) 0.6 20 - 60 ~~
a i - r A iiG.oi 2 . 4 sa-4s ( 4 7 0 . 1 ) 2 . 3 0 ~ 30
2 . 6 0 - io I,O
85-EA [ s s l . ~ ) 1 . 8 10 - 1.0 - 0 . 3 0 - 30 - 0 . 1
85-ec (550.3) 1 . n 10 - 110 -0 .4 85-9 (583.31 a.9 0 - 20 3 . 6 81-IOA ( 5 1 8 . 3 ) 4 . 8
~~
0 - 50 2 . 9 0 - 3 0 0 . 9
85-11B (558.2) 2 . 5 10 - LOO+ -0.5 0 - 4 0 -1.1 0 - 60 -0.3 0 ~ 10
0 - 50 2 . 5
85-108 (588.7) b e @ 2.4
0 - loo+ 0 - 30 1.5
85-11 ( 5 9 7 . 4 ) 3.9 backfilled 2.8 1.2 0 - 40 -0.1
8 5 - 1 Z A ( 6 0 8 . 6 ) 3.1 0 - a0
0 - 70 1 . 7 0 - 20 0 . 3 0.1
115-128 (b011.7) 3.7 0 - loo* -0.8 84-5A (783.0) 1 . 9
0 - 50 NIA
-1.1
84-58 (783.3) 1 . 9 NIA 0.0
81-6 (819.5) 1.8 NI4 - 0 . 1 - 0 . 2
N I A -0.1 N/R 0.0
0 . 4 N/A
NOTES :
cantrelina. The BOW AT04 i s thm reraindec Of the surveyed right-of-way. 1) The Trench Area includes the trmnch and 2 m on either side of the pip.
2 ) The range of settlement (en) decmrmined from the surface elevation
OFF-BMI is not Covernd by thm nuKvey. 3) Pips tmaperatures shown are SUKveys is dafinrd by the minimum and maximum amount obeerved. The
m a n annuals (average o f the 5 pip. Sensors) calculated for the second ycrf of oparation, 1.e . A p r i l 1986 t o m r c h 1997. CaiC1Ilations were pmrrormed by curve fittinq to the approximate monthly values.
annual ground tbmpetaturms a ~ e the calculated values (sanm method of Interpolating weekly values and datermining 52 wesk mean^. 4 ) noan
Ca1cUlation as above) f o r the smcond year of operation. for the sensor at a nominal depth of 1 m (which is thm averaqe dapth o f covmr oves the pipe). y N/A: not available since 4 second survey from which ssZtlemmnt oould be calculatad hae nat yet been undertaksn. b) * : avmraqs of two cables: elmuhare only one ground campecature Cable.
Table I 1 presents the calculated mean annual pipe temperatures (using the average of the 5 sensors on the pipe) for each fence during the second year of operation. The calculated mean annual ground temperatures on the ROW, using the 1 m sensor at the deep borehole' several metres distant from the pipe. f o r the same time period, are included in Table 1 1 . The 1 m sensor was selected f o r comparison since this is the average depth of cover over the pipe. (Note: Since the ground temperature cables are in anchored PVC tubes, the absolute depth of
the 6enaors may change as the grouhd surface heaves or settles; the sensor spacing is however fixed. All references in this paper to L m sensor of 1 m depth are thus to ground temperatures at a nominal depth of 1 m.) Mean annual pipe temperatures are between Oo and + l 0 C at fences along the northern portion of the route. The mean ROW ground temperatures, which are between -2- and +1OC, are on average about 1 degree colder.
Pipe temperatures recorded at the Pump Station site, km 0.02, were variable after start-up. During the first year of operation, when the oil was chilled to about -2OC (Pick, 1986). the mean annual pipe temperature at the fence wa0 about 0.6OC. The delivery temperature has since been -5OC and the mean annual p i p e temperatur,e at the fence has dropped to -0.2OC.
Southern section (fences from km 477 t o 820)
In this section permafrost underlies approximately 25% of the terrain with numerous frozen/unfrozen interfaces. teaching a8 many as 15/km (Kay et 81. 1983). The range of p i p e temperatures recorded over time at the 14 fences located in this portion of the route are plotted in Figure 3 . Pre-flow temperatures are not shown since most sites were established in 1985 and only sparse data was gathered at the few 1984 sites.
?J 1 1 ,SI IJ , I 1 ,S I 1985 1986 1987
I
1
a at monitoring sltes from km 477 to 818 Observed range of pipe temperatures
Fig.3 Pipe Temperatures - Southern Section Winter pipe temperatures have again been conspicuously warmer since the pipeline has been in operation. Table I1 indicates that all of the monitoring fences, nine of which were originally underlain by permafrost, now have mean annual pipe temperatures well above O°C and between +a0 and +5OC. Mean annual ground temperatures recorded on the ROW several metres from the pipe, and listed in Table 11, range from -1 to +4OC. At the permafrost fences mean pipe temperatures are from 1.5 to 5 degrees warmer (average about 2 . 5 ) than the mean ROW ground temperatures.
Pipe temperatures at any time are consistently 2-3 degrees warmer at fence 10A (km 5 8 8 . 3 ) than at fence 9 (km 583.3); mean annual ptpe temperatures during the second year of operation
91 8
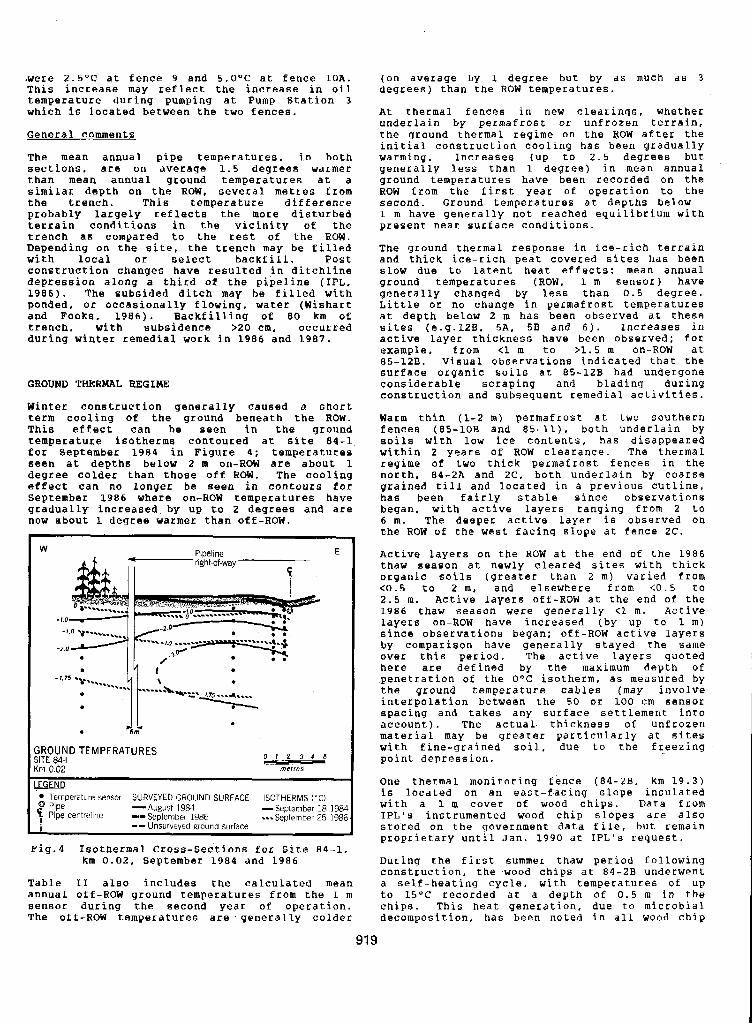
uere 2.5OC at fence 9 and 5 . 0 ° C at fence 1 0 A . This increase may reflect the increase in oil temperature during pumping at Pump Station 3 which is located between the two fences.
General comments
The mean annual pipe temperatures, in both sections. are on average 1.5 degrees warmer than mean annual ground temperatures at a similar depth on the ROW, several metres from the trench. This temperature difference probably largely reflects the more disturbed terrain conditions in the vicinity of the trench as compared to the rest o f the ROW. Depending on the site, the trench may be filled with local or select backfill. Post construction changes have resulted in ditchline depression along a third of the pipeline (IPL, 1986). The subsided ditch may be filled with ponded. or occasionally flowing, water (Wishart and Fooks, 1986). Backfilling of 80 km of trench, with subsidence >20 cm. occurred during winter remedial work in 1986 and 1987.
GROUND THERMAL REGIME
Winter construction generally caused a s h o r t term cooling of the ground beneath the ROW. This effect can be seen in the ground temperature isotherms contoured at site 84-1 for September 1984 in Figure 4; temperatures seen a t depths below 2 m on-ROW are about 1 degree colder than those off-ROW. The cooling effect can no longer be seen in contours for September 1986 where on-BOW tempecatures have gradually increased by up to 2 degrees and are now about 1 degree warmer than off-ROW.
E
- 1.0
- I
;ROUND TEMPERATURES ITE 8 4 - 1 m 0.02 metres
=D Ternperature sensor SURVEYED GROUND SURFACE ISOTHERMS ( " 0
E Pipe centretine --September 1986 @ Pipe -August 1984
i --Unsurveyed ground surface I
-3eptemher 18 1984 -.-September 25 198E
Fig.4 Isothermal Cross-sections for Site 84-1. km 0.02, September 1984 and 1986
Table f I also includes the calculated mean annual off-ROW ground temperatures from the 1 m sensor during the second year of operation. The off-ROW temperatures are generally coldet
degrees) than the ROW temperatures. (on average by I degree but by as much as 3
At thermal fences in new clearings, whether underlain by permafrost or unfrozen terrain, the ground thermal regime on the ROW after the initial construction cooling has been gradually warming. Increases (up to 2 . 5 degrees but generally less than 1 degree) in mean annual ground temperatures have been recorded on the ROW from the first year of operation to the second. Ground temperatures at depths below 1 m have generally not reached equilibrium with present near surface conditions.
The ground thermal response in ice-rich terrain and thick ice-rich peat covered sites has been
ground temperatures (ROW, 1 m sensor) have slow due to latent heat effects: mean annual
generally changed by less than 0.5 degree. Little or no change in permafrost temperatures at depth below 2 m has been observed at these sites (e.g.lZB, 5 A . 5B and 6). Increases in active layer thickness have been observed; for example, from <1 m to >1.5 m on-ROW at
surface organic soils at 85-12B had undergone 85-12B. Visual observations indicated that the
considerable scraping and blading during construction and subsequent remedial activities.
Warm thin (1-2 m) permafrost at two southern fences (85-10B and 85-11), both underlain by eoile with low ice contents, has disappeared within 2 years of ROW clearance. The thermal regime of two thick permafrost fences in the north. 8 4 - Z A and ZC, both underlain by coarse grained till and located i n a previous cutline, has been fairly stable since observations began, with active layers ranging from 2 to 6 m. The deeper active layer is observed on the ROW of the west facing slope at fence 2C.
Active layers on the ROW at the end of the 1986
organic soils (greater than 2 m ) varied from thaw season at newly cleared sites with thick
C 0 . 5 to 2 m, and elsewhere from C 0 . 5 to 2.5 m. Active layers off-ROW at the end of the 1986 thaw season were generally (1 m. Active layers on-ROW have increased (by up to 1 m) since observations began; off-ROW active layers by comparison have generally stayed the same over this period. The active layer6 quoted here are defined by the maximum depth of penetration of the O°C isotherm, a6 measured by the ground temperature cables (may involve interpolation between the 50 or LOO cm sensor spacing and takes any surface settlement into
material may be greater particularly at sites account). The actual thickness of unfrozen
with Eine-grained soil, due t o the freezing point depres6ion.
One thermal monitoring fence (84-ZB, km 19.3)
with a 1 m cover o f wood chips. Data from is located on an east-facing slope insulated
IPt's instrumented wood chip slopes are a l s o stored on the government data file, but remain proprietary until Jan. 1990 at IPL's request.
During the first summer thaw period following construction, the wood Chip6 at 84-ZB underwent a self-heating cycle, with temperatures of up t o 159C Pecorded a t a depth of 0.5 m i n the chips. This heat generation, due t o microbial decomposition, has been noted in all wood chip
91 9
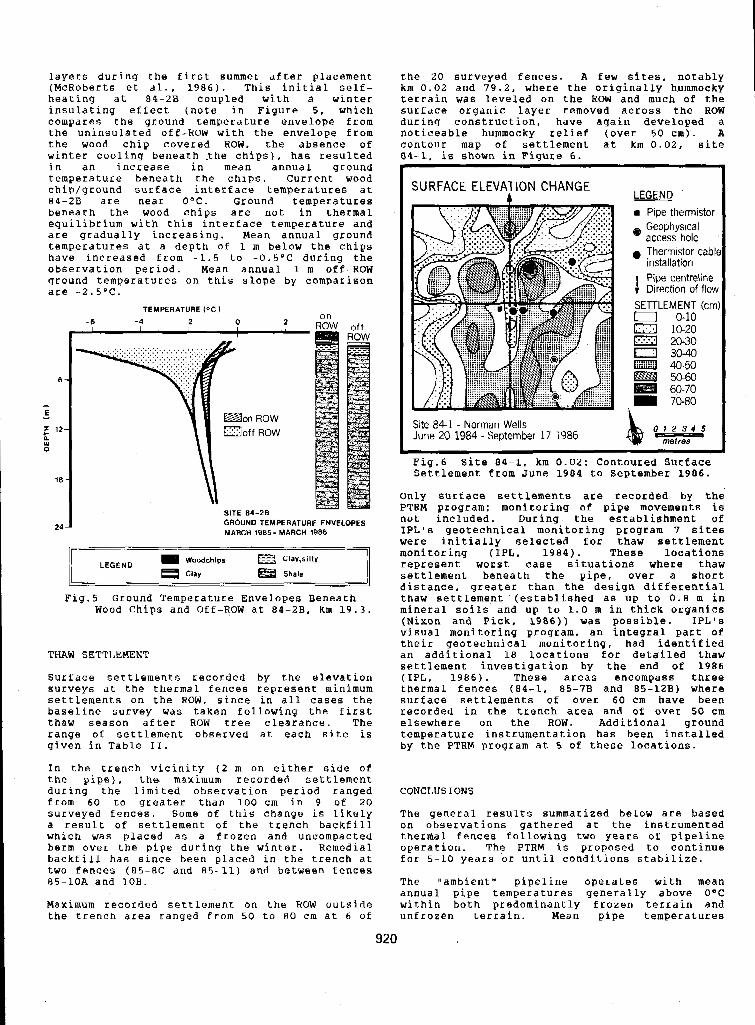
layers during the first summet after placement (McRoberts et dl.. 1986). This initial self- heating at 84-2B coupled with a winter insulating effect (note in Figure 5, which compares the ground temperature envelope from the uninsulated off-ROW with the envelope from the wood chip covered ROW, the absence of winter cooling beneath .the chips), has resulted in an increase in mean annual ground temperature beneath the chips. Current wood chip/ground surface interface temperatures at 84-28 are near 0°C. Ground temperatures beneath the wood chips are not in thermal equilibrium with this interface temperature and are gradually increasing. Mean annual ground temperatures at a depth o f 1 m below the chips have increased from -1.5 to -0.5OC during the observation period. Mean annual 1 m off-ROW ground temperatures on this slope by comparison are -2.5OC.
TEMPERATURE (OC 1 -6 -4 2 0 2
SITE 84-28
ROW on
GROUND TEMPERATURE ENVELOPES MARCH 1985 - MARCH 1986
LEGENO Woodchips e C l w , s i l t y Shale
Fig.5 Ground Temperature Envelopes Beneath Wood Chips and Off-ROW at 84-2B. km 19.3.
TKAW SETTi.EMENT
Surface settlements recorded by the elevation surveys at the thermal fences represent minimum settlements on the ROW, since in all cases the baseline survey was taken following the first thaw season after ROW tree clearance. The range o f settlement observed at each site is given in Table 11.
two 85-
Ma x the
In the trench vicinity (2 m on either side of the pipe), the maximum recorded Settlement during the limited observation period ranged from 60 to greater than 100 cm in 9 of 20 surveyed fences. Some o f this change is likely a result of settlement of the trench backfill which was placed as a frozen and uncompacted berm over the pipe during the winter. Remedial backfill has since been placed in the trench at
fences (85-8C and 85-11) and between fences 1 0 A and 10B.
imum recorded settlement on the ROW outside trench area ranged from 50 to 80 crn at 6 o f
920
the 20 surveyed fences. A few sites, notably km 0.02 and 79.2, where the originally hummocky terrain was leveled on the ROW and much of the surface organic layer removed across the BOW during construction. have again developed a noticeable hummocky relief (over 50 cm). A contour map of settlement at km 0.02, site 84-1. is shown in Fiaure 6 .
~ ~ ~ .~ .. ..
SURFACE ELEVATION CHANGE LEGEND
Pipe thermistor Geophysical access hale
0 Thermistor cab11 Installation
y Dlrectlon of flou I Pipe centreline
Site 841 - Norman Wells June 20 1984 - September 17 1986
0-4 7 metres
~
Fig.6 Site 84-1. km 0 . 0 2 : Contoured Surface Settlement from June 1984 to September 1986.
Only surface settlements are recorded by the PTRM program: monitoring o f pipe movements is not included. During the establishment o f IPL's georechnical monitoring program 7 sites were initially selected for thaw settlement monitoring (IPL, 1984). These locations represent worst case situations where thaw settlement beneath the pipe, over a short distance. greater than tho design differential thaw settlement (established as up to 0.8 m in mineral soils and up to 1.0 m in thick organics (Nixon and Pick, 1986)) was possible. IPL's visual monitoring program, an integral part of their geotechnical monitoring, had identified an additional 18 locations for detailed thaw settlement investigation by the end of 1986 (IPL, 1986). These areas encompass three thermal fences (84-1, 85-7B and 85-12B) where surface settlements o f over 60 cm have been recorded i n the trench area and of over 50 cm elsewhere on the ROW. Additional ground temperature instrumentation has been installed by the PTRM program a t 5 of these locations.
CONCLUSIONS
The general results summarized below are based on observations gathered at the instrumented thernlal fences following two years of pipeline operation. The PTBM i s proposed to continue for 5-10 years or until conditions stabilize.
The "ambient" pipeline operates with mean annual pipe temperatures generally above 0 - C within both predominantly frozen terrain and unfrozen terrain. Mean pipe temperatures
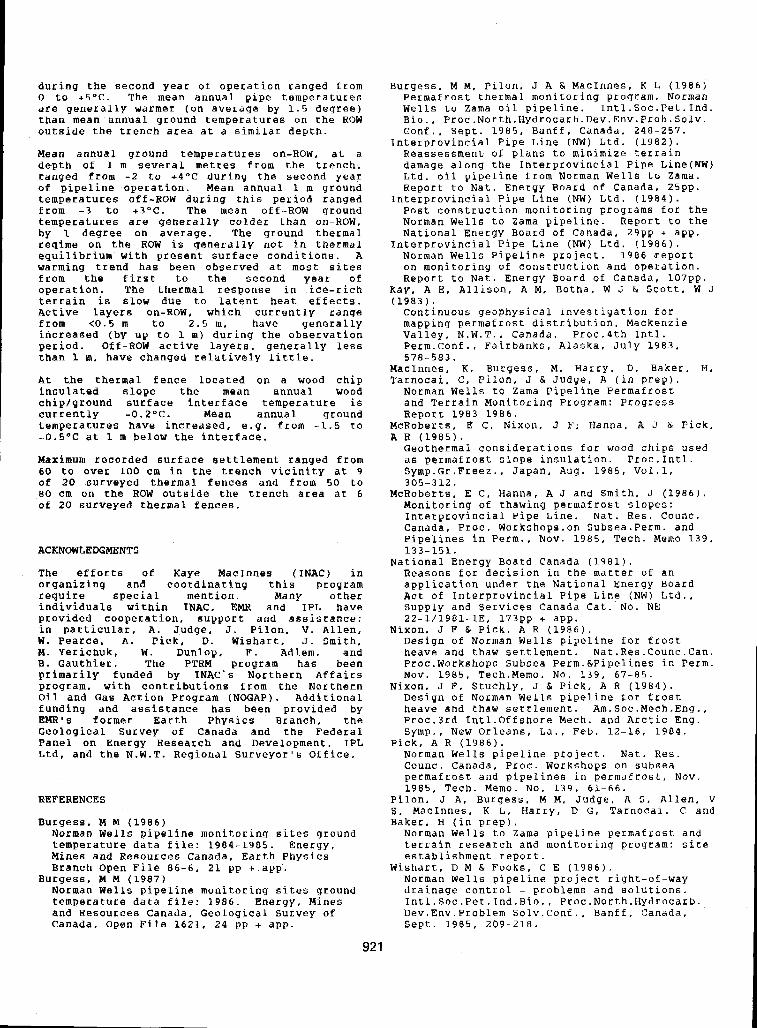
du ring the second year of operation ranged f 0 to -+5OC. The mean annual pipe temperatures
r om
are generally warmer (on average by 1.5 degree) than mean annual ground temperature6 on the ROW outside the trench area at a similar depth.
Mean annual ground temperatures on-ROW, at a depth of 1 m several metres from the trench, ranged from -2 to +4OC during the second year of pipeline operation. Mean annual 1 m ground temperarures off-ROW during this period ranged from - 3 to +3OC. The mean off-ROW ground temperatures are generally colder than on-ROW, by 1 degree on average. The ground thermal regime on the ROW is generally not in thermal equilibrium with present surface conditions. A warming trend has been observed at most sites from the first to the second year of operation. The thermal response in ice-rich terrain i s slow due to latent heat effects. Active layers on-ROW, which currently range from (0.5 m to 2.5 m. have generally increased (by up to 1 m) during the observation period. Off-BOW active layers, generally less than 1 m. have changed relatively little.
At the thermal fence located on a wood chip insulated slope the mean annual wood chip/ground surface interface temperature is currently -0.2-C. Mean annual ground temperatures have increased, e.g. from -1.5 to - 0 . 5 O C at 1 m below the interface.
Maximum recorded surface settlement ranged from 60 to over 100 cm in the trench vicinity at 9 o f 20 surveyed thermal fences and from 5 0 to 80 cm on the ROW outside the trench area at 6 of 20 surveyed thermal fences.
ACKNOWLEDGMENTS
The efforts of Kaye MacInnes (INAC) in organizing and coordinating this program require special mention. Many other individuals within INAC, EMR and IPL have provided cooperation, support and assistance: in particular, A. Judge, J. Pilon, V. Allen, W. Pearce. A. Pick, D. Wishart, J. Smith, M. Yerichuk, W. Dunlop, F . Adlem, and B . Gauthier. The PTRM program has been primarily funded by INAC's Northern Affairs program. with contributions from the Northern Oil and Gas Action Program (NOGAP). Additional funding and assistance has been provided by EMR's former Earth Physics Branch, the Geological Survey of Canada and the Federal Panel on Energy Research and Development, IPL Ltd, and the N.W.T. Regional Surveyor's Office.
REFERENCES
Burgess. M M (1986) Norman Wells pipeline monitoring sites ground temperature data file: 1984-1985. Energy, Mines and Resources Canada, Earth Physics Branch Open File 86-6. 21 pp + app.
Norman Wells pipeline monitoring sites ground temperature data file: 1986. Energy. Mines and Resources Canada, Geological survey of Canada, open File 1621, 24 pp + app .
Burgess, M M (1987)
Burgess. M M, Pilon. J A & MacInnes, K L (1986)
Wells to Zama o i l pipeline. 1ntl.Soc.Pet.Ind. Permafrost thermal monitoring program. Norman
B i o . , Proc.North.Hydrocarb.Dev.Env.Prob.Solv.
Interprovincial Pipe Line (NW) Ltd. (1982). Conf.. Sept. 1985, Banff. Canada. 248-257.
Reassessment of plans to minimize terrain damage along the Interprovincial Pipe Line(NW) Ltd. oil pipeline from Norman Wells to Zama. Report to Nat. Energy Board of Canada, 25pp.
Norman Wells to Zama pipeline. Report to the Post construction monitoring programs for the
National Energy Board of Canada, 29pp + app.
Norman Wells Pipeline project. 1986 report on monitoring of construction and operation. Report to Nat. Energy Board of Canada, 107pp.
Kay. A E, Allison, A M, Botha, W 3 6 Scott, W J (1983).
Interprovincial Pipe Line (NW) Ltd. (1984).
Interprovincial Pipe Line (NW) Ltd. (1986).
continuous geophysical investigation for mapping permafrost distribution, Mackenzie Valley, N.W.T.. Canada. Proc.4th Intl. Perm.conf., Fairbanks, Alaska, J u l y 1983, 578-583.
MacInnes, K. Burgess, M, Harry, D, Baker, H. Tarnocai. C. Pilon. J b Judge. A (in p r e p ) . Norman Wells to Zama Pipeline Permafrost
Report 1983-1986. and Terrain Monitoring Program: Progress
McRoberta, E C, Nixon, J F , Hanna, A J & Pick. A R (1985). Geothermal considerations for wood chips used a s permafrost slope insulation. Proc.Int1. Symp.Gr.Freez.. Japan, Aug. 1985, Vol.1, 305-312.
Monitoring of thawing permafrost slopes: Interprovincial Pipe Line. Nat. Res. COunC. Canada, Proc. Workshops.on Subsea.Perm. and Pipelines in Perm., Nov. 1985, Tech. Memo 139,
McRoberts, E C, Hanna, A J and Smith. J (1986).
133-151. National Energy Board Canada (1981).
Reasons for decision in the matter of an application under the National Energy Board Act of Interprovincial Pipe Line (NW) Ltd., Supply and Services Canada Cat. No. NE 22-1/1981-1E, 173pp t app.
Nixon, J F & Pick. A R (1986). Design of Norman Wells pipeline for frost heave and thaw settlement. Nat.Res.Counc.Can. P~oc.Workshops Subsea Perm.&Pipelines in Perm.
Nixon, J F, Stuchly, J & Pick, A R (1984). NOV. 1985, Tech.Memo. No. 139, 67-85.
Design of Norman Wells pipeline for frost heave and thaw settlement. Am.Soc.Mech.Eng., Proc.3rd Intl.Offshore Mech. and Arctic Eng. Symp., New Orleans, La., Feb. 12-16, 1984.
Norman Wells pipeline project. Nat. Res. Count. Canada, PIOC. Workshops on subsea permafrost and pipelines in permafrost, Nov.
Pilon. J A , Burgess. M M, J u d g e . A S , Allen, V 1985, Tech. Memo. No. 139, 61-66.
S, MacInnes. K L . Harry, D G , Tarnocai. C and Baker. H (in prep). Norman Wells to Zama pipeline permafrost and terrain research and monitoring program: site establishment report.
Norman Wells pipeline project right-of-way drainage control - problem6 and solutions. 1ntl.Soc.Pet.Ind.Bio.. Proc.North.Hydrocarb. Dev.Env.Problem Solv.Conf., Banff. Canada, Sept. 1985, 209-218.
Pick, A B (1986).
Wishart, D M & Fooks, c E (1986).
92 1
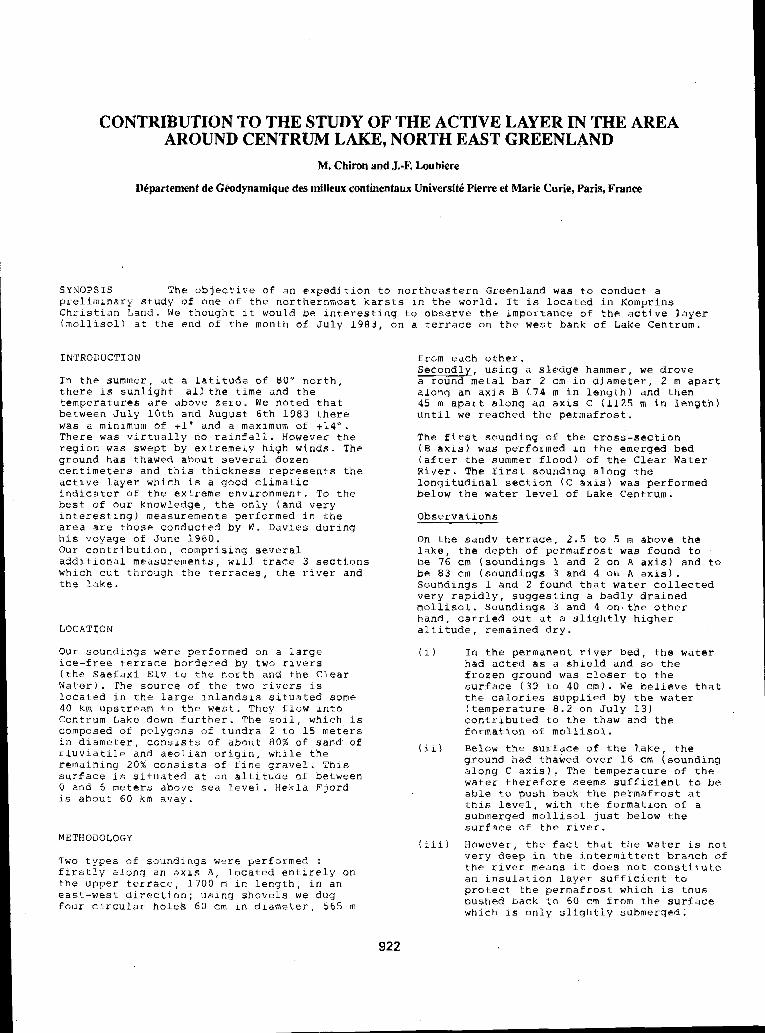
CONTRIBUTION TO THE STUDY OF THE ACTIVE LAYER IN THE AREA AROUND CENTRUM LAKE, NORTH EAST GREENLAND
M. Chiron and J . 4 Loubiere
Dipartement de CQdynamique des milieux continentaux Universitb Pierre et Marie Curie, Paris, France
SYNOPSIS The ob jec t ive o f an exped i t ion t o no r theas t e rn Green land was t o conduct a pre l iminary s tudy of one of the no r the rnmos t ka r s t s In t he wor ld . It is l o c a t e d i n Komprins C h r l s t i a n Land. We thought I t would b e i n t e r e s t i n g t o o b s e r v e t h e i m p o r t a n c e of t h e a c t i v e l a y e r ( m o l l i s o l ) a t t h e e n d o f t h e month of J u l y 1 9 8 3 , on a t e r race o n t h e west bank of Lake Centrum.
INTRODUCTION
t h e r e i s s u n l i g h t a l l t h e time and t he I n t h e summer, a t a l a t i t u d e of EO' n o r t h ,
t empera tu res a r e above z e r o . We n o t e d t h a t between July 10th and August 6th 1 9 8 3 t h e r e was a mlnimum of +lo and a maximum of +14". There was v i r t u a l l y no r a i n f a l l . However t h e reg ion was swept by extremely high winds. The ground has thawed about several dozen c e n t i m e t e r s a n d t h i s t h i c k n e s s r e p r e s e n t s t h e a c t i v e l a y e r w h i c h i s a good c l imat ic i n d i c a t e r o f the extreme environment . To t h e best of our knowledge, the only (and very i n t e r e s t i n g ) m e a s u r e m e n t s p e r f o r m e d i n t h e a r e a a re those conducted by W . Davies dur ing h i s voyage of June 1960. Our c o n t r i b u t i o n , c o m p r i s i n g s e v e r a l addi t lona l measurements , wlll t race 3 s e c t i o n s which c u t t h r o u g h t h e te r races , t h e r ive r and t h e l a k e .
LOCATION
Our soundings were performed on. a l a r g e i c e - f r e e te r race bordered by two r lvers ( t h e S a e f a x i E l v t o t h e n o r t h and t h e Clear Water). The s o u r c e of t h e two r l v e r s i s l o c a t e d i n t h e l a r g e i n l a n d s l s s i t u a t e d some 40 km upstream t o t h e west. They f l o w l n t o Centrum L a k e down f u r t h e r . The s o i l , which i s composed of polygons of tundra 2 t o 1 5 meters i n d l a m e t e r , c o n s l s t s of about 80% of sand of f l u v i a t i l e a n d a e o l i a n o r i g l n , w h i l e t h e remaining 2 0 % c o n s l s t s of f l n e g r a v e l . ThLs s u r f a c e i s s i t u a t e d a t an a l t . i tude o f be tween 0 and 6 meters above sea l e v e l . H e k l a F jo rd i s about 6 0 km avay.
METHODOLOGY
Two types o f soundings were performed : firstly a l o n g a n a x i s A , l o c a t e d e n t i r e l y o n the upper t : e r race , 1 7 0 0 m in l e n g t h , i n an e a s t - w e s t d i r e c t i o n ; u s i n g s h o v e l s w e dug f o u r c i r c u l a r h o l e s 6 0 c m I n d l a m e t e r , 565 m
from e a c h o t h e r . Secondly , us ing a s l e d g e hammer, we d rove a round metal bar 2 cm i n d i a m e t e r , 2 m a p a r t a l o n g a n a x i s B ( 7 4 m i n Leng th ) and t hen 45 m a p a r t a l o n g an a x i s C 1 1 1 2 5 m i n l e n g t h ) u n t i l w e r e a c h e d t h e p e r m a f r o s t .
The f i r s t sounding of t h e c r o s s - s e c t i o n ( B a x i s ) was p e r f o r m e d i n t h e emerged bed ( a f t e r t h e summer f l o o d ) of t h e Clear Water R i v e r . The f i r s t s o u n d i n g a l o n g t h e l o n g i t u d i n a l s e c t i o n (C a x i s ) was performed below t h e water l e v e l of L a k e Centrum.
Obse rva t ions
On t h e s a n d y te r race , 2.5 t o 5 m above the l a k e , t h e d e p t h of permafrost was found t o be 76 cm ( sound ings 1 and 2 on A a x i s ) and t o be 8 3 cm (soundings 3 and 4 on A axis) . Soundings 1 and 2 found t ha t water c o l l e c t e d v e r y r a p i d l y , s u g g e s t i n g a b a d l y d r a i n e d mol l i so l . Sound ings 3 and 4 on, t h e o t h e r h a n d , c a r r i e d o u t a t a s l i g h t l y h i g h e r a l t i t u d e , r e m a i n e d d r y .
( i ) I n t he pe rmanen t r i ve r Bed , t he water had acted as a s h i e l d and so t h e frozen ground was c loser t o t h e s u r f a c e ( 3 9 t o 40 cm). We b e l i e v e t h a t t h e c a l o r i e s s u p p l i e d by the watex ( t empera tu re 8 . 2 on Ju ly 1 3 ) c o n t r i b u t e d t o the thaw and t h e fo rma t ion of m o l l i s o l .
(il) B e l o w t h e s u r f a c e of t h e l a k e , t h e ground had thawed over 1 6 c m (sounding a long C a x i s ) . The temperature of t h e water t h e r e f o r e seems s u f f i c i e n t t o be a b l e t o push back t h e p e r m a f r o s t a t t h i s l e v e l , w i t h t h e f o r m a t i o n of a submerged mo l l i so l j u s t be low the s u r f a c e o f t h e r i v e r .
( l i i ) However, t h e f a c t t h a t t h e w a t e r i s not v e r y d e e p i n t h e i n t e r m i t t e n t b r a n c h of t h e r i v e r means it: does not. const . i tul .c a n i n s u l a t i o n l a y e r s u f f i c i e n t t.0
pushed back t o 60 cm from t h e s u r f a c e p ro tec t t he pe rmaf ros t wh ich is t h u s
which i s on ly s l i gh t ly submerged .
922
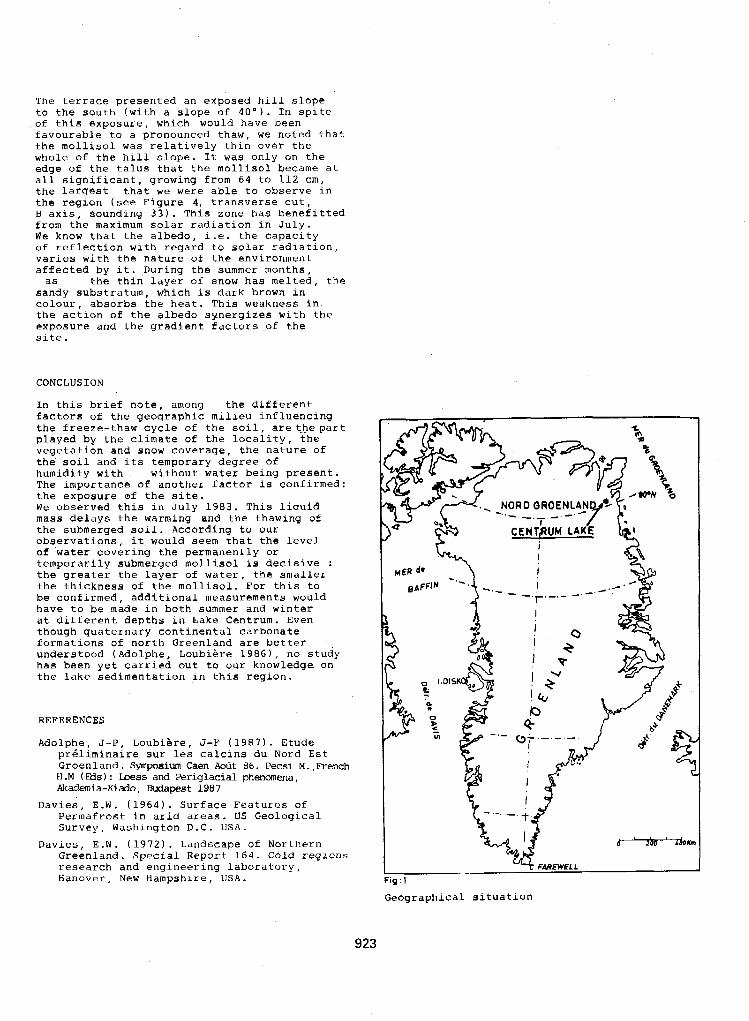
The terrace presented an exposed hill slope
of this exposure, which would have been to the south (with a slope of 40"). In spite
favourable to a pronounced thaw, we noted that the mollisol was relatively thin over the whole of the hill slope. It was only on the edge of the talus that the mollisol became at all Significant, growing from 6 4 to 112 cm, the largest that we were able to observe in the region (see Figure 4. transverse cut, B axis, sounding 3 3 ) . This zone has benefitted
We know that the albedo, i.e. the capacity from the maximum solar radiation in July.
of reflection with regard to s o l a r radiation, varies with the nature of the environment affected by it. ,During the summer months,
sandy substratum, which is dark brown in colour, absorbs the heat. This weakness in the action of the albedo synergizes with the exposure and t h e gradient factors..of the site.
as the thin layer of snow has melted, the
CONCLUSION
In this brief note, among the different factors of the geographic milieu influencing the freeze-thaw cycle of the soil, arethe part played by the climate of the locality, the vegetation and snow coverage, the nature o f the s o i l and its temporary degree of humidity with without water being present. The importance of another factor is confirmed: the exposure ef the site. We observed this in July 1983. This liquid mass delays the warming and the thawing of the submerged soil. According to Our observations, it would seem that the level of water covering the permanenily or temporarily submerged mollisol is decisive : the greater the layer of water, the smaller the thickness o f the mollisol. For this to be confirmed, additional measurements would have to be made in both summer and winter at different depths in Lake Centrum. Even though quaternary continental carbonate formations o f north Greenland are better understood ( Adolphe, Loubihre 1986), no study has been yet carried out to our knowledge on the lake sedimentation in this region.
REFERENCES
Adolphe, J-P, Loubihre, J-F (1987). Etude preliminaire sur les calcins du Nord Est Groenland. Symponium Caen Aout Bb. Pecsi M.,Prench H.M (Eds): Loess and Periglacial phenomena, Akademia-Kiaddo, Wldapest 1887
Davies, E.W. (1964). Surface Features of Permafrost in arid areas. US Geological Survey, Washington D.C. USA.
Davies, E.W. (1972). Landscape of Northern Greenland. Special Report 164. Cold reglons research and engineering laboratory, Hanover, New Hampshire, USA.
f
FAROYELL
Geographical situation
923
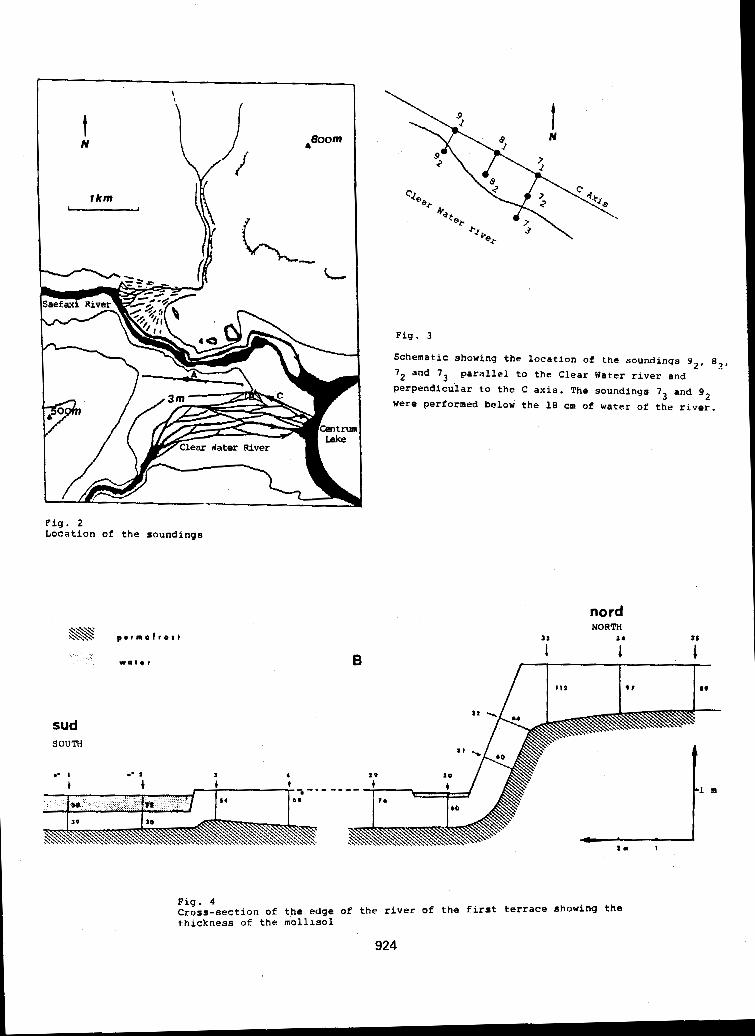
I i I i N ,Gloom
1 km -
'Clear dater River I
L
F i g . 2 L o c a t i o n of t h e s o u n d i n g s
sud SOUTH
t 1 4
4
- " - " 54 b I
F i g . 3
Schemat ic showing the l oca t ion of t h e soundings g 2 , E , ,
72 and 73 p a r a l l e l to the C lear Water r i v e r and perpendicular to t h e C a x i s . The soundings 73 and g2
were performed below the 18 cm o f water of t h e r i v e r .
.+
nord NORTn
a a 3 4
1 *I
1 1
F i g . 4 C r o s s - s e c t i o n of t h e e d g e of t h e r i v e r o f t h e f i rs t t e r r a c e s h o w i n g t h e t h i c k n e s s o f t h e rnollisol
924
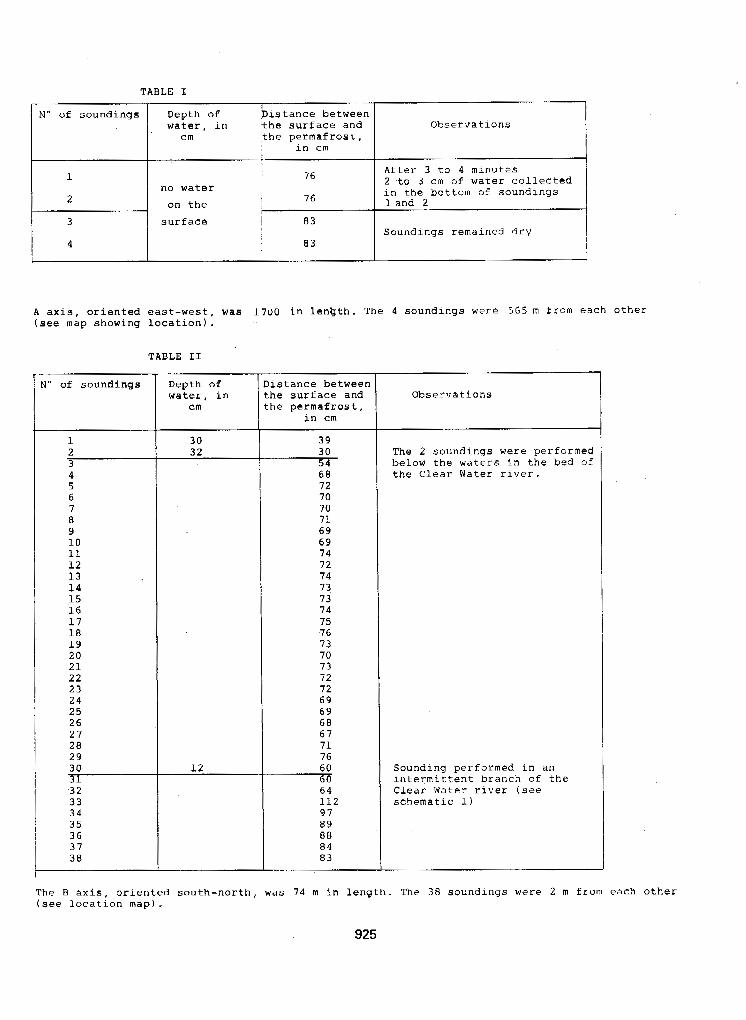
TABLE I
N" of soundings Depth of istance between w a t e r , i n h e s u r f a c e a n d O b s e r v a t i o n s
cm i the permafrost , I i n c m I
1 76
2 I 16
3 s u r f ace ~ 83
After 3 t o 4 minutes 2 t o 3 cm o f w a t e r c o l l e c t e d i n t h e bottom of soundings no water
on t he 1 and 2 I
I
4 Soundings remained dry
83
TABLE I1
1" of soundings
1 2 3 4 5 6 7 8 9 10 11 1 2 1 3 1 4 15 16 1 7 18 19 20 21 22 23 24 25 2 6 21 28 29 30
32 33 34 35 36 37 38
31
Depth of water , in
cm
30 32
"
i s tance be tween h e surface and he permaf ros t ,
i n cm
39 30 54 68 72 70 70 7 1 69 69 74 72 74 73 7 3 74 75 76 73 70 73 72 72 69 69 68 67 71 76 60 60 64 1 1 2 9 7 8 9 88 84 83
Observat ions
The 2 soundings were performed below the waters i n t h e bed of t h e Clear Water r i v e r .
Sounding performed in a n i n t e r m i t t e n t b r a n c h of t h e C lea r Water r i v e r (see schematic 1)
The B a x i s , o r i e n t e d s o u t h - n o r t h , was 74 m i n l e n g t h . The 38 soundings were 2 m f rom each other (see l o c a t i o n map).
925
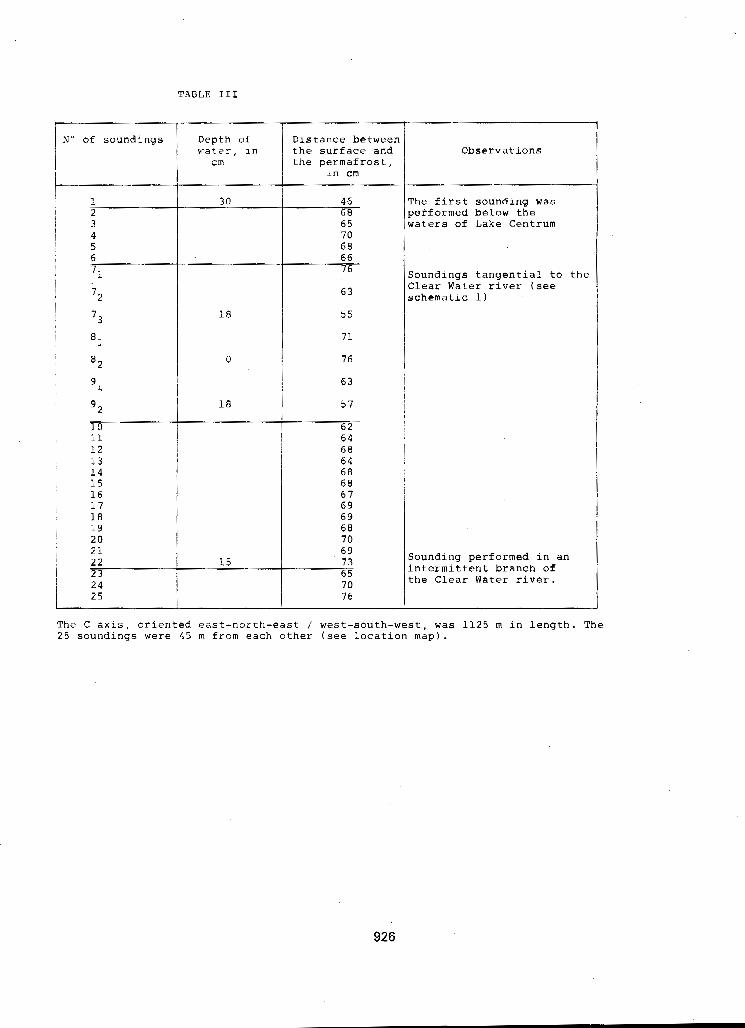
r N" o f soundings
1 2 3 4 5 6 71
'2
7 3
8 1
82
91
92 10 11 1 2 13 14 15 16 1 7 18 19 20 21 2 2 2 3 24 2 5
Depth o f b-ater, ~n
crn
30
18
0
18
t
Distance between the surface and the permafrost,
I n cm
46
65 68
7 0 68 66 76
63
5 5
7 1
76
63 1 5 7
62 64 68 6 4 6 8 68 6 1 69 69 68 70 6 9
j
1 1
7 3 65 70
Observations
The first sounding was performed below the waters of Lake Centrum
Soundings tangential to t-he Clear Water river (see schematic 1)
Sounding performed in an intermittent branch of the Clear Water river.
76 1
1
The C axis, oriented east-north-east / west-south-west, was 1125 rn in length. The 25 soundings were 45 rn from each other ( s e e location map).
926
SEASONAL VARIATIONS IN RESISTIVITY AND TEMPERATURE IN DISCONTINUOUS PERMAFROST
A. Delaney, P. Sellmann and S. Arcone
U.S. Army Cold Regions Research and Engineering Laboratory, Hanover, N.H. 03755-1290 USA
SYNOPSIS Electrical resistivity and temperature were measured in two 12.2-m-deep boreholes in interior Alaska in perennially frozen ice-rich silt and in coarse-grained alluvium. Seasonal temperature and resistivity changes were most noticeable in the upper 6 m at both sites, with resistivity varying more than several thousand ohm-m during the year. Resistivity profiles were compared with lithology, temperature and moisture content. At the alluvium site resistivity and grain size strongly correlated. Values ranging over 10.000 ohm-m occurred with
material section. At the ice-rich silt site, resistivity values were generally lower, but in coarse-grained material and values an order of magnitude lower occurred in the fine-grained
agreement with values for the fine-grained part of the alluvial section. Lithologic variations in the discontinuous permafrost 20ne can be as important as the high permafrost temperatures and correspondingly large unfrozen water contents in accounting for significant seasonal resistivity changes in fine-grained sediment.
INTRODUCTION
The electrical resistivity of perennially frozen materials can be a direct indication of material type, permeability, volumetric water or ice content and temperature. Resistivity is usually interpreted from meaaurements of apparent resistivity using multi-electrode galvanic arrsp (Wenner, 1915)~ low frequency magnrtotelluric, wavetilt or surface impedance plans wave method$ (ems., Hoekstra et al., 1974; Areone et a l . , 1978, 1979; Koziar and Strangway, 1978) pr by magnetic induction and induced polarization techniques (e.g. Sinha, 1976; Hoekatra, 1978). The transient electro- magnetic technique has proven useful for stud- ies of thick permafrost (Ehrenbard et al., 1983). It was our intention to observe direct- ly sessional variations in ground resistivity using a permanent vertical electrode array and
material characteriatics. to compare the results with temperature and
Vertiaal. arrays were installed at sites,o€ previous geophysical investigations (e.g., Arcone et al., 1978: Arcone and Delaney, 1985). In early April 1985, strings of elec- trodes, 11.2 m long, were placed in boreholes
where so i l type and ice content had been in gravelly alluvium and in Fairbanks silt
vals, which allowed vertical profiling at logged. The electrodes were at 30 cm inter-
various electrode separations. The tempera-
holes and data were recorded throughout the ture holes were within 3 m of the resistivity
year.
RESISTIVITY OF EARTH MATERIALS
The resistivity of most earth materials usual- ly falls between 10 and 10,000 ohm-m. The
factors that most influence the resistivity of unfrozen earth materials containing nonconduc- tive (i.e., nonmetallic) minerals are free water content, ionic concentration, pemeabil-
mainly electrolytic along continuous films o f ity, porosity and grain size. Conduction is
water adsorbed on grain boundaries, and through water in pore spaces (Parkhomenkho, 1967). Conductivity (the inverse o f resistiv- ity) is proportional to the ionic concentra- tion of the water and the ionic mobility, i.e., the concentration and quality of con- ducting paths, determined by material tex- tural properties. As temperature drops below O'C, the resistivity increases as the amount
water exists in an adsorbed state on the grain of unfrozen water decreases. This unfrozen
surfaces and in a saline condition in the pore spaces (hndersen et al., 1973). Consequently, the amount of fine-grained material in a sec- tion and the temperature will strongly control the unfrozen water content. Resistivities greater than 10' ohm-m have been encountered when the ground ice content is far in excess of saturation (Hoekstra et al., 1974).
METHODS AND MEASUREMENT TECHNIQUES
Rssistivitv Weawrements of apparent resistivity were made in vertical boreholes using the Wenner con- figuration. A Wenner array consists of four colinear, equispaced electrodes. A current I is delivered and received between the outer electrodes, and the resulting potential dif- ference V is measured between the inner elec- trodes. For this array on the ground surface an apparent ground resistivity p a is computed from
927
where g is the inter-electrode separation. If the array is within the ground (Fig. 1)
Pa = 4WBI * Y
This separation is varied to sound into the earth, or held constant to profile. If the ground is homogeneous, p a is the actual ground resistivity p . Complicated integral formula- tions are required to relate layer parameters to p a in the usual case of a horizontally layered earthl and interactive computer pro- grams now facilitate intarpretation of ,sound- ings made from the surface. Procedures are not available to interpret data for subsurface arrays. close a separations were used to give readings indicative of the immediate surround- ings: the radius o f the zone o f influence o f a particular separation is generally asmmed to be about.0.7 g. However, high-resistivity materials may force the current close to the borehole and reduce the depth of investigation (Labo, 1987).
The transmitter used was a Huntec LOW E"3, which has a selectable output impedance to match electrode resistance as variations in ground conditions occur throughout the year. Maximum output current was selected (generally 0.2 to 1.5 A) and recorded for each data sta- tion. Potential was measured with a Dc diqi- tal voltmeter (Fluke 8600A). Potentials were recorded for both cycles o f the transmitter output and, during the off-cycle, to check for spurious self-potential readings that may indicate high contact resistance. The average voltage level was used to compute pa for each station. ,
tt" H
1 Apparent Resistivity * 47r of
Fig. 1 A schematic drawing of the buried Wenner array.
The electrodes were placed at 30-cm intervals from the ground surface to a depth o f 12.2 m and connected to a junction black at the ground surface. Each electrode was made up from several strands of tinned copper wire wrapped around the cable bundle. The cable bundles were armored with spiral wrap poly- ethylene to prevent damage both during instal- lation and from frost action in the active layer. This bundle was then taped to the out- side of a 3.8-cm-diameter (1-1/2-in.) ABS pipe for insertion into the drilled holes. This assured a straight cable array and accurate podtioning o f the electrodes. - vertical temperature profiles were recorded coincidentally with the resistivity measure- ments in a 3.8-m-diameter cased hole filled with ethylene glycol. A thermistor calibrated to O.0loC was attached to a 15.2-m cable and resistance was recorded with a Fluke 8600A digital multimeter as the thermistor was lowered down the glycol filled hole. Readings were made when the ohm-meter indicated thermal equilibrium at stations every 30 cm for the top 5 m and at 1.5-m increments below that level.
SITES
The study sites contained soils common to in- terior Alaska on much of the Yukon-Tanana uplands and on the broad Tanana floodplain. The silt site is at the USACRREL field station located off Farmers Loop Road near Fairbanks. It is an area of undisturbed permafrost with a natural black spruce forest and an organic ground cover. The active layer thickness is usually less than 1.0 m. The soil is retrans- ported Fairbanks silt and i s frozen deeper than 33 m (Pbwe', 1958). Holes for casing in- stallation at the silt site were rotary drilled using compressed air for circulation. Grab samples were obtained during drilling and the casing was backfilled with a silt slurry. Gravimetric water content was measured and converted to volumetric ice content using the calibration discussed by Arcone and Delaney (this volume) . The alluvium site is located near the Chena River on Ft. Wainwright in an area mapped ,as flood plain sand and gravel (~ewc?', 1958). The annual active layer thickness is usually about 1.5 m and the so i l s are continuously frozen to at least 12.2 m. The 20.3-m-diameter holes for casing installatiorl were,augered to 12.2 m.
RESULTS
Eighteen resistivity and temperature profiles were recorded betwean July 1985 and September 1986 at both the Ft. Wainwright and Farmers
at 38 vertical locations on each recording Loop sites. Apparent resistivity was recorded
session. Apparent resistivity results are €or an 1 separation of 30 cm, and we assume that
928
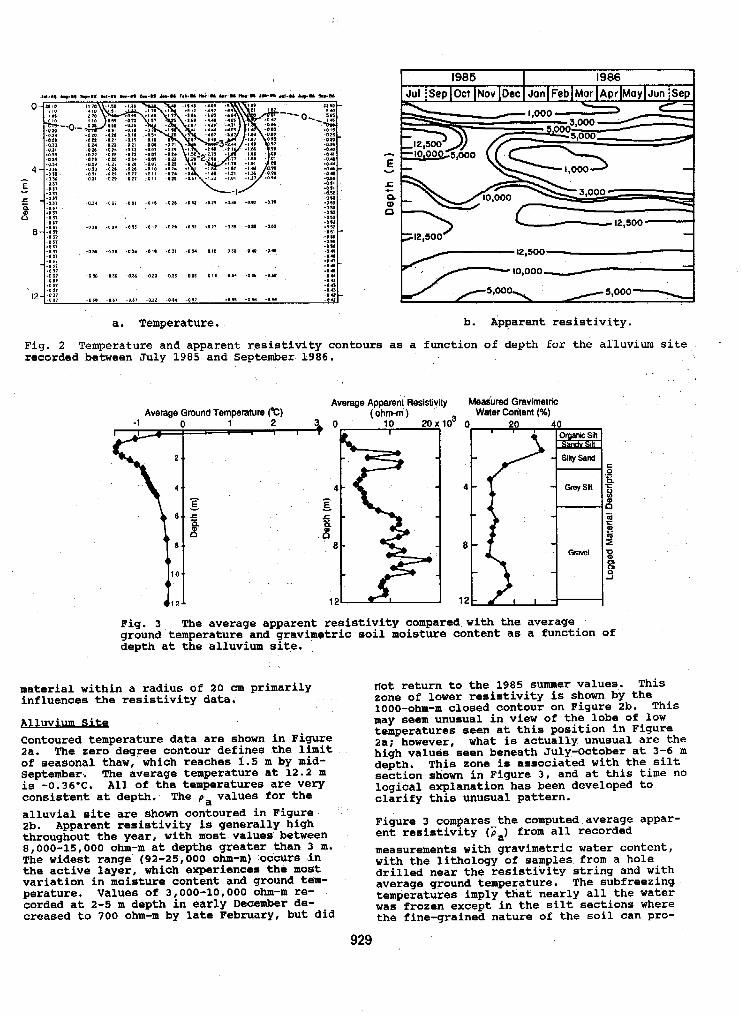
E
f v
W CL
0
a. Temperature. b. Apparent resistivity.
Fig. 2 Temperature and apparent resistivity contours as a function of depth for the alluvium site '
recorded between J u l y 1985 and September 1986.
Average Ground Temperature @) Average Apparent Resistivity
41
10.. 4 1
*12-
Measured Gravimetric Water Content (X)
Fig. 3 The average apparent resistivity compared with the average ground temperature and gravimetric Soil moisture content as a function of depth at the alluvium site. ,
material within a radius of 20 cm primarily influences the resistivity data.
Flluvium Site Contoured temperature data are shown in Figure 2a. The zero degree contour defines the limit of seasonal thaw, which reaches 1.5 m by mid- September. The average temperature at 12.2 m is -0.36T. All of the temperatures are very consistent at depth. The p a values for the alluvial site are shown contoured in Figure 2b. Apparent resistivity is generally high throughout the year, with most values between 8,000-15,000 ohm-m at depths greater than 3 m. The widest range (92-25,000 ohm-m) occurs . in the active layer, which experiences thi most variation in moisture content and ground tem- perature. Values of 3,000-10,000 ohm-m re- corded at 2-5 m depth in early December de- creased to 700 ohm-m by late February, but did
rIot return to the 1985 summer values. This zone of lower resistivity is shown by the 1000-ohm-rp closed contour on Figure 2b. This may seem unusual in view of the lobe of low temperatures seen at this position in Figure
high values seen beneath July-October at 3-6 m Za; however, what is actually unusual are the
depth. This zone is associated with the silt section shown in Figure 3, and at this time no logical explanation has been developed to clarify this unusual pattern.
Figure 3 compares the computed average appar- ent resistivity (5,) from all recorded measurements with gravimetric water content, with the lithology of samples from a hole drilled near the resistivity string and with average ground temperature. The subfreezing temperatures imply that nearly all the water was frozen except in the silt sections where the fine-grained nature of the soil can pro-
929
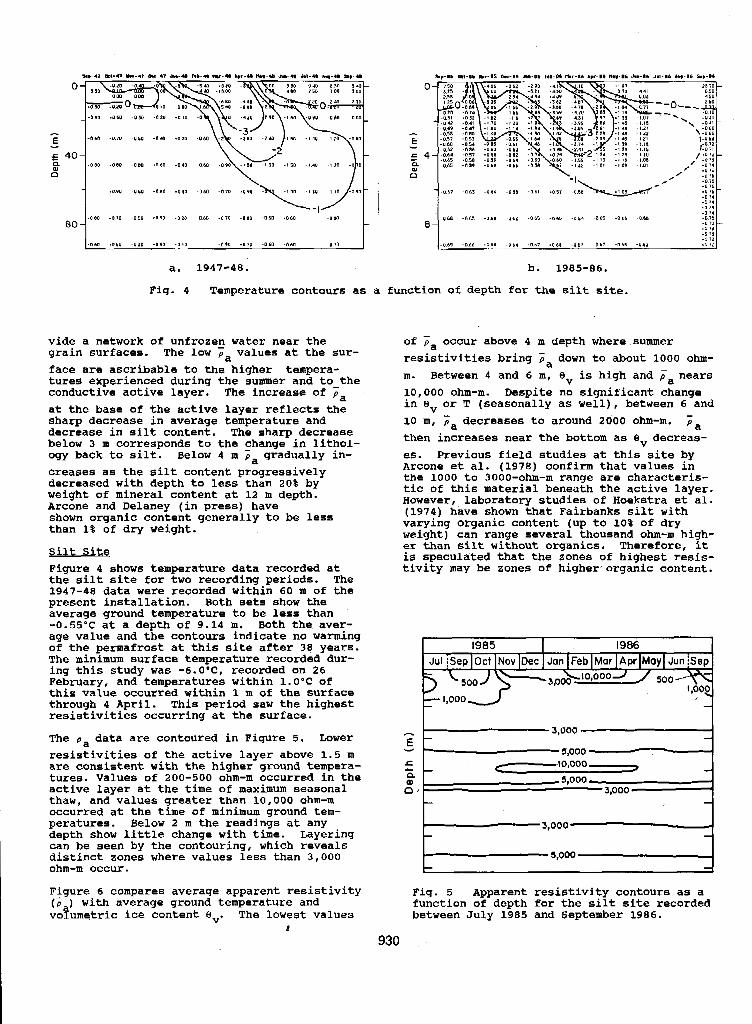
- 0 6 0 .PO0 - 0 2 0 - 0 1 0 . O l O -010 . a 7 0 -010 -010 - 0 10
a. 1947-48.
Fig. 4 Temperature contours as
vide a network of unfrozen water near the grain surfaces. The low Fa values at the sur- face are ascribable to the higher tempera- tures experienced during the summer and to the conductive active layer. The increase of pa at the base of the active layer reflects the sharp decrease in average temperature and decrease in silt content. The sharp decrease below 3 m corresponds to the change in lithol- ogy back to silt. Below 4 m pa gradually in- creases as the silt content progressively decreased with depth to less than 20% by weight of mineral content at 12 m depth. Arcone and Delaney (in press) have shown organic content generally to be less than 1% of dry weight.
Silt site
the silt site f o r two recording periods. The Figure 4 shows temperature data recorded at
1947-48 data were recorded within 6 0 m o f the present installation. Both sets show the average ground temperature to be less than -0.5S'c at a depth of 9.14 m. Both the aver- age value and the contours indicate no warming of the permafrost at this site after 38 years. The minimum surface temperature recorded dur- ing this study was -6.O'C, recorded on 26 February, and temperatures within 1.O'C of this value occurred within 1 m of the surface through 4 April. This period saw the highest resistivities occurring at the surface.
The p a data are contoured in Figure 5. Lower resistivities of the active layer above 1.5 m are consistent with the higher ground tempera- tures. Values of 200-500 ohm-m occurred in the active layer at the time of maximum seasonal thaw, and values greater than 10,000 ohm-m occurred at the time of minimum ground tem- peratures. Below 2 m the readings at any depth show little change with time. Layering can be seen by the contouring, which reveals distinct zones where values less than 3,000 ohm-m occur.
Figure 6 compares average apparent resistivity (p ) with average ground temperature and vofumetric ice content Bv. The lowest values
1
0
c - E
E 4 Q
0
b. 1985-86.
function o f depth for the silt site.
of Fa occur above 4 m depth where summer resistivities bring Pa down to about 1000 ohm- m. Between 4 and 6 m, Bv is high and Pa nears 10,000 ohm-m. Despite no significant change in Bv ox T (seasonally as well), between 6 and 10 m, pa decreases to around 2000 ohm-m. p a then increases near the bottom as ev decreas- es. Previous field studies at this site by Arcone et al. (1978) confirm that values in the 1000 to 3000-ohm-m range are characteris- tic of this material beneath the active layer. However, laboratory studies of Hoekstra et al. (1974) have shown that Fairbanks silt with varying organic content (up to 10% of dry weight) can range several thousand ohm-m high- er than silt without organics. Therefore, it is speculated that the zones of highest resis- tivity may be zones of higher organic content.
I 1985 1 1986 I
r ''OOOd '1
r 1 3,000 -
5,000 - 7
Fig. 5 Apparent resistivity contours as a function of depth for the silt: site recorded between July 1985 and September 1986.
930
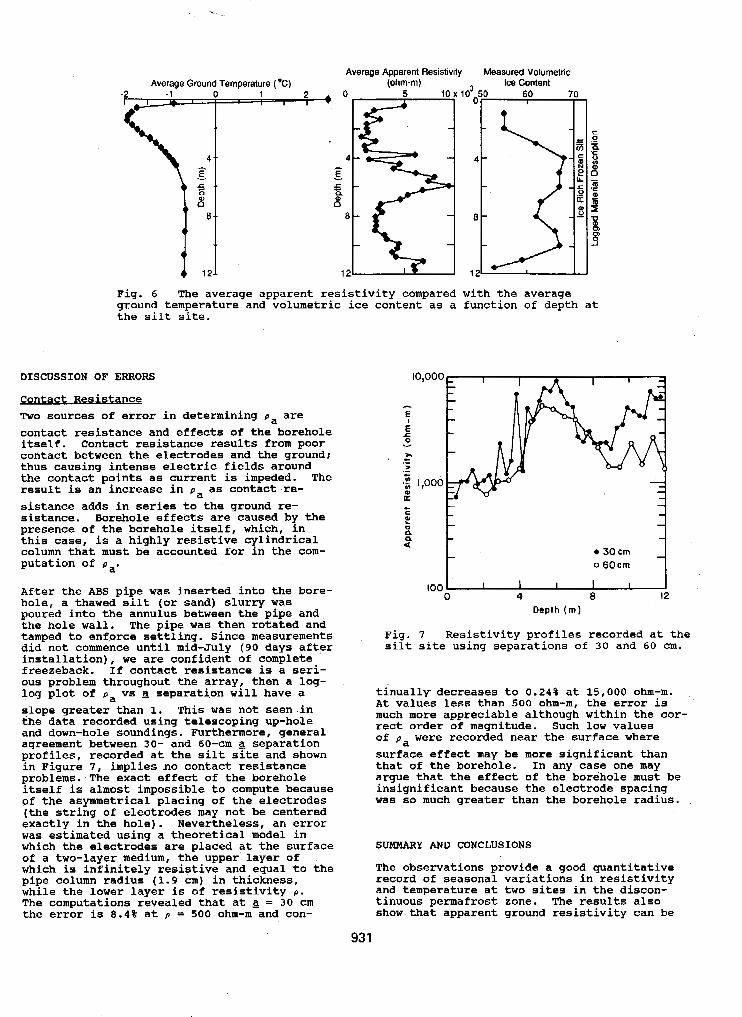
Averme Aaoarent Resistivitv Measured Volumetric
Fig. 6 The average apparent resistivity compared with the average ground temperature and volumetric ice content as a function of depth at the silt site.
DISCUSSION OF ERRORS
Contact+&sistance TWO sources of error in determining p a are contact resistance and effects o f the borehole itself. Contact resistance results from poor contact between the electrodes and the ground; thus causing intense electric fields around the contact points as current is impeded. The result is an increase in p a as contact re- sistance adds in series to the ground re- sistance. Borehole effects are caused by the presence of the borehole itself, which, in this case, i s a highly resistive cylindrical column that must be accounted for in the com- putation of p a .
After the ABS pipe was inserted into the bore- hole, a thawed silt (or sand) slurry was poured into the annulus between the pipe and the hole wall. The pipe was then rotated and tamped to enforce settling. Since measurements did not commence until midduly (90 days after installation), we are confident of complete freezeback. If contact resistance is a seri- ous problem throughout the array, then a log- log plot of pa vs 3 separati,on will have a slope greater than 1. This was not seen-in the data recorded using telescoping up-hole and down-hole soundings. Furthermore, general agreement between 30- and 60-cm a separation profiles, recorded at the silt site and shown
problems.-The exact effect of the borehole in Figure 7, implies no contact resistance
itself is almost impossible to compute because of the asymmetrical placing of the electrodes (the string of electrodes may not be centered exactly in the hole). Nevertheless, an error was estimated using a theoretical model in which the electrodes are placed at the surface of a two-layer medium, the upper layer of which is infinitely resistive and equal to the pipe column radius (1.9 cm) in thickness, while the lower layer is of resistivity p . The computations revealed that at a = 30 cm the error is 8.4% at p = 500 ohm-m and con-
c
t x 4 a
30cm o 6 0 c m
100 0 4 8 12
Dtpth ( m )
Fig. 7 Resistivity profiles recorded at the silt site using separations of 30 and 60 cm.
tinually decreases to 0.24% at 15,000 ohm-m.
much more appreciable although within the cor- At values less than 500 ohm-m, the error is
rect order of magnitude. Such low values of p a were recorded near the surface where surface effect may be more significant than that of the borehole. In any case one may argue that the effect of the borehole must be insignificant because the electrode spacing was so much greater than the borehole radius.
SUMMARY AND CONCLUSIONS
The observations provide a good quantitative record of seasonal variations in resistivity and temperature at two sites in the discon- tinuous permafrost zone. The results also show that apparent ground resistivity can be
93 1
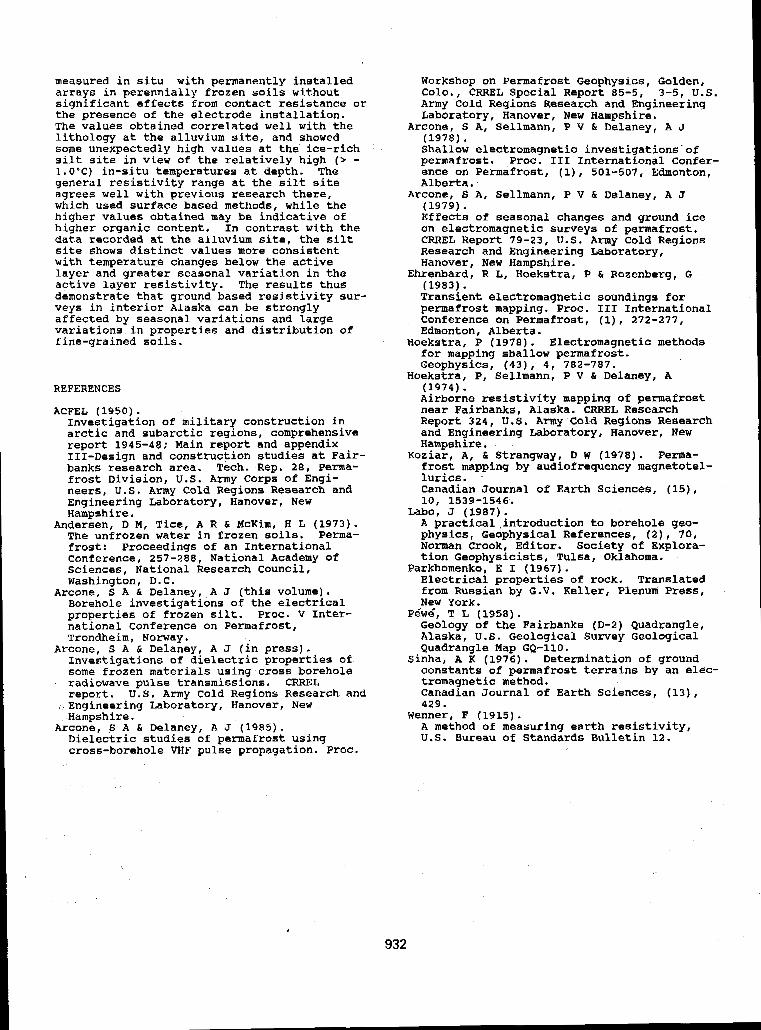
measured in situ with permanently installed arrays in perennially frozen soils without significant effects from contact resistance or the presence of the electrode installation. The values obtained correlated well with the lithology at the alluvium site, and showed some unexpectedly high values at the ice-rich silt site in view of the relatively high (> - 1 . 0 ' C ) in-situ temperatures at depth. The general resistivity range at the silt site agrees well with previous research there, which used surface based methods, while the higher values obtained may be indicative of higher organic content. In contrast with the data recorded at the alluvium site, the silt site shows distinct values more consistent with temperature changes below the active layer and greater seasonal variation in the active layer resistivity. The results thus demonstrate that ground based resistivity SUK- veys in interior Alaska can be strongly affected by seasonal variations and large variations in properties and distribution of fine-grained soils.
REFERENCES
ACFEL (1950). Investigation of military construction in arctic and subarctic regions, comprehensive report 1945-48; Main report and appendix 111-Design and construction studies at Fair- banks research area. Tech. Rep. 28, Perma- frost Division, U.S. A m y Corps of Engi- neers, U.S. Army Cold Regions Research and Engineering Laboratory, Hanover, New
Andersen, D M, Tice, A R ti McKim, H L (1973). Hampshire.
The unfrozen water in frozen soils. Perma- frost: Proceedings of an International Conference, 257-288, National Academy of Sciences, National Research Council,
Arcone, S A & Delaney, A J (this volume) . Washington, D.C.
Borehole investigations o f the electrical properties of frozen silt. Proc. V Inter- national Conference on Permafrost, Trondheim, Norway.
Arcone, S A & Delaney, A J (in press). Investigations of dielectric properties of some frozen materials using cross borehole radiowave pulse transmissions. CRREL report. U.S. Army Cold Regions Research and
Hampshire.
Dielectric studies of permafrost using cross-borehole VHF pulse propagation. Proc.
:Engineering Laboratory, Wanover, New
Arcone, S A & Delaney, A J (1985).
Workshop on Permafrost Geophysics, Golden, Colo., CRREL Special Report 8 5 - 5 , 3-5, U.S. Army Cold Regions Research and Engineering Laboratory, Hanover, New Hampshire.
Arcone. S A, Sellmann, P V & Delaney, A J (1978). Shallow electromagnetic investigations-of permafrost. Proc. 111 International Confer- ence on Permafrost, (l), 501-507, Edmonton, Alberta.
(1979). Effects of seasonal changes and ground ice on electromagnetic surveys of permafrost. CRREL Report 79-23, U.S. A m y Cold Regions Research and Engineering Laboratory, Hanover, New Hampshire.
Ehrenbard, R L, Hoekstra, P L Rozenberg, G (1983). Transient electromagnetic soundings for permafrost mapping. Proc. 111 International Conference on Permafrost, (I), 272-277, Edmonton, Alberta.
Hoekstra, P (1978). Electromagnetic methods for mapping shallow permafrost. Geophysics, ( 4 3 ) , 4, 782-787.
Arcone, S A , Sellmann, P V & Delaney, A J
Boekstra, P, Sellmann, P V & Delaney, A (1974). Airborne resistivity mapping of permafrost near Fairbanks, Alaska. CRREL Research Report 324, U . S . Army Cold Regions Research and Engineering Laboratory, Hanover, New Hampshire.
Koziar, A, & Strangway, D W (1978). Perma- frost mapping by audiofrequency magnetotel- lurics. Canadian Journal of Earth Sciences, (15), 10, 1539-1546.
A practica1,introduction to borehole geo- physics, Geophysical References, ( 2 ) , 70, Norman Crook, Editor. Society of Explora- tion Geophysicists, Tulsa, Oklahoma.
Electrical properties of rock. Translated from Russian by G.V. Keller, Plenum Press, New York.
Geology of the Fairbanks (D-2) Quadrangle, Alaska, U.S. Geological Survey Geological Quadrangle Map 64-110.
Sinha, A K (1976). Determination of ground constants of permafrost terrains by an elec- tromagnetic method. Canadian Journal of Earth Sciences, (13), 4 2 9 .
A method of measuring earth resistivity, U.S. Bureau of Standards Bulletin 12.
Labo, J (1987) .
Parkhomenko, E I (1967).
P&d, T L (1958) .
Wenner, F (1915) .
932
PERMAFROST CONDITIONS IN THE SHORE AREA AT SVALBARD 0. Gregersenl and T. Eidsmoen2
1Norwegian Geotechnical Institute, Oslo, Norway 2Norwegian State Railways, Drammen, Noway (formerly of NGI)
' ABSTRACT. Permafrost registrations at Svalbard are few, and have so far been restricted to inland areas. This article describes a recent project which has studied permafrost conditions in the shore area of Svalbard. Two representative sites, Longyearbyen and Svea, were chosen for the project. At both sites thermistors were permanently installed in 100 m deep drillholes. The data confirm the previous assumptions of no offshore permafrost and indicate the shore area to be a zone of "warm" permafrost. The data also give some interesting information on the geological history.
$ 5
INTRODUCTXON
With a mean annual temperature- of about -6OC. the permafrost in central parts of Svalbard is classified as "cold permafrost". The geological history of Svalbard, however, makes the existence of offshore permafrost unlikely. Therefore, the shore area ir believed to form a transition zone between frozen and unfrozen ground. a zone of "warm permafrost". As "warm permafrost" very often presents difficult foun- dation conditions, it ia important to have this problem investigated prior to design of constructions in the shore area.
Previously no observations or analysis have been carried out to investigate this phenomenon. Neither have the few existing shore area constructions given any reliable information on this question.
During the period December 1986 to December 1987 this problem was given considerable attention by NGI, and a project includlng both temperature measurements and a theoretical analysis was carried out. Recent interest in this problem has grown from increased activity aasociated with reeourca prospecting both on Svalbard and ita near-shore areas. The possible exploiting of new resources in the Svalbard region will make the shore area a very important zone for the location of different types of constructions such ae docks, storage buildings and supply facilities. A h a , the shore area is an impor- tant region for pipeline crossings.
TEST SITES AND INSTALLATIONS
Two Locations were chosen for measurements of temperatures in the ground, Longyearbyen and Svea, see Figure 1. The climatic conditions are much the same at the two locations, with a mean annual temperature of about -6OC. However, the recent geological history is very different at
area is "old land", raised about sea level after the two locations. A t Longyearbyen the shore
the last glaciation, probably a few thousand
0
Figure 1 Map of Svalbard showing location of test sites Longyearbyen and Svea.
years ago. The soil profile is one of marine clay and silt overlain by fluvioglacial dcpo- sits. The Svea Lowland is "new land", about 700 years old. The area was submerged until surges of the Paula glacier across the van Mijen fjord compressed the seabed sediments and lifted them above sea level, Haga (1978) and P&w& (1981). The locations are shown in more detail in Figure 2.
The temperature measurement programme was based on preliminary theoretical calculations of the
geratures Were assumed to be -6OC and +I°C res- thermal conditions. The surface and water tem-
psctively, and the temperature gradient to be 50 m/OC. Thermal conductivities were varied
3.5 W/mK for bedrock. The results of these from 1.7 to 1.9 W/mK for clay and from 2.5 to
calculations are presented in Figure 3. The calculations show clearly that temperature measurements must be taken to considerable depths to give the necessary information. For practical reasons the depth was limited to 100 m. The figure also shows that the sea influences the ground temperatures to some 200 m from
933
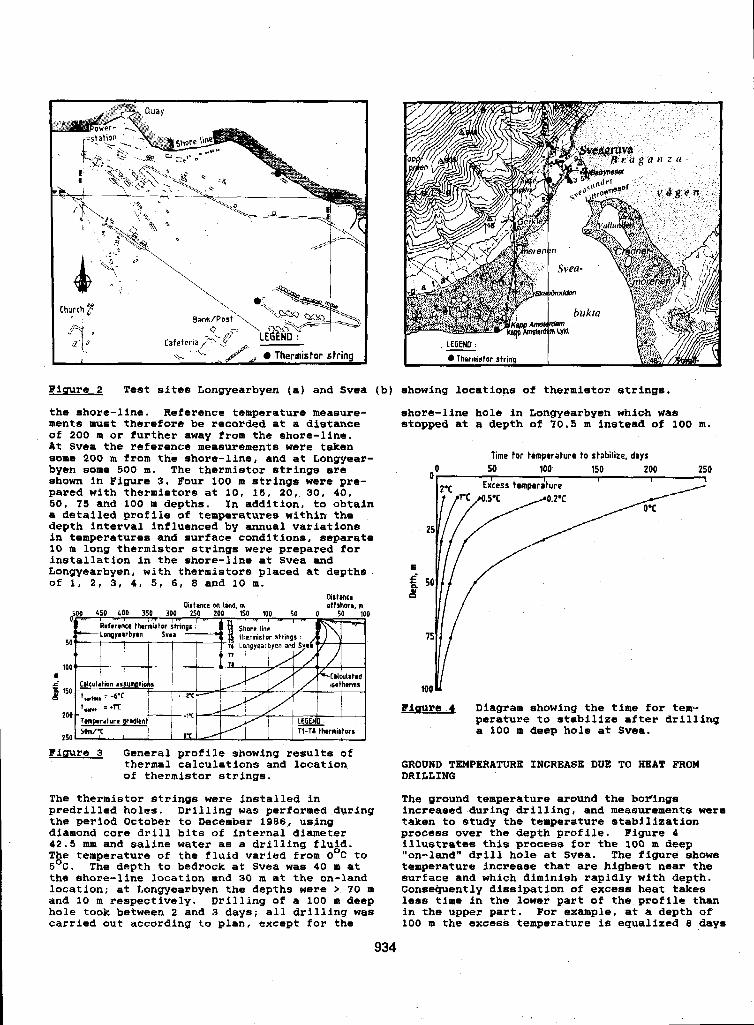
Fiqure 2 Test sites Longyearbyen (a) and Svea (b) showing locations of thermistor strings.
the shore-line. Reference temperature measure- ments must therefore be recorded at a distance o f 200 m or further away from the shore-line. At Svea the reference measurements were taken same 200 m from the ahore-line, and at Longyear- byen some 500 I. The thermiBtor strings are ahown in Figure 3. Four 100 m strings were pre- pared with thermistors at 10, 18, 20, 30, 40 , 50, 1 5 and 100 m depths. In addition, to obtain a detailed profile of temperatures within the depth interval influenced by annual variations in temperatures and surface conditione, meparate 10 m long thermistor strings were prepared for installation in the shore-line at Svea and Longyearbyen, with thermiators placed at depths of 1, 2, 3, 4 , 5, 6, 8 and 10 m.
mstmt.
tlM i .lY -Tmpwature grad#dL"'"
"+ I L= '
250 Z O m P C 0-c /
T1-Tl thermistors L
Fioura 3 General profile showing results of thermal calculations and location of thermistor strings.
The thermistor strings were installed in predrilled holes. Drilling was performed during the period October to December 1986, using diamond core drill bits of internal diameter
The temperature of the fluid varied from O°C to 42.5 mm and saline water as a drilling f lu id .
5OC. The depth to bedrock at Svea was 40 m at the share-line location and 30 m at the on-land location; at Longyearbyen the depths were > 7 0 m and 10 m respectively. Drilling o f a 100 m deep hole took between 2 and 3 days; all drilling was carried out according to plan, except for the
shore-line hole in Longyearbyen which was stopped at a depth of 1 0 . 5 m instead o f 100 m.
lime for tempwature t o stabilize, days
0 o , ,
50 100 150 200 250
2.C €;cess tomperdture I 1
25
E $ 50
I5
100
Piaura 4 Diagram showing the time for tem- perature to stabilize after drilling a 100 m deep hole at Svea.
GROUND TEMPERATURE INCREASE DUE TO HEAT FROM DRILLING
The ground temperature around the boFings increased during drilling, and measurements ware taken to study the temperature stabilization procaas over the depth profile. Figure 4 Illustrates this process for the 100 m deep "on-land" drill hole at Sveu. The figure shows temperature increase that are highest near the surface and which diminish rapidly with depth. ConseQuently dissipation o f excess heat takes lese time in the lower part o f the profile than in the upper part. For example, at a depth of 100 m the excess temperature is equalized 8 days
934
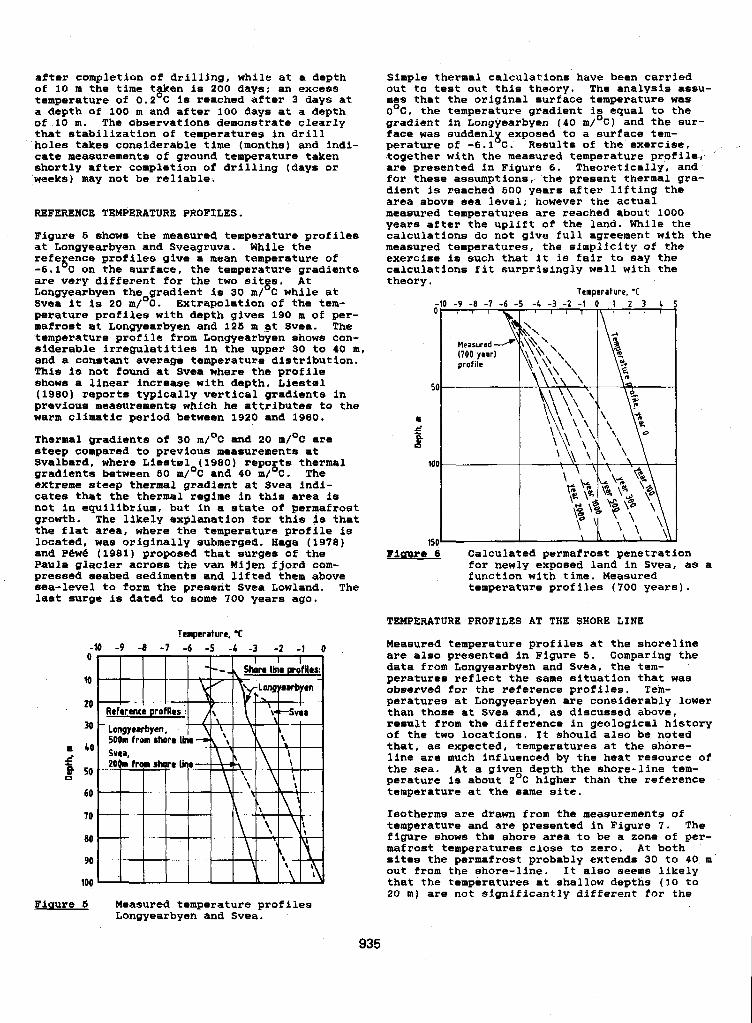
after completion of drilling, while at a depth of 10 m the time tgken is 200 days; an excess temperature of 0.2 C is reached after 3 days at a depth of 100 m and after 100 days at a depth o f 10 m. The observations demonstrate clearly that stabilization of temperatures in drill holes takes considerable time (months) and indi- cate measurements of ground temperature taken shortly after completion of drilling (days or weeks) may not be reliable.
REFERENCE TEMPERATURE PROFILES.
Figure 5 shows the measured temperature profiles at Longyearbyen and Sveagruva. While the refe ence profiles give a mean temperature of -6.1 C on the surface. the temperature gradients are very different for the two sftgs. At Longyearbyen the gradient is 30 m/ C while at Svea it is 20 m/OC. Extrapolation of the tem- perature profiles with depth gives 190 m o f per- mafrost at Longyearbyen and 128 m .at Svea. The
siderable irregulatities in the upper 30 to 40 m. temperature profile from Longyearbyen shows con-
This is not found at Svea where the profile and a constant average temperature distribution.
shows a linear increase with depth. Lisstrrrl (1980) xegorts typically vertical greclients in prsvioua measurements which he attributes to the warm climatic period between 1920 and 1960.
Thermal gradients of 30 m/OC m a 20 m/OC are steep compared to previous measurements at Svalbard, where Liestrl (1960) reports thermal gradients between 130 m/'C and 40 m/'C. The extreme steep thermal gradient at Svea indi- cates that the thermal regime in this area is not in equilibrium. but in a state of permafrost growth. The likely explanation for thie i s that the flat area, where the temperature profile i s located, was originally submerged. Haga (1978) and Pew& (1981) proposed that surges of the Paula glacier across the van Mijen fjord com- pressed seabed sediments and lifted them above
ti
sea-level to form the preeent Svea Lowland. last surge is dated to some 700 yerra ago.
Temperature, .C -IO -9 -8 -1 -6 -5 4 -3 -2 -1 0 0
10
20
30
d I 40
0 so 0
60
70
80
90
100
Fiuure I Measured temperature profiles Longyearbyan and Svea.
The
Simple thermal calculations have been carried out to test out this theory. The analysis assu- mes that the original surface temperature was o0C, the temperature gradient is equal to the gradient in Longyearbyen (40 d o c ) and the sur-
perature of -6.1 C. Results of the exercise, face was sudclenlg exposed to a surface tem-
are presented in Figure 6. Theoretically, ana together with the measured temperature profile,-
disnt is reached 500 years after llfting the for these assumptions, the present thermal gra-
area above sea level; however the actual measured temperatures are reached about 1000 years after the uplift of the land. While the calculations do not give full agreement with the measured temperatures, the simplicity of the exercise 18 such that it is fair to say the calculations fit surprisingly well with the theory.
Temperature, 'C
0 1 , i ! b , ? , , 7 ~ \ m , ' ' 1 -10 -9 -8 -7 -6 -5 -4 -3 -2 -1 0 1 2 3 4 5
~
Blcrure 6 Calculated permafrost penetration I>""
for newly expoeed land in Svea, as a function with time. Measured temperature profiles (700 years).
TEMPERATURE PROFILES AT THE SWORE LINE
Measured temperature profiles at the shoreline are also presented in Figure 6. Comparing the data from Longyearbyan and Svea, the tem- peratures reflect the same situation that was observed for the reference profiles. Tem- peratures at Longyearbyen are considerably lower than those at Svea and, as discussed above, result from the difference in geological history of tho two locations. It should also be noted that, as expected, temperatures at the shore- line are much influenced by the heat resource o f
peraturc i s about 2OC higher than the reference the sea. A t a given depth the shore-line tam-
temperature at the same site.
Isotherms are drawn from the measurements of temperature and are presented in Figure 7. The figure shows the shore area to be a zone of per- mafrost temperatures close to zero. At both sites the permafrost probably extends 30 to 40 m out from the shore-line. It also seems likely that the temperatures at ,shallow depths (10 to 20 m) are not significantly different for the
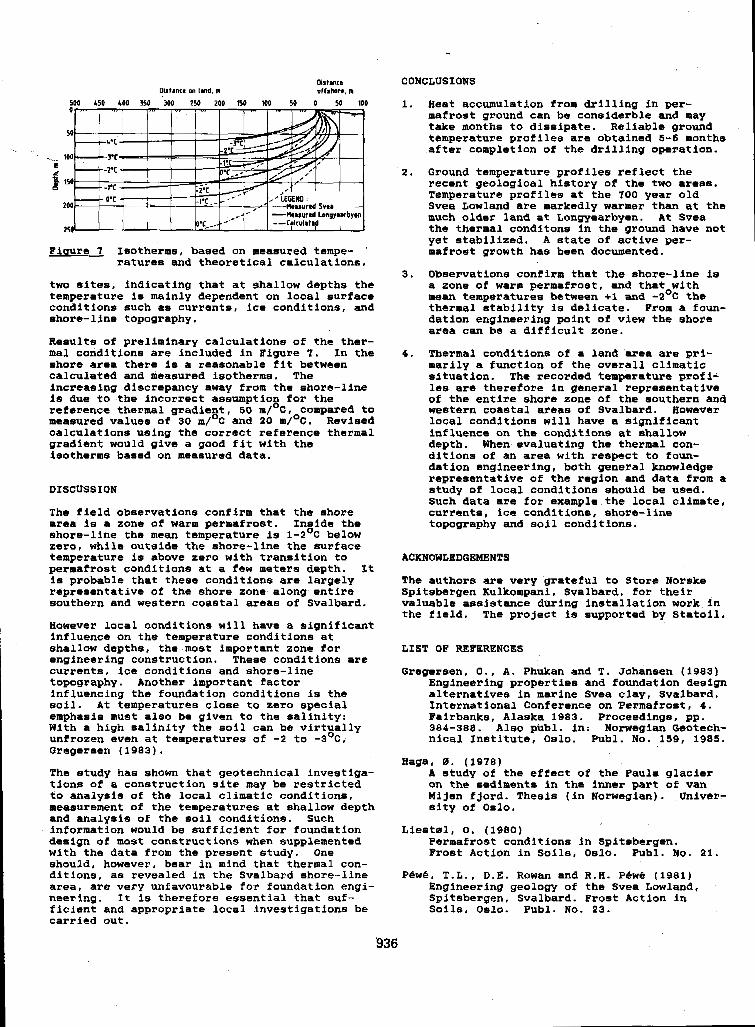
Oirtmrc offrhorc. m DistmtR on land, m
500 450 (00 350 300 250 200 150 100 50 0 50 100
Fimre 7 Isotherms, based on measured tempe- '
ratures and theoretical calculations.
two sites, indicating that at shallow depths the temperature is mainly dependent on local surface conditions such as currents, ice conditions, and shore-line topography.
Results of preliminary calculations of the ther- mal conditions are included in Bigure 7. In the shore area there is a reasonable fit between calculated and measured isotherms. The increasing discrepancy away from the shore-line is due to the incorrect assumption for the reference thermal gradient, 50 m/%. compared to meaeured values of 30 m/OC and 20 m/OC. Revised calculations using the corruct reference thermal gradient would give a good fit with the isotherms based on measured data.
DISCUSSION
The field observations confirm that the shore area is a zone of warm permafrost. Inside the shore-line the mean temperature is 1-2OC below zero, while outside the shore-line the surface temperature is above zero with transition to permafrost conditions at a fsw meters depth. It is probable that these conditions are largely representative of the shore zone along entire southern an& western coastal areas of Svalbard.
However local conditions will have a significant influence on the temperature conditions et shallow dsptha, the most important zone for engineering construction. These conditions are currents, ice conditions and shore-line topography. Another important factor influencing the foundation conditions is the soil. At temperatures close to zero apscisl
With a high salinity the soil can.be virtually emphasis must also be given to the aalinity:
unfrozen even at temperatures of -2 to -3'~. Oregersen (1983).
The study has shown that geotechnical investiga- tions of a construction site may be restricted to analysis of the local climatic conditions, measurement of the temperatures at shallow depth and analysis of the soil conditions. Such information would be sufficient for foundation design of most constructions when supplemented with the data from the present study. One should, however, bear in mind that thermal con- ditions, as revealed in the Svalbard shore-line area, are very unfavaurable f o ~ foundation engi- neering. It is therefore essential that suf- ficient and appropriate local investigations be carried aut.
CONCLUSIONS
1. Heat accumulation from drilling in per- mafrost ground can be conmiderble and may take months to dissipate. Reliable ground temperature profiles are obtained 6-6 months after completion of the drilling operation.
2. Ground temperature profiles reflect the recent geological history o f the two areas. Temperature profiles at the 700 year old Svea Lowland are markedly warmer than at the much older land at Longyearbyen. A t Svea the thermal conditons in the ground have not yet stabilized. A state of active ger- mafrost growth has been documented.
3. Observations confirm that the shore-line i s a zone of warm permafrast, and that with mean temperatures between +1 and -2OC the thermal stability is delicate. From a faun- dation engineering point of view the shore area can be a difficult zone.
4. Thermal conditions of a land area are pri- marily a function of the overall climatic situation. Tha recorded temperature profi- les are therefore in general regreaentative of the entire shore zone of the southern and western coastal areas of Svalbard. However local conditions will have a significant influence on tha conditione at shallow depth. When evaluating the thermal con- ditions o f an area with respect to foun- dation engineering, both general knowledge representative of the region and data from a study of local conditions should be used. Such data are for example the local climate, currents, ice conditions, shore-line topography and soil conditions.
ACKNOWLEDGEMENTS
The authors are very grateful to Store Norske Spitsbergrn Kulkompani, Svalbard, for their valuable assistance during installation wark in the field. The project is supported by Statoil.
LIST OF REBERENCES
Gregersen, 0.. A. Phukan and T. Johansen (1983) Engineering properties and foundation design alternatives in marine Svea clay, Svalbard. Intsrnational Conference on 'Permafrost. 4 . Rairbanks, Alaska 1983. Proceedings. pp.
nical Institute, Oslo. Publ. No. 159, 1985. 384-388. Ale0 publ. in: Norwegian Qeotech-
H a p , 0. (1978) A study of the effect of the Paula glaciar on the sediments in the inner part of van Mijsn fjord. Thesis (in Norwegian). Univer- sity of Oslo.
Liestd, 0 . (1980) Permafrost conditions in Spitrbergen. Frost Action in Soils, Oslo. Publ. No. 21.
Plwl, T.L., D.E. Rowan and R.H. Few& (1981) Engineering geology of the Svea Lowland, Spitsbergen, Svalbard. Frost Action in Soils, Oslo. Publ. No. 23.
936
CORE DRILLING THROUGH ROCK GLACIER-PERMAFROST W. Haeberli, J. Huder, H.-R. Keusen, J. Pika and H. Rathlisberger
Versuchsanstalt fur Wasserbau, Hydrologie und Glaziologie, ETH Zurich, Switzerland
SYNOPSIS: Rock glaciers are perennially frozen debris masses which slowly creep down mountain slopes. Their ice contains undeciphered information about the evolution of periglacial environments since the last Ice Age. In addition, creep of rock glacier permafrost takes place under practically constant temperatures, stresses and strain rates. Rock glacier flow is therefore a natural large-scale/ longterm experiment on the steady state creep of ice-rock mixtures. In order to study these aspects, a core drilling project has been started on the active rock glacier Murtil I, Piz Corvatsch, Engadin, Swiss Alps. The drilling operation took place in spring 1987. Borehole temperature at 15m depth is close to -2OC. Permafrost reaches down to the severely fissured and highly permeable bedrock at about: 50m depth. Beneath a 3m-active layer, it contains (with increasing depth) pure and massive ice (12m), supersaturated frozen sands with ice lenses (17m), and ice-bearing blocks (18m).
INTRODUCTION
In mountain regions, ice-rich permafrost often occurs within steep, debris covered slopes. With increasing thickness of the ice bearing debris, stresses can build up which trigger the creep of the permafrost. During the process of permafrost creep, the original debris accumulation - for instance a scree slope or a moraine - is slowly deformed. The product of this deformational process is the rock glacier, certainly the most
Based on the evidence now accumulated from striking phenomenon of mountain permafrost.
geomorphological observations, geophysical soundings, and from geodetic and photogrammetric measurements, rock glaciers can be assumed to flow in a steady-state creep mode under fairly constant strqsses, strain rates and temgera- tures. They kontain large amounts of various kinds of congelation ice (Shumskii 1 9 6 4 ) - interstitial ice, ice lenses and massive ice - as well as sometimes also buried sedimentary ice from avalanche cones and glacierets. First at- tempts to model rock glacier flow indicate that the age of most rock glacier permafrost is in the order of I O3 to 1 O4years, i.e. comparable to the duration of the Holocene time period (Wahr- haftig ana Cox 1959, Olyphant 1983, Haeberli 1985 , Vitek and Giardino 1987). In'order to gain more insight into these aspects, a core drilling project has been recently started in the Swiss Alps. The present contribution briefly describes the concept of the project, the investigated site, the drilling operation and some first results.
CONCEPT OF THE PROJECT
Flow of rock glacier permafrost can be consid- ered to be a natural large-scale and long-term experiment on the creep of rock-ice mixtures.
Compared to laboratory tests, this natural ex- periment has great advantages as well as severe
the fact that steady state creep obviously takes limitations. The greatest advantage is given by
over extended time periods, mainly due to the place; and that boundary conditions vary little
thermal inertia of ice-rich permafrost. It is, however, very difficult to exactly define these boundary conditions; the 3-dimensional distribu- tion of ice content, temperature, stress and strain rate cannot be accurately studied by sur-
techniques alone (Haeberli 1985). As an impor- face observations and geophysical prospecting
tant step towards at least partially overcoming these problems, it was decided to drill through the permafrost of an active rock glacier, to take core samples from the permafrost table down to bedrock, and to prepare the borehole for long-term monitoring of temperature and deforma- tion. The results of core analysis and borehole observations are expected to furnish basic input data for modelling large-scale permafrost creep (cf. Sayles 1968, Hooke et al. 1972, Haynes 1978, Vyalov 1978, Echelmeyer and Wang 1987).
The ice within rock glacier permafrost is assum- ed to have farmed within nonconsolidated sedi- ments. In contrast to high-mountain firn and glacier ice, it probably originates from frozen groundwater rather than from directly-accumulat-
glacier permafrost could contain information on ed layers of atmospheric precipitation. Rock-
be complementary to the information extracted the evolution of the Alpine environment and so
from high-altitude glacier cores (cf, Oeschger et al. 1978, Wagenbach et al., in press). A num- ber of analyses are therefore planned on the xe- covered cores in order to investigate- the possi- bilities of reconstructing the past evolution of high-altitude permafrost; as well as of finding paLeoenvironmental information o n climate, hydrological processes or rock-wall weathering. These analyses will include studies of ice crys- tals (size and orientation) , impurities in the ice (dust, pollen, air bubbles) and isotopes
937
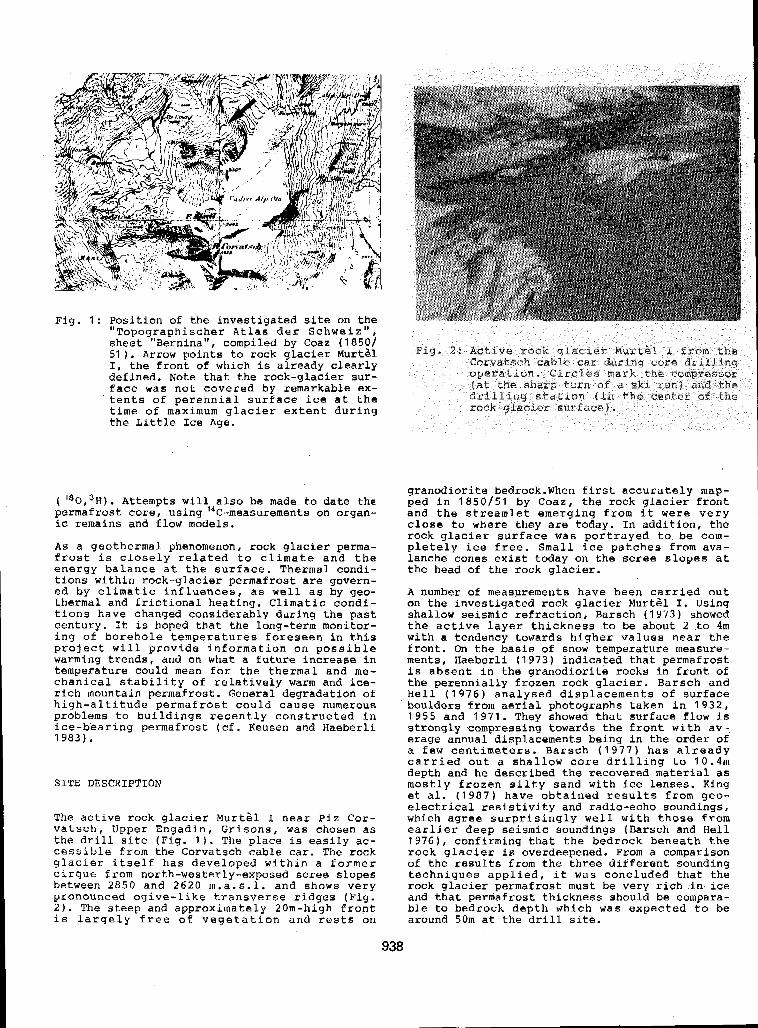
Fig. 1: ;osition of the investigated site on tbe
sheet Bernina”, compiled by Coaz ( 1 8 5 0 1 Topog,faphischer Atlas der Schweiz ,
51 ) . Arrow points to rock glacier Murtsl I, the front of which is already clearly defined. Note that the rock-glacier sur- face was not covered by remarkable ex- tents of perennial surface ice at the time of maximum glacier extent during the Little Ice Age.
( 180,3H). Attempts will also be made to date the permafrost core, using measurements on organ- ic remains and flow models.
As a geothermal phenomenon, rock glacier perma- frost is closely related to climate and the energy balance at the surface. Thermal condi- tions within rock-glacier permafrost are govern- ed by climatic influences, as well as by geo- thermal and frictional heating. Climatic condi- tions have changed considerably during the past century. It is hoped that the long-term monitor- ing o f borehole temperatures foreseen in this project will provide information on possible warming trends, and on what a future increase in temperature could mean for the thermal and me- chanical stability of relatively warm and ice- rich mountain permafrost. General degradation of high-altitude permafrost could cause numerous problems to buildings recently constructed in ice-bearing permafrost (cf. Keusen and Haeberli 1 9 8 3 ) .
SITE DESCRIPTION
The active rock glacier Murtsl I near Piz Cor- vatsch, Upper Engadin, Grisons, was chosen as the drill site (Fig. 1 ) . The place i s easily ac- cessible from the Corvatsch cable car. The rock glacier itself has developed within a former cirque from north-westerly-exposed scree slopes between 2850 and 2620 m.a.s.1. and shows very pronounced ogive-like transverse ridges (Fig. 2 ) . The steep and approximately 2Om-high front is largely free of vegetation and rests on
9
granodiorite bedrock.When first accurately map- ped in 1850/51 by Coaz,, the rock glacier front and the streamlet emerging from it were very close to where they are today. In addition, the rock glacier surface was portrayed to be com- pletely ice free. Small ice patches from ava- lanche cones exist today on the scree slopes at the head of the rock glacier.
A number of measprements have been carried out on the investigated rock glacier Murtgl I. Using shallow seismic refraction, Barsch ( 1 9 7 3 ) showed the active layer thickness .to be about 2 .to 4m with a tendency towards higher values near the
ments, Haeberli ( 1 9 7 3 ) indicated that permafrost f r o n t . On the basis of snow temperature measure-
is absent in the granodiorite rocks in front of the perennially frozen rock glacier. Barsch and Hell ( 1 9 7 6 ) analysed displacements of surface boulders from aerial photographs taken in 1932, 1955 and 1 9 7 1 . They showed that surface flow is strongly compressing towards the front with av-
a few centimeters. Barsch ( 1 9 7 7 ) has already erage annual displacements being in the order of
carried out a shallow core drilling to 10.4111 depth and he described the recovered material as mostly frozen silty sand with ice lenses. King et al. ( 1 9 8 7 ) have obtained results from geo- electrical resistivity and radio-echo soundings, which agree surprisingly well with those from earlier deep seismic soundings (Barsch and Hell 1 9 7 6 ) , confirming that the bedrock beneath the rock glacier is overdeepened. From a comparison of the results from the three different sounding techniques applied, it was concluded that the rock glacier permafrost must be very rich in, ice and that permafrost thickness should be compara- ble to bedrock depth which was expected to be around 50m at the drill site.
#38
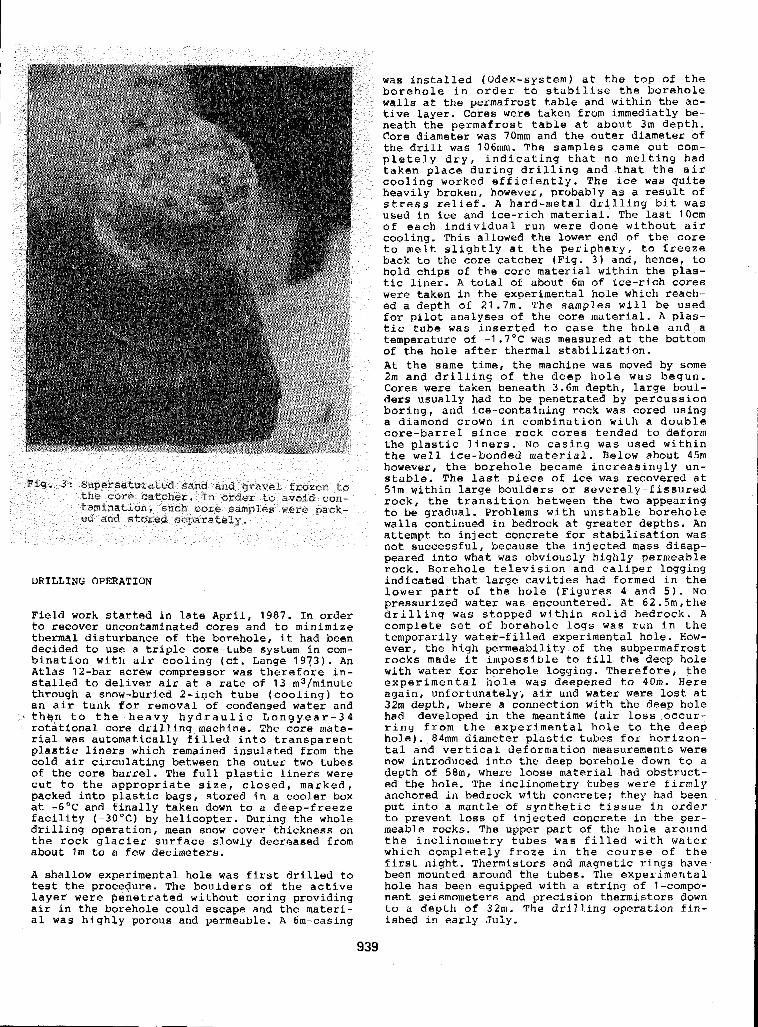
DRILLING OPERATION
Field work started in late April, 1987. In order to recover uncontaminated cores and to minimize thermal disturbance of the borehole, it had been decided to use a triple core-tube system in com- bination with air cooling (cf. Lange 1 9 7 3 ) . An Atlas 12-bar screw compressor was therefore in- stalled to deliver air at a rate of 13 m3/minute through a snow-buried 2-inch tube (cooling) to an air tank for removal of condensed water and
then to the heavy hydraulic Longyear-34 rotational core drilling machine. The core mate- rial was automatically filled into transparent plastic liners which remained insulated from the cold air circulating between the outer two tubes of the core barrel. The full plastic liners were cut to the appropriate size, closed, marked, packed into plastic bags, stored in a cooler box at -6'C and finally taken down to a deep-freeze facility (-30°C) by helicopter. During the whole drilling operation, mean snow cover thickness on the rock glacier surface slowly decreased from about Im to a few decimeters.
A shallow experimental hole was first drilled to test the procequre. The boulders of the active layer were fienetrated without coring providing air in the borehole could escape and the materi- al was highly porous and permeable. A 6rn-casing
was installed (Odex-system) at the top of the borehole in order to stabilise the borehole walls at the permafrost table and within the ac-
neath the permafrost table at about 3m depth. tive layer. Cores were taken from immediatly be-
Core diameter was 70mm and the outer diameter of the drill was 106mm. The samples came out com- pletely dry, indicating that no melting had taken place during drilling and that the air cooling worked efficiently. The ice was quite heavily broken, however, probably as a result of stress relief. A hard-metal drilling bit was used in ice and ice-rich material. The last 10cm of each individual run were done without air cooling. This allowed the lower end of the core to melt slightly at the periphery, to freeze back to the core catcher (Fig. 3 ) and, hence, to hold chips of the core material within the plas- tic liner. A total of about 6m of ice-rich cores were taken in the experimental hole which reach- ed a depth of 21.7m. The samples will be used for pilot analyses of the core material. A plas- tic tube was inserted to case the hole and.a temperature of -1.7'C was measured at the bottom of the hole after thermal stabilization. At the same time, the machine was moved by some 2m and drilling of the deep hole was begun. Cores were taken beneath 3.6m depth, large boul- ders usually had to be penetrated by percussion boring, and ice-containing rock was cored using a diamond crown in combination with a double core-barrel since rock cores tended to deform the plastic liners. No casing was used within the well ice-bonded material. Below about 4% however, the borehole became increasingly un- stable. The last piece of ice was recovered at 51m within large boulders or severely-fissured rock, the transition between the two appearing to be gradual. Problems with unstable borehole walls continued in bedrock at greater depths. An attempt to inject concrete for stabilisation was not successful, because the injected mass disap- peared into what was obviously highly permeable rock. Borehole television and caliper logging indicated that Large cavities had formed in the lower part of the hole (Figures 4 and 5). No pressurized water was encountered. At 62.5mIthe drilling was stopped within solid bedrock. A complete set of borehole logs was run in the temporarily water-filled experimental hole. How- ever, the high permeability of the subpermafrost rocks made it impossible to fill the deep hole with water for borehole logging. Therefore, the experimental hole was deepened to 40m. Here again, unfortunately; air and water were lost at 32m depth, where a connection with the deep hole had developed in the meantime (air loss occur- ring from the experimental hole to the deep hole). 84mm diameter plastic tubes for horizon- tal and vertical deformation measurements were now introduced into the deep borehole down to a depth of 58m, where loose material had obstruct- ed the hole. The inclinometry tubes were firmly anchored in bedrock with concrete; they had been put into a mantle of synthetic tissue in order to prevent loss of injected concrete in the per- meable rocks. The upper part of the hole around the inclinometry tubes was filled with water which completely froze in the course of the first night. Thermistors and magnetic rings have- been mounted around the tubes. The experimental hole has been equipped with a string of l-compo- nent seisrnometers and precision thermistors down to a depth of 32m. The drilling operation fin- ished in early July.
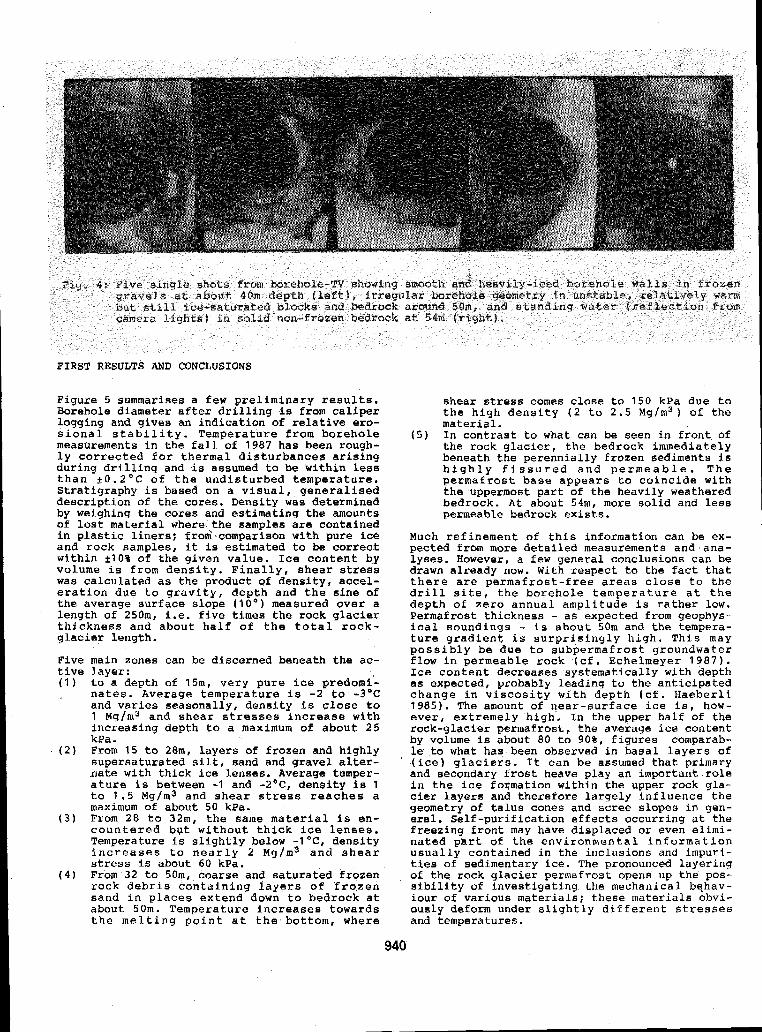
FIRST RESULTS AND CONCLUSIONS
Figure 5 summarises a few preliminary results. Borehole diameter after drilling is from caliper logging and gives an indication of relative ero- sional stability. Temperature from borehole measurements in the fall of 1987 has been rough- ly corrected €or thermal disturbances arising during drilling and i s assumed to be within less than + 0 . Z 0 C of the undisturbed temperature. Stsatigraphy i s based on a visual, generalised description of the cores. Density was determined by weighing the cores and estimating the amounts of lost matesial where the samples are contained in plastic liners; from'.comparison with pure ic& and rock samples, it is estimated to be correct within ? l o % of the given value. Ice content by volume is from density. Finally, shear stress was calculated as the product of density, accel- eration due to gravity, depth and the sine af the average surface slope ( 1 0 ' ) measured over a length of 250m, i.e. five times the rock glacier thickness and about half o f the total rock- glacie? length.
Five main zones can be discerned beneath the ac- tive layer: ( 1 ) to a depth of 15m, very pure ice predomi- . nates. Average temperature is - 2 to -3OC
and varies seasonally, density is close to 1 Mg/m3 and ahear stresses increase with increasing depth to a maximum of about 25 @a.
( 2 ) From 15 to 28m, layers of frozen and highly supersaturated silt, sand and gravel alter- nate with thick ice lenses. Average temper- ature is between -1 and -Z0C, density is 1 to 1.5 Mg/m3 and shear stress reaches a maximum of about 50 kPa.
3 ) From 2 8 to 32m, the same material is en- countered blpt without thick ice lenses. Temperature is slightly below -loC, density increases to nearly 2 M g / m 3 and shear stress is about 60 kPa.
4 ) Fxom 32 to 50m, coarse and saturated' frozen rock debris containing layers o f frozen sand in places extend down to bedrock at about 50m. Temperature increases towards the melting point at the bottom, where
940
shear stress comes close to 150 kea due to the high density ( 2 to 2.5 Mg/m3) of the
(5) In contrast to what can be seen in front of material.
the rock glacier, the bedrock immediately beneath the perennially frozen sediments i s highly fissured and permeable. The permafrost base appears to coincide with the uppermost part of the heavily weathered bedrock. At about 54m, moxe solid and less permeable bedrock exists.
Much refinement of this information can be ex- pected from more detailed measurements and"ana-
drawn already now. With respect to the fact that lyses. However, a few general conclusions can be
there are permafrost-free areas close to the drill site, the borehole temperature at the depth of zero annual amplitude is rather low. Permafrost thickness - as expected from geophys- ical soundings - is about 50m and the tempera- ture gradient is surprisingly high. This may possibly be due to subpermafrost groundwater flow in permeable rock (cf . Echelmeyer 1 9 8 7 ) . Ice content decreases systematically with depth as expected, probably leading to the anticipated change in viscosity with depth (cf. Haeberli 1985) . The amount of near-nurface ice is, how- ever, extremely high. In the upper half of the rock-glacier permafrost, the av.erage ice content by volume is about 80 to 90%, figures comparab- le. to what has been observed in basal layers of (ice) glaciers. It can be assumed that primary and secondary frost heave play an important role in the ice foqmation within the upper rock gla- cier Layers and therefore largely influence the geometry of talus cones and scree slopes in gen- eral. SelE-purification effects occurring at the freezing front may have displaced or even elimi- nated part of the environmental information usually contained in the inclusions and impuri- ties of sedimentary ice. The pronounced layering of the rock glacier permafrost opens up the pos- sibility of investigating the mechanical bqhav-
ously deform under slightly different stresses iour of various materials; these materials obvi-
and temperatures.
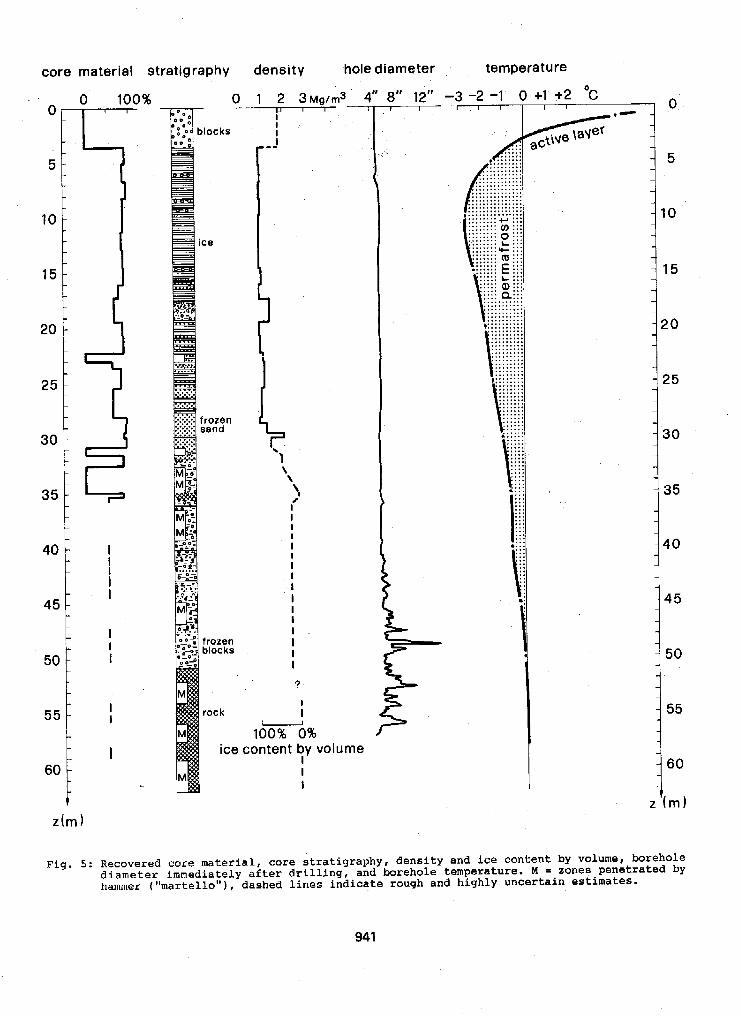
core material stratigraphy density hole diameter temperature
fl 100% *
I I
ice
frozen sand
I i '1 !
frozen blocks
rock
ice
I
\ \i : I I I I I I I I I I I I I I I
?
I - I 100% 0%
content by volume I I I
1
.........
....... ....... ....... ..... ..... ..... ..... ..... \;;; .... at..
L. 1 .: 1
U
I
Fig. 5: Recovered core material, core stratigraphy, density and i c e content by volume, borehole diameter immediately after drilling, and borehole temperature. M = zones penetrated by hammer ("martello"), dashed lines indicate rough and highly uncertain estimates.
941
ACKNOWLEDGEMENTS
The drilling work was carried out by Stump Bohr AG, Ziirich, with substantial cooperation from the Cable Car Company Surlej - Silvaplana - Corvatsch. The project is being supported by a research fund from ETH Ziirich. Bernhard Etter, Paul Gnos, Wernes Nobs, Willy Schmid, Daniel Vonder Miihll and a number of other colleagues helped with the planning of the project and the field work. Pamela Alean edited the English of
Dr. D. Vischer, director of VAW/ETH, for his the manuscript. Special thanks are due to Prof.
constant encouragement and assistance.
REFERENCES
Barsch, D (1973). Refraktionsseismische Bestim- mung der Obergrenze des gefrorenen Schuttksrpers in verschiedenen Block- gletschern Graubiindens, Schweizer Alpen. Zeitschrift fiir Gletscherkunde und Glazialgeologie (9), 1 - 2, 143 - 167.
Barsch, D (1977). Ein Permafrostprofil aus Grau- biinden, Schweizer Alpen. Zeitschrift fiir Geomorphologie NF (211, 79 - 8 6 .
Barsch, D and Hell, G ( 1 9 7 6 ) . Photogrammetrische Bewecpngsmessungen am Blockgletscher Murtel I, Oberengadin, Schweizer Alpen. Zeitschrift fiir Gletscherkunde una Glazialgeologie (11 ) , 2, 1 1 1 - 142.
Echelmeyer, K (1987). Anomalous heat flow and temperatures associated with sub- glacial water flow. IAHS Publication (170), 93 - 104.
Echelmeyer, K and Wang, 2 (1987). Direct obser- vation of basal sliding and deforma- tion of basal drift at subfreezing temperatures. Journal of Glaciology (33), 113, 83 - 98.
Haeberli, W (1 973). Die Basis-Temperatur der winterlichen Schneedecke a l s mtiglicher Indikator fiir die Verbreitung von Per- mafrost in den Alpen. Zeitschrift fiir Gletscherkunde und Glazialgeologie (9), 1 - 2, 221 - 227.
Haeberli, W (1 9 8 5 ) . Creep of mountain perma- frost: internal structure and flow of Alpine rock glaciers. Mitteilungen der Versuchsanstalt fiir Wasserbau , Hydro- logic und Glaziologie der ETH Ziirich (77) I 1 4 2 ~ ~ .
Haynes, FD (1978). Strength and deformation of frozen silt. Third International Con- ference on Permafrost, NRC-Ottawa, ( I ) , 656 - 661.
Hooke, RL, Dahlin, i3B and Kauper, MT (1972). Creep of ice containing dispersed fine sand. Journal of Glaciology (1 1 ) , 63, 327 - 336 .
Keusen, HR and Haeberli, W (1903). Site inveati- gation and foundation design asopects o f cable car construction in Alpine permafrost at the “Chli Matterhorn”, Wallis, Swiss Alps. Fourth Interna- tional Conference on Permafrbst, NAP- Washington, Proc., 601 - 605.
Xing, L, Fisch, W , Haeberli, W and Waechter, HP (1987). Comparison of resistivity and
permafrodt. Zeitschrift fiir Glet- radio-echo soundings on rock glacier
scherkunde und Glazialgeologie (23), 1 , 77 - 97.
Lange, GR (1973). Investigation of sampling per-. ennially frozen allpvial gravel by core drilling. Permafrost Second In- ternational Conference, North American Contribution, NAS-Washington D.C., 535 - 541.
Oeschger, H, Schotterer, U, Stauf fer, B , Haeberli, W and R6thlisberger, H (1978). First results from Alpine core drilling projects. Zeitschrift fiir Gletscherkunde und GlaziaLgeologie (13), 193 - 208.
Olyphant, GA ( 1 983). Computer simulation of rock-glacier development under viscous and pseudoplastic flow. Geological S t i c i e t y of America Bulletin (941, 499 - 505.
Sayles, FB (1 968). Creep of frozen sand. USA CRREL Technical report (190), 54pp.
Shumskii, P A (1964). Principles uf structural
New York, 437pp. glaciology. Transl. D. Ksaus. Dover,
V i t e k , JD and Giardino, JR (2987). A bibliogra- phy on rock glaciers. Oklahoma State Urliversity and Texas A r4r M University, 48pp.
Vyalov, SS (1978). Kinetic theory of deformation of frozen1 soils .. Third International Conference on Permafrost , NRC-Ot tawa , ( I ) , 750 - 755.
Wagenbach, D, Miinnich, KO, Schotterer, U and Oeschger, H (in press). The anthropo- genic impact on snow chemistry at Col- le Cnifetti, Swiss Alps. Annals of Glaciology.
Wahrhaftig, C and Cox , A ( 1959). Rock glaciers in the Alhska Range. Geological Socie- ty of America Bulletin (70) , 3 8 3 - 435,
942
REMOTE SENSING LINEAMENT STUDY IN NORTHWESTERN ALASKA Hump, S.L.1 and N. Loq~nd
Wniversity of Alaska, Fairbanks Wniversity of Mississippi
SYNOPSIS: Landsa t images have p roven va luab le i n mapp ing o f r eg iona l and l oca l l i neamen t s t h a t con t ro l mine ra l occu r rences . An i n v e s t i g a t i o n was conducted oh Landsat MSS image t o e x p l o r e t h e f e a s i b i l i t y o f u s i n g s p a t i a l f i l t e r i n g t e c h n i q u e s for g e o l o g i c a l s t t u c t u r e s t u d i e s i n t h e Red Dog depos i t a r ea . The Red Dog depos i t , l oca t ed i n no r thwes te rn A laska , is one of t h e w o r l d ' s l a r g e s t z i n c d e p o s i t s . T h e t e s t Landsa t image was p r o c e s s e d w i t h a e v e f a l 3 - b y - 3 m a t h e n i a t i c e l f i l t e r s . Examination o f t h e p r b c e s s e d i m a g e s r e v e a l e d t h a t a low-pass f i l t e r enhanced the s u b t l e l i n e a r f e a t u r e s i n t h e a rea bes t . Major l ineaments were t r a c e d on t h e f i l t e r e d image and t h e r e s u l t was c o m p a r e d w i t h e x i s t i n g maps and r epor t s . Not o n l y were t h e mapped s t r u c t u r e s c o m p a r a b l e t o t h e
which had not been documented previously. f i e l d o b s e r v a t i o n s , b u t t h e r e s u l t i n g i n f o r m a t i o n a l s o r e v e a l e d two sets o f m a j o r s t r u c t u r a l t r e n d s
INTRODUCTION REGIONAL GEOLOGY OB STUDY AREA
R e m o t e s e n s i n g t e c h n i q u e s h a v e b e e n w i d e l y u t i l i z e d t o l o c a t e g e o l o g i c a l s t r u c t u r e s a s s o c i a t e d w i t h m a j o r m i n e r a l o c c u r r e n c e s . T h e s e t e c h n i q u e s r e d u c e t h e s i z e o f p o t e n t i a l t a r g e t a r e a s , d e c r e a s e e x p l o r a t i o n c o s t s , a n d f u r t h e r m o r e , i n c r e a s e t h e m i n e r a l d i s c o v e r i e s . The i d e n t i f i c a t i o n o f l i n e a m e n t s on images has an important implicat ion in economic geology. Many min ing d i s t r i c t s o c c u r a l o n g l i n e a r t r e n d s e x t e n d i n g h u n d r e d s o f k i l o m e t e r s i n l e n g t h . W i t h i n t h e m i n e r a l i z e d z o n e s , i n d i v i d u a l m i n e s a r e commonly l o c a l i z e d b y i n t e r s e c t i n g f r a c t u r e s y s t e m s . L a n d s a t imagery is u s e f u l f o r l o c a t i n g b o t h r e g i o n a l s t r u c t u r e a n d l o c a l l i n e a m e n t s .
A l b e r t a n d S t e e l e ( 1 9 7 6 ) d e m o n s t r a t e d t h a t t h e r e was s t r o n g c o r r e l a t i o n b e t w e e n d e n s i t i e s o f l i n e a r s t r u c t u r e s a n d m i n e r a l o c c u r r e n c e s , s u c h a s t h o s e f o u n d i n t h e M c C a r t h y q u a d r a n g l e , w i t h a p p r o x i m a t e l y l p l B m i n e r a l occurrences. Metz (1983) conducted a s t u d y i n t h e i n t e r p r e t a t i o n o f l i n e a r f e a t u r e s o f L a n d s a t c o v e r a g e o f Alaska a n d r a t i o i m a g e a n a l y s i s o f m a j o r m i n e r a l o c c u r r e n c e s t o d e t e r m i n e c h a r a c t e r i s t i c s o f t h e a l t e r a t i o n z o n e s a n d l o c a l s t r u c t u r e s . M e t z c o n c l u d e d t h a t ' r a t i o i m a g e a n a l y s i s c o u l d b e a n e f f e c t i v e method of l o c a t i n g a l t e r a t i o n z o n e s a s s o c i a t e d w i t h m a j o r m i n e r a l o c c u r r e n c e s , h o w e v e r , n o d i s t i n c t i o n b e t w e e n t y p e s o f o r e d e p o s i t s c o u l d b e made.
I n t h i s s t u d y , t h e a u t h o r s a p p l i e d a ser ies of m a t h e m a t i c a l f i l t e r s t o a L a n d s a t m u l t i s p e c t r a l s c a n n e r (MSS) image t o enhance a n d i d e n t i f y g e o l o g i c a l s t ruc tu res i n t h e Red Dog d e p o s i t a r e a . T h e e n h a n c e m e n t m e t h o d s used were o f a s i m p l e , p r a c t i c a l n a t u r e a n d a l l o w e d t h e a u t h o r s t o o b t a i n p r e l i m i n a r y in fo rma t ion on t he l i nea r f ea tu re s wh ich migh t b e r e l a t e d t o m i n e r a l o c c u r r e n c e s .
943
The Red Dog minera l d e p o s i t is l o c a t e d i n n o r t h w e s t e r n A l a s k a (Fig. 1) , a b o u t 9 6 0 km by a i r f r o m A n c h o r a g e , A l a s k a . K o t z e b u e , t h e l a r g e s t v i l l a g e n e a r t h e mine, is l o c a t e d 144 km s o u t h w e s t o f the d e p o s i t . T h e t o p o g r a p h y a r o u n d t h e m i n e c o n s i s t s o f r o l L i n g h i l l s , l e a d i n g i n t o m o u n t a i n s t o t h e n o r t h a n d t h e e a s t . T h e e l e v a t i o n o f t h e m i n e is 305 m a b o v e sea l e v e l a n d t h e a r e a is w i t h i n t h e cont inuous permafros t zone.
T h e p r e s e n t m i n e r e s e r v e is e s t i m a t e d t o b e 77 m i l l i o n metric t o n s a t a g r a d e o f 17.1% zinc, 5 % l e a d a n d 8 2 grams p e r t o n o f s i l v e r . T h e m i n e l i f e is e s t i m a t e d a t n e a r l y 5 0 years ( G i e g e r i c h , 1987) . A t f u l l p r o d u c t i o n , t h i s mine will b e t h e l a r g e s t z i n c m i n e a n d o n e o f t h e l o w e s t c o s t producers i n t h e wes texn world 6
The wes te rn . Brooks Range and ad jacen t a r e a s are d i v i d e d b y M a y f i e l d e t a l . (1983) i n t o
M o u n t a i n s a l l o c h t h o n b e l t ; 2 ) t h e C o l v i l l e f o u r g e o l o g i c p r o v i n c e s : 1) t h e DeLong
b a s i n ; 3 ) t h e S c h w a t k a M o u n t a i n s p r o v i n c e ; and 4) t h e Yukon-Koyukuk province. The DeLong M o u n t a i n s a l l o c h t h o n b e l t c o n s i s t s o f t h e Endicott Mountains, DeLong Mountains, Lisburne h i l l s , a n d n o r t h e r n and w e s t e r n p a r t s o f t h e Baird Mountains. In t h i s p r o v i n c e t h e b e d r o c k is coinposed o f s e d i m e n t a r y a n d , t o a lesser e x t e n t , i g n e o u s t o c k s t h a t r a n g e i n a g e f r o m O r d o v i c i a n t o E a r l y C r e t a c e o u s . T h e r o c k s o c c u r i n a seties o f s t a c k e d t h t u s t s h e e t s , t h e s m a l l e s t d i v i s i o n of a s t r u c t u r a l l e v e l .
T h e t h r u s t s h e e t s t h a t e x i s t i n t h e CleLong M o u n t a i n s a l l o c h t h o n b e l t c o n t a i n p a r t s o f s t r u c t u r a l l y o v e r l a p p i n g s e q u e n c e s . T h e s e s e q u e n c e s a r e compbsed o f s e d i m e n t a r y , m e t a s e d i m e n t a r y a n d / o r i g n e o u s r o c k s . T h i s
Fig . 1. Locat ion O f Red Dog Mineral Deposi t (Gieger ich , 1 9 8 7 ) .
r e g i o n i s t h o u g h t t o m a k e u p a l a r g e s y n c l o n o r i u m w i t h s t r a t a t h a t d i p s o u t h or s o u t h w e s t a l o n g t h e n o r t h f r o n t o f t h e DeLong and Endicot t Mounta ins , and nor th o r northwest a long the southern boundary . Whi le many Eolds h a v e d i v e r s e o r i e n t a t i o n s , m o s t a x e s i n t h e D e L o n g M o u n t a i n s g e n e r a l l y p a r a 1 l e 1 t h e w e s t e r l y or southwes ter ly phys iographic t rend of the mountain range and a re t h o u g h t t o b e a t r i g h t a n g l e s t o t h e p r i n c i p l e t h r u s t d i r e c t i o n .
The d i f f e r e n t i a t e d a l l o c h t h o n s i n t h e DeLong M o u n t a i n s a l l o c h t h o n b e l t i n c l u d e t h e B r o o k s R a n g e a l l o c h t h o n a n d six o t h e r a l l o c h t h o n s . The Red Dog d e p o s i t i s w i t h i n t h e Brooks Range a l l o c t h o n . T h e h o s t r o c k c o n s i s t s o f b l a c k s h a l e , s i l t s t o n e , a n d s c h i s t of t h e E a r l y M i s s i s s i p p i a n t o E a r l y M i d d l e P e n n s y l v a n i a n Kuna f o r m a t i o n ( C u e c k , 1 9 8 3 ) . T h e o r e i s
' f o u n d a s s u l f i d e d i s s e m i n a t i o n s i n t h e h o s t r o c k ; d i s c o r d a n t q u a r t z - r i c h s u l f i d e v e i n s and s t o c k w o r k f i l l i n g s ; m a s s i v e , f i n e g r a i n e d , conformable podi form bodies ; and bar i te ve ins , some of w h i c h c o n t a i n v a r i a b l e amount o f z i n c , l e a d , a n d i r o n s u l f i d e s . T h e m i n e r a l i z e d h o r i z o n i s o v e r l a i n b y r o c k s o f t h e Pennsylvanian t o E a r l y Tr iass ic E t i v l u k Group t h a t c o n s i s t m a i n l y o f u n s i l i c i f i e d g r a y , g r e e n a n d red a r g i l l i t e s i n t e r b e d d e d w i t h r a d i o l a r i a n cher ts a n d t h i n b a r i t e l a y e r s o f t h e Permian Siksikpuk format ion.
IMAGE ANALYSIS METHODOLOGY
Landsat Data
T h e s a t e l l i t e image ( s cene I D 1387-22090) s e n s e d b y L a n d s a t 1 o n Augus t 1 4 , 1973 was o b t a i n e d t o s t u d y t h e r e g i o n a l q e o l o g i c a l s t r u c t u r e s . M u l t i s p e c t r a l s c a n n e r s (MSS) , the p r i m a r y s e n s o r s a b o a r d L a n d s a t s 1 t o 3 , p r o v i d e d a n e n t i r e g r o u n d c o v e r a g e of 185-by- 1 8 5 k m s q u a r e p e r s c e n e w i t h a g r o u n d r e s o l u t i o n of 7 9 m. R e f l e c t a n c e f r o m t h e
"
18 CH 1
12 1 : I . i . PI
I ) K Y
CH 3
1
0 ) . . . . . . . 0 63 i11 191 :
BRIC3HTNESS VALUE
Fig . 2 H i s t o g r a m s o f p i x e l b r i g h t n e s s o f t h e t a r g e t i m a g e a t four s p e c t r a l ranges
t e r r a i n w a s s e p a r a t e d i n t o f o u r s p e c t r a l c h a n n e l s . Band numbers 1 t o 4 d e s i g n a t e d i m a g e s f r o m t h e MSS s y s t e m a n d s e p a r a t e d t h e r e f l e c t a n c e i n s p e c t r a l r a n g e s o f 0.5 t o 0 . 6 m i c r o m e t e r ( g r e e n ) 0 . 6 t o 0.7 micromete r ( r e d ) , 0 . 7 t o 0.8 m i c r o m e t e r ( n e a r I R ) and 0.8 t o 1.1 micrometer (near IR) , r e s p e c t i v e l y . A s u b i m a g e o f 4 0 . 5 - b y - 4 0 . 5 k m s q u a r e co r re spond ing t o a subscene o f 512-by-512 MSS p i x e l s was used i n t h e i n v e s t i g a t i o n .
C o n t r a s t S t r e t c h
Image processing o f t h e s t u d y was performed on a Comta l /3M Vi s ion one /20 image p rocesso r , w i t h a V A X 11/750 a s t h e h o s t c o m p u t e r . ELAS ( E a r t h R e s o u r c e s L a b o r a t o r y A p p l i c a t i o n S o f t w a r e ) , a g e o b a s e d i n f o r m a t i o n c o m p u t e r program package, was used i n con junc t ion w i th t h e C o m t a l p r o c e s s i n g f u n c t i o n s t o e x t r a c t data from Landsat image.
T h e i n i t i a l a t t e m p t w a s t o e n h a n c e t h e c o n t r a s t o f t h e o r i g i n a l L a n d s a t image. Fig. 2 s h o w s t h e s p e c t r a l r a d i a n c e ( b r i g h t n e s s v a l u e ) d i s t r i b u t i o n s o f t h e t a r g e t i m a g e a t f o u r s p e c t r a l r a n g e s . S t a t i s t i c a l d a t a i n d i c a t e d t h a t t h e mean b r i g h t n e s s v a l u e s o f t h e s t u d y i m a g e s r a n g e d b e t w e e n 1 8 and 32. In o r d e r t o p r o d u c e t h e o p t i m u n c o n t r a s t , t h e o r i g i n a l b r i g h t n e s s v a l u e s o f four band images w e r e s t r e t c h e d o v e r t h e e n t i r e r a n g e of 256 g r a y l e v e l s a c c o r d i n g t o t h e n o r m a l d i s t r i b u t i o n c u r v e s . Xn t h e s t u d y a f a l s e c o l o r c o m p o s i t e i m a g e o f t h e Red Dog d e p o s i t a r e a w a s g e n e r a t e d b y c o m b i n i n g b a n d s 1, 2 , and 3 w i t h b lue , g reen , and red a s t h e pr imary c o l o r f o r each corresponding image.
944
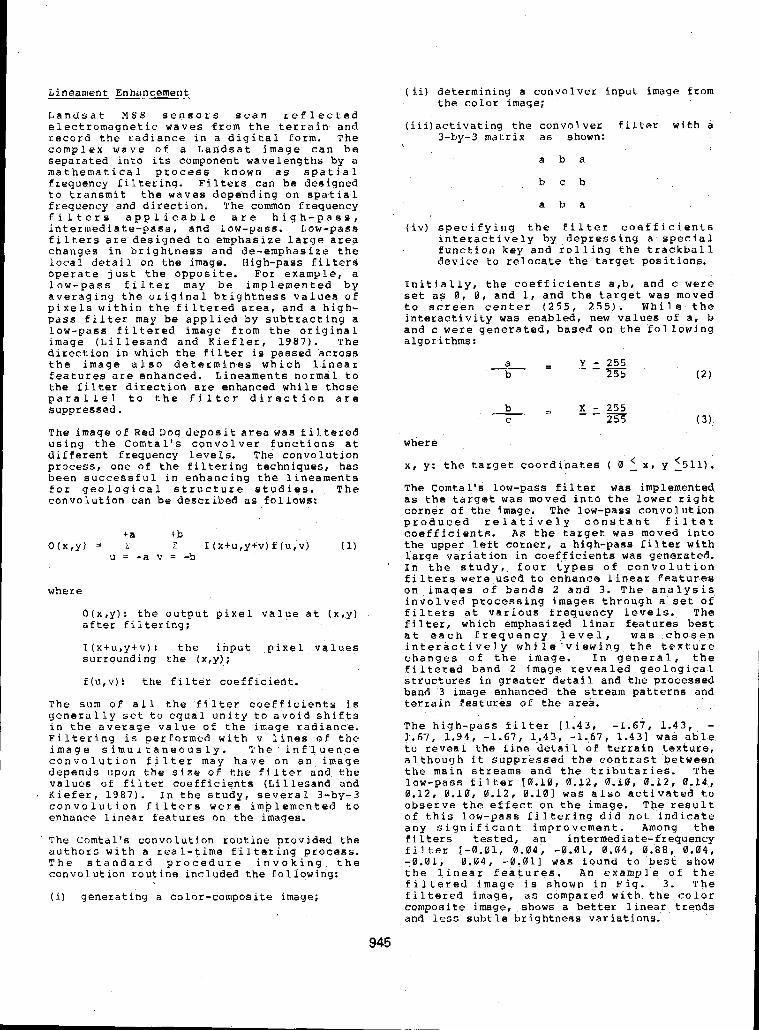
Lineament Enhancement
Landsat M S S sensors scan reflected electromagnetic waves from the terrain and record the radiance in a digital form. The complex wave of a Landsat image can be separated into its component wavelengths by a mathematical process known as spatial frequency filtering. Filters can be designed to transmit the waves depending on spatial frequency and direction. The common frequency f i l t e r s a p p l i c a b l e a r e h i g h - p a s s , intermediate-pass, and low-pass. Low-pass filters are designed to emphasize large area changes in brightness and de-emphasize the local detail on the image. High-pass filters operate just the opposite. For example, a low-pass filter may be implemented b y averaging the original brightness values of pixels within the filtered area, and a high- pass Eilter may be applied by subtracting a
image (Lil lesand and Kiefler, 1987). The low-pass filtered image from the original
direction in which the filter is passed across the image also determines which linear features are enhanced. Lineaments normal to the filter direction are enhanced while those parallel t o the filter direction are suppressed.
The imageof Red Dog deposit areawas filtered using the Comtal's convolver functions at different frequency levels. The convolution process, one of the filtering techniques, has been successful in enhancing the lineaments for geological structure studies. The convolution can be described as follows:
+a +b O ( X , Y ) =c c f I (x+u,ytv)f (u,v) (1)
u = -a v = -b
where
O(x,y): the output pixel value at (x,y) after f i 1 ter ing ;
I(x+u,y+v): the input pixel values surrounding the (x,y),;
f (u, v) : the filter coefficient.
The sum of a1 1 the filter coefficients is generally set to e q u a l unity to avoid shif,ts in the average value of the image radiance. Filtering is performed with v lines o f the image simultaneously. The influence convolution filter may have on an image depends upon the size o f the filter and the values of filter coefficients (Lillesand and Kiefer, 1987). In the study, several 3-by-3 convolution filters were implemented to enhance linear features on the images.
The Comtal's convolution routine provided the authors with a real-time filtering process. The standard procedure invoking the convolution routine included the following:
(i) generating a color-composite image;
945
(ii) determining a convolver input image from the color image;
(iii)activating the convolver filter with a 3-by-3 matrix as shown:
a b a
b c b
a b a
(iv) specifying the filter coefficients interactively by depressing a. special function key and rolling the trackball device to relocate the target positions.
Initially, the coefficients a,b, and c were set as 0, 0, and 1, and the target was moved to screen center (255, 255). While the interactivity was enabled, new values of a, b and c were generated, based on the following algorithms:
a - 1 - 255 b 255 "
where
x , y: the target coordinates ( 0 x, y 5511).
The Comtal's low-pass filter was implemented as the target was moved into the lower right corner of the image. The low-pass convolution produced relatively constant filter coefficients. A s the target was moved into the upper left corner, a high-pass filter with
I n the study, four types o f convolution large variation in coefficients was generated.
filters were used to enhance linear features on images of bands 2 a n d 3. The analysis involved processing images through a set of filters at various frequency levels. The filter, which emphasized linar features best at each frequency level, was chosen interactively while'vi'ewiny the texture changes o f the image. In general, the filtered band 2 image revealed geological structures in greater detail and the processed band 3 image enhanced the stream patterns and terrain features of the area.
The high-pass filter [1.43, -1.67, 1.43, - 1.67, 1.94, -1.67, 1-43, -1.,67, 1.431 was able to reveal the fine detail o f terrain texture, although it suppressed the contrast between the main streams and the tributaries. The low-pass filter 10.10, 0.12, 0.10, 0 . 1 2 , 0.14, 0.12, 0.10, 0.12, 0,101 was also activated t o observe the effect on the image. The result o f this low-pass filtering did n o t indicate any significant improvement. Among the filters tested, an intermediate-frequency filter 1-0.01, 0.04, -0.01, 0.04, 0.88, 0.04, -0.01, 0.04, -0.011 was found to best show the linear features. An example o f the filtered image is shown in Fig. 3 . The filtered image, as compared with the c o l o r composite image, shows a better linear trends and less subtle brightness variations.
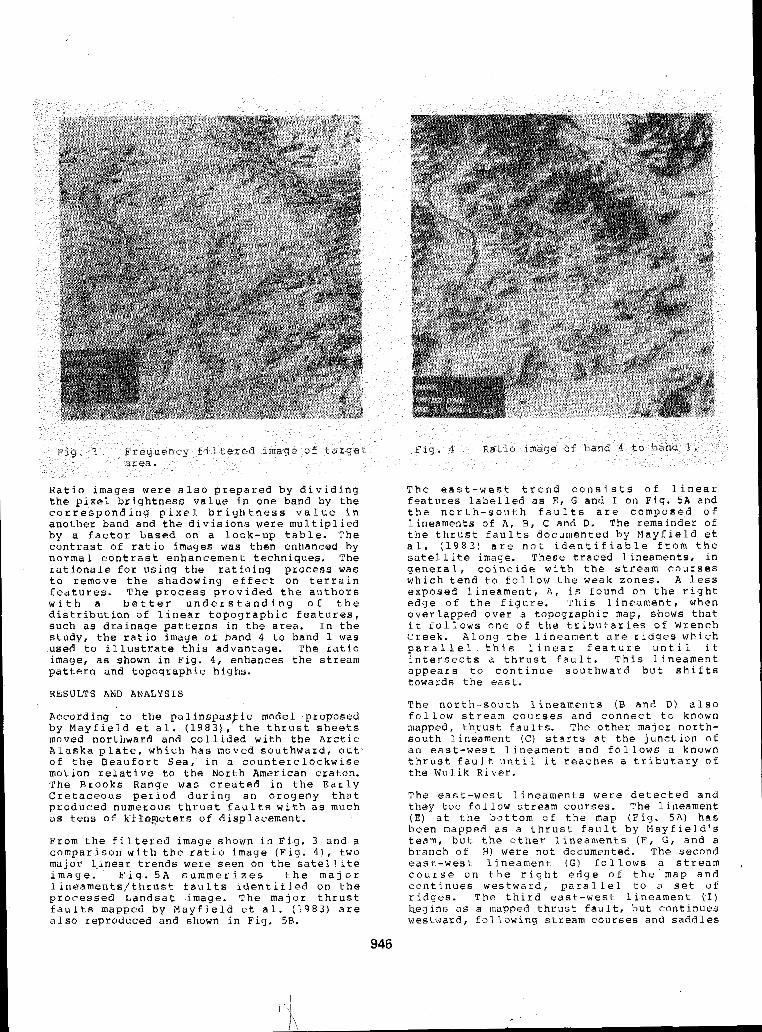
R a t i o i m a g e s were a l s o p r e p a r e d b y d i v i d i n g the p i x e l b r i g h t n e s s v a l u e i n o n e b a n d by t h e c o r r e s p o n d i n g p i x e l b r i g h t n e s s v a l u e i n ano the r band and t he d iv i s ions were m u l t i p l i e d by a f a c t o r b a s e d o n a l o o k - u p t a b l e . The c o n t r a s t o f r a t i o images was then enhanced by no rma l con t r a s t enhancemen t t echn iques . The r a t i o n a l e f o r u s i n g t h e r a t i o i n g p r o c e s s was t o remove t h e s h a d o w i n g e f f e c t o n t e r r a i n f e a t u r e s . T h e p r o c e s s p r o v i d e d t h e a u t h o r s w i t h a b e t t e r u n d e r s t a n d i n g o f t h e d i s t r i b u t i a n of l i n e a r t o p o g r a p h i c f e a t u r e s , s u c h as d r a i n a g e p a t t e r n s i n t h e a r e a . I n t h e s t u d y , t h e r a t i o image o f band 4 t o band 1 was used t o i l l u s t r a t e t h i s a d v a n t a g e . The r a t i o image, a s shown i n Fig. 4 , enhances the s t ream pa t te rn and topographic h ighs .
RESULTS AND ANALYSIS
According t o t h e p a l i n s p a s J i c model proposed b y M a y f i e l d e t a l . ( 1 9 8 3 ) ' t h e t h r u s t s h e e t s moved nor thward and co l l ided w i t h t h e Arct ic A l a s k a p l a t e , w h i c h h a s moved southward , ou t o f t h e B e a u f o r t S e a , i n a c o u n t e r c l o c k w i s e mot ion r e l a t ive t o t he Nor th Amer ican c r a ton . T h e B r o o k s R a n g e w a s c r e a t e d i n t h e E a r l y C r e t a c e o u s p e r i o d d u r i n g a n o r o g e n y t h a t p r o d u c e d n u m e r o u s t h r u s t f a u l t s w i t h a s much a s t e n s o f k ' ihye ters o f d i sp lacement .
From t h e f i l t e r e d image shown i n F i g . 3 and a c o m p a r i s o n w i t h t h e r a t i o image (F ig . 41, two major 1-iriear t r e n d s were s e e n on t h e s a t e l l i t e i m a g e . F i g . 5 A s u m m e r i z e s t h e m a j o r l i n e a m e n t s / t h r u s t f a u l t s i d e n t i f i e d o n t h e p rocessed Landsa t image . T h e major t h r u s t f a u l t s mapped b y M a y f i e l d e t a l . ( 1 9 8 3 ) a r e a l so reproduced and shown in F ig . 5R.
946
T h e e a s t - w e s t t r e n d c o n s i s t s o f l i n e a r f e a t u r e s l a b e l l e d a s E , G and I on F i g . 5 A and t h e n o r t h - s o u t h f a u l t s a r e c o m p o s e d o f l ineaments o f A , B , C and D. The remainder of t h e t h r u s t f a u l t s documented by Mayf ie ld e t a l . ( 1 9 8 3 ) a r e n o t i d e n t i f i a b l e f r o m t h e s a t e l l i t e image. These t r aced l i neamen t s , i n g e n e r a l , c o i n c i d e w i t h t h e s t r e a m c o u r s e s w h i c h t e n d t o f o l l o w t h e weak zones. A l ess e x p o s e d l i n e a m e n t , A, is f o u n d o n t h e r i g h t e d g e o f t h e f i g u r e . T h i s L i n e a m e n t , when ove r l apped ove r a topographic map, shows t h a t i t f o l l o w s o n e o f t h e t r i b u t a r i e s o € Wrench C r e e k . A l o n g t h e l i n e a m e n t a r e r i d g e s w h i c h p a r a l l e l t h i s l i n e a r f e a t u r e u n t i l i t i n t e r s e c t s a t h r u s t f a u l t . T h i s l i n e a m e n t a p p e a r s t o c o n t i n u e s o u t h w a r d b u t s h i f t s towards t h e e a s t .
T h e n o r t h - s o u t h l i n e a m e n t s ( B and D) a l s o f o l l o w s t r e a m c o u r s e s a n d c o n n e c t t o known mapped, t h r u s t f a u l t s . The other major north- south l ineament ( C ) s t a r t s a t t h e j u n c t i o n o f a n e a s t - w e s t l i n e a m e n t a n d follows a known t h r u s t f a u l t u n t i l i t r e a c h e s a t r i b u t a r y o f t h e WuJ i k R i v e r .
T h e e a s t - w e s t l i n e a m e n t s w e r e d e t e c t e d and they t o o fo l low s t r eam cour ses . The l ineament ( E ) a t t h e b o t t o m o f t h e map ( F i g . 5A) has been mapped a s a t h r u s t f a u l t b y M a y f i e l d ' s t e a m , b u t t h e o t h e r l i n e a m e n t s ( F , E , and a branch o f H ) were not documented. The second e a s t - w e s t l i n e a m e n t ( G ) f o l l o w s a s t r e a m , c o u r s e o n t h e r i g h t e d g e o f t h e map a n d c o n t i n u e s w e s t w a r d , p a r a l l e l t o a s e t o f r i d g e s . T h e t h i r d ' e a s t - w e s t l i n e a m e n t (I) h e g i n s a s a mapped t h r u s t f a u l t , b u t c o n t i n u e s westward, fol lowing s t ream courses and s a d d l e s
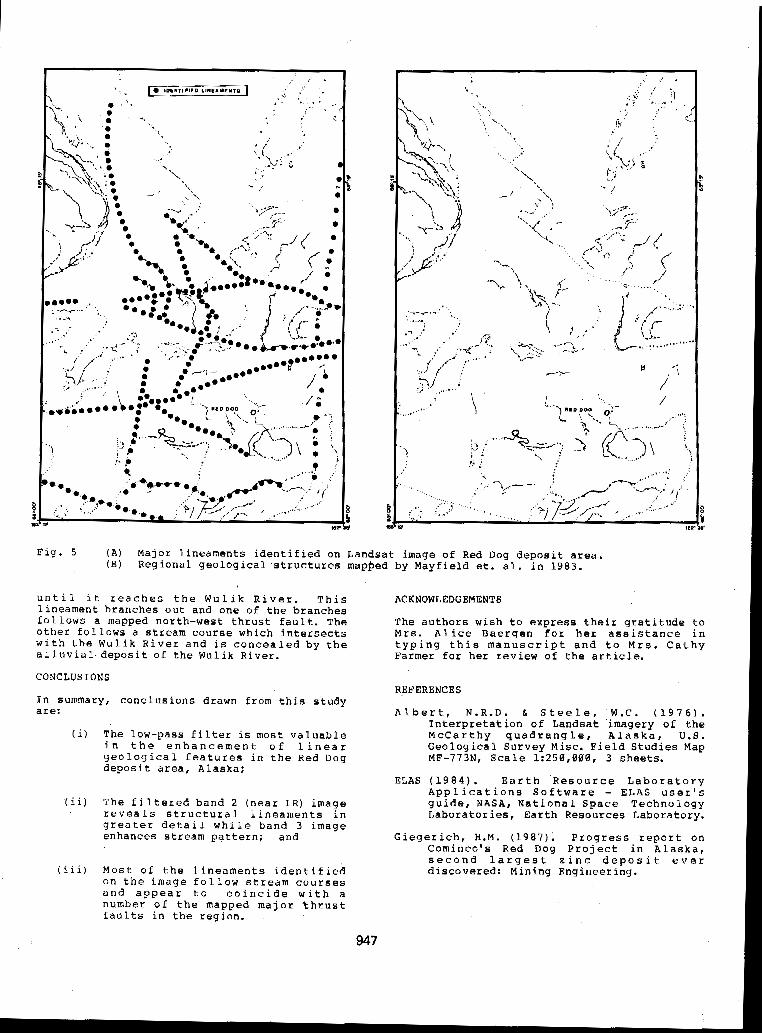
? I
m B
i
II r
Fig. 5 ( A ) Major lineaments identified on Landsat image of Red Dog deposit area. ( B ) Regional geological structures mapeed by Mayfield et. al. in 1983.
until it reaches the Wulik River. This
follows a mapped north-west thrust fault. The lineament branches out and one o f the branches
with the Wulik River and is concealed by the other follows a stream course which intersects
alluvial. deposit of the Wulik River.
CONCLUSIONS
In summary, conclusions drawn from this study are:
( i ) The Low-pass filter is most valuable
geological features in the Red Dog in the enhancement of linear
deposit area, Alaska;
(ii) The filtered band 2 (near IR) image reveals structural lineaments in greater detail while band 3 image enhances stream pattern; and
(iii) Most o f the lineaments identified on the image follow stream courses and appear t o coincide with a number of the mapped major thrust faults in the region.
ACKNOWLEDGEMENTS
The authors wish to express their gratitude to MKS. Alice Baergen f o r her assistance in typing this manuscript and to Mrs. Cathy Farmer for her review of the article.
REFERENCES
Albert, N.R.D. & Steele, W . C . (1976). Interpretation o f Landsat imagery of the
Geological Survey Misc. Field Studies Map McCarthy quadrangle, Alaska, U.S.
MF-773NI Scale 1:250,000, 3 sheets.
ELAS ( 1 9 8 4 ) . Earth Resource Laboratory Applications Software - ELAS user's guide, NASA, National Space Technology Laboratories, Earth Resources Laboratory.
Giegerich, H.M. (1987). Progress report on Cominco's Red Dog Project in Alaska, second largest zinc deposit ever discovered: Mining Engineering.
947
tillesand, T.M. & Kiefer, R.W. (1987). Remote sensing and image interpretation, 721p, John Wiley and Sons, 2nd Edition, N e w York
Lueck, L. (1983). Petrologic and geochemical characterization of the Red Dog and other base-metal sulfide and barite deposits in the DeLong Mountaina, Western Brooks Range, Alaska, in M a s t e r thesis, University o f Alaska.
Mayfield, C.F., Tailleur, I.L., h Ellesiek, I. (1983). Stratigraphy, structure, and palinspastic synthesis of the western Brooks Range, northwestern Alaska. U.S. Geological Survey, Open-File Report OF 83-779.
Metz, P.A. (1983). Landsat linear features and mineral occurrences In Alaska. MIRL Report No. 6 6 , University of Alaska- Fairbanks, Alaska.
,948
THERMAL EVIDENCE FOR AN ACTIVE LAYER ON THE SEABOTTOM OF THE CANADIAN BEAUFORT SEA SHELF
J.A. Hunter, H.A. MacAulay, S.E. Pullan. R.M. GagnC, R.A. Burns and BL. Good
Geological Survey of Canada, 601 Booth Street, Ottawa, Ontario, Canada, K1A O M
SYNOPSIS Thick permafrost occurs widely beneath the Canadian Beaufort Sea continental shelf. Over much of the seafloor, the water temperatures are below O O C . However, in nearshore regions, out to 25 km offshore, seasonal changes in water temperatures occur due to variations in the Mackenzie River outflow. During summer months, warm river water (above O°C) flows on to' the shelf and i s in contact with the bottom t o water depths of up to 20 m. During winter months, the flow is reduced and the effects of the upwelling of Arctic seawater (below O ° C > on the shelf can be observed in water depths as shallow as 2 m. An active layer at the seabottom is produced by these seasonal changes and the thermal effects reach beyond 10 m sub-bottom. Between 1977 and 1986, six regional temperature profiles were compiled from the readings of thermistor cables installed in 80 drill-holes on the Beaufort shelf. These data, whioh were obtained at the end of the winter period, showed the previous summer's warming effect to be at a depth of 7 to 10 m below bottom, with the thermal anomalies attenuating seaward. At one additional shoreline site, both summer and winter sub-seabottom temperature profiles show large Seasonally reversing thermal gradients of up to 2OC per metre within the first kilometre offshore. The Dresence of an active laver should be a consideration in seabottom engineering design in a permafrost regime.
INTRODUCTION
The Canadian Beaufort Sea continental shelf has recently become an area of intense oil exploration activity. Sufficient oil reserves have been established to warrant consideration of plans for future development from offshore wells. Designs for well completions and pipelines are not without technical difficulties due to the presence of ice- bearing permafrost at shallow depths.
The Beaufort Sea shelf is relatively shallow, extending 120 km offshore to a shelf break between 90 and 110 m water depth. Since the shelf was thought not to have been glaciated during the late stage Pleistocene ice advance, Mackay (1972) suggested that extensive permafrost could have accreted beneath the seafloor which, because of sea-level lowerin was exposed as dry land. Hunter et al. ( 197 f : 1978) provided geophysical evidence that indicated the widespread occurrence of ice- bearing permafrost under the Canadian Beaufort Sea shelf, and this has been subsequently confirmed by industry drilling (O'Connor, 1984). Taylor and Allen ( 1987) have shown, from seabottom temperature measurements deaward of the 25 m isobath, that permafrost conditions presently occur at the seabed over almost the entire outer shelf zone, where the measured seabottom temperatures range from -0.41 to -1.92'C.
The heat transport of the Mackenzie River has a strong influence on the inshore water temperatures on the Canadian Beaufort shelf (Fig. I ) , and this in turn affects the
distribution of offshore permafrost (Mackay and Mackay, 1974) . The Mackenzie factor makes the configuration and thermal history of sub-
different from that of offshore permafrost seabottom permafrost in this region very
beneath the Alaskan Beaufort Sea shelf (e.g. Swift et al., 1983). This present study
River discharge as it affects the nearshore focusses on the influence of the Mackenzie
water depths o f 20 m. Studies of this nature sub-seabottom permafrost configuration out t o
may be a necessary consideration in designing nearshore pipeline approaches and shoreline crossings.
The Mackenzie River discharge has a strongly seasonal character. Figure 2 is a generalized flow-rate curve based on an average of four years (1980-1983) observations at Arctic Red River, which is at the apex of the Mackenzie Delta ( e . g . Environment Canada, 1982). Characteristically, an abrupt increase in discharge rate occurs in late May or early June, when flow rates can reach ten times that of the winter low. The rate drops off rapidly to about half its maximum during June, and then decreases uniformly throughout the summer. By the end of November the Mackenzie discharge is back to its low winter value. Although no discharge records are available at the mouths of any of the delta channels, it is suggested that the discharge at the seacoast follows the general trend of the curve shown in Figure 2 , with perhaps a time delay of' some days.
Between 1977 and 1986, a series of end-of- winter temperature measurements of both
949
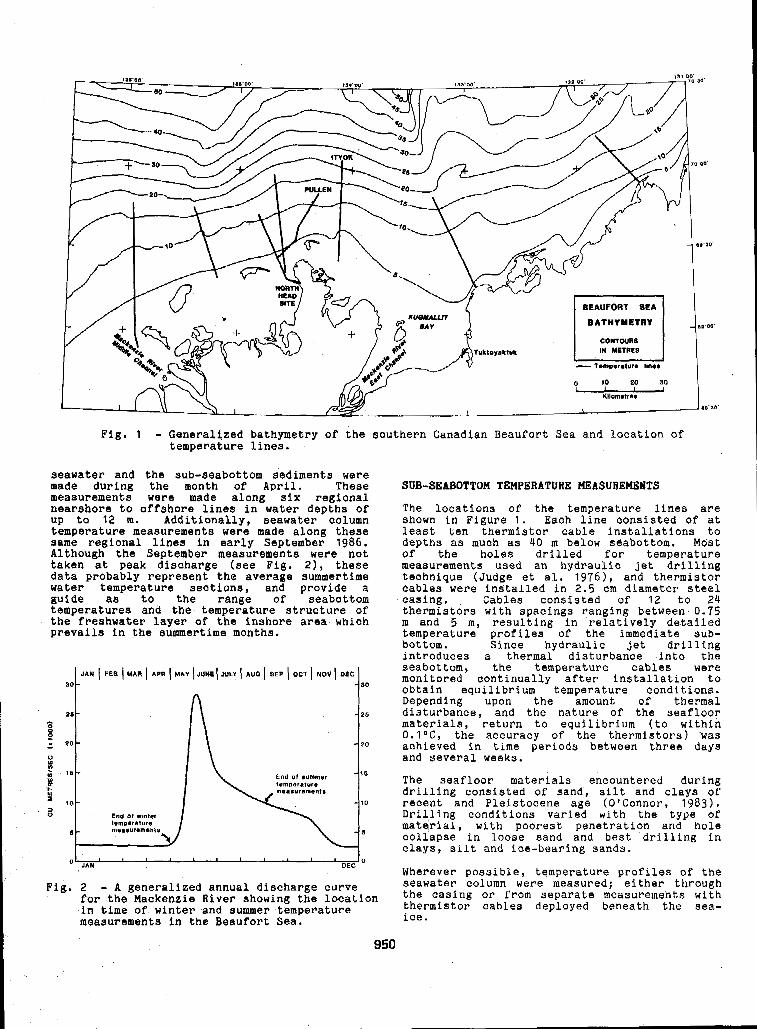
Fig . 1 - Generalized bathymetry of the southern Canadian Beaufort Sea and location of temperature lines.
seawater and the sub-seabottom sediments were made during the month of April. These measurements were made along six regional nearshore to offshore lines in water depths of up to 12 m. Additionally, seawater column temperature measurements were made along these same regional lines in early September 1986. Although the September measurements were not taken at peak discharge (see Fig. 21, these data probably represent the average summertime water temperature sections, and provide a guide as to the range of seabottom temperatures and the temperature structure of the freshwater layer of the inshore area which prevails in the summertime months.
Fig. 2 - A generalized annual discharge curve for the Mackenzie River showing the location in time of' winter and summer temperature measurements i n the Beaufort Sea.
SUB-SEABOTTOM TEMPERATURE MEASUREMENTS
The locations of the temperature lines are shown in Figure 1. Each line consisted o f at least ten thermistor cable installations to depths as much as 40 rn below seabottom. Most Of the holes drilled for temperature measurements used an hydraulic Jet drilling technique (Judge et al. 19761, and thermistor cables were installed in 2.5 cm diameter steel casing. Cables consisted of 12 to 24 thermistors with spacings ranging between 0.75 m and 5 m, resulting in relatively detailed temperature profiles o f the immediate sub- bottom. Since hydraulic jet drilling introduces a thermal disturbance into the
monitored continually after installation to seabottom, the temperature cables were
obtain equilibrium temperature conditions. Depending upon the amount of thermal disturbance, and the nature of the seafloor materials, return to equilibrium ( t o within Q.IoC, the accuracy of the thermistors) 'was achieved in time periods between three days and several weeks.
The seafloor materials encountered during drilling consisted o f sand, silt and clays of recent and Pleistocene age (O'Connor, 1983) . Drilling conditions varied with the type of material, with poorest penetration and hole collapse in loose sand and best drilling in clays, silt and ice-bearing sands.
Wherever possible, temperature profiles of the seawater column were measured; either through the casing or from separate measurements with thermistor cables deployed beneath the sea- ice.
950
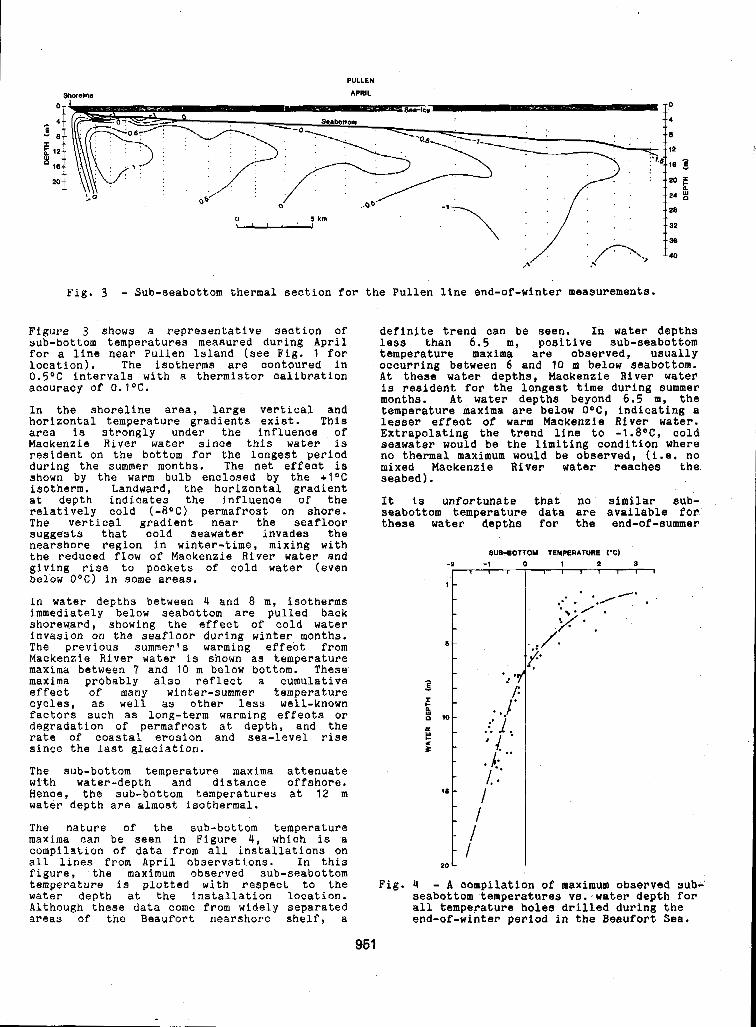
Fig. 3 - Sub-seabottom thermal section for the Pullen line end-of-winter measurements.
Figure 3 shows a representative section of sub-bottom temperatures measured during April for a line near Pullen Island (see Fig. 1 for location). The isotherms are contoured in 0.5OC intervals with a thermistor calibration accuracy of 0 . 1 O C .
In the shoreline area, Large vertical and horizontal temperature gradients exist. This area is strongly under the influence of Mackenzie River water since this water is resident on the bottom for the longest period during the summer months. The net effect is shown by the warm bulb enclosed by the 4 I 0 C isotherm. Landward, the horizontal gradient at depth indicates the influence of the relatively cold (-8OC) permafrost on shore. The vertical gradient near the seafloor suggests that cold seawater invades the nearshore region in winter-time, mixing with the reduced flow of Mackenzie River water and giving r ise to pockets of cold water (even below OOC) in some areas.
In water depths between 4 and 8 m, isotherms immediately below seabottom are pulled back shoreward, showing the effect of cold water i n v a s i o n on the seafloor during winter months. The previous summer's warming effect from Mackenzie River water i s shown as temperature maxima between 7 and 10 m below bottom. These maxima probably also reflect a cumulative effect of many winter-summer temperature cycles, as well as other less well-known factors such as long-term warming effects or degradation of permafrost at depth, and the rate of coastal erosion and sea-level rise since the last glaciation.
The sub-bottom temperature maxima attenuate with water-depth and distance offshore. Hence, the sub-bottom temperatures at 12 m water depth are almost isothermal.
The nature of the sub-bottom temperature maxima can be seen in Figure 4, which is a compilation of data from all installations on all lines from April observations. In this figure, the maximum observed sub-seabottom
water depth at the installation location. temperature is plotted with respect to the
Although these data come from widely separated areas of the Beaufort nearshore shelf, a
95 1
definite trend can be seen. In water depths less than 6.5 m, positive sub-seabottom temperature maxima are obaerved, usually occurring between 6 and 10 m below seabottom. At these water depths, Mackenzie River water
months. At water depths beyond 6.5 m, the is resident for the longest time during summer
lesser effect o f warm Mackenzie River water. temperature maxima are below Q O C , indicating a
Extrapolating the trend line to -1 .8OC, cold seawater would be the limiting condition where no thermal maximum would be observed , (i .e. no mixed Mackenzie River water reaches the seabed).
It is unfortunate that no similar aub- seabottom temperature data are available for these water depths for the end-of-summer
SUB-BOTTOM TEMPERATURE PC) -8 -1 0 1 P S
1 " ' l " " " ' ' t I
I ..' : .
Fig. 4 - A compilation of maximum observed sub- seabottom temperatures vs. water depth for all temperature holes drilled during the end-of-winter period in the Beaufort Sea,
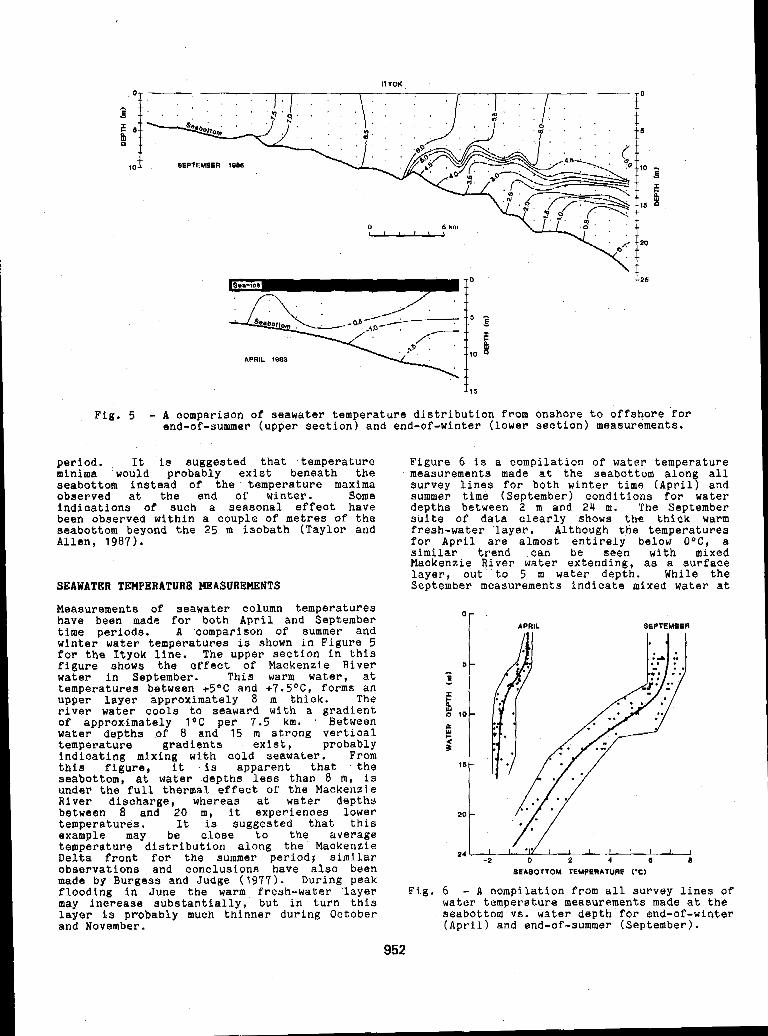
ITYOK
Fig, 5 - A comparison of seawater temperature distribution from onshore to offshore for end-of-summer (upper section) and end-of-winter (lower section) measurements.
period. It is suggested that temperature minima would probably exist beneath the seabottom instead of the temperature maxima observed at the end of winter. indications of such a seasonal effect have
Some
been observed within a couple of metres of the
SEAWATER TEMPERATURE HEASURGMENTS
Measurements of seawater column temperatures have been made for both April and September time periods. A comparison of summer and winter water temperatures is shown in Figure 5 for the Ityok line, The upper section in this figure shows the affect of Mackenzie River water in September. This warm water, at temperatures between + 5 O C and + 7 . 5 a C , forms an upper layer approximately 8 m thick. The river water cools to seaward with a gradient of approximately l a c per 7.5 km. Between water depths o f 8 and 15 m strong vertical temperature gradients exist, probably indicating mixing with cold seawater. From this figure, it is apparent that the seabottom, at water depths less than 8 m, is under the full thermal effect o f the Mackenzie River discharge, whereas at water depths between 8 and 20 m, it experiences lower temperatures. It i s suggested that this example may be close to the average temperature distribution along the Mackenzie Delta front for the summer period; similar
made by Burgess and Judge ( 1 9 7 7 ) . During peak observations and conclusions have also been
flooding in June the warm fresh-water layer may inereaae substantially, but in turn this layer i s probably much thinner during October and November.
952
Figure 6 i s a compilation of water temperature measurements made at the seabottom along all survey lines for both winter time (April) and summer time (September) conditions for water depths between 2 m and 24 m. The September suite o f data clearly shows the thick warm fresh-water layer. Although the temperatures for April are almost entirely below O ° C , a similar trend .can be seen with mixed Mackenzie River water extending, as a surface layer, out to 5 m Water depth. While the September measurements indicate mixed water at
SEPTEMBER
-2 0 2 4 I SEAEOTTOM TEMPERATURE ( ‘C)
Fig. 6 - A compilation from all survey lines of water temperature measurements made at the seabottom vs. water depth for end-of-winter (April) and end-of-summer (September).
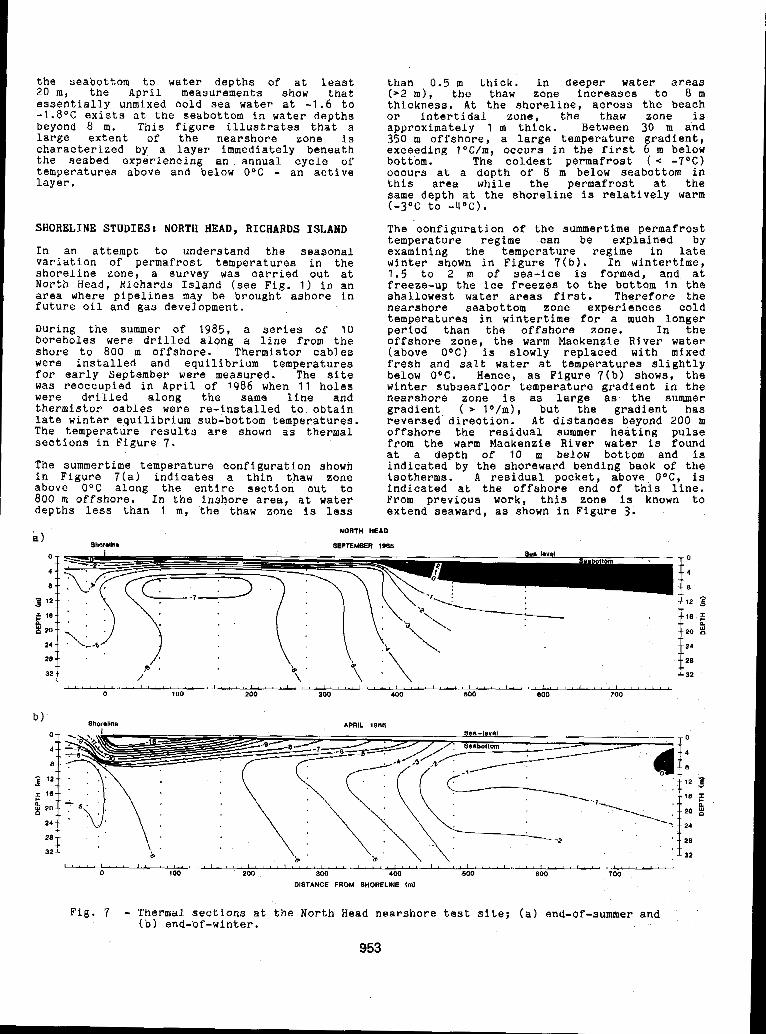
the seabottom to. water depths of at least 20 m, the April measurements show that essentially unmixed cold sea water at -1.6 to -1.8OC exists at the seabottom in water depths beyond 8 m. This figure illustrates that a large extent of the nearshore zone is characterized by a layer immediately beneath the seabed experiencing an annual cycle o f temperatures above and below O°C - an active layer.
SHORELINE STUDIES: NORTH HEAD, RICHARDS ISLAND
In an attempt to understand the seasonal variation of permafrost temperatures in the
North Head, Richards Island (see Fig, 1) in an shoreline zone, a survey was carried out at
area where pipelines may be brought ashore in future oil and gas development.
During the summer of 1985, a series of 10 boreholes were drilled along a line from the shore to 000 m offshore. Thermistor cables were installed and equilibrium temperatures f o r early September were measured. The site was reoccupied in April of 1986 when 1 1 holes were d,rilled along the same line and thermistor cables were re-installed to obtain late winter equilibrium sub-bottom temperatures. The temperature results are shown as thermal sections in Figure 7. The summertime temperature configuration shown in Figure 7 ( a ) indicates a thin thaw zone above O°C along the entire section out to 800 m offshore. In the inshore area, at water depths less than 1 m, the thaw zone is less
than 0.5 m thick. In deeper water areas (r2 m), the thaw zone increases to 8 m thickness. At the shoreline, across the beach or intertidal zone, the thaw zone is approximately 1 m thick. Between 30 m and
exceeding 1°C/m, occurs in the first 6 m below 350 m offshore, a large temperature gradient,
bottom. The coldest permafrost ( < -7OC) occurs at a depth of 8 m below seabottom in this area while the permafrost at the same depth at the shoreline is relatively warm ( - 3 O C to -4OC).
The configuration of the summertime permafrost temperature regime can be explained by
winter shown in Figure 7(b). In wintertime, examining the temperature regime in late
1 . 5 to 2 m of sea-ice is formed, and at freeze-up the ice freezes to the bottom in the shallowest water areas first. Th8refOre the nearshore seabottom zone experiences cold
period than the offshore zone. temperatures in wintertime for a much Longer
In the offshore zone, the warm Mackenzie River water (above O ° C ) is slowly replaced with mixed fresh and salt water at temperatures slightly below O ° C . Hence, as Figure 7(b) shows, the winter subseafloor temperature gradient in the nearshore zone is as large as the summer gradient ( t 1°/m), but the gradient has reversed direction. At distances beyond 200 m offshore the residual summer heating pulse
at a depth of 10 m below bottom and is from the warm Mackenzie River water is found
indicated by the shoreward bending back of the isotherms. A residual pocket, above, O ° C , is indicated at the offshore end of this line. From previous work, this zone is known to extend seaward, as shown in Figure 3 .
"i 32 , :.6:, , , , / I , , P ' , , , ,:, , , , , , , , y,: lp' \ , , , , , ' \ , ,?\, \ , , , , I , , , , , , , , j , , , , ( , , , , , , , , ,
A 100 200 aoo 400 600 eo0 roo
b) lhorallns APRIL 1908
1 1 1 1 1 1 ~ 1 1 , 1 1 1 1 , 1 . . 1 , 1 , , , , 1 , , , , 1 1 , , . 1 1 , , . l . , r , l , , , l l , , l l l , . . , I . I I , I . I I , ~ . ~ , , ~ , , , . ~ . . ,
0 100 200 500 400 500 800 700
DISTANCE FROM SHORELINE (m)
Fig. 7 - Thermal sections at the North Head nearshore test site; (a) end-of-summer and ( b ) end-.of -winter.
953
In Figure 7 it can be seen that the shoreline permafrost temperatures at depths below 8 m are warmer than those occurring in the nearshore. The shoreline beach and cliff areas characteristically are covered by thick drifts of snow ( ' 2 m in places) which act as a thermal blanket. This effect is clearly seen in the horizontal gradients at shallow depths which occur across the shoreline area.
Terrain geological studies i n these, areas have indicated that this particular test site has a relatively stable coastline; that i s , no measurable coastal erosion has taken place in the last 30 years (Dallimore et al., 1988). Hence, the thermal effects shown in the nearshore sub-seabottom are probably not indicative of relict permafrost. The major factor appears to be the relatively broad inshore zone of shallow water that freezes to the bottom early in the winter season. This area has the thinnest thaw layer in summer and the largest vertical thermal gradi-ents. It is interesting to speculate on the origin of this zone - do frost heave and ice-lense formation contribute substantially to the development of the shallow water zone? Such a question can be answered only by further detailed studies of ice content and soil type in the first 8 m below seabottom.
'It is thought that similar winter and summer conditions prevail in many areas of the Beaufort sea coast where stable shorelines exist. Hence, pipeline landfall designs which interact with, or may. cause to change, *existing permafrost condltions, must consider horizontal temperature gradients exceeding 1 5 O per kilometre and seasonally reversing vertical seabottom gradients exceeding I0C/m.
S W A R Y
The seafloor of the nearshore Canadian Beaufort Sea i s subjected to annual temperature cycles above and below O°C as a result of the fluctuating warm freshwater levels of the Mackenzie River. The resulting temperature distribution in the sub-bottom
which extends out to the 20 m isobath. This indicates an "active layer" above permafrost
active layer effect is most pronounced in shallow water areas and attenuates seaward.
At the coastline, where seawater freezes to bottom in winter, large temperature gradients are developed in the immediate seabottom. During summer months the gradients are reversed. Both summer and winter gradients may be in excess of l0C per metre.
Construction engineering of bottom-founded structures and pipelines should consider the widespread occurrence of the sub-seabottom active zone.
REFERENCES
Burgess, M. and Judge, A.S . (1977) . Thermal observations conducted as part of Beaufort Delta Oil Project Limited's sampling cruise on the M.S. Norwerta, Beaufort Sea, 1976. Geothermal Service of Canada, Earth Physics Branch, Internal Report 77-1.
Dallimore, S.R., Kurfurst, P.J. and Hunter, J.A.M. (1988). Geotechnical and geothermal conditions of nearshore sediments, Southern Beaufort Sea, Northwest Territories, Canada. % Proceedings, Fifth International Conference on Permafrost, Aug. 2-5, 1988, Trondheirn, Norway.
Environment Canada. (1982) . Sediment data, Canadian rivers 1980. Inland Water Directorate, Water Survey of Canada, 167- 168.
Hunter, J.A., Judge, A.S., MacAulay, H.A., Good, R.L., Gagnk, R.M. and Burns, R . A . (1976). Permafrost and frozen sub-bottom materials in the Southern Beaufort Sea. Beaufort Sea Project, Technical Report No. 22, Dept. Environment Canada, 174 pp.
Hunter , J .A. , Neave, K.G., MacAulay, H.A. and Hobson, G.D. (1978). Interpretation of sub-seabottom permafrost in the Beaufort Sea by seismic methods. Part I. Seismic refraction methods. in Proceedings, Third International Conference on Permafrost, July 10-13, 1978, Edmonton, Alberta, Canada, 514-520.
Judge, A.S., MacAulay, H.A. and Hunter, J.A. (1976). An application of hydraulic jet drilling techniques to mapping of sub- seabottom permafrost. Geological Survey of Canada, Paper 76-1C, 75-78.
Mackay, J.R. ( 1 9 7 2 ) . Offshore permafrost and ground ice, Southern Beaufort Sea, Canada. Canadian Journal of Earth Sciences, 9, 1550-1561.
Mackay, D.K. and Mackay, J.R. (1974) . Heat energy of the .Mackenzie River. Further Hydrologic Studies in the Mackenzie Valley, Dept. Environment Canada, Environmental-Social Program, Northern Pipelines, Report 74-35, 1-24.
O'Connor, M.J. (1983). Development of a proposed model to account for the surficial geology of the Southern Beaufort
File 954, 128 pp. Sea. Geological Survey of Canada, Open
"-""* ( 1984) . Distribution and occurrence of frozen sub-seabottom sediments: A comparison of geotechnical and shallow seismic evidence from the Canadian Beaufort Sea. Report prepared for the Geological Survey of Canada, 106 pp.
Swift, D.W., Harrison, W.D. and Osterkarnp, T.E. ( 1 9 8 3 ) . Heat and salt transport processes in thawing subsea permafrost at Prudhoe Bay, Alaska. &I Proceedings, Fourth International Conference on Permafrost, July 17-22, 1983, Fairbanks, Alaska, 1221-1226.
Taylor, A.E. and Allen, V. ( 1 9 8 7 ) . Shallow sediment temperature perturbations and sediment thermal conductivities, Canadian Beaufort Shelf. Canadian Journal of Earth Sciences, 24, 2223-2234.
954
FOUNDATION CONSIDERATIONS FOR SITING AND DESIGNING THE RED DOG MINE MILL FACILITIES ON PERMAFROST
T.G. Knewinski', T.A. Hammer2 and G.G. Booth3
'Lakehead Testing Laboratory, Duluth, MN 2Dames & Moore, Portland, OR
3Cominco Alaska, Anchorage, AK
SY N O P S I S T h e R e d D o g M i n e ( z i n c / l e a d ) p r o j e c t i s b e i n g a d v a n c e d b y C o m i n c o A l a s k a I n c o r p o r a t e d ( C A I ) a n d c o n s t r u c t i o n a t t h e m i n e s i t e b e g a n i n t h e w i n t e r o f 1 9 8 8 . T h e mill f a c i l i t y f o r p r o c e s s - i n g t h e o r e i n t o c o n c e n t r a t e will b e l o c a t e d a d j a c e n t t o t h e o p e n p i t m i n e on r e l a t i v e l y w a r m p e r m a - f r o s t s o i l a n d r o c k . T h i s p a p e r will s u m m a r i z e t h e s i t e c h a r a c t e r i s t i c s a n d d e s c r i b e t h e a n a l y t i c a l a n d d e s i q n t e c h n i q u e s u t i l i z e d t o f o u n d t h e v a r i o u s c o m p o n e n t s o f t h e mill f a c i l i t y . T h e m o r e s e n s i - t i v e f a c i l i t i e s will b e m o n i t o r e d d u r i n g t h e e a r l y s c h e m e s s e l e c t e d a r e p e r f o r m i n g a s d e s i g n e d .
INTRODUCTION
D e v e l o o m e n t o f t h e R e d D o a M i n e will r e a u i r e a t a i 1 ings dam,
d i t c h e s . T h e a r e a s f o r was
c a t e d a t L o n g 6 7 " 6 6 ' n o r t h t h e s u m m e r s o 1987, Dames & i n v e s t i g a t i o n f o r t h e s e f a c g e o t e c h n i c a l
t
i
f
S i i
w a t e r s u p p l y dam, mill s i t e , dump e fill a n d a s e r i e s o f d i v e r s i o n m i n e a n d mill f a c i l i t i e s a r e l o - t u d e 1 6 2 ' 5 8 ' w e s t a n d L a t i t u d e i n n o r t h w e s t e r n A l a s k a . D u r i n g
M o o r e c a r r i e d o u t g e o t e c h n i c a l
l i t i e s . T h i s p a p e r s u m m a r i z e s t h e n v e s t i g a t i o n s c o n d u c t e d t o e x p l o r e
1 9 8 4 a n d 1 9 8 5 , a n d t h e w i n t e r o f
a t t h e s i t e s a n d s i t e a l t e r n a t i v e s
f o u n d a t i o n a n d t h e r m a l c o n d i t i o n s a t t h e mill s i t e l o c a t i o n a n d p r o v i d e s t h e f o u n d a t i o n d e s i g n c o n c e p t s d e v e l o p e d t o s u p p o r t t h e mill f a c i l i - t i e s . T h e g e o t e c h n i c a l i n v e s t i g a t i o n s c a r r i e d o u t a r e d e t a i l e d i n a p r e v i o u s p a p e r b y t h e a u t h o r ( K r e z e w i n s k i , S t a n l e y & M o o r e , 1 9 8 6 ) .
T h e i n v e s t i g a t i o n s w e r e c o n d u c t e d d u r i n g f i v e
c o n d u c t e d b e t w e e n J u n e 1 9 a n d J u n e 3 0 , 1 9 8 4 , t h e s e p a r a t e f i e l d e x p l o r a t i o n s , t h e f i r s t b e i n g
s e c o n d b e t w e e n A u g u s t 1 0 a n d S e p t e m b e r 2, 1 9 8 4 , t h e t h i r d b e t w e e n A u g u s t 7 a n d A u g u s t 1 6 , 1 9 8 5 , t h e f o u r t h o n S e p t e m b e r 1 9 , 1 9 8 5 , a n d t h e l a s t b e i n g c o n d u c t e d b e t w e e n M a r c h 2 5 a n d A p r i l 1 , 1 9 8 7 . T w e n t y - n i n e b o r i n g s w e r e d r i l l e d i n t h e v i c i n i t y o f t h e mill s i t e . F i g u r e 1 i s a S i t e P l a n o,f t h e Mill S i t e w h i c h s h o w s t h e l o c a t i o n s o f t h e s e b o r i n g s . T h e b o r e h o l e s w e r e a u g e r e d a n d / o r c o r e d t o d e p t h s r a n g i n g f r o m 8 t o 1 1 3 f e e t ( 3 t o 3 8 m e t e r s ) f o r t h e p u r p o s e o f l o g g i n g s u b - s u r f a c e s o i l a n d t h e r m a l c o n d i t i o n s a n d o b t a i n i n g u n d i s t u r b e d s o i l a n d r o c k s a m p l e s f o r i d e n t i f i c a - t i o n a n d l a b o r a t o r y t e s t i n g .
PROJECT DESCRIPT
A t o t a l o f 2 5 b u h a v e b e e n i d e n t i t u r e s t o b e c o n s
I O N
i l d i n q s a n d s u p p o r t f a c i f i e d h t r u c t e
t h e l o c a t i o n s s h o w n o n i n c l u d e o r e p r o c e s s i n g p r o c e s s w a t e r t r e a t m e n
l i t i e s
y e a r s o f o p e r a t i o n s t o v e r i f y t h a t t h e f o u n d a t i o n
f u e l s t o r a g e , a p o w e r p l a n t , r o a d s , r e t a i n i n g w a l l s a n d v a r i o u s o t h e r s u p p o r t f a c i l i t i e s . P r i o r t o c o n s t r u s i t e will b e e x c i n g f r o m 9 6 7 t o
m o s t o f t h e f a c i v a t i o n s s h o w n o n
e v e r , s e v e r a l o f a b o v e b e d r o c k on d e s i g n c o n d i t i o n a d e q u a t e f o u n d a t
S i
t i o n o f f a c i l i t i e s , t h e mill v a t e d d o w n t o e l e v a t i o n s r a n g - 8 5 f e e t ( o r i g i n a l g r o u n d e l e - F i g u r e 1 ) . T h i s will p l a c e i t i e s d i r e c t l y on b e d r o c k . H o w - t h e f a c i l i t i e s will b e l o c a t e d o v e r b u r d e n s o i l s a n d s p e c i a l will b e r e q u i r e d t o e n s u r e
o n p e r f o r m a n c e ,
F I E L D W O R K
T h e f i e l d p r o g r a m u t i l i z e d C e n t r a l M i n e E q u i p - m e n t C o m p a n y (CME) - 5 5 d r i l l r i g s w h i c h w e r e t r a n s p o r t e d t o t h e v a r i o u s d r i l l s i t e s b y a B e l l 2 0 5 h e l i c o p t e r . T h e CME-55's w e r e e q u i p p e d w i t h b o t h h o l l o w s t e m a u g e r f o r , d r i l l i n g a n d d r i v e s a m p l i n g o v e r b u r d e n s o i l s a n d w i r e - l i n - e d i a m o n d c o r e d r i l l i n g e q u i p m e n t w i t h a n o p t i o n a l r e f r i g - e r a t e d d r i l l i n g - f l u i d u n i t f o r c o r i n g p e r m a f r o s t a n d m a i n t a i n i n g t h e c o r e i n a f r o z e n s t a t e .
N i n e o f t h e t w e n t y - n i n e h o l e s w e r e d r i l l e d u t i l i z i n g r e f r i g e r a t e d c o r i n g t e c h n i q u e s . I n i c e - r i c h a n d i c e - b o n d e d p e r m a f r o s t z o n e s , t h e o n l y w a y t o r e t r i e v e u n d i s t u r b e d c o r e s a m p l e s m a i n t a i n e d a t t h e i r i n - s i t u d e n s i t i e s i s t h r o u g h t h e u s e o f r e f r i g e r a t e d c o r i n g t e c h n i q u e s . , T h e r e c o v e r e d c o r e w a s p r o t e c t e d f r o m t h a w i n g i n t h e f i e l d a n d t h e c o r e w a s t r a n s p o r t e d p e r i o d i c a l l y t o A n c h o r a g e f o r f r o z e n s t o r a g e .
T h e r m i s t o r s t r i n g s w e r e i n s t a l l e d i n 1 1 o f t h e b o r e h o l e s t o p e r m i t f u t u r e o b s e r v a t i o n s o f t h e t h e r m a l c o n d i t i o n o f t h e s o i l / r o c k a t b o r i n g l o c a t i o n s . E a c h t h e r m i s t o r s t r i n g was p l a c e d i n 1 . 2 5 i n c h ( 3 . 2 c e n t i m e t e r ) 1 . 0 . P V C p i p e i n s t a l l - e d t o t h e f u l l d e p t h a n d f i l l e d w i t h a 5 0 / 5 0 m i x - t u r e o f p r o p y l e n e g l y c o l a n d w a t e r . T h e s t r i n g s w e r e i n s t a l l e d t o t h e b o t t o m o f t h e P V C p i p e a n d t h e a n n u l a r s p a c e b e t w e e n t h e PVC p i p e a n d t h e b o r e h o l e w a l l w a s b a c k f i l l e d w i t h s a n d . A t t h e
y t h e d e s i g n e r s a s s t r u c - d i n t h e mill s i t e a r e a a t
F i g u r e 1 . The f a c i l i t i e s a n d s t o r a g e f a c i l i t i e s ,
t f a c i l i t i e s , a c c o m o d a t i o n s , g r o u n d s u r f a c e , a I
955
i h o r t 5 ; e c t i o n o f 3 o r 4 - i n c h
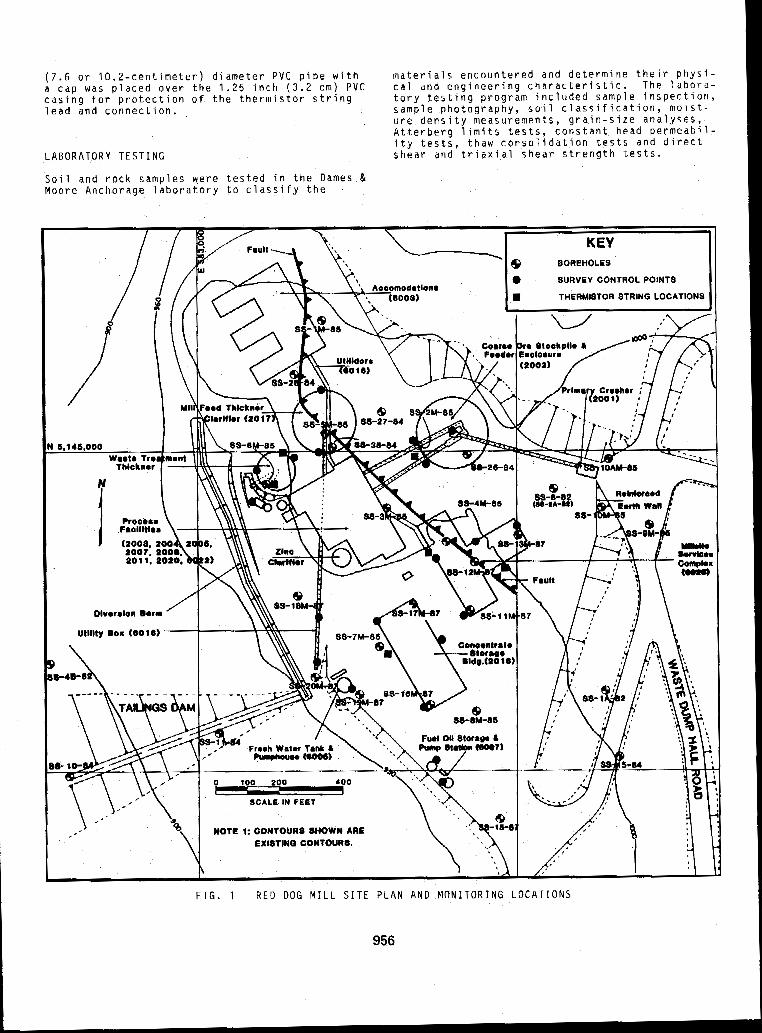
(7.6 or 10.2-centimeter) diameter P V C pipe with materials encountered and determine their physi- a cap was placed over the 1.25 inch (3.2 cm) P V C cal and engineering characteristic. The labora- casing f o r protection o f the thermistor string tory testing program included sample inspection, lead and connection, sample photography, soil classification, moist-
Atterberg limits tests, constant head permeabil- ure density measurements, gra.in-size analyses,
ity tests, thaw consolidatian tests and direct shear and triaxial shear strength tests. LABORATORY TESTING
Soil and rock samples were tested in the Dames & Moore Anchorage laboratory to classify t h e
FIG. 1 RED D O G MILL SITE PLAN AND MONITORING LOCATIONS
956
S I T E CONDITIONS
T h e m i l l s i t e i s l o c a t e d a d j a c e n t t o b o t h t h e o r e d e p o s i t a n d t h e t a i l i n g s dam. The e n t i r e s i t e
o v e r b u r d e n S o i l s , w h i c h a p p e a r t o b e c o l l u v i a l i s c o v e r e d w i t h a l o w - g r o w i n g t u n d r a m a t , T h e
d e p o s i t s c a p p e d w i t h a t h i n l a y e r o f s u r f i c i a l s i l t s a n d p e a t , v a r y i n t h i c k n e s s f r o m 0 t o 1 3 f e e t ( 0 t o 4.3 m e t e r s ) . T h e u n d e r l y i n g b e d r o c k o c c u r s a s t w o d i s t i n c t r o c k f o r m a t i o n s a n d a p - p e a r s t o b e s e p a r a t e d b y a t h r u s t f a u l t e x t e n d - i n g t h r o u g h t h e s i t e . B e d r o c k t o t h e w e s t o f t h e f a u l t i s c h e r t - c a r b o n a t e w h i l e s h a l e s a n d ~
s a n d s t o n e s w e r e l o g g e d t o t h e e a s t o f t h e f a u l t . T h e c h e r t - c a r b o n a t e i s r e l a t i v e l y c o m p e t e n t , h a r d , d e n s e , m o d e r a t e l y - f r a c t u r e d c h e r t a n d d o l o m i t e .
T h e s h a l e a n d s a n d s t o n e d e p o s i t s c o n t a i n e d n u m -
d e p t h s o f 20 t o 30 f e e t ( 6 . 7 t o 10 m e t e r s ) . T h e e r o u s c l a y g o u g e z o n e s a n d e x c e s s i c e d o w n t o
f r a c t u r e s a n d b e d d i n g w i t h i n t h e c h e r t d e p o s i t c o n t a i n e d v i t r o n i t e w h i l e v i t r o n i t e w a s n o t
T h e t h e r m i s t o r d a t a a t t h e mill s i t e i n d i c a t e s l o g g e d w i t h i n t h e s h a l e a n d s a n d s t o n e d e p o s i t .
p e r m a f r o s t t e m p e r a t u r e s i n t h e 2 7 t o 30°F (-2.8 t o -1.IOC) r a n g e .
DESIGN CONCEPTS
c a v a t i o n o f 30 t o 40 f e e t (IO t o 1 3 m e t e r s ) o f T h e p r e s e n t p l a n a t t h e mill s i t e c a l l s f o r e x -
m a t e r i a l f r o m t h e s i t e f o r u s e a s b o r r o w i n o t h e r a r e a s a n d t h e f o u n d i n g o f t h e h e a v i e r c o m p o n e n t s o f t h e mill on t h e m o r e c o m p e t e n t c h e r t b e d r o c k w i t h i n t h e e x c a v a t e d s i t e a r e a .
SITE EXCAVATION A N D CONSTRUCTION MATERIALS
M a t e r i a l t o b e e x c a v a t e d d u r i n g s i t e g r a d i n g c a n b e c l a s s i f i e d i n t o 4 g r o u p s , d e p e n d i n g o n s o i l c o n s t i t u e n t s a n d i c e c o n t e n t . T a b l e 1 p r e s e n t s t h e 4 m a t e r i a l c l a s s i f i c a t i o n s a n d c h a r a c t e r i s t i c s u s e d f o r c a t e g o r i z i n g t h e e x c a v a t i o n m a t e r i a l .
TABLE 1
CLASSIFICATION CATEGORIES FOR EXCAVATED MATERIAL
M a t e r i a 1 G r o u p W a s t e
R e s t r i c t e d U s e
S p e c i a l H a n d l i n g
S e l e c t M a t e r i a l
M a t e r i a l C h a r a c t e r i s t i c s
S u r f i c i a l / c o l l u v i u m ; h i g h i c e a n d / o r o r g a n i c c o n t e n t ; f i n e g r a i n e d w i t h l i t t l ' e or no r o c k T y p i c a l l y d i r e c t l y b e n e a t h w a s t e m a t e r i a l ; h i g h i c e c o n - t e n t (10% t o 30% b y v o l u m e ) ; s i g n i f i c a n t g r a v e l c o n ' t e n t ( G M ) w i t h l i t t l e o r g a n i c s
R e l a t i v e l y c o m p e t e n t r o c k c o n - t a i n i n g s i g n i f i c a n t i c e ( 5 % t o 10% b y v o l u m e ) ; l e s s t h a n 20% f i n e s Re t a v o
THERMAL ANALYSES FOR SITE EXCAVATION
T h e r m a l a n a l y s e s u s i n g a c o m p u t e r s o l u t i o n o f t h e M o d i f i e d B e r g g r e n e q u a t i o n ( B r a l e y 1984) w e r e p e r f o r m e d t o e v a l u a t e t h e e f f e c t o f e x c a v a -
e d p a r a m e t e r s f o r t h i s m e t h o d o f a n a l y s i s i n - t i n g t h e s i t e d o w n t o d e s i g n g r a d e . T h e r e q u i r -
c l u d e : l o c a l c l i m a t o l o g i c a l d a t a , t h e r m a l p r o p -
c h a r a c t e r i s t i c s w h i c h a r e e x p r e s s e d i n t e r m s o f e r t i e s o f t h e i n - s i t u s o i l a n d r o c k , a n d s u r f a c e
a n " n " f a c t o r . T h e c l i m a t o l o g i c a l d a t a i n c l u d e s t h e m e a n a n n u a l t e m p e r a t u r e , t h a w d e g r e e - d a y s a n d t h e n u m b e r o f t h a w d a y s a n n u a l l y . T h i s i n - f o r m a t i o n w a s c o l l e c t e d f r o m a v a r i e t y o f
mill s i t e . P h y s i c a l p r o p e r t i e s o f t h e i n - s i t u s o u r c e s i n c l u d i n g p r e v i o u s e x p e r i e n c e a t t h e
s o i l a n d r o c k w e r e d e t e r m i n e d b y l a b o r a t o r y t e s t i n g o f r e l a t i v e l y u n d i s t u r b e d s a m p l e s o b - t a i n e d f r o m s u b s u r f a c e e x p l o r a t i o n s . T a b l e 2 c o n t a i n s a t a b u l a t i o n o f t h e i n p u t p a r a m e t e r s u s e d i n o u r a n a l y s i s :
TABLE 2
THERMAL ANALYSIS I N P U T PARAMETERS
E n v i r o n m e n t a l P a r a m e t e r s
M e a n A n n u a l T e m p e r a t u r e ( O F ) 18 ( - 7 . 8 ' C ) T h a w D e g r e e D a y s ( O F d a y s ) 1400 ( 7 7 8 ' C d a y s ) T h a w S e a s o n L e n g t h ( d a y s ) 1 4 0
M a t e r i a l C l a s s i f i c a t i o n R e s t r i c t e d U s e a n d S p e c i a l S e l e c t
M a t e r i a l P r o p e r t i e s W a s t e H a n d l i n g M a t e r i a l
Thaw n 1 . 7 1 . 8 1 . 4 D r y D e n s i t y ( l b / c u f t ) 70-90 105-125 1 4 6 M o i s t u r e ( % ) 20 -30 2-15 2 - 4 H e a t C a p a c i t y ( B T U / C U f t - O F ) 2 9 27 2 8 C o n d u c t i v i t y ( B T U / f t - h r - ' F ) 0 .7 1.1 1.7 L a t e n t H e a t ( BTUICU f t 2600-3000 400-2300 400-850
N O T E : 1 g r a m / c u cm = 6 2 . 4 l b / c u f t 1 BTU = 2 5 2 . 2 g r c a l 1 c u f t = 2 8 3 1 7 c u cm 1'C = 1.8'F
T h e a n a l y s i s w a s d i r e c t e d a t e v a l u a t i n g t h e t h e r m a l r e s p o n s e o f t h e s i t e t o e x c a v a t i o n t o d e s i g n g r a d e a n d t h e b e n e f i c i a l e f f e c t o n t h e p r o p o s e d f o u n d a t i o n s i n a r e a s o f c u t d u e t o t h a w i n g a n d d r a i n i n g o f e x c e s s i c e f r o m t h e s u b s u r f a c e S o i l a n d r o c k . T h e a n a l y s e s i n c l u d e d c o n s i d e r a t i o n o f t h e e x t e n t o f t h e t h a w r e s u l t - i n g f r o m e x p o s u r e t o b o t h o n e a n d t w o t h a w s e a s o n s . T h e t w o t h a w s e a s o n s c e n a r i o a s s u m e d t h a t s i g n i f i c a n t d r a i n a g e w o u l d o c c u r d u r i n g t h e i n i t i a l t h a w s e a s o n . A l t h o u g h t o t a l f e e e z e - b a c k w o u l d t h e n o c c u r d u r i n g t h e i n t e r v e n i n g
w o u l d p r o d u c e g r e a t e r t h a w d e p t h s d u e t o t h e w i n t e r f r e e z e s e a s o n , t h e f o l l o w i n g s u m m e r t h a w
r e d u c e d m o i s t u r e c o n t e n t ( a n d r e d u c e d l a t e n t h e a t ) o f t h e p r e v i o u s l y t h a w e d a n d d r a i n e d r o n e .
l a t i v e l y c o m p e t e n t r o c k c o n - A s u m m a r y o f t h e a n a l y s e s i s p r e s e n t e d b e l o w . i n i n g l e s s t h a n 5% i c e b y l u m e ; l e s s t h a n 20% f i n e s
957
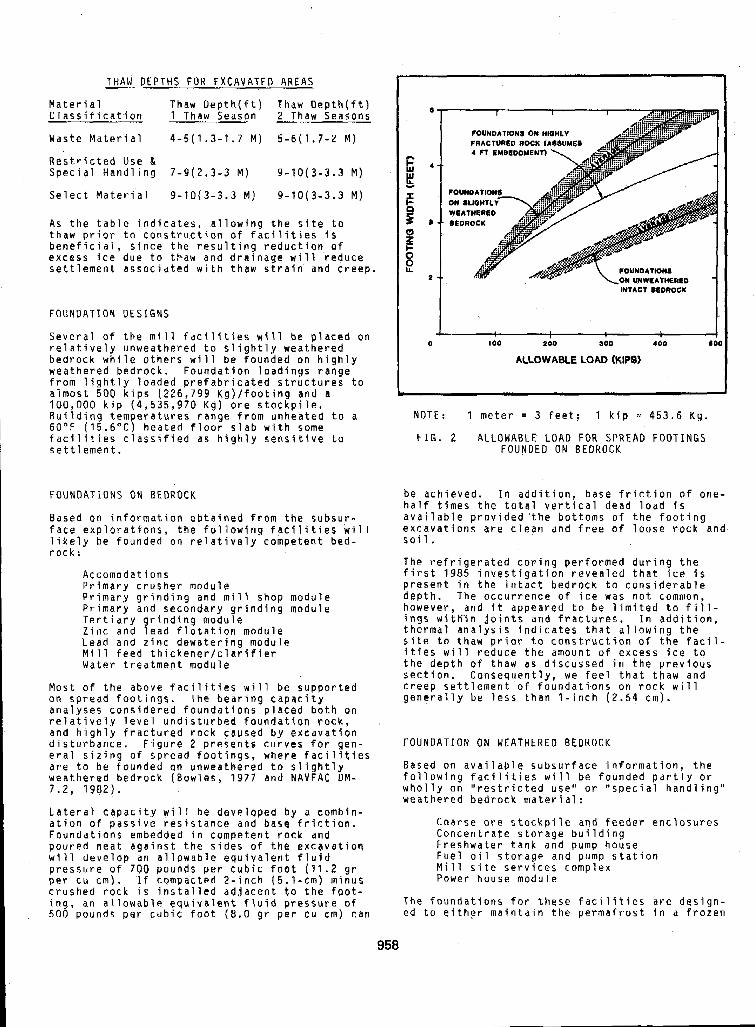
THAW DEPTHS FOR EXCAVATED AREAS
Material Thaw Depth(ft) Thaw Depth(ft) Classification 1 Thaw Season 2 Thaw Seasons
Waste Material 4-5(1.3-1.7 M) 5 - 6 ( 1 . 7 - 2 M )
Restricted U s e & Special Handling 7-g(2.3-3 M) 9-lO(3-3.3 M )
Select Material 9-lO(3-3.3 M ) 9-lO(3-3.3 M )
A s the table indicates, allowing the site to thaw prior to construction of facilities is beneficial, since the resulting reduction o f excess ice due to t4aw and drainage w i l l r educe settlement associated with thaw S
FOUNDATION D E S I G N S
train and creep.
Several of the mill facilities w relatively unweathered to slight
i 1
bedrock while others will be founded o n highly weathered bedrock. Foundation loadings range from lightly loaded prefabricated structures to almost 500 kips (226,799 Kg)/footing and a 100,000 kip (4,535,970 Kg) ore stockpile. Bujlding temperatures range from unheated to a 60°F ( 1 5 . 6 O C ) heated floor slab with some facilities classified as highly sensitive to settlement.
F O U N D A T I O N S ON BEDROCK
Based on information obtained face explorations, the follow likely be founded on relative rock:
Accomodations Primary crusher module Primary grinding and mil Primary and secondary gr Tertiarv arlndina module
1 1 b e placed on y weathered
from the s n g facilit y competen
U i t
shop modul nding modul
bsur- es will bed-
e e
Zinc and iead flotation module
Mill feed thickener/claritier Lead and zinc dewatering module
Water treatment module
Most of the above facilities will be supported on spread footings. The bearing capacity analyses considered foundations placed both on relatively level undisturbed foundation rock, and highly fractured r o c k caused by excavatian disturbance. Figure 2 presents curves for gen- eral sizing o f spread footings, where facilities are to be founded on unweathered to slightly weathered bedrock (Bowles, 1977 and NAVFAC DM- 7.2, 1982).
Lateral capacity will be developed by a combin- ation of passive resistance and base frictian. Foundations embedded in competent r o c k and poured neat against the sides of the excavation will develop an allowable equivalent fluid pressure of 700 pounds per cubic foot (11.2 gr per cu c m ) crushed r o ing, an a1 500 pounds
. If comva ck i s installed adjacent t o the foot-
cted '2-inch (5.1-cm) minus
lowable equivalent fluid pressure o f per cubic foot (8.0 g r per cu cm) can
fOUNDATlONl ON HlQnlY
1 FT EMBEDOYENT)
FOUNDATION
UNWCATHERLO INTACT LEDROCK
0 io0 PO0 DO0 400 801
ALLOWABLE 4OAD (KIP$)
NOTE: 1 meter = 3 feet; 1 kip = 453.6 Kg.
FIG. 2 ALLOWABLE LOAD FOR SPREAD FOOTINGS F O U N D E D O N BEDROCK
be achieved. In addition, base friction of one- half times the total vertical dead load is avallable provided 'the bottoms of the footing excavations are clean and free of loose rock and soil.
The refrigerated coring performed during the first 1985 inyestigation revealed that ice is present in the intact bedrock to considerable depth. The occurrence of ice was not common, however, and it appeared to be limited to fill- ings with'jn joints and fractures. In addition, thermal analysis indicates that allowing the site to thaw prior to construction of the PacJ1- ities will reduce the amount of excess ice to the depth o f t h a w a s discussed in the previous section. Cansequently, we feel that thaw and creep settlement of foundations on rock will generally be l e s s than I-inch (2.54 cm).
FOUNDATION ON WEATHERED BEDROCK
Based on available subsurface information, following facilities will be founded partly wholly on "restricted use" o r "special hand weathered bedrock material:
t h e or
1 i ng"
Coarse o r e stockpile and feeder enclosures Concentrate storage building Freshwater tank and pump h o u s e Fuel oil storage and pump station Mill site services complex Power house module
The foundations for these facilities are design- ed to either maintain the permafrost in a frozen
958
s t a t e o r t r a n s m i t t h e l o a d s t o t h e b e d r o c k l e v e l o r b o t h . H e a t e d a n d u n h e a t e d b u i l d i n g s will b e f o u n d e d o n s p r e a d f o o t i n g s w i t h i n a n i n s u l a t e d p a d o r o n p i l e s , w h e n t h e b u i l d i n g s c a n b e e l e - v a t e d t o a l l o w a m b i e n t a i r f l o w b e n e a t h t h e s t r u c t u r e . I n t h o s e a r e a s w h e r e b e d r o c k i s n o t e x c e s s i v e l y d e e p , f a c i l i t i e s will e i t h e r b e f o u n d e d o n t i p e n d b e a r i n g p i l e s o r e x c a v a t i o n r e p l a c e m e n t t e c h n i q u e s will b e u s e d t o t r a n s m i t l o a d s t o t h e b e d r o c k s t r a t a . E x a m p l e s o f f a c i l - i t i e s w i t h f o u n d a t i o n s t h a t o c c u r a b o v e t h e l e v e l o f u n w e a t h e r e d b e d r o c k a r e d i s c u s s e d i n t h e f o l l o w i n g p a r a g r a p h s .
C o a r s e O r e S t o c k p i l e a n d F e e d e r E n c l o s u r e s :
T h i s f a c i l i t y c o n s i s t s o f a n 8 4 - f o o t ( 2 8 - m e t e r ) h i g h c o n i c a l p i l e o f c o a r s e o r e o v e r l y i n g a d o u b l e h o p p e r / c o n v e y o r s y s t e m w h i c h s u p p l i e s o r e t o t h e mill f a c i l i t i e s . T h e h o p p e r f e e d e r s a n d c o n v e y o r s y s t e m a r e e n c l o s e d b e n e a t h t h e o r e p i l e i n a h o r s e s h o e a r c h t u n n e l g a l l e r y c o n s t r u c - t e d o f c o r r u g a t e d s t e e l p l a t e w i t h r i g i d f r a m i n g w h i c h i s s u p p o r t e d o n r e i n f o r c e d c o n c r e t e f o o t - i n g s , T h e c o n v e y o r s y s t e m will b e h o u s e d i n t w o 9 - f o o t ( 3 - m e t e r ) d i a m e t e r s t e e l p i p e s . T h e o r e s t o c k p i l e i s s u p p l i e d v i a a n o v e r h e a d c o n - v e y o r s y s t e m h o u s e d i n a 9 - f o o t d i a m e t e r s t e e l p i p e . T h e o v e r h e a d s y s t e m i s s u p p o r t e d b y g u y e d v e r t i c a l s u p p o r t s w h i c h i n t u r n a r e s u p p o r t e d o n s p r e a d f o o t i n g s . T h e v e r t i c a l c o l u m n s will s u p - p o r t a n a p p r o x i m a t e 1 0 0 - f o o t (33.3 m e t e r ) s p a n o f t h e c o n v e y o r s y s t e m a t a b o u t 400 p o u n d s p e r f o o t ( 5 4 0 K g p e r m e t e r ) , r e s u l t i n g i n a v e r t i c a l d o w n w a r d l o a d o n t h e o r d e r o f 40 k i p s (18,140 K g ) f o r e a c h s u p p o r t , A p r o t e c t i v e u m b r e l l a will a l s o b e s u p p o r t e d o v e r t h e s t o c k p i l e t o r e d u c e
o r e p i l e will b e a p p r o x i m a t e l y 50,000 t o n s d u s t . A t o t a l s t o r a g e c a p a c i t y o f t h e c o a r s e
(4,535,970 K g ) .
B a s e d e x p l o u n d e r
b y s l i c e - r
s h a l e i n c h t o t a l
i i
r 1
o n i n f o r m a t i o n o b t a i n e d f r o m s u b s u r f a c e a t i o n s , t h e p r o p o s e d f a c i l i t y s i t e i s a i n b y a p p r o x i m a t e l y 1 2 f e e t ( 4 m e t e r s ) o f c h c o l l u v i u m w h i c h , i n t u r n , i s u n d e r l a i n g h t l y t o s e v e r e l y w e a t h e r e d c a r b o n a c e o u s w i t h o c c a s i o n a l t o f r e q u e n t 1/8 t o 1/4 0.3 t o 0.6 cm) i c e f i l l e d f r a c t u r e s t o t h e d e p t h o f t h e b o r i n g ( 5 0 f e e t / 1 6 . 7 m e t e r s ) .
G e n e r a l s i t e e x c a v a t i o n will r e m o v e t h e c o l l u v - i u m a n d a b o u t 9 f e e t (3 m e t e r s ) o n a v e r a g e o f t h e i c e - r i c h b e d r o c k . I n a d d i t i o n , t h e r m a l a n a l y s i s i n d i c a t e s t h a t a l l o w i n g t h e s i t e t o t h a w a f t e r s i t e e x c a v a t i o n a n d p r i o r t o c o n s t r u c -
r o c k t o a d e p t h o f 7 t o 9 f e e t (2.3 t o 3 m e t e r s ) t i o n will e l i m i n a t e t h e e x c e s s i c e i n t h e b e d -
a n d 9 t o 10 f e e t ( 3 t o 3.3 m e t e r s ) f o r o n e a n d t w o ' t h a w s e a s o n s , r e s p e c t i v e l y .
C o n s i d e r i n g t h e b e n e f i c i a l e f f e c t s o f r e m o v i n g t h e u p p e r i c e - r i c h c o l l u v i u m a n d b e d r o c k a n d t h e r e d u c t i o n o f e x c e s s i c e d u e t o t w o t h a w s e a s o n s ,
a n d t h e u n d e r l y i n g f a c i l i t i e s will s e t t l e u p t o t h e a n a l y s i s i n d i c a t e s t h a t t h e c o a r s e o r e p i l e
6 i n c h e s ( 1 5 . 2 c m ) d u e t o c r e e p . T h i s s e t t l e - m e n t will b e g r e a t e s t a t t h e c e n t e r o f t h e o r e p i l e a n d d i m i n i s h t o l e s s t h a n 1 i n c h ( 2 , s cm) a t t h e p i l e e d g e . T h e t o t a l s e t t l e m e n t s h o u l d o c c u r a t a n e s t i m a t e d r a t e o f o n e - h a l f i n c h
t h e g a l l e r y i s s u p p o r t e d o n s p r e a d f o o t i n g s w i t h (1.3 c m ) p e r y e a r . T h e a n a l y s i s a s s u m e s t h a t
o f 10 k s f ( 4 . 9 Kg p e r s q c m ) c o n t a c t p r e s s u r e s a n d t h a t s u b s u r f a n i f i c a n t l y a c r o s s t o t h e u n c e r t a i n t
c e c o n d i t i o n s d o n o t v a r y s i g -
i e s a s s o c i a t e d w i t h t h e a n a l y - t h e a r e a o f t h e o r e p i l e . Due
s i s , g r e a t e r s e t t l e m e n t s ( i n e x c e s s o f 6 i n c h e s /
u n d e r l y i n g t h e o r e p i l e will b e m o n i t o r e d f o r 15.2 c m ) m a y o c c u r . T h e r e f o r e , t h e s t r u c t u r e s
s e t t l e m e n t b y p e r i o d i c l e v e l s u r v e y s a t s e l e c t e d p o i n t s a l o n g t h e c o n v e y o r a n d h o p p e r g a l l e r i e s , I n a d d i t i o n , a t h e r m i s t o r s t r i n g will b e i n s t a l - l e d t o t h e w e s t o f t h e c o n c e n t r a t e p i l e b e t w e e n t h e b e l o w g r o u n d c o n v e y o r g a l l e r i e s . It i s a n t i - c i p a t e d t h a t m o d e r a t e s e t t l e m e n t o f t h e h o p p e r a n d c o n v e y o r s y s t e m s c a n b e c o m p e n s a t e d f o r b y
m e t h o d s . E x c e s s i v e s e t t l e m e n t , a l t h o u g h u n l i k e l y , p e r i o d i c a d j u s t m e n t u t i l i z i n g j a c k i n g o r s h i m m i n g
m a y r e q u i r e t h a t t h e g a l l e r i e s b e r e l e v e l e d a f t e r s e v e r a l y e a r s o f u s e .
T h e v e r t i c a l c o l u m n s s u p p o r t i n g t h e o v e r h e a d c o n v e y o r s y s t e m will b e f o u n d e d o n s p r e a d f o o t - i n g s e m b e d d e d 5 f e e t (1.7 m e t e r s ) i n t o t h e e x p o s - e d w e a t h e r e d b e d r o c k ( . s p e c i a l h a n d l i n g m a t e r i a l ) . A s s t p t e d p r e v i o u s l y , t h e w e a t h e r e d b e d r o c k s h o u l d e x p e r i e n c e a b o u t 9 f e e t ( 3 m e t e r s ) o f t h a w i f e x p o s e d t o t w o t h a w s e a s o n s . S e t t l e m e n t d u e t o c r e e p c a n b e r e d u c e d t o t o l e m b l e l e v e l s i f t h e b e a r i n g s t r e s s e s a c t i n g o n t h e l o w e r b o u n d a r y o f t h e p r e v i o u s l y t h a w e d z o n e ( 9 f e e t - 3 m e t e r s ) a r e l i m i t e d t o 2 k s f ( 1 . 0 K g p e r s q c m ) . A c c o r d -
s p . r e a d f o o t i n g e m b e d d e d t o a 5 - f O O t (1.7 m e t e r s ) i n g l y , a l l o w a b l e b e a r i n g s t r e s s e s i m p o s e d b y t h e
d e p t h will b e l i m j t e d t o a b o u t 5 .5 k s f ( 2 . 1 K g p e r s q c m ) . F o u n d a t i o n s d e s i g n e d a c c o r d i n l y s h o u l d e x p e r i e n c e l e s s t h a n 2 i n c h e s ( 5 cm? t o t a l s e t t l e m e n t ,
P o w e r H o u s e M o d u l e : T h e p o w e r h o u s e m o d u l e i s l o c a t e d a t t h e s o u t h - w e s t e r n p o r t i o n o f t h e P r o c e s s F a c i l i t y C o m p l e x . T h e p o w e r h o u s e i s c o n s i d e r e d v e r y s e n s i t i v e t o s e t t l e m e n t a n d will b e s u p p o r t e d o n i n d i v i d u a l s p r e a d f o o t i n g s w i t h a m a x i m u m v e r t i c a l l o a d o f a b o u t 240 k i o s (108,860 K q ) . E x t e n s S v e c
1 r a n g i n g f r o m ' a b o u t 30 t o 4 0 f e e t (IO t o m e t e r s ) i n t h i c k n e s s will b e r e q u i r e d a t s i t e . As a r e s u l t , t h e f i n i s h e d f l o o r o m o d u l e will b e p r i m a r i l y i n b e d r o c k , b u t w e s t e r n p o r t i o n m a y l i e i n s p e c i a l h a n d 1 m a t e r i a 1 . T h e e x c a v a t i o n f o r t h e D o w e r h o u s e m o d u l
f
i
u t s 3 t h e
t h e f a r n g
t h e
will b e . l E f t o p e n f o r a t l e a s t o n e t h a w s e a s o n p r i o r t o c o n s t r u c t i o n . T h i s s h o u l d i n d u c e t h a w w e l l i n t o t h e s e l e c t m a t e r i a l , S i n c e t h e p o w e r h o u s e m o d u l e h a s b e e n c l a s s i f i e d a s v e r y s e n s i t i v e t o m o v e m e n t a n d s i n c e s l o p i n g r o c k s t r a t a a r e p r e - s e n t b e n e a t h t h e f a c i l i t y , t h e s t r u c t u r e will b e d e s i g n e d f o r a l o w a l l o w a b l e b e a r i n g v a l u e . F o o t i n g s e m b e d d e d a t l e a s t 3 f e e t ( 1 m e t e r ) b e - l o w f i n i s h e d g r a d e will b e d e s i g n e d u s i n g a n a l l o w a b l e b e a r i n g c a p a c i t y o f 6 k s f ( 2 . 9 K g p e r s q c m ) . F o u n d a t i o n c o n s t r u c t e d a s d e s c r i b e d a b o v e will u n d e r g o e s t i m a t e d t o t a l t h a w a n d c r e e p s e t t l e m e n t o f l e s s t h a n 1 i n c h ( 2 . 5 c m ) .
e
INSPECTION A N D MONITORING
V a r i a t i o n s i n s u b s u r f a c e c o n d i t i o n s will p r o b a b -
t o p e r m i t c o r r e l a t i o n s b e t w e e n t h e f o u n d a t i o n l y b e e n c o u n t e r e d d u r i n g c o n s t r u c t i o n . I n o r d e r
u t i l i z e d a n d t h e a c t u a l c o n d i t i o n s e n c o u n t e r e d e d w i t h t h e p l a n s a n d s p e c i f i c a t i o n s , a q u a l i f i
g e o t e c h n i c a l e n g i n e e r will p e r f o r m d a i l y c o n s t r u c t i o n i n s p e c t i o n s . O b s e r v a t i o n s m a d e d u t h e s e i n s p e c t i o n s will i n c l u d e , b u t n o t b e 1 t o , t h e f o l l o w i n g :
r i n g i m i t e d
959
1.
2,
3 .
4.
5 .
6.
7 .
Delineating and categorizing excavation material as waste, restricted u s e , spe- cial handling, and select.
Proper ground preparation for fill placement. Determining ice-rich zones and/or waste material zones where over excavation will be required.
Fill placement procedures and fill density testing.
F i l l gradation and quality monitoring and testing.
Foundation excavations.
Installation and initial reading of monitoring instrumentation.
Stability of'cut slopes, retaining structures and drainage structures.
A monitoring scheme has been developed for sev- eral o f the mill site facilities, where founda- tion conditions are difficult and/or sensitive structures are located. Figure 1 includes a site plan showing where thermistor strings and vertical control survey pegs will be installed. The number o f monitoring locations shown on the figure are considered to be a minimum; addition- al survey pegs may also be placed on any of the heated facilities founded above bedrock. In addition to the monitoring points, periodic site inspections will be performed to assess the per- formance of cut slopes, retaining structures, drainage structures and fill sections. Site inspections duri.ng the early and late summer periods (June and September) would provide the most relevant information. All thermistor strings and settlement points will be monitored on a regular basis. The following reading sche- dule has been recommended for the first two years after installation:
Once in early May, just before breakup June through September, once each month Once each in.November, January and March
The data will be analyzed as soon a s possible after reading during the early stages. Where signs of movement or thermal degradation are detected, the monitoring schedule will be accel- erated to refine definition of performance. In this way, remedial measures can be instigated before damage t o facilities occurs.
After 2 years, if performance o f facilities is satisfactory, the monitoring schedule will be reduced to just a few readings p e r year,
CONCLUSIONS
The founding of a world class mine's mill facility on relatively warm permafrost soil and rock is within the capabilities of the current state of the practice in arctic geotechnical engineering. Utilizing standard geotechnical analysis techniques and current understanding o f the creep phenomenon, buildable foundations f o r large, heavily loaded facilities on perma- frost rock can be designed. The performance data for similar structures is, however, nearly
non-existent and a well planned system for mon- itoring short and long term performance is a n important part of design process,
REFERENCES
Braley, W.A. (1984). A Personal Computer Beraaren Eauation. Solution to the Modified
Alaska D O T / P F Report No. Fairbanks, Alaska
Bowles, J.E. ( 1 9 7 7 ) . Foundat Design, 2nd Edition, 750 Inc.
i
A K - i b - 8 5 - 1 9 ,
on Analysis and pp. McGraw-Hill,
Krtewinski, T . G . , Stanley, J.M., & Moore, D.W. ( 1 9 8 6 ) . Geotechnical Investigation - Cominco's Red Dog Mine Facilities. Proc, Fourth International Cold Regions Engineering Specialty Conference (ASCE), Anchorage, Alaska.
NAVFAC DM - 7.2 ( 1 9 8 2 ) . Foundations And Earth Structures - Design Manual, Department of The Navy.
ACKNOWLEDGEMENTS
Acknowledgement is made to Cominco Alaska, Inc- orporated, for their support during this design effort and for their permission to p u b l i s h this paper.
ELECTRIC PROSPECTING OF INHOMOGENEOUS FROZEN MEDIA V.V. Kuskov
Faculty of Geology, Moscow State University, M~scow, USSR
SYNOPSIS To attain tbe increased efficiency of electrical prospecting of inhomogeneous media it i a necesealy t o develop two- and three-dbensional interpretation apparatus including: a body of mathematics f o r the so lu t ion of direct pmblems; library of typ ica l models of inhomoge- neous media; methodology of experimental work; and in te rpre ta t ion methods. Two-dimensional b- terpretation procedures f o r gome classes of two-dimensional models are discussed. The pr inciples of interpret ing the data 09 e l e c t r i c a l sounding of horizontally-inhomogeneous media have been formulated.
In engineering-geological studies of frosen grounds great role is played by f i e l d geophysi- cal methods enabling t o promptly survey an area t o a required depth. The dependence aP SpeCi- f i c e l e c t r i c a l r e s i s t i v i t y of gmunds on t h e i r l i thology , f racturjng, moisture content, and temperature makes it possible t o apply electro- metric prospecting methods t o obtain data nee-
Electr ic prospect ing by the m s i s t l v i t y method ded f o r compilbg maps of the permafrost zone.
due t o its suff ic ient eff ic iency and sfmplicity.
The ex is tbg in te rpre ta t ion appara tus of elec- tric p m s p e c t k rsets on the ana ly t ica l SoLu- tiona obtained Box hol-izontallg and ver t ica l ly- layerad geoelectric models. Permafrost geo- e l e c t r i c p ro f i l ea are dist inguished by t h e i r g rea t spa t ia l var iab i l i ty , therefore , ac tua l media cannot often be satisfactorily approxima- ted by such mode16. Pract ice has shown that the formalis t ic use of the one-dhensional in- terpretation apparatus may lead t o grave errom. Two- a n d three-dimensional interpretation of the ERM is needed t o s t u d y horizontally inhomo- geneous media. The main problems here are:
is of prime importance in such studies
(1 1 development of interpretation apparatus permitt ing solution of d i rec t problems of ERM f o r horizontally hhomogeneoue models;
models of inhomogeneous media; (2) establishment of a l ib rary o f typical
(3) val idat ion 09 f i e l d work methodology; (4) development o f the pr inciples unde-
lying the ERM data in te rpre ta t ion for inhomogeneous media.
These problems have been studied f o r several years at the Department of Geocryology, Moscow State University.
Po ten t i a l i t i e s of ana ly t ica l methods f o r solving d i rec t problems of t he ERNI a re l imi t ed t o s t u - dying models with only inhomogeneous e l e c t r i c a l conductivity, Numerical methods of mathematical
961
modeling of e l e c t r i c f i e l d s In inhomogeneous media such a8 methods of fintte differences, f in i te elements , and integral equations are oommonly employed. The most simple and univer- s a l is t h e f inite de fe rence method. It a88umes quantization o f t he model under s t u d y and approximake solut ion o f respective boundary problem.
We have developed a body of mathematics a n d a package of programs f o r f ini te-difference si- mulation of d i rec t ERM problems f o r two-dimen- sional models (Baatis and Kuskov , 1985; Kuskov, "1985 1986). At- present , a Library o f two-di- mensional geoelectr ical madelm, most typ ica l OP t h e permafrost regions, is being established. Thus f o r hstmce, very many estimations of longhxdina l and transverse ,curves of vedi ical e lec t r ica l soundbg (VES) f o r 811 escarpment, horst , graben, cyl indrical h s e r t of a rectaa- gular cross-section, semi-confined horizon e tc , have been made. We have considered several geometric patterns of these models for various combinations of spec i f i c r e s i s t i v i ty , The e s t l - nation results have been ueed t o com iLe an album of master curves (Ruskov , .lSd. A.n analysis of the estimated data and practicaJ experience of the ERM application in inhomoge- neous media led t o t h e development of principles
method data. underlying the interpretation of t h e r e s i s t i v i Q
While studying two- a n d three-dimensional Fnho- mogeneous media, a problem a r i se s of choosing efficient observation systems to assist in ob- taining information adequate f o r an unambiguous solut ion of the inverse problem. We believe that an unambiguous determination of the e lect- ric conductivity of a medium necess i ta tes the cohcidence of the dimensions of experimental data and the object under s t u d y . In other words, in one- two- and three-dimensional cas- we should ob& one-, two- and three-dimen- s ional functions of appweni* r e s u t i v i t y :
pa( r ,x ) , and p,(r ,x,y) , respect i -
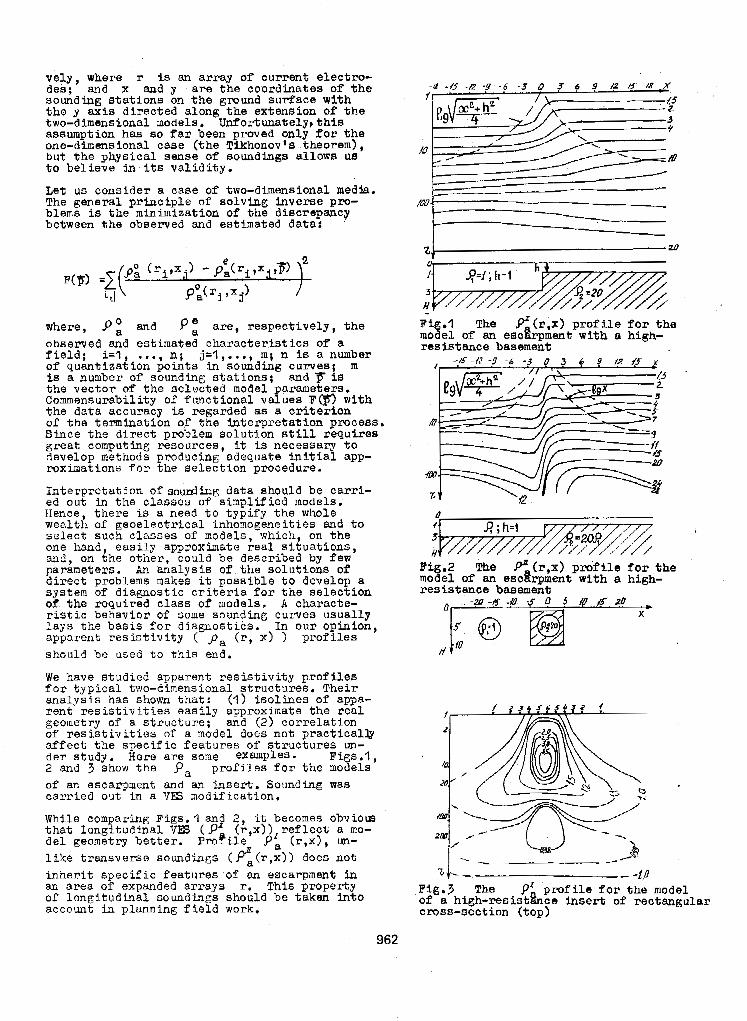
souidiniag-BtatioiiE bn the gmund surface with t h e y axis directed along the extension of t h e two-dimensional models, Unfortunatelyt t h i s assumption has so Tar been proved only for t h e one-dimensional case (the Tikhonov's theorem), but the physical sense of soundings allows UB to be l ieve in its va l id i ty .
Let ua consider a case of two-dimensional media.
blems is the minfmization of the BiBCrepancy The general pr inciple of SolvFng bverse pro-
between t h e observed a n d estimated data:
. - - "" _"" " _"_
where, P and P E are, respectively, the observed and estimated characterist ics of a f i e l d ; i=l, . . . , n; j=l ,.. . , m; n i s a number of quantization points in sounding curves; m is a number o f sounding atations; and 'p is the vector of the selected model parameters. Commensurability of functional values P@) with the data accuracy is regarded as a c r i t e r ion o f the termination o$ the in te rpre ta t ion process. Since the direct problem solution st111 requires great computing resources, it is necessar t o develop methods producing adequate Fnitiai app- roxha t ions for the SQkCtiOn procedure.
In te rpre ta t ion of soulldhg data should be car r i - e d out Fn t h e classes of s i m p l i f i e d models. Hence, there i s a need t o typify the whole wealth. of geoelectrical inhomogeneities a n d t o select such c lasses of m o d e l s , which, on the one h a n d easily approxbnate real si tuations, a n d , on i h e other , could be described by few parameters. An analysis of . the so lu t ions o f diPect problems makes it possible t o develop a system of d i agnos t i c c r i t e r i a for t he s e l ec t ion o f the required class of models. A cbaracte- r i s t ic behavior of some sounding curves usually l ays the basis f o r diagnostics. In o u r o p h i o n , apparent res i r t iv i t y ( pa (r, x) ) pro f i l e s should be u s e d t o t h i s end.
We have studied apparent res is t ivi ty prof i les f o r typ ica l two-dinensional s t ructures . TheLr analysis has shown tha t : (I) i s o l h e s of appa- r e n t r e s i s t i v i t i e s e a s i l y approximate the real geometry of a s t ruc ture ; a n d ( 2 ) correlat ion of r e s i s t i v i t i e s of a node1 does not practicallg a f f ec t the spec i f ic fea tures of s t ruc tures un- der s t u d y . Here are some f=mPles- Figs.1, 2 and 3 show the pa profiles f o r the models of an escarpment and an inser t . Sounding was carried out in a V E j modification.
While comparing Figs. I a n d 2 , it becomes obviom that longitudinal V B (9' (r ,x) ) r e f l ec t a mo- del geometry bet te r . Propi le p', (r,x), un- l ike t ransverse soundinngs ( f a ( r , x ) ) does not inher i t spec i f ic fea tures of an escarpment in
o f longitudinal soundings should be taken i n t o an area of expanded arrays r. This property
account in planning f i e l d work.
4
Fig.1 The p ( r , X ) profile f o r t ba model of an escgrpment with a high- resis tance basement
f 3 H
Fig.2 The P' (r,x) pro f i l e for the model o r an esc8rpmen.t; with a high- resistance basement
2M
- - -f ,O Fig.7 The f f p r o f i l e f o r t h e model of a h i g h - r e s i s t h e insert of rectangular crosa-section (top)
962
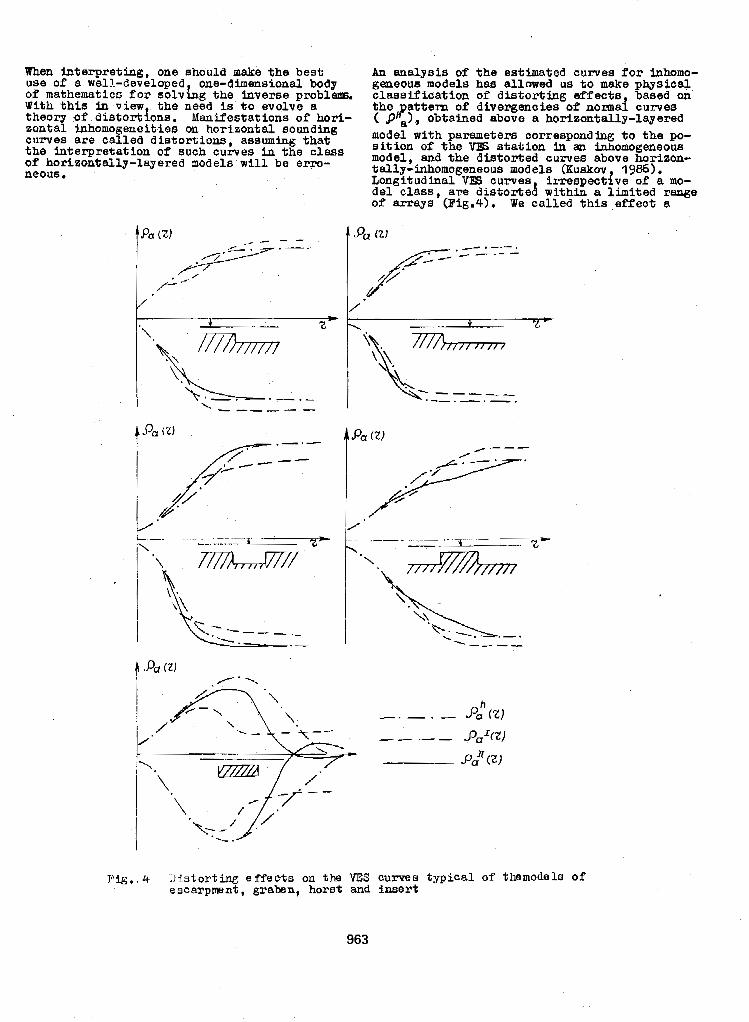
Wben interpreting, one ,should make the best An analyeis of the estimated curves f o x inhomo-
of mathematics for soLv& the invsree problem. classification of distorting effects based on use o f a well-developed one-dimeneional body geneous models has allawed us t o make ph~ysLcal.
With this in viewt the need i s t o evolve a the attem of dlveergeaoies of nomsi curves theom o f distortions. Manifestations o f hori- ( 9 -1. obtabed above a borizontaLl.y-layersd P
del-class, are distorted withii a limited range o f arrays (Fig.4). We called t h i s effect a
" -. t z -
~""" I
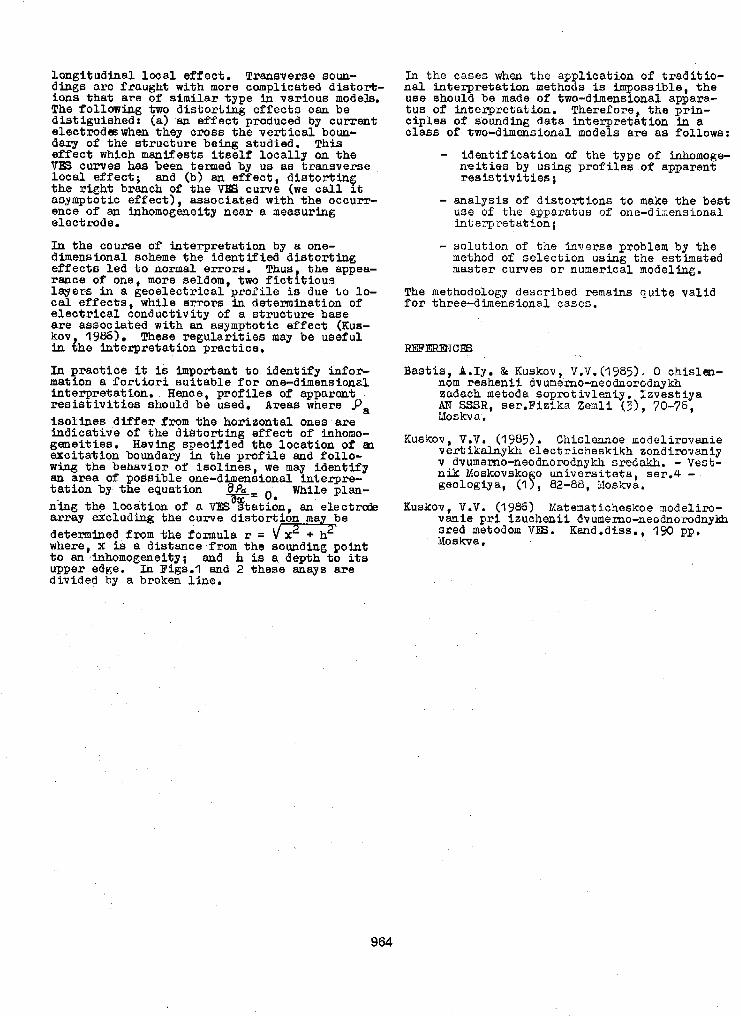
Longitudinal local. effect . TraneverBe soun- dings are fraught with more complicated d ia tor t -
The following two d is tor t ing e f fec ts can be ions that are of s imilar type in various models.
distiguishedt (a) 89 ef fec t produced by current electrodeswhen they cross the v e r t i c a l bow- darg of the s t ructure being studied. This e f fec t which manifests i t s e l f l oca l ly on the VFS curves has been termed by u s as transverse loca l e f fec t ; and (b) an ef fec t , d ia tor t ing the right branch of the vp;6 curve (we c a l l i t asymptotic effect) , associated with the occurr- ence of an inhomogeneity near a maasurbg electrode.
I n the coume of interpretat ion by a one- dimensional scheme the ident i f ied dis tor t ing e f fec ts l ed t o normal errors. Thus the appea- rance o f one, more seldom, two fictitious layers in a geoelec t r ica l p rof i le is due to 10- ca l e f f ec t s , whXle errors in determination o f e lectr ical conduct ivi ty of a structure base are associated with an asymptotic effect (Kus- kov 1986) These regular i t ies may be useful in the inteqret .a t ion pract ice .
In prac t ice it is important t o identify infoa- mation a fortiori su i tab le f o r one-dimensional Fnterpret,ation. Hence, prof i les of apparent r e s i s t i v i t i e s S h d d be used Areas where 9, isolines d i f f e r f r o m the horizontal ones are Fadicative of t h e d i s t o r t b g e f f e c t of inhomo- geneities. Waving specified the location of m exci ta t ion boundarg in t he p ro f i l e and f o l l o -
While plan-
determined from %he formula r = where, x Js a distance from the sounding point t o an inhomogeneity; and h is a depth t o i t a upper edge. In Figs.1 and 2 these mays are divided by a broken line.
In the cases when the application o f t rad i t io - nal Fnterpretat ioa methods is impossible, the use should be made of two-dimensional. appara- t u s of Fntemretation. Therefore. the nrin-
- ident i f icat ion of the type o f Fnhomoge- meitties by using profiles o f apparent r e s i s t i v i t i e s ;
- analysis of dis tor t ions to make the bes t use of the sunsra tus of one-dhens iona l
- solution o f the inverse problem by the method of selection using the estimated master Curves o r numerical modeling.
The methodology described remains quite valid f o r three-dhensional cases.
REFERENCES
Bast is , A.Iy 80 K U S k O V , V.V. (I 985). 0 chis lm- nom resheniF dvumerno-neodnorodnvkh
Uoskva, ' . Kuskov, V.V. (1985). Chislennoe modelirovanie
vertikalagkh electricheskikh zondiro;raniy v dvumsrno-neodnorodnykh sredalth. - Vest- nik Moskovako o univers i te ta , ser.4 - geologiya, ('If, 82-88, i;ioskva.
Kuskov, V.V. (19%) Matenaticheskoe model i ro- vanie p r i izuchenii dvumexno-neodnorodny& sred metodom VES. Kand.diss., 1% pp. Moskva.
964
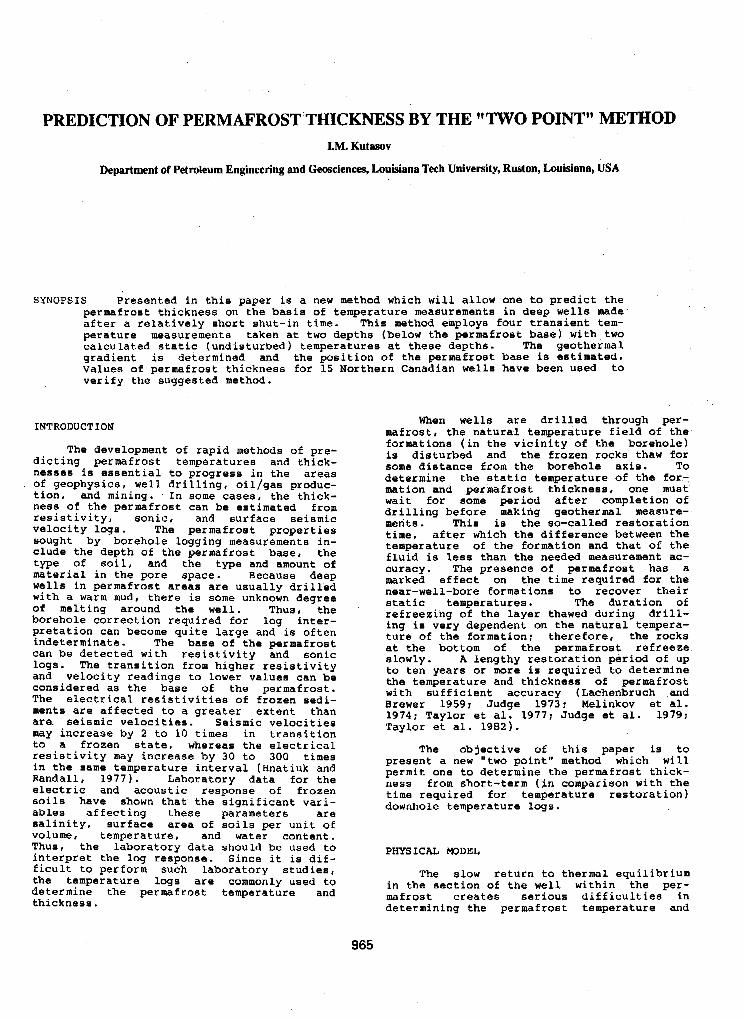
SYNOPSIS Presented in this paper is a new method which will allow one to predict the permafrost thickness on the basis of temperature measurements in deep wells made after a relatively short shut-in time. This method employs four transient tem- perature measurements taken at two depths (below the permafrost base) with two calculated,static (undisturbed) temperatures at these depth&. The geothermal
Values of permafrost thickness for 15 Northern Canadian wells have been used to gradient 1s determined and the polition of the permafrost base is estimated.
verify the- suggested method.
INTRODUCTION
The development of rapid methods of pre- dicting permafrost temperatures and thick- nesses is essential to progress in the areas of geophysics, well drilling, oil/gas produc- tion, and mining. - In some cases, the thick- ness of the permafrost can be estimated from resistivity, sonic, and surface seismic velocity logs * The permafrost properties sought by borehole logging measurements in- clude the depth of the permafrost base, the type of soil , and the type and amount of material in the pore space. Because deep wells in permafrost areas are usually drilled with a warm mud, there is some unknown degree o f melting around the well * Thus, the borehole correction required for log inter- pretation can become quite large and is often indeterminate. The base of the permafrost can be detected with resistivity and sonic logs. The transition from higher resistivity and velocity readings to lower values can be considered as the base of the permafrost. The electrical resistivities of frozen sedi- ments are affected to a greater extent than are. seismic velocities. Seismic velocities may increase by 2 to 10 times in transition to a frozen state, whereas the electrical resistivity may increase by 30 to 300 times in the same temperature interval (Hnatiuk and Randall, 1977). Laboratory data for the electric and acoustic response of frozen soils have shown that the significant vari- ables affecting these parameters are salinity, surface area of soils per unit of volume, temperature, and water content. Thus, the laboratory data should be used to interpret the log response. Since it is dif- ficult to perform such laboratory studies,
determine the permafrost temperature and the temperature logs are commonly used to
thickness.
When wells are drilled through per- mafrost, the natural temperature field of the formations (in the vicinity of the borehole) is disturbed and the frozen rocks thaw for some distance from the borehole axis. To determine the static temperature of the for- mation and permafrost thickness, one must wait for some period after completion of drilling before making geothermal measure- menta. This is the so-called restoration time, after which the difference between the temperature of the formation and that of the fluid is leas than -the needed measurement ac- curacy. The presence of permafrost has a marked effect on the time required for tho near-well-bore formations to recover their static temperatures. The duration of refreezing of the layer thawed during drill- ing is very dependent on the natural tempera- ture of the formation: therefore, the rocks at the bottom of the permafrost refreeze slowly. A lengthy restoration period of up to ten years or more is required to determine the temperature and thickness of permafrost
Brewer 1959; Judge 1973: Melinkov et al. with sufficient accuracy (Lachenbruch and
1974; Taylor et al. 1977; Judge et al. 1979; Taylor et al. 1982).
present a new "two point" method which will The objective of this paper is to
permit one to determine the permafrost thick- ness from short-term (in comparison with the time required for temperature restoration) downhole temperature logs.
PHYS IChL MODEL
The slow return to thermal equilibrium in the section of the well within the per- mafrost creates serxous difficulties in determining the permafrost temperature and
965
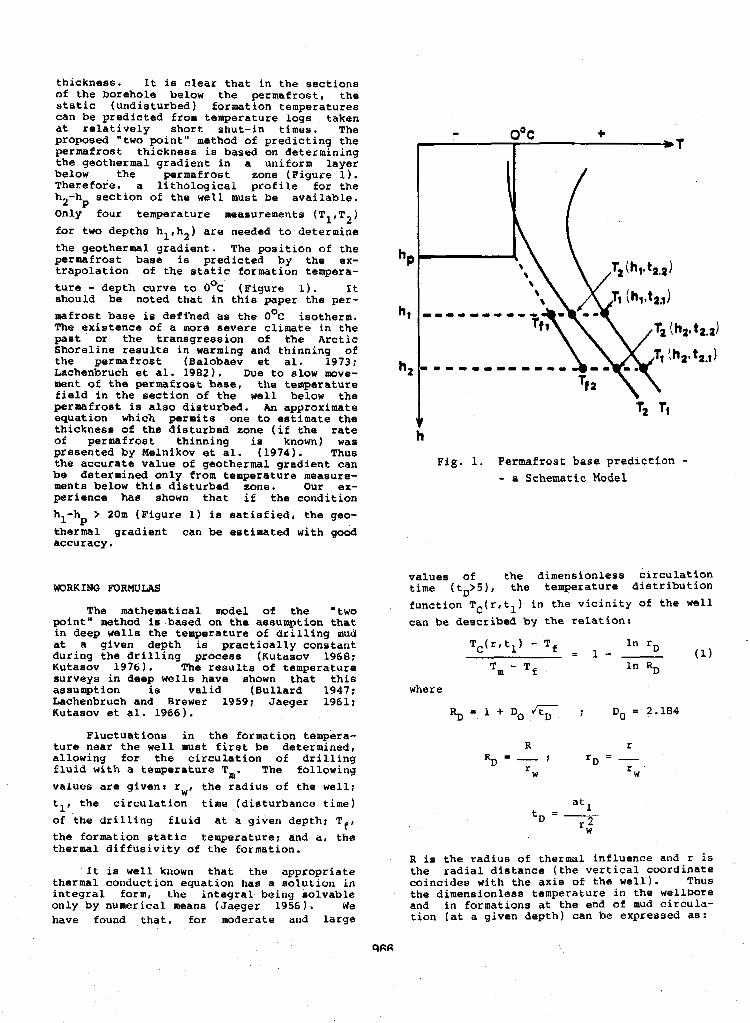
thickness. It i o clear that in the sections of the borehole below the permafrost, the static (undisturbed) formation temperatures can be predicted from temperature logs taken at relatively short shut-in times. The proposed "two point" method of predicting the permafrost thickness is based on determining the geothermal gradient in a uniform layer below the permafrost zone (Figure 1). Therefore. a lithological profile for the h -h section of the well must be available. Only four temperature measurements ( T1 ,T2) for two depths hl,hz) are needed to determine the geothermal gradient. The position of the permafrost base is predicted by the ex- trapolation of the static formation tempera- ture - depth curve to O°C (Figure 1). It should be noted that in this paper the per- mafrost base is deffned as the O°C isotherm. The existence of a more severe climate in the past or the transgression of the Arctic Shoreline results in warming and thinning of the permafrost (Balobaev et al. 1973; Lnchenbruch et al. 1982). Due to slow move- ment of. the permafrost base, the temperature field in the section of the well below the permafrost is also disturbed. An approximate equation which permits one to estimate the thickness of the disturbed zone (it the, rate of permafrost thinning is . known) was presented by Melnikov et al. (1974). Thus the accurate value of geothermal gradient can be determined only from temperature measure- ments below this disturbed zone. Our ex- perience ha0 shown that if the condition h -h > 20m (Figure 1) i5 satisfied, the geo- thermal gradient can be estimated with good accuracy.
2 P
1 P
W R K I N G FORMULAS
The mathematical model of the "two point" method is based on the assumption that in deep wells the temperature of drilling mud at a given depth is practically constant during the drilling process (Kutasov 1968: Kutasov 1976). The results of temperature surveys in deep wells have shown that this assumption i s valid (Bullnrd 1947: Lachenbruch and Brewer 1959: Jaeger 1961: Kutasov et al. 1966).
Fluctuations in the formation tempera- ture near the well must first be determined, allowing for the circulation of drilling fluid with a temperature Tm. The following values are given: rw, the radius of the well: tl, the Circulation time (disturbance time) of the drilling fluid at a given depth: Tf, the formation static temperature; and a. the thermal diffusivity of the formation.
It is well known that the appropriate thermal conduction equation ha5 a solution in integral form, the integral being solvable only by numerical means (Jaeger I956 1 . We have found that, for moderate and large
I-r ooc
-\ \
h
Fig. 1. Permafrost base prediction - - a Schematic Model
values of the dimensionless circulation time ( tD>5), the temperature distribution function TC(r, t,) in the vicinity of the well can be described by the relation:
TC(r,tl) - Tf In rD
Tm - Tf In % = 1 - - (1)
where
R r
r R D = - : rD = -
W r"
at 1 = ',2
R is the radius of thermal influence and r is the radial distance (the vertical coordinate coincides with the axis of the well). Thus
and in formations at the end of mud circula- the dimensionlese temperature in the wellDora
tion (at a given depth) can be expressed as:
O C r D i l
- In rD/ln RD: 15 rD 5 RD (2)
"D ' RD where
TC(r,tl) - T f
Tm * Tf TCD(rD, tal -
To determine the temperature along the well axis T(O,tZ) after circulation of drilling
thermal diffusion equation that describes fluid has ceased, we used the solution of the
cooling along the axis of a cylindrical body with known initial distribution, placed in an infinite medium at constant temperature (Carslaw and Jaeger ,1959).
TD(tD,n) = 2p rTCD(?,tD) exp(-p? 1 d.r ( 3 )
where T i s a variable of integration, t2 is the Bhut-in time (time between the log and well completion) and
r 2
0
T(O,tZ) - Tf TD(tD,n) =
=m - * f
4ere we asaume that, for deep wells, the radius of thermal influence is much larger hhan the well radius and, therefore, the difference in thermal properties of drilling muds and formations can be neglected. By inserting TCD into Equation 3, we obtain
I. 2 1 1 - - exp(-p% 1 + - exp(-p)
2P 2P
and 1 RD
I2 = - - I;exp(-pT 2 ) In TdT In RD
Integrating by part and using substitution u = T 2 , and noting that:
the
I explbx) dx = E i ( b x )
wa obtain
I2 = - axp ( 'PRD L
2P
Where Ei is the tabulated function) 12, and TD into Equ
Ei(-pRi) - Ei(-p) - 4p In RD
exponential integral (a Inserting valuas of 11,
tion 4, we obtain:
5
for deep wells (large tD In practice, and small p) we can assume that:
Introduction of equations 6 and 7 into Formula 5 yields:
D
~ ( 0 , t ~ ) - T t n Ei(- -) + In n - D 1
" I_
Tm - Tf In tD + 2 In Do
where
4
Dl = 0.5772 + In D = 0 . 7 5 3 2
If two measured temperatures (T1,T2) are available for the given depth with t2 = t 2 * 1 and t2 * t2.2, we obtain:
967
Finally, base (hp) (Figure 1)
where
i I
Thus the well radius and thermal diffusivi ty of the formation have no influence on Tf, as
the unknown parameter6 T and tD have been eliminated. The quantit ies rw and a , however, affect the value of Tf through TI and T2.
method to the procedure just described for We have given the name "two-point''
determining the natural formation tempera- ture. In order for th i s method to be em- ployed, the temperature logs must be per- formed i n a well under unsteady-state thermal conditions.
m
The disturbance time a t given depth isz
t l = td - th
Where ta is the total dri l l ing time, th is the period of time needed to reach the given depth. The values of th can be determined from drilling records. I n our ca6eI the drilling records were not available and the following formula was used:
h
H t l = td ( l - -1 (11 1
where h is the given depth, H is the total ver t ical depth of the well.
To determine the geothermal gradient, one, should calculate the s t a t i c formation temperature a t two different depths (Figure 1) . From formulas 8-11, one obtains:
For h = h2 ; Tf = T f Z
Thus the geothermal gradient i s t
A = T f 2 - T f l
h2 - hl
the position of the permafrost is estimated by extrapolation
T f l hp hl - - A
FIELD DATA
i n 15 deep wells located i n Northern Canada Precise temperature measurements taken
(Arctic Islands and Mackenzie Delta) were used to verify the proposed method (Taylor and Judge 1977: Judge e t aL. 1979). The to ta l depth of the wells (H), dr i l l ing time ( td ) , shut-in time (time between termination of: dr i l l ing and logging) for two temperature surveys ( t2. and t2 and two randomly selected depths (hl and h2) are presented i n Table I . The transient temperatures for depths h = hl and h = hz a t shut-in times t2
= tZ.l and t2 = t2. were taken from the previously mentioned references and are also presented i n Table I. I t should be noted that interpolation was often used to get values of temperature at the same depth for two different s h u t - i n times.
DATA PROCESSING AND DISCUSSION
From Formula 11 and Table I (a t h .I hl or h - h2) the parameter t l was calculated with an IBM PC and program util izing the E i - function for calculation of y i n Formula 9 . The formation s t a t i c temperaturea for two depths are determined from Formula 8 . A general computer program was prepared to calcu1ak.e the permafrost thickness from Formulas 8-13 : The resul ts of the calculations are presented i n Table 11. The predicted formation s t a t i c temperatures ( T f l 1 T f Z ) for two depths ( h l I h 2 ) are a lso presented i n Table 11. Permafrost thicknesses (hp*) obtained from temperature logs a f te r long s h u t - i n times ( t z * ) were
point" method (Table 11). compared to those determined by the "two
Comparison indicates that the proposed "two point" method can be used to predict the permafrost
of the suggested method can be improved i f thickness with good accuracy. The accuracy
mre than two depths are selected i n the section of the w e l l below the permafrost. I n Table 111, the values of h are presented for s i x combinations of hl and h2 (four depths). The average value of permafrytit thickness is
permafrost thickness (h * ) for this well is 276.3 m . If one assumes the exact" value of
259 m as determined by the long-time method of Taylor, et a3.. , a (Table II ) then the proposed short-time method provides a value
P
P
968
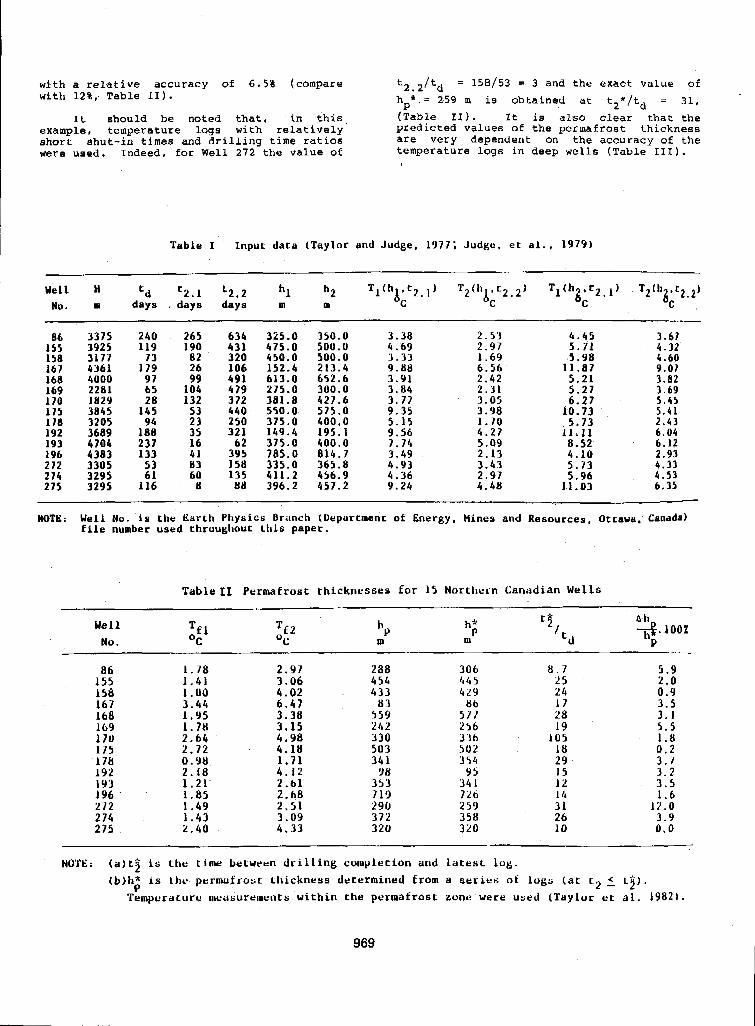
with a re la t ive accuracy of 6.5% (compare t2. 2/ta = 158/53 = 3 and the exact value of with 12%. Table 11). h * , = 259 m is obtained at tZx/td = 3 1 ,
It should be noted that. i n t h i s (Table 11). ft is also clear that the example, temperature Logs with relatively p red ic t ed values of the permafrost thickness short: shu t - in times and dr i l l i ng time ra t ios are very dependent on the accuracy of the were used. Indeed, for Well 272 the value Of temperature logs i n deep wells (Table 111).
P
Table I Input data (Taylor and Judge, 1977; Judge, e t al.. 1979)
155 3925 119 190 431 86 3375 240 265 634
158 3177 73 82 320 167 4361 179 26 106 168 4000 91
65 104 479 99 491
170 1829 169 2281
28 132 312 175 3845 145 53 440 " _ - _ .. 1711 3205 94 23 250 192 3689 188 35 321 193 4704 237 16 62
~ " ~~
196 4383 133 41 395 ~- ~
272 3305 53 83 158 274 3295 61 60 135 275 3295 116 8 88
355.0 475.0 450.0
613.0 152.4
381.8 275.0
550.0 3 1 5 . 0
375.0 149.4
785.0 335.0 411.2 396.2
350.0 500.0 500.0
652.6 213.4
427.6 300.0
400 * 0 575.0
400.0 195.1
814.7 365.8 456.9 457.2
3.38 4.69 3.33 9.88 3.91 3.84 3.77 9.35 5.15 9.56 7.74 3 . 4 9 4.93 4 . 3 6 9.24
2.53 4.45 2.97 I .69
5.71
6.56 2.42
11.87 5.21
2.31 3 .05 6 .27
5.21
5.98
3.98 10.13 1.70 4.27
5.13
5.09 2.13
0.52
3.43 4.10 5.73
2.97 5.96
. . _ .
il.11
4.48 11.03
3.67 4 . 3 2 4 . 6 0 9.07 3.82 3.69 5 . 4 5 5.41 2.43 6.04 6.12 2.93 4 . 3 3 4 . 5 3 6.35
NOTE: Well NO. is the Earth Physics Branch (Department of Energy, Mines and Resources, Ottawa, Canada) file number used throughaut this paper.
Table11 Permafrost thicknesses for 15 Northern Canadian Wells
Well No.
Tf 1 OC
Tf 2 OC
hP m
t9, 'd
86 1.78 2.97 288 306 8.7 155 1 - 4 1 3.06 454 445 25
5.9
I58 2.0
1 .uil 4.02 4 33 429 24 167
0.9 3.44 6.47 8 3 8 b 17
168 3.5
1 . Y 5 3.38 559 571 28 169 1.78 3.15 242 256 19 5.5
3.1
1 l U 175 I78 192 193 196 272 274 275
NOTE: (a
( b
2.64 2.72 O , Y 8 2.18 1 . 2 1 1.85 1 . 4 9 1 . 4 3 2.40
4.90 4.18 1.71 4.12 2.61 2.68 2.51 3.09 4.33
330 336 105 503 502 18 34 1 354 29
98 9!l 15 353 34 1 719
I 2 7 2 0 14
290 2 59 372
3 1 358 26
32U 320 10
1.8 0.2 3.7 3.2 3.5 1.6
12.0 3.9 0 . 0
)tj$ is t h e time becueen drilling completion and l a t e s t log.
969
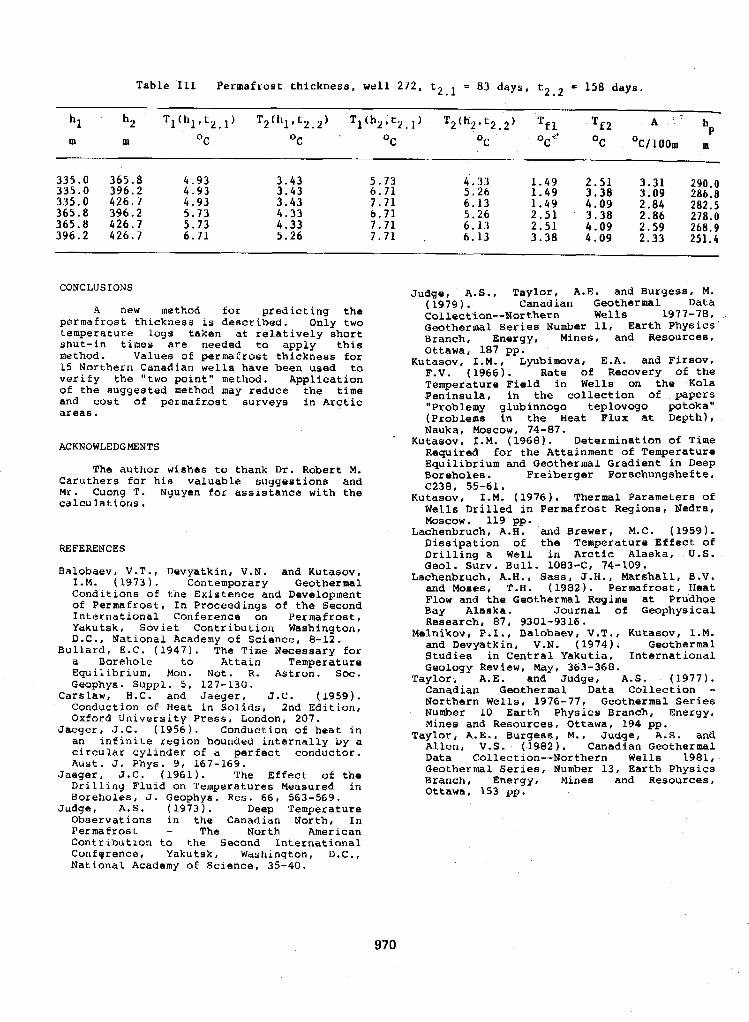
Table 111 Perm laf r ost thickness. I
335.0 365.8 4.93 3.43 5.73 335.0 396.2 4.93 335.0 426.7 4.93
3.43 6.71
365.8 396.2 3.43
5.73 7.71
4.33 6.71 5.73
396.2 426.7 4.33 7.71
6.71 5.26 7.71 365.8 426.7
4.33 5.26 6.13 5.26 6.13 6.13
1.49 1,49 1.49 2.51 2.51 3.38
2.51 3.38 4.09 3.38 4.09 4,09
3-31 3.09
2 .86 2.59 2.33
2 . 8 4
290.0
282.5 278.0 268.9 251.4
286.8
CONCLUSIONS
A new method for predicting the permafrost thickness is described. Only two temperature logs taken at relatively short shut-in times are needed to apply this method. Values of Permafrost thickness for 15 Northern Canadian wells have been used to verify the "two point" method. Application of the suggested method may reduce the time and cost o f permafrost surveys in Arctic areas
ACKNOWLEDGMENTS
The author wishes to thank Dr. Robert M. Caruthers for his valuable suggestions and Mr. Cuong T. Nguyen for assistance with the calculations e
REFERENCES
Balobaev, V.T., Devyatkin. V.N. and Kutasov. I.M. (1973). Contemporary Geothermal Conditions of the Existence and Development of Permafrost, In Proceedings of the Second
Yakutek, Soviet Contributian Washington, International Conference on Permafrost,
Bullard, E.C. (1947). The Time Necessary for D.C., National Academy of Science, 8-12.
a Borehole to Attain Temperature Equilibrium, Mon. Not. R . hstron. SOC.
Carslaw, H.C. and Jaeger. J.C. (1959). Conduction of Heat in Solids, 2nd Edition, Oxford University Press, London, 207.
Jaeger, J.C. (1956). Conduction of heat i n an infinite region bounded internally by a circular cylinder of a perfect conductor.
Jaeger, J.C. (1961). The Effect of the Drilling Fluid on Temperatures Measured in Boreholes, J. Geophys. Res. 66, 563-569.
Judge, A . S . (1973) Deep Temperature Observations in the Canadian North, In Permafrost - The North American Contribution to the Second International Confqrence, Yakutsk, Washington, D.C., National Academy aE Science, 35-40.
Geophys. SuppL. 5. 127-130.
Aust. Y . Phys. 9, 167-169.
Judge, A . S . , Taylor, A.E. and BUrqess, M.
Collection--Northern Wells 1977-78, Geothermal Series Number 11, Earth Physics' Branch, Energy, Mines, and Reaources,
Kutasov, I.M., Lyubimova, E.A. and FirBOv. Ottawa, 187 pp.
F.V. (1966). Rate of Recovery Of the Temperature Field in Wells on the Kola peninsula, in the collection of papers "Problemy glubinnogo teplovogo potoka" (Problems in the Heat Flux at Depth) I Nauka, Moscow, 74-87.
Kutasov, I.M. (1968). Determination of Time
Equilibrium and Geothermal Gradient in Deep Required for the Attainment of Temperature
Boreholes. Freiberger Porechungshefte.
Kutasov, 1.M. (1976). Thermal Parameters of Wells Drilled in Permafrost Regions, Nedra,
Lachenbruch, A.H. and Brewer , M. C - ( 1959 1. Moscow. 119 pp.
Dissipation of the Temperature Effect of
Geol. Surv. Bull. 10834, 74-109. Drilling a Well in Arctic Alaska, U . S .
Lachenbruch. A.H. , Sass, J.H., Marshall, B . V . and Moses, T.H. (1982). Permafrost, Heat Flow and the Geothermal Regime at Prudhoe Bay Alaska. Journal of Geophysical Research, 87, 9301-9316.
Melnikov, P.I., Balobaev, V.T., Kutasov, 1.M. and Devyatkin, V . N . (1974). Geothermal Studies in Central Yakutia, International
Taylor, A.E. and Judge, A.S. (1977). Geology Review. May, 363-368.
Northern Wells, 1976-77, Geothermal Series Canadian Geothermal Data Collection
Number 10 Earth Physics Branch. Energy, Mines and Resources, Ottawa, 194 pp.
TayLor , A.E., Burgess, M., Judge, A . S . and Allen, V.S. (1982). Canadian Geothermal Data Collection--Northern Wells 1981, Geothermal Seriea, Number 13, Earth Physics Branch, Energy, Mines and Resources, Ottawa, 153 pp.
(1979) * Canadian Geothermal Data
C238, 55-61.
970
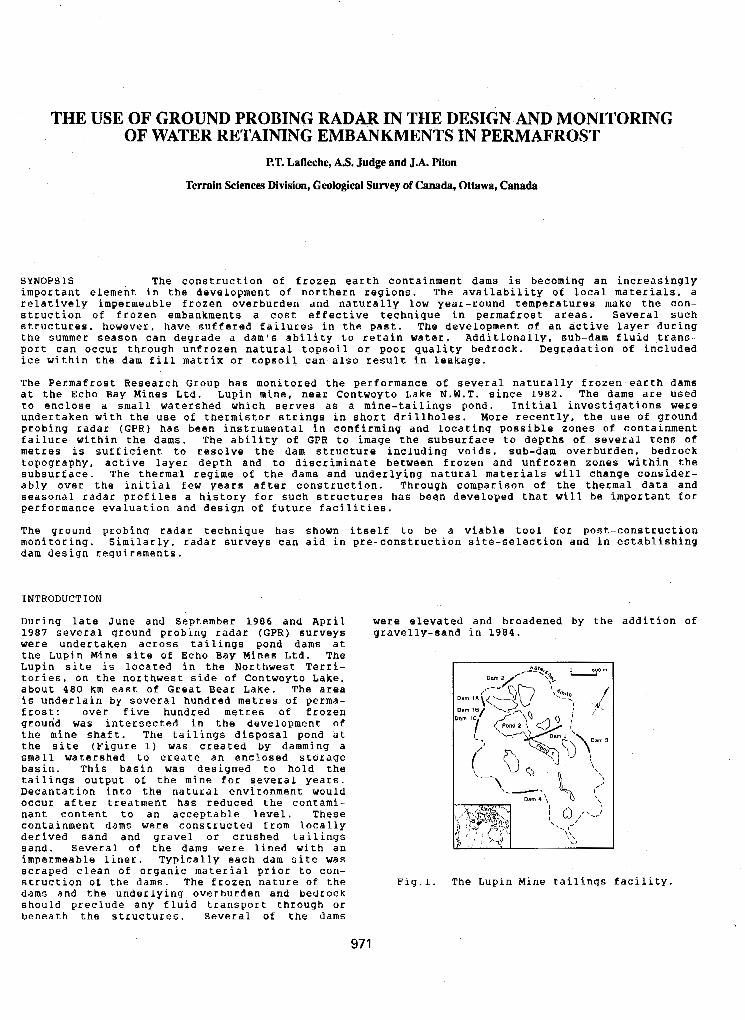
THE USE OF GROUND PROBING RADAR IN THE DESIGN AND MONITORING OF WATER RETAINING EMBANKMENTS IN PERMAFROST
P.T. Lafleche, A.S. Judge and J.A. Pilon
Terrain Scienca Division, Geological Survey of Canada, Ottawa, Canada
SYNOPSIS The construction of frozen earth containment dams is becoming an increasingly important element in the development o f northern regions. The availability of local materials. a relatively impermeable frozen overburden and naturally low year-round temperatures make the con-, struction o f frozen embankments a c o s t effective technique in permafrost areas. Several such structures, however, have suffered failures in the past. The development of an active layer during the summer season can degrade a dam's ability to retain water. Additionally. sub-dam fluid trans- port can occur through unfrozen natural topsoil or poor quality bedrock. Degradation of included ice within the dam fill matrix or topsoil can also result in leakage.
The Permafrost Research Group has monitored the performance of several naturally frozen earth dams at the Echo Bay Mines Ltd. Lupin mine, near Contwoyto Lake N.W.T. since 1982. The dams are used to enclose a small watershed which serves a8 a mine-tailings pond. Initial investigations were undertaken with the use of thermistor strings in short drillholes. More recently, the use of ground probing radar ( G P R ) has been instrumental in confirming and locating possible zones o f containment failure within the dams. The ability of GPR to image the subsurface to depths of several tens of metres is sufficient to resolve the dam structure including voids, sub-dam overburden, bedrock topography. active layer depth and to discriminate between frozen and unfrozen zones within the subsurface. The thermal regime of the dams and underlying natural materials will change consider- ably over the initial few years after construction. Through comparison of the thermal data and seasonal radar profiles a history for such structures has been developed that will be important for performance evaluation and design of future facilities.
The ground probing radar technique has shown itself to be a viable tool for poet-construction monitoring. Similarly, radar surveys can aid in pre-construction site-selection and in establishing dam design requirements.
INTRODUCTION
During late June and September 1986 and April were elevated and broadened by the addition of 1987 several around probing radar (GPR) surveys gravelly-sand in 1984. were undertaken across tailings pond dams at the Lupin Wine site of Echo Bay Mines Ltd. The Lupin site is located in the Northwest Terri- tories, on the northwest side of Contwoyto Lake. about 4 8 0 km east of Great Bear Lake, The area is underlain by several hundred metres of perma- frost: over five hundred metres of frozen ground was intersected in the development of the mine shaft. The tailing6 disposal pond at the site (Figure 1) was created by damming a small watershed to create an enclosed storage \
basin. This basin was designed to hold the tailings output o f the mine for several years. Decantation into the natural environment would occur after treatment has reduced the contami- \
nant content to an acceptable level. These j 0 , d containment dams were constructed from locally derived sand and gravel or crushed tailings s a n d . Several of the dams were lined with an impermeable liner. Typically each dam site was scraped clean of organic material prior to con- struction of the dams. The frozen nature of the Fig.1. The Lupin Mine tailing8 facility. dams and the underlying overburden and bedrock should preclude any fluid transport through or beneath the structures. Several of the dams
x , <' ':>
.\ \ \
97 1
Despite the precautions taken in the design and construction of the dams. leakage o f tailing6 water has been known to occur during the thaw
The purpose of the GPR surveys was to establish season through or around several of the dams.
if a high resolution geophysical technique, such as GPR , could detect unfrozen zones (taliks) within or below the dams and so reveal a picture of the dam and overburden conditions. Unfrozen zones were thought to be the cause of fluid transport from the tailings pond into the sur- rounding environment. In addition to the radar surveys, a ground temperature monitoring program has been carried out at the site since 1982. Thermistors are ,installed in boreholeg through four of the dams. Early temperature measuring cables suffered failures but reliable ground temperature data are available from June 1, 1985 to the present date. Temperature data normally are collected several times per month.
The ability of GPR to image the ground to 5 0 m in some casea allows resolution of the dam structures, sub-dam overburden conditions, bed- rock topography and depth of thaw: and to locate un€rozen zones (taliks) within the overburden and uppermost bedrock.
FROZEN CORE CONTAINMENT DAMS
Frozen core containment dams have been used extensively in the Soviet Union for a number of years. The main advantage of these structures is that they are impermeable to fluid flow due to their frozen nature and ate relatively cheap to construct as materials can be found locally. Typically the structures are built upon the natural Overburden and are less than 50 m in height [Sayles, 1983). Such dams are maintained i n an impermeable state either by naturally low local temperatures or through active refrigera- tion techniques such as the installation of cold air or liquid refrigerant piping. Several instances of dam failure have occurred in the Soviet Union. These usually involve a small area o f leakage which rapidly expands due to local melting around the leak site. Causes of potentia1 leakage are insufficient freezing of the dam during construction, degradation of the dam base due to thermal heating by the retained fluid which eventually results in a sub-dam talik, thaw desradation o € the reservoir side of the dam embankment. melting arising from h fluid flows at outlet structures or the creat of voids within the dam arising from the melt of large ice pockets inadvertently included the dam during construction.
GROUND PROBING RADAR (GPR)
The GPR is a fairly new geophysical tool, the f j r s t models being commercially available in the mid 1970's. GPR i s similar in principle to the reflection seismic method in that a p u l s e of energy is directed into the ground and the arrival times of reflections from subsurface interfaces are recorded. The main difference between the techniques is that radar uses an electromagnetic as opposed to an acoustic energy source. Radar possesses a much more limited depth of penetration than seismic, typically of
the order of 50 m or less, but provides a s'ig- nificant increase in resolution. Subsurface resolution is dependant upon the puIse length and, a s such, can be a s low as one half a metre. This high spatial resolution can be important in the solution of complex near surface prob- lems. GPR has been found to be host usefvl in engineering geophysical applications s.uch as the delineation o f overburden thic'kness, perma- frost extent and depth (LaFleche and Judge. 1987a). water table depth and ice thickness (Annan and Davis, 1977) or for locating buried cables, pipes (Morey. 1974). fractures (Olhoeft, 1978). voids (Owen and Suhler. 1980). gravels (Davis et a l . . 1984) and tunnels (Dolphin et al., 1978).
Radar reflections are produced by interfaces between materials of contrasting electrical properties. specifically the dielectric permit- tivity or electrical conductivity. Common causes of subsurface reflections are material interfaces (overburden-rock, gravel-sand), top of the water table, boundaries between frozen and unfrozen water, voids, fractures and ice lenses. Within the radio frequency band, a large dielectric and conductivity contrast exists between water and most natural geologic materials (Morey, 1974). The ability of a material to retain water within its pore spaces is an important factor for the deterrhination of its bulk electrical properties. As such. the presence or absence of water and its chemistry controls, to a large degree, the subsurface propagation characteristics o f the radar pulse. Distinct variations in grain size or rock porosity. and the associated changes in the volume percentage of retaiped water, will pro- duce radar reflections.
The depth to which a radar pulse will effec- tively "penetrate" is dependant upon the electromagnetic absorption characteristics of the ground and the amount of energy lost due to reflection. refraction and diffraction effects. In a general sense, the depth of penetration will decrease with increasing water content. Dry, homogenous or frozen materials will offer the greatest potential depth penetration.
The depths to specific reflectors are calculated from a knowledge of the subsurface radar veloc- icy distribution. In air, the radar pulse, typically in the MHz o r GHz frequency range, travels with the speed of light (0.3 m / n s ) . In the ground the pulse travels with a velocity (typically 10 to 50% of the speed of light) which is dependent upon the electrical proper- ties of the material traversed. The radar velocity distribution in the ground can be determined, as in the case of seismic surveys, by a common depth point sounding ( C D P ) .
The low conductivity and low dielectric losses of very high frequency (VAF) electromagnetic wave6 in frozen ground allow considerable pene- tration in permafrost. The extent of taliks can be mapped a6 the sharp contrasts in conduc- tivity and permittivity between frozen and un- frozen zones result in strong reflections from these boundaries.
-.
972
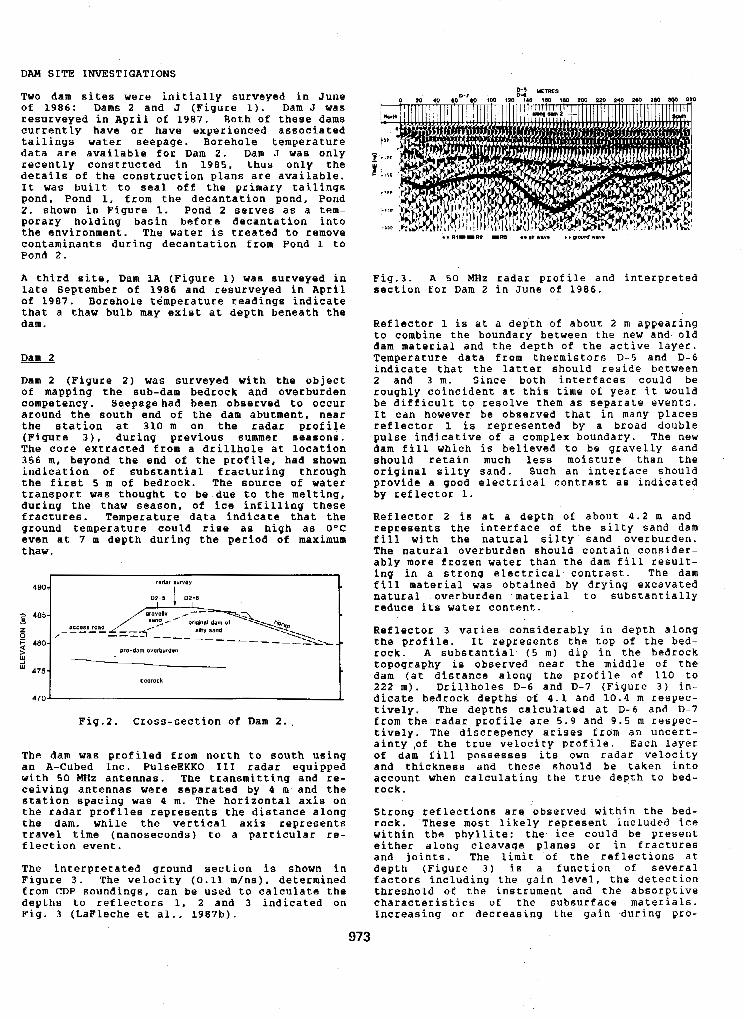
DAM SITE XNVESTXGATIONS
Two dam sites were initially surveyed in June of 1986: Dams 2 and J (Figure 1). Dam J was resurveyed in April of 1987. Both of these dams currently have or have experienced associated
data are available for Dam 2. Dam J was Only tailings water seepage. Borehole temperature
recently constructed in 1985, thus only the details of the construction plans are available.
pond. Pond 1, from the decantation pond, Pond It was built to seal off the primary tailings
2, shown in Figure 1. Pond 2 serves as a tem- porary holding basin before decantation into the environment. The water is treated to remove contaminants during decantation from Pond 1 to Pond 2.
A third site, Dam 1A (Figure 1) was surveyed in late September of 1986 and Ke8UrVeyed in April of 1987. Borehole temperature readings indicate that a thaw bulb may exist at depth beneath the dam.
Dam 2
Dam 2 (Figure 2 ) was surveyed with the object of mapping the sub-dam bedrock and overburden competency. Seepagehad been observed to occur around the south end of the dam abutment, near the station at 310 m on the radar profile
The core extracted from a drillhole at location (Figure 3 ) . during previous summer seasons.
3 5 6 m, beyond the end of the profile, had shown
the first 5 m o f bedrock. The source of water indicarion of substantial fracturing through
during the thaw season. of ice infilling these transport was thought to be due to the melting,
fractures. Temperature data indicate that the ground temperature could r i s e as high as O'C even at 7 m depth during the period o f maximum thaw.
"-1"""-
Fig.2. Cross-section o f Dam 2 .
The dam was profiled from north to south using
with 50 MHz antennas. The transmitting and re- an A-Cubed fnc. PulseEKKO I 1 1 radar equipped
ceiving antennas were separated by 4 m and the station spacing was 4 m. The horizontal axis On the radar profiles represents the distance along the dam, while the vertical axis represents travel time (nanoseconds) to a particular re- flection event.
The interpretated ground section is shown in Figure 3 . The velocity (0.11 m/ns). determined from CDP soundings, can be used to calculate the depths to reflectors 1. 2 and 3 indicated on Fig. 3 (LaFleche et al., 1987b).
Fig.3. A 50 MHz radar profile and interpreted section for Dam 2 in June of 1986.
Reflector 1 is at a depth of about 2 m appearing
dam material and the depth of the active layer. to combine the boundary between the new and old
Temperature data from thermistors D-5 and D-6 indicate that the latter should reside between 2 and 3 m. Since both interfaces could be roughly coincident at this time of year it would be difficult to resolve them as separate events. It can however be observed that in many places reflector 1 is represented by a broad double pulse indicative of a complex boundary. The new dam fill which is believed to be gravelly sand should retain much less moisture than the original silty sand. Such an interface should provide a good electrical contrast a s indicated by reflector 1.
Ref lector 2 is at a depth of about 4.2 m and
fill with the natural silty sand overburden. represents the interface of the silty sand dam
The natural overburden should contain consider- ably more frozen water than the dam fill result-
fill material was obtained by drying excavated ing in a strong electrical contrast. The dam
natural overburden material to substantially reduce its water content.
Reflector 3 varies considerably in depth along the profile. It represents the top of the bed- rock. A substantial ( 5 m) dip in the bedrock topography is observed near the middle of the dam (at distance along the profile of 110 to 222 m). prillholes D-6 and D-7 (Figure 3 ) in- dicate bedrock depths of 4.1 and 10.4 m respec- tively. The depths calculated at D-6 and D-7 from the radar profile are 5.9 and 9.5 m respec- tively. The discrepency arises from an Uncert- ainty ,of the true Velocity profile. Each layer of dam fill possesses its own radar velocity and thickness and these should be taken into account when calculating the true depth to bed- rock.
Strong reflections are observed within the bed- rock. These most likely represent included ice within the phyllite: the ice could be present either along cleavage planes or In fractures and joints, The limit of the reflections at depth (Figure 3 ) is a function of several factors including the gain level, the detection threshold of the instrument and the absorptive characteristics of the subsurface materials. Increasing or decreasing the gain during pro-
973
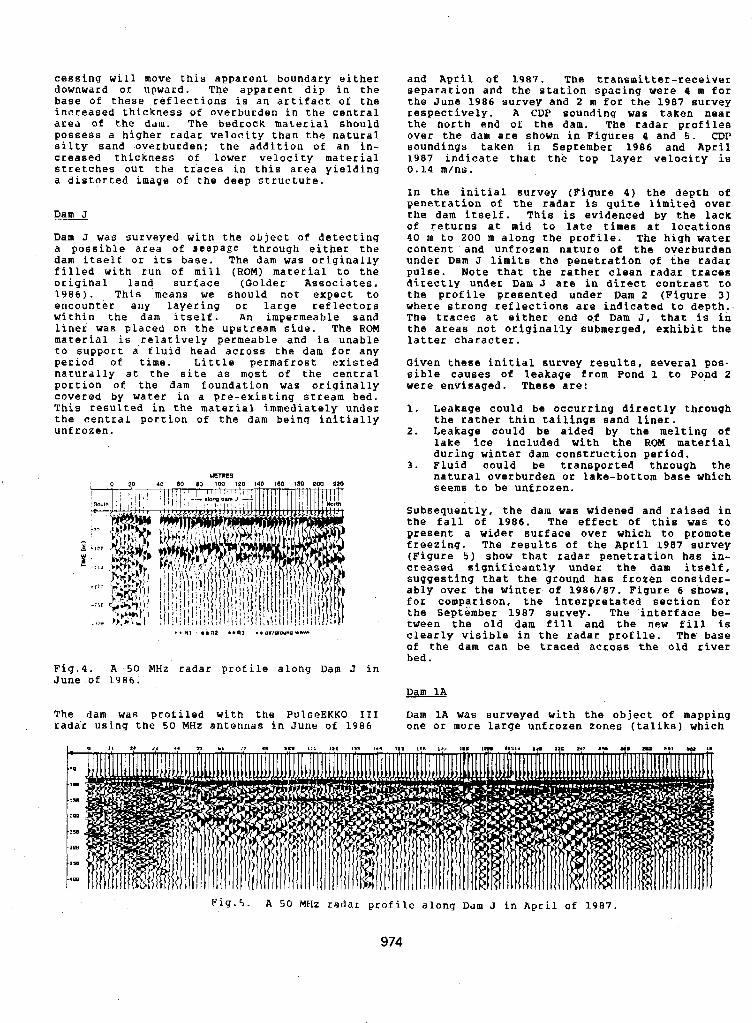
cessing will move this apparent boundary either downward O K upward. The apparent dip in the base of these reflections is an artifact of the increased thickness of overbucden in the central area of the dam. The bedrock material should possess a higher radar velocity than the natural silty sand overburden: the addition of an in- creased thickness of lower velocity material stretches out the traces in this area yielding a distorted image of the deep structure.
Dam J
Dam J was surveyed with the object of detecting a possible area of Beepage through either the dam itself or its base. The dam was originally filled ,with run o f mill (ROM) material to the original land surface (Golder Associates, 1986). This means we should not expect to
within the d a m itself. An impermeable sand encounter any layering or large reflectors
liner was placed on the upstream side. The ROM material is relatively permeable and is unable to SUppOKt a fluid head across the dam for any period o f time. Little permafrost existed naturally at the site as most of the central portion o f the dam foundation was o~iginally covered by water in a pre-existing stream bed. This resulted in the material immediately under the central portion of the dam being initially unf cozen.
40 e0 83 100 120 i d 0 Id0 1 8 0 200 120 METRE8
. . R i ..R2 ..e3 +.awIIWI1(1w."C
Fig.4. A 50 MHz radar profile along Dam J in June of 1986.
and April of 1987. The transmitter-receiver separation and the station spacing were 4 m for the June 1986 survey and 2 m for the 1987 survey respectively. A CDP sounding was taken near the north end of the dam. The radar profiles over the dam are shown in Figures 4 and 5 . CDP soundings taken i n September 1986 and April 1987 indicate that the top layer velocity is 0 . 1 4 m/ns.
In the initial survey (Figure 4) the depth of penetration of the radar is quite limited over the dam itself. This is evidenced by the lack of returns at mid to late times at locations 40 m to 200 m along the profile. The high water
under Dam J limits the penetration o f the radar content and unfrozen nature of the overburden
pulse. Note that the rather clean radar traces directly under Dam J are in direct contrast to the profile presented under Dam 2 (Figure 3) where strong reflections are indicated to depth, The traces at either end of Dam Y , that is in the areas not originally submerged, exhibit the latter character.
Given these initial survey results, several pos- sible causes of leakage from Pond 1 to Pond 2 wer@ envisaged. These are:
1. Leakage could be occurring directly thiough the rathex thin tailings sand liner.
2. Leakage could be aided by the melting o f lake ice included with the ROM material
3. Fluid could be transported through the during winter dam construction period.
natural overburden or lake-bottom base which seems to be unfrozen.
Subsequently, the dam was widened and raised in the fall of 1986. The effect of this was to present a widet surface over which to promote freezing. The results of the April 1987 survey (Figure 5) show that radar penetration has in- creased significantly under the dam itself, suggesting that the ground has frozen consider- ably over the winter of 1986/87. Figure 6 shows. for comparison, the interpretated section for the September 1987 survey. The interface be- tween the old dam fill and the new fill is clearly Visible i n the radar profile. The base of the dam can be traced accoss the old river bed e
Dam 1A
The dam was profiled with the PulseEKKO I I I Dam 1A was surveyed with the object of mapping rada-r using the 50 MHz antennas in June of 1986 one or more large unfrozen zones (talik8) which
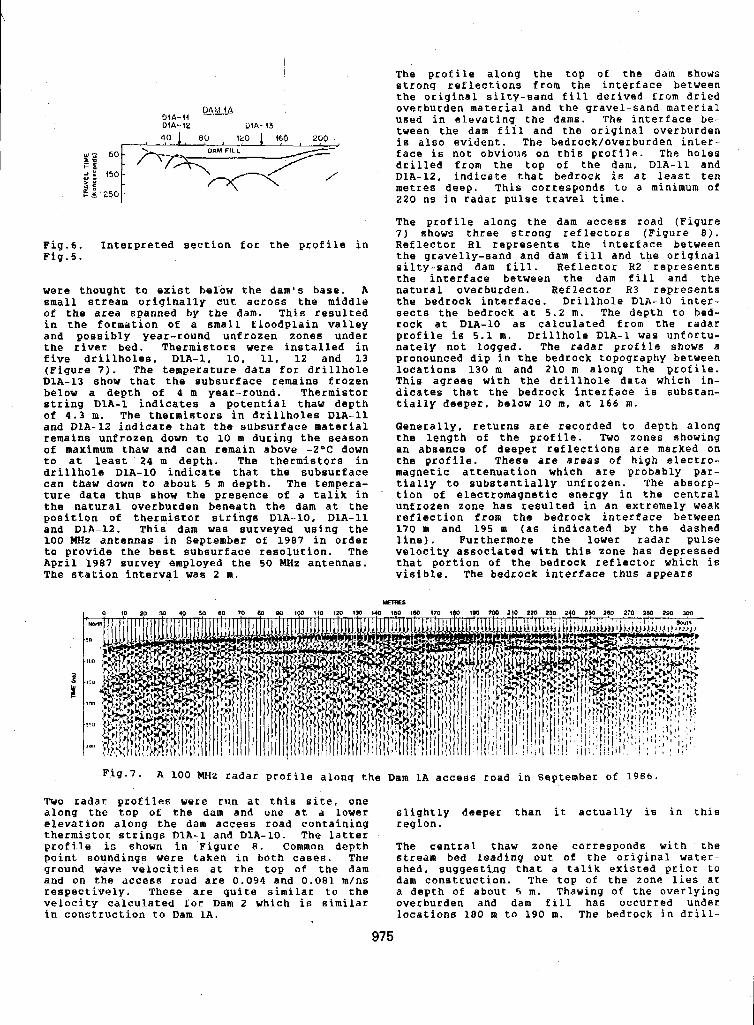
Fig.6. Interpreted section for the profile in Fig. 5.
were thought to exist below the dam's base. A small stream originally cut across the middle of the area spanned by the dam. This resulted in the formation of a small floodplain valley and possibly year-round unfrozen zones UndeL the rivet bed. Thermistors were installed in five drillholes, D1A-1, 10, 11, 12 and 13 (Figure 7). The temperature data fOK drillhole D1A-13 show that the subsurface remains frozen below a depth of 4 m year-round. Thermistor string D1A-1 indicates a potential thaw depth of 4.3 m. The thermistors in drillholes D1A-11 and D1A-12 indicate that the subsurface material remains unfrozen down to 10 m during the season of: maximum thaw and can remain above - 2 - C down t o at least 24 m depth. The thermistors in drillhole D1A-10 indicate that the subsurface can t h a w down t o about 5 m depth. The tempeta- ture data thus show the presence of a talik in the natural overburden beneath the dam at the position of thermistor strings D1A-10. D1A-11 and D1A-12. This dam was surveyed using the 100 MHz antennas in September of 1907 in order to provide the best subsurface resolution. The April 1987 survey employed the 50 MHz antennas. The station interval was 2 m.
The profile along the top of the dam shows strong reflections from the interface between the original silty-sand fill derived from dried overburden material and the gravel-sand material used in elevating- the dams. The interface be- tween the dam fill and the original overburden is also evident. The bedrock/overburden inter- face is not obvioue on this profile. The hole6 drilled from the top of the dam, D1A-11. and D1A-12, indicate that bedrock i s at least ten metres deep. This corresponds to a minimum of 220 ns in radar pulse travel time.
The profile alonq the dam accesB road (Figure 7) shows three strong reflectors (Figure 8 ) . ReflectOK R1 represents the interface between the gravelly-sand and dam fill and the original silty-sand dam fill. Reflector R2 represents the interface between the dam fill and the natural overburden. ReflectOK R3 represents the bedrock interface. Drillhole D1A-10 inter- sect6 the bedrock at 5.2 m. The depth to bed- rock at D1A-10 as calculated from the radar profile i6 5 . 1 m. Drillhole D1A-1 was uniortu- nately not logged. The radar profile shows a pronounced dip in the bedrock topography between
This agrees with the drillhole data which in- locations 130 m and 210 m along the profile.
dicates that the bedrock interface is substan- tially deeper. below 10 m, at 166 m.
Generally, returns are recorded to depth along the length o f the profile. Two zones showing an absence of deeper reflections are marked on the profile. These are area6 of high electro- magnetic attenuation which are probably par- tially to substantially unfrozen. The absorp- tion of electromagnetic energy in the central unfrozen zone has resulted in an extremely weak reflection from the bedrock interface between 170 m and 195 m (a6 indicated by the dashed
velocity associated with this zone has depressed line). Furthermore the lower radar pulse
that portion of the bedrock reflector which is visible. The bedrock interface thus appears
Fig-7. A 100 MHz radar profile along the Dam 1A access road in September of 1986.
Two radar profiles were run at this site. one along the top of the dam and one at a lower elevation along the dam access road containing thermistor strings DTA-1 and D1A-10. The latter profile is shown in Figure 8 . Common depth point soundings were taken in both cases. The ground wave velocities at the top of the dam ana on the access road are 0.094 and 0.081 m/ns respectively. These are quite similar to the velocity calculated for Dam 2 which is similar in construction to Dam 1A.
slightly deeper than it actually is in this region.
The central thaw zone corresponds with the stream bed leading out of the original water- shed, suggesting that a talik existed prior to dam construction. The top of the zone lies at a depth of about 5 m . Thawing o f the overlying overburden and dam fill has occurred under locations 180 m to 190 m , The bedrock in d r i l l -
975
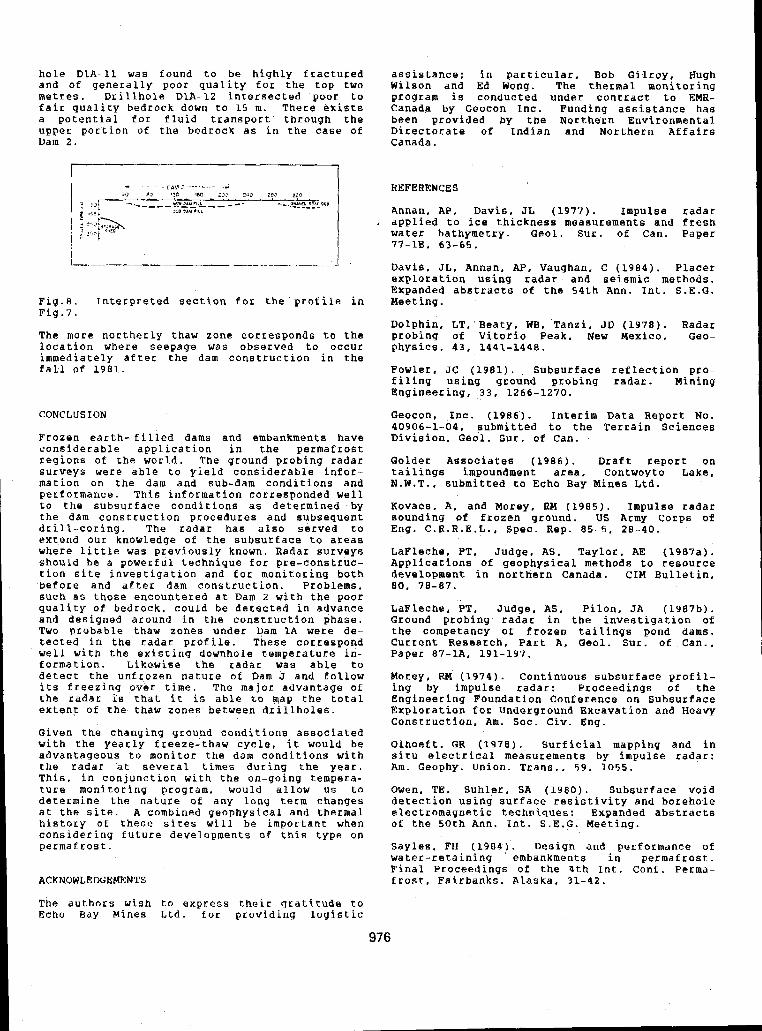
hole D1A-11 was found to be highly fractured and of generally poor quality for the top two metres. Drillhole D1A-12 intersected poor to fair quality bedrock down to 15 m. There exists a potential for fluid transport through the upper portion of the bedrock as in the case of Dam 2.
Fig.8. Interpreted section for the profile in Fig.7.
The more northerly thaw zone corresponds to the
immediately after the dam construction in the location where seepage was observed to occur
fall of 1981.
CONCLUSION
Frozen earth-Eilled dams and embankments have considerable application in the permafrost regions of the world. The ground probing radar surveys were able to yield considerable infor- mation on the dam and sub-dam conditions and performance. This information corresponded well to the subsurface conditions as determined by the dam construction procedures and subsequent drill-coring. The radar has also served to extend our knowledge of the subaurface to areas where little was previously known. Radar surveys should be a powerful technique for pre-construc- tion site investigation and for monitoring both before and after dam construction. Problems, such a s those encountered at Dam 2 with the poor quality of bedtock. could be detected in advance
Two probable thaw zones under Dam 1A were de- and designed around in the construction phase.
tected in the radar profile. These correspond well with the existing downhole temperature in- formation. Likewise the radar was able to detect the unfrozen nature of Dam J and Iollow
the radar is that it is able to map the total its freezing Over time. The major advantage of
extent o f the thaw zones between drillholes.
Given the changing ground conditions associated with the yearly freeze-thaw cycle, it would be advantageous to monitor the dam conditions with the radar at several times during the year. This, in conjunction with the on-going tempera- ture monitoring program. would allow us to determine the nature o f any lony term changes at the site. A combined geophysical and thermal history o f these sites will be important when considering future developments of this type on permafrost.
ACKNOWLEDGEMENTS
The authors wish to express their gratitude to Echo Bay Mines Ltd. €or providing logistic
assistance; in particular. Bob Gilroy, Hugh Wilson and Ed Wong. The thermal monitoring program is conducted under contract to EMR- Canada by Geocon Inc. Funding assistance has been provided by the Nocthern Environmental Directorate of Indian and Northern Affairs Canada.
REFEKENCES
Annan, A!?, Davis, JL (1977). Impulse radar applied to ice thickness measurements and fresh water bathymetry. Geol. Sur. of Can. Paper 7 7 - 1 B . 6 3 - 6 5 .
Davis, JL, Annan, AP, Vaughan, C (1984). Placer exploration using radar ana seismic methods. Expanded abstracts of the 54th Ann. Int. S.E.G. Meeting.
Dolphin, LT, Beaty, WE. Tanzi. JD (1978). Radar probing of Vitorio Peak, New Mexico. Geo- physics. 4 3 , 1441-1448.
Fowler, JC (1981). Subsurface reflection pro- filing using ground pEobing radar. Mining Engineering, 3 3 , 1266-1270.
Geocon. Inc. (1986). Interim Data Report No. 40906-1-04, submitted to the Terrain Sciences Division, Geol. Sur. of Can.
Goldet Associates (1986). Draft report on tailings impoundment area, Contwoyto Lake, N.W.T., submitted to Echo Bay Mines Ltd.
Kovacs. A , and Morey, RM (1985). Impulse radar sounding of frozen ground. US Army Corps of Ens. C.R.R.E.L., Spec. Rep. 85-5. 2 8 - 4 0 .
LaFleche, PT, Judge, AS, Taylor, AE (1987a). Applications of geophysical methods to resource development in northern Canada. CIM Bulletin, 8 0 , 78-87.
LaFleche. PT, Judge, AS, Pilon, JA (1987b). Ground probing radar in the investigation of the competancy of frozen tailings pond dams. Current Research, Part A, Geol. Sur. of Can., Paper 87-1A. 191-197,
MOKey, RM (1974). Continuous subsurface p r o f i l - ing by impulse radar: Proceedings of the Engineering Foundation Conference on Subsurface Exploration for Underground Excavation ana Heavy Construction, Am. SOC. Civ. Eng.
Olhoeft. GR (1978). Surficial mapping and in situ electrical measurements by impulse radar: Am. Geophy. Union. Trans., 59, 1095.
Owen, TE, Suhler. SA (1980). Subsurface Void detection using surface resistivity and borehole electromagnetic techniques: Expanded abstracts of the 50th Ann. Int. S.E.G. Meeting.
Sayles. FH ( 1 9 8 4 ) . Design and performance of water-retaining embankments in permafrost. Final Proceedings of the 4th fnt. Conf. Perma- frost. Fairbanks. Alaska. 31-42.
976
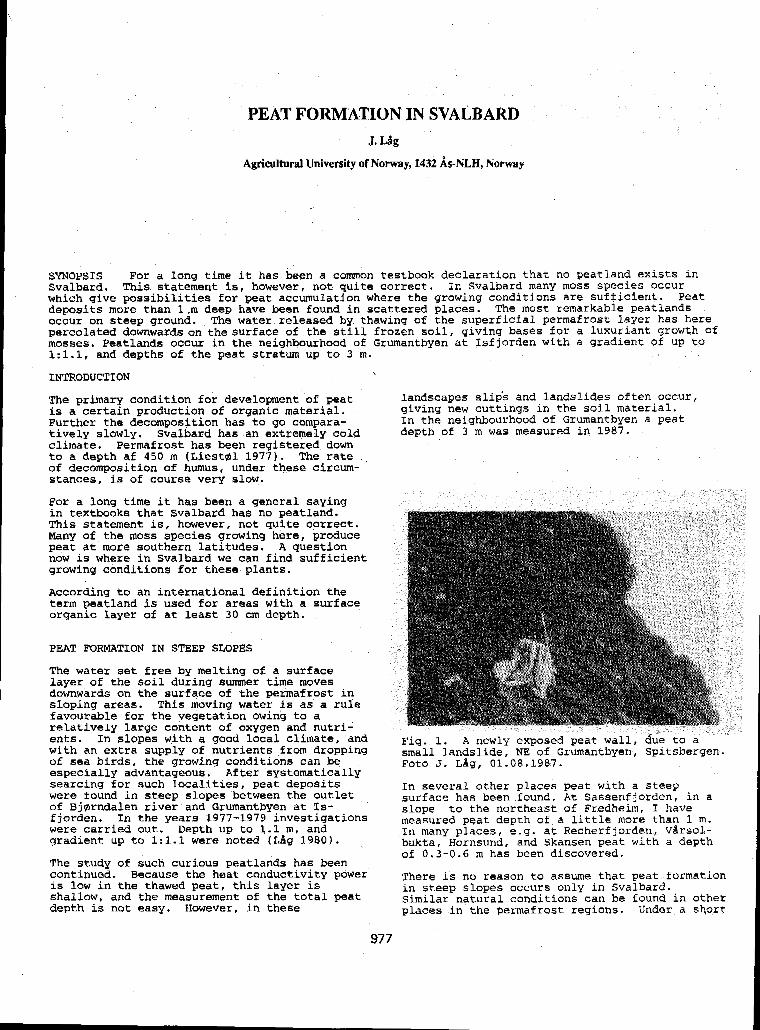
PEAT FORMATION IN SVALBARD J. LPg
Agricultural University of Norway, 1432 As-NLH, Norway
SYNOPSIS For a long time it has been a common testbook declaration that no peatland exists in
which give possibilities fox peat accumulation where the growing conditions are sufficient. Peat Svalbard. This statement is, however, not quite correct. In Svalbard many moss species occur
deposits more than 1.m deep have been found in scattered places. The most remarkable peatlands occur on steep ground. The water released by thawing of the superficial permafrost layer has here percolated downwards on the surface of the still frozen soil, giving bases for a luxuriant growth of mosses. Peatlands occur in the neighbourhood of Grumantbyen at Isfjorden with a gradient of up to
landscapes slips and Landslides often occur, giving new cuttings in the soil material. In the neighbourhood of Grumantbyen a peat depth of 3 m was measured in 1987.
1: 1.1, and depths of the peat stratum up to 3 m.
INTRODUCTION
The primary condition for development of peat is a certain production of organic material. Further the decomposition has to go compara- tively slowly. SvaLbard has an extremely cold climate. Permafrost has been registered down to a depth af 450 m (LiestaL 1977). The rate of decomposition of humus, under these circum- stances, is of course very slow.
For a long time it has been a general saying in textbooks that svalbard has no peatland. This statement is, however, not quite correct. Many of the moss species growing here, produce peat at more southern latitudes. A question now is where in Svalbard we can find sufficient growing conditions for these plants.
According to an international definition the term peatland i s used for areas with a surface organic layer of at least 30 cm depth.
PEAT FORMATION IN STEEP SLOPES
The water set free by melting of a surface layer of the soil during summer time moves downwards on the surface of the permafrost in sloping areas. This moving water i s as a rule favourable for the vegetation owink to a relatively large content of oxygen and nutri- ents. In slopes with a good local climate, and with an extra supply of nutrients from dropping of sea birds, the growing conditions can be especially advantageous. After systematically searcing for such localities, peat deposits were found in steep slopes between the outlet of BjQrndalen river and Grumantbyen at I s - fjorden. In the years 1977-1979 investigations were carried out. Depth up to 1.1 m, and gradient up to 1:l.l Were noted ( L b g 19801.
The study of such curious peatlands has been continued. Because the heat conductivity power is Low in the thawed peat, this layer is shallow, and the measurement of the total peat depth is not easy. However, in these
977
Fig. 1. A newly exposed peat wall, due to a small landslide, NE of Grumantbyen, Spitsbergen. m t o J. Llg, 01.oa.19a7.
In several other places peat with a steep surface has been found. A t Sassenfjorden, in a slope to the northeast of Fredheim, I have measured peat depth of a littie more than 1 m.
bukta, Hornsund, and Skansen peat with a depth In many places, e.g. at Recherfjorden, Vdrsol-
of 0.3-0.6 m has been discovered.
There is no reason to assume that peat formation in steep slopes occurs only in Svalbard. similar natural conditions can be found in other places in the permafrost regions. Under a short
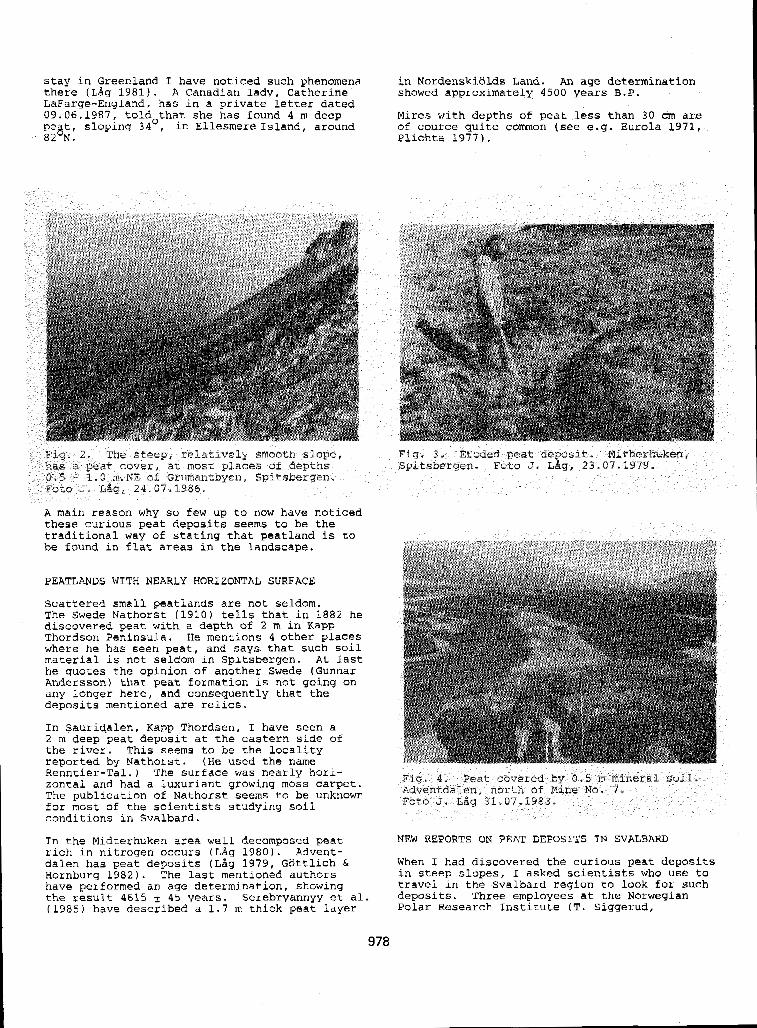
stay in Greenland f have noticed such phenomena in Nordenskialds Land. An age determination there (LAg 1981). A Canadian lady, Catherine showed approximately 4500 years B.P. LaFarge-England, has in a private letter dated 09.06.1987, told that she has found 4 m deep Mires with depths of peat less than 30 cm a m pegt, sloping 34', in Ellesmere Island, around 8 2 N.
of coufce quite common (see e.g. Eurola 1971, Plichta 1 9 7 7 ) .
PEATLANDS WITH NEARLY HORIZONTAL SURFACE
The Swede Nathorst (1910) tells that in 1882 he Scattered small peatlands are not seldom.
discovered peat with a depth of 2 m in Kapp Thordson Peninsula. He mentions 4 other places where he has seen peat., and says that such soil material is not seldom in Spitsbergen. At last he quotes the opinion of another Swede (Gunnar Andersson) that peat formation is not going on any longer here, and consequently that the deposits mentioned are relics.
In Sauridalen, Kapp Thordsen, I have seen a 2 m deep peat deposit at the eastern side of the river. This seems to be the locality reported by Nathorst, (He used the name Renntier-Tal.) The surface was nearly hori- zontal and had a luxuriant growing moss carpet. The publication of Nathorst seems to be unknown for most of the scientists studying soil conditions in Svalbard.
In the Midterhuken area well decomposed peat NEW REPORTS ON PEAT DEPOSITS IN SVALBARD rich in nitrogen occurs (LBg 1980). Mvent- dalen has peat deposits (LZig 1979, Gottlich E. When I had discovered the curious peat deposits Hornburg 1982). The last mentioned authors in steep slopes, I asked scientists who use to have performed an age determination, showing travel in the Svalbard region to look for such the result 4615 'I 45 years. Serebryannyy et al. deposits. Three employees at the Norwegian ( 1 9 8 5 ) have described a 1.7 rn thick peat layer Polar Research Institute (T. Siggerud,
978
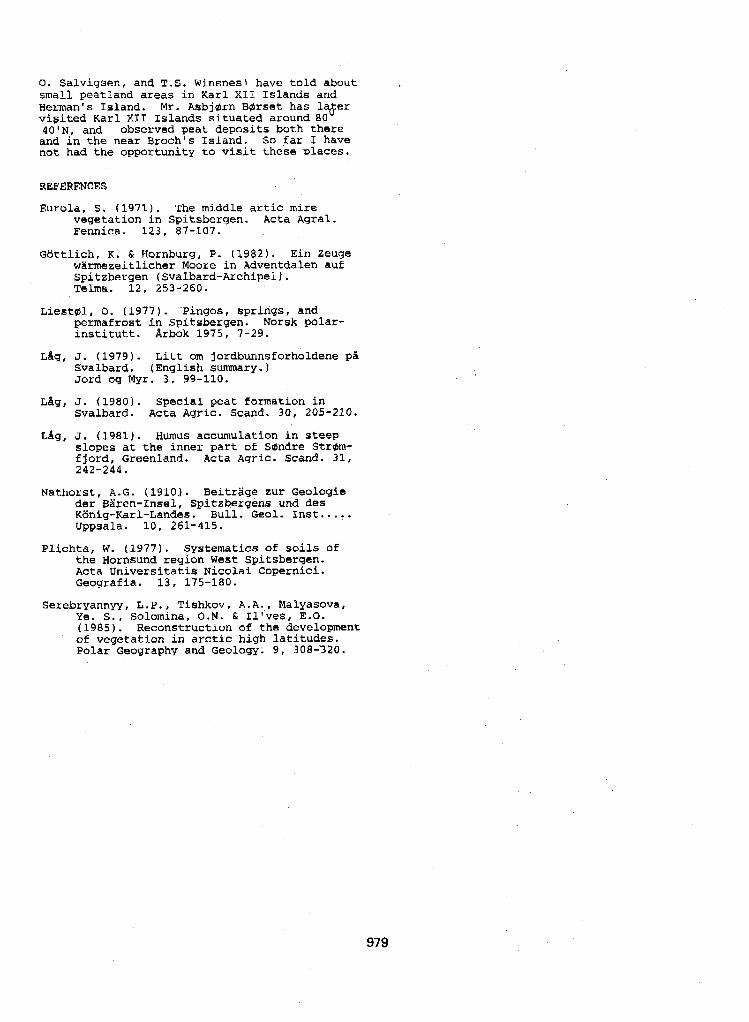
0. Salviqsen, and T.S. Winsnes) have told about small peatland areas in Karl XI1 Islands and Herman's Island. Mr. Asbjdrn Berset has l q e r visited Karl X I 1 Islands situated around 80
and in the near Bxoch's Island. So far I have 40'N, and observed peat deposits both there
not had the opportunity to visit these places.
REFERENCES
Eurola, S. ( vegetat Fennica
Gottlich. K. warmeze
1971). The middle artic mire .ion in Spitsbergen. Acta Agral. . 123, 87-107.
& Hornburg, P. (1982). Ein Zeuge iitlicher Moore in Adventdalen auf
Spitzbergen (Svalbard-Archipel). Telma. 12, 253-260.
Liestdl, 0. (1977). -Pingos, springs, and permafrost in Spitsbergen. Norsk palar- institutt. Arbok 1975, 7-29.
LAg, J. (1979). Litt om jordbunnsfosholdene pH Svalbard. (English summary. Jord og Myr. 3 , 99-110.
Lbg, J. (1980). Special peat formation in Svalbard. Acta Agric. Scand. 30, 205-210.
Lhg, J. (1981). Humus accumulation In steep slopes at the inner part of Sandre StrQm- fjord, Greenland. Acta Agric. Scand. 31, 242-244.
Nathorst, A.G. (1910). Beitrage zur Geologie der Biiren-Insel, Spitzberqens una des K8nig-Karl-Landes. Bull. Geol. Inst..... Uppsala. 10, 261-415.
Plichta, W. (1977). Systematics of soils Of the Hornsund region West Spitsbergen. Acta Universitatis Nicolai Copernici. Geografia. 13, 175-180.
Serebryannyy, L.P., Tishkov, A.A,, Malyasova, Ye. S . , Solomina, O.N. & IL'ves, E.O. (1985). Reconstruction of the development of vegetation in arctic high latitudes. Polar Geography and Geology. 9, 308-320.
979
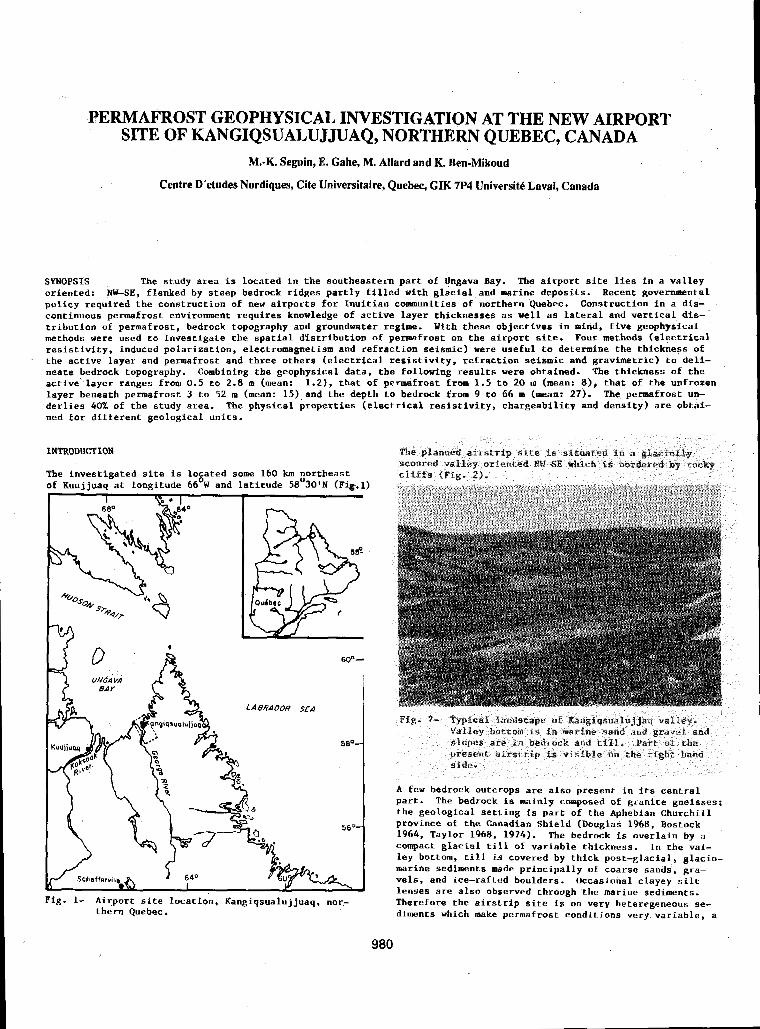
PERMAFROST GEOPHYSICAL INVESTIGATION AT THE NEW AIRPORT SITE OF KANGIQSUALUJJUAQ, NORTHERN QUEBEC, CANADA
M.-K. Seguin, E. Gahe, M. Allard and K. Ben-Mikoud
Centre D'etudes Nordiques, Cite Universitaire, Quebec, GIK 7P4 UniversitC Lava!, Canada
SYNOPSIS The study area is located in the southeastern part of Ungava Bay. The airport site lies in a valley oriented: NW-SE, flanked by steep bedrock ridges partly filled with glacial and marine deposits. Recent governmental policy required the construction of new airports for Inuitian communities of northern Quebec. Construction in a dis- continuous permafrost environment requires knowledge of active layer thicknesses as well as lateral and vertical dis-' tributiorl of permafrost, bedrock topography and groundwater regime. With these objectives in mind, five geophysical methods were used to investigate the spatial dlstribution o f permafrost on the airport site. Four methods (electrical resistivity, induced polarization, electromagnetism and refraction seismic) were useful to determine the thickness of the active layer and permafrost and three others (electrical resistivity, refraction seismic and gravimetric) to deli- neate bedrock topography. Combining the geophysical data, the following results were obtained. The thickness of the active layer ranges from 0.5 to 2.8 m (mean: 1.2), that of permafrost from 1.5 to 20 m (mean: 8 ) , that of the unfrozen layer beneath permafrost 3 to 52 m (mean: 15) and the depth to bedrock from 9 to 66 m (mean: 27). The permafrost un- derlies 40% of the study area. The physical properties (electrical resistivity, chargeability and density) are Obtai- ned for different geological units.
INTRODUCTION
The investigated site is located some 160 km northeast of Kuuiiuaq at longitude 66OW and latitude 58°30*N (Fig.1)
SO0-
980
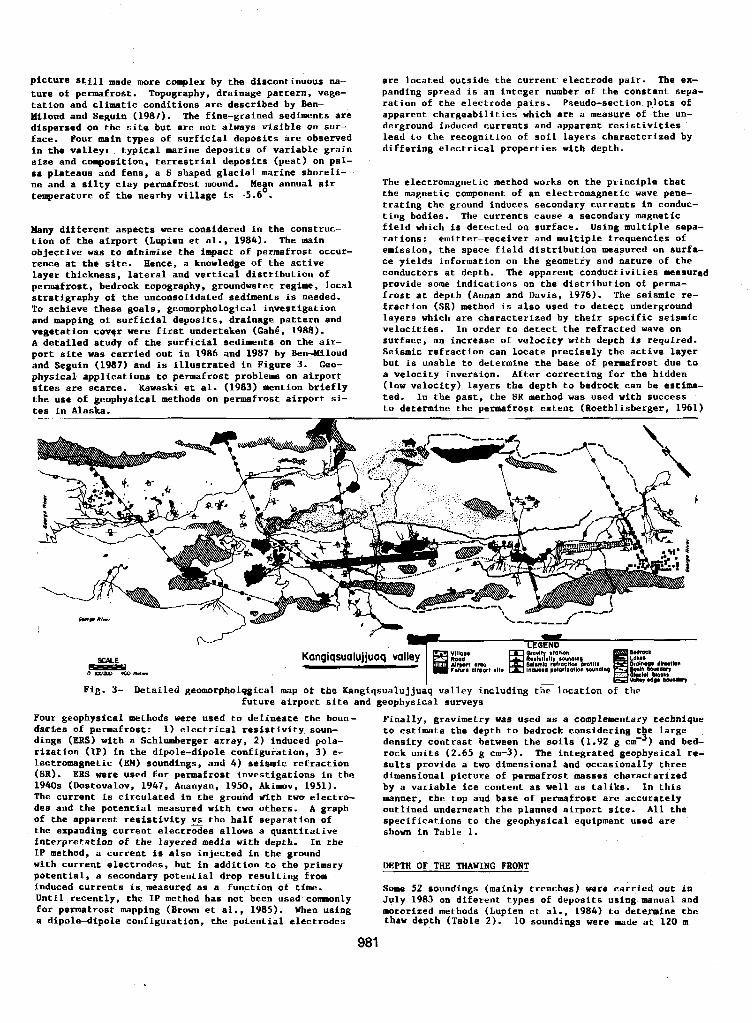
Picture sfill made more complex by the discontinuous na- are located outside the current'electrode pair. The ex- ture of permafrost. Topography, drainage partern. vege- panding spread is an integer number of the constant sepa- tation and climatic conditions are described by Ben- ration of the electrode pairs. Pseudo-section plots of Miloud and Seguin (1987). The fine-grained sediments are apparent chargeabilities which are a measure of the un- dispersed on the site but are not always visible On sur- derground induced currents and apparent resistivities face. Four mnin types of surficial deposits are observed lead t o the recognition of soil layers characterized by in the valley: typical marine deposits of variable grain differing electrical properties wlth depth. sire and composition, terrestrial deposits (peat) on pal- sa plateaus and fens, a S shaped glacial marine shoreli- ne and a silty clay permafrost mound. Mean annual air The electromagnetic method works on the principle that temperature of the nearby village is -5.6'. the magnetic component of an electromagnetic wave pene-
trating the ground induces secondary currents in conduc- ting bodies. The currents cause a secondary magnetic
Many different aspects were considered in the construc- field which is detected on surface. Using multiple sepa- tion of the airport (Lupien et al., 1984). The main rations: emitter-receiver and multiple frequencies of objective wag t o minimize the impact of permfrost occur- emission, the space field distribution measured on surfa- rence at the site. Hence, a knowledge of the active ce yields information on the geometry and nature of the layer thickness, lateral and vertical distribution of conductors at depth. The apparent conductivities measured permafrost, bedrock topography, groundwater regime, local provide some indications on the distribution o f perma- stratigraphy o f the unconsolidated sediments is needed. frost at depth (Annan and Davis, 1976). The seismic re- To achieve these goals, geomorphological investigation fraction (SR) method is also used to detect underground and mapping of surficial deposits, drainage pattern and layers which are characterized by their specific seismic vegetation covqr were first undertaken (Gahi. 1988). velocities. In order t o detect the refracted wave on
A detailed study of the surficial sediments on the air- surface, an increase o€ velocity with depth is required. port site was carried out in 1986 and 1987 by Ben-Miloud Seismic refraction can locate precisely the active layer and Seguin (1987) and is illustrated in Figure 3. Geo- but is unable to determine the base of permafrost due to physical applications to permafrost problems on airport a velocity inversion. After correcting for the hidden sites are scarce. Kawaski et al. (1983) mention briefly (low velocity) layers the depth to bedrock can be estlma- the use of geophysical methods on permafrost airport si- ted. In the past, the SR method was used with success tes in Alaska. to determine the permafrost extent (Roethlisberger, 1961)
SCALE sR*p o m a o e-
Fie. 3- Detailed geomorpholqgical map of the Ungiqsualuj juaq valley including the location of the future airport site and geophysical surveys
Four geophysical methods were used to delineate the boun- dartes of permafrost: 1) electrical resistivity. soun- dings (ERS) with a Schlumberger array, 2) induced pole- rizatlon (IP) in the dipole-dipole configuration, 3) e- lectromagnetic (EM) soundings, and 4) seismic refraction (SR). EBS were used for permafrost investigations in the 1940s (Dostovalov, 1947, Ananyan, 1950, Akinov, 1951). The current is circulated in the ground wlth two electro- des and the potential measured with two others. A graph of the apparent resistivity ys the half separation of the expanding current electrodes allows a quantitative interpreee&ion of the layered media with depth. In the IP method, a current is also injected in the ground with current electrodes, but in addition to the primary potential, a secondary potential drop resulting from induced currents is.measured as a function of time. Until recently, the fP method has not been used conmonly for permafrost mapping (Brown et al., 1985). When using a dipole-dipole configuration, the potential electrodes
Finally, gravimetry was used as a complementary technique to estimate the depth to bedrock considering the large density contrast between the soils (1.92 g cK3) and bed- rock units (2.65 g cm-3). The integrated geophysical re- sults provide a two dimensional and occasionally three dimensional picture of permafrost masses characterized by a variable ice content as well as taliks. In this manner, the top and base of permafrost are accurately outlined underneath the planned airport site. All the specifications to the geophysical equipment uBed are '
shown in Table 1.
DEPTH OF THE THAWING FRONT
Some 52 soundings (mainly trenches) were carried out in July 1983 on diferent types of deposits using manual and motorized methods (Lupien et al., 1984) to determine the thaw depth (Table 2) . 10 soundings were made at 120 m
981
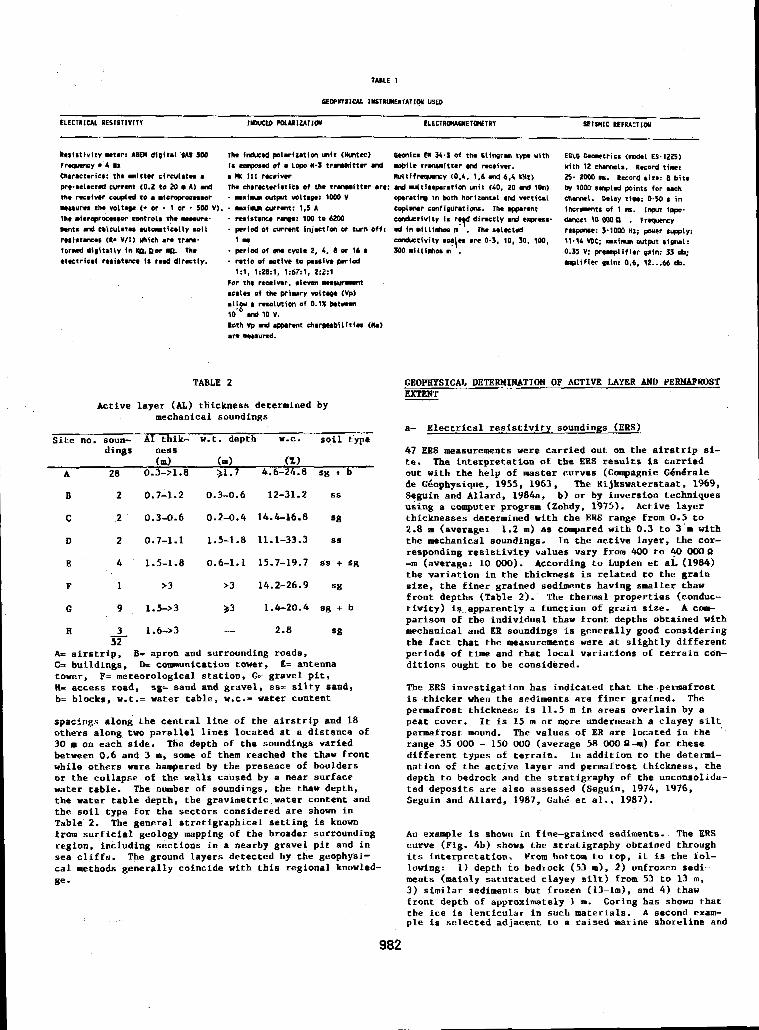
TABLE 1
IiEWPwVSlUL IWSTRUIEYTATIOI I USED
E L E C T R I C A L R E S l P l l V l f T IYWCEO PCtIlllUflDW ELECTRRUQYET(I IETRY SEISMIC REFRACTIOW
Aeslrtfvlty I t e r : ABEM dlpitml U S 300
Chnractmricr: the rnirter circulatn I rr-y m 4 nr
pre.ne1oct.d currmt (0.2 to ZO II A ) wd thm rKolYCr c0rpl.d to m mfcwrocnror mwWJru tha voltape {* or - 1 or f 500 V). lhe mlcroprocnror eontroln the monwc. m 8 h-d cnltulmtn W t a r t l c I l l y sol1 rrslr turrF (Ra V I I ) *lch mn trm.
e l ~ t t r l e n l rtriatoncr I s r e d dlrmetly. f o d digltmlly In W,nor Hi. ThR
ECLG bamtr ics ( d e l E S . 1 2 2 5 ) Yfth 1 2 chsmoh. R.cord tim: 5 - 2000 m. Record sixe: I bits
ch-1. Dmlay ttm: 0.50 e i n bv 1000 s w l d p i n t s for mech
f n c r m t e of 1 ms. 1-t 1-c. dust: ?D ODOl l . F r w n c y ruprmt: 1 . 1 0 0 0 Hz; p w w l y : 11.14 WC; u x t n r m nutplt rlml: 0.35 V; p r e w l i f l e r prln: 33 e; aqaHfltr saln: 0.6, 12 ..A &.
TABLE 2 GEOPHYSICAL DETERMINATION OF ACTIVE LAYER AND PERMAFROST EXTENT
Active layer (At) thickness determined by mechanical soundings
Site no. soun- AI thik- w.t. depth W.C. soil type
- a- Electrical resistivity soundings (EPS)
47 EBS measurements were carried out on the airstrip si- te. The interpretation of the EBS results i s carried out with the help of master curves (Compagnie Ginirale de Ghophysique, 1955, 1963, The Rijkswaterstaat. 1969,
using a computer program (Zohdp, 1975). Active layer thicknesses determined with the ERS range from 0.5 to 2.8 ut (average: 1.2 m) as ccmpared with 0.3 to 3'm with the mechanical soundings. In the active layer. the cor- responding resistivity values vary from 400 to 40 OOOQ
the variation in the thickness is related to the grain
G front depths (Table 2). The thermal properties (conduc-
9 1.5->3 33 1.4-20.4 sg + b tivity) is..apparenCly a function of grain size. A com-
H parison of the individual thaw front depths obtained with
3 1 . 6 4 3 " 2.8 sg mechanical and ER soundings is generally good considering the fact that the measurements were at slightly different
A= airstrip, E- apron and surrounding roads, periods of time and that local Variations of terrain con- C= buildings, O= communication tower, E= antenna ditions ought to be considered. tower, F= meteorological station, G= gravel pit, lb access road, sg= sand and gravel, ss= silty sand, The ERS investigation has indicated that the,permafrost b= blocks, w.t.= water table, w.c.= water content is thicker when the sediments are finer grained. The
permafrost thickness is 11.5 m in areas overlain by a spacings along the central line of the airstrip and 18 peat cover. It is 15 m or more underneath a clayey silt others along two parallel lines located at a distance of permafrost mound. The values of ER are located in the 30 m on each side. The depth of the soundings varied range 35 000 - 150 000 (average 58 000n-m) for these between 0.6 and 3 m, some o f them reached the thaw front different types of terrain. In addition to the detemi- while others were hampered by the presence of boulders nation of the active layer and permafrost thickness, the or the collapse of the walls caused by a neat surface depth to bedrock and the stratigraphy of the unconsolida- water table. The number of soundings, the thaw depth, ted deposits are also assessed (Seguin, 1974, 1976, the water table depth, the gravimetric water content and Seguin and Allard, 1987, Cah6 et a l . , 1987). the soil type for the sectors considered are shown in Table 2. The general stratigraphical setting i s known from surficial geology mapping of the broader surrounding An example is shown in fine-grained sediments. The ERS region, including sections in a nearby gravel pit and in sea cliffs. The ground layers detected by the geophysi-
curve (Pig. 4b) shows the stratigraphy obtained through
cal methods generally coincide with this regional knowled- lowing: 1) depth to bedrock (53 m), 2) unfrozen sedi- its interpretation. Prom bottom to top, it is the fol-
dings ness (d (m) ( X )
A 28 0.3-?1.8 31.7 4.6-24.8 ~g + b
B 2 0.7-1.2 0.3-0.6 12-31.2 ss Seguin and Allard, 1984a, b) or by inversion techntques
C 2 0.3-0.6 0-2-0.4 14.4-16.8 Sg
D 2 0.7-1.1 1.5-1.8 11.1-33.3 ss
e 4 1.5-1-8 0-6-1.1 15-7-19.7 5s + Sg -m (average: 10 000). According to Lupien et a L (1984)
F 1 >3 >3 14.2-26-9 ~g size, the finer grained sediments having smaller thaw
- 52
Be - ments (mainly saturated clayey silt) from 53 to 13 m, 3) similar sediments but frozen (13-1m), and 4) thaw front depth of approximately 1 m. Coring has shown that the ice i s lenticular in such materials. A second exan- ple is selected adjacent to a raised marine shoreline and
982
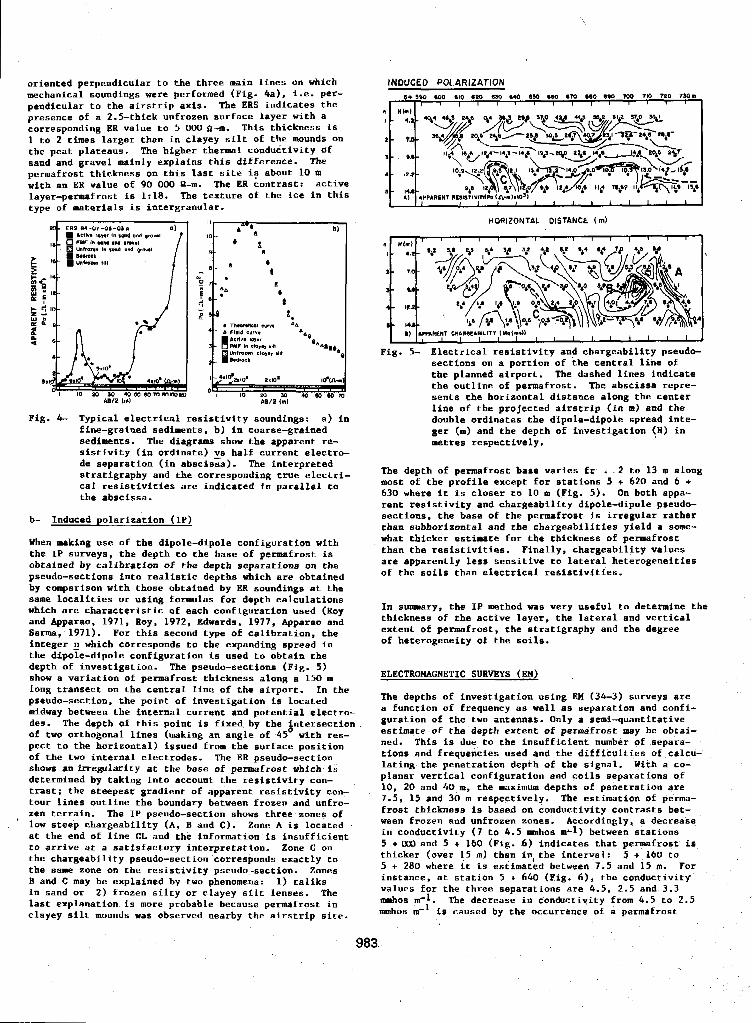
oriented Deroendicular to the three main lines On which INDUCED POLARIZATION mechanical soundings were performed (Pig. 4a), i.e. per- Dendicular to the airstrip axis. The ERS indicates the
. - I+ 110 600 Ul0 IPO 6W O M 654 660 1M 110 6M 100 TK) 710 ?mor
I l l l t I I I l I I I I J ' . . . presence of a 2.5-thick unfrozen surface layer with a corresponding ER value to 5 000 Q-m. This thickness is
the peat plateaus. The higher thermal conductivity Of 1 to 2 times larger than in clayey silt of the mounds on
sand and gravel mainly explains this difference. The permafrost thickness on this last site is about 10 m 4 I 12.P-
with an ER value of 90 000 P-m. The ER contrast: active layer-permafrost is 1:18. The texture of the ice in this I tvpe of materials is intergranular.
I 11m1 I I
c_
h I 1 1 1 1 ~ 1 1 1 1 1 ~ 1 1
HORIZONTAL DISTANCE (m)
Pig. 4- Typical electrical resistivity soundings: a) in fine-grained sediments, b) in coarse-grained sediments. The diagrams show the apparent re-
I) I W R E M T CkbIBLAOILITV l M @ ( d I . .
I I I I I 1 1 1 1 1 1 1 1 1 1
sections on a portion of the central line o f the planned airport. The dashed lines indicate the outline of permafrost. The abscissa repre- sents the horizontal distance along the center line of the projected airstrip (in m) and the double ordinates the dipole-dipole spread inte- ger (m) and the depth of investigation (,HI in metres respectively.
Fig. 5- Electrical resistivity and chargeability pseudo-
stratigraphy and the corresponding true electri- urprp cnL pernrsr' cal resistivities are indicated in parallel to most of the profile the abscissa. 630 where it is clot
rent resistivity ant
sistivity (in ordinate) ~s half current electro- de Separation (in abscissa). The interpreted . " - 2"" -e _"" f
rost base varies fr I . 2 to 13 m along except for stations 5 + 620 and 6 + 3er to 10 m (Fig. 5). On both appa- 1 chargeability dipole-dipole pseudo- 3 f the permafrost is irregular rather and the chargeabilities yield a some- te for the thickness of permafrost Les. Finally, chargeability values
tectrical resistivittes. sensitive to lateral heterogeneities
and Appatao, 1971, Roy, 1972, Edwards,-1977, Apparao and Satma, 1971). For this second type o f calibration, the integer E which corresponds to the expanding spread in of heterogeneity of the soils. the dipole-dipole configuration is used to obtain the
tntc~~nees 01 the active layer, the lateral and vertical extent o f permafrost, the stratigraphy and the degree
b- Induced polarization ( I P ) sections. the base I than subhorizontal a
When making use of the dipole-dipole configuration with what thicker estimal the IP surveys, the depth to the base of permafrost is than the resistivit: obtained by calibration of the depth separations on the are apparently less pseudo-sections into realistic depths which are obtained the than e: by comparison with those obtained by ER soundings at the same localities or using formulas for depth calculations which are characteristic of each configuration used (Roy In sunnnary, the IP method was very useful to determine the . . . I .
depth of investigation. The pseudo-sections (Fig. 5) show a variation of permafrost thickness along a 150 m _I
long transect on the central line of the airport. In the pseudo-section, the point of investigation is located midway between the internal current and potential electro- a function . . c Of _. frequ4 .
The depths of invest . . ' . ".. , _ . I .,\ ~ ~ ~~ clgatlon uslng nn ( > + > I surveys are ancy as well as separation and confi-
pect to the horizontal) issued from the surface position nea. ln ls 1s aue CI
of the two internal electrodes. The KB pseudo-section tions and frequencil show an irregularity at the base of permafrost which is lating the penetrat: determined by taking into account the resistivity con- planar vertical con! trast; the steepest gradient of apparent resistivity con- lo* and 40 mp th' tour lines outline the boundary between frozen and unfro- 7.5 ' l5 and 30 re' zen terrain. The IP pseudo-section shows three zones of frost thickness is I
' low steep chargeability (A, B and C). Zone A is located ween frozen and unf~ at the end of line CL and the information is insufficient in conductivity (' ' to arrive at a satisfactory interpretation. Zone C on 5 + m3 and 5 + 160 1
the chargeability pseudo-section corresponds exactly to thicker (over 15 m) the same zone on the resistivity pseudo-section. Zones 5 + 280 where it is estimated betweer B and C may be explained by two phenomena: 1) taliks instance, at statio1 L" '" L '
in sand or 2 ) frozen silty or clayey silt lenses, The values for the three separat last explanation is more probable because permafrost in
mhos m.-l. m . . A"-"" _._
clayey silt mounds was observed nearby the airstrip site. nnnhos ,-' is
as used and the difficulties ofcalcu- ion depth of the signal. With a co- Eiguration and coils separations o f a maximum depths of penetration are spectively. The estimation of perma- based on conductivity contrasts bet- roeen zones. Accordingly, a decrease. to 4.5 mnhos fi") between stations (Fig. 6) indicates that permafrost i s than iqthe interval: 5 + 160 to
I 1 . 5 and 15 m. For . . 1 > + o w ( r i g . o), the conductivity
ions are 4.5, 2.5 and 3.3
. by the occurrence of a permafrost &ne aecrease in conductivity from 4.5 t o 2.5
983
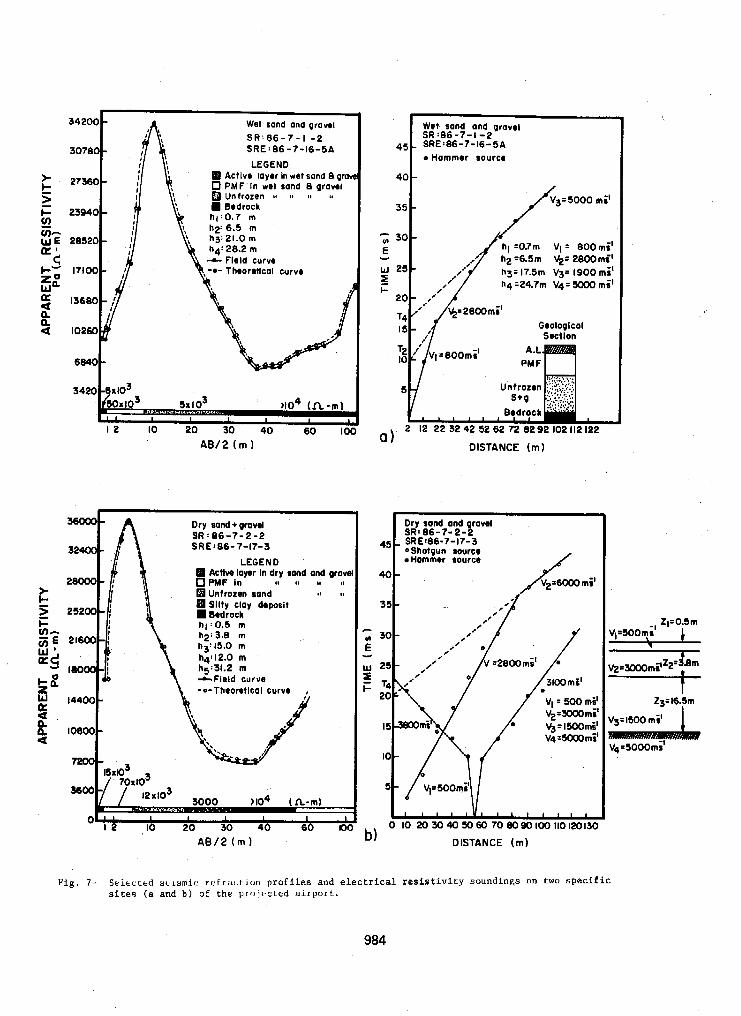
SRE:86-7- IB-SA
LEGEND Actlve layor In wet sand 8 g m
0 PMF In wet sand 8 gravol
A W 2 (rn 1
Dry sand +grovd
SRE186-7-17-3 S R : 8 6 - 7 - 2 - 2
LEGEND Actlw layer In dry rand and gravl
OPMF I n Unfrozen sand
81 Sllty Cloy d o p o ~ i t Bodrock
h2'3.8 m h i ~ 0 . 5 rn
h3:15.0 m
h5:31.2 m h4'12.0 rn
&Field curve
I, I, I 4 I,
.I I,
1 1 I I 20 30 40 60
L K)(
AE/2 ( r n )
. ". -
SRz86-7-1-2 Wet sand and grovel
c Hammer ~ o u r c o
40
3 5 1 / V 3 = 5 0 0 0 mi '
2 12 2 2 31? 4 2 52 62 72 8292 102 112 I22 n \
Dry sand and ravel
Hammer aource shotgun wurce 45 - SRE:86-7-17-3 SR: 8 6 - 7 - 2 4
40 -
L \ 0 IO 2 0 3 0 4 0 5 0 0 7 0 8 0 9 0 1 0 0 1 1 0 1 2 0 1 3 0
01 DISTANCE (m)
t V~=ISOO m i '
984
ELECTROMAGNETIC SURVEY ON LINE LC - 9 - - 'E
KANGIQSUALUJJUAQ AIRPORT
Z I 3 h 0 0 5*200 ' 5+400 S + k Q O+ihOkrn)
I I
1 t 215m 7.5-15m bISm 7.5-15rn
Fig. 6- Electromagnetic profiles (coplanar configura- tion, EM 34-3) with transmitter-receiver separa- tion(s) of 10, 20 and 40 m. Uean conductivities
timate o f the thickness of permafrost. The abs- (rr) are shown and allow a semi-quantitative es-
cissa represents the horizontal distance and the ordinate the apparent conductivity in m h o s .
layer the base of which i s bounded at an approximate depth of 15 m. The increase of conductivity at the 40 m separation suggests strongly that there is no permafrost
mafrost thicknesses determined by resistivity and char- at depth greater than 15 m. By comparison with the per-
which yielded 10 and 13 m respectively, it is concluded geability pseudo-sections from the IF survey (Pig. 5 )
that the permafrost thickness at this station is located between 12 and 15 m. The interpretation of this EM sur- vey indicates that the lower boundary of permafrost is irregular as observed in the resistivity pseudo-section (Fig. 5 ) . Although it gives less detailed results, the EM method is also useful to outline vertical and lateral variations of permafrost and it confirms results obtained with other methods.
SEISMIC REFRACTION (SR)
SR is an ancillary method of confirming the results ob- tained with other geophysical methods relative to perma- frost thickness and a substitute for drilling. The in- terpretation of the SR profiles was complicated by the occurrence of a low velocity layer generally located between the base of permafrost in the sediments and the deeper bedrock. The true depth to bedrock can be esti- mated by assuming a realistic value for this low veloci- ty layer (Whitely and Greenhalgh, 1978) and calculating its thickness. An estimate of the velocity of this third layer (below the permafrost base) is obtained from the seismic lines done in unfrozen areas contiguous to the discontinuous permafrost zones characterized by a similar stratigraphy. Thirteen seismic lines were surveyed over the new airport site. All haher shots were detonated 1 m off the line andwhen a shotgun source was used, a hole of about 0.65 m below the ground level was dug to insure maximum energy transfer into the ground. Without a knowledge of the velocity inversion, the travel-time graph would be interpreted as a 2 layer structure (Pig. 7).
DISCUSSION OF THE RESULTS AND CONCLUSIONS
Some difficulties are faced in the interpretation of the results obtained with the geophysical methods used. Pro- blems are encountered with ERS measurements in areas of very dry sand and gravel. This is mainly due to large electrode contact resistance and the extremely high re- sistivity of near surface soils. Quite often the IP me- thod encounters the same difficulties as ERS in dry sand and gravel. Consequently, the moist mass cover and soil water table level are important factors to be considered in the determination o f the lateral and vertical distri- bution of permafrost in marine and fluvioglacial coarse grained deposits. A comparison of the mechanical and geophysical soundings is of the upmost impostance as it provides a good oportunity to verify the precision of the ER and IP soundings in estimating active layer thick- nesses. when using the dipole-dipole configuration, IP data are not reliable to outline the active layer bounde- ry; the large electrode spread ( 210 m) does not allow a sufficient resolution. The thickness of discontinuous permafrost ranges from 1.5 to 20 (average: 8.1 m) under the new airport site. No drilling through the permafrost is available for ground thruthing but these vdlues are
data in similar materials available around the village. in accordance with many drill holes and thermistor cable
The thickness is quite variable in sand and gravel. ERS, IP pseudo-sections and EM surveys indicated that permafrost i s perforated with taliks and is quite irre- gular at its base. This situation is explained by the grain size variation of the sediments which influences the physical parameters of the soils (e.g. thermal con- ductivity) which in their turn control the electrical pro- perties of permafrost terrains. Some of the difficulties related to field conditions are solved through the inte- gration of the various geophysical results. This allowed a more accurate estimate of permafrost distribution as illustrated in the fence diagram (Fig. 8). In the study
H(m) A - 64-0-3-1 L8-6-30-S 84-8-6-4
LL
.
"I[ b I
St000 5+160 5+320 5+480 I 5+640 5+720(m)
Fig. 8- Fcncp diagram showing active layer thickness and permafrost distribution under the proposed airstrip according to the integrated interpre- tation of all geophysical methods.
985
of the airport site located in a discontinuous permafrost zone, integrated geophysical methods are useful for three reasons: 1) determination of active layer thickness, 2) delineation of horizontal and vertical extension of per- mafrost, 3) estimation of the depth to bedrock. Optimi- sation of the combined geophysical results demons- that the ERS and SR surveys are most useful to estimate thick active layer depths. In decreasing order of resolution, IP, ERS and EM surveys are the most reliable integrated geophysical methods to outline the horizontal and verti- cal distribution of permafrost. ER and IP soundings are most appropriate to calculate its thickness while IP and EM methods are the best techniques to determine both its lateral extent and thickness. Depth to bedrock i s most accurately defined with integrated ERS, RS and gra- vimetric methods.
Most of the stratigraphic data are obtained with.the ERS methods. The water table level is generally located with a combination of ERS, IP and SR methods. The amount of heterogeneity in the soils is usually eviden- ced by the parameters: chargeability (IP) and conducti- vity (I”.
Permafrost investigations are clearly needed for the plan- ning and construction of airstrip and roads in northern Canada. The geophysical methods used in this investiga- tion are complementary tools to geomorphological, drai- nage and soil studies.
The results are needed: a) to plan and locate an air- strip site, access roads and ancillary comadities, b) to plan infrastructure and geotechnlcal studies, c) for the choice of nature, type, volume and thickness of construction materials, d) to indicate the areas when an artificial insulating pad could be needed, e) to es- timate the volume ofbedrockexcavation required under- neath a thin layer of sedimentary cover. Engineering problems such as blasting, quarrying, crushing and their associated costs can be more easily apprehended with the aid of the geophysical information. In this rebpect, we think that the sequence of geophysical methods used for this purpose is necessary considering its relatively low cost.
ACKNOWLEDGEMENTS
The authors wish to thank the following persons.who con- tributed to the execution of this study: Claire Beysse- rias, Christian Bouchard, Jacqueline Bouchard, Jean Des- biens, Alain Pournier, Richard Fortier, Bet& Ghlinas, Yvan Grenler, Lyne Messier, Florence Nicollin, Yvon PelLetier and Johanne Plourde.
REFERENCES
Akimov, A.T. (1951). The study of permafrost by geophy- sical and geoelectrical methods in the eastern part o f the Bolshezenealtaya tundra. Manuscript Pondy in to Merzlotov AN SSSR.
Ananyan, A.A. (1950). Investigation of the passage of an electric current through freezing and frozen soils. Rukopis Fondy in to Heralotoved, SSSR.
Annan, A.P. and Davis, J.L. (1976). Impulse radar pro-
Canada, Paper 75-1C. 343-351. filing i n permafrost. Geological Survey of
Apparao, A. & Sarma, V.S. (1981). A modified pseudo- depth section as a tool in resistivity and IP prospecting. Geophys. Res. Bull, (19), 187-208.
Ben-Hiloud, K. & Seguin, H.-K. (1987). Solution of velo- city inversion in seismic refraction surveys with the use of electrical methods in three types of terrains from the Kangiqsualujjuaq valley, Northern Quebec. Comptes Rendus du 55iSme Con- gres de 1’ACFAS. Ottawa, 17 p.
Bostock, H.S. (1964). A provisional physiographic map of Canada. Geol. Surv, Can., Paper 64-35, 24 pp.
Brown, J., Metz, H.C. and Hoekstra, P. (1985). Workship on pe-frost geophysics. Golden, Colorado, 23-24 October 1984, CREEL, 118 pp.
Compagnie Ginirale de GPophysique (1955). Abaques de sondage ilectrique. Geophysiml Prospecting, ( 3 ) , Suppl. No. 3, 50 pp.
Compagnie Gindrale de Gdophysique (1963). Abaques de sondage PlectriquelMaster Curves for Electrical Sounding. European Association of Exploration Geophysicists.
Dostovalov, B.N. (1947). Electrical charactertstlcs of permanently frozen rocks. Akad. Nauk SSSR, 5, 18-35.
Douglae. B.J.W. (1968). Ghologie et reasources minira- les du Canada. Partie A, Sdrie de la giologie
Canada, 50-165. iconomique No. 1. Comission giologique du
Edwards, L.S. (1977). A modified pseudosection for resistivity and IP. Geophysics, ( 4 2 ) , 5, 1020- io36 -
Gahi, E. (1988). Giomorphologie cryoghe et giophysi- que dans la rigion de Kangiqsualujjuaq. Ph.D. thesis, Universite Laval, 210 pp.
Gahi. E., Allard, M., h Seguin, M.-K. (1987). GLophysi- que et dynamique holocine de plateaux palsiques i Kangiqsualujjuaq,Qu&bec nordique. Giographie physique et Quaternaire (41). 1, 33-46.
Kawaski, K., Gruol, V. and Osterkamp, T.E. (.1983). Field Evaluation Site for Ground Ice Detection. Report No. FHWA-”83-27, Alaska Dept. of Trans- portation and Publication Facilities.
tupien, Rosenberg, Yourneaux & Assoc. Inc. (1984). Etu- de giotechnique, (George River), Report 5-84-710, 27 PP.
Rijkswaterstaat, The Neherlands (1969). Standard graphs for resistivity prospecting. European Associa- tion of Exploration Geophysicists.
Roethlisberger, H. (1961). Seismic Refraction Soundings in Permafrost near Thuli,,Greenland, in G.O. Roasch, edit., Geology of the Arctic, Vol. 2 , International Symposium on Arctic Geology. lrst Calgicy (Alberta) Proceedings, 1960, 970-981.
Roy, A. (1972). Depth of investigation in Wenner, three- ctectrode.and dipole resistivity methods. Geo- physical Prospecting, (20), 329-430.
Roy, A. & Apparao, A. (1971). Depth of investigation in direct current methods+ Geophysics, ( 3 6 ) , 943- 959.
986
Seguin, M.-L (1974) . The use o f geophysical methods in permafrost investigation: iron ore deposits of the central part of the Labrador Trough, northeas- tern Canada. Geoforum. (18) , 55-68.
Seguin, H.-K. (1976). Observations gcophysiques sur le
de GCographie de Quibec, (TO), 20, 327-364. perghlisol des environs du lac Minto. Cahiers
Seguin, W.-K. & Allard, H. (1984s). La repartition du pergilisol dans la rCgion du detroit de Manitou- nuk, c8t6 outst de la mer d'hdson, Canada. Garladian Journal of Earth Sciences, (21 ) . 354- 364.
Seguin, H.-K. EL Allard, M. (1984b). Le pergelisol et les processus themokaystiques de la rhgion de la rivibre Nastopoca, Nouveau-QuBbec. GQogra- phie physique et Quaternaire, (38) , 11-25.
Seguin, M.-K. & Allard, d. (1987). La geophysique ap- pliquge au pergelisol, Quibec nordique: histori- que et diveloppements recents. Giographie phy- sique et Quaternaire, ( 4 t ) , 127-140.
Taylor, F.C. (1968). Operation Torngat, Quebec, New- foundland-Labrador. 1_" Report of activities; Geol. Surv. Can. Part A, Study 68-1, 149-150.
Taylor, P.C. (1974). Reconnaissance geology of a part o f the Precambrian Shield, Northern Quebec and Northwest Territories. Geol. Surv, Can., Paper 74-21, 9 pp and map.
Whitely, R.Y. & Greeshalgh, S.A. (1978). Velocity in- version and the shallow seismic refraction me- thod. Geoexploration, (17), 125-141.
Zohdy, A.A.R. (1975). Automatic interpretation of Schlumberger sounding curves, using modified Dar Zarrouk Functions, U.S. Geol. Surv. Bull. no. 1313 E, 41 pp.
987
D.C. RESISTIVITY ALONG THE COAST AT PRUDHOE BAY, ALASKA P.V. Sellmann, AJ. Delaney and S.A. Arcone
U.S. Army Cold Regions Research and Engineering Laboratory, Hanover, N.H. 03755-1290 USA
SYNOPSIS Electrical resistivity measurements, at three sites in Prudhoe Bay, Alaska, were made to provide an understanding of marine modification to eoastal permafrost, and to evaluate D.C. resistivity techniques for coastal subsea permafrost studies. The measurements were made using Wenner electrical resistivity soundings. Profiles extended 2.8 km offshore and '
inland beyond the last siyns OF tundra modification by coastal processes. Offshore measurements were made with a floating cable, and inland measurements were made using driven electrodes. The observations indicate that the electrical properties of permafrost beneath the coastal bluf f and adjacent tundra are rapidly modified by coastal erosion and periodic flooding during storms. Alony one control line, apparent resistivity changes corresponded with the configuration of the top of ice-bonded permafrost observed by Baker (1987). Modeling supported by the control data permitted a close interpretation of the position of the top of ice-bonded subsea permafrost and provided a ranye of real resistivities for offshore materials.
INTRODUCTION
Background
Most subsea permairost formed on the con- tinental shelves when they were exposed during low sea level stands associated with periods of major yLacial activity. This permafrost was covered by risiny sea level as the glac- iers melted. Even though the sea level is now fairly stable, permafrost i s still heiny .inun- dated in some areas of active coastal erosion. Inundation can dramatically change the proper- ties of permafrost due to exposure to salt; water and to as much as a 10°C warming in some coastal settings. Alony segments of the Beau- fort Sea coastline, permafrost is undergoing a siynificant reduction in strenyth, thaw set- tlement, gas hydrate decomposition, and redis- tribution of free gas. This study establishes some electrical resistivity values for coastal permafrost near Prudhoe Bay, an area under- goiny active coastal modification.
Recent studies (Scott, 1975; Corwin, 1983; Dyck 'et al., 1 Y 8 3 ; Sellmann et al., 1Y85) indicate that yeophysical D.C. resistivity methods can be used for subsea permafrost investiyations. These methods may be best suited for shallow coastal waters where ice- bonded permafrost i s expectea at shallow depths (C30 m) below the seabed, permitting relatively short, mare-manageable electrode arrays. The technique also has potential in areas where seismic methods may encounter problems, such as sediments containing small amounts of natural gas in voids, which yreatly attenuate seismic signals. Thus, practical implementation of the D.C. soundiny method can complement deeper soundiny transient electro- magnetic methods for certain areas. Studies, by the Earth Technology Corp. ( 1 9 M 5 , 1986) have suggested that modified transient EM
equipment and procedures and magnetic induc- tion might a l s o be used for investigations at shallow depths below the seabed. ,At present, however, a combination oE D.C.'and Transient EM is the most practical yeophysical approach to obtaining information on the entire off- shore permafrost section (Ehranbard et al., 1983: Walker et al., 1985).
Resistivity data are interpreted by construct- iny models that generate output similar to observations. Hecause closed-form inversion solutions are virtually impossible to achieve, computational programs utilizing fast, itera-
duce a layered model to fit the data. These tive procedures are now commo~Ly used to pro-
programs often require some preliminary esti- mates for the resistivity and thickness of each assumed layer. Only a small amount of resistivity data has been correlated with sub- surface sections having a known distribution of ice-bonded permafrost, and much of it i s proprietary. This lack of resistivity data near shore is also due to the limited experi- ence with shallow penetrating electrical methods in areas of ice-bonded subsea yerma- frost and is one of the reasons for this study . objectives and Approach
The objectives of this study were to establish resistivity values and their spatial variation for coastal permafrost in areas of active erosion, and to understand the inf Iuence of erosion and periodic flooding during storms upon those values. Thus we hoped to gain
of electrically based methods. A aecond- information necessary tor the interpretation
a r y ob~ective was to evaluate our marine D.C. resistivity surveying equipment for detecting subsea permafrost at shallow depths in coastal waters.
988
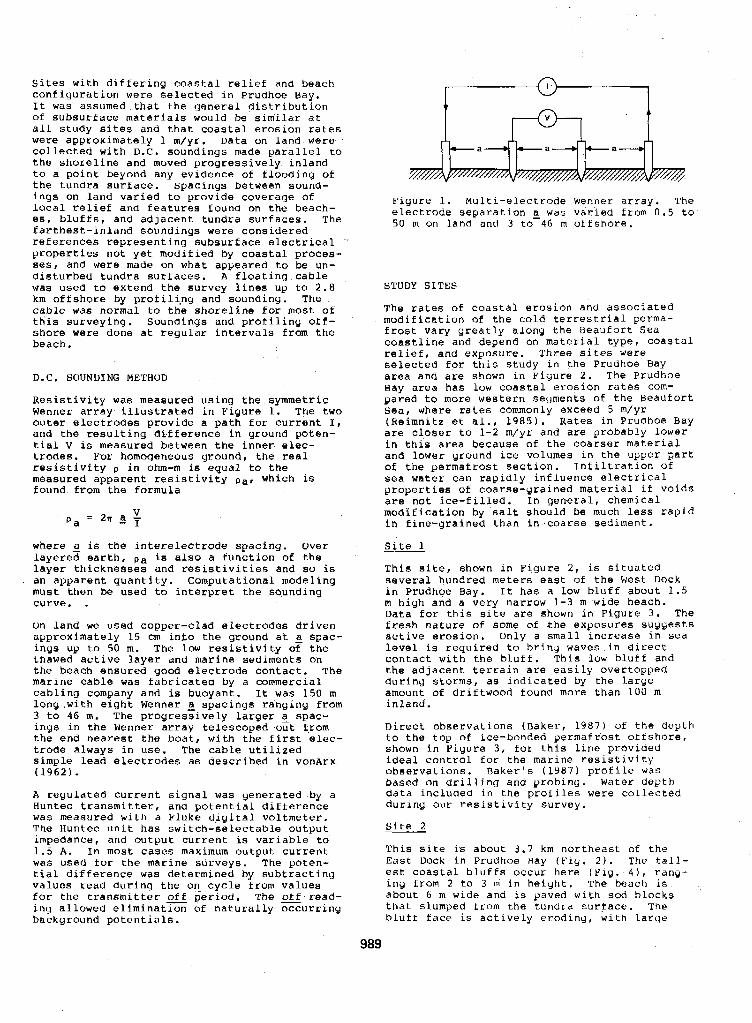
S i t e s w i t h d i f f e r i n g coas ta l re l ief and beach c o n f i g u r a t i o n were s e l e c t e d i n P r u a h o e b a y . I t was a s s u m e d t h a t t h e g e n e r a l d i s t r i b u t i o n of s u b s u r f a c e mater ia l s would be sim'ilar a t a l l s t u d y si tes and t h a t coas ta l e r o s i o n r a t e s were a p p r o x i m a t e l y 1 m/yr. Data on , land were collected w i t h D . C . s o u n d i n g s made p a r a l l e l t o t h e s h o r e l i n e a n d moved p r o g r e s s i v e l y i n l a n d t o a p o i n t b e y o n d a n y e v i d e n c e of E l o o d i n y ot t h e t u n d r a s u r f a c e . s p a c i n g s b e t w e e n s o u n d - i n g s o n l a n d v a r i e d to p r o v i d e c o v e r a g e of loca l relief a n d f e a t u r e s f o u n d o n t h e beach- e s , b l u f f s , a n d a d j a c e n t t u n d r a s u r f a c e s . T h e f a r t h e s t - i n l a n d s o u n d i n g s were c o n s i d e r e d r e f e r e n c e s r e p r e s e n t i n g s u b s u r f a c e e l e c t r i c a l p r o p e r t i e s n o t y e t modif ied by coastal p r o c e s - ses, and were made o n w h a t a p p e a r e d t o be un- d i s t u r b e d t u n d r a s u r f a c e s . A f l o a t i n g c a b l e was u s e d t o e x t e n d t h e s u r v e y l i n e s u p t o 2 . 8 km o f f s h o r e by p r o t i l i , n y a n d s o u n d i n y . T h e cable was norma l to t h e s h o r e l i n e for most of t h i s s u r v e y i n g . s o u n d i n g s a n d p r o t i l i n y o t f - shore were done a t r e g u l a r i n t e r v a l s from t h e b e a c h .
D.C. SOUNDING METHOD
R e s i s t i v i t y was m e a s u r e d u s i n g t h e s y m m e t r i c Wenner a r r a y i l l u s t r a t e d i n F i g u r e 1 . The two o u t e r e l e c t r o d e s p r o v i d e a p a t h for c u r r e n t I , and t h e r e s u l t i n g d i f f e r e n c e i n g r o u n d p o t e n - t i a l v is measured be tween t h e i n n e r elec- trodes. For homogeneous g round, t h e real r e s i s t i v i t y p i n ohn-m i s e q u a l to t h e m e a s u r e d a p p a r e n t r e s i s t i v i t y p a r which is f o u n d from t h e f o r m u l a
p a = 2t 2 i V
where is t h e i n t e r e l e c t r o d e s p a c i n y . O v e r l a y e r e d e a r t h , P a is a l so a f u n c t i o n of t h e l a y e r t h i c k n e s s e s a n d r e s i s t i v i t i e s a n d so is an a p p a r e n t q u a n t i t y . C o m p u t a t i o n a l m o d e l i n g mus t t h e n b e u s e d t o i n t e r p r e t t h e Sound ing c u r v e . . On l a n d we u s e d c o p p e r - c l a d electrodes d r i v e n a p p r o x i m a t e l y 15 cm i n k 0 t h e g round a t a s p a c - i n g s u p to 50 m. The low r e s i s t i v i t y of t h e t h a w e d a c t i v e l a y e r a n d m a r i n e s e d i m e n t s o n t h e b e a c h e n s u r e d good electrode c o n t a c t . The m a r i n e cable was f ab r i ca t ed by a commercial c a b l i n g company and is b u o y a n t . I t was 150 m l o n g . w i t h e i g h t Wenner a s p a c i n g s r a n g i n y from 3 t o 46 m . T h e p r o g r e s s i v e l y l a r g e r 5 s p a c -
t h e end n e a r e s t t h e b o a t , w i t h t h e f i r s t elec- i n g s i n t h e Wenner a r r a y t e l e s c o p e d o u t f,rom
trode a l w a y s i n u s e . T h e cable u t i l i z e d s i m p l e lead electrodes as d e s c r i b e d i n VOnArX (1962).
A r e g u l a t e d c u r r e n t s i g n a l was y e n e r a t e d by a
was measu red w i t h a F l u k e d i g i t a l v o l t m e t e r . H u n t e c t r a n s m i t t e r , a n d p o t e n t i a l d i f t e r e n c e
T h e H u n t e c u n i t h a s switch-selectable o u t p u t i m p e d a n c e , a n d o u t p u t c u r r e n t is v a r i a b l e to 1 . 5 A. I n most cases maximum o u t p u t c u r r e n t was u s e d for t h e m a r i n e s u r v e y s . T h e p o t e n - t i a l d i f f e r e n c e w a s d e t e r m i n e d by s u b t r a c t i n g v a l u e s read d u r i n g t h e c y c l e from v a l u e s f o r t h e t r a n s m i t t e r off period. T h e otf r e a d - i n g allowed e l i m i n a t i o n of n a t u r a l l y o c c u r r i n y b a c k g r o u n d p o t e n t i a l s .
1 1
A A A A
F i g u r e 1. Multi-electrode h e n n e r a r r a y . T h e electrode s e p a r a t i o n a was v a r i e d from 0 . 5 t o 50 m on land and 3 t o 46 m o t f s h o r e .
T h e r a t e s of c o a s t a l e r o s i o n a n d a s soc ia t ed m o d i f i c a t i o n of t h e cold t e r r e s t r i a l perma- f r o s t v a r y g r e a t l y a l o n y the Beaufor t S e a c o a s t l i n e a n d d e p e n d o n m a t e r i a l t y p e , c o a s t a l r e l i e f , a n d e x p o s u r e . T h r e e s i tes were selected f o r t h i s s t u d y i n t h e P rudhoe Ray area and a re shown i n F i y u r e 2 . The P r u d h o e
p a r e d t o more w e s t e r n s e y m e n t s of t h e B e a u t o r t Bay a r e a h a s low c o a s t a l e r o s i o n r a t e s com-
S e a , w h e r e r a t e s c o m m o n l y e x c e e d 5 m/yr
are c loser t o 1-2 m/yr and are p r o b a b l y lower ( R e i m n i t z e t a l . , 1 9 8 5 ) . Rates i n P r u o h o e B a y
i n t h i s area b e c a u s e of t he coarser m a t e r i a l a n d lower g r o u n d ice v o l u m e s i n t he u p p e r p a r t of the p e r m a f r o s t sect ion. I n f i l t r a t i o n of
p r o p e r t i e s of c o a r s e - y r a i n e d material i f v o i d s sea water c a n r a p i d l y i n f l u e n c e e l ec t r i ca l
a re n o t ice-f i l l e d . I n g e n e r a l , c h e m i c a l m o d i f i c a t i o n by s a l t s h o u l d b e much less r a p i d i n f i n e - g r a i n e d t h a n i n . c o a r s e s e d i m e n t .
S i t e 1
T h i s s i t e , shown i n F i g u r e 2 , is s i t u a t e d s e v e r a l h u n d r e d meters eas t of t h e Nest Dock i n P r u d h o e B a y . I t h a s R low b l u f f a b o u t 1 . 5 m h i y h a n d a v e r y n a r r o w 1-3 m -wide beach. Data f o r t h i s s i t e are shown i n F i g u r e 3 . The f r e s h n a t u r e of some of t h e e x p o s u r e s s u y y e s t s a c t i v e e r o s i o n . O n l y a s m a l l i n c r e a s e i n sea
c o n t a c t w i t h the b l u f f . T h i s low b l u f f a n d l e v e l is r e q u i r e d t o b r i n g w a v e s i n d i rec t
d u r i n y storms, as i n d i c a t e d by t h e l a r g e t h e a d j a c e n t t e r r a i n a re e a s i l y o v e r t o p p e d
a m o u n t o f d r i f t w o o d f o u n d more t h a n 1 0 0 m i n l a n d .
Direct o b s e r v a t i o n s (Baker , 1987) o f t h e d e p t h t o t h e t o p of i c e - b o n d e d p e r m a f r o s t o t f s h o r e , shown i n F i g u r e 3 , for t h i s l i n e p r o v i d e d
o b s e r v a t i o n s . Rake r ' s (1987) p r o f i l e w a s i dea l c o n t r o l f o r the m a r i n e r e s i s t i v i t y
based o n d r i l l i n g a n d p r o b i n g . Water d e p t h d a t a i n c l u a e a i n t h e p r o f i l e s were co l l ec t ed d u r i n y o u r r e s i s t i v i t y s u r v e y .
S i te 2
T h i s s i te is a b o u t 3 . 7 km n o r t h e a s t of t h e E a s t Uock i n P r u d h o e Hay ( F i y . 2 ) . T h e t a l l - e s t coas t a l b l u f f s o c c u r here ( r i g . 4 ) , r a n g - i n y from 2 t o 3 m i n h e i g h t . T h e beach is a b o u t 6 m wide and is paved w i t h sod b l o c k s t h a t s lumped t m m t h e t u n d r a sur tace. T h e b l u f t f a c e is a c t i v e l y e r o d i n y , w i t h l a r q e
989
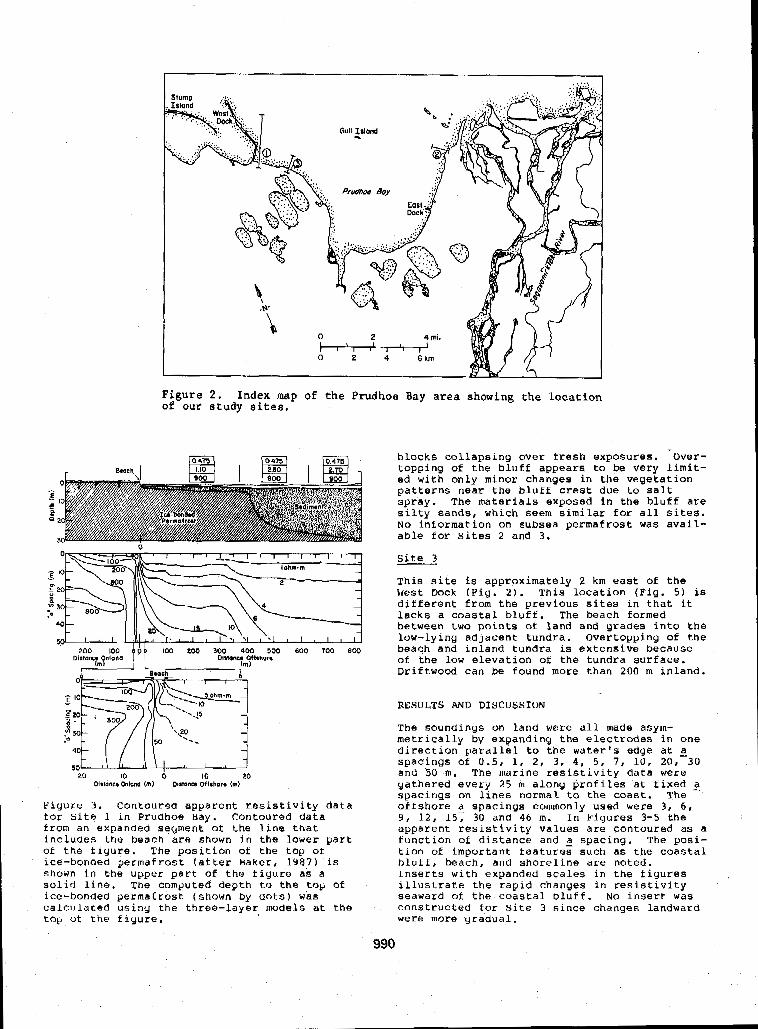
~~ ~” ~~ -
Figure 2 . Index map o f the Prudhoe Bay area showing the location of our study s i t e e ,
Boa roo
F i g u r e 3 . C o n t o u r e d a p p a r e n t r e s i s t i v i t y d a t a tor s i t e 1 i n P r u a h o e b a y . C o n t o u r e d d a t a from an expanded s egmen t ot t h e l i n e t h a t i n c l u d e s t h e beach are shown in t h e lower p a r t ot t h e i i y u r e . T h e p o s i t i o n ot: t h e t o p ot i ce-bonded permaf r o s t ( a t t e r H a k e f , 1987) is shown i n t h e u p p e r p a r t of t h e f i g u r e as a s o l i d l i n e , T h e c o m Q u t e d d e p t h t o the t o p of i c e - b o n d e d p e r m a f r o s t ( s h o w n by d o t s ) was ca l cu la t ed u s i n g t h e t h r e e - l a y e r models a t t h e top ot the f i y u r e .
b l o c k s c o l l a p s i n g o v e r f resh e x p o s u r e s . Over- t o p p i n g of the b l u f f a p p e a r s t o be very limit- e d w i t h o n l y m i n o r c h a n g e s i n t h e v e g e t a t i o n p a t t e r n s n e a r t h e b l u f f crest d u e to s a l t spray. The mater ia ls e x p o s e d i n t h e b l u f f are s i l t y s a n d s , w h i c h seem similar €or a l l sites. No i n f o r m a t i o n o n s u b s e a p e r m a f r o s t was a v a i l - able f o r s i tes 2 and 3 .
si te 3
T h i s s i t e is a p p r o x i m a t e l y 2 km east of t h e West Dock ( P i g . 2 ) . T h i s L o c a t i o n ( F i g . 5 ) is d i f f e r e n t . f r o m t h e p r e v i o u s sites i n t h a t it lacks a c o a s t a l b l u f f . The beach tormed be tween two p o i n t s of l a n d a n d y r a d e s i n t o t h e l o w - l y i n g a d j a c e n t t u n d r a . O v e r t o p y i n y of the b e a c h a n d i n l a n d t u n d r a is e x t e n s i v e b e c a u s e o f t h e low e l e v a t i o n of t h e t u n d r a s u r f a c e . Driftwood c a n b e f o u n d more t h a n 200 m i n l a n d .
RESULTS AND DISCUSSION
T h e s o u n d i n g s o n l a n d were a l l made asym- m e t r i c a l l y by e x p a n d i n g t h e electrodes i n o n e d i r e c t i o n p a r a l l e l t o t h e water’s e d g e a t a s p a c i n g s of 0.5, 1 , 2 , 3 , 4 , 5, 7, 1 0 , 20, 30 and 50 m. The marine r e s i s t i v i t y da t a were y a t h e r e d e v e r y 25 m a l o n y p r o f i l e s a t f i x e d 5 s p a c i n g s o n l i n e s n o r m a l to t h e coast. The o f f s h o r e 5 s p a c i n g s commonly used were 3 , 6 , 9 , 12, 15, 30 and 46 m. I n Y i y u r e s 3-5 t h e a p p a r e n t r e s i s t i v i t y v a l u e s a r e c o n t o u r e d as a t u n c t i o n of d i s t a n c e a n d a s p a c i n g . T h e p o s i - t i o n o f i m p o r t a n t t e a t u r e s s u c h a6 t h e coastal h l u t f , b e a c h , a n d s h o r e l i n e a re n o t e d . I n s e r t s w i t h expanded scales i n t h e t i y u r e s i l l u s t r a t e t h e r a p i d c h a n g e s i n r e s i s t i v i t y seaward of t h e coas ta l b l u f f . No i n s e r t was c o n s t r u c t e d tor Si te 3 s i n c e changes l andward were more y r a d u a l .
990
r 1
0
Dlstancn Offshore (rn)
kBer i~h ~
IO o'b,p 1000
- c
I I 1 1 1 '
nn ' 1 4 , ' Zohm-m 3
\
\
30 20 IO 0 IO 20 Dlatonce Onlond (rn) Distoncn Offshore (m)
F i g u r e 4 , Contoured a p p a r e n t r e s i s t i v i t y d a t a for site 2 i n P rudhoe Ray . water d e p t h , h e i g h t o f t h e coas ta l b l u f f , a n d c o m p u t e d d e p t h t o t h e t o p o f i c e - b o n d e d p e r m a f r o s t are
ot t h e f i g u r e . c o n t o u r e d d a t a f o r an expanded shown i n t h e cross sect ion i n t h e u p p e r p a r t
s e g m e n t of t h e l i n e t h a t i n c l u d e s t h e b e a c h a re shown i n t h e lower p a r t of t h e f i g u r e .
L a n d o b s e r v a t i o n s
T h e r e are some u n i q u e f e a t u r e s i n t h e o n - l a n d r e s i s t i v i t y d a t a t h a t a p p e a r r e l a t e d to s u r - f a c e r e l i e f , b e a c h w i d t h , a n d p o t e n t i a l f o r s u r f a c e f l o o d i n y . T h e g r e a t e s t res is t ivi t ies were o b s e r v e d a t s i t e 2 ( F i g . 4 ) , w h i c h h a d t h e h i g h e s t b l u f f s a n d t h e l eas t p h y s i c a l i n d i c a t i o n of f l o o d i n g or o t h e r i n l a n d dis- t u r b a n c e . A maximum a p p a r e n t r e s i s t i v i t y of 2800 ohm-m was o b s e r v e d 65 m i n l a n d ot t h e b l u f f . T h e h i g h v a l u e s a n d t h e h o r i z o n t a l d i s p o s i t i o n of t h e c o n t o u r s s u g g e s t t h a t ' s i t e 2 h a s h a d t h e l ea s t m o d i f i c a t i o n . I n c o n - t ras t , S i t e s 1 and 3 show t h e i n f l u e n c e o f p a s t f l o o d i n g by t h e s i g n i f i c a n t r e d u c t i o n i n n e a r - s u r t a c e r e s i s t i v i t i e s a n d t h e s e a w a r d s l o p i n y of t h e r e s i s t i v i t y contours. Near- s u r f a c e r e s i s t i v i t i e s a t S i t e 3 are less t h a n 6 ohm-m more t h a n 1 7 5 m i n l a n d f r o m t h e i n n e r e d g e of t h e a c t i v e b e a c h , a d i s t a n c e t h a t c o r r e s p o n d s w i t h t h e i n n e r limit ot most r e c e n t f l o o d i n g as i n d i c a t e d by d r i t t w o o d a n d o t h e r d e h r i s . T h e t o p o y r a y h y i n t h i s area
.. 200 100 6 100 200 300 400 S O 0 Dlrrancr Onlond (rn) Dlstnnca Offshora (rn)
F i g u r e 5. Contoured a p p a r e n t r e s i s t i v i t y d a t a f o r S i t e 3 i n P r u d h o e B a y . water d e p t h , coas ta l r e l i e f , a n d c o m p u t e d d e p t h to t h e t o p of i c e - b o n d e d p e r m a t r o s t a r e s h o w n i n t h e u p p e r p a r t o f t h e f i g u r e .
s u g g e s t s t h a t c o a s t a l f l o o d i n g may h a v e o c c u r r e d a t t h i s s i t e for many y e a r s . Values g r e a t e r t h a n 500 ohm-rn are n o t f o u n a a t d e p t h u n t i l t h e i n n e r limit of f l o o d i n g is e x c e e d - e d . A t t h e more e a s t e r l y s i t e 2 , t h e 50U ohm-m va lues c o r r e s p o n d w i t h t h e t a l l b l u f f s a n d h i g h e r - e l e v a t i o n t u n d r a s u r f a c e w h e r e t l o o d i n g a p p a r e n t l y aoes n o t o c c u r .
S e a w a r d U b g e r v a t i o n s
T h e r e are some common p a t t e r n s i n a l l d a t a f r o m s e a w a r d of t h e coas ta l b l u f f s . No a p y a r - e n t r e s i s t i v i t y v a l u e s g r e a t e r t h a n 1 0 0 ohm-m were o b s e r v e d a t a l l a s p a c i n g s . The v a l u e s a n d t r e n d s were s imilar b e t w e e n t h e b l u f t s and t h e water e d g e , w i t h n o v a l u e s a t t h e water e d g e g r e a t e r t h a n 50 ohm-m a t 50-m s p a c i n y s ; . . most v a l u e s were less t h a n 40 ohm-m.
v a r i a t i o n s i n water d e p t h a l o n y t h e s t u d y l i n e s were u s u a l l y less t h a n 1 m , t h e t o t a l d e p t h n e v e r e x c e e d e d 2 rn, a n d t h e water re- s i s t i v i t y was a l w a y s a b o u t 0 . 4 7 ohm-m, The c o n t o u r e d d a t a of F i g u r e 3 d e m o n s t r a t e t h a t t h e s e p a r a m e t e r s were n o t s u f f i c i e n t to mask r e s i s t i v i t y v a r i a t i o n s a t d e p t h . For examgle, t h e l a r g e r c h a n g e i n r e s i s t i v i t y , a t d e p t h i n F i g u r e 3 occurs i n a zone be tween 3UU and 400 m w h e r e t h e r e is less t h a n a 0.5-rn v a r i a t i o n i n water d e p t h . T h i s small c h a n g e i n w a t e r d e p t h c a n n o t a c c o u n t f o r t h e more t h a n 6 ohm-m r e s i s t i v i t y c h a n y e s e e n across t h e zone a t an - a s p a c i n g o f 46 m , s i n c e e a r l i e r f i e l d o b s e r - v a t i o n s a n d t h e o r e t i c a l c o n s i d e r a t i o n s ( S e l l m a n n e t a l . , 1985) h a v e s h e w n t h a t a 0 . 5 - m c h a n y e i n w a t e r d e p t h w o u l d account for a v a r i a t i o n of less t h a n 1 ohm-m. R e s i s t i v i t y c h a n g e s a t t h e s m a l l a s p a c i n g s ( 3 - 6 m) a r e e x p e c t e d f o r t h e s m a l l c h a n y e s i n water d e p t h (k ' i y . 3 and 6 ) .
99 1
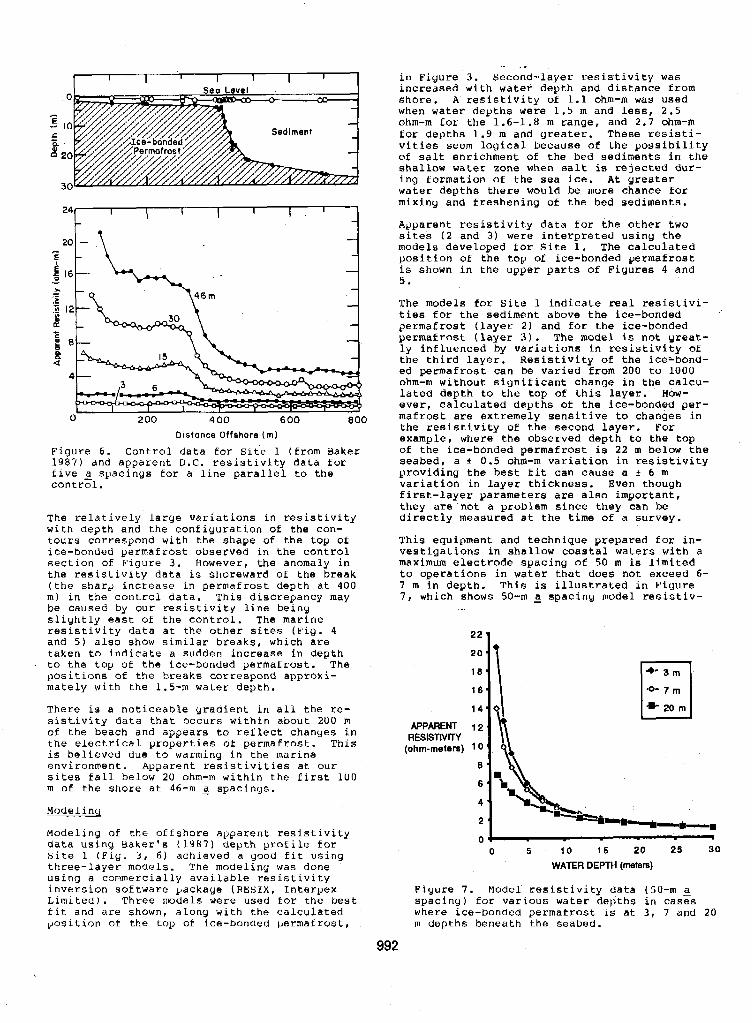
I 1 I I I I I I 0
- - 10 E
f 63 20 e
30
24a 7
E
a a
4
0 200 4 00 6 00 800
Olstance Offshore (m) Figure 6. Control data for Site 1 (from Baker 1 9 8 7 ) and apparent D.C. resistivity data for five a spacings for a line parallel to the control.
The relatively large variations in resistivity with depth and the configuration of the con- tours correspond with the shape of the top of ice-bonded permafrost observed in the control section of Figure 3 . However, the anomaly in the resistivity data is shoreward of the break (the shard increase in permafrost depth at 400 m) in the control data. This discrepancy may be caused by our resistivity line beiny slightly east of the control. The marine resistivity data at the other sites (Yiy. 4 and 5 ) also show similar breaks, which are taken to indicate a sudden increase in depth to the top of the ice-bonded permafrost. The positions of the breaks correspond approxi- mately with the 1.5-m water depth.
There is a noticeable gradient in all the re- sistivity data that occurs within about 200 m of the beach and appears to reflect chanyes in the electrical properties of permafrost. This is believed due to warming i n the marine environnent. Apparent resistivities at our sites fall below 20 ohm-m within the first 1 0 0 rn of the shore at 46-m fi spacinys.
Modelinq
Modeling of the offshore apparent resistivity data using Baker's (1987) depth profile for site 1 (Pig. 3 , 6) achieved a good fit using three-layer models. The modeling was done using a commercially available resistivity
Limited). Three models were used tor t h e best inversion software packaye (RBSIX, Interpex
fit and are shown, along with the calculated posi t ion of the top of ice-boncied permafrost,
in Figure 3 . Second-layer resistivity was increased with water depth and distance from shore. A resistivity of 1.1 ohm-m was used when water depths were 1 . 5 m and less, 2 . 5 ohm-m for the 1.6-1.8 m range, and 2.7 ohm-m for depths 1 . 9 m and greater. These resisti- vities seem logical because of the possibility of salt enrichment of the bed sediments in the shallow water zone when salt is rejected dur- ing formation of the sea ice. At yreater water depths there would be more chance for mixiny and treshening of the bed sediments.
Agparent resistivity data for the other two sites ( 2 and 3 ) were interpreted using the models developed for Site 1 . The calculated position of the top of ice-bonded permafrost is shown in the upper parts of Figures 4 and 5.
The models for Site 1 indicate real resistivi- ties for the sediment above the ice-bonded permafrost (layer 2) and for the ice-bonded permafrost (layer 3 ) . The model i s not yreat- ly influenced by variations in resistivity of the third layer. Resistivity of the iceibond- ed permafrost can be varied from 200 to 1000 ohm-m without siynificant change in the calcu- lated depth to the top of this layer. How- ever, calculated depths of the ice-bonded per- mafrost are extremely sensitive to changes in the resistivity of the second layer. For example, where the observed depth to the top of the ice-bonded permafrost is 22 m below the seabed, a f 0.5 ohm-m variation in resistivity providing the best fit can cause a f 6 m variation in layer thickness. Even though first-layer parameters are also important, they are not a problem since they can be directly measured at the time of a survey.
This equipment and technique prepared for in- vestiyations in shallow coastal waters with a maximum electrode spacing of 50 m is limited to operations in water that does not exceed 6- 7 m in depth. This is illustrated in Fiyure 7 , which shows 50-m 2 spaciny model resistiv-
.- . f
APPARENT RESISTNIW
(ohmmeters)
7 m
O J i
0 5 I O 1 5 20 25 30 WATER DEPTH (meters)
Fiyure 7 . Model resistivity data (50-m g spaciny) for various water depths in cases where ice-bonded perrnatrost is at 3 , 7 and 20 m depths beneath the seabed.
992
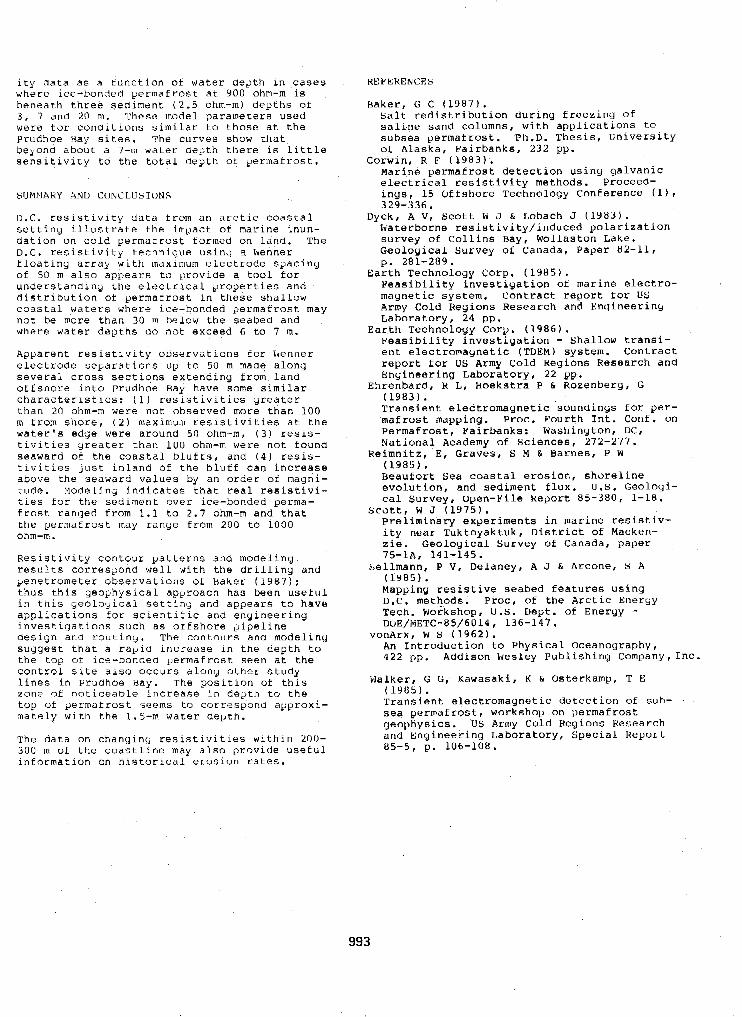
w h e r e i c e - b o n d e d p e r m a f r o s t a t Y O 0 ohm-m is i t y d a t a as a t u n c t i o n o t water d e p t h i n cases
b e n e a t h t h r e e s e d i m e n t ( 2 . 5 ohm-m) d e p t h s ot 3 , 7 and 20 m. These m o d e l p a r a m e t e r s used were f o r c o n d i t i o n s s i m i l a r t o t h o s e a t t h e P rudhoe Ray s i tes . T h e c u r v e s show t h a t b e i o n d a b o u t a 7-m water d e p t h t h e r e is l i t t l e s e n s i t i v i t y t u t h e t o t a l d e p t h of p e r m a t r o s t .
SUEIPIAKY AND C O N C L U S I O N S
D.C . r e s i s t i v i t y d a t a trom a n a r c t i c c o a s t a l s e t t i n g i l l u s t r a t e t h e i m p a c t o f m a r i n e i n u n - d a t i o n o n c o l d p e r m a r r o s t f o r m e d o n l a n d , T h e D . C . r e s i s t i v i t y t e c h n i q u e u s i n g 3 Wenner f l o a t i n y array w i t h maximum e l e c t r o d e s y a c i n y o f 50 m a l s o a p p e a r s t o p r o v i a e a tool f o r u n d e r s t a n d i n g t h e e l e c t r i c a l y r o p a r t i e s a n d d i s t r i b u t i o n of: p e r m a t r o s t i n t h e s e s h a l l o w c o a s t a l waters w h e r e i c e - b o n d e d p e r m a f r o s t may n o t b e more t h a n 30 m below t h e s e a b e d a n d where water d e D t h s uo n o t e x c e e d 6 to 7 m.
A g y a r e n t r e s i s t i v i t y o b s e r v a t i o n s f o r h e n n e r e l e c t r o d e s e p a r a t i o n s u p t o 50 m made a l o n y s e v e r a l cross s e c t i o n s e x t e n d i n g f r o m l a n a o f f s h o r e i n t o P r u d h o e Bay h a v e some s imilar c h a r a c t e r i s t i c s : ( 1 ) r e s i s t i v i t i e s y r e a t e r t h a n 20 ohm-n were n o t o b s e r v e d more t h a n 1 0 0 m trom s h o r e , ( 2 ) maximum r e s i s t i v i t i e s a t t h e water‘s e d y e were a r o u n d 50 ohm-m, ( 3 ) resis- t i v i t i e s g r e a t e r t h a n 100 ohm-m were n o t t o u n d s e a w a r d of t h e c o a s t a l blufts, and ( 4 ) resis- t i v i t i e s J u s t i n l a n d of t h e b l u f f c a n i n c r e a s e above t h e s e a w a r d v a l u e s by a n o r d e r of mayni - t u d e . M o d e l i n g i n d i c a t e s t h a t rea l r e s i s t i v i - t i e s f o r t h e s e d i m e n t o v e r i c e - b o n d e d p e r m a - f r o s t r a n g e d f r o m 1.1 to 2 . 7 ohm-m a n d C h a t t h e p e r m a f r o s t may r a n g e f r o m 200 t o 1000 ohm-m.
R e s i s t i v i t y c o n t o u r p a t t e r n s a n d m o d e l i n g resu l t s c o r r e s y o n d well x i t h t h e d r i l l i n g a n d p e n e t r o m e t e r o b s e r v a t i o n s of Baker ( 1 9 8 7 ) : t h u s t h i s g e o p h y s i c a l a p p r o a c h h a s b e e n u s e f u l i n t h i s y e o l o y i c a l s e t t i n y a n d a p p e a r s to h a v e a p p l i c a t i o n s fo r s c i e n t i t i c a n d e n y i n e e r i n y
d e s i g n a n u r o u t i n y . T h e c o n t o u r s a n d m o d e l i n y i n v e s t i g a t i o n s s u c h a s o f f s h o r e i l r i p e l i n e
s u g g e s t t h a t a r a p i c l i n c r e a s e i n t h e d e p t h t o t h e t o p ot i c e - b o n d e a p e r m a f r o s t s e e n a t t h e control s i t e a l s o occurs a l o n y o t h e r s t u d y l ines i n P r u d h o e Hay. T h e p o s i t i o n of t h i s zone ~f n o t i c e a b l e i n c r e a s e i n d e p t h t o t h e t o p of g e r m a t r o s t seems to c o r r e s p o n d a p p r o x i - m a t e l y w i t h t h e 1.5-m water d e l ~ t h .
T h e d a t a on c h a n g i n g r e s i s t i v i t i e s w i t h i n 200- 300 m of t h e c o a s t l i n e may a l s o p r o v i d e u s e t u l i n f o r m a t i o n on h i s t o r i c a l erosion r a t e s .
993
KEYEHENCES
B a k e r , G C ( 1 9 8 7 ) . s a l t r e d i s t r i b u t i o n d u r i n g f r e e z i n g of s a l i n e s a n d c o l u m n s , w i t h a p p l i c a t i o n s CO s u b s e a P e r m a f r o s t . Ph.D. T h e s i s , U n i v e r s i t y ot A l a s k a , F a i r b a n k s , 232 pp.
M a r i n e p e r m a f r o s t d e t e c t i o n u s i n y g a l v a n i c e l e c t r i c a l r e s i s t i v i t y m e t h o d s . P r o c e e d -
C o r w i n , R F ( 1 9 8 3 ) .
i n y s , 15 O f f s h o r e T e c h n o l o y y C o n f e r e n c e ( 1 ) I
3 2 9 - 3 3 6 . Uyck, A Vi S c o t t W J & Lobach J ( 1 9 8 3 ) .
W a t e r b o r n e r e s i s t i v i t y / i n d u c e d p o l a r i z a t i o n s u r v e y of C o l l i n s Bay , Wol l a s ton Lake . Geoloyical s u r v e y of Canada , Pape r 82 -11 , p . 281-289.
E a r t h T e c h n o l o g y C o r p . (1985). F e a s i b i l i t y i n v e s t i y a t i o n of marine e lectro- m a y n e t i c s y s t e m . Contract r e p o r t to r US Army C o l d R e g i o n s R e s e a r c h a n d E n g i n e e r i n g L a b o r a t o r y , 24 pp.
F e a s i b i l i t y i n v e s t i g a t i o n - s h a l l o w t r a n s i - e n t e l e c t r o m a y n e t i c (TDEM) s y s t e m . C o n t r a c t r e p o r t for Us Army C o l d R e g i o n s R e s e a r c h a n d E n y i n e e r i n g Laboratory, 22 pp.
( 1 9 8 3 ) . T r a n s i e n t e l e c t r o m a y n e t i c . s a u n d i n q s for p e r - mafrost m a p p i n g . P r o c . F o u r t h I n t . Conf . on P e r m a f r o s t , F a i r b a n k s : W a s h i n y t o n , DC, National Academy of S c i e n c e s , 2 7 2 - 2 7 7 .
E a r t h T e c h n o l o g y C o r y . ( 1 9 8 6 ) .
E h r e n b a r d , R L , H o e k s t r a P & R o z e n b e r g , G
K e i m n i t z , E , Graves, S M & B a r n e s , P W ( 1 9 8 5 ) . B e a u f o r t sea coastal erosion, s h o r e l i n e e v o l u t i o n , a n d s e d i m e n t f l u x . U.S. G e o l o y i - c a l S u r v e y , o p e n - F i l e R e p o r t 8 5 - 3 8 0 , 1-18.
p r e l i m i n a r y e x p e r i m e n t s i n m a r i n e r e s i s t i v - i t y n e a r T u k t o y a k t u k , Dis t r ic t oi Macken-
Sco t t , W J ( 1 9 7 5 ) .
z i e . G e o l o y i c a l S u r v e y of C a n a d a , p a p e r 75-1A, 141-145.
(1985). be l lmann , P V, D e l a n e y , A J & A r c o n e , Y A
M a p p i n q r e s i s t i v e s e a b e d f e a t u r e s u s i n g D.C. m e t h o d s . P r o c , o f t h e Arctic Energy Tech . Workshop, U.S. Dept . of E n e r g y - DUE/METC-85/6014 , 136-147.
VonArX, W S (1962). An I n t r o d u c t i o n t o P h y s i c a l O c e a n o g r a p h y , 4 2 2 p p . A d d i s o n W e s l e y P u b l i s h i n g C o m p a n y , I n c .
c J a l k e r , G G , Kawasak i , K & O s t e r k a m p , T E ( 1 9 8 5 ) . T r a n s i e n t e l e c t r o m a y n e t i c d e t e c t i o n of suh-
g e o p h y s i c s . US Army Cold H e u i o n s R e s e a r c h sea p e r m a f r o s t , w o r k s h o p o n p e r m a f r o s t
. .
a n d - E n g i n e e r i n g L a b o r a t o r y , s p e c i a l R e p o r t 8 5 - 5 , p . 106-108.
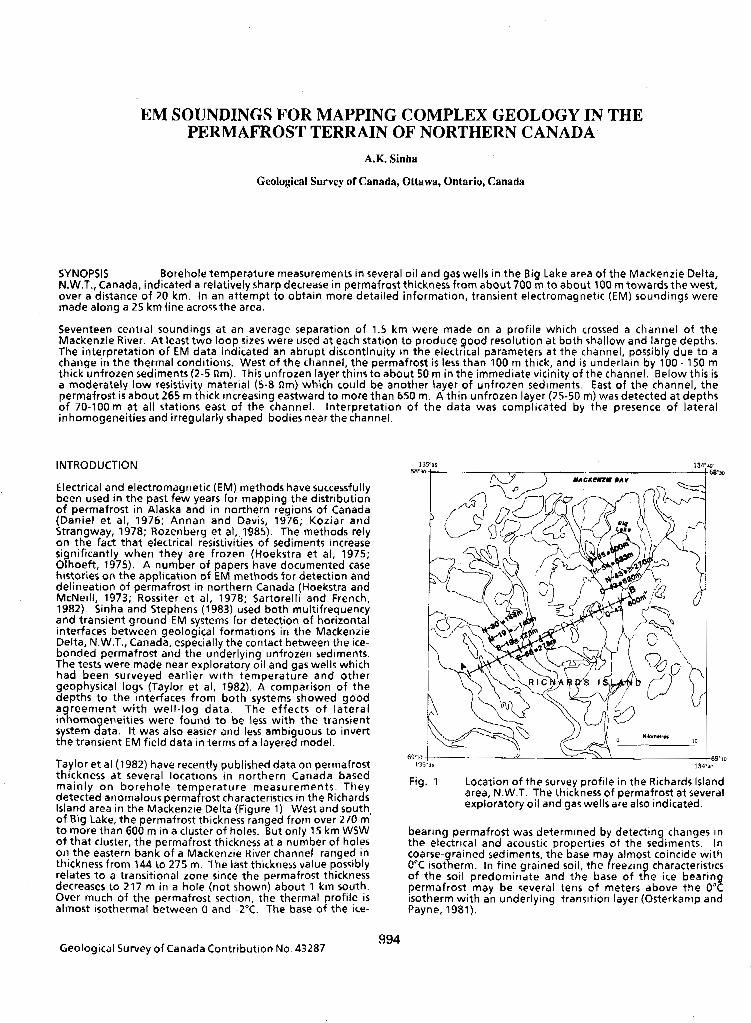
EM SOUNDINGS FOR MAPPING COMPLEX GEOLOGY IN THE PERMAFROST TERRAIN OF NORTHERN CANADA
A.K. Sinha
Geological Survey of Canada, Ottawa, Ontario, Canada
SYNOPSIS Borehole temperature measurements in several oil and gas wells in the Big Lake area of the Mackenzie Delta, N.W.T., Canada, indicated a relatively sharp decrease in permafrost thickness from about 700 m to about 100 m towards the west, over a distance of 20 km. In an attempt to obtain more detailed information, transient electromagnetic (EM) soundings were made along a 25 km line across the area.
Seventeen central soundings at an average separation of 1.5 km were made on a profile which crossed a channel of the Mackenzie River. At least two loop sizes were used at each station to produce good resolution at both shallow and large depths. The interpretation of EM data indicated an abrupt discontinuity in the electrical parameters at the channel, possibly due to a change in the thermal conditions. West of the channel, the permafrost is less than 100 m thick, and is underlain by 100 - 150 m thick unfrozen sediments (2-5 om). This unfrozen layer thins to about 50 m in the immediate vicinity of the channel. Below this is a moderately low resistivity material (5-8 nm) which could be another layer of unfrozen sediments. East of the channel, the
o f 70-100m at all stations east of the channel. Interpretation of the data was complicated by the presence of lateral permafrost is about 265 m thick increasing eastward to more than 650 m. A thin unfrozen layer (25-50 m) was detected at depths
inhomogeneities and irregularly shaped bodies near the channel
INTRODUCTION
been used in the past few years for mapping the distribution Electrical and electromagnetic (EM) methods have successfully
of permafrost in Alaska and in northern regions of Canada (Daniel et al, 1976; Annan and Davis, 1976; Koziar and Strangway, 1978; Rozenberg et at, 1985). The methods rely on the fact that electrical resistivities of sediments increase si nificantly when they are frozen (Hoekstra et al, 1975: Oyhoeft, 1975). A number of papers have documented case
delineation of permafrost in northern Canada (Hoekstra and histories on the application of EM methods for detection and
McNeill, 1973; Rossiter et al, 1978; Sartorelli and French, 1982). Sinha and Stephens (1983) used both multifrequency and transient ground EM systems for detection of horizontal interfaces between geological formations in the Mackenzie
bonded permafrost and the underlying unfrozen sediments. Delta, N.W.T., Canada, especially the contact between the ice-
The tests were made near exploratory oil and gas wells which had been surveyed earlier with temperature and other
depths to the interfaces from both systems showed good geophysical logs (Taylor et al, 1982). A comparison of the
a reement with well-log data. The effects of lateral inl(\orno eneities were found to be less wi th the transient system %ta. It was also easier and less ambiguous to invert the transient EM field data in terms of a layered model.
Taylor et al (1982) have recently published data on permafrost thickness at several locations in northern Canada based
detected anomalous permafrost characteristics in the Richards mainly on borehole temperature measurements. They
Island area in the Mackenzie Delta (Figure 1). West and south, of Blg Lake, the permafrost thickness ranged from over 270 m t o more than 600 m in a cluster of holes. But only 15 km WSW of that cluster, the permafrost thickness at a number of holes
thickness from 144 to 275 m. The last thickness value possibly on the eastern bank of a Mackenzie River channel ranged in
decreases to 217 m in a hole (not shown) about 1 km south. relates t o a transitional zone since the permafrost thickness
Over much of the permafrost section, the thermal profile is almost isothermal between 0 and -2°C. The base of the ice-
135% 134
59'm
Fig. 1 Location of the survey profile in the Richards Island area, N.W.T. The thickness of permafrost at several exploratory oil and gas wells are also indicated.
bearing permafrost was determined by detecting changes in the electrical and acoustic properties of the sediments. In coarse- rained sediments, the base ma almost coincide with 0°C isot%erm. In fine gralned soil, the {reezint characteristics of the soil predominate and the base of t e Ice bearing permafrost may be several tens of meters above the 0°C Isotherm with an underlying transltlon layer (Osterkamp and Payne, 1981).
Geological Survey of Canada Contribution No. 43287 994
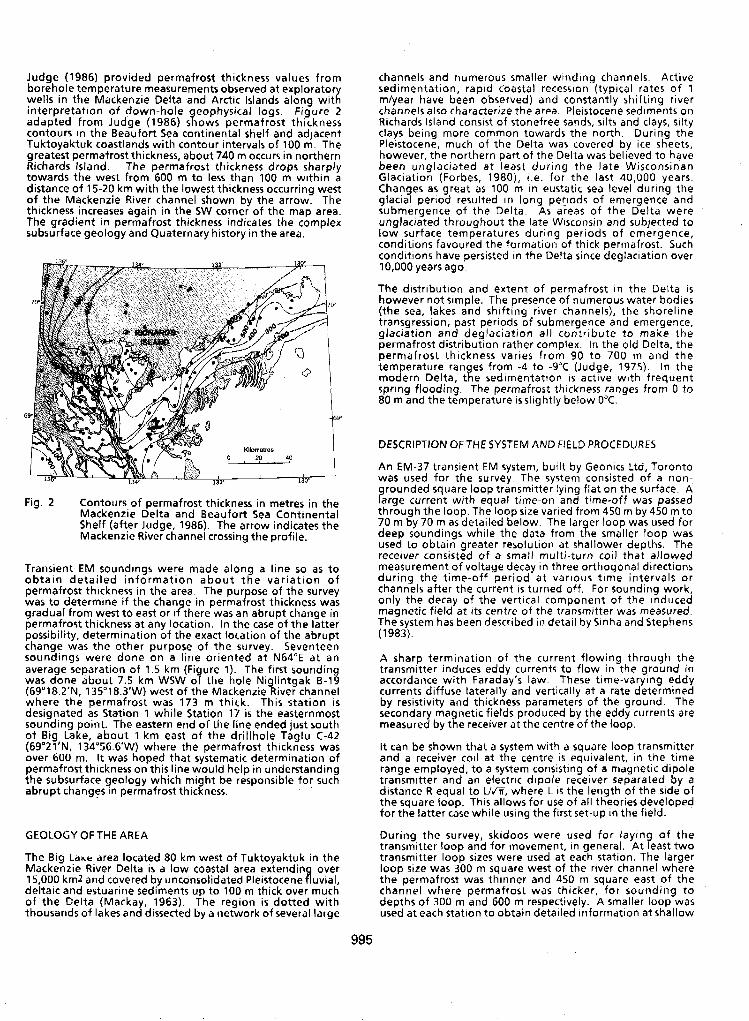
Judge (1986) provided permafrost thickness values from
wells in the Mackenzie Delta and Arctic Islands along wit; borehole temperature measurements observed at explorator
adapted from Judge (1986) slows permafrost thickness interpretation of down-hole eophysical logs. Figure 2
contours in the Beaufort Sea continental shelf and adjacent Tuktoyaktuk coastlands with contour intervals of 100 m. The greatest permafrost thickness, about 740 m occurs in northern Richards Island. The permafrost thickness drops sharply towards the west from 600 m to less than 100 m within a distance of 15-20 km with the lowest thickness occurring west of the Mackenzie River channel shown by the arrow. The thickness increases again in the SW corner of the map area. The gradient in permafrost thickness indicates the complex subsurface geology and Quaternary history in the area.
Fig. 2 Contours of permafrost thickness in metres in the
Shelf (after Judge, 1986). The arrow indicates the Mackentie Delta and Beaufort Sea Continental
Mackenzie River channel crossing the profile.
Transient EM soundings were made along a line so as t o obta in deta i led in format ion about the var ia t ion o f
was to determine if the chan e in permatost thickness was permafrost thickness in the area. The pur ose of the survey
gradual from west t o east or ifthere was an abrupt change in permafrost thickness at any location. In the case of the latter possibility, determination of the exact location of the abrupt
soundings were done on a line oriented a t N64"E a t an change was the other purpose of the survey. Seventeen
was done about 7.5 km WSW 03 the hole Niglintgak B-19 average separation of 1.5 km (Fi ure 1). The first sounding
where the permafrost was 173 m thick. This station is (69"18.2'N, 135"18.3'W) west of the Mackenzie River channel
designated as Station 1 while Station 17 is the easternmost sounding point. The eastern end of the line ended just south of Big Lake, about 1 km east of the drillhole Taglu C-42 (69'21'N, 134'56.6'W) where the permafrost thickness was over 600 m. It was hoped that systematic determination of permafrost thickness on this line would help in understanding the subsurface geology which might be responsible for such abrupt changes in permafrost thickness.
channels and numerous smaller winding channels. Active sedimentation, rapid coastal recession (typical rates of 1 m/year have been observed) and constantly shifting river channels also characterize the area. Pleistocene sediments on Richards Island consist of stonefree sands, silts and clays, silty clays being more common towards the north. During the Pleistocene, much of the Delta was covered by ice sheets; however, the northern part of the Delta was believed to have been unglaciated at least during the late Wisconsinan Glaciation (Forbes, 1980). i.e. for the last 40,000 years. Changes as great as 100 m in eustatic sea level during the glacial period resulted in long periods of emergence and submergence of the Delta. As areas of the Delta were unglaciated throughout the late Wisconsin and subjected to low surface temperatures during periods of emergence, conditions favoured the formation of thick permafrost. Such conditions have persisted In the Delta since deglaciation over 10,000 years ago.
The distribution and extent of permafrost in the Delta is however not simple. The presence of numerous water bodies (the sea, lakes and shifting river channels), the shoreline transgression, past periods of submergence and emergence, glaciation and deglaciation all contribute to make the permafrost distribution rather complex. In the old Delta, the permafrost thickness varies from 90 t o 700 m and the temperature ran es from -4 to -9°C (Judge, 1975). In the modern Delta, t t e sedimentatton is active with frequent spring flooding. The permafrost thickness ranger from 0 to 80 m and the temperature isslightly below 0°C.
DESCRJPTION OF THE SYSTEM AND FIELD PROCEDURES
An EM-37 transient EM system, built by Geonics Ltd, Toronto was used for the survey. The system consisted of a non-
rounded square loop transmitter lyin flat on the surface. A %rge current with equal time-on an3 time-off was passed through the loop. The loop size varied from 450 m by 450 m to 70 m by 70 m as detailed below. The lar er loop was used for deep soundings while the data from t\e smaller loop was used to obtain greater resolution at shallower depths. The receiver consisted of a small multi-turn coil that allowed measurement of voltage decay in three orthogonal directions during the time-off period at various time intervals or channels after the current Is turned off. For sounding work, only the decay of the vertical component of the induced
The system has been described in detail by Sinha and Stephens magnetic field at Its centre of the transmitter was measured.
(1983).
A sharp termination of the current flowing through the transmitter induces eddy currents to f low in the ground in accordance with Faraday's law. These time-varying eddy currents diffuse laterally and vertically at a rate determined
secondary magnetic fields produced by the eddy currents are by resistivity and thickness parameters of the ground. The
measured by the receiver at the centre of the loop.
It can be shown that a s stem with a square loop transmitter and a receiver coil at tKe centre IS equivalent, in the time range employed, t o a system consisting of a magnetic dipole transmitter and an electric dipole receiver separated by a distance R equal to U f i , where L is the length of the side of the square loop. This allows for use of all theories developed for the latter case while using the first set-up in the field.
GEOLOGY OF THE AREA During the survey, skidoos were used for laying of the transmitter loop and for movement, in general. A t least two
The Big L d w drea located SO km west of Tuktoyaktuk in the transmitter loop sizes were used a t each station. The larger Mackenzie River Delta is a low coastal area extendin over loop size was 300 m square west of the river channel where 15.000 km2 and covered by unconsolidated Pleistocene iuvial, the permafrost was thinner and 450 m square east of the deltaic and estuarine sediments up to 100 m thick over much of the Celta (Mackay. 1963). The region is dotted with
channel where permafrost was thicker, for sounding to depths of 300 m and 600 m respectively. A smaller loop was
thousands of lakes and dissected by a network of several large used at each station to obtain detailed information at shallow
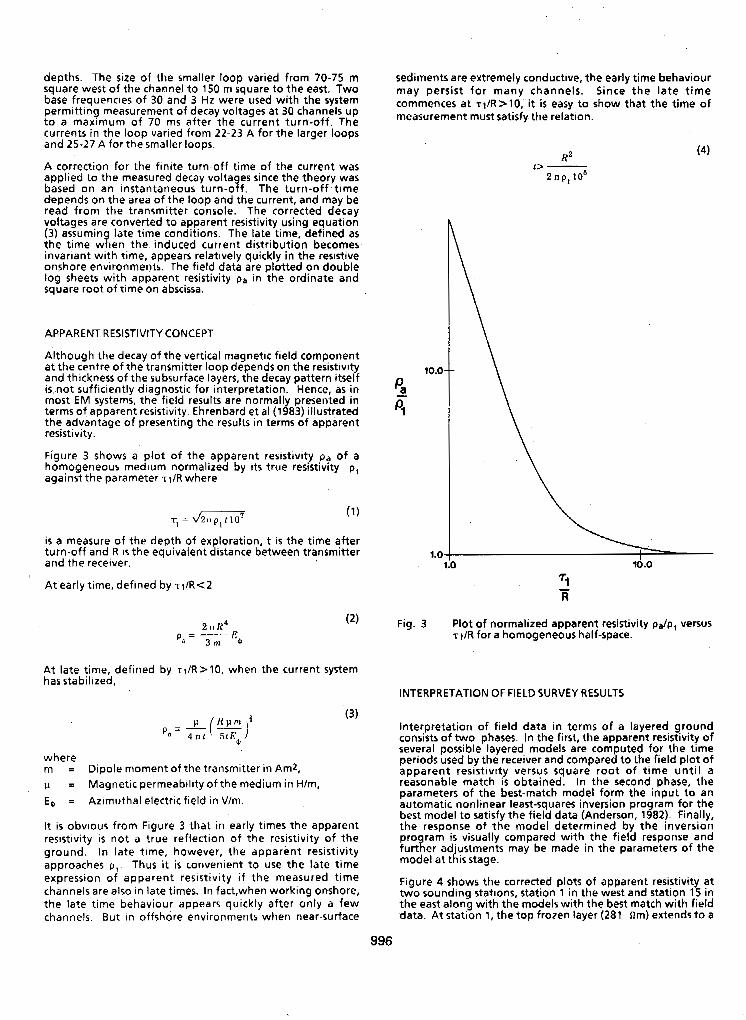
depths. The site of the smaller loop varied from 70-75 m square west of the channel t o 150 m square to the east. Two base frequencies of 30 and 3 Hz were used with the system permitting measurement of decay voltages at 30 channels up t o a maximum of 70 ms after the current turnroff. The currents in the loop varied from 22-23 A for the larger loops and 25-27 A for the smaller loops.
A correction for the finite turn-off time of the current was applied to the measured decay volta es since the theory was based on an instantaneous turn-ojf . The turn-of f t ime depends on the area of the loop and the current, and may be read from the transmitter console. The corrected decay voltages are converted to apparent resistivity using equation
the time wfen the induced current distribution becomes (3) assumin late time conditions. The late time, defined as
invariant with time, appears relatively quickly in the resistive onshore environments. The field data are plotted on double log sheets with apparent resistivity Pa in the ordinate and square root of time on abscissa.
A,PPARENT RESISTIVITY CONCEPT
Although the decay of the vertical magnetic field component at the centre of the transmitter loop depends on the resistivity and thickness of the subsurface layers, the decay pattern itself is not sufficiently diagnostic for interpretation. Hence, as in
terms of apparent resistivity. Ehrenbard et al (1983) illustrated most EM systems, the field results are normally presented in
the advantage of presenting the results in terms of apparent resistivity.
Figure 3 shows a plot of the apparent resistivity pa of a homogeneous medium normalized by i ts true resistivity p, against the parameter TI/R where
T, = (1)
turn-off and R is the equivalent distance between transmitter is a measure of the depth of exploration, t is the time after
and the receiver.
At early time, defined by r t /R<2
2 l l H' P " = -
3 m
At late time, defined by ~1/R>10, when the current system hasstabilized,
sediments are extremely conductive, the early time behaviour may persist for many channels. Since the la te t ime commences at ~1/R>10, it is easy t o show that the time of measurement must satisfy the relation.
H2 2 105
1> -
10.0
pa 4 I
1.0
Fig. 3 Plot of normalized apparent resistivity pa/p, versus T 1IR for a homogeneous half-space.
where m = Dipole moment of the transmitter in Am2,
= Magnetic permeability of the medium in Hlm, E+ = Azimuthal electric field in V/m.
It is obvious from Figure 3 that in early times the apparent resistivity is not a true reflection of the resistivity of the ground. In late time, however, the apparent resistivity approaches p,. Thus it is convenient to use the late time expression of apparent resistivity if the measured time channels are also in late times. In fact,when working onshore, the late time behaviour appears quickly after only a few channels. But in offshore environments when near-surface
INTERPRETATION OF FIELD SURVEY RESULTS
Interpretation of field data in terms of a layered ground
several possible layered models are computed for the time consists o f two phases. In the first, the apparent resistivity of
periods used by the receiver and compared to the f ield plot of apparent resistivity versus square root o f t ime unt i l a reasonable match is obtained. In the second phase, the parameters of the best-match model form the input to an automatic nonlinear least-squares inversion program for the best model t o satisfy the field data (Anderson, 1982). Finally, the response of the model determined by the inversion
furt fer ad.ustments may be made in the parameters of the pro ram is visually compared with the f ield response and
model at t k i s stage.
Figure 4 shows the corrected plots of apparent resistivity at
the east along with the models with the best match with field two sounding stations, station 1 in the west and station 15 in
data. At station 1, the top frozen layer (281 nm) extends t o a
996
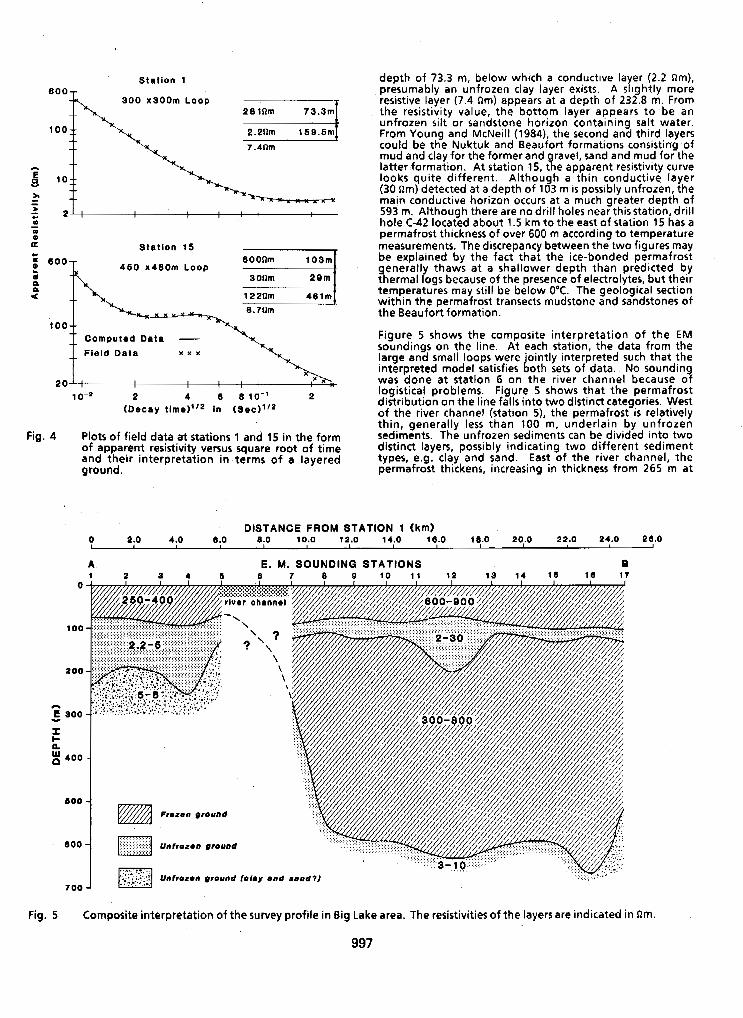
Station 1
300 x300m Loop 201nm 73.3rn
2.2nm 169.6m
7.4nm
1 1 1 : - ID 0
Station 15
460 x480m LOOP
I
C 6 0 0 - f a
BOOnm
4 0
122nm 8.70m * x * * "
100" Computed Data - Field Data Y Y Y
20 I I
lo -= 2 4 6 8 10" 2 (Decay tlme)l'2 in (aec)1 '2
Fig. 4 Plats of field data at stations 1 and 15 in the form of apparent resistivity versus square root of time and their interpretation in terms of a layered ground.
0
100
200
n
Y E 300
r n F
400
600
800
700
depth of 73.3 m, below which a conductive la er (2 .2 nm), presumably an unfrozen clay layer exists. A srightly more resistive layer (7.4 Qm) appears at a depth of 232.8 m. From the resistivity value, the bottom layer appears to be an unfrozen silt or sandstone horizon containing salt water. From Young and McNeill (1984). the second and third layers could be the Nuktuk and Beaufort formations consisting of mud and clay for the former and ravel, sand and mud for the latter formation. At station 15, &e apparent resistivity curve
(30 nm) detected a t a depth of 103 m is possibly unfrozen, the looks quite different. Although a thin conductive layer
main conductive horizon occurs at a much greater depth of 593 m. Although there are no drill holes near this station, drill hole C-42 located about 1.5 km to the east of station 15 has a permafrost thickness of over 600 m according to temperature measurements. The discrepancy between the two figures may be explained by the fact that the ice-bonded permafrost
thermal logs because of the presence of electrolytes, but their generally thaws at a shallower depth than predicted by
temperatures may still be below 0°C. The geological section within the permafrost transects mudstone and sandstones of the Beaufort formation.
Figure 5 shows the composite interpretation of the EM soundings on the line. At each station, the data from the large and small loops were -ointly interpreted such that the interpreted model satisfies both sets of data. No sounding was done at station 6 on the river channel because o f
distribution on the line falls into two distinct categories. West logistical problems. Figure 5 shows that the permafrost
of the river channel (station 5), the permafrost is relatlvely thin, generally less than 100 m, underlain by unfrozen sediments. The unfrozen sediments can be divided into two distinct layers, possibly indicating two different sediment types, e.g. clay and sand. East of the river channel, the permafrost thickens, increasing in thickness from 265 m at
0 P.0 4.0 1.0 8.0 10.0 12.0 14.0 18.0 18.0 20.0 22.0 24.0 21.0 I I I
DISTANCE FROM STATION 1 (km)
Fig. 5 Composite interpretation of the survey profile in Big Lake area. The resistivities of the layers are indicated in nm.
997
station 7 to about 675 m at station 16, beyond which the thickness drops to 513 m at station 17. An interesting feature at all soundin stations east of the river channel i s the presence of a &in layer of unfrozen sediments close to the surface. The layer is thickest under station 12 where it is
Thisthin unfrozen layer may reflect a zone which had thawed about 125 m thick and more resistive than a t nearby stations.
either due to the proximity of warm lakes or rivers or cover by a former extensive lake and subsequent slow refreezing after drainage of that lake.
The thickness of the permafrost increases abruptly between stations 7 and 8 but stays reasonably uniform east of station 8. At some of the stations, the sounding curves were greatly distorted perhaps implyin the presence of lateral inhomogeneities such as ta l i f s forming two- and three- dimensional bodies instead of simple horizontal layers. This could again be due to the very complex recent geological history of the area resulting in very irregular boundaries.
A similar transient EM survey was carried out on a N-S line in 1983 (Rozenberg et al, 1985) SW of Big Lake. One of their sounding stations was located about 1 km WSW of station 16. Rozenberg et a1 (1985) interpreted the permafrost thickness at their station to be 670 m which agrees well with our interpretation of 675 m at station 16. However, they did not report detecting any unfrozen sediments close to the surface at that station, although they reported detecting unfrozen material a t a depth of 30 m, 400 m south of that station. Thus, there is good agreement between their interpretation and our results in that area.
CONCLUSIONS
Deep transient EM soundings were carried out on a 25 km long line southwest of the Big Lake in the Mackenzie Delta, N.W.T., to obtain detailed information where borehole temperature measurements indicated a sharp change in the permafrost thickness. The permafrost was rather thin west of the Mackenzie River channel which forms the present boundary between the modern and the old delta. East of the channel, the permafrost thickness was much reater, of the order of 500 m or more from 2 km east 07 the channel onward.
At five sounding stations west of the river channel, the permafrost was never more than 100 m thick. Below the permafrast, two conductive layers were detected which could be unfrozen clay and sandy sediments. To the east of the cha.nne1, an abrupt change in permafrost thickness was noted at station 7, less than a km from the eastern edge of the river channel, where it was 265 m. The thickness increased to 560 m at station 8, 1.5 km further east from station 7 and stayed reasonably uniform further east. A thin, shallow unfrozen layer was also detected at all stations east of the channel. This layer increased in thickness 8 to 10 km east from the river channel where the sounding curves were rather distorted. The bottom unfrozen sediments east of the channel were quite conductive (3-10 rim), sug esting the presence of unfrozen clays, mixtures of clay antsilt or the presence ofsalt water in the pores.
The success of the EM survey in delineatin the subsurface conditions in this area down to depths of 780 m proves that such techniques can be used in mapping the distribution of permafrost in areas where permafrost thickness may change rapidly. This type of survey may be extended to offshore areas with minor changes in equipment although the depth of investigation may be somewhat reduced because of the presence of highly conductive near-surface materials.
ACKNOWLEDGMENTS
The author wishes to thank his colleagues L.E. Stephens and D. Gresham of the Geological Survey of Canada and Perry Lanthier of the former Earth Physics Branch for help in carrying out the field survey and preliminary interpretation of the data. Thanks are also extended to Polar Continental Shelf Pro'ect for providin logistical help during the field program and to the office oathe Energy Research and Development, EMR, for partial1 financin the field work. Dr. A.S. Judge of GSC sug ested t t e idea opcarrying out EM soundings in the area anjcritically read this manuscript.
REFERENCES
Anderson, W.L. (1982). Nonlinear least-squares inversion of transient soundin s for a central induction loop system (Program NLSfC8. Open-File report 82-1 129, U,S. Geological Survey, 35 p.
in permafrost. Radio Science, v. 11 h , 383-394.
Computer-assisted interpretation of electromagnetic soundings over a permafrost section. Geophysics, 41,
Annan, A.P. and Davis, J.L. (1976). Im ulse radar sounding
Daniels, J.J., Keller, G.V. and Jacobson, J.J. (1976).
752-765.
Ehrenbard, R.L., Hoekstra, P. and Rotenberg, G. (1983). Transient electromagnetic soundings for permafrost map ing Proc. 4th Int. Conf. on Permafrost, National AcackmyPress, Washington, DX., 272-277.
Forbes, D.L. (1980). Late Quaternary,sea levels in the Southern Beaufort Sea. Current Research, Paper 80-18, Geological Survey of Canada, 75-87.
Hoekstra, P. and McNeill, J.D. (1973). Electromagnetic
American Contribution t o 2 n d Int. Conf., Yakutsk, probing of permafrost. in Permafrost -- The North
Washington, D.C., 517-526.
Ground and airborne resistivity surveys of permafrost near Fairbanks. Alaska. Geophysics, v. 40 (4), 641-656.
Judge, A.S. (1975). Geothermal studies in the Mackenzie Valley by the Earth Physics Branch. Geothermal. Series No. 2, Geothermal Service of Canada, 12 p.
Hoekstra, P., Sellmann, P.V. and Delaney, A. (1975).
Judge, A. (1986). Permafrost distribution and the quaternary history of the Mackenzie-Beaufort region: A geothermal perspective. Open-File Report 1237, Geological Survey of Canada, 41-45.
Koziar, A. and Strangeway. D.W. (1978). Permafrost mapping by audio frequency magnetotelluric. Can. J. of Earth Sclences, v. 15. 1535-1 546.
Mackay, J.R. (1963). The Mackenzie Delta Area, N.W,T. Geographical Branch Memoir No. 8, Dept. of Mines and Technical Surveys, Canada.
Olhoeft, G. (1975). The electrical properties of permafrost. Ph.D. thesis, University of Toronto, Toronto, Canada.
Osterkamp, T.E. and Payne, M.W. (1981). Estimates of permafrost thickness from well logs in northern Alaska. Cold Regions Science and Technology, v. 5,13-27.
998
Rossiter, J.R., Strangwa D.W., Koziar, A., Wong, J. and Olhoeft, G.R. (19%). Electromagnetic sounding of
Ottawa, National Research Council of Canada, 567-572. permafrost. Proc. 3rd Int. Conf. on Permafrost, v. 1,
Rozenber , G., Henderson, J.D., Sartorelli, A.N. and Judge,
soundings for permafrost deltneation. Workshop on A.S. ? 1 9 ~ ~ ~ . Some aspects of transient electromagnetic
Permafrost Geophysics, CRREL Special Rep. 85-5 (J. Brown, M.C. Metr and P. Hoekstra ed), 74-90.
Sartorelli, A.N. and French, R.B. (1982). Electromagnetic induction methods for mapping permafrost along northern pipeline corridors. Proc. 4th Canadian
Ottawa, 283-295. Permafrost Conf, National Res. Council of Canada,
Sinha, A.K. and Stephens, L.E. (1983). Deep
the Mackenzie Delta, NfV.T., Canada. Proc. 4th Int. electromagnetic soundin over the permafrost terrain in
Conf. on Permafrost, Washington, D.C.; Natlonal Academy Press, 1166-1171.
Taylor, A.E., Burgess, M., Judge, AS. and Allen, V.S. (1982).
1981. Geothermal Series No. 13, Earth Physics Branch, Canadian geothermal data collection - Northern wells,
154 p.
Young, F.G. and McNeill, D.H. (1984). Cenozoic
Territories. gulletin 336, Geological Survey of Canada, stratigraph of the Mackentle Delta, Northwest
63 p.
999
MAPPING AND ENGINEERING-GEOLOGIC EVALUATION OF KURUMS A.I. Tyurin, N.N. Romanovsky and D.O. Sergeyev
Faculty of Geology, Moscow State University, Moscow, USSR
mmI6 Over the last 10 t o 15 years rock streams are more frequently used o r treated
f r o m the studies of the Transbaikal bald mountain belt- where rock streams occupy more than a half a0 a pmbable base f o r engineering structures. The present paper I s based on the data obtained
o f the slo e &Tea and are diatiaguished by large ais9 and complex s t ructure due to gsostructural peculiari tPei, of near-surface so l id rocks , a l t i t udha l permafrost ana climatic zonality, ana epe- c i f i c fea.t;umes of the eubsuTface water flow. !Phe author8 have propoaed the methods f o r mapping stable paragenetic complexes o f fac ies (rock stream, deluvial solifluction, etc.) occurring in a cer ta in area termed "slope segment". Features, which are facjes of slope formations, are identi- f i e d as conventional. unite within slope Be ents as a resu l t of engineering-geological analyeis. By the conlabiaations of the peculiarities &?the s t ructure and movement mechanisms, the features are subdivided into four groups depending on the lnaeafd f o r engineering development. Based on the s t u d i e s of the Paaturels the principles of Slope segment evaluation have been developed t o aid in ohoosrslg a proper m e h o d f o r laying a roadbed and working out a set of engineering measures t o achieve safe road operation, The procedures which have bean elaborated are embodied In the maps of tmgbeering-geologic conditions and engineering-geo~ogical evaluation.
For about; 200 gears rock streame (kurums) have be- a t t rac t ing a t ten t ion of sc ien t i s t s . Over t he l a s t 10-15 years rock stmama are more and more often considered as a base for various eeiaeerlng projectis. It should be noted that the problem of aonstructing OIL rock rstreams has alwayer existed. Bullders treated and con- tinue t o t r e a t rock streame aa a oomph% and
them. In the majority of cases such a practice incomprehensive phenomenon, t rg i ag t o by-pase
was a lsuccess because 80 far, only re ions with rock streams of iimited extent haf bean developed. Avoidance of rock streams b e v i - tably incurred additlcraal expenditures. A t present, when high-mountain regions where rock streamar occupy up t o 60 percent of' the area are being developed it is impossible t o pass them around and construction on them i s inevitable.
The present paper is based on the data obtalnd from the s t u d i e s of rock streams in the bald- mouutain b e l t of the Transbaikal region. The authors have experience of rock-stream investi- gation in South Yakutiya based on the cryo- facies analyeis. Rock streams in this area are formations limited in extent from Dome t e n a t a a few hundred meters. They occur mainly on tb sides of valleys cut in plateaus and have d i s - t h c t belts o f mobilization transit and accu- mulation of c l a s t i c m a t e d . The rock stre- ams in the Transbaikal mountaha are d l f f e - rent; t he i r f ea tu re s are as Pollows t (1) they are large and extended down slope; (2) se r ies o f a l texnatbg rock streams, of t en de fe ren t in morphology and genesis are located, as a rule , on every slope; (3) there i s no d i s t l n c t dFPPerention of rock stream bel t s (of mobiliza- t i on , t r ans i t m a accumulation). One rack
stream cover m a y be incorporated Fnto the mobi- lination belt o f the other. This pattern sometimes complicated by several accumudive belts, may repeatedly occur on a slope; (4) due t o a large alt i tude gradient, a rock-stream slope is frequently characterized by climatio and geocryologlc a l t f t u d b a l sonality ; and (5) complex geostruct ural cond it ions (topogra- phy, diverse and cloea $0 the surface aolid rock bedding, f a u l t and block tectonics etc.) that lead t o complicated paragenetic connec- tions o f rock streams and thelr association with different types of erogenetic processes and phenomena.
The golats listed above require a l a rger scope of methods and procedures as compared with pmviously used in s t u d y i n g rock streams.
The Btudies of rock streams in the Transbaikal region have ahown tha t in different part6 of the mountains they are dlfferentlg d i s t r i b u t e d and duffer significadtly in morphology, In addition, rock streams have been found t o be paragenetically related t o cerbain types of slope formations (accumulations) Cosequently , we have conducted (1) special geomorphological mapping t o etudy in de ta i l the s lopes depend- on the neotectonic sett ing, glacial phenomena in the Pleistocene, as well a8 composition and geostructural features of bedrock; and (2) special mappiq o f the Quaternary fornations connected paragenetically with rock streams deserptium. It hae been established that Qua- ternarg fomationa of eluvial, colluvia1,gla- c ia1 and even aquatio series may (a) serve a8 a subatratum for the formation of rock- stream deserptium; (b) be connected perageneti- call7 with the l a t t e r , f o r m k g al ternat ing
areas; and (c) exclude the presence of mck- stream desergtium. It has also been establi- shed that mck-stream deserptium i tnelf may serve a basis f o r the formation.of other ene- t i c types of Quaternary deposits. These %; in- dings allowed us t o compile a Wap of Rock Streamstt based on a special map of Quaternarg deposits . It represents in detai l e lope f o r - mations and especially various mck stream fac ies and t h e l r combinations. The nsab taxo- nomic unit of rock stream that wa8 d i s t i n g u i - shed a d studied in the course of special geo-
foflowing rock stream fac ies were identified l o ical surveys was a rock stream facies . The
by common morpholo and orientation o f ' t h e '
procesees that d b g a c e a and transformed ruda- ceouB material.: Ylowa of rock streams1', net- l i k e rock streams, rock-stream ~ l o p e s , . a s well as complicated combinations of Plow rock strean forms with areal aaea; Therefore, a t the f i r s t stage o f studies o r rock-stream facies , three large morphological groups of sock- atream forma were ident i f ied$ (I) isometrio;
comprise6 different facies dietFnguisbed by (2) Linear (flow); and (3) net-like. Each
individual morphological peculiarities of the
re l ie f forms. This is due t o the f a c t that rock stream body and occurrence in various
b their genesis. Geostructural features of the morphology of rock streams is predetermined
stopes are also very important. fhese axe: (1) presence of d u f erent k h d s of f ruc tum systeme and tectonoc fxagmentation sones; (2) lithoological peculiarikiee of rock6 and orientation of geologic l ayefs re la t ive to the slopee; (3) slope steepness and evolution; (4) dimensions of the drainage system and t h e associated slope inundation; ( 5 ) preesnce of external sources of rock stmame; and (6) the type of unconsolidated sediments which semed
With t h i s in view, rock-stream fac ies within as a background for rock streams development.
morphological groups were identified based on an obligatory analysis o f a l l the factors involved Fa rook-stream formation directly on the slope under s t u d y .
The next stage of the work was mapping of rock- stream facies . However, large-scale mapping of rock streams is impossible because o f t h e i r
, limited size. Many rock streams are only a few meters wide. Rock-stream facies a l ternate with , those of other slope deposits 'such as, for example , eluvial-deluvlal ones f o m i n a para- genetically related group of d o p e facfes. Buch groups occupy considerable parts o f sl.opes cor- responding, in the taxonomic ser ies of lands-
metric forma g f t h e l a t t e r on the slope are capes, t o the "facies association". The geo- often similar t o segments; therefore in th is paper they were conditionally termed :'slope segments'*. Thus , a8 a resu l t o f a special geo- logical Survey, it were not the boundaries of individual rock stream6 that have been identi- f i e d and mapped but the paragenesee of Slope Pormationa, including also the groups of rock stream facies.
Within the slope segments identified, the per-
faa les was determined. The map shows t h e rock centage of areas occupied by their conatituent
stream llcoverage" (percentage) tn a %egment" . which was shaaed in color correaponding t o the rock fitream genesis W it covered more than 50 percent of the segment's area or t o the type
100
of alope deposits prevalent in this llse@entll.
A n engineering-geological prediction of the interaction between a rock stream azl4.a road along the en t i re rock stream slope is not yet feasible. Within the limits of slope segmen*s, an engbeerlng-geological analysis enabled identification o f conditional units o r features. Most f r e q u s a t l y , these are rock stream fac ies o r other types of slope formations, They can alao be repreaented by rock stream subfacies,
rable size. The ident i f icat ion of such fea- i.e. by smaller units b u t s t i l l - o f conside-
turea w a ~ based upon the Iollowfng faetora:
re la t ion t o the depth of the seaamally t h a w i n g (1) thickness of the xudaceous cover and its
mountain-ice-containing horizon and its thick- layer (STTI); (2) preaence o r absence of a bald-
nessv1 (3) sins and shape o f rock Pragments,and, main4 the degree of thelr mLlndness# (4) den- sity o t the structiure ("packing**) of the ,ruaa-
da ted , thlxOtPOgiC fine-grahed material in ceaus cover; (5) presence of a layer 09 bun-
the basement of the ST5 and/or the same mate- r i a l in a perennially froBen s t a t e ; ( 6 ) pre- sence of water O J s w from the STL in the rock stream body in'summer; and (7) slope steep- ness.
$0 evaiuate the s tabi l i ty o f a eegment feature , obaexvatione were conduoted o f the behavior of engineering structures and of the mghee- ring-geological processes and phnomena Fndu- ced bg t h a . We could than predict mdesi- xable displacements of the rock stream cover under the impact of road construction, auoh as: allding of the rudaceous cover down the ice- ground base; plas t ic .deformation of the bald- mauntab ice layer; its p a r t i a l or complete tha~blng aad associated subsidence; visco- p las t ic deformations of the f ine-earth lager;
mic head o f the SfL waters; and fine-earth the cover deformations caused by t h e hydrodyna- suffoeion and gravitational diaplacaments. Beg- ments with an area l o r stream-like (concentra- ted) patterns of the rudaceous cover movement have been distbguished. Tphe order o f the
placed have been evaluated.9or the both, de- r a t e s of--movement arid amounts of material d i s -
pending on slope steepness rudaceoua cover thiclmssa, and quality of h e displacemetit cur- face in natural conditions and. those of slope cutting," . By-the rspecjfice o f st ructure and me-
slopes are subdivzded in to four groups as Co canisms .of motion, the features of rock stream
the extent of hazard associated with t h e i r en- gineer-ing-geological development: safe, com- paratively aafe, hazardous and extremely hazar- dous
The safe type of rock stream features and other slope foxmations i s characterized by a f a i r l g a table s , ta te of the rudaceous cover; absence o f conditions fox its catastmphic displace- ments due t o alope cut t ings absence of debris movement; , and ra tes of movement, if any, tha t do not exceeding a few millimeter6 a year. Construction of roads on such rock streams is safe.
The comparatively safe t y p e o f rock stream fea- tures is characterized b y the fragments with bald-mountain ice o f ins igni f icant th icbess (up t o 0.3 m ) ; unconsolidated structure of debris Fn the rudaceous cover, etc. Roads
I1
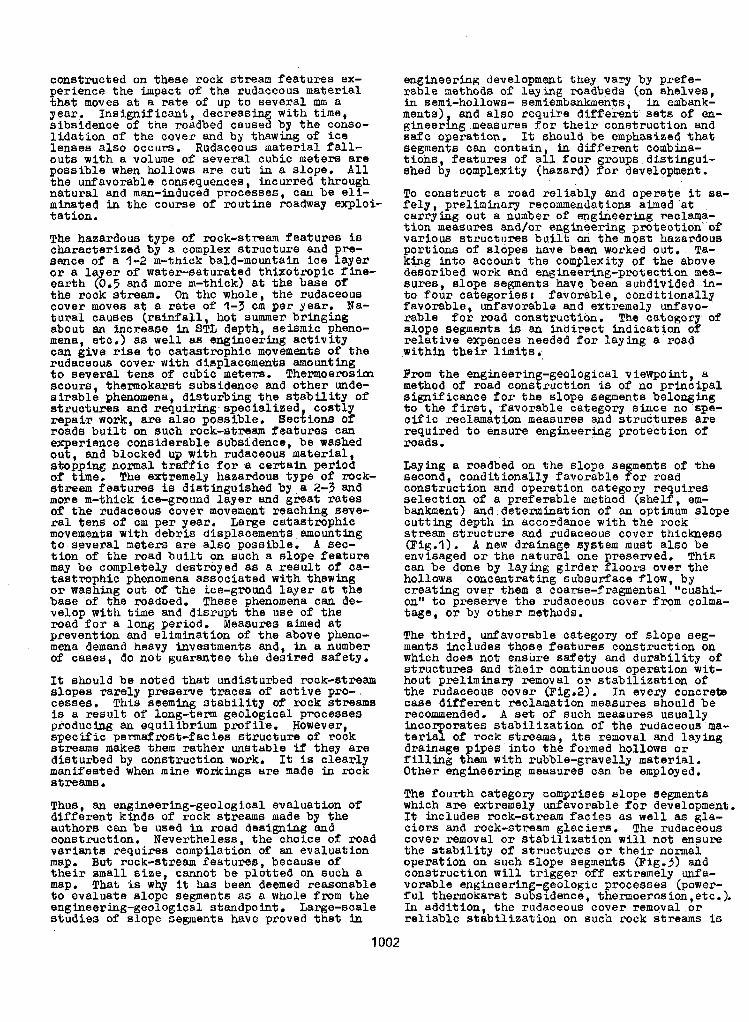
constructed on these rock stream features ex- perience the impact o f the rudaceous material t ha t moves a t a r a t e of up t o several mm a year. Insignificant, decreasing with time, sibsidence of the roadbed caused by the conso- l i da t ion o f the cover and by thawing of i ce
outs with a volume of several. cubic metem a r e lenses also occurs. Rudaceous material fall-
possible when hollows are cut in a slope. A l l
natural and man-hduced processes, can be e l i - the unfavorable consequences, incurred through
mlnated in the course o f routine roaawq exploi- ta t ion.
The hazardous type o f rock-stream features ia characterized by a complex s t ructure and pre- sence o f a 1-2 m-thick bald-mountain ice layer o r a layer of water-saturated thixotropic fine- earth (0.5 and more m-thick) at the base of the rock stream. On the whole, t he rudaceous cover moves at a r a t e of 1-3 cm per year. Na- tural causes ( rabfa l l , ho t summer bringing about an increase in STL depth, seismic pheno- mena, etc.) as well as engineering activity can give rise t o catastrophic movements 00 t he rudaceous cover wi th diaplacemanta am0Unthg t o several tens of cubic metem. Themoerosim scour^, thermokarst subsidence and other unde- s i r a b l e phenomena, d i s turb ing the s tab i l i t of s t ructures and requiring specialized cost 9 y r epa i r work, are also possible. Sections of roade b u i l t on such rock-stream features c tu experience considerable subsidence, be washed ou t , and blocked up with rudaceous material, stoppiag normal t r a f f i c f o r a cerOain period
streem features i s distinguished by 8 2-3 and of time, The extremely hazardous type of rock-
more m-thick ice-ground layer and great ra tes of the audaceous cover movement reaching seve-
movementgl with debris displacements amounting ra l tans of cm per year. Large catastrophic
t o several metem a re also possible. A sec- t i o n of the road b u i l t on such a slope feature may be completely destroyed as a result of ca- tastrophic phenomena associated with thawing o r washing out of the ice-ground layer at t he base of the roamed. These phenomena can de- velop wiCh time and disrupt the use of t he
prevention and elimination of the above pheno- road f o r a long period. Meaauree aimed at
men8 demand heavy investments a n d , j~ a number of cases, do not guarantee the desired safety.
It should be noted that undisturbed rock-stream slopes rarely preserve traces of active gro-, cessea. This seeming s t a b i l i t y of rock streams i s a result of long-term geological proceasas producing an equilibrium profile. However, specific permafrost-faciea structure of rock streme makes them r a t h e r w t a b l e if they are disturbed by con6truction work. It is clearly maniPe8ted when mine workings a re made in rock streams . Thus, an engineering-geological evaluation of different k i n d s o f rock streams made by the authors can be used in road designing a n d construction. Nevertheless, the choice o f road variant8 requires compilation of an evaluation map. B u t rock-stream features , because o f t h e i r amall size, cannot be plotted on such a map. That is w h y i t kas been deemed reasonable t o evaluate slope segments as a Whole from the
s tudies of slope segments have proved t h a t in engineering-geological standpoint. Large-scale
engineerkg development they vary by prefe- rable methods of Lay 'Lng roadbeds (on shelves, in semi-hollows- semiembankments, in embank- ments) and also require di f fe ren t se t s of en- gineer& measures f o r their construction and safe operation, It ahould be emphasized t h a t segments can contain, in dsfferent combha- t ions, features of a l l four r o u p dist ingui- shed by complexity (hazard) f o r development.
To construct a road reliably and operate it sa- fely, preliminary recommendations aimed a t
t i o n measures and/or engineering protection o f carrying o u t a number of engineering reclama-
var ious s t ructures bui l t on the most hazardous portions of slope8 have been worked out. Ta- king into account t he complexity of t h e above described work and eng,Sneer¶sg-profection mea- eurm, slope segments have been subdivided in- to four categories! favorable, conditionally favorable, unfavorable and extremely unfavo- rable f o r road construction. The categorg of slope segments is an indirect indication of
wi th in the i r limits. r e l a t ive expences needed f o r lay Fng a road
Prom the engineering-geological viewpoint, a method of road construction is of no principal significance for the slope segments belonging t o the first, favorable category since no spa- c i f i c reclamation measures a n d atrucfufes are required to ensure engineering protection o f roads.
Laying a roadbed on the slope segments o f the second, conditionally favorable f o r road construction and operation category requires selection of a preferable method (shelf , em- bankment) and .determination o f an optimum slope cutting depth in accordance with the rock stream structure a n d rudaceous cover thickness (Fig.1). A new d rahage system m u s t also be envisaged or the natural one presaIue8. This can be done by laying girder floors over the hollows concentrating subsuflace f l o w , by c r e a t b g over them a coarse-fragmental llcushl- onr1 t o preserve the rudaceous cover f r o m colma- tage, o r by other methods.
The third unfavorable category of slope seg- ments includes those features construction on which does not ensure safety and durabili ty o f hout preliminaq removal o r stabil iBation of s t ructures and t h e i r continuous operation w i t -
the rudaceous cover (Fig.2). In every concrete case different reclamation measures should be recommended. A s e t o f such measures usually LncorporateB s t ab i l i za t ion of the rudaceous ma- t e r i a l of rock streams, its removal and layFng drainage pipes i n t o the formed hoLlOw8 or filling them with rubble-gravelly material. Other engineering measures cao be employed.
The fourth category comprises slope segments which a re extremely unfavorable f o r development. It includes rock-stream f a c i e s as well as gla- c i e r s and rock-stream glaciers. The rudaceous cover removal or s t ab i l i za t ion will not e n s u r e t he s t ab i l i t y of s t ructures or t h e i r normal. operation on such slope segments (Fig.3) and construction will t r igge r o f f extremely unfa- vorable engineering-geologic processes (power- f u l thermokarst aubsidence, themoerosion,etc.). Ln addition, the rudaceous cover removal or reliable s t ab i l i za t ion on such rock streams is
1002
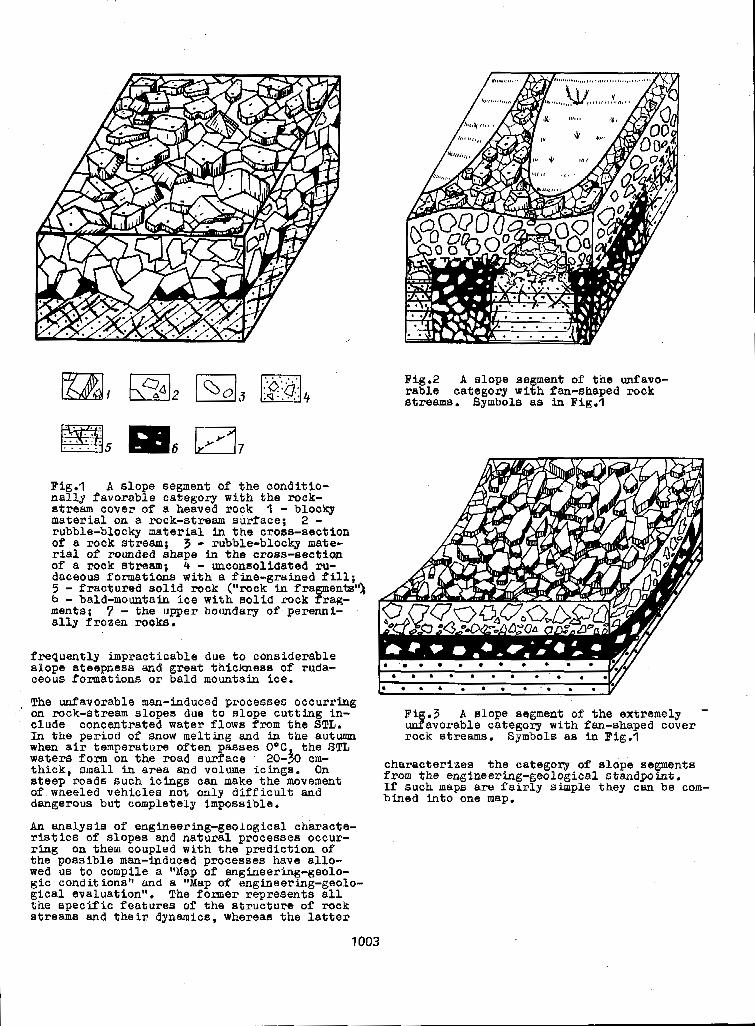
Fig.2 A slope segment of the &avo- rab3.e category with fan-shaped rock streams. Gymbola a$ in Pig.1
Fig.1 A slope segment of the conditio- nally favorable c a t e g o q with the rock- atream cover of a heaved rock 1 - blocky material on a rock-stream suflace; 2 - rubble-blocky material. in the cross-section of a rock stream; 3 - rubble-blocky mate- r i a l of rounded shape Fa the croas-section of a rock Stream; 4 - unconsolidated r u - daceous formations with a fine-grained f i l l5 5 - fractured s o l i d rock ("rock in fragmentsi% 6 - bald-mountah i c e with a o l i d rock frag- ments; 7 - the upper boundayy of perenni- ally f roaen rocks.
frequently impracticable due t o considerable slope steepness and great thicEmesB o f ruda- ceous formations o r bald mountain i ce .
The unfavorable man-fnduced processes occurring ' on rock-stream slopes due t o slope cutt ing in-
clude concentrated water f lows f r o m the STL. In the period of anow melting and in the autumn when air temperature often passes O°C the STL waters form on the road surface 20-30 cm- thick, small in area and volume icings. On ateep roads such iclngs can make the movement o f wheeled vehiclea not only d i f f i c u l t and dangerous but completely impossible.
An analysis of engineering-geological characte- r i a t i c s of slopes and natural processes occur- ring on them coupled with the prediction o f the possible man-induced processes have allo- wed us t o compile a "Map of engheesing-geolo- gfc conditions'' and a "Map o f engbeerhg-geolo- gical evaluation". The former representa all the specif ic features of the s t ructure of rock streams and t h e i r dynamics, whereaa t h e l a t t e r
. . Big.3 A slope segment o f the extremely - unfavorable categorg with fan-shaped cover rock streams. Symbols as in Fig.?
characterizes the category o f slope segments from the engineerFng-geological s tmapoh t . If such maps are fairly simple they can be com- b h e d Fnto one map.
1003
DEVELOPMENT AND THAWING OF ICE-RICH PERMAFROST AROUND' CHILLED PIPELINES MONITORED BY RESISTANCE GAUGES
B.O. Van Everdingen and L.E. Carlson
The Arctic Institute of North America, Calgary, Canada T2N 1N4 L.E.C. Engineering Ltd., Calgary, Canada T2K 4R5
SYNOPSIS Data from electrical-resistance freezing gauges installed alongside three test sections of chilled, buried pipeline show development of frost bulbs around the pipes; development of increasing ice contents with time; and,proqressive melting of excess ice and thawing
FREEZING GAUGES
astrumentation
Three freezing gauges of the Type 11 variety described by Banner and van Everdingen (1979) were constructed as shown in Figurt 1.
of the-ground after the shutdown of chilling.
INTRODUCTION
The Calgary Test Site
In early 1974, the Calgary Frost Heave Teat Facility was constructed by Canadian Arctic Gas Study Ltd., to study the potential development of frost heave around chilled, large-diameter pipelines buried in unfrozen, frost-susceptible Soils. The initial installation consisted of four pipe sections (CONTROL, GRAVEL, DEEP- BURIAL and RESTRAINED), each 1.22 m in diameter and 12.2 m long, through which refrigerated air at atmospheric pressure could be circulated at a temperature of about -12'C. Additional details of the test installation, site layout, and s m a r i e s of teat results can be found in Slusarchuk e t a1.(1978) and Carlson et al.
of the heave history to the end of 1980. (1982). The latter presented an interpretation
Operation of the test site started on 20 March 1974. The CONTROL section was removed in the fall s t 1977. The facility was taken over by Foothills Pipe Lines Ltd. at the end of 1977. Two additional insulated pipe ecctians were activated in February 1979. Chilling was discontinued on 24 February 1986 and shortly thereafter the DEEP-BURIAL section was excavated to enable insp6ction of the frost bulb around the pipe. The remainder of the facility was dismantled in October 1986.
Resistivity Measurements
Installation of electrical-resistance freezing gauges in the test site was to serve two purposes. First, the test site provided an excellent oggortuni'ty for testing the long-term performance of this type of freesing detactor. As at least some excess ice could be expected to form in the frost bulbs around the chilled pipe sections, the test site also presented a chance to establish whether the growth af ice- rich permafrost would be reflected in a gradual increase in measured resistance values.
kl Fig. 1 Freezing gauge construction (after
Banner and-van Everdingen, 1979). 1 - soldered wire stubs; 2 - galvanized steel pipe couplings; 3 - threaded PVC nipples: 4 - connecting wires.Yo'ints waterproofed with Teflon tape. L - effective electrode interval.
1004
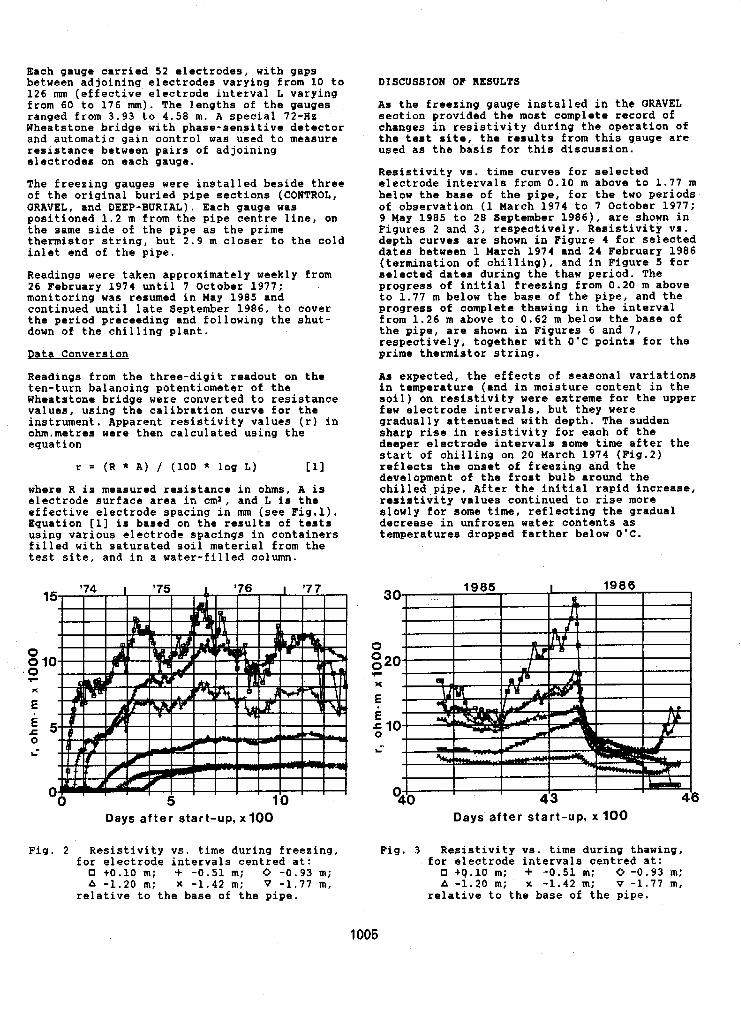
Each gauge carried 52 electrodes, with gaps between adjoining electrodes varying from 10 t o 126 mm (effective electrode interval L varying from 60 to 176 mm). The lengths of the gauges ranged from 3.93 t o 4.58 m. A special 72-Hz Wheatstone bridge with phase-sensitive detector and automatic gain control was used to measure resistance between pairs of adjoining electrodes on each gauge.
The freezing gauges were installed beside three of the original buried pipe sections (CONTROL, GRAVEL, and DEEP-BURIAL). Each gauge was positioned 1.2 m from the pipe centre line, on the same side of the pipe as the prime thermistor string, but 2.9 m closer to the cold inlet end of the pipe.
Readings were taken approximately weekly from 26 February 1974 until 7 October 1977; monitoring was resumed in May 1985 and continued until late September 1986, to cover the period proceeding and following the shut- down of the chilling plant.
Data Conversion
Readings from the three-digit readout on the ten-turn balancing potentiometer of the Wheatstone bridge were converted to resistance values, using the calibration curve for the instrument. Apparent resistivity values (r) in ohm.metres were then calculated using the equation
r = (R * A ) / (100 * log L) 111
where R i s measured- resistance in ohms, A is electrode surface area in cm2, and L is the effective electrode spacing in mm (see Fig.1). Equation [L] is based on the results of tests using various electrode spacings in containers filled with saturated soil material from the test site, and in a water-filled column,
15
0 0 10 0 r
X
E
c 5 E 0 L-
0
Days after start-up, x 1 0 0
Fig. 2 Resistivity vs. time during freezing, for electrode intervals centred at:
0 +0.10 m; 4 -0.51 m; 0 -0.93 m; A -1.20 m; X -1.42 m; V -1.77 m,
relative to the base of the pipe.
DISCUSSION OF RESULTS
As the freezing gauge installed in the GRAVEL section provided the most complete record of changes in resistivity during the operation o f the test site, the results from this gauge are used as the basis for this discussion.
Resistivity vs. time curves for selected electrode intervals from 0.10 m above to 1,77 m below the base of the pipe, for the two periods of observation (1 March 1974 to 7 October 1977; 9 May 1985 to 28 September 1986), are shown in Figures 2 and 3, respectively. Resistivity vs. depth curves are shown in Figure 4 for selected dates between 1 March 1974 and 24 February 1986
selected dates during the thaw period. The (termination o f chilling), and in Figure 5 for
progress of initial freezing from 0.20 m above to 1.77 m below the base of the pipe, and the progress of complete thawing in the interval from 1.26 m above to 0.62 m below the base of the pipe, are shown in Figures 6 and 7, respectively, together with O'C points for the prime thermistor string.
As expected, the effects of seasonal variations in temperature (and in moisture content in the soil) on resistivity were extreme €or the upper
gradually attenuated with depth. The sudden few electrode intervals, but they were
sharp rise in resistivity for each o f the deeper electrode intervals some time after the start of chilling on 20 March 1974 (Fig.2) reflects the onset of freezing and the development of the frost bulb around the chilled pipe. After the initial rapid increase, resistivity values continued to rise mora slowly for some time, reflecting the gradual decrease in unfrozen Water contents as temperatures dropped farther below O'C.
301 .. I 1985 I 1986 I t I I
I I I I T I
Days after start -up, x 100
Fig. 3 Resistivity vs. time during thawing,
0 tQ.10 m; + -0.51 m; 0 -0.93 m: A -1.20 m; x -1.42 m; v -1.77 m,
for electrode intervals centred at:
relative to the base of the pipe.
1005
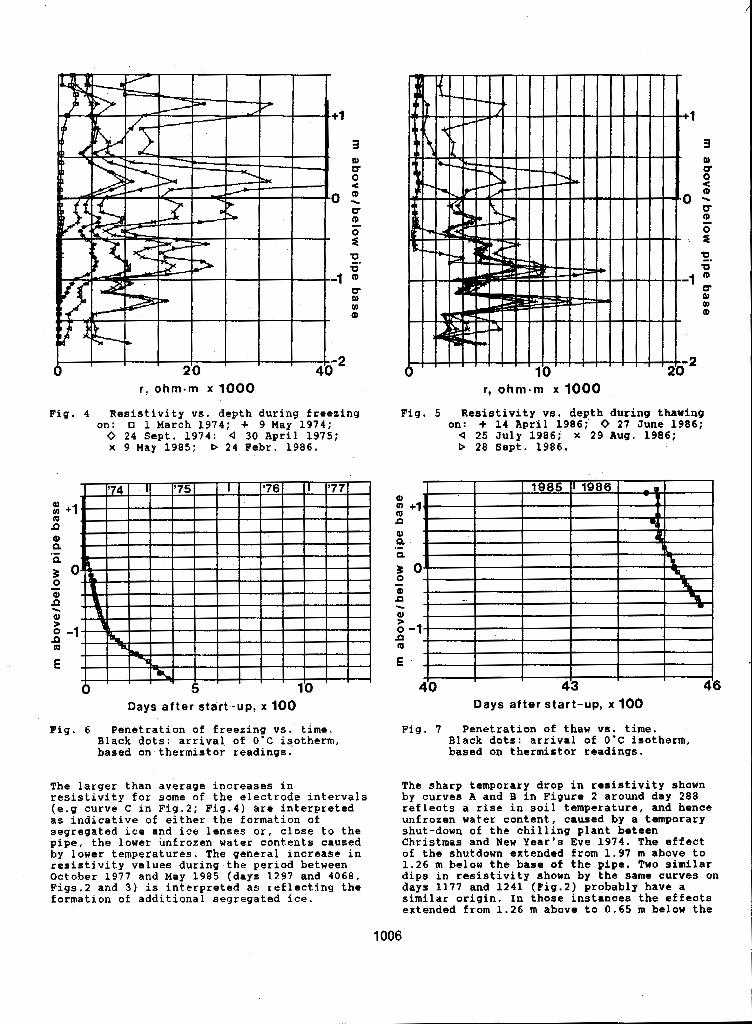
r , o h m a m x 1000
Fig. 4 Resistivity vs. depth during freezing on: 0 1 Parch 1974: + 9 May 1974;
0 24 Sept. 1974: 4 30 April 1975; x 9 May 1985: D 2 4 Febr. 1986.
al
P m
al
P
v1 +1
n .- r O
P,
n 0 -1 m
E I I I 7 1 1 1 1 1 1 1 1
0 al - Q >
lb ' ' Days after start -up, x 100
Fig. 6 Penetration of freezing vs. time. Black dots: arrival of O ' C isotherm, based on thermistor readings.
The larger than average increases in resistivity for some o f the electrode intervals (e.g curve C i n Fig.2; Fig.4) arc interpreted as indicative of either the formation of segregated ice and ice lenses o r , close to the pipe, the lower unfrozen water contents caused by lower temperatures. The general increase in resistivity values during the period between October 1977 and May 1985 (days 1297 and 4 0 6 8 , Figs.2 and 3) is interpreted as reflecting the formation of additional segregated ice.
r, ohmam x 1000
Fig. 5 Resistivity va. depth during thawing on: + I4 April 1986: 0 27 June 1986;
4 25 July 1986; x 29 Aup. 1986; b 28 Sept. 1986.
I I 1 I I I 4'0 45
Days after start-up, x 100
Fig. 7 Penetration of thaw vs. time. Black dots: arrival of O'C isotherm, based on thermistor readings.
The sharp temporary drop in resistivity shown by curves A and B in Figure 2 around day 288 reflects a rise in soil temperature, and hence unfrozen water content, caused by a temporary shut-down of the chilling plant betcen Christmas and New Year's Eve 1974. The effect o f the shutdown extended from 1.97 m above to 1.26 m below the base of the pipe. Two similar dips in resistivity shown by the same curves on days 1177 and 1241 (Fig.2) probably have a similar origin. In those instances the effects extended from 1.26 m above to 0.65 m below the
1006
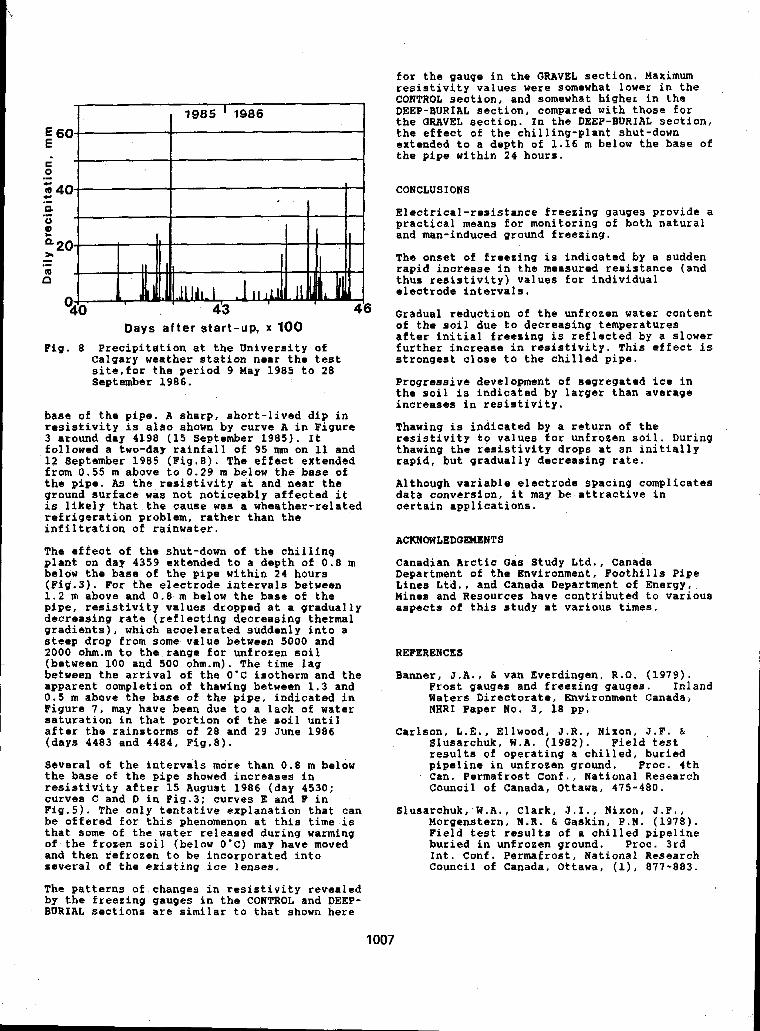
1985 ' 1986
60
Days after start-up, x 100
Calgary weather station near the test site,for the period 9 May 1985 to 28 September 1986.
Fig. 8 Precipitation at the University of
base of the pipe. A rrharp, short-lived dip in resistivity i s also shown by curve A in Figure 3 around day 4198 (15 September 1985). It
12 September 1985 (Pig.8). The effect extended followed a two-day rainfall o f 95 m on I1 and
from 0.55 m above to 0.29 m below the base of the pipe. As the resistivity at and near the ground surface was not noticeably affectod it is likely that the cause was a wheather-related refrigeration problem, rather than the infiltration o f rainwater.
The effect of the shut-down of the chilling plant on day 4359 extended to a depth of 0.8 m below the base of the pipe within 24 hours
1.2 m above and 0.8 m below the base of the (Fig.3). For the electrode intervals between
pipe, resistivity values dropped at a gradually decreasing rete (reflecting decreasing thermal gradients), which accelerated suddenly into a steep drop from some value betweon 5000 and 2000 0hm.m to the range for unfrozen soil (between 100 and 500 0hm.m). The time lag between the arrival of the O'C isotherm and the
0.5 m above the base of the pipe, indicated in apparent completion of thawing between 1.3 and
Figure 7, may have been due to a lack of water saturation in that portion of the soil until after the rainstorms of 28 and 29 June 1986 (days 4403 and 4484, Fig.8).
Several of the intervals more than 0.8 m below the base of the pipe showed increases in resistivity after 15 Auqust 1986 (day 4530; curves C and D in Pig.3; curves E and F in Fig.5). The only tentative explanation that can be offered for this phenomenon at this time is that some of the water released during warming of the frozen soil (below O ' C ) may have moved and then refrozen to be incorporated into several of the existing ice lenses,
The patterns of changes in resistivity revealed by the freezing gauges in the CONTROL and PEEP- BURIAL sections are similar to that shown here
for the gauge in the GRAVEL section. Maximum
CONTROL section, and somewhat higher in the resistivity values were somewhat lower in the
DEEP-BURIAL section, compared with those f o r the QRAVEL section. In the DEEP-BURIAL section, the effect of the chilling-plant shut-down extended to a depth of 1.16 m below the base of the pipe within 24 hours.
CONCLUSIONS
Electrical-resistance freezing gauge8 provide a practical means for monitoring of bath natural and man-induced ground freezing.
The onset of freezing is indicated by a sudden
thus resistivity) values for individual rapid increase in the measured resistance (and
electrode intervals.
Gradual reduction of the unfrozen water content
after initial frsazing is reflected by a slower of the soil due to decreasing temperatures
strongest close to the chilled pipe. further increase in resistivity. This effect is
Progressive development of segregated ice in the soil is indicated by larger than average increases in resistivity.
Thawing is indicated by a retu,rn of the resistivity to values for unfroeen soil. During thawing the resistivity drops at an initially rapid, but gradually decreasing rate.
Although variable electrode spacing complicates data conversion, it may be attractive in certain applications.
ACKNOWLEDQEMENTS
Canadian Arctic Qas Study Ltd., Canada Department of the Environment, Foothills Pipe Lints Ltd., and Canada Department of Energy, Mines and Resources have contributed to various aspects of this study at various times.
REFERENCES
Banner, J.A., b van Evordingen, R.O. (1979). Frost gauges and freeeing gauges. Inland Waters Directorate, Environment Canada, NHRI Paper No. 3, 18 pp,
Carlson, L.E., Ellwood, J.R., Nixon, J . F . & Slusarchuk, W.A. (1982). Field test results of operating a chilled, buried pipeline in unfroaen ground. Proc. 4th Can. Permafrost Conf., National Research Council of Canada, Ottawa, 475-480.
Slusarchuk, W.A., Clark, J.I., Nixon, J.F., Morgenstern, 1.R. & Gaskin, P.N. ( 1 9 7 8 ) . Field test results o f a chilled pipeline buried in unfrozen ground. Proc. 3rd
Council of Canada, Ottawa, (I), 877-883, Int. Conf. Permafrost, National Research
1007
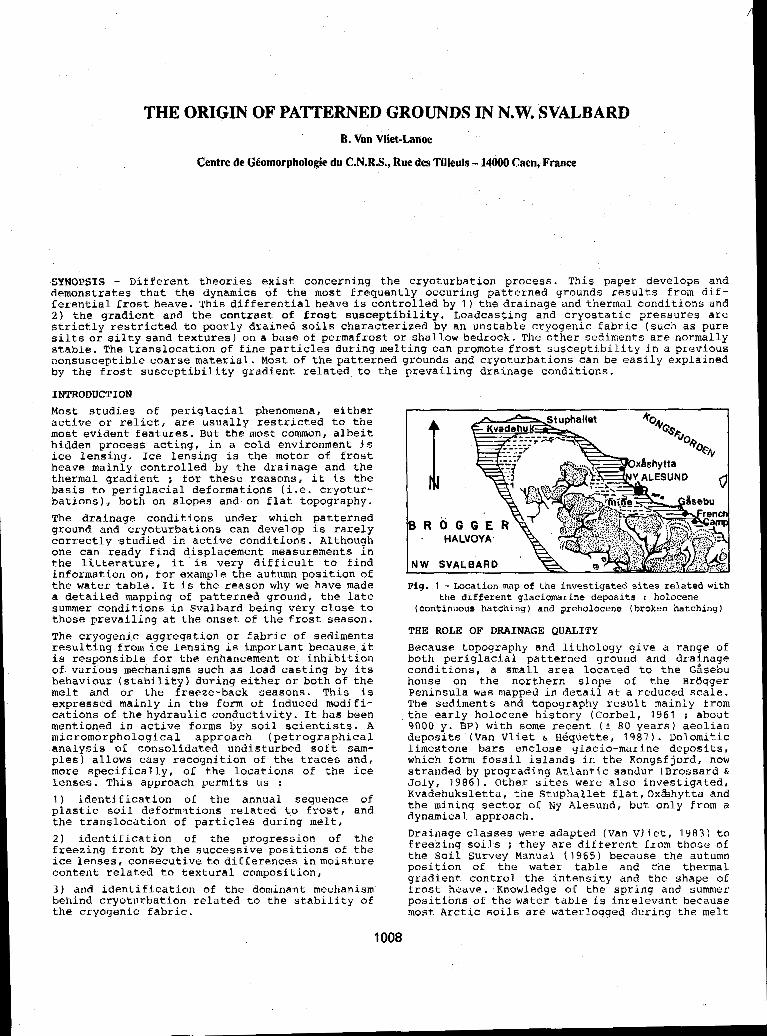
THE ORIGIN OF PATTERNED GROUNDS IN N.W. SVALBARD B. Van Wet-Lanoe
Centre de Chmorphologie du C.N.R.S., Rue des Tilleuls - 14000 Csen, France
SYNOPSIS - Different theories exist concerning the cryoturbation process. This paper develops and demonstrates that the dynamics of the most frequently occuring patterned grounds results from dif- ferential frost heave. This differential heave is controlled by 1 ) the drainage and thermal conditions and 2 ) the gradient and the contrast of frost susceptibility. Loadcasting and cryostatic pressures are strictly restricted to poorly drained soils characterized by an unstable cryogenic fabric (such as pure silts or silty sand textures) on a base of permafrost or shallow bedrock. The other sediments are normally stable. The translocation of fine particles during melting can promote frost susceptibility in a previous nonsusceptible coarse material. Most of the patterned grounds and cryoturbations can be easily explained by the frost susceptibility gradient related to the prevailing drainage conditions.
INTRODUCTION Most studies o f periglacial phenomena, either active or relict, are usually restricted to the most evident features. But the most common, albeit hidden process acting, in a cold environment is ice lensing. Ice lensing is the motor of frost heave mainly controlled by the drainage and the thermal gradient ; for these reasons, it is the basis to periglacial deformations (i.e. cryotur- bations), both on slopes and on flat topography. The drainage conditions under which patterned ground and cryoturbations can develop is rarely correctly studied in active conditions. Although - HALVOYA" one can ready find displacement measurements in the litterature, it is very difficult to find information on, fox example the autumn position o f the water table. It is the reason why we have made Fig. 1 - Location map of the investigated sites related with a detailed mapping o f patterned ground, the late summer conditions in Svalbard being very close to
the different qlaciomarine deposits : holocene
those prevailing at the onset of the frost season. (uontinuous hatching) and preholocene (broken hatching)
The cryogenic aggregation or fabric of sediments resulting from ice lensing is important because it is responsible far the enhancement or inhibition of various mechanisms such as load casting by its behaviour (stability) during either or both of the melt and or the freeze-back seasons. This is expressed mainly in the form of induced modifi- cations of the hydraulic conductivity. It has been mentioned in active forms by soil scientists. A micromorphological approach (petrographical analysis of consolidated undisturbed soft sam- ples) allows easy recognition of the traces andl more specifically, of the locations of the ice lenses. This approach permits us : 1 ) identification of the annual sequence of plastic soil deformstions related to frost, and the translocation o f particles during melt, 2 ) identification of the progression of the freezing front by the successive positions of the ice lenses, consecutive to differences inmoisture content related to textural composition, 3 ) and identification of the dominant mechanism behind cryoturbation related to the stability of the cryogenic fabric.
THE ROLE OF DRAINAGE QUALITY Because topography and lithology give a range of both periglacial patterned ground and drainage conditions, a small area located to the Gisebu house on the northern slope o f the Bragger
The sediments and topography result mainly from Peninsula was mapped in detail at a reduced scale.
the early holocene history (Corbel, 1 9 6 1 ; about 9000 y. BP) with some recent ( t 8 0 years) aeolian deposits (Van Vliet & HGquette, 1 9 8 7 ) . Dolomitic limestone bars enclose glacio-marine deposits, which form fossil islands in the Kongsfjord, now stranded by prograding Atlantic sandur (Brossard & Joly, 1 9 8 6 ) . Other sites were also investigated, Kvadehuksletta, the Stuphallet flat , Ox%hytta and the mining sector of Ny Alesund, but only from a dynamical approach. Drainage classes were adapted (Van Vliet. 1 9 8 3 ) to freezing soils ; they are different from those of the Soil Survey Manual ( 1 9 6 5 ) because the autumn position of the water table and rhe thermal gradient control the intensity and the shape of frost heave. Knowledge o f the spring and summer positions of the water table is inrelevant because most Arctic soils are waterlogged during the melt
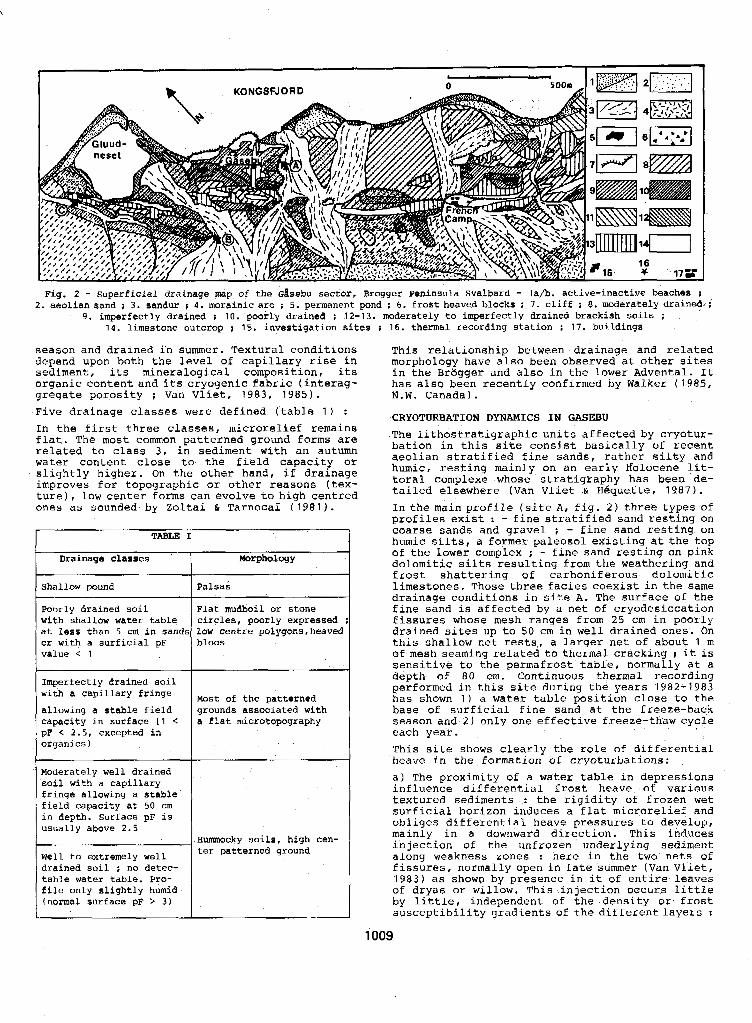
Fig. 2 - Superficial drainage map of the dsebu sector, Brcgger Peninsula Svalbard - la/b. active-inactive beaches ; 2, aeolian sand ; 3. sandur ; 4. morainic arc ; 5. permanent pond ; 6. frost heaved blocks ; 7. cliff ; 8. moderately drained,,;
9, imperfectly drained ; IO. poorly drained ; 12-13. moderately to imperfectly drained brackish soils ; 14. limestone outcrop ; 15. investigation sites ; 16. thermal recording station ; 17. buildings
season and drained in summer. Textural conditions depend upon both the level of capillary rise in sediment, its mineralogical composition, its organic content and its cryogenic fabric (interag- gregate porosity ; Van Vliet, 1 9 8 3 , 1 9 8 5 ) .
Five drainage classes were defined (table 1 ) :
In the first three classes, microrelief remains flat. The most common patterned ground forms are related to class 3 , in sediment with an autumn water content close to the field capacity or slightly higher. On the other hand, if drainage improves for topographic or other reasons (tex- ture), low center forms can evolve to high centred ones as sounded by Zoltai & Tarnocai ( 1 9 8 1 ) .
TABU I
Drainage classes ' Morphology
Shallow pound Palsas
Poorly drained soil Flat mudboil or stone with shallow water table circles, poorly expressed at less than 5 cm in sands low centre polygons,heaved or with a surficial pF blocs value < 1
Imperfectly drained soil with a capillary fringe
allowing a stable field
pF < 2.5, excepted in capacity in surface (1 <
organics 1
Most of the patterned grounds associated with a flat microtopography
Moderately well drained soil with a capillary fringe allowing a stable field capacity at 50 cm in depth. surface pF is usually above 2 . 5
well to extremely well drained soil ; no detec- table water table. Pro- file only slightly humid, (normal surface pF > 3 )
Hummocky soils, high cen- ter patterned ground
This relationship between drainage and related morphology have also been observed at other sites in the Bragger and also in the lower Advental. It has also been recently confirmed by Walker (1985, N.W. Canada).
CRYOTURBATION DYNAMICS IN GASEBU The lithostratigraphic units affected by cryotur- bation in this site consist basically of recent aeolian stratified fine sands, rather silty and humic, resting mainly on an early Holocene lit- toral complexe whose stratigfaphy has been de- tailed elsewhere (Van Vliet & Hdquette, 1 9 8 7 ) .
In the main profile (site A, fig. 2 ) three types of profiles exist : - fine stratified sand resting on coarse sands and gravel ; - fine sand resting on humic silts, a former paleosol existing at the top of the lower complex ; - fine sand resting on pink dolomitic silts resulting from the weathering and frost shattering of carboniferous dolomitic
drainage conditions in site A . The surface of the limestones. Those three facies coexist in the same
fine sand- is affected by a net of cryodesiccation
drained sites up to 50 cm in well drained ones. On fissures whose mesh ranges from 2 5 cm in poorly
this shallow net rests, a larger net of about 1 m of mesh seaming related to thermal cracking ; it is sensitive to the permafrost table, normally at a depth of 8 0 cm. Continuous thermal recording performed in this site during the years 1 9 8 2 - 1 9 8 3 has shown 1 ) a water table position close to the base of surficial fine sand at the freeze-back season and 2 ) only one effective freeze-thaw cycle each year. This site shows clearly the role of differential heave in the formation of cryoturbations: a ) The proximity of a water table in depressions influence differential frost heave 'of various textured sediments : the rigidity of frozen wet surficial horizon induces a flat microrelief and
mainly in a downward direction. This induces obliges differential heave pressures to develop,
along weakness zones : here in the two nets of injection o f t h e unfrozen underlying sediment
fissures, normally open in late summer (Van Vliet,
of dryas or willow, This injection occurs little 1 9 8 3 ) as showp by presence in it o f entire- leaves
by little, independent of the density or frost susceptibility gradients of the different layers :
1009
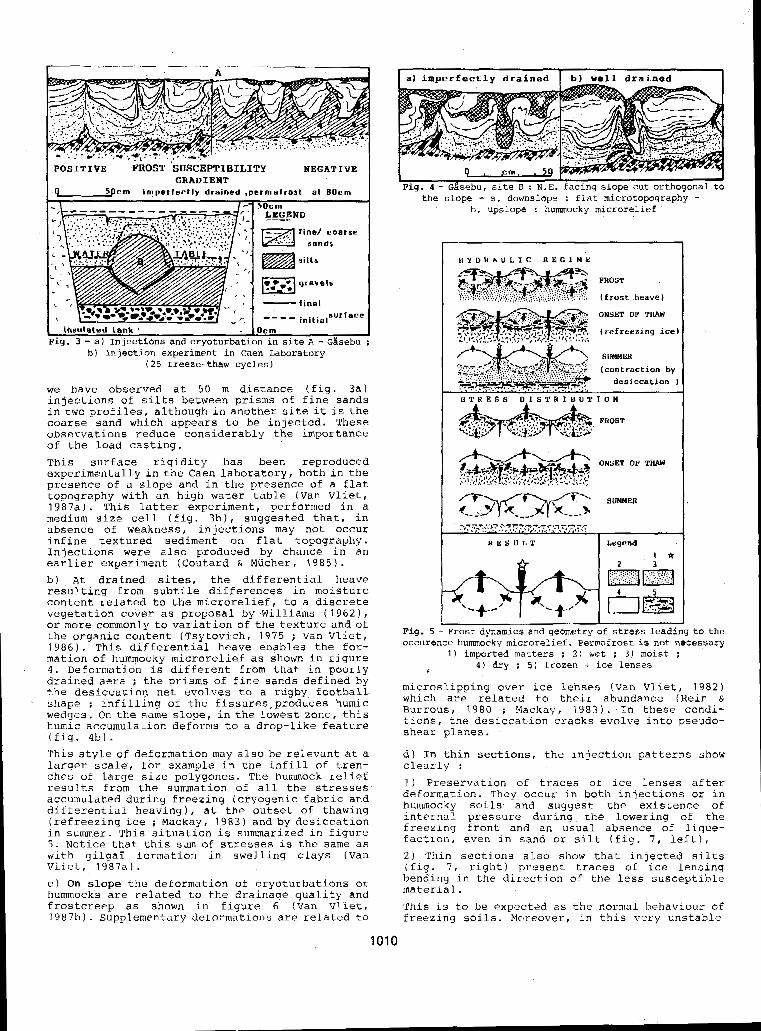
I a) imperfectly d r a i n e d I b) well d r a i n e d -1
POSITIVE FROST 'SUSCEPTIBILITY
P 5pem imperfectly drained ,permafrost a l BOcm
GRADIENT NEGATIVE
5Dcm ~
~~ -
&EGE_ND line/ caarse .,. ... Sands
-final " - 1 initialsurface
insulated lank I 'ig. 3 - a ) Injections and cryoturbation in site A - Gisebu ;
b) Injection experiment in Caen Laboratory (25 freeze-thaw cycles)
we have observed at 50 m distance (fig. 3a) injections of silts between prisms of fine sands in two profiles, although in another site it is the coarse sand which appears to be injected. These observations reduce considerably the importance of the load casting. This surface rigidity has been reproduced experimentally in the Caen laboratory, both in the presence of a slope and in the presence of a flat topography with an high water table (Van Vliet, 1 9 8 7 a ) . This latter experiment, performed in a medium size cell ( f i g . 3b) , suggested that, in absence of weakness, injections may not occur infine textured sediment on flat topography. Injections were also produced by chance in an earlier experiment (Coutard & Mucher, 1 9 8 5 ) .
b) At drained sites, the differential heave resulting from subtile differences in moisture content related to the microrelief, to a discrete vegetation cover as proposal by Willidms ( 1 9 6 2 ) , or more commonly to variation of the texture and of the organic content (Tsytovich, 1 9 7 5 ; Van Vliet, 1 9 8 6 ) . This differential heave enables the for- mation of hummocky microrelief as shown in figure 4. Deformation is different from that in poorly drained aera ; the prisms of fine sands defined by the desiccatiop net evolves to a rugby football shape ; infilling of the fissures,produces humic wedges, On the same slope, in the lowest zone, this humic accumulation deforms to a drop-like feature ( f i g . 4 b ) . This style of deformation may also be relevant at a larger scale, for example in the infill of tren- ches of large size polygones. The hummock relief results from the summation of all the stresses accumulated during freezing (cryogenic fabric and differential heaving), at the outset of thawing (refreezing ice ; Mackay, 1983) and by desiccation in summer. This situation is summarized in figure 5 . Notice that this sum of stresses is thc same as with gilga: formation in swelling Clays (van Vliet, 1Y87a). c) On slope the deformation of cryoturbations or hummocks are related to the drainage quality and frostcreep as shown in figure 6 (Van Vliet, 1987b). Supplementary deformations are related to
the slope - a. downslope : flat microtopography - b. upslope : hummocky microrelief
H Y D W A U L I C R E G I M E
ONSET OF THAW
(refreezing ice1
SUMMIM
(contraction by desiccation )
I O N
SUMMER
Fig. 5 - Frost dynamics and geometry of stress leading to the occurence hummocky microrelief. Permafrost i s not necessary
1 ) imported matters ; 2 ) wet ; 3 ) moist ; 4 ) dry ; 5 ) frozen + ice lenses
L
microslipping over ice lenses (Van Vliet, 1982) which are related to their abundance (Rein & Burrous, 1980 ; Mackay, 1983). In these condi- tions, the desiccation cracks evolve into pseudo- shear planes.
d ) In thin sections, the injection patterns show clearly :
1) Preservation of traces of ice lenses after deformation. They occur in both injections or in hummocky soils and suggest the existence of internal pressure during the lowering of the freezing front and an u s u a l absence of lique- faction, even in sand or silt ( f i g . 7, left), 2 ) Thin sections also show that injected silts (rig. 7, right) present traces of ice lensing bending in the direction o f the less susceptible material. This is to be expected as the normal behaviour o f freezing so i l s . Mcmreover, in this very unstable
1010
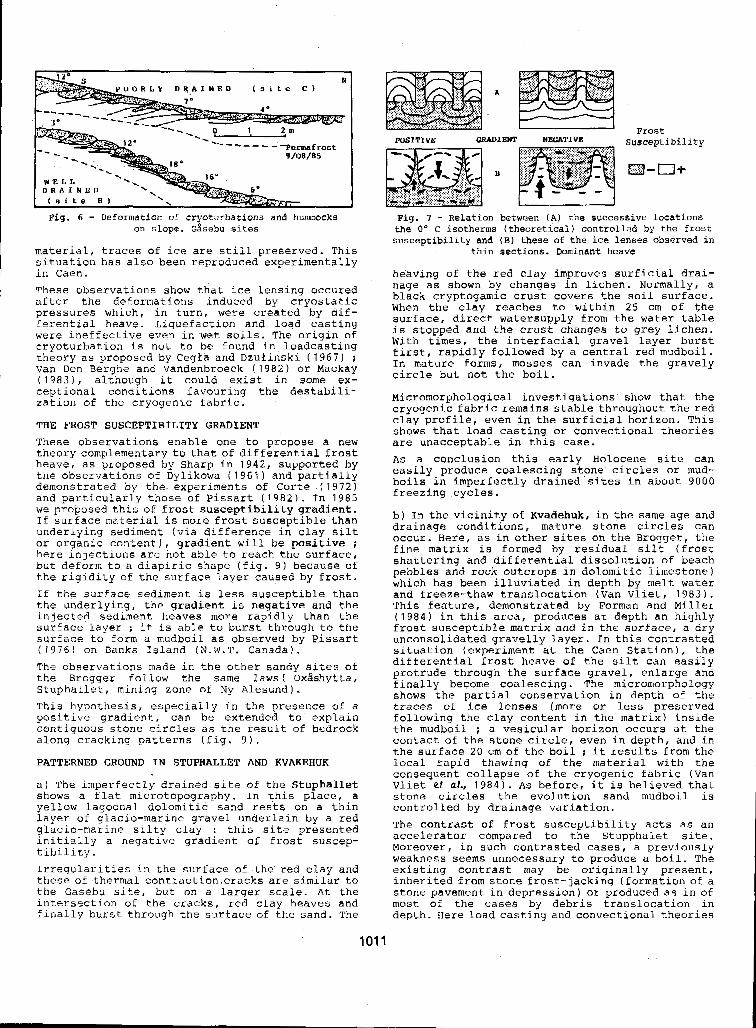
Fig. 6 - Deformation of cryoturbations and hummocks on slope. Gasebu sites
material, traces of ice are still preserved. This situation has also been reproduced experimentally in Caen. These observations show that ice lensing occured after the deformations induced by cryostatic pressures which, in turn, were created by dif-
were ineffective even in wet soils. The origin of ferential heave. Liquefaction and load casting
cryoturbation is not to be found in loadcasting theory as proposed by C e g h and Dzulinski ( 1 9 6 7 ) I van Den Berghe an6 Vandenbroeck ( 1 9 8 2 ) or Mackay ( 1 9 8 3 ) , although it could exist in some ex- ceptional conditions favouring the destabili- zation of the cryogenic fabric.
THE FROST SUSCEPTIBILITY GRADIENT These observations enable one to propose a new theory complementarytothatof differential frost heave, as proposed by Sharp in 1942, supported by the observations o f Dylikowa ( 1 9 6 1 ) and partially demonstrated by the. experiments of Corte ( 1 9 7 2 ) and particularly those of Pissart ( 1 9 8 2 ) In 1 9 8 5 we proposed this o f frost susceptibility gradient. If surface material is more frost susceptible than underlying sediment (via difference in clay silt or organic content), gradient will be positive ;
but deform to a diapiric shape (fig. 9 because of here injections are not able to reach the surface,
the rigidity of the surface layer caused by frost. If the surface sediment is less susceptible than the underlying, the gradient is negative and the injected sediment heaves more rapidly than the surface layer ; it is able to burst through to the surface to form a mudboil as observed by Pissart ( 1 9 7 6 ) on Banks Island (N.W.T. Canada). The observations made in the other sandy sites o f the Brogger follow the same laws( Oxdshytta, Stuphallet, mining zone of Ny Alesund) . This hypothesis, especially in the presence of a positive gradient, can be extended to explain contiguous stone circles as the result of bedrock along cracking patterns (fig. 9 ) .
PATTERNED GROUND IN STUPHALLET AND KVAREHUK
a) The imperfectly drained site of the Stuphal le t shows a flat microtopography, In this place, a yellow lagoonal dolomitic sand rests on a thin layer of glacio-marine gravel underlain by a red glacio-marine silty clay : this site presented initially a negative gradient of frost suscep- tibility. Irregularities in the surface of the red clay and these of thermal contraction.cracks are similar to the Gasebu site, but on a larger scale. At the intersection of the cracks, red clay heaves and finally burst through the surface of the sand. The
rzIsI+rvP: GRADIENT NEGATIVE susceptibility _""
Fig. 7 - Relation between ( A ) the successive locations the 0' C isotherms (theoretical) controlled by the frost susceptibility and (B) these of the ice lenses observed in
thin sections. Dominant heave
heaving of the red c lay improves surficial drai- nage as shown by changes in lichen. Normally, a black cryptogamic crust covers the soil surface. When the clay reaches to within 25 cm of the surface, direct watersupply from the water table is stopped and the crust changes to grey lichen. With times, the interfacial gravel layer burst first, rapidly followed by a central red mudboil. In mature forms, mosses can invade the gravely circle but not the boil.
Micromorphological investigations show that the cryogenic fabric remains stable throughout the red clay profile, even in the surficial horizon. This shows that load casting or convectional theories are unacceptable in this case. As a conclusion this early Holocene site can easily produce coalescing stone circles or mud- boils in imperfectly drained.sites in about 9 0 0 0 freezing cycles.
b ) In the vicinity of Kvadehuk, in the same age and drainage conditions, mature stone circles can occur. Here, as in other sites on the Brogger , the fine matrix is formed by residual silt (frost shattering and differential dissolution of beach pebbles and rock outcrops in dolomitic limestone) which has been illuviated in depth by melt water and freeze-thaw translocation (van Vliet, 1 9 8 3 ) . This feature, demonstrated by Forman and Miller ( 1 9 8 4 ) in this area, produces at depth an highly
unconsolidated gravelly layer. In this contrasted frost susceptible matrix and in the surface, a dry
differential frost heave of the silt can easily situation (experiment at the Caen Station), the
protrude through the surface gravel, enlarge and finally become coalescing. The micromorphology shows the partial conservation in depth of the traces of ice lenses (more or less preserved
the mudboil ; a vesicular horizon occurs at the following the clay content in the matrix) inside
contact of the stone circle, even in depth, and in the surface 20 crn of the boil ; it results from the
consequent collapse of the cryogenic fabric (Van local rapid thawing of the material with the
Vliet et a!., 1 9 8 4 ) . As before, it is believed that stone circles the evolution sand mudboil is controlled by drainage variation. The contrast of frost susceptibility acts as an accelerator compared to the Stupphalet site. Moreover, in such contrasted cases, a previously weakness seems unnecessary to produce a boil. The existing contrast may be originally present, inherited from stone frost-jacking (formation of a
most of the cases by debris translocation in stone pavement in depression) or produced as in o f
depth. Here load casting and convectional theories
101 1
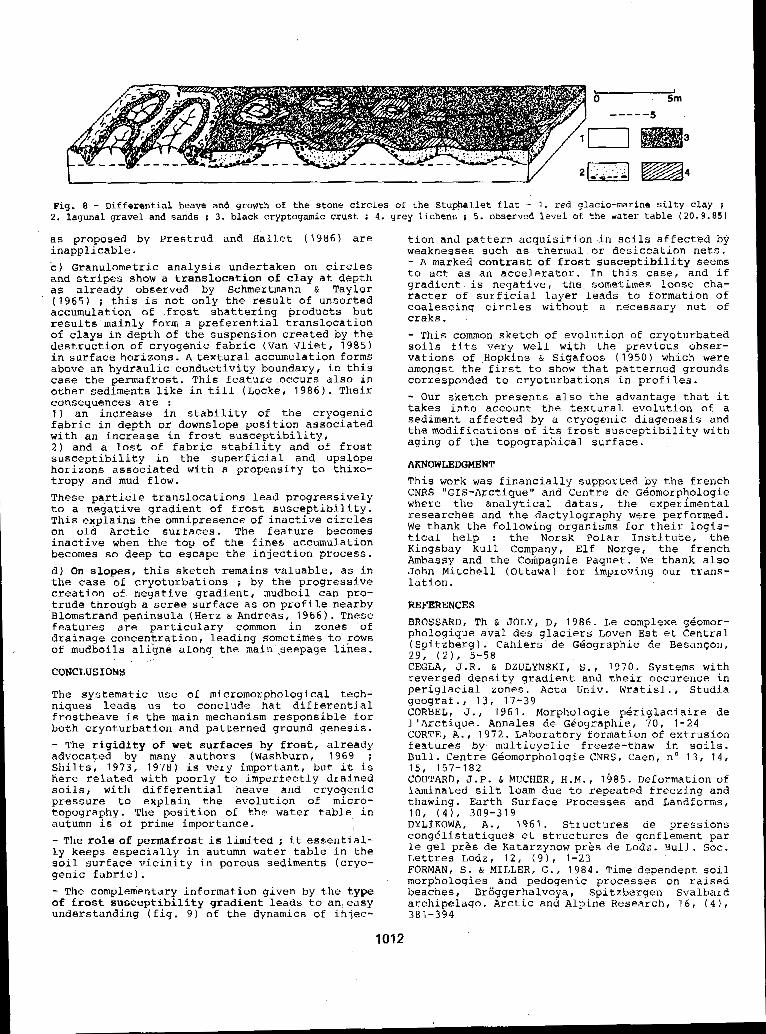
Fig. 8 - Differential heave and growth of the stone circles of the StuphaLlet flat - 1 . red glacio-marine silty clay ; 2. laguna1 gravel and sands i 3. black cryptogamic crust ; 4. grey lichens ; 5. observed level of t h e water table ( 2 0 , 9 . 8 5 )
as proposed by Prestrud and Hallet ( 1 9 8 6 ) are inapplicable. c ) Granulometric analysis undertaken on circles and stripes show a translocation of clay at depth as already observed by Schmertmann & Taylor ( 1 9 6 5 ) ; this is not only the result of unsorted accumulation of frost shattering products but results mainly form a preferential translocation of clays in depth of the suspension created by the destruction of cryogenic fabric (van Vliet, 1 9 8 5 ) in surface horizons. Atextural accumulation forms above an hydraulic conductivity boundary, in this case the permafrost. This feature occurs also in other sediments like in till (Locker 1986). Their consequences are : 1 ) an increase in stability of the cryogenic fabric in depth ox downslope position associated with an increase in frost susceptibility, 2 ) and a lost of fabric stability and of frost susceptibility in the superficial and upslope horizons associated with a propensity to thixo- tropy and mud flow, These particle translocations lead progressively to a negative gradient of frost susceptibility. This explains the omnipresence of inactive circles on old Arctic surfaces. The feature becomes inactive when the top of the fines accumulation becomes so deep to escape the injection process. d) On slopes, this sketch remains valuable, as in the case of cryoturbations ; by the progressive creation of negative gradient, mudboil can pro- trude through a scree surface as on profile nearby Blomstrand peninsula (Herz & Andreas, 1 9 6 6 ) . These features aye particulary common in zones 'of drainage concentration, leading sometimes to rows o f mudboils aligne along the main seepage lines.
CONCLUSIONS
The systematic use of micromorphological tech- niques leads us to conclude hat differential frostheave is the main mechanism responsible for both cryoturbation and patterned ground genesis. - The rigidity of wet surfaces by frost, already advocated by many authors (Washburn, 1 9 6 9 ; Shilts, 1 9 7 3 , 1 9 7 8 ) is very important, but it is here related with poorly to imperfectly drained soils, with differential heave and cryogenic pressure to explain the evolution of micro- topography. The position of the water table in autumn is of prime importance. I
- The role o f permafrost is limited ; it essential- ly keeps especially in autumn water table in the soil surface vicinity in porous sediments (cryo- genic fabric). - The complementary information given by the type of frost susceptibility gradient leads to an easy understanding (fig. 9 ) of the dynamics of ihjec-
tion and pattern acquisition in soils affected by weaknesses such as thermal or desiccation nets. - A marked contrast of frost susceptibility seems to act as an accelerator, In this case, and if gradient is negative, the sometimes loose cha- racter of surficial layer leads to formation of coalescing circles without a necessary net of craks. - This common sketch of evolution o f cryoturbated soils fits very well with the previous obser- vations of Hopkins & Sigafoos ( 1 9 5 0 ) which were amongst the first to show that patterned grounds corresponded to cryoturbations in profiles. - Our sketch presents also the advantage that it takes into account the textural evolution of a
the modifications of its frost susceptibility with sediment affected by a cryogenic diagenesis and
aging of the topographical surface.
AKNOWLEDGMENT This work was financially supported by the french CNRS "GLS-Arctique" and Centre de G6omorphologie where the analytical datas, the experimental researches and the dactylography were performed. We thank the following organisms for their logis- tical help : the Norsk Polar Institute, the Kingsbay Kull Company, Elf Nofge, the french Ambassy and the Cohpagnie Paquet. We thank also John Mitchell (Ottawa) for improving our trans- lation.
REFERENCES BROSSARD, Th & JOLY, D, 1986. Le complexe g6omor- phologique aval des glaciers Loven Est et Central
29, ( 2 ) , 5 - 5 8 (Spitzbergl. Cahiers de Gdoqraphie de Besanqon,
CEGLA, J.R. & DZULYNSKI, S., 1970. Systems with reversed density gradient and their occurence in periglacial zones. Acta Univ. Wratisl., Studia geograf., 1 3 , 17-39 CORBEL, J., 1961. Morphologie periglaciaire de
CORTE, A . , 1 9 7 2 . Laboratory formation of extrusion I'Arctique. Annales de Geoqraphie, 70, 1-24
features by multicyclic freeze-thaw in soils. Bull. Centre G6omorphologie CNRS, Caen, no 1 3 , 14 , 15, 157-182 COUTARD, J.P* & MUCHER, H.M. , 1485 . Deformation of laminated silt loam due to repeated freezing and thawing. Earth Surface Processes and Landforms, IO, (4l, 3 0 9 - 3 1 9 DYLIKOWA, A., 1961. Structures de pressions cong4listatiques et structures de gonflement par le gel pres de Katarzynow pres de Lodz. Bull. SOC. Lettres Lodz, 1 2 , ( 9 1 , 1-23 FORMAN, S. & MILLER, G . , 1984. Time dependent soil morphologies and pedogenic processes on raised beaches, Broggerhalvoya, Spitzbergen Svalbard archipelago. Arctic and Alpine Research, 16, ( 4 ) , 381-394
1012
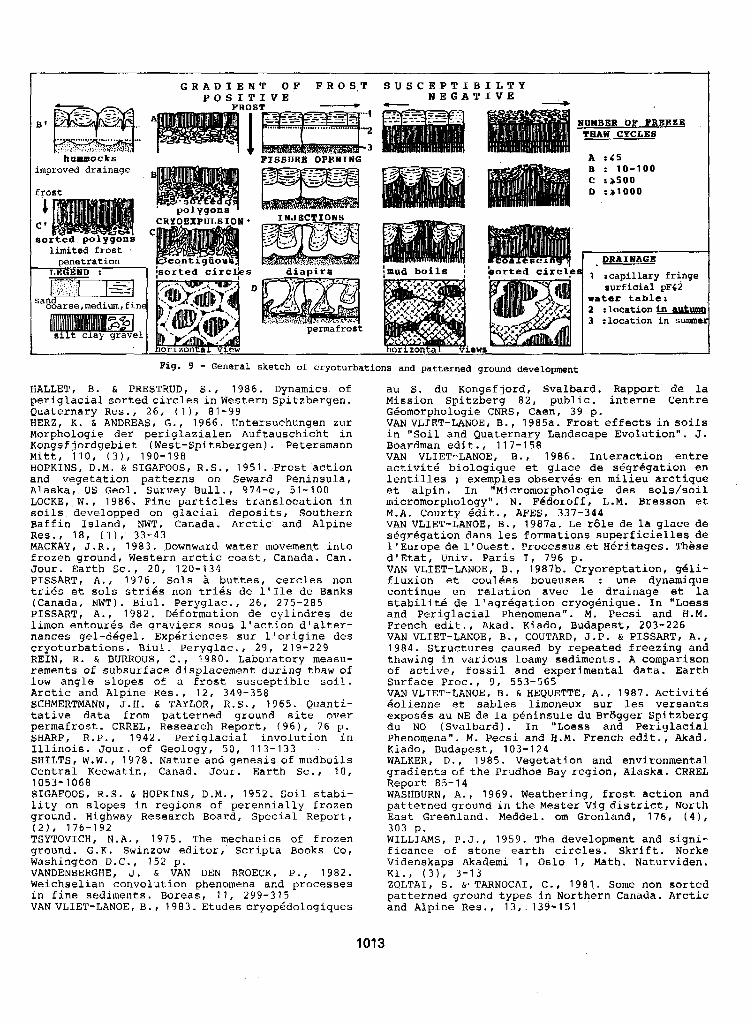
G R A D I E N T O F F R O S , T S U S C E P T I B I L T Y P O S I T I V E , - N E G A T I V E -
A POWBEB OF FREE%& . ,... ..... *... .... .... ...,... TEAW CYCLES .f?"m& r;.:::,., ~ ..., 1 : o ;
hummocks F I S S U R R O P E B I N G
limited frost penetration
LEGBPD :
, :.. "
coarse,rnedium,finc
1
improved drainage - "
HALLET, B. & PRESTRUD, S . , 1986. Dynamics of periglacial sorted circles in Western Spitzberqen. Quaternary Res., 26, ( 1 ) , 81 -99 HERZ, K. & ANDREAS, G., 1966. Untersuchungen zur Morphologie der periglazialen Auftauschicht in
Mitt, 110, ( 3 ) , 190-198 Kongsfjordgebiet (West-Spitsbergen). Petersmann
HOPKINS, D.M. & SIGAFOOS, R.S., 1951. Frost action and vegetation patterns on Seward Peninsula, Alaska, US Geol. Survey Bull., 974-c, 51-100 LOCKE, W,, 1986. Fine particles translocation in soils developped on glacial deposits, Southern Baffin Island, NWT, Canada. Arctic and Alpine Res., 18, (I),' 33-43 MACKAY, J.R., 1983. .Downward water movement into
Jour. Earth Sc,, 20, 120-134 frozen ground, Western arctic coast, Canada. Can.
PISSART, A,, 1976. Sols h buttes, cercles non triks et sols stries non tries de 1'Ile de Banks (Canada, NWT). Biul. Peryglac., 26, 275-285 PISSART, A., 1982. Dkformation de cylindres de limon entoures de qraviers sous l'action d'alter- nances gel-degel. Experiences sur l'origine des cryoturbations. Biul. Peryglac., 29, 219-229 REIN, R . & BURROUS, C. , 1980. Laboratory measu- rements of subsurface displacement during thaw of low angle slopes of a frost susceptible soil, Arctic and Alpine Res., 12, 349-358 SCHMERTMANN, J.H. & TAYLOR, R . S . , 1965, Quanti- tative data from patterned ground site over permafrost. CRREL, Research Report, (96). 7 6 p. SHARP, R.P., 1942, Periglacial involution In Illinois. Jour. of Geology, 50, 113-133 SHILTS, W.W. , 1978. Nature and genesis of mudboils Central Keewatin, Canad. Jour. Earth Sc. , 10 , 1053-1068 SIGAFOOS, R.S. E, HOPKINS, D.M., 1952. Soil stabi- lity on slopes in regions of perennially frozen ground. Highway Research Board, Special Report,
TSYTOVICH, N.A., 1975. The mechanics of frozen ground. G.K. Swinzow editor, Scripta Books Cot Washington D.C., 152 p. VANDENBERGHE, J. & VAN DEN BROECK, P., 1982. Weichselian convolution phenomena and processes in fine sediments, Bareas, 1 1 , 299-3 15 VANVLIET-LANOE, B., 1983. Etudes cryop6dologigues
( 2 1 , 176-192
A : 4 5
C : ) 5 0 0 D :slOOO
B : 10-100
DBAflPAGE
1 :capillary fringe surficial pFC2
water t a b l e s 2 rlocationin a u w 3 :location in summe
Fig. 9 - General sketch of cryoturbations and patterned ground development
au S . du Kongsf jord, Svalbard. Rapport de la Mission Spitzberg 82, public. interne Centre G&omorpholoqie CNRS, Caen, 39 p. VAN VLIET-LANOE, B. , 1985a. Frost effects in soils in "Soil and Quaternary Landscape Evolution" * J. Boardman edit., 117-158 VAN VLIET-LANOE, B., 1986. Interaction entre activite biologique et glace de s6grigation en lentilles ; exemples observ8s- en milieu arctique et alpin, In "Micrornorphologie des sols/soil micromorphology". N. Fidoroff, L.M. Bresson et M.A. Courty idit., AFES, 337-344 VAN VLIET-LANOE, B . , 1987a, Le r61e de la glace de dgrigation dans les formations superficielles de 1'Europe de l'ouest, Processus et Hiritages. Thbse d'Etat, Univ. Paris I, 796 p. VAN VLfET-LANOE, B., 198713. Cryoreptation, g6li- fluxion et coulees boueuses : une dynamique continue en relation avec le drainage et La
and Periglacial Phenomena". M. Pecsi ana H.M. stabilit4 de l'aqr6gation cryog8nique. In "Loess
French edit., Akad. Kiado, Budapest, 203-226
1984. Structures caused by repeated freezing and thawing in various loamy sediments. A comparison of active, fossil and experimental data. Earth Surface Proc., 9, 553-565 VAN VLIET-LANOE, B . & HEQUETTE, A., 1987. Activitd Bolienne et sables limoneux sur les versants exposes au NE de la phinsule du Br6gqer Spitzberg du NO (Svalbard). In "Loess and Periqlacial Phenomena". M. Pecsi and H.M. French edit., Akad. Kiado, Budapest, 103-124 WALKER, O., 1985. Vegetation and environmental gradients of the Prudhoe Bay region, Alaska. CRREL Report 85-1 4 WASHBURN, A., 1969. Weathering, frost action and patterned ground in the Mester Vig district, North East Greenland. Meddel. om Eronland, 176, ( 4 ) , 303 p. WILLIAMS, P.J., 1959. The development and signi- ficance of stone earth circles, Skrift. Norke Videnskaps Akademi 1 , Oslo 1 , Math. Naturviden. Kl., ( 3 1 , 3-13 ZOLTAI, S . PTARNOCAI, C., 1981,. Some non sorted patterned ground types in Northern Canada. Arctic and Alpine Res,, 13,. 139-1 51
VAN VLIET-LANOE, B., COUTARD, J.P. & PISSART, A+,
1013
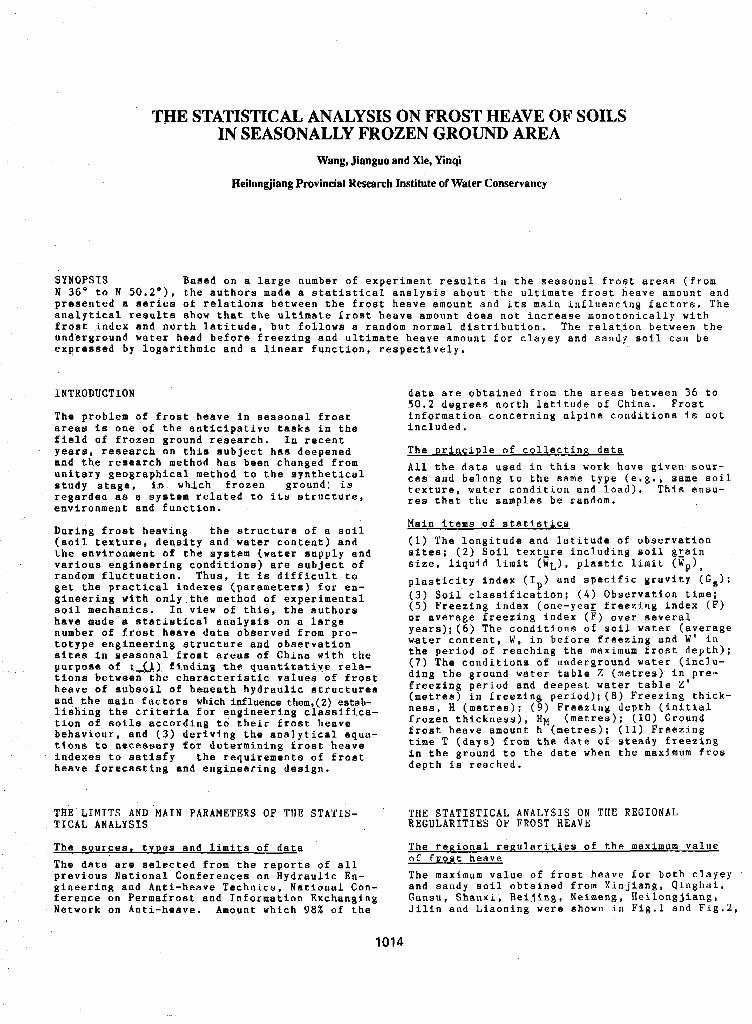
THE STATISTICAL ANALYSIS ON FROST HEAVE OF SOILS IN SEASONALLY FROZEN GROUND AREA
Wang, Jianguo and Xie, Yinqi
Heilongjiang Provincial Research Institute of Water Conservancy
SYNOPSIS Based on a large number of experiment results in the seasonal frost areas (from N 36' to N 50 .2 ' ) , the authors made a statistical analysis about the ultimate frost heave amount and presented a series of relations between the frost heave amount and its main influencing factors. The analytical reaultB show that the ultimate frost heave amount does not increase monotonically with frost index and north latitude, but follows a random normal distribution. The relat,ion between the underground water head before freezing and ultimate heave amount for clayey and sandy soil can be expressed by logarithmic and a linear function. respectively.
INTRODUCTION
The problem of frost heave in seasonal frost areas is one of the anticipative tasks in the field of frozen ground research. In recent years, research on this subject has deepened and the research method has been changed from unitary geographical method to the synthetical study stage, in which frozen ground! is regardea as a system related to i t s structure, environment and function.
During frost heaving the structure of a soil (soil texture, density and water content) and the environment of the system (water supply and varioum engineering conditions) are subject of random fluctuation. Thus, it is difficult t o get the practical indexes (parameters) for en- gineering with only the method o f experimental soil mechanics. In view of this, the authors have made a statistical analysis on a large number of frost heave data observed from pro- totype engineering structure and observation sites In seasonal frost areas of China with the purpose o f :&lJ finding the quantitative rela- tions between the characteristic values of frost heave of subsoil of beneath hydraulic structures and the main factors which influence them,(2) estab- lishing the critefia for engineering classifica- tion of soils according to their frost heave behaviour, and ( 3 ) deriving the analytical equa- tions to necessary for determining frost heave indexes to satisfy the requirements of frost heave forecasting and engineering design.
THE LIMITS AND MAIN PARAMETERS OF THE STATIS- TICAL ANALYSIS
The sources, tyDes and limits of data The data are selected from the reports of all previous National Conferences on Hydraulic En- gineering and Anti-heave Technics, National Cbn- ference on Permafrost and Information Exchanging Network on Anti-heave. Amount which 98% of the
data are obtained from the areas between 36 to 5 0 . 2 degrees north latitude o f China. Frost information concerning alpine conditions is not included.
The principle of collecting data All the data used in this work have given sour- ces and belong to the same type (e.g., same soil texture, water condition and load). This ensu- res that the samples be random.
Main items of statistics
sites; ( 2 ) Soil text_ure including soil grain ( 1 ) The longitude and latitude of observation
size. liquid limit (WL), plastic limit (W,), plasticity index (I ) and specific gravity (Gs): ( 3 ) Soil classification; ( 4 ) Observation time; ( 5 ) Freezing index (one-year freezing index (F) or average freezing index ( F ) over several. years);(d) The conditions of soil water (average w.ater content, W, in before freezing and W' in the period o f reaching the maximum frost depth); (7) The conditions of underground water (inclu- ding the ground water table 2 (metres) in pre- freezing period and deepest water table 2 '
ness, H (metres): ( 9 ) Freezing depth (initial (metres) in freezing period);(8) Freezing thick-
frozen thickness), HM (metres); (10) Ground frost heave amount h (metres); (11) Freezing time T (days) from the date o f steady freezing in the ground to the date when the maximum fros depth is reached.
P
THE STATISTICAL ANALYSIS ON THE REGIONAL REGULARITIES OF FROST HEAVE
The renional regularities of the maximum value of fcost heave The maximum value of frost heave for both clayey '
and sandy soil obtained from Xinjiang, Qinghsi, Gansu, Shanxi, Beijing, Neimeng, Heilongjiang, Jilin and Liaoning were shown in Fig.1 and Fig.2,
1014
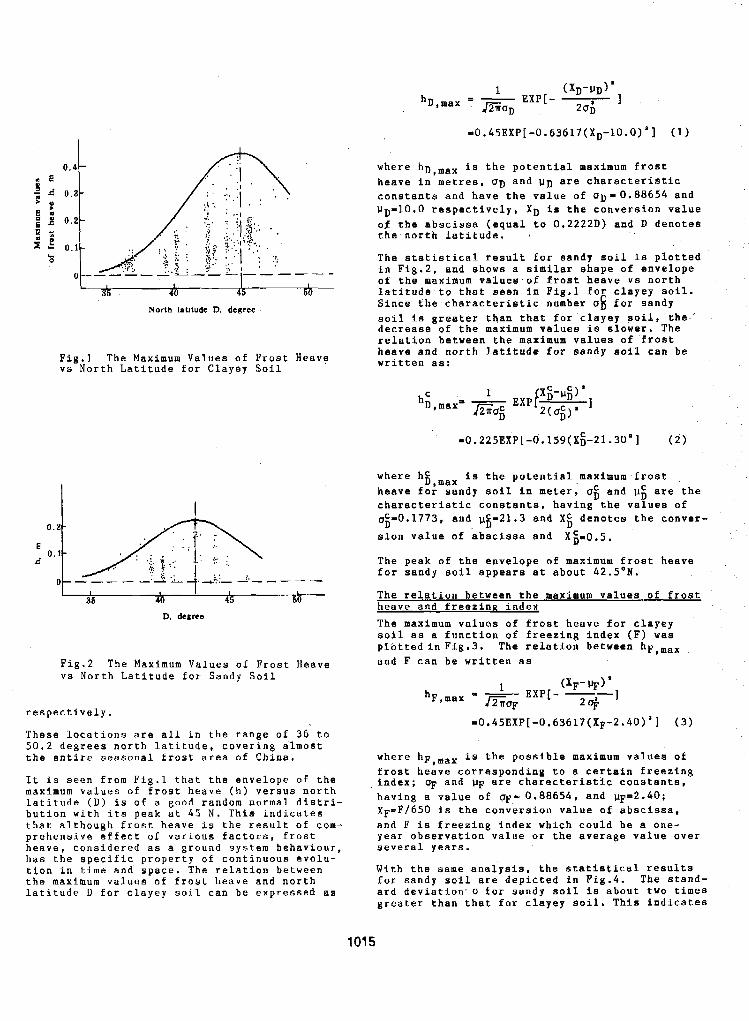
ul- "
L North latitude D. dcerec
Fig.1 The Maximum Values of Frost Heave vs North Latitude for Clayey S o i l
I I I I 35 40 45 50
0, dtgrtc
Fig.2 The Maximum Values of Frost Heave vs North Latitude for Sandy Soil
respectively.
These locations are all in the range of 36 t o 5 0 . 2 degrees north latitude, covering almost the entire seasonal frost area of China,
It i s seen from Fig.1 that the envelope of the maximum values of frost heave (h) versus north latitude (D) is o f a good random normal distri- bution with its peak at 45 N. This indicates that although f r o s t heave i s the result of com- prehensive effect o f various factors, frost heave, considered as a ground system behaviour, has the specific property of continuous evolu- tion in time and space. The relation between the maximum values of frost heave and north latitude D f o r clayey soil can be expressed as
101 5
-0.4SEXP[-0.63617(X~-lO.O)*] (1)
where hD,max is the potential maximum frost heave in metres, OD and u~ are Characteristic constants and have the value of OD-0.88654 and !J~-10.0 respectively, XD is the conversion value of the abscissa (equal to 0.2222D) and D denotes the-north latitude. *
The statistical result for sandy soil is plotted in Fig.2, and shows a similar shape o f envelope of the maximum values o f frost heave v s north latitude to that seen i n Fig.1 for clayey soil. Since the chasacteri8tic number us f o r sandy soil i s greater than that €or clayey soil, the '
decrease of the maximum values is slower. The relation between the maximum values of frost heave and north latitude for aandy soil can be written as:
where hc is the potential maximum f r o s t heave for sandy soil in meter, ug and pg are the characteristic constants, having the values of 0;-0.1773, and US-21.3 and X; denotes the conver- sion value of abacissa and Xi-0.5.
The peak of the envelope of maximum frost heave for sandy soil appears at about 42.5'N.
D,max
The relation between the maximum values o f frost heave and freezing index The maximum values of frost heave for clayey soil as a function of Ereezing index (F) was plottedinFig.3. The relation between hp,max and F can be written as
where hp,max is the possible maximum values of frost heave corresponding to a certain freezing index; OF and IJF are characteristic constants, having a value of w- 0 . 8 8 6 5 4 , and u~'2.40; X~=F/650 is the conversion value of abscissa, and F is freezina index which could be a one- year observation value or the average value over several years.
With the same analysis. the statistical results for sandy soil are depicted in Fig.4. The stand- ard deviation, B for sandy soil is about two times greater than that for clayey soil. This indicates
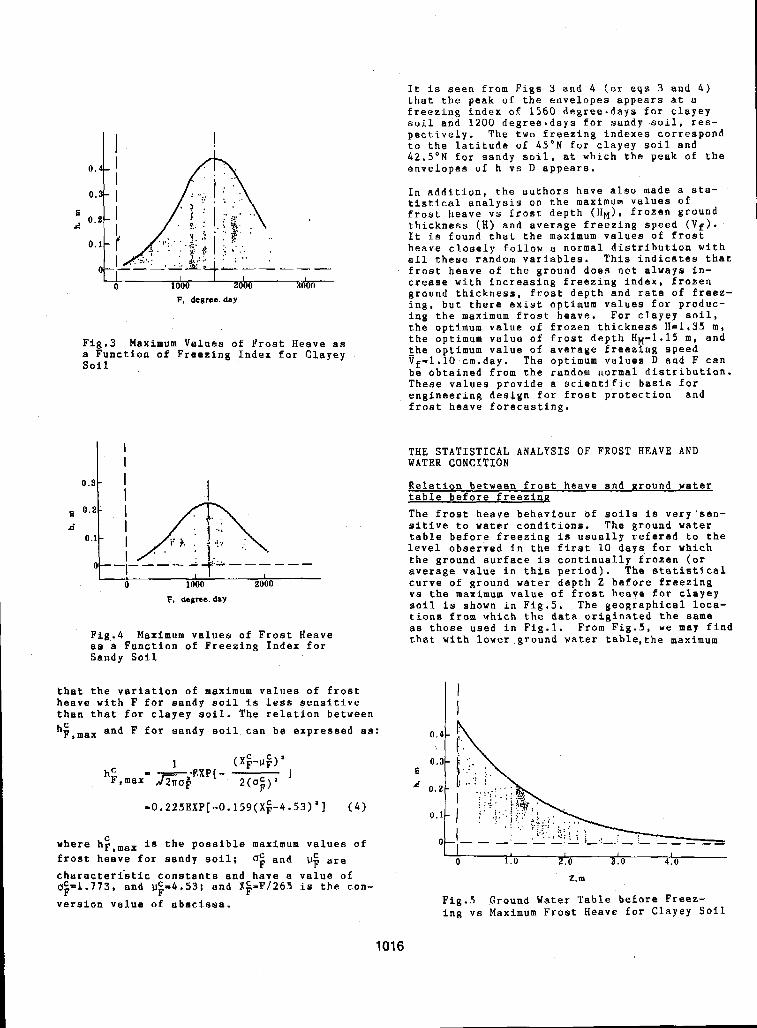
P, degree. day
Fig.3 Maximum Values of Frost Heave as a Fupction of Freezing Index for Clayey Soil
I I
I d
0.1
I
0 1000 2000
I I o . 3 t I I
n 0.1
. . . . I 0 1000 2000
I
Fig.4 Maximum values of Frost Heave as a Function o f Freezing Index for Sandy Soil
that the variation of maximum values of frost heave with F for sandy soil I s less sensitive than that for clayey soil. The relation between hi,max and F for sandy soil can be expressed as:
~0.225EXP[-O.l5S(X~-4.53)'] (4)
where h;,,,, is the possible maximum values of frost heave for sandy soil; 0; and U; are characteristic constants and have a value of "CF =1.773, and uE-4.53; and Xij-Pf265 i s the con- version value of abscissa.
It is seen from Figs 3 and 4 (or eqs 3 and 4)
freezing index o f 1560 degree-days for clayey that the peak of the envelopes appears at a
soil and 1200 degreehdays for sandy soil. res- pectively, The two freezing indexes correspond
42.5'N for sandy soil, at which the peak of the to the latitude of 45'N for clayey soil and
envelopes of h vs D appears.
In addition, the authors have also made a sta- tistical analysis on the maximum values Of frost heave vs frost depth (Hn), frozen ground
It is found that the maximum values of frost thickness (H) and average freezing speed (Vf).
all these random variables. This indicates that heave closely follow a normal distribution with
frost heave of the ground does not always in- crease with increasing freezing index, frozen ground thickness, frost depth and rate of freez- i n g , but there exist optimum values for produc- ing the maximum frost heave. For clayey soil, the optimum value of frozen thickness H-1.35 m, the optimum value of frost depth H"1.15 m, and the optimum value of average freezing speed if-l.lO~cm.day. The optimum values D and F can be obtained from the random normal distribution. These values provide a scientific basis for engineering design for frost protection and frost heave forecasting.
THE STATISTICAL ANALYSIS OF FROST HEAVE AND WATER CONGITION
Relation between frost heave and nround water table before freezing The frost heave behaviour of soils I s very'sen- sitlve to water conditions. The ground water
level observed in the first 10 days for which table before freezing is usually refered to the
the ground surface I s continually frozen (or average value in this period). The statistical curve of ground water depth Z before freezing va the maximum value of frost heave for clayey soil I s shown in Fig.5. The geographical loca- tions from which the data originated the same as those used in Fig.1. From Fig.5, we may find that with lower ground water table,the maximum
L I 1 1 I 1 0 1.0 2 .0 3 . 0 4.0
2 . m
Fig.5 Ground Water Table'before Freez- ing vs Maximum Frost Heave for Clayey S o i l
1016
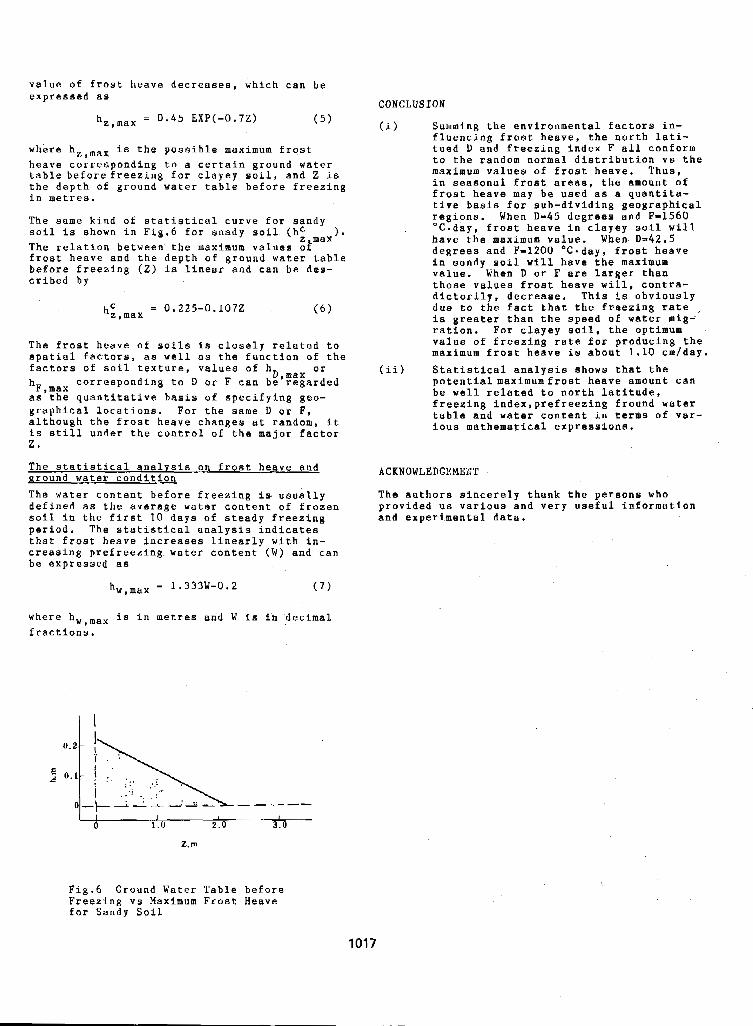
value of frost heave decreases, which can be expressed as
h,,,,, = 0.45 EXP(-0.7Z)
where hz,max is the possible maximum frost heave corresponding to a certain ground water table beforefreezing for clayey soil, and Z is the depth of ground water table before freezing in metres.
The same kind of statistical curve €or sandy soil is shown in Fig.6 for snady soil (hc 1. The relation between the maximum values oi frost heave and the depth of ground water table before freezing (Z) is linear and can be des- cribed by
z max
hC,, max 0.225-0.1072
The frost heave o f soils is closely related to spatial factors, as well as the function of the factors of soil texture, values of hD or
hF, max as the quantitative basis o f specifying geo- graphical locations. For the same D or F, although the frost heave changes at random, it is still under the control of the major factor Z.
The statistical analvsis on frost heave and ground water condition The water content before freezing is usually defined as the average water content of frozen soil in the first 10 days of steady freezing period. The statistical analysis indicates that frost heave increases linearly with in- creasing prefreezing water content (W) and can be expressed as
corresponding to D or F can be regarded , max
hw,max = 1.333W-0.2
where h,,,,, is in metres and W is in decimal fractions.
I I 0 1.0 2.0 3 . 0
Z. m
CONCLUSION
(i) Summing the environmental factors in- fluencing frost heave, the north lati- tued D and freezing index F all conform to the random normal distribution va the maximum values of frost heave. Thus, in seasonal frost areas, the amount of frost heave may be used as a quantita- tive basis f o r sub-dividing geographical regions. When D m 4 5 degrees and F-1560 'C-day, frost heave in clayey soil will have the maximum value. When D142.5 degrees and F-1200 'C-day, frost heave in sandy soil will have the maximum value. When D or F are larger than those values f r o s t heave will, contra-
due t o t h e f a c t that the freezing rate , dictorily, decrease. This is obviously
is greater than the speed of water mig- ration. For clayey soil. the optimum
maximum frost heave is about 1.10 cm/day. value of freezing rate f o r producing the
(ii) Statistical analysis shows that the potential maximumfrost heave amount can be well related to north latitude, freezing index,prefreezing fround water table and water content in terms of var- ious mathematical expressions.
ACKNOWLEDGl!MEBT
The authors sincerely thank the pereons who provided us various and very useful information and experimental data.
Fig.6 Ground Water Table before Freezing vs Maximum Frost Heave for Sandy Soil
1017
DISCONTINUOUS PERMAFROST MAPPING USING THE EM-31 D.S. Washburn and A. Phukan
Cold Regions Laboratory, Inc. (CRL), Anchorage, The University of Alaska at Anchorage (UAA)
SYNOPSIS T h i s p a p e r o u t l i n e s t h e s u c c e s s f u l u s e a n d a d v a n t a F e o f e m p l o y i n g a combined g e o p h y s i c a l i n d u c t i o n r e s i s t i v i t y s u r v e y a n d d r i l l i n g p r o g r a m f o r t h e d e l i n e a t i o n o f w a r m , s h a l l o w , d i s c o n t i n u o u s p e r m a f r o s t . A f e w l i n e s of d a t a a r e g i v e n i n b u i l d i n 5 by b u i l d i n g d e t a i l f r o m a m a j o r h o u s i n g p r o j e c t in F t . Wainwright , Fa i rbanks , Alaska . The a p p a r e n t r e s i s t i v i t y s i g n a t u r e s of f r o z e n , t r a n s i t i o n a l l y f r o z e n , a n d u n f r o z e n soils a r e s h o w n . S u r v e y c o s t s a r e g i v e n e n d s u c c e s s r a t e s a r e d i s c u s s e d .
IMTRORUCTION
A F o r t W a i n w r i g h t , F a i r b a n k s , A l a s k a , h o u s i n g p r o j e c t i s l o c a t e d in t h e s h a l l o w d i s c o n t i n u o u s p e r m a f r o s t z o n e . I t l i e s on a n 80 a c r e (32 .4 h e c t a r e ) s i t e i n t h e C h e n a R i v e r s i l t y , s a n d y , q r a v e l l y a l l u v i u m . T h e 400 u n i t p r o j e c t h a s i p p r o x i m a t e l y 150 i n d i v i d u a l b u i l d i n g s t h a t a r e p r i m a r i l y t w o s t o r y , wooden f r a m e d , m u l t i p l e x townhouses. The d e s i g n - s t a g e g e o t e c h n i c a l s i t e i n v e s t i g a t i o n r o u g h l y o u t l i n e d t h e a r e a s o f f r o z e n a n d u n f r o z e n g r o u n d . An i n d u c t i v e r e s i s t i v i t y g e o p h y s i c a l s u r v e y w a s p l a n n e d as t h e m o s t c o s t - e f f e c t i v e m e a n s t o d e t e c t t h e p r e s e n c e o r absence o f p e r m a f r o s t on a proposed b u i l d i n g b y b u i l d i n g b a s i s . S u c h i n f o r m a t i o n w o u l d h e l p t o d e s i g n m o r e c o s t - e f f e c t i v e f o u n d a t i o n s y s t e m s f o r t h e b u i l d i n g s , w o u l d h e l p t o d i r e c t a n d m i n i m i z e a n y a d d i t i o n a l d e t a i l e d d r i l l i n g t h a t w o u l d b e r e q u i r e d p r i o r t o c o n s t r u c t i o n , a n d f o r e c o n o m i c a n d s u p p l y p l a n n i n g p u r p o s e s , w o h l d h e l p t o e s t i m a t e t h e r e q u i r e d n u m b e r o f t h e m o r e e x p e n s i v e f o u n d a t i o n d e s i g n s f o r p e r m a f r o s t .
The t r a d i t i o n a l a p p r o a c h i n e n g i n e e r i n g f o r l o c a t i n g p e r m a f r o s t u n d e r c o n s t r u c t i o n p r o j e c t s i s t o c o n d u c t e x t e n s i v e d r i l l i n g p r o g r a m s . I n many c a s e s h o w e v e r , g e o p h y s i c a l s u r v e y s s h o u l d b e c o n d u c t e d i n o r d e r t o a u g m e n t t h e b o r e h o l e i n f o r m a t i o n . The ma jo r advan tage o f a combined g e o p h y s i c a l a n d d r i l l i n g p r o g r a m is t h a t o f t e n m o r e g r o u n d c a n be c o n t i n u o u s l y e x p l o r e d a t
For e x a m p l e , P e f f e r and Robelen (1983) show a s l e s s c o s t t h a n w i t h a d r i l l i n g p r o g r a m a l o n e .
much a s a 1 2 t o 1 c o s t a d v a n t a g e w i t h v a r i o u s g e o p h y s i c a l m e t h o d s f o r s t u d i e s t h a t a r e c o m p a r a b l e i n s c o p e a n d t e c h n i q u e t o t h e e f f o r t r e q u i r e d f o r t h e s e a r c h o f s h a l l o w f r o z e n g r o u n d i n m a j o r e n g i n e e r i n g p r o j e c t s .
A d d i t i o n a l c o n s i d e r a t i o n s f o r t h e c h o i c e o f t h e i n d u c t i v e r e s i s t i v i t y m e t h o d i n g e n e r a l a n d t h e G e o n i c s EM-31 i n p a r t i c u l a r f o r t h i s p r o b l e m i n c l u d e t h e f o l l o w i n g .
O f t h e common s u r f a c e g e o p h y s i c a l t o o l s , r e s i s t i v i t y c a n b e e x p e c t e d t o h a v e t h e g r e a t e s t p h y s i c a l p r o p e r t y c o n t r a s t b e t w e e n f r o z e n a n d u n f r o z e n soils ( s e e C h a r m i c h a e l , 1 9 5 2 ; C l a r k , 1 9 5 5 ; o r K a w a s a k i , 1935). M a x i m i z i n g t h e t a r g e t ' s c o n t r a s t w i t h i t s h o s t i n c r e a s e s i t s d e t e c t i b i l i t y a n d t h u s i n c r e a s e s t h e c h a n c e o f s u c c e s s f o r t h e s u r v e y . F o r example , a t warm p e r m a f r o s t t e m p e r a t y r e s , Hoekstra and McNeil l (1975) show c o n t r a s t s o f a b o u t 3 f o r s a t u r a t e d s a n d y g r a v e l a n d o f e b o u t 1.5 f o r F a i r b a n k s s i l t . That is t o s a y , a w a r m F a i r b a n k s s i l t p e r m a f r o s t i s g e n e r a l l y a v e r y d e t e c t a b l e 1.5 t i m e s m o r e r e s i s t i v e t h a n t h e s a m e , b u t . t h a w e d s i l t .
S e i s m i c c o n t r a s t s may o r may n o t b e s u f f i c i e n t i n t h i s p r o j e c t ' s m o s t l y i c e - poor a l luv ium. Moreove r , s e i smic su rveys a r e g e n e r a l l y much slower and more complex
complex, less d u r a b l e , less- r e l i a b l e , snd t o r u n ; r e q u i r e l a r g e r c r e w s ; h a v e more
m o r e e x p e n s i v e i n s t r u m e n t a t i o n : a n d , a r e n o t a s q u a l i t a t i v e l y e a s y t o i n t e r p r e t i n t h e f i e l d w h i l e u n d e r w a y . W i t h a d e q u a t e c o n t r a s t s , s e i s m i c m e t h o d s c a n h o w e v e r g i v e a much b e t t e r t a r g e t d e f i n i t i o n a t d e p t h . B u t i n t h i s s h a l l o w c a s e , t h i s i s n o t a govern ing concern .
I n d u c t i v e r e s i s t i v i t y m e t h o d s h a v e a t l e a s t t h r e e times more l a t e r a l r e s o l u t i o n t h a n t h e g a l v a n i c , o r d i r e c t c u r r e n t ,
d e t a i l e d d a t a f r o m t h e n o n t r a d i t i o n a l r e s i s t i v i t y t e c h n i q u e s . T h u s , m o r e
i n d u c t i v e r e s i s t i v i t y method i s p o s s i b l e e
The i n d u c t i v e m e t h o d uses n o n - c o n t a c t i n g f i e l d s c o i l s s o t h a t s i g n i f i c a n t t i m e and e f f o r t is s a v e d f r o m m a k i n g f o u r g o o d e l e c t r i c a l e l e c t r o d e c o n t a c t s w i t h t h e g r o u n d f o r e a c h m e a s u r e m e n t a s i s r e q u i r e d by the g ,a lvanic sys tems.
1018
To t h e i r d i s a d v a n t a g e i n v e r y r e s i s t i v e m s t e r i a l s , y a l v a n i c s y s t e m s a r e s u s c e p t i b l e t o d e t r i m e n t s l l y h i g h e l e c t r o d e c o n t a c t r e s i s t a n c e s , w h e r e 3 s t h e i n d u c t i v e m e t h o d s s u f f e r f r o m a r e d u c e d s e n s i t i v i t y ( s e e A r c o n e , 1 9 9 1 ) . N e i t h e r t u r n s o u t t o b e a p r o b l e m f o r t h e d a t a found below.
On t h i s p r o j e c t , a l l t h e p e r m a f r o s t t h a t h a s b e e n d r i l l e d w a s h i t a t l e a s t b e f o r e a d e p t h o f 1 5 f e e t ( 4 . 6 m ) . S o , f o r t h e s i m p l e t w o - l a y e r c a s e o f 1 5 f e e t (4.5 TI) o f t h a w e d m a t e r i a l o v e r p e r m a f r o s t , t h e EM-31 r e c e i v e s a p p r o x i m a t e l y 3 5 6 o f i t s s i g n a l f r o m t h e more r e s i s t i v e p e r m a f r o s t ( s e e G e o n i c s , 1979). T h u s , t h e EM-71 h a s a n a d e q u a t e d e p t h o f e x p l o r a t i o n .
- The EM-11 weiThs about 20 p o u n d s , r e q u i r e s o n l y 3 o n e - m a n c r e w , a n d i s v e r y e a s y t o o p e r a t e .
- And, i n A n c h o r a g e , t h e EM-31 r e n t s f r o m a l o c a l s o u r c s f o r 80 $US per day o r 750 %US p e r w e e k , o r c o s t s a b o u t 10 000 BUS. So i t is q u i t e a f f o r d a b l e .
h a v e e f f e c t i v e l y m a p p e d t h e a r s a l e x t e n t o f t h i s f r o s t s u s c e p t i b l e , F7 t o F 7 , s o i l t h e r e b y s a v i n g s o m e o f t h e d e l i n e a t i o n d r i l l i n g c o s t s . F u r t h e r m o r e , e x c a v a t i o n e s t i m a t e s f o r i t s removal f rom undernea th t h e p r o p o s e d b u i l d i n g s i t e s c o u l d h a v e b e e n made from t h e d a t a . T h e r e i s n o c o n f u s i o n a b o u t t h i s r e l a t i v e l y r e s i s t i v e m a t e r i a l ' s r e s p o n s e b e i n g t h a t o f p e r m a f r o s t b e c a u s e o f i t s s u r f a c e e x p r e s s i o n a n d c o r r e l a t i o n w i t h t h e e x i s t i n g d r i l l h o l e d a t a . H o w e v e r , a s a r e s u l t o f t h e r e d u c e d p e r m a f r o s t t o ove rburden con t r a s t and hence i t 5 r e d u c e d d e t e c t a b i l i t y , a f e w d r i l l h o l e s w o u l d
f r o z e n g r o u n d l a y h i d d e n u n d e r n e a t h t h e d r y s t i l l h a v e b e e n n e c e s s a r y t o c h e c k i f a n y
s a n d s
Over t he suspec ted un f rozen g round , we a r e a b l e t o p o s i t i v e l y e s t a b l i s h t h a t n o p e r m a f r o s t e x i s t s u n d e r a n y o f t h e p r o p o s e d f o u n d a t i o n s t o w i t h i n a d e p t h o f a t l e a s t 3 5 f e e t (10.7 m).' B e c a u s e c u t t i n g l i n e is the mos t t ime consuming p a r t o f t h e s u r v e y a n d s i n c e l i t t l e w a s r e q u i r e d h e r e , i t t o o k t w o men o n l y a d a y a n d a h a l f t o s t a k e a n d s u r v e y t h e n e c e s s a r y 1 4 l i n e s i n t h i s u n f r o z e n a r e a . T h i s f i g u r e s t o a b o u t 50 $US p e r a c r e ( 1 2 4 $US p e r h e c t a r e ) f o r a c q u i s i t i o n c o s t s , o r a b o u t t h e c o s t o f two of t he t w e n t y e x i s t i n g a u g e r h o l e s i n t h e a r e a .
SURVEY DATA A N D RESULTS Line 2 0 "
T h e EM-31 w a s u s e d t o d e t e c t s h a l l o w p e r m a f r o s t a l o n g p r o p o s e d r o a d s , u n d e r g r o u n d u t i l i t y r i g h t - o f - w a y s , s n d b u i l d i n g l i n e s . T h e g o a l w a s t o e s t a b l i s h t h e p r e s e n c e o r a b s e n c e o f f rozen g round unde r e sch p roposed s i t e so t h a t t h e p r o p e r d e s i g n s c o u l d b e p l s n n e d . T h i s w a s t o b e a c c o m p l i s h e d b y m e a s u r i n g : t h e a p p a r e n t r e s i s t i v i t y a t e s c h s i t e a l o n g l i n e s a t 30 f o o t (5.1 m ) s t a t i o n i n t e r v a l s a n d b y u s i n g a n y n e a r b y d r i l l h o l e s f r o m t h e d e s i $ n - s t a g e g e o t e c h n i c a l i n v e s t i g a t i o n a s g r o u n d t r u t h t o h e l p c o n t r o l t h e i n t e r p r e t a t i o n . T h e n , 2 m i n i m a l d r i l l i n g a n d t r e n c h i n g p r o g r a m w o u l d be p lanned t o c h e c k a n y a r e a s i n ques t ion and any i n t e r p r e t e d h i d d e n f r o z e n z o n e s t h a t l a y b e n e a t h t h e p r o p o s e d s t r u c t u r e s f o r f u r t h e r t h a w s t r a i n a n d t h e r m a l c o n s i d e r a t i o n s .
Line 5 A t f i r s t , a 15 a c r e (5 .5 h e c t a r e ) a r e a , a b o u t o n e f i f t h o f t h e p r o j e c t , w a s s u r v e y e d . No p e r m a f r o s t was d r i l l e d i n t h i s a r e a p r i o r t o t he su rvey , and consequen t ly none was expec ted . A p p r o p r i s t e l y , n o n e i s d e t e c t e d b y t h e r e s i s t i v i t y s u r v e y , The l e f t h a l f o f f i y u r e 1 s h o w s a t y p i c a l a p p a r e n t r e s i s t i v i t y l i n e , l i n e 9, o v e r u n f r o z e n p r e d o m i n s t e l y s i l t y s a n d s and grave ls . Note t h e 170 ohm-m v a l u e s f o r t h e u n f r o z e n m a t e r i a l i n t h i s a r e a . E x c e p t f o r -3
f e w c u l t u r s l s p i k e s a t s t s t i o n s T t O O a n d 1 + 7 0 ( i n f e e t ) , n o t e a l s o how r e l s t i v e l y s m o o t h a n d n o i s e - f r e e t h e d a t a i s .
As s e e n a t t h e s t a r t o f l i n e 8 , t h e m o s t r e s i s t i v e m a t e r i a l e n c o u n t e r e d i n t h e a r e a i s a v e r y d i s t i n c t , d r y d e p o s i t o f l o o s e , v e r y f i n e - 4 r s i n e d a e o l i a n s a n d s . I t h a s a n s p p a r e n t r e s i s t i v i t y o f 753 ohm-m. Had the su rvey been p l a n n e d a n d c o n d u c t e d e s r l i e r i n t h e p r o - d e s i e n s i t e I n v e s t i r g a t i o n p r o r g r a m , i t would have t u r n e d o u t t h a t t h e r e s i s t i v i t y m e t h o d w o u l d
-
1019
The r i g h t s i d e o f f i g u r e 1 s h o w s l i n e 20 w i t h t h e l o c a t i o n s o f t h e p r o p o s e d b u i l d i n g s . I t a 1 3 0 s h o w s t h e r e s u l t s o f t h e p o s t - s u r v e y , p r e - c o n s t r u c t i o n d r i l l i n g a t t h e b o t t o m o f t h e s e c t i o n . L i n e 20 i s a n o f f s e t e x t e n s i o n o f l i n e 9. L i n e R s t a t i o n O+OO i s p r o x i m a l t o l i n e 2 0 s t a t i o n 5t70. The 350 ohm-m, d r y a e o l i a n s a n d ..
hump c a n be s e e n c e n t e r e d a t s t a t i o n 5+30. From s t a t i o n 4+50 t o a b o u t ? + g o , t h e d a t a s h o w s t h e c h a r a c t e r i s t i c t r a n s i t i o n t o r e s i s t i v e p e r m a f r o s t , w h i c h i n t h i s c a s e i s f rozen aandy
p o i n t s s t s t a t i o n s 4t40 a n d 2 + R O are d u e t o g r a v e l s a n d g r a v e l l y s a n d s . The anomalous da t a
man-made c l u t t e r a n d c a n be i g n o r e d . A t 0+50, t h e d a t a - s h o w s t h a t a l o w r e s i s t i v i t y t h a w b u l b e x i s t s a n d e x t e n d s o f f t h e b e g i n n i n g o f t h e l i n e . The t h a w b u l b c o i n c i d e s w i t h a n e x i s t i n g r o a d t h a t i s l o c a t e d o f f t h e end o f t h e l i n e a t s t a t i o n 0-70.
T h e g r o u n d c o n d i t i o n s u n d e r t h e p r o p o s e d b u i l d i n g s a l o n g l i n e 20 a r e i n t e r p r e t e d t o b e :
B u i l d i n g 89 - u n f r o z e n 90 - u n f r o z e n 91 - t r a n s i t i o n a l 97 - f r o z e n , a n d 96 - f r o z e n .
L a t e r d r i l l i n g c o n f i r m s t h e a b o v e i n t e r p r e t a t i o n e x c e p t t h a t b o r e h o l e E-91 i s c o m p l e t e l y u n f r o z e n . N o t e t h e h e a v y f r o z e n b a r a n d t h e i c e d e s c r i p t i o n c o d e on t h e b o r e h o l e l o g s i n t h e f i g u r e . I t t u r n s o u t t h a t l i n e 2 0 t r a v e r s e s b u i l d i n g 91 n e a r t h e b a c k o f t h e 70 f o o t ( P I m ) d e e p b u i l d i n g , w h i c h i s a l s o
91 was d r i l l e d n e a r i t s f r o n t , w h i c h i s a l s o t o w a r d s c o n f i r m e d f r o z e n g r o u n d , a n d t h a t R H B-
t o t h e l e f t ' a n d i n f r o n t o f t h e s e c t i o n a n d towards t hawed g round . Thus , t hawed so i l s l i e
b u i l d i n y , a n d f r o z e n S o i l 5 l i e t o t h e r i g h t a n d b e h i n d t h e b u i l d i n g . We t h e r e f o r e m a i n t a i n
th .at the interoret ation of tran sitionally frozen soil i s correct and that the much more expensive single borehole did not adequately investigate the site. Furthermore, if the foundation was built f o r being on an unfrozen ground, we would then predict that the back left corner of the building will soon be differentially settling due to thaw consolidation.
Lines 17 and I 8
Figure 2 shows two more lines from the same general area having permafrost a3 line 20. Lines 20, 18, and 17 are all sub-parallel t o each other and are separated by about 575 feet (IO2 m ) and 135 feet (41 m) respectively. Buildings 121, 122, 124, and,ll7 and 118 a r e all correctly interpreted t o lie on frozen ground. Note the apparent resistivity highs and the l o g s on the figure. Numbers 125 and 119 are thought to lie on transitionally thawed material. But, EH B-125 shows only thawed, moist to saturated, medium sandy gravels and fine gravelly medium sands. And, drilling
""
-600 ohm-m
-500
- 400
-300
-
verifies that building 120 lies on unfrozen ground.
The rayqed, irregular response 3t the ends o f lines, 17 and 18, particularly from stations 5 + 2 0 to 7t20 on line 13, supports a variety of interpretations. N o n e of which have been particularly confirmed or denied at this point. Since some rubbish is found overgrown on the ground in the woods at station 5t40 on line 15 (note the missing data point), the conservative interpretation is that there is more metal junk in the ground at the end of line I 8 and that there is some kind of marginal conductor, like an old buried metal pipeline, that runs from line 18 station 5t59 to line 17 station 5+50. The conductor bounds evidence of man's activities on the one s i d e f r o m undisturbed permafrost on the other. A more Speculative interpretation says that there is only a little cutural noise a t line 13 station 5t40 and that there i s on line 1 9 a very irregular and thermally unstable permafrost margin. A margin that includes a thaw channel at ststions 5+59 on both lines 17 and 19. Along these lines of
A0- -600 ohrn-m
c # - 500
-400
-P -200 P, 200- \ LINE 20
LINE 8
LEGEND
SP-SM Sand with Silt SP Sand, to Sand with Gravel, to
Gravelly Sand
Sandy Gravel with Silt GP-GM Gravel wilh Silt and Sand. lo
GP Sandy Grovel
Nbn Non-Vlsiblr, Well-Bonded, No Excess Ice Nbe Non-Visible, Well-Bonded, Excerr Ice Figure 1: EM-51 Apparent Resistivity Survey Vx Visible individual Ice Crystals Lines 8 and 30. Shown with Proposed Vc , Viribia icr Coatinga on Particles
Drillhole Logs. Building Locations and Post-Survey
1020
-800 ohm-m h 800-
-700
600-
-5c 4
7+00 6tOO 5 0 0 I 4 t O 0 1 , 3+00 2?0,0, , ItOpl , 0 - I I I -
-800 ohm-m 800-
700-
600-
-
5.00 pro0 I +op 2t00, 1*00 * -
SM Figure
- 7t00 6+00 w GP-GM 30 f l
3: EM - 71 Apparent Resistivity Survey L i n e s 17 and 18. Shown with Proposed Building Locations and Post - s u r v e y Drillhole Logs.
1021
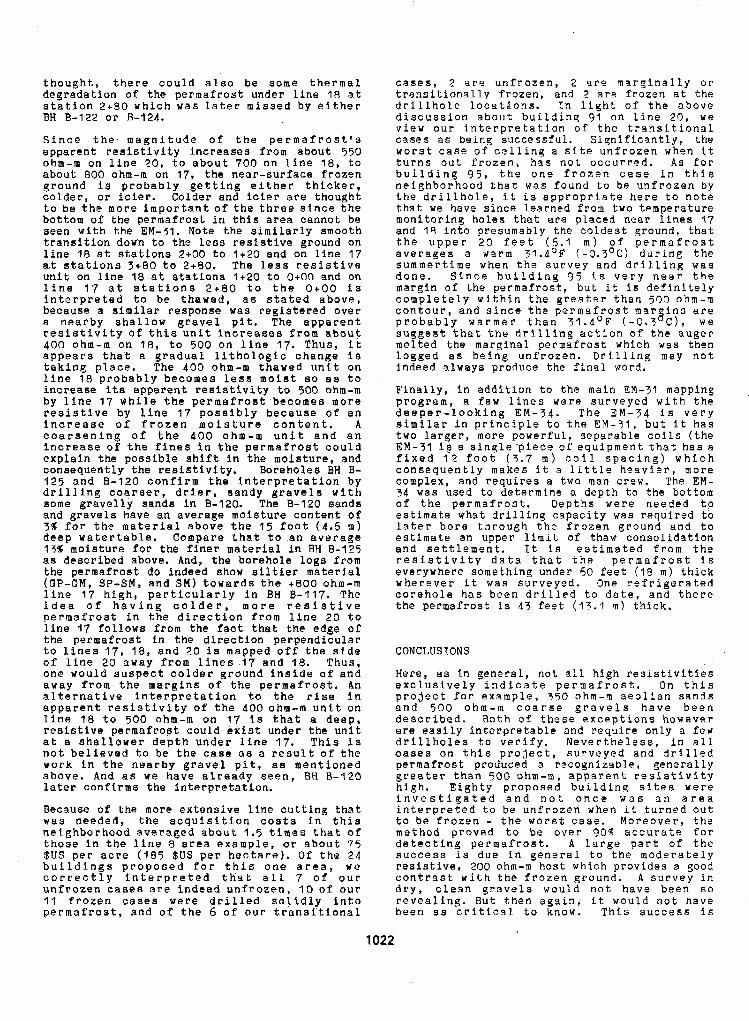
t h o u g h t , t h e r e c o u l d a l s o be some thermal d e g r a d a t i o n o f t h e p e r m a f r o s t u n d e r l i n e 18 a t s t a t i o n 2+30 w h i c h was l a t e r missed by e i t h e r BH 8-122 o r 8-124.
S i n c e t h e m a g n i t u d e o f t h e p e r m a f r o s t ' s a p p a r e n t r e s i s t i v i t y i n c r e a s e s f r o m a b o u t 550 ohm-m o n l i n e 70, t o a b o u t 700 o n L i n e 18, t o a b o u t 800 ohm-m on 17, t h e n e a r - s u r f a c e f r o z e n g r o u n d is p r o b a b l y g e t t i n g e i t h e r t h i c k e r , c o l d e r , o r icier. Co lde r and i c i e r a re t h o u g h t t o be t h e m o r e i m p o r t a n t o f t h e t h r e e s i n c e t h e bot tom of t h e p e r m a f r o s t i n t h i s area c a n n o t be s e e n w i t h t he EM-31. Note t h e s i m i l a r l y s m o o t h t r a n s i t i o n down t o t he less r e s i s t i v e g r o u n d on l i n e 18 a t s t a t i o n s 2400 t o 1 + 2 0 a n d o n l i n e 17 at s t a t i o n s 3480 t o 2+80. The less r e s i s t i v e u n i t o n l i n e 18 a t s t a t i o n a 1+20 to O+OO and on l i n e 1 7 a t s t a t i o n s 2+80 t o t h e O + O O is i n t e r p r e t e d t o be t h a w e d , a s s t a t e d a b o v e , b e c a u s e a similar r e s p o n s e was regis tered o v e r a n e a r b y s h a l l o w g r a v e l p i t . The a p p a r e n t r e s i s t i v i t y o f t h i s u n i t i n c r e a s e s from a b o u t 400 ohm-m on 18, t o 500 on l i n e 17. T h u s , i t a p p e a r s t h a t a g r a d u a l l i t h o l o g i c c h a n g e is t a k i n g p l a c e . T h e 400 ohm-m t h a w e d u n i t o n l i n e 18 p r o b a b l y b e c o m e 8 l e s s m o i s t so a s t o i n c r e a s e its a p p a r e n t r e s i s t i v i t y t o 500 ohm-m by l i n e 17 w h i l e t h e p e r m a f r o s t b e c o m e s m o r e r e s i s t i v e by l i n e 17 p o s s i b l y b e c a u s e o f a n i n c r e a s e o f f r o z e n m o i s t u r e c o n t e n t . A c o a r s e n i n g o f t h e 400 ohm-m u n i t a n d a n i n c r e a s e o f t h e f i n e s i n t h e p e r m a f r o s t c o u l d e x p l a i n t he p o s s i b l e s h i f t i n t h e moi s tu re , and c o n s e q u e n t l y t h e r e s i s t i v i t y . B o r e h o l e s BH B- 125 a n d 8-120 c o n f i r m t h e i n t e r p r e t a t i o n b y d r i l l i n g c o a r s e r , d r i e r , s a n d y g r a v e l s w i t h s o m e g r a v e l l y s a n d s i n B-120,. The 8-120 s a n d s a n d g r a v e l s h a v e a n a v e r a g e m o i s t u r e c o n t e n t o f 7% for t h e m a t e r i a l a b o v e t h e 1 5 f o o t (4.6 m ) d e e p w a t e r t a b l e . C o m p a r e t h a t t o a n a v e r a g e 1% m o i s t u r e f o r the f i n e r material in BH 8-125 as described above. And, t h e b o r e h o l e l o g s from t h e p e r m a f r o s t do indeed show s i l t i e r material (GP-GM, SP-SM, a n d SM) t o w a r d s t h e +BOO ohm-m l i n e 17 h i g h , p a r t i c u l a r l y i n BH 8-117. The i d e a o f h a v i n g c o l d e r , m o r e r e s i s t i v e p e r m a f r o s t i n t he d i r e c t i o n f,rom l i n e 20 t o l i n e 17 f o l l o w s f r o m t h e f ac t t h a t t h e edge o f t h e p e r m a f r o s t i n t h e d i r e c t i o n p e r p e n d i c u l a r t o l i n e s 17 , 19, a n d 20 is mapped o f f t h e s i d e of l i n e 20 a w a y f r o m l i n e s 17 and 98. T h u s , o n e w o u l d s u s p e c t c o l d e r g r o u n d i n s i d e o f a n d a w a y f r o m t h e m a r g i n s o f t h e p e r m a f r o s t . An a l t e r n a t i v e i n t e r p r e t a t i o n t o t h e r i s e i n a p p a r e n t r e s i s t i v i t y o f t h e 400 ohm-m u n i t o n l i n e 70 t o 5 0 0 ohm-m on 17 i s t h a t a d e e p , r e s i s t i v e p e r m a f r o s t c o u l d e x i s t u n d e r t h e u n i t a t a s h a l l o w e r d e p t h u n d e r l i n e 17. T h i s i s n o t b e l i e v e d t o be t h e case a s a r e s u l t o f t h e v o r k i n t h e nearby g r a v e l p i t , a s m e n t i o n e d a b o v e . And as we h a v e a l r e a d y s e e n , BH 8-120 l a t e r cwfirms t h e i n t e r p r e t a t i o n .
Because of t h e m o r e e x t e n s i v e l i n e c u t t i n g t h a t was n e e d e d , t he a c q u i s i t i o n c o s t s in t h i s n e i g h b o r h o o d a v e r a g e d about 1.5 t i m o s t h a t of t h o s e i n t h e l i n e 8 a rea e x a m p l e , o r a b o u t 75 $US per a c r e ( 1 9 5 $US p e r h e c t a r e ) . O f t h e 2 4 b u i l d i n g s p r o p o s e d f o r t h i s o n e a r e a , we c o r r e c t l y i n t e r p r e t e d t h a t a l l 7 o f o u r u n f r o z e n cases a r e i n d e e d u n f r o z e n , 1 0 of o u r 11 frozen cases were d r i l l e d s o l i d l y i n t o p e r m a f r o s t , and o f t h e 6 o f o u r t r a n a f t i o n a l
c a s e s , 0 a r e u n f r o z e n , 2 a r e m a r g i n a l l y o r
d r i l l h o l e l o c a t i o n s . In l i g h t o f t h e a b o v e t r a n s i t i o n a l l y f r o z e n , a n d 2 a re f r o z e n a t t h e
d i s c u s s i o n a b o u t b u i l d i n g 91 o n l i n e 20, we v i e w o u r I n t e r p r e t a t i o n o f t h e t r a n s i t i o n a l c a s e s as b e i n g s u c c e s s f u l . S i g n i f i c a n t l y , t h e w o r s t case o f c a l l i n g a s i t e u n f r o z e n w h e n i t t u r n s o u t f r o z e n , h a s not o c c u r r e d . As f o r b u i l d i n g 9 5 , t h e o n e f r o z e n c a s e in t h l s n e i g h b o r h o o d t h a t w a s f o u n d t o be u n f r o z e n b y t h e d r i l l h o l e , i t i s a p p r o p r i a t e h e r e t o n o t e t h a t we h a v e s i n c e l e a r n e d f r o m t w o t e m p e r a t u r e m o n i t o r i n g h o l e s t h a t are placed near l i n e s 17 and 19 i n t o p r e s u m a b l y t h e c o l d e s t g r o u n d , t h a t t h e u p p e r 2 0 f e e t (5 .1 m ) o f p e r m a f r o s t a v e r a g e s a warm 31.4OF ( - 0 . 3 O C ) d u r i n g t h e s u m m e r t i m e w h e n t h e s u r v e y a n d d r i l l i n g w a s d o n e . S i n c e b u i l d i n q 9 5 i s v e r y n e a r t h e m a r g i n o f t h e p e r m a f r o s t , b u t i t is d e f i n i t e l y c o m p l e t e l y w i t h i n t h e g r e a t e r t h a n 500 ohm-m c o n t o u r , a n d s i n c e t h e p e r m a f r o s t m a r i n s a r e p r o b a b l y w a r m e r t h a n 31.4'F ( - 0 . 3 C), we s u g g e s t t h a t t h e d r i l l i n g a c t i o n o f t h e a u g e r m e l t e d the m a r g i n a l p e r m a f r o s t wh ich was then l o g g e d a s b e i n g u n f r o z e n . Drilling may n o t i ndeed a lways p roduce t h e final word.
Finally, in a d d i t i o n t o t h e m a i n EM-71 mapping p r o g r a m , a f e w l i n e s w e r e s u r v e y e d w i t h t h e d e e p e r - l o o k i n g EM-34. T h e EM-74 is v e r y s i m i l a r in p r i n c i p l e t o t h e EM-31, b u t i t has t w o l a r g e r , m o r e p o w e r f u l , s e p a r a b l e c o i l s ( t h e EM-31 i s a s i n y l e p i e c e o f e q u i p m e n t t h a t h a s a f i x e d 1 2 f o o t ( 5 . 7 m ) c o i l s p a c i n g ) w h i c h c o n s e q u e n t l y m a k e s i t a l i t t l e h e a v i e r , m o r e c o m p l e x , a n d r e q u i r e s a two man crew. The EM- 34 w a s u s e d t o d e t e r m i n e a d e p t h t o t h e bot tom o f t h e p e r m a f r o s t . D e p t h s were n e e d e d t o es t imate w h a t d r i l l i n g c a p a c i t y w a s r e q u i r e d t o l a t e r b o r e t h r o u g h t h e f r o z e n g r o u n d a n d t o e s t i m a t e a n u p p e r limit o f t h a w c o n s o l i d a t i o n a n d s e t t l e m e n t . I t is e s t i m a t e d f r o m t h e r e s i s t i v i t y d a t a t h a t t h e p e r m a f r o s t i s eve rywhere some th ing unde r 50 f e e t (19 m ) t h i c k
c o r e h o l e h a s been d r i l l e d t o d a t e , a n d t h e r e w h e r e v e r i t was s u r v e y e d . One r e f r i g e r a t e d
t h e p e r m a f r o s t is 43 f e e t (11.1 TI) t h i c k .
8
CONCLUSIONS
Here, as in g e n e r a l , n o t a l l h i g h r e s i s t i v i t i e s e x c l u s i v e l y i n d i c a t e p e r m a f r o s t . On t h i s p r o j e c t f o r e x a m p l e , 750 ohm-m a e o l i a n s a n d s a n d 500 ohm-rn c o a r s e g r a v e l s h a v e b e e n d e s c r i b e d . B o t h o f t h e s e e x c e p t i o n s h o w e v e r are e a s i l y i n t e r p r e t a b l e a n d r e q u i r e o n l y a few d r i l l h o l e s t o v e r i f y . N e v e r t h e l e s s , i n a l l cases on t h i s p r o j e c t , s u r v e y e d a n d d r i l l e d permafrost produced a r e c o g n i z s b l e , g e n e r a l l y g r e a t e r t h a n 500 ohm-m, a p p a r e n t r e s i s t i v i t y h i g h . E i g h t y p r o p o s e d b u i l d i n g s i t e s w e r e i n v e s t i g a t e d a n d n o t o n c e w a s a n a r e a i n t e r p r e t e d t o be u n f r o z e n w h e n i t t u r n e d o u t t o be f r o z e n - t h e w o r s t c a s e . M o r e o v e r , t h e m e t h o d p r o v e d t o be o v e r 90% a c c u r a t e f o r d e t e c t i n g p e r m s f r o s t . A l a r g e p a r t o f t h e s u c c e s s i s d u e i n g e n e r a l t o t h e m o d e r a t e l y r e s i s t i v e , 300 ohm-m h o s t w h i c h p r o v i d e s a good c o n t r a s t w i t h t h e f r o z e n g r o u n d . A s u r v e y i n d r y , c l e a n g r a v e l s w o u l d n o t h a v e b e e n s o r e v e a l i n g . B u t t h e n a g a i n , i t w o u l d n o t h a v e been a s c r i t i c a l t o know. T h i s s u c c e s s is
1022
n o t e w o r t h y i n t h a t t h e p e r m a f r o s t h e r e is q u i t e warm, a b o v e j l o F (-O.S°C), and i s t h u s n o t n e a r l y so r e s i s t i v e a n d d e t e c t a b l e a s c o l d e r p e r m a f r o s t . T h i s s u r v e y was v e r y s u c c e s s f u l a n d p r o v i d e d a l a r g e a m o u n t o f r e l a t i v e l y i n e . x p e n s i v e d a t a t h a t g r e a t l y c o m p l i m e n t e d t h e b o r e h o l e i n f o r m a t i o n . The i n d u c t i v e r e s i s t i v i t y m e t h o d o n t h i s p r o j e c t h a s p r o v e n t o b e a c c u r a t e , r e l i a b l e , f a a t , a n d v e r y c o s t - e f f e c t i v e .
REFERENCES
A r c o n e , S.A. ( 1 9 3 1 ) . S o m e f i e l d s t u d i e s o f t h e c o r r e l a t i o n b e t w e e n e l e c t r o m a g n e t i c a n d d i r e c t c u r r e n t m e a s u r e m e n t s o f g r o u n d r e s i s t i v i t y . U n d e r g r o u n d C o r r o s i o n , ASTM S p e c i a l T r e a t m e n t T e c h n i c a l T e s t i n g P u b l i c a t i o n 7 4 1 , p 92-110.
C h a r m i c h a e l , R.S., ed. (1992). Handbook of 2 , 749 PP
C lark, S.P., J r . , e d . ( 1 9 6 6 ) . P h y s i c a l C o n s t a n t s , 587 pp, G New York.
G e o n i c s L i m i t e d (1979). O p e r a t i n g M a n u a l f o r EM-31 N o n - C o n t a c t i n g T e r r a i n C o n d u c t i v i t y Meter wi th Technica l Notes , 57 pp , Geonica , Ontar io , Canada .
H o e k s t r a , P . & M c N e i l l , J.D. ( 1 9 7 3 ) . E l e c t r o m a g n e t i c p r o b i n g o f p e r m a f r o s t . Proc. 3nd XCP, p 517-525, Yakutsk, USSR.
K a w a s a k i , K. & O s t e r k a m p , T . E . ( 1 9 8 5 ) .
P e r m a f r o s t T e r r a i n f o r D e t e c t i n g G r o u n d Ice E l e c t r o m a g n t i c I n d u c t i o n M e a s u r e m e n t s i n
a n d I c e - R i c h S o i l s , 1 9 5 pp., U n i v e r s i t y of A l a s k a G e o p h y s i c a l I n s t i t u t e Report U A G 300, F a i r b a n k s .
P e f f e r , J.R. & R o b e l e n , P.C. ( 1 9 8 3 ) . A f f o r d a b l e : O v e r b u r d e n m a p p i n g u s i n g n e w g e o p h y s i c a l t e c h n i q u e s . P i t & Quarry , August 1987.
1023
A DISCUSSION ON MAXIMUM SEASONAL FROST DEPTH OF GROUND Xu, Ruiqi, Pang, Guoliang and Wang, Bingcheng
Hdlongjiang Water Conservancy School, Harbin, China
SYNOPSIS Maximum seasona l f ro s t dep th of ground a f f eo tS t he oa lou la t ion of f r o s t heave, f r o s t heave rate. o i roumferent ia l fome and noma1 foroe, Whiuh is a l so t he i nd i spensab le da t a for a r c h i t e o t u n l d e s i @ and wonstruction. But habitually maximum f r o s t d e p t h of ground and the depth of freesing Soil layer are confurred and w i t h o u t s t r i o t d i s t i n c t i o n .
The paper is for re reamhing and analyzing maximum seasonal f ros t depth of wornd. make a l e a r t h e c r i t e r i o n o f o a l a u l a t i n g t h e maximum seasonal f ros t depth of p u n d .
Maximum seasonal f ros t depth of ground d i r e c t l y a f f e c t s t h e c a l c u l a t i o n of f roa t heave oapac i ty , f r o s t heave rate, normel f o r m and uircumfe- r e n t i a l foroe, which is ind ispensablo da ta in t he a r ch i t ec tu ra l des ign and conatruot ion. However a t present the maximum f r o s t d e p t h o f grornd and t h e t h i o h e s s of freesing a o i l layer are habi tua l ly mixed up both a t home and abroad, and a re no t d i s t i ngu i shed s t r i c t ly . For ins- tance, t h e ne t eo ro log iun l s t a t ion and in and outdoor experiments measured t h a t t h e f r o a t depth was the thiokneas of freezing a o i l lqyer , no t t he maximum fr0a.t depth of gromd.
Whether wi th theore t ica l squa t ion o r empir ioal equat ion. f rost heave oapaoi t j . water aontent migration and frost heave rate are a l l r e l a t e d wi th f roa t depth . While adopt ing inoorrea t f roa t dep th , t he frost heave rate t h a t is uounted will be d i f f e ren t . Thus t h e olrrssiii- ca t ion of f r o s t heave divided by fTo,at h e a v e r a t e is influenoed.
The seasonal f ros t depth o f ground is d i f f e r e n t , whioh has a grea t in f luence on the normal f ros t heave. See fig. I
Fmal depth. cm
fig-1 the r e l a t i o n between f ros t depth and normal froat heave
Frost depth inoreaaes as t h e f r o a t heave 16 inureaaed. Vhen f ros t dop th l a at its maximum the acuumulating valua of t h e f r o s t heave is t he g rea t ea t .
The c h a r a c t e r i s t i c of front heave in soi l can be r e f l ec t ed by t h e law t h a t t h e f r o s t heave capaci ty and f r o s t heave change along f r o s t depth. See f i g . 2.
F~OSI hemvc cnpncW. mm
P
Maximum frost deplh
""""
iiK.2 f r o s t heave VB f r o a t d e p t h
1024
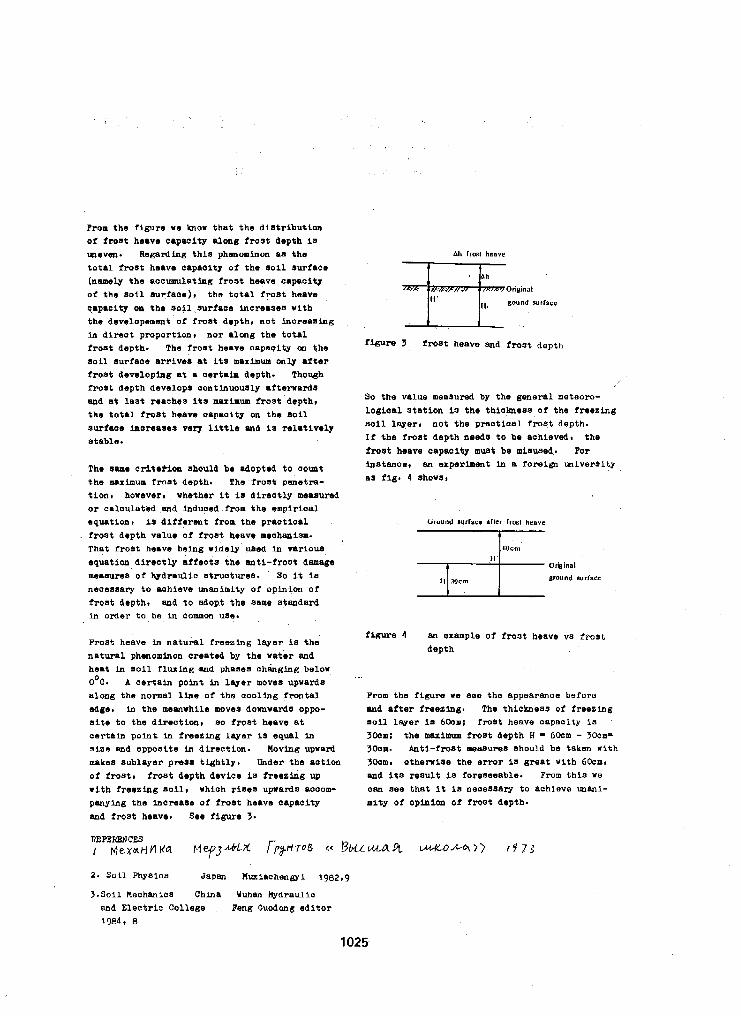
From t h e f i g u r e we b o w t h a t t h e d i s t r i b u t i o n of frost heave capaoity along frost depth l a mevm. Regarding this phwominw a8 t h e t o t a l f r o s t heave capaoity of t h e so i l sur face (namely t h e accumulating f r o s t heave capacity of t h e s o i l s u r f a c e ) , t h e t o t a l f r o s t heave qapaaity on t h e s o i l surfaoe inareasea with the developsment of f ros t depth , no t increa8ing in dixeot proport ion, nor a lwg t h e t o t a l f roa t depth . The f r o a t henve onpaoity m t h e s o i l s u r f a c e a r r i v e s at its mnximun'only after f r o s t d e v e l o p b g a t a oer ta ia depth . Though frost depth develops aontlnuously afterward6 and a t l a a t r s a a h e s i t a maximum f r o s t d e p t h , t h e t o t a l f r o s t heave aapaai ty on t h e 6 0 i l
aurfaoe inoreases very l i t t l e and l a r e l a t i v e l y s tab le .
The same c r i t e r i o n ahould be adopted to ooua t the muinurn f ros t depth . The f ros t pene t ra - t i o n . however. whether it is d i r e Q t l y rnenaumd or oalaulatBd and induaed from the empir ical squat iont is d i f f e r e n t from the p r a o t i o a l
. f ros t dep th va lue of f ros t heave meohanism. That froat heave being widely med in mrioua equa t ion d i r ea t ly a f f eo t s t he an t i - f ros t damage maaures of hydraul lo a t rua tures . So it l a
neceaaary to aohieve manimi ty of opinion of f ros t depth . and to adop t t he snme standard i n o d e r t o b e in common use.
Frost heave in n a t u r a l f r e e z i n g layer is t h e n a t u r a l phenominon crented by t h e water and hent in S o i l fluxing and phP8Oa ohinging below OOC. A o e r t a h p o i n t in layer moves upwads along the normal line of t h e a o o l i n g f r o n t a l edge. in the meanwhile move9 downwards oppo- s i t e t o t h e d i r o o t i o n t so frost heave a t c e r t a i n point in freezing l a y e r is equal in sieo and opposi te in d i r e c t i o n . Moving upwnd makes sublayer pN98 t i g h t l y . Under the na t ion of frost, f roa t dep th dev ice is f r e e s i n g up wlth f reez ing s o i l , which rises upwards aocom- pnnylng the increase of frost heave capacity and f r o s t heave. See fi@uw 3.
Ah lronl heave
t ' h
So the value measured by the general meteoro- logioal s t a t i o n is t h e t h i o h e s s of the freezhg so i l layer, n o t t h e p m o t i a a l f r o s t d e p t h . I f t h e f r o a t d e p t h needs t o be aohievedt the f r o s t heave oapaoity m u S t be mi8USed. For instance, an experiment in a f o r e i a m i v e r s l t y as f ig . 4 shows,
fiRure 4 an example of f r o s t heave va f r o s t
depth
From the f i y r e we see the appearance before and a f t e r freeling. The thickueas of freeelng so i l layer is 60~10: f r o s t heave oapacity 1s 3Ocmi t h e maximum f r o s t d e p t h H - 6Oam - 30cm- 30orn. Antl-frost remured ahould bo taken wi th
3Ooml o t h e r r i s e t h e ermr l a grea t wi th 6 0 c m t end its r e s u l t is foreseeable. From t h i s we
o m see t h a t it l a necessary t o achieve unani- mity of opinion of frost depth.
2. soil PhySiQS Japan Muxiachengyi 1982,9
3.9011 Mechanics China W u h a n Hydraulio and E lec t r i c Co l l ege Feng Guodong e d i t o r 1984, 8
1025
PRINCIPLES FOR COMPILING AN ATLAS OF SEASONAL FROST PENETRATION, JILIN, CHINA (1: 2000000)
Zhang, Xing, Li, Yinrong and Song, Zhengyuan
Institute of Water Conservancy, Jilin, China
SYNOPSIS For purposes of engineering design an atlas has been compiled to reflect the dynamics of seasonally frozen ground, and particularly the depth of frost penetration in soils under different freezing conditions, variations in the freezing process with time during the freezing sea- son and interannual variation in the depth of frost penetration. In a given geographical region, soil properties and the moisture content of the soil prior t o freezing are the major internal fac- tors influencing the seasonal depth of frost penetration, while the thickness of snow cover and the freezing index, which very with latitude and altitute, are the main external factors. The dynamic of frost penetration in seasonally frozen ground is shown in the atlas by the following four par- ameters: the standard frozen depth (Zo), the coefficient of variation o f frost depth (Cv), coeffi- cient for the influence of snow cover ( 8 ) and the elapsed time of the freezing season (T).
INTRODUCTION
The mapping of seasonally frozen ground is a complicated problem because of the variety o f natural factors that deeply affect the process and result of ground freezing. At a given site, the position of the freezing front varies with time, the maximum depth of frost penetration differs from year to year; and at any time, the depth of frozen soil can vary by a factor of 2 to 4 within a distance of a few kilometres.
For engineering purpose, it is necessary to know the regime of seasonal freezing processes, i.e., to show the seasonally frozen depth, the
variations in frozen depth each of which is process of freezing vs time and the interannual
shown in the atlas.
In this paper the authors discuss the principles for Compilation of the atlas seasonally frozen ground in Jilin Province, China.
TERMINOLOGY AND CONCEPTIONS
The soil-type classification and terminology are based on the "Regulations for geotechnical tests SDSOI-79" promulgated by the Mini.stry of Water Conservancy and Electri,city, People's Republic of China.
The period of time with a mean air temperature below 0°C is called the freezing season; the number of 10-day periods (T) is called the elapsed time of freezing season.
The freezing index ( F 1 ) is defi.ned as the in- tegrated area of temperature-time curve within the freezing season i n "C.10 days.
The period from' the beginning of the freezing
season t o the time of maximum frost penetration is the calculated duration of the freezing season (TI).
The period of time with mean daily air tempera- tures below O°C and the beginning of soil freez- ing is the pre-freezing period, in which t,he water content of the soil is defined as the pre-freezing water content (W, % ) . The term seasonally frozen depth refers to the maximum value o f frost penetration,.including frost heave.
STANDARD FROZEN DEPTH
The standard frozen depth is defined as the mean depth of frost penetrat-ion in fine-grained inorganic soil with a pre-freezing water con- tent of 25% (Wo-standard pre-freezing water content), observed €or several years at a snow- free meteorological observation site (Central Meteorological Bureau, 1979b)
A standard frozen depth is dependent mainly on the freezing index, as controlled by latitude (L) and altitude (H) of the observation site, and is affected by local conditions such as surface cover, hydrogeology and engineering- geology *
The standard frozen depth is a site-specific characteristic determined by statistical analy- sis of observatory data. It is a basic index in the mapping of seasonally frozen ground.
RELATIONSHIP BETWEEN STANDARD FROZEN DEPTH AND FREEZING INDEX
From statistical analysis o f several years data
1026
from 30 observation sites it is known that the standard frozen-depth (Zo,m) is dependent on the freezing index F1:
where a, -coefficient of the standard forzen depth, known to be 0.115 in Jilin Province: and
several years. F1- mean value of freezing index for
At the 30 observation sites,the fine-grained particle content of the seasonally frozen soils ranges from 48 to 78%, in which salt content i s 11 to 74%,and the clay content is from 2 to 34%. A t 15 sites, the depth of the groundwater table i s less than 4 m. Four observation sites are on frost susceptible soils with frost heav- ing amounts of 10 t o 31.5 cm, or 6 to 2 5 % o f the maximum frozen depth.
INFLUENCE OF PRE-FREEZING WATER CONTENT ON DEPTH OF FROST PENETRATION
A t a snow-free site, as the pre-freezing water content W is not equal to Way the mean frozen depth for any year ( Z ) differs from Z o , and can be expressed by the following equation:
regions east to west.
Region I, the Changbaishan Natural Environment Protected Region, is very mountainous and F, is found t o be closely-related to latitude.
where L- latitude,in degrees;
The correlation coefficient of Eq.(5) is 0.934.
In Region 11, the central-eastern hills,
H- elevation in 100 m.
PI= -665.7+18.2L+13.68 ( 6 )
The correlation coefficient of Eq.(6) is 0 , 8 3 8 .
Substituting Eq.(5) and (6) into Eq.(l), the relation of 2, to L and H can be derived.
Inprinciple the formulae Eq.(5) and (6)should b e applied only to those areas lower than 1000 m a.s.1.
and the Western Plain, the relief is less than In Regions I11 and IV, the Central-western Bills
100 m , the distribution of mainly depends on latitude,and the observed data of 2, are applied directly to mapping.
z = KwZo
where K,- the revised coefficient of water content
W
Equation ( 4 ) , although it is approximate theore- tically, has proved by comparison with field data t o b e accurate enough f o r practical purposes (Zhang, 1983). The water content value used for statistical analysis ranges from 8 to 30%.
VARIATION IN
Within the Jilin Province, 187000 km' in area, there are 48 observation sites. In addition, data from 20 adjacent sites were used. Thus, in a total area of 260000 k m a , data from 68 o b - servation sites were used in thP analysis: in other words, there wef;e more than 10 observation sites for each 100 cm on the map (1:2000000). This is dense enough for mapping.
I n the mountainous regions, variation in eleva- tion affects the values of F 1 and 2,. The 2,
increases by h to 7 cm per 100 m increase in elevation.
Jilin Province can be divided into four physical
EFFECTS OF SNOW COVER ON THE MEAN VALUE OF SEASONAL FROST DEPTH
An increase in the de th of snow cover will reduce the effect of %1 on the seasonal frost - depth, So, f l i n Eq.(l) should be changed to F2, s o :
where B - coefficient shew snow cover on F1
B = 0.193 + 0.
ing the effect o f
'402 1, ( 8 )
where ix- mean depth of snow cover for several
Eq. (9), years, and can be determined from
- C Hi H, =- 120
where Hi- daily depth o f snow cover during the period from the beginning of November the end of February, in centimetres.
INTERANNUAL VARIATION OF FROST PENETRATION
The depth frost penetration at a any site can vary greatly from year to year. The coefficient of variability (C,) ranges from 0 .04 to 0.27 in
1027
Jilin Province.
Based on analysis o f empirical frequency curves from 100 sites within the temperate zone in China (Central Meteorological Bureau, 1979a), it is considered that the third type of Poisson normal distribution curve, with a skewness coefficient ( C , ) - O can be the theoretical distribution curve for the depth of frost penetration (Zhang and Wang, 1981). The Cv value is the index to show the interannual variation of seasonal frost penetration.
It is necessary to examine carefully the observed data to determine the value of Cv seasonaly frost penetration under natural conditions, be- cause any change in position will cause the observed data to vary widely.
Observations a t 40 meteorological stations for 25 years show that the thicker the snow cover, the greater will be the value of Cv.
C, = 0,081 t 0.135Tx (10)
The correlation coefficient for Eq.(lO) is 0.92. In this province, H, is less than 16 cm.
From Eq.(lO), it can be shown that-if jx=o, Cv=0,081. A calculation based on F1 shows that the Cv value should be O.OG2,however. The-fact that two values are close indicates that F1 is the major factor i n controlling the depth of frost penetration at a snow-free site.
PROGRESS OF FROST PENETRATION VS TIME DURING THE FREEZING PERIOD
The progress of frost penetration can be expres- sed by 5q.(ll).
where a(t)- time-course coefficient o f the depth of frost penetration;
t - elapsed time, in 10-day periods: a 4 2 - mean annual value o f maximum depth
of frost penetration.
In the temperate z o n e o f China, can be ex- pressed by Eq.(12),
where, the value of in depends mainly on the pre-freezing water content (W). As W ranges in- creases from 8 t o 30%, m increases from 0.51 to 0.73.
As the duration o f freezing season (T) is less than is IO-day periods depth of frost penetra- tion will continue to increases after the freez- i n g season, but the amount of chis increase will not exceed 5 % of the annual frost depth. T h i s situation often occurs in regions near the south- ern limit of the discontinuous permafrost zone. As T<lSO days,?'lis always less than T .
CONTENTS OF THE ATLAS
The atlas includes the following maps: 1.Isopleths o f the standard frozen depth ( Z o ) for Jilin Province;
2.Isopleths of the coefficient o f variation in frost depth (C,) under natural conditions;
3.Isopleths o f the coefficient for the effect of snow cover on depth of frost penetration;
4.Regionalisation of the duration of the freez- ing season (T) in Jilin Province.
In the accompanying text, curves showing the relationship o f Z o to L and H for defferent natural regions, moisture coefficient and a table showing the a(t) values are presented.
The atlas can be used to predict the frequency o f a given depth o f frost penetration and the progress of frost penetration. ,
CONCLUSIONS
The atlas (1:2000000) of seasonal frost penetra- tion for Jilin Province is the result of studies for the compilation an atlas of seasonal frost for the temperate zone o f China.
Based on examination and analysis of field ob- servations from more than 100 meteorological stations, it can be concluded that:
(1) The seasonal ground freezing regime can be expresses by the standard value ( Z o ) , coefficient of variability ( C v ) , coef- ficient of snow effects (6) alld a time- course coefficient(a(,h
properties and pre-freezing water con- tent are the t w o major internal factors that influence the seasonal frost depth, while the depth of snow cover and the freezing index are the major external factors. The mean frozen depth for several years is the basic index to evaluate the quantitative characteristics of seasonally frozen ground. The Cv value reflects the interannual variations.and the coefficient a ( c ) can be used to ex- press the freezing process.
(iii) The principles suggested above can also be used for compilation of an atlas of seasonal frost depth for the whole tem- perate zone o f China, only some parame- ters will have to be changed f o r dif- ferent regions.
(ii) In a given geographical region, soil
The results demonstrate that the equations sug- gested can be used to determine the seasonal frost depth and the time-course of freezing penetration for coarse-grained soils with a fines content (<2 mm particles) greater than 5 0 % (Zhang, 1983)'. However, they are not suitable for the Boils influenced b y saline ground water.
1028
I REFERENCES Central Meteorological Bureau of China, (1979a).
Climatic atlas, China. p . 2 2 2 - 2 2 3 , Carto- rn graphic Publishing House. Central Meteorological Bureau of China, ( 1 9 7 9 b ) .
I . Regulations for surface air observation. Meteorological Publishing House.
Zhang Xing and Wang Shiduo, ( 1 9 8 1 ) . Statis- tical characteristics of seasonal frozen ground in Jilin, China. Journal of Gla- ciology and Cryopedology, ( 3 ) , 3 7 - 4 6 .
Zhang Xing. ( 1 9 8 3 ) . Natural freezing penetrative rate of the seasonally frozen ground in the medium temperate zone of China. Pro.2nd Chinese National Conference on Permafrost, p.138-145, Gansu People's Publishing House.
1029
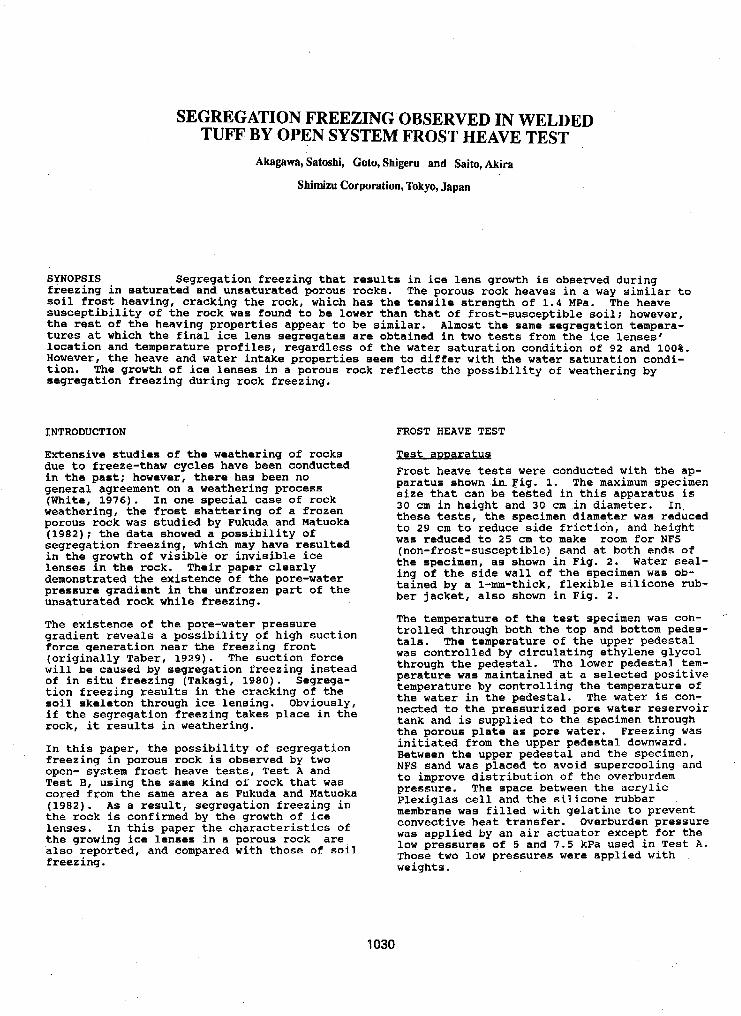
SEGREGATION FREEZING OBSERVED IN WELDED TUFF BY OPEN SYSTEM FROST HEAVE TEST
Akagawa, Satoshi, Goto, Shigeru and Saito, Akira
Shimizu Corporation, Tokyo, Japan
SYNOPSIS Segregation freezing that results in ice lens growth is obaerved during freezing in saturated and unsaturated porous rocks. The porous rock heaves in a way similar to soil frost heaving, cracking the rock, which has the tensile strength of 1.4 MPa. The heave susceptibility of the rock was found to be lower than that of frost-susceptible soil; however, the rest of the heaving properties appear to be aimilar. Almost the same segregation tempera- tures at which the final ice lens segregates are obtained in two tests from the ice lenses' lwcation and temperature profiles, regardless of the water saturation condition of 92 and 100%. However, the heave and water intake properties seem to differ with the water saturation condi- tion. The growth of ice lenses in a porous rock reflects the possibility o f weathering by segregation freezing during rock freezing.
INTRODUCTION
Extensive studies o f the weathering of rocks due to freeze-thaw cycles have been conducted in the past: however, there has been no general agreement on a weathering process (white, 1976). In one special case o f rock weathering, the frost shattering of a frozen porous rock was studied by Fukuda and Matuoka (1982); the data showed a possibility of Segregation freezing, which may have resulted in the growth of visible or invisible ice lenses in the rock. Their paper clearly demonstrated the existence of the pore-water pressure gradient in the unfrozen part of the unsaturated rock while freezing.
The existence of the pore-water pressure gradient reveals a possibility of high suction force generation near the freezing front (originally Taber, 1929). The suction force will be caused by segregation freezing instead of in situ freezing (Takagi, 1980). Segrega- tion freezing results in the cracking of the soil skeleton through ice lensing. Obviously,
rock, it results in weathering. if the segregation freezing takes place in the
In this paper, the possibility of segregation freezing in porous rock is observed by two
Test I3, using the same kind of rock that was open- system frost heave tests, Test A and
cored from the same area as Fukuda and Matuoka
the rock is confirmed by the growth o f ice (1982). As a result, segregation freezing in
lenses. In this paper the characteristics of the growing ice lenses in a porous rock are also reported, and compared with those o f soil freezing .
FROST HEAVE TEST
Test Frost heave tests were conducted with the ap- paratus shown h . F i g . 1. The maximum specimen size that can be tested in this apparatus is 30 cm in height and 30 cm in diameter. In, these tests, the specimen diameter was reduced to 29 cm to reduce side friction, and height was reduced to 25 cm to make room for NFS (non-frost-susceptible) sand at both ends of the specimen, as shown in pig. 2. Water seal- ing of the side wall of the specimen was ob- tained by a I-mu-thick, flexible silicone rub- ber jacket, a160 shown in Fig. 2.
The temperature of the test specimen was con- ".
trolled through both the top and bottom pedes-
was controlled by circulating ethylene glycol tals. The temperature of the upper pedestal
through the pedestal. The lower pedestal tem- perature was maintained at a selected positive temperature by controlling the temperature of the water in the pedestal. The water is con- nected to the pressurized pore water reservoir tank and is supplied to the specimen through the porous plate as pore water. Freezing Was initiated from the upper pedestal downward.
NFS sand was placed to avoid supercooling and Between the upper pedestal and the specimen,
to improve distribution of the overburdem pressure. The space between the acrylic Plexiglas cell and the silicone rubber membrane was filled with gelatine to prevent
was applied by an air actuator except for the convective heat transfer. Overburden pressure
low pressures of 5 and 7 . 5 kPa used in Test A. Those two low pressures were applied with weights.
1030
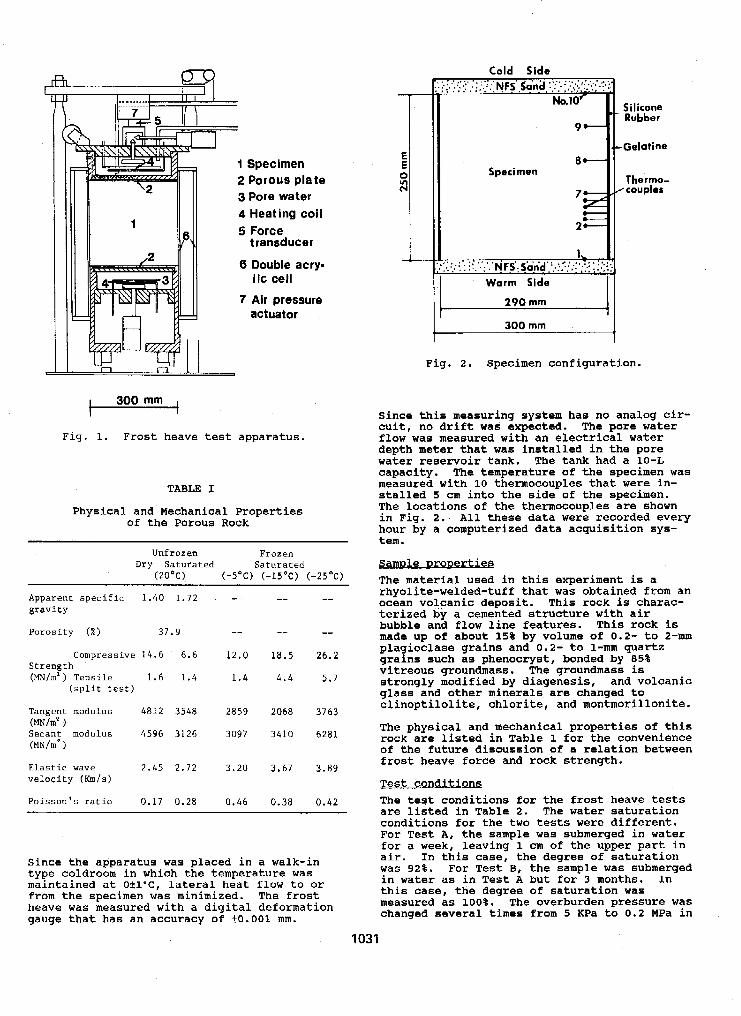
Cold Side
2 Porous plate 3 Pore water 4 Heating coil
transducer
6 Double acry-
7 Air pressure
Fig. 1. Frost heave test apparatus.
TABLE I
Physical and Mechanical Properties oE the Porous Rock
Unfrozen Frozen Dry Saturated Saturated
(200C) (-5'C) (-15'C) ( -25-C)
Apparent spec i f i c 1 . 4 0 1.72 " " "
g r a v i t y
Poros i ty ( X ) 37 .9 " "
Compressive 14.6 6.6 12.0 18.5 2 6 . 2 Strength (MN/ma ) T e n s i l e 1.6 1 , 4 1.4 4 . 4 5.7
( s p l i t t e s t )
Tangent modulus 4812 3548 2859 2068 3763 (MN/rn' Secant modulus 4596 3126 3097 3410 6281. (MN/m')
E l a s t i c wave 2.45 2 . 7 2 3.20 3.67 3 . 8 9 v e l o c i t y (bn/s)
P o i s s o n ' s r a t i o 0 .17 0 .28 0.46 0 . 3 8 0 . 4 2
Since the apparatus was placed in a walk-in type coldroom in which the temperature was maintained at Okl'C, lateral heat flow to or from the specimen was minimized. The frost heave was measured with a digital deformation gauge that has an accuracy of +0.001 mm.
9-
8- Specimen
-
, .:
5
S i I irone - Rubber
-Gelatine
Thermo- .,couplrs
300 mm i
Fig. 2. Specimen configuration.
Since this measuring system has no analog cir- cuit, no drift was expected. The pore water flow was measured with an electrical water depth meter that was installed in the pore water reservoir tank. The tank had a 10-L
measured with 10 thermocouples that were in- capacity. The temperature of the specimen was
stalled 5 cm info the side of the specimen. The locations of the thermocouples are shown in Fig. 2. All these data were recorded every hour by a computerized data acquisition sys- tem.
S a m p m r t l e s The material used in this experiment is a rhyolite-welded-tuff that was obtained from an ocean volcanic deposit. This rock is charac- terized by a cemented structure with air bubble and flow line features. This rock is made up of about 15% by volume of 0.2- to 2-mm plagioclase grains and 0.2- to 1-mm quartz grains such as phenocryst, bonded by 85% vitreous groundmass. The groundmass is strongly modified by diagenesis, and volcanic glass and other minerals are changed to clinoptilolite, chlorite, and montmorillonite.
The physical and mechanical properties of this rock are listed in Table 1 for the convenience of the future diswasion of a relation between frost heave force and rock strength.
yest ... . The test conditions for the frost heave tests are listed in Table 2. The water saturation conditions for the twa tests were different. For Test A, the sample was submerged in water
air. In this case, the degree o f saturation for a week, leaving 1 cm of the upper part in
was 92%. For Test B, the sample was submerged in water as in Test A but for 3 months. In
measured as 100%. The overburden pressure wa6 this case, the degree of saturation was
changed several times from 5 KPa to 0.2 MPa in
1031
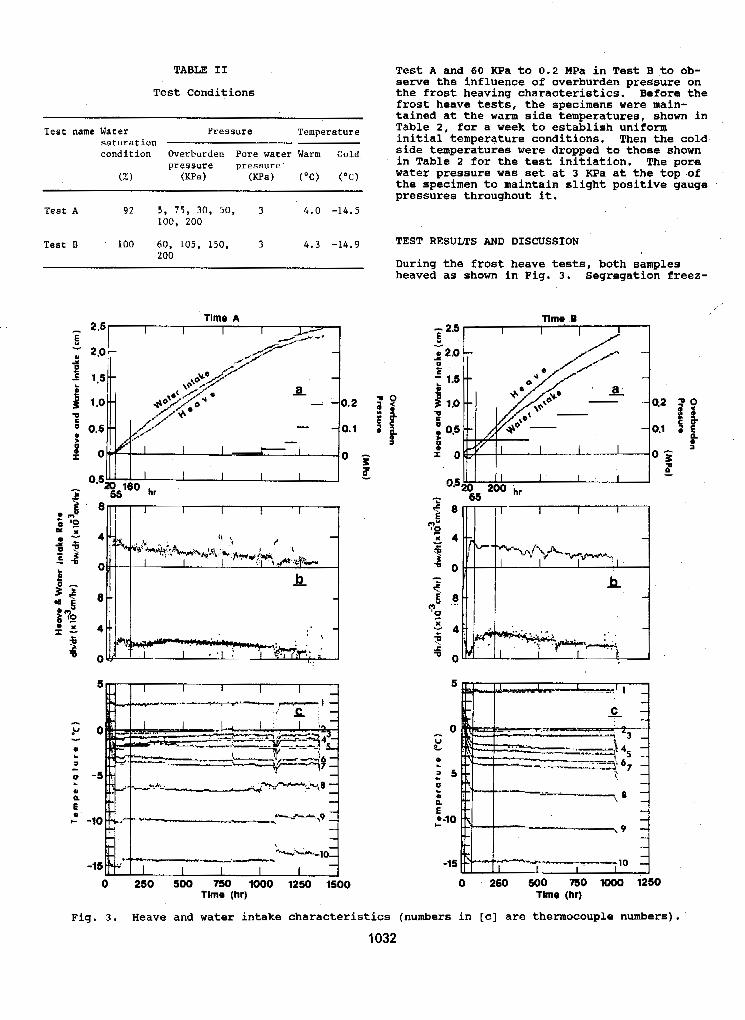
TABLE I1
Test Conditions
Test name Water Pressure Temperature
condi t ion Overburden Pore water Warm C o l d saturation
pressure pressure ( X ) W W (KPd ("C) ( " C )
Test A 92 5 , 7 5 , 30, 50 , 3 4.0 -14.5 100, 200
Test B 100 60, 105, 150, 3 4 . 3 -14.9 200
0.1
S
0
-5
flmm (hr)
Test A and 60 KPa to 0.2 Mea in Test B to ob-
the frost heaving characteristics. Before the serve the influence of overburden pressure on
frost heave tests, the specimens were main- tained at the warm side temperatures, shown in Table 2, for a week to establish uniform initial temperature conditions. Then the cold side temperatures were dropped to those shown in Table 2 for the teat initiation. The pore water pressure was set at 3 KPa at the top of the specimen to maintain slight positive gauge pressures throughout it.
TEST RESULTS AND DISCUSSION
During the frost heave tests, both samples heaved as shown in Fig. 3. Segregation freez-
0 250 500 750 1000 1250 Time (hr)
Fig. 3. Heave and water intake characteristics (numbers in [c] are thermocouple numbers).
1032
ing activity in the rock is confirmed by analyzing the heave and water intake curves and the ice lens distribution.
water intake vrowerties The heave and water intake curves are shown in Fig. 3a with values of applied overburden pressures. The heave rate and water intake rate are shown in Fig. 3b: they are calculated by subtraating adjacent pairs of heave or water intake data and dividing by the time difference of 1 hour. The specimen tempera- tures are shown in Fig. 3c. The temperatures were measured with 10 thermocouples installed in the specimens, as shown in Fig. 2.
During the frost heave test's, both samples heaved about 2 CIR at 1,000 hours. The heave amount observed in Test A, which used the un- saturated sample, is slightly smaller than than in Test B, which used the saturated sample, although the overburden pressure in Test B was usually larger than Test A. The heave amount observed in Test B is larger than the water intake amount, whereas the inverse relation was observed in Test A. One possible explanation of these properties will be dis- cussed later.
The frost heave and heave rate curves acquired from Test A show that heaving started at time t=55 hours after an initial slight shrinkage. The heave and heave rate curves of Test I3 show heaving that is similar to that of the saturated frost-susceptible soil observed in a frost heave test conducted with the same specimen size, overburden pressure, and freez- ing conditions (Akagawa, 1983).
In general, a saturated frost-susceptible soil first shows in situ freezing, expelling pore water if overburden pressure is high. The heave rate due to in situ freezing then decreases sharply as the freezing rate decreases and segregation freezing becomes predominant, increasing the heave rate and drawing the pore-water into the sample. When segregation freezing becomes dominant, ice lenses start to grow following the depth of the zero isotherm, and the heave amount is 9% greater than the water intake amount (Akagawa, in press). The data shown in Fig. 3 may be understood as following the heaving modes found in the soil mentioned above:
1) A period of predominant in situ freezing. Negative water intake rates were observed in the first 20 hours in both Test A and Test B. These data reveal that in situ freezing was predominant during this period.
2) A transition period from in situ freezing to segregation freezing. The water intake rates turned positive and increased steeply during the periods of t= 20 to 55 hours in Test A and 20 to 65 hours in Test B. These data reveal that in situ freezing was tapering off and segregation freezing was becoming pre- dominant .
(3) A period of predominant segregation freez- ing. The ratios of heave rate to water intake
rate, (dh/dt)/(dw/dt), at each recorded time seem to be about 1.09 after 55 hours in Test A and 65 hours in Test B, except , for a period from t=20 to 380 hours in Test A. These data reveal that segregation freezing was predominant in this period.
From this point of view concerning the heave and water intake properties, it may be said that segregation freezing has been taking place in both unsaturated and saturated porous rock and that expansion due to in situ freezing has also peen active in Test B, in at least the first 20 hours of freezing, which used a saturated sample.
Ice lens distribution After the frost heave tests, both specimens were cut to observe the water content profile and ice lens distribution to confirm the
vations are shown in Fig. rla and b. Several segregation freezing. Results of these obser-
visible ice lenses were observed, and their distribution and variation of thickness were found to resemble ice lenses seen in frost susceptible soils; however, there were fewer visible ice lenses in the rock than in the soil. Therefore, the occurrence of segrega- tion freezing, which was revealed by the heave and water intake properties, was confirmed by the existence of the segregated ice lenses.
Additional experimental results of note for the f r o s t heave study are listed below, and are compared to the heave characteristics of the above-mentioned frost-susceptible-soil:
Heave rate durina Eeareaation freezinq The heave rate of the rock appeared to remain constant at relatively low values such as 0.01 to 0.03 m/hr shown in Fig. 3b, whereas the heave rate of the frost-susceptible soil, which was observed in a frost heave test using the same specimen size and similar freezing conditions, varied from 0.3 to 0.02 m/hr as time elapsed (Akagawa, 1983).
effect of overburden wressure on heave and water intake rate durina seareaation freezinq The heave and water intake rates at each over- burden pressure during segregation freezing are plotted in Fig. 5. AS i s generally ac- cepted in soil frost heave studies, a higher
The same situation applies fo r rock heaving. overburden pressure causes a lower heave rate.
effect of unsaturation on frost heavinq
period between t=O to 55 hours, but slight In Test A, no heaving was observed during the
heaving was observed in Test B during t=O to 65 hours, as shown in Fig. 3a. The Water intake rate was higher than the heave rate between t=55 to 380 hours in Test A, whereas the rest of the data in Fig. 3b show an in- verse relationship between the heave rate and the water intake rate. One possible explana- tion for the appearance of the heaving in Test
water, which was locally developed by in situ B in this period is that the excess pore
freezing in the saturated sample, cracked the rock, causing expansion, and absence of the heaving in Test A is thought to be the result of insufficient excess pore water for cracking the unsaturated specimen. This lower heave
1033
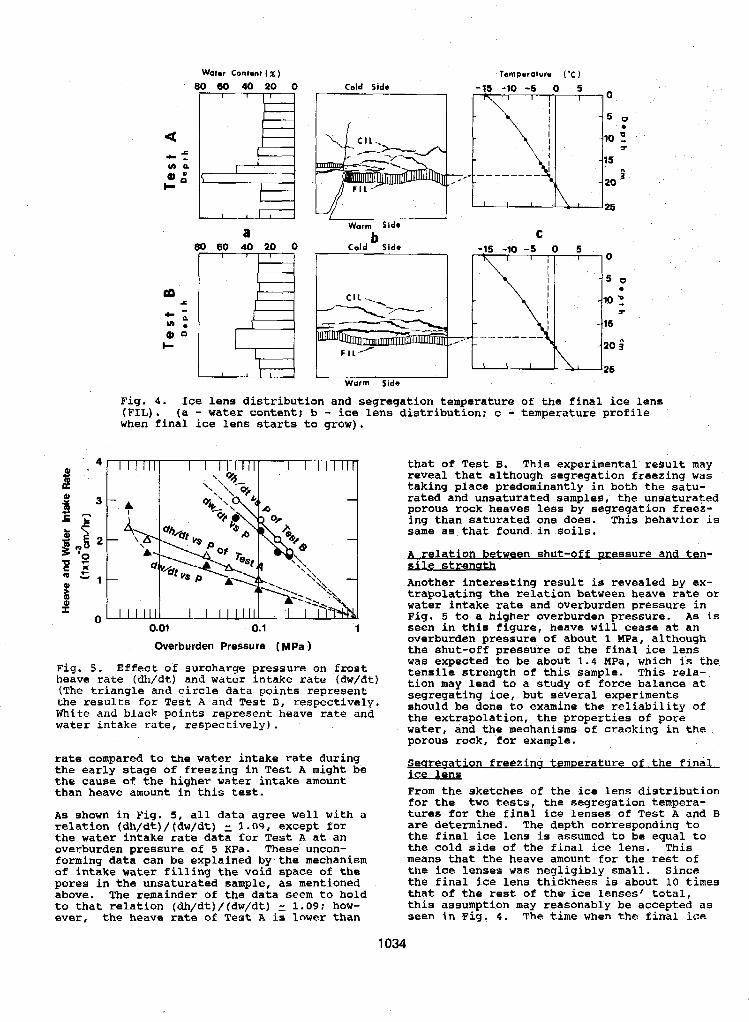
Wator Contmt ( x ) 80 60 40 20 0
80 H 60 40 a 20 0
Temperature ( " C )
Warm Side
b Cold Side
I C
Warm Side
Fig. 4. Ice lens distribution and segregation temperature of the final ice lens (FIL). (a - water content; b - ice lens distribution; c - temperature profile when final ice lens starts to grow).
4 that of Test B. This experimental result may 4 ' reveal that although segregation freezing was K
P taking place predominantly in both the satu- rated and unsaturated samples, the unsaturafed porous rock heaves less by segregation freez-
same as that found in soils.
-lation betsen shut-off Dressure and tm-
Another interesting result i s revealed by ex- trapolating the relation between heave rate or water intake rate and overburden pressure in
E - ing than saturated one does. This behavior i s
z H strenaa m ?;, 2 $ r
0 Fig. 5 to a higher overburden pressure. As is 0.01 0.1 1 seen in this figure, heave will cease at an Overburden Pressure ( MPa )
overburden pressure of about 1 MPa, although the shut-off pressure of the final ice lens
Fig. 5. Effect of surcharge pressure on frost heave rate (dh/dt) and water intake rate (dw/dt) (The triangle and circle data points represent the results for Test A and Test B, respectively. White and black points represent heave rate and water intake rate, respectively) .
rate compared to the water intake rate during the early stage of freezing in Test A might be the cause of the higher water intake amount than heave amount in this test.
A s shown in Fig. 5, all data agree well with a relation (dh/dt)/ (dw/dt) 1. 09, except for the water intake rate data for Test A at an overburden pressure of 5 KPa. These uncon- forming data can be explained by the mechanism of intake water filling the void space of the pores in the unsaturated sample, as mentioned above. The remainder of the data seem to hold to that relation (dh/dt)/ (dw/dt) 1.09; how- ever, the heave rate of Test A is lower than
was expected t o be about 1.4 MPa, which is the tensile strength of this sample. This rela- tion may lead to a study of force balance at segregating ice, but several experiments should be done to examine the reliability of the extrapolation, the properties of pore water, and the mechanisms of cracking in the porous rock, for example.
Seareaation freezing femeerature of the final
From the sketches of the ice Lens distribution for the two tests, the segregation tempera- tures f o r the final ice Lenses of Test A and B are determined. The depth corresponding to the final ice lens is assumed to be equal to the cold side of the final ice lens. This means that the heave amount for the rest of the ice lenses was negligibly small. Since the final ice lens thickness is about 10 times that of the rest of the ice lenses, total, this assumption may reasonably be accepted as seen in Fig. 4 . The time when the final ice
lens
1034
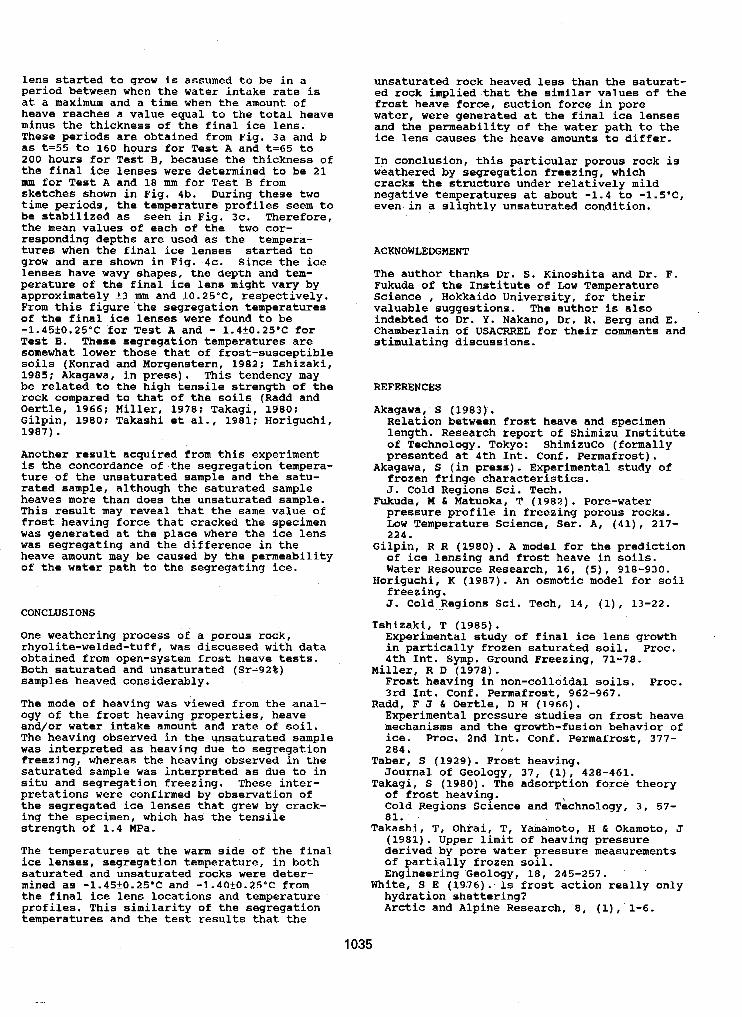
lens started to grow is assumed to be in a period between when the water intake rate is at a maximum and a time when the amount of heave reaches a value equal to the total heave minus the thickness of the final ice lens. These periods are obtained from Fig. 3a and b as t=55 to 160 hours for Test A and t-65 to 200 hours fox Test B, because the thickness o f the final ice lenses were determined to be 21 mm for Test A and 18 mm for Test B from sketches shown in Fig. 4b. During these two time periods, the temperature profiles seem to be stabilized as seen in Fig. 3c. Therefore, the mean values of each of the two cor- responding depths are used as the tempera- tures when the final ice lenses started to grow and are shown in Fig. 4c. Since the ice
perature of the final ice lens might vary by lenses have wavy shapea, the depth and tem-
approximately +3 mm and f0.25'Cr respectively. From this figure the segregation temperatures o f the final ice lenses were found to be -1.45f0.25'C for Test A and - 1.4+0.25'C for Test B. These segregation temperatures are somewhat lower those that of frost-susceptible soils (Konrad and Morgenstern, 1982: Ishizaki,
be related to the high tensile strength of the 1985; Akaqawa, in press). This tendency may
rock compared to that of the soils (Radd and Oertle, 1966; Miller, 1978: Takagi, 1980: Gilpin, 1980: Takashi et a l . , 1981; Horiguchi, 1987).
Another result acquired from this experiment is the concordance o f the segregation tempera- ture of the unsaturated sample and the satu- rated sample, although the saturated sample heaves more than does the unsaturated sample. This result may reveal that the same value of frost heaving force that cracked the specimen was generated at the place where the ice lens was segregating and the difference in the heave amount may be caused by the permeability of the water path to the segregating ice.
CONCLUSIONS
One weathering process o f a porous rock, rhyolite-welded-tuff, was discussed with data obtained from open-system frost heave tests. Both saturated and unsaturated (Sr=92%) samples heaved considerably.
The mode of heaving was viewed from the anal- ogy o f the frost heaving properties, heave and/or water intake amount and rate of soil. The heaving observed in the unsaturated sample was interpreted as heaving due to Segregation freezing, whereas the heaving observed in the saturated sample was interpreted as due to in situ and segregation freezing. These inter- pretations were confirmed by observation of the segregated ice lenses that grew by crack- ing the Specimen, which has the tensile strength of 1.4 MPa.
The temperatures at the warm side of the final ice lenses, segregation temperature, in both saturated and unsaturated rocks were deter- mined as -1.45+0.25'C and -1.40+0.2'5"C from the final ice lens locations and temperature profiles. This similarity of the segregation temperatures and the test results that the
unsaturated rock heaved less than the saturat- ed rock implied that the similar values of the frost heave force, suction force in pore water, were generated at the final ice lenses and the permeability of the water path to the ice lens causes the heave amounts to differ.
In conclusion, this particular porous rock is weathered by segregation freezing, which cracks the structure under relatively mild negative temperatures at about -1.4 to -1 .5 'C, even in a slightly unsaturated condition.
ACKNOWLEDGMENT
The author thanks Dr. S. Kinoshita and Dr. F. Fukuda of the Institute of Low Temperature Science , Hokkaido University, for their valuable suggestions. The author is also indebted to Dr. Y. Nakano, Dr. R. Berg and E. Chamberlain of USACRREL for their comments and stimulating discussions.
REFERENCES
Akagawa, S (1983). Relation between frost heave and specimen length. Research report of Shimizu Institute of Technology. Tokyo: ShimizuCo (formally presented at 4th Int. Conf. Permafrost).
Akagawa, S (in press). Experimental study of frozen fringe characteristics. J. Cold Regions Sci. Tech.
pressure profile in freezing porous rocks. Low Temperature Science, Ser. A, (41), 217-
Gilpin, R R (1980). A model for the prediction of ice lensing and frost heave in soils. Water Resource Research, 16, ( 5 ) , 918-930.
Horiguchi, K (1987). An osmotic model for soil freezing. J. Cold-Regions Sci. Tech, 14, (l), 13-22.
Fukuda, I & Matuoka, T (1982). Pore-water
224.
IShiZaki, T (1985). Experimental study of final ice lens growth in partically frozen saturated soil. Proc. 4th Int. Symp. Ground Freezing, 71-78.
Frost heaving in non-colloidal soils. Proc. 3rd Int. Conf. Permafrost, 962-967.
Experimental pressure studies on frost heave mechanisms and the growth-fusion behavior of
284. ice. Proc. 2nd Int. Conf. Permafrost, 377-
Journal Of Geology, 37, (l), 428-461.
Miller, R D (1978) .
Radd, F J & Oertle, D n (1966) *
Taber, S (1929). Frost heaving.
Takagi, S (1980). The adsorption force theory of frost heaving. Cold Regions Science and Technology, 3 , 57- 81.
Takashi, T, Ohrai, T, Yamamoto, H & Okamoto, J (1981). Upper limit of heaving pressure derived by pore water pressure measurements of partially frozen soil. Engineering Geology, 18, 245-257.
hydration shattering? Arctic and Alpine Research, 8, (11, 1-6.
White, S E (19.76). Is frost action really only
1035
SOME ASPECTS OF SOILS ENGINEERING PROPERTIES . '
IMPROVEMENT DURING DAM CONSTRUCTION G.F. Bianovl, V.I. Makarovz and E.L. Kadkinaz
lscientific Research Centre of the "Hydroproject" Institute, Moscow, USSR zThe Permafrostology Institute, Yakutsk, USSR
size composition and moisture content.
For construction of embankment dams impervious elements sandy loams are used with coarse
and relatively large internal friction angle. fractions having a low seepage coefficient
In practice the qualitative compaction of soils with cparse fraction (with over 5 0 per cent of 2 mm and larger fractions of the dry soil mass) presents some difficulties because of the formation of rigid skeleton during com- paction which impedes the fine soil filler compaction.
It is a common fact that with the equal amount of compaction applied the soil is compacted most effectively only at the appropriate moisture content called the optimum compaction moisture. In case the sail moisture is b e l o w optimum it is wetted before placement into the structure which is usually done without any difficulties. When the moisture content exceeds the optimum value the soil is called overmoiat. The moisture content reduction of these s o i l s is quite a problem.
The easiest way is to dry the soil b y natural means, in the open air, i.e. to aerate it. Un- fortunately.this method of soils moisture re- duction is only applicable in dry climate re- gions where the amount of summer precipita- tions is considerably lower than the evaporated moisture. In the regions with the amount of
moisture the aeration does not give positive summer precipitations exceeding the evaporated
results, and it may even lead to the soil moisture content increase,
The process of s o i l drying in specially de- signed furnaces is not only energy and labour consuming but low productive as well, Generally the moisture content reduction does not exceed 2 - 3 per cent after drying in furnaces. A more
decrease of the furnace output and higher fuel intensive soil drying results in the sharp
consumption.
In Japan a method was developed of the clay soil moisture reduction by adding 20 per cent o f crushed granite with 1 5 mm maximum grain size. After mixing the moisture of the initial soil was decreased by 4 0 per cenf due to water absorbtion by the granite fragments (Borovoi,
SYNOPSIS The paper focuses on upgrading soils engineering characteristics by basic parameters defining their strength, deformation and seepage properties, with change or optimization of grain-
1 9 5 7 ) . The drawback of this method is the impossibility of simultaneous regulation o f the soil moisture and grain-size composition. It is even more significant in cases of soil and soil mixtures with caarse fractions. The higher the cohesive soils moisture, the greater amount of coarse fractions is needed. But the greater the coarse-grained content of the soil, the smaller amount of fragments may be added, For example, the preparation of soil mixture with given grain-size composition inc1udir:g 3 components, namely: the deluvial sandy loam with pebble, gravel and crushed stone, glacial rubby sandy loam and sand gravel for construc- tion of the Ust-Khantaisk dam cores provided the fine component moisture reduction in the soil mixture only by 1 . 0 - 1 . 5 per cent (Kouper- man, Myznikov, Plotnikov, 1 9 7 7 ) .
The studied literature allows to conclude that at present there is no sufficiently reliable procedure for soil reclamation accepted world- wide, which could considerably change the major compactibility parameters, i.e. the moisture content and grain-size composition.
The Authors' investigations indicate that in general there is a soil reclamation method allowing to change t h e soil properties s o chat
meters, this method may be called the soil they achieve some previously prescribed para-
improvement method. It includes the crushing o f coarse fraction present or added to the soil (Bianov, Makarov, Kadkina, 1 9 8 2 ) , After crushing, the coarse fraction amount reduces, resulting in the fine grains increase. The crushed material absorbs moisture from the initial fine soil. After this treatment the soil heterogeneity and fine soil moisture decrease, resulting in higher soil compacti- bility.
Let us look at the feasibility of this soil improvement method for dam impervious elements construction in various climatic, engineering and geological conditions.
Example N 1 . For the Kolym dam core construc- tion the deluvial solifluction deposits were used which are natural sand soil mixture fil- lers with g r u s s crushed argillites, aleurolites
1036
and shales fractions. The natural moisture of these soils ranges from 6 to 50 per cent with the coarse fraction ( P ) amounting to 3 5 - 7 3 per cent by weight, the coarse fractions moisture being 4 . 9 per cent. The design criteria for dam materials require the soil moisture below 15 per cent and P C 5 0 per cent, the dry fine soil density in compacted state f = 1 . 6 5
g/cm3 for 90 per cent occurence.
Suppose we are to use sandy loam with 2 0 per cent dry fine soil moisture (Wdfs) and P - 35 per cent for dam core construction. To reduce the soil moisture some crushed argillites, aleurolites and shales may be added which are provided from the quarry for dam shoulders ma- terial. The crushed stone moisture i s below 3 per cent. This mixture is an initial mate- rial for improvement and is to be crushed in a given mode. The improved soil is to conform to the design moisture, the grain-size composi- tion and the compactibility requirements.
The fine soil moisture to be obtained upon improvement i s calculated by the formula
.t Gfs (PES - P d f s ' p m . IOOX ( 1 ) w f s = p f s * P d f s
where Gfs 0.8 is the minimum fine soil sa- turation coefficient allowable for dam core material compaction; Pfs - 2 . 7 5 g/cm3 is the fine component density (specific weight) o f the
soil; Pm = 1 . 0 g/cm3 is the moisture density of the soil.
In compliance with equation 1 for the improved soil material of the Kolym dam core the fine soil moisture is to be W:s - 1 9 . 3 per cent.
Determination of the soil improvement parame- ters includes two aspects: estimation of the required additions mass (relations of the ini- tial components of the soil prior to crushing) and the choice of the crushing mode to attain the improved soil.
The relation between the initial components o f the soil mixture is calculated by:
where X and Y are the amount of the soil com- ponents by weight (for example, sand and clay); Wx and W are these components moisture values in per cents.
The condition of the soil moisture calculation is that the soil moisture remains unchanged during crushing, i.e. the moisture of the s o i l mixture prior to crushing is equal t o that of the improved soil material. During crushing the soil moisture c,ontent is redistributed due to absorbtion by the crushed products.
Y
1037
Wdfs c w*= 0.01 w* (100-P )+WCSP x * * fa
wher.e Wrs is the coarse fragments moisture of the improved soil in per cent equal to the coarse fragments saturation.
The experiments proved that argillites, aleuro- lites and shales fractions available at the Kolym hydropower plant construction site in- creased their saturation by 2-4 per cent*after crushing. For the given case we accept W c s =
= 7 per cent, P*- 50 per cent, then Wdf s=W*= - 1 3 . 2 per cent, and consequently X:Y = 1:0.8, which means that to attain the soil mixture with 1 3 . 2 per cent moisture content it is neces- sary to mix sandy loam soil with 3 5 per cent moisture content and P - 20 per cent and the crushed stone with 3 per cent moisture content in the proportion 1 : O . S . Thus the prepared mixture will contain 60 per cent coarse frac- tions which is derived by the formula
where Pdfs is the cdarse fraction amount o f the
soil mixture by weight, in per cents; Px and P Y
are the coarse fractions amount in each compo- nent of the soil mixture by weight, in per cents.
To obtain the improved soil properties with P*= = 5 0 per cent from the initial soil with P f s =
= 61 per cent the crusher mode is chosen s o that 18 per cent o f the coarse fraction turn into fine-grained soil.
The soil improvement procedure i5 a s follows. The inirial soil (component X) from the quarry i s conveyed to the crusher along with the additives- in the form of crushed stone (compo- nent Y). The crusher produces the improved soil with prescribed parameters: W* = 1 3 . 2 per cent,
W f s - 1 9 . 3 per cent, P*- 50 per cent. Compac- ting this soil up to Gf8= 0.8 the dry fine com- ponent density is achieved equal to
= 1 . 6 5 g/cm . Example N 2 . For the Rogun dam core the soils including 53 per cent o f coarse components with 2 3 per cent fragmgnts above 80 mm, and up to 3 7 per cent of fragments above 4 0 mm were used. The fine soil component moisture is 17 per cent, the fine particles density (specific weight) is 2 . 7 gfcm , The design envisages the following dam core material properties: the dry fine com- ponent density Pdfs= 2 . 1 g f c m , but not below 2.05 g/cm , the dry soil densityfds = 2.25
g/cm3, but not b e l o w 2 . 1 5 g/cm3, and the soil moisture 1 1 - 1 2 per cent.
Calculation b y the formula
*
3 fdfs
3
3
3
shows that the soil with ps = 2 . 7 0 g/cm3 and 11.5 per cent moisture content can be compac- ted up to the available soil
p x:: =
pdfs b 2 . 1 3 g/cm 3
As with the example improved soil prope
i
2 . 0 5 g/cm3 at maximum. Still s to be compacted up to thus it is t o be improved,
above we calculate the ties: W* = 10.1 per cent, r * - *
, W f s - 1 1 . 5 per cent, P = 0.25. The calcula- tions also reveal that no additives are re- quired for the soil improvement. The crushing o f 40 mm and above fraction alone will suffice.
At present in the Permafrostology Institute o f the Siberian Branch of the USSR Academy of Sciences a testing soil improvement installa- tion is exhibited using a double-drum crushtr, the installation is based on the soil mixture preparation procedure suggested by the Authors (Bianov, Makarov, Kadkina, 1982). It is equip- ped with devices preventing the wet clay soil from aticking to the drums. The soil improve-3 ment installation has the productivity of 1 m /h per one linear centimeter of the drum l e n g t h ,
and the energy consumption is 1 kwt.h/m . The installation operation proves the versita- lity of this method concerning its applicability to practically all types of initial soils and materials, and the process o f soil improvement by crushing, according to experiments, is suffi- ciently productive, cost-effective and low energy and labour consuming. The experiments indicate that some mechanical energy envolved in crushing is transformed into thermal one increasing noticeably the final soil mixture temperature. which is o f particular importance for construction in l o w temperature conditions.
It is a l s o essential that the soil improvement allows to significantly diminish the dam pro- file due to high compactipn density o f the s o i l mixtures, to reduce the dimensions of impervi- ous elements and transition zones of earth- and rockfill dams comparing with overwetted soil mixtures.
3
The above examples illustrate the efficiency of the given method of soil improvement. It is a sufficient argument for the unification of em- bankment dams impervious elements and develop- ment of a versatile improvement procedure for various initial soils for these elements.
Recently the Central Asian Branch of the "Hydro- project" Institute has performed development projects of an experimental installation for improvement of overwetted loams with coarse fragments for the Rogun dam core. The project needs further refinment. Still the problem lies with the choice o f adequate crusher. The home- made crushers, f o r example, drum crushers, which are the most suitable for the material to be crushed, have limited inlet and outlet opening parameters.
CONCLUSIONS
An optimization procedure of grain-size compo- sition and moisture content of overwetted clay soils with coarse fragments has been developed and experimentally verified. The crushing of coarse fractions of the s o i l mixture results in the rock material specific surface and absorb- tion increase, the grain-size composition impro- vement and lower moisture content due to its re- distribution among the soil mixture components.
REFERENCES
Bianov G.F,, Makarov V.I., Kadkina E.L. ( 1 9 8 2 ) .
Authors' Certificate N 971991. Bulletin Sposob prigotovlenija gruntovykh srnesei,
of Inventions, N 4 1 .
i stroitelstvo bolshykh plotin. Review of the papers, presentid for the 7th and 8th International Congresses on Large Dams, Energia, Moscow, p.63-64.
Kouperman V.P., Myznikov Yu.N., Plotnikov V . M . (1977). Use-Khantaiskie plotiny. Energia, Moscow, 151 p.
Borovoi A . A . , editor. (1957), Proektirovanije
1038
FROST HEAVE FORCES ON H AND PIPE FOUNDATION PILES J.S. Buska and J.B. Johnson
U.S. Army Cold Regions Research and Engineering Laboratory, Hanover, N.H. 03755-1290 USA
SYNOPSIS The magnitude and variation of forces and shear str~sses, caused by frost heaving in Fairbanks silt and the adfreeze effecta of a surface ice layer and a gravel layer, were determined as a function of depth along the upper 2.75 m of a pipe pile and an H pile for three consecutive winter seasons (1982-1985). The peak frost heaving forces on the H pile during each winter were 752, 790 and 802 ]EN, Peak froat heaving forces on the pipe pile of 1218 and 1115 kN were determined only f o r the second and third winter seasons. Maximum average shear stresses acting on the H pile were 256, 348 and 308 kPa during the three winter seasons. Maximum average shear mtresses acting on the pipe pile were 627 and 972 kea for the second and third winter seasons. The surficial ice layer may have contributed 15 to 20% of the peak forces measured on the piles. The gravel layer on the H pile contributed about 35% of the peak forces meaeured.
INTRODUCTION
Foundations embedded in frost-susceptible soils can be subjected to large uplift forces resulting from frost heaving of the soils. These forces can cause an upward vertical dis- placement of foundations that are not embedded below the frost depth or do not have suffi- cient resistance to counteract heaving forces. In Alaska, H and pipe piles are often used to
tures. It is important that design engineers support buildings, bridges and dock Estruc-
know the magnitude o f frost heaving forces that can act on foundation piles: and how these forces are,distributed along the piles. This information is used to determine the tensile strength requirements of a pile and the depth to which a p i l e needs to be embedded or how it must be loaded to resist heaving forces.
This paper presents the results of a three- year study (1982-85) designed to measure and record the magnitude and distribution of axial strains, as a function of depth, time and tem- perature, for an H pile and a pipe pile pane- trating surficial layers o f ice and gravel and embedded in Fairbanks silt with an active layer overlying permafrost.
METHODS AND MATERIALS
soil conditions The study was conducted at the Cold Regions Research and Engineering Laboratory's Alaska Field Station, Fairbanks, Alaska. The test site had bean cleared of vegetation and con- sisted of deep colluvial deposits of slightly
moisture content was not measured in the fall organic silts (Crory and Reed, 1965). Soil
preceding the 1982-83 measurement program: however, it was observed that the soil
deposits were saturated below a depth of about 0.5 m. Soil moisture prior to the 1983-84 winter was found to have 405 water content by weight near the surface and varied from 25% to 29% between the surface and a.depth of about 2.4 rn. The thickness of the seasonally thawed or active layer between the piles at the beginning of the winter sea6on was 2.3 m in 1982, 1 .6 m in 1983 and 1.6 m in 1984. The soil in the active layer froze to the depth of the permafrost each winter during the study, as illustrated in Figure 1. Frost heaving at the site ranges from 2 to 7 cm during a typical winter.
TWO commonly encountered situations for pile installations in Alaska are aufeis buildup around piles pear rivet crossings and the use of gravel backfill around the top of pilea. he experimental Configuration was designed to allow for surficial ice buildup and the uae of gravel backfill. Ice collars of 1.8-m diameter were installed to a thiekneas of 25 cm during the 1982-83 season and 45 cm during the 1904-85 season around the upper sections of the piles in an effort to measure the ad- freeze effects of surface ice depoaits (Fig. 1). A 0.6-m-thick by 1.8-m tliameter gravel layor was used to replace the original back-
August 1983 and left in place through the fill soil around the t~ppe of the piles in
1904-85 season ( F i g . I).
The top 3-m section of an H p i l e (HP10~57, 25.4 cm web, 85 kg/lineal meter) and a pipe pile (30.5-cm I.D., 0.95-cm wall thickness) was instrumented with hermetically sealed weldable strain gauges and copper-constantan thermocouples. These were placed every 15.2 cm along the centerline on both sides of the web o f the H pile and on diametrically oppo- site sides of the pipe pile. Strain gauges
1039
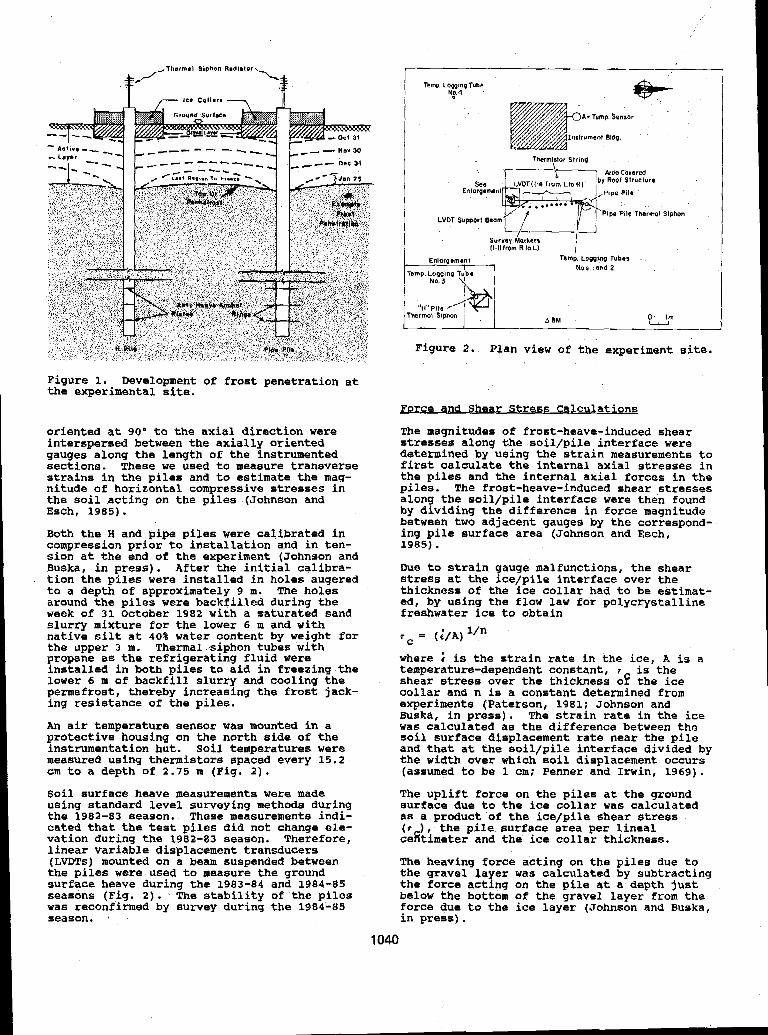
Pipe Pol0 Tharmol Siphon LVDT Support 0.a
Figure 2 , Plan view of the experiment site.
Figure 1. Development of frost penetration at the experimental site.
oriented at 90' to the axial direction were interspersed between the axially oriented gauges along the length o f the instrumented sections. These we used to measure transverse strains in the piles ana to estimate the mag- nitude of horizontal compressive stresses in the soil acting on the piles .(Johnson and EsCh, 1 9 8 5 ) .
Both the H and pipe piles were calibrated in compression prior to installation and in ten- sion at the end of the experiment (Johnson ana Buska, in press). After the initial calibra- tion the piles were installed in holes augered to a depth of approximately 9 m. The holes around the piles were backfilled during the week of 31 October 1982 with a saturated sand slurry mixture for the lower 6 rn and with native silt at 40% water content by weight for the upper 3 m. Thermal-siphon tubes with propane as the refrigerating fluid were installed in both piles to aid in freezing the lower 6 m of backfill slurry and cooling the permafrost, thereby increasing the frost jack- ing resistance of the piles.
An air temperature sensor was mounted in a protective housing on the north side of the instrumentation hut. soil temperatures were measured using thermistors spaced every 15.2 cm to a depth of 2.75 m (Fig. 2).
Soil surface heave measurementa were made using standard level surveying methods during the 1902-83 season. These measurements indi- catea that the test piles did not change ele- vation during the 1982-83 season. Therefore, linear variable displacement transducers (LVDTs) mounted on a beam suspended between the piles were used to measure the ground surface heave during the 1983-84 and 1984-05 seasons (Fig. 2). The stability of the piles was reconfirmed by survey during the 1984-85 season. *
Force and Shear Stress Calculations
The magnitudes o f frost-heave-induced shear stresses along the -soil/pile interface were determined by using the strain measurements to first calculate the internal axial stresses in the piles and the internal axial forces in the pilea. The frost-heave-induced shear stresses along the soil/pile interface were then found by dividing the difference in force magnitude between two adjacent gauge6 by the correspond- ing pile surface area (Johnson and Esch, 1985).
Due to strain gauge malfunctions, the shear stress at the ice/pile interface over the thickness of the ice collar had to be estimat- ed, by using the flow law for polycrystalline freshwater ice to obtain
r = (:/A) l'n
where is the strain rate in the ice, A is a temperature-dependent constant, r is the shear ,stress over the thickness oE the ice collar and n is a constant determined from experiments (Paterson, 2981; Johnson and Buska, in press). The strain rate in the ice was calculated as the difference between the soi l surface displacement rate near the pile and that at the soil/pile interface divided by the width over which soil displacement occurs (assumed to be 1 cm; Penner and Irwin, 1969).
The uplift force on the piles at the ground surface due to the ice collar was calculated as a product of the ice/pile shear stress (r ) , the pile surface area per lineal cekimeter and the ice collar thickness.
The heaving force acting on the piles due to the gravel la er was calculated by subtracting the force actlng on the pile at a depth just below the bottom o f the gravel layer from the force due to the ice layer (Johnson and Buska, in press).
C
1040
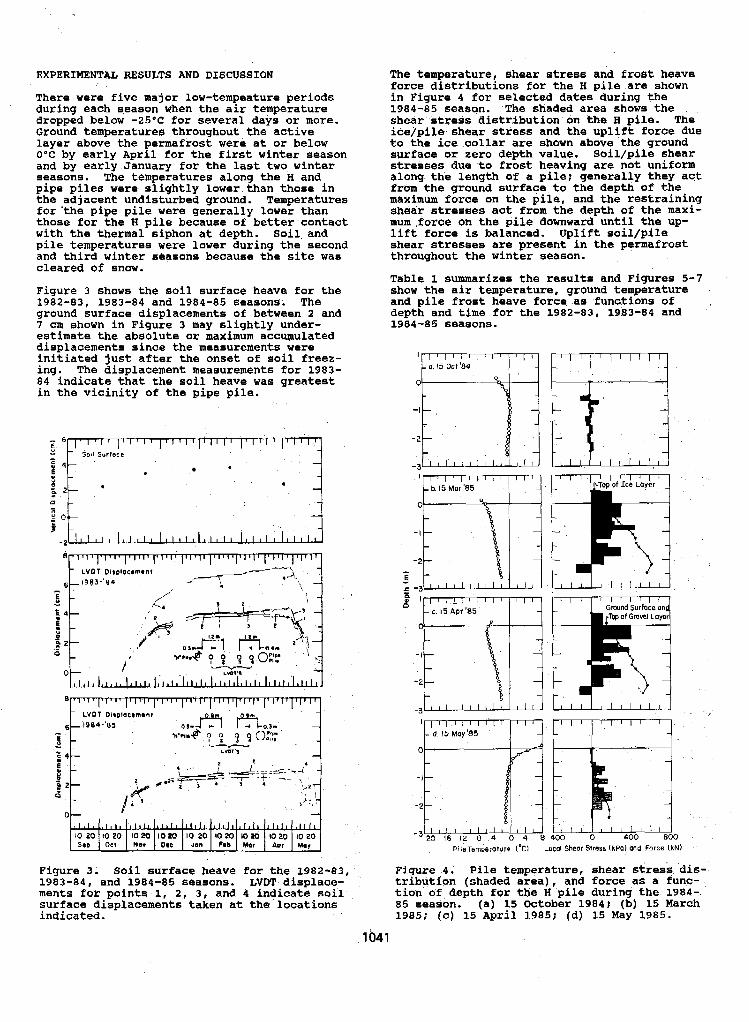
EXPERIMENTAL RESULTS AND DISCUSSION
There were five major low-tempeature periods during each season when the air temperature dropped below -25'12 for several days or more. Ground temperatures throughout the active layer above the permafrost were at or below O'C by early April for the first winter season and by early January for the last two winter
pipe piles were slightly lower than those in seasons. The temperatures along the H and
the adjacent undisturbed ground. Temperatures for'the pipe pile were generally lower than those for the H pile because of better contact with the thermal siphon at depth. Soil. and pile temperatures were lower during the second and third winter seasons because the site was cleared o f snow.
Figure 3 shows the soil surface heave for the 1982-83, 1983-84 and 1984-85 seasons. The ground surface displacements of between 2 and 7 cm shown in Figure 3 may slightly under- estimate the absolute or maximum accumulated displacements since the measurements were initiated just after the onset of soil freez- ing. The displacement measurements for 1983- 84 indicate that the soil heave was greatest in the vicinity of the pipe pile.
- 6 , 1 1 1 1 1 1 7 1 1 , 1 1 1 1 i I I I ' 1 I I I I I I 1 ' 1 1 1 1 - 5001 Surroce 0 - E 4t I
0- I
l , l , l , l , l , l , l ~ l , l ~ l , l l l l t ~ , IO 20 IO 20 IO 20 lox ) IO 20 SOD Oct NOV Oec Jon
The temperature, shear stress and frost heave force distributions for the H pile are shown in Figure 4 for selected dates during the
shear stress distribution on the H pile. The 1984-85 season. The shaded area shows the
ice/pile shear stress and the uplift force due to the ice collar are shown above the ground surface or zero depth value. Soil/pile shear stresses due to frost heaving are not uniform along the length of a pile: generally they act
maximum force on the pile, and the restraining from the ground surface ta the depth of the
shear stresses act from the depth o f the maxi- mum,force on the pile downward until the up- lift force is balanced. Uplift soil/pile shear stresses are present in the permafrost throughout the winter season.
Table 1 summarizes the results and Figures 5-7 show the air temperature, ground temperature and pile frost heave force as functions of , depth and time for the 1982-83, 1983-84 and 1984-85 sea6ons.
I
0
-I
- 2
E -
1 -rr- M Top af Grovel Loyer
I
0
- I
-3 0
PileTemperolure ("C) Local Sheor Stress ( W a ! and Force IkN)
Figure 3. Soil surface heave for the 1982-83, Figure 4 . P i l e temperature, shear siresa ais- 1983-84, and 1984-85 ssaoons. LVDT displace- tribution (shaded area), and force as a func- ments for points 1, 2 , 3 , and 4 indicate s o i l , tioh of depth for the I4 pile during the. 1984- surface displacements taken at the locations 85 season. (a) 15 October 1984; (b) 15 March indicated. 1985: (c) 15 April 1985; (d) 15 May 1985.
.lo41
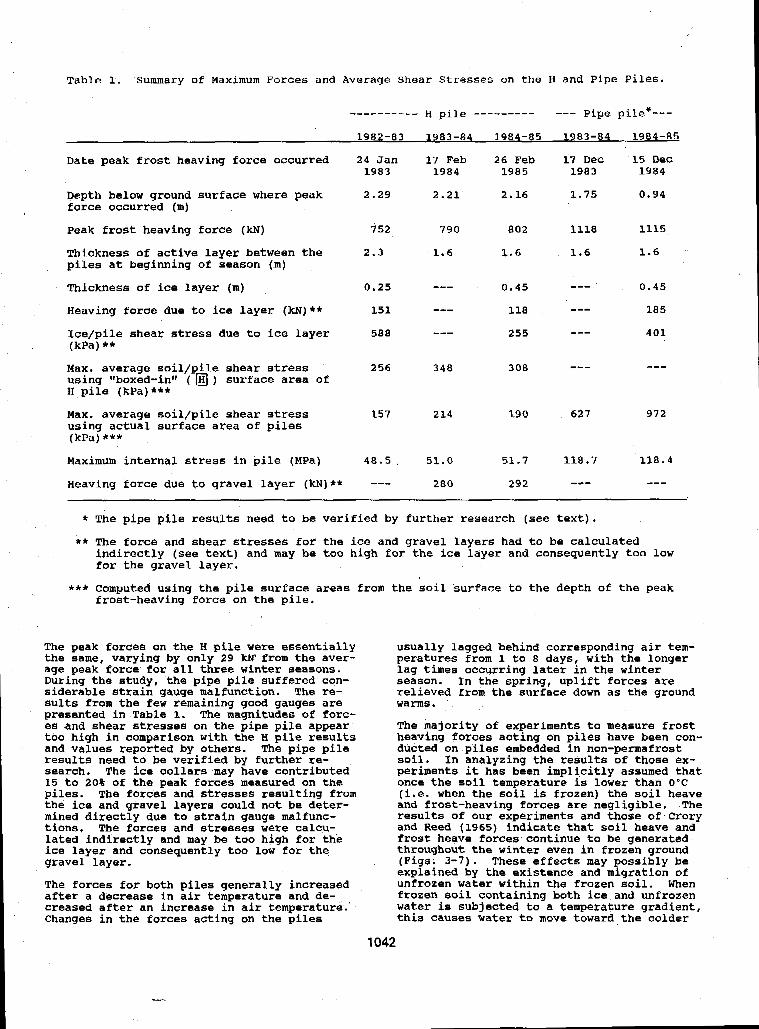
Table 1. Summary of Maximum Forces and Average Shear Stresses on the H and Pipe Piles.
""""" H p i l e _--f____- __- pipe pi l e* - - -
1982-83 1983-84 1984-85 1983-84 1984-85
Date peak frost heaving force occurred 24 Jan 17 Feb 26 Feb 17 Dec 15 Dec 1983 1984 1985 1983 1984
Depth below ground surface where peak 2.29 2.21 2.16 1.75 0.94 force occurred (m)
Peak frost heaving force (kN) 752 790 802 1118 1115
Thickness of active layer between the 2.3 1.6 2 . 6 1.6 1.6 , piles at beginning of season (m)
Thickness of ice layer (m) 0.25 "- 0.45 -" 0 . 4 5
Heaving force due to ice layer (lcN)** 151 -" 118 "I 185
Ioe/pile shear stress due to ice layer 5aa "- 255 "- 401 (kPa) ** Max. average soil/pile shear stress 256 348 308 "- using Itboxed-in" ( ) surface area of H pile (kPa)***
Max. average soil/pile shear stress 157 2 14 190 627 972 using actual surface area of piles (kPa) *** Maximum internal stress in pile (MPa) 4 0 . 5 , 51.0 51.7 218.7 118.4
Heaving force due to gravel layer (kN)** --- 280 292 "- -"
"-
* The pipe pile results need to be verified by further research (see text). ** The force and shear stresses for the ice and gravel Layers had to be calculated
indirectly (see text) and may be too high for the ice layer and consequently too low for the gravel layer.
*** Computed using the pile surface areas from frost-heaving force on the pile.
The peak forces on the H pile were essentially the same, varying by only 29 W from the aver- age peak force for all three winter seasons. During the study, the pipe pile suffered con- siderable strain gauge malfunction. The re- sults from the few remaining good gauges are presented in Table 1. The magnitudes of forc- es and shear stresses on the pipe pile appear too high in comparison with the H pile results and values reported by others. The pipe pile results need to be verified by further re- search. The ice collars may have contributed 15 t o 20% o f the peak forces measured on the piles. The forces and stresses resulting from the ice and gravel layers could not be deter- mined directly due to strain gauge malfunc- tions. The forces and stresses were calcu- lated indirectly and may be too high for the ice layer and consequently too low for the gravel layer.
The forces for both piles generally increased after a decrease in air temperature and de- creased after an increase in air temperature. Changes in the forces acting on the piles
the soil surface to the depth of the peak
usually Lagged behind corresponding air tem- peratures from 1 to 8 days, with the longer lag times occurring later in the winter season. In the spring, uplift forces are relieved from the surface down as the ground warms.
The majority of experiments to measure frost heaving forces acting on piles have been con- ducted on piles embedded in non-permafrost soil. In analyzing the results of those ex- periments it has been implicitly assumed that once the soil temperature is lower than 0 ° C (i.e. when the soil is frozen) the soil heave and frost-heaving forces are negligible. The results of our experiments and those of Crory and Reed (1965) indicate that soil heave and frost heave forces continue to be generated throughout the winter even in frozen ground (Figs. 3-7). These effects may possibly be explained by the existence and migration of unfrozen water within the frozen soil. When frozen soil containing both ice and unfrozen water Sa subjected to a temperature gradient, this cauaes water to move toward the colder
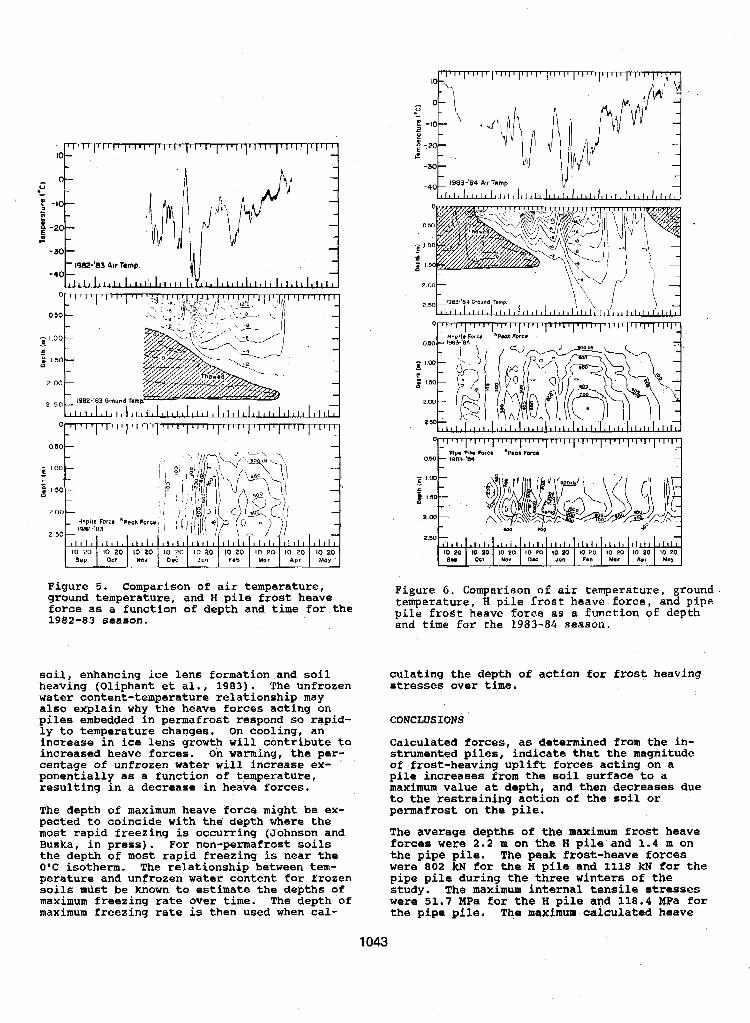
i Figure 5. Comparison of air temperature, ground temperature, and H pile frost heave force as a function of depth and time for the 1982-83 season.
soil, enhancing ice lens formation and soil heaving (Oliphant et al., 1983). The unfrozen water content-temperature relationship may
piles embedded in permafrost respond so rapid- also explain why the heave forces acting on
ly to temperature changes. On cooling, an increase in ice lens growth will contribute to increased heave forces. On warming, the per-
ponentiall as a function of temperature, centage of unfrozen water will increase ex-
resulting In a decrease in heave forces.
The depth of maximum heave force might be ex- pected to coincide with the depth where the most rapid freezing is occurring (Johnson and Buska, in press). For non-permafrost soils the depth o f most rapid freezing i s near the O'C isotherm. The relationship between tem- perature and unfrozen water content for frozen s o i l s mrist be known to estimate the depths of maximum freezing rate over time. The depth of maximum freezing rate is then used when cal-
Figure 6. Comparison of air temperature, ground. temperature, H pile f r o s t heave force, and pipe pile frost heave force as a function of depth and time €or the 1983-84 season.
culating the depth of action for frost heaving stresses over time.
CONCLUSIONS
Calculated forces, as determined from the in- strumented piles, indicate that the magnitude
p i l e increases from the soil surface to a of frost-heaving uplift forces acting on a
maximum value at depth, and then decreases due to the restraining action of the so i l or permafrost on the pile.
The average depths of the maximum frost heave forces were 2.2 m on the N pile and 1.4 m on the pipe pile. The peak frost-heave forces were 802 kN for the H pile and 1118 kN for the pipe pile during the three winters of the
were 51.7 MPa for the H pile and 118.4 MFa for study. The maximum Internal tensile stresses
the pipe pile. The maximum calculated heave
1043
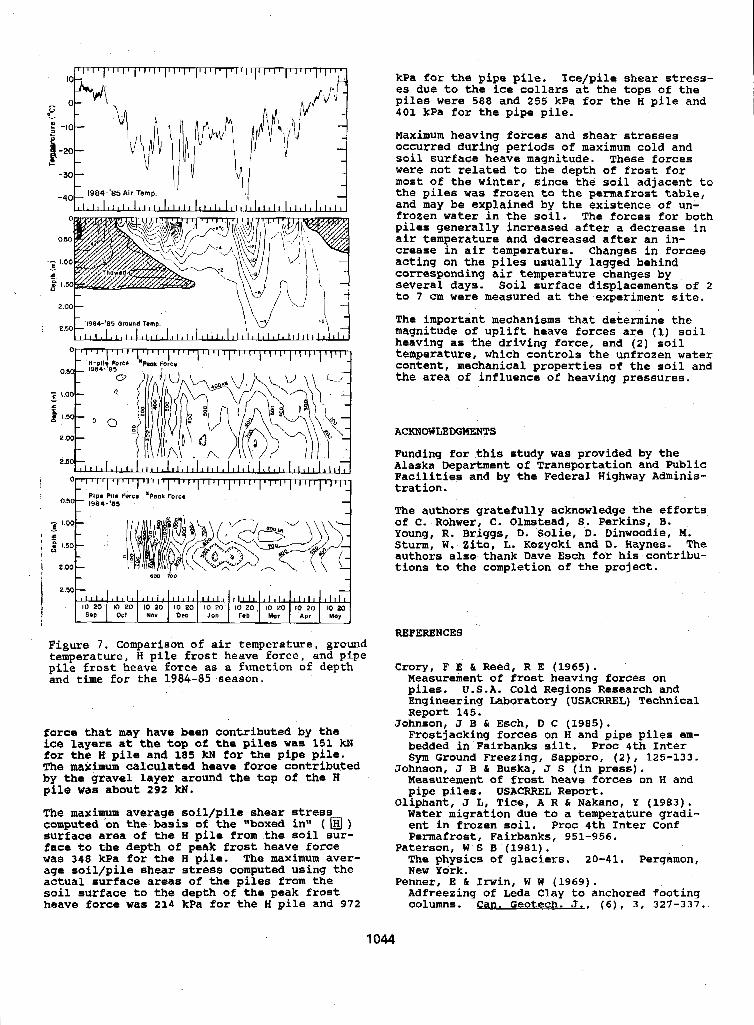
Figure 7. Comparison of air temperature, ground temperature, H p i l e frost heave force, and pipe pile frost heave force as a function of depth and time fo r the 1984-85 season.
force that may have been contributed by the ice layers at the top o f the piles was 151 IEN for the H pile and 185 kN for the pipe pile. The maximum calculated heave force contributed by the gravel layer around the top o f the H p i l e was about 292 kN.
kPa for the pipe pile. Ice/pile shear stress- es due to the ice collars at the tops of the piles were 588 and 255 kPa for the H pile and 401 kPa for the pipe pile.
Maximum heaving forces and shear stresses occurred during periods of maximum cold and s o i l surface heave magnitude. These forces were not related to the depth of froat for most o f the winter, since the soil adjacent to the piles was frozen to the permafrost table, and may be explained by the existence of un- frozen water in the soil. The forces for both piles generally increased after a decrease in air temperature and decreased after an in- crease in air temperature. Changes in forces acting on the piles usually Lagged behind corresponding air temperature changes by several days. Soil surface displacements of 2 to 7 cm were measured at the experiment site.
The important mechanisms that determine the magnitude of uplift heave forces are (1) soil heaving as the driving force, and (2) soil temperature, which controls the unfrozen water content, mechanical properties o€ the, soil and the area of influence of heaving pressures.
ACKNOWLEDGMENTS
Funding for this study was provided by the Alaska Department of Transportation and Public Facilities and by the Federal Highway Adminis- tration.
The authors gratefully acknowledge the efforts of C . Rohwer, C. Olmstead, S. Perkins, B. Young, R. Briggs, D. Solie, D. Dinwoodie, M. Sturm, W. Zito, L. Koaycki and D. Haynes. The authors also thank Dave Esch for his contribu- tions to the completion of the project.
REFERENCES
Crory, F E & Reed, R E (1965) . Measurement of frost heaving forces on piles. U.S.A. Cold Regions Research and Engineering Laboratory (USACRREL) Technical Report 145.
Frostjacking forces on H and pipe piles em- bedded in Fairbanks silt. Proc 4th Inter Sym Ground Freezing, Sapporo, (2), 125-133.
Measurement of frost heave forces on H and uiue viles. USACRREL Renort.
Johnson, J B & Esch, D C (1985).
Johnson, J B & Buska, J S (in press).
The maximum average soil/pile shear stress Olipiiant, J L, Tice, A R &*Nakano, Y (1983).
computed on the basis o f the "boxed in" ( @ ) Water migration due to a temperature gradi-
surface area of the H pile from the soil sur- ent in frozen soil. P ~ Q C 4th Inter Conf Permafrost, Fairbanks. 951-956.
face t o the depth of peak frost heave force was 348 kPa f o r the H pile. The maxidlum aver-
Paterson, w S B (1981) . ' The physics of glaciers. 20-41. Pergamon,
age soil/pile shear stress computed using the actual surface areas of the piles from the
New Yoxk. Penner, E h Irwin, W W (1969).
soil surface to the depth o f the peak frost Adfreezing of Leda Clay to anchored footing heave force was 214 kPa for the H pile and 972 columns. Can. Geotsch. J., (6), 3 , 327-337.
1 044
A NEW FREEZING TEST FOR DETERMINING FROST SUSCEPTIBILITY E.J. Chamberlain
U.S. Army Cold Regions Research and Engineering Laboratory
SYNOPSIS A new freezing test for determining the frost susceptibility of soils used in pavement systems is designed to supplant the standard CRREL freezing test. This new test cuts the time required to determine frost susceptibility in half. It also allows for the detemina- tion of both the frost heave and thaw weakening susceptibilities and considers the effects o f freeze-thaw cycling. The new freezing test also eliminates much of the variability in test re- sults by completely automating the temperature control and the data observations.
INTRODUCTION
Laboratory freezing tests are necessary to accurately characterize the frost susceptibil- ity of soils. This is especially true for borderline granular materials used for the base and subbase layers in roads and runways.
The U.S. Army Corps of Engineers has employed a freezing test (Chamberlain and Carbee, 1981) for more than 30 years. While this test has proven adequate for-identifying and classify- ing frost-susceptible soils, it suffers from several serious defects. Most significant of these are poor temperature control,. indeter- minate side friction, lengthy test period, lack of thaw weakening index, and provision for only one freeze. Furthermore, the stan- dard CRREL freezing test is conservative and appears to reject many non-frost-susceptible materials as frost-susceptible.
This report discusses the current Corps of Engineers practice for Conducting freezing tests on soils, presents a new freezing test designed to replace it, describes test equip- ment and procedures, and suggests a method for classifying the frost susceptibility of soils based on both frost heave and thaw weakening.
CURRENT FREEZING TEST
The freezing t e a t employed by the corps of Engineers, often referred to as the CRaEL standard freezing test, was developed to evaluate the relative frost susceptibility o f soils and granular base and subbase materials used in pavement systems. In the standard test, materials are subjected to a very severe combination of freezing and moisture condi- tions that are highly conducive to frost heav- ing. The test does not predict the actual magnitude of frost heave under field condi- tions, but is designed to provide a relative indication of the potential for frost heave.
Soil samples are generally compacted and frozen from the top down at a constant rate of 13 mm/day for 12 days. The samples are frozen in tapered, acrylic Plexiglas cylinders that are Teflon-lined and lightly coated with sili- cone grease to reduce side friction. A porous stone at the base and a constant-head water
the sample bottom. A surcharga of 3.5 kPa 18 supply provide a source of water 10 mm above
placed on the sample to simu1ate.a 150 mm thickness of asphalt concrete- pavement. The samples are frozen in groups of four in a freezing cabinet. The lower boundary tempera- ture is maintained at +4'C throughout the test, while the upper boundary ais temperature is lowered once a day in steps to facilitate the average frost penetration rate of 13 ram/day.
measured by thermocouples placed through the The temperatures in the s o i l samples are
data acquisition system. Frost heave is ob- cell walls and are automatically recordea by a
served with displacement transducers and is continuously recorded, along with the ther- mocouple outputs, on the data acquisition sys- tem. Frost depths are determined by plotting the temperature profiles and interpolating the position of the O'C isotherm. The maximum frost heave rate occurring during the test period is used as an index of the frost sus- ceptibility.
The standard test has several limitations. The test requires too much time (12 days) and
menta. Side friction is not eliminated, par- is encumbered by manual temperature adjust-
ticularly with coarser-grained materials. The teat does not consider the effects of freeze- thaw cycling. The test is principally an in- dex test for frost heave and does not directly address thaw weakening, which is frequently more of a problem in roads than frost heave. Furthermore, the standard test appears to be conservative, and there i m no evidence of direct correlation with field observations.
1045
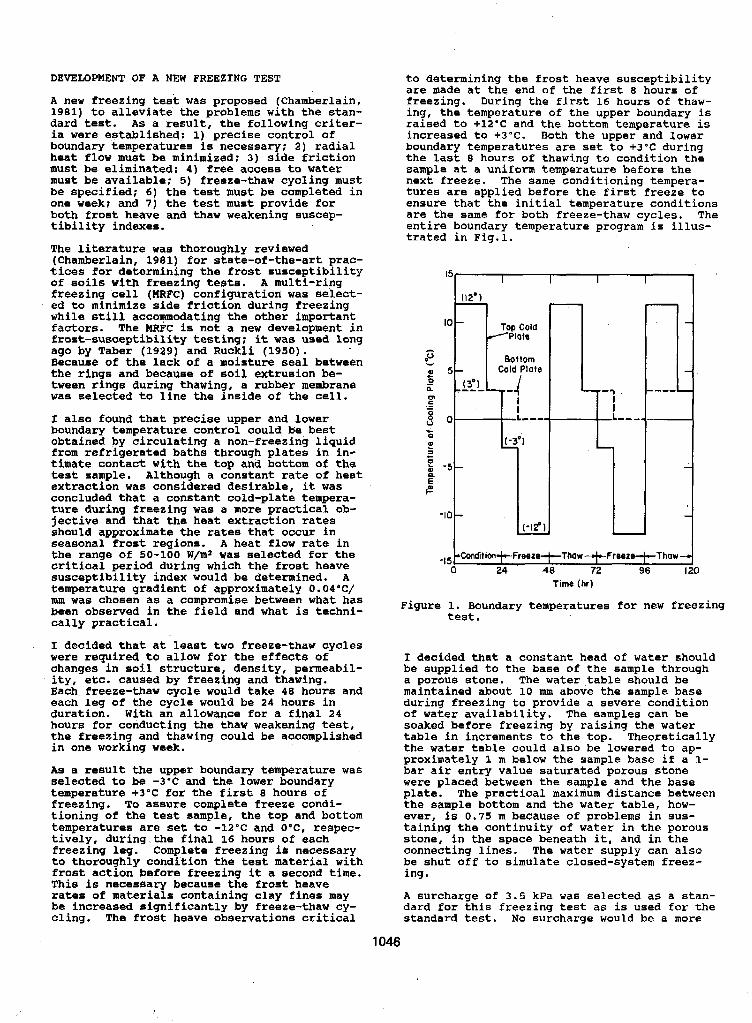
DEVELOPMENT OF A NEW FREEZING TEST
A new freezing test was proposed (Chamberlain, 1981) to alleviate the problems with the stan- dard test. As a result, the following criter- ia were established: 1) precise control of boundary temperatures is necessary; 2) radial heat flow must be minimized: 3) side friction must be eliminated: 4) free access to water must be available: 5) freeze-thaw cycling must be specified; 6) the test must be completed in one week: and 7) the test must provide for both frost heave and thaw weakening suscep- tibility indexes.
The literature was thoroughly reviewed (Chamberlain, 1981) for state-of-the-art prac- *ices for determining the frost susceptibility of soils with freezing tests. A multi-ring freezing cell (MRFc) configuration was select- ed to minimize side friction during freezing while still accommodating the other important factors. The EIRFC is not a new development in frost-susceptibility testing; it was used long ago by Taber (1929) and ~uckli (1950). Because of the lack of a moisture seal between the rings and because of soil. extrusion be- tween rings during thawing, a rubber membrane was selected to line the inside of the cell.
I also round that precise upper and lower boundary temperature control could be best obtained by circulating a non-freezing liquid
timate contact with the top and bottom o f the from refrigerated baths through plates in in-
test sample. Although a constant rate of heat extraction was considered desirable, it was concluded that a constant cold-plate tempera- ture during freezing was a more practical ob- jective and that the heat extraction rates should approximate the rates that occur in seasonal frost regions. A heat flow rate in the range of 50-100 n/mP was selected €or the critical period during which the frost heave susceptibility index would be determined. A temperature gradient o f approximately 0.04*C/ IMI was chosen as a compromise between what has been observed in the field and what is techni- cally practical.
I decided that at least two freeze-thaw cycles were required to allow for the effects of changes in soil structure, density, permeabil- ity, etc. caused by freezing and thawing. Each freeze-thaw cycle would take 4 0 hours and each leg of the cycle would be 24 hours in duration. With an allowance for a final 24 hours for conducting the thaw weakening test, the freezing and thawing could be accomplished in one working week.
As a result the upper boundary temperature was selected to be -3 -C and the lower boundary temperature +3'C for the first 8 hours of freezing. To assure complete freeze condi- tioning of the test sample, the top and bottom temperatures are set to -12-C and O ' C , respec- tively, during.the final 16 hours of each
to thoroughly condition the test material with freezing leg. Complete freezing i s necessary
frost action before freezing it a second time. This is necessary because the frost heave rates of materials containing clay fines may be increased significantly by freeze-thaw cy- cling. The frost heave observations critical
to determining the frost heave susceptibility are made at the end of the first 8 hours of freezing. During the first 16 hours of thaw- in?, the temperature of the upper boundary is ralsed to +12"C and the bottom temperature is increased to +3'C. Both the upper and lower boundary temperatures are set to +3'C during the last 8 hours of thawing to condition the sample at a uniform temperature before the next freeze. The same conditioning tempera- tures are applied before the first freeze to ensure that the initial temperature conditions are the same for both freeze-thaw cycles. The entire boundary temperature program i s illus- trated in Fig.i. -
"
Plata
Bottom Cold Plate
" -
L
-15 ~ d i t i w l ~ F r e e t e + T h o w " . f c F r e e t e ~ T h o w - 0 24 48 72 96
Time (hr)
Figure 1. Boundary temperatures for new freezing test.
I decided that a constant head of water should be supplied to the base of the sample through a porous stone. The water table should be maintained about 10 mm above the sample base during freezing to provide a severe condition of water availability. The samples can be soaked before freezing by raising the water table in increments to the top. Theoretically the water table could a180 be lowered to ap- proximately 1 m below the sample base if a 1- bar air entry value saturated porous stone were placed between the sample and the base plate. The practical maximum distance between the sample bottom and the water table, how- ever, is 0.75 m because of problems in sus- taining the continuity of water in the porous stone, in the space beneath it, and in the connecting lines. The water supply can also be shut off to simulate closed-system freez- ing.
A surcharge of 3.5 kPa was selected as a stan- dard for this freezing test as is used for the standard test. N o surcharge would be a more
1046
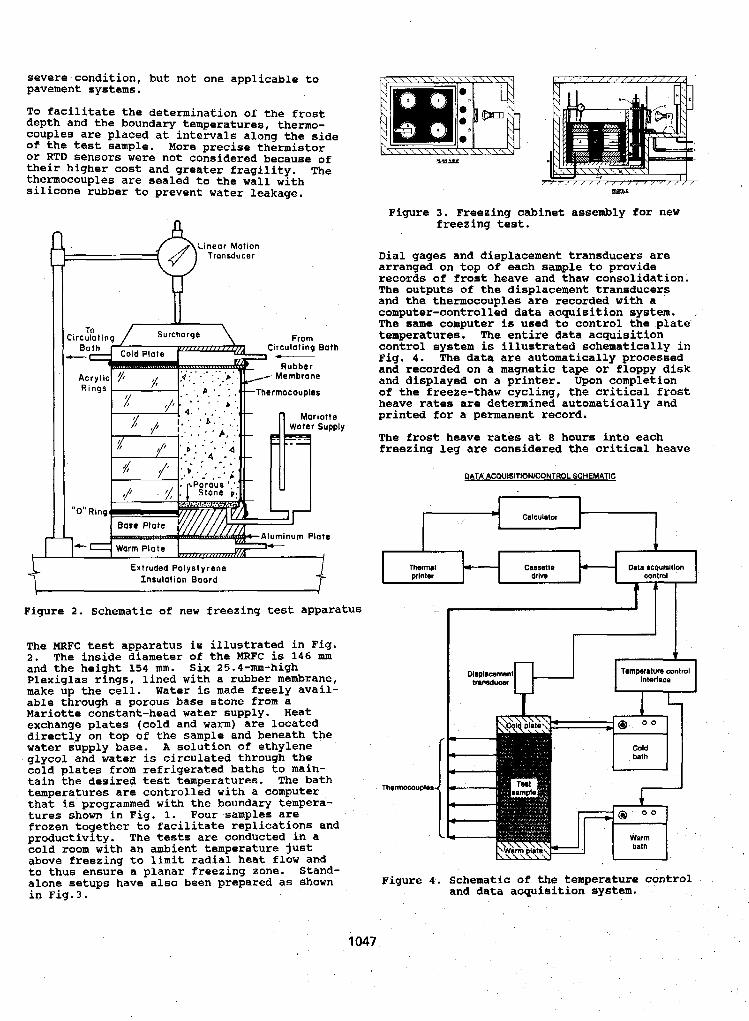
severe condition, but not one applicable to pavement systems.
To facilitate the determination of the f m s t depth and the boundary temperatures, thermo- couples are placed at intervals along the side of the test sample. More precise thermistor or RTD sensors were not considered because of their higher cost and greater fragility. The thermocouples are sealed to the wall with silicone rubber to prevent water leakage.
i Linear Motion
Transducer
Circulating Bath
Figure 2. Schematic of new freezing test apparatus
The MRFC test apparatus is illustrated in Fig. 2. The inside diameter of the MRFC is 146 nun and the height 154 mm. Six 25.4-mm-high Plexiglas rings, lined with a rubber membrane, make up the cell. Water is made freely avail-
Mariotte constant-head water supply. Heat able through a porous base stone from a
exchange plates (cold and warm) are located directly on top of the sample and beneath the water supply base. A solution of ethylene glycol and water is circulated through the cold plates from refrigerated baths to main- tain the desired test temperatures. The bath temperatures are controlled with a computer that i s programmed with the boundary tempera- tures shown in Fig, 1. Four samples are frozen together to facilitate replications and productivity. The tests are conducted in a cold room with an ambient temperature just above freezing to limit radial heat flow and to thus ensure a planar freezing zone. Stand- alone setups have also been prepared as shown in Fig.3.
Figure 3. Freezing cabinet assembly for new freezing test.
Dial gages and displacement transducers are arranged on top of each sample to provide records of frost heave and thaw consolidation. The outputs of the displacement transducers and the thermocouples are recorded with a computer-controlled data acquisition system. , The same computer is used to control the plate temperatures. The entire data acquisition control system is illustrated schematically in Fig. 4. The data are automatically processed and recorded on a magnetic tape or floppy disk and displayed on a printer. Upon completion of the freeze-thaw cycling, the critical frost heave rates are determined automatically and printed for a permanent record.
The frost heave rates at 8 hours into each freezing leg are considered the critical heave
DATA ACW181TIONICONTROL SCWEMATIC
Calculator
Thermal Orla acquisltion prlnter contml
Thsrmocouplo#
I I1 I I
Figure 4 . Schematic of the temperature control and data acquisition.system.
1 047
"I
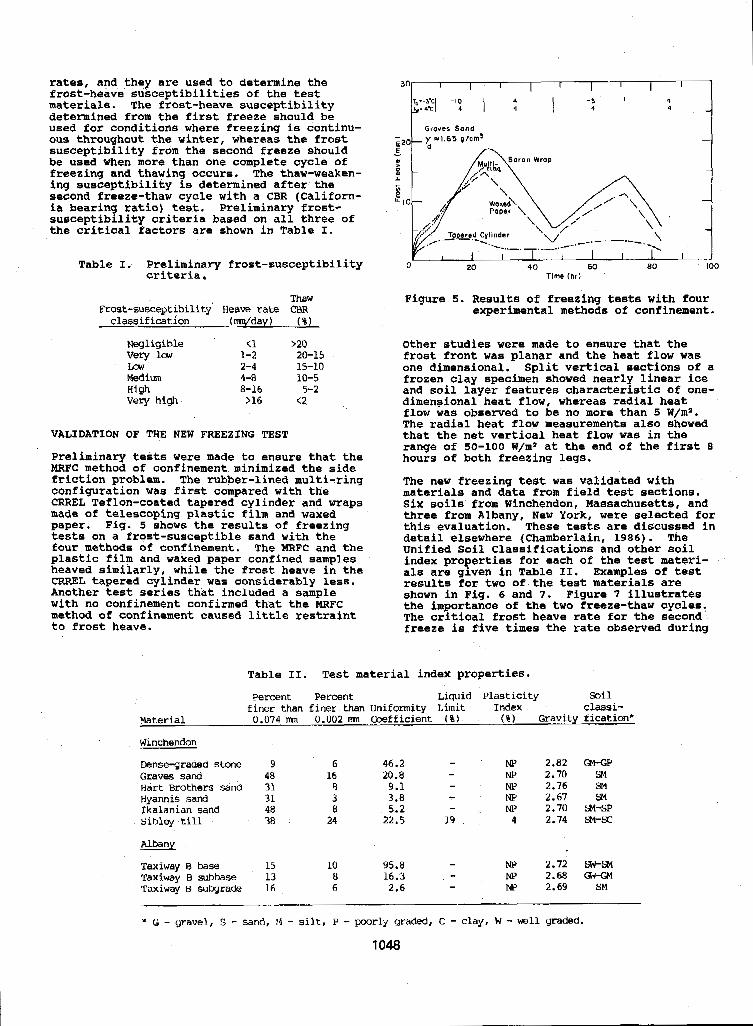
rates, and they are used to determine the frost-heave susceptibilities of the test materials. The frost-heave susceptibility determined from the first freeze should be used for conditions where freezing is continu- ous throughout the winter, whereas the frost susceptibility from the second freeze should be used when more than one complete cycle o f freezing and thawing occura. The thaw-weaken- ing susceptibility is determined after the second freeze-thaw cycle with a GBR (Californ-
susceptibility criteria based on all three of i a hearing.ratio) test. Preliminary frost-
the critical factors are shown in Table I.
Table I. Preliminary frost-susceptibility criteria
Thaw Frost-susceptibility Heave rate Cm classification (&day) ( % I
Negligible (1 >20 Very l a 1-2 20-15 LmJ 2-4 15-10 Medim High Very high >16 c2
4-8 10-5 8-16 5-2
VALIDATION OF THE NEW FREEZING TEST
Preliminary tests were made to ensure that the MRFC method of confinement minimized the side friction problem. The rubber-lined multi-ring configuration was first compared with the CRREL Teflon-coated tapered cylinder and wraps made of telescoping plastic film and waxed paper. Fig. 5 shows the results of freezing tests on a frost-susceptible sand with the four methods of confinement. The MRFC and the plastic film and waxed paper confined samples heaved similarly, while the frost heave in the CRREL tapered cylinder was considerably less. Another test series that included a sample with no confinement confirmed that the MRFC method of confinement caused little restraint to frost heave.
;,n L Grover y -1.65 q1cm3 k--l A C I " h
I I I 1 I I I 0 20 4 0 60
Time (hf) BO
Figure 5. Results of freezing tests with four experimental methods of confinement.
Other studies were made to ensure that the frost front was planar and the heat flow was one dimensional. Split vertical sectione of a frozen clay specimen showed nearly linear ice and soil layer features characteristic o f one- dimensional heat flow, whereas radial heat flow was observed to be no more than 5 W/m2. The radial heat flow measurements also showed that the net vertical heat flow was in the range of 50-100 W/mp at the end o f the first 8 hours o f both freezing legs.
The new freezing test was validated with materials and data from field test sections. Six soils from Winchendon, Massachusetts, and three from Albany, New York, were selected for this evaluation. These tests are discussed in detail elsewhere (Chamberlain, 1986). The unified Soil Classifications and other soil index properties for each of the test materi- als are given in Table 11. Examples of test results for two of the test materials are shown in Fig. 6 and 7. Figure 7 illustrates the importance o f the two freeze-thaw cycles, The critical frost heave rate €or the second freeze is five times the rate obsewed during
Table 11. Test material index properties.
Percent Percent Liquid Plasticity Soil finer than finer than Uniformity Limit Index classi-
Material U.074 nm 0.002 mn Coefficient ( % I ( % I Gravity tication"
Winchendon
Dense-graded stone 9 6 46.2 NP 2.82 Graves sand 48 16 20.8 NP 2.70 SM Hart Brothers sand 31 8 9.1 NP 2.76 SM Hyannis sand 31 3 3.8 M! 2.67 3 4 Ikalanian sand 48 a 5.2 NP 2.70 S"SP sibley till 38 24 22.5 19 4 2.74 S"SC
Albany
Taxiway €3 base 15 10 95.8 Taxiway B subbase 13 8 16.3 Taxiway H subgrade 16 6 2.6
- - - - -
- NP 2.72 WSM Np 2.68 W-Gt4 W 2.69 SM
- -
* ti - yravel, S - sand, rfi - silt, P - poorly graded, C - clay, W - well graded. 1048
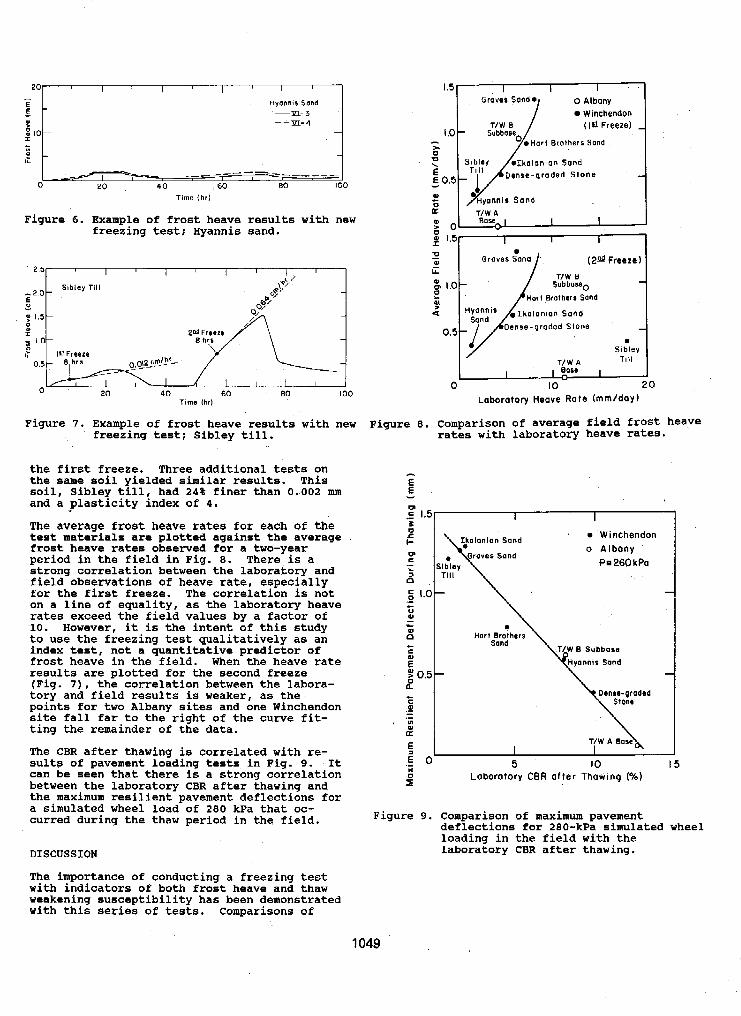
0 20 4 0 60 80 """
100 Time (hr)
Figure 6. Example of frost heave results with new freezing test: Hyannis sand.
' 251 I I I I I 1
20 40 Tlme (hr)
Figure 7. Example o f frost heave results with new freezing test; Sibley till.
the first freeze. Three additional tests on the same so i l yielded similar results. This soil, Sibley till, had 24% finer than 0.002 nun and a plasticity index of 4.
The average frost heave rates for each o f the test materials are plotted against the average
period in the field in Fig. 8 . There is a frost heave rates observed for a two-year
strong correlation between the laboratory and field observations of heave fate, especially for the first freeze. The correlation i s not on a line of equality, as the laboratory heave rates exceed the field values by a factor of 10. However, it is the intent of this study to use the freezing test qualitatively as an index test, not a quantitative predictor of frost heave in the field. When the heave rate results are plotted for the second freeze (Fig. 7 ) , the correlation between the labora- tory and field results is weaker, as the points for two Albany sites and one Winchendon site fall far to the right of the curve fit- ting the remainder of the data.
The CBR after thawing is correlated with re- sults of pavement loading tests in Fig. 9. It can be seen that there is a strong correlation between the laboratory CBR after thawing and the maximum resilient pavement deflections for a simulated wheel load of 280 kPa that oc- curred during the thaw period in the field.
DISCUSSION
The importance of conducting a freezing test with indicators of both frost heave and thaw weakening susceptibility has been demonstrated with this series of tests. Comparisons of
I .5 I I I 0 Albany
Winchendon (Iu Freeze)
c m
Base * o 1 l.5r-i
Laboratory Heave R a t e (rnrnlday)
Figure 8. Comparison of average field frost heave rates with laboratory heave rates.
c Ikalanlan Sand Winchendon o Albany
Sibley P 260 kPo
Hart Brothers
'\&graded T/W Hyonnis B Subbase Sond Stone
Hort Brothers
'\&graded T/W Hyonnis B Subbase Sond Stone
P Laboratory CBR after Thawing (%)
Figure 9. Comparison of maximum pavement deflections €or 280-kPa simulated wheel loading in the field with the laboratory CBR after thawing.
1049
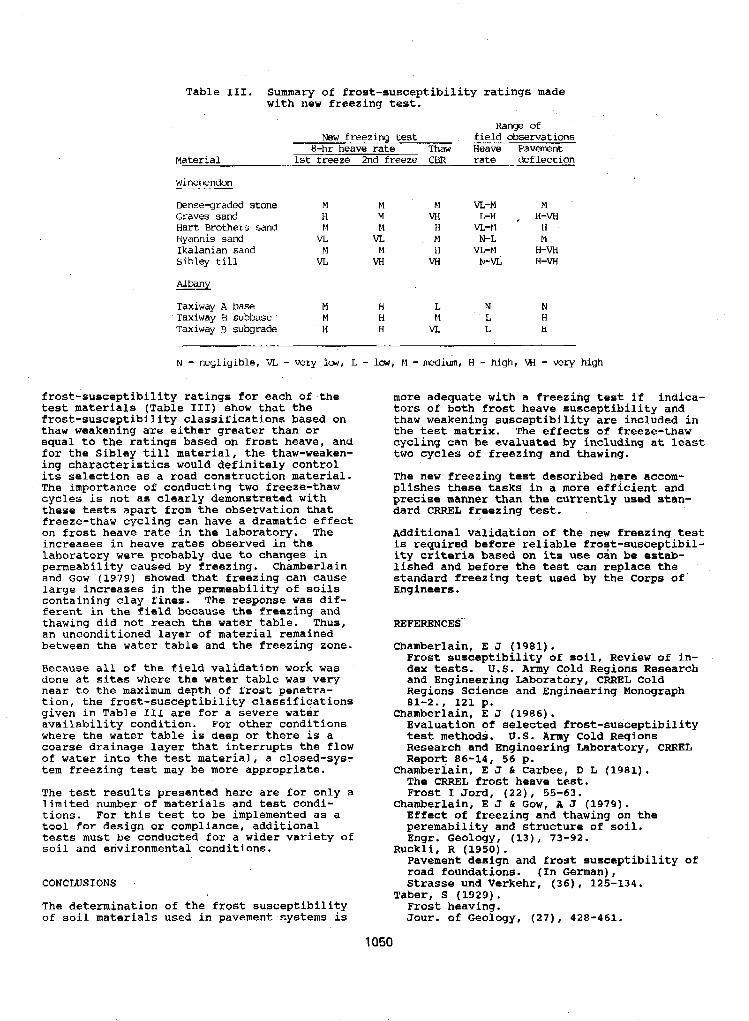
Table 111. Summary of frost-susceptibility ratings made with new freezing test.
Range oE New freezing test field observations
Material 1 s t t r e e z e 2nd freeze CBR rate def lect ion
Winchendon
Denseqraded stone M M M VL-M M Graves sand n M VH G H , H-VH Hart Brothers sand M M H VL-bI H Hyannis sand VL VL M N-L El Ikalanian sand M M n VI" H-VH Sibley till VL VH VH N-VL H-VH
8-hr heave rate Thaw Heave Pavement
- Alba= Taxiway A base M H L N N Taxiway R subbase M H M L H Taxiway R subgrade H H VI, L H
N - negliyible , VL - very lw, L - lm, M - mdium, H - high, VH - very hiyh
frost-susceptibility ratings for each of the test materials (Table 111) show that the frost-susceptibility classifications based on thaw weakening are either greater than or equal to the ratings based on frost heave, and for the Sibley till material, the thaw-weaken- ing characteristics would definitely control
The importance of conducting two freeze-thaw its selection as a road construction material.
cycles is not as clearly demonstrated with these tests apart from the observation that freeze-thaw cycling can have a dramatic effect on frost heave rate in the laboratory. The increases in heave rates observed in the laboratory were probably due to changes in permeability caused by freezing. Chamberlain and Gow (1979) showed that freezing can cause Large increases in the permeability of soils containing clay fines. The response was ai€- ferent in the field because the freezing and thawing did not reach the water table. Thus, an unconditioned layer of material remained between the water table and the freezing zone.
Because all of the field validation work was done at sites where the water table was very n e a r to the maximum depth of frost penetra- tion, the frost-susceptibility classifications given in Table If1 are for a severe water availability condition. For other conditions where the water table is deep or there is a coarse drainage layer that interrupts the flow of water into the test material, a closed-syst tem freezing test may be more appropriate.
The test results presented here are for only a limited number of materials and test condi- tions. For this test t o be implemented as a tool f o r design or compliance, additional tests must be conducted for a wider variety o f soil and environmental conditions.
CONCLUSIONS
The determination of the frost susceptibility of soil materials used in pavement systems is
more adequate with a freezing test if indica- tors of both frost heave susceptibility and thaw weakening susceptibility are included in the test matrix. The effects of freeze-thaw cycling can be evaluated by including at least two cycles of freezing and thawing.
The new freezing test described here accom- plishes these tasks in a more efficient and precise manner than the currently used stan- dard CRREL freezing test.
Additional validation of the new freezing test is required before reliable froqt-susceptibil- ity criteria based on its use can be estab- lished and before the test can replace the standard freezing test used by the Corps of Engineers.
REFERENCES-
Chamberlain, E J (1981). Frost susceptibility of soil, Review of in- dex tests. U.S. Army Cold Regions Research and Engineering Laboratory, CRREL Cold Regions Science and Engineering Monograph 81-2. , 121 p. Evaluation of selected frost-susceptibility test methods. U.S. Army Cold Regions Research and Engineering Laboratory, CRREL Report 86-14, 56 p.
The CRREL frost heave test. Frost I Jord, (22) , 55-63.
Effect of freezing and thawing on the peremability and structure of soil. Engr. Geology, (13), 73-92.
Pavement design and frost susceptibility of road foundations. (In German), Strasse und Verkehr, (36), 125-134.
Taber, S (1929). Frost heaving. Jour. of Geology, (27), 4 2 8 4 6 1 .
Chamberlain, E J (1986).
Chamberlain, E J & Carbee, D L (1981).
Chamberlain, E J & GWW, A J (1979) .
RUCkli, R (1950).
1050
THAW SETTLEMENT OF FROZEN SUBSOILS IN SEASONAL FROST REGIONS
SYNOPSIS The laboratory thaw consolidation tests with undisturbed samples and the in-situ observations on thaw settlements of testing buildings and in-operation buildings were carried out. for investigating the thaw settlement of frozen ground, It is found that the settlement of frozen soils starts with the soil temperature increasing and the relation between the settlement amount and elapsed time of thawing is practically linear. The consolidation settlement tends t o be stable in ten days after the soil was completely thawed. The thawing consolidation settlement amount is di- rectly proportional to the applied load, A commonly used formula for predicting the thawing and consolidation settlement was checked by testing 967 samples taken from 11 sites.
INTRODUCTION
In seasonal frost regions, if the soil i s frost susceptible, the thaw settlement of foundation will take place during thaw. With a certain level of load on thawing frozen soil, the set- tlements are caused by thaw as well as compres- sion. Combination of these two kinds of set,- tlements will make the building based on the soil t o settle in different extents. As the settlement is greater than the allowable deforma- tion of a building, the building will be de- stroyed. In order to investigate thaw-settlement behaviour o f frozen soils and predict the thaw settlement of actual engineering, the following work i.e., laboratory thaw-consolidation tests with undisturbed frozen soil samples, field observations on thaw settlement of natural ground with or without external loads, and obser- vations on thaw settlement of frozen subsoils beneath actual buildings were performed during 1981-1985.
THE COMMONLY-USED FORMULA FOR CALCULATING THAW- CONSOLIDATION SETTLEMENT
As mentioned above, if there are Loads on frozen subsoils, the consolidation settlement will take place in company with thaw settlement during thaw. This total value of the settlements of frozen soils may be calculated with the follow- ing formula (Tsytovich, 1962).
S = AoH + aPH ( 1 )
where A, is the coefficient of thaw settlement;
H is the thickness o f thawing frozen-soil; a is the coefficient of consolidation;
P is the total compression stress o n the subsoils concerned,
If the values of A,, a and P vary with the depth, i n calculating the total Settlement frnzen s u b -
soil, it is necessary to divide the'frozen s o i l concerned into several layers. The settlement in i-th layer may be estimated by
Then, the total thaw and consolidation settlement is given by
If external pressure is equal to zero, eq.(3) becomes:
E q . ( 4 ) i s only used to calculate soi'l thaw set- tlement in the self-weight.
DETERMINATION OF PARAMETERS A,, a AND P
The key to use e q . ( 3 ) and ( 4 ) is t O determine the values of A, and a at construction site. Investigation shows that the parameters A, and L\
are closely related to the water'content, d r y uni,t weight and structure of frozen soils.
In order to get the values of A, and a for foun- dation design in Daqing region, a series of thaw- cunsolidation tests were conducted o n 967 un- disturbed samples. By analyzing the test data, the parameters A , and a can be evaluated with water content (W) and d r y unit weight ( yd) in terms of the following equations (Tong et al., 1985).
In the case o f compression after thawed:
1051
A: = 0.00445W - 0.07015 ( 5 )
o r A ~ = 4 7 . 7 2 4 - 6 2 . 5 0 4 y d + l O . 8 4 2 EXP (Yd) (6)
In the case of compression while thawing:
A; = 0.00586W -0.1027 ( 7 )
o r 4~=40.088-37.404yd+4.2288 EXP (Yd) (8)
Under a l o a d of 200 kPa
a-0.0025~-0.0179-1.93~10-24E~~ (w) (9)
a-O.2202-0.1203Yd+0.0012 EXP (Yd) (10)
tlements of thawing and consolidation of frozen soils under different l o a d s at the test sites and compared the observed values. The comparison .shows that at some test sites, the calculated values are concordant with observed values, as shown in Table 11.
The reasons why the observed and calculated set- tlements are in a good agreement may be;
(i) The s o i l at the test site are of waak or medium frost susceptibility and are dis- tributed homogeneously.
(ii) The applied pressure on the test foun- dation is not greater than the compres- sive strength of the thawed s o i l s , there- fore, plastic sliding of the soil beneath the foundation may not take place.
Value of Hi in the formulas mentioned above depends upon the thickness total of frozen soil and the evenness of A and a in the frozen soil laver concerned underneath the foundations. If
However, €or other test sites, the calculated values are discordant with observed values, as shown in Table 111.
distribution of A, and a in all of frozen soil layers is even, then the frozen soil can be
soil should Be divided into several layers, treated as one layer, other-wise, the frozen
The value of P for each subsoil 1 a y e r . i ~ deter- mined by:
where PI and P 2 are the applied stresses at upper-and lower-surface of each layer,ql and 9 2
are self-weight pressure on the upper-and lower- surface o f each layer, respectively.
APPLICATION CONDITION AND VERIFICATION OF EQUA- TIONS (3) AND ( 4 )
To test the reliability of eqs (3) and ( 4 ) , 40 model test foundations-were placed in Fangxiao, Oilfield Construction Design and Research Institute of Daqing Petrolem Administerative BuEeau.;and.. Children's palace test sites with different buried depthes, and their thaw set- tlements were observed. In addition, laboratory thaw -settlement tests on the undisturbed samples from the observation sites were also carried out.
Verification of E a . ( 4 )
The test results from the laboratory thawing tests on the undisturbed samples from the three test sites were used to calculate thaw settlement with eq.(4). Then, the calculated thaw set- tlements were compared with the observed values, a s shown in Table I.
Note that the compressive strength of thawed soils listed in Table I1 and III are evaluated according to the Standard o f Subsoil and Foun- dation Design for Industrial and Civil Architec- ture (GTJ7-74) .
From the data in Table 111, observed settlements
explained as following: are greater than calculated ones, this may be
The soil in the test site is a saturated loam, strong frost susceptible soil. So, its angle o f internal friction after thawing will be gregtly decreased (Tsytovich, 1962).
many ice lenaes were formed in the frozen soils. Because of moisture migration during freezing,
After thawing, the water content of the subsoil is very high, about 5 6 . 2 % in maximum, and the subsoil becomes in plastic-flow state. There- f o r e , the compression and shear strength of sub- soil are very low. As a result, under the
will be squeezed out plasticly and the settle- action o f load, the subsoil beneath foundation
ment will be much greater. In this case, the field testing condition did not accord with the condition of lateral restraint, under which eq. ( 3 ) was drived. That eq.(3) is inapplicable to this case.
By analysing the results observed at the test site, the conditions for the application of eq. (4) are: ( 1 ) The value of A, should be obtained from the tests on the undisturbed samples taken
dicted and in the time when frost depth is from the place where settlement needs to be pre-
deepest: and (2) the water content of frozen soil i6 less than 50%.
The application of eq.(3) requires more condi- tions. Thev are: ( 1 ) The structure of frozen . .
From Table I, it is seen that the calculated and A, and a should be less than 0 , 0 7 and 0.06 kpa observed values are very close. Thus, formula ( 4 ) can be used to predict thaw settlement in respectively, and ( 3 ) the addltional stress in engineering practice with a enough accuracity. subsoil caused by applied load must be less than
the compressive strength of the soil after thaw- Verification of Eq.(3) ing . With formula (3)'we calculated the total set-
soil must be massive o r laminal; ( 2 ) Values of
1052
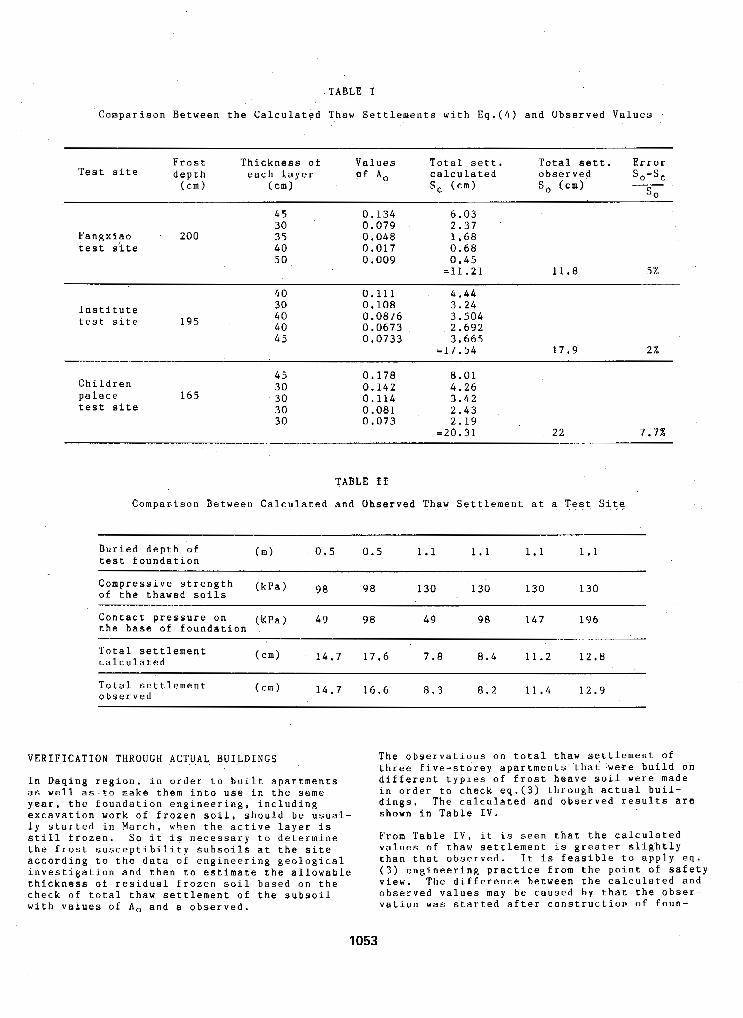
TABLE I
Comparison Between the Calculated Thaw Settlements with E q . ( 4 ) and Observed Values
Frost Thickness o f Values Total sett. Test site
Total sett. Error depth each layer ?f A 0 calculated observed
(cm) (cm) S, (cm) S o Icm) so-sc
s o "
45 0.134 6 . 0 3 30 0 . 0 7 9 2 . 3 7
Fangxiao 200 35 0 . 0 4 8 1.68 test site 40 0 .017 0.68
50 0.009 0 .45 =11.21 11.8 5%
Institute test s i t e 195
4 0 0.111 4 -44 30 40 40 45
. " "
0 108 3.24
0.0673 2.692 0.0733 3 . 6 6 5
o .oa76 3 .504
=17.54 17.9 2%
Children palace 165 test site
45 30 30 30 30
0 . 1 7 8 8 . 0 1 0.142 4 .26 0.114 3 . 4 2 0 , 0 8 1 2 . 4 3 0.073 2.19
= 2 0 . 3 1 22 7 . 7 %
Comparison aetween Calculated and Observed Thaw Settlement at a Test S i t %
Buried depth of test foundation
( m ) 0.5 0.5 1 . 1 1 . 1 1.1 1.1
Compressive strength ( k p a ) of the thawed soils 98 98 130 130 130 130
Contact pressur.e on ( K p a ) 4 9 98 49 98 147 196 the base of foundation
Total settlement calculated (cm) 1 4 . 7 1 7 . 6 7 . 8 8 . 4 1 1 . 2 1 2 . 8
Total settlement observed
(cm) 14.7 1 6 . 6 8.3 8 . 2 1 1 . 4 12.9
VERIFICATION THROUGH ACT.U.AL BUILDINGS
In Daqing region, in order to built apartments a s well as-to make them into use in the same year, the foundation engineering, including excavation work of frozen soil, should be usual- l y started in March, when the active layer is still frozen, So it is necessary t o determine the frost susceptibility subsoils at the site according to the data of engineering geological investigation and then t o estimate the allowable thickness of residual frozen soil based on the check o f total thaw settlement of the subsoil with values of A, and a observed.
The observations on total thaw sqttlement of
different typies o f frost heave soil were made three five-storey apartments that were build on
dings, The calculated and observed results are in order to check e q . ( 3 ) through actual buil-
shown in Table IV.
From Table IV, it is seen that the calculated values of chaw settlement is greater slightly than that observed, It is feasible to apply eq. ( 3 ) engineering practice from the point of safety view. The difference between the calculated and observed values may be caused by that the obser- vation was started after construction of foun-
1053
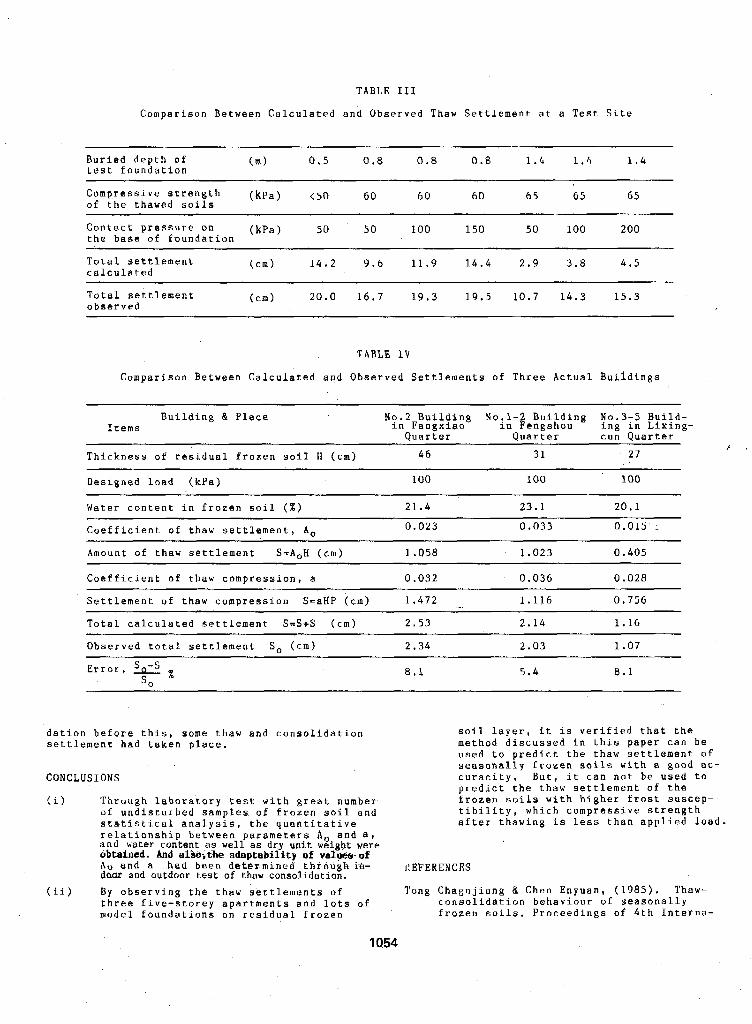
TABLE 111
Comparison Between Calculated and Observed Thaw Settlement at a Test Site
Buried depth o f test foundation
(m) 0.5 0.8 0.8 0 . 8 1 . 6 1 . 4 1.4
Compressive strength ( k p a ) ( 5 0 of the thawed soils
60 60 60 65 65 65
Contact pressure on (kPa 1 50 50 1 00 150 50 LOO 200 the base of foundation
T o t a l settlement calculated
(cm) 14.2 9.6 11.9 14.4 2 . 9 3 . 8 4.5
Total settlement observed
(cm) 2 0 . 0 16.7 19.3 19.5 10 .7 14.3 15.3
TABLE I V
Comparison Between Calculated and Observed Settlements o f Three Actual Buildings
Building & Place Items
No.2 Building No,l-2 Building No.3-5 Build- in Fangxiao In Feanshou inn in Lixinn-
Quarter Quarter cui Quarter - i
Thickness of residual frozen soil H (cm) 46 3 1 27
Designed load (kPa) 100 100 100
Water content in frozen soil ( X ) 21.4 2 3 . 1 2 0 . 1
Coefficient o f thaw settlement, A, 0.023 0 . 0 3 3 0.015 1
Amount of thaw-settlement S=AnH (cm) 1 .058 1.023 0.405
Coefficient of thaw compression, a 0.032 0.036 0 . o m Settlement of thaw compression S=aHP (cm) 1.472 1.116 0.756
Total calculated settlement S=S+S (cm) 2.53 2.14 1.16
Observed total settlement So (cm) 2.34 2.03 1.07
Error, e S n
8.1 5.4 8.1
dation before this, some thaw and consolidation settlement had taken place.
CONCLUSIONS
(i) Through laboratory test with great number of undisturbed samples of frozen s o i l and statistical analysis, the quantitative relationship between parameters A, and a , a n d hater content as well as dry unit weight were ebtelned. And alkeithe adaptability of values-of A 0 and a h a d been dettr,minsd through ii$- d m and outdoor test of thaw consolidation.
soil layer, it is verified that the method discussed in this paper can be used to predict the thaw settlement of seasonally frozen s o i l s with a good ac- curacity, But, it can not be used to predict the thaw settlement of the frozen soils with higher frost suscep-
after thawing is less than applied load. tibility, which compressive strength
r!EFERENCES
(ii) By observing the thaw settlements of Tong Chagnjiang & Chen Enyuan, ( 1 9 8 5 ) . Thaw- three five-storey apartments and lots of consolidation behaviour of seasonally model foundations on residual frozen frozen soils. Proceedings of 4th Interna-
1054

tional Symposium on Ground Freez ing , Sap- p o r o , J a p a n , p . 1 5 9 - 1 6 3 .
T s y t o v i c h , N . A . , ( 1 9 6 2 ) . Base a n d F o u n d a t i o n s o n F r o z e n G r o u n d , ( C h i n e s e t r a n s l a t i . o n ) . C h i n e s e I n d u s t r i a l P u b l i s h i n g H o u s e , p . 2 9 - 1 3 *
S t a n d a r d of Subsoil a n d F o u n d a t i o n D e s i g n f o r I n d u s t r i a l a n d C i v i l A r c h i t e c t u r e ( G T J 7 - 7 4 ) . Chinese A r c h i t e c t u r e Publishing H o u s e , 1 9 7 4 .
1055
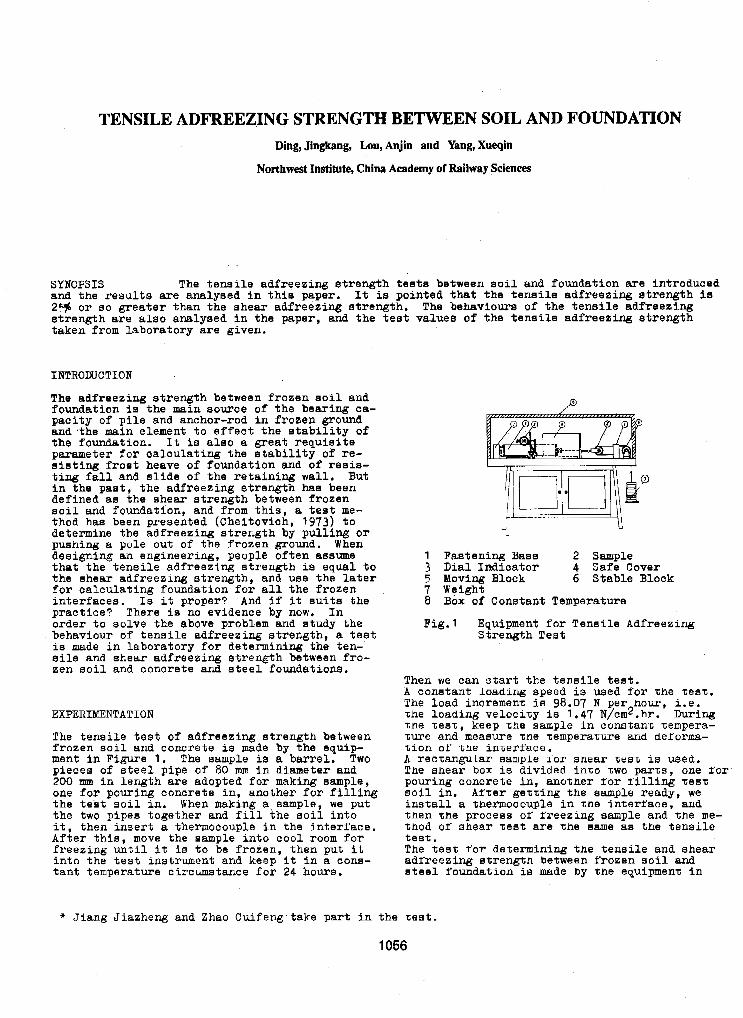
TENSILE ADFREEZING STRENGTH BETWEEN SOIL AND FOUNDATION Ding, Jingkang, Lou, Anjin and Yang, Xueqin
Northwest Institute, China Academy of Railway Sciences
SYNOPSIS The tensile adfreening strength tests between soil and foundation are introduced and the results are analysed in %hie paper. It is pointed that the tensile adfxeeeing atrength i s 2e;$ or so greater than the shear adfreezing atrength. The behavioure of the tensile adfreezing strength are also analysed in the paper, and the test values of the tenaile adfreezing strength taken-from laboratory are given.
ITlTROIXlCTION
The adfreezing strength between frozen soil and foundation is the main souxce of the bearing ca-
and -the main element to effect the stability of pacity of pile and anchor-rod in frozen ground
the foundation. It is ala0 a great requisite parameter f o r calculating the stability of re- sisting iroet heave of foundation and of resia- ting fall ana slide of the retaining wall. But
defined as the ehear strength between frozen in the paat, the adfreezing strength haa been
thod has been presented (Cheitovich, 1973) to soil and foundation, and from this, a test me-
determine the adfreezing strength by pulling o r pushing a pole out of the frozen ground. When designing an engineering, people often assume that the tensile adfreezing strength is equal t o the shear adfreezing strength, and use the later for calculating founda-t;ion for all the f rozen interfaces. Is it proper? And if it suits the practice? There is no evidence by now. In
behaviour of tensile adfreezing strength, a test order to solve the above problem and study the
is made in laboratory for determining the ten- sile ana shear adfreezing strength between f r o - zen soil ana concrete and steel foundations.
EXPERIICEFENTATION
The tensile test of adfreezing strength between ment in Figure 1. The sample is a barrel. Two frozen soil and concrete is made by the equip-
pieces of steel pipe of 80 mm in diameter and one for pouring concrete in, another for filling 200 mm in length a r e adopted for making sample,
the teat soil in. When making a\sample, we put the two pipes together ana fill the soil into it, then insert a thermocouple in the interface. After this, move the sample into cool room f o r freezing until it is to be frozen, then put it into the test inatrument and keep it in a cona- tant temperature circumstance for 24 hours.
1 Faatening Base 2 Sample 3 Dial Indicator 4 Safe Cover
7 Wsight 8 Box of Constant Temperature
Fig.1 Equipment f o r Tensile Adfreezing
5 Moving Block 6 Stable Block
Strength Teat
* Jiang Jiazheng and Zhao Cuifeng take part in the test.
1056
Then we can start the tensile test. A constant loading speed is w e d for the test. The l oad increment is 98.07 N per hour, i,e. The loading ve1ocir;y is 1.47 N/cm2.hx. During the tesr;, keep the sample in constant Tempera- T w e and measure tne temperature and deforma- tion o f %ne interface. A rec.r;angul.ar sample 103: shear tesL is wed. The ahear box is divided into TWO parts, one ror pouring concrete in, anotner r o r Tilling test soil in. Arter getting the sample ready, we install a thermocouple in tne interrace, and then tbe process OX ireezing sample and the me- tnod OX shear test are %he same as the tensile test. The teat for determining the tensile and shear adireezing atrengtn between frozen soil and steel foundaZion is made by tne equipment in
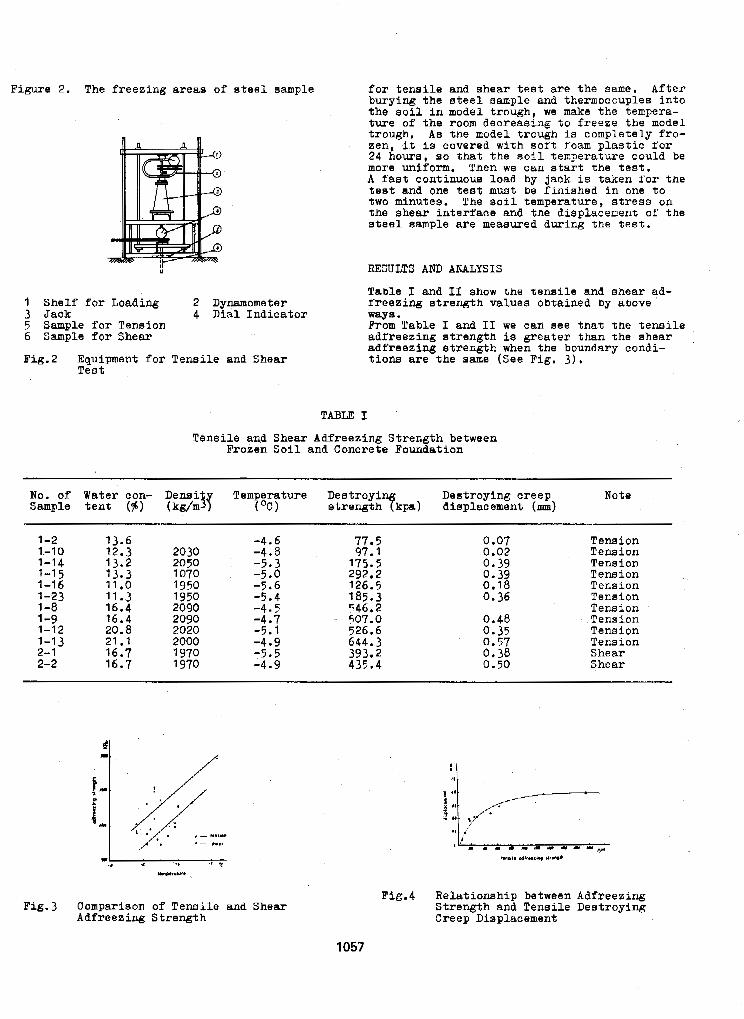
Figure 2. The f r e e z i n g a r e a s of s t e e l sample
I U
1 Shelf for Loading 2 Dynamometer 3 Jack 5 Sample for Tension 6 Sample f o r Shear
Fig.2 Equipment f o r Tensile and Shear
4 Dial I n d i c a t o r
Test
for t e n a i l e and shear t es t a re t h e same. After bu ry ing t he s t ee l eample and thermocouples into t h e s o i l i n model trough, we make the tempera-
trough. A s tne model trough is completely fro- t u r e of t h e room decreasing t o f r eeze t he model
Zen, it is covered with s o f t Soam p l a s t i c f o r 24 hours, BO that the so i l t empera ture could be more uniform. Tnen we can start t h e t e a t . A fast continuoue load by jack is taken Tor the t e s t and one t e a t m u s t be f i n i e h e d i n one t o two minutes. The s o i l t e m p e r a t u r e , s t r e s s on the shea r i n t e r f ace and tna displacement o f the a t e e l a m p l e axe meamred dur ing the t e s t .
RESULTS ANIl ANALYSIS
Table 1 and I1 show t h e t e n s i l e and shear ad- r reez ing s t rength va lues ob ta ined by above ways. Prom Table I and 11 we can see that t h e t e n s i l e adf reez ing s t rength is g rea t e r t han t he shea r . adfreez ing s t rength when the boundary condi- tions a r e t h e aame (See Fig. 3) .
TABLE 5
Tensile and Shear Adfreezing Strength between Frozen Soil and Concrete Foundation
1-2 13.6 1-10 12.3 1-14 13.2 1-16 1-1 5 13.3
11 .o 1-23 11.3 1-8 16.4 1-9 16.4 1-12 20.8 1-1 1 21 .I 2-1 - 1617 2-2 16.7
2030 2050 1070 1950 1950 2090 2090 2020 2000 1970 1970
-4.6 -4.8 -5.3 -5.0 -5.6 -5.4 -4.5 -4.7 -5.1 -4.9 -5.5 -4.9
77.5 97.1 175.5 292.2 126.5
746.2 507.0 526.6 644.3 393.2 435.4
185.3
0.07 0.02 0.39 0.39 0.18 0.36
0.48 0.35 0.57 0.38 0.50
Tension Tension Tension Tension Tension Tension Tension Tension Tension
She ax Tension
Shear
II
I- [ ""
Fig.3 Comparison of Tensile and Shear Adfreezing Strength
Fig.4 Relationship between Adfreezing Strength and Tensile Destroying Creep Displacement
1057
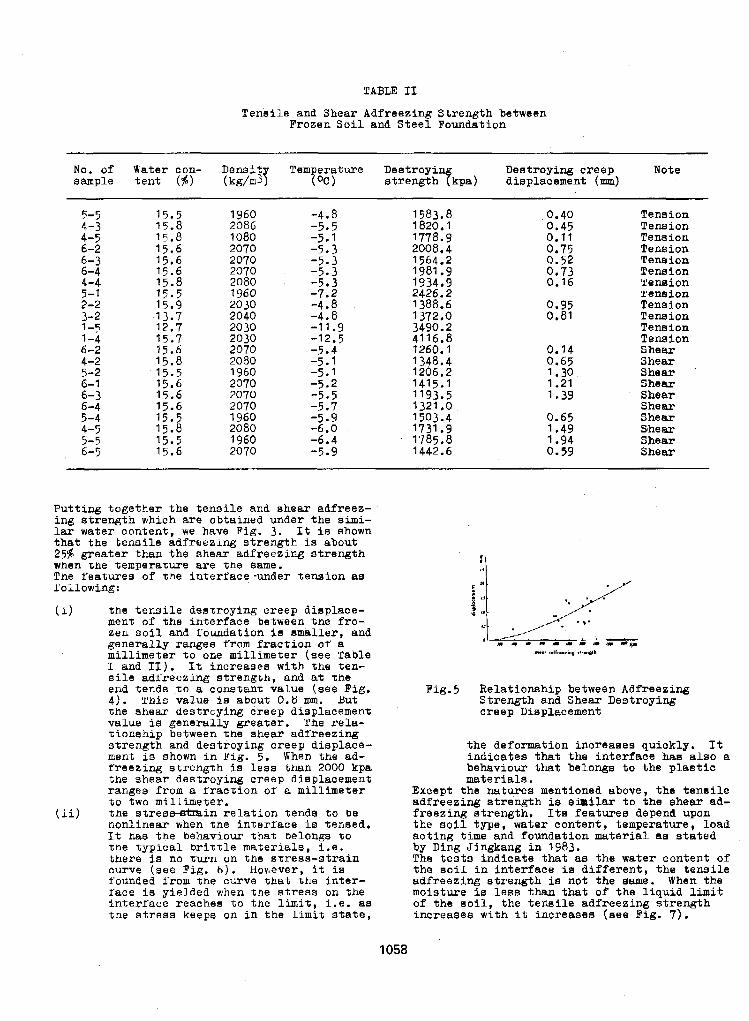
TABLE I1
Tensile and Shear Adfreeeing Strength between Frozen Soil and Steel Foundation
5-5 4-3 4-5 6-2 6-3 6-4 4-4 5- 1 2-2 3-2 1-5
6-2 1-4
4-2 5-2 6-1 6-3 6-4 5-4 4-5 5-5
, 6-5
15.5 15.8 17.8 15.6 15.6 15.6 15.8
15.9 15.5
13.7 12.7 15.7 15.6 15.8 15.5 15.6 15.6
1960 2086 1080 2070 2070 2070 2080 1960 2030 2040 2030 2030 2070 2080 1960 2070 2070
15.6 2070 15.5 1960 15.8 2080 15.5 1960 15.6 2070
-4.8 -5.5 -5.1 -5.3 -5.3 -5.3 -5.3 -7.2 -4.8 -4.8 -11.9 -12.5 -5.4 -5.1 -5.1 -5.2 -5.5 -5.7 -5.9 -6.0 -6.4 -5.9
1583.8 1820.1 1778.9 2008.4 1564.2 1981.9 1934.9 2426.2 1388.6 1372.0 3490.2
1260.1 1348.4 1206.2 1415.1 1193.5 1321 .O 1503.4 1731.9 1785.8 1442.6
4116.8
0.40 0.45 0.11 0.75 0.52 0.73 0.16
0.95 0.81
0.14 0.65 1.30 1.21 1.39
0.65 1.49 1.94 0.59
Tension Tension Tension Tension Tension Tension Pension Tension Tension Tenaion Tension
Shear Tension
Shear Shear Shear Shear Shear Shear S'hear Shear Shear
Putting together the tensile and shear adfreez- ing strength which are obtained under the simi- lar water content, we have Fig. 3. It is shown that the tensile adfreezing strength is about 25% greater than the shear adfreezing strength when the temperature are tne same. Tne features of the interrace-under tension as following:
(i) the tensile destroying creep diaplace- ment o f the inxerface between tne fro- zen soil and foundation i a amkller, and
millimeter to one millimeter (see Table generally ranges f r o m fraction of a
1 and 11). It increases with the ten- sile adrreezing strength, and at the end tends ,to a constant value (see Fig. 4 ) . This value ie about 0.8 mm. But The shear destroying creep displacement value I s generally greater. Yhe rela- tionship between the shear adireezing strength and destroying creep displace- ment is shown in Yig. 5 . When the ad- ireezing strength i s leas than 2000 kpa the shear destroying creep displacement ranges from a iraction of' a millimeter to two millimeter.
nonlinear when the interface is tensed. It has the behaviour that Delonga to the typical Drittle materials, i.e. them i s no tuxn on the stress-strain curve (see Fig. b ) , However, it is founded from the c m v e that the inter- face ia yielded when tne stress on the interface reaches to tne limit. i.e. as
(ii) tne stresa4min relation tends to De
Pig.5 Relationship between Adfreezing Strength and Shear Destroying creep Displacement
the deformation increases quickly. It indicates that the interface has also a behaviour that belongs to the plastic materials.
Except the natures mentioned above, the teneile adfreezing atrength is eimllar to the shear ad- freezing strength. Its features depend upon the soil type, water content, temperature, load acting time and foundation material as stated by Ping Jingkang in 1983. The teste indicate that as the water content of the soil in interface is different, the tensile adfreezing strength ie not the same. When the moisture is less than that of the liquid limit of the soil. the tensile adfreezinu strenRth
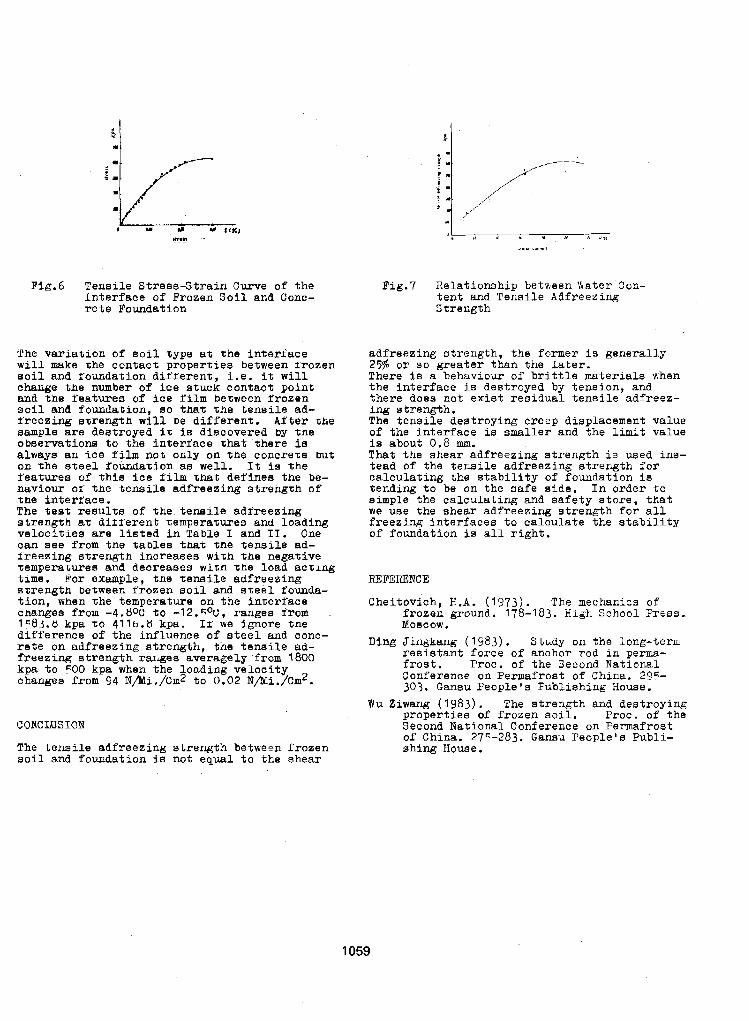
.,.mil - .. .
Fig.6 Tensile Stress-Strain Curve of the Interface of Frozen Soil and Conc- rete Foundation
The variation of soil type at the interface will make the contact properties between frozen soil and foundation diirerent, i.e. it will change the number of ice stuck contact point and the features of ice film bezween frozen soil and foundation, so that the tensile ad- Sreezing strength will be different. After she
obaervationa to the interface that there is sample are destroyed it i0 discovered oy tne
always an ice film not only on th8 concre'Ge but on the steel foundation as well. 1-1; is the features of this ice rilm that defines the be- haviour 02 the tensile adfreezing atrengzh of the interface. The test results o f the teneile adfreezing strength at difXerent tempera-curas ana loading velocities are listed in Table 1 and 11. One can see from the tables tnat the tensile ad- I'reezing strength increases wi'Gh the negative temperatures and decreases wish the load acting tune. Por example, the tensile adfreezing sfrength between froaen soil and s-ceel founda- tion, when the temperature on the imerrace cnangea from -4. t lOc: to -12. ~ O L ! , ranges t'rom 1*83.& kpa to 4116.8 kpa. 11' we ignore %ne difference of the influence o f steel and conc- rete on adfreezing strength, the tenaile ad- freezing strength rangea averagely from 1800 kpa to =OO kpa when the loading velocity changes from 94 N,&i./Cm2 to 0.02 N/Mi,/Cm2.
CONCLUSION
The tensile adfreezing strength between frozen soil and foundation i s not equal to the shear
Fig.7 Relationship between hater Con- tent and Tensile Adfreezing Strength
adfreezing strength, the former i s generally 25% o r so greater than the later. There is B behaviour of brittle materials u-hen the interface i s destroyed by tension, and there does not exist residual tensile adfreez- ing strength. The tensile deatroying creep displacement value of the interface is smaller and the limit value is about 0.8 mm. T h a t the shear adfreezing strength is used ins- tead of the tensile adfreezing strength for calculating the stability of foundation is tending to be on the safe side. In order to simple the calculating and safety store, that we uae the shear adfreezing strength for all freezing interfaces to calculate the stability of foundation is a l l right.
REFERENCE
Cheitovich, H.A. (1973). The mechanics of frozen ground. 178-183. High School Press. Moscow.
resiatant force of anchor rod in perna- frost. Proc. of the Second N a t i o n a l Conference on Permafrost of China. 295- 303. Ganau People's Publishing Howe.
Wu Ziwang (1983). The strength and destroying properties of frozen soil. Proc. o f the Second National Conference on Permafrost of China. 276-283. Gansu Peoplela Publi- shing House,
D i n g Jingkang (1983). Study on the long-term
1059
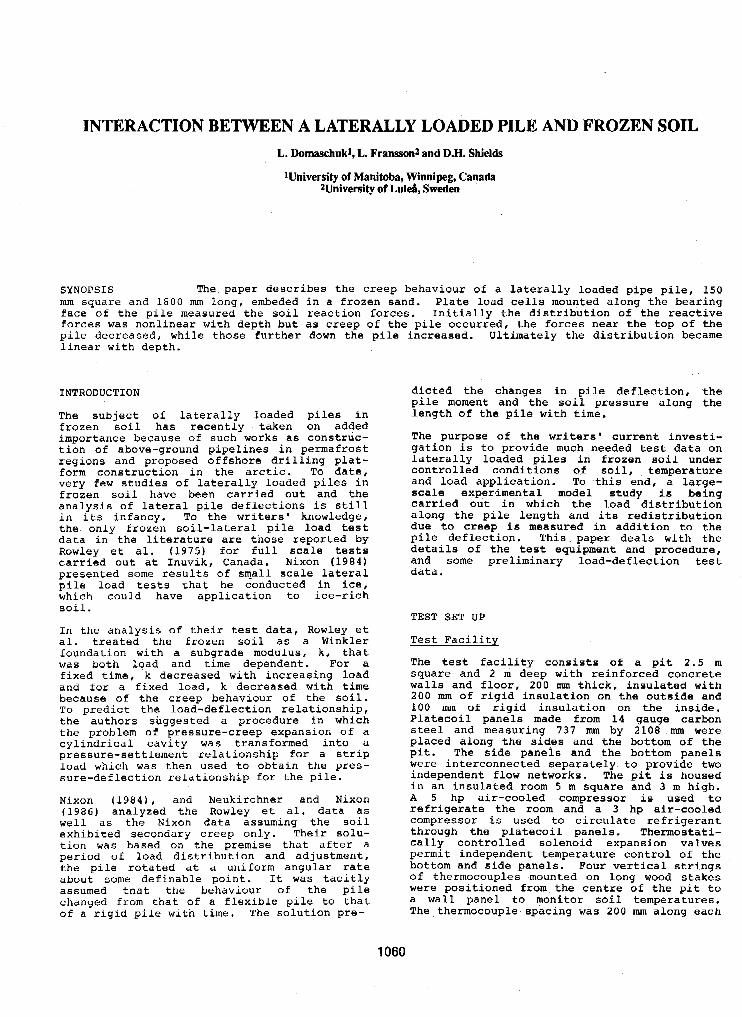
INTERACTION BETWEEN A LATERALLY LOADED PILE AND FROZEN SOIL L. Domaschukl, L. Franssonz and D.H. Shields
Wniversity of Manitoba, Winnipeg, Canada Wniversity of Luld, Sweden
SYNOPSIS The. paper describes the creep behaviour of a laterally loaded pipe pile, 1 5 0 mm square and 1800 nun long, embeded in a frozen sand. Plate load cells mounted along the bearing face of the pile measured the soil reaction forces. Initially the distribution of the reactive
pile decreased, while those further down the pile increased. Ultimately the distribution became forces was nonlinear with depth but as creep of the pile occurred, the forces near the top of the
linear with depth.
INTRODUCTION
The subject of laterally loaded piles in frozen soil has recently taken on added importance because of such works as construc- tion of above-ground pipelines in permafrost regions and proposed offshore drilling plat-
very few studies of laterally loaded piles in form construction in the arctic. To date,
analysis of lateral pile deflections is still frozen soil have been carried out and the
in its infancy. To the writers' knowledge, the only frozen soil-lateral pile load test data in the literature are those reported by Rowley et al. (1975) for full scale tests carried out at Inuvik, Canada. Nixon (1984) presented some results of small scale lateral pile load tests that he conducted in ice, which could have application to ice-rich soil.
In the analysis of their test data, Rowley et al. treated the frozen soil as a Winkler
was both load and time dependent. For a foundation with a subgrade modulus, k, that
fixed time, k decreased with increasing load and for a fixed load, k decreased with time because of the creep behaviour of the soil. To predict the load-deflection relationship, the authors suggested a procedure in which the problem of pressure-creep expansion of a cylindrical cavity was transformed into a pressure-settlement relationship for a strip load which was then used to obtain the pres- sure-deflection relationship for the pile.
Nixon (19841, and Neukirchner and Nixon (1986) analyzed the Rowley et al. data as well as the Nixon data assuming the soil exhibited secondary creep only. Their solu- tion was based on the premise that after a period of load distribution and adjustment, the pile rotated at a uniform angulas rate about some definable point. It was tacitly assumed that the behaviour of the pile changed from that of a flexible pile to that of a rigid pile with time. The solution pre-
dicted the changes in pile deflection, the pile moment and the soil pressure along the length of the pile with time.
The purpose of the writers' current investi- gation is to provide much needed test data on laterally loaded piles in frozen s o i l under controlled conditions of soil, , temperature and load application. To this end, a large- scale experimental model study i s being carried out in which the load distribution along the pile length and its redistribution due to creep is measured in addition to the pile deflection. This, paper deals with the details of the test equipment and procedure, and some preliminary load-deflection test data.
TEST SET UP
Test Facility
The test facility consists of a pit 2.5 m
walls and floor, 200 mm thick, insulated with square and 2 m deep with reinforced concrete
200 mm of rigid insulation on the outside and 100 mm of rigid insulation on the inside. Platecoil panels made from 14 gauge carbon steel and measuring 737 mm by 2108 . m m were placed along the sides and the bottom of the pit. The side panels and the bottom panels were interconnected separately. to provide two independent flow networks. The pit is housed in an insulated room 5 m square and 3 m high. A 5 hp air-cooled compressor is used to refrigerate the room and a 3 hp air-cooled compressor is used to circulate refrigerant through the platecoil panels. Thermostati- cally controlled solenoid expansion valves permit independent temperature control of the bottom and side panels. Four vertical strings of thermocouples mounted on long wood stakes were positioned from the centre of the pit to a wall panel to monitor soil temperatures. The thermocouple spacing was 200 mm along each
1060
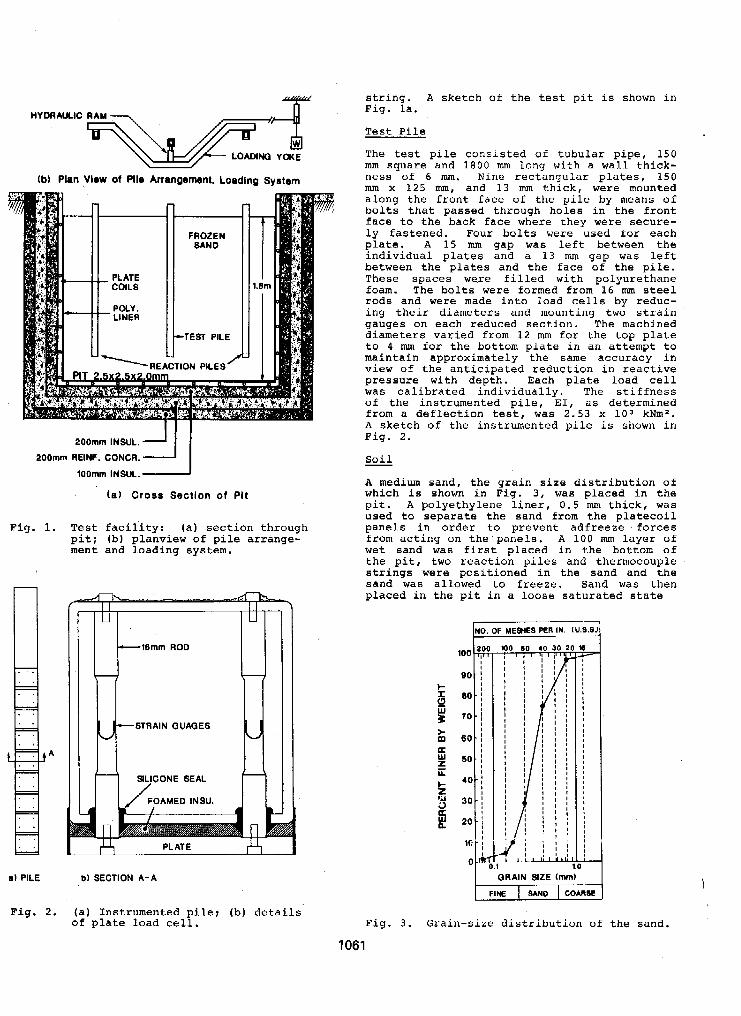
"k"
(bl Plan ,Vlrw of Pile Arrangement, Loading System
FROZEN
TEST PILE
200mm INSUL. 2 200mm REINF. CONCR.
100mm INSUL.
(a ) Cross Section of Pit
Fig. 1.
A
a) PILE
Fig. 2.
Test facil'ity: (a) section through pit; (b) planview of pile arrange- ment and loading system.
1 1
U
-16mm ROD
-STRAIN OUAQES
SlLlCONE SEAL /
b) SECTION A-A
of plate load cell. (a) Instrumented pile; (b) details
string. A sketch of the test pit is shown in Fig. l a .
Test Pile
The test pile consisted o f tubular pipe, 150 mm square and 1800 mm long with a wall. thick- ness of 6 mm. Nine rectangular plates, 150 mm x 125 mm, and 1 3 nun thick, were mounted along the front face of the pile by means of bolts that passed through ho les in the front face to the back face where they were secure- ly fastened. Four bolts were used for each plate. A 15 mm gap was left between the individual plates and a 13 nun gap was left between the plates and the face of the pile. These spaces were filled with polyurethane foam. The bolts were formed from 16 mm steel rods and were made into load cells by reduc- ing their diameters and mounting two strain gauges on each reduced section. The machined diameters varied from 12 mm for the top plate to 4 mm for the bottom plate in an attempt to maintain approximately the same accuracy in view of the anticipated reduction in reactive pressure with depth. Each plate load cell was calibrated individually. The stiffness of the instrumented pile, EI, as determined from a deflection test, was 2.53 x l o 3 kNm2. A sketch of the instrumented pile is shown in Fig. 2 .
Soil
A medium sand, the grain size distribution of which is shown in Fig, 3 , was placed in the pit. A polyethylene liner , 0.5 mm thick, was used to separate the sand from the platecoil panels in order to prevent adfreeze forces from acting on the panels. A L O O nun layer of wet sand was first placed in the bottom of the pit, two reaction piles and thermocouple strings were positioned in the sand and the sand was allowed to freeze. Sand was then placed in the pit in a loose saturated state
I 40 - I I I 1 I
30
I I I I I I I I
I
4, j , Ij * I
GRAIN SIZE lmm) FINE SAND COARSE
Fig. 3 . Grain-size distribution of the sand.
1061
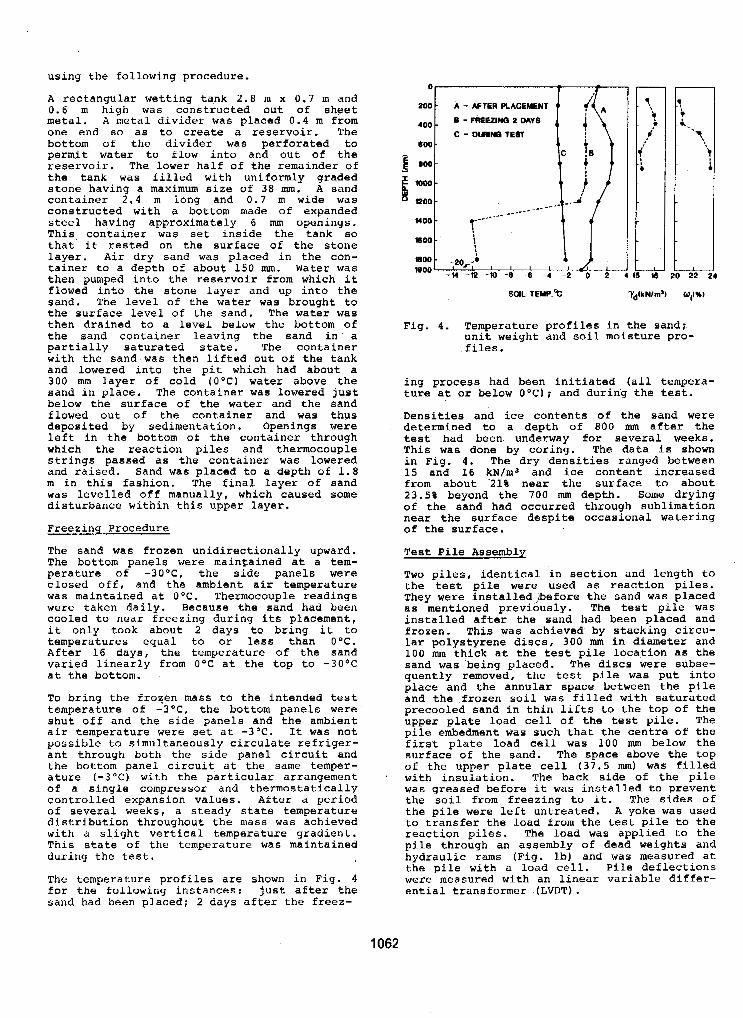
using the following procedure.
A rectangular wetting tank 2 . 8 m x 0.7 m and
metal. A metal divider was placed 0 . 4 m from 0.6 m high was constructed out of sheet
one end so as to create a reservoir. The bottom of the divider was perforated to permit water to flow into and out of the reservoir. The lower half of the remainder of the tank was filled with uniformly graded
container 2 . 4 m long and 0.7 m wide was atone having a maximum size of 38 mm. A sand
constructed with a bottom made of expanded steel having approximately 6 nun openings. This container was set inside the tahk so that it rested on the surface of the stone
tainer to a depth of about 150 mm. Water was layer. Air dry sand was placed in the con-
then pumped into the reservoir from which it
sand. The level of the water was brought to flowed into the stone layer and up into the
the surface level of the sand. The water was then drained to a Level below the bottom of the sand container leaving the sand in a
with the sand was then lifted out of the tank partially saturated state. The container
and lowered into the pit which had about a 300 mm layer of cold (OOC) water above the sand in place. The container was lowered just below the surface of the water and the sand
deposited by sedimentation. Openings were flowed out of the container and was thus
left in the bottom of the container through which the reaction piles and thermocouple
and raised. Sand was placed t o a depth of 1 . 8 strings passed as the container was lowered
m in this fashion. The final layer of sand was levelled off manually, which caused some disturbance within this upper layer.
Freezing Procedure
The sand was frozen unidirectionally upward. The bottom panels were maintained at a tem- perature of -3OoC, the side panels were closed off, and the ambient air temperature was maintained at O O C . Thermocouple readings were taken daily. Because the sand had been cooled to near freezing during its placement, it only took about 2 days to bring it to
After 16 days, the temperature of the sand temperatures equal to or less than O'C.
varied linearly from O°C at the top to -30°C at the bottom.
To bring the frozen mass to the intended test temperature of -3'C, the bottom panels were shut off and the side panels and the ambient air temperature were set at -3°C. It was not possible to simultaneously circulate refriger- ant through both the side panel circuit and the bottom panel circuit at the same temper- ature (-3OC) with the particular arrangement of a single compressor and thermostatically controlled expansion values. After a period
distribution throughout the mass was achieved of several weeks, a steady state temperature
with a slight vertical temperature gradient. This state of the temperature was maintained during the test.
The temperature profiles are shown in Fig. 4 for the following instances: just after the sand had been placed; 2 days after the freez-
Fig. 4 . Temperature profiles in the sand; unit weight and soil moisture pro- files.
ing process had been initiated (all tempera- ture at or below O O C ) ; and during the test.
Densities and ice contents of the sand were determined to a depth of 800 mm after the test had been underway for several weeks. This was done by coring. The data i s shown in Fig. 4 . The dry densities ranged between 15 and 16 kN/mJ and ice content increased from about -21% near the surface to about 23.5% beyond the 700 nun depth. Some drying of the sand had occurred through sublimation near the surface despite occasional watering of the surface.
Test Pile Assembly
Two piles, identical in section and length to
They were installed jbefore the sand was placed the test pile were used as reaction piles.
as mentioned previously. The test pile was installed after the sand had been placed and frozen. This was achieved by stacking circu- lar polystyrene discs, 300 mm in diameter and 100 mm thick at the test pile location as the sand was being placed. The discs were subse- quently removed, the test pile was put into place and the annular space between the pile and the frozen soil was filled with saturated precooled sand in thin lifts to the top of the upper plate load cell o f the test pile. The pile embedment was such that the centre of the first plate load cell was 100 mm below the surface of the sand. The space above the top of the upper plate cell (37.5 mm) was filled with insulation. The back side of the pile was greased before it was installed to prevent the soil from freezing to it. The sides of the pile were left untreated. A yoke was used to transfer the load from the test pile to the reaction piles. The load was applied to the pile through an assembly of dead weights and hydraulic rams (Fig. lb) and was measured at the pile with a load cell. Pile deflections were measured with an linear variable differ- ential transformer (LVDT) .
1062
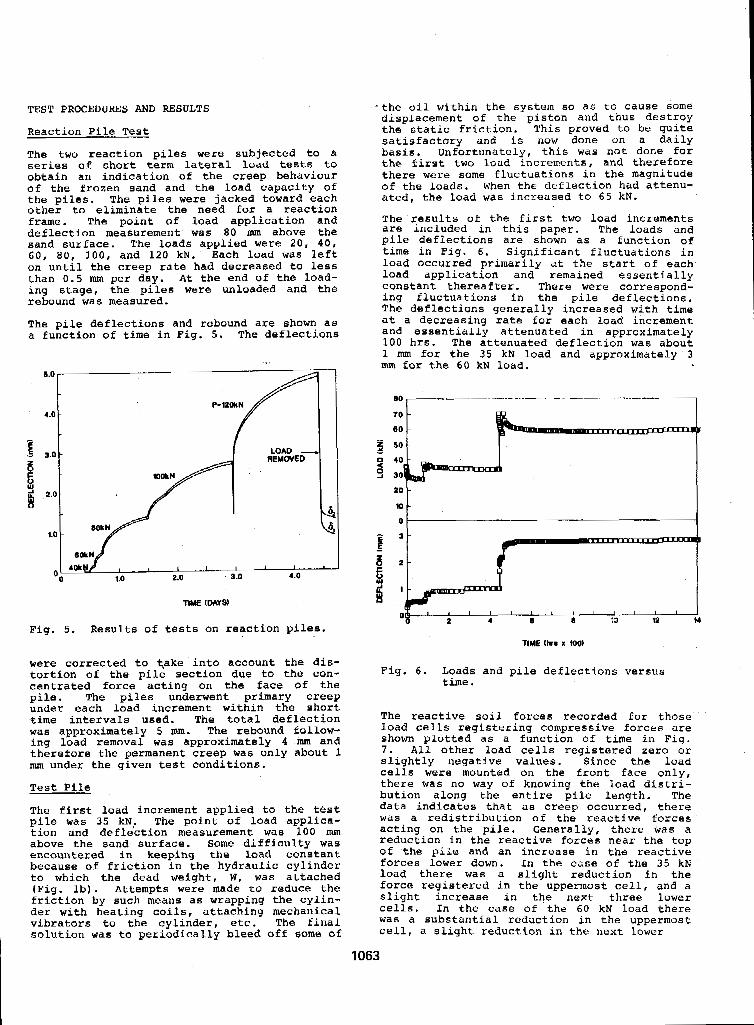
TEST PROCEDURES AND RESULTS
Reaction Pile Test
The two reaction piles were subjected to a series o f short term lateral load tests to obtain an indication of the creep behaviour of the frozen sand and the load capacity of the piles. The piles were jacked toward each other to eliminate the need for a reaction frame. The point of load application and deflection measurement was 8 0 mm above the sand surface. The loads applied were 20, 40, 60, 8 0 , 100, and 120 kN. Each load was left on until the creep rate had decreased to less than 0.5 mm per day. At the end of the load- ing stage, the piles were unloaded and the rebound was measured.
The pile deflections and rebound axe shown as a function o f time in Fig. 5. The deflections
7- 4 1
-the oil within the system so as to cause some displacement of the piston and thus destroy the static friction. This proved to be quite satisfactory and is n o w done on a daily basis. unfortunately, this was not: done for the first two load increments, and therefore there were some fluctuations i n the magnitude of the loads. when the deflection had attenu- ated, the load was increased to 6 5 kN.
The .results of the first two load increments are included in this paper. The loads and pile deflections are shown as a function of time in Fig. 6 . Significant fluctuations in load occurred primarily at the start of each load application and remained essentially constant thereafter. There were correspond- ing fluctuations in the pile deflections. The deflections generally increased with time at a decreasing rate for each load increment and essentially attenuated in approximately 100 hss. The attenuated aeflection was about 1 mm for the 35 kN load and approximately 3 mm for the 60 kN load.
2.0 3.0 4.0
TIME (DAYS)
Fig. 5 . Results o f tests on reaction piles.
r 9 40
s SO
d
were corrected to fake into account the dis- tortion of the pile section due to the con- centrated force acting on the face of the pile. The piles underwent primary creep under each load increment within the short *he intervals used. The total deflection was approximately 5 nm. The rebound follow-
therefore the permanent creep was only about 1 m g load removal was approximately 4 mm and
mm under the given test conditions.
Test Pile
The first load increment applied to the test pile was 35 kN, The point of load applica- tion and deflection measurement was 100 mm above the sand surface. Some difficulty was encountered in keeping the load constant because of friction in the hydraulic cylinder to which the dead weight, W, was attached (Fig. lb) . Attempts were made to reduce the friction by such means as wrapping the cylin- der with heating coils, attaching mechanical vibrators to the cylinder, etc. The final solution was to periodically bleed off some of
1063
TIME lhr x 1001
Fig. 6. Loads and pile deflections versus time .
The reactive s o i l forces recorded for those load cells registering compressive forces axe shown plotted as a function of time in Fig. 7 . All other load cells registered zero or slightly negative values. Since the load cells were mounted on the front face only, there was no way of knowing the load distri- bution along the entire pile length. The data indicates that as creep occurred, there was a redistribution o f the reactive forces acting on the pile. Generally, there *a6 a reduction in the reactive forces near the top of the pile and an increase in the reactive forces lower down. In the case of the 35 kN load there was a slight reduction in the force registered in the uppermost cell, and a slight increase in the next three lower cells. In the case of the 6 0 kN load there was a substantial reduction in the uppermost cell, a slight reduction in the next lower
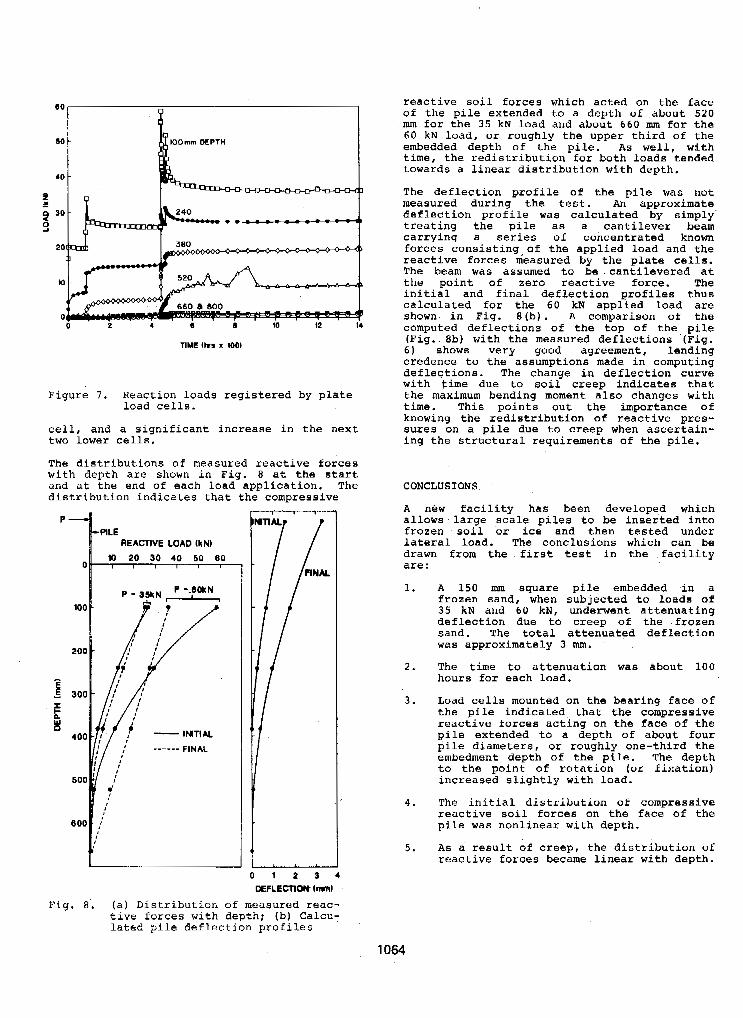
50 - IOOmm DEPTH
40 -
f - 9 s
m
0 0 2 8 10 12 14
TIME ( h a x 1001
Figure 7 . Reaction loads registered by plate load cells.
cell, and a significant increase in the next two lower cells.
The distributions of measured reactive forces with depth are shown in Fig. 8 at the start and at the end of each load application. The distribution indicates that the compressive
REACTIVE LOA0 (kN)
0 1 2 3 4 OEFLECflW- (mn)
Fig. 8. (a) Distribution of measured reac- t i v e forces with depth; (b) Calcu- lated pile d e f l e c t i o n profiles
of the pile extended to a depth of about 520 reactive s o i l forces which acted on the face
mm for the 35 kN load and about 6 6 0 mm for the 60 kN load, or roughly the upper third of the embedded depth of the pile. As well, with time, the redistribution fo r both loads tended towards a linear distribution with depth.
The deflection profile of the pile was not measured during the test. An approximate deflection profile was calculated by simply treating the pile as a cantilever beam carrying a series of concentrated known forces consisting,of the applied load and the reactive forces measured by the plate cells. The beam was assumed to be cantilevered at the point of zero reactive force. The initial and final deflection profiles thus calculated for the 60 kN applied load are shown in Fig. 8 ( b ) . A comparison of the computed deflections of the top of the pile (Fig. 8b) with the measured deflections '(Fig. 6) shows very good agreement, lending credence to the assumptions made in computing deflections. The change in deflection curve with time due to soil creep indicates that the maximum bending moment alao changes with time. This points out the importance of knowing the redistribution of reactive pres- suxes on a pile due to creep when ascertain- ing the structural requirements of the pile.
CONCLUSIONS
A new facility has been developed which allows large scale piles to be inserted into frozen soil or ice and then tested under lateral load. The conclusions which can be drawn from the- first test in the facility are :
1.
2 .
3 .
4 .
5.
1064
A 150 nun square pile embedded in a frozen sand, when subjected to loads of 35 kN and 60 kN, underwent attenuating deflection due to creep of the frozen sand. The total attenuated deflection was approximately 3 mm. The time to attenuation was about 100 hours for each load.
Load cells mounted on the bearing face of the pile indicated that the compressive reactive forces acting on the face of the pile extended to a depth of about four pile diameters, or roughly one-third the embedment depth of the pile. The depth to the point of rotation (or fixation) increased slightly with load.
The initial distribution of compressive reactive soil forces on the face of the pile was nonlinear with depth.
As a result of creep, the distribution of reactive forces became linear with depth.
REFERENCES
Neukirchner, R.J. and Nixon, J.F. (1987). Behaviour of Laterally loaded piles in permafrost. Jour. o f Geot. Eny., V o l . 113, No. 1, Jan., 1-14.
Nixon, J.F. ( 1 9 8 4 ) . Laterallv loaded oiles in permafrost. Can. Gdot. Jou;. , Vol. 2 1 , 431-438.
Rowley, R.K., Watson, G.H. and Ladanyi, B . (1975). Prediction of pile performance in permafrost under lateral load. Can. Geot. Jour., V o l . 12, 510-523.
ACKNOWLEDGEMENTS
The writers' wish to acknowledge the financial assistance provided by NSERC, Ottawa, Canada, and the Swedish American Foundation. As well, special thanks qo to Mr. Brian Turnbull and Mr. Ed Lemke, who provided invaluable assistance in setting up the testing facility.
1065
CHOICE OF PARAMETERS OF IMPACT BREAKAGE OF FROZEN SOILS AND ROCKS
AI, Fedulov and V.N. Labutin
Mining Institute of the Siberian Branch of the USSR Academy of Sciences, Novosibirsk, USSR
ABSTRACT The paper deals with the technological schemes of breakage o f various hard materials including seasonal-frozen soils and ever-frozen rocka by impact load; a change of the parameters of the process, its action and a change in time a e shorn. The concept concerning the specific per unit length of impact Load per unit of length of a blade of a wedge-like tool is introduced.The character o f a change of the components of force of breakage, the values of an angle of positioning of the tool, the intensity and the energy-intensi%y o f the process is established. The obtained materials of the investigations are the basis for creatjng the r e a l working members for practice of breaking and mining of hard materials.
The industrial exploitation of the districks of the East and the North-East of the Soviet Union is associated with uLning of considerable volumes of rocks and seasonal- frozen soils as well as ever-frozen ones. A traditional method of the solution of t h i s problem is the drilling-and-blasting method of loosening followed by loading and t r ans fe r of rock mass by the mechanisms of various types, such as excavators, loaders, scrapers and bulldozers, etc. Only t o a lesser degree, in some places, t h e rippers mounted on the
AS known the drilling-and-blasting method o f tractors axe used.
mining supposes the specific cyclicity o f the process. At the same time the most advanced high-production continuous flow process technology supposes cont'inuity of the process. In fairly hard rocks as well as frozen s o i l a one may perform this only by means of the working members o f impact action which may provide t he high-efficient flow of the process of breakwe, The existing examples in the field o f percussion drilling o f hard rocks and orea confirm convincingly the reality o f this direction. For designing and project- the high - production impact devices f o r breakage, the initial data of the parameters o f the effective flow of this process axe required. Over a long period of time, under the various
Siberian Branch of the USSR Academy o f conditions, the Mining Institute of the
Sciences conducted the investigations into the impact method of breakage of coals, frozen soils which made it possible to obtain a series o f the fundamental results (Nedorezov, 1965, Vikhlyayev, 1969. FeduLov, 1973, 1975, 1977. Fedulev, Pofonsky, 1977. Sleptsov,l982), D u r l n g the lnvestlgation o f impact breakage of materials, two schemes of loading were considered. The first scheme takes i n t o account t h c various existing in practice technological processes associated with breakage of specimens o f end sizes (oversizes of various rocks, laminated, block materials, etc.) , the second one i s typical of t h e
technological processes of separation of a layer of a material, its extraction and mini%. Tf the first one is associated with a single action completing with a crack of a specimen, the second one supposes some continuity of the process and in this connection it must possess the high efficiency. As a result,of the analfiica5 and experimental investigations of the process of impact breakage of various hard makerials, a number of very important scientlfically and practically dependences were establiahed making it possible f o approach to the solution of the question about the paramefers of the impact devices for these purposes with sufficient validity. The obtained experimental dependences of some parameters of the impact process ( m a a m u m impulsive force, pulse length, m a x i m u m aeptb of penetration per impact) upon the quantity o f sequentially deliverFng impacts against the wedge-like indenter show a fairly sharp change of their values from impact to impact. The character of the graph of the maximum impulsive force representing the curve innoseasing with a deceleration indicates the change of the properties of the material under the indenter, and makes it possible to draw fhe import=% conclusions. One may state that the traditional indices of the mechanical properties o f the material characterize only its condition before the first impact and cannot be used in the process of growth of stresses uadar the tool. On the other hand, clearly the magnitude of the maximum force has the most substantial influence on the process intensity (aepth of penetration of the indenker) from the very beginning o f the breaking process during the first impacts. Thus, for evaluating the effectiveness of the impact breakage, it; is necessaxy to use the integral indices characterizing it as a whole and incluaing the procese intensiky in themselves. Suck index may be represented by the energy-intensity of breakage of the
1066
material. As a r e s u l t o f the experiments with the specimena having the end s i zes , it was found t h a t the energy-intensity o f breakage considerably depends on the impact energy, For providing the couxse of the process in tbe mode of thxee-dimensional bxeakage,with
and the striker mass must be not less than enough low energy-intensity, the impact energy
some minimum values. Upon exceeding the optimal value of the energy, the energy - intensi ty var ies only s l ight ly whereby an increase of the impact power m u s t lead t o a growth of crushing capacity. The process of impact breakage may begin o n l y at a defined value o f load falling a t a per-unit o f the indenter size. In t h i s
tool, the underst8ndiug o f "per unit length connection, particularly, f o r the wedge-like
of impact energy" was introduced. The values of the impact parameters as t o
with due regard f o r the physico-mechtmical t he s t r i ke r energy and maas should be chosen
character is t ics of the material to be broken. Thus, f o r example, f o r the e f f ic ien t f l o w of the process o f impact breakage o f the specimens with the end s izes , the "per unit
referred t o the length o f the wedge-like tool length of impact energy'., such as the energy
blade having , as it haa been established, the or iented effect o f breakage, m u s t be not below 120-150 J / m - IOm2 f o r most rocks and other bard materials. Our knowledge about the physical essence o f the process o f impact breakage o f materiala one l a y e r a t a time, a t present, reduces t o t h e scheme according t o which the breakage of the materials by the working member of impact action between two succeasive impacts may be divided conventionally into three etages t impact breaking i n EL zone of penetration o f the tool into the material , cueting of a zone with disturbed links produced a f t e r it due t o arising fracturing, and , . a t last, cutt ing of undisturbed material under the action o f the force of the movement of the working member. Depending on the speed of the movement, three var iants o f the values o f the indices of the process are poasible o f which the most favowable variant as regards the breaking intensi-, the magnitude of %he force o f the movement and the apecific energy consumptions is the case when the next impact delivers a f t e r completion o f cutt ing of the zane with disturbed linke. Such frequency of impacts makes it possible to obtain, a fa i r ly h igh speed of the movement at comparatively small t ract ive forces , The optimal values of the parameters o f the process depend on the properties of the medium broken. For example, t o provide a desired magnitude o f penetration o f the wedge-like t o o l when breaking one layer a t a time of a certain thickness o f the frozm s o i l , the per unit length of impact energies of no l e s s than 80-100 J / m . are required. Based on the values of the per unit length of impact energy obtained during experimenlx, fhe minimum value o f the impact energy for most p rac t i ca l ca8es must be not below 800-1000 J. The principle of the impact breakage one layer a t a time has been best widely checked in the f rozen s o i l s and the coals.
1067
The experimental investigations i n t o the breakage of the coals were conducted i n the Kuzbass opencast c o l l i e r i e s , o f the seasonal- frozen soils i n i!IoscovJ, Novosibirsk and Ust-Kamenogorsk,.of the war- f rozen rocks in
Subjected t o the impact br:;&age were the the Zapolyaxye mmes.
coals w i t h hardness o f 0.8 t o 3.0 according t o Prof. M.X. Protodyal.oncv scale , the seasonal-frozen s o i l s o f various grain compo- s i t i ons : loamy, l i g h t sand loam, gravel, the tempepture o f the soils var i ed between -1 t o -12 C, the humidity be tmen 16 t o 287;;. The ever-frozen rocks included SO.. .6C$i o f hard fractions - gravel and quar t i z i t i c boulde ls in s ize t o 0.3xO.3fi.3 m and had a f i l l e r a s a loamy l i g h t sand, clay, s i l t and i ce (common icing of t h e rocks ranged from 20 t o 307i). The temperature o f the frozen mass varied between -7 t o -1OOC. The investigations were carried out on the spec ia l ized fu l ly dimensional stands developed and manufactured f o r the s p e c i f i c conditions. of the breakage as well as with the use o f the base machines (excavator, hard-rock tunneling machine, truck loader) on which the experimental working impact lnembers,such as the pneumatic hammers w i t h energy p e r blow of 500...1700 J and frequency of blows of 6...15 8- l developed by the Mining I n s t i t u t e o f the Siberian Branch o f the USSK Acadeiqy o f Sciences were mounted. The equi la teral chisel teeth with the l i p -le of 35O were used a8 a t o o l . In fhe process o f the investigation o f the break%e one l a y e r a t a time o f the hard materials, the variaUe parameters were as f o l l o w s : the thickness of the layer broken, the energy per single blow, the physico- mechanical properties o f the material, the distance between the t o o l s - pitch o f break%e, angle o f inclination o f t o o l a x i s t o plane of face (angle o f attack). According t o t h i s , t he following magnitudes were determined; the thic'mess o f the broken layer; the cross sections and the Lergth of cuts foxmea a f t e r t he passage of t h e iapact working member; the force o f the movement of the working member; the normal force ac t ing on the t o o l from the s i d e of the face; the speed of the movement of the experimental working members; the duration o f the t e s t s ; the physico-mechanical properties of the material broken. AS a r e s u l t of the conducted investigations of the process o f the breakqe one layemt a time of the hard materials using the impact working members, the knowledge of the physical essence of the process under investigation was obtained, and in par t icu lar the pa t te rn of the formed t race of the breakage was revealed. The process o f the impact breakage one layer at a time is outwardly similar t o the process o f the cutt ing, and is fol lowed by the periodic separation of the elements of spalling with t h e formation o f the t race o f the breakage, whose cross section has a fo rm s imilar t o the trapezoid. The side surfaces o f the t race a r e inclined t o t he ve r t i ca l a t the -le of s ide sp l i t t i ng which decreases wi th an increase o f the thickness of the layer broken (Fig. I). The cross- sectional area of the t race of the breakwe
varied depending on the angle of side split,
y ZQd
Fig.1 Dependence of angle of s p l i t on
I - seasonal-frozen soils; 2 - coal alow the bedding; 3 - coal cross the bedaing; 4 - amy-year-frozen rocks
thickness of layer broken
The exterior ap2earance of the trace of the breakage showed the deformations of breaking- o f f a l o n g the s ide surfaces and the presence of crumple and shear on its bottom. The share of the side surfaces increased with an increase of the thickness of the broken layer, thus the breakage in thick layers ehould be recognized more evedient energetically, The character of the process of the impact breakage of t h e coal and frozen soil using the doubled tools is mainly similar to the process of the breakage using the single tools with tho difference that between the teeth a ridge of undisturbed soil was formed whose height decreased with an increase o f the thickness of the broken layer h and with a decrease of the distance beheen the teeth 1
The horizontal component of the tractive forces increased with an increase o f the broken layer thickness from the parabolic law
w h m breaking the frozen soils, their physico- mechanical properties and temperature acted on the tractive forcas. Thus, when breaking the sandy loam, the magnitude of the horizontal cornponent was less compared to the gravel and
The magnitude of the horizontal component was loamy soils.
dependent on the extent of blocking of the trace of the breakage, In case of t he ever- frozen rocks for the blocked, half-blocked and f r e e schemes of the breakqe,the horizon*al component in the relative units accounted for l:O.5tO.3. These data fox the coal presented in Table show that the broken layer thickness influences the distribution of the magnitude of the horizontal component.
(Fig. 2).
. . (Fie.3).
Fig.2 Dependence of ridge height on thickness of layer to be broken and distance between tools - - coal across the bedding; - -" - aeasoaal-frozen soils
Distribution 09 Foraea for .Various Breaking Schemes
Thickness Form of separation o f layer to be o f layer broken to be broken , cm Blooked' Free Half-blocked with
pitch o f breakage 1, cm 30 I 40 I 50 1 60
Force P, , % I I I
I I I I I I
As the investigations show the normal component 09 the movement force is directed from the face o r towarda the face, dependirq on the magnitude of the impact energy, the strength of worked- out Boil, the angle of attack and the broken layer thickness.Tbus,for the broken layer thickness leea than 15 cm, t h e tendency for expelling of the working member f rom the broken material was obsemred, particularly this was marked for more hard soils, low energies of single impact and low angle of attack. The optimal angle of setti% of the a ~ s of the working members (angle of attack) ranged from 25 to 309. When evaluating the degree of the effecfivenees o f the breaking process, the index of the
1068
specific energy intensity was usea,The t o t a l specific consumption o f energy was determined by the 8um of the consumption of energy for the movement o f t he working member and the consumption of energy for air, in this case the share of the lat ter accounted for 25. ..‘cy0
for the seasonal-frozen soils, 60.*.75% for the coal, up to 94% f o r the ever-frozen rocks.
Fig.3. Dependence of horizontal component o f force o f movement on thickness o f layer t o be broken:
1 - energy per impct A=I000 J , gravel Boil t =-6 C; 2 - A=I000 S, loan~y soil, t =-5OC* 3 - A=500 J , sandy loam, t = - 3 * 5 b ; 4 - A=1000 J, coal* ccompr. = 20 MPa
The specific energy intensity af the breakage one layer at a time of the hard materials by means of the impact woxking members depends on the enepgy per impact,the physico-mechanical propertiaa of the material to be broken, the thickness of the layer to be broken (Fig.4), and takes the optimal value at the definite relatione of the said parameters It decreases to a certain limit with an increase o f the thickness o f the layer to be broken, whereupon (depending on t he conditiom of the breakage) it begina e i t h e r to increase, or remains constant. The increase of the energy o f single impact o f the working member decreaeee t h e magnitude o f the specific consumption of energy. When breaking the material using two or several impact tools, the group influence of the tools on the ma33 to be broken occurs.In this oase at defined values of the pitch o f the breakage and the thickness o f the layer to be separated, the energy intensity of the breakage decreases in comparison t o the operation by one t o o l , The specific energy - intensity o f the impact breakage o f the studied hard materials varied
between 0.1 and 1 ,T k i i - h / m 3 depending. on their stpength. The minium values were obtained when breaking the coal , and the maximum ones when b r e a k i n g t2:e ever-frozen rocks. The coefficient of nonuniformity of the load of the working member varied within 1.5 and 2,5, its values decreased with the increase of t he thickness of t h e Layer to be broken.
Pig.4. Dependence o f specific energy- intensi ty on thickness o f layer t o be broken :
1 - A-500 5 , n=15 s” , frozen l o a q light sand; 2 - A=500 J, k 1 5 s-1, frozen Loamy soil; 3 - A=1000 J , -9.5 s”’# frozen gravel soil; 4 - A = I ~ O O J, n=8.3 s”’ , ever-frozen rocks
The results of the conducted in-situ experimental investigations of t h e impact breakage of the coals, frozen soils and rocks show that the effectiveness of the breakage aP the hard materials is largely dependent on their physico-mechanical properties, grain composition and temperature (for seasonal-
According to the obtained data, the ever- frozen soils and ever-frozen rocks).
fxozen rocks have the greatest resistance, which is explained by their relative low temperatures as well as the content of silt and clay in them possessing the high cementing properties at a negative temperature. The greatest intensity-of the impact breakage was attained in the coals and the se sonal- frozen soils and ranged 150 to 200 m 3 /h far one impact t o o l with energy o f single impact
1069
1000 S and frequency 9.5 s-'.The i n t e n s i t y
fragmental. rocks o b t ined during the of the breakage of the ever-frozen coarse-
experiments was 20 u ~ ; 11 on the averaSe. This index m a y be increased at the expense of an increase o f t h e power o f the inpact device and the d r ive o f the working member. As one nay believe the obtained materials first re su l t i ng from o u r inveacigations fall into the category o f the fundmenta l resu l ta making it p o s s i b l e t o judge w i t h any w s u a n c e about the possibil i ,W a d the aggl ica t ion o f the impact breakage. The data on the per snit length o f the impact energy even _ooint t o t he r equ i r ed l eve l s of t he energy o f single impact o f the device, and hence i t s Joss ib l e s t ruc tu ra l s i ze s . The tendency for an incrcnse o f the pe r un i t length o f the inpact energy a t the elcpense o f a decrease o f t h e width o f t h e t o o l invar i - ably brings about a decrease o f the width of the , trace o f the breakage and may give rise t o d i f f i c u l t i e s a s s o c i a t e d with free passage of the impact device , through the trace of the breakage. The similar pa t t e rn w i l l be obse,rved when increasing the ger un i t l ength of the iapact energy a t the expense o f the parase te rs o f the impact device which with other conditions being equal may lead t o an increase o f i ts overall dimensions. In this case the t rac t ive forces of the movement ( the ho r i zon ta l component of t he t r ac t ive forces) sharply increase and the impact tireaking process stops. The obta ined resu l t s o f the conducted in s i tu experimental invest i fa t ions showed t h e o u t l o o k of the use of t he impact method of the breakage o f the hard coals , f rozen soi ls and rocks. For real iz ing this e f f i c i e n t method of the breakage, the I n s t i t u t e o f Mining of the Siber ian Branch o f the USSR Academy of Sciences has developed and a number o f the ~~laxtts produces i n q u a n t i t y the PXl3OO and PlSl7OO pneumatic hammers which may be mounted on the working e uipmeat
breakage of t h b var ious hard materials of t h e hydraul ic excavators and used 8 o r t he
includinE; the frozen s o i l s . Based on such inrpsct devices, t h e experimental models o f t he ivolking members of t he . t h ing machines of various technological aurposes have been created. The ouclret cf ac t ive action for the excavators o f s t ruc tura l (wi th capac i ty 0 . 6 ~ ~ ) ana quarry (4.6 d ) c la s ses have advantageously passed t h e i n d u s t r i a l t e s t s . The prelianinaxy scientific-engineering developments and the economic designs have shovm tile p o s s i b i l i t y o f c rea t ing the mining rnachines with the working meabers o f impact action and f o r underground mining i n the cocditions o f permafrost.
&J77JCXfj
Nedorezov, I., Eedorov,D., Fedulov,A., Khamc- .shukov,Yu. ('1965). Hezanie i udarnoe
Sibirskoe otdolenie , 15.2 S. razrushenie s~~untov . Novosibirsk: Nauka
Vikhliacv,A., Kamonskii,V., Pedulov,A, (1969). Udarnoe razrushenie krepkilrh materialov. Novosibirsk: NaUa Sibirskoe otdelenie , 158 S O
Fedulov,A., Labutin,V. (1973). Udarnoe razrushenie uglia. Novosibirak: Nauka Sibirskoe otdelenie , 120 8 .
Fedulov,A., Ivanov, R. (1975). Udarnoe
Novoaibirakr Nauka Sibirskoe otdelenie . razrushenie merzlykh gruntov.
'135 5.
udarnogo razrusheni ia bsphykh materialov. Novosibirsk: Bibirakoe otdelenie,
Fedulov,A. (1977). 0 dvykh skhemakh
FT PIipL N 6, S, 63-67" Fedulov,A. Polonskii, G., Karnaulrhov,A.
(19773. Razrabotka merzlykh gruntov rykhliteliami udunogo de is tv i ia , Novosibirakt Nauka Sibirskoe otdelenie. 70 8 .
V, i dr, (1982). Perspektivy sozdanlia potochnoi tekhnologi i na osnove udarnogo
porod pnevmomolotom PN1300. Magadan, razrwheniia mogoletnemerzlykh gornykb
BLepcov,A., Fedulov,A., Labu.t;in,V., Kostyrkin,
K o l w , N 11, 8 . 7-9.
1070
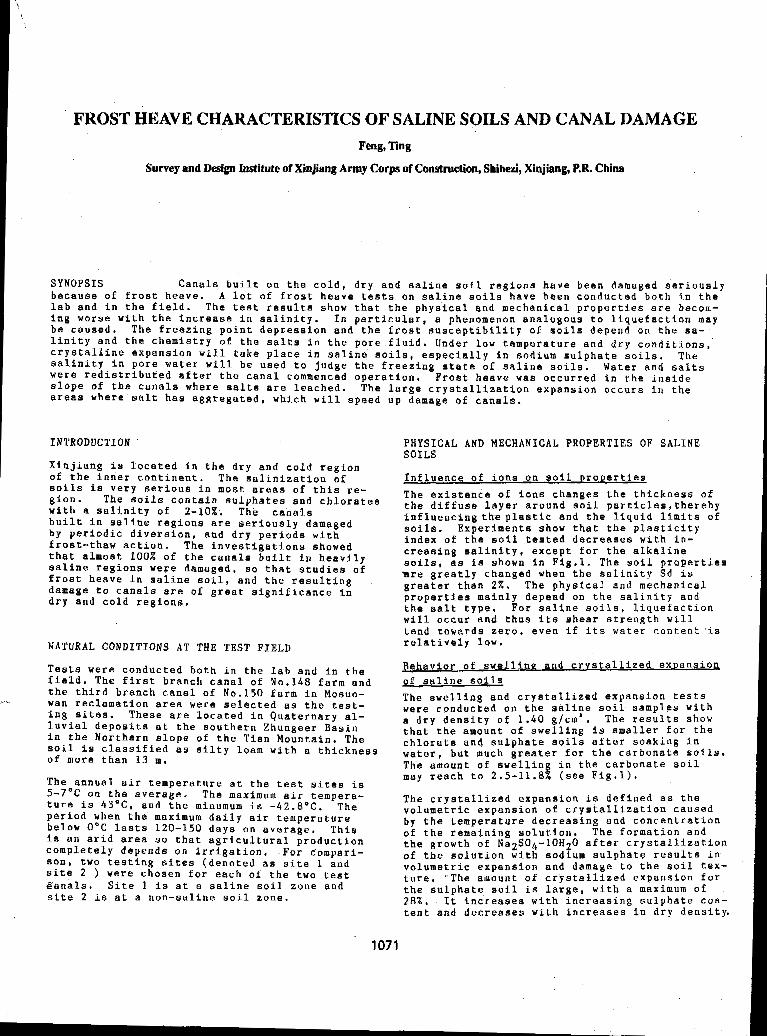
FROST HEAVE CHARACTERISTICS OF SALINE SOILS AND CANAL DAMAGE Feng, Ting
Survey and Design Institute of Xinjiang Army Corps of Construction, Shihezi, Xinjiang, P.R. China
SYNOPSIS Canals built on the cold, dry and saline s o i l regions have been damaged seriously because of frost heave. A lot of frost heave tests on saline soils have been conducted both in the lab and in the field. The test results show that the physical and mechanical properties are becom- ing worse with the increase in salinity. In particular, a phenomenon analogous to liquefaction may be caused. The freezing point depression and the frost susceptibility o f soils depend on the sa- linity and the chemistry of the salts in the pore fluid. Under low temperature and dry conditions,' crystalline expansion will take place in saline soils, especially in sodium sulphate soils. The salinity in pore water will b e used to judge the freezing stare of saline soils. Water and salts were redistributed after the canal commenced operation. Frost heave was occurred in the inside alope of the canals where salts are leached. The large crystallization expansion occurs in the areas where salt has aggregated, which will speed up damage of canals.
INTRODUCTION
Xinjiang is located in the dry and cold region of the inner continent. The salinization of
gion. The soils contain sulphates and chlorates soils is very serious in most areas of this re-
with a salinity of 2-10%. The canals built in saline regions are seriously damaged by periodic diversion, and dry periods with frost-thaw action. The investigations showed that almost 100% of the canals built in heavily saline regions were damaged, so that studies of frost heave in saline soil, and the resulting damage to canals are of great significance in dry and cold regions.
NATURAL CONDITIONS AT THE TEST FIELD
Tests were conducted both in the l a b and in the field. The first branch canal of No.148 farm and the third branch canal of No.150 farm in Mosuo- . ". wan reclamation area were selected aa the test- ing sites. These are located in Quaternary al-
i n the Northern slope of the Tian Mountain. The luvial deposits at the southern Zhungeer Basin
soil is classified as silty loam with a thickness of more than 13 m.
The annual air temperature at the test sites i s 5-7OC on the average. The maximum air tempera- ture is 4 3 ' C . and the minumum is -42.8'C. The period when the maximum daily air temperature below OOC lasts 120-150 days on average. This is an arid area so that agricultural production completely depends on irrigation. For compari- son, two testing sites (denoted a s site 1 and site 2 ) were chosen for each of the two test ganals. Site 1 is at a saline soil zone and site 2 is at a non-saline soil zone.
PHYSICAL AND MECHANICAL PROPERTIES OF SALINE SOILS
Influence o f ions on soil properties The existence o f ions changes the thickness of the diffuse layer around soil particles,thereby influencingth-eplaatic and the liquid lfmits of soils. Experiments show that the plasticity index o f the soil tested decreases with in- creasing salinity, except for the alkaline soils, a s is shown in Fig.1. The soil properties %re greatly changed when the salinity Sd is greater than 2 % . The physical and mechanical properties mainly depend on the salinity and the salt type. For saline soils, liquefaction will occur and thua it8 shear strength will tend towards zero, even if i t 5 water content is relatively l o w .
Behavior o f swelling and crvstallized exDansion o f saline soils The swelling and crystallized expansion tests were conducted on the aali:e soil samples with a dry density o f 1.00 glcm . The results show that the amount of swelling is smaller for the chlorate and sulphate soils after soaking in water, but much greater for the carbonate soils. The amount oE swellin in the carbonate soil may reach to 2.5-11.8$ (see F i g . 1 ) .
The crystallized expansion is defined as the volumetric expansion of crystallization caused by the temperature decreasing and concentration of the remaining solution. The formation and the growth of Na2SOh-lOH20 sfter crystallization of the solution with sodium sulphate results in volumetric expansion and damage to the soil tex- ture. "The amount of crystallized expansion for the sulphate soil is large, with a maximum of 2 8 % . It increases with increasing sulphate con- tent and decreases with increases in dry density.
1071
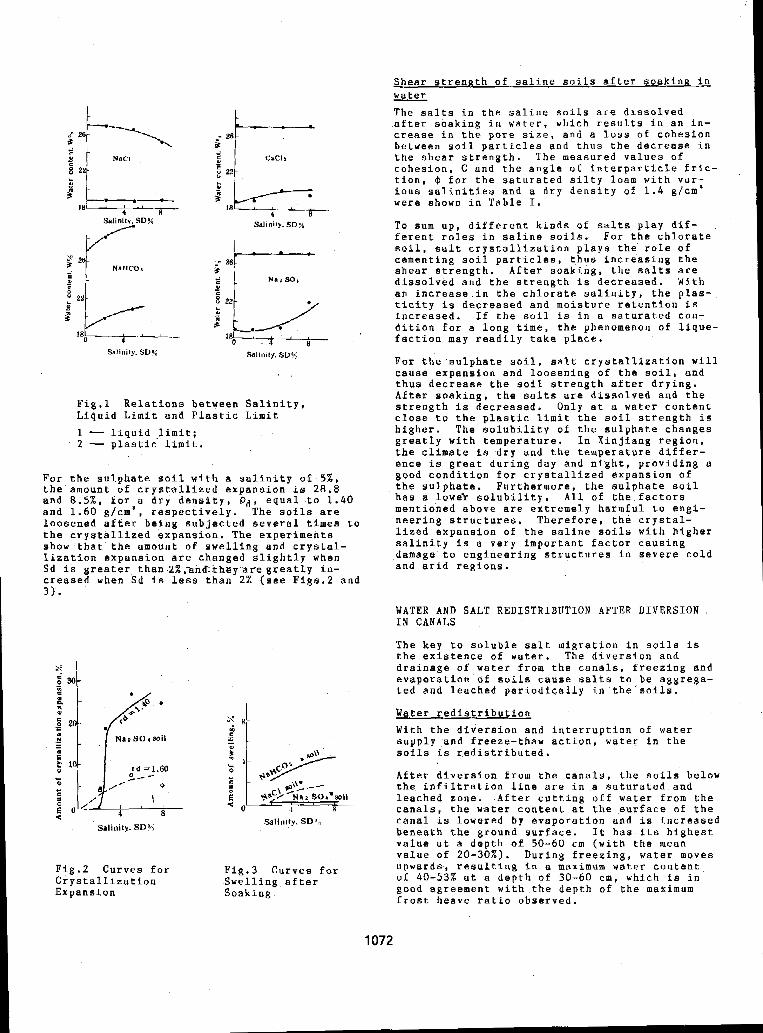
I8
I
Fig.1 Relations between Salinity, Liquid Limit and Plastic Limit 1 - liquid -limit; 2 - plastic limit.
For the sulphate s o i l with a salinity of S % , the amount of crystallized expansion is 2 8 . 8 and 8 . 5 % , forla dry density, Pd, equal to 1.40 and 1.60 g/cm , respectively. The soils are loosened after being subjected several times to the crystallized expansion. The experiments show that the amount of swelling and crystal- lization expansion ate changed slightly when Sd is greater than.Z%,xnd:tkay,are greatly in- creased when Sd is less than 2% (see Figs.2 and 3 ) .
Salinity. SD",,
Fig.2 Curves for Fig.3 Curves for Crystallization Swelling after Expansion Soaking
1072
Shear strenath o f saline soils after soakinn in water The salts in the saline soils are dissolved after soaking in water, which results in an in- crease in the pore size, and a loss of cohesion between soil particles and thus the decrease in the shear strength. The measured values of cohesion, C and the angle o f interparticle fric- tion, 4 for the saturated silty loam with var; ious salinities and a dry density o f 1.4 g/cm were shown in Table I.
To sum up, different kinds of salts play dif- ,
ferent roles in saline soils. For the chlorate soil, salt crystallization plays the role of cementing soil particles, thus increasing the shear strength. After soaking, the salts are dissolved and the strength is decreased. With an increase in the chlorate salinity, the plas- ticity is decreased and moisture retention is increased. If the soil is in a saturated con- dition for a long time, the phenomenon of lique- faction may readily take place.
For the sulphate soil, salt crystallization will cause expansion and loosening of the soil, and thus decrease the soil strength after drying. After soaking, the salts are dissolved and the
close to the plastic limit the soil strength is strength is decreased. Only at a water content
higher. 'The solubility of the sulphate changes greatly with temperature. I n Xinjiang region, the climate is dry and the temperature differ- ence is great during day and night, providing a good condition for crystallized expansion o f the sulphate. Furthermore, the sulphate soil has a lowek solubility. All of the factors mentioned above are extremely harmful to engi- neering structures. Therefore, the crystal- lized expansion of the saline soils with higher salinity is a very important factor causing damage to engineering structures in severe cold and arid regions.
-
WATER AND SALT REDISTRIBUTION AFTER DIVERSION ,
IN CANALS
The kep to soluble salt migration in soils is the existence of water. The diversion and drainage of water from the canals, freezing and evaporation of s o i l s cause salts to be aggrega- ted and leached periodically in the soils.
Water redistribution With the diversion and interruption of water supply and freeze-thaw action, water in the soils is redistributed.
After diversion from the canals, the soils below the infiltration line are in a saturated and leached zone. After cutting o f f water from the canals, the water content at the surface of the canal is lowered b y evaporation and is increased beneath the ground surface. It has its highest value at a depth of 50-60 cm (with the mean value o f 20-3OX). During freezing, water moves upwards, resulting in a maximum water content o f 40-532 at a depth of 30-60 cm, which is in good agreement with the depth of the maximum frost heave ratio observed,
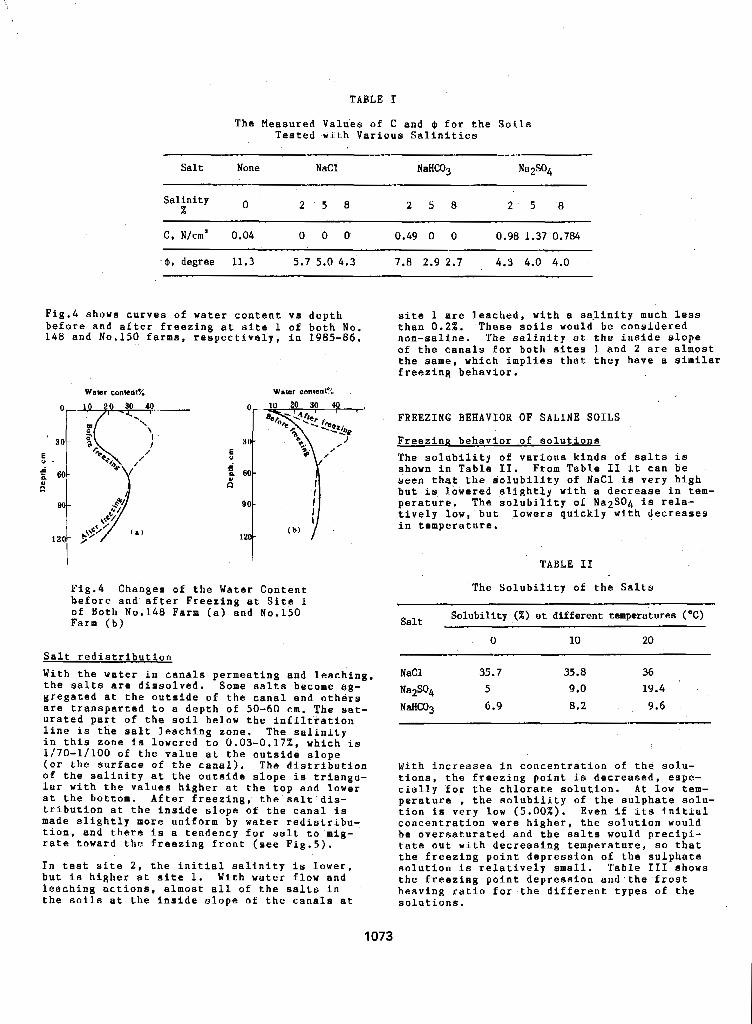
TABLE I
The Measured Values of C and 4 for the Soils Tested with Various Salinities
Salt None NaCl NaHC03 Na2SO4
Salinity x 2 5 8 2 5 8 2 5 '8
C, N/cm' 0.04 0 0 0 0.49 0 0 0.98 1.37 0.784
4, degree 11.3 5.7 5.0 4 . 3 7.8 2.9 2.7 4 . 3 4.0 4.0
Fig.4 shows curves of water content vs depth site 1 are leached, with a salinity much less before and after freezing at site 1 of both No. than 0 . 2 % . These soils would be considered 148 and No.150 €arms, respectively, in 1985-86. son-saline. The salinity at the inside slope
of the canals for both sites 1 and 2 are almost the same, which implies that they have a similar freezing behavior.
Wawr coeitn~%
90
12 i FREEZING BEHAVIOR OF SALINE SOILS
Freezing behavior of solutions The solubility of various kinds of salts is shown in Table 11. From Table I1 it can be seen that the iolubility of NaCl i s very high but is lowered slightly with a decrease in tem- perature. The solubility of NazSO4 i s rela- tively low, but lowers quickly with decreases in temperature.
I I TABLE I1
Fig.4 Changes of the Water Content before and'after Freezing at Site 1 o f Both No.148 Farm (a) and No.150 Farm (b)
Salt redistribution With the water in canals permeating and leaching. the salts are dissolved. Some salts become ag- gregated at the outside of the canal and others are transparted to a depth o f 50-60 cm. The sat- urated part of the soil below the infiltration line is the salt leaching zone. The salinity in this zone is lowered to 0.03-0.17%, which is 11'70-1/100 of the value at the outside slope ( o r the surface of the canal). The distribution of the salinity at the outside slope is triangu- lar with the values higher at the top and lower at the bottom. After freezing, the salt dis- tribution at the inside slope of the canal is made slightly mors uniform by water redistribu-
rate toward the freezing front (see Fig.5). tion, and there is a tendency for salt to mig-
In test site 2 , the initial salinity is lower, but is higher at site 1. With water flow and leaching actions, almost all of the salts In the soils at the inside slope of the canals at
The Solubility of the Salts
Solubility ( X ) at different temperatures ("C)
0 10 20
NaCl 35.7 35.8 36
Na2S04 5 9.0 19.4
NaHC03 6.9 8.2 9.6
With increases i n concentration of the solu- tions, the freezing point is decreaeed, espe- cially for the chlorate solution. At low tem- perature , the solubility of the sulphate solu- tion is very low (5.00%). Even if its initial concentration were higher, the solution would be oversaturated and the salts would precipi- tate out with decreasing temperature, so that the freezing point depression of the sulphate solution is relatively small. Table 111 shows the freezing point depression and,the frost heaving ratio for the different types of the solutions.
1073
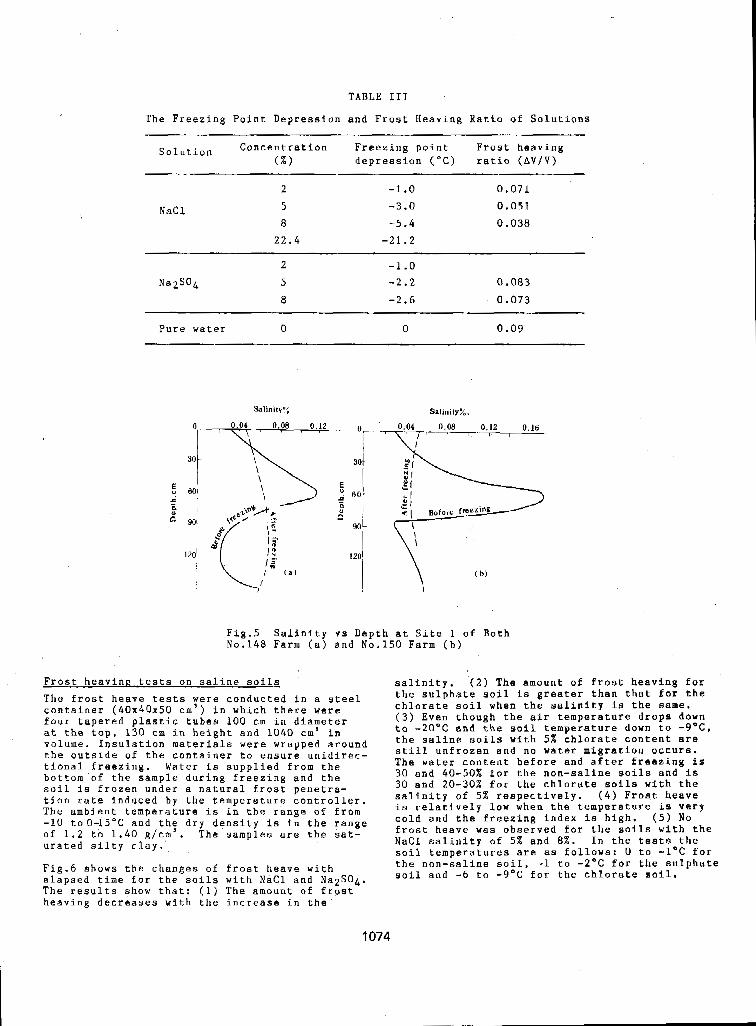
TABLE 111
The Freezing Point Depression and Frost Heaving Ratio of Solutions ~~ ~~ . .
solution Concentration Freezing point Frost heaving - .-
( X ) depression ( " C ) ratio (AV/V)
2 -1 .o 0.071
NaCl 5 8
- 3 . 0 0 . 0 5 1 - 5 . 4 0 . 0 3 8
22.4 - 2 1 . 2
2 - 1 .o Na2S04 5 - 2 . 2 0.083
8 - 2 . 6 0.073
Pure water 0 0 0.09
30
120'
'\ \ \ \ J
- -7
Salinity%.
Fig.5 Salinity vs Depth at Site 1 o f Both N0.148 Farm (a) and N o . 1 5 0 Farm ( b )
Frost heavin.n tests on saline soils The frost heave tests were conducted in a steel container ( 4 0 x 4 0 ~ 5 0 cm') in which there were four tapered plastic tubes 100 cm in diameter at the top, 130 cm i n height and 1040 cm' in volume. Insulation materials were wrapped around the outside o f the container to ensure unidirec-
bottom o f the sample during freezing and the tional freezing. Water is supplied from the
s o l 1 i s frozen under a natural frost penetra- tion rate induced by the temperature controller. The ambient temperature is in the range of from -10 toO-15DC and th: dry density is in the range of 1.2 to 1 . 4 0 g/cm . The samples are the sat- urated silty clay.
Fig.6 shows the changes of frost heave with elapsed time Tor the soils with NaCl and NazS04. The results show that: ( 1 ) The amount o f frost heaving decreases with the increase in the
1074
salinity. ' ( 2 ) The amount of frost heaving f o r the sulphate soil is greater than that €or the chlorate soil when the salinity i e the same. ( 3 ) Even though the a i r temperature drops down to -20°C and the soil temperature down to -9 'C , the saline soils wlth 5% chlorate content are still unfrozen and no water migration occurs. The water content before and after freezing is
30 and 20-30Z for the chlorate soils with the 30 and 4 0 - 5 0 Z for the non-saline soils and is
salinity of 5Z respectively. ( 4 ) Frost heave is relatively low when the temperature is very cold and the freezing index i s high. ( 5 ) No frost heave was observed for the soils with the NaCl salinity of 5% and 8X. In the tests the s o i l temperatures are as follows: 0 to -1OC for the non-saline soil, -1 to -2OC for the sulphate soil and -6 to -9 'C for the chlorate soil.
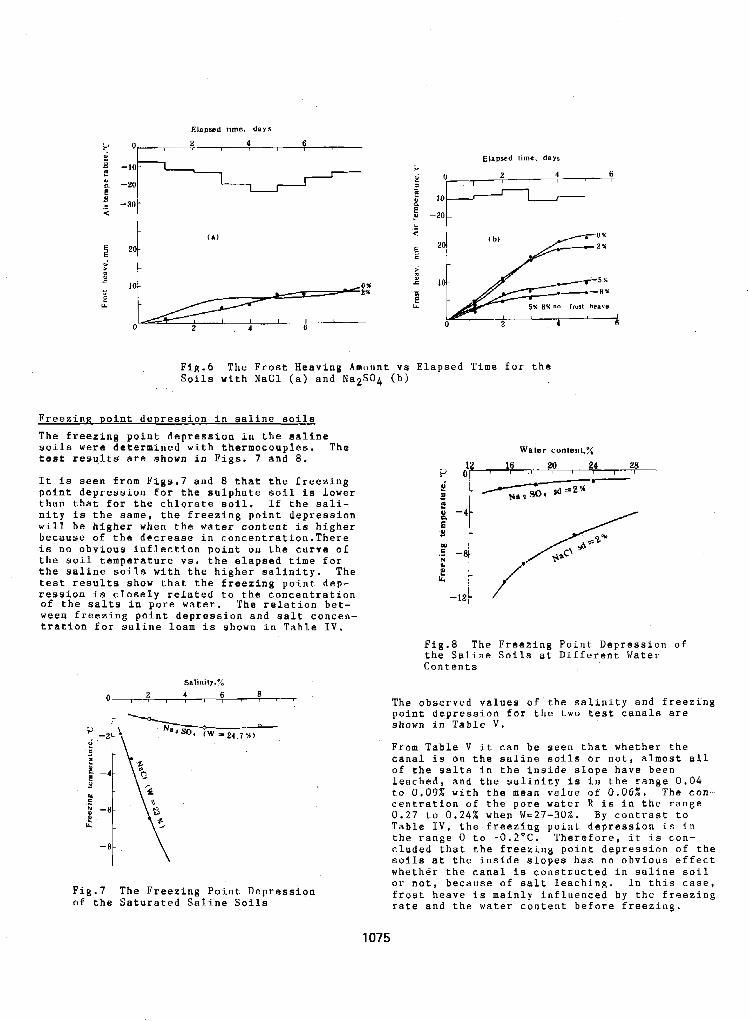
Elapsed time, days
P 0, 2 4 6 I
Freezinn Doint depression in saline soils The freezing point depression in the saline soils were determined with thermocouples. The test results are shown i n Figs. 7 and 8.
It is seen from Figs.7 and 8 that the freezing point depression for the sulphate soil is lower than that for the chlorate s o i l . If the sali- nity is the same, the freezing point depression will be higher when the water content is higher because of the decrease in concentration.There is no obvious inflection point on the curve of the soil temperature VS. the elapsed time for the saline soils with the higher salinity. The test results show that the freezing point dep- ression is closely related to the concentration of the salts in pore water. The relation bet- ween freezing point depression a n d salt concen- tration for saline loam is shown in Table IV.
Salinity.%
0 , 1 , ( , , , ( , I 2 4 6 8
Fig.7 The Freezing Point Depression of the Saturated Saline soils
Water content.%
Fig.8 The Freezing Point Depression of the Saline Soils at Different Water Contents
The observed values o f the salinity and freezing point depression €or the two test canals are shown i n Table V.
From Table V it can b e seen that whether the canal is o n the saline soils or not, almost all of the salts in the inside slope have been leached, and the salinity is i n the range 0 . 0 4 to 0.09% with the mean value of 0.06%. The con- centration o f the pore water R i s in the range 0 . 2 7 to 0.24% when W=27-30%. By contrast to Table IV, the freezing point depression is in
cluded that the freezing point depression o f the the range 0 to -0.2'C. ThereEore, it is con-
soils at the inside elopes has no obvious effect whether the canal is constructed in saline soil or not, because of salt leaching. In this case, frost heave is mainly influenced by the freezing rate and the water cont-ent before freezing.
1075
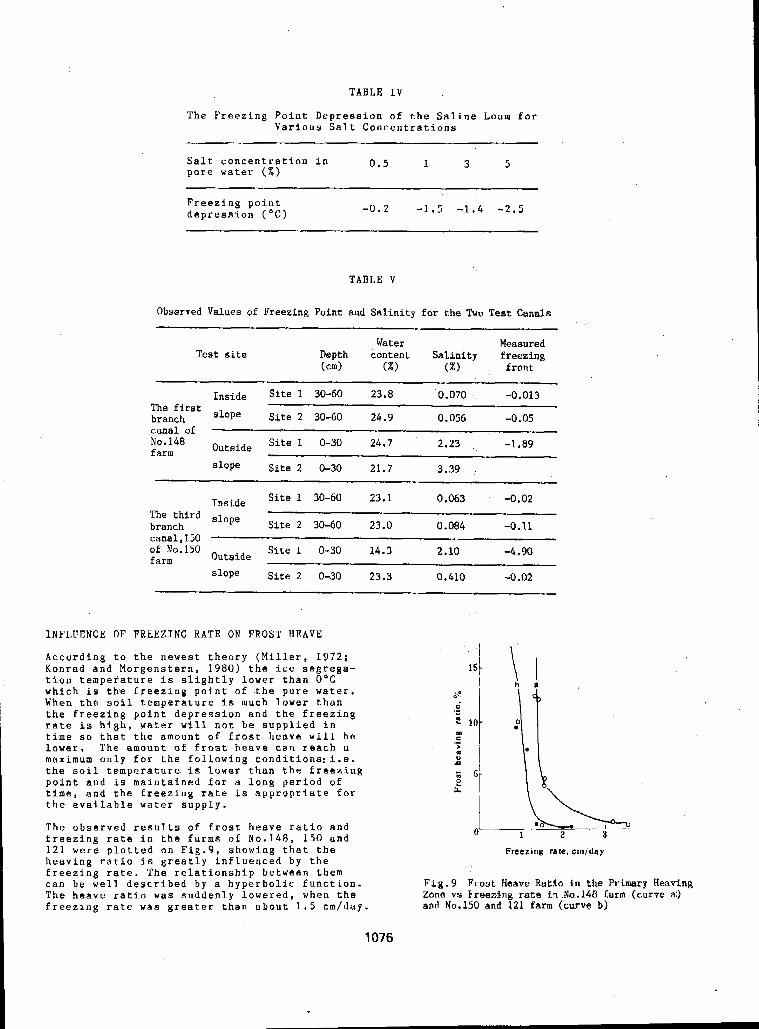
TABLE IV
The Freezing Point Depression of the Saline Loam for Various Salt Concentrations
Salt concentration in pore water ( X ) 0.5 1 3 5
Freezing point depression ( " C ) -0.2 -1.5 -1.4 -2.5
TABLE V
Observed Values of Freezing Point and Salinity for the Two Test Canals
Test site Water Measured
Depth content Salinity freezing ( cm> (X> ( X ) front
Inside Site 1 30-60 23.8 0.070 -0.013 The first slope branch Site 2 30-60 24.9 0.056 -0.05 canal of No*148 Outside farm
Site 1 0-30 24.7 2.23 -1.89
Site 2 0-30 21.7 3.39
Site 1 30-60 23.1 0.063 -0.02 The third slope branch Site 2 30-60 23.0 0.084 -0.11
of No.150 canal, 150
farm Outside Site 1 0-30 14.3 2.10 -4.90
Site 2 0-30 23.3 0.410 -0.02
Inside
INFLUENCE OF FREEZING RATE ON FROST HEAVE
According to the newest theory (Miller, 1972; Konrad and Morgenstern, 1980) the ice segrega- tion temperature is slightly Lower than O ° C which is the freezing point of the pure water. When the soil temperature is much lower than the freezing point depression and the freezing rate is high, water will not be supplied in time s o that the amount of frost heave will be lower. The amount of frost heave can reach a maximum only for t h e following conditi0ns:i.e. the soil temperature is lower than the freezing point and is maintained for a long period of time, and the freezing rate i s appropriate for the available water supply.
The observed results of frost heave ratio and freezing rate in the farms of No.148. 150 and 121 were plotted on Fig.9, showing that the heaving ratio is greatly influenced b y the
can be well described by a hyperbolic function. freezing rate. The relationship between them
The heave ratio was suddenly lowered, when the freezing rate was greater than about 1.5 cm/day
151 I \ b a I
0 L L 1 2 3
Freezing rate, crnlday
Fig.9 F1,ost Heave Ratio in the Primary Heaving Zone vs keening rate i n .N0.140 farm (cur-re a:) and No.150 and 121 farm (curve b)
1076
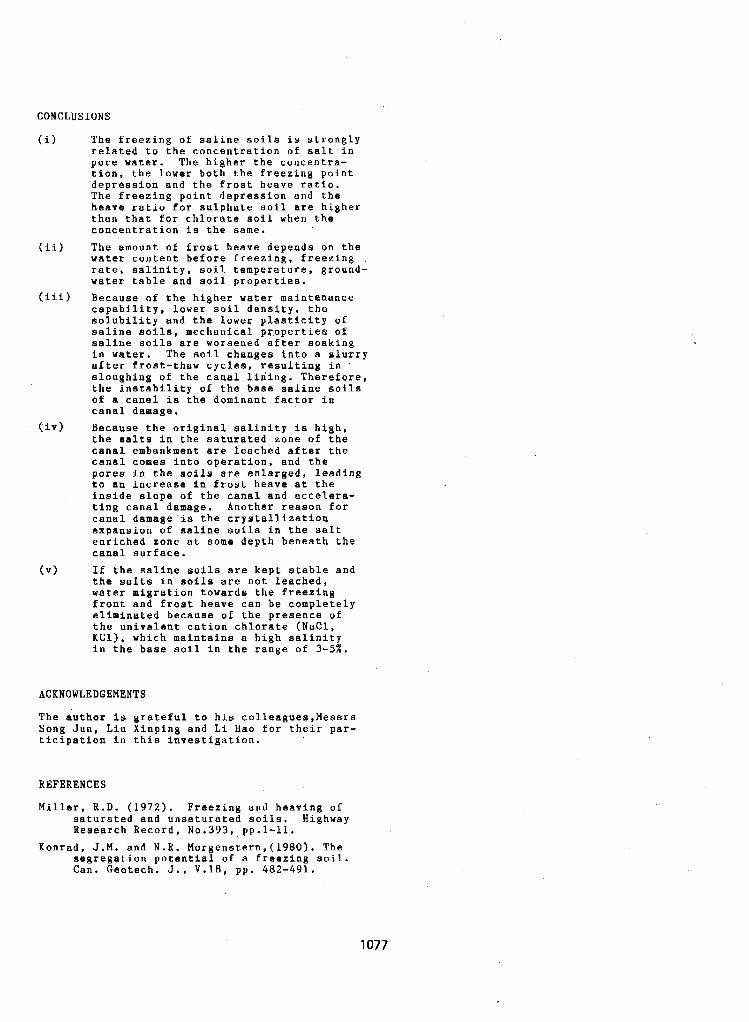
CONCLUSIONS
(i) The freezing of saline soils is strongly related to the concentration of salt in pore water. The higher the concentra- tion, the lower both the freezing point
The freezing point depression and the depression and the frost heave r a t i o .
heave ratio for sulphate soil are higher than that for chlorate soil when the concentration is the same.
(ii) The amount of frost heave depends on the water content before freezing. freezing rate, salinity, soil temperature, ground- water table and s o i l properties.
(iii) Because of the higher water maintenance capability, lower soil density, the solubility and the lower plasticity o f saline soils, mechanical properties of saline soils are worsened after soaking in water. The soil changes into a slurry after frost-thaw cycles, resulting in sloughing of the canal liriing. Therefore, the instability of the base saline soils of a canal is the dominant factor in canal damage.
(iv) Because the original salinity is high, the salts in the saturated zone of the canal embankment are leached after the cana.1 comes into operation, and the pores i n the soils ere enlarged, leading to an increase in frost heave at the inside slope of the canal and accelera- ting canal damage. Another reason for canal damage is the crystallization expansion of saline s o i l s in the salt enriched zone at some depth beneath the canal surface.
(VI If the saline soils are kept stable and the salts In soils are not leached, water migration towards the freezing front and froat heave can be completely eliminated because of the presence of the univalent cation chlorate (NaC1, KCl), which maintains a high salinity in the base soil in the range of 3 - 5 X .
ACKNOWLEDGEMENTS
The author is grateful to his colleagues,Messrs Song Jun, Liu Xinping and Li Hao for their par- ticipation i n this investigation.
REFERENCES
Miller, R.D. (1972). ,Freezing and heaving of saturated and unsaturated soils. Highway Research Record, No.393, pp.1-11.
Konrad. J.M. and N.R. Morgenstern,(l980). The
Can. Geotech. J., V.18, pp. 482-491. segregation potential of a freezing soil.
1077
MECHANICAL PROPERTIES OF FROZEN SALINE CLAYS T. Furuberg' and A.-L. Berggren2
ISINTEF, Division of Geotechnical Engineering, Trondheim, Norway 2Geofrost AB, Oslo, Norway
ABSTRACT A test series which we performed on a very saline permafrost clay from Svalbard drew our attention to the nexus between pore water salinity and the mechanical properties of frozen sa- line soil. To further investigate the effect of pore water salinity we have tested three frozen clays with pore water salinity of -0 g/l, 3 g/1 and 3 3 g/L. Unremoulded samples are used to keep the natural structure of the clays. We have performed both strength and creep tests on the three clays. Unfrozen water content as function of temperature is also determined. For the clay with 33 g/1 sali- nity tests at - 3 , -5. -10 and -2OOC are reported, For the other clays only tests at -5OC are regor- tea, Prom the test results it is seen that increasing gore water salinity leads to increased unfro-
of salinity on mechanical properties of frozen soil is best accounted for through the unfrozen water Zen water content and creep strains and to decreased creep and compressive strength. The influence
content.
TNTRODUCTTON
Our interest in frozen saline soils was initi- ated by a test series which we performed on saline permafrost clay from Svea, Svalbard. The Svea clay has a gore water salinity of 50-60 g/1 and we discovered that its long term strength was very low compared to other frozen clays. Saline marine clays are common in many areas of Norway, thus a knowledge of the properties of frozen saline soil is needed for ground freezing projects. Relatively few tests on frozen saline soils axe reported in the Literature, hence we
clays with different gore water salinities. We started a test aeries on artifically frozen
tested three clays, Risvollan, Stjdrdal and Eberg clay, with gore water salinity of -0 g/1, 3 g/l and 3 3 g/l, respectively. When testing
bed soil samples. Remoulded soil samples are of soils one may either use remoulded or undistur- uniform quality and one may vary a single para- meter like salinity. whilst keeping the others constant. The natural structure of the soil is, however, disturbed; we therefore chose to use unremoulded sanwles. The test series will thus contribute to a database containing results from tests on some typical Norwegian clays. By compa- ring the results from tests on clays with diffe- rent salinities, we hoped to determine the in- fiuence of pore water salinity on the mechanical properties of frozen clay.
We performed both strength and creep tests, Un-
gerature was also determined. A selection of frozen pore water cantent as a function of tem-
the tests performed are presented in this paper, For Stjdrdal clay results from tests at diffe- rent temperatures are given. For the other clays only tests performed at -5OC are presented.
TEST PROCEDURE
cores. The samples were frozen, with no access to water, in a freezer at -26OC. Permafrost clay was cored with an 3" auger. The samples were trimmed on a lathe to a height to diameter ratio of 2. For triaxial tests the samples were clad in a rubber membrane sealed to top and bottom pieces by O-ring seals. For uniaxial tests the
keep the ice from sublimating. samples were given a thin coating of kerosene to
The strength tests were performed in a Geonor press with 5 0 kN capacity. The most commonly used strain rate was 1% min-l. The creep tests were performed in a triaxial creep apparatus. The equipment is described by Berggren (1985). Radial stress is applied by pressurizing the cell fluid. Constant axial stress is produced by an air pressure actuator with constant air pres- suxe. The air pressure is regulated manually to correct Tor sample cross-section increase during the test. All mechanical tests were performed in a cold room.
Unfrozen water content i s determined by two methoas, both in an adiabatic calorimeter and by
tests were performed at the Division of Refrige- the nuclear magnetic resonance method. These
ration Engineering, The Norwegian Institute of Technology, and at the US Army's Cold Regions Research and Engineering Laboratories, respecti- vely.
MATERIAL DATA
origin. Its pore water is almost twice as saline The Svea clay is a permafrost clay of marine
as seawater and the clay holds thick vertical seams of fresh ice. The clay is dark brown with -a relatively high content of organic matter. Risvollan-, Eberg- and Stjdrdal clay are marine clays with varying salinity.
Astifically frozen samples were cut from 5 4 m A summary o f material data is given in Table I
1078
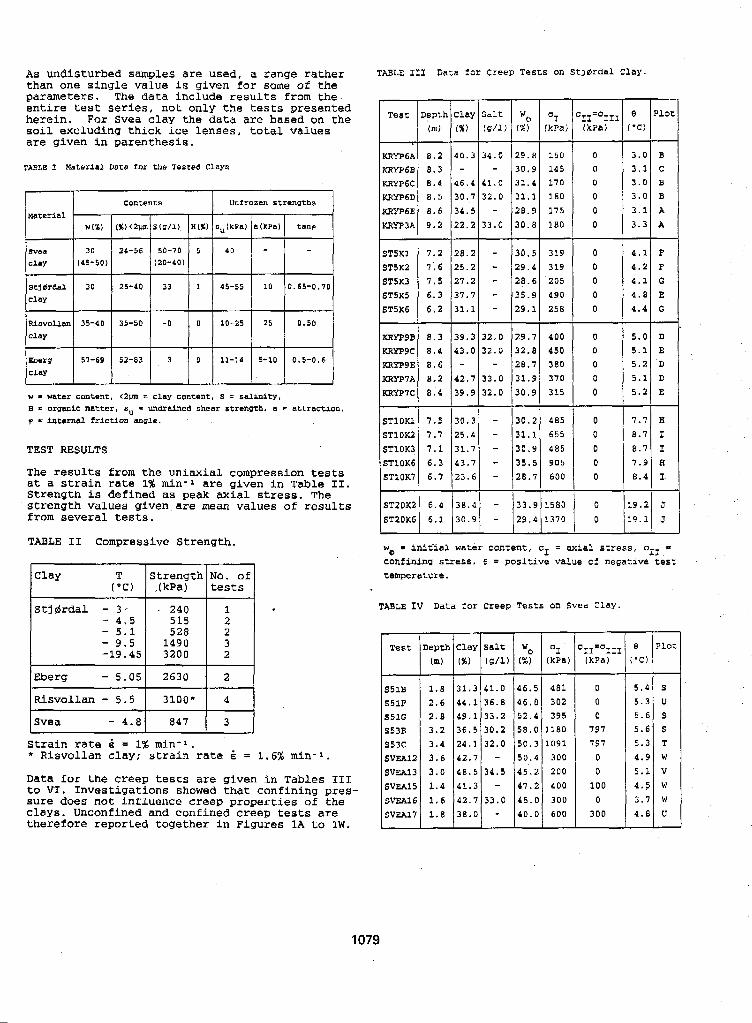
As undisturbed samples are used, a range rather than one single value is given f o r some of the parameters. The data include results from the entire test series, not only the tests presented herein. For Svea clay the data are based on the soil excluding thick ice lenses, total values are given in parenthesis.
TABLE r Nateriul Datu for the Tested C l a m
Contents I untrozen strengths I I
I I I I I I
w - water content, <2pm F cluy content, 8 = selinity, H = organic matter, su = undrained shear strength, a - attruction, p = internal friction angle.
TEST RESULTS
The results from the uniaxial compression tests at a strain rate 1% min-l are given in Table 11. strength is defined as peak axial stress. The strength values given are mean values of results from several tests.
TABLE I1 Compressive Strength.
Clay T strength NO, of ("c) (kPa) tests
Stjdrdal - 3 I' . 240 1 - 4 . 5 515 2 - 9.1 528 2 - 9.5 1490 3 -19.45 3200 2
Eberg - 5.05 2630 2
RisvolLan - 5.5 3100* 4
Sve a - 4 . a 847 3 "
Strain rate i = 1% min-1, * Risvollan clay: strain rate 2 = 1.6% min-1.
Data for the creep tests are given in Tables I11 to V I . Investigations showed that confining gres-
clays. Unconfined ana confined creep tests are sure does not influence creep properties of the
therefore reported together in Figures 1A to 1W,
TABLE I11 Data fox Creep Tests on Stjdrdal clay.
Test Depth
KRYP6A 8.2 KRYP6B 8.3 KRYPSC 8.4 KRYP6D 8.5 KRYP6E 8.6 KRYP3A 9.2
ST5Xl 7.2 ST5K2 7.6 ST5K3 7.5 ~ ~ 5 x 5 6.3 ST5K6 6.2
KRYP9B 8.3 KRYP9C 8.4 mD9E 8.6 KRYP7A 8.2 KRyp7C 0.4
STlOKl 7 .5
STlOK2 7.7 STlOK3 7.1 STlOK6 6.3 STlOK7 6.7
ST20K2 6.4 ST20K6 6.1
I I
40.3 34.0 29.8 - 30.9
46.4 41.0 31.4 30.7 32.0 31.1 34.5 - 28.9
22.2 33.0 30.8
-
28.2 - 30.5 25.2 - 29.4 27.2 - 28.5 37.7 - 35.9 31.1 - 29.1
39.3 32.0 29.7 43.0 32.0 32.8
28.7 42.7 33.0 31.9 39.9 32.0 30.9
- -
I_
OI kPa; I_
150 145 170 160 17 5
180 - 319 319 205 490 258 - 400 450 380 370 315 - 485 655 485 905 600 -
!580 L370 -
0 3.0 B 0 3.1 c 0 3.0 B 0 3.0 B 0 3.1 A 0 3.3 A
0 4.1 F 0 4.2 F 0 4.1 G 0 4.8 E 0 4 .4 G
0 5.0 D 0 5.1 E 0 5.2 D 0 5.1 D 0 5.2 E
0 1 8.7 I 0 8.7 I
7.9 H 0 8.4 I O I
w - i n i t l a 1 water content, cI = axial stress, oII =
con:ining stress, e = positive value 0: negative test temperature.
TABLE IV Data for Creep Tests on Svea Clay.
Clay salt Wo ( 9 6 ) (g/l) (%)
31.3 41.0 46.5 44.1 36.8 46.8 49.1 33.2 52.4 36.5 30.2 58.0 24.1 32.0 50.3 42.7 - 50.4 48.5 34.5 45.2 41.3 - 47.2 42.7 33.0 45.0 38.0 - 40.0
1180 1091
200
300 600
0
1079
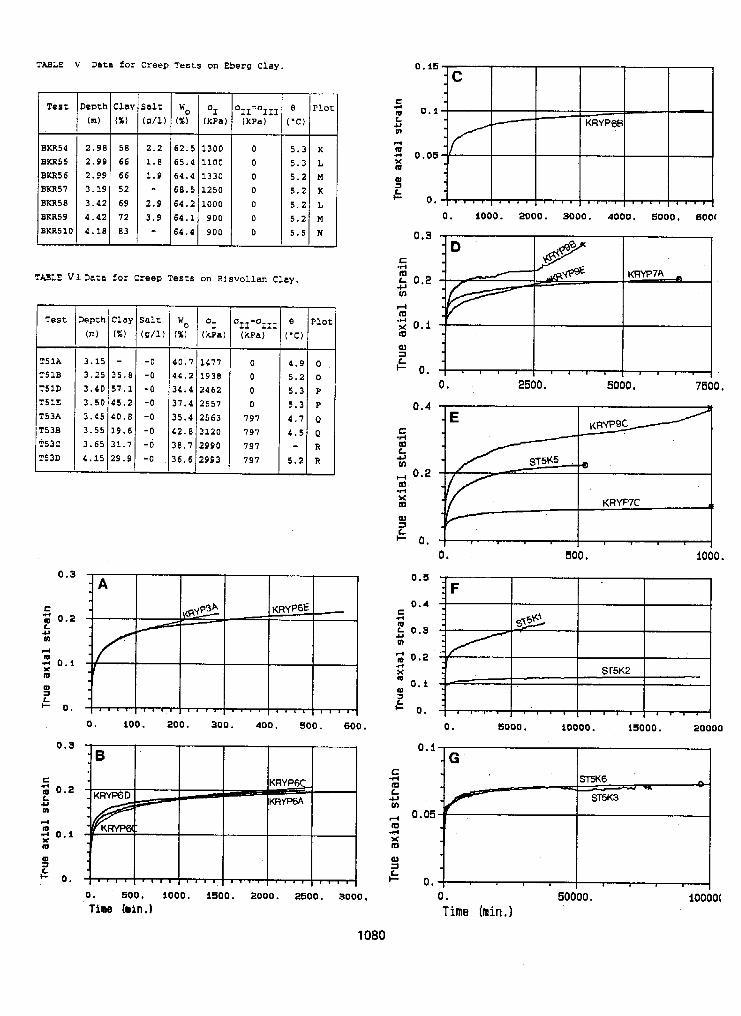
TABLE v Data for Creep Tests on Eberg Clay.
BKR55
BKR57 BKR58
BKR51C
Depth
(m) - 2.98 2.99 2.99 3.19 3.42 4.42 4.18
Clal ( X ) -
58
66 66 52 69 72 83
Salt ( 8/1) - 2.2 1.8 1.9 *
2.9 3.9 -
5.3 5.3 5.2 5.2 5.2 5.2 5 . 5 -
TWLE VIDcZa for Creep Teszs on Risvollan Clay.
T5 1A
T51D T 5 1 E
9 3 : T53D
- lepth
(A ) - 3.15 3.25 3.40 3.50 3.45 3.55 3.65 4.15 -
- -0 40.7 1477 0 35.8 -0 44.2 1938 0
15.2 -0 31.4 2557 o 57.1 -0 34.4 2462 0
40.8 -0 35.4 2563 797 19.6 -0 l 2 . 8 3120 797 31.7 -0 38.7 2990 197 29.9 -0 36.6 2993 797
- e (‘C) - 4.9 5.2 5.3 5.3 4.7 4.5 - 5 . 2 -
’i N M
0 . i 0 0 . 200. 300. 400. 500. 600.
0 . 500. i 000 . 1500. 2000. 2500. 3000.
Time (min. 1
0 . LOOO. 2000. 9000. 4000. 9000. 6001
0.3
c .d
U m !-I
.A
E 0.2
m x 0.1 m
0.
0.4 - - E
2500 e 5000. 7500,
E KRYPQC .d
cl L v1
m
0.2 -rl m
rn
a
x KRYP7C m L
I I
I- 0. , 0. 500. 1000.
0 . 5000. ioooo. 19000. 20000
0.1 1E 4 c tu Y L
VI ,+ 0.05 .A m X rn a2 1 L I- 0.
0. 50000 * 10000( Time (min.1
1080
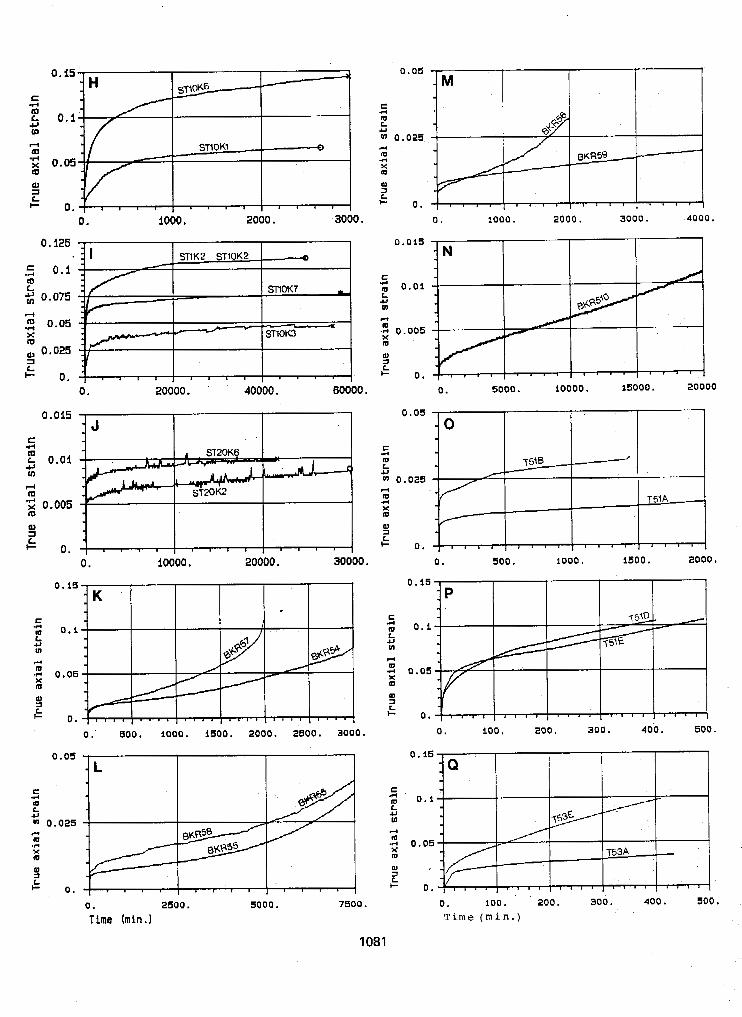
0.15- - H II
0.1
SNOK1 0
0.05
0. 1000. 2000. 3000.
0 . 0 5 -jM
I I I I
0. 1000. 2 0 0 0 . 3000. 4000.
0 . 0 1 5
0. 5000. 10000. isooo. 20000
0. io000 . 20000. 30000. 0 . 5 0 0 . 1000. 1500. 2000 *
0 . i s
C .r( m 0.1 L 4J UI
rl m -c 0.05 m P) 3
0 .
0 . 8 0 0 . 1000. 0 .
" L 0 .os
.rl c m L 4J
0.025 c .C m Br(p58 X I 4' 0 1 0
t 0 .
0 . 2500. 5 0 0 0 . 7 5 0 0 . 0. 100. 2 0 0 . 300. 400. 500 I
Time hin.1 T i m e ( m i n . )
1081
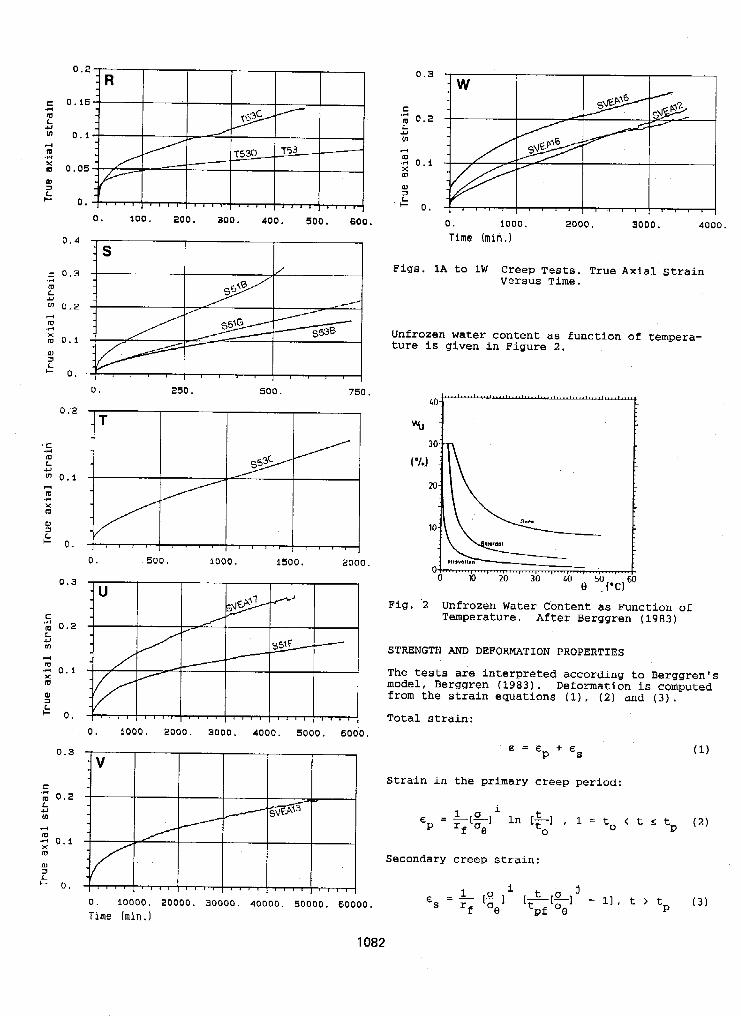
0.2 j R
0.15 1
0 . 0 5 -
0. , " , , , , , , , ( ) , , , , , 0. 100. 2 0 0 . 300. 400. 500. 6 0 0 .
0 , 4 S
m 3 L + 0.
0 . 2
' C .rl
Y L m
(0 0.1 m e
." X m W 1 L + 0.
0.3
C .r( 0.2 L Y tn
rl
.- 0.1 m
m X
ru 3 L + 0.
0.3
c ." L c) u1
rl
m 0.2
" 0.1 m X IU
m 3
0 .
0. 500. l 0 0 0 . i soo . 2000.
0. 1000. 2000. 3000. 4000. 5000. 6000.
I W
0. i o o o . 2000. 3000. 4000. Time (min . I
Unfrozen water content as function of tempera- ture is given in Figure 2 ,
Fig . 2 Unfrozen Water Content as Function of Temperature. After Berggren (1983)
STRENGTH AND DEFORMATION PROPERTIES
The teats are interpreted according to Berggren's model, Berggren (1983). Deformation is computed from the strain equations (1) , (2) and ( 3 ) ,
Total strain:
Strain in the primary creep period:
1 0 i E = -1-1 In , 1 = to < t s t (2) 'f % P
Secondary creep strain:
1082
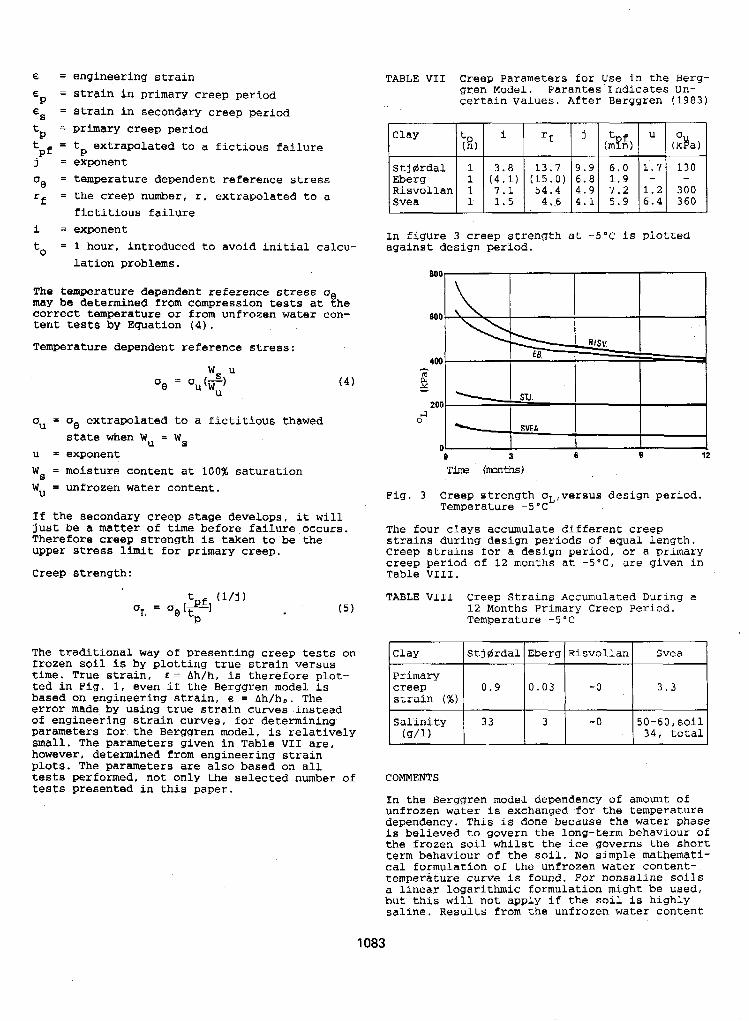
E = strain In primary creep period Es = strain in secondary creep period tp primary creep period t = t extrapolated to a fictious failure j = exponent 0, = temperature dependent reference stress rf = the creep number, r. extrapolated to a
i = exponent to = 1 hour, introduced to avoid initial calcu-
P
Pf p
fictitious failure
lation problems.
may be determined from compression tests at !he The temperature dependent reference stress u
correct temperature or from unfrozen water con- tent tests by Equation ( 4 ) .
Temperature dependent reference stress:
ae = 0 (-) "s
"u ( 4 )
ou = o8 extrapolated to a fictitious thawed
u = exponent WB = moisture content at 100% saturation W,, = unfrozen water content.
If the secondary creep stage develops, it will just be a matter of time before failure occurs. Therefore creep strength is taken to be the upper stress limit for primary creep.
Creep strength:
state when Wu = Ws
t ( l / j ) OL e tp = a [ S I ( 5 )
The traditional way of presenting creep tests on frozen soil is by plotting true strain versus time. True strain, E = Ah/h, i s therefore plot- ted in Fig. 1, even if the Berggren model is based on engineering strain, E = Ph/ho. The error made by using true strain curves instead of engineering strain curves, for determining parameters for the Berggren model, is relatively small. The parameters given in Table VI1 are, however, determined from engineering strain plots, The parameters are also based on all tests performed, not only the selected number of tests presented in this paper.
TABLE VI1 Creep Parameters for Use in the Berg- gren Model. Parantes Indicates Un- certain Values. After Berggren (1983)
Clay I :E) Eberg Risvollan
i
3 . 8 (4.1) 7.1 1.5
In figure 3 creep strength at -5OC is against design period.
plotted
Fig. 3 Creep strength aL,versus design period. Temperature -5°C
The four clays accumulate different creep strains during design periods of equal length. Creep strains for a design period. or a primary creep period of 12 months at -5'C, are given in Table VIII.
TABLE VI11 Creep Strains Accumulated During a 12 Months Primary Creep Period. Temperature -5°C
clay Stjdrdal Eberg RisvoLlan Svea
Primary creep 0.9 0.03 -0 3.3 strain (%)
Salinity 3 3 3 -0 50-60,SOil (g/l) 3 4 , total
COMMENTS
In the Berggren model dependency of amount of unfrozen water is exchanged for the temperature dependency. This is done because the water phase is believed to govern the long-term behaviour of the frozen soil whilst the ice governs the short- term behaviour of the soil. No simple mathemati- cal formulation o f the unfrozen water content- temperature curve is found. Fox nonsaline soils a linear logarithmic formulation might be used, but this will not apply i f the soil is highly saline. Results from the unfrozen water content
1083
tests should therefore be used directly when determining the temperature dependent reference stress, oe.
A3 seen from Fig. 2, the amount of unfrozen water increases with increasing salinity. The most saline clays were therefore expected to be the weakest clays. As seen from Table 11, this is not quite true. The Sves clay has consider- ably higher compression strength than the slight- ly less saline Stjdrdal clay, We believe that this is due to the vertical fresh ice seams in the clay, acting as reinforcement when the clay is subjected to rapid loading. From Fig. 3 it is seen that the creep strength of Svea clay is far less than the creep strength of Stjdrdal clay. The difference between the creep strengths of the two clays are larger than one would expect rrom the difference in total salinity of the clays. In the Svea clay, however, the salt is concentrated in the pores in the soil, 50-60 g / l . whilst the ice seams are fresh, This is probably the reason for the Svea clay's low creep strength.
It i s difficult to quantify directly the influ- ence of pore water salinity on strength o f fro- zen soils. Results presented by Ogata (1983) clearly show that the relative strength reduc- tion caused by increasing salinity is different for different types of soils. Our tests indicate that the relative strength reduction caused by increasing salinity is not the same for compres- aion and creep strength. In our opinion the in- fluence of salinity on strength of frozen soil is best accounted for through the use of unfro- zen water content-temperature curves for deter- mining the temperature dependent reference stress.
A comparison of the creep strengths determined by Berggren's model to creep strengths determi- ned by other methods, shows that the Berggren model gives relatively low creep strengths, This is due to the fact that the model only allows
stresses resulting in primary creep. The creep strains accumulated in the same design period uxe different for different clays. From Table VI11 it'is seen that the creep strains are strongly dependent on pore water salinity. The most saline clays accumulate largest creep strains. As for creep strength, the influence of
through the unfrozen water content. salinity on creep strain is accounted for
CONCLUSIONS
Creep strains and unfrozen water content in- crease with increasing salinity of the clay, whereas creep and compressive strqngth decrease with increasing salinity. The relative strength reduction as salinity,increases is not equal for craep and ComDreSsion. This makes it difficult to quantify t& influence o'f salinity on frozen clay strength directly,. In our opinion the in- fluence o f salinity on strength and deformation properties is best accounted For through the re- lationship between the unfrozen water content and mechanical properties of clay.
REFERENCES
Berggren, A-L. (1983). "Engineering creep models for frozen soil behaviour". Dr. of Engineering thesis at the Norwe- gian Institute of Technology.
Berggren, A-L. and Furuberg, T. (1985). "A new Norwegian creep model and creep equipment". Proceedings ISGF85 Hokkaido University, Sapporo, Japan. pp. 181-185.
Ogata, N,, Yasuda, M. and Kataoka, T. ( 1 9 8 3 ) . "Effects of salt concentration on strength and creep behaviour of artifically frozen soils". Cold Regions Science and Techno- logy 8 (1983) pp. 139-153.
1084
DECREASED SHEAR STRENGTH OF A SILTY SAND SUB.JECTED TO FROST G.P. Gifford
Union College, Schenectady, N.Y.
SYNOPSIS A unique direct simple shear device is described. The device is used to quantitatively assess the thaw-weakening of a soil. A relationship between void ratio and simple shear strength af a silty sand is established. The device is used with a specimen mold, a frost cabinet, and auxiliary instrumentation to establish a relationship between void ratio and post- thaw simple shear strength of the soil. The resulting relationship between void ratio and post- thaw shear strength indicates the soil has weakened due to freeze and thaw. The causes of weakening are increased void ration due to moisture migration during freezing and weakened planes at the location of previous ice lenses. During shear, suspected motion of the thaw-freeze inter- face and flexibility of the reinforced membrane prove shear was not performed at constant volume. Therefore, it cannot be categorically stated that the post-thaw shear strength is Less than the prefreeze strength at all magnitudes of void ratio. However, the device shows great promise for ‘quantitative assessment of thaw-weakening.
INTRODUCTION
The phenomenon of frost heave and subsequent thaw of soils can cause engineering problems, Present solution techniques are expensive and often based on past experience with Little or no scientific basis. A more thorough understanding is required to develop economical design techniques. This paper reports the use of a device which employs the simple shear test mode on unfrozen and thawed soil samples.
The device was developed at Worcester Polytechnic Institute and modeled after the simple shear device of the Norwegian Geotechnical Institute as reported by Bjerrum and Landva (1966). The dimensions of the shear sample are ideal for measuring the shear resistance in a highly anisotropic material, such as a soil sample containing melted ice lenses.
As reported by Bishop (1971), the shearing resistance of a saturated soil is inve.rsely proportional to water content when all other factors are equal. During thaw a soil contains “thaw-weakenedtt zones with little or no ability to resist shear. Alkire (1983) assumes that some form of metastable cluster structure develops in a lOOP8 silt during freeze and thaw, and collapses under load. Little is known regarding the magnitude of strength change caused by this metastable structure.
The objective of this report is to demonstrate a new device capable of assessing the shear strength of a silty sand subjected to frost action. To this end the device was used to develop a relationship between void ratio and shear resistance for a frost-susceptible soil, both before and after thermal conditioning. The test data is statistically analyzed, and a best
void ratio to shear strength. The primary fit empirical equation i s developed relating
thermal conditioning variables which were purposely varied during freeze are rate of heat extraction, thermal gradient, and cycling of freeze--thaw. The effects which these variables have on the post-thaw shear strength are discussed. k
EQUIPMENT EMPLOYED DURING THIS RESEARCH
The direct simple shear (DSS) device consists of a specimen mold and top cap assembly. The device, shown in Fig. 1, is discussed i n detail by Gifford (1984), and is briefly reviewed here.
The specimen mold consists of twenty tapered and interlocked split acrylic discs. As recommended by Shen et a1 (l978), a maximum height to diameter ratio of 1:8 is utilized to maintain relatively uniform shear strain distribution.
The mold is Lined with a tapered rubber membrane which i s laterally reinforced with nylon thread. This membrane is employed during DSS testing to prevent leakage and provide lateral support of the sample.
The top cap assembly i s used to apply normal and shear stress to the thawed sample through the roughened porous stone. The heating element thaws the top of a previously frozen specimen to produce a thaw-weakened DSS test sample. The elevation of the top cap assembly is variable, t o enable a series of DSS tests to be performed on each previously frozen specimen.
The frost cabinet and auxiliary instrumentation are discussed by Gifford et a1 (1983) and reviewed here. In order to simulate frost action in the field, the cabinet i s equipped
1085
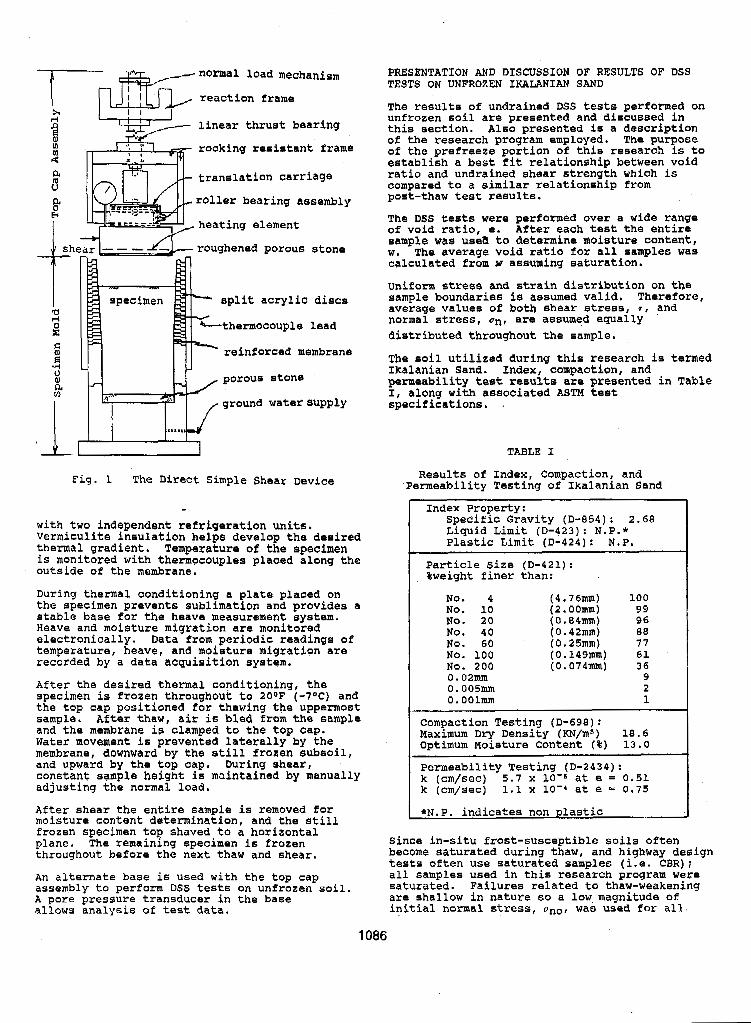
normal load mechanism
reaction frame x I I I rl p linear thrust bearing
rocking resistant frame 2 4 translation carriage 0
roller bearing assembly
heating element
shear roughened porous stone
split acrylic discs
thermocouple lead
reinforced membrane
a, ; B ..!
porous stone
ground watersupply
Fig. 1 The Direct Simple Shear Device
with two independent refrigeration units. Vermiculite insulation helps develop the desired thermal gradient. Temperature of the specimen is monitored with thermocouples placed along the outside of the membrane.
During thermal conditioning a plate placed on the specimen prevents sublimation and provides a
Heave and moisture migration are monitored stable base for the heave measurement system.
electronically, Data from periodic readings of temperature, heave, and moisture migration are recorded by a data acquisition system,
After the desired thermal conditioning, the specimen is frozen throughout to 20°F (-7OC) and the top cap positioned For thawing the uppermost sample. After thaw, air is bled from the sample and the membrane ig clamped to the top cap. Water movement is prevented laterally by the membrane, downward by the still frozen subsoil, and upward by the to^ cap. During shear, constant sample height is mointained by manually adjusting the normal load.
After shear the entire sample is removed f o r moisture content determination, and the still frozen specimen top shaved to a horizontal plane. The remaining specimen is frozen throughout before the next thaw and shear.
An alternate base is used with the top cap assembly to perform DSS tests on unfrozen soil. A pose pressure tranaducer in the base allows analysis of test data.
PRESENTATION AND DISCUSSION OF RESULTS OF DSS TESTS ON UNFROZEN IKALANIAN SAND
The results of undrained DSS tests performed on unfrozen soil are presented and discussed in thie section. Also presented i s a description of the research program employed. The purpose of the prefreeze portion of this research is to establish a best fit relationship between void r a t i o and undrained shear strength whieh is compared to a similar relationship from post-thaw test results.
The DSS tests were performed over a wide range of void ratio, e. After each test the entire sample was uses to determine moisture content, w. The average void ratio for all samples was calculated from w assuming saturation.
uniform stress and strain distribution on the sample boundaries is assumed valid. Therefore, average values of both shear stress, 7 , and normal stress, onl are assumed equally distributed throughout the sample.
The soil utilized during this research is termed Ikalanian sand. Index, compaction, and permeability test results are presented in Table I, along with associated ASTM test specifications. .
TABLE I
Results of Index, Compaction, and Permeability Testing of Ikalanian Sand
Index Property: Specific Gravity (D-854): 2.68 Liquid Limit (D-423): N.P.* Plastic Limit ID-4241: N.P.
Particle Size (D-421): %weight finer than:
No. 4 (4.76mm) 100 No. 10 (2 a OOmm) 99 No. 20 (0.84mm) 96 No. 40 (0 * 42mm) 88 No. 60 (0-25mm) 77 No. 100 (0.1491t1m) 61 NO. 200 (0.074m) 36 0.02mm 9 0.005mm 2 0 . OOlmm 1
Compaction Testing (D-698): Maximum Dry Density (KN/mS) 18.6 Optimum Woisture Content (%) 13.0
Permeability Testing (D-2434) : k (cm/sec) 5 . 7 x LO'$ a t e = 0.51 k (cm/sec) 1.1 x 10" at e - 0.75 *N.P. indicates non plastic I
Since in-situ frost-susceptible soils often become saturated during thaw, and highway design tests often use saturated samples (i.e. CBR): all samples used in this research program were saturated. Failures related t o thaw-weakening are shallow in nature so a low,magnitude oi initial normal stress, uno, was used for all.
1086
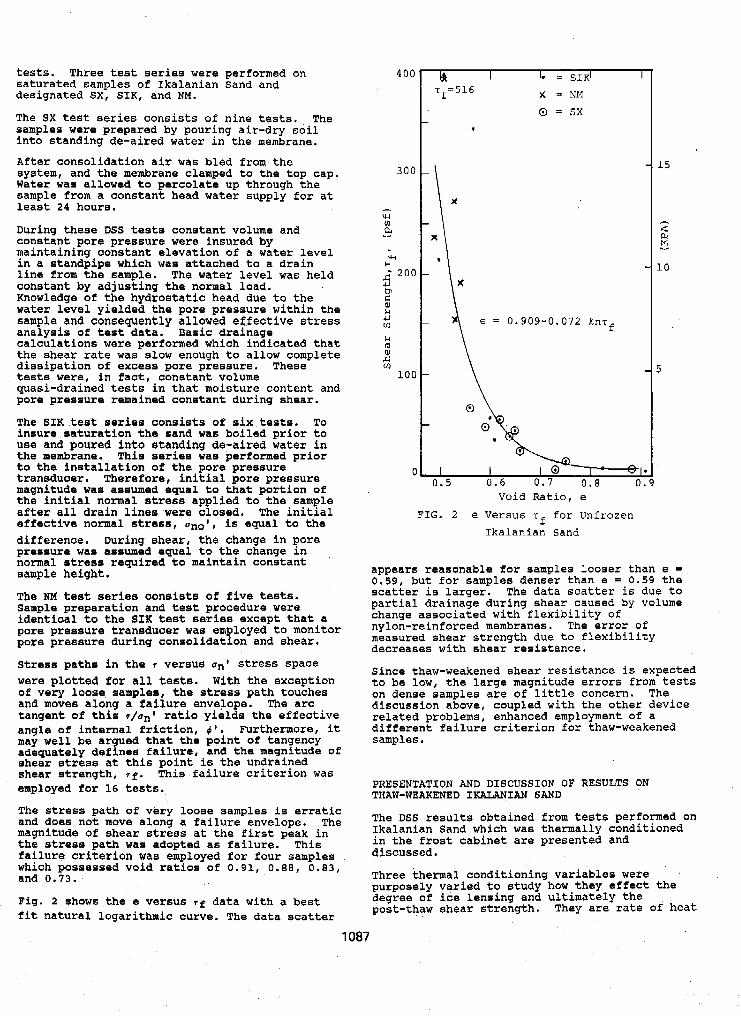
tests. Three test series were performed on
designated SX, SIK, and NM. saturated samples of Ikalanian Sand and
The SX test series consists of nine tests. The samples were prepared by pouring air-dry soil into Standing de-aired water in the membrane.
After consolidation air was bled from the system, and the membrane clamped to the top cap. Water was allowed to percolate up through the sample from a constant head water supply for at least 24 hours.
During these DSS tests constant volume and constant pore pressure were insured by maintaining constant elevation of a water level in a standpipe which was attached to a drain line from the sample. The water level was held constant by adjusting the normal load. Knowledge of the hydrostatic heaa due to the water level yielded the pore pressure within the sample and consequently allowed ef.fective stress analysis o f test data. Basic drainage calculations were performed which indicated that the shear rate was slow enough to allow complete dissipation of excess pore pressure. These tests were, in fact, constant volume quasi-drained tests in that moisture content and pore pressure remained constant during shear.
The SIK test series consists of six tests. To ivsure saturation the sand was boiled prior to use and poured into etanding de-aired water in the membrane. This series was performed prior to the installation of the pore pressure transducer. Therefore, initial pore pressure magnitude Was assumed equal to that portion of the initial normal stress applied to the sample after all drain lines were closed. The initial effective normal stress, uno', is equal to the difference. During shear, the change in pore pressure was assumed equal to the change in normal stress required to maintain constant '
sample height.
The NM t e ~ t series consists of five tests. Sample preparation and test procedure were identical to the SIK test series except that a pore pressure transducer was employed to monitor pore pressure during consolidation and shear.
stress paths in the T versus On' Stress Space were plotted f o r all teats. W i t h the exception of very loose samplea, the stress path touches and moves along a failure enve&ope. The arc tangent of this r/un' ratio yields the effective
may well be argued that the point of tangency angle of internal friction, 9 ' . Furthermore, it
adequately definae failure, and the magnitude of shear stress at this point is thg undsained shear strength, ~ f . This failure criterion was employed for 16 tests.
The stress path of very loose samples is erratic and does not move along a failure envelope. he magnitude of shear stress at the first peak in the stress path was adopted as failure. This failure criterion was employed for four samples which possessed void ratios of 0.91, 0 . 8 0 , 0.83, and 0.73.
Fig. 2 shows the e versus r f data with a best fit natural logarithmic cuwe. The data scatter
0 = sx
X \ x
I I I el 0.5 0.6 0 . 7 0 .8 0
Void Ratio, e FIG. 2 e Versus r f for Unfrozen
Ikalanian Sand
appears reasonable fo r samples looser than e
scatter is larger. The data scatter is due to 0.59, but for raamples denser than e = 0.59 the
partial drainage during shear caueed by volume change associated with flexibility o f
measured shear strength due to flexibility nylon-reinforced membranes. The error of
decreases with shear resistance.
Since thaw-weakened shear resistance is expected to be low, the large magnitude errors from tests on dense samples are of little concern. The discussion above, coupled with the other device related problems, enhanced employment of a different failure criterion for thaw-weakened samples.
PRESENTATXON AND DISCUSSION OF RESULTS ON THAW-WEAKENED IKALANIAN SAND
The DSS results obtained from tests performed on Ikalanian Sand which was thermally conditioned in the frost cabinet are presented and discussed.
Three 'thermal conditioning variables were purposely varied to study how they effect the degree of ice lensing and ultimately the post-thaw shear strength. They are rate of heat
1087
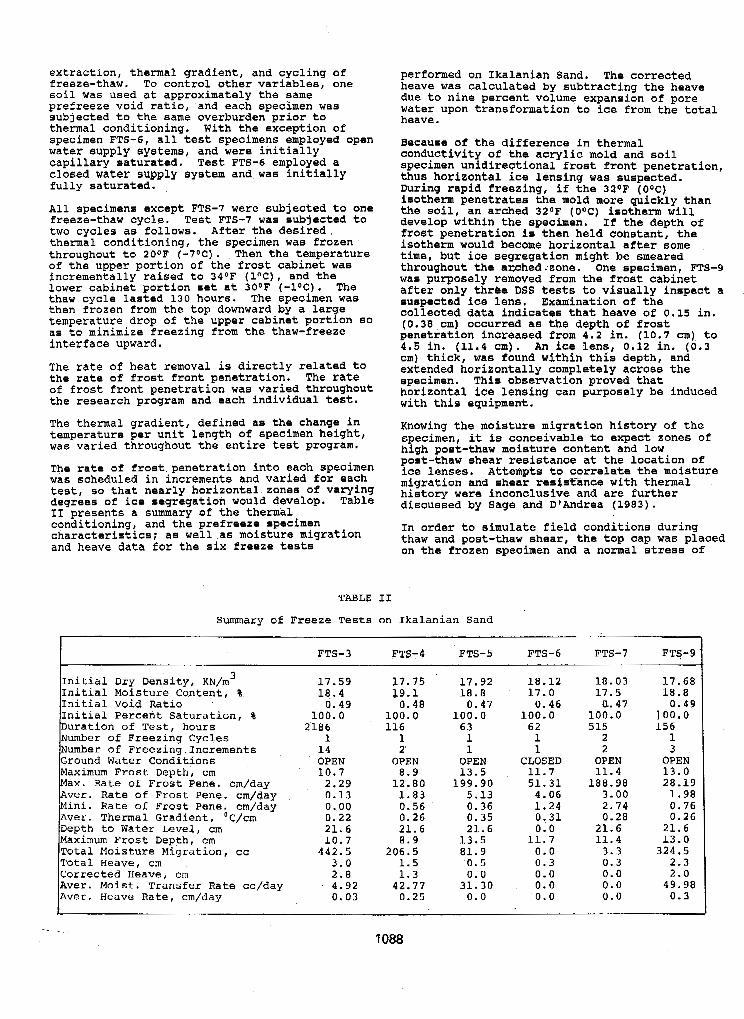
extraction, thermal gradient, and cycling of
soil was used at approximately the same freeze-thaw. To control other variables, one
prefreeze void ratio, and each specimen was subjected to the same overburden prior to thermal conditioning. With the exception of specimen FTS-6, all test specimens employed open water supply systems, and were initially capillary saturated. Test FTS-6 employed a closed water supply system and was initially fully saturated.
All specimens except FTS-7 were subjected to one freeze-thaw cycle. Test FTS-7 was subjected to two cycles as follows. After the desired thermal conditioning, the specimen was frozen throughout to 200F ( - 7 o C ) . Then the temperature of the upper portion of the frost cabinet was incrementally raised to 340F (lac), and the lower cabinet portion set at 30°F ( -1OC) . The thaw cycle lasted 130 hours. The specimen was then frozen from the top downward by a large temperature drop of the upper cabinet portion so as to minimize freezing from the thaw-freeze interface upward.
The rate of heat removal is directly related to the rate of frost front penetration. The rate of frost front penetration was varied throughout the research program and each individual test.
The thermal gradient, defined as the change in temperature per unit length o f specimen height, was varied throughout the entire test program.
The rate of frost penetration into each specimen was scheduled in increments and varied f o r each test, so that nearly horizontal zones of varying degrees of ice segregation would develop. Table I1 presents a summary of the thermal conditioning, and the prefreeze specimen characteristics; as well as moisture migration and heave data for the six freeze tests
performed on Ikalanian Sand. The corrected heave was calculated by subtracting the heave due to nine percent volume expansion of pore water upon transformation to ice from the total heave.
Because of the difference in thermal conductivity of the acrylic mold and soil specimen unidirectional frost front penetration, thus horizontal ice lensing was suspected. During rapid freezing, if the 32OF ( o w ) the soil, an arched 32OF (OOC) isotherm will isotherm penetrates the mold more quickly than
develop within the specimen. If the depth of frost penetration is then held constant, the isotherm would become horizontal after some time, but ice segregation might be smeared throughout the azchedizone. One specimen, FTS-9 was purposely removed from the frost cabinet after only three DSS tests to visually inspect a suspected ice lens. Examination of the collected data indicates that heave o f 0.15 in. (0.38 cm) occurred a8 the depth of frost penetration increased from 4.2 in. (10.7 cm) to 4 .5 in. (11.4 cm). An ice lens, 0.12 in. (0.3 cm) thick, was found within this depth, and extended horizontally completely across the specimen. This observation proved that horizontal ice lensing can purposely be induced with this equipment,
Knowing the moisture migration history of the specimen, it is conceivable to expect zones of high post-thaw moisture content and low post-thaw shear resistance at the location of
migration and shear resisc%nce with thermal ice lenses. Attempts to correlate the moisture
history were inconclusive and are further discussed by Sage and D'Andrea (1983).
In order to simulate field conditions during thaw and post-thaw shear, the top cap was placed on the frozen specimen and a normal stress of
Summary of Freeze Tests on Ikalanian Sand
FTS-3 FTS-4 FTS-5 FTS - 6 FTS-7 FTS-9 ' Initial Dry Density, KN/m 3 17.59 Initial Moisture Content, % 18.4 Initial void Ratio 0.49 Initial Percent Saturation, % 100.0 Duration of T e s t , hours 2186 Number of Freezing Cycles 1 Number of Freezing Increments 14 Ground Water Conditions OPEN Maximum Frost Depth, cm 10.7 Max. Rate of Frost Pene. cm/day 2.29 Aver. Rate of Frost Pene. cm/day 0.13 Mini. Rate o f Frost Pene. cm/day 0.00 Aver. Thermal Gradient, 'C/crn 0.22 Depth to Water Level, cm 21.6 Maximum Frost Depth. cm 10.7
17.75 19.1 0.48
100.0 116
1 2
OPEN
12.80 8.9
1.83
0.26 0.56
21.6 8.9
17.92 18.8
100.0 0.47
63 1 1
OPEN 13.5 199.90
5.13 0.36 0.35 21.6
13.5
18.12 18.03 17.0 17.5 0.46 a. 47
100.0 100.0 62 515 1 2 1 2
CLOSED OPEN 11.7 51.31 188.98
11.4
4.06 3.00 1.24 2.74 0.31 0.28 0.0 21.6
11.7 11.4
17.68 18.8
100.0 0.49
156 1 3
OPEN 13.0 28.19 1.98 0.76 0.26
21.6 13.0
Total Moisture Migration , cc 442.5 206.5 81.9 0.0 3.3 324 e 5 Total Heave, cm 3.0 1.5 0.5 0.3 0.3 2.3 Corrected Heave, cm 2.8 1.3 0.0 0.0 0.0 2.0 Aver. Moist. Transfer Rate cc/day 4.92 42.77 31.30 0.0 0.0 49.98 Aver. Heave Rate, cm/day 0.03 0.25 0.0 0.0 0.0 0.3
1088
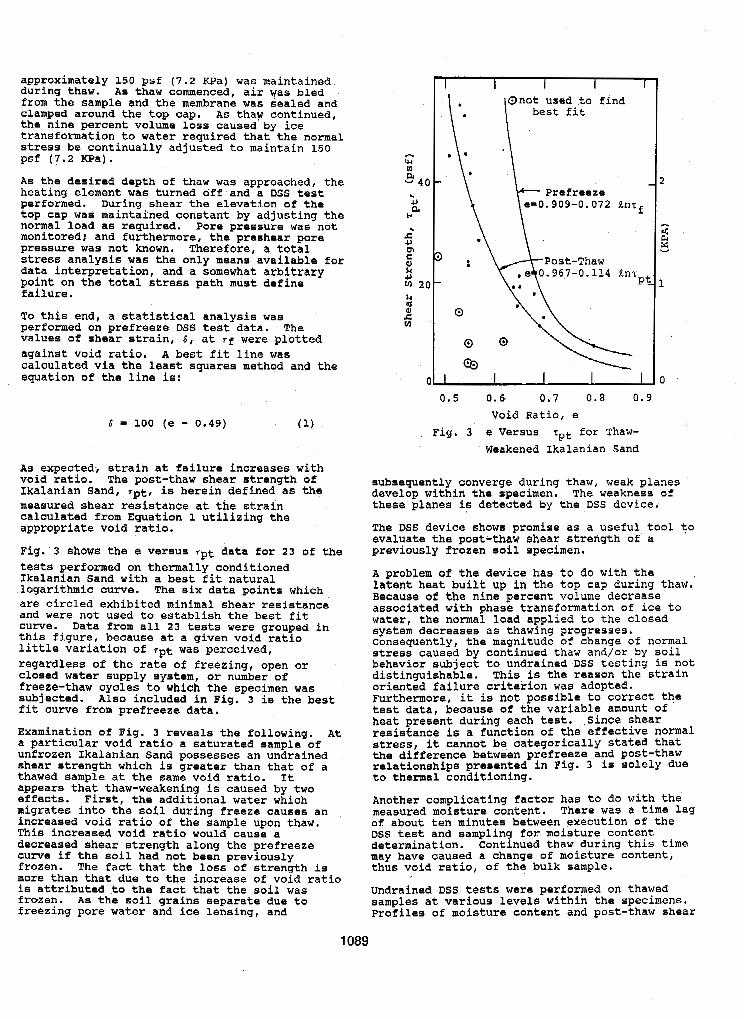
approximately 150 psi (7.2 KPa) was maintained during thaw. ha thaw commenced, air was bled from the sample and the membrane was sealed and clamped around the top cap. As thaw continued, the nine percent volume loss caused by ice transformation to water required that the normal stress be continually adjusted to maintain 150 psf (7.2 KPa)
As the desired depth o f thaw was approached, the heating element was turned off and a DSS test performed. During shear the elevation o f the top cap was maintained constant by adjusting the normal load as required. Pore pressure was not monitored; and furthermore, the preshear pore pressure was not known. Therefore, a total stress analysis was the only means available for data interpretation, and a somewhat arbitrary point on the total stress path must define failure.
To this end, a statistical analysis was performed on prefreeze DSS test data. The values o f shear strain, 6, at rf were plotted against void ratio. A best fit line was calculated via the least squares method and the equation of the line is:
6 = 100 (e - 0.49) (1)
AS expected, strain at: failure increases with void ratio. The post-thaw shear strength of Ikahnian Sand, rpt, is herein defined as the measured shear resistance at the strain calculated from Equation 1 utilizing the appropriate void ratio.
Fig. 3 shows the e versus r P t data for 23 of the tests performed on thermally conditioned Ikalanian Sand with a best fit natural logarithmic curve. The s i x data points which are circled exhibited minimal shear resistance and were not used to establish the best fit curve. Data from all 23 tests were grouped in this figure, because at a given void ratio little variation of r P t was perceived, regardless of the rate o f freezing, open or closed water supply syetem, or number of freeze-thaw cycles to which the specimen was subjected. Also included in Fig. 3 is the best fit cuxve from prefreeze data.
Examination of Fig. 3 reveals the following. At a particular void ratio a saturated sample of unfrozen Ikalanian Sand possesses an undrained shear strength which is greater than that of a thawed sample at the same void ratio. It appears that thaw-weakening is caused by two effects. First, the additional water which migrates into the soil during freeze causes an increased void ratio of the sample upon thaw. This increased void ratio would cause a decreased shear strength along the prefreeze curve if the soil had not been previously frozen. The fact that the loss of strength is more than that due to the increase of void ratio is attributed to the fact that the soil was frozen. AS the soil grains separate due to freezing pore water and ice lensing, and
1089
Prefreeze 909-0.072 Enrf
0 . 5 0.6 0.7 0 . 8 0.9 Void Ratio, e
Fig. 3 e Versus T~~ €or Thaw- Weakened Ikalanian Sand
subsequently converge during thaw, weak planes develop withih the specimen. The weakness of these planes is detected by the DSS device.
The DSS device shows promise as a useful tool to evaluate the post-thaw shear strength of a previously frozen eoil specimen.
A problem of the device has to do with the latent heat built up in the top cap during thaw. Because of the nine percent volume decrease
water, the normal load applied to the closed associated with phase transformation of ice to
system decreases as thawing progresses. Consequently, the magnitude of change of normal stress caused by continued thaw and/or by soil behavior subject to undrained DSS testing is not distinguishable. This is the reason the strain oriented failure criterion was adopted. Furthermore, it is not possible to correct the test data, because of the variable amount of heat present during each test. Since shear resistance is a function of the effective normal
the difference between prefreeze and post-thaw stress, it cannot be categorically stated that
relationships presented in Fig. 3 is solely due to thermal conditioning.
Another complicating factor has to do with the
of about ten minutes between execution of the measured moisture content. There was a time lag
DSS test and sampling for moisture content determination. continued thaw during this time may have caused a change of moisture content, thus void ratio, of the bulk sample.
Undrained DSS tests were performed on thawed samples at various levels within the specimens. Profiles of moisture content and post-thaw shear
strength with depth are presented by Gifford (1984). The profiles accentuate the anisotropic s o i l shear strength which is expected in a previously frozen soil column. The DSS test mode is geometrically ideal to investigate the shear resistance at the thaw-weakened zones of limited vertical extent.
CONCLUSIONS
As demonstrated herein, this unique direct
post-thaw shear strength of a frost-susceptible simple shear device can be used to evaluate the
soil. This pioneering use of the DSS test mode is particularly useful to assess the shear resistance at weakened zones of a previously frozen soil column. Even though the results presented are inconclusive, a new method of quantitatively measuring both the prefreeze and post-thaw shear strength o f soil i s introduced.
The following conclusions were reached:
transducer into the alternate DSS test device is 1. The incorporation of a pora pressure
useful, in that effective stress analysis of test data is available.
2. As presently designed, the DSS device i s Less effective in assessing the strength of a thaw-weakened soil utilizing total. stress analysis.
-3. Use of this DSS device lends itself to examination of the anisotropic zonal nature of thaw-weakened soil; especially Considering previous studies which used conventional test methods.
4. Based on test results presented herein, the following behavioral characteristics are noted specifically for Ikalanian sand:
a. The undrained shear strength of saturated Ikalanian sand decreases with increased void ratio.
b . Under appropriate conditions, frost heaving of Ikalanian Sand produces ice lensing and subsequent zones of high moisture content after thaw. Furthermore, these zones exhibit undrainad DSS strength magnitudes which are greatly reduced from the prefreeze strength,
c. The post-thaw DSS strength of Ikalanian Sandis independent of the rate of frost penetration, the water supply system (open or closed), and the number of freeze-thaw cycles to which it had been previously subjected.
Sand 'is less than that of the unfrozen saturated soil at an equivalent void ratio.
e. Thermal conditioning which causes an increase in Localized moisture content produces a weakened plane within the Ikalanian Sand upon thaw. Therefore, thaw-weakening is produced not only by the
and decreased residual stress, but also from increased moisture content (i.e. void ratio)
grain separation on some plane.
d . The post-thaw DSS strength of Ikalanian
ACKNOWLEDGEMENTS The research described has been partially supported by the United States Department of
Research.and their contributions are gratefully Transportation, office o f University
acknowledged. The views presented herein, however, are those of the author. Thanks are also extended to the Massachusetts Department of Public Works Frost Research Station for supplying the Ikalanian Sand used during research.
REFERENCES
Alkire, B. D., and Morrison, J. M., (1983
t his
"Chanae in Soil Structure Due to Freeze-Thaw 1 . - - - . - -
and RGpeated Loading, Transportation Research
Bishop, A. W. , (1971) . "Shear Skrength Parameters Record #918, pp. 15-22.
for Undisturbed and Remolded Soil Specimens," In Stress-Strain Behavior of Soils, Proceedings, Roscoe Memorial Symposium, Cambridge University, Cambridge, England, pp. 3-58.
Bierrum, L. and Landva, A , , (1966). "Direct -Simple Shear Tests on a Norwegian Quick Clay, I 1
Geotechnique, Vol. 16, No. 1, pp. 1-20. Gifford, G. P. , (1984) - 'IAssessment of Shear
Strenqth Loss of a Silty Sand Subjected to Frost-Action, Dissertation Presented to the Faculty of Worcester Polytechnic Institute, Worcester, Ma., in partial fulfillment of the requirements for the degree o f Doctor of
Gifford, G. P., DIAndrea, R. A., and Sage, J. Philosophy.
D . , (1983). "A Device for the Evaluation of Thaw-Weakening of Frost-Susceptible Soil,'I Transportation Research Record #918, pp. 16-15.
Sage, J. D. , and D'Andrea, R. A., (1983). "Shear Strength Characteristics of Soils Subjected to Frost Action," Final Report DTRS 5680-C-00035, Department of Transportation, Washington, D. C. , 143 pp. .
Shen, C., Sadigh, K., and Hermann, L., (1978). "An Analysis of NGI Simple Shear Apparatus €or Cyclic Soil Testing," Dynamic Geotechnical Testing, ASTM STP654, pp. 148-162.
1090
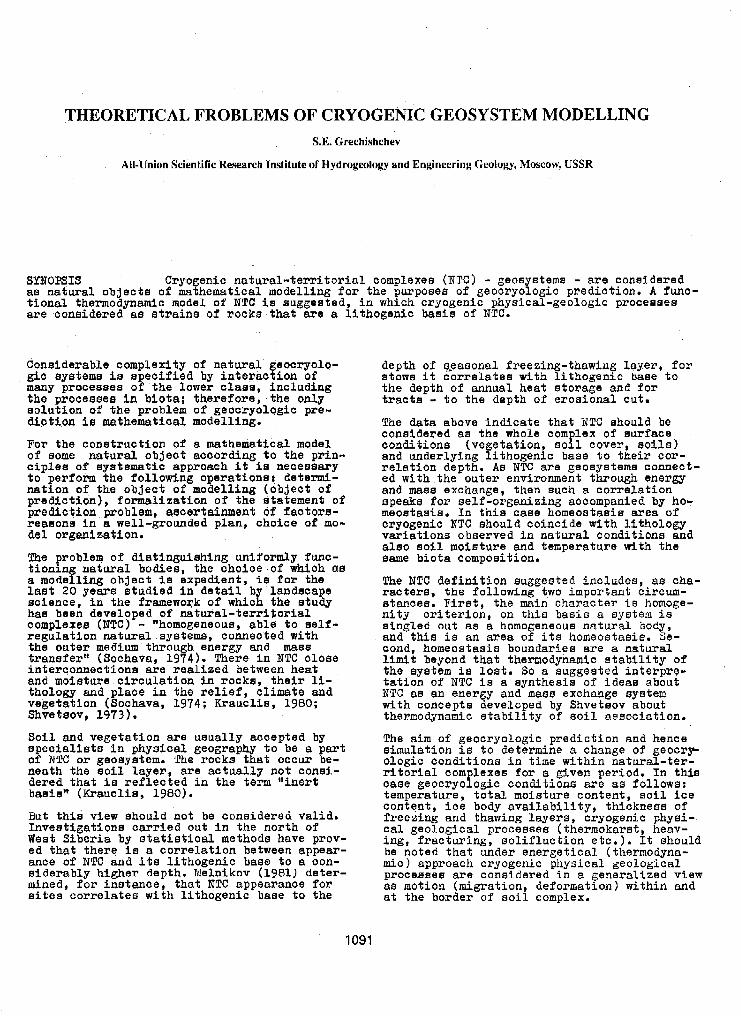
THEORETICAL FROBLEMS OF CRYOGENIC GEOSYSTEM MODELLING S.E. Grechishchev
All-Union Scientific Research Institute of Hydrogeology and Engineering Geology, MOSCOW, USSR
SYNOPSIS Cryogenic natural-territorial complexes ( N E ) - geosystems - are considered a8 natural objecte of mathematical modelling for the purposee of geocryologic prediction. A funo- tional thermodynamic model of NTC is suggested, in which cryogenic physical-geologic proceases are considered as etrains of rocks that a r e a lithogerdc baais of NTC.
Considerable complexity of natural geocryolo- gic ayetema i e specified by interaction of m y pxocessea of the lower elaas, including the proceases i n biota; therefore, the only aolution of the problem of geocryologic pre- action i s mathematical modelling.
For the conetruction of a mathematical model of some natural object according t o the pfin- ciplea of eystematic approach it ia necessary t o perfom the following operation88 determi- nation of the object of modelling (objec t of prediction), formalization o f the statement of prediction problem, ascertainment o f faotors- reasona in a well-grounded plan, choice o f mo- del organization.
The problem of distinguishing uniformly funa- tfonin natural bodies, the choice of which ELB a modefling object ie expedient, is for the last 20 years studied in detail by Landwape science, in the framework of which the study hae been developed of natural-territorial complexes (BTC) - "homogeneous, able to 8819- regulation natural ayateme, connected with the outer medium through energy and mass transfern (Sockava, 1974). There in NTC close interconnectiona axe realized between heat and moisture circulation in rocks, their li- thalogy and place in the relief, climate and vegetation (Sochava, 1974; Krauclis, 1980; Shveteov, 1973).
Soil and vegetation a r e uaually accepted by apecialists in physical geography to be a part of WTC or geoayafem. The rocka that occur be- neath the soil l ayer , are actually not conei- dered that i a reflected in the term "inert baSis" (Krauclis, 1980).
But this view should not be considered valid. lnveatigatione carried out in the north of West Siberia by statistical methods have prov- ed that there is a correlation between appeax- ance of NTC and ita lithogenic base to a con- siderably higher depth. Melnikov (1981) deter- mined, f o r inatance, that NTC appearance for eifea correlates with lithogenic base to the
depth of qeaaonaZ freezing-thawing layer, for atows it correlates with lithogenic baee to the depth of annual heat storage and for tract8 - t o the depth o f eroslonal cut.
The data above indicate that NTC ahould be considered as the whole complex of eurface conditione (vegetation, so i l . cover, soils) and underlying lithogenic baae t o their cor- relation depth. As NTC are geoeysterne connecf- ea with the outer environment through energy and masa exchange, then such a correlation apeaka for self-orgeaizing accompanied by ho- meostaais, I n this case homeostaeie area of cfyogenic NTC should coincide with lithology variations observed in natural conditiona and also soil moisture and temperature with the 88me biota composition.
The NTC definition euggested includes, as cha- racters, the following two important circum- stances, First, the main character i~ homoge- nity criterion, on this basis a system is
and this is an area of its homeostasis. Se- singled out as a homogeneous nntural body,
cond, homeostasis boundaries are a natural limit beyond that thermodynamic stability of the eyetem ie lost. So a suggeefed interpre- tation of NTC is a aynthesi~l of ideae about BTC as an energy and masa exchange syatem with concepts developed by Shveteov about thermodynamic stability of soil aeaociation.
The aim of geocryologic prediction and hence simulation is to determine a change of geocrye ologic conditions in time wlthin natural-ter- riforial complexes f o r a given period. In thin ca8e geocryologic conditions w e as follows: temperature, total moisture content, aoil. ice content, ice body availability, thickness of freezing and thawing layem, cryogenic &ai-- cal geological proceeaee (thermokarst, heav- ing, fmcturing, solifluction etc,). It should be noted that under energetical (thermodyna- mic 1 approach cryogenic physical g e o l o g i c a l procaaees are considered in a generalized view aEi motion (migration, deformation) within and at the border o f soil complex.
1091
NTC functioning allows t o make i ts funct ional The energetical approach to the analysis of
thermodynamic model.
To formalize the aim o f geocryologic predicti- on, NTC ahould be considered a8 a c e r t a i n a rea D with one re la t ion , cons t i tu ted by rocka tha t a r e a l i thogenic base of NTC with the boarder l i n e L, t h a t I s the s o i l aurface. With- i n t h e D area there is area D, with one and many re l a t ions and with the temperature lower than OOC (seasonal ly and perennial ly frozen ground) with boarderline L . In i t s tu rn t he re i s a subarea with many r e d t i o n a C2 o f i c e bodies with the boarderline L, within the area
Formalizing o f "cryogenic physical geologLca1 proce8st1 notFon is no t d i f f i cu l t i f t o take account of i t a d e f i n i t i o n as a "morphogenetic pxoaeas". Such a def in i t ion i s i terpre ted by the deformation (motion) vector 8 notion of the surface L, t ha t i s boundasy meaning of the deformation vector #of the whole a rea D. Thue cryogenic proc 88s can be formalized aa deformation vector v( including ruptures- f r a c t u r e e ) i n t h e a r e a E. This i e one of the main differences of the suggeated functional model oaxiant from analogous models i n phyai- cal geography and o the r r e l a t ed Bciencea. To
,baaing on vector @jo in t ly with boundariee L, idelzt i r icate the pes of cryogenic proceaaee
and L , occurr ing in soil, i t i a neceaaary to e l i b o r a t e t h e c r i t e r i a o f i den t i f i ca t io l i (i.e. a c e r t a i n analyzing block i n t h e model).
Considering the above mentioned, the aim o f geocryologic prediction can be formalized a8
D l
w ( t o t a l
dar iea L, and L2 time Z i n t he a r ea C f L, When select ing factors that affect changes
l i zed de f in i t i on of geocryologio rediction o f geocryologic conditions of NTC, a forma-
aim should be considered. In par t fcular , fact- ora should not be considered with a period of v a r i a t i o n e s e e n t i s l l y more ( t rend ones) o r ea- eent ia l ly l ese (ehorf -per iod ones) than a pre- dic ted one. Changes of world ocean l e v e l , c l i - mat ic f luctuat ions (as climate i e a mean value for a 30-yeare , t ec tonic movement gla- c ia t ion e t c . ref%":: trend changes. Ea& f luc tua t ions of meteoelemente re fer t o short- period changes.
One of the main purposes o f geocryology i s Btudying the factore that influence the pro- cess of geocryologic conditions change. They
works (Pr inc ip les of permafrost predictions, are preeented in a number of genera l i s ing
1974; Pavlov, 1979; Grechiehchev, Chistotinov, Shur, 1984 e tc . ). Vi th r ega rd t o t h i s a hysi- cal-geographical axiom by Shvetaov (19737 ie a very useful one according t o i t geocryologic conditione are determined by in t e rac t ion of th ree components: climate, ground compoaition ana i t a place i n the r e l i e f . The following groups of factors , affect ing geocryologic con&Ltions should be singled out: hydxometeo- rologic, compoaition and proper t ies of soil
cover, relief, composition and propartiee o f ground, human a c t i v i t i e s . The l a t t e r include8 any changes o f heat and masB exchan e, r e l i e f , s o i l cover, cauaed by human activitfee (con- s t ruc t ion and operation o f engineering a,truc- tures).
To make a functional (mathematical in f u t u r e ) NTC model i t is reasonable to subdivide the above mentioned groupe af f ac to re i h to two
within D + L area (i.8. I n grounde, oonet i tut- subgroupe: f a c t o r s depending on the processea ing BTC) a a d f ac to r s t ha t do not depend on the procesa inside the area. A l ist of factom, a f f ec t ing MTC geocryologic conditions with allowance for formalized aim of geocryologic predict ion i s given i n Table 1.
Pesign of a funct ional cybernet ic NTC model can be carrie'd out on the baela o f d i f f e ren t principlee.For instance, 1 4 can be made on t he b a a i s of claeeifying . the factore va l id for the input t o t he area D. But the complexity of such a model. i s t o o high. That I s why a xa t io- nal organizing principle ahould eerve a basis of a model.
AB the purpose of geocryo~ogic predict ion i s t o determine changes of thermal and moisture conditions of rocka (physical proceeeea) and development of cryogenic phyaical geological procewes (mechanical proceseree), then a model should ref lect a connection between the- physics and mechanics, $.e, t o r e fe f t o a c l a m o f thermodynamic modela. As far a such NTC, aocording t o d e f i n i t i o n , i s a syatem open t o energy and maser, then a model ahould refled energy and mas8 exchange.
!Chum BTC model ehould base on the pr inciple o f energy and masa exchange o f the area D + L with the outer environmenf. Noreover p a e BX- change will moan only moisture exchange ae for the main types of cxyogenic NTC the other com- ponents o f mas8 exchange a r e not s ignif icant eolian rede o a i f s of sand and'auat 8011~) or can be. consflderad i n a d i f f e r e n t way (for in-
ken into account wtth E ce r t a in coe f f i c i en t , etance, anowstorm t ransport of m o w oan be ta-
constant for each NTC and depending on r e l i e f and surface rougbeae).
Rela t ive to the Pac t ths t . there the input of NTC system must be energy and maam, t h e i r ba- lance on the surface L ahoula be considered. Thie approach t o thermophysicd aspect8 of hndacapes is common and i n conformity with permafrost zone i t ie well. preaented in Pavl lov's work, 1979. As far atl heat , entering the soil. i e t h e morJt i n t e re s t ing a spec t o f heat balance for UB, then the main equation of heat balance will be as follows:
P = Qc - (QcA + Ief t P + LE), (1)
where Q - heat , enter ing the s o i l ; L - moistu- re evapora t ion hea t ; the rea t a re g iven in Table 1.
Components o f heat balance in equation 1 ae- fend on oondltfona on the aurface L, t ha t al-
ows t o wri te this equat ion i n the following generalized way:
1092
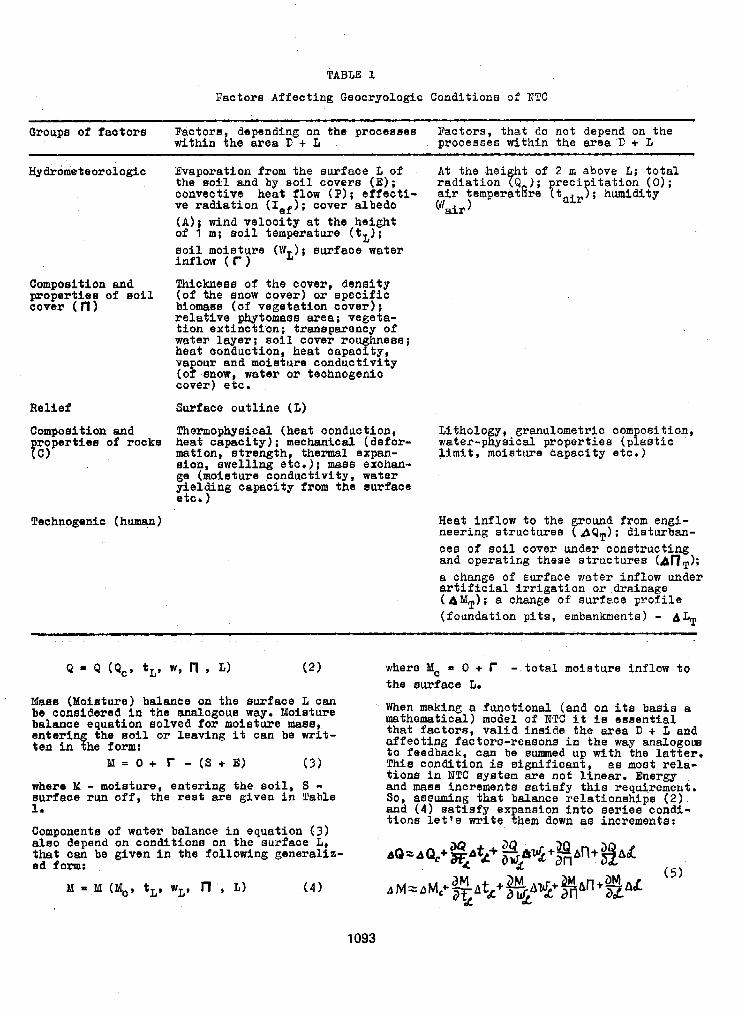
TABLE 1
Factora Affecting Geocryologlc Condi t ione of NTC
Groups of factors Factora, depending on the procesees Factors, that do not depend on the within the area E + L processes within the area C + L
Hydrometeorologic
Composition and
cover ( rt) properties of soil
Belief
Composition a d
PC 1 ropartiss of roeka
Technogenic (human
Evaporation from the surface L of At the height of 2 m above L; total the soil and by soil covers (E); radiation (Q 1; reci itation (0) ; convective heat flow (P); effecti- air temperatare ?tairP; humidity ve radiation (Ieee); cover albedo c'y,i* 1 (A); wind velocity at the height o f I m; aoil temperature (tL); soil moisture (WL); surface water inflow ( r ) Thickness o f the cover, density (of the anow cover) or epecific biomes (of vegetation cover); relative phytomass area; vegeta- tion extinction; traneparency of water layer; 8011 cover roughness; heat conduction, heat capacity, vapour and moiature conductivity (of mow, water o r technogenic cover) etc.
Surface outline (b)
Thermophysical (heat conauction, Lithology,.granulometric Composition, heat capacity); mechanical (deform wafer-physical properties (plastic mation, strength, thermal expan- limlt, moisture capacity etc.) slon, ewelling etc.); mass exchan- ge (moisture conductivity, water yielding capacity from the surface etc . )
Heat inflow to the ground Prom engi- neering structuree (AQT); disturban- ces o f aoil cover under constructing and operating these structures (bnP); B change of surface water inflow under artificial irrigation or drainage ( &MT); a change of surface profile (foundation p i t s , embankments) - d L T
Maes (Moisture) balance on the surface L can be considered in the analogous way. Moisture balance equation solved for moieture msa, entering the rroil or leaving it can be writ- ten in the form:
M = O + r - ( s + E ) ( 3 )
where Y - moisture, entering the eoil, S - surface run o f f , the rest are given in Table 1.
Componenta of water balance in equation ( 3 ) alao depend on conditions on the surface L, that can be given in the following generaliz- ed. f o m r
When making a functional (and on its baeis a mathematical) model o f NTC it is essential that factors, valid inside the area D + L and affecting factora-reasone in the w a y analogow to feedback, can be summed up with the latter, This condition is significant, ae most rela- tions in NTC aystem are not l inear . Energy and mama incrementa satisfy thls requirement. So, assuming that balance relationships (2). and ( 4 ) satisfy expansion into seriea condi- tions let's m i t e them down as increments:
I 1093
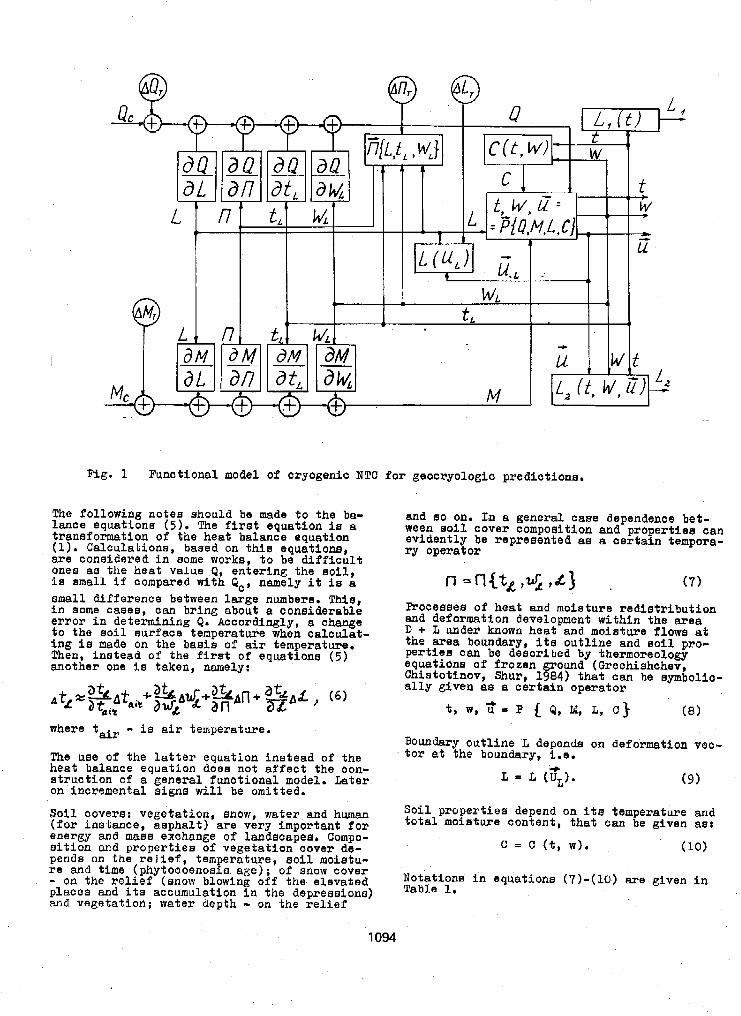
Fig. 1 Functional model of cryogenic NTC f o r geocxyologic predlotiona.
The following notea should be made t o the bs- lance equations ( 5 ) . The first equat ion ia a transformation o f the heat balance equation (I). Calculations, based on thi8 equations, are considered in Borne works, t o be d i f f l c u l t one8 a s t he heat value Q, enter ing the Boil, i s small i f compared with Q,, namely i t i e a small difference between large numbers. Phia, i n some cams , can bring about a coneiderable emor i n deterfillzing Q. Accordingly, a change to the eoi l surface temperatufe when oalculat- i ng ie made on the basis of a i r temperature. Then, ins tead of t h e f i r a t of equations ( 5 ) another one i s taken, namely:
where tair - is a i r temperature.
The uae of the l a t te r equa t ion ine tead o f the heat balance equation doea not affect the con- s t ruc t ion of a general funct ional model. Later on incremental signs w i l l be omitted.
S o i l covers: vegetation, m o w , water and human (for instance, asphal t ) a r e very important for energy and mass exchange o f Landacapes. Compo- s i t i o n and proper t ies of vegetation cover de- pends on t h e r e l i e f , tern m a t u r e , s o i l moietu- re and time (phytocoenosfs age); of snow cover - on the relief (snow blowing off the elevated places and i t a accumulation i n the depressions) and vegetation; water depth - on the relief
and 80 on. In a general c a m dependence bet- ween soil cover compoaition and pro erfiea can evidently be represented aa a oertaxn tempora- ry operat OF
Proceeaes o f heat and moisture rediatr ibut ion and deformation development within the area D + L under known heat and moisture flows at the area boundary, i f a out l ine and so i l pro- pe r t i e s can be described by thermoreology equa t ims of f rozen ground (Grechiahchev, Chistotinov, Shur, 1984) that can be symbalio- a l ly g iven as a cer ta in opera tor
Boundary ou t l ine L depends on deformation VBC- t o r at the boundary, i.e.
L = L (U,). 4 (9)
Soi l p roper t ies depend on i t s temperature total moieture content , that can be given
( c = c (t, w).
and as :
10)
1094
Equations (5)-(10) form a closed aystem. They axe graphically shown in the acheme of Fig. 1, that represent functioning o f NTC and can be called a functional model of NTC. It refers to a class of aimultation thermodynamic modela and i e composed of the following, united by feedback and feedforward, blocke: relief, com- osition and properties of surface covers biota, snow and technogenic covere etc.),
composition and properties of NTC to the depth
At the input to the model there are factore of i t a correlation with the surface covera.
of energy exchange (climate energetic compo- nente: radiation or sir temperature above and geotermic gradient or mean temperature of the higher NTC rank) and mass exchange (precipita- tion and hydrologic regime), ut the output of the model there are thermal moisture c o n a t i - ona and cryogenic physical geological praceas- ea. There on the acheme possible incrementa axe also given for heat, moisture, surface covera and relief caused by technogenic rea- sons (see Table l).
The main advantage of a functional model ia that it makes visible the whole complex of processes ocaurring in a natural. object and contributing to a better understanding of pre- diction aim. Besides, if allows to combine de- tmrminiBtic physical mathematical modele with empirical relationa, obtalned Prom direct ob- servations for the regime of separate NTC com- ponents without physioal analyeis o f their interrelatione.
Investlgatiin of moil complex functioning can be carried out with the offered functional thermodynamic model. In particular, it6 ana- lysis, allows to aoncretize a principle noti- on of thermodynamic etability of natural geo- crgologic bodies, that oan be defined 88 a rekurn of the aystem, after outer impaot, t o the homeostaaia area that is the area o f e ui- libxium in phase apace of characters. If a%ter an outer (technogenic, for instance) impact a
P
system does not return to a homeostaais area, then it means a lose of equilibrium. In this way the value can be determined of perdesible outer impacts on NTC, that is required f o r determining the purposes of environment pro- tection, for instance.
One of the future problems in mathematical modelling is the problem OP model atability due to a great number of factors ana to a probabilistic character of the initial data, obtained in the process o f regional investiga- tions. A possible way to solve thio problem is development o f optimal. mathematical models, to minimizing calculation errom.
REFERENCES
Grechishchev, S.E., Chietofinov, L.V.,Shur, Y.L. (1984). Osnovy modelirovaniya kriogennykh fiziko-geologicheskikh pro: tseeaov. M., Nauka, 230 a.
Krauklis, A.A. (1980). Eksperimantalnoye landshaftovedenie. Bovoeibirak, IJauka, 320 a.
hlelnikov, E.S. (1981). K razvitiyu metodo- logicheskikh omov regionalnof inzbener- noi geologi i . Inzhenernaya geologiye,
Osnovy merzlotnogo prognoza p r i inzhenerno-
N 6.
geologicheakikh iseledovaniyakh. M., IZd-VO MGU, 1974, 432 El.
F’avlov, A.V. (1979). Eeplofizika landahaf-
Shvetsov, P.F. (1973). Obshchie polozheniya.
tov. Novosibirsk, Nauka, 320 a.
V knige: Osnovy metodiki inzhenerno-geo- kriologichetjklkh prognozov pri razvedke mestorozhdenii tverdykh poleznykh iako- paemykh. M., Neha, 8.10-20.
1095
USE OF GEOTEXTILES TO MITIGATE FROST HEAVE IN SOILS K. Henry
U.S. Army Cold Regions Research and Engineering Laboratory, Hanover, N.H. 03755-1290 USA
SYNOPSIS One potential use of geotextiles is horizontal placement in soil above the water table to act as a capillary break or barrier to mitigate frost heave. A capillary break works because larger pore sizes and/or wetting angles of the material than simrounding soil result in lower unsaturated hydraulic conductivity and lowered height of capillary rise'of water. This reduces frost heave by limiting the rate of upward water migration.
Five series o f open-system, unidirectional frost-heave tests were run in which three nonwoven polypropylene geotextiles were tested for their ability to mitigate frost heave. Certain fabrics were successful in reducing frost heave by as much as 85%. Test results also indicate that the optimum fabric thickness required to mitigate frost heave is a function of soil type as well as properties of the geotextile.
INTRODUCTION
Frost action in soi ls poses significant prob- lems for highway and airport pavements. The advent of the use of geotextiles in pavement sections offers the possibility o f mitigating frost effects. Certain geotextiles can be placed horizontally in the soil above the water table to reduce upward water migration under freezing conditions.
The presence of a capillary break in frost- susceptible soil can, in certain cases, reduce frost heave by reducing the height of capil- lary rise of ground water and by reducing the upward migration of water under tension gradi- ents when the capillary break is not saturat- ed. It is hypothesized that geotextiles with comparatively large pore sizes and fibers that are hydrophobic can be successfully used as capillary breaks.
The laboratory investigation currently under way at CRREL is attempting to show that properly chosen geotextiles will behave as capillary breaks when placed in froat-suscep- tible soi l and to better define the charac- teristics important to a geotextile's ability to mitigate frost heave. To date, only non- woven polypropylene qeotextiles have been tested because they performed comparatively well in preliminary tests.
PREVIOUS WORKS
The placement of layers of clean sands and gravels in frost-susceptible materials has
lary path and thereby reducing water available at the freezing front (e.g. Rengmark, 1963). The saturated hydraulic conductivities of many geotextiles are similar to clean medium to fine sands (Bell et al., 1980), which suggests their use as capillary breaks due to pore siz- es. In addition, some fabrics consist of fibers that have a lower affinity for water than soil particles, which is likely to en- hance their ability to reduce capillary rise.
In a laboratory study conducted by Allen st al. (1983) in which five geotextilee were tested by placing them in samples of frost- susceptible soil and freezing the samples, they stated that the qeotextiles that reduced frost heave the most were either relatively thick and permeable* as well as somewhat hydrophobic or were l'strongly hydrophobic." The 'lhydrophobicityl' o f the materials was
water on the surface of these materials evaluated based on the casual observation of
(Allen, 1986). One geotextile that was described as being made of hydrophilic materi- al actually increased f ros t heave compared to the reference sample (Allen et al., 1983). Allen et al. (1983) did not discuss the re- sults in terms o f pore characteristics such as pore size distribution in the various fabrics compared to the pore or grain size distribu- tion of the soil. A survey of manufacturers' literature revealed that the AOS** of the
rics t e s ted wexe published; however, it is implied No actual values o f permeability for s p e c i f i c fab-
that they ranged from 0 . 1 to 0 . 0 1 cm/sec ( A l l e n e t a l . , 1 9 8 3 ) . These values o f permeability are compaf- able to those of clean sand.
been known to reduce fkost heave (Rengmark, 1963: Taivainen, 1963). It is thought that when wlaced above the water table and below
** AOS, or apparent opening si2e (a l so referred to as equivalent opening size or EOS), is defined as
the dipth of frost penetration,- coarse materi- the number of the U.S. standard sieve with openings al reduces frost heave by breaking the capil- closest in e i z e to the largest openings i n the geo-
t e x t i l e (CW-02215. 1986).
1096
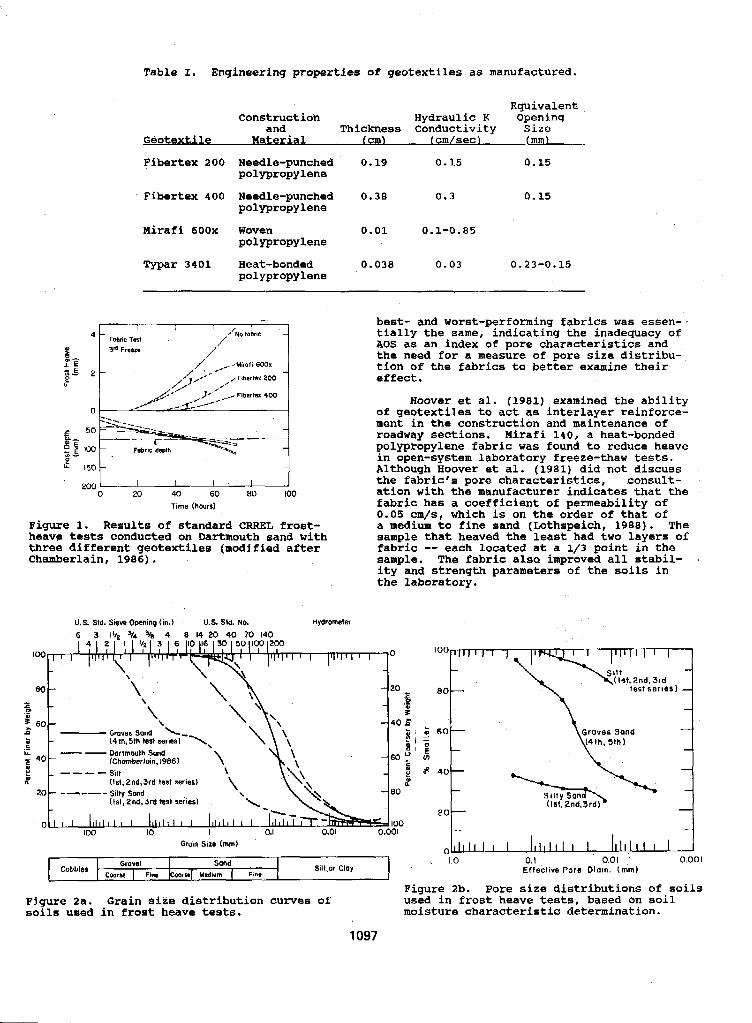
Table I. Engineering properties of geotextiles as manufactured.
Equivalent Construction
and Geotaxtile
Thickness Conductivity Size I cm\ Icm/sec) tmm)
Fibertex 200 Needle-punched 0.19 0.15 0.15
Hydraulic K Opening
polypropylene
Fibertex 400 Needle-punched 0.38 0.3 0.15 polypropylene
Mirafi 60Qx Woven polypropylene
Typar 3401 Heat-bonded polypropylene
1 5 0 1 i 200 ,
0 X) 40 60 80 1 0 0
Time (hours)
Figure 1. Results of standard CRREL frost- heave tests conducted on Dartmouth sand with three different geotextiles (modified after Chamberlain, 1986).
0.01 0.1-0.85
0.038 0.03 0.23-0.15
best- and worst-performing fabrics was essen-- tially the same, indicating the inadequacy o f AOS as an index of pore characteristics and the need for a measure of pore size distribu- tion of the fabrics to better examine their effect.
Hoover et al. (1981) examined the ability of geotextiles to act as interlayer reinforce- ment in the construction and maintenance of roadway sections. Mirafi 140, a heat-bonded polypropylene fabric was found to reduce heave in open-system laboratory freeze-thaw tests. Although Hoover et al. (1981) did not discuss the fabric's pore characteristics, consult- ation with the manufacturer indicates that the fabric has a coefficient of permeability of 0.05 cm/s, which is on the order of that of a medium to fine sand (Lothspeich, 1988). The sample that heaved the least had two layers of fabric -- each located at a 1/3 point in the sample. The fabric also improved all stabil- ity and strength parameters of the soils in the laboratory.
U. S. Std. Sieva Openinq (in.) U.S. Std. No. Hydrometer
6 3 Illz =/4 s /s 4 8 14 20 40 70 140
(Ist,Znd. 3rd 80 test ser ies)
\ Groves Sand (4th, 5th)
(1st. 2nd,Jrd)
Grain Size (mm) 0 1 1 1 1 I I ' I 1 1 1 I I I I IIII I I I I I
Sond Silt or Cloy 1 . 1.0 0. I 0.01 0.001 1 C m r z ' Fine iCmrm, Mndlvrn [ Fin. I Effective Pore Diom. (mm)
Figure 2b. Pore s i z e distributions of soils Figure 2a. Grain size distribution curves of used in frost heave tests, based on soil soils used in frost heave tests. moisture characteristic determination.
1097
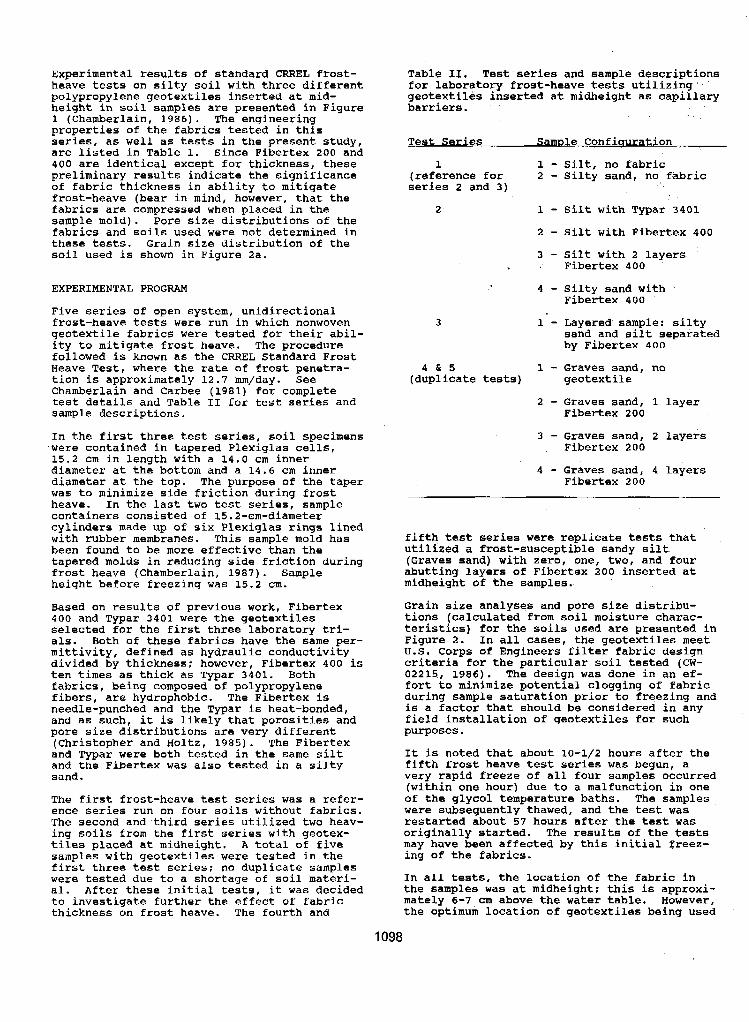
Experimental results of standard CRREL frost- heave tests on silty soil with three different polypropylene geotextiles inserted at mid- height in soil samples are presented in Figure 1 (Chamberlain, 1986). The engineering properties of the fabrics tested in this series, as well as tests in the present study, are listed in Table 1. Since Fibertex 200 and 400 are identical except for thickness, these preliminary results indicate the significance of fabric thickness in ability to mitigate frost-heave (bear in mind, however, that the fabrics are compressed when placed in the sample mold). Pore size distributions of the fabrics and soils used were not determined in these tests. Grain size distribution of the soil used is shown in Figure 2a.
EXPERIMENTAL PROGRAM
Five series of open system, unidirectional frost-heave tests were run in which nonwoven geotextile fabrics were tested for their abil- ity to mitigate frost heave. The procedure followed is known as the CRREL Standard Frost Heave Test, where the rate of frost penetra- tion is approximately 12.7 mm/day. See Chamberlain and Carbee (1981) fo r complete test details and Table I1 f o r test series and sample descriptions.
In the first three test series, soil specimens 'were contained in tapered Plexiglas cells, 15.2 cm in length with a 14.0 cm inner diameter at the bottom and a 14.6 cm inner diameter at the top. The purpose of the taper was to minimize side friction during frost heave. In the last two test series, sample containers consisted of 15.2-cm-diameter cylinders made up of s i x Plexiglas rings lined with rubber membranes. This sample mold has been found to be more effective than the tapered molds in reducing side friction during frost heave (Chamberlain, 1987). Sample height before freezing was 15.2 cm.
Based on results of previous work, Fibertex 400 and Typar 3401 were the geotextiles selected for the fir.st three laboratory tri-
mittivity, defined as hydraulic conductivity als. Both o f these fabrics have the same per-
divided by thickness: however, Fibertex 400 is ten times as thick as Typar 3401. Both fabrics, being composed of polypropylene fibers, are hydrophobic. The Fibertex is needle-punched and the Typar is heat-bonded, and as such, it is likely that porosities and pore size distributions are very different (Christopher and Holtz, 1985). The Fibertex and Typar were both tested in the same silt and the Fibertex was also tested in a silty sand.
The first frost-heave test series was a refer- ence series run on four soils without fabrics. The second and third series utilized two heav- ing soils from the first series with geotex- tiles placed at midheight. A total of five sainples with geotextiles were tested in the first three test series: no duplicate samples were tested due to a shortage of soil materi- al. After these initial tests, it was decided to investigate further the effect of fabric thickness on frost heave. The fourth and
Table 11. Test series and sample descriptions €or laboratory frost-heave tests utilizing' geotextiles inserted at midheight as capillary barriers.
Test Series s-le Confiawtion
1 1 - Silt, no fabric
series 2 and 3) (reference for 2 - Silty sand, no fabric
2 1 - Silt with Typar 3401
2 - Silt with Fibertex 400 3 - Silt with 2 layers . Fibertex 400
4 - Silty sand with Fibertex 400
3 1 - Layered sample: silty
by Fibertex 400 sand and silt separated
4 & 5 1 - Graves sand, no (duplicate tests) geotextile
2 - Graves sand, 1 layer Fibertex 200
3 - Graves sand, 2 layers Fibertex 200
4 - Graves sand, 4 layers Fibertex 200
fifth test series were replicate tests that utilized a frost-susceptible sandy silt (Graves sand) with eero, one, two, and four abutting layers of Fibertex 200 inserted at midheight of the samples.
Grain size analyses and pore size distribu- tions (calculated from soil moisture charac- teristics) for the soils used are presented in Figure 2. In all cases, the geotextiles meet U.S. Corps of Engineers filter fabric design criteria for the particular soil tested (CW- 02215, 1986). The de8ign was done in an e€- fort to minimize potential clogging of fabric during sample saturation prior to freezing and is a factor that should be considered in any field installation of geotextiles €or such purposes.
It is noted that about 10-1/2 hours after the fifth frost heave test series was begun, a very rapid freeze of all four samples occurred (within one hour) due to a malfunction in one of the glycol temperature baths. The samples were subsequently thawed, and the test was restarted about 57 hours after the test was originally started. The results of the tests may have been affected by this initial freez- ing of the fabrics.
In all tests, the location of the fabric in the samples was at midheight; this is approxi- mately 6-7 cm above the water table. However, the optimum location of geotextiles being used
1098
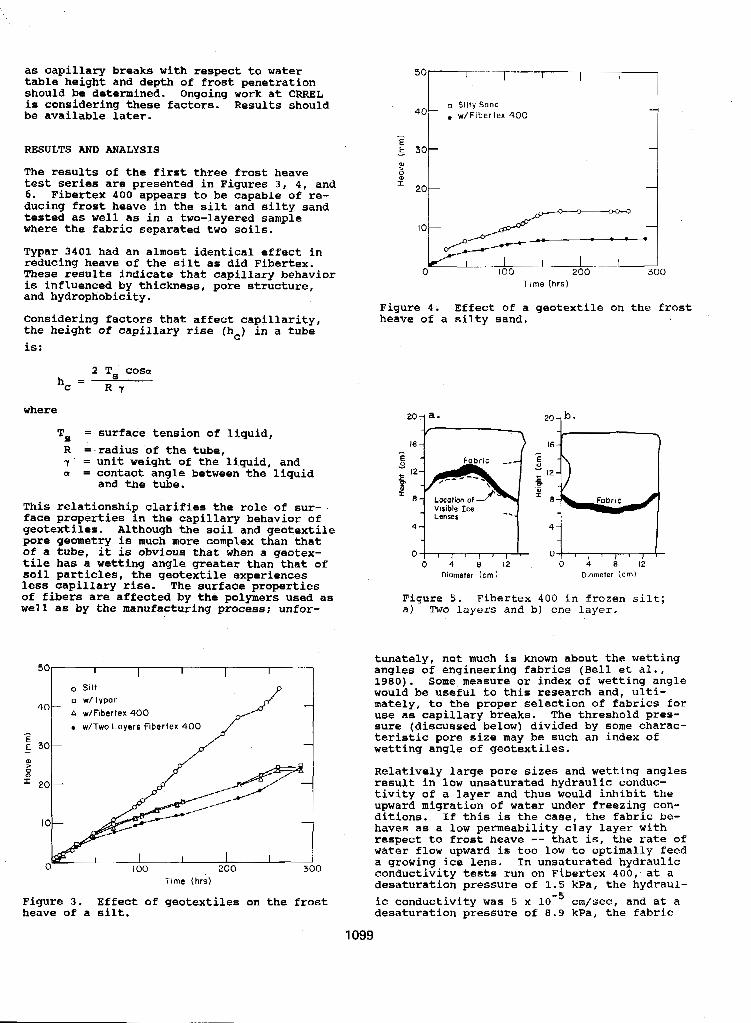
as capillary table height
breaks with respect to water and depth of frost penetration
should be-determined. Ongoing work at CRREL i s considering these factors. Results should be available later.
RESULTS AND ANALYSIS
The results of the first three frost heave test series are presented in Figures 3 , 4 , and 6. Fibertex 400 appears to be capable of re- ducing frost heave in the silt and silty sand tested as well as in a two-layered sample where the fabric separated two soils.
Typar 3401 had an almost identical effect in reducing heave of the silt as did Fibertex. These results indicate that capillary behavior is influenced by thickness, pore structure, and hydrophobicity.
Considering factors that affect capillarity, the height of capillary rise (he) in a tube is:
where
T, = surface tension of liquid, R =-radius of the tube, 7 = unit weight of the liquid, and a = contact angle between the liquid
and the tube.
This relationship clarifies the role of sur- face properties in the capillary behavior of geotextiles. Although the soil and geotextile pore geometry is much more complex than that of a tube, it is obvious that when a geotex- tile has a wetting angle greater than that of
less capillary rise. The surface properties soil particles, the geotextile experiences
of fibers are affected by the polymers used as well as by the manufacturing process: unfor-
50 I I I I I
. w/Two Layers Flbertex 400 1
I I I I I I 0" I O 0 200 300
Tlme (hrs)
Figure 3. Effect of geotextiles on the frost heave of a silt.
4 0 t o Si l ty Sand . w/Flbertex 400
0 200 300 Time (hrs)
Figure 4. Effect of a geotextile on the frast heave of a silty sand.
tunately, not much is known about the wetting angles o f engineering fabrics (Bell et al., 1980). Some measure or index of wetting angle would be useful to this research and, ulti- mately, to the proper selection of fabrics for use as capillary breaks. The threshold pres- sure (discussed below) divided by some charac-
wetting angle of geotextiles. teristic pore size may be such an index of
Relatively large pore sizes and wetting angles result in low unsaturated hydraulic conduc- tivity of a layer and thus would inhibit the upward migration of water under freezing con- ditions. If this is the case, the fabric be- haves as a low permeability clay layer with
water flow upward is too low to optimally feed respect to frost heave -- that is, the rate of a growing ice lens. In unsaturated hydraulic conductivity tests run on Fibertex 400, at a desaturation pressure of 1.5 kPa, the hydraul- ic conductivity was 5 x cm/sec, and at a desaturation pressure of 8.9 kPa, the fabric
1099
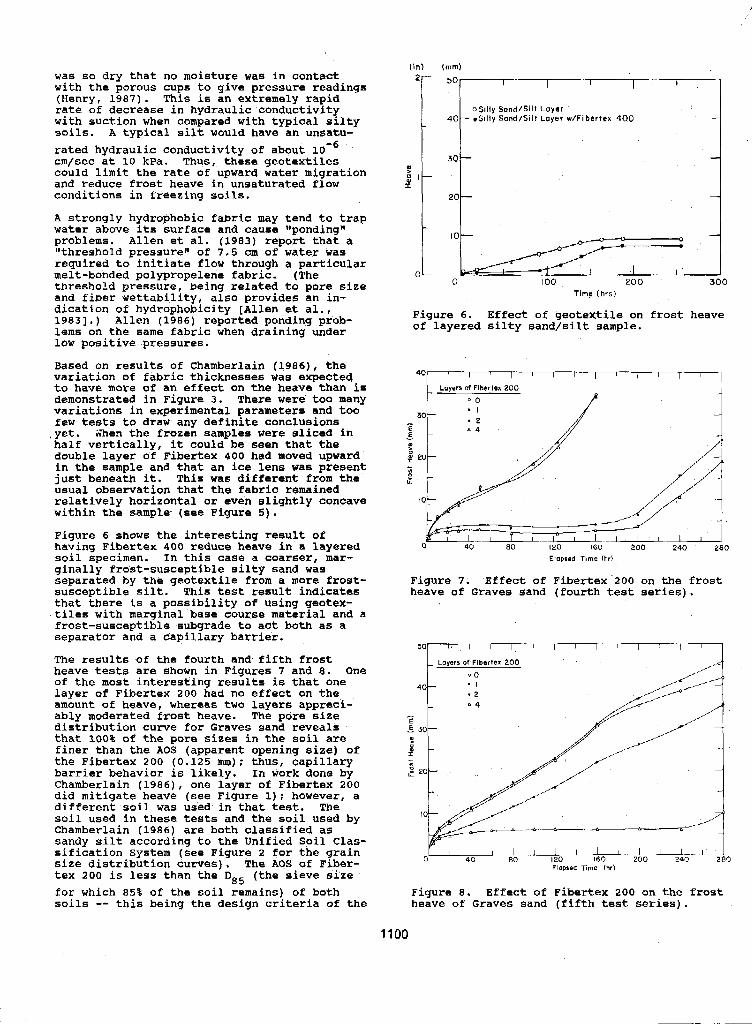
was so dry that no moisture was in contact with the porous cups to give pressure readings (Henry, 1987). This i s an extremely rapid rate o f decrease in hydraulic conductivity with suction when compared with typical silty soils. A typical silt would have an unsatu- rated hydraulic conductivity of about lom6 cm/sec at 10 kPa. Thus, these geotextilas could limit the rate of upward water migration and reduce frost heave in unsaturated flow conditions in freezing soils.
A strongly hydrophobic fabric may tend to trap water above its surface and cause "pending" problems. Allen et al. (1983) report that a "threshold pressure" of 7.5 cm of water was required to initiate flow through a particular melt-bonded polypropelene fabric. (The threshold pressure, being related to pore size and fiQer uettability, also provides an in- dication of hydrophobicity [Allen et al., 19831.) Allen (1986) reported ponding prob- lems on the same fabric when draining under low positive pressures.
Based on results o f Chamberlain (1986), the variation of fabric thicknesses was expected to have more of an effect on tlm heave than is demonstrated in Figure 3. There were too many variations in experimental parameters and too few tests to draw any definite conclusions yet. &%en the frozen samples were sliced in half vertically, it could be seen that the double layer of Fibertex 400 had moved upward
just beneath it. This was different, from the in the sample and that an ice lens was present
usual observation that the fabric remained relatively horizontal or even slightly concave within the sample (see Figure 5) . Figure 6 shows the interesting result of having Fibertex 400 reduce heave in a layered soil specimen. In this case a coarser, mar- ginally frost-susceptible silty sand was separated by the geotextile from a more frost- susceptible silt. This test result indicates that there is a possibility of using geatex- tiles with marginal base course material and a frost-susceptible subgrade to act both as a separator and a capillary barrier.
The results of the fourth and fifth frost heave tests are shown in Figures 7 ana 8. One of the most interesting results is that one layer of Fibertex 200 had na effect on the amount oL heave, whereas two layers appreci- ably moderated frost heave. The pore size distribution curve for Graves sand reveals that 100% of the pore sizes in the soil are finer than the AOS (apparent opening size) of the Fibertex 200 (0.125 mn) ; thus, capillary barrier behavior is likely. In work done by Chamberlain (1986), one layer of Fibertex 200 did mitigate heave (see Figure 1): however, a different soil was used in that test. The soil used in these testa and the sail used by Chamberlain (1986) are both classified as sandy silt according to the Unified Soi l Clas- sification System (see Figure 2 for the grain size distribution curves). The AOS of Fiber- tex 2 0 0 is less than the DS5 (the sieve size for which 85% of the soil remains) of both soils -- this being the design criteria of the
- 10- 0
I I 0 I O 0 200 300
Time (hrs)
Figure 6. Effect of geotextile on frost heave of layered silty sand/silt sample.
P
Elapsed Tlme (hr)
Figure 7. Effect of Fibertex.200 on the frost heave of Graves sand (fourth test series).
Figure 8. Effect of Fibertex 200 on the frost heave of Graves sand (fifth test series).
1100
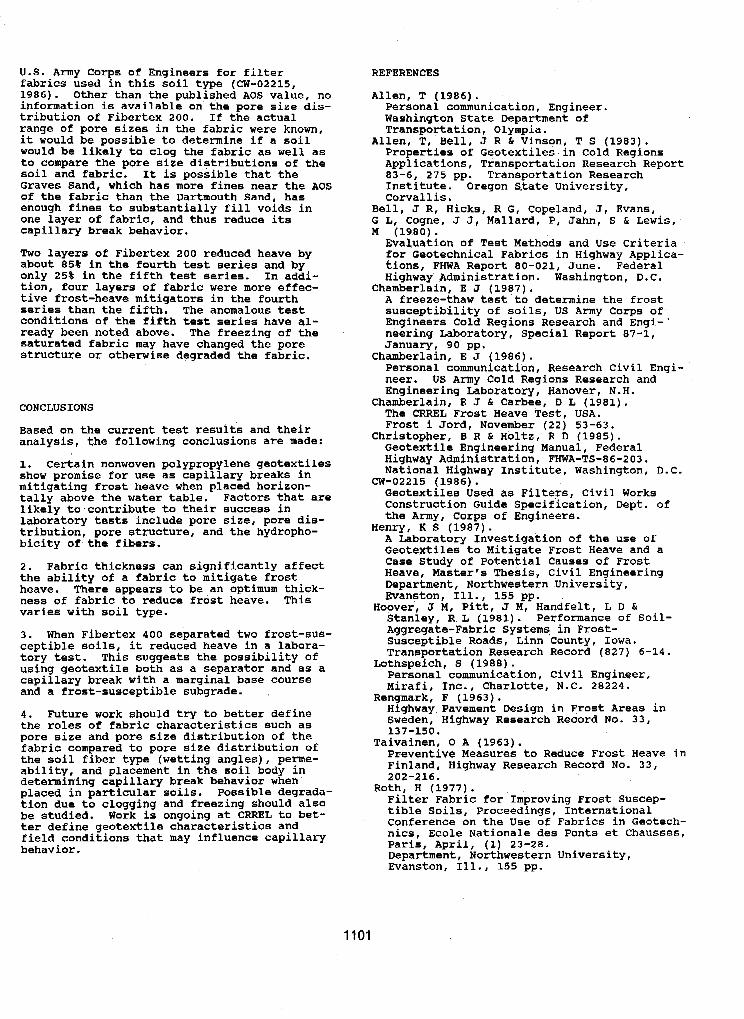
U.S. Army Corps of Engineers for filter fabrics used in this soil type (CW-02215, 1986). Other than the published AOS value, no
tribution of Fibertex 200. If the actual information is available on the pore size dis-
range of pore sizes in the fabric were known, it would be possible to determine if a soil would be likely to clog the fabric as well as to compare the pore size distributions of the soil and fabric. It is possible that the Graves Sand, which has more fines near the AOS o f the fabric than the Dartmouth Sand, has enough fines to substantially fill voids in one layer of fabric, and thus reduce its capillary break behavior.
Two layers of Fibertex 200 reduced heave by about 85% in the fourth test series and by only 25% in the fifth test series. In addi- tion, four layers of fabric were more effec- tive frost-heave mitigators in the fourth series than the fifth. The anomalous test conditions of the fifth test series have al- ready been noted above. The freezing of the saturated fabric may have changed the pore structure or otherwise degraded the fabric.
CONCLUSIONS
Based on the current test results and their analysis, the following conclusions are made:
show promise for use as capillary breaks in 1. Certain nonwoven polypropylene geotextiles
mitigating frost heave when placed horizon- tally above the water table. Factors that are likely to contribute to their success in
tribution, pore structure, and the hydropho- laboratory tests include pore size, pore dis-
bicity of the fibers.
2. Fabric thickness can significantly affect the ability of a fabric to mitigate frost heave. There appears to be an optimum thick- ness of fabric to reduce frost heave. This varies with soil type.
3. When Fibertex 400 separated two frost-sus- ceptible soils, it reduced heave in a labora- tory test. This suggests the possibility of using geotextile both as a separator and as a capillary break with a marginal base course and a frost-susceptible subgrade.
4. Future work should try to better define the roles of fabric characteristics such as pore size and pore size distribution of the fabric compared to pore size distribution of the soil fiber type (wetting angles), perme- ability, and placement in the soil body in determining capillary break behavior when placed in particular soils. Possible degrada-
be studied. Work is ongoing at CRREL to bet- tion due to clogging and freezing should also
ter define geotextile characteristics and field conditions that may influence capillary behavior.
REFERENCES
Allen, T (1986) . Washington State Department o f Personal communication, Engineer.
Transportation, Olympia.
Properties of Geotextiles in Cold Regions Applications, Transportation Research Report 83-6, 275 pp. Transportation Research Institute. Oregon State University, Corvallis.
Allen, T, Bell, J R & Vinson, T S (1983).
Bell, J R, Hicks, R G, Copeland, J, Evans, G L, Cogne, J J, Mallard, P, Jahn, S & Lewis; M (1980) .
Evaluation of Test Methods and Use Criteria for Geotechnical Fabrics in Highway Applica- tions, FHWA Report 80-021, June. Federal Highway Administration. Washington, D.C.
A freeze-thaw test to determine the frost
Engineers Cold Regions Research and Engi-' susceptibility o f soils, US Army Corps of
neering Laboratory, Special Report 87-1, January, 90 pp.
neer. US Amy Cold Regions Research and Personal communication, Research Civil Engi-
Engineering Laboratory, Hanover, N.H. Chamberlain, E J & Carbee, D L (1981). The CRREL Frost Heave Test, USA.
Christopher, B R & Holtz, R D (1985). Frost i Jord, November (22) 53-63.
Geotextile Engineering Manual, Federal Highway Administration, FHWA-TS-86-203. National Highway Institute, Washington, D.C.
Geotextiles Used as Filters, Civil Works Construction Guide Specification, Dept. of the Army, Corps of Engineers.
A Laboratory Investigation of the use of Geotextiles to Mitigate Frost Heave and a Case Study of Potential Causes of Frost Heave, Master's Thesis, Civil Engineering Department, Northwestern University, Evanston, Ill., 155 pp.
Hoover, J M, Pitt, J M I Handfelt, L D & Stanley, R L (1981). Performance of Soil- Aggregate-Fabric Systems in Frost- Susceptible Roads, Linn County, Iowa. Transportation Research Record (827) 6-14.
Mirafi, Inc., Charlotte, N.C. 28224. Personal communication, Civil Engineer,
Highway Pavement Design in Frost Areas in Sweden, Highway Research Record No. 33, 137-150.
Chamberlain, E J (1987).
Chamherlain, E J (1986) .
CW-02215 (1986) .
Henry, K S (1987) .
Lothspeich, S (1988) .
Rengmark, F (1963).
Taivainen, 0 A (1963). Preventive Measures to Reduce Frost Heave in Finland, Highway Research Record No. 33, 202-216.
Roth, H (1977). Filter Fabric for Improving Frost Suscep- tible Soils, Proceedings, International Conference on the Use of Fabrics in Geotech- nics, Ecole Nationale des Fonts et Chausses, Paris, April, (1) 23-28. Department, Northwestern University, Evanston, Ill., 155 pp.
1101
VOLUME OF FROZEN GROUND STRENGTH TESTING L.N. Khrustalev and G.P. Pustovoit
Laboratory of Engineering Ceocryology, Faculty of Geology, Moscow State University, Moscow, USSR
sYNomIB A n optimization approach t o dettermking the volume of imzen ground strength tes t ing is described which Involves minimisation of the coats of euoh tes t ing a d of possible losses due t o its Insufficent volume. A derivation is given fox the analytic relationship connsctlng optimal volume o f tessing wt th , i t s cost, construction project cost; and variabi l i ty of permafrost characteristics. This relationship can form the bmis o f sumey piapnbg.
One of geology 19733.
the fundamental principles of engfneeriDg 1 is *he principle of feed-back (Rater,
- . r . It demands tha t the so lu t ion of a geo- logical problem should be made taking into account the aims and resu l t s of the correspond- ing engbeering problem solution. In recent years, Fncrsasing importance is attached t o the methods for contrw11ing the quality o f geotech- n ica l systems. For t h i s reason the q u a l i t y factors of the system t o be constructed which are detemnhed from the appropriate moc!el,~hou~ be taken into consideration ih engineering- geologic investigations. It is these which can and should ensure the feed-back mentioned above.
With these considerations in view, we are k o h g t o exambe a specific ( b u t very important) problem of engineering geology that a r i ses in a n y investigations: determination of the vo- lume of ground tes t ing, The approach we suggest here is general enough and can be applied t o any testing, both of frozen and unfrozen gmunds. However, the problem being very comp- l icated there is no general solution of it availabie in complete form that; can be used in practice, Such a aolution has been obtained by u s In appltcation to the use o f permafrost, when character is t ics o f ground strength have the c o n t r o l l h g influence on the quality and s t a b i l i t g of structures. We sha l l t r y no t to
the f ina l resu l t t h a t can form the basis o f r e s t r i c t the generali ty o f our exposition, b u t
survey planning is given f o r the par t icular case mentioned above a n d reflected Fn the t i t l e of o u r paper.
The purpose of tes t ing commonly consists Fn estimating the mean value of a character is t ic x of the ground in a s ta t i s t ica l popula t ion (an engineering-geologic element) a n d 3n providing the uncertainty o f that estimate which does not exceed a f i x e d value wlth a f i x e d probability. If n trials have been made, the t e s t i n g re- sults are sampling mean x. and sampling vari- ance E' , the emor being estimated usin@; the random q u a n t i t y
1102
The methods tn use fo r a t a t i s t i ca l . proceesSng of testing resul ta are based on the assumption of the normal dis t r ibut ion law f o r characterts- tics of the ground. In that cane t h e random
t h e numger of trials can be found f r o m the equation
quanti* (1) b B Student's t-dietribution, m d
b & O
where tn-, (d ) is quentile o r the t - d i n t r l - bution with n-1 degree of freedom corm8 onding t o the confidence c o e l ? f i c l ~ t & ; and $ i s re laelve emor in determining the oharacterist ie t o be ensured with probability d . The l a s t f ao to r f n the equa.t;ion beoomes known only when data have been obtained and proeessed, that is, a volume o f t e s t i a g depends on its re~ults, One can break th ie vioioua c i r c l e by u a h g the method of sudoesslve approximations consisthng of a mu1tist;age correction of mrvey planning in the courde of work.
culate the mean value of the obracierbt lo un- It has been suggeeted, for lnatance t o recal-
d e r s t u d y a8 new data come in, rrtop in$ the trials when the mea has been ssabdi red mas- loo, 1968) . However, t o do th i s one needs t o es tabl ish a continuous Xhk between the labom- t o r y and the f i e l d wit, a condition that cannd always be sat isf ied. The most natural prooedw seem8 t o be the practtce of a multir3tage sumeg in which the volume o f testing at a aubsequent stage is determined from the results obtained at the previous one. Fmbably , better schemes
when considered within the framework of deter- of successive approximations can be dev%ned b u t ,
ministic or *lsemiprobabilisticll conFepta usual.l$ adopted j,n deai@, all such procedures encounter the hardly surmountable obstacle related t o Fa- aetemnlnacy of the first factor b tho right- hand aide of equation (2).
The question of confidence co$$ficient d
guaranteeing the accuracy and r e l i a b i l i t y of desim indices remains open so f a r . The design codes $n fo roe in the USGR recommend the value
OL ~ 0 . 8 5 for permafrost. Some authors propose t o r e l a t e t h i s quant i ty to the t y p e of conat-
out specific probability values, sub8tantiating ruction e n d survey stage (Kagan,'lp3) and point
them with construction practices. One has t o admit, however, that in a l l casea the confidence probability l a actually aesigned. One mag even assert that the established approach based on the detemlnlstion o f confidence intervals and subsequent u8e of deterministic theoretical va- lues of chaxacteriatfce In deai@ practice i s
babi l i ty . incapable of a just i f ied assignment of the pro-
Indeed, a confidence probabtllty ia an inevi- table consequence o f the a ~ i f i c i a l mplaoement of random quantit ies b y deterministic theoreti- ca l values and in principle it cannot be obbai- ned as a result of ang kind of measusements because it depends on the purpose of such mea- surements. However, there is a one-aide connec- t ion only between surveys a d their fFnaL ob- jeet ive - fhe struct.ure t o be erxected, namely8 the output data of surveys with a f i x e d relia- b i l i t y (oonfidence probability) axe the input
r e l i a b i l i t y is an i npu t parameter for the BUP ones for the s t ructure desi= project. B u t data
vsgs and cannot be detexmnnlned Lmlesa through the r e l i ab i l i t y of the f ina l r e su l t , i . e . the s t ructure s tabi l i ty . However, t h i s r e l t a b i l i t p cannot be estimated by using the deterministic approach. Therefore, the necessary feed-back
the r e l i ab i l i t y of the input data. is absent, thus m a k i n g It impossible t o ensure
When t ha t f ac t is realized, th i s leads to 8 different approach based on probabilist ic con-
noted by Rata (19731, can be summarized in the cepte and economic c r i t e r i a . Its essence, as
following question: "ROW much w i l l the guaran- tees cost UB and what do we r isk if our guaran- tees are broken?" The word "guarantee" here refera, not t o accuracy of the data, b u t t o
feed-back is prvlded, not by an a r t i f i c i a l con- s t a b i l i t y of the s t ructure , and the necessary
fidence probability, but by actual economic indices: survey cost and the cost o f possible loases d u e to Insuf f ic ien t volume of tes t ing. By minimising the s m of them quant i t ies ,
Cs 4 C1 - + m i n i m u m (3) one can determine a volume of t es t ing that is economically optimal , The arising optimization problem is a t t rac t ive d u e to its apparent simplicity; solutions
how, however, not; a single attempt has resulted having been t r i e d many timea. As far as we
in a closed solution free of a r t i f i c i a l restric- t ions (such as normative r e l i ab i l i t y l eve l s eta.), which are essentially equivalent to a s s i p k g a confidence probability in arbitrary mmner. The cause of t h i s i s as follows,
Stabil i ty of structures is affected by a great many random fac tom, many of them being depen-
the foundation playa the controlling role In dent on time; thus, the temperature regime of
construction on permafrost. ' Consequently, even when the accuracy and r e l i a b i l i t y of geologic data are identical , structures b u i l t in di f ie rmt
natural conditions have differing degrees of being pfobabi l is t ic in nature 'Ln adCStion t o stabil i ty guarantee. The loss cost ala0 var'188,
this. The re lat ion between the accuracy of ba- s i c data, stabil i ty guarantee, and loss cost is indirect . It depends on processes, both de- terministic and randam ones, that take place d u r i a g interaction o f foundation soil with the s t ructure end the environment. For this ma- eon it is Smpoesible t o provide a sound eat i - mation of losses outside of a conaiate&t pro- babilieftic approach t o the description of the "foundation-structure" system. Such an approach,as developed by the present authom, permits a sound formulation and Bolution of I
the optimization problem (3) . We now examlne the basic Ideas and resu l t s o f that approach.
F i r s t of a l l , we have t o admit tha t any Btabi-
posed on random functions o f time, such as loa- l i t g criterion formulated is a condition im-
dhag on the foundation, ita temperature,
o f z a t condition, called failure of the systsm, car iag capacity, and st rain. A violation
during a given interval of with aome pro- 1s a random event which may o r may not occur
babi l i ty . The probability of fa i lure less functioning of a eystem regarded ae a function of time interval i13 termed the l i f e function. The function has the value one for an Mini-
when the htemtal indefisi tely increases. tesimal. internal o f time and tend6 t o zero
The liPe function depends 011 dl parameters (both Betermlabtic and s tochast ic) that contml s t ruc tu ra l s t ab i l i t y . When 8 methemstXca1 (stochastic) model of a system is being b u i l t , l e ra significant parameters are identified and
to construct a parameter-complex w F t h the help discarded, while the -remaining ones are used
o f a s tabi l i ty cr i ter ion; th i s is termed sa- fe ty character is t ic and is another argument in the lFfe function (the f kcst being the time)
foun8ation (according to pr inciple I), the Thug f o r example, when permafrost is used as
s tab i l i ty c r i te r ion is the carrying capacity of the fomdation whfch m u s t always remain greater than the ioad on it. The normalized strength margln (the dlffemnce between the c a r r g b g eapacit and the load divided by the square root of t i e variance of that difference) which is a random function of time m u s t be po- a i t ive. A peak in this function towarda the negative region meam f a i l u r e o f the system, while the probability of the absence of such peaks determines the l i f e function. The safety character is t ic I s the mathematical expectat ion of normalized s t rength margin which is const- ructed f r o m the mathematical expectations of basic quant i t ies (regarded as random functions), t h e i r variances and spectral character is t ics , !The form of the hfe ,function P( 'c, 1 and the method f o r calculating the safety characte- r i e t i c r were obtabed by u s (Khruetalev and Pustovoit, 1904, 1985t Pustovolt, 1986), the la t ter paper giving more exact results, according t o which
The l i f e func t ion i s a quantitative measure of the guarantee that a s t ructure will be Btable under unfavorable random excitations. This
1103
measud bas a merely mathematical meanhg how- ever. The correspondbg measure invested with economic content has been called risk cost by us. It is defined as the mathematical expecta- t ion o f loss due t o premature f a i l u r e of the foundation a n d is expressed through the time derivative of t he l i f e func t ion ( t he l a t t e r taken with the m i n u s sign is the probability density of the t h e i n t e r v a l u n t i l t h e f i r s t f a i l u r e ) . The meaning of risk cost is suffi- ciently exactly rerlected in i ts name. When s t a b i l i t y (and t he safety characterist lc) inc- reases the coat decreases, but t h e h i t l a 1 ex- pense (foundation construction, preparation of the foundation base etc.) increases. The sum o f the init ial cost o f the s t ructure and risk cost is called the reduced to ta l cos t and we expect it t o be a m i n i m u m a t some value of the s a f e t y characterist ic, Investigations show t h a t t h i s is the case, The value of safety character is t ic (and the corresponding design solut ion) that provides the least reduced t o t a l c o s t is optimal from the economic point of view. Any departure from It causes unjustified ex- pensest either during construction (strength margin i s unjustifiably increased) or during
t o low s t a b i l i t y ) . use (premature repairs and reconseruction due
We have obzained a general eguation f o r the optimal safety characteristic which, however, is l i t t l e convenient f o r rout ine pract ical calculations. In the par t icu lar case indicated ( p r i n c i p l e I) , the specif ic form of function (4) has permitted considerable simplifications, representing the equation Fn the form
t e r i s t i c ; V i s tho combined coefficient of : fo desired aptimal value o f safety charac-
variation that incorporatea variabil i ty in the carrying capacity a n d loads; E is an econo- mic coefficient characterizing relative c o s t o f base and foundation; ('Le is the duration of structure use, in years. The method f o r calcu- la t ing the coeff ic ients E and F from ba- s i c design cost FnSormation is described, in t h s papers mentioned above.
The result8 obtained have aerved as a basis for solving problem (3) central t o OUT paper,which we can at last conalder, Let UB retmrn t o ex- pression (I) and the notation Fntroduced there. After surveyhg, we Fnaert sampling mean x. Fnto the calculation and get from equation (5) the optimal value of safety characterist ic rb cosreaponding t o t h e l e a s t reduced to ta l cos t C,, B u t the population mean x which w i l l ac t on the st ructure ia different from x o , hence the actual value of safety character isf ic will be different from Ifb and the comespond- ing value c f r o m C,. Since C, is the l ea s t possible cost of the st ructure designed for con- dt t ions determined by xo, we have C > C m no matter what are the signs o f x-x. or r- fo We explaln: if > ro , t ha t means tha t the geological conditions have turned out t o be
"better than we thought" and we had desiuned too costly foundations - the t o t a l cost t i s increased aue eo h i t l a 1 cost; tr 6.c- ro t ha t would mean that the conditions have t u r - m a o u t t o be "wome than we thought", and the a t a b i l i t y I s lower than deaijped - the cost has increased due t o r isk cost . In e i t h e r case the difference A C = C - Cm meam extra cost (losses) because of inaccurate bowledge o f soil characterlBt ice
Consider the above total cost 88 the function C(x>. Xu that case C = C(x 1, and the loss A C is a function ofmthe d ihe rence x-xG. If we expand t ha t f u n c t i o n i n t o Taylor's series and c' eubskitute variable & for. x aC,oording . ko (I) we shall have
where C(k) is the k-th derivative of C(x) a t + pais* x0. The serisa begins with the second- order term, because x,., I s a point where the reduced to ta l coa t is at; a m i n l m u m , hence dl) = 0.
Since E l a a random quantity, the cost o f possible loeses due t o Fnsuufficlent volume of testing should be defiaed a~ the mathamatical expectation 'of (6) t -
(7 1 "
where P( E. 1 i a the diBtrlbution density of random quanttty (I), thae i s , the t-distri- but ion.
As can be seen from (61, t h a . h t e g r a l c a ~ be
the moments of t he d!!stributlon. We can calculated by summin t he s e r i e s composed of
rea t r ic t ourselves t o t he first term of the series, because all odd momentrs of the t-dist- rlbution are zero, while the second term (corresponding t o k=4) already differs from the f i r s t by a factor o f order can now write down t he loas coat as a function of volume of t e s t ing nt
(4n)-I, one
The dependence of survey cost on n i s a t r a i m fomard (it can be taken linear, f a r instance), so problem (3) is f u l l y detemmined. Naturally, the diff icul ty mentioned above st111 remains: (y m d x. can be determined only after
t r i a l s . It is involved in t he problem i t a e l i ana cannot be obviated except b y the method o f successive appraximations, In t he cam o f multistage surveys c(2) m a IT should be calculated based on t e s t i n g results obtained at the preceding stage (these quantit ies at the f i r s t stage can be d e t e m b e d by analogs - we are an t t t l ed to cons ider tha t there i a
1104
always some information on the subject of s t u d y ) ; in such a case in expression (8) they s h o u l d be Te arded as independent; of the deei- red size n o f the subsequent stage S u b s t i t u t - ing ( 8 ) in (31, different ia t ing wiih respect t o n and equating the derivative to zero, we o b t a L an equation from which to de temlne the optimal volume of t es t ing n t
where
The existence and uniqueness of the solution follow from t he f ac t t ha t when n > 3 function ( IO) monotonically decreases f ~ o m d i n i t y t o zero, while all the other quantit ies In (9)
n should be rounded. If (9) yields 8. value of are posit ive. 02 course, non-integer values of
n that is smaller than the volume of testing a t the precedhg stage, further survey is not reh- sonable economically . !Po 8um u the general solution of the basic problem !k given by (g),. We have confined OUT conaideration t o the caee of t e a t j s g a single ground charaotesfstic in order not t o encumber the logic with more technical i t ies , The problerm ia easily extended t o cover the multidimensio- n a l caset: (9) is then reglaaed by a set o f eguatlons In the unknowns nl, n2 ,..., volumes . .
o f t es t ing for various ground charactepistics. The solution could b.e found because we have succeeded in establishin a feed-backs f r o m cost ana st ructure s t d i t y guarantees to s u p veys. The feed-back has turned out t o be com- plex enough, b terns of the derivative c(2) which concentrates in I t s e l f a l l information on the interaction of base grounds with the struc- ture and the environment, in addition to b c o r - porating economic indicea. This cbmplex'itg is not posslble t o get the solution t o thiB partly the reason w h y it has f o r ao long been
problem, although the relevant ideaa fldated in t h e a i r so t o speakr the problem seems t o be
methoda t o solve it. genuineig nontr ivial and requires nontrivial
Let us eonalder a% laat t he be t t e r developed particular cam (principe I). Here the main object of t es t ing fs st rength character is t ics of permafrost contmllhng a s t ruc ture s tab i l i ty and function (4). Using equation ( 5 ) and the relat ion between reduced to ta l cos t and its ae-
l a t t e r in terns of known (computable) parameters. cond derivative at the m l n i m u m , we express the
Denottng the derivative in the left-hand side of' (9) by C, (cost of a slngle t r i a l ) , we get the equation
The reader shou ld pay a t ten t ion to the genera l character of the relationship between the cos* 00 a s t ructure and optimal volume of testing: n- Eo, i.e. t o the fac t that volume o f tes t ing increases less rapidly than the COBC. Therefore, the larger the structure the smallsr is the cost o f aurveys in the s u m total of expeditures. This should be kept in mind by those dealing with economics of construction. The remaining parameters In the right-hand side of (11) re la te the o p t h a l volume of t es t ing t o a great number of regional and local fac- toret climate and ground conditions, construc- t ional pecul iar i t ies economic indices of '
construction, etc. 111 these factors should be taken Fnto account when plannin surveys in the permafrost zone. Equation (117 should serve here as a specific instrument of calcu- lation. '
IZEFERENCEB
Kagan A.A, (1973) . Raschetnge pokazateli Piaiko-mekhaaichesklkh svoiatv gruutov , IM pp. Leningrad: S tmi leda t .
Khrus!alev LON . (1 979). Tekhniko-akonomi- cheskb raschet optimalnoi g lub iny predpostmechnogo ottaivaniya vechno- merslykh gruntov pod zdmiem. - Osnova- niya fundamentg i mechanika gruntov, 3, 19-23
naznachenil koeffitsienta nadezhnosti p r i raschete vechnomerzlykh osnovaniy sooru-
nika gruntov, 5, 21-39. zheniy . - Osnovaniy a f undamentg i mekha-
Namachenie koeffitsienta nadezhnosti p r i raschete vechnomerzlykh osnovanfy sooru- zheniy s chiato ekonornicheskoi otvetst-
mekhanFka grun%ov, 2, 26-22. vemostyu, - Osnovaniya f u n d a m e n t y i
h!aslov, N .N. (1968) . Dlitelnaga uEltoichivostt i deformatsir smeshcheniya podpornykh soosuzheniy, 159 pp. Moskvar Energiya.
Pustovoit G.P. (1986) i P r o p o z ustoichivosti zdaniy vozvodimykh 8 sokhraneniem vech- nomerziogo sostoganba gruntov osnovmiya, V knige: Trudy Severnogo ofdeleniya NII osnovanty , vyp.5, 28-34, Sgktyvkar.
nernoi geologii, 214 pp. Mosknra: Nedra.
Rbrustalev, L.N. & Pustovoit, G.P. (1984). 0
KhrustaLev, L.N. .!I, Pustovoit, G.P. (1985)
Rats, M.V. (1973). Strukturnge modeli v behe-
1105
MECHANICAL FROZEN ROCK-FILL PROPERTIES AS SOIL STRUCTURE Ya.A. Kronik, A.N. Gavrilov and V.N. Shramkova
Branch Research Laboratory for Engineering Cryopedology in Power Plant Construction (BRLECPPC), Kuibyshev Civil Engineering Institute, Moscow, USSR
smoPsIs Physical and mechanical properties of t h i s qua l i t a t ive ly new material-fce- rock (stone) system differ f rom those of the components forming it, tha t -dry rock f i l l and ice. The r e s u l t s o f the experemental laboratory and f ield researches o f the deformation and strengkh propertyes of the f rosen coarse-grained soils are discussed in this topic . Deformation characte- r i s t i c of the rock - f i l l r e l a t ionsh ip no!nograms of the temperature and ice con ten t t o be used in the engineerirlg work are s e t i n this repork too.
INTRODUCTION
When hydraulic s t ruc tu res ' a r e bu i l t in the Par North such material as coarse-grain s o i l is used which, however, gets saturated with ice when-moisture p&netrates it. Xde sa tu ra t ion m a y take place i n a na tura l way-through conden-
' sation of moisture from i n t e r s t i t i a l pore air , t h rough i n f i l t r a t ion o f atnospheric precipita- tion which is observed, for instance, i n rock- earthfill dam, o r it is formed a r t i f i c i a l l y by pouring we-ber as, f o r ins tance , in bu i ld ing port hydraul ic s t ructures . The degree o f natu- ral i ce s a tu ra t ion o f coarse-grain soil nay vary midel;) being caused by anizotropy o f the a a t e r i a l as well as by i t s being placod in to the Etructurc body i n stages.
index ( e ) varying from 0,43-0,48. The degree of i c e content; ( Gi ) varied from zero (a i r -dq mixture) t o 1 (ice-rock mixture), negative temperatures ( 8 ) - from zero to -21OC below zero, which corresponds t o t h e data of f i e l d observations of thermo-regime o f embankment darns b u i l t i n t h e Far North. Under f i e l d con- dit ions deformabili ty o f zock fill was estima- ted having f ract ion diameter up t o Im and more, and densi ty ( p ) of 2,2 t/m3. For t h i s pur- pose a piLot embankment was b u i l t or+ the si te of the Kolima hyydrostation,
To define deforma*ive pro-pertiep, o f the rnate- r i a l under laboratory conditions compression devices were used placed i n the working sec- t i o n oi' the climatic chanber o f KTK-800.
~
Physico.1 2nd mechanical properties of this gua- l i t a t i v e l ; new ' l a t e r i a l - ice-rock (stone) sys- ~ $ 3
oils were studed using d i r e c t shecar apparatus
tern - d i f f e r f r o ? ? those o f t h e components form- ra r ing appara tus in the dam of the Kolima hyd- 0 placed i n the gal1el.y of t h e cont ro l mea-
ing it, thal; is dry rock f i l l and 1ce. T h i s ros ta t ion . The experirnen-bs were conducted i n should be takel: into consideration i n design- the ,nethod described i n (Vjalov S.S., 1978) ing and building hylrotechnical s t r u c t u r e s i n which impl ies carq- ing or1 a s e r i e s of t e s t s t he Forth. under condftions of r a i d shear t o define "in-
The object o f the researches carr ied on was t o r i e s of t e s t s i n app ly in . d i r ec t ahear loading s tudy the e f fec t o f t he degree of ice satura- i n stages, w i t h a t = O , l $ i , the time of load t i o n and negat ive tenperatwe on deformative api j l icat ion on each stage ( A t ) being 24 hours. and s t rength cha rac t e r i s t i c s of the ice-rock Prolonged strength ( 'IT ) for each t e s t is de- material. f ined by design using {he point where direc-
t i o n o f t h e s t r a i g h t l i n e of the raph of de- pendence of shear deformations ( # ) on a ting stress 6 = ST) in coordinates hc-hk
Strength proper t ies of f rozen .coGse-grain
stan'caneous" s t rength ? ti) follovred by a se-
!:XCHBNJSbI OF SUPPORT U a x i m u r n v e r t i c s t r e s s ( 6' ) was 0,9.. . Experimental researches were conducted both i n t h e BRLZCPPC and a t t h e Kolima hydrostat ion now under construction, the Kolima b io t i t e g ra - n i t e seming as the mater ia l f o r s tudies . I n studying deformability under laboratory condi- t i o n s homogeneous gruss-grsvel mixbure with fract ion diameter of 3-5 mm was used while i n evaluat ing strenb%h a mixture formed by cruah- ing Larger p i e c e s o f h i o t i t u par:i-Le with frac- t i o n d i a w t ; ; r of ' 3-10 1 1 1 wac tes ted . ".:e den- s i t y of hard particle:; ( f t n o s o i l test- ed ! ~ R S v / i th in 1 ,&4 - 1 , 5 w i t h porosi ty
Analysis The anal;/sis of t he r edu l t s o f tes t ing defor- mqtive properties 01 f rozen coarse-grain soi l under compression conditions allowed to use f ract ional- l inear re la t ionship (Tsytovich N.A. and o ther , 1981) t o describc the development of deformations i n t i m e , v e r t i c d s t r e s s b e i n s var iab le : .. I* . A
1106
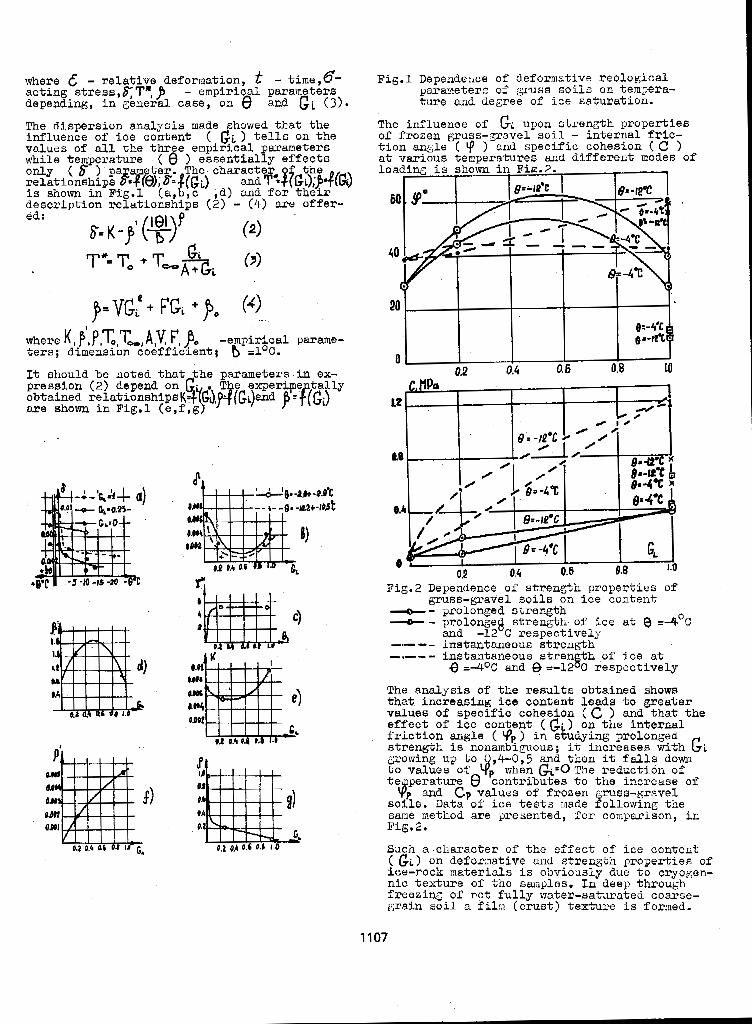
where & - relative deformation, - time ,8- acting stress,S;T*, ,!3 - empirical parameters depending, in general case, on and Gi ( 3 ) . The dispersion analysis made showed tha t the influence of ice content ( Gi ) t e l l s on the
while temperature ( 8 ) e s s e n t l a l l s e f f e c t s values of a l l the three empirxcal parameters
only ( r- ) pax ter: The charactek of fhe +(a relationships Fy));F=#(&) =a Tzf &),P is shown i n Fig.1 (a,b,c ,d) and for t h e i r description relationships ( 2 ) - (4) are offer-
It should be noted t ha t f h e aarameters i n ex-
Fig.1 Dependezce o f deformctive reological
ture and degree o f ice saturation. paraxeters of gruss s o i l s on tempera-
The influence o f G; upon strenzth properties of frozen gmss-gravel s o i l - in te rna l f r ic - t i o n angle ( ) and specific cohesion ( C ) a t various temperatures and different modes o f loading i s shown i n Fia.2. I
0.2 0.4 0.6 0.8 10
Fig.2 Dependence of s t reneh proper t ies o f gruss-gravel soils on i ce conteat - prolonged strength - prolongeg strewth o f ice at e = ~ O C
and -12 C respectively
-*I-- instantaneous stren th of i c e a t -.- x - instantaneous strength
8 =-4OC and e -12 C respectively
The analysis of the results obtained shows that increasing ice contenk leads t o greater Values Of specific cohesion ( c ) and that; the e f f ec t of ice content ( G. ) on tkle internal f r i c t i o n angle ( q p i n s k y i n g prolonged strength is nonambiguous; it increases with Gi gxowing up t o ,4-0,5 a d then it falls down to values of when Gi.0 The reduction of teaperatwe 8 contributes t o the increase o f
q p and cp values o f f rozen grmss-gravel soils. Data of ice t e s t s made following tine same nethod a r c $resented, f o r co:nparison, i n Fig. 2.
Such a-cilarncter o f the e f f e c t o f ice content ( GL) on deformative 2nd strength properties of
nic t ex tu re o f thc samples. In deep through ice-rock materials is obviously due t o cryogen-
freezing o f not fu l ly water-satuated coarse- main soil a f i 1 .n (crust) texture is formed.
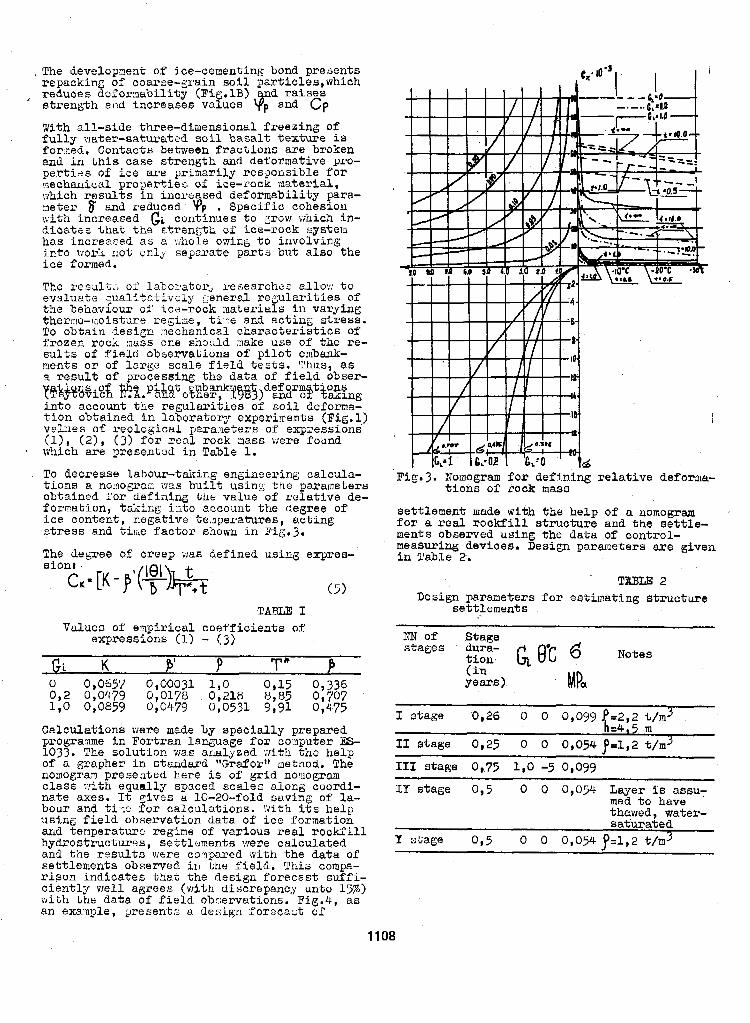
, The developrlent of ice-cementing bond presents repackinE of coarse-grain s o i l pcxticles,which
~ reduces deforrnability (Fig.lB) d r a i s e s s t ren&h and increases values and cp With all-side three-dimensional freezing o f fully vater-saturated s o i l basa l t t ex tu re is for:ned. Contacts between fractions are broken and i n th i s ca se s t r eng th and deformative pro- p e r t i z s of i ce are primzrily responsible f o r !nechanical pro-,,er-t;ies of ice-i30ck material, which results in incl%ased deforaabi l i ty para- :.letex 8 and reduced 'Pp . Specific cohesion vdth increased G; c o n t i m e s t o Zrow vihich in- d i c a t e s that the ctrengti; o f ice-rock system has increased a s a .,,ihole owin& t o involving. into \-:ark r:ot or112 s e p u a t e ?arts but also the i ce formed.
The result.:j o f labor.ator, renearchGz aLLov: t o evaluate z u a l i $ n t i v c i y "enera1 regular i t ies of the behaviour o f icd-rock nater ia ls i n varying themo-moisture rcgize , ti-,:e and ac t ing stress. To obtain aesigr :?echanical character is t ics of f r o z e n rock :nass one sho:lld nake use of thc re- s u l t s of field observations of p i l o t embank- ments o r o f k r ~ s s c a l e f i e l d t e s t s . Thus, as 8 reault of p o c e s s i n g t he da t a o f f i e l d obser-
in to account the regular i t ies of s o i l &forma- t ion obtained i n IaboFabory experixen-bs (Fig.1) vzluea o f reological pera:qeters of expxessions (l), ( 2 ) , ( 3 ) for r e a l rock m a s were found which are presentad in Table 1.
Y%$H+io,f, R % . p W o%l~~~%$ ana lo? Eexlng def rm t ' o p s
*
. To decrease Labour-taking engineerirlg calcula- t i o n s a no:nogra:: V I ~ S buil t us in; the parameters obtained :or defining %he value of r e l a t i v e de- formation, taking i n t o account the degree o r i c e content, negative te:ggeratures, acting stress and t i n e f a c t o r shorn i n Fig.3.
The dekTee of creep xas defined using expres-
TABLE I Values of el: lpirical coefficients o f
expressions (1) - ( 3 )
C; K 8' P T* b
Calculat ions were made by apecially prepared programme i n Fortran language f o r coilputer ES- 1033. The so lu t ioa vla8 a-mlyzed n i t h t h e h e l p o f a grnpher i n staaddard "Grafor" laethod. The nomogran prese:ited here is of gr id no.nogram c l a s s with equally spaced scales along coordi- nate axes. It gives a 10-20-fold saving o f la- bour and ti% for calculat ions. % i t h i t s help us ing f ie ld observa t ion date. of ice formation and temperature regime o f var ious r ea l rock f i l l hydrostmcturss, set t lements were ca lcu la ted and t h e r e su l t z were c o q a r e d ivith the da t a of settlements observed i n t he f i e ld . This compa- rison ind ica tes t h a t the design forecast suff i - ciently well agrees (with discrepancy unto 17$) with the da ta of field obriervations. Fig.4, as an exaTnple, LJresent:; I). design Yorocact o f
Fig.3. Nomogram for def in ing r e l a t ive deforma-
set t lement made with the help of a nomogram for a real roclrfi lZ structure and t h e s e t t l e - ments observed using the da t a of control-
t i o n s of rock maw
measuring device^. Besign parameters are given i n Table 2.
' TXBLE 2 Design parameters f o r es t imat ing s t ruc ture
set t lements
I stage 0,26 0 0 0,099 p=2,.2 t/m3
I1 stage 0,25 0 0 0,054 p=1,2 t / m 3 h=4,5 m
111 stage 0,.75 1,0 -5 0,099
511 stage 0,5 0 0 0,054 Layer is aaau- med t o have thawed, water- saturated
Y stage 0,5 0 0 0,054 P d , 2 t/m3
1108
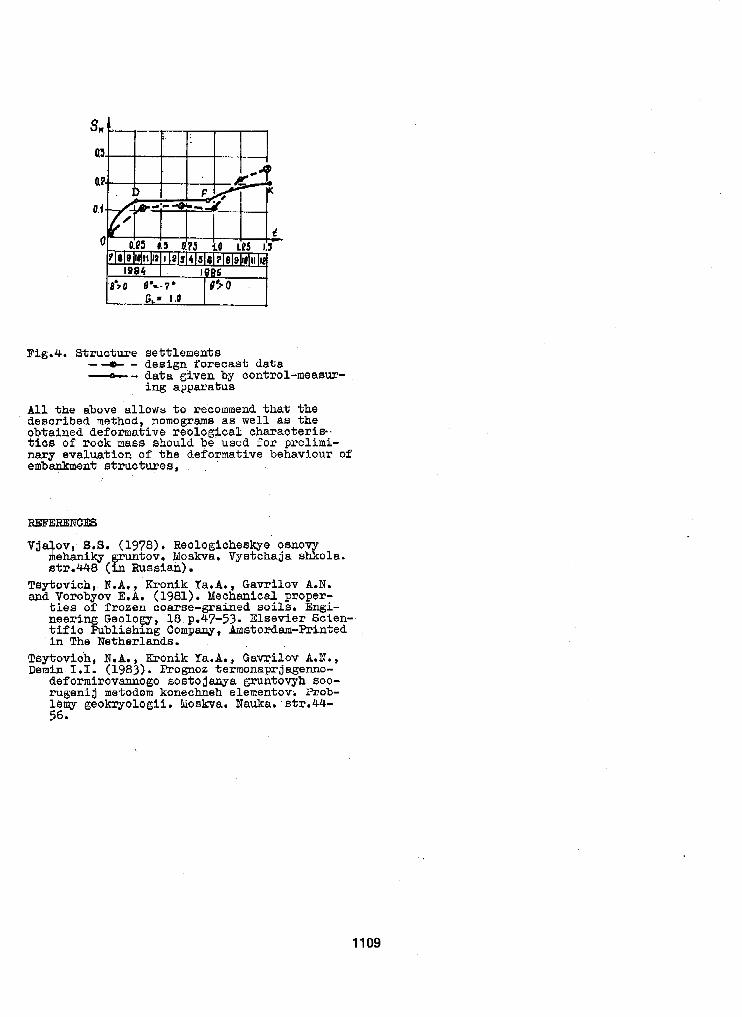
Fig.4. Structure set t lements -* - design forecast data -- data gkven by control-meaaur- ing apparatus
All the above a l lows to recommend that the described method, nomograms as well 4s the obtained deformative reological characteris-. tics of rock mass should be used f o r prelimi- nary evaluation o f the deformative behaviour of embankmant s t r u c t m e s ,
REFERENOES
Vja OVl 8.8. (1978). ReOlQgiCheSkye OSnOVY iehaaiky tov. MoskVa. Vystchaja shkola. str.448 (E%Ussiad
Tey-bovich,. N.A., Kronik Ta.A., Gavrilov A.N. and Vorobyov E.A. (1981). Mechanical proper-
ties of frozen comae-grained soils. Engi- neering Geolow, 18 p.47-53. Elsevier Scien- t i f i c Pub l i sh ing Company, Amsterdam-Rinted in The Netherlands.
Isytovich, N.A., Tironik Ja.A., Gavrilov A.N., Dernin 1.1. (1983). Prognoz termonaprjagenno-
deformirovannogo soato janya gruntovyh SOO- rugeni j metodom konechneh elementov. -ob- lemy geokryologii. bioskva. Nauka. -str.44- 569
1109
A STUDY OF FROST HEAVE IN LARGE U-SHAPED CONCRETE CANALS Li, Anguo
Northwest Institute of Water Conservancy, Ministry of Water Resources and Electric Power, Yangling Town, Shanxi, People’s Republic of China
SYNOPSIS Based on the data obtained from observations in an experimental canal and a test site during the three cold seasons, the freezing and the frost heave behaviour of the subsoils be- neath large U-shaped concrete canals were analyzed and the methods for predicting the frost depth and the heaving rate are presented. It was found that frost heave will not occur if the water con- tent in the subsoils before freezing, is not greater than 15.1% and the normal frost heave force will be negligible i f it is not greater than 1 7 . 3 % . The normal frost heave force determined by a pressure transducer was 1.8 times greater than that determined by a dynamometer, on the everage, and was 5 . 5 times greater in completely confined conditions than in lining-confined conditions. After revision, values of the normal frost heave force are suggested for engineering design under the same condi- tions.
INTRODUCTION
‘To study the freezing and the frost heave behav- iour in subsoils beneath large U-shaped concrete canals and to study the feasibility and the meth- ods for the design and the construction of the linings, an experimental canal was built in Shanxi in 1981 and a site for observing frost heave of different buried plates ( 1 0 , 30 and 50 cm in diameter) was set up nearby. The experi- mental canal was located on the loess terrace, on the east bank of the Qian river with a north- east trend and without snow cover in winter s o
were observable. The soil was classified a s a that the slopes, whether facing the sun or not,
s i l t : , -lay with the ground water table at about the -’ I rPepth, The size of the test section of
at the L a p , sides having a 3 . 2 m radius and 10’ the c:. i was: 5 . 1 m in depth, 7 .17 m in width
slope of the bottom. The lining was built with spray concrete with a thickness of 1 0 cm and cross flexible seams every 2 m. On the southern bank of the canal, there was a site used fgr determining air temperatures, precipitation, ground temperatures and frost depth. The water content o f the subsoils was obtained by drilling and sampling. The amounts of frost heave (or thaw settlement) in the subsoils and the displace- ments of canal lining were determined by dial
mined by both a pressure transducer (set up in a gauges. The normal frost heave force was deter-
completely confined pattern) and a dynamometer (set up in completely confined and lining- confined patterns). All o f the instruments were set u p normal to the surface at the observation points and calibrated before using. The observa- tion period lasted €or three cold seasons and all of the data showedalmost the same regularity.
FREEZING BEHAVIOUR OF CANAL SUBSOILS
In the U-shaped canal, each observation point
had its own slope orientation and degree o f direct sunshine, so that each point had its own difference between ground surface temperature and air temperature in winter, According to the observations, the ratios ‘li o f the accumulated
values of temperaturesin the period f.rom the negative temperatures (the sum of the absolute
start o f the cold season to the day of maximum frost depth) at the surface of each observation points to the freezing index (the sum o f the absolute values of mean daily air temperature during the cold season), are shown in Table I and contours of this ratio, below the canal, at a particular times,are shown in Fig.1.
TABLE I
Values of rli and ai at Each Location Within the Canal
position Sol $1 $2 $3 S4 S5
rl 4.00 3.45 2.55 2.58 2.81 3.27
Cli 2.66 2.95 2 .46 1.96 2.34 2.28
position 0 N5 N4 N3 N2 N 1 No1
‘li 3.28 2.58 1.73 1.03 1.01 1.25 1.95 ai 3.22 2.15 2.06 1.31 1.30 2.45
The distribution pattern of frost depth was in good agreement with that of surface temperature patterns. The frost depth was relatively deep at the southern slope which had a longer freez- ing period and relatively shallow at the north- ern slope which had a shorter freezing period
1110
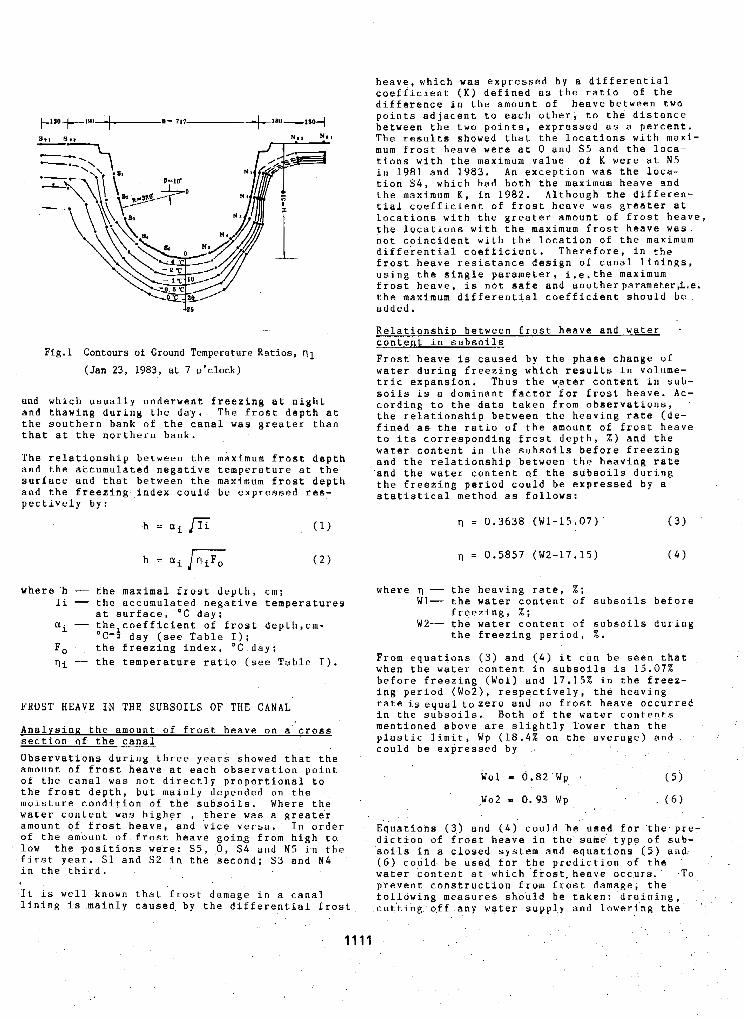
Fig.1 Contours of Ground Temperature Ratios, q1
(Jan 23, 1983, at 7 o'clock)
and which usually underwent freezing at night and thawing during the day. The frost depth at the southern bank of the canal was greater than that at the northern bank.
The relationship between the maximum frost depth and the atcumulated negative temperature at the surface and that between the maximum frost depth and the Ereezing index could be expressed res- pectively by:
h = ai I=' where h - the maximal frost depth, cm;
Ii - the accumulated negative temperatures ai - the+coefficient of frost depth,cm* Fo - the freezing index, ' C day; qi - the temperature ratio (see Table I).
at surface, 'C day;
' C - 2 day (see Table I);
FROST HEAVE IN THE SUBSOILS OF THE CANAL
Analysing the amount of frost heave o n a cross section of the canal Observations during three years showed that the amount of frost heave at each observation point o f the canal was not directly proportional to the frost depth, but mainly depended on the moisture condition of the subsoils. Where the water content was higher , &here was a greater amount of frost heave, and vice versa. In order of the amount of frost heave goin,g from high to low the positions were: S 5 , 0 , $ 4 and N5 im the first year. S1 and S2 in the second: S3 and N4 in the third.
It is well known that frost damage in a canal
heave'which was expressed by a differential coefficient ( K ) defined as the ratio o f the difference in the amount of heavebetween two points adjacent to each other, to the distance between the two points, expressed as a percent. The results showed that the locations with maxi- mum frost heave were at 0 and S 5 and the loca- tions with the maximum value of K were at N5 in 1981 and 1983. An exception was the loca- tion 54, which had both the maximum heave and the maximum K , in 1 9 8 2 . Although the differen- tial coefficient of frost heave was greater at locations with the greater amount o f frost heave, the locations with the maximum frost heave was. not coincident with the location of the maximum differential coefficient. Therefore, in the frost heave resistance design of canal linings, using the single parameter. i.e.the maximum frost heave, is not safe and another parameter,i.e.
added. the maximum differential coefficient should be
Relationship between frost heave and water . content in subsoils Frost heave is caused by the phase change of water during freezing which results in volume- tric expansion. Thus the w,ater content in sub- soils is a dominant factor for frost heave. Ac- cording to the data taken from observations, the relationship between the heaving rate ( d e - fined as- the ratio o f the amount of frost heave to its corresponding frost depth, % ) and the water content in the subsoils before freezing and the relationship between the heaving rate and the water cantent Qf the subsoils during the freezing period could be expressed by a statistical method as follows:
q = 0.3638 (W1-15.07)' ( 3 )
q = 0.5857 (W2-17.15) (4)
where q - the heaving rate, %; W1- the water content of subsoils before
W2- the water content o f subsoils during freezing, X ;
the freezing period. %. From equations ( 3 ) and (4) it can be seen that when the water content in subsoils is 15.07% before freezing (Wol) and 17.15% in the freez- ing period ( W O ~ ) , respectively, the heaving rate i s equal tozero and no frost heave occurred in the subsoils. Both of the water contents mentioned above are slightly lower than the plastic limit, Wp (18.4% on the average) and could be expressed by .
Equations ( 3 ) and ( 4 ) could be used for .the pre- diction of frost heave in the same type of sub- soils in a closed system and Bquations ( 5 ) and ,
(6) could be used for the prediction of the water 'content.at which frost, heave occurs,' , T o prevent construction from frost damage, the fo1,lowing measures should be taken: draining,
lining is mainly caused, by the differential frost cutting off any water supply and lowering the
' 1111
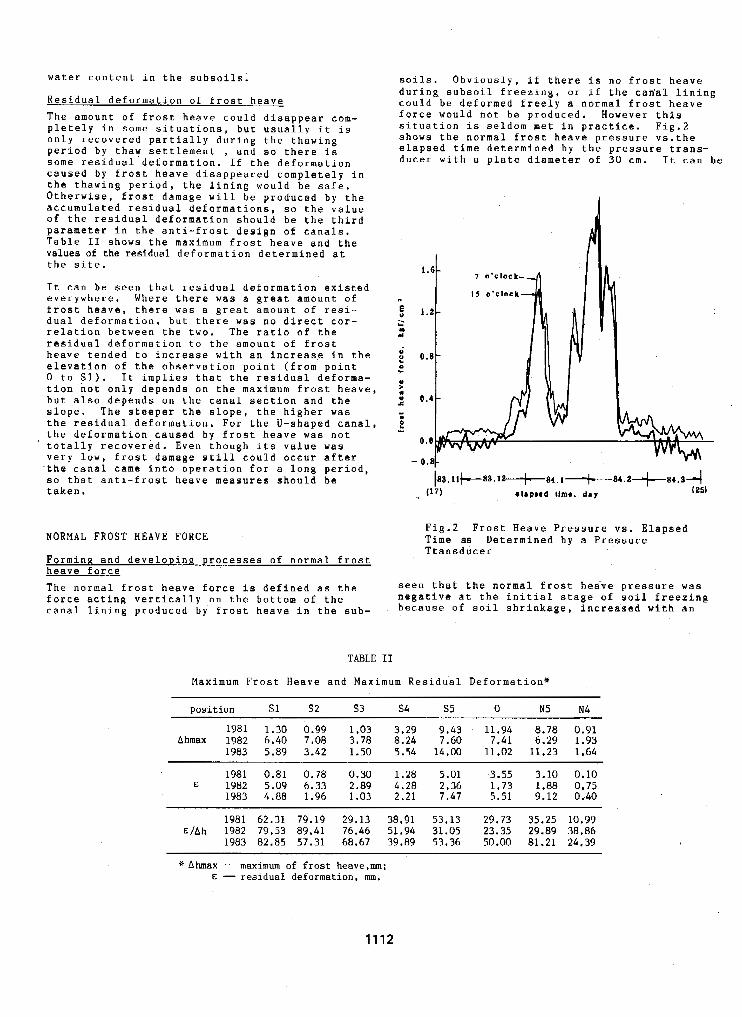
water content in the subsoils.
Residual deformation of frost heave
The amount o f frost heave could disappear com- pletely in some situations, but usually it is only recovered partially during the thawing period by thaw settlement , and s o there is some residual deformation. If the deformation caused b y frost heave disappeared completely in the thawing period, the lining would be safe, Otherwise, frost damage will be produced by the accumulated residual deformations, s o the value of the residual deformation should be the third parameter in the anti-frost design of canals. Table I1 shows the maximum frost heave and the values of the residual deformation determined at the site.
It can be seen that residual deformation existed everywhere. Where there was a great amount of frost heave, there was a great amount of resi- dual deformation, but there was no direct cor- relation between the two. The ratio of the residual deformation to the amount of frost heave tended to increase with an increas.e in the elevation o f the observation point (from point 0 to S l ) . It implies that the residual deforma- tion not only depends on the maximum frost heave, but also depends on the canal section and the slope. The steeper the slope, the higher was the residual deformation. For the U-shaped canal, the deformation.caused by frost heave was not
very low, frost damage still could occur after ,the canal came into operation for a long period, s o that anti-frost heave measures should be taken.
' totally recovered. Even though its value was
NORMAL FROST HEAVE FORCE
soils. Obviously, if there is no frost heave during subsoil freezing, or if the can'al lining could be deformed freely a normal frost heave force would not be produced. However this situation is seldom met in practice. Fig.2 shows the normal frost heave pressure vs.the elapsed time determined by the pressure trans- ducer with a plate diameter of 30 cm. It c a n be
Fig.2 Frost Weave Pressure vs. Elapsed Time a6 Determined by a Pressure
Forming and developine. processes of normal frost heave force
Ttansducer
TABLE I1
Maximum Frost Heave and Maximum Residual Deformation*
position s1 s 2 s 3 s 4 s5 0 N5 N4
Ahmax 1982 6 .40 7.08 3.78 8.24 7.60 7.41 6 .29 1.93 1981 1.30 0.99 1.03 3.29 9 . 4 3 11.94 8.78 0.91
1983 5 .89 3.42 1.50 5.54 14.00 11.02 11.23 1.64
E 1982 5.09 6 . 3 3 2 .89 4 . 2 8 2 .36 1 . 7 3 1.88 0.75 1981 0 .81 0 .78 0 .30 1 .28 5 .01 , 3 .55 3 .10 0.10
1983 4 . 8 8 1.96 1.03 2.21 7.47 5.51 9 .12 0 .40
1981 62.31 79.19 29.13 38.91 53.13 29.73 35.25 10.99 €/Ah 1982 79.53 89.41 76.46 51.94 31.05 23.35 29.89 38.86
1983 82.85 57.31 68.67 39.89 53.36 50.00 81.21 24.39
* Ahmax -maximum of frost heave,mm; E - residual deformation, mm.
1112
TABLE I11
Maximum Normal Frost Heave Pressure in Different Locations of the Canal, kgf/cm’
position S1 S2 S3 S4 S5 0 N5 N4
by transducer completely confined 1.71 0.98 1.22 1.08 1.64 1 . 7 7 1,21 0.29
by dynamometer 0.97 0.86 0.41 1.28 0.92 0.90 completely confined
by dynamometer 0.11 0.12 0.25 0.11 0.37 0.02 lining-confined-like
increase in frost depth after cont.inuous freez-
imum frost depth occurred, decreased sharply in ing occurred, reached a maximum after the max-
the thawing period, and finally dropped down to a negative value lower than the values in the initial stage of subsoil freezing.
Distribution of normal frost heave force a l o x the cross section of the canal From Table 111 it can be seen that the locations with the normal frost heave pressure from high t o low are.as follows: 0, S 5 , S 1 in the first; N5, $ 2 , S3. S4 in the second; N4 in the third and N 1 , N2, N3 with the values equal to zero. Under completely confined conditions, the normal frost heave force determined by the pressure transducer was 1.8 times higher than that deter- mined by the dynamometer, on the average. When the dynamometer was used, the normal frost heave force under the completely confined condition was 5.5 times higher then that under the lining- confined condition, on the average.
Factors affecting normal frost heave force The factors influencing the normal f r o s t heave force could be the following: frost heave factors of the subsoils including soil properties, water content, temperature and freezing rate; and the deformation factors of the lining plates,includ- ing strut-ture, type of lining plates and their section size, e t c .
1) influence of moisture condition of subsoils on normal frost heave fprce In the closed system, the normal frost heave force increased with an increase in the initial water content greater than that initiating frost heave. For a plate diameter plate of 30 c m , the relationship between the maximum normal frost heave pressure and the water content be- fore freezing could be expressed by
U = 0 . 2 1 2 7 (Wl-17.28) ( 7 )
Where 0 is tge maximum normal frost heave pres- sure, kgf/cm . The water content o f the subsoils before freez- i n g was 0 . 9 4 times the plas’tic limit.
2 ) influence of heaving rate on the normal frost
heave force
I n the closed system, the normal frost heave pressure increased with an increase in the heav- ing rate of the subsoils. The relationship between them could be expressed by
0 = 1 . 1 6 4 q O . 7 9 3 ( 8 )
Where ,q is the heaving rate, %. 3 ) influence.of the area o f the test plate o n normal frost heave force
The relationship between the normal frost heave pressure and the area o f the test plate could be expressed by
u uo (Y
+T (9)
Where u - the determined value of the yormal frost heave pressure, kgf/cm ;
o0 - the frost heave pressure of the soil column under the test plate, tgf/cm’;
51 - the area of the test plate,cm ; a - the coefficient, kgf, which is the
frost heave force o f the soil body surrounding the confined soil column.
Based on.the determined values of the normal frost heave force with different areas oE the test plates at the site, equation (9) could be written in the following form:
0 = 0 , 3 5 6 8 + - 6 2 .875 L 1
From equations ( 9 ) and (10) ft can be seen that ( lo i s equal to 0.3568 kgf/cm , which is the normal frost heave pressure without the influ- ence of the surrounding soils.
Adopted values of normal frost heave force
The values, shown in Table 111, of the normal frost heave pressure were obtained by different methods, The values, Oi, determined by the pres- sure.transducer were greater than their tru,e values s o they could be used in engineering design until they are revised. First, consider- i n g the confined condition, the values o f oir shown i n Table 111, should be divided by 5.5
1113
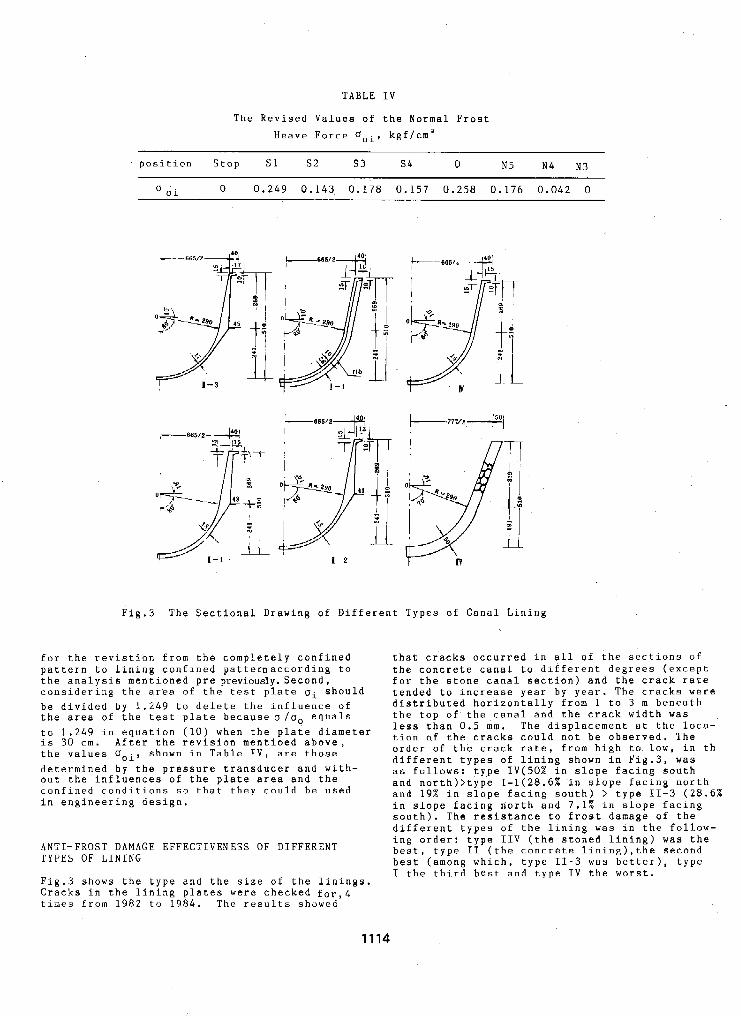
TABLE IV
The Revised Values of the Normal Frost Heave Force aoi, kgf/cma
position Stop S 1 $2 s3 s4 0 N5 N4 N3
' oi 0 0 . 2 4 9 0.143, 0.178 0 . 1 5 7 0 . 2 5 8 0.176 0.042 0
Fig.3 The Sectional Drawing of Dif
for the revistion from the completely confined pattern to lining confined patternaccording to the analysis mentioned pre previously. Second, considering the area of the test plate ui should be divided by 1 . 2 4 9 to delete the influence of the area of the test plate because u / o o equals to 1 . 2 4 9 in equation ( 1 0 ) when the plate diameter is 30 cm. After the revision mentioed above, the values Uoi, shown in Table IV, are those determined by the pressure transducer and with- out the influences of the plate area and the confined conditions s o that they could be used in engineering design.
ANTI-FROST DAMAGE EFFECTIVENESS OF DIFFERENT TYPES OF LINING
Fig.3 shows the type and the size o f the linings. Cracks in the lining plates were checked for,4 times from 1982 to 1984. The results showed
ferent Types of Canal Lining
that cracks occurred in all of the sections o f the concrete canal to different degrees (except for the stone canal section) and the crack rate tended to increase year by year. The cracks were distributed horizontally from 1 to 3 m beneath the top of the canal and the crack width was less than 0.5 mm. The displacement at the loca-
order of the crack rate, from high to low, in th tion of the cracks could not be observed. The
different types of lining shown in Fig.3, was as follows: type IV(50% in slope facing south and north)>type 1-1(28.6% in slope facing north and 19% in slope facing south) > type 11-3 (28 .6% in slope facing north and 7 . 1 % in s l o p e facing south). The resistance to frost damage of the different types of the lining was in the follow- i n g order: type IIV (the stoned lining) was the best, type I1 (the concrete lining),the second best (among which, type 11-3 was better), type T the third best and type IV the worst.
1114
(ii)
(iii)
'( iv
'The distribution o f both frost depth and frost heave observed along the cross section of a canal lining was nonuni- form. For similar canal conditions, the frost depth at different locations could be calculated by equation ( 1 ) or ( 2 ) according to whether the data are air temperatures or grodnd surface tem- peratures. The heaving rate could be calculated by equation ( 3 ) or ( 4 ) ac- cording to the water content in the subsoils. Where the water content in the subsoils, before freezing, was less than 15.07%, frost heave did not occur, and where it was less than 1 7 . 2 8 2 , the normal frost heave force was negligible. the ratio of the two water contents~mentioned above to the plastic limit was 0.82.and 0 . 9 4 , respectively, The dominant design parameters f o r frost heave resistance,in canal linings should be the maximum frost heave, the differential coefficient o f frost heave and the residual deformation. T h e value and the distribution of the normal frost heave force depends on the magnitude o f the frost heave in the sub soilsand the deformationof the lining 'plates. The values of the normal frost heave force changed with the determina- tion method. The values determined by
higher than those determined by the the pressure transducer were 1.8 times
dynamometer, on the average, and the values determined in the completely confined pattern were 5 . 5 times higher than those determined in the lining- confined pattern, on the avmage. The influence of the area of the test plates on the normal frost heave pres- sure could be expressed by equation (10) and the values of the normal heave , pressure, shown in Table IV, could be used f o r engineering design if the con- ditions are the same. €racks occurred in each type of canal lining and the crack rate tended to increase year by year. Type I1 lining was better than type I and type I V was the worst. I n the large U-shaped concrete canals, the lining was not only uplifted but also displaced to the inside at -the slope facing north by the frost heave forces, and the displacement caused by frost heave was not totally recovered and so frost damage occurred. Measures f o r preventing frost heave in subsoils should be taken into account i n the design and construction o f canals.
C h e n g Xlaobal, ( l r t r u ) . U ~ S C U S S ~ O ~ on ~ u r zsrrrysa method f o r calculating t h e normal frost heave force at the bottom o f foundations. J.of Water Conservancy and Electric Power ( 2 ) .
Orlov, B.O. (1962). Frost heave in fine-grained
'long Changjiang and Cuan Fennian, (1985). Frost heave in soils and prevention of frost
Water Conservancy and Electric Power. damage in structures. Publishing House of
soils. Moscow, Publishing House of Sciences
1115
FROST HEAVING FORCE ON THE FOUNDATION OF A HEATING BUILDING Liu, Hongxu
Beilongjiang Provincial Institute of Low Temperature Construction Science, Harbin, China
SYNOPSIS In order to investigate the frost heaving for,ce on the foundation of heating building, an experimental heating building with various test foundations was constructed at the Yan- jiagang Frozen Ground Field Station nearby Harbin, Northeast China. Frost heaving force on the test foundations was observed for three winters from 1982 to 1985. The test results thaw that the frost heaving forces on the foundations of a heating building are much smaller than that on the similar foundations at a natural test site, which are not heated. Based on the test results, emperical equations for calculating the frost heaving forces on footings or pile foundations of a heating building were presented.
INTRODUCTION
Many investigations on frost heaving forces at natural sites in permafrost and seasonal frozen areas have been carried out (Liu, 1983; Tong, 1983), but only a few studies are concerned with the frost heaving force on the outside of foun- dations o f the heating buildings. This subject had been intensively investigated by the author and his colleagues through an experimental heat- ing building at the Yanjiagang Field Station nearby Harbin, Northeast China, for three winters from 1982 t o 1985. This report is the summary o f this work.
F I E L D EXPERIMENT
mine the ground temperature and thaw depth of the aubaoil beneath the test building, 2 7 sets of thermal couples (No.1-27) and 11 detectors of frost depth (No.28-38) were embedded around the building foundations, as shown in Fig.1.
Foundations A and C are square footings with a dimention'of lOOxl00 cm and a layer of 50-CUI-
strip footing with the dimention of 100 cm long thick underlying sand pad. Foundation B is a
by 60 cm wide. It was embedded 50 cm deep below natural ground surface o n a 50-cm-thick sand pad. To eliminate the frost heaving force on the ends of the strip footing, subsoils around both ends o f the footing were replaced with coarse-grained sand in a volume of 130 cm long by 30 cm wide and by 300 cm deep. Foundation D is a grounding pile, which is 40 cm in diameter by 155 cm long.
Site conditions For comparison, three seperate foundations a , b The test site f o r the experimental heating building is located at the Yanjiagang Frozen
and d, which are similar to the test foundations A , B and D, respectively, were constructed at the test site nearby the testing building where
Ground Field Station, which is about 30 km South- no effect were induced b v the heatinn. west to Harbin. It is on the first terrace of - the Sonhua River and has a thick layer of the Quaternary river and lake deposits.
The maximum frost depth at this site is about 155 cm. The subsoil beneath the experimental building is loam, with an average plastic limit of 20% and 1i.quid limit of 35%. The amount o f frost heave occured at this site is 30.9 mm in maximum and 17.5 cm in minimum, with an average heaving ratio of 20%,belonging to a high f r o s t susceptibility.
Construction of the experimental buildin&
The experimental heating building is composed of f o u r rooms, wi.th a total area of 61.75 m a , as
with a diameter o f 40 cm b y 10 m long (denoted drown in Fig.1. It is suppurted by eight piles
as M1,M2, ... M8 in Fig.1). These piles are also used as the anchoring piles for the four test foundations A , B , C and D (see Fig.1). To deter-
TEST RESULTS
The variation of daily mean air temperature (ed), frost depth (H), frost heave amount (Ah)
and ground water table at the test site from November 1 9 8 2 to June 1983 were shown in Fig.2. The in-door monthly mean air temperature ( e ) of each room o f the experimental heating building for three winters from 1982 to 1985 was Listed in Table I. The observed values of the total frost heaving force on each pair of comparative foundations A and a, B and b, D and d and foun- dation C in two winters of 1983-1985 were illus- trated in Figs. 3, 4 , 5 and 6 , respectively. Variation o f the frost depth and thaw depth beneath these foundations and at the test site were also plotted in these figures.
1116
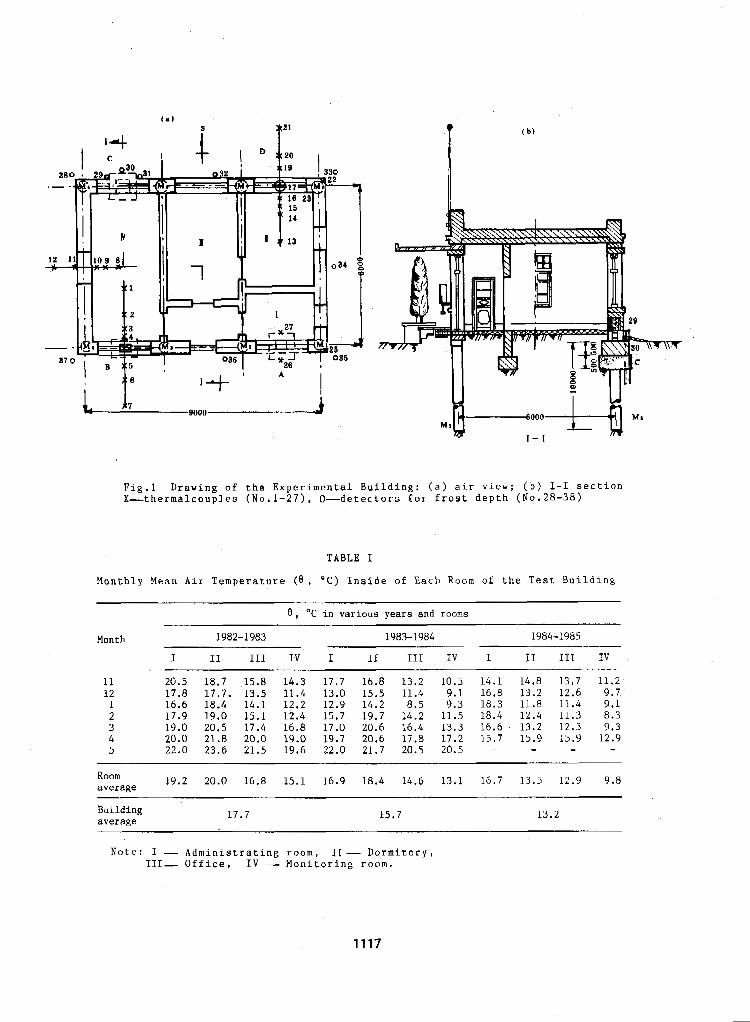
I ! $ 6 "t- ' * I
Fig.1 Drawing of t h e Experimental Building: (a) a i r view: ( b ) 1-1 s e c t i o n X-thermalcouples (No.l-27), 0-detectors for frost depth ( N o . 2 8 - 3 8 )
TABLE I
Monthly Mean Air Temperature ( a , "C) I n s i d e o f Each Room of t h e Test B u i l d i n g
0 , "C in various years and rooms
Month ~
1982-1983
I I1 I11 IV
11 20.5 18.7 15.8 14.3 12 1
17.8 17.7. 13.5 11.4
2 16.6 18.4 14.1 12.2
3 17.9 19.0 15.1 12.4
4 20.0 21.8 20.0 19.0 5 22.0 23.6 21.5 19.6
19.0 20.5 17.4 16.8
1983-1984
I I1 I11 IV
17.7 16.8 13.2 10.5 13.0 15.5 11.4 9.1 12.9 14.2 8.5 9.3 15.7 19.7 14.2 11.5 17.0 20.6 16.4 13.3 19.7 20.6 17.8 17.2 22.0 21.7 20.5 20.5
I
14.1 16.8 18.3 18.4 16.6 15.7
-
1984-1985
I1 111 IV
14.8 13.7 11,2 13.2 12.6 9.7 11.8 11.4 9.1 12.4 11.3 8.3 13.2 12.3 9.3 15.9 15.9 12.9 - - -
Room average 19.2 20.0 16.8 15.1 16.9 18.4 14.6 13.1 16.7 13.5 12.9 9.8
B u i l d i n g average
17.7 15.7 13.2
Note: I - Administrating r o o m , 11- Dormitory, 111- Office, I V - Monitoring room.
1117
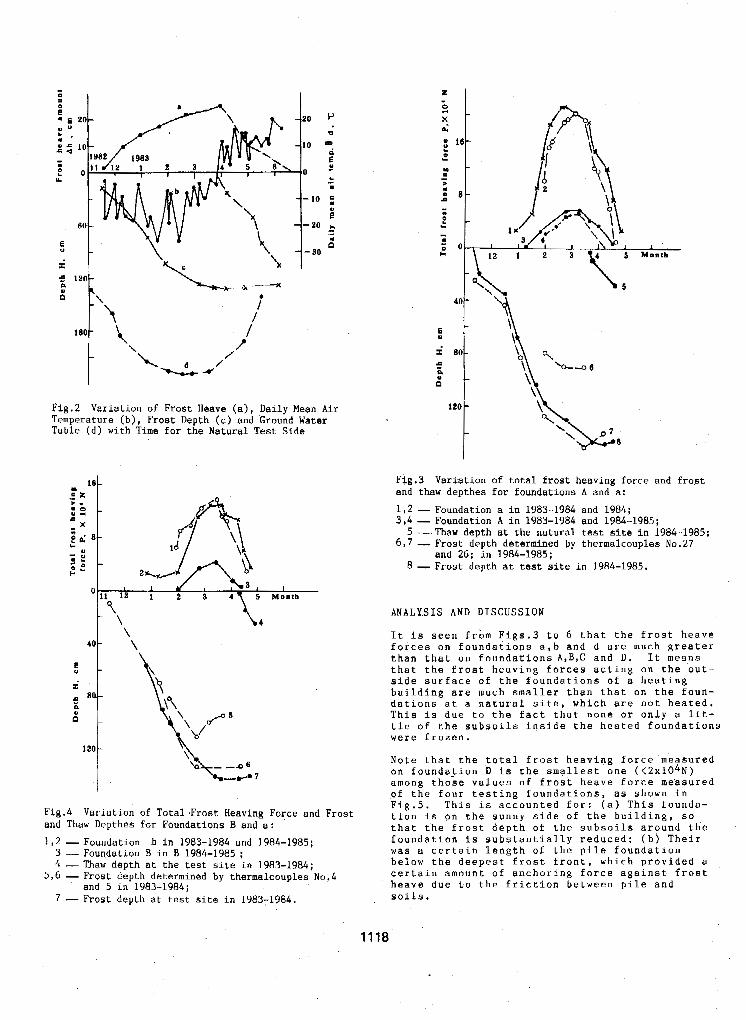
Fig.:! Variation of Frost Heave ( a ) , Daily Mean Air
Table (d) with Time for the Natural Test Side Temperature (b), Frost Depth (c) and Ground Water
16 - .E m o - u - c .
c u
\ 40 - \
Fig.4 Variation of Tota1,Frost Heaving Force and Frost and Thaw Depthes for Foundations B and a:
1,2 - Foundation b in 1983-198s and 1984-1985; 3 - Foundation B in B 1984-1985 ; 4 -Thaw depth at the test site in 1983-1984;
5,6 - Frost depth determined by thermalcouples No.4 and 5 in 1983-1984;
7 - Frost depth at test site in 1983-1984.
Fig.3 Variation of total frost heaving force and frost and thaw depthes for foundations A and a: 1,2 - Foundation a i n 1983-1984 and 1984; 3,4 - Foundation A in 1983-1984 and 1984-1985;
6,7 - Frost depth determined by thermalcouples No.27 5 -Thaw depth at the natural test site in 1984-1985;
and 26; in 1984-1985; 8 - Frost depth at test site in 1984-1985.
ANALY.SIS AND DISCUSSION
It is seen from Figs.3 to 6 that the frost heave forces on foundations a,b and d are much greater than that on foundations A,B,C and D. It means that the frost heaving forces acting on the out- s,ide surface o f the foundations of a heating building are much smaller than that on the foun-
This is due to the fact that none or only a lit- dations at a natural site, which are not heated.
tle of the subsoils inside the heated foundations were frozen.
Note that the total frost heaving force measured on foundation D is the smallest one ((2xlO4N) among those values o f frost heave force measured of the four testing foundations, as shown in Fig.5. This is accounted for: ( a ) This founda- tion is on the sunny side o f the building, 8 0 that the frost depth of the subsoils around the foundation is substantially reduced; ( b ) Their was a certain length of the pile foundation below the deepest frost front, which provided a certain amount of anchoring force against frost heave due to the friction between pile and soils.
1118
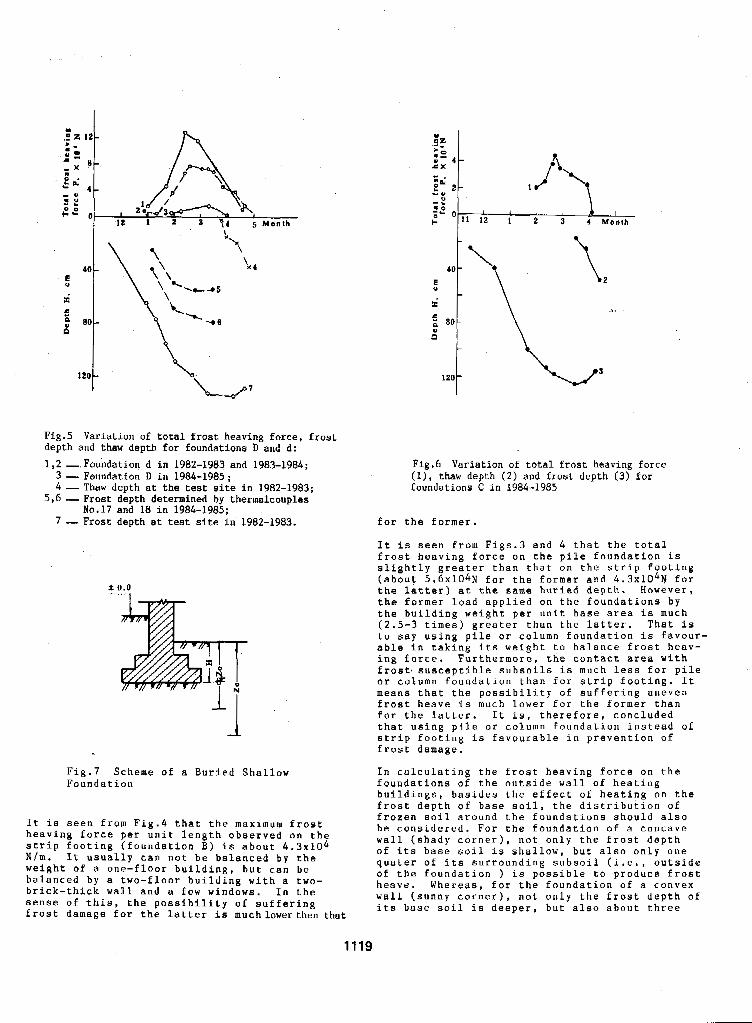
Fig.5 Variation of total frost heaving force, frost depth and thaw depth for foundations D and d: 1,2 -.Foundation d in 1982-1983 and 1983-1984;
3 - Foundation D in 1984-1985 ; 4 - Thaw depth at the teat site in 1982-1983;
5,6 - Frost depth determined by thermalcouples 7 - Frost depth at test site i n 1982-1983.
No.17 and 18 in 1984-1985:
II Fig.7 Scheme of a Buried Shallow Foundation
It is seen from Fig.4 that the maximum frost heaving force per unit length observed o n the strip footing (foundation B) is about 4.3~104 N / m . It usually can not b e balanced by the weight of a one-floor building, but can be balanced by a two-floor building with a two- brick-thick wall and a few windows. In the senae o f this, the possibility of suffering frost damage for the latter is much lowerthen that
Fig.6 Variation of total frost heaving force (I), thaw depth ( 2 ) and frost depth (3) for foundations C in 1984-1985
f o r the former.
It is seen from Figs.3 and 4 that the total
slightly greater than that o n the strip footing frost heaving force on the pile foundation is
(about 5.6x10⁴N for the former and 4.3x10⁴N €or the latter) at the same buried depth. However. the former load applied on the foundations by the building weight per unit base area is much ( 2 . 5 - 3 times) greater than the latter. That is to say using pile or column foundation is favour- able in taking its weight to balance frost heav- ing f o r c e . Furthermore. the contact area with frost, susceptible subsoils is much less €or pile or column foundation than for strip footing. It means that the possibility of suffering uneven frost heave is much lower for the former than for the latter. It is, therefore, concluded that using pile or column foundation instead of strip footing is favourable i n prevention of frost damage.
foundations of the outside wall of heating In calculating the frost heaving force o n the
buildings, basides the effect of heating on the frost depth of base soil, the distribution o f frozen soil around the foundations should also be considered. For the foundation of a concave wall (shady corner), not only the frost depth of its base soil i s shallow, but also only one
of the foundation ) is possible to produce frost quater of its surrounding subsoil (i.e., outside
wall (sunny corner), not only the frost depth of heave. Whereas, for the foundation o f a convex
its base soil is deeper, but also about three
1119
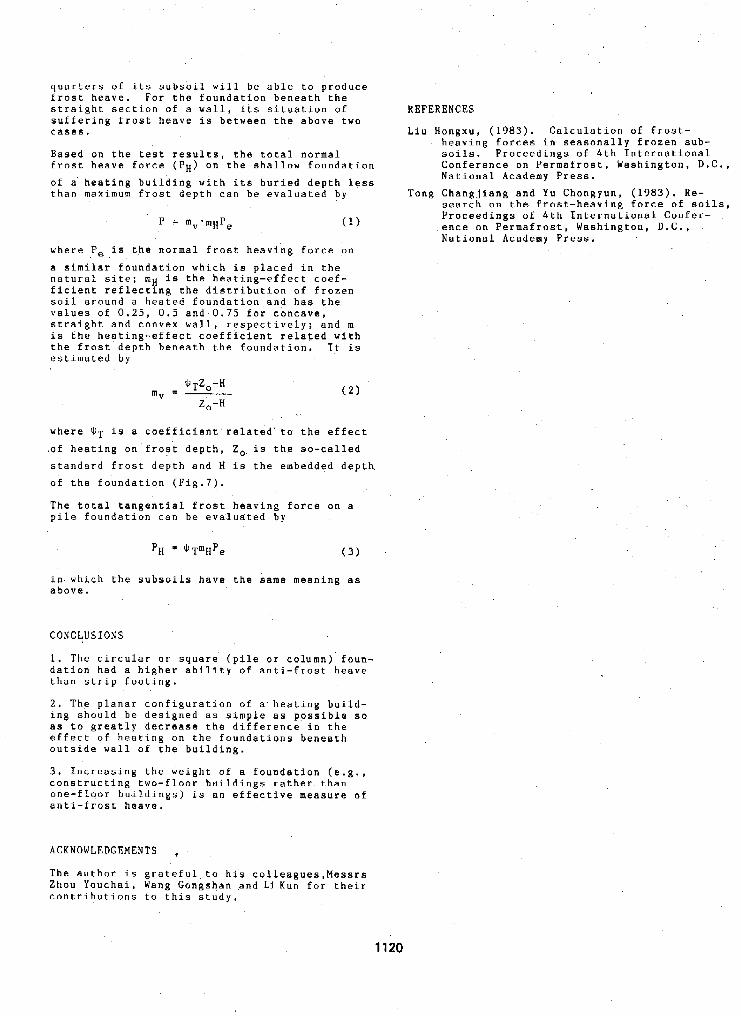
suar irost heave.
ters o f its subso For the
il will be able to produce foundation beneath the
straight section o f a wall, its situation of suffering frost heave is between the above two cases,
Based on the test results, the total normal f r o s t heave force (PH) on the shallow foundation of a heating building with its buried depth less than maximum frost depth can be evaluated b y
where Pe is the normal frost heaving force on
a similar foundation which is placed in the natural site; m u is the heating-effect coef- ficient reflectlng the distribution of frozen soil around a heated foundation and has the values of 0.25, 0 . 5 and 0 . 7 5 for concave, straight and convex wall, respectively; and m is the heating-effect coefficient related with the frost depth beneath the foundation. It is estimated by
mv = - ILTZ,-H 2,-H
where UT i s a coefficient'related'to the effect
.of heating o n frost depth, Zo i s the so-called standard frost depth and H is the embedded depth, o f the foundation (Fig.7).
The total tangential frost heaving force on a pile foundation can be evaluated by
in which the subsoils have the same meaning a s above.
CONCLUSIONS
1. The circular or square (pile o r column) foun- dation had a higher ability of anti-frost heave than strip footing.
2 . The planar configuration of a heating build- ing should be designed a s simple as possible s o a s t o greatly decrease the difference in the effect of heating on the foundations beneath outside wall of the building.
3 . Increasing the weight of a foundation (e.g., constructing two-floor buildings rather than one-floor bu-ildings) is an effective measure o f anti-frost heave,
ACKNOWLEDGEMENTS , The author is grateful to his colleagues,Messrs Zhou Youchai, Wang Gongshan and L j K u n for their contributions to this study.
REFERENCES
Liu Hongxu, (1983). Calculation of frost- heaving forces in seasonally frozen sub- soils. Proceedings of 4th International Conference on Permafrost, Washington, D.C., National Academy Press.
Tong Changjiang and Yu Chongyun, ( 1 9 8 3 ) . Re-
Proceedings of 4th International Confer- search o n the frost-heaving force of soils,
ence on Permafrost, Washingtou, D.C., National Academy Press.
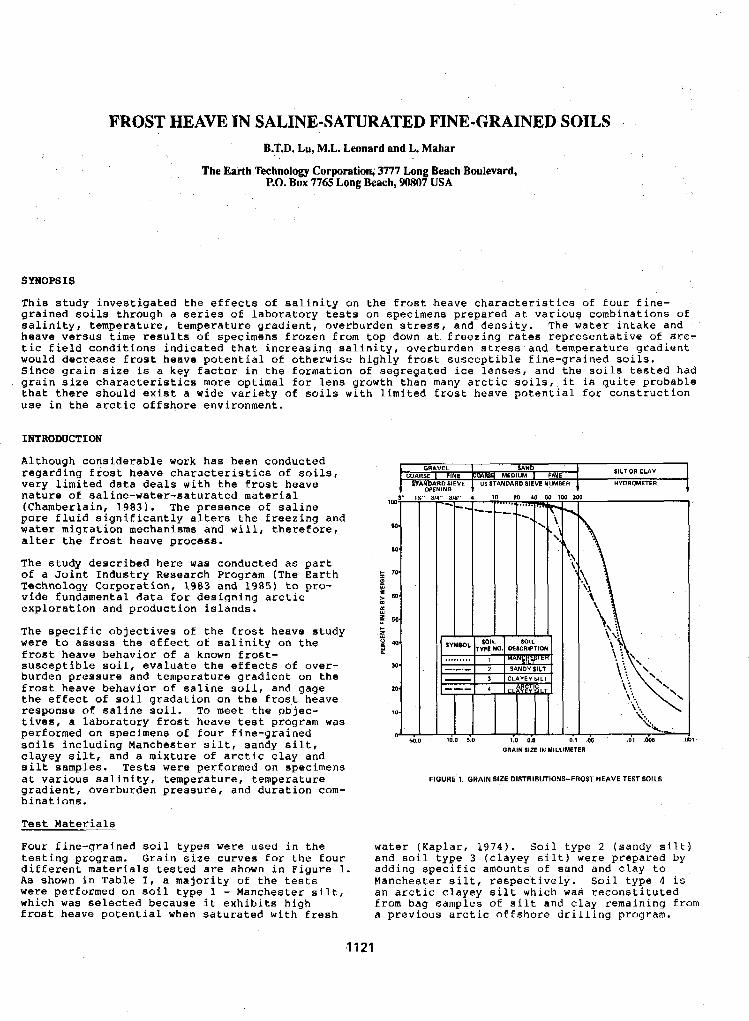
FROST HEAVE IN SALINE-SATURATED FINE-GRAINED SOILS B.T.D. Lu, M.L. Leonard and L. Mahar
The Earth Technology Corporation; 3777 Long Beach Boulevard, P.O. Box 7765 Long Beach, 90807 USA
SYNOPSIS
This study investigated the effects of salinity an the frost heave characteristics of four fine- grained sails through a series of laboratary tests on specimens prepared at various combinations of salinity, temperature, temperature gradient, averburden stress, and density. T h e water intake and heave versus time results of specimens frozen from top down at Ereezing rates representative of arc- tic field conditions indicated that increasing salinity, overburden stress and temperature gradient would decrease frost heave potential of atherwise highly frost susceptible fine-grained soils. Since grain size is a key factor in the farmation of segregated ice lenses, and the soils tested had grain size characteristics mare optimal €or lens growth than many arctic soils, it is quite probable that there should exist a wide variety af soils with limited frost heave potential far construction use in the arctic offshore enviranment.
INTRODUCTION
Althaugh considerable work has been canducted
very limited data deals with the frost heave regarding frast heave characteristics of sails,
nature of saline-water-saturated material
pare fluid significantly alters the freezing and (Chamberlain, 1983). The presence of saline
water migration mechanisms and will, therefore, alter the frost heave process.
The study described here was conducted as part of a Joint Industry Research Program (The Earth Technology Corporation, 1983 and 1985) to pro- vide fundamental data for designing arctic exploratian and productian islands.
The specific objectives of the frost heave study were to assess the effect of salinity on the
susceptible soil, evaluate the effects of over- frost heave behaviar of a known frost-
burden pressure and temperature gradient on the frost heave behavior of saline soil, and gage the effect of soil gradation on the frast heave response of saline soil. Ta meet the objec- tives, a laboratory frost heave test program was performed on specimens af four fine-grained sails including Manchester silt, sandy silt, clayey silt, and a mixture of arctic clay and silt samples. Tests were performed on specimens at various salinity, temperature, temperature gradient, overburden pressure, and duration com- binations.
Test Materials
Four fine-grained sail types were used in the
different materials tested are shown in Figure 1. testing pragram. Grain size curves for the four
As shown in Table I, a majority of the tests were performed on sail type 1 - Manchester silt, which was selected because it exhibits high frost heave potential when saturated with fresh
'1 12
IL NC
1.0 0.9
H SILTOR CLAY
HYDROMETER
GRAIN SIZE IN MILLIMETER
FIGURE 1. GRAIN SIZE DISTRIBUTIONS-FROST HEAVE TEST SOILS
water (Kaplar and soil type adding specif Manchester si
, 1974). Sail type 2 (sandy silt)
ic amounts of sand and clay to 3 (clayey silt) were prepared by
It, respectively. Soil type 4 is an arctic clayey silt which was reconstituted from bag samples of silt and clay remaining from a previous arctic offshore drilling program.
1
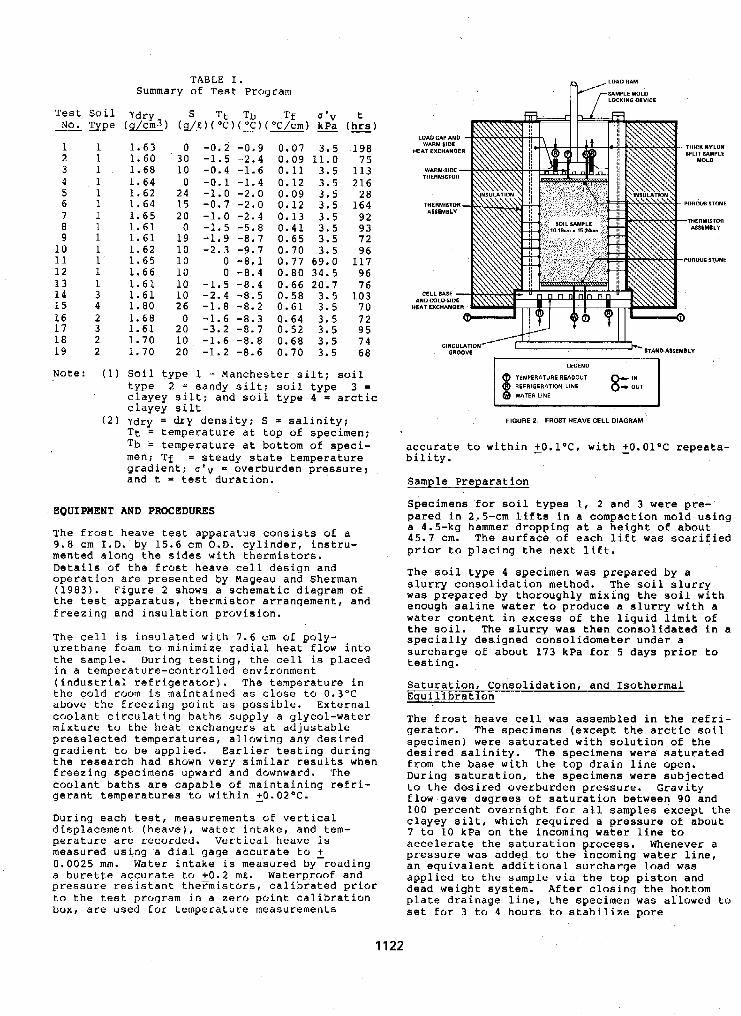
TABLE I. Summary of Test Program
1 1 1.63 0 2 1 1.60 30 3 1 1.68 10 4 1 1.64 0 5 1 1.62 24 6 1 1.64 1 5 7 1 1.65 20 8 1 1.61 0
10 1 1.62 10 1 1 1 1.65 10 12 1 1.66 10 13 1 1.61 10 14 3 1.61 10 15 4 1.80 2 6
17 3 1.61 20 16 2 1.68 0
18 2 1.70 10 19 2 1.70 20
9 1 1.61 19
- 0 . 2 -1.5 -0.4 -0.1 -1.0 -0.7 -1.0
-1.9 -1.5
- 2 . 3 0 0
-1.5
-1.8 -2.4
-1.6 -3.2 -1.6 -1.2
-0.9 0.07 3.5 ,198 -2.4 0.09 11.0 7 5 -1.6 0.11 3.5 113 -1.4 0.12 3.5 216 -2.0 0.09 3.5 28 -2.0 0.12 3.5 164 -2.4 0.13 3 . 5 92 -5.8 0.41 3.5 93 -8.7 0.65 3.5 72
-8.1 0.77 69.0 117 -9.7 0.70 3.5 96
-8.4 0.80 34.5 96 -8.4 0.66 20.7 76
-8.2 0.61 3 . 5 70 -8.5 0 .58 3 . 5 103
-8.7 0 . 5 2 3 . 5 95 -8.8 0.68 3.5 74 -8.6 0.70 3.5 68
-8.3 0.64 3.5 72
Note: (1) Sail type 1 = Manchester silt; soil type 2 = sandy silt: soil type 3 =
clavev silt clayey silt: and soil type 4 = arctic
CIRCULATIDN' GROOVE -STAND AOEMBLY
@ TEMPERATURE READOUT @ REFRIGERATION LINE 85 b",T
(2) Ydry = d r y density; S * salinity; "
FIGURE 2. FROST HEAVE CELL DIAGRAM
Tt = temperature at top of specimen; Tb = temperature at bottom of speci- accurate to within +O.l°C, with +O.Ol°C repeata- men; Tf = steady state temperature bility. gradient; atv = overburden pressure; and t = test duration. Sample Preparation
EQUIPMENT AND PROCEDURES
The frost heave test apparatus consists af a 9.8 cm I . D . by 15.6 cm O.D. cylinder, instru- mented alang the sides with thermistors.
Specimens for soil type5 I, 2 and 3 were pre- pared in 2.5-crn lifts in a compaction mold using a 4.5-kg hammer dropping at a height af about 45.7 cm. The surface of each lift was scarified prior to placing the next lift.
Details o f the frost heave cell design and operation are presented by Mageau and Sherman (1983). Figure 2 shows a schematic diagram of the test apparatus, thermistor arrangement, and : ~ ~ u ~ h ' e ~ x f f ~ e b ~ a ~ ~ ~ r ~ ~ g ~ ~ ~ d ~ ~ ~ i ~ g s ~ ~ ~ r ~ o ~ ~ ~ ~ i ~ h freezing and insulation provision.
The soil type 4 specimen was prepared by a slurry consolidation method. The soil slurry
water content in excess af the liauid limit of The cell is insulated with 7.6 cm of poly- urethane foam to minimize radial heat flaw into the sample. During testing, the cell is placed in a temperature-controlled environment
the cold room is maintained as close to 0.3"C (industrial refrigerator). The temperature in
above the freezing point as possible. External coolant circulating baths supply a glycol-water mixture to the heat exchangers at adjustable preselected temperatures, allowing any desired gradient to be applied. Earlier testing during the research had shown very similar results when freezing specimens upward and downward. The
gerant temperatures to within +O.0ZoC. coolant baths are capable o f maintaining refr i -
During each test, measurements of vertical displacement (heave), water intake, and tem- perature are recorded. Vertical heave is measured using a dial gage accurate tu 2 0.0025 mm. Water intake i s measured by reading a burette accurate to +0.2 mP,. Waterproof and pressure resistant theFmistors, calibrated prior to the test program in a zero point calibration bux, are used for temperature measurements
the soil. The slurry was then consolidated in a specially deaigned cansolidometer under a surcharge ~f abaut 173 kPa for 5 days prior to testing.
Saturatian, Consalidation, and Isothermal Equilibration
The frost heave cell was assembled in the refri- gerator. The specimens (except the arctic soil specimen) were saturated with salutian of the desired salinity. The specimens were saturated from the base with the tap drain line open. During saturation, the specimens were subjected to the desired overburden pressure. Gravity flow gave degrees of saturation between 90 and 100 percent overnight for all samples except the clayey silt, which required a pressure of about 7 to 10 kPa on the incoming water line to
pressure was added to the incoming water line, accelerate the saturation process. Whenever a
an equivalent additional surcharge load was applied to the sample via the top piston and dead weight system, After closing the bottom plate drainage line, the specimen was al'lowed tu set for 3 to 4 hours to stabilize pore
1122
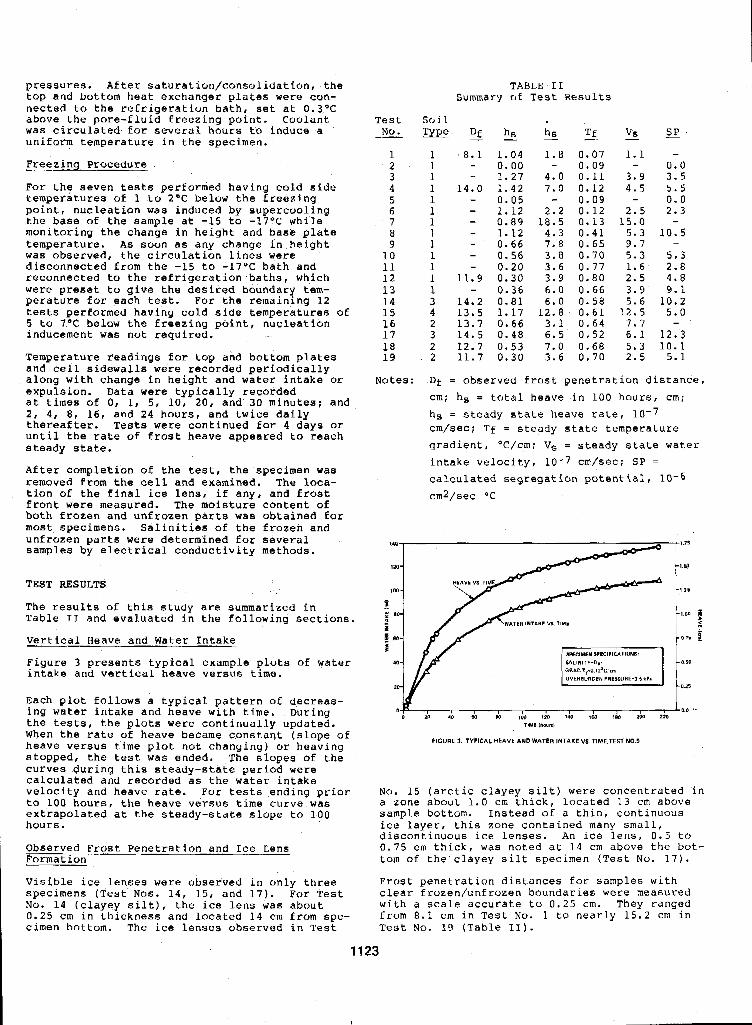
p r e s s u r e s . After saturation/consulidation, the t u p a n d b o t t o m h e a t e x c h a n g e r p l a t e s were con- n e c t e d t o t h e r e f r i g e r a t i o n b a t h , s e t a t 0.3T a b o v e t h e p o r e - f l u i d f r e e z i n g p o i n t . C o o l a n t was c i r c u l a t e d f o r s e v e r a l h o u r s tu induce a u n i f o r m t e m p e r a t u r e i n t h e specimen.
F r e e z i n q P r o c e d u r e
F o r t h q s e v e n tests p e r f o r m e d h a v i n g c o l d s i d e t e m p e r a t u r e s of 1 t o 2OC b e l o w t h e f r e e z i n g p o i n t , n u c l e a t i o n was induced by s u p e r c o o l i n g t h e b a s e of t h e s a m p l e a t -15 t o -17OC w h i l e m o n i t o r i n g t h e c h a n g e i n h e i g h t a n d base p l a t e t e m p e r a t u r e . As s o o n a s a n y c h a n g e i n h e i g h t was o b s e r v e d , t h e c i r c u l a t i o n l i n e s were d i s c o n n e c t e d f r o m t h e -15 ta - 1 7 T bath and r e c o n n e c t e d t a t h e r e f r i g e r a t i o n b a t h s , w h i c h were p r e s e t t o g i v e t h e d e s i r a d b o u n d a r y tem- p e r a t u r e f o r e a c h test . For t h e r e m a i n i n g 12 tests p e r f o r m e d h a v i n g c o l d s ide t e m p e r a t u r e s o f 5 t o 7OC b e l o w t h e f r e e z i n g p o i n t , n u c l e a t i o n inducement was n o t r e q u i r e d .
T e m p e r a t u r e r e a d i n g s f o r t o p a n d b a t t o m p l a t e s and c e l l s i d e w a l l s were r e c o r d e d p e r i o d i c a l l y a l o n g w i t h c h a n g e i n h e i g h t a n d water i n t a k e or e x p u l s i o n . Data were t y p i c a l l y r e c o r d e d a t times of 0, 1, 5 , 10, 20, and 30 minu tes ; and 2 , 4 , 8, 16, and 24 hours , and twice d a i l y t h e r e a f t e r . T e s t s were c o n t i n u e d f o r 4 d a y s o r u n t i l t h e r a t e of f r o s t h e a v e a p p e a r e d t o r e a c h s t e a d y s ta te .
After c o m p l e t i o n o f t h e test, t h e s p e c i m e n was remaved f ram the ce l l and examined. The laca- t i o n af t h e f i n a l ice l e n a , i f a n y , a n d f r o s t f r o n t were measu red . The mo i s tu re con ten t o f b o t h f r o z e n a n d u n f r o z e n p a r t s was o b t a i n e d f o r most s p e c i m e n s . S a l i n i t i e s of t h e f rozen and u n f r o z e n p a r t s were d e t e r m i n e d for s e v e r a l samples by e l e c t r i c a l c o n d u c t i v i t y m e t h o d s .
TEST RESULTS
The results o f t h i s s t u d y are summar ized in T a b l e 11 a n d e v a l u a t e d i n t h e f a l l o w i n g s e c t i o n s .
V e r t i c a l Heave and Water I n t a k e
F i g u r e 3 p r e s e n t s t y p i c a l e x a m p l e p l o t s o f water i n t a k e a n d v e r t i c a l h e a v e v e r s u s time.
Each p l o t f a l l o w s a t y p i c a l p a t t e r n o f d a c r e a s - i n g water i n t a k e a n d h e a v e w i t h time. . D u r i n g t h e tests, t h e p l o t s were c o n t i n u a l l y u p d a t e d . When t h e r a t e of h e a v e b e c a m e c o n s t a n t ( s l o p e of h e a v e v e r s u s time p l o t n a t c h a n g i n g ) or h e a v i n g s t o p p e d , t h e t e s t was ended . The s lopes of t h e c u r v e s d u r i n g t h i s s t e a d y - s t a t e p e r i o d were c a l c u l a t e d a n d r e c o r d e d a s t h e water in t ake v e l o c i t y a n d h e a v e rate. For tests e n d i n g p r i o r
e x t r a p o l a t e d a t t h e s t e a d y - s t a t e s l o p e t o 1 0 0 t a 100 h o u r s , t h e h e a v e v e x s u 6 time c u r v e was
h o u r s .
Observed Frost P e n e t r a t i o n a n d Ice Lens Format ion
Test NO.
2 1
3 4
6 5
7
9 8
1 0 11 12 1 3 1 4 15 1 6 1 7 1 8 19
-
Nates:
TABLE I1 Summary of Test R e s u l t s
S o i 1 Z Y L S D f h , h. Lf- ys 2
1 1 8 .1 1 -04 1 .8 0.07 1.1 - 1 - 1.27 4.0 0 . 1 1 3 . 9 3.5
- 0.00 - 0 . 0 9 - 0.0
1 1 4 . 0 1 . 4 2 7.0 0.12 4.5 5 . 5 1 - 0 . 0 5 - 0.09 - 0.0 1 - 1 . 1 2 2 . 2 0 . 1 2 2.5 2 . 3 1 1
- 0.89 18.5 0.13 15.0 - 1
- 1 . 1 2 4 . 3 0.41 5 . 3 10.5
1 - 0.66 7 , 8 0.65 9.7 -
1 - 0.56 3 .8 0.70 5 . 3 5 . 3 - 0 . 2 0 3 . 6 0.77 1 . 6 2.8
1 11.9 0.30 3.9 0.80 2 . 5 4 . 8 1 - 0.36 6.0 0.66 3.9 9.1 3 14.2 0.83 6.0 0.58 5.6 10.2 4 13.5 1.17 12.8 0 . 6 1 1 2 . 5 5.0 2 13.7 0.66 3.1 0.64 7 . 7 - 3 1 4 . 5 0.48 6 . 5 0.52 6.1 12 .3 2 12.7 0 . 5 3 7.0 0.68 5 . 3 10.1 2 11.7 0.30 3.6 0.70 2.5 5 . 1
Df = o b s e r v e d f r o s t p e n e t r a t i o n d i s t a n c e , cm; hs = t o t a l h e a v e i n 100 hour s , cm; hs = s t e a d y s t a t e h e a v e r a t e , cm/sec: Tf = s t e a d y s t a t e t e m p e r a t u r e g r a d i e n t , O C / c m ; V, = s t e a d y s t a t e water
i n t a k e v e l o c i t y , 10-7 cm/sec; S P =
c a l c u l a t e d s e g r e g a t i o n p o t e n t i a l , 10-6 cm2/sec oc
TIME Ihwnl
FIGURE 3. TYPICAL HEAVE AND WATER INTAKE VS.TIME.TEST N0.S
No. 1 5 ( a r c t i c c l a y e y s i l t ) were c o n c e n t r a t e d i n a zone about 1 . 0 cm t h i c k , l o c a t e d 1 3 cm above sample bo t tom. In s t ead o f a t h i n , c o n t i n u o u s ice l a y e r , t h i s z o n e c o n t a i n e d many s m a l l , d i s c o n t i n u o u s i c e l e n s e s . An ice Lens, 0.5 to 0.75 cm t h i c k , was n o t e d a t 1 4 cm a b o v e t h e bot- tom o f t h e c l a y e y s i l t specimen ( T e s t No. 1 7 ) .
V i s ib l e ice l e n s e s were o b s e r v e d i n o n l y three Frost p e n e t r a t i o n d i s t a n c e s f o r s a m p l e s w i t h spec imens (Test Nos. 14, 15, a n d 1 7 ) . F o r Test c l e a r f r o z e n / u n € r o z e n b o u n d a r i e s were measured Nu. 14 ( c l a y e y s i l t ) , t h e ice l e n s was a b o u t w i t h a s c a l e a c c u r a t e t o 0 . 2 5 cm. They ranged 0.25 cm i n t h i c k n e s s a n d located 1 4 cm from spe- f rom 8.1 cm i n T e s t No. 1 t o n e a r l y 1 5 . 2 cm i n cimen bottom. The ice l e n s e s o b s e r v e d i n Test Test No. 19 (Tab le 11).
1123
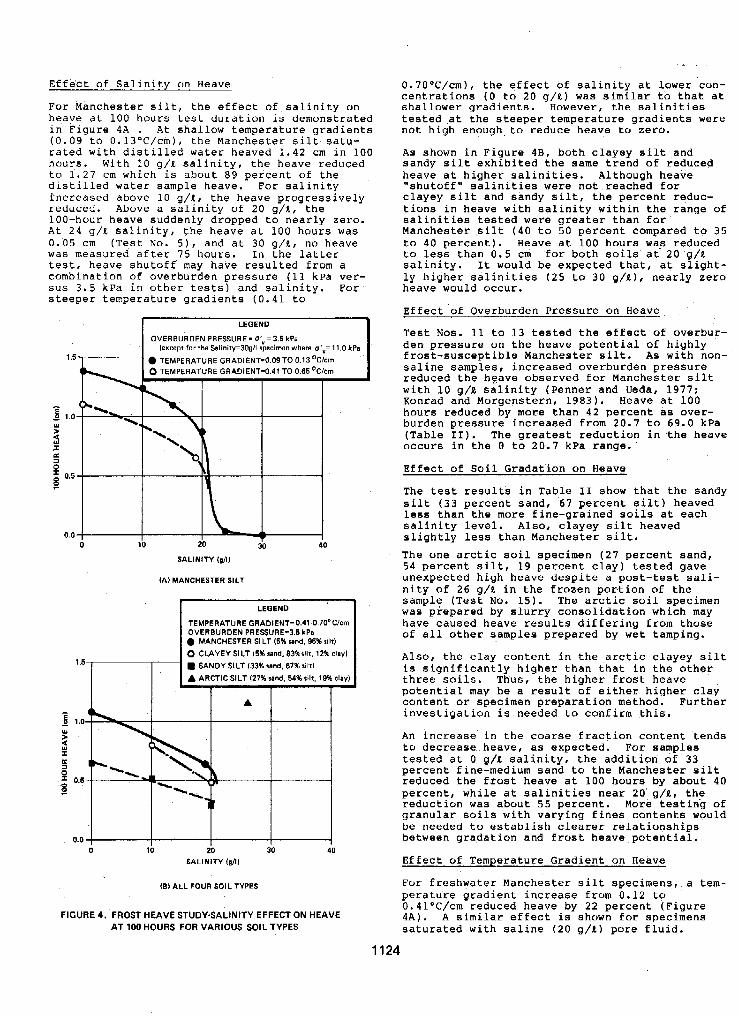
E f f e c t of S a l i n i t y o n H e a v e
For Manches te r s i l t , t h e e f f e c t o f s a l i n i t y on heave a t 100 h o u r s t e s t d u r a t i o n is d e m o n s t r a t e d i n F i g u r e 4A . A t s h a l l o w t e m p e r a t u r e g r a d i e n t s ( 0 . 0 9 to 0.13"C/cm), t h e Manches te r s i l t sa tu - r a t e d w i t h d i s t i l l e d water heaved 1 .42 c m i n 100 hours . Wi th 10 g / i s a l i n i t y , t h e h e a v e reduced t n 1 . 2 7 cm which is a b o u t 8 9 p e r c e n t of the d i s t i l l e d w a t e r s a m p l e h e a v e . For s a l i n i t y
reduced. Above a s a l i n i t y of 20 g / l , t h e increased above 1 0 g / l , t h e heave p r o g r e s s i v e l y
100-hour heave suddenly drapped t o n e a r l y z e r o . A t 2 4 g/ll s a l i n i t y , t h e h e a v e a t 100 h o u r s was 0 . 0 5 cm (Test N o . 5), and a t 30 g/E, no heave w a s m e a s u r e d a f t e r 75 h a u r s . I n t h e l a t t e r t es t , h e a v e s h u t o f f may h a v e r e s u l t e d f r o m a Combinat ion o f o v e r b u r d e n p r e s s u r e (11 kPa v e r - s u s 3 . 5 kPa i n o t h e r t es t s ) and s a l i n i t y . F o r s t e e p e r t e m p e r a t u r e g r a d i e n t s ( 0 . 4 1 t a
1.5
3 1.0 YI >
T a d
s 0.5
r
0.0
OVERBURDEN PRESSURE-O'v=3.6 kPa (except for the Salinity=3Oo/l spciman where (I,"= 11.0 kPa
TEMPERATURE GRADIENT4.09TO 0.13OC/Cm TEMPERATURE GRADIENT-0.41 TO 0.86 'Ckm
& 20
SALINITY (p/l)
(A) MANCHESTER SILT
r 40
LEGEND
TEMPERATURE GRADIENT=0.41-0.7O"ClCm
MANCHESTER SILT (6% ssnd. 06% s i l d OVERBURDEN PRESSURE-3.6 kPs
0 ClAYEY SILT 15% ssnd. 83%silt. 12% clayl 1.5 - SANDY SILT (33% sand. 87% silt1
A ARCTIC SILT (27% rand. 54% silt, 19% clay)
A
0.0 ! I I I 4 0 10 io 30 40
SALINITY Ig/l)
IBI ALL FOUR SOIL TYPES
FIGURE 4. -FROST HEAVE STUDY4ALlNITY EFFECT ON HEAVE A T 100 HOURS FOR VARIOUS SOIL TYPES
1
0 . 7 0 ° C / c m ) , t h e e f f e c t a f s a l i n i t y a t lower con- c e n t r a t i o n s ( 0 t o 20 g/R) was s i m i l a r t o t h a t a t s h a l l o w e r g r a d i e n t s . H o w e v e r , t h e s a l i n i t i e s t e s t e d a t t h e s t e e p e r t e m p e r a t u r e g r a d i e n t s were no t h igh enough t o reduce heave t o z e r o .
As shown i n F i g u r e 4 B , bo th c l a y e y s i l t and sandy s i l t e x h i b i t e d t h e same t r e n d of reduced heave a t h i g h e r s a l i n i t i e s . A l t h o u g h h e a v e
c l a y e y s i l t and sandy s i l t , t h e p e r c e n t r e d u c - " s h u t a f f " s a l i n i t i e s were n a t r e a c h e d f o r
t i o n s i n h e a v e w i t h s a l i n i t y w i t h i n t h e r a n g e a f s a l i n i t i e s t e s t e d were g r e a t e r t h a n f o r Manches te r s i l t ( 4 0 t o 50 pe rcen t compared t o 3 5 t o 4 0 p e r c e n t ) . H e a v e a t 100 hour s was reduced t o less t h a n 0 . 5 cm f o r b o t h soils a t 20 g/R s a l i n i t y . I t w o u l d b e e x p e c t e d t h a t , a t s l i g h t - l y h i g h e r s a l i n i t i e s ( 2 5 t o 30 g / k ) , n e a r l y z e r o heave would accur .
Effect of Overburden Pressure on Heave
Test Nos. 11 t a 1 3 t e s t e d t he e f f e c t of o v e r b u r - d e n p r e s s u r e o n t h e h e a v e p o t e n t i a l o f h i g h l y f r o s t - s u s c e p t i b l e M a n c h e s t e r s i l t . As with nan- s a l i n e s a m p l e s , i n c r e a s e d o v e r b u r d e n p r e s s u r e reduced t he hFave obse rved fo r Manches te r silt w i t h 1 0 g/.e s a l i n i t y ( P e n n e r a n d Ueda, 1977; Konrad and Mosgenstern, 1 9 8 3 ) . Heave a t 100 hours reduced by more t h a n 4 2 p e r c e n t a s over - b u r d e n p r e s s u r e i n c r e a a e d from 20.7 t o 69.0 kPa
o c c u r s i n t h e 0 t a 20.7 kPa range. ( T a b l e 11). T h e g r e a t e s t r e d u c t i o n i n the heave
E f f e c t a f S a i l Gradat ion on Heave
The t es t resu l t s i n T a b l e I1 show t h a t t h e s a n d y s i l t ( 3 3 p e r c e n t s a n d , 67 p e r c e n t s i l t ) heaved less t h a n t h e more f i n e - g r a i n e d soils a t each s a l i n i t y l e v e l . Also, c l a y e y s i l t heaved s l i g h t l y less than Manches t e r silt. The one a r c t i c soil s p e c i m e n ( 2 7 p e r c e n t s a n d , 54 p e r c e n t s i l t , 1 9 p e r c e n t c l a y ) t e s t e d g a v e u n e x p e c t e d h i g h h e a v e d e s p i t e a p o s t - t e s t sa l i - n i t y of 26 g/R i n t h e f r o z e n p o r t i a n o f t h e s a m p l e ( T e s t No. 1 5 ) . The a r c t i c soil specimen was p k e p a r e d b y s l u r r y c o n s o l i d a t i o n wh ich may have caused heave resu l t s d i f f e r i n g f r o m t h o s e o f a l l o t h e r s a m p l e s p r e p a r e d b y w e t tamping.
Also, t h e c l a y c o n t e n t i n t h e a r c t i c c l a y e y silt is s i g n i f i c a n t l y h i g h e r t h a n t h a t i n t h e o t h e r t h r e e sails . T h u s , t h e h i g h e r f r o s t h e a v e p o t e n t i a l may be a r e s u l t o f e i t h e r h i g h e r c l a y c o n t e n t or s p e c i m e n p r e p a r a t i o n m e t h o d . F u r t h e r i n v e s t i g a t i o n is needed t o c o n f i r m t h i s .
An i n c r e a s e i n t h e coarse f r a c t i o n c o n t e n t t e n d s t o d e c r e a s e h e a v e , as expec ted . Fo r s amples t e s t e d a t 0 g/R s a l i n i t y , the a d d i t i o n of 33 p e r c e n t f i n e - m e d i u m s a n d t u t h e M a n c h e s t e r s i l t r e d u c e d t h e f r o s t h e a v e a t 100 h o u r s by a b o u t 4 0 p e r c e n t , w h i l e a t s a l i n i t i e s n e a r 20 g/R, t h e r e d u c t i o n w a s a b o u t 55 p e r c e n t . More t e s t i n g o f g r a n u l a r soils w i t h v a r y i n g f i n e s c o n t e n t s w o u l d be needed t o e s t a b l i s h clearer r e l a t i o n s h i p s be tween g rada t ion and f rost h e a v e p o t e n t i a l .
E f fec t o f Tempera tu re Grad ien t on Heave
For f r e s h w a t e r M a n c h e s t e r s i l t spec imens , a tem- p e r a t u r e g r a d i e n t i n c r e a s e from 0.12 t o 0.41°C/cm reduced heave by 2 2 p e r c e n t ( F i g u r e 4 A ) . A similar e f f e c t is shown f o r s p e c i m e n s s a t u r a t e d w i t h s a l i n e ( 2 0 g/L) p o r e f l u i d .
I124
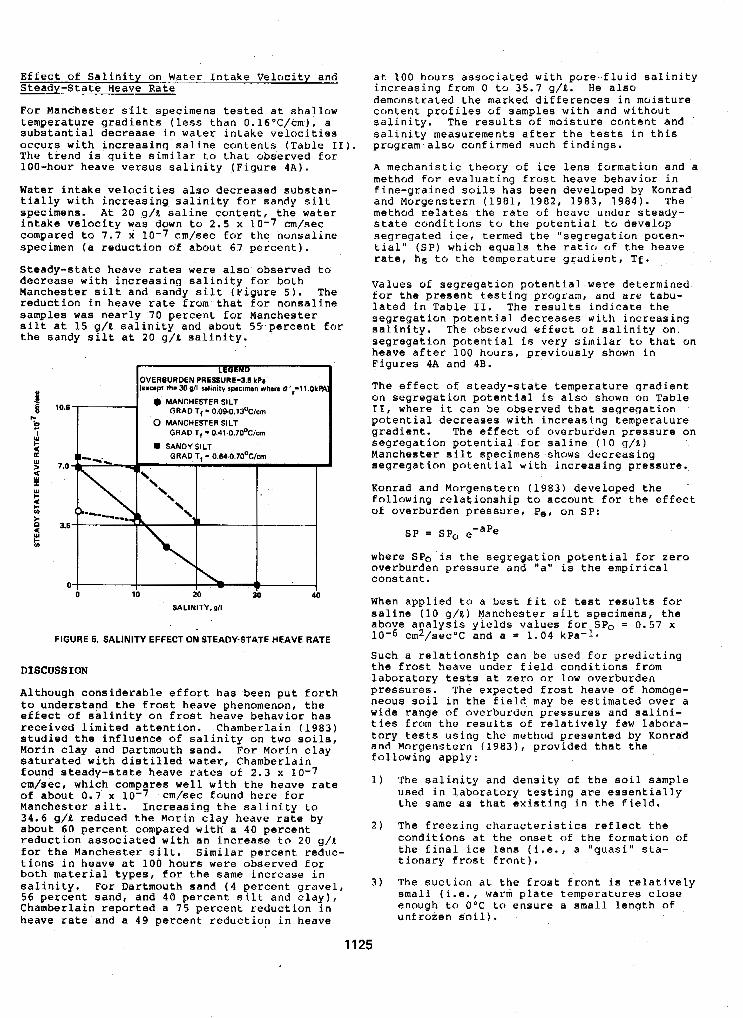
E f f e c t of S a l i n i t y o n Water I n t a k e V e l o c i t y a n d S t e a d y - S t a t e H e a v e Rate
F o r M a n c h e s t e r s i l t s p e c i m e n s t es ted a t S h a l l o w
s u b s t a n t i a l d e c r e a s e i n water i n t a k e v e l o c i t i e s t e m p e r a t u r e g r a d i e n t s ( l e s s t h a n 0.16'C/cm), a
T h e t r e n d is q u i t e similar t o t h a t o b s e r v e d f o r o c c u r s w i t h i n c r e a s i n g s a l i n e c o n t e n t s ( T a b l e 11).
1 0 0 - h o u r h e a v e v e r s u s s a l i n i t y ( F i g u r e 4 A ) .
Water i n t a k e v e l o c i t i e s a l s o d e c r e a s e d s u b s t a n - t i a l l y w i t h i n c r e a s i n g s a l i n i t y f o r s a n d y s i l t s p e c i m e n s . A t 20 g/L s a l i n e c o n t e n t , t h e water i n t a k e v e l a c i t y was down t o 2 . 5 x 10⁻⁷ cm/sec compared t o 7 . 7 x 10⁻⁷ cm/sec f o r t h e n a n s a l i n e s p e c i m e n ( a r e d u c t i o n of a b a u t 6 7 p e r c e n t ) .
S t e a d y - s t a t e h e a v e rates were a l sa o b s e r v e d t o d e c r e a s e w i t h i n c r e a s i n g s a l i n i t y fo r b o t h M a n c h e s t e r s i l t a n d s a n d y silt ( F i g u r e 5 ) . The r e d u c t i a n i n h e a v e r a t e f r o m t h a t f o r n o n s a l i n e s a m p l e s was n e a r l y 70 p e r c e n t f a r M a n c h e s t e r s i l t a t 1 5 g/L s a l i n i t y a n d a b o u t 55- p e r c e n t f o r t h e s a n d y s i l t a t 20 g / t s a l i n i t y .
10.6
7.0
3.5
0
SALINITY,pll
FIGURE 6. SALINITY EFFECT ON STEADY-STATE HEAVE RATE
DISCUSSION
A l t h o u g h c o n s i d e r a b l e e f f o r t has b e e n p u t f o r t h t o u n d e r s t a n d t h e f r o s t h e a v e p h e n o m e n o n , t h e e f f e c t o f s a l i n i t y o n f r o s t h e a v e b e h a v i a r h a s r e c e i v e d l i m i t e d a t t e n t i o n . C h a m b e r l a i n ( 1 9 8 3 ) s t u d i e d t h e i n f l u e n c e o f s a l i n i t y o n two soils, M o r i n c l a y a n d D a r t m o u t h s a n d . F o r M o r i n c l a y s a t u r a t e d w i t h d i s t i l l e d water, C h a m b e r l a i n f o u n d s t e a d y - a t a t e h e a v e ra tes o f 2.3 x 10⁻⁷ cm/sec, w h i c h compares well w i t h t h e h e a v e r a t e o f a b a u t 0.7 x 10⁻⁷ cm/sec f o u n d h e r e f o r M a n c h e s t e r s i l t . I n c r e a s i n g t h e s a l i n i t y t o 3 4 . 6 g/ll r e d u c e d t h e M o r i n c l a y h e a v e r a t e by a b a u t 6 0 p e r c e n t c o m p a r e d w i t h a 40 p e r c e n t r e d u c t i o n a s s o c i a t e d w i t h a n i n c r e a s e t o 20 g/a f o r t h e M a n c h e s t e r s i l t . S i m i l a r p e r c e n t r e d u c - t i o n s i n h e a v e a t 1 0 0 h o u r s were o b s e r v e d for b o t h material t y p e s , f o r the same i n c r e a s e i n s a l i n i t y . F a r D a r t m o u t h s a n d ( 4 p e r c e n t g r a v e l , 5 6 p e r c e n t s a n d , a n d 4 0 p e r c e n t s i l t a n d c l a y ) , C h a m b e r l a i n r e p o r t e d a 75 p e r c e n t r e d u c t i o n i n h e a v e ra te a n d a 4 9 p e r c e n t r e d u c t i o n i n h e a v e
a t 1 0 0 h c r u r s a s s o c i a t e d w i t h p o r e - f l u i d s a l i n i t y i n c r e a s i n g from 0 t o 35.7 9/11. He a l s o d e m o n s t r a t e d t h e m a r k e d d i f f e r e n c e s i n m o i s t u r e c o n t e n t p r o f i l e s of s a m p l e s w i t h a n d w i t h o u t s a l i n i t y . T h e results o f m o i s t u r e c o n t e n t a n d s a l i n i t y m e a s u r e m e n t s a f t e r t h e tests i n t h i s p r o g r a m - a l s o c o n f i r m e d s u c h f i n d i n g s .
A m e c h a n i s t i c t h e o r y of ice l e n s f o r m a t i o n a n d a method f u r e v a l u a t i n g frost h e a v e b e h a v i o r i n
a n d M o r g e n s t e r n (1981, 1 9 8 2 , 1 9 8 3 , 1 9 8 4 ) . T h e f i n e - g r a i n e d soi ls h a s b e e n d e v e l o p e d b y K o n r a d
me thod r e l a t e s t h e r a t e o f h e a v e u n d e r s t e a d y - s t a t e C o n d i t i o n s t o t h e p o t e n t i a l t o d e v e l o p s e g r e g a t e d i ce , t e r m e d t h e " s e g r e g a t i o n p o t e n - t i a l " (SP) w h i c h e q u a l s t h e r a t i o crf t h e h e a v e ra te , h s t o t h e t e m p e r a t u r e g r a d i e n t , T f .
V a l u e s o f s e g r e g a t i o n p o t e n t i a l were d e t e r m i n e d . fo r t h e p r e s e n t t e s t i n g p r o g r a m , a n d a re t a b u - l a t e d i n T a b l e 11. The results i n d i c a t e t h e s e g r e g a t i o n p o t e n t i a l d e c r e a s e s w i t h i n c r e a s i n g s a l i n i t y . T h e o b s e r v e d e f f e c t o f s a l i n i t y o n . s e g r e g a t i o n p o t e n t i a l is v e r y similar t o t h a t o n h e a v e a f t e r 1 0 0 h o u r s , p r e v i o u s l y Shown i n F i g u r e s 4A and 4B.
T h e e f f e c t o f s t e a d y - s t a t e t e m p e r a t u r e g r a d i e n t o n s e g r e g a t i o n p o t e n t i a l is a l s o s h o w n a n T a b l e 11, where i t c a n b e o b s e r v e d t h a t s e g r e g a t i o n p o t e n t i a l d e c r e a s e s w i t h i n c r e a s i n g t e m p e r a t u r e g r a d i e n t . T h e e f f e c t a f O v e r b u r d e n p r e s s u r e o n s e g r e g a t i o n p o t e n t i a l f o r s a l i n e ( 1 0 g / a ) M a n c h e s t e r s i l t s p e c i m e n s s h o w s d e c r e a s i n g s e g r e g a t i o n p o t e n t i a l w i t h i n c r e a s i n g p r e s s u r e .
K o n r a d a n d M o r g e n s t e r n ( 1 9 8 3 ) d e v e l o p e d t h e f o l l o w i n g r e l a t i o n s h i p t o a c c o u n t f o r t h e e f f e c t of o v e r b u r d e n p r e s s u r e , P e l o n SP:
SP = SP,
w h e r e SPO is t h e s e g r e g a t i o n p o t e n t i a l f o r z e r o o v e r b u r d e n p r e s s u r e a n d "a" is t h e e m p i r i c a l c o n s t a n t .
When a p p l i e d t o a b e s t f i t of t es t r e s u l t s f o r s a l i n e (10 9/11) M a n c h e s t e r s i l t s p e c i m e n s , t h e a b o v e a n a l y s i s y i e l d s v a l u e s € o r SPo = 0 .57 X 30-6 cmz/sec"C and a = 1.04 kPa-1 .
S u c h a r e l a t i o n s h i p c a n b e u s e d f o r p r e d i c t i n g t h e f ros t h e a v e u n d e r f i e l d c o n d i t i o n s f r o m l a b o r a t o r y tes ts a t z e r o or low o v e r b u r d e n p r e s s u r e s . T h e e x p e c t e d f r o s t h e a v e of homoge- n e o u s s o i l i n t h e f i e l d . m a y b e e s t i m a t e d o v e r a wide r a n g e o f o v e r b u r d e n p r e s s u r e s a n d s a l i n i - t i e s f r o m t h e r e s u l t s of r e l a t i v e l y f e w l a b o r a -
a n d M o r g e n s t e r n (19831, p r o v i d e d t h a t t h e t o r y tests u s i n g t h e m e t h o d p r e s e n t e d b y K o n r a d
f o l l o w i n g a p p l y :
1 ) T h e s a l i n i t y a n d d e n s i t y o f t h e s o i l s a m p l e u s e d i n l a b o r a t o r y t e s t i n g a re e s s e n t i a l l y t h e same a s t h a t e x i s t i n g i n t h e f i e l d .
2 ) T h e f r e e z i n g c h a r a c t e r i s t i c s r e f l e c t t h e c o n d i t i o n s a t t h e o n s e t of the f o r m a t i o n o f t h e f i n a l ice l e n s ( i . e , , a " q u a s i " s t a - t i o n a r y frost f r o n t ) .
3 ) The s u c t i o n a t t h e f r o s t f r o n t is r e l a t i v e l y small ( i . e . , warm p l a t e temperatures close enough t o O°C t o e n s u r e a small l e n g t h of u n f r o z e n s o i l ) .
1125
SUMMARY OF RESULTS AND CONCLUSIONS REFERENCES
The effects of the various parameters on frost Chamberlain, E.J. (1983). Frost heave a€ saline heave test results can be summar<ized as follows: soils. Proc. Faurth International Conference
on Permafrost, Fairbanks, Alaska, 121-126. I Increased salinity decreas.ed the heave at 100 hours test duration.
The frost heave patential of the highly frost-susceptible Manchest'er silt effectively "shut off" at saline cantents abave about 24 g/L*
Few significant ice lenses farmed in the saline-water-saturated silt soils subjected to freezing conditions that are generally optimum for segregated ice formation in such soils.
At salinities of 10 to 20 g/$, the heave (at 100 hours) was substantially reduced (by 38 to 54 percent) from that observed for nonsaline-saturated specimens.
The arctic soil, formed by a composite of silt and clay specimens fram the Beaufort seabed, heaved Considerably despite what was considered to be a saline content of 26 g/g. Due to the difficulties encountered during testing, there is some degree o f uncertainty in salinity determination.
At increased overburden pressures, the frost heave potential of Manchester silt at 10 g/t salinity was significantly reduced (42 per- cent reduction in heave between 20.7 and 69.0 kPal.
Addition of anly 33 percent fine-medium sand to the Manchester silt resulted in substan- tial reductions in heave potential at sali- nity level$ o f 0, 10, and 20 g/R. The heave reductions were in the range of 40 to 55 per- cent.
Heave at 100 hours was considerably lower at temperature gradients of 0.59 to 0,79°C/cm than at small temperature gradients (less than 0,16T/cm). Heave reductions ranged from about 22 to 60 percent depending on salinity.
Salinity increases generally decreased steady-state water intake velacities, heave rates, and segregation potential.
The water intake and heave versus time results of specimens frozen from top down at freezing rates representative of arctic field conditions indicated that increasing salinity, overburden Stress and temperature gradient would decrease frost heave potential of atherwise highly frost susceptible fine-grained soils. Since grain size is a key factor in the formation of segre- gated ice lenses, and the soils tested had grain size characteristics more optimal for lens growth than many arctic soils, it is quite pru- bable that there should exist 3 wide variety of sails with limited frost heave potential for construction use in the arctic offshore environ- ment, .
Kaplar, C.W. (1968). New experiments to simplify frost susceptibility testing of sails. Highway Research Recard, Na. 215, 48-59.
KBphr, C.W. (1974). Feezing test far eva- luating relative frost susceptibility of
Army Corps of Engineeris, Cold Regions various soils. Technical Report 250, U . S .
Research and Engineering Laboratory, Hanover, New Jersey, 37 .p.
Konrad, J.M. h Morgenstern, N.R. (1981). A mechanistic theory of ice lens formation in fine-grained soils. Canadian Geotechnical Journal (17), 473-486.
Konrad, J.M. h Morgenstern, N.R. (1982). The segregation potential of a freezing sail. Canadian Geotechnical Journal (l8), 482-491.
Konrad, J.M. & Margenstern, N.R. (1983). Prediction of frost heave in the laboratory during transient freezing, Canadian Geatechnical Journal (19), 250-259.
Konrad, J.M. h Morgenstern, N.R. (1984). Frost heave prediction of chilled pipelines buried in unfrozen soils. Canadian Geotechnical Journal (211, 100-115,
Mageau, D.W. h Sherman, M.B. (1983). Frost cell design and aperation. Proceedings Fourth
Fairbanks, Alaska, 6 p. International conference on Permafrost,
Ono, N. (1975). Thermal properties of sea ice IV. Thermal constants af sea ice. Draft Translation 467, U.S. Army Corps of Engineers, Cold Regions Research and Engineering Laboratory, Hanover, New Hampshire.
Penner, E. & Ueda, T. (1977). The dependence of frost heaving on load applicatian - prelim- inary results. Proceedings International Symposium on Frost Action in Soils, University of Lulea, Sweden.
Penner, E. &,Ueda, T. (1978). A soil frost- Susceptibility test and a basis for interpre- ting heaving rates. Proceedings Third
Edmanton, Alberta, Canada, Volume 1, 721-778. International Conference on Permafrast,
Tart, R.G., Jr. (1983). Winter constructed gra- vel islands. Proceedings Fourth International conference on Permafrost, Fairbanks, Alaska.
The Earth Technology Corporation (1983). Geotechnical considerations for design of arctic exploration and production islands. Phase I repart.
The Earth Technology Corporation (1985). Geotechnical cbnaiderations Ear design af arctic exploration and production islands, Phase 11 repart.
1126
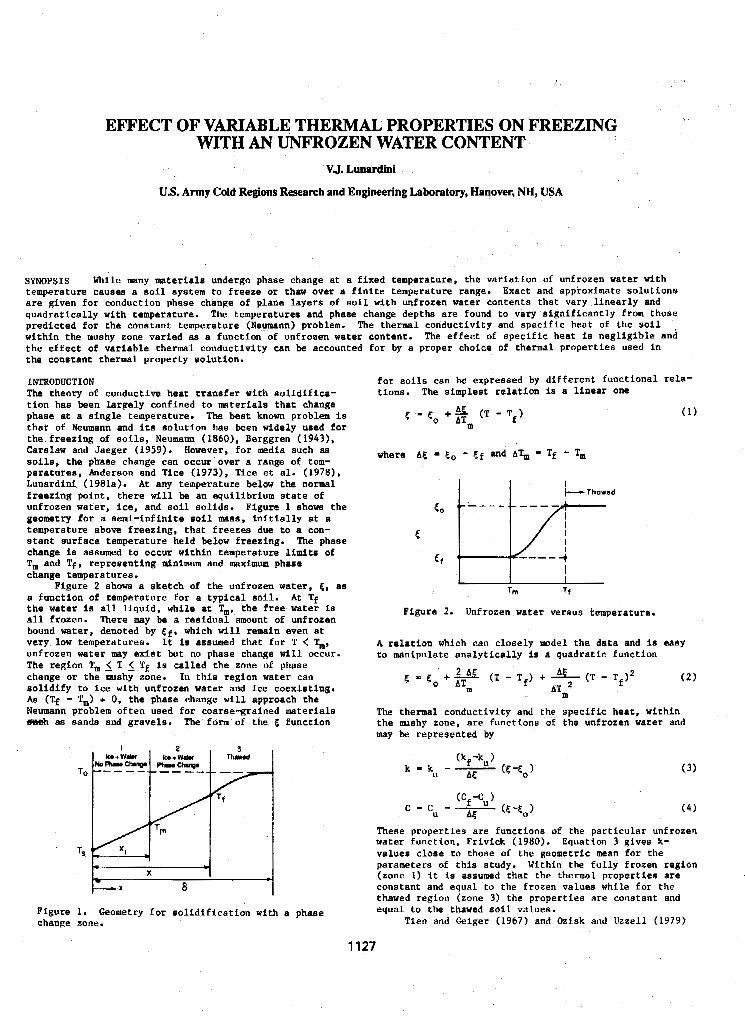
EFFECT OF VARIABLE THERMAL PROPERTIES ON FREEZING WITH AN UNFROZEN WATER CONTENT
VJ. Lunardini
U.S. Army Cold Regions Research and Engineering Laboratory, Hauover, NH, USA
SYNOPSIS While many materials undergo phase change a t a f ixed temperature, the variation of unfrozen water with temperature causes a s o i l system to freeze or thaw over a finite temperature range. Exact and approximate solutions a re g iven for conduction phase change of plane layers of soi l wi th unfrozen water contents that vary l inear ly and quadratically with temperature. The temperatures and phase change depths are found to va ry s ign i f i can t ly from those predicted for the constant temperature (Ne-umann) problem. The thermal conductivity and spec i f i c heat of t h e s o i l within the mushy zone varied a8 a function of unfrozen water content. The e f f e c t of spec i f ic hear is neg l ig ib l e and t h e e f f e c t of variable thermal conductivity can be accounted for by a proper choice of thermal properties used in the constant thermal property solut ion.
INTRODUCTION The theory of conduct ive heat t ransfer with sol idif ica- t i o n has been largely confined to mater ia ls that change phase at a single temperature. The beat known problem i s t h a t of Neumann and its so lu t ion has been d d e l y used fo r t he . f r eez ing of s o i l s , Neumann (1860), Berggren (1943), Carslaw and Jaeger (1959). However, f o r media such as so i l s , the phase change can occur over a range of tem- pera tures , Anderson and Tice (1973), Tice et al. (1978) , Lunardini (1981s). A t any temperature below the normal f r eez ing po in t , t he re w i l l be an equi l ibr ium s ta te of unfrozen wafer, ice, and so i l so l id s . F igu re 1 shown the geometry for a s e m i - i n f i n i t e s o i l mass, i n i t i a l l y at a temperature above f reez ing , tha t f reezes due t o a con- s tan t sur face t empera ture he ld below freezing. The phase change is assumed to occur within temperature limits of T, and Tf, represent ing mlnimum and maximum phase change temperatures.
a func t ion of temperature for a typ ica l soi l . A t Tf t he water is a l l l i q u i d , w h i l e at T,. the f ree water is a l l frozen. There may be a r e s idua l amount of unfrozen
Figure 2 show a sketch of the unfrozen water, E , a s
f o r s o i l s can be expressed by d i f fe ren t func t iona l ra la - t ions . The s implest re la t ion is a l i nea r one
I I I +Thowsd
I I Tm Tf
Figure 2. Unfrozen water verau8 temperature.
bound water, denoted by E f , which w i l l remain even at very low temperatures. It i s assumed t h a t f o r T < Tm, 4 r e l a t i o n which can c lose ly model the data and is easy unfrozen water may exis t bu t no phase change will occur. TO manipulate analyt ical ly is a quadra t ic func t ion The region T,,, 5 T 5 Tf i R ca l led the zone of phase change or t he mshy zone. In t h i s r eg ion water can s o l i d i f y t o ice with unfrozen water and ice coexis t ing. As (4 - T,) + 0, the phase change will approach the ATm
errch as sands and grave ls . The form of the func t ion Neumann problem of ten used for coarse-grained mater ia ls The thermal conductivity and the spec i f ic hea t , wi th in
t h e rmshy zone, are funct ions of the unfrozen water and may be represented by
r , = c 0 + 24 (T - Tf) + % (T - Tf)2 4Tm
(2 )
I I 2
h + W * b + W h T h W d 3
(kf -ku ) k - k u -- A5 (5-2, ) ( 3 )
(Cf Xu) c = cu - ( € 3 , ) (4)
water function, Fr iv ick (1980). Equation 3 gives k- These proper t ies a re func t ions of the particular unfrozen
va lues c lose to those of the geometric r a n for the I - parameters of this study. Within the fully frozen region
(zone 1 ) i t i s assumed that the thermal propert iee are l " - x 6 constant and equal to the frozen valuea while €or the
X
thawed region (zone 3) the properties are constant and Figure 1. Geometry f o r s o l i d i f i c a t i o n w i t h a phase equal to the thawed so i l va luea . change zone. Tien and Geiger (1967) and Ozjsk and Uzzell (1979)
I 1127
used an unfrozen liquid content which varied with posi- t i o n w i t h i n t h e two-phase zone but did not dea l w i th so i l systems. Cho and Sunderland (1974) found a so lu t ion fo r the f reeze of a mater ia l wi th thermal conductivity vary- ing l inear ly with temperature and with a single phase change temperature.
BASIC EQUATIONS
For a small volurne within the mushy zone, energy w i l l be conducted in and out of the volume and l a t en t hea t w i l l be re leased dur ing so l id i f ica t ion : the problem is one of conduction with a distributed energy source. The governing equations were derived by Lunardini (1985, 1987). The energy equation is
Thermal ConductiviLy and spec i f ic hea t in reg ion 2, f o r the l inea r E case, are
k = k o ( l + 61 02) ( 6a)
c = C o C l + 6 2 e,) (6b)
For the rmshy zone with var iable thermal propert ies ko - ku and Co - Cu. however, ko, Co can be any va lues i f the thermal properties in region 2 are constant .
In the mushy zone the following transformation i s used.
For l i nea r 6 the function $ can be eva lua ted expl ic i t ly .
k - ko 41 + 2E,$ ( 9 )
The most general case is a problem with 3 regions as ahown in Figure 1 , The equat ions for the three regions a r e
lim e 3 ( x . t ) = - x4- $0
e3(x , t ) = o (14)
Exact solutions for the three-zone problem with var iable
so lu t ions can be obtained using the heat balance inte- thermal properties have not been found. Approximate
g r a l , however, before doing t h i s i t is use fu l t o examine the s impler two-zone problem. If the surface tempera- t u r e , Ts, i s greater than or equai to the minimum phase change temperature then a completely frozen zone dl1 not e x i s t . Thus we need only examine regions 2 and 3.
lW0 ZONE PROBLEMS
The two-zone problem is simpler than the three-zone case and will lead t o r e su l t s t ha t can s implify the need f o r t h e f u l l three-zone problem. The l inear unfrozen water case will be examined for both variable and constant thermal properties while the quadratic water content case w i l l be evaluated only f o r the constant property prob- lem. This w i l l be shown t o be adequate for the general problem.
Linear Unfrozen Water Function
Equations (12-14) are va l id fo r t h i s ca se excep t t ha t t he Variable Thermal Proper t ies
boundary condition (12b) becomes
E 92 9 ( 0 . t ) = 0 ,+ * - p (15)
An approximation to the solution m y be obtained with the heat balance integral method which has been adapted to prob.lems of f reez ing in so i l s sys tems by Lunardini
The equations a re w e l l known and w i l l not be derived (i981b, 1982, 1983) and Lunardini and Varorta (1981).
here, the in te res ted reader can consult Lunardini (1981a). Referring to Figure 1, Equations (12) and (13) become
For the hea t ba lance in tegra l Eqs (13a,b) becom-3
Quadratic temperature profiles are assumed for $ and since experience has shown that they yield good results for the hea t ba lance in tegra l wthod.
In order to simplify the are defined
x - 2yq 6-X - BX
’ algebra the following parameters
The so lu t ion of Eqe (16) and (17) is stralghtforward but tedlous; the algebraic manipulations are given in
1128
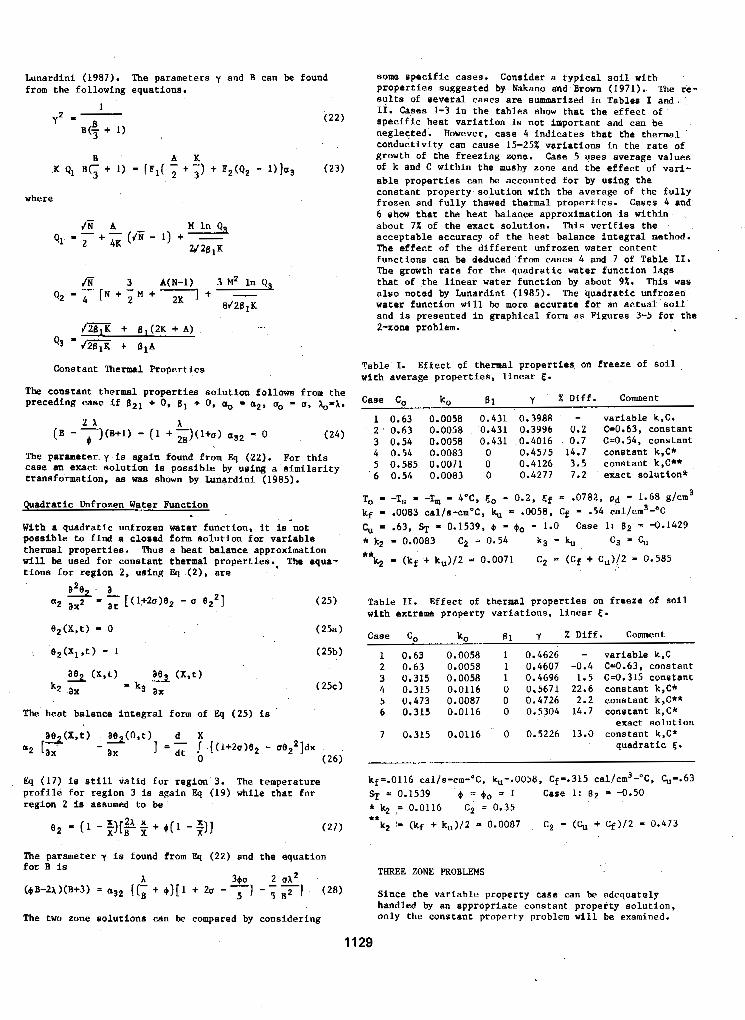
Lunardini (1987). The parameters y and B can be found from the following equations.
I Q2 - [N t Y M + T I t - 'y
8J2BlK
r12BlK + B1(2K t A) -
Q3 - Jw + %1A
Constant Thermal Proper t ies
The constant thermal propert ies solut ion fol lows from the preceding case i f f l P l + 0, B1 + 0, a. = a2, uo - u, &,-A.
The parameter. y is again found from Eq (22). For t h i s case an exact solution is possible by using a s i m i l a r i t y transformation, as was shown by Lunardini ( 1 9 8 5 ) .
Quadratic Unfrozen Water Function
With a quadratic unfrozen water function, it is not poss ib le to f ind a closed form so lu t ion for var i ab le thermal propert ies . Thus a heat balance approximation w i l l be used for constant thermal properties. . The equa- t i ons fo r r eg ion 2, using IQ (21, are
a2 aL2 - a t [(1+2u)e2 - 0 e 2 2 ] a- a
( 2 5 )
The heat balance integral form of Eq (25) is
Eq (17) is s t i l l val id €or region 3. The temperature p ro f i l e fo r r eg ion 3 is again Eq (19) while that for region 2 is assumed to be
some specific cases. Consider a typ ica l 8011 with Properties suggested by Nakano and Brown (1971). The re- s u l t r of several cases are summrrired i n Tables I and 11. Cases 1-3 in the tables show tha t the e f fec t of spec i f i c hea t va r i a t ion is not important and can be neglected. However. case 4 indicates that the thermal conductivity can cause 15-25% va r i a t ions in t he r a t e of growth of the f reezing zone. Case 5 uses average values of k and C within the mushy zone and the e f f ec t of var i - ab le p roper t ies can be accounted for by using the constant property solution with the average of t h e f u l l y frozen and f u l l y thawed thermal properties. Cases 4 and 6 show that the heat balance approximation is with in about 7% of the exact solution. This v e r i f i e s t h e acceptable accuracy of the heat balance integral method. The e f f e c t of the different unfrozen water content functions can be deduced from cases 4 and 7 of Table 11. The growth ra te for the quadra t ic water func t ion lags tha t of the l inear water funct ion by about 9%. This was also noted by Lunardini (1985). The quadratic unfrozen water function w i l l be more accu ra t e fo r an a c t u a l s o i l and i s presented in graphical form as Figures 3-5 for the 2-zone problem.
Table 1. Effec t of thermal properties on f reeze of Boil with average propert ies , l inear 6.
Case Co ko 61 y X Diff. Comment
1 0.63 0.0058 0.431 0,3988 - var iab le k.C* 2 0.63 0.0058 '0.431 0.3996 0.2 CzO.63, constant 3 0.54 0.0058 0.431 -0.4016 0.7 Cx0.54, constant 4 0.54 0.0083 0 0.4575 14.7 constant k,C* 5 0.585 0.0071 0 0.4126 3.5 constant k,C** 6 0 .54 0.0083 0 0,4277 7.2 exact solution*
To - -T, - -Tm - 4'.c, 60 * 0.2, Ef x ,0782, Pd 1.68 g/Cm3 kf - .0083 cal/s-cm'C, = a0058. Cf - -54 cal/cm3-"C cu = .63, =. 0.1539, ,$ - ,$o - 1.0 Case 1: 62 = -0.1429 * k2 - 0.0083 C2 = 0.54 kg k, c3 = c, **
k2 - (kf + ku)/2 0.0071 C p * (Cf + Cu)/2 0.585
Table 11. Effec t of thermal properties on f reeze Of Soi l with extreme property var ia t ions, l inear 5 .
Case Co k0 g1 y 4, Diff. Comment
1 0.63 0.0058 1 0.4626 - var iab le k.C 2 0.63 0.0058 1 0.4607 -0.4 -30.63. constant 3 0.315 0.0058 1 0.4696 1.5 C4.315 constant 4 0.315 0.0116 0 0.5671 22.6 constant k,C* 5 0.473 0.0087 0 0.4726 2.2 constant k,C** 6 0.315 0.0116 0 0.5304 14.7 constant k,C*
7 0.315 0.0116 0 0.5226 13.0 constant k.C* exact solut ion
quadra t ic 6.
kf=.0116 cal/s-cm-'C, 4-.0058, Cf-.315 c a l / ~ m ~ - ~ C , &-.63 ST 0.1539 4 = +o 5 1 Case 1: 82 = -0.50 * ,= 0.0116 C2 0.35 **
k2 ir (kf + ku)/2 = 0.0087 C2 - (C, + Cf)/2 0.473
The parameter y is found from Eq (22) and the equation f o r B i s
(4B-2h)(B+3) a32 {& @ ) I 1 + 2cI - y1 - 3 71 (28) Since the variable property case can be adequately h
THREE ZONE PROBLEMS 340 2 .x*
handled by an appropriate constant property solut ion, The two zone so lu t ions can be compared by considering only the constant property problem w i l l be examined.
1129
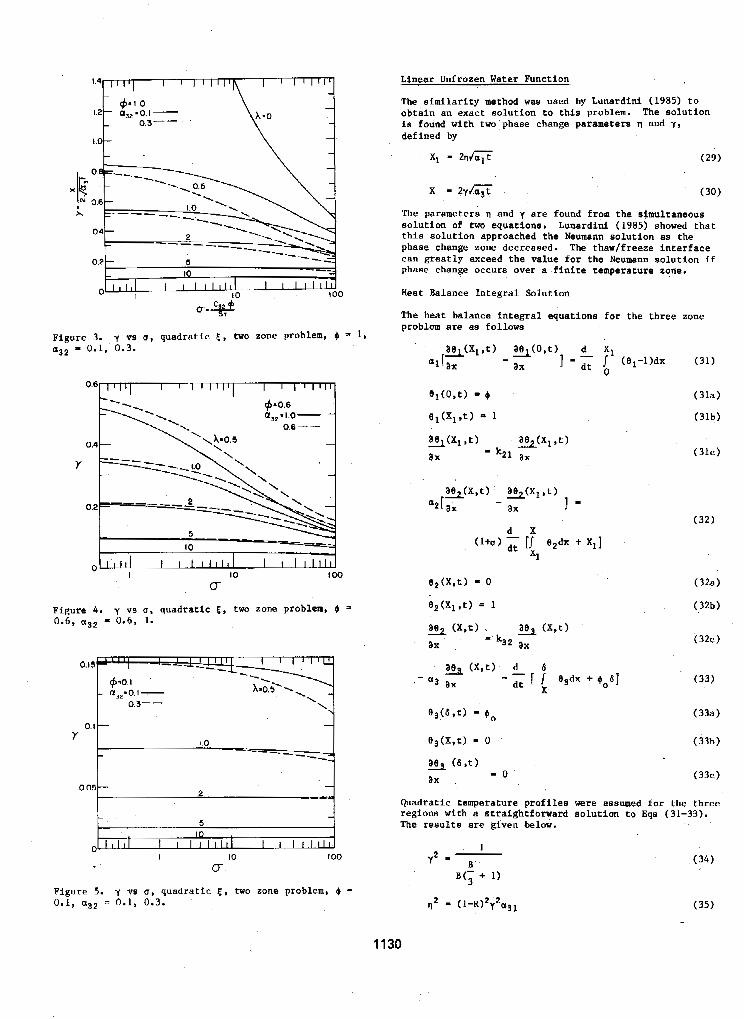
Linear Unfrozen Water Function
The s i m i l a r i t y method was used by Lunardini (1985) t o ob ta in an exac t so lu t ion t o t h i s problem. The so lu t ion is found with two phase change parameters tl and y, defined by
c p = 1.0
0.3" -
0
Figure 3. y vs u , quadratic E. two zone problem, + = 1, = 0.1, 0 . 3 .
0.05k -I
I 1 - 5
I O
0 ' 1 1 1 1 I I I I I l l l l I I I I I l l 1 I IO IO0
0
Figure 5. y vs u , quadra t ic E , two zone problem, 9 0 . 1 , = 0.1, 0.3.
The parameters 11 and y a r e found from the simultaneous so lu t ion o f two equations. Lunardini (1985) showed t h a t this solution approached the Neumann so lu t ion as the phase change zone decreased. The thaw/f reeze in te r face can great ly exceed the value for the Neumann so lu t ion if phase change occurs over a f in i te t empera ture zone.
Heat Balance Integral Solution
The heat balance integral equat ions for the three zone problem are as follows
Quadratic temperature profilea were aesurned fo r t he t h ree regions with a s t ra ight forward so lu t ion to Eqe (31-33). The resu l t s a re g iven below.
( 3 4 )
1130
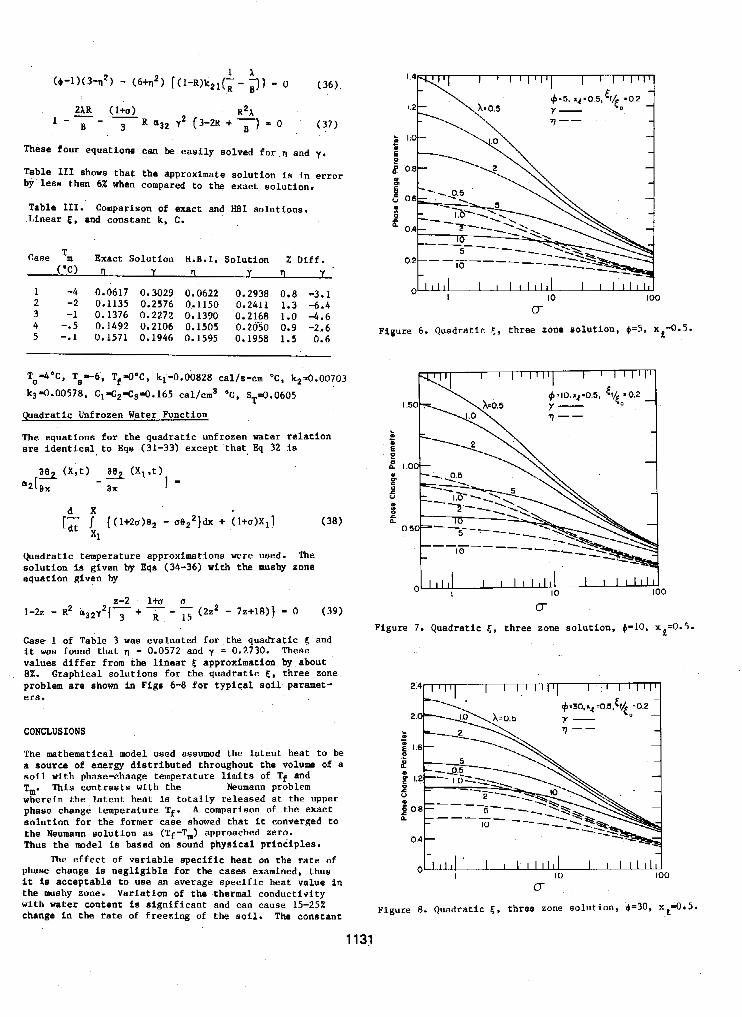
Todoc, TH"6, TfSIOoC, k1-0,00828 cal/s-cm 'c, k2=0.00703 b40.00578. c142-C34.165 cal/cm3 'C, ST4.O605
Quadratic Unfrozen Water Function
The equations for the quadratic unfrozen water r e l a t i o n a r e i d e n t i c a l " t o Eqs (31-33) except that , Eq 32 is
a& (X,t) 3 (XI&)
a2 ax ax I - - d X [z I {(1+2u)e2 - U O ~ ~ } ~ X + (l+u)X11 (38)
X1
Quadratic temperature approximations were used. The so lu t ion l a given by Eqs (34-36) with the mushy zone equation given by
1-22 - R2 O 3 2 y 2 { T + - 15 (2Z2 - 7~+18)} - O (39) 2-2 5 e
Case 1 of Table 3 was evaluated for the quadra t ic E and i t was found tha t 0 - 0.0572 and y = 0.2730. These va lues d i f fe r from the l i n e a r E approximation by about 8%. Graphical solut ions for the quadrat ic E , th ree zone problem are shown in Figs 6-8 f o r t y p i c a l soil paramet- ers.
CONCLUSIONS
The mathematical model used assumed the l a ten t hea t to be a eource of energy distributed throughout the volume of a s o i l w i t h phase-change temperature limits o f Tf and Tm. This contrasts with the Neumann problem wherein the la tent heat is to t a l ly r e l eased at the upper phase change temperature Tf. A comparison of the exact solut ion for the former case showed tha t i t converged t o the Neumann so lu t ion as (Tf-T,) approached zero. Thus t h e m d e l is based on sound physical pr inciples .
phase change is neg l ig ib l e for the cases examined, thus i t i s acceptab le to uae an average specif ic heat value in the mushy zone. Variation of the thermal conductivity with water content is s ign i f i can t and can cause 15-252 change in t h e r a t e of f reez ing of the soil. The constant
The e f f e c t of va r i ab le spec i f i c hea t on t he r a t e of
-------"
0-
Figure 7. Quadratic E , th ree zone so lu t ion . 9-10, x =0.5. II
"""
IO I O 0
0
Figure 8. Quadratic 5 , th ree zone so lu t ion , +=30, xQ=O.5.
1131
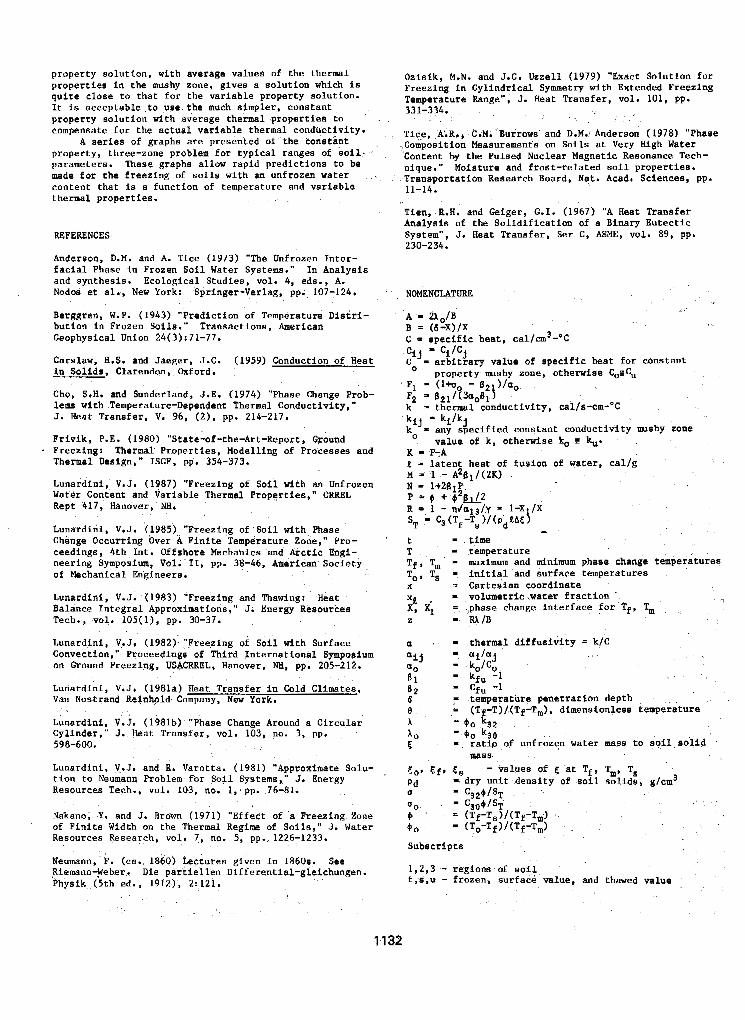
property solution, with average values of the thermal
quite close to that for the variable property solution. properties in the mushy zone, gives a solution which is
It is acceptable to use the much s+mpler, constant property solution rlth average thermal properties to compensate for the actual variable thermal Conductivity.
property, three-zone problem for typical ranges of soil: parameters. These graphs allow rapid predictions to be made for the freezing of soile with an unfrozen water content that i s a function of temperature and variable thermal properties. ' . ,
A series of graphs are presented of the consrant
REFERENCES
Anderson, D.M. and A. Tice (1973) "The Unfrozen Inter- facial Phase i n Frozen Soil Water Systems." In Analysis and synthesis. EcoloRical Studies, vol. 4, eds., A. Nodoi et e l . , New Yort: Springer-Verlag, pp. 107-124,
Berggren, W.P. (1943) "Prediction of Temperature Distri- bution in Frozen Soils." Transactions, American Geophysical Union 24(3):71-77.
Carslaw. H.S. and Jaeger, J.C. (1959) Conduction of Heat i n Solids, Clarendon, Oxford.
Cho, S.H, and Sunderland, J.E. (1974) "Phase Change Prob- lems with Temperature-Dependent Thermal Conductivity," 3. Heat Transfer. V. 96, (2), pp. 214-217.
Frivik, P.E. (1980) "State-of-the-Art-Report, Ground Freezing: Thermal Properties, Modelling of Processes and Thermal Design," ISGF, pp. 354-373.
Lunardini, V.J. (1987) "Freezing of Soil with an Unfrozen WatCr Content and Variable Thermal Properties," CRREL Rept 417, Hanover,'NH.
Lunardini, V.J. (1985) "Freezing of Soil with Phase Change Occurring Over A Finite Temperature Zone," Pro- ceedings, 4th Int. Offshore Mechahics and Arctic Engi- neering Symposium, Vol. II, pp. 38-46, Alnerican Society, of Mechanical Engineers.
Lunardini, V.J. (1983) ';Freezing and Thawing: Heat Balance Integral Approximations," J. Energy Resources Tech., vol. 105(1), pp. 30-37.
Ozisik, M.N. and J.C. Uzzell (1979) "Exact Solution €or Freezing in Cylindrical Symmetry with Extended Freezing Temperature Range", J. Heat Transfer, vol. 101, pp. 331-334.
, Tice, A.R., C.M. 'Burrows and D.M., Anderson (1978) "Phase ,,Composition Measurements &I Soils at Very High Water Content by ,the Pulsed Nuclear Magnetlc Reeonance Tech- nique." Moisture and frost-related soil properties. Transportation Research Board, Nqt. Acad. Sciedces, pp. 11-14.
Tien, R.H. and Geiger, G.I. (1967) "A Heat Transfer Analysis of the Solidification of a Binary Eutectic System", Y. Heat Transfer, Ser C, ASME, vol. 89 , pp. 230-234.
NOMENCLATURE
A - 2A0/B B = (6-X)/X C = specific heat, ~ a l / c m ~ - ~ C
value of specific heat for constant
F1 - (1- - 82 ) / a o
k thermal conductivity, cal/s-cm-'C :y- any specified constant conductivity mshy zone
K - F A L * latent heat of fusion of water, cal/g M a 1 - A261/(2K)
property nushy zone, orherwise C+G
F p B21/?3aofl1\
* k i J k j
value of k, otherwise k, 5 ku.
t T
- time
Tf, T,,, - maximum and minimum phase change temperatures To, Ts = initial and Burface temperatures
2; X; = ,phase change interface for Tf, Tm
temperature
X = Cartesian coordinate - volumetric ,water fraction "
e - RA/B
Lunardini, V.J. (1982)' "Freezing of Soil with Surface a I - thermal diffusivity k/C Convection," Proceedings of Third International Symposium a i l -, a i / a j on Ground Freezing, USbCRREL, Hanover, I", pp. 205-212, a0
6 1 = kp.. -1 - k O / C O ,
Lunardini, V,J, (19Bla) Heat Transfer in Cold Climates, Van Nostrend Reinhpld Company, New York. 6 - temperature penetration depth
"
62 - CfU -1
e (T- T)/(Tf-Tm). dimensionless temperature
A 0 - 90 ' 3 0 Lunardini,* V.Y. (1981b) "Phase Change Around a Circular A = $0 E'- 32 Cylinder," J. Heat Transfer. vol. 103, no. 3, pp. 598-600.
Lunardini, V.J. and R. Varotta. (1981) "Approximate Solu- , to, &f, tion to Neumann Problem for Soil Systems," J. Energy
- values of 5 at Tf, Tm, T,
Resources Tech., vol. 103, no. 1,' pp. 76-81. pd -, dry unit density of soil, so l id&, g/cm3 a - C329fS~
Xakano; Y. and J. Rrotm (1971) "Effect of a Freezing Zone $, (Tf-T,)/(Tf-T,). of Finite Width on the Thermal Regime of Soils,'' J. Water Resources Research, vol. 7, no. 5, pp. 1224-1233.
E - ratio ,of unfrozen water ma88 to soil, solid mass
00 - cso$/sT 4 0 - ITo-Tf)/(Tf-Tm) Subscripfs
Neumann, F. (ca. 1860) 9ctures given in 1860s. See Riemann-Weber, Die partiellen Differential-gleichungen 'Physlk (5th ed., 1912.). 2: 121.
1,2,3 - regions of soil f.8.u - frozen, surface value, and thawed value
1132
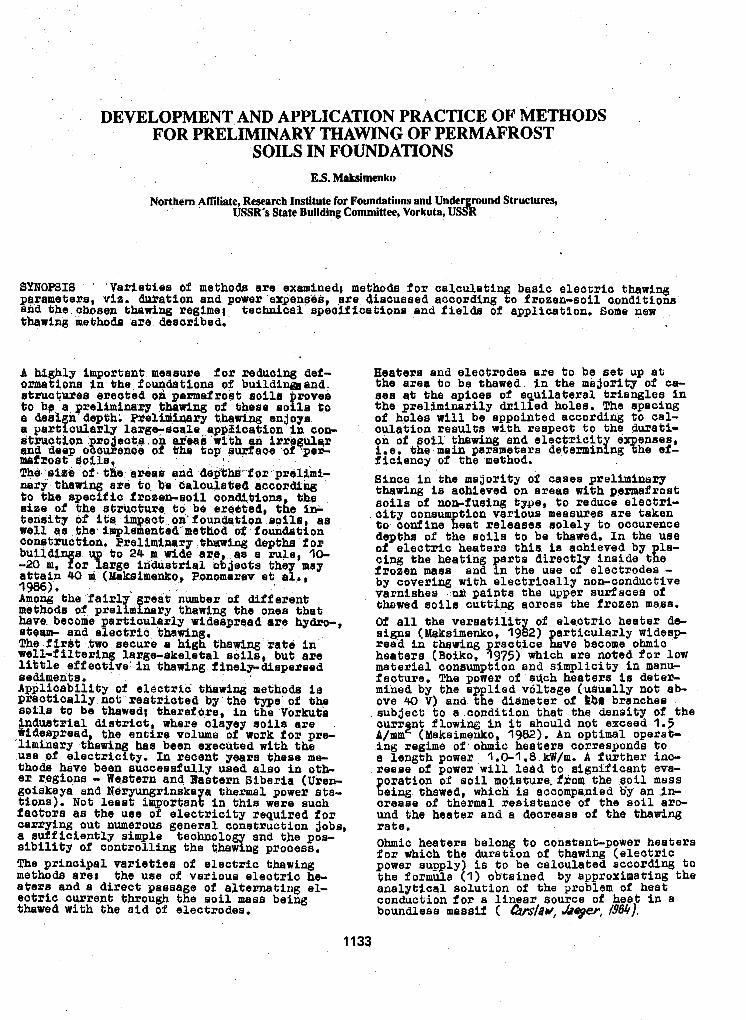
- . DEVELOPMENT AND APPLICATION PRACTICE OF METHODS FOR PRELIMINARY THAWING OF PERMAFROST
SOILS IN FOUNDATIONS E.S. Maksimenko
Northern Affiliate, Research Institute for Foundations and Underground Structures, USSR's State Building Committee, Vorkuta, USSR
SYNOPBIS ' 'Variet ies O f methoda are examined( methods fo r ca l cu la t i bas i c e l ec t r i c thawing parametera, via. charation and power expen@&, pre Qiacuaaed according~o frozen-soil oondltiona and the . chosen thewing regime;, technical apecliicafions and f ieLds o f application, Some new thawing methods ard deaozibed.
A highly important measue f o r reduaing dei- owations in the foun&t$ow of buildlximand. strua4wba exeated 05 prmafroe t ao i lb xovea t o b9 a pralimimq thawtng of $hew so Q la t o I design depth: Preli@inary t h a w i n g enjoya a par t iou lar lg l a rgs-male epgl ica t ioa- in COP
and deep ocou$Bnoe o f strmctiozl gro acta. o e&eaS 'wtth an irri.&ul&r
the top s w a m oi 'Re- nurfxost 9oib* 1 ,
TM. e t s i 'o f . trie a ~ k r i aa8"8e~tbrr..for,prslimi- nary thawing e m to, be &alculkrbe& rccordiiag t o the apeciIia froaen-soil conaPtiioaa, the sise o f the struoCul?.e bo be rrerlted, the iw tenaity o f its, i o t o n ' i 6 ~ 4 q l ; i o o iapila, as well 881 the, im&ntrd. mebhod oi 'ioundaflon c3ongtruet~oa. Preliminary ebranning depth f o r
-20 m , y o r large ir ldustrial OB jeofa they may buil8s a QQ t o 24 $p wide ar,e as a ruJe, 10- attaS,n 40 m (Maksimenko, Pmornersv e t air, 9986). A m o n g the 'f a l r ly ' g rea t 'number o f different methods of, preliminary thawing the ones t ha t have become pa r t iou l~wly wideagreed a r e hydro-, steam- and e leo t r i c , thawing. The f i r i t two secuxe a high thawing 'rat6 ' in Well-filteriog largebskeletal soils, but are little ef feotive' in thawing iinelgl.disgezsed
Applicability of e l a a t r i c thewing mefhoda is sediments.
Rraat ioal ly not res t r ioted by. the type ' of I549 s o i l s t o be thawed; thereibre, i n the .Vorkuta
Sridespreed the ent i re volume of work f o r pre- indus tx ie l d l s t r io t , where clayey a o i l a axe
'liminasy t h n g her been executea with the uBe of eleotr ic i ty . Xn recent years these me- thods have been suoceasfullg used also in 0th- BE Pegions - Waetern en4 Eastern Siberia (Umn- goiakaya end Ndr ungrinskaya thermal power sta- tions). N o t l e a d important In this were such i ao tp r s as the use of e lec t r i c i ty r equ i r ed fo r oarr ing out numerous general conetrmction jobs, a a&iciently sim l e technology and the poa- s l b i l i t g of oontrolling the Ghawing process. The gr inoipa l var ie t ies of e l ec t r to thawing methods are: the use o f var ious e lea t r ic h e a t e r s and a d i r ec t passage of eJternatiug el- ectr ic current through the soil mass being thawed with the a i d of electrodes,
1133
Heaters and eleo$rodes are t o be s e t up a t the area t o be thawed. in the majority o f ca- aes at the apioes of e u i l a t e r e l triangles in the preliminarily d x i l h d holes. The spading of holes w i l l be appointed according t o cal- oulat ioa resul ts with respect; t o the duxat5- on o f s o i l thawing and e l e c t r i c i t i.s. the main parametera determin&$?he ef-
enses, i ie ienoy of the method. Since i n the meJority o f cases preliminary thawing is achieved on areas with permafrost s o i l s of nondueing type, t o reduoe electr i - t o o o d i n s t e a t releases solely t o oacurence depfha of the soila t o be thawed. In the use of e leotr ic heaters this. ia achieved by la- c ing the heat in ar ts d i rect ly inside t e frozen maw ant i n the w e of electrodes - by covering with electrically nowconductive varnishee nit paints the upper surfaces of thawed soils cutting gcxasa the f rozen mass. Of a11 the v e r s a t i l i t of e lac t r ic hea te r de- algns (Maksimenko, l&) af t icu ler ly wideap reed in thawing r aa t i ce %ave become ohmlc heaters (Boiko, f S 7 S ) which are noted f o r low material consumption and s impl ic i ty in manu- facture. The power o f such heaters is deter- mined by the applied v6ltege (ulhally not a b o w 40 V) and the diameter of ib# branches
cuxrgnt f lowing in i t should not exceed 1.5 subject t o B .condition that the density o f the
A/mm (Meksimenko, 1982). An optimal operet-
a length power, 1 .GI .8 .kW/m. A fu r the r in- ing regime of, ohmic heatera corresponds t o
r e a m of power will lead t o s ignif icant eva-
!ehg thawed, which is accompanied b'y an .in- oration of soil moist;ure. f.xoa the @ o i l mass
orease of thermal resistance of the soil aro- uqd the heafer and a decrease of the th~dw ra te .
for which the duration o f thawing ( e l e c t r i c Ohmic heatera belong t o constant-power heaters
power aupply) is t o be calculated according to fhe formula (1) obtainea by approximating the analytical aolution of the problem of heat conauction for a l inear source of hea t in a boundless massif ( hrdaw, &6p, #&).
. c i t y aonsum t ion various measuxes are taken
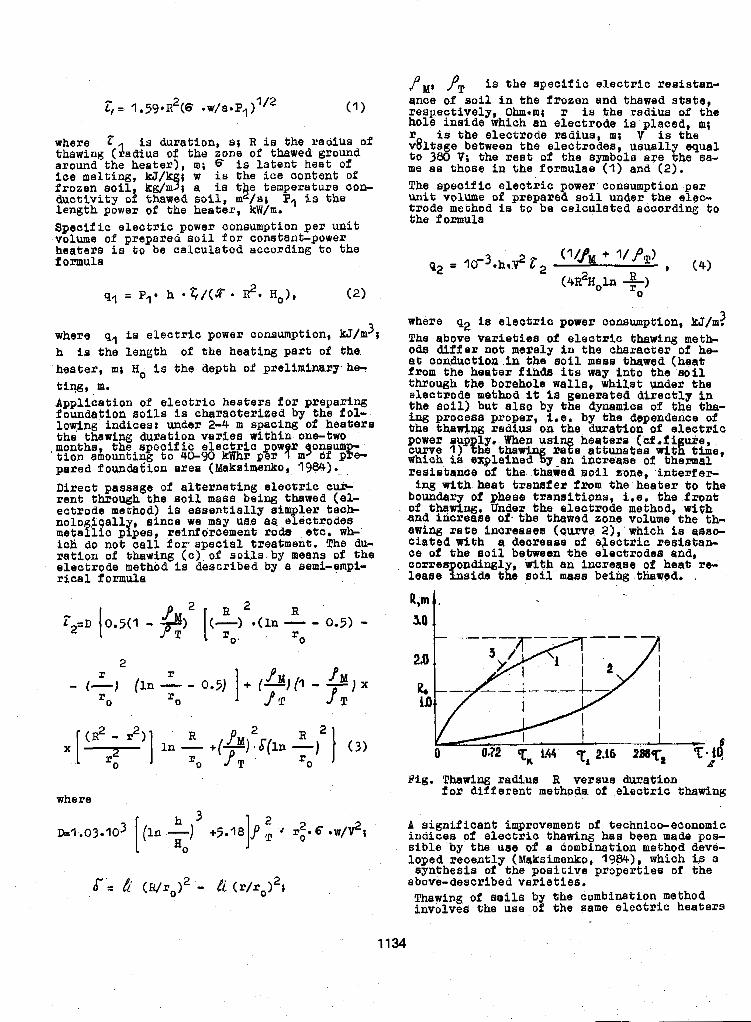
py, yT is the spec i f ic e lec t r ic res i s tan- ance of s o i l in the f rozen and thawed s t a t e , respectively, O b m m ; r is the radius of the h o W inside which an electroae is'glaced, Y? i s the electrode radius, m; V is the v8ltege between the electrodes, usually equal t o 380 V; the res t o f the symbols axe the sa- me as those in the formulae ( I ) ana (2). The spec i f ic e lec t r ic power consumption per unit volume o f prepared soil under the elgc- txode meshod is to be calculated according t o the i ormula
where is duration, a; R i s the radius of thawing ( h d i u s of the zone of thawed ground around the heater) , m; 6 is la tent heat of ice melting, kJ/k 8 w i a the ice content o f frozen soil, kg/m 9 4 a is t e temperature con- ductivity of thawed s o i l , m .B / s i Fl La the length power of the heater, kW/m. Bpecific e l e c t r i c powep consumption per unit volume of prepared soil f o r conatant-power
i ormula heaters i s t o be calculated according t o the
where q1 is electric power consumption, kJ/m ; h is the length of the heating part o f the heater, mi R, i a the depth of preliminary he?
Application of e l ec t r i c hea t e r s fo r preparing foundation soils i s characterised by the f o b lowing indices; under 2-4 m spacing of heaters the thewing duration v a r i e s within one-two t ion amounting t o 4G98 kWhr pel' ? mgo35K- perad foundation area (Maksimenko, 'I 984) .. Direct passage of a l te rna t ing e lec t r lo cui+ rent through the soil mass being thawed (el-
nolo i c a l l , since we may use as. efectrodes ectxode method) i s eeeentially elm l e r t e c b
metafiic pfpes, xeiddrclement ro- etc , wh- i a 6 do not ca l l f o r special treatment. The du- ration o f tbawing (c), of soils by means o f the electrode method I s described by a aemi-empi- rice1 formula
3
t iw, . m-
, montha, the speoific e e c t r i c pow r
I where
where q2 l e e l e c t r i c power consumption, kY/m? The above var i e t i e s o f e l e c t r i c thawing meth- ods differ not merely in the character of he- e t conduction .in the mil mass thewad (heat from the heater finds its way i n t o the soil through the borehole walls, whilst under t4e electrode method it i s generatea directly in the soil) but also b the dynamlos of the tha- 1ng process proper, $.e. by the dependence of the thawiqg radius on the durabion of e l e c t r i c power up ly.. When usi heatefa (ef.f i ure, curve 1) h e tha~y which i s explained y an increase o f thermal
2% attunatee w i t i time,
resisbance bf thw. thawed s o i l zone, ,interfer- ing with heat tranafer from the .beater t o the
boundary of phaeta tranait igns, i ,e. the front of thawing. Under the electrode method, with and increase 02. the thawed zone volume the th- awing rate inareaees (cumre 2),'which ia asso- ciated with a decrease o f B ectf ic res ia tan- oe of the soil between t h g e 1 ectrodea and,
leese inside d e s o i l m a s bel% . t b w g d . ,
oorrespoadingl , with an inoxease of heat re-
Fig. Thawing redtus R versua duration for different methoda.. of e lec t r i c thawing
h 3 2 r>=.1-03a103 [(In -1 +5'm18]P p '' ':06 gw/v2r indices of e l e c t r i c thawing has been made PO+
A signif icant impxovement of technico-economic
loped receetly (Maksimenko, 19E4), which is a synthesis of the poait lve propertier of the
Thawing of soils b the combination method involves the use OK the same electric heaters
HO Bible by the w e o f a combination method deve-
r.= .& ( ~ / r , ) ~ - ti ( r / ~ ~ > ~ ; above-deacxibed var ie t ies .
1134
as current receivers with a variable, two- -stage power supply regime. A t the f ifst s tage
med by the electrod8 incrsses with the thaw- voltage is supplied t o the cdrxent receivers
ing re dius) . i n accordance with the specifications of the Using the Solution of the problem of e l e c t r i c electric heaters used.' In t h i s case the thaw- resistencs between coaxial ly arranged inf ini-
te:- and f i n i t e cylinders ( loeae l , Kochanov,
q~hieved. separately by the heatera and by the electrode method the f i r s t stage is ovex. Ab the' second stage, voltage, mostly 380 V, i s $ roo y.v2 BU p l i e d t o the adjacent current receivers, P = 9 (5) usfng them a8 electrodes f o y a direct passage o f electric current through the s o i l (curve 31 0.87*yr0 Reduction of thawing'length and of e l e c t r i c power conaumption under the combination method .is achieved: a t the first; stage - due t o a , higher rate o f thawing by the us0 of heaters where $/ = 0.637 + 0.554*(h/2 ro)0*761 theotber for an inaignificenf thermal resistance of of the symbols are the same a8 i n the pxevt-
f i can t xe,semtes of heat accumulated i n thia %he thawed zoile and, correspondingly, Inaigni- o\is i ormula e.
zone! a t , the second atage - due t o :e high r a t e :&YAYe Of H, be calculated from the of deCtXQd8' thawing fop a sufficient1 well- -developed procesa and concentration of heat *rd.eaaes inside the soil mass being thawed. Beginning f r o i 1984 the combination methqd o f eleotr ic thawing has been intensively i n t ro - . qucucad in the c i fy o f Vorkuta,' wherw during t.he ,f irst thzlee ears alone i t was .uaed i n the where constructioe o f 5 indusff ia l and civvil groj- ecta and is a t presant beilog mastered by the builders of the Uxe oiskaya thermal powex s t a t ion ana the Tikh i comaunity centre. As comparaa, to - the design solutiomproviding f o r J T (1 - q p , , the use of ohmic heaters for e o i l thawing, i f waa possible t o m o m than aouble improve the main teabnfco-economio indicesr volume o f bo- rehole d r i l l i n g t o accomodete heaters, mefal consumption in fabrioating current: receivezs, 1.3lv;? e lec t r i c power conawntion, Correapondlngly,
il was twice reduced. It is t o be underlined that on these projects while, using the combi- nat ion method the tkawkng depth d$d pot, un- derbtandablg, changh ' (1422 m ) i q imi lhxl i s did the volumes o f .prepared 80 1. Opry f [ e spa- cixig o f current receivers increased from 2.2-
' -3.5 m t o 4.0-4.5 m. I n , t h e c a m of object i The duration of s o i l thawing by the use of the ~ ~ t ~ r f ~ ~ & $ ~ ~ & f ~ ~ ' ~ $ ~ ~ z2!ttfG :$- the formula (7) and B ecif i c electric power
combination method w i l l be calculated a f t e r
i n one-one 'and a @;elf months, the spacing of consumption - a f t e r t f e formula ( 8 ) . current receivers can bs'increased t o 5.C-7.0 m. The length o f the first stage o f soil thawing by the uag of the combination method I s . t o be c$lcula'twd a f t e r the formula (1) by substiut- ing R values i n .it, 'and that of the second stagso- after the fbrmula' (3) by preLimSaerily aubsti tufing . r fox , %. 0.25010'~f h e , I The value of R i s dependent bo th on the ape- Ptl + eific .froeen-eoh and technological pareme- In( Wx0 1 terst spacing of curxqnt xeceivexa, t h e i r geo- Pn = metribal dimensions, the magnitude a9 applied I x R2-Ro voltage the power of electric beaters used a t t h e 2irst stage. Moreovax, 'in app'o$nting technological parameters it would be f eas ib l e to secure the poss ib i l i t y of using the aame -.I
where ,? i s the duration of the first sources of e l e c t r i c power (transforinars) f o r
2nd SeCOdi s t&e calculated accordkng t o the formulae (?) and (2) f o r tbe respective para-
popex supply of current receivers a t b a t h the sfageii, i . e , t o apppint the power o f the he-
meter values, st qk i a e l e c f r i c power consun+ ption, kJ/cu.m.
s, (1 - 7 1
R, r,*exp(A (6)
jY
9 4M .. In 3 A=B+C# B 7 - i
C = the O O S t O f pXepPrlD& 1. OUrU, Of 'fOWdatiOP SO-
. . - r k = L q + r2 i (7)
mination of the thawing process (power a t the conau- ter- m e x i e n c e in using t'bwing t o thet Of the
1135
in the Voxkuta i n d u s t r i a l d i s t r i c t and i n o t b er regions snables u8 t o give the following cha rac t e r i s t i c of t h e f i e l d of app l i cab i l i t y of these methoda, The use of e l e c t r i c h e a t e r s i s not controll- ed by the frozen-soil conditions of the are- as t o be thawed, and the technico-economic indices of Che s a i d method axe grincLpally determined by the i ce conten t of the SOi18, their thermal-physical properties and the chosen thawing regime (heater power, thawing ra diua) . The appl ica t ion e f f ic iency of the electrode method is , mopeover, dependent on the e lec- t r i c p r o p e r t i e s of the s o i l s . Frozen soils a r e endowed with a . s ign i f i can t spec i f i c res- istanae and the process o f electrode thawing proceeds rather slowly, We length of thawing, p a r t i c u l a r l y i n l a r g e s k e l e t a l soils, may be as long as several months. Furtherpore, by v i r t u e of the natural inhomogeneity of the s o i l mas8 with respect t o e l ec f r i c r e s i s t ance t h e r e a r i s e a t t h e g n i t i a l s t a g e l o c a l heat- ing zones the growth of which accounts f o r a significant non-wiformity bf- heat releas- es. Therefore, 9 r a t i o n a l f i e l d of applicat- ion f o r the plectrode methd prove t o be the sec t iona l ly liomogeneou's clayey grounds with a specific e l e c t r i c r e s i s t a n c e i n the f rozen s t a t e up t o 100 Ohm-m. The above drawbacks of the e lectrode method s ign i f i can t ly lese a f fec t t he e f f i c i ency of the combination method because fh8 passage o f electzic current through the s o i l mass OC- curs with the p resence in the l a t te r ,of suf- ficiently developed zones of thawed s o i l ar- ound the current receivers . Its a p l i c a t i o n is not; res t r icbed by dlspers ion of the soils, but so l e ly by the spec i f ic raa ia tance i n the f rozen s t a t e - 300-400 Ohm .m. The above-described methods for re l iminary thawing, f o r a l l t h e i r univereelfty and tech- no lo ica l advantages , ca l l f o x the presence i n $e construct ion area of e l e c t r i c power which is not always available in required am- oun t s i n the areas o f pioneer construction, p a r t i c u l a r l y o i l and $as f i e l d s . To deal with such conditions there has been developed the energe t ica l ly autonomous method involving a direct burning of l i q u i d f u e l in the boraho- les (Naksimenko and Pavlichenko, 1986). We may use as f u e l petroleum- ana oil-contain- ing wastes .of mpchine building, straw o i l , masouf, e tc . The method is real iaed in the fol lowing men- ner. Placed i h a borehole preliminarily dril- led t o the requisite thawing depth is an in- ,ventory pipe o f 80-100 ma diaqetex with a '
welded bottom, in tp which f u e l i s poured and a perfora ted tubular air conduit of 2550 mm diameter is lowered. S e t t i n g the f u e l on fixe is achieved by means o f a lowered wick with a i r supplied into the borehole from compres- sox. As f u e l burns up, there occurs an automa'tic movement o f the zone of p r inc ipa l hea t re le - ases (f lame) ovex the depth of the layer be- illg dea l t with. Heat i s conveyed in to t he soil mass being thawed around the borehole through radiation and a convective heat exch- ange between gaseous combustion proaucts and
borehole walls. This method i s notable f o r 8 s u f f i c i e n t l y un- sofisticated production technology end a pots- e i b i l i s o f con t ro l l i ng t he , r a t e of f u e l bur- ning (t ough a i r iupply) and. df the number: of , urns-through i n a borehole, and.by $ha leligth of operatirlg stag'es. The combiq,ed, fS- e l d and laboratory teats OP the new method have" pointed t o a suf f ic ien t ly h igh eff ic ien- ~ 3 . ; . in the use of f u e l (0,'5+0,8), as detesm-
f r o z e n s o i l t o t he ca lo r i f i c va lue of the1 Zu- ined. by the r a t i o of beat sgent bn thawing
e l (Maksimenko and Pavlicbenko, ?986). I n conalusi'on we would l i k e t o point out that a preliminary thawing of permafrost soila i n foundat ions r ignif icant ly ,extends the pos- aibilitias of constmction reclamation of n+ r the rn areas and of the us8 of numerous met& ods af foundation design, Mwreoyer, the thaw- ing rocess proper and the constxuction pro- '
p s r t f e a of thawed aoils a m well cos t ro l lab le , thus enabling p r a c t i c a l l y any prsaeC re l iab i - l i t y of the foundation t o be securpd for the ' e n t i r e eervice period.
Boiko I.V.-(1975). Preconstruction thawing o f ermaf rost a o i l s in t he i o ~ d r r t i ~ n a o f h l d i x l g e and s t ructures in Vorkuta. - In: Mater ia ls on Construction Problems i n Vorkuta, Komi ~ a q k Publishers, p. 9- -15, Syktyvkar. .
Iossel Yu,Ya., Kochanov B.S., Stxunaki i M,G, (7981). Calculat ion of e l e c t r i c c a a c b tgnce. mergoizdet Publishers, p.218,
Maksinmnko E.S, (1982). Becogmendations f o r the use ,of electrOc heaters i n thew"
ing permafrost soiZs. N.M.Gersevanov Re- s e a r c h I n s t i t u t e foS Bpundationa ard unaergrouna Btructurea, p.26, MOSCOW.
"aksimenko E.5 , (198ft). Combination m0tbod , fo r e l ec t r i c t hawing . of permafroat gro-
unds and foundations. *%ases, Foundati- ons an8 So i l Mechanics", I 6, p.21-23, Moecow.
Maksimenlrd X.S., Ponomaref V.D., Sorokin V.A., Fedoseev Yu.G. (1986) Determination. of deformation characterist ics of permafr- o s t soils by using. Che method o f t e s t thawing. "Bases, Foundation and S o i l Mechsnics", I 6, p.21,,22, Moscow. -
Yakaimenko B.S., Pavlicbenko S.4, (1986). Es t imat iw the e f f ic iency o f u s m liqu- id f u e l for preliminary thawing 045 t o m - dat ion S Q ~ ~ E I . - PTDC, N.M*Gwxevanov Re- s e a r c h I n s t i t u t e f o r Foundations a d Un- derground Btructnres, issue 85, p.1521.
1136
SECONDARY CREEP INTERPRETATIONS OF ICE RICH PERMAFROST Secondary Creep, Permafrost Soils, Creep of Ice
E.C. McRoberts
Hardy BBT Limited, Edmonton, Alberta
SYNOPSIS 2econdary greep interpretations of samples of ice r i c h p e r m a f r o s t s o i l s a t temp- e r a t u r e s from -0.8 C t o -4.0 C are presented. The d a t a a r e compargd t o recent ly publ i shed sum- maries of ice creep. I t i s found khat for temperatures below -2.0 C ice c reep da t a cons t i t u t e s a good upper bound o r conse rva t ive r e l a t ionsh ip fo r pe rmaf ros t so i l c r eep r a t e s . A t warmer tempera- tures samples of ice r ich permafros t exhib i t fas te r secondary c reep ra tes .
INTRODUCTION
A secondary creep model can o f f e r a realist ic interpretat ion of load-deformation response of ice and ice-r ich permafrost soi1s , for example, Roggensack (1977) , McRoberts e t a1 (1978) , Morgenstern e t a1 (1980), and Savigny and Morgenstern (1986) . In addi t ion , secondary creep models provide a r easonab ly s t r a igh t fo r - ward method of predict ing load-deformation re- sponse for a w i d e v a r i e t y of des ign requi re - ments i n pe rmaf ros t , i.e., Nixon and McRoberts (1976) , Nixon (1978,) , and Morgenstern e t a 1 (1980). Th i s paper repor t s on secondary creep i n t e r p r e t a t i o n s of undisturbed samples of nat- u r a l p e r m a f r o s t o b t a i n e d a t s e v e r a l sites i n t h e Mackenzie River Valley. Upper bound cor- r e l a t i o n s r e l a t i n g s e c o n d a r y c r e e p r a t e to app- l i e d stress are provided. While t h e g r e a t e r p a r t of the da ta cons iaered a re based on uncon- f ined tests, confined t e s t s are a lqo reviewed. as appropr ia te , secondary c reep cor re la t ions a r e compared with publ ished data on flow laws for ice.
SECONDARY CREEP
The creep response obtained by step loadfng a frozen sample of ice o r i ce - r i ch pe rmaf ros t s o i l c a n e x h i b i t t h r e e d i s t i n c t s t a t e s ; p r i m - ary, Secondary, and ter t iary creep. A t high stress leve ls the secondary c reep s tage i s t rans i tory wi th deformat ions pass ing qu ick ly i n t o a t e r t i a r y p h a s e , the o n s e t of which de- n o t e s f a i l u r e . A t low stresses, and depending
no t be reached. The tes t d a t a considered here upon test du ra t ion , a secondary c reep s tage may
a r e w e l l described bysecondary creep behaviour. The form of the flow law for Secondary creep t akes t he form (see McRoberts e t a l 1978)
= A o;/(l-TIm . . . . . * . * . . . . . . 1
where A, F, and n a re cons tan ts de te rmined by t e s t i n g , E i s the secondary c reep ra te , a t he appl ied devia tor stress, and T is the temgera- tu re . In some cases, Equation 1 t a k e s a b i l i - near form, see Equation 3 .
There has been considerable discussion on t h e magnitude of exponent , n , in Equat ion 1. Nixon and McRoberts (1976) cons idered c reep da ta for ice and reported a range of n from near 1 . 0 up t o 4 .0 as a function of temperature and shear stress l e v e l . More recently Morgenstern e t a 1 (1980) and Sego and Morgenstern (1983) report t h a t n converges on 3 f o r ice. This is i n agreement w i t h Paterson and Budd (1982) whocon- c lude t ha t n = 3 f o r g l a c i a l ice. A s noted by McRoberts (19821, low n values reported byNixon and McRoberts ( 1 9 7 6 ) were inf luenced by low shear stress, r e l a t i v e l y warm tes t s on w e l l - s t r a i n e d g l a c i a l ice w i t h p r e f e r e n t i a l l y o r i - ented ice c r y s t a l s t r u c t u r e . McRoberts (1982) reported a best fit n = 3.2 f o r a r t i f i c i a l l y prepared ice with randomly or iented crystal s t r u c t u r e .
Creep da t a fo r i ce r i ch pe rmaf ros t so i l s suppor t a value of n = 3 . Roggensack ( 1 9 7 7 ) reported creep tes ts on undisturbed samples of i c e - r i c h Eine-gra ined g lac io lacus t r ine so i l anit reported a bi l inear f low law. However by e l imina t ing c e r t a i n d a t a he defined a flow law with ~ 2 . 7 5 . McRoberts e t a 1 ( 1 9 7 8 ) t e s t e d ice-rich g lac io - l a c u s t r i n e s i l ts and repor ted a b i l inear f low low w i t h n =3.0 a t low stress. However a t h i q h - er stresses, where creep response was dominated by samples wpich u l t i m a t e l y r e a c h e d t e r t i a r y creep, an exponent value of 6.0 was reported.
The magnitude of t h e exponent m in Equat ion 1 accounts fox temperature effects . McRoberts et a1 (1978)used an m value of 1 . 8 , based on co r re l a t ions w i th ice a s r e p o r t e d . b y McRoberts (1982). Nixon (1978)provided a re-analyses of t h e McRoberts e t a1 (1978)da ta and used a value of m = 2 for a re fe rence t empera ture o f -2 .s'c. Creep data for ice reported by Morgenstern e t a 1 (1980) i s presented i n t h e form o f l og A, versus l o g (1-T) following Nixon andNeukirchner (1 984), see Figure 1. The slope of log A, versus Log (1-T) d e f i n e s the m parameteg, which for ice a p p e a r s t o be E = 2 f o r T =-1 C and m =1 f o r T co lder than -2 C .
SAMPLE DESCRIPTION The creep tes t data reported byRoggensack(1977),
1137
McRoberts e t a1 (1978), and Savigny and Morgen- s t e r n ( 1 9 8 6 ) a s w e l l as a d d i t i o n a l d a t a r e p o r t e d h e r e a ’ r e a l l for i c y p e r m a f r o s t s o i l s o b t a i n e d i n t h e Mackenzie River Valley between FortSimp- son and Norman Wells NWT. The test d a t a d i s - cussed here i s r e f e r r e d t o a s B , E , G and P
pany L t d . (1977) , t h e data from Roggensack(l977) S e r i e s , from Nor thern Engineer ing Serv ices Com-
as R series, and from Savigny and Morgenstern
d e s c r i b e d i n d e t a i l by McRoberts e t a l ( 1 9 7 8 ) . (1986) as S series. The B series samples were
The E series samples were ob ta ined by ho r i zon t - a l l y c o r i n g i n t h e headscarp o f a l a rge l and - s l i d e i n c l o s e p r o x i m i t y t o t h e s i te d i scussed by Roggensack (1977) . The G series were ob- t a i n e d from t h e same boreho les r epor t ed by Sav- igny and Morgenstern (1986) * The P series a r e pea t samples ob ta ined f rom an e leva ted pea t bog i n t h e F o r t Simpson area. Table1 summarizes t h e i n d e x p r o p e r t i e s of the samples tested. A list of t h e water ( ice) c o n t e n t d a t a is given
McRoberts e t a 1 (1978) for B samples. €or each sample i n Table 2 a s well as i n
The B samples consisted of a f i n e l y banded str- a t i f i e d ice wi th sub -pa ra l l e l bands of v i s i b l e ice from 5 t o 20 nun i n t h i c k n e s s s e p a r a t e d by soi l l a y e r s o f e q u i v a l e n t t h i c k n e s s . TheE sam- p l e s . o b t a i n e d by h o r i z o n t a l l y c o r i n g i n ice- r i c h g l a c i o l a c u s t r i n e soils, have the same gen- e r a l water conten t range as t h e B samples , bu t h a v e a n e n t i r e l y d i f f e r e n t ice s t r u c t u r e . The ice i n t h e E s a m p l e s e x i s t s a s s u b s t a n t i a l v e i n s up t o 80 rran t h i c k o r i e n t e d a t vary ing angles t o t h e main a x i s o f the sample. The G coxes ob- t a i n e d by v e r t i c a l s a m p l i n g o f f i n e g r a i n e d
o f t y p i c a l l y 2 2 % t o 30% with one sample a t 748. g l a c i o l a c u s t r i n e clay have lower water c o n t e n t s
V i s i b l e ice was u s u a l l y p r e s e n t i n t h e f o r m of t h i n l e n s e s a n d i n c l u s i o n s e v e n i n the lower water content samples . The P se r iessamples had c o n s i d e r a b l e v i s i b l e ice wi th water ( ice) con- t en t s r ang ing f rom 4 1 0 % t o 2 0 0 0 % .
Details o f l abo ra to ry equ ipmen t and t e s t ing procedures are d i scussed by McRoberts e t a1 (1978). In a l l cases c r e e p i n t e r p r e t a t i o n s were done u s i n g l a r g e s i z e c o m p u t e r d e r i v e d p l o t s of temp- e r a t u r e v e r s u s t i m e , s t r a i n v e r s u s time and log s t r a i n rate ve r sus l og time. The average c reep ra te of the sample could then be e a s i l y d e t e r - mined from t h e s l o p e , o f t h e s t r a i g h t L i n e s e g - ment of t h e s t r a in - t ime cu rve . The c r e e p rate, so ob ta ined was then compared a g a i n s t t h e l o g E v e r s u s l o g t t o c h e c k t h a t a secondary creep s t a g e had been reached. An example of the type o f p l o t u s e d t o d e r i v e s t r a i n r a t e s € o r a l l tes ts quoted here i s g i v e n i n F i g u r e 2. I n t h i s p a r t i c u l a r t es t , pr imary creep ended a t about 3.0 x l o 4 min. For the next 3 . 0 x104 min. a sec- ondary. rate of E = 9.09 x lO-’/year was c a l c u l a t e d a t a tempera ture of -1.2’~, A rise i n temper- a t u r e t o -1,OOC t h e n r e s u l t e d i n a second per- i o d o f s e c o n d a r y c r e e p a t a r a t e of 1 . 1 2 x lO- l / y e a r . T y p i c a l s t r a i n time p l o t s f o r some 30
1138
B series samples are g i v e n a s F i g u r e s 1 t o 7 i n McRoberts e t al (1978).
A l i m i t e d series o f tests were conducted with c o n f i n i n g p r e s s u r e s of from 28 t o 276 kPa us ing jacketed samples and either a i r , minera l o i l t o r
McRoberts e t a1 (1987) . TheR series h a d a l i g h t a weak methanol s o l u t i o n as cell f l u i d , see
minera l o i l a s ce l l f l u i d , n o membrane, and a l i g h t coat o f ice sprayed on the sample as a j a c k e t . No p e n e t r a t i o n of o i l i n t o t h e s a m p l e was r epor t ed . S series samples were unjacke ted .
Test temperatures ranged f rom -0.8OC t o -4 -0 0 c and w i t h t h e m a j o r i t y a t -l.O°C and -3.OOC. Tes t ing du ra t ion va r i ed depend ing upon stress
t u r e $he test durat ion ranged f rom 1 xlOf t o
l e v e l . For samples t ha t r e s u l t e d i n cre p rup-
2 x10 min. Long-term tests a t low stress Leve l s r anged i n du ra t ions f rom 2 x10 t o2 x IO5 min. I n c e r t a i n cases, tests were t e rmina ted a f t e r s i g n i f i c a n t test d u r a t i o n s b u t before a. secondary c reep s tage , as evidenced on a l o g E - l o g time p l o t was reached. Such tests are sep- a r a t e l y i d e n t i f i e d .
SECONDARY CREEP INTERPRETATIONS
Basic data for each sample tested are g iven either i n T a b l e 2 0 r by McRoberts .et a1 ( 1 9 7 8 ) . The g r e a t e r p a r t of t h e c r e e p d a t a is f o r ternp- e r a t u r e s n e a r -1.0%. all B,E,G and P series d a t a was f i r s t g rouped toge ther us ing m = 2 .O t o a r e fe rence t empera tu re Of - 1 O C us ing Equation 2 , McRoberts e t a1 (1978), see F igure 3 . A cross superimposed on the se‘ries symbol indicates t h e c reep test t e r m i n a t e d i n c r e e p r u p t u r e . A ver - t i ca l l i n e d e n o t e s t h a t t h e s a m p l e was t e s t e d i n a conf ined cond i t ion . A best f i t upper bound l i n e t o a l l d a t a was ob ta ined by judgment t o be:
T h i s r e l a t i o n s h i p e x h i b i t s a marked b i l i n e a r form. The exponent n = 6 is heav i ly i n f luenced by s amples t ha t u l t ima te ly f a i l ed . Manysamples a t stress l eve l s above 400 kPa d i d n w t f a i l , b u t may well have done so fox s u f f i c i e n t l y l o n g t e s t d u r a t i o n s . A b e s t f i t a v e r a g e l i n e t o t h e s e d a t a u s i n g s t a t i s t i c a l m e t h o d s has n o t been ob- t a i n e d , b u t would c l e a r l y r e s u l t i n s i g n i f i - c a n t l y lower c r e e p r a t e s t h a n t h o s e p r e d i c t e d by the upper bound r e l a t ionsh ip o f -Equa t ion 2 .
Figures 4 . 5 and 6 c o n s i d e r t h r e e t e m p e r a t u r e ranges o f B,E,G and P series d a t a a t average r e fe rence t empera tu res of -1.0, -2.5 and -3.50Ct r e s p e c t i v e l y . As ice d a t a r e p o r t e d i n F i g u r e 2
e x a t u r e an m = 2 was used for the s o i l d a t a be- sugges t a v a r i a t i o n i n m a s a f u n c t i o n of temp-
tween -0.5 and -1.5OC and an m =1 f o r c o l d e r data. A l l samples which fa i led were e l i m i n a t e d i n F i g u r e s 4 , 5 and 6. F i g u r e 4 s u g g e s t s t h e flow law f o r ice is s l igh t ly non-conserva t ive and an u p p e r b o u n d c o n s i s t i n g o f t h e f i r s t term of Equation 2 i s a good f i t t o t h e w a r m so i l d a t a . For so i l data between -2 .O and - 3 .O°C t h e ice
er than - 3 . O°C i s s o l e l y %series da ta and the d a t a i s a reasonable upper bound. Thedata co ld-
g r e a t e r p a r t of t h e d a t a s u g g e s t s c r e e p rates somewhat less than ice. Var ious a t t empt s were made t o q u a n t i f y r e a s o n s f o r t h e scatter appa ren t i n t h e d a t a by cons ide r ing i ndex p rope r t i e s , s o i l c l a s s i f i c a t i o n s a n d so f o r t h . However, no
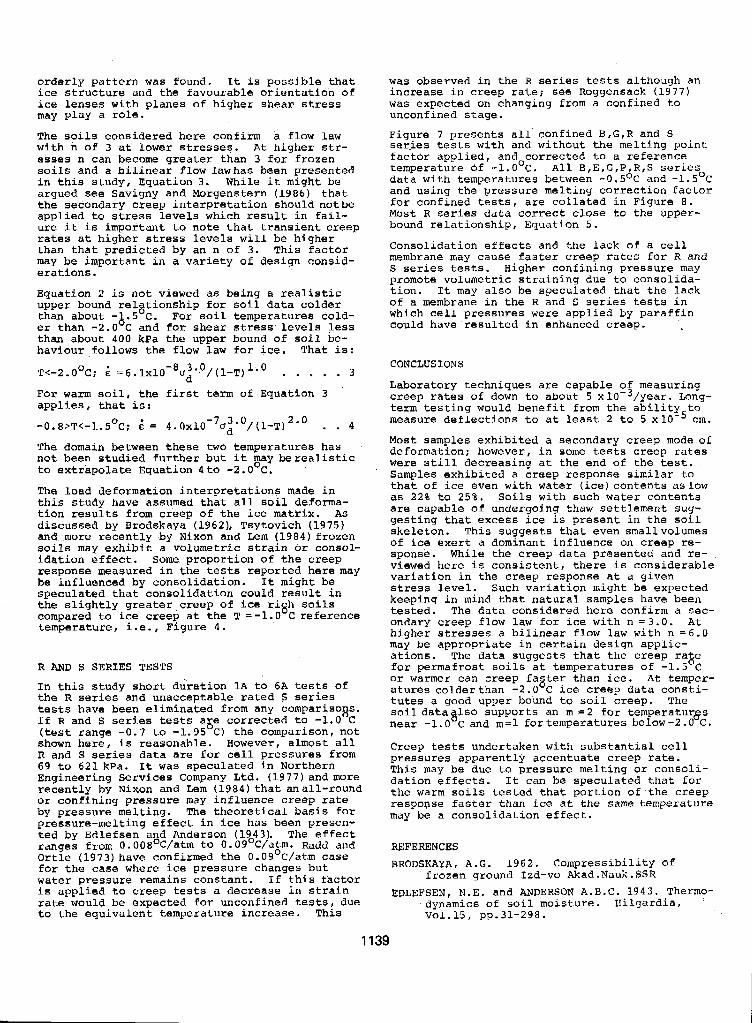
o r d e r l y p a t t e r n was found. I t is p o s s i b l e t h a t ice s t r u c t u r e a n d t h e f a v o u r a b l e o r i e n t a t i o n o f ice l e n s e s w i t h p l anes o f h ighe r shea r stress may p l a y a role.
The s o i l s c o n s i d e r e d h e r e c o n f i r m a flow law wi th n of 3 a t lower stresses. A t h i g h e r str- esses n can become g r e a t e r t h a n 3 f o r f r o z e n soils and a b i l i n e a r P l o w lawhas been presented i n t h i s s t u d y , E q u a t i o n 3 . While it might be argued see Saviqny and Morgenstern (1986) that t h e s e c o n d a r y c r e e p i n t e r p r e t a t i o n s h o u l d n o t b e a p p l i e d t o stress l eve l s wh ich r e su l t i n f a i l - u r e it i s impor tan t t o n o t e t h a t t r a n s i e n t c r e e p rates a t h i g h e r stress l e v e l s w i l l be h igher t h a n t h a t p r e d i c t e d by an n of 3. T h i s f a c t o r may b e i m p o r t a n t i n a v a r i e t y o f d e s i g n c o n s i d - e r a t i o n s .
Equation 2 is n o t viewed as be ing a r e a l i s t i c upper bound re lg t ionship for so i l d a t a c o l d e r than about -&.5 c. For so i l temperatures cold- er than - 2 . 0 C a n d f o r s h e a r stress l e v e l s l e s s than about 400 kPa the upper bound o f s o i l be- h a v i o u r . f o l l o w s t h e f l o w l a w f o r ice. That is:
T<-2. O°C; = 6 . 1 ~ 1 0 - ~ 0 ~ ' ~ / (1-T) . . . . . 3
For Warm s o i l , t h e first term of Equat ion 3 a p p l i e s , t h a t is:
-0.8>T<-1.5°C: E = . . 4
The domain between these two t empera tu res has n o t b e e n s t u d i e d f u r t h e r b u t it may berealist ic t o ex t r apo la t e Equa t ion 4 t o -2 . OOC.
The l o a d d e f o r m a t i o n i n t e r p r e t a t i o n s made i n th i s s tudy have a s sumed t ha t a l l s o i l deforma-
discussed by Bcodskaya (1962), Tsytovich (1975) t i o n r e s u l t s f r o m c r e e p o f t h e ice matrix. As
and more r e c e n t l y by Nixon and Lem (1984) f rozen soils may e x h i b i t a v o l u m e t r i c s t r a i n or consol- i d a t i o n e f f e c t . Some p ropor t ion of t h e c r e e p response measured in the tests r e p o r t e d h e r e may be in f luenced by consol ida t ion . I t might be s p e c u l a t e d t h a t c o n s o l i d a t i o n c o u l d r e s u l t i n t h e s l i g h t l y g r e a t e r c r e e p of ice r i g h soils compared t o ice c reep a t t h e T =-1.0 C reEerence tempera ture , l . e . l Figure 4 .
R AND S SERIES TESTS
I n this s tudy short d u r a t i o n 1A t o 6A tests o f t h e R series and unacceptab le ra ted S series tests have been eliminated from any comparisons. If R and S series tests age corrected t o -l.O°C (test range -0.7 t o -1.95 C) the compar ison , no t
R and S series data are f o r ce l l p r e s s u r e s from shown h e r e , i s reasonab le . However, a lmost all
69 t o 621kpa . I t was specu la t ed i n Nor the rn Eng inee r ing Se rv ices Company Ltd. (1977) and more r e c e n t l y by Nixon and Lem ( 1 9 8 4 ) t h a t a n a l l - r o u n d o r c o n f i n i n g p r e s s u r e may i n f l u e n c e c r e e p rate by p res su re me l t ing . The t h e o r e t i c a l b a s i s f o r p r e s s u r e - m e l t i n g e f f e c t i n ice has been presen- t e d by Edlefsen and Anderson (1943). The e f f e c t ranges from 0.008°C/atm to O.Og°C/atm. Radd and Ortle (1973) have confirmed the O.OS°C/atm c a s e f o r t h e case where ice p res su re changes bu t water p r e s s u r e r e m a i n s c o n s t a n t . I f t h i s factor i s a p p l i e d t o c reep tests a decrease i n s t r a i n rate would be expec ted for unconf ined tests, due t o t h e equ iva len t t empera tu re i nc rease . Th i s
11
was observed i n the R series tests al though an i n c r e a s e i n c r e e p r a t e ; see Roggensack ( 1 9 7 7 ) was expec ted on changing from a conf ined t o unconf ined s tage .
F igure 7 p r e s e n t s a l l c o n f i n e d B , G , R and S ser,ies tests wi th and wi thout the m e l t i n g p o i n t
tempera ture o f -l.o0c. ~ l l B , E , G , P , R , S series f a c t b r a p p l i e d , a n d c o r r e c t e d t o a r e f e r e n c e
d a t a w i t h temperatures between -0.5OC and -1.5OC a n d u s i n g t h e p r e s s u r e m e l t i n g c o r r e c t i o n f a c t o r f o r c o n f i n e d tests, a r e c o l l a t e d i n F i g u r e 8 . Most R series d a t a correct close tc the upper - bound r e l a t i o n s h i p , E q u a t i o n 5 .
Conso l ida t ion effects and the lack of a c e l l membrane may cause fas ter c r e e p r a t e s f o r R and S series tests. Higher conf in ing pressure may p romote vo lumet r i c s t r a in ing due t o conso l ida - t i o n . I t may a l s o be specu la t ed t ha t t he l ack of a membrane i n t h e R and S series tes ts i n which ce l l p r e s s u r e s were a p p l i e d by p a r a f f i n cou ld have r e su l t ed i n enhanced c r eep .
CONCLUSIONS
Labora to ry t echn iques a r e capab le of measuring c r e e p r a t e s of down t o a b o u t 5 x 10⁻³/year. Long- term t e s t i n g would b e n e f i t from the a b i l i t y t o m e a s u r e d e f l e c t i o n s t o a t l e a s t 2 t o 5 x ~ O - ~ cm.
Most samples exhib i ted a secondary creep mode of deformat ion; however , in some tests c r e e p r a t e s were s t i l l d e c r e a s i n g a t t h e e n d of t h e tes t . Samples exhibited a c r e e p r e s p o n s e s i m i l a r t o t h a t of ice even with water ( i c e ) c o n t e n t s aslow as 2 2 % t o 25%. S o i l s w i t h such wa te r con ten t s axe capab le of undergoing thaw set t lement sug- g e s t i n g t h a t e x c e s s ice is p r e s e n t i n t h e s o i l ske le ton . This sugges ts tha t even smal lvolumes of ice e x e r t a dominant inf luence on c r e e p re- sponse . Whi le the c reep da ta p resented and re- viewed here i s c o n s i s t e n t , t h e r e i s cons ide rab le v a r i a t i o n i n t h e c r e e p r e s p o n s e a t a g iven stress l e v e l . S u c h v a r i a t i o n m i g h t b e e x p e c t e d k e e p i n g i n mind tha t na tu ra l s amples have been tested. The da ta cons ide red he re con f i rm a sec- ondary creep flow law for ice w i t h n =3 .0 . A t h i g h e r stresses a b i l i n e a r f l o w law w i t h n =6.0 may b e a p p r o p r i a t e i n c e r t a i n d e s i g n a p p l i c - a t i o n s . The d a t a s u g g e s t s t h a t the c reep rage for p e r m a f r o s t s o i l s a t t e m p e r a t u r e s o f - 1 . 5 c ox warmer c a n c r e e p f a p e r t h a n Ice. A t temper- a t u r e s c o l d e r t h a n -2.0 C ice c r e e p d a t a c o n s t i - t u t e s a good upper bound t o s o i l c reep . The
near -1.0 c and m = l fo r t empera tures be low-2 .O C . s o i l d a t a 8 l s o s u p p o r t s a n m = 2 €or tempera turgs
Creep tests undertaken w i t h s u b s t a n t i a l c e l l
Th i s may be due t o p r e s s u r e m e l t i n g o r c o n s o l i - p r e s s u r e s a p p a r e n t l y a c c e n t u a t e c r e e p rate.
d a t i o n e f f e c t s . I t c a n b e s p e c u l a t e d t h a t f o r t h e w a r m s o i l s tested t h a t p o r t i o n o f - t h e c r e e p respopse faster than ice a t t h e same tempera ture may be a c o n s o l i d a t i o n e f f e c t .
REFERENCES BRODSKAYA, A . G . 1 9 6 2 . Compress ib i l i t y O f
frozen ground Izd-vo Akad.Nauk.SSR
dynamics of so i l m o i s t u r e . H i l q a r d i a , V01.15~ pp.31-298.
EDLEFSEN, N . E . and ANDERSON A.B.C. 1943. Thermo-
39
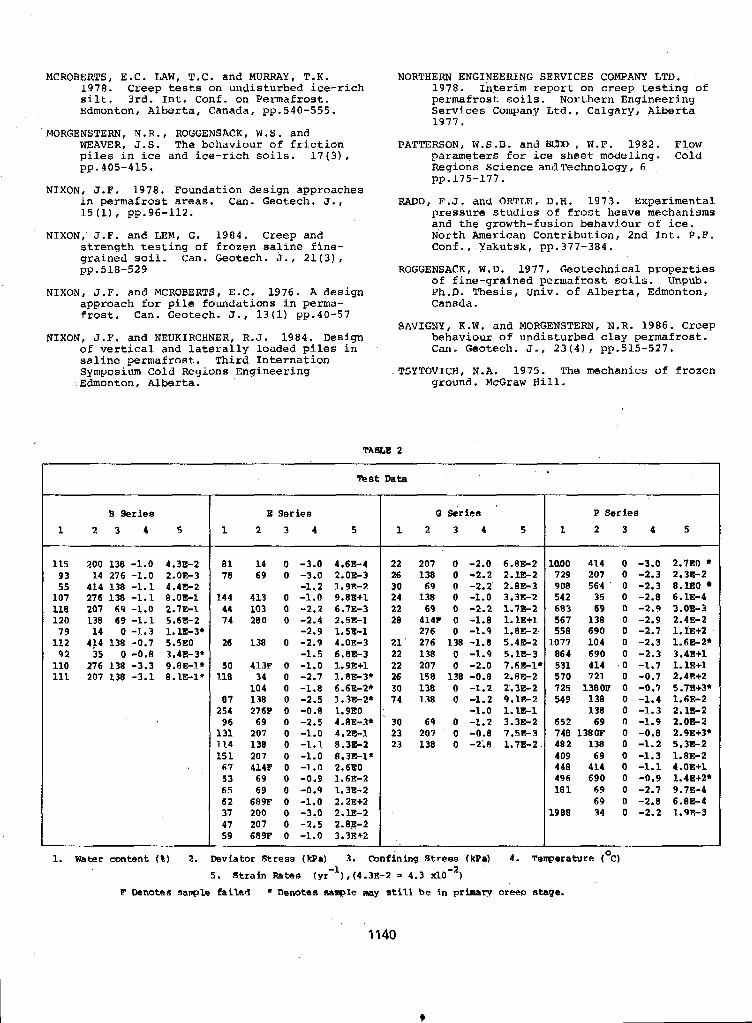
MCROBERTS, E.C . L A W , T.C. and MURRAY, T.K. 1978. Creep tests on und i s tu rbed i ce - r i ch silt . 3rd. I n t . Conf. on Permafrost. Edmonton, Alberta, Canada, pp.540-555.
MORGENSTERN , N . R. , ROEGENSACK , W S . and WEAVER, J.S. The behaviour of f r i c t i o n p i l e s i n ice and i c e - r i c h soils. 1 7 ( 3 ) , pp.405-415.
NIXON, J .F . 1978. Foundation design approaches i n p e r m a f r o s t areas. Can. Geotech. J.. 15 (1) I pp.96-112.
N I X O N , J . F . and LEM, G. 1984. Creep and s t r e n g t h t e s t i n g o f f r o z e n saline f i n e - g ra ined soi l . Can. Geotech. J., 2 1 ( 3 ) , pp.518-529
N I X O N , J . F . and MCROBERTS, E.C. 1976. A des ign approach for p i l e f o u n d a t i o n s i n perma- frost. Can. Geotech. J . , 1 3 ( 1 ) pp.40-57
N I X O N , J.F. and NEUKIRCHNER, R . J . 1984. Design of ver t ical and l a t e r a l l y l o a d e d p i l e s i n sa l ine p e r m a f r o s t . T h i r d I n t e r n a t i o n Symposium Cold Regions Engineering Edmonton, A lbe r t a .
TABLE 2
NORTHERN ENGINEERING SERVICES COMPANY LTD. 1978. In t e r im r e p o r t o n c r e e p t e s t i n g o f permafros t soils. Northern Engineer ing S e r v i c e s Company Ltd . , Ca lgary , Alber ta 1977 .
PATTERSON, W.S.B. and BUXl , W.F. 1982. Flow p a r a m e t e r s f o r ice sheet model ing. Cold Regions Science and Technology, 6 pp.175-177.
RADD, F . J . and ORTLE, D.H. 1973. Experimental p r e s s u r e s t u d i e s of frost heave mechanisms and the growth-fusion behaviour of ice. North American Con t r ibu t ion , 2nd f n t . P.F. Conf., Yakutsk, pp.377-384.
ROGGENSACK, W.D. 1977. Geotechnica l p roper t ies o f f i ne -g ra ined pe rmaf ros t soils. Unpub. Ph.D. Thes i s , Univ. of A l b e r t a , Edmonton, Canada.
SAVTGNY, K.W. and MORGENSTERN, N.R. 1986. Creep behaviour of und i s tu rbed c l ay pe rmaf ros t . Can. Geotech. J., 2 3 ( 4 ) , pp.515-527.
TSYTOVICB, N.A. 1975. The mechanics of f rozen ground. McGraw H i l l .
B Series 1 2 3 4 5
115 200 138 -1.0 9 3 14 276 -1.0
107 276 138 -1.1 55 414 138 -1.1
118 207 69 -1.0 120 138 69 -1.1
7 9 1 4 0 -1 .3 112 4 l4 138 -0 .7 92 35 0 -0.8
110 276 138 -3.3 111 207 138 -3.1
4 .33-2 2.OE-3 4.4E-2 8.OE-1 2.7-1 5.6E-2 1.1E-3* 5.93.0 3 4E- 3*
8. IE-l* 9.8E-t*
Test Data
E S e r i e s G Series 1 2 3 4 5 1 2 3 4 5
8 1 1 4 0 -3.0 4.6E-4 22 207 0 -2.0 6.83-2 78 69 0 -3.0 2.OE-3 26 138 0 -2.2 2.1E-2
-1.2 1.9E-2 30 69 0 -2.2' 2.83-3 144 413 0 -1.0 9 .8S+l 24 138 0 -1.0 3.3E-2
44 103 0 -2.2 6.73-3 22 69 0 -2.2 1.7-2 74 280 0 -2.4 2.5E-1 28 414P 0 -1.8 1.18+1
-2.9 1.5E-1 276 0 -1.9 1.852. 26 138 0 -2.9 4.03-3 2 1 ' 276 138 -1.8 5.43-2
-1.5 6.8E-3 22 138 0 -1.9 5.1E-3 50 413P 0 -1.0 1.9E+1 22 207 0 -2.0 7.6E-1'
1-18 34 0 -2.7 1.8E-3* 26 158 138 -0.8 2.8E-2 104 0 -1.8 6.6E-2* 30 138 0 -1.2 1.3E-2
87 138 0 -2.5 1.3E-2* 74 138 0 -1.2 9.1E-2
96 69 0 -2.5 4.8E-3* 30 64 0 -1.2 3.3E-2 -1.0 1.1E-1
131 207 0 -1.0 4.2E-1 23 207 0 -0.8 7.5E-3 114 138 0 -1.1 8.33-2 23 138 0 -2.8 1.7E-2 151 207 0 -1.0 8.3E-1*
254 2761 0 -0.8 1.9EO
67 414F 0 -1.0 2.6EO 53 69 0 -0.9 1.6E-2 6 5 69 0 -0.9 1.3B-2 6 2 689F 0 -1.0 2.2E+2 37 200 0 -3.0 2.1E-2 47 207 0 -2 .5 2.83-2 59 6898 0 -1.0 3.33+2
P S e t i e s
1 2 3 4 5
moo 414 o 729 207 0 908 564 . . 0 542 35 0 683 69 0 567 138 0 558 690 0
LO77 104 0 861 690 0 531 414 I 0 570 721 0 725 13BOF 0 549 138 0
138 0 652 69 0 748 1380F 0 482 138 0 409 69 0 448 414 0 496 690 0 1 8 1 69 0
69 0 1988 34 0
-3.0 -2.3 -2 .3 -2.8 -2.9 -2.9 -2.7 -2.3 -2 .3 -1.7 -0.7 -0.7 -1.4 -1.3 -1.9
-1.2 -0.8
-1 .3 -1.1 -0.9 -2.1 -2.8 -2 .2
2.7EO * 2 . w - 2 8.MO 6.1E-4 3.0-3 2.4E-2 1,1E+2 1.6E-2* 3.4E+1 1.1E+1 2.4E+2 5.7E*3* 1.6E-2 2 . U - 2 2.ol?-2 2.9E+3* 5.313-2 1.8R-2 4 .OE+l 1.4E+2* 9.73-4 6.8E-4 1.9E-3
I
1140
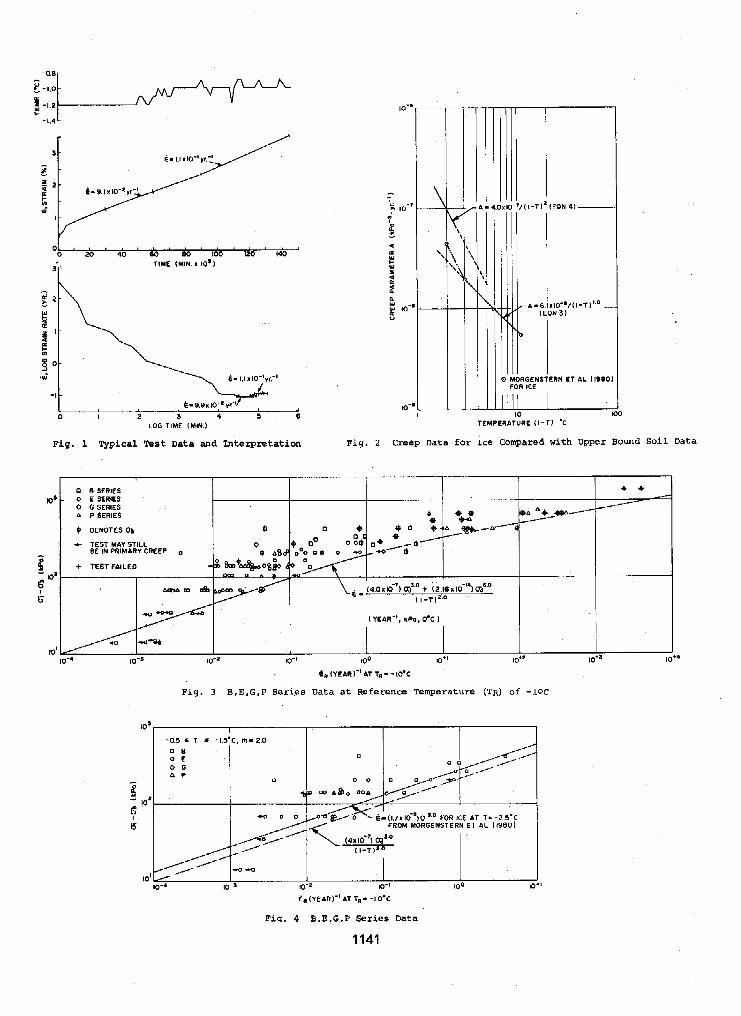
0 I 2 3 4 5 6 LOG TIME (MIN.1
10 100 TEMPERATURE ( 1 - t ) 'C
Fig. 1 Typical % s t Data and Interpretation Fig. 2 Creep Data for Ice Compared with Upper Bound Soil Data
' 0 E SERIES 0 B SERIES
0 G SERIES P SERIES 1
IO" 10- 100 IO"
6, (YEAR)" AT T.- -1.0.c
Fig. 3 B,E,G,P Series Data at Reference Temperature (TR) of -loc
E" (YEAR)" AT rR- -1.0.c
Fiq. 4 B,E,G,P Series Data
1141
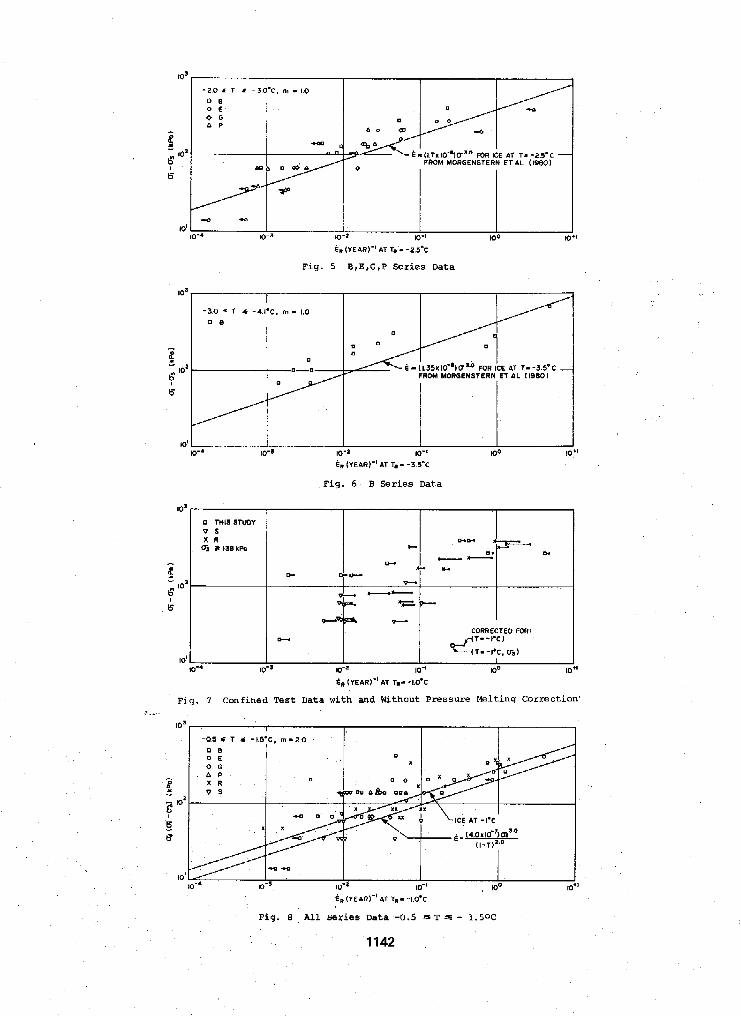
108 I -3.0 a 7 G -4.I.C. rn - 1.0
O B
0
€-(1.35x10")0'" FOR ICE AT T--3.1°C - FROM MORGENSTERN E T A L 11980)
IO' lo" 10-3 10- 10-1 I00 10*l
En (YEAR)" AT Tp - - 3 . d C
Fig . 6 B Series Data
IO
i - lo
6
IC
v s 0 THIS STUOY
U3 a I3BkPa X R
E, ( Y E ~ R ) " A T r,. -I.O'C
Fig. 8 All Series Data -0.5 S T S - 1.50C
1142
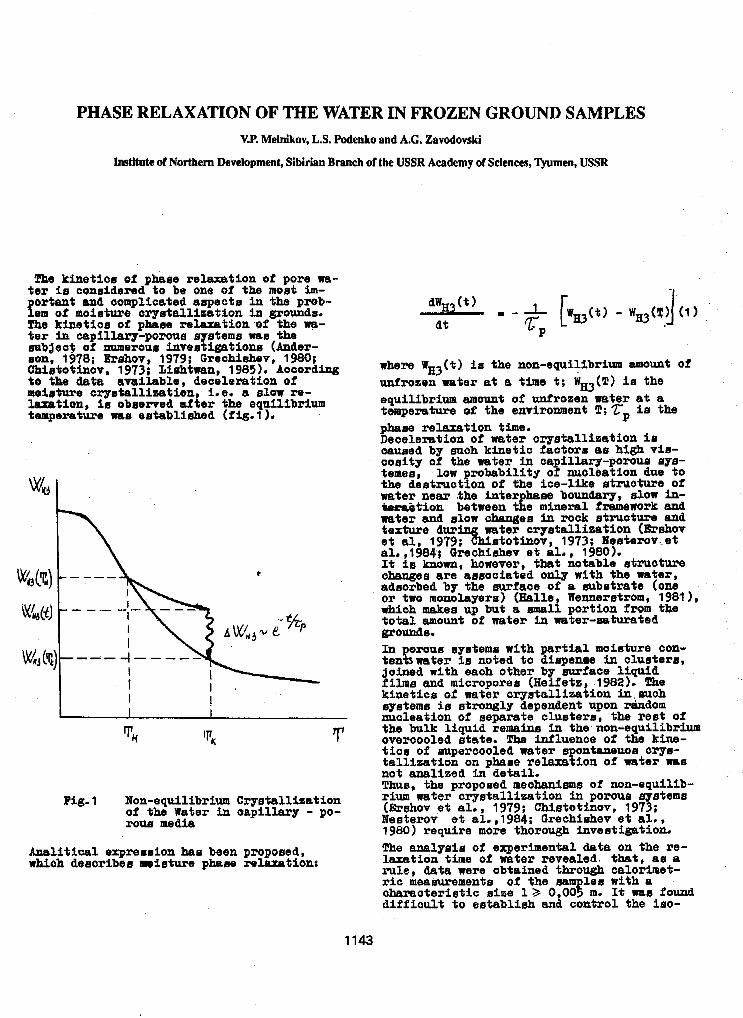
PHASE RELAXATION OF THE WATER IN FROZEN GROUND SAMPLES V.P. Melnikov, L.S. Podenko and A.G. Zavodovski
Institute of Northern Development, Sibirian Branch of the USSR Academy of Sciences, Tyumen, USSR
!Cha kinetictu of phase rel-tion of pore WB- ter i e conaidessd to be one of the most Sm- ortant and oornpliaated aapeats in the pmb-
The kfxletioa of phase sslarstion -of the m- em of moisture crystall imation Sa grounds.
t ex ip oapilhxy-porous asterns was the mbjeat of numerow bveetigstions (Mer- a m , 1978; Errrhov, 1979; Greohiahev, 1980; Chistotinor, 1973; Eisb tnan , 1985). Acoording t o the data available, deoelerrrtion of moirrtttre cryetallisation, L e , a elow xe- laxation, is oblrened after the equilibrium temperature -0 entablished (fig. 1
P
I I I
'T: T
Fig.1 Non-equilibrium Crystallisation of the Water in oapilLarJr - po- r o w media
1143
-1
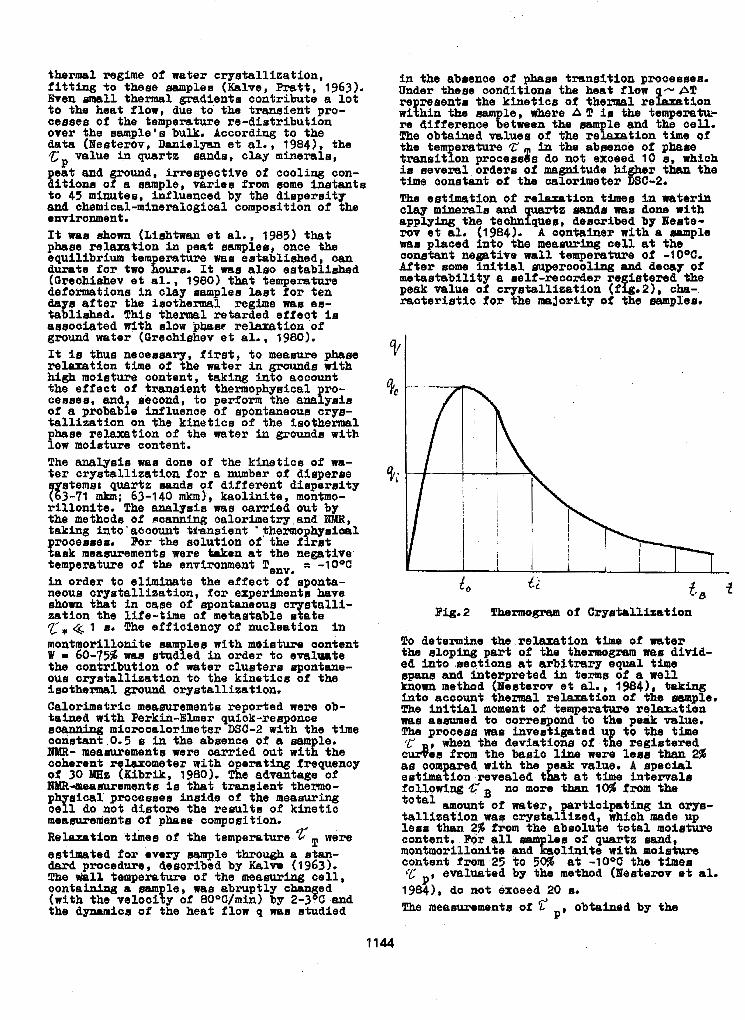
thermal xegime of water crystal l izat ion, fitting t o these samples (Kalve, Pmtt, 1963). Even mall thermal gradients contribute a l o t t o the heat flow, due to the transient pro- cessea of the temperature re-dietribution over the samplels bulk. According to the data (Nesterov, Danielyan e t al., 1984), the 2;, value in quartz 0ands, clay r n b m l a , peat and ground, irrespective of cooling con- ditione o f a sample, variee from aome instants t o 45 minutea, influenced by the dispersi ty and cherniosl-mineralogical composition of the environment. It m a ahown (Liahtwan e t al., 1985) that phatre relazation i n peat ssmples, once the equilibrium tern eratuxe was e e t a b l i a e d , c&p durate for two bwa. It was also e s t a b l l d d (Oreobirrhev e t al., 1980) that temperature dt3fQm.U%tionS in lay 8 ~ m lee h a t ; for t e a daym a f t e r the iaothermaf regime m a ea- tablished. ThSe thermal retarded e i feo t is aaaooiated with slow p b ~ e xe-tion of ground water ([frechishev e t ale , 1980).
relaxation time of the mter in grounds with It is thus neoeaaary, f i r s t , t o meawe p b ~ e
high moisture content, taking into aooount the effect of tmtnsient thermophysical ro- ceseee, and, second, t o perform the anafyeie of a probable influence of spontaneous crye- t a l l i z a t i o n on the kineticrj of the Leathermal phase rel-tion of the water in grounds with low moisture content. The a ~ ~ l g e i e was done of the kinetics of wa- t e r c rys ta l l iza t ion fox a number o f dieperse $ateme: quartz sands of different dispernity ( 3-71 mkm: 63-140 dun), kaolinite, montmo- r i l lon i te . The analyrris was oarried out by the methoda of #canning calorimetry,and NMR, taking insto‘atscount tlt.anBient ‘thermo hyalael proaeames. por the solution of the f f r p t to& meaaurements were -en a t the negative temperature of the environment Tenv. -loo(: in order t a eliminate the e f f e c t of sponta- neoua cryatal l izat iou, Pox experiments have a h o m that in oase of Bpontaneous c rys ta l l i - zation the life-time 02 metartable s t a t e c* 8 1 sr The effioiency of nuc lea t ion in montmorillonite aam l es with moieture oontent W = 60-75% was etudfed i n order to evaluate the oontribution of water c luaters sgontaae- ous crye ta l l i5a t ion to the kinet ics of the isothemal ground crystall isation. Calorimetric meamremente reported were ob- tained with Perkin-Elmer quick-rempome mamiag miorooalorimeter DSC-2 with the time constant 0.5 a in the absence of a sam le. I9MR- measurements were aarried out w i d the
o f 30 laaz (Kibrik, 1980). !&e advantage of cobxent xebrometer with 0 esating Srequenoy
IWR-mearrurements is that transient thermo- p d c a l prooesses inside of the meaeuring oe hs 1 do not diatom the results o f kinet ic meamreniente of phase composition. Relaxation t h e e of the temperature ST were
dard procedure, deaoribed by Kalvr, (1 963 1. estimated for every ample through a atan-
The uiall temperature of the measuring ce l l , oontaining a sample, w m abruptly o (with the veloaity of 80°C/min) by hang;ed 2-3 C and the dynamior oi the heat f low q was studied
i n t h e abeenoe of phase t rans i t ion proceeeee. Under these condition@ the heat flow - AT re rebenta the kinetics o f thermal re?exation within the eatu l e , where P T i n the tempemtm- re difference getween the !he obtained valuer of the%
le and the cell. t lon time of
the te e r a h e 2 in the abaenoe of phare tranrizon procemrs%e do not exoeed 10 e, which is several orders of magnitude W&r than the time constant o f the calorlmeter DSO-2. The estimrrtion o f relaxation times in waterin c l a y mlnerals aad quarts E a n d m warn done with applying the techniques, tleeoxibed by Heate- mv e t al. (19841. A con.t;alneer with a asmple was placed i a t o the measuring aell at the constant negative wall temperatuxe of -loo& Aftex Home init ial mapercooXing and dewy of metaetability a self-rrreorder xegiertemmd the peak value a i o~ydd. l i5at iOn ( f ig .21, cha- raoteristic for the majoxity OS the errmplee.
To determine fhe relaxation t h e of water
ed into .motioae at arbitrary equal time ~ppaas an8 interpreted $n temrr of a well holm method (Beeterov e t aZ., 19841, tak? Into acoount $hemal m u t i o n of the RIEIU~ e. The initial moment o f temperature r e l s w t i o n was alrenuaed t o correspond t o the peak value. The prooess m e inveatigated up to the time (C , when the deviations o f the xegirrtrred ouden from the basic lFna were le130 than 2% as oom ared with the eak value. A special estfmafion revealed tLt at time intervale following C B no more than 1% Srom the
amount of water, rtioipat- in crye- tallisation w a @ oxystal p* ized, whioh made up Lese than 2% from the abnolute total moiarhrse
montmorillonite and %aolieife with moleture content. For all sam les of quarts d,
content Srom 25 t o 5% at -1OOC the times “i: p, evaluated by the method (Neeterov e t al. 19841, do not exoeed 20 B. The measurement* of , obtained by the
the Slog- mt o f the themOg= *BS divid-
P
1144
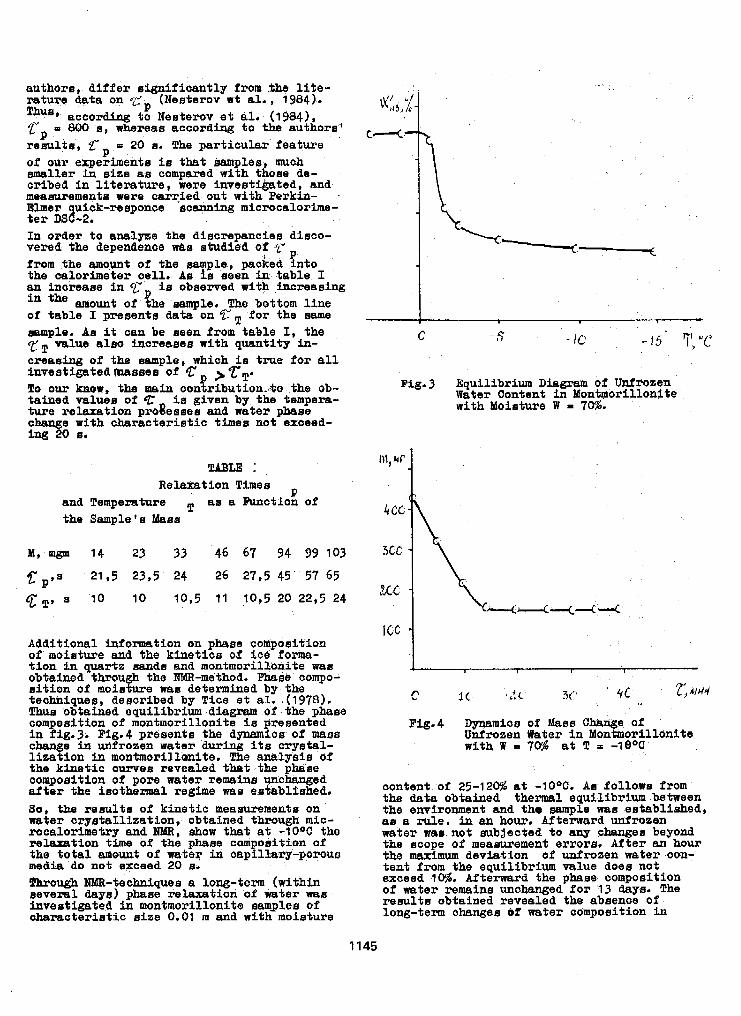
authors, differ signtfiuantly from $he l i t e - ra ture data on (Neeterov st al. , 1984). Tbuar, according to Nesterov e t al.. (1984), tVp = 800 I , whereas according to the authors" resul t@, E, 20 s. The part icular feature o f our experiments ie that samples, much smaller in sfze as compared with those de- cribed Sn LiPexature, were i n v a s t i h t e d , and meamrements were a a q i e d out with" Perkin- Elmer quick-resgonce scapning microcalorip- t e r DSC-2. In oFder t o analme the discrepancies diaco- vemd the dependence m a studied of from' ,the amowt of the sample, paoked ?nto the calorimeter oell. As irr seen i n t ab l e I an inoreaee in i a obsemed w i t h increarring in 'ire m o u n t of !he sample. The bottom l i n e of table I preaents data on %' f o r the m a ample. AB it can be men from table I, the f T value also increases with quantity in- oreasing o f the eample, which is true for a l l investigated w e e a s of C .rn. To oux ]mow, the main coniributionAo the ob- tained valuea of 'T: i s given by the tempera- ture r e b t i o n probrree ana water p h e e a w e with character is t ic timea not exaeed- ing 20 B.
P
TABLE 1 Relaxation Times
and Temperalame aa a h c t i o n of the Sample's hkss
Additional iaIormEitiOn on plum COmp08itiOn of moicrture and the kinetics of io6 forma- tion in quarts aanda and montmorillonite wae obtained tbough tbs nadR-method. Phase compo- s i t i o n of moiature was determined by the techniquen, described by f i c e e t al. .(1978). Thus obtained equilibriua diagram of the phase cornpoetition of montmorillonite is presented in fig. 3. Fig.4 preoeate the dynamics of mass change i n W r o z e n watep during its crystal- lization in montmosillanite. The analysis of the kinetic c w e a revcsalsd that , the pbadte aompoaitioa o f pore water rewine yohanged after the isotherms1 regime was established. So, the results of kinet ic measurement& on water crystallization, obtained through mic- socaloxirne.l;ry and m, &ow that at -1 O W the relaration time o f the phaae componition of t he t o t a l amount of nater in capillary-porous media do not exceed 20 s. Through NlGi-teobnLquee a long-term (within several days) phase r e h t i o n of water warn investigated in montmorillonite samples of aharaaterist ic eiae 0.01 m and with moiature
C - IC -X
Fig.3 Equilibrium Diagram Of Unfrozen Water Content in YontmorilLonite with Moistwe W = 70%.
icc .I
c IC ' 41
Fig.4 Dynamic# o f Mass C h u g e of Unfrozen Water i n Montmorillonite with W w 70% at T -lB°C
content of 25-12m at -1OOC. Am folLowa f rom the data obtained thermal equilibciwn between the environment and the sample me- establiahed, as a ru l e . i n an hour. Afterward uafrosen water wam.not mbjected t o any changes beyond the scope of measurement errom. After an hour the m a x i m u m deviation o f ualmzen water oon-
exceed 10%. Afterward the phase composition teat from the equilibrium value does not
of water remains unchanged for '13 b y e . The results obtained revealed the absence of long-term changes of water oomposition i n
1145
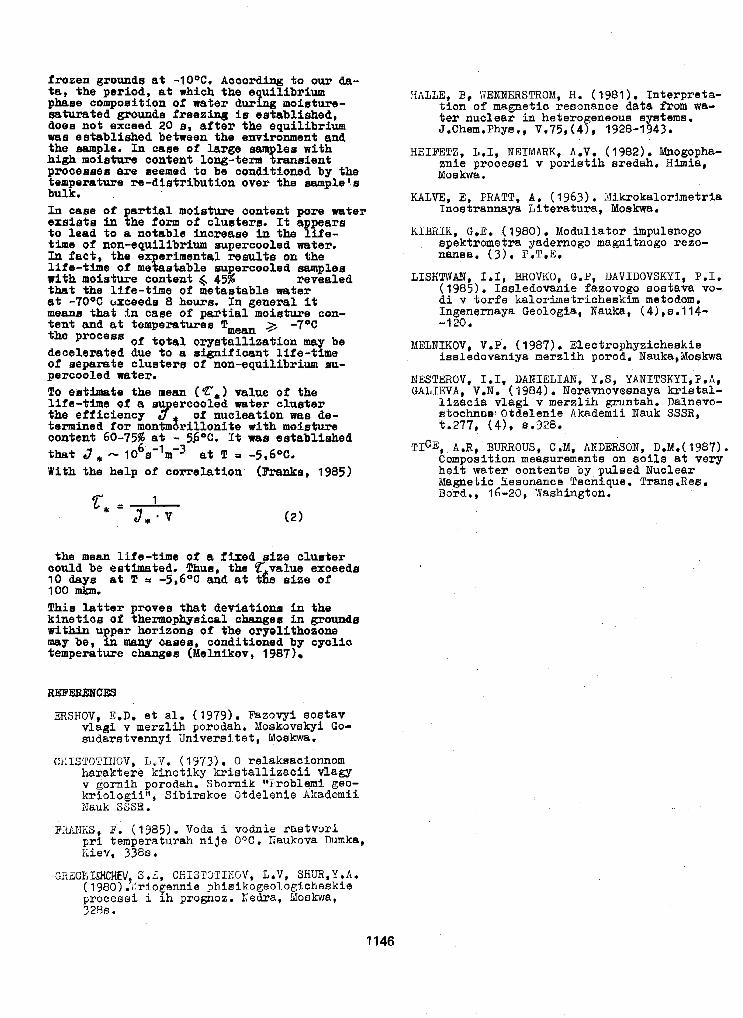
frozen grounds a t -1OOC. Acooxding to olwl da-
pharse composition of water a ~ r l n g moistuse- ta, the period, at which the e uillbbrium
saturated grounds freeziq irr eprtablished, doea not exceed 20 s, after the equilibrium m a established between the environment and
high moiature content long-term kaawient the eample. Xn case of large B B ~ les with
proceases are seemed to be conditioned by the temperature re-distribution ovex the ample’s bulk. In case of partial moieture eontent pore water exsista in the iom of clueters. It appears to lead to a notable increase in the l l f e - time o f non-equilibrium aupercooled water. In fact, the experimental reeulte on the life-time of metaetable supercooled V l e m with moiature content 4 45% that the Life-time 00 metastable water
revealed
m e a w that in case of partial moisture con- tent and at temperatures Tmean & -7OC the procesls of total cryetallization may be decelerated due to a sigaifioant l i f e - the of aeparate clustere of non-equilfbrium m- pexcooled water. To etrfimate the mean (%‘“,I value o f the life-time o f a BU ercooLed nater cluster the efficiency $ of nucleatfun waa de- termined for montm8rilloaite with moisture content 60-75% at - 56V. It w a ~ eetablished that j * - 1 06,1-1m-3 at T a -5,6OC* With the help of correlation (Franks, 1985)
at -7OOC bXCeedS 8 hours. b~ general it
the mean life-time of a f ixed aize cluster could be estimated. Thus, the %value exceedm 10 da 8 at T -51~6°C and at &e size of 100 &. This latter proves that deviatione in the kinetics of themnophysical ohangee in gruunde within upper horizons of the oxyolithosope may be, in many CBaea, conditioned by oyolio %emperatwe changes (MelnlkQV , 1 987)
WSHOV, E.D. et al. (1979). Fazovyi 8ostaV vlagi v merzlih porodah. Moekovskyi Go- sudarstvennyi Univeraitet, Morjkwa.
CI:ISTI)TINOV, L,Sr. ( 1973) . 0 relaksacionnom haraktere kinetiky kristallizacii vlagy v gornih gorodah. Sbornik IVroblemi geo- k x i o l o g i i ” , Sibirskoe dtdelenie kkademii Xauk SSSS.
I?;UNKS, F. (1985) . Voda i vodnie raatvorl. pri temperaturah nije OW. Iiaukova Dumka, Kiev, 338s .
IMLLE, B, WENNERSTROM, H. (1981) . Interprefa- tion of magnetic resonance data from wa- fer nuclear in hetero eneouB syatema. J.Cheh.Phys,, V.75,(4$, 1928-1943.
znie processi v poristih wedah. Himia, Moskwa.
HEIFETZ, L.1, NEINARK, A.V. (1982). Mnogogha-
KAZVE, E, PRATT, A. (1963). Mikrokalorimetria
KIBRIK, G.E. (1980). Moduliator imgulsnogo
Inostrannaya Ziteratura, Moskwa.
spektrometra yadexnogo magnitnogo rezo- nansa. (3). P.T.E.
LISBTWAN, 1.1, BROVKO, GmP, DAVIDOVSKYI, P.1. (1985). Zssledovanie fazovogo soetava vo- di v forfe kalorimetricheskbn rnetodom. Ingenarnaya Geologia, Bauka, (4),s.114- -120.
MELLNIKOV, V.P. (1987). Electrophyzicheskie iealedovaniya merzlih gorod. Nauka,Moskwa
NESTEROV, 1.1, DANIELIAN, Yes, YANITSKYI,P.A, GALIEVA, V.N. (1984). Neravnovesnaya kristal-
l i zac ia vlagi v merzlih gruntah. Dalnevo- stochnoe,Otdelenie Akademii mauk SSSR,
TICE, A.R. BURROUS, C.M, ANDERSON, D.M.(1987).
hei! water contente by pulaed Nuclear Corn osition measurements on soila at very
Magnetic 3esonance Tecnique. Trans.Re8. Bord., 16-20, Washington.
t.277, (4), S.928.
1146
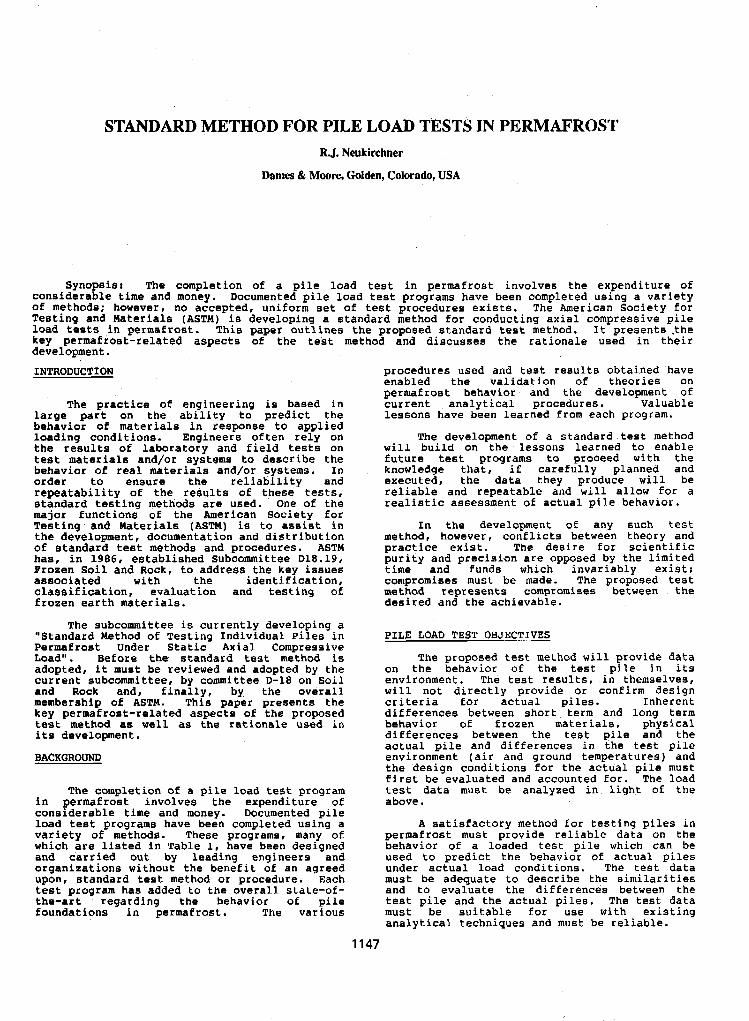
STANDARD METHOD FOR PILE LOAD TESTS IN PERMAFROST RJ. Neukirchner
Dames & Moore, Golden, Colorado, USA
Synopsis: The completion of a pile load test in permafrost involves the expenditure of considerable time and money, Documented pile load test programs have been completed using a variety Of methods; however, no accepted, uniform set of test procedures exists. The American Society for Teating and Materiala (ASTM) is developing a standard method for conducting axial compressive pile load tests in permafrost. This paper outlines the proposed standard test method. It presents .the
development. key permafrost-related aspects of the test method and discusses the rationale used in their
INTRODUCTION
large part on the ability to predict the The practice of engineering is based in
behavior of materials in response to applied laading conditions. Engineers often rely on the results of laboratory and field tests on teat materials and/or systems to describe the behavior of real materials and/or systems. In order to ensure the reliability and repeatability of the results of these tests, standard testing methods are used. One of the major functions o f ' the American Society for Testing and Materials (ASTM) is to assist in the development, documentation and distribution of standard test methods and procedures. ASTM has, in 1986, established Subcommittee D18.19, Frozen Soil and Rock, to address the key issues associated with the identification, classification, evaluation and testing of frozen earth materials.
"Standard Method of Testing Individual Piles in The subcommittee is currently developing a
Permafrost Under Static Axial Compressive Load". Before the standard test method i s adopted, it must be reviewed and adopted by the current subcommittee, by committee D-18 on Soil and Rock and, finally, by. the overall membership of ASTM. This paper presents the key permafroat-related aspects of the proposed test method as well as the rationale used in its development.
BACKGROUND
in permafrost involves the expenditure o f The completion of a pile load test program
considerable time and money. Documented pile load test programs have been completed using a variety of methods. These programs, many o f which are listed in Table 1, have been designed and carried out by leading engineers and organizations without the benefit of an agreed upon, standard test method or procedure. Each test program has added to the overall state-of- the-art regarding the behavior of pile foundations in permafrost. The various
procedures used and teat resulta obtained have
permafrost behavior and the development of enabled the validation of theories on
current analytical procedures. Valuable lessons have been learned from each program.
will build on the -lessons learned to enable The development of a standard test method
future test programs to proceed with the knowledge that, if carefully planned and executed, the data they produce will be reliable and repeatable and will allow far a realistic assessment of actual pile behavior.
In the development of any such test method, however, conflicts between theory and practice exist. The desire fo r scientific purity and precisian are apposed by the limited time and funds which invariably exist: compromises must be made. The proposed test method represents compromises between the desired and the achievable.
PILE LOAD TEST OBJECTIVES
The proposed test method will provide data on the behavior of the test pile in its environment. The test results, in themselves, will not directly provide or confirm design criteria for actual piles. Inherent differences between short term and long term behavior of frozen materials, physical differences between the test pile and the actual pile and differences in the test pile environment (air and ground temperatures) and the design conditions for the actual pile must
test data must be analyzed in light of the first be evaluated and accounted for. The load
above.
A satisfactory method for testing piles in permafrost must provide reliable data on the behavior of a loaded test pile which can be used to predict the behavior of actual piles under actual load conditions. The test data must be adequate to describe the similarities and to evaluate the differences between the test pile and the actual piles. The test data must be suitable for use with existing analytical techniques and must be reliable.
1147
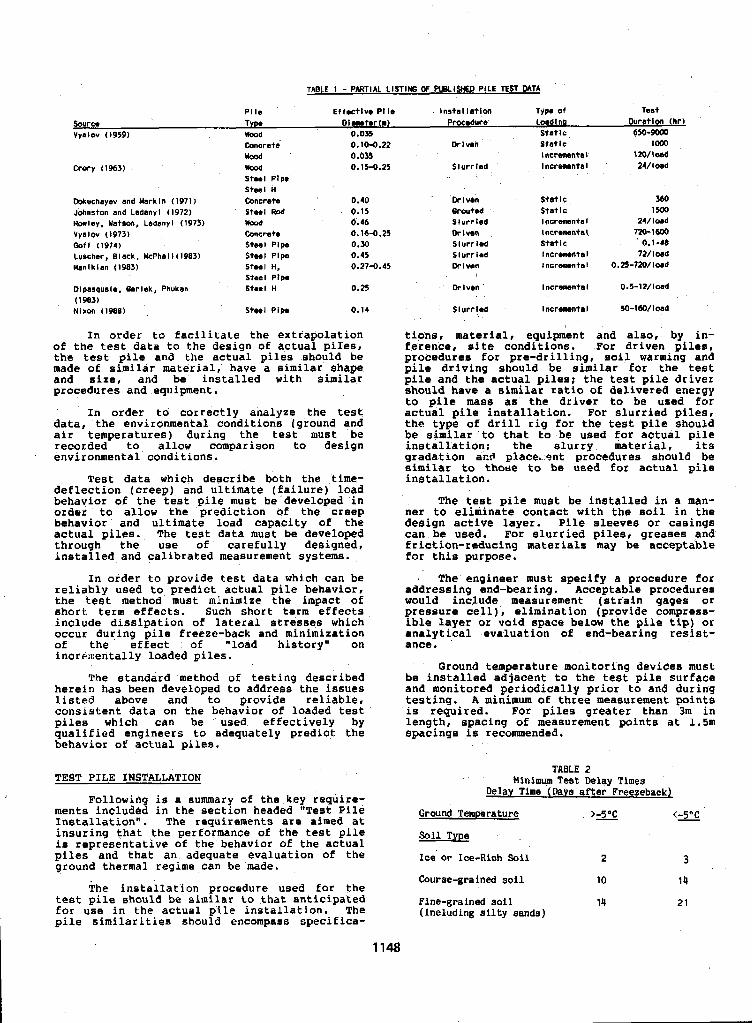
TAELE 1 - PARTIAL LlSTlffi OF wBLlSH@ PILE TEST DATA
Pi le E f f K t l v l PI IS Instal lstlon Type Of Test Source TYp4 Dlslstor(m) Procedure Load I na Ouratlon (hr l VyaIw (1959) wood 0.035 Statlc 650-9000
Concrete 0.10-0.22 Dr I van Static 1oM)
C r w y (1963) . wood 0.15-0.25 Slurrlsd I n c r m n t a I 24/lwd Wood 0 .os3 I ncreiwnta 1 lM/losO
S t H l PIP* Stwl H
Wuchayev and Harkln (1971) Concrete 0.40 Or I v*n s ta t ic 360 Johnston and Ladanyl (1972) S t H l Rad 0.15 Croutod Static 1KK)
Rowley, Watson, Ladonyl (1973) wwd O . < M Siurrlsd I ncrsrnsnta I 24/load
Vyalov (1973) Concrete 0.16-0.25 Orlvsn l n c r m n t a i ? Z O - I r n Boff (1974) S t e e l PIPS 0.30 Slurried Statlc 0.1-18
Luscher, Black, McPhaIl(1983) Steel PIPS 0.45 Slurr1.d I n c r w n t s I 72/ I W d
Msniklan (1983) S t e e l ti, 0.27-0.45 or I van tncr-ntal 0.23-7KMload
Dlpasquale, Qorlek, Phuken S t H l H 0.25 Dr1v.n Incremental 0.5-12/l-d .
(1983) Niuon (1988) S t H l PIP. 0.14 S l u r r h d I ncrsrsnta I 5 0 - 1 6 W i ~ d
St401 P ip .
of the test data to the design of actual piles, In order to facilitate the extrapolation
the teat pile and the actual piles should be made of similar material, have a saimilar shape and size, and be installed with similar procedures and equipment.
In order to correctly analyze the test data, the environmental conditions (ground and air temperatures) during the test must be recorded to allow comparison to design environmental .conditions.
deflection (creep) and ultimate (failure) load Test data which describe both the time-
behavior of the test pile must be developed in order to allow the prediction of the creep behavior and ultimate load capacity of the actual piles. The test data must be developed through the use of carefully designed, installed and calibrated measurement systems.
In order to provide test data which can be reliably used to predict actual pile behavior, the test method must minimize the impact of short term effects. Such short term effects include dissipation of lateral stresses which
of the effect of "load history" on occur during pile freeze-back and minimization
incrPn:entally loaded piles.
The standard method o f testing described herein has been developed to address the issues listed above and to provide reliable, consistent data on the behavior of loaded test piles which can be used effectively by qualified engineers to adequately predict the behavior of actual piles.
tions, material, equipment and also, by in- ference, site conditions. For driven piles, procedures for pre-drilling, soil warming and pile driving should be similar Lor the test pile and the actual piles; the test pile driver should have a similar ratio of delivered energy to pile mass as the driver to be used for actual pile installation. For slurried piles, the type of drill rig for the test pile should be similar to that to be used for actual pile installation; the slurry material, its gradation ar.3 place. ..ont procedures should be similar to thove to be used for actual pile installation.
The test pile must be installed in a man- ner to eliminate contact with the soil in the design active layer. Pile sleeves or casings can be used. For slurried piles, greases and friction-reducing materials may be acceptable for this purpose.
The engineer must specify a procedure for addressing end-bearing. Acceptable procedures would incJude measurement (strain gages or pressure cell), elimination (provide compress- ible layer or void space below the pile tip) or analytical evaluation of end-bearing resist- ance.
be installed adjacent to the test pile surface Ground temperature monitoring devices must
and monitored periodically prior to and during testing. A minimum of three measurement points is required. For piles greater than 3m in length, spacing of measurement points at 1.5m spacings i8 recommended,
TEST PILE INS'LALLATION TABLE 2
Minimum Test Delav Times
Following is a summary of the key require- ments included in the section headed "Test Pile Installation". The reauirements are aimed at Ground Temperature >- < - s " c
Delay Time (Days after" Freezeback)
insuring that the performance of the test pile is representative of the behavior of the actual piles and that an adequate evaluation of the ground thermal regime can be made.
Ice or Ice-Rich Soil 2
. .. ~~
soil Type
3
The installation procedure used for the Course-grained 6oil 10 14
test pile should be similar to that anticipated for use in the actual pile installation. The
Fine-grained'aoil 14 21
pile similarities should encompass specifica- (including s i l t y sanda)
1148
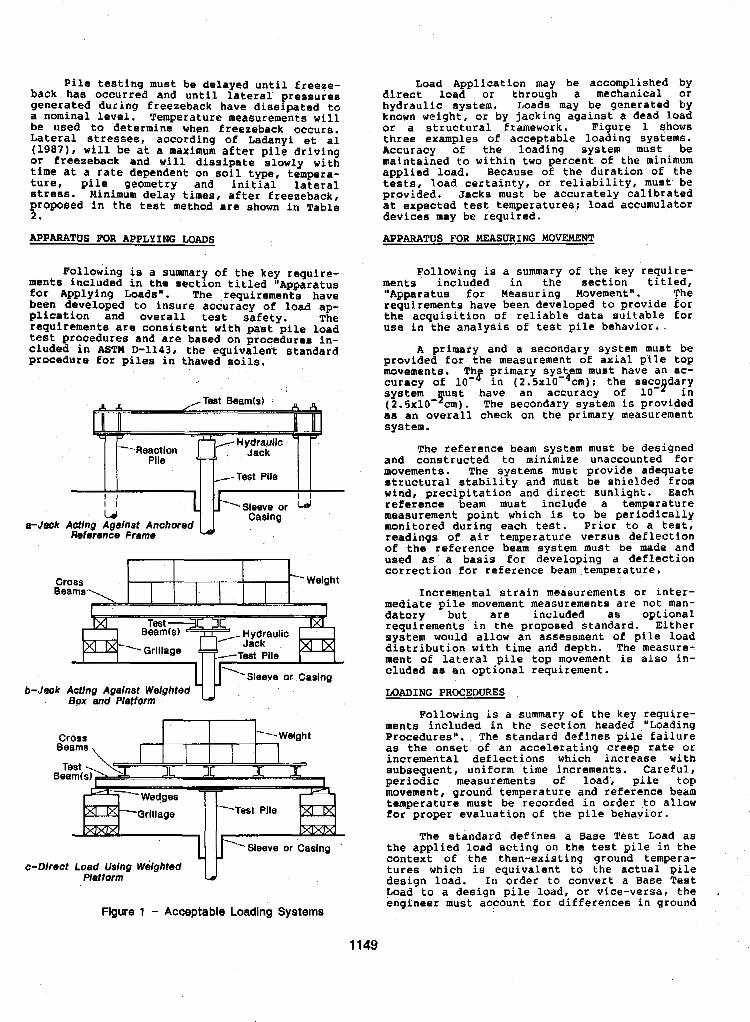
Pile testing must be delayed until freeze- back has occurred and until lateral pressures generated during freezeback have dissipated to a nominal level. Temperature measurements will be used to determine when freezeback occurs. Lateral stresses, according of Ladanyi et a1 (19871, will be at a maximum af ter pile driving or freezeback and will dissipate slowly with time at a Kate dependent on sail type, tempera- ture, pile geometry and initial lateral stress. Minimum delay times, after freezeback, proposed in the test method are shown in Table 2"
APPARATUS FOR APPLYING LOADS
ments included in the section titled "Apparatus Following i s a summary of the key require-
for Applying Loads". The requirements have been developed to insure accuracy of load ap- plication and overall test safety. The
test procedures dnd are based on procedures in- requirements are consistent with past pile load
cluded in ASTM D-11431 the equivalerrt standard procedure for piles in thawed soils.
a-Jaek Acrlng Against Anchored Reference Frame
W Casing
Cross Beams
'Sleeve or Casing b-Jaek Actlng Agalnst Welghted
Box and Platform
Beams Cross
Test Beam(
c-Direct Load Uslng Weighted Platform
Figure 1 - Acceptable Loading Systems
1149
direct load or through a mechanical or Load Application may be accomplished by
hydraulic system. Loads may be generated by
or a structural Eramework. Figure 1 shows known weight, or by jacking against a dead load
Accuracy of the loading system must be three examples of acceptable loading systems.
maintained to within two percent o f the minimum applied load. Because o f the duration of the
provided. Jacks must be accurately calibrated tests, load certainty, or reliability, must be
at expected test temperatures; load accumulator devices may be required.
APPARATUS FOR MEASURING MOVEMENT
ments included in the section titled, Following is a summary of the key require-
"Apparatus for Measuring Movement". The requirements have been developed to provide for
use in the analysis of test pile behavior.. the acquisition o f reliable data suitable for
provided for the measurement of axial pile top A primary and a secondary system must be
movements. Thg primary sys em must have an ae- curacy of 10' in (2.5~10- cm); the seco dary system p s t have an accuracy o f lo-' in (2.5~10- cm). The secondary system is provided as an overall check on the primary measurement system.
h
and constructed to minimize unaccounted for The reference-beam system must be designed
movements. The systems must provide adequate
wind, precipitation and direct sunlight. Each structural stability and must be shielded from
reference beam must include a temperature measurement point which is to be periodically monitored during each test. Prior to a test, readings of air temperature versus deflection of the reference beam system must be made and used as a basis for developing a deflection correction for reference beam.temperature,
mediate pile movement measurements are not man- Incremental strain measurements or inter-
datory but are included as optional requirements in the proposed standard. Either
distribution with time and depth. The measure- system would allow an assessment of pile load
ment of lateral pile top movement i s also in- cluded as an optional requirement.
LOADING PROCEDURES
menta included in the section headed "Loading Following is a summary of the key require-
Procedures". The standard defines pile failure as the onset of an accelerating creep rate or incremental deflections which increase with subsequent, uniform time increments. Careful, periodic measurements of load, pile top movement, ground temperature and reference beam temperature must be recorded in order to allow for proper evaluation of the pile behavior.
The standard defines a Ease Test Load as the applied load acting on the test pile in the context of the then-existing ground tempera- tures which is equivalent to the actual pile design load. In order to c0nver.t a Base Test Load to a design pile load, or vlce-versa, the engineer must account for differences in ground
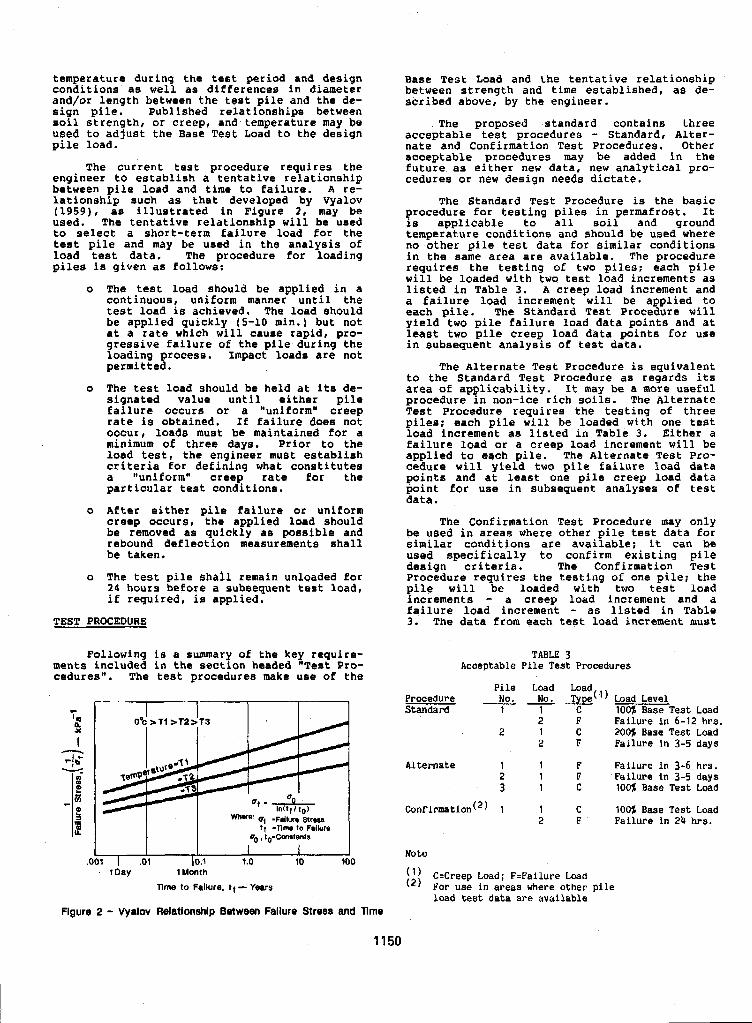
conditions as well as differences in diameter temperature during the test period and design
and/or length between the teat pile and the de- sign pile. Published relationships between soil strength, or creep, and temperature may be used to adjust the Base Test Load to the design pile load.
The current test procedure requires the engineer to establish a tentative relationship between pile load and time to failure. A re- lationship such as that developed by Vyalov (1959), as illustrated in Figure 2, may be used. The tentative relationship will be used to select a short-term failure load for the test pile and may be used in the analysis of load test data. The procedure for loading piles is given as follows:
o The test load should be applied in a continuous, uniform manner until the test load is achieved. The load should be applied quickly (5-10 min.) but not at a rate which will cause rapid, pro- gressive failure of the pile during the
permitted. loading process. Impact loads are not
o The test load should be held at its de- signated value until either pile failure occurs or a *'uniformH creep rate is obtained. If failure does not occur, loads must be maintained for a minimum of three days. Prior to the load test, the engineer must establish criteria for defining what conrtitutes a "uniform" creep rate for the particular test conditions.
o After either pile failure or uniform creep occurs, the applied load should be removed as quickly as possible and rebound deflection measurements shall be taken.
o The test pile shail remain unloaded for 24 hours before a subsequent test load, if required, is applied.
TEST PROCEDURE
Base Test Load and the tentative relationship between strength and time established, as de- scribed above, by the engineer.
The proposed standard contains three acceptable test procedures - Standard, Alter- nate and Confirmation Test Procedures. Other acceptable procedures may be added in the future as either new data, new analytical pro- cedures or new design needs dictate.
The Standard Test Procedure is the basic procedure for testing piles in permafrost. It ig applicable to all soil and ground temperature condition8 and should be used where no other pile test data for similar conditions in the same area are available. The procedure requlres the testing of two piles; cach pile will be loaded with two test load increments as listed in Table 3. A creep load increment and a failure load increment will be applied to each pile, The Standard Test Procedure will yield two pile failure load data points and at least two pile creep load data points for use in subsequent analysis of test data.
The Alternate Test Procedure is equivalent to the Standard Test Procedure as regards its area of applicability. It may be a more useful procedure in non-ice rich soils. The Alternate Test Procedure requires the testing of three piles: each pile will be loaded with one test load increment as listed in Table 3. Either a failure load or a creep load increment will be applied to eqch pile. The Altcrnate Test Pro- cedure will yield two pile failure load data points and at least one pile creep load data point for use in subsequent analyses of test data.
The Confirmation Test Procedure may only he used in areas where other pile test data for similar conditions are available; it can be us49 specifically to confirm existing pile design criteria. The Confirmation Test procedure requires the testing of one pile; the pile will be loaded with two test load
Lailure load increment - as listed in Table increments - a creep load increment and a
3. The data from each test load increment must
Following is a summary of the key require- TABLE 3 ments included in the section headed "Test Pro- Acceptable Pile Test Procedures cedures". The test procedures make use of the
Pile Load Load Procedure No. No. %(') Load Level Standard 1 1 C 100% Base Test Load
2 F Failure in 6-12 hrs. 2 1 C 200% Base Test Load
2 F Failure in 3-5 days
Alternate 1 1 F Failure in 3-6 hrs. 2 1 F Failure in 3-5 days 3 1 C 100s Base Test Load
Confirmation(') 1 1 C 100% Base Test Load
c
'a o.,I>Tl z T 2 2 n % I
0 Of -
l"(l,O1tO, Whew -WIWO 8tress
I I .OOl I .a1 10.1 1.0 10
7; -7'Inu to Falluro 2 F Failure in 24 hrs.
q-, , tO-conotants
Note 100
, 1Day 1 Month ( l ) C-Creep Load; PSFallure Load Time to Failure, t f - Yoars (*) For use i n areas where other pile
load test data are available Figure 2 - Vyalov Relationship Between Failure Stress and Time
1150
be compared, in the field, to the predicted creep rate and the predicted failure time. If either the actual creep rate is greater than
failure is less than the predicted time to the predicted creep rate ox if the time to
failure, a second pile must be tested. The second pile, if required, would be loaded as described in Table 3 for the Standard Test Procedure, test pile number 2.
measurements of load, axial movement and During each test load increment,
reference beam temperature are to be taken and recorded at specified time intervals. These readings must be taken as nearly simultaneously a8 possible. Ground temperatures must be measured at least once a day during each test load increment.
designed to provide adequate data for analysis The test procedures described above are
by a qualified engineer or practitioner. Each test procedure has been set at a minimum level in order to encourage the organizations
foundations in permafrost areas to conduct such responsible for the installation of pile
test programs. For large, new Eacilities or for areas with unusual or complicated
described above should be expanded to include subsurface conditions, the test procedures
additional test piles in order to provide additional failure load and creep load
creep load tests should be conducted in order information. In particular, longer duration
to provide a better basis for assessing long term behavior of the actual piles.
ASTM is developing a standard test method for individual piles in permafrost under a static, axial, compressive load. This test method, which must be approved by the overall membership of ASTM, will provide a standard method for carrying out load tests on piles in permafrost.
test pile installation, for the apparatus for The test method includes requirements for
applyitig loads, for the apparatus for measuring pile movement, for pile loading procedures and for the pile teat procedures.
The development of the proposed test method has taken into account the lessons learned in previous pile test programs. The test method, when adopted, will enable future test programs to proceed with, the knowledge that the data they produce should be reliable and repeatable and should allow for a realistic assessment of actual pile behavior.
REFERENCES
Crory, F.E., (1963) "Pile Foundations in Permafrost", Proceedings International Conference on Permafrost, Lafayette, Ind., pp 467-472.
Dipasquale, L., Gerlek, S. and Phukan, A. , (1983) "Design and Construction of Pile Foundations in the Yukon-Kuekokwim Delta, Alaska", Proceedings of the Fourth International Conference on Permafrost; Fairbanks, National Academy of Science Press, pp 232-237.
Dokuchayev, W. and Markin, K., (1971) "Pile Foundations in Permafrost", in Russian, Gostroyizdat, 143 pp.
Goff., R.D., (1974), "Pile Foundations in Arctic Areas," Preprint, ASCE National Structural Engineering Meeting, Cincinnati, 26 pp.
Johnston, G.H. and Ladanyi, B. (1972) "Field Tests of Grouted Rod Anchors Embedded in Permafrost", Canadian Geotechnical Journal, Vol. 11, No. 4, pp. 531-553.
Ladanyi, B. and Guichaqua, A. (1986) "Time Dependent Bond Regain in Driven Piles in Permafrost, I' Proceedings of the International Conference on Deep Foundations; Beijing, Vol. 1, pp. 2164- 2169 *
Luscher, U. , Black, W.T. and McPhail, J.F. (1983) "Results o f Load Tests. on Temperature Controlled Piles . in Permafrost", Proceedings o f the Fourth International Conference on Permafrost; Fairbanks, National Academy of Science Press, pp. 756-761.
Manikian, V. (1983) "Pile Driving and Load Tests in Permafrost For the Kuparuk Pipeline System," Proceedings of the Fourth International Conference on Permafrost: Fairbanks, National Academy of Science Press, pp. 804-810.
Nixon, J.F. (1988) "Pile Load Tests on Saline Permafrost at Clyde River, N.W.T.", Canadian Geotechnical Journal, Vol. 25, No. 1.
Rowley. B.K., Watson, G.H,, and Ladanyi, B. (1973) "Vertical and Lateral Pile Load Test in Permafrost," Proceedings, Second
Yakutsk, North American Contribution, pp. International Conference on Permafrost,
712-721.
Vyalov, S.S., (1959) "Rheological Properties and Bearing Capacity of Frozen Soils", Translation 74, U.S. Army Cold Regions Research Engineering Laboratory, translated 1965, 219 pp.
Vyalov, S.S., (1962) "Strength and Creep o f Frozen Soils and Calculations in ice-soil
Regions Research Engineering Laboratory, Retaining Structures", U.S. Army Cold
Translation 76, 301 pp.
Vyalov, S.S, (1978) "Long Term Settlement of Foundations on Permafrost", Proceedings, Third International Conference on Permafrost, Edmondton, Alta., Vol 1, pp. 898-903.
1151
Rowley. B.K., Watson, G.H, , and Ladanyi, B. (1973) "Vertical and Lateral Pile Load
CRYOGENIC HEAVE UNDER FREEZING OF ROCKS V.L. Nevecherya
Moscow Geological Prospecting Institute
SYNOPSIS The main regularities o f cryogenic heeve of rocko in time and a r e a , obtained in perennial studies, are given in the work. A new technique was uaed, asserting that cryogenic heave within bomoganaoua sites, distinguished by zonation, is considered to be a stochastic (random) procesa that allows the probability theory and statistical methods to be widely used fox a reliable determination of this pxocesa parameters. Seasonal heaving is estimated to regularly transform into perennial one in neoformation of permafrost. Neverthelesa, a cyclic process of seasonal heaving becomes progressive, whiah reaulta in gradual rise of freezing rocks. The in- tensify and irregularity of heaving in an area aharply decreaees with the growth of freezing depth,
INTRODUCTION
Regardless of perennial. investigations, oxyo- genic (frost) heave under seasonal end peren- nial freezing of rock~l has been eo f e r insuffi- ciently studied. Inadequate consideration o f this process has a harmful impaot, eepecially in the seasonal freezing-thawing layer (SFL- -SML), which reeulta in freezing deforinations o f various constructions and primarily linear ones (railweye, motor roads pipelines, irri- gation channels, communication lines, atc.). These defomationa do not have cataetrophic affects, but they cause coneidexable losses to national economy, due to their multiplicity. Active development of the north and east ter- ritories of the country where dust-clay over- aaturated soila with deep seaaonal freezing- thawing predominate, haa made a further study o f cryogenic procesaee neceSaery. That i a why apecial attention was paid to cryogenic haavs of rocks when studying these areas. The re- aulta of perennial investigations (1958-1986), made by the author to develop the technique and to study cryogenic heave in different re- gions of tho countxy, are given briefly in this report. As a process of cryogenic heave under seaeonal freezing is a bit different from that under perennial one, they should be first considered separately.
MECHANISM OF SUPPORT
Before considering cryogenic heave under sea-
that by the beginning o f the 706 a tendency sonal freezing of rocks, it should be noted
of permafrost zone development has been chsn- ged. Vast area8 are involvad in economic deve- lopment instead o f small oneB. A trend in cryogenic heave lnvestigotions has also boen changed since conditionB for construction were not everywhere favourable, The main efforts are focused on revealing the intensity of c ryo - genic heave manifeatation in an a r e a when de- veloping these territories. Consequently, for
atudying cryogenic heave in soils (SFL-SML) a new methodology, different from those sccep- ted before, has been worked out to study and predict this process, besed on the idea that cry0 enic heave is' coneiderad to be a stochas- tic $random) process, that allows to widely use the probability theory and statistical methods to estimate it in time and area. '
Analyeis It 18 known that seaeonal cryogenic heave, cauaing general freezing of heaving rock, i a R complex natural process that occurs in cer- tain engineering-geological conditions and is caueed not only by the rock composition, but a l s o by thermal-physical and physical-mecha- nical regularities of the rock (SFL-SML) freezing, Special and time variability of the main eng inee r i~ -geoc ryo log ica l parameters results in the change of intensity of cryo- genic heave for different cites, within con- siderable limits and in some homogeneous sites it i s not uniformly manifested in area but as a random (stochastic) process. Thus, when ea- timating cryogenic heave manifestation of the territory, above all ite,zoning (typtfying) i o made according t o this manifestation intensity. With this aim in view a classification has been worked out that helps to correlate cryogenic, heave procerraee with the main natural factors, specifying them: soil (SFL--SML) CQmpOSitiOn, moiature before freezing and freezing tempera- ture regime (Nevecherya, 1973). Depending on the combination of these factors, all the vari- ability of cryogenic heave through the inten- sity of ita manifentation should be subdivided into four types: I -- rather inteneive; I1 -- intensive; 111 -- week; liV -- hardly manifes- ted. The type of cryogenic heave baeed on the intensity of its manifestation is determined by comparative estimation of natural factors according to the clasaification (Table I). For a typifying unit an engineering-geological subdivision is accepted that is characterized
1152
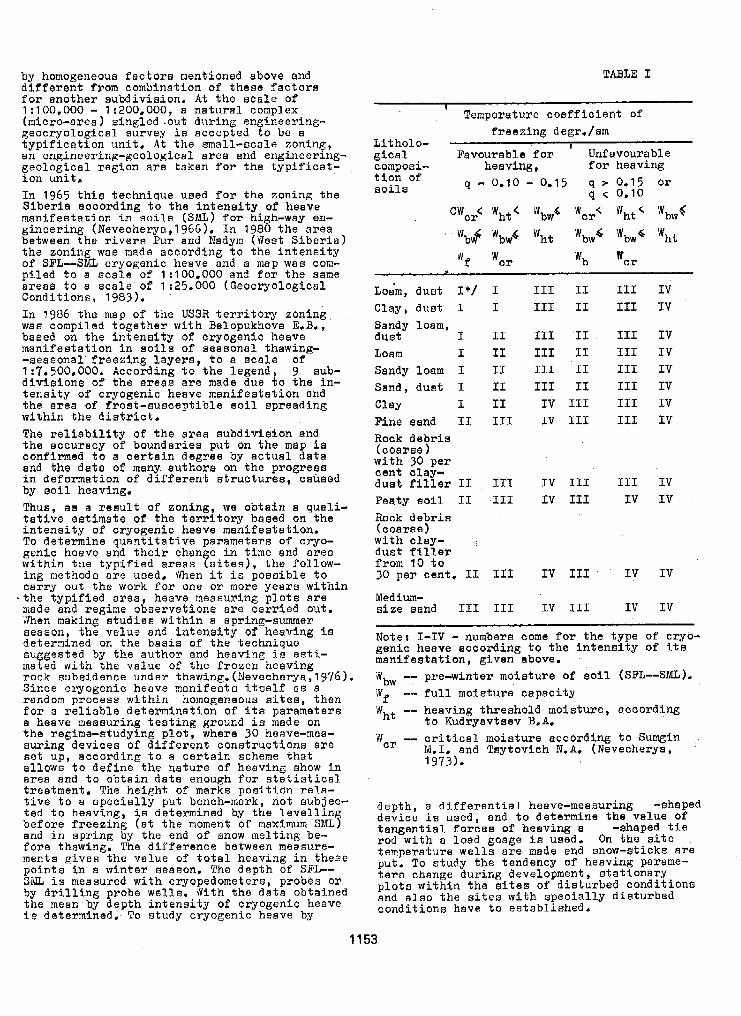
by homogeneous f a c t o r s mentioned above and d i i f e r e n t from combination of t h e s e f a c t o r a f o r another subdivis ion. A t t h e s c a l e o f 1:100,000 - 1:200,000, a n a t u r a l complex (micro-area) sineled .out during engineering- geocryologica l aurvey ia accepted to be a t y p i f i c a t i o n u n i t . A t thw small-scale zoning, an engineering-geological area and engineering- geological. reg ion a re t aken for t h e t y p i f i c a t - i o n u n i t , In 1965 t h i s t e c h n i q u e used f o r t h e z o n i n g t h e S iber ia accord ing t o t h e i n t e n a i t y of heave manifestat ion i n s o i l s (BML) f o r high-way on- gineering (Nevecherya,l966). In 1980 t h e area between the r i vo r r j Pur and Nadym (West Siberia) the zoning was made a c c o r d i n g t o t h e i n t e n s i t y of SFL--SML cryogenic heave and a map W Q B com- p i l e d t o a scale of 1 :100.000 and f o r t h e same a r e a s t o a s c a l e of 1 :25.000 (Geocryologicnl Conditions, 19831, I n 1986 t h e map of t h e USSR t e r r i t o ry zon ing was compiled together with Belopukhova E.%, baeed on t h e i n t e n s i t y o f cryogenic heave mani fes ta t ion i n soils o f seasona l thawing- -seasonal f r e e z i n g l a y e r s , t o a s c a l e of 1 :7.500.000. According t o t he l egend , 9 aub- d i v i s i o n s of t h e a r e a s a r c made due t o t h e i n - t e n s i t y of cryogenic heave manifestation and the a r ea of f r o s t - s u a c e p t i b l e soil spreading w i t h i n t h e d i s t r i c t . The r e l i a b i l i t y of the a rea subdiv is ion and the accuracy of boundaries put on t h e map i s confirmed t o a ce r t a in deg ree by a c t u a l d a t a and the da t a of many au thors on the p rog res s in deformat ion of d i f f e ren t s t ruc tu res , caused by s o i l heaving. Thus, a s a r e s u l t o f zoning, we obta in 8. qual i - t a t i v e e s t i m a t e o f t h e t e r r i t o r y based on t h e i n t e n s i t y of cryogenic heave manifestation. To de te rmine quant i ta t ive parameters of cryo-
wi th in t h e t y p i f i e d a r e a s $ s i t e s ) , t h e f o l l o w - genic heave and t h e i r chan e i n t ime and area
ing methods are used. When i t i s p o s s i b l e t o car ry ou t the work f o r one or more yea r s w i th in t h e t y p i f i e d area, heave measuring plots are made and regime observat ione are carr ied out . Jhen making studies within a Bpring-summer season, the velue and i n t e n s i t y of heaving i s detera ined on the baaiE of the technique suggested by the au tho r and heaving i a e s t i - mated wi th the va lue o f the f rozen heaving rock wbsidence under thawing. (Nevecherya ,1976). Since cryogenic heave manifests itaelf a s a random process wi th in homogeneous s i t e s , t h e n f o r a r e l i ab le de t e rmina t ion o f i t a p a r a m e t e r s a heave measuring tes t ing g r o m d i a made on the regime-studying plot , where 30 heave-moa- su r ing dev ices of d i f f e r e n t c o n a t r u c t i o n s a r e sc t up , acco rd ing t o a c e r t a i n scheme t h a t a l l o w n t o d e f i n e the na tu re of heaving show i n area and t o o b t a i n d a t a enough f o r s t a t i s t i c a l treatment. The height of marks p o s i t i o n r e l a - t i v e t o a spec ia l ly pu t bench-mark, not subjec- t ed t o heav ing , i s determined by t h e l e v a l l i n p be fo re f r eez ing (st t h e n~oment o f maximum SML5 and i n spring by t h e end of snow melt ing be- fore thawing. The d i f f e r e n c e botween measure- ments give8 the value of t o t a l h e a v i n g i n t h e s e p o i n t s i n a winter wason. The d c p t h of SPL- SML i s measured wi th cryopedometcrs, probes o r by d r i l l i n g probe wells. Nith the data obtained the mean by d e p t h i n t e n s i t y of cryogenic heave is determined. To study cryogenic heave by
TABLE I
1
Temperature coeff ic ient of f r e e z i n a dem./sm
g i c a l Favourable for ’ Unfavourable composi- heaving, fo r heav ing t i o n of s o i l s q - 0.10 - 0.15 q w 0.15 o r
q E 0.10 cw c r c Wht WbWQ lcr< Wht < Wbwd
wyf Wcr ‘b wcr
’ “b$ ‘bw4 ‘ht ‘bw‘ ‘bw‘ ‘hf
*
Loa;n, dus t I*/ 1 I11 TI III IV Clay, duet I I 111 I1 I11 IV Sandy loam, dus t I 11 I11 11 I11 IV Loam T I1 111 TI I11 IV Sandy loam 1 I1 I11 I1 111 IV Sand, dust 1 TI I11 I1 I11 IV
Clay I 11 IV 1x1 111 IV Pine sand I1 111 IY 111 111 Iv Rock d e b r i s
w i t h 30 per (coarse 1 cent clay- d u s t f i l l e r I1 111 I V T I T 111 I V Peaty soi l I1 1x1 IV I11 IV IV Rock d e b r i s (coarse) w i t h clay- duat f i l i e r from 10 t o 30 per cent. II I11 IV 111 IV IV
Medium- - s i z e sand I11 I11 IV 111 IV IV
1153
Note: I - I V - numbers come f o r t h e t y p e of cryo- gen ic heave acco rd ing t o t he i n t ens i ty o f i t s mani fee ta t ion , g iven above. $vbW - pre-winter moiature o f s o i l (SFL--S&Iz). If -- f u l l m o i s t u r e c a p a c i t y Wht -- heaving threshold moisture, according
Wcr -- c r i t i ca l mo ia tu re acco rd ing t o Sumgin t o Kudxyavtsev B.A.
M.1, and Tsytovich N.A, (Nevecherya, 1973).
depth, a d i f f e r e n t i a l heave-measuring -shaped device i s used, and to de t e rmine the value of t a n g e n t i a l f o r c e s of heaving a -shaped t i e rod w i t h a load goage i s umd. On t h e s i t e temperature wel ls ore mad6 and snow-sticks arc put. To s tudy the tendency of heaving pareme- t e r n change duxing development, atationary p l o t s w i t h i n t h e s i t e s of d i s turbed condi t ions and a l s o t h e sites wi th apec ia l ly d i s tu rbed condi t ions have to en tab l i shed .
The data on the total amount of heaving and mean intensity of cryogenic heave, obtained in observations on the proving ground using accelerated technique, can be considered as random values, due to a randomness of cryoge- nic heave or as realiaation o f a random func- tion during the analysis o f the proceus inten- s i t y dependence on space and time coordinates. That is why corresponding mathematical methods
tions (Nevecherya, 1978). Without diecusaing are used for the treatment of theae observa-
the technique of the data treatment in detail, it should be noted that to determine spacial irregularity of cryogenic heave menifestation, an auto-correlation function is used, charac- terizing a change o f interdependence of heaving value with a distance growths between two mea- surement points, An auto-correlation chart gives the idea of froat motmde nature in on area while the correlation radius value, with the function value equal to zero,characteria- tims dimensions of a separate frost mound. The radiue value allows to obtain a r e a l mean- ing of irregularity coefficient and a module of heaving relative irregularity, The irregu- larity coefficient value can be determined in the following WRY. Correlation radius deter- mines the length o f a separate frost mound. In an extreme caae heaving summarized value is equal to a maximum one in the centre of the frost mound and t o a minimum one at the edge. Conaequently, the irregularity coefficient i~ equal to R difference between these values, divided by a half of aorrelation radius. So w3 obta in maximum value of Lrregularity coeffi- cient that should be conaidered whan estimating heaving capacity of the territory, Treatment o f the perennial observations by means of the above mentioned technique helped to raV6al the following regularities o f the seasonal. cryo- genic heave. Fir& of all. it wag Pound out that cryogenic heave of aoila (SFL-SML) under natural conditiona i s a steady process of annual surface ascending ana descending, its parametera changing within comparatively nar- row limits or being practically unchanged. Separate frost mound centres are hardly ever
by the data obtained and also by the fact that displaced from year to year. This ia confirmed
correlation radius, being very characteristic o f the plot, remains almost unchanged for yeara. It should be noted that the coxxalation radiua increases a bit with a growth o f heaving mean value, that i s the dimensions of a separate frost mound expand somewhat with the increase of the heaving total value. Particular mean- ing of the heave total value at a point is not
there is no trend in it. The intensity of theae constant. It changee from year to year but
changes are considerably detarmined by the type of natural conditions. There, within the natural complexes where aoil moisture, the depth o f SFL-SML and conditions of freezing change a bit from year to year, the value o f heaving at a point changes within a ve.3; narrow interval. Changes o f the mean, for the proving ground, value of the heaving total amount are also small. Tundra, forest tundra and t a i g a the increase o r decrease of the mean f o r the proving ground, value of the heaving total amount if compared with a previoua season i s observed in the caae when a cdrrewponding in- creage or decrmse o f SFL-SML thickness i s marked. Estimation of this factor impact hao demonstrated that an average, over depth
heaving intensity that doea n o t depend on the depth of SPL--SIKL, ie a more stable, in-time value, characteristic of a given cryogenic type. Thif: has allowed to obtain a formula f o r deter- mining 8 summarized value of heaving over the thickneas of SFL-SML. Aa a whole l o r the abovc- mentioned zones the mean ovcr-depth heaving in- tensity is characterized a e follows: 6 -- 10 per cent and more f o r SFL Boils come for the plots with a very intensive manifestation of cryogenic heave, 3 - 6 per cent come f o r plots with an intensive manifestation and 1 - 3 per cent come fox the plots with a weak manifes- tation of cryogenic heave. There in the forest steppe and steppe zones average over-depth heaving intensity changes considerably depend- ing on the pre-winter moisture content. Accord- ingly, the technique w a s worked out for deter- mining pre-winter moisture of soils before freezing on the basie of perennial data on the nature of moistening in this area (Nevecherya, 1 9 6 6 ) and for determining moieture content ba- sed on the data of separate measurements in the summer-autumn season (Nevecherya,l965). It has been defined that a correlation r a d i u s and, con- sequently, the dimensions of single frost mounds under heaving of SFL so i l s averages IC metres, from 15 to 8 m. The size of the frost mounds under heaving of SML soils amounte to 6-8 m. with the exception of cites with medallion-like apots, where correlation radius amounts to 3-4 m., which coincidea with the dimensions of medallion-like apots in plan. So, the eetab- liahed type of cryogenic heave corresponds in nature to one of the three types of the sites, singled out due to the intensity of cryogenic heave. Thua, the data obtained within one-two winter periods can be conaidered as an averaged characteriatica of cryogenic heave of the terri- tory. According to the first-year observations, it is possible to determine a minimum number of heave-measuring marks, basing one self on a gfven reliability and accuracy of heaving mean value. It ahould be noted that when developing the territory the established type of cryogenic heave coneiderably changes, but a s fer a 8 an average by depth intensity of heaving for ShL soils does not change, then the data obtained for natural conditions can be used for predic- tions when estimating soil cryogenic heave. It has also been defined that under neoformat- ion of permafrost (PPI a seasonal cryogenic heave regularly transforms into a perennial one. Separate aeasonal frost mounds turn into grow- ing frost mounda in proper conditions: It is confirmed by the fact that dimensions of grow- ing frost mounds in plan in the first years are equal to those under very inteneive seasonal cryogenic heave manifestation. Neoformation of PF is a s 8 rule accompanied by its heaving. In the southern part of a permafrost zone with a conaiderable thickness o f a mow cover it i e cryogenic heave that mekes f o r the formation of a short-term permafrost and PF neoformation. Elevation of the surface a s a result o f heaving brings about notable decrease o f ' t h e mow-cover thickness, whit:,. ,lakes lor a eudden cooling of ground in winter, Particularly intensive heav- ing is observed with a growing of perennial segregated mounds and heaving ridges, convex- hillocky and large-hillocky peat lands and also string bogs. To reveal the dynamics Of cryo- genic heave under perennial freezing, constant observations were organiscd to watch mounds
1154
growing and heaving a r e a s of e l e v a t i o n u s i n g spec ia l marks and bench marks. Observations w e r e i n i t i a t e d i n 1971-72 y e a r s and axe be ing cont inued toda te . To de te rmine the age o f t h e mounds and consequent ly average heaving r a t e , the method was used of f i e l d c o m p a r a t i v e i n t c x p r e t a t i o n of a e r i a l p h o t o g r a p h s (@I) f o x d i f f e r e n t y e a r s ( G e o c r y o l o g i c a l c o n d i t i o n s , 1983). It has been de termined the t under peren- n i a l s o i l f r e e z i n g c r y o g e n i c h e a v e m a n l f e a t e i t s e l f a s B eeasonal ( c y c l i c ) one, i.e. i t l a s t s f o r a c e r t a i n p e r i o d e a c h y e a r . The s t a r t o f t h e heaving per iod and i t s d u r a t i o n i s determined by t h e d e p t h of p e r e n n i a l f r e e - z i n g a n d i n t e n s i t y of win te r coo l ing ou r o f s o i l s , t h a t a c t i v e l y shows i t s e l f u n d e r h e a v e s e g r e g a t i o n mounds growth. Cryogenic heave r a t e . d e c r e a s e s a b r u p t l y w i t h t h e p e r m a f r o s t t h i cknese . Thus i n t h e y e a r o f t h e mound form- a t i o n # i . e . when s e a s o n a l f r e e z i n g t u r n s i n t o p e r e n n i a l o n e , t h e r a t e of cryogenic heave amounts t o 200-250 mm p e r yea r , With a growth o f permafros t th ickness f rom 1.5 mm t o 3 mm t h e r a t e d e c r e a s e s Prom 130 t o 60 mm p e r year . vJi th permafrost th ickness below t h e mound be ing 8 mm and o the r f avourab le cond i t ions , c ryoge - n i c heave r a t e amoun t s t o 7-10 m/y. In perma- f r o s t and r a r e p e r m a f r o s t i s l a n d zone t h e growth o f s e p e r a t e f r o s t mounds i n un f rozen l a y e r c e a a e e , t h e t h i c k n e s s of newly-formed PF be ing 10-1 5 mm. A change of h e i g h t is noted of such mounds w i t h i n 10-30 mm o v e r t h e y e a r s caused by d isp lacement of t h e PP lower bound- s r y i n h e a v i n g s o i l w i t h a change of heaving mound t h e r m s 1 s t a t e i n Bome winter seasona . With a c o n s t a n t i n c r e a e e o f s o i l t empera tu re , an e l eva t ion t akes p l ace o f t he PI? lower Bur- f a c e , c a u s i n g t h e mound s e t t l e m e n t w i t h t h e r a t e o f 60-200 nun p e r y e a r and t h e n i t s f e i - lure. Cryogenic heave w i t h an a r e a l PF form- a t i o n i s a l s o no ted , bu t i t s r a t e i s markedly lower than w i t h f r o s t mound growth. In perma- f rost is land zone i t amounts t o 5-15 m / y . It s h o u l d be no ted t ha t when deve lop ing t he t e r r i t o r y , t h e i n t e n s i f i c a t i a n of p e r e n n i a l cryogenic heave is often observed and f r o s t mound growth i s resumed t h a t i n n a t u r a l con- d i t i o n s d o e s not occur.
COBCL!JSIOW ThuE, c r y o g e n i c h e a v e m a n i f e s t s i t s e l f a s B l i m i t e d process under Reasons1 and p e r e n n i a l gsound freezing. However, when s e a s o n a l frse- z i n g t r a n s f o r m s i n t o p e r e n n i a l o n e , c r y o g e n i c heave t u rns f rom o c y c l i c p r o c e s s i n t o a cyc- l i c pxogrese ive , and t h a t b r i n g s a b o u t g r a d u a l e l e v a t i o n of some l a y e r s and t h e f r e e z i n g ground sur face t o a c o n s i d e r a b l e h e i g h t . It should be t a k e n i n t o c o n s i d e r a t i o n when making g e o l o g i c a l and geomorpho log ica l i nves t iga t ions i n p e r m a f r o s t zone. H e a v i n g i r r e g u l a r i t y o c c u r - ring u n d e r s e a a o n e l f r e e z i n g causes v a r i o u s i c e c o n t e n t o f t h e upper 10-15 rn t h i c k n e s s of PF homogeneous a s t o c o m p o s i t i o n and t o t a l moi- s t u r e .
RElJEREIJC ES Geologicheskiye us lovia Znpadno-Sib imkoi e;szo-
n o s n o i p r o v i n t s i i , (1983). Izd-vo "Nauka", S ib i r skoye o tde l e r . i e , Novos ib i r sk , 197 s.
Metodicheskie rekomendatai i PO pxognozu izme- r e n i y a inzhenexno-geologicheakikh u a l o v i i i
r a z v i t i y a c r i o g e n n y k h p r o t a e s a o v p r i l i n e i n o m s t r o i t e l s t v e v severno-tayozhnoi zone Zapadnoi Sibfrf (1976). Nauchn, red. Nevecherya V.L., M., YSEGINGEO, 44
Nevecherya V.L., (1965). 0 metodike rasche ta p redz imne i v l szhnos t i g run tov yuga Zepad- n o i S i b i r i . V kn.: " I z v e s t i y a SO AN SSSR", vyp. 3 , N 10, 134-1 39, Novosibirak.
Nevecherya V,z. (1 966 1. K voproau prOgnOBi- rovaniya predzimnei vlazhnoat i gruntovykh oanovanii zheleznykh dorog Zapadnoi S i - b i x i , . . V kn. : "Mexzlotnye iasledovaniya". Vyp, 5 , 100-1 11, Moskovski i Univers i te t , Moakwa.
Nevecherya, V.L. (19661, K x s i o n i r o v s n i y u Zapadnoi S i b i r i PO i n f e n a i v n o s t i p r o t s e s - 8ov puchino-obrazovaniya v gruntakh . V kn. 8 W a t e r i a l y VI11 Vseeoyuzn. mezhved. aoveshch. po g e o k x i o l o g i i , vyp. 3 , 53-59. Yakutak.
Nevccherya, V.L. (1973). K metodike r a i o n i r o - v a n i y a t e r r i t o r f i PO i n t e n s i v n o a t i p r o - yavleniya protaeaEtov puchinoobrszovaniya v gruntakh. V kn.: "Uskorennye metody inzhenerno-geologichaekogo fzucheniya nefte-gazonosnykh raianov Zapadnoi Sibiri na oanove landshaf tnoi i n d i k a t s i i , Trudy VSEGINGEO, vyp. 62, 21-27. Moskwa.
Nevecherya,V.L., Goralchuk M.I. (1978). Neko-
g r u n t o v v seve ro tayozhno i zone Zapadnoi torye zakonornernosti sezonnogo putcheniya
S i b i r i . V kn,: Krfgennye @rOtsessy. 177-188. tlNauka*t, Moskwa.
1155
EFFECTIVE LIFE IN CREEP OF FROZEN SOILS V.R. Parameswaran
Department of Materials Science and Engineering, Northwestern University, Evanston, IL 60208 USA
SYNOPSIS
A new method t o p r e d i c t t h e o n s e t o f f a i l u r e i n t h e c r e e p o f f r o z e n s o i l s i s s u g g e s t e d . By t h i s t e c h n i q u e an e f f e c t i v e l i f e l o n g e r t h a n t h a t p r e d i c t e d f r o m t h e t i m e t o r e a c h m i n i m u m c r e e p r a t e o r t h e t i m e o f t r a n s i t i o n f r o m s t e a d y s t a t e t o a c c e l e r a t i n g c r e e p , c a n b e o b t a i n e d d u r i n g t h e p e r f o r m a n c e o f a s t r u c t u r e p r i o r t o u l t i m a t e f a i l u r e . Us ing a personal computer t o m o n i t o r t h e p e r f o r m a n c e o f t h e f o u n d a t i o n , a w a r n i n g s i g n a l c a n b e a c t i v a t e d p r i o r t o t h e o n s e t o f f a i l u r e .
INTRODUCTION
B e a r i n g c a p a c i t i e s o f f o u n d a t i o n s i n p e r m a f r o s t a r e a s a r e g o v e r n e d b y t h e s t r e n g t h and c r e e p o f f r o z e n s o i l s . A p i l e f o u n d a t i o n f o r f n s t a n c e , b e a r s t h e l o a d due t o t h e s t r u c t u r e m a i n l y b y t h e a d f r e e z e b o n d s t r e n g t h a t t h e p i l e - s o i l i n t e r f a c e , and p a r t l y by end bearing. If the g round can be assumed t o c o n s i s t e s s e n t i a l l y o f one t y p e o f s o i l c o n s i d e r e d homogeneous, t h e above two f a c t o r s c a n be combined t o c a l c u l a t e t h e t o t a l b e a r i n g c a p a c i t y 9 as:
where Tad. i s t h e s h e a r s t r e n g t h o f t h e a d f r e e z i n g b o n d a t t h e p i l e - s o i l i n t e r f a c e , i n t e r f a c i a l area, u i s t h e l o n i a e e r m s t r e n g t h o f t h e
i s t h e a d f r e e z i n g
s o i l i n c o m p r e s s i o n and Ab i s t h e end bear ing area of t h e p i l e t i p . Thus t h e i m p o r t a n t p a r a m e t e r s t h a t g o v e r n t h e b e a r i n g c a p a c i t y a r e : t h e l o n g t e r m adf reeze bond s t rength between a p i l e and t h e s o i l (T), a n d t h e l o n g t e r m s t r e n g t h o f t h e s o i l u n d e r
t o a r r t v e a t s u i t a b l e ( o r a l l o w a b l e ) v a l u e s o f t h e compression (u). The o b j e c t i v e o f any good d e s i g n i s
s t r e s s e s T and U, so t h a t t h e y a r e not exceeded i n p r a c t i c e .
The s o i l a r o u n d t h e p i l e i s u n d e r a c o n s t a n t l o a d c r e e p c o n d i t i o n , and t h e p i l e i s c o n t i n u o u s l y b e i n g d i s p l a c e d a t a r a t e ( a l t h o u g h i m p e r c e p t i b l y s m a l l ) t h a t depends o n t h e a p p l i e d l o a d , t e m p e r a t u r e , p h y s i c a l c h a r a c t e r i s t i c s s u c h as g r a i n s i z e , I c e c o n t e n t , p o r o s i t y e t c . o f t h e soll, s u r f a c e c h a r a c t e r i s t i c s o f t h e p i l e , a n d s e v e r a l o t h e r f a c t o r s . I n p r a c t i c e , based on an a l l o w a b l e s e t t l e m e n t t o o c c u r d u r i n g t h e a n t i c i p a t e d l i f e o f t h e s t r u c t u r e , a n a l l o w a b l e r a t e o f p i . l e d i sp lacemen t o r se t t l emen t i s c a l c u l a t e d . The s t r e s s c o r r e s p o n d i n g t o t h i s a l l o w a b l e d i s p l a c e m e n t r a t e has t o be determined i n o r d e r t o a r r i v e a t t h e number o f p i l e s r e q u i r e d t o s u p p o r t a s t r u c t u r e .
* F o r m e r l y S e n i o r R e s e a r c h O f f i c e r . I n s t i t u t e f o r Research i n C o n s t r u c t i o n , N a t i o n a l R e s e a r c h C o u n c i l o f Canada
1156
T h r e e d i f f e r e n t a p p r o a c h e s t o o b t a i n t h e a l l o w a b l e s t r e s s e s T and U, w e r e r e v i e w e d e a r l i e r (Parameswaran, 1985a, 1986). I n one approach, stress obtained by e x t r a p o l a t i o n o f t h e r e s u l t s f r o m r a t e c o n t r o l l e d t e s t s c a r r i e d o u t a t h i g h e r r a t e s , t o a l o w e r a l l o w a b l e d isp lacement ra te , i s always much h i g h e r t h a n t h a t o b t a i n e d f r o m c o n s t a n t l o a d c r e e p t e s t s c a r r i e d o u t a t t he l ower d i sp lacemen t ra tes . I n t he second me thod , t h e a l l o w a b l e s t r e s s i s d e t e r m i n e d f r o m a p l o t o f a p p l i e d s t r e s s vs t h e minlmum o r s t e a d y s t a t e c r e e p r a t e o b s e r v e d i n c r e e p t e s t s , n e g l e c t i n g t h e i ns tan taneous d i sp lacemen t and p r i m a r y c r e e p . I n t h e t h i r d method proposed by Vyalov (1959, 1962) t n e f a i l u r e t i m e t f ( d e f i n e d as t h e t i m e a t w h i c h s e c o n d a r y o r s t e a d y s t a t e c r e e p ends and t e r t i a r y o r a c c e l e r a t i n g c r e e p s t a r t s ) i s r e l a t e d t o t h e a p p l i e d s t r e s s -C a t t h e p i l e - s o i l i n t e r f a c e , b y an equa t ion :
where t and -c0 a r e c h a r a c t e r i s t i c c o n s t a n t s f o r t h e s o i l d e r c o n s i d e r a t i o n . ( I n t he case of c r e e p t e s t s c a r r i e d o u t on f r o z e n s o i l m a t e r i a l i n t h e f o r m o f samples o f c y l i n d r i c a l o r o t h e r shape, t h e s h e a r s t r e s s z i n e q u a t i o n 2 i s r e p l a c e d b y t h e c o m p r e s s i v e o r t e n s i l e s t r e s s u). F r o m a p l o t o f I n ( t ) v s l / ( s t r e s s ) . t h e a l l o w a b l e s t r , e s s f o r an expec ted l i f e i s c a l c u l a t e d .
All t h e t h r e e methods underes t imate the a l lowab le l i f e o f a s t r u c t u r e i n f r o z e n s o i l u n d e r a g i ven l oad , because , i n g e n e r a l , f r o z e n s o i l s c r e e p w i t h a p r o l o n g e d t e r t i a r y c r e e p r e g i o n . A much l o n g e r f a i l u r e t i m e e x t e n d i n g i n t o t h e e a r l y p a r t o f t e r t i a r y c r e e p reg ion can be chosen by a me thod p roposed recen t l y f o r d e t e r m t n a t i o n o f f a i l u r e t i m e i n c r e e p i n any m a t e r i a l (Parameswaran, 1987). The method i s based on t h e p r e m i s e t h a t f a i l u r e t i m e i n c r e e p c a n be t a k e n as t h e t i m e a t w h i c h t h e s t r a i g h t l i n e f r o m t h e o r i g i n t o t h e p o i n t c o r r e s p o n d i n g t o t h e d i s p l a c e m e n t ( o r s t r a i n ) on
t h i s p o i n t , t h e s l o p e o f t h e l i n e , which i s equal t o t h e c reep curve becomes a t angen t t o t h e curve. A t
t h e t o t a l d i s p l a c e m e n t or s t r a i n d i v i d e d b y t h e e l a p s e d t i m e s i n c e t h e b e g i n n i n g o f a t e s t , i s a l s o a minimum. I n t h i s p a p e r , r e s u l t s f r o m s e v e r a l c r e e p t e s t s c d r r i e d
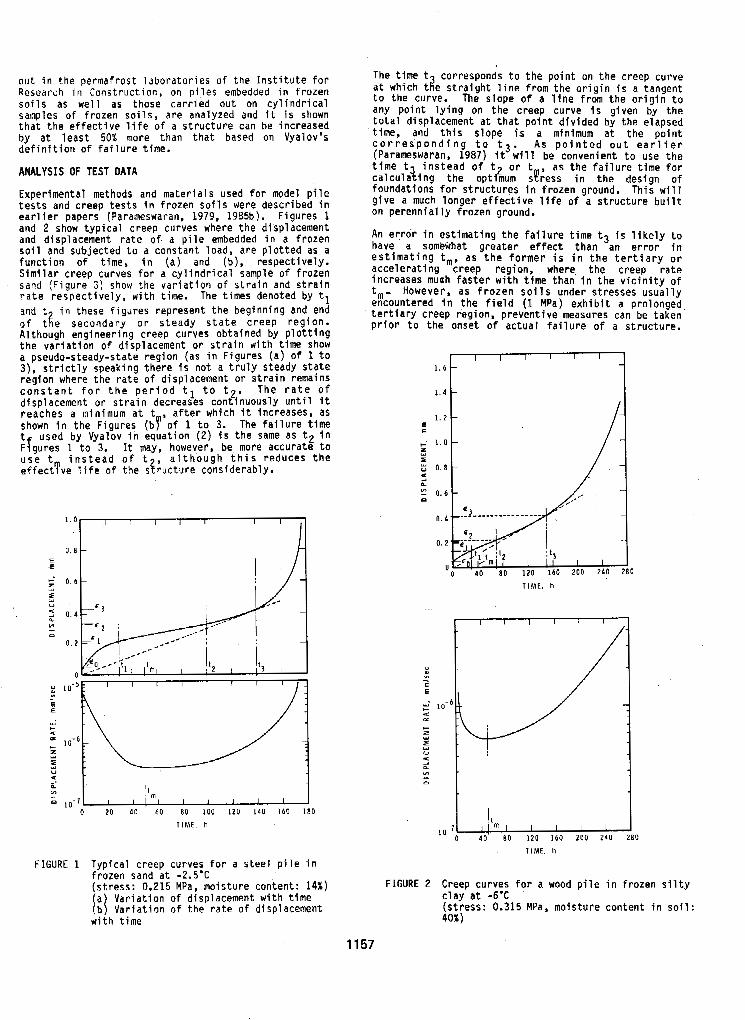
o u t i n t h e p e r m a f r o s t l a b o r a t o r i e s o f t h e I n s t i t u t e f o r Research i n C o n s t r u c t i o n , on p i l e s embedded i n f r o z e n s o i l s as w e l l as t h o s e c a r r i e d o u t on c y l i n d r i c a l samples o f f r o z e n s o i l s , a r e a n a l y z e d and i t i s shown t h a t t h e e f f e c t i v e l i f e o f a s t r u c t u r e c a n be increased b y a t l e a s t 50% more than that based on Vyalov 's d e f i n i t i o n o f f a i l u r e t i m e .
ANALYSIS OF TEST DATA
Exper imenta l methods and mater ia ls used fo r mode l p i le t e s t s a n d c r e e p t e s t s i n f r o z e n s o i l s w e r e d e s c r i b e d i n e a r l i e r p a p e r s (Parameswaran, 1979, 1985b). F i g u r e s 1 and 2 show t y p i c a l c r e e p c u r v e s w h e r e t h e d i s p l a c e m e n t and d isp lacement ra te o f a p i l e embedded i n a f r o z e n s o i l and subjected t o a c o n s t a n t l o a d , a r e p l o t t e d as a f u n c t i o n o f t i m e , i n ( a ) and (b), r e s p e c t i v e l y . S i m i l a r c r e e p c u r v e s f o r a c y l i n d r i c a l sample o f f r o z e n sand (F igure 2 ) show t h e variation o f s t r a i n and s t r a i n r a t e r e s p e c t i v e l y , w i t h t i m e . The t imes denoted by tl and t i n t h e s e F i g u r e s r e p r e s e n t t h e b e g i n n i n g and end $of t $ e s e c o n d a r y o r s t e a d y s t a t e c r e e p r e g i o n . A l t h o u g h e n g i n e e r i n g c r e e p c u r v e s o b t a l n e d b y p l o t t i n g t h e v a r i a t i o n o f d i s p l a c e m e n t o r s t r a i n w i t h t i m e show a pseudo-s teady-s ta te reg ion (as i n F i g u r e s ( a ) o f 1 t o 3), s t r i c t l y s p e a k i n g t h e r e i s n o t a t r u l y s t e a d y s t a t e r e g i o n w h e r e t h e r a t e o f d i s p l a c e m e n t o r s t r a i n r e m a i n s c o n s t a n t f o r t h e p e r i o d tl t o t2, T h e r a t e o f d isp lacement o r s t r a i n d e c r e a s e s c o n t i n u o u s l y u n t i l i t r e a c h e s a minimum a t t , a f t e r w h i c h i t increases, as shown i n t h e F i g u r e s ( b y o f 1 t o 3. The f a i l u r e t i m e t used by Vya lov i n e q u a t i o n ( 2 ) i s t h e same as t2 i n F fgu res 1 t o 3. It may, however, be more accurate t o u s e t i n s t e a d o f t , a l t h o u g h t h i s r e d u c e s t h e e f f e c t r v e l i f e o f t h e s t r u c t u r e c o n s i d e r a b l y .
1 . 0 I I l l 1 I I
2
YI - El 10" I 1 1 1 1 1 I
0 20 4 0 60 8 0 1 0 0 1 2 0 1 4 0 1 6 0 1 8 0
TIME. h
FIGURE 1 Typ ica l c reep cu rves f o r a s t e e l p i l e i n f rozen sand a t -2.5.C ( s t r e s s : 0.215 MPa, mo is tu re con ten t : 14%) a V a r i a t i o n o f d i s p l a c e m e n t w i t h t i m e b V a r i a t i o n o f t h e r a t e o f d isp lacement I1
w i t h t i m e
The t i m e t corresponds t o t h e p o i n t on t h e c r e e p c u r v e a t w h i c h t g e s t r a i g h t l i n e f r o m t h e o r i g i n i s a tangen t t o t h e curve. The s l o p e o f a l i n e f r o m t h e o r i g i n t o a n y p o i n t l y i n g on t h e c r e e p c u r v e i s g i v e n b y t h e t o t a l d i s p l a c e m e n t a t t h a t p o i n t d i v i d e d b y t h e e l a p s e d t ime , and t h i s s l o p e i s a minimum a t t h e p o i n t c o r r e s ' p o n d i n g t o t 3 . A s p o i n t e d o u t e a r l i e r (Parameswaran, 1987) i t will b e c o n v e n i e n t t o use t h e t i m e t i n s t e a d o f t2 o r t , a s t h e f a i l u r e t i m e f o r c a l c u l a l i n g t h e o p t i m u m s!ress i n t h e d e s i g n o f f o u n d a t i o n s f o r s t r u c t u r e s i n f rozen ground. Th is will g i v e a much l o n g e r e f f e c t i v e l i f e o f a s t r u c t u r e b u i l t on p e r e n n i a l l y f r o z e n ground.
An e r r o r i n e s t i m a t l n g t h e f a i l u r e t i m e tJ I s l i k e l y t o have a somewhat g r e a t e r e f f e c t t h a n a n e r r o r i n e s t i m a t i n g tm, a s t h e f o r m e r i s i n t h e t e r t i a r y o r a c c e l e r a t i n g c r e e p r e g i o n , where t h e c r e e p r a t e Inc reases muoh f a s t e r w i t h t l m e t h a n i n t h e v i c i n i t y o f
H o w e v e r , a s f r o z e n s o i l s u n d e r s t r e s s e s u s u a l l y h:ountered i n t h e f i e l d (1 MPa) e x h i b i t a p ro longed t e r t i a r y c r e e p r e g i o n , p r e v e n t i v e measures can be t a k e n p r i o r t o t h e o n s e t o f a c t u a l f a i l u r e o f a s t r u c t u r e .
l . L t 1 1.
E E
" 1. z z Y
0. 5 0 v) - 0. a
0 .
0.
TIME. h
I , I t r n I I , , 1 10"0 4 0 80 1 2 0 1 6 0 200 2 4 0 280
TIME. h
FIGURE 2 Creep c u r v e s f o r a wood p i l e i n f r o z e n s i l t y c l a y a t -6'C
40%) ( s t r e s s : 0.315 MPa, m o i s t u r e c o n t e n t i n s o i l :
1157
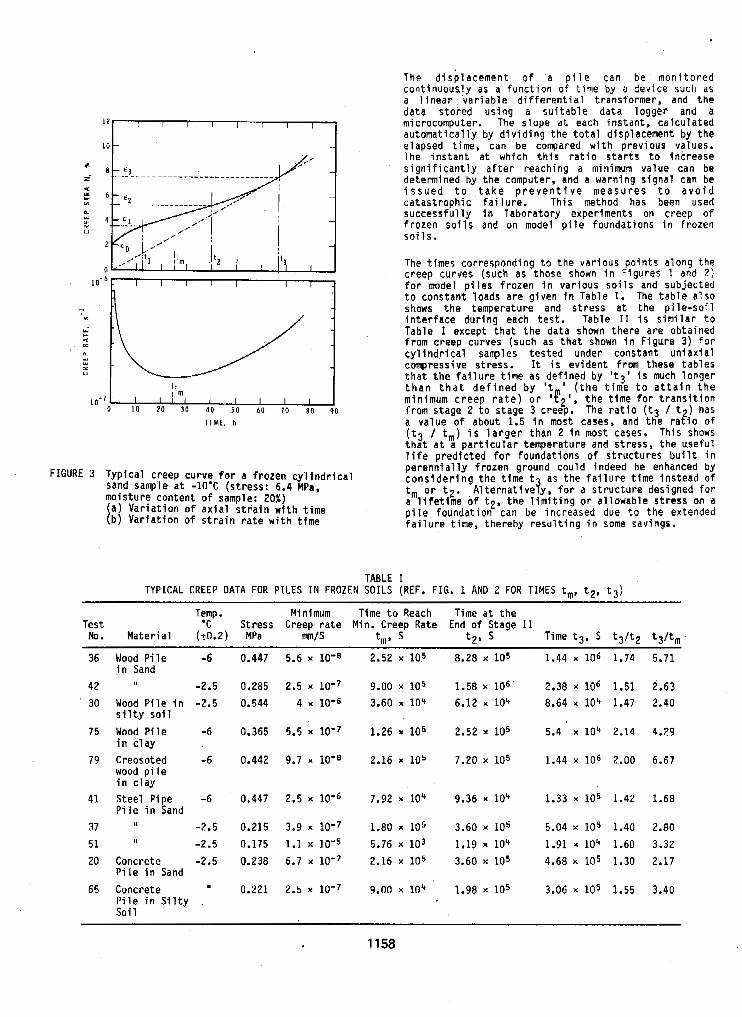
10 1 2 9
h
TIME, h
FIGURE 3 Typ ica l c reep cu rve f o r a f r o z e n c y l i n d r i c a l sand sample a t -1O'C ( s t r e s s : 6.4 MPa, m o i s t u r e c o n t e n t o f sample: 20%)
a) V a r i a t i o n o f a x i a l s t r a i n wlth t i m e b ) V a r i a t i o n o f s t r a i n r a t e w i t h t i m e
T h e d i s p l a c e m e n t o f a p i l e c a n be m o n i t o r e d c o n t i n u o u s l y as a f u n c t i o n o f t i m e b y a device such as a l i n e a r v a r i a b l e d i f f e r e n t i a l t r a n s f o r m e r , and t h e d a t a s t o r e d u s i n g a s u i t a b l e d a t a l o g g e r and a microcomputer. The s l o p e a t e a c h i n s t a n t , c a l c u l a t e d a u t o m a t i c a l l y b y d i v i d i n g t h e t o t a l d i s p l a c e m e n t b y t h e e lapsed t ime, can be compared wi th prev ious va lues. The i n s t a n t a t w h i c h t h i s r a t i o s t a r t s t o i n c r e a s e s i g n i f i c a n t l y a f t e r r e a c h i n g a minimum value can be determined by the computer, and a warn ing s igna l can be i s s u e d t o t a k e p r e v e n t i v e m e a s u r e s t o a v o i d ca tas t roph ic fa i lu re . Th is method has been used s u c c e s s f u l l y i n labo ra to ry exper imen ts on c reep o f f r o z e n s o i l s and on model p i l e f o u n d a t i o n s i n f r o z e n s o i l s .
c reep curves (such as those shown i n F tgu res 1 and 2 ) The t imes co r respond ing t o t h e v a r i o u s p o l n t s a l o n g t h e
t o c o n s t a n t l o a d s a r e g i v e n i n Tab le I . The t a b l e a l s o f o r model p i l e s f r o z e n i n v a r i o u s s o i l s and s u b j e c t e d
shows t h e t e m p e r a t u r e and s t r e s s a t t h e p i l e - s o i l i n t e r f a c e d u r i n g e a c h t e s t . T a b l e I1 i s s i m i l a r t o Tab le I e x c e p t t h a t t h e d a t a shown t h e r e a r e o b t a i n e d f rom c reep curves (such as tha t shown i n F i g u r e 3) f o r c y l i n d r i c a l samples t e s t e d u n d e r c o n s t a n t u n i a x i a l compress ive s t ress . It i s e v i d e n t frpm t h e s e t a b l e s t h a t t h e f a l l u r e t i m e as def /ned by I t 3 i s much l o n g e r t h a n t h a t d e f i n e d b y It ( t h e t i m e t o a t t a l n t h e m i n i m u m c r e e p r a t e ) o r '!2', t h e t i m e f o r t r a n s i t i o n f rom s tage 2 t o s t a g e 3 creep. The r a t i o ( t 3 / t ) has a v a l u e o f a b o u t 1.5 i n most cases, and t h e r a t i o of ( t3 / tm) i s l a r g e r t h a n 2 i n most cases. This shows t h a t a t a p a r t i c u l a r t e m p e r a t u r e a n d s t r e s s , t h e u s e f u l l l f e p r e d i c t e d f o r f o u n d a t i o n s o f s t r u c t u r e s b u i l t i n p e r e n n i a l l y f r o z e n g r o u n d c o u l d i n d e e d be enhanced by c o n s i d e r i n g t h e t i m e t as t h e f a l l u r e t i m e i n s t e a d o f tm o r t2. A l t e r n a t i v e j y , f o r a s t r u c t u r e d e s i g n e d f o r a l i f e t i m e of t 2 , t h e l i m i t i n g o r a l l o w a b l e s t r e s s on a p i l e f o u n d a t i o n c a n be increased due t o t h e e x t e n d e d f a i l u r e t i m e , t h e r e b y r e s u l t i n g i n some sav ings.
TABLE I TYPICAL CREEP DATA FOR PILES IN FROZEN SOILS (REF. FIG, 1 AND 2 FOR TIMES t,, t 7 , t q )
Ttmp . Minimum Tlme t o Reach Time a t t h e Test c S t ress C reep ra te Min. Creep Rate End of Stage 11
No. M a t e r i a l ( t0.2) MPa m / s tm, S t 2 , s Time t 3 . S t 3 / t 2 t 3 / t m
36 Wood P i l e -6 0.447 5.6 x 10'8 2.52 x ios 8.28 X io5 1.44 x 10⁶ 1.74 5.71
42 -2.5 0.285 2.5 x 9.00 x lo5 1.58 X lo6 2.38 x lo6 1.51 2.63 30 Wood P i l e i n -2.5 0.544 4 x 3.60 x io4 6-12 x lo4 8.64 x 10⁴ 1.47 2.40
75 Wood P i l e -6 0.365 5.5 x 1.26 x io5 2.52 X io5 5.4 x 10⁴ 2.14 4.29
79 Creosoted -6 0.442 9.7 x 2.16 x lo5 7.20 x IO5 1.44 x lo6 2.00 6.67
i n Sand
s i l t y so11
i n c l a y
wood p i l e i n c l a y
P i l e i n Sand 41 S t e e l P i p e -6 0.447 2.5 x lom6 7.92 X IO4 9.36 X io4 1.33 x lo5 1.42 1.68
37 51 20 Concrete -2.5 0.238 6.7 x low7 2.16 x IO5 3.60 X lo5 4.68 x lo5 1.30 2.17
65 Concrete 11 0.222 2.5 x 10⁻⁷ 9.00 X 10⁴ 1.98 X 10⁵ 3.06 x lo5 1.55 3.40
I 1 -2.5 0.215 3.9 x 10⁻⁷ 1.80 x 10⁵ 3.60 x 10⁵ 5.04 x lo5 1.40 2.80 II -2.5 0.175 1.1 x 10⁻⁵ 5.76 X 10³ 1.19 X 10⁴ 1.91 x lo' 1.60 3.32
P i l e i n Sand
P i l e i n S i l t y Soi 1
1158
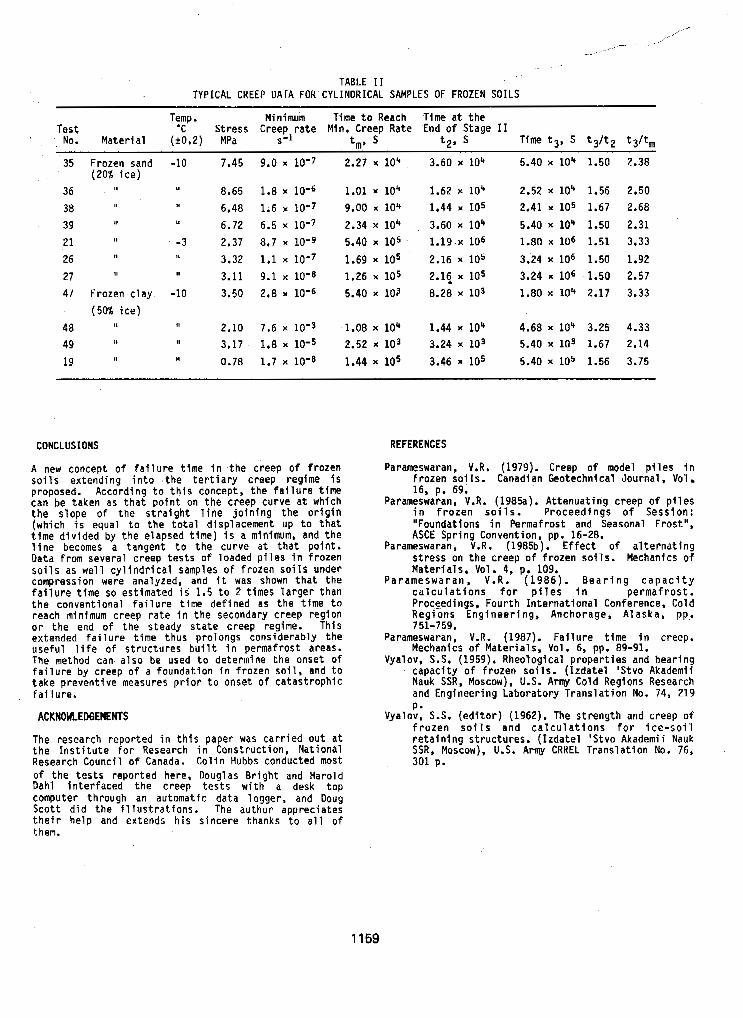
TABLE I 1 TYPICAL CREEP DATA FOR CYLINDRICAL SAMPLES OF FROZEN SOILS
T y p . Minimum Time t o Reach Time a t t h e Test C Stress Creep r a t e Min. Creep Rate End of Stage I1
No. Mater ia l (k0.2) MPa s-1 tm, 5 t 2 , 5 t ime tg, S t3/t2 t 3 / t m
35 Frozen sand -10 7.45 9.0 x 10⁻⁷ 2.27 x 10⁴ 3.60 X 10⁴ 5.40 x lo4 1.50 2.38
36 I II 8.65 1.8 x loW6 1.01 x lo4 1.62 x lo4 2.52 x lo4 1.56 2.50
38 II 6.48 1.6 x 1 0 4 9.00 x 10⁴ 1.44 x 10⁵ 2.41 x 10⁵ 1.67 2.68
39 I1 I1 6.72 6.5 x lom7 2.34 x lo4 , 3.60 x lo4 5.40 x 10⁴ 1.50 2.31
21 -3 2.37 8.7 x 10⁻⁹ 5.40 x lo5 . 1.19.~ lo6 1.80 x 10⁶ 1.51 3.33 26 II I1 3.32 1.1 x 10⁻⁷ 1.69 x 10⁵ 2.16 x 10⁵
27 II I1 3.11 9.1 x 10⁻⁸ 1.26 x 10⁵ 2.15 x 10⁵ 3.24 x 10⁶ 1.50 2.57
47 Frozen clay -10 3.50 2.8 x lom6 5.40 x 10³ 8.28 x lo3 1.80 x 10⁴ 2.17 3.33
48 I1 I 1 2.10 7.6 x 10⁻³ 1.08 x 10⁴ 1.44 x 10⁴ 4.68 x IO4 3.25 4.33
49 II II 3.17 1.8 x lom5 2.52 X lo3 3.24 x lo3 5.40 x lo3 1.67 2.14
19 I1 I1 0.78 1.7 x 1.44 x lo5 3.46 x lo5 5.40 x lo5 1.56 3.75
(20% i c e )
I1
3.24 x lo6 1.50 1.92
(50% i c e )
CONCLUSIONS
A new concept o f f a i l u r e t i m e l n t h e c r e e p o f f r o z e n so i l s ex tend ing i n to . t he t e r t i a ry c reep reg ime I s proposed. According t o t h i s concept , the fa i lure time can be taken as t h a t p o i n t on the creep curve at which the s lope o f t h e s t r a l g h t l i n e j o i n i n g t h e o r i g i n (which i s equal t o t he t o ta l d i sp lacemen t up t o t h a t t ime d i v ided by the e lapsed t ime) i s a mlnlmum, and the l i n e becomes a tangent t o t h e c u r v e a t t h a t p o i n t . Data f rom several creep tests of loaded pi les i n frozen s o i l s as w e l l c y l i n d r i c a l samples o f frozen Soi l5 under compression were analyzed, and i t was shown t h a t t h e f a i l u r e t i m e so est imated i s 1.5 t o 2 t imes larger than the conven t iona l f a i l u re t ime de f i ned as t h e t i m e t o reach minimum c r e e p r a t e i n t h e secondary creep region o r t h e end of the s teady s ta te creep regime. This extended fa i lure t ime thus pro longs cons iderably the u s e f u l l i f e o f s t r u c t u r e s b u i l t i n p e r m a f r o s t areas. The method can a l so be used t o determine the onset of f a i l u r e by creep o f a foundat ion i n f r o z e n s o i l , and t o take p revent ive measures p r i o r t o o n s e t of ca tas t roph ic f a i l u r e ,
ACKNOWLEDGEMENTS
The research reported i n t h i s paper was c a r r i e d o u t a t t h e I n s t i t u t e f o r Research i n Construction, National Research Council o f Canada. Co l i n Hubbs conducted most of the tests reported here, Douglas B r igh t and Harold Dah1 in te r faced the c reep tes ts w i th a desk top Computer through an automatic data logger, and Doug S c o t t d i d t h e i l l u s t r a t i o n s . The author appreciates t h e i r h e l p and ex tends h i s s ince re t hanks t o a l l o f them.
REFERENCES
Parameswaran, V.R. (1979). Creep o f model p i l e s i n f rozen so i l s . Canadian Geotechni cal Journal , Vol 16, p. 69.
Parameswaran, V.R. (1985a). At tenua t ing c reep o f p i l es i n f r o z e n s o i l s . P r o c e e d i n g s o f Session: "Foundations i n Permafrost and Seasonal Frost" ,
Parameswaran, V.R. (1985b). E f f e c t o f a l t e r n a t i n g ASCE Spring Convention, pp. 16-28.
s t ress on the creep o f f rozen so i l s . Mechanics o f
Parameswaran, V.R. (1986). B e a r i n g c a p a c i t y Mater la ls . Vol . 4, p. 109.
c a l c u l a t i o n s f o r p i l e s i n Proceedings, Fourth International Conference, Cold
permaf ros t .
Regions Engineer ing, Anchorage, Alaska, pp,.
Parameswaran, V.R. (1987). F a i l u r e t i m e i n creep. Mechanics of Mater ia ls , Vol. 6, pp. 89-91.
Vyalov, S.S. (1959). Rheological propert ies and beartng capac i ty o f f rozen so i l s . ( I zda te l 'S tvo Akademii Nauk SSR, Moscow), U.S. Army Cold Regions Research and Engineer ing Laboratory Translat ion No, 74, 219 P.
Vyalov, S.S. ( e d i t o r ) (1962). The s t rength and creep o f f r o z e n S o i l 5 a n d c a l c u l a t i o n s f o r i c e - s o i l re ta in ing s t ruc tu res . ( I zda te l 'S tvo Akademii Nauk SSR, Moscow), U.S. Army CRREL Trans la t ion No. 76, 301 P.
751-759.
1159
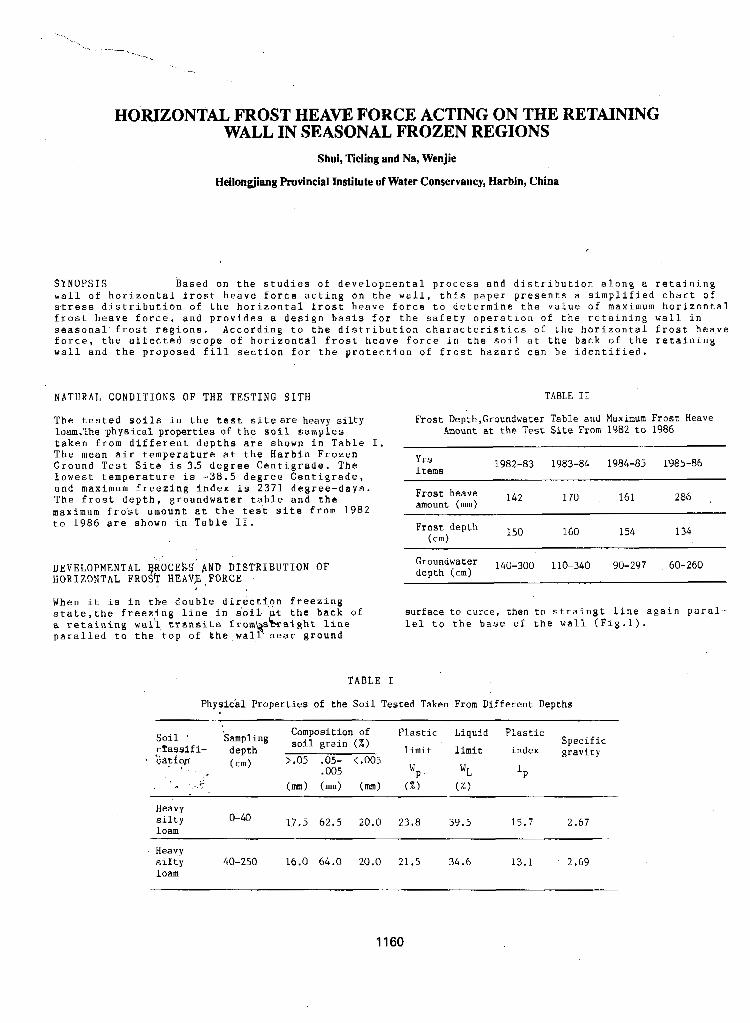
HORIZONTAL FROST HEAVE FORCE ACTING ON THE RETAINING WALL IN SEASONAL FROZEN REGIONS
Shui, Tieling and Na, Wenjie
Heilongjiang Provincial Institute of Water Conservancy, Harbin, China
SYNOPSIS Based on the studies of developmental process and distribution along a retaining wall of horizontal frost heave force acting on the wall, this paper presents a simplified chart o f stress distribution of the horizontal frost heave force to determine the value of maximum horizontal frost heave force, and provides a design basis for the safety operation of the retaining wall in seasonal frost regions. According to the distribution characteristics of the horizontal frost heave force, the affected scope of horizontal frost heave force in the soil at the back of the retaining wall and the proposed fill section f o r the protection of frost hazard can be identified.
NATURAL CONDITIONS OF THE TESTING SITB TABLE I1
The tested soils in the test site are heavy silty Frost Depth,Groundwater Table and Maximum Frost Heave loam,The physical properties of the soil samples Amount at the Test Site From 1982 to 1986 taken from different depths are shown in Table I. The mean air temperature a t the Harbin Frozen Ground Test Site is 3.5 degree Centigrade. The lowest temperature is - 3 8 . 5 degree Centigrade, and maximum freezing index is 2371 degree-days. The frost depth, groundwater table and the maximum frost amount at the test site from 1982
Yrs It ems
Frost heave 142 amount (mm)
1982-83 1983-84 1984-85 1985-86
170 161 286 ,
to 1986 are shown in Table 11. Frost depth 150 (cm)
160 154 134
DEVELOPMENTAL OCESS' AND DISTRIBUTION OF HORIZONTAL FRO% HEAV,E *FORCE
Groundwater 140-300 110-340 90-297 60-260 depth (cm)
When it is in the double directi,on freezing state, the freezing line in s'oil at the back of surface to curce, then to straingt line again paral- a retaining wall, transits from shaight line paralled to the top of the wall near ground k le1 t o the base of the wall (Fig.1).
TABLE I
Physic-a1 Properties of the Soil Tested Taken From Different Depths
Soil '
classifi- depth Composition of Plastic Liquid Plastic soil grain (2) limit limit index gravity Specific
' 'dation. (Cm) > d o 5 .05- <e005 r .005 wP WL
Heavy silty loam
Heavy silty 40-250 16.0 64.0 20.0 21.5 34.6 13.1 2 -69 loam
o-40 17.5 62.5 20.0 23.8 39.5 15.7 2.67
1160
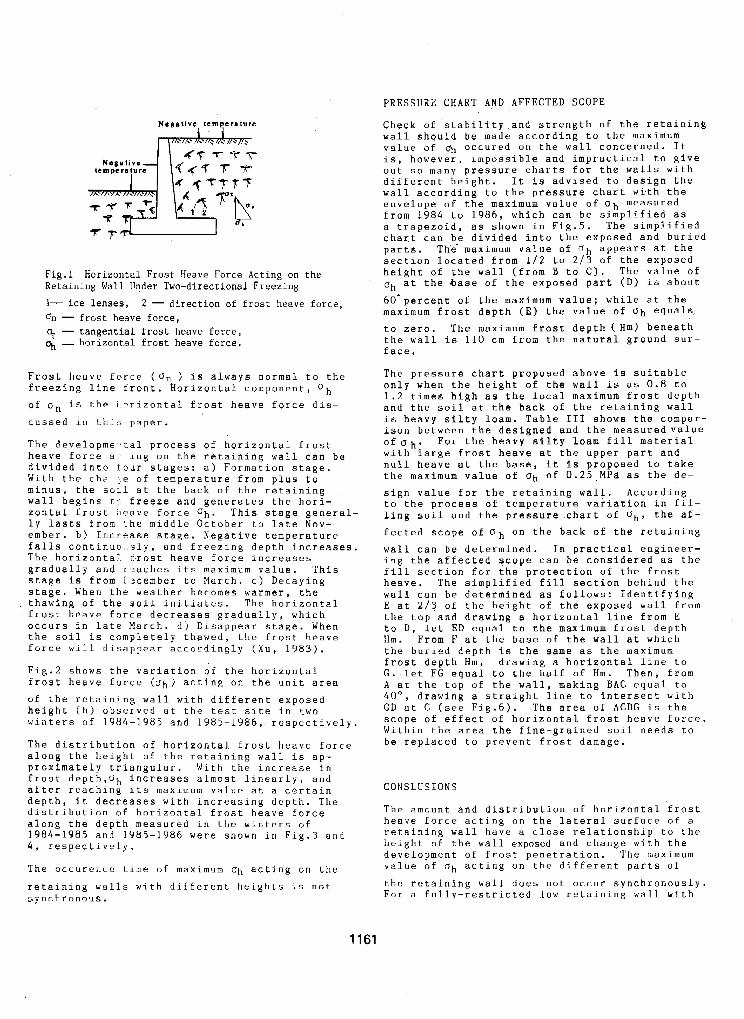
Fig.1 Horizontal Frost Heave Force Acting on the Retaining Wall Under Two-directional Freezing
1- ice lenses, 2 - direction of frost heave force, an - frost heave force, 5 - tangential frost heave force, q, - horizontal frost heave force.
Frost heave force ( O n ) is always normal to the freezing line front. horizontal component, 'h of on is the 1.7rizontal frost heave force dis- cussed in thl, paper.
The deve1opme':al process of horizontal frost heave force a - ing on the retaining wall can be divided into fodr stages: a) Formation stage. With the cha .e of temperature from plus to minus, the soil at the back of the retaining wall begins r ' freeze and generates the hori- zontal frost heave force oh. This stage general- l y lasts frorn '.he middle October t o late Nov- ember. b) Increase stage. Negative temperature f a l l s continuo sly, and freezing depth increases. The horizontal frost heave force increases gradually and rzaches its maximum value, This stage is from i 2cember to March. c) Decaying stage. When the weather becomes warmer, the thawing of the soil initiates. The horizontal frost heave force decreases gradually, which occurs in late March. d ) Disappear stage. When the soil is completely thawed, the frost heave force will disappear accordingly (Xu, 1983).
Fig.2 shows the variation of the horizontal frost heave force (oh) acting o n the unit area of the retaining wall with different exposed height (h) observed at the test site in two winters of 1984-1985 and 1 9 8 5 - 1 9 8 6 , respectively.
The distribution of horizontal. frost heave force along the height of the retaining wall is ap- proximately triangular. With the increase in frost depth,5h increases almost linearly, and after reaching its maximum value at a certain depth, it decreases with increasing depth. The distribution of horizontal frost heave force along the depth measured in the winters of 1984-1985 and 1985-1986 were shown in Fig.3 and 4 , respectively.
The occurencc time u f maximum Oh acting on the
retaining w a l l s with diffcrent heights is not synchronous.
PRESSURE CHART A N D AFFECTED SCOPE
Check of stability and strength of the retaining wall should be made according to the maximum value of oh occured on the wall concerned. It is, however, impossible and impractical to give out s o many pressure charts for the walls with different height. It is advised to design the wall according to the pressure chart with the envelope of the maximum value of o h measured from 1984 to 1986, which can be simplified as a trapezoid, as shown in Fig.5, The simplified char.t can be divided into the exposed and buried parts. The maximum value of "h appears at the
height of the wall (from B to C). The value of section located from 1 / 2 to 2 1 3 of the exposed
oh at the +ase of the exposed part (D) is about
60'percent o f the maximum value; while at the maximum frost depth (E) the value of Oh equals, to zero. The maximum frost depth (Hm) beneath the wall i s 110 cm from the natural ground sur- face.
The pressure chart proposed above is suitable only when the height of the wall is as 0.8 to 1.2 times high as the local maximum frost depth and the soil at the back o f the retaining wall is heavy silty loam, Table I11 shows the compar- ison between the designed and the measuredvalue o f oh. F o r the heavy silty loam fill material with large frost heave at the upper part and null heave at the base, it is proposed t o take the maximum value of oh of 0.25.MPa as the de- sign value for the retaining wall. According to the process of temperature variation in fil- ling soil and the pressure chart of oh, the af- fected scope of o h on the back of the retaining wall can be determined. In practical engineer- ing the affected scope can be considered as the
heave. The simplified fill section behind the fill section for the protection o f the frost
wall can be determined a s follows: Identifying E at 2 / 3 . of the height of the exposed wall from the top and drawing a horizontal line from E to D, let ED equal to the maximum frost depth Hm. From F at the base of the wall at which the buried depth is the same as the maximum
G. let FG equal to the half of Hm. Then, from frost depth Hm, drawing a horizontal line to
A at the top of the wall, making BAC equal to 40°, drawi.ng a straight line to intersect wiLh G D at C (see Fig,6). The area of ACDG is the scope of effect of horizontal, frost heave force. Within the a r e a the fine-grained soil needs to be replaced to prevent frost damage.
CONSLUSIONS
The amount and distribution of horizontal frost heave force acting on the lateral surface of a retaining wall have a close relationship tu the height of the wall exposcd and change with the development of frost penetration. 'l'he maximum value o f oh acting on the different parts o f
the retaining wall does not occur synchronously. For a fully-restricted low retaining wall wi.th
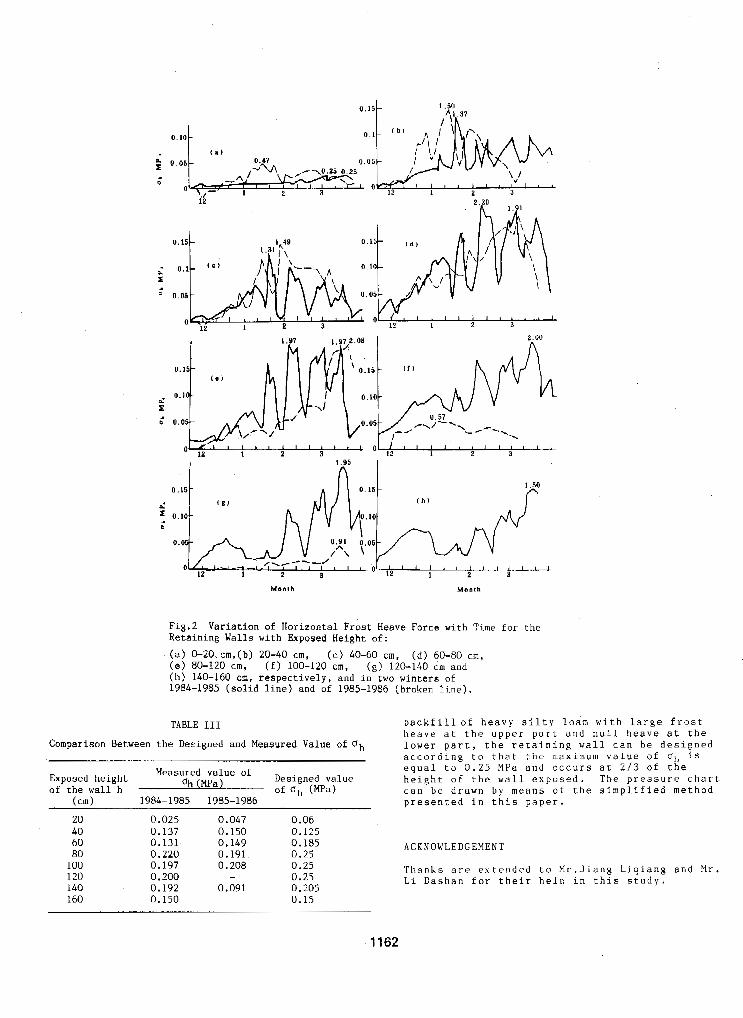
0.15-
Monlh M o n l h
F i g . 2 V a r i a t i o n of H o r i z o n t a l F r o s t H e a v e Force w i t h T i m e f o r t h e R e t a i n i n g Walls w i t h E x p o s e d H e i g h t o f :
(a) 0-20.cm,(b) 20-40 cm, ( c ) 40-60 cm, ( d ) 60-80 cm, ( e ) 80-120 cm, ( f ) 100-120 cm, (8) 120-140 cm and ( h ) 140-160 cm, r e s p e c t i v e l y , a n d i n t w o w i n t e r s of 1984-1985 ( s o l i d l i n e ) and of 1985-1986 ( b r o k e n l i n e ) .
TABLE I11
Compar ison Between the Deeigned and Measured Value of Oh
Exposed h e i g h t of t h e wall h
Measured va lue of o h (MPa) Designed v a l u e
of O h (MPa) (cm) 1984-1985 1985-1986
b a c k f i l l o f h e a v y s i l t y l o a m w i t h l a r g e f r o s t h e a v e a t t h e u p p e r p a r t a n d n u l l . h e a v e a t t h e Lower p a r t , t h e r e t a i n i n g w a l l c a n h e d e s i g n e d a c c o r d i n g t o t h a t t h e m a x i m u m v a l u e o f o h is e q u a l t o 0.25 MPa a n d O C C U ~ S a t 2 / 3 o f t h e h e i g h t o f t h e w a l l e x p o s e d . T h e p r e s s u r e c h a r t c a n b e d r a w n b y means of t . h e s i m p l i f i e d m e t h o d p r e s e n t e d i n t h i s p a p e r .
20 40 60 80 100
140 120
160
0.025 0.137 0.131 0.220 0.197 0,200 0.192 0.150
0,047 0.150 0.149 0.191 0.208
0.091 I
-
0.06 0.125 0.185 0.25 0.25 0.25 0.205 0,15
ACKNOWLEDGEMENT
' T h a n k s a r e e x t . e n d e d t o M r . J i n n g L i q i a n g a n d M r + L i D a s h a n f o r t h e i r h e l p i n t h i s s t u d y .
1162
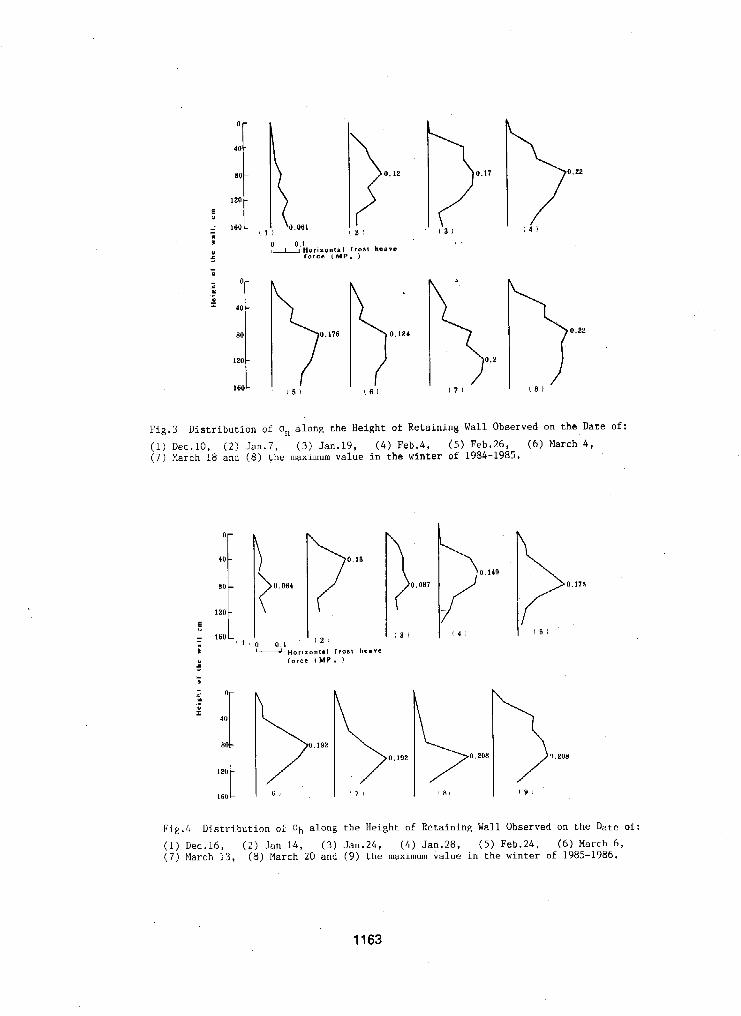
0.12
1 2 '
- 0-
II
u = 40-
80 -
I20 -
180 -
0.176
1 5 1 ?;+ 0.124
1 6 1 ;:. 0.2
Fig . ? Distribution of On along the Height of Retaining Wall Observed on the Date o f :
(1) Dec.10, ( 2 ) Jan.7, ( 3 ) Jan.19, ( 4 ) Feb.4, ( 5 ) Feb.26, (6) March 4, (7 ) March 18 a n d (8) the maximum value in the winter of 1984-1985.
80
120 4:t \ 0.084 0.175
1 5 1
Fig.4 Distribution 0: Uh along the Height of Rctakning Wall Observed un the Date of: (1) Dec.16, (2) Jan 14, ( 3 ) Jan.24, (4) Jan.28, ( 5 ) Feb.24, ( 6 ) March 6 , ( 7 ) March 13, ( 8 ) March 20 and (9 ) the maximum value in the winter of 1985-1986.
1163
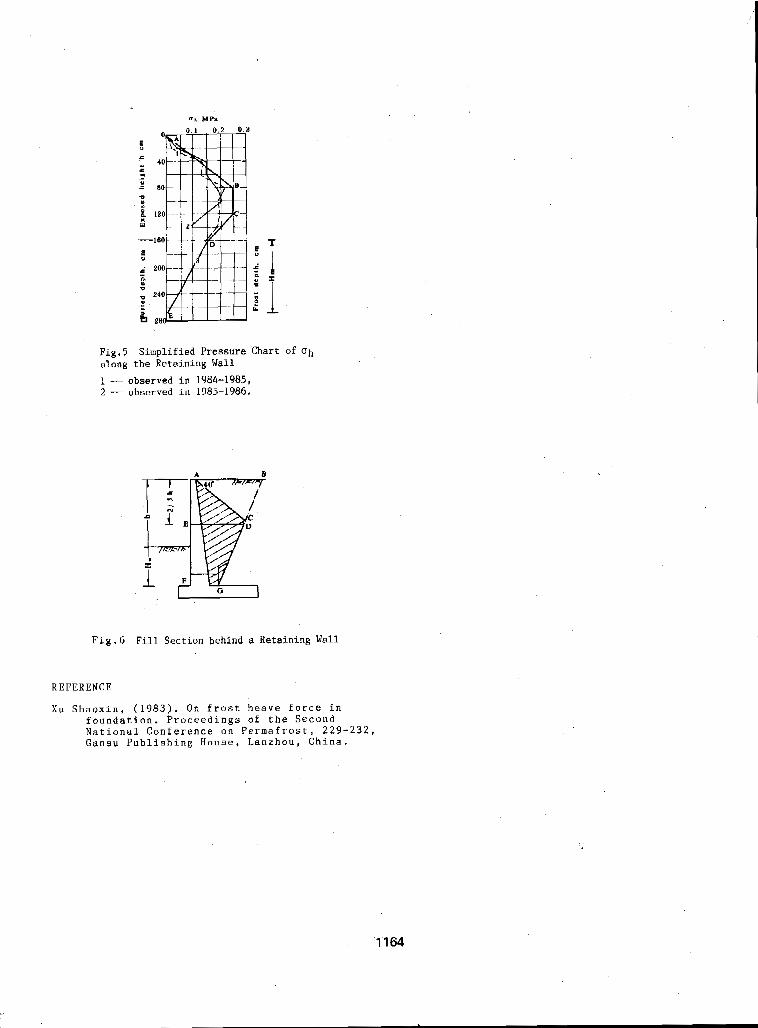
0
W
0 u
Fig.5 Simplified Pressure Chart of Oh along the Retaining Wall 1 - observed in 1984-1985, 2 - observed in 1985-1986.
A B
-
Fig.6 Fill Section behind a Retaining Wall
REFERENCE
Xu Shaoxin, (1983). On frost heave f o r c e in foundation. Proceedings of the Sccond National Conference on Permafrost, 229-232, Gansu Publishing House, Lanzhou, China.
1164
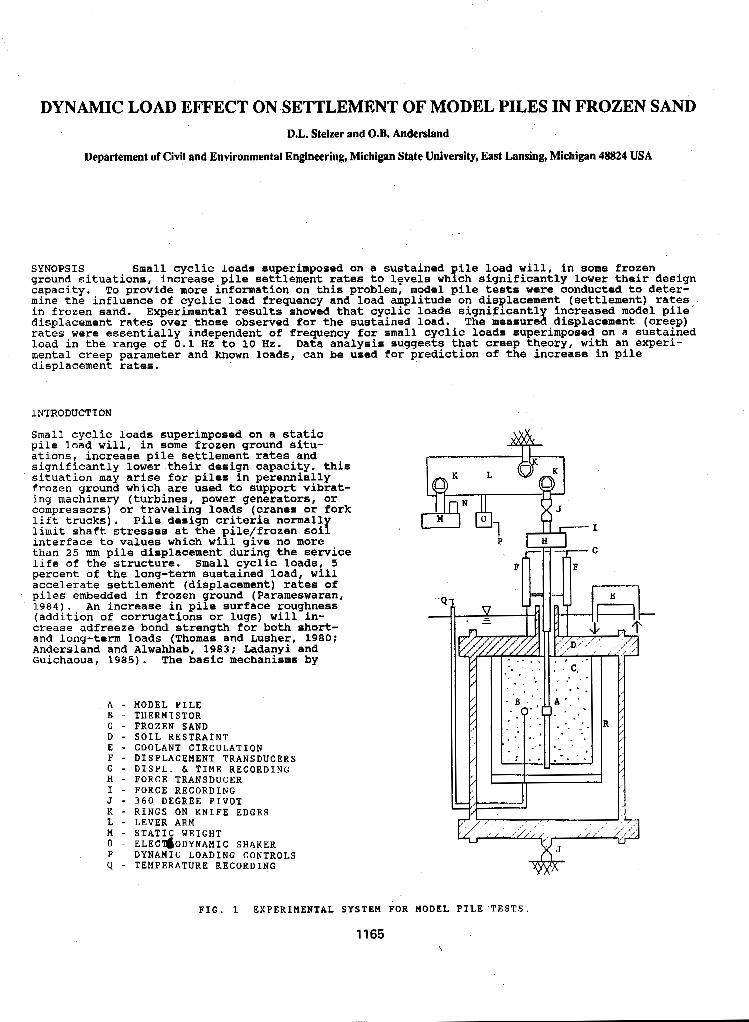
DYNAMIC LOAD EFFECT ON SETTLEMENT OF MODEL PILES IN FROZEN SAND D.L. Stelzer and O.B. Andersland
Departement of Civil and Environmental Engineering, Michigan State University, East Lansing, Michigan 48824 USA
SYNOPSIS Small cyclic loads superimposed on a sustained ile load will, in some frozen ground situations, increase pile settlement rates to lFvels whfch significantly lower their design
mine the influence of cyclic load frequency and load amplitude on displacement (settlement) rates I
capacity. To provide more information on this problem, model pile tests were conducted to deter-
in frozen sand. Experimental results showed that cyclic loads significantly increased model pile displacement rates over those observed for the sustained load. The measured displacement (creep) rates were essentially independent of frequency for small cyclic loads superimposed on a sustained load in the range of 0.1 Hz to 10 Hz. Data analysis suggests that creep theory, with an experi- mental creep parameter and known loads, can be used for prediction of the increase in pile displacement rates.
INT'RODUCTLON
Small cyclic loads superimposed on a static pile load will, in some frozen ground situ- ations, increase pile settlement rates and significantly lower their design capacity. this situation may arise fqr piles in perennially frozen ground which are used to support vibrat- ing machinery (turbines, power generators, or compressors) or traveling loads (cranes or fork lift trucks). Pile design criteria normally limit shaft stresses at the pile/frozen soil interface to values which will give no more than 25 mm pile displacement aurin the service life of the structure. Small cycl?c loads, 5 percent o f the long-term sustained load, will accelerate settlement (displacement) rates of piles embedded in frozen ground (Parameswaran, 1984). An increase in pile surface roughness (addition of corrugations or lugs) will in- crease adfreeze bond strength for both short- and long-term loads (Thomas and Lusher, 1980; Andersland and Alwahhab, 1983; Ladanyi and Guichaoua, 1985). The basic mechanisms by
A - MODEL PILE B ~ THERMISTOR C - FROZEN SAND D - SOIL RESTRAINT E - COOLANT CIRCULATION F - DISPLACEMENT TRANSDUCERS
H - FORCE TRANSDUCER G - DISPL. & TIME RECORDING
I - FORCE RECORDING J - 360 DEGREE PIVOT K - RINGS ON KNIFE EDGES L - LEVER ARM M - STATIC WEIGHT 0 - ELECdODYNAMIC SHAKER
Q - TEMPERATURE RECORDING p - DYNAMIC LOADING CONTROLS
FIG. 1 EXPERIMENTAL SYSTEM FOR MODEL PILE TESTS.
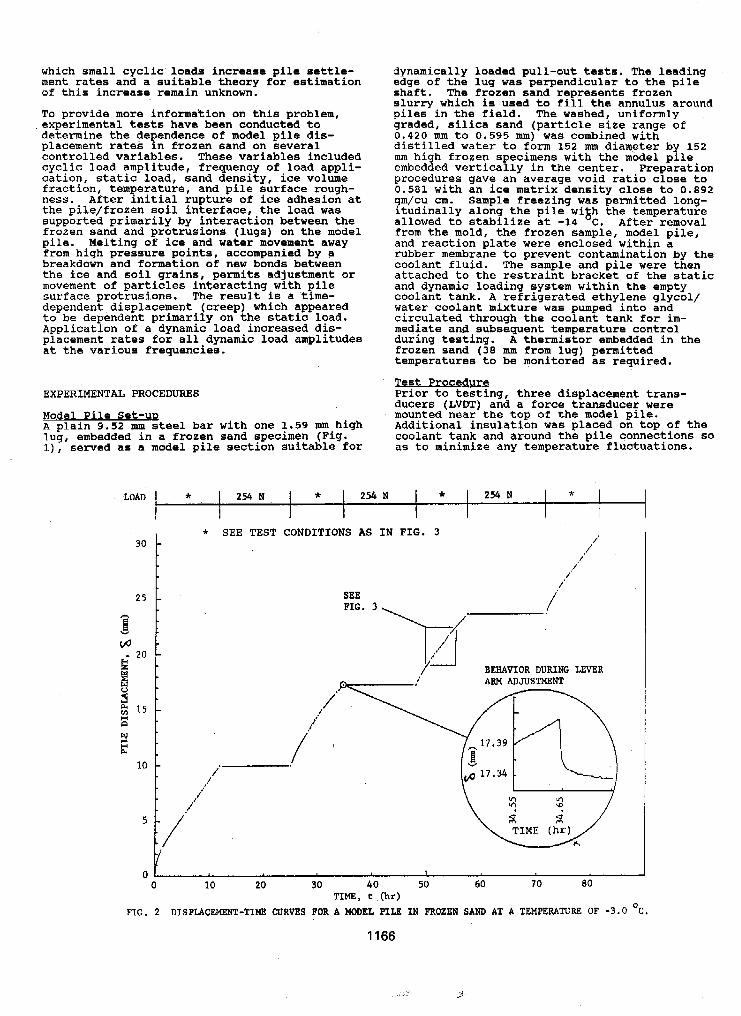
which small cyclic loads increase pile settle- ment rates and a suitable theory for estimation of this increase remain unknown.
To provide more information on this problem,
determine the de endence of model pile dis- experimental tests have been conducted to
placement rate& Tn f,rozen sand on several controlled variables. These variables included cyclic load amplitude, frequency of load appli- cation. static load, sand density, ice volume
ness. After iliitial rupture of ice adhesion at fraction, temperature, and pile surface rough-
the pile/frozen soil interface, the load was supported primarily by interaction between the frozen sand and protrusions (lugs) on the model pile. Melting o f ice and water movement away from high pressure points, accompanied by a breakdown and formation of new bonds between
movement of particles interacting with the ice and soil grains, permits adjustment or
dependent displacement (creep) which appeared
Application of a dynamic load increased dis- to be dependent primarily on the static load.
placement rates for all dynamic load amplitudes at the various frequencies.
EXPERIMENTAL PROCEDURES
A plain 9.52 mm steel bar with one 1.59 mm high Model Pile Set-ug
lug, embedded in a frozen sand specimen (Fig. I), served as a model pile section suitable for
dynamically loaded pull-out tests. The leading edge of the lug was perpendicular to the pile shaft . The frozen sand represents frozen slurry which is used to fill the annulus around piles in the field. The washed, uniformly graded, silica sand (particle size range of 0 .420 mm to 0.595 nun) was combined with distilled water to form 152 mm dialpeter by 152 mm high frozen specimens with the model pile embedded vertically in the center. Preparation procedures gave an average void ratio close to 0.581 with an ice matrix density close to 0.892 gm/cu cm. Sample freezing was permitted long-
allowed to stabilize at -14 C. After removal itudinally along the p i l e wigh the temperature
and reaction plate were enclosed within a from the mold, the frozen sample, model pile,
rubber membrane to prevent contamination by the coolant fluid. The sample and pile were then attached to the restraint bracket o f the static and dynamic loading system within the empty coolant tank. A refrigerated ethylene glycol/ water coolant mixture was pumped into and
mediate and subsequent temperature control circulated through the coolant tank for im-
during testing. A thermistor embedded in the frozen sand (38 mm from lug) permitted temperatures to be monitored a8 required.
m n g , three displacement trans- ducers (LVDT) and a force transducer were mounted near the top of the model pile. Additional insulation was placed on top of the coolant tank and around the pile connections so as to minimize any temperature fluctuations.
LoAD * I 254 N I * 1 254 N * I 254 N * I I 1
I * SEE TEST CONDITIONS AS IN FIG. 3
/'
- SEE FIG. 3
- BEHAVIOR DURING LEVER ARM ADJUSTMENT
- /* .'
/*
,,"
i/" J
0 10 20 30 40 50 60 70 80 TIME, t ,(hr)
FIG. 2 DISPLACEMENT-TIHE CURVES FOR A MODEL RILE IN FROZEN SAND AT A TEMPERATURE OF -3.0 'C.
1166
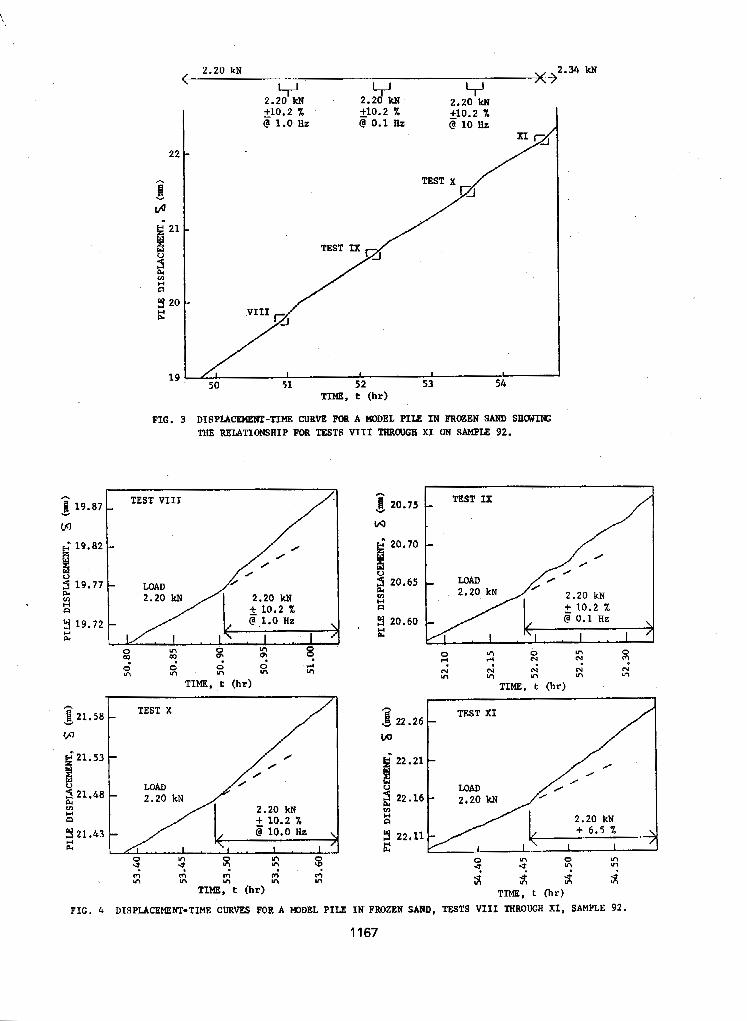
< 2.20 kN 2.34 kN
LJ LJ hJ n
2.20' ICN 2.26 m 2.2O'kU 5 0 . 2 x +10.2 7. @ 1.0 Hz $ 0.1 Hz
+10.2 x @ 10 Hz
50 5 1 52 53 54 TIME, t (hr)
FIG. 3 DISPUCEMENT-TIHE CURVE FOB A MODEL PIE3 'IN FROZEN SAND SBWING THE RELATIONSHIP FOR TESTS VI11 THR(I1GB XI ON SAMPLE 92.
/
TIME. t (hr)
3 21.58 w Y t g21.53
3 21.48 n f 8 m CI
321*43 E t
TEST X
2.20 kN
0 -f r 0
r? ":
VI YI 3
Wt ul 3 m m VI ul
m
TIME, t (hr)
3 20.75
W t TEST IX Y
E 20.70
3 20.65
n
9 20.60
m H
E
AD 2.20 kN
V
FIG. 4 DISPLACEMENT-TIME CURVES FOR A MODEL PILE IN FROZEN SAID, TESTS VI11 THROUGH XI, SAMPLE 92.
1167
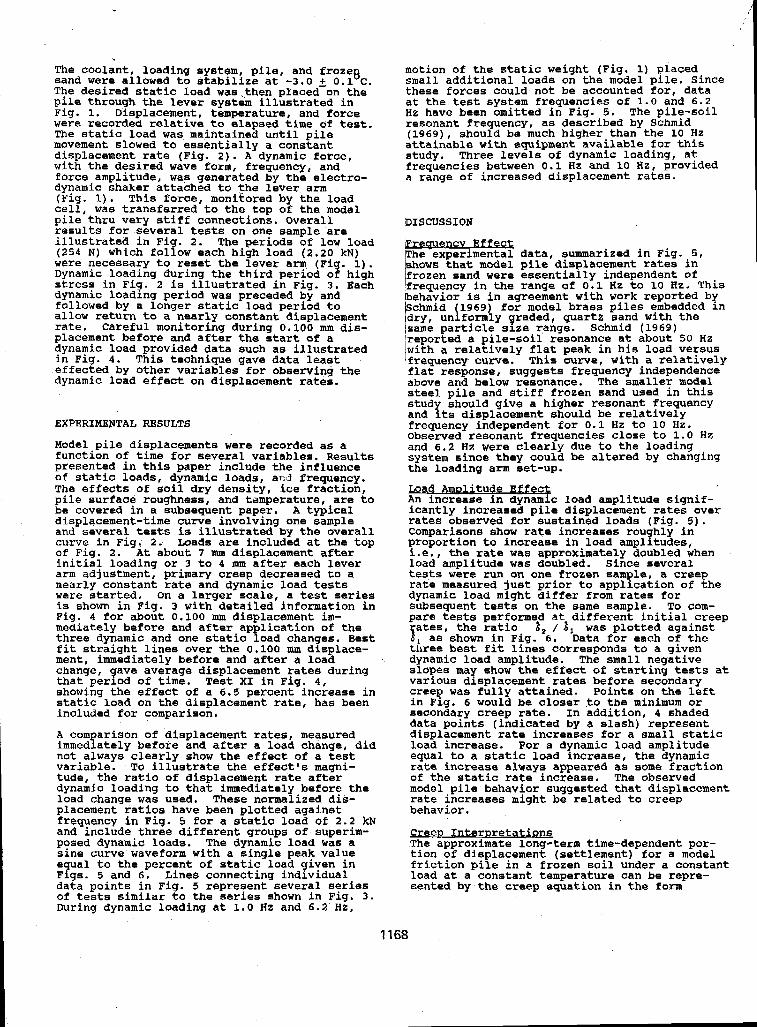
The coolant, loading system, pile, and froze8 sand were allowed to stabilize at -3.0 & 0.1 C . The desired static load was,then placed on the pile through the lever system illustrated in
were recorded relative to elapsed time of test. Fig. 1. Displacement, temperature, and force
movement slowed to essentially a constant The static load was maintained until pile
with the desired wave form, frequency, and displacement rate (Fig. 2). A dynamic force,
dynamic shaker attached to the lover arm force amplitude, was generated by the electro-
(Fig. 1). This force, monikored by the load cell, was transferred to the top of the model pile thru very stiff connectians. Overall results for several tests on one sample are illustrated in Fig. 2. The periods of low load (254 N) which follow each high load (2.20 kN) were necessary to reset the lever arm (Fig. 1). Dynamic loading during the third period of high
dynamic loading period was preceded by and stress in F i q . 2 18 illustrated in Fig. 3. Each
allow return to a nearly constant displacement followed by a longer static load period to
placement before and after the start of a rate. Careful monitoring during 0.100 mm dis- dynamic load provided data such as illustrated in Fig. 4. This technique gave data least
dynamic load effect on displacement rates. effected by other variables for observing the
EXPERIMENTAL RESULTS
Model pile displacements were recorded as a function of time for several variables. Results presented in this paper include the influence of static loads, dynamic loads, ar:,3 frequency. The effects o f soil dry density, ice fraction, pile surface roughness, and temperature, are to be covered in a subsequent paper. A typical displacement-time curve involving one sample and several tests is illustrated by the overall curve in Fig. 2; Loads are included at the top of Fig. 2. At about 7 mm displacement after initial loading or 3 to 4 mm after each lever arm adjustment, primary creep decreased to a nearly constant rate and dynamic load tests were started. on a larger scale, a test series is shown in Fig. 3 with detailed information in
mediately before and after application of the Fig. 4 for about 0.100 mm displacement im- three dynamic and one static load changes. Beat fit straight lines over the 0.100 mm displace- ment, immediately before and after a load change, ave average displacement rates during that perfod of time. Test XI in Fig. 4 , showing the effect of a 6.5 percent increase in static load on the displacement rate, has been included for comparison.
A com arison of displacement rates, measured immedfately before and after a load change, did
variable. To illustrate the effect's magni- not always clearly show the effect of a test
tude, the ratio of displacement rate after dynamic loading to that immediately before the
placement ratios have been plotted against load change was used. These normalized dis-
and include three different groups of superim- frequency in Fig. 5 for a static load of 2.2 )rN
posed dynamic loads. The dynamic load was a sine curve waveform with a single peak value e ual to the percent of static load given in Fygs. 5 and 6. Lines connecting individual data points in ~ i g . 5 represent several series of tests similar to the series shown in Fig. 3. During dynamic loading a t 1.0 Hz and 6.2 HZ,
motion of the static weight (Fig. 1) placed
these forces could not be accounted for, data small additional loads on the model pile. Since
Hz have been omitted in Fig. 5. The pile-soil at the test system frequencies of 1.0 and 6.2
resonant frequency, as described by Schmid
attainable with equipment available for this (1969), should be much higher than the 10 Hz
study. Three levels of dynamic loading, at
a range of increased displacement rates. frequencies between 0.1 Hz and 10 Hz, provided
;DISCUSSION
the experimental data, summarized in Fig. 5, lshows that model pile displacement rates in frozen sand were essentially independent of /frequency in the range of 0.1 Hz to 10 Hz. This lbehavior is in agreement with work reported b
same particle size range. Schmid (1969) Ireported a pile-soil resonance at about 50 Hz with a relatively flat peak in his load versus lfrequency curve. This curve, with a relatively
above and below resonance. The smaller model flat response, suggests frequency independence
steel pile and stiff frdzen sand used in this stud should give a higher resonant frequency and 'its displacement should be relatively
Observed resonant frequencies close to 1.0 Hz frequency independent for 0.1 Hz to 10 HZ.
and 6.2 HZ were clearly due to the loading
the Loading arm set-up. system since they could be altered by changing
An increase in Uynamic load amplitude signif- icantly increased pile displacement rates over rates observed for sustained loads (Fig. 5). Comparisons show rate increases rou hly in proportion to increase in load ampl?tudes, i.e., the rate was approximately doubled when load amplitude was doubled. Since several tests were run on one frozen Sam le, a creep
dynamic load might differ from rates for rate measured just prior to applycation of the
pare tests performed at different initial creep subsequent tests on the same sample. To com-
rates, the ratio b , / b , was plotted against
three best fit lines corresponds to a given 6, as shown in Fig. 6. Data for each of the
dynamic load amplitude. The small negative
various displacement rates before secondary slopes may show the effect of starting tests at
creep was fully attained. Points on the left in Fig. 6 would be closer ,to the minimum or secondary creep rate. In addition, 4 shaded data points (indicated by a slash) represent displacement rate increases for a small static load increase. For a d namic load amplitude equal to a static load Increase, the dynamic rate increase always appeared as some fraction
model pile behavior suggested that displacement of the static rate increase. The observed
behavior. rate increases might be related to creep
Creee fntere The approximate long-term time-dependent por-
r e t a t i m
tion of displacement (settlement) for a model friction pile in a frozen soil under a constant
sented by the creep equation in the form load at a constant temperature can be repre-
I CY
1969) for model brass piles embedded In formly qraued, quartz sand with the
Amalitude Effed
1168
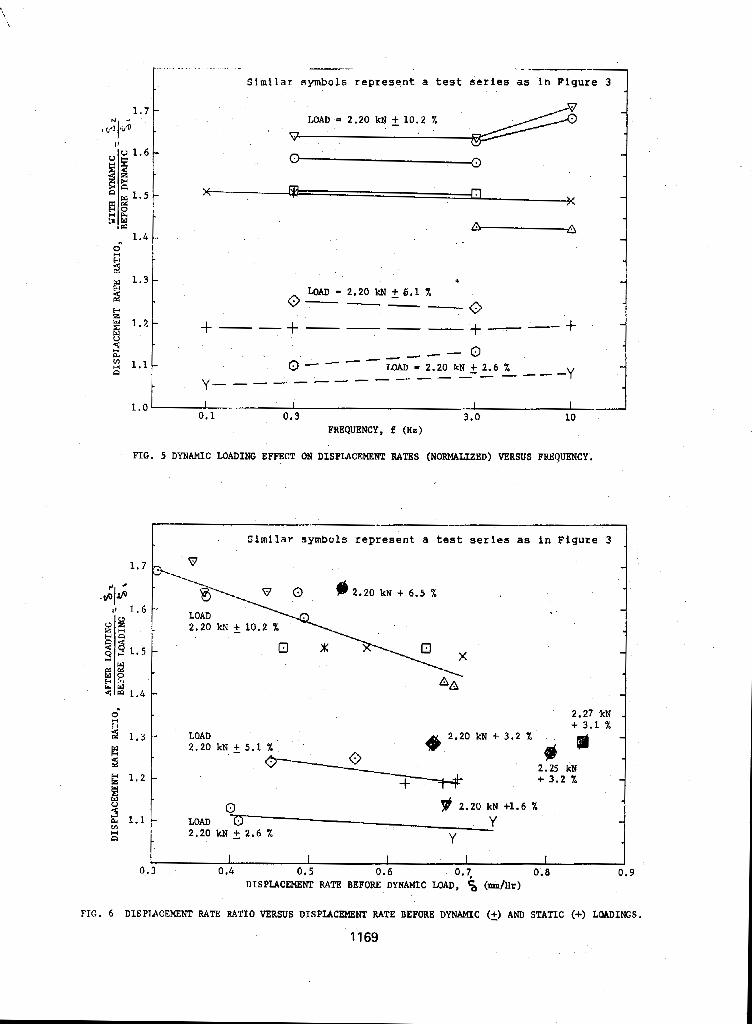
, . . . , .. ""
Similar symbols represent a test series as in Figure 3 _. ."
LOAD = 2.20 kN 10.2 %
w 0 0
X I7 K
4
LOAD - 2.20 kN 2 6.1 ik 0"" 0 +- -+""+--+
h 0°C ""-u
y """""" -"" - 2.20 kN 5 2.6 9: -Y
I I I I 0.1 0.3 3.0 10
FREQUENCY, E (He)
FIG. 5 DYNAMIC LOADING EFFECT ON DISPLACEMENT RATES (NORMALIZED) VERSUS FREQUENCY.
Slmllar symbols represent a t e s t s e r i e s as in Figure 3
1.7
2.27 kN + 3.1 %
LOAD 2.20 k N 5 5.1 %
G 0 d 2.25 kN + 3.2 9:
CI 9 2.20 kN +1.6 7. - LOAD 0 Y 2.20 k N f 2.6 % Y
\ I I I I I 0.3 0.4 0.5 0 . 6 0.7, 0.8
DISPLACEMENT RATE BEFORE DYNAMIC LOAD, 5 (m/Hr) 9
FIG. 6 DISPIACEKENT RATE RATIO VERSUS DISPLACEMENT RATE BEFORE DYNAMXC (2) AND STATIC (+) LOADINGS.
1169
6 - 6, F.1" e
where b i s a reference creep rate correspond-
t is time, and n a Cree& parameter, The model ing to h e proof load P , P is the pile load, pile load can be readily converted to a shear stress by dividing by the pile surface area. Differentiation of equation (1) with respect to time gives the displacement (creep) rate b . For a small increase in load, with other vari- ables constant, the ratio of displacement rates can be expressed in terms of the initial load
thus P i , the new load P,, and the creep parameter n,
Equation (2) may also be obtained from the
Applying equation (2) to the rates represented relationship representing primary creep.
in Fig. 4, test XT, with b , = 0.540 mm/hr,
t 0.065(2.20) = 2.34 IcN gives n = 8.13. Similar 62 = 0.092 mm/hr, P, = 2.20 kN, and Pa = 2.20
computations can be made for the other static load increase data points shown on Fig.-6 with good agreement and an average n close to 8.22.
With frequency effects very small or negli- gible, and load change taken equal to the dynamic load amplitude, calculations with equa- tion (2) using P, = (static load + dynamic load amplitude) , P, , 6 , , and 6, as before, give an average value of n = 4.20 tor all dynamic loads. Examination of Fig. 6 shows a decrease in the displacement rate ratio (6, / 6,) with
before dynamic loading. The slower 6, values an increase in displacement rate immediately
ACKNOWLEDGMENTS
The authors wish to express their appreciation to the National Science Foundation for their support of this research project.
REFERENCES
Andersland, O.B., and Alwahhab, H.R.M. (1983) Lug behavior for model steel piles in frozen sand. PERMAFROST, Proceedings 4th International Conference, National Academy Pxess, Washington, D.C., p. 16-21.
Ladan i, B. , and Guichaoua, A. 1985. Bearing capacrty and settlement of shaped piles in permafrost. Proceedings, 11th International conference on Soil Mechanics and Foundation Engineering, A.A. Balkema, Boston, Vol. 3 , p. 1421-1427.
Parameswaran, V.R. (1984) Effect of dynamic loads on piles in frozen soils. Proceedings, 3rd International Cold Regions Engineering Specialty Conference, Canadian Society for Civil Engineering, Montreal, Canada, Vol. I, p. 41-52.
Schmid, W.E. (1969) Driving resistance and bearing capacity of vibro-driven model piles. PERFORMANCE OF DEEP FOUNDATIONS, American
Technical Publication 444, p. 362-375. society for Testing and Materials, Special
Stelzer, David (in preparation, 1988). Cyclic
sand. Ph.D Dissertation, Michigan State load effects on model pile behavior in frozen
University, East Lansing, Michigan. correspond more closely to secondary creep. For the same loads (PI and P2), the creep Thomas, H.P., and Lusher, U. (1980)
parameter n changed, i-e., n appears to by corrugations. collection of papers from a Improvement of bearing capacity of pipe piles
decreased. Available information indicates increase from about 3.1 to 5.5 as 6 U.S. Soviet Joint Seminar, Leningrad, USSR.
that n does not change for a static load increase applied to the model pile. The range
magnitude of the displacement rate changes for in n values provides an estimate of the
dynamic loading.
CONCLUSIONS
1. A technique has been developed for measure- ment of displacement rate changes due to dynamic loads superimposed on statically loaded model piles. For small static load increases and nonresonant cyclic loading this method appears to be suitable for determination of a creep parameter n.
2. Model pile displacement rates in frozen sand were observed to be essentially independent of frequency for small dynamic loads superimposed on a large static load
3. Cyclic loads significantly increased pile in the range of 0.1 Hz to 10 Hz.
displacement rates over those observed for a sustained load. The magnitude of rate increase was shown to be dependent on amplitude of the cyclic load.
ment rates due to a small cyclic load. The prediction of the change in pile displace-
method does require use of loads and a reduced creep parameter n determined exper- imentally following procedures outlined in this paper.
4 . Creep theory appears to he suitalle for
1170
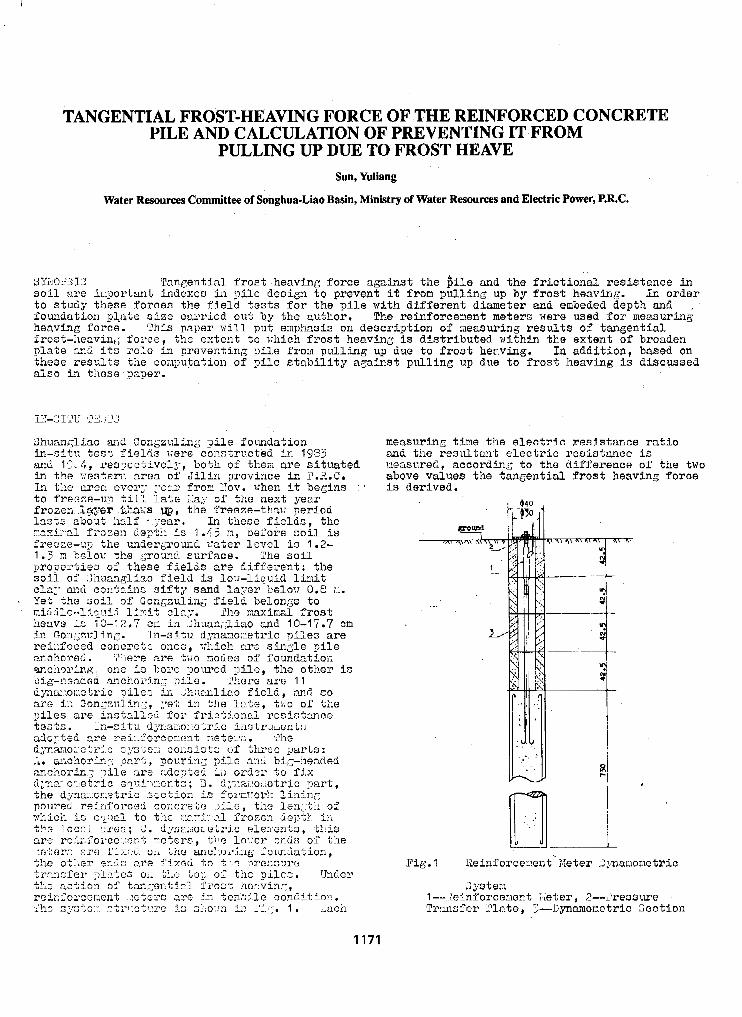
TANGENTIAL FROST-HEAVING FORCE OF THE REINFORCED CONCRETE PILE AND CALCULATION OF PREVENTING IT FROM
PULLING UP DUE TO FROST HEAVE Sun, Yuliang
Water Resources Committee of Songhua-Liao Basin, Ministry of Water Resources and Electric Power, P.R.C.
measuring tinlo the e l ec t r i c r e s i s t a n c e r a t i o and t h o r e 3 u l t a n l e l e c t r i c r e s i s t a n c e i a aeasured, amordin;: t o t h e d i f f e r e n c e o f the two above values t h e t a n e e n t i a l f r o s t hoavhng fo rce i s derived.
1171
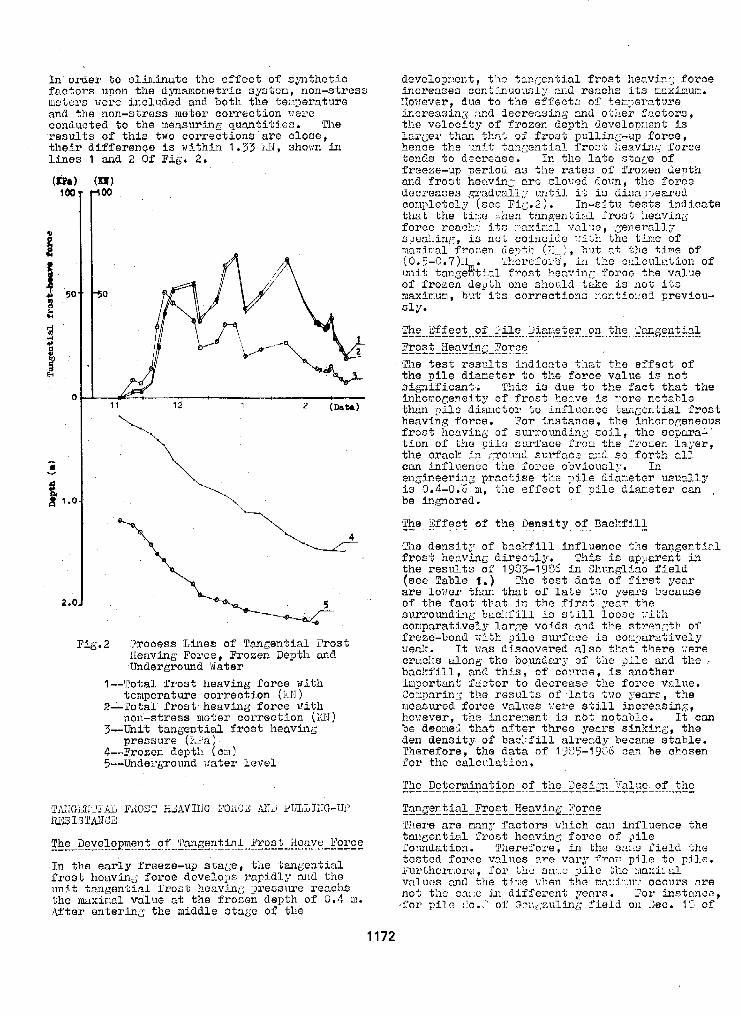
In order t o elirrlj.nnate the e f f e c t o f s:,mthctic factors upon the dmamorletric sp.;tom, non-stress metwo vem Inclu.dcd and. both the te;.:perature and the non-s t ress meter co r roc t ion vert
-renults of t h i s two correct ions a rc clone, conducted t o the xeasu r ing quantifjcz. Tho
t he i r differenpe is within 1.53 i.N, shorrn h l b e s 1 and 2 O f Fig. 2.
IOi
Pig.2 .)recess Lines of Tangent in1 Frost IIanvin,- Polace, Frozen Depth and Underground Water
l--':'otal frost heaving f o r c e with
2--Total f r o s t heaving force r i t h temperature corroct ion (iS1)
non-stress meter corrcctrion ( U ) 3--UnIt tangent ia l frost heaving
4--Prozcn dopth ( e n ) pressure ( 2 . m )
5--Undei3grol~nd m t e r l e v e l
1172
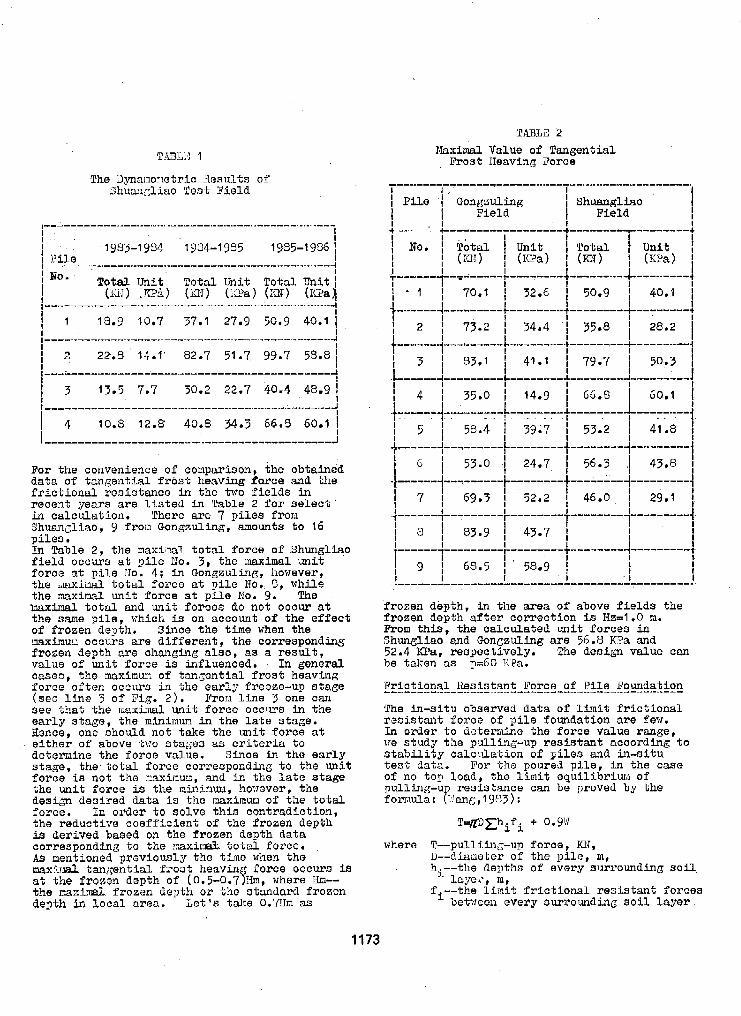
For the convenience of corlparison, the obtained data of tmngoitial f r b s t heaving force and the frictional reaiistance in the two f i e lds in recent yeam a r e Listed in Table 2 f o r s e l e c t Fn calculation. There are 7 piles from Shmn,-liao , 9 f r o u Gongzuling, amounts t o 16
In Table 2 , the naximl t o t a l f o r c e of YhunSliao f i e l d o c c w s a t p i l e Eo. 3, the maxim1 m i t forco st p i l e ITo. 4; fn Gongzuling, liouever, the aaxilml t o t a l force a t p i l e Bo. 5 , while the Laaximl unit force a t p i l e No. 9. The
~~ t o t a l and unit forcos do not occur a t the same p i l e , Irhich is on account o f the e f feo t of frozen de'th. Since the time vhen the m x i n w occurs are d i f fe ren t , the cor respondhe frozen depth a re ohmging also, as a romilt, value of uni t force is influenced. In general cases, tho mxinux o f tmgcnt ia l f rost heaving force o f t e n occurs i n the early freaze-up atage (see l i n e 7 o f Fig. 2) Prou l i n e 3 one can see that the mrirnal unit force occurs in the early stago, the niniixn i n the late staze. Bsnce, one should not take the unit force at e i the r o f above tt:o stakp?s as c r i t e r i a t o deternine the form value. Yinoe in the ear ly stage, the.tot;al force correzpondinz t o the uni t force i s not the ::aximm, and in tho late stage the unit force is the m i n i m u , hovcver, tho deDi@ desired data is tho mximur.~ of t h e t o t a l force. In order to solve thin contradict ion, the reduct ive coeff ic ient of the frozen depth is derived based on the frozen depth data
As mentioned p rcv iou~ ly t ho time when tho corresponding t o tho zaaxir& t o t a l Porcc.
m a x i ~ d t anfpnt ia l fcos t heavin? force occura is a t the frozen depth Qf (0.5-0.77Ih, whore Ih--
depth in local area. L e t ' s tdce 0.71h m tho mxi& . frozen dcpth o r 3-m standard frozen
p i les .
G 1 53.0 I 24.7 I 56.3 I .+"" """"-~""-"-+"""-- I 1 - I I 7 i 69.5 I 52.2 i 46.0.
i 7""""-p"""" i i *---""" t""" I I I
9 I 60.5 j ' 58.9 I i t I I
T I
I
" I I I I
I
t I I
4- I t
"""" t
40.1 I """" *
I 28.2 I
i 50.3 I
,"""" 1 I 60.1 I
. " i. 41.8
1- I I I I _""""""""""""""""""""""-
?roeen depth, in the area of above f i e l d s t h e frozen depth a f te r cor rec t ion is Kz=l.O m. horn t h i s , the aalculated unit forces in Shungliao and Gongzuling a r e 56.8 K?a and 52.4 KPa, respectively. The desi,% value aan be tdcan aa p=G0 Ua.
Frict ional Resis tant Force of P i l e Foundation
The in-situ observed data of limit f r i c t i o n a l ronfstant l'orce o f pile foundation are few. In order t o dctertlinc the force value range, Ire s tudy the pulling-up resis tant according to s t a b i l i t y c a l c u l a t i o n of pi l e s and in-si tu t e s t data. Pox the poured p i l e , i n the case of no t o p l oad , tho limit equilibrium of pulling-u resistance can be proved by the forr.lula: ?,!an!;, I ~ 3 ) :
i "" -_l."""""""""""~".*-.-~~~~~~
whom T--pulliing-up fo roe , K L T , U--dinnoter o f t he p i l e , m, h,.--the depths of every surrounding s o i l
fi--the limit f r i c t iona l r e s i s t an t fo rcea ." layo,-, rn,
ketxco:1 every surrounding soil Layer,
1173
and t h e p i l e surt'ace, E a , :/--the weight o f pilo i t f i o l f , K T , for the
underwater part, tzke float urei$it. For p i l e ITo.3 of Shungliao Sio ld vrre corquted the limit pulling-up f r i o t i o n a l resistant force. The diovleter of pile No.3 is 0.45 n vith embedcd depth o f 9 m. According t o the teat data, from Jan, 13,1925, tho p i l e was pulJ.ed-up Lgr:~dmll;r, till Jan. 31 the t a t a l pulling-up mountod t o 6 m. On the b a s i s of the two different frozen depths on Jan. 73 and Jan. 31, t h e aalculatetl r o o u l t s are ad follows: the frozen dopth on Jan. 13 is 0.9 n, p u l l i n p u p foroe is 72 KN, f r i c t iona l r e s i s t a n t form f =4.5IrPa; t h e frozen depth on Jan. 31 is 1 . f 2 m, Julling-up force 1s 79.71Q, f x i c t i o n a l force f =6.4 =a. In order t o o b e a h tho p ~ l l b g - u p f h c t i o n a l r e s i s t a n t force, t h e pull-out tests Were car r ied out at Gongeuling f ie ld . The teated two p i l e s axe i?ith diaMQt9r o f 0.6 m and enbeded depth of 9 r.1. Jn order t o explo i t the n o m 1 f r o s t heave fo roe t o yXLL-out the p i l o , a reinforcod concrate p l a t e w i t h ?Lameter o f 1 m wos fixed onto the top o f the pile. The lover surface of it was againat the ground, tharoforo, p i l e s h a f t w a s pulled-out by the norlllal f r o n t heaving force. According t o the measured pulling-out force, the calculated pulling-up f r i o t i o n d resis tances m e f =9.02 KPa, f =7.30 Ecpa, respeotively. Conpa?ing t h e f r i c h o n d res i s tance f wi$h f2 in Shu~n~liao fTeI.4, f < f . From tde dynmometric anu akfo&tdn measurement reouts one can see that the pulling-up amount o f pf i e foundation on Jan. 13 ~fns 3 m, did not reaoh i t a limit, till Yan. 31 t h e pulling-up amount w a s 6 m, and the pulling-up force of t h e p i l e had already reached its limit, . Themfore, i t i s rational. t o take the valuo of f , that is, t h e de8ign frictional resistant fogce is talcen m f =6 KPa. With the t angent ia l f r o s t heavhg foroe mnd the limit frictkonal. resbtanco, the pulling-up a t a b i l i t y andysL.5 of pile foundat ion can be oarr ied out aacrding t o t h e corresponding c r i t e r i a .
CaNcm IOHS
The teat results of t angent ia l f r o s t heave force of shuangliao and Gongzuling can be applied t o bore-poured reinforced ooncrete pi l e s whose em'ueded parts h f rozen layer are required t o be formwork poured. In order t o avoid t h e effect of normal f r o o t heaving, it is not allowed t o construct crossgirders 19nkinng pile s h a f t s in the f rozen layers o r on the ground surface. Tho reinforcement bars s h o d d s t ra fch to the ~ O W W end of the pfie in order to mect the pulling-up atrongth roquiromenfs. From the r e s u l t s , tre can dratr the concluoions as f ollotm : ( 1 ) Tho reinforced concroto p i l e s at
Shuanglino and Gongzuling f i e l d s are formurar!: poured with.h tho frozen depth, hence tho values of t m z e n t i a l frost heavhg force la dotemined when t h e p i l e s u r f a c e is conpar i t ive ly smooth. As tho average front howin;? rate of tho local areas is 6.9-12.2'X; , tho design value of unit t a g e n t i n 1 f r o s t heavhng force is =60 lii'a, which a m be refered t o for pulh-q-up denign o f p i l e
1 t,74
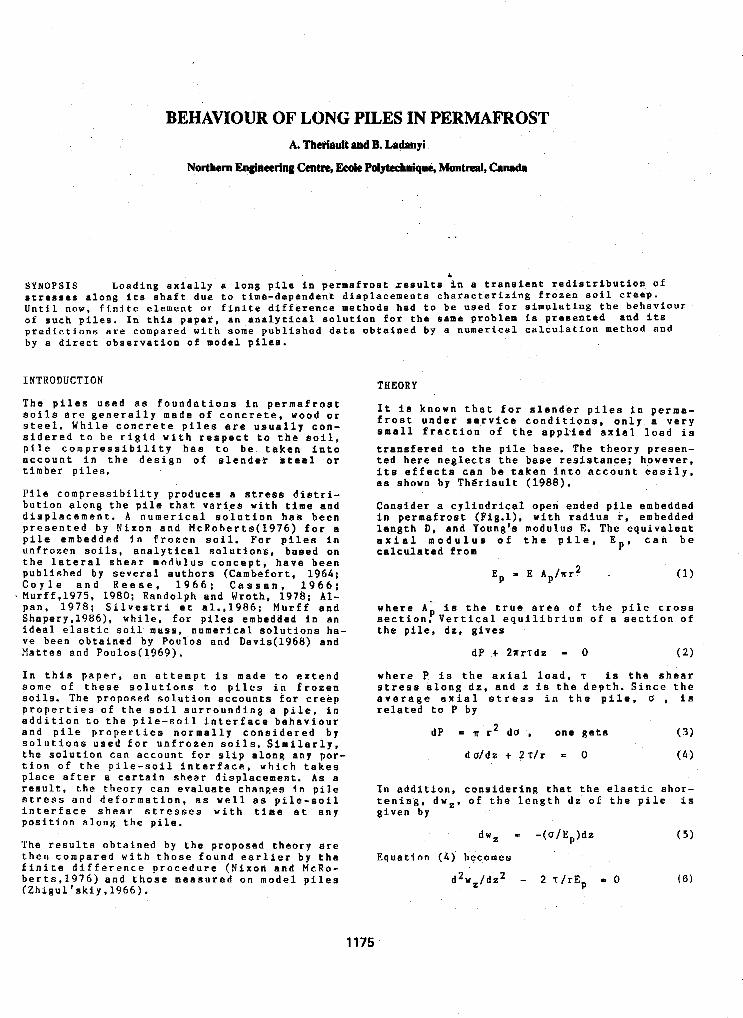
BEHAVIOUR OF LONG PILES IN PERMAFROST A. Theriauft and B. Ladanyi
Northern Engineering Centre, W e Polytecblaque, Montreal, Canada
&
SYNOPSIS L o a d i n g a x i a l l y a l o n g p i l e i n p e r m a f r o s t t e s u l t s i n a transient r e d i s t r i b u t i o n of
U n t i l n o w , f i n i t e e l e m e n t or f i n i t e d i f f e r e n c e methods had t o be u s e d f o r s i m u l a t i n g t h e b e h a v i o u r I
s t r e s s e s a l o n g i t s s h a f t d u e t o t i m e - d e p e n d e n t d i s p l a c e m e n t s c h a r a c t e r i z i n g f r o z e n s o i l c r e e p .
o f s u c h p i l e s . I n this p a p e r , an a n a l y t i c a l s o l u t i o n f o r t h e $ame p r o b l e m i s p r e s e n t e d a n d i t s p r e d i c t i o n s n r e c o m p a r e d w i t h s o m e p u b l i a h a d d a t a o b t a i n e d b y a n u m e r i c a l c a l c u l a t i o n method a n d by a d i r e c t o b s e r v a t i o n o f m o d e l p i l e s .
INTRODUCTION
T h e p i l e s u s e d a s f o u n d a t i o n s i n p e r m a f r o s t s o i l s a r e g e n e r a l l y m a d e o f c o n c r e t e , w o o d o r s t e e l . W h i l e c o n c r e t e p i l e s a r e u s u a l l y c o n - s i d e r e d t o b e r i g i d w i t h r e s p e c t t o t h e s o i l , p i l e c o m p r e s s i b i l i t y h a s t o b e t a k e n i n t o a c c o u n t i n t h e d e s i g n o f s l e n d e r s t e e l or t i m b e r p i l e s .
P i l e c o m p r e s s i b i l i t y p r o d u c e s a stress d f r t r i - b u t i o n a l o n g t h e p i l e t h a t v a r i e s w i t h t ime a n d d i s p l a c e m e n t . A n u m e r i c a l s o l u t i o n h a s b e e n p r e s e n t e d b y N i x o n a n d M c R o b e r t s ( l 9 7 6 ) f o r a p i l e e m b e d d e d i n f r o z e n s o i l . For p i l e s i n u n f r o z e n soils, a n a l y t i c a l s o l u t i o n s , b a a e d o n t h e l a t e r a l s h e a r m o d h l u s c o n c e p t , h a v e b e e n p u b l i s h e d by s e v e r a l a u t h o r s ( C a m b e f o r t , 1 9 6 4 ; C o y l e a n d R e e s e . 1 9 6 6 ; C a s s a n , 1 9 6 6 ; M u r f f , 1 9 7 5 , 1 9 8 0 ; R a n d o l p h a n d W r o t h , 1 9 7 8 ; A l - p a n , 1 9 7 8 ; S i l v e s t r i e t a1.,1986; M u r f f a n d S h a p e r y . l 9 8 6 ) , w h i l e , f o r p i l e s e m b e d d e d i n a n i d e a l e l a s t i c s o i l mass. n u m e r i c a l s o l u t i o n s h a - v e b e e n o b t a i n e d b y P o u l o s a n d D a v i s ( 1 9 6 8 ) a n d Mattes a n d P o u l o s ( 1 9 6 9 ) .
I n t h i s p a p e r , a n a t t e m p t i s m a d e t o e x t e n d s o m e o f t h e s e s o l u t i o n s t o p i l e s i n f r o z e n s o i l s . T h e p r o p o s e d s o l u t i o n a c c o u n t s f o t c r e e p
a d d i t i o n t o t h e p i l e - s o i l i n t e r f a c e b e h a v i o u r p r o p e r t i e s o f t h e s o i l s u r r o u n d i n g a p i l e , i n
a n d p i l e p r o p e r t i e s n o r m a l l y c o n s i d e r e d b y s o l u t i o n s u s e d f o r u n f r o z e n s o i l s . S i m i l a r l y .
t i o n o f t h e p i l e - s o i l i n t e r f a c e , w h i c h t a k e s t h e s o l u t i o n c a n a c c o u n t for s l i p a l o n g a n y p o r -
p l a c e a f t e r a c e r t a i n s h e a r d i s p l a c e m e n t . As a r e su l t , t h e t h e o r y c a n e v a l u a t e c h a n g e 8 in p i l e s t r e s s a n d d e f o r m a t i o n , a s w e l l a s p i l e - s o i l i n t e r f a c e s h e a r s t r e s s e s w i t h t ime a t a n y p o s i t i o n a l o n g t h e p i l e .
The r e s u l t s o b t a i n e d b y t h e p r o p o s e d t h e o r y a r e t h e n c o m p a r e d w i t h t h o s e f o u n d e a r l i e r b y t h e f i n i t e d i f f e r e n c e p r o c e d u r e ( N i x o n a n d McRo- b e r t s . 1 9 7 6 ) a n d t h o s e m e a s u r e d o n m o d e l p i l e s ( Z h i g u l ' s k i y . 1 9 6 6 ) .
THEORY
I t i s k n o w n t h a t f o r s l e n d e r p i l e s i n p e r m a - f r o s t u n d e r s e r v i c e c o n d i t i o n a , o n l y a v e r y S m a l l f r a c t i o n o f t h e a p p l i e d a x i a l l o a d i s
t r a n s f e r e d t o t h e p i l e b a s e . T h e t h e o r y p r e s e n - t e d here n e g l e c t s t h e b a s e r e s i s t a n c e ; h o w e v e r . i t s e f f e c t s c a n be t a k e n i n t o a c c o u n t e a s i l y . as s h o w n b y T h e r i a u l t (1988).
C o n s i d e r a c y l i n d r i c a l o p e n e n d e d p i l e e m b e d d e d i n p e r m a f r o s t ( F i g . L ) , w i t h r a d i u s t, e m b e d d e d l e n g t h D, a n d Y o u n g ' s m o d u l u s E. T h e e q u i v a l e n t a x i a l m o d u l u s o f t h e p i l e , c a n b e c a l c u l a t e d from E P *
Ep = E Ap/rr2 - (1)
w h e r e A i i s t h e t r u e a r e a o f t h e p i l e c r o s s s e c t i o n . V e r t i c a l e q u i l i b r i u m o f a s e c t i o n o f t h e p i l e , dz , g i v e s
d P t 2 t r ~ d z - 0 ( 2 )
w h e r e P is t h e a x i a l l o a d , T i s t h e s h e a r s t r e s s a l o n g d z , a n d z i s t h e d e p t h . S i n c e t h e a v e r a g e a x i a l s t r e s s i n t h e p i l e , 0 , is r e l a t e d t o P b y
d P = r2 d o , o n e g e t s ( 3 )
d d d z + 2 T / r = 0 ( 4 )
I n a d d i t i o n , c o n s i d e r i n g t h a t t h e e l a s t i c s h o r -
g i v e n by t e n i n g , dw,. o f t h e l e n g t h d z o f t h e p i l e i s
dw, = - ( o / E p ) d z ( 5 )
E q u a t i o n (4) b e c o m e s
d 2 w z / d z 2 - 2 r / r E p 0 ( 6 )
1175
I O P
F i g u r e 1. S c h e m a t i c v a r i a t i o n w i t h t ime o f p i l e
a l o n g t h e s h a f t . s e t t l e m e n t a n d t h e c o r r e s p o n d i n g s h e a r s t r e s s e s
T h i s d i f f e r e n t i a l e q u a t i o n c a n b e i n t e g r a t e d i f t h e v a r i a t i o n o f T a l o n g t h e p i l e s h a f t i s s p e - c i f i e d . A u s u a l a s s u m p t i o n m a d e i n u n f r o z e n s o i l mechanics , i s t h a t f i s a l i n e a r f u n c t i o n o f t h e s h e a r d i s p l a c e m e n t a t t h e s o , i l - p i l e i n t e r f a c e , s, a t t a i n i n g a peak value, T - T m x , when a s l i p o c c u r s a t a g i v e n l i m i t i n g d i s p f a - cement , sf. A f t e r t h e s l i p , T e i t h e r re- m a i n s c o n s t a n t , o r f a l l s t o i t s r e s i d u a l v a l u e ,
I n e v a l u a t i n g t , n o s t p r e s e n t t h e o r i e s limit t h e m s e l v e s t o t h e m o b i l i z a t i o n o f bond a t t h e
, p i l e - s o i l i n t e r f a c e , n e R l e c t i n g t h e d e f o r m a t i - ons o f t h e s u r r o u n d i n g s o i l . I!owever, a s shown
b y J o h n s t o n a n d L a d a n y i ( l 9 7 2 ) f o r p i l e s i n f r o z e n s o i l s , and h y F r a n k ( 1 9 7 4 ) , and Ran- do lph and t . ' r o th ( 1 9 7 8 ) f o r p i l e s i n u n f r o z e n s o i l s , t h i s r e l a t i o n s h i p c a n be e s t a b l i s h e d e a s i l y , u s i n g :he model o f c o n c e n t r i c c y l i n d e r s i n s i m p l e s h e a r .
1 : s i n g t h i s m o d e l a n d a s s u m i n g a p o w e r - l a w s t r e s s - s t r a i n r a t e r e l a t i o n s h i p f o r f r o z e n s o i l i n s i m p l e s h e a r
-7 = - 7 y T y ( 7 )
where T,and T C a r e r e f e r e n c e s h e a r s t r e s s and s h e a r s t r a i n r a t e , r c s p c c t i v c l y . J o h n s t o n a n d L a d a n y i f 1 5 7 2 ) o h t a i n e d f o r a p i l e o f r a d i u s r , and f o r n o - s l i p c o n d i t i o n , t h e f o l l o w i n r : r e l a - t i o n s h i p h e t w e e n t h e s e t t l e m e n t r a t e , 4 = d s / d t a n d t h c s h e a r s t r e s s T a l o n r , t h e s h a f t
Figu're 2 . True (n > 1) and assumed (n = 1 ) mobi- l i z a t i o n of b o n d s t r e n g t h t w i t h s h e a r d i s p l a c e - ment 8 and time t , f o r a p i l e i n p e r m a f r o s t .
Equat ion ( 8 ) can be w r i t t e n a s
I f , i n s t e a d o f s i m p l e s h e a r i n f o r m a t i o n . o n e w a n t s t o u s e t h e r e s u l t s o f t r i a x i a l . c o m p r e s s i o n c r e e p t e s t s , t h e n , a s suming t he va - l i d i t y o f t h e v o n H i s e s l a w , i t can he shown ( L a d a n y l , 1 9 7 2 ) t h a t i n t h e above e q u a t i o n s T C s h o u l d be r e p l a c e d b y
w i t h Tc50c, where b , and uc a r e c reep parame- t e r s I n t h e t r i a x i a l c o m p r e s s i o n c r e e p l a w
where be and ue a r e t h e von Mises equiva len t s t r a i n r a t e and s t r e s s . N o t e t h a t c o n t a i n s t h e e f f e c t o f t e m p e r a t u r e a n d c o n f i n i n g p r e s - s u r e , a s s h o w n b y L a d a n y i ( l 9 7 2 ) . S e g o a n d M o r g e n s t e r n ( 1 9 8 5 ) h a v e s h o w n t h e v a l i d i t y o f Eq.(7) f o r i c e - r i c h soil a n d p o l y c r y s t a l l i n e i c e .
I n a d d i t i o n , i f o n e w a n t s t o u s e Eq.(lO) f o r a l s o r e p r e s e n t i n g t h e p r i m a r y c r e e p , t h i s c a n h e done, u n d e r a t i m e - h a r d e n i n g a s s u m p t i o n . b y r e p l a c i n g i n E q . ( l O ) t h e t i m e t b y a n a p p r o p r i a t e t i m e f u n c t i o n , s a y btb, i n w h i c h c a s e E, i n Eq.(l l) becomes (E,/b) , where h 5 1 . ( L a d a n y i . 1 9 7 5 ) . F i n a l l y , E q . ( l O ) c a n t h e n h e w r i t t e n i n a f ieneral form
Equat ion ( 1 3 ) s h o w s t h a t , f o r a n y R i v e n time t = c o n s t . , T is a n o n l i n e a r f u n c t i o n o f s. I f t h e r e i s no s l i p b e t w e e n t h e p i l e a n d t h e s o i l , s = w z , and s u b s t i t u t i o n of T f rom E q . ( 1 3 ) i n t o Eq.(6) g i v e s
S i n c e , f o r Ion:: t e r n , when c r c e p d i sp lacemen t s where M i s a t i m e - d e p e n d e n t c o e f f i c i e n t . R T C m u c h l a r q c r t h a n i n s t n n t a n e o u s ones
1176
t h e p r o b l e m , s i m i l a r t o t h a t u s e d i n u n f r o z e n s o i l s . h a d t o b e t a k e n . I n t h e l a t t e r , i t i s u s u a l l y a s s u m e d ( F i g . 2 ) t h a t f o r w z < s f , t h e m o b i l i z e d s h e a r s t r e s s i s l i n e a r l y r e l a t e d t o t h e s h e a r d i s p l a c e m e n t a t t h e p i l e - s o i l wz = w [ cosh N( I ) - z ) i n t e r f a c e , s u c h t h a t , f o r w z < s f , o cosh (ND)
wo = (uo/E N ) c o t h (ND) P
g i v i n g w z i n terms o f w o
f 2:)
( 2 4 )
T = (s/sf) Tmax ( 1 5 ) A t t h e m o m e n t w h e n s l i n s t a r t s a t e = 0, w Z i s g i v e n b y Eq.(24), i n w h i c h v 0 =
F o r s = sf, -r = Trnax, b u t f o r s > s f , T 5 -r Sf
w h e n t h e a d h e s i o n b o n d is b r o k e n ( F i g . Z ) , ( s e e a l s o M u r f f , 1980) .
, e v e n t u a l l y f a l l i n g t o ~ ~ ~ ~ i d ~ ~ l , max ( 2 ) S l i p - e v e r y w h e r e s o l u t i o n (w, > s f )
U n d e r t h e s e c o n d i t i o n s . E q . ( G ) c a n h e i n t e - g r a t e d , a n d s e v e r a l a p p r o p r i a t e s o l u t i o n s a r e r e a d i l y a v a i l a b l e i n t h e l i t e r a t u r e . I n o r d e r t o u s e t h e s e s o l u t i o n s f o r a p i l e i n f r o z e n soil, t h e a g i n g t h e o r y o f c r e e p c a n b e a p p l i e d , a s d o n e b y M u r f f a n d S h a p e r y ( l 9 8 6 ) . I n t h i s p a r t i c u l a r case, t h i s c o n s i s t s i n e x p r e s s i n g o n l y Tmax i n E q . ( 1 5 ) a s a f u n c t i o n - o f t i m e a n d t e m p e r a t u r e , a n d i n f i n d i n g s o l u t i o n s f o r a s e r i e s o f i n c r e a s i n g t i m e i n t e r v a l s . F o r a n y g i v e n t ime , ( t = t i > 0 ) , a n d € o r a g i v e n s o i l t e m p e r a t u r e , Eq.(13) g i v e s t h e v a l u e o f ‘Crnax,i, c o r r e s p o n d i n g t o t h e c r i t i c a l ( s l i p ) d i s p l a c e m e n t . s = s F :
S i n c e , f o r s < s f , s = w z , s u b s t i t u t i n g
Eq.(15) into E q . ( 6 ) , t h e l a t t e r b e c o m e s
I n E q . ( 1 8 ) , ( s f ) r e p r e s e n t s a s h e a r r e a c t i o n m o d u l u s , w h i c h i s a f u n c t i o n o f t i m e a n d t e m p e r a t u r e . T h e w e l l k n o w n s o l u t i o n o f Eq.(17) i s
W z = C1 exp(h’z) + C2 exp(-Nz) ( 1 9 )
a n d f r o m E q . ( 5 ) , t h e a x i a l s t r e s s i n t h e p i l e i s
w h e r e C1 a n d C 2 a r e i n t e g r a t i o n c o n s t a n t s t o b e d e t e r m i n e d f r o m t h e h o u n d n r y c o n d i t i o n s . T h e p a r t i c u l a r s o l u t i o n s h a v e t h e f o l l o w i n g f o r m .
( I ) No s l i p s o l u t i o n ( w o < s c )
I f i t i s a s s u m e d t h a t t h e r e i s no s l i p h e t w e e n t h e p i l e a n d t h e s o i l , Rqs.(l?) a n d ( 2 0 ) C a n h r s o l v e d b y i n t r d u c i n g t h e h o u n d a r y c o n d i t i o n s
T h i s y i e l d s ( e . g . , F a r m e r , 1075) (Jz = Uo = P,/nrY a t z = 0 , a n d oz = 0 n t z = D.
cosh N ( D - z) “2 = (‘o/EpN)[ s i n h (ND) 1 ( 2 1 )
u = z ‘ 0 [ s i n h (ND)
sinh N(D - z) 1
A s t h e o t h e r e x t r e m e , w h e n s l i p h a s t a k e n p l a c e
a l o n g t h e w h o l e p i l e l e n g t h , a n d T h a s d r o p p e d t o i t s c o n s t a n t r e s i d u a l v a l u e , 'ere,, E n . ( 1 7 ) b e c o m e s
w h e r e ( T r e s / l m ) i s t h e n e w s h e a r r e a c t i o n m o d u l u s , c o n s t a n t a l o n g t h e p i l e , b u t d e o e n d i n c o n t i m e a n d t e m p e r a t u r e , b e c a u s e T r e S u s u a l l y r e p r e s e n t s a f r a c t i o n o f T ~ ~ ~ ,
I n t e g r a t i n g E q . ( 2 4 ) a n d r e s p e c t i n g t h e b o u n d a r y c o n d i t i o n s t h a t a t z = 0 , wz = w o a n $ d w z / d z = - U o / E p , y i e l d s
I n f a c t , E q . ( 2 6 ) i s v a l i d only w h e n t h e d i s p l a - c e m e n t a t t h e p i l e b a s e h a s a l s o a t t a i n e d t h e c r i t i c a l v a l u e , i . e . , W D = s a t z = D . Jr. t h a t i n s t a n t , t h e s e t t l e m e n t o f t h e p i l e h e a d will he
N o t e t h a t , u n d e r f i e l d c o n d i t i o n s , T~~~ uill t e n d w i t h t i m e t o a f i n i t e v a l u e , a f f e c t e ? b y g r a v i t y s t r e s s e s a n d S e n e r a l l y i n c r e a s i n g \ : i t h d e p t h . A s o l u t i o n f o r s u c h c o n d i t i o n s i n u n f r o - z e n s o i l w a s o b t a i n e d b y S i l v e s t r i e t a l . ( 1 9 R G )
( 3 ) P a r t i a l - s l i p s o l u t i o n ( v o 2 s f )
I n t h a t c a s e . i t i s a s s u m e d t h a t s l i p h a s o c c u r r e d t l o u n t o t h e d e p t h z = 9 f ( F i F . l ) , w h i l e t h e r e i s n o s l i p a l o n g t h e r e s t o f t h e p i l e l e n a t h , ( n - Il ). T h e b o u n d a r y c o n d i t i o n s f o r E q s . ( l 9 ) a n d ( 2 6 ) a r e t h e n : wz = s f a t z = Df, a n d d w , / d z = 0 a t z = n . T h i s g i v e s f o r t h e p o r t i o n o f t h e p i l e b e l o v t h e z o n e o f s l i p (I), < z 4 I?),
1177
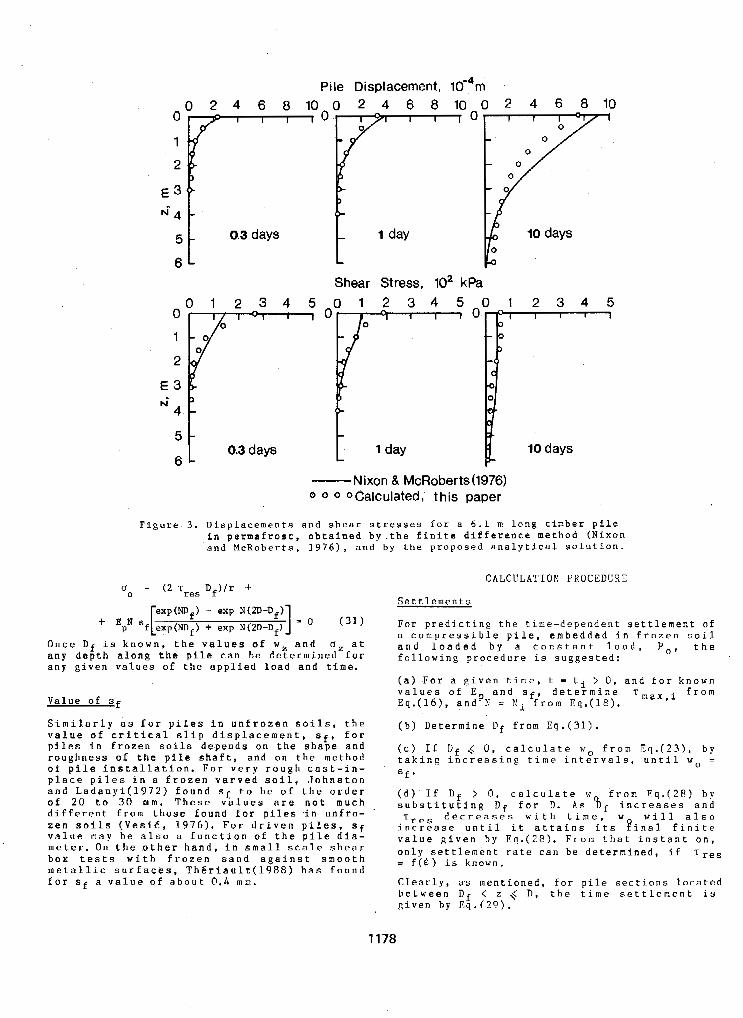
0
1
2
€ 3 G 4
5 6
0 2 4 6 8 1 0
E 0.3 days
0 0 1 2 3 4 5
1 1 - 1 I 1 0
5
6 0.3 days
F i g u r e 3 . Dl. i n
s p l a c e m e n t s p e r m a f r o s t ,
and M c R o b e r t s .
Pile Displacement, IOm4m 0 2 4 6 8 1 0 0 2 4 6 8 1 0
3 t+
- 1 day
- Shear Stress, lo2 kPa 0 1 2 3 4 5 0 1 2 3 4 5
1 I I I O '
I I .
- 1 day -
Nixon & McRoberts(1976) 0 0 0 oCalculated, this paper
and s h e a r s t r e s s e s f o r a 6.1 m l o n g t imber p i l e o b t a i n e d b y . t h e f i n i t e difference m e t h o d (Nixon 1976), and b y t h e p r o p o s e d a n a l y t i c a l s o l u t i o n .
0 - (2 -rres D f ) / r -+
+ exp N(2D-Df) 1 = 0 ( 3 1 )
Once Df i s k n o w n , t h e v a l u e s o f w z a n d u z a t a n y d e p t h a l o n g t h e p i l e c a n b e d e t e r m i n e d f o r any g i v e n v a l u e s o f t h e a p p l i e d l o a d a n d time.
V a l u e o f sf
S i m i l a r l y a s f o r p i l e s i n u n f r o z e n soils, t h e v a l u e o f c r i t i c a l s l i p d i s p l a c e m e n t , sf, f o r p i l e s i n f r o z e n soils d e p e n d s o n t h e s h a p e a n d r o u g h n e s s o f t h e p i l e s h a f t , a n d o n t h e m e t h o d o f p i l e i n s t a l l a t i o n . F o r v e r y r o u g h c a s t - i n - p l a c e p i l e s i n a f r o z e n v a r v e d s o i l , J o h n s t o n a n d L a d a n y i ( l 9 7 2 ) f o u n d s f t o b e o f t h e o r d e r o f 2 0 t o 3 0 r n m . T h e s e v a l u e s a r e n o t m u c h d i f f e r e n t f r o m t h o s e f o u n d €or p i l e s i n u n f r o - z e n s o i l s (VesiE, 1 9 7 6 ) . F o r d r i v e n p i l e s , sf v a l u e may b e a l s o a f u n c t i o n o f t h e p i l e d i a - m e t e r . On t h e o t h e r h a n d , i n s m a l l s c a l e s h e a r b o x t e s t s w j t h f r o z e n s a n d a g a i n s t s m o o t h m e t a l l i c s u r f a c e s , T h E r i a u l t ( l 9 8 8 ) h a s f o u n d f o r sf a v a l u e o f a b o u t 0.4 m m .
CALCULATION PROCEDURE
S e t t l e m e n t s
Fo r p r e d i c t i n g t h e t i m e - d e p e n d e n t s e t t l e m e n t o f a c o m p r e s s i b l e p i l e . e m b e d d e d i n f r o z e n s o i l a n d l o a d e d b y a c o n s t a n t l o a d , P o , t h e f o l l o w i n g p r o c e d u r e is s u g g e s t e d :
( a ) F o r a g i v e n t i m e , t = t i > 0 , a n d f o r k n o w n v a l u e s o f E p a n d sf, d e t e r m i n e T ~ ~ ~ , ~ f r o m E q . ( 1 6 ) , a n d N = K i f r o m E q . ( 1 8 ) .
( b ) D e t e r m i n e Df f r o m Eq.(31).
( c ) I f D f 4 0 , c a l c u l a t e w o f r o m E q . ( 2 3 ) , b y t a k i n s i n c r e a a i n g t i m e i n t e r v a l s , u n t i l w o =
S f *
( d ) I f IIf > 0 . c a l c u l a t e w f r o m F q . ( 2 P ) b y s u b s t i t u t i n g D f f o r D. P.s 8, i n c r e a s e s a n d
T~~~ d e c r e a s e s w i t h t i m e , w will a l s o i n c r e a s e u n t i l i t a t t a i n s i t s P i n a l f i n i t e v a l u e g i v e n b y F q . ( 2 8 ) . F r o m t h a t i n s t a n t o n , only s e t t l e m e n t r a t e c a n b e d e t e r m i n e d , i f = f ( 6 ) is k n o w n .
C l e a r l y , a s m e n t i o n e d , f o r p i l e s e c t i o n s l o c a t e d b e t w e e n D f < z 6 D, t h e t i m e s e t t l e m e n t i s ~ i v e n b y i ? q . ( 2 9 ) .
1178
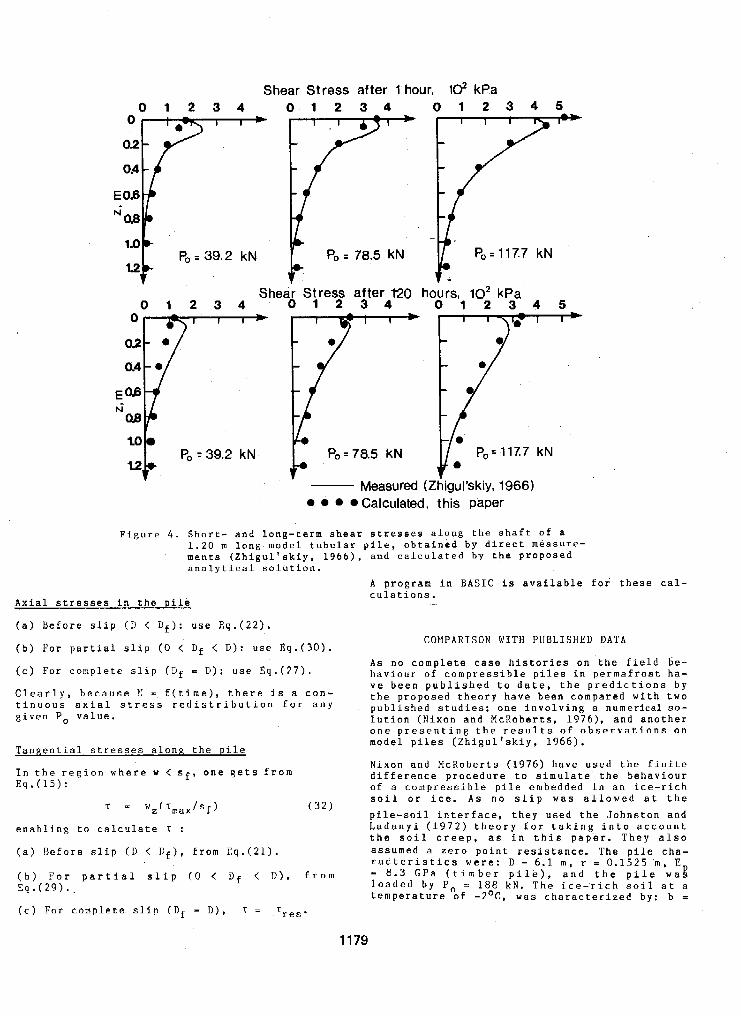
Shear Stress after 1 hour, Id kPa 0 1 2 3 4 0 1 2 3 4 0 1 2 3 4 5
I l ' c
1.0
1.2 Po = 39.2 kN
Shear Stress after l20 hours, lo2 kPa 0 1 2 3 4 0 1 2 3 4 0 1 2 3 4 5
t o Po = 39.2 kN
1.2p I+ 78.5 kN
tf 0 1 2 3 4 4 5
T 1
Measured (Zkgul'skiy, 1966) Calculated, this paper
F i g u r e 4 . S h o r t - a n d l o n g - t e r m a h e a r stresses a l o n g t h e s h a f t o f a 1 . 2 0 m l o n g m o d e l t u b u l a r p i l e , o b t a i n e d b y d i r e c t measure- m e n t s ( Z h i g u l ' s k i y , 1966), a n d c a l c u l a t e d b y t h e p r o p o s e d a n a l y t i c a l solution.
A p r o g r a m i n BASIC is a v a i l a h l e f o r t h e s e c a l -
A x i a l s t r e s s e s i n t h e p i l e c u l a t i o n s .
( a ) B e f o r e s l i p (D < Df): u s e Eq.(22).
(b) For p a r t i a l s l i p ( 0 < D f < D ) : u s e F , q . ( 3 0 ) . COMPARISON WITH PUBLISHED DATA
( c ) F o r c o m p l e t e s l i p ( D f = D ) : u s e Eq.(27). As n o c o m p l e t e c a s e h i s t o r i e s o n t h e f i e l d $e- h a v i o u r of c o m o r e s s i b l e p i l e s i n p e r m a f r o s t h a -
C l e a r l y , b e c a u s e !: = € ( t i m e ) . t h e r e i s a con- v e b e e n p u b l i s h e d t o d a t e , t h e p r e d i c t i o n s b y
t i n u o u s a x i a l s t r e s s r e d i s t r i h u t i o n f o r a n y t h e p r o p o s e d t h e o r y h a v e b e e n c o m p a r e d w i t h t w o
g i v e n Po v a l u e , p u b l i s h e d s t u d i e s : o n e i n v o l v i n g a n u m e r i c a l so- l u t i o n ( N i x o n a n d M c R o b e r t s . 1 9 7 6 ) . a n d a n o t h e r o n e resenti in^ t h e r e s u l t s o f o b s e r v a t i o n s o n
T a n g e n t i a l s t r e s s e s a l o n g t h e p i l e m o d e i p i l e s ( Z i i g u l ' s k i y , 1 9 6 6 ) .
I n t h e r e g i o n w h e r e w < s f , o n e g e t s f r o m N i x o n a n d M c R o b e r t s (1976) h a v e u s e d t h e f i n i t e d i f f e r e n c e p r o c e d u r e t o s i m u l a t e t h e b e h a v i o u r o f a c o m p r e s s i b l e p i l e e m b e d d e d i n a n i c e - r i c h s o i l o r i c e . As n o s l i p was a l l o w e d a t t h e
p i l e - s o i l i n t e r f a c e , t h e y u s e d t h e J o h n s t o n a n d e n a b l i n g t o c a l c u l a t e 'I : L a d a n y i (1972) t h e o r y f o r t a k i n g i n t o a c c o u n t
t h e s o i l c r e e p , a s i n t h i s p a p e r . T h e y a l s o ( a ) R e f o r e s l i p ( n < U f ) , f r o m Eq.(21). a s s u m e d a z e r o p o i n t r e s i s t a n c e . T h e p i l e c h a -
r a c t e r i s t i c s were: D = 6.1 m , r = 0 . 1 5 2 5 m , E ( b ) F o r p a r t i a l s l i p ( 0 < D f < TI). f r o m = 8 .3 G P a ( t i m b e r p i l e ) , a n d t h e p i l e w a g
t e m p e r a t u r e o f -2OC, was c h a r a c t e r i z e d b y : b =
Eq.(15):
T = wz' T m a x ' s f ) ( 3 2 )
Eq.(29)." l o a d e d b y P o = 188 kN. T h e i c e - r i c h s o i l a t a
( c ) F o r c o m p l e t e s l i p ( D f = D), T = 'res.
1179
F i g u r e 3 s h o w s a c o m p a r i s o n b e t w e e n t h e f i n i t e d i f f e r e n c e s o l u t i o n ( f u l l l i n e a ) a n d t h e p r o - p o s e d a n a l y t i c a l s o l u t i o n ( p o i n t s ) f o r t h r e e d i f f e r e n t t i m e s a f t e r l o a d a p p l i c a t i o n . A r e a s o n a b l y g o o d a g r e e m e n t c a n b e s e e n i n b o t h t h e d i s p l a c e m e n t s a n d t h e s h e a r s t r e s s e s a l o n g t h e s h a f t .
A s e c o n d c o m p a r i s o n i s b a s e d o n t h e t e s t r e s u l t s o n m o d e l p i l e s , p u b l i s h e d b y Z h i g u l ' s k i y ( l 9 6 6 ) . His t e s t s w e r e m a d e o n t u b u l a r o p e n - e n d e d a l u m i n i u m p i l e s e m b e d d e d i n f r o z e n s a n d . T h e p i l e c h a r a c t e r i s t i c s were: D = 1 . 2 0 m , r - 0.103 m ( w a l l t h i c k n e s s 3 m m ) . A 3 n o p r o p e r t i e s o f t h e f r o z e n s a n d u s e d i n t h e t e s t s h a v e b e e n r e p o r t e d b y t h e a u t h o r , s o m e
T h e r i a u l t ( l 9 8 4 ) f o r a s imi la r f r o z e n f i n e s a n d t y p i c a l v a l u e s o f p a r a m e t e r s , f o u n d b y
( " J o l i e t t e S a n d " ) , h a v e b e e n used i n t h e c a l c u l a t i o n . F o r t h e t e s t t e m p e r a t u r e o f - 3 . 2 O C , t h e s e a r e : b = 0 . 6 7 , n = 4 . 0 , a n d U c = 1390 k P a a t ic = m i n - l . As b e f o r e , i t kraa a s s u m e d t h a t s f = 0.4 mm. F i g u r e 4 s h o w s t h e r e s u l t s o f t h e c o m p a r i s o n f o r b o t h s h o r t - t e r m ( t - 1 h o u r ) h n d l o n g - t e r m ( t - 1 2 0 h o u r s ) t e s t s , a n d f o r t h e a p p l i e d l o a d s o f 3 9 . 2 , 7 8 . 5 , a n d 118 kN, r e s p e c t i v e l y . T h e a g r e e m e n t b e t w e e n t h e o b s e r v a t i o n s ( f u l l l i n e s ) a n d t h e p r e d i c t i o n s ( p o i n t s ) i s B e e n t o b e q u i t e r e a s o n a b l e , k e e p i n g i n m i n d t h a t t h e p r o p e r t i e s o f f r o z e n s a n d u s e d i n t h e t e s t s , a n d t h e value o f s f h a d t o b e t a k e n f r o m o t h e r s o u r c e s . ,
CONCLUSION
A c o m p l e t e a n a l y t i c a l s o l u t i o n f o r a n a x i a l l y l o a d e d c o m p r e s s i b l e p i l e , e m b e d d e d i n f r o z e n s o i l i s p r e s e n t e d . T h e s o l u t i o n a c c o u n t s f o r . c r e e p p r o p e r t i e s o f t h e s o i l , i n a d d i t i o n t o
t h e u s u a l p i l e - s o i l i n t e r f a c e b c h a v i o u r . i n - c l u d i n g s l i p . C o m p a r i s o n b e t w e e n s t r e s s e s a n d d i s p l a c e m e n t s p r e d i c t e d b y t h e p r o p o s e d s o l u t i o n , a n d t h o s e o b t a i n e d e a r l i e r h y a n u - m e r i c a l p r o c e h u r e a n d b y a d i r e c t o b s e r v a t i o n o n m o d e l piles, r e s p e c t i v e l y , s h o w s a s a t i s f a c - t o r y a g r e e m e n t . I t i s n o t e d t h a t a l l n e c e s s a r y c a l c u l a t i o n s c a n b e m a d e o n a P C , u s i n g B A S I C , o r c a n b e p r o g r a m m e d f o r a p o c k e t c a l c u l a t o r .
ACKNOWLEDGEMENT
V o l . 1 7 , . n o ' . 2 0 4 , p i 1 4 6 2 . C a s s a n , X. ( 1 9 6 6 ) . Le t a s s e m e n t d e s p i e u x :
s y n t h e s e d e s r e c h e r c h e s r g c e n t e s e t e s s a i s c o m p a r a t i f s . S o l s - S o i l s , 1.!0.18-19, pp .43- 52.
C o y l e . I{.!,!. B n d R e e s e , L . C . ( 1 9 6 6 ) . L o a d T r a n s f e r f o r A x i a l l y L o a d e d P i l e s i n C l a y . J . o f S o i l ! l e c h . & F o u n d . D i v . , A S C E , V a 1 . 9 2 ,
F a r m e r . I.K. ( 1 9 7 5 ) . S t r e s s D i s t r i b u t i o n a l o n g a R e s i n G r o u t e d R o c k A n c h o r . I n t . J . o f R o c k I 4 e c h . E M i n i n g S c i . , V o 1 . 1 2 . K o . 1 1 . p p . 3 4 7 - 3 5 1 .
J o h n s t o n , G.I!. a n d L a d a n y i , B. ( 1 9 7 2 ) . F i e l d T e s t s o f G r o u t e d r o d A n c h o r s i n P e r m a f r o s t . C a n a d . G e o t e c h . J . , V o 1 . 9 , p p . 1 7 6 - 1 9 4 .
L a d a n y i , B . ( 1 9 7 2 ) . An E n g i n e e r i n g T h e o r y o f C r e e p o f F r o z e n S o i l s . C a n a d . C e o t e c h . . J . .
L a d a n y i , B . ( 1 9 7 5 ) . E e a r i n g C a p a c i t y o f S t r i p
F:o.s112, p p . 1 - 2 6 .
V 0 1 . 9 , p p . 6 3 - 8 0 .
F o o t i n g s i n F r o z e n S o i l s . C a n a d . G e 0 t e c h . J . . V 0 1 . 1 2 , p p . 3 9 3 - 4 0 7 .
M a t t e s , X.S. a n d P o u l o s , R . G . ( l 9 6 9 ) . S e t t l e m e n t o f S i n g l e C o m p r e s s i b l e P i l e . J . o f S o i l K e c h . & F o u n d . C i v . , A S C E , V o 1 . 9 5 , S y ! l , p p . 1 8 9 - 2 0 7 .
M u r f f , J.D. ( 1 9 7 5 ) . R e s p o n s e o f A x i a l l y ! , o a d e d P i l e s . J . o f G e o t e c h . E n g r g . D i v . A S C C ,
M u r f f , J.D. ( 1 9 8 0 ) . P i l e C a p a c i t ! ' i n a S o f t e n i n g S o i l . 1 n t . J . o f K u m e r . ! : A n a l y t . l , l e t h . i n G e o m e c h . , V o l . h , p p . 1 8 5 - 1 3 9 .
b l u r f f , J.D. a n d S c h a p e r y , R . A . ( 1 9 8 6 ) . T i m e D e p e n d e n c e o f A x i a l P i l e R e s p o n s e . 1 n t . S . o f Numer.& A n a l y t . > l e t h . i n G e o m e c h . , V o l . 1 0 , p p . 4 4 9 - 4 5 8 .
N i x o n , J . F . a n d F l c R o b c r t s , E . C . ( 1 9 7 6 ) . A D e s i g n A p p r o a c h f o r P i l e F o u n d a t i o n s i n P e r m a f r o s t . C a n a d . G e o t e c h . 3 . . V o l . l 3 . p p . 4 0 - 5 7 .
P o u l o 8 , B.G. a n d D a v i s , E . H . ( 1 9 6 8 ) . T h e S e t t l e - m e n t n e h a v i o u r o f S i n g l e A x i a l l y L o a d e d I n c o m p r e s s i b l e P i l e s a n d P i e r s . G e o t c c h n i q u e , l e , p p . 3 5 1 - 3 7 1 .
R a n d o l p h , V.F. a n d \ t ! r o t h , C . P . ( 1 9 7 6 ) . A n a l y s i s o f D e f o r m a t i o n o f V e r t i c a l l y L o a d e d P i l e s . J . o f C e o t c c h . E n g r p . D i v . A S C F , Y o 1 . 1 0 4 ,
S e g o , D .C . a n d K o r g e n s t e r n . ? . R . ( 1 9 8 5 ) . P u n c h I n d e n t a t i o n o f P o l y c r y s t a l l i n e I c e . C a n a d . G e o t e c h . J . , V o 1 . 2 2 , p p . 2 2 6 - 2 3 3 .
S i l v e s t r i , V . , C h a p u i s , R.P. a n d S o u l i 6 , P i . ( 1 9 6 6 ) . P r e d i c t i o n o f A x i a l C a p a c i t y o f L o n g P i l e s i n S o . f t C o h e s i v e S o i l s . P r o c . 3 r d I n t . C o n f . o n N u m e r . I . i e t h o d s i n O f f s h o r e P i l i n g , N a n t e s , F r a n c e , p p . 1 9 1 - 200 .
V01.101, G T 3 , p p . 3 5 6 - 3 6 0 .
GT12, p p . 1 4 S 5 - 1 4 8 8 .
T h B r i a u l t ( G u i c h a o u a ) . A . ( 1 9 8 4 ) . C a p a c i t E T h i s w o r k was f i n a n c i a l l y s u p p o r t e d b y t h e g r a n t s A-1801 a n d G-1566 (R. L a d a n y i ) o f t h e
p o r t a n t e d e s p i e u x t r o n c o n i q u c s e t c r e n e l C s . ) : & m o i r e ! . I . S c . . \ . . P c o l e
N a t i o n a l S c i e n c e a n d E n g i n e e r i n g R e s e a r c h P o l y t e c h n i q u e , I l o n t r 6 a l . l l l p . C o u n c i l o f C a n a d a . T h B r i a u l t . A . ( 1 9 8 8 ) . C a p n c i t e p o r t a n t e d e s
p i e u x d a n s ' l e . p e r g e ' l i s o l . ' T h E s e Ph.?.,
REPEREF!!CES P e s i E , A . S . ( 1 9 7 7 ) . D e s i g n o f P i l c F o u n d a t i o n s . E c o l e P o l y t c c h n i q u c , X o n t r e a l , 3 5 0 ~ .
T r a n s p . R e s . C o a r d ; i o n o g r a p h . ! ; ? . C , I ' a s h i n g t o n . 6 8 p . A l p a n , I. ( 1 9 7 8 ) . Dae L a s t - S e t z u n g v e r h a l t e n d e s
E i n z e l p f a h l e s ( L o a d - S e t t l e m e n t I 3 e h a v i o u r Z h i p , u l ' s l : i y , A . A . (1966). E x p e r i r e n t a l I n v e s t i - o f a S i n g l e P i l e ) . n a u i n g e n i e u r , V o 1 . 5 3 , g a t i o n o f t h e S t a t e o f S t r e s s a n d S t r a i n p p . 2 9 3 - 2 9 8 . i n t h c S o i l a r o u n d R P i l c . T ' r o c . E t h
C o n f . o n G e o c r y o l o g y , Y a k u t s k . L'SSR, P a r t 5 , p p . 2 1 1 - 2 2 3 . ( I n R u s s i a n ) .
1180
INVESTIGATION ON TANGENTIAL FROST HEAVING FORCES Tong, Changjiangl, Yu, Chongyunr, and Sun, Weimin2
1Lanzhou Institute of Glaciology and Geocryology, Academia Sinica, China zlnstitute of Daqing Oilfield Construction Design and Research
SYNOPSIS The tangential frost heaving force acting od the lateral surface of foundations depends upon the composition and moisture condition of -the soil, freezing rate and foundation mate- rial. Test results show that silty soil and loam may create the maximum tangential frost heaving force. The tangential frost heaving force increases with increasing moisture content, negative tem- perature and freezing rate of soils and the roughness of the surface of foundations. The tangential force also increases with the rise of the groundwater table. The tangential force varies with the foundation material. It has a maximum value for concrete piles and lower values for steel and wood piles. Test results also show that the tangential frost heaving force does not depend upon the di- ameter o f piles. The design values of tangential frost heaving forces, which were determined based on the susceptibility of soils, are also given in this paper.
INTRODUCTION
In the last 50 to 6 0 years, extensive researches on tangential frost heaving forces acting upon lateral surfaces o f foundation piles in the freezing process have been conducted by many investigators. Since 1965, the authors have , carried o u t a lot of experiments on this subject both in the laboratory and at field stations.In addition, plenty of data on frost heaving forces were obtained by the Wangjia F i e l d Test Station of Heilongjiang Provincial Institute of Water Conservancy, the Qingan Field Test Station of Heilongjiang Provincial Institute of Traffic Science and the Yanjiagong Field Observation Station of Heilongjiang Provincial Institute of Low-Temperature Construction Science. Some achievements have been made in the study on the formation and development o f the tangential frost heaving force and its influencing factors.Design values o f tangential frost'heaving stresses have been proposed, Further research, however, is still needed f o r better, understanding of the mechanism o f formation o f theforce and the inter- action between foundations and frozen ground,as well as stress distribution in frozen ground. This paper discusses some of the test results obtained by the authors and other investigators.
DISCUSSION
Distribution u f Tangential Frost Heaving Stress on Lateral Surface o f a Pile
The experimental results show that the distribu- tion of tangential frost heaving stress o n the lateral surface of a pile is extremely non- uniform during the process o f freezing. The peak value of the stress moves down with the penetration o f the frost front and reaches its maximum value when the frost front drops down to
the 2 / 3 of the maximum penetration depth, a s is shown in Fig.1 (Tong and Guan, 1985a). The var- iation of tangential frost heaving stress at different depths is closely relaeed to soil moisture, temperature and the vo.lume of moisture migration. During the whole process o f freezing, each layer o f soil experiences four stacges: initial freezing, active freezing, cooling and super-cooling. Tangential frost heaving pressure increases chiefly in the 1st and 2nd stapes, and decreases in the 3rd and*hth stages.
Influence of Soil Characteristics on TanRential Frost HeavinR Stress
Under siftrilar thermal and moisture conditions, a decrease in grain size leads to an increase in tangential frost heaving stress. The magnitudes o f the stress for various types of soil are in the order of: silty loam>loam>clay gravel>medium sand>coarse sand (Fig.2). The value o f the stress for saturated coarse sand with 9 8 % grains larger than 0.1 mm i s 95% less than that for the saturated sandy loam. If the content o f the grains smaller than 0.1 mm i s over 30-50% in sand and gravel, the value of the stress for the soil is about 50% greater than that for the pure sand and gravel.
Influence of Soil Moisture on Tangential Frost
Weaving Forces
The experimental evidence shows that in a closed system, the tangential frost heaving stress fur clayey s o i . l s increases with an increase in water content as the water cmtent is greater than the plastic limit, and finally reaches the value o f the tangential stress for ice, a s i s shown in F i g . 3 .
For water contents ranging from Wp t o Wp+l7,the
1181
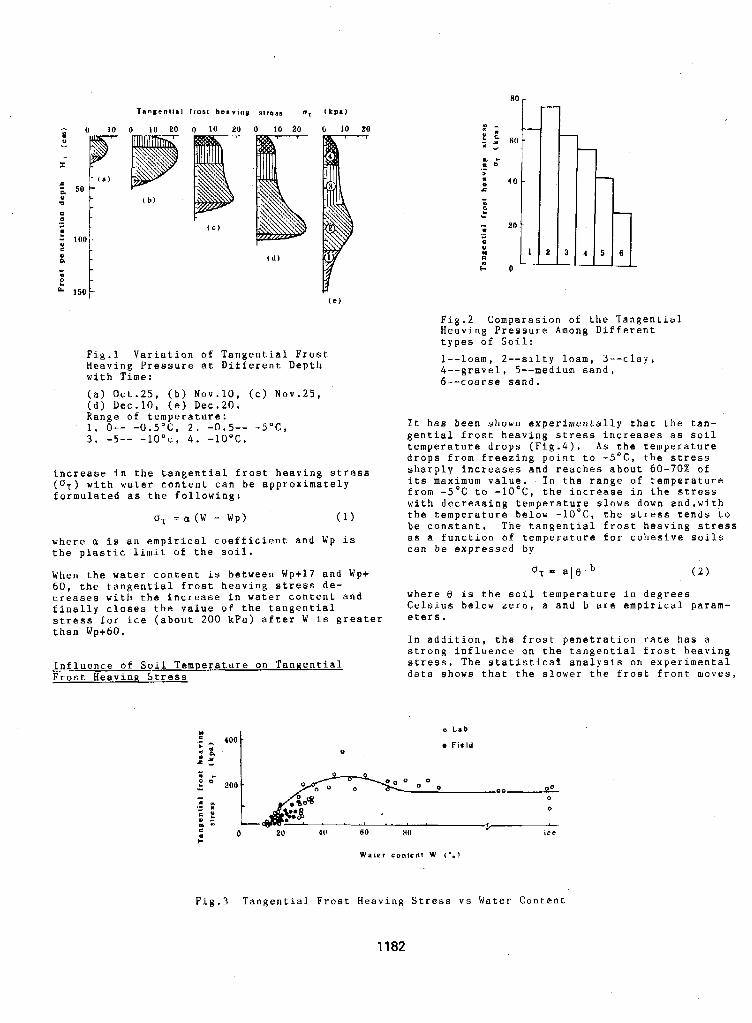
0 c
150, e
0 10 20 0 10 20 0 10 20 (r 10 20
Pig.1 Variation of Tangential F r o s t Heaving Pressure at Different Depth with Time: (a) Oct.25, ( b ) Nov.10, ( c ) H o v . 2 5 , ( d ) Dec.10, ( e ) Dec.20. Range o f temperature: 1. 0" -0 .5 'C, 2 . -0.5" -5"C, 3 , -5" -1O"c, 4 . -10°C.
increase in the t-angential frost heaving stress
formulated a s the following: ( U T ) with water content can be approximately
= a (w - wp) ( 1 )
where a is an empirical coefficient and Wp is the plastic limit of the soil.
When the water content is between Wp+17 and w p t 60, the tangential frost heaving stress de- creases with the increase in water content and finally closes the value of the tangential stress f o r ice (about 200 kPa) after W is greater than Wpt60.
Influence of Soil Temperature on Tangential Frost Heaving Stress
Fig.2 Comparasion of the Tangential Heaving Pressure Among Different types o f Soil: 1--loam, 2--silty loam, 3--clay, 4--gravel, 5--medium sand, 6--coarse sand.
It has been shown experimentally that the tan- gential frost heaving stress increases as soil temperature drops (Fig.4). As the temperature drops from freezing point to -5'C, the stress sharply increases and reaches about 60-70% of its maximum value. In the range of temperature from - 5 O C to -1O'C, the increase in the stress with decreasing temperature slows down and,with the temperature below - l O ° C , the stress tends t o be constant. The tangential frost heaving stress as a €unction of temperature for cohesive soils can be expressed b y
oT = a l g l b ( 2 )
where e is the soil temperature in degrees Celsius below zero, a and b a r e empirical param- eters.
In addition, the frost penetration rate has a strong influence on the tangential frost heaving stress, The statistical analysis on experimental data shows that the slower the frost front m o v e s ,
o L a b
Fie ld
W a t e r c o n t e n t W ( * . I
Fig.3 Tangential Frost Heaving Stress v s Water Content
1182
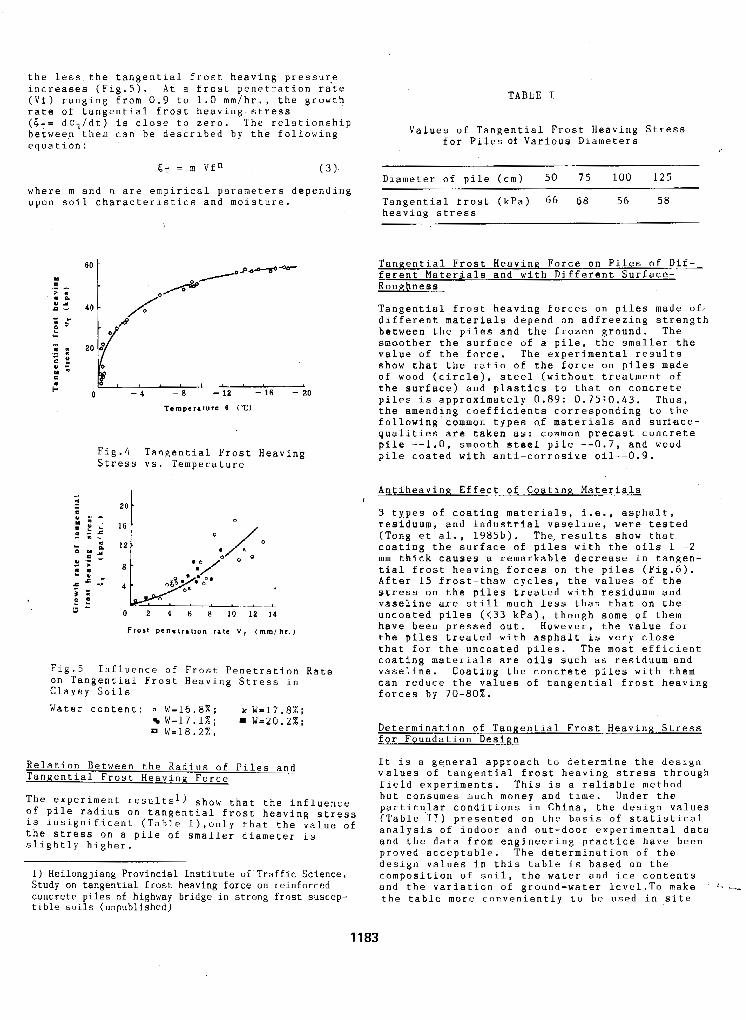
the less the tangential lrost heaving pressure increases (Fig.5). A t a frost penetration rate ( V f ) ranging from 0.9 to 1.0 mm/hr., the growth rate o f tangential frost heaving stress (<,= dUT/dt) is close to zero. The relationship between them can be described by the following equation:
TABLE T
Values of Tangential Frost Heaving Stress for Piles Qf Various Diameters
= m Vf" ( 3 ) Diameter of pile (cm) 50 7 5 100 1 2 5
where m and n are empirical parameters depending upon soil characteristics and moisture. Tangential frost (kPa) 66 6 8 56 5 8
heaving stress \
Temperature 0 (TI
Fig.4 Tangential Frost Heaving Stress vs. Temperature
",. 6 I
0 2 4 6 8 10 1 2 1 4
Frost p e n e t r a t i o n r a t e V , ( r n m l h r . 1
Fig.5 Influence of Frost Penetration Rata
Clayey Soils on Tangential Frost Heaving Stress in
Water content: 0 W=16.8%; x W = 1 7 . 8 % ; W=17.1%; 8 W=20.2%; W=18.2X.
Relation Between the Radius of Piles and Tangential Frost HeavinR Force
The experiment results1) show that the influence of pile radius on tangential frost heaving stress is insignificant (Table I),only that the value of the stress on a pile of smaller diameter is slj.ghtly higher.
Tangential Frost Heaving Force on Piles o € Dif- ferent Materials and with Different Surface- Roughness
Tangential frost heaving forces o n piles made of. different materials depend on adfreezing strength between the piles and the frozen ground. The smoother the surface of a pile, the smaller the value of the force. The experimental results show that the ratio of the force on piles made of wood (circle), steel (without treatment of the surface) and plastics to that on concrete piles is approximately 0.89: 0 . 7 5 : 0 . 4 3 . Thus, the amending coefficients corresponding to the Eollowing common types of materials and surfsce- qualities are taken as: common precast concrete pile "1.0, smooth steel pile " 0 . 7 , and wood pile coated with anti-corrosive oil--0.9.
Antiheaving Effect o f Coating Materials
3 types o f coating materials, i.e., asphalt, residuum, and industrial vaseline, were tested (Tong et al., 1985b). The,results show that coating the surface of piles with the oils 1 - - 2 mm thick causes a remarkable decrease in tangen- tial frost heaving forces on the piles (Fig.6). After 15 frost-thaw cycles, the values of the stress on the piles treated with resi.duum and vaseline are still much less than that on the uncoated piles ( ( 3 3 kPa), though some of them have been pressed out. However, the value for the piles treated with asphalt is very close that for the uncoated piles. The most efficient coating materials are oils such as residuum and vaseline. Coating the concrete piles with them can reduce the values of tangential frost heaving forces by 70-80%.
Determination o f Tangential Frost HeavinE: Stress for Foundation Design
It is a general approach to determine the design values of tangential frost heaving stress through field experiments, This is a reliable method but consumes much money and time. Under the particylar conditions in China, the design values (Table T I ) presented o n the basis of statistical ana1ysi.s of indoor and out-door experimental data and the data from engineering practice have been proved acceptable. The determination of the
I ) Heilongjiang Provincial Institute of Traffic Science, hesign values i n this table is based on the
Study on tangential frost heaving force on reinforced composition o f soil, the water and ice contents and the variation of ground-water 1r.vel.To make ' 1. I
concrete piles of highway bridge in strong frost suscep- ti blc soils (unpublished)
the tablc more conveniently t o be used irl site
1183
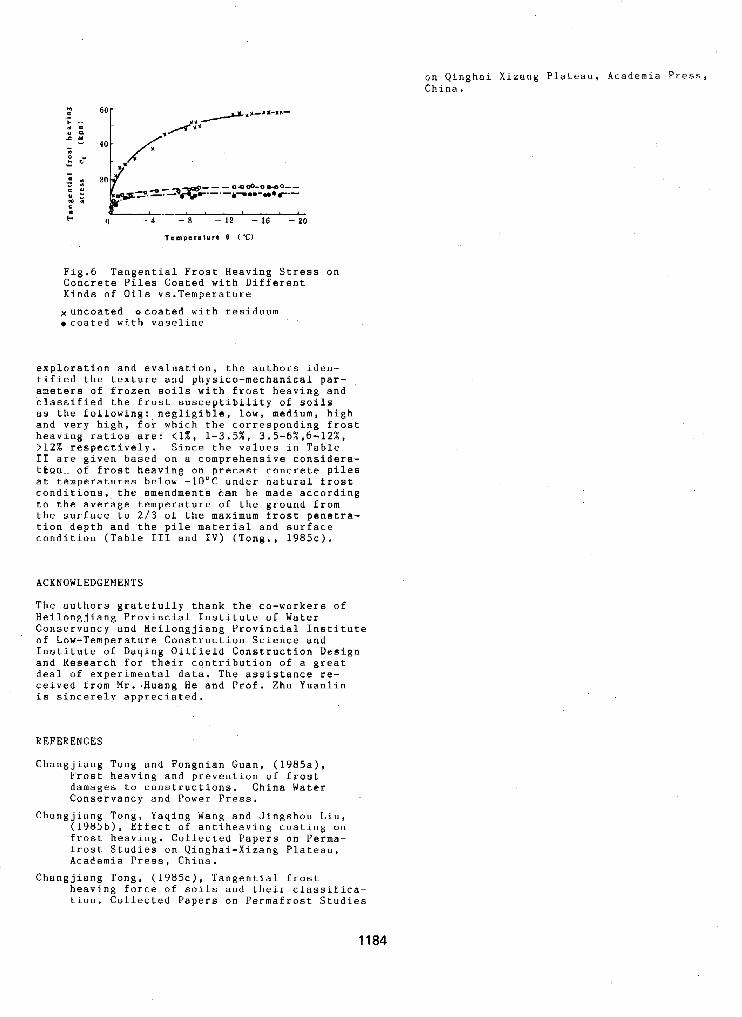
m
Fig.6 Tangential Frost Heaving Stress on Concrete Piles Coated with Different Kinds of Oils vs.Temperature %uncoated ocoated with residuum ocoated with vaseline
exploration and evaluation, the authors iden- tified the texture and physico-mechanical par- ameters of frozen soils with frost heaving and classified the frost susceptibility o f soils as the following: negligible, low, medium, high and very high, for which the corresponding Erost heaving ratios are: < l % , 1-3.5%, 3 . 5 - 6 % , 6 4 1 2 % , > 1 2 % respectively. Since the values in Table 11 are given based on a comprehensive considera- t t a n . . of frost heaving on precast concrete piles at temperatures below -10°C under natural frost conditions, the amendments can be made according to the average temperature of the ground from the surface to 2 / 3 of the maximum frost penetra- tion depth and the pile material and surface condition (Table I11 and IV) (Tong., 1 9 8 5 ~ ) .
ACKNOWLEDGEMENTS
The authors gratefully thank the co-workers of Heilongjiang Provincial Institute of Water Conservancy and Heilongjiang Provincial Institute o f Low-Temperature Construction Science and Institute of Daqing Oilfield Construction Design and Research for their contribution o f a great
ceived from Mr..Huang He and Prof. Zhu Yuanlin deal of experimental data. The assistance re-
is sincerely appreciated.
REFERENCES
Changjiang Tong and Fongnian Guan, (1985a), Frost heaving and prevention of frost damages to constructions. China Water Conservancy and Power Press.
Changjiang Tony, Yaqing Wang and Jingshou L i . u , (1985b), Effect of antiheaving coating on frost heaving. Collected Papers o n Perma- frost. Studies u n Qinghai-Xizang Plateau, Academia Press, China.
Changjiang Tong, (1985c), Tangential frost heaving f0rc.e o f soils and their classifica- tion. Collected Papers on Permafrost Studies
on Qinghai- China.
Xizang Plateau, Academia Press,
1184
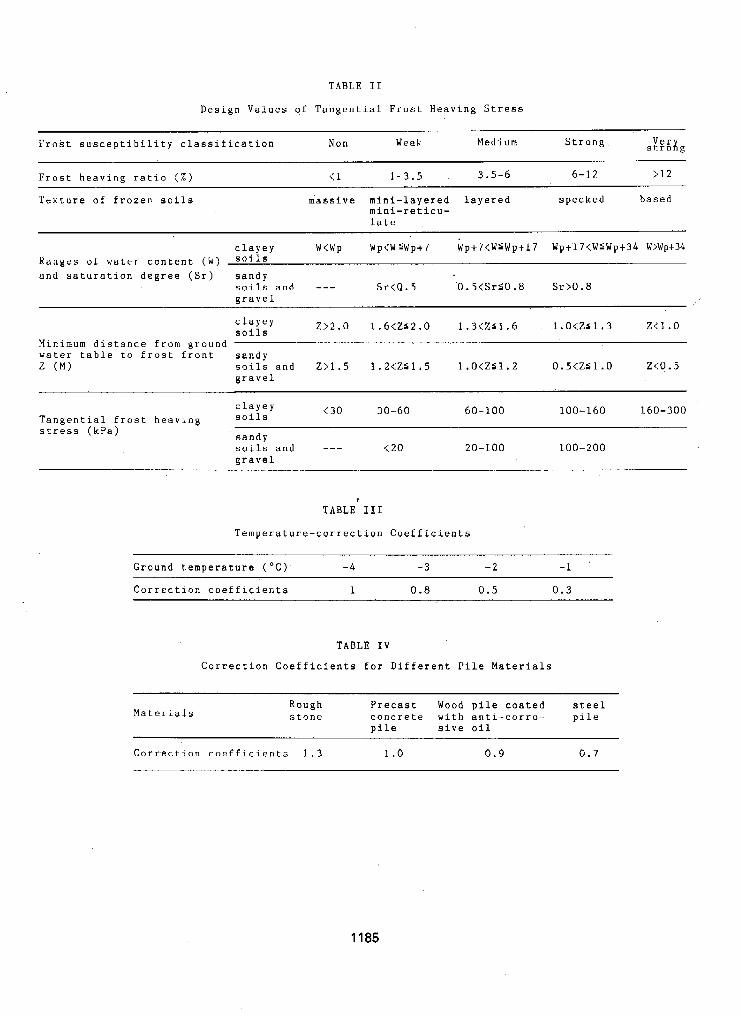
TABLE I1
Design Values of Tangential Frost Heaving Stress
Frost susceptibility classification N o n Weak Med i unt Strong stro VerX g
Frost heaving ratio ( X ) < l 1-3.5 3.5-6 6-12 >12
Texture of f r o z e n soils massive mini-layered layered specked based mini-reticu- late
clayey w<wp Wp<WSWp+7 Wp+f<WSWp+l7 Up+l7<W'Wpt34 w>wp+34 Haikges of w a t r r content (w) Soils and saturation degree (Sr) sandy
soils and --- SrtP.5 0.5<SrSO. 8 Sr>O a 8 gravel
clayey soils
Minimum distance f rom ground water table to frost front sandy
Z > 2 . 0 1.6<252.0 1.3<Zr1.6 1.O<ZS1,3 z<1 . o
(M) soils and Z>1.5 1.2<ZS1.5 1.0<251.2 0.5<ZS1.0 Z<O. 5 gravel
clayey Tangential frost heaving stress (kPa)
(30 30-60 60- 100 100-160 160-300
sandy soils and --- ( 2 0 20-100 100-200 gravel
I
TABLE I11
Temperature-correction Coefficients
Ground t-emperature ("C) -4 - 3 - 2 -1 . . -. - .. " . . .. . . . . . . .. . . .
Correction coefficients 1 0.8 0.5 0.3
TABLE IV
Correction Coefficients for Different Pile Materials
Materials Rough Precast Wood pile coated steel stone concrete with anti-corro- pile
pile sive oil
Correction coefficients 1 . 3 1 . o 0 .9 0.7
1185
STRESS-STRAIN BEHAVIOUR OF FROZEN SOILS S.S. Vyalovl, R.V. Maximyakz, V.N. Razbeginz, M.E. Slepak2 and A.A. Chapayevz
1Moscow Civil Engineering Institute, Moscow, USSR 2Gersevanov Research Institute of Bases and Underground
Structum, MOSCOW, USSR
ABSTRBCT In practice, predicting the stress-strain behavioux of frozen soil loaded by a locally distributed presaure i s the most usual problem o f engtneerbg geocrgology. Xn this paper some experimental results are given, whFch have been obtained recently f r o m both microscopic nnd macroScopic investigations of f rozen soil deformation and failure under a rigid plate as well as f r o m uniaxial compression tests. A mathematical model i s proposed and discussed to describe the basia peculiarities o f frozen soil mechanical bebartour. An analytical solution of plane strain problem has been found using simplified modification o f nodel proposed. This modification can also be regarded &s the partial variane of strain-hardening theory. Calculation results are given which oompare well-with experimental data.
INTRODUCTION
Up to preeent, o w a few work^ are h o r n deal- ing with M erperlmeatal study o f plate pmb- lem in frozen soils (Berezantchev, 1947, Vy& rities o f s o i l behavlour under a loaded r ig id lov, 1959, Marimyak, 1985). Physical peculia-
plate were firstly investigated by S.S.Vyalov (19.59), who described a set of interdependent physicod.uecharrlca1 prooessea associated with plate indentation, among them local phase transitions, unfrozen water migration, cracks nucleation and other ones. This paper develope earlier jsoestigations to acueve a better understandhg of various structure deteriorat-
loading conditione. A mathematical model o f fng processes conparative ro le unaer various
new type i s px'oposed to describe the basta of revealed peculiaritkes, including microcrack- ing influence aad elastoviscoplastic effects at the variable loading regimes.
TESTING MEPHODS' BND RESKiXS
Experiments were carried out with a' disturbed clay of fired density and water content, con- fined into the ateel shoot of 1oOr30~1~0 m. Soil waa freezing at the fired temperature during about I00 hours. After that, a constant load was applied through a rigid rectangular steel plate 100x30 am and 3 mm thicbess. h a d values were choosd over a range 1.3-13'm. Corresponding test continuties were f r o m seve- - xal days to several seconds. Quasi-instant strength value (3.75 "a) had been previously determined In uniaxial cornpression teats with the same soil.
Structure changes were studied both by visual observations and by investigations of micro- ecopic section of representative soil areas. Resulting soil aenaity, temperature and water
content were also measured in the wrious points though the V O ~ W ~ .
Plate settlement in time was fixed by usual way and the typical results are Shorn on Figure I .
Generally, a frozen soil under a loaded pXab defoms like a multicomponent system with phase transitions and component relative mow- ments occuring. Near the plates foot i ia zone
re" is obtained where soil density increases o f compressed s o i l usually named as soil co-
and a high looal pressure occurs on the par- ticle contacts. This leads to an ice melting and the unfrozen water migration to the l ess stressed outlying zones where it freezes once again. Correspondingly, soil temperature was found to decrease nearby the plate and to in- crease at the remote areas due to latent heat of phase transitions. Visually, there are no ice layers within the core zone whereas a fan- like system of such layers I s obtained around it . Depending on the loads level, the various types of structure detarLorating processes are to be prevailing one.
when a load is high enough, n s o i l under the plate f a i l s its bearing capacity Fn time, that can 'be neglected for practice. mre brittle failure takes place characterized by macro- scopic cracks inltiating instant growth and merging, a3 it is shown on Figure 2 . Micro-
tions leading role LII the failure process. The structural analyses ahow the inltial imperfec-
intrknsic soil. cracks, cavities, inclusions and so on Initiate stress concentration and unlimited cracks development up to ,the Full destruction. At f i x s t , macfoscopic cracks of 4 5 O incline were observed under the plate ends. Then a
1186
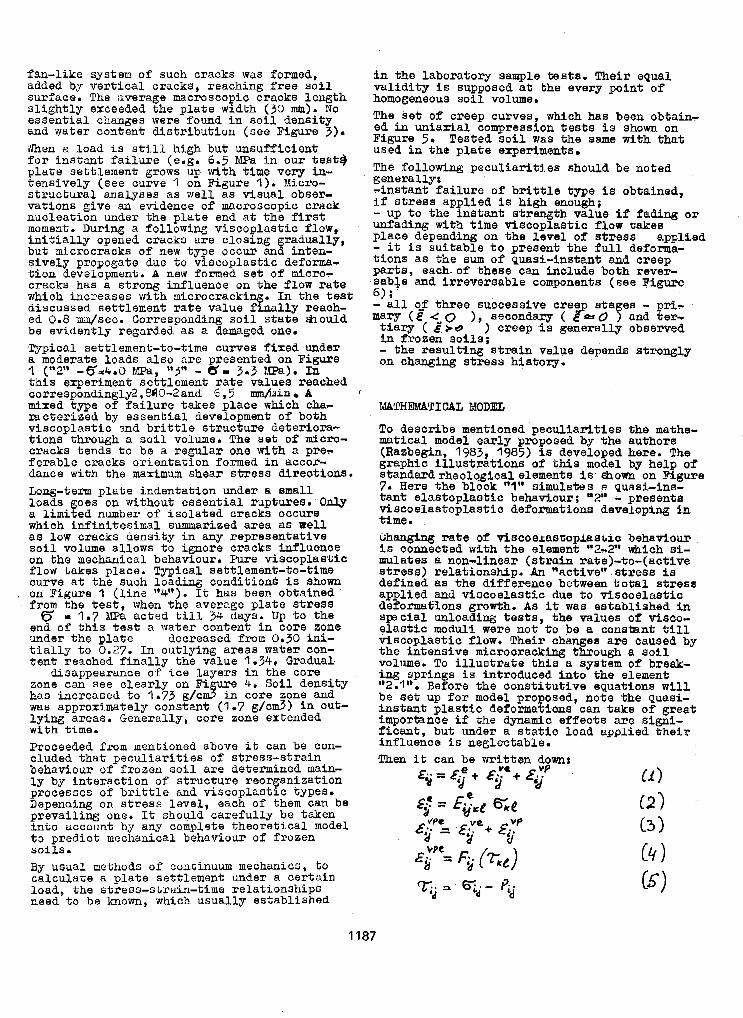
fan-like system of such cracks was formed, added by vertical cracks, reaching free s o l 1 surface. The average macroscopic cracks length slightly exceeded the plate width (30 m). No essential changes were found in soil. density and water content distribution (see Figure 3). 'men 2 load is still high but unsufficient for inst;ant failure (e.@;. 6.5 MPa in our teste plate settlement grows up with time very in- tensively (see curve 1 on Figure 1). Micro- structural analyses as well as visual obser-
nucleation under the plate end at the first vationa give an evidence of macroscopic crack
moment. During a following viscoplnatic f l o w , initially opened cracks are closing gradually, but microcracks of new type occur and inten- sively propogate due to viacoplastkc deforma- tion devolopment. A new formed set of micro- cracks has a strong influence on the flow rate which increases with microcracking. In the test discussed settlement rate value finally reach- ed 0.8 mm/sec. Corresponding soil state &ould be evidently regarded as a damaged one. Typiaal settlement-to-time curves f ixed under 8. moderate loads also are presented on Figure
this experiment settlement rate values reached correspondingly2,8RO-2 and 5,5 d i n i n A mixed type of failure takes place which cha- mcterized by essential development of both viscoplastic and brittle structure deteriora- tions through a soil volume. The set of mlcro- cracks tends to be a regular one with a prey ferable cracks orientation Formed in acco- dance with the marFmum shear sereas directiona. Long-term plate indentation under a small loads goes on without essential. ruptuxes. Only a limited number of isolated cracks occuxs which infinitesimal summarized area as ae l l as low cracks density in any representative Soil volume allows to ignore cracks influence on the mechanical behaviour. Pure viscoplastic flow takes place. Typical settlement-to-time
on Figure I (line "4"). It has been obtained curve at the such loading conditions l a shown
f rom the test, when the average plate stress 5 I 1.7 ma acted till. 34 days. Up to the end of this test a water content; in core zone under the plate decreased fmm 0.30 ini- tially to 0.27. In outlying areas wat-er con- tent reachod finally the value 1.34. Gradual
disappearance of ice layers in the core
has increased to 1.73 g/cm$lre zone can see clearly on Fi . Sol1 density waa approximately constant (1.7 g/cm3) in out-
in core zone and
lying areas. Generally, cope zone extenaea with time. Proceeded fmm mentioned above it can be con- cluded that peculiarities of stress-strain behavtour o f frozen soil are determined main- l y by Interaction o f structure reorganization processes of brittle and viscoplastic types. Depending on stress level, each of them can be prevailing one. It s h o a d carefully be taken into account by any complete theoretical model t3 predict mechanical behaviour of frozen soils 0
By usual methods o f continuum mechanics, t o calculate a plate settlement under a certain Load, the stress-strain-time relationships need to be known, which usually established
1 ("2" - 6 d + o C ) D, "3" - 6 ' ~ 3.7 E a p a > o Ib
in the laboratory sample teats. Their equal valiaity is supposed at the every point of homogeneous soil volume. The set of creep curves, which has been obtain- ed in uniaxial compression teste is shown on Figurn 51 Tested Soil was the same with that used in the plate experiments. The following peculiarities should be noted geaexallyr -instant failure o f brittle type i s obtained, if strees ap lied is high enough8 - up to the ?natant strength value if fading or unfading with time viscoplastic flow takes place depen&ing on the level of stress applled - it is suitable to present the Pull deforma- t ions as khe sum of puaai-instant and creep parts, each. of these can include both revex-
6) ; sabJe and Irreversable components (see Figure
maq ( E 4- 0 >, secondary ( 8- 0 f and ter- - all qp three successive Cree eta BB - pri-
tiary ( f r o ) creep Os generally observed
- the reaulting strain value depends strongly in f r o z e n soils;
on changing stress histon,
I
hrIfl'I'HEWTfCBL MODEL
l o describe mentioned peculiadties the mathe- matical model early proposed by the authors (Razbegin, 1983, 1985) i s developed here. The graphic illustrations of tbLs model by help of standardrheolpgical elemento i s - shown on Figure 7. Here the block nl" sirnulatea a quasi-ins- t a d elastoplastic behadour; ''2" - presents viscoslaatoplastic deformations developrag In time. (;banging rate of dscoemscoplaesia behaviour is connected with the element v'2T2" which si- mulates a non-linear (strain rate)-to-(aotive stress) relationship. An "actOve" -stress is defined as the difference between total streas applied and viscoelastic due to viscoelastic deformafions gxowth. As it waa established in sgecial unloading tests, the values of visco- elastic moauli were not to be a constant till vtscoplaetic f low. Their changes are cause& by the intensive microcxackb.g through a s o i l volume. To illustrate this a syatem of break- ing springs is introduced into the element "2.1". Before the constitutive equations wLll
Lnstant plastic deformations can take of great importance if the dynamic effects are signi - ficant, but under a static load applied the i r influence i s neglectable. Then it can be written down:
be set up Tor model proposed, note *he Quasi-
1187
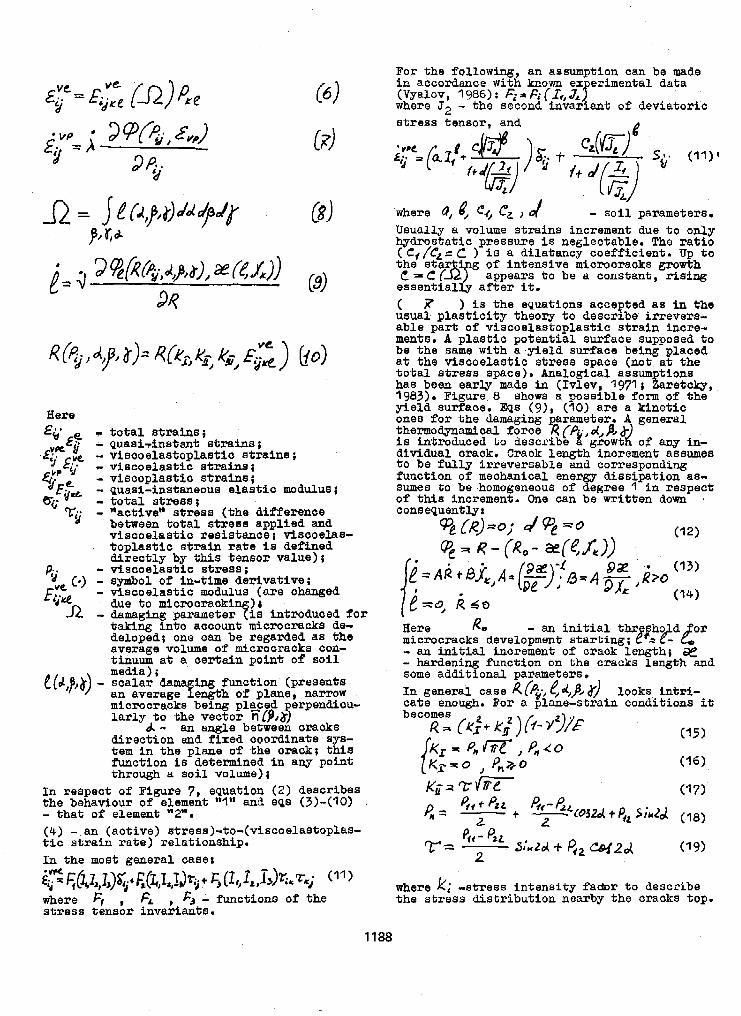
CBJ
Here total strabs; - ~uas i~ instant; st ralns 8
E'? ' - viscoelastoplarstic serawe; LJ - viscoelastic etxaue;
EJP - viscoplastic straws; d~g, - quasi-instaneoua elast io modulus4 - t o t a l stress; Tg I ~'actSven stress (the difference
between total stress applied and visooelaatio reeistmce; riscoelas- toplaetic strain ra te io defined atrect ly by %his tensor value); - viscoelastic stress;
- vlscoelastic modulus (are champ8
A - damaging parameteryis introduced fox
4. (a) - symbol of In-time derivative ;
due t o mlcxocracki )i
t;aking into amount microcracks de- deloped; one can be regarded as the thuum at a certain point o f s o i l average volume o f microcracka con-
[(d,j$$) - scalar damaging function (pmeents media) ;
an average length of plane, nar row microcracks being plscced perpen8lcu- larly t o the vector n [pJ&) direction and fixed coordinate sys- tem i n the p l a e o f the arack; this function I s determined In any poink through a s o i l volume);
E$&
A - an angle between cracks
In xespeot of Figure 7, eQUatiOI3 (2) describes the behaviour of element rrlt' and egs (3)-(10) . - that o f elemenb "2". (4) -,an (active) stresa)~to-(viscoelaatoglao- t ic s t ra in ra te) re la t ioaship. In the most Reneral caset
wbere F, , FA , PJ - functions of the stress tensor invariants.
. "
1188
For the f o l l o w h g , an assumption can be made i n accordance with lu~own ex erimental data (Vyalov, 1986) : 6 a F; (IqJ JLf where J2 - the second Invariant o f deoiatoric stress tensor, and
- s o i l parameters. Usually a volume strains increment due t o only Qdros ta f ic pressure is neglectable. The ratio ( C, /Cz = c ) is a dilatancy coefficient. UP t o the s ta of intensive microcracks growth
essent ia l ly af ter it. f. i7 ) i s t h e equations accepeed as in the usual plaat ic i ty theory t o describe irrevers- able part o f viscoelastoplastic strain incre- ments. A plastic potential surface supposed t o be the same with a yield surface being placed at the viacoelast ic stress space (not at the total atxeae space). Analogical assumptions has been early made in (Ivlev, 1971 ; ZaretcQ, q983). Figure 0 sihows a posaible form of the yield surface. Eas (q), ( IO) are a klnetic ones for the damaging arametex. A general thexmodyramical force ?? (P', d,p, i s in+broducsd t o describe growt of any in- divfdual crack. Crack length incxement assumes t o be fully Irreversable and corresponding function of mechanical energy dissipation as- sumes t o be homogeneous o f degree 1 in respect of this increment. One can be written down consequently:
appears t o be a constant, rising
3 &-)*o; d % =o ('12)
Here Re - an initial tbr sho d o r microcracks development starting; !+z k e", - an i n i t i a l increment o f crack length; x - hardening function on the cracks length and some additional parameters. In general case R (%, ( d , , ~ 6-/ looks in.t;ri- cate enough. For a plane-strain conditions it
where k; -stress intensity fa*r t o describe the stress distribution nearby tbe cracks top.
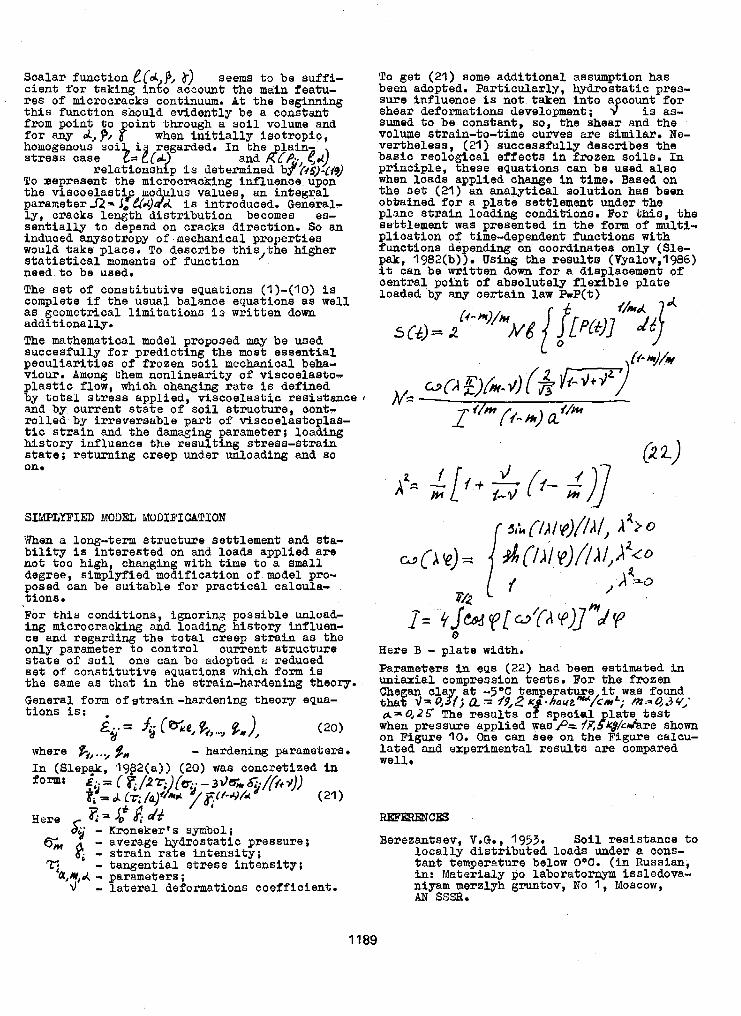
Scalar function e(& p, b-) seems to be suffi- To get (21) some additional assumption has cient for taking indo accout the main featu- been adopted. Particularly, hydrostatic pres- res of microcracks continuum. A t the beginning s u m influence is not taken into a count for this function should evidently be a constant shear deformations development ; 4 is as- from polnt to oint thxough a soil volume and S u e d to be constant, so, the shear and the f o r any d, p, f when initially isotropic, volume strain-to-time curves axe similar. me- homogenous s o i i regarded. In the lain- vertheless, (21) successfully describes the atreas case is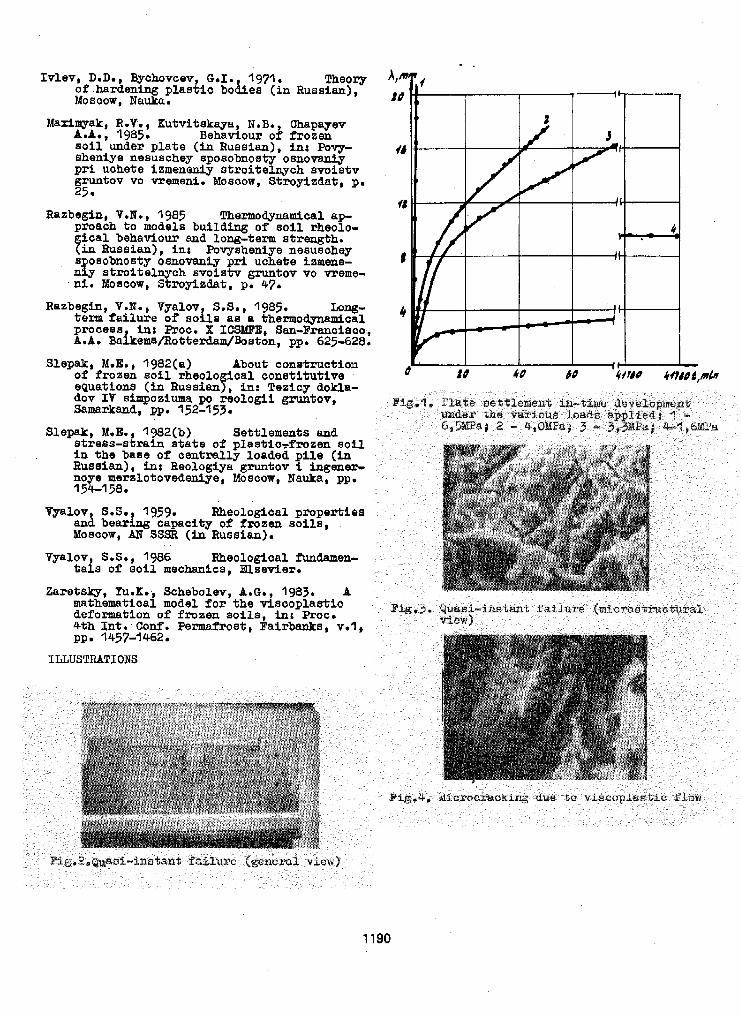
1190
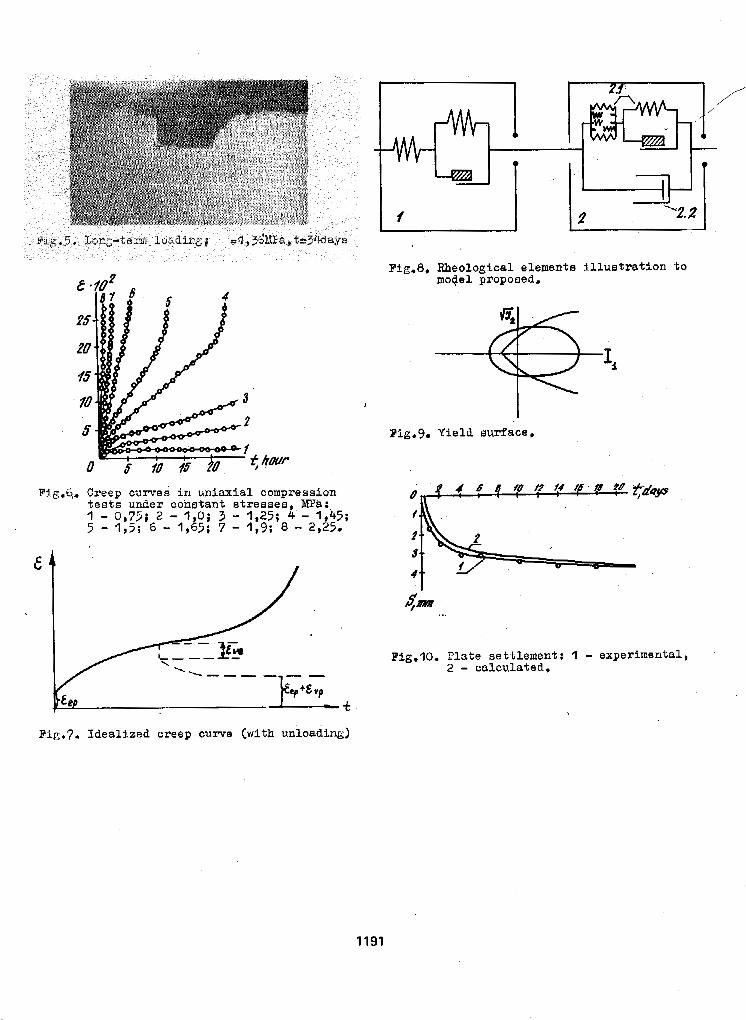
I
Fig*G?. Creep curves in uniaxial compression tests under constant atremes . MPa:
Pie.?. Ideal ized creep curve (with unloading)
J L
Pig-8, Rheological elements illustration to moqel propoeedc
pig.9. Y i e l d surface.
3 4 :b$"=--
Fig.10. Plate settlement: I - experimental, 2 - calculated,
1191
- - FROST HEAVING FORCES ON FOUNDATIONS IN SEASONALLY FROZEN GROUND lXu, Shaoxin
Heilongjiang Provincial Research Institute of Water Conservancy
SYNOPSIS All three types of frost heaving forces, are examined in this paper. The results of laboratory and f types of frost heaving forces have not only the same physica generation and development. Consequently, the values o f the and estimated from each other.
INTRODUCTION
In seasonal frost areas, freezing ground exerts heaving forces o n the foundations of structures when frost heave of the ground is restrained by the foundation. Based on the difference in the form o f restraint, frost heaving forces are generally classified as three types: tangential frost heaving force, horizontal frost heaving force on the lateral surface of a foundatin, and normal frost heaving force acting vertically on a'foundation. Considering the physical basis of their generation, all three forces are caused by the restraint to volume expansion o r heave of the soil due t o the phase-change of moisture to ice. Further analysis of laboratory and field experiment data indicates that the three types of frost heaving forces not only have the same physical basis but also are similar wfth regard to the combined action o f temperature, moisture andstress fields i n the generation and develop- ment of the forces. I n similar foundation soils some close relationships exist among the three types of frost heaving forces. This means that empirical examination and estimation of the three types of forces from each other can be made.
DISCUSSION
Tangential Frost Heaving Force on Pile Founda-- t iol ls
The adfreezing bond strength between a pile and the surrounding frozen ground is a prerequisite for the generation of tangential frost heaving forces on the lateral surface of a pile. The volume cxpansi.on due to the phase-change o f water-to-ice in the surrounding soil is the source-of the force. The weight of a pile, ap- plied load and compressibility of the underlying unfrozen soil are the main factors influencing the magnitude of the tangential frost heaving force.
A literature survey shows that most o f the exper- imental investigations on the tangential frost heaving furce on piles focused on the infl.uence
i.e., tangential, normal and horizontal, ield experiments show tbat the three 1 meaning but also a similar process of three types of forces can be examined
o f moisture, temperature and properties of the pile material. Without any d o u b t , a clear un- derstanding o f the generation, development and variation o f the force can be attained with the method o f monofactor analysis. In engineering practice, however, the requirement for preventing the frost uplift of a pile foundation is that the tangential frost. heaving stress must be less than the adfreezing strength.
Investigations show that the magnitude of the tangential frost heaving force o n a pile depends chi.efly on the frost-heave susceptibility of the surrounding soil and the degree of the pile's restraint t o frost heave. In considering the stability of a pile subjected to frost uplift for design, the following formula is generally used as the stability criterion:
0~ * S S P + G + f m s l (1)
where 0~ is the tangential frost heaving stress; P is the applied load o n the pile; G is the weight of the pile; f is the friction between the pile and
unfrozen soil; S is the surface area of the section of
the pile in contact with the frozen soil layer;
and S 1 is the surface area of the section of the pile in contact with the unfrozen soil layer.
I f the right side in eq.(l) is greater thanoT*b, then the magnitude of the tangential force de- pends on the frost heaving potential of the sur- rounding soil. In this case, the buried pile foundation restricts the upward frost heave de- formation o f the surrounding soil body. Accord- ing t o laboratory and field experiments, the radius of influence ( I ) is approximately equal to the frost deplh H (see Fig.1).
I f a loading plate with the samecross-section as the pile i.s used to restrain fully the frost heave deformation of the underlying soil, then t h e angle o f the irost heaving stress in the subgrade i s generally regarded a s 4 5 O ; t.hat j . s , the radius of influence ( 1 ) of the stress is a l s o equal to
1192
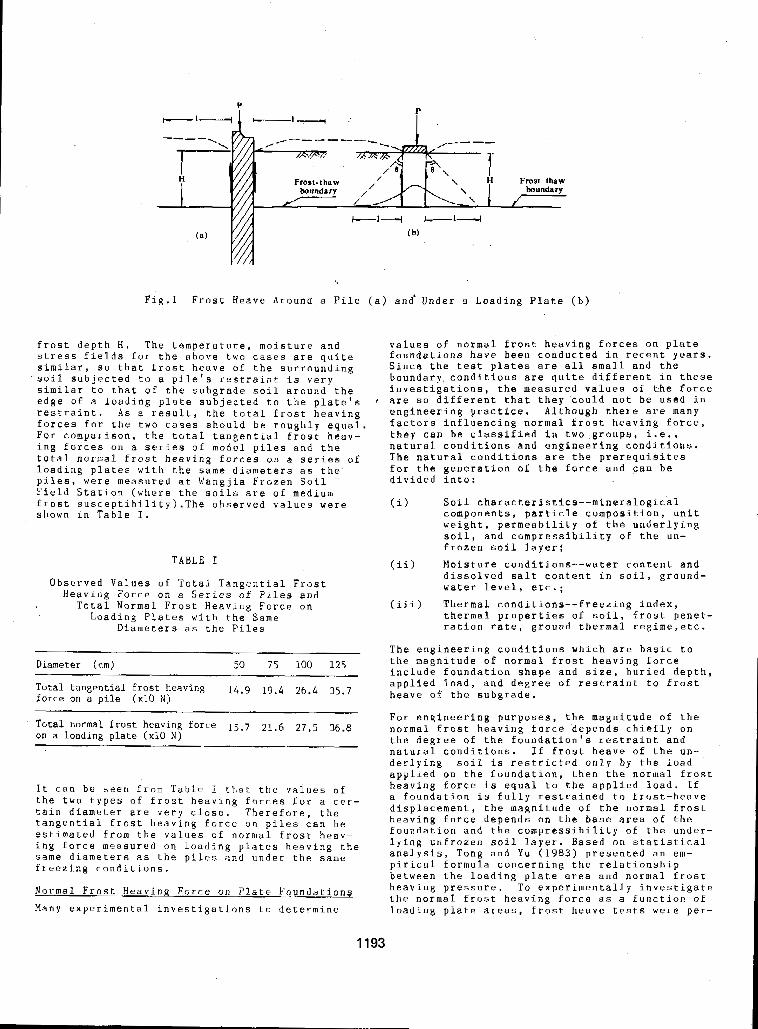
Fig.1 Frost Heave Around a Pile (a) and' Under a Loading Plate (b)
frost depth H. The temperature, moisture and stress fields f o r the above two cases are quite similar, s o that frost heave of the surrounding soil subjected t o a pile's restraint is very similar to that o f the subgrade soil around the edge of a loading plate subjected to the plate's ' restraint. As a result, the total frost heaving Eorces for the two cases should be roughly equal. For comparison, the total tangential frost heav- ing forces on a series of model piles and the total normal frost heaving forces on a series o f loading plates with the same diameters as the piles, were measured at Wangjia Frozen Soil -. Field Station (where the soils are of medium frost susceptibility).The observed values were shown in Table I.
TABLE 1
Observed Values of Total Tangential Frost Heaving Force on a Series of Files and
Total Normal Frost 'Heaving Force on
Diameters as the Piles Loading Plates with the Same
values of normal frost heaving forces on plate
Since the test plates are all small and the foundations have been conducted in recent years.
boundary, conditions are quite different in these investigations, the measured values o f the force are s o different that they could not be used in engineering practice. Although there are many factors influencing normal frost heaving force, they can be classified i n two groups, i,e,, natural conditions and engineering conditions. The natural conditions are the prerequisites for the generation of the force and can be divided into:
(i) Soil characteristics--mineralogical components, particle composition, unit weight, permeability of the underlying s o i l , and compressibility of the un- frozen soil layer:
dissolved salt content in soil, ground- water level, etc.;
thermal properties of soil, frost penet- ration rate, ground thermal regime,etc.
(ii) Moisture conditions--water content and
(iii) Thermal. conditions--freezing index,
The engineering conditions which are basic to
include foundation shape and size, buried depth, applied load, and degree o f restraint to frost
Diameter (cm) 50 75 100 125 the magnitude o f normal frost heaving force
Total tangential frost heaving 14.9 19.4 26.4 35.7 force on a pile (x10 N) heave of the subgrade.
Total normal frost heaving force 15.7 21.6 2 7 . 5 36.8 on a loading plate (x10 N)
I t can bo seeu from T a h l v I ChaL t h c values o f the two types of frost heaving forces for a cer- tain diameter are very c l o s e . Therefore, the tangential frost heaving force on piles can b e estimated frum the values of normal frost heav- ing force measured on loading plates heaving the same diameters as the piles a n d under the same freezj.ng conditions.
Normal Frost Heaving Force on Plate Foundations
Many experimental investigations t o determine
1193
For engineering purposes, the magnitude o f the normal frost heaving force depends chiefly o n the degree of the foundation's restraint and natural conditions. If frost heave o f the un- derlying soil is restricted only by the Load applied o n the foundation, then the normal frost heaving force is equal to the applied load. If a foundation is fully restrained to frost-heave displacement, the magnitude of the normal frost heaving force depends on the base area o f t h c foundation a n d the compressibility of the under-
analysis, Tong and Yu (1983) presented an em- lying unfrozen soil layer. Based on statistical
pirical formula concerning the relationship between the loading p1at.e area and normal frost heaving pressure. To experimentally investigate the normal frost heaving force as a function of loading plate areas, frost heave tests were per-
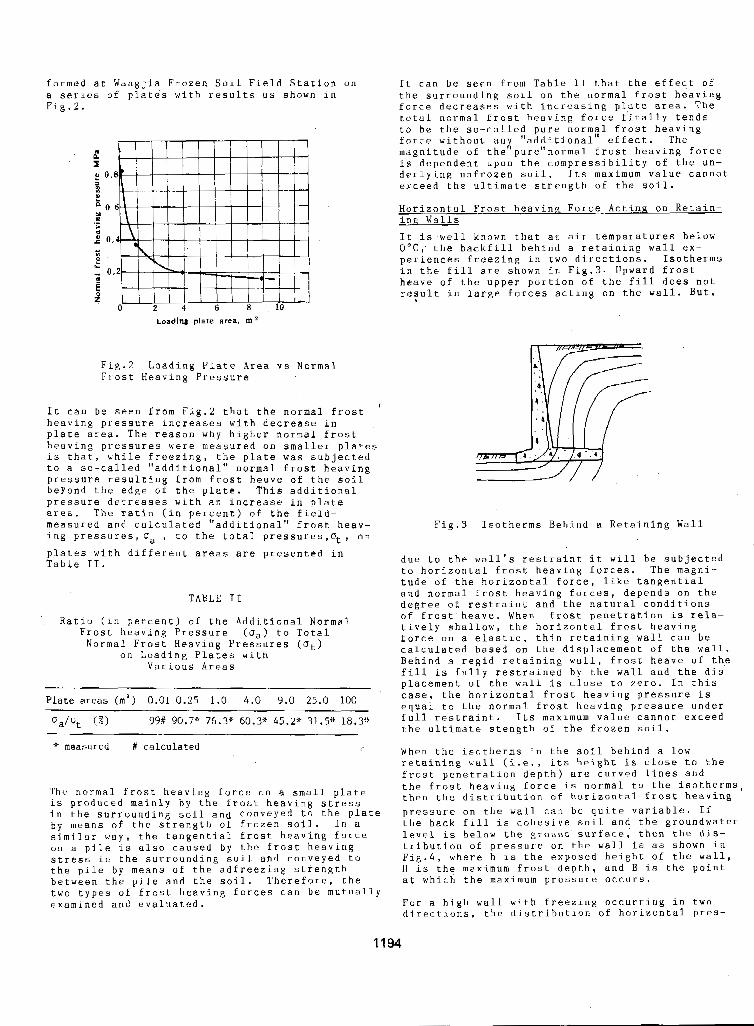
f o r m e d a t W a n g j i a F r o z e n S o i l F i e l d S t a t . i o n o n a s e r i c s o f p l a c e s w i t h r e s u l t s a s s h o w n i n F i g . 2 .
I t c a n b e s e e n f r o m T a b l e I I t h a t t h e e f f e c t o f t h e s u r r o u n d i n g s o i l o n t h e n o r m a l f r o s t h e a v i n g f o r c e d e c r e a s e s w i t h i n c r c a s i n g p l ~ t e a r e a , T h e c o t a l n o r m a l f r o s t h e a v i n g f o r c e f i n a l l y t e n d s t o b e t h e s o - c a l l e d p u r e n o r m a l f r o s t h e a v i . n g f o r c e w i t h o u t an " a d d i t i o n a l " e f f e c t . T h e m a g n i t u d e o f t h e ' p u r e " n o r m a 1 f r u s t h e a v i n g f o r c e i s d e p e n d e n t u p o n t h e c o m p r e s s i b i l i t y o f t h e u n - d e r l y i . n g u n f r o z e n s o i l . .Its m a x i m u m v a l u e c a n n o t e x c e e d t h e u l t i m a c e s t r e n g t h o f t h e s o i l .
H o r i z o n t a l F r o s t h e a v i n g F o r c e A c t i n g o n R e t a i n - i n E W a l l s
O'C, t h e b a c k f i l l b e h i n d a r e t a i n i n g wall. e x - I t i s wel l k n o w n t h a t a t a i r c e m p e r a t u r e s b e l o w
p e r i e n c e s f r e e z i n g i n t w o d i r e c t i o n s . I s o t h e r m s i n t h e f i l l a r e s h o w n i n F i g . 3 + U p w a r d f r o s t h e a v e o f t h e u p p e r p o r t i o n o f t h e f i l l d o e s n o t r e f u l t i n l a r g e f o r c e s a c t i n g o n t h e w a l l , B u t ,
Y
Loading plate area. m a
F i y . 2 L o a d i n g P l a t e Area v s N o r m a l F r o s t H e a v i n g P r e s s u r e
I t c a n b e s e e n f r o m F i g . 2 t h a t t h e n o r m a l f r o s t ' h e a v i n g p r e s s u r e i n c r e a s e s w i t h d e c r e a s e i n p l a t e a r e a . T h e r e a s o n why h i g h e r n o r m a l f r o s t h e a v i n g p r e s s u r e s were m e a s u r e d on s m a l l e r p l a t e s j.s t h a t , w h i l e f r e e z i n g , t h e p l a t e was s u b j e c t e d t o a s o - c a l l e d " a d d i t i o n a l " n o r m a l f r o s t h e a v i n g
b e y o n d t h e e d g e o f t h e p l a t e . T h i s a d d i t i o n a l p r e s s u r e r e s u l t i n g f r o m f r o s t h e a v e o f t h e s o i l
p r e s s u r e d e c r e a s e s w i t h a n i n c r e a s e i n p l a t e a r e a . T h e r a t i o ( i n p e r c e n t ) of t h e f i e l d - m e a s u r e d a n d c a l c u l a t e d " a d d i t i o n a l " f r o s t h e a v - i n g p r e s s u r e s , U a , t o t h e t o t a l p r e s s u r e s , q , o n
T a b l e 11. p l a t e s w i t h d i f f e r e n t a r e a s a r e p r e s e n t e d i n
TABLE I1
R a t i o ( i n p e r c e n t ) o f t h e A d d i - t i o n a l N o r m a l F r o s t h e a v i n g P r e s s u r e ( U a ) t o T o t a l
N o r m a l F r o s t H e a v i n g P r e s s u r e s ( u t ) o n L o a d i n g P l a t e s w i t h
V a r i o u s Areas
P l a t e a r e a s (m') 0.01 0 .25 1.0 4.0 9.0 25.0 100
oa/ut ( X ) 99# 90.7" 76.31b 60.3* 45.2* 31.5" 18.3%
'$ measured # c a l c u l a t e d
' l ' hc no rma l f r o s t h e a v i n g f(JrCF: o n a s m a l l p l a t e i s p r o d u c e d m a i n l y by t h e f r o s t h e a v i n g s t r e s s i n t h e s u r r o u n d i n g s o i l a n d c o n v e y e d t o t h e p l a t e b y m e a n s o f t h e s t r e n g t h o f f r o z e n s o i l . 111 a s i m i l a r w a y , t h e t a n g e n t i a l f r o s t h e a v i n g f o r c e on a p i l e i s a l s o c a u s e d b y t h c f r o s t h e a v i n g s t r e s s i.n t h e s u r r o u n d i n g s o i l a n d c o n v e y e d t o t h e p i l e b y means o f t h e a d f r e e z k n g s t r e n g t h b e t w e e n t h e p i , l e a n d t h e s o i l . T h e r e f o r e , t h e t w o t y p e s o f f r o s t h e a v i n g f n r c e s c a n b e m u t u a l l y e x a m i n e d a n d e v a l u a t e d .
F i g . 3 I s o t h e r m s B e h i n d a R e t a i n i n g Wall
d u e t o t h e w a l l ' s r e s t r a i n t it will b e s u b j e c t e d t o h o r i z o n t a l f r o s t h e a v i n g f o r c e s . T h e m a g n i - t u d e o f t h e h o r i z o n t a l f o r c e , l i k e t a n g e n t i a l a n d n o r m a l f r o s t h e a v i n g f o r c e s , d e p e n d s o n t h e d e g r e e o f r e s t r a i n t a n d t h e n a t u r a l c o n d i t i o n s o f f r o s t . h e a v e . When f r o s t ; p e n e t r a t i o n i s r e l a - t i v e l y s h a l l o w , he h o r i z o n t a l f r o s t h e a v i n g f o r c e o n a e l a s t i c , t h i n r e t a i n i n g w a l l c a n b e c a l c u l a t e d b a s e d o n t h e d i , s p l a c e m e n t o f t h e w a l l . B e h i n d a r e g i d r e t a i n i n g w a l l , f r o s t h e a v e o f t h e f i l l i s f u l l y r e s t r a i n e d by t h e we l l a n d t h e d i s - p l a c e m e n t o f t h e w a l l i.s c l o s e t o z e r o . I n t h i s c a s e , t h e h o r i z o n t a l f r o s t h e a v i n g p r e s s u r e i s e q u a l t o t h e n o r m a l f r o s t h e a v i n g p r e s s u r e u n d e r f u l l r e s t r a i n t . Tts m a x i m u m v a l u e c a n n o t e x c e e d t h e u l t i m a t e s t e n g t h of t h e f r o z e n s o i l .
When t h e i s o t h e r m s i n t h e s o i l b e h i n d a l o w r e t a i n i n g w a l l ( i - e . , i t s h e i g h t i s c l o s e t o t h e f r o s t p c n e t r a t i o n d e p t h ) a r c c u r v e d 1 i . n e s a n d t h e f r o s t h e a v i n g f o r c e i s n o r m a l t o t h e i s o t h e r m s , t h e n t h e d i s t r i b u t i o n o f h o r i z o n t a l f r o s t h e a v i n g p r e s s u r e o n t h e w a l l c a n b c q u i t e v a r i a b l e . I f t h e b a c k f i l l i s c o h e s i v e s o i l a n d t h e g r o u n d w a t e r l e v e l i s b e l o w t h e g r o u n d s u r f a c e , t h e n t h e d i s - t r i b u t i o n o f p r e s s u r e on t h e w a l l i s a s s h o w n i n F i g . 4 , w h e r e h i s t h e e x p o s e d h e i g h t o f t h c w a l l , I I i s t h e maxi.mum f r o s t d e p t h , a n d B i s t h e p o i n t a t w h i c h t h e m a x i m u m p r e s s u r e o c c . u r s .
F o r a h i g h w a l l w i t h f r e e z i n g o c c u r r i n g i n t w o d i r e c t i u n s , t h e d i s t r i b u t i o n o f h o r i x u n t a l p r e s -
1194
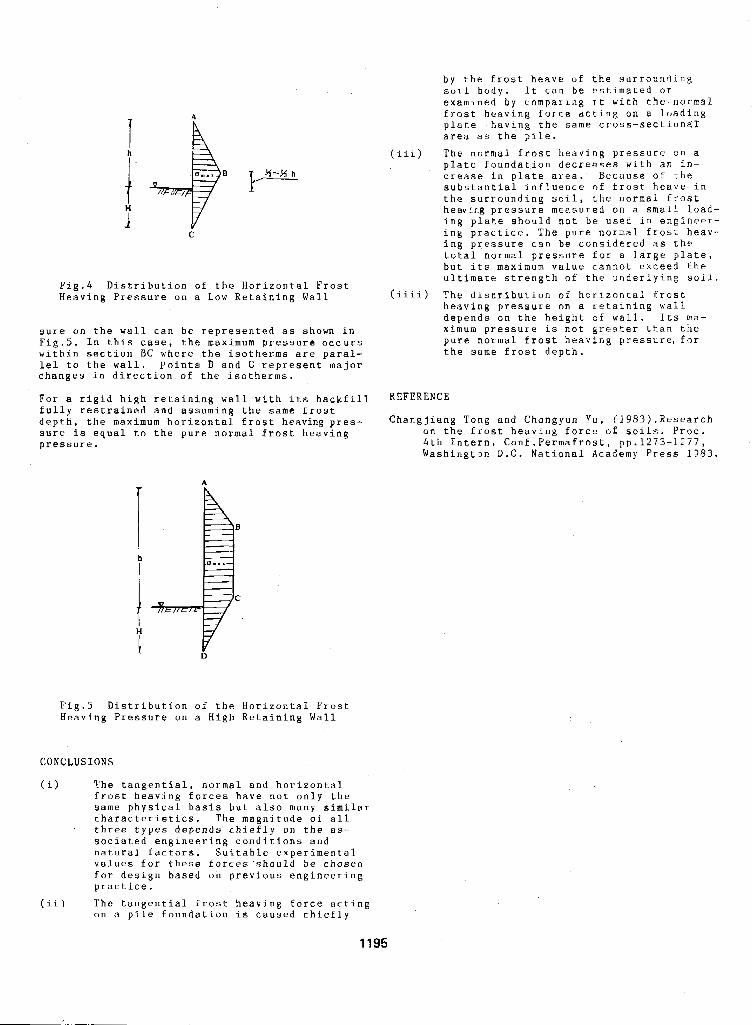
7 A
El
(iii)
1.
Fig.4 Distribution of the Horizontal Frost Heaving Pressure o n a Low Retaining Wall (iiii)
sure on the wall can be represented as shown in Fig.5. I n this case, the maximum pressure occurs within section BC where the isotherms are paral- lel to the wall. Points B and C represent major changes in direction o f the isotherms.
by the frost heave o f the surrounding S U J , ~ b o d y , I t can b e estimaLed or examlned b y comparing i t with the n o r m a l frost heaving force acting o n a loading plate having the same cross-sectional area as the pile. ‘The normal frost heaving pressure o n a plate foundation decreases with an in- crease in plate area. Because of the substantial influence of frost heave in the surrounding soil, the normal frost heaving pressure measured on a small load- ing plate should not be used i n enyineer- ing practice. The pure normal frost heav- ing pressure can be considered as the total normal pressure for a Large plate, but its maximum value cannot exceed the ultimate strength o f the underlying s o i l .
The distribution of horizontal frost heaving pressure on a retaining wall depends o n the height of wall. Its ma- ximum pressure is not greater t h a n the pure normal frost heaving pressure, for the same frost depth.
For a rigid high retainl.ng wall with its backfill REFERENCE
depth, the maximum horizontal frost heaving pres- C h a n g j i a n g T o n g and ChongYun Yu, (1983)nResearch fully restrained and assuming the same frost
sure is equal t o the pure normal frost heaving on the frost heaving force o f soils. Proc. pressure. 4th Intern. Conf.Permafrost, pp.1273-1Y77,
Washingt3n D.C. National Academy Press 1383.
A I I B
C
I D
Fig.5 Distribution of the Horizontal Frost Heaving Pressure o n a High Retaining Wall
CONCLUSIONS
(i) The tangential, normal and horizontal f r o s t heaving forces have not o n l y the same physical basis but also many similar characteristics. The magnitude of all three types depends chiefly on t h e a s - sociated engineering conditions and natural factors. Suitable experimental values for these forces should be chosen for design based on previous engineering practice.
(ii) The tangential frost heaving force acting on a pile foundation is caused chiefly
1195
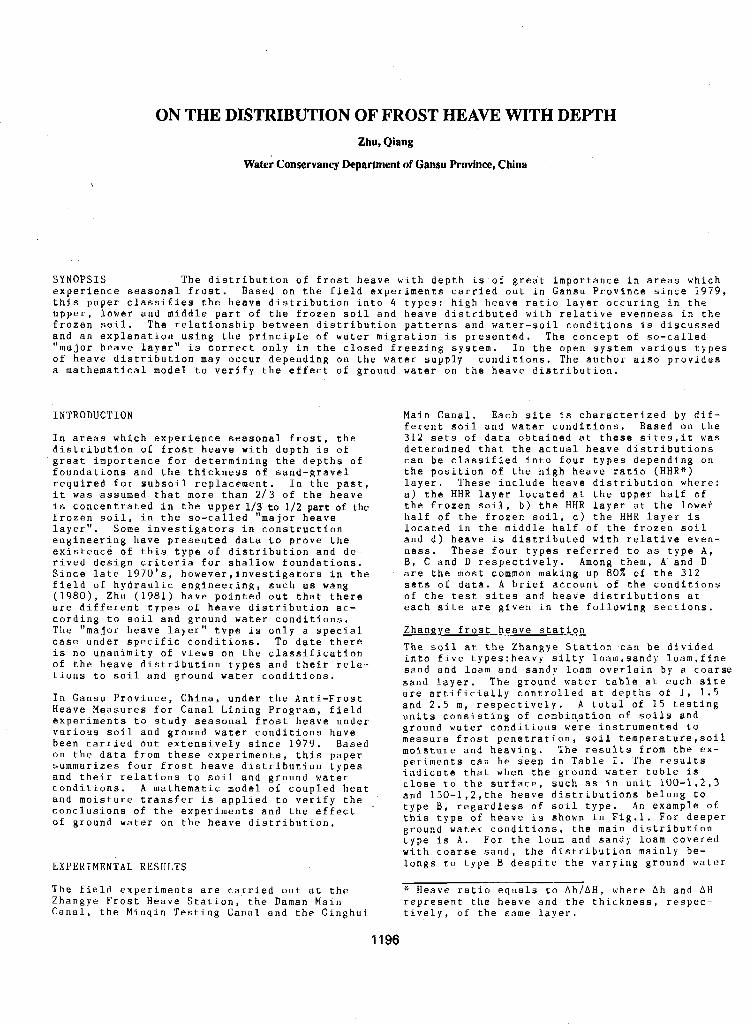
ON THE DISTRIBUTION OF FROST HEAVE WITH DEPTH Zhu, Qiang
Water Conservancy Department of Gansu Province, China
SYNOPSIS The distribution o f frost heave with depth is of great importance in areas which experience seasonal frost. Based on the field experiments carried out i n Gansu Province since 1979, this paper classifies the heave distribution into 4 types: high heave ratio layer occuring in the upper, lower and middle part o f the frozen soil and heave distributed with relative evenness in the frozen soil. The relationship between distribution patterns and water-soil conditions is discussed and an explanation using the principle of water migration is presented. The concept o f so-called
of heave distribution may occur depending on the water supply conditions. The author also provides ''major heave layer" is correct only in the closed freezing system. In the open system various types
a mathematical model to verify the effect o f ground water on the heave distribution.
INTRODUCTION
In areas which experience seasonal frost, the distribution of frost heave with depth i s o f great importance for determining the depths o f foundations and the thickness of sand-gravel required for subsoil replacement. I n the past, it was assumed that more than 2 / 3 o f the heave is concentrated in the upper 1/3 to 1 f 2 part of the frozen soil, in the so-called "major heave layer". Some investigators in construction engineering have presented data to prove the existence of this type of distribution and de- rived design criteria for shallow foundations. Since late 1 9 7 0 ' s , however,investigators i n the field of hydraulic engineering, such as wang ( 1 9 8 0 ) , Zhu (1981) have pointed out that there are different types o f heave distribution a c - cording to soil and ground water conditions. The "major heave layer" type is only a special case under specific conditions. To date there is n o unanimity of views o n the classification o f the heave distribution types and their rela- tions to soil and ground water conditions.
In Gansu Province, China, under the Anti-Frost Heave Measures for Canal Lining Program, field experiments to study seasonal frost heave under various soil and ground water conditions have been carried out extensively since 1979. Based o n the data from these experiments, this paper summarizes four frost heave distribution types and their relations to soil and ground water conditions. A mathematic model of coupled heat and moisture transfer is applied to verify the conclusions o f the experiments and the effect of ground water on the heave distribution.
EXPERIMENTAL RESULTS
The field experiments are carried out at the Zhangye Frost Heave Station, the Daman Main Canal, the Minqin Testing Canal and the Ginghui
Main Canal. Each site is characterized by dif-
312 sets of data obtained at these sites,it was ferent soil and water conditions. Based on the
determined that the actual heave distributions can be classified into four types depending o n the position of the high heave ratio (HHR*) layer. These include heave distribution where: a) the HHR layer located at the upper half o f the frozen soil, b) the HHR layer at the lowef half of the frozen soil, c) the HHR layer is located in the middle half of the frozen soil and d) heave is distributed with relative even- ness. These four types referred to as type A ,
are the most common making up 80% of the 312 B, C and D respectively. Among them, A and B
sets of data. A brief account of the conditions of the test sites and heave distributions at each site are given in the following sections.
Zhangye frost heave station
The soil at the Zhangye Station can be divided into five types:heavy silty loarn,sandy loam,fine sand and loam and sandy loam overlain by a coarse sand layer. The ground water table at each site are artificially controlled at depths of 1 , 1.5 and 2 . 5 m, respectively. A total o f 15 testing units consisting of combin,ation of s o i l s and ground water conditions were instrumented to measure frost penetration, soil temperature,soil moisture and heaving. The results from the ex-
indicate that when the ground water teble is periments can be seen in Table I. The results
and 150-1,2,the heave distributions belong to close t o the surface, such as in unit 100-1,2,3
type B, regardless of soil type. An example o f this type of heave is shown in Fig.1. For deeper ground water conditions, the main distribution type is A. For the loam and sandy loam covered with coarse sand, the distribution mainly be- longs to type B despite the varying ground water
Heave ratio equals to Ah/AH, where Ah and AH represent the heave and the thickness, respec- tively, of the same layer.
1196
, TABLE I
Heave Distribution Types in Zhangye Frost Heave Station
Unit Numbers of distribut i .on ty es number Total A B C E 100-1 to 5 4 4 15 15 150-1,2,4,5 6 6 250-1,2 3 3 250-4,5 4 4
**The number before dash denotes the water depth in cm, the number after dash denotes soil types:
1-heavy silty loam; 2-sandy Loam; 3"sand: 4-loam under coarse sand: 5-sandy loam under coarse sand.
Fig.1 Distribution of Heave Ratio and Water Content of Unit 100-1 in Zhangye Frost Heave Station
depth ranging from 100 to 2 5 0 cm.
Daman main canal This is a concrete lined canal with subsoil mainly consisting o f clay and heavy silty loam, replaced to various depths by sand-gravel. The ground water table varied from 0.5 m at the beginning of winter to 1.5 m at the end of win- ter. Table I 1 summarizes the results and indi- cate the heave distribution is mainly type B , which amounts to 71% of the data observed. It is apperenr. in the data f rom the north facing slopes that heave distribution is also effects by posi- tion relative to the ground water table. The shorter the distance between freezing front and the ground water table, the higher the heave
Main Canal is shown in Fig.2. ratio. An example of test result from Daman
Ginnhui main canal The ground water table at the Ginghui Main Canal is deeply seated, s o the freezing process is similar to a closed system. The s u h s o i l is a
TABLE 11
Statistics of Heave Distribution Types in Daman Main Canal
Location of Numbersof distribution types heave measur.ernent Total A B C D
NS* upper haef 20 10 2 I 7 NS* lower half 20 12 3 5 bottom 22 21 1 SS** -lower half 2 3 21 2 S S upper half 25 23 2
* NS: north- facing slope, that is the sun-ex- * * S s : south facing slope, that is the shade side
posed side and is warmer.
and is colder.
e E
&Oronnd water t a h l n
Fig.2 Distribution of Heave Ratio and Water. Content of Point No.04 in Section No.2, Daman Main Canal
TABLE I11
Statistics of Heave Distribution Types in Ginghui Main Canal
Location of Numbers of distribution types heave measurement Total A B C D
WS* upper half 19 1 7 2 WS lower half 30 30 bottom 10 7 3 ES** lower half 30 18 2 10 ES upper half 20 17 1 2
* WS: west slope, the colder side. +*ES: east slope, the warmer side.
loess with vertically developed fissures alluw- ing rapid downward drainage. The results a r c shown in Table 111. The results indicate that
A heave distribution, This type of heave is over 80% of the site are characterized by type
1197
very predominant on the colder west slopes where it makes up 96% o f the total (Fig.3).
Fig.3 Distribution Curve of Heave Ratio and Water Content o f WS Lower Half in Section No.1, Ginghui Main Canal
Fig.4 Distribution of Heave Ratio and Water Content of South Facing Slope in Section No.2, Minqin Testing Canal
M i n a i n testing canal seated ground water table, we can 'see from the The depth of ground water table of the Minqin Testing Canal is about 4 m under the canal bot- tom. The soil is heavy silty loam and silty clay with poor drainage capability. The data are shown in Table IV. When no replacement by sand takes place, the distribution types are mainly A and D. In the case of replacement by sand, the distribution mainly belongs to type B , A typical. example of experimental resulta from a site with subsoil replacement by sand is shown in Fig.4.
TABLE IV
Heave Distribution Types in Minqin Testing Canal
Location o f Numbers of distribution types heave measurement Total A B C Ir
~ ~
without subsoil replacement NS upper half 6 1 2 NS lower half 8 7 bottom a 3 SS lower half 8 2 SS upper half 1 2 4 With subsoil replacement b y sand NS upper half 4. 4 NS lower half . 4 3 bottom 4 3 SS lower half 4 4 S S upper half 4 4
1 2 1
4 ' 1 6 a
1 1
HEAVE DISTRIBUTION VERSUS SOIL-GROUND WATER CONDITIONS
soil moisture profile shown in Fig.3 that a high moisture content zone corresponding to the HHR layer is present i n the upper part of the frozen soil. This zone is caused by the increase o f moisture which occurs during freezing. Under this layer, the moisture content decreases and ade-wateringzone is present corresponding to a low or non-heaving layer. The de-watering is' due t o two mechanisms: 1) as a result of seepage from the canal, the moisture in the upper part of subsoil is greater than that in the lower. The moisture transfers downward under the gra- dient of moisture content and the gravity force, which is the main mechanism of de-watering in the well drainage capability soil; 2 ) since ground water table is quite deep, the source of water migration during freezing can only origi- nate from the moisture redistribution in a thin zone beneath the HHR layer. According to the observed data, the thickness o f de-watering layer affected by the redistribution is about 30 to SO cm. If it is assumed that all of the moisture causing 5 cm heaving originates from this layer, a loss of 8% water content in the Lower 40 cm can be expected, In areas with shallowly seated ground water tables, no de- watering in the moisture profile i g observed. On the contrary, the freezing front approaches closer to the ground water table, the soil mois- t u r e content increases rapidly as a result of water movement from the water table. Moisture content exceeding 100% (by weight) were meas- ured in the frozen soil below Daman Main Canal invert, Based o n the results from Zhangye Frost Heave Station, correlation curves o f the heave ratio versus ground water depth have been de- termined. The equations for the curves for each s o i l type is given below.
heavy silty loam ~=60.5exp(-0.01462) ( 1 )
In order to have a thorouah understandinR of sandy loam n=2a4/2 + 0.2 ( 2 ) heave distribution at each site, it is neces- sary to study the change of soil moisture pro- f j l e s during freezing. In the case of deeply
fine sand q=65 .2 / (2 -10 ) + 0.15 ( 3 )
1198
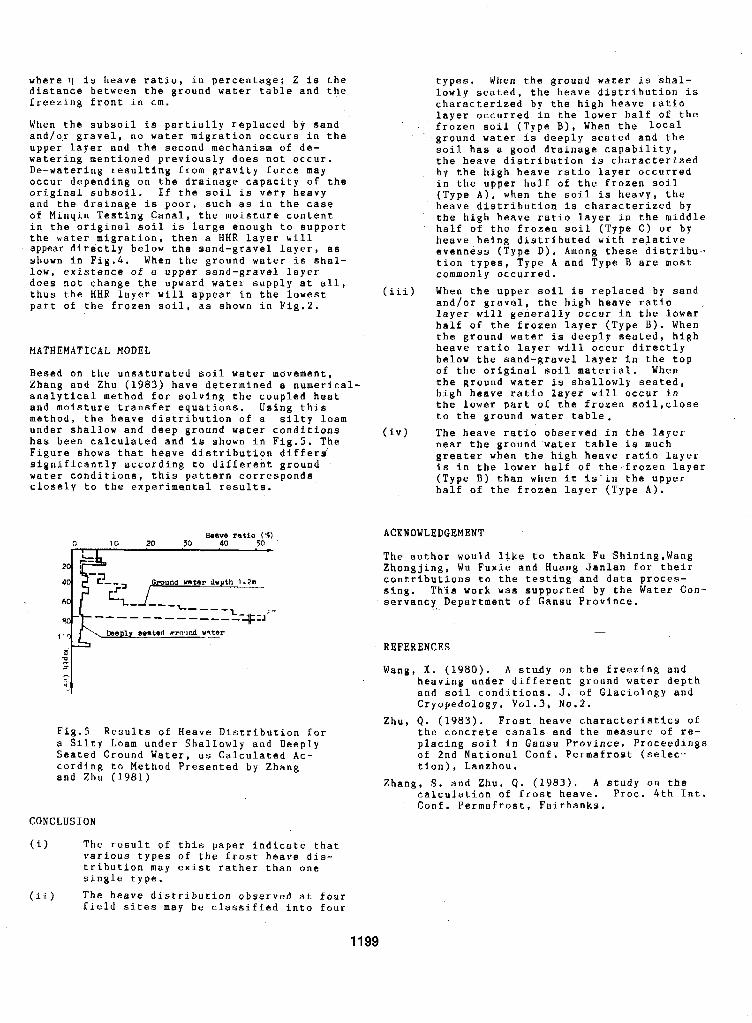
where q i s heave ratio, in percentage; Z is the distance between the ground water table and the freezing front in cm.
When the subsoil is partially replaced by sand and/o,r gravel, no water migration occurs in the upper layer and the second mechanism of de- watering mentioned previously does not occur. De-watering resulting f rom gravity force may occur depending on the drainage capacity of the original subsoil. If the soil is very heavy and the drainage is poor, such as in the case of Minqin Testing Canal, the moisture content in the original soil is large enough to support the water migration. then a HHR layer will appear directly below the sand-gravel layer, a s shown in Fig.4. When the ground water i s shal- low. existence of a upper sand-gravel layer does not change the upward water supply at all, thus the HHR layer will appear in the lowest (iii) part of the frozen soil, as shown in Fig.2.
M A T H E M A T I C A L MODEL
Besed on the unsaturated soil water movement, Zhang and Zhu (1983) have determined a numerical- analytical method for solving the coupled heat and moisture transfer equations. Using this method, the heave distribution of a silty loam under shallow and deep ground .water conditions has been calculated and is shown in Fig.5. The Figure shows that heave distribution differs’ significantly according to different ground water conditions, this pettern corresponds closely to the experimental results.
(iv)
0 I O 20 50 40 50 Heave ratio ( 8 )
,.
Fig.5 Results of Heave Distribution for a Silty Loam under Shallowly and Deeply Seated Ground Water, as Calculated Ac-
and Zhu (1981) cording to Method Presented by Zhang
CONCLUSION
(i) The result of this paper indicate that various types of the frost heave dis- tribution may exist rather than one single type.
(ii) The heave distribution observed at four field sites may be classified into four
types. When the ground water is shal- lowly seated, the heave distribution is characterized by the high heave ratio
frozen soil (Type B), When the local layer occurred in the lower half of the
ground water is deeply seated and the soil. has a good drainage capability, the heave distribution is characterized by the high heave ratio layer occurred in the upper half of the frozen soil (Type A), when the soil is heavy, the heave distribution is characterized by the high heave ratio layer in the middle half of the frozen soil (Type C) o r by heave being distributed with relative evenness (Type D). Among theee distribu- tion types, Type A and Type B are most commonly occurred. When the upper soil i s replaced by sand and/or gravel, the high heave ratio layer will generally occur in t h e lower half o f the frozen layer (Type B). When the ground water is deeply seated, high heave ratio layer will occur directly below the sand-gravel layer in the top of the original soil material. When the ground water is shallowly aeated, high heave r a t i o layer will occur in the lower part of the frozen soi1,close to the ground water table. The heave ratio observed in the layer near the ground water table i s much greater when the high heave ratio layer is in the lower half of thesfrozen layer (Type B ) than when it is-in the upper half of the frozen layer (Type A).
ACKNOWLEDGEMENT
The author would like to thank Fu Shining,Wang Zhongjing, Wu Fuxie and Huang Janlan for their contributions to the testing and data proces- sing. This work was supported by the Water Con- servancy , .,. Department of Gansu Province.
REFERENCES
Wang, X. (1980). A study on the freezing and
-
heaving under different ground water depth and soil conditions. J. of Glaciology and Cryopedology, Vo1.3, No.2.
Zhu, Q. ( 1 9 8 3 ) . Frost heave characteristics of the concrete canals and the measure of re- placing soil in Gansu Province. Proceedings of 2nd National Con€. Permafrost (selec- tion), Lanzhou.
calculation o f frost heave. Proc. 4th Int. Conf. Permafrost, Fairbanks.
Zhang, S. and Zhu, Q. (1983). A study o n the
1199
TRIAXIAL COMPRESSIVE STRENGTH OF FROZEN SOILS UNDER CONSTANT STRAIN RATES
Zhu, Yuanlinl and D.L. C a r b d
1Lanahou Institute of Glaciology and Geocryology, Academia Siniea, Lanzhou, China W.S. Army CRREL, Hanover, NH 03755, U.S.A.
SYNOPSIS Triaxial compressive strength tests were conducted on remolded, saturated Fair- banks silt and Northwest sand taken from,Alaska under various constant strain rates ranging from 5.27~10- to 9.84~10-~s" and confining pressures up to 3.43,MPa at -2 'C. The average dry densities of the samples tested were 1.20 g/cm for silt and 1.52 g/cm for sand, respectively. It was found that within the range of confining pressure employed the maximum deviator stress, ( C J ~ - Q ~ ) , , , , for the silt did not vary with Ua, i.e., its angle o f int,ernal friction 4-0 and its shear strength Tzcohe- sion C. For a given temperature and dry density, the value of C inc.reased with increasing strain rate. However, the maximum deviator stress for frozen sand increased srgnificantly with increasing 0,; and the increase was not linear, indicating that at a given temperature and strain rate, the values of C and Q f o r frozen sand depended upon the range of normal stress (I. At the temperature tested and ~ , = 1 . 0 4 ~ 1 0 - ~ s - ~ , the values of C and 4 f o r the sand varied as follows: C-1.62 MPa and d1=22.8' for 053.1 MPa, and Cs2.30 MPa and $=12.1' for Ok3.1 MPa. The test results also showed that the axial failure strain for silt was independent of a,, but varied with el. It changed abruptly at a strain rate of about 10-4-10-5~-1 , indicating that a transition of deformation mode occured at this strain rate. Whereas, the failure strain for sand increased with increasing 0 3 , The initial tangent modulus of frozen silt and sand seemed to decrease slightly with increasing hydrostatic pressure, presumably owing to the pressure-meltifig of ice. Significant dilation at larger strains was observed for the sand samples, but not for the ailt samples.
INTRODUCTION
The design of stable underground structures in cold regions and artificially frozen-ground sup- porting structures requires the knowledge of strength and deformation behaviour of frozen soils under the action of both confining (hy- drostatic) pressure and vertical load, i.e., at a complex stress state. In the past two decades, therefore, more attention has been paid to the research on the stress-strain behaviour of fro- zen soils under triaxial stress. While many researchers have studied this subject from var- ious aspects, detailed studies are still re- quired t o gain a better understanding of the 'subject.
The objective of this study was to investigate the effect of confining pressure and strain rate on the stress-strain behaviour of disturbed, frozen saturated Fairbank silt and Northwest
average try densities of the samples,tested were sand, The testing temperature was -2'C. The
1.20g/cm for the silt and 1.52 g/cm for the sand, and their corresponding water'content were 42.7% and 25-33, respectively. The desired con- fining pressures and cross-head speeds employed are shown in Table I .
MATERIAL AND SPECIMEN PREPARATION
Material The material used in this investigation are a remolded Fairbanks Fox tunnel silt (FTS) and a
remolded Northwest (Irvine) sand (NWS) taken
and physical properties of the materials are from Alaska. The grain size distribution curves
shown in Fig.1 and Table 11.
TABLE I
Confining Pressure and Croas-Head Speed Used
Silt samples Sand samples
Conf ining Pressure 0, 0.49, 0.98, 1.96 0, 0.98, 1.96, 3.43
0Q"P) Cross-head speed 10, 1. 0.1, 0.01, 0.005 1
Specimen preparation The samples tested were made by using a gang mold, machined from acrylic plastic, which has a capacity of forming 19 cylindrical specimens at one time. The details of specimen preparation
trimming) were described by the authors (1987). (including compacting, saturating, freezing and
By using the dual source y-ray technique with the help of J. Ingersoll, it is known that the distribution of density and moisture along the specimen lhngth was quite uniform.
In order to prevent the pressurizing liquid per-
1200
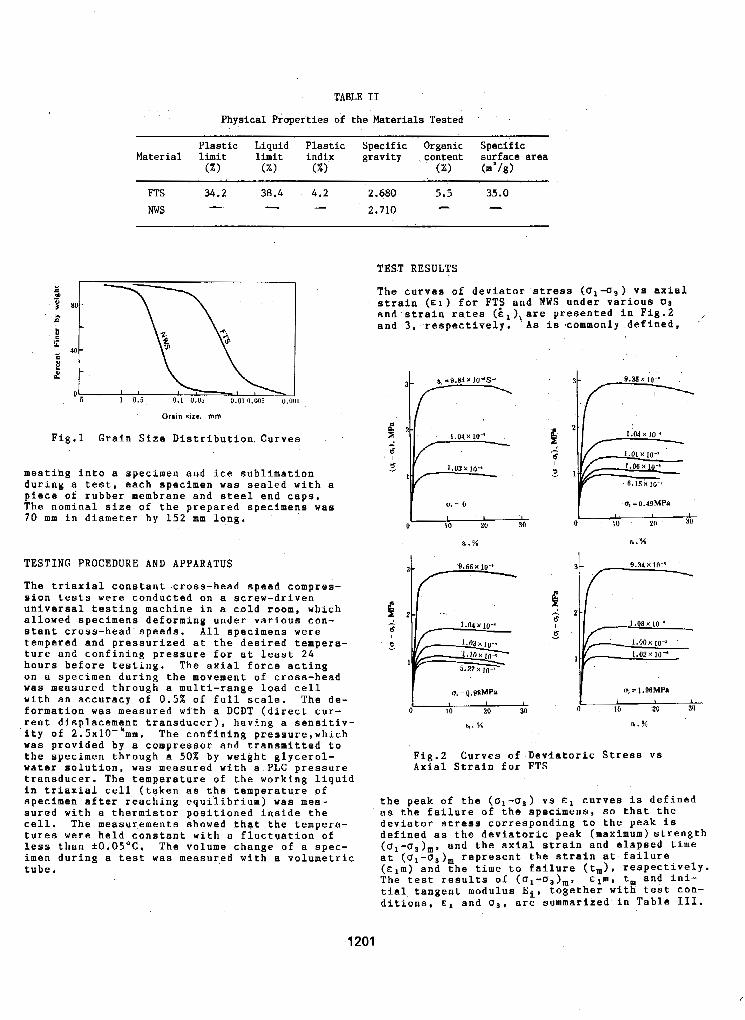
TABLE I1
Physical Properties of the Materials Tested
Plastic Liauid Plastic Specific Organic Specific
FTS 34.2 38.4 4.2 2.680 5.5 35.0
NWS I - I c - 2.710
Grain rizc. mm
Fig.1 Grain Size Diatribution.Curves
meatihg into a specimen and ice subllmation during a test, each specimen was sealed with a piece of rubber membrane and steel end caps. The nominal size of the prepared specimens was 70 mm in diameter by 152 mm long.
TESTING PROCEDURE AND APPARATUS
The triaxial constant cross-head speed compres- sion tests were conducted on a screw-driven universal testing machine in 8 cold room, which allowed specimens deforming under various con- stant cross-head.speeds. All specimens were tempered and pressurized at the desired tempera- ture and confining pressure for at least 24 hours before testing. The a x i a l force acting on a specimen during the movement of cross-head was measured through a multi-range load cell with an accuracy of 0.5% of full scale. The de- formation was measured with a DCDT (direct cur- rent displacement transducer), havLng a sensitiv-
was provided by a compressor and transmitted to .ity of 2.5xlO-'mrn. The confining pressure,which
the specimen through a 50% by weight glycerol- water solution, was measured with a PLC pressure transducer. The temperature of the working liquid in triaxial cell (taken as the temperature o f specimen after reaching equilibrium) was mea- sured with a thermistor positioned inside the cell. The measurements showed that the tempera- tures were held constant with a fluctuation of less than i0.05'C. The volume change of a spec- imen during a test was measured with a volumetric tube.
TEST RESULTS
The curves of deviator stress (U,-U,) VB axial strain ( E I ) for FTS and NUS under various 0 3 and strain ratee (i ) are presented in Fig.2 , and 3 , respectively: ' As is commonly defined. '
I I 0 10 20 30
&.X
I n, = p.RRMPa I I
0 10 20 30
%. %
Fig.2 Curves of Deviatoric Stress vs Axial Strain for FTS
the peak of the (Ol-ua) vs E l curves is defined a s the failure of the specimens, so that the deviator stress corresponding to the peak is defined as the deviatoric peak (maximum)strength ( O ~ - U ~ ) ~ , and the axial strain and elapsed time at ( ~ ~ - 0 ~ ) ~ represent the strain at failure (Elm) and the time to failure (tm), respectively. The test results o f (u,-u,)~. ~ , m , t and ini- tial tangent modulus Ei, together w f t f test con- ditiona, E~ and a , , are summarized in Table 111.
1201
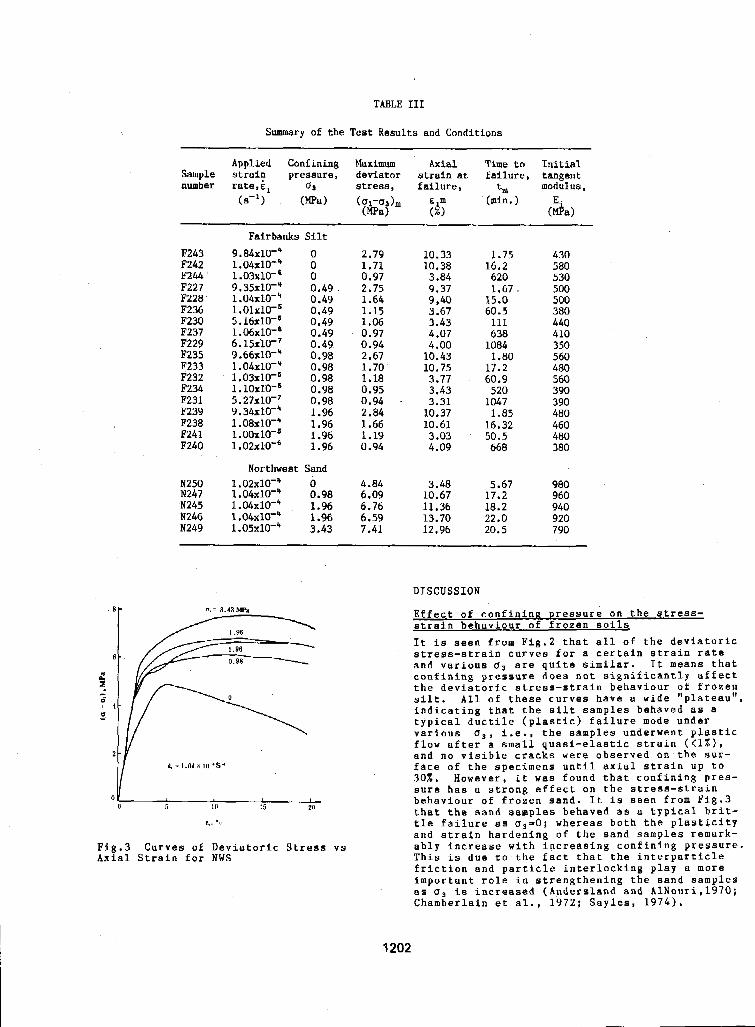
TABLE 111
Summary of the Tes t Resul t s and Condi t ions
Applied Confining Maximum Axial Time t o I n i t i a l Sample strai? p r e s s u r e , d e v i a t o r s t r a i n a t f a i l u r e , t a n g e n t number rate , E, 6 3 stress, f a i l u r e , t, modulus,
F a i r b a n k s S i l t F243
F244 F242
F227 F228 F236 F230 F237 F229 F235 F233 F232 F234 F231 F239
F241 F240
m a
0 2.79 0 0 0.97
1.71
0.49. 2.75 0.49 1.64 0.49 1.15 0.49 1.06 0.49 0.97 0.49 0.94 0.98 2.67 0.98 1.70 0.98 1.18 0.98 0.95 0.98 0.94 1.96 2.84 1.96 1.66 1.96 1.19 1.96 0.94
10.33 10.38
9.37 9,40
3.43 3.67
4.07 4.00
10.43 10.75 3.77 3.43 3.31
10.37 10.61 3.03 4.09
3 .a4 16.2
1.75
620 1.67 15.0 60.5 111 638
1084 1.80
60.9 17.2
520 1047 1.85
16.32 50.5 668
430 580 530 500 500 380 440 410 350 560 480 560 390 390 480 460 480 380
Northwest Sand ~ 2 5 0 1.02~10-* 0 N247 1.04x10-" 0.98 6.09
4.84 3.48 5.67 980
N245 1.04x10-' , 1.96 6.76 10.67 17.2 960
N246 1.04~10"' 11.36 18.2 940
1.96 6.59 N249 1 . 0 5 ~ 1 0 - ~ 3.43 7.41
13.70 22.0 920 12.96 20.5 790
DISCUSSION
E f f e c t of c o n f i n i n n p r e s s u r e o n t h e s t r e s s - s t r a i n b e h a v i o u r o f f r o z e n s o i l s I t is s e e n from F i g . 2 t h a t a l l of t h e d e v i a t o r i c
a n d v a r i o u s C J ~ a re q u i t e similar. I t m e a n s t h a t s t r e s s - s t r a i n c u r v e s f o r a c e r t a i n s t r a i n r a t e
c o n f i n i n g p r e s s u r e does n o t s i g n i f i c a n t l y a f f e c t t h e d e v i a t o r i c s t r e s s - s t r a i n b e h a v i o u r o f f r o z e n s i l t . All o f t h e s e c u r v e s h a v e a w i d e " p l a t e a u " , i n d i c a t i n g t h a t t h e s i l t s a m p l e s b e h a v e d a s a t y p i c a l d u c t i l e ( p l a s t i c ) f a i l u r e m o d e u n d e r v a r i o u s u , , i . e . , t h e s a m p l e s u n d e r w e n t p l a s t i c f l o w a f t e r a small q u a s i - e l a s t i c s t r a i n ( < l X ) , a n d n o v i s i b l e cracks were o b s e r v e d on the sur- f a c e o f t h e s p e c i m e n s u n t i l a x i a l s t r a i n u p t o 30%. H o w e v e r , it was f o u n d t h a t c o n f i n i n g p r e a -
b e h a v i o u r o f f r o z e n s a n d . I t is seen f r o m F i g . 3 s u r e h a s a s t r o n g e f f e c t on t h e s t r e s s - s t r a i n
t h a t t h e s a n d s a m p l e s b e h a v e d a s a t y p i c a l b r i t - t l e f a i l u r e a s a,=O; w h e r e a s b o t h t h e p l a s t i c i t y a n d s t r a i n h a r d e n i n g of t h e s a n d s a m p l e s r e m a r k - a b l y i n c r e a s e w i t h i n c r e a s i n g c o n f i n i n g p r e s s u r e . T h i s i s d u e t o t h e f a c t t h a t t h e i n t e r p a r t i c l e f r i c t i o n a n d p a r t i c l e i n t e r l o c k i n g p l a y a m o r e
a s U 3 i s i n c r e a s e d ( A n d e r s l a n d and A l N o u r i , l 9 7 0 ; i m p o r t a n t r o l e i n s t r e n g t h e n i n g t h e s a n d s a m p l e s
C h a m b e r l a i n e t a l . , 1972; S a y l e s , 1 9 7 4 ) .
e.. 0 "
F i g . 3 C u r v e s o f D e v i a t o r i c S t r e s s v s A x i a l S t r a i n f o r NWS
1202
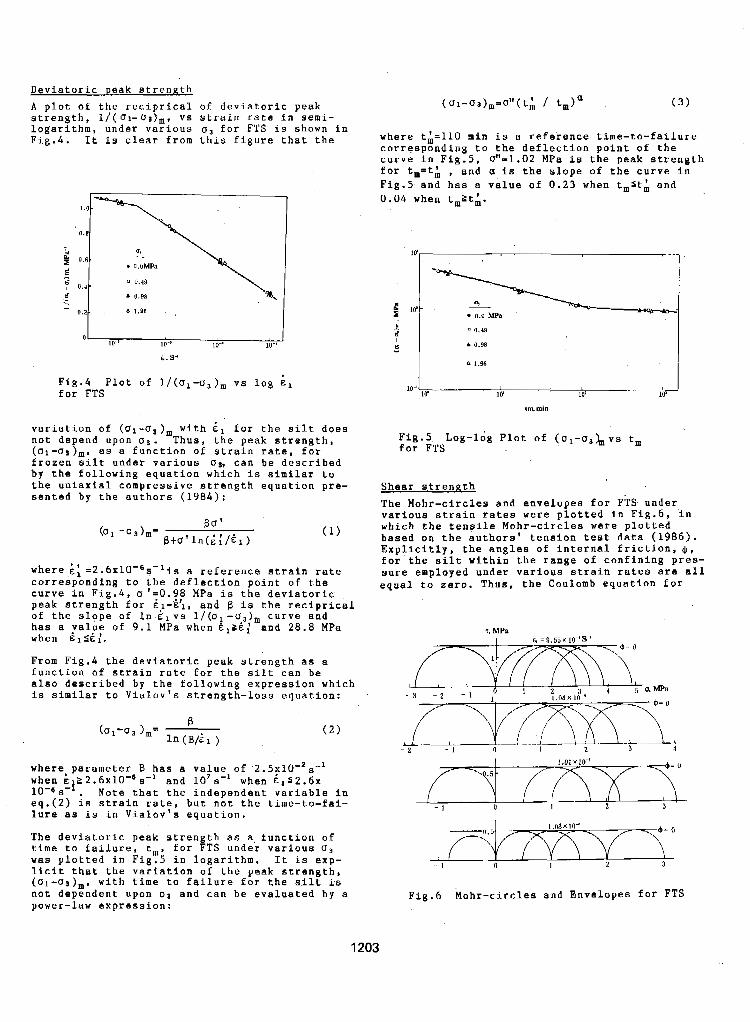
Deviatoric peak strength A plot of the reciprical o f deviatoric peak strength, l / ( u ~ - U a ) ~ , vs strain rate in semi- logarithm, under various for FTS is shown in Fig.4. It is clear from this figure that the
Fig.4 Plot of l / (u1 -U3) , , , v 8 log E l for FTS
variation of (U1-Ua)m with il for the silt does not depend upon og. Thus, the peak strength, (ol-09)m. as a function of strain rate, for frozen silt under various oar can be described b y the following equation which is similar to
sented b y the authors (1984): the uniaxial compressive strength equation pre-
where &: =2.6~10-'s-'is a reference strain rate corresponding to the deflection point o f the curve in Fig.4, u '=0.98 MPa is the deviatoric peak strength for kl-k ' l , and B is the reciprical of the slope o f In i , v 8 l/(ul -0 ) curve and has a valre of 9.1 MPa when Slk:6; mand 2 8 . 8 MPa when 6 1 SE r'. From Fig.4 the deviatoric peak strength as a
also described b y the following expression which function of strain rate for the silt can be
is similar to Vialov's strength-loss equation:
where parameter B has a value of 2.5~10-2s" when & ?~2.6xlO-~s-' and 1O'a-l when Elf12.6~ l odes - . Note that the independent variable i n eq.(2) is strain rate, but not the time-to-€ai- lure as is in Vialov's equation.
1
The deviatoric peak strength as a, function o f time to failure, tm, €or FTS under various 03 was plotted in Fig.5 in logarithm. It is exp- licit that the variation o f the peak strength, ( o l - O a ) , , with time to failure €or the silt is not dependent upon u9 and can be evaluated b y a power-law expression:
1203
where tA=llO min is a reference time-to-failure corresponding to the deflection point of the curve in Fig.5. O"-1.02 MPa is the peak strength for t,=tA , and c1 is the slope of the curve in Fig.5 and has a value of 0.23 when tmbtA and 0.04 when tm2tA.
Q u.49
Fig.5 Log-log Plot of ( u1-u3 ),,, vs t, for FTS
Shear strength The Mohr-circles and envelopes for FTS under various strain rates were plotted in Fig.6, in which the tensile Mohr-circles were plotted based on the authors' tension test data (1986). Explicitly, the angles of internal friction, $, f o r the silt within the range of confining pres- sure employed under various strain rates are all equal to zero. Thus. the Coulomb equation for
1. MPa 6, = 9 . 5 5 x IO'S"'
4
Fig.6 Mohr-circles and Rnvelopea for FTS
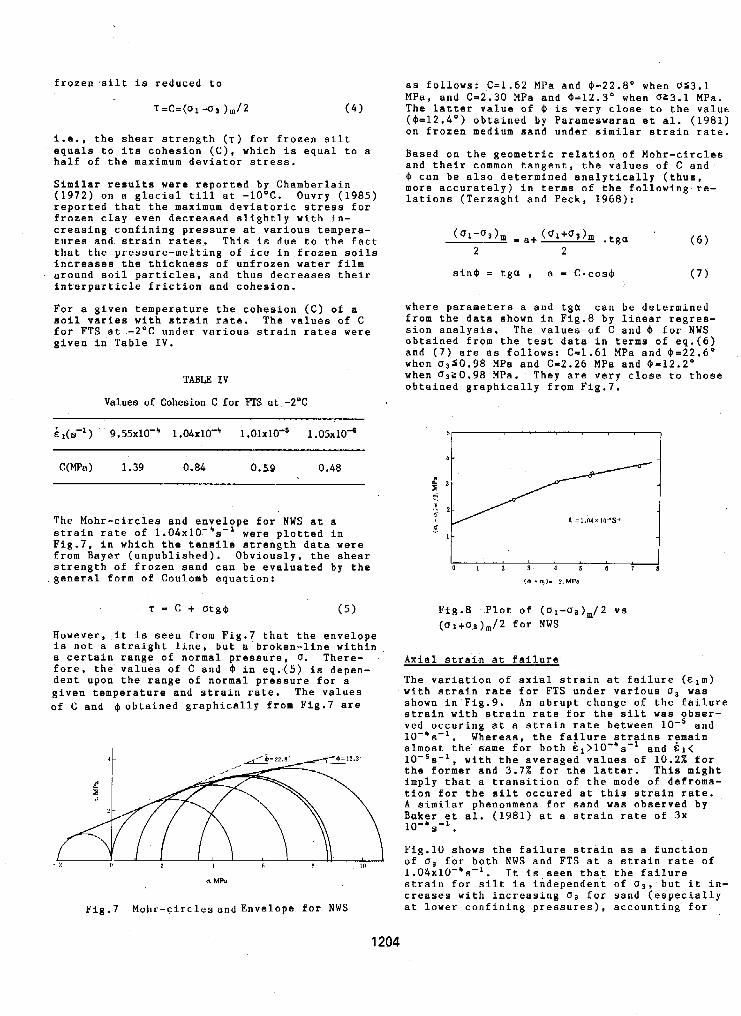
frozen silt is reduced to
i.e., the shear strength ( T ) for frozen silt equals to its cohesion (C), which is equal to a half o f the maximum deviator stress.
Similar results were reported by Chamberlain (1972) on a glacial till at -1O'C. Ouvry ( 1 9 8 5 ) reported that the maximum deviatoric stress for frozen clay even decreased slightly with in- creasing confining pressure at various tempera- tures and strain rates. This is due t o the fact that the pressure-melting of ice in frozen soils increases the thickness o f unfrozen water film around soil particles, and thus decreases their interparticle friction and cohesion.
For a given temperature the cohesion (C) of a soil varies with strain rate. The values of C for FTS at -2 'C under various strain rates were given in Table IV.
TABLE IV
Values o f Cohesion C for ITS at.-2'C
as follows: C=1.62 MPa and 4-22.8' when OS3.l MPa, and C-2.30 MPa and ,$=12.3' when 023.1 MPa. The latter value o f 9 is very close to the value (,$=12.4') obtained by Parameswaran et al. (1981) on frozen medium sand under similar strain rate.
Based on the geometric relation of Mohr-cfrcles and their common tangent, the values of C and 9 can be also determined analytically (thus, more accurately) in terms of the following re- lations (Tereaghi and Peck, 1968):
where parameters a and t g a can be determined from the data shown in Fig.8 b y linear regres- sion analysis. The values of C and ,$ f o r NWS obtained from the test data in terms of eq.(6) and (7) are as follows: Cm1.61 MPa and ,$=22.6' when 0350.98 MPa and C-2.26 MPa and 4-12.2" when U9ZO.98 MPa. They are very close to those obtained graphically from Flg.7.
E l(8-l) 9.55~10-~ 1.04~10"~ 1 . O ~ X ~ O - ~ 1 .05x10a 56 I I
C(MPa) 1.39 0.84 0.59 0.48
The Mohr-circles and envelope for NWS at B 4 = 1.04 Y I O 4 S
strain rate of 1 . 0 4 ~ 1 0 - ~ s - ~ were plotted in Fig.7, in which the tensile strength data were from Bayer (unpublished). Obviously, the shear strength of Erozen sand can be evaluated by the 0 1 2 3 4 6 8 7 8
- 1 -
.general form of Coulomb equation: ( Q + q ) m 2,MPa
However, it is seen from Fig.7 that the envelope
a certain range of normal pressure, U. There- is not a straight line, but a'broken-line within
fore. the values of C and ,$ in eq.(5) is depen- dent upon the range of normal pressure for a given temperature and strain rate. The values o f C and ,$obtained graphically from Fig.7 are
a MPa
Fig.7 Mohr-circLesandEnvelope for NWS
Axial strain at failure
The variation of axial strain at failure (Elm) with strain rate for FTS under various Us was shown in Fig.9. An abrupt change of the failure strain with strain rate for the silt was obser- ved occuring at a atrain rate between and
almost the same for both ~,>lO-'a" and E l < 10-5s-1. with the averaged values of 10.2% for the former and 3.7% for the latter. This might imply that a transition of the mode o f defroma- tion for the silt occured at this strain rate. A similar phenomena for sand was observed by Baker et al. (1981) at B strain rate of 3x 10⁻⁴ - 1
Whereas, the failure strains rgmain
S .
Fig.10 shows the failure strain as a function of ug f o r both NWS and FTS at a strain rate of 1.04~10-~s-~. It i s seen that the failure strain for silt is independent of O g , but it in- creases with increasing 0 3 for sand (especially at lower confining pressures), accounting for
1204
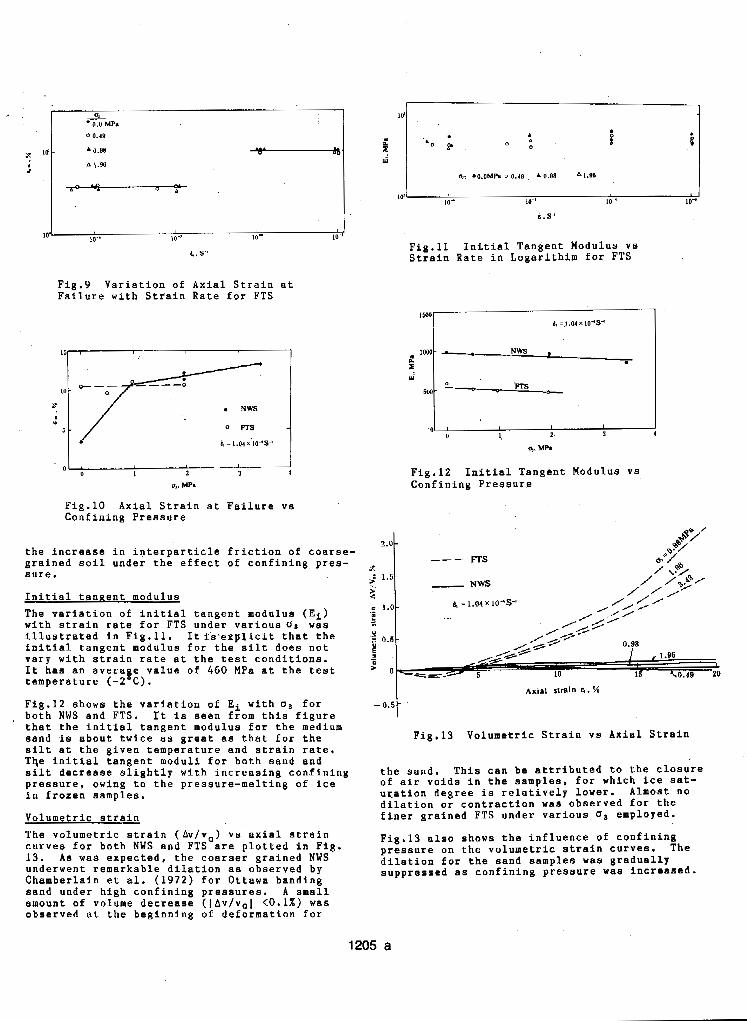
Fig.11 Initial Tangent Modulus vs Strain Rate in Logarithim €or FTS
Fig.9 Variation of Axial Strain at Failure with Strain Rate f o r FTS
I
0,. MPm
Fig.10 Axial Strain at Failure vs Confining Pressure
the increase in interparticle friction of coarse- grained soil under the effect of confining pres- sure.
Initial tanRent modulus The variation of initial tangent modulus (Ei) with strain rate for FTS under various 4 3 waa illustrated in Fig.11. 1tis.exgIicit that the initial tangent modulus for the silt does not vary with strain rate at the test conditions. It has an average value o f 460 MPa at the test temperature (-2'C).
Fig.12 shows the variation of Ei with US for both NWS and FTS. I't is seen from this figure that the initial tangent modulus for the medium sand is about twice as great as that for the silt at the given temperature and strain rate, The initial tangent moduli for both sand and silt decrease slightly with increasing confining pressure, owing to the pressure-melting of Ice in frozen samples.
Volumetric strain The volumetric strain (AvV/vo) V E axial strain curves f o r both NWS and FTS are plotted in Fig. 13. As was expected, the coarser grained NWS underwent remarkable dilation as observed b y Chamberlain et al. (1972) for Ottawa banding sand under high confining pressures. A small amount of volume decrease (IAv/vol <0.1%) was observed at the beginning of deformation for
Fig.12 Initial Tangent Modulus vs Confining Pressure
I_ NWS
P, =1.04x10⁴S"
Fig.13 Volumetric Strain vs Axial Strain
the sand. This can be attributed to the closure of air voids in the samples, for which ice sat- uration degree is relatively lower. Almost no dilation or contraction was observed for the finer grained FTS under various employed.
Fig.13 also shows the influence of confining pressure on the volumetric strain curves. The dilation for the sand samples was gradually suppressed as confining pressure waa increased.
1205 a
CONCLUSIONS
It can be concluded from this investigation
Confining pressure does not affect the deviatoric stress-strain curves for frozen silt, but significantly in- creases the plasticity and strain har- dening of frozen sand within the range of confining pressure employed. The angle of internal friction ( b ) is equal t o zero for frozen silt: it varies with the range of u3 for frozen medium sand: 2 1 2 2 . 6 " when ~ ~ $ 0 . 9 8 MPa and 4-12.2 when 0 ~ S 0 . 9 8 MPa. A sudden change of the axial strain at failure with strain rate was observed
and 10-'s- I occurin at a strain rate between lo-'
for frozen silt at - 2 " C , indicating that a transition of the mode of deformation and/or failure may occur at this strain rate. The axial strain at peak stress does not depend upon confining pressure f o r frozen silt, but increases with in- creasing confining pressure for frozen sand, especially at low confining pres- sure. The initial tangent modulus of frozen soil is not dependent upon strain rate, but slightly decreases with increasing confining pressure because of the
average value of 460 MPa for silt and pres~ure-melting of ice. It has an
960 MPa for medium sand at -2°C. Remarkable dilation in triaxial compres- sion was observed for the coarser grained soil, but almost no volume changes were measured €or the finer grained soil.
ACKNOWLEDGEMENTS
This study was sponsored b y the U.S.Army Corps of Engineers at the Cold Regions Research t5 Engineering Laboratory. The authors wish to express their appreciation and thanks for the technical advice and instructive discussion from Dr. A. Assur, Messrs W. Quinn. E, Chamber- lain, F. Saylea, D. Cole, Dr. M. Mellor and Dr. Y.C. Yen. We also would like to thank Msssrs J. Bayer, J. Rajkowski, J. Ingeraoll and G. Durell for their technical support and instru- mentation assistance, Thanks are also given to Dr. T.H.W. Baker for review of this paper.
REFERENCES
Andersland, O.B. I% Alnouri, I. (1970), Time- dependent strength behaviour of frozen soils. Jnl Soil Mech. Fdns Div. Am. SOC. Civ. Engrs 96, SM4, 1249-1265.
(1981), Confined and unconfined compression Baker, T.H.W., Jones, S,J. & Parameswaran, V.R.
teats on frozen sand, Proceedings o f Fourth Canadian Permafrost Conference, p. 387-393..
Bayer,J., Investigation into compression and
USA CRREL Technical Note (unpublished). tensile strength of frozen sand and silt,
(1972), The mechanical behaviour of frozen earth materials under high pressure tria- xial test conditions, Geotechnique. "01. 22, No.3, p.469-483.
Chamberlain, E.J., Groves, C. & Perham. R.
Ourvy, J.F. (1985), Results of triaxial com- pression tests and triaxial creep tests on an artificially frozen stiff clay, Proceedings of the 4th International sym- posium on Ground Freezing, Vol.11, p.207- 212.
Parameswaran, V.R. & Jones, S.J. (19al), Tria- xial testing of frozen sand, Journal of Glaciology, Vo1.27, No.95, p.147-156.
rate tests and triaxial creep tests on frozen Ottawa sand, USA CRREL Technical Report 253.
pressive strength of frozen silt under constant deformation rates, Cold Regions Science and Technology. 9(1984), 3-15.
strength of frozen silt, Journal of Gla- ciology and Geocryology. Vo1.8, No.1, P.
Sayles, F.H. (1974), Triaxial conatant strain
Zhu, Y.L. & Carbee, D.L. (1984). Uniaxial com-
Zhu, Y.L. & Carbee, D.L. (L986), Tensile
15-28,
Zhu, Y.L. & Carbee, D . L . (1987), Creep and strength behaviour of frozen silt in uniaxial compression, USA CRREL Report 87-10.
1205 b
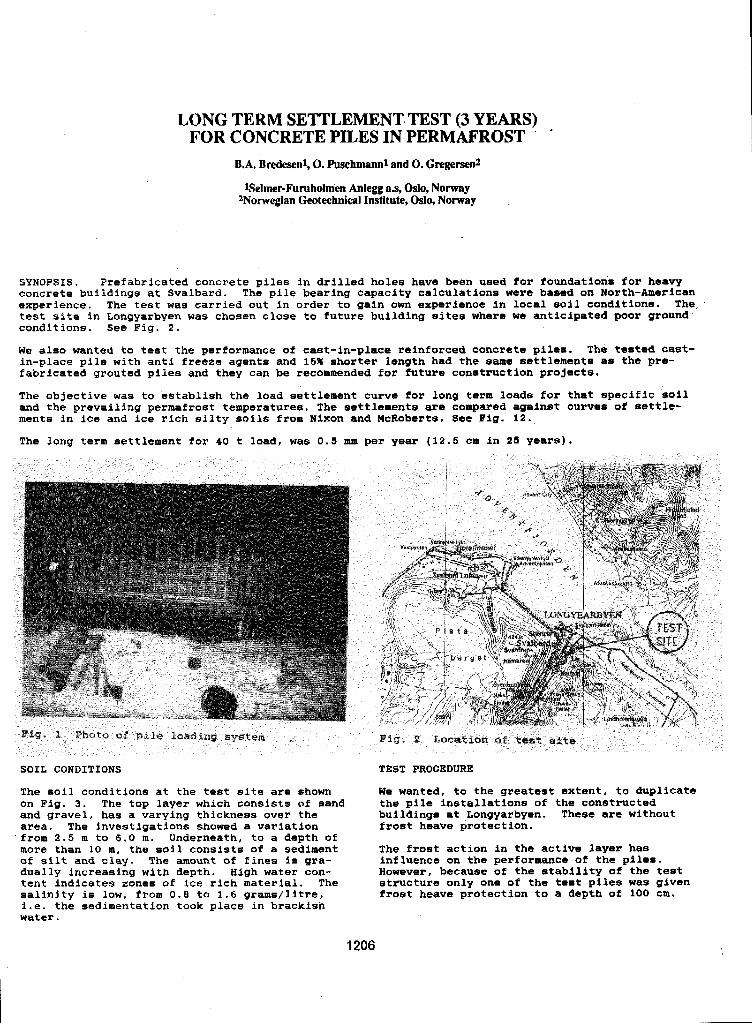
LONG TERM SETTLEMENT TEST (3 YEARS) FOR CONCRETE PILES IN PERMAFROST
B.A. Bredesenl, 0. Puschmannl and 0. Gregersenz
ISelmer-Furuholmen Anlegg a.s, Oslo, Norway 2Norwegian Geotechnical Institute, Oslo, Norway
SYNOPSIS. Prefabricated concrete piles in drilled holes have been used for founaations for heavy concrete buildings at Svalbard. The pile bearing capacity calculations were based on North-American experience. The test was carried out in order to gain own experience in local soil conditions. The, test site in Longyarbyen was chosen close to future building aites where we anticipated poor ground' conditione. See Fig. 2.
We also wanted to test the performance of cast-in-glace reinforced concrete piles. The testad cast- in-place pile with anti freeze agents and 15% shorter length had the eamm settlemente as the pre- fabricated grouted pilee and they can be recommended for future construction projects.
The objective was to establish the load settlement curve for long term loads for that specific S o i l and the prevailing permafrost temperatures. The settlements are compared against curves of settle- ments in ice and ice rich silty sails fiom Nixon and McRoberts. See Fig. 12.
The long term settlement for 40 t load, was 0.5 mm per year (12.5 cm in 25 yeare).
SOIL CONDITIONS TEST PROCEDURE
The aoil conditions at the test site are shown on Fig. 3. The top layer which consists of sand and gravel, has a varying thickness over the area. The investigations showed a variation fram 2.5 m to 6.0 m. Underneath, to a depth of more than 10 m. the soil consists of a sediment of silt and clay. The amount of fines is gra- dually increasing with depth. High water con- tent indicates zones of Ice rich material. The salinity is low, from 0.8 to 1.6 grams/litre, i.e. the sedimentation took place in brackish water.
We wanted, to the greatest extent, to duplicate the pile installations of the constructed '
builclinge at Longyarbyen. These are without frost heave protection.
The frost action in the active layer has influence on the performance of the pilea. However, because of the stability of the test structure only one of the test piles was given froat heave protection to a depth of 100 cm.
1206
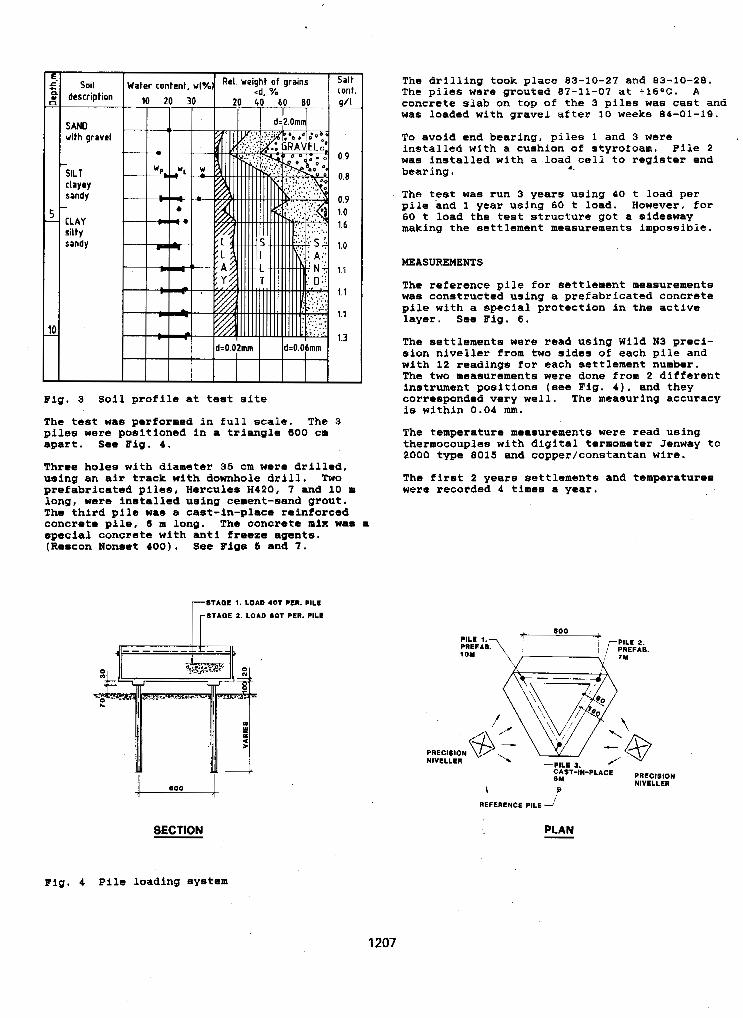
SAND with gravel
SILT
sandy clayey
CLAY silty sandy
0.9
0.8
0.9 1.0 1.6
1.0
1.5
1.1
1.1
1.3
F i g . 3 Soil profila at test site
The teat was performed in full scale. The 3 piles were podtioned in a triangle 600 cm apart. 3a8 Fig. 4.
Three holes with diamet8r 35 cm were drilled, using an air track with downhole drill. Two prefabricated piles, Hercules H420. 7 and 10 m
The third pile was a cast-in-place reinforced long, were installed using cement-send grout.
concrete pile, 6 m long. The concrete mix wae spacial concrete with anti freeze agents. (Reecon Nonset 400). See Blgs 6 and 7 .
STAOL 1. LOA8 407 PER. PILL
STAOE 2. LOAD I O T PER. PILE
The drilling took place 83-10-21 and 83-10-28. The piles were grouted 87-11-07 at +16*C. A concrete slab on top of the 3 piles was cast and was loaded with gravel after 10 weeks 84-01-19.
To avoid end bearing, piles 1 and 3 were installed with a cushion of styrofoam, Pile 2 was installed with a load cell to register end bearing . The test was run 3 years using 40 t load per pile and 1 year using 60 t load. However, f o r 60 t load the test structure got a aidesway making the settlement measurements impossible.
4.
MEASUREMENTS
was constructsd using a prefabricated concrete The reference pile for settlement measurements
pile with a special protection in the active layer. ?d¶8 Fig. 6 .
The settlements were read using Wild N3 preci- sion niveller from two sidts o f each pile and with 12 readings for each settlement number. The two measurements were done from 2 different instrument positions (see Fig. 4 ) , and they corresponded very well. The measuring accuracy i s within 0.04 mm.
The temperature maasurements were read using thermocouples with digital termameter Jenway tc 2000 type 8015 and copper/constantan wire.
The first 2 years settlements and temperatures were recorded 4 times a year.
a
PREClllON NIVCLLER
SECTION
Fig. 4 P i l e loading syatam
REFERENCE PILE -/
- PLAN
1207
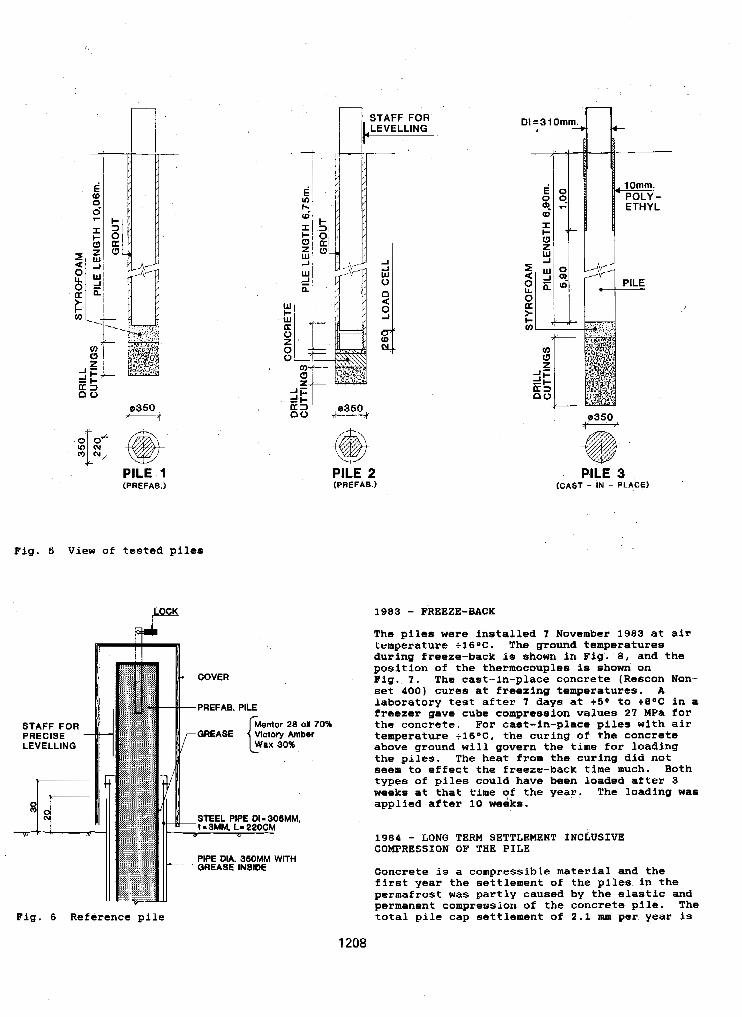
PILE 1 (PREFAB.)
Fig. 6 View of tested piles
STAFF FOR PRECISE LEVELLING
PREFAB. PILE
PIPE OW. 360" WITH " OREASE INSIDE
Fig. 6 Reference pile
PILE 2 (PREFAB.)
1208
P-ILE 3 (CAST - IN - PLACE)
1983 - FREEZE-BACK The piles were installed 1 November 1983 at air temperature +16OC. The ground temperatures during freeze-back is shown in Big. 8 , and the position of the thermocouples is shown on Fig. 7. The cast-in-glace concrete (Rsscon Non- set 400) cures at freezing temperatures. A laboratory teat after f days at +50 to + B 0 C in a freezer gave cube eompreeraion values 27 MPa for the concrete. For cast-in-place piles with air temperature + 1 6 D C , the curing of the concrete above ground will govern the time for loading the piles. The heat from the curing did not seem to effect the freeze-back time much. Both types of piles could have been loaded after 3 weeks at that time of the year. The loading was applied after 10 weiks.
1984 - LONG TERM SETTLEMENT INCLUSIVE COMPRESSION OF THE PILE
Concrete is a compressible material and the first year the settlement of the piles in the permafrost was partly caused by the elastic and permanent compression of the concrete pile. The total pile cap settlement of 2.1 mm per year i s
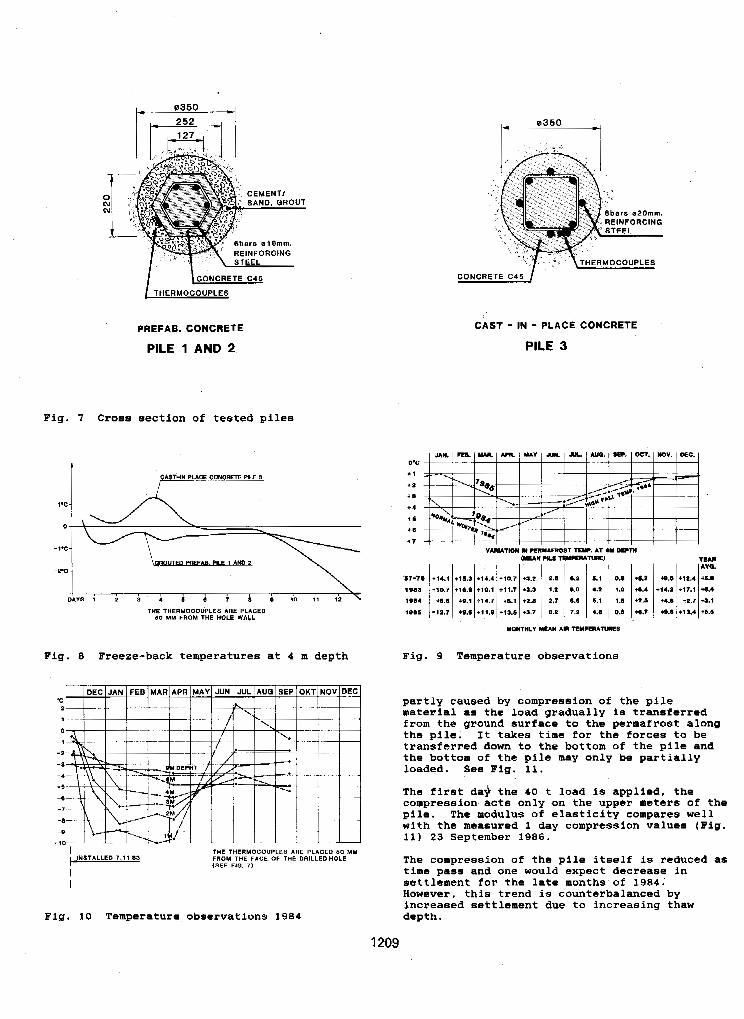
B b W E 018mm. REINFORCING
CONCRETE C46
PREFAB. CONCRETE
PILE 1 AND 2
Fig. 7 Cross section af tested piles
I PIKFAU. W E 1 A M 2
- 7 \
Fig. 8 Freeze-back temperatures at 4 m depth
THE THERMOCOUPLES ARE PLACED 60 MU
(SEE FIR. 7 ) FROM THE FACE OF THE DRILLED HOLE
I I
Fig. 10 Temperature observations 1984
CONCRETE C46
CAST - IN - PLACE CONCRETE
PILE 3
MONTHLY MEAN ANI TEMPERATIMES
Fig. 9 Temperature observations
partly caused by compression of the pile material as the load gradually is transferred from the ground surface to the permafrost along the pile. St takes time for the forces to be transferred down to the bottom o f the pile and the bottom of the pile may only be partially loaded. See Fig. 11,
The first da+ the 40 t load is applied, the
pile. The modulus of elasticity compares well compression acts only on the upper meters of the
with the measured 1 day compression values (Fig. 11) 23 September 1986.
The compression of the pile itself is reduced as time pass and one would expect decrease in settlement for the lata months of 1984. However, this trend is counterbalanced by increased settlement due to increasing thaw depth.
1209
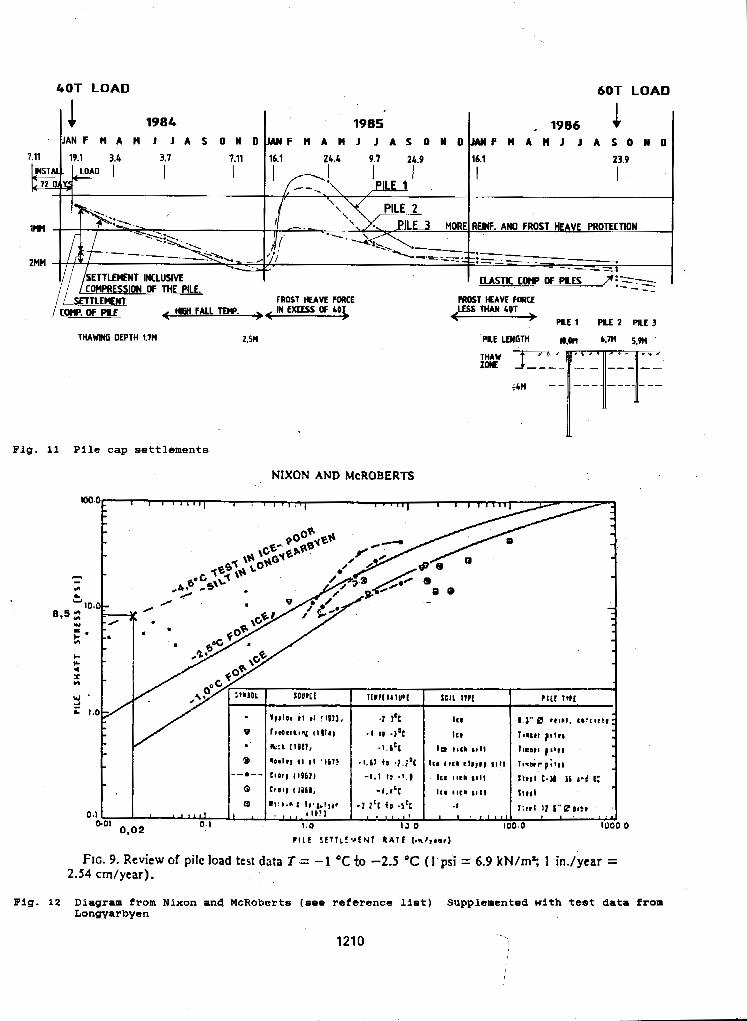
40T LOAD 1
60T LOAD
7.11 19.1 3.4 3.7 7.11 16.1
I I I r: I" I y,,, 12Y 16.1 I 23.9 I / . / -.. -
1HM
2"
FROST HEAVE
THAWING DEPTH t7H
Fig. 11 Pile cap settlements
', \ , PILL z I PROTECTION
FDRCE
3 LESS THAN COT FROST MAW FORCE
' PLE 1 P L E 2 PILE
1
NlXON AND McROBERTS
FIG. 9. Review of pile load test data T = -1 *C to -2.5 'C ( 1 psi = 6.9 k N h 4 1 in./ycar = 2.54 cm/year).
Fig. 12 Diagram from Nixon and McRoberts (see reference list) Supplemented with test data from tongyarbyen
1210 I
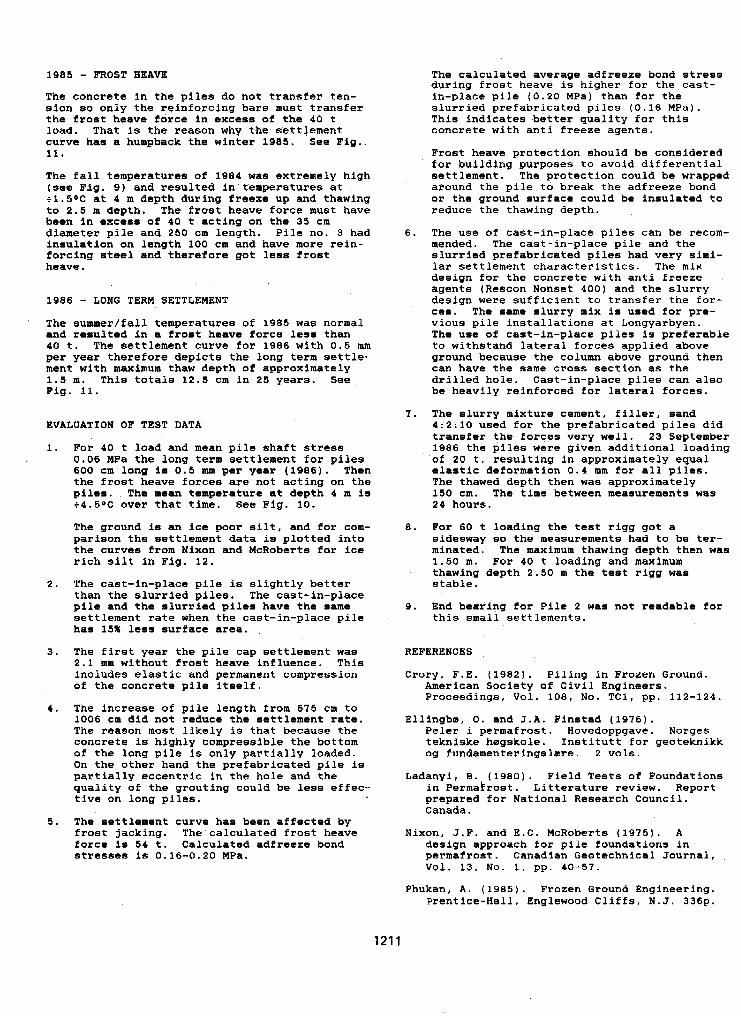
1985 - FROST HEAVE The concrete in the piles do not transfer ten- sion so only the rTinforcing bars must transfer the frost heave force in excess of the 40 t load. That is the reason why the settlement curve has a humpback the winter 1985, See Fig,. 11 *
The fall temperatures of 1984 was extremely high (see Fig. 9) and resulted in temperatures at +l.tiOC at 4 m depth during freeze up and thawing to 2.5 m depth. The frost heave force must have been in excess w f 40 t acting on the 35 cm diameter pile and 250 cm length. Pile no. 3 had
forcing steel and therefore got less frost insulation on length 100 cm and have more rein-
heave.
1986 - LONG TERM SETTLEMENT The summer/fall temperatures o f 1985 was normal and resulted in a frost heave force less than 40 t. The settlement curve for 1986 with 0.5 mm per year therefore depicts the long term settle- ment with maximum thaw depth of approximately 1.5 m. This totals 12.6 cm in 25 years. See Fig. 11.
EVALWATION OF TEST DATA
1.
2 .
3.
4 .
9 .
For 40 t load and mean pile shaft stress 0.06 MPa the long term settlement for pilea 600 cm long i e 0 . 6 mm per year (1986). Then the frost heave forces are not acting on the piles. The mean ternpetature at depth 4 m is i4.5oC over that time. Sea Fig. 10.
The ground is an ice poor silt, and for com- parison the settlement data is plotted into the curves from Nixon and McRoberts for ice rich silt in Fig. 12.
The cast-in-place pile is slightly better than the slurried piles. The cast-in-place pile and the slurried piles have the same
has 15% less surface area. settlement rate when the cast-in-place pile
The first year the pile cap settlement was 2.1 mm without frost hcave influence. This includes elastic and permanent compression of the concrete pile itself.
The increase of pile length from 675 cm to 1006 cm did not reduce the settlement rate. The reason moat likely is that because the concrete is highly compressible the bottom of the long pile is only partially loaded. On the other hand the prefabricated pile is partially eccentric in the hole and the quality of the grouting could be less effec- tive an long piles.
The settlement curve has been affected by frost jacking. The calculated frost heave force is 54 t. Calculated adfreeze bond atresses is 0.16-0.20 MFa.
during frost heave is higher for the cast- The calculated average adfreeze bond stress
in-place pile (0.20 MPa) than for the slurried prefabricated piles (0.16 MPa). This indicates better quality for this cuncrete with anti freeze agents.
Frost heave protection should be considered for building purposes to avoid differential settlement. The protectian could be wrapped around the pile to break the adfreeze bond or the ground surface could be insulated to reduce the thawing depth.
6. The use of cast-in-place piles can be recom- mended. The cast-in-place pile and the slurried prefabricated piles had very sini- lar settlement characteristics. The mix design for the concrete with anti freeze agents (Rcscon Nonset 400) and the slurry design were sufficient to transfer the for- ces. The same slurry mix is used €or pre- vious pile installations at Longyarbyen. The use of cast-in-place piles is preferable to withstand lateral forces applied above ground because the column above ground then can have the same cross section as the
be heavily reinforced for lateral forces. drilled hole. Cast-in-place piles can also
7 . The slurry mixture cement, filler, sand 4:2:10 used for the prefabricated piles did transfer the forces very well. 23 September 1986 the piles were given additional loading af 20 t, resulting in approximately equal elastic deformation 0.4 mm for all piles. The thawed depth then was approximately 150 cm. The time between measurements was 24 hours.
8. For 60 t loading the test rigg got a sidesway so the measurements had to be ter- minated. Tht maximum thawing depth then was 1.50 m. For 40 t loading and maximum thawing depth 2 , 5 0 m the test rigg was stable.
9. End bearing for Pile 2 was not readable for this small settlements.
REFERENCES
Crory. F.E. (1982). Piling in Frozen Ground. American Society of Civil Engineers. Proceedings, Vol. 108, No. TC1, pp. 112-124.
Ellingbe, 0. and J . A . Finstad (1976). Peler i permafrost. Hovedoppgave. Norges tekniske hegskole. lnstitutt for geoteknikk og fundamenteringslare. 2 vols.
Ladanyi, B. (1980). Field Tests of Foundations
prepared for National Research Council. in Permakrost. Litterature review. Report
Canada.
Nixon, J.F. and E.C. McRoberts (1975). A design approach for pile foundations in permafrost. Canadian Geotechnical Journal, Val. 13, No. 1 , pp. 40-57.
Phukan, A . (1985). Frozen Ground Engineering. Prentice-Hall, Englewood Cliffs, N.J. 3368.
121 1
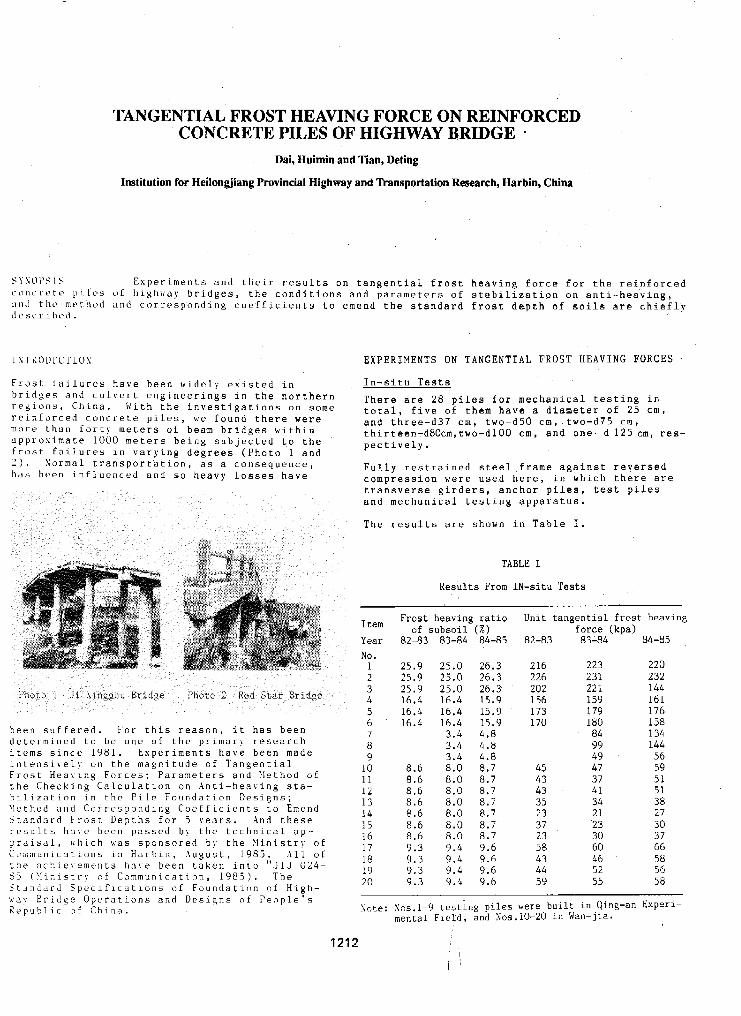
TANGENTIAL FROST HEAVING FORCE ON REINFORCED CONCRETE PILES OF HIGHWAY BRIDGE
Dai, Buimin and Tian, Deting
Institution for Heilongiiang Provincial Highway and Transportation Research, Harbin, China
SYXOI'S I S E x p e r i m e n t s a n d t h e i r r e s u l t s o n t a n g e n t i a l f r o s t h e a v i n g f o r c e f o r t h e r e i n f o r c e d ~ . t l n t . ~ - t ~ t r p i Lcs u i h i g h w a y b r i d g e s , t h e c o n d i t i o n s a n d p a r a m e t e r s o f s t a b i l i z a t i o n o n a n t i - h e a v i n g , ~ n t l t h c I n t ~ t h u d a n d c o r r e s p o n d i n g c u c f f i c i . e n t s t o e m e n d t h e s t a n d a r d f r o s t d e p t h of s o i l s a r e c h i e f . l y d c s c 1- i h c ti .
I N II~OI~L'CTIOA' EXPERIMENTS ON TANGENTIAL FROST HEAVING FORCES
F r o s t . f - a i l u r c s h a v e b e e n r g i d c l y e x i s t e d i n I n - s i t u Tests b r i d s e s a n d c u l v c r t e n g i n e e r i n g s i n t h e n o r t h e r n T h e r e a r e 2 8 piles f o r m e c h a n i c a l testing in rey ic rns , C h i n a . t t i t h t h e i n v e s t i g a t i o n s o n some to ta l , f i v e o f t h e m h a v e a d i a m e t e r of 2 5 cm, r c i n f o r c e d c o n c r e t e p i l e s , we f o u n d t h e r e were a n d t h r e e - d 3 7 c m , t w o - d 5 0 cm, tw0-d75 cm, more t h a n f o r t y rnet.ers o f b e a m b r i d g e s w i t h i n t h i r t e e n - d 8 0 c m , t w o - d l O O cm, and o n e - d 125 cm, res- a p p r o x i m a t e 1000 meters b e i n g s u b j e c t e d t o t h e f r o s t f , l i l u r e s i n v a r y i n g d e g r e e s ( P h o t o 1 a n d 1). X o r m a l t r a n s p o r t a t i o n , a s a c o n s e q u e n c e , h a s b e e n i n f l u e n c e d a n d s o h e a v y l o s s e s h a v e
p e c t i v e l y .
F u l l y r e s t r a i n e d s t e e l frame a g a i n s t r e v e r s e d c o m p r e s s i o n were u s e d h e r e , i n w h i c h t h e r e a r e t r a n s v e r s e g i r d e r s , a n c h o r p i l e s , t e s t p i l e s a n d m e c h a n i c a l t e s t i n g a p p a r a t u s .
T h e r e s u l t s a r e s h o w n i n T a b l e I .
TABLE I
R e s u l t s F r o m I N - s i t u T e s t s
beerr s u f f e r e d . F o r t h i s r e a s o n , i t h a s b e e n d e t e r m i n e d t o b e o n e o f t h e p r i m a r ! r e s e a r c h i t c m s s i n c c 1981. E x p e r i m e n t s h a v e b e e n m a d e i n t e n s i v e l y uti t h e m a g n i t u d e o f T a n g e n t i a l F r o s t H e a v i n g F o r c e s ; P a r a m e t e r s a n d ' l e t h o d of t h e C h e c k i 11s C a l c u l a t i o n o n A n t i - h e a v i n g s t a -
Y e t h o d ~ n d C u l - r e s p o n d i n g C o e f f i c i e n t s t o Emend h i l i z a t i o n i n t h e P i l e F o u n d a t i o n D e s i g n s ;
5 t a n d o r d Frost . D e p t h s f o r J v e a t - s . And t h e s e r c s u l t s h a v e b e e n p a s s e d b!- t h e t e c h n i c a l a p - prrllscll, \ < h i c h \;as s p o n s o r e d b y t h e ! l i n i s t r y o f C ~ ) ~ n u n t c a t i o n s i n H a r h i n , . A u g u s t . 198i,., All o f t h e n c h i e v e r n e n t s h o v e b e e n t a k e n i n t o . J T J 024- $5 ( : 4 i n 1 s t r x o f C o m m u n i c a t i o n , 1 9 8 3 ) . T h e
I tern Year No.
1 2 3 4 5 6 7 8 9
10 11 12 13 14 15 16 1 7 18 19 20
F r o s t h e a v i n g r a t i o of s u b s o i l (%)
82-83 83-84 84-85
25.9 25.0 26.3 25.9 25.0 26.3 25.9 25.0 26.3 16.4 16.4 15.9 16.4 16.4 15.9 16.4 16.4 15.9
3.4 4.8 3.4 4.8
8.6 8.0 8 . 7 8.6 8.0 8.7 8.6 8.0 8.7 8.6 8.0 8.7 8.6 8.0 8.7 8.6 8.0 8 . 7 8.6 8.0 8.7 9.3 9.4 9.6 9.7 9.4 9.6 9.3 9.4 9.6 (4.3 9.4 9.6
3.4 4.8
U n i t t a n g e n t i a l f r o s t h e a v i n g - 82-83 83-84 84-85
f o r c e ( k p a )
216 223 220 226 231 232 202 221 144 56 73 70
45 43 43 35 23 37 23 58 43 44 59
159 179
84 99 49 47 37 41 34 21 23 30 60 46 52 55
180
161 176 158 134 144 56 59 51 51 38 27 30 37 66 58 56 58
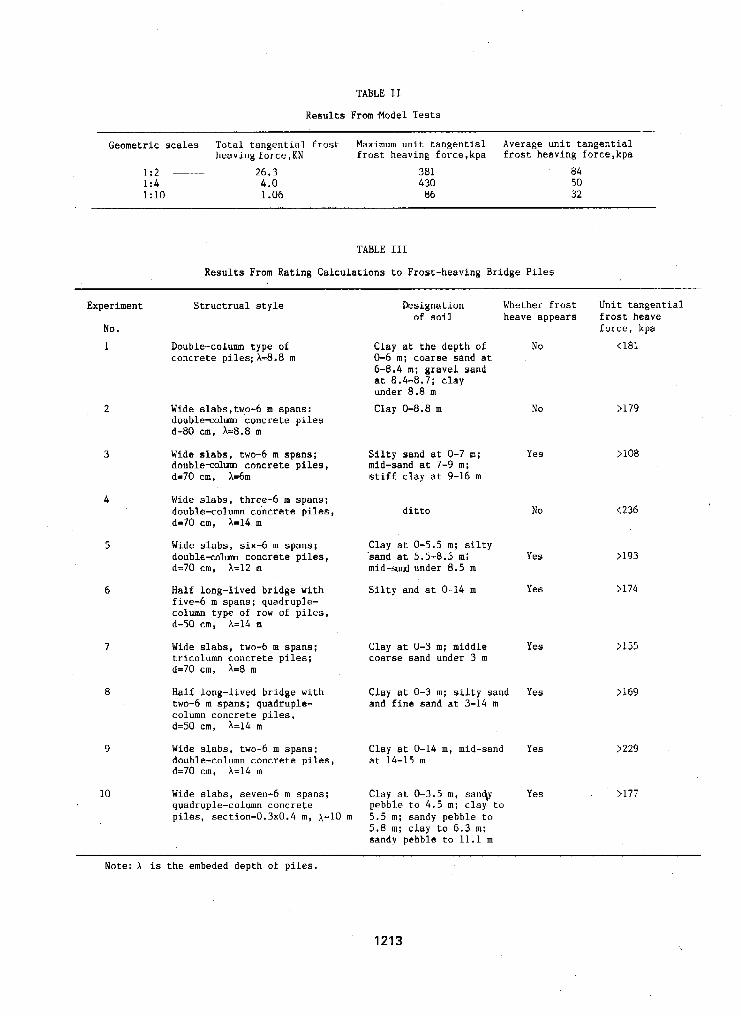
TABLE 1.1
Results From.Mode1 Tests
Geometric scales Total tangential frost Maximum unit tangential Average unit tangential heavingforce,KN frost heaving force,kpa f r o s t heaving force,kpa
1:2 26.3 381 84 1:4 4.0 430 SO 1: 10 1.06 66 32
-
6
Wide slabs,two-6 m spans: d o u b l e d m concrete piles d-80 cm. L8.8 m
Wide slabs, two-6 m spans; double-olum concrete piles, d=70 cm, X=6rn
Wide slabs, three-6 m spans; double-column concrete piles, d=70 cm, X=14 m
Wide slabs, six-6 m spans; doubleuAm concrete piles, d=70 cm, X=12 m
Half Long-lived bridge with five-6 m spans; quadruple- column type of row of piles, d-50 cm, X=14 m
Wide slabs, two-6 m spans; tricolumn concrete piles; d=70 cm. X=8 m
Half long-lived bridge with two-6 m spans: quadruple- column concrete piles, d=50 crn, i=14 m
9 Wide slabs, two-6 m spans: double-column concrete piles, d=70 cm, X=14 m
10 Wide slabs, seven-6 m spans; quadruple-column concrete piles, section-0.3x0.4 m, X=lO m
Clay at t he depth o f No <181 0-6 m; coarse sand at 6-8.4 m: gravel sand a t 8.4-8.7; clay under 8.8 m
Clay 0-8.8 m
Silty sand at 0-7 m; mid-sand at 7-9 m; s t i f f c l a y at 9-16 m
ditto
Clay at 0-5.5 m; silty 'sand at 5.5-8.5 m; mid-sand under 8 . 5 m
Silty and at 0-14 m
No
Yes
No
Yes
Yes
Clay at 0-3 m; middle Yes coarse sand under 3 m
Clay at 0-3 m; silty sand Yes and fine sand at 3-14 m
C l a y at 0-14 m, mid-sand Yes at 14-15 m
Clay at 0-3.5 m, sa"+ Yes pebble to 4 . 5 m; clay to 5 .5 m; sandy pebble t o 5.8 m; clay to 6.3 m; sandy pebble t o 11.1 m
>179
>lo8
<236
>193
>174
>155
>169
>229
>177
Note: h is the embeded depth of piles.
1213
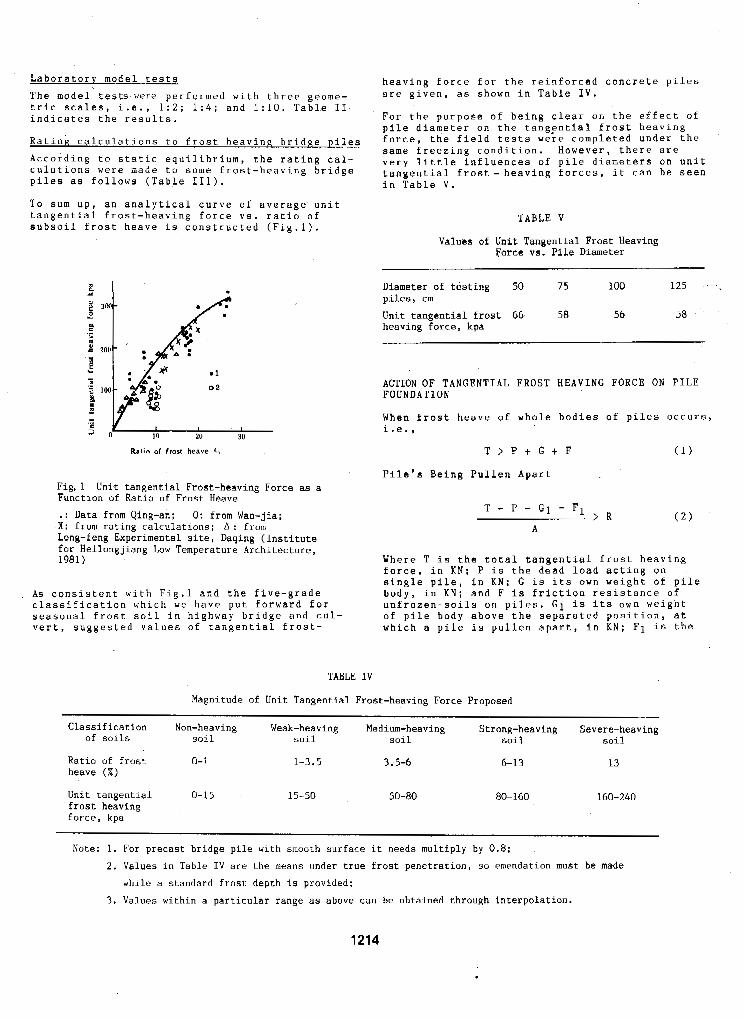
Laboratory model tests
The model tests were performed with three geome- tric scales, i.e., 1:2; 1 : 4 ; and 1 : l O . Table I1 indicates the results.
Rating calculations to frost heaving bridge piles According t o static equilibrium, the rating cal- culations were made t o some frost-heaving bridge piles as follows (Table 111).
To sum up, an analytical curve o f average unit tangential frost-heaving force vs. ratio of subsoil frost heave is constructed (Fig*l).
Fig.1 Unit tangential Frost-heaving Force as a Function of Ratio of Frost Heave .: Data from Qing-an; 0 : from Wan-jia; X : from rating calculations; A : from Long-feng Experimental site, Daqing (Institute for Heilongjiang Low Temperature Architecture, 1981)
As consistent with Fig.1 and the five-grade classification which we have put forward for seasonal frost soil in highway bridge and cul- vert, suggested values of tangential frost-
heaving force €or the reinforced concrete piles are given, as shown in Table IV.
For the purpose o f being clear on the effect of pile diameter on the tangpntial frost heaving force, t h e field tests were completed under the same freezing condition, However, there are very little influences of pile diameters on unit tangential frost-heaving forces, it can be seen in Table V.
TABLE V
Values of Unit Tangential Frost Heaving Force vs. Pile Diameter
Diameter of testing 50 75 100 125 piles, cm Unit tangential frost 66 58 56 58 heaving force, kpa
ACTION OF TANGENTIAL FROST HEAVING FORCE ON P I L E FOUNDATION
When frost heave of whole bodies of piles occurs, i.e.,
T > P t G t F (1)
Pile's Being Pullen Apart
A
Where T is the total tangential frost heaving force, in K N ; P is the dead load acting o n single pile, in KN; G is its own weight of pile body, in K N ; and F is friction resistance of unfrozen-soils on piles. G 1 is its own weignt of pile body above the separated position, at which a pile is pullen apart, in K N ; F1 is the
TABLE IV
Magnitude o f Unit Tangential Frost-heaving Force Proposed
Classification Non-heaving Weak-heaving Medium-heaving Strong-heaving Severe-heaving of soils soil soil soil soil soil
Ratio of frost 0- I heave ( X )
Unit tangential 0-1 5 frost heaving force, kpa
1-3.5 3.5-6
15-50 50-80
6-1 3 13
80-160 160-240
. . . . . -. -.
Note: 1. For precast bridge pile with smooth surface it needs multiply by 0.8; 2 . Values in Table IV are the means under true frost penetration, so emendation must be made
while a standard frost depth is provided;
3 . Values within a particular range as above can be obtained through interpolation.
1214
friction resistance of the unfrozen soils above the practice.
a1 area of the separated section, in m ( the the separated position, in KN; A is th: section-
2 . Chosing the different coefficients for the sectional area of tensile reinforcement when checking calculations on frost-heaving bridge the reinforced concrete is concerned); and R is piles, we are able to find out which coefficient the ultimate tensile strss of materials, in kpa. is mostly in accord with the practical situation
o f frost heave.
CALCULATION ON ANTI-HEAVING STABILIZATION OF FILE FOUNDATION
Conditions of the anti-heaving stabilization Based on the analysis of tangential frost-heaving force on pile foundation mentioned above, the two basic conditional equations ( 3 ) and ( 4 ) must be taken into consideration simultaneously, and only s o , the stabilization against frost heave would be assured for the reinforced con- crete piles inseasonal frost regions,
P t G t F S K . T (3)
a = K.T - P - GI - F L Io] ( 4 ) A
Where K is the assurance coefficient of struc- ture with the value of 1 . 2 for statically deter- minate structures, or 1.3 for statically in- determinate structures;o is the theoretical stress for a checked section, in kpa; and [(r] is the allowable stress of materials, in kpa.
Determination of total tangential frost-heavinq force
When the measured frost depth is available, then
T Ta'U*Hp + T ~ * U ' H ~ ~ ( 5 )
From above, a formula is established to deter- mine the frictional resistance of a frost-heav- ing pile,
Where T~ i s the ultimate frictional resistance o f each soil layer under the freezing front, acting against the sides of piles, in kpa; Li is the thickness o f each layer of soils, i n m .
Determination of the dead weight of the p i l e body The effects o f the dead weight of the pile body have come t o an end far before the test on its vertical supportability of a pile is proceeded with. I n other words, the Ti value obtained from the tests, i.e., the so-called ultimate fric- tional resislance of soils around bored pile, provided by "The Standard Specifications of the Foundation of Highway Bridge Operations and designs of People's Republic of China", much obviously, i s totally resulted, from the external load (or test load), n o effects from the dead weight o f the pile body involved again. Hence, the entire weight of a pile should be taken into account during the calculation on the frictional resistance against a frost-heaving pile (the floating volumetric weight used for the soil that lies both below the freezing front and the level of under ground water).
if not (and with the presumption o f n o ice EMENDATION OF STANDARD FROST DEPTH OF SOILS formed in river beds during winter), then
F r o m looking into the large amount of data col- lected and the test results on frost heave sus- ceptibility for a varity of soils, it is indica- ted that there is such a fairly close relation- ship between the frost depth and its own frost heave susceptibility. The frost depth gets smal-
T = Ta'U*Zo'Czo ( 6 )
Where -ra is unit tangential frost-heaving force of soils, in kpa; U is the circumferential ler with increases of its frost heave suscep- length of a pile, in m; Hp is the measured frost tibility (see Fig.2) depth, in m ; T I is the unit tangential frost-
heaving force of ice, in kpa; Hpl is the thick- lyses, we consider it is reasonable and there- ness o f ice layer from field measurement, in m: fore permissible to put forward for the varia- Z o is the standard frost depth in a certain tion of emending coefficients for standard frost region, in m, and C E O is a coefficient for depths against frost heave ratio as shown in emending standard frost depth. Fig.3.
Based on the aforementioned and the further ana-
Determination of friction resistance for the Subsequently, according to such a linear envelop- frost heaving bridge piles ing relation, the emending coefficients to stand- In order to solve this problem, we have made quite a few experimental studies and analyses as follows :
. ard frost depth can be determinated by theequa- tion,
C,, = 1 - Kd ( 8 )
1. W e adopted some intermediate-and small-sized bridges in severe heaving soils, for which we Where K d is frost heave ratio of subsoil in cfllculated thcir depths o f pile embedment by decimal. means o f the trial-and-error procedure with different coefficients, then we could find Considering the convenience to practical applica- which coefficient is the most conformable to tion of calculation by the equation ( 8 1 , we s u g -
1215
TABLE VI
Magnitude of Emending Coefficients to Standard Frost Depth
Classification Non-heaving Weak-heaving Medium-heaving Strong-heaving Severe-heaving of soils soil soil soil soil soil
Emending coefficient 1 .o 0.95 0.9 0.85 0.75
Ratio of frost heave. 0 "
I
Fig.2 Graph of Frost Depths as a Function of Frost Heave Susceptibility:
' - Clay; o - Fine sand; A -Coarse sandy soil, and a - Clay-gravel.
X
X Y
Fig.3 Variation of Emending Coefficients w i t h Frost Heave Susceptibility of Subsoil: o - Data from Qing-an Experimental Field; X - From Kaiyuan Experimental Field,
belonging to Institution fo r Lian-ning Provincial Water Conservancy (Wang Xirao, (1980).
gest the specific magnitude of emending coef- ficientsto standard frost depth (Table VI).
CONCLUSION
(i) The unit tangential frost-heaving forces
obtained from the in-situ testa on 28 for the reinforced concrete piles, were
tested piles with different diameters, experienced for 3-5 years. Moreover,it has already got througn the supplement and proof by the rating calculation to frost heaving bridges. Therefore, the results could be trustworthy.
(ii) Concerning the reinforced concrete bridge piles built in the strong and extra strong frost heaving soils, the tangential frost heaving-forces are frequently their control load. So check- ing calculation on Anti-heaving heaving stability must be given in the process of designing, proceeding by means of the procedure with its formula and parame- ters set forth in this paper.
(iii) The methods and coefficients for emenda- tion to standard frost depth were also
Hence, it is quite certain for them to from a large amount of in-situ tests.
be used.
REFERENCES
Institution for Heilongjiang Low Temperature Architecture, etc.: "Deciding on the Magni- tude o f Tangential Frost Heaving Force in Design, (1981) , p.1-5.
Ministry of Communications: "JTJ024-85, Standard Specifications of the Foundation o f Highway and Bridge Operations and Designs o f the People's Republic o f China", the People's Communication Press, (1985) , p.63.
Freezing and Frost Heave Susceptibility ' under Different Underground Water Level and Different Soils, in collection: "Journal of Glaciology and Geocryology", VoL.2, N o , 3 ,
Wang Xirao, (1980) , Experimental Studies on the
p. 4 0 - 4 5 .
1216
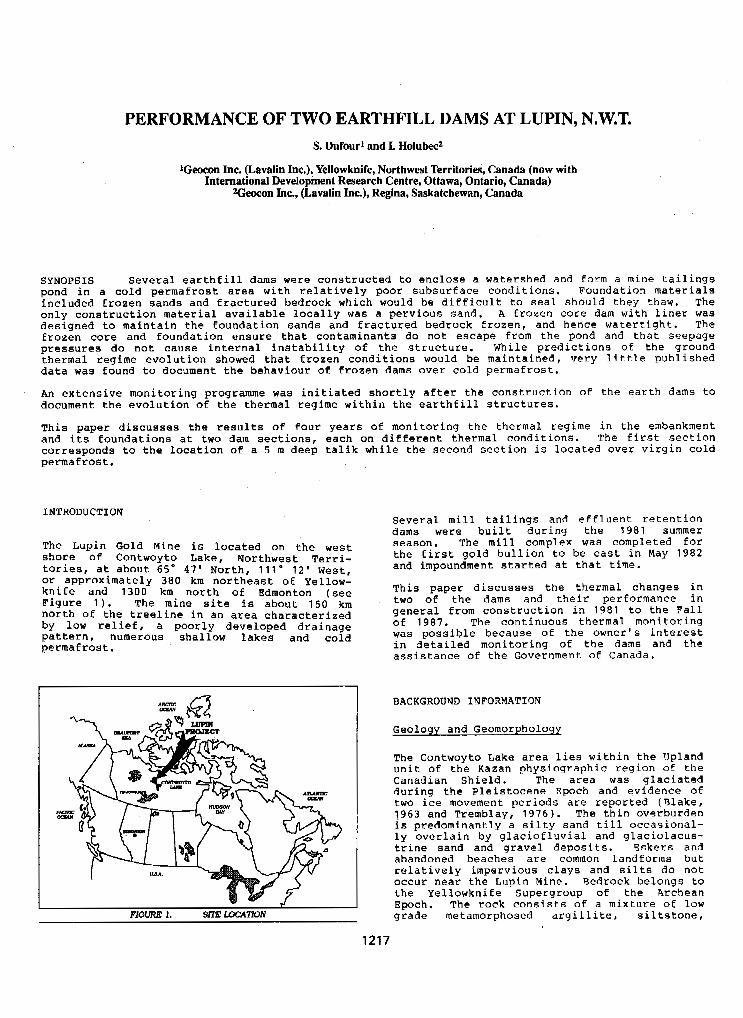
PERFORMANCE OF TWO EARTHFILL DAMS AT LUPIN, N.W.T. s. Dufourl and I. Wolubecz
'Geocon Inc. (Lavalin Inc.), Yellowknife, Northwest Territories, Canada (now with International Development Research Centre, Ottawa, Ontario, Canada)
*=on Inc., (Lavalin Inc.), Regina, Saskatchewan, Canada
SYNOPSIS Several earthfill dams were constructed to enclose a Watershed and form a mine tailings pond in a cold permafrost area with relatively poor subsurface conditions. Foundation materials included frozen sands and fractured bedrock which would be difficult to seal should they thaw. The only construction material available locally was a pervious sand. A frozen core dam with liner was designed to maintain the foundation sands and Eractured bedrock frozen, and hence watertight. The frozen core and foundation ensure that contaminants do not escape from the pond and that seepage pressures do not cause internal instability of the structure. While predictions of the ground thermal regime evolution showed that frozen conditions would be maintained, very little published data was found to document the behaviour of frozen dams over cold psrmafrost.
An extensive monitoring programme was initiated shortly after the construction of the earth dams to document the evolution of the thermal regime within the earthfill structures.
This paper discusses the results o€ four years of monitoring the thermal regime in the embankment and its foundations at two dam sections, each on different thermal conditions. The first section corresponds to the location of a 5 rn deep talik while the second section is located over virgin cold permafrost.
INTRODUCTION
The Lupin Gold Mine is located on the west shore of Contwoyto Lake, Northwyt Terri- tories, at about 65' 4 1 ' North, 111 1 2 ' West, or approximately 380 km northeast of Yellow- knife and 1300 km north of Edmonton (see Figure 1 ) . The mine site is about 150 km north of the treeline in an area characterized
pattern, numerous shallow lakes and cold by low relief, a poorly developed drainage
permafrost.
Several mill tailings and effluent retention dams were built during the 1 9 8 1 summer season. The mill complex was completed for the first gold bullion to be cast in May 1982 and impoundment started at that time.
This paper discusses the thermal changes in two of the darns and their performance in general from construction in 1981 to the Fall of 1 9 8 7 . The continuous thermal monitoring was possible because of the owner's interest in detailed monitoring of the dams ana the assistance of the Government of Canada.
BACKGROUND INFORMATION
Geology and Geomorpholoa
The Contwoyto Lake area lies within the TJpland unit of the Kazan physiographic region of the Canadian Shield. The area was glaciated during the Pleistocene Epoch and evidence of two ice movement periods are reported (Rlake, 1963 and Tremblay, 1 9 7 6 ) . The thin overburden is predominantly a silty sand till occasional- ly overlain by glaciofluvial and glaciolacus- trine sand and gravel deposits. Eskers and abandoned beaches are common landforms but relatively impervious c lays and silts do not occur near the Lupin Mine. Redrock belongs to the Yellowknife Supergroup o f the Archean Epoch. The rock consists of a mixture of low grade metamorphosed argillite, siltstone,
1217
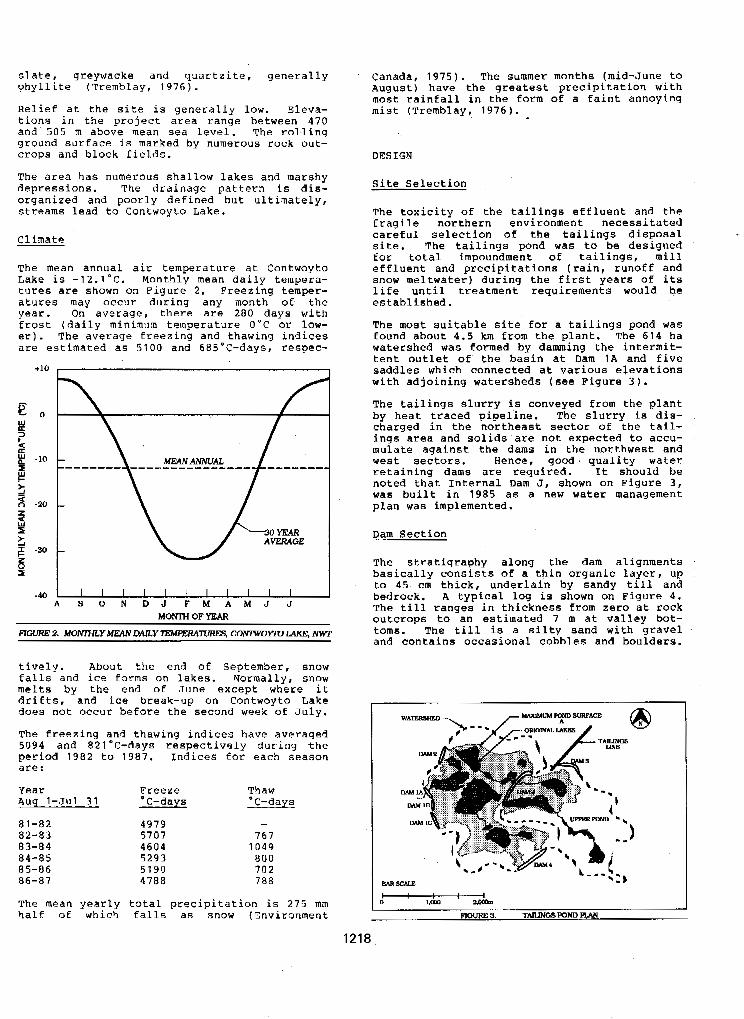
phyllite (Tremblay, 1976). slate, greywacke and quartzite, generally
Relief at the site is generally low, 31eva-
and 505 m above mean sea level. The rolling tions in the project area range between 4 7 0
ground surface is marked by numerous rock out- crops and block fields.
The area has numerous shallow lakes and marshy depressions. The drainage pattern is dis- organized and poorly defined but ultimately, streams lead to Contwoyto Lake.
Climate
The mean annual air temperature at Contwoyto Lake is -12 .1 ”C . Monthly mean daily tempera- tures are shown on Figure 2. Freezing temper- atures may OCCUP during any month o f the year. On average, there are 280 days with
er). The average €reezing and thawing indices frost (daily minimum temperature O’C or low-
are estimated as 5 1 0 0 and 6RS0C-days, respec-
.. A S 0 N D J F M A M J J
M0NT-I OF YEAR
FYGURE 2. MONIWLY MEAN DAILY ’E”’IURES. COhTWOYID LAKE. NWT tively. About the end of September, snow
melts by the end of June except where it falls and ice forms on lakes. Normally, snow
drifts, and ice break-up on Contwoyto Lake does not occur before the second week of July.
The freezing and thawing indices have averaged 5094 and 821°C-days respectively during the period 1982 to 1987. Indices for each season are :
Year peeze Thaw hug I-JUl 31 C-days C-days
81-82 4979 -
83-84 4604 1 0 4 9 84-85 5293 800 85-86 5190 7 0 2 86-87 4 7 8 8 788
8 2 - 8 3 5707 767
The mean yearly total precipitation is 275 mrn half of which falls as snow (Znvironment
Canada, 1 9 7 5 ) . The summer months (mid-June to August) have the greatest precipitation w-ith most rainfall in the €orm of a faint annoying mist (Tremblay, 1976).
DESIGN
Site Selection
The toxicity of the tailings e€fluent and the
careful selection o f the tailings disposal fragile northern environment necessitated
site. The tailings pond was to be designed €or total impoundment oE tailings, mill effluent and precipitations (rain, runor€ and snow meltwater) during the first years of its
established. life until treatment requirements would be
The most suitable site €or a tailings pond was found about 4 . 5 km from the plant. The 6 1 4 ha watershed was formed by damming the intermit- tent outlet of the basin at Dam 1A and five saddles which connected at various elevations with adjoining watersheds (see Figure 3 ) .
The tailings slurry is conveyed from the plant by heat traced pipeline. The slurry is dis- charged in the northeast sector of the tail-
mulate against the dams in the northwest and ings area and solids are not expected to accu-
west sectors. Hence, good. quality water retaining dams are required. It should be noted that Internal Dam J, shown on Figure 3 , was built in 1 9 8 5 as a new water management plan was implemented.
Dam Section
The stratigraphy along the dam alignments basically consists of a thin organic layer, up to 45 cm thick, underlain by sandy till and bedrock. A typical log is shown on Figure 4 . The till ranges in thickness from zero at rock outcrops to an estimated 7 m at valley bot- toms. The till is a silty sand with gravel and contains occasional cobbles and boulders.
1218
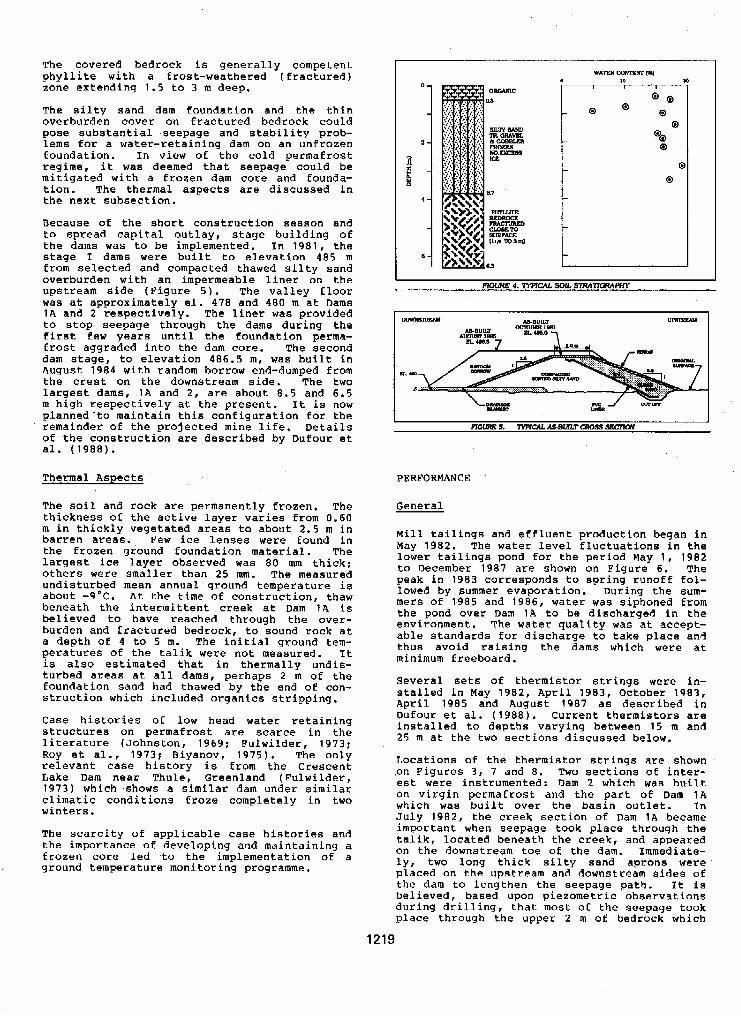
The covered bedrock is generally competent phyllite with a frost-weathered (fractured) zone extending 1 . 5 to 3 m deep.
The silty sand dam foundation and the thin overburden cover on fractured bedrock could pose substantial seepage and stability prob- lems for a water-retaining dam on an unfrozen foundation. In view of the cold permafrost regime, it was deemed that seepage could be mitigated with a frozen dam core and founda- tion. The thermal aspects are discussed in the next subsection.
Because of the short construction season and to spread capital outlay, stage building of the dams was to be implemented. In 1 9 8 1 , the stage I dams were built to elevation 4 8 5 m from selected and compacted thawed silty sand overburden with an impermeable liner on the upstream side (Figure 5). The valley floor was at approximately el. 4 7 8 and 4 8 0 m at Dams 1A and 2 respectively. The liner was provided to stop seepage through the dams during the first few years until the foundation perma- frost aggraded into the dam core. The second dam stage, to elevation 486.5 m, was built in August 1 9 8 4 with random borrow end-dumped from the crest on the downstream side. The two largest dams, 1 A and 2 , are about 8 . 5 and 6 . 5 m high respectively at: the present. It is now planned'to maintain this configuration €or the remainder of the projected mine life. Details of the construction are described by Dufour et al. ( 1 9 8 8 ) .
Thermal Aspects
The soil and rock are permanently frozen, The thickness of the active layer varies from 0.60 m in thickly vegetated areas to about 2 . 5 m in barren areas. Few ice lenses were found in the frozen ground foundation material. The largest ice layer observed was 80 nun thick: others were smaller than 25 mm. The measured undisturbed mean annual ground temperature is about -9 'C. At the time of construction, thaw beneath the intermittent creek at Darn 1~ is believed to have reached through the over- burden and fractured bedrock, to sound rock at a depth of 4 to 5 m. The initial ground tem- peratures of the talik were not measured. It is also estimated that in thermally undis- turbed areas at all dams, perhaps 2 nl of the foundation sand had thawed by the end of con- struction which included organics stripping.
Case histories of low head water retaining structures on permafrost are scarce in the literature (Johnston, 1 9 6 9 ; Fulwilder, 1973:
relevant case history is from the Crescent Roy et al., 1 9 7 3 : Biyanov, 1 9 7 5 ) . The only
Lake Dam near Thule, Greenland (Fulwilder, 1 9 7 3 ) which ,shows a similar dam under similar climatic conditions froze completely in two winters.
The scarcity of applicable case histories and the importance of developing and maintaining a frozen core Led to the implementation o€ a ground temperature monitoring programme.
P B B
19- I I
PERFORMANCE
General
Mill tailings and effluent production began in May 1 9 8 2 . The water level fluctuations in the lower tailings pond for the period May 1 , 1 9 8 2 to December 1 9 8 7 are shown on Figure 6 . The peak in 1983 corresponds to spring runoff fol-
mers of 1 9 8 5 and 1 9 8 6 , water was siphoned from lowed by summer evaporation. During the sum-
the pond over Dam 1A to be discharged in the environment. The water quality was at accept- able standards for discharge to take place an3 thus avoid raising the dams which were at minimum freeboard.
Several sets of thermistor strings were in- stalled in May 1982, April 1 9 8 3 , October 1 9 8 3 , April 1 9 8 5 and August 1 9 8 7 as described in Dufour et al. ( 1 9 8 8 ) . Current thermistors are installed to depths varying between 15 m and 2 5 m at the two sections discussed below.
Locations of the thermistor string's are shown .on Figures 3 , 7 and 8 . Two sections of inter- est were instrumented: Dam 2 which was huilt on virgin permafrost and the part of Dam 1A which was built over the basin outlet. In July 1 9 8 2 , the creek section o f Dam 1 A became important when seepage took place throuqh the talik, located beneath the creek, and apDeared on the downstream toe o f the dam. Immediate- ly, two long thick silty sand aprons were placed on the upstream and downstream sides of the dam to lengthen the seepage path. It is believed, based upon piezometric observations during drilling, that most: of the seepage took place through the upper 2 m of bedrock which
1219
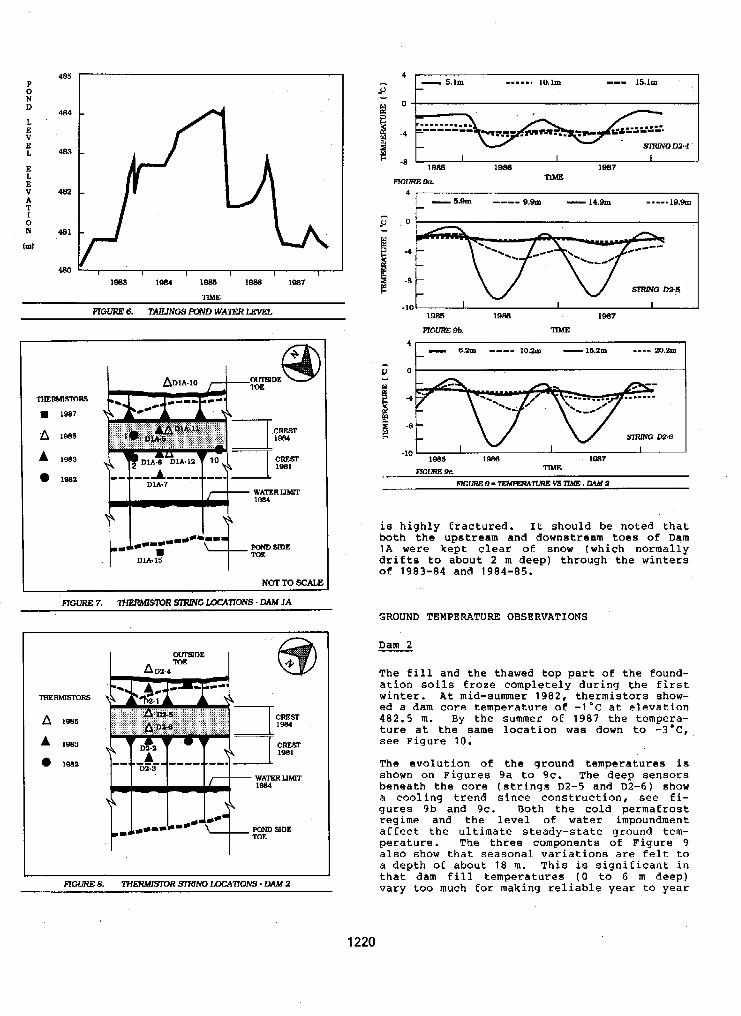
0 P
N D
E L
V E L
E L E V A T
0 I
N
(tu)
NOTTOSCALE
is highly fractured. It should be noted that both the upstream and downstream toes of Dam
drifts to about 2 m deep) through the winters 1A were kept clear of snow (which normally
of 1983-84 and 1984-85.
GROUND TEMPERATURE OBSERVATIONS
Dam 2 - The fill and the thawed top part of the found- ation soils froze completely during the first winter. At mid-summer 1 9 8 2 , thermistors show- ed a dam core temperature o f -1 'C at elevation 4 8 2 . 5 m. By the summer of 1 9 8 7 the tempera- ture at the same location was down to -3 'C, see Figure 10 .
The evolution o f the ground temperatures is shown on Figures 9a to 9c. The deep sensors beneath the core (strings D2-5 and 02-6) show a cooling trend since construction, see Ei- gures 9b ana 9c. Both the cold, permafrost regime and the level o€ water impoundment affect the ultimate steady-state ground tem- perature. The three components of Figure 9 also show that seasonal variations are felt to a depth of about 18 m. This is significant in that dam fill temperatures (0 to 6 m deep) vary too much €OK making reliable year to year
1220
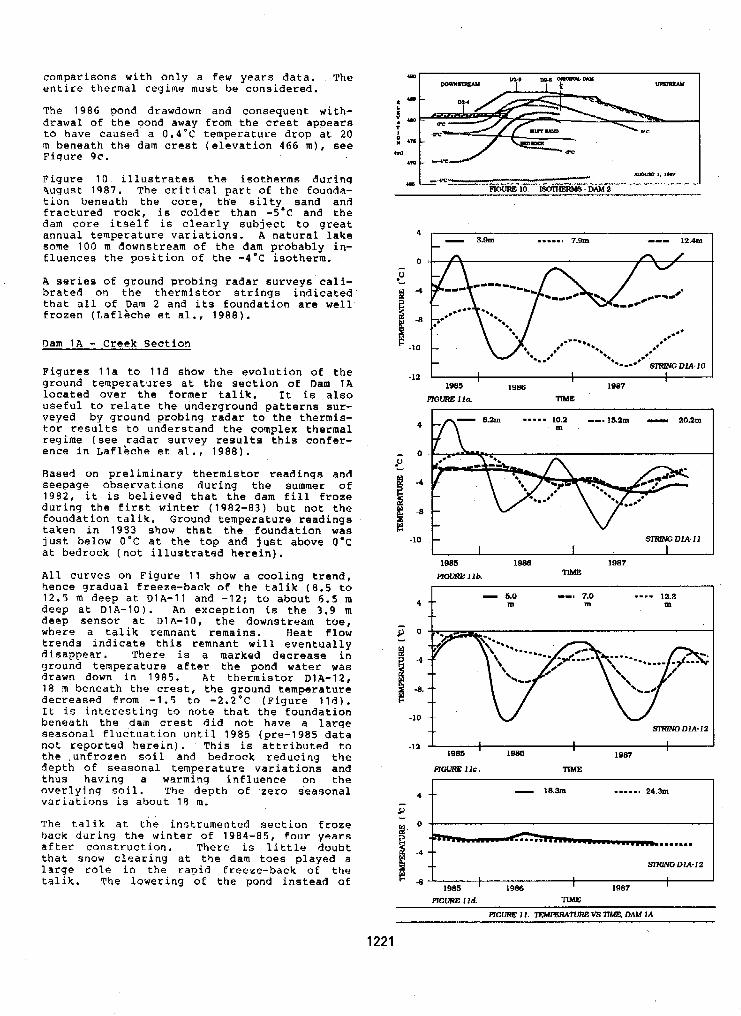
comparisons with only a €ew years data. The entire thermal regime must be considered.
The 1986 pond drawdown and consequent with- drawal of the oond away from the crest appears to have caused a 0 . 4 ' C temperature drop at 20 m beneath the dam crest (elevation 466 m), see Figure 9c.
Figure 1 0 illustrates the isotherms during Uqust 1987. The critical part of the founda- tion beneath the core, the silty sand and fractured rock, is colder than -5°C and the dam core itself is clearly subject to great annual temperature variations. A natural late some 100 m downstream of the dam probably in- fluences the position of the -4'C isotherm.
A series o€ ground probing radar surveys cali- brated on the thermistor strings indicated that all o f Dam 2 and its foundation are well frozen (Laflhche et al., 1 9 8 8 ) .
Dam 1 A - Creek Section Figures lla to lld show the evolution of the ground temperatures at the section of Dam 1A located over the former talik. It is also useful to relate the underground patterns sur- veyed by ground probing radar to the thermis- tor results to understand the complex thermal regime (see radar survey results this confer- ence in Laflbche et al., 1988).
Rased on preliminary thermistor readings and seepage observations during the summer of 1982, it is believed that the dam fill froze during the first winter ( 1 9 8 2 - 8 3 ) but not the foundation talik. Ground temperature readings taken in 1933 show that the foundation was just below O'C at the top and j u s t above O'c at bedrock (not illustrated herein).
All curves on Figure 1 1 show a cooling trend, hence gradual freeze-back o f the talik (8.5 to 1 2 . 5 m deep at D1A-11 and - 1 2 ; to about 6 . 5 m deep at D I A - ~ O ) . An exception is the 3.9 m deep sensor at D1A-10 , the downstream toe, where a talik remnant remains. Heat €low trends indicate this remnant will eventually disappear. There is a marked decrease in ground temperature after the pond water was drawn down in 198.5. At thermistor D1A-12, 18 m beneath the crest, the ground temperature decreased from - 1 . 5 to -2.2'C (Figure lld). It is interesting to note that the foundation beneath the dam crest did not have a large seasonal fluctuation until 1985 (pre-1985 data not reported herein). This is attributed to the .unfrozen soil and bedrock reducing the depth of seasonal temperature Variation8 and thus having a warming influence on the overlying soil. The depth of 'zero seasonal variations is about 18 m.
The talik at the instrumented section Eroze hack during the winter of 1984-85, four years after construction. There is little doubt that snow clearing at the dam toes played a large role in the raFid freeze-back of the talik. The lowering o€ the pond instead of
4 - 3.9m ..... 1 7 . m --- 12.41~
1221
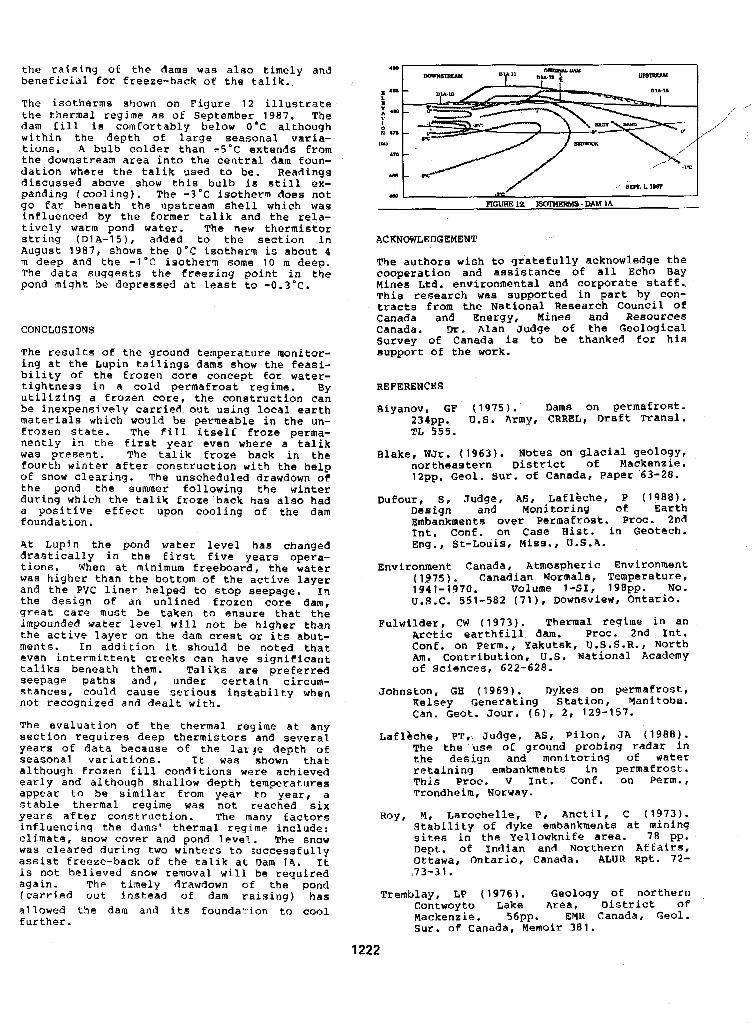
the raising oE the dams was also timely and beneficial for freeze-back of the talik.
The isotherms shown on Figure 12 illustrate the thermal regime as of September 1987. The dam fill is comfortably below O'C although within the depth o f large seasonal varia- tions. A bulb colder than -5'C extends from the downstream area into the central dam foun- dation where the talik used to be. Readings discussed above show this bulb is still ex- panding (cooling). The -3 'C isotherm does not go far beneath the upstream shell which was influenced by the former talik and the rela- tively warm pond water. The new thermistor string ( ~ 1 ~ - 1 5 ) , added to the section in August 1987, shows the O ' C isotherm is about 4 m deep and the - 1 'C isotherm some 10 m deep,
pond might be depressed at least to - 0 . 3 - C . The data suggests the freezing point in the
CONCLUSIOPJS
The results o€ the ground temperature monitor- ing at the Lupin tailings dams show the feasi- bility of the frozen core concept for water- tightness in a cold permafrost regime. By utilizing a frozen core, the construction can
materials which would be permeable in the un- be inexpensively carried out using local earth
€rnzen state. The fill itself froze perma- nently in the first year even where a talik was present. The talik froze back in the fourth winter after construction with the help of snow clearing. The unscheduled drawdown of the pond the summer following the winter during which the talik froze back has also had a positive effect upon cooling of the dam foundation.
At Lupin the pond water level has changed drastically in the first five years opera- tions. When at minimum freeboard, the water was higher than the bottom of the active layer and the PVC liner helped to stop seepage. ~n the design of an unlined frozen core d m , great care must be taken to ensure that the impounded water level will not be higher than the active layer on the dam crest or its abut- ments. In addition it should be noted that even intermittent creeks can have significant taliks beneath them. Taliks are preferred seepage paths and, under certain circum-
not recognized and dealt with. stances, could cause serious instabilty when
The evaluation o f the thermal regime at any section requires deep thermistors and several years of data because of the larp depth of
although frozen fill conditions were achieved seasonal variations. It was shown that
early and although shallow depth temperatures appear to be similar from year to year, a stable thermal reqlme was not reached six years after construction. The many factors influencing the dams' thermal regime include: climate, snow cover and pond level.. The snow was cleared during two winters to successfully assist freeze-back of the talik at Dam 1A. It is not believed snow removal will be required again. The timely drawdown of the pond (carried out instead of dam raising) has allowed the dam and its foundation to cool further.
,I
ACKNOWLEDGEMENT
The authors wish to gtatefully acknowledge the cooperation and aasistanoe of all Echo Bay Mines Ltd. environmental and corporate staff.. This research was supported in part by con- tracts from the National Research Council of
Canada, Dr. Alan Judge o f the Geological Canada and Energy, Mines and Resources
Survey of Canada is to be thanked for his support of the work.
REFERENCES
Biyanov, GF (1975). Dams on permafrost.
TL 555 . 234pp. U.S. Army, CRREL, Oraft Transl.
Blake, WJr. (1963). Notes on glacial geology, northeastern District of Mackenzie. 12pp. Geol. Sur. of Canada, Paper 63-28.
Dufour, S I Judge, AS, Lafl'eche, P ( 1988). Design and Monitoring of Earth Embankments over Permafrost. Proc. 2nd Int. Con€. on Case Hist. in Geotech. Eng., St-Louis, Miss., U.S.4.
Environment Canada, Atmospheric Environment (1975). Canadian Normals, Temperature,
Volume l-SI, 198pp. NO. U.S.C. 551-582 ( 7 1 1 , Downsview, Ontario. 1941-1970.
Fulwilder, CW (1973). Thermal regime in an Arctic earthfill dam. Proc. 2nd Int. Conf. on Perm., Yakutsk, U.S .S .R . , North
of Sciences, 622-628. Am. Contribution, U.S. National Academy
Johnston, GH (1969). Dykes on permafrost, Uelsey Generating Station, Manitoba. Can. Geot. Jour. ( 6 1 , 2 , 129-157.
Laflbche, PT,) Judge, AS, Pilon, JA (1988). The the'use of ground probing radar in the design and monitoring of water retaining embankments in permafrost. This Proc. V Int, - Conf. on Perm., Trondheim, Norway.
Roy, M I Larochelle, P I Anctil, C (1973). Stability of dyke embankments at mining sites in the Yellowknife area. 78 pp.
Ottawa, Ontario, Canada. ALUR Rpt. 72- Dept. of Indian and Northern Affairs,
$73-31.
Tremblay , LP ( 1976). Geology of northern Contwoyto Lake Area, Oistrict of Mackenzie. 56pp. EMR Canada, Geol. Sur. of Canada, Memoir 381.
1222
ROADWAY EMBANKMENTS ON WARM PERMAFROST PROBLEMS AND REMEDIAL TREATMENTS
D. Esch
Alaska Department of Transportation - Research Section, Fdrbankq Alaska, USA
INTRODUCTION
Road embankment performance studies on "warm" permafrost, de f ined as having an average temperature above -1' C were in i t i a ted nea r G lenna l l en , A laska i n 1954 when f i v e highway cross-sect ions were instrumented t o r e c o r d surface and subsurface temperatures. Paving was f i r s t p laced on the roadway a t t h e s e s i t e s i n 1957 and observa- t i o n s c o n t i n u e d u n t i l 1960 (Greene e t a l . , 1960) The study a t Richardson Highway M i l e 130 demonstrated that i n sp l te o f t he da rk aspha l t su r face and t h e f a c t t h a t average annual a i r temperatures were as h igh as -3" C, f u l l annual refreezing was occurrSng beneath the paved roadway surfaces, and average roadway surface tempera- tu res were s im i la r t o t hose a t und is tu rbed pe rmaf ros t s i t e s . The pr imary thermal e f fec t o f the roadway surface was t h a t o f g r e a t l y i n c r e a s i n g t h e seasonal v a r i a t i o n s i n surface temperatures, which resulted i n a much t h i c k e r act ive layer beneath the road. The a c t i v e l a y e r t h i c k - ness a t t h e s t u d y s i t e s averaged 2.0 m beneath the gravel roadway surface and 3.1 m a f t e r t h e pavement was placed i n 1957.
The f i r s t N o r t h American i n s t a l l a t i o n o f subgrade insula- t i o n o v e r warm permafrost, using extruded polystyrene foam, was constructed near Chit ina, Alaska i n 1969 (Esch, 1973). Temperature, set t lement, and thaw depth monitor- i n g work has con t inued a t t he Ch i t i na s i t e t h rough 1987. The data have demonstrated that warming o f t h e roadway slopes, caused by the combined e f f e c t s o f summertime heat ing o f the exposed gravel , and the winter t ime insu- l a t i n g snow cover, i s t he p r imary p rob lem w i th bo th i nsu la ted and un insu la ted embankments on warm permafrost. These observat ions have since been confirmed a t f o u r o t h e r I n t e r i o r Alaska si tes, where add i t iona l records o f roadway and slope surface temperatures have been made (Esch, 1983).
I n summary, the roadway side-slope surfaces have been found t o g e n e r a l l y become much warmer than e i ther the t r a v e l l e d roadway sur face or the ad jacent undis turbed ground surfaces. I n a l l cases s t u d i e d i n warm permafrost areas, the slope surfaces have averaged s i g n i f i c a n t l y warmer than 0" C and have warmed t o average up t o +5" C, As a resul t , progressively deeper annual thawing of the permafrost occurs and tal iks develop beneath s lope and di tch areas, causing s lope area set t lements and u l t ima te - l y r e s u l t i n g i n a loss o f l a t e r a l and ve r t i ca l suppor t for the roadway i t s e l f (Esch, 1983; McHattie, 1983).
SYNOPSIS Mon i to r ing s tud ies on eight exper imental road embankment sect ions constructed on warm (0" t o -1" C ) permafrost .fn t h e i n t e r i o r o f Alaska, have provided a basis for design- l i fe performance predict ions. Expertmental features evaluated have i n c l u d e d i n s u l a t i o n and peat layers, toe berms, a i r convection cool ing ducts, thermosyphons, solar screens, and geofabric reinforcement. Thermal adjustments and surface movements o f these embankments have cont inued to occur over the fu l l des ign l l fe . It has been concluded that the major i ty o f long- term embankment problems occur as a resu l t o f excess ive ne t warming o f the s ide-s lopes . The greatest reduct ions i n thawing and movements came from solar screens and snow con t ro l sheds on the side-slopes.
Surface and Air Temperature Observations
Highway pavement and side-slope mean annual surface temperatures, and f reez ing and thawing season n-factors measured a t I n t e r i o r Alaska s i t e s on warm permafrost are summarized by Tables 1 and 2 . As can be seen from these summaries, the average annual pavement surface tempera- tu res have ranged from 3.1' t o 4.4" C above the average a i r temperatures, while the embankment slope temperatures have averaged from 4.0" t o 7.7" C warmer than t he a i r . Annual a l r temperatures. f a r most o f t h e paved highway system i n t h e I n t e r i o r o f Alaska are represented by two long- te rm record ing s i tes loca ted a t the Un ivers i ty o f Alaska near Fairbanks and a t Big Delta. located about 150 km east of Fairbanks. Data f o r these s i tes from 1931 through 1986 are shown by Figure 1, which indicates several mult i -year per iods of warmer than normal average a i r temperatures. Since pavement temperatures exceed average a i r temperatures by 3 t o 4" C, there i s the
TABLE 1 - Road Surface and Slope Surface Annual Temperature Averages f o r s i t e s i n I n t e r i o r Alaska.
Anwl Averaw Terrperatures (C")
I site Period & Roaky %?E
Chittna 1971-72 -4.5' -1.4' -0.6" Canyw, Creek 1975-77 -4.6' Bonanza C w k 1975-79 -2.7" M.5"
-1.1" t2.9"
"- 6.0" "- +1 I go
south Slop It
North Slope "
"* II
I1
Peger Road 1982-83 -3.3" t1.1" *"
TABLE 2 - Side-Slope n-Factors for Alaskan Sites.
- Site Slope-Face
- Period & Height Bearing n-Freeze n-Thaw
Chitina N 1971-72 3:l 2.1 m S 30" W 0.70 1.33 Cam Ck 1974-77 3:l 1.4 m S 45" W 0.39 1.37 BoMnta Ck 1975-79 21. 7.0 m S 10" E 0.45 1.72
Bawnza Ck 1975-79 2: l 7.0 n l N 10" W 0.40 1.02 south Slope
NDrth Slope
1223
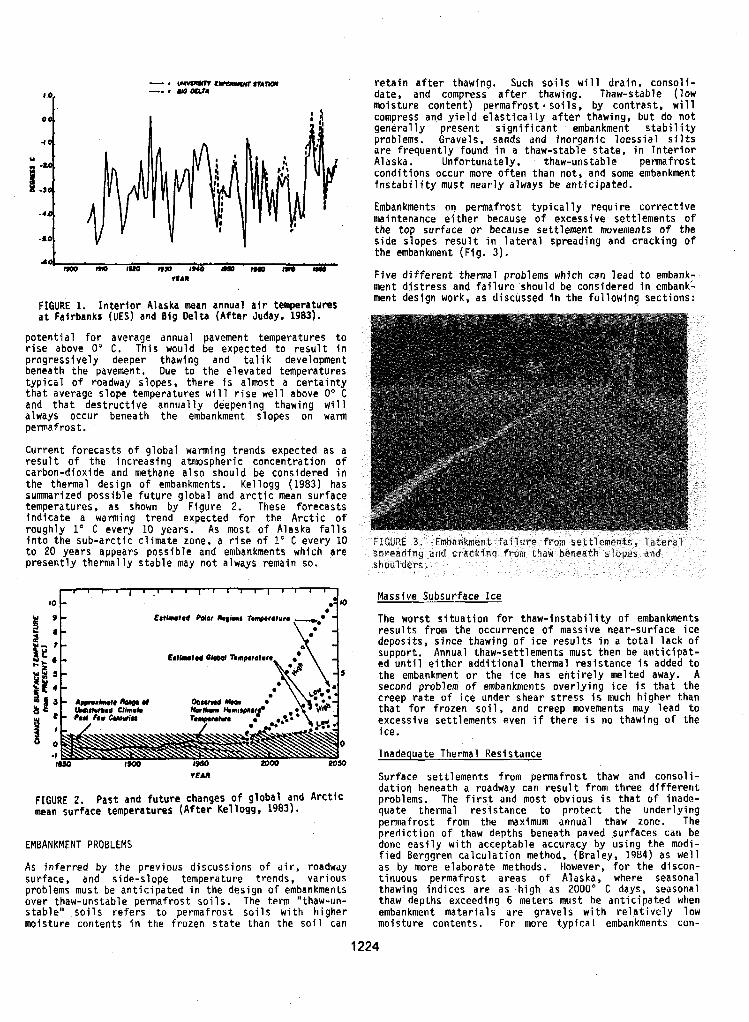
a t Fafrbanks (UES) and Big Delta (A f te r Juday, 1983). FIGURE 1. I n t e r i o r Alaska maan annual a i r temperatures
potent ia l for average annual pavement temperatures t o r i s e above 0" C. This would be e x p e c t e d t o r e s u l t i n p rogress ive ly deeper thawing and t a l i k development beneath the pavement. Due to the e levated temperatures t yp i ca l o f roadway slopes, there i s almost a c e r t a i n t y t h a t average slope temperatures will r i s e w e l l above 0" C and that destruct ive annual ly deepening thawing will always occur beneath the embankment slopes on warm permafrost.
Current forecasts of g lobal warming trends expected as a resu l t o f t he i nc reas ing a tmospher i c concen t ra t i on o f carbon-dioxide and methane also should be considered i n the thermal design o f embankments. Kel logg (1983) has summarized poss ib le f u tu re g loba l and a r c t i c mean surface temperatures, as shown by Figure 2. These fo recas ts i nd i ca te a warming t r e n d e x p e c t e d f o r t h e A r c t i c o f roughly 1' C every 10 years. As most o f Alaska f a l l s
t o 20 years appears poss ib le and embankments whfch are i n to t he sub -a rc t i c c l imate zone, a r i s e o f 1" C every 10
present ly thermal ly s tab le may no t always remain so,
Catlnrlrl Polar hqimr
EMBANKMENT PROBLEMS
As i n f e r r e d by the prev ious d iscuss ions o f a i r , roadway surface, and side-slope temperature trends, various problems must be an t ic ipa ted in the des ign o f embankments over thaw-unstable permafrost soils. The term "thaw-un- s t a b l e " s o i l s r e f e r s t o p e r m a f r o s t s o i l s w i t h h i g h e r mo is tu re con ten ts in the f rozen s ta te than the so i l can
1
r e t a i n a f t e r t h a w i n g . Such s o i l s will dra in , conso l i - date, and compress a f t e r thawing. Thaw-stable (low moisture content) permafrost . soi ls, by cont ras t , will compress and y i e l d e l a s t l c a l l y a f t e r t h a w i n g , b u t do no t genera l l y p resen t s ign i f i can t embankment s t a b i l i t y problems. Gravels, sands and i n o r g a n i c l o e s s i a l s i l t s a re f requent ly found i n a t h a w - s t a b l e s t a t e , i n I n t e r i o r Alaska. Unfortunately, thaw-unstable permafrost condi t ions occur more often than not, and some embankment i n s t a b i l i t y must nearly always be antlcipated.
Embankments on pe rmaf ros t t yp i ca l l y requ i re co r rec t i ve maintenance e i t h e r because o f excessive sett lements of the top sur face o r because sett lement movements o f t h e s ide s lopes resu l t i n l a te ra l sp read ing and c rack ing of the embankment (Fig. 3) .
F ive d i f ferent thermal problems which can lead to embank- ment d i s t ress and fa i l u re shou ld be considered i n embank' ment design work, as discussed i n t h e f o l l o w i n g s e c t i o n s :
Massfve Subsurface I c e
The w o r s t s i t u a t i o n f o r t h a w - i n s t a b i l i t y o f embankments resul ts f rom the occurrence of massive near-surface ice deposits, since thawing o f i c e r e s u l t s i n a t o t a l l a c k o f support, Annual thaw-settlements must then be a n t i c i p a t - ed u n t i l e i t h e r a d d i t i o n a l t h e r m a l r e s i s t a n c e i s added t o the embankment o r t h e i c e has e n t i r e l y m e l t e d away. A
creep r a t e o f i c e under shear s t ress i s much h igher than second problem of embankments ove r l y ing i c e i s t h a t the
t h a t f o r f r o z e n s o i l , and creep movements may l e a d t o excessive sett lements even i f t h e r e i s no thawing of the ice.
Inadequate Thermal Resistance
Surface sett lements from permafrost thaw and conso l i - dation beneath a roadway can r e s u l t f r o m t h r e e d i f f e r e n t problems. The f i r s t and most obvious i s t h a t of inade- quate thermal res is tance to protect the under ly ing permafrost from the maximum annual thaw zone. The p r e d i c t i o n o f thaw depths beneath paved surfaces can be done easi ly wi th acceptable accuracy by using the modi- f i e d Berggren c a l c u l a t i o n method, (Braley, 1984) as we l l as by more e labora te methods. However, f o r t he d i scon - t inuous permafrost areas of Alaska, where seasonal thawing indices are as h igh a s 2000' C days, seasonal thaw depths exceeding 6 meters must be an t i c ipa ted when embankment m a t e r i a l s a r e g r a v e l s w i t h r e l a t i v e l y l o w moisture contents. For more t y p i c a l embankments con-
I224
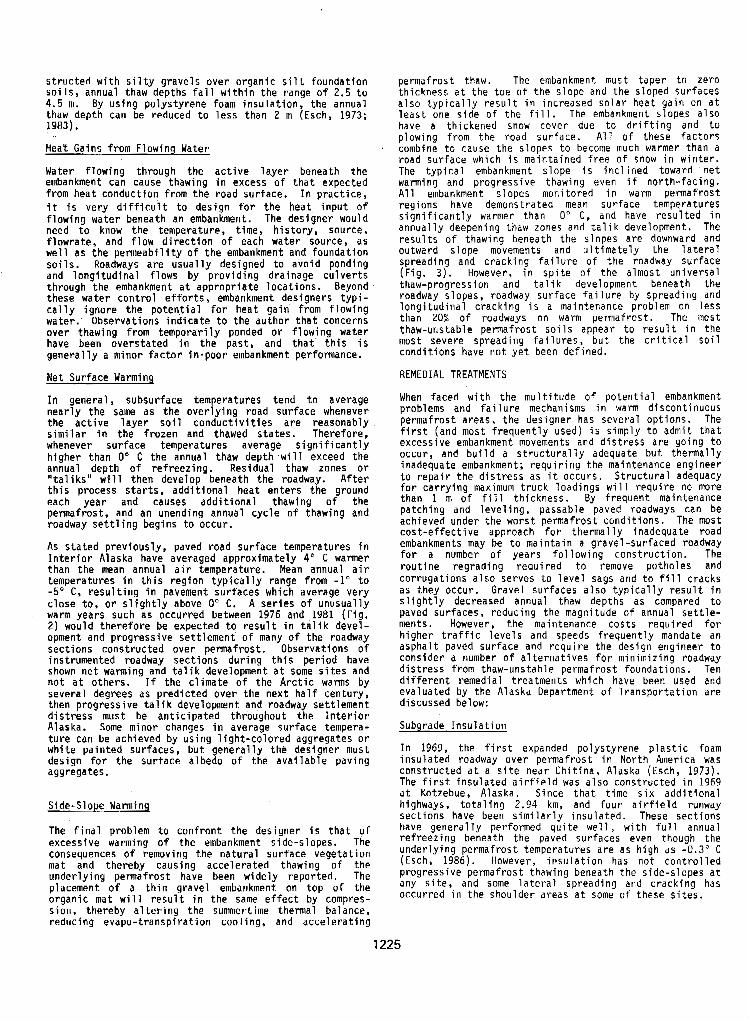
s t r u c t e d w i t h s i l t y g r a v e l s o v e r o r g a n i c s i l t f o u n d a t i o n s o i l s , a n n u a l t h a w d e p t h s f a l l w i t h i n t h e r a n g e o f 2.5 t o 4 .5 m. By u s i n g p o l y s t y r e n e foam i n s u l a t i o n , t h e a n n u a l thaw depth can be reduced t o l e s s t h a n 2 m (Esch, 1973; 1983).
Heat Gains f rom Flowing Water
W a t e r f l o w i n g t h r o u g h t h e a c t i v e l a y e r b e n e a t h t h e embankment can cause thawing i n excess o f tha t expec ted f rom hea t conduc t ion f rom the road su r face . I n p rac t i ce , i t i s v e r y d i f f i c u l t t o d e s i g n f o r t h e h e a t i n p u t o f f l ow ing wa te r benea th an embankment. The des igner wou ld need t o know the t empera tu re , t ime , h i s to ry , sou rce , f l o w r a t e , a n d f l o w d i r e c t i o n o f e a c h w a t e r s o u r c e , a s w e l l a s t h e p e r m e a b i l i t y o f t h e embankment and foundat ion s o i l s . Roadways a r e u s u a l l y d e s i g n e d t o a v o i d p o n d i n g and l o n g i t u d i n a l f l o w s b y p r o v i d i n g d r a i n a g e c u l v e r t s t h r o u g h t h e embankment a t a p p r o p r i a t e l o c a t i o n s . Beyond t h e s e w a t e r c o n t r o l e f f o r t s , embankment d e s i g n e r s t y p i - c a l l y i g n o r e t h e p o t e n t i a l f o r h e a t g a i n f r o m f l o w i n g w a t e r . O b s e r v a t i o n s i n d i c a t e t o t h e a u t h o r t h a t c o n c e r n s o v e r t h a w i n g f r o m t e m p o r a r i l y p o n d e d o r f l o w i n g w a t e r have been overstated i n t h e p a s t , a n d t h a t t h i s i s g e n e r a l l y a m i n o r f a c t o r i n + p o o r embankment performance.
Net Surface Warming
In genera l , subsu r face t empera tu res t end t o ave rage n e a r l y t h e same as t h e o v e r l y i n g r o a d s u r f a c e w h e n e v e r t h e a c t i v e l a y e r s o i l c o n d u c t i v i t i e s a r e r e a s o n a b l y s i m i l a r i n the f rozen and thawed s ta tes. Therefore, whenever su r face t empera tu res ave rage s ign i f i can t l y h i g h e r t h a n 0" C the annual thaw depth will exceed the ;nnual d e p t h o f r e f r e e z i n g . R e s i d u a l t h a w z o n e s o r
t a l i k s " will then deve lop beneath the roadway. A f te r t h i s p r o c e s s s t a r t s , a d d i t i o n a l h e a t e n t e r s t h e g r o u n d each yea r and causes add i t i ona l t haw ing o f t he permaf ros t , and an unend ing annua l cyc le o f t haw ing and roadway s e t t l i n g b e g i n s t o o c c u r .
As s t a t e d p r e v i o u s l y , p a v e d r o a d s u r f a c e t e m p e r a t u r e s i n In te r i o r A laska have ave raged app rox ima te l y 4 C warmer t h a n t h e mean annual a i r t e m p e r a t u r e . Mean annual a i r temperatures i n t h i s r e g i o n t y p i c a l l y r a n g e f r o m -1" t o -5" C , r e s u l t i n g i n pavement surfaces which average very c l o s e t o , o r s l i g h t l y above 0" C. A s e r i e s o f u n u s u a l l y warm years such as occurred between 1976 and 1981 ( F i g . 2 ) w o u l d t h e r e f o r e b e e x p e c t e d t o r e s u l t i n t a l i k d e v e l - opmen t and p rog ress i ve se t t l emen t o f many o f t h e roadway s e c t i o n s c o n s t r u c t e d o v e r p e r m a f r o s t . O b s e r v a t i o n s o f i ns t rumen ted roadway sec t i ons du r ing t h i s pe r iod have
n o t a t o t h e r s . I f t h e c l i m a t e o f t h e A r c t i c warms by shown net warming and t a l i k development a t some s i t e s and
s e v e r a l d e g r e e s a s p r e d i c t e d o v e r t h e n e x t h a l f c e n t u r y , t h e n p r o g r e s s i v e t a l i k development and roadway set t lement d i s t r e s s m u s t b e a n t i c i p a t e d t h r o u g h o u t t h e I n t e r i o r Alaska. Some minor changes i n average surface tempera-
w h i t e p a i n t e d s u r f a c e s , b u t g e n e r a l l y t h e d e s i g n e r m u s t t u r e c a n b e a c h i e v e d b y u s i n g l i g h t - c o l o r e d a g g r e g a t e s o r
d e s i g n f o r t h e s u r f a c e a l b e d o o f t h e a v a i l a b l e p a v i n g aggregates.
Side-Slope Warming
The f i n a l p r o b l e m t o c o n f r o n t t h e d e s i g n e r i s t h a t o f excessive warming o f t h e embankment s ide -s lopes , The
mat and thereby caus ing acce le ra ted thawing o f the consequences o f remov ing the na tura l sur face vegeta t ion
under ly ing permaf ros t have been w ide ly repor ted . The placement of a t h i n g r a v e l embankment on t o p o f t h e organ ic mat will r e s u l t i n t h e same effect by compres- sion, t h e r e b y a l t e r i n g t h e summertime thermal balance, r e d u c i n g e v a p o - t r a n s p i r a t i o n c o o l i n g , a n d a c c e l e r a t i n g
permafrost thaw. The embankment m u s t t a p e r t o z e r o t h i c k n e s s a t t h e t o e o f t h e s l o p e and the s loped su r faces a l s o t y p i c a l l y r e s u l t i n i n c r e a s e d s o l a r h e a t g a i n on a t l e a s t one s i d e o f t h e fill. The embankment s l o p e s a l s o have a t h i c k e n e d snow cove r due t o d r i f t i n g and t o p low ing f rom the road su r face . All o f t h e s e f a c t o r s combine t o cause t h e s l o p e s t o become much warmer than a r o a d s u r f a c e w h i c h i s m a i n t a i n e d f r e e o f snow i n w i n t e r . The t y p i c a l embankment s l o p e i s i n c l i n e d t o w a r d n e t warming and progressive thawing even i f n o r t h - f a c i n g . All embankment s l o p e s m o n i t o r e d i n warm pe rmaf ros t reg ions have demonstrated mean sur face tempera tures s i g n i f i c a n t l y warmer than 0" C, and have r e s u l t e d i n annually deepening thaw zones and t a l i k development. The r e s u l t s o f t h a w i n g b e n e a t h t h e s l o p e s a r e downward and ou tward s lope movements and u l t i m a t e l y t h e l a t e r a l s p r e a d i n g a n d c r a c k i n g f a i l u r e o f t h e roadway surface ( F i g . 3 ) . However, i n s p i t e o f t h e a l m o s t u n i v e r s a l thaw-progression and t a l i k development beneath the roadway s lopes , roadway sur face fa i lu re by sp read ing and l o n g i t u d i n a l c r a c k i n g i s a maintenance problem on less than 20% of roadways on warm permafrost . The most t h a w - u n s t a b l e p e r m a f r o s t s o i l s a p p e a r t o r e s u l t i n t h e m o s t s e v e r e s p r e a d i n g f a i l u r e s , b u t t h e c r i t i c a l s o i l c o n d i t i o n s have n o t y e t been d e f i n e d .
REMEDIAL TREATMENTS
When f a c e d w i t h t h e m u l t i t u d e of p o t e n t i a l embankment problems and fa i lure mechanisms i n warm d i s c o n t i n u o u s permaf ros t a reas , the des igner has severa l op t ions . The f i r s t ( a n d m o s t f r e q u e n t l y u s e d ) i s s i m p l y t o a d m i t t h a t excess i ve embankment movements and d i s t r e s s a r e g o i n g t o occu r , and bu i l d a s t r u c t u r a l l y adequate bu t thermal ly inadequate embankment; requ i r i ng t he ma in tenance eng inee r t o r e p a i r t h e d i s t r e s s as i t o c c u r s . S t r u c t u r a l adequacy f o r c a r r y i n g maximum t r u c k l o a d i n g s will r e q u i r e no more than 1 m o f fill t h i c k n e s s . By f requent maintenance patch ing and leve l ing, passable paved roadways can be ach ieved under t he wors t pe rmaf ros t cond i t i ons . The most cos t -e f fec t i ve app roach f o r t he rma l l y i nadequa te road embankments may be t o m a i n t a i n a gravel-surfaced roadway f o r a number o f yea rs f o l l ow ing cons t ruc t i on . The r o u t i n e r e g r a d i n g r e q u i r e d t o remove potholes and c o r r u g a t i o n s a l s o s e r v e s t o l e v e l sags and t o fill cracks as t h e y o c c u r . G r a v e l s u r f a c e s a l s o t y p i c a l l y r e s u l t i n s l i gh t l y dec reased annua l t haw dep ths as compared t o paved su r faces , reduc ing t he magn i tude o f annua l se t t l e - ments. However , the maintenance costs requi red for h i g h e r t r a f f i c l e v e l s a n d speeds f r e q u e n t l y mandate an a s p h a l t p a v e d s u r f a c e a n d r e q u i r e t h e d e s i g n e n g i n e e r t o c o n s i d e r a number o f a l t e r n a t i v e s f o r m i n i m i z i n g roadway d i s t ress f rom thaw-uns tab le pe rmaf ros t f ounda t ions , Ten d i f fe ren t remed ia l t rea tments wh ich have been used and eva lua ted by t he A laska Depar tmen t o f T ranspor ta t i on a re d iscussed be low:
Subgrade I n s u l a t i o n
I n 1969, t h e f i r s t expanded po lys ty rene p las t i c foam insu la ted roadway ove r pe rmaf ros t i n Nor th Amer i ca was c o n s t r u c t e d a t a s i t e n e a r C h i t i n a , A l a s k a ( E s c h , 1973). The f i r s t i n s u l a t e d a i r f i e l d was a l s o c o n s t r u c t e d i n 1969 a t K o t t e b u e , A l a s k a . S i n c e t h a t t i m e s i x a d d i t i o n a l highways, t o t a l i n g 2.94 km, and four a i r f i e l d runway sec t i ons have been s im i la r l y i nsu la ted , These s e c t i o n s have g e n e r a l l y p e r f o r m e d q u i t e w e l l , w i t h f u l l a n n u a l re f reez ing beneath the paved sur faces even though the under l y ing pe rmaf ros t t empera tu res a re as h igh as -0.3" C (Esch, 1986) . However , insu la t ion has no t con t ro l led p r o g r e s s i v e p e r m a f r o s t t h a w i n g b e n e a t h t h e s i d e - s l o p e s a t any s i t e , and some l a t e r a l s p r e a d i n g and c r a c k i n g has o c c u r r e d i n t h e s h o u l d e r a r e a s a t some of t h e s e s i t e s .
1225
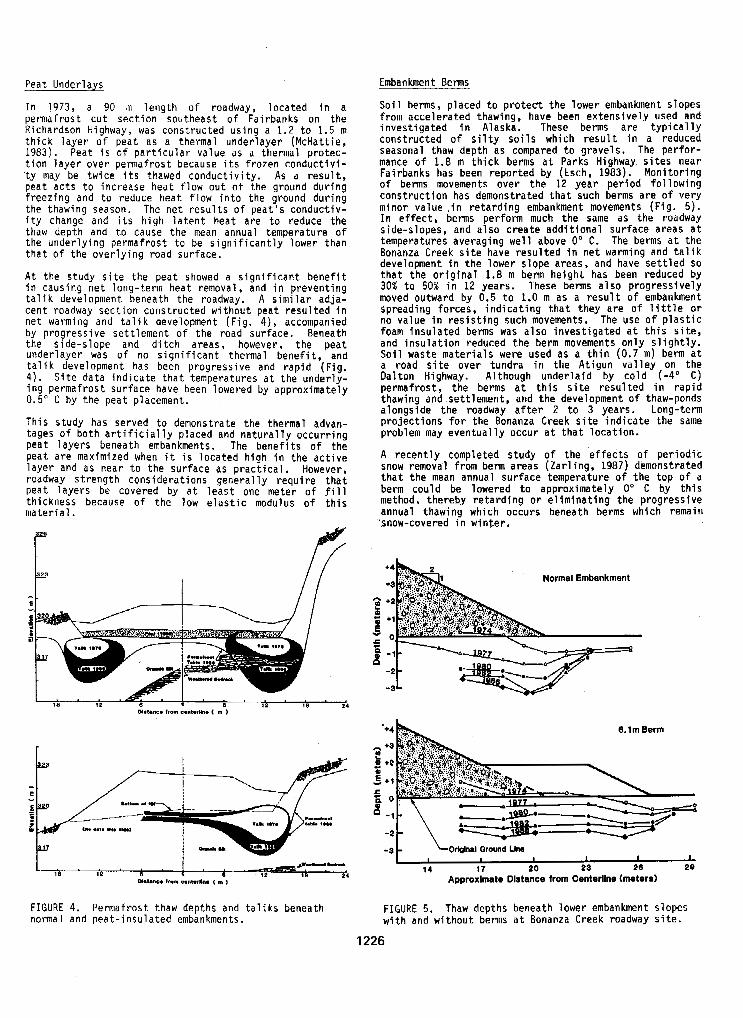
Peat Under lays
I n 1973, a 90 m length o f roadway, loca ted i n a pe rmaf ros t cu t sec t i on sou theas t o f Fa i rbanks on t he Richardson Highway, was c o n s t r u c t e d u s i n g a 1.2 t o 1.5 m t h i c k l a y e r o f p e a t as a thermal under layer (McHat t ie , 1983). Peat i s o f p a r t i c u l a r v a l u e as a the rma l p ro tec - t i o n l a y e r o v e r p e r m a f r o s t b e c a u s e i t s f r o z e n c o n d u c t i v i - ' ty may be t w i c e i t s t hawed conduc t i v i t y . As a r e s u l t , p e a t a c t s t o i n c r e a s e h e a t f l o w o u t o f t h e g r o u n d d u r i n g f r e e z i n g a n d t o r e d u c e h e a t f l o w i n t o t h e g r o u n d d u r i n g the thawing season. The n e t r e s u l t s o f p e a t ' s c o n d u c t i v - i t y change and i t s h i g h l a t e n t h e a t a r e t o r e d u c e t h e thaw depth and to cause the mean annual temperature of t h e u n d e r l y i n g p e r m a f r o s t t o be s i g n i f i c a n t l y l o w e r t h a n t h a t o f t h e o v e r l y i n g r o a d s u r f a c e .
A t t h e s t u d y s i t e t h e p e a t showed a s i g n i f i c a n t b e n e f i t i n c a u s i n g n e t l o n g - t e r m h e a t r e m o v a l , and i n p r e v e n t i n g t a l i k development beneath the roadway. A s i m i l a r a d j a - c e n t r o a d w a y s e c t i o n c o n s t r u c t e d w i t h o u t p e a t r e s u l t e d i n ne t warm ing and t a l i k deve lopmen t (F ig . 4) , accompanied by p rog ress i ve se t t l emen t o f t he road su r face . Benea th the s ide -s lope and d i t ch a reas , however , t he pea t u n d e r l a y e r was of no s i g n i f i c a n t t h e r m a l b e n e f i t , a n d t a l i k development has been progressive and rapid (Fig, 4 ) . S i t e d a t a i n d i c a t e t h a t t e m p e r a t u r e s a t t h e u n d e r l y - ing permafrost sur face have been lowered by approx imate ly 0.5' C by the peat p lacement .
Th is s tudy has served to demonst ra te the thermal advan- t a g e s o f b o t h a r t i f i c i a l l y p l a c e d and n a t u r a l l y o c c u r r i n g pea t l aye rs benea th embankments. The b e n e f i t s o f t h e Peat are maximized when it i s l o c a t e d h i g h i n t h e a c t i v e l a y e r and a s n e a r t o t h e s u r f a c e a s p r a c t i c a l . However, r o a d w a y s t r e n g t h c o n s i d e r a t i o n s g e n e r a l l y r e q u i r e t h a t p e a t l a y e r s be covered by a t l e a s t one m e t e r o f fill thickness because o f t h e l o w e l a s t i c m o d u l u s o f t h i s m a t e r i a l .
Embankment Berms
S o i l b e r m s , p l a c e d t o p r o t e c t t h e l o w e r embankment s lopes f rom acce le ra ted thawing , have been ex tens ive ly used and i n v e s t i g a t e d i n A laska. These berms a re typ ica l l y c o n s t r u c t e d o f s i l t y s o i l s w h i c h r e s u l t i n a reduced seasonal thaw depth as compared t o g r a v e l s . The p e r f o r - mance of 1.8 m t h i c k berms a t Parks Highway s i t e s n e a r Fairbanks has been reported by (Esch, 1983). M o n i t o r i n g o f berms movements o v e r t h e 12 y e a r p e r i o d f o l l o w i n g cons t ruc t i on has demons t ra ted t ha t such berms a r e o f v e r y m i n o r v a l u e , i n r e t a r d i n g embankment movements ( F i g . 5 ) . I n e f f e c t , berms perform much t h e same as the roadway s i d e - s l o p e s , a n d a l s o c r e a t e a d d i t i o n a l s u r f a c e a r e a s a t tempera tures averag ing we l l above 0' C. The berms a t t h e Bonanza Creek s i t e h a v e r e s u l t e d i n net warming and t a l i k development i n t h e l o w e r s l o p e a r e a s , a n d h a v e s e t t l e d so t h a t t h e o r i g i n a l 1.8 m berm height has been reduced by 30% t o 50% i n 12 years. These berms a lso progress ive ly moved outward by 0.5 t o 1.0 m as a r e s u l t o f embankment s p r e a d i n g f o r c e s , i n d i c a t i n g t h a t t h e y a r e o f l i t t l e or no va lue i n r e s i s t i n g s u c h movements. The u s e o f p l a s t i c foam i n s u l a t e d berms was a l s o i n v e s t i g a t e d a t t h i s s i t e , a n d i n s u l a t i o n r e d u c e d t h e berm movements o n l y s l i g h t l y . So i l was te ma te r ia l s were used as a t h i n (0.7 m) berm a t a r o a d s i t e o v e r t u n d r a i n t h e A t i g u n v a l l e y o n t h e Da l ton H ighway . A l though under la id by co ld (-4" C) p e r m a f r o s t , t h e b e r m s a t t h i s s i t e r e s u l t e d i n r a p i d thawing and set t lement , and the development of thaw-ponds a l o n g s i d e t h e r o a d w a y a f t e r 2 t o 3 years. Long- term p r o j e c t i o n s f o r t h e Bonanza Creek s i t e i n d i c a t e t h e same problem may e v e n t u a l l y o c c u r a t t h a t l o c a t i o n .
A r e c e n t l y c o m p l e t e d s t u d y o f t h e . e f f e c t s o f p e r i o d i c maw remova l f rom berm a reas (Zar l ing , 1987) demonstrated t h a t t h e mean a n n u a l s u r f a c e t e m p e r a t u r e o f t h e t o p of a berm could be lowered t o approx ima te l y 0" C by t h i s method, thereby re ta rd ing or e l i m i n a t i n g t h e p r o g r e s s i v e annual thawing which occurs beneath berms which remain ',snow-covered i n w i n t e r .
Normal Embankment
6.lm Berm
-9 LOrIg1n.I Qround Uno I 1 I I 1 I
14 17 20 23 26 20 Approxlmatr Diatance from Centerline (meters)
FIGURE 4. Permafrost thaw depths and t a l i k s b e n e a t h FIGURE 5. Thaw depths beneath lower embankment Slopes normal and peat - insu la ted embankments. w i t h a n d w i t h o u t berms a t Bonanza Creek roadway S i t e .
1226
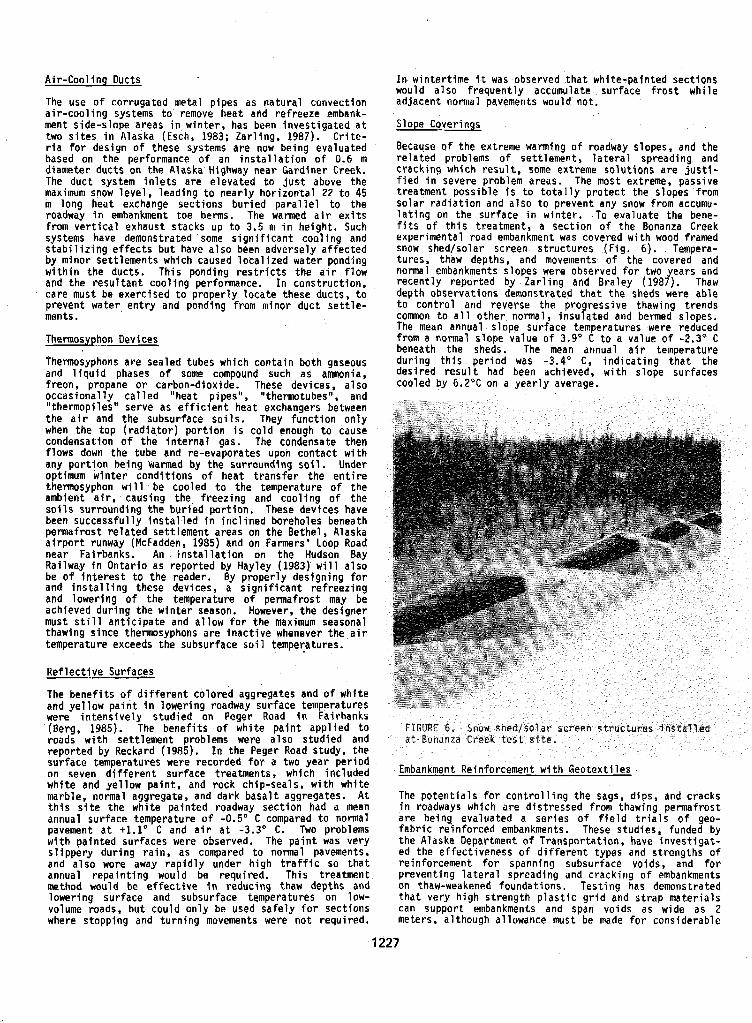
Air-Cool ing Ducts
The use o f corrugated metal pipes as natural convect ion a i r - c o o l i n g systems t o remove heat and re f reeze embank- ment side-slope areas i n w i n t e r , has been i n v e s t i g a t e d a t two s i t e s i n Alaska (Esch, 1983; Zar l ing , 1987). C r i t e - r i a f o r design o f these systems are now being evaluated based on the performance of an i n s t a l l a t i o n o f 0.6 m diameter ducts on the Alaska Highway near Gardiner Creek. The duc t sys tem i n le t s a re e leva ted t o j us t above the maximum snow l e v e l , l e a d i n g t o n e a r l y h o r i z o n t a l 22 t o 45 m long heat exchange s e c t i o n s b u r i e d p a r a l l e l t o t h e roadway i n embankment toe berms. The warmed a i r e x i t s from ver t ica l exhaust s tacks up to 3.5 m i n h e i g h t . Such systems have demonstrated some s i g n i f i c a n t c o o l i n g and s t a b i l i z i n g e f f e c t s b u t have a l so been adverse ly a f fected by minor sett lements which caused local ized water ponding w i t h i n t h e d u c t s . T h i s p o n d i n g r e s t r i c t s t h e a i r f l o w and the resul tant cool ing per formance. In const ruct ion, care must be exerc ised to proper ly locate these ducts , t o prevent water ent ry and ponding from minor duct sett le- ments.
Thermosyphon Devices
Themosyphons are sealed tubes which contain both gaseous and l i q u i d phases o f some compound such as amnonia, freon, propane o r caqpon-dioxide. These devicesl: a l so tccas ional ly ca l led heat p ipes" , " thermotubes , and
thermopj les" serve as ef f ic ient heat exchangers between t h e a i r and the subsurface Soi ls. They func t i on on l y when t h e t o p ( r a d l a t o r ) p o r t i o n i s c o l d enough t o cause condensation o f t h e i n t e r n a l gas. The condensate then flows down the tube and re-evaporates upon c o n t a c t w i t h any po r t i on be ing harmed by the surrounding so i l . Under optimum w i n t e r c o n d i t i o n s o f h e a t t r a n s f e r t h e e n t i r e thermosyphon will . be cooled to the temperature o f the ambient a i r , caus jng the f reez ing and c o o l i n g o f t h e so i l s su r round ing t he bu r ied po r t i on . These devices have been success fu l l y i ns ta l l ed i n i nc l i ned bo reho les benea th
a i r p o r t runway (McEadden, 1985) and on Farmers' Loop Road permafrost re lated set t lement areas on the Bethel , Alaska
near Fairbanks. An i n s t a l l a t i o n on the Hudson Bay Railway i n O n t a r i o as repor ted by Hayley (1983) will also
and ins ta l l ing these dev ices , a s i g n i f i c a n t r e f r e e z i n g be o f i n te res t t o t he reader . By p roper l y des ign ing f o r
and lower ing o f the temperature of permafrost may be achieved dur ing the winter season. However, the designer must s t i l l a n t i c i p a t e and a l l o w f o r t h e maximum seasonal thawing since thermosyphons a r e i n a c t i v e whenever t h e a i r temperature exceeds the subsurface soil temperatures.
Reflect ive Surfaces
The b e n e f i t s o f d i f f e r e n t c o l o r e d a g g r e g a t e s and of white
were i n tens i ve l y s tud ied on Peger Road fn Fairbanks and y e l l o w p a i n t i n l o w e r i n g roadway surface temperatures
(Berg, 1985). The bene f i t s o f w h i t e p a i n t a p p l i e d t o roads with sett lement problems were a lso s tud ied and reported by Reckard (1985). I n t h e Peger Road study, the
on seven d i f f e r e n t surface treatments, whlch included surface temperatures were recorded f o r a two year per iod
wh i te and ye l l ow pa in t , and rock ch ip -sea ls , w i th wh i te marble, normal aggregate, and dark basalt aggregates. A t t h i s s i t e t h e w h i t e p a i n t e d roadway sec t ion had a mean annual surface temperature o f -0.5" C compared t o normal pavement a t +1.1" C and a i r a t -3 .3" C. Two problems wi th pa inted sur faces were observed. The p a i n t was very s l i ppe ry du r ing ra in , as compared t o normal pavements, and a l s o wore away r a p i d l y u n d e r h i g h t r a f f i c so t h a t annual repaint ing would be required. This t reatment method would be e f f e c t i v e i n reducing thaw depths and lowering surface and subsurface temperatures on low- volume roads, bu t cou ld on ly be used s a f e l y f o r s e c t i o n s where stopping and tu rn ing movements were not requi red.
I n w i n t e r t i m e i t was observed that whi te-painted sect ions would also f requent ly accumulate sur face f rost whi le adjacent normal pavements would not.
Slope Coverings
Because of the extreme warming o f roadway slopes, and the r e l a t e d problems of set t lement, lateral spreading and c rack ing wh ich resu l t , some extreme solut ions are j u s t i - f ied in severe problem areas. The most extreme, passive t r e a t m e n t p o s s i b l e i s t o t o t a l l y p r o t e c t t h e s l o p e s from s o l a r r a d i a t i o n and a l so t o p reven t any snow from accumu- l a t i n g on t h e s u r f a c e i n w i n t e r . To evaluate the bene- f i t s o f t h i s t r e a t m e n t , a sec t ion of the Bonanza Creek experimental road embankment was covered wi th wood framed snow shed/solar screen. structures (Fig. 6 ) . Tempera- tures, thaw depths, and movements of the covered and normal embankments slopes were observed f o r two years and recent ly repor ted by Z a r l i n g and Bra ley (1987). Thaw depth observations demonstrated that the sheds were able t o c o n t r o l and reverse the progressive thawing trends common t o a l l o t h e r normal, insulated and bermed slopes. The mean annual slope surface temperatures were reduced from a normal s lope value of 3.9" C t o a value o f -2.3" C beneath the sheds. The mean annual a i r temperature du r ing t h i s pe r iod was -3.4" C , i n d i c a t i n g t h a t t h e d e s i r e d r e s u l t had been achieved, wi th s lope surfaces cooled by 6.2"C on a y e a r l y average.
Embankment Reinforcement wi th Geotext i les
The p o t e n t i a l s f o r c o n t r o l l i n g t h e sags, dips, and cracks i n roadways which are d istressed from thawing permafrost are be ing evaluated a s e r t e s o f f i e l d t r i a l s o f geo- fab r i c re in fo rced embankments. These studies, Funded by the Alaska Department of Transportat ion, have i n v e s t i g a t - ed the ef fect iveness of d i f f e r e n t t y p e s and s t r e n g t h s o f reinforcement for spanning subsurface voids, and fo r prevent ing la tera l spreading and c r a c k i n g o f embankments on thaw-weakened foundat ions. Test ing has demonstrated t h a t v e r y h i g h s t r e n g t h p l a s t i c g r i d and s t rap ma te r ia l s can support embankments and span voids as wide as 2 meters, although allowance must be made fo r cons iderab le
1227
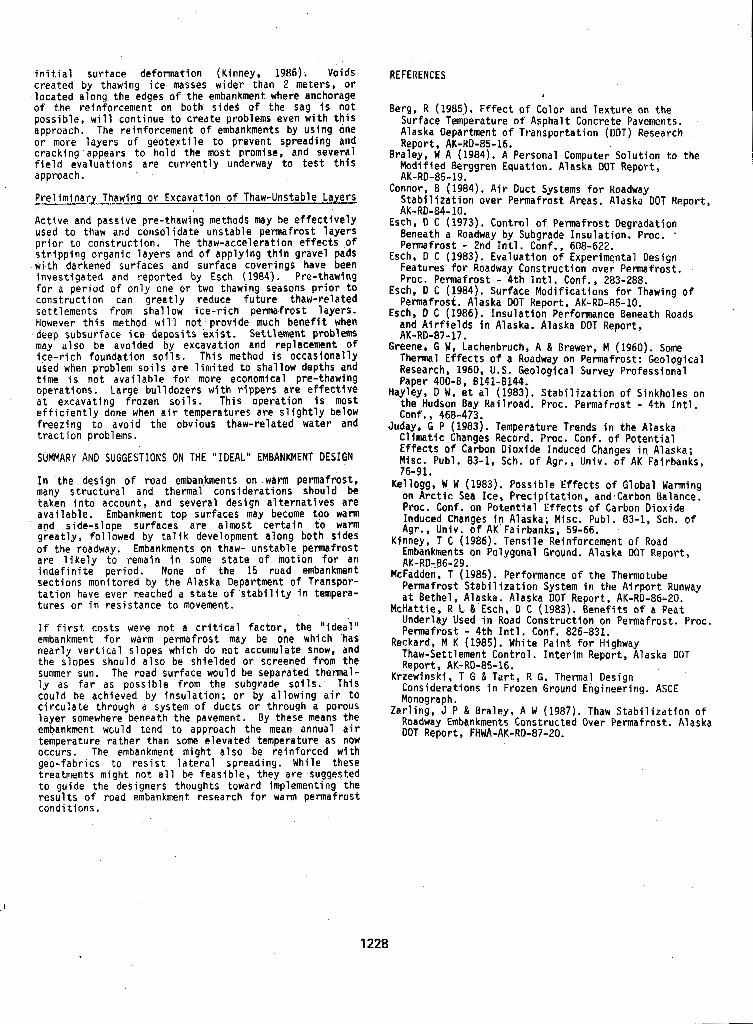
i n i t ia l sur face de format ion (K inney , 1986). Voids created by thawing ice masses wider than 2 meters, o r located along the edges o f the embankment where anchorage o f the re in fo rcement on bo th s ides o f the sag i s n o t possible, will cont inue to create problems even w i t h t h i s approach. The reinforcement of embankments by us ing one o r more layers o f geotex t i le to p revent spread ing and cracking appears to hold the most promise, and several f i e l d e v a l u a t i o n s a r e c u r r e n t l y underway t o t e s t t h i s approach.
Pre l im inary Thawing o r Excava t ion o f Thaw-Unstable Layers
Ac t ive and passive pre-thawing methods may be e f fec t i ve l y used t o thaw and consol idate unstable permafrost layers p r i o r t o cons t ruc t ion . The thaw-acce le ra t ion e f fec ts .of s t r i pp ing o rgan ic l aye rs and o f a p p l y i n g t h i n g r a v e l pads w i t h darkened surfaces and surface coverings have been inves t l ga ted and repor ted by Esch (1984). Pre-thawing fo r a per iod o f on l y one o r two thawing seasons p r i o r t o cons t ruc t ion can great ly reduce fu ture thaw-re la ted sett lements f rom shal low ice-r ich permafrost layers. However t h i s method will not p rov ide much b e n e f i t when deep subsurface ice deposi ts exist . Sett lement problems may a l so be avoided by excavation and replacement of i ce - r i ch f ounda t ion so i l s , Th i s method i s occas iona l l y used when prob lem so i l s a re 1 imi ted to shal low depths and time i s n o t a v a i l a b l e f o r more economical pre-thawing operat ions. Large bul ldozers with r i p p e r s a r e e f f e c t i v e a t excava t ing f rozen so i l s . Th i s ope ra t i on is most e f f i c i e n t l y done when a i r temperatures are s l ight ly be low f reez ing to avoid the obv ious thaw-re la ted water and t r a c t i o n problems.
SUMMARY AND SUGGESTIONS ON THE "IDEAL" EMBANKMENT DESIGN
In ' t he des ign o f road embankments on warm permafrost, many s t r u c t u r a l and thermal considerations should be taken into account, and severa l des ign a l ternat ives are ava i lab le . Embankment top surfaces may become t o o warm and s ide-s lope sur faces are a lmost cer ta in to warm great ly , fo l lowed by t a l i k development along both sides o f t h e roadway, Embankments on thaw- unstable permafrost a r e l i k e l y t o r e m a i n i n some s t a t e o f m o t i o n f o r an
sections monitored by the Alaska Department of Transpor- i n d e f i n i t e p e r i o d . None o f t h e 15 road embankment
t a t i o n have ever reached a s t a t e o f s t a b t l i t y i n tempera- t u r e s o r i n r e s i s t a n c e t o movement.
I f f i r s t c o s t s were no t a c r i t i c a l f a c t o r , t h e " i d e a l " embankment f o r warm permafrost may be one which 'has near ly ver t i ca l s lopes wh ich do n o t accumulate snow, and the slopes should also be shielded or screened from the summer sun. The road surface would be separated thermal- l y as f a r as possible f rom the subgrade so i l s . Th i s could be achieved by insu lat ion; or by a l l o w i n g a i r t o c i r cu la te t h rough a system o f duc ts o r th rough a porous l aye r somewhere beneath the pavement. By these means the embankment w w l d t e n d t o approach the mean annual a i r
occurs, The embankment might a lso be r e i n f o r c e d w i t h temperature rather than some e leva ted temperature as now
geo- fabr ics to res is t la tera l spreading. Whi le these t rea tmen ts m igh t no t a l l be feasible, they are suggested to guide the designers thoughts toward implementing the r e s u l t s o f road embankment research fo r warm permafrost cond i t ions .
REFERENCES
Berg, R (1985). E f f e c t o f C o l o r and Texture on the Surface Temperature of Asphal t Concrete Pavements. Alaska Department o f T r a n s p o r t a t i o n (DOT) Research Report, AK-RD-85-16.
Braley, W A (1984). A Personal Computer S o l u t i o n t o t h e Modif ied Berggren Equatton. Alaska DOT Report, AK-RD-85-19.
Connor. B (1984). Air Duct Svstems f o r Roadwav S t a b i l i r a t i o n . o v e r P e r m a f r i s t Areas. Alaska-DOT Report, AK-RD-84-10.
Esch, D C (1973). Control of Permafrost Degradation Beneath a Roadway by Subgrade Insulat ion. Proc. '
Permafrost - 2nd I n t l . Conf., 608-622. Esch, D C (1983). Evaluation of Experimental Design
Features f o r Roadway Construction over Permafrost. Proc. Permafrost - 4 t h I n t l . Conf. , 283-288.
Esch, D C (1984) . Sur face Modi f icat ions for Thawing of Permafrost. Alaska DOT Report, AK-RD-85-10.
Esch, D C (1986). I n s u l a t i o n Performance Beneath Roads and A i r f i e l d s i n Alaska. Alaska DOT Report,
Greene, G W , Lachenbruch, A & Brewer, M (1960). Some Thermal E f f e c t s o f a Roadway on Permafrost: Geological Research, 1960, U.S. Geological Survey Professional Paper 400-8, 6141-8144.
Hayley, D W . e t a1 (1983). S tab i l i za t i on o f S inkho les on the Hudson Bay Railroad. Proc. Permafrost - 4 t h I n t l . Conf, , 468-473.
Juday, G P (1983). Temperature Trends i n t h e Alaska C l imat ic Changes Record. Proc. Conf. o f P o t e n t i a l E f fec ts o f Carbon Dioxide Induced Changes i n Alaska; Misc. Publ. 83-1, Sch. o f Agr., Univ. o f AK Fairbanks,
Kellogg, W W (1983). Possible Effects o f Global Warming on A r c t i c Sea Ice, Precipi tat ion, and,Carbon Balance. Proc. Conf. on Poten t ia l E f fec ts of Carbon Dioxide
Agr., Univ. o f AK Fairbanks, 59-66. Induced Changes i n Alaska; Misc. Publ. 83-1, Sch. of
AK-RD-87-17.
76-91.
Kinnev. T C (1986). Tensile Reinforcement of Road Embhnkments on Polygonal Ground. Alaska DOT Report, AK-RDyB6-29.
McFadden. T (19851. Performance o f the Thermotube Permafrost'Stabilization System i n t h e A i r p o r t Runway a t Bethel, Alaska. Alaska DOT Report, AK-RD-86-20.
McHattie, R L & Esch, D C (1983). Bene f i t s o f a Feat Underlay Used i n Road Construct ion on Permafrost. Proc. Permafrost - 4 t h I n t l . Conf. 826-831.
Thaw-Sett lement Control. Interim Report, Alaska DOT Report, AK-RD-85-16.
Considerations i n Frozen Ground Engineering. ASCE Monograph.
Roadway Embankments Constructed Over Permafrost. Alaska DOT Report, FHWA-AK-RD-87-20.
Reckard, M K (1985). White Paint for Highway
Krzewinski, T G & Tar t , R G. Thermal Design
Zar l ing , J P & Braley, A W (1987). Thaw S t a b i l i z a t i o n o f
1228
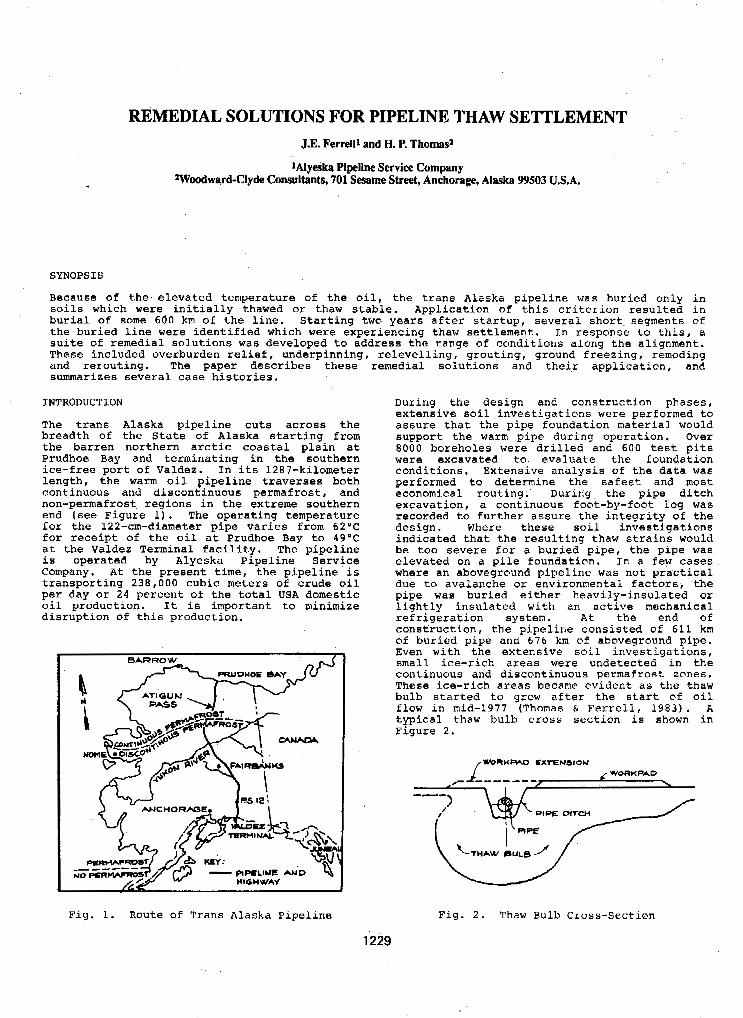
REMEDIAL SOLUTIONS FOR PIPELINE THAW SETTLEMENT J.E. Ferrelll and H. P. Thomas2
1Alyeska Pipeline Service Company 2Woodward-Clyde Consultants, 701 Sesame Street, Anchorage, Alaska 99503 USA.
SYNOPSIS
Because of the elevated temperature of the oil, the trans Alaska pipeline was buried only in soils which were initially thawed or thaw stable. Application of this criterion resulted in burial of same 600 km of the line. Starting two years after startup, several short, segments of the buried line were identified which were experiencing thaw settlement. In response to this, a suite of remedial solutions was developed to address the range of conditions along the alignment. These included overburden relief, underpinning, relevelling, grouting, ground freezing, remoding
remedial solutions and their application, and and rerouting. The paper describes these summarizes several case histories.
INTRODUCTION
The trans Alaska pipeline cuts across the breadth of the State o f Alaska starting from the barren northern arctic coastal plain at Prudhoe Bay and terminating in the southern ice-free port of Valdez. In its 1287-kilometer length, the warm o i l pipeline traverses bath continuous and discontinuous permafrost, and non-permafrost, regians in the extreme southern end (see Figure 1) . The operating temperature for the 122-cm-diameter pipe varies from 62OC for receipt of the o i l at Prudhoe Bay to 49 'C at the Valdez Terminal facility. The pipeline is operated by Alyeska Pipeline Service Campany. At the present time, the pipeline i s transporting 238,000 cubic meters of crude ail per day or 2 4 percent of the total USA domestic biL production. It is important to minim disruption of this production.
Fig. 1. Route Of Trans Alaska Pipeline
iz e
During the design and construction phases, extensive soil investigations were performed to assure that the pipe foundation material would support the warm pipe during operation. Over 8000 boreholes were drilled and 600 test pits were excavated to evaluate the foundation conditians. Extensive analysis of the data was performed to determine the safest and most economical routing. During the pipe ditch excavation, a continuous foot-by-foot log was recorded to further assure the integrity of the design. Where these s o i l investigations indicated that the resulting thaw strains would be too severe OS a buried pipe, the pipe was elevated on a pile faundation. In a few cases where an aboveground pipeline was not practical due to avalanche ox environmental factors, the pipe was buried either heavily-insulated or lightly insulated with an active mechanical refrigeration system. A t the end of conseruction, the pipeline consisted of 611 km of buried pipe and 676 kn of aboveground pipe. Even with the extensive soil investigations, small ice-rich areas were undetected in the continuous and discontinuous permafrost zones. These ice-rich areas became evident as the thaw bulb started to grow after the start of oil flow in mid-1977 (Thomas & Ferrcll, 1983) * k typical thaw bulb cross section is shown in Figure 2 .
Fig. 2 . Thaw Bulb Cross-Section
1229
In 1979, after two years of operation and a period of rapid thaw bulb grawth, two oil leaks occurred in the buried pipe at Mileposts (MP) 166 and 734. A t MP 166, the pipe had settled 1.2 n over a i20-m span as a result of thawing of massive ice in bedrock in a high mountain pass area and, at NP 734, the pipe hac? settled '1.7 m over a 90-m span as a result of thawing of an ice-rich "permafrost island" in an otherwise thawed environment (Johnson, 1981) . The leaks were contained by full-encirclement sleeves welded to the pipe with the annulus between the pipe wall and the sleeve filled with cement grout.
Figure 3 shows the sleeve installed at MP 166. These sleeves allowed oil flow to resume. However, because they could not tolerate future pipe movements, pipe settlement had to be arrested. Based rnalnly on availability of contingency stockpiled material and equipment, expedient repair designs were implemented due to time constraints. Both designs consisted of piles to carry the pipe loads, downarag loaas and other Loads which could result in further pipe movement.
BELOUGROUND STABILITY PROGWU.1
Concurrent with repair of the two leaks, a line-wide extensive geotechnical investigation was initiated to locate other buried pipe segments which could also be experiencing thaw settlement but which had not yet damaged the pipe sufficiently to cause leaks. This lnvestigativo program identified additional settled segments i n the years from 1979 to 1988. Ten o f these have been successfully stabilized, beginning in 1980, before severe pipe damage occurred, and an additional segment is proposed for repair in 1988. The balance of the settled segments had only minor pipe strains and are being monitwred via settlement monitoring rods affixed to t h e top of the pipe, instrumented pigs, and remote sensing (McDevitt and Cole, 1 9 8 8 ) . The necessity for a repair was determined by calculating pipe curvature change fram the as-built pipe profile to the
123
present pipe profile determined from a closely- spaced top-of-pipe survey (Simmons and Alto, 1988).
Defined as that value of pipe curvature corresponding to onset of buckling, critical buckling curvature (K 1 is based on results of iull-scale pipe buck'ixing testing (Bouwkamp & Stephen, 1973). If a value of 8 5 percent ox more o f K was measured, Alyeska has proceeded to stabilfge the settled pipe by one of several measures. Both the stabilized and non-stabilized settlement areas are being manitored on a regular basis. Data from the stability monitoring program have shown that the thaw bulb growth as of 1988 is slow and little additional pipe movement is occurring.
As part of the early belowground stability investigation, available construction geotechnical information and operation data, were evaluated. As questioned segments were identified, monitoring rods were installed on top of the pipe and instrumented soil boreholes were drilled along-side the pipe. If the rods revealed a settled area or the soil aata and thermistors identified ice-rich permafrost, a more-detailed geotechnical investigation was initiated to determine the foundation parameters. However, the repair design was often delayed because the results from further drilling and soil testing could use up several weeks of the short construction season. It became evident that, if a conceptual repair design could be identified early on, the investigation program could be better focused and investigation and repair designs could thereby proceed on parallel courses. Tt was decided in 1981 that a suite of feasible repair designs from which Alyeska could pattern the geotechnical investigation would reduce investigative cost and design time and facilitate implementation of remedial measures. These Repair Contingent Designs could also identify x'equired materials (especially long-lead items) and required Soil3 information for implementation.
In 1982, Woodward-Clyde Consultants was retained to summarize experience to date and develop new conceptual designs which could satisfy the aforementioned criteria. The goal of the designs was to assure uninterrupted throughput, low risk of pipeline damage, controlled restraint on the exposed buried pipe, and be the most economical with the inherent risks. These designs would also be constrained by weather, river breakups, permits, and availability of men, material, and equipment. Since their development, these contingent designs have significantly sped investigations,-evaluation, and repairs.
REMEDIAL SOLUTIONS, THEIR APPLICABILITY, AND CASE HISTORIES
The optimal remedial solution for a given pipe segment depends on a number af factors. Especially important among these are (1) the amount of pipe settlement and resulting state of pipe curvature at the time the problem is identified, and (2) thc potential for future pipe settlement and its rate.
10
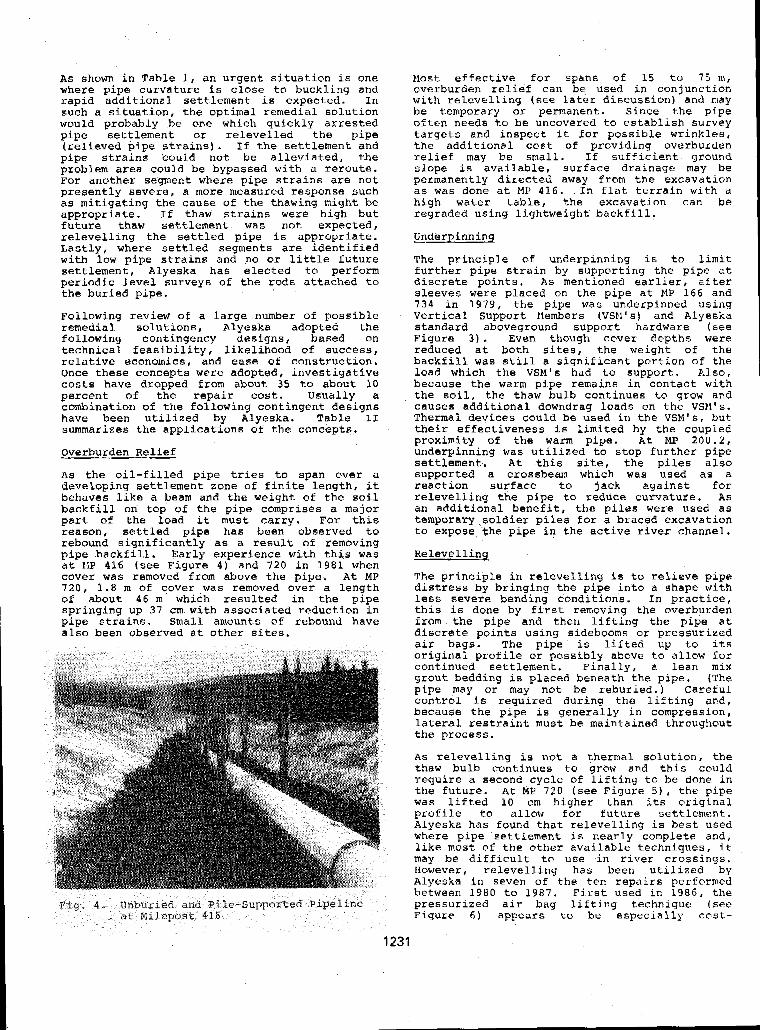
As shown in Table 1, an urgent situation is one where pipe curvature is close to buckling and rapid additional settlement is expected. In such a situation, the optimal remedial solution would probably be one which quickly arrested pipe settlement or relevelled the pipe (relieved pipe strains). If the settlement and pipe strains kould not be alleviated, the problem area could be bypassed with a remute. For another segment where pipe strains axe not presently severe, a more measured response such as mitigating the cause of the thawing might be appropriate. If thaw strains were high but future thaw settlement was not expected, relevelling the settled pipe is appropriate. Last ly , where settled segments are identified with low pipe strains and no or little future settlement, Alyeska has elected to perform periodic level surveys of the rods attached to the buried pipe.
Following review o f a large number of possible remedial solutions, Alyeska adopted the following contingency designs, based on technical feasibility, likelihood of success, relative economics, and ease of constructian. Once these concepts were adopted, investigative costs have dropped from abaut 35 to about 10 percent of the repair cost. Usually a combination of the fallowing contingent designs have been utilized by Alyeska. Table IT summarizes the applications of the concepts.
Overburden Relief
As the oil-filled pipe tries to span over a developing settlement zone of finite length, it behaves Like a beam and the weight of the soil backfill on top of the pipe comprises a major part of the laad it must carry. Far this reason, settled pipe has been observed to rebound significantly as a result of removing pipe backfill. Early experience with this was at 1IP 416 (see Figure 4 ) and 720 in 1981 when cover was removed fram above the pipe. At MP 7 2 0 , 1.8 m of cover was removed over a length of about 46 m which resulted in the pipe springing up 31 cm with associated reduction in pipe strains. SmaLl amounts o f rebound have also been observed at other sites.
Most effective for spbns of 15 tu 75 m, overburden relief can be dsed in conjunction with relevelling (see later discussion) and may be temporary or permanent. Since the pipe often needs to be uncovered to establish survey targets and inspect it f o r possible wrinkles, the additional cost o f providing overburden relief may be small. If sufficient ground slope is available, surface drainage may be permanently directed away from the excavation as was done at PIP 416. In flat terrain with a high water table, the excavation can be regraded using lightweight backfill.
Underpinning
The principle of underpinning is to limit further pipe strain by supporting the pipe at discrete points. A s mentioned earlier, after sleeves were placed cn the pipe at MP 166 and 134 in 1979, the pipe was underpinned using Vertical Suppart Members (VSEl's) and Alyeska standard aboveground support hardware (see Figure 3 ) . Even though cover depths were reduced at both sites, the weight of the backfill was still a significant portion of the load which the VSM's had to support. Aiso, because the warm pipe remains in contact with the soil, the thaw bulb continues to grow and causes additional downdrag loads on the VSM's. Thermal device.s could be used in the VSM's, but their effectiveness i s limited by the coupled proximity of the warm pipe. At MP 200.2, underpinning was utilized to stop further pipe settlement. At this site, the piles also supported a crossbean which was used as a reaction surface to jack against €or relevelling the pipe to reduce curvature. A5 an additional benefit, the piles were used as temporary>swldier piles for a braced excavation to expose the pipe in the active river channel.
Relevellinq
The principle in relevelling is to relieve pipe distress by bringing the pipe into a shape with less severe bending conditions. In practice, this is done by first rem0vir.g the overburden from. the pipe and then lifting the pipe at discrete points using sidebooms or pressurized air bags. The pipe is lifted up to its originai profile ox possibly above to al low for continued settlement. Finally, a lean mix grout bedding is placed beneath the pipe. (The pipe may or may not be reburied.) Careful control is required during the lifting apd, because the pipe is generally in compression, lateral restraint must be maintained throughout the process.
As relevelling is not a thermal solution, the thaw bulb continues to grow and this could require a second cycle of Lifting t o be done in the future. A t MP 720 (see Figure 51, the pipe was lifted 10 cm higher than its original profile to allow for future Settlement. Alyeska has found that relevelling is best used where pipe scttlement is neasly complete and, like most of the other available techniques, it may be difficult tc use in river crossings. However, relevelling has been utilized by Alyeska in seven of the ten repairs performed between 1980 to 1987. First used ir. 1986, the
p ig . 4. Unburied and ~ ~ ~ e - ~ u ~ ~ ~ ~ t ~ ~ P i p e l i n e pressurized air bag lifting technique (see at Milepost 416 Figure 6 ) appears to be especially cost.-
1231
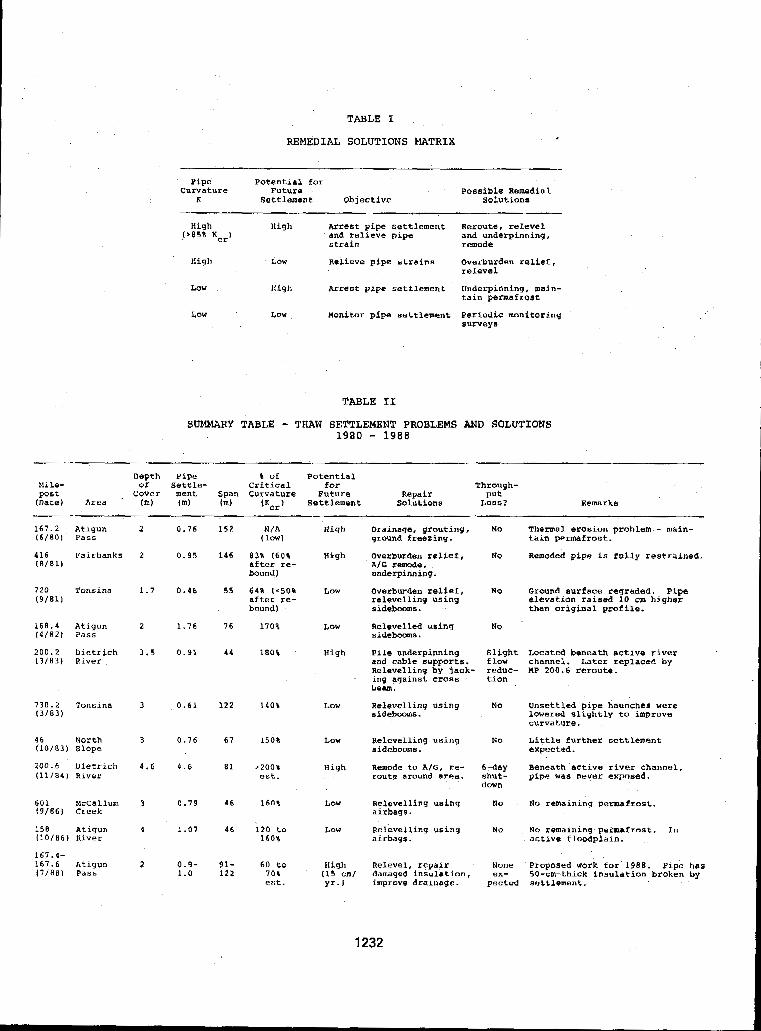
TABLE I
REMEDIAL SOLUTIONS MATRIX
Pipe Curvature
Potential for Future Possible Remedial
K Settlement Objective Solutions
High High Arrest pipe settlement Reroute, relevel and relieve pipe strain
1'85% Kcr) and underpinning, remode
nigh LOW Relieve pipe strains Overburden relief, relevel
LOW High arrest pipe settlement underpinning, main-
LOW LOW Monitor pipe settlement Periodic monitoring
tain permafrost
surveys
SUEWRY TABLE - THAW SETTLEMENT PROBLEMS AND SOLUTIONS 1980 - 1988
Mile- Depth Pipe 8 of Potential of Settle- Critical for Through-
post Cover ment Span Cuxvature Future (Date) Area - (m) (m) (m) ( K ~ ~ ) Settlement Solutions LOSS?
Repair Put Remarks
1 6 7 . 2 Atigun ( 6 / 8 0 1 Pass
416 Fairhanks ( 8 / 8 1 1
7 2 0 Tonsina (9/81)
168.4 Atigun ( 4 / 8 2 ) Pass
200.2 Dietrich ( 3 / 8 3 ) River
730.2 Tonsina 1 3 / 8 3 )
46 (10/83) Slope
North
200.6 Dietrich ( 1 1 / 8 4 ) River
6 0 1 McCallum 1 9 / 6 6 ] Creek
158 Atigun ( 1 0 / 8 6 ) River
167.4- 1 6 7 . 6 Atigun 17 /88 ] Pass
2
2
1.7
2
3 . 5
3
3
4 . 6
3
4
2
0.76
0 . 9 5
0 . 4 6
1.76
0 . 9 1
0.61
0 . 7 6
4 . 6
0 . 7 9
1 . 0 7
0 .9 - 1 . 0
152 N / A High Drainage, grouting, NO Thermal erosion problem - main- ( low) qround freezing. tain permafrost.
1 4 6 8 3 % (60% High Overburden relief, NO Remoded pipa is fully restrained. aEter re- A/G ramode, bound) underpinning.
5 5 6 4 % ( c 5 0 1 Lon Overburden relief, No Ground surface regraded. Pipe after re- bound)
relevelling using elevatian raised 10 cm higher sidebooms . than original profile.
7 6 1708 LOW Relevelled using No sidebooma.
44 180% High Pile underpinning Slight Located beneath active river and cable supports. flow channel. Later replaced by Relevelling by jack- reduc- MP 200.6 reroute.
beam. ' ing against cross tion
122 1 4 0 % Low Relevelling using No Unsettled pipe haunches were sidebooms. Lowered slightly to improve
curvature.
6 7 150% LOW Relevelling using NO Little further settlement sidebooms. expected.
8 1 1 2 0 0 % High Remode to A/G, xe- 6:day Beneath active river channel, e s t . route around ar*a. shut- pipe was never exposed.
down
4 6 160% Low Relcvelling using No No remsininq permafrost. airbags.
4 6 120 to L O W Relevelling usiny airbags.
NO NO remaining petmatroat. In 1 6 0 % active floodplain.
91- 60 to 1 2 2 7 0 % (15 em/ damaged insulation, ex- 50-cm-thick insulation broken by
High Relevel, repair None Proposed work for 1 9 8 8 . Pipe has
est. yr.1 improve drainage. pectcd acttlemant.
1232
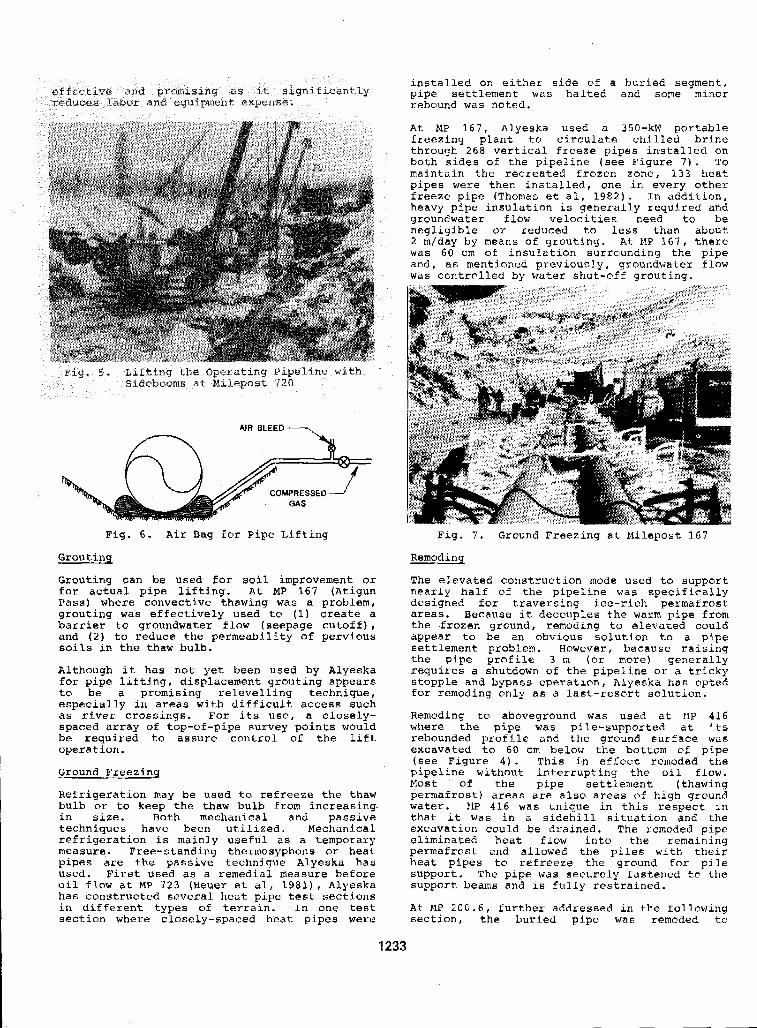
installed or. either side of a buried segment, pipe settlement war, halted and some minor rebound was noted.
At MP 167, Alyeska. used a 350-k1.I portable freezing plant to circulate chilled brine through 268 vertical freeze pipes installed on bath sides of the pipeline (see Figure 7 ) . TO maintain the recreated frozen zone, 133 heat pipes were then installed, one in every other freeze pipe (Thomas et al, 1982). In addition, heavy pipe insulation is generally required and groundwater f l o w velocities need to be negligible or reduced to less than about 2 rnfday by means of grouting. At MP 167, there was 60 cm wf insulation surrounding the pipe
was controlled by water shut-off qroutinq. and, as mentioned previously, groundwater flow
Fig. 6 . Air Bag for Pipe Lifting Fig. I . Grwund Freezing at Milepost 167
Grouting
Grouting can be used for soil improvement or for actual pipe lifting. At MP 167 (Rtigun Pass) where convective thawing was a problem, grauting was effectively used to (1) create a barrier to groundwater flaw (seepage cutoff), and ( 2 ) to reduce the permeability of pervious soils in the thaw bulb.
Although it has not yet been used by Alyeska for pipe lifting, displacement grauting appears to be a promising relevelling technique, especially in areas with difficult access such as river crossings. For its use, a closely- spaced array of top-of-pipe survey paints would be required to assure control of the lift operation.
Ground Freezing
Refrigeratian may be used tw refreeze the thaw bulb or to keep the thaw bulb from increasing. in size. Both mechanical and passive techniques have been ut-ilized. Mechanical refrigeration is mainly useful as a temporary measure. Free-standing thermosyphons or heat pipes are the passive technique Alyeska has used. First used as a remedial measure before o i l flow at MP 7 2 3 (fleuer et all 1981) , Alpfska has constructed several heat pipe test sections in different types of terrain. In one test section where clasely-spaced heat pipes were
1233
Rernadinq
The elevated construction mode used to support nearly half of the pipeline was specifically designed for traversing ice-rich permafrost areas. Because it decouples the warm pipe from the -frozen ground, remclding to elevated could appear to be an obvious solution to a pipe settlement problem. However, because raising the pipe profile 3 IX (or more) generally requires a shutdown of the pipeline or a tricky stopple and bypass operation, Alyeska ha6 opted for rernoding only as a last-resort solution.
Remoding to aboveground was used at r1P 4 1 6 where the pipe was pile-supported at i t s rebounded proflle and the ground surface was excavated to 60 cm below the bottom of pipe (see Figure 4 ) . This in effect remoded the pipeline without interrupting the oil flow. Mast of the pipe settlement (thawing permafrost) areas are a l so areas of high ground water. MP 416 was unique in thiG respect in that it was in a sidehill situation and the excavation could be drained, The remoded pipe eliminated heat flow into the remaining permafrost and allowed the piles with their heat pipes to refreeze the ground for pile suppart. The pipe was securely fastened to the support beams and is fully restrained.
At MP 200.6, further addressed in the following section, the buried pipe was remoded to
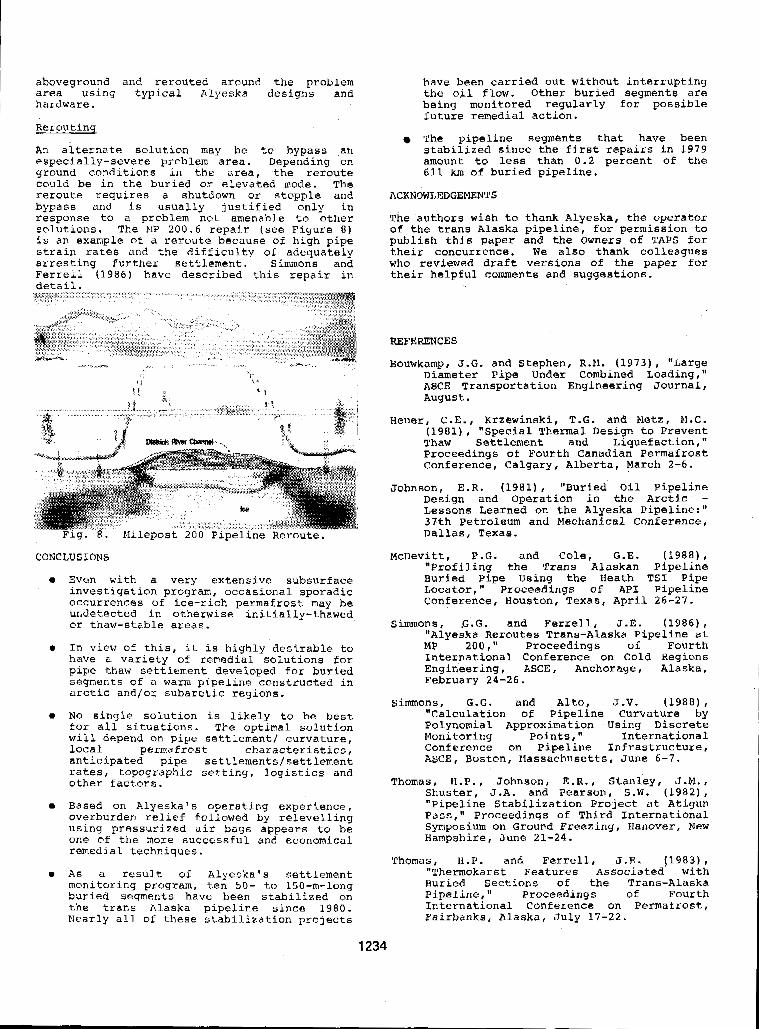
aboveground and, rerouted around the problem area using typical Alyeska designs and hardware.
Reroutinq
An alternate solution may be to bypass an especially-severe problem area. Depending on ground conditions in the mea, the reroute could be in the buried or elevated mode. The reroute requires a shutdown or stopple and bypass and is usually justified only in response to a problem not amenable to other :elutions. The IIP 200.6 repair (see Figure 8) is an example of a reroute because of high pipe strain rates and the difficulty of adequately arresting further settlement. Simmons and Ferrell (1986) have described this repair in det.a i 1 .
have been carried out without interrupting the oil flow. Other buried segments are being monitored regularly for possible future remedial action.
The pipeline segments that have been stabilized since the first repairs in 1979 amount to less than 0.2 percent of the 611 km of buried pipeline.
ACKNOWLEDGEMENTS
The authors wish to thank Alyeska, the operator o f the trans Alaska pipeline, for permissinn t o publish this paper and the Owners of TAPS for
who reviewed draft versions of the paper for their concurrence. We also thank colleagues
their helpful comments and suggestions.
I,,
Fig. 8. Hilepost 200 Pipeline Reroute.
CONCLUSIONS
Even with a very extensive subsurface investigation program, occasional sporadic occurrences of ice-rich permafrost nay be undetected in otherwise initially-thawed, or thaw-stable areas.
In view af this, it is highly desirable to have a variety of remedial solutions for pipe thaw settlement developed fo r buried segments of a warm pipeline constructed in arctic and/or subarctic regions.
No single mlution is likely to be best for all situatians. The optimal solution will depend on pipe settlement/ curvature, local permafrost anticipated pipe settlementslsettlement
characteristics,
rates, topographic setting, logistics and other factors.
Based on Alyeska's operating experience, overburden relief followed by relevelling using pressurized air bays appears to be one o f the more successful and economical
REFERENCES
Bouwkamp, J . G . and Stephen, R.11. (1973) , "Large Diameter Pipe Under Combined Loading," ASCE Transportatian Engineering Journal, August .
Heuex, C.E., Krzewinski, T.G. and Netz, 11.C. (1981) , "Special Thermal Design t o Prevent Thaw Settlement and Liquefaction," Proceedings of Fourth Canadian Permafrost Conference, Calgary, Alberta, March 2-6.
Johnson, E.R. (1981) , "Busied- Oil Pipeline Design and Operation in the Arctic - Lessons Learned on the Alyeska Pipeline:" 37th Petroleum and Mechanical Conference, Dallas , Texas.
McDevitt, P.G. and Cole, G.E. (1988),
Buried Pipe IJsing the Heath TSI Pipe "Profiling the Trans Alaskan Pipeline
Locator," Proceedings of API Pipeline Conference, HQUStOn, Texas, April 26-27.
Simmons, G . G . and Ferrell, J.E. (1986), "Alyeska Reroutes Trans-Alaska Pipeline at MP 200 ," Proceedings of Fourth International Conference on Cold Regions Engineering, ASCE, Anchorage, Alaska, February 24-26.
Simmons, G . G . and Alto, J.V. (1988) , "Calculation of Pipeline Curvature by
Monitoring Polynomial Approximation Using Discrete
Points," International
ASCE, Boston, Massachusetts, June 6-7. Conference on Pipeline Infrastructure,
Thomas, H.P., Johnson, E.R., Stanley, J.M., Shuster, J . A . and Pearsun, S.W. (1982), "Pipeline Stabilization Project at Atiqun Pass," Proceedings of Third International Symposium on Ground Freezing, Hanover, New Hampshire, June 21-24.
remedial techniques. Thomas, 1l .P . and FerreL1, J.E. (1983) I
As a result of Alyeska's settlement "Thermokarst Features Associated with monitoring program, ten 50- tn 150-m-long Buried Sections o f the Trans-Alaska buried seqments have been stabilized on Pipeline, I' Proceedings of Fourth the trans Alaska pipeline sincc 1980. International conference on Permafrost, l l e a r l y all of these stabilization projects Fairbanks, Alaska, July 17-22.
1234
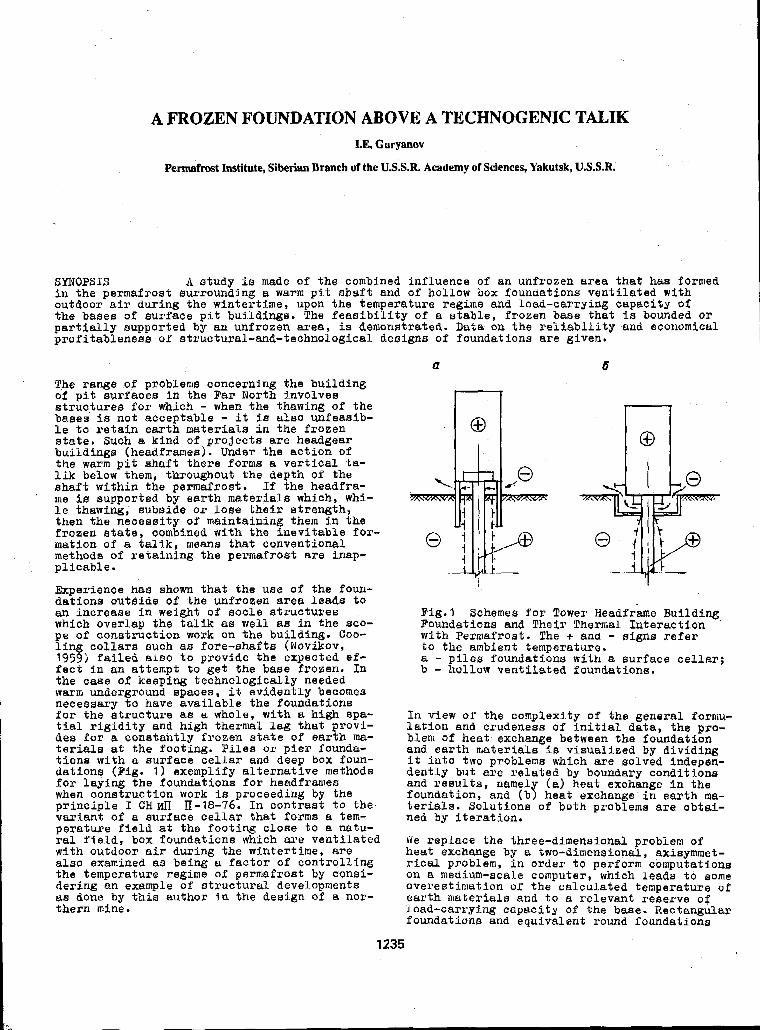
A FROZEN FOUNDATION ABOVE A TECHNOGENIC TALIK I.E. Guryanov
Permafmst Institute, Siberian Branch of the U.S.S.R. Academy of Sciences, Yakutsk, U.S.S.B.
SYNOPSIS A hitudy is made of the combined influence of an unfrozen area that has formed in the permafrost surrounding a warm p i t shaft and of hollow box foundations ventilated with outdoor air during the wintertime, upon the temperature regime and load-carrying capacity o f the baaes o f surface pit buildings. The feasibility of a stable, frozen base that is bounded ox partially supported by an unfrozen axe&, ia demonstrated. Data on the r e l i a b i l i t y and economical profitableness of stxuotural-and-technologioaL designs o f foundations are given.
The range of problems concerning the building of pit aurfaces in the Far North involves structures f o r which - when the thawing o f the bases is not acceptable - it i a a l s o unfeasib- le to retain earth materials in the frozen atate. Such a kind of projects axe headgear buildings (headfxamesj. Under the action o f
lik below them, throughout the depth of the the warm pit ahaft there forms a vertical ta-
shaft within the permafrost. If the headfra- me is supported by earth materials which, whi- le thawing; subside or lose their strength, then the necessity of maintaining them in the frozen state, combined with the inevitable f o r - mation o f a talik, means that conventional methods o f retaining the permafrost are inap- plicable.
Experience has ahown that the use of the foun- dations outside of the unfrozen area leads to
which overlap the talik as well as in the w o - an increase in weight of socle atructuxes
pe o f construction work on the building. Coo- ling collars such as fore-shafts (Novikov, 19593 failed also to provide the expected e i - fect in an attempt to get the base frozen. In the case o f keeping technologically needed w a r m underground spaces, it evidently becom8a necesaary to have available the foundations for the structure as a whole, with a high apa- tial rigidity and high thermal lag that provi- des for a conatantly frozen atate of earth ma- terials at the footing. Piles O X pier Pounda- t i o n s with a aurface cellar and deep box foun- dations (Fig. 1) exemplify alternative methods for laying the foundations for headframes when construction work i a proceeding by the principle 1 CHnn II-18-76. In contrast to the- variant of a surface cellar that forms B tem- perature field at the footing close to a natu- ral f i e l d , box foundations which axe ventilated with outdoor air during the wintertime, &re a l s o examined as being a factor of controlling the temperature regime of permafrost by conai-
as done by th.is author in the design o f a nor- dering an example of structural developments
them mine.
a
\
0
6
Fig.1 Schemes for Tower Headframe Building Foundation8 and Their Thermal Interaction with Permafrost. The + and - aigns refer t o the ambient temperature. a - piles foundatione with a surface cellar; b - hollow ventilated foundations.
In view o f the complexity o f the general Pormu- lation and crudeness of initial data, ths pro- blem o f heat exchange between the founda"con and earth ttiaterlals is visualized by dividing it into two problems which are solved indepen- dently but are related by bounaary conditions and results, name1 (a) heat exchange in the founaation, and (by heat exchange i n earth ma- terials. Solutions of both problems are abtai- ned by iteration.
We replace the three-dimensional problem of heat exchange by a two-dimensional, axisymmet- rcictll problem, in order to perform computations on a medium-scale computer, which leads to some overestimation o f the calculated temperature of earth materiale ana t o a relevant reeerve of load-carrying capacity o f the base. Rectangulsr foundations and equivalent round foundations
1235
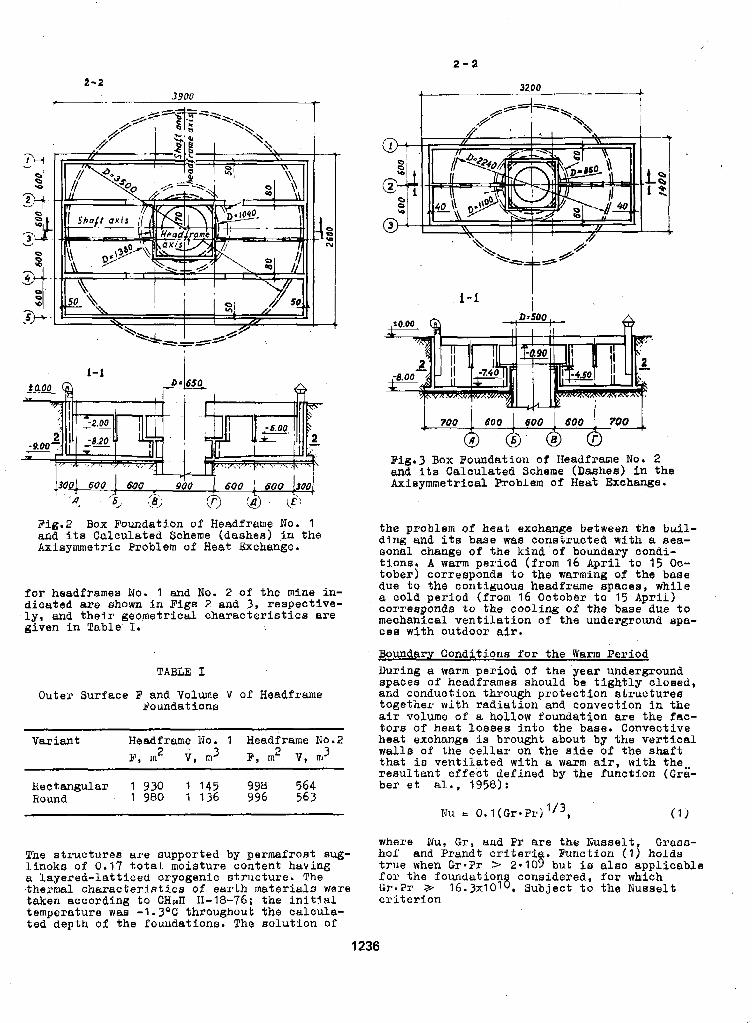
2-2 3900
1-1
Pig.2 Box Poundation of Weadframe No. 1 and its Calculated Scheme (dashes) i n the Axisymmetric Problem of Neat Exchange.
f o r headframes No. 1 and No. 2 of the mine in- dicated are shown in pig^ 2 and 3 , reapective- ly, and their geometrical characteristics are given in Table I.
TABLE I
Outer Surface F and Volurrie V of Headframe Poundat ions
Variant Headframe No. 1 Headframe 110.2 31, .2 v, .3 F, .2 v, m 3
Rectangular 1 930 1 145 998 564 Hound 1 980 1 136 996 563
The structures are supported by permafroat eug- Linoks of 0.17 t o t a l moisture content having a layered-latticed cryogenic structure. The thermal Characteristics o f earth materials were taken according to C H d I 11-18-76; the initial temperature waa -1.3OC throughout the calcula- ted depth o f the foundations. The solution of
2 - 2
3200 +
1 700 & 600 600 600 & 700
Big.3 Box Foundation of Headframe No. 2 and its Calculated Schema (Dashes) in the Axieyrnrnetxlcal Problem of Beat Exchange.
il- ding-and its base was constructed with a sea- sonal change of the kind of boundary condi- tions. A warm period (from 16 April t o 15 Oc- tober) corresponds to the warming o f the base due to the contiguoua headframe spaces, while a cold period (from 16 October to 15 April) corresponds to the cooling of the baae due t o mechanical ventilation of the underground spa- cea with outdoor air.
Boundary Conditiona f o r the Warm Period During a warm period o f the year underground spacee of headframes should be tightly cloQed, and conduction through protection etxucturee together with radiation and convection in the QiF volume of a hol low foundation are the Pac- tors o f heat losses into the base. Convective heat exchange is brought about by the vertical walls of the c e l l a r on the aide of the shaft that l a ventilated with a warm air, with the-, resultant effect defined by the function (Gra- ber e t d., 1958):
Nu O.I(Gr*Prj 1 / 3 , ( 1 )
where Iuu, Gr, and P r axe the Nusaelt, Grass- hof' and Prandt criteria. B'unction (1) holds true when GrmPx 3 2.109 but ie also appl icable f o r the foundation considered, f o r which
criterion Gr.Pr 16.3XlOl6 Subject to the Nusselt
the problem of heat exchange between the bu
1236
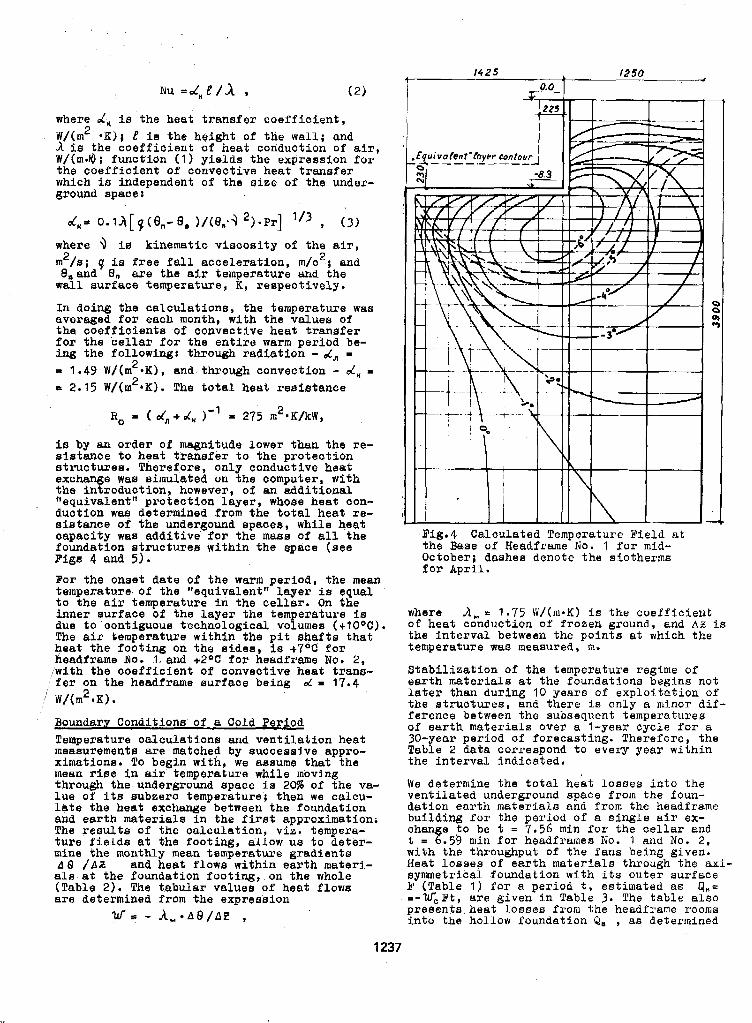
where d , i s the heat transfer coefficient, W/(m2 *IC); E is the height of the wall; and 1 is the coefficient of heat conduction of air, W/(m.@i function (1) yields the expression for the coefficient of Convective heat transfer which. is independent of the size of the under- ground space :
where 3 I s kinematic viscosity of the a h , m /s; 7 is free fa l l acceleration, m/c2; and 2 8,and 8, are the air temperature and the wall. rsurfaoe temperature, K, respectively.
In doing the calculations, the temperature was averaged f o r each month, with the values of the coefficlents of convective heat transfer f o r the callax f o r the entire warm period be- ing the following: through radiation - d , = = 1.49 W/(m2*K), and through convection - d , = P 2.15 W/(rn2*K). The total heat resistance
B, = ( d, + d , )'I = 275 m2*K/kW,
is by an order of magnitude lower than the re- sistance t o heat transfer to the protection structures. Therefore, only conductive heat exchange waa simulated on the computer, with the introduction, however, o f an daitional llequivalenttt protection layer, whose heat con- duction was determined from the total heat re- sistance of the undergound apaces, while heat capacity was additive f o r the mass of all the foundation etructurea withln the space (see Figs 4 and 5 ) . For the onaef date of the warm period, the mean temperature, of the Itequivalent" layer is equal to the air temperature in the cellar. On the inner surface of the layer the temperature is due to contiguous technological volumes ( + l O ° C ) . The air temperature within the pit shafts that heat the footing on the sides, i s + 7 O C for beadframe No. 1. and + 2 O C Pox headframe No. 2, iwith the coefficient of convective heat trans-
I) fer on the headframe surface being d = 17.4 /I iV/( m2 OK).
Boundary Conditions of a cola Period Temperature calculationB and ventilation heat measurements are matched by successive appro- ximations. To begin with, we assume that the mean rise in air temperature while moving through the undexground space i s 205e of the va- lue of its subzero temperature; then we calcu- late the heat exchange between the foundation ana earth materials in the first approximation; The resulto of the calculation, v i z . tampera- ture fielde at the footing, allow us to deter- mine the monthly mean temperature gradients A 8 /Ai! and heat flows within earth materi- als at the foundation footing, on the whole (Table 2). The tabular values of heat flows are determined from the expreesion
W a - A , A G / b ? ,
Fig.4 Calculated Temperature E'ield at the Baee of Headframe No. 1 for mid- October; dashes denote the siotherms for Apr i l .
where h, c 1.75 W/(m.;C) is the coefficient o f heat conduction of frozen ground, and AZ is the interval between the points at which the temperature wae measured, m.
Stabilization o f the temperature regime of earth materials at the foundatione begins not latex than during 10 years of exploitation of the structures, and there is only a minor dif- ference between the aubsequent temperatures of earth. materials over a l-yeas cycle for a 30-year period of forecasting, Therefore, the Table 2 data correspond to every year within the interval indicated.
We determine the total heat losses into the ventilated underground space from the foun- dation earth materials and from the headframe building f o r the period of a single air ex- chan e t o be t = 7 . 5 6 rnin for the cellar and t = f .59 min for headframes iio. 1 and No. 2, with the throughput of the fane being given. Heat losees of earth materials through the axi- symmetrical foundation with its outer surface P (Table 1) f o r a period t, estimated as qH= =-Z(TcBt, are given in Table 3. The table a l s o presents heat losses from the headfr'ame I'OQ~ZIS into the hollow foundation Q e , as dstermined
1237
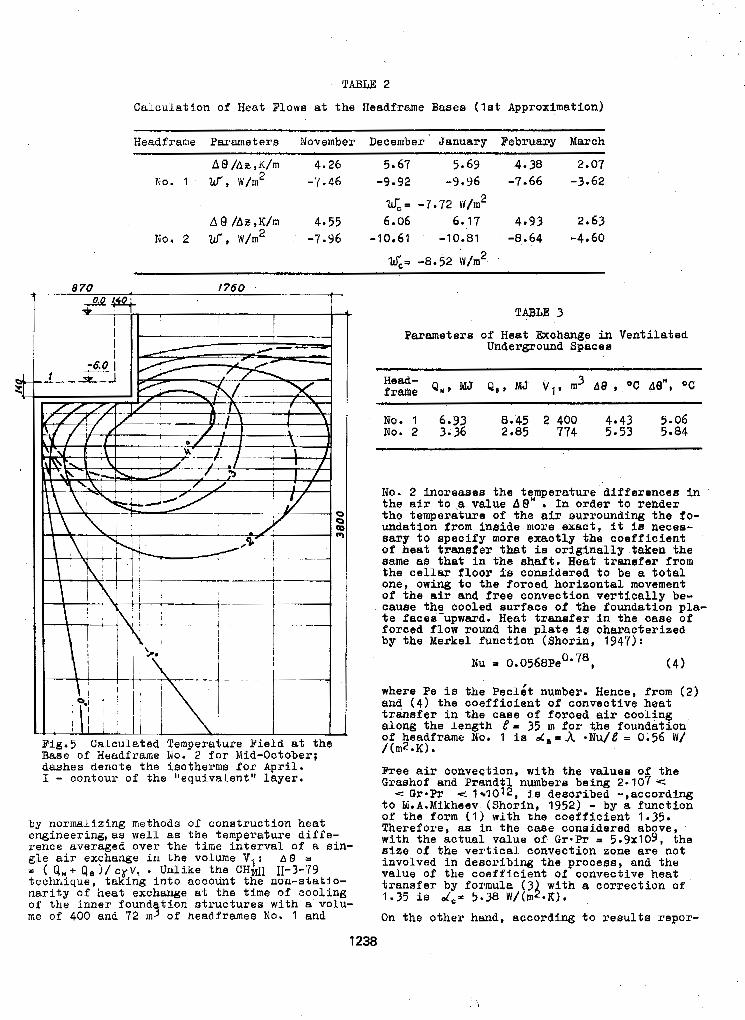
TABLE 2
Calculation of Beat Flows a t t h e Headframe Bases (1st Approximation)
Headframe Paratnetere November' December January February March
A s / A i t , K / m 4.26 5 * 6'7 5.69 4.38 2.07 No. 1 ZJ , W/n2 -7 - 46 -9.92 -9.96 -7.66 -3.62
"7.72 W/m 2
A f3 /Aa ,K/m 4.55 6.06 6.17 4.93 2.63 No. 2 w*, W/m2 -7.96 -10.61 -10.81 -8.64 -4.60
x.= -8.52 W/m2
* ' I I ! I "_ 1-
" .
x a 7-
t
I Fig.5 Calculated Temperature Field at the Baae of Headframe Iio. 2 f o r Mid-October; dashes denote the isotherms f o r A p r i l . I - contour o f the "equivalent11 layer.
by normalizing methode o f conatruction heat engineering,as well as the temperature diffe- rence averaged over the time interval o f t3. sin- g l e air exchange i n the volume VI: A B = = ( q.+ Q e ) / c ~ V , . Unlike the CH,n II-3-'79 technique, taking i n t o account the non-statio- nar i ty o f heat exchange at the time of cooling o f the inner found t i o n s t ruc tu res with a volu- me of 400 and '72 m 4 o f headframos No. 1 and
TABLE 3
Parameters of Heat Exohange in Ventilated Underground Spaces
No. 2 increases the t~mperafure-d i f fe rences in t he a i r t o a value A8 . In order t o rehder the temperature of the aLr aurxounding the f o - undation from inlslde more exact , i t L a necee- sary t o specify more exact ly the coef f ic ien t of hea t t ransfer that is originally taken the same as t h a t i n the shaft. Heat t ranefer from the cellar floor La cowiaered t o be a t o t a l one, owing t o the forced horizontal movement of the air and free convect ion ver t ical ly be- cause the cooled surface of the foundation pla- t e faces"upwaxd. Heat t r a n s f e r i n t h e cam o f forced f low round the plate i s character ized by the Merkel function (Shosin, 19471:
NU a 0.0568Pe 0.78 , (4)
where Pe ia the Pecl& number. Hence, from (2) and (4) the coef f ic ien t of convective heat trEinsfer i n the case o f forced a i r cool ing along the length E - 35 m for the foundation
/(m2.K). of headframe NO. I i s d e = h *Nu/,? 0.56 w/
Free air ConveFtion, with the valuesl of t he Graahoi and Prandt l numbers being 2-107 e r Gr*Pr -= 1 1012, is described -,according
t o M.A.likheev (Shorin, 1952) - by a funct ion of the form (1) with the coeff ic ient 1.35. Therefore, as i n the cme conaidered above, with the actual value o f Er*Pr = 5.9~109, the s i z e o f the ver t ical convect lon zone are not involved in descr ib ing the p rocess , and the value o f the coef f ic ien t of convective heat t r ans fe r by formula ( 3 with a correct ion of 1.35 i s dc- 5.38 W/(m 3 .K). On the other hand, according to resul ts repor-
1238
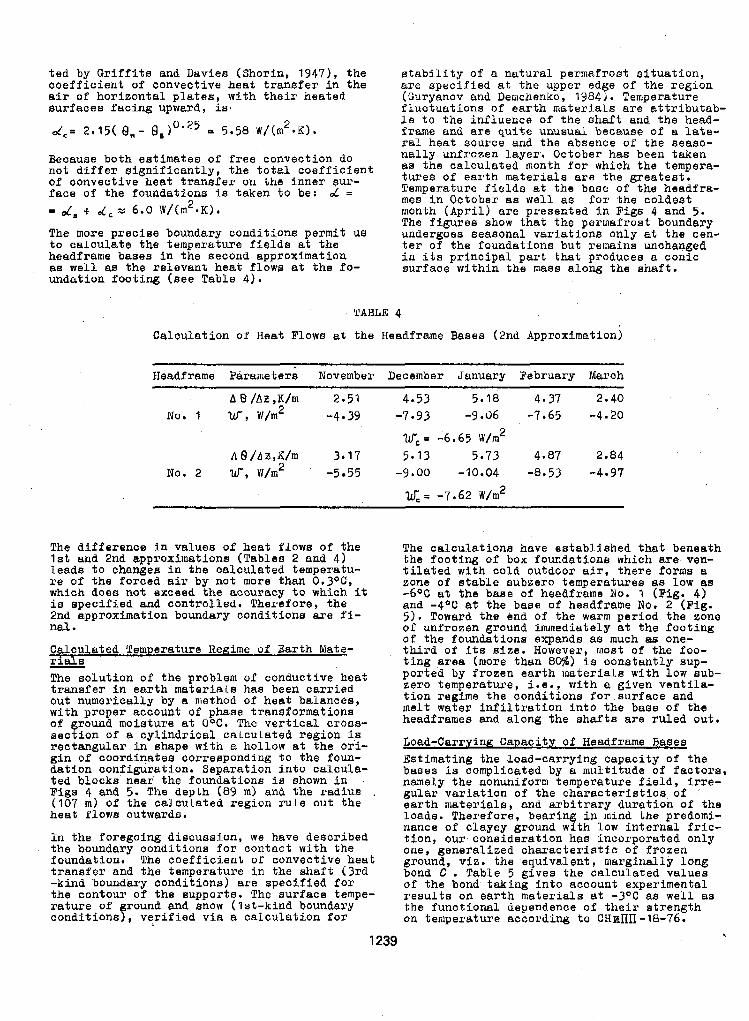
ted by Griffits and navies (Shorin, 1947), the coefficient of convective heat transfer in the air of horizontal plates, with their heated surfaces facing upward, ish
Because both estimates of free convection do not differ significantly, the total coefficient of convective heat transfer on the inner cur- face of the foundations i s taken to be: d =
= dm + d , x 6.0 W/(m .K).
The more precise boundary conditions permit us to calculate the temperature fields at the headframe basas in the second approximation aB well aB the relevant heat flows at the fo- undation footing (see Table 4).
2
stability of a natural permafrost situation, are specified at the upper edge of the region (Guryanov and Demchenko, 1984). Temperature fluctuations of earth materials are attributab- le t o the influence o f the shaft and the head- frame and axe quite unusual because o f a late- ra l heat source and the absence of the seaso- nally unfrozen layer, October has been taken as the calcuLated month for which the tempera- tures of earth materials are the greatest. Temperature fields at the base of the headfra- mes in October as well a8 f o r the coldest month (April) are presented in Figs 4 and 5. The figures show that the permafrost boundary undergoes seasonal variations only at the cen- ter of the foundations but rsmaine unchanged in its principal part that produces a conic surface within the mass along the shaft.
TABLE 4
Calculation of Heat Flows at the Headframe Bases (2nd Approximation)
Headframe Parameters November December January February March
A 8 /A2 ,K/m 2.51 4.53 5.18 4.37 2.40 NO. I W , W/m2 -4 39 -7.93 -9.06 -7.65 -4.20
Wc = -6.65 I / m 2
A f l / A Z , K / m 3.17 5.13 5.73 4.07 2 .a4 NO. 2 v , W/m2 -5 55 -9.00 -10.04 -0.53 -4.97
x = -7.62 #/m2
The difference i n values of heat f lowa of the 1st and 2nd approximations (Tables 2 and 4) leads to changes in the calculated temperatu- re of the Poroed air by not more than 0.3OC, which aoes not exceed the accuracy to which it ia specified and controlled. Therefore, the 2nd approximation boundary conditions axe fi- nal.
Calculated Temperature Regime of Eaxth Mate- rial 8
The solution of the problem of conductive heat transfer in earth materiaie has been carried out numerically by a niethod o f heat balances, with proper account of phase transformations of ground moiature at OOC. The vertical cxoss- section o f a cylindrical calculated region is rectangular in shape with a hollow at the ori- gin of coordinates corresponding to the f o u n - dation configuration. Separation into calcula- ted blocks near the foundations is shown in Pigs 4 and 5. The depth (89 m) and the radius . (IO7 m ) of the calculated region rule out the heat flows outwards.
In the foregoing discussion, we have described the boundary oonditions for contact with the Poundation. The coefficient o f convective heat transfer and the temperature in the shaft (3rd -kind boundary conditions) are spec i f ied for the confour of the supports. The surface tempe- rature of round and snow (1st-kind boundary conditionay, verified via a calculation for
The calculationa have astabliahed that beneath the footing o f box foundations which are ven- tilated with cold outdoor air, there forma a zone of stable subzero temperatures a8 low as -6OC at the base of headframe No. 1 (Fig. 4) and -4OC at the base of headframe No. 2 (Pig. 5). Toward the end of the warm period the zone of unfrozen ground immediately at the footing o f the foundations expands as much as one- third o f its size. However, most of the foo- ting area (more than 80%) i a constantly sup- ported by frozen earth materials with low sub- ze ro temperature, i.e., with a given ventila- tion regime the conditions f o r surface and melt water infiltration into the base of the headframes and along the shafts are ruled out.
Load-Carrying Capacity of Headframe Bases Estimating the load-carrying capacity of the bases is complicated by a multitude of factors, namely the nonuniform temperature field, irre- gular variation of the characteristics of earth nlateriale, and arbitrary duration of the loade. Therefore, bearing in mind the predomi- nance of clayey ground with low internal fric- tion, our consideration has incorporated only one, generalized characteristic of frozen ground, vie. the equivalent, marginally long bond C . Table 5 gives the calculated values of the bond taking into account experimental results on earth materials at -3OC a8 well an the functional. dependence of their strength on temperature according to CHnllJ-18-76.
1239 \
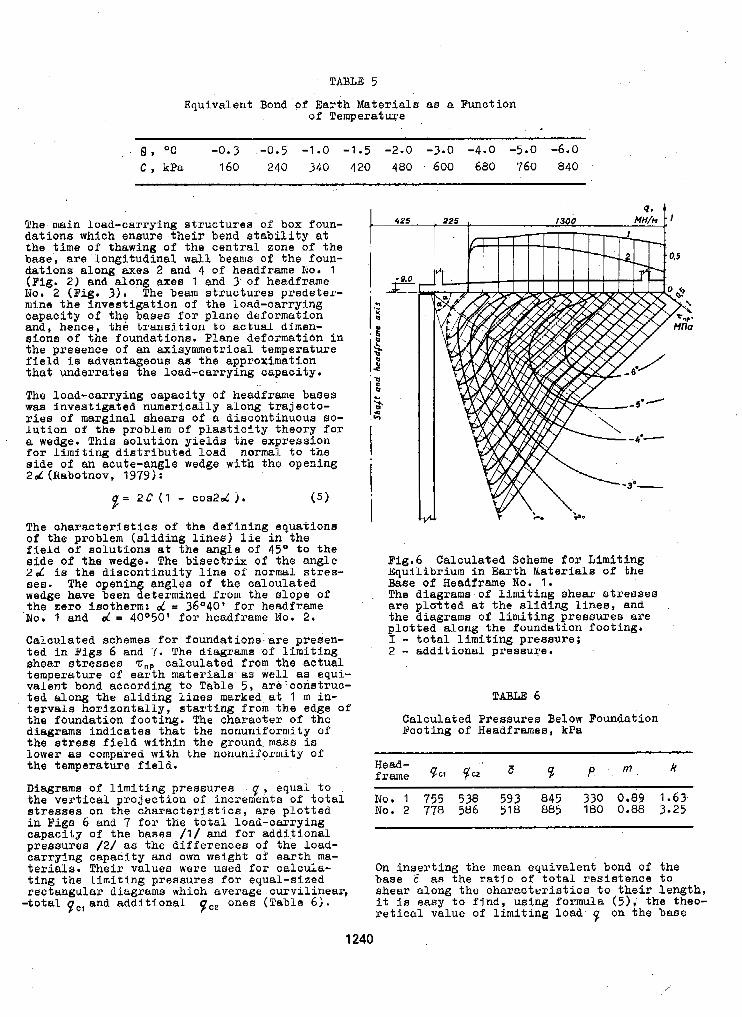
TABLE 5 Equivalent Bond of Earth Materials as a Function
of Temperature
8 , O C -0.3 -0.5 -1.0 -1.5 -2.0 -3.0 -4.0 -5.0 -6.0 c , kPa 160 240 340 420 480 . 600 680 760 840
The main load-carrying structures of box foun- dations which ensure their bend stability at the time of thawing of the central zone o f the base, are longitudinal wall beanie o f the foun- datlone along axes 2 and 4 o f headframe No. 1 (Fig. 2) and along axes 1 and 3' of headframe No. 2 (Fig. 3 ) . The beam structures prsdeter- mine the investigation of the load-carrying capacity of the bases f o r plane deformation and, hence, the transition to actual dimen- sions of the foundations. Plane deformation in the presence of an axisymmetrical temperature fleld is advantageous as the approximation that underrates the load-carrying capacity.
The load-carrying capacity of headframe bases was investigated numerically along trajecto- riee of marginal shears of a discontinuoua so- lution of the problem of plaeticity theory for a wedge. This solution yielda the expression for limiting distributed load normal to the side of an acute-angle wedge with the opening 2d (Rabotnov, 1979;:
f = 2C ( 1 - C O S W j . ( 5 )
The oharacteristics of the defining equations of the problem (sliding lines) l i e in the field of solutions at the angle of 4 5 O to the side of the wedge. The bisectrix of the angle 2 d is the discontinuity line o f normal stres- ses. The opening angles of the calculated wedge have been determined f r o m the slope o f the zero isotherm: d = 36O40' fox headframe No. 1 and d P 40°50' f o r headframe No. 2.
Calculated schemes f o r foundations axe presen- ted in b'igs 6 and '7. The diagrams of limiting shear stresses T,, calculated f rom the actual temperature of earth materials as well as equi- valent bond according to Table 5, are'construc- tea along the sliding lines marked at 1 m in- tervals horizontally, starting from the edge of the foundation footing. The character of the diagrams indicates that the nonuniformity Of the stress field within the ground.maas is Lower as compared with the nonuniformity of the temperature field.
Diagrams o f limiting pressurea 9 , equal to the vertical projection of increments of total stresses on the characteristics, are plotted in Pigs 6 and 7 for the total load-carrying capacity of the bases /1/ and for additional pressurea /2/ as the differences of the load- carrying capacity and own weight of earth ma- terials. Their values were used for calcula- ting the limiting pressures fox equal-sized rectangular dingxarns which average curvilinear, -total yc, and additional g,, ones (Table 6 ) .
pig.6 Calculated Scheme f o r Limiting Equilibrium in Earth lateriala o f the Base of Headframe No. 1. The diagrame of limiting shear streesea axe p l u t t e d at the sliding lines, and the diagrams of limiting preasures axe plotted a long the foundation footing.
2 - additional pressure. I - total limiting pressure;
TABLE 6
Calculated Pressures Below Foundation Footing of Headframes, kPa
1240
On inserting the mean equivalent bond of the base E as the ratio o f total resistence t o shear along the characteristics to their length, it is easy to find, using formula IS), the theo- retical value of limiting load 9 on the base
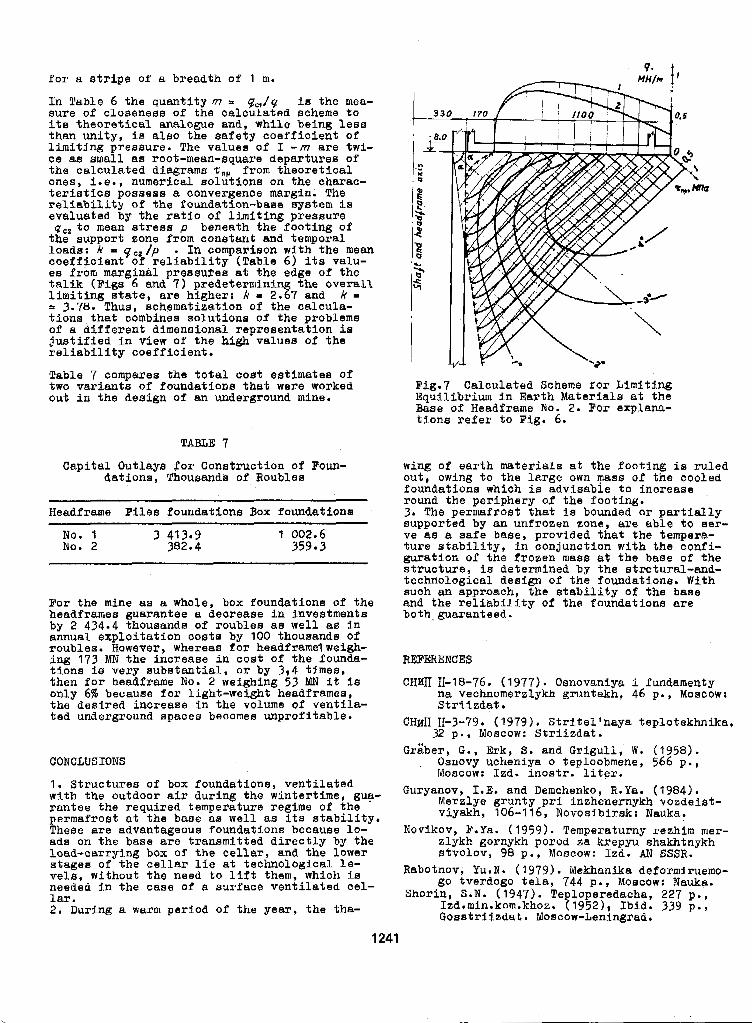
f o r a stripe of a breadth of 1 m.
In Table 6 the quantity m - ec,/q is the mea- suxe of closeness of the calculated scheme to ita theoretical analogue and, while being leas than unity, is a L ~ o the safety coefficient of limiting pressure. The values of I - m are twi- ce &a small aa root-mean-rrquare departures of the caloulated diagrams ZnP from theoretical ones, l.e., numerical aolutions on the chaxac- texisticsl possess a convergence margln. The reliability of the foundation-base system i s evaluated by the ratio of limiting presaure qC2to mean stress p beneath the footing of the support zone from conatant and temporal loade: k IP 9 c2 / p . In comparison with the mean coefficient of reliability (Table 6) its valu- es from marginal preaaueea at the edge of the talik (Figs 6 and 7) pxedeterrnini the overall limiting state , are higher: k = 227 and k = 3.78. Thus, mhematixation o f the calcula- tions that combines solutions of the problem8 of a different dimensional representation is justified in view of the high value6 o f the reliability coefficient.
Tabla 7 compares the total coat estimates of two variants of foundations that were worked out in the design of an underground mine.
TABLE 7
Capital Outlays for Construction o f Foun- dations, Thousands of Roubles
Headframe Pilee foundations Box foundations
No. 1 3 413.9 1 002.6 No. 2 302.4 359 3
For the mine as a whole, box foundations of the headframes guarantee a decrease in investments by 2 434.4 thousands of roubles &a well as in annual exploitation costa by 100 thousands of roubles. However, whereas for headframelweigh- ing 173 MN the increaae in cost o f the founda- tions i~l very substantial, ox by 3,4 times, then for headframe No. 2 weighing 53 MN it I s only 6% because for light-weight headframee, the desired increase in the volume of ventila- ted underground spaces becomes unprofitable.
CONCLUSIONS
1. Structures of box foundations, ventilated with the outdoor air during the wintertime, gua- rantee the required temperature regime of the permafrost at the base as well aa ita stability. These are advantageous foundatione because lo- ads on the base are transmitted directly by the load-carrying box of the cellar, and the lower stages of the cellar lie at technological Le- vels, without the need to lift them, which i s needed in the case of a surface ventilated cel- lar. 2. During a warm period o f the year, the tha-
Fig.7 Calculated Scheme ror Limiting Equilibrium in Earth Materiale at the Base o f Headframe No. 2. POP explana- tiono refer to Fig. 6.
wing of earth materials at the footing is ruled out, owing to the large own mass of the cooled roundations whlch is advisable to increase , round the periphery o f the footing. 3. The permafrost that is boundad ox partially supported by an unfrozen zone, ax0 able to ~er- ve aa a safe base, provided that the tempexs- fure stability, in conjunction with the confi- guration of the frosen mass at the base of the structure, is determined by the etrctural-and- technological design o f the foundatione. With such an approach, the stability o f the ba8e and the reliability of the foundations are both, guaranteed.
REFERENCES
CHHII 11-18-76, (1977). Osnovaniya i fundamenty na vechnomerzlykh gmntakh, 46 p . , Moscow: Striizdat.
C H H ~ 11-3-79, (1979). Stritel'naya teplotekhnika,
Graber, G., Erk, S. and Grigul l , W. (1958). Osnovy ucheniya o teploobmene, 566 p . , Moscow: Izd. inostr. liter.
Guryanov, I .E. and Demchenko, R.Ya. (1984). Merzlye grunty pri inzhenernykh vozdeiet- viyakh, 106-116, Novosibirsk: Nauka.
Novikov, F.Pa. (1959). Temperaturny rezhlm mer- zlykh gornykh porod za krepyu ehakhtnykh
32 p . , Moscow: Striizdat.
StVUlOv, 98 p.9 MOSCOW: Izd. AN SSSR. Rabotnov, Yu.N. (1979). Pekhanika deformiruemo-
go tverdogo tela, 744 p a , Moscow: Nauka. Shorin, S.N. (1947). Teploperedacha, 227 p . ,
Izd.min.kom.khoz. (19521, Ibid. 339 p . , Goastriizdat. Moscow-Leningrad.
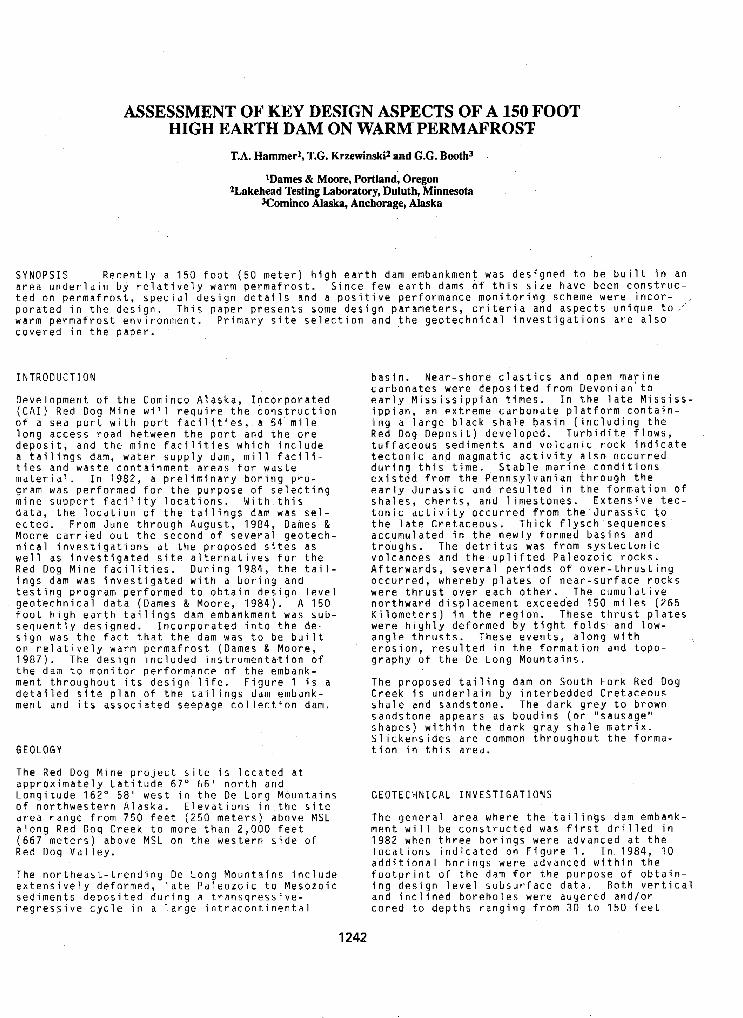
ASSESSMENT OF KEY DESIGN ASPECTS OF A 150 FOOT HIGH EARTH DAM ON WARM'PERMAFROS'F
T.A. Hammerl, T.C. Krzewinskiz and G.G. Booth3
IDarnes & Moore, Portland, Oregon ZLakehead Testing Laboratory, Duluth, Minnesota
JCominn, Alaska, Anchorage, Alaska
S Y N O P S I S R e c e n t l y a 1 5 0 f o o t ( 5 0 m e t e r ) h i g h e a r t h d a m e m b a n k m e n t w a s d e s i g n e d t o b e b u i l t i n a n
t e d o n p e r m a f r o s t , s p e c i a l d e s i g n d e t a i l s a n d a p o s i t i v e p e r f o r m a n c e m o n i t o r i n g s c h e m e w e r e i n c o r - a r e a u n d e r l a i n b y r e l a t i v e l y w a r m p e r m a f r o s t . S i n c e f e w e a r t h dams o f t h i s s i z e h a v e b e e n c o n s t r u c -
w a r m p e r m a f r o s t e n v i r o n m e n t . P r i m a r y s i t e s e l e c t i o n a n d t h e g e o t e c h n i c a l i n v e s t i g a t i o n s a r e a l s o p o r a t e d i n t h e d e s i g n . T h i s p a p e r p r e s e n t s some d e s i g n p a r a m e t e r s , c r i t e r i a a n d a s p e c t s u n i q u e t o '
c o v e r e d i n t h e p a p e r .
INTRODUCTION
D e v e l o p m e n t o f t h e C o m i n c o A l a s k a , I n c o r p o r a t e d ( C A I ) R e d D o g M i n e will r e q u i r e t h e c o n s t r u c t i o n o f a s e a p o r t w i t h p o r t f a c i l i t i e s , a 5 4 m i l e l o n g a c c e s s r o a d b e t w e e n t h e p o r t a n d t h e o r e d e p o s i t , a n d t h e m i n e f a c i l i t i e s w h i c h i n c l u d e a t a i l i n g s dam, w a t e r s u p p l y dam, mill f a c i l i -
m a t e r i a l . I n 1 9 8 2 , a p r e l i m i n a r y b o r i n g p r o - t i e s a n d w a s t e c o n t a i n m e n t a r e a s f o r w a s t e
g r a m w a s p e r f o r m e d f o r t h e p u r p o s e o f s e l e c t i n g m i n e s u p p o r t f a c i l i t y l o c a t i o n s . W i t h t h i s d a t a , t h e l o c a t i o n o f t h e t a i l i n g s dam was s e l - e c t e d . F r o m J u n e t h r o u g h A u g u s t , 1 9 8 4 , Dames & M o o r e c a r r i e d o u t t h e s e c o n d o f s e v e r a l g e o t e c h -
w e l l a s i n v e s t i g a t e d s i t e a l t e r n a t i v e s f o r t h e n i c a l i n v e s t i g a t i o n s a t t h e p r o p o s e d s i t e s a s
R e d D o g M i n e f a c i l i t i e s . D u r i n g 1 9 8 4 , t h e t a i l - i n g s dam was i n v e s t i g a t e d w i t h a b o r i n g a n d t e s t i n g p r o g r a m p e r f o r m e d t o o b t a i n d e s i g n l e v e l g e o t e c h n i c a l d a t a ( D a m e s & M o o r e , 1 9 8 4 ) . A 1 5 0 f o o t h i g h e a r t h t a i l i n g s dam embankment was sub- s e q u e n t l y d e s i g n e d . I n c o r p o r a t e d i n t o t h e d e - s i g n was t h e f a c t t h a t t h e dam was t o be b u i l t o n r e l a t i v e l y w a r m p e r m a f r o s t ( D a m e s & M o o r e , 1 9 8 7 ) . T h e d e s i g n i n c l u d e d i n s t r u m e n t a t i o n o f t h e dam t o m o n i t o r p e r f o r m a n c e o f t h e e m b a n k - m e n t t h r o u g h o u t i t s d e s i g n l i f e . F i g u r e 1 i s a d e t a i l e d s i t e p l a n o f t h e t a i l i n g s dam embank- m e n t a n d i t s a s s o c i a t e d s e e p a g e c o l l e c t i o n dam.
G E O L O G Y
T h e R e d D o g M i n e p r o j e c t s i t e i s l o c a t e d a t a p p r o x i m a t e l y L a t i t u d e 6 7 " h 6 ' n o r t h a n d L o n g i t u d e 1 6 2 " 58' w e s t i n t h e De L o n g M o u n t a i n s o f n o r t h w e s t e r n A l a s k a . E l e v a t i o n s i n t h e s i t e a r e a r a n g e f r o m 7 5 0 f e e t ( 2 5 0 m e t e r s ) a b o v e MSL
m o r e t h a n 2,000 f e e t o n t h e w e s t e r n s i d e o f
De L o n c l M o u n t a i n s i n c l u d e
a l o n g R e d D o g C r e e k t o ( 6 6 7 m e t e r s ) a b o v e MSL R e d D o g V a l l e y .
T h e n o r t h e a s t - t r e n d i n g e x t e n s i v e l y d e f o r m e d , s e d i m e n t s d e p o s i t e d d u r e g r e s s i v e c y c l e i n a
b a s i n . N e a r - s h o r e c l a s t i c s a n d o p e n m a r i n e c a r b o n a t e s w e r e d e p o s i t e d f r o m D e v o n i a n t o e a r l y M i s s i s s i p p i a n t i m e s . I n t h e l a t e M i s s i s s -
i n g a l a r g e b l a c k s h a l - e b a s i n ( i n c l u d i n g t h e i p p i a n , a n e x t r e m e c a r b o n a t e p l a t f o r m c o n t a i n -
R e d D o g D e p o s i t ) d e v e l o p e d . T u r b i d i t e f l o w s , t u f f a c e o u s s e d i m e n t s a n d v o l c a n i c r o c k i n d i c a t e t e c t o n i c a n d m a g m a t i c a c t i v i t y a l s o o c c u r r e d d u r i n g t h i s t i m e . S t a b l e m a r i n e c o n d i t i o n s e x i s t e d f r o m t h e P e n n s y l v a n i a n t h r o u g h t h e e a r l y J u r a s s i c a n d r e s u l t e d i n t h e f o r m a t i o n o f s h a l e s , c h e r t s , a n d l i m e s t o n e s . E x t e n s i v e t e c - t o n i c a c t i v i t y o c c u r r e d f r o m t h e J u r a s s i c t o t h e l a t e C r e t a c e o u s . T h i c k f l y s c h s e q u e n c e s a c c u m u l a t e d i n t h e n e w l y f o r m e d b a s i n s a n d t r o u g h s , T h e d e t r i t u s w a s f r o m s y s t e c t o n i c v o l c a n o e s a n d t h e - u p l i f t e d P a l e o z o i c r o c k s . A f t e r w a r d s , s e v e r a l p e r i o d s o f o v e r - t h r u s t i n g o c c u r r e d , w h e r e b y p l a t e s o f n e a r - s u r f a c e r o c k s w e r e t h r u s t o v e r e a c h o t h e r . T h e c u m u l a t i v e n o r t h w a r d d i s p l a c e m e n t e x c e e d e d 150 m i l e s ( 2 6 5
w e r e h i g h l y d e f o r m e d b y t i g h t f o l d s a n d l o w - K i l o m e t e r s ) i n t h e r e g i o n , T h e s e t h r u s t p l a t e s
e r o s i o n , r e s u l t e d i n t h e f o r m a t i o n a n d t o p o - a n g l e t h r u s t s . T h e s e e v e n t s , a l o n g w i t h
g r a p h y o f t h e De L o n g M o u n t a i n s .
T h e p r o p o s e d t a i l i n g d a m o n S o u t h F o r k R e d Dog C r e e k i s u n d e r l a i n b y i n t e r b e d d e d C r e t a c e o u s s h a l e a n d s a n d s t o n e . T h e d a r k g r e y t o b r o w n s a n d s t o n e a p p e a r s a s b o u d i n s ( o r " s a u s a g e " s h a p e s ) w i t h i n t h e d a r k g r a y s h a l e m a t r i x . S l i c k e n s i d e s a r e common t h r o u g h o u t t h e f o r m a - t i o n i n t h i s a r e a .
GEOTECHNICAL INVESTIGATIONS
m e n t will b e c o n s t r u c t e d was f i r s t d r i l l e d i n T h e g e n e r a l a r e a w h e r e t h e t a i l i n g s dam embank-
1 9 8 2 w h e n t h r e e b o r i n g s w e r e a d v a n c e d a t t h e l o c a t i o n s i n d i c a t e d o n F i g u r e 1 . I n 1 9 8 4 , 10 a d d i t i o n a l b o r i n g s w e r e a d v a n c e d w i t h i n t h e f o o t p r i n t o f t h e dam f o r t h e p u r p o s e o f o b t a i n -
l a t e P a i e o z o i c t o M e s o z o i c i n g d e s i g n l e v e l s u b s u r f a c e d a t a . B o t h v e r t i c a l r i n g a t r a n s g r e s s i v e - a n d i n c l i n e d b o r e h o l e s w e r e a u g e r e d a n d / o r l a r g e i n t r a c o n t i n e n t a l c o r e d t o d e p t h s r a n g i n g f r o m 30 t o 1 5 0 f e e t
1242
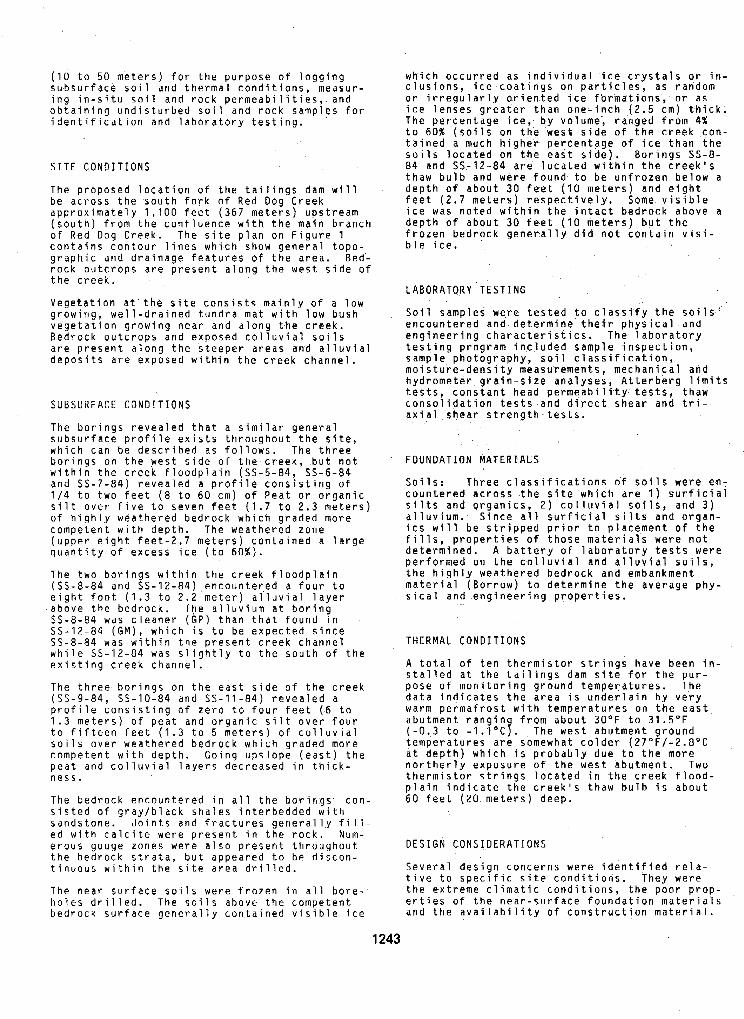
( I O t o 50 m e t e r s ) f o r t h e p u r p o s e o f l o g g i n g s u b s u r f a c e s o i l a n d t h e r m a l c o n d i t i o n s , m e a s u r - i n g i n - s i t u s o i l a n d r o c k p e r m e a b i l i t i e s , a n d o b t a i n i n g u n d i s t u r b e d s o i l a n d r o c k s a m p l e s f o r i d e n t i f i c a t i o n a n d l a b o r a t o r y t e s t i n g .
S I T E C O N D I T I O N S
T h e p r o p o s e d l o c a t i o n o f t h e t a i l i n g s dam will b e a c r o s s t h e s o u t h f o r k o f R e d D o g C r e e k a p p r o x i m a t e l y 1,100 f e e t ( 3 6 7 m e t e r s ) u p s t r e a m
o f R e d D o g C r e e k . T h e s i t e p l a n o n F i g u r e 1 ( s o u t h ) f r o m t h e c o n f l u e n c e w i t h t h e m a i n b r a n c h
c o n t a i n s c o n t o u r l i n e s w h i c h s h o w g e n e r a l t o p o - g r a p h i c a n d d r a i n a g e f e a t u r e s o f t h e a r e a . B e d - r o c k o u t c r o p s a r e p r e s e n t a l o n g t h e w e s t s i d e o f t h e c r e e k .
V e g e t a t i o n a t t h e s i t e c o n s i s t s m a i n l y o f a l o w g r o w i r ! g , w e l l - d r a i n e d t u n d r a m a t w i t h l o w b u s h v e g e t a t i o n g r o w i n g n e a r a n d a l o n g t h e c r e e k . B e d r o c k o u t c r o p s a n d e x p o s e d c o l l u v i a l s o i l s a r e p r e s e n t a l o n g t h e s t e e p e r a r e a s a n d a l l u v i a l d e p o s i t s a r e e x p o s e d w i t h i n t h e c r e e k c h a n n e l .
S U B S U R F A C E C O N D I T I O N S
T h e b o r i n g s r e v e a l e d t h a t a s i m i l a r g e n e r a l s u b s u r f a c e p r o f i l e e x i s t s t h r o u g h o u t t h e s i t e , w h i c h c a n b e d e s c r i b e d a s f o l l o w s . T h e t h r e e b o r i n g s o n t h e w e s t s i d e o f t h e c r e e k , b u t n o t w i t h i n t h e c r e e k f l o o d p l a i n (SS-5-84, SS-6-84 a n d SS-7-84) r e v e a l e d a p r o f i l e c o n s i s t i n g o f 1/4 t o t w o f e e t (8 t o 6 0 c m ) o f P e a t o r o r g a n i c s i l t o v e r f i v e t o s e v e n f e e t ( 1 . 7 t o 2 .3 m e t e r s ) o f h i g h l y w e a t h e r e d b e d r o c k w h i c h g r a d e d m o r e c o m p e t e n t w i t h d e p t h . T h e w e a t h e r e d z o n e ( u p p e r e i g h t f e e t - 2 . 7 m e t e r s ) c o n t a i n e d a l a r g e q u a n t i t y o f e x c e s s i c e ( t o 6 0 % ) .
T h e t w o b o r i n g s w i t h i n t h e c r e e k f l o o d p l a i n (SS-8-84 a n d SS-12-84) e n c o u n t e r e d a f o u r t o e i g h t f o o t (1.3 t o 2 . 2 m e t e r ) a l l u v i a l l a y e r a b o v e t h e b e d r o c k , T h e a l l u v i u m a t b o r i n g SS-8-84 w a s c l e a n e r ( G P ) t h a n t h a t f o u n d i n 55-12-84 ( G M ) , w h i c h i s t o b e e x p e c t e d s i n c e
w h i l e $5-12-84 was s l i g h t l y t o t h e s o u t h o f t h e SS-8-84 was w i t h i n t h e p r e s e n t c r e e k c h a n n e l
e x i s t i n g c r e e k c h a n n e l .
T h e t h r e e b o r i n g s o n t h e e a s t s i d e o f t h e c r e e k (SS-9-84, SS-10-84 a n d SS-11-84) r e v e a l e d a p r o f i l e c o n s i s t i n g o f z e r o t o f o u r f e e t ( 6 t o 1 .3 m e t e r s ) o f p e a t a n d o r g a n i c s i l t o v e r f o u r t o f i f t e e n f e e t (1,3 t o 5 m e t e r s ) o f c o l l u v i a l s o i l s o v e r w e a t h e r e d b e d r o c k w h i c h g r a d e d m o r e c o m p e t e n t w i t h d e p t h . G o i n g u p s l o p e ( e a s t ) t h e p e a t a n d c o l l u v i a l l a y e r s d e c r e a s e d i n t h i c k - n e s s .
T h e b e d r o c k e n c o u n t e r e d i n a l l t h e b o r i r l g s . c o n - s i s t e d o f g r a y l b l a c k s h a l e s i n t e r b e d d e d w i t h s a n d s t o n e . J o i n t s a n d f r a c t u r e s g e n e r a l l y fill- e d w i t h c a l c i t e w e r e p r e s e n t i n t h e r o c k . Num- e r o u s g o u g e z o n e s w e r e a l s o p r e s e n t t h r o u g h o u t t h e b e d r o c k s t r a t a , b u t a p p e a r e d t o b e d i s c o n - t i n u o u s w i t h i n t h e s i t e a r e a d r i l l e d .
T h e n e a r s u r f a c e s o i l s h o l e s d r i l l e d . T h e s o b e d r o c k s u r f a c e g e n e r a
w e r e f r o z e n i n a 1 1 b o r e - i l s a b o v e t h e c o m p e t e n t l l y c o n t a i n e d v i s i b l e i c e
w h i c h o c c u r r e d a s i n d i v i d u a l i c e c r y s t a l s or i n - c l u s i o n s , i c e c o a t i n g s o n p a r t i c l e s , a s r a n d o m o r i r r e g u l a r l y o r i e n t e d i c e f o r m a t i o n s , o r a s i c e l e n s e s g r e a t e r t h a n o n e - i n c h (2.5 c m ) t h i c k . T h e p e r , c e n t a g e i c e , b y v o l u m e , r a n g e d f r o m 4% t o 60% ( s o i l s on t h e w e s t s i d e o f t h e c r e e k c o n - t a i n e d a m u c h h i g h e r p e r c e n t a g e o f i c e t h a n t h e
84 a n d SS-12-84 a r e l o c a t e d w i t h i n t h e c r e e k ' s s o i l s l o c a t e d on t h e e a s t s i d e ) . Borings SS-8-
d e p t h o f a b o u t 30 f e e t (IO m e t e r s ) a n d e i g h t t h a w b u l b a n d w e r e f o u n d t o b e u n f r o z e n b e l o w a
f e e t ( 2 . 7 m e t e r s ) r e s p e c t i v e l y . Some v i s i b l e i c e w a s n o t e d w i t h i n t h e i n t a c t b e d r o c k a b o v e a d e p t h o f a b o u t 30 f e , e t (IO m e t e r s ) b u t t h e f r o z e n b e d r o c k g e n e r a l l y d i d n o t c o n t a i n v i s i - b l e i c e .
LABORATORY TESTING
S o i l s a m p l e s w e r e t e s t e d t o c l a s s i ' f y t h e s o i l s , ' e n c o u n t e r e d a n d d e t e r m i n e t h e t r p h y s i c a l a n d e n g i n e e r i n g c h a r a c t e r i s t i c s . T h e l a b o r a t o r y t e s t i n g p r o g r a m i n c l u d e d s a m p l e i n s p e c t i o n , s a m p l e p h o t o g r a p h y , s o i l c l a s s i f i c a t i o n , m o i s t u r e - d e n s i t y m e a s u r e m e n t s , m e c h a n i c a l a n d h y d r o m e t e r g r a i n - s i t e a n a l y s e s , A t t e r b e r g l i m i t s t e s t s , c o n s t a n t h e a d p e r m e a b i l i t y t e s t s , t h a w c o n s o l i d a t i o n t e s t s a n d d i r e c t s h e a r a n d t r i - a x i a l s h e a r s t r e n g t h - t e s t s .
FOUNDATION MATERIALS
S o i l s : T h r e e c l a s s i f i c a t i o n s o-f s o i l s w e r e e n - c o u n t e r e d a c r o s s t h e s i t e w h i c h a r e 1 ) s u r f i c i a l s i l t s a n d o r g a n i c s , 2 ) c o l l u v i a l s o i l s , a n d 3 ) a l l u v i u m . S i n c e a l l s u r f i c i a l s i l t s a n d o r g a n - i c s wjll b e s t r i p p e d p r i o r t o p l a c e m e n t o f t h e f i l l s , p r o p e r t i e s o f t h o s e m a t e r i a l s w e r e n o t d e t e r m i n e d . A b a t t e r y o f l a b o r a t o r y t e s t s w e r e p e r f o r m e d o n t h e c o l l u v i a l a n d a l l u v i a l s o i l s , t h e h i g h l y w e a t h e r e d b e d r o c k a n d e m b a n k m e n t m a t e r i a l ( B o r r o w ) t o d e t e r m i n e t h e a v e r a g e p h y - s i c a l a n d e n g i n e e r i n g p r o p e r t i e s .
THERMAL CONDITIONS
A t o t a l o f t e n t h e r m i s t o r s t r i n g s h a v e b e e n i n - s t a l l e d a t t h e t a i l i n g s dam s i t e f o r t h e p u r - p o s e o f m o n i t o r i n g g r o u n d t e m p e r a t u r e s . T h e d a t a I n d i c a t e s t h e a r e a i s u n d e r l a i n b y v e r y w a r m p e r m a f r o s t w i t h t e m p e r a t u r e s a n t h e e a s t a b u t m e n t r a n g i n f r o m a b o u t 30'F t o 3 1 . 5 " F ( - 0 . 3 t o -1.l'CT. T h e w e s t a b u t m e n t g r o u n d t e m p e r a t u r e s a r e s o m e w h a t c o l d e r ( 2 7 ' F / - 2 . 8 O C a t d e p t h ) w h i c h i s p r o b a b l y d u e t o t h e m o r e n o r t h e r l y e x p o s u r e o f t h e w e s t a b u t m e n t , Two t h e r m i s t o r s t r i n g s l o c a t e d i n t h e c r e e k f l o o d - p l a i n i n d i c a t e t h e c r e e k ' s t h a w b u l b i s a b o u t 60 f e e t ( 2 0 m e t e r s ) d e e p .
D E S I G N CONSIDERATIONS
S e v e r a l d e s i g n c o n c e r n s w e r e i d e n t i f i e d r e l a - t i v e t o s p e c i f i c s i t e c o n d i t i o n s . T h e y w e r e t h e e x t r e m e c l i m a t i c c o n d i t i o n s , t h e p o o r p r o p - e r t i e s o f t h e n e a r - s u r f a c e f o u n d a t i o n m a t e r i a l s a n d t h e a v a i l a b i l i t y o f c o n s t r u c t i o n m a t e r i a l .
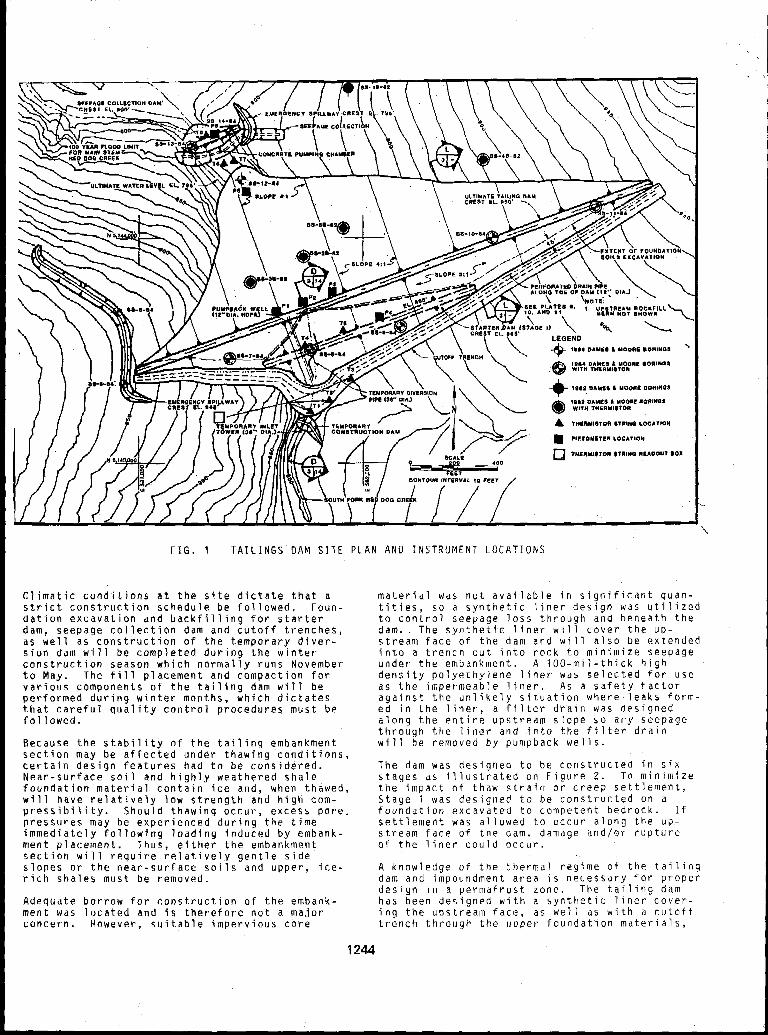
F I G . 1 TAILINGS D A M SITE P L A N AND INSTRUMENT LOCATIONS
Climatic conditions at the site dictate that a strict construction schedule be followed, Foun- dation excavation and backfilling for starter dam, seepage collection dam and cutoff trenches, a s well as construction o f the temporary diver- sion dam will be completed during the winter construction season which normally runs November t o May. The fill placement and compaction for various components o f the tailing dam will be performed during winter months, which dictates that careful quality control procedures must be followed.
Because the stability of the tailing embankment section may be affected under thawing conditions, certain design features had t o be considered. Near-surface soil and highly weathered shale foundation material contain ice and, when thawed, will have relatively low strength and high com- pressibility. Should thawing occur, excess pore. pressures may be experienced during the time immediately following loading induced by embank- ment placement, Thus, either the embankment section will require relatively gentle side slopes or the near-surface soils and upper, ice- rich shales must be removed.
Adequate borrow for construction of the embank- ment was located and is therefore not a major concern. However, suitable impervious core
. >
L
'\
material was not available in significant quan-
to control seepage loss through and beneath the tities, s o a synthetic liner design was utilized
dam.. The synthetic liner will cover the up- stream face of the dam and will also be extended into a trench c u t into rock t o minimize seepage under the embankment. A 100-mil-thick high density polyethylene liner was selected for use as the impermeable liner. A s a safety factor
ed in the liner, a filter drain was designed against the unlikely situation where leaks form-
through the liner and into the filter drain along the entire upstream slope s o any seepage
will be removed by pumpback wells.
The dam was designed to be constructed i n six stages as illustrated on Figure 2 . To minimize the impact o f thaw strain or creep settlement, Stage 1 w a s designed to be constructed on a foundation excavated to competent bedrock. I f settlement was allowed to occur along the up- stream face of the dam, damage and/or rupture of the liner could occur.
A knowledge o f the thermal regime of the tailing dam and impoundment area is necessary for proper design in a permafrost zone, The tailing dam has been designed with a synthetic liner cover- ing t h e upstream face, as well as with a cutoff trench through the upper foundation materials, I
1244
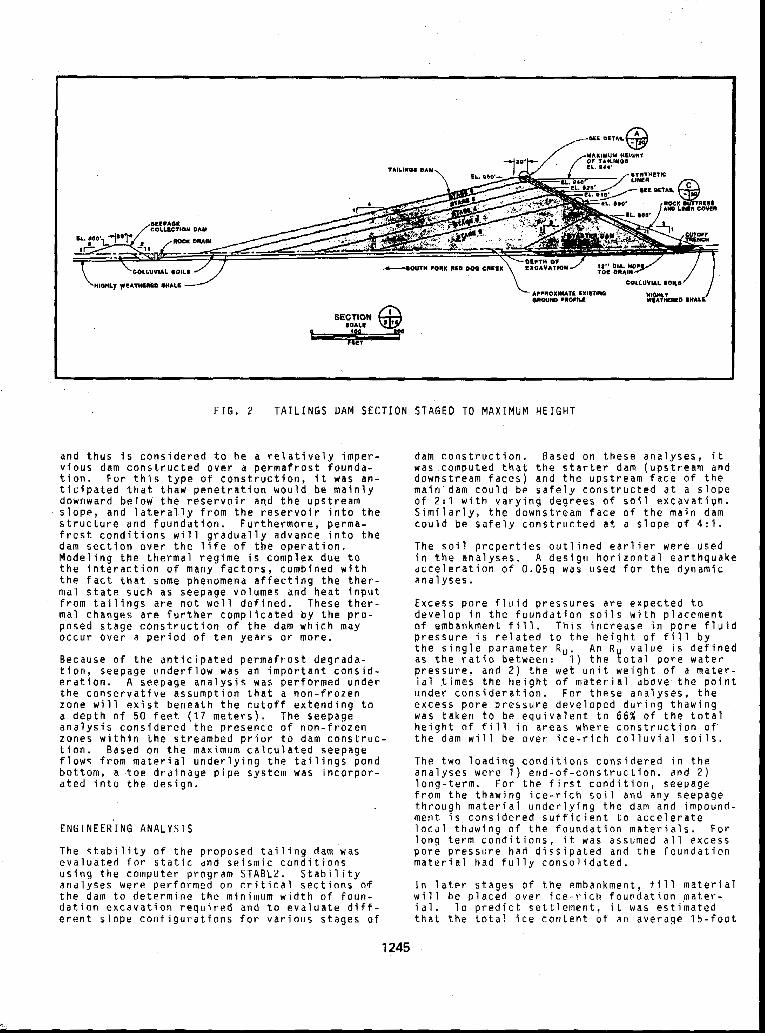
F I G . 2 T A I L I N G S DAM SECTION STAGED TO M A X I M U M H E I G H T
a n d t h u s i s c o n s i d e r e d t o b e a r e l a t i v e l y i m p e r - v i o u s dam c o n s t r u c t e d o v e r a p e r m a f r o s t f o u n d a - t i o n . F o r t h i s t y p e o f c o n s t r u c t i o n , i t was an - t f c i p a t e d t h a t t h a M p e n e t r a t i o n w o u l d b e m a i n l y d o w n w a r d b e l o w t h e r e s e r v o i r a n d t h e u p s t r e a m s l o p e , a n d l a t e r a l l y f r o m t h e r e s e r v o i r i n t o t h e s t r u c t u r e a n d f o u n d a t i o n . F u r t h e r m o r e , p e r m a - f r c s t c o n d i t i o n s will g r a d u a l l y a d v a n c e i n t o t h e dam s e c t i o n o v e r t h e l i f e o f t h e o p e r a t i o n . M o d e l i n g t h e t h e r m a l r e g i m e i s c o m p l e x d u e t o t h e i n t e r a c t i o n o f m a n y f a c t o r s , c o m b i n e d w j t h t h e f a c t t h a t s o m e p h e n o m e n a a f f e c t i n g t h e t h e r - m a l s t a t e s u c h a s s e e p a g e v o l u m e s a n d h e a t I n p u t f r o m t a i l i n g s a r e n o t w e l l d e f i n e d . T h e s e t h e r - m a l c h a n g e s a r e f u r t h e r c o m p l i c a t e d b y t h e p r o - p o s e d s t a g e c o n s t r u c t i o n o f t h e dam w h i c h m a y o c c u r o v e r a p e r i o d o f t e n y e a r s o r m o r e .
B e c a u s e o f t h e a n t i c i p a t e d p e r m a f r o s t d e g r a d a - t i o n , s e e p a g e u n d e r f l o w w a s a n i m p o r t a n t c o n s i d - e r a t i o n . A s e e p a g e a n a l y s i s w a s p e r f o r m e d u n d e r t h e c o n s e r v a t i v e a s s u m p t i o n t h a t a n o n - f r o z e n z o n e will e x l s t b e n e a t h t h e c u t o f f e x t e n d i n g t o a d e p t h o f 50 f e e t ( 1 7 m e t e r s ) . The s e e p a g e a n a l y s i s c o n s i d e r e d t h e p r e s e n c e o f n o n - f r o z e n z o n e s w i t h i n t h e s t r e a m b e d p r i o r t o d a m c o n s t r u c -
f l o w s f r o m m a t e r i a l u n d e r l y i n g t h e t a i l i n g s p o n d t i o n . B a s e d o n t h e m a x i m u m c a l c u l a t e d s e e p a g e
b o t t o m , a t o e d r a i n a g e p i p e s y s t e m w a s i n c o r p o r - a t e d i n t o t h e d e s i g n .
E N G I N E E R I N G ANALYSIS
T h e s t a b i l i t y o f t h e p r o p o s e d t a i l i n g dam was e v a l u a t e d f o r s t a t i c a n d s e i s m i c c o n d i t i o n s u s i n g t h e c o m p u t e r p r o g r a m S T A B L Z . S t a b i l i t y a n a l y s e s w e r e p e r f o r m e d o n c r i t i c a l s e c t i o n s o ' f t h e dam t o d e t e r m i n e t h e m i n i m u m w i d t h o f f o u n - d a t i o n e x c a v a t i o n r e q u i r e d and t o e v a l u a t e d i f f - e r e n t s l o p e c o n f i g u r a t i o n s f o r v a r i o u s s t a g e s o f
dam c o n s t r u c t i o n . B a s e d o n t h e s e a n a l y s e s , i t w a s c o m p u t e d t h a t t h e s t a r t e r d a m ( u p s t r e a m a n d d o w n s t r e a m f a c e s ) a n d t h e u p s t r e a m f a c e o f t h e m a i n dam c o u l d b e s a f e l y c o n s t r u c t e d a t a s l o p e o f 2:l w i t h v a r y i n g d e g r e e s o f s o i l e x c a v a t i p n . S i m i l a r l y , t h e d o w n s t r e a m f a c e o f t h e m a i n dam c o u l d b e s a f e l y c o n s t r u c t e d a t a s l o p e o f 4 : l .
T h e s o i l p r o p e r t i e s o u t l i n e d e a r l i e r w e r e u s e d i n t h e a n a l y s e s . A d e s i g n h o r i z o n t a l e a r t h q u a k e a c c e l e r a t i o n o f 0 . 0 5 9 w a s u s e d f o r t h e d y n a m i c a n a l y s e s .
E x c e s s p o r e f l u i d p r e s s u r e s a r e e x p e c t e d t o d e v e l o p i n t h e f o u n d a t i o n s o i l s w i t h p l a c e m e n t o f e m b a n k m e n t fill. T h i s i n c r e a s e i n p o r e f l u i d p r e s s u r e i s r e l a t e d t o t h e h e i g h t o f fill b y t h e s i n g l e p a r a m e t e r R u . An R u v a l u e i s d e f i n e d a s t h e r a t i o b e t w e e n : 1 ) t h e t o t a l p o r e w a t e r p r e s s u r e , a n d 2 ) t h e w e t u n i t w e i g h t o f a m a t e r - i a l t i m e s t h e h e i g h t o f m a t e r i a l a b o v e t h e p o i n t u n d e r c o n s i d e r a t i o n . F o r t h e s e a n a l y s e s , t h e e x c e s s p o r e p r e s s u r e d e v e l o p e d d u r i n g t h a w i n g w a s t a k e n t o b e e q u i v a l e n t t o 6 6 % o f t h e t o t a l h e i g h t o f fill i n a r e a s w h e r e c o n s t r u c t i o n o f t h e dam will b e o v e r i c e - r i c h c o l l u v i a l s o i l s .
T h e t w o l o a d i n g c o n d i t i o n s c o n s i d e r e d i n t h e a n a l y s e s w e r e 1 ) e n d - o f - c o n s t r u c t i o n , a n d 2 ) l o n g - t e r m . F o r t h e f i r s t c o n d i t i o n , s e e p a g e f r o m t h e t h a w i n g i c e - r i c h s o i l and a n y s e e p a g e t h r o u g h m a t e r i a l u n d e r l y i n g t h e dam and impound- m e n t i s c o n s i d e r e d s u f f i c i e n t t o a c c e l e r a t e l o c a l t h a w i n g o f t h e f o u n d a t i o n m a t e r i a l s . F o r l o n g t e r m c o n d i t i o n s , i t was assumed a l l e x c e s s p o r e p r e s s u r e h a d d i s s i p a t e d a n d t h e f o u n d a t i o n m a t e r i a l h a d f u l l y c o n s o l i d a t e d ,
I n l a t e r s t a g e s o f t h e e m b a n k m e n t , fill m a t e r i a l will b e p l a c e d o v e r i c e - r i c h f o u n d a t i o n m a t e r - i a l . To p r e d i c t s e t t l e m e n t , i t w a s e s t i m a t e d t h a t t h e t o t a l i c e c o n t e n t o f a n a v e r a g e 1 5 - f o o t
1245
thick soillhighly weathered shale horizon within the foundation area was about seven percent. The tundra and surficial soils were considered a s being removed. Total thawing within the sub- surface profile will result in about one foot (30 em) of estimated subsidence due to the dis- sipation of the melted ice. Greater subsidence are expected in subsurface profiles containing higher ice contents. Subsidence of as.much as two feet ( 6 0 cm) or more may be expected in some locations within the foundation area*
Hydrologic and hydraulic analyses were completed to assist with the design of the seepage collec- tion system, the tailing dam and associated emergency spillways. The U . S . Army Corps of Engineers generalized computer program Flood Hydrograph Package (HEC-1) was used to develop inflow hydrographs, peak flow rates, runoff volumes, and to route hydrographs through the reservoir ( U . S . Army Corps, 1981). A similar program f o r analysis o f water surface profiles (HEC-2) was utilized to evaluate spillway flow characteristics ( U . S . Army Corps, 1982).
INSTRUMENTATION
The long-term stability of both the seepage dam and the tailing dam is dependent upon assumed pore water pressures in the foundation material, the position of a phreatic surface in the em- bankment, if any, and permafrost conditions. High excess pore pressure and/or permafrost degradation beneath the embankment could in- fluence the long term stability o f the dam. Therefore, it was considered important that the tailing embankment be instrumented s o that deviations from anticipated behavior of the embankment could be detected and appropriate measures be designed to compensate for such deviations. Piezometers and thermistors were specified to be installed in the dams to monitor subsurface water levels and temperature varia- tions to verify the design assumptions. Pressure-type piezometers were specified to monitor seepage and pore pressure buildup with- in the potentially weak foundation soils and to monitor the phreatic surface within the rockfill embankment.
Measurement of the subsurface temperature var- iations before and after construction o f the starter dam and subsequent embankment raises will be evaluated by installing thermistor strings to depths of about 100 feet ( 3 3 meters) below the base o f the dam. The thermistor strings will be installed in sealed PVC pipe casing filled with silicon.
Figure 1 illustrates the locations of the in- struments scheduled for installation within the embankment.
SUMMARY
The design of a 1 5 0 foot high tailing dam embank- ment at Red Dog was complicated by the fact that poor foundation conditions and fragile perma- frost is present across the site. Due to the complexity of the hydrology, the predicted gen- eral degradation of permafrost within the
impoundment, and staged construction, a quanti- tative analysis o f the thermal performance be- neath the embankment could not provide reliable results. Rather, simplified thermal procedures were utilized to predict permafrost aggradation i n t o the dam section by the time the ultimate dam section is constructed. Liner tears, larger than anticipated flows through the underlying rock beneath the cutoff trench, or other factors could significantly alter the predicted thermal regime. Therefore, a positive monitoring
from the assumed thermal and hydrologic condi- scheme was developed to detect any deviations
tions as early as possible, s o corrective mea- sures could be instigated in a timely manner.
REFERENCES
Dames & Moore, 1984, Report of Geotechnical Investigation for the Red Dog Mine Tailings
December 3, 1984. Dam, prepared for Cominco Alaska, Inc,
Dames & Moore, 1 9 8 7 , Design Report, Proposed Tailings Dam, Red,Dog Mine Development for Cominco Alaska, Inc, July 1, 1987.
U . S . Army Corps of Engineers, 1981, Hydrologic Engineering Center, User's Manual, Flood Hydrograph Package, HEC-1.
U . S . Army Corps of Engneers, 1982, Hydrologic
Survace Profiles, HEC-2. Engineering Center, User's Manual, Water
ACKNOWLEDGEMENTS
The project described in this paper was per- formed as part of the Red Dog Mine development project in Northwest Alaska. The authors wish t o acknowledge Cominco Alaska, Incorporated, f o r permitting the authors to use the data pre- sented in this paper as well as Cominco's project representatives, Mr. Tony Vecchio and Mr, Jerry Booth, who assisted us and monitored our work throughout the project.
1246
PERMAFROST SLOPE DESIGN FOR A BURIED OIL PIPELINE A J. Hanna and E.C. McRoberts
Hardy BBT Limited, Alberta, Canada
~
SYNOPSIS many permafrost slopes. The paper reviews the slope stability design approach f o r this buried oil
The Interprovincial Pipe Line from Norman Wells, NWT to Zama, Alberta traverscs
pipeline and presents a range of design parameters. A summary of the design configurations is also provided.
INTRODUCTION
During April 1985, Interprovincial Pipe Line Limited began delivery of oil through the 300 mm diameter Norman Wells pipeline 868 km south to Zama, Alberta. Discontinuous permafrost occurs over a large proportion of the pipeline route varying in thickness up to 50 m. The pipeline is fully buried but the properties of Norman Wells crude allow the oil to be discharged at - 2 O C thereby restricting
description of this project has been provided thermal input into the surrounding soil. A
by Pick et a1 (1984).
From Norman Wells south the pipeline parallels the east bank of the Mackenzie River f o r 500-km, crossing many tributary creeks and rivers. While the route was located so as to avoid major areas of known inatability. permafrost slopes were unavoidable. In total over 165 slopes were identified as requiring geotechnical evaluation and site specific design response. The purpose of this paper is
design methodology used in slope stability to present background information and the
evaluations for the Norman Wells pipeline.
OVERVIEW OF D E S I G N APPROACH
The slope stability design process began with the classification of likely failure modcs. Following terminology established by earlier studies of permafrost slope failures (McRoberts, 1978), a matrix relating likely failure modes with thermal condition was developed, Table I * F o r frozen slopes, shear through permafrost is associated with specific geological conditions (McRoberts and Morgensternr 1974) that were largely avoided by the pipeline. Conventional slope stability analysis methods and control measures were adopted for unfrozen or non-permafrost slopes
of the design effort was therefore directed and are not considered further. The major part
towards assessing thawing permafrost slopes. S k i n flows or planar movements can develop as an active layer forms or penetrates deeper than normal beneath the thermally disturbed
"""I TABLE I
Failure Modes """"""_ Thermal Condition
Failure Frozen Unfrozen Thawing Mode$
Skin/Planar 0 X X Plug 0 0 X Ditch Backfill 0 X X ~ e e p Seated X X 0
X-posaible condition. 0-unlikely condition. ~ ~~~~~
permafrost right of way ( R O W ) . Excess pore pressures develop at the thaw front and can lead to unstable conditions depending upon rate of thaw, ice content, type of soil and slope inclination. As thaw proceeds deeper into the slope, two dimensional effects can be considered as a "thaw plug" develops. This thaw plug is confined by undisturbed permafrost terrain adjacent to the ROW. Ditch backfill placed during winter construction operation may also become unstable and fs another form of a thaw plug.
While this paper concentrates on the geotechnical methods and procedures used for analytical designr other elements of the design approach were important and are considered briefly as follows. Slope design began during alignment location and where possible and practical, the centreline was located on previously cleared slope segments that had already experienced geothermal disturbance and thawing. In addition, areas Of known instability were avoided and field
' reconnaissance was undertaken to check slopes for signs of instability or thermal erosion. All major permafrost sl.opes were dril.led 8 6
well as a representative selection of other slopes. The slope catalogue, terrain
was relied an to establish likely s o i l and ice analyses, and general knowledge of the route
conditions in slopes which were not drilled. It was later possible to confirm these assumptions to some extent during the
1247
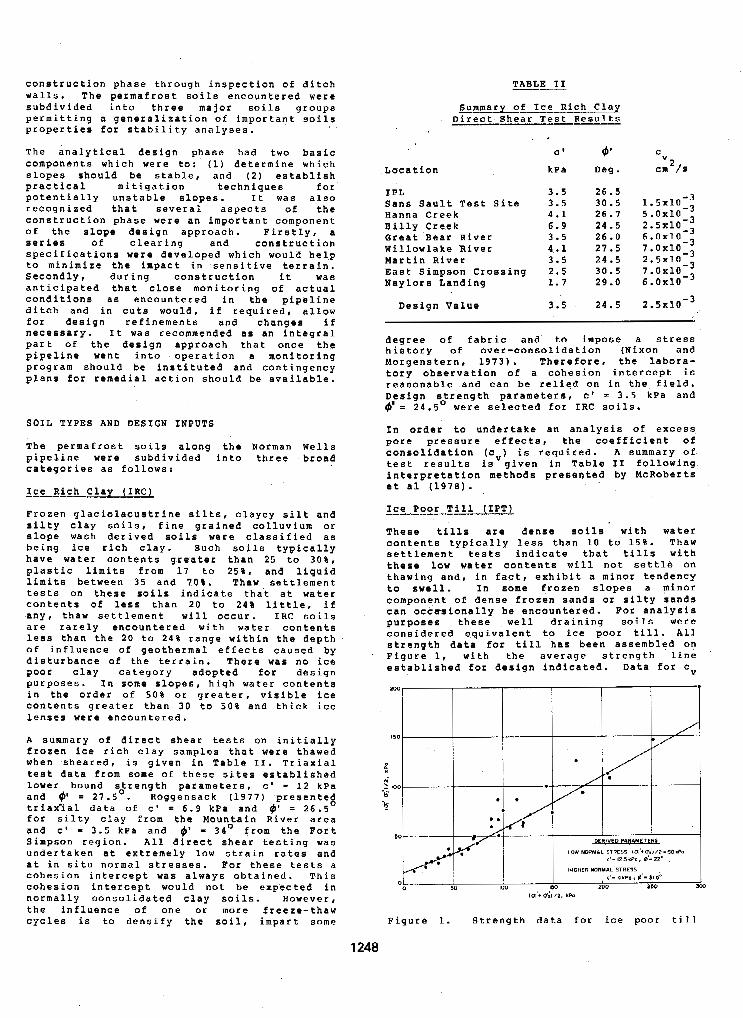
construction phase through inspection of ditch walls. The permafrost soils encountered were subdivided into three major soils groups permitting a generalization of important soils properties for stability analyses.
The anal.ytica1 design phase had two basic components which were tor (1) determine which slopes should be stable, and (2) establiah practical mitigation techniques potentially unstable slopes. It was also
for
recognized that several aspects of the construction phase were an important component of the slope design approach. Firstly, a series o f clearing and construction specifications were developed which would help to minimize the impact in sensitive terrain. Secondly, during construction it was anticipated that close monitoring of actual conditions as encountered in the pipeline ditch and in cuts would, if required, allow f o r design refinements and changes i f necessary. It was recommended as an integral part of the design approach that once the pipeline went into operation a monitoring program should be instituted and contingency plans for remedial action should be available.
SOIL TYPES AND DESIGN INPUTS
The permafrost s o i l s along pipeline were subdivided categories as follows:
Ice Rich Clay ( I R C )
Frozen glaciolacustrine silt silty clay s o i l s , fine ara
i
S
the Norman Wells nto three broad
, clayey silt and ned colluvium or i
slope wash derived soi ls- were classified as being ice rich clay. Such so i l s typically have water contents greater than 25 to 30%, plastic limits from 17 to 2 5 % , and liquid limits between 3 5 and 7 0 % . Thaw settlement tests on these soils indicate that at water contents of less than 20 to 24% little, if any, thaw settlement will occur. IRC $Oil5 are rarely encountered with water contents le66 than the 20 to 24% range within the depth of influence of geothermal effects caused by disturbance of the terrain. There was no i c e poor clay category adopted for design purposes. In some slopes, high water contents in the order of 50% or greater, visible ice contents greater than 30 to 50% and thick ice lenses were encountered.
A summary of direct shear tests on initially frozen ice rich clay samples that were thawed when -sheared, i s given in Table 11. Triaxial test data from some of these sites established lower bound strength parameters, c' - 12 kPa and 9' = 2 7 . 5 O . Roggensack (1977) presenteg triafial data of c' = 6.9 kPa and 9' = 26.5 for silty clay from the Mountain River area and c' - 3 . 5 kPa and @' - 34O from the Fort Simpson region. All direct shear testing was undertaken at extremely low strain rates and
cohesion intercept was always obtained. This at in situ normal stresses. For these tests a
cohesion intercept would not be expected in normally consolidated clay s o i l s . However, the influence of one or more freeze-thaw cycles is to densify the s o i l , impart some
TABLE I1 "_ "" Summaly_of Ice Rich Clay -
"""II"" Direct Shear Test Results
C'
Location kPa
I PL 3 . 5 Sans Sault Test Site 3.5 Hanna Creek 4.1 Billy Creek 6.9 Great Bear River 3.5 Willowlake River 4.1 Martin River 3 . 5 East Simpson Crossing 2 . 5 Naylors Landing 1.7
9' Deg.
26.5 30.5 2 6 . 7 2 4 . 5 26,O 2 7 . 5 2 4 . 5
29 . O 30.5
Design Value 3.5 2 4 . 5
c" cm / a
2
7 . 0 ~ 1 0 " 2 . ~ x I O - ~ 7 . O X ~ O - ~ 6 . O X ~ O - ~
2 . S X ~ O - ~
degree of fabric and to impose a stress history of over-consolidation (Nixon and Morgenstern, 1973) * Therefore, the labora- tory observation of a cohelion intercept is reasonable and can be relied on in the field.
#'= 2 4 . 5 O were selected for IRC soils. Design strength parameters, c ' = 3 . 5 kPa and
In order to undertake an analysis o f excess pore pressure effects, the coefficient of consolidation ( c ) is required. A summary of test results is'given in Table I1 following
et al (1978). interpretation methods presented by McRoberts
Ice Poor Till (IPT) ""
These tills are dense soils with water contents typically less than 10 to 15%. Thaw settlement tests indicate that tills with these low water contents will not settle on thawing and, in fact, exhibit a minor tendency to swell. In some frozen slopes a minor component of dense frozen sands or silty sands can occasionally be encountered. For analysis purposes these well draining soils were considered equivalent to ice poor till. All strength data €or till has been assembled on Figure 1, with the average strength line established for design indicated. Data for c
Figure 1. Strength data for ice poor till
1248
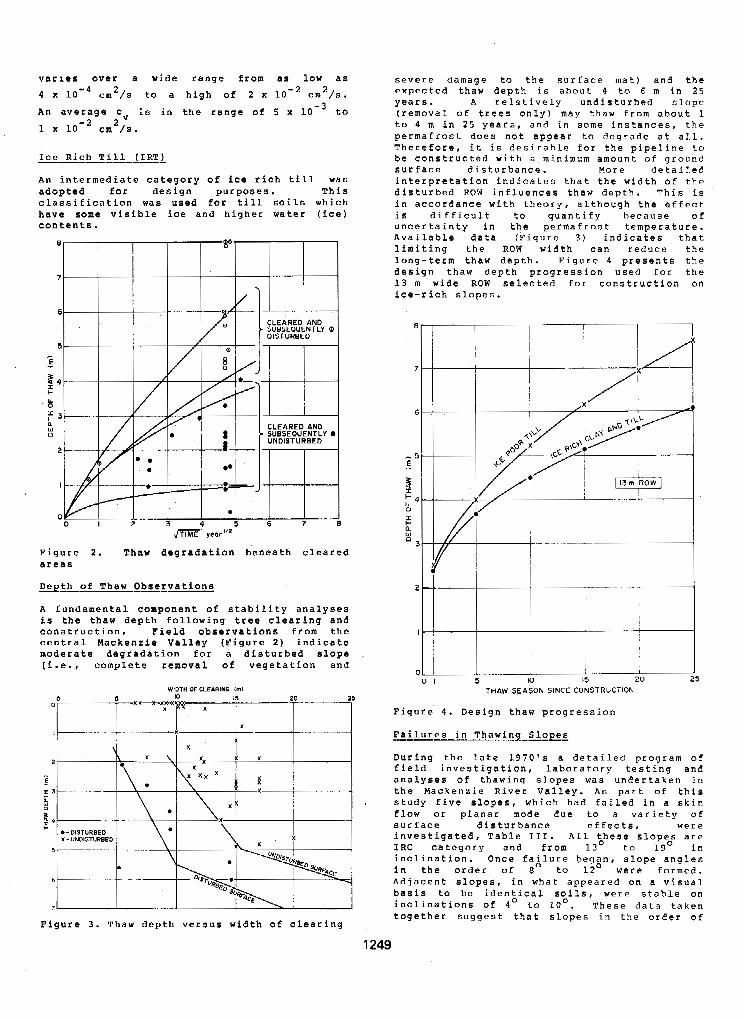
varles over a wide range from as low as 4 x loe4 cm2/s to a high of 2 x cm2/sa
An average c is in the range of 5 x to 1 x cm /s. 2 v
Ice Rich Till ( I R T L
An intermediate category of ice rich till was adopted for design purposes. This classification was used for till sails which have some visible ice and higher water (ice) contents.
Figure 2 . Thaw degradation beneath cleared areaa
Depth of Thaw Observations
A fundamental component of stability analyses i s the thaw depth following tree clearing and construction. Field observations from the central Mackenzie Valley (Figure 2 ) indicate moderate degradation for a disturbed slope (i.e., complete removal of vegetation and
Figure 3 . Thaw depth versus width of clearing
1249
severe damage to the surface mat) and the expected thaw depth is about 4 to 6 m i n 2 5 years . A relatively undisturbed slope (removal of trees only) may thaw from about 1 to 4 m in 2 5 years, and in some instances, the permafrost does not appear to degrade at all. Therefore, it is desirable for the pipeline to be constructed with a minimum amount of ground surface disturbance. More detailed interpretation indicates that the width of the disturbed ROW influences thaw depth. This is in accordance with theory, although the effect is difficult to quantify because of
Available data (Figure 3 ) indicates that uncertainty in the permafrost temperature.
limiting the ROW width can reduce the long-term thaw depth. Figure 4 presents the dasign thaw depth progression used for the 13 m wide ROW selected for construction on ice-rich slopes.
1
i 5 10 I5 20
THAW SEASON SINCE CONSTRUCTION
Figure 4 . Design thaw progression
Failures in Thawinq "" S l o p 5
During the late 1970's a detailed program of field investigation, laboratory testing and analyses of thawing slopes w a s undertaken in the Mackenzie River Valley. As part of this study five slopes, which had failed in a skin flow or planar mode due to a variety of surface disturbance effects, were investigated, Table 111. A l l these slopes are I R C category and from 13' to 19' in inclination. Once failure began, slope angles in the order of 8' to 12O were formed. Adjacent slopes, in what appeared on a v S s u a l basis to be identical s o i l s , were stable on inClinatiOnS of to loo. These data taken together suggest that slopes in the order of
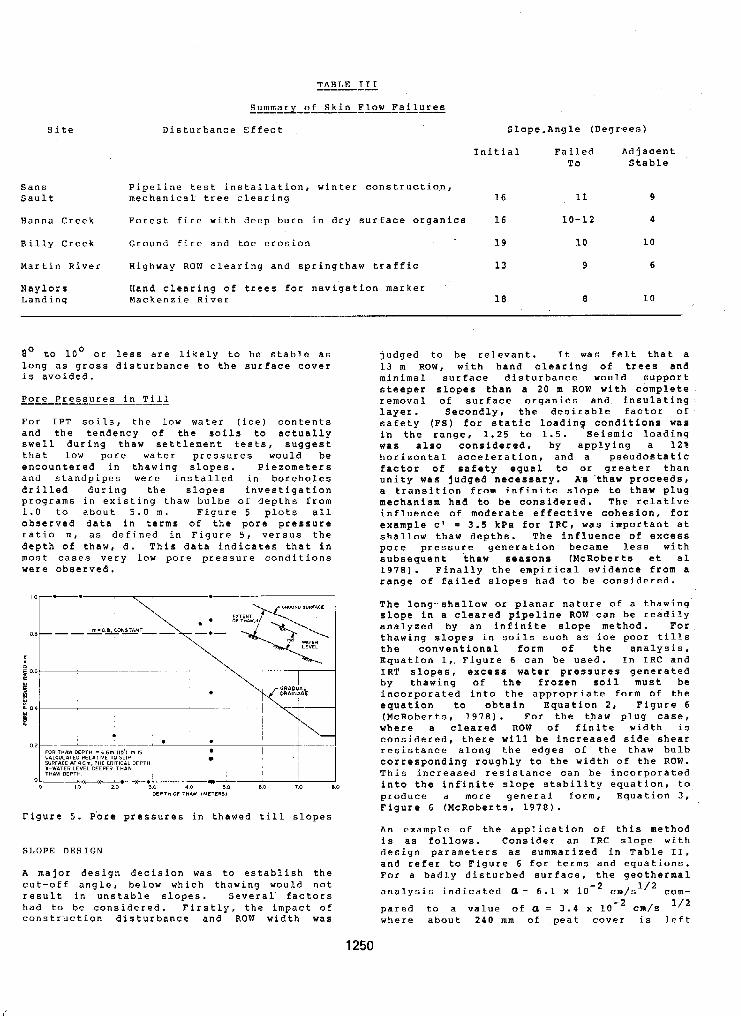
Site
TABLE-LIT Summary of Skin Flow Failures """
Disturbance Effect Slope.Angle (Degrees)
Initial Failed Adjacent TO Stable
Sans Pipeline test installation, winter construction, Sault mechanical tree clearing 16 11 9
Hanna Creek Forest fire with deep burn in dry surface organics 16 10-12 4
Billy Creek Ground fire and toe erosion 19 10 10
Martin River Highway ROW clearing and springthaw traffic 13 9 6
Naylors Hand clearing of tree3 for navigation marker Landing Mackenzie River 18 8 10
g o to 10' o r less are likely to be stable as long as gross disturbance to the surface cover is avoided,
Pore Pressures in Till
For I P T soils, the low water (ice) contents and the tendency o f the soils to actually swell during thaw settlement tests, suggest that low pore water pressures would be encountered in thawing slopes. Piezometers and standpipes were installed in boreholes drilled during the slopes investigation programs in existing thaw bulbs of depths from 1.0 to a b o u t 5 . 0 m. Figure 5 plots a l l observed data in terms of the pore pressure ratio m, as defined in Figure 5, versus the depth of thaw, d . This data indicates that in most cases very low pore pressure conditions were observed.
"I FOR THAW M P T H 3 1 6 m 1 1 5 ' ) m 15 I I SURFACE 4 T 4 6 m . T H t : CRITICAL DEPTH C4LCUL4TEO REL4TIVE TOSLIP a X-WATER LEVEL DEEPER T H A N THnW DEPTH I
OL"..X"-Y""i2." "".* ~ I 0 I O 2 0 30 4 0 so 60 7 0
W"
D E P T H OF TH4W lMETER5i 8 0
Figure 5 . Pore pressures in thawed till slopes
SLOPE D E S I G N
judged to be relevant. It was felt that a 13 m ROW, with hand clearing of trees and minimal surface disturbance would support steeper slopes than a 20 m ROW with complete removal of surface organics and insulating layer. Secondly, the desirable factor of safety (FS) f o r static loading conditions was in the range, 1.25 to 1.5. Seismic loading was also considered, by applying a 12% horizontal acceleration, and a pseudostatic factor of safety equal to or greater than unity was judged necessary. A s -thaw proceeds, a transition from infinite slope t o thaw plug mechanism had to be considered. The relative influence of moderate effective cohesion, for example c' = 3 . 5 kPa f o r I R C , was important at shallow thaw depths. The influence of excess pore pressure generation became l.ess with subsequent thaw seasons (McRoberts et a1
range of failed slopes had to be considered. 1978). Finally the empirical evidence from a
The long--shallow or planar nature o f a thawing slope in a cleared pipeline ROW can be readily analyzed by an infinite slope method. For thawing slopes in soils such as ice poor tills
Equation I, Figure 6 can be used. In I R C and the conventional form of the analysis,
I R T slopes, excess water pressures generated by thawing of the frozen s o i l must be incorporated into the appropriate form of the equation to obtain Equation 2 , Figure 6 (McRoberts, 1978)- For the thaw plug case, where a cleared ROW of finite width is Considered, there will be increased side shear resistance along the edges of the thaw bulb corresponding roughly to the width of the ROW. This increased resistance can be incorporated into the infinite slope stability equation, to produce a more general. form, Equation 3 , Figure 6 (McRoberts, 1978).
An example of the application of this method is a s follows. Consider an IRC slope with design parameters as summarized in Table 11, and refer to Fiaure 6 for terms and eauations.
A major design decision was to establish the cut-off angle, below which thawing would not
For a badly disturbed surface, the geothermal
result in unstable slopes. Several factors analysis indicated a = 6.1 x cm/s1'2 com- had to be considered. Firstly, the impact of construction disturbance and ROW width was
pared to a value of a = 3 . 4 x cm/s 1/2 where about 2 4 0 mm of peat cover i s left
1250
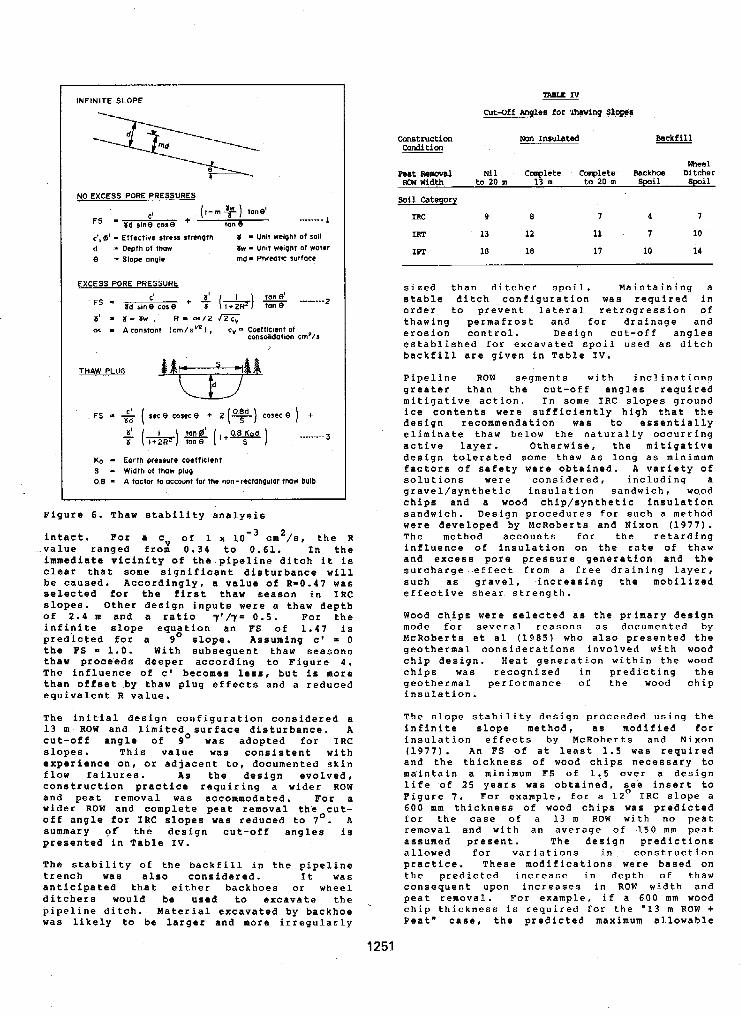
INFINITE SLOPE
3
NOEXCESS PORE PRESSURES
C' (I-rn +) tanel FS - c', 0' - Effective strers strtnqtn U - Unit weiqnt Of soil d - Depth of thaw KW - Unit weignt of wotmr e - Slope ongle rnd- Phreatic surface
8d sine coae + tan e .."._" I
1' = I - I w , R - -/2 OT - A conatant (crn/s"') cy - Coefflegsnt of
consoildatlon crnz/a
THAW PLUG
, FS - 6 ( sec e cnscce + 2 (9) cosec e ) + ) ........ -
KO - Eorth pressure coefficient
0.8 - 4 factor to occount for the non-rectanqular thaw bulb S - Width of thaw plug
Figure 6. Thaw stability analysis
intact. For a c of 1 X IOm3 cm2/s, the R value ranged fro; 0.34 to 0.61. In the immediate vicinity of the pipeline ditch it is clear that some significant disturbance will be caused. Accordingly, a value of R-0.47 was selected for the f i r s t thaw season in I R C slopes. Other design inputs were a thaw depth of 2.4 m and a ratio ' y ' / ~ = 0.5. For the infinite slope equation an FS of 1.47 is predicted f o r a 9' slope. Assuming c' = 0 the FS = 1.0. With subsequent thaw Beasone thaw proceeds deeper according to Figure 4. The influence of c' becomes less, but is more than offset by thaw plug effects and a reduced equivalent R value.
The initial design configuration considered a 13 m ROW and limited surface disturbance. A cut-off angle o f go was adopted for IRC slopes. This value was consistent with experience on, or adjacent to, documented skin flow failures. &s the design evolved, construction practice requiring a wider ROW
wider ROW and complete peat removal the cut- and peat removal was accommodated. For a
off angle for I R C slopes was reduced to 7 O . A summary of the design cut-off angles is presented in Table IV.
Th@ stability of the backfill in the pipeline trench was also considered. anticipated that either backhoes or wheel
It was
ditchers would be used to excavate the pipeline ditch. Material excavated by backhoe was likely to be larger and more irregularly
Construction condition
Feat Removal Row Width
soil Category
IRC
IRT
IPT
TABLE IV
Cut-Off Angles for "mwing Slopes
Non Insulated Backfill
Nil Colaplcte Cmplete Backhm Ditcher Wheel
to 20 m 13 m to 20 m Spoil Spoil
9 e 7 4 1
13 12 11 7 10
18 18 17 10 14
sized than ditcher spoil. Maintaining a stable ditch configuration w a s required in order to prevent lateral retrogression of thawing permafrost and for drainage and erosion control. established for excavated spoil used as ditch
Design cut-off angles
backfill are given in Table IV.
Pipeline ROW segments with inclinations greater than the cut-off angles required mitigative action. In some IRC slopes ground ice contents were sufficiently high that the design recommendation was to essentially eliminate thaw below the naturally occurring active layer. Otherwise, the mitigative design tolerated some thaw a6 long a6 minimum factors of safety were obtained. A variety of solutions were considered, including a gravel/synthetic insulation sandwich, wo.od chips and a wood chip/synthetic insulation sandwich. Design procedures for such a method were developed by McRoberts and Nixon (1977). The method accounts €or the retarding influence of insulation on the rate of thaw and excess pore pressure generation and the surcharge effect from a free draining layer, such as gravel, increasing the mobilized effective shear strength.
Wood chips were selected as the primary design mode for several reasons as documented by McRobertg et a1 (1985) who also presented the geothermal considerations involved with wood chip design. Heat generation within the wood chips was recognized in predicting the geothermal perrormance of the wood chip insulation.
The slope stability design proceeded using the infinite slope method, as modified for insulation effects by McRoberts and Nixon (1977). An FS of at least 1.5 was required and the thickness of wood chips necessary to maintain a minimum FS of 1.5 over a design life o f 25 years was obtained, see insert to Figure 7. F o r example, for a 12' I R C slope a 600 mm thickness of wood chips was predicted for the case of a 13 m ROW with no peat removal and with an average of 150 mm peat assumed present. The design predictions allowed for variations in construction practice. These modifications were based on the predicted increase in depth o € thaw consequent upon increases in ROW width and
.- chip thickness is required for the "13 m ROW + peat removal. For example, i f a 600 mm wood
Peat" case, the predicted maximum al.lowahle
1251
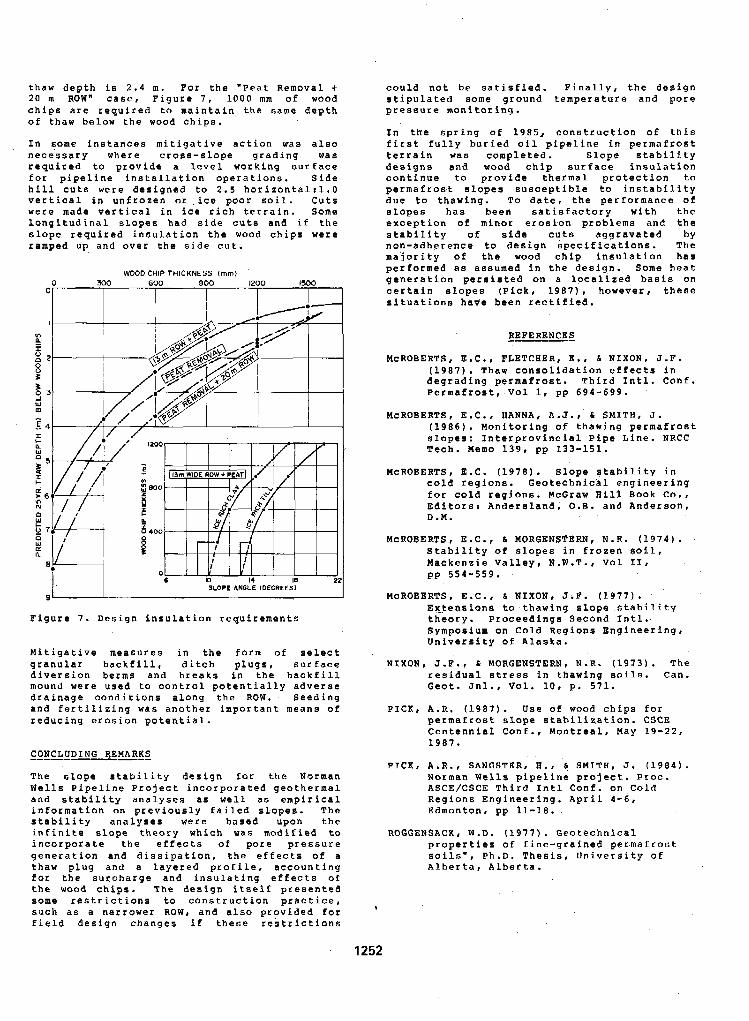
thaw depth is 2.4 m. For the "Peat Removal t 20 m ROW" c a s e , Figure 7, 1000 mm of wood chips ate requited to maintain the same depth of thaw below the wood chips.
In some instances mitigative action was also necessary where cross-slope grading was required to provide a level working surface for pipeline installation operations. Side hill cuts were designed to 2.5 horizonta1:l.O vertical in unfrozen or ice poor soil. Cuts were made vertical in ice rich terrain. Some longitudinal slopes had side cuts and if the slope required insulation the wood chips were ramped up and over the side cut.
0 300 600 900 1200 IS00 WOOD CHIP THICKNESS Imml
0
/
Figure 7. Design insulation requirements
Mitigative measures in the form o f select granular backfill, ditch plugs, surface diversion berms and breaks in the backfill mound were used to control potentially adverse drainage conditions along the ROW. Seeding and fertilizing was another important means of reducing erosion potential.
CONCLUDING 3EMARKS ""
The slope stability design for the Norman Wells Pipeline Project incorporated geothermal and stability analyses as well a6 empirical
stability analyses were based upon the information on previously failed slopes. The
infinite slope theory which was modified to incorporate the effects of pore pressure generation and dissipation, the effects of a thaw plug and a layered profile, accounting for the surcharge and insulating effects o f the wood chips. The design itself presented some restrictions to construction practice, such as a narrower ROW, and also provided for field design changes if these restrictions
cou Id not be satisf ied. Fina ~lly, the design stipulated some ground temperature and pore pressure monitoring.
In the spring of 1985, construction of this first fully buried oil pipeline in permafrost terrain was completed. Slope stability designs and wood chip surface insulation continue to provide thermal protection to permafrost slopes susceptible to instability due to thawing. To date, the performance of slopes has been satisfactory with the exception of minor erosion problems and the stability o f side cuts aggravated by non-adherence to design specifications. The majority of the wood chip insulation has performed as assumed in the design. Some heat generation persisted on a localized basis on certain slopes ( P i c k , 19871, however, these situations have been rectified.
REFERENCES
McROBERTS, E.C., FLETCHER, E., & NIXON, J.F.
degrading permaftoat. Third Intl. Conf. (1987). Thaw consolidation effects in
Permafrost, Vol 1, pp 694-699.
McROBERTS, E .e., HANNA, A.J., & SMITH, ;I. (1986). Monitoring of thawing permafrost slopem: Interprovincial Pipe Line. NRCC Tech. Memo 139, pp 133-151.
McROBERTS, E.C. (1978). Slope stability in cold regions. Geotechnical engineering for cold regiona. McGraw Hill Book Co., Editors: Andersland, O.B. and Anderson, D.M.
McROBERTS, E.C., 6 MORGENSTERN, N.R. (1974). Stability of slopes in frozen s o i l . Mackenzie Valley, N.W.T., V o l I T , pp 554-559.
McROBERTS. E.C., L NIXON, J.F. (1977). Ex.tensions to thawing s lope stability theory. Proceedings Second Intl.
University of Alaska. Symposium on Cold Regions Engineering,
NIXON, J.F., & MORGENBTERN, N.R. (1973). The residual stress in thawing soila. Can. Geot. Jnl., Vol. 10, p. 571.
PICK, A.R. (1987). Use of wood chips for permaftoat slope stabilization. CSCE Centennial Conf., Montreal, May 19-22, 1987.
PICK, A.R., SANGSTER, n., & SMITH, J. (1984). Norman Wells pipeline project. Proc. ASCE/CSCE Third Intl Conf. on C o l d Regions Engineering. April 4 - 6 , Edmonton, pp 11-18.
ROGGENSACK, W.D. (1977). Geotechnical properties of fine-grained permafrost
Alberta, Alberta. soils", Ph.D. Thesis, University of
1
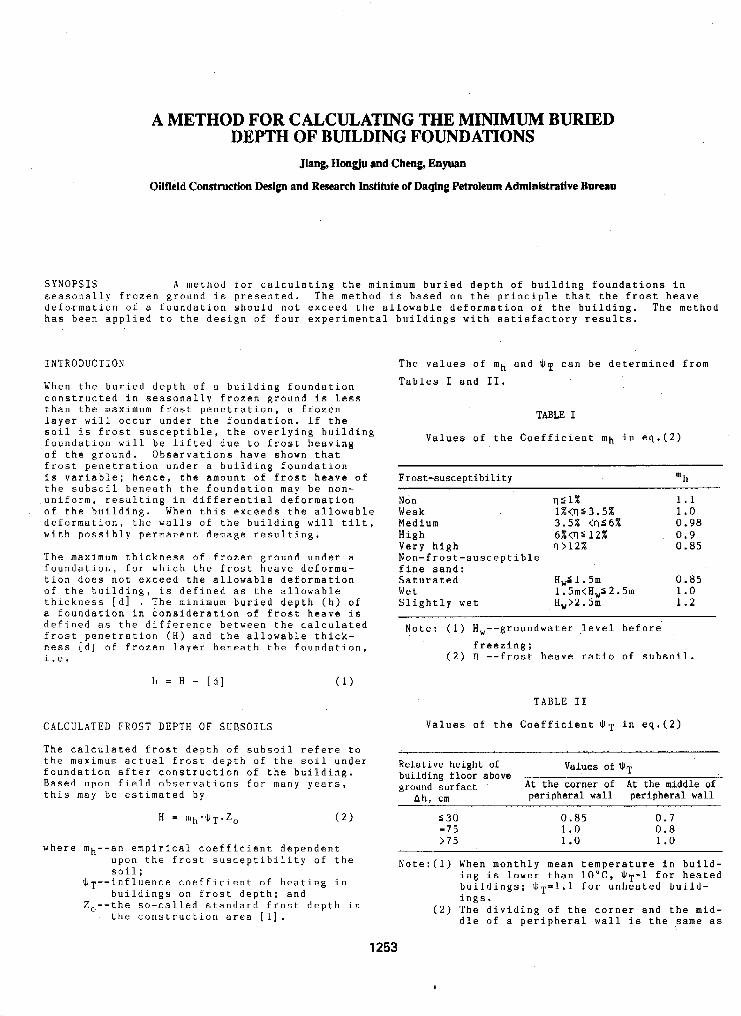
SYNOPSIS seasonal defo.rmat has been
A METHOD FOR CALCULATING THE MINIMUM BURIED DEPTH OF BUILDING FOUNDATIONS
Jiang, Hongju and Cheng, Enyuan
Oilfield Construction Design and Research Institute of Daqing Petroleum Administrative Bureau
INTRODUCTION
When the buried depth of a building foundation constructed in seasonally frozen ground is less than the maximum frost penetration, a frozen layer will occur under the foundation. If the soil i s frost susceptible, the overlying building foundation will be lifted due to frost heaving of the ground. Observations have shown that frost penetration under a building foundation is variable: hence, the amount of frost heave of the subsoil beneath the foundation may be non- uniform, resulting in differential deformation of the building. When this exceeds the allowable deformation, the walls of the building will tilt, with possibly permanent demage resulting,
A method for calculating the minimum buried depth of building foundations in 1y frozen ground is presented. The method is based o n the principle that the frost heave ion of a foundation should not exceed the allowable deformation of the building. The method applied to the design of four experimental buildings with satisfactory results.
The values of m h and $ T can be determined from Tables I and 11.
TABLE I
Values of the Coefficient m h in eq.(Z)
Frost-susceptibility mh
The maximum thickness of frozen ground under a foundation, for which the frost heave deforma- tion does not exceed the allowable deformation o f the building, is defined as the allowable thickness [dl . The minimum buried depth (h) of a foundation in consideration of frost heave is defined a5 the difference between the calculated frost penetration (H) and the allowable thick- ness [dl of frozen layer beneath the foundation, i.e.
h = H - [ d l ( 1 )
CALCULATED FKOST DEPTH O F SUBSOILS
The calculated frost depth of subsoil refere to the maximum actual frost depth of the soil under foundation after construction o f the building. Based u p o n field observations for many years, this may be estimated by
H = mh'$T.Zo ( 2 )
where mh--an empirical coefficient dependent u p o n the frost susceptibility of the soil;
buildings un frost depth; and
the construction area [I].
influence coefficient of heating in Z,--the so-called standard frost depth in
Non Ils 1% 1 . 1 Weak l % < q S 3 . 5 % 1 .o Medium 3 . 5 % Cq56X 0.98 High 6 X C I l S 12% 0.9 Very high Il >12% 0.85 Non-frost-susceptible fine sand: Saturated H,S 1.5m 0.85 Wet l.5m<Hw5 2 . 5 m 1 .o Slightly wet HW>2.5m 1.2
Note: (1 ) Hw--groundwater level before freezing;
( 2 ) ?'I --frost heave ratio of subsoil.
TABLE II
Values of the Coefficient $T in eq.(2)
Relative height of Values of BT building floor above ground surfact At the corner of At the middle o f
Ah, cm peripheral wall peripheral wall
S 3 0 0 .85 0.7 3 7 5 > 7 5
1.0 0 .8 1 .o 1 . o
Note:(l) When monthly mean temperature in b u i l d - ing is lower than 10°C, $ ~ = 1 f o r heated building?; d ~ ~ = I . l f o r unheated build- ings.
(2) The dividing of the corner and the mid- dle of a peripheral wall is the same a s
1253
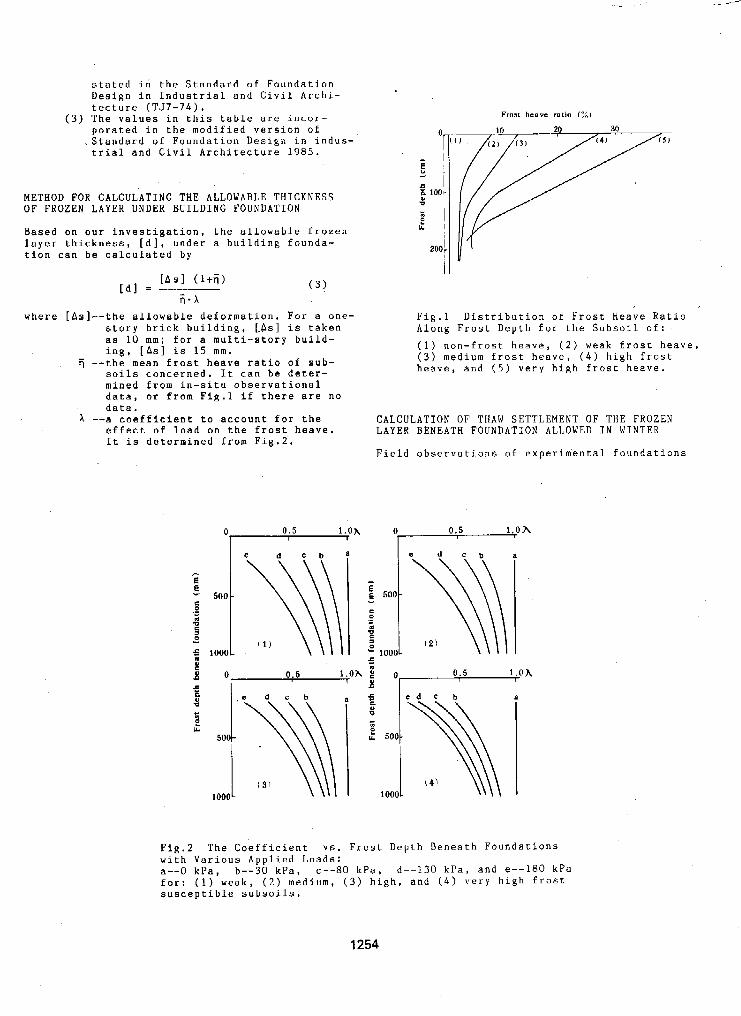
stated in the Standard of Foundation Design in Industrial and Civil Archi- tecture (TJ7-74).
porated in the modified version o f
trial and Civil Architecture 1985 .
( 3 ) The values in this table are incor-
.Standard of Foundation Design in indus-
METHOD FOR CALCULATING THE ALLOWABLE THICKNESS OF FROZEN LAYER UNDER BUILDING FOUNDATION
Based on o u r investigation, the allowable frozen layer thickness, [ d l , under a building founda- tion can be calculated by
[As1 (l+!) [dl = ( 3 )
:.x where [As]--the allowable deformation. For a one-
story brick building, [.As] is taken a s 10 mm; for a multi-story build- ing, [As] is 1 5 mm.
i j --the mean f r o s t heave ratio of sub-
mined from in-situ observational s o i l s concerned. It can be deter-
data, or from Fig.1 if there are no data.
1 --a coefficient t o account for the effect of load on the frost heave. It is determined from Fig.2.
Fig.1 Distribution of Frost Heave Ratio Along Frost Depth € o r the Subsoil o f :
( 1 ) non-frost heave, ( 2 ) weak frost heave, ( 3 ) medium frost heave, ( 4 ) high frost heave, a n d (5) very high frost heave.
CALCULATION OF THAW SETTLEMENT OF THE FROZEN LAYER BENEATH FOUNDATION ALLOWED IN WINTER
Field observations of experimental foundations
Fig.2 The Coefficient vs. Frost Depth Beneath Foundations with Various Applied Loads: a--0 kPa, b - - 3 0 kPa, c- -80 kPa, d--130 k P a , and e--180 kPa for: ( 1 ) weak, ( 2 ) medium, ( 3 ) high, and ( 4 ) very high frost susceptible subsoils.
1254
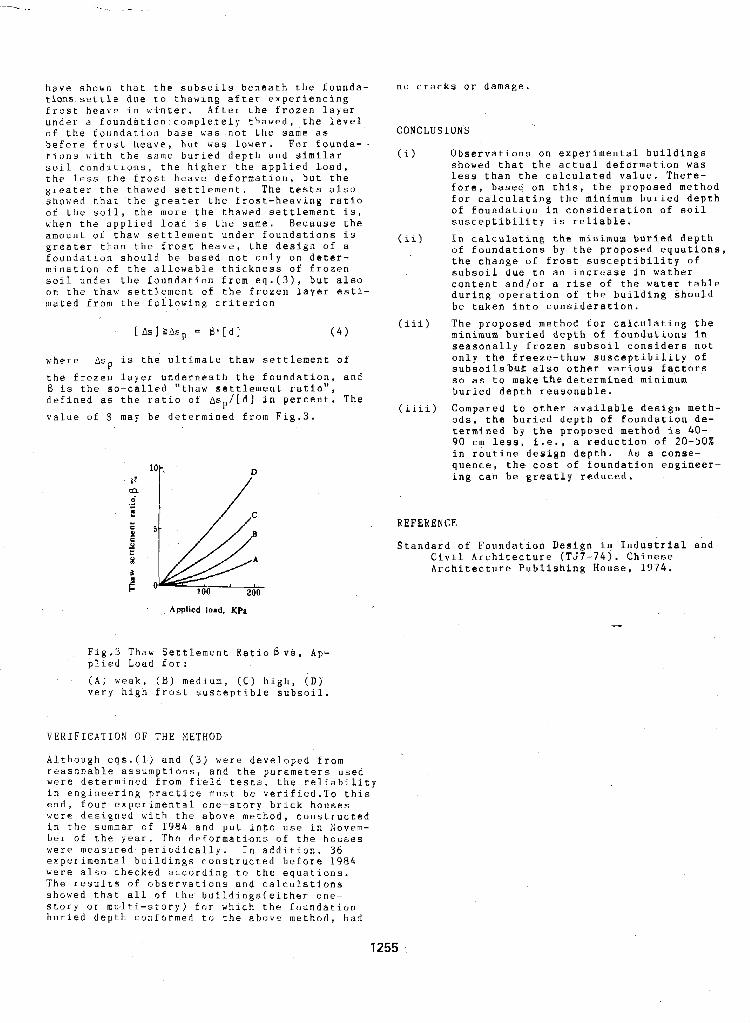
have sho\;n that the subsoils beneath the founda- tions settle due t o thawing after experiencing frost heave in \si-nter. After the frozen layer under a foundation completely thawed, the level of t.he foundation base was not the same as before frost heave, but was lower. F o r founda- tions riith the same buried depth and similar soil conditions, the higher the applied load, the less the frost heave deformation, but the greater the t-hawed settlement. The tests also s h o ~ e d t h a t the greater the frost-heaving ratio of the soil, t h e more the thawed settlement is, vhen the applied load is the same. Because the amount of thaw settlement under foundations is greater than the frost heave, the design of a foundation should be based not only on deter- mination of the allowable thickness o f froz'en soil under the foundation from eq.(3), but also o n the thaw settlement o € the frozen layer esti- mated from the following criterion
vhere Asp i s the ultimate thaw settlement o f
the frozen layer underneath the foundation, and R i s the so-called "thaw settlement ratio", defined as the ratio of Asp/[d] in percent. The value of B may be determined from Fig.3.
nrl cracks or damage.
CONCLUSIONS
(i) Observations o n experimental buildings showed that the actual deformation was less than the calculated value. There- fore, based on this, the proposed method €or calculating the minimum buried depth of foundation i n consideration of soil susceptibility is reliable.
(ii)
(iii)
(i1i.i)
I n calculating the minimum buried depth of foundations by the proposed equations, the change of frost susceptibility of subsoil due to an incrt!ase in wather content and/or a rise of the water table during operation of the building s h o u l d be taken into consideration. The proposed method for calculating the minimum buried depth of foundations in seasonally frozen subsoil considers not only the freeze-thaw susceptibility o f subsoilsb,uL a l s o other various factors s o as to make Lhe determined minimum buried depth reasonable. Compared to other available design meth- ods, the buried depth of foundation de- termined by the proposed method is 40- 90 cm less, i.e., a reduction o f 20-50X in routine design depth. As a conse- quence, the cost of foundation engineer- ing can be greatly reduced.
REFERENCE
Standard of Foundation Design in Industrial and Civil Architecture (TJ7-74). Chinese Architec,ture Publishing House, 1974.
Fig.3 Thaw Settlement Ratio B v s . Ap- plied Load f o r :
( A ) weak, (B) medium, (C) high, (D) very high frost susceptible subsoil.
VERIFItATION OF THE METHOD
Al.though eqs.(l) and ( 3 ) were developed from
were determined from field tests, the reliability reasonable assumptions, and the parameters used
in engineering practice must be verified.To this end, f o u r experimental one-story brick houses were designed with the above method, constructed in the summer o f 1 9 8 4 and put into use in Xovem- ber o f the year. Tho deformations o f the houses were measured periodically. In addition, 3 6 experimental buildings constructed before 1 9 8 4 were a l s o checked according to t h e equations. The results of observations and calculations showed that all o f the huildings(either one- story or multi-story) for which t h e foundation buried depth conformed to the above method, h 8 d
1255
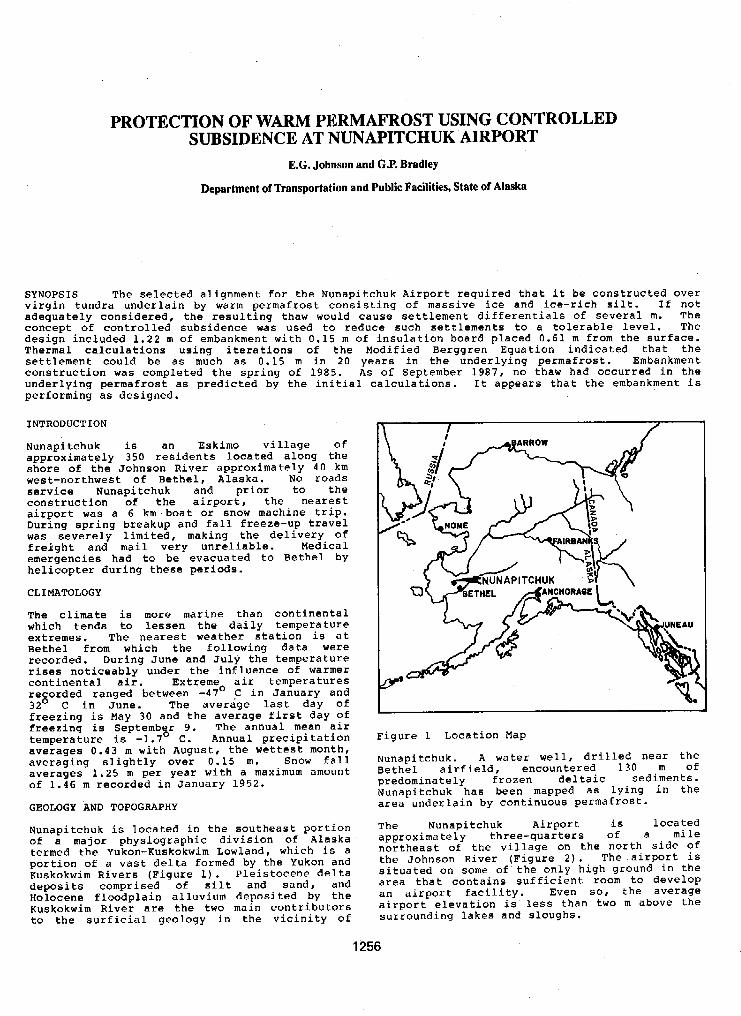
PROTECTION OF WARM PERMAFROST USING CONTROLLED SUBSIDENCE AT NUNAPITCHUK AIRPORT
E.G. Johnson and E.P. Bradley
Department of Transportation and Public Facilities, State of Alaska
SY NOPS I S T h e s e l e c t e d a l i g n m e n t for t h e N u n a p i t c h u k A i r p o r t r e q u i r e d t h a t i t b e c o n s t r u c t e d o v e r v i r g i n t u n d r a u n d e r l a i n by warm p e r m a f r o s t c o n s i s t i n g of m a s s i v e ice and ice-rich s i l t . I f n o t a d e q u a t e l y c o n s i d e r e d , t h e r e s u l t i n g thaw w o u l d c a u s e s e t t l e m e n t d i f f e r e n t i a l s of s e v e r a l m. T h e c o n c e p t of c o n t r o l l e d s u b s i d e n c e was used t o r e d u c e s u c h s e t t l e m e n t s t o a t o l e r a b l e l e v e l . The d e s i g n i n c l u d e d 1 . 2 2 rn of embankment w i t h 0.15 m of i n s u l a t i o n b o a r d p l a c e d 0 . 6 1 m f r o m t h e s u r f a c e . T h e r m a l c a l c u l a t i o n s u s i n g i t e r a t i o n s of t h e M o d i f i e d B e r g g r e n E q u a t i o n i n d i c a t e d t h a t t h e
c o n s t r u c t i o n was c o m p l e t e d t h e s p r i n g of 1985. As of September 1987, no thaw had occur red in t h e s e t t l e m e n t c o u l d b e as much a s 0 . 1 5 m i n 20 y e a r s i n t h e u n d e r l y i n g p e r m a f r o s t . Embankment
u n d e r l y i n g p e r m a f r o s t as p r e d i c t e d by t h e i n i t i a l c a l c u l a t i o n s . I t a p p e a r s t h a t t h e embankment i s p e r f o r m i n g as d e s i g n e d .
INTRODUCTION
Nunapi tchuk i s a n E s k i m o v i l l a g e o f a p p r o x i m a t e l y 350 r e s i d e n t s l o c a t e d a l o n g t h e s h o r e of t h e J o h n s o n R i v e r a p p r o x i m a t e l y 4 0 km w e s t - n o r t h w e s t of B e t h e l , Alaska. No roads s e r v i c e N u n a p i t c h u k a n d p r i o r t o the c o n s t r u c t i o n of t h e a i r p o r t , t h e n e a r e s t a i r p o r t was a 6 km boat or snow machine t r i p .
was s e v e r e l y l i m i t e d , making t h e d e l i v e r y o f D u r i n g s p r i n g b r e a k u p and f a l l f r e e z e - u p t r a v e l
f r e i g h t a n d mail v e r y u n r e l i a b l e . M e d i c a l emergenc ie s had to b e e v a c u a t e d t o B e t h e l by h e l i c o p t e r d u r i n g t h e s e p e r i o d s .
CLIMATOLOGY
The climate is more m a r i n e t h a n c o n t i n e n t a l w h i c h t e n d s to l e s s e n t h e d a i l y t e m p e r a t u r e e x t r e m e s . T h e n e a r e s t w e a t h e r s t a t i o n i s a t B e t h e l from which t h e f o l l o w i n g d a t a were r e c o r d e d . D u r i n g J u n e a n d J u l y t h e t e m p e r a t u r e rises n o t i c e a b l y u n d e r t h e i n f l u e n c e o f w a r m e r c o n t i n e n t a l a i r . Extremeo a i r t e m p e r a t u r e s recorded ranged be tween - 4 7 C i n J a n u a r y a n d 32O C i n J u n e . T h e a v e r a g e l a s t d a y o f f r e e z i n g is May 30 a n d t h e a v e r a g e f i r s t d a y of f r e e z i n g is September 9. T h e a n n u a l mean a i r t e m p e r a t u r e i s -1.7' C. A n n u a l p r e c i p i t a t i o n a v e r a g e s 0 . 4 3 m w i t h A u g u s t , t h e wettest month, a v e r a g i n g s l i g h t l y o v e r 0 . 1 5 m. Snow f a l l ave rages 1 .25 m p e r y e a r w i t h a maximum amount of 1.46 m r e c o r d e d i n J a n u a r y 1 9 5 2 .
GEOLOGY ~ N D TOPOGRAPHY
Nunapi tchuk i s l o c a t e d i n t h e s o u t h e a s t p o r t i o n of a m a j o r p h y s i o g r a p h i c d i v i s i o n of Alaska termed t h e Yukon-Kuskokwim Lowland, which is a p o r t i o n of a v a s t d e l t a f o r m e d by t h e Yukon and Kuskokwim R i v e r s ( F i g u r e 1 ) . P l e i s t o c e n e d e l t a d e p o s i t s c o m p r i s e d of s i l t and sand, and H o l o c e n e f l o o d p l a i n a l l u v i u m d e p o s i t e d by t h e Kuskokwim R i v e r a re t h e two m a i n c o n t r i b u t o r s to t h e s u r f i c i a l g e o l o g y i n t h e v i c i n i t y o f
F i g u r e 1 L o c a t i o n Map
Nunapi tchuk. A w a t e r well, d r i l l e d n e a r t h e B e t h e l a i r f i e l d , e n c o u n t e r e d 130 m of p r e d o m i n a t e l y f r o z e n d e l t a i c s e d i m e n t s . Nunap i t chuk has been mapped a s l y ing i n t he area u n d e r l a i n b y c o n t i n u o u s p e r m a f r o s t .
The Nunap i t chuk A i rpo r t i s l o c a t e d a p p r o x i m a t e l y t h r e e - q u a r t e r s of a mile n o r t h e a s t of t h e v i l l a g e on t h e n o r t h s i d e of
s i t u a t e d o n some of t h e o n l y h i g h g r o u n d i n t h e t h e J o h n s o n R i v e r ( F i g u r e 2 ) . The a i r p o r t i s
area t h a t c o n t a i n s s u f f i c i e n t room t o d e v e l o p a n a i r p o r t f a c i l i t y . Even so, t h e a v e r a g e a i r p o r t e l e v a t i o n i s less t h a n two m above t h e s u r r o u n d i n g l a k e s a n d s l o u g h s .
1256
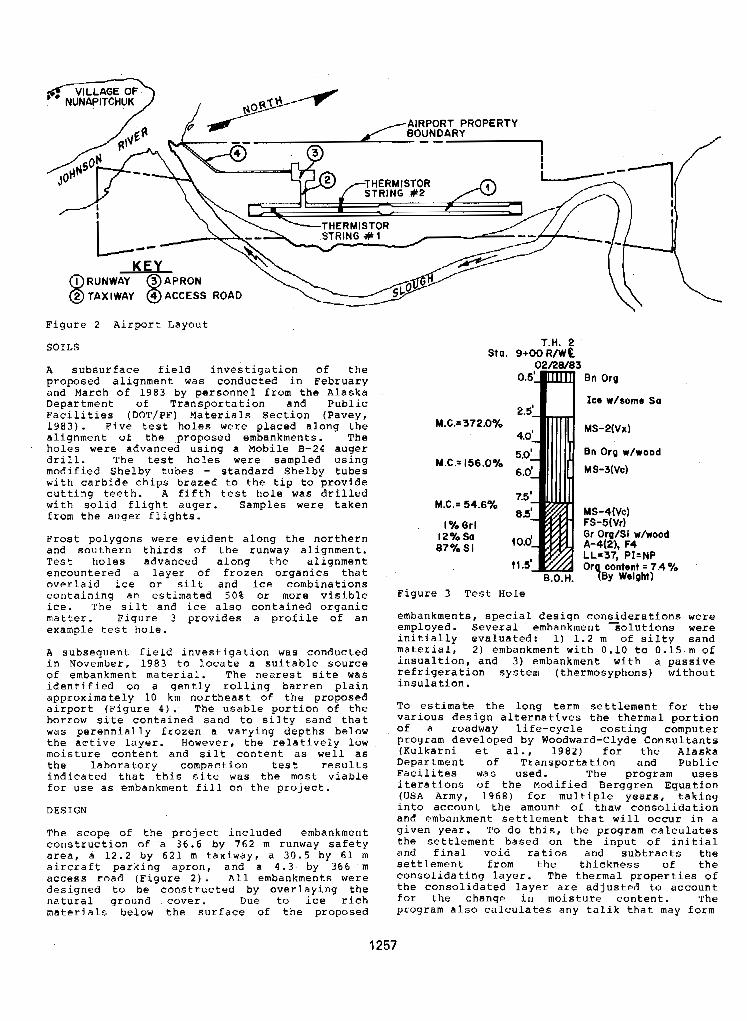
F i g u r e 2 A i r p o r t L a y o u t
SOILS
A s u b s u r f a c e f i e l d i n v e s t i g a t i o n of t h e p r o p o s e d a l i g n m e n t was c o n d u c t e d i n F e b r u a r y and March of 1983 by p e r s o n n e l f r o m t h e A l a s k a D e p a r t m e n t of T r a n s p o r t a t i o n a n d P u b l i c F a c i l i t i e s (DOT/PF) Materials S e c t i o n ( P a v e y , 1 9 8 3 ) . F i v e t e s t h o l e s were p l a c e d a l o n g t h e a l i g n m e n t of t h e p roposed embankmen t s . T h e h o l e s were a d v a n c e d u s i n g a M o b i l e E-24 a u g e r d r i l l . T h e t e s t h o l e s were s a m p l e d u s i n g m o d i f i e d S h e l b y t u b e s - s t a n d a r d S h e l b y t u b e s w i t h ca rb ide c h i p s b r a z e d t o t h e t i p t o p r o v i d e c u t t i n g t e e t h . A f i f t h t e s t h o l e was d r i l l e d w i t h s o l i d f l i g h t a u g e r . S a m p l e s were t a k e n f rom t h e a u g e r f l i g h t s .
Frost p o l y g o n s were e v i d e n t a l o n g t h e n o r t h e r n a n d s o u t h e r n t h i r d s of t h e r u n w a y a l i g n m e n t . T e s t holes a d v a n c e d a l o n g t h e a l i g n m e n t e n c o u n t e r e d a l a y e r o f f r o z e n o r g a n i c s t h a t o v e r l a i d i ce or s i l t a n d ice c o m b i n a t i o n s c o n t a i n i n g a n estimated 50% or more v i s i b l e i ce . T h e s i l t and ice a l s o c o n t a i n e d o r g a n i c matter. F i g u r e 3 p r o v i d e s a p r o f i l e of a n e x a m p l e t es t h o l e .
A s u b s e q u e n t f i e l d i n v e s t i g a t i o n was c o n d u c t e d i n November, 1983 t o l o c a t e a s u i t a b l e s o u r c e of embankment mater ia l . T h e n e a r e s t s i t e was i d e n t i f i e d o n a g e n t l y r o l l i n g b a r r e n p l a i n a p p r o x i m a t e l y 1 0 km n o r t h e a s t of t h e p r o p o s e d a i r p o r t ( F i g u r e 4 ) . T h e u s a b l e p o r t i o n of t h e borrow s i t e c o n t a i n e d s a n d t o s i l t y s a n d t h a t was p e r e n n i a l l y f r o z e n a v a r y i n g d e p t h s below t h e a c t i v e l a y e r . H o w e v e r , t h e r e l a t i v e l y low m o i s t u r e c o n t e n t a n d s i l t c o n t e n t a s well a s t h e l a b o r a t o r y c o m p a c t i o n t es t r e s u l t s i n d i c a t e d t h a t t h i s s i t e was t h e most v i a b l e for u s e a s embankment f i l l on t h e p r o j e c t .
DES I GN
T h e s c o p e o f t h e p r o j e c t i n c l u d e d e m b a n k m e n t c o n s t r u c t i o n of a 3 6 . 6 by 7 6 2 m r u n w a y s a f e t y a rea , a 1 2 . 2 b y 6 2 1 m t a x i w a y , a 30.5 b y 6 1 m a i r c r a f t p a r k i n g a p r o n , a n d a 4 . 3 by 366 m access r o a d ( F i g u r e 2 ) . A l l embankments were d e s i g n e d t o b e c o n s t r u c t e d by o v e r l a y i n g t h e n a t u r a l g r o u n d c o v e r . Due t o i ce r i c h m a t e r i a l s b e l o w t h e s u r f a c e of t h e p r o p o s e d
Sta.
M.C.* 156.0%
M.C.= 54.6%
I% Grl 12% Sa 87% S i
9+00 R/WE T.H. 2
02/2W83
Ice W/SQmO Sa
Bn Org w/wood
Gr Org/SI w/wood
F i g u r e 3 T e s t Hole
e m b a n k m e n t s , s p e c i a l d e s i g n c o n G d e r a t i o n s were e m p l o y e d . S e v e r a l e m b a n k m e n t s o l u t i o n s were i n i t i a l l y e v a l u a t e d : 1) 1 . 2 m of s i l t y s a n d m a t e r i a l , 2 ) e m b a n k m e n t w i t h 0 .10 t o 0.15 m of i n s u a l t i o n , a n d 3 ) embankment w i t h a p a s s i v e r e f r i g e r a t i o n s y s t e m ( t h e r m o s y p h o n s ) w i t h o u t i n s u l a t i o n .
To es t imate t h e l o n g term s e t t l e m e n t f o r t h e v a r i o u s d e s i g n a l t e r n a t i v e s t h e t h e r m a l p o r t i o n of a r o a d w a y l i f e - c y c l e c o s t i n g c o m p u t e r p r o g r a m d e v e l o p e d b y W o o d w a r d - C l y d e C o n s u l t a n t s - ( K u l k a r n i e t d l . , 1 9 8 2 ) for t h e Alaska D e p a r t m e n t of T r a n s p o r t a t i o n a n d P u b l i c F a c i l i t e s was used . The program u s e s i t e r a t i o n s of t h e Modif ied B e r g g r e n E q u a t i o n (USA Army, 1 9 6 8 ) for m u l t i p l e y e a r s , t a k i n g i n t o a c c o u n t t h e a m o u n t o f t haw c o n s o l i d a t i o n a n d e m b a n k m e n t s e t t l e m e n t t h a t w i l l o c c u r i n a g i v e n y e a r . To d o t h i s , t h e p r o g r a m c a l c u l a t e s t h e s e t t l e m e n t b a s e d o n t h e i n p u t of i n i t i a l a n d f i n a l v o i d r a t i o s a n d s u b t r a c t s t h e s e t t l e m e n t f r o m t h e t h i c k n e s s of t h e c o n s o l i d a t i n g l a y e r . T h e t h e r m a l p r o p e r t i e s o f t h e c o n s o l i d a t e d l a y e r a r e a d j u s t e d t o a c c o u n t €or t h e c h a n g e i n m o i s t u r e c o n t e n t . T h e p r o g r a m a l s o c a l c u l a t e s a n y t a l i k t h a t may form
1257
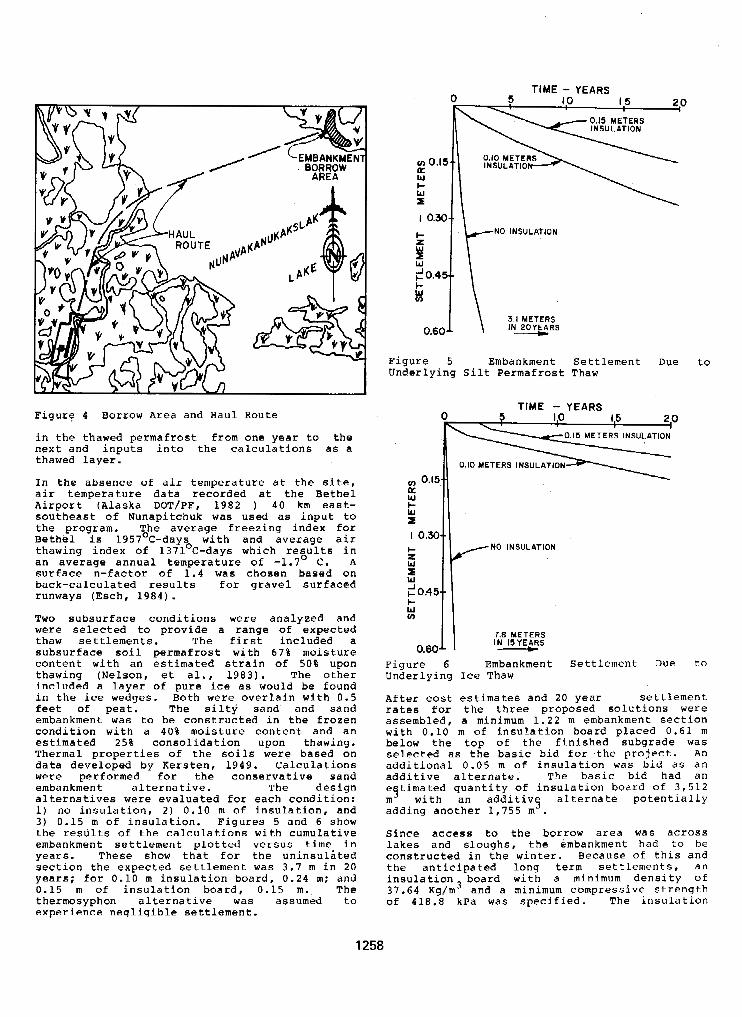
F i g u r e 4 Borrow Area a n d H a u l R o u t e
i n t h e t h a w e d p e r m a f r o s t from o n e y e a r t o t h e n e x t a n d i n p u t s i n t o t h e c a l c u l a t i o n s a s a t h a w e d l a y e r .
I n t h e a b s e n c e of a i r t e m p e r a t u r e a t t h e s i t e , a i r t e m p e r a t u r e d a t a r e c o r d e d a t t h e B e t h e l A i r p o r t ( A l a s k a DOT/PF, 1 9 8 2 ) 40 km east- s o u t h e a s t of N u n a p i t c h u k was u s e d as i n p u t t o the program. T h e a v e r a g e f r e e z i n g i n d e x for B e t h e l i s 1 9 5 7 O C - d a y s w i t h a n d a v e r a g e a i r t h a w i n g i n d e x of 1 3 7 l 0 C - d a y s w h i c h r e s u l t s i n a n average a n n u a l t e m p e r a t u r e of -1.7O C . A s u r f a c e n - f a c t o r of 1.4 was c h o s e n b a s e d o n b a c k - c a l c u l a t e d r e s u l t s €or g r a v e l s u r f a c e d runways (Esch , 1984) . Two s u b s u r f a c e c o n d i t i o n s were a n a l y z e d a n d were s e l e c t e d t o p r o v i d e a r a n g e of e x p e c t e d thaw s e t t l e m e n t s . The f i r s t i n c l u d e d a s u b s u r f a c e so i l permafrost w i t h 67% m o i s t u r e c o n t e n t w i t h a n e s t i m a t e d s t r a i n of 50% upon t h a w i n g ( N e l s o n , e t a l . , 1 9 8 3 ) . The other i n c l u d e d a l a y e r of p u r e i ce as would be f o u n d i n t h e ice wedges . Both were o v e r l a i n w i t h 0.5 feet of p e a t . T h e s i l t y s a n d a n d s a n d embankment was t o be c o n s t r u c t e d i n t h e f r o z e n c o n d i t i o n w i t h a 4 0 % m o i s t u r e c o n t e n t a n d a n e s t i m a t e d 2 5 % c o n s o l i d a t i o n u p o n t h a w i n g . The rma l p r o p e r t i e s of t h e soils were b a s e d o n da t a d e v e l o p e d b y K e f s t e n , 1 9 4 9 . C a l c u l a t i o n s were p e r f o r m e d for t h e c o n s e r v a t i v e s a n d e m b a n k m e n t a l t e r n a t i v e . T h e d e s i g n a l t e r n a t i v e s were e v a l u a t e d f o r e a c h c o n d i t i o n : 1) n o i n s u l a t i o n , 2 ) 0.10 m of i n s u l a t i o n , a n d 3 ) 0.15 m of i n s u l a t i o n . F i g u r e s 5 a n d 6 show t h e r e s u l t s of t h e c a l c u l a t i o n s w i t h c u m u l a t i v e e m b a n k m e n t s e t t l e m e n t p l o t t e d v e r s u s time i n y e a r s . T h e s e s h o w t h a t for t h e u n i n s u l i t e d s e c t i o n t h e e x p e c t e d s e t t l e m e n t was 3 . 7 m i n 20 y e a r s ; fo r 0 . 1 0 m i n s u l a t i o n b o a r d , 0 . 2 4 m ; and 0 .15 m of i n s u l a t i o n b o a r d , 0 .15 m . T h e t h e r m o s y p h o n a l t e r n a t i v e was assumed t o e x p e r i e n c e n e g l i g i b l e s e t t l e m e n t .
TIME - YEARS TIME - YEARS
c
0.4 I-
F i g u r e 5 E m b a n k m e n t S e t t l e m e n t Due t o U n d e r l y i n g S i l t P e r m a f r o s t Thaw
0 TIME - YEARS
I ,o 1.5 2 0
-0.15 METERS INSULATION
1 0.10 METERS INSULATION-)
v) 0.15-.
w E k- w ai
I 0.30.- k
3 W t
0.45- I-
3
1 1 I N 15YEgRS 7.8 METERS
0.60 F i g u r e 6 Embankment u n d e r l y i n g Ice Thaw
s e t t l e m e n t Due to
A f t e r cost estimates a n d 2 0 y e a r s e t t l e m e n t r a t e s for t h e t h r e e p r o p o s e d s o l u t i o n s were
w i t h 0 .10 m o f i n s u l a t i o n b o a r d p l a c e d 0 . 6 1 m a s s e m b l e d , a minimum 1 . 2 2 m e m b a n k m e n t s e c t i o n
below t h e t o p of t h e f i n i s h e d s u b g r a d e was selected as t h e b a s i c b i d €or t h e p r o j e c t . An a d d i t i o n a l 0 . 0 5 m of i n s u l a t i o n was b i d a s a n a d d i t i v e a l t e r n a t e . T h e bas i c b i d had a n
m9 w i t h a n a d d i t i v g a l t e r n a t e p o t e n t i a l l y e timated q u a n t i t y of i n s u l a t i o n b o a r d of 3 , 5 1 2
a d d i n g a n o t h e r 1 , 7 5 5 m . S i n c e access to t h e b o r r o w a r e a was across l a k e s a n d s l o u g h s , t h e kmbankment had t o be c o n s t r u c t e d i n t h e w i n t e r . B e c a u s e of t h i s a n d t h e a n t i c i p a t e d l o n g term s e t t l e m e n t s , a n i n s u l a t i o n b o a r d w i t h a minimum d e n s i t y of
of 418.8 kPa was s p e c i f i e d . T h e i n s u l a t i o n 37.64 Kg/m3 a n d a minimum c o m p r e s s i v e s t r e n g t h
1258
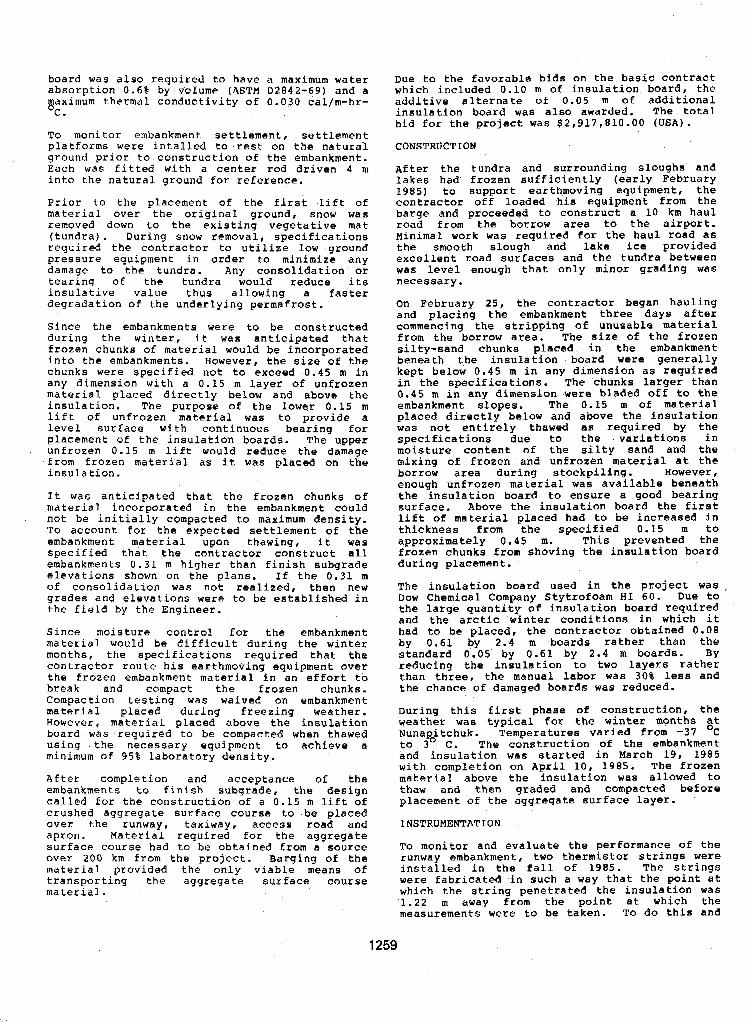
board was also r e q u i r e d to have a maximum w a t e r a b s o r p t i o n 0.6% by volume (ASTM D 2 8 4 2 - 6 9 ) and a
aximum t h e r m a l c o n d u c t i v i t y o f 0.030 cal /m-hr- % . To m o n i t o r embankment s e t t l e m e n t , s e t t l e m e n t p l a t f o r m s were i n t a l l e d t o - res t on t h e n a t u r a l g r o u n d p r i o r t o c o n s t r u c t i o n of t h e embankment. Each was f i t t e d w i t h a c e n t e r rod d r i v e n 4 m i n t o t h e n a t u r a l g r o u n d f o r r e f e r e n c e .
P r i o r t o t h e p l a c e m e n t of t h e Eirst l i f t of m a t e r i a l o v e r t h e o r i g i n a l g r o u n d , snow was removed down t o t h e e x i s t i n g v e g e t a t i v e m a t ( t u n d r a ) . D u r i n g snow r e m o v a l , s p e c i f i c a t i o n s r e q u i r e d t h e c o n t r a c t o r t o u t i l i z e low ground p r e s s u r e e q u i p m e n t i n order to minimize any damage t o t h e t u n d r a . Any c o n s o l i d a t i o n or t e a r i n g o f t h e tundra would reduce i t s i n s u l a t i v e v a l u e t h u s a l l o w i n g a f a s t e r d e g r a d a t i o n of t h e u n d e r l y i n g p e r m a f r o s t .
S i n c e t h e embankments were t o b e c o n s t r u c t e d d u r i n g t h e w i n t e r , it was a n t i c i p a t e d t h a t f r o z e n c h u n k s o f m a t e r i a l w o u l d b e i n c o r p o r a t e d i n t o t h e embankments. However, t h e s i z e of t h e chunks were s p e c i f i e d n o t t o exceed 0 . 4 5 m i n any d imens ion w i th a 0.15 m l a y e r of u n f r o z e n material p l a c e d d i r e c t l y b e l o w and a b o v e t h e i n s u l a t i o n . T h e p u r p o s e of t h e lower 0.15 m l i f t o f u n f r o z e n m a t e r i a l was t o p r o v i d e a l e v e l s u r f a c e w i t h c o n t i n u o u s b e a r i n g for p lacement of t h e i n s u l a t i o n b o a r d s . T h e u p p e r unf rozen 0 .15 m l i f t would reduce the damage from f r o z e n m a t e r i a l a s it was p l a c e d o n t h e i n s u l a t i o n ,
I t was a n t i c i p a t e d t h a t t h e f r o z e n c h u n k s of material i n c o r p o r a t e d i n t h e embankment could n o t b e i n i t i a l l y c o m p a c t e d t o maximum d e n s i t y . To a c c o u n t for t h e e x p e c t e d s e t t l e m e n t o f t h e embankment mater ia l upon thawing, i t was s p e c i f i e d t h a t t h e c o n t r a c t o r c o n s t r u c t a l l embankments 0 . 3 1 m h i g h e r t h a n f i n i s h s u b g r a d e e l e v a t i o n s shown on t h e p l a n s . I f t h e 0.31 m of c o n s o l i d a t i o n w a s n o t r e a l i z e d , t h e n new g r a d e s a n d e l e v a t i o n s were t o b e e s t a b l i s h e d i n t h e f i e l d by t h e E n g i n e e r .
m a t e r i a l w o u l d b e d i f f i c u l t d u r i n g t h e winter S i n c e moisture c o n t r o l f o r t h e embankment
months, t h e s p e c i f i c a t i o n s r e q u i r e d t h a t t h e c o n t r a c t o r r o u t e h i s e a r t h m o v i n g e q u i p m e n t o v e r t h e f r o z e n e m b a n k m e n t m a t e r i a l i n a n e f f o r t t o break and compact t h e f rozen chunks . Compact ion tes t ing was waived on embankment m a t e r i a l p l a c e d d u r i n g f r e e z i n g w e a t h e r . H o w e v e r , m a t e r i a l p l a c e d above t h e i n s u l a t i o n board was requi red t o be compacted when thawed u s i n g . t h e n e c e s s a r y e q u i p m e n t t o a c h i e v e a minimum of 95% l a b o r a t o r y d e n s i t y .
A f t e r c o m p l e t i o n a n d a c c e p t a n c e of t h e embankments t o f i n i s h s u b g r a d e , t h e d e s i g n c a l l e d f o r t h e c o n s t r u c t i o n o f a 0.15 m l i f t o f c r u s h e d a g g r e g a t e s u r f a c e course t o b e p l a c e d o v e r t h e runway, t ax iway, access road and a p r o n . M a t e r i a l r e q u i r e d for t h e a g g r e g a t e s u r f a c e c o u r s e h a d t o be ob ta ined f rom a source o v e r 200 km from t h e p r o j e c t . B a r g i n g of t h e m a t e r i a l p r o v i d e d the o n l y v i a b l e means of t r a n s p o r t i n g t h e a g g r e g a t e s u r f a c e course m a t e r i a l .
Due to t h e f a v o r a b l e b i d s on t h e b a s i c c o n t r a c t w h i c h inc luded 0 .10 m o f i n s u l a t i o n b o a r d , t h e a d d i t i v e a l t e r n a t e of 0.05 m o f a d d i t i o n a l
b i d f o r t h e p r o j e c t was $2,917,810.00 (USA) . i n s u l a t i o n board was a l so awarded. The t o t a l
CONSTRUCTION
A f t e r t h e t u n d r a a n d s u r r o u n d i n g s l o u g h s a n d l a k e s h a d f r o z e n s u f f i c i e n t l y ( e a r l y F e b r u a r y 1985) t o s u p p o r t e a r t h m o v i n g e q u i p m e n t , t h e c o n t r a c t o r o f€ l o a d e d h i s e q u i p m e n t f r o m t h e barge and proceeded t o c o n s t r u c t a 10 km h a u l r o a d from t h e b o r r o w a r e a t o t h e a i r p o r t . Minimal work was r equ i r ed for t h e h a u l r o a d a s
e x c e l l e n t r o a d s u r f a c e s a n d t h e t u n d r a b e t w e e n the smoo th s lough and l ake ice p r o v i d e d
was l e v e l e n o u g h t h a t o n l y m i n o r g r a d i n g was n e c e s s a r y .
On February 25 , t h e c o n t r a c t o r b e g a n h a u l i n g a n d p l a c i n g t h e e m b a n k m e n t t h r e e d a y s a f t e r commencing t h e s t r i p p i n g of u n u s a b l e material f rom the bo r row area. The s i z e o f t h e f r o z e n
b e n e a t h t h e i n s u l a t i o n b o a r d were g e n e r a l l y s i l t y - s a n d c h u n k s p l a c e d i n t h e embankment
kep t be low 0 . 4 5 m i n a n y d i m e n s i o n as r e q u i r e d i n t h e s p e c i f i c a t i o n s . The chunks larger t h a n 0.45 m i n a n y d i m e n s i o n were b l a d e d off t o t h e embankment slopes. The 0.15 m of material
was n o t e n t i r e l y t h a w e d as r e q u i r e d by t h e p l a c e d d i r e c t l y b e l o w a n d a b o v e t h e i n s u l a t i o n
m o i s t u r e c o n t e n t of t h e s i l t y s a n d a n d t h e s p e c i f i c a t i o n s d u e t o t h e v a r i a t i o n s i n
mixing of f r o z e n a n d u n f r o z e n material a t t h e b o r r o w a r e a d u r i n g s t o c k p i l i n g . enough unf rozen material was a v a i l a b l e b e n e a t h
However , t h e i n s u l a t i o n b o a r d t o e n s u r e a good bear ing s u r f a c e . Above t h e i n s u l a t i o n b o a r d t h e f i r s t l i f t of material p laced had t o b e i n c r e a s e d i n t h i c k n e s s f r o m t h e s p e c i f i e d 0 . 1 5 m t o a p p r o x i m a t e l y 0 . 4 5 m. T h i s p r e v e n t e d t h e f r o z e n c h u n k s f r o m s h o v i n g t h e i n s u l a t i o n b o a r d d u r i n g p l a c e m e n t .
T h e i n s u l a t i o n b o a r d u s e d i n t h e p r o j e c t was , Dow Chemical Company S t y t r o f o a m HI 6 0 . Due to t h e l a r g e q u a n t i t y of i n s u l a t i o n b o a r d r e q u i r e d a n d t h e a rc t ic w i n t e r c o n d i t i o n s i n w h i c h i t had to b e p l a c e d , t h e c o n t r a c t o r o b t a i n e d 0 . 0 8 by 0.61 by 2 . 4 m b o a r d s r a t h e r t h a n t h e s t a n d a r d 0.05 by 0.61 by 2 . 4 m b o a r d s . By r e d u c i n g t h e i n s u l a t i o n to two l a y e r s r a t h e r t h a n t h r e e , t h e m a n u a l l a b o r was 30% less and t h e c h a n c e of damaged boards was reduced .
D u r i n g t h i s f i r s t p h a s e o f c o n s t r u c t i o n , t h e w e a t h e r w a s t y p i c a l for t h e w i n t e r m o n t h s a t Nunapi tchuk. Tempera turee var ied f rom -37 OC t o 3' C. T h e c o n s t r u c t i o n of t h e embankment
w i t h c o m p l e t i o n o n A p r i l 1 0 , 1985. T h e f r o z e n And i n s u l a t i o n was s t a r t e d i n March 19, 1985
material a b o v e t h e i n s u l a t i o n was a l l o w e d t o thaw and then graded and compacted before p lacement of t h e a g g r e g a t e surface l a y e r .
INSTRUMENTATION
TO m o n i t o r a n d e v a l u a t e t h e p e r f o r m a n c e of t h e runway embankment, two t h e r m i s t o r s t r i n g s were i n s t a l l e d i n t h e f a l l of 1985. The s t r i n g s were f a b r i c a t e d i n s u c h a way t h a t t h e p o i n t a t which t h e s t r i n g p e n e t r a t e d t h e i n s u l a t i o n was 1 . 2 2 m away f rom the po in t a t which t h e measurements were t o b e t a k e n . To d o t h i s a n d
1259
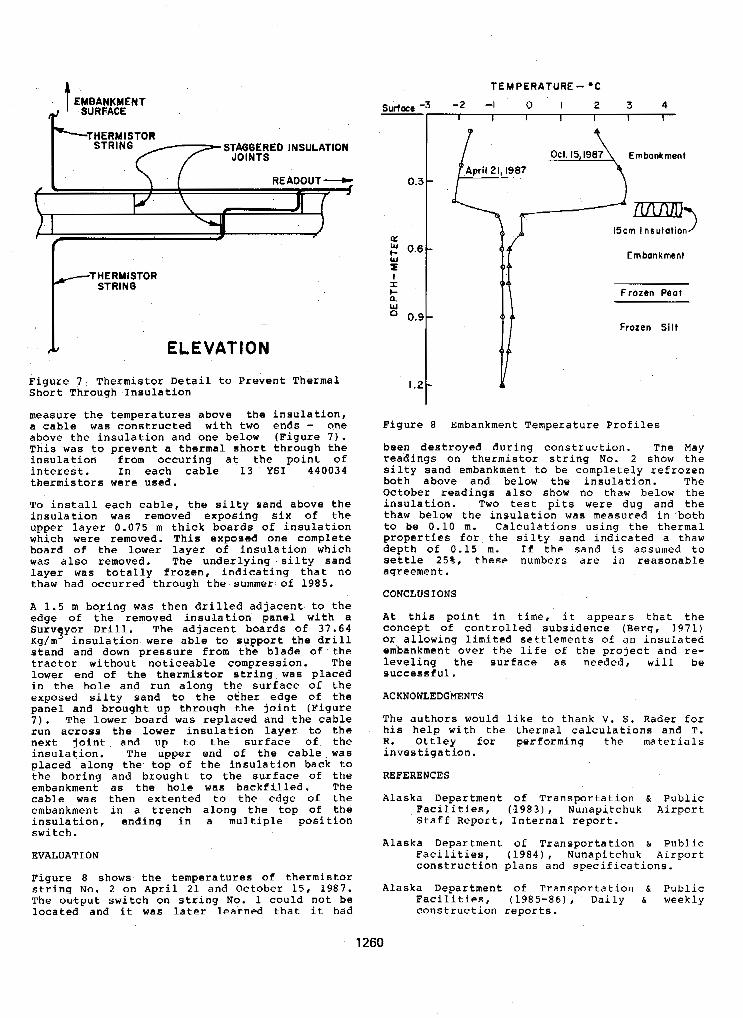
EMBANKMENT SURFACE
THERMISTOR STAGGERED INSULATION
JOINTS
STRING
.. .
I ELEVATION
F i g u r e 7 T h e r m i s t o r Detai l t o P reven t The rma l S h o r t T h r o u g h I n s u l a t i o n
measure t h e t e m p e r a t u r e s a b o v e t h e i n s u l a t i o n , a c a b l e was c o n s t r u c t e d w i t h two e n d s - one a b o v e t h e i n s u l a t i o n a n d o n e b e l o w ( F i g u r e 7 ) . T h i s was t o p r e v e n t a thermal s h o r t t h r o u g h t h e i n s u l a t i o r i f r o m o c c u r i n g a t t h e p o i n t of i n t e r e s t . I n e a c h c a b l e 1 3 YSI 440034 thermistors were used .
T o i n s t a l l each cable , t h e s i l t y s a n d a b o v e t h e i n s u l a t i o n was r e m o v e d e x p o s i n g s i x of t h e uppe r l aye r 0 .075 m t h i c k b o a r d s of i n s u l a t i o n which were removed. T h i s exposed one comple t e board of t h e Lower l a y e r of i n s u l a t i o n w h i c h was a l s o r e m o v e d . T h e u n d e r l y i n g s i l t y s a n d l a y e r was t o t a l l y f r o z e n , i n d i c a t i n g t h a t n o thaw had occu r red t h rough t he summer of 1985.
A 1.5 m b o r i n g w a s t h e n d r i l l e d a d j a c e n t t o t h e edge of t h e r e m o v e d i n s u l a t i o n p a n e l w i t h a Survgyor D r i l l . The a d j a c e n t b o a r d s o f 3 7 . 6 4 Kg/m i n s u l a t i o n were a b l e to s u p p o r t t h e d r i l l s t and and down p r e s s u r e f r o m t h e b l a d e of the t r a c t o r w i t h o u t n o t i c e a b l e c o m p r e s s i o n . T h e lower end of t h e thermistor s t r i n g was p laced i n t h e hole a n d r u n a l o n g t h e s u r f a c e of t h e e x p o s e d s i l t y s a n d t o t h e o t h e r e d g e of t h e pane l and b rough t up t h rough t h e j o i n t ( F i g u r e 7 ) . The lower board was r e p l a c e d a n d t h e c a b l e r u n a c r o s s t h e lower i n s u l a t i o n l a y e r t o t h e n e x t j o i n t a n d u p t o t h e s u r f a c e of t h e i n s u l a t i o n . T h e u p p e r e n d o f t h e c a b l e was p l a c e d a l o n g t h e t o p o f t h e i n s u l a t i o n b a c k t o t h e b o r i n g a n d b r o u g h t t o t h e s u r f a c e of t h e embankment as t h e hole was b a c k f i l l e d . T h e c a b l e was t h e n e x t e n t e d t o t h e e d g e of t h e embankment i n a t r e n c h a l o n g t h e t o p of t h e i n s u l a t i o n , e n d i n g i n a m u l t i p l e p o s i t i o n s w i t c h .
EVALUATION
F i g u r e 8 shows t h e t e m p e r a t u r e s of thermistor s t r i n g No. 2 o n A p r i l 21 and October 1 5 , 1987. T h e o u t p u t s w i t c h on s t r i n g No. 1 c o u l d n o t be loca ted and it was l a t e r l e a r n e d t h a t i t had
. . . . . - .
15cm I nsu1at ionI
Embankment
Frozen Peat
Frozen Silt
F i g u r e 8 Embankment Temperature Profiles
b e e n d e s t r o y e d d u r i n g c o n s t r u c t i o n . T h e May r e a d i n g s o n thermistor s t r i n g No. 2 show t h e s i l t y s a n d embankment t o b e c o m p l e t e l y r e f r o z e n both above and below t h e i n s u l a t i o n . T h e O c t o b e r r e a d i n g s a l s o show no thaw below t h e i n s u l a t i o n . Two t e s t p i t s were dug and t h e t h a w b e l o w t h e i n s u l a t i o n w a s m e a s u r e d i n b o t h t o be 0.10 m. C a l c u l a t i o n s u s i n g t h e t h e r m a l p r o p e r t i e s for t h e s i l t y s a n d i n d i c a t e d a thaw d e p t h of 0.15 m. I f t h e s a n d i s assumed t o se t t le 2 5 % , these numbers a r e in r e a s o n a b l e agreement .
CONCLUSIONS
A t t h i s p o i n t i n time, i t a p p e a r s t h a t t h e c o n c e p t of c o n t r o l l e d s u b s i d e n c e ( B e r g , 1 9 7 1 ) or a l l o w i n g l i m i t e d s e t t l e m e n t s of a n i n s u l a t e d embankment over the l i f e of t h e p r o j e c t a n d re- l e v e l i n g t h e s u r f a c e a s n e e d e d , will b e s u c c e s s f u l .
ACKNOWLEDGMENTS
The au thors would l i k e t o thank V. S . Rader for h i s h e l p w i t h t h e t h e r m a l c a l c u l a t i o n s a n d T. R. O t t l e y for p e r f o r m i n g t h e m a t e r i a l s i n v e s t i g a t i o n .
REFERENCES
A l a s k a Department of T r a n s p o r t a t i o n & P u b l i c F a c i l i t i e s , (1983), Nunap i t chuk A i rpo r t S t a f f R e p o r t , I n t e r n a l r e p o r t .
Alaska Department of T r a n s p o r t a t i o n & P u b l i c F a c i l i t i e s , (1984), Nunap i t chuk A i rpo r t c o n s t r u c t i o n p l a n s a n d s p e c i f i c a t i o n s .
Alaska Department of T r a n s p o r t a t i o n & P u b l i c F a c i l i t i e s , ( 1 9 8 9 - 8 6 1 , D a i l y & weekly c o n s t r u c t i o n r e p o r t s .
1260
* - r o t e c t l o n of Warm P e r m a f r o s t U s i n g C o n t r o l l e d S u b s i d e n c e a t N u n a p i t c h u k A i r p o r t
B e r g , R . L . , (1971), C o n t r o l l e d s u b s i d e n c e o f embankments o n p e r m a f r o s t , P a p e r fo r A d v a n c e d F o u n d a t i o n E n g i n e e r i n g Class, U n i v e r s i t y of A l a s k a , F a i r b a n k s . I
E s c h , D.C., ( 1 9 8 6 ) , E v a l u a t i o n of i n s u l a t e d h i g h w a y a n d a i r p o r t e m b a n k m e n t s . Alaska D e p a r t m e h t o f T r a n s p o r t a t i o n a n d P u b l i c F a c i l i t i e s R e p o r t No. AK-RD-86-34.
K e r s t e n , M . S . , ( 1 9 4 9 ) , T h e r m a l p r o p e r t i e s of soils. Univ . o f M i n n e s o t a , E n g i n e e r i n g E x p e r i m e n t S t a t i o n , B u l l . 2 8 .
K u l k a r n i , R . , S a r a f , C. F i n n , F. , H i l l i a r d , J. and Van T i l , C . , ( 1 9 8 2 ) , L i f e c y c l e c o s t i n g o f p a v e d A l a s k a n h i g h w a y s , Vol. I & I I . , Alaska D e p a r t m e n t of T r a n s p o r t a t i o n & P u b l i c F a c i l i t i e s , R e p o r t No. AK-RD-83- 6 .
N e l s o n , R.A. , L u s c h e r , U . , Rooney, L.W. a n d S t r a m l e r , A.R., ( 1 9 8 3 ) , Thaw s t r a i n d a t a and thaw s e t t l e m e n t : p r e d i c t i o n s for A l a s k a n s o i l s , P r o c e e d i n g s of t h e F o u r t h I n t e r n a t i o n a l C o n f e r e n c e o n P e r m a f r o s t , F a i r b a n k s , pp. 912-917.
P a v e y , D . R . , ( 1 9 8 3 ) , C e n t e r l i n e a n d b o r r o w mater ia l s r e p o r t fo r N u n a p i t c h u k Airport , Alaska D e p a r t m e n t .of T r a n s p o r t a t i o n a n d P u b l i c F a c i l i t i e s .
U.S. D e p a r t m e n t s of t h e Army a n d A i r F o r c e ,
c o n s t r u c t i o n - c a l c u l a t i o n m e t h o d s f o x d e p t h s of f r e e z e a n d thaw i n s o i l . TM-5- 852-6.
(1966 1 Arctic a n d S u b a r c t i c
1261
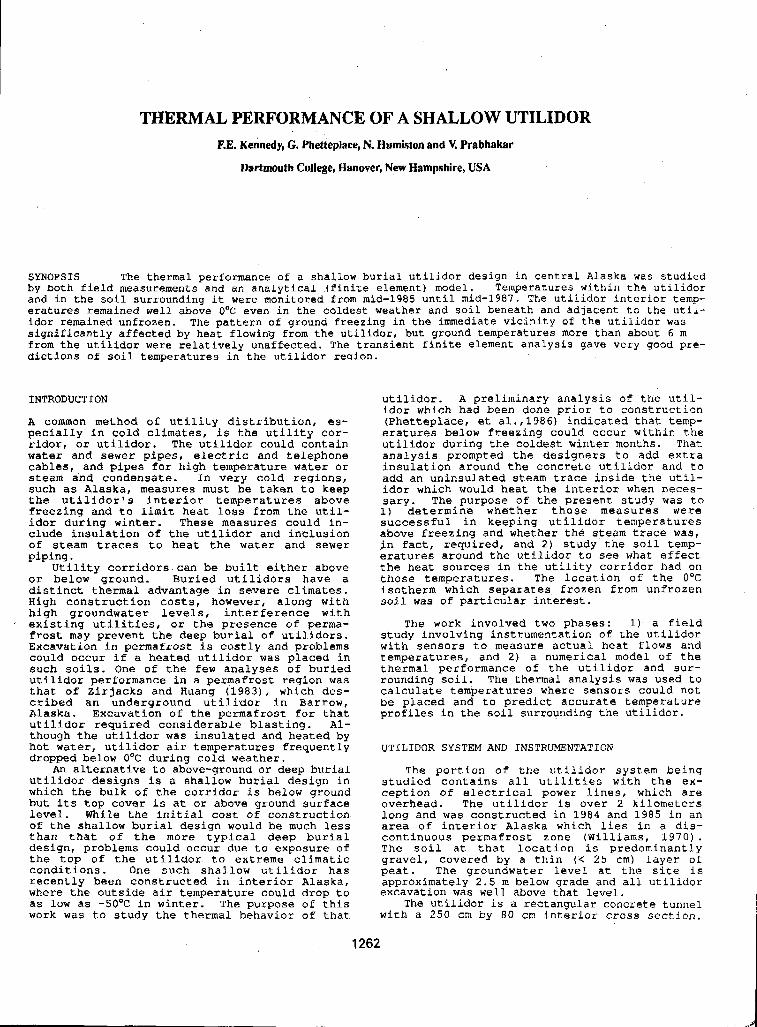
THERMAL PERFORMANCE OF A SHALLOW UTILIDOR F.E. Kennedy, C. Phetteplace, N. Humiston and V. Prabhakar
Dartmouth College, Banover, New Hampshire, USA
SYNOPSIS The thermal performance of a shallow burial utilidor design in central Alaska was studied by both field measurements and an analytical (finite element) model. Temperatures within the utilidor
eratures remained well above O'C even in the coldest weather and soil beneath and adjacent to the util- and in the soil surrounding it were monitored from mid-1985 until mid-1587. The utilidor interior temp-
significantly affected by heat flowing from the utilidor, but ground temperatures more than about 6 m idor remained unfrozen, The pattern of ground freezing in the immediate vicinity of the utilidor was
dictions of Soil temperatures in the utilidor reqion. from the utilidor were relatively unaffected. The transient finite element analysis gave very good pre-
INTRODUCTION
A common method of utility distribution, es- pecially in cold climates, i s the utility cor- ridor, or utilidor. The utilidor could contain water and sewer pipes, electric and telephone cables, and pipes for high temperature water or steam and condensate. In very cold regions,
the utilidor's interior temperatures above such as Alaska, measures must be taken to keep
freezing and to limit heat loss from the util- idor during winter. These measures could in- clude insulation of the utilidor and inclusion of steam traces to heat the water and sewer
Utility corridors can be built either above or below ground. Buried utilidors have a distinct thermal advantage in severe climates. High construction costs, however, along with high groundwater levels, interference with existing utilities, or the presence of perma- frost may prevent the deep burial of utilidors. Excavation in permafrost is costly and problems could occur if a heated utilidor was placed in such soils. One of the few analyses of buried utilidor performance in a permafrost region was that of Zirjacks and Huang (1983), which des- cribed an underground utilidor in Barrow, Alaska. Excavation of the permafrost for that utilidor required considerable blasting. Al- though the utilidor was insulated and heated by hot water, utilidor air temperatures frequently dropped below O°C during cold weather.
utilidor designs is a shallow burial design in An alternative to above-ground or deep burial
which the bulk of the corridor i s below ground but its top cover is at or above ground surface level, While the initial cost of construction of the shallow burial design would be much less than that of the more typical deep burial design, problems could occur due to exposure of the top of the utilidor to extreme climatic conditions. One such shallow utilidor has recently been constructed in interior Alaska, where the outside air temperature could drop to as low as -5OOC in winter. The purpose of this work was to study the thermal behavior of that
piping
1262
utilidor. A preliminary analysis of the util- idor which had been done prior to construction (Phettepldce, et al, , 1986) indicated that temp- eratures below freezing could occur within the utilidor during the coldest winter months. That analysis prompted the designers to add extra insulation around the concrete utilidor and to add an uninsulated steam trace inside the util- idor which would heat the interior when neces- sary. The purpose of the present study was to 1) determine whether those measures were successful in keeping utilidor temperatures above freezing and whether the steam trace was, in fact, required, and 2) study the soil temp- eratures around the utilidor to see what effect the heat sources in the utility corridor had on those temperatures. The location of the 0°C isotherm which separates frozen from unfrozen soil was of particular interest.
The work involved two phases: 1) a field study involving instrumentation of the utilidor with sensors to measure actual heat flows and temperatures, and 2 ) a numerical model of the thermal performance of the utilidor and sur- rounding soil. The thermal analysis was used to
be placed and to predict accurate temperature calculate temperatures where sensors could not
profiles i n the soil surrounding the utilidor.
UTILIDOR SYSTEM AND INSTRUMENTATION
The portion of the utilidor system being studied contains all utilities with the ex- ception of electrical power lines, which are overhead. The utilidor is over 2 kilometers long and was constructed in 1984 and 1985 in an area of interior Alaska which lies in a dis-
The soil at that location is predominantly continuous permafrost zone (Williams, 1970).
gravel, covered by a thin (< 25 cm) layer of peat. The groundwater level at the site is approximately 2.5 m below grade and all utilidor excavation was well above that level.
The utilidor is a rectangular concrete tunnel with a 250 cm by 80 crn interior cross section.
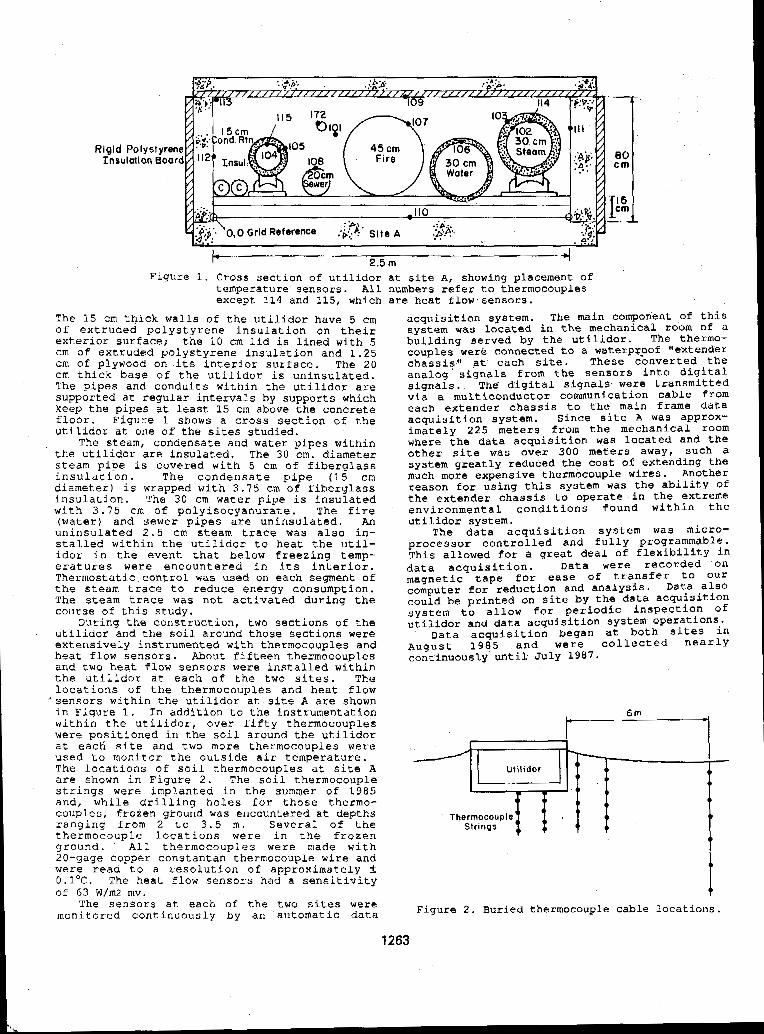
Rigid Ins1
it yl BC
Figure 1. Cross section of utilidor at site A, showing placement Of temperature sensors. A 1 1 numbers refer to thermocouples except 114 and 115, which are heat flow sensors.
The 15 cm thick walls of the utilidor have 5 cm
exterior surface; the 10 cm lid is lined with 5 of extruded polystyrene insulation on their
cm of extruded polystyrene insulation and 1.25 crn of plywood on its interior surface. The 20 cm thick base of the utilidor is uninsulated. The pipes and conduits within the utilidor arc supported at regular intervals by supports which keep the pipes at least 15 cm above the concrete floor. Figure 1 shows a cross section of the utilidor at one of the sites studied.
The steam, condensate and water pipes within the utilidor are insulated, The 30 cm. diameter steam pipe is covered with 5 crn of fiberglass insulation. The condensate pipe (15 cm diameter) is wrapped with 3 .75 cm o f fiberglass insulation. The 30 cm water pipe is insulated with 3.75 cm of polyisocyanurate. The fire (water) and sewer pipes are uninsulated. An uninsulated 2.5 cm steam trace was also in- stalled within the utilidor to heat the util- idor in the event that below freezing temp- eratures were encountered in its interior. Thermostatic control was used on each segment of the steam trace to reduce energy consumption. The steam trace was n o t activated during the course o f this study.
utilidor and the soil around those sections were During the construction, two sections o f the
extensively instrumented with thermocouples and heat flow sensors. About fifteen thermocouples and two heat flow sensors were installed within the utilidor at each o f the two sites. The locations of the thermocouples and heat f low 'sensors within the utilidor at site A are shown in Figure 1. In addition to the instrumentation within the utilidor, over fifty thermocouples were positioned in the soil around the utilidor at each site and two more thermocouples were used to monitor the outside air temperature. The locations of soil thermocouples at site A are shown in Figure 2. The soil thermocouple strings were implanted in the summer of 1985 and, while drilling holes f o r those thermo- couples, frozen ground was encountered at depths ranging from 2 to 3 . 5 m. Several o f the thermocouple locations were in the frozen ground. All thermocouples were made with 20-gage copper constantan thermocouple wire and were read to a resolution of approximately f 0 . 1 O C . The heat flow sensors had a sensitivity of 6 3 W/m2 mv.
The sensors at each af the two sites were monitored continuously by an automatic data
acquisition system. The main component of this
building served by the utilidor. The thermo- system wad located in the mechanical room of a
couples were connected to a waterpqoof "extender chassis" at each site. These converted the analog signals from the sensor3 into digital signals.. The' digital signals were transmitted v i a a multiconductor communication cable from each extender chassis to the main frame data acquisition system. Since site a was approx- imately 2 2 5 meters from the mechanical room where the data acquisition was located and the other site was over 300 meters away, such a system greatly reduced the cost o f extending the much more expensive thermocouple wires. Another
the extender chassis to operate in the extreme reason for using this system was the ability of
environmental conditions found within the utilidor system.
The data acquisition system was micro- processor controlled and fully programmable. This allowed for a great deal of flexibility in data acquisition. Data were recorded on magnetic tape for ease of transfer to our computer for reduction and analysis. Data also could be printed on site by the data acquisition system to allow for periodic inspection of utilidor and data acquisition system operations.
Data acquisition began at both site9 in August 1985 and were collected nearly continuously until. July 1987.
6 m
1 1
Utilidor
# I
Thermocouple
I )
t 1
Figure 2 . Buried thermocouple cable locations;
1263
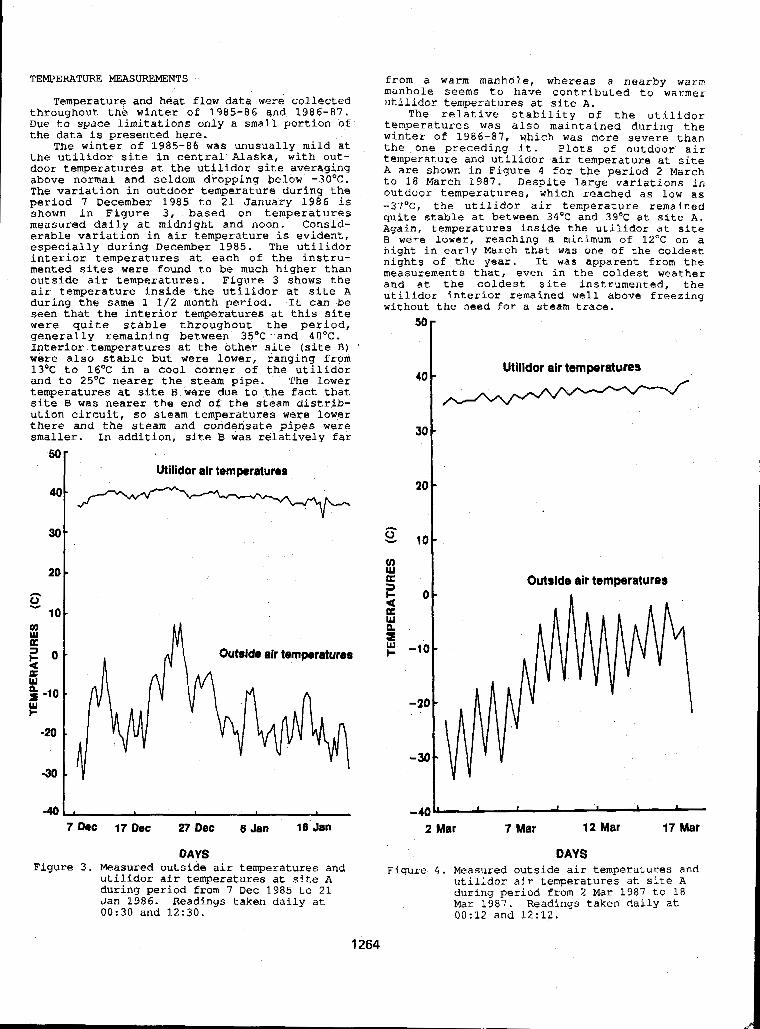
TEMPERATURE MEASUREMENTS
Temperature and heat flow data were collected throughout the winter of 1985-86 and 1986-87. Due to space limitations only a small portion of' the data is presented here.
The winter of 1985-86 was unusually mild at the utilidor site in central Alaska, with out- door temperatures at the utilidor site averaging above normal and seldom dropping below -30°C.
period 7 December 1985 to 21 January 1986 is The variation in outdoor temperature during the
shown in Figure 3 , based on temperatures measured daily at midnight and noon. Consid- erable variation in air temperature is evident, especially during December 1985. The utilidor
mented sites were found to be much higher than interior temperatures at each of the instru-
outside air temperatures. Figure 3 shows the air temperature inside the utilidor at site A during the same 1 1/2 month period. It can be
were quite stable throughout the period, seen that the interior temperatures at this site
generally remaining between 35OC. and 40°C. Interior temperatures at the other site (site B) '
were also stable but were lower, ranging from 13OC to 16OC in a cool corner of the utilidor and to 25OC nearer the steam pipe. The lower temperatures at site I3 were due to the fact that site B was nearer the end of the steam distrib- ution circuit, so steam temperatures were lower there and the steam and condensate pipes were smaller. In addition, site B was relatively far
Utilidor air tempersturea
40t 1
from a warm manhole, whereas a nearby warm manhole seems to have contributed to warmer utilidor temperatures at site A .
The relative stability o f the utilidor temperatures was also maintained during the winter of 1986-87, which was more severe than the one preceding it. P l o t s of outdoor air
A are shown in Figure 4 €or the period 2 March temperature and utilidor air temperature at site
to 18 March 1987, Despite large variations in outdoor temperatures, which reached as low as -37OC, the utilidor air temperature remained quite stable at between 34°C and 39'C at site A . Again, temperatures inside the utilidor at site B were lower, reaching a minimum of 12'C on a night in early March that was one of the coldest nights of the year. It was apparent from the measurements that, even in the coldest weather and at the coldest site instrumented, the utilidor interior remained well above freezing without the need f o r a steam trace.
"r
_I 20
tn W E ' O I 0 -
PE 4 w n p -10.
-20 '
- 30
Outside air temperatures
-40 L I 1 I 1 1
7 b C 17 Dec 27 Dec 6Jan 16-Jen 2 Mar 7 Mar 12 Mar 17 Mar
DAYS DAYS Figure 3 . Measured outside air temperatures and Figure 4. Measured outside air temperatures and
utilidor air temperatures at site A during period from 7 Dec 1985 to 21 Jan 1986. Readings taken daily at 00:30 and 12:30.
utilidor air temperatures at site A during period from 2 Mar 1987 to 18 Mar 1987. Readings taken daily at 00:12 and 12:12,
1264
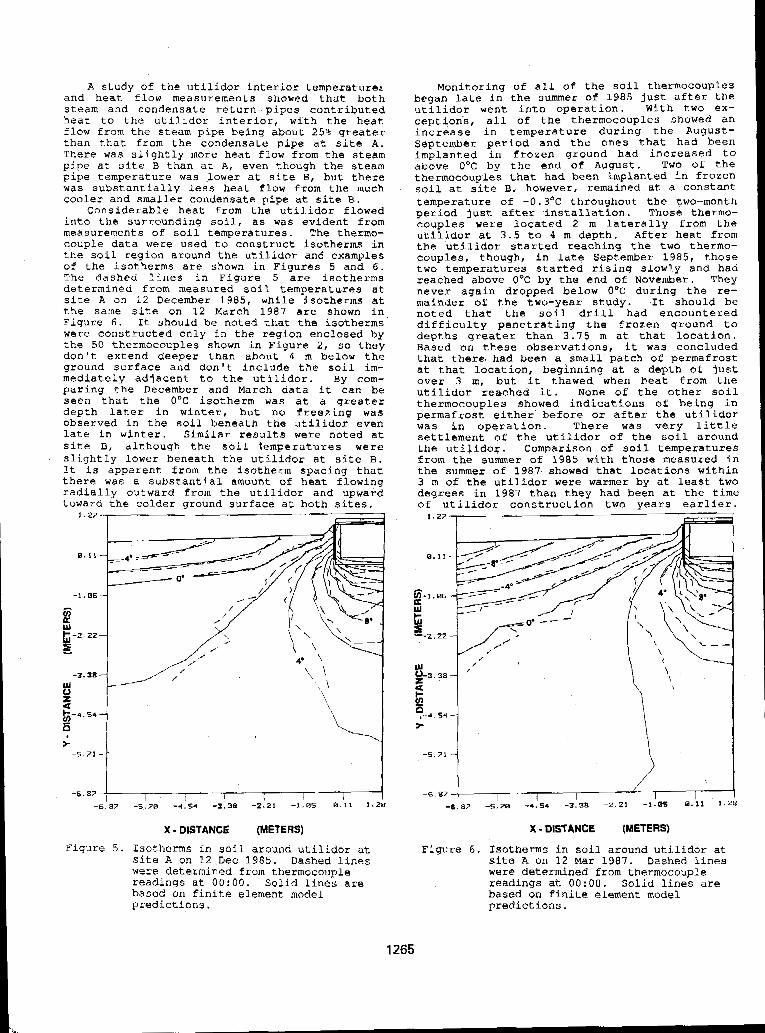
and heat f low measurements showed that both A s tudy of t h e u t i l i d o r i n t e r i o r t e m p e r a t u r e :
h e a t t o t h e u t i l i d o r i n t e r i o r , w i t h t h e h e a t s t eam and condensa te r e tu rn p ipes con t r ibu ted
flow from t h e s team pipe being about 25% greater t h a n t h a t f r o m t h e c o n d e n s a t e p i p e a t s i t e A . There was s l i g h t l y more heat flow from the steam p i p e a t s i t e B t han a t A, even though t h e steam pipe t empera ture was .lower a t s i t e B , b u t there was s u b s t a n t i a l l y less heat flow from t h e much cooler and smaller condensate pipe a t s i te E.
Considerable hea t f rom the u t i l i d o r f l o w e d i n t o t he s u r r o u n d i n g s o i l , as was evident f rom measurements of soi l temperatures . The thermo- couple da ta were used t o c o n s t r u c t i s o t h e r m s i n t h e s o i l r e g i o n a r o u n d the u t i l idor and examples of t h e i s o t h e r m s a r e shown i n F i g u r e s 5 and 6. The d a s h e d l i n e s i n F i g u r e 5 are i s o t h e r m s de te rmined f rom measu red so i l t empera tu res a t s i t e A on 1 2 December 1985, wh i l e i so the rms a t t h e same s i t e on 1 2 March 1 9 8 7 a r e shown i n F igure 6 . I t should be noted t h a t the i so therms were cons t ruc t ed on ly i n t he r eg ion enc losed by t h e 50 thermocouples shown i n F i g u r e 2, so t h e y don ' t ex tend deeper than about 4 m be low the g r o u n d s u r f a c e a n d d o n ' t i n c l u d e t h e s o i l i m - m e d i a t e l y a d j a c e n t t o t he u t i l i d o r . By com- p a r i n g t h e December and March d a t a it can be s e e n t h a t t h e O'C i so the rm was a t a g r e a t e r d e p t h l a t e r i n w i n t e r , b u t n o f r e e z i n g was obse rved i n the s o i l b e n e a t h t h e u t i l i d o r e v e n l a t e i n w i n t e r . S i m i l a r results were noted a t s i t e B, a l t h o u g h the s o i l t e m p e r a t u r e s w e r e s l i gh t ly l ower benea th the u t i l i d o r a t s i t e B .
t h e r e was a s u b s t a n t i a l amount of hea t f l owing I t i s apparent f rom the i so therm spac ing t h a t
rad ia l ly ou tward f rom t h e u t i l i d o r a n d upward toward the co lde r g round su r f ace a t bo th s i tes .
1.27
0.11
-1.06
K Y
E
; -2- 22
5 \
; i -5.71
X - DISTANCE (METERS)
Figure 5 , I so therms in s o i l a r o u n d u t i l i d o r a t s i t e A on 12 Dec 1985. Dashed l i nes were determined from thermocouple r e a d i n g s a t 0 O : O O . S o l i d l i n e s a r e based on f i n i t e e l e m e n t model p r e d i c t i o n s .
\ \ - \
,\ \
28
began l a t e i n t h e summer of 1985 j u s t a f te r t h e Monitoring o f a l l of t h e s o i l thermocouples
u t i l i d o - r went i n t o o p e r a t i o n . With two ex- c e p t i o n s , a l l o f t h e thermocouples showed an i n c r e a s e i n t e m p e r a t u r e d u r i n g t h e August- September period and t h e ones t h a t had been i m p l a n t e d i n f r o z e n g r o u n d h a d i n c r e a s e d t o above DOC by t h e end of August. Two Of t he the rmocoup les t ha t had been imp lan ted i n f rozen s o i l a t s i t e B. however, remained a t a cons t an t t empera tu re of -0 .3 'C th roughout t he two-month period j u s t a f te r in s t a l l a t ion . Those t he rmo- coup les were l o c a t e d 2 m l a t e r a l l y f r o m t h e u t i l i d o r a t 3.5 t o 4 m dep th , A f t e r heat from the u t i l i d o r started reach ing the two thermo- couples , though, in l a t e September 1985, those two tempera tures started r i s i n g s l o w l y a n d had reached above O°C by t h e end of November. They never again dropped below O°C d u r i n g the re- mainder of t he two-year s tudy. I t should be n o t e d t h a t t h e s o i l d r i l l had encoun te red d i f f i c u l t y p e n e t r a t i n g t h e f r o z e n g r o u n d t o d e p t h s g r e a t e r t h a n 3 . 7 5 m a t t h a t l o c a t i o n . Based on these obse rva t ions , it was concluded tha t there. had been a small pa tch o f permafros t a t t ha t l o c a t i o n , b e g i n n i n g a t a depth of j u s t ove r 3 m, b u t it thawed when hea t f rom t h e u t i l i d o r r e a c h e d i t . None of the o t h e r s o i l thermocouples showed ind ica t ions of b e i n g i n permafros t e i ther ' b e f o r e or a f t e r t h e u t i l i d o r was i n o p e r a t i o n . There was v e r y l i t t l e s e t t l e m e n t o f t h e u t i l i d o r o f the s o i l a r o u n d t h e u t i l i d o r . Comparison of s o i l t e m p e r a t u r e s from t h e summer of 1985 wi th those measured in the summer of 1987 showed t h a t l o c a t i o n s w i t h i n
d e g r e e s i n 1987 than t hey had been a t the time 3 m o f the u t i l i d o r were warmer by a t least two
o f u t i l i d o r c o n s t r u c t i o n t w o years e a r l i e r .
?-4.54
-5.71
-6 .87 1 /
I I I I I - 6 . 8 7 -5.78 -4.54 -3.38 -2.21 -1.05 8.11 I . '
X - DISTANCE (METERS)
Figure 6 . I s o t h e r m s i n s o i l a r o u n d u t i l i d o r a t S i t e A on 12 Mar 1987. Dashed l i n e s were determined from thermocouple readings a t 0O:OO. S o l i d l i n e s are based on f i n i t e e l e m e n t model p r e d i c t i o n s .
1265
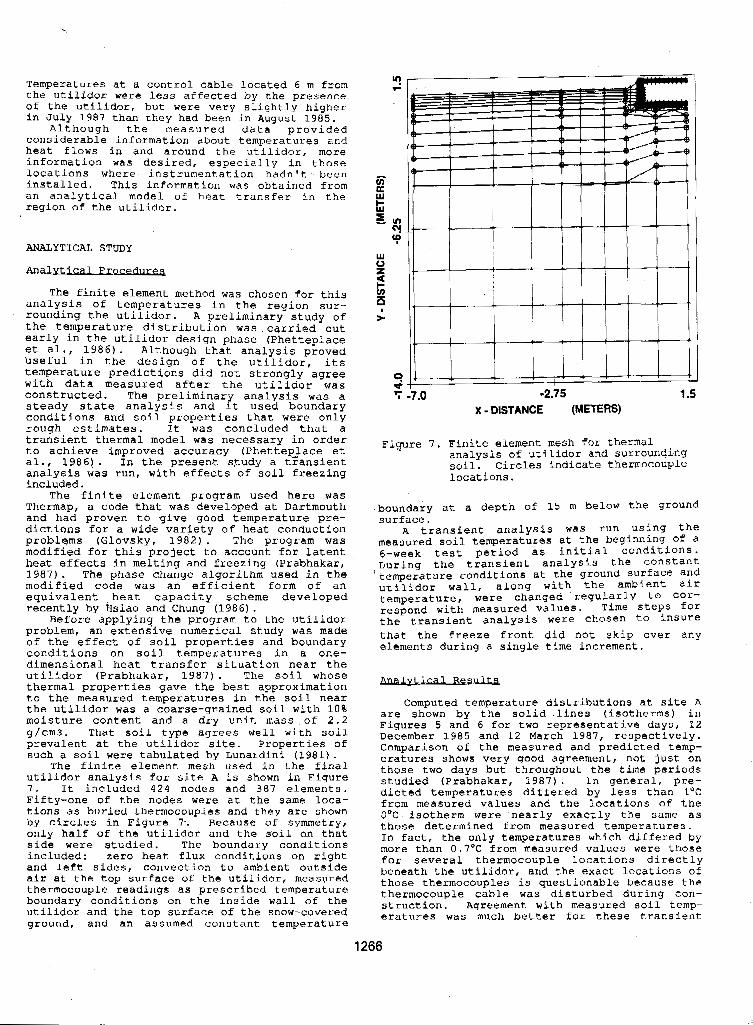
x,
Tempera tures a t a c o n t r o l c a b l e l o c a t e d 6 m from t h e u t i l i d o r were less a f f e c t e d by t h e presence o f the u t i l i d o r , b u t were v e r y s l i g h t l y h i g h e r i n J u l y 1987 than they had been in August 1985.
A l t h o u g h t h e measu red d a t a p r o v i d e d
hea t f l ows i n and a round t h e u t i l i d o r , more cons iderable in format ion about temperatures and
i n f o r m a t i o n was d e s i r e d , e s p e c i a l l y i n t h o s e l o c a t i o n s w h e r e i n s t r u m e n t a t i o n h a d n ' t b e e n i n s t a l l e d . This in format ion was obtained from a n a n a l y t i c a l m o d e l o f h e a t t r a n s f e r i n t h e r e g i o n o f t h e u t i l i d o r .
ANALYTICAL STUDY
The f i n i t e element method was chosen for th is a n a l y s i s Of t e m p e r a t u r e s i n t he r e g i o n s u r - rounding the u t i l i d o r . A pre l imina ry s tudy o f t h e t e m p e r a t u r e d i s t r i b u t i o n was c a r r i e d o u t e a r l y i n the u t i l i d o r d e s i g n p h a s e ( P h e t t e p l a c e e t a l a , 1986). A l t h o u g h t h a t a n a l y s i s p r o v e d u s e f u l i n the d e s i g n o f t h e u t i l i d o r , i t s
w i t h d a t a m e a s u r e d a f t e r t h e u t i l i d o r was t empera tu re p r e d i c t i o n s d i d n o t s t r o n g l y a g r e e
c o n s t r u c t e d . T h e p r e l i m i n a r y a n a l y s i s was a s t e a d y s t a t e a n a l y s i s a n d it used boundary c o n d i t i o n s a n d s o i l p r o p e r t i e s t h a t were on ly r o u g h e s t i m a t e s . I t was conc luded t h a t a t r a n s i e n t t h e r m a l model was necessa ry i n o r d e r t o a c h i e v e i m p r o v e d a c c u r a c y ( P h e t t e p l a c e e t aL., 1986) . I n t he p r e s e n t s.tudy a t y a n s l e n t a n a l y s i s was run, w i t h e f f e c t s o f s o i l f r e e z i n g inc luded ,
The f i n i t e e l e m e n t p r o g r a m u s e d h e r e was Thermap, a c o d e t h a t was developed a t Dartmouth and had p r o v e n t o g i v e g o o d t e m p e r a t u r e p r e - d i c t i o n s f o r a wide v a r i e t y o f hea t conduc t ion problems (Glovsky , 1982) . The program was m o d i f i e d f o r th i s p r o j e c t t o a c c o u n t f o r l a t e n t h e a t effects in me l t ing and f r eez ing (P rabhaka r , 3 9 8 7 ) . The phase change a lgor i thm used i n the m o d i f i e d c o d e w a s a n e f f i c i e n t ' f o r m o f a n e q u i v a l e n t h e a t c a p a c i t y scheme d e v e l o p e d r e c e n t l y by Hsiao and Chung ( 1 9 8 6 ) .
B e f o r e a p p l y i n 9 the program t o the u t i l i d o r problem, an extensive numerical s tudy was made o f t h e effect o f s o i l p r o p e r t i e s a n d b o u n d a r y c o n d i t i o n s o n s o i l t e m p e r a t u r e s i n a one-
u t i l l d o s ( P r a b h a k a r , 1 9 8 7 ) . The s o i l whose d i m e n s i o n a l h e a t t r a n s f e r s i t u a t i o n n e a r the
t h e r m a l p r o p e r t i e s g a v e t h e b e s t a p p r o x i m a t i o n t o t h e m e a s u r e d t e m p e r a t u r e s i n t h e soil n e a r the u t i l i d o r was a c o a r s e - g r a i n e d s o i l w i t h 1 0 % m o i s t u r e c o n t e n t a n d . a d r y u n i t m a s s o f 2 . 2 g/cm3. That s o i l t y p e a g r e e s w e l l w i t h s o i l p r e v a l e n t a t t h e u t i l i d o r s i t e . P r o p e r t i e s O f such a soil were t a b u l a t e d by Lunardini ( 1 9 8 1 ) .
The f i n i t e e l e m e n t mesh u s e d i n t h e f i n a l u t i l i d o r a n a l y s i s f o r s i t e A i s shown i n F igu re 7 . I t i n c l u d e d 4 2 4 nodes and 387 e l emen t s . F i f ty-one of t h e nodes were a t t h e same loca- t i o n s a s b u r i e d thermocouples and they are shown by circles i n F i g u r e 7.. Because of symmetry, o n l y h a l f of t h e u t i l i d o r a n d the s o i l on t h a t s i d e were s t u d i e d . The boundary cond i t ions i n c l u d e d : z e r o h e a t f l u x c o n d i t i o n s on r i g h t and l e f t sides, c o n v e c t i o n t o a m b i e n t o u t s i d e a i r a t the t o p s u r f a c e o f t h e u t i l i d o r , measured
boundary cond i t ions on t he i n s ide wa l l o f t h e thermocouple readings as p rescr ibed tempera ture
u t i l i d o r a n d t h e t o p s u r f a c e of t h e snow-covered ground, and an assumed cons tan t t empera ture
I I I I 1 I I I 1 t I I
~
7 .O -2.75 1.5 X - DISTANCE (METERS)
Ficp re 7 . Fin i t e e l emen t mesh for thermal a n a l y s i s of u t i l i d o r and s u r r o u n d h g s o i l . Circles indicate thermocouple l o c a t i o n s .
boundary a t a dep th of 1 5 m below the ground s u r f a c e .
A t r a n s i e n t a n a l y s i s was r u n u s i n g t h e measured s o i l t e m p e r a t u r e s a t t h e b e g i n n i n g Of a 6-week t e s t p e r i o d as i n i t i a l c o n d i t i o n s . Dur ing t h e t r a n s i e n t a n a l y s i s t h e C o n s t a n t t empera tu re cond i t ions a t t he g round su r f ace and u t i l i d o r w a l l , a l o n g w i t h t h e a m b i e n t a i r t e m p e r a t u r e , were c h a n g e d r e g u l a r l y t o Cor-
t he t r a n s i e n t a n a l y s i s w e r e c h o s e n t o i n s u r e respond w i t h measured values . Time s t e p s f o r
e lements during a s ing le t ime increment . t h a t t he f r e e z e f r o n t d i d n o t s k i p Over any
Computed t e m p e r a t u r e d i s t r i b u t i o n s a t s i t e A a r e shown b y t h e s o l i d . l i n e s ( i s o t h e r m s ) i n F igu res 5 and 6 f o r two r ep resen ta t ive days , 1 2 December 1985 and 12 March 1987, r e s p e c t i v e l y . Comparison of the measured and predicted temp-
t h o s e two days but throughout t h e time periods e r a t u r e s shows very good agreement, not just on
d i c t e d t e m p e r a t u r e s d i f f e r e d by l e s s t h a n l0C s t u d i e d ( P r a b h a k a r , 1 9 8 7 ) . I n g e n e r a l , p r e -
from measured values and the l o c a t i o n s o f t h e O°C isotherm w e r e n e a r l y e x a c t l y t he same a s those de te rmined f rom measured tempera tures . I n f a c t , the only t empera tures which d i f fe red by more than 0 . l ° C from measured values were those
b e n e a t h t h e u t i l i d o r , a n d t h e e x a c t l o c a t i o n s of f o r s e v e r a l . t h e r m o c o u p l e l o c a t i o n s d i r e c t l y
those thermocouples i s ques t ionab le because t he thermocouple cable was d i s tu rbed du r ing con- s t r u c t i o n . Agreement w i t h measu red so i l temp- e r a t u r e s was much bet ter f o r t h e s e t r a n s i e n t
1266
analyses than had been the case for the earlier steady-state analysis (Phetteplace, et al. 1986).
The isotherms presented in Figures 5 and 6 offer convincing evidence that no freezing occurs in the soil beneath or adjacent to the utilidor, irrespective o f outdoor air temperature or time of year. The analysis predicts that soil temperatures reached 2'C or higher at depths down to at least 15 m in the region within 6 meters of the utilidor at site A . These temperatures would have a very significant effect on the annual patterns o f freezing and thawing of the soil in that region.
CONCLUSIONS
The measurements and predictions of this work showed that temperatures within and around this shallow utilidor did not drop below freezing at the sites instrumented, even during the cold winter weather in central Alaska. The presence o f a large steam pipe, even though it was insu-
above 30°C throughout the year at site A and lated, kept utilidor interior air temperatures
above 10°C at the colder site, site B. A steam trace placed within the utilidor for emergency heating o f the corridor proved to be unneces- sary. Temperatures in the soil beneath and adjacent to the utilidor were also kept above O'C by heat conducted from the warm utilidor. Soil temperatures beneath the utilidor at site A increased to above 2OC to depths of at Least 15 m, preventing any freezing of that soil. There was evidence that a small patch of permafrost was initially present at a depth of slightly over 3 m near the utilidor at site B. Whereas the temperature at that location had been constant at about -0.3OC for an extended period at the time of utilidor construction, once heat from the utilidor reached that region the temperature increased slowly to above O°C and remained above freezing throughout the remainder of the two-year study. At lateral distances of 6 m from the utilidor the ground froze to depths of greater than 3 m during the winter, but even there the soil temperatures were slightly influenced by heat conducted from the utilidox and at greater depths the temperature remained above O'C.
predict temperatures around the utilidor proved The transient finite element analysis used to
to be quite accurate. Predictions of soil temperatures and O°C isotherm location agreed very well with measured values. At present the analysis relies on the specification of measured utilidor wall temperatures as time-varying boundary conditions. Since those temperatures are not usually known a priori to the designer, the program is currently more useful as an analysis tool than as an aid in design. A more complete study of heat t r a n s f e r within the utilidor is planned, with the goal being a better understanding of heat transfer coef- ficients from the various heat sources, such as steam pipes. This would eliminate the need for measured utilidor temperatures and would increase the effectiveness of the program as a utilidor design aid.
ACKNOWLEDGEMENTS
The authors acknowledge and thank the following persons for their contributions: S. Lederman of the U . S . Army Corps of Engineers Alaska District, whose cooperation and knowledge of the study sites were invaluable; H. Barger, Eielson Energy Engineer, who was instrumental in obtaining funding and monitoring the data collection system; and, finally, the W.S. Air Force for providing the funding for the field study.
REFERENCES
Glovsky, R.P. (1982) . Development and Application o f Thermap. Master of Engineering Thesis, Thayer School of Enginepring,Dartmouth College,Hanover,NH.
Hsiao, J.S. and Chung, B.T.F. (1986) . An Efficient Algorithm for Finite Element Solution+to Two-DimensionaL Heat Transfer with Melting and Freezing. ASME Journal o f Heat Transfer (108) , 462-464.
Lunardini, V. J. (1981) . Heat Transfer In Cold Climates, Van Nostrand Reinhold, New York
Phetteplace,G., Richmond,P. and Humiston,N. (1986). Thermal Analysis o f a Shallow Utilidor., Presented at 77th Annual Conference of International District Heating and Cooling Association, Asheville, NC.
Utilidors. Master of Engineering Thesis, Thayer School bf Engineering, Dartmouth College, Hanover, NH.
Williams, J.R. (1970). Ground Water in the Permafrost Regions of Alaska, U . S . Geological Survey Professional Paper # 696
Underground Utilidors at Barrow, Alaska: A Two-Year History. Proc. 4th Int'l Conf on Permafrost, National Academy Press, Washington, DC, 1513-1517
Prabhakar, V. (1987). Heat Transfer from
Zirjacks, W.L. and Hwang, C.T. (1983)
1267
CONSTRUCTION OF HYDROS IN COLD CLIMATE: ACHIEVEMENTS AND PROBLEMS
L.I. Kudoyarov' and N.F. Krivonogovaz
Whe V.V. Kuibyshev MISI, Moscow, USSR %The B.E. Vedeneev VNIIG, Leningrad, USSR
SYNOPSIS Specific features of hydros under design, construAion and operation in cold climate are considered to demonstrate the advances and urgent problems in estimating engineering geocryological conditions of their founda- tions: lav-out and desian solutions enswing safe performance of embankment and concrete d a m s built on frozen and - . - thawing foundations are looked into.
Water powr resDurces of the Swi& Wrth are estimated to be 1,400 TWhr which accounts for 3746 of the total USSR hydro power resources. The swere climate, comp- l e x engineering geological conditions ( t o a large extent determined by geocryological situation), Lack of material bases in the uninhabited regions together with transport problems are responsible for difficulties in the develop- ment of the northern hydro power engineering, On the other hand, these very factors have stimulated the drive for finding new promising and. economically effe'dtive solu- tio- rehted to the design and construction of hydros in the Soviet North. The engineering geological conditions are aggravated primarily due to the evolution of perma- frost. At the valley stretches wedging into rock formation the transforming role of cryogen.esis shows up as the occurrence of upheaved zones in the rock masses with inEerior physico-mechrlaical properties. Widespread on the *ep slopes of the d a m abutmefits and forebay por- tions of the reservoirs are stone streams revealing their instability caused by the excavation and change of rock thermal conditions in the process of construction. When dealing with semirocks distinguished for high ice content
rapid rise of deformability and loss d strength at W i r thawing, non-uniform thermal settlements and thermkarst manifestations. B-ides, vdley slopes may contain the beds of weak argillaceous rock or there may be slide- induced displacements suspended by permafrost. It is
general stability of the slopes or activation of slides at quite natural, therefor%. to foresee the loss of local or
the change of thermodynamc conditions. This possibility
vative designs which ensure the stability of slopes and i s duly allowed for 'by the specialists implementing inno-
reduce seepage losses. Mawry hydraulic structures ore designed to be built on loose frozen formations different from one another not only by the consituent rocks but, what is more important, by the cryogenic structwe and properties. If this is the case, the frozen-type hydraulic
to be the best from the safety and environmental points structure is adopted. This type of struchre is considered
of view, though if the fouh&tion is formed by the thick strata of clastic rocks their thawing i s unavoidable and, therefore, the foundation treatment procedure must be based on the detailed consideration for the rock behavi- our in the process of thawing. All this conditions the se- lection of the damsite, layout and design of the structur- e5 and the relevant construction techniques.
Experience gained in crmting designs of dpms, power houses, spilhvays and other structures, both being elabo-
and non-uniform cryogenic structure one m a y expect the
rated and already realized, enables the lay-out problems to be solved for practically all climatic, topographic and geological conditions.
In so doing, the lay-out solutions adopted a re meant not
heterogeneous thawed-froza? foundations with timdepend- only to make for smooth operation of s t r ~ t u r e s built on
ent properties but to do as little harm as possible to the easily injured northern nature. Tk heaviest and most heat-releasing structures a re advisable to be construct- ed either in the talik zones or on the frozen rocks un- disturbed by upheaval. In this case speck1 attention should be paid to the treatment of foundations, especially if the latter are formed mostly by argillaceous rocks This is important since at the year-round construdion
air temperatures which results in freezing of thawed the large number of operations i s performed at subzero
rocks and hence in the change of their condtions and properties. To control this process is one of the most vital tasks which need to be substrpntiated by comprehm- sive scientific studies prior to construction.
Also of primary importance in the hydraulic engineering of the Extreme North is the elaboration of new sientific- d.ly s o d mnstruction schemes. Numerous investigations in this field, including those performed with participation and under guidance of the authors, have demonstrated that as far as water retaining atrudures are concmed one of WE most pronlisirg diredions i s the application of construction schemes permitting of easy control of heat exchange processes. Constrwtion of d a m shells k n g rockfill does not involve any .difficulties. Its excawtion, transportation and placemnt in ungraded wncitions are done in the s a m e mannw as outside t l ~ North- Climtic Zone. Rockfill can be placed in the shells in hi& lifts or in layers with subsequent compaction. When using nu-
d a m s mn be constructed either by dry methods or by rainic soils which have nearly optimum composition the
edly tested in practice and proved to be good from the dumping tl-E soil into mter. 'Ihe6e techriqueg were repeat-
design and construction point2 of viav.
AQrisable to be constructed in the North ore embankment d a m s built from soil and mimi ( soil and non-soil) mate- rials with s k l l s made of ungraded stone and impervious elements made of local soil materials or real izd in the form of steel diaphraglllS, steel membranes, asphaltic a d precast concrete diaphragn& A l a remmnlended are e m bankment dams Imving impewious elements in the furrrl o f ice-soil \\ails and "frozcn ct1rtains" created snd inairr
1268
tained Ivith the aid of air, fluid and steam-and-fluid set- ups. In tile latter case the design of the contact zone behveen an impervious element and a thawed-frozen foun- dation liable to non-uniform defornlations needs special consideration.
A s i s !vel1 known, erlibanlcment dam foundation settlements and self-compaction of soil in the construction and post- construction periods sllall not cause hazardous deforma- tions of ilnpervious elements, drains, transition zones and rigid members of other structures linked to the d a w body. Neither concentrated seepage paths nor dangerous piping zones shall appear in the dam. Proceeding from the above considerations tha "Code for designing embankment d a m s in the Northern Climatic Zone" recommends the design density of soil to be adop- ted so that the design settlements of different parts of the d a m would be close to each other by absolute value, lvhereas relative settlements of the crest in the operation period Iuould not exceed 2-2.5% of the dam height a t a given cross-section. The above recommendation pertains to the embankment d a m s to be constructed from soil ma- terials only.
Experience shows that in the construction of thawed-type embankment dam it i s not feasible to build a core or membrane entirely of thawed soils; the only possible de- sign i s s pie-like structure formed by interstratified zon- es of thawed, frozen and cooled below O°C saline soils. That i s why to meet the requiremants on permissible sew- ements it is necessary to regulate temperature canditions of impervious elements and determine, with or without the allowance made for salinity, the ultimate temperature con- ditions at which the settlement rates and values are well within the allowable limits both in the construction and. post-construction periods, Ivliulti-purpose studies on the method of conshction of the Kolymskaya temporary and stationary d a m s have made it possible to refine the requi- rements on soil materials and techniques of, their place- ment in the d a m body. The construction procedure modifl- ed accordingly enabled optimum temperature conditions to be maintained so that the core could be kept in thawed condition a5 early a5 at the construction stage. This, in turn, resulted in uniform deformations at the consolidation of all parts of the structure thereby ensuring its safe thermal stress-strain state. Long-term investigations of the temperature condition c h n g e s and ice formation in rockfill shells of the Kolymskaya, Vilyiskaya and Khantai- skaya d a m s permitted of assessing the effect of these processes 011 the thermal stress-strain state of the d a m and controlling them by placing surface soil layers of predetermined grain-size composition and thickness.
LDamy soil5 on the major part of the USSR North-East a r e known for high ice and silt contents, which determiw es the scarcity of soil material suitable for constructing impervlous elements. It looks promising, therefore, to make the latter from non-soil materials, e*g. from steel. In par- ticular, impervious diaphragms can be made from steel plates or l o w carbon steel piles of more than 10-12 mm thickness. Given a n anticorrosive ymil, epoxy, bitumen or asphaltic coating such elements may last 200 years, To provide for joint deformation of the diaphragm and the shells it is most reasonable to ensure its free contact with the sides through the medium of bitumen keys,
high heads. Their advantage resides in the shell being The d a m s with steel membranes may be recommended at
dry to the downstream water level. This increases the shell seismic stability, whereas the membrane attains greater freedom of deformations collaborating with the shell, which contributes to the safety and relaxes the re- quirements on material placement. construction of d a m s with steel seepage control elements is best suited to the
conditions of the North.
When designing the Adychanskaya power plant to be con- struded under extremely Severe conditions, among other versions the d a m s with steel diaphragms have been sug- gested. In this case, due to severity of climate, the steel structwes are proposed to be bolt-connected. Owing to exceptional transportation difficulties the volumes of out- side materials have to be cut short. ConsequenELy, a pre- cast concrete diaphragm has been suggested. The dia- phragm parts (5-7 kg plates) can be made of concrete protected with heat-and-darrpproof mats, of i m p r e ~ t e d concrete a?d lightweight concrete. The design of joints sealed with cold-resistant materials permits of some d P formation. At small heads such dams turn out to be pre- ferable to all other kinds of "dam of the North".
The version with an asphaltic concrete diaphragm consi& ered in several design projects of northern dam, is be- ing realized at the Boguchanskaya d a m constructicn. It features the following special merits: an msy-to-realize design admitting of complex rnechaniation with the use of standard road-building equipen6 small quantities of outside materials ( bitumen up to 8%), high waterproof- ness and deiormability of we material wen a t marked settlements of the d a m body( resting on thawing ice-rich foundation) and- at seisnic effects.
The extreme severity of Magadan district known for oc- currence of thick strata of permafrost rocks .calls for ma- ximum adaptability of a heat-accumulating power structure to the existing natural complex.
Of much practical and theoretical interest in the construc-
(by forced or gravity water delivery) i s the ascertain- tion of natural and artificial ice-soil impewious elements
ment of relationship between temperature conditions of the rocks, seepage rate and self-l-ealing of cracks and por- es with ice (Le freezing up of, the seepage paths) . The Latter p r o c s s i s seemngly governed by the cbaracter and degree of cracking, porosity, ice cuntent and ice ladeness of the rocks as well as by the rigidity of ternperawe conditions.
Soils a r e maintained in frozen condition by natural cold
set-ups used to create "frozen M n s " in the dad body or by artificial cooling with air, fluid and steamand-fluid
and part of the foundation.
There also exists a theoretically substantiated procedwe for constructing impervious elements by dumping frozen soils in cold water or phcing them in dry condition and then pouring with water. It has been found that consolida- tion of such soils proceeds better than that of thawed soils and their further freezing i s easier. The new tedni- ques have been tested in practice and look very promis- ing for power construction in the Soviet No&-East.
In view of extremely irregular northern river discharges
cially in the construction periods. These problem need of great concern are the problem of their passing e s p e
further studies The radically new design solutions being
hence require amprehensive mechanical and hydraulic s u s e s t e d are not yet approved for practical uses and
investi@tions to optimiz the designs of hydroele&ic plant water conveyance structures. Almost all maju- types of concrete d a n q with exoepticn of arch and mdti-ard7
ized by severe climatic conditions. ones, have been realized in the LSSR regions chracter-
of concrete d a m s located in these regions shows that Experience gained in design, corlstruction and operation
:their stresses, strength and durability depend greatly on terrperatu-e effects. All other things being equal, it leads
1269
to a somewhat greater volume of concrete in such d a m s as compared to those constructed in mild clirrlntic condi- tions.
As far as concrete volume is concerned, the main typ- es of concrete d a m s on rock foundations built in the USSR are quite comparable with the best specimens Of foreign d a m s realized under more favourable conditions. It can be positively stated that for mass concrete con- ventional gr vity d a m s the concrete consumption of 0.76-0.77 m 3 per ton (force) of hydrostatic pressure is a limiting value from the strength considerations. This value can be reduced only if the d a m design envisages an upstream face membrane, preliminary compression of concrete, arrangement of widened intercolumnar joints or large longitudinal recesses, etc.
The specific consumption of concrete at the Zeyskaya m a s s concrete buttress d a m practically equals Wmi at the Ust-Ilimskaya m a s s concrete gravity d a m but i s well over the specific conswption at the Ihipu d a m being constructed in Brazil-Paraguay. It is likely that the con- struction of a mass concrete buttress diim under rigor- ous climatic conditions can be cost-effective if it re- sults in 15-20% reduction of the material consumption capacity as compared to a mass concrete gravity d a m ( to compensate for the higher unit job price of concret- ing which rises due to the increase of concrete con- sumption at the deepened partions) . For cost-effective mass concrete buttress d a m s the yecific consumption of concrete should be 0.60-0.65 m per ton ( force) Of hydrostatic pressure.
The relative steel consumption at the existing”native d a m s and at the Sayano-Shushenskaya arch-gravity Qm which i s under construction is, on the average, around 10 kg/m.
Among most promising d a m s planned to be constructed on good rivers of Siberia and Soviet Far East, provid- ing the engineering-geological conditions a re favourable, is a gravity d a m of composite profile ,built of compact concrete or heat-insulated polymer concrete with the crest and core made of stiff lean concrete. The com- pact or polymer concretes ensure waterpmohess of the dam and protect it from season variations of the ambi- ent a i r temperature. Besides, they form the main ( seep- age-control) element. of the structure.
One of the problems encountered at the construction of concrete d a m s in severe climatic conditions is the performance of grouting operations to provide grout cur- tains in the foundation and to seal the joints.
So far the elaboration of joint grouting techniques at subzero temperatures ampunted to We selection of speci- a l cold-resistant grouts and different vlays of warming the joints. Grouting of construction joints preceeded by hydrodefrosting is considered to be promising. This me- thod has been tested at the Zeyskaya and Sayano-Shu- shenshya d a m s and, according to the imrestiigation re- sults, proved to be rather simple and inexpensive.
In the construction OC d a m s on soils susceptible to settl- ing under thermal effects, where th,e foundation should be kept frozen, P frozen-up d a m with cooling system en- suring its integrity is required. Arrangemmt of thermoin- sulating curtains cutting off frozen concrete dams from reservoirs presents some difficulties. In this case ther- mohydroinsuhting hcings of and impewious membranes in the concrete d a m s and other reinforced concrete structures appear to be rather effective. The d a m s so protected can be built of low-cement concrete with re- k e d requirements on wterproohess, frost and crack resistance.
The designs are elaborated of highly reliable and durable impervious membranes and complex therrmhydroinsulating facings of asphaltic lightweight concrete, foam plastics and foam asphalt with reinforced concrete and glass-re- inforced plastic enclosure. Also elaborated a re the de- signs of deformation joint sealings and methods for de- sign calculation of plastic thermohydminsubting facings.
A 200 m2 experimental strip of such facing ‘has been constructed and tested for 3 years at the Andizhanskaya dam. The tests have demonstrated that in plastic light-
weight asphaltic concrete w e n 2-3 mm cracks and joints undergo self-healing thus restoring waterproofness. of the facing. The tests of e h n k m e n t facings on the Barents Sea and Sea of Okhotsk and thermohydroinsulating fac- ings at the Vilujskaya dam conducted for 10 years have confirmed high reliability of thermahydroinsulation and i ts protective enclosure.
Construction Of hydraulic structwes in cold clirrate i s a
technological and design solutions. complicated task which c a b for innovative organiationak
1270
STUDY OF SOME GEOTECHNICAL ASPECTS EFFECTING CONSTRUCTION IN GLACIAL REGIONS OF HIMALAYAS
D.S. Lalji and R.C. Pathak
Dte of Engg (Def R&D O w ) , Kashmir House, New Delhi, India
SYNOPSIS The higher morphogenic tracts of lofty snow bound Himalayas possess the largest glacier resources in the world, outside the Polar regions. Besides the perennial ice cover, vast reaches of Himalayas come under periglacial environment. Due to unique orographical features of the Himalayas, the' lithotecbnic zones like Pir Panjal, Great Himalayas and Trans Himalaya ranges receive maximum snow precipitation whereas Zanskar and Ladakh ranges almost receive no snow-fall. In the Western Himalayas, the snow f a l l pattern is primarily governed by Western Disturbances. In the present paper terrain evaluation, pavement and foundation construction problems o f the permafrost and periglacial regions have been attempted. Icing phenomenon, de-icing techniques and the freeze-thaw cycles h a w been highlighted. The salient; geomorphological and aeotechnical expressions have been studied ,with a veiw especially to analyse coli region construction problems.
fNTRODUCTION
The remote high-altitude areas of North Western tracts of most enchanting Hima- layas inherit some of the largest glacier and permafrost resources in the world. The unique orography and the litho-tec-
tonic structure of the lofty . regions of Himalayas exposes a varied and vivid type of geotechnical studies under varying seasonal environment. Besides the pere- nnial ice cover, vast reaches of Himalayas come under periglacial snow cover. Not- withstanding with the fact that human spatial pattern, flora and fauna is sparse in the extreme- ly cold regions, the bare essential need of communications means like tracks, pavements, shelters etc. poses a gigantic task especially under adverse climatic conditions. The problems arc further aggra- -vated by the presence of numerous devastating and active snow-ice avalanches.
In the present study the various geomor- pholo- g i c a l and geotechnical expressions have been looked into with a view to analyse the identified c o l d region prob- lems and offer some viable solutions to keep up the normal functional aspects o f the populace. The terrain evalua- tion of the region, the de-icing techni- ques and foundation parameters o f the periglacial and permafrost regions have been highlighted. The construction tech- niques of pavements and suitable type of habitats alongwith essential supportlng
sented in the paper after thorough ground services are discussed and suitably pre-
checks and physical with the helps of large scale topographi-
reconnainances
cal survey maps.
REVIEW OF .LITERATURE
The inaccessible, unapproachable and hostile terrain of the Himalayas poses challenging tasks in carrying out geotech- nicalstudies and maintaining communi- cations. However, unde-terred by the cold climatic haiards, Indian Scientists' and gebtechnical engineers have accepted the challenges and have made commendable progress and tackled permafrost engineer- ing problems with success. The mehro- logical and environmental effects save been studied in detail by the weather scientists (Pradhan et.a1.,1977). The effect of vege- tation and slope
stability aspect of peri- glacial regions o f Western Himalayas have been analysed (Pathsk71987)Pathak et.al, 1987) . The snow and ice technology o f snow bound regions have been amply studied by t h e author ( Lalji D'.Singh et.a1.,1977). Deicing and anti-icing problems of the roads and pavements have been attempted since early seventies by the scientists of Snow & Avalanche Study Establishment (SASE) and engineers of Border Roads Organi- sation (BRO) ,The various tech- niques of de-icing prahtlced by the above
a1 SASE Report 1974-75, 1980-81). organisat-, ions have been presented (Annu-
Vombatkere (1985) has studied the l ong term behaviour of glacial ice and also has organised for construction of a bailey bridge at the altitude of 5580 m ( 1 9 8 6 ) . Freeze-thaw cycle ( Pathak et.al. 1987) and frost-heaving has been studied for pavement construction etc. In somewhat similar scenar'io Dayal( 1985) has reported a frost action study for trasmission line routes between Labrador and Newfound-
1271
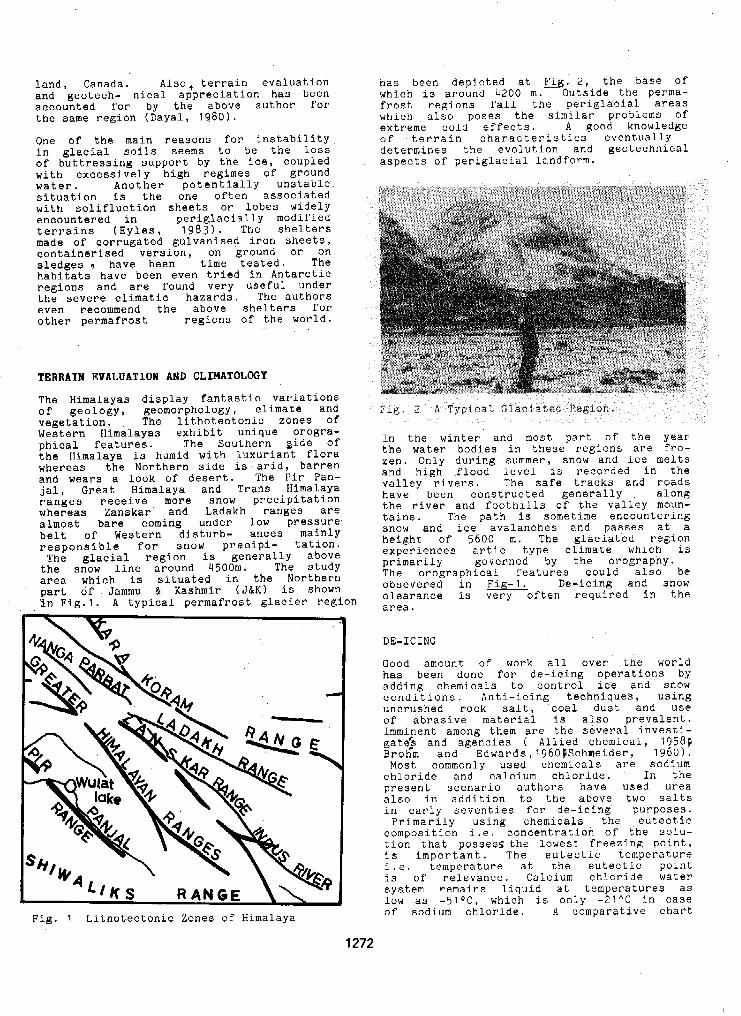
Land, Canada. Also, terrain evaluation and geotech- nical appreciation has been accounted for by the above author for the same region (Dayal, 1980).
One of the main reasons For instability in glacial soils seems to be the loss of buttressing support by the ice, coupled with excessively high regimes of ground water. Another potentially unstable
with solifluction sheets or lobes widely situation is the one often associated
encountered in periglacially modified terrains (Eyles, 1 9 8 3 ) . The shelters made of corrugated gulvanised iron sheets, containerised version, on ground or on sledges 9 have been time tested. The habitats have been even tried in Antarctic regions and are found very useful. under the severe climatic hazards. The authors even recommend the above shelters for other permafrost regions of the world.
TERRAIN EVALUATION AND CLIMATOLOGY
The Himalayas display fantastic variations of geology, geomorphology, climate and vegetation. The lithotectonic zones of Western Himalayas exhibit unique orogra- phical features. The Southern aide of the Himalaya i s humid with luxuriant flora whereas the Northern side is arid, barren and wears a l o o k of desert. The Pir Pan- jal, Great Himalaya and Trans Himalaya
whereas Zanskar' and Ladakh ranges are ranges receive more snow precipitation
almost bare coming under low pressure belt of Western disturb- ances mainly reaponsible for snow pracipi- tation.
the snow line around 4500111. The study The glacial region is generally above
area which is situated in the Northern part of . Jammu & Kashmir (J&K) i s shown 'in Fig. 1. A typical permafrost glacier region
has been depicted at Fia. 2, the base of which is around 4200 m. Outside the perma- frost regions fall the periglacial areas which also poses the similar problems of extreme cold effects. A good knowledge of terrain characteristics eventually determines the evolution and geotechnical aspects of periglacial landform.
In the winter and most part of the year the water bodies in these regions are f r o - zen. Only during summer, snow and ice melts and high flood level is recorded in the valley rivers. The safe tracks and roads have been constructed generally . along the river and foothills of the valley moun- tains. The path is sometime encountering snow and ice avalanches and passes at a height of 5600 m. The glaciated region experiences artic type climate which is
The orographical features could also be primarily governed by the orography.
obsevered in FiR-1. De-icing and snow clearance i s very often required in the area.
Fig. 1 Lithotectonic Zones of Himalaya
DE-ICING
Good amount of work all over the world has been done for de-icing operations by adding chemicals to control ice and snow conditions. Anti-icing techniques, using uncrushed rock salt, coal dust and use of abrasive material i s also prevalent.
gate? and agencies ( Allied chemical, 1958F Imminent among them are the several investi-
Brohm and Edwards,l960~Schneider, 1 9 6 0 ) .
chloride and calcium chloride. ' In the Most commonly used chemicals are sodium
present scenario authors have used urea also in addition to the above two salts in early seventies for de-icing purposes. Primarily using chemicals the eutectic
composition i.e. concentration of the solu- tion that posses5 the lowest freezing point, is important. The eutectic temperature i.e. temperature at the eutectic point is of relevance. Calcium chloride water system remains liquid at temperatures as low as -5I0C, which i s only - 2 1 O C in case of sodium chloride. A comparative chart
1272

of sodium chloride, calcium chloride and urea are drawn at FiR. 3 ( a ) . Fig 3 ( b ) repre- sents the melt rate comparison between coaldust with soil as anti-icing measures. It was observed that melt rate of sodium chloride is more than the calcium chloride and 60% melting is achieved within 90 minu- tes time interval. Though initial. melt rate of calcium chloride is faster because of
!Iw ratez
W I Y
- Fb Cl "". c1 Clr --+ UREA
0 20 10 60 w3 100 T I M E -
Fig. 3 (a) Melt Rate of Ice Using Chemicals
30000
i g 2 0000 Q-""
TIME +
Fig. 3 ( b ) Melt Rate with Coal Dust And Soil
itsexo-thermic reaction, imparting additional heat energy. For achieving similar results, almost double spread rate of urea has to be used. In Fig, 4, a vehicle loaded with container is shown passing through after deicing operation.
the bridge constructed at the height of In Fig 5, a Jonga vehicle is approaching
5580m on the glacier. Deicing trials with sodium chloride using s a l t spreader was
at the critical stretches in J&K under compared with the mannual spreading rate
minimum temperature condition of - 1 7 O C . Use of coal dust and abrasives is effective
when adequate heat is received from solar
Fig. 5 A Jonga C r o s s i n g Bridge at ht of 55
a long the side drains and in the moui-th effective in controlling the ice formation
of culverts. (Refer Fig, 6)
CONSTRUCTION OF PAVEMENTS
Tracks and roads are the most vital arteries of an efficient communication system. Frost susceptability of the perma- frost regions, subgrade soil condition and freeze-thaw
ment plays a very significant role for design 'cycle pheno-menon of the periglacial environ-
and construction of the pavment. As is generally observed in the mountainous tract the roads/tracks passes through saddles/peaks of at places but normally it is along the foothills or near the bed of ,the valley. Some of the salient factors viz, periglacial solifluxion, f r o s t susceptability, freezing
and new line O C approach adopted in Indian conditions of western Himalayan Region.
1273
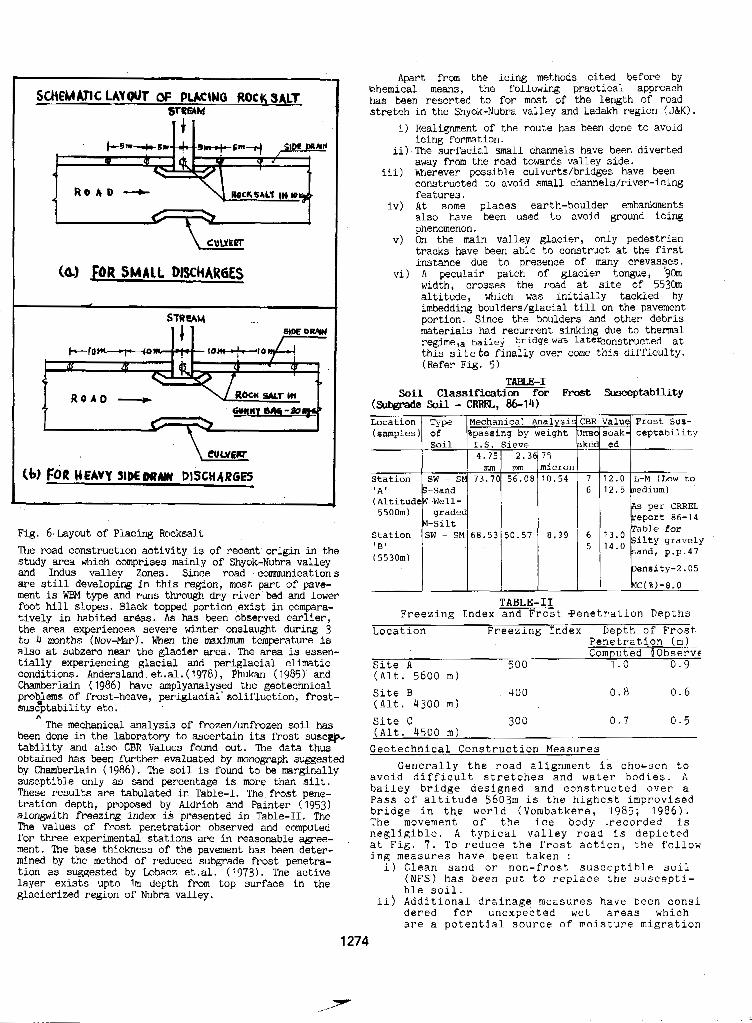
R O L D -+
Fig. 6. Layout of Placing Rocksalt The road construction activity is of recent origin in the study area which comprises mainly of Shyok-Nubra valley and Indus valley Zones, Since road 'comunications are still developing in this region, most part of pave- ment is WBM type and runs through dry river bed and lower foot hill slopes. Black topped portion exist in compara- tively in habited areas. As has been observed earlier, the area experiences severe winter onslaught during 3 to 4 months (Nov-Pkr) . When the maximum temperature is also at subzero near the glacier area. The area is essen- tially experiencing glacial and periglacial climatic conditions. Andersland, et.al. (19781, Phukan (1985) and Chamberlain ( 1986) have amplyanalysed the geotechnical problms o f frost-heave, periglacial' aolifluction, frost- suszptability etc.
The mechanical analysis of frozen/unfrozen soil has been done in the laboratory to ascertain its frost susc~- tability and also CBR Values found out. The data thus obtained has been further evaluated by monograph suggested by Chamberlain (1986). The soil is found to be marginally suscptible only as sand percentage is mre than silt. These results are tabulated in Table-I. The frost pene- tration depth, proposed by Aldrich and Painter (1953) alongwith freezing index is presented in Table-11. The The values of frost penetration observed and computed
ment. The base thickness of the pavement has been deter- for three experimental stations are in reasonable agree-
mined by the method of reduced subgrade frost penetra- tion as suggested by Lobacz et .al. ( 1973). The active layer exists upto Im depth from top surface in the glacierized region of Nubra valley.
A
Apart from the icing methods cited before by bhemical means, the following practical approach has been resorted to for most of the length of road stretch in the Shyok-Nubra valley and Ladakh region (J&K).
i) Realignment of the route has been done to avoid
ii),The surfacial small channels have been diverted icing formation.
away from the road towards valley side.
constructed to avoid small channels/river-icing
iv) At some places earth-boulder embanlanents features.
a h 0 have been used to avoid ground icing
v) On the main valley glacier, only pedestrian phenomenon.
tracks have been able to construct at the first instance due to presence of many crevasses.
vi) A peculair patch of glacier tongue, 9hl width, crosses the road at site of 553Gm altitude, which was initially tackled by imbedding boulders/glacial till on the pavement portion. Since the boulders and other debris materials had recurrent sinking due to thermal regime,a bailey ?ridge was IateEonstructed at this sjlteto finally over come this difficulty. (Refer Fig. 5)
iii) Wherever possible culverts/bridges have been
TABLGI Soil Classification for Frost Susceptability
Soil - CRREL, 86-14) Location Type Mechanical AnaLysislCBR Valu Frost Sus- (samples) o f %passing by weight bnsdsoak ceptability
Station SW - SM 73.70 56.08 10.54 7 12.0 L-M (LOW to ' A ' S-Sand 6 1 2 . 5 edium)
mm mm micron
~~
(5530m)
1 TABLE-I1
Freezing Index and Frost Qenetration Depths -
Location Freezing Index Depth of Frost Penetration (m) Computed lobserve
Site A 500 1 . o 0.9 (Alt. 5600 m) Site B 400 0.8 0.6 (Alt. 4300 rn) Site C 300 0.7 0.5 (Alt. 4500 m) Geotechnical Construction Measures
avoid difficult stretches and water bodies. A Generally the road alignment is chocsen to
bailey bridge designed and constructed over a Pass o f altitude 5603m is the highest improvised bridge in the world (Vombatkere, 1985; 1986). The movement of the ice body .recorded is negligible. A typical valley road is depicted at Fig. 7 . To reduce the frost action, the follow in$ measures have been taken : i) Clean sand o r non-frost susceptible soil
( N F S ) has been put t o replace the suscepti- ble soil.
ii) Additional drainage measures have been consi dered for unexpected wet areas which are a potential source of moisture migration
1274
." -7
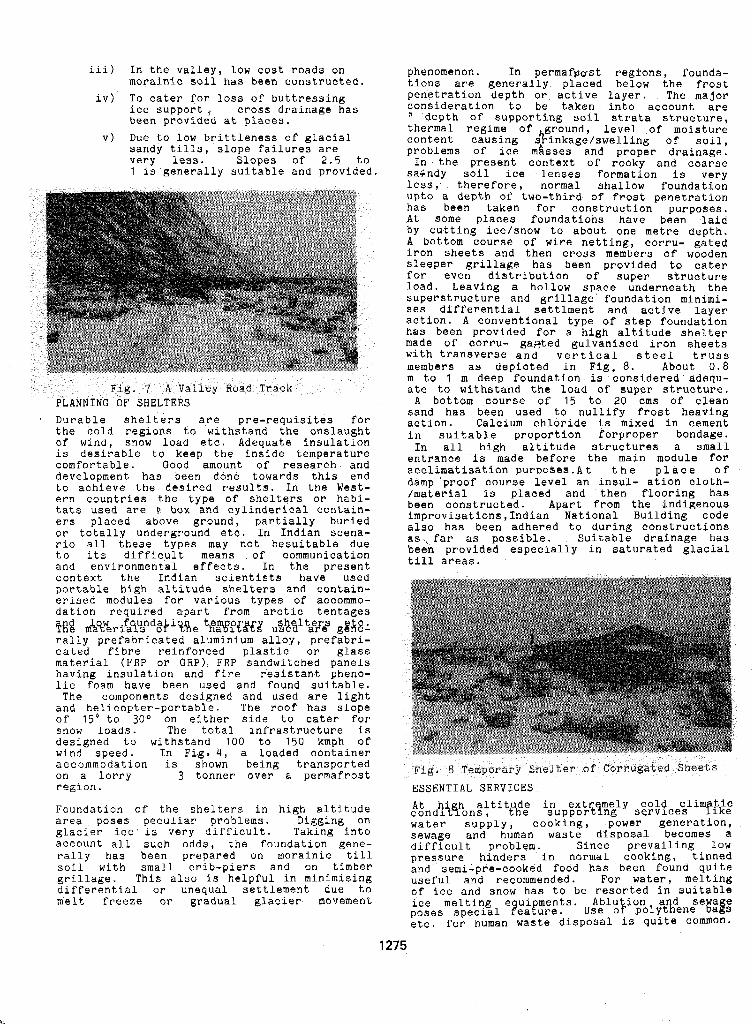
iii) In the valley, low cost roads on phenomenon. In permarpast regions, founda- morainic soil has been constructed. tions are generally placed below the frost
iv) To cater for loss of buttressing penetration depth or active layer. The major ice support, cross drainage has consideration to be taken into account are been provided at places. ? depth of supporting soil strata structure,
v) Due to low brittleness of glacial thermal regime of ground, level of moisture
sandy tills, slope failures are content causing s)inkage/swelling of soil,
v e r y less. problems of ice masses and proper drainage.
Slopes of 2.5 to In the present context o f rocky and coarse 1 is generally suitable and Provided. sa6ndy soil ice lenses formation is verv
Durable shelters are pre-requisites for the c o l d regions to withstand the onslaught of wind, snow load etc. Adequate insulation is desirable to keep the inside temperature comfortable. Good amount of research and development has been done towards this end to achieve the desired results. In the West- ern countries the type of shelters or habi- tats used are I‘ box and cylinderical contain- ers placed above ground, partially buried o r totally underground etc. In Indian scena- rio all these types may not besuitable due to its difficult means of communication and environmental effects. I n the present context the Indian scientists have used portable high altitude shelters and contain- erised modules for various types of accommo- dation required apart from arctic tentages TK! &werir61’”s”d@iHe %@XXY u&~”,err,~ g ~ k ~ l rally prefabricated aluminium alloy, prefabri- cated fibre reinforced plastic or glass material ( F R P or GRP), FRP sandwitched panels having insulation and fire resistant pheno- lic foam have been used and found suitable. The components designed and used are light and helicopter-portable. The roof has slope of 1 5 O to 30° on either side to cater f o r snow loads. The total infrastructure is designed to withstand 100 to 150 kmph of wind speed. In Fig. 4 , a loaded container accommodation is shown being transported on a lorry 3 tonner over a permafrost region.
Foundation of the shelters in high altitude area poses peculiar problems. Digging on glacier ice is very difficult. Taking into account all such odds, the foundation gene- rally has been prepared on morainic till s o i l with small crib-piers and on timber grillage. This also is helpful in minimising differential or unequal settlement due to melt freeze or gradual glacier movement
less ,- therefore, normal shallow foundatibi upto a depth of two-third of frost penetration has been taken for construction purposes. At Some places foundations have been laid by cutting ice/snow to about one metre depth. A bottom course of wire netting, corru- gated iron sheets and then cross members of wooden sleeper grillage has been provided to cater for even distribution of super structure load. Leaving a hollow space underneath the superstructure and grillage foundation minimi- ses differential settlment and active layer action. A conventional type of step foundation has been provided for a high altitude shelter made of corm- ga,&ed gulvanised iron sheets with transverse and vertical steel truss members as depicted in Fig, 8. About 0 . 8 m to 1 m deep foundation, is considered adequ- ate to withstand the load of super structure.
A bottom course of 15 to 20 cms of clean sand has been used to nullify frost heaving action. Calcium chloride is mixed in cement in suitable proportion forproper bondage, In all high altitude structures a small
entrance i s made before the main module for acclimatisation purposes. A t t h e p 1 a c e 0 f damp ‘proof course level an insul- ation cloth- /material is placed and then flooring has been constructed, Apart from the indigenous improvisations,Indian National Building code also has been adhered to during constructions as., far as possible, Suitable drainage has been provided especially in saturated glacial till areas.
F i g , 8 Temporary Shelter of ~ ~ ~ ~ u ~ ~ t e ~ Sheets ESSENTIAL SERVICES
condliqons, &e supportfng services Bike At i~ h altit de id extr mely cold clim tic water supply, cooking, power generation, sewage and human waste disposal becomes a difficult problem. Since prevailing low pressure hinders in normal cooking, tinned and semi-pre-cooked food.has been found quite useful and recommended. For water, melting of ice and snow has t o be resorted in suitable
poses special Feature. use o f polyt%ene M S ice melting e ui ments. Ablution a d se a e
etc. for human waste disposal is quite common.
1275
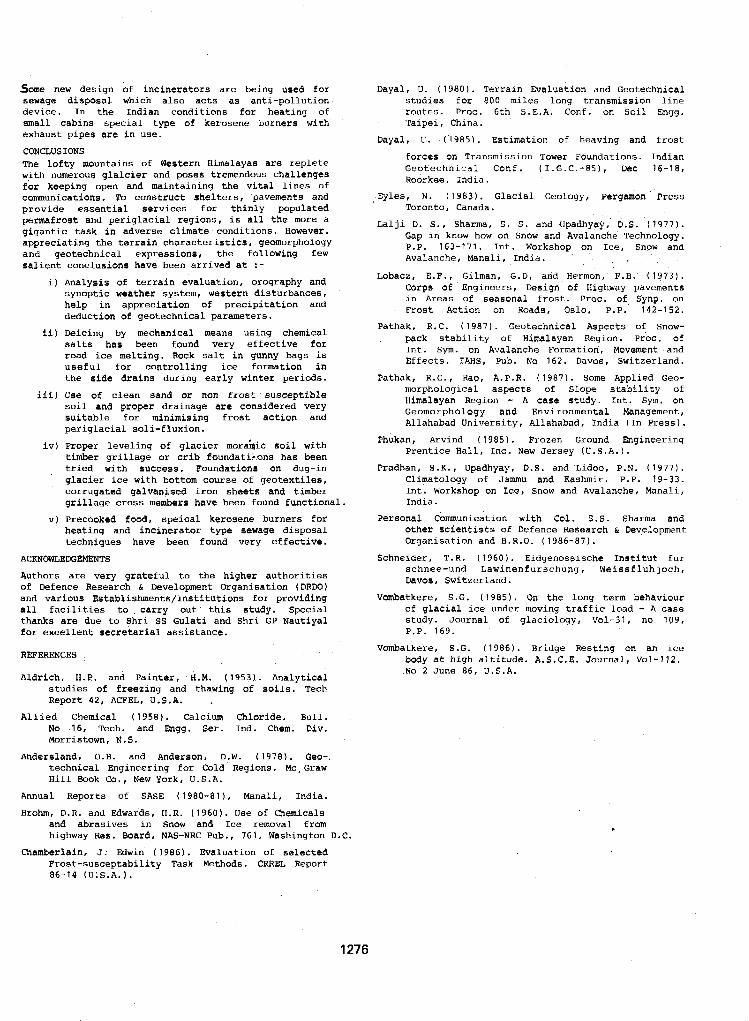
Some new design of incinerators are being used for sewage disposal which also acts as anti-pollution- device. In the Indian conditions for heating o f small cabins special type of kerosene burners with exhaust pipes are in use.
CONCLUSIONS The lofty mountains of Western Himalayas are replete with numerous glalcier and poses tremendous challenges for keeping open and maintaining the vital lines of communications. To construct shelters, pavements and provide essential services for thinly populated permafrost and periglacial regions, is all the more a gigantic task in adverse climate conditions. However, appreciating the terrain characteristics, geomorphology and geotechnical expressions, the following few salient conclusions have been arrived at :-
i) Analysis of terrain evaluation, orography and synoptic weather system, western disturbances, help in appreciation of precipitation and deduction of geotechnical param@ters.
ii) Deicing by mechanical means using chemical salts has been found very effective for road ice melting. Rock salt in gunny bags is useful for controlling ice formation in the side drains during early winter periods.
iii) Use of clean sand or non frost susceptible soil and proper drainage are considered very suitable for minimising frost action and periglacial soli-fluxion.
iv) Proper leveling of glacier mor&ic soil with timber grillage or crib foundati+ons has been tried with success. Foundations on dug-in glacier ice with bottom course of geotextiles, corrugated galvaniaed iron sheets and timber grillage cross members have been found functional.
v) Precooked food, speical kerosene burners for heating and incinerator type sewage disposal techniques have been found very effective.
ACKNOWLEDGEMENTS
Authors are very grateful to the higher authorities of Defence Research & Development Organisation (DRDO) and various Establishments/Institutions for providing all facilities to. carry out this study. Special thanks are due to Shri SS Gulati and Shri GP Nautiyal for excellent secretarial assistance.
REFERENCES
Aldrich, H.P. and Painter, H.M. ( 1 9 5 3 ) . Analytical studies of freezing and thawing of soils. Tech Report 4 2 , ACFEL, U.S.A.
Allied Chemical (1958). Calcium Chloride. Bull. No 16, Tech. and Engg. Ser. Ind. Chem. Div. Morristown, N.S.
Andersland, O.B. and Anderson, D.W. (1978). Geo-. technical Engineering for Cold Regions. Mc+Graw Hill Book Co., New York, U.S.A.
Annual Reports of SASE (1980-81), Manali, India.
Brohm, D.R. and Edwards, H.R. (1960). Use of Chemicals and abrasives in Snow and Ice removal from highway Res. Board, NAS-NRC Pub., 761, Washington D.C.
Chamberlain, J. Fdwin (1986). Evaluation of selected Frost-susceptability Task Methods. CRREL Report 86-14 ( U 1 S . A . ) .
1276
Dayal, U. (1980). Terrain Evaluation and Eeotechnical studies for 800 miles long transmission line routes. Proc. 6th S . E . A . Conf. wn Soil Engg. Taipei, China.
Dayal, U. ( 1 9 8 5 ) . Estimation of heaving and frost
forces on Transmission Tower Foundations. Indian Geotechnical Conf. (I.G.C.-85), Dec 16-18, Roorkee, India.
Eyles, N. (1983). Glacial Geology, Pergamon Press Toronto, Canada.
La1 ji D. S . , Sharma, S . S . and Upadhyay, D.S. ( 1977). Gap in know how on Snow and Avalanche Technology.
Avalanche, Manali, India. P.P. 163-171. Int. Workshop on Ice, Snow and
Lobacz, E.F., Gilman, G.D. and Htrmon; F . B . (1973). Corps of Engineers, Design of Highway pavements in Areas of seasonal frost. Proc. of Synp. on Frost Action on Roads, Oslo, P.P. 142-152.
Pathak, R.C. (1987). Geotechnicai Aspects of Snow- pack stability of Himalayan Region. Proc. of Int. Sym. on Avalanche Formation, Movement and Effects. IRHS, Pub. No 162. Davos, Switzerland.
Pathak, R.C., Rao, A.P.R. (1987). Some Applied Geo- morphological aspects of Slope stability of Himalayan Region - A case study. Int. Sym. on Geomorphology and Environmental Management, Allahabad University, Allahabad, India (In Press).
Phukan, Arvind (1985). Frozen Ground Engineering Prentice Hall, Inc. New Jersey (U.S.A.).
Pradhan, S.K., Upadhyay, D.S. and Lidoo, P.N. ( 1977) . Climatology of Jammu and Kashmir. P.P. 19-33. Int. Workshop on Ice, Snow and Avalanche, Manali, India.
Personal Communication with Col. S.S. Sharma and other scientists of Defence Research & Development Organisation and B.R.O. (1986-87).
Schneider, T.R. (1960). Eidgenossische Institut fur schnee-und Lawinenfurschung, Weissfluhjoch, Davos, Switzerland.
Vombatkere, S.G. (1985). On the long term behaviour of glacial ice under moving traffic load - A case study. Journal of glaciology, Vol-31, no 109, P.P. 169.
Vombatkere, S.G. (1986). Bridge Resting on an ice body at high altitude. A . S . C . E . Journal, Vol-112, No 2 June 86, U . S . A .
A SUBGRADE COOLING AND ENERGY RECOVERY SYSTEM E.L. Long and E. Ysnnak Jr.
Arctic Foundations, he., Anchorage, Alaska, USA
the heat of the mechanical system. Subsequently, been reversed.
INTRODUCTION
The village of Kotzebue is located in northwest Alaska at the north end of the Baldwin Peninsula between Kotzebue Sound and a substantial lagoon. To the e a s t and south of the lagoon, low hills dominate the landscape of the peninsula. West of the lagoon, a gravel spit exists upon which the majority of the village's development is clustered. The entire Baldwin Peninsula lies within the region of continuous permafrost with the depth to the
meters in the Kotzebue area (Brown and PiwB, base of permafrost being approximately 7 3
1973; Ferrians, 1 9 6 5 ) .
The gravel and sandy gravel deposits that form the Kotzebue Sound side of the spit are generally 9 to 12 meters in depth and are underlain by fine-grained deposits of sand, silt, clay and organics. The soils in the hills to the east and south are predominately ice-rich fine grained deposits. The transition zone between the coarse grained spit deposits and the fine grained ice-rich deposits is interfingered with varying quantities o f all the sail types found in the area and generally is capped by a tapering strata of granular soil.
Early structures in Kotzehue were small and used conventional footings on the gravelly soils near the beach where they experienced few foundation problems. As the village grew, the size of the structures increased and new construction was forced east where the surficial granular deposits were thinner and frequently interhedded with fine-grained lagoon sediments, organics and some ice. Even on the better portions of the spit, as the size of the structures increased, settlement became a
SYNOPSIS The Kotzebue Senior Citizen's Cultural Center had experienced foundation distress due to thaw settlement since construction in the summer of 1975, The structure was originally constructed with a conventional foundation (i.e. heated crawl space) on gravel fill over ice-rich permafrost. A mechanical refrigeration system utilizing 20 horizontal copper loops was installed in 1 9 7 6 to circulate a cooled glycol/water mixture beneath a layer of polyurethane insulation. Due to operational difficulties, this system only slowed the permafrost degradation and subsequent settlement of the structure. In the summer of 1986, the mechanical system was converted to a two-phase thermosyphon with parallel evaporators and a common external condenser using carbon dioxide as the working fluid, Each of the 20 existing copper loops is utilized as an evaporator. The heat removed from the subgrade i s used to preheat make-up air for the ventilation system. Existing mechanical refrigeration equipment was utilized to provide back-up refrigeration capabili- ty. Without energy input, the subgrade cooling system now has the capacity to withdraw five times
the progression of thaw beneath the structure has
problem as the thaw bulbs penetrated through the granular soils into the ice-rich fine grained material.
The Kotzebue Senior Citizen's Cultural Center
sited east of the main village near the (originally named the Kotzebue Pioneer Home) is
transition zone between the gravel and fine-grained deposits. The main portion of the structure is a hexagon with 18 m long sides. Two residential wings are attached to the south and southwest sides of the hexagon and a short mechanical wing is attached on the northeast side. The single story structure i s founded on continuous footings with concrete stem walls approximately 1 . 4 m high. The crawl space beneath the floor is heated by the underfloor utilities. The original foundation design did not provide for maintaining the permafrost beneath the structure. The structure is shown on Figure 1.
In the fall of 1 9 7 4 , the immediate area of the building site was stripped of organics down to in situ granular soils. In the spring and early summer of 1975, the site was filled with
a level building pad (Abbott, 1 9 7 5 ) . The total 1 to 2 m of compacted granular material to form
depth of gravel averaged 2 . 5 m over frozen
when the subfloor was installed, the south and sand, silt and organics. By August 1 , 1975,
southwest wings had settled as much as 5 cm.
EXPLORATION
in 1 9 7 3 with 2 3 borings over the general site Initial exploration of the site was conducted
area. The majority of the holes were to a depth of 4.6 m, however, three borings were
1277
made to depths of 12 and 17 m. Moisture contents of less than 30 percent were reported except for a 1-m ice lens in the southeast corner o f the area at a depth of 1 to 2 m.
Following the observed settlement in August 1975, seven holes were put down around the structure with depths varying from 3 to 4,6 m. In January 1976, four additional holes were put down to approximately 15 m in depth taking continuous undisturbed samples which were shipped in the frozen condition to Cold Regions Research and Engineering Laboratory (CRREL) at Fairbanks, Alaska and Hanover, New Hampshire for analysis. The primary tests conducted were water content, gradation analysis, density determinations, and thaw consolidation.
SETTLEMENT ANALYSIS
Early settlement while the structure was under construction was attributed primarily to the thawing of seasonally frozen soils. It was also possible that consolidation of loose gravel fill and compressible soils not stripped from the site may have contributed to the problem (Abbott, 1975). The boring data obtained in January 1976 for CRREL indicated that much o f the soil to a 1 5 m depth had moisture contents well in excess of 30 percent. Three of the '4 holes had strata with water contents well over 90 percent, while the fourth hole had strata with water contents in excess of 60 percent.
CRREL estimated that total settlements at the boring locations were expected to be 10 to 20 cm with thaw to 6 m, 20 to 30 cm with thaw to 9 m, and 45 to 60 cm with thaw to 15 m (Crory, 1976). As a result of the CRREL study, the State of Alaska Division of Buildfngs elected to mechanically refrigerate the entire foundation to maintain the permafrost. This option was one of five alternatives offered by CRREL. Plans and specifications were prepared and forwarded to the contractor.
MECHANICAL REFRIGERATION
around the perimeter of the foundation while 16 Four ].oops of copper tubing were installed
loops were installed in the bottom of the crawl space. The loops varied from 107 to 3 9 1 m in length with a total combined length of 4400 m, of which 3450 m are beneath the heated floor space. The 2 . 2 cm outside diameter copper loops
beneath 7.6 cm of sand, 7.6 cm of spray applied (spaced 0 . 4 5 m center to center) were buried
rigid closed cell 2-component urethane foam, and covered in turn with a layer of spray applied fireproofing.
Refrigerated ethylene glycol was pumped through the coils having been cooled with two 1 1 kw capacity compressor/chiller packages. Initial freezeback was to be accomplished with both compressors running. Following initial freezeback, the second unit would serve as back-up. Eight fan coil heat transfer units (unit coolers) i n two groups of four were connected in parallel to provide outside air cooling when ambient air temperatures dropped below -12°C. Switchover from the refrigera- tion/chiller unit to the unit coolers was performed automatically.
history of the refrigeration system was In September 1981, a review of the operational
performed and it was determined that the mechanical system had been operating with less than 100 percent of all subsystems properly functioning. The building manager indicated that hiring properly trained personnel to operate the system was a major problem. The turnover rate for operators was so high that new operators were almost always being trained.
was a complicated operation which required The refrigeration system, with its subsystems,
continual monitoring and maintenance to function properly. This amount of "Tender Loving Care" could not be obtained from short term operators. Because the system was Located
often delays involving ordering and delivery of in a somewhat remote city in Alaska, there were
repair items and scheduling of repairmen. Of course, any time the system was inoperative, subgrade warming and thawing took'place.
It was estimated that the mechanical system cost $2300.00/rnonth to operate in the summer and $1200.00/month~in the winter (1981 costs). Assuming 4 4 months of summer operation and 7 4 months of winter operation, the total annual operating cost for the mechanical system was $19,350.00 (U.S.) in 1981. Additionally, periodic re-leveling was still. being performed as settlement continued at a slower rate.
In 1983, the State of Alaska turned the operation of the Kotzebue Pioneer Home over to the Kotzebue community where it became the Kotzebue Senior Citizen's Cultural Center managed by Maniilaq Corp. In June 1984, Maniilaq advertised for a re-design of the
a conversion of the circulating glycol soil refrigeration system. The system accepted was
cooling system to a two-phase passive system (thcrmosyphon) which used the exjsting mechanical refrigeration and unit cooler system as back-up.
1278
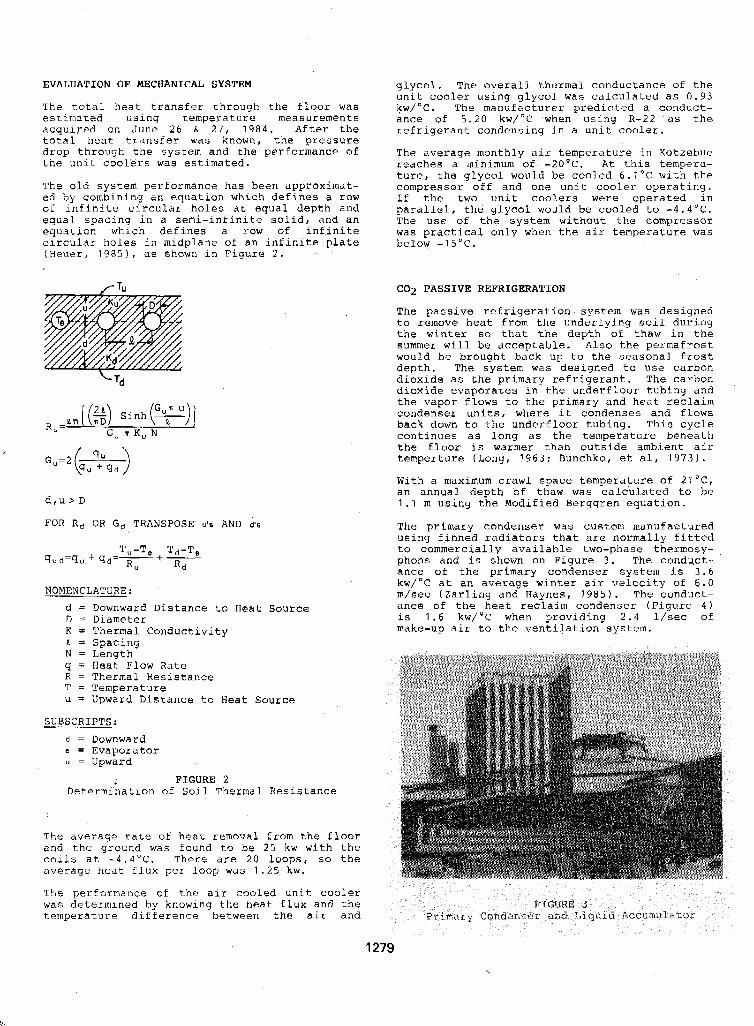
EVALUATION OF MECHANICAL SYSTEM
The total heat transfer through the floor was estimated using temperature measurements acquired on June 26 & 27, 1984. After the total heat transfer was known, the pressure drop through the system and the performance of the unit coolers was estimated.
The old system performance has been approximat- ed by combining an equation which defines a row of infinite circular holes at equal depth and equal spacing in a semi-infinite solid, and an equation which defines a row of infinite circular holes in midplane of an infinite plate (Heuer, 1 9 8 5 ) , as shown in Figure 2 .
R u = G, n K, N
d,u > D
FOR Rd OR G, TRANSPOSE u's AND d's
NOMENCLATURE: d = Downward Distance to Heat Source D = Diameter K = Thermal Conductivity p. = Spacing N = Length q = Heat Flow Rate R = Thermal Resistance T = Temperature u = Upward Distance to Heat Source
SUBSCRIPTS: d = Downward e = Evaporator u = Upward
Determination of Soil Thermal Resistance R FIGURE 2
The average rate of heat removal from the floor and the ground was found to be 2 5 kw with the coils at -4.4"C. There are 2 0 loops, so the average heat flux per loop was 1 . 2 5 kw.
The performance of the a i r cooled unit cooler was determlncd by knowing the heat flux and the temperature difference between tho air and
glycol. Thc overall thermal conductance of the unit cooler using glycol was calculated as 0.93 kw/"C. The manufacturer predicted a conduct- ance of 5 .20 kw/"C when using R-22 as the refrigerant condensing in a unit cooler.
The average monthly air temperature in Rotzebue reaches a minimum of -2O'C. At this tempera- ture, the glycol would be cooled 6.1°C with thc compressor off and one unit cooler operating. If the two unit coolers were operated in parallel, the glycol would be cooled to -4.4'C. The use of the system without the compressor was practical only when the air temperature was below -15°C .
C02 PASSIVE REFRIGERATION
The passive refrigeration system was designed to remove heat from the underlying soil during the winter so that the depth of 'thaw in the summer will be acceptable. Also the permafrost would be brought back up to the seasonal frost depth. The system was designed to use carbon dioxide as the primary refrigerant. The carbon dioxide evaporates in the underfloor tubing and the vapor flows to the primary and heat reclaim condenser units, where it condenses and flows back down to the underfloor tubing. This cycle continues as long as the temperature beneath the floor is warmer than outside ambient air temperture (Long, 1 9 6 3 ; Bunchko, et all 1973).
With a maximum crawl space temperature of 2 1 " C , an annual depth of thaw was calculated to be 1.1 m using the Modified Berggren equation.
The primary condenser was custom manufactured using finned radiators that are normally fitted to commercially available two-phase thermosy- phons and is shown on Figure 3 . The condyct- ance of the primary condenser system is 3.6 kw/"C at an average winter air velocity of 6.0 m/sec (Zarling and Haynes, 1 9 8 5 ) . The conduct- ance of the heat reclaim condenser (Figure 4 ) is 1 . 6 kw/'C when providing 2 .4 l/sec of make-up air to the ventilation system.
1279
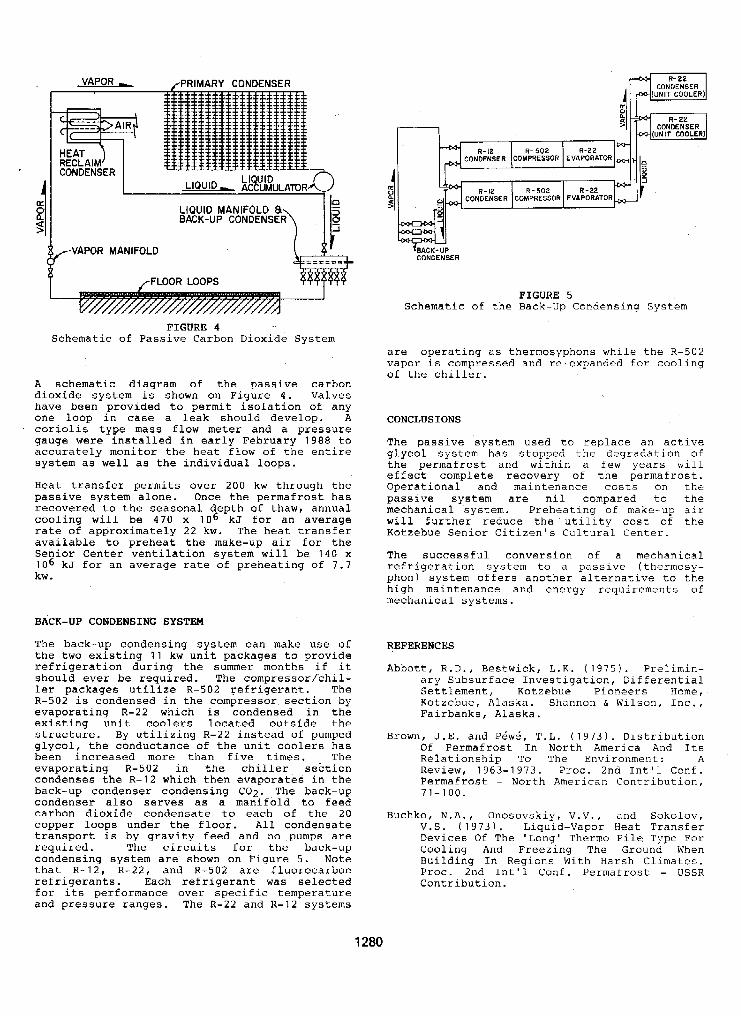
VAPOR - ,PRIMARY CONDENSER
HEAT ) RECLAIM CONDENSER
I
1
BACK-UP CONDENS LIQUID MANIFOLD
VAPOR MANIFOLD
FIGURE 4 Schematic of Passive Carbon Dioxide System
A schematic diagram of the passive carbon dioxide system is shown on Figure 4. Valves have been provided to permit isolation of any one loop in case a leak should develop. A Coriolis type mass flow meter and a pressure gauge were installed in early February 1 9 8 8 to accurately monitor the heat flow of the entire system as well as the individual loops.
Heat transfer permits over 200 kw through the passive system alone. Once the permafrost has recovered to the seasonal depth o f thaw, annual cooling will be 470 x 106 kJ for an average rate of approximately 22 kw. The heat transfer available to preheat the make-up air for the Senior Center ventilation system will be 1 4 0 x 106 kJ for an average rate of preheating of 7 . 7 kw .
BACK-UP CONDENSIN& SYSTEM
The back-up condensing system can make use o f the two existing 1 1 kw unit packages to provide refrigeration during the summer months if it should ever be required. The compressor/chil- ler packages utilize R-502 refrigerant. The R-502 is condensed in the compressor section by evaporating R-22 which is condensed in the existing unit coolers located outside the
glycol, the conductance of the unit coolers has structure. By utilizing R-22 instead of pumped
been increased more than five times. The evaporating R-502 in the chiller section condenses the R-12 which then evaporates in the back-up condenser condensing C02. The back-up condenser also serves as a manifold to feed carbon dioxide condensate to each of the 20 copper loops under the floor. All condensate transport is by gravity feed and no pumps are required. The circuits for the back-up condensing system are shown on Figure 5. Note that R-I 2, R-22 , and R-502 axe fluorocarbon refrigerants. Each refrigerant was selected for its performance over specific temperature and pressure ranges. The R-22 and R-12 systems
wp CONDENSER
FIGURE 5 Schematic of the Back-up Condensing System
are operating as thermosyphons while the R - 5 0 2 vapor is compressed and re-expanded for cooling of the chiller.
CONCLUSIONS
The passive system used to replace an active glycol system has stopped the degradation of the permafrost and within a few years will effect complete recovery of the permafrost. Operational and maintenance costs on the passive system are nil compared to the mechanical system. Preheating of make-up air will further reduce the utility cost of the Kotzebue Senior Citizen's Cultural Center.
The successful conversion of a mechanical
phon) system offers another alternative to the refrigeration system to a passive (thermosy-
high maintenance and energy requirements of mechanical systems.
REFERENCES
Abbott, R.D., Bestwick, L.K. (1975). Prelimin- ary Subsurface Investigation, Differential Settlement, Kotzebue Pioneers Home, Kotzebue, Alaska. Shannon E, Wilson, Inc., Fairbanks, Alaska.
Brown, J.E. and P6w6, T.L. ( 1 9 7 3 ) . Distribution Of Permafrost In North America And Its Relationship To The Environment: A Review, 1 9 6 3 - 1 9 7 3 . Proc. 2nd Int'l Conf. Permafrost - North American Contribution, 7 1 - 1 0 0 .
Buchko, N.A., Onosovskiy, V . V . , and Sokolov, V.S. ( 1 9 7 3 ) . Liquid-Vapor Heat Transfer Devices Of The 'Long' Thermo-Pile Type For Cooling And Freezing The Ground When Building In Regions With Harsh Climates. Proc. 2nd Int'l Conf. Permafrost. - USSR Contribution,
Crory, F.E. (1976). Final Report on Foundation Investlgation f o r Kotzebue Pioneer Home, Kotzebue, Alaska. CRREL, Hanover, N e w Hampshire.
Ferrians Js., O.J. (1965). Permafrost Map of Alaska. U.S. Geological Survey, Washing- ton D . C .
H e u e r , C.E., Long, E.L., and Zarling, J .P . (1985). Passive Techniques for Ground Temperature Control. Thermal Design/Con- siderations In Frozen Ground Engineering. ASCE, 7 2 - 1 5 4 .
Long, E.L. ( 1 9 6 3 ) . The Long Thermopile. Proc. 1st Int'l Conf. Permafrost. Nat'1,Academy of Sciences, 4 8 7 - 4 9 1 .
Zarling, J.P. and Haynes, F.D. (1985). Therrno- syphon Devices and Slab-On-Grade Founda- tion Design. State of Alaska, Dept, of Transportation and Public Facilities, Repor t No. AK-RD-86-16.
1281
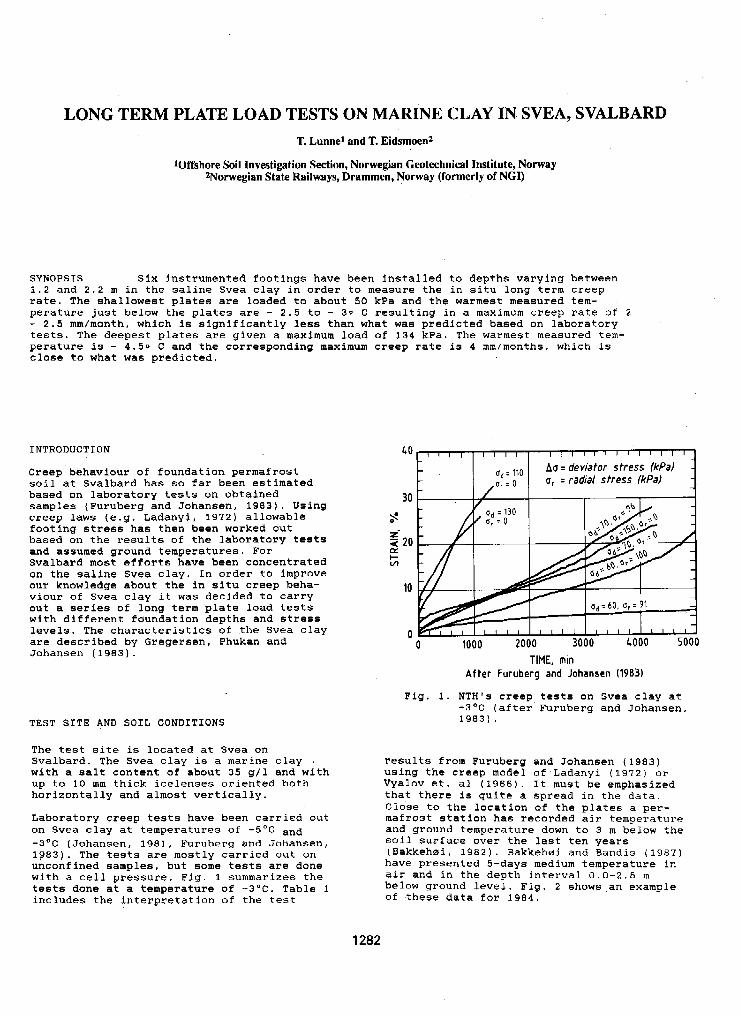
LONG TERM PLATE LOAD TESTS ON MARINE CLAY IN SVEA, SVALBARD T. Lunnel and T. Eidsmoed
Wffshore Soil Investigation Section, Norwegian Geotechnical Institute, Norway 2Norwegian State Railways, Drammen, Norway (formerly of NGI)
SYNOPSIS Six instrumented faotings have been installed to depths varying between 1.2 and 2.2 m in the saline Svea clay in order to measure the in situ long term creep rate. The shallowest plates are loaded to about 50 kPa and the warmest measured tem- perature just below the plates are - 2.5 to - 30 C resulting in a maximum creep rate of 2 - 2.5 mm/month. which is significantly less than what was predicted based on laboratory teste. The deepest plates are given a maximum load of 134 kPa. The warmest measured tem- perature is - 4 . 5 0 C and the corresponding maximum creep rate is 4 mm/months, which is close to what was predicted.
INTRODUCTION
Creep behaviour of foundation permafrost soil at Svalbard has so far been estimated based on laboratory tests on obtained samples (Furuberg and Johansen, 1983). Using creep laws ( e . g . Ladanyi, 1972) alloWable footing stress has then been worked out based on the results of the laboratory tests and assumed ground temperatures. For Svalbard mast efforts have been concentrated on the saline Svea clay. In order to improve our knowledge about the in situ creep beha- viour of Svea clay it was decided to carry
with different fdundation depths and stress out a series of long term plate load tests
levels. The characteristics o f the Svea clay are described by Gregersen, Phukan and Johansen ( 1 9 8 3 ) .
TEST SITE AND SOIL CONDITIONS
The test site is located at Svea on Svalbard. The Svea clay is a marine clay . with a salt content of about 35 g/1 and with up to 10 mm thick icelenses oriented both horizontally and almost vertically.
Laboratory creep tests have been carried out on Svea clay at temperatures of -5°C and -3OC (Johansen, 1981, Furuberg and Johansen, 1983). The tests are mostly carried out on unconfined samples, but some tests are done with a cell pressure. Fig. 1 summarizes the tests done at a temperature of - 3 O C . Table 1 includes the interpretation of the test
30
s $- 20 L
10
0 0 1000 2000 3000 4000 so00
TIME, min After Furuberg and Johansen 11983)
Fig. 1. NTH’S creep tests on Svea clay at -3OC (after Furuberg and Johansen, 1983).
results from Furuherg and Johansen (1983) using the creep model o f Ladanyi (1972) or Vyalov et. a1 (1966). It must be emphasized that there is quite a spread in the data. Close to the location of the plates a per- mafrost station has recorded air temperature and ground temperature down to 3 m below the soil surface over the last ten years (Bakkeholi, 1982). Bakkehei and Bandis (1987) have presented 5-days medium temperature in air and in the depth interval 0 . 0 - 2 . 5 rn below ground level. Fig. 2 shows an example of these data for 1984.
1282
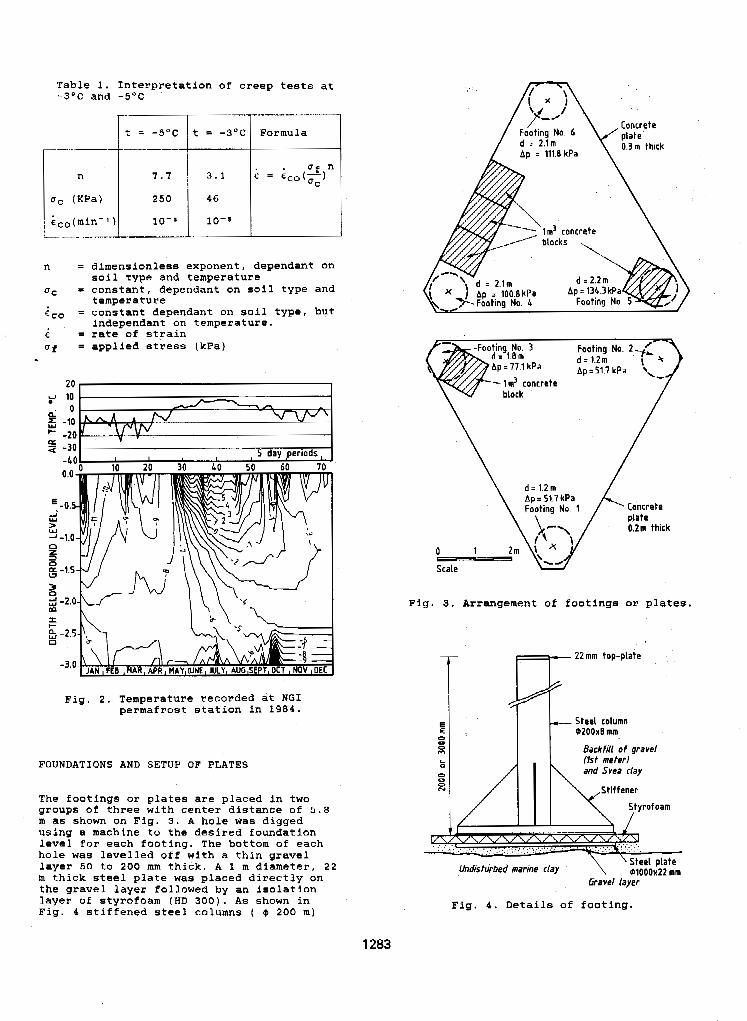
Table 1. Interpretation of creep tests at - 3 O C and -5Oc
t = - 3 O C Formula
n = dimensionless exponent, dependant on
uc = constant, dependant on soil type and
= constant dependant on soil type, but
soil type and temperature
temperature
independant on temperature. .i = rate of strain uf = applied stress (kPa)
" I
I I-
c3 9 -2
-3
.5
*o
Fig. 2. Temperature recorded at NGI permafrost station in 1984.
FOUNDATIONS AND SETUP OF PLATES
The footings or plates are placed in two groups of three with center distance of 5.8 m as shown on Fig. 3. A hole was digged using a machine to the desired foundation level for each footing. The bottom of each hole was levelled off with a thin gravel layer 50 to 200 mm thick. A 1 m diameter, 22 m thick steel plate was placed directly on the gravel layer followed by an isolation layer of styrofoam (HD 300). As shown in Fig. 4 stiffened steel columns ( 4 200 m)
Concrete plate 0.2m thick
Fig. 3. Arrangement of footings or plates.
22 mm top-plate
Steel column B200xB mm
0
0 m Backfill of aravel
Gravel layer
Fig. 4. Details of footing.
1283
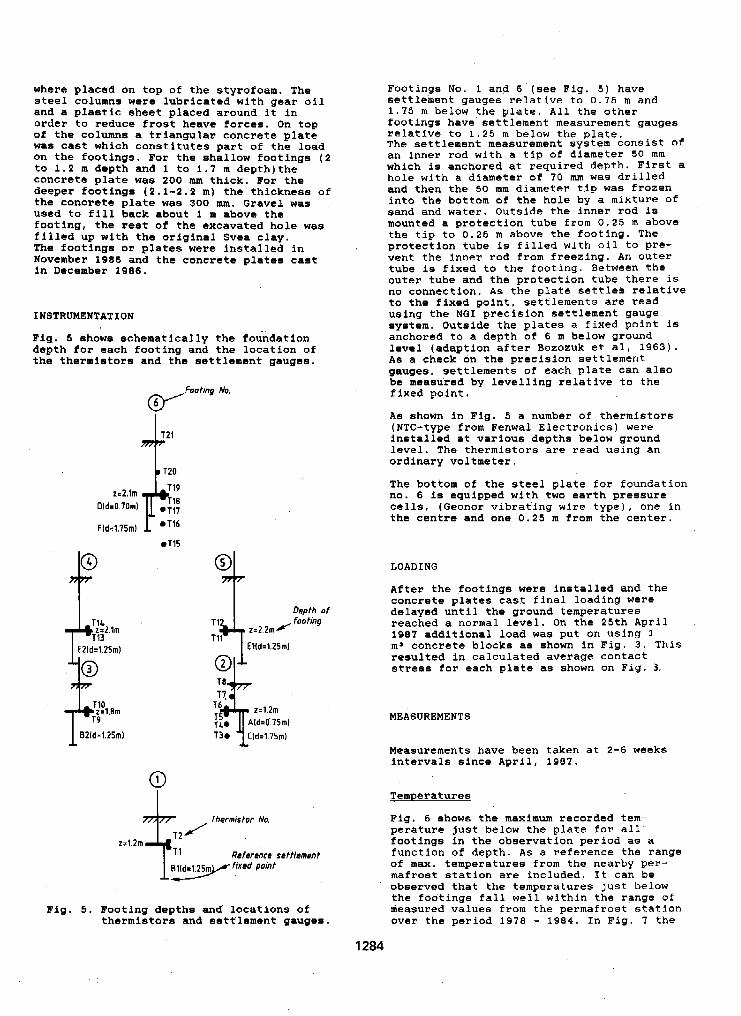
where placed on top o f the styrofoam. The
and a plastic sheet placed around it in steel columns were lubricated with gear oil
order to reduce frost heave forces. On top of the columns a triangular concrete plate was cast which constitutes part of the load on the footings. For the shallow footings (2 to 1.2 m depth and 1 to 1 . 1 m degth)the concrete plate was 200 mm thick. For the deeper footings (2.1-2.2 m) the thickness of the concrete plate was 300 mm. Gravcl was used to fill back about I m above the footing, the rest of the excavated hole was filled up with the orlginal Svea clay. The footings or plates were installed in November 1986 and the concrete plates cast in Docember 1986.
INSTRUMENTATION
Fig. 6 shows schematically the foundatian depth for each footing and the location of the thermistors and the settlement gauges.
T20
F(de1.75m) 1 OTi6
oT15
4 I Dedh of
Fig. 5. Footing depths and locations of thurmistors and settlement gauges.
1284
Footinps No. 1 and 6 (see Fig. 5 ) have settlement gauges relative to 0 . 7 5 m and 1.75 m below the plate. All the other
relative to 1.25 m below the plate. footings have settlement measurement gauges
The settlement measurement system consist O f an inner rod with a t i p of diameter SO mm which is anchored at required depth. First a hole with a diameter of 7 0 mm was drilled and then the 50 mm diameter tip was frozen into the bottom of the hole by a mixture of sand and water. Outside the inner rod i 8 mounted a protection tube from 0.25 m above
protection tube is filled with oil to pre- the tip to 0.25 m above the footing. The
vent the inner rod from freezing. An outer tube is fixed to the footing. Between the outer tube and the protection tube there is no connection. A s the plate settles relative to the fixed point, settlements are read using the NGI precision settlement gauge system. Outside the plates a fixed point is anchored to a depth of 6 m bclow ground level (adaption after Bozozuk et al, 1963). As a check on the precision settlement gauges, settlements of each plate can also be measured by levelling relative to the fixed paint.
AS shown in Fig. 5 a number of thermistors (NTC-type from Fenwal Electronics) were installed at various depths below ground level. The thermistors are read using an ordinary voltmeter.
The bottom of the steel plate for foundation no. 6 is equipped with two earth pressure cells, (Geonor vibrating wire type), one in the centre and one 0.25 m from the center.
LOADING
After the footings were installed and the concrete plates cast final loading were delayed until the ground temperatures reached a normal level. On the 25th A p r i l 1987 additional load was put on using 1 mJ concrete blocks as shown in Fig. 3. This resulted in calculated average contact stress for each plate as shown on Fig. 3.
MEASUREMENTS
Measurements have been taken at 2-6 weeks intervals since April, 1987.
Temperatures
Fig. 6 show6 the maximum recorded tern- peraturc just below the plate for all footings in the observation period as a function of depth. As a reference the range of max. temperaturea from the nearby per- mafrost station are included. It can be observed that the temperatures just below the footings fall well within the range of measured values from the permafrost station over the period 1978 - 1 9 8 4 , In Fig. 7 the
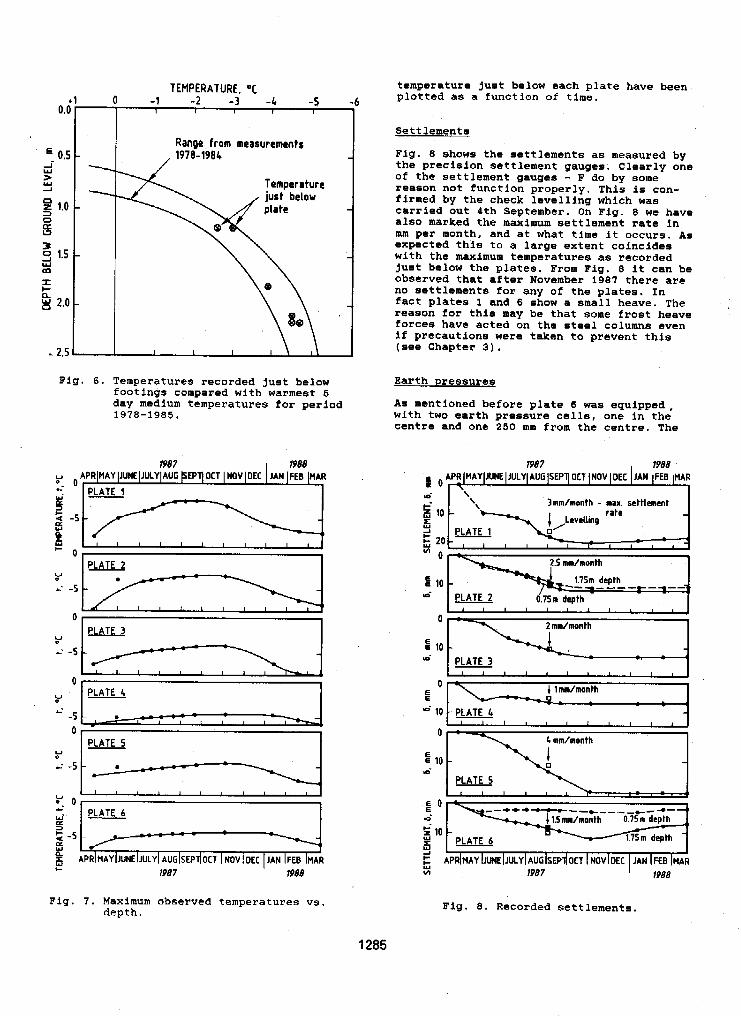
Fig. 6 . Temperatures recorded just below footings compared with warmest 5 day medium temperatures for period 1978-1985.
I PLATE 2 "1
0 1 .
n
Y I PLATE &
- L _I
0 -
-. ,.
I I I % ,
PLATE 5 U
- - - - "4
r n
/ - - = = Y APRIHAYIJUNEIJULYIAUGISEP~OCT INOV~DEC JAN IFEB IMAR
1987 ' 1988
Fig. 7. Maximum observed temperatures vs. depth.
temperature juat below each plate have been plotted as a function of time.
Settlements
Fig. 8 shows the settlements as meaaured by the precision settlement gauges. Clearly one of the settlement gauges - F do by some reason not function properly. This is con- firmed by the check levelling which was carried out 4th September. On Fig. 8 we have also marked the maximum settlement rate in mm per month, and at what time it occurs. As expected this to a large extent coincides with the maximum temperatures as recorded just below the plates. From Fig. 8 it can be observed that after November 1987 there are no settlements for any of the plates. In fact plates 1 and 6 show a small heave. The reason f o r this may be that some frost heave forces have acted an the steel columns even if precautions were taken to prevent this (see Chapter 3).
Earth pressures
As mentioned before plate 6 was equipped. with two earth pressure cells, one in the centre and one 250 mm from the centre. The
1987 1988
rr 0 , q APR lHAYlJUNE I JULY1 AUGISEPI OCT I NOV I DEC JAN 1 FEB ]MAR
a
3mn/month - man. settlement I
2.5 mdnonth
i.75m depth
PLATE 2 0.75111 depth
Z mmhonth 1
d PLATE 3
0 E 4 imm/month
Q - 10 - PLATE 4
I
1 1 1 1 , 1 1 1 1 1 ,
L mn/nonth
I 1 1 1 1 1
J
AFR~HAY LUNE IJULY I AUG ISEPII OCT I NOV I DEC JAN I FEE IMAR # 1987 1988
Fig. 8. Recorded settlements.
1285
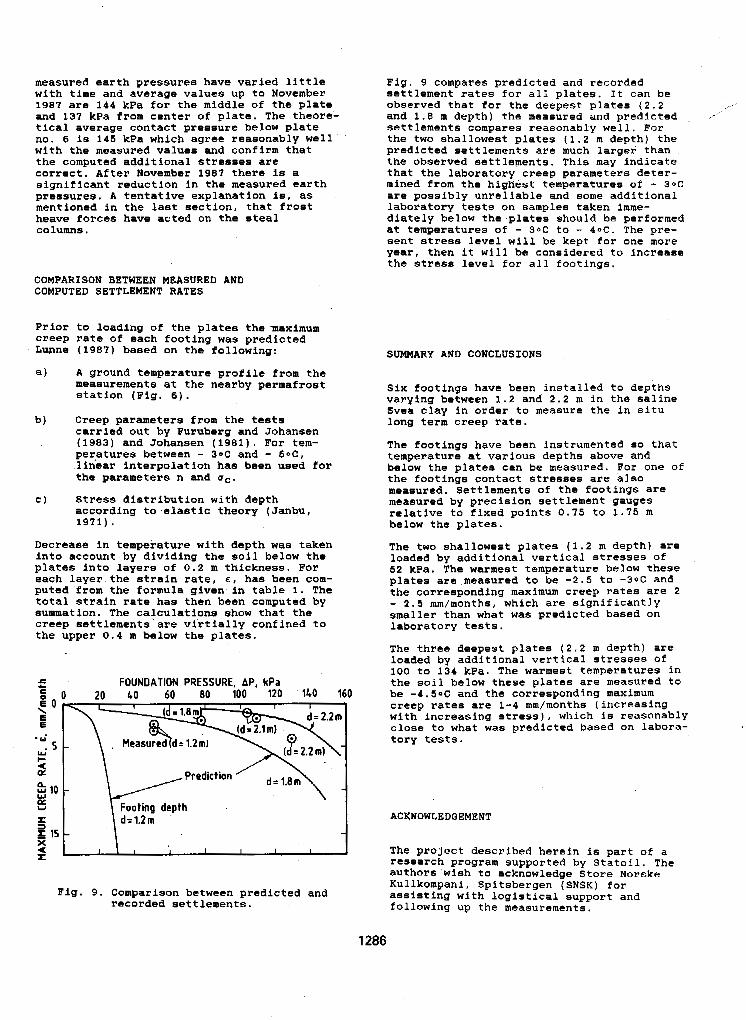
measured earth pressures have varied little with time and average values up to Novtmber 1981 are 144 kPa for the middle of the plate and 137 kPa from center o f plate. The theore- tical average contact pressure below plate no. 6 is 145 kPa which agree reasonably well with the measured values and confirm that the computed additional stresses are correct. After November 1987 there is a significant reduction in the measured earth pressures. A tentative explanation is, as mentioned in the last section, that frost heave forces have acted on the steal columns.
Fig. 9 compares predicted and recorded settlement rates for all plates. It can be observed that for the deepest plates (2.2 and 1.8 m depth) the measured and predicted . - settlements compares reasonably well. For the two shallowest plates (1.2 m depth) the predicted settlements are much larger than the observed settlements. This may indicate
mined from the highest temperatures of - 3oC that the laboratory creep parameters dster-
are possibly unreliable and some additional laboratory tests on samples taken lmme- diately below the plates should be performed at temperatures of - 30C to - 4 o C . The pre-
year, then it will be considered to increase sent stress level will be kept for one more
the stress level for all footings. CQMPARISON BETWEEN MEASURED AND COMPUTED SETTLEMENT RATES
Prior to loading of the plates the maximum
Lupne (1987) based on the fallowing: creep rate of each footing was predicted
SUMMARY AND CONCLUSIONS
a) A ground temperature profile from the measurements at the nearby permafrost station (Fig. 6).
b) Creep parameters from the tests carried out by Furuberg and Johansen (1983) and Jahansen (1981). For tem- per,atures between - 3oC and - S o C , linear interpolation has been used for the parameters n and uc.
e) Stress distribution with depth according to-elastic theory (Janbu, 1971).
Decrease In temperature with depth was taken into account by dividing the soil below the plates into layers of 0.2 m thickness. For
putsd from the farmula given in table 1. The each layer the strain rate, e , has been com-
total strain rate has then been computhd by summation. The calculations show that the creep sattlements'are virtially confined to the upper 0.4 m below the plates.
2 10 8 E 1 15 X
FOUNDATION PRESSURE, AP, kPa 0 20 40 60 EO 100 120 1 M 160
Fig. 9. Comparison between predicted and recorded settlements.
Six footings have been installed to depths varying between 1,2 and 2.2 m in the saline Svea clay in order to measure the in situ long term creep rate.
The footings have bean instrumented so that temperature at various depths above and belaw the plates can be measured. For one of the footings contact stresses are also measured. Settlements of the footings are measured by precision settlement gauges relative to fixed points 0.75 to 1 . 1 5 m belaw the plates.
The two shallowest plates (1.2 m depth) are loaded by additional vertical stresses of 52 kPa. The warmest temperature below these plates are measured to be -2.5 to -3oC and the corresponding maximum creep rates are 2 - 2.5 mm/months, which are significantly smaller than what was predicted based on laboratory tests.
The three deepest plates (2,2 m depth) are
100 to 134 kPa. The warmest temperatures in loaded by additional vertical stresses of
the soil below these plates are measured to be -4.5oC and the correaponding maximum creep rates are 1-4 mm/months (increasing with increasing stress), which is reasonably close to what was predicted based on labora- tory tests.
ACKNOWLEDGEMENT
The project described herein is part o f a research program supported by Statoil. The authors wish to acknowledge Store Norske Kullkampani, Spitsbergen (SNSK) for assisting with loglstical support and following up the measurements.
1286
REFERENCES
1. Bakkehei, S. (1982) Datainnsamling pB permafroststasonen I Svea, Svalbard Frost i jord, publ. Nr. 24, Oslo.
2. Eakkehai, S. and C. Bandis (1987) A preliminary analysis o f climatic data from the permafrost station at Svea, Spitzbergen Frost I jord nr. 26, Oslo .
3 . Bozozuk, M.. G.H. Johnston and J.J. Hamilton (1963) Deap bench marks in clay and per- mafrost areas. In Field testing of soils, ASTM Sp. Tech. Pub. No. 322, p . 265.
4. Gregersen, O., A . Phukan and T. Sohan- sen (1983) Engineering properties and foundation design alternatives in marine Svea clay, Svalbard. International Con- ference on Permafrost, 4. Fairbanks, Alaska 1983. Proceedings, pp. 384-388. Also publ. in: Norwegian Gsotechnical Institute, Oslo, Publ. No. 159, 1985.
5. Furuberg, T. og T . Johansen (1983)
port til NTNF. NTH Rapport No, Svealsira sin mekaniske etyrke. Rap-
F-63.03.
6. Janbu, N. (1971) Qrunnlag i geoteknikk. Tapir forlag, Trondhaim.
7. Johansen, T. (1981) Krypforsak pb Svealeirc. Rapport til NTNF. NTH Rapport F.081.05.
8 . Ladanyi, B. (1972) An engineering theory of creep in fro- zen soils. Canadian Geotechnical Jour- nal Vo1. No. 1, pp. 63-79.
9. Lunne, T . (1987) Arktisk geotcknikk og fundarnentering. Forutberegnede krypsetninger for platebelastningsforsmk i Svea. Intern Rapport 52704-5. 2 0 . januar, 1987.
10. Vyalov, S.S. et. a1 (1966) Methods of determining creep, long term strength and compressibility characteristics of frozen soil. Nauka Moscow Nat. Res. Counc. of Canada. Techn. Trans. 1364 Ottawa, 1969.
1287
MELIORATION OF SOILS OF CRYOLITHOZONE O.V. Makeev
Institute of Soil Science and Photosynthesis USSR, Academy of Sciences, Pushchino, Moscow Region, USSR, 142292
SYNOPSIS Effective complex melioration of soils with frost in the profile is possible if a simultaneous control of the two processes, namely frost and soil formation is ensured. A number of soils of cryolithozone due to the permafrost effect as a factor of soil formation specific cryogenic features, horizons and regimes, thus forming new types of soils, the most peculiar of which are cryogenic frozen ones.
Specific character of melioration techniques is increased from the south to the north in the cryolithozone.
The melioration technology of the following ecologo-meliorative groups of tundra soils: frozen tundra mineral gley, frozen tundra bog (peat) gley, coldgenic tundra soils of the bottoms .of dried -up thermokarst lakes, coldgenic tundra floodplain and frozen tundra surface-gley, as well as recultivation of the soils destroyed by excavations; phytomelioration of the frozen tundra surface-gley soils are described in the present paper. The data on effective melioration are also presented.
In the northern hemisphere the formation of soils and soil cover is greatly affected by their annual freezing. and thawing (Makeev, 1981). The greatest effect is observed in the northern regions where the soil profile often rests on permafrost.
Frost as a factor of soil formation accounts for a number of soil properties including the formation of their taxons. These soils are considered by u s to belong to a big taxonomic group - massif of freizing-thawing or short-term trawfrost soils in- cluding megaformations of cryogenic and noncryo- '
genic soils (Makeev, 1986). The megaformation of the freezing-thawing cryogenic soils includes the Soils formed mainly in the high northern and southern latitudes as well as in the corresponding zones of mountain systems. The genesis develop- ment and functioning of such soils are greatly affected by negative temperatures resulting in phase transformation of soil moisture into ice and vice versa. These soils are to have one or several specific cryogenic horizons in their profiles and to develop under conditions of cryogenic (thermal, water, biological, etc.) regimes: During this process both cryogenic and noncryogenic horizons are destroyed and their parts can move in various di- rections.
The freezing-thawing soils unaffected by the soil cryogenesis, Le. without profile properties, content, solum and regime characteristics belong to the me- gaformation of the freezing-thawing noncryogenic soils. They include, for example, all the soils with a short-term and shallow soil profile freezing (sand rubble, etc.).
The mefaformation of the cryogenic soils includes two formations: frozen and coldgenic ones,
The frozen formation consists of the freczing- -thawing cryogenic soils, the profile of which is resting on permafrost rocks, being reached by the
layer of seasonal thawing during winter time. Thus, these soil are called overfrozen ones. Their ave- rage temperature is negative.
hlelioration of the following soils from the forma- tion: frozen tundra mineral gley, frozen tundra bog (peat) gley and frozen tundra surface-gley, - i s discussed in the present paper.
The coldgenic soil formation includes the soils, the profile of which does not rest on the permafrost,
:and they have no contact with the seasonal freez- ing layer. The presence of cryogenic properties, horizons and regimes in these soils I s due to their lingering and deep seasonal freezing the degree of which depends not only on climatic con- ditions but also on granulometric content and some other lactors. According to literature data they are shown to be in the frozen state not less than 5 months. Their mean temperature is positive.
Melioration of the following soils from the forma- tion: coldgenic tundra gley on the bottoms of dried-up thermokarst lakes and coldgenic tundra floodplain, - is d iscussed in the present paper. The above-mentioned frozen and coldgenic soils of the cryolithozone have the most exhibited complex of specific features connected with the frost that results in specific techniques of their melioration. Effective melioration of the soils with the frost in
of the two complex processes: frozen and soil forming, however the task is simplified when the techniques coinside.
The techniques of controlling the frozen process in the soil grounds according to V.A.Kydryavtsev and E.D.Ershov (1969) are subdivided into €our groups: a) changing the outer heat exchange; b) control- ling heat exchange by changing the content and properties of the meliorated thicknesses; c) chang- ing the temperature regime and heat state of the
the profile is possible under simultaneous control
1288
meliorated thicknesses by using additional sources and runoffs of heat, and d) controlling temperature conditions it1 the rocks deposited lower than the meliorated thickness. The techniques of controlling soil forming process during soil melioration outside the cryolithozone are rather well grounded (Kovda, 1985).
Melioration of the soils with the frost in the profile is scientifically based on the estimation of the ne- cessary level of soil heat provision which can be energetically evaluated as a part of annual heat exchange spent on heating the soil surface at its positive temperatures Q o. This part of heat
energy plays the main role in soil formation and vital activity of organisms. Its increase or decrease leads to a change both in the soil formation direc- tion and soil bioproduction. Hydrotechnical as well as nonhydrotechnical techniques are used for this purpose. An artificial change both in heat and water regimes of the soils provided by all the tech- niques results in the increase of soil bioproduction. Therefore, it i s rightfull to speak about hydrotherm- a;l meliorations when these techniques a re applied r
in complex. However, in the majority of cases hyd- rotechnical meliorations and among them -drainage occupy the leading place.
The nonhydrotechnical techniques include
I. Snow meliorations providing control of snow ac- cumulation and snow drive away. The effect of snow on the depth of freezing and thawing is many- -sided. Due to its high albedo it has a cooling e€- fect and being a thermal insulator in warms the soil by decreasing efficient irradiation. At a small thickness of the snow cover it5 cooling effect pre- vails over the warming one. Accordingly, complete snow detention with the formation of snow drifts provided due to smal l field areas, in the forest zone also preserves soil from strong and deep cooling and freezing, sharply spring warming up to a great depth and increases the amount of snow melting water. After heavy snow winters the snow drive away is required, it provides a sharp decre- ase .of heat spent on snow evaporation, an addition- al input of heat into soil and good soil loading with moisture. In the region of Vorkuta the snow drive avay provides the positive heat flow into the soil by 20-30 days earlier. In the a reas with the near-to-surface ice deposit in the rocks the snow drive away combined with water drain from the surface prevents the appearance of thermocarst* Snow can be removed mechanically or by intensive thawing. Prolongation of the vegetation period re- sults in from the snow drive away.
2. Application of various covers for soil surfaces (heat-light- and moisture insulating) is one of the main components of the thermal soil melioration. Coverage with synthetic films decreases the amount of heat spent on evaporation and heat emission coefficient% detains long wavelength infrared irradia- tion and increases heat provision coefficient of the seasonal-thawing layer. It results in the increase of heat accumulation in soil (temperature is in- creased by 6-8OC) and soil seasonal thawing. Ef- fective irradiation can be decreased by covering the soil with the film before snowfall, the soil freezing being delayed by 2-3 weeks. Additional thermoinsulation after the snowfall can be provided with cheap wastes in the form of sawdust, peat, moss and artificial snow. In Yakutiya foam coverage gives the positive effect (it increases average tem-
perature of the rocks by 1.3OC and the depth OP thawing i s decrea ed 3-6 times - Gavrilova, 1978). Covering with an ice-air layer or foam-ice of 35cm thickness at -20°C, decreases the soil freezing 5 times, i.e. 40 c m instead of 2 m (Merzlotovedeniye, 1981). This group of techniques also includes colouring the soil surface (blackening, or whitening), Weakly-moisture-permeable covers (mulch, synthet- ic films) decrease the amount of heat spent on phase transformation of moisture.
3. The increase of soil roughness by its surface loosening allows to decrease albedo by 20-30% and to increase absorption of short wavelength light energy, the coefficient of heat conductance being considerably changed as compared with heat ca- pacity. It probably results in the decrease of soil temperature. The opposite effect, le. the increase of the surface layer temperature, can be obtained by soil packing,
4. Subsoil tillage provides stubble preservation and in the arable layer it leads to the appearance of
Ithe cavities filled with air which in their turn de- crease heat. emission.
5. Application of row plant growing under row orientation from the north to the south has a heat- ting effect, since the total soil surface is increased
sorbed. and greater amount of solar energy will be ab-
6. Earthing of the frozen bog (peat) gley soils. In Magadan region (Korekovtsev, Orlovskaya, 1984) application of 200-300 m3/ha of sand -ice alluvium provided the increase of the thawing depth at an average by 4096, +5OG isotherm reached the depth of 60 c m as compared with 35 c m in the control,
7. Rational forest concernation and field-protecting forestry preserve the soil from extreme winter cooling, decrease inefficient heat expenditures spent on ice thawing and evaporation from soiL Coulisses of perennial grasses and stubble preservation can be additionally used. Culturtechnical practice in- cludes wood vegetation clearance, hassock cutting off and stone I.emoving.
8. Placement of agricultural fields on downwind, flat slopes protecting from the north decreases soil cooling.
9.Application of fertilizers including those increasing cold hardness and frost endurance of plants: nitrogen ones - ammoniacal and ammoniacal-nitrate forms; phosphorus ones - simple superphosphate, containing sulfur; microelement ones molybdenum and nickel forms. In the regions with cryarid soils
crop drought-resistance. The soils with high acidity it is necessary to apply microelements, increasing
require liming.
10. Phytomelioration of soils, For this purpose it is necessary to select plants and grow new varieties adapted to the conditions of the extreme north as well as to use the productive local g ra s ses on pasture and hay lands. I h e to possible day and night photosynthesis with the absorption of not only visible but also infrared r ays the amount of the organic matter synthetized under these conditions can be compared with that synthetized in a mild climate.
In the tundra zone the majority of the techniques
1289
mentioned above can be often used together with
tion and field -protecting forestry are included in the hydrotechnical meliorations. Forest conserva-
the techniques mentioned above for the zones be- ginning, mainly, from forest-tundra one and southw- ard.
The technology of cryolithozone soil melioration is the most specific in the tundra zone and it will be discussed below, however a number of its elements
lithozone on the soils with the frost in the profile. can be applied in more southern parts of the cryo-
This technology has been developed in energy detail for the groups of soils where drainage plays'a leading part (Makeev, Vasilevskaya and al., 1981; Proektirovanie meliorativnykh system na Dal'nem Vwstoke, 1984). Let us consiger the technology of the following soils:
1. Frozen tundra mineral gley soils, the profile of which is resting on permafrost with visible ice, have the depth of seasonal thawing of- up to 1.5 m and the heat provision of 20.000 kcal/m2 year. The soils are of loamy, often medium loamy mecha- nical content characterized by poor water perme- ability and frequent thixotropy. Their excessive water stores are due to underground ice lenses and overfrost vadose water. They arc situated on the slopes of the over-floodplain terraces. Agricul- tural development can result in the formation of thermokarst.
11. Frozen tundra bog (peat) gley soils, the profile of which is also resting on permafrost, have, however, the depth of seasonal thawin and heat provision of 15.000 kcaum 8 year. Of 0*4-0,8m The soils have a peat horizon badly decomposed on the top and well decomposed at the bottom. Minerd ground of various mechanical content often thixo- tropic underlays this horizon. Excessive water stores are the s a m e as in the soils of the first group, but they include gravity supported water formed during snow melting in the seasonal thawing layer. The soils are situated on the depressed
of thermokarst i s great. district of the over-floodplain terraces. The threat
Melioration of the soils of the 1st and 2nd groups have to be carried out in two steps. During the first step (3-4 yea r s ) the thawing of the under- ground ice is carried out to obtain an even layer of the seasonal thawing, 0.6 and 0.6 m thick in the 1st and 2nd groups, respectively. This aim i s achieved by constructing an open network of canals being placed at 100-200 m distance from each other in accord with agricultural needs, Taking into account possible thermokarst the depth of the ca- nals should be not less than 1.4-1.6 m. The begin- ning of ice melting i s provided by sheet preparing, then as far as the thawing proceeds the repeated (nqt less than three times during the warm period) ridging of a thick network o f f urrous at a depth of the thawing layer is carried out. The excessive water is removed from the thermokarst depressions which are then planned. It prevents the thermokarst formation during application of soils aEter meliora- tion. During the 2nd step a drainage network is reconstructed and an irrigation one is built for sprinkling. In the soils of the 2nd group 400-500
m /mm of mineral ground per ha should be applied to the arable area.
3
Building of the roads and hydrotechnical construc- tions is carried out during both the steps. It is prohibited to remove the soil cover from the routes inorder to decrease the threat of thermokarst
IIL Coldgenic tundra gley soils of the bottoms
there but the soils have a tendency towards aggra- of dried-up thermokarst lakes. Permafrost is absent
heat provision 20.000-25.000 kcaum2 year. Accord- dation. The depth of the seasonal thawing is 1.5 m,
ing to the mechanical cohtent the soils are loes- sial silt clay loam, The bottoms of shallow lakes have flat slopes.
Melioration of the soils of the 3d group should be realized by the construction of canals for water discharge from the thermokarst lakes, control over the overgrowth of the lake bottoms with productive arctic perennial grasses including their undersowing Arctagrostis broad-leaved, in particular. Liming and application of mineral and organic fertilizers a re
ha (Shvirst, 1984). required. The yield reaches 30-35 c/of hay per I
While operating the drainage systems some measur- es should be taken to prevent possible frost aggra- dation and flooding of the dried-up lakes with sprin$ floods. After degradation of meadow associa- tions it i s necessary to flood the lakes and to begin using the bottoms of other ones (grass-fallow system of landscape rotation).
Iv; Goldgenic tundra floodplain soils. They ex- hibit no permafrost, the depth of the seasonal thaw- in$ i s 1.5 m, heat provisi n, 25,000-30,000 kcal/m2 year. The majority of these soils except those si-
permeability. The soils are systematically flooded tuated in the floodplain depressions has high water
with spring waters and heated with high table ground waters. This group of soils occupies the river floodplains. Thermokarst Is absent.
Melioration of the soils of the 4th group should be carried out together with flood control, prevention of water stagnation and lowering of the ground
is built, depressions with no runoff are filled with wster table. For this purpose a network of canals
earth and the surface is levelled. Selected closed drainage systems m a y be required. As a result, 50-70 c of high quality fodder per ha is obtained (Andreev, 1984).
fn the frost regions of the North the soils dest- royed by excavations are recultivated and applied for agricultural need6 (Papernov, Zamoshch, Zakar, 1983). 'The technology preventing the thermokarst processes is developed. According to it, the total thickness of the potentially fertile sail, drainage layer and deposits from silt basins applied to the recultivated surface must be greater than the depth of their seasonal thawing.
Under conditions of the East-European tundra in the region of Vorkuta according to the method suggested by the Institute of Biology of the Komi Branch of the U S S R Academy of Sciences the phytomeliora- tion of the frozen tundra surface-gley soils i s suc- cessfully carried out with application of relatively low fertilizer rates. This method consis ts of virgin soil reclamation by discing for cutting the plant co- ver and for mixing it with the soiL 'Then local grass mixtures are sowed and hay-mowing is annually carried out, The application of this method resulted in the development of about 5.000 ha of the frozen
1290
tundra surface gley in the Vorkuta region, The hay harvest of the meadow-foxtail grass mixture and cane-type canary grass was 15-20 c/ha and up to 100 c/ha, respectively (Zaboeva, Rubtsov, 1985).
CONCLUSION
In the regions of the Extreme North of the U S S R mainly under conditions of the perennial cryolitho- zone there are about 6*106 ha of agricultural lands (Nosov, Vashanov, 1984). Their effective applica- tion greatly depends on melioration. Hydrotechnicel and nonhydrotechnical techniques of complex melio- ration can be applied taking into account the spe- cific character of soils: cryogenic frozen and cold- genic ones.
The data on productivity given above allow to pre- dict high efficiency but only in cmse when the qua- lity of melioration i s drastically increased. Such negative consequences of melioration m6 secon- dary salinization during excessive irrigation, secon- dary swamping and an increase of the freezing depth as well as the corresponding measures should be considered while designing melioration systems. I t i s well known that the subarctic soils &an be greatly destroyed under the anthropogenic effect therefore special techniques of soil conser- vation are required.
LITERATURE
Andreev N.G. (1984). Osnovnye napravleniya raz- vitiya kormoproizvodshta v raionakh Krainego Severa. V Knige: Sel'skoe i promyslovoe kho- zyaistvo Krainego &vera. Sektsiya pochvo- vedenie i agrokhimiya Novosibirsk, Sibirskoe otdelenie Vseeojuznoi Academii Sel'skokho- zyaistvennykh Nauk (VASKHNIL). s t r , 64-66,
Gavrilova M.K. (1978). Klimat i mnogoletnee pro- merzanie gornykh porod. Kovosibirsk, h'auka, str. 214.
Zaboeva I.V., Rubtsov M,D, (1985). Zemel'nye re- sursy Bol'shezemel'skoi tundry i ikh ispol'so- vanie. - V knige: Problemy pochvennogo crio- g e n e z a Syktyvkar, Komi filial Akademii Nauk S S S R , str. 6-7.
Kovda V.A. (1985). Pochvennyi pokrov, zemledelie
Tsentr Biologicheskikh Issledovanii ( NTsBI) i melioratsiya Preprint, Pushchino, Nauchnyi
Akademii Nauk S S S R , str. 25.
Korckovtsev A.S., Orlovskaya K.V. (1984). Vliya- nie tcplovoi melioratsii na svoistva bolotnykh merzlothykh pochv Magadanskoi oblasti. V knige: Sel'skoe promyslovoe khozyaistvo Krai- nego S e v e r a E e k t s j a pochvovedenie i agro-
VASKHNIL), str.27-29. chimiya, Novosibirsk, Sibirskoe otdeleniye
upravleniya rnerzlotnym protsessom - V sbor- nike: Merzlotnye issledovaniya, vypusk IX, Moskva, Moskovskii Gosudarstvennyi 'Ciniver- sitet, str. 156-157.
Kudryavtsev V.&, Ershov E.D. (1969). Printsipy
Makeev O.V. (1981). Fatsii pochvennogo cryogene- za i osobennosti organizatsii v nikh pochven- nykh profilei. Moskva, Kauka, str. 88.
Makeev O.V. (1986). Sovremennaya kontseptslya pochvennogo cryogeneza, evolutsiyya criogen- nykh pochv v Golocenr i problemy melioratsii
pochv a merzlotoi v profile. V knige: Evolut- aiya i vozrast pochv SSSR. Pushchino, NTsBI Akademii Nauk S S S R , str. 37-46.
Makeev O.V., Vasilevakaya .V.D., Volkovintser V.S., Elovskaya L.G., Zaboeva LV., Ignatenko LV., Kovalev RV., Stepanov A.N., Gershevich V.D. (1981). Plodorodie i ratsional'noe iopol'zova- nie pochv Krainego Severa (tundrovaya i le- sotundrovaya zony). - V sbornike: Znachenie pochvennykh issledovanil v reshenii Prodo- vol'stvennoi programmy (doklady General'nogo simposiuma VI s'eeda Vsesouznogo obshchest- va pochvouedov) , Tbilisi, str. 130-147.
Merzlotovedenie (1981). Moskva, Moskovskii Go- sudarstvennyi Universitet. str. 229.
Nosov SI,, Vashanov V.A. (1984). Osnovnye nap- ravleniya ratsionel'nogo ispol'zovaniya i okhra- ny eemel'nykh resursov Severa V knige: Sell- ,
skoe i promyslovoe khozyaistvo Krainego ,Se- vera. Sektsiya pochvovedenie i agrokhimiyer. Novosibirsk, Sibirskoe otdelenie VASKHNIL, str. 17-19.
Papernov ZM., Zamonhch M.N., Lazar &Ya. (1984) Osnovnye printsipy, metodika i resul'taty eks- perimental'nykh issledovanii technogeneza i rekultivatsit usloviyakh Swero-Vostoka. V acornike: Biologicheskie problemy pochv seve r+ Chast' I, Magadan. str. 293-294.
Proektirovanie meliorativnykh sistem na Dal'nem Vostoke (1984). Posobie Ministersha vodnogo khozyaistva S S S R , Vladivostok, str. 8'7.
Shvirst AT. (1984). Isrlsdovaniya PO sozdaniju senokosov na termokarstovykh ponizheniyakh v subarcticheskoi zone Chukotki, V knige: Sel'skoe i promyslovoe khozyhisstvo v raio- nakh Krainego Sevsra Sektsiya pochvovede- nie i agrokhimiya. Novosibirsk, Sibirskoe ot- delenie VASKHNIL, otr. 10'7-108.
1291
EMBANKMENT FAILURE FROM CREEP OF PERMAFROST FOUNDATION SOILS
A CASE HISTORY R. McHattie and D. Esch
Alaska Department of Transportation, Research Section, Fairbanks, Alaska, USA
SYNOPSIS A r o a sec t ion 10.6 meters i n h e i g h t was c o n s t r u c t e d i n 1975 over warm s i l t permafrost soi ls near Fairbanks, Alaska, and was observed t o have se t t led very no t iceab ly a f te r severa l years of service. Borings were made and inc l inometer and temperature logging casings were i n s t a l l e d e a r l y i n 1983 along wi th re ference markers for ver t ica l and l a t e r a l movement observations, Measurements s ince tha t t ime have ind ica ted tha t c reep movements a r e o c c u r r i n g i n t h e f rozen foundat ion soi ls which contain large massive Ice deposi ts. Embankment surface sett lements have averaged 30 cm per year s ince const ruct ion, and measurement po in ts loca ted 9 m outs ide the embankment toes have been u p l i f t e d a t a r a t e O f 7.5 cm per year. Incl inometer readings have shown t h a t l a t e r a l c r e e p movements- o f the f ro ten foundat ion so i ls a re occur r ing a t depths g rea ter than 13 meters, even though seasonal thawing reaches t o a dep th o f on l y 6.4 m. Measurements Ind icate the permafrost foundat ion so i l temperatures , to be ve ry c lose t o - 0 . 4 O C .
TO r a i s e and l e v e l t h e roadway i n t h i s area t o i t s o r i g i n a l h e i g h t , t h e embankment was reconstructed i n 1987 us ing wood chips as l i gh twe igh t fill f o r replacement o f a p o r t i o n of the embankment s0fl.s. By this means, i t was poss ib le t o ra ise the road sur face to I t s o r i g i n a l e l e v a t i o n w h i l e a c t u a l l y reducing the to ta l overburden load on the foundation S o i l s by about 20%. New monitoring equipment has since been ins ta l led to mon i to r the behav io r o f the recons t ruc ted embankment. Resul ts o f a l l p rev ious mon i to r ing s tud ies a re d iscussed, a long w i th cos ts and a l te rna t ives cons idered fo r r e p a i r o f t h i s embankment.
BACKGROUND desc r ibed l a te r . The embankment set t lements were determined t o be caused by plast ic creep displacements
I n 1975, the Alaska Department o f Highways completed a o f the i ce- r i ch permaf ros t foundat ion so i l s , as section of the Parks Highway on new alignment across the discussed herein. Creep movements had no t p rev ious ly Al-der Creek val ley, approximately 13 km west of been considered a problem for roadway embankments.
Fairbanks, a t l a t i t u d e 64" 5 2 ' North. The val leyrbottom SITE AND SOILS DESCRIPTIONS s o i l s were p e r e n n i a l l y f r o z e n , i c e - r i c h s i l t s w i t h frequent occurrences o f massive subsurface ice. Because The Alder Creek v a l l e y i s a shor t , U-shaped v a l l e y of concerns over permafrost thawing and resu l t ing sur rounded by l o w h i l l s . The val ley-bottom creek has a roadway sett lements, the ' two shal low cut areas required low f low-rate and i s c a r r i e d beneath the roadway by a 3 a t each side o f t h e v a l l e y were i n s u l a t e d w i t h m d iamete r s t ruc tu ra l s tee l p la te Cu lve r t . The polystyrene foam and were extensively instrumented and va l ley -bo t tom so i l s were inves t iga ted w i th Severa l monitored as repor ted by Esch (1983). The road auger borings during the roadway design Stage, and found embankment across the val ley bot tom had a t o t a l l e n g t h t o c o n s i s t o f g r a y , s l i g h t l y o r g a n i c , p e r e n n i a l l y f r o t e n o f 500 m and var ied f rom 3 t o 11 m i n h e l g h t . To s i l t s w i t h d e p o s i t s o f massive subsurface ice. Moisture i m p r o v e t h e t h e r m a l s t a b i l i t y , i n i t i a l r o a d c o n s t r u c t i o n c o n t e n t s i n t h e s i l t g e n e r a l l y r a n g e d between 25 and was n o t p e r m i t t e d u n t i l t h e s t a r t o f t h e 1973-74 w in te r 50%. Extensive moisture content and ice occurrence data f reez ing season, and " toe -s tab i l i za t i on " berms 6 m wide were obtained from the six borings made through the 3 m by 1.8 m t h i c k were a lso const ructed on bo th s ides o f t h i ck roadway fill f o r temperature monitoring cable the 2:l embankment s lopes . i ns ta l l a t i ons a t t he two nea rby i nsu la ted embankment
s i t e s ( F i g u r e 1). All six o f t hese i ns t rumen ta t i on By 1980, excessive movements o f t h e embankment were bor ings encountered massive ice, general ly at depths apparent on bo th s ides o f t he va l l ey . In 1982, the between 6 and 14 meters below the new road Surface. One dec is ion was made t o survey, instrument, and mon i to r the p re-cons t ruc t ion bor ing had a l so been made i n 1972 movements i n t h e a r e a o f t h e g r e a t e s t a p p a r e n t w i t h i n 15 m o f t h e maximum settlement area, and sett lements, which by tha t t ime had exceeded 2 meters in encountePed o n l y i c e a t d e p t h s of 2.3 and 6.0.m below e leva t i on change. Movement reference points, an t h e o r i g i n a l ground surface, wi th layered ice and s i l t incl inometer casing, and a temperature monitoring casing below that depth. From inspect ion o f these bor ings One were insta l led. Observat ions were made several t imes might conclude that over hal f of the subsurface " S O i l S " ove r t he f o l l ow ing 3 years. Because the maximum i n t h i s v a l l e y between depths o f 3 and 9 m consisted Of sett lement area had created a vehic le safety hazard due t o shortened sight-distances, the roadway was
i c e masses, w i t h an average i ce l aye r t h i ckness of 3.7
r e c o n s t r u c t e d t o i t s o r i g i n a l e l e v a t i o n i n 1986 using m.
wood chips as a l i gh twe igh t f i l l - r ep lacemen t ma te r ia l . Vegetation i n t h e A l d e r Creek Va l ley cons is ts Pr imar i lY S u f f i c i e n t r o c k - f i l l was removed from the embankment and of smal l , s tunted, b lack spruce t rees to 5 m i n height, rep laced w i th wood ch ips so t h a t a s i g n i f i c a n t o v e r a l l w i t h a ground surface cover of sphagnum moss. The r e d u c t i o n i n embankment weight was achieved, as will be c l i m a t e i n t h i s a r e a i s t y p i c a l o f t h e d r y i n t e r i o r of
1292
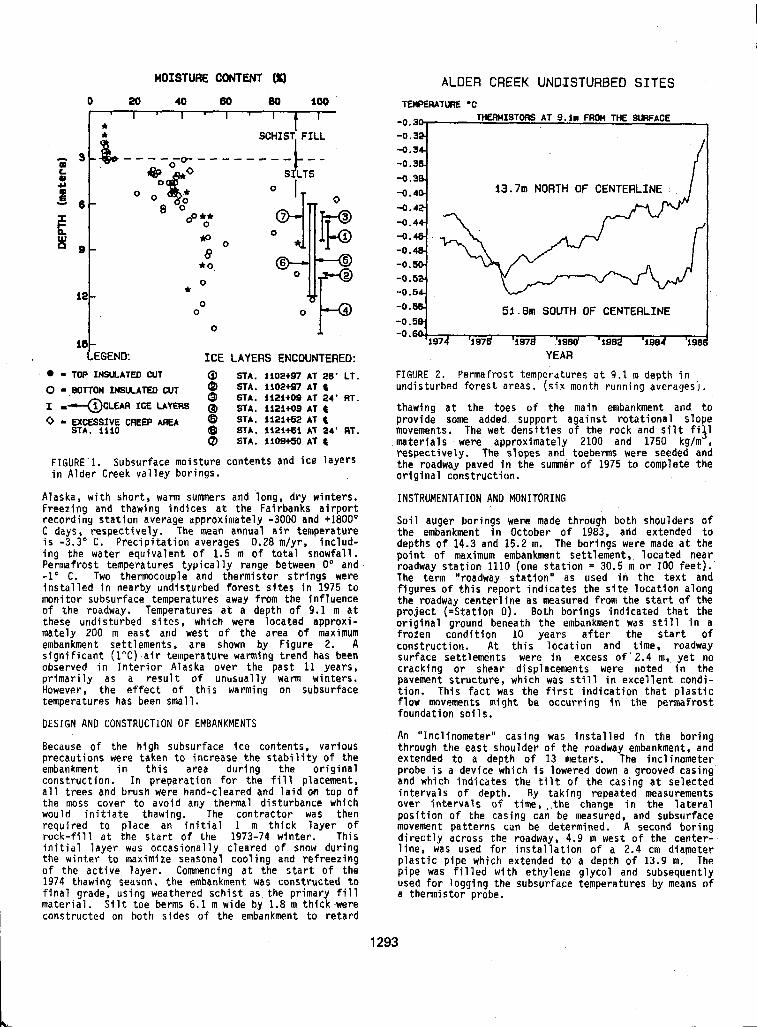
HOISTUAE CONTENT (%I ALDER CREEK UN0,ISTURBEO SITES 0 20 40 80 Bo io0 TEMPERATURE 'C r r I , I . I , I ~
* - 9-&"- -o-[r- * - - - - r
6 -
0
0 ?$ 13.7m NORTH OF CENTERLINE
E !!I a -
8 B *o"
* O 8
* O
0 * i o - 0
0
0
is - LEGEND: ICE LAYERS ENCOUNTERED: YEAR
TOP INSULATED CUT 0 STA. 1i02+97 AT 26' LT. FIGURE 2 . Permafrost temperatures a t 9.1 m depth i n 0 - BOTTOM INSULATED CUT @ STA. i102t97 AT e I "CLEAR ICE LAYERS 0 STA. i121t09 AT thawing a t t h e t o e s o f the main embankment and t o 0 - EXCESSIVE CREEP AREA @ STA* 112i*52 AT prov ide some added suppor t aga ins t ro ta t iona l S lope
STA. 1 1 2 i t 0 9 AT 24' RT. und is tu rbed fo res t a reas . (s ix month running averagesj.
STA. 1110 8 5TA. 1121+61 AT 24' RT. a STA. 1109+50 AT C movements. The wet dens i t ies o f the rock and s i l t f i 3 1 ma te r ia l s were approximately 2100 and 1750 kg/m ,
FIGuRE.1. Subsurface moisture contents and i c e l a y e r s respec t ive ly . The slopes and. toeberms were seeded and the roadway paved i n t h e sumner o f 1975 t o complete the
i n A l d e r Creek va l l ey bo r ings . o r i g ina l cons t ruc t i on .
A laska, wi th shor t , warm summers and long, dry winters. INSTRUMENTATION AND MONITORING f reez ing and thaw lng i nd i ces a t t he Fa i rbanks a i rpo r t recording stat ion average approximately -3000 and +1800° Soi l auger bor ings were made through both shoulders o f C days, respec t ive ly . The mean annual a i r temperature the embankment i n October of 1983, and extended t o i s -3 .3" C. P r e c i p i t a t i o n averages 0.28 m/yr, i nc lud - dep ths o f 14.3 and 15.2 m. The bor ings were made a t t h e ing the water equiva lent o f 1.5 m o f t o t a l s n o w f a l l . p o i n t o f maximum embankment set t lement, located near Permafrost temperatures typical ly range between 0" and roadway s t a t i o n 1110 (one s i a t i o n = 30.5 m o r 100 f ee t ) . -1' C. Two thermocouple and the rmts to r s t r i ngs were i n s t a l l e d i n n e a r b y u n d i s t u r b e d f o r e s t s i t e s i n 1975 t o
The term "roadway s t a t i o n as used i n t h e t e x t and f l g u r e s o f t h i s r e p o r t i n d i c a t e s t h e s i t e l o c a t i o n a l o n g
monitor subsurface temperatures away from the inf luence the roadway cen te r l i ne as measured f r o m t h e s t a r t of the o f t he roadway. Temperatures a t a depth o f 9.1 m a t p r o j e c t ( = S t a t i o n 0). Both bor ings ind ica ted tha t the these undisturbed s i tes, which were located approxi- or ig inal ground beneath the embankment was s t i l l i n a mately 200 m eas t and west o f the a rea o f maximum f rozen condi t ion 10 y e a r s a f t e r t h e s t a r t of embankment set t lements, are shown by Figure 2. . A constyuct ion. A t t h i s l o c a t i o n and time, roadway s i g n i f i c a n t ( 1 ° C ) a i r temperature warming trend has been surface sett lements were i n excess o f ' 2.4 m, y e t no observed i n I n t e r i o r Alaska over the past 11 years, cracking or shear displacements were noted i n the p r i m a r i l y as a resu l t o f unusua l ly warm winters. pavement s t r u c t u r e , w h i c h ' w a s s t i l l i n e x c e l l e n t c o n d i - However, t h e e f f e c t o f t h i s warming on subsurface t ion. This fact was t h e f i r s t i n d i c a t i o n t h a t p l a s t i c temperatures has been small, f low movements might be occur r ing i n the permafrost
DESIGN AND CONSTRUCTION OF EMBANKMENTS foundat ion so i ls .
Because of the h igh subsur face ice contents , var ious An " Inc l inometer" cas ing was i n s t a l l e d i n t h e b o r i n g
precaut ions were t a k e n t o i n c r e a s e t h e s t a b i l i t y of t he through the east shoulder of the roadway embankment, and
embankment i n t h i s a rea dur ing the o r ig ina l extended t o a depth o f 13 meters. The inc l inometer
cons t ruc t i on . I n p repara t i on f o r t he fill placement, probe i s a device which i s lowered down a grooved casing
a l l t r e e s and brush were hand-cleared and l a i d an t o p o f and which ind icates the tilt o f the cas ing a t se lec ted
the moss cover t o avo id any thermal disturbance which intervals of depth. By taking repeated measurements o v e r i n t e r v a l s o f t ime, . the change i n t h e l a t e r a l
would i n i t i a t e thawing. The con t rac to r was then requ i red to p lace an i n i t i a l 1 m t h i c k l a y e r of
pos i t ion o f the cas ing can be measured, and subsurface movement patterns can be determined. A second bo r ing
r o c k - f i l l a t t h e s t a r t o f t h e 1973-74 winter . Th is i n i t i a l l a y e r was occasional ly c leared o f snow dur ing
d i rec t l y ac ross t he roadway, 4.9 m west o f t he cen te r -
t h e w i n t e r t o maximize seasonal cooling and re f reez ing l i n e , was used f o r i n s t a l l a t i o n o f a 2.4 cm diameter
o f t h e a c t i v e l a y e r . Comnencing a t t h e s t a r t o f the p las t i c p ipe wh ich ex tended to a depth o f 13.9 m. The
1974 thawing season, the embankment was cons t ruc ted t o Pipe was f i l l e d w i t h e t h y l e n e g l y c o l and subsequently used for logging the subsurface temperatures by means o f
mate r ia l . Silt toe berms 6.1 m wide by 1.8 m th i ck -were f i n a l grade, 'using weathered schist as the pr imary fill a thermistor probe.
constructed on bo th s ides o f the embankment t o r e t a r d
1293
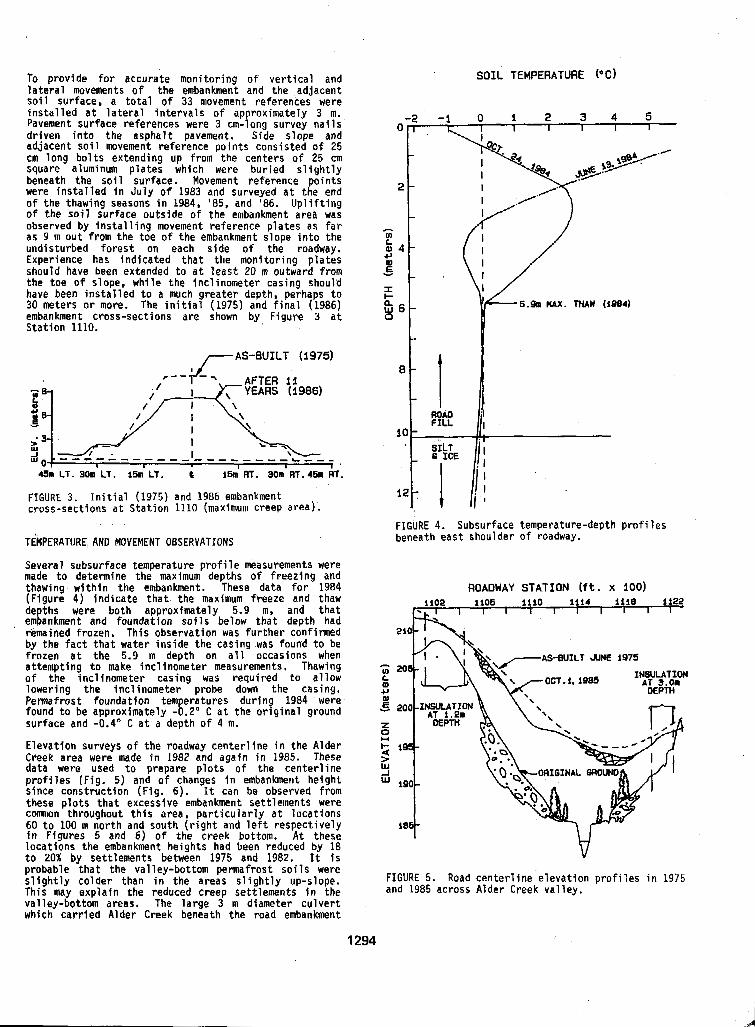
To prov ide for a c c u r a t e m o n i t o r i n g o f v e r t i c a l and SOIL TEMPERATURE ('C) l a t e r a l movements o f t h e embankment and the ad jacent so i l sur face, a t o t a l o f 33 movement references were i n s t a l l e d a t l a t e r a l i n t e r v a l s o f a p p r o x i m a t e l y 3 m. Pavement surface references were 3 cm-long survey n a i l s d r i v e n i n t o t h e a s p h a l t pavement. Side slope and
0 - 1
a d j a c e n t s o i l movement re ference po lnts cons is ted o f 25 cm long bo l t s ex tend ing up f rom the cen ters o f 25 cm square aluminum plates which were b u r i e d s l i g h t l y
were i n s t a l l e d i n J u l y o f 1983 and surveyed a t t h e end beneath the soi l surface. Movement reference points 2 - o f t he t haw ing seasons i n 1984, '85, and '86. U p l i f t i n g o f t he so i l su r face ou ts ide o f t he embankment areh was - observed by ins ta l l ing movement re ference p la tes as f a r as 9 m o u t from t h e t o e o f t h e embankment s lope i n to t he undis turbed forest on each s i d e o f t h e roadway. b 4 - Experience has indicated that the monitor ing p lates U
should have been e x t e n d e d t o a t l e a s t 20 m outward from al E
the toe o f s lope, wh i le the inc l inometer cas ing shou ld have been i n s t a l l e d t o a much r e a t e r depth, perhaps t o I
30 meters o r more. The i n l t i a ? (1975) and f i n a l (1986) I-
embankment cross-sect ions are shown by Figure 3 a t 0 Sta t i on 1110.
- 2 - 1 0 1 2 3 4 5
-
c lo
Y -
86- I
LAS-EUILT (1975) 8 -
YEARS (1986)
10 - ' SILT
451 LT. 301 LT. 15n LT. t 15m RT. 30m RT.45n RT.
FIGURE 3 . I n i t i a l (1975) and 1986 embankment c ross-sec t ions a t S ta t ion 1110 (maximum creep area).
TMPERATURE! AND MOVEMENT OBSERVATIONS FIGURE 4. Subsurface temperature-depth prof i les beneath east shoulder o f roadway.
Several subsurface temperature prof i le measurements were made t o determine the maximum depths o f f reez ing and thawing w l th in the embankment. These d a t a f o r 1984 ROADWAY STATION (ft . X 100) ( F i g u r e 4 ) i n d i c a t e t h a t t h e maxfmum freeze and thaw de t h s were both approximately 5.9 m, and t h a t emgankment and foundat ion so i ls be low that depth had remained frozen. This observation was fur ther conf i rmed by t he f ac t t ha t wa te r i ns ide t he cas ing was found t o be f r o z e n a t t h e 5.9 m depth on a l l occasions when a t tempt ing t o make inc l inometer measurements, Thawing o f t he i nc l i nomete r cas ing was r e q u i r e d t o a l l o w lowering the incl inometer probe down the casing. Permafrost foundatlon temperatures during 1984 were found t o be approximately -0.2" C a t t h e o r i g i n a l ground surface and -0.4' C a t a depth o f 4 m.
E leva t ion surveys o f the roadway cen te r l i ne i n the A lder Creek area were made i n 1982 and a g a i n i n 1985. These data were used t o p r e p a r e p l o t s o f t h e c e n t e r l i n e p r o f i l e s ( F i g . 5) and o f changes i n embankment he igh t s ince const ruct fon (F ig . 6) . It can be observed from these p lo ts that excess ive embankment set t lements were comon th roughou t t h i s a rea , pa r t j cu la r l y a t l oca t i ons 60 t o 100 m no r th and south ( r i g h t and l e f t r e s p e c t i v e l y i n Figures 5 and 6) o f the creek bottom, A t these
t o 20% by sett lements between 1975 and 1982. It i s l oca t i ons the embankment he igh ts had been reduced by 18
4 118 i122
AS-BUILT &NE 1979
INSULATION AT 3.01
probab le tha t the va l ley -bo t tom permaf ros t so i l s were s l i g h t l y c o l d e r t h a n i n the a reas s l igh t ly up-s lope. FIGURE 5. Road c e n t e r l i n e e l e v a t i o n p r o f i l e s i n 1975 This may explafn the reduced creep sett lements i n the and 1985 across Alder Creek va l l ey . val ley-bottom areas. The la rge 3 m d iameter cu lver t which carr ied A lder Creek beneath the road embankment
1294
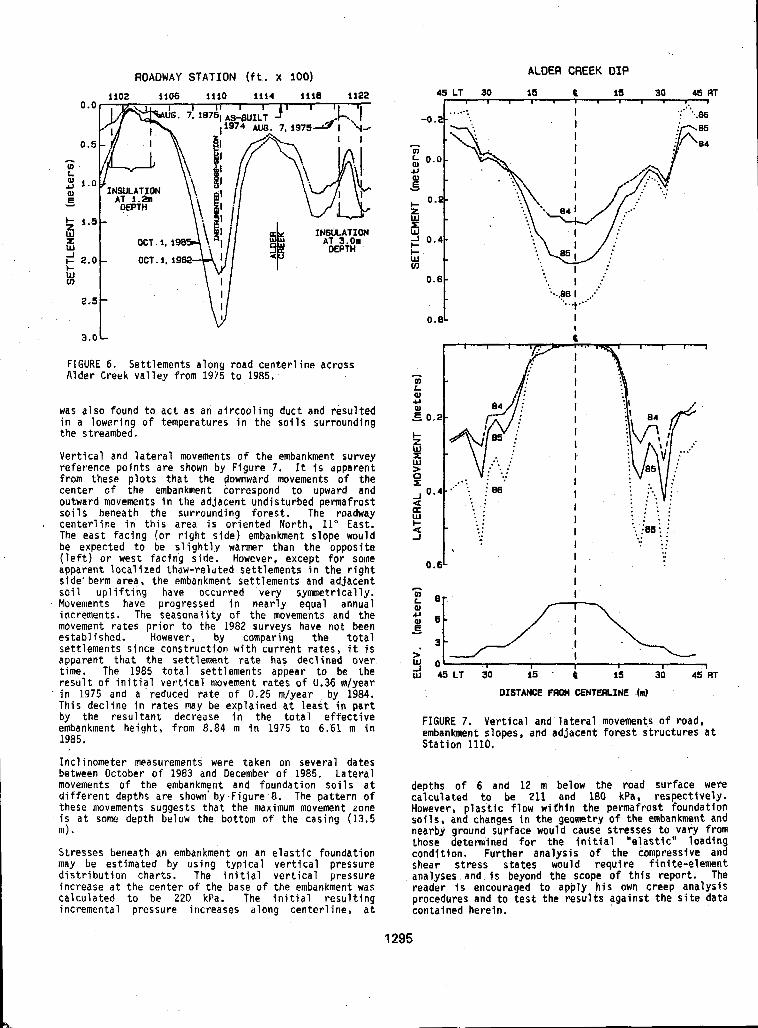
ROADWAY STATION ( f t . X 100) ALDER CREEK DIP
1102 1106 1110 1114 I l l 0 1122 0 .0
0.5 rr v) L J 1.0 (u E - + t .5
x w 5 F' 2.0
INSULATION
k W to
2.5 t 3 . 0 L
Alder Creek va l ley f rom 1975 t o 1985. FIGURE 6. Settlements along road center l ine across
was a l so f ound to ac t as an a i r coo l i ng duc t and resu l ted i n a lowering of temperatures i n the so i ls surrounding the streambed.
V e r t i c a l and l a t e r a l movements of the embankment survey reference po lnts are shown by Figure 7. It i s apparent f rom these p lo ts that the downward movements o f t h e center o f the embankment correspond t o upward and outward movements in the ad jacent undis turbed permafrost s o i l s beneath the surrounding forest. The roadway c e n t e r l i n e i n t h i s a r e a i s o r i e n t e d N o r t h , 11" East. The e a s t f a c i n g ( o r r i g h t s i d e ) embankment slope would be expected t o be s l i g h t l y warmer than the opposi te ( l e f t ) or west facing side. However, except for some apparen t l oca l i zed t haw- re la ted se t t l emen ts i n t he r i gh t s ide' berm area, the embankment set t lements and adjacent s o i l u p l i f t i n g have occurred very symmetrically. Movements have progressed in near ly equal annual increments. The seasona l i t y . of the movements and the movement r a t e s p r i o r t o t h e 1982 surveys have not been establ ished. However, by comparing t h e t o t a l se t t lements s ince cons t ruc t ion w i th cur ren t ra tes , i t i s apparent tha t the se t t lement ra te has dec l ined over time. The 1985 to ta l se t t lements appear to be the r e s u l t o f i n i t i a l v e r t i c a l movement ra tes o f 0.36 m/year i n 1975 and a reduced r a t e of 0.25 m/year by 1984. T h i s d e c l i n e i n r a t e s may be e x p l a i n e d a t l e a s t i n p a r t by t h e r e s u l t a n t d e c r e a s e I n t h e t o t a l e f f e c t i v e embankment height, from 8.84 m i n 1975 t o 6.61 m i n 1985.
between October o f 1983 and December of 1985. La te ra l Inc l inometer measurements were taken on several dates
movements o f the embankment and f o u n d a t i o n s o i l s a t d i f ferent depths are shown' by Figure 8 . The pa t te rn of these movements suggests that the maximum movement zone i s a t some depth below the bottom o f the cas ing (13.5 m).
Stresses beneath an embankment on an e las t i c f ounda t ion may be est imated by us ing t yp i ca l ve r t i ca l p ressu re d i s t r i b u t i o n c h a r t s . The i n i t i a l ve r t i ca l p ressu re
c a l c u l a t e d t o be 220 kPa. The i n i t i a l r e s u l t i n g inc rease a t the cen ter o f the base of the embankment was
incremental pressure increases along centerl ine, a t
0.6 L ' I I I
FIGURE 7. V e r t i c a l and l a t e r a l movements of road, embankment s lopes, and adjacent forest structures a t S ta t i on 1110.
depths of 6 and 12 m below the road surface were c a l c u l a t e d t o be 211 and 180 kPa, respec t ive ly . However, p las t i c f l ow w i th in t he pe rmaf ros t f ounda t ion s o i l s , and changes i n the geometry o f the embankment and nearby ground surface would cause str4:ses t o v a r y from those determined for t h e t n i t i a l e l a s t i c " l o a d i n g cond i t ion . Fur ther ana lys is o f the compressive and
analyses and i s beyond the scope o f t h i s r e p o r t . The shear stress s ta tes would requi re f in i te-e lement
reader i s encouraged t o a p p l y h i s own creep analysis procedures and t o t e s t t h e r e s u l t s a g a i n s t t h e s i t e d a t a contained herein.
1295
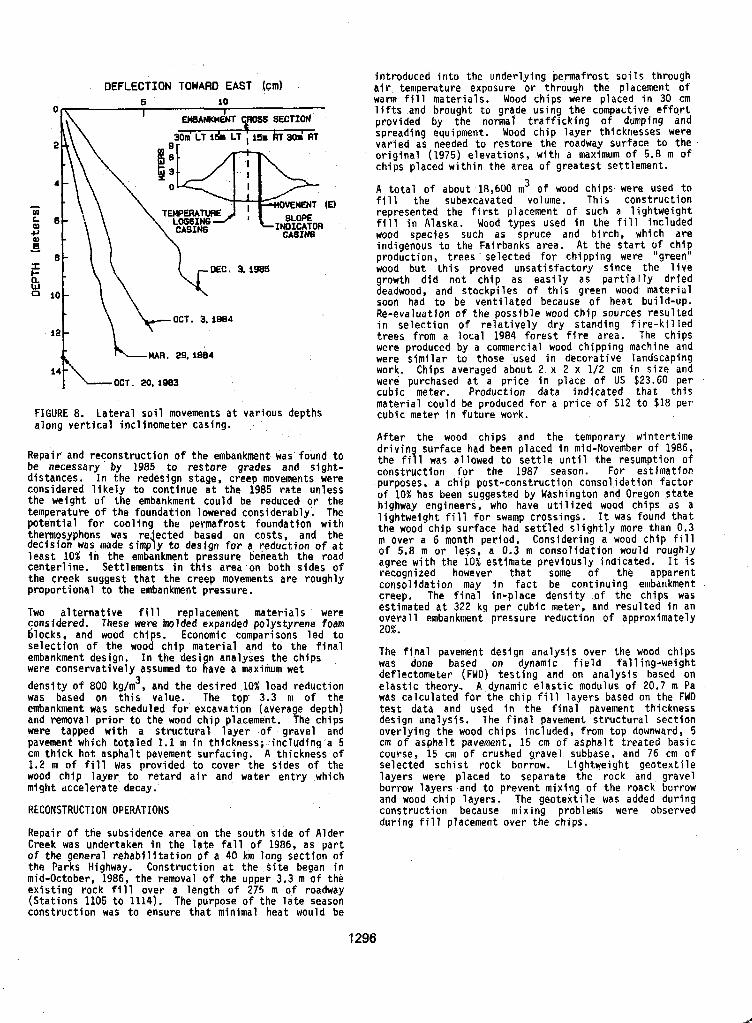
in t roduced in to the under ly ing permafrost so i ls through DEFLEC~ION TOWARD EAST (cm) a i r temperature exposure or through the placement of
5 10 warm fill mater ia ls . Wood chips were placed i n 30 cm l i f t s and brought to grade using the com a c t i v e e f f o r t provided by the no rma l t ra f f i ck ing o! dumping and spreading equipment. Wood ch ip layer th icknesses were va r ied as needed t o r e s t o r e t h e roadway surface t o t h e o r ig ina l (1975) e leva t i ons , with a maximum of 5.8 m of ch ips p laced wi th in the area o f greatest set t lement .
A t o t a l o f about 18,600 m o f wood chips were used t o fill the subexcavated volume. This const ruct ion represented the f i r s t placement of such a l i gh twe igh t fill i n Alaska. Wood types used i n t h e fill included wood species such as spruce and birch, which are indigenous to the Fairbanks area. A t t h e s t a r t :,f chi; product ion, t rees se lected for ch ipp ing were green wood bu t th is p roved unsat ’ i s fac to ry s ince the l i ve g rowth d id no t ch ip as e a s i l y as p a r t S a l l y d r i e d deadwood, and s tockp i l es o f t h i s g reen wood mate r ia l soon had t o be v e n t i l a t e d because o f heat bui ld-up. Re-evaluation o f t h e p o s s i b l e wood ch ip sources resul ted i n s e l e c t i o n o f r e l a t i v e l y d r y s t a n d i n g f i r e - k i l l e d t rees f rom a l o c a l 1984 f o r e s t f i r e a r e a . The chips were produced by a commercial wood ch ipp ing machine and were s i m i l a r t o t h o s e -used in decorat ive landscaping work. Chips averaged about 2 x 2 x 112 cm i n s i z e and
OCT. 2 0 . m 3 were purchased a t a p r i c e i n p l a c e o f US $23.60 per cub ic meter . Produc t ion da ta ind ica ted tha t th is
FIGURE 8. L a t e r a l s o i l movements a t var ious depths ma te r ia l cou ld be produced f o r a p r i c e of $12 t o 818 per
a long ver t i ca l inc l inometer cas ing . cubic meter i n f u t u r e work.
A f t e r t h e wood chips and the temporary wintert ime
Repair and reconst ruct ion o f the embankment was’ found t o t h e fill was allowed to settle until the resumption of d r i v ing su r face had been p l a c e d i n mid-November of 1986,
be necessary’ by 1985 to res to re g rades and s lgh t - c o n s t r u c t i o n f o r t h e 1987 season. For est imat ion
considered likely to ‘Ontinu@ at the 1985 rate ‘“less of 10% has been suggested by Washington and Oregon s t a t e
temperature of the foundation lowered considerably. The lightweight fill for swamp crossings. It was found that potentia’ for ‘‘‘ling the permafrost foundation with the wood chip surface had s e t f l e d s l i g h t l y more than 0.3
dec is ion as made simp y t o design for a reduc t ion of a t thermosyphons was re ected based On and the m Over a 6 month period. Considering a wood ch ip fill l e a s t 1 0 s i n the embankment pressure beneath the road Of 5 * 8 Or less* a O a 3 consolfdation centerline. Settlements in this area on both sides of agree w i t h t h e 10% est imate prev ious ly ind icated. It i s
the creek suggest that the creep movements are roughly consolidation may in fact be continuing embankment recognized however t h a t some o f the apparent
p r o p o r t j o n a l t o t h e embankment pressure. creep. The f i n a l i n - p l a c e d e n s i t y of the ch ips was Two a l t e r n a t i v e fill replacement mater ia ls were e s t i m a t e d a t 322 kg per cubic meter, and r e s u l t e d i n an
6locks. and wood chips, Economic comparisons l e d t o 20%.
embankment design. In the design analyses the chips Of the wood chip and to the The f i n a l pavement design analysis over the wood chips were conserva t ive ly assumed t o have a maximum wet was done based on dynamic f i e l d f a l l i n g - w e i g h t
def lectometer (FWD) t e s t i n g and on ana lys is based on densi ty o f 800 kg/m3, and the des i red 10% l o a d r e d u c t i o n e l a s t i c theory, A dynamic e l a s t i c modulus o f 20.7 m Pa was based on th i s va lue . The top. 3.3 m of the was c a l c u l a t e d f o r t h e c h i p fill laye rs based on the FWD embankment was scheduled for excavat ion (average depth) test data and used i n t h e f i n a l pavement th ickness and removal p r i o r t o t h e wood c h i p placement. The chips design analysis. The f i n a l pavement s t r u c t u r a l s e c t i o n were tapped w i t h a s t r u c t u r a l l a y e r o f g rave l and ove r l y ing t he wood chips included, from top downward, 5 pavement wh ich to ta led 1.1 m i n th ickness; inc lud ing a 5 cm o f a s p h a l t pavement, 15 cm o f aspha l t t r ea ted bas i c cm t h i c k h o t a s p h a l t pavement surfacing. A th ickness o f 1.2 m o f fill was prov ided to cover the s ides o f the
course, 15 cm of crushed g.rave1 subbase, and 76 cm of se lec ted sch is t rock bor row. L igh twe igh t geotex t i le
wood c h i p l a y e r t o r e t a r d a i r and water ent ry which layers were p laced to separate the rock and gravel might accelerate decay. borrow layers and to p reven t m ix ing o f t he roack bo r row
and wood ch ip layers . The g e o t e x t i l e was added dur ing RECONSTRUCTION OPERATIONS cons t ruc t ion because mixing problems were observed
Repair of the subsidence area on the south s ide Qf Alder du r ing fill placement over the chips.
Creek was undertaken i n t h e l a t e f a l l o f 1986, as p a r t of t he genera l rehab i l i t a t i on o f a 40 km l o n g s e c t i o n o f the Parks Highway. C o n s t r u c t i o n a t t h e s l t e began i n mid-October, 1986, the removal o f t he upper 3.3 m o f t h e e x i s t i n g r o c k fill over a l eng th o f 275 m o f roadway (S ta t ions 1105 t o 1114). The purpose o f t h e l a t e season cons t ruc t ion was t o ensure that minimal heat would be
30m’ LT $dm LT ; ~ S U k~ 30; RT
3
distances* In the redesign stages creep movements were pUrpOSeS, a ch ip pos t -cons t ruc t ion conso l ida t ion fac to r
the weight Of t he embankment Could be reduced O r the highway engineers, who have wood ,.hips a
J
cons{dewd. These were molded expanded polystyrene foam Overall embankment pressure reduction Of
1296
SUMMARY
Embankment sett lements averaging 0.3 m per year have been observed over a 10 y e a r p e r i o d f o r a roadway embankment o r l g i n a l l y 10.5 m i n height. The foundat ion s o i l s a t t h e s i t e c o n s i s t o f p e r e n n i a l l y f r o z e n s i l t s with massive ice layers. The i c e masses are est imated t o exceed 50% of the to ta l subsur face volume below a depth o f 2 t o 3 m. Permafrost temperatures a t th is depth were measured a t -0.4'C. Reconstruct ion of the embankment was done i n 1986 t o r e s t o r e t h e roadway t o t h e o r i g i n a l e l e v a t i o n a f t e r t o t a l s e t t l e m e n t s o f 3 m had occurred.
A wood ch lp fill was used I n t h e r e c o n s t r u c t i o n t o increase the fill he igh t wh i l e l ower ing t he e f fec t i ve pressure on the foundat ion soils by 20%. The wood c h i p l aye r had a maximum t h i c k n e s s o f 5.8 m, and was capped on the top and sfdes by 1.1 and 1,2 m o f fill,
embankment will be done t o record the benef i t s and respect ive ly . Per formance moni tor ing o f the new
problems o f t h i s t r e a t m e n t .
REFERENCES
Esch, D.C. (1983) "Evaluat ion of Exper imental Deslg; Features for Roadway Construct ion Over Permafrost, Proceedings, Permafrost - Four th In ternat ional Confer- ence, pp. 283-288.
1297
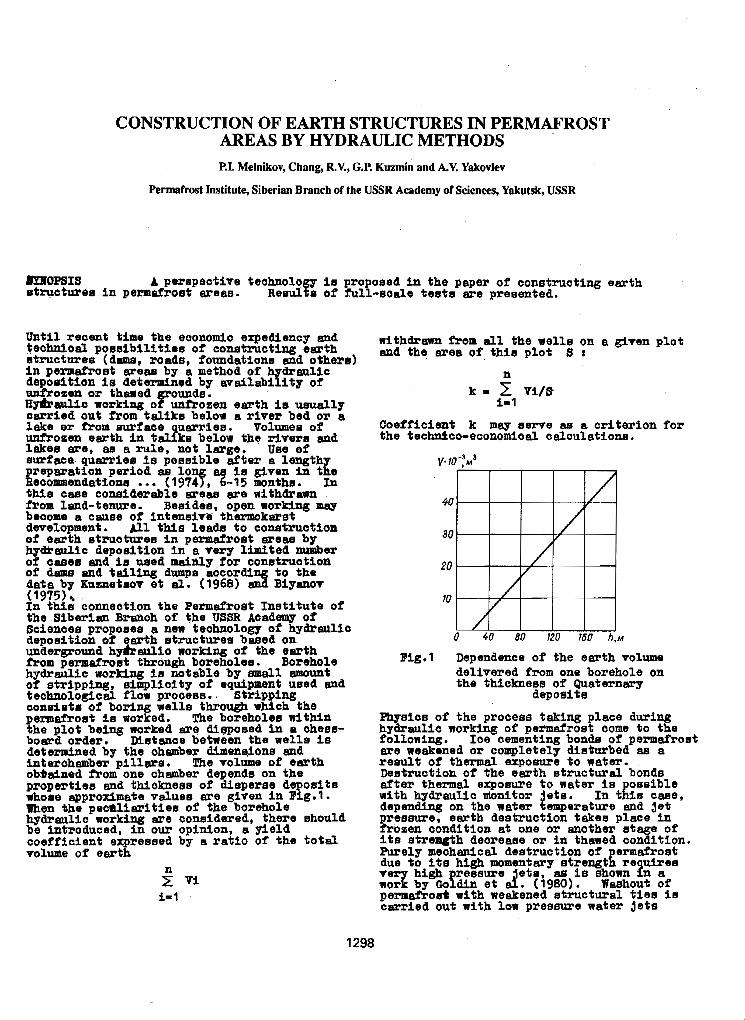
CONSTRUCTION OF EARTH STRUCTURES IN PERMAFROST AREAS BY HYDRAULIC METHODS P.I. Melnikov, Chang, R.V., G.P. Kuzmin and A.V. Yakovlev
Permafrost Institute, Siberian Branch of the USSR Academy of Sciences, Yakutsk, USSR
moPS1s A PWepeOtiVe teohnology in proposed i n the paper o f oonetruatiag earth Etl3lOtWee i n permafrost me-. Remlts of f i lL-ecds t es t s preeented.
Until recent time the eoommio expediency and technical pore ib i l i t i ee of conetructing e a t h withdranm *om all the wella on a given plot etrucfrrree ( d m , roade, foundations a d othesr) and the ares of- th le p lo t S I
in permafroet meam by a method of draalic degoeltion i s detemtned by availabi h9 i t y o f rrafi.oeen ox thawed k - Vi/S Iia#r&cr working of%%gkn eartb l e usually i-1 carr ied out from te l ika below a r i v e r bed or a lake ox from surfacs quarries. Volumes of' Coefficient k may seme aa a cr i te r ion for uaffozen eerth in t a l i k s below the r ivere and the technSco-economical calculations. lakes are, as EL rule, not large. U E I ~ of mxfgca. uasriea ir poseible af te r a Length preparetfon period em 1.0 ae ter &+en in tKs Reconmendations . ". (1978, 6-1 5 laonths. Xn tbis c a e conelderable a e a ~ w e withdrawn from lead-tenure. Beeides, open working may beoeme a aauee o f Inteneire fhermokafet devexopment. All this leads t o oonsfruofion o f e a t h s t r u e t a r e s i n permafrost m e a by bydk.aatl1~ depoaition i n a very limited number of cam6 end ia aged mainly for construction of dame and tailing damp@ according to the data by Kuznetsor e t al . ( 1968) and B i y W V
In t h i n OOMeCfiOn the Penn&oat Xnetitute Of the Siberian Branoh of the USSR Academy of Soiencea p r o p ~ ~ e ~ i a new feahnology of hydreulia deposition of earth structuses based on 0 40 80 120 160 h,M underground hydraulic working of the eerth fxor permdmst through boreholes. Borehole Flg.1 Dependence of the ear th volume
of stripping, simpglicity of equipment used atla the t h i c b e s s of Quaternary tecbnologlcal flow procese.. StripplPg deposits
p e r m b o a t is worked. The borehole8 Witbin ooaeists of boriM wells through whioh the
Phyaice of the proceae taking place during the plot being worked are digposed i n R ahees- hydraulio working of permafrost come t o the boara order. Dletaaoe between the wells 161 following. Ice cementing bonds of permafrost determined by the ohhambex dimengione and are weakened o r completely disturbed as a interohamber pillare. Tbe volume of ear th remI.t of thermal exporure t o water. ob+aiae& *om one chamber depends on the Deetruotion of the esrth st ructural bonds propertiea and Chioknere of dieperee d q o s i t e a f t e r thermal exposure t o water ie osaible whose approximate values are given i n Big.1. uith hydreulic nlonitor . In t h a ome, men the pecaliaritiea of the borehole depending on the water emperatme and j e t bg&-lj.c working -e considered, there should preeewe, earth deatruction takes plme i n be introduced, In OUT opinion, 8 y ie ld frbsen condition at one or another stage of ooefficient expreeeed by a xat lo of the to ta l i t e e t r sag th deereaee ox in thawed condition, oolums of earth Purely meohdcal deatruct ion o f emairoat
due t o i t e high momentary strengtf: Fe u ~ s e e
zz by Qofdin e t J e t s , . (1980). Washout of carried out with low pressure water j e t s
n
v.
40
30
20
(1975) IO
hydraulic working ps notable by mall EmQUnt delivered from one borehole on
Zeta
2 V I high ressure i s shown In a
i= 1 p e r m d x o d with weakened rstructurel t ies i s
1298
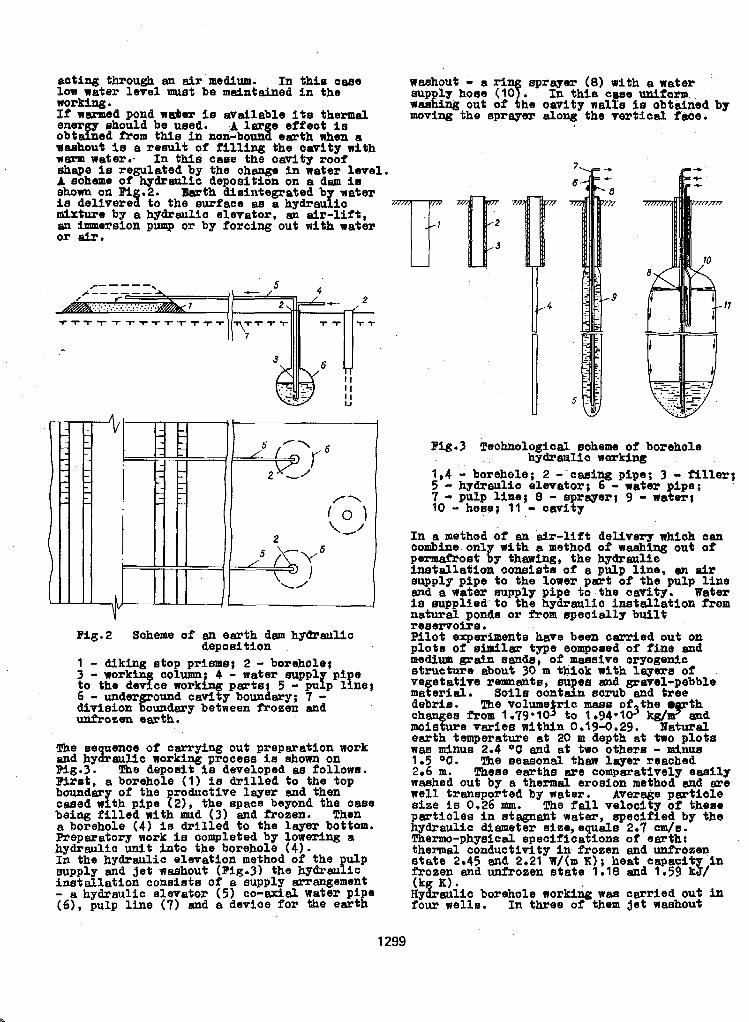
c.---"-\ 5
Fig.2 , Scheme of an ear th dam hydraulic
1 - Ulcing stop p r i m a ; 2 - borehole;
6 - underground eavi y boundary; 7 - division boundary between fYozen and unfrozen earth.
depoeition
to - the norki3 de ce worki parts3 5 - pu p 1 ne8 9 I column; 4 - water suppl p i e
9
!the se uenoe of carrying out preparation work -a &mulic working prOOe8a ~e ahom on Flg.3. !I!he depoeit i a developed as follows. Biret, a borehole (1) i s dr i l l ed t o t he top boundary o f the roduetive layer and then caeed with pipe ?2), the apace beyond the ome being f i l l ed w i th mud (3) and frozen. Then a borehole (4) is d r i l l e d t o the layer bottom,
hydraulic unit i n t o the borehole (4 ) . WepaFatory work is completed by lowering a
In the hydraulic elevation method of the pulp supply and j e t washout (Big.3) the hyBraulic i n s t d l a t i o n c o n s i s t s o f a supply arrangement - a hydraulic elevator ( 5 ) c o - a i d water p l e ( 6 ) , pulp l ine (7) and a device for the e m t i
Fig.3 %eChlloiogieal soheme of borehole hydraplio working
1,4 - borehole; 2 --cesing pipe; 3 * filler; 5 L. hgdraulio elevator: 6 - rater pipe ; '
7 - pulp 1Sne; 0 - 8 ray=; 9 - wafer;
In a method QS an dr-lift delivem whioh can
purmafrasf i y thawing, the hy&rarlie combine on3 nlth er method of waehbing out of i n s t a l l a t i o n eoneiats of a gulp line, an air eupplg pipe to the lower par t of the pulp line and a water stlpply p i e t o the cavity. W & e r Se supplied to the h y k a u l i c inetallatioa *om natural ponds or from special ly b u i l t reservoirs. Pi lo t sxperkmente have been e m l e d out on p l o t s of siSdlsr type ooarpoeed of fine a d medium grain BBPBs, of maersive C ~ Y Q ~ S Z C L ~ : etructure about 30 rn t4iak with layere 02 ve etatlve remnatm, mupss and mmvel-pebble maferial. Soile contalo scrub and t r e e debria. Tbe volume r ic m a s s of the th ohangee *om 1.79*103 t o 1,94*103 kg/lgraad moieture varies within 0.19-0.29. Natural earth temperature at 20 m depth at trro plots w a e a n u s 2.4 and at two others - minum 1.5 OC. The eeasonal than layer reaohed 2.6 m. Them ear ths ace comparatively easl ly weehed out by a thermal erosion method a d are Well tsaneporfed by water. Average particle a i z e is 0.26 mm. Tbe Pall. velocity of these par t i c l e s ili &a@& mater, specified by the hydraulic diameter si!ae, equele 2.7 cm/s. Thermo-physical epealficationa af ear tht
state 2.45 and 2.21 W/(m K); heat capwi t in thema1 conduotivitg Sn frozen and uniroaep frozen and unffoaen state 1.18 and 1.59 k$/ (k X). Ky%aulic borehole working w a a carr ied out in four wells. In three of them j e t waahout
10 - hose; 11 - o s p i $ 7
1299
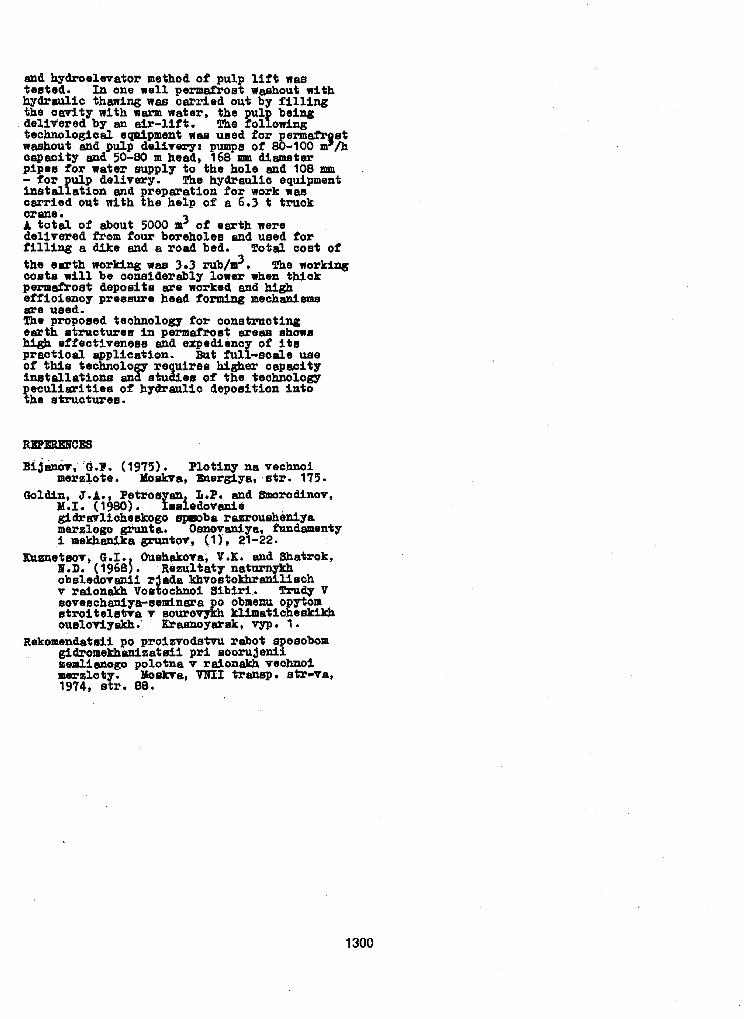
1300
STORAGE TANK FOUNDATION DESIGN, PRUDHOE BAY, ALASKA, U.S.A. B. Nidowicd, D. BruggerG and V. Manikiad
IHarding Lawson Associates, Anchorage, Alaska, U.S.A. ZHarding Lawson Associates, San Francisco, CA, U.S.A.
JARCO Alaska, Inc,, Anchorage, Alaska, U.S.A.
SYNOPSIS A Crude Oil Topping Unit (COTU) was constructed in Prudhos Bay, Alaska to provide aviation fuel, gasoline and diesel to North Slope clients. Recently, ARCO Alaska, Inc. redesigned the storage tank farm with the addition of a new 4290 cubic meter welded steel tank and the relocation of two existing 790 cubic meter tanks. Subsurface s o i l exploration and laboratory testing programs were performed to determine the soil properties at the site. The thermal behavior of two Arctic foundation designs was analyzed using a two-dimensional finite element computer program.
The initial design f o r support of the 38 degree C crude oil tank consisted of AISC W24 by 68 beams spaced on 1.2 meter centers in order to provide a 61.0 cm air space between the bottom of the tank and the top o f the gravel pad. The beams were underlain by 22.9 cm of insulation.
The initial tank foundation design was revised because of the high coat of structural beams and the availability of a fin-fan oil cooler in the plant. The final design incorporated the use o f the fin-fan oil cooler to reduce storage tank temperature, and involved founding the tank bottom on a sand cushion underlain by 22.9 cm of insulation placed directly on the gravel pad. The temperature criterion f o r the storage oil was set at 1.7 degrees C for the winter months (November - May),
\
To confirq this design, additional thermal modeling was conducted ueing the new criterion. The results indicated that the maximum thaw penetration depth, below the center line o f the tank, was 1.3 meters. This depth is above the organic and ice-rich soils. A thaw-settlement o f less than 5 cm was predicted, an acceptable condition.
This paper discusses the alternate design modes investigated and the results of the thermal analysis.
INTRODUCTION failure in the ice-rich permafrost. At-grade heated structures are acceptable only if
The COTU Fuel Storage facility, at Prudhoe Bay, founded on a non-frost susceptible fill gad and Alaska, i s located West of the ARC0 Operations the permafrost integrity is maintained. Pile center and consists of ten steel tanks. The foundations are commonly used on the North tanks are presently supported on gravel pads, Slope, but they are expensive. It is typically 1.5 meters thick, and are surrounded advantageous to use gravel since it is abundant by gravel containment berms. in the Prudhoe Bay aree.
Due to the increased demand. for product, additional tank capacity was needed at the facility. ARCO Alaska, Xnc. designed a new 4290 cubic meter tank with a diameter of approximatcly 24 meters and a height o f 9 meters, ARCO also planned to remove two existing tanka and replace them with two larger tanks having diameters of 12 meters and heights o f 8 meters. Replacement o f the tanks necessitated removing the existing tanks, recompaction and placement of additional fill, and construction o f the new tanks.
Two significant design considerations for foundations on the North slope of Alaska are the continuous permafrost and the annual freeze-than cycles of the active layer. Conventional shallow spread footings do not perform well because o f frost heave from the active layer and the large potential for creep
The objective of this study was to design a cost-effective foundation that would preserve the ice-rich permafrost beneath the tanks throughout the life of the tanks. To provide data far use in design, seven borinqa were drilled and sampled to depths ranging from 5.5 to 8 , s meters. Selected samples were tested to measure their moisture content, dry density, particle size, specific gravity, Atterberg Limits and freezing point depression.
PHYSICAL SETTING
The Prudhoe Bay area is located on the Arctic Coastal Plain, a geologic province bounded on the north by the Beaufort Sea and on the south by the foothills of the Brooks Range (Wahrhaftig, 1965). ' Several sea level fluctuations due to various glacial epochs have occurred along the Arctic Coastal Plain during
the last 100,000 years, These advances and retreats of the shoreline have alternatively flooded and exposed significant portions of the North Slope.
The Arctic Coastal Plain is mantled by unconsolidated deposits of the Gubik Formation (Black, 1964) consisting of lenses and mixtures of sand, gravel, silt and clay. Though mainly of marine origin, the Gubik formation has also been modified by alluvial, lacustrine, eolian and frost processes.
The principal soil types in the Prudhoe Bay area are fluvial sand and gravel deposited by the Kuparuk-Sagavanirktok River Systems during the last retreat of the Brooks Range glaciers. The sand and gravel are overlain by wind-blown deposits and usually a thin surface mantle of organic soils and tundra vegetation.
The Prudhoer Bay region has an arctic coastal climate. The mean annual air temperature i s -13 degrees C (Walker et al., 1980). Mean monthly temperatures range from 17 degrees C in July to -31 degrees C in February.
Permafrost underlies the entire Arctic Coastal Plain. The bottom of the permafrost in the
below the surface (Brown and PGwe', 1973). Prudhoe Bay area is approximately 600 meters
Thawing during summer months usually does not extend deeper than about 30 cm in undisturbed tundra areas.
SITE CONDITIONS
Test borings show that most of the tank site area is covered by gravel fill of varying thickness. Research o f published geologic maps and aerial photographs indicates that the surf ce conditions beneath the gravel fill consilst of a gently undulating ground surface supporting typical tundra vegetation of grasses, sedges, mosses, and low shrubs. The general area is characterized by poor surface drainage, many low marshy areas and shallow wind oriented lakes up to several hundred acres. The site lies at an elevation of about 9 to 12 meters above mean sea level.
Based on the test borings, it was determined that the three tank sites have similar soil profiles. In general, sandy gravel fill, approximately 1.5 meters thick, was found to overlie ice-rich, nonplastic sandy silt and silty sand to depths of 4 to 6 meters. Beneath these soils, sand and gravel extend to the depths explored. Massive ice, in the form of
within the ice-rich soil. ice lenses and wedges, was commonly encountered
The fill typically contains 31 to 64 percent gravel. 31 to 56 percent sand, and 5 to 12 ,percent silt. The moisture content of the fill averages about 8 percent. According to the Unified Soil Classification System, the fill is classified as GP-GM or SP-SM. This fill is representative of Prudhoe Bay area gravel.
The ice-rich soil had moisture contents that varied between 30 and 350 percent. with an average of about 140 percent. The coarse- grained sand and gravel underlying these soils was ice-poor. and had moisture contents ranging
1302
between 11 and 36 percent. The freezing point depression of the samples tested varied between -0.1 c to - 0 - 4 c. DESCRIPTION OF COMPUTER CODE
Computer Code FROSTPB (CRREL, 1984) was used to model the thermal regime beneath the heated fuel tanka. FROST2B is a two-dimensional computer code that uses a nodal domain integration.mode1 of heat and soil-water flow coupled through isothermal soil-water phase change. The program can be used to analyze two-dimensional freezinp/thawing problems where known information is sufficient to supply the necessary modeling parameters, boundary conditions, and initial conditions. The key assumptions used In the thermal analysis of the program are:
1. Heat transport i n freezing soils occurs due to conductive and convective processes and follows the general equation of heat transfer in solids and liquids. Additionally, the heat transport equation is nonlinear, as the thermal conductivity and heat capacity of the soil-water-air- ice mixture is a function of ice and water content in a freezing and thawing soil, A volumetric fraction proportion equation is used to describe the thermal conductivity and heat capacity of soil-watar-air-ice- mixture as a function of the volumetric content of each composing constituent.
2. Soil-water phase change i s assumed to occur isothermally in a partially saturated soil element. The phase change model'that couples the heat and soil-water transport models is based on the apparent specific heat capacity model whereby the latent heat effects of freezing water are lumped into the transient heat capacity term of the heat transport equation.
3. Unfrozen zones are nondeformable, and in freezing zones or frozen Zones, deformation is due to ice segregation or lens thawing only.
4. Constant parameters, such as porosity, remain constant with respect to time: i.e.. freeze-than cydles do not modify parameters.
5. Hysteresis effects are napligible.
negligible, 6. Saline exclusion processes are
7. Freczina and thawing processes in a two-dimer s:ion.-.- medium occur suck that there are no internal shear or stress forces developed between different zones.
DESCRIPTION OF THE BASIC MODEL
The model selected consists of a 2.4-meter-high supporting gravel pad with 2 horizontal: 1 vertical (28:lV) side slopes. The gad is underlain with a 30.5-cm-thick organic layer overlying about 4.6 meters of ice-rich soil overburden. The mechanical and thermal properties of the soils the model consists of - were obtained from the laboratory tests and
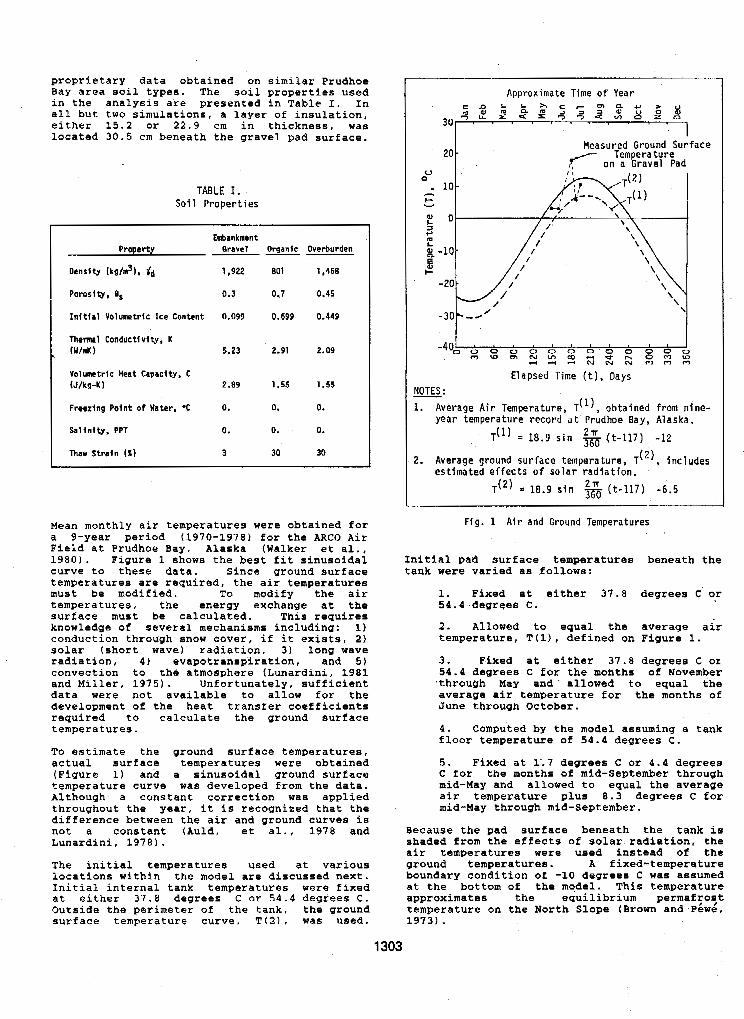
proprietary data obtained on similar Prudhoe Bay area soil types. The soil properties used in the analysis are presented in Table I. In all but two simulations, a layer of insulation, either 15.2 or 22.9 cm in thickness, was located 30.5 cm beneath the gravel gad surface.
TABLE I . Soil Properties
Embankment Property Gravel Organic Overburden -"
Denrl ty (kg/m3), i d 1,922 801 1.458
Porosity, 8, 0.3 0.7 0.45
I n i t i a l Volumetric Ice Content 0.099 0.699 0.449
Thermal Conductivlty, K ( W / d 5.23 2.91 2.09
Volurmtric Heat Capacity, C (J/kg-K) 2.89 1.55 1.55
Freezing Point o f Water, O C 0. 0. 0.
Sa l in i ty . PPT 0. 0. 0.
Thaw St ra in (%) 3 30 30
Mean monthly air temperatures were obtained for a 9-year period (1970-1978) for the ARC0 Air Field at Prudhoe Bay, Alaska (Walker et al., 1980). Figure 1 shows the best fit sinusoidal curve to these data. Since ground surface
must be modified. temperatures are required, the air temperatures
To modify the air temperatures, the energy exchange at the surface must be calculated. This requires knowledge of several mechanisms including: 1) conduction through snow cover, if it exists, 2 ) solar (short wave) radiation, 3 ) long wave radiation, 4 ) evapotranspiration, and 5 ) convection to the atmosphere (Lunardini, 1981 and Miller, 1975). Unfortunately, sufficient data were not available to allow for the development of the heat transfer coefficients required to calculate the ground surface temperatures,
T o estimate the ground surface temperatures, actual surfac! temperatures were obtained (Figure 1) and a sinusoidal ground surface temperature curve was developed from the data, Although a constant correction was applied throughout the year, it is recognized that the difference between the air and ground curves is not a constant (Auld, et al., 1978 and Lunardini, 5978).
The initial temperatures used at various locations within the model are discussed next. Initial internal tank temperatures were fixed at either 37.8 degrees C or 5 4 . 4 degfees C. Outside the perimeter of the tank, the ground surface temperature curve, T ( 2 ) , was used.
Approximate Time o f Year
Measured Ground Surface Temperature ,< on a Gravel Pad
Elapsed Time ( t ) , Days - NOTES : 1. Average Air Temperature, T ( l ) , obtained from nine-
year temperature record a t Prudhoe Bay, Alaska. T ( 1 ) = 18.9 s in 360 21T It-117) -12
2 . Average ground surface temperature, T ( 2 ) , includes estimated effects of splar radiation.
T(') * 18.9 sin $& ( t - 1 1 7 ) - 6 . 5
Fig. 1 Air and Ground Temperatures
Initial pad surface temperatures beneath the tank were varied as follows:
1. Fixed at either 37.8 degrees C o\r 54.4 degrees C.
2. Allowed to equal the average air temperature, T ( l ) , defined on Figure 1.
3. Fixed at either 37.8 degrees C OL 54.4 degrees C f o r the months of November ,through May and. allowed to equal the average air temperature for the months of June through October.
4 , Computed by the model assuming a tank floor temperature of 54.4 degrees C.
5. Fixed at 1-.7 degxees C or 4.4 degrees C €or the months of Mid-September through mid-May and allowed to equal. the average air temperature plus 8.3 degrees C for mid-lag through mid-September.
Because the pad surface beneath the tank is shaded from the effects o f solar radiation, the air temperatures were used instead of the ground temperatures. A fixed-temperature boundary condition of -10 degrees C was assumed at the bottom of the model. This temperature approximates the equilibrium permafrost temperature on the North Slope (Brown and P h d , 1973).
1303
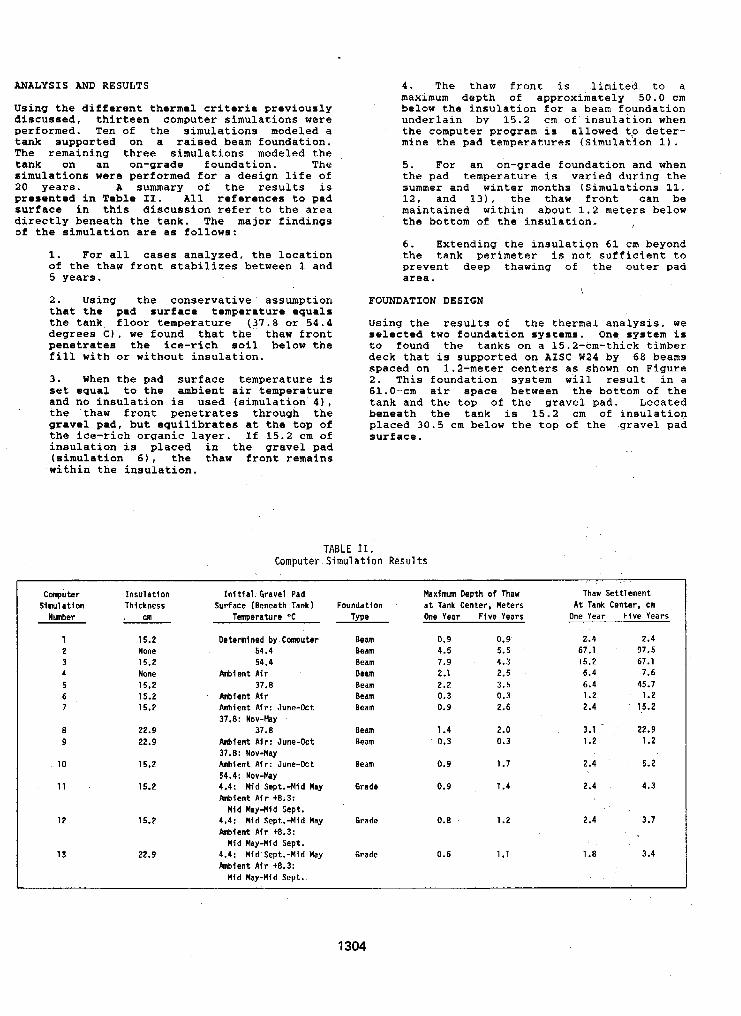
ANALYSIS AND RESULTS
Using the different thermal criteria previously discussed, thirteen computer simulations were performed. Ten o€ the simulations madeled a tank supported on a raised beam foundation. The remaining three simulations modeled the tank on an on-grade foundation. The simulations were performed for a design life of 20 years. A summary of the results is presented in Table 11. All references to pad surface in this discussion refer to the area directly beneath the tank. The major findings 3f the simulation are as follows:
1. For all cases analyzed. the location of the thaw front stabilizes between 1 and 5 years.
2. Using the conservative assumption that the pad surface temperature equals the tank floor temperature ( - 3 1 . 8 or 54.4 degrees C ) , we found that the thaw front penetrates the ice-rich soil below the fill with or without insulation.
3. When the pad surface temperature is set equal to the ambient air temperature and no insulation is used (simulation. 4 1 , the thaw front penetrates through the gravel ped, but equilibrates at the top of the ice-rich organic layer. If 15.2 cm of insulation i s placed in the gravel pad (simulation 6), the thaw front remains within the insulation.
4. The thaw front is limited to a maximum depth of approximately 50.0 cm below the insulation for a beam foundation underlain by 15.2 cm oi insulation when the computer program i s allowed tp deter- mine the pad temperatures (Simulation 1).
5. For an on-grade foundation and when the pad temperature i s varied during the summer and winter months (Simulations 11, 12, and 13). the thaw front can be maintained within about 1,2 meters below the bottom of the insulation.
6. Extending the insulation 61 cm beyond the tank perimeter is not sufficient to prevent deep thawing of the outer pad area.
\ FOUNDATION DESIGN
Using the results of the thermal analysis, we selected two foundation systems. One system is
deck that is supported on AISC W24 by 68 beams to found the tanks on a 15.2-cm-thick timber
spaced on 1.2-meter centers as shown on Figure 2. This foundation system will result in a 61.0-cm air space between the bottom of the tank and the top of the gravel pad. Located beneath the tank is 15.2 cm o f insulation placed 30.5 cm below the top of the gravel pad surface.
TABLE 11. Computer Slmulation Results
Slmulat lon Computer
Number
1 2 3 4 5 6 7
8 9
10
11
12
13
I n s u l a t l o n Thickness , c m
15.2 None 15.2 None 15.2 15.2 15.2
22.9 22.9
15.2
15.2
15.2
22.9
I n l t l a l Gravel Pad Surface (Beneath Tank)
Temperature "C
Detemlned by Computer 54.4 54.4
Amblent Air
Ambient Alr Ambient Air: June-Oct 37.8: Nov-May
37.8 h b l c n t Air: June-Oct
Ambient Afr: June-Oct 37.8: Nov-May
4.4: Mid Sept.-Mfd May k b i e n t Air tE.3:
4.4: Mid Sept.-Mid May Pmbient Air t8.3:
4.4: Mid Sept.-Mid May Ambient Air t8.3:
3 7 3
54.4: N O V - M U
M l d M a y d l d Sept.
Mid Hay-Mld Sept.
Mid May-Mid Sept.
Foundatlon Type
Beam Beam Beam Beam Beam Beam Beam
Beam Beam
Beam
Grade
Grade
Grade
Maximum Depth o f Thaw a t Tank Center, Meters One Year F l v e Years
0.9 0.9 4.5 5.5 7.9 4.3 2.1 2.5 2.2 3.5 0.3 0 . 3 0.9 2.6
1.4 2.0 0.3 0.3
0.9 1.7
0 .9 1.4
0.8 1.2
0.6 1.1
Thaw Sett lcment A t Tank Center, cm
On@ Year F i ve Years
2-4 2.4 67,l 97.5 15.2 67.1
6.4 7.6 6.4 45.7 1.2 1.2 2.4 1.5.2
3.1 22,9 1.2 1.2
2.4 5.2
2.4 4.3
2.4 3.7
1.8 3.4
1304
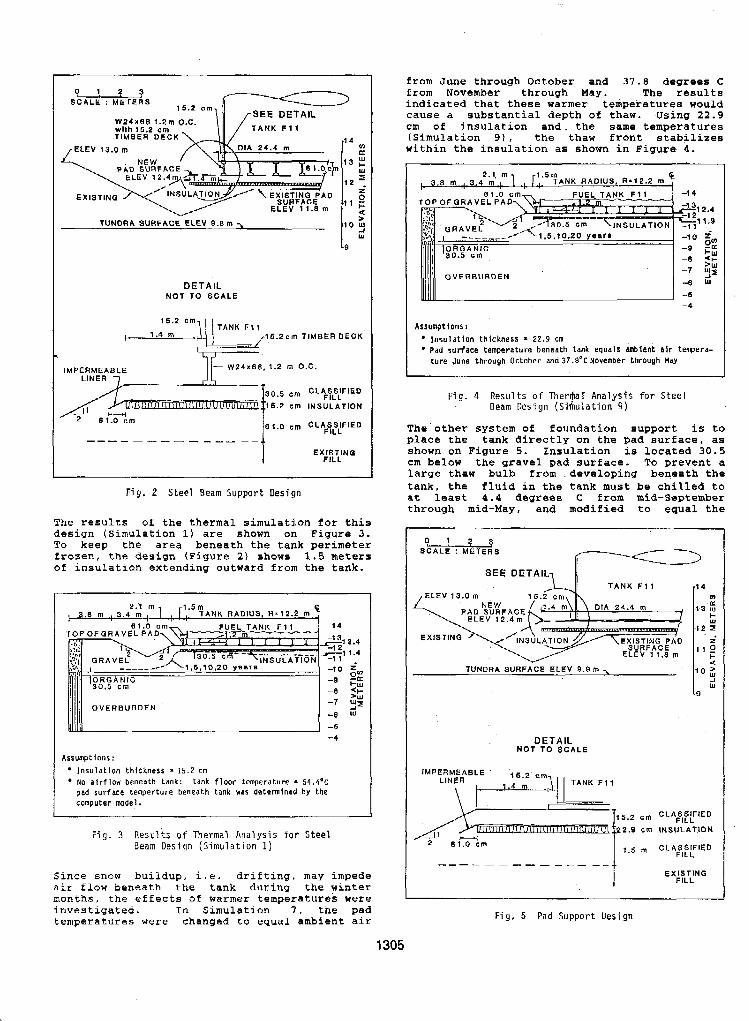
W 2 4 x 8 8 , 1.2 rn 0
T 30.5 em
::15.2 ern
81.0 crn
"I" "" _ "
.c .
CLASSIFIED FILL
INSULATION
CLASSIFIED FILL
EXISTING FILL
SCALE : M E T E R S 0 ! 2 3
1 5 . 2 c m
TIMBER DECK T A N K F 1 1
TUNDRA SURFACE ELEV 9 .B m -,
DETAIL N O T T O S C A L E
Fig. 2 Steel Beam Suppor t Design
The results of the thermal simulation for this design (Simulation 1) are shown on Figure 3 . To keep the area beneath the tank perimeter frozen, the design (Figure 2 ) shows 1.5 meters of insulation extending outward from the tank.
, 3.8 rn , 3.4 rn , 1 , 1, TANK RADIUS. R-12 .2 rn 2.1 m 1 . 5 m
1 , I
O V E R B U R D E N
Ullll l -4
Assumptions: Insulat ion th ickness = 15.2 cm No airflow beneath tank: tank floor temperaturp * 54.4'i
computer model. pad surface temperture beneath tank was detemlned by the
F i g . 3 Results o f Thermal A n a l y s i s far Steel Beam D e s i g n ( S i m u l a t i o n 1)
Since snow buildup, i.e. drifting, may impede air flow beneath the tank dur ing the winter months. the effects o f warmer temperatures were investigated. In Simulation 7. the pad temperatures were changed to equal ambient air
from June through October and 3 7 . 8 degrees C from November through May. The results indicated that these warmer temperatures wauld cause a substantial depth of thaw. Using 2 2 . 9 cm of insulation and. the same temperatures (Simulation 9 ) , the thaw front stabilizes within the insulation as shown in Figure 8 .
L. 3.8 m ! 3-4 rn 1 ! I , 2.1. rn 1.5m TANK RADIUS, R512.2 rn 7
Ulllll ". 6 -4
Assumptions: Insulat ion th ickness = 2 2 . 9 cm
' Pad surface temperature beneath tank equals ambient air tempera- t u r e June through October and 37.B'C November through May
Fig. 4 Results o f Therrfial Analysis f o r Steel Beam Design ( S h u l a t i o n 9)
Thaother system of foundation support is to place the tank directly on the gat3 surface, as shown on Figure 5 . Insulation i s located 3 0 . 5 cm below the gravel gad surface. To prevent a Large thaw bulb from .developing beneath the tank, the fluid in the tank must be chilled to at least 4 . 4 degrees C from mid-September through mid-May, and modified to equal the
0 1 p g SCALE : METERS
SEE DETAIL1 I
EXISTIN
ELEV 11.8 m
-1 4 Y) t
-13 w Ly
.1 2, I z'
.I 1 0 5
TUNDRA SURFACE ELEV 9.0 rn , r; DETAIL
N O T T O S C A L E
""-""-""I I EXISTING FILL
F i g . 5 Pad Suppor t Design
1305
outside ambient air temperature plus 8.3 degrees C from mid-May through mid-September. This will be accomplished by adding a cooling system to the tank inflow lines.
The results of the computer analysis indicated that 15.2 cm of insulation (Simulations 11 and 12) would provide satisfactory designs. However, due to the relatively low cost of the additional insulation, it was decided to use 22.9 cm of insulation as an additional factor of safety.
The results of the thermal analysis performed on this design (Simulation 13) are shown on Figure 6. Like the beam design, to keep the outer area frozen, the design (Figure 5) shows the insulation extending 1.5 meters outward from the tank.
I 30.5 c m ORQANIC
3.8 m .3.5 m 2 . 8 m. TANK RADIUS, ~ ~ 1 2 . 2 m t 61.0 cm
. " I
OVERBURDEN
Assumptions: * Insulat ion thickness - 2 2 . 9 cm
Pad surface temperature equals 4.1OCfor days 0 to140.and260ta360 and i s equal to ambient a i r temperature plus f1.3~Cfrorn days140to 260 during any g i v e n year.
F i g . 6 ,Results of Thermal Analysis for Pad Support Design (Simulation 13)
DESIGN CONSIDERATIONS
To prevent frost heave, the gravel pad was constructed of classified fill consisting of sand and gravel containing less that 5 percent by weight passing the No. 200 sieve size. The fill was compacted to a minimum of 95 percent maximum dry density as determined by the ASTM Method D 1557 laboratory test procedure.
The insulation was installed on a smooth, level bearing surface with the joints staggered and overlapped to prevent cold leaks, and extended a minimum of 1.5 meters in all directions beyond the tank perimeter, FOAMGLAS celLular glass insulation, as manufactured by Pittsburgh Corning Corporation, was used. Although the thermal properties of this insulation are not as good as fiberglass, it was selected for its long-term stability. Specifically, it does not break down when immersed in oil. An impermeable barrier, resistant 3 degradation from petroleum products, was placed on top of the insulation for protection against fuel spills.
CONCLUSIONS
Warm fuel storage tanks can be constructed on the Alaskan North Slope using the design con-
upon the fluid temperatures and pad thickness, cepts presented within this paper. Depending
the tank can either be placed directly on the gravel pad or elevated. Instrumentation should be installed at the time of construction to allow for continual monitoring of ground temperatures and settlements.
ACKNOWLEDGEMENTS
The permission of the C O W Owners to publish this gaper is gratefully acknowledged. Appreciation is extended to ANVIL Corporation, project consulting engineers.
REFERENCES
Auld. et al. 1978. Pad foundation design and
Mackenzio Delta. Proceedings of the Third performance of surface facilities in the
International Conference on Permafrost. Val, 1, pp, 1 6 5 - 7 7 1 .
Black, R.P. 1964. The Prudhoe Bay Field. Proceedings of the geological seminar on the North Slope of Alaska. pp. LI-LII.
Brown,' R.3.E. and T. L. Piwe. 19" 1. Distribution of permafrost in North America and its relationship to the environment: a review, 1963-1973. Permafrost, Second Conference, North American Contribution.
International
CRREL. 1984, FROST2B - A Nodal Domain Integration Model of Two-Dimensional Heat and Soil-Water Flow Coupled by Soil-Water Phase Change. Hanover: Cold Regions Research and Engineering Laboratory.
Lunardini, V.J. 1981. Heat Transfer in Cold , Climates. Von Nostrand Reinhold Co., New York.
Lunardini, V . Y . 1978. Theory o f N-factors and correlation of data. Proceedings of the Third International Conference on Permafrost. Vol. 1, pp. 4 0 - 4 6 .
Miller, T.W. 1975. The surface heat balance in simulations of permafrost behavior. ASME paper 75-WA/HT-66, November.
WahrhaFtig, C. 1965. Physiographic divisions of Alaska: a classification and brief description with discussion of high latitude physiographic processes. USGS Professional Paper 482.
Walker. D.A., et al. 1980. Geobotanical Atlas of the Prudhoe Bay Region, Alaska. Report 80-14. Hanoves: Cold Regions Research and Engineering Laboratory.
1306
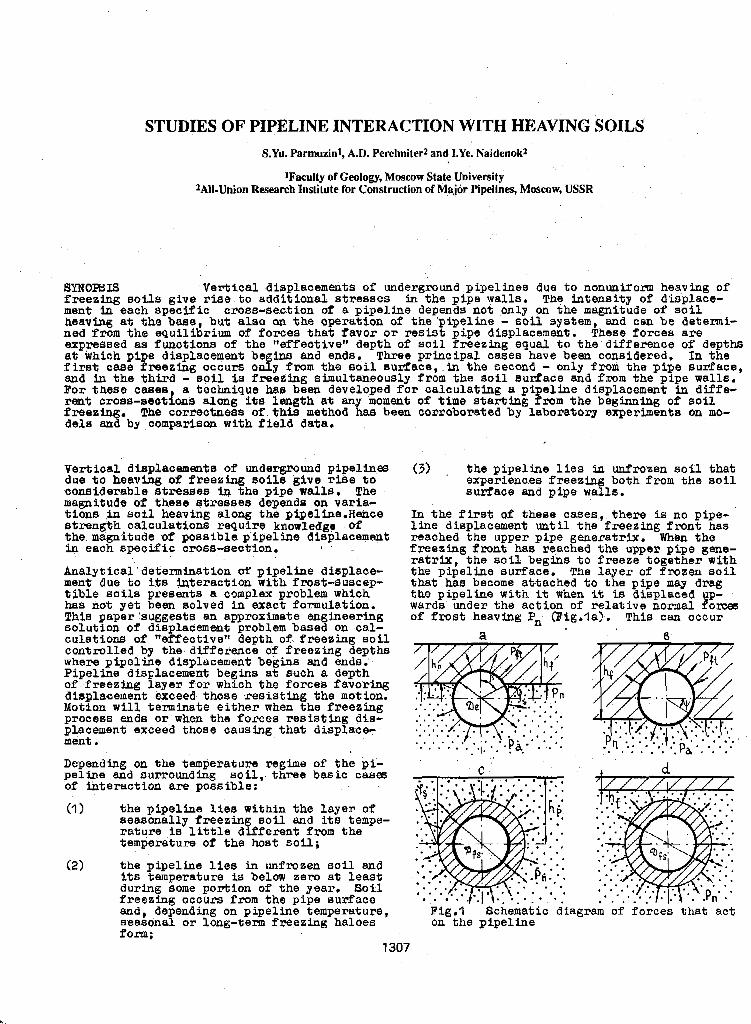
STUDIES OF PIPELINE INTERACTION WITH HEAVING SOILS S.Yu. Parmuzinl, A.D. Perelmiter2 and Lye. Naidenokz
1Faculty of Geology, Moscow State University 2AII-Union Research Institute for Construction of Major Pipelines, Moscow, USSR
B Y N O P a S Vertical displacements of underground pipelines due t o nonunirorm heaving of freeslng aoils give r ise t o addi t ional s t resses in the pipe W81LS. The intensity of displace- ment in each BpecYic cross-section of a pipeline depende not only on the magnitude of s o i l heaving a t the barse, but also ob the Operation of the 'pipeline - soil system, and can be detenai- ned from the equilibrium O f forces that favor or resist pipe displacement. TPbese forces a re expressed as functions of the "effective" depth of so i l f reez ing equal. t o t he difference of depths at ihich pipe displacement be h a and ends. Three principal cases have been considered, In t he first caBe freezing occura onfy f m m the soil ~ufpace, in the second - only f r o m the pipe surface, and in t he t h i rd - soil i s freezing simultaneously f rom the so i l sur face a n d fmm the pipe walls. For these ca8es a technique has been developed for ca lcu la t ing a pipeline displacement in d j f f e - rant cross-seodons along itits length at any moment o f time start ing f r o m the beginning of soil freeoing, The correctness of this method hae been cocroborated b y Laboratom experimente on mo- dele and by comparison wi th f i e ld data.
Vertical. displacemanta o f underground pipellnet3 (3) t he p ipe l ine l i e s unfrozen soil that; due t o heaving of fpeeeing so i l e g ive r i s e t o considerable stresses ixl the pipe walls. The
experiences freezing both from t h e s o i l
magnitude of these stressea depends on varia- surface ana pipe walls.
t ions in s o i l heaving along the pipelfne.Hence In the f i r s + a i these cases, there is no pipe- atrangth calculations require knowledgg of l i n e displacement until the f r e e z b g f r o n t has the magnitude of possible p i p e l a e displacement reached the upper pipe generatrix. When the in each specific ~ r o s s - ~ e c t l o n . f r e e e b g front has reached the upper pipe gene-
ra t r ix , the Boi l begins t o freeze together with Analytical'determinatfon of p i p e l h e displace- the pipeline surface. The layer of f rozen so i l ment due t o its in.teraction with frost-suscep- that has become attached t o the pips may drag t i b l e soils presents a complex problem which the p i p e l h a with it; when it is displaced p- has not y e t been aolved in exact formulation. wards under the action of r e l a t ive normal :: om# This paper 'suggests an approximate engineering of f r o s t heaving P, (Fig.1a). This can occur solution of displacement problem based on cal- culat iom o f "effective1' depth o f freezing s o i l a 0 controlled by the difference of f r e e z h g deptha where p i p e l b e displacement begins and ends. Pipeline difiFlaCement begins a t m c h a depth of f reezing layear for which the forces favor- diapla,cemeht exceed those res is t ing the motion. Motlon will terminate e i ther when the freezing process ends o r when the forces resistbng d i s - placement exceed those causing that displace- ment,
Depending on the tempepature regime of the pi- peline a a d surrounding soil,. three basic cas= of interaction axe possible:
(1) t he pipeline lies within the layer o f eeaaonallg freezing soil and its tempe- . rature i s l i t t l e d i f f e r e n t from the temperature of the host soi l ;
it6 temperature i s below zero at l e a s t d u r l n g Some portion o f the year . Soi l freezhng occurs from the pipe suxface a n d , depending on pipeline temperature, agram of forces that ac t seasonal or long-term freezing haloes on the pipeline form;
. . . . . .
(2) the pipeline l i e s in unfrozen s o i l and
when the resul tant %t of specific freezing- together forces (Pft>, appl ied to the p ipe lbe
the t o t a l weight of the pipeline with the surface in the freezing-together zone, exceeds
transported item q the weight of unfrozen soil above the pipe in t h e pockets and t h e shear strength of the unfrozen s o d (qeh) a t the segment from the pipe half-diameter t o the bottom o f the frozen soil, as well 8s forces of soil adhesiveness a t t h e lower p i p e l b e ge- neratriz 9,. If the adhesion forcea are grea- t e r than the rupture strength of uafrozen s o i l (qr), then the pipeline displacement occura together with the s o i l that has stuck t o the pipe and the value of qr i s taken into account Fn the calculations. Apart from the loa& men- tioned above one should include the Inteneitg of ver t ica l ioad (4) in 8 cross-section due to the adjoining pipel ine segments.
Up t o the time when the depth o f s o i l f r e e o b $ has reached the depth of pipeline axis ( ), the condition for displacement t o begin i a ' written in the form
P'
!e
Here q1 is equal t o the smaller of two values, q, and 9,. The resultant of specifio freezing forces is determined as has been ShQWn by Perelmiter e t al . (1 $811, from
+ P& De sinJ3 where
p = cos-' 2 3 L L ; ,
De is a coeff lcient of proport Oonality having
t h e dimension MFa . deg" ; Pft denotea speci- f i e forces of freezing together a t O'C; De is the external pipe diameter3 tmin is t h e mean monthly temperature o f soi l . surface during the coldeat month; Tw is the duration of the winter period, rt is the time from the beginn- iag of freezing t o the beginning of displace- ment; 9 is the depth o f f rozen layer a t time T . Formula (2) is derived on the assumptione that temperature changes linearly with depth the temperature change at the soi l surface during w h t e r time is described by a harmonic func- t ion, and the specif ic forces of freezing de- pend l inearly on soil temperature.
The quant i t ies qa, g,, and qSh are, determined Prom the following relatione (Perelmiter et al., 1981) I
0
(3)
1308
et I* = s; De 1 (41
where Pa denotes specif ic forces of adhesion between unfrozen soil and pipeline; 6, et is the l imlting long-term strength o f unfrozm soil f o r tension; g is the acceleration due t o gravity; p s o i l density above the pipe; ys is the angle of In te rna l f r ic t ion for unfmmn soil; C the adhesive force of unfrozen s o i l . The valuea o f adhesion an? long-term ~trength o f &mzm soil a r e given Irr a number of pub- l ica t ions (Vetrov and Kondra 1 2; Rekomen- datsi i ... , 1983; S i m t a , IbO? The forces sft and qBh, as can be seen ia (2) and (5) are the functioas of time (r and of freezing depth 9. h o w i n g the dependence of % on C , one o m f i n d f r o m (I) the time when the pipe- l i n e began to aove and the minimum depth of freezing ( hpmm ) a% which tha t motion will begin. Subsequently, the pipeline and the surrounding s o i l move together. Pipeline mo- t ion terminates on reaching the m a x i m u m of soil freezing (hpmax). The difference batween and la equal t o the "effect,Ive*i thick- ness which cauaes pipeline motion ( A ) in the C~SS-8eCtiOIl considered.
A = ( - where kh is the coefficient of soil heaving equal t o the ra t io of heavlng amount at the f ree surface of s o i l t o the m a x i m u m freezing depth; it is determined experimentally.
If calculation by (1) shows *ha$ tpe lbe motion doea not occur before the ?xeezing front has reached the depth of pipeline axia, one should examine the equilibrium of forces f o r klp s 9 G 5 + 0.5 De @ig.lb).
In that case noma1 forces of heaving s, which begin to act d i rect ly on the p$pe are added t o the loads that cause the motion. The forces t h a t r e s i s t motion decrease, because qah = 0. The conditioi for equilibrium of forces tha t act on the pipeline i s writiten in the form
Kh (6)
I I I q $ t + s , - s , - 9 p 2 9 " 0 . (7 1
Normal heaving forces under this conditfon are determbed from
(8)
The coefficient of proportionality K is 0.6 MN/m3 f o r s o i l s of medium heaving capacity
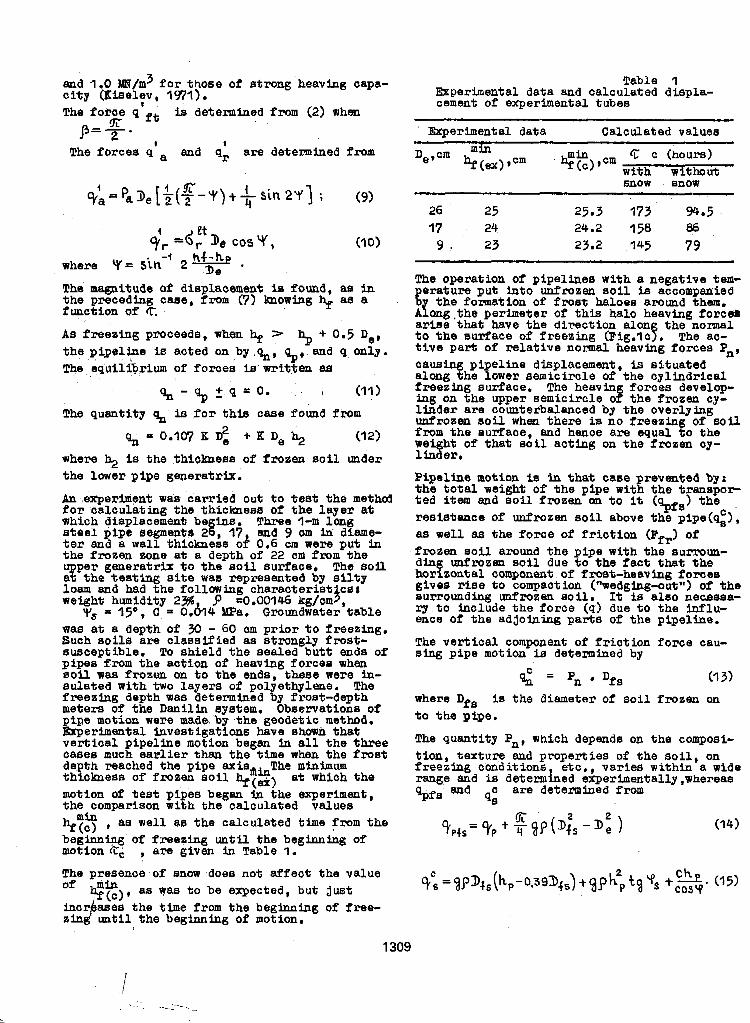
and 1.0 W/m3 f o r those of strong heavlng capa- c itg (Kisely, 1971 1. The foice q f t ia determined from ( 2 ) when
p+. , I
The forces 4 a and 9, are determined from
The magnitude of dis$laaenent is found, as in the precediag cam, from (7) bowing + as a Puuation of t. AS f reeoing pTOCead8, when hp % + 0.5 De, the pipeline is acted on by .%, g~, and q, onlg. TM .dqu~lib,rium of force; 1s written an
a , - a p . t . s = O - 1 (11)
The quantity % is f o r th is case f o h d f r o m
= 0.107 K 6 + K De % ('1 2)
where $ l e the thickness of frozen a011 under the lower pipe generatr&.
&a ,experbuent waa carried ou t to t es t the method for oalculating the thickness of the layer a% which diaplacement be ins. Three I-m l a g steel pipe Begmente z f , 17 and 9 om w diame- t e r a n d a wall t h i h e a s 0 ) 0.6 uu were puk h the Prosen zone a t a depth of 22 cm f m m the wper generatrix t o the soil surface, The SOU at; the t es t ing s i te waa rapresentea by s i l t y
weight humidi ty 23% P =0.00146 Irg/cm3, loam and had the following characterist CBI
was a t B depth o f 30 - 60 cm prior t o freesing. Such soils are classified as strongly frost- susceptible. To shield the sealed b u t t ends of pipee from the action of heaving forces whan soil was frozen on t o the ends, theee were ia- eulated with two layers o f pol ethylene. The freesing depth was determined %y frost-depth meters o f the D a n i l i n system. Observations o f ptpe motion were ma&. by the geodetic method. Experbental investigations have shown that vertical pipeline motion began in all the three Cases much ear l ie r than the time when the f rost depth reached the pipe thiclmess of froeen soil axiamhThe minbimum a t which the motion of t e s t pipes began In the experiment, the comparison wi th the calculated valuea $Ts , as well aa the calculated t h e fmm the beginnbg of freesing until the beginning of motion ae a m given in Table 1.
The presence of snow does not affect the value Of $E) , as waa t o be expected, but j u s t
ul, = 15*, C = 0.614 ma. Groundwater table
!
ases the time from the beginnixlg of free- until the b e g h l n g of motion.
1309
1
fable 1 Experimental data and calculated displa- cement of experimental tubes
~~ ~
Experimental data Calculated valuea . . ~~~~ . . . -
snow anow
E6 25 25.3 173 94.5 17 24 24.2 158 06 9 . 23 23.2 145 79
The opefatian of pipeline8 with a negative fern- eratuxe put into unfmeen s o i l i s accompanied y the formation of f r o & haloes around them.
Along .the perimeter of this halo heaving forcab
t o the suFface of freezing (Fig.lo$. The ac- arlae that have the direction alon the normal
t ive part of relative nomal heaving forces Pp, causing pipeline displacement, is situated along the lower semicircle of the cglindrleaL freezing surface. The heavin forces develop- ing on the upper semicircle o$ the Prosen cg- Ihder are counterbalanced by the overlying unfromn SOU when there is no ireeaing of soil f r o m the t3uTface, and hence are equal t o t he wei ht of that soil acting on the frosen cg-
Pipeline motion i e in that case revented by: the to ta l weight of the pipe w i t % the transpor- ted item and so i l frozen an t o it (gprs) the resistance of unfrozen soil above the pipe(@, aa well as fhe force of f r ic t ion afr) of frozen so i l around the pipe with the nurroun- diag d m z e n so i l due to the fac t that the horizontal component of f roat-haaviag forces gives Pise t o compaction ("wedging-outs1) of the surrounding ImProzen soil. It is also neCgsaa- r y t o include the force (4) due t o the influ- ence of the adjoining parts of the pipeline.
The vertical component of f r ic t ion force cau- sing pipe motion is determined by
%
1 h L .
where Dfs i s the diameter of so i l f r o z e n on t o the pipe.
The quantity Pn, which depends on the composi- tion, texture end properties of the s o i l , on freezing conditions etc., varies within a wide range and ie determined experimentally ,whereas
are determbed from $Pa and q:
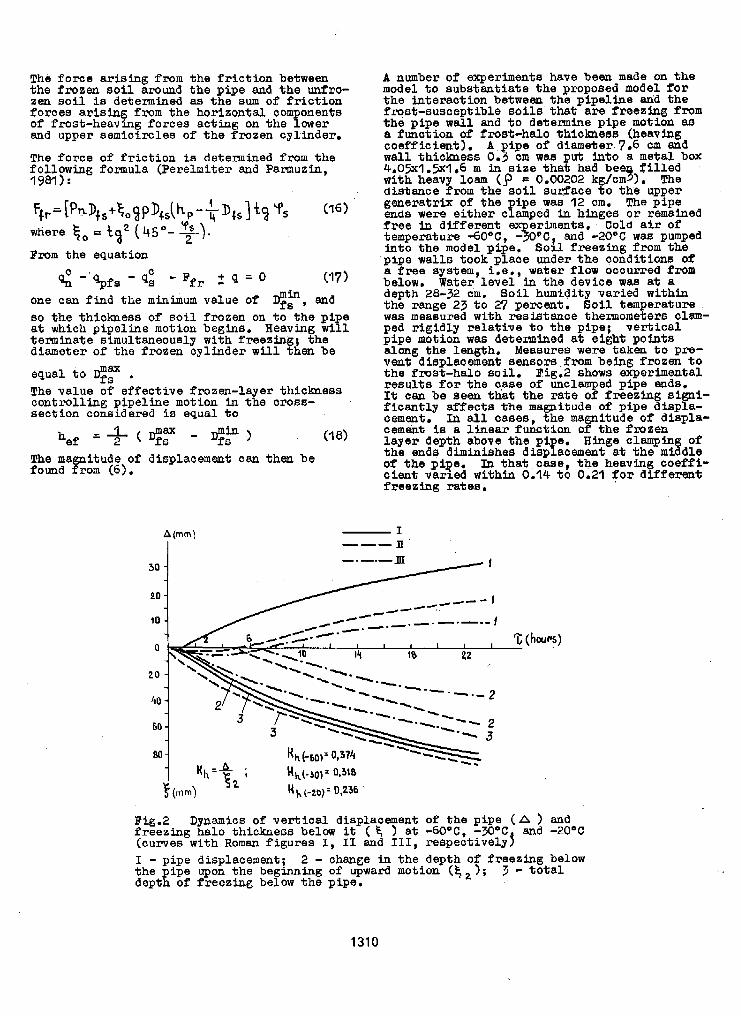
The force arising f r o m the f r ic t ion between the frozen s o i l around the pipe and the unfro- zen s o i l is detembed as the sum of f r ic t ion forces arising fmm the horizontal components of frost-heavhg forces acting on t h e l m e r and upper semicircles of the frozen cylinder.
The force o f f r ic t ion is determined f r o m the following formula (Perelmiter and Pamuzin, 1981):
From the equation
4 -'%fa - qi - Ffr 2 4 = 0 (17) one can f h d the m i n i m u m value of $:, and BO the thickness of s o i l frozen on t o the pipe a t which pipeline motion begins. Heavbg w i l l t e rmbats slmultaneously with Ereezhg; the diameter of the frozen cylinder w L l 1 then be
equal t o I$: . The value of effective frozen-layer thfclmess controlling pipeline motion In the m o m - section considered is equal t o
The ma i t u d e of displacement can then be found Rom (6).
3u 1
A number of experimenta have bean made on the model. t o substantiate the proposed model for the Snteracltion between the pipeline &d the frost-susceptible s o i l s that are freezing from the pipe w a l l and t o determine pipe motion a8 a function of frost-halo thickless (heavhg coefficient) . A .pipe of diameter 7.6 cm and wall thickness 0.5 cm was put into a metal box 4.05~1.5~1.6 m in size that had be f i l l ed with heavy loam (p = 0.00202 kg/&. The distance fmm the s o i l surFace t o t h e upper generatrix o f the pipe was 12 cm. The pipe
f ree in different; erhents. Cold a i r of ends were either clamped in hinges o r remalned
temperature dO°C,%oCt and -20°C wa8 pumped into the model pipe. S o i l f r eezbg f r o m the pipe walls took place under the conditions o f a f ree system, i . e . , water f low occurred from below. Water level 3n the device was a t a
the range 23 t o 27 percant. So51 temperature wa8 measured with resistance thennometem cI.8.t~- ped r i g i d l y re la t ive $0 the pipe; vertical pipe motion was determhed 8% eight pohl j s along the length, Measures were taken t o pre- vent displacement sensors P r o m being frozen t o the frost-halo Soil. Ffg.2 shows experimental
It can be 88811 that the rate o f Oreezbg ai@- rewlts f o r the case of unclamped pipe ends.
PicantLy affects the magnitude of ptpe displa- cement. In all cases, the ma itude of displa- CemehI j is a Linear function opthe fmzen layer depth above the pipe. Hinge clampfn of the .ends diminishes displacement a t the mi8dY.e o f the pipe. Itl that ,case, the heavbg coeffi- c ient varied within 0.14 t o 0.21 f o r differat freezing ra tes .
depth 28-32 cm. Soi l humidity varied with*
I ""II
"1 Pig.2 Dynamics of ver t ical displaoement of the pipe (A ) and freezing halo thickness below it ( f ) a t -6OoC, -N0C and -20°C (curves with Roman figures I, I1 and 111, reepectivelyj
the pipe upon the beginning of upward motion ( 5 1; 3 - t o t a l I - pipe displacement; 2 - change in the depth of freezing below
depth o f freezing below the pipe, ' #
1310
Slusarchuk e t al. (1978) described experfmen- t a l inves t iga t ions i n t o the motion of 12 m-1- and 1220 nun in diameter pipe sections when a
pipe. The heaving coefficient o f pipe sections fmst-susceptible sol1 was freezing fmm the
was 0.205-0.215, L e . it was close t o t h e va- lues obtained by u s in model studies.
When soil is freesing ajmultaneously f r o m the surface and from the pipe walls ($ig.ld), the first thing that occurs is compaction of a layer o f unfmzen s o i l undes the bottom o f the
t h a t Payer SignWicantly diminishes and (when layer of seasonal freezing. The response o f
s tops p ipe lhe heaving until the time when t h e It reaches a c e r b i n thiclmess) completsLy
soil t h a t in b e h g frozen from the suTface comes in contact wifh the frozen soil around the pipe. AFter that, when the aoil 28 being furtiher frozen from the sureace, the pipeline will begin t o move.
Thua the method proposed here can predict the poasibfli ty m a magnitude of displacement of
frost-susceptible soils. The relevant formulas undergmund pipellnes when these interact with
involve the main character is t ics of t h e s t a t e and properties of s o i l s that control the inten- sity of pipe motion in a specific cross-section along the length of" the pipeline. One o f the tasks facing future s t u d i e s is t o omduct na-
t o detemhe the coefficients of soil heaving tural-s ize experbents in feat areas in order
f o x different pipe diameters the effect of. the motion of pfpel,$ne clamp& in t h e s o i l , and t h e load due t o the areas adjacent t o t h e pipeline cross-section under consideration.
REFFXENCEFj
Vetrov, Yu.A. & Kondra, A.S.(1972). Rezultaty Issledovaniya lipkosti gruntov. Sb. : Gor- nye, s tmi te lnye i dorozhnye ma8hiny.Vyp. 14, pp.12-18. Kiev.
Kiselev, M,F, (19'71). Meropriyatiya protiv de- formatsii zdaniy i sooxuaheniy o t deist- viya si1 moroznogo vypuchivan'lya fundamen- t o v , 102 pp. Moskva: Izdatelstvo Litera- tux8 PO s t m i t e l s f v u ,
Perelmiter, A.D. & Pamuzin, S.Yu. (1980) . Vzaimodeiatvie truboprovodov a puchini- s t y m i gruntami. Gb.nauchnykh trudov m.IIS!Ct Ronstruktsii, metody rascheta ga- soprovodov i sposoby s t ro i te la tva , pp.57-68. Moakva.
8.1. Spiridonov , V.V. (19811. Opredele- nie peremeshcheniy i nagruzokl deistvuyu- shchikh na truboprovod v puchlnistykh grwtakh. Nauchno-tekhuicheskig refera- tivny sbornlk: Sroektirovanie i stroi- te ia tvo truboprovodov i gazopromyslovykh sooruzhenig. Vyp.?4, pp.26-33. MoslNa.
Bokomendatsii PO opredeleniuy lipkosti gruntov v statsionarnykh laboratornykh i polevykh usloviyakh. (19831, 31 pp. Moskva: S t ro i iadat.
Strota Yu.L. (1980). Issledovaniya prochnosti giinistogo grunta pri rastgazhenii . Nauchno-tekhnichesky referativng sbornLklk: S t m i t e l s t v o i arkhitektura, Seriyya 15: Inehenarnye ieyskaniya v s t ro i te l s tve . Vyp.4. Otechestvenny opgt, pp.5-9.Moskva.
Morgenstern, R.B. & Gaskin P.N.(19783. Fie ld t es t resu l t s of a chhlea p ipe l ine buriea in unfrozen gmund. Proc.3rd @t. Confr. on Permarrost , v.1, 877-8B4, . Edmonton, Canaaa.
Perelmiter ADD. , PamuzFn, S,Yu. Alekseyev
8lusarchuk, B.A., Clark, J.1, Nlzon, J.E.
131 1
YUKON RIVER BANK STABILIZATION: A CASE STUDY C.H. Riddle, J.W. Rooney and S.R. Btedthauer
B&M Consultants, Inc., Anchorage, Alaska 99503 USA
SYNOPSIS: Erosion on the right bank of the Yukon River above the Galena Airfield is caused by a combination of thermo-erosional niching of the frozen upper bank, causing massive block failures, and erosion of the failed material by river currents and natural thalweg migration. The average annual erosion rate is relatively uniform throughout the ' 8 km long bend upstream of Galena, ran ing from 4 - 6 m per year. Subsurface investigations and geotechnical evaluation identified soif conditions. the extent of massive ground ice and other geotechnical parameters necessary €or design and construction of bank protection. To limit continued erosion of the upper bank by
geotechnical and h draulic conditions along the study reach. A conventional rock revetment was thermo-qrosional niching, alternative design concepts were prepared, each reflecting the different
recommended for tze more stable soil section. An insulated, rock protected revetment was suggested a s an alternative for those areas found to have ice-rich soil and high thaw strain potential.
INTRODUCTION
Galena, Alaska is located on the north bank of an 11 km long meander of the Yukon River about 435 km west of Fairbanks (Fig. 1). The town of Galena was established around 1919 as a supply base for galena prospecrs in the vicinity. The Civil Aetonautics Adminis- tration constructed an airfield at Galena in late 1941 and the airfield was occupied by the military soon after. Although the site was known for periodic flooding, the military felt the Galena airfield could best fill their emergencv needs at that time. Following an ice jam- flood in 1971, which flooded the original townsite and nearly overtopped the flood control dike around the airfield, much of the civilian population relocated to a new
The new townsite is also in the path of the townsite about 2 . 5 km upstream of the runway.
migrating meander.
Since establishment of the airfield, several .studies and projects have been completed by the U.S. Army Corps of Engineers (Corps) in efforts to control erosion in this area. Specific features within the project study area are shown in Fig. 1. Most of these actions have concentrated on protecting the airfield. In 1984 the exiting sheet pile hard point was in danger o f being flanked due to erosion upstream of the piles.
Erosion at the old town site is primarily by wave attack of the upper bank, averaging
slightly upstream of the Galena Airfield 1.4-1.8 m per year. From the old town to
(points A to F on Fig. l), the un rotected upper bank materials consist of un?rozen or relatively thaw stable frozen silt and sand. Upstream of the Galena Airfield and extending to near Beaver Creek (points F to J on Fig. l), the shoreline generally consists of
4.5-7.5 m o f frozen silt containing massive ice. In all cases, these materiaxs overlie a typically frozen sand and gravelly sand deposit. This underlying granular material appears to be thaw stable, where frozen, representing a suitable foundation on which to place some form of embankment for upper bank slope protection.
Construction of longitudinal segments of bank protection was felt to be the most practical method of completing any significant portion of this project due to budget restrictions. A 656 m long section (identified as Phase I on Fi . 1) , extending upstream from the sheet pi'ie hardpoint, was constructed during the winter and spring of 1986. An additional 328 m long section (identified as Phase XI on Fig. 1) located in front of the new town site is currently being completed by the Corps.
SITE CONDITIONS
General
Galena lies in a wide floodplain of the Yukon River. Sediments contained within the plain are Pleistocene or Holocene fine to coarse-grained deposits generally exhibiting distinct thin parallel stratification. The floodplain has four physiographic phases or units. each with distinct permafrost, drain- age, vegetation, and engineering characteris- tics (PCwd, 1948). Each of these phases is temporary (relative t o geologic time) and somewhat evolutionary in nature due to permafrost growth, flooding, river meandering, and associated changes in vegetation. These phases are readily identifiable from air pho- tos, based on the shape and distribution of lakes and vegetation. The four phases in
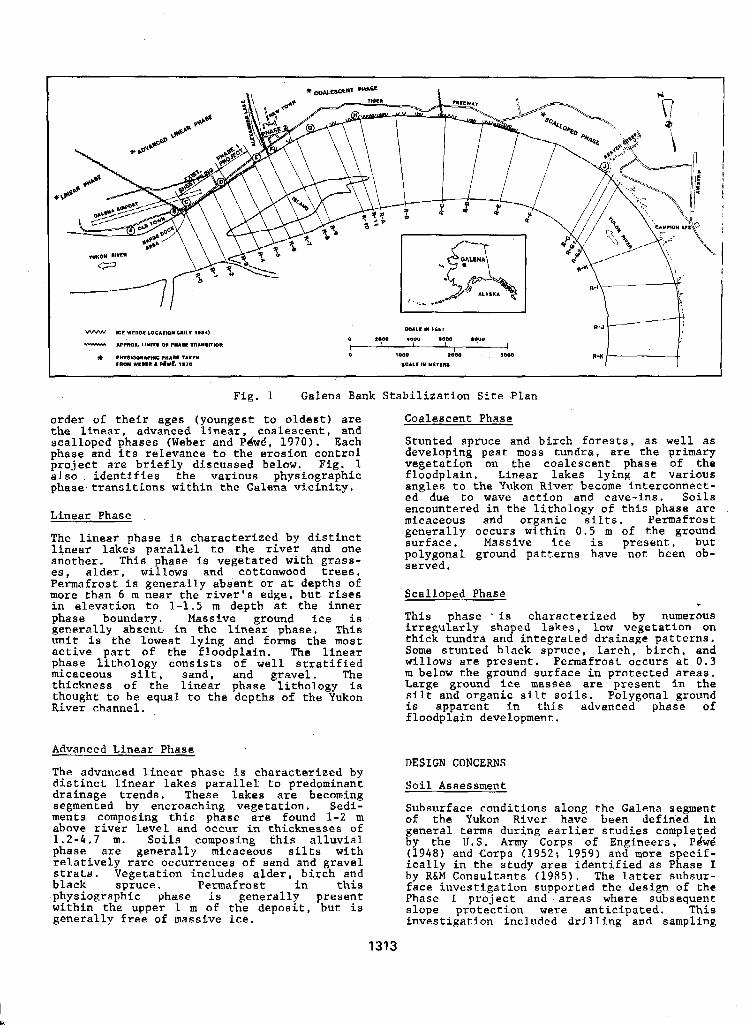
L
order o f their ages (youngest to oldest) are the linear, advanced linear, coalescent, and scalloped phases (Weber and PbwWB, 1970). Each phase and its relevance to the erosion control project are briefly discussed below. Fig. 1 also identifies the various physiographic phase transitions within the Galena vicinity.
Linear Phase
The linear phase is characterized by distinct linear lakes parallel to the river and one another. This phase is vegetated with grass- es, alder, willows and cottonwood trees, Permafrost is generally absent or at depths o f more than 6 m near the river's edge, but rfses in elevation to 1-1.5 rn depth at the inner phase boundary. Massive ground ice is generally absent in the linear phase. This unit is the lowest lying and forms the most active part of the floodplain. The linear phase lithology consists of well stratified micaceous siit, sand, and gravel. The thickness of the linear phase lithology is thought to be equal to the depths of the Yukon Biver channel,
Advanced Linear Phase
The advanced linear phase is characterized by distinct linear lakes parallel to predominant drainage trends. These lakes are becoming segmented by encroaching vegetation. Sedi- ments composing this phase are found 1-2 m above river level and occur in thicknesses of 1.2-4.7 m. Soils composing this alluvial phase are generally micaceous silts with relatively rare occurrences of sand and gravel strata. Vegetation includes alder, birch and black spruce. Permafrost in this physiographic phase is generally present within the upper 1 m of the deposit, but i s generally free of massive ice.
Coalescent Phase
Stunted spruce and birch forests, as well as developing peat moss tundra, are the primary vegetation on the coalescent phase of the floodplain. Linear lakes lying at various angles to the Yukon River become interconnect- ed due to wave action and cave-ins. Soils encountered in the lithology of this phase are micaceous and organic silts. Permafrost generally occurs within 0.5 m of the ground surface. Massive ice i s present, but polygonal ground patterns have not been ob- served.
Scalloped Phase
This phase .is characterized by numerous irregularly shaped lakes, low vegetation on thick tundra and integrated drainage patterns. Some stunted black spruce, larch, birch, and willows are present. Permafrost occurs at 0.3 m below the ground surface in protected areas. Large ground ice masses are pxesent in the silt and organic silt soils. Polygonal ground is apparent in this advanced phase o f floodplain development.
DESIGN CONCERNS
Soil Assessment
Subsurface conditions along the Galena segment o f the Yukon River have been defined in general terms during earlier studies completed by the U . S. Army Corps of Engineers, Pe'wd (1948) and Corps (1952; 1959) and more specif- ically in the study area identified as Phase I by R&M Consultants (1985). The latter subsur- face investigation supported the design of the Phase I project and areas where subsequent slope protection were anticipated. This investigation included drilling and sampling
1313
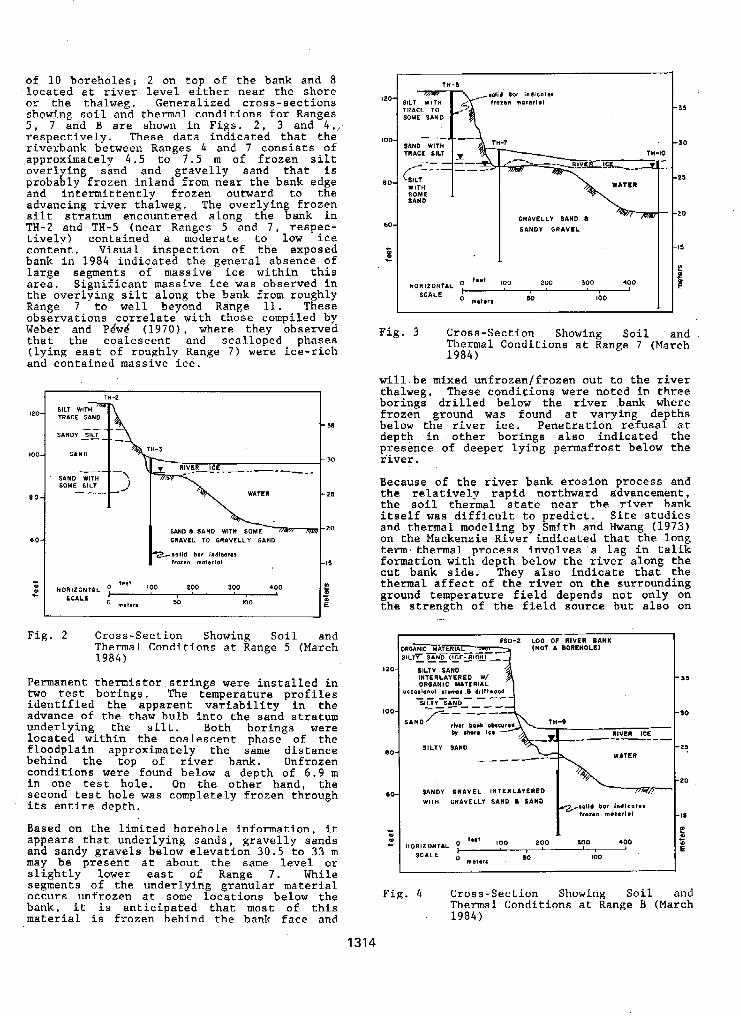
of 10 boreholes; 2 on top o f the bank and 8 located at river level either near the shore or the thalweg. Generalized cross-sections
5, 7 and B are shown in Figs, 2 , 3 and 4 , . shOwing soil and thermal conditions €or Ranges respectively. These data indicated that the riverbank between Ranges 4 and 7 consiets of ,approximately 4 . 5 to 7.5 m of frozen silt
probably frozen inland from near the bank edge overlying sand and gravelly sand that is
and intermittently frozen outward to the advancing river thalweg. The overlying frozen silt stratum encountered along the bank in TH-2 and TH-5 (near Ranges 5 and 7 , respec- tivelv) contained a moderate to low ice
bank in 1 9 8 4 indicated the general absence of content. Visual inspection of the exposed
large segments o f massive ice within this area. Significant massive ice was observed in the overlying silt along the bank from roughly Range 7 to well beyond Range 11. These
Weber and Pdwd (1970), where they observed observations correlate with those compiled by
that the coalescent and scalloped phases (lying east of roughly Range 7 ) were ice-rich and contained massive ice,
I 2 0
100
8 0
6 0
e (Y el L
TRACE SAND
WD a SAND w l r n \ SOME GRAVEL TO GRAVELLY SAND
aohd bar Indlcarrr Irmon maledo1
HORIZONTAL 7 tee1 100 200 300 400
50 100 SCALE
0 malar.
35
30
25
20
l'i
I
Fig. 2 Cross-Section Showing Soil and Thermal Conditions at Range 5 (March 1 9 8 4 )
Permanent thermistor strings were installed in two test borings. The temperature profiles identified the apparent variability in the advance of the thaw bulb into the sand stratum underlying the silt. Both borings were located within the coalescent phase of the
behind the top of river bank. Unfrozen floodplain approximately the same distance
conditions were found below a depth of 6.9 m in one test hole. On the other hand, the second test hole was completely frozen through its entire depth.
Based on the limited borehole Information, it appears that underlying sands, gravelly sands and sandy gravels below elevation 30.5 to 3 3 m may be present at about the same level or slightly lower east of Range 7 . While segments of the underlying granular material occurs unfrozen at some locations below the bank, it is anticipated that most of this material is frozen behind the bank face and
120-
100-
BO-
60-
c
""L"-L
kATER I I ORAVELLY SAND a + I SANDY GRAVEL I I
HORIZONTAL SCALE
"" ' y o 200 300 ' metere 10 100
Fig. 3 Cross-Sectirm Showing Soil and Thermal Conditions at Range 7 (March 1 9 8 4 )
will.be mixed un€rozen/frozen out to the river thalweg. These conditions were noted in three borings drilled below the river .bank where frozen ground was found at varying depths below the river ice. Penetration refusal at depth in other borings also indicated the presence o f deeper lying permafrost below the river . Because of the river bank erosFon process and the relatively rapid northward advancement, the soil thermal state near the river bank itself was difficult to predict. Site studies and thermal modeling by Smith and Hwang (1973) on the Mackenzie River indlcated that the long term. thermal process involves a lag in tallk
cut bank side. They also indicate that the formation with depth below the river along the
thermal affect of the river on the surrounding ground temperature field depends not only on the strength of the field source but also on
SILTY SAND INTERLAYERED VI/
~cc0114001 #IumoI 8 driftwood OROANIC MATERIAL
SILTY SANO _ _ 3 """"
S I L T Y SANO """" vw WATER t2?
SANDY GRAVEL INTERLAYERED 1 &Izo 1
HORIZONTAL 100 200 S O 0 400 S C A L E
' met.,*
50 IO0
Fig. 4 Cross-Section Showing Soil and Thermal Conditions at Range B (March 1 9 8 4 )
1314
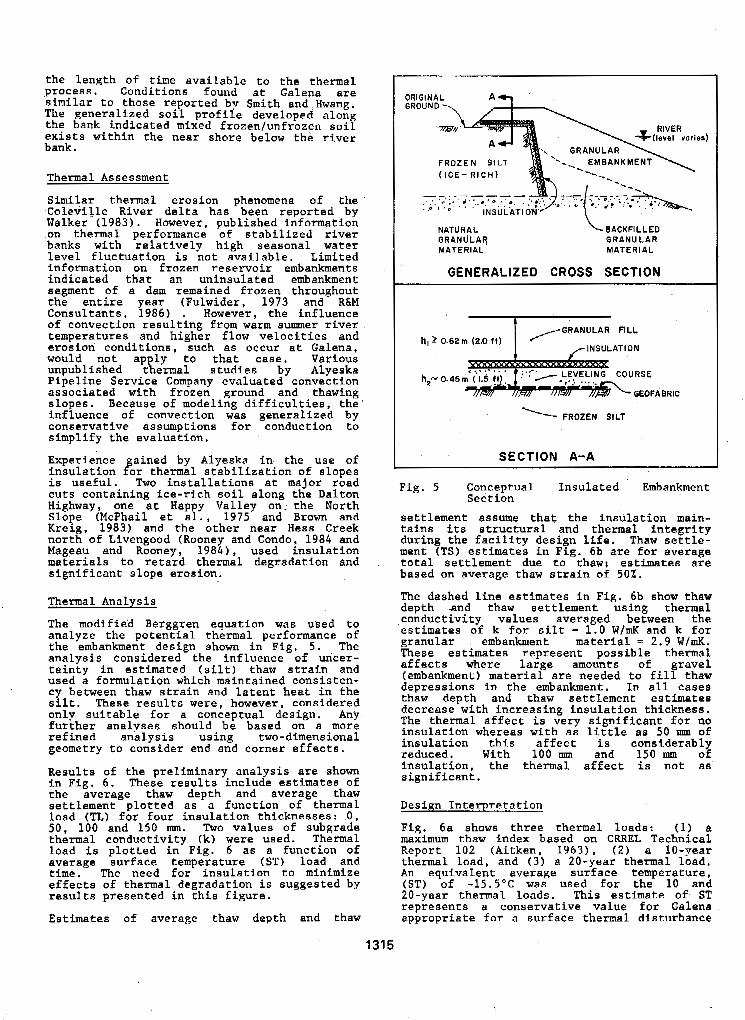
the length of time available to the thermal process. Conditions found at Galena are similar to those reported by Smith and Hwang. The generalized soil profile developed along the bank indicated mixed frozen/unfrozen soil exists within the near shore below the river bank.
Thermal Assessment
Coleville River delta has been reported by Similar thermal erosion phenomena of the
Walker (1983). However, published information on thermal performance of stabilized river banks with relatively high seasonal water level fluctuation is not available. Limited information on frozen reservoir embankments indicated that an uninsulated embankment segment of a dam remained frozen throughout the entire year (Fulwider, 1973 and B&M Consultants, 1986) . However, the influence of convection resulting from warm summer river temperatures and higher flow velocities and
would not apply to that case. Various erosion conditions, such as occur at Galena,
unpublished thermal studies by Alyeska Pipeline Service Company evaluated convectfon associated with frozen ground and thawing slopes. Because of modeling difficulties, the influence of convection was generalized by conservative assumptions for conduction to simplify the evaluation.
Experience ained by Alyeska in the use of insulatlon ?or thermal stabilization of slopes is useful. Two installations at major road cuts containing ice-rich soil along the Dalton Highway, one at Happy Valley on" the North Slope (McPhail et al. , 1975 and Brown and Kreig, 1983) and the other near Hess Creek north of Livengood (Rooney and Condo, 1984 and Mageau and Rooney, 1984), used insulation materials to retard thermal degradation and significant slope erosion.
Thermal Analysis
The modified Berggren equation was used to analyze the potential thermal performance of the embankment design shown in Fig, 5. The analysis considered the influence of uncer- tainty in estimated (silt) thaw strain and used a formulation which maintained consisten- cy between thaw strain and latent heat in the silt. These results were, however, considered only suitable for a conceptual design. Any further analyses should be based on a more refined analysis using two-dimensional geometry to consider end and corner effects.
Results of the preliminary analysis are shown in FFg. 6. These results include estimates of the average thaw depth and average thaw settlement plotted as a function of thermal load ('Iz) for four insulation thicknesses: 0 , 5 0 , 100 and 150 mm. Two values of subgrade thermal conductivity (k) were used. Thermal load i s plotted in Fig. 6 as a function of average surface temperature (ST) load and time. The need for insulation to minimize effects of thermal degradation is suggested by results presented in this figure.
Estimates of average thaw depth and thaw
NATURAL GRANULAR MATERIAL
GENERALIZED CROSS SECTION
h, 2 0.62m (2.0 t t ) QRANULAR FILL
/INSULATION
h,- 0.45
FROZEN SILT
SECTION A-A
Fig. 5 Conceptual Insulated Embankment Sect ion
settlement assume that the insulation main- tains its structural and thermal integrity during the facility design life. Thaw settle- ment (TS) estimates in Fig. 6b are for average total settlement due to thaw; estimates are based on average thaw strain of SOX.
The dashed line estimates in Flg. 6b show thaw depth and thaw settlement using thermal conductivity values averaged between the estimates of k for silt - 1.0 W/mK and k for granular embankment material = 2.9 W/mK. These estimates represent possible thermal affects where large amounts of gravel (embankment) material are needed to fill thaw depressions in the embankment. In all cases thaw depth and thaw settlement estimates decrease with increasing insulation thickness. The thermal affect is very significant for no insulation whereas with as 'little as 50 nun of
reduced. With 100 mm and 150 mm of insulation this affect is considerably
insulatton, the thermal affect is not a8 significant.
Design Interpretation
FigZ. 6a shows three thermal loads: (1) a maximum thaw index based on CRREL Technical Report 102 (Aitken, 1963), ( 2 ) a 10-year thermal load, and ( 3 ) a 20-year thermal load, An equivalent average surface temperature, (ST) of -15.5"C was used for the 10 and 20-year thermal loads. This estimate of ST represents a conservative value for Galena appropriate for a surface thermal disturbance
1315
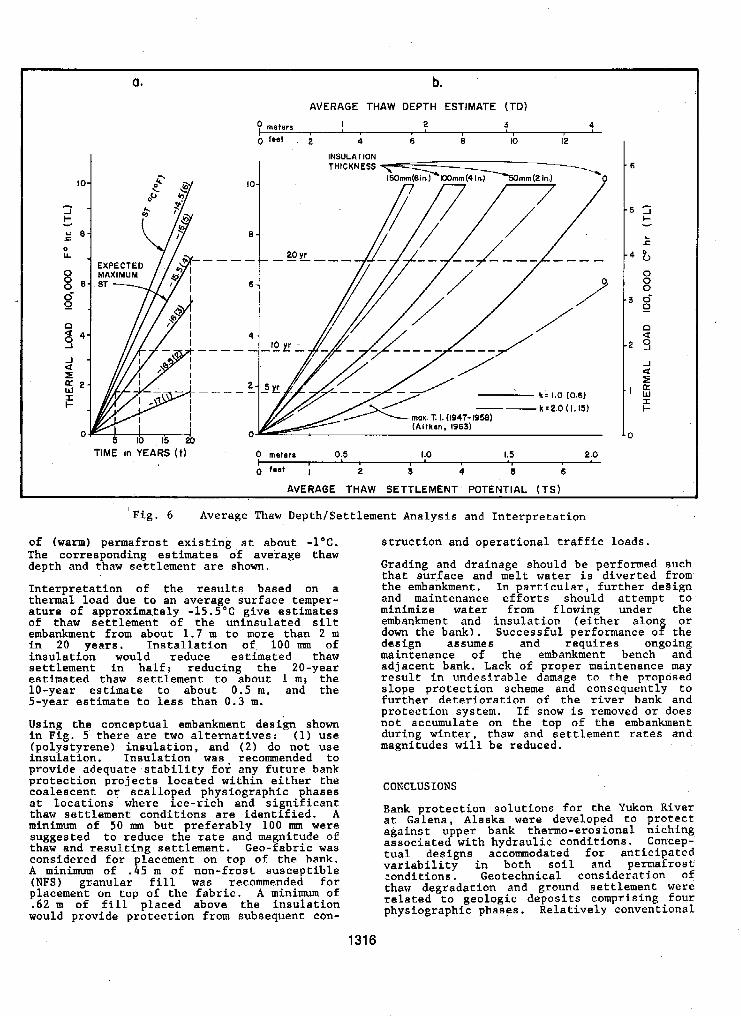
a. b. AVERAGE THAW DEPTH ESTIMATE (TD)
p meters I 2 3 4 0 feet 6 4 6 8 IO 12
IO
a
""
8
4 ""_
2 -""
0
INSULATION THICKNESS
150mm(6ln~KX)mm(4 InJ SOrnm(2 In.) \
0
TIME In YEARS ( t ) 0 meters 0.5 1.0 1.5 2.0
0 faat ; 2 3 4 5 6
AVERAGE THAW SETTLEMENT POTENTIAL (TS)
'Fig. 6 Average Thaw DepthISettlement Analysis and Interpretation
of (warm) pennafrost existing at about -1°C. The corresponding estimates of average thaw depth and thaw settlement are shown.
Interpretation of the results based on a thermal load due to an average surface temper- ature of approximately -15.5"C give estimates of thaw settlement of the uninsulated silt embankment from about 1.7 m to more than 2 m fn 20 years. Installation of 100 nrm of inaulation would reduce estimated thaw settlement in half: reducing the 20-year estimated thaw settlement to about 1 m; the 10-year estimate to about 0.5 m, and the 5-year estimate to less than 0.3 m.
Using the conceptual embankment design shown in Fig. 5 there are two alternatives: (1) use
insulation. Insulation was recommended to (polystyrene) insulation, and ( 2 ) do not use
provide adequate stability for any future bank protection projects located within either the coalescent or scalloped physiographic phases at locations where ice-rich and significant thaw settlement conditions are identified. A minimum of 50 mm but preferably 100 mm were suggested to reduce the rate and magnitude of thaw and resulting settlement. Geo-fabric was considered f o r placement on top o f the bank. A minimum of .45 m of non-frost susceptible (NFS) granular fill was recommended for placement on top of the fabric. A minimum o f .62 m of fill placed above the insulation would provide protection from subsequent con-
structton and operational traffic loads.
Grading and drainage should be performed such that surface and melt water is diverted from the embankment. In particular, further design and maintenance efforts should attempt to minimize water from flowing under the embankment and insulation (either along or down the bank), Successful performance of the
maintenance of the embankment bench and design assumes and requires ongoing adjacent bank, Lack of proper maintenance may result in undesirable damage to the proposed slope protection scheme and consequently to further deterioration of the river bank and protection system. If snow is removed or does not accumulate on the top of the embankment
magnitudes will be reduced. during winter, thaw and settlement rates and
CONCLUSIONS
Bank protection solutions for the Yukon River at Galena, Alaska were developed to protect against upper bank thermo-erosional niching associated with hydraulic conditions. Concep" tual designs accommodated for anticipated variability in both soil and permafrost
thaw degradation and ground settlement were Zonditions. Geotechnical consideration of
physiographic phases. Relatively conventional related to geologic deposits comprising four
1316
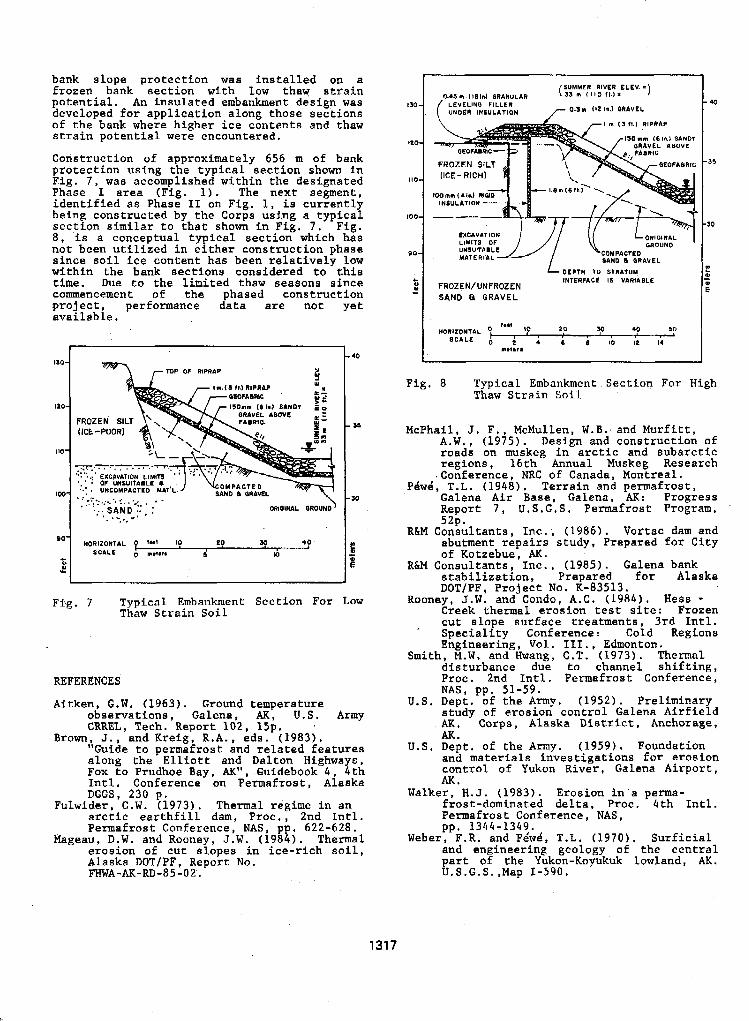
bank slope protection was installed on a frozen bank section wFth low thaw strain potential. An insulated embankment design was developed for application along those sections of the bank where higher ice contents and thaw strain potential were encountered.
Construction of approximately 656 m of bank protection using the typical section shown in Fig. 7, was accomplished within the designated Phase I area (Fig. 1). The next segment. identified as Phase I1 on Fig. 1, is currently being constructed by the Corps using a typical section similar to that shown in Fig. 7. Fig. 8 , i s a conceptual typical section which has not been utilized in either construction phase since soil ice content has been relatively low within the bank sections considered t o this time. Due to the limited thaw seasons since commencement o f the phased construction project, performance data are not yet available.
130
IPO
110
100
90,
+ u c
~..-.-*-."
.'.: UNCOMPACTLO MAT SAND I ORAVEL
- 31
I 1
Fcg. 7 Typical Embankment Section For Low Thaw Strain Soil
REFERENCES
Aitken, G.W. (1963). Ground temperature observations, Galena, AK, U.S. Army CRREL, Tech. Report 102, 15p.
Brown,,, J., and Kreig, R.A. , eds. (1983). Guide to permafrost and related features
Fox to Prudhoe Bay, AK", Guidebook 4 , 4th along the Elliott and Dalton Highways,
Int1. Conference on Permafrost, Alaska DGGS, 230 p .
arctic earthfill dam, Proc., 2nd Intl. Permafrost Conference, NAS, pp. 622-628.
Mageau, D.W. and Rooney, J.W. (1984). Thermal,
Alaska DOTfPF, Report No. erosion of cut slopes in ice-rich soil,
Fulwider, C.W. (1973). Thermal regime in an
FWA-AK-RD-85-02.
(SUMMLR RIVER ELEV. =
/I O.Sn (12 In.) ORAVEL
0.43 111 I lEIn4 QRANULAR LEVELlNO FILLER -40 ( UNDER INSULATION
100 mm INSU
- "
-38
-30
L DEPTH TO STRATUM L? INTERFACE 15 VARIABLE *
E c
FROZEN/UNFROZEN SAND R GRAVEL
Fig. 8 Typical Embankment Section For High Thaw Strain Soil
McPhail, J. F., McMullen, W.B. and Murfitt, A.W., (1975). Design and construction of roads on muskeg in arctic and subarctic regions, 16th Annual Muskeg Research
Pdwd. T.L. (1948). Terrain and permafrost, .Conference, NRC of Canada, Montreal.
Galena Air Base. Galena, AK: Progress Report 7, U.S.G.S. Permafrost Program,
RLM Consultants, Inc. . (1986). Vortac dam and 52p.
abutment repairs study, Prepared for City of Kotzebue, AK.
DOTIPF, Project No. K-83513. stabilization. Prepared €or Alaska
Creek thermal erosion test site: Frozen cut slope surface treatments. 3rd Intl.
. Speciality Conference: Cold Regions Engineering, Vol. III., Edmonton.
disturbance due to channel shifting,
NAS, pp. 51-59. Proc. 2nd Intl. Permafrost Conference,
R&M Consultants, Inc., (1985). Galena bank
Rooney, J.W. and Condo, A.C. (19841, Hess *
Smith, M.W. and Hwang, C.T. (1973). Thermal
U.S. Dept. of the Army. (1952). Preliminary study of erosion control Galena Airfield AK. Corps, Alaska District, Anchorage, AK. and materials investigations f o r erosion control of Yukon River, Galena Airport, AK ,
Permafrost Conference, NAS, frost-dominated delta, Proc. 4th Intl.
U.S. Dept. of the Amy. (1959). Foundation
Walker, W.J. (1983). Erosion in'a perma-
pp. 1344-1349. Weber, F . R . and Pdwd, T.L. (1970). Surficial
and engineering geology of the central part of the Yukon-Koyukuk lowland, AK. U.S.G.S.,Map 1-590.
1317
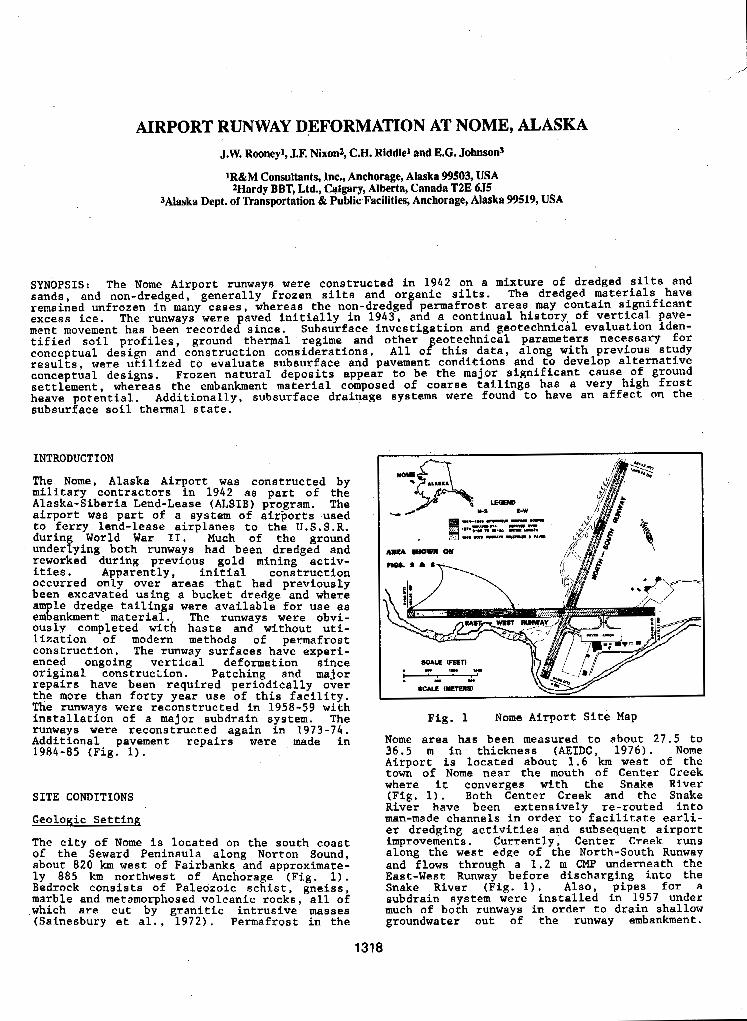
AIRPORT RUNWAY DEFORMATION AT NOME, ALASKA J.W. Rmneyl, J.E Nixonz, C.H. Riddle* and E.G. Johnson3
1R&M Consultants, hc., Anchorage, Alaska 99503, USA *Hardy BBT, Ltd., Calgary, Alberta, Canada T2E 655
3Alaska Dept. of Transportation & Public Facilities, Anchorage, Alaska 99519, USA
SYNOPSIS: The Nome Airport runways were constructed in 1942 on a mixture of dredged silts and sands, and non-dredged, generally frozen silts and organic silts. The dredged materials have remained unfrozen in many cases, whereas the non-dredged permafKOSt areas may contain significant excess ice. The runways were paved initially in 1943, and a continual history of vertical pave- ment movement has been recorded since. Subsurface investigation and geotechnical evaluation iden- tified soil profiles, ground thermal regime and other geotechnical parameters necessary f o r conceptual design and construction considerations. All of this data, along with previous study results, were utilized to evaluate subsurface and pavement conditions and to develop alternative conceptual designs. Frozen natural deposits appear to be the major significant cause of ground settlement, whereas the embankment material composed of coarse tailings has a very high frost heave potential. Additionally, subsurface drainage systems were found to have an affect on the subsurface s o i l thermal state.
INTRODUCTION
The Nome, Alaska Airport was constructed by military contractors in 1942 as part of the Alaska-Siberia Lend-Lease (ALSIB) program. The airport was part o f a system of airports used
durin World War 11. Much of the ground to ferry lend-lease airplanes to the U.S.S.R.
underfying both runways had been dredged and reworked during previous gold mining activ-
occurred only over areas that had previously ities. Apparently, initial construction
been excavated using a bucket dredge and where ample dredge tailings were available for use as
ously completed with haste and without uti- embankment material. The runways were obvi-
lization of modern methods of permafrost construction. The runway surfaces have experi- enced ongoing vertical deformation since original construczion. Patching and major repairs have been required periodically over the m3re than forty year use of this facility. The runways were reconstructed Fn 1958-59 with installation of a major subdrain system. The runways were reconstructed again in 1973-74. Additional pavement repairs were made in 1984-85 (Fig. 1).
SITE CONDITIONS
Geologic Setting
The city of Nome is located on the south coast of the Seward Peninsula along Norton Sound, about 820 km west of Fairbanks and approximate- ly 885 km northwest of Anchorage (Fig. 1). Bedrock consists of Paleozoic schist, gneiss, marble and metamorphosed volcanic racks, all of ,which are cut by granitic intrusive masses (Sainesbury et al., 1972). Permafrost in the
- 'k ....
Fig. 1 Nome Airport Site Map
Nome area has been measured to about 27.5 to 36.5 m in thickness (AEIDC, 1976). Nome Airport is located about 1.6 km west of the town of Nome near the mouth of Center Creek where it converges with the Snake River (Fig. 1). Both Center Creek and the Snake River have been extensively re-routed into man-made channeh in order to facilitate earli- er dredging activltles and subsequent airport improvements. Currently. Center Creek runs along the west edge of the North-South Runway and flows through a 1.2 m CMP underneath the East-West Runway before discharging into the Snake River (F ig . 1). A l s o , pipes for a subdrain system were installed in 1957 under much of both runways in order to draln shallow groundwater out of the runway embankment.
1318
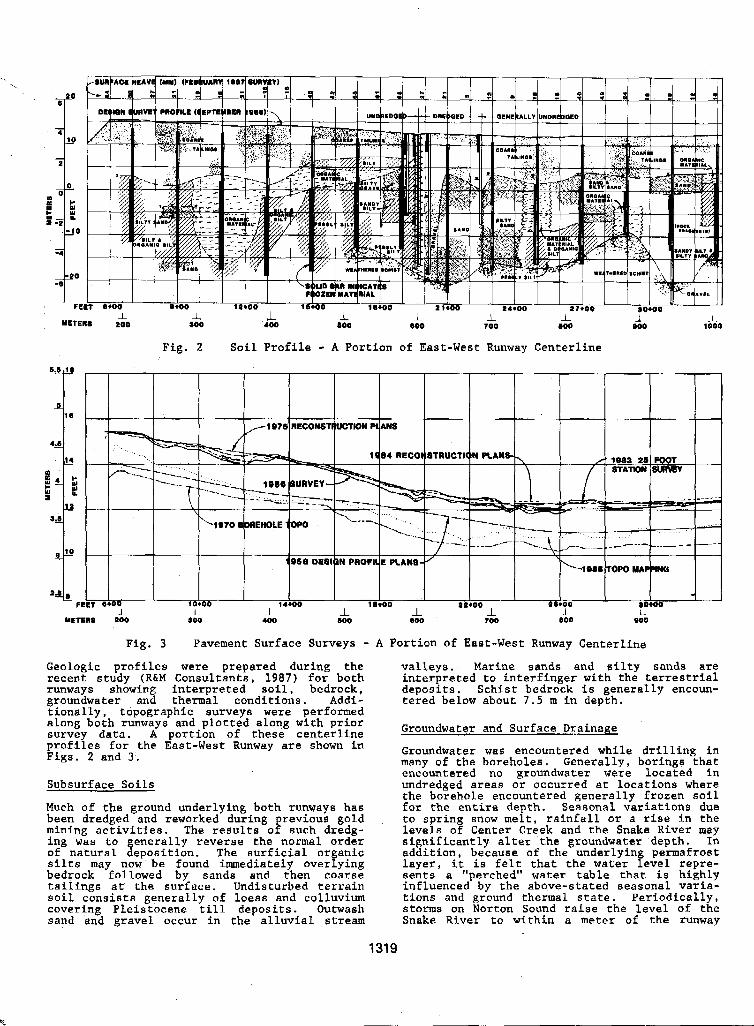
I METER8 PO0
I too 400 600 100 700 100 so0
I
Fig. 3 Pavement Surface Surveys - A Portion of East-West Runway Centerline
Geologic profiles were prepared during the recent study (RLM Consultants, 1987) for both runways showing interpreted soil, bedrock, groundwater and thermal conditions, Addi- tionally, topographic surveys were performed along both runways and plotted along with prior survey data. A portion of these centerline profiles for the East-Weat Runway are shown in Figs. 2 and 3 .
Subsurface Soils
Much of the ground underlying both runways has been dredged and reworked during previous gold mining activities. The results of such dredg- ing was to generally reverse the normal order of natural deposition. The surficial organic silts may now be found immediately overlying bedrock followed by sands and then coarse tailings at the surface. Undisturbed terrain soil consists generally of loess and colluvium covering Pleistocene till deposits. Outwash sand and gravel occur in the alluvial stream
valleys. Marine sands and s i l t y sands are interpreted to interfinger with the terrestrial deposits. Schist bedrock i s generally encoun- tered below about 7.5 rn in depth.
Groundwater and Surface Drainage
many of the boreholes. Generally, borings that Groundwater was encountered while drilling in
encountered no groundwater were located in undredged areas or occurred at locations where the borehole encountered generally frozen soil for the entire depth. Seasonal variations due to spring snow melt, rainfall or a rise in the levels of Center Creek and the Snake River may significantly alter the groundwater depth. In addition, because of the underlying permafrost layer, it is felt that the water level repre- sents a "perched" water table that i s highly influenced by the above-stated seasonal varia- tions and ground thermal state. Periodically, atoms on Norton Sound raise the level o f the Snake River to within a meter of the runway
1319
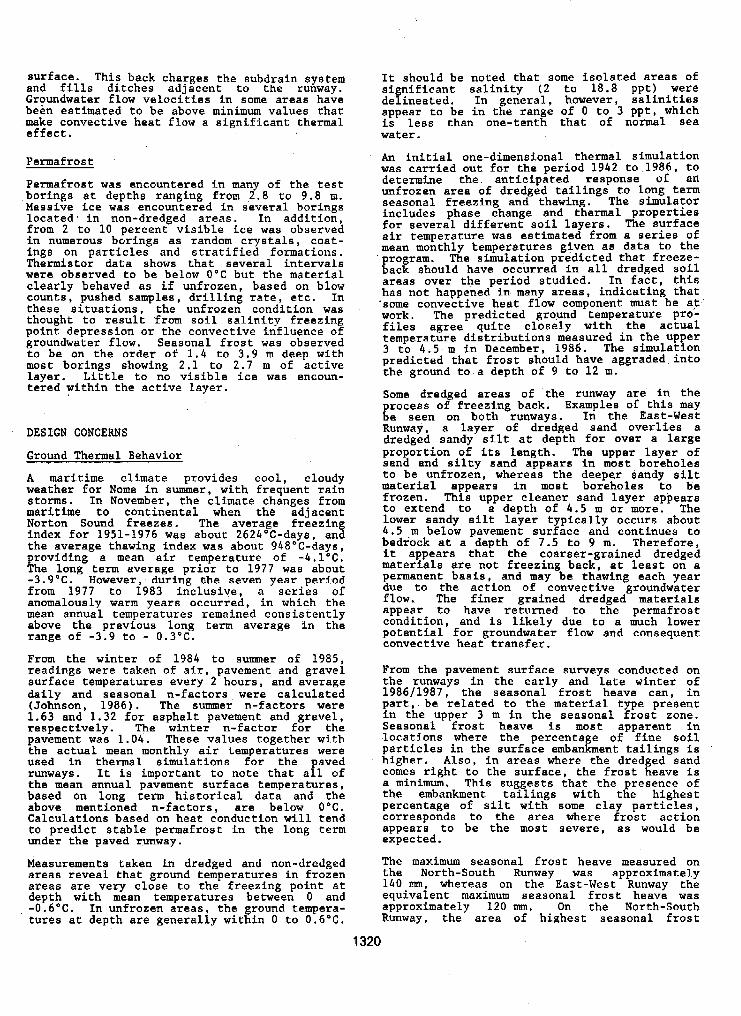
and fills ditches adjacent to the runway. surface. This back charges the subdrain system Groundwater Elow velocities in some areas have been estimated to be above minimum values that make convective heat flow a significant thermal effect.
Permafrost
Permafrost was encountered in many of the test borings at depths ranging from 2.8 to 9.8 m. Massive ice was encountered in several borings
from 2 to 10 percent visible ice was observed located,' in non-dredged areas. In addition,
in numerous borings as random crystals, coat- ings on particles and stratified formations.
were observed to be below O°C but the material Thermistor data shows that several intervals
clearly behaved as if unfrozen, based on blow counts, pushed samples, drilling rate, etc. In these situations. the unfrozen condition was thought to result from soil salinity freezing point depression or the convective influence of groundwater flow. Seasonal frost was observed to be on the order of 1.4 to 3.9 m deep with most borings showing 2.1 to 2.7 m of active layer. Little to no visible ice was encoun- tered within the active layer.
DESIGN CONCERNS
Ground Thermal Behavior
A maritime climate provides cool, cloudy weather for Nome in summer, with frequent rain storms. In November, the climate changes from maritime to continental when the adjacent Norton Sound freezes. The average freezing index for 1951-1976 was about 2624°C-days, and the average thawing index was about 948"C-days, providing a mean air temperature of -4.1"C. The Long term average prior to 1977 was about -3.9OC. However, during che seven year period from 1977 to 1983 inclusive, a series of anomalously warm years occurred, in which the mean annual temperatures remained consistently above the previous long term average in the range of -3.9 to - 0.3"C. From the winter of 1984 to summer of 1985, readings were taken of air, pavement and gravel surface temperatures every 2 hours, and average daily and seasonal n-factors were calculated (Johnson, 1986). The summer n-factors were 1.63 and 1.32 for asphalt pavement and gravel, respectively. The winter n-factor for the pavement was 1.04. These values together with the actual mean monthly air temperatures were used in thermal simulations for the paved runways. It is important to note that all of
based on long term historical data and the the mean annual pavement surface temperatures,
above mentioned n-factors, are below 0°C. Calculations based on heat conduction will tend to predict stable permafrost in the long term under the paved runway.
Measurements taken i n dredged and non-dredged areas reveal that ground temperatures in frozen areas are very close to the freezing point at depth with mean temperatures between 0 and -0.6"C. In unfrozen areas, the ground tempera- tures at depth are generally within 0 to 0.6"C.
It should be noted that some isolated areas of significant salinity ( 2 to 18.8 ppt) were delineated. In general, however, salinities appear to be in the range of 0 to 3 ppt, which i s less than one-tenth that of normal sea water.
An initial one-dimensional thermal simulation was carried out for the period 1942 to 1986, to determine the. anticipated response o f an unfrozen area of dredged tailings to long term seasonal freezing and thawing. The simulator includes phase change and thermal properties for several different soil layers. The surface air temperature was estimated from a series of mean monthly temperatures given as data to the program. The simulation predicted that freeze- back should have occurred in all dredged soil areas over the period studied. In fact, this has not happened in many areas, indicating that some convective heat flow component must be at work. The predicted ground temperature pre- files agree quite closely with the actual temperature distributions measured in the upper 3 to 4.5 m in December, 1986. The simulation predicted that frost should have aggraded into the ground to a depth of 9 to 12 m.
Some dredged areas of the runway are in the rocess of freezing back. Examples o f this may {e seen on both runways. In the East-West Runway, a layer of dredged sand overlies a dredged sandy silt at depth for over a large proportion of its length. The upper layer of sand and silty sand appears in most boreholes to be unfrozen, whereas the deeper sandy silt material appears in most boreholes to be frozen. This upper cleaner sand layer appears to extend to a depth of 4 a 5 m or more. The lower sandy silt layer typically occurs about
bedrock at a depth of 7.5 to 9 m. Therefore, 4 . 5 m below pavement surface and continues to
materials are not freezing back, at least on a it appears that the coarser-grained dredged
permanent basis, and may be thawing each year due to the action of convective groundwater f low. The finer grained dredged materials appear t o have returned to the permafrost condition, and is likely due to a much lower potential for groundwater flow and consequent convective heat transfer.
From the pavement surface surveys conducted on the runways in the early and late winter of 198611987, the seasonal frost heave can, in part, - be related to the material type present in the upper 3 m in the seasonal frost zone. Seasonal frost heave i s most apparent in locations where the percentage o f fine soil particles in the surface embankment tailings i s higher. A l s o , in areas where the dredged sand comes right to the surface, the frost heave is a minimum. This suggests that the presence of the embankment tailings with the highest percentage o f silt with some clay particles, corresponds to the area where frost action appears to be the most severe, as would be expected.
The maximum seasonal frost heave measured on the North-South Runway was approximately 140 mm, whereas on the East-West Runway the equivalent maximum seasonal frost heave was approximately 120 m. On the North-South Runway, the area of highest seasonal frost
1320
heave is at Station 40+00; This is an area of relatively thick embankment tailings, and the percentage of fines is around 2 4 % (minus #200 sieve size). Frost heave tests confirmed the significant frost susceptibility o f this material, even though the grain size curve does not suggest a particularly high degree of frost susceptibility.
In relatively impermeable soils, vertical heat flow by conduction is the primary mode of heat transfer causing seasonal freezing and thawing. In coarser grained s o i l s , the possibility for near horizontal groundwater flow exists, and a new source of heat becomes available, should groundwater enter the freezing or thawing system at temperatures above freezing. As the dredged channels meander through the study site, and old river channels are present in the area, the potential for groundwater flow along
I coarse grained river channels or dredged areas is extremely high. In addition, a creek has been diverted through the East-West Runway by means of a 1.2 m diameter CMP near the inter- section between the two runways. Assuming that the culvert entrance is not protected by impermeable soils, then it is very likely that a significant component of groundwater flow exists across the East-West Runway parallel to this CMP. In addition, the sub-drain system installed in 1957 provides further possibil- ities for lateral groundwater flow along old drain trenches, that have been backfilled with more permeable or looser backfilled materials.
In general, the influence of convection is to cause a positive inflow o f heat into the system thereby slowing down or preventing long term freeze back of the affected s o i l , or alterna- tively, accelerating the depth o f thaw. In view of the fact that the ground temperatures in this area are very close to the melting point, any small positive convective heat influx may be responsible €or significant deviation in the depth of freezing and thawing predicted by purely conductive analyses. Convective heat flow is likely the explanation why some areas o f dredged material have not frozen back in the 45 years since runway construction. Comparison o f the pavement surface surveys carried out In late 1986 with earlier surveys (Fig. 3 ) confirms that settle- ment of the pavement surface has taken place over many years, at certain reasonably well identified settlement areas. These areas
ADOTIPF report (Johnson, 1986). include the seven areas described in the
Frost Heave
A bulk sample of silty, sandy gravel tailings was collected for frost heave testing. The fine fraction of this material was comprised of micaceous platy particles. The grain size
with 4% clay sizes (minus 0 . 0 0 2 nun). There was distribution indicated 11X finer than 0.02 mm,
no change in grain size characteristics before and after the freeze thaw cycles carried out in this test series. This indicated that weather- ing was not continuing to take place in the sample due to freeze-thaw cycles in the labo- ratory. The initial water content of the soil was 10.8% and the final water content after four freeze thaw cycles was 8.3%. The sample was saturated throughout the test process. The
Segregation Potenti+l parameter varied from approximately .17Ox1O1 mmZ/sec"S at a pressure o f 4 3 kPa, to a value of 32x10 mm2/sec0C at the highest test pressure of 144 kPa. These values are indicative o f a material of rela- tively high frost susceptibility. A descrip- tion on the use o f the Segregation Potential parameter in frost heave predictions can be obtained from Nixon (1987). The frost suscep- tibility decreases rapidly with increasing pressure. Therefore, this material can be expected to exhibit significant frost heave under conditions 'of low overburden pressure. However, as the degree of confinement or pressure in the ground increases, with depth, the degree of frost heave susceptibility can be expected to decrease significantly.
The tailings embankment material i s more frost susceptible than would be expected from the grain size curve. It i s strongly suspected that this is due to the mineralogy and platy nature of the silt and fine sand size parti- cles, That is, material retained on the 200 mesh may .have one dimension equal to the 200 mesh, but the other dimensions of the platy particles may be significantly less. There- fore, the smaller dimension could contribute to an increase in frost susceptibility.
In order to study the near surface seasonal frosc heaving apparently taking place in the surface dredged tailings, another simulation was carried out as shown in Fig. 4 . The profile assumed was 0.15 m of asphalt overlying 1.7 m of the coarse tailings at a water content o f 64. This upper layer was assumed To be non-frost susceptible, in view of the fact it is above the water table and likely unsat-' urated. Below the 2 m elevation, another layer of coarse tailings was assumed to be present to a depth of 3 . 4 m below pavement surface. Below this, a dredged sandlsilt of 20% moisture content was assumed. Fig. 4 shows the predicted frost depth from 1969 to the present, and also shows the predicted seasonal frost heave that would take place as the resukt of the seasonal frost action.
The seasonal depth of frost is shown to vary between 3 . 4 and 4 . 4 rn depending on the severity of the winter. The amount of seasonal frost heave occurring as a result of this is shown to vary from 30 to 50 mm, again depending on the severity of the winter. Considering that this
of the frost heave parameters, this appears to is based on a single or average determination
heave measured over the winter 198611987 by the agree reasonably well with the average frost
topographic surveys ( 0 - 1 4 0 nun),
One option for stabilizing the runway surface may involve pre-thawing of currently frozen areas containing ice, and densifying the soil. One problem with this approach i s the possibil- ity of re-freezing and frost heave over a long period of time in the future after remedial action has been taken. The prediction carried out earlier used historical surface temperature data to predict long term frost advance. In order to project the future freezeback of a thawed area of silt or sandy silt, another freezeback simulation was completed using 30 year average surface temperatures, and assuming these would apply for the future. The same
1321
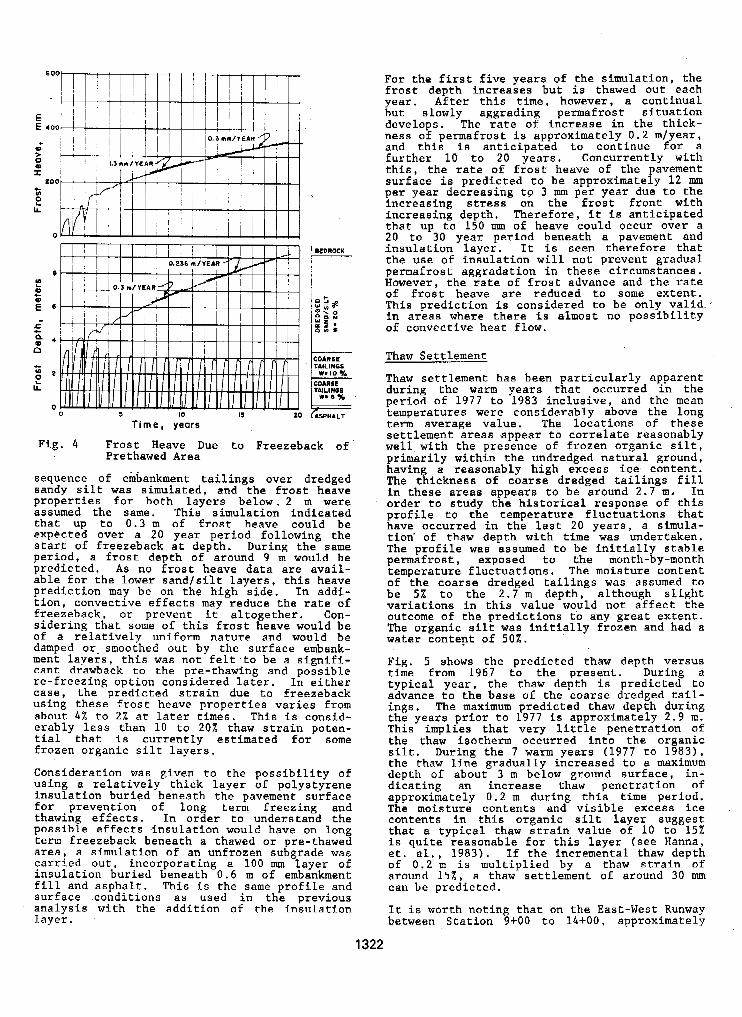
600
E E 400
0 > 0
2 c
PO0
e L
0
0 s IO I5 20 Ti rn e , yeors
UEDROCK
COARSC TAILINQS
W " l O %
TAILINBS
Fig. 4 Frost Heave Due to Freezeback of Prethawed Area
sequence of embankment tailings over dredged sandy silt was simulated, and the frost heave properties for both layers below. 2 m were assumed the same. This simulation indicated that up to 0.3 m of frost heave could be expected over a 20 year period following the start of freezeback at depth, During the same period, a frost depth o f around 9 m would be predicted. As no frost heave data are avail- able for the lower sandfsilt layers, this heave prediction may be on the high side. In addi- tion, convective effects may reduce the rate o f freezeback, or prevent it altogether. Con- sidering that some o f this frost heave would be o f a relatively uniform nature and would be damped o r * smoothed aut by the surface embank- ment layers, this was not felt,to be a signifi- cant drawback to the pre-thawing and possible re-freezing option considered later. In either case, the predicted strain due to freezeback using these frost heave properties varies from about 4% to 2% at later times. This is consid- erably less than 10 to 20% thaw strain poten- tial that is currently estimated for some frozen organic silt layers.
Consideration was given to the possibility of using a relatively thick layer of polystyrene insulation buried beneath the pavement surface
thawing effects. In order to understand the for prevention o f long term freezing and
possible effects insulation would have on long term freezeback beneath a thawed or pre-thawed area, a simulation of an unfrozen subgrade was carried out, incorporating a 100 mm layer of insulation buried beneath 0.6 m of embankment fill and asphalt. This is the same profile and
analysis with the addition of the insulation surface conditions as used in the previous
layer.
For the first five years of the simulation, the frost depth increases but is thawed out each year. After this time, however, a continual but slowly aggrading permafrost situation develops. The rate of increase in the thick- ness of permafrost is approximately 0.2 mlyear, and this is anticipated to continue for a further 10 to 20 years. Concurrently with this, the rate of frost heave of the pavement
per year decreasing tg 3 mm per year due to the surface is predicted to be approximately 12 mm
increasing stress on the frost front with increasing depth. Therefore, it i s anticipated that up to 150 mm of heave could occur over a 20 to 30 year period beneath a pavement and insulatlon layer. It is seen therefore that the use of insulation will not prevent gradual
However, the rate of frost advance and the rate permafrost aggradation in these circumstances.
This prediction is considered to be only valid. of frost heave are reduced to some extent.
in areas where there is almost no possibility o f convective heat flow.
Thaw Settlement
Thaw settlement has been particularly apparent
period of 1977 to 1983 inclusive, and the mean during the warm years that occurred in the
temperatures were considerably above the long term average value. The locations of these settlement areas appear to correlate reasonably well with the presence of frozen organic silt, primarily within the undredged natural ground, havin a reasonably high excess ice content. The tkickness of coarse dredged t-ailings fill in these areas appears t o be around 2.7 m. In
profile to the temperature fluctuations that order to study the historical response o f this
have occurred in the last 20 years, a simula- tion' of thaw depth with time was undertaken. The profile was assumed to be initially stable permafrost, exposed to the month-by-month temperature fluctuations. .The moisture content of the coarse dredged tailings was assumed to be 5% to the 2.7 m depth, although slight variations in this value would nor affect the
The organic silt was initially frozen and had a outcome of the predictions to any great extent.
water content of 50%.
Fig. 5 shows the predicted thaw depth versus time from 1967 to the present, During a typical year, the thaw depth is predicted to advance to the base of the coarse dredged tail- ings. The maximum predicted thaw depth during the years prior to 1977 is approximately 2.9 m. This implies that very little penetration o f the thaw iantherm occurred into the organic silt. During the 7 warm years (1977 to 1983). the thaw line gradually increased to a maximum depth of about 3 m below ground surface, in- dicating an increase thaw penetration of approximately 0.2 m during this time period. The moisture cantents and visible excess ice contents in this organic silt layer suggest that a typical thaw strain value of 10 to 15%
et. al. , 1983). If the incremental thaw depth is quite reasonable for this layer (see Hanna,
of 0.2 m is multiplied by a thaw strain of around 15%, a thaw settlement o f around 30 mm can be predicted.
between Station 9+00 to 14+00. approximately It is worth noting that on the East-West Runway
1322
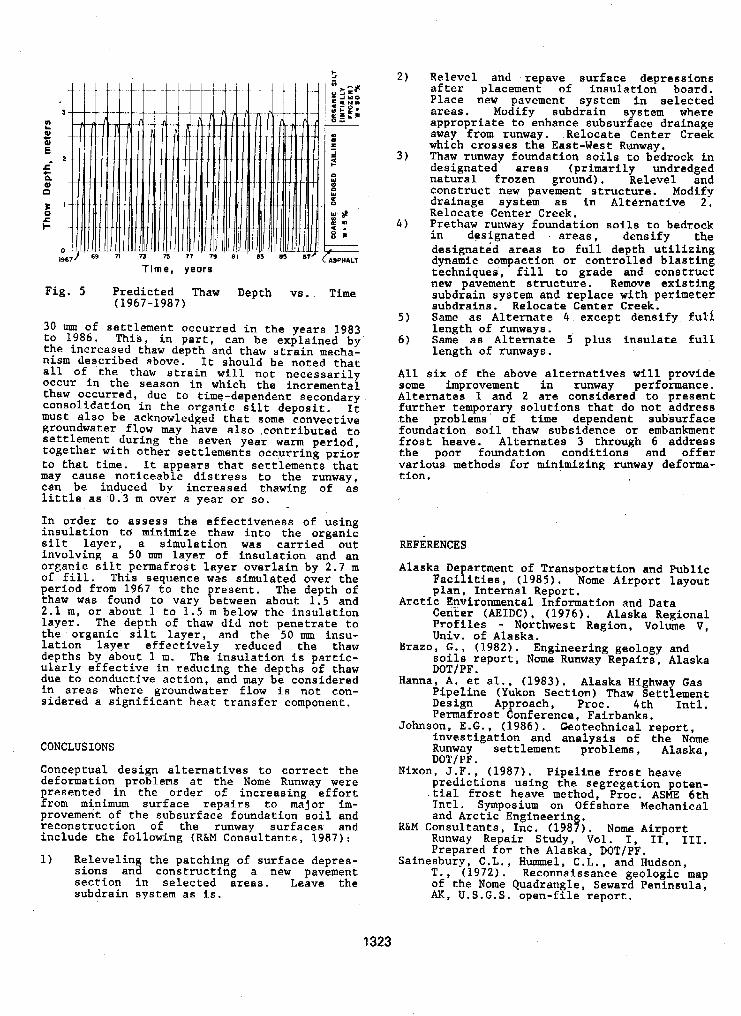
Tlrne, years
Fig. 5 Predicted Thaw Depth vs. (1967-1987)
30 mm of settlement occurred in the years 1983 to 1986, This, in part, can be explained by the increased thaw depth and thaw strain mecha- nism described above. It should be noted that all of the thaw strain will not necessarily occur in the season in which the incremental
consolidation in the organic stlt deposit. It thaw occurred, due to time-dependent secondary
must also be acknowledged that some convective groundwater flow may have also contributed to settlement during the seven year warm period, together with other settlements occurring prior to that time. It appears that settlements that may cause noticeable distress to the runway, can be induced by increased thawing of as little as 0.3 m over a year or so.
In order to assess the effectiveness o f using insulation to minimize thaw into the organic silt layer, B simulation was carried out involving a 50 mm layer of insulation and an organic silt permafrost layer overlain by 2.7 m of fill. This sequence was simulated over the period from 1967 to the resent. The depth of thaw was found to vary {etween about 1.5 and 2.1 m, or about 1 to 1.5 m below the insulation layer. The depth o f thaw did not penetrate t o the organic silt layer, and the 50 m insu- lation layer effectively reduced the thaw depths by about 1 m. The insulation is partic- ularly effective in reducing the depths of thaw due to conductive action, and may be considered in areas where groundwater flow is not con- sidered a significant heat transfer component.
CONCLUSIONS
Conceptual design alternatives to correct the deformation problems at the Nome Runway were presented in the order o f increasing effort from minimum surface repairs to major im- provement of the subsurface foundation soil and reconstruction of the runway surfaces and include the following (RhM Consultants, 1987):
1) Releveling the patching of surface depres- sions and constructing a new pavement section in selected areas. Leave the subdrain system as i s .
Relevel and repave surface depressions after placement of insulation board. Place new pavement system Fn selected areas. Modify subdrain system where appropriate to enhance subsurface drainage away from runway. Relocate Center Creek which crosses the East-West Runway. Thaw runway foundation soils to bedrock in designated areas (primarily undredged natural frozen ground). Relevel and construct new pavement structure. Modify drainage svstem as in Alternative 2 . RelocaEe CeAter Creek. Prethaw runwav foundation so i l s to bedrock in designaced areas, densify the designated areas t o full depth utilizing dynamic compaction or controlled blasting techniques, fill to grade and construct new pavement structure. Remove existing subdrain system and replace with perimeter subdrains. Relocate Center Creek. Same as Alternate 4 . except densify full length of runways. Same as Alternate 5 plus insulate full length of runways.
All six of the above alternatives will provide some improvement in runway performance. Alternates 1 and 2 are considered to present further temporary solutions that do not address the problems of time dependent subsurface foundation soil thaw subsidence or embankment frost heave. Alternates 3 through 6 address the. poor foundation conditions and offer various methods f o r minimizing runway deforma- tion.
REFERENCES
Alaska Department of Transportation and Public Facilities, (1985). Nome Airport layout
Arctic Environmental Information and Data plan. Internal Report.
Center (AEIDC), (1976). Alaska Regional Profiles - Northwest Region, Volume V, Univ. of Alaska.
soils report, Nome Runway Repairs. Alaska DOTIPF.
Design Approach, Proc. 4th Intl. Pipeline (Yukon Section) Thaw Settlement
Permafrost Conference, Fairbanks. Johnson, E.G., (1986). Ceotechnical report,
investigation and analysis of the Nome
DOTIPF. Runway settlement problems, Alaska,
predictions using the segregation poten- tial frost heave method, Proc. ASME 6th Intl. Symposium on Offshore Mechanical and Arctic Engineering.
Runway Repair Study, Vol. I, 11, 111. Prepared for the Alaska, DOT/PF.
Sainesbury, C.L., Hummel. C.L.. and Hudson, T., (1972). Reconnaissance geologic map of the Nome Quadrangle, Seward Peninsula, AK, U.S.G.S. open-file report.
Brazo, G . , (1982). Engineering geology and
Hanna, A . et al., (1983). Alaska Highway Gas
Nixon, J.F., (1987). Pipeline frost heave
RhM Consultants, Inc. (1987). Nome Airport
1323
PHYSICAL MODEL STUDY OF ARCTIC PIPELINE SETTLEMENT T.S. Vinsonl and A X . Palmer2
'Oregon State University, Corvallis, OR 97331, USA 2Andrew Palmer and Associates Ltd., London, England SWlP 1QF
SYNOPSIS: A physical model study was conducted to investigate the effect of (1) arching and later- al load transfer, and ( 2 ) soil/pipe interaction phenomena on arctic submarine pipeline settlements. Typical field conditions were represented to be a 75 cm diameter pipeline, with a 1.6 cm wall. at a burial depth of 3.0 m, underlain by ice-rich permafrost at a depth of 8.5 m. With time, the warm Oil in the pipeline may thaw the ice-rich permafrost to produce settlements of approximately 0.3 to 0.9 m. Based on an analysis of the test results obtained in the model study, pipeline displace- ments were observed to increase as the width of the settlement mass increased and the depth to the settlement mass decreased; centerspan displacements of the pipeline were substantially greater than quarterspan displacements; surface settlements directly above the pipeline were less than surface settlements over the settlement mass adjacent to the pipeline.
INTRODUCTION
It i s likely in the future that submarine pipe- lines will be constr,ucted offshore of the north coast of Alaska. One of the areas where pipe- lines may be needed is Harrison Bay. Surveys have shown that subsea permafrost exists under the bay out to a water depth of at least 25 m (some 20 km from the shoreline) and that the permafrost boundary may be as shallow as 5 m below the mudline. A pipeline to shore will be at a depth of approximately 3 to 5 m below the mudline to protect it from ice scour and the pipeline trench may be backfilled. Thermal calculations indicate that a warm pipeline may,
below. If the permafrost is ice-rich, thaw in time, thaw permafrost several tens of meters
settlement will occur and will be followed by deformations within the unfrozen seabed soil that surrounds the pipeline. The pipeline will deform with the soil, and there is a possibil-
to damage the pipeline. To avoid damage to the ity that the deformation may be severe enough
pipeline it may be necessary to heavily insul- ate the pipeline, to prethaw the permafrost, or to support the pipeline independently, but these measures are likely to be expens,ive.
An analysis of the influence of thaw consolida- tion settlements on pipeline stresses and de- formations will be part of the design process. It is essential that this analysis not be un- duly oversimplified or overconservative. There is a risk that an oversimplified analysis may generate pessimistic conclusions which in turn would lead to the adoption of costly and diffi- cult construction alternatives (such as pre- thawing). There is a secondary risk that regu- latory authorities may adopt an unduly conserv- ative design approach, and that it may become part of regulations.
One of the important factors in a pipeline set- tlement analysis is the extent to which the
pipeline follows the thaw strain in the soil
know if a thaw settlement of (say) 0.1 m in the beneath. More directly, it is important to
thawed region necessarily induces 0.1 m move- ment in the soil immediately under the pipe- line, or in the pipeline itself. Preliminary work by Walker et al. (1983) , indicates there ace several factors that mitigate the effect on the pipeline. For example, the frozen ice-rich region has a limited horizontal extent, and thaw consolidation leads to settlement in the zone above (surrounding the pipeline) which is partially constrained by the resistance to de- formation of the soil to either side of the
weight of the pipeline and the soil around it zone. This arching phenomenon transfers the
laterally, so that vertical movements are
were of infinite extent. Further, the stiff- smaller than they would be if the thawed region
horizontally, and further reduces settlement. ness of the pipeline itself transfers loads
Studies of the Interprovincial Norman Wells to Zama Lake pipeline (Nixon et a1 ., 1984) have reached a similar conclusion.
OBJECTIVES AND SCOPE OF THE RESEARCH PROGRAM
The objective of the research program reported herein is to investigate the effect of (1) arching and lateral load transfer, and ( 2 ) soil/pipe interaction phenomena, on submarine pipeline settlements, using physical models tested on a centrifuge. The scope of the re- search program is limited to the results ob- tained in ten centrifuge tests conducted at the Cambridge Geotechnical Centrifuge Facility, Cambridge, England. The test results obtained
analysis of the test results, including a in the program are reported herein. An
comparison of the physical model results to the results of an analytical model, will be made in the future.
1324
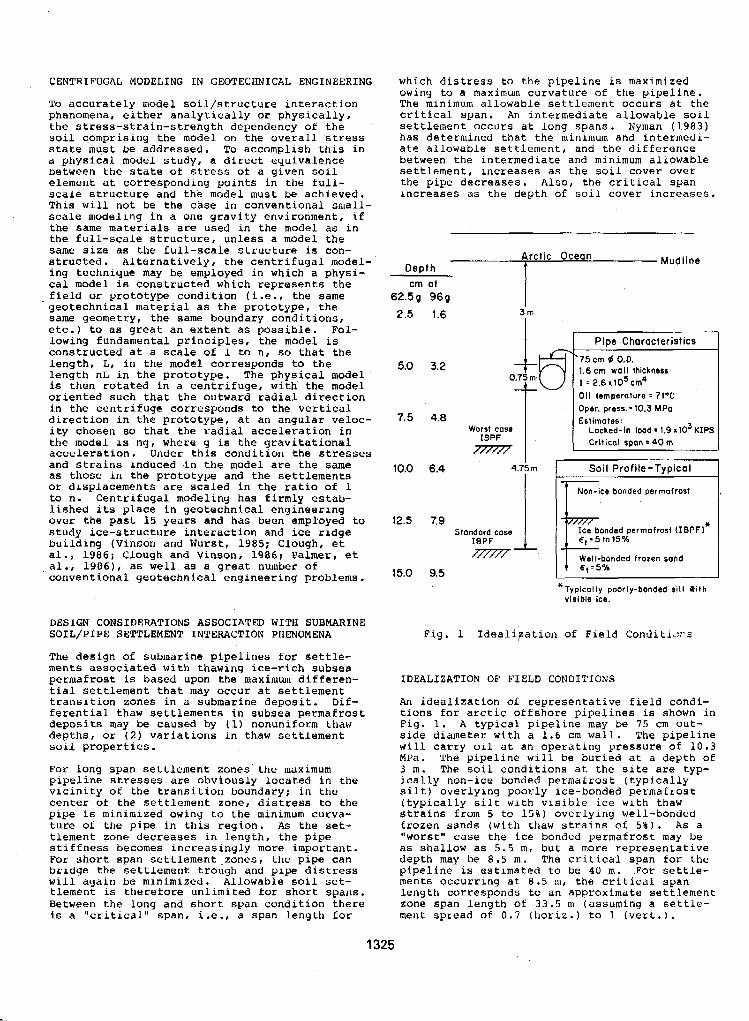
CENTRIFUGAL MODELING IN GEOTECHNICAL ENGINEERING
To accurately model soil/structure interaction phenomena, either analytically or physically, the stress-strain-strength dependency of the soil comprising the model on the overall stress state must be addressed. To accomplish this in a physical model study, a direct equivalence between the state of stress of a given soil element at corresponding points in the full- scale structure and the model must be achieved. This will not be the case in conventional small- scale modeling in a one gravity environment, if the same materials are used in the model as in the full-scale structure, unless a model the same size as the full-scale structure is con- structed. Alternatively, the centrifugal model- ing technique may be employed in which a physi- cal model is constructed which represents the field or prototype condition (i .e ., the same geotechnical material as the prototype, the same geometry, the same boundary conditions, etc.) to as great an extent as possible. Fol- lowing fundamental principles, the model is constructed at a scale of 1 to n, so that the length, L, in the model corresponds to the length nL in the prototype. The physical model is then rotated in a centrifuge, with the model oriented such that the outward radial direction in the centrifuge corresponds to the vertical direction in the prototype, at an angular veloc- ity chosen so that the radial acceleration in the model is ng, where g is the gravitational acceleration. Under this condition the stresses and strains induced in the model are the same as those in the prototype and the settlements or displacements are scaled in the ratio of 1 to n . Centrifugal modeling has firmly estab- lished its place in geotechnical engineering over the past 15 years and has been employed to study ice-structure interaction and ice ridge building (Vinson and Wurst, 1985; Clough, et al., 1986; Clough and Vinson, 1986; Palmer, et a1 ., 1986) , as well as a great number of conventional geotechnical engineering problems.
DESIGN CONSIDERATIONS ASSOCIATED WITH SUBMARINE SOIL/PIPE SETTLEMENT INTERACTION PHENOMENA
The design of submarine pipelines for settle- ments associated with thawing ice-rich subsea permafrost is based upon the maximum differen- tial settlement that may occur at settlement transition zones in a submarine deposit. Dif- ferential thaw settlements in subsea permafrost deposits may be caused by (1) nonuniform thaw depths, or ( 2 ) variations in thaw settlement soil properties.
For long span settlement zones'the maximum pipeline stresses are obviously located in the vicinity o f the transition boundary; in the center of the settlement zone, distress to the pipe is minimized owing to the minimum curva- ture of the pipe in this region. As the set- tlement zone decreases in lenyth, the pipe stiffness becomes increasingly more important. For short span settlement .zones, the pipe can bridge the settlement trough and pipe distress will again be minimized. Allowable soil set- tlement is therefore unlimited for short spans. Between the long and short span condition there is a "critical" span, i.e., a span length for
which distress to the pipeline is maximized owing to a maximum curvature of the pipeline. The minimum allowable settlement occurs at the critical span. An intermediate allowable soil settlement occurs at long spans. Nyman (1983) has determined that the minimum and intermedi- ate allowable settlement, and the difference between the lntermediate and minimum allowable Settlement, increases as the soil cover over the pipe decreases. Also, the critical span increases as the depth of soil cover increases.
Deoth t rct ic Ocean
crn at 62.51~ 969 2.5
5.0
7.5
10.0
12.5
15.0
1.6
3.2
4.8
6.4
7.9
0.' -
Worst case IBPF rn
4.
Standard case IBPF zz77-
9.5
I 3rn
Pipe Characteristics
.75 cm 9 0.0. 1.6 cm wal l thickness I = 2.6 X lo5 cm4 Oil temperature : 71'C Oper. press.=10.3 MPa Estlmotes:
Locked-in load = 1 . 9 ~ 1 0 ~ KIPS Crlt lcol soan = 40 m
m Soil Prof i le-Typical - I T Non-ice bonded permafrost
permafrost ( IBPF)" E , = 5 to 15% - I. I 1 Well-bonded frozen sand E , E 5%
*Typically poorly-bonded silt W t h ~ ~~~
visible ice.
Fig. 1 IdealiFation of Field ConditiG:r'2
IDEALIZATION OF FIELD CONDITIONS
An idealization of representative field condi- tions for arctic offshore pipelines is shown in
slde diameter with a 1.6 cm wall. The pipeline Fig. 1. A typical pipeline may be 75 cm out-
will carry oil at an operating pressure o f 10.3 MPa. The pipeline will be buried at a depth of 3 m. The soil conditions at the site are typ- ically non-ice bonded permafrost (typically si1 t) overlying poorly ice-bonded permafrost (typically silt with visible ice wlth thaw strains from 5 to 158) overlying well-bonded frozen sands (with thaw strains o f 5%). As a "worst" case the ice bonded permafrost may be as shallow as 5.5 m, but a more representative depth may be 8.5 m. The critical span €or the pipeline is estimated to be 40 m. .For settle- ments occurring at 8.5 m, the critical span length corresponds to an approximate settlement zone span length of 33.5 m (assuming a settle- ment spread of 0.7 (horiz.) to 1 (vert.).
1325
Based on a preliminary analysis of the thermal regime associated with the condition repre- sented in Fig. 1 the depth of the thaw bulb beneath the 5.5 m level will be 9 m after 20 years with 2.5 to 5 .O cm of insulation. If ice-rich permafrost occurs at 8.5 m with thaw strains from 5 to 15%, the settlement beneath the pipeline will be approximately 0.3 to 0.9 m. Surrounding the thawed mass i s frozen ice- bonded permafrost and overlying non-ice-bonded permafrost. The pipeline, filled with warm oil, gpans the mass o f thawed ice-bonded perma- frost, the length of which, along the axis of the pipeline, varies according to the actual geometry of the ice-bonded permafrost in the field. Prom the standpoint of pipeline design and analysis, the length of the thawed mass is presumed to be associated with the critical span for the pipe. Away from the settlement mass, the pipeline is considered to be infi- nitely long.
It i s not possible to create a physical model that exactly duplicates the field condition described above. Consequently, it i s necessary to idealize the field condition. It should be recognized a priori that only finite pipeline lengths can be employed in a centrifuge model container. Further, from an experimental standpoint, it would be difficult to create a mass of ice-bonded frozen material and thaw a portion of the mass with warm oil flowing through a model pipeline. In fact, from a phe- nomenological standpoint, it is not necessary to produce settlement beneath the pipeline with a thawed mass; it is only necessary to have a mass of material that will settle with time be- neath the pipeline.
As a "first" physical model idealization of the field condition, the thawed mass may be repre- sented with a compressible saturated clay block. The clay mass will settle with time under the high inertial accelerations created in the centrifuge. Also, the clay mass geometry is easily changed to allow different settlement mass geometries to be investigated in an exper- imental program. The incampressible frozen ice-bonded permafrost surrounding the settle- ment mass, and overlying non-ice bonded perma- frost, may be represented with a cohesionless soil, for example, sand. Sand will experience only minor settlement under high inertial accelerations and will not settle with time. Further, sand is easily placed and saturated. The dimensions of the model pipe (i.e., diam- eter and wall thickness) must be scaled down by a factor "n". The model pipes should be made of steel to reflect the field condition and filled with oil. If the ends of the pipe are not fixed at a specified length in the model container, they will assume an unknown degree of fixity in the soil surrounding the pipe ends during an experiment. Recognizing that eventu- ally the results from the physical model study may be used to validate an analytical model, it is desirable to set the conditions at the ends of the model pipe. The easiest condition to set ia a fixed-end (i .e., no rotation of the plpe end) .
CAMBRIDGE GEOTECHNICAL CENTRIFUGE FACILITY
The Cambridge Geotechnical Centrifuge Facility (CGCF).was constructed in 1994, The facility has been in continuous operation since that
with a centrifuge model study involves building time. The general test procedure associated
a model which represents the field situation as closely as possible. Next the model in a steel container is attached to the swinging bucket at a radius of 4 m from the hub of the centrifuge. Counterbalance weight is added to the bucket on
scopically balanced configuration. The centri- the opposite end of the arm to maintain a gyra-
fuge operator then accelerates the centrifuge to the revolutions per minute (rpm) correspond- ing to the desired inertial acceleration of the test. The instrumentation on board the model container is monitored remotely during the test.
The model container and test system employed in the research program is shpwn schematically in; Fig. 2. The model container and test system consists of an 85 cm diameter, 40 cm high steel cylinder filled with saturated soil to a depth of 30 cm. The soil deposit is comprised of a gravel layer approximately 5 cm in depth under- lying a fine sand approximately 25 cm in depth. Embedded within the fine sand are clay blocks, foundation plates, pipe clamps, and model pipes. Tubular stainless steel extension rods, 1.7 mn diameter, are attached to the model pipe, foundation plates, or settlement plates at settlement points. LVDTs were used to moni- tor model pipe soil surface settlement, and foundation plate movement. Druck miniature pore water pressure (pwp) transducers were
pressible clay blocks employed to monitor pore pressure in the com-
TEST RESULTS
Ten tests were conducted st the CGCF during the period March to August, 1984. To conduct a "modeling of modela" study, two model pipe sizes were considered. Both 7.9 nun O.D. x 0 .024 nun wall thickness and 12.1 mm O.D. x 0.04 nun wall thickneas stainlesa steel tubular sections were commercially available. Given the representa- tive field condition selected in the study (re Fig. 1) for which the full-scale pipeline is 75 cm O.D. x 1.6 cm wall thickness, the ratios of the full-scale to model pipeline dimensions suggest that inertial accelerations of 96 (re 7 .9 mm O.D.) and 62.5 g (re 12.2 nun O . D . ) would be appropriate in the test program. These levels of inertial acceleration further suggest the model depth scale given in Fig. 1. For the 7 .9 mm model pipe, the depth of overburden is 3.2 cm and for the 12.1 nun, i t is 4 . 9 cm.
An example of the test results from the re- search program is given in Fig. 3 . During the conduct of a test, the following responses of
pipe displacements at center and yuarterspan, the physical model were monitored: (1) model
( 2 ) soil surface settlements, ( 3 ) porewater pressure dissipation in the clay blocks, ( 4 ) centerspan strains in the model pipe, and (5) inertial acceleration of the model.
1326
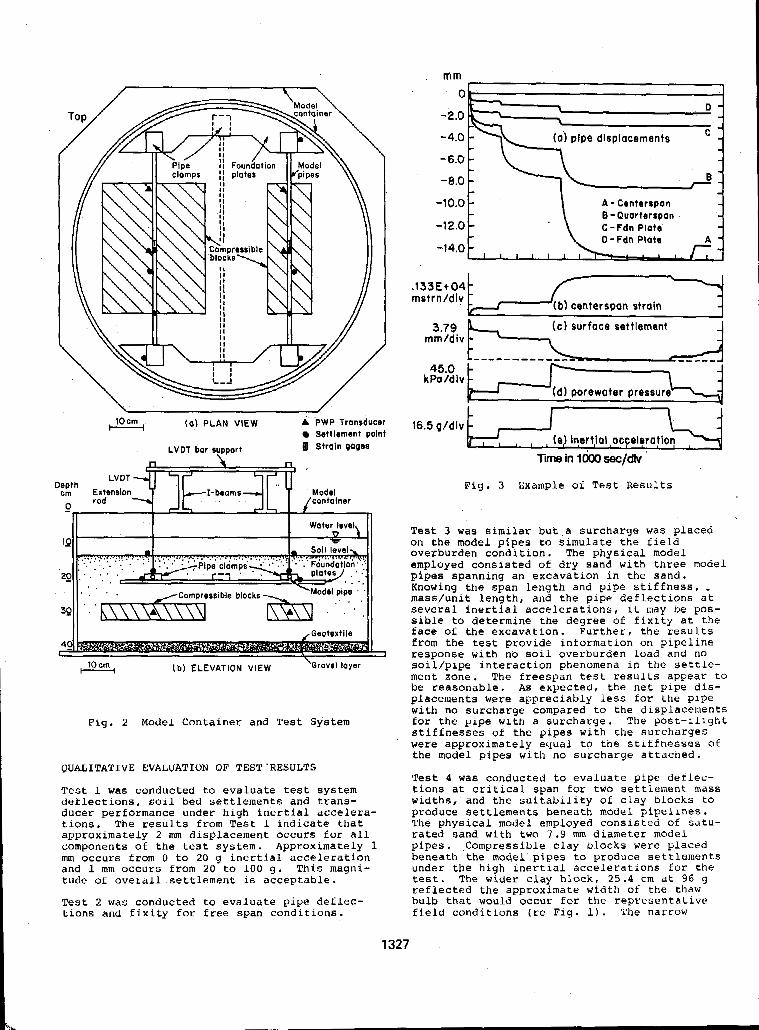
(a) PLAN VIEW A PWP Transducer Settlement point
LVDT bar sypport N Strain pages
m m
- ( 0 ) pipe displacements C -
-,
-10.0 A - Centerspan
-12.0 B - Quartartpan C - Fdn Plate 0 - Fdn Plate
-14.0 I
rnstrnldiv 4 b ) centerspan strain
3.79 + ( c ) surface settlement - mm/dlv - -
( d l porewater pressur I I
Fig. 3 Example o f Test Results
F l g . 2 Model Container and Test System
QUALITATIVE EVALUATION OF TEST'RESULTS
Test 1 was conducted to evaluate test system deflectlons, soil bed settlements and trans- ducer performance under high inertial accelera- tions. The results from Test 1 indicate that approximately 2 nun displacement occurs for all components of the test system. Approximately 1 mm occurs from 0 to 20 g inertial acceleration and 1 mm occurs from 20 to 100 g . This magni- tude of overall settlement is acceptable.
Test 2 was conducted to evaluate pipe deflec- tions and fixity €or free span conditions.
Test 3 was similar but .a surcharge was placed on the model pipes to simulate the field overburden condition. The physical model employed consisted of dry sand with three model pipes spanning an excavation in the sand. Knowing the span length and pipe stiffness, mass/unit length, and the pipe deflections at several inertial accelerations, it may be pos- sible to determine the degree of fixity at the face of the excavation. Further, the results from the test provide information on pipeline response wlth no soil overburden load and no eoil/pipe interaction phenomena in the settle- ment zone. The freespan test results appear to be reasonable. As expected, the net plpe dls- placements were appreciably less for the pipe with no surcharge compared to the dlsplacements for the pipe with a surcharge. The post-Cllght stiffnesses of the pipes with the surcharges were approximately equal to the stiffnesses o f the model pipes with no surcharge attached.
Test 4 was conducted to evaluate pipe detlec- tions at critical span for two settlement mass widths, and the suitability o f c.Lay blocks to produce settlements beneath model pipelines. The physical model employed consisted of satu- rated sand with two 7.9 mm diameter model pipes. Compressible clay blocks were placed beneath the model pipes to produce settlements under the high inertial accelerations for the test. The wider c l a y block, 2 5 . 4 cm at 96 g reflected the approximate width of the thaw bulb that would occur for the representative field conditions (re Fig. 1). The narrow
1327
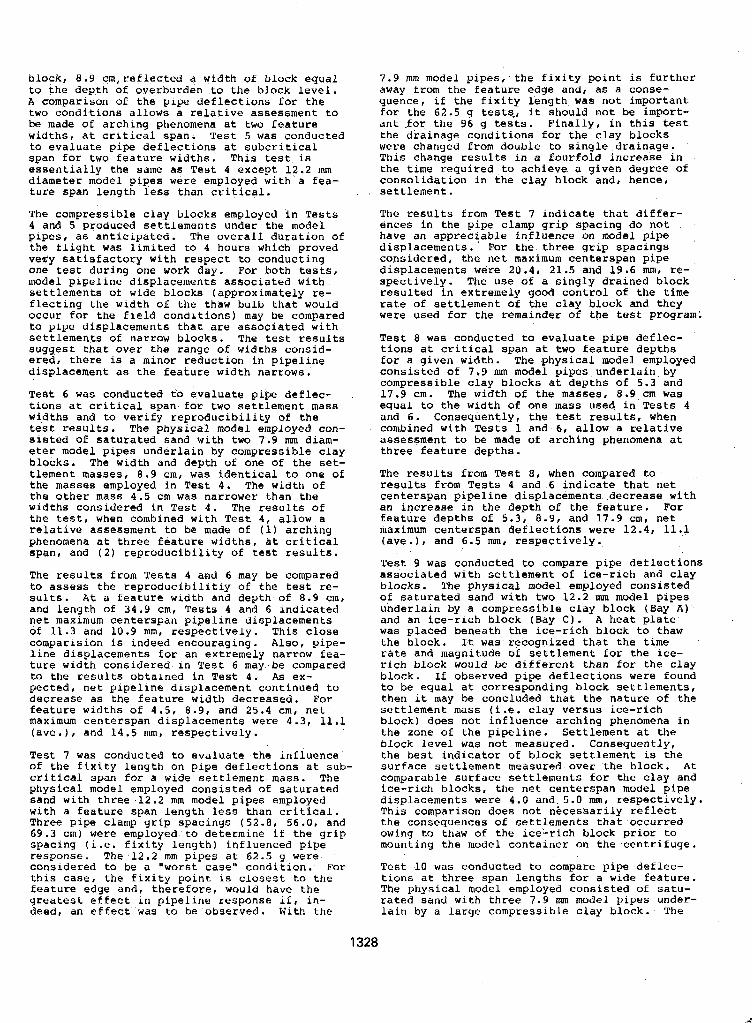
block, 8.9 cm, reflected a width of block equal to the depth of overburden to the block level. A comparison of the pipe deflections for the two conditions allows a relative assessment to be made of arching phenomena at two feature widths, at critical span. Test 5 was conducted to evaluate pipe deflections at subcritical span for two feature widths. This test is essentially the same as Test 4 except 12.2 mm diameter model pipes were employed with a fea- ture span length less than critical.
The compressible clay blocks employed in Tests 4 and 5 produced settlements under the model pip@s, as anticipated. The overall duration of the flight was limited to 4 hours which proved veuy satisfactory with respect to conducting one test during one work day. For both tests, model pipeline displacements associated with settlements of wide blocks (approximately re- flecting the width of the thaw bulb that would occur €or the field conditions) may be compared to pipe displacements that are associated with settlemen,ts of narrow blocks. The test results suggest that over the range of widths consid- ered, there is a minor reduction in pipeline displacement as the feature width narrows.
Test 6 was conducted to evaluate pipe deflec-
widths and to verify reproducibility of the tions at critical span for two settlement mass
test results. The physical model employed con- sisted of saturated sand with two 7.9 nun diam- eter model pipes underlain by compressible clay blocks. The width and depth of one of the set- tlement masses, 8.9 cm, was identical to one of the masses employed in Test 4. The width of the other mass 4.5 cm was narrower than the widths considered in Test 4 . The results of the test, when combined with Test 4, allow a relative assessment to be made of (1) arching phenomena at three feature widths, at critical span, and ( 2 ) reproducibility of test results.
The results from Tests 4 and 6 may be compared to assess the reproducibilitiy of the test re- sults. 4t a feature width and depth of 8.9 cm, and length of 34.9 cm, Tests 4 and 6 indicated net maximum centerspan pipeline displacements of 11.3 and 10.9 mm, respectively. This close comparision is indeed encouraging. Also, pipe- line displacements for an extremely narrow fea- ture width considered in Test 6 may be compared
pected, net pipeline displacement continued to to the results obtained in Test 4 , As ex-
decrease as the feature width decreased. For feature widths of 4.5, 8.9, and 25.4 cm, net maximum centerspan displacements were 4 . 3 , 11.1 (ave.) , and 14.5 mm, respectively. Test 7 was conducted to evaluate the influence of the fixity length on pipe deflections at sub- critical span for a wide settlement mass. The physical model employed consisted of saturated sand with three 12.2 mm model pipes employed with a feature span length less than critical. Three pipe clamp grip spacings ( 5 2 . 8 , 56.0, and 69.3 cm) were employed to determine if the grip spacing ( i .e. fixity length) influenced pipe
considered to be a "worst case" condition. For response. The 12.2 mm pipes at 62.5 g were
this case, the fixity point is closest to the feature edge and, therefore, would have the greatest effect in pipeline response if, in- deed, an effect was to be observed. With the
1328
7.9 mm model pipes, the fixity point is further away from the feature edge and, as a conse- quence, if the fixity length was not important for the 62.5 g tests., it should not be import- ant .for the 96 g tests. Finally, in this test the drainage conditions for the clay blocks were changed from double to single drainage. This change results in a fourfold increase in the time required to achieve a given degree of consolidation in the clay block and, hence, settlement.
The results from Test 7 indicate that differ- ences in the pipe clamp grip spacing do not have an appreciable influence on model pipe , displacements. For the three grip spacings considered, the net maximum centerspan pipe displacements were 20.4) 21.5 and 19.6 mm, re- spectively. The use of a singly drained block resulted in extremely good control of the time rate of settlement of the clay block and they were used for the remainder, of the test program;
Test 8 was conducted to evaluate pipe deflec- tions at critical span at two feature depths for a given width. The physical model employed consisted of 7.9 mm model pipes underlain by compressible clay blocks at depths of 5.3 and 17.9 cm. The width of the masses, 8 . 9 cm was equal to the width of one mass used in Tests 4 and 6 . Consequently, the test results, when combined with Tests 1 and 6 , allow a relative assessment to be made of arching phenomena at three feature depths.
The results from Test 8 , when compared to results from Tests 4 and 6 indicate that net centerspan pipeline displacements decrease. with an increase in the depth of the feature, For feature depths of 5.3, 8 .9 , and 17.9 cm, net maximum centerspan deflections were 12.4, 11.1 (ave.), and 6.5 nun, respectively.
Test 9 was conducted to compare pipe deflections associated with settlement of ice-rich and clay blocks, The physical model employed consisted of saturated sand with two 12.2 mm model pipes underlain by a compressible clay block (Bay A) and an ice-rich block (Bay C 1 . A heat plate was placed beneath the ice-rich block to thaw the block. It was recognized that the time rate and magnitude of settlement for the ice- rich block would be different than for the clay block. If observed pipe deflections were found to be equal at corresponding block settlements, then it may be concluded that the nature of the settlement mass (i .e. clay versus ice-rich block) does not influence arching phenomena in the zone of the pipeline. Settlement at the block level was not measured. Consequently, the best indicator of block settlement is the surface settlement measured over the block. At comparable surface settlements for the clay and ice-rich blocks, the net centerspan model pipe displacements were 4.0 and 5.0 mm, respectively. This comparison does not necessarily reflect
owing to thaw of the ice-rich block prior to the consequences of settlements that occurred
mounting the model container on the centrifuge.
Test 10 was conducted to compare pipe deflec-
The physical model employed consisted of satu- tions at three span lengths for a wide feature.
rated sand with three 7.9 mm model pipes under- lain by a large compressible clay block. The
settlement mass span lengths were 24.0, 4 6 . 0 , and 3 4 . 9 cm. The test results allow an evalua- tion to be made of the critical span concept. Also the results at the assumed critical span for the pipeline, 3 4 . 9 cm may be compared to the wide feature, 25.4 cm results from Test 4 to allow an approximate assessment of the repro- ducibility of the test results to be made. Fi- nally, the results from the shortest span length 2 4 . 0 cm may be compared to the results obtained in Test 5 to make an approximate assessment o f "modeling of models" in the test program.
The results from Test 10 indicate that net max-
and 18.0 mm for feature lengths of 24.0 , 3 4 . g r imum centerspan displacements are 8 . 2 , 16.6,
and 46.0 cm, respectively. These results sug- gest that the "critical span" employed in the test program may not be correct. Further anal- ysis of the results from Teat LO are necessary before a conclusive statement can be made.
At a span length of 34.9 cm, the results from Test 10 may be compared to the results from Test 4 to further assess reproducibility of the results. For a feature width of 25.4 cm (and span length of 3 4 . 9 cm) , net maximum centerspan displacements were 14.5 nun in Test 4 compared to 16.6 mm in Test 10.
An approximate assessment of "modeling of models" may be made by compkring the results from Test 10 at a span length of 2 4 . 0 cm to the results from Test 5 at a span Length of 37.6 cm and a feature width of 30.0 cm. At these model span lengths both tests reflect a span length in the field of 23 m. The ratio of net maximum centerspan displacements is 12.9 mm (e37.6 cm)/ 8 .2 mm (e24 .0 cm) = 1.57. This may be compared to the ratio of inertial accelerations, namely, 96 g/62.5 g = 1 . 5 4 . Clearly, there is a very favorable comparison.
When the settlement was induced by consolida- tion at a shallow depth below the pipeline, the surface displacements immediately above the pipeline were less than the displacements on either side. The relative settlement profile is similar to the displacement profile that occurs when a pipe i s pulled upwards out of the seabed. In both cases, the vertical force act- ing on the pipeline is much greater than the weight of a column of soil whose width is equal to the pipeline; this is well known in pipeline mechanics (Boer, et al., 1986; Palmer, 1972). The analysis required to determine the limiting vertical force, and therefore the moment in- duced in the pipeline, is similar to the analy- sis of breakout resistance of buried objects (Vesic, 1969).
CONCLUSIONS
Ten physical model tests were conducted at the CGCF to investigate the effect of (1) arching and lateral load transfer, and ( 2 ) soil/pipe interaction phenomena on arctic submarine pipe- line settlements. Further development of the technique, and complementary finite-element analysis, follow from a more detailed under- standing of the stress-strain behavior of the materials employed and of the interaction be- tween the pipe surface and the soil.
The experience of this program reinforces con- fidence In the application of the centrifuge technique to soil-structure interactions created by thaw settlement, and to pipeline problems in particular. The technique not only gives a clear picture of the overall pattern of movements, but can be used quantitatively to assess pipeline strains. It can readily by ex- tended to cover pipe deformation in the plastic
marine pipeline is a robust structure which can range. This is important in practice because a
withstand plastic deformations without dis- tress, and a limitation to elastic behavior may be unnecessarily restrictive.
ACKNOWLEDGEMENTS
The authors thank Sohio Petroleum Company for their support of this program and David Walker, Andrew Schofield, and Malcolm Bolton €or their helpful advice and use of the CGCF.
REFERENCES
Boer, B., Hulsbergen, C.H., Richards, D.M., Klok, A., and Biaggi, J-P. (19&6), "Buckling Considerations in the Design of the Gravel Cover for a High-Temperature Oil Line," Proc. , 18th OTC, Houston, TX, V 4.
Clough, H. and Vinson, T.S. (1986), "Centrifuge Model Experiments to Determine Ice Forces on Vertical Cylindrical Structures," Cold Regions Science and Technology, V. 12, N. 3. ,
Clough, H., Wurst, P., and Vinson, T.S. (19861, "Determination of Ice Forces with Centrifuge Models," Geotech. Test. J., ASTM, V . 9, N. 2 .
Nixon, J .F . , Stuchly, J., and Pick, A . R . (1984), "Design of Norman Wells Pipeline for Frost Heave and Thaw Settlement," Proc. , ASME 3rd Intl. Symp. on OMAE, New Orleans, LA.
Nyman, K.J. (19831, "Thaw Settlement Analysis
ASCE Spec. Conf. on Pipelines in Adverse for Buried Pipelines in Permafrost," Proc.,
Environments 11, San DiegO, CA.
Palmer, A . C . (1972) , "Settlement of a Pipeline on Thawing Permafrost," ASCE, J. of the Transportation Div., V. 98, N . TE3.
Palmer, A.C., Schofield, A.N. , Vinson, T.S., and Wadhams, P. (19851, "Centrifuge Modelling of Underwater Permafrost and Sea Ice," Proc., ASME 4th Intl, Symp. on OMAE, Dallas, TX.
Vesic, A.S. (1969), "Breakout Resistance of objects Embedded in the Sea Bottom, 'I A X E , C i v i l Engineering in the Oceans 11.
Vinson, T.S. and Wurst, P. (1985). "Centrifugal Modeling of Ice Forces on Single Piles," Roc. I ASCE ARCTIC ' 85 : Civil Engin. in the Arctic Offshore, San Francisco, Ch.
Walker, D.B.L., Hayley, D.W., and Palmer, A . C . (19831, "The Influence of Subsea Permafrost on Offshore Pipeline Design," Proc., 4th Intl. Conf. on Permafrost, Fairbanks, AK.
1329
BETHEL AIRPORT CTB PAVEMENT PERFORMANCE ANALYSIS
C.L. Vita', J.W. Rwney2 and T.S. Vinson3
1Engineering Reliability, Risk and Optimization, Woodinville (Seattle), Washington 98W2, USA 2R&M Consultants, Inc., Anchorage, Alaska 99503, USA
3Dept. of Civil Engineering, Oregon State University, Corvallis, Oregon 97331, USA
SYNOPSIS: Long-term performance of the Bethel Airport pavement structure overlying permafrost is presented. The runway pavement structure, originally constructed in 1958 with an extension in 1971, consists of cement treated base (CTB) underlying asphalt concrete (AC). Soil cement usage in cold regions, particularly in permafrost areas such as Bethel Airport, is unusual, and thus provides the focus of interest in the Bethel project. Observations and analyses indicate use of CTB at Bethel Airport has been operationally successful. Compared to untreated crushed gravel base, CTB provides economically and structurally superior pavement performance. Current design practices for CTB appear suitable for cold regions. Good construction control and quality remain essential, as subsequent 1970 construction deficiencies at Bethel demonstrated. There seems to be no technological reason for inadequate performance of properly designed and constructed CTB in cold regions. In fact, the high quality of the 1958 CTB at Bethel has shown adequate performance for nearly 30 years, and the results of a mechanistic analysis indicates a very long remaining fatigue and rutting life for the current CTB pavement structure.
INTRODUCTION
Bethel Airport is located in western Alaska. approximately 650 km west of Anchorage. The
base (CTB) underlying asphalt concrete (AC). pavement structure consists of cement treated
Soil cement usage in cold regions, particular- ly in permafrost areas such as Bethel Airport, is unusual. Therefore, a study was undertaken t o improve understanding o f the application. of soil cement in Alaska by evaluating the CTB pavement Performance at -Bethel Airport. The scope of the activities associated with the study which is summarized here included:
(1) Identification of pertinent aspects o f the natural s o i l , thermal, groundwater and climatological factors:
( 2 ) Identification of CTB construction history:
( 3 ) A field and laboratory program to (a) measure pavement structure and thickness- es at selected sampling locations, (b) obtain AC, CTB, crushed gravel base (CGB) and subgrade samples of the pave- ment for laboratory testing, and (c) measure deflections at sampling points using Benkelrnan beam procedures;
( 4 ) Investigation of the relationship between and
pavement structural characteristics (as estimated from the field and laboratory program) and deflections using engineer- ing analysis techniques.
Results from the study (Vita, et al., 1986) are summarized here.
BETHEL AIRPORT SITE CONDITIONS
Bethel Airport lies in permafrost composed of
frozen Pleistocene delta deposits of silt and sand and Holocene floodplain alluvium from the Kuskokwim River. Frozen deltaic sediments are found to 130 m of depth in a nearby water well, With an average annual air temperature of -1.8"C, Bethel has an average freezing index of about 2 4 4 0 C degree-days during a 196-day freezing season and an average thawing index of about 1720 C degree-days over a 169-day thawing season. The airport site is located 7.2 km west o f the Clty of Bethel on a tundra covered sandy ridge lying above the Kuskokwim River active floodpla\f, Soil boring data presented on 1958 as-built'' drawings for the airport indicate frozen tundra or organic material overlying frozen silt, silty sand or sand to the maximum depth of exploration, 5.5 m below original ground surf ace.
CONSTRUCTION HISTORY
The present Bethel Airport (Fig. 1) was built
Aviation Airport located across the Kuskokwim to replace the aging and flood-prone Civil
River from the City of Bethel. Construction was phased to improve the facility as demands increased. Four construction phases are iden- tified as follows.
Phase I: Initial site construction was begun in the summer of 1955 and continued through the summer of 1956. Excavation and subgrade preparation included stripping of surficial organic material to expose the underlying sandy material. Subsequent construction, into 1957, included continued excavation and grading to complete site rough grading for the runway, taxiway, parking apron and related support facilities.
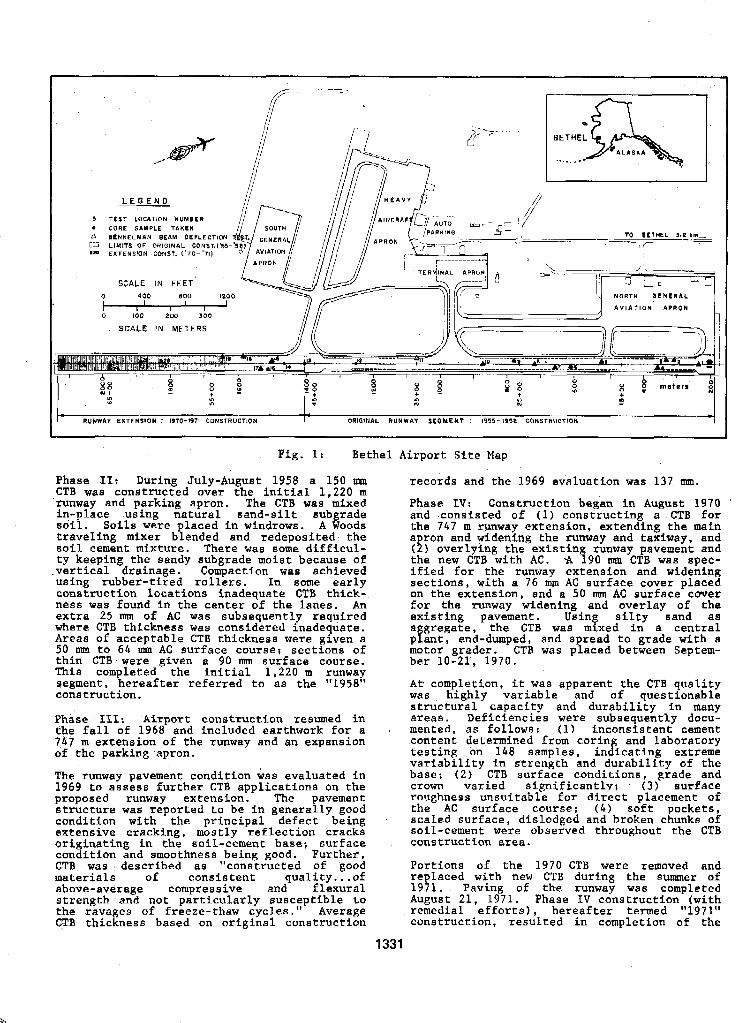
BETHEL c ..._. ."
L
L E G E N D
L T E S T LOCATION NUMBER CORE SAMPLE TAKEN BENKELMAN BEAM DEFLECTION
i j L I M I T S OF ORIGINAL CONST.('!J- EXTENSION CONS?. (470-'711
SCALE I N FEET
SCALE IN METERS
Fig. 1: Bethel Airport Site Map
Phase 11: During July-August 1958 a 150 m CTB was constructed over the initial 1,220 m runway and parking apron. The CTB was mixed in-place using natural sand-silt subgrade soil. Soils were placed in windrows. A Woods traveling mixer blended and redeposited the soil cement mixture. There was some difficul- ty keeping the sandy subgrade moist because of .vertical drainage. Compaction was achieved using rubber-tired rollers. In some early construction locations inadequate CTB thick- ness was found in the center of the lanes. An extra 25 m of AC was subsequently required where CTB thickness was considered inadequate. Areas of acceptable CTB thickness were given a 50 nrm to 64 mm AC surface course; sections of
This completed the initial 1,220 rn runway thin CTB were given a 90 mm surface course.
segment. hereafter referxed to as the "1958" construction,
Phase 111: Airport construction resumed in the fall of 1968 and included earthwork for a 747 m extension of the runway and an expansion of the parking apron.
The runway pavement condition was evaluated in 1969 to assess further CTB applications on the proposed runway extension. structure was reported to be in genera The pavement ly good condition with the principal defect being extensive cracking, mostly reflection cracks originating in the soil-cement base; surface condition and smoothness being good. Further, CTB was described as "constructed of good materials of consistent quality ... of above-average compressive and flexural strength and not particularly suyptible to the ravages of freeze-thaw cycles. Average GTB thickness based on original construction
records and the 1969 evaluation was 137 m.
Phase IV: Construction began in August 1970 and consisted of (1) constructing a CTB for che 747 rn runway extension, extending the main a ron and widening the runway and taxiway, and
the new CTB with AC. *A 190 um~ CTB was spec- (!) overlying the existing runway pavement and
ified for the runway extension and wldening sections, with a 76 tnm AC surface cover placed on the extension, and a 5 0 mm AC surface cover for the runway widening and overlay of the existing pavement. Using silty sand as aggregate, the CTB was mixed in a central plant, end-dumped, and spread to grade with a motor grader. CTB was placed between Septem- ber 10-21, 1970.
A t completion. it was apparent the CTB quality was highly variable and of questionable structural capacity and durability in many areas. Deficiencies were subsequently docu- mented. as follows: (1) inconsistent cement content determined from coring and laboratory testing on 148 samples, indicating extreme variability in dtrength and durability of the base; ( 2 ) CTB surface conditions, grade and crown varied significantly: ( 3 ) surface roughness unsuitable for direct placement of the AC surface course: (4) soft pockets, scaled surface, dislodged and broken chunks of soil-cement were observed throughout the CTB construction area.
Portions of the 1970 CTB were removed and replaced with new CTB during the summer of 1971. Paving o f the runway was completed August 21, L971. Phase IV construction (with remedial efforts), hereafter termed "1971" construction. resulted in completion of the
1331
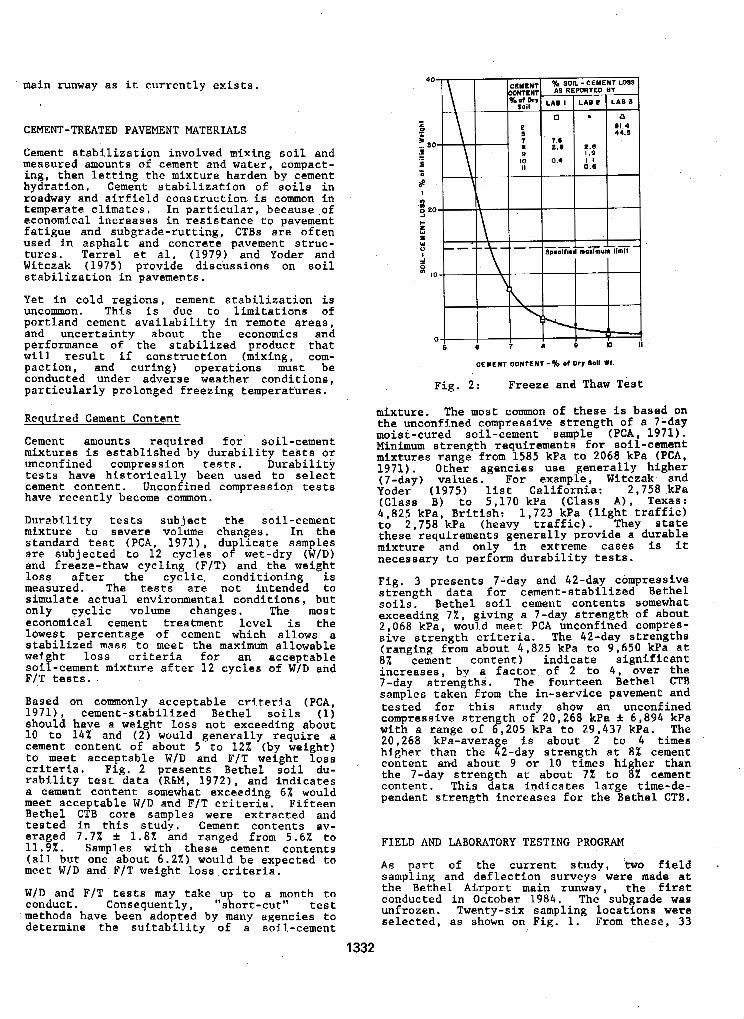
main runway as it currently exists.
CEMENT-TKEATED PAVEMENT MATERIALS
Cement stabilization involved mixing soil and measured amounts of cement and water, compact- ing, then letting the mixture harden by cement hydration. Cement stabilization o f soils in roadway and airfield construction is common in temperate climates, In particular, because of economical increases in resistance to pavement fatigue and subgrade-rutting, CTBs are often used in asphalt and concrete pavement struc- tures. Terrel et al. (1979) and Yoder and Witczak (1975) provide discussions on soil stabilization in pavements.
Yet in cold regions, cement stabilization is uncommon. This is due to limitations of portland cement availability in remote areas, and uncertainty about the economics and performance o f the stabilized product that will result if construction (mixing, com- paction, and curing) operations must be conducted under adverse weather conditions , particularly prolonged freezing temperatures.
Required Cement Content
mixtures is established by durability tests or Cement amounts required for soil-cement
unconfined compression tests. Durability tests have historically been used to select
have recently become common. cement content. Unconfined compression tests
Durability tests subject the soil-cement mixture to severe volume changes. In the standard test (PCA. 1971), du licate samples are subjected to 12 cycles o!! wet-dry (WID) and freeze-thaw cycling (FIT) and the weight loss after the cyclic, conditioning is measured. The tests are not intended to simulate actual environmental conditions, but only cyclic volume changes. The most economical cement treatment level is the lowest percentage of cement which allows a stabilized mass to meet the maximum allowable wei ht loss criteria for an acceptable
FIT tests. sol?-cement mixture after 12 cycles of WID and
Based on commonly acceptable criteria (PCA, 1971), cement-stabilized Bethel soils (1) should have a weight loss not exceeding about 10 to 14% and (2) would generally require a cement content of about 5 to 12% (by weight) to meet acceptable WID and FIT weight loss criteria. Fig. 2 presents Bethel soil du- rability test data (RLM, 1972), and indicates a cement content somewhat exceeding 6% would meet acceptable WID and FIT criteria. Fifteen Bethel CTB core samples were extracted and tested in this study. Cement contents av- era ed 7.7% f 1.8% and ranged from 5.62 to 11.8% Samples with these cement contents (all but one about 6 . 2 % ) would be expected to meet WID and FIT weight loss criteria.
WID and FIT t e s t s may take ,pp to a month to conduct. Consequently, short-cut" test methods have been adopted by many agencies to determine the suitability of a soil-cement
CEMENT CONTENT-% O f Dry 8011 wt.
Fig. 2: Freeze and Thaw Test
mixture. The most: common of these is baaed on the unconfined compressive strength of a 7-day moist-cured soil-cement sample (PCA, 1971). Minimum strength requirements f o r soil-cement mixtures range from 1585 kPa to 2068 kPa (PCA, 1971). Other agencies use generally higher
Yoder (1975) list California: 2,758 kPa (7-day) values. For example, Witczakk- and
(Class B) to 5,170 kPa (Class A ) , Texas: 4,825 kPa, British: 1,723 kPa (light traffic) to 2,758 kPa (heavy traffic). They state these requirements generally provide a durable mixture and only in extreme cases is it necessary to perform durability tests.
Fig . 3 presents 7-day and 42-day compressive strength data for cement-stabilized Bethel soils. Bethel sol1 cement contents somewhat exceeding 72, giving a 7-day strength of about 2,068 kPa, would meet PCA unconfined compres- sive strength criteria. The 42-day strengths (ranging from about 4,825 kPa to 9 , 6 5 0 kPa at 8Z cement content) indicate significant increases, by a factor of 2 to 4, over the 7-day strengths. The fourteen Bethel CTB samples taken from the in-service pavement and tested for this study show atl unconfined compressive strength of 20 ,268 kPa * 6,894 kPa with a range of 6.205 kPa to 29,437 kPa. The 20,268 kPa-average i s about 2 to 4 times higher than the 42-day strength at 8% cement content and about 9 or 10 times hi her than the 7-day strength at about 7% to !2 cement content. This data indicates large time-de- pendent strength increases for the Bethel CTB.
FIELD AND LABORATORY TESTING PROGRAM
As part of the current study, 'two field sampling and deflection surveys were made at the Bethel Akport main runway, the first conducted in October 1984, The subgrade was unfrozen. Twenty-six sampling locations were selected, as shown on Fig. 1. From these, 33
1332
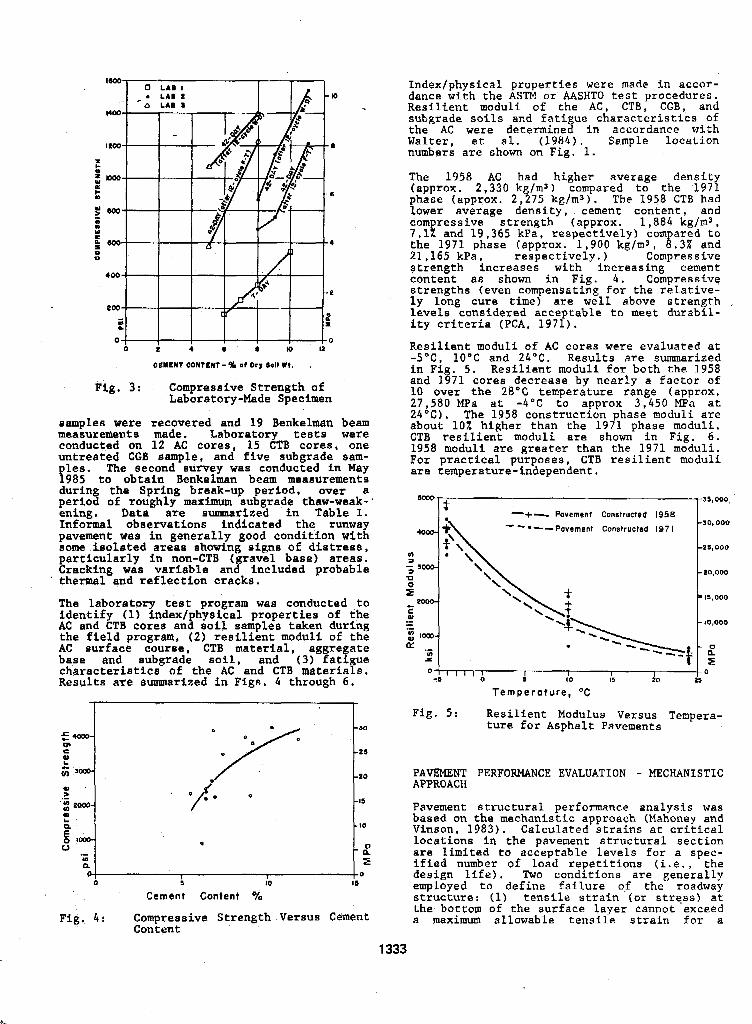
CEMENT KINtKWt- % of Prv lol l W t .
k ig . 3: compressive Strength of Laboratory-Made Specimen
samples were recovered and 19 Benkelman beam measurements made. Laboratory tests were conducted on 12 AC cores, 15 CTB cores, one untreated CGB sample, and five subgrade gam- . The gecmd eurvey was conducted in May 985 to obtain Benkelman beam measurements
during the Spring break-up period, over a period of roughly maximum subgrade thaw-weal-' ening. Data are sunrmarized in Table I. Informal observations indicated the runway pavement was in generally good condition with some isolated areas showing signs of distress, particularly in non-CTB ( ravel base) areas. Cracking was variable ant included probable thermal and reflection cracks.
The laboratory test program was conducted to identify (1) index/ hysical properties of the AC and CTB cores an! soil samples taken during the field program, (2) resilient moduli of the AC surface course, CTB material, aggregate base and aubgrade soil, and (3) fatigue characteristics of the AC and CTB materials. Results are summarized in Figs. 4 through 6.
!les
-
-ao
-95
-pa
"I
-10
0 -ch E
dance with the ASTM or AASHTO test procedures. Index/physical properties were made in accor-
Resilient moduli o f the AC, CTB, CGB, and subgrade soils and fatigue characteristics of
Walter, et al. ( 1 9 8 4 ) . Sample location the AC were determined in accordance with
numbers are shown on Fig. 1.
The 1958 AC had higher average density
phase (approx. 2,275 kg/m3). The 1958 CTB had (approx. 2,330 kg/m3) compared to the 1971
lower average density. cement content, and com resstve strength (approx. 1,884 kglrns. 7. I! and 19,365 kPa, respectively) corn ared to the 1971 phase (approx. 1,900 kg/m3, l.3X and 21,165 kPa, respectively.) Compressive strength increases with increasing cement content as shown in Fig. 4. Compresslve strengths (even compensating for the relative- ly long cure time) are well above strength , levels considered acceptable to meet durabil- ity criteria (PCA, 1971).
Resilient moduli o f AC cores were evaluated at -5"C, 10°C and 24°C. Results are summarized in Fi . 5. Resilient moduli for both the 1958 and 1871 cores decrease by nearly a factor of 10 over the 28°C temperature range (approx. 27,580 MPa at: -4°C to approx 3,450 MPa at 24°C). The 1958 construction hase moduli are about 10% higher than the 1 9 A phase modulF. CTB resilient moduli are shown in Fig. 6. 1958 moduli are greater than the 1971 moduli. For practical purposes, CTB resilient moduli are temperature-independent.
4
"
If- Pavement Constructed 19.58
"-Pavement Constructed 1971 10.000
25.000
\
- '\; -00,000
I l ,OOO '. p"
10,000
5 l o
I I I -5 0 a 10 I5 40 25
T e m p e r a t u r e , "C
- 1 0 5 1
IO
Cement Content %
T- 16
Fig. 4 : Compressive Strength Versus 'Cement Content
Fig. 5: Resilient Modulus Versus Tempera- ture for Asphalt Pavements
PAVEMENT PERFORMANCE EVALUATION - MECHANISTIC APPROACH
Pavement structural performance analysis was based on the mechanistic approach (Mahoney and Vinson, 1983). Calculated strains at critical locations in the pavement structural section are limited to acceptable levels for a spec-
design life). Two conditions are generally ified number o f load repetitions (i.e., the
employed to define failure o f the roadway structure: (1) tensile strain (or stress) at the bottom of the surface layer cannot exceed a maximum allowable tensile strain for a
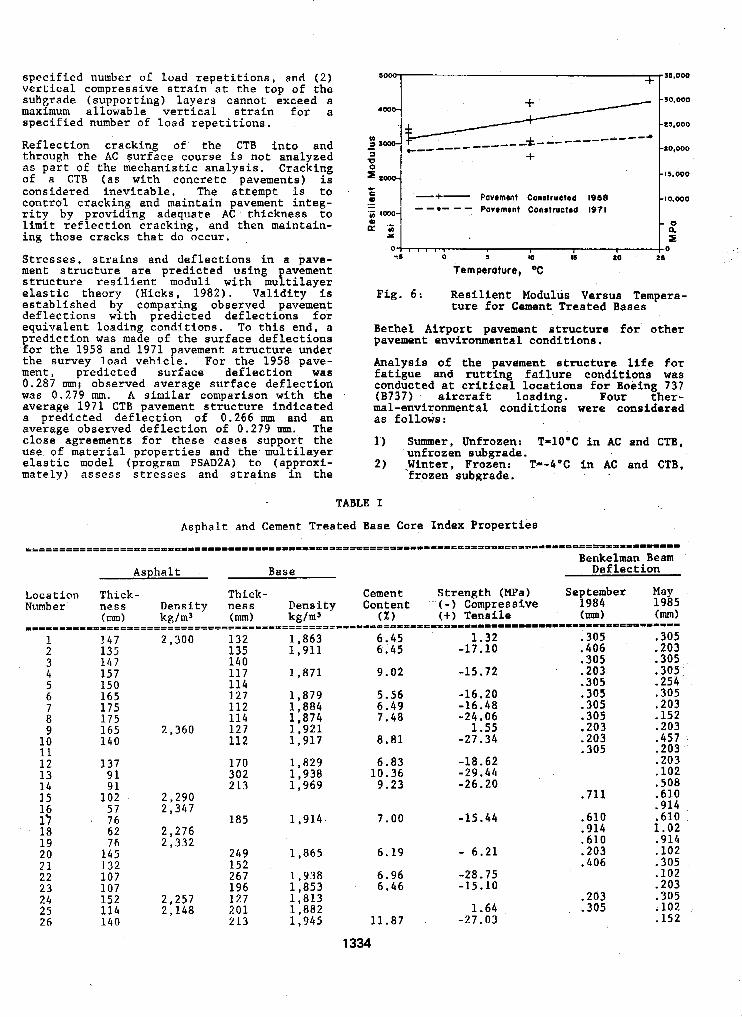
specified number of load repetitions, and (2) vertical compressive strain at the top of the subgrade (supporting) layers cannot exceed a maximum allowable vertical strain f o r a specified number of load repetitions.
Reflection cracking of the CTB into and through the AC surface COUKSB is not analyzed as part o f the mechanistic analysis. Cracking of a CTB (as with concrete pavements) is considered inevitable, The attempt is to control cracking and maintain pavement integ- rity by providing adequate AC thickness t o limit reflection cracking, and then maintain- ing those cracks that do occur. ,
Stresses, strains and deflections in a pave- ment structure are predicted using pavement structure resillent moduli with multilayer elastic theory (Hicks. 1982). Validity is established by comparing observed pavement deflections with predicted deflections for equivalent loading conditions. To this end. a prediction was made of the surface deflections for the 1958 and 1971 pavement structure under the survey load vehicle. For the 1958 pave- ment, predicted surface deflection was 0.287 nun; observed average surface deflection was 0.279 mm. A similar comparison with the average 1971 CTB pavement structure indicated a predicted deflection o f 0.266 rmn and an average observed deflection of 0.279 m. The close agreements for these cases support the use of material properties and the multilayer elastic model (program PSAD2A) to (approxi- mately) assess stresses and strains in the
+-
" " ~ ~ ~ ~ ~ ~ ~ ~ ~ ~ ~ ~ ~ - ~ a +
Pavornmt Constructed IQSB Pavement Con8tructrd 1971
(1: 1 X
-5 0 5 IO I6 t O
Temparature, O C
.f1,000
-ao.ooo
-25,000
-xo,ooo
-15.000
-10.000
- 0 n. 1
-0 6
Fig. 6: Resilient Modulus Versus Tempera-
Bethel Airport pavement etructure far other pavement environmental conditions.
Analysie of the pavcment structure life for fatigue and rutting failure conditions was conducted at cr i t ica l locations for Boeing 737 (B737) aircraft loading. Four ther- mal-environmental conditions were considered as follows:
1) Summer, Unfrozen: T=lO"C in AC and CTB,
2) Winter, Frozen: T--4"C i n AC and CTB,
ture for Cement Treated Baaes
unfrozen subgrade.
frozen subgrade. , .
TABLE I
Asphalt and Cement Treated Base Core Index Properties
2 1
3 4 5 6
8 7
9 10 11 12 13 14 1.5 16 17 la 19 20 21 22 23 24 25 26
147 135 147 157 150 165 175 175 165 140
137 91 91
1 0 2 57 76 62 76
145 132 107 107 152 114 140
2,300 132 135 1 4 0 117 114 127 112 114
2.360 127 112
170 302 213
2,290 2,347
2,276 2,332
185
249 152 267 196
2,257 127 2 , 1 4 8 201
213
1,863 1,911
1,871
1,879 I, 884 1,874 1,921 1,917
1 ,a29 1,938 1,969
1,914
1,865
1,938 1,853 1,813 1,882 1 , 9 4 5
8.81
6.83 10,36 9.23
7 .OO
6.19
6.96 6 . 4 6
11.87
1334
-27.34
-18.62 -29 e 44 -26.20
-15.44
- 6.21 -28.75 -15 * 10
1 . 6 4 -27.03
.203
.305
.711
-610 ,914 .610 .203 .406
.203
.305
.457
.203
.203 * 102 .508 .610 .914 .610 1.02 .914 .102 .305 .102 .203 .305 .102 .152
3 ) Spring-Breakup, Shallow-Thaw: T-2'C in AC and CTB, subgrade thawed to 0.6 m and frozen below.
4 ) Spring-Breakup, Deep-Thaw: T=2"C in LC and CTB, thawing subgrade to infinite depth .
AC and CTB moduli used in the multilayer elastic analysis were obtained from Figs. 5 and 6. Frozen soil. moduli were increased by roughly 300% over unfrozen moduli and thawing soil moduli reduaed to about 25% o f the unfrozen moduli, Presentation of the results is given by Vita, et al. (1986). In summary:
1) I At comparable thermal/environmental conditions surface displacements for the untreated CGB are about twice the dis-
2) Fatigue failure for the AC layer will not placements for the CTB sections.
occur for any reasonable number of B737 loadings.
3 ) Rutting failure in the subgrade will not occur for any reasonable number of B737 loadings,
4) AC temperature does not appreciably influence the strain or flexural stress at the bottom of the CTB or vertical
does influence the strain at the bottom strain on the subgrade; AC temperature
o f the AC layer.
The operationally successful use of CTB at
CTB at other locations in cold regions. Of Bethel provides support to the general use of
course, any given candidate location €or CTB must be evaluated for case-specified con- ditions, needs, and constraints. For example, CTB does not have any special advantage in overcoming adverse effects of subgrade founda- tion thaw in areas of thaw-unstable perma- frost. However, pre-thawing of subgrade permafrost several years in advance (as was done for the Bethel runway) may, in the right siruation, improve foundation soil perfor- mance. Further, the performance of CTB in poorly draining soils (unlike Bethel soils) with a high groundwater table is unknown. Also, in cases where abundant crushed gravel
advantage t o CTB. Finally, where a su erior is locally available. there may be no economic
natural subgrade exists, there may !e no advantage to CTB.
CTB experience a t Bethel indicates that in poor subgrade areas where gravel is not economically available, CTB can provide a cost-saving solution which will contribute to high quality pavement performance. Following proper planning, design, construction and maintenance, CTBs can be used in cold regions to effect superior economy and long-term pavement performance.
SUMMARY AND CONCLUSIONS
Observations and anal ses indicate that the use of cement treateg base, CTB, at Bethel Airport has been operationally successful. Corn ared t o untreated CGB. CTB gives econom- icayly and structurally superior pavement performance.
In all cases of CTB use, proper design and construction is essential to a successful product. Current design practices for CTB appear suitable for cold regions. Good construction control and quality are essen- tial, as the 1970 construction season defi- ciencies at Bethel demonstrated.
There seems to be no special technological reasons for inadequate performance of properly designed and constructed CTB in cold regions. In fact, the high quality of the 1958 CTB at Bethel has shown adequate performance for nearly 30 years, and the results of the mechanistic analysis described above indicates a very long remaining fatigue and rutting life f o r the current CTB pavement structure.
Reflection cracking, a common and general tondition of all CTB pavements, is generally controlled with adequate AC thickness to reduce surface cracking and crack sealing, as part of routine maintenance. Surface cracking on the Bethel Airport runway includes thermal cracking effects (similar to those found, for example, in the Fairbanks area) and CTB-induced reflection cracking. However, CTB
particular problem at Bethel. reflection cracking does not appear to be a
1335
CITED REFEmNCES
Hicks, R . G . (1982). Use of Layered Theory in , the Design and Evaluation of Pavement
1
Systems, Report No. FHWA-AK-RD-83-8, Alaska DOTPF.
Mahoney, J. and Vinson, T.S., (1983). A mechanistic approach to pavement design in cold regions, Proc. 4th Intl. Confer- ence on Permafrost. NAS.
Soil-Cement Laboratory Handbook, Skokie.
(R&M) , (1972). Bethel Airport, Stage V Construction, Rept. to AK. Div. of AviaGion.
Terrel, R.L., et a1 (1979). Soil Stabilization in Pavement Structures, A User's Manual,
Portland Cement Association (PCA), (1971).-
R&M Engineering h Geological Consultants
- 2 vols., USDOT, FHWA-IP-80-2. Vinson, T . S . , Mahoney, J.P.. and Kaminski,
J.J. (1984). Cement stabilization for
-3rd Intl. Cold Regions Engineering road construction in cold regions, Proc.
Specialty Conference, Edmonton. Vita, G.L., Vinson. T.S., and Rooney, J.W.
(1986). Bethel Airport CTB-AC Pavement Performance Analysis, Report No. AK-RD-86-31, Alaska DOTPF.
Vinson, T.S. (1984). Installation Opera- tion and Maintenance Procedures for Repeated Load Triaxial and Diametral Test S stems, Transportation Research Report
Walter, Y . . Brickman, A.M., Hicks, R.G., and
ST-1 , 0 Yoder, E.J. and Witczak, M.W. (1975).
regon State University.
Principles of Pavement Design, 2nd ed., Wiley, New York.
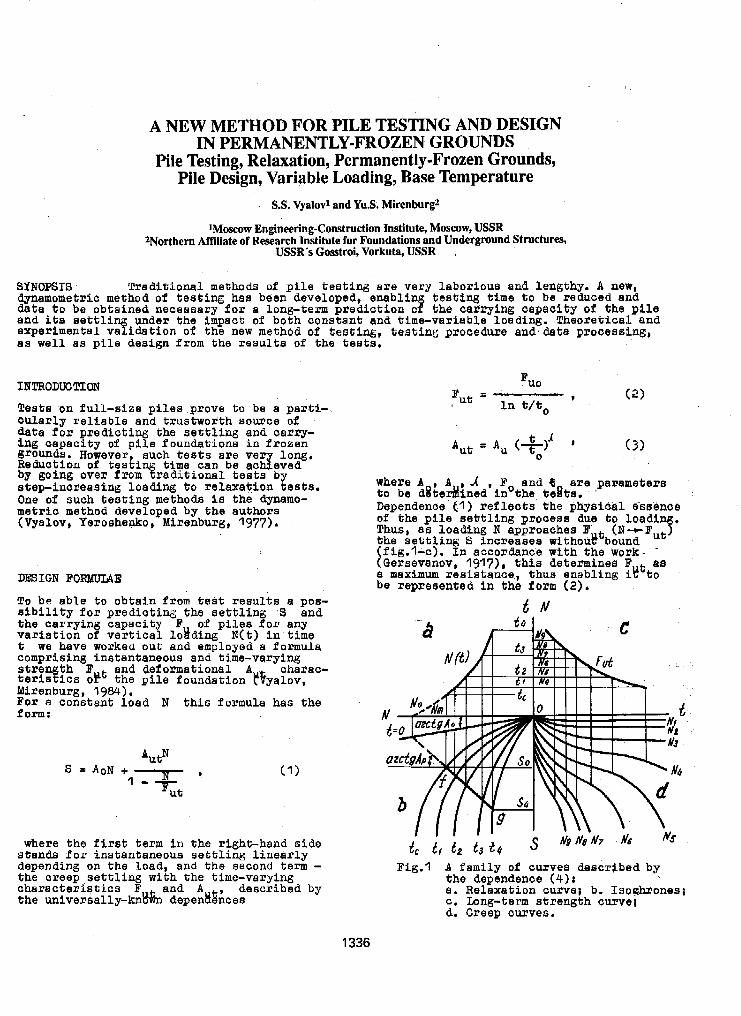
A NEW METHOD FOR PILE TESTING AND DESIGN
Pile Testing, Relaxation, Permanently-Frozen Grounds, Pile Design, Variable Loading, Base Temperature
IN PERMANENTLY-FROZEN GROUNDS
S.S. Vyalod and Yu.S. Mirenburg2
1Mosmw Engineering-Construction Institute, Moscow, USSR 2Northern Affiliate of Research Institute for Foundations and Underground Structures,
USSR’s Gmtroi, Vorkuta, USSR ,
SYNOPSIS Tradi t ional methods o$ pile testing are very laborious and lengthy. A new, dynamometric method of t e s t i n g haa been developed, enabling testing time to be reduced end
and its a e t t l i n f under the impact of both constant and time-variable loading. Theoretical and da ta t o be obtained necessary for a long-term prediction of the carrying capacity o f the p i l e
experimental va ida t ion of the new method of tes t ing , testing procedure and.date processing, as wel l as p i l e design f r o m the resu l t s of the t es t s ,
I~5TRODUC’PION
Teste on fu l l - s ize p i les p rove t o be a par t i - cu la r ly re l iab le and t rus twor th somce of data for pred ic t iw t he settling and carry- ing capaci ty of pile foundat ions in f rozen
Reauction of testin t ime can be achfeved grounds. However aucb t e e t s are ver long. by going ovex from fraditional t e s t s by a tep increas ing loading to relaxagion t e s t s . One o f such tes t ing methods I s the dynamo- metric method developed by the authors (Vyalov, Yeroshenko, Mirenburg, 1977).
DEBIGN FORMULAE
To be able to ob ta in from test r e s u l t s a poa- a i b i l i t y f o r pred ic t ing the se t t l ing S and
var i a t ion of v e r t i c a l l o l d i n g N ( t ) i n time the carrying capacity F of p i l e s f o r any
t we have worked our; and employed a formula comprising instantaneoua and time-varying
~ % i c s opt the pi le foundat ion t tyalov, Mirenburg, 1984). For a constant l o a d N t h i s foxmula has the i0m:
t h F and deformetional A charac-
where t h e f i r a t term in the right-hand side stands f o r ins tan taneoua se t t l ing l inear ly depending on the load, and the second term - cha rac t e r i s t i c s F and A t he c r eep ae t t l i rq with the time-varying
described by the universally-lcn% depen&&cea
1336
where A , A 1 , F and % are parameters t o be d8tedined in’the te8 ts . ’
Dependence (1) r e f l ec t s t he physical 6sp18ncB o f the p i l e aett’l ing prooesa due t o loadin . Thus, 88 loading N approaches B (N+Butf t h e s e t t l i n g S increasee without! bound fig.1-c). In accoraance with the work
a maximum r e s i s t a m e , thus enabling ib’to Gexsevanov, 1917), t h i s determines P as
be represented i n the form (2).
tnl
Fig.l A family o f curves described by the dependence (4); a. Relaxation curvei b. Isoqhfones~ c. Long-term s t rength curve! d. Creep cuxves.
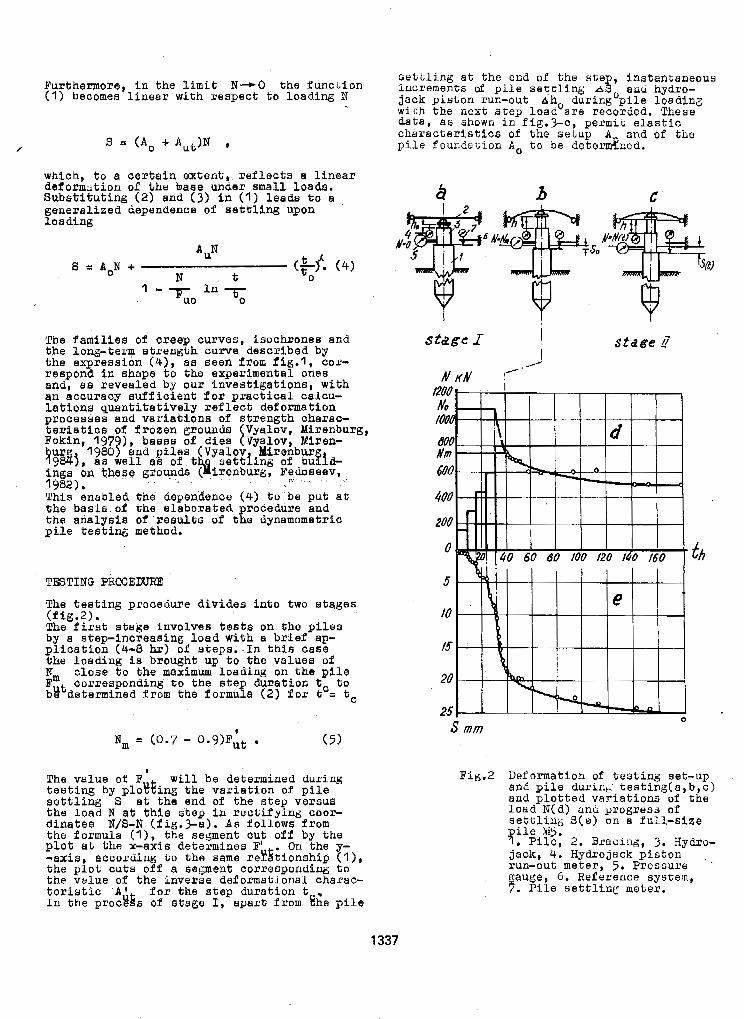
Furthermore, i n t h e limit N-0 the Punchion ('I) becomes l i nea r w i th r e spec t t o loading N
which, t o a c e r t a i n e x t e n t , r e f l e c t s a l i neax
Subs t i t u t ing (2) and (3) i n ('I) l eads t o a deformation of the baae under s m a l l loads.
generalized dependence of s e t t l i n g upon loading
The families of creep curves, Isochmnes and the long-term strength curve describea by the expression (4), as seen f r o m fig.1, cor- respona i n shape t o the experimental ones end, a s revealed by DUX invea t iga t iona , wi th an accuracy suff ic ient f o r pract icaL calcu- l a t i o n s q u a n t i t a t i v e l y reflect deformation processes and var ia t iona of strength cbarac-
F ~ k i n , 197 ), basas of diea (Vyalov, Yiren- t a r i s t i c s o f frozen grounda (Vyelov, Mixenburg,
Q W j , a8 w e l l as of t9, a a t t i i n g of budd- 19807 and pi l e s (Vyalov Mirenbuq
ings on these gfounds ( lrenburg, Fedoseev, 1982). This enabled the depen;$ance (4) t o 'be put a t the bas i s o f the elaborated procedure and
p i l e t e s t i n g method. the ana lys i s OP r e s u l t s o f the dynamometric
, 1:' I.
T&BTING PROCEDURE!
The tesbing procedure divides into two s t ages
The f z r s t s tage involves t es ta on the piles by a s tep-Increasing load with a brief ap- plication (4-8 hr) of steps. ,In t h i s c a s e the loading is brought up t o the values of N close t o t h e maximum loading on the p i l e prn corresponding t o t he s t ep au ra t ion t t o b'8'determined f r o m the formula (2) for tC= t,
(fig.?).
I The value o f P will be determined during testing by plobking the var ia t ion of p i l e s e t t l i n g S e t t h e end of the step versus the Load N a t t h i s step In xect i fy ing coox- dinates N/S-N (f ig.3-a). As follows from the formula (I), the segment cu t o f f by the p l o t ab the x-axis determines P' , On the y- -axis , according t o the same Perkt ionship (I ), t he p lo t cu t s o f f a seGment corresponding t o t he vcllue o f the inverse dsformational charac- t e r i s t i c A ' for the step durat ion t I n t h e proc?&s o f s tage I, apar t from Ehe p i l e
s e t t l i n g a t t h e end of the step, instantaneous increments of p i l e s e t t l i n g AS anu hydro- jack p i s ton run-out a h during'pile Loading wich the next s tep l o a d o a r e recorded. These da ta , a s shown i n fig.3-c, permit elastic character is t ics of the setup A and of t he p i l e four .da t ion A, t o be d e t e d n e d .
stage 1 I
'E 1
s mm
stage d
0
Fig.2 Deformat ion o f tes t ing set-up
and p l o t t e d v a r l a t l o n s of the and p i l e during.. testing(a,b,c)
load N(d) anu progress of sett1j.m s ( e ) on a f u l l - s i z e
e l e N255; . .
P i l e , 2. Bracing, 3. Hydro- jack, 4. Hydrojack p i s t o n run-out meter, 5. Pressure gauge, 6. Reference system, 7. P i l e settling meter.
1337
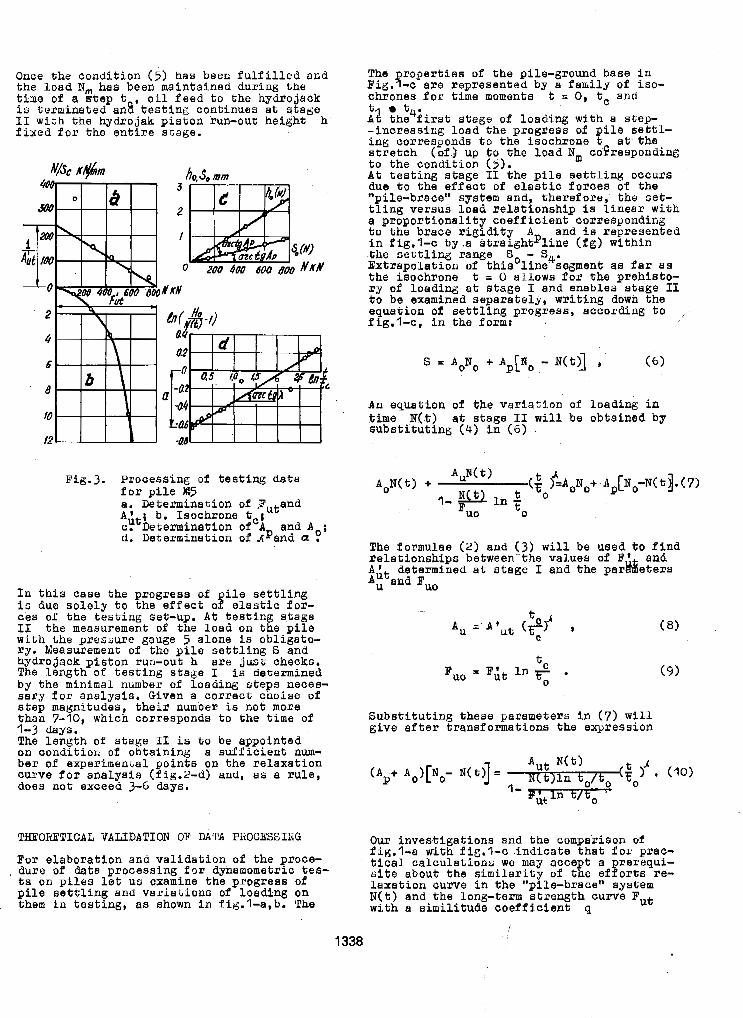
Once the Condition ( 5 ) has been f u l f i l l e d and t he l o a d N, has been maintained during the tLme of a s tep t , o i l f e e d t o the hydrojack
I1 with the hydrojak p i s t o n run-out height h i s terminated an8 t e s t i n g c o n t i n u e s a t s t a g e
f i x e d f o r t h e e n t i r e s t a g e .
Fig.3. Processing of t e s t ing da t a for p i l e @5 a. Determination of Putand A ; b. Isochrone t 1 cYtDetexmination ofCA and A * d. Determination of Apand a ?'
In th i s case the p rogress of p i l e s e t t l i n g i s due s o l e l y t o t h e e f f e c t o f e l a s t i c for- ces of the tes t ing set-up. A t t e s t i n g s t a g e I1 the measurement of the Load on t h e p i l e wi th the pressure gauge 5 alone is obligato- ry . Measurement of t h e p i l e s e t t l i n g S and hydrojack p i s ton run-out h a r e just checkc. The length o f t e s t i n g s t a g e I is determined by the minimal number o f loading steps neces- sa ry Pox analysis. Given a cor rec t cboiae of s tep magni tudes, their number i s not more than 7-10, which corresponds t o the time of '1-3 days. The length of s tage 11 is t o be appointed on condition of obtaining a s u f f i c i e n t num- ber of experimencal points on the r e l axa t ion curve for analyais (fig.2-d) and, a s a ru l e , does not exceed 3-6 days.
The rope r t i e s of the pi le-ground base in Fig.q-c axe represented by a family of iso- ckrones f o r time moments t z 0, t, and
A$ t h e f i r s t s t a g e of loading with a step- - increas ing losd the p rogress of p i l e s e t t l - ing corresponds t o the isocbrone t a t t h e s t r e t c h (of 5 up t o t he l o a d Nm cogresponding t o the condi t ion (5). A t t e s t i n g s t a g e II t h e p i l e s e t t l i n g occurs due t o t h e e f f e c t o f e l a s t i c f o r c e s of t he 'Qpile-brace" system and, therefore , the se t - t l i ng ve r sus l oad r e l a t ionsh ip is l i n e a r w i t h a propor t iona l i ty coef f ic ien t cor responding t o t h e b r a c e r i g i d i t y A and is represented i n fig.1-c by.a a t ra ightPl ine ( fg) with in
Ertxapolat ion of this'line segment 3 ~ l f a x aa the sec t l ing range El - S4. the isochrone t 4 0 al lows for the prehiabo- r y of l o a d i n g a t s t a g e I and enables stage 11 t o be examined separa te ly , wr i t ing down the equat ion of se t t l i ng p rog res s , acco rd ing t o , f ig . l -c , in the form:
t t4'
An equation of t h e v a r i a t i o n of loading in time N ( t ) a t s t a g e I1 w i l l be obtained by s u b s t i t u t i n g (4) in (6)
The formulae (2) ana (3 ) w i l l be usea, to find r e l a t ionsh ips between the values of F and A ' determined a t s t age I and t h e p s x g e t e r s A:tsnd I?,,
Subat i tut iug these parameters i n (7) will give a f te r t ransformat ions the express ion
TKEORETICAL VALIDATION OF DATA PIiOCESSZPjG Our investigations and the comparieon of
For e labora t ion ana va l ida t ion of the proce- fig.1-a with fig.1-c i n d i c a t e t h a t for prac- duxe of d a t a processing for dynamometric tes- t i c a l c a l c u l a t i o n s we may acce t a prarequi- t s on p i l e s l e t us examine the progress of t i i t e about the s imi la r i ty of t f e ef f a r t s re- p i l e s e t t l i n g and va r i a t ions of loading on l axa t ion CUXVB i n the "pile-brace" system them i n t e s t i n g , as shown i n fig.l-a,b. The with a s i m i l i t u d e c o e f f i c i e n t q N(t) and the long-term strength curve FUt
1338 I
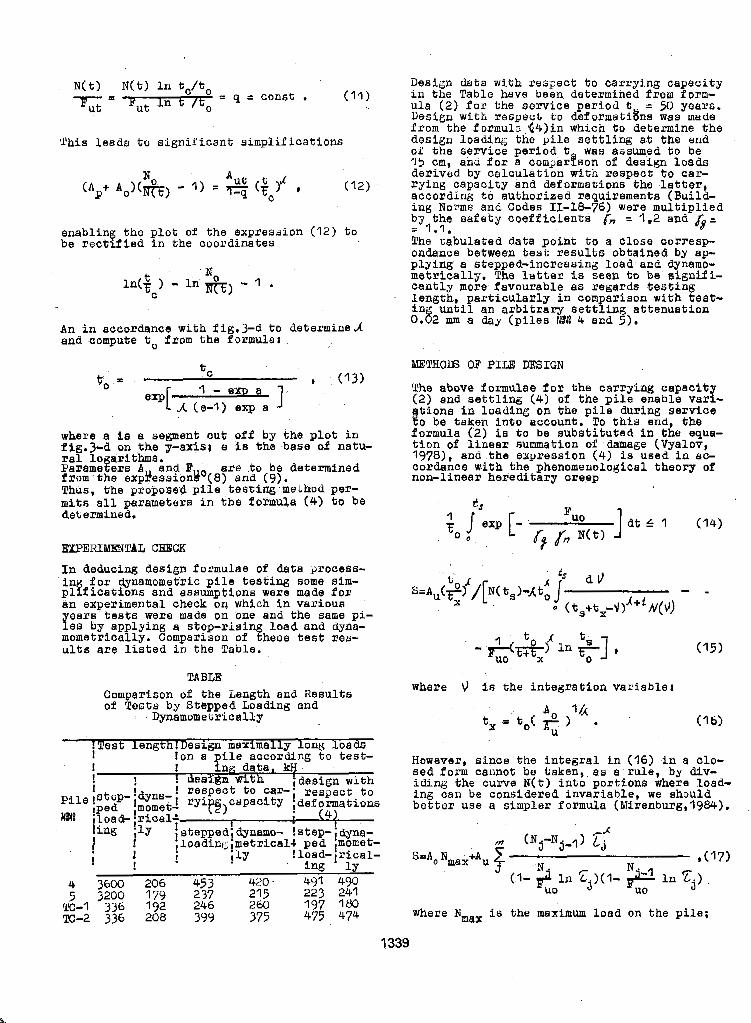
enabling the plot of the expsession (12) to be rectified in the coordinates
where a is a segment cut off by the plot in iig.3-d on the g-axial e i s the base o f natu- ral lo arithms. Paramefers A and B ape to be determined fxom'the exp8essiongo(8) and (9). Thus, the propose@ pile testing method per- mits a l l parameters in the formula (!+) to be determined.
EXPERIMENTAL CHXCK
In deducing design formulae of daca process- 'in f o r dynemometric pile testing some aim- plfficstions and assumptions were made for an experimental check on Which in various
yes by applying a step-rising l oad and dyna- mometrically. Comparison of these teat xes- ults axe 1is.ted in the Table.
ears teats were made on one and the same pi-
TABLE Comparison of the Length and Results o f !Pasts by Stepped Loading and
Dynamometrically
!Test 1engthlDesign maximally long loads ! !on a p i l e according to test- 1 ! in# date, ky ! ! ! dresi$n with i desian with
Design d a t a with respect to carrying capacity in the Table have been determined from form- u l a (2) f o x the service period t = 50 years. Design w i t l s respect to deformstib was made from the formula C4)i.n which to determine the design loading the pile settling st the end of the service period t was assumed to be 15 cm, ana f o r a com2arfeon of design loads derived by calculation witn respect to cax- rying capacity and deformations the latfer, according to authorized requirements (Bui ld- ing Norms and Codes 11-18-76) were muZtiplied by the safety coefficienta = 1.2 and 6 The uabulated data point to a close coxresp ondance between teat- results obtained by ep- plying a stepped-increasing l o a d ana dynamo- metrically. The latter is seen to be a i g n i f i - cantly more favourable as regards testing length, particularly in Comparison with test- ing until an arbitrary settling attenuation 0.02 mm a day (p i les N%? 4 and 5).
z 1.1. 8 =
" . H O B OF PTLE D E I G N
The above formulae for the carrying capacity (2) and settling (4) o f the p i l e enable veri- frons in loading on the pile during service o be taken into account. To this end, the
formula (2) i s to be substituted in the equa- tion of linear summation of damage (Vyalov, 19781, and the expression (4) is used in ac-
non-linear hereditary creep cordance with the phenomenological theory of
!
where 9 is the integration variable!
However, since the integral in (16) in a clo- sed form callnot be taken, a s a rule, by div- id ing the curve N ( t ) into portions where load-
better use a simpler formula (Mixenburg,I9&). ing can be considered invariable, we should
where Nmax is the maximum load on the p i l e ;
1339
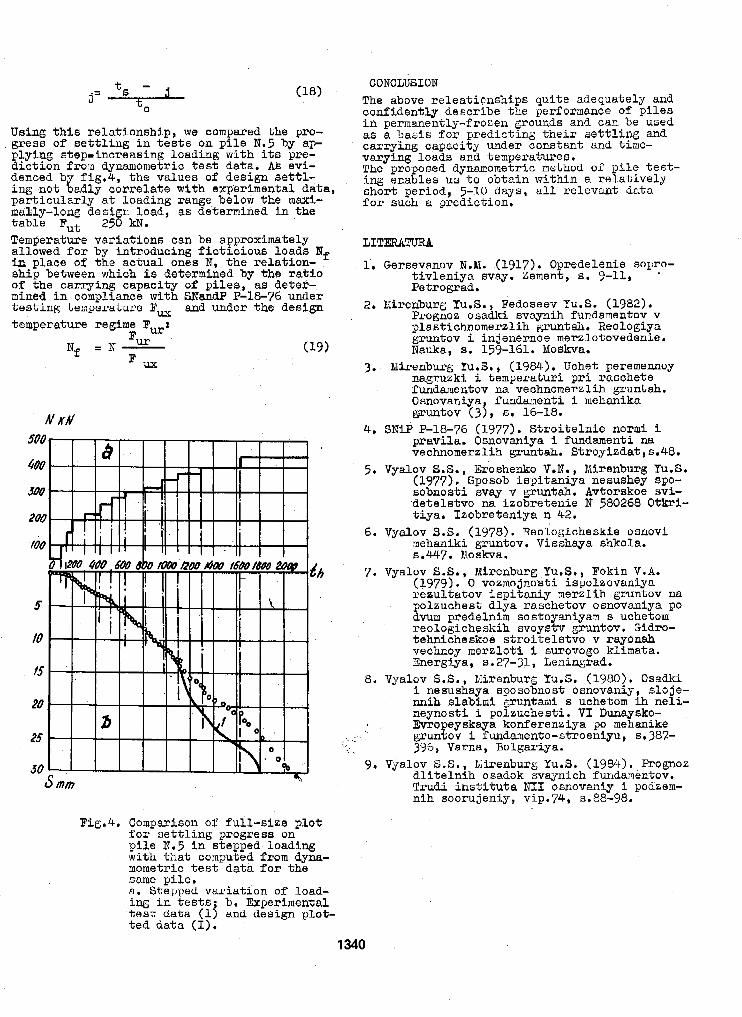
j= t, t- j CONCLUSION
(18) ' The above releaticnships quite adequately and
Using t h i s r e l a t i o n s h i p , we compared the pro- i n permanently-frozen grounds and can be used
gress o f s e t t l i n g i n t e s t s on pile N.5 by ap- as a basis fox p red ic t ing t he i r s e t t l i ng and
plying s tepincreasing loading with its pre- carrying capacity under constant and time-
d i c t ion f r o n dynamometric t e s t data. As evi- varying loads and teznperatures.
denced by fip.4, the values o f design settl- The proposed dynamometric mcthod o? p i l e t e s t - ing enables us t o obtain within a r e l a t i v e l y
par t icular ly a t loading range below the maxi- mally-long desigr: load, as determined in the
f o r such a prediction.
t a b l e Fut 250 kN. Temperature variations can be approximately allowed f o r by in t roducing f ic t ic ious loads Nf LITERA!CURA
in place o f the actual ones N, t he r e l a t ioa - sh ip beheen which is determined by the ratio
1. Gersevanov N.Y. (1917). Opredelenie sopro-
o f the carrying capacity o f piles, a s detek- mined i n compliance with SNandP P-18-76 under testing temperature F, aad under the design 2. Pirenburg X U . ~ . , Fedoseev '91u.S. (1982). temperature regime P,:
0 confidently describe the performance of p i l e s
ing not badly COPXehte with experimedd. data, period, 5-10 d a y s , all r e l e v a t d a t a
t i v l en iya svay. Zement, 8 . 9-11, '
Petrograd.
Prognoz osami svaynih fudarnentov V plasticbnomerzlih gruntah. Reologiya gruntov i injenernae merzlotovedenie.
Nf = N - Fur (19) Nauka, 8 . 159-161. MoSkva. FLW 3. hlirenburg Yu.S., (19W). Uchet peremennoy
nagruzki i temperaturi p r i raschete funaamentov na vechnornerzlih gruntah. Osnovaniya fundamnt i i mehanika gsuntov (33 , S . 16-18.
pravi la . Osnovaniya i Pundamenti na vechnomerzlih gruntah. Stroyi~dat~s.48.
5. Vyalov S.S., Eroshenko V.N., Mirenburg Yu.S. (1977)..Sposob ispitaniya aesushey spo- sobnostl may v g u t a h . Avtorskoe svi- detelstvo na izobreteuie N 580268 O t k r i - t iya. Izobreteniya D. 42.
rnehaniki gruntov. Visshaya shkola.
N K N 4. SNiP I)-18-76 (1977). S t r o i t e l n i e normi i
6. Vyalov S.S. (1978). Reoiogicheskie osnovi
8.447. !dOSkva.
7. Vyalov S . S . , Mirenburg Yu.S., Fokin V.A. (1979). 0 vozmojnosti ispoleovanlya r e m l t a t o v i s p i t a n i y rnerzlih gruntov na
dvum predelnim sostoyaniyam s uchetom polauchest dlya raschetov osnovaniya PO
reologicheskih svoystv grmntov. Gidro- tehnicheskoe s t roi te ls tvo v rayonah vechoy merzlot i i surovogo klimata. Energiya, a.27-31, Leninpad.
i nesushaya sposobnost osnovaniy, s loje- nnih slabimi gruntami s uchetom i h ne l i - neynosti i polzuchesti. VI Dunaysko-
8. VyaLov S.S., klirenburg Yu.S. (1980). Osadki
. . Wropeyskaya konferenziya po mehanike , . . , i gruntov i fundaaenfzo-stroeniyu, s.387-
396, Varna, Bolgariya.
d l i t e l n i h osadok wsynich furidamentov. Trudi i n s t i t u t a NII osnovaxiy i podzem- nih sooru j eniy , vip. 74, s . 88-98.
9. Vyalov S.S., Birenburg 1u.S. (1984). Prognoz
Fig.4, Comparison o f full-size plo t f o r s e t t l i n g progress on p i i e N . 5 in stepped loading with that computed from dyna- mometric t e s t data f o r bhhe same p i le . a. Stepped variation o f load- ing i n t e s t s ; b. Experimental t e s t d a t a (1) and design plot- t ed da t a (I).
1 340
CLASSIFICATION OF FROZEN HEAVE OF GROUND FOR HYDRAULIC ENGINEERING IN SEASONAL FROZEN REGIONS
Xie, Yinqi, Wang, Jlanguo and Yian, Weijun
Heilongjiang Provincial Research Institute of Water Conservancy
SYNOPSIS In order to satisfy the requirements of hydraulic engineering, the frost heave .property is classified into five types with absolute values of frost heave amount. On the basis of statistical analysis, the formulas are provided to calculate frost heave amount which is relative to the conditions of density, freezing index, ground water table and surcharge load.
PREFACE
In China, seasonal frozen ground mainly distri- butes in the south and north temperate zones and the mountain areas of the north subtropical zone (Xu and Wang,1983),of which the total area is about 5.137 million square kilometers and takes 5 3 . 5 % of the area of China. In seasonal frost areas, frost heave of soil has caused a large number of damages in verying degrees for various engineering constructions, such as water conservancy project, bridge, highway, pipeline. railway, airport and other buildings.Classifica- tion of frost heave of soil, which ic called the evaluation of freezing sensitivity in some coun- tries, reflects the research level and trend in some degree. Up to now, over one hundred kinds of classification methods of soil frost heave have been suggested in China and abroad, some o f which have been brought into the relevant cri- teria (Ministry of Communication, PRC, 1975; National Construction Committee, PRC,,1974). In China, since 1960's, along with the development of economy, the problem of engineering freeze damage in seasonal frost area has been paid much attention. For various trades with the classi- fication standards of frost heave in seasonal frost area were provided, but there is no any standard for water conservancy projects.
In recent years, in China and abroad a lot of research work and engineering practise.have testified that frost heave of foundation soil is not only relative to the factors of soil particle size. water content and ground water 'cable, but also closely related to engineering measures or conditions(Chen et al., 1978; Tong et al., 1985). For example, under the prerequi- site of not changing the soil composition, both the ground ramming and the additional load o f construction will greatly affect the frost heave property of ground. This shows that, if the ground soil is regarded as a system, ramming will change the inner texture of a system, which, in microscopic view, is that the increase of soil density changes the frost heave function o f the system. The additional load, a s the environmental condition, along with the condi- tions of temperature and water will also obvi-
ously change the frost heave function of the system.
The authors consider that a classification in frost heave should be faced on the following ptinciples e.i. it should be able to reflect the features of speciality and engineering, its quantitative indexes should be clear and direct: these indexes should be easy to determine. and could be applied to engineering design practi- cally, The main contents of classification should contain (1) classifying the frost heave, ( 2 ) the quantitative indexes of classifying '
frost heave, and ( 3 ) the determining method o f quantitative indexes.
Selection on indexes for classification is one of the key problems. The current classification principles are mostly based on the average frost heave rate (in America) or the frost heave ratio (such as Ollove's classification in Soviet Union), the former must be specified in laboratory with special instruments and foi the latter,the same frost heave ratio will have quite different: frost heave amount in the areas of having different frozen depth. This will make the classification very confused. Although the absolute value of frost heave amount is nor very large, it will be put into the class of strong frost heave be- cause of the small frozen depth. In the oppo- site, although the absolute value o f frost heave amount is very large, it will be put into the lower class of frost heave because of the large frozen depth.
It is obvious that the indexes of specifying frost heave classes must be clear, and should be able t o directly and quantitat'ively reflect the possible degree of damage o f ground frost heave to construction, that is, the "adaptation" degree for the permissible deforming of ground soil and constructions. Thus, it might be bet- ter to apply the absolute value of frost heave as the quantitative index for classification.
Considering that a same frost heave amount may cause various degrees of damages to different types of constructions, and even the sensitiv- ities of different parts of a construction to
1341
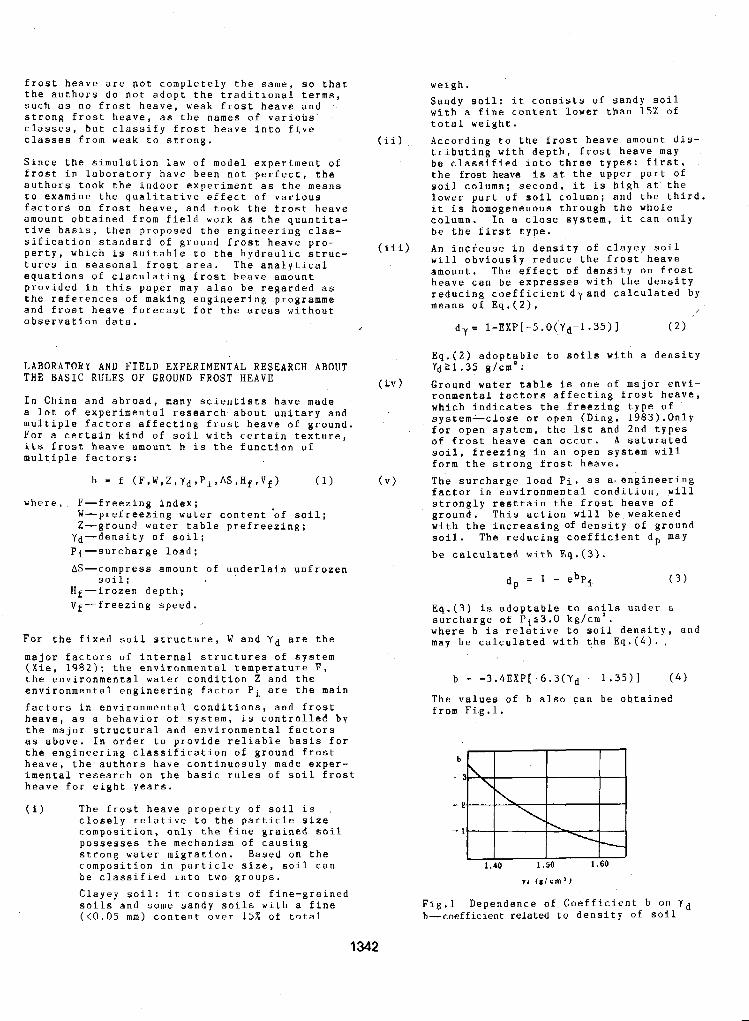
frost heave are not completely the same, s o that the authors do not adopt the traditional terms, such as n o frost heave, weak frost heave and strong frost heave, as the names of various classes, but classify frost heave into five classes from weak to strong.
Since the simulation law o f model experiment o f frost in laboratory have been not perfect, the authors took the indoor experiment as the means to examine the qualitative effect of various factord on frost heave, and took the frost heave amount obtained from field work as the quantita- tive basis, then proposed the engineering clas- sification standard of ground frost heave pro- perty, which is suitable to the hydraulic struc- tures in seasonal frost area. The analytical equations of claculating frost heave amount provided in this paper may also be regarded as the references of making engineering programme and frost heave forecast for the areas without observation data.
LABORATORY AND FIELD EXPERIMENTAL RESEARCH ABOUT THE BASIC RULES OF GROUND FROST HEAVE
In China and abroad, many scientists have made a lot of experimental research about unitary and multiple factors affecting frost heave of ground. For a certain kind of soil with certain texture, its frost heave amount h is the function of mult.iple factors:
h f (F,w,z,Yd,P,,AS,Hf,Vf) (1)
where, F-freezing index: W-prefreezing water content-of soil; Z-ground water table prefreezing;
yd-density of soil; Pi-surcharge load;
AS-compress amount of underlain unfrozen
Hf-frozen depth; Vf-freezing speed.
soil;
For the fixed soil structure, W and Yd are the major factors of internal structures of system (Xie, 1982); the environmental temperature F , the environmental water condition Z and the environmental engineering factor Pi are the main factors in environmental conditions, and frost heave, as a behavior of system, is controlled by the major, structural and environmental factors a s above. In order to provide reliable basis f o r the engineering classification o f ground frost heave, the'authors have continuosuly made exper- imental research o n the basic rules of soil frost heave for eight years.
(i) The frost heave property of soil is closely relative to the particle s i z e composition, only the fine grained soil possesses the mechanism of causing strong water migration. Based on the com~osition in particle size, soil can be ilassified into two g
Clayey soil: it consists soils and some sandy s o i ((0.05 m m ) content over
weigh. Sandy soil: it consists of sandy Soil with a Eine content lower than 15% of total weight.
tributing with depth, frost heave may be classified into three types: first, the frost heave is at the upper part o f soil column; second, it is high at the lower part of soil column: and the third. it is homogeneuous through the whole column. In a close system. it can only be the first type.
(ii) .. According to the frost heave amount dis-
(iii) An incfease in density of clayey soil will obviously reduce the frost heave amount. The effect of density on frost heave can b e expresses with the denaity reducing coefficient dyand calculated by means o f Eq.(2),
d y = l-EXP[-5.0('Yd-1.35)1 ( 2 )
ydk1.35 g/Cm ; E q . ( 2 ) adoptfble to soils with a density
(i.V) Ground water table is one of major envi- ronmental factors affecting frost heave, which indicates the freezing type of system-close or open (Ding, 1983).0nly for open system, the 1st and 2nd types of frost heave can occur. A saturated soil, freezing in an open system will form the strong frost heave.
factor in environmental condition, will strongly restrain the frost heave of ground. This action will be weakened with the increasing of density of ground soil. The reducing coefficient d p may be calculated with E q . ( 3 ) .
( V I The surcharge load Pi, a s a. engineering
dp = 1 - ebPi ( 3 )
Eq,(3) is adoptable to sofls under 8 surcharge of P i S 3 . 0 kg/cm . where b-is relative t o soil dens may be calculated with the Eq.(4
i
The values of b also can be obtai from Fig.1.
t y , and . ,
( 4 )
ned
roups.
1s with a fine 15% of total
of fine-grained Y d ( r / c m 2 )
Fig.1 Dependence of Coefficient b on Y d b-coefficient related to density of soil
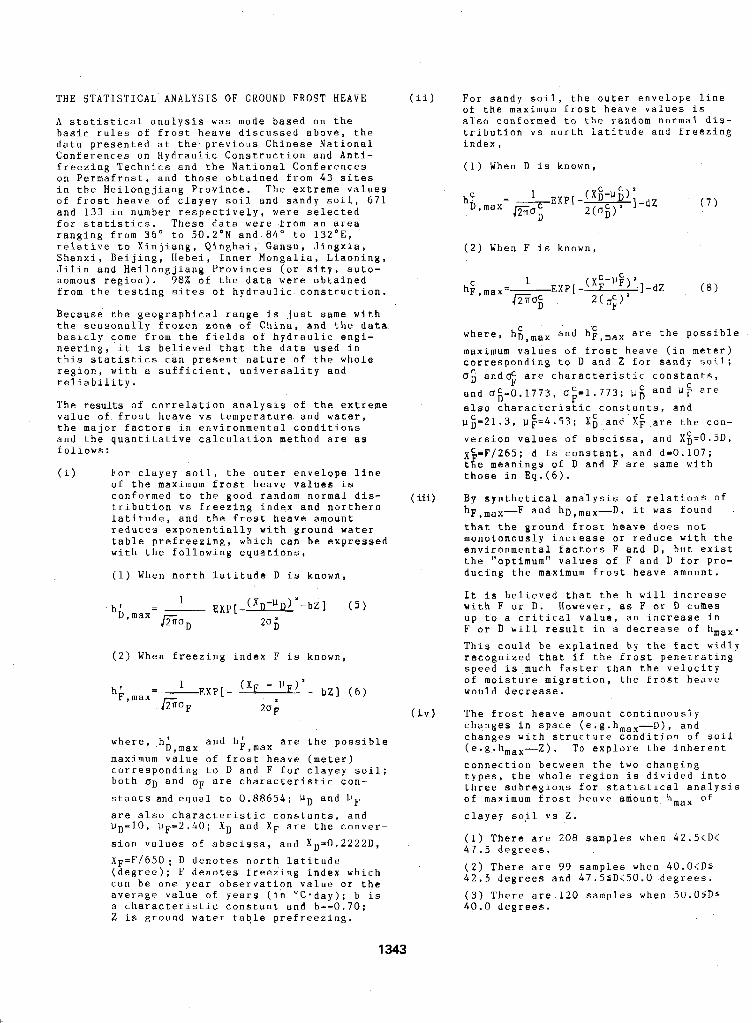
THE STATlSTICAL ANALYSIS OF GROUND FROST HEAVE
A statistical analysis was made based on the basic rules of frost heave discussed above, the data presented at the previous Chinese National Conferences on Hydraulic Construction and Anti- freezing Technics and the National Conferences on Permafrost, and those obtained from 4 3 sites
of frost heave o f clayey soil and sandy soil, 671 in the Heilongjiang Province. The extreme values
and 133 in number respectively, were selected for statistics. These data were from an area ranging from 3 6 " to 50.2'N and 84" to 132'E, relative to Xinjiang, Qinghai, Gansu, Jingxia, Shanxi, Beijing, Hebei, Inner Mongalia, Liaoning, Jilin and Heilongjiang Provinces (or sity, auto- nomous region). 98% of the data were obtained from the testing sites of hydraulic construction.
Because the geographical range is just same with the seasonally frozen zone o f China, and the d a t a basicly come from the fields of hydraulic engi- neering, it is believed that the data used in this statistics can present nature of the whole region, with a sufficient, universality and reliability.
The results of correlation analysis o f the extreme value of frost heave vs temperature and water, the major factors in environmental conditions and the quantitative calculation method are as follows:
(i) For clayey s.oil, the outer envelope line of the maximum frost heave values is conformed to the good random normal d i s - tribution vs freezing index and northern latitude, and the frost heave amount reduces exponentially with ground water table prefreezing, which can be expressed with the following equations,
(1) When north latitude D is known,
(2) When freezing index F is known,
where, ' and h+,max are the possible maximum value o f frost heave (meter) corresponding t o D and,F for clayey soil; both OD and oF are characteristic con- stants and equal to 0.88654; UD and U F
UD=lO, vF=2.4O; Xg and X F are the conver- are also characteristic Constants, and
sion values of abscissa, and X~=0.2222D, X ~ = F / 6 5 0 ; D denotes north latitude (degree); F denotes freezing index which can be one year observation value or the average value of years (in OC-day); b is a characteristic constant and b--0.70; X is ground water table prefreezing.
hD max
(ii) For sandy soil, the outer envelope line
also conformed to the random normal dis- of the maximum frost heave values is
tribution vs north latitude and freezing index,
( 1 ) When D is known,
(2) When F is known,
where, hb,max and hb,max are the possible
maximum values of frost heave (in meter) corresponding to D and 2 €or sandy soil; u s and& are characteristic constants, and 0:=0.1773, OC=1.773; Llh and are also characteristic constants, and
F
ub=21.3, Uke4.53; x; and X: are the con- version values of abscissa, and X6=0.5D, xC-F/265; d i s constant, and d=0.107; t;; meanings o f D and F are same with those in Eq.(6).
F
(iii) B y synthetical analysis of relations of hp,,,,-F and hD,max"D, it was found . that the ground frost heave does not monotonously increase or reduce with the environmental factors F and D, but exist the "optimum" values of F and D f o r pro- duci'ng the maximum frost heave amount.
with F or D. However, as F or D cones It is believed that the h will increase
F or D will result in a decrease o f h,,,. up to a critical value, an increase in
This could be explained by the fact widly recognized that if the frost penetrating speed is much faster than the velocity of moisture migration, the frost heave would decrease.
(iv) The frost heave amount continuously changes in space (e,g.hma,-D), and changes with structure condltlon of soil (eeg.hmax-Z). T o explore the inherent connection between the two changing types? the whole region is divided into three subregions for statistical analysis o f maximum frost heave amount hmax o f
clayey soil vs Z.
( 1 ) There are 208 samples when 42.5<D< 47,5 degrees.
( 2 ) There are 99 samples when 40.0<DS 42.5 degrees and 47.55D<50.0 degrees. (3) There are 1 2 0 samples when 5U.OSDZ
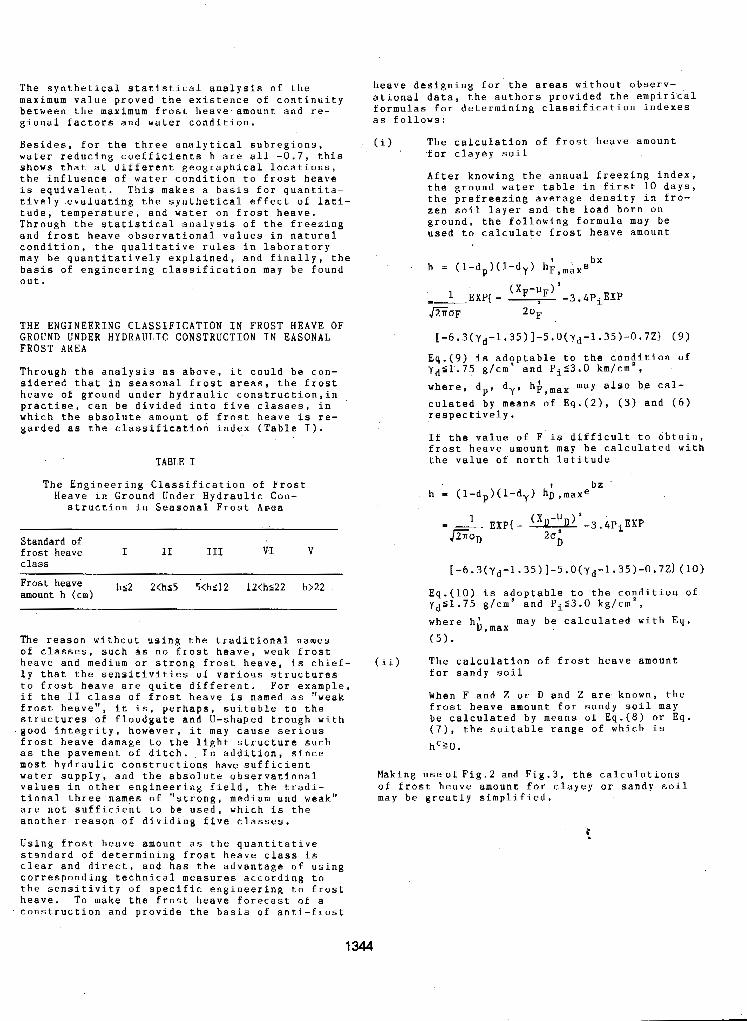
The synthetical statistical analysis of the maximum value proved the existence of continuity between the maximum frost heave amount and re- gional factors and water condition.
Besides, €or the three analytical subregions, water reducing coefficients b are a l l -0.7, this shows that at different geographical locations, the influence of water condition to frost heave is equivalent. This makes a basis for quantita- tively .evaluating the synthetical effect of lati- tude, temperature, and water on frost heave. Through the statistical analysis of the freezing and frost heave observational values in natural condition, the qualitative rules in laboratory may be quantitatively explained, and finally, the basis o f engineering classification may be found out.
TIIE ENGINEERING CLASSIFICATION IN FROST HEAVE OF GROUND UNDER HYDRAULIC CONSTRUCTION IN EASONAL FROST AREA
. - - . . -. . - . .
Through the analysis as above, it could be con- sidered that in seasonal frost areas, the frost heave of ground under hydraulic construction,in practise, can be divided into five classes, in which the absolute amount of frost heave is re- garded as the classification index (Table I).
TABLE I
The Engineering Classification of Frost Heave in Ground Under Hydraulic Con-
struction in Seasonal Frost Apea
Standard of frost heave I I1 I11 VI V class
Frost heave h ~ 2 2<hc5 5<h512 12<h522 h>22 amount h (cm)
. .. "~
The reason without using the traditional names o f classes, such as no frost heave, weak frost heave and medium or strong frost heave, is chief- ly that the sensitivities of various structures to frost heave are quite different. For example, if the I1 class of frost heave is named as "weak f r o s t j heave", it is, perhaps, suitable to the structures of floodgate and U-shaped trough with .good integrity, however, it may cause serious frost heave damage to the light structure such a s the pavement of ditch. In addition, since most hydraulic constructions have sufficient water supply, and the absolute observational values in other engineering field, the tradi- tional three names of "strong, medium and weak" are not sufficient to be used, which is the another reason of dividing five classes.
Using frost heave amount as the quantitative
clear and direct, and has the advantage ~f using standard of determining frost heave class is
corresponding technical measures according to the sensitivity of specific engineering to frost heave. TO make the frost heave forecast of a construction and proqide the basis of anti-frost
heave de signing for the a ational data. the authors
reas without observ- provided the empirical
as follows: formulas for determining classification indexes
(i) The calculation o f frost heave amount for clayey soil
After knowing the annual freezing index, the ground water table in first 10 days, the prefreezing average density in fro- zen soil layer and the load born on ground, the following formula may be used t o calculate frost heave amount
I h = (l-dp)(
Eq.(9) is adtptable to the contition of yd51.75 g/cm and P i ~ 3 . 0 krn/cm , where, dp, d y , hblmax may also b e cal- culated by means of Eq.(2), (3) and ( 6 ) respectively.
If the value of F is difficult to obtain, frost heave amount may be calculated with the value of north latitude
Eq.(lO) is adoptable to the condition of "fdS1.75 g/cm4 and Pi53.0 kg/cma,
where hh,max may be calculated with E q .
(5).
(ii) The calculation o f frost heave amount for sandy soil
When F and Z o r D and Z are known, the
be calculated by means of Eq.(8) or E q . frost heave amount for sandy soil may
( 7 ) , the suitable range of which is
hCzO.
Making use of Fig.2 and Fig.3, the calculations
may be greatly simplified. o f frost heave amount for clayey or sandy soil
c,
1 344
Z (m) 1.0 2 .0 8 .0
Fig.2 Normograph for Determining the Maximum Value of Frost Heave o f Clayey Soil
hA,max, hi,ma,-maximum value of frost heave based o n D (latitude,in degree) or
yd-density of soil (in g/cm'). F (freezing index, in 'C-day);
Fig.3 Normograph for Determining the Maximum Value of Frost Heave of Sandy S o i l
REFERENCES
,Chen Xiaobai, et a1.,(1978). The preliminary study about the effect of loading on frost heave (abstract)'. Proc.Symposium o n Gla- ciology and dryopedology, (Cryopedology) , 126-127, Lanzhou.
Ding Dewen, (1983). The calculation of freezing depth and moisture condition in open system. Proc.2nd Chinese National Conference o n Permafrost. 191-196, Lanzhou.
Ministry of Communications, PRCI(1975).Standard o f design of highway, bridge and culvert, '
People's Publishing House. National Construction Committee, PRC,(1974).
Standard of foundation design o f industrial and civil architecture TJ7-74, Chinese Architecture Publishing House.
Tong Changjiang and Guan Fengnian, (1985). Frost heave of ground and the prevention and - control.of frost damage o f construction. pp.265, Publishing House of Water Conser- vancy and Electric power, Beijing.
Xie Yinqi, (1982). The exploration of using prossed soil as the foundation o f anti-frost have. Journal of Building Technics o n Low Temperature, ( 1 1 .
X u Xuezu and Wang Jiacheng, (1983), Preliminary discussion on the distribution o f frozen ground and its zonality in China, Proc.2nd Chinese National Conference on Permafrost, 3 - 1 2 , Lanzhou.
1345
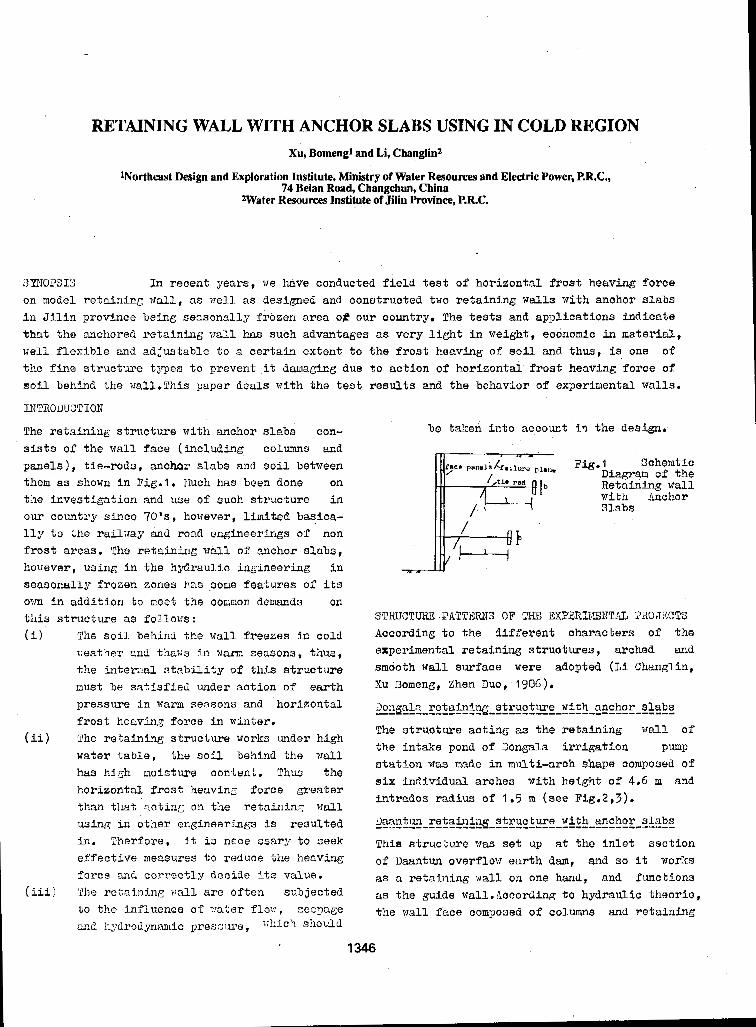
RETAINING WALL WITH ANCHOR SLABS USING IN COLD REGION Xu, Bomengl and Li, Changlinz
1Northeast Design and Exploration Institute, Ministry of Water Resources and Electric Power, P.R.C., 74 Beian Road, Changchun, China
2Water Resources Institute of Jilin Province, P.R.C.
SYNO?S I3 In recent years, we have conducted f i e l d t e s t of horizontal f rost heaving force on model retaining t.lall, as u e l l as designed and constructed two r e t a i n i n g walls with anchor slabs i n J i l i n p r o v i n c e being seasonal ly f rozen area of our country. The tests and appl ica t ions ind ica te tha t the anchored re ta in ing ~ ra l l has such advantages as v e r y l i g h t i n weigh$, economic i n mater ia l , well f l e x i b l e and ad jus t ab le t o a c e r t a i n e x t e n t t o t h e f r o s t heaving o f s o i l and thus, i s one of t h e f i n e structure types t o prevent it danaginng duo to ac t ion of horizontal froat heaving force of s o i l behind the wall.lChis paper deals with t h o t e a t r e s u l t s and the behavior of experimental walls.
IITTROJIUCTION
The r e t a i n i n g s t r u c t u r e with anchor slabs con- sists o f t h e wall face ( inc luding columns and panels), t ie-rods, anchor slabs and s o i l between them as shown i n Pig.1 . Nuch has been done on the inves t iga t ion and use of suoh s t r u c t u r e i n OUT country s ince T O ' S , hovever, l i m i t e d basica- lly t o t h e r a i l w a y and road engineerings o f non f r o s t areas. The retaLnninG nal l o f anchor slabs, hovever , us ing in the hydraul ic ingineer ing I n seasonally frozen zones has -3one fea tures o f i t s own i n addi t ion to meet t h e conaon demands on t h i s s t r u c t u r e as f o l l o v s :
The s o i l behind the wall f reezes i n cold xea'chcr and thaws .in ?;am seasons, thus , t h e i n t c r m l s t a b i l i t y o f thLs atrlzcture nus t be s a t i s f i e d under action o f earth pressure i n warm seasons and horjeontal f rost heaving force i n winter. The r e t a i n i n g s t r u c t u r e works under high water t ab le , the so11 behind the wall has high moisture content. Thus the hor izonta l f ron t heavin;; force ,@eater than that ;>.ctin: o n t he r e tn in ine mlZ.
using i n other cngineer ines is resu l ted in. ?herfore , L t is nccc ssary t o neek e f f e c t i v e measures t o reduce the heaving fo rce and correctly decide its value. The r e t a i n i n g I K C L ~ axe of ten subjected t o the in f luence oi" rrater f l o r l , cccpage m a 11;rdrodyn;mlic ppe:;:jlll*e, v L ~ c ~ s h o u l d
be taken into account in t h e design.
1346
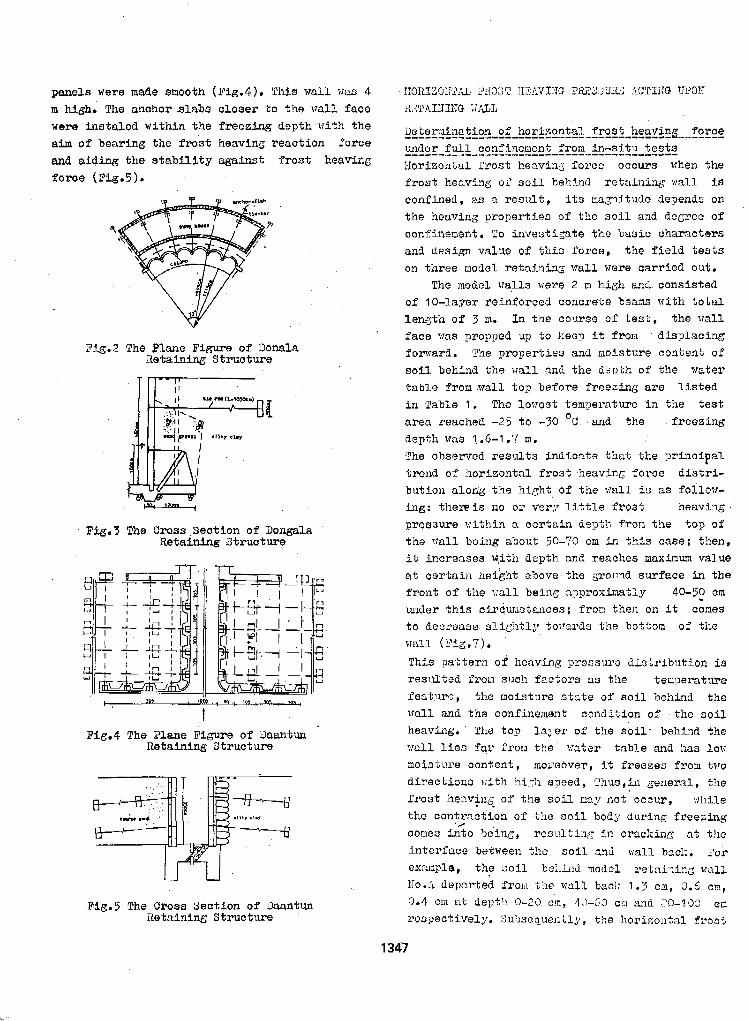
panels were made smooth (Fig.4) . !?h?a wall was 4 m high. The anchor d a b s c l o s e r t o the vall face were instaled within the freezing depth r r i t h the aim of bearing the frost heavLnE react ion force and a id ing the s t a b i l i t y against fxost heaving force (Fig.5).
4
Fig.2 The Plane F i v e o f Uonala Retaining Struoture
4 u
Fig.5 The Cross Beation o f Oaantun Retaining Struct*we
1347
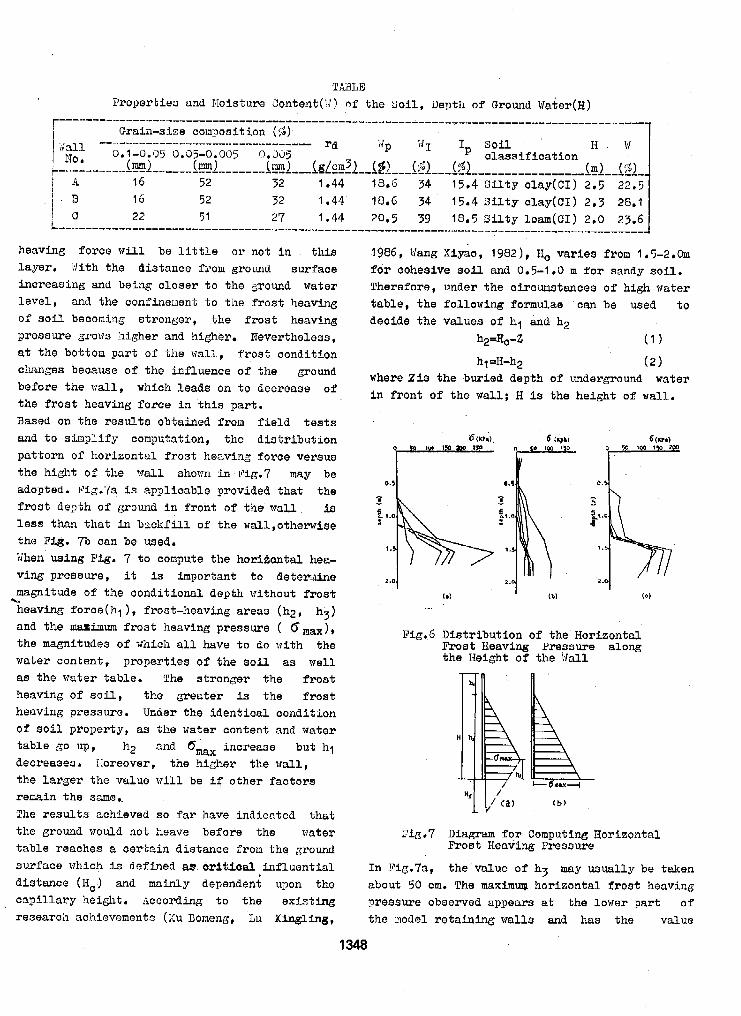
heaving forco w i l l bo l i t t l e o r not i n t h i s layer. J i t h the distance from grovnd s w i a c e inoreasing and being closer t o the g o u n d water level, and the confinewnt t o the frost heaving of soil beconing stronger, the f r o s t heaving preasure grows higher and higher. Nevertheless , at the bo t tou par t o f the wall, frost condition chnnges because of the influence o f the ground before the vall, which leads on to decrease of the frost heaving force i n this part . Based on the results obtained from field t e s t s and t o simplify computation, the distribution pat tern o f horizontal frost heaving force versus the hight of the 'C.rd1 shown i n Pig.7 may be adopted. P i g . 7 ~ i s apalioablo provided that the frost deyth o f ground i n f r o n t o f the wall is l ess than tha t in b-ckfi l l of the waJ.J.,otherwise the Fig. 7b C M be wed. When using Fig. 7 t o compute the hor ihnta2 hea- virQ pressure, i t is important t o detomine magnitude o f the conditional depth without frost heaving foroe( hl ) , frost-heaving areas (hg , h3) and the maximum frost heaving pressure ( 6 -), the magnitudes of which all. have t o do with the water content, propepties o f t h e s o i l as well as the water table. The s t ronger the f ros t heaving of s o i l , the Greater is the f ros t heaving pressure. Under the identioal oondition of soil pro?erty, 33 tho water content and water tab le go up, h2 and emX increase b u t hl decreases. I,loreover, the hizher the wall , the larger the value will be if other factors remain the 3i~ne.. The results achieved so far have indicated that the ground would not heave before the water table reaches a cer ta in dis tance from the around surface which i a dcfined as orifioal i n f luen t i a l distance (14,) and mainly dependent upon the capillary height. nccording to the existing research achiovenent3 (Lu Bonang, Lu K i n g l i n g ,
+%
1986, Wang Xiyao, 1982), El, varies from 1 . 5-2 .b f o r cohesive soil and 0.5-1.0 m f o r sandy so i l . Therefore, under the circumstances of high 'cuatex fable, the following formulae can be used t o decide the values o f hl and. h2
hg=H,-Z ( 1 1 (2) hl cII-h2
where Z i s the buried depth of underground water in f ront of the wall: H is the height of wall.
Fig.6 Distr ibut ion of the Horizontal Frost EIeaving Pressure along the Height o f the Wall
Pig.7 Dingram for Computing Borizontal Frost IIeaving Prensure
In P i~ .7a , the value o f h3 may usually be taken about 50 cm. The maximu horizontal f rost heaving prassure observed appears a t the lower ?art o f the nods1 re ta in ing walls and has the value
1348
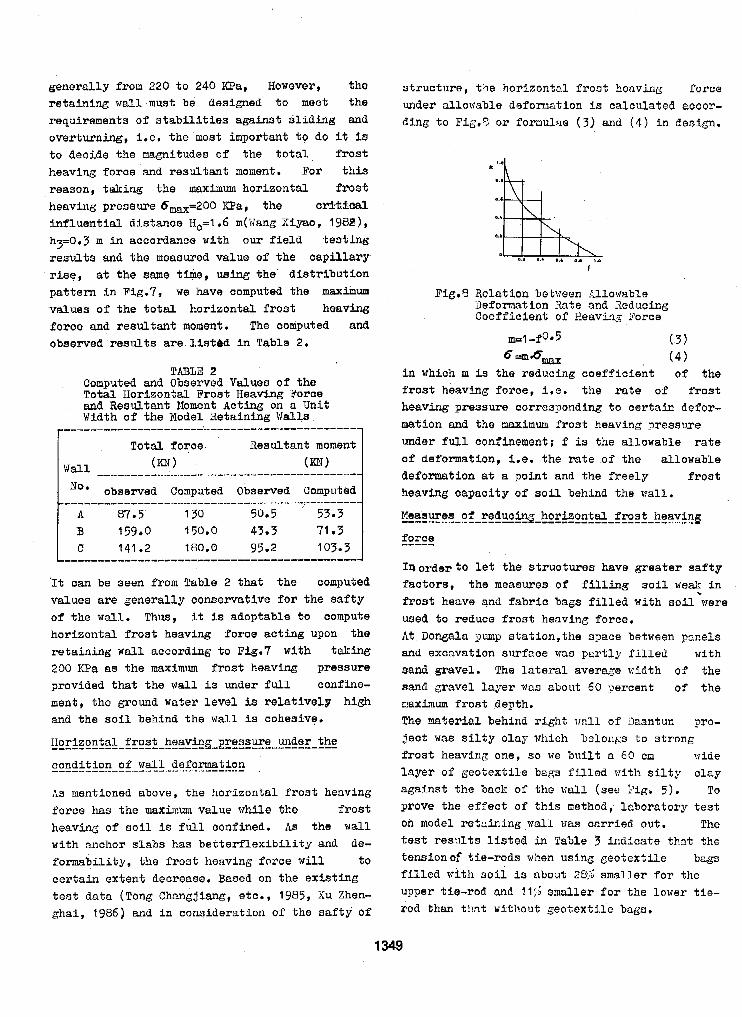
generally from 220 t o 240 KPa, Howover, the re ta in ing w a l l must be deeigned t o m o d the requirements o f s t a b i l i t i e s a g a i n s t slidhng and overturning, i.e. the.most important to do it i s t o docide the magnitudes o f the t o t a l , f r o s t heavtng force and resu l tan t moment. For t h i s reason, taking the maximum horizontal f rost heaving pressure 6,x=200 ICPa, the cr5tical inf luent ia l d is tance H,=l,6 m(Wang Xiyao, I982), h3=0.3 m in accordance with ou r f i e ld t eo t ing r e su l t s and the measured value o f the cap i l la ry rise, at the same tirim, wing tho d i s t r ibu t ion Pa f tQm i n Fig.7, we have computed tho maximum values o f the t o t a l horizontal frost heaving foroe and resultant moment. The oomputed and observed results are l i a t h d In Table 2.
TABLZ 2 Computed and Observed Values o f the Total Horizontal Frost Heavlng Force
'rlidth o f the Nodel Retaining Walls and Resultant !loment Acting on a Unit
r"""""""""""""""""""""" 1 I Total. ioroe Reaultant moment I
(m) (KN) I j Wall """""""" - """"- "* observed Computed Observed Computed
"" """""
A 87.5. 1 30 50.5 B 159.0 150.0 43.3 71 03 C 141 02 180.0 95.2 103- 3
r-"""
"""""""""""""""""""-""- 'It oan be seen from Table 2 that the computed values are generally oonservative for the safty of the wall. Thus, it i s adoptable to oompute horizontal frost heaving foroe ac t ing upon the retaining w a l l according to Pig.7 with taking
s t ructure , tho horizontal f rost heaving force under allowable deformtion ia calculated accor- ding to Pig.S o r f o m u l n e ( 3 ) and ( 4 ) i n dosign.
a ... ' ' L
Pig.9 Helation bet~cen Ulowabla Deformation Rate and Reducing Coefficient of Eeavinz Sorce
,f0* 5 ( 3 )
c-.bmax ( 4 ) in which m i s the reducing coefficient o f the frost heaving force, i,w. the rate o f f r o s t heaving pressure corrosponding t o ce r t a in defor- mation and the maximum f r o s t heaving pressure under fu l l confinement: f is the allowable rate of defamation, i.e. the rate of the allowable deformation at a point and the f ree ly f ros t heaving capacity of soil behind the wall.
I n o ~ d 9 s t o l e t t he s t ruo tu res have g rea t e r s a f ty factors , the measures o f filling s o i l weak in f r o s t heave qnd fabr ic bags f i l l ed with soil. were used t o reduca frost heaving force. A t Donmln l>un.p s ta t ion , the o p z e between panels and excavation surfszce was p a r t l y f i l l e d with
*
A s mentioned above, the horizontal f rost heaving force has the maxircum value while the frost hoaving of s o i l is f i l l confined. A s the wall with anchor slabs has b e t t e r f l e x i b i l i t y and de- formabili ty, the frost heaving force will t o certain extent decrease. Based on the axiat ing t e s t d a t a (Tong Changjiang, etc., 1985, Xu Zhen- &ai , 1996) and in consideration o f the snf ty Of
against the back OS the vall (see Yig. 5) . To prove the effect o f t h i s method, Icboratory t e s t on made1 ret.=ir,ing wall BXS carried ou t . The t e s t r e s u l t a l i s t e d in Table 3 irldicate t h a t the tensionof tie-rods when using GeotextiZe bags f i l l e d v i t h soil is about 281; smaller f o r the upper tie-rod and 11:: smaller fo r t he l ove r t i e - rod than tlmt without g c o t e x t l l e bags.
1349
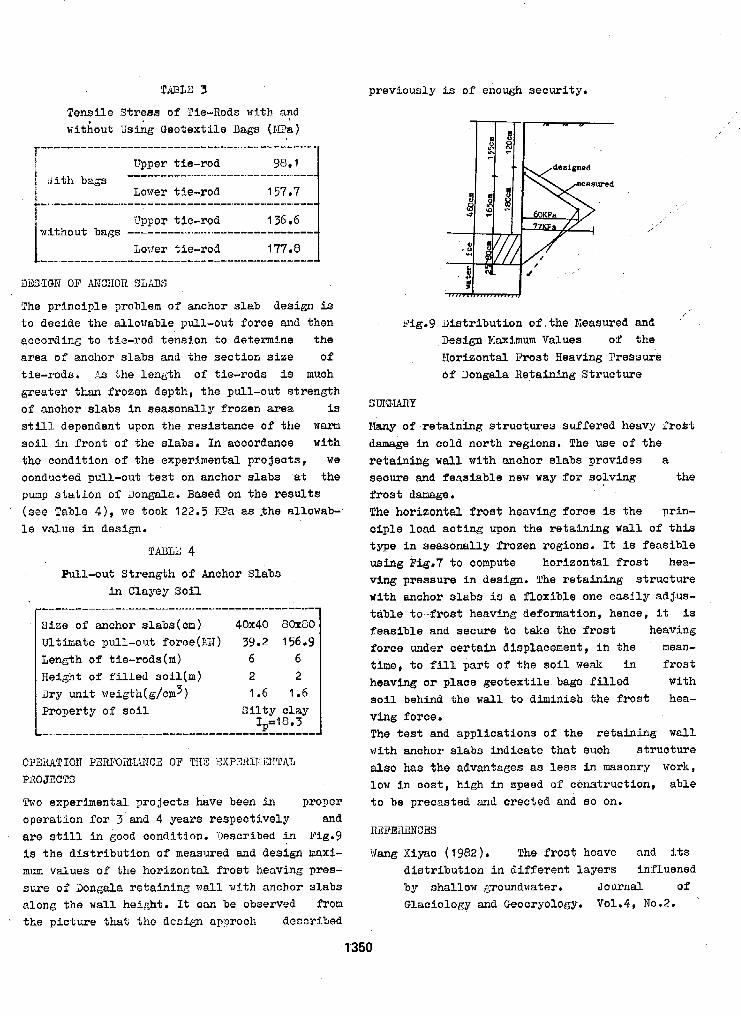
TArYLE 3
Tenai le S t rees of Tie-Rods wi th y d without Vsi& Geotext i le Dag8 (PPa)
Upper t ie-rod 93.1
Lover tie-rod 1 57 07
irpper t ie-rod 136.6
Lover t ie-rod 177.8
1
~"""".... "_ ~ iklith bzgs
-. "lI""".~"""I"~""""_..".*".I.~ "-.I"
without b q p
"" "_"""~~"""""""" DESIGN OF i JCHOH SLAB3
The principle problem o f anchor s U b design is to decide the al lotmble pull-ouf force and then according to t ie-rod tension t o determine the area of anchor slabs and t h e s e c t i o n s i z e of t ie-rods. ?is the l ength o f t ie-rods is much greater than f rozen depth, the pul l -out s t rength of anchor slabs in seasonal ly f rozen area i s still dependent upon the ree is tanoe of t h e warm soil in f r o n t o f the slabs. Tn accordanae with the condi t ion o f the experimental projeote, we conducted pull-out t e s t on anchor slabs at the pump s t a t i o n o f i)ongnle* Based on t h e results (see Table 4 ) , we took 122.5 D a as .the allowab-, l e value in desi,m.
TABL% 4 Pull-out Strength of Anchor Slabs
i n Clayey 9011 ~ ~
Size of anchor slabs( on) 40x40 8Oxl lO
mt ina t e pu l l -ou t fo rce (PJ ) 39.2 156.9 Length of tie-rods(m) 6 6 Height of f i l l e d s o i l ( m ) 2 2 m y u n i t weigth(g/cm3) 1.6 1.6
OPZlUTIOB PElu~oiu~~J:ci3 OP THY 3XXPEIIIIlimTAL Pl?OJZCTS
Two experimental. projects have been in proper operation for 3'and 4 years respoct ively and are still i n good condition. Described i n Pig.9 is the d i s t r i b u t i o n o f measured and design m x i - mum values of the horizontal frost heaving proa- Sure of J o n g d a r e t a i n i n g uall with anchor slabs along the wall heipbt. It OM be observed fron
. t h e p i c t u r e that tho d w i @ approch doocxihed
previously i s of enough secur i ty .
I 1350
Fig.9 Dis t r ibu t ion of . the rteasuxed ana Design Naximum Values of t h e Borizonfal F ros t Heaving Pressure o f Dongala Retalnlnng St rua ture
3 U m i Y
Hany of re ta in ing s t ruot ,ures suf fe red heavy i rab t damage in cold north regions. The w e of t h e r e t a i n i n g wall with anohor slabs provides 8.
secure and feasiable new way for ao lv ing the f r o s t damage. The horizontal frost heaving force is the pr in- c i p l e load a c t i n g upon t h e retahknng wall of t h i s type in seasonal ly f rozen regions. T t is f e a s i b l e using Fig.7 t o compute ho r i zon ta l f ro s t hea- ving pressure i n design. The re ta inhng s t ruc ture with anchor s labs i s a flexible one e a s i l y adjus- t a b l e t o - f r o s t honvinp; deformation, hence, it i s
Peaslble and secure t o take tho froat heaving force under oer tah displacement , i h the mean- t ime , t o f i l l part o f t h e s o i l wed< in f r o s t heaving or p lace geo tex t i l e bags filled with s o i l behind the wall to d iminish the f r o s t hen- ving force. The t e s t and appl ica t ions o f the r e t a i n i n g wall v i t h anohor s l abs hd ica t e that such s t r u c t u r e also has the advantages as l e s s in masonry work, low in c o s t , high i n speed o f cbnatruct ion, able t o be precasted and orected and so on.
RZFEBXNCES
lhng Xiyao ( 1982) . The f r o s t heave and its d i s t r i b u t i o n i n d i f f e r e n t l a y e r s i n f l u e n e d by shallow groundwater. Journal of Glaciology and Eeocryology. Vo1.4, No.2.
xu Bornens, Lu Xingling ( 1906) Influence of moisture aondition on frost hoave i n clay, Journal o f Glacioloiry and G-eocryology. V O l . 8 , NO.?.
Ton?: Chacgjinng, Guan Fengnian (1905) Prost; heave o f soil and treatment o f frost damage of engineering structures. P.95.
Li mangkin, Xu Bomeng, Zhen IJUO (1936 1. dxpo- rimenfa o f anchor s lab re ta in ing w a l l f o r hydraulic enginewings in seasonally frozen region. Joux-hal of Northeant Hydraulic and Hydroelectric Engineering. No.11.
‘Xu Zhcnghai ( I986 1, Approxinlate calculat ion o f the n o m L fro3t heaving f o r o e acting on the base of foundation, Journal Of
Glaciology and Geocryology. Vol,B, N o r 3 ,
1351
THAW STABILIZATION OF ROADWAY EMBANKMENTS J.P. Zarling,' W.A. Braky2 and D.C. Esch3
%chool of Engineering, University of Alaska Fairbanks 2Institute of Northern Engineering, University of Alaska Fairbanks
3State of Alaska, Dept. of Transportation & Public Facilities
SYNOPSIS The thermal degradation of permafrost beneath Alaskan roads leads to expensive maintenance and repair costs. This study evaluated two .methods to stabilize the thaw. Snow sheds were built along two sections of roadways to shade the ground during summer and prevent snow from acting as an insulating blanket during winter. The second method consisted of re- moving snow during the winter months to reduce surface temperature. The res'ults show Chat the snow sheds were more effective in decreasinq the ground surface temperatures and, as such, the concept could be further developed.
INTRODUCTION
The existence of permafrost in northern regions has required highway engineers to carefully examine the effect of construction on the thermal regime of the ground. In both continu- ous-and discontinuous permafrost areas, chang- ing the ground surface condition can lead to thaw degradation of the underlying permafrost, and subsequent thaw consolidation and settle- ment in ice-rich soils. It is well established that in most northern locations, a . 5 O C to 5°C temperature difference exists between the mean annual air and ground surface temperatures. This difference is a function of slope and surface orientation, vegetative and snow cover, ground thermal properties, meteorological conditions, and surface and subsurface drain- age. For example , shading the ground surface from the summer time sun and removing the insulating snow cover during the winter months should result in the mean annual soil surface temperature (MASST) approaching equality with the mean annual air temperature. If these modifications result in lowering the MASST below O " C , permafrost will tend to be formed or thaw degradation of the permafrost will be prevented o r stopped.
In the cooler Arctic regions the most common method of protecting a roadway constructed over permafrost against thaw settlement is through the use of gravel fill of sufficient depth to contain the active layer. As the MASST in- creases the required fill thickness increases.
MASST approaches O T . The fill thickness can The use of fill becomes uneconomical as the
be reduced through the use of rigid foam plastic insulation (Esch, 1973, 1983). Al- though the fill will protect the permafrost beneath the center of the roadway, the sloping of the fill to zero thickness at the toe o f the embankment allows this region to experience thaw degradation. This is further exacerbated by plowing snow from the roadway during winter, which increases the thickness of snow cover on the side-slopes and the toe zone, further
insulating the ground from the cold air. When the side slope thaw front penetrates into ice-rich permafrost, consolkdation ana thaw settlements occux. The effects of this settle- ment are sliding or rotation o f the slopes and cracking of the surface.
Air duct systems (Zarling et al., 1983) have been used as an attempt to mktigate this problem. The concept is to bury a duct or pipe in each side-slope near the toe of the roadway with its ends open to the atmosphere. Cold air by either natural or forced convection will flow through the pipe, cooling and freezing the
been the use of insulation placed in the toe of surrounding ground. Other alternatives have
fill and construction of a berm at the toe of fill (Esch, 1983). However, none of these treatments have yet proven totally effective in preventing slope thawing and movements.
In discontinuous permafrost areas, the MASST of the paved roadway may be above O O C . In this case, no amount of insulation or fill will prevent thaw degradation, only SLOW it down. Berg et al. (1983) have applied white and
ments to pavements in an attempt to lower the yellow paint and several other surface treat-
MASST. As their study demonstrated, a painted roadway surface does yield a lower surface
high solar albedo of the surface. Additional- temperature, but traffic quickly degrades the
ly, there are safety considerations when using painted roadway surfaces which become slippery when wet.
This study addresses two snow management schemes in an attempt to achieve colder roadway slope surface temperatures. The scope of the project was to build snow sheds along two sections and to remove the snow cover along one section of roadway embankments. The snow sheds were designed to shade the ground surface from the sun during summer and to prevent the snow cover from insulating the ground surface during winter,
1352
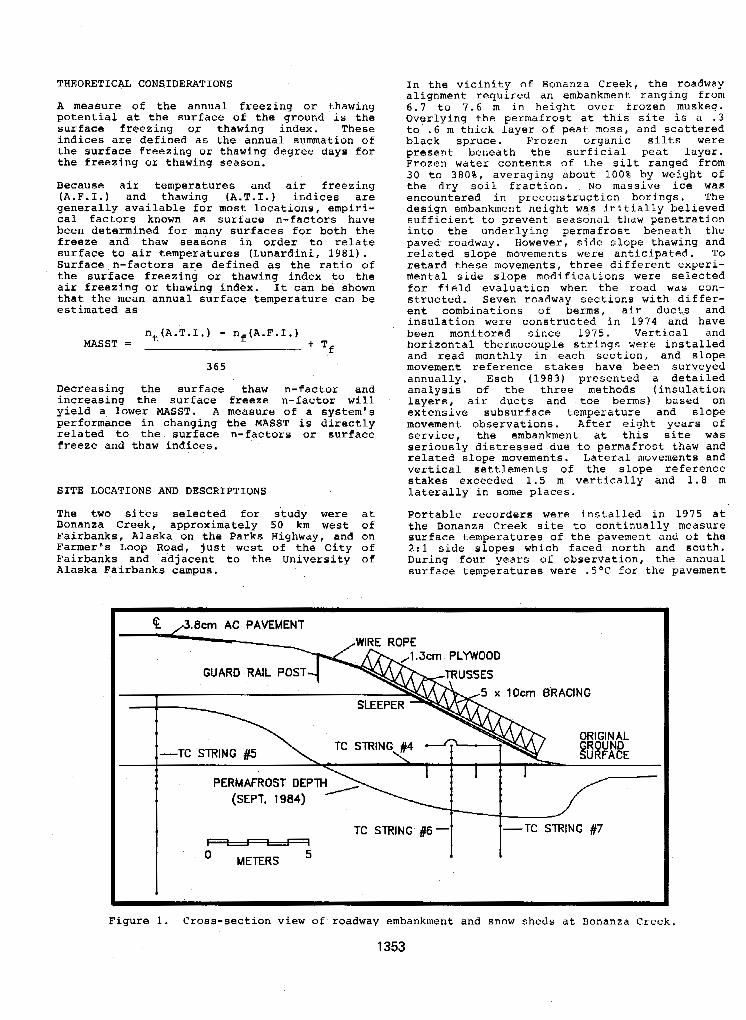
THEORETICAL CONSIDERATIONS
A measure o f the annual freezing or thawing potential at the surface of the ground i s the surface freezing or thawing index. These indices are defined as the annual summation of the surface freezing or thawing degree days for the freezing or thawing season.
Because air temperatures and air freezing (A.F.I.) and thawing (A.T.I.) indices are generally available for most locations, empiri- cal factors known as surface n-factors have been determined for many surfaces for both the freeze and thaw seasons in order to relate surface to air temperatures (Lunardini, 1981). Surface n-factors are defined as the ratio of the surface freezing or thawing index to the air freezing or thawing index. It can be shown that the mean annual surface temperature can be estimated as
nt(A.T.I.) - nf (A.F.I*) MASST =
+ Tf 365
Decreasing the surface thaw n-factor and increasing the surface freeze n-factor will yield a lower MASST. A measure of a system's performance in changing the MASST is directly related to the surface n-factors or surface freeze and thaw indices.
SITE LOCATIONS AND DESCRIPTIONS
The two sites selected for study were at Bonanza Creek, approximately 50 km west of Fairbanks, Alaska on the Parks Highway, and on Farmer's Loop Road, just west of the City of Fairbanks and adjacent to the University of Alaska Fairbanks campus.
In the vicinity of Bonanza Creek, the roadway alignment required an embankment ranging from 6.7 to 7.6 m in height over frozen muskeg. Overlying the permafrost at this site is a . 3 to . 6 m thick layer of peat moss, and scattered black spruce. Frozen organic silts were present beneath the surficial peat layer. Frozen water contents of the silt ranged from 30 to 380%, averaging about 100% by weight of the dry soil fraction. No massive ice was encountered in preconstruction borings. The design embankment height was initially believed sufficient to prevent seasonal thaw penetration into the underlying permafrost beneath the paved roadway. However, side slope thawing and related slope movements were anticipated. To retard these movements, three different experi- mental side slope modifications were selected for field evaluation when the road was con- structed. Seven roadway sections with differ- ent combinations of berms, air ducks and insulation were constructed in 1 9 7 4 and have been monitored since 1975. Vertical and horizontal thermocouple strings were installed and read monthly in each section, and slope movement reference stakes have been surveyed annually, Esch (1983) presented a detailed analysis of the three methods (insulation layers, air ducts and toe berms) based on extensive subsurface temperature and slope movement observations. After eight years of service, the embankment at this site was seriously distressed due to permafrost thaw and related slope movements. Lateral movements and vertical settlements o f the slope reference stakes exceeded 1.5 m vertically and 1.8 m laterally in some places.
Portable recorders were installed in 1 9 7 5 at the Bonanza Creek site to continually measure surface temperatures of the pavement and of the 2:1 side slopes which faced north and south. During four years of observation, the annual surface temperatures were .5OC for the pavement
10cm BRACING
PERMAfROSf DEP
~
TC STRING #6- - METERS 5 t -TC STRING #7
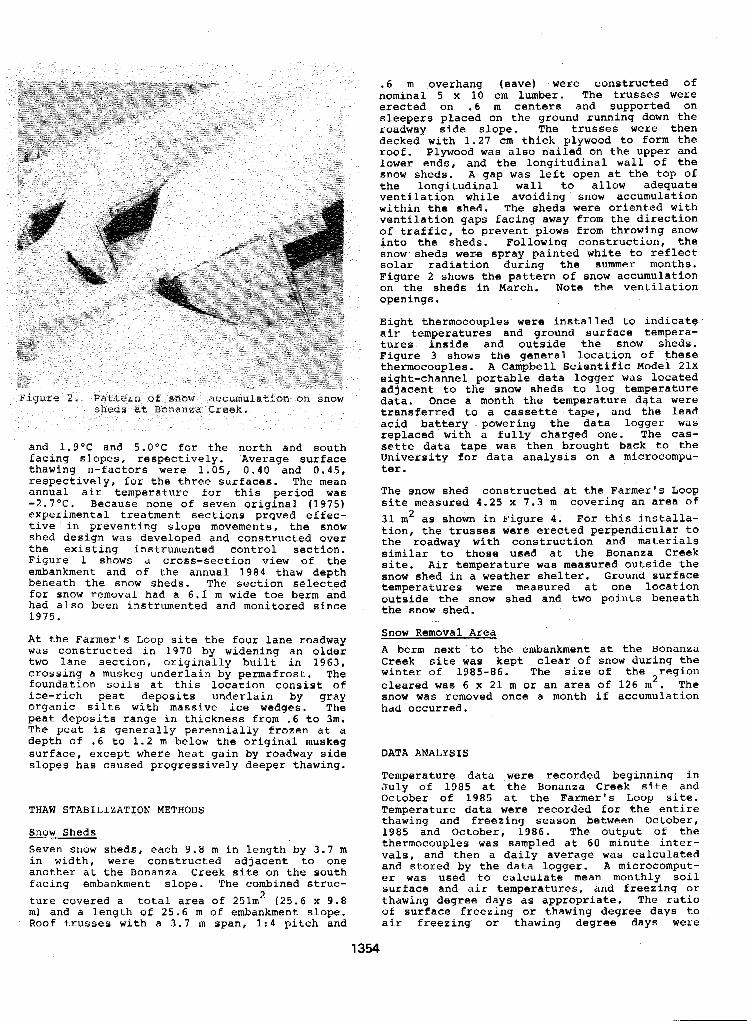
and 1.9'C and 5.O0C for the north and south
thawing n-factors were 1.05, 0.40 and 0 . 4 5 , facing slopes, respectively. Average surface
respectively, for the three suxfaces. The mean annual air temperature for this period was -2.7OC. Because none of seven original (1975) experimental treatment sections prQved effec- tive in preventing slope movements, the snow shed design was developed and constructed over the existing instrumented control section. Figure 1 shows a cross-section view of the embankment and of the annual 1984 thaw depth beneath the snow sheds. The section selected for snow removal had a 6 . I m wide toe berm and had also been instrumented and monitored since 1975.
At the Farmer's Loop site the four lane roadway was constructed in 1 9 7 0 by widening an older two lane section, originally built in 1963, crossing a muskeg underlain by permafrost. The foundation soils at this location consist of
organic silts with massive ice wedges. The ice-rich peat deposits underlain by gray
peat deposits range in thickness from .6 to 3m. The peat i s generally perennially frozen at a depth of .6 to 1.2 m below the original muskeg surface, except where heat gain by roadway side slopes has caused progressively deeper thawing.
THAW STABILIZATION METHODS
Snow Sheds Seven snow sheds, each 9.8 m in length by 3 . 7 m in width, were constructed adjacent to one another at the Bonanza Creek site on the south facing embankment slope. The combined struc- ture covered a total area of 251m2 (25.6 x 9.8 m) and a length of 2 5 . 6 m of embankment slope. Roof trusses with a 3 . 7 m span, 1:4 pitch and
. 6 m overhang (eave) were constructed of nominal 5 x 10 cm lumber. The trusses were erected on - 6 m centers and supported on sleepers placed on the ground running down the roadway side slope. The trusses were then decked with 1.27 cm thick plywood to form the roof. Plywood was also nailed on the upper and lower ends, and the longitudinal wall of the snow sheds. A gap was left open at the top of the longitudinal wall to allow adequate ventilation while avoiding snow accumulation within the shed. The sheds were oriented with ventilation gaps facing away Erom the direction of traffic, to prevent plows from throwing snow into the sheds. Following construction, the snow sheds were spray painted white to reflect ,solar radiation during the summer months. Figure 2 shows the pattern of snow accumulation on the sheds in March. Note the ventilation openings.
Eight thermocouples were installed to indicat9 air temperatures and ground surface tempera- tures inside and outside the snow sheds. Figure 3 shows the general location of these thermocouples. A Campbell Scientific Model 21X eight-channel portable data logger was located adjacent to the snow sheds to log temperature data. Once a month the temperature dqta were transferred to a cassette tape, and the lead acid battery -powering the data logger was replaced with a fully charged one. The cas- sette data tape was then brought back to the University for data analysis on a rnicrocompu- ter . The snow shed constructed at the Farmer's Loop site measured 4 .25 x 7.3 m covering an area of 31 m as shown in Figure 4 . For this installa- tion, the trusses were erected perpendicular to the roadway with construction and materials similar to those used at the Bonanza Creek site. Air temperature was measured outside the snow shed in a weather shelter. Ground surface temperatures were measured at one location outside the snow shed and two points beneath the snow shed.
2
Snow Removal Area A berm next to the embankment at the Bonanza
winter of 1985-86. The size of the region Creek site was kept clear of snow during the
cleared was 6 x 21 m or an area of 126 m . The snow was removed once a month if accumulation had occurred.
2
DATA ANALYSIS
Temperature data were recorded beginning in July of 1985 at the Bonanza Creek site and October of 1985 at the Farmer's Loop site. Temperature data were recorded for the entire thawing and freezing season between October, 1985 and October, 1986. The output of the thermocouples was sampled at 60 minute inter- vals, and then a daily average was calculated and stored by the data logger. A microcomput- er was used to calculate mean monthly soil surface and air temperatures, and freezing or thawing degree days as appropriate. The ratio of surface freezing or thawing degree days to air freezing or thawing degree days were
1354
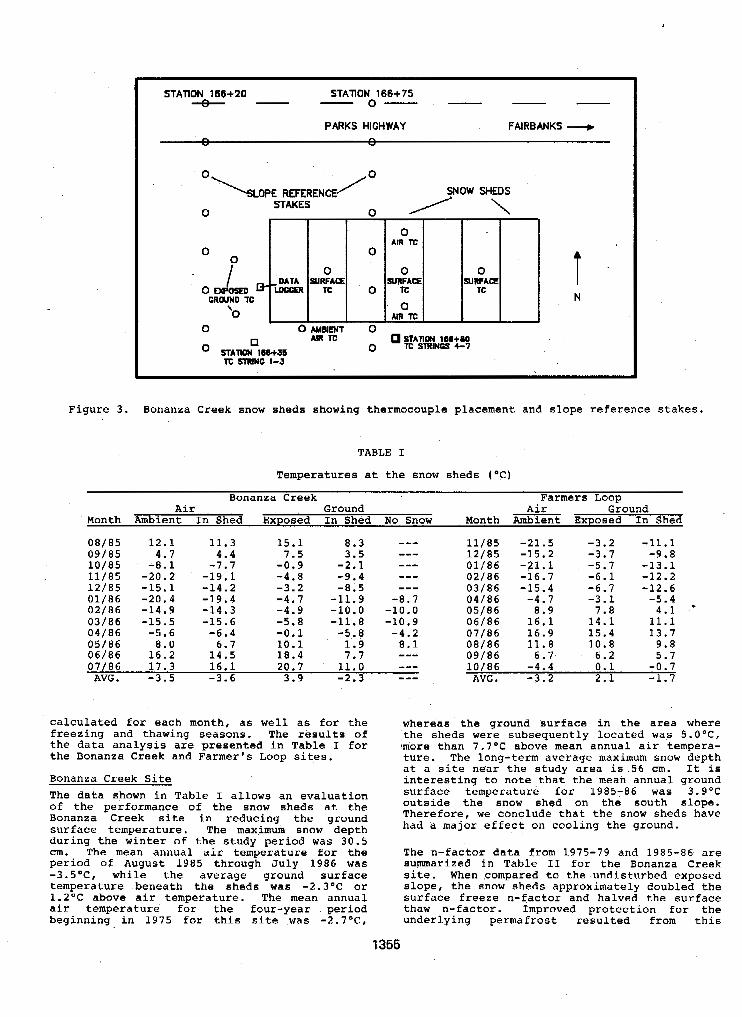
STATION 160+20 STATION 166+75 " - 0 - - -
PARKS HIGHWAY FAIRBANKS "+ F, " v
'\LOPE REFERENCE /O
0 STAKES
0
0
P '0
0 AIR lt
0
SURFAEE 0
o m 0
0 SJRFAEE
TC
0 STATION 186+35 TC SIRING 1-3
AIR TE STATION 168+M 0 Tc STRING5 4-7
T N
Figure 3. Bonanza Creek snow sheds showing thermocouple placement and slope reference stakes.
TABLE I
Temperatures at the snow sheds ("C)
Bonanza Creek Farmers Loop
Month Amb ient In Shed Exposed In Shed No Snow Month Ambient Exposed In Shed Air Ground Air Ground
08/85 12.1 11.3 09/85 4.7 10/85 -8.1
4.4
11/85 -20.2 -19.1 -1.7
12/85 -15.1 -14.2 01/86 -20.4 -19.4 02/86 -14.9 -14.3 03/86 -15.5 -15.6 04/86 -5.6 -6.4 05/86 8.0 06/86 16.2 14.5
6.1
07/86 17.3 16.1 AVG . -3.5 -3.6
15.1 7.5
8.3 3.5
-0.9 -2.1 -4.8 -9.4 -3.2 -8.5
-4.9 -10.0 -10.0 -4.7 -11.9 -8.7
-5.8 -11.8 -10.9 -0.1 -5.8 -4.2 10.1 1.9 18.4
8.1 7.7
_" "- -" -"
"*
20.7 11.0 3.9 -2.3 "-
11/85 -21.5 -3.2 -11.1 12/85 -15.2 -3.7 01/86 -21.1
-9.8
02/86 -16.7 -5.7 -13.1
03/86 -15.4 -6.1 -12.2
04/86 -4.7 -6.7 -12.6 -3.1 -5.4
05/86 8.9 7.8 06/86 16.1
4.1 - 14.1 11.1
07/86 16.9 08/86 11.8
15.4 13.7
09/86 10.8
6.7 6.2 9.8 5.7
10/86 -4.4 0.1 AVG . -0.7
-3.2 2.1 -1.7
calculated for each month, as well as for the whereas the ground surface in the area where freezing and thawing seasons. The results of the sheds were subsequently located w a s 5.O0C, the data analysis are presented in Table I for ;more than 7 ,T0C above mean annual air tempera- the Bonanza Creek and Farmer's Loop sites. ture. The long-term average maximum snow depth
Bonanza Creek Site at a site near the study area is -56 cm. It i s interesting to note that the mean annual ground
The data shown in Table T allows an evaluation of the performance of the snow sheds at the Bonanza Creek site in seducing the ground surface temperature. The maximum snow depth during the winter of the study period was 30.5
period o f August 1985 through July 1986 was cm. The mean annual air temperature for the
-3.5'C, while the average ground surface temperature beneath the sheds was -2.3OC or 1.2'C above air temperature. The mean annual air temperature for the four-year period beginning in 1975 for this site was -2.7OC,
surface temperature for 1985-86 was 3.9'C outside the snow shed on the south slope. Therefore, we conclude that the snow sheds have had a major effect on cooling the ground.
The n-factor data from 1975-79 and 1985-86 are summarized in Table If for the Bonanza Creek s i t e . When ,compared to the undisturbed exposed slope, the snow sheds approximately doubled the surface freeze n-factor and halved the surface thaw n-factor. Improved protection for the underlying permafrost resulted from this
1355
TABLE I1
N-factor comparisons from the 1975-79'data and the 1985-86 data at Bonanza Creek.
Exposed Slope Snow Shed Air thawing 1975-79 1985-86 1985-86 and freezing
indices 1985-86
nt 1.72 1.25 0.55 1,767 Co-day
nf 0.40 0.28 0 . 5 9 3,068 co-day
increased winter cooling and reduced summer warming of the ground surface. The exposed embankment slope surface n-factors for the two observation periods differed significantly as shown in Table 11. These differences in n-factors may be the result oE different solar exposure due to vegetation growth differences and sensor positioning, and to differences in wintertime snow depths.
Farmer's Loop Site Data were recorded at the Farmer's Loop Road snow sheds starting in August of 1985. At the completion of one annual temperature observa- tions cycle, the n-factor data show the same trend as the data from Bonanza Creek. Table 111 summarizes this n-factor data.
TABLE 111
N-factor data from the Farmer's Loop snow sheds.
Exposed slope Snow shed Air thawing and 1985-86 1985-86 freezing indices
1985-86
"t . 8 8 .66 1,649 CO-day
"f .30 .67 2,976 C'-day
During the test period the mean annual air temperature, mean annual soil surface tempera- ture-exposed, and mean annual soil surface temperature with snow sheds were -3.2OC, 2.1'C and -1.7"C, respectively. The maximum snow depth attained at the site during this period was approximately 30 cm while the long-term average maximum at a site near the study area is 61 cm. Again, the effect o f the snow shed
this case by 3.9OC. The mean annual soil is to reduce the ground surface temperature, in
surface temperature beneath this snow shed i s -1.7'C and as a result, refreezing and stabilization of the embankment slope should occur over a period of time. The surface thawing n-factor €or the exposed slope is about one-half the value for the same parameter at Bonanza Creek. This is most likely explajned by the heavier vegetative ground cover, the lower slope height and the less southerly exposure of the FarmeY's Loop site.
Snow Removal Area The benefits of snow removal from the top of the section of the embankment berm were not nearly as notable as at the snow shed section. This is to be expected because the snow was only removed monthly and the treatment width was only 6.1 m. Removal of the snow from the 2:l embankment side slopes was not found feasible due to the steepness and the presence o f large rocks. Evidence of a benefit from the snow removal was found during the annual thaw depth probing surveys, done in late September of 1986. At that time a layer of residual frost approximately 15 cm in thickness was encountered beneath the snow cleared areas at a depth between 1.2 m to 1.5 'm. Probing could penetrate this layer if considerable effort was expended. However, the presence of residual frost from the prior winter at this late date indicated that the snow removal had the effect of preventing the further progression o f annual thawing into the underlying permafrost.
Temperatures recorded at the ground surface on the snow removal area did not cover the entire winter due to equipment problems. Data record- ed are shown in Table I in the "no snow" column. Extrapolation of this data over the full season indicates that the freezing n- factor resulting from periodic snow removal was approximately 0.50 and that the average resul- tant mean annual surface temperature was very close to O°C.
At both study sites during the winter season of the study period, the snowfall and the maximum depth of snow accumulation were approximately half of the long-term averages o f these values. It could be expected that during a year of average snowfall the surface freezing index for exposed ground would be lessened due to the increase of the insulating ability of the snow cover. In thia case the usefulness of snow sheds and snow removal in lowering the MASST would be accentuated when compared to an area retaining the natural snowfall through the winter.
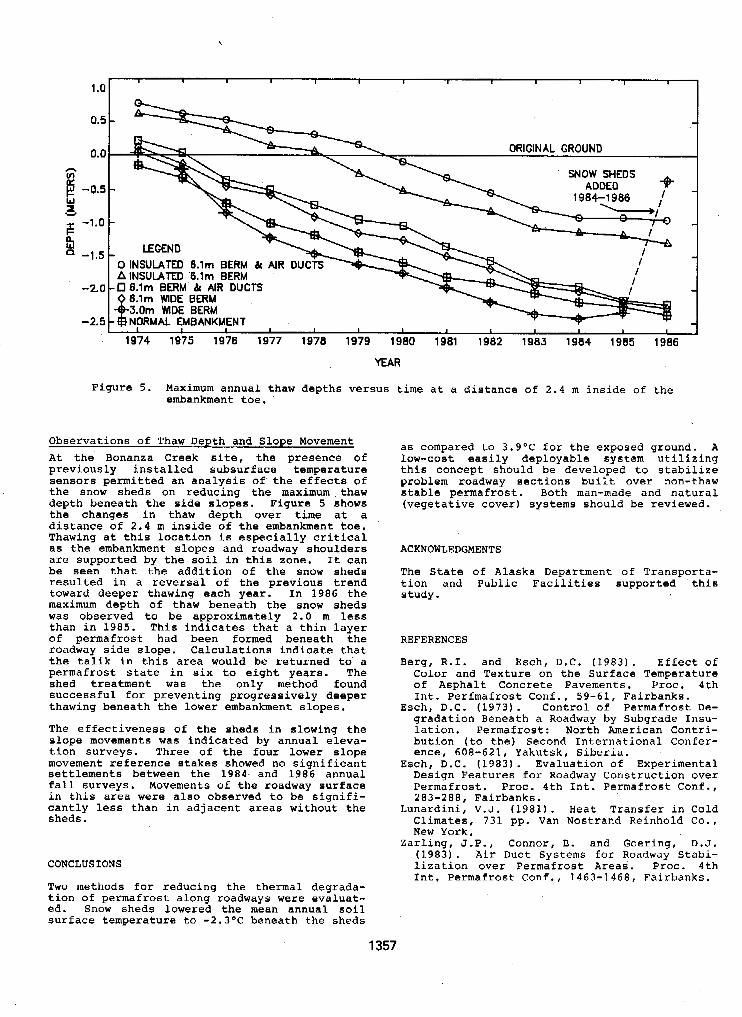
1 .c
0.:
0. c h E -0.5
%. -1.5
Y Y
F -l.O
-2.0
-2.5
Figure 5. Maximum annual thaw deaths versus time at a distance o f 2 . 4 m inside of the embankment toe.
Observations of Thaw Depth and Slope Movement At the Bonanza Creek site, the presence of previously installed subsurface temperature sensors permitted an analysis of the effects of the snow sheds on reducing the maximum thaw depth beneath the side slopes. Figure 5 shows the changes in thaw depth over time at a distance of 2 . 4 m inside of the embankment toe. Thawing at this location i s especially critical as the embankment slopes and roadway shoulders are supported by the soil in this zone. It can be seen that the addition of the snow sheds resulted in a reversal of the previous trend toward deeper thawing each year. In 1986 the maximum depth of thaw beneath the snow sheds was observed to be approximately 2 . 0 m less than in 1985. This indicates that a thin layer of permafrost had been formed beneath the roadway side slope. Calculations indicate that the talik in this area would be returned to a permafrost state in six to eight years. The shed treatment was the only method found successful €or preventing progressively deeper thawing beneath the lower embankment slopes.
The effectiveness of the sheds in slowing the slope movements was indicated by annual eleva- tion surveys. Three o f the four lower slope movement reference stakes showed no significant settlements between the 1984. and 1986 annual fall surveys. Movements of the roadway surface in this area were also observed to be signifi- cantly less than in adjacent areas without the sheds.
CONCLUSIONS
as compared to 3.9OC for the exposed ground. A
this concept should be developed to stabilize low-cost easily deployable system utilizing
problem roadway sections built over non-thaw stable permafrost. Both man-made and natural (vegetative cover) systems should be reviewed.
ACKNOWLEDGMENTS
The State of Alaska Department of Transporta- tion and Public Facilities supported this study.
REFERENCES
Berg, R.I. and Esch, D.C. (1983). Effect of Color and Texture on the Surface Temperature o f Asphalt Concrete Pavements. Proc. 4th Int. Perfmafrost Conf., 59-61, Fairbanks.
Esch, D.C. (1973). Control of Permafrost De- gradation Beneath a Roadway by Subgrade Insu- lation. Permafrost: North American Contri- bution (to the) Second International Confer- ence, 608-621, Yakutsk, Siberia.
Esch, D.C. (1983). Evaluation of Experimental Design Features for Roadway Construction over Permafrost. Proc. 4th Int. Permafrost Conf., 283-288, Fairbanks.
Lunardini, V.J. (1981). Heat Transfer in Cold Climates, 731 pp. Van Nostrand Reinhold Co., New York.
Zarling, J.P., Connor, B. and Goering, D.J. (1983). Air Duct Systems for Roadway Stabi- lization over Permafrost Areas. Proc. 4th fnt, Permafrost Conf., 1463-1468, Fairbanks.
Two methods for reducing the thermal degrada-
ed. Snow sheds lowered the mean annual soil tion of permafrost along roadways were evaluat-
surface temperature to -2.3OC beneath the sheds
1357
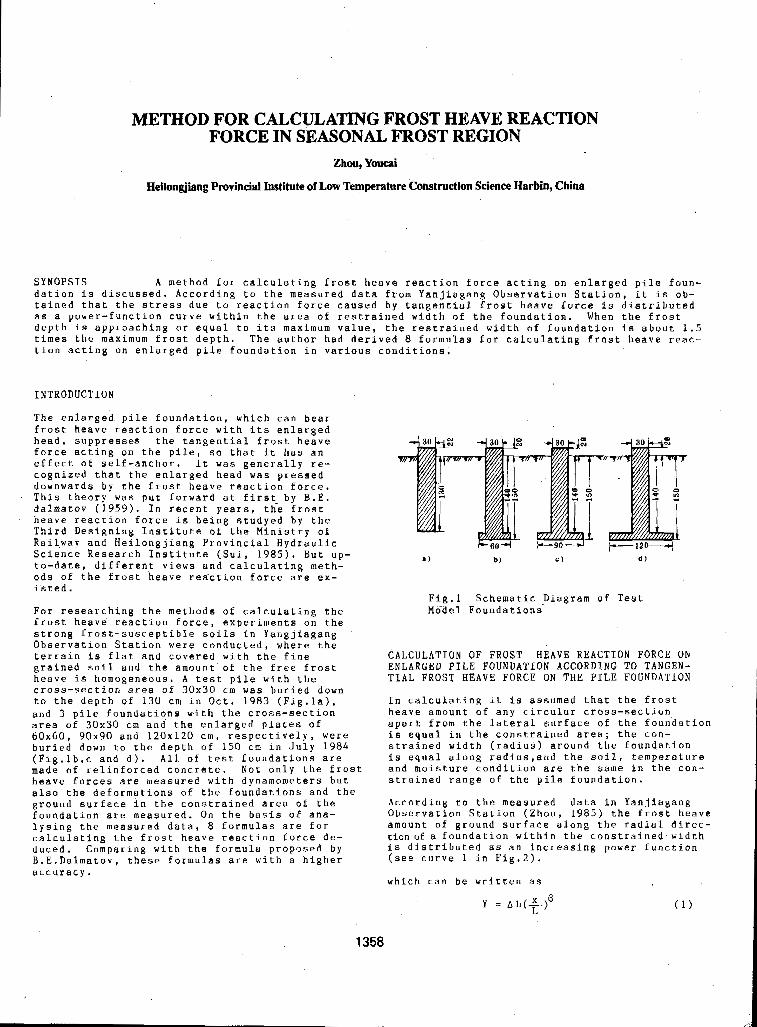
METHOD FOR CALCULATING FROST HEAVE REACTION FORCE IN SEASONAL FROST REGION
Zhou, Youcai
Heilongjiang Provincial Institute of Low Temperahre Construction Science Harbin, China
SYNOPSIS A method for calculating frost heave reaction force acting on enlarged pile foun- dation is discussed. According to the measured data from Yanjiagang Observation Station, it is ob- tained that the stress due to reaction force caused by tangential frost heave force is distributed as a power-function curve within the area of restrained width of the foundation. When the frost depth is approaching o r equal to its maximum value, the restrained width of foundation is about 1.5 times the maximum frost depth. The author had derived 8 formulas for calculating frost heave reac- tion acting on enlarged pile foundation in various conditions.
INTRODUCTION
The enlarged. pile foundation, which can bear frost heave reaction force with its enlarged head, suppresses the tangential frost heave for.ce acting on the pile, s o that it has an effect of self-anchor. It was generally re- cognized that the enlarged head was pressed downwards by the frost heave reaction force. This theory was put forward at first" by B.E. dalmatov (1959) . In recent years, the frost heave reaction force is being studyed by the Third Designing Institute of the Ministry of Railway and Heilongjiang Provincial Hydraulic Science Research Institute (Sui, 1985). But up- to-date, different views and calculating meth- ods of t'he frost heave rea-ction force are ex- isted.
For researching the methods of calculating the frost heave reaction force, experiments on the strong frost-susceptible soils in Yangjiagang Observation Station were conducted, where the terrain is flat and covered with the fine grained soil and the amount of the free frost heave is homogeneous. A test pile with the cross-section area of 30x30 cm was buried down to the depth of 130 cm in Oct. 1983 (Fig.la), and 3 pile foundations with the cross-section area of 30x30 cm and the enlarged plates of 6 0 x 6 0 , 90x90 and 120x120 cm, respectively, were buried down to the depth o f 150 cm in J u l y 1984 (Fig.lb,c and d). A l l of test foundations are made of relinforced concrete. Not only the frost heave forces are measured with dynamometers but also the deformations of the foundations and the ground surface in the constrained area of the foundation are measured. On the basis of ana- lysing the measured data, 8 formulas are € o r calculating the frost heave reaction force de- duced. Comparing with the formula proposed by B.E.Dalmatov, these formulas are with a higher accuracy.
P ) b) C )
Fig.1 Schematic .Diagram of Test Model Foundations
CALCULATION OF FROST HEAVE REACTION FORCE ON
TIAL FROST HEAVE FORCE ON THE PILE FOUNDATION ENLARGED PILE FOUNDATION ACCORDING TO TANGEN-
In calculating it is assumed that the frost heave amount o f any circular cross-section apart from the lateral surface of the foundation is equal in the constrained area; the con- strained width (radius) around the foundation is equal along radius,and the soil, temperature and moisture condition are tne same in the con- strained range of the pile foundation.
Observation Station (Zhou, 1985) the frost heave According t o the measured data in Yanjiagang
amount of ground surface along the radial direc- tion of a foundation within the constrained width is distributed as an increasing power function ( s e e curve 1 in Fig.2).
which c a n be written as
1358
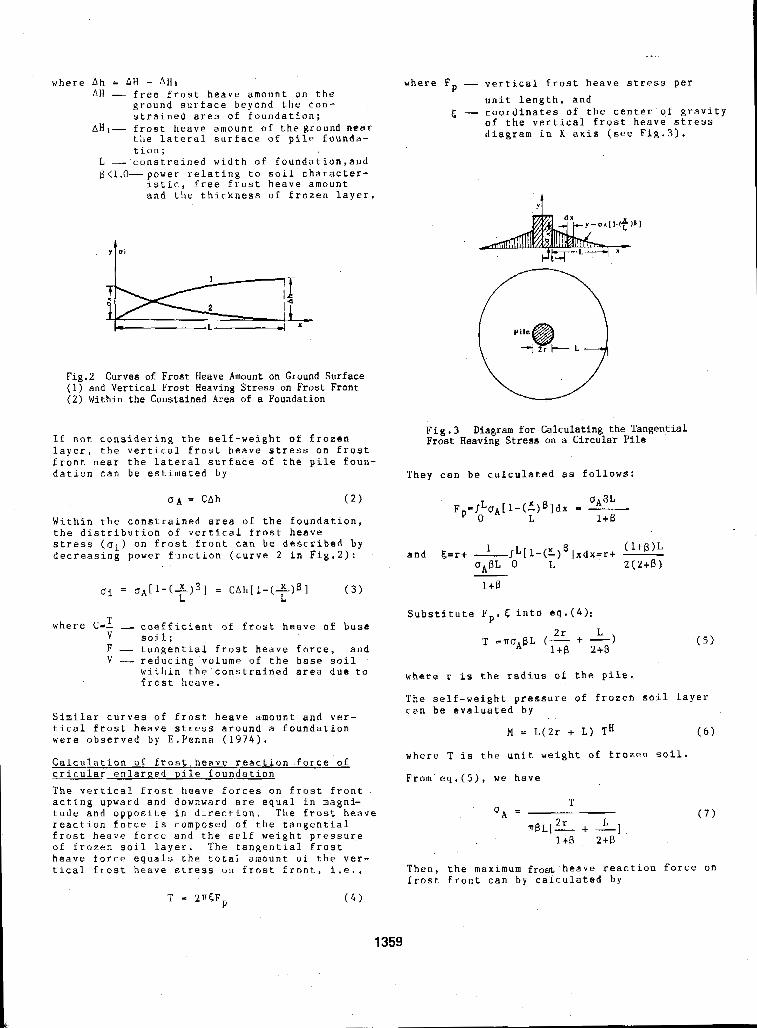
where Ah = AH - AH1 AH - free frost heave amount on the
ground surface beyond the c o n - strained area of foundation;
nH1- frost heave amount of theground near the lateral surface of pile founda- tion;
L "constrained width of foundation,and B<l.O-power relating to soil character-
istic, free frost heave amount and the thickness of frozen layer.
Fig.2 Curves o f Frost Heave Amount on Ground Surface (1) and Vertical Frost Heaving Stress on Frost Front ( 2 ) Within the Constained Area of a Foundation
If n o t considering the self-weight of frozen laver. the vertical frost heave stress on frost
where F p - vertical frost heave stress per unit length, and
E - coordinates of the center o f gravity o f the vertical frost heave stress diagram in X axis (see Fig.3).
Fig.3 Diagram for Calculating the Tangential Frost Heaving Stress on a Circular Pile
front near the lateral surface o f t h e pile foun- dation can be estimated b y They can be calculated a s follows:
, .
U A - CAh ( 2 )
Within the constrained area o f the foundation, the distribution of vertical frost heave stress (oi) on frost front can be described by decreasing power f~nction (curve 2 in Fig.2):
o i = O A [ ~ - ( ~ ) B ] = CAh[ 1 - ( 2 ) @ 1 ( 3 ) t L
where C=- coefficient of frost heave of base
F - tangential frost heave force, and V - reducing volume of the base soil
within the constrained area due to frost heave.
T v soil;
Similar curves of frost heave amount and ver-
were observed b y E.Penna (1974). tical frost heave stress around a foundation
Calculation of frost heave reaction force of cricular enlarRed pile foundation The vertical frost heave forces on frost front acting upward and downward are equal in magni- tude and opposite in direction. The frost heave reaction force is composed of the tangential frost heave force and the self-weight pressure of frozen soil layer. The tangential frost heave force equals the total amount of the ver- tical f r o s t heave stress on frost front, i.e.,
Substitute F p , 5 into eq.(4):
where r is the radius of the pile.
The self-weight pressure of frozen soil layer can b e evaluated by
M = ~ ( 2 r + L) TH ( 6 )
where T is the unit weight of frozen s o i l .
From eq.(5), we have
T h e n , the maximum fro& heave reaction force on frost front can by calculated b y
1359
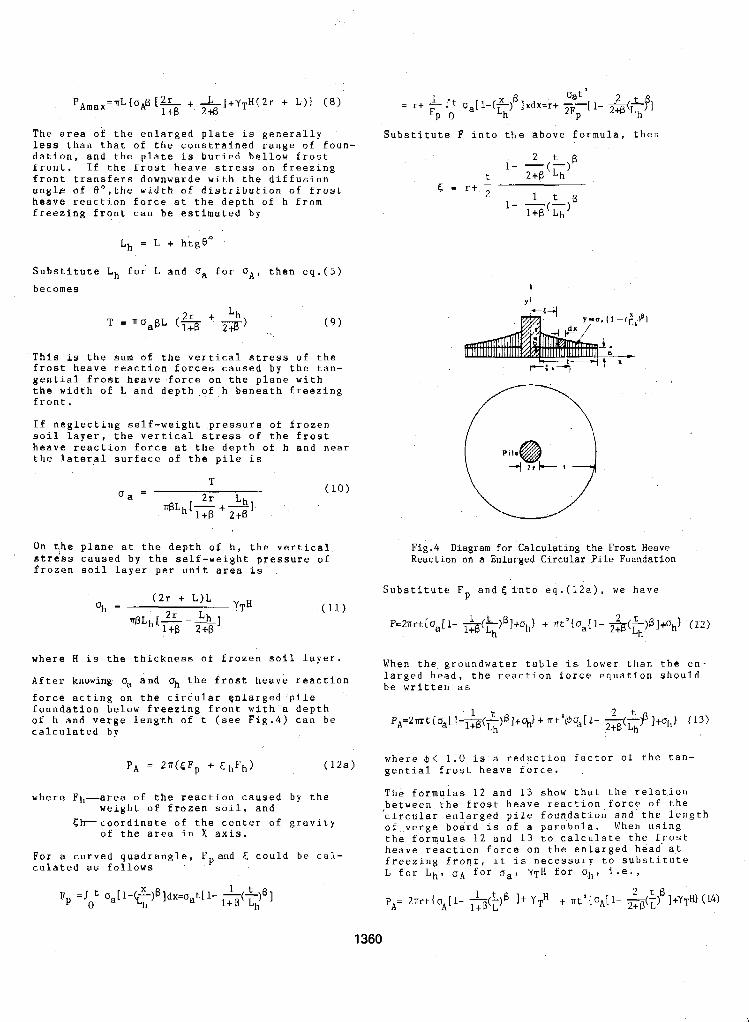
T h e a r e a o f t h e e n l a r g e d p l a t e i s g e n e r a l l y
d a t i o n , a n d t h e p l a t e i s b u r i e d b e l l o w f r o s t l ess t h a n t h a t o f t h e c o n s t r a i n e d r a n g e o f f o u n -
E r o n t . I f t h e f r o s t h e a v e s t r e s s o n f r e e z i n g f r o n t t r a n s f e r s d o w n w a r d e w i t h t h e d i f f u s i o n a n g l e of @ ' , t h e w i d t h o f d i s t r i b u t i o n o f € r o s t h e a v e r e a c t i o n f o r c e a t t h e d e p t h o f h f r o m f r e e z i n g f r o n t c a n b e e s t i m a t e d by
Lh = L + h t g e "
S u b s t i t u t e Lh f o r L a n d Ua f o r O A , t h e n e q . ( 5 ) b e c o m e s
T h i s is t h e sum of, t h e v e r t i c a l s t r e s s o f t h e f r o s t h e a v e r e a c t i o n f o r c e s c a u s e d b y t h e t a n - g e n t i a l f r o s t h e a v e f o r c e on t h e p l a n e w i t h t h e w i d t h o f L a n d d e p t h , o f h b e n e a t h f r e e z i n g f r o n t .
I f n e g l e c t i n g s e l f - w e i g h t p r e s s u r e o f f r o z e n s o i l l a y e r , t h e v e r t i c a l s t r e s s o f t h e f r o s t h e a v e r e a c t i o n f o r c e a t t h e d e p t h o f h a n d n e a r t h e l a t e r a l s u r f a c e o f t h e p i l e i s
rn 1
On t , h e p l a n e a t t h e d e p t h o f h , t h e v e r t i c a l s t r e s s c a u s e d b y t h e s e l f - w e i g h t p r e s s u r e o f f r o z e n s o i l l a y e r p e r u n i t a r e a i s
S u b s t i t u t e F i n t o t h e a b o v e f o r m u l a , t h e n
F i g . 4 Diagram f o r C a l c u l a t i n g t h e Frost Heave Reaction on a Enlarged Circular P i l e Foundation
w h e r e H i s t h e t h i c k n e s s o f f r o z e n s o i l l a y e r .
A f t e r knowing Oa a n d % t h e f r o s t heave r eac t ion l a r g e d h e a d , t h e r e a c t i o n f o r c e e q u a t i o n s h o u l d
f o r c e a c t i n g o n t h e c i r c u l a r e n l a r g e d p i l e
o f h a n d v e r g e l e n g t h o f t ( s e e F i g . 4 ) c a n b e f o u n d a t i o n b e l o w f r e e z i n g f r o n t w i t h a d e p t h
c a l c u l a t e d by 2+8 Lh
When t h e g r o u n d w a t e r t a b l e i s l o w e r t h a n t h e e n -
b e w r i t t e n a s
PA=2mtIo,[l-1+0(2h)B]+~}+ 1 t at 'I@ca[l- L(Lp ]+ah) (13)
PA = 2 n ( E F p + EhFh> w h e r e ,$< 1 .0 i s a r e d u c t i o n f a c t o r o f t h e t a n -
( I z a ) g e n t i a l f r o s t h e a v e f o r c e .
w h e r e F h - a r e a o f t h e r e a c t i o n c a u s e d by t h e T h e f o r m u l a s 1 2 a n d 13 s h o w t h a t t h e r e l a t i o n w e i g h t o f f r o z e n s o i l , a n d , b e t w e e n t h e f r o s t h e a v e r e a c t i o n , f o r c e o f t h e
c i r c u l a r e n l a r g e d p i l e f o u n d a t i o n a n d t h e l e n g t h
o f t h e a r e a i n x axis. o f v e r g e b o a r d i s o f a p a r a b o l a . When u s i n g
h e a v e r e a c t i o n f o r c e o n t h e e n l a r g e d h e a d a t t h e f o r m u l a s 1 2 a n d 13 t o c a l c u l a t e t h e f r o s t
f r e e z i n g f r o n t , i t i s n e c e s s a r y t o s u b s t i t u t e L f o r L h , O A f o r o a , ~ T H f o r oh9 i . . e . I
F h - c o o r d i n a t e o f t h e c e n t e r o f g r a v i t y
c u l a t e d as f o l l o w s F o r a c u r v e d q u a d r a n g l e , F p a n d E, c o u l d b e c a l -
Fp =I Oa[1-~L)8]dx=o,t[1- -(-) tf3 ] p 21TrtlI3 [ 1- It yTH f Tlt'{oA[ 1- -(-) 2 t R ]+yTHI (14) 0 h 1+8 Lh A A Ita L 2+!3 L
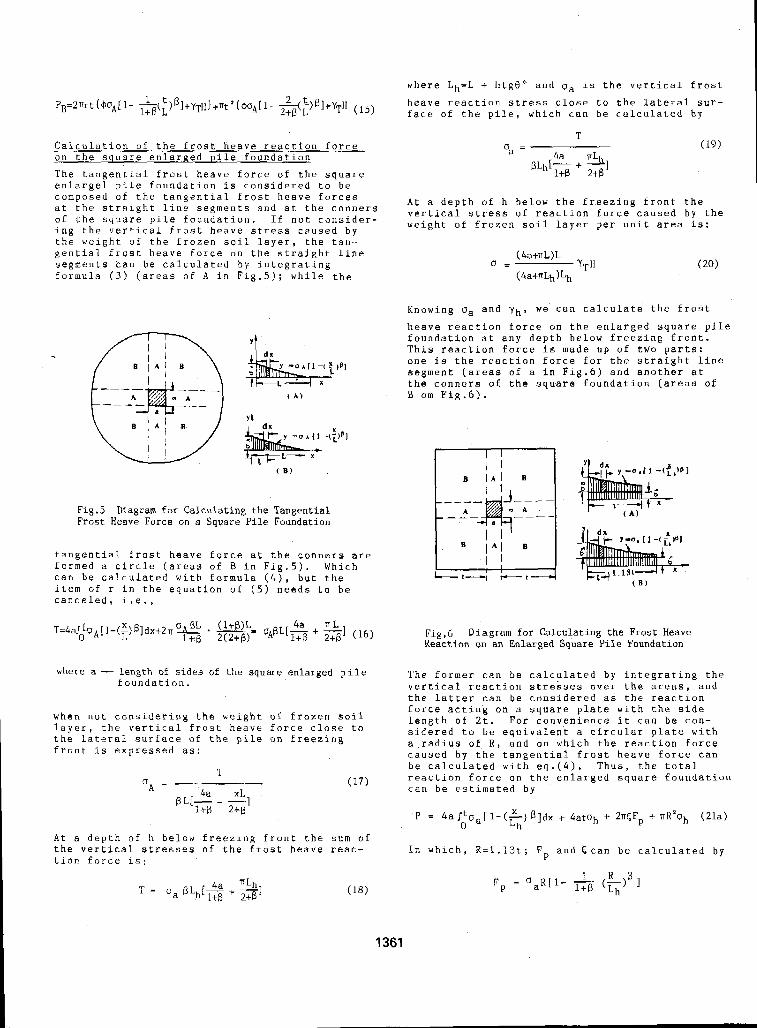
where Lh=L + htge' and oa is the vertical frost heave reaction stress close to the lateral sur- face of the pile, which can be calculated b y
Calculation of the frost heave reaction force on the square enlarged pile foundation The tangencial frost heave force o f the square enlarge1 pile foundation is considered to be composed of the tangential frost heave forces at the straight line segments and at the conners of the square pile foundation. If not consider- ing the vertical frost heave stress caused by the weight of the frozen soil layer, the tan- gential frost heave force on the straight line segments can be calculated b y integrating formula (3) (areas of A in Fige5): while the
Fig.5 Diagram for Calculating the Tangential Frost Heave Force on a Square Pile Foundation
tangential frost heave force at the conners are formed a circle (areas of B in Fig.5). Which can be calculated with formula (4), but the i.tem of r in the equation o f (5) needs t o be canceled, i.e.,
A t a depth of h below the freezing front the vertical stress of reaction force caused by the weight of frozen soil layer per unit area is:
Knowing ua and yh, we can calculate. the frost heave reaction force on the enlarged square pile foundation at any depth below freezing front. This reaction force is made up o f two parts: one is the reaction force for the straight line segment (areas o f a in Fig.6) and another at the conners of the square foundation (areas o f B om Fig.6).
T=4aJ.Lo~[1-(2)B]dx+2n~~ 0 - ML= oA@L[= 4a -+ 2 + 8 ] n L (16) Fi$,6 Diagram for Calculating the Frost Heave Reaction on an Enlarged Square Pile Foundation ltf i 2(2+8)
where a - length of sides of the square enlarged pile foundation.
when not considering the weight of frozen soil layer, the vertical frost heave force close to the lateral surface of the pile on freezing front i .s expressed as:
x 4a XI,
l + R 2+0 BL[- - -1
At a depth of h below freezing front the sum of the vertical stresses o f the frost heave reac- tion force is:
The former can be calculated b y integrating the vertical reaction stresses over the areas, and the latter can be considered as the reaction force acting on a square plate with the aide length of 2t. For convenience it can be con- sidered to be equivalent a circular plate with a radius of R , and on which the reaction force caused by the tangential frost heave force can be calculated with eq.(4). Thus, the total reaction force o n the enlarged square foundation can be estimated by
P = 4aJt(7,[ l-(p) f i ]dx + batoh t. 2nEFp f nR'oh (21a) 0 h
In which, R-1.13t; F and &can b e cal.cula'ced hy P
1361
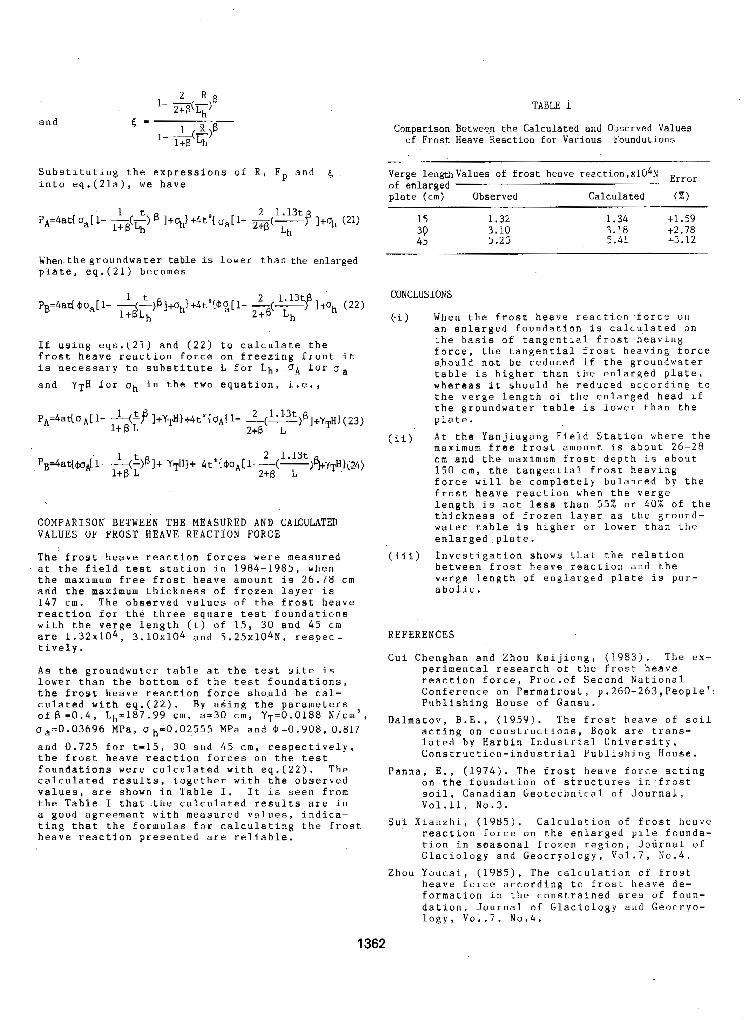
1- --(-)B 2 R 2 4 L,
and
Substituting the expressions of R, F p and 6 into eq.(Zla), we have
When-the groundwater table is lower than the enlarged plate, eq.(21) becomes
I f using eqs.(21) and ( 2 2 ) to calculate the frost heave reaction force on freezing front it is necessary to substitute L for Lh# 'JA for u a and ~ T H for oh in the two equation, i.e.,
COMPARISON BETWEEN THE MEASURED AND CALCULATED VALUES OF FROST HEAVE REACTION FORCE
The frost heave reaction forces were measured at the field test station in 1984-1985, when the maximum free frost heave amount is 26.78 cm and the maximum thickness of frozen layer is 147 cm. The observed values of the frost heave
with the verge length (t) of 1 5 , 30 and 45 cm reaction for the three square test foundations
are 1.32~104, 3.10~104 and 5.25x10⁴N, respec- tively.
As the groundwater table at the test site is lower than the bottom of the test foundations, the frost heave reaction force should be cal- culated with eq.(22). By using the parameters of B = 0 . 4 , Lh"187.99 cm, a=30 cm, YT=O.O188 N/cmS, oa=0.03696 MPa, u h-0.02555 MPa and @=O.Y08, 0,817 and 0.725 for t=15, 30 and 45 cm, respectively, the frost heave reaction forces on the test foundations were calculated with eq.(22). The calculated results, together with the observed values, are shown in Table I. It is seen from the Table I that the calculated results are in a good agreement with measured values, indica- ting that the formulas f o r calculating the frost heave reaction presented are reliable.
TABLE I
Comparison Between the Calculated and Observed Values of Frost Heave Reaction for Various Foundations
Verge lengrhvalues of frost heave reaction,xlOhN Error of enlarged plate (cm) Observed Calculated (%)
15 1.32 1.34 +l. 50 "
3P 3.10 45 5.25
3.18 t2.70 5.41 +3.12
CONCLUSIONS
ti) When the frost heave reacti.on force on an enlarged foundation i s calculated o n
force, the tangential frost heaving force the basis of tangential frost heaving
s-hould nat be reduced if the groundwater table is higher than the enlarged plate, whereas it should be reduced according t o the verge length of the enlarged head if the groundwater table is lower than the plate.
maximum free frost amount is about 26-28 cm and the maximum f r o s t depth is about 150 cm, the tangential frost heaving force will be completely balance-d by the frost heave reaction when the verge length is not less than 5'5% or 40% o f the thickness of frozen layer as the ground- water table i s higher or lower than the enlarged plate.
verge length of englarged plate is par- between frost heave reaction and the
abolic.
(ii) At the Yanjiagang Field Station where the
(iii) Investigation shows that the relation
REFERENCES
Cui Chenghan and Zhou Kaijiong, (1983). The ex-
reaction force, Proc.of Second National perimental research of the frost heave
Conference on Permafrost, p.260-263,People': Publishing House of Gansu,
Dalmatov, B.E., (1959), The frost heave of soil acting on constructions, B a o k are trans- lated by Harbin Industrial University, Construction-industrial Publishing H o u s e .
Panna, E., (1974). The frost heave force acting on the foundation of structures in frost soil, Canadian Geotechnical of Journal, Vol.11, No.3.
Sui Xianzhi, (1985), Calculation of frost heave reaction force on the enlarged pile founda- tion in seasonal frozen region, Journal of Glaciology and Geocryology, Vo1.7, Nu.4.
Zhou Youcai, (1985), The calculation of frost heave force according to frost heave de- formation in the constrained area o f foun- dation, Journal of Glaciology and G e o c r y o - l o g y , Vo1.7, No.4.
1362
COLD-MIX ASPHALT CURING AT LOW TEMPERATURES A.N.S. Beaty and P.M. Jarrett
Royal Military College of Canada
of c o l d - m i x asphalt in t h e environment of t h e
fNTRODUCTION
Asphalt cold-mix is a mixture o f unheated mineral aggregate and emulsified or cutback bitumen. Mixtures may be prepared either in a central plant or in place at the paving site using simple equipment.
The advantages claimed for cold-mix asphalt include:
- its adaptability to suit the requirements of a range of aggregate types in varying weather conditions.
- economy of production with simple equipment and unheated aggregate.
The most important of these advantages arise from not having to heat the aggregate. This makes the use of cold-mix asphalt particularly attractive at remote northern job sites where provision of heating would be difficult and expensive. The Asphalt Institute (1977) has
should be limited to temperatures above 1O'C suggested that cold-mix asphalt operations
and to good weather conditions. In the high Arctic, road and runway pavements may have to be constructed at remote sites where neither the atmospheric temperature nor that of the
Wocjik, Jarrett and Beaty ( 1 9 8 3 ) and Jarrett, aggregate will normally reach 1 0 ° C . However,
Beaty and Wocjik ( 1 9 8 4 ) have shown that cold- mix operations can be succesfully carried out at temperatures approaching the freezing point.
The low temperature work referred to arose from a requirement to study viable methods f o r the stabilisation of the unbound aggregate runway at Alert, located at 82"30'N, 62'20'W in the Canadian North West Territories as shown in figure 1. In that study the general question Of low temperature stabilisation was addressed using low temperature laboratory testing, pilot
I n July 1981 a series of cold-mix asphalt test sections were canstructed at. CFS Alert, situated at 8 2 0 N in the Canadian North West Territories. The performance of these test sections has been monitored with particular reference to the rate of curing, the change .in strength with age and the long term effects of the asphalt pavement, both painted white and unpainted, on the permafrost rbgime. The observed data are presented and the pexformance
high Arctic is discussed.
field trials and in 1981 a series o f full scale trial sections at Alert.
The purpose of the present paper is to review the performance of the full-scale trial sections of cold-mix asphalt over the six years since they were laid and in particular to consider the following:
- rate of curing
- strength variation with time
- effect of asphalt on ground thermal regime
- general performance of the paved surfaces
FIELD TEST BECTIONS
In July 1 9 8 1 a seriea'of nine test sections was constructed on the runway apron at Alert. These consisted of a basecourse of crushed rock aggregate, compacted at a moisture content of 6% to a finished thickness of 8cm. Two low viscosity cht-back bitumens were used, these were an RC-30 and a primer, both produced by Gulf Oil. Using a range of binder contents. nine mixtures were made by mixing the binder with unheated crushed rock aggregate at about 4 " C , in a Cedar Rapids pug mill having a capacity of 700 tonnes per hour. Binder contents ranged from 3.5% to 8 .7% f o r the RC-30 mixtures and from 5.0% to 6 . 4 % €or those made with the primer binder. The mixtures were laid in four 3.8 metre wide lanes and compacted with a 9 tonnes vibrating roller. In order to investigate the effects of the construction on the permafrost regime approximately half the surface area was painted white and a series of thermistors were installed beneath the various
1363
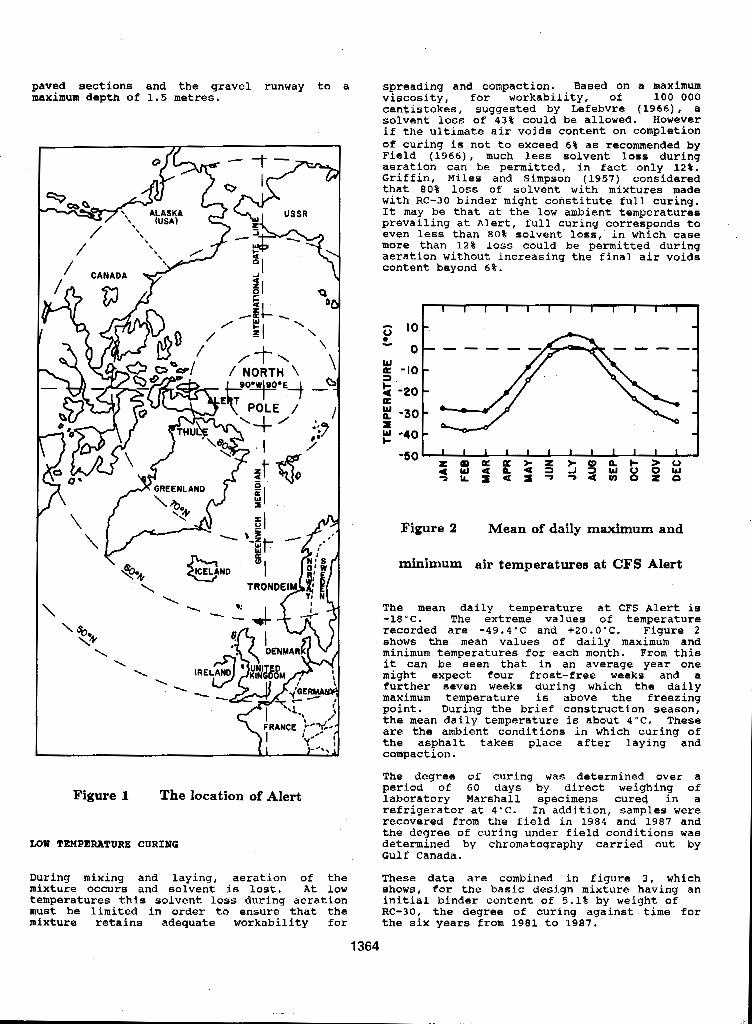
paved sections and the gravel runway to a maximum depth of 1.5 metres.
Figure 1 The location of Alert
GOW TEMPERATURE CURING
During mixing and laying, aeration of the mixture occurs and solvent is lost. At low temperatures this solvent loss during aeration must be limited in order to ensure that the mixture retains adequate workability €or
spreading and compaction. Based on a maximum viscosity, f o r workability, of 100 000 centistokes, suggested by Lefebvre (1966) I a solvent loss of 43% could be allowed. However if the ultimate air voids content on Completion of curing is not to exceed 6% as recommended by Field (1966) , much less solvent loss during
Griffin, Miles and Simpson (1957) considered aeration can be permitted, in fact only 12%.
with RC-30 binder might constitute full curing. that 80% loss of solvent with mixtures made
It may be that at the low ambient temperaturea prevailing at Alert, full curing corresponds to
more than 12% loss could be permitted during even less than 80% solvent loss, in which case
aeration without increasing the final air voids content beyond 6%.
- IO Y Y
!i -20 K
I -30
Figure 2 Mean of daily maximum and
minimum air temperatures at CFS Alert
The mean daily temperature at CFS Alert is -18'C. The extreme values of temperature recorded are -49.4-C 'and +ZO.O'C. Figure 2 shows the mean values of daily maximum and minimum temperatures f o r each month. From this it can be seen that in an average year one might expect four frost-free weeks and a further seven weeks during which the daily maximum temperature is above the freezing point. During the brief construction season, the mean daily temperature is about 4°C. These are the ambient conditions in which curing of the asphalt takes place after laying and compaction.
The degree of curing was determined over a period of 60 days by direct weighing of laboratory Marshall specimens cured in a refrigerator at 4 ' ~ . In addition, samples were recovered from the field in 1984 and 1987 and the degree of curing under field conditions was determined by chromatography carried out by Gulf Canada.
These data are combined in figure 3, which 6how8, €or the basic design mixture having an initial binder content of 5.1% by weight o f RC-30, the degree of curing against time f o r the s i x years from 1981 to 1987.
1364
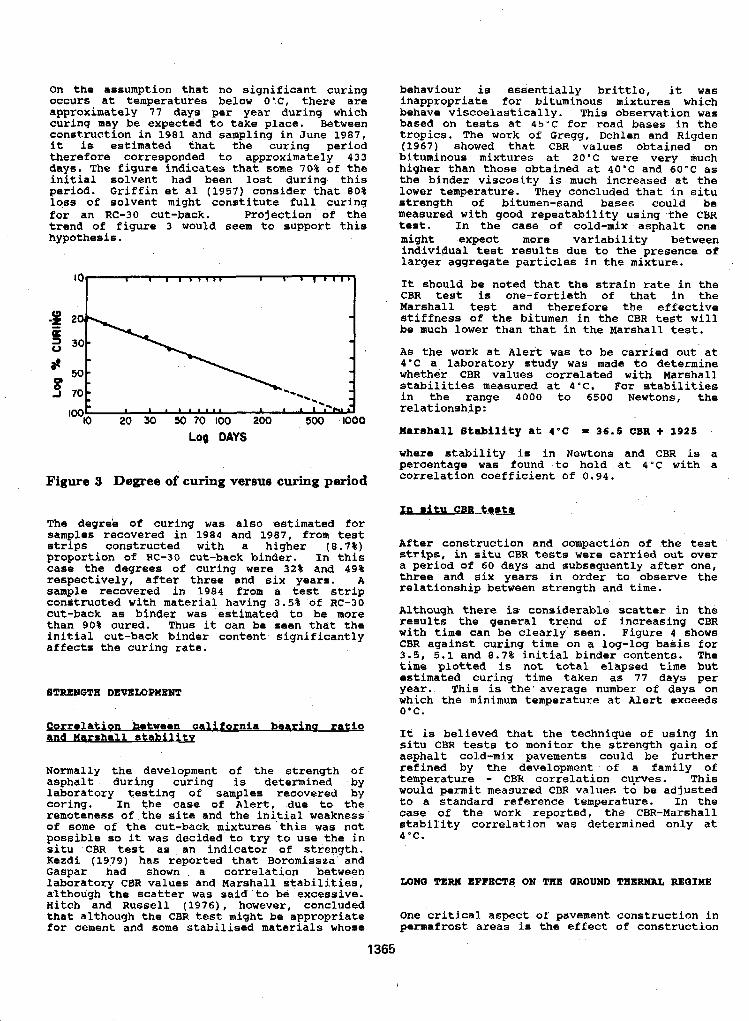
On the assumption that no significant curing occurs at temperatures below O'C, there are approximately 77 day6 per year during which
construction in 1981 and sampling in June 1987, curing may be expected to take place. Between
it is estimated that the curing period therefore corresponded to approximately 433 days. The figure indicates that some 70% of the initial solvent had been lost during this period. Griffin et al (1957) consider that 80% loss of solvent might constitute full curing for an RC-30 cut-back. Projection of the trend of figure 3 would seem to support this hypothesis.
Log DAYS
Figure 3 Degree of curing versus curing period
The degre'e of curing was also estimated for samples recovered in 1984 and 1987, from test strips constructed with a higher (8.7%) proportion of RC-30 cut-back binder. In this case the degrees of curing were 32% and 49% respectively, after three and six years. A sample recovered in 1984 from a test strip constructed with material having 3.5% o f RC-30 cut-back as binder was estimated to be more than 90% cured. Thus it can be seen that the initial cut-back binder content significantly affects the curing rate.
STRENGTH DEVELOPMENT
S;grrd.ation batween calitornia b e ~ n u r &ti0 u s h a l l stability
Normally the development of the strength of asphalt during curlng i s determined by
coring. In the case of Alert, due to the laboratory testing o f samples recovered by
remoteness of the site and the initial weakness of some of the cut-back mixtures this was not possible so it was decided to try to use the in situ CBR test as an indicator o f strength. Kezdi (1979) has reported that Boromissza and Gaspat had shown . a correlation between laboratory CBR values and Marshall stabilities, although the scatter was said to be excessive. Hitch and Russell (1976) , however, concluded that although the CBR test might be appropriate for cement and some stabilised materials whose
behaviour is essentially brittle, it was inappropriate for bituminous mixtures which behave viscoelastically. This observation was based on tests at 45 ' C for road bases in the tropics. The work of Gregg, Dehlen and Rigden (1967) showed that CBR values obtained on bituminous mixtures at 20'C were very much higher than those obtained at 40°C and 60°C as the binder viscosity is much increased at the lower temperature. They concluded that in situ strength o f bitumen-sand bases could be measured with good repeatability using the CBR test. In the case of cold-mix asphalt one might expect more variability between individual test results due to the presence of larger aggregate particles in the mixture.
It should be noted that the strain rate in the CBR test is one-fortieth of that in the Marshall test and therefore the effective stiffness of the bitumen in the CBR test will be much lower than that in the Marshall test.
As the work at Alert was to be carried out' at
whether CBR values correlated with Marshall 4 ' C a laboratory study was made to determine
stabilities measured at 4 ' ~ . For stabilities in the range 4000 to 6500 Newtons, the relationship:
Harmhall Btability a t 4 . C = 36.5 CBR + 1925
where stability i s in Newtons and CBR is a percentage was found to hold at 4 'c with a correlation coefficient of 0.94.
ri tu CBR
After construction and compaction of the test strips, in situ CBR teste were carried out over a period of 60 days and subsequently after one, three and six years in order to observe the relationship between strength and time.
Although there is considerable scatter in the results the general trend o f increasing CBR with time can be clearly seen. Figure 4 shows CBR against curing time on a log-log basis for 3.5, 5.1 and 8.7% initial binder contents. The time plotted is not total elapsed time but estimated Curing time taken as 77 days per year. This is the, average number o f days on which the minimum temperature at Alert exceeds O ' C .
It is believed that the technique of using in situ CBR tests to monitor the strength gain of asphalt cold-mix pavements could be further refined by the development of a family of temperature - CBR correlation cu.rves. This would permit measured CBR values to be adjusted to a standard reference temperature. In the case of the work reported, the CBR-Marshall etability correlation was determined only at 4 'C.
M N Q TERN EFFECTS ON THE GROUND THERMAL REQIME
One critical aspect of pavement construction in permafrost areas is the effect of construction
1365
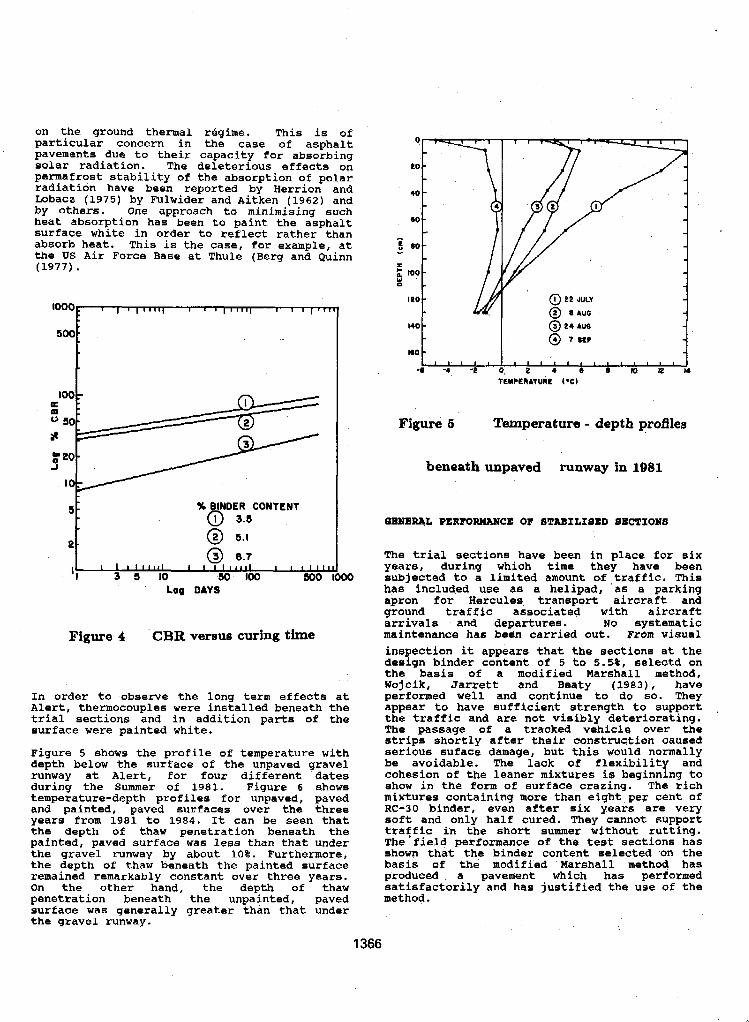
on the ground thermal rdgime. This is of particular concern in the case of asphalt pavements due to their capacity for absorbing solar radiation. The deleterious effects on permafrost stability of the absorption of polar radiation have been reported by Herrion and Lobacz (1975) by Fulwider and Aitken (1962) and by others. One approach to minimiaing such heat absorption has been to paint the asphalt surface white in order to reflect rather than
the US Air Force Base at Thule (Berg and Quinn absorb heat. This i s the case, for example, at
, (1977) .
40 -
a0 -
r
-,
‘ O o 0 b
‘ I
K) Log DAYS
Figure 4 CBR versus curing time
In order to observe the long term effects at Alert, thermocouples were installed beneath the trial sections and in addition parts of the surface were painted white.
Figure 5 shows the profile of temperature with depth below the surface of the unpaved gravel runway at Alert, €or four different dates during the Summer of 1981. Figure 6 shows temperature-depth profiles for unpaved, paved
years from 1981 to 1904. It can be seen that and painted, paved surfaces over the three
the depth of thaw penetration beneath the painted, paved surface was less than that under the gravel runway by about 10%. Furthermore, the depth of thaw beneath the painted surface
O n the other hand, the depth of thaw remained remarkably constant over three years.
penetration beneath the unpainted, paved surface was generally greater than that under the gravel runway.
Figure 6 Temperature - depth profiles
beneath unpaved runway in 1981
QENERAL PERFORMANCE OF STABILIBED BICTXONE
The trial sections have been in place for six years, during which time they have been subjected to a limited amount o’f ,traffic. This has included use as a helipad, as a parking apron for Hercules, transport aircraft and ground traffic associated with aircraft arrivals and departures. No systematic maintenance has been carried out. From visual inspection it appears that the sections at the design binder content of 5 to 5.SI, selectd on the basis of a modified Marshall method, Wojcik, Jarrett and Beaty (1983), have performed well and continue to do so. They appear to have sufficient strength to support the traffic and are not visibly deteriorating. The passage of a tracked vehicle over the strips shortly after their construction caused serious suface damage, but this would normally be avoidable. The lack of flexibility and cohesion of the leaner mixtures is beginning to show in the form of surface crazing. The rich mixtures containing more than eight per cent of RC-30 binder, even after six years are very soft and only half cured. They cannot support traffic in the short summer without rutting. The field performance of the test sections has shown that the binder content selected ‘on the basis of the modified Marshall method has produced a pavement which has performed satisfactorily and has justified the use o f the method.
1366
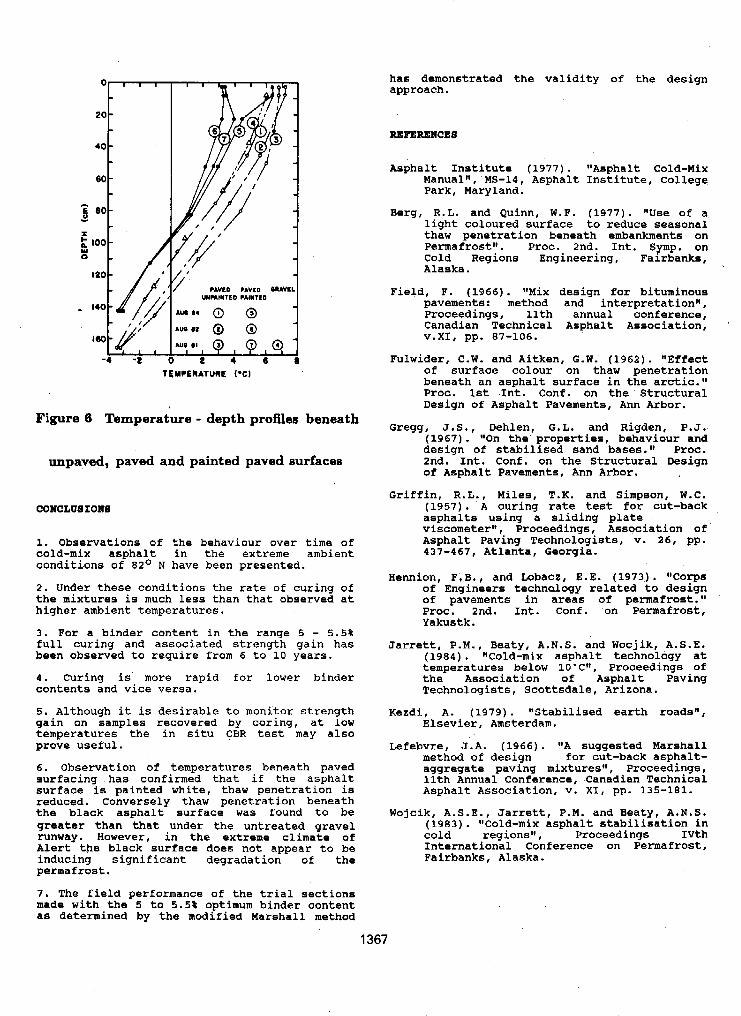
TEMPERATURE PC)
Figure 6 Temperature - depth profiles beneath
unpaved, paved and painted paved Burfaces
COMCLUSIOUB
1. Observations of the behaviour over time of cold-mix asphalt in the extreme ambient conditions of 82' N have been presented.
2. Under these conditions the rate of curing of the mixtures is much less than that observed at higher ambient temperatures.
3. For a binder content in the range 5 - 5.5% full curing and associated strength gain has been observed to require from 6 to 10 years.
4. Curing is more rapid for lower binder contents and vice versa.
5. Although it is desirable to monitor strength gain on samples recovered by coring, at low temperatures the in situ CBR test may also prove useful.
6. Observation of temperatures beneath paved surfacing has confirmed that if the asphalt surface is painted white, thaw penetration is reduced. Conversely thaw penetration beneath the black asphalt surface was found to be greater than that under the untreated gravel runway. However, in the extreme climate of Alert the black surface does not appear to be inducing significant degradation of the permafrost.
7. The field performance of the trial sections made with the 5 to 5.5% optimum binder content as determined by the modified Marshall method
has demonstrated the validity of the design approach.
Asphalt Institute (1977). "Asphalt Cold-Mix Manualtt, MS-14, Asphalt Institute, College Park, Maryland.
Berg, R.L. and Quinn, W.F. (1977). "Use of a light coloured surface to reduce seasonal thaw penetration beneath embankments on Permafrostll. Proc. 2nd. Int. Symp. on
Alaska. Cold Regions Engineering, Fairbanks,
Field, F. (1966). "Mix design for bituminous pavements: method and interpretationt1, Proceedings, 11th annual conference, Canadian Technical Asphalt Association, V.XI, pp. 87-106.
Fulwidar, C.W. and Aitken, G.W. (1962). "Effect of surface colour on thaw penetration beneath an asphalt surface in the arctic." Proc. 1st Int. Conf. on the . Structural Design of Asphalt Pavements, Ann Arbor.
Gregg, J.S., Dehlen, G.L. and Rigden, P.J.. (1967) . "On the properties, behaviour and design of stabilised sand bases.I@ Proc. 2nd. Int. Conf. on the Structural Design of Asphalt Pavements, Ann Arbor.
Griffin, R.L., Miles, T.K. and Simpson, W.C. (1957). A curing rate test for cut-back asphalts using a sliding plate viscometer" , Proceedings, Association of Asphalt Paving Technologists, v. 26, pp. 437-467, Atlanta, Georgia.
Hennion, F.B., and LobaczI E.E. (1973). ltCorps of Engineers technalogy related to design of pavements in areas of permafrost.I' Proc. 2nd. Int. Conf . on Permafrost, Yakustk.
Jarrett, P.M., Beaty, A.N.S. and Wocjik, A.S.E. (1984) . IfCold-mix asphalt technology at temperatures below 10"C1l, Proceedings Of the AsSOCiatiOn of Asphalt Paving Technologists, Scottsdale, Arizona.
Kezdi, A. (1979). "Stabilised earth roadsQ1, Elsevier, Amsterdam.
Lefebvre, J. A. (1966) . '*A suggested Marshall method of design €or cut-back asphalt- aggregate paving mixtures" , Proceedings I 11th Annual Conference, Canadian Technical ~sphalt Association, v. XI, pp. 135-181.
Wojcik, A.S.E., Jarrett, P.M. and Beaty, A.N.S. (1983). IICold-mix asphalt stabilisation in cold regions" , Proceedings IVth International Conference on Permafrost, Fairbanks, Alaska.
1367
PROGNOSIS OF SOIL TEMPERATURE AT THE AREA UNDER CONSTRUCTION A.L. Chekhovskyi
Research Institute of Engineering Site Investigations, Moscow, USSR
SYNOPSIS Methods and nomograme w e proposed to estimate a two-three-dimensional stable temperature field when heat sources are freely arranged. To predict or to eatimate a nulti- variate unstable temperature f i e l d with or- without a change of soil phase i s supposed to reduce t o solvation of a one-dimensional problem, For this purpose a piecewise smooth function of boundary conditions i s changed to a mean equivalent prescribed by the exponential law. The pro- posed approximate analytical method permita to eatimate multivariate tcrnperaturs field f o r real conditions of town development.
From the very beginning of construction worka engineering-geocryological conditians of the @rea under construction are exposed to great chengee. ThiEc prooass continuee when the con- struction works are completed, From B thsrmophysical point o f view an area under construction presents a combination of a number of eream with different heat xeleaew and heat absorptLon. A temperature field of every hest release or heat absorption a rea i s formed under complex affects of natural and technogenic factora, If coneider a city area as a whole ita influence on a heat field of permafroat rrtrafa is estimated ae hundreds metres ana beneath individual districts and quarters of a city a depth of heat impulees
buildings it exceeds 10-15 m a local tempera- penetration reaches doesns metres; under some
ture Pield of every specific point should be entimated with account of a temperature field of the area under oonatruotion aa a whole. To eolve different engineering-geological or building problems of the area under construc- tion it is neceesary to estimate or t o predict as a stable so unetable temperature field. A prognosis of R etable temperature field per- mits t o determine a maximum depth OP perennial thawing of soile under buildings and structu- res; t o solve problems of underfloading the territory under conmtruction; to estimate a bearing capacity of piles, An unstable tempe- rature field permits to prognoze development of oryogenic processes; to eelect an engineer- ing technology for buildings and structures, industrial sanitary communications, railwaya and motor roads. Two-dimensional temperature field of a city development can be presented a 8 8. ~ w n o f in- tegrals determined a temperature beneath a
centre of the infinite band, i.8. XnaO
... +
wtse smooth functlon T ( x > for every interval: A surface temperature is prescribed a s a piece-
- - + n,, ml + m2, mnel j %,rnn+ - ; Yo- depth of a temperature control point; T(Yo) - ground temperature at point Yo. It follows from the foregoing equation that ell the eourcea of: heat release end heat ab- Etorption should be taken into account., but it presents some difficulties due to their great number. A computer-aided design shows that
be neglected when measuring a tempereture with the remote heat sources and hest release can
an accuracy of 0,l O C and a building deneity var iee from 0.2 to 0.8. There i~l a 11 depan ence between a dimension of a deaign
'near
area (L) and a depth of a point dip (Yo) where a temperature is meamwed* Pumtion graphics L Q f(Yo) lor tenperature differences in the intervals of the piecewi8e smooth function are presented in Pig. 1. For an effective dertign of a two-dimensiocal stable tern erature field aome nomograms are recommended aPig.2). A pro- cedure o f a temperature measuring is a 8 fol- l o w ~ . The Ti values (r'nrr in number)are esti- mated depending on a depth of point Yo dip; a distsnce from an origin of coordinates to mi and a difference in temperatures ( A T) at mi point. Temperature at point Yo can be de- duced from the formula:
R
where g - stands f o r a value of geothermal gradient, O C / m ; for the values To and Tn see formula (I). Design of a three-dimensional
1368
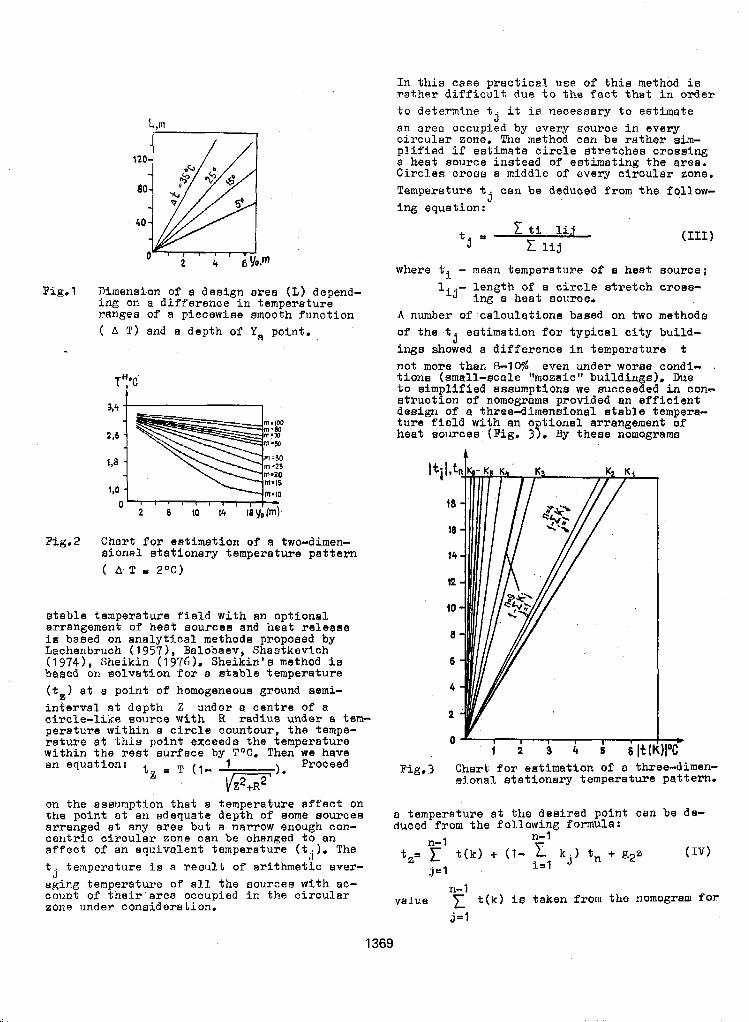
In this case practical use of this method is r a t h e r difficult due to the f a c t that in o r d e r to determine t . it i s necessary to eatlmate an area occupied by every aource in every circular zone. The method can be rather sim- plified if estimate circle stretchee crossing a heat BouFce instead of estimating the arm, Circles crom a middle o f every circular zone, Temperature t can be deduced from the follow- ing equation:
J
j
.1 Dimension o f a design area (Z) depend- i ng on a difference in temperature range8 of a piecewise smooth function ( A T 1 and a depth of Y, point I
Tn,"C
3,4 t
Fig.2 Chart f o r estimation of a two-dimen- sional BtationaFy temperature pattern ( A T 2 O C )
stable temperature field with an optional arrangement o f heat sourcea and heat release is baaed on analytical methods proposed by Lachenbruch (19571, Balobaev, Shastkevich (19741, Sheikin ( 1 976). Sheikin's method is baaed on solvstion f o r a atable temperature (t,) at a point of homogeneoua ground semi- inferval at depth Z under a centre of a circle-like souxoe with R rad ius under 8. tem- perature within a circle countour, the tempe-
within the rest surface by TW. Then we have reture at thie point exceeds the temperature
an equation: 1 Proceed tZ T (1- ) *
b v the point at an adequate depth o f aome souxces on the assumption that a temperature affect on
centric circular zone can be changed t a an arranged at any 8rea but a narrow enough con-
affect o f an equivalent temperature (t.). The t . temperature i s a X 8 B d t of arithmetic aver- aging temperature of all the source3 with ac- count o f t h e i r area occupied in the circular zone under consideration.
3
J
where ti - mean temperature of a heat source; lij- length of a circle stretch CTOSS-
ing a heat sourcer A number o f calcuhtiona based on two methods of the t. estimation fox typical city build- inga showed a difference in temperature t not m o m than 0-10% even under worm condi- . fione (small-scale 9nozaic" buildings). Due to simplified assumptions we succeeded in con- struction of nomograms provided an efficient design of a three-dimensional stable tempera- ture field with an o tional arrangement of heat BOUXCBB (Fig, 3yr By these nomograms
J
Fig.3 Chart for estimation of a three-dirnen- aional stationary temperature pattern.
a temperature at the deaixed point can be de- duced from the following formula:
1369
every circle and t(k) is found by equation approximating zero when spreading at the bound- n-1 ary of the deaign area let's aaaume a law of
111. Value (1 - z kj) tn is taken from the decrease to be exponential. Mean temperature j=1 at the surface of the area under examination
nomogram with account of a definite tempera- ture t, (temperature at point Z projected
(Tmean) i s prescribed in the following way:
to the plane). Number Of circles ia 10 for an accurate design and 5 - f o r an approximate ATeX$-IIIi/L/2 = 9) (VI design,
'I
Methods of prediction an unstable temperature where: To-temperature of the surface at point field of areas under construction are sub- divided to two groups. The first group envi- sages design problema of unstable temperature ATj-difference in temperatures of the f i e l d without soil phaBe changes. The second subsequent and previous interval group io known as Stephanls problem including at the point breaks in a piecewise design methods o f an unstable temperature smooth function, O C ; field with soil phase changes. In case of com- plicated distribution OP surfsce temperature the design is reduced to solvation of e two- three-dimensional problem o f heat conductivity.
x o w ;
mi-diatance from point x L: o t o the
L - dimension of a deeian area. m . i - interval ; As f o r a two-dimensional design area a band can be distinguished within the built-up terri- tory; a width of this band i s too mall ae com- pare to its length. Within thirs band the tem- perature distribution is a function of the X coordinate. Outmide of the built-up area a tern- pereture is constant and does not depend on coordinates. The problem i s solved by uaual methods under simple boundary conditions with- out soil phase changesc A two-dimensional pro- blem of heat conductivity with a free preaori- bed function at the upper border o f the half- -plane waa solved by S,S,Kovner, A problem of a half-plate and a two-dimaneiona1 p l a t e was solved by A.V.Lykov (1967). But the solvations of the Poregoing suthore are so awkward that cannot be used in pracfieal design. An appro- ximate solvation of a two-dimensional. unetable problem of heat conductivity with a prescribed piecewlae amooth temperature a t the upper re- gion under examination waa effected, for the first time by L.N,Khrustalev (1971 by redu- cing a two-dimensional problem to one-dimen- sional, The authors of the present paper pro- pose a method to eolve a two-dimensional Like aa three-dimensionel problems o f unetable heat conductivity on the b a s i s of eolving one-di- menatonal problems with aesumptions differ from those accepted by L.N.Khrustalev. If a temperature is determined by Y coordinate for point X a o the area under examination
Dimensions of the area are determined by a can be rather accurately aesumed a s a terminal.
range variation of a temperature within thb limite of the area under examination and a depth o f the desired point. As a result, for the pofnta depending on coordinate y, when x = o the one-dimensional problem o f unstable heat conductivity can be eolved with an acau- racy sufficient f o r practice under condition when a temperature at the boundary of the, m e a under examination is assumed constent and de-
- It followa from the proposed formula, if at centre of "the design area within an interval A L B temperature is Ti and outside of this interval a temperature i a constant T2 then
-TI. A temperature at the desired point Y can be deduced from the well known formula:
where a - coefficient of temperature conduc- tivlty, m2/h;
5- time p e r i o d , h.
Fig.4 represents a design, area for deter- mination o f Tmean when solving a three-dimen- sional problem o f unetable heat conductivity.
t
1 L/* Y
Fig.4 An example of a design echeme f o r estimation of Tmean when solving a two-dimensional problem of vari able thermal conductivity.
fined ae Tmean. A three-dimenaional problem can be Bolved by So, the difficulty is a transition from a piecewise smooth function of temperature a t the ~ ~ e i ~ u ~ $ ~ ~ ~ a ~ ~ e t ~ ~ ~ 6 ~ ~ ~ ~ ~ ~ e ~ e ~ ~ ~ ~ ~ q f ~ ~ ~ ~ boundary of the area undey examination to a
reducing t o one-dimensional. F o r this purpose
constant temperature Tmean. With account of a Value Tmean degree of thermal effect of a heat source
I11 depends on an a r e a of heat ab- Etorption and heat release stretches; their tem-
1370
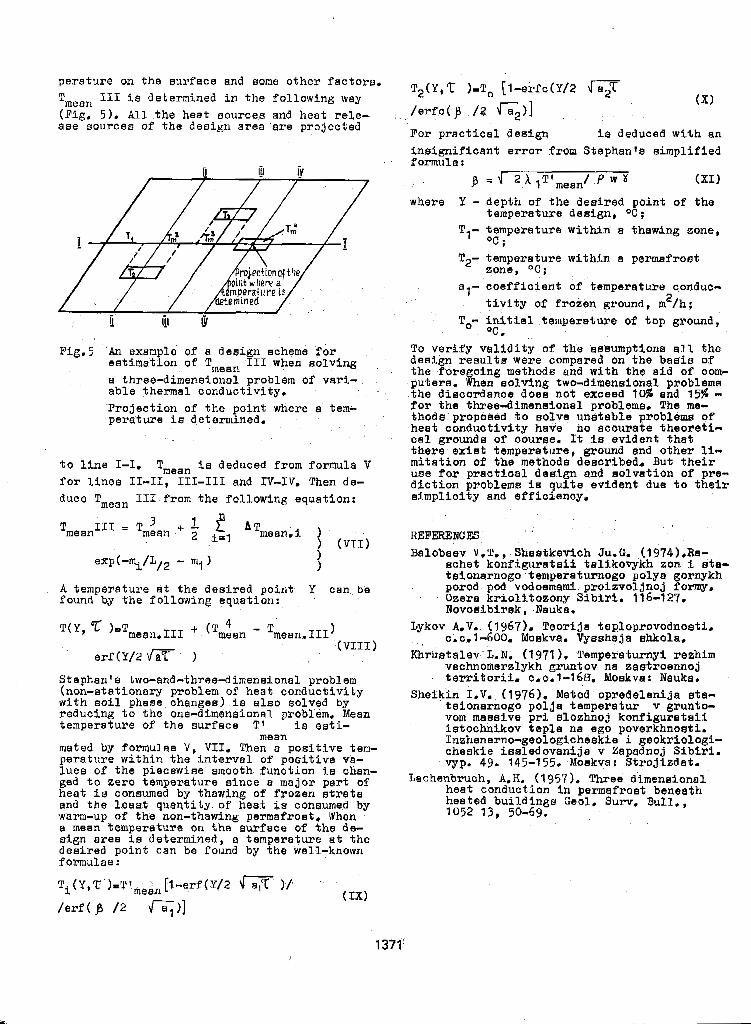
pers ture on the sur face and some o ther fac tora . T2(Y,T )-To i,-erfc(Y/2 Tmean I11 i s determined in t he fo l lowing way (Pig, 5). A l l the heat sources and heat re le- . , ase sources of the design area 'are projected
/ e r f c ( p /2 G 2 ) 1 (X)
Far p rac t i s a l des ign i s deduced wFth an i n s i g n i f i c a n t e r r o r from Stephan's simplified formula :
J = J 2 X ITtmean/ P w X (XI 1 ir iv
where Y - depth o f the desired point of t he temperature design, OC;
oc ;
zone, 'IC;
Tl- temperature within a thawing zone,
T2- temperature within a permafrost
8,- coe f f i c i en t o f temperature conduc- tivity of frozen ground, m2/h;
To- i n i t i a l t e m p e r a t u r e of top ground, OC.
Fig.5 An example of a design mheme for est imat ion of Tmean 111 when solving B three-dimensional problem of var i - ab le t h e m e l conduct ivi ty , Pro jec t ion of the po in t where a tem- perature i s determined.
t o l i n e 1-1. Tmean is deduced from formula V for L ines 11-11, T I L - I 1 1 and IV-"IV. Then de- duce T,,,, 1IL.frorn the following equation:
To v e r i f y v a l i d i t y of the 'askumptions a l l , the d e a i n r e s u l t s were compared on t h e b a s i s o f the !omgoing methode and with the a id of com- puters. When so'lvtng two-dimeneional problems the discordance does not exceed 10% and 15% - for the three-dimensional probleme. The me- thodrs propoded to so lve uns tab le p roblems oP heat conductivity have no accura te thsore t i - a a l grounda of c o u r ~ e . It l a evident tha t
mi ta t ion of t he methods deecribed, But t h e i r t he re exist temperature, ground and o ther Ii-
m e f o r p r a c t i c a l deHign and so lva t ion of pre- d i c t i o n problems ie qui te ev ident due t o t h e i r s impl ic i ty and eff iolency,
TmeanT'l = 'mean + ? - f: A T 2 i=l mean. i REFERENCES
exp(-mi/LI2 - ml 1 Balobaev V. To, Shaatkevich Ju. G. ( 1974 ) .Ra- echef konf igura te i i t a l ikovykh zon i eta- tsionarnogo temparaturnogo polya gornykh
Novoekbirsk. Nauke.
A tempereture a t the des i red p o i n t Y can be porod pod vodoemami profzvol noj f o m , found by t h e following equation: Ozera kr io l i tozony Sibiri. 146-72'7.
Stephan's two-and-three-dimensional problem (non-atationary problem of heat conduct ivi ty wi th soil phaae changes) i8 a l a 0 solved by reducing to the one-dimensional problem, Mean temperature of the aur face IT' is a s t i -
mated by formulae V , VII. Then a pos i t ive tern- pera tu re w i th in t he i n t e rva l of pos i t i ve va- lues of the piecewiae arnooth func t ion i s chan- ged to zero t empera ture s ince a major par t of heat i s consumed by thawing of f r o z e n s t r a t a and the l s a a t quant i ty of heat is oonsumed by warm-up of t he non-thawing permafroet, When a mean tempereture on the surface of t h e de- sign area i s determined, a temperature a t the desired point can be found by the well-known formulae:
mean
1371'
Lykov A.V., (1967). Teorija feploprovodnoati. c;c.l-600. Moakva. Vyashaja &kolar
Khrustalev L.N. (1971 ). Temppsraturnyi rezhirn vachnbrneralykh gruntov na zastroennoj t e x r i t o r i i . c.a.1-168. Moakva: Nauka.
Sheikin I.V. (1976). Metod opredelenija ata- ta ionarnogo pol ja tempsratur v gmnfo- vom massive pri sloehnoj konf igu ra t e i i ie tochnikov tepla na ego poverkhnosti. Inzhenerno-geologicheskie i geokriologi- cheakie iaaledovani ja v Zapadnoj S i b i r i . vyp. 49, 145-155. Moakva: S t ro j i zda t ,
Lechsnbruch, A.H. (1957). Threi dimenelonel heat conduction in permefroet beneath heated buildlngs Geol. Surv. Bull., 7052 13, 50-69.
PRESSURE IN RELATION TO FREEZING OF WATER-CONTAINING MASSES IN A CONFINED SPACE
M.M. Dubina
Permafrost Institute, Siberian Branch of the U.S.S.R. Academy of Sciences, Yakutsk, U.S.S.R.
SYNOPSIS Water-to-ice phase traneition is accompanied by an abrupt change in density, which causes the volume of water-containing masses to increase as they are freezing. Such a pro- cess occurring in a confined space entails a pressure increase in the unfrozen phase aa well a19 loading of the frozen phase and material that reatricts a free deformation of the water-containing maas. The level of the stregsea-defosmed state during the course of freezing is able to reach a value 8UffiCienf for inducing failure of the material locking the mass. Obtaining quantitative estimates o f the stressed-deformed state for auoh kind of procemea i! mandatory f o r purposes of tackling problems of maintaining safe servicing o f engineering structures and describing the ice foxmation under natural conditionlir (Pekhoviah, 1 9 8 3 ; , h b i n a and Krasovitaky, 1983; Wood and Good- man, 1975). Previoualy documented casea of a manifestation of ice formation in confined cavities determine the upper bound on the magnitude of pressures o f about two hundrede NIP&, viz. under conditione o f ice phaae modificationf(Pekhovich, 1983). Under real conditions %he pressures indi- cated axe limited by the manifestation of a variety of thermal, physico-chemical and mechanical parameeers of ice formation. This paper coneiders eome s e m l t a derived from mathematical aimula- tion of the development of prererauree of ice formation which yield computational relationships uaeful for making quantitative estlmatea.
FOIiMULATION OF THE PROBLEM
The following conditions may be categorized a8 ones forming ice formetion pxemures. Pixat , it is the pxeaenae of 8 confined space that irs filled with a water-containink mass increasing in i t a volume a8 it freepeB. The aecoud necee- s a y condition impliea aatiefying thermodynami- cal conditions for ice formation, inoluding the poaeible cooling of the water-containing maw and the dependence of the phaee-transition tem- perature on the preeaure and density of admix- tures, in partioulaf dissolved salta. We a h 0
tical applications, the model of the process take into consideration that, in cases of prrc-
may be limited to the scope of axial and sphe- rical symmetry when the freezing prooeao is proceeding in the direction from the cooled outer walls of the apace to its center.
In such a w a y , we conaider the following speci- fy ing system of equations:
1372
where & , 7;: a,. , and are density, tem- peratur'e and the coefficients of tenrperature- and heat-conductivity; rand /- a r e time and spatial coordinate$ so and 8 are the original and current poaitions of the freezing front XB- diua; tf is concealed heat o f phaae traneition; w is total moisture content; L' = 1, a&,-&SCr), and i = 2, S(r)sr*so are the unfrozen,and fro- zen zones of 8. freezing water-containing maas; i 3 is the frozen zone that includes the
space filled with a freezing mass; T,, is the natural, undisturbed temperature of frosen soil involving the space and the cooling temperature of a cylindrical (spherical) shell of radius
& involving the space, in which case T&,Z)n I r, ; i s the radius of the inner shell pla- ced at the center of the freezing mass ( 0 6 aL So , which occura for certain variants o f engineering practice; 7+ , Tpte) is the original and current value of temperature of the water-to-ice phase transition; C6- and bd are admixture salt concentration and its dif- fusion coefficient; k i s the distribution coef- ficient describing the effect of partial ea- p u l t i m of admixture salt ( o I k r l ); C" fp) i s the initial diatribution of admixture salt; P ( C 1 i s the pressure in the given unfrozen zone that is unable to resist to shear deforma- tions; M i s the maas of 1 kilomole of solvent; R is a universal gas constant; El , $1 , FRi ,
and are the elastic modulus, Poiwon 's coef- ficient, the yield point, ana the angle of in- ternal friction; d~ = i-& /&, ia the coefflci- ent ofvolumestrain of the freezing mass ( olv > O j; and P 1 i s cylindrical symmetry and a 2 ie spherical symmetry.
The syetem (1)-(10) involves the following re- lationships: heat conduction equation ( 1 ) ; the Stephan condition at the front of a phase transition (2); initial and boundary oonditions o f the heat exchange problem ( 3 ) and (4); d i f - fusion equation f o r admixture salt (5) and a relevant balance equation at the front of free- zing (6); initial and boundary conditions for the admixture field concentration (7) and ( 8 ) ; Equation of ice formation phase diagram (9) ob- tainable from the equality condition for chemi- cal potentials at the phaae separation bounda- ry; and a solution to the problem of the atres- sed-deformed s t a t e for the gresauxe of our in- terest in auppoeed liquid, unfrozen phase (IO).
SPECIFYING THE MECHANICAL PART OF THE IWDEL
The particular form of the relationship (IO) involved in the system (1)-(10) is defined by the given particular c a m o f geometry and the model used for mechanical behaviour of the me- dium. In the simplest case o f freezing of the water-containing mam in-between two coaxial and concentric shells the expreaeion (IO) has the form of an obvious relationship between the preasure and geometrical and mechanioal parame- ters o f the problem. Because these are trivial expresaione and, therefore, we do not give them here.
For freezing in a cavility in the ground mass, we obtain the most simple solution f o r the me- chanical part o f the problem by aasuming the strain distribution in the freezing mas8 to be
hydrostatic. Such an approach provides a simple means to take into account elastic-plastic de- formation of cavity-containing rocka, which seems t o be done first in a paper of Wood and Goodman (1975). The elastio stage of deforma- tion iB limited by the pressure Level which is calculated in the 8ame manner aa done by Dubina (1986) using the formula
where & is rock presswe.
For the stage o f elastio-plastic deformation of rocka, depending on the kind of tl plaeficity condition, the xelationahip (IO) can be obtri- ned in the form of a nonlinear algebraic equa-
of a freezing mas8 and rigidity of its internal tion f o r p . In the case of noncompreaaibility
plifies to an explicit relation P ( S ) which l e boundary in xadiua r-ct this equation sim-
given for the Mieees fluidity condition beceu- Be the expressions f o r the Coulomb-Moore COMA- tion axe unwieldy. Accofdin& to Dubina (19861, f o r p>pc I we have
Examination of (12) suggekt~t an important oon- CluaiOn about the limitedneare of preeeures in the cavity due t o the quantity &p the expressions f o r which fo l low Prom (12) if it ia assumed that S4<So The maximum preusure
rocks, i.e:%rne kind OP their reaponee t o the quantity is a mechanical property of
process of solidification o f the maas within the cavity. A similar effect o f the exirstenoe of a preesure maximum has ala0 been obtained for a viecaue-elastic model o f freezing repor- ted by Dublna and Krasooitsky (1983) when the exprerreion (10) haa the form
1373
REDUCTION TO ORDINARY DIFFERENTIAL EQUATIONS
The ayetem (1)-(10) presented here is too com- plicated to be solved, even if proper allowan- oe is made for simplifications to the mechanical part of variants (12) and (13) under considera- tion. Numerical estimates can, nonethelesa, be obtained by further aimplifying the formula- tion of the problem. Assuming the unfrozen zone t o have no temperature gradient (i P 11 and the temperature diatribution in the frozen zone to be quasi-atationmy (i I 2 ) and by specify- ing the cooling temperature on the con- t OUT , we aimpliiy conaidexably the heat exchange part of the problem etatemsnt. We also simplify the diffuaion part asauming both re- gions of the freezing mass to have no gradient as well aa the abeence of admixture in surroun- ding rocks, and write the redistribution o f admixture salt ocourring at the front ( ), according to the concentration balance equa- tion in the unfrozen zone, in the form
where & is initial conoentration that I s uniform throughout the entire freezing mase.
Bearing in.mj.nd all of the assumptione made, one is able to reduce the system (1)-(10) t o two ordinary differential equations for an el- aatic-plaetic model of the behaviour o f rocka *ad foraase of a freezing between two elarjtic ahella (hxbina, 1986). Equation (9) is the firef of theee equatione which should inoorpo- rate the seaond expression o f (81 , thue enab- ling the unknown C, to be eliminated. Besides equation (9 ) should include the explicit rela- tion o f P ( S ) s n d C ( S ) o f the form (12) and (14). The aecond equation is known to have the form
In the case o f a viscous-elastic model for de- foxmation, with the exponential form of rela- xation cores 4,. ( , t ), the problem can also be reduced to aolving ordinary differen- tial equationa (Dubina and Krasovitsky, 1985).
AN W I P L L CALCULATION
Pig8 1-4 present the calculation results on the axisymmetrical. cam of a water solution of salt NaCl freezing in a space produced by an elas- tic shell of radius S o o r a space in a natural sook which is coneidered f o r both an elastic and elastic-plastic model. In all exampleB the following parametera are assumed constant I bo =
1374
P 3600 s; Tp0 = 273 K ; Po = 0.1 IVlPa ( 4 being the pressure sca le ) ; A = 8.32~103 J/(K.mole); N = 0.018 kg/mole; .t! m 334.103 J/kg; ;Ira 2.21 W / ( m - K ) ; + e 1000 kg m 3 ; 4 = 910 kg/m3; 40 = I 0.01 m; Eso I 2.10 f MPa; a m 0; s, = 1 rn; and k, I w & The notation used is the following: &, and .Fc0 are the thickness of the walls and the elasticity modulus of the shell that forms the space; and kt and ke are thetolums elasticity modulus of the unfrozen and frozen phases of a freezing mass. The re- sults of the calculation f o r the elastic space axe marked by solid lines, and those f o r the elastic-plastic space are shown by dashed li- nes. Cases of the absence of salinization for the elastic-plastic space are marked by dash- dot lines. A total of seven calculation vaxi- ants are shown in Figs 1-4. Variant 1 corres- ponda t o curves 1.1-1.3 plotted for three va- lues of initial mass concentration: X. = 2.5; 5; and 15 kg/m3 for = 263 K. Curves 2 and 3 correspond to Q-. 1.103 and 0.3~103 MPa f o r
TH = 268 K and XO 5 15 kg/m3; curves 4 and 5 correspond to the same values of TM and & but withx:, a 0. Plots 6 and 7 have been construc- ted for an elaatic-plastic model o f rocks in- volving th cavity, for the aame @,,> = 1 MPa$ 6 I 5*103 MPa; and X. a 5 kg/m3 for TN I 268 and 263 K. Curven 1-5 also correspond to free- zing in a eingle ahell for which So = 0.27 m and Efo- 2.105 N W a , while the value 3f G3 5 1.10 MPa corresponds to & = 2-10' m and that of 41 0.3~103 MPa corresponds to 6so = = 6.7~10-4 rn. The qualitative implications of the analysis results regarding the calculations made in this paper may be summarized a8 follows.
CONCLUSIONS
1 . 1. In the case of the absence o f salinization the water-containing mass either i s able to Pree- ze campletely or the parameters s , p , and & a s a w e ateady-state values on an infinite time interval. In the presence of saliniza- tion the parameters S , p , & , and C, assu- me steady-state valuea on a finite time inter- val. In the case where the remaining condi- tione remain unchanged, salinization reducee the value of the pressure being evolved, in proportion to the degree of salinization but increases the atsengthening of the material containing the freezing mass. Proper account of plastic deformations of rocks, with other con- ditions remaining unaltered, reduces conside- rably the l eve l of evolving preseure. When the CoulombPoore fluidity condition is applied, an increase of the angle of internal friction of rockc3, J3 , lead5 t o an increaee in preasu- xes and time of freezing.
2. Viscous-elastic treatment (Dubina and Kraso-
When the variability of is taken into ac- count, the process o f freezing proceeds at lo- wer rates. Without salinization, the water-con- taining mass freezes completely, with extrema of the parametere p and %on the freezing interval. If the freezing of a viscous-elastic maas proceed8 within an elastic space or bet- ween elastic shells, then the mass i s a b l e to
VitSkY (19851.
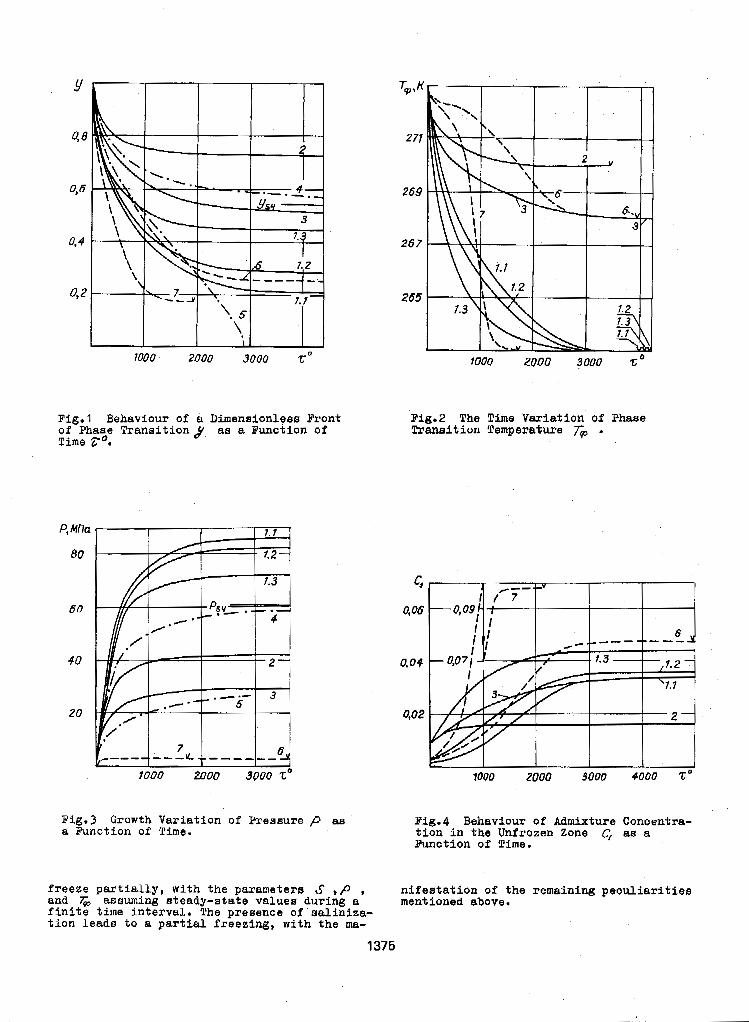
1000 2000 3000 To 7000 2000 3000 Z
Fig.1 Behaviour o f a Dimensionless Front of Phase Transition$ as a Function of Time To.
PI Mna
80
60
40
20
1000 2000 3000 T o
Fig.2 The lime Variation of Phaae Transition Temperature r, .
Ol 06
4 04
402
Pig.3 Growth Variation of Preesure p ae Fig.4 Behavioux of Admixture Conoentra- a Function OP Time. tion in the Unfrozen Zone C, as a
Function of Time.
freeze partially, with the parameters S ,P , nifeatation o f the remaining peculiarities and i& assuming ateady-atate V Q l U e 8 during a finite time interval. The presence o f rraliniza-
mentioned above.
tion leada to a partial freezing, with the ma-
1375
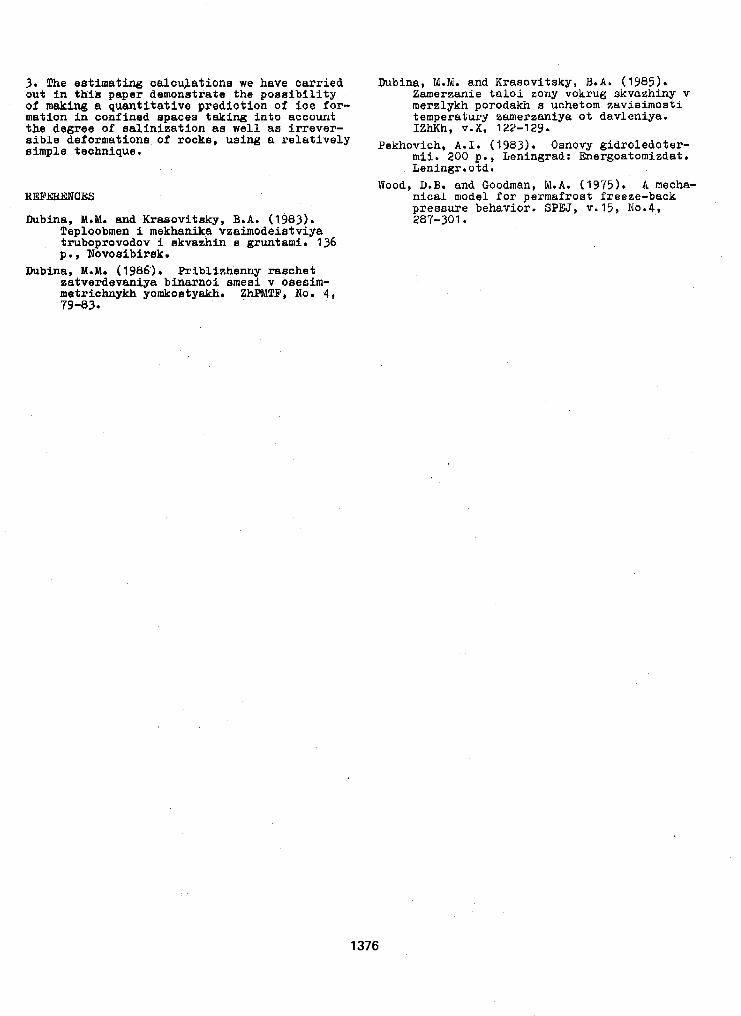
3. The estimating calculations we have carried out i n thih paper demonstrate the p o a s i b i l i t y of making 8. quantitative prediction o f ice for- mation in confined spaces taking into amount the degree of salinization as well as irrever- sible deformatlona of rocks, uaing a relatively simple technique.
REFEFiRPNCES
Dubina, M.M. and Krasovitsky, B.A. (1983). Teploobmen i mekhanika vzaimodeietviya truboprovodov i akvazhin s grunfami. 136 P., 'NOVOBibirak.
Rubina, W.M. (1986). Priblizhenny raschet
metrichnykh yOmk08fyakh. Z W T F , No. 4, zafverdevaniya binarnoi smesi v osesim-
79-83.
Dubina, M.M. and Krasovitsky, B.A. (1985). Zamerzanie taloi zony vokrug Bkvazhiny v merzlykh porodakh a uchetom zavisimoati temperatury zamerzaniya ot davleniya. IZhKh, v.X, 122-129.
Pekhovich, A . I . (1983). Osnovy gidroledoter- mii. 200 p . , Leningrad: Energoatomizdat. Laningr . o td.
Wood, U.B. and Goodman, M.A. (1975). A mecha- nical model f o r permafrost fraeze-back pressure behavior. SPEJ, v.15, No.4,, 287-301.
1376
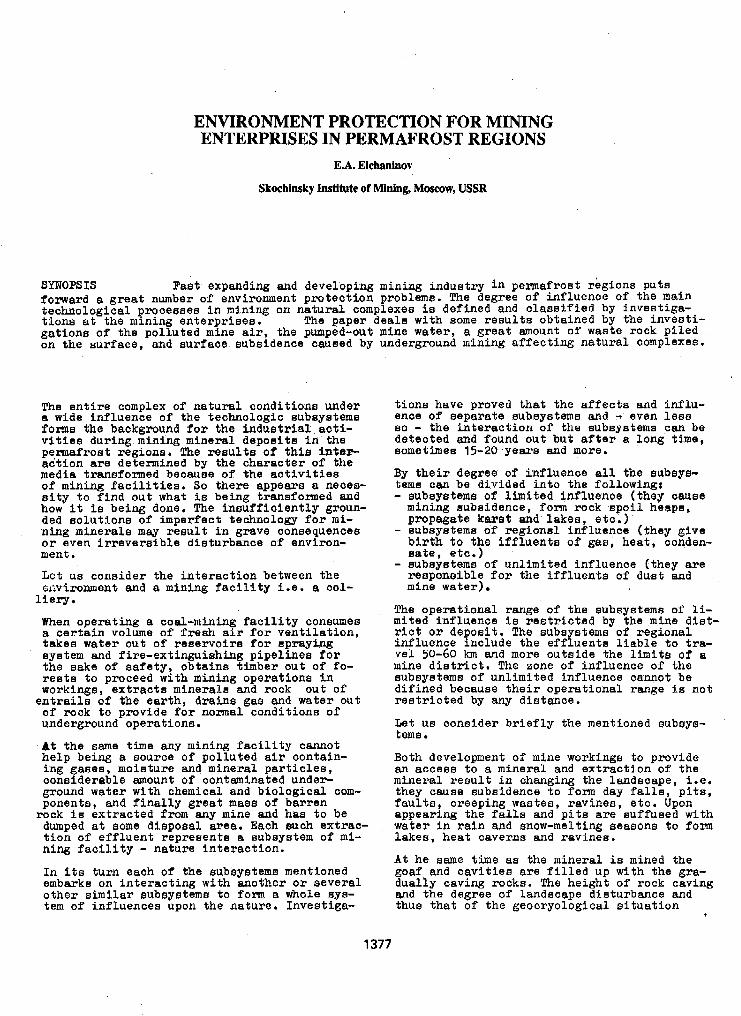
ENVIRONMENT PROTECTION FOR MINING ENTERPRISES IN PERMAFROST REGIONS
E.A. Elchaninov
Skochinsky Institute of Mining, Moscow, USSR
SYmOPSIS Paat expanding and developing mining industry in permafrost rkgions puts forward a great number of environment protection problems. 'Phe degree of influence of the main technological processee in mining on natural. complexes is defined and classified by investiga- tions at the mining enterprises. The paper deals with eome results obtained by the investi- gations of the polluted mine air , the pumped-out mine water, a great amount of waste rock piled on the surface, and surface subsidence caused by underground mining affecting natural complexes.
The entire complex o f natural oonditions under a wide influence of the technologic aubaystems forms the background for the industrial acti- vities during mining mineral deposits in the permafrost regions. !Che results of thie intar- action are determined by the character of the media transformed becauee of the activities of mining facilities. So there appears a neces-
how it is being done. !The insufficiently groun- sity to find out what is being transformed a n d
ded solutione of imperfect technology for mi- ning minerals may result in grave consequences or even irreversible disturbance of environ- ment.
Let us consider the interaction between the mvfroment and 8 mining facility i.e. a col-
When operating a coal-mining facility consumes a certain volume of fresh air for ventilation, takes water out of reselvoira for spraying system and fire-extinguishing pipelines for the aake of safety, obtain= timber out o f fo- reets to proceed with mining operations in workings, extracts minerals and rock out of entrails of the earth, drains gas and water out of rock to provide f o r normal conditions of underground operations.
A t the same time any mining facility cannot help being a source of polluted air contain- ing gases, moisture and mineral particles,
ground water with chemical and biological com- considerable amount o f contaminated under-
ponents, and Pinally great mass o f barren
dumped at aome dispoaal area. Each such extrac- tion of effluent represents a subsyntem of mi- ning facility - nature interaction. In i t a turn each of the subkystemms mentioned embarks on interacting with another or several other similar subsyrrtema to form a whole eys- tern of influences upon the nature. Investiga-
liery
rock is extracted from any mine and has to be
tions have proved that the affects and influ- enoe o f separate subsystems and - even less so - the interaction o f the subsystems can be detected and found out but after a long t ime, sometimes 15-20 -years a n d more.
By their degree o f influence a11 the subsyrs- terne can be divided into the following: - subsyetems o f limlfed inPluenoe (they C ~ U B B mining subsidence, f o rm rock spoil heape, propagate karat and lakea, eta.)
- subsystems of regional influence (they give birth to the iffluents of gas, heat, conden-
- aubaystems of unlimited influence (they are sate, etc.)
responsible for the iffluents of duat and mine water)
!Che operational range of the subsyetems of li- mited influence i s restricted by the mine dist- rict or deposit. The subs stems of regional influence include the efffuents Liable to fra- vel 50-60 km and more outside the limits of a mine district. The zone of influence of the subsystems of unlimited influence cannot be difinad because their operational range i s not restricted by any distance.
Let us consider briefly the mentioned wbsye- tems
Both development of mine workings to provide an access to a mineral and extraction o f the mineral result in changing the landscape, i.e. they cause subsidence to form day falls, pits, faults, creeping wastes, ravines, etc. Upon appearing the falls a n d pits are suffused with water in rain a n d snow-melting seaaons t o form lakes, heat owerne and ravines.
At he same time as the mineral is mined the goaf and cavities are filled up with the gra- dually caving rocks. The height of rock caving and the degree of landscape disturbance and thus that of the geocryological situation
1377
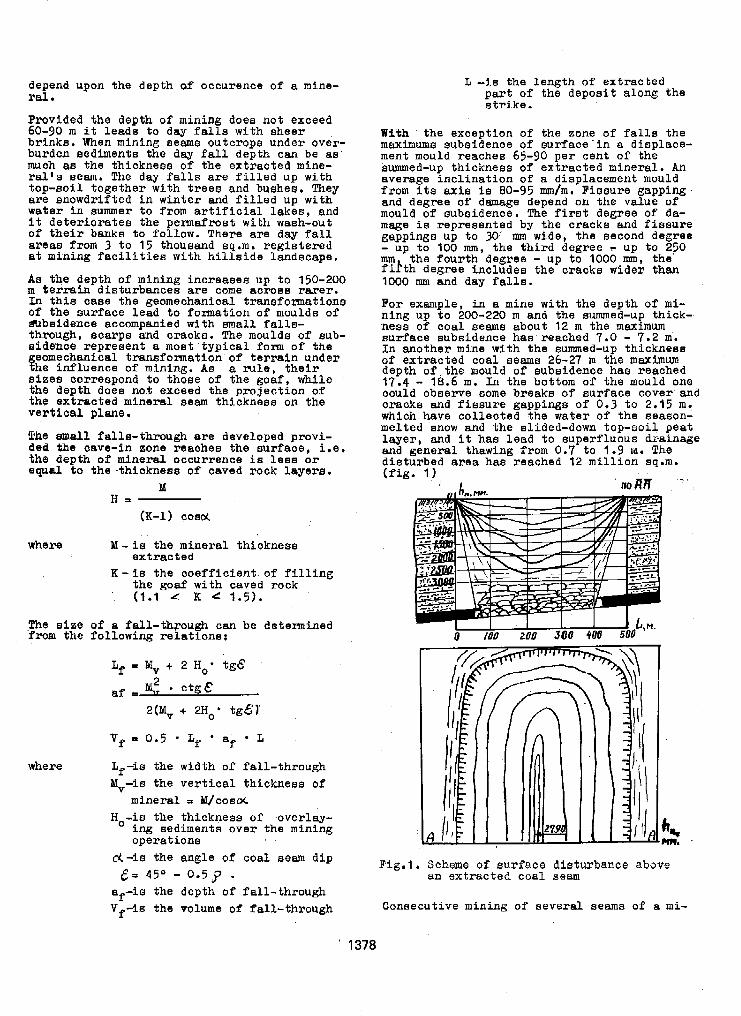
depend upon the depth of occurence of a mine- ral *
Provided the depth of mining doee not exceed 60-90 m i t l eads t o day f a l l s with sheer b r b k s . When mining a e m 8 outcrops under over- burden sediments the day f a l l depth can be a s . much as the thickness of the extracted mine- ral's seam. The d a y falls are f i l l e d up w i t h top-Boil together with trees and buehes. They are snowdrif ted in winter and f i l l e d up with water in summer t o from a r t i f i c i a l l a k e s , and i t de te r io ra t e s t he pemaf roe t w i th wash-out o f t h e i r banks t o follow. There axe day f a l l areas from 3 t o 15 thousand sq.m. reg is te red a t mining fac i l i t i es with hi l ls ide landscape.
As the depth of mining increases up t o 150-200 m terrah dis turbances a re come across ra re r .
of the surface lead t o formation o f moulds of I n this case the geomechanical tranefomations
mbeidence accompanied with small falls- thmugh, scarps and cracks. The moulds of sub- sidence represent a moat ' typ ica l form of the
fhe inf luence of mining eomechanical transformation o f terrain under . AB a m l e , t h e i r
Bises correspond to those of the goaf, while the depth does not exceed the projection of the extracted mineral seam thickneaa on the v e r t i c a l plane.
!We amall falls-through are, developed provi- ded the cave-in zone reaches the surface, i .e.
equal t o the -thioknese o f caved rock l ayere . the depth o f mineral occurrence i s l e s s o r
Y H a
(K-1) COSM
where Y - i e the minera l th ickness extracted
the goaf with caved rock K-is the coef f ic ien t of f i l l i n g
(1.1 4 K 4 1.5).
The size o f a fall- through can be detemined f r o m the fo l lowing re la t ions :
2(& + 2Ho* tgET
Bf I 0.5 - Lf . af L
where Lf-is the width o f fa l l - through Yv-is t he ve r t i ca l t h i ckness o f
mineral 3 M/cosoC H o - i s the thickness o f -overlay-
ing sediments over the mining operat ions
&-is the angle o f coal Beam d ip & - 45' - 0.59 *
af-is the depth o f fa l l - through V f i s the volume of fall- through
L -La the length of extracted p a r t of the deposit along the s t r i k e .
With the exception of the zone of falls the maximums subsidence of surface- in a displace- ment mould reaches 65-90 per cent of the summed-up thickness of extracted mineral . An average inclination of a displacement mould from its ax is i s 80-95 mm/m. Fissure gapping and degree of damage depend on the value o f mould of subsidence. !Che first degree o f d a - mage is represented by the cracka and f i s s u r e gappings up t o 30 m wide, the second degree - up t o 100 mm, the third degree - up t o 250 mm the fourth degree - up to 1000 mm, the f i h h degree includes the cracka wider than 1000 mm and day falls .
For example, i n a mine with the depth of m i - n ing up to 200-220 m and the summed-up thick- ness of coal seams about 12 m the m e x i m u m surface subsidence has reached 7.0 - 7.2 m. In another mine with the Eturmned-up thicknese of extracted coal seam8 26-27 m the m a x i m u m depth o f the mould of subsidence has reached 17.4 - 18.6 m. Tn the bottom of the mould one could observe some breaks of surface cover a n d cracks and f issure gappings o f 0.3 t o 2.15 m. which have col lected the water of the season- melted snow a n d the Elided-down top-soil peat l aye r , and i t has lead to superf luous dzainage and general thawing from 0.7 to 1.9 Y. The dis turbed area has reached 12 mi l l i on 8a.m.
Fig.1. Scheme o f surface disturbance ebove an ex t rac ted coal seam
Consecutive mining of several seams of a m i -
' 1378
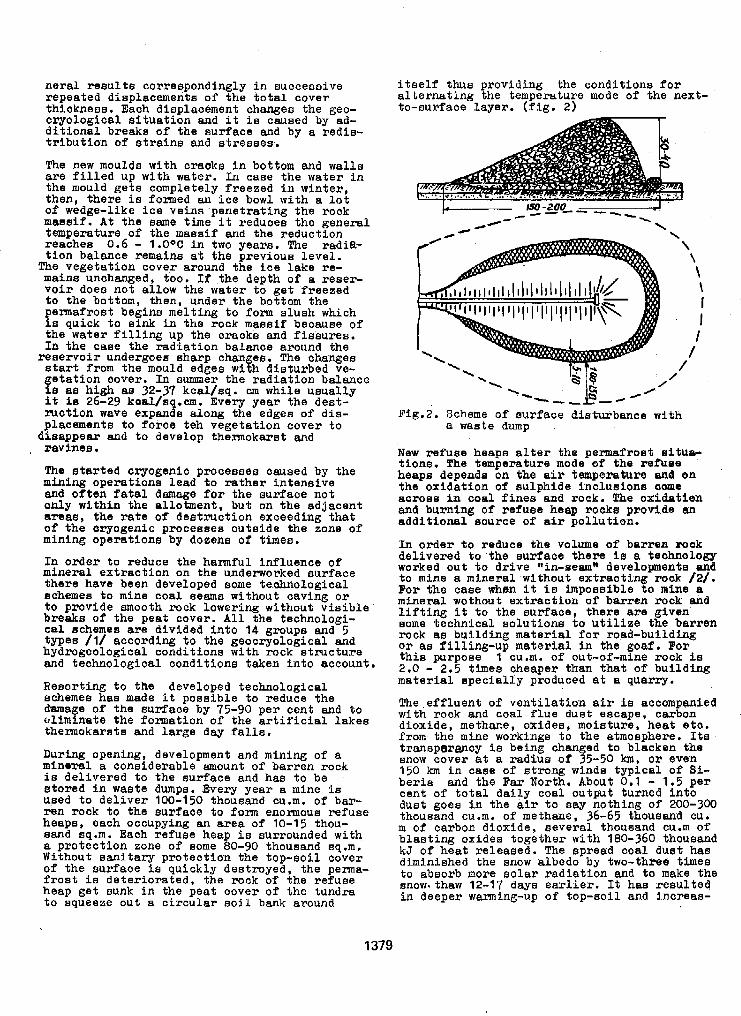
n e r d r e s u l t B corresDondi repeated displacemen%s of the to ta l cover thickness. Each displacement changes the geo- cryological s i tuat ion and i t i a caused by ad- dit ional breaka of the surface and by a redie- t r ibu t ion of s t ra ine and s t r e s ses .
.ngly in successive
The new moulds with craaks in bottom and walls a r e f i l l e d up with water. In case the water in the mould gets completely freezed in winter, then, there is formed an ice bowl with a l o t of wedge-like ice veins .penetrat ing the rock maesif. A t the aame t h e i t reduces the general temperature of the massif and the reduction reaches 0.6 - l .O°C i n two years. The radia- tion balance remains a t the previous level.
The vegetation cove,r around the ice lake re- mains unchanged, too. If the depth of a reser- voir does not allow the water to get Preezed to the bottom, then, under the bottom the permafrost begins melting to f o rm s lush which is quick to sink in the rock massif because of t he wa te r f i l l i ng up the cracke and f i ssures .
reservoir undergoes sharp changes. The changes In the case the radiat ion balance around the
start from the mould edges with disturbed ve- ge t a t ion cover. I n summer the radiation balance ie a8 high a8 32-37 kcal/sq. cm while usually i t i e 26-29 koal/sq.cm. Every year the dest- ruc t ion wave expands along the edges of d i s - placements to force teh vegetation cover t o
ravines.
The started cryogenic processes caused by the mining operations lead t o r a the r i n t ens ive and of ten fatal damage f a r the surface not only within the allotment, but on the adjacent areaa, t he r a t e o f destruction exceeding that of the cryogenic processes outeida the zone of mining operations by doaens of timea.
In order to reduce the harmful influence o f mineral extraction on the underworked surface there have been developed some feohnological schemes t o mine coal Beams without caving o r to provide smooth rock lowering without visible breaks of the peat cover. A l l the technologi- cal schemes are divided into 14 groups a n d 5 types / I / according t o the geocryological and hydrogeological conditions with rock stxuctum a n d technological conditions taken into account.
Resorting to the developed technological schemes haa made i t possible to reduce the
tllhninafe the formation o f t h e a r t i f i c i a l l a k e s dgmage of the surface by 75-90 per cent and to
thermokarsts a n d l a rge day f a l l s .
During opening, development and mining of a mineral a considerable amount o f barrea rock i s delivered to the surface and has t o be s tored in waste dumps. f i e r y y e a r a mine is used t o d e l i v e r 100-150 thousand cu.rn. of bar- ren rock to the surface to form enomous refuse heaps, each occupying an a rea of 10-15 thou- sand sq.m. Each refuse heap ia surrounded with a pro tec t ion zone of Borne 80-90 thousand 8 q . m . Without sanitary protection the top-soil cover o f the surface is quickly destroyed, the perma- f r o s t ie deter iorated, the rock of the refuae heap get sunk i n the peat cover of the tundra t o squeeze out a c i r c u l a r s o i l bank around
disappear and to develop themnokarst and
i t s e l f thua providing the conditions f o r alternating the temperature mode o f the next- to-surface layer. (f ig. 2)
Fig.2. Scheme of aurface diertuxbance with a waste dump
New refuse heaps a l ter the permafroat Bitua- t ions. The temperature mode of the reiusle heaps depend8 on the a i r temperature and on the oxidation of sulphide knclusions oome aoross i n coal f ines and rock. The oxida t i sn and burning of refuse heap rocks provide an additional source of air pollut ion.
Tn order to reduce the volume of barren rook delivered to the suxffacs there is a technology worked out t o drive "in-semn developments a d
For the case when i t is h p o s e i b l e t o mine a t o mine a mineral without extraoting rock /2/.
mineral wothout extraction of barren rock and l i f t i n g it to the sureace, there ere given some technical solut ions to utilis8 the barren rock as building mater ia l for road-bui lding o r as f i l l ing-up material in the goaf. For t h i s purpoae 1 cu.m, of out-of-mine rock is 2.0 - 2.5 times cheaper than that of building mater ia l spec ia l ly produced at ta quarry.
The ef f luent o f ven t i l a t ion a i r ie accompanied with rock a n d coal f lue d u s t escape, carbon dioxide, methane, oxidas, moieture, heat efe. from the mine workings to t he atmosphere. Ita t r anepe ra~~cy i s being changed to blacken the snow cover a t a r a d i u s of 35-50 km, o r even 150 km i n case o f strong winds typical o f S i - ber i a and the Far North. About 0.1 - 1.5 per cent of total dai ly coal output turned into dust goea i n t he a i r t o say nothing of 200-300 thoueand cu.m. of methane, 36-65 thousand cu. m of carbon dioxide, aeveral thousand cu.m o f blast ing oxides together with 180-360 thousand kJ o f heat released. The spread coal duat has diminished the snow albedo by two-three times
snow.thaw 12-17 d a y s e a r l i e r . It has resu l ted to abeoxb more ao la r rad ia t ion a n d t o make the
i n deeper waming-up of top-soil and increas-
1379
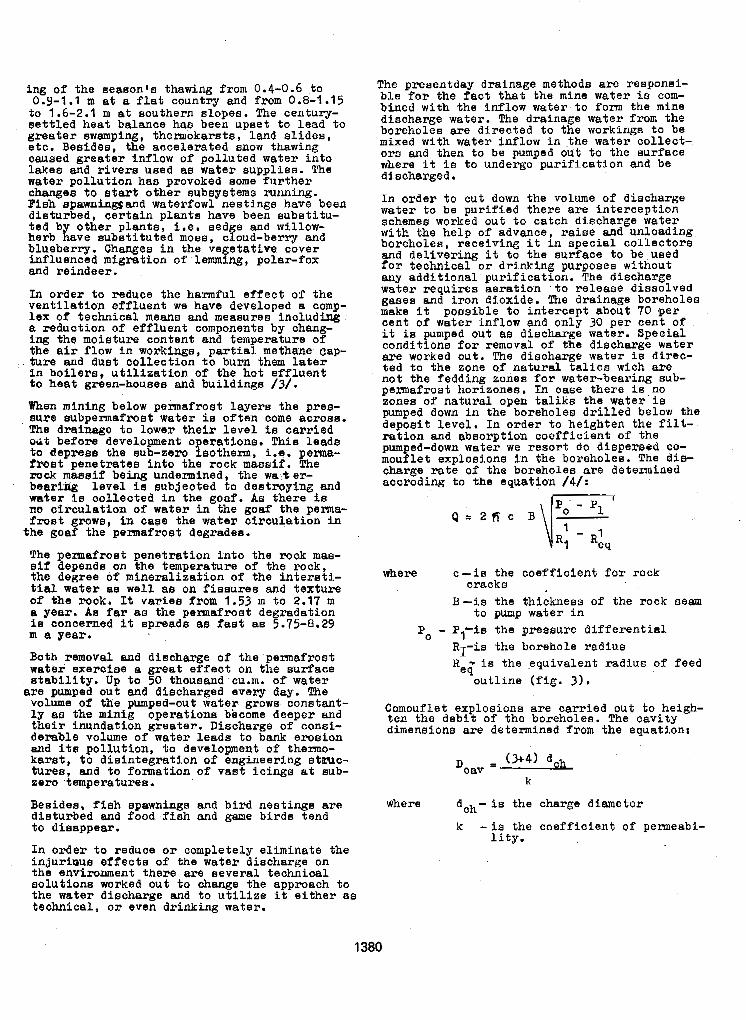
ing o f the season's thawing from 0.4-0.6 to 0.9-1.1 m at a flat country and from 0.8-1.15 to 1.6-2.1 m at southern slopes. The century- settled heat balance has been upset to lead to greater swamping, thermokarsts, land slides, etc. Besides, the aocelerated anow thawing caueed greater inflow o f polluted water into lakes and rivers used as water aupplies. The water pollution ha8 provoked aome further ehangea to start other subsystems mnning. Bieh spawningrand waterfowl nestings have been disturbed, certain plants have been substitu- ted b other plants, i.e. sed e and willow- herb have substituted moea, cfoud-berry and blueberry. Changes in the vegetative cover influenced migration o f lemming, polar-fox and reindeer.
In order to reduce the harmful effect of the Ventilation effluent we have developed a comp- lex o f technical means and measures includi'ng a reduction of effluent components by chang- Ing the moiBture content and temperature of the air flow in workings, partial methane Cap- ture and duet collection to burn them later in boilers, utiliaation of the hot effluent t o heat green-house8 and buildings /3/.
When mlnlng below permafrost layers the pres- Bure subpermaimat wafer is often come acrosa. The drainage to lower their level SB carried out before development operations. This leads t o deprese the sub-zero isotherm, i.e. perna- frost penetratee into the rock massif. The rock maeeif being undermtnnad, the wa t or- beertag Level is subjected to destroytng and wafer i s collected in the g o d . As there i s no circulation o f water in the goaf the pema- frost grows, in caas the water circulation in
!Phe permafrost penetration into the rock mas- aik depends on the taperature of the rock, the degree of mineralization o f the intersti- t ia l water as well as on fiseures a n d texture of the rook. Tt varies from 1.53 rn to 2.17 rn a year. As far as the permafroat degradation is concerned it spreads an fast a6 5.75-8.29 m a year.
the goaf the pemafroet degradee.
Both removal and discharge of the permafrost wafer exeralse a great effect on the eurface stability. Up to 50 thouaand cu.m. 09 water are pumped out and discharged every day. !Che volume of the pumped-out water grows constant- Ly a@ the minig operations become deeper and their inundation greater, Discharge of conai- derable volume of water leads to bank erosion and its pollution, to development of thenno- karst, to disintegration of engineering efwc- tures, and to formation of vast icings at sub- zero ,temperatures.
Besider~, fish spawning8 and bird nestings axe diaturbed and food fish and game birds tend to disappear.
In order to reduce or completely elbinate the injuriuue effects of the water discharge on the environment there are several technical solutions worked out to ahange the approach to the water discharge and to utilize it either as technical, OF even drinking water.
The preaentday drainage methods are responsi- ble f o r the fact that the mine water is com- bined with the inflow water to form the mine discharge water. The drainage water from the boreholes are directed to the workings to be mixed with water inflow in .the water collect- ors and then to be pumped out to the surface where it is to undexgo purification a n d be discharged.
In order to ,cut down the volume of discharge water to be purified there are interception schemes worked out to catch discharge water with the help of advance, raiee and unloading boreholes, receiving it in special collectors and delivering it to the surface to be used f o r technical o r drinking purposea without any additional purification. The discharge water requires aeration to release dissolved gaees and iron dioxide. The drainage boreholes make it possible t o intercept about 70 p e r cent of water inflow and only 30 per cent of it is pumped out as diecharge water. Special OOnditlOns for removal of the discharge water are worked out. The discharge water ie direc- ted to the zone af natural talica wich are not the fedding zones f o r water-bearing sub- pexmafrost horiaones. In case there i s n o zones o f natural open taliks the water is pumped down in the boreholes drilled below the deposit level. In order to heighten the filt- ration and absorption coefficient of the
mouflet explosions in the boreholes. The dis- pumped-down water we resort do dispersed co-
charge rate o f the boreholes a m determined accroding t o the equation /4/:
where c - i s the coefficient for rock cracks
13-is the thickness of the rock seam to pump water in
Po - P,+e the presaure differential RI-is the borehole radius
Req - is the .equivalent radius of feed outline (fig. 3 ) .
Comouilet explosions are carried out to heigh- ten the debit of the boreholes. The cavity dimensions are determined from the equation:
k
where dch- i s the charge diameter
k - is the coefficient of pemneabi- lity.
1380
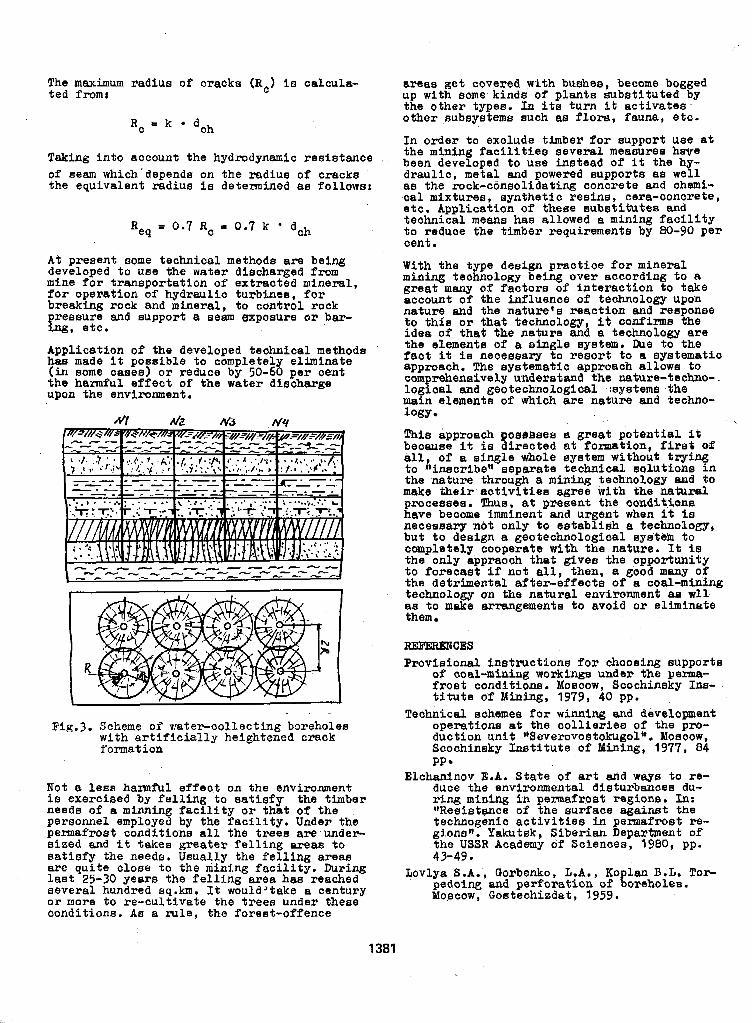
The m a x i m u m radius o f cracks (Rc) is calcula- ted fromt
R, = k dch
3aking into account the hydrodynwrdc resistance of seam which'depends on the radius o f cracks the equivalent radius is determined as follows;
At present aome technical methods are being developed to use the water discharged f r o m mine for transportation of extracted mineral, for operation OP hydraultc turbines, for breaking rock and mineral, to control. rock
P reasure and support a seam exposure or bar- ng, etc. Application of the developed technical methode has made It polssible to completely eliminate
the hannf'ul effect of the water diecharge (Fn some cases) or reduce by 50-60 per cent
upon the environment.
d !
Fig.3. Scheme of water-collecting boreholes with artificially heightened crack formation
Not E less hannful effec.t on the environment i s exercised by felling to satisfy the timber needs of a miming facility or that of the personnel employed by the facility. Under the permafrost conditions all the trees are u n d e r ~ F z e d and it takes greater felling areas to satisfy the needs. Usually the felling atrew are quite close to the mining facility. During Last 25-30 years the felling area has reached aeveral hundred sq.km. It would'take a century or more t o re-cultivate the treee under these conditions. As a r u l e , the forest-offence
areas gat covered with bushee, become bogged up with aome kindls of plants substituted by the other types. In its turn it activates- other subsyetems such as flora, fauna, eto. I
1381
In order to exclude timber f o r support uae at the mining facilitiee seveeaal meaaurea have been developed to use instead o f it the hy- draulic, metal and powered supports as well aa the rock-consolidating concrete and chmi-
etc . Application o f these substitutes and cal mixtures, eynthetic resins, cera-concrete,
technical means has allowed a mining facility to reduce the timber requirements by 80-90 per cent.
With the type design practice for mineral mining technology being over according to a great m a n y o f factors of interaction to take account of the influence of teohnology upon nature and the naturela reaction and res onse to this o r that technology, if confirms !he idea o f that the nature and a technology are the elements of a aingla system. Due to the feet if is necemary to resort to a systematio approach. The systematic approach allowfl t o oomprehens3.vel.y understand the nature-techno-. logical and geotechological ;systeme the main elements of which are nature a n d teehno- logy
This approach posrrbsea a great potential it because it is directed at formation, first of all, of a single whole syetm without trying to ltinscribefi separate technical solutions in the nature through a mining technology and to make their activities agree with the nat;Uml proceseee. Thus, at preeent the oondithns have become imminent and urgent when it is nscessaxy nbt only to establish a technology, but t o design a geotechnological sya'tem to completeXy cooperate with the nature. It is the only appraoch that givee the opportunity to forecast If not a l l , then, a good many of the detrimental after-effacte of a coal-mining technology on the natural environment as up11 am to make arrangamenta to avoid or elimlnate them
REFERENCES Provisional inBtmctions for choosing supports
of coal-mining workings under the pema- frost conditions. MOBCOW, Scochinsky Ins- titute of l i n h g , 1979, 40 pp-
Tec&icd schemes f o r winning and aevelopment operations at the collieries of the pro- duction unit "Severovostokugol'l, Moscow, Scochinsky Institute of Mbining, 1977, 84 PP
Elchaninov E.A. State of art and waya to xe- duce the environmental dioturbmcea du- ring mining in pemarrost regions. In: 'IReeistWce of the eurface against the technogenic activities in permafrost re- gionsll. Yakutsk, Siberian Department of the USSR Academy of Sclmnces, 1900, pp. 43-49.
Lovlya S.A., Gorbenko, L.A., KO L a n B.L, T o r pedoing and perforation of !orehoLes. Yoacow, Goetachidat, 1959.
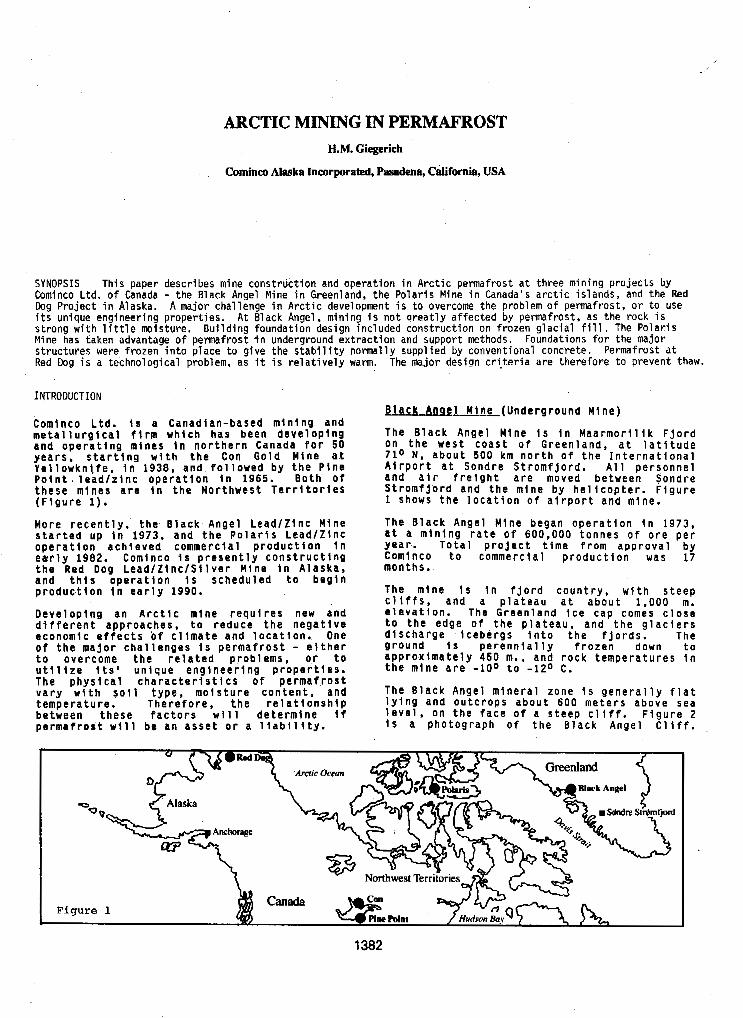
ARCTIC MINING IN PERMAFROST H.M. Giegerich
Cominco Alaska Incorporated, Pasndena, Califarnia, USA
SYNOPSIS This paper describes mine construction and operat ion in Arc t i c permaf ros t a t th ree min ing p ro jec ts by Cominco Ltd. o f Canada - the Black Angel Mine i n Greenland, the Polar is Mine i n Canada's a rc t i c i s l ands , and the Red Dog Pro ject i n Alaska. A major challenge i n A r c t i c development i s t o overcome the problem o f permafrost , or t o use
s t rong w i th l i t t l e moisture. Bul ld ing foundation design included const ruct ion on f r ozen g lac ia l fill. The Po la r i s i t s unique engineering propert ies. A t Black Angel, minlng i s n o t a rea t l y a f fec ted by permafrost, as the rock i s
Mine has taken advantage of permafrost i n underground extract ion and support methods. Foundations fo r the ma jor s t ructures were f rozen i n to p lace t o g i ve t he s tab i l i t y no rma l l y supp l i ed by conventional concrete. Permafrost a t Red Dog i s a technological problem, as it i s r e l a t i v e l y warm. The major design cr i , ter ia are therefore to prevent thaw.
INTRODUCTION
Cominco L td . i s a C a n a d i a n - b a s e d m i n i n g a n d n e t a l l u r g l c a l firm w h i c h h a s b e e n d e v e l o p i n g a n d o p e r a t i n g m i n e s i n n o r t h e r n C a n a d a for 50 y e a r s , s t a r t i n g w i t h t h e Con G o l d Mine a t Y e l l o w k n i . f e . i n 1938, a n d f o l l o w e d b y t h e P i n e P o i n t . l e a d l z i n c o p e r a t i o n i n 1 9 6 5 . B o t h o f t h e s e m i n e s a r e i n t h e N o r t h w e s t T e r r i t o r i e s ( F i g u r e 1).
M o r e r e c e n t l y , t h e B l a c k A n g e l L e a d l Z i n c M i n e s t a r t e d u p i n 1973, a n d t h e P o l a r i s L e a d l Z i n c o p e r a t i o n a c h i e v e d c o m m e r c l a l p r o d u c t i o n i n e a r l y 1982. Cominco i s p r e s e n t l y c o n s t r u c t i n g t h e Red Dog L e a d / Z i n c / S i l v e r M i n e i n A l a s k a , a n d t h i s o p e r a t i o n i s s c h e d u l e d t o b e g i n p r o d u c t i o n i n e a r l y 1990.
D e v e l o p i n g an A r c t i c m i n e r e q u i r e s new and d i f f e r e n t a p p r o a c h e s , t o r e d u c e t h e n e g a t i v e e c o n o m i c e f f e c t s of c l i m a t e a n d l o c a t i o n . One o f t h e m a j o r c h a l l e n g e s i s p e r m a f r o s t - e i t h e r t o o v e r c o m e t h e r e l a t e d p r o b l e m s , o r t o u t l l i z e i t s ' u n i q u e e n g i n e e r i n g p r o p e r t i e s . T h e p h y s i c a l c h a r a c t e r i s t i c s o f p e r m a f r o s t v a r y w i t h s o i l t y p e , m o i s t u r e c o n t e n t , a n d t e m p e r a t u r e . T h e r e f o r e , t h e r e l a t i o n s h i p b e t w e e n t h e s e f a c t o r s will d e t e r m i n e i f p e r m a f r o s t will b e a n a s s e t or a l i a b i l i t y .
" B l a c k A m 1 M i n e ( U n d e r g r o u n d M i n e )
T h e B l a c k A n g e l M i n e i s i n M a a r m o r i l i k F j o r d o n t h e w e s t c o a s t o f G r e e n l a n d , a t l a t l t u d e 7 1 0 N, a b o u t 500 km n o r t h o f t h e I n t e r n a t i o n a l A i r p o r t a t S o n d r e S t r o m f j o r d . All p e r s o n n e l a n d a i r f r e i g h t a r e moved be tween Sondre S t r o m f j o r d a n d t h e m i n e by h e l i c o p t e r . F i g u r e 1 shows t h e l o c a t i o n o f a i r p o r t a n d m i n e .
T h e B l a c k A n g e l M i n e b e g a n o p e r a t i o n i n 1 9 7 3 , a t a m i n i n g r a t e o f 600,000 t o n n e s o f ore p e r y e a r . T o t a l p r o j e c t t l m e f r o m a p p r o v a l b y Cominco t o c o m m e r c i a l p r o d u c t i o n w a s 17 months.
The m ine i s i n f j o r d c o u n t r y , w l t h s t e e p c l i f f s , a n d a p l a t e a u a t a b o u t 1 , 0 0 0 m. e l e v a t i o n . T h e G r e e n l a n d i c e c a p comes c l o s e t o t h e e d g e o f t h e p l a t e a u , a n d t h e g l a c i e r s d i s c h a r g e I c e b e r g s i n t o t h e f j o r d s . The g r o u n d i s p e r e n n i a l l y f r o z e n down t o a p p r o x i m a t e l y 4 5 0 m.. a n d r o c k t e m p e r a t u r e s i n t h e m i n e a r e - l o 0 t o -12O C .
T h e B l a c k A n g e l m i n e r a l z o n e i s g e n e r a l l y f l a t l y i n g a n d o u t c r o p s a b o u t 6 0 0 m e t e r s a b o v e s e a l e v e l , o n t h e f a c e o f a s t e e p c l i f f . F i g u r e 2 i s a p h o t o g r a p h o f t h e B l a c k A n g e l Cliff.
1382
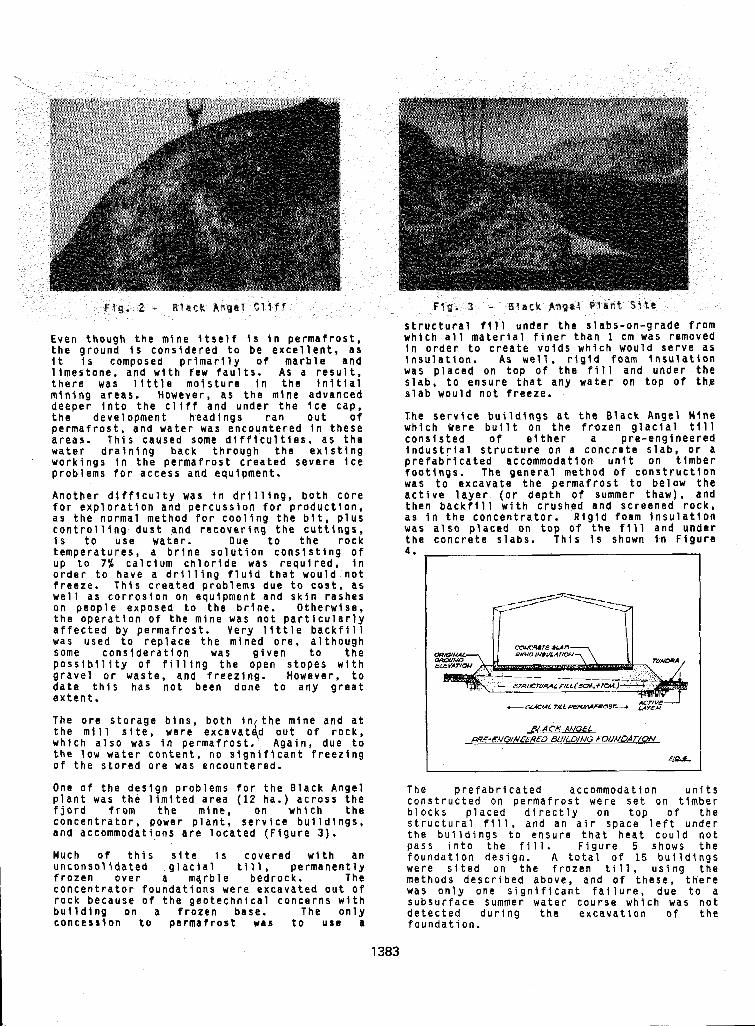
E v e n t h o u g h t h e m i n e i t s e l f I s i n p e r m a f r o s t , t h e g r o u n d i s c o n s i d e r e d t o b e e x c e l l e n t , a s i t i s c o m p o s e d p r i m a r i l y o f m a r b l e a n d 1 i m e s t o n e , a n d w i t h f e w f a u l t s . A s a r e s u l t , t h e r e was l i t t l e m o i s t u r e i n t h e i n i t i a l m i n i n g a r e a s . H o w e v e r , a s t h e m i n e a d v a n c e d d e e p e r i n t o t h e c l i f f a n d u n d e r t h e i c e c a p , t h e d e v e l o p m e n t h e a d i n g s r a n o u t o f p e r m a f r o s t , a n d w a t e r was e n c o u n t e r e d i n t h e s e a r e a s . T h ' i s c a u s e d some d l f f i c u l t l e s . a s t h e w a t e r d r a i n l n g b a c k t h r o u g h t h e e x i s t i n g w o r k i n g s i n t h e p e r m a f r o s t c r e a t e d s e v e r e i c e p r o b l e m s for a c c e s s a n d e q u i p m c n t .
A n o t h e r d i f f i c u l t y was i n d r l l l i n g , b o t h c o r e f o r e x p l o r a t i o n a n d p e r c u s s i o n f o r p r o d u c t l o n , a s t h e n o r m a l m e t h o d f o r c o o l i n g t h e b i t , p l u s c o n t r o l l i n g d u s t a n d r e c o v e r i n g t h e c u t t i n g s , i s t o u s e w a t e r . Due t o t h e r o c k t e m p e r a t u r e s , a b r i n e s o l u t i o n c o n s i s t i n g o f u p t o 7% c a l c i u m c h l o r i d e was r e q u i r e d . i n o r d e r t o h a v e a d r l l l i n g f l u i d t h a t w o u l d n o t f r e e z e . T h i s c r e a t e d p r o b l e m s d u e t o c o s t , a s w e l l a s c o r r o s i o n o n e q u i p m e n t a n d S k l n r a s h e s o n p e o p l e e x p o s e d t o t h e b r i n e . O t h e r w i s e ,
a f f e c t e d b y p e r m a f r o s t . V e r y l i t t l e b a c k f i l l t h e o p e r a t i o n o f t h e m f n e was n o t p a r t i c u l a r l y
was u s e d t o r e p l a c e t h e m l n e d o r e , a l t h o u g h some c o n s i d e r a t i o n was g i v e n t o t h e p o s s i b i l i t y o f f i l l i n g t h e o p e n s t o p e s w i t h g r a v e l o r w a s t e , a n d f r e e z i n g . H o w e v e r , t o d a t e t h i s h a s n o t b e e n d o n e t o a n y g r e a t e x t e n t .
T h e o r e s t o r a g e b i n s , b o t h i n t h e m i n e a n d a t t h e mil 1 s i t e , w e r e e x c a v a t i d o u t o f r o c k , w h i c h a l s o was i n p e r m a f r o s t . A g a i n , d u e t o t h e l o w w a t e r c o n t e n t , n o s l g n i f i c a n t f r e e z i n g o f t h e s t o r e d o r e was e n c o u n t e r e d .
One o f t h e d e s i g n p r o b l e m s f o r t h e B l a c k A n g e l p l a n t was t h e l i m i t e d a r e a ( 1 2 h a . ) a c r o s s t h e f j o r d f r o m t h e m i n e , o n w h l c h t h e c o n c e n t r a t o r , p o w e r p l a n t , s e r v i c e b u i l d i n g s , a n d a c c o m m o d a t i o n s a r e l o c a t e d ( F i g u r e 3 ) .
Much o f t h i s s i t e i s c o v e r e d w i t h a n u n c o n s o l i d a t e d g l a c i a l till, p e r m a n e n t l y f r o z e n o v e r a m a r b l e b e d r o c k . T h e c o n c e n t r a t o r f o u n d a t i o n s w e r e e x c a v a t e d o u t o f r o c k b e c a u s e o f t h e g e o t e c h n i c a l c o n c e r n s w i t h b u i l d i n g o n a f r o z e n b a s e . T h e o n l y c o n c e s s i o n t o p e r m a f r o s t was t o u s e a
s t r u c t u r a l fill u n d e r t h e s l a b s - o n - g r a d e f r o m w h i c h a l l m a t e r i a l f i n e r t h a n 1 cm was removed
i n s u l a t l o n . As w e l l . r i g i d f o a m i n s u l a t i o n i n o r d e r t o c r e a t e v o l d s w h i c h w o u l d s e r v e a s
was p l a c e d o n t o p o f t h e fill a n d u n d e r t h e s l a b , t o e n s u r e t h a t a n y w a t e r o n t o p o f t h e s l a b w o u l d n o t f r e e z e .
T h e s e r v i c e b u i l d i n g s a t t h e B l a c k A n g e l M i n e w h i c h W e r e b u i l t o n t h e f r o z e n g l a c i a l till c o n s i s t e d o f e i t h e r a p r e - e n g i n e e r e d
p r e f a b r i c a t e d a c c o m m o d a t i o n u n i t o n t i m b e r i n d u s t r i a l s t r u c t u r e o n a c o n c r e t e s l a b , o r a
f o o t i n g s , T h e g e n e r a l m e t h o d o f c o n s t r u c t l o n was t o e x c a v a t e t h e p e r m a f r o s t t o b e l o w t h e a c t i v e l a y e r ( o r d e p t h o f summer t h a w ) , a n d
as i n t h e c o n c e n t r a t o r . R i g i d foam i n s u l a t i o n t h e n b a c k f i l l w i t h c r u s h e d a n d s c r e e n e d r o c k ,
was a l s o p l a c e d o n t o p o f t h e fill a n d u n d e r t h e c o n c r e t e s l a b s . T h i s i s shown i n F i g u r e 4 ,
t s :r
T h e p r e f a b r i c a t e d a c c o m m o d a t i o n ur c o n s t r u c t e d o n p e r m a f r o s t w e r e s e t o n t l n
11' nbl
b l o c k s p l a c e d d i r e c t l y o n t o p o f t h e s t r u c t u r a l fill, a n d a n a i r s p a c e l e f t u n d e r t h e b u l l d i n g s t o e n s u r e t h a t h e a t c o u l d n o t p a s s i n t o t h e fill. F i g u r e 5 s h o w s t h e f o u n d a t i o n d e s i g n . A t o t a l o f 1 5 b u i l d t n g s w e r e s i t e d o n t h e f r o z e n till, u s i n g t h e m e t h o d s d e s c r i b e d a b o v e , a n d o f t h e s e , t h e r e was o n l y o n e s i g n i f i c a n t f a i l u r e , d u e t o a
d e t e c t e d d u r i n g t h e e x c a v a t i o n o f t h e s u b s u r f a c e summer w a t e r c o u r s e w h i c h w a s n o t
f o u n d a t i o n .
1383
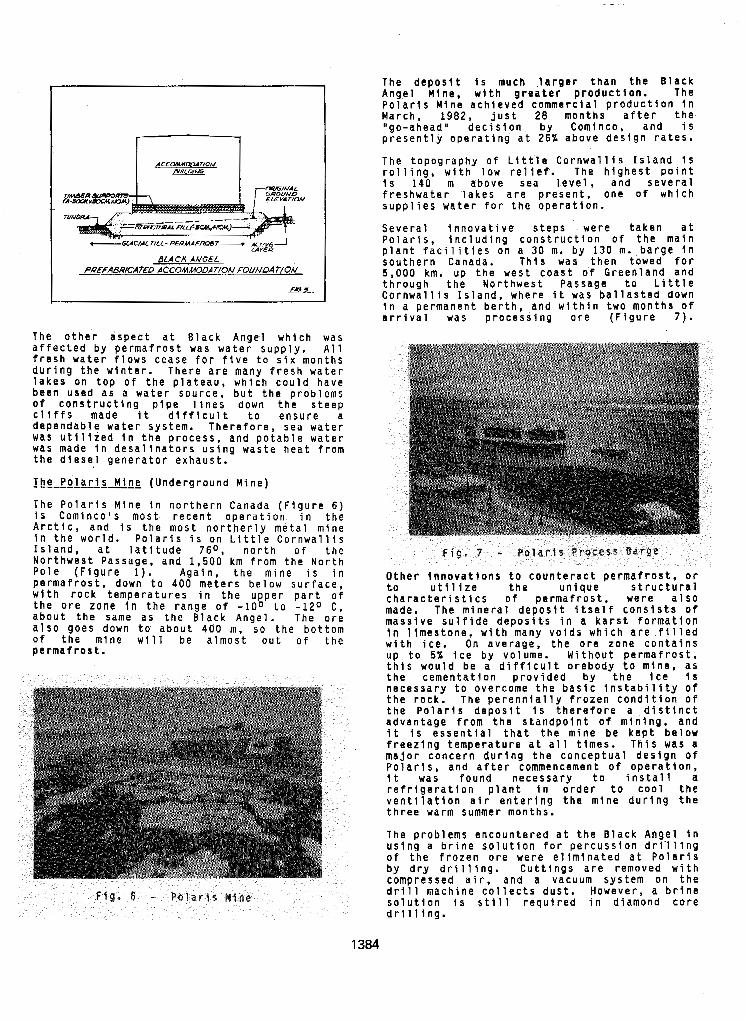
BLA CX ANGEL PR€FA6R/CAT€D ACCOMMODAt/ON FOUNDA T/ON I - I
T h e o t h e r a s p e c t a t B l a c k A n g e l w h i c h was a f f e c t e d b y p e r m a f r o s t was w a t e r s u p p l y . All f r e s h w a t e r f l o w s c e a s e f o r f i v e t o s i x m o n t h s d u r i n g t h e w i n t e r . T h e r e a r e many f r e s h w a t e r l a k e s o n t o p o f t h e p l a t e a u , w h i c h c o u l d h a v e been used as a w a t e r s o u r c e , b u t t h e p r o b l e m s o f c o n s t r u c t i n g p i p e l i n e s down t h e s t e e p c l l f f s made i t d i f f i c u l t t o e n s u r e a d e p e n d a b l e w a t e r s y s t e m . T h e r e f o r e , s e a w a t e r was u t l l i z e d i n t h e p r o c e s s , a n d p o t a b l e w a t e r was made i n d e s a l i n a t o r s u s i n g w a s t e h e a t f r o m t h e d l e s e l g e n e r a t o r e x h a u s t .
"""""""" T h e P o l a r i s M i n e ( U n d e r g r o u n d M i n e )
T h e P o l a r i s M i n e i n n o r t h e r n C a n a d a ( F i g u r e 6 ) i s C o m l n c o l s m o s t r e c e n t o p e r a t i o n i n t h e A r c t i c , a n d i s t h e m o s t n o r t h e r l y m e t a l m i n e I n t h e w o r l d . P o l a r i s i s on L i t t l e C o r n w a l l i s I s l a n d , a t l a t i t u d e 7 6 O , n o r t h o f t h e N o r t h w e s t P a s s a g e , a n d 1 , 5 0 0 km f r o m t h e N o r t h P o l e ( F i g u r e 1) . A g a i n , t h e m i n e i s i n p e r m a f r o s t , d o w n t o 4 0 0 m e t e r s b e l o w s u r f a c e , w i t h r o c k t e m p e r a t u r e s i n t h e u p p e r p a r t o f t h e o r e z o n e i n t h e r a n g e o f - l o o t o - 1 2 O C , a b o u t t h e same a s t h e B l a c k A n g e l . T h e o r e a l s o g o e s down t o a b o u t 400 m, s o t h e b o t t o m o f t h e m i n e will be a l m o s t o u t o f t h e p e r m a f r o s t .
T h e d e p o s l t I s much l a r g e r t h a n t h e B l a c k A n g e l H l n e , w i t h g r e a t e r p r o d u c t i o n . T h e P o l a r l s M i n e a c h i e v e d c o m m e r c i a l p r o d u c t i o n i n March , 1982, j u s t 28 m o n t h s a f t e r t h e " g o - a h e a d " d e c i s l o n b y C o m i n c o , a n d i s p r e s e n t l y o p e r a t i n g a t 25% a b o v e d e s i g n r a t e s .
T h e t o p o g r a p h y o f L i t t l e C o r n w a l l i s I s l a n d i s r o l l i n g , w i t h l o w r e l i e f . T h e h i g h e s t p o i n t i s 1 4 0 m a b o v e s e a l e v e l , a n d s e v e r a l f r e s h w a t e r l a k e s a r e p r e s e n t , o n e o f w h i c h s u p p l i e s w a t e r f o r t h e o p e r a t l o n .
S e v e r a l i n n o v a t i v e s t e p s w e r e t a k e n a t P o l a r i s , i n c l u d i n g c o n s t r u c t i o n o f t h e main p l a n t f a c i l i t i e s on a 30 rn. b y 1 3 0 m. b a r g e i n s o u t h e r n C a n a d a . T h i s was t h e n t o w e d f o r 5 ,000 km. u p t h e w e s t c o a s t o f G r e e n l a n d a n d t h r o u g h t h e N o r t h w e s t P a s s a g e t o L i t t l e C o r n w a l l l s I s l a n d , w h e r e i t was b a l l a s t e d down I n a p e r m a n e n t b e r t h , a n d w i t h i n t w o m o n t h s o f a r r i v a l w a s p r o c e s s l n g o r e ( F i g u r e 7 ) .
O t h e r I n n o v a t l o n s t o c o u n t e r a c t p e r m a f r o s t , o r
made. The m i n e r a l d e p o s l t i t s e l f c o n s i s t s o f c h a r a c t e r i s t i c s o f p e r m a f r o s t , w e r e a l s o
m a s s i v e s u l f i d e d e p o s i t s i n a k a r s t f o r m a t i o n I n l i m e s t o n e , w i t h m a n y v o i d s w h i c h a r e f i l l e d w i t h i c e . On a v e r a g e , t h e o r e z o n e c o n t a i n s u p t o 5% i c e b y v o l u m e . W f t h o u t p e r m a f r o s t , t h i s w o u l d b e a d i f f l c u l t o r e b o d y t o m i n e , a s t h e c e m e n t a t l o n p r o v i d e d b y t h e i c e i s n e c e s s a r y t o o v e r c o m e t h e b a s i c I n s t a b i l l t y o f t h e r o c k . T h e p e r e n n i a l l y f r o z e n c o n d i t i o n o f t h e P o l a r i s d e p o s i t i s t h e r e f o r e a d i s t l n c t a d v a n t a g e f r o m t h e s t a n d p o i n t o f m i n i n g , a n d i t i s e s s e n t i a l t h a t t h e m i n e b e k e p t b e l o w f r e e z i n g t e m p e r a t u r e a t a l l t i m e s . T h i s was a m a j o r c o n c e r n d u r i n g t h e c o n c e p t u a l d e s i g n o f P o l a r i s , a n d a f t e r commencement o f o p e r a t l o n , l t w a s f o u n d n e c e s s a r y t o i n s t a l 1 a
v e n t l l a t i o n a i r e n t e r i n g t h e m i n e d u r i n g t h e r e f r i g e r a t i o n p l a n t i n o r d e r t o c o o l t h e
t h r e e w a r m summer months.
T h e p r o b l e m s e n c o u n t e r e d a t t h e B l a c k A n g e l i n u s i n g a b r i n e s o l u t i o n f o r p e r c u s s i o n d r l ' l l i n g o f t h e f r o z e n o r e w e r e e l i m i n a t e d a t P o l a r i s b y d r v d r l l l i n a . C u t t i n g s a r e r e m o v e d w i t h
t o u t l l i z e t h e u n i q u e s t r u c t u r a l
comp r d r i l l s o l u t d r i l l
e s s e d a i r ; a n d a vacuum sys tem on t h e
i o n i s s t i l l r e q u i r e d i n d i a m o n d c o r e m a c h i n e c o l l e c t s d u s t . H o w e v e r , a b r i n e
i ng.
1384
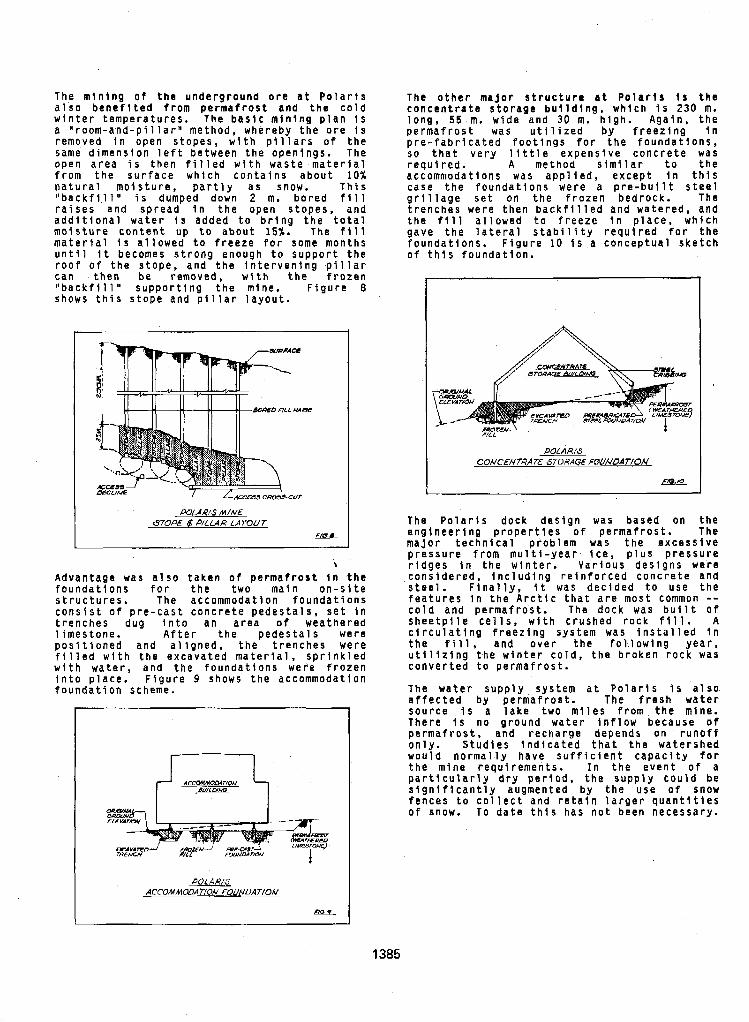
T h e m i n i n g o f t h e u n d e r g r o u n d ore a t P o l a r l s a l s o b e n e f i t e d f r o m p e r m a f r o s t a n d t h e c o l d w i n t e r t e m p e r a t u r e s . T h e b a s l c m i n i n g p l a n i s a " r o o m - a n d - p i l l a r " m e t h o d , w h e r e b y t h e o r e i s removed i n o p e n s t o p e s , w i t h p i l l a r s o f t h e same d i m e n s i o n l e f t b e t w e e n t h e o p e n i n g s . T h e o p e n a r e a i s t h e n f i l l e d w i t h w a s t e m a t e r i a l f r o m t h e s u r f a c e w h i c h c o n t a i n s a b o u t 10% n a t u r a l m o i s t u r e , p a r t l y a s snow. T h i s " b a c k f i l l " i s dumped down 2 m. b o r e d fill r a i s e s a n d s p r e a d i n t h e o p e n s t o p e s , a n d a d d i t i o n a l w a t e r 1 s a d d e d t o b r i n g t h e t o t a l m o i s t u r e c o n t e n t u p t o a b o u t 15%. The fill m a t e r i a l i s a l l o w e d t o f r e e z e f o r some m o n t h s u n t i l i t b e c o m e s s t r o n g e n o u g h t o s u p p o r t t h e r o o f o f t h e s t o p e , a n d t h e i n t e r v e n i n g p i l l a r c a n t h e n b e r e m o v e d , w l t h t h e f r o z e n l l b a c k f i l l " s u p p o r t i n g t h e m i n e . F i g u r e 8 shows t h i s s t o p e a n d p i l l a r l a y o u t .
&?OPE 6 PILLAR LAYOUT WLAR/S MINE
\
A d v a n t a g e was a l s o t a k e n o f p e r m a f r o s t i n t h e f o u n d a t i o n s f o r t h e t w o m a i n o n - s i t e s t r u c t u r e s . T h e a c c o m m o d a t i o n f o u n d a t i o n s c o n s i s t o f p r e - c a s t c o n c r e t e p e d e s t a l s , s e t i n t r e n c h e s d u g i n t o a n a r e a o f w e a t h e r e d l i m e s t o n e , A f t e r t h e p e d e s t a l s w e r e p o s i t l o n e d a n d a l i g n e d , t h e t r e n c h e s w e r e f i l l e d w i t h t h e e x c a v a t e d m a t e r i a l . s p r i n k l e d w i t h w a t e r , a n d t h e f o u n d a t i o n s w e t e f r o z e n i n t o p l a c e . F i g u r e 9 shows the accommoda t ion f o u n d a t i o n s c h e m e .
ACCOMMODATION FQUNDATION DOLAR/S
eZ5L
The o t h e r m a j o r s t r u c t u r e a t P o l a r i s 1 s t h e c o n c e n t r a t e storage b u i l d i n g , w h i c h i s 2 3 0 m. l o n g , 5 5 m. w l d e a n d 30 m. h i g h . A g a i n , t h e p e r m a f r o s t was u t i l i z e d b y f r e e z i n g i n p r e - f a b r i c a t e d f o o t i n g s f o r t h e f o u n d a t i o n s , s o t h a t v e r y l i t t l e e x p e n s i v e c o n c r e t e was r e q u i r e d . A m e t h o d s i m i l a r t o t h e a c c o m m o d a t i o n s w a s a p p l i e d , e x c e p t i n t h i s
g r i l l a g e s e t o n t h e f r o z e n b e d r o c k . The c a s e t h e f o u n d a t i o n s w e r e a p r e - b u i l t s t e e l
t r e n c h e s w e r e t h e n b a c k f i l l e d a n d w a t e r e d , a n d t h e fill a l l o w e d t o f r e e z e i n p l a c e , w h i c h g a v e t h e l a t e r a l s t a b i l i t y r e q u i r e d f o r t h e f o u n d a t i o n s . F i g u r e 10 i s a c o n c e p t u a l s k e t c h o f t h i s f o u n d a t i o n .
CONCENTRATE STORAGE FOUNDAT/ON POLAR/S
The P o l a r i s d o c k d e s i g n was b a s e d o n t h e e n g i n e e r i n g p r o p e r t i e s o f p e r m a f r o s t . T h e m a j o r t e c h n i c a l p r o b l e m was t h e e x c e s s i v e p r e s s u r e f r o m m u l t i - y e a r i c e , p l u s p r e s s u r e r i d g e s i n t h e w i n t e r . V a r i o u s d e s i g n s w e r e c o n s i d e r e d , i n c l u d i n g r e i n f o r c e d c o n c r e t e a n d s t e e l . F i n a l l y , i t was d e c i d e d t o u s e t h e f e a t u r e s i n t h e A r c t i c t h a t a r e m o s t common -- c o l d a n d p e r m a f r o s t . T h e d o c k was b u i l t o f s h e e t p i l e c e l l s , w i t h c r u s h e d r o c k fill. A c l r c u l a t i n g f r e e z i n g s y s t e m was i n s t a l l e d i n t h e fill, a n d o v e r t h e f o l l o w i n g y e a r , u t i l i z i n g t h e w i n t e r c o l d , t h e b r o k e n r o c k was c o n v e r t e d t o p e r m a f r o s t .
T h e w a t e r s u p p l y s y s t e m a t P o l a r i s i s a l s o a f f e c t e d b y p e r m a f r o s t . T h e f r e s h w a t e r s o u r c e i s a l a k e t w o m i l e s f r o m t h e m i n e . T h e r e i s n o g r o u n d w a t e r i n f l o w b e c a u s e o f p e r m a f r o s t , a n d r e c h a r g e d e p e n d s on r u n o f f only. S t u d i e s i n d i c a t e d t h a t t h e w a t e r s h e d w o u l d n o r m a l l y h a v e s u f f i c i e n t c a p a c i t y f o r
p a r t l c u l a r l y dry p e r i o d , t h e s u p p l y c o u l d b e t h e m i n e r e q u i r e m e n t s . I n t h e e v e n t o f a
f e n c e s t o c o l l e c t a n d r e t a i n l a r g e r q u a n t i t i e s s i g n i f i c a n t l y a u g m e n t e d b y t h e u s e o f snow
o f snow. T o d a t e t h i s h a s n o t b e e n n e c e s s a r y .
1385
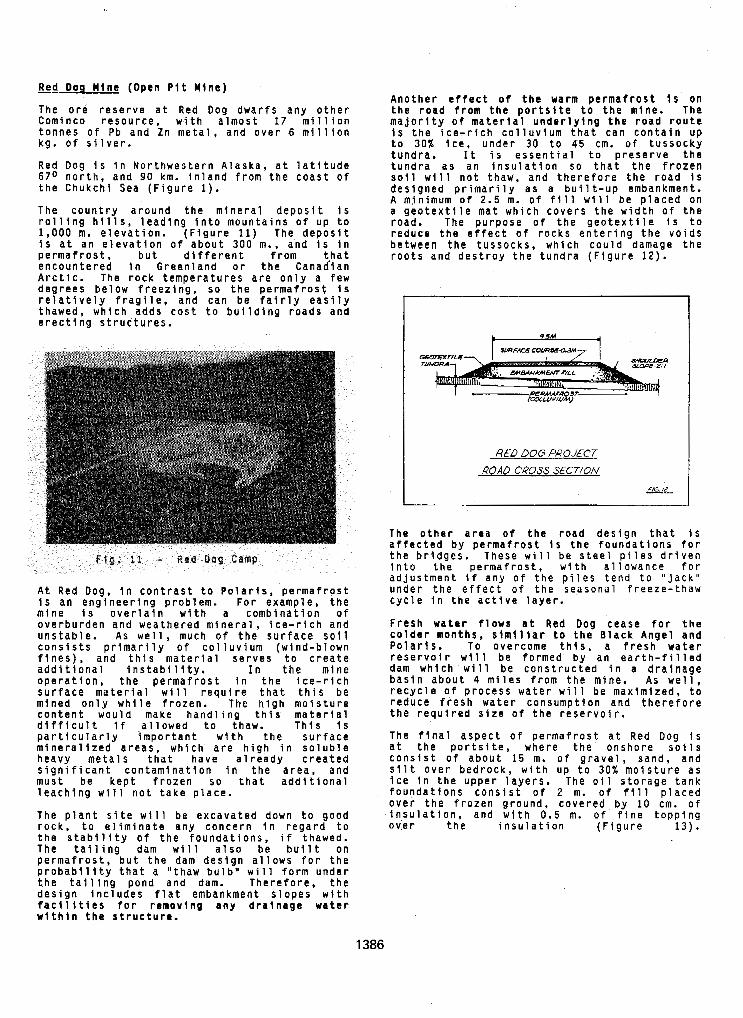
". Re t M i n e does H l n e (Open P i
T h e o r e r e s e r v e a t Red Dog d w a r f s a n y o t h e r C o m i n c o r e s o u r c e , w i t h a l m o s t 17 m i l l i o n t o n n e s o f Pb a n d Zn m e t a l , a n d o v e r 6 m i l l i o n kg. o f s i l v e r .
Red Dog i s i n N o r t h w e s t e r n A l a s k a , a t l a t i t u d e 6 7 0 n o r t h , a n d 90 km. i n l a n d f r o m t h e c o a s t o f t h e C h u k c h i S e a ( F i g u r e 1).
T h e c o u n t r y a r o u n d t h e m i n e r a l d e p o s i t i s r o l l i n g h i l l s , l e a d l n g I n t o m o u n t a i n s o f u p t o 1 ,000 m. e l e v a t i o n . ( F i g u r e 11) T h e d e p o s l t Is a t a n e l e v a t l o n o f a b o u t 3 0 0 m., a n d i s i n p e r m a f r o s t , b u t d i f f e r e n t f r o m t h a t e n c o u n t e r e d i n G r e e n l a n d or t h e C a n a d i a n A r c t l c . T h e r o c k t e m p e r a t u r e s a r e o n l y a f e w d e g r e e s b e l o w f r e e z i n g , s o t h e p e r m a f r o s t Is r e l a t l v e l y f r a g l l e , a n d c a n b e f a i r l y e a s i l y t h a w e d , w h l c h a d d s c o s t t o b u i l d i n g r o a d s a n d e r e c t i n g s t r u c t u r e s .
A t Red Dog, i n c o n t r a s t t o P o l a r l s , p e r m a f r o s t Is a n e n g i n e e r l n g p r o b l e m . F o r e x a m p l e , t h e m i n e i s o v e r l a i n w i t h a c o m b i n a t i o n o f o v e r b u r d e n a n d w e a t h e r e d m i n e r a l , i c e - r i c h a n d u n s t a b l e . As w e l l , much o f t h e s u r f a c e s o i l c o n s i s t s p r i m a r i l y o f c o l l u v i u m ( w i n d - b l o w n f i n e s ) , a n d t h i s m a t e r l a l s e r v e s t o c r e a t e a d d i t i o n a l i n s t a b i l i t y , I n t h e m i n e o p e r a t i o n , t h e p e r m a f r o s t i n t h e i c e - r i c h S u r f a c e m a t e r i a l will r e q u i r e t h a t t h i s b e m i n e d o n l y w h i l e f r o z e n . The h l g h m o i s t u r e c o n t e n t w o u l d m a k e h a n d l i n g t h i s m a t e r i a l d i f f i c u l t i f , a l l o w e d t o t h a w . T h i s i s p a r t i c u l a r l y i m p o r t a n t w i t h t h e s u r f a c e m i n e r a l i z e d a r e a s , w h l c h a r e h i g h i n s o l u b l e h e a v y m e t a l s t h a t h a v e a 1 r e a d y c r e a t e d
m u s t b e k e p t f r o z e n s o t h a t a d d l t l o n a l s i g n i f i c a n t c o n t a m l n a t l o n i n t h e a r e a , a n d
l e a c h i n g wlll n o t t a k e p l a c e .
T h e p l a n t s i t e will b e e x c a v a t e d d o w n t o g o o d r o c k , t o e l i m i n a t e a n y c o n c e r n i n r e g a r d t o t h e s t a b i l i t y o f t h e f o u n d a t i o n s , i f thawed. The t a i l i n g dam will a l s o be b u i l t o n p e r m a f r o s t , b u t t h e dam d e s i g n a l l o w s f o r t h e p r o b a b i 1 i t y t h a t a " t h a w b u l b " will f o r m u n d e r t h e t a i l l n g p o n d a n d dam. T h e r e f o r e , t h e d e s i g n i n c l u d e s f l a t e m b a n k m e n t s l o p e s w i t h f a c l l i t i e s f o r r e m o v i n g a n y d r a l n a g e w a t e r w l t h l n t h e s t r u c t u r e .
A n o t h e r e f f e c t o f t h e warm p e r m a f r o s t i s o n t h e r o a d f r o m t h e p o r t s l t e t o t h e m l n e . The m a j o r i t y o f m a t e r l a l u n d e r l y i n g t h e r o a d r o u t e
t o 30% i c e , u n d e r 3 0 t o 45 cm. o f t u s s o c k y i s t h e i c e - r i c h c o l l u v i u m t h a t c a n c o n t a i n u p
t u n d r a . I t i s e s s e n t i a l t o p r e s e r v e t h e t u n d r a a s a n I n s u l a t l o n s o t h a t t h e f r o z e n s o i l will n o t t h a w , a n d t h e r e f o r e t h e r o a d Is d e s i g n e d p r i m a r i l y a s a b u i l t - u p e m b a n k m e n t . A mln imum o f 2.5 m. o f fill w l l l b e p l a c e d o n a g e o t e x t l l e m a t w h i c h c o v e r s t h e w i d t h o f t h e r o a d . T h e p u r p o s e o f t h e g e o t e x t i l e i s t o r e d u c e t h e e f f e c t o f r o c k s e n t e r i n g t h e v o i d s b e t w e e n t h e t u s s o c k s , w h l c h c o u l d d a m a g e t h e r o o t s a n d d e s t r o y t h e t u n d r a ( F i g u r e 1 2 ) .
RED DOG PAOJECT
ROAD CROSS-S€C7/ON f/G I2
. . . . . . - " " .
T h e o t h e r a r e a o f t h e r o a d d e s i g n t h a t i s a f f e c t e d b y p e r m a f r o s t i s t h e f o u n d a t l o n s f o r t h e b r i d g e s . T h e s e will b e s t e e l p i l e s d r i v e n
a d j u s t m e n t i f a n y o f t h e p i l e s t e n d t o " J a c k " I n t o t h e p e r m a f r o s t , w i t h a l l o w a n c e f o r
u n d e r t h e e f f e c t o f t h e s e a s o n a l f r e e z e - t h a w c y c l e i n t h e a c t i v e l a y e r .
F r e s h w a t e r f l o w s a t Red Dog c e a s e f o r t h e c o l d e r m o n t h s , s i m i l l a r t o t h e B l a c k A n g e l a n d P o l a r l s . T o o v e r c o m e t h i s , a f r e s h w a t e r r e s e r v o i r wlll b e f o r m e d b y a n e a r t h - f i l l e d dam w h l c h will b e c o n s t r u c t e d i n a d r a i n a g e b a s i n a b o u t 4 m i l e s f r o m t h e m l n e . As w e l l , r e c y c l e o f p r o c e s s w a t e r will b e m a x l m l z e d , t o r e d u c e f r e s h w a t e r c o n s u m p t i o n a n d t h e r e f o r e t h e r e q u i r e d s i r e o f t h e r e s e r v o i r .
The f i n a l a s p e c t o f p e r m a f r o s t a t Red Dog i s a t t h e p o r t s i t e , w h e r e t h e o n s h o r e s o l l s C o n s i s t o f a b o u t 1 5 m. o f g r a v e l , s a n d , a n d s l l t o v e r b e d r o c k , w i t h u p t o 30% m o l s t u r e a s i c e i n t h e u p p e r l a y e r s . The o i l s t o r a g e t a n k f o u n d a t i o n s c o n s i s t o f 2 m. o f fill p l a c e d o v e r t h e f r o z e n g r o u n d , c o v e r e d b y 10 cm. o f i n s u l a t l o n , a n d w i t h 0 . 5 m. o f f i n e t o p p l n g o v e r t h e i n s u l a t i o n ( F l g u r e 1 3 ) .
1386
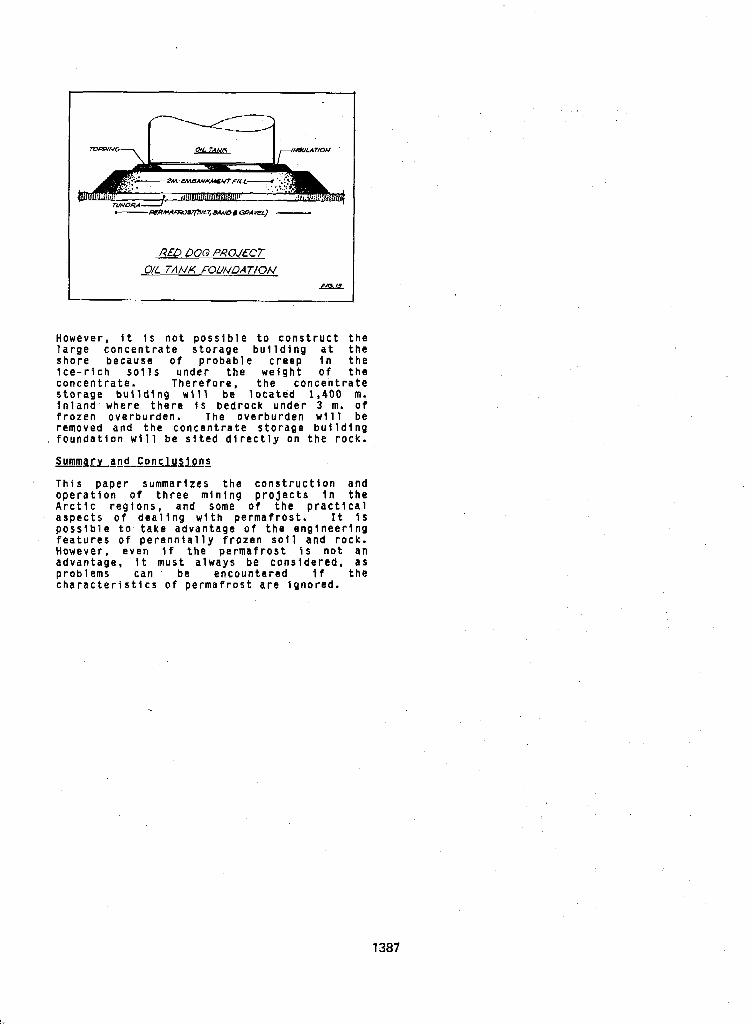
RED DOG PROJ€CT O/L TANK FOUNDATION
I I
However , i t i s n o t p o s s l b l e t o c o n s t r u c t t h e l a r g e c o n c e n t r a t e s t o r a g e b u l l d i n g a t t h e s h o r e b e c a u s e o f p r o b a b l e c r e e p I n t h e i c e - r i c h s o i l s u n d e r t h e w e i g h t o f t h e c o n c e n t r a t e . T h e r e f o r e , t h e c o n c e n t r a t e s t o r a g e b u l l d l n g wlll b e l o c a t e d 1 ,400 m. f r o z e n o v e r b u r d e n . T h e o v e r b u r d e n wlll b e i n l a n d w h e r e t h e r e i s b e d r o c k u n d e r 3 m. o f
f o u n d a t i o n wlll b e s i t e d d i r e c t l y on t h e r o c k . r e m o v e d a n d t h e c o n c e n t r a t e s t o r a g e b u i l d i n g
SummarLnnd-conelusrons T h i s p a p e r s u m m a r i z e s t h e c o n s t r u c t i o n a n d
A r c t i c r e g i o n s , a n d some o f t h e p r a c t i c a l o p e r a t i o n o f t h r e e m i n l n g p r o j e c t s i n t h e
a s p e c t s o f d e a l i n g w i t h p e r m a f r o s t . I t 4 s p o s s l b l e t o t a k e a d v a n t a g e o f t h e e n g l n e e r i n g
However , e v e n I f t h e p e r m a f r o s t 1 s n o t a n f e a t u r e s o f p e r e n n i a l l y f r o z e n s o l 1 a n d r o c k .
a d v a n t a g e , i t m u s t a l w a y s b e c d n s l d e r e d , a s p r o b l e m s c a n b e e n c o u n t e r e d i f t h e c h a r a c t e r i s t i c s o f p e r m a f r o s t a r e i g n o r e d .
1387
APPLIED STUDY OF PREVENTING STRUCTURES FROM FROST DAMAGE BY USING DYNAMIC CONSOLIDATION
Han, Huaguang and GUO, Mingzhu
Heilongjiang Provincial Low Temperature Construction Science Research Institute, Harbin, China
SYNOPSIS Some applied examples o f subsoil treatment by using dynamic consolidation in buildings with shallow foundations, large tanks, road and sports ground engineerings have been in- troducted systematically in this paper. O u r engineering practice shows that this treatment is a new technique f o r preventing structure from frost damage reliably and economicaly and can be used widely in future.
INTRODUCTION
Since 1 9 8 2 , a dynamic consolidation construction method has been used in Daqing, Harbin and other districts for treatment of frost susceptible subsoil, and lots of test engineerings were con- ducted at sametime, such as: industrial build- ings, public and dwelling buildings with shallow foundation,-large oil and gas tanks, water pools, pipe piers, pipe shelvers, road, large sports ground and so on. Our experimental results and operation condition of above various buildings for years were described and discussed in this paper.
INGS APPLIED EXAMPLES OF ENGINEER
Shallow foundation
Generally speaking, a main p building set up on strong frost susceptible sub- soil with shallow groundwater level is to pre- vent the buildings from frost damage. A dynamic consolidation method for improving subsoil such as silty clay with bog o r pond was used in some en- gineerings. The brief conditions of test en- gineerings by using dynamic consolidation is shown In Table I.lt is obvious :hat buildings with shallow foundation can be set up on strong frost susceptible subsoil as long as the dynamic consolidation technique is designed properly and coefficients are selected correctly.
roblem for large
Anti-heave practice for foundation o f unheated open structures This kind of structure with a deep frost depth under foundation, affected by air temperature directly, is easy to be suffered frost hazard, especially when the load u p on foundation bed is not heavy and its construction is undertaken over winter or years. In order to prevent above structures from frost damage, a treatment of dynamic consolidation method has been used in the engineering base i n the area of crude o i l tanks. The conditions of dynamic consolidation used in crude oil tank area is listed in Table 11. From Table I1 we know that even though the
structures set up on' the,ground surface with frost susceptible subsoil, by using dynamic con- solidation method, all o f tanks have worked well. Meanwhile, a large amount o f materials and money has been saved, What we have to point out is tank 7 6 and 7 7 started to work after con- struction for two years: tank 78 was set up in the next year after subsoil treatment by dynamic consolidation and started to work in third year; and all of the tanks were built in the subsoil with a middle sand or asphalt sand cushion with a thickness o f only 0.3 to 0 . 4 5 m. Pipe piers and pipe shelvers were directly set up in spring in the pits with a depth of 1 . 2 m formed by dynamic consolidation, They, with a little load, have been worked well for years without any ob- vious frost heave and differential deformation caused by freeze-thawing cycles. As a conclu- sion, frost heave of subsoil can be completely controlled by using dynamic consolidation and the treatment subsoil may be constructed in frozen condition.
Prevention of frost heave and boil road
The subgrade, pavement, culvent, and bridge o f road will be suffered frost damage in winter, and will be boiled or deformed differently in spring, which influences on transportation, con- struction serviously in cold regions. For pre- venting road engineering from frost damage, the dynamic consolidation method has b e e n used for treatment of subgrade.
Test sections in two roads have been conducted in Daqing city. One o f them named United road hfd a test length of 2 7 0 m and an area of 3300 m . The section was set u p o n the subsoil of clay and sandy clay with a sandy gravel pavement. It used to be stopped working because of frost heave and boil until rebuilding with a concrete pavement in 1 9 8 4 . The next section named Zhong- q i road had a length of 100 m, a n area of 2500 m , and was set u p on the subsoil o f sandy clay, silt and sandy, with asphalt pavement which replaced by concrete pavement in 1985.
The observation results in both test sections with or without treatment subgrade b y dynamic
1388
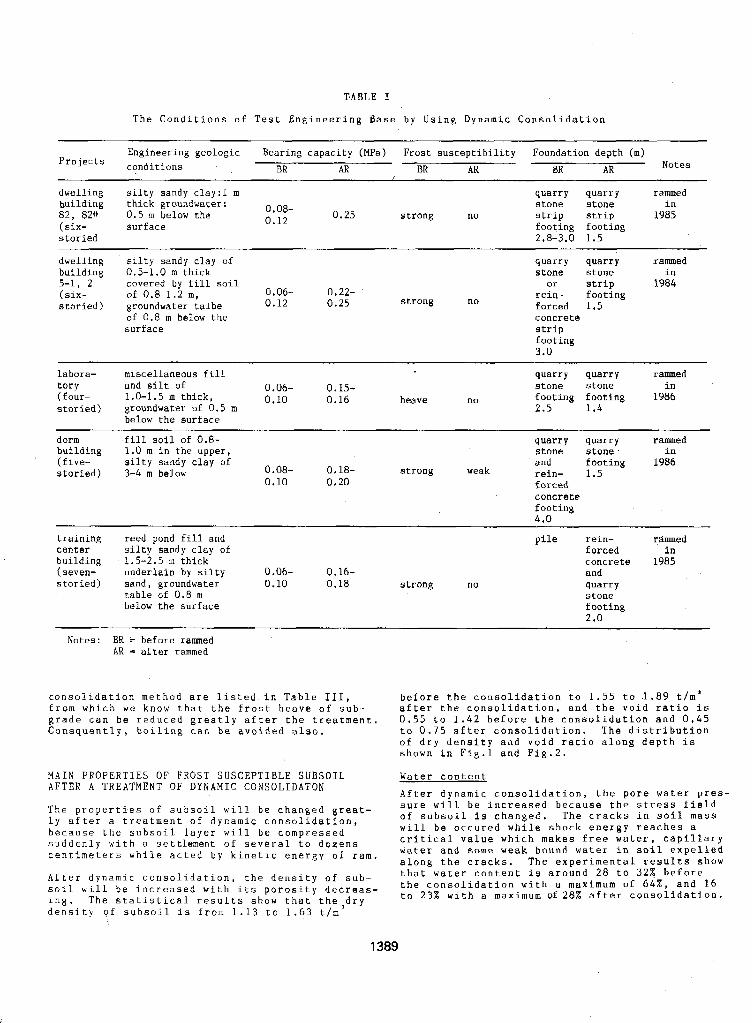
TABLE I
The Conditions of Test Engineering Ease by Using Dynamic Consolidation
Engineering geologic Bearing capacity (MPa) Frost susceptibility Foundation depth (m) Projects conditions BR AR BR AR BR AR Notes
dwelling silty sandy c1ay:l m quarry quarry building thick groundwater:
rammed
8 2 , 82+ 0.5 m below the (six- surface footing footing storied 2.8-3.0 1.5
0. oa- stone stone in 0.25 strong no strip strip 1985 0.12
dwelling silty sandy clay of buildinn 0.5-1.0 m thick
quarry quarry rammed stone stone in
I
5-1, 2 covered by €ill soil or strip (six- of 0.8-1.2 m, 0.06- 0.22- rein- footing
1984
storied) groundwater talbe 0.12 0.25 strong no forced 1.5 zf 0.8 m below the concrete surface strip
3.0 footing
labora- miscellaneous fill quarry quarry rammed tory and silt of 0 06- 0.15- stone stone in (four- 1.0-1.5 m thick, 0.10 0.16 heave no footing footing 1986 storied) groundwater of 0.5 m 2 . 5 1.4
below the surface
dorm fill s o i l of 0.8- quarry quarry rammed building 1.0 m in the upper, stone stone (five- silty sandy clay of
in
0.08- 0.18- and footing 1986
storied) 3-4 m below strong weak 0.10
rein- 1.5
concrete
1.0 footing
0.20 forced
training reed pond fill and pile rein- center silty sandy clay of forced in
rammed
building 1.5-2.5 m thick (seven- underlain by silty 0.06- 0.16-
concrete 1985 and
storied) sand, groundwater 0*10 0.18 strong no quarry stone footing 2 .o
table of 0.8 m below the surface
~~~ ~~~ ~ ~~
Notes: BR = before rammed . .~ ""
AR = after rammed
consolidation method are listed i n Table 111, before the consolidation t o 1.55 to -1.89 t/m' from which we know that the frost heave of sub- after the consolidation, and the void ratio is grade can be reduced greatly after the treatment. 0 . 5 5 to 1.42 before the consolidation and 0 . 4 5 Consquently, boiling can be avoided also. to 0.75 after consolidation. The distribution
of d r y density and void ratio along depth is shown in F i g . 1 and Fig.2.
MAIN PROPERTIES OF FROST SUSCEPTIBLE SUBSOIL AFTEK A TREATMENT OF DYNAMIC CONSOLIDATON
Water content
After dvnamic consolidation, the pore water p r e s - The properties of subsoil will be changed great- sure wiil be increased because the stress field l y after a treatment of dynamic consolidation, of subsoil is changed. The cracks in soil mass because the subsoil layer will be compressed will be occured while shock energy reaches a suddenly with a seftlsment of several to dozens critical value which makes free water, capillary centimeters while acted by kinetic energy of ram. water and some weak bound water in soil expelled
along the cracks. The experimental results show After dynamic consolidation, the density o f sub- that water 'Ontent is around 28 to 32z before soil will be increased with its porosity decreas- the consolidation with a maximum of 64%, and 1 6 ing, The statistical results show that the to 23% with a maximum of28% after consolidation. density Qf subsoil is from 1.13 to 1.63 t/m' .
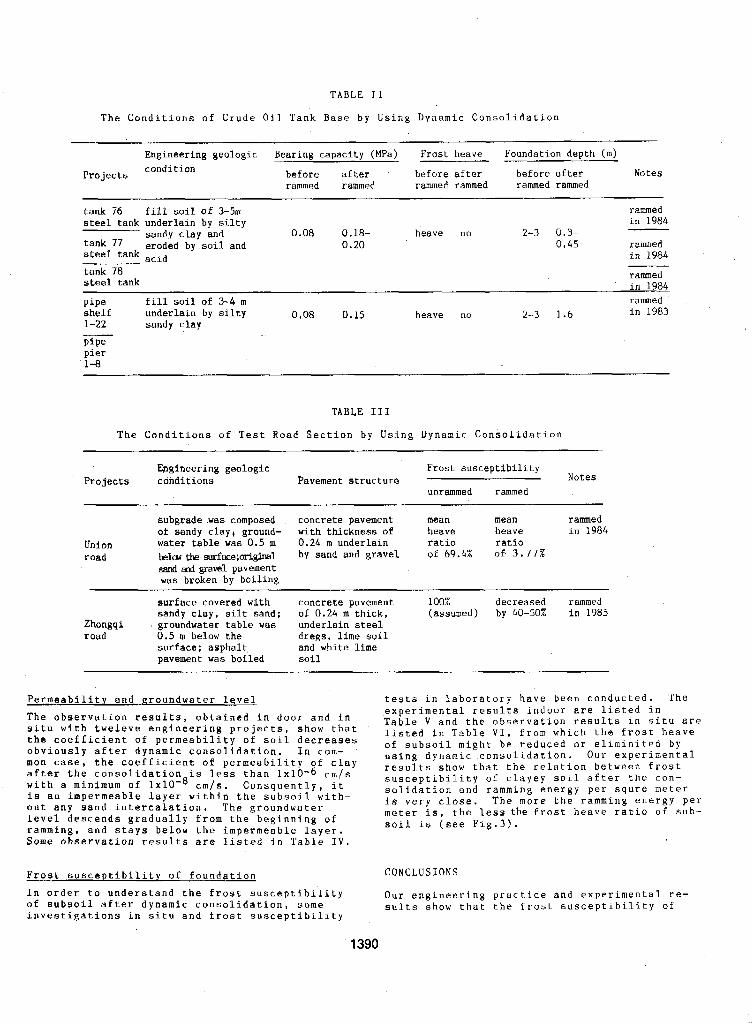
C".,n I r
steel tank acid i n 1984
tank 78 steel tank
rammed in 1984
pipe underlain by silty fill soil of 3-4 m rammed
shelf 0.08 0.15 heave no 2-3 1.6 in 1983 1-22 sandy clay
pipe pier 1-0
eroaea ay sol^ ana U , L U V.1IJ L d I I I l I I C U
-
TABLE I11
The Conditions o f Test Road Section by Using Dynamic Consolidation
bgineering geologic Frost susceptibility Projects conditions Pavement structure Notes
unrammed rammed
subgrade was composed concrete pavement mean mean rammed of sandy clay, ground- with thickness oE heave heave in 1984
Union water table was 0.5 m 0.24 m underlain ratio ratio road belrn &.&a;or~inal by sand and gravel of 69.4% of 3.77%
sand md gravel pavement was broken by boiling
surface covered with concrete pavement 100% decreased rammed sandy clay, silt sand; o f 0.24 m thick, (assumed) by 40-50%, in 1905
Zhongqi I groundwater table was underlain steel road 0.5 m below the dregs, lime soil
surface; asphalt and white lime pavement was boiled soil
Permeability and nroundwater level
The observation results, obtained in door and in situ with tweleve engineering projects, show that the coefficient of permeability of soil decreases obviously after dynamic consolidation. In com- mon case, the coefficient of permeability o f clay after the consolidation is less than 1 x 1 0 - 6 c m / s with a minimum of 1 ~ 1 0 - ~ cm/s. Consquently, it is an impermeable layer within the subsoil with- out any sand intercalation. The groundwater level descends gradually from the beginning o f ramming, and stays below the impermeable layer, Some observation results are listed in Table IV.
tests in laboratory have been conducted. The experimental results indoor are listed in Table V and the observation results in situ are listed i n Table VI, from which the frost heave o f subsoil might be reduced or eliminited by using dynamic consolidation, Our experimental results show that the relation between frost susceptibility of clayey soil after the con- solidation and ramming energy per squre meter
meter is, the less the frost heave ratio o f s u b - is v e r y close. The more the ramming energy p e r
soil is (see Fig.3).
Frost susceptibility o f foundation CONCLUSJONS In order to understand t h e frost susceptibility Our engineering prac.tice and experimental re- o f subsoil after dynamic consolidation, some sults show that the frost susceptibility of investigations in situ and frost susceptibility
1390
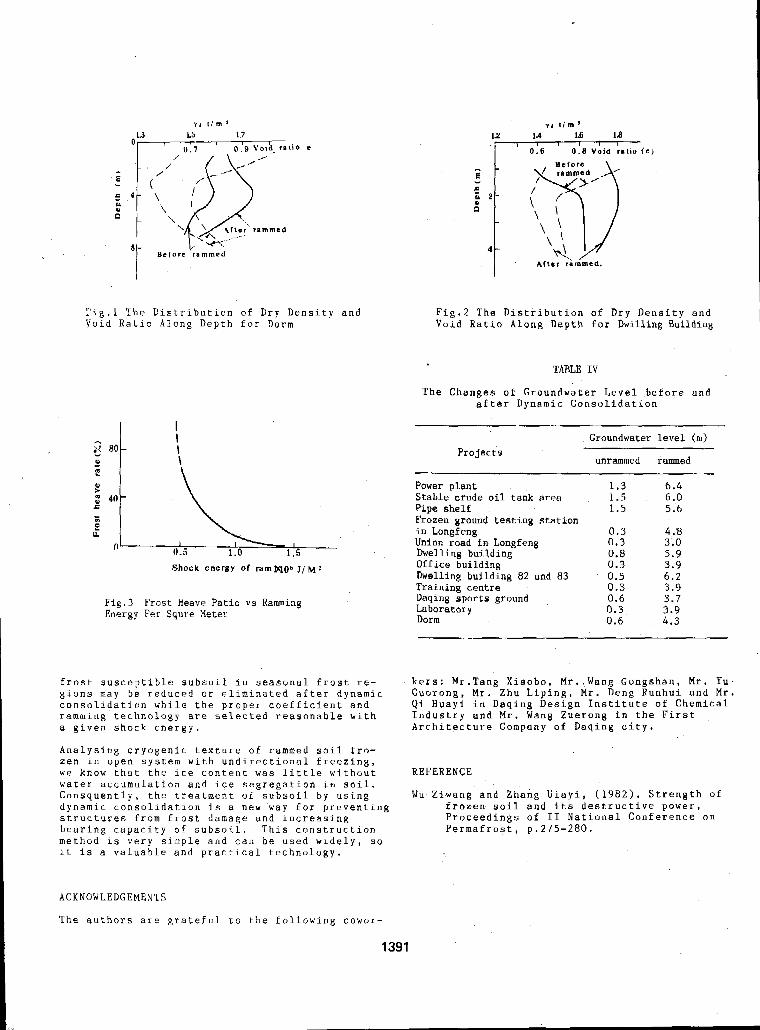
Yig.1 The Distribution of Dry Density and Void Ratio Along Depth f o r Dorm
Fig.3 Frost Heave Patio v s Ramming Energy Per Squre Meter
frost gions conso
susceptible subsoil in seasona may be reduced or eliminated a lidation while the uroDer coeff
1 frost re- fter dynamic
. I icient and ramming technology are selected reasonable with a given shock energy.
Analysing cryogenic texture o f rammed soil fro- zen in open system with undirectional freezing, we know that the ice content was little without water accumulation and ice segregation in soil. Consquently, the treatment of subsoil by using dynamic consolidation is a new way for preventing structures from frost damage and increasing bearing capacity o f subsoi.1. This construction method is very simple and can be used widely, s o it is a valuable and practical technology.
Fig.2 The Distribution of Dry Density and Void Ratio Along Depth for billing Building
TABLE IV
The Changes of Groundwater Level before and after Dynamic Consolidation
Groundwater level (m) Projects
unrammed rammed
Power plant 1.3 6 . 4 Stable crude oil tank area 1 . 5 6.0 Pipe ahelf 1.5 5.6 Frozen ground testing station in Longfeng 0.3 4.8 Union road in Longfeng 0.3 belling building
3.0 0.8
Office building 0.3 5 . 9 3.9
belling building 82 and 83 0 . 5 6 . 2 Training centre 0.3 3.9 Daqing sports ground 0.6 Laboratory 0.3
3 . 7 3.9
Dorm 0.6 Ir.3
kers: Mr.Tang Xiaobo, Mr..Wang Gongshan, Mr. Yu Guorong, Mr. Zhu Liping, Mr. Deng Runhui and M r , Qi Huayi in Daqing Design Institute of Chemical Industry and Mr. Wang Zuerong in the First Architecture Company o f Daqing city.
REFERENCE
Wu Ziwang and Zhang Uiayi, (1982). Strength of frozen soil and its destructive power, Proceedings o f I1 National Conference o n Permafrost, p.275-280.
ACKNOWLEDGEMENTS
The authors are grateful to t h e following cowor-
1391
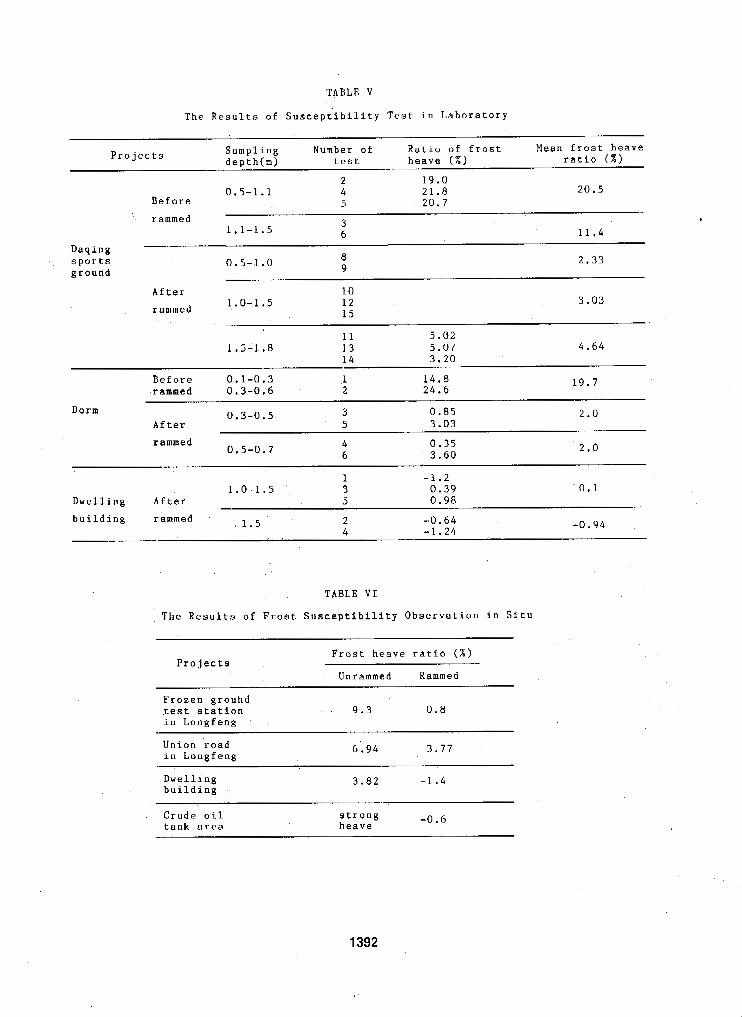
TABLE V
T h e Results of Susceptibility T e s t in Laboratory
Projects Sampling Number of Ratio of frost Mean frost heave depth(m) test heave ( X ) ratio ( X )
2 19.0
Before 5 2 0 . 7
rammed
0.5-1 .1 4 21.8 2 0 . 5
1.1-1.5 3 6 11.4
Daqing sports 0.5-1 .0 8 2 . 3 3 ground 9
After rammed 1 .o -1 .5
10 12 15
3 . 0 3
I1 5 . 0 2 1.5-1.8 13 5.07 4.64
14 3.20
Before 0.1-0.3 1 1 4 . 8 .rammed 0.3-0.6 2 24.6
19 .7
Dorm 0 . 3 - 0 . 5 3 0.85 2.0 After 5 3 . 0 3
rammed 4 0 . 3 5 6 3 . 6 0
1 -1.2
0.5-0.7 2.0
1 . 0 - 1 . 5 3 0 . 3 9 0 . 1 Dwelling After 5 0 . 9 8
building rammed . 1 . 5 2 - 0 . 6 4 4 -1 .24
- 0 . 9 4
TABLE VI
The Results of Frost Susceptibility Observation in Situ
Frost heave ratio ( W )
Unrammed Rammed Projects
Frozen grouhd test station 9 . 3 0 . 8 in Longfeng
Union road in Longfeng 6.94 3 . 7 7
Dwelling building
3 .82 - 1 . 4
Crude oil strong tank area -0 .6 heave
1392
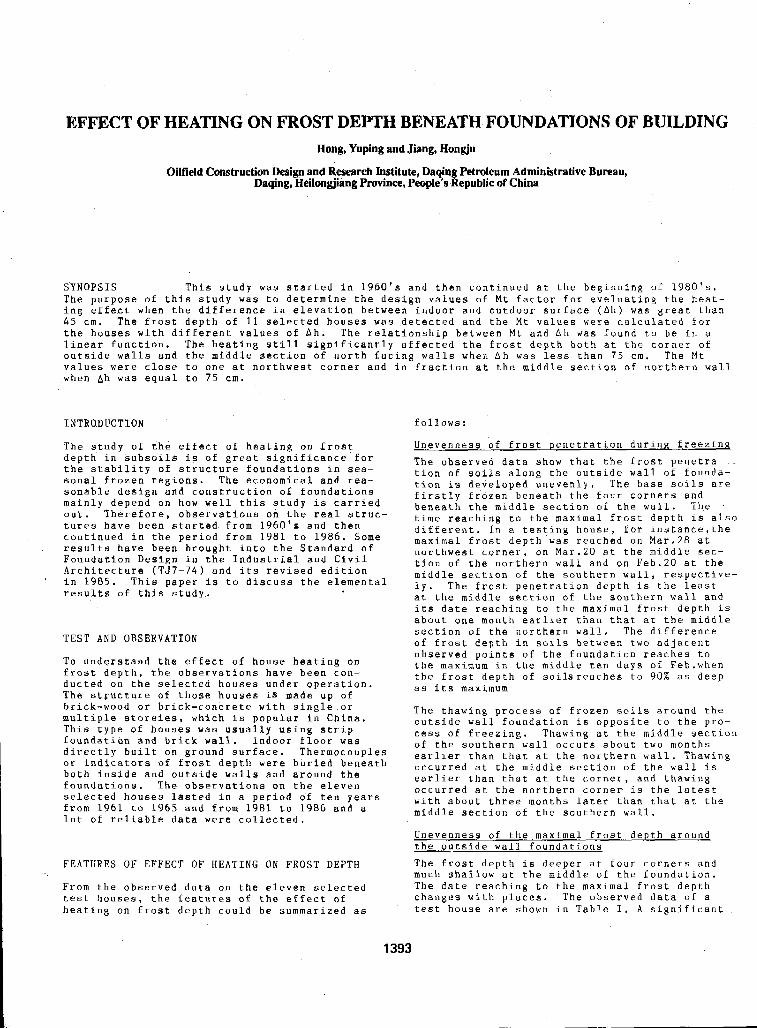
EFFECT OF HEATING ON FROST DEPTH BENEATH FOUNDATIONS OF BUILDING Bong, Yuping and Jiang, Hongju I
Oilfield Construction Design and Research Institute, Daqin Petroleum Administrative Bureau, Daqing, Heilongjiang Province, People's Piepublic of China
SYNOPSIS This study was started in 1960's and then continued at the beginning of 1 9 8 0 ' s . The purpose of this study was to determine the design values of Mt factor for eveluating the heat- ing effect when the difference in elevation between indoor and outdoor surface (Ah) was great than 45 cm. The frost depth of 11 selected houses was detected and.the Mt values were calculated for the houses with different values of Ah. The relationship between Mt and Ah was found to be in a linear function. The heating still significantly affected the frost depth both at the corner of outside walls and the middle section of north facing walls when Ah was less than 7 5 cm. The Mt values were close to one at northwest corner and in fraction at the middle section of northern wall when Ah was equal to 75 cm.
INTR0.DUCTION follows:
The study of the effect of heating on frost depth in subsoils i s of great significance for the stability of structure foundations in sea- sonal frozen regions. The economical and rea- sonable design and construction of foundations mainly depend on how well this study is carried out. Therefore, observations on the real struc- tures have been started from 1960's and then continued in the period from 1981-to 1986. Some results have been brought into the Standard of Foundation Design in the Industrial and Civil Architecture (TJ7-74) and its revised edition in 1985. This paper is t o discuss the elemental results of this study.
TEST AND OBSERVATION
To understand the effect o f house heating on frost depth, the observations have been con- ducted o n the selected houses under operation. The structure of those houses is made up of brick-wood or brick-concrete with single or multiple storeies, which is popular in China. This type of houses was usually using strip foundatian and brick wall. Indoor floor was directly built on ground surface. Thermocouples or indicators of frost depth were buried beneath both inside and outside walls and around the foundations. The observations on the eleven
from 1961 to 1965 and from 1981 to 1986 and a selected houses lasted in a period of ten years
lot of reliable data were collected.
Unevenness of frost penetration during freezinR
The observed data show that the frost penetra .
tion of soils along the outside wall o f founda- tion is developed unevenly, The base soils are Eirstly frozen beneath the four corners and beneath the middle section of the wall. The '
time reaching to the maximal frost depth is also different, In a testing house, f o r instance,the maximal frost depth was reached on Mar.28 at northwest corner, on Mar.20 at the middle sec- tion of the northern wall and on Feb.20 at the middle section of the southern wall, respective- ly. The frost penetration depth is the least at the middle section of the southern wall and its date reaching to the maximal frost depth is about one month earlier than that at the middle section of the northern wall, The difference o f frost depth in s o i l s between two adjacent observed points of the foundation reaches to
the frost depth of soilsreaches to 90% as deep the maximum in the middle ten d a y s of Feb.when
as its maximum
The thawing process of frozen soils around the outside wall foundation is opposite to the pro- cess of freezing. Thawing at the middle section of the southern wall occurs about two months earlier than that at the northern wall. Thawing occurred at the middle section of the wall is earlier than that at the corner, and thawing occurred at the northern corner is the latest with about three months later than that at the middle section of the southern wall.
Unevenness of the maximal frost depth around the outside wall foundations
FEATURES OF EFFECT OF HEATING ON FROST DEPTH The frost depth is deeper at f o u r corners and much shallow at the middle of the foundation.
From the observed data o n the eleven selected The date reaching to the maximal frost depth test houses, the features of the effect of changes with places, The observed data o f a heating on frost depth could be summarized as test house are shown in Table I. A significant
1393
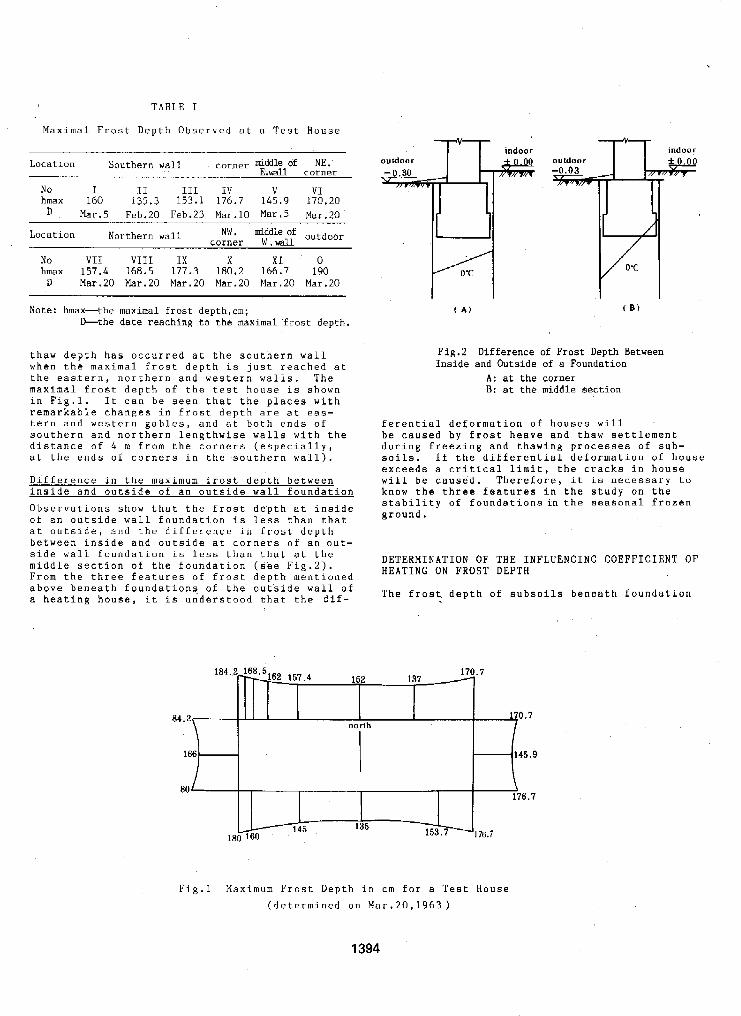
TABLE I
Maximal Frost Depth Observed at a Test House
Location Southern wall middle of NE. E.wall corner
No I I1 I11 IV V VI hmax 160 13.5.3 153.1 176.7 145.9 170.20 D Mar.5 Feb.20 Feb.23 Mar.10 Mar.5 Mar.20
Location Northern wall NW. niddle of corner W .wall
. .
No VI1 VI11 IX X X 1 0 hmax 157.4 168.5 177.3 180.2 166.7 190 D Mar.20 Mar.20 Mar.20 Mar.20 Mar.20 Mar.20
Note: hmax-the maximal frost depth,cm; "the date reaching to the maximal frost depth.
thaw depth has occurred at the southern wall when the maximal frost depth is just reached at the eastern, northern and western walls. The maximal frost depth of the test house is shown in Fig.1. It can be seen that the places with remarkable changes in frost depth are at eas- tern and western gables, and at both ends of southern and northern lengthwise walls with the distance of 4 m from the corners (especially, at the ends o f corners in the southern wall).
Difference in the maximum frost depth between inside and outside of an outside wall foundation Observations show that the frost depth at inside of an outside wall foundation is less than that at outside, and the difference in frost depth between inside and outside at corners o f an out- side wall foundation is less than that at the middle section of the foundation (see Fig.2). From the three features o f frost depth mentioned above beneath foundations o f the outside wall o f a heating house, it is understood that the dif-
outdoor * 4.
indoor outdoor
Fig.2 Difference o f Frost Depth Between Inside and Outside of a Foundation
A: at the corner B: at the middle section
ferential deformation o f houses will b e caused by frost heave and thaw settlement during freezing and thawing processes o f sub- soils, If the differential deformation of house exceeds a critical limit, the cracks in house will be caused. Therefore, it is necessary to know the three features in the study on the stability of foundationsin the seasonal frozen ground.
DETERMINATION OF THE INFLUENCING COEFFICIENT OF HEATING ON FROST DEPTH
The frost depth of subsoils beneath foundation
Fig.1 Maximum Frost Depth in cm for a Test House (determined on Mar.20,1963)
1394
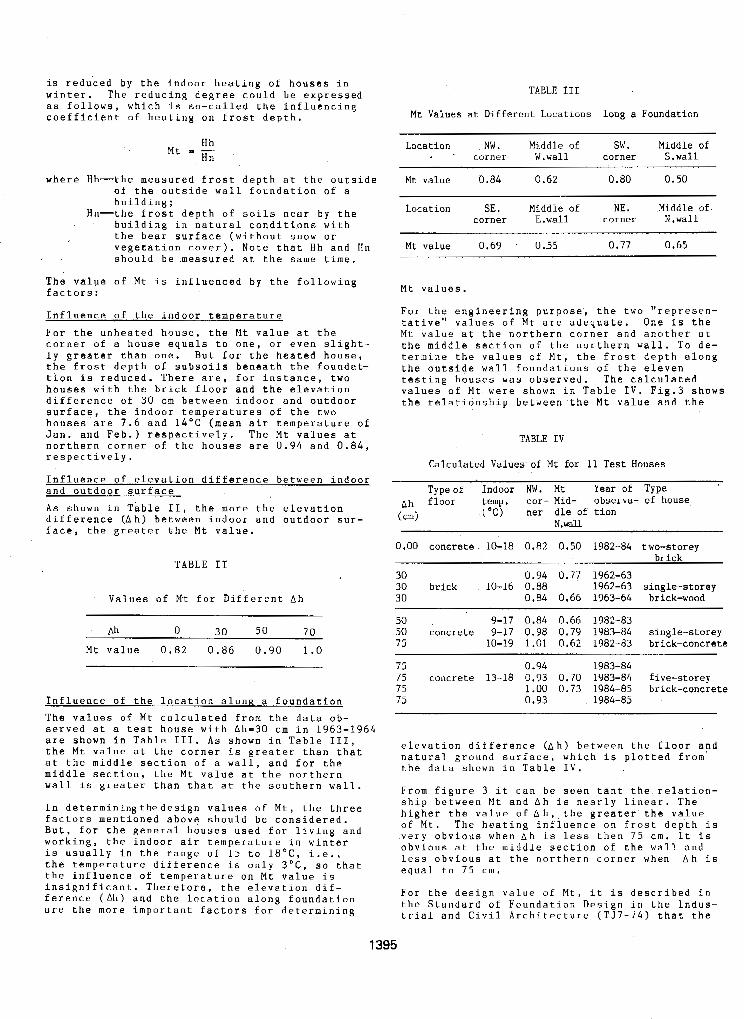
is redu.ced by the indoor heating o f houses in winter. The reducing degree could be expressed as follows, which is so-called the influencing coefficient of heating on frost depth.
Mt - Hh where Hh-the measured frost depth at the outside
of the outside wall foundation of a building;
building in natural conditions with the bear surface (without snow or vegetation cover). Note that Hh and Hn
Hn-the frost depth of soils near by the
should be measured at the same
The value of Mt i s influenced by the fol factors:
Influence of the indoor temperature
For the unheated house, the Mt value at corner of a house equals to one, or even lv Greater than one. But for the heated
time.
owing
he slight- house.
the-frost depth o f subsoils beneath the foundat-
houses with the brick floor and the elevation tion is reduced. There are, for instance, two
difference o f 30 cm between indoor and outdoor surface, the indoor temperatures of the two houses are 7 . 6 and 14°C (mean air temperature of Jan. and Feb.) respectively. The Mt values at northern corner of the houses are 0.94 and 0 . 8 4 , respectively.
Influence of elevation difference between indoor and outdoor surface As shown i n Table TI, the more the elevation difference (Ah) between indoor and outdoor sur- face, the greater the Mt value.
TABLE I1
Values of M t €or Different Ah
Ah 0 sn 50 7n
Mt value 0.82 0 . 8 6 0 . 9 0 1.0
Influence of the location alonn a foundation The values of Mt calculated from the data ob- served at a test house with Ah=30 cm in 1963-1964 are shown in Table 111. As shown in Table 111, the Mt value at the corner is greater than that at the middle section of a wall, and for the middle section, the Mt value at the northern wall is greater than chat at the southern wall.
In determiningthedesign values o f Mt, the three factors mentioned above should be considered. But, for the general houses used for living and working, the indoor air temperature i n winter is usually i.n the range o f 15 to 18'C, i.e., the temperature difference is only 3"C, s o that the influence of temperature o n M t value is insignificant. Therefore, the elevation dif- f e r e n c e (Ah) and the location along foundation are the more important factors for determining
TABLE I11
Mt Values at Different Locations long a Foundation
Location NW. Middle o f SW. Middle of + . corner W.wall corner S .wall
Mt value 0.84 0.62 0.80 0.50
Location SE. Middle of NE. Middle of. corner E.wal1 corner N.wal1
Mt value 0.69 0 . 5 5 0 . 7 7 0.65
Mt values.
For the engineering purpose, the two "represen- tative" values of Mt are adequate. One is the Mr. value at the northern corner and another at the middle section of the northern wall. To de- termine the values of Mt, the frost depth along the outside wall foundations of the eleven testing houses was observed. The calculated values of Mt were shown in Table IV. Fig.3 shows the relationship between the Mt value and the
TABLE IV
Calculated Values of Mt for 11 Test Houses
T V D ~ O € Indoor NW. Mt Year of Type Ah fibor temp. cor- Mid- observa- of house ( c d ("C) ner dle of tion
Y.wFI11
0.00 concrete 10-18 0.82 0.50 1982-84 two-storey brick
30 0.94 0.77 1962-63 30 brick 10-16 0.88 30
1962-63 single-storey
50 9-17 0.84 0.66 1982-83 50 concrete 9-17 0.98 0.79 1983-84 single-storey 75 10-19 1.01 0.62 1982-83 brick-concrete
75 0.94 1983-84 75 concrete 13-18 0.93 0.70 1983-84 five-storey 75 75 0.93 1984-85
0.84 0.66 1963-64 brick-wood
1.00 0.73 1984-85 brick-concrete
elevation difference (Ah) between the floor and natural ground surface, which is plotted from the data shown in Table IV.
From figure 3 it can be seen tant the relation- ship between Mt and Ah i s nearly linear. The higher the value of A h , the greater the value o f Mt. The heating influence on frost depth is very obvious when Ah is less then 75 cm. It is obvious at the middle section of the wall and less obvious at the northern corner when Ah is equal to 75 cm.
F o r the design value o f Mt, it is described in the Standard of Foundation Design in the Indus- trial and Civil Architecture (TJ7-74) that the
1395
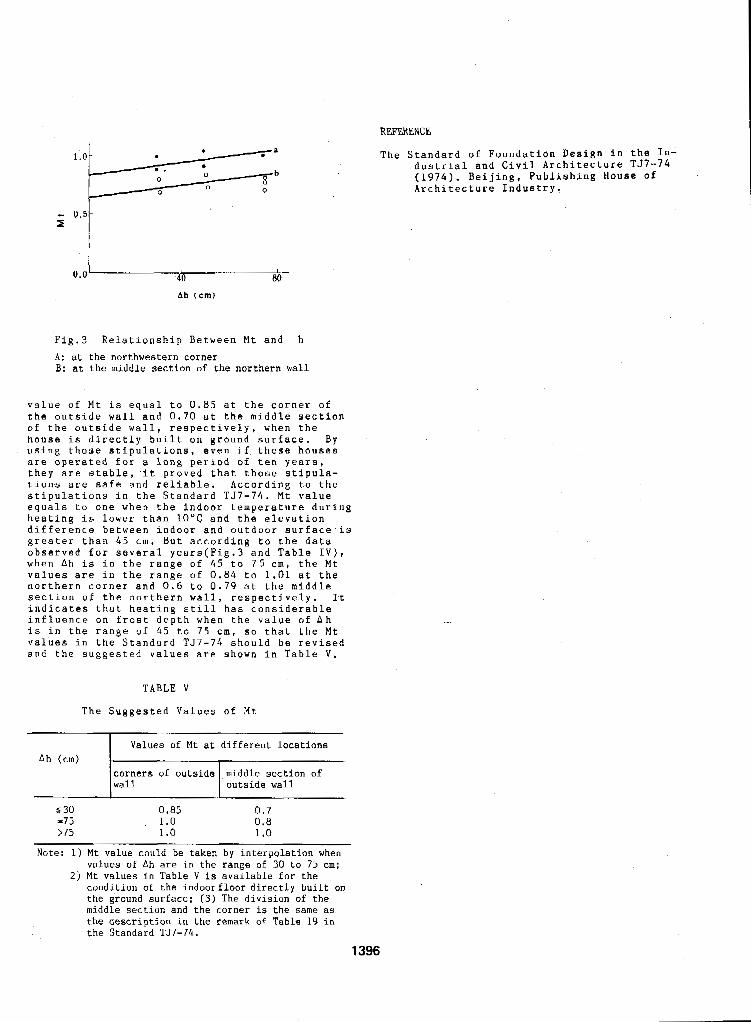
Fig.3 Relationship Between Mt and h A : at the northwestern corner B: at the middle section of the northern wall
value of Mt is e q u a l to 0.85 at the corner of the outside wall and 0.70 at the middle section o f the outside wall, respectively, when the house is directly built on ground surface. B y using those stipulations, even i f . these houses are operated for a long period o f ten years, they are stable, it proved that those stipula- tion-s are safe and reliable. According to the stipulations J.n the Standard TJ7-74. Mt value equals t o one when the indoor temperature during heating is lower than 10°C and the elevation difference between indoor and outdoor surface is greater than 4 5 cm. But according to the data observed for several years(Fig.3 and Table IV), when Ah is in the range of 45 to 75 cm, the Mt values are in the range of 0 . 8 4 to 1.01 at the northern corner and 0 , 6 to 0 .79 at the middle section o f the northern wall, respectively. It indicates that heating still has considerable influence o n frost depth when the value o f A h is in the range of 4 5 to 75 cm, s o that the Mt values in the Standard TJ7-74 should be revised and the suggested values are shown in Table V.
TABLE V
The Suggested Values of Mt
tT"--- Values of Mt at different locations Ah (cm)
corners of outside middle section of outside wall
5 30 0.85 -75 >75
0.7 0.8 1 .o
1 .o 1 .o
Note: 1) Mt value could be taken by interpolation when values of Ah are in the range of 30 to 75 cm:
condition of the indoorfloor directly built on the ground surface; ( 3 ) The division of the middle section and the corner is the same as the descriution i n the remark of Table 19 in
2 ) Mt values in Table V is available for the
REFERENCE
The Standard of Foundation Design in the I n - dustrial and Civil Architecture T J 7 - 7 4 (1974). Beijing, Publishing H o u s e of Architecture Industry.
PREDICTION OF PERMAFROST THAWING AROUND MINE WORKINGS V.Yu. Xzaksonl, E.E. Petrovl and A.V.' Samokhinz
1Institute of Mining Engineering of the North, Yakutsk, U.S.S.R. 2Yakutsk State University, Yakutsk, U.S.S.R.
SYNOPEiLS We have derived approximate formulae f o r prediction of the size o f thaw areas of the mine working walls under the influence o f warm air f o r positive and sign-vaxying thermal regimes. An analysie is,made o f the influence o f a variety of factors upon thawing dynamica. The usefulness of heat insulation as applied depending on operating condition8 for woxkinge i s ahom "
Advantageous ueage and deprign of the eupports of mine w o r k l n p within the permafroat are im- porrslble unleea thawing dynamic@ o f the walls under the effect OS a warm air i~ predicted. 'Phi8 question ha0 been addrerrsed by a number of papere having the aatne dieadvantage in common, namely the analyeia waa made for oonditions of a conatant, poaifive temperatwe of the air in the mine.
For practiaal puxpoees, howevex, it is the xe- aults for variable temperaturea whi& ar5 re- quired on moat occaeione beoause mine workings o f all underground mining enterprises in the North-East o f the U.S.S.R. operating through- out the year, are under conditions of a eign- varying heat regime.
,Pagers faking account of air temperature fluc- tuations are not numerow and a x e , baaically, ooncerned with problem statements. hhgineering prediction teehniquea (Ieaknon and Petxov, 1985) find a llmited field of application and Lack the am%ly8iS of thawing dynamics for poeitive and sign-varying heat regimels.
In the preeent paper thie problem w i l l . be sol- ved by a method of mafhematioal simulation on a computer by an algorithm reported in a paper of Ioakson and Petrov (1986).
The algorithm aolvea muLtifxolst Stephan prob- lems by the finite differenoe method via auto- matic sampling o f the amoothing parameter. A large-scale computer simulation experiment has been conducted for the following variations of affecting parametera (Table 1).
Mathematleal simulation was carried out in two stages. The first stage involved selecting thermal characteristic# of the problem (the heat exchange coefficient d , the heat conduc- tivity and heat capacity coefficients for rock ground in unfrozen a d frozen conditions A , ,
A,,, , cTp , and C,,,JJ , and moiatuxe content of rook ground 15 ) such a8 to achieve agree- ment between calculated and experimental re- sults obtained under natural conditions (Dad" kin et el., 1968) and laboratory experiments
1397
TABLE I
Limits and Steps of Variation o f Values in Mathematical Simulation
Parameter
Natural temperature of a rook maee, To, *C -6 -2 2
Yearly amplitude of air 0 10 2 temperature fluotuations in the mine, A , 9 O C
Service time o f the working r , month6
1 48 0.1 1 240 0.25
3 0.5
Tn the second stage of mathematical eimulation the variants were calculated using data in Table I. The caloulation results were handled by the method of least aquares, Although f o r each variant, we aalculated the entire tempera- ture field, we, nevertheless, investigated the behaviour of the main parameter o f the tempera- ture field, namely the size of the thaw area ( 5 ), whose boundary was taken to be the zero isotherm.
The case of heat exchange at constant, positive
aion8. The beet repreeentation o f the dependen- temperature w a ~ investigated on numerous occa-
ce of the depth of thaw on the time o f heat exchange is
5 = a +segz, ( 1 )
where Z is the service time of the working (years I. For each variant, we determined the c o e f f i - cients of equation (11, fox each a9 which we chose a complex argument giving the beat (in the sense of a minimum of atandard deviation) representation of the deaeadences of the coef-
ting the dependences of the above arguments may be characterized as being good (Fig5 1, 2).
Fig. 1 The Dependence of the Coefficient Involved in Equation ( 1 1 upon Affecting Para- meters. Mathematioal Simulation Data axe Numbered: 1st Figure tmem, 2nd Figure, I,, O C 8-2 (I), 6-2 (21, 4-2 (31, 6-4 (41, 6-6 ( 5 ) , 4-4 (61, 2-2 (7), 4-.6 (81, 2-4 (91, and 2-6 (IO), Points 11-15 are obtained at tmean aea of 0.125; 0.4; 0.9; 1.3; and 1.53 W/(m2 K), respectively.
P 6OC and To = -2OC, f o r heat reslstan-
The variable o f air temperature of the mine was simulated ueing the relationship
where 5 is time (months), i . e . , allowance i a made only for the annual cycle of temperature fluctuations and the beginning of heat exchange is accomplished with m a x i m u m yearly temperature.
In the aaae of 8 posit ive heat regime
front of thaw is proceeding in the same manner a# depicted in P i g . 3 which a l o o ehows the mo- vement of the front o f thaw at a conatant tem- perature equal to tmea.
The movement ia oacillatoxy in character, i.~., the poeition of the front of thaw fluctuates
0, A ~ S tmeanl, movement of the
Pig.2 The Dependenae 09 the Coefficient 8 ; Point Numbering Irs the Same as Pig.1.
1 2 4 z, ysazs
Fig.3 The Movement of the hont of Thaw in the Case of a Poaitive Heat Regime, O C :
tmeaa 1.6, To - -2, At IC 0(1), 6 (2).
The movement is oscillatory i n oharaater, i . e . , the poaitlon of the f r o n t of,thaw fluctuatee about a position defined by equation ( I ) . POX- lowing 4 ox 5 cycles, the movement becornerr a
side by 5 to 8% fthe smaller i s the yearly am- stationary one, ulaatfng toward the amallex plitude o f air tempexatwe fluctuations, the smaller i8 the deviation). Ignoring thie, the 8ir;e of the area of thaw at a variable, poei-
dicted using equation (1). five air temperature in the mine oan be pre-
the air inside the working, thawing aJmamies In the case of B eign-varying heat reerne o f
are different for negative and posltive yearly mean temperatures. When tmem Q OOC, the mo- vement of the front of thaw is pulsating in character (Pig. 4).
Por prediction purpoesa &a regaxde the greateat s ize of the area o f thaw, for ~ > l year, WB obtained the equation
1398
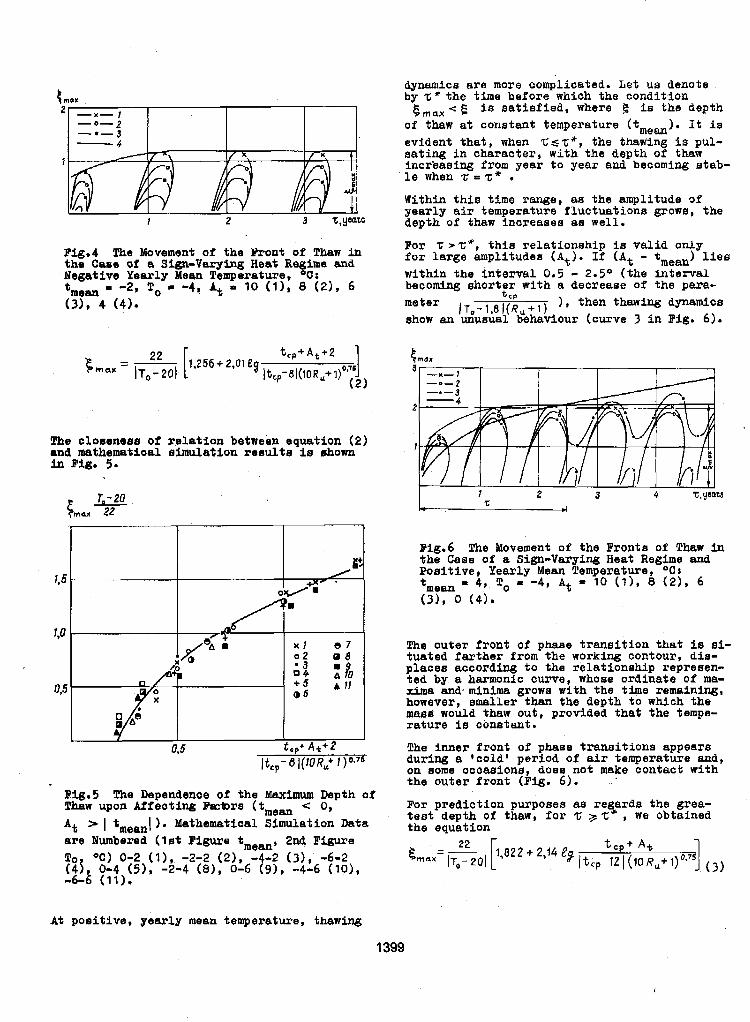
1 2
dynamics are more oomplicated, Let UB denote by z * the time before which the condition emax e is satisfied, where 5 is the depth of thaw at constant temperature (tmean). It ia evident that, when ZSZ*, the thawing is pul- sating in character, with the depth of t h a w incrkasing from year to year and becoming atab- le when z = z" . Within this time range, as the amplitude 3f yearly air temperature fluctuations grow^, the depth of t h a w increares as well.
For z rZ*, this relationship is valid o n l y for large amplituder (At). If (At - lies within the interval 0.5 - 2.5O (the Interval becoming shorter with a decrease o f the para-
1, then thawing dynamics show an'unwual behaviour (curve 3 in Pig, 6).
t C P
T0-1,8i(Ru+1)
t , p + A t + 2 1,256 + 2.01 E a
~t,p-8J(10R,+1)0'75 1 (2)
ation between equation (2) dat ion results ils shown
Fig.5 !Che Dependenoe of the Maximum Depth o f Thaw upon Affecting Fdors (tmem 0 , At 1 I tmean( 1. Mathematical Simulation Data are Numbered (1st Figure fmean, 2nd Figwe
~ig.6 The Movement of the Fronts of 'Phew in the Case of a Sign-Varying Heat Regime and Posit ive, Yearly Mean Temperature, OCI
4, ICo -4, A t 10 (11, 8 (21, 6 (31, 0 (4).
The outer f ront o f phaae tranaition that is si- tuated farther from the working contour, dis- places according to the relationahip repreaen-
xima and,minima grows with the time remaining, ted by a harmonio curve, whose ordinate of ma-
however, amallex than the depth to which the maad would thaw out, provided that the tempe- rature is constant.
The inner front o f phaae transitlons appears during a 'cold' period o f air temperature and, on Borne ooca~lions, doem not make contact with the outer front (Big. 6).
For prediction purposes as regarda the grea- test depth o f thaw, for 't; r, z' , we obtained the equation
A t poeitive, yearly mean temperature, thawing
1399
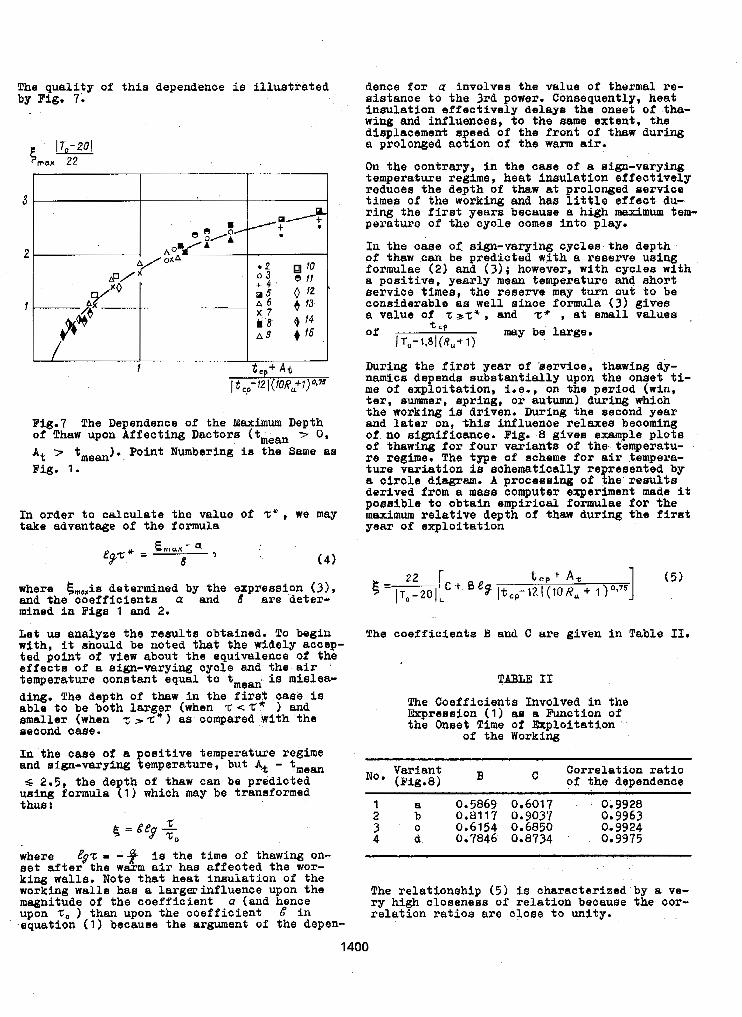
this dependence is illustrat ed den
3 I I
I OhA
'0 e I1 0 ' 2 a '3 4 '4 + '6
'
Fig.7 The Dependence of the M a x i m u m Depth of Thaw upon Affecting Dactors (emean 7 0, At 7 t,,,,) .. Point Numbering ia the Same as F i g . 1.
In order to calculate the value of z* , we may take advantage of the formula
where emaria determined by the expression (31, and the coefficients a and 8 are deter- mined in Figs 1 and 2.
Let us analyze the remlts obtained. To begin with, it rshould be noted that the widely accep- ted pobt of view about the equivalence of the effectB of a sign-varying cycle and the air temperature conatant equal to tmem, is mislea- ding. The depth of thaw in the firs3 cam is able to be both Larger (when z c 2: and smaller (when > z " ) as compared with the second ease.
In the case of a positive temperature regime and sign-varying temperature, but At - tmeU 5 2.5, the depth of thaw can be predicted using formula (1) which may be transformed thus t
where &C = - + 1s the time of thawing on-
k i n g walls. Note that heat ineulation of the set after the warm air has affected the wor-
working walls has a largerinfluence upon the magnitude of tha coefficient a (and hence upon Z, ) than upon the coefficient 8 in -equation (1) because the argument of the depen-
.ce f o r a involves th e value 09 thermal re- sistance t o the 3rd power. Consequently, heat insulation effectively delaya the onset o f tha- w i n g and influences, to the same extent, the displacement apeed of the front of thaw during a prolonged action o f the warm air.
On the contrary, in the caee of a sign-varying temperature regime, heat ineulation effectively reduces the depth of thaw at prolonged service t imes of the working and bsla little ef fec t du- ring the first years because a high maximum tem- perature of the cycle come@ into play.
Xn the case 04 sign-varying cycleis the depth of thaw can be predioted with a xeeerve using formulae (2) and (3); however, with cycle8 with a positive, yearly mean temperature and short service times, the r e m n e may turn out t o be conaidersble as well since formula ( 3 ) gives a value of z 32 * , and z* , at small. valuels ,
During the f i r e t year of 'eervioe, thawing dy- namics dependa eubetantially upon the onset ti- me of exploitation, i . e . , on the period (win, ter, summer, tapring, o r autumn) Buring which the working is driven, During the second year and later on, this influence relaxerr becoming of no signiflosnce. Pig, 8 givea example plots of thawing for four variant8 of the temperatu- re regime. The type of acheme f o r air tempera- ture variation i a achematically represented by a circle aiagram. A processing o f the'reaulte dQrived from a mass computer experiment made it posaible to obtain empirical formulae fox the maximum relative depth o f thaw during the first year of exploitation
The coefficients B and C are given In Table XI.
TABU 11
The Coefficienfa Involved in the Expression (1) as a Function of the Onset Time of Exploitation
o f the Working ". . . . . . - .. . . - . .
NO. Variant Correlation ratio (Fig981 o f the dependence
1 a 0,5869 0,6017 0,9928 2 b 0.8117 0.9037 0.9963 3 c 0.6154 0,6850 4 d 0,7846 0.8734
0.- 9924 0.9975
The relationship (5) i s characterized by a ve- ry high closeness of relation because the cor- relation ratios are close to unity.
1400
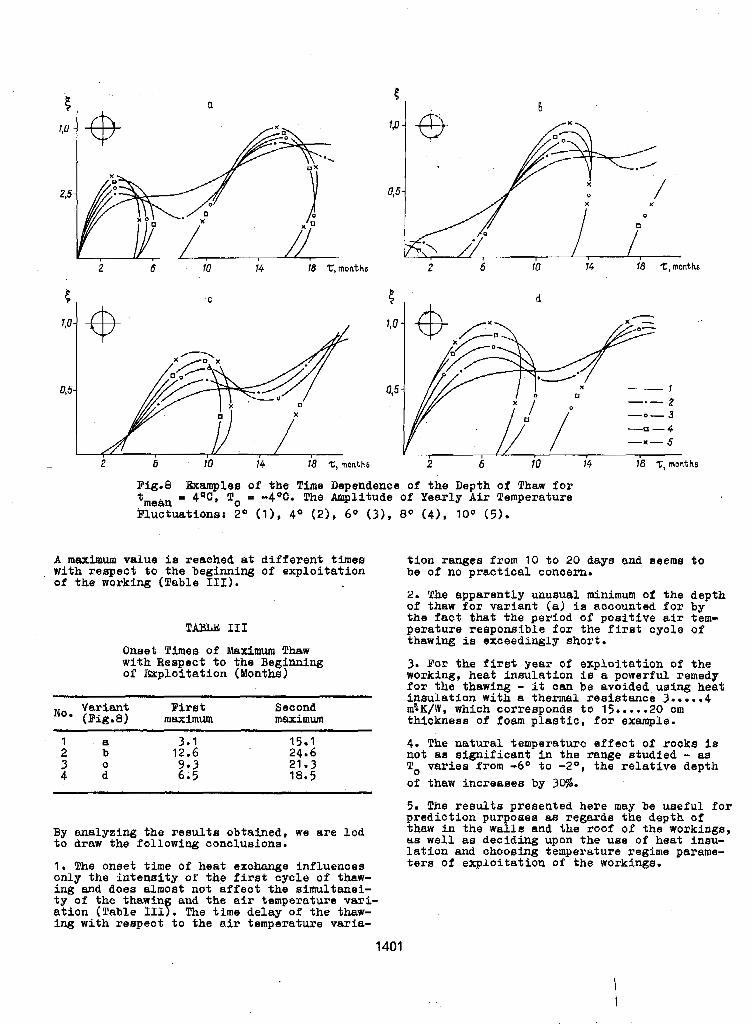
a
2 6 1D 14 18 Z, mcnt hs
C
6 i4 18 Z,months
2 6 io i4 I’8 G, months
Fig.8 Examplea of the Time Dependence of the Depth o f Thaw f o r tmean = 4qC, To = - 4 O C . The Amplitude of Yearly A i r Temperature Fluatuations: 2 O ( I ) , 4 O (21, 60 (3 ) , 8 O (41, 100 ( 5 ) .
A m a x i m u m value is reached at different t imes with relspect to the beginning of explo i ta t ion of the working (Table TSI).
TABLE I31
Onset Times of Maximum Thaw with Respect t o the Beginning of Rrp lo i ta t ion (Months)
No. Variant (Pig.8)
F i r s t Second m a x i m u m maximum
1 2
a 3.1 b 12.6
3 4 d
9 .3 6.5
15.1 24.6 21 - 3 C 18.5
By analyzing the result8 obtained, we a r e l e d t o draw the following conclusions.
1. Phe onaet time of heat exchange inf luences only the intenai ty of t h e f i r s t c y c l e of thaw- ing and does almoat not affect the aimultaaei-
ation (Table IIIf t y of the thawin and the air temperature vari- . The time delay of: the thaw- ing with respect to the air temperature varia-
t i o n ranges erom 10 t o 20 days and seeme t o be o f no practical conaern.
2. The apparently unusual. minimum of the depth of thaw for var ian t (a) is accounted f o r by the f a c t that the period of pos i t ive air tem- pera ture rmpons ib le for the f i r s t cyc le of thawing is exceedingly short.
3. For t h e f i r & y e a r o f explo i ta t ion of the working, heat insulation is a powerful remedy f o r the thawing - i t can be avoided uaing heat insu la t ion with a thermal reaistance 3.....4 m:K/W, which corresponda t o 15.....20 om thickness of foam p l a s t i c , f o r example.
4. The natural temperature effect of xocko ie not as s ign i f i can t i n the range studied - as To var i e s from - 6 O t o - 2 O , the re la t ive depth of thaw increases by 30$.
5. The resul ts presented here may be useful for predic t ion purposes a8 regarde the depth of thaw i n the walls and the roof of the workings, as well as deciding upon the use of heat insu- lation and choosing temperature regime parame- t e r s of explo i ta t ion of the workingrs.
1401

REFERENCES
Dyad’kin, Yu.D. Zilberbrod, A.F., and Chaban, P.D. (1968). Teplovoi rezhim ruanykh, ugolnykh i rossypnykh ahakhf Severa, Mon- cow: Nauka.
zhenerny metod prognozirovaniya i reguli- rovaniya razmerov oreolov protaivsnipa vokrug gornykh vyrabotok o b l a e t i mnogolat- nei merzloty, No. 5, FTPRPI.
leakson, V.Yu. and Petrov, E.E. (19851. In-
Izakson, V.Yu. and Petrov, E.E. (1986). Chis- lennye metody prognosirovaniya i reguliro- vaniya teplovogo rezhirna &ornykh pOrOd o b l a s t i mnogoletnei mer5loty, YakufPk: Tad. Yap so AN SSSR.
1402
EXPERIENCE IN CONSTRUCTION BY STABILIZATION METHOD L.N. Khrustalevl and V,V. Nikiforovz
1Laboratory of Engineering Geocryology, Faculty of Geology, Moscow State University ZResearch Institute of Bases and Underground Structures, Moscow, USSR
6YNOpsIS The paper presents a new method f o r building foundations on perennially fro-
technological designs of baaee, foundations and coaling systems are described and the data ob- 2- grounds along with the assessment of the f i e l d of i t s possible application. 8tructural and
tained in the course of observations o f the bui ldbgs b u i l t bg tbja method are analyzed.
In permafrost regions all the areas under conatruction can be d i v i d e d into two groups: area8 with conthuoua o r discontinuous perenni- ally frozen grounds.
The former 'are most simple for development. Hence, the first principle of using gmunda as a bass ia applied here: foundations are b u i l t in the permafrost; ventilated v a u l t s o r oljher cooling sygtems being arranged under a bui l - ding. These systems help maintain a f r o z e n s t a t e o f the ground under buildings over the whole period o f exploitation.
The Lat ter are more complicated, s ince they re- quire preliminarg f r e e z i n g o r thawing of *he
Preliminary freezing art if icially creates the permafrost to prepare a base for construction.
conditions characterist ic of the first group of areas, and then the ground o r the base is used according t o t he f irst principle. The preliminary thawing creates conditions under which a fu r the r thawing o f perennially frozen grounds under the action of heat generated by a building will not r e su l t ia abnormal set t le- ment of the foundation6 during the entire pe- r i o d o f exploitation.
A t preaent, a more economical way of construct- h g on permafrost of discontinuous type has been develo ed which envisages Eitabilizatiw of t he initfel permafrost table over the whole period o f a buildhg exploi ta t ion. The idea of such a s t ab i l i za t ion was proposed and pro- tected by the authora ' cer t i f icate granted to G.V.Porkhaev, L.N .Kkrustalev, V.N.Yeroahenko and others (Avtorskoe svidetelstvo.. . , 1975).
The method o f s t ab i l i za t ion is applied a t
PreezFng a n d thawing do- not merge with the construct ion s i tes where the layer o f seasonal
permafrost f u l l y O r partially withln the area
grounds are characterized by a considerable of a building, and the perennially frozen
compressibility at thawing, a n d the overlying thawed grounds possess heavFng properties du- ring freezing.
The method Lnvolves maintenance of t he i n i t i a l - l y prescribed permafrost table over the whole
1403
period of e%ploitation.with the help of a ven-
The bottom of the foundatlane is located ia t 'iiated vault arranged under the building. '
mafroat t a b l e and the bottom of a seasanally the layer of unfrozen ground between the p e r
or perennially f r o z e n layerr
A mean alr-Bempexature close t o zero is main- tained in the vaul t f o r the whole period of exploitation t o exclude the heat influeme of a building on the underlying permafroat. In that case, the depth of seasonal o r perennial ground freezing under thq building beoomes equal t o that of seasonal OT perennial thawing, producing a phase bouuaarg o f t he stable maia- tenanae .of freezing temperature above the foundation bottom the year round. The second phase boundary i a located at the tog o f the permafrost, a n d a, layer 00 unOroeen ground the "buffer layer",. whoee temperature grad€- ents are equal 'practically t o aero, a d so, consequently a m the heat fluxes passing through it,:ia looated between t h e p W e boun- daries. The buffer layer s e m w a8 a heat- t ight cur ta in ensuring s tabi l izat ion of the i n i t i a l permafrost table and protecting the ,unfrozen ground Prom perennial freezinng. The base of a building being protected f mm pe- rennial freezing and thawhg does not deform Fn the p r o c e ~ s o f exploitation which ensures i t a s tab i l i ty . In the construction and exploitation of bui l - ding5 by the method o f Beabilization the fol lo- wing two modes of ventilated vaults operation: variable ana permanent are possible.
The variable mode involves regulation of he& Fnteraction between a building and its base in the process o f exploitation.and is aimed pri- marily at creating a special mode o f t he ven- t i lated vault operation. It consiste in maia- tafninsg 10-15 year periods o f negative mean annual air temperature alternating with 2-5 year ones of posi t ive mean annual a i s tempera- ture Fn the v a u l t .
Perennial freezing of round wcurs b a the v a u l t during the perio ! 09 negative air tamps- rature. The modulus OP the v a u l t vent i la t ion
for that eriod i s calculated BO tha t the mean annuaf a i r temperature h the v a u l t , ta- k u into account probable deviations f r o m t he estimated values, should a f o r t i o r i be negati- ve. The depth of perennial freezing at the baae o f a building is limited b y the condition of the fouudat ion s tabi l i ty against the action of heaving forces . Upon reaching such a depth, the perennial freeslag is stopped by changing the a i r temperature in the v a u l t from negative to pos i t ive .
The resultant perennially $rozen ground layer thawa out during the period of posi t ive air temperature in the v a u l t , and t h e i n i t i a l con- dit ions are res tored ~JI the barse o f a bu t ldbg . Thla cycle recurs.
The operatton mode of a v e n t i l a t e d vault is
nhngs. Paxameters of t he v a u f t . design a m changed by opening and closin vant i la t ion ope-
mean annual air temperature with cl.osed v e n t i - assigned by calculations t o ensum a posi t ive
l a t ion openings not l ess than the absolute - value o f the ambient mean annual a i r tempera- ture in the region. This ensures a complete thawbing of the short-term permafrost that forme during the period. o f negative mean annual. a i r temperature in the ; v a u l t at , any temperature of t h e ground surface out'aiae '%he contourof the
The al ternat ion of control periods Lf¶ carried out baaed on the resu l t6 of temperature measu- rements ' i n - the base of the building In speoial
made, once B year t o detemhe the ac tua l depth thermometric boreholes. Such meaaurements are
of pezennial freezing o r thawing in the upper layer over the ent i re area of the bui lding so as t o -make 8 decision on the al ternat ion of contml .periods.
In applying the stabil ization method, a perma- nent mode of the ventilated, v a u l t bperatlon Is a l so possible. It is a,$articul.ar came of the variable mode when one of the periods lasts f o r the whole term o f exploitation of a building. An average mean annual air temperature bh the vault is aaaigned t o be- alone .t? O°C (-0.5 t o
A method has been devised t o calculate the main parametera of the base when construction is effected by the s tab i l iza t ion method. It- b- plies ' calculat ion and rjipecjfication o f t h e f o l - lowhng character is t ics needed t o desiga 8 bui l - ding:
bu i ldhg .
+2 .oca)
(1 1 depth of foundation a n d its carrying
(2) dep the of the admissible perennial capacity ;
The calculation i s based on t he method of t he worst case. The essence of t h i s method! as applied to the problem under conaideratlon,ia as follows.
'pwo conditional cross-sectioaa a re chosen Fn the base of a building to calculate the depths of perennial freezing and thawing for the whole period of exploitation. The calculation is pexforrned f o r probable deviations o f mean
the ventilated vault and outside the building annual tempesatures o f the ground Surface in
f r o m the mean values. In one of the cross- sections these temperatures are to be maximum,
The depth o f perennial thawinng o f t he under- taking into account t h e i r probable deviations.
lying permafrost and the resultant settlement of the base and foundations are calculated f o r this cross-section. From the condition, L i m i - t ing the settlement, the thickness o f the pro- t e c t i v e m r o z e n ground layer is determined. In the other section, the mean annual tempera- t u re s of the ground surface Fn the ventilated vault and outside the building, taking i n t o account t h e i r poss ib le deviations, are assumed as m i n b u m . In this cross-section the depth of perennial freez'ing of t he thawed layer around. the foundations is calculated. Proceed- Fng from the necessity of maintaining the sta- b i l i t y of foundations in this cross-section fmm the aation of tangential heaving forces in the course of perennial. f r e e z k g , one has t o determine t h e i r depth as well as permissible depth of perennial freezing of the mfrozen
the protective thawed Layer, the depth of. foun- ground layer. In such a way, t he thiclmess of
datiOnS, and the admissible depth of perennial freezing at the base both st permanent and va- r iable modes of the ventilated vault operation a re determined.
The parameters of the ven*ilated vault; aesim (thermal resistance of the floor and enclosing structures, as well as t he t o t a l area of ven- t i l a t i o n openhings) are specified from the f 01- lowing considerations.
Under the permanent mode of a ventilated vault operation these parameters axe d e t e m b e d by calculated m a n annual temperature of the ground surface beneath the building which is a resul t of the calculation and the l imi ta t ion o f the perennial freezing of the unfrozen ground layer Fn the bamr
Under the variable mode of operation of a ven- t i l a ted vaul t , its design parameters ark deter- mined 80 aa t o ensure the desired calculated meen annual temperature o f the ground surface under a building during warm and cold periods of exploitat ion.
freezing of grounds at the base; The distance between the ranges of the monitor- (3) resis tance to the heat transfer of the h a thermometric boreholes under both modes of .-
floor over the ventilated vault end s t ructures which surround iti;
operation is specified b y a special calculation
homogeneity of the thermal reglmme 5n the vaul t , nings ; the admissible depth of perennial freeaing-,and
accuracy of ground temperature measurements in thiclmess of the protective unfrozen the boreholes. mound laser over the aermafmostr
depending 011 the w i d t h o f the building, the in- (4) areas of t h e v a u l t vent i la t ion ope-
(5) - (6 1 distance between the ranges of moni- Thfs calculation method of the main parameters
of a base is described Sn d e t a i l i n the recom- toring thermometric boreholes. mendations on the application of t h e s t a b l l i - sat ion method (Khrustalev and N ikiforov , 1985).
1404
A t present, more than 30 appartment houses and publ ic bui ldhgs have been b u i l t and ~uccess- fully exploited in t h e northern Euhpean UBSR by the s tabi l izat ion method. Many of them were pu t into operation over I O yeam ago. Therefore, to-day we can analyse the experience ga'ined in the course of their construct ion and exploitation by t h i s method.
The advantages of the s tab i l iza t ion method can be appreciated on the example of a resident ia l micro-re ion (neighborhood housing unit) b u i l t in 1975-88.
Its geology is represented by deluvial and upper-morainic 0.5-5.0 m-thick lams overlying f luvioglacial d osits with a frequent bterbea- ding o f loams ,?oamy sands, coarse and fine- rained sands, a n d gravelly deposita with Band ill and some boulders.
The permafrost in t h i s micro-region is charac- terized b y great diversity and complexity. The s i t e s of contlnuous permafrost occupy about 108, those o f ahallow permafrost (less than 10- 12 m) about 30%, and of deep pexmafrost (more than 12 m) ab0 u t 60% of the area. The upper ground layer In the micro-region is d i a t b u i - shed by a g r e a t e r t h i c b e s s o f t h e s e a e o n a h frozen lager which reaches 2.5-3.0 m. In addition, llpereletokslv (short-term permafrost extendjng down to.6-7 rn) frequently occur here, covering more than a half of the area.
Due t o t he f ac t t ha t t he , permafrost in this micro-region is of discontinuous type, the tem- perature a t the depth of mnuaL aero amplitudes is close to O O C .
Loams in the upper layer of the geological Bee- tion are subject to heavhg during freezing. Perennially frozen fluvi.oglaciLa1 deposits axe characterized by considerable shrinkage d u r i n thawing (over 5 cm/m). Ln t h i s connection, if was decided t o apply the method of s tabi l iza- t ion when developing th i s micro-region.
Twenty s3x five-storied * large-panel appartment houses and public buildinLngs2with a t o t a l gene- r a l useful. area of 69,109 m have been b u i l t h t h i s micro-region. Friction pi les , driven t o a depth o f 8-12 m , with a high foundation mat were used as foundation. Ventilated vaults were constructed beneath a l l the buildings o f the micro-region. A l l sanitary engbneering networks were concentrated in the technical f l o o r 8 which w m located between the vent i la ted vault and the ground floor.
The s tab i l iaa t ion method made it possible t o m i n b i z e the preliminary preparatibn of the bases. The amount of preliminary thawing la the entire micro-re ion amounted t o 36 thou. m , 3 versus 1445 thou, m envisaged by the second principle of construction. Pile foundations and considerable reduction of the volume of preliminary thawing and excavation work allowed us t o Fndustrialize the basement erection and t o reduce the duration of construction by +4 months.
A t all atages of designing a n d construction, the problem8 involved in town planning were Bolved jointly. Attention was focuased on laying sanitary-engineering communications
B
s
withfn the micro-region and on their inlet- out le t s in the buildings. This was accompli- shed by the same s tab i l iza t ion method u s i n ventilated chaxzaels. Ground ror the terra% l e v e l b g was transported from the outsiae. An efficient drainage ,was envisaged In the ven t i - lated vaults t o prevent flood and break-down water from penetrating i n k 0 the ground. A11 these measurea, oompletely ' prevented penetration o f heat from buildlngs and engineering communi- cations into the ground.
The stab' i l isation method permitts free planniag of housing construction. 'Phis has enabled t o employ modern architectural Uesigas. The three-dimensional unification of resident ia l groups adopted In the rojeet made it poseible t o use the' Pmnt row os buildings 88 protection f r o m w i n d and mow and thereDy t o increase com- f o r t within the ilntrablock areas a n d d e n s i t y of construction, m a t o r t ~ ~ c e the length 09 roads and underground smi*ary-engineerSng networks.
A I 1 measures mentioned above have l e d t o a considerable increase In the level of comfort Is tha t area. The cost of houshng construc- ' t ion in t h i s micro-region has proved t o be smaller than in the neighboring ones where other construction methode were applied. The estimates show that the s tab i l iza t ion method employment had decreased the cost o f conatruo- t ion of 1 m2 of u s e f u l area by 121.6 ma '19-7 rouble8 aa compared with Principle 11, baaed on prelhintnay thawing, and Principle I,usfng preliminary freesing, respectively.
The s ta tus o f the bases of buildings has been monitored since 1976 f W m the moment when the f i rs t of them were put Ynto exploitation in th ia micro-region. The resu l t s of ObsemjPg the bases of three buildinge are given below by wag of example.
The measurements involve a i r temperakure regime in the ventilated v w l t B , ground temperature regime in the bases of buildings, and the fom- dation aettlement . Results of stationary ibaervatione of a i r tem-
, ,
perature in tne vent i la ted vaul ts o f the three buildings in 1977-I981 show tha t average long- term values of this temperature are close t o O°C and are - I o C in b u i l d i n g I, O*C in bull- d i n g 2, and O°C in building 3. The negative air temperature in the vault of buildin I 0852 be explainea by the increase of its socfe height as compared with the projected one. The obeervations have also shown that In the venti- lated vaults o f these buildings. there waB an inhomogeneity of mean annual air temperature which occurred only along the length of the vaults was random. Fn character and its value d i d no4 exceed 1OC.
Ground temperature regime ob$ervatinns in the bases o f three b u i l d i n g s show tha t a perennial- l y frozen 3-5 m-thick lager formed and stabi- lized aver the ten-yoar period of expJoLtation. Beneath the bui ldings, th is layer i s &tdarlain by unfrozen ground w.herein temperature gradi- ents practicalJy equal zero. The thawing o f the underlying pemafros$ in .the bases .of the buildings has not been noted.. 'Phi8 is indirsc- t l y evidenced by the small values of settlement
1405
of the buildings under consideration not exceeding 5 cm f o r the period surveyed.
In addition t o the stationary observations described, numerous urgent measurements of a i r temperature in the ventilated vaults and ground temperature in the bases 00 the majority of b u i l d i n s in the micra-region were made during ,9764986. Besides, measurmente of the eet t - lement o f a l l the bui1ding.s were made'on a re- glrlar basis.
The .s tudies show that on the whole the air tem- perature regime in the ventilated vaults and grounds of the bases o f theJbuildjng6 corres- ponds t o the estimated one. The mean annual a i r temperature jn the vent i la ted vaul ts , de- pending on the mean annual ambient a i r tempera- ture over the perioa surveyed,. ranged P r o m -1.0 t o Y . 5 O C . The data obtained f r o m practi- cally all the thermometric boreholes indicate tha t a thawed-out protective layer with zero temperature and zero temperature gradients has formed in the bases. T h i s layer i s located between the bottom of seasonal o r perennial freezing and the permafrost table. The thawing of the underlyhg permafrost ha6 not been reve- aled from the data obtained in the thermometric boreholes. Perennial freezing was obaexved in the base8 of some of the buildings a t the be- ginnhng of exploitation. Its depth has already stabilized and does not exceed 5 m.
Thus, the ten-year successful. exploitation o f the buildings in t h i s micro-region has demon- s t ra ted the re l iab i l i ty o f the s tab i l iza t ion method and the validity of theoretical notions on which the mentioned method is based.
RFFERENCES
Avtorskoe svidetelstvo 480803 MK12E 02 a 27/32 ( '1975). Zdanie voevodimoe na vechnomerz- lykh gruntalch (G.V. Porkhaev, L.N. -us- ta lev, V.N. Yeroshenko i d r . (SSSR) (Otkrytiya, Izobreteniya), N 30,str.W.
Rekomendatsii PO psimeneniyu sposobov s t a b i l i z a t a i i vechnomerzlykh gruntov v osnovanii z d m i y , u str. Moskva: NII osnovaniy .
Khrustalev , L.N. & NikWorov V.V. (I 985)
The absence of the underlying permafrost thawing and the superadmissible perennial freezing of mmds a% the foundations i s confirmed by the ouudations leveling. For the period o f b v e -
stigatione the settlemen% of a l l t h e b u i l d - ings in t h i s micra-region has not exceeded 6 cm (the maximum admissible value being 15 om)
f i
1406
GEOCRYOLOGICAL STUDIES FOR RAILWAY CONSTRUCTION (STATE, PRIMARY TASKS)
V.G. Kondratyev, A.A. Korolyev, M.I. Karlinski, E.M.+Tirnopheev and P.N. Lugovoy
Moscow State Design and Survey Institute of Transport Construction, MOSCOW, USSR
SYNOPSIS This report deals with the history o f the problem; the experience of the BaykaLo-Amurakaya Idain Line (BAPJ) and, in particular, icing prevention are analysed here. A question is raiaed about fundamental. changes of volumes, contents and quality o f geocryological studies for railway construction purpoaee. The report gives characteristic of the object of
railways in pemlafrost zone. Geocryological problems and ways of their solution m e considered inveatigations and general scheme 09 woxk, covering smveys, deaigning and construction of
on example of a new railway line Derkakhit-Yakutak - one of the BAiJ Northern extensions.
Ftrst the necessity of clewing up o f the &eo- cryological conditions for railway conatrudAon appeared 100 years ago, when during survvys of Trans-Siberian Railway i n Zabaykalye and Pri- amuxye they came acrom permafrost, which strongly complicated designing and construc-
Sumgin (1937, p. 41-42) mote, characterizing tion and later on - main line operation. Thun,
200-year his'tory of permafroat investigation: "The permafrost soil inveatigation has conei- derably changed and advanced after consfruc- tion of the Great :Xberian Railway.. The Pmb- lern of permafrost faced UQ in all its magnitu- de. It was necessary to give definite anawere t o practical requests... It is considered that only permanent repair of buildings and struc- tuxes under deformations on Zabaykalskaya and Amurskaya railways has already cost the g m - ment 50 mln. o l d roubles, not faking into ac- count losses from driving offence on these xailways". For the first time in Russia ayste- matic studies of permafrost were carried o u t for grounding of Transsib construction f o r practical neecln. The P k s t in the world buil- ding on permafrost with aired cellar was built on the Iclogzon station (Zenzinov, 1986). The first permafroat station w m establiahed on that railway in Scovordino in 1927. It did a lot f o r enswance o f transport construction in Siberia as well as f o r development of permn- frost studies as a whole. In general, railway construction in Siberia, Canada, on Alaska and in China stimulRted development of many prob-
rev and gatskiy, 1994; Bykov and Ilapterev, lems of ermafrost studies (Lvov, 1916; Tisa-
1940; Suhodolskiy, 1945; Nekrasov and Kllmov- ~ k i y , 1978; Cornell, Law and Lake, 1972; Zabo- Lotnik, 1903; Yueheng et al., 19811.
In thia respoct, the Yaykalo-bmurakaya
have been carried out with different intensity Line occupies a special. place. Its surveys
during several decades since 1932. A t present its construction, begun in 1974, i s completjng. As lone ago as in 1937 a specially organized geocryological expedition worked on the Bh1.1; beaideEt design and survey expeditions it ful-
filled research works on investigation of per- mafrost regime. A powerful. impulse in the geo- cryology development was observed in the 70- 808, when realization of the BAi.1 project took place. This project was elaborated by i;loscow State Desi@ and Survey Institute (LIoaguipro- trans) with participation of more than 200 re- search, design a n d survey organizations. Pxac- ticalLy all Leading permafrost centres of the country (institute of .Jerzlotovedeniya, i cade- my o f Sciences of the USSR, ;:loscow State Uni-' veraity and e t c . ) also took part in solution of the BAi.1 geocryological problems a d a spe- cial section f o r coordination and methodologi- cal management of permafrost inveatigations of
' different organization? on the B&;il was or-i- zed in the Counsil of Aarth cryolo,T, Academy of Sciences of the USSR. ,
The BAL1 is a complicated technogenic complex, consisting of roadbed, embanlanents and cuts, bridges and tunnels, stations, settlements,
tions of different purposes. The length of the tovms, buildings, structures and communica-
main line i s 3102 km, it has about 4200 bui l - dings and structures, including 1 5 0 large brid- ges, over 30 hn of tunnels , over 200 stations, over 20 large settlements; if lies in compli- cated nature conditions, i s characterized by inclement climate, mainly by mountain relief, various geological structure , permafrost and high seismic activity of sepaxate r o u t e sec- tions. By the beginning of rnilway constructim the degree of studying of natural conditions turned out to be uneven. Some factors, such as spreading, depositing conditions, temperature conditions, permafrost cryogenic structxxe tuxned out to be weakly studied. That i s why their studying was to be fulfilled simultane- oualy with designing nnd sometimes during main line construction with the help o f airphoto and spacephoto identification, engineering-& geological survey, geophysical and drilling works. On the whole, the B;L; engineering-and- geological conditions had been defined c o r e however geocryologicnl support of the L l I . 1 de- siming turned o u t t o be insufficient in the
1407
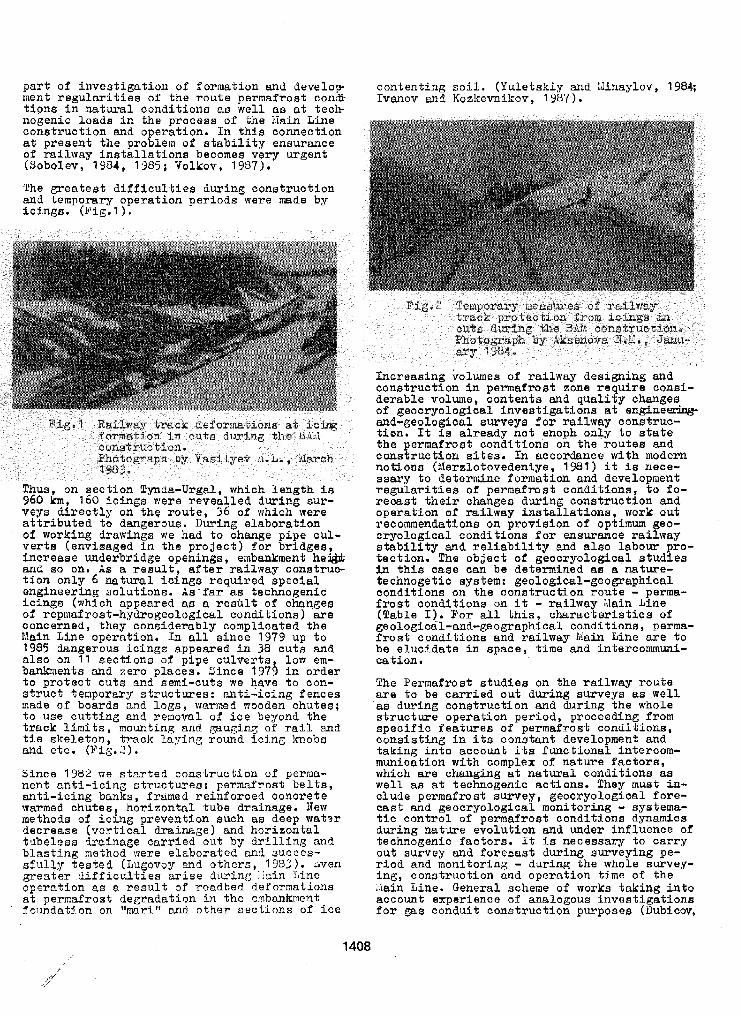
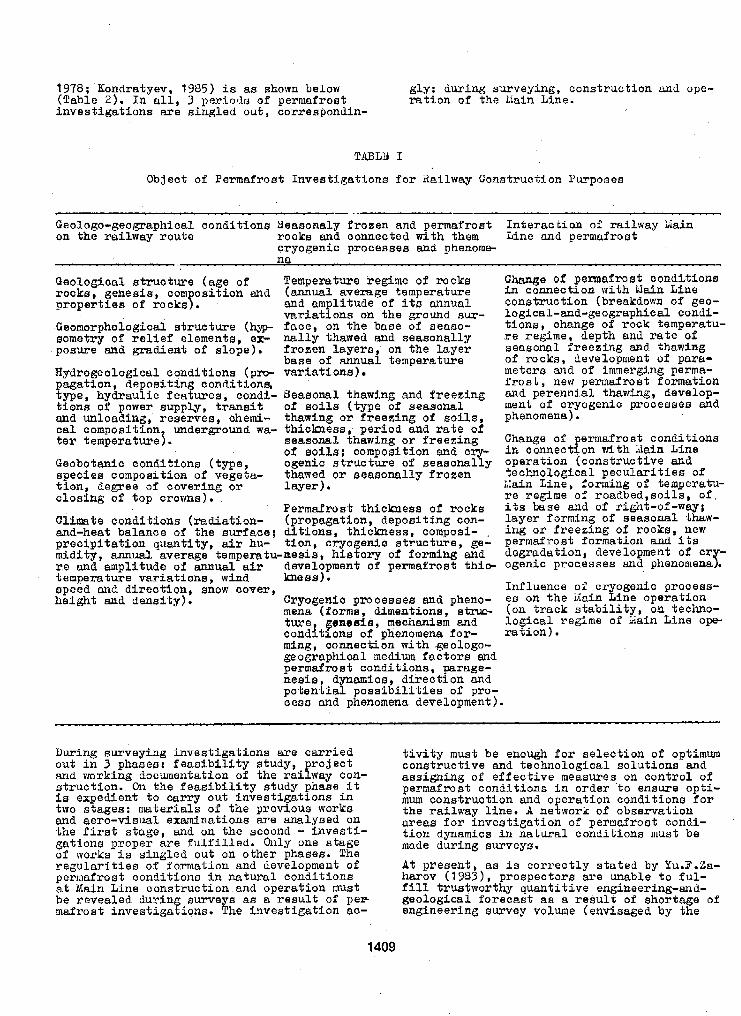
1978;.Kondratyev, 1905) is as shown below gly: during surveying, conntruction nnd ope- (Table 2 ) . In a l l , 3 periorla of permafroet ration o f thc LIain Line. investigations are singled out, correspondin-
TlLBLU I
Object of Permafrost Investigations f o r Railway Conatxuction Pwposen
.- Geologo-geographical conditions Seasonaly frozen and permafrost Interaction of railway idain on the railway route rocks and connected with them Line and permafroef
cryogenic processes and phenome
Geological structure (age of Temperatwe regime o f rocks rocks, genesilt corn o n i t i o n and (aual average temperatme properties of rocksP. a d amplitude of i t s annual
Geomorphological structure (hyp- face, on the base of oeaso- sometry of relief elements, ex- nally thawed and seasonally posuxe and gradient of slope). frozen layeFs, on the layer
Hydrogeological conditions (prcr variations) pagation, de ositing aonditione, type, hydraufic features, condi- Seasonal thawing and freezing tion8 of power supply, +ransit of soils (type of seasonal and unloading, reservea, chemi- thawing OF freezing of soils, cal composition underground wa- thickness; period and rate of ter temperature j . seasonal thawing or freezing
o f s o i l s ; composition and cry- Geobotazlic conditions (type, ogenic structure of seasonally epecies composition of vegetn- thawed or seasonally f rozen tion, degree of covering or layer). closing of top crovms).
Permafrost thiclmese of rocks Olimate conditions (radiation- (propagation, depositing con- and-heat balance of the Burface; ditions, thiclcnesa, composi- ,
precipitation quantlty, air hu- tion, c ryogen io structure, ge- midity, amuaZ average tempexatu-nesirs, hietory o f forming and re and amalituda of annual air development of permafrost thicr
variationsl on the ground sur-
base o f annual temperature
U w e o f pemafrost condLtions in connection with Ualn Line construction (breakdown o f geo- logical-and-geographical condi- tions, change of rock temperatu- re regime, depth and rate o f seasonal freezing and thawing of xocks, development o f para- meters and of immerging perma- f r o s t , new permafrost formation and perennial thawing, develop- ment o f cryogenic processes and phenomena).
Change of permafrost conditions In connection vri th Lain Line operation (constructive and technological pecularities o f &in Line, forming of temperatu- re regime of roadbed,soils, of, its base and of right-of-way; layer forming o f seasonal thaw- ing or freezing o f xocks, new permafrost formation and ita degradation, development of cr - ogenic processes and phenomenay.
miag, oonnection with geologo- geographical medium factors end permafrost conditions, parage- nesis, dynamics, direction and potential posslbilities of pro- cess and phenomena development).
During surveying investigations are carried out in 3 phases: feasibility study, project and working documentation o f the railway con-
is expedient t o carry out investigations in struction. On the feasibility study phase it
two stagee: materials of the previous works and aero-viaual examinations are analyoed on the first stage, and on the second - investi- gations proper are fulfilled. Only one stage of works i s singled out on other phases. The regularities o f formation and development of permafrost conditions in natural conditions at blain Line oonstruction and operation must be revealed during surveys as a result of pep mafrost investigations. The investigation ac-
tivity muat be enough for selection of optimum constructive and technological solutions and assigning of effeotive measures on control o f permafrost conditions in order ' t o ensure opti- mum construction and operation conditions for the railway line. A network of observation areas f o r investigation of permafrost condi- ' tion dynamics in natural conditions must be made during surveys. A t present, a8 is correctly stated by Yu.F.Za- harov (1983) , prospectors are unable to ful- fill truatworthy quantitive engineering-and- geological forecast as a result of shortage of engineering survey volume (envisaged by the
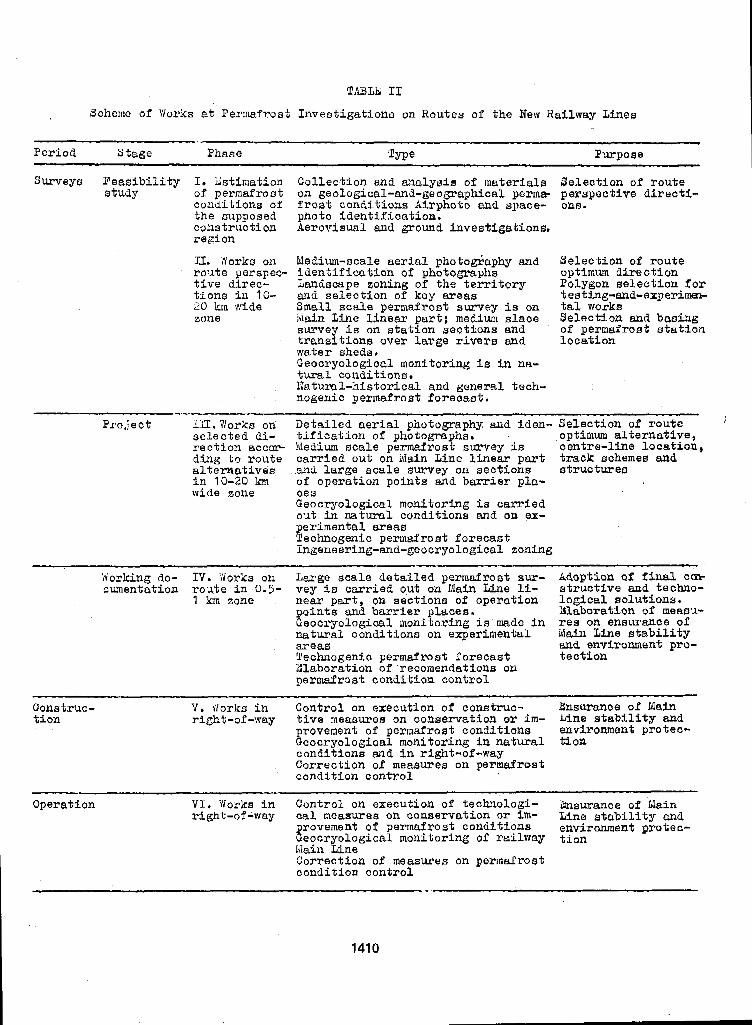
T X B h 11:
Scheme of Works at Permafrost Investigations on Routes of the Hew Railway Lines
Period Y tage Phase Type
Sumreys Feasibility I. bstimntion Collection and analysis of materials Selection o f route
~~ . ~ ~ ~~~ . ”
Purpose
study o f permafrost on geological-and-eeographical perm& perspective d i r e c t i - conditions of frost conditions Airphoto and space- ons. the supposed photo identification. construction Aerovisual and ground investigations, region
ZI. Yorks on Medium-8cale aerial photo&aphy and route pcrspec- identification o f photographs tive direc- Landscape zoning of the territory tions in IO- and selection of key areas 20 km wide Small scale permafroat survey ie on zone Iviain Line Linear part; medium slaw
survey i s on station secttons and traneitions over large rivers and water shede. Geocryological monitoring is in na- tural conditions. Natural-historical and general tech- nogenic permafrost forecast.
Selection of route opttmwn direction Polygon selection for testing-and-experima- tal works Selection and basing o f permafrost etation X o C R f i O B
Project III.Ylorks on Detailed aer ial photogmphy and iden- Selection o f route selected di- tification of photographs. optimum alternative, rection ~CCOP Ivledium soale permafrost survey is oantre-lbe location, ding t o r o u t e carried aut on Main Line linear p a r t track schemes and alternatives .and large scale survey on sections structures in 10-20 km of operation points and barrier pla- wide zone ces
Geocryologioal monitoring is carried out in natural conditions and on BX-
8 erimental areas echnogenic permafrost forecast Ingeneering-and-geocryological zoning
iforlcing do- IV. Yiorks on Large scale detailed permafrost BUT- cumentation roqte in 0.5- vey is carried out on Main Line li-
1 km zone near part, on sections o f operation pointa and barrier places. Geocryological monitoring is made in natural conditions on experimental areas Technogenic permaimst forecast Elabora t ion of recomendations on permafrost condition control
AdOptbLI Qf final C* structive and techuo- logical solutions. Uaboration of measu- rea on enauxance of Main Line Btability and envtrorontnent pro- tection
cons t PUC - tion
V. fiorks in Control on cr8cution o f conetruc- Xnsurance of Main right-of-way tive measuxea on conservation ox i m - Line stability and
provemenf of permafrost conditions environment protec- Geocryological monitoring in natural tion conditions and in right-of-way Correction of measures on permafroat condition control
Operation VI. Works in Control on execution of technologi- h s w a n c e of blain right-of-way cnl measuxes on conservation ox in- Line stability and
provement o f permafrost conditions environment protec- Geocryological monitoring of railway tion Main Line Correction of measures on permafrost condition control
1410
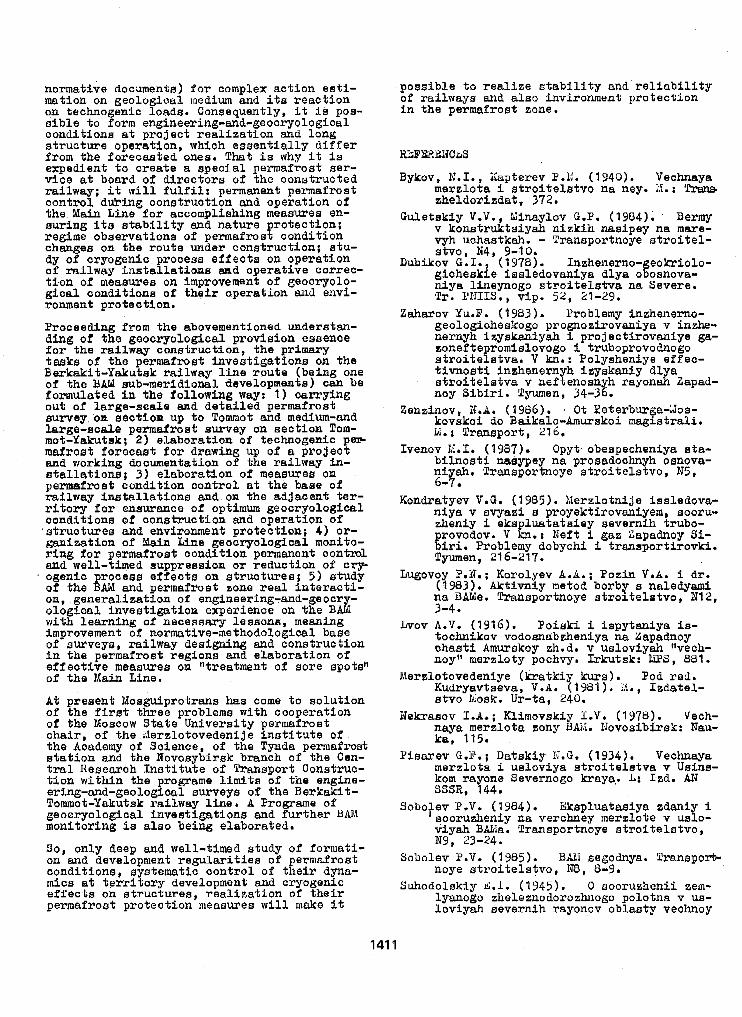
normative documents) for complex action esti- mation on geolagical medium and its reaction on technogenic loads. Consequently, it is pos- sible t o form engineering-and-geooryological conditiona at projeot realization and long structure operation, which essentially differ from the forecmted ones. That is why it i e expedient to create a special permafrost ser- vice at board of diractors o f the constructed railway; it will fulfil: permanent permafrost control dming construction and operation of the.hlain Line for accomplishing measLu.eB en- suring ita stability and nature protection; regime observations o f permafrost conditlon changw on the route under condzuction; stu- dy of cryogenic process effects on operation of railway installations and operative correc- tion of measweB o n improvement o f geocryolo- gioal conditione o f their operation and envi- ronment protection.
Proceeding from the abovementioned maderstan- ding of the geocxyologioal provision essence f o r the railway conatruction, the primary. tasks of the ermafrost investigations on the Berlcakit-Yakufsk railway line route (being one of the BAM sub-meridional developments) c m be formulated in the following way: 1) o a r r y b g out of large-scale and detailed permafrost survey 01’1 section up to Tomot and.mecUum-and
mot-Yaltak; 2 ) elaboration of technogenic p e r large-mala permafrost erumrey on section lorn-
mafrost forecarst for drawing up o f a project and working documentation of the railway in- stallations; 3 ) elaboration of meaBuxe8 on permfroet conditron oontroL at th8 base o f railway installatione and.oa the adjacent ter- ritory for enaurame of optimum geocryological conditions o f oonstruction and operation of structures ana environment protection; 4) or- ganization of Main h e geocryological monito- ring f o r errnairost ooladition permanent contml a d wsll-!imed suppression ox reduotion o f cry. ogenic #rocem effects OM stratwee; 5) study o f the AM and permafrost cone real intermti- ou, generalization o f engineering-and-geocry- ologlcal investigation experience on the BAM with learnlng of neceesexy lessons, meaning improvement o f normative-methodological base of surveya, railway designing and construction in the permafrost regions and elaboration of effective meaauree on “treatment o f sore spotel’ of the Main. Line.
At present Nosguiprotrana has come to solution of the first three problems with cooperation of the Moscow State University permafroat ohair, of the l’derzlotovedenije institute o f the Aoademy of Soienoe, o f the Tynda permafro& station and the Novosybirsk branch of the Cen- tral Reseerch Institute of Transport Conatruc- t i o n within the programe limit8 o f the engine- ering-and-geological surveys o f the Berkakit- fommot-Yakutsk railway line. A Propame of geocxyologioal investigations and further BAM monitoring is also being elaborated.
So, only deep and well-timed study of formati- on and development regularitlea of pertnafrost conditions, systematic control of their dyna- mics at territory development and cryogenic effects on stxuctwes, realization of their permafrost protectLon measures will make it
possible to realize stability and reliability of railways and also invironment protection in the permafrost zone.
K;%WHiLIJCdS
Bykov, N . I . , Kapterev P.N. (1940). Vechpaya merzlota i stroitelstvo na ney. X.: P r a n ~ zhe ldorhda t , 372.
Guletakiy V.V., blinaylov G.P. (1984). . Bermy v konstruktsiyah nizkih nasipey na maxe- w h uchastkah. - TransDortno?te atroitel- gicheskie -issledoVarziya dlya oFoanova- niya lineynogo stroitelstva na Severe. Tr. PNIIYo, vip. 52, 21-29.
Zaharov Yu.P. ( 1 983 ) . Problemy iazhenerno- geologicheskogo propozirovaniya v in&- nernyh izyakaniyah i projectirovaniye ga-
stroiteEstva. v b. : Polysheniye effec- zonefte romislovogo i truboprovodnogo
tivnosti inzhenernyh izyskaniy dlya sttoitelstva v neftenoan h rayonah Zapad- noy S i b i r i . Tyumen, 34-3 E . kovskoi do Baikalo-Amurskoi magistrali. Ei. t TranBport, 216.
Ivenov 1~1.1, (1987), Opyt obespecheniya eta-
niyah. Transportnoye stroitelstvo, N5, bilnosti nasypey na prosadochnyh omova-
Zanzinov, X . I . (1986). Ot Yeterbuxga-Xos-
6-7 Kondratyev V.G. (19G5). Merzlotnije issledova-
niya v svyazi B proyektirovaniyem, sooru- zheniy i ekspluatataiey severnih trubo- provodov. V be: Neft i gaz Zapadnoy S l - bPxi. Psoblemy dobychi i transportirovki. Tyumen, 216-217.
Lugovoy P.N.; Korolyev A . R . ; Poz in V.A. i dr. (1983). Aktivniy metod borby B naledyami na BAMe. Tr,wsportnoye etroiteletvo, N12, 3-4.
tochnikov vodosnabzheniya na i5apadnoy chaati Amurskoy zh.d. v usloviyah Wech- noy“ merzloty pochvy. Irkutsk: K i 3 , 881.
Kudryavtaeva, V.A. (1981). X., Izdatel- stvo Mosk. UT-ta, 240.
Nekrasov 14.; IUimovsLiy 1.V. (1978). Vech- naya merzlota zany BAii. Novosibirsk: Nau-
Inrov A.V. (1916). Poiak i i ispytaniya is-
Merclotovedeniye (lcratkiy kurs). Pod red.
ke, 115. Pisarev G.F.; Datskiy M.G. (1934). Vechnaya
merzlota 1. ueloviya stroitelstva Y Usins- kom rayone Severnogo kraya,. L: Iad. AlJ YSSR, 144.
3obofev P.V. (1984). Xkspluatasiya zdaniy i sooruzheniy na verchney merelote v uslo- viyah Bdlla. Transportnoye stroltelatvo, Ng, 23-24.
Sobolev P.Y. (1985). BAL1 segodnya. Transporb- noye etroitelstvo, N8, 8-9.
Suhodolskiy d.1. (1945). 0 sooruzhenii eem- lyanogo zbeleznodorozhnogo polotna v us- loviyah aevernih rayonov oblasty vechnoy
141 1

merzloty. Tx. In-ta Kerzlotovedeniya im. V.A. Obrucheva, t.P.iI.-L: Iz-vo An SSSR,
- 5-120
Cornell, i4j.R.; Law, C.L.; Lake ii.i.'* (1971). The Arctic railway - environ:nenntal as- pects. - &g. J., 56, 3 , 22-27.
Zabolotnik, S.J. (1983). Conditions of Per- mafrost Formation in Zone o f the Raikal-
A m u r liailway. Perrrlafrost: Fourth inter- I.
natolnal conference. ProceedingB, Natio- nal academy preas. Washington D,C., 1451-1456.
Yusheng L.; Xhugui W.; and e.a. (1383). Permafrost study and xailraad construc- tion in permafrost weas of China: Fouxeh intornatioasl conference. Proceedings. National academy press, 707-714. Washin- gton.-
1412
VENTILATED SURFACE FOUNDATIONS ON PERMAFROST SOILS Permafrost, Soil Bed, Surface Foundation, Ventilated Through Space,
Heat-Engineering Analysis N.B. Kutvitskaya and M.R. Gokhman
The Gersevanov Research Institute of Bases and Underground Structures, Moscow, USSR
SYNOPSIS The main design s o l u t i o n s f o r v e n t i l a t e d s u r f a c e f o u n d a t i o n s on p e n a f r o s t B o i l s a n d t h e i r a d v a n t a g e s a s compared t o o t h e r t y p e s o f foundat ions a re cons idered . Pr inc ipa l p ro- positions of the hea t -engineer ing ana lus ia of permafrost beds of v e n t i l a t e d s u r f a c e f o u n d a t i o n s aye presented. Resul tB of the heat-engineer ing analysis of a bed of a n i n d u s t r i a l b u i l d i n g r e s t e d on a vent i la ted p la te - type sur face foundat ion a re g iven .
Vent i la ted sur face foundat ions on permafrost
a t i o n c o n s t r u c t i o n a n d a s o i l c o o l i n g meane. eoils a r e s e r v i n g aa both a supporting found-
Such foundat ion furn ishes a thin-wal led re in- forced: concre te spa t ia l sye tem be ing mounted on a subbed which is prepared f rom p lane p la tes , channeled or hipped plate e lements ,hol low vol- umetric blocks, Cooling of bed s o i l s which y i e lds c r ea t ion and p re se rva t ion o f t h e i r s p e c - i f i e d t e m p e r a t u r e regime i s brought about i n win ter per iod by the motion of the co ld a-tmos- pher ic a i r through spaces provided i n a foundation. Ventilated foundations of a p l a t e o r s t r i p t ype a r e empoyed depending on a char- a c t e r o f loadin2 t ransmi t ted from bui ld ings o r s t r u c t u r e s . Pig.1 shows examples o f crosn-sec- t i o n a l view of beds w i t h a p l a t e founda t ion (a) and a s t r i p foundation (b).
B I 6
/
4 h
Fig.1 Cross-sectional views o f bedo with a p l a t e founda t ion (a) and a s t r i p ioundat ion(b) .
Compared t o deep foundat ions (pi le founda-Lions , column pad founda-tionu and o t h e r s ) the erpoy-
aent of vent i la ted sur face r "oundat ions embles t o e l imina te a lxos t completely the labour-con- awning and expensive excavation of fr*ozen soils and to r educe t he coneup t io r , o f b u i l d i n s xat- e r i a l s and e lectr ic energy. Surface foundat iocs t ake l oads t r ansmi t t ed t o the:x by upper s t n c - t u r e s a n d d i s t r i b u t e t h e n a l o n g t h e s o i l s u r - face beneath a bui lding thus reducing the pres- sure on s o i l lay ex^ o c c u n e d below. Phe?efore this type of a foundat ion is advantageous to employ a t s i t e s b u i l t by sa l ty h igh- texpeFat - uIne i ce-sa tura ted soils as sell a s by eoile '
with crgopegs and under;round i c e . The bear ing capac i ty o f a s o i l bed of a v e n t i l a t e d s u r f a c e foundat ion is def i zed . e s sen t i a l ly by p h p i c a l and mechanica l charac te r i s t ics o f bed upper s o i l l a y e r s v r h i c h , i n t u r n , depend on a t h e r n a l regime i n a building and ins ide of foundat ion vent i la ted th rough spaces as wel l as qn a ther- mal re,ri:ae o f a so i l su r f ace a round a building. 4s a consequence the solution o f a problea on con juga te hea t t r ans fe r i:1 a s p t e n "building- ventilated foundation-pei..mafrost enables t o de tennin un ique l ly the Sear in , capac i ty o f a ven t i l a t ed su r f ace founda t ion bed. P'he analy- t ica l xe thod of the hea t -engineer ing ana lys i s which was developed enables t o select p r i n c i p a l parameters o f a foundation c o o l h g s y s t e m which ensure a required bearin,; capacity o f a bed. ' J i th t h i s ai:n i n v ien ,a t g iven des igns o f a s t ruc ture f loor , subbed and vent i la ted foundat - ion ic is determined through the use o f heat- e n g i n e e d n g analysis a depth of seasonal thaw- ing o f soils beneath a s-tmc,i:u:-e and t h e r e a r e computed telnperatuzes o f p e m a f r o s t ued - ;he !naximun t e x p e r a t u r e s at a given depLh ~,T:!~,and m a n maximum tenperaLu-es aion,; a depth z , T e , accor,ding t o a inean tenpera ture fo1, t he ven t i l - a t ion peldod and. an average annual l;e1!lpel-ature o f f o m d a t i o n through space wall. 3 e l o n is giv- e n t h e d i s t r i b u t i o n o f the :.lean fo-4 t h e v e n t i l - a t i o n peLsiod temperature, lhv, o f t h e f o u d a t i o r , through space wall along the foundation axis y which was analg t icn l ly oo'taincd sy Gokh:~an and
Kutv i t skaya (19713). Ivanov (1 985) and i:;l'ourlded exp:* i :xn&al l ; by
1413
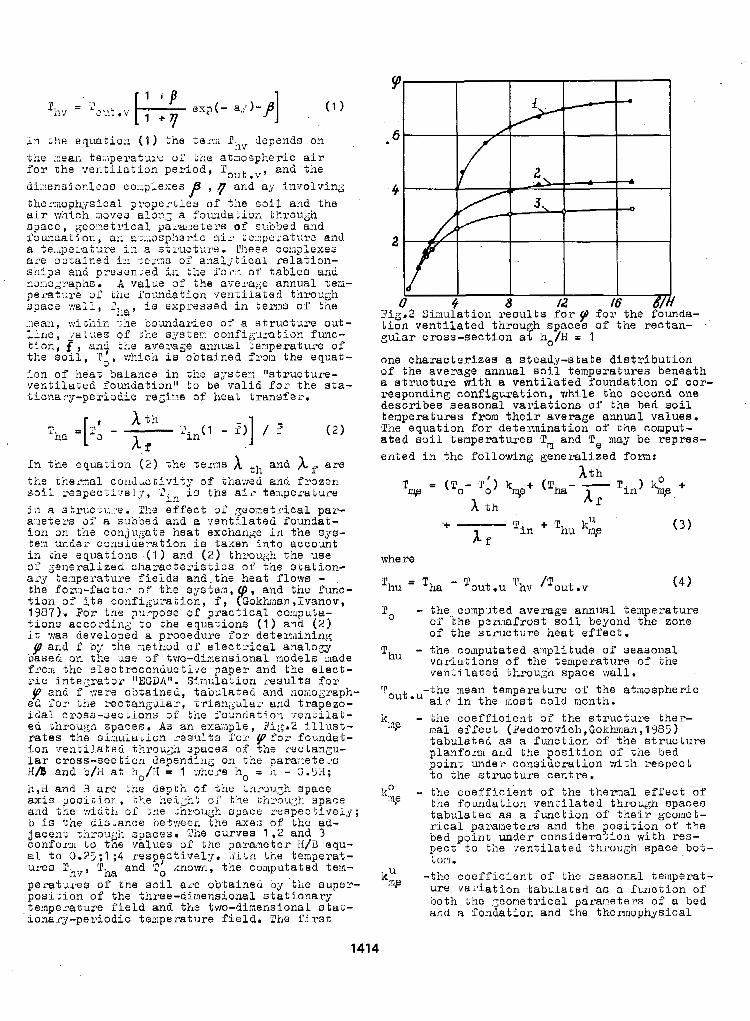
In -the equaxion ( 2 ) .the t e r n s x th and x, a r e the t h e x a l cor-!ilucr;i-vi;y o f thane6 and frozen s o i i :-e3pectl-~eLy, 2 . i s t h e a i r t e x p e r a t u r e ill a s:rl;cc\X..*e. =!:e effect of geo:ne, t r ical par- a:x've:s si a subbed and a v e n t l l a t e d foundat- i o n on the conjugate heat exchange in the sys-
i n ;he equa t ions ( 1 ) and ( 2 ) through the use t e n u x i e r c o n s i d e r a t i o n i s tairen i n t o account
01 ; ; enera l ized charac teAst ics o f t h e s t a t i o n - a q t e :npe ra tu re f i e lds and . the hea t f l ows - t h e f o m - f a c t o - o f the sgstm, , and the func- t i o n o f i t s configuraGion, f , ? Gokh.ian,Ivanov, 1.337). For the purpose o f prac t i ca l coapu ta - t ions accord ing t o t he equa t ions (1) and (2) it; was developed a prooedure f o r d e t e m i n i n g 9 ar,d f by :he nel;hod o f e l ec%- ica l ana loey
ba8ed or, t he use af two-dimensional xodels :nade f:o:n the e lec t roconduct ive paper and the e lec t - i-ic integ2a:or Y d G i U f t . Sinu las ion r<esu l t s f o r p and f :./ere o5taine21, t abs la ted and nomograph-
ed f o r t i e rectanguia:, ;yian,plar and trapezo- i d a l c ros s - sec t ions of ';he foundat ion ; ren; i la t - ed through spaces . As an e x m p l e , 3ig.2 i l l u s t - r a t e s t h e s i : m l a s i o n c e s u l t s TOY p f o r foundat- ion ; .enJilateC tnrouzh spaces o f t h e x c t a n g u - l a r c r o s s - s e c t i o n d e p e n d i n ~ on the para:lete L*B lI/B and u/3 a t hJ;i = 1 3 v h e ~ e ho = h - CJ .5I-i; i1,d and 3 a r e t k e ciegch of *he th:ougn space a x i s p o n i ~ i o c , ik,e %I:;?; 0: the b:im1u:;h space and t L e xid2i1 01 ;r,e mu& =>ace renpcc Lively; 13 is tne dis . ;ancs between the axe:; of the ad- j a c e n t i;kir3'2gh Spaces. i'he carves 1 , 2 and 3 conform t o the va lues o f the para ,?eter ~ i / n equ- a l t o 0.25;l ;4 resp7ctivel;y. J i t h tne t expe ra t - u re s T. nv, Tha and T o xnowrl, the coaputa ted teld- peratur*es o f the SOIL aL-e ob.tained 02 .tl-ie super- p o s i t i o n o f t h e t h r e e - d i a e n s i o n a l s t a t i o n a r y tempeFature f ie ld and the two-dirnensional otat -
' i o n a r y - p e r i o d i c t e x p e r a t u r e f i e l d . ~ h c f i r s t
In
l a g u l a r c r o s s - s e c t i o n a5 h o ' / ~ = I
one cha rac t e r i zes a s t e a d y - s t a t e d i s t r i b u t i o n
a s t r u c t u r e with a ven t i l a t ed founda t ion of cor- o f the average annual s o i l temperatures beneath
reaponding configuration, while the secovd one d e s c r i b e s seasonal v a r i a t i o n s o f the bed s o i l temperatures from t h e i r a v e r a g e annual values . 'The equa t ion for de tenn ina t ion of t he comput- a t ed s o i l temperatures T, and T, may be r ep res - e n t e d i n t h e f o l l o w i n g g e n e r a l i z e d f o r a :
where
Thu = Tha 'out .U 'hv .v
To - the computed average annual temperature o f "the p e r m a f r o s t s o i l beyond t h e zone 02 t h e s t r u c t u r e h e a t a f f e c t .
Thu - the cornputated amplitude of seasonal v a r i a t i o n s o f the temperature of the ven ; i l a t ed through space waZ1.
a i r i n t h e most co ld month. - the mean temperature o f the a tmospheric
- -the c o e l l i c i e n t o f t h e s t r u c t u r e t h e r - mal e f f e c t (Pedorovich,Gokhnan,1985) t a b u l a t e d a s a func t ion o f t he s t ruc . tu re planform and the posi t ion o f t h e bed poin t under cons idera t ion wi th respec- t t o t h e s t r u c t u r e c e n t r e .
- ,the c o e f f i c i e n t o f ,the t h e m a l e f f e c t o f
t a b u l a t e d as a f u n c t i o n of t h e i r geolnet- the foundat ion venki la ted th-mugh spaces
r i c a l p a r a m e t e r s and t h e p o s i t i o n of t he bed p o i n t under consideraLion w i t h r e s - pect , to t i le .ventilated I;hi*ough space bo-6-
-fhc c o e f f i c i e n t o f tho s easona l tert1pera.t- val'iat-ion kabulated as a f u n c t i o n o f
b o t h khc ::cornetrical p a r m e t e r s of a bed and G iondation and the themnophysical
t 0:il.
1414
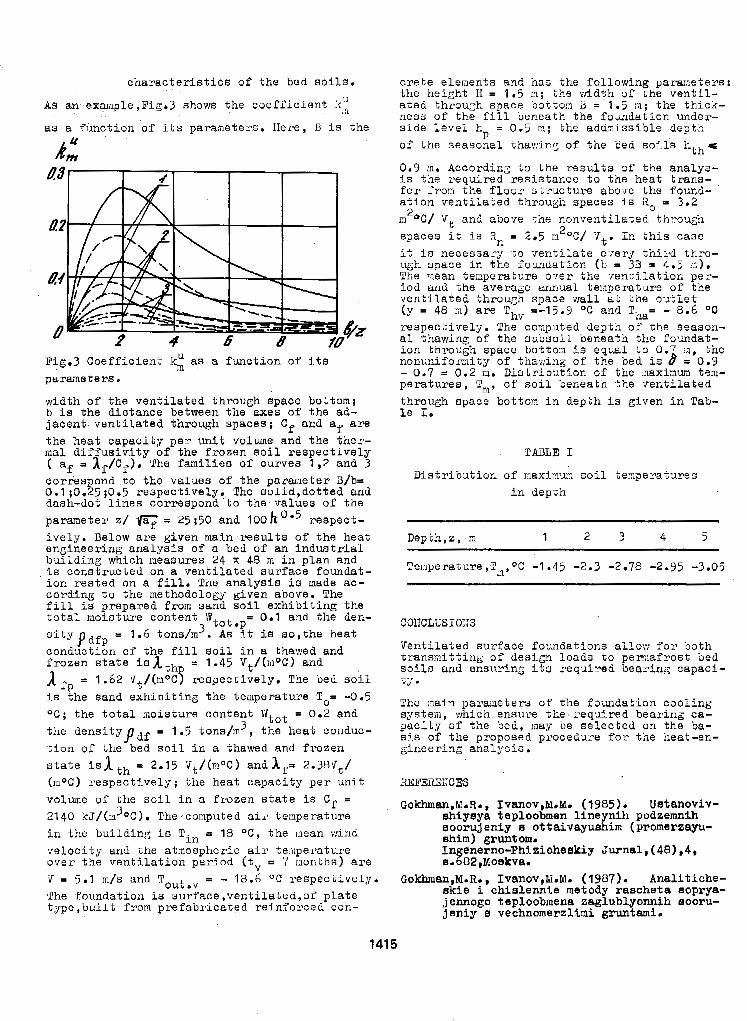
c h a r a c t e r i s t i c s of t h e bed s o i l s .
As an example,Pig.3 shows the coefficient IC,:
a s a fuhc t ion o f i t s parametecs. IIei-e, R is t h e
Crete elements and nan the fo l lowing pa rme te r s : the height II = 1.5 m; the width 3f i he ven t i l - a t e d throu;;h space bottom 2 = 1.5 m ; the thick- nesu o f t h e f i l l a e m a t h t h e f o u n d a t i o n u n d e r - s i d e l e v e l h = 0.5 m; the addxiosible depth of the seasonal thar lng o f t h e bed noils h t h C
P
Pig.3 Coefficient ki as a f u n c t i o n of its parameters.
width o f the vent i la ted through space bot tom; b i s the distance between the axes of ,the ad- j a c e n t v e n t i l a t e d t h r o u g h s p a c e s ; Cf and af are t h e h e a t c a p a c i t y p e r unit volume and the ther - mal d i f f u s i v i t y of t h e f r o z e n s o i l r e s p e c t i v e l y ( af = af/Cf). The f a m i l i e s o f curves 1,2 and 3 correspond to the values of the parameter B/b= 0.1 ;0.25;0,5 respec t ive ly . The so l id ,do t t ed and dash-dol; l i nes co r re spond t o t he values of the p a r m e t e r z / = 25;50 and 100h ' 0 5 respec t - i v e l y . Below are g iven main resu l t s o f t he hea t eng inee r ing ana lys i s o f a bed o f a n i n d u s t r i a l b u i l d i n g which measures 24 x 48 m i n p l a n and is constructed on a ven t i l a t ed su r f ace founda t - i o n r e s t e d on a f i l l . The a n a l y s i s i s made ac- cording t o the methodology given above. The f i l l i s prepared from sand s o i l e x h i b i t i n g t h e t o t a l m o i s t u r e c o n t e n t l t o t - 0.1 and t h e den- s i t y p dfp = 1.6 tons/m3. As i t is so , the hea t conductron o f t h e f i l l Soil i n a -thawed and f r o z e n s t a t e hatth = 1.45 V t / ( m O C ) and A f p = 1.62 Vt/(moC$ respect-ively. The bed s o i l i s the sand exhib i t ing the t empera ture To= -0.5 O C ; t he t o t a l mo i s tu re con ten t Vtot = 0.2 and ,the dens i i ;ypdf = 1.5 tons/m3 , t he hea t conduc- t ion o f t h e bed s o i l i n a thawed and frozen s t a t e isb,th = 2.15 Vt/(moC> a n d l f = 2.38Vt/ (m°C) r e spec t ive ly ; t he hea t capac i ty p e r u n i t volume o f bhe s o i l i n a f r o z e n s t a t e i s Cf = 21 40 l t J / ( 1 2 ~ ~ C ) . The "computed a i r .temperature i n the bui ldin) : is T . P 18 OC, the : lean w i n d veloctty and the at:nospheric a i r te:llpel.atu.re o v e r t h e v e n t i l a t i o n p e r i o d ( tv = '1 nonthn) a r e
.P-
I n
0.9 In. Accordine t o t h e r e s u l t s o f the analyo- i s t he r equ i r ed r e s i s t ance t o t h e heat t rans- f e r from t h e f l o o r s t x c t u r e abo;re t h e found- a t ion ven t i l a t ed t h rougn spaces is Ro = 3.2 m'OC/ V t and above :hc nonvent i la ted th::ough spaces i t i s ;In = 2.5 n20C/ 'Jt. Ir, :his case i t i s necessa2y to v e n t i l a t e e - rer l third tb ro- u.Eh space i n t h e J"oundation (1; a 3B = 4.5 .:). The mean fenpera ture o - ~ e r the - Jenbi la t ion pe-- fod and the average annual tenperature o f the vent i la ted th rough space wal l a t i h e 3 7 3 ' , , l e t (y = 48 m) a r e Thv =-I 5.9 OC and Tha= - 8.6 O C
respeckively. The cornputed depth or' the Beason- al thawing of the subsoi l beneath - the fomdat - ion through space botto:n i s equal n o n u n i f o m i t y o f tha.;Ting o f the bed 1s - 0.7 = 0.2 m. D i s t r i b u t i o n of t h e :naxi:num tem- p e r a t u r e s , Tm, o f s o i l b e n e a t h ,the v e n t i l a t e d through space botton i n depkh i s g i v e n i n Tab- l e I.
i0.D.J y p
T O L E I
D i s t r i b u t i o n o f maximus s o i l t e z p e r a t u r e s i n d e p t h
The :nain para3:leters of the foundat ion cool ing
p a c i t y o f the bed, may b e s e l e c t e d on the ba- system, which ensure the i-equired bearing ca-
s i s of the proposed procedure f o r t h e heat-err- g inee r ing ana lys i s .
REFERXHCES
Gokhmsn,M.R., I V ~ O V , M O M . (1985). U S ~ ~ O V ~ V - ahiyeya teploobmen lineynih podzemnih eoorujeniy I oftaivayuehim (promereap- shim) gruntom. In enerno-Phizicheskiy Jurnal, (48),4, a . L , M o a h s .
ir = 5.1 rn/s and Tout.V = - 13.6 O C respec t ive ly . Gokhman,M.Rt, Tvanov,M.M. (1987). Analitiche- 2he L'oundation is s u r f a c e , v e n t i l a t e d , o f p l a t e skle 3 chialennie metody rascheta aoprya- t y p e , b u i l t f rom prefabr ica ted re inforccd con- jennogo teploobmena zsglublyonnih sooru- jeniy 0 vechnomerzlimi gruntmi.
141 5

P e ' d o r o v i c h , D . I . , G o k ~ ~ , ~ ~ ~ ~ (1985). Utoch- nenie raechetnih temperatur vechnomsrs- l i h gruntov v omovanil. zdaniy i ~ooru- j eni y. Oenovaniya,Fundamenty i Mekhanika Grun- fov,5,es.22-24,~oskva.
~ r u d y Nauchno-X,ssLedovatelskogo Inmtitu- ta Osnovaniy i Poazemrdh soorujeniy,69, 88.117-1 26, MOB~VEL.
1416
RESULTS OF RESEARCHES AND EXPERIENCE OF HYDRAULIC MINING OF FROZEN ROCKS
N.P. Lavrov, G.Z. Perlshtein and V.K. Sarnyshin
All-Union Scientific Research Institute of Gold and Rare Metals, Magadan, USSR
SYNOPSIS Ice-rich fine-dispersed SedimentE may be successful ly mined by a hydraul ic method. Tn th i s r epor t t he new1 determined regularit ies of hydrowashing of thawing rocks are given, The formulae f o r cs lculaf ion of water temperature and denei ty of heat f low into eroding rock MeBif a m given.The dependence of i n t e n s i t y o f erosion of loamy-sand and loamy rocks on t h e i r i n i t i a l moisture i s studied. The r e s u l t s of the researches are real ized i n Borne flow sheete o f hydrowaehing of permafrost placere.
There axe thiok ice-rich Tine-dispereed sediments that are widely distributed through Arctic and Subaxatlc zonee o f permafroat. The problem of t h e i r mining by a hydraulic method i e o f great i n t e r e s t since the use of ear th- moving equipment for t h i s purpose does not aetsum good performance.
So called washing off works w e r e mastered i n Rusmia ear ly in the 19 th cen tury a t the Ural and Altai p lacere . To the end of the last
wide use a t the Lena and Zabaikal placers. century rook waehing by preseure jetsr had got
I n t h e 40-es of th i s cen tury hydrauLio s t r i p p i n g operat ions were agreat srucceo~ i n permafrost lacers near Fairbanks ,Alaska. The hydra& mining o f placers in permafrost region8 of the USSR was employml but i n rare cams beoauss o f a deff ic ient a tudy of quan t i t a t ive r egu la r i t l ea of water Plow interaction with eroding permafrost .
To fill u the gap the author. have car r ied out the w h e complex of t heo re t i ca l and experimental reeearches, The ana lys i s o f heat exchange i n the syetemr thawing rocke - water Plow - atmoaphere waa given. The water flow of a Bingle width moving over the suxface o f the thawed rock layer of h thicknefla along a a x i ~ was considered.
The temperature chan ing through the flow length occur8 under fhe influence of heat exchange with atmosphere and rock. It i a supposed t h a t owing to turbulent water mixing i t s temperature down the depth does not change. On the water surface them i a a convective heat exchange with a i r ( Hc ) and energy exchange by evaporation or condensation ( M ). The water surfaoe a lso receives radiant energy i n t h e form o f t o t a l shortwave radi- a t i o n ( Pt 1 and longwave atmoaphere ( ID 1 radiation, According to the aurface albedo A the art o f ehortwave radiation of AQt quaneity i e r a f l eo ted . L ike any heated body water f l o w emits longwave energy ( I w 1 i n t o space. We don't. consider tho radiant heat erchango below water eurface as t h i s p r a c t i - c a l l y has no e f f e c t on f i n a l results. Beoidee,
the papt of heat ( 4 ) ier t m s f e r i n n g thxough the thawed layer to permafrost surface.
As follows from the law o f conservation of energy the changing of water flow heat content fox an area of elemental length dx i s equal to the a lgebra ic sum of heat ~ouraes acting on the area:
where c i n the volume spec i f ic hea t o f water, W'h/(y3*0C); T i s the water ternperature,OC;
k) 1w a single consumption of water flow, m3/(m*h) . The deneity of heat f l o w Fnto thawing massif i e defined from:
af IS the coeff ic ient o f water PLo heat exchange with under1 inng rocks,W/(myaoC); Tr j,s the rock surface $emperature,OC; h i s the thermal conductivity of thawing xockB, W/(m*oc).
The e f f ec t of water f low velocity on at erosion o r loamy-sand and loamy sediment8 is experLmentally researched (fig.1).
Expressing the remaining constituents of heat exchange by the known physical lwas (Newbon'S, Stefan-Boltaman's) and using their l h e a r ap roximations taking into account formula (*P, le t Is present equat ion ( 1 ) aa:
1417
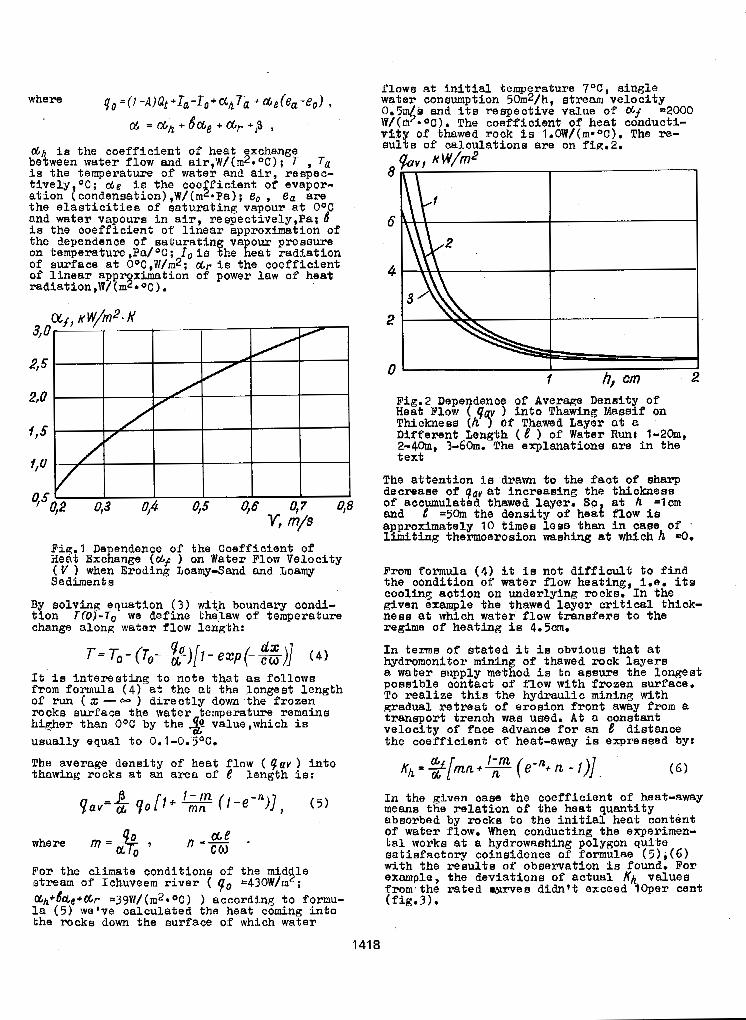
beiween water flow and air,W/(rn2*°C); 7 , Tu al i a the coef f ic ien t of heat exchange
i s the temperature o f water and a i x , respec- t i v e l y OC; be i s the COB f i c i e n t o f evapor- ation (condensation) ,W/(ms*Pa); e, , e a are t h e e l a s t i c i t i e s of aaturating vapour at OaC and water vapours in a i r , respect ively,Pa: B i 8 the Coefficient o f linear approximation of the dependence o f sa tu ra t ing vapour presswe on temperature ,Pn/OC; I o is the heat radiat ion of su r face a t O°C,W/m*; cGr i s the coeff ic ient
radiation,~/(mE*Oc). o f l inear appr ximation of power law of heat
Fig.1 De endence o f the Coefficient of Hent Exchnge (&,c 1 on Water Flow Velocity
Sediments ( V 1 when Eroding Loamy-Sand and Loamy
BY Solving equation ( 3 ) w i t ? boundary condi- t i on TTQ)=J, we define theJaw of temperature change along water Plow length:
It i s i n t e r e s t i n g t o n o t e t h a t a8 follows f rom formula ( 4 ) a t the a t the Longest length of run ( X - - ) d i r e c t l y down the frozen
higher than O O C by the 2 value,which i s rocke surface the water temperature remains
usually equal t o 0.1-0.5°C.
The average density of heat flow ( 4av ) i n t o thawing rocks a t an area of e length i s :
where m=& 9 n = - ae - CCI)
F o r the climate conditions o f the m i d p stream of Ichuveem r i v e r ( q0 -430W/m ; ah+be+cCr = 3 9 ~ / ( r n 2 * 0 ~ ) a c c o r d a q t o formu- La (5 ) we've calculated the heat coming info the rocke down the surface o.f which water
1418
water consumption 50m2/h, atream velocity flows at i n i t i a l temperature 7OC, s ingle
W/($-0C). The coefficient o f heat I conducti- 0.5 B and i t s respective value of aLf ~2000
vZ%y of thawed rock i s 1.0W/(m-8C), The re- e u l t s of ca lcu la t ions are on fia.2,
- &vr w / m 2
v f hl cm 2
Fig.2 Dependence o f Average Daneity OP Heat Flow ( Q y 1 i n t o Thawing Massif on Thicknesa (h 5 o f Thawed Lager a t a Different Length ( d ) o f Water R u n t 1-20n-1, 2-4Om, 3-60m. The explanationa are i n the t ex t
The a t t e n t i o n ia drawn t o t h e f a c t of sharp decrease of qav at increasbg the th ickness o f accumulated thawed layer. So a t h = l a and e =50m the densi ty o f heat flow i a a proximately 10 tirnea lese t han i n oam of '
lgmiting thermoerosion waehing at which h 4. From formula ( 4 ) i t i s no t d i f f i cu l t t o f i n d the condition o f water flow heating, i.e. its c o o l t q a c t i o n on underlying rocks. In the given example the thawed l a y e r c r i t i c a l t h i c k - nesa at which water f low t r ans fe r s t o t he regime of heat ing i~l 4.5cm.
I n t e r n s o f e ta t sd i t i a obvious that a t hydromonitor mining of thawed rock l a y e m a water supply method is t o amsure the longest posBible contact of f l o w with frozen ~ u ~ f a c e . To real ize thia the hydraul lc mining with gradual retreat o f eroaion f ront away f r o m a t r anmor t t r ench waa umd. At a oonstant ve loc i ty of face advance for an e distance the coef f ic ien t o f heat-away i s expremed by:
In the given case the coef f ic ien t of heat-away meane the re la t ion of the heat quant i ty absorbed by racks t o t he i n i t i a l hea t oon t in t Of Water flow. When conducting the experimen- t a l works a t a hydrowaahing polygon quite satisfactory coinaidence o f formulae ( 5 ) ; ( 6 ) with the resu l t s o f obaemation ie found. For example, the deviationa o f ac tua l Kh values Prom.the rated *3u1ves didn't exceed 1Oper cent (fig.3).
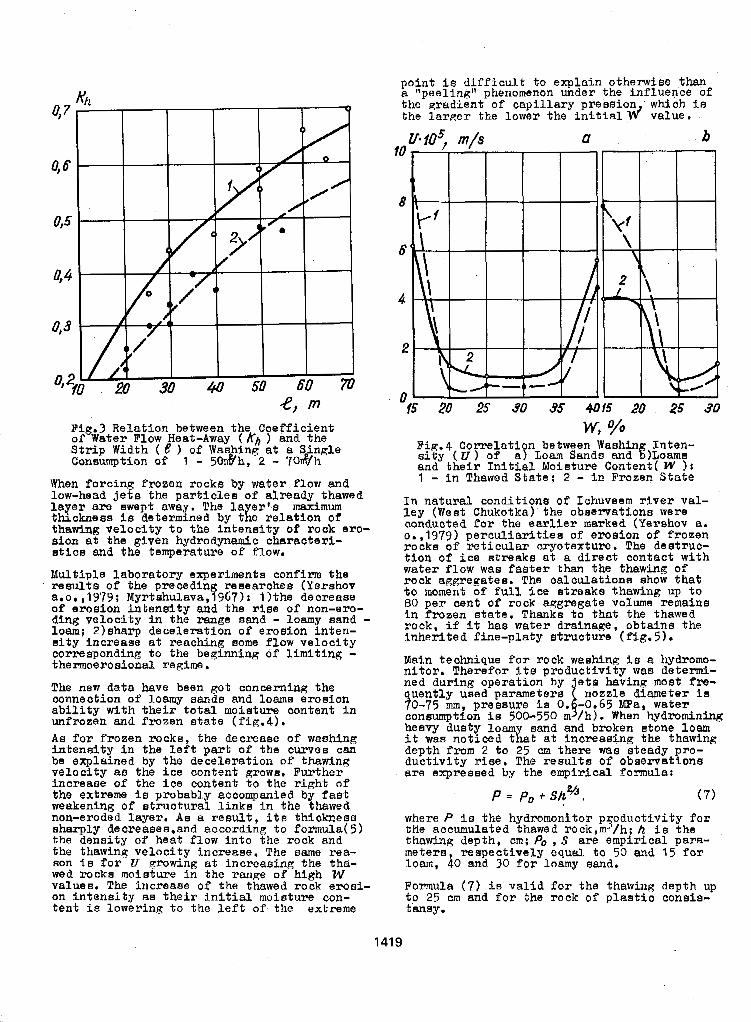
poin t i s d i f f i c u l t t o explain otherwise than a t lpeeling' l phenomenon under the influence of the qradient o f cap i l l a ry pression which i~ the ZarRer the lower t h e i n i t i a l w' value,
Pig.3 Relation between the Coeff ic ient of Water Flow Heat-Away ( K h 1 and the S t r i p Width ( e ) of Washing a t a S nale Consumption of 1 - 50&h, . 2 - 7O&h
When forc ing frozen rockn by water flow and low-head j e t s the pa r t i c l e s o f a l r eady thawed Layer a m swept away. The l a er's maximum thickness i a determined by d e r e l a t i o n of t hawing ve loc l ty t o t he i n t ens i ty of rook ero- aion a t the g iven hydrodynamic charec te r i - e t i c s and the temperature of flow.
Mult iple laboratory experiments confirm the result8 o f the preceding researches (Yerahov a.0. ,1979; Myrtehulava,1967): 1)thm decrease of e ros ion i n t ens i ty and t h e r i a e o f non-ero- ding veloci ty i n the range sand - loamy sand - loam; 2)sharp decelerat ion o f eromion inten- s i t y i n c r e a s e at reachinR some Plow ve loc i ty corresponding to the beginnin8 o f l i m i t i n g - thexmoerosional regime,
The new da ta have been got concerning the
ab i l i t y w i th t he i r t o t a l mo ia tu re con ten t i n connection of loamy aands and loams erosion
unfrozen and f r o z e n d a t e ( f i g . 4 ) . As for ffrosen rocks, the decrease o f washing i n t e n s i t y in t h e l e f t p a r t of the cuxves can be explained by the decelerat ion of thawing ve loc i ty as the ice content gxowa. Fur ther increase of the i ce conten t to the r igh t o f the extreme is probably accompanied by f a s t weakening o f s t r u c t u r a l l i n k s i n t h e thawed non-eroded layer . As a r e m l t , i t s thickness sharply decreases,and according to formula( 5) the densi ty of heat f l o w into the rock and the thawing velocity increase. The same rea- son i s for S f growing at increas ing the tha- wed rocks moisture i n the range of high w values. The increase o f the thawed rock erosi- on i n t e n s i t y a e t h e i r i n i t i a l m o i s t u r e con- t en t i s l ower ing t o t he l e f t o f the extreme
1419
w, % Fig.4 Correlation between Washin Inten- s i t y ( U ) of a ) Loam Sands and %)Lome and the i r In i t ia l Mois ture Content ( W 1: 1 - i n Thawed S t a t e ; 2 - i n Frozen State
I n n a t u r a l conditions of Ichuveem r i v e r v a l - l e y (West Chukotka) the observations were conducted fox t h e e a r l i e r marked (Yerehov a. o., 1979) p e r c u l i a r i t i e a o f erosion of frozen rocka o f r e t i cu la r c ryo tex tu re . The destruc- t i o n o f i c e s t r e a k s a t a direct contact wi th water f low waa faster than the thawing of rock aagregatee. The ca lcu la t ione show t h a t t o moment of f u l l i c e streaka thawing up t o
i n f r o z e n s t a t e . Thanks t o tha t the thawed 80 per cent o f rock aqgregate volume remains
rock, i f i t has water drainage, obtains the inher i ted f ine-p la ty s t ruc ture ( f ig . 5). Main technique for rock wanhinff i s a hydromo- n i tor . Therefor ite product iv i ty was detexmi- ned during operat ion by e t e having moet Pre- quently used parameters nozzle diameter i s 70-75 nun, pressure ia 0. -0.65 m a , water consumption i~ 500-550 m 4 /h) . When hydromining heavy dusty loam sand and broken Btone loam i t was not iced t$at a t increaefng the thawing depth from 2 t o 25 cm there was steady TO- duc t iv i ty r i s e . The results of obsematfone are expressed by the empirical formula:
where P i e the hydromonitor pSoductivity f o r the accumulated thawed rock,m-/h; h is the thawing depth, cm; Po , S axe empir ical pare- meters, reepectively equal t o 50 and 15 f o r loam, 40 and 30 for loamy sand.
Formula (7 ) is. va l id for the thawinn: depth up t o 25 em and for the rock of plast ic consle- tansy.
I Pig. 5 ~ n ~ e ~ ~ ~ ? ~ ~ o ~ ~ ~ ~ y w ~ ~ ~ i Q ~ 4 ~~~~~~~~~
~~Y~~ ~~~~~ hand. ~ ~ & ~ e ~ a f Loam Sand and Lo my ~ ~ ~ ~ @ n ~ ~ op ~ ~ ~ ~ v e ~ ~
The conducted reaearches allow to ohoose ra- t i o n a l tecknklogical parameters of hydrowaah- in& The necessary value of a day surface advance i s determined on the base of i n i t i a l requirements to the planned date o f working out the p l ace r of the given thickness, Then according to known ca lcu la t ion methodm OP radiation thawing (Pavlov,Olovin,1974) and formulae (5)-(7) they determine the optimum hydroerosion rate which assurea suf f ic ien t i n t e n s i t y o f mining operationa and the best equipment productivity. After t ha t t he nece- ssary quant i ty of hydromonitor i n s t a l l a t i o n s f o r the en t i r e mining area i s determined.
The r e seache r s ' a r e su l t s are r e a l i z e d i n t h e range of flow shee ts o f hydrostripping works which have been employed over the paBt five years a t p lacer depos i t s of the North-East of the USSR a t d i f f e r e n t m i n h g and geological and permafrost-climatic conditione, Hydromi- ning was car r ied ou t by s ta t ionary and se l f - propel led hydromonitor u n i t s (fig.6,7,8) and a l s o by sprinkling apparatus.
Depending on the type o f a unit and the pro- p e r t i e s of eroding rocka watezj consumption was changed from 100 t o 630 m /h, pressure from 0.2 t o 0.8 MPa. Before Btarting hydro- stripping Operations the earthmoving machines removed moan and plant cover away from p lace r depo~li t surface, then waehed out per iodical ly the rock l a y e r thawed down by the oun r ad ia t ion hea t ; the sa id rock being t ransported t o a hydrodump by runninR by g rav i ty o r by dredge pumps. If mined placer depoeits contain plemty o f large f ragrnenta , their moving through t ransport ing t renches and p 1 l j . n ~ waa ca r r i ed out by earthmoving equipment.
I Durlng hydrostripping operations next indices have been g o t :
s p e c i f i c cons p t ion of e l e c t r i c power - O.R-2.5kW*h/m Y apec i f ic water consumptJon - 3-6rn3/m3 hydromonitor productivity - 100-250m3/h
It should be noted that the proposed technology starts t o compete againat the most e f f i c i e n t
meter depth. The mom the mining depth the conventional f'low sheetn beginninp: f rom 3
best will be the e f f ic iency of the method(Sa- myshin a.o. ,1903).
While developing open-pit deposits containing large rock fxagments the most e f fec t ive a r e combined technoloKies FncludLing washing away a f ine diapersed f i l l e r and t ransport inE tho remained rocks by earthmoving machines.
Nowadaya the sca les o f hydromining use are quickly widening i n the North-East o f tho USSR.
1420
1421
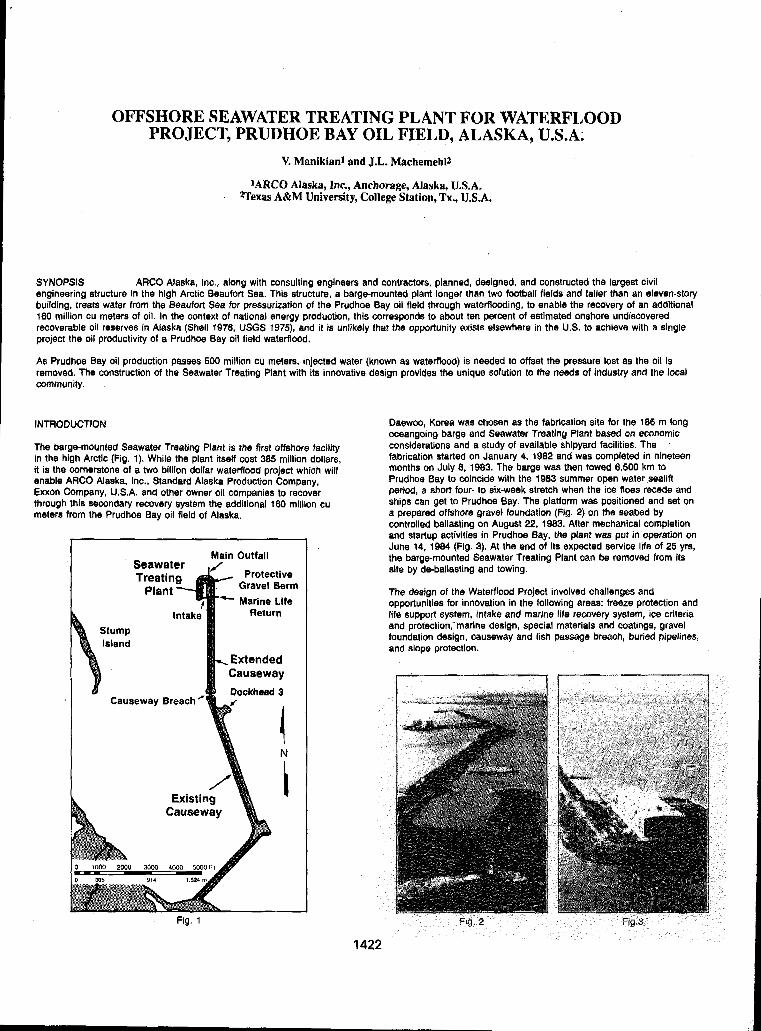
OFFSHORE SEAWATER TREATING PLANT FOR WATERFLOOD PROJECT, PRUDHOE BAY OIL FIELD, ALASKA, U.S.A;
V. Manikianl and J.L. Machemehlz
'ARC0 Alaska, Inc., Anchorage, Alaska, U.S.A. qexas A&M University, College Station, Tx., U.S.A.
SYNOPSIS ARC0 Alaska, Inc., along with consulting engineers and contractors, planned, designed, and constructed the largest civil engineering structure in the hlgh Arctic Beaufort Sea. This structure, a barge-mounted plant longer than two football fields and taller than an eleven-story building, treats water from the Beaufort Sea for pressurization of the Prudhoe Bay oil field through waterflooding, to enable the recovery of an additional 160 million CU meters of oil. In the context of national energy production, this corresponds to about ten percent of estlmated onshore undiscovered
project the oil productivity of a Prudhoe Bay oil field waterflood. recoverable oil reserves in Alaska (Shell 1978, USGS 1975), and it is unlikely that the opportunity exists elsewhere in the US. to achleve with a single
As Prudhoe Bay oil production passes 500 million cu meters, injected water (known as waterflood) is needed to offset the pressure lost as the oil is removed. The construction of the Seawater Treating Plant with its innovative design provides the unique solution to the needs of industry and the local community.
INTRODUCTION
The barge-mounted Seawater Treating Plant is the first offshore facility in the high Arctic (Fig. 1). While the plant itself cost 385 million dollars, it is the cornerstone of a two billion dollar waterflood project which will enable ARC0 Alaska, Inc., Standard Alaska Production Company,
through this secondary recovery system the additional 160 mllllon cu Exxon Company, U.S.A. and other owner oil companies to recover
meters ,from the Prudhoe Bay oil field of Alaska,
I
utfall
tive iravel Berm
larine Llfe Return
tended useway :khead 3
1 N
Fig. 1
Daewoo, Korea was chosen as the fabrlcation site for the 186 m long oceangoing barge and Seawater Treating Plant based on economic conslderations and a study of available shlpyard facilities. The fabrication started on January 4, 1982 and was completed in nineteen months on July 8, 1983. The barge was then towed 6,500 km to Prudhoe Bay to colncide with the 1983 summer open water sealift period, a short four- to six-week stretch when the ice floes recede and ships can get to Prudhoe Bay. The platform was positioned and set on a prepared offshore gravel foundation (Flg. 2) on the seabed by
and startup activities in Prudhoe Bay, the plant was put in operation on controlled ballasting on August 22, 1963. After mechanical completion
June 14. 1984 (Fig. 3). At the end of its expected service life of 25 yrs, the barge-mounted Seawater Treating Plant can be removed from its site by de-ballasting and towlng.
The design of the Waterflood Project involved challenges and opportunities for innovation in the following areas: freeze protection and life support system, Intake and marlne life recovery system, ice criteria and protection; marine design, special materials and coatings, gravel foundation design, causeway and fish passage breach, buried pipelines, and slope protection.
14
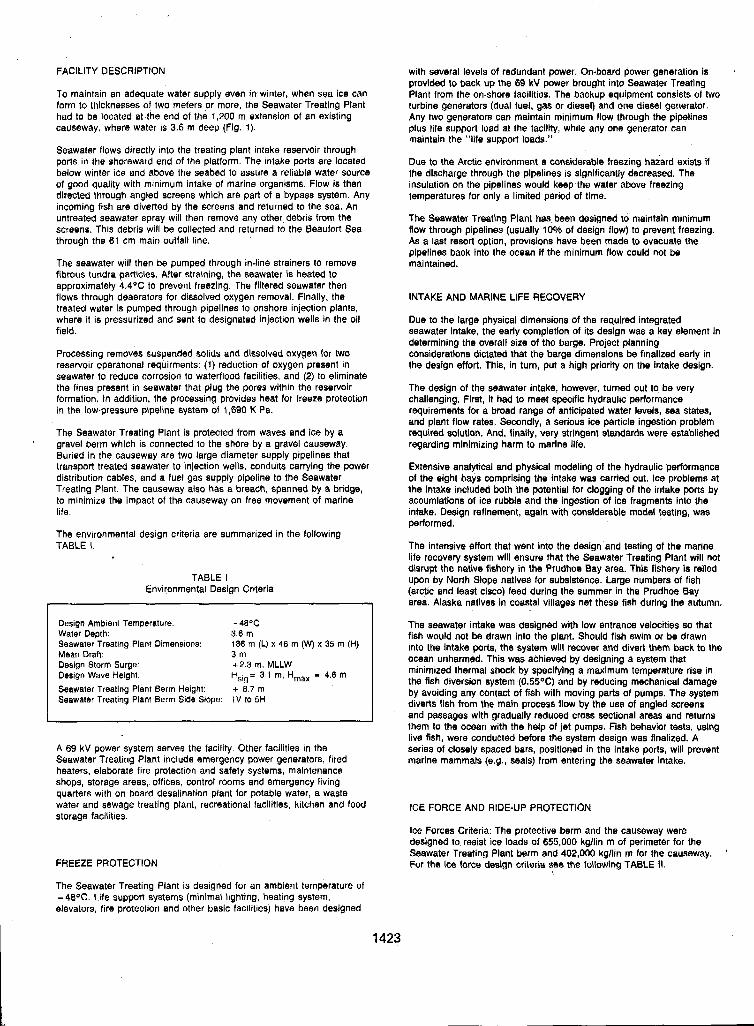
FACILITY DESCRiPTlON
To maintain an adequate water supply even in winter, when sea ice can form to thicknesses of two meters or more, the Seawater Treating Plant had to be located at .the end of the 1,200 m extension of an existing causeway, where water is 3.6 m deep (Fig. 1) .
Seawater flows directly into the treating plant intake reservoir through ports in the shoreward end of the platform. The intake ports are located below winter ice and above the seabed to assure a reliable water source of good quality with minimum intake of marine organisms. Flow is then directed through angled screens which are part of a bypass system. Any incoming fish are diverted by the screens and returned to the sea. An untreated seawater spray will then remove any other debris from the screens. This debris will be collected and returned to the Beaufort Sea through the 61 cm main outfall line.
The seawater will then be pumped through in-line strainers to remove fibrous tundra particles. After straining, the seawater is heated to approximately 4.4T to prevent freezing. The filtered seawater then flows through deaerators for dissolved oxygen removal. Finally, the treated water is pumped through pipelines to onshore injection plants, where it is pressurized and sent to designated injection wells in the oil field.
Processing removes suspended solids and dissolved oxygen for two reservoir operational requirments: ( 1 ) reduction of oxygen present in seawater to reduce corrosion to waterflood facilities, and (2) to eliminate the fines present in seawater that plug the pores within the reservoir formation, in addition, the processing provides heat for freeze protection in the low-pressure pipeline system of 1,690 K Pa.
The Seawater Treating Plant is protected from waves and ice by a ’ gravel berm which is connected to the shore by a gravel causeway.
Buried in the causeway are two large diameter supply pipelines that transport treated seawater to injection wells, conduits carrying the power distribution cables, and a fuel gas supply pipeline to the Seawater Treating Plant. The causeway also has a breach, spanned by a bridge, to minimize the impact of the causeway on free movement of marine life.
The environmental design criteria are summarized in the following TABLE I .
TABLE I Environmental Design Criteria
Design Ambient Temperature: - 4aoc Water Depth: Seawater Treating Plant Dimensions: 186 m (L) x 46 m (W) x 35 m (H) Mean Draft: Design Storm Surge: Design Wave Height: HSig= 3 1 m, H,, - 4.6 m Seawater Treating Plant Berm Height: + 8.7 m Seawater Treating Plant Berm Side Slope: 1V to 5H
3.6 rn
3 m +2.3 m, MLLW
with several levels of redundant power. On-board power generation is provided to back up the 69 kV power brought into Seawater Treating Plant from the on-shore facilities. The backup equipment consists of two turbine generators (dual fuel, gas or diesel) and one diesel generator. Any two generators can maintain minimum flow through the pipelines plus life support load at the facility, while any one generator can maintain the “life support loads.”
Due to the Arctic environment a considerable freezing hazard exists if the discharge through the pipelines is significantly decreased. The insulation on the pipelines would keep the water above freezing temperatures for only a limited period of time.
The Seawater Treating Plant has been designed to maintain mlnimum flow through pipelines (usually 10% of design flow) to prevent freezing. As a last resort option, provisions have been made to evacuate the pipelines back into the ocean if the minimum flow could not be maintained.
iNTAKE AND MARINE LIFE RECOVERY
Due to the large physical dlmensions of the required integrated seawater intake, the early completion of its design was a key element in determining the overall size of the barge. Project planning consideratlons dictated that the barge dimensions be finalized early in the design effort. This, in turn, put a high priority on the intake design.
The design of the seawater intake, however, turned out to be very challenging. First, it had to meet specific hydraulic performance requirements for a broad range of anticipated water Ieveis, sea states, and plant flow rates. Secondly, a serious ice particle ingestion problem required solution. And, finally, very strlngent standards were established regarding minimizing harm to marine ilfe.
Extensive analytical and physical modeling of the hydraulic performance of the eight hays comprising the intake was carried out. Ice problems at the intake included both the potential for Clogging of the intake ports by accumlations of ice rubble and the ingestion of ice fragments into the intake. Design refinement, again with considerable model testing, was performed.
The intensive effort that went into the design and testing of the marine
disrupt the native fishery in the Prudhoe Bay area. This fishery is reiled life recovery system will ensure that the Seawater Treating Plant will not
upon by North Slope natlves for subsistence. Large numbers of fish (arctlc and least cisco) feed during the summer in the Prudhoe Bay area. Alaska natives in coastal vlllages net these fish during the autumn.
The seawater intake was deslgned with low entrance velocities so that fish would not be drawn into the plant. Should fish swim or be drawn into the intake ports, the system will recover and divert them back to the ocean unharmed. This was achieved by designing a system that
the fish diversion system (0.55%) and by reducing mechanical damage minimized thermal shock by specifying a maximum temperature rise in
by avoiding any contact of fish with moving parts of pumps. The system diverts fish from the main process flow bv the use of anoled screens
I and passages with graduaily reduced cross sectional areas and returns them to the ocean with the help of let Dumps. Flsh behavior tests, usina live fish, were conducted before the system design was finalized. A - series of closely spaced bars, positioned in the intake ports, will prevent marine mammals (e.g., seals) from entering the seawater intake.
A 69 kV power system serves the facility. Other facilities in the Seawater Treating Plant include emergency power generators, fired heaters, elaborate fire protectton and safety systems, maintenance shops, storage areas, offices, control rooms and emergency living quarters with on board desalination plant for potable water, a waste water and sewage treating plant, recreational facilities, kitchen and food ICE FORCE AND RIDE-UP PROTECTION storage facilities.
FREEZE PROTECTION
The Seawater Treating Piant is designed for an ambient temperature of - 48%. Life support systems (minimal lighting, heating system, elevators, fire protection and other basic facilities) have been designed
1423
Ice Forces Criteria: The protective berm and the causeway were designed to resist ice loads of 655,000 kgliin m of perimeter for the Seawater Treating Plant berm and 402,000 kg/lin m for the causeway. ’ For the ice force design criteria see the following TABLE II.
\
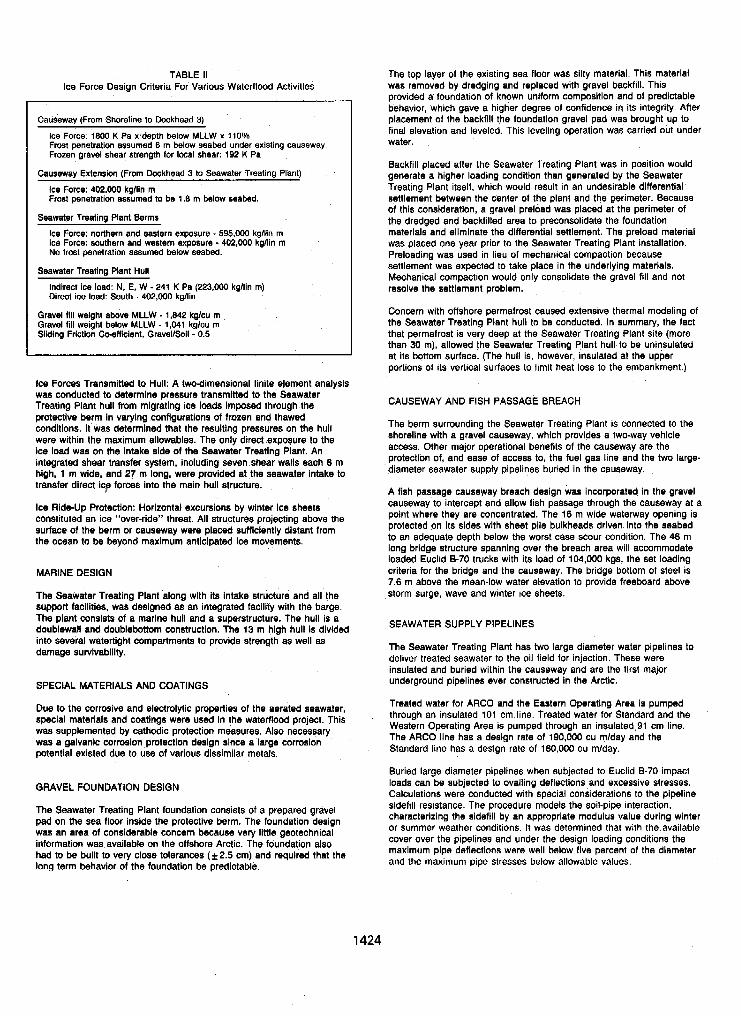
TABLE II Ice Force Design Criteria For Various Waterflood Activitles
Causeway (From Shoreline to Dockhead 3)
Ice Force: 1600 K Pa x,depth below MLLW x 110% Frost penetration assumed E m below seabed under existing causeway. Frozen Qravel shear strength for local shear: 192 K Pa
Causeway Extension (From Dockhead 3 to Seawater Treating Plant)
ice Force: 402.000 kgllin m Frost penetration assumed to be 1.8 rn below seabed.
Seawater Treating Plant Berms
Ice corce: northern and eastern exposure ~ 595,000 kgllin rn Ice Force: southern and western exposure - 402,000 kgllin m No frost penetration assumed below seabed.
Seawater Treating Plant Hull
Indirect ice load: N, E, W - 241 K Pa (223,000 kgllin rn) Direct ice load: South ~ 402,000 kgllin
Gravel fill weight below MLLW - 1,041 kglcu rn Gravel fill welght above MLLW - 1,642 kg/cu rn
Slidinp Friction Cwfficient, GravellSoil + 0.5
Ice Forces Transmitted to Hull: A two-dimensional finite element analysls
Treating Plant hull from migrating Ice loads Imposed through the was conducted to determlne pressure transmltted to the Seawater
protective berm in varylng configurations of frozen and thawed condltlons. It was determined that the resultlng pressures on the hull were within the maximum allowables. The only direct exposure to the ice load was on the intake side of the Seawater Treating Plant. An integrated shear transfer system, including seven shear walls each 6 m high, 1 m wide, and 27 m long, were provided at the seawater Intake to transfer direct icp forces into the main hull structure.
Ice Ride-Up Protection: Horizontal excursions by wlnter Ice sheets constituted an ice “over-ride’’ threat. All structures projecting above the surface of the berm or causeway were placed sufficiently distant from the ocean to be beyond maximum anticipated Ice movements.
MARINE DESIGN
The Seawater Treating Plant along wlth Its Intake structure and all the support facilltles. was designed as an integrated facility with the barge. The plant conslsts of a marlne hull and a superstructure. The hull is a doublewall and doublebottom construction. The 13 m high hull is divided into several watertight compartments to provide strength as well as damage survivability.
SPECIAL MATERIALS AND COATINGS
Due to the corrosive and electrolytic properties of the aerated seawater, special materials and coatings were used In the waterflood project. This was supplemented by cathodic protection measures. Also necessary was a galvanic corrosion protection design since a large corrosion potential existed due to use of various dissimilar metals.
GRAVEL FOUNDATION DESIGN
The Seawater Treating Plant foundation consists of a prepared gravel pad on the sea floor inside the protective berm. The foundation design was an area of considerable concern because very little geotechnical Information was available on the offshore Arctic. The foundation also had to be built to very close tolerances ( f 2.5 cm) and required that the long term behavior of the foundation be predictable.
The top layer of the existing sea floor was silty material, This material was removed by dredging and replaced with gravel backfill. This provided a foundation of known uniform composition and of predictable behavior, which gave a higher degree of confidence in its integrity. After placement of the backfill the foundation gravel pad was brought up to final elevation and leveled. This leveling operation was carried out under water.
Backfill placed after the Seawater Treating Plant was in position would generate a higher loading condition than generated by the Seawater Treating Plant itself, which would result in an undesirable differential settlement between the center of the plant and the perimeter. Because of this consideration, a gravel preload was placed at the perimeter of the dredged and backfilled area to preconsolidate the foundation materials and eliminate the differential settlement. The preload material was placed one year prior to the Seawater Treating Plant installation. Preloading was used in lieu of mechanical compaction because settlement was expected to take place in the underlying materials. Mechanical compaction would only consolidate the gravel fill and not resolve the settlement problem.
Concern with otfshore permafrost caused extensive thermal modeling of the Seawater Treating Plant hull to be conducted. In summary, the fact that permafrost is very deep at the Seawater Treating Plant site (more than 30 m), allowed the Seawater Treating Plant hull to be uninsulated at its bottom surface. (The hull is, however, insulated at the upper portions of its vertical surfaces to llmit heat loss to the embankment.)
CAUSEWAY AND FISH PASSAGE BREACH
The berm surrounding the Seawater Treating Plant is connected to the shoreline with a gravel causeway, which provides a two-way vehicle access. Other major operational benefits of the causeway are the protectlon of, and ease of access to, the fuel gas line and the two large- diameter seawater supply pipelines buried in the causeway.
A fish passage causeway breach design was incorporated in the gravel causeway to intercept and allow fish passage through the causeway at a point where they are concentrated. The 16 m wide waterway opening is protected on Its sides with sheet pile bulkheads driven into the seabed to an adequate depth below the worst case scour condition. The 46 m long bridge structure spanning over the breach area will accommodate loaded Euclid 8-70 trucks with its load of 104,000 kgs, the set loading criteria for the bridge and the causeway. The bridge bottom of steel is 7.6 m above the mean-low water elevation to provlde freeboard above storm surge, wave and winter Ice sheets.
SEAWATER SUPPLY PIPELINES
The Seawater Treating Plant has two large diameter water pipelines to dellver treated seawater to the oil field for injection. These were insulated and buried within the causeway and are the f!rst major underground pipelines ever constructed in the Arctic.
Treated water for ARCO and the Eastern Operating Area is pumped through an insulated 101 cm line. Treated water for Standard and the Western Operating Area is pumped through an insulated 91 cm line. The ARCO line has a design rate of 190,OOO cu mlday and the Standard line has a deslgn rate of 160,000 cu mlday.
Buried large diameter pipelines when subjected to Euclid 6-70 impact loads can be subjected to ovalling deflections and excessive stresses. Calculations were conducted with special considerations to the pipeline sidefiil resistance. The procedure models the soil-pipe interaction, characterizing the sidefill by an appropriate modulus value during winter or summer weather conditions. It was determined that with the-available cover over the pipelines and under the design loading conditions the maximum pipe deflections were well below five percent of the diameter and the maximum pipe stresses below allowable values.
1424
The Waterflood project was the first project requiring a decision on long Shell, 1978. Shell: Alaska holds 58 percent of future U.S. oil finds. Oil term slope protectlon in the Arctic Ocean. During its design, a and Gas Journal, November 20, 1978, p. 214, management decision was made to allow the exposed berm and causeway slopes to erode. The decision to treat all exposed gravel USGS, 1976. Water resources data for Alaska, water year 1975. U.S. surfaces as “sacrificial beaches” was based on a risk and economic Geological Survey, Water-Data Report ALK.75-1, 410 pp. analysis in which various slope protection alternatives were considered. The “sacrificial beach” concept allowed for estimated levels of beach erosion, thus, requiring restoration of the slopes after storms and on an “as-needed” basis. A program for future malntenance was found cost
than other alternatives. The project will be monitored by the Prudhoe effective (i.e., substantially less expensive, on a “present worth basis”)
Bay Unit to ensure that the causeway and seawater treating plant can continue to function adequately with limited maintenance or down time.
CONCLUSIONS
The Seawater Treating Plant was a unique challenge requirlng resolution of many complex problems. It was in many ways an unprecedented facility. We conclude that:
I. An offshore permanent industrial plant in the Arctlc has proven to be technically feasible.
2. An Integrated process plant and oceangoing vessel can be a viable cost-effective Option in comparison to conventlonal modular construction.
3. It can be an attractive option when a complete plant is to be fabricated as a single transportable unit for remote locations.
4. This approach may be preferable for temporary process plant locations where marlne access is avallabie. or when a process piant has to be removed after completion of its assignment.
5. Process plant construction and shipbuilding techniques can be integrated with proper planning of engineering and constructlon. Experience gained on the Seawater Treating Plant project can be of tremendous value on slmilar projects in future.
6. Underwater foundations for large industrial plants can be prepared to close tolerances cost effectlvely.
7. A marine life recovery system can be designed without any moving mechanical parts coming in contact with the fish.
E . A “sacriflcial beach” type of slope protection appears to be a viable alternative in the near-shore Beaufort Sea.
9. Providing pipeline access to an offshore site from the shoreline, by way of burial of the pipeline within a causeway, appears to be an efficient solution to many design problems including those related to subsea permafrost.
ACKNOWLEDGEMENTS
The permisslon of the Prudhoe Bay Unit owners to publish this paper is gratefully acknowledged.
Appreciation is extended to the following contractors and consultants that participated in the design and construction of the project: Alaska International Constructors, ARCTEC Engineering, Bechtel Petroleum, Daewoo Shipbuilding & Heavy Machinery, Dames & Moore, Harding - Lawson, Western Canada Hydraulic Laboratory, Woodward - Clyde.
1425
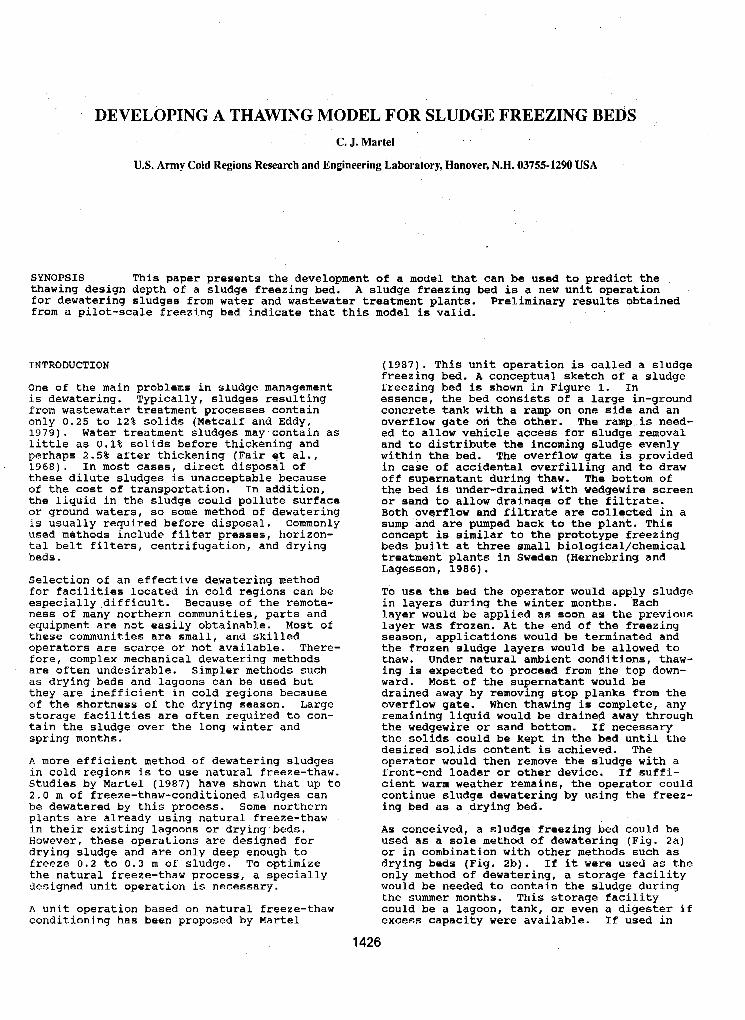
DEVELOPING A THAWING MODEL FOR SLUDGE FREEZING BEDS C, J. Martel
U.S. Army Cold Regions Research and Engineering Laboratory, Hanover, N.H. 03755.1290 USA
SYNOPSIS This paper presents the development of a model that can be used to predict the thawing design depth of a sludge freezing bed. A sludge freezing bed is a new unit operation for dewatering sludges from water and wastewater treatment plants. Preliminary results obtained from a pilot-scale freezing bed indicate that this model is valid.
INTRODUCTION
One of the main problems in sludge management i s dewatering. Typically, sludges resulting
only 0.25 to 12% solids (Metcalf and Eddy, from wastewater treatment processes contain
1979). Water treatment sludges may,contain as little as 0.1% solids before thickening and perhaps 2.5% after thickening (Fair et al., 1968). In most cases, direct disposal of these dilute sludges is unacceptable because of the cost of transportation. In addition, the liquid in the sludge could pollute surface or ground waters, so some method of dewatering is usually required before disposal. commonly used methods include filter presses, horizon- tal belt filters, centrifugation, and drying beds.
Selection of an effective &watering method for facilities located in cold regions can be especially,difficult. Because of the remote- ness of many northern communities, parts and equipment are nst easily obtainable. Most of these communities are small, and skilled operators are scarce or not available. There- fore, complex mechanical dewatering methods are often undesirable. Simpler methods such as drying beds and lagoons can be used but they are inefficient in cold regions because of the shortness of the drying season. Large
tain the sludge over the long winter and storage facilities are often required to con-
spring months.
A more efficient method of dewatering sludges
Studies by Martel (1987) have shown that up to in cold regions is to use natural freeze-thaw.
2.0 m of freeze-thaw-conditioned sludges can be dewatered by this process. Some northern plants are already using natural freeze-thaw in their existing lagoons or drying beds. However, these operations are designed fo r drying sludge and are only deep enough to freeze 0.2 to 0.3 m of sludge. To optimize the natural freeze-thaw process, a specially designed unit operation is necessary.
A unit operation based on natural freeze-thaw conditioning has been proposed by Martel
freezing bed. A conceptual sketch of a sludge (1987). This unit operation is called a sludge
freezing bed is shown in Figure 1. In essence, the bed consists of a large in-ground concrete tank with a ramp on one side and an overflow gate on the other. The ramp is need- ed to allow vehicle access for sludge removal
within the bed. The overflow gate is provided and to distribute the incoming sludge evenly
in case of accidental overfilling and t o draw off supernatant during thaw. The bottom of the bed is under-drained with wedgewire screen or sand to allow drainage of the filtrate. ~ o t h overflow and filtrate are collected in a sump and are pumped back to the plant. This
beda built at three small biological/chemical concept is similar to the prototype freezing
treatment plants in Sweden (Hernebring and Lagesson, 1986).
To use the bed the operator would apply sludge in layers during the winter months. Each layer would be applied as soon as the previous
season, applications would be terminated and layer was frozen. At the end of the freezing
the frozen sludge layers would be allowed to thaw. Under natural ambient conditions, thaw- ing is expected to proceed from the top down- ward. Most of the supernatant would be drained away by removing stop planks from the overflow gate. When thawing is complete, any remaining liquid would be drained away through the wedgewire or sand bottom. If necessary the solids could be kept in the bed until the desired solids content is achieved. The operator would then remove the sludge with a front-end loader or other device. If suffi- cient warm weather remains, the operator could continue sludge dewatering by using the freez- ing bed as a drying bed.
As conceived, a sludge freezing bed could be used as a sole method of dewatering (Fig. 2a) or in combination with other methods such as drying beds (Fig. 2b). If it were used as the only method of dewatering, a storage facility would be needed to contain the sludge during the summer months. This storage facility could be a lagoon, tank, or even a digester if excess capacity were available. If used in
1426
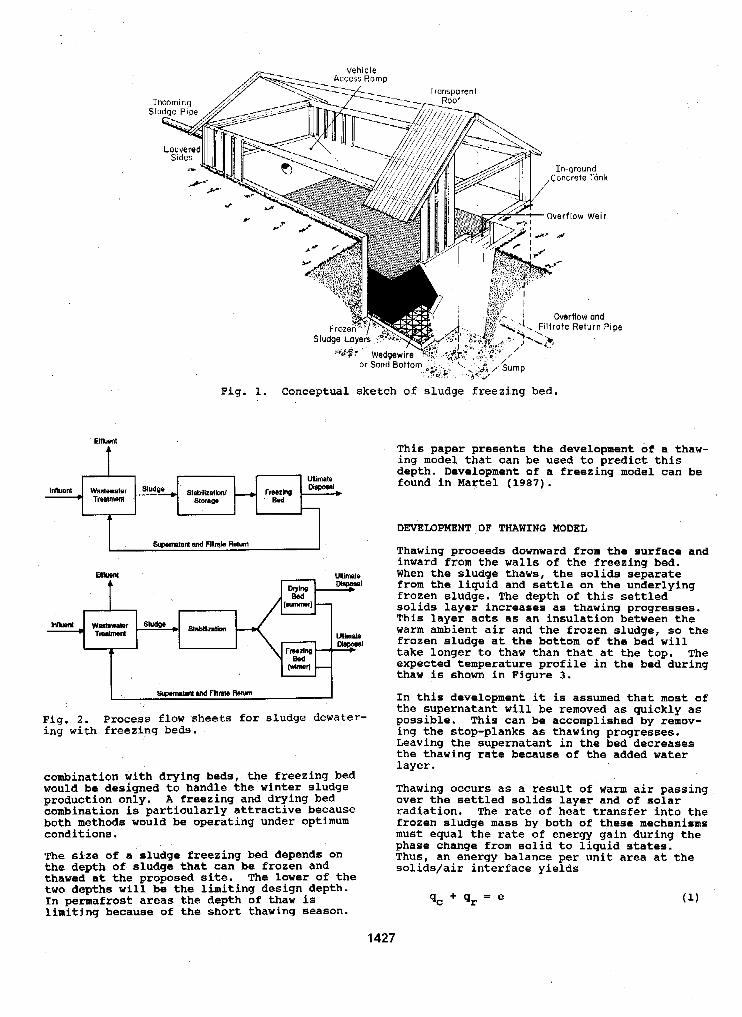
““7
1 E&- I
combination with drying beds, the freezing bed would be designed to handle the winter sludge production only. A freezing and drying bed combination is particularly attractive because both methods would be operating under optimum conditions.
The size of a sludge freezing bed depends on the depth of 6ludge that can be frozen and thawed at the proposed site. The Lower of the two depths will be the limiting design depth. In permafrost areas the depth of thaw is limiting because o f the short thawing season.
This paper presents the development of a thaw- ing model that can be used to predict this depth. Development of a freezing model can be found in Martel (1987).
DEVEMPMENT OF THAWING MODEL
Thawing proaeeds downward from the surface and inward from the walls of the freezing bed. When the sludge thaws, the solids separate from the liquid and settle on the underlying frozen sludge. The depth of this settled
This layer acts as an insulation between the solids layer increases as thawing progresses.
warm ambient air and the frozen sludge, so the frozen sludge at the bottom of the bed will take longer to thaw than that at the top. The expected temperature profile in the bed during thaw is 6hown in Figure 3.
In this development it is assumed that most of the supernatant will be removed as quickly as possible. This can be accomplished by remov- ing the stop-planks as thawing progresses. Leaving the supernatant in the bed decreases the thawing rate because of the added water layer.
Thawing occurs as a result of warm air passing over the settled solids layer and of solar radiation. The rate of heat transfer into the frozen sludge mass by both of these mechanisms must equal the rate of energy gain during the phase change from solid to liquid states. Thus, an energy balance per unit area at the solids/air interface yields
1427
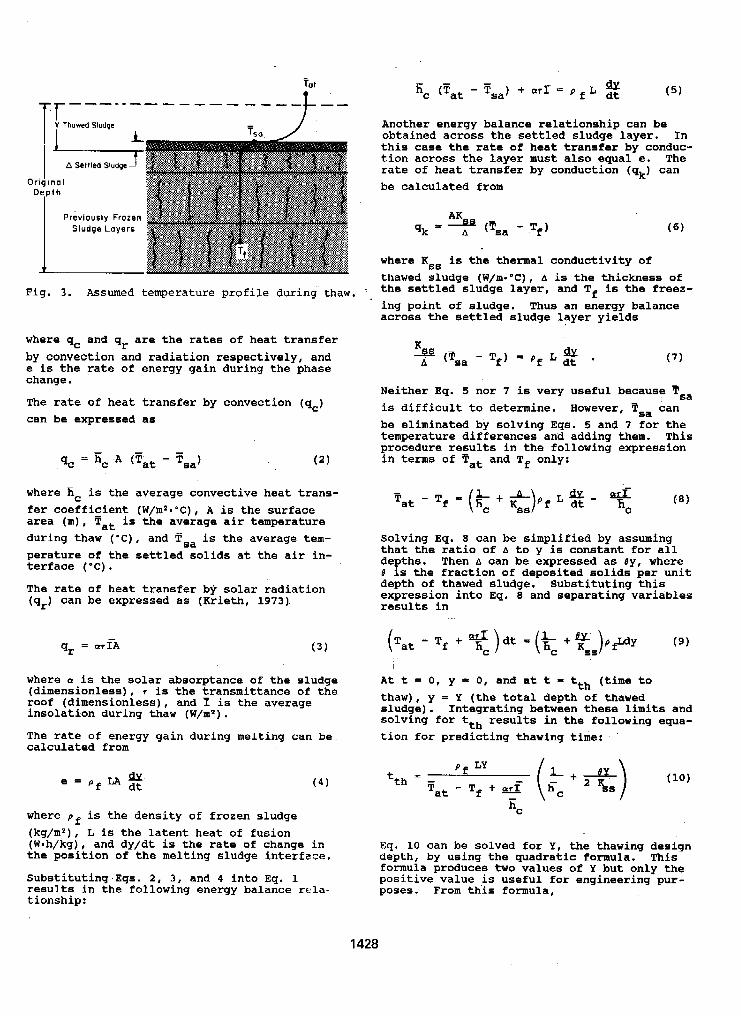
+
Y Thawed Sludae
A Settled Sludqe
Qriglnal Depth
Prevlously Frozen Sludge Layers
Fig. 3. Assumed temperature profi le during thaw
where q and q, are the rates of heat transfer by convection and radiation respectively, and e is the rate of energy gain during the phase change.
The rate of heat transfer by convection (9,) can be expressed as
C
where i s the average convective heat trans- fer coefficient (W/m2.'C) , A is the surface area (m), Tat is the average air temperature during thaw ("C) , and TIsa is the average tem- perature of the settled solids at the air in- terf ace ( ' C ) . The rate of heat transfer by solar radiation (9,) can be expressed as (Krieth, 1973)
where a is the solar absorptance of the sludge (dimensionless), T is the transmittance of the roof (dimensionless), and 7 is the average insolation during thaw ( W / m Z ) .
The rate o f energy gain during melting can be calculated from
where p f is the density of frozen sludge (kg/mz), L is the latent heat of fusion (W.h/kg), and dy/dt is the rate o f change in the position of the melting sludge interface.
Substituting Eqs. 2, 3, and 4 into Eq. 1
tionship: results in the following energy balance rcla-
Another energy balance relationship can be obtained across the settled sludge layer. In this case the rate of heat transfer by conduc- tion across the layer must also equal e. The rate of heat transfer by conduction (q,) can be calculated from
where Kss is the thermal conductivity of thawed sludge (W/m.*C), A is the thickness of the settled sludge layer, and Tf is the freez-
across the settled sludge layer yields ing point of sludge. Thus an energy balance
Neither Eq. 5 nor 7 is very useful because Tsa is difficult to determine. However, Fsa can be eliminated by solving Eqs. 5 and 7 for the temperature differences and adding them. This procedure results in the following expression in terms of Fat and Tf only:
Solving Eq. 0 can be simplified by assuming that the ratio of A to y is constant for all depths. Then A can be expressed as By, where 8 i s the fraction of deposited solids per unit depth of thawed sludge. Substituting this expression into Eq. 8 and separating variables results in
A t t = 0 , y = 0, and at t = tth (time to thaw), y = Y (the total depth o f thawed sludge). Integrating between these limits and solving for tth results in the following equa- tion for predicting thawing time:
Eq. 10 can be solved for Y, the thawing design depth, by using the quadratic formula. This formula produces two values of Y but only the positive value i s useful for engineering pur- poses. From this formula,
1428
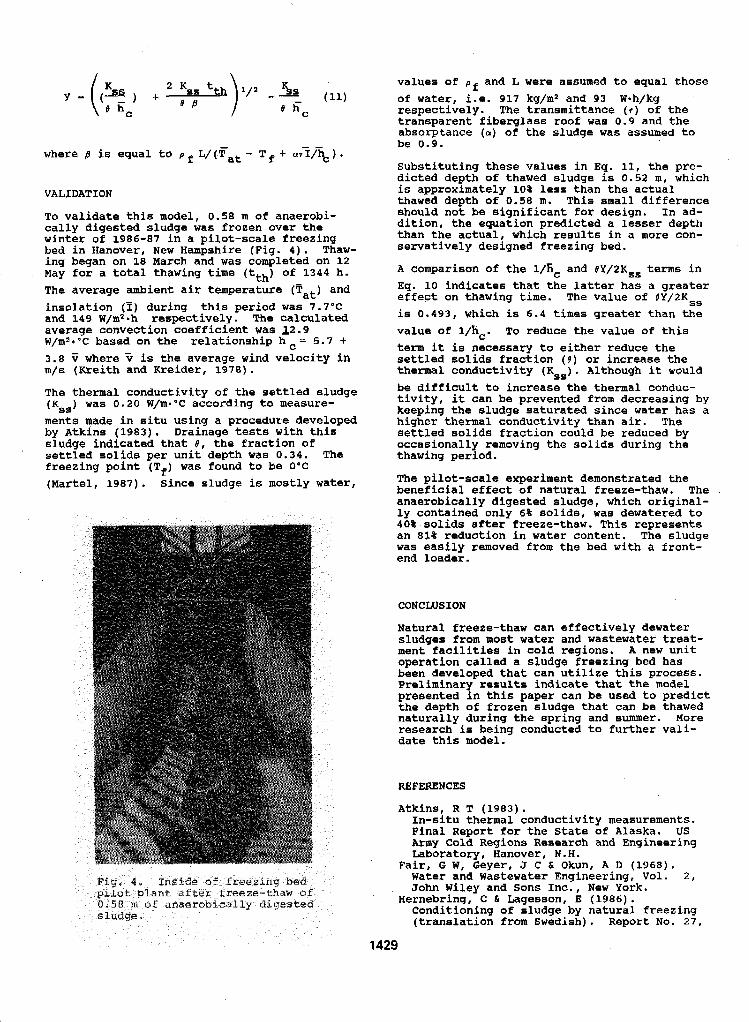
VALIDATION
To validate this model, 0.58 m o f anaerobi- cally digested sludge was frozen over the winter of 1986-87 in a pilot-scale freezing bed in Hanover, New Hampshire (Fig. 4). Thaw-
May for a total thawing time (tth) of 1344 h. ing began on 18 March and was completed on 12
The average arnbient air temperature (!Fat) and insolation (T) during this period was 7.7 'C and 149 W/m2*h respectively. The calculated average convection coefficient was 12.9 W/ma* 'C based on the relationship h = 5.7 +
m/a (Kreith and Kreider, 1978). 3.8 7 where v is the average wind velocity in
The thermal conductivity of the settled sludge (Kss) was 0.20 W/m-'C according to measure- ments made in situ using a procedure developed by Atkins (1983). Drainage tests with this sludge indicated that 9 , the fraction of settled solids per unit depth was 0.34. The freezing point (Tf) was found to be O'C
(Martel, 1 9 8 7 ) . Since sludge is mostly water,
14
values of p f and L were assumed to equal those of water, i.e. 917 kg/m2 and 93 W.h/kg respectively. The transmittance ( 7 ) of the transparent fiberglass roof was 0.9 and the absorptance ( u ) of the sludge was assumed to be 0.9.
Substituting these values in Eq. 11, the pre- dicted depth of thawed sludge is 0.52 m, which is approximately 10% less than the actual thawed depth of 0.58 m. This small difference should not be significant for design. In ad- dition, the equation predicted a lesser depth than the actual, which results in a mare con- servatively designed freezing bed.
A comparison of the 1/hc and 8Y/2KS,terms in Eq. 1 0 indicates that the latter has a greater effect on thawing time. The value of 8Y/2Kss
is 0.493, which is 6.4 timea greater than the value of l&. To reduce the value of this term it is necessary to either reduce the settled solids fraction (0) or increase the thermal conductivity (Kss). Although it would be difficult to increase the thermal conduc- tivity, it can be prevented from decreasing by keeping the sludge saturated since water has a higher thermal conductivity than air. The settled solids fraction could be reduced by occasionally removing the solids during the thawing period.
The pilot-scale experiment demonstrated the beneficial effect of natural freeze-thaw. The . anaerobically digested sludge, which original- ly contained wnly 6% solids, was dewatered to 40% solids after freeze-thaw. This represents an 81% reduction in water content. The sludge was easily removed from the bed with a front- end loader.
CONCLUSION
Natural freeze-thaw can effectively dewater sludges from most water and wastewater treat- ment facilities in cold regions. A new unit operation called a sludge freezing bed has been developed that can utilize this process. Preliminary results indicate that the model presented in this paper can be used to predict the depth of frozen sludge that can be thawed naturally during the spring and summer. More research is being conducted to further vali- date this model.
REFERENCES
Atkino, R T (1983) . In-situ thermal conductivity measurements. Final Report for the State o f Alaska. US Army Cold Regions Research and Engineering Laboratory, Hanover, N.H.
water and Wastewater Engineering, Vol. 2, John Wiley and Sons Inc., New York.
Conditioning of sludge by natural freezing (translation from Swedish). Report No. 27,
Fair, C W, Geyer, J C t Okun, A D (1968).
Hernebring, C & Lagesson, E (1986).
829

Institute for Urban Construc Water and Sewage Technology,
Kreith, F (1973). Lulea, Sweden.
Principles of Heat Transfer. McGraw-Hill Inc., New York.
Kreith, F & Kreider, J F (1978 Principles of Solar Engineer Inc., New York.
tion, Dept. of Martel, C J (1987) . university of Develwpment and design o f sludge freezing
beds, Ph.D. Dissertation, Colorado State University, Ft. Collins.
Wastewater Treatment/DisposaL/Reuse. 2nd 3rd Edition, Wetcalf and Eddy, Inc. (1979).
1. Edition, McGraw-Hill Inc., New York. ing, McGraw-Hill
1430
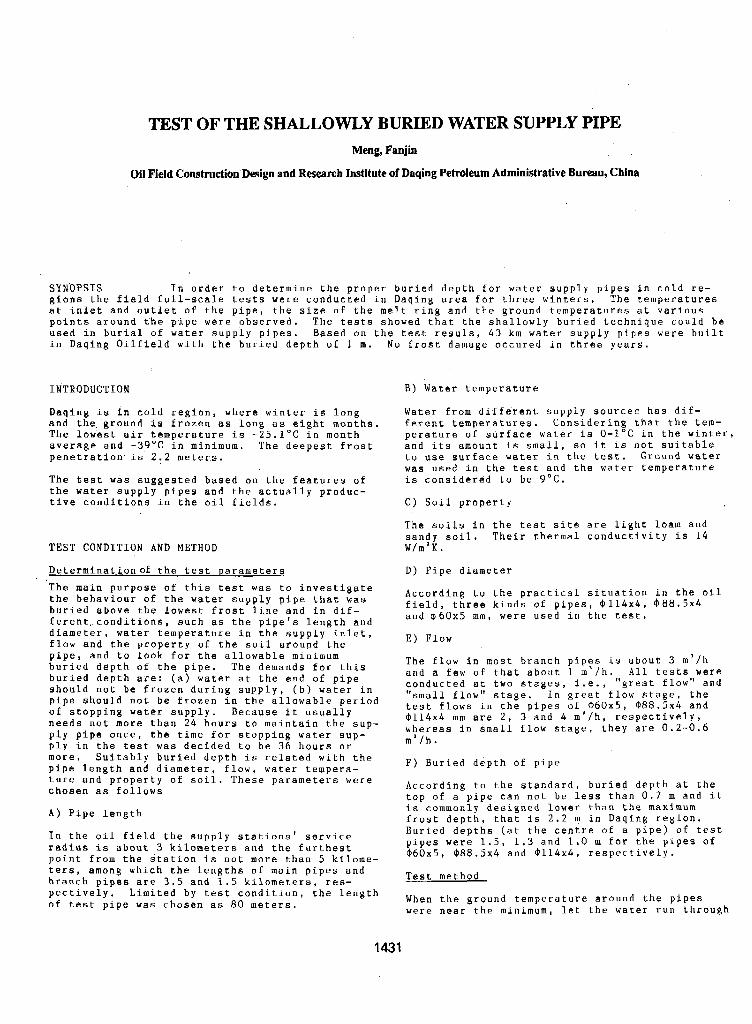
TEST OF THE SHALLOWLY BURIED WATER SUPPLY PIPE Meng, Fanjin
Oil Field Construction Design and Research Institute of Daqing Petroleum Administrative Bureau, China
SYNOPSIS gions the field full-scale tests were conducted in Daqing area for three winters. The temperatures a t inlet and outlet o f the pipe, the size of the melt ring and the ground temperatures at various points around the pipe were observed. The tests showed that the shallowly buried technique could be used in burial of water supply pipes. Based on the test resuls, 4 3 km water supply pipes were built in Daqing Oilfield with the buried depth o f 1 m. No frost damage occured in three years.
In order to determine the proper buried depth for water supply pipes in cold re-
INTRODUCTION B) Water temperature
Daqing is in cold region, where winter is long and the. ground i s frozen as long as eight months. The lowest air temperature is - 2 5 . 1 " C in month average and -39'C in minimum. The deepest frost penetration is 2 : 2 meters.
The test was suggested based on the features o f the water supply pipes and the actually produc- tive conditions in the oil fields.
TEST CONDITION AND METHOD
Water from different supply sources has dif- ferent temperatures. Considering that the tem- perature of surface water is 0 - 1 ° C in the winter, and its amount is small, so it is not suitable to use surface water in the test. Ground water was used in the test and the water temperature is considered to be 9 ' C .
C) Soil property
The soils in the test site are light loam and sandy soil. Their thermal conductivity is 1 4 WIrn'K.
Determinationof the test parameters D) Pipe diameter
The main purpose of this test was to investigate the behaviour o f the water supply p i p e that was buried above the lowest frost line and in dif- ferent,conditions, such as the pipe's length and diameter, water temperature in the supply inlet, flow and the property o f the soil around the pipe, and to look for the allowable minimum buried depth of the pipe. The demands for this buried depth are: ( a ) water at the end o f pipe should not be frozen during supply, (b) water in pipe should not be frozen in the allowable period o f stopping water supply, Because it usually needs not more than 2 4 hours to maintain the sup- ply pipe once, the time for stopping water sup- ply in the test was decided to be 36 hours o r more. Suitably buried depth is related with the pipe length and diameter, flow, water tempera- ture and property of soil. These parameters were chosen as follows
A ) Pipe length
I n the oil field the supply stations' service radius i s about 3 kilometers and the furthest point from the station is not more than 5 kilome- ters, among which the lengths of main pipes and branch pipes are 3.5 and 1.5 kilometers, res- pectively. Limited by test condition, the length of test pipe was chosen a s 80 meters.
According to the practical situation in the oil field, three kinds of pipes, 4 1 1 4 x 4 , 6 8 8 . 5 ~ 4 and 6 6 0 x 5 mm, were used in the test.
E) Flow
The flow i n most branch pipes is about 3 m'/h and a few of that about 1 m'/h. All tests,,were conducted at two stages, i.e., "great flow and "small flow" stage, In great flow stage, the
$ 1 1 4 ~ 4 mm are 2 , 3 and 4 mg/h, respectively, test flows in the pipes o f b 6 0 x 5 , m88.5xb and
whereas in small flow stage, they are 0 . 2 - 0 . 6 m'/h.
F) Buried depth of pipe
According to the standard, buried depth at the top o f a pipe can not be less than 0 . 7 m and it is commonly designed lower than the maximum frost depth, that is 2.2 m in Daqing region. Buried depths (at the centre o f a pipe) o f test pipes were 1.5, 1 . 3 and 1.0 m for the pipes of 6 6 0 x 5 , 6 8 8 . 5 ~ 4 and 4 1 1 4 x 4 , respectively.
Test method
When the ground temperature around the pipes were near the minimum, let the water r u n through
1431
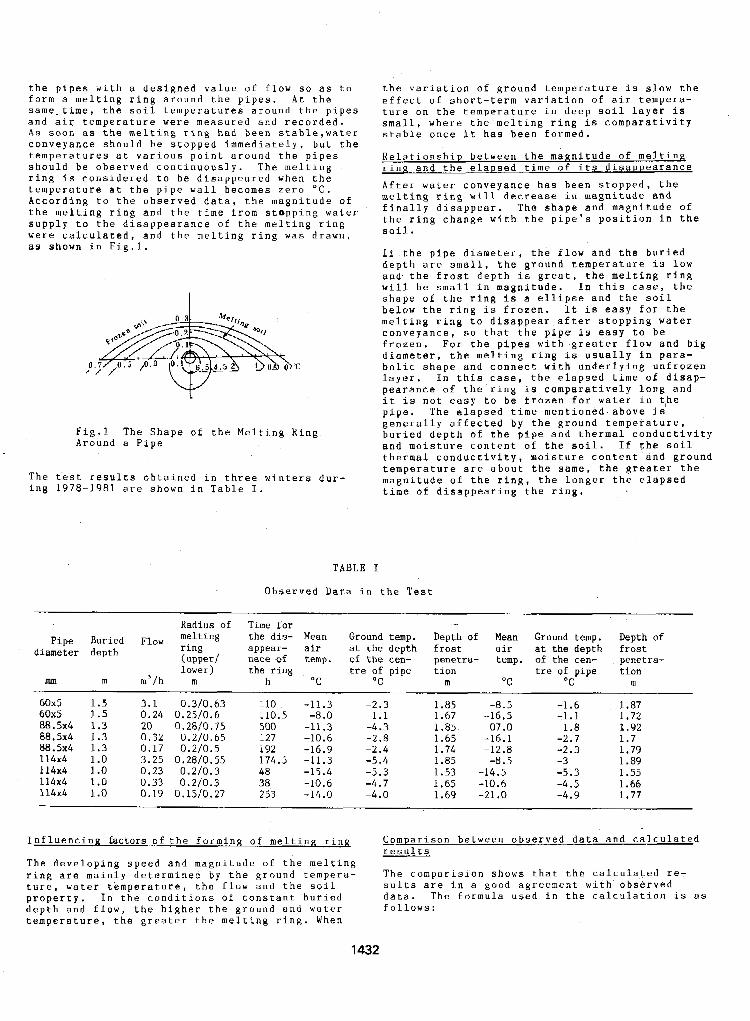
the pipes with a designed value of flow s o as to form a melting ring around the pipes. At the same.time, the soil temperatures around the pipes and air temperature were measured and recorded. As soon a s the melting ring had been stable,water conveyance should be stopped immediately, but the temperatures at various point around the pipes should be observed continuously. The melting ring is considered to be disappeared when the temperature at the pipe wall becomes zero " C . According to the observed data, the magnitude of the melting ring and the time from stopping water supply to the disappearance of the melting ring were calculated, and the melting ring was drawn, as shown in Fig.1.
L
F i g . 1 The Shape o f the Melting Ring. Around a Pipe
The t.est results obtained in three winters dur- ing 1 9 7 8 - 1 9 8 1 are shown in Table I.
che variation of ground temperature is slow the effect of short-term variation o f air tempera- ture o n the temperature in deep soil layer is small, where the melting ring is comparativity stable once it has been formed.
Relationship between the magnitude of melting rinR and the elapsed time of its disappearance
After water conveyance has been stopped, the melting ring will decrease in magnitude and finally disappear. T h e shape and magnitude of the ring change with the pipe's position in the soil,
If the pipe diameter, the flow and the buried depth are small, the ground temperature is low and the frost depth is great, the melting ring will be small in magnitude. In this c a s e , the shape o f the ring is a ellipse and the soil below the ring is frozen. It is easy for the melting ring to disappear after stopping water conveyance, s o that the pipe is easy to be frozen. For the pipes with greater flow and big diameter, the melting ring i s usually in para- bolic shape and connect with underlying unfrozen layer. I n this case, the elapsed time of disap- pearance of the ring is comparatively long and it is not easy to be frozen for water in t,he pipe. The elapsed time mentioned above is generally affected by the ground temperature, buried depth o f the pipe and thermal conductivity and moisture content of the soil. If the soil thermal conductivity, moisture content and ground temperature are about the same, the greater the magnitude of the ring, the longer the elapsed time of disappearing the ring,
TABLE I
Observed Data in the Test
Radius of Time for pipe B~~~~~ Flow melting the dis- Mean Ground temp. Depth of Mean Ground temp. Depth of
ring appear- air at the depth frost air at the depth frost (upper/ nace of temp. of the cen- penetra- temp. of the cen- penetra- lower) the ring
~~ ~ ~ ~~ . .. ~
diameter depth
mm m m'/h m h " C "C m "C O C m tre of pipe tion tre of pipe tion
60x5 60x5 88.5x4 88,5x4
114x4 114x4 114x4 114x4
a8.5x4
1.5 1.5 3.1 0.3/0.63
0.24 0.25/0.6 1.3 20 0.2810.75 1.3 0.32 0.2/0.65 1.3 0.17 0.2/0.5 1 .o 3.25 0.28/0.55 1 .o 0.23 0.2/0.3 1 .o 0.33 0.2/0.3 1 .o 0.19 0.15iQ.27
110
500 110.5
127 192
48 174.5
38 253
-11.3 -8.0
-11.3 -10.6 -16.9 -11.3 -15.4 -10.6 -14,O
-2.3 -1.1 -4.3 -2.8 -2.4 -5.4 -5.3 -4.7 -4.0
~~
1.85 1.67 2.85 1.65 1.74 1.85 1.53 1.65 1.69
-8.5 -16 5
07 .0 -16.1 -12.8
-8.5
. "
-14.5 -10.6 -21.0
-1.6 1.87 71.1 1 . 7 2 -1.8 1.92 -2.7 1.7 -2.3 1.79 -3 1.89 -5.3 1.55 -4.5 1.66 -4.9 1.77
. . ."
Influencing factors of the forminR o f pelting ring Comparison between observed data and calculated results
The developing speed and magnitude of the melting ring are mainly determined by the ground tempera- The cornparision shows that the calculated re- ture, water temperature, the flow and the soil sults are i n a good agreement with observed property. In the conditions of constant buried data. The formula used in the calculation is as depth and flow, the higher the ground and water follows: Eemperature, the greater the melting ring. When
1432
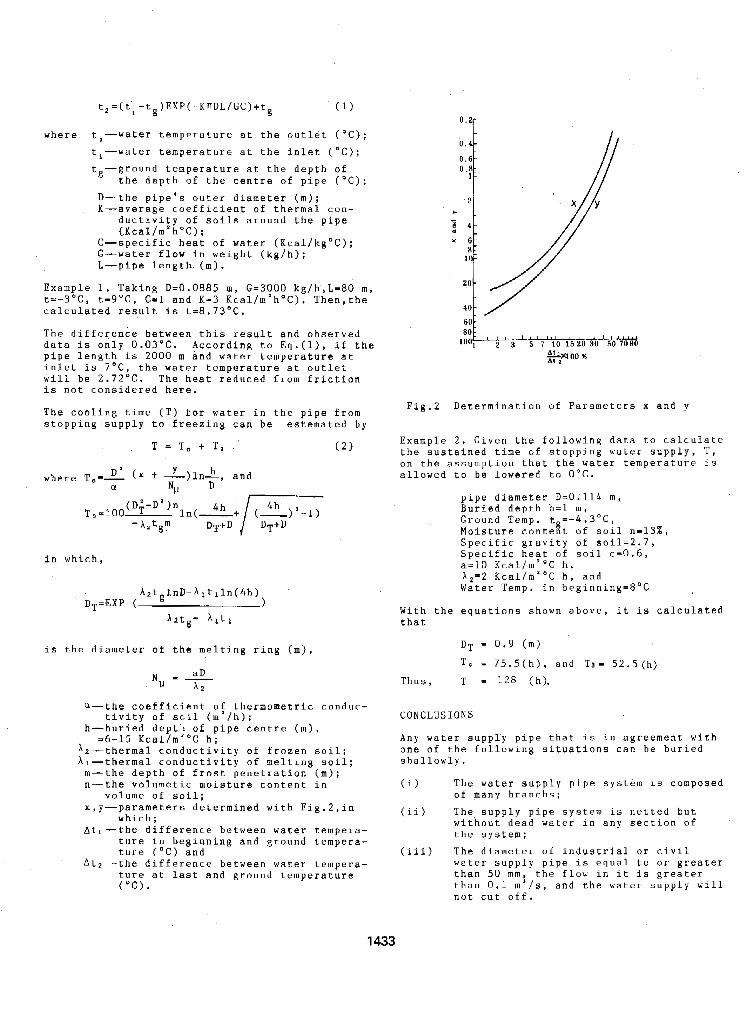
where t?-Water temperature at the outlet ("C); tl-water temperature at the inlet ( " C ) ;
t "ground temperature at the depth o f E. the depth of the centre o f pipe ("C); D-the pipe's outer diameter (m); K-average coefficient o f thermal con-
ductivity o f soils around the pipe (.Kcal/rn'h"C);
C-specific heat of water (Kcal/kg"C); G-water flow in weight (kg/h); L-pipe length. (m).
Example 1. Taking D=0.0885 m , G=3000 kg/h,L=80 m, t=-3'C, t-9"C, C=L and K-3 Kcal/m'h'C). Then,the calculated result is t-8.73"C.
The difference between this result and observed data is only 0.03"C. According to Eq.(l), i f the pipe length is 2000 m and water temperature at
will be 2.72"C. The heat reduced from friction inlet is 7"C, the water temperature at outlet
is not considered here.
The cooling time ( T ) for water in the pipe from stopping supply to freezing can be estemated by
T = To t T, (2)
0.2-
0 .4 -
0.6- 0.8:
1-
- 2 - * - B 4 -
x 6 - R -
10-
20 -
40 -
80 - 60-
1001 ' k ' ; ' 5 ' .f ' ' l o 1'5 i o i o ' io';i9d S 2 X l 00 %
in which,
is the diameter o f the melting ring (m),
a-the coefficient of thermometric conduc-
h-buried dept'l of pipe centre (m), tivity o f s ~ i l (m'/h);
-6-15 Kcal/m"C h; A,-thermal conductivity of frozen soil; AI-thermal conductivity o f melting soil; m-the depth of frost penetration (m); n-the volumetic moisture content in
x,y-parameters determined with Fig.2,in which;
Atl--the difference between water tempera- ture in beginning and ground tempera- ture ("C) and
At2 -the difference between water tempera- ture at last and ground temperature
volume of soil;
( " C ) .
Fig.2 Determination of Parameters x and y
Example 2 . Given the following data to calculate the sustained time o f stopping water supply, T , o n the assumption that the water temperature i s allowed to be lowered to OOC.
pipe diameter D=0.114 m , Buried depth h=l m, Ground Temp. t = - 4 . 3 " C , Moisture content o f soil n=13%, g
Specific gravity of soil=2.7, Specific heat of soil c=O.6, a=10 Kcal/m"C h , A 2 = 2 Kcal/m"C h, and Water Temp. i n beginning=S"C
With the equations shown above, it is calculated that
DT = 0.9 (m)
T o = 75.5(h), and T3= 52.5(h) Thus, T = 1 2 8 (h).
CONCLUSIONS
Any water supply pipe that is in agreement with one o f the following situations can be buried shallowly.
(1) The water supply pipe system is composed of many branchs;
(ii) The supply pipe system i s without dead water in any the system;
(iii) The diameter of industria water supply pipe is equa than 5 0 mm. the flow in i
netted but section of
1 or civil 1 t o or greater t is greater
than 0.1 m 3 / s , and the water supply will not cut off,
1433

According to the test reults, 4 3 kilometers w a t e r s u p p l y pipe was constructed in Daqing Oil Field in 1983 with buried depth of 1 m. y o '
frost damage has occured after t h r e e year s run- ning. About 1000 k i l o m e t e r s water suppLy pipe has been buried shallowly in the soil field in recent years.
1434
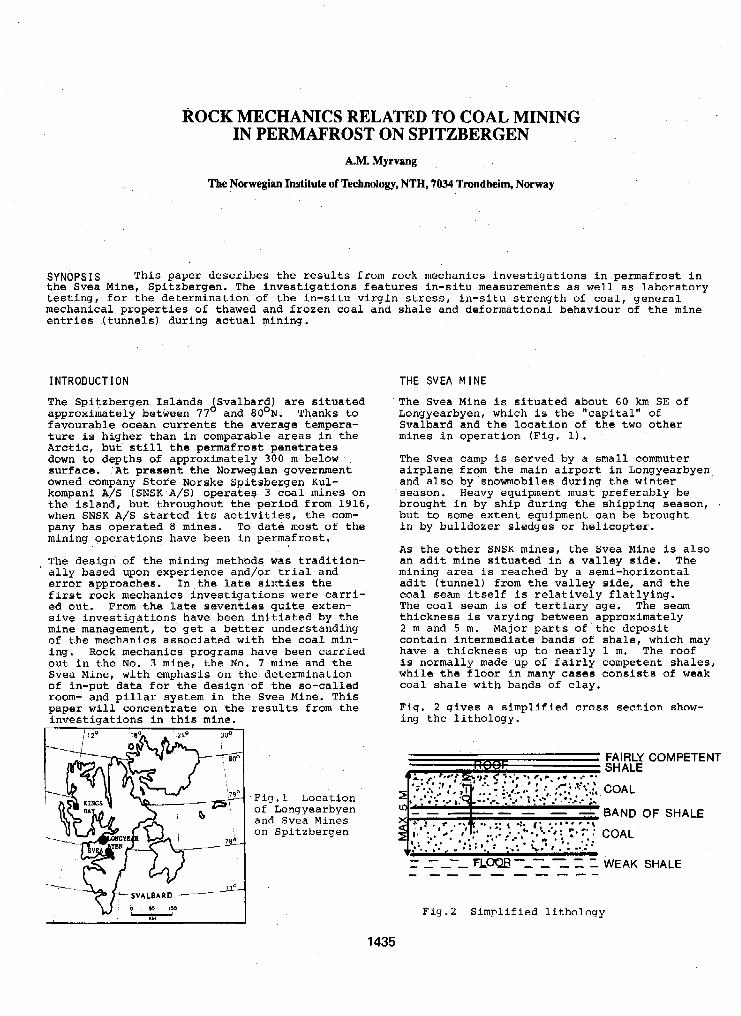
ROCK MECHANICS RELATED TO COAL MINING IN PERMAFROST ON SPITZBERGEN
A.M. Myrvang
The Norwegian Institute of Technology, NTH, 7034 Trondheim, Norway
SYNOPS I S T h i s p a p e r d e s c r i b e s t h e r e s u l t s f r o m r o c k m e c h a n i c s i n v e s t i g a t i o n s i n p e r m a f r o s t i n the Svea Mine, Spitzbergen. The i n v e s t i g a t i o n s f e a t u r e s i n - s i t u m e a s u r e m e n t s as w e l l a s l a b o r a t o r y t e s t i n g , f o r the de te rmina t ion of t h e i n - s i t u v i r g i n stress, i n - s i t u s t r e n g t h of c o a l , g e n e r a l mechanical propert ies of thawed and f rozen coal and shale and deformatlonal behaviour o f t h e mine e n t r i e s ( t u n n e l s ) d u r i n g a c t u a l m i n i n g .
INTRODUCTION The Sp i t zbe rgen I s l ands Sva lba rd ) are s i t u a t e d approximately between 77' and 80°N. Thanks t o f avourab le ocean cu r ren t s t he ave rage t empera - t u r e is h ighe r t han i n comparab le areas i n t h e Arctic, b u t s t i l l t h e p e r m a f r o s t p e n e t r a t e s down t o d e p t h s o f a p p r o x i m a t e l y 300 rn below su r face . .'At p r e s e n t t h e Norwegian government owned company Store Norske Spitsbergen Kul- kompani A/S ( S N S K A/S) opera t eg 3 coal mines on t h e i s l a n d , but throughout the per iod f rom 1916, when SNSK A/S s t a r t e d i t s act ivi t ies , t h e com- pany has operated 8 mines. To d a t e most of t h e mining opera t ions have been in permafros t .
The des ign of the mining methods was t radi t ion- a l l y b a s e d upon exper ience and/or t r i a l and e r r o r a p p r o a c h e s . I n the l a t e s i x t i e s t h e f i r s t rock mechanics inves t iga t ions were c a r r i - ed ou t . From the Late s e v e n t i e s q u i t e e x t e n - s i v e i n v e s t i g a t i o n s h a v e b e e n i n i t i a t e d by t h e mine management, t o g e t a b e t t e r u n d e r s t a n d i n g of t h e m e c h a n i c s a s s o c i a t e d w i t h t h e c o a l min- i ng . Rock mechanics programs have been carried o u t i n t h e No. 3 mine, the No. 7 mine and the Svea Mine, with emphasis on the.determination o f i n -pu t da t a fo r t h e d e s i g n of t h e s o - c a l l e d room- and p i l l a r s y s t e m i n t h e Svea Mine. This paper w i l l c o n c e n t r a t e o n t h e r e s u l t s f r o m t h e i n v e s t i g a t i o n s i n t h i s m i n e .
. Fig . 1 Locat ion of Longyearbyen and Svea Mines on Spi tzbergen
THE SVEA M I N E
The Svea Mine i s s i t u a t e d a b o u t 60 km SE of Longyearbyen, which i s t h e " c a p i t a l " o f S v a l b a r d a n d t h e l o c a t i o n o f t h e two o t h e r mines i n o p e r a t i o n (Fig. 1).
The Svea camp is served by a sma l l commuter a i r p l a n e from t h e main a i r p o r t i n Longyearbyen and also by snowmobiles during t h e w i n t e r
b r o u g h t i n by s h i p d u r i n g t h e s h i p p i n g s e a s o n , . season . Heavy equipment must preferably be
b u t t o some extent equipment can be brought i n by b u l l d o z e r s l e d g e s o r h e l i c o p t e r .
A s t h e o t h e r SNSK mines, the Svea Mine i s a l s o an ad i t m i n e s i t u a t e d i n a v a l l e y s i d e . The mining area is reached by a semi-hor izonta l a d i t ( t u n n e l ) f r o m t h e v a l l e y s i d e , a n d t h e coal seam i t s e l f i s r e l a t i v e l y f l a t l y i n g . The c o a l seam is of t e r t i a r y a g e . The seam t h i c k n e s s i s varying between approximately 2 m and 5 m. I 4 a j o r p a r t s of t h e d e p o s i t con ta in i n t e rmed ia t e bands o f shale, which may have a t h i c k n e s s up t o n e a r l y 1 m. The roof i s normally made up of f a i r l y c o m p e t e n t s h a l e s , w h i l e the f l o o r i n many cases c o n s i s t s of weak c o a l shale with bands of c l a y .
Fig. 2 g i v e s a s i m p l i f i e d c r o s s s e c t i o n show- i n g t h e l i t h o l o g y .
~ SHALE FAIRLY COMPETE : NT
COAL
BAND OF SHALE
COAL
WEAK SHALE
1435
F i g . 2 Simpl i f ied L i thology
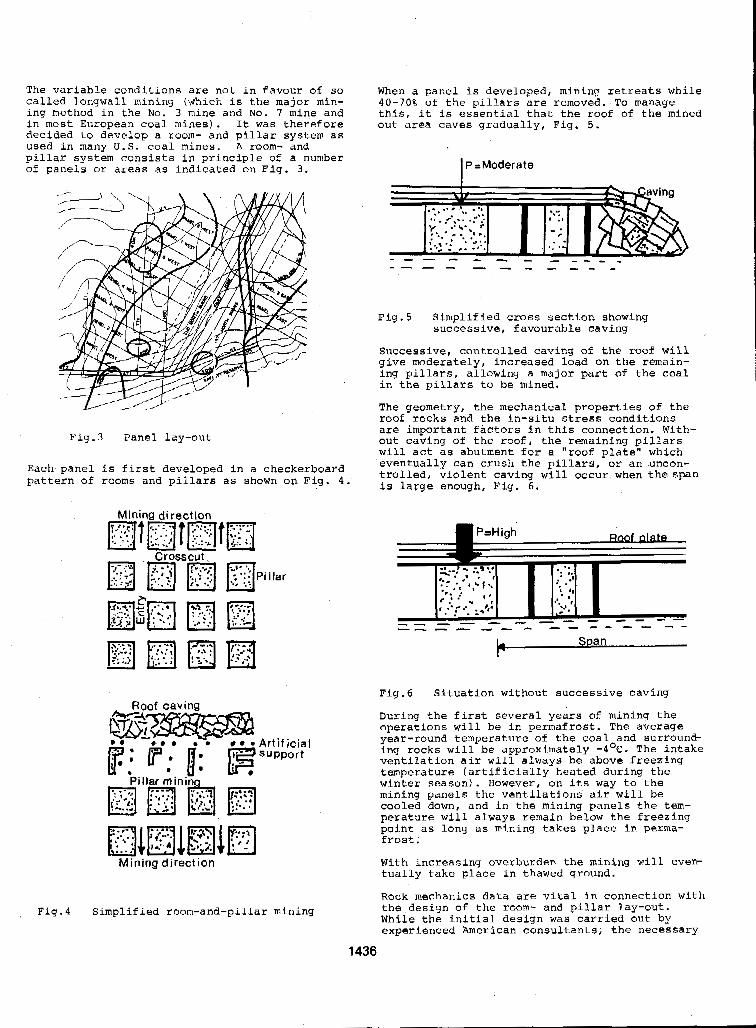
" - - - - - - - - "" "1""""
Fig * 5 Slmplif ied c r o s s s e c t i o n showing success ive , favourable cav ing
Success ive , con t ro l l ed cav ing of t h e roof w i l l g ive modera t e ly , i nc reased Load on t h e remain- i n g p i l l a r s , a l l o w i n g a ma jo r pa r t of t h e c o a l i n t h e p i l l a r s t o be mined.
The geometry, t h e mechan ica l p rope r t i e s of t h e roof r o c k s a n a t h e i n - s i t u stress c o n d i t i o n s a r e i m p o r t a n t f a c t o r s i n t h i s c o n n e c t i o n , With- ou t cav ing of t h e r o o f , the remaining pillars w i l l act a s a b u t m e n t f o r a "roof p l a t e " which
t r o l l e d , v i o l e n t c a v i n g w i l l occur when t h e s p a n e v e n t u a l l y can c rush t h e p i l l a r s , o r a n - u n c o n -
i s l a r g e enough, F ig . 6 .
t+ Span
Fig.3 Panel lay-out
Each pane l is f i r s t d e v e l o p e d i n a checkerboard p a t t e r n of rooms and p i l l a r s a s shown on Fig. 4 .
Fig.6 Si tua t ion w i thou t success ive cav ing
Artificial support
D u r i n g t h e f i r s t s e v e r a l y e a r s of mining the o p e r a t i o n s will be in permafros t . The average year-round temperature of the coal a n d s u r r o u n h ing rocks w i l l be approximately -4OC. The i n t a k e v e n t i l a t i o n a i r w i l l always be above f r e e z i n g t e m p e r a t u r e ( a r t i f i c i a l l y h e a t e d during t h e w i n t e r s eason) . However, on i t s way t o the m i n i n g p a n e l s t h e v e n t i l a t i o n s a i r w i l l be cooled down, a n d i n the mining pane ls the t e m - p e r a t u r e w i l l always remain below t h e f r e e z i n g p o i n t a s l o n g a s m i n i n g takes p l a c e i n perma- f r o s t .
With increasing overburden t h e mining will even- tua l ly t ake p l ace i n t hawed g round .
Mining direction
Rock mechanics data a r e v i t a l i n connec t ion wi th Fig.4 Simplified room-and-pillar mining the des ign of t h e room- and p i l l a r l a y - o u t .
While t h e i n i t i a l d e s i g n was carried out by experienced American consul tants ; the necessary
1436
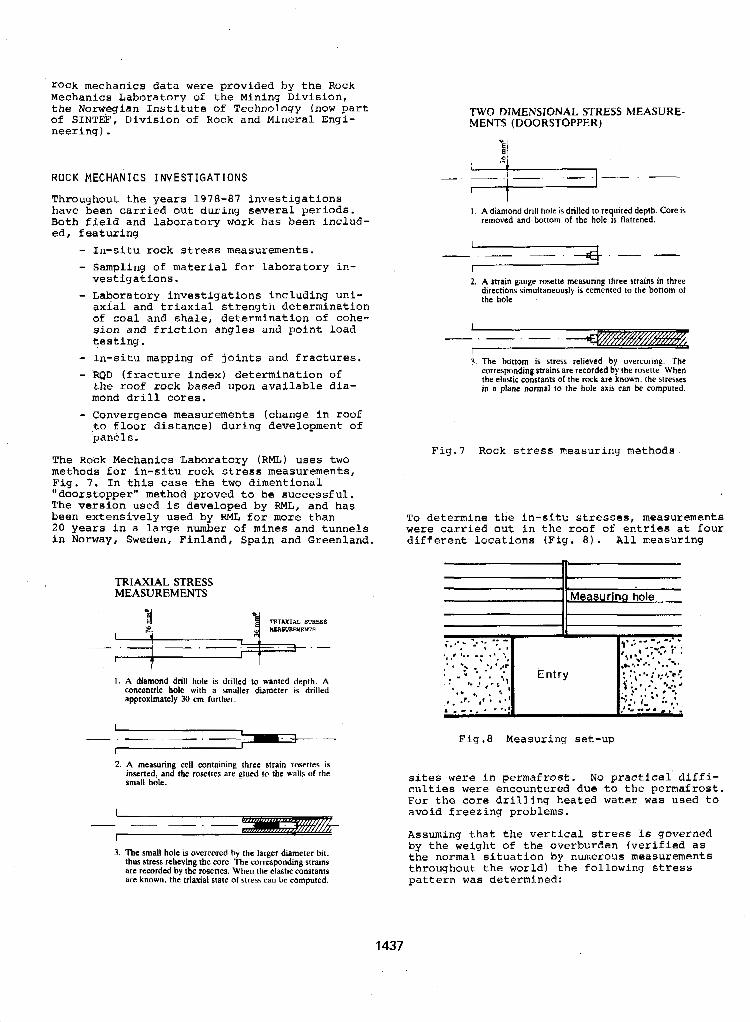
rock mechanics d a ta were pr ovided by t h e Rock Mechanics Laboratory of the Mining Div i s ion , t h e Norwegian I n s t i t u t e of Technology (now p a r t of SINTEF, Div i s ion of Rock and Mineral Engi- n e e r i n g ) .
ROCK MECHANICS INVESTIGATIONS
Throughout the years 1978-87 i n v e s t i g a t i o n s have been cars ied out d u r i n g s e v e r a l p e r i o d s . Both f ie ld and laboratory work has been includ- ed, f e a t u r i n g
- I n - s i t u r o c k stress measurements. - Sampling of m a t e r i a l f o r l a b o r a t o r y i n -
- L a b o r a t o r y i n v e s t i g a t i o n s i n c l u d i n g u n i - v e s t i g a t i o n s . .
a x i a l and t r i a x i a l s t r e n g t h d e t e r m i n a t i o n of coal and sha le , de te rmina t ion of cohe- s ion and f r i c t i o n a n g l e s and p o i n t l o a d t e s t i n g .
- I n - s i t u mapping of j o i n t s a n d f r a c t u r e s . - RQD ( f r a c t u r e i n d e x ) d e t e r m i n a t i o n of
t h e roof rock based upon a v a i l a b l e d l a - mond d r i l l cores.
- Convergence measurements (change i n r o o f t o f loor d i s tance) dur ing deve lopment o f pandl s I
The Rock Mechanics Laboratory (RML) u s e s t w o methods for i n - s i t u r o c k stress measurements, F i g . I . I n t h i s case t h e two d iment iona l
The ve r s ion u sed i s developed by RML, and has "doorstopper" method proved t o be success fu l .
been extensively used by RML f o r more t h a n 20 y e a r s i n a l a r g e number of mines and tunnels i n Norway, Sweden, Finland, Spain and Greenland.
TRIAXIAL STRESS MEASUREMENTS
MEASURBIIBMIS TRIAXIAL STRESS
"
1. A diamond drill hole is drilled to wanted depth. A concentric hole with a smaller dlsmcter is drilled approximately 30 cm further.
TWO DIMENSIONAL STRESS MEASURE- MENTS (DOORSTOPPER)
1 A diamond drill hole i 5 drilled to required depth. Cort is removed and bottom of the hole 1s flattened.
I
2. A strain gauge rosette measuring three strains in three directions simultaneourly is cemented to the bottom of the hole
3. The bottom is stress relieved by overconng. The corresponding strains are recorded by the rosette. When the elastic constants of the rwk are known. the stresses in a plane normal to the hole m i $ can be computed.
Fig.7 Rock stress n-easuring methods
T o d e t e r m i n e t h e i n - s i t u stresses, measurements were c a r r i e d o u t i n t h e r o o f of e n t r i e s a t f o u r d i f f e r e n t l c c a t i o n s ( F i g . 8) , A l l measuring
#Measuring hole
Fiq .8 Measuring set-up
2. A measuring cell wntaming three strain rosettes is
small hole. inserted, and the rosettes are glued IO the walls of the
3. The small hole is overcored by the larger diameter bit, thus stress relieving the core. Thc corresponding strains are recorded hy the rosettes. When the clastic constants are known. the triaxial state of stress can be computed.
sites were i n p e r m a f r o s t . No p r a c t i c a l d i f f i -
F o r t h e c o r e d r i l l i n g h e a t e d w a t e r was used t o c u l t i e s were encountered due t o the pe rmaf ros t .
avoid f reezing problems.
Assuming t h a t t h e v e r t i c a l stress is governed by the weight o f the ove rburden (ve r i f i ed as t h e n o r m a l s i t u a t i o n by numerous measurements th roughout t h e world) t he fo l lowing stress p a t t e r n was determined:
1437
- The v e r t i c a l stress is i n acco rdance w i th overburden I . e.
u v = p * g * h where p = d e n s i t y - 2500 kg/m 3
g = a c c e l l e r a t i o n o f g r a v i t y h = overburden
By 300 m overburden uv = 7.5 MPa
- The measured maximum h o r i z o n t a l p r i n c i - p a l stress uhl i s p a r a l l e l t o t h e moun- t a i n s i d e a n d i s e q u a l t o or s l i g h t l y h ighe r t han the v e r t i c a l stress. A t t h e innermost measuring s i t e uhl = 1 2 MPa.
- The measured minimum h o r i z o n t a l p r i n c i - p a l stress uh2 is normal t o t h e m o u n t a i n s i d e a n d is i n t h e o r d e r o f m a g n i t u d e of t h e h o r i z o n t a l g r a v i t y i n d u c e d h o r i z o n t a l stress g iven by
V 'h = 1-v 'v
where v = P o i s s o n s r a t i o
It is very impor tan t and i n t e r e s t i n y t o n o t e t h a t e v e n i n t h e s e young t e r t i a r y r o c k s , t h e r e e x i s t c o n s i d e r a b l e " g e o l o g i c a l " stresses t h a t supe r impose t he g rav i ty stresses.
Considerable problems with so c a l l e d floor heave a n d p a r t l y r o o f s l a b b i n g i n some of the deve lop- ment entries a re p robab ly caused by high hori-
combined with low strength of the rock , F ig . 9 . z o n t a l stresses normal to t h e a x i s o f t h e e n t r y
the soft floor Pillar pinches
Fiq.9 Floor heave and roof spa l l inq
Floor heave is caused by buckl inq due t o h iqh h o r i z o n t a l stress o r s q e e s i n g d u e t o n i l l a r p e n e t r a t i o n i n t h e f l o o r . The s t i f f e r c o a l p i l l a r p i n c h e s t h e s o f t f l o o r c a u s i n n t h e f l o o r t o heave. Roof s n a l l i n q is s h e a r f a i l u r e due t n h iqh ho r i zon ta l s tress.
F o r coa 1
t h e d e t e r m i n a t i o n of i n - s i t u s t r e n g t h o f a t es t a x e a p i l l a r t h a t showed qu i t e heavy
s u r f a c e s p a l l i n g a n d s l a b b i n g was selected. T h i s i n d i c a t e s t h a t t h e p i l l a r stress i s close t o o r o v e r t h e i n - s i t u s t r e n g t h o f t h e c o a l . By t a k i n g stress measurements from the s u r f a c e a n d i n t o t h e p i l l a r , t h e stress v a l u e s w i l l g i v e an i n d i - c a t i o n of t h e i n - s i t u s t r e n g t h . F i g . 10 shows the measured stresses a s a f u n c t i o n of h o l e depth .
v) VI 15-1
Q
CORE D I S C I N G ' "1
AND FRACTURING
S U B B I N G AND W A L L I N G FROM * THE SURFACE
J HOLE DEPTH M -
Fig.10 Measured stress as f u n c t i o n of h o l e s t r e n g t h
The f i r s t s u c c e s s f u l measurement w a s t a k e n a t a hole depth of 3 m. Measurements a t sha l lower dep th were n o t p o s s i b l e d u e t o c o r e d i s c i n g a n d f r a c t u r i n g . T h i s i n d i c a t e s h i g h e r v e r t i c a l stress n e a r t h e s u r f a c e of the p i l l a r a s would b e e x p e c t e d , a n d t h a t t h e stress h e r e is Close t o t h e i n - s i t u s t r e n g t h of t h e c o a l . The h i g h e s t measured value is 11,6 MPa and f o r p r a c t i c a l p u r - poses it can now be assumed t h a t t h e i n - s i t u s t r e n g t h of the c o a l is c l o s e t o tha t va lue . The labora tory de te rmined un iax ia l compress ive s t r e n g t h i s 1 6 . 3 MPa (se Table 1 on next page) .
m e l y d i f f i c u l t , as bo th t h e c o a l and the shale Sampling € o r l a b o r a t o r y t e s t i n g has been e x t s e -
d i s i n t e g r a t e s very e a s i l y . T o o b t a i n t h e best p o s s i b l e r e s u l t s , the l a b o r a t o r y t e s t i n g s h o u l d be car r ied ou t on f rozen spec imens , and the specimens should also be kep t f rozen a11 the time from the removal from the mine. The d r i l l - coxes were t h e r e f o r e k e p t i n i n s o l a t e d p o l y u r e - t a n cases i n t he mine. Upondeparturethey were b rough t a s hand baggage on theplane t o Trondheim a n d i m m e d i a t e l y a f t e r a r r i v a l s t o r e d i n a f reez- er wi th -4OC t empera tu re . Th i s p roved t o work o u t well, and t h e c o r e s were s t i l l f rozen upon a r r i v a l . The c o r e s were t h e n r a p i d l y p r e p a r e d ( c u t w i t h a diamond saw) and again kept i n t h e f r e e z e r u n t i l i m m e d i a t e l y b e f o r e t e s t i n g . Al- though this is not c o m p l e t e l y i d e a l , it i s f e l t t h a t t h e r e s u l t s a r e n o t v e r y f a r from t h e real va lues . Tab le 1 shows t he mechan ica l p rope r t i e s
1438
of f rozencoa l and sha l e .
TABLE I Mechanica l da ta for f rozen coa l and s h a l e (based upon c o r e s d r i l l e d o u t i n t h e mine
Rock t y p e Younqs Poissons Uniaxia l modulus r a t i o c o m p r e s s i v e
V s t r e n g t h GPa MPa
Coal 10,o 0,35 16,3 Sha le 1 bedding 13,4 0,20 77,8 Shale I I bedding 1 7 , O 0,20 86,4
T r i a x i a l tests were c a r r i e d o u t o n thawed c o a l co red f rom b locks i n t he l abo ra to ry . The r e s u l t s a r e p r e s e n t e d i n T a b l e I f .
TABLE 1 1 T r i a x i a l d a t a fo r coal ( thawed)
F a i l u r e stress u1 Confining stress u3 MPa MPa
13 ,7 0 47,7 4,9 66,7 9 1 8 80,4 14,7
The u n i a x i a l c o m p r e s s i v e s t r e n g t h i s h e r e 13 ,7 MPa vs . 1 6 , 3 MPa f o r f r o z e n c o a l , i n d i c a t -
than the thawed coal . Fig. 11 shows t h e Mohr i n g t h a t the f r o z e n c o a l is s l i g h t l y s t r o n g e r
f a i l u r e e n v e l o p e fo r t h e c o a l . I t w i l l be no ted t h a t t h e e n v e l o p e c u r v e i s no t l i nea r , wh ich i s t h e c a s e for most rocks . For p r a c t i c a l p u r p o s e s i n c o n n e c t i o n w i t h p i l l a r d i m e n t i o n i n g t h e com- mon Mohr-Coulomb f a i l u r e c r i t e r i o n i s o f t e n used assuming a s t r a i g h t l i n e e n v e l o p e c u r v e .
g a t i o n s is t h a t the ob ta ined va lues coicide w e l l w i t h v a l u e s f r o m c o a l f i e l d s o t h e r p l a c e s i n t h e wor ld and tha t the Bermafros t as such does no t seem t o a f f e c t t h e m a t e r i a l p r o p e r t i e s much.
The resu l t s f rom the in -s i tu measurements and l a b o r a t o r y tests have been used by the consul - t a n t s a s i n - p u t d a t a i n e m p i r i c a l l y and com- puter based des ign of the room- and p i l l a r s y s t e m s . T h i s r e s u l t e d i n 5 m wide e n t r i e s a n d c r o s s c u t s , l e a v i n g 2 4 m x 2 4 m p i l l a r s .
A v i t a l f a c t o r i n t h e d e s i g n is t he a b i l i t y of t h e r o o f r o c k t o c a v e d u r i n g p i l l a r r e c o v e r y . To g e t i n f o r m a t i o n a b o u t t h i s s e v e r a l diamond d r i l l h o l e s were d r i l l e d 50-60 m v e r t i c a l l y upwards i n the xoof, a n d t h e c o r e s were mapped a c c o r d i n g t o t h e so c a l l e d RQD-system and a l s o t h e Raith-Li-system.
The RQD (Rock Q u a l i t y D e s i g n a t i o n ) g i v e s a measu re o f t he f r ac tu r ing of the rock mass, while the Rai th-Li-system (developed mainly by t h e l a te professor Bj@rn L i , Norwegian I n s t i t u t e of Technology) i n a d d i t i o n a l s o g i v e s some i n - d i c a t i o n of t h e s t r e n g t h of t he rock mass. Both
bad" t o "very good". In this case both methods systems rate t h e r o c k in c la s ses f rom "ve ry
the roo f w a s " b a d " . T h i s i n t u r n i n d i c a t e s t h a t i n g e n e r a l i n d i c a t e d t h a t t h e f i r s t 10-15 m of
t h e c a v i n g a b i l i t y of the roo f i s good.
Throughout the years from 1984 the development
As ment ioned ea r l i e r , cons ide rab le p rob lems o f t h e room- and p i l l a r s y s t e m h a s p r o g r e s s e d .
have been experienced w i t h f l oo r heave and some- times a l s o s p a l l i n y f r o m t h e r o o f . T h i s i s pro-, bab ly pa r t ly caused by h igh ho r i zon ta l stresses. To map t h i s more a c c u r a t e l y , a convergence measuring program was s t a r t e d i n l a t e 1 9 8 6 .
F ig .11 Mohr f a i l u r e e n v e l o p e f o r coal
A f i t t e d s t r a i g h t l i n e a p p r o a c h w i l l g i v e t h e f o l l o w i n g v a l u e s f o r i n t e r n a l f r i c t i o n a n d cohesion:
- I n t e r n a l f r i c t i o n a n g l e Qi = 39,6' - Cohesion c = 4 , 5 MPa
A gene ra l conc lus ion of t h e l a b o r a t o r y i n v e s t i -
EFFECT OF THAWING
The i n t a k e v e n t i l a t i o n a i r t o the mine is nor- mal ly a lways above f reezing point . During the win te r s eason t he a i r is a r t i f i c i a l l y h e a t e d . The i n t a k e a i r i s taken th rough the main ad i t . T h r o u g h o u t t h e y e a r s c o n s i d e r a b l e s t a b i l i t y problems have been experienced in t h e roof of the a d i t , as t h e r o o f s h a l e g r a d u a l l y d i s i n t e - g r a t e s . I t is, however , no t qu i t e c l ea r i f t h i s is due t o thawing or a g e n e r a l e f f e c t d u e t o e x p o s u r e t o a i r and/or humidity. It is known from o the r non-pe rmaf ros t l oca l i t i e s a round the w o r l d t h a t some sed imen ta ry rocks t end t o d i s i n t e g r a t e when exposed t o a i r and/or molstur€. T h i s i s c a l l e d s l a k i n g . I n a d d i t i o n t h e e f f ec t of h igh ho r i zon ta l stresses may a l s o c a u s e t h e roof t o s p a 1 1 o r d i s i n t e g r a t e .
Normally, the roof was sys t ema t i ca l ly rock bolted combined w i t h s teel n e t ( F i g . 1 2 a ) . I n t h e main a d i t , t h e l o o s e n e d c h i p s of rock is c o l l e c t e d by t h e n e t which would e v e n t u a l l y bulge down by t h e w e i g h t a s i n d i c a t e d o n t h e f i g u r e . From time t o time t h e n e t had t o be opened t o remove the debris . Because of t h i s major p a r t s of t h e a d i t i s now suppor ted by steel sets as ind ica t ed on F ig . 12b. Tests wi th s h o t c r e a t e combined w i t h r o c k b o l t s h a s proved t o be q u i t e s u c c e s s f u l (Fig. 12c) . I t seems t h a t t h e t h i n l a y e r of s h o t c r e a t e seals t h e
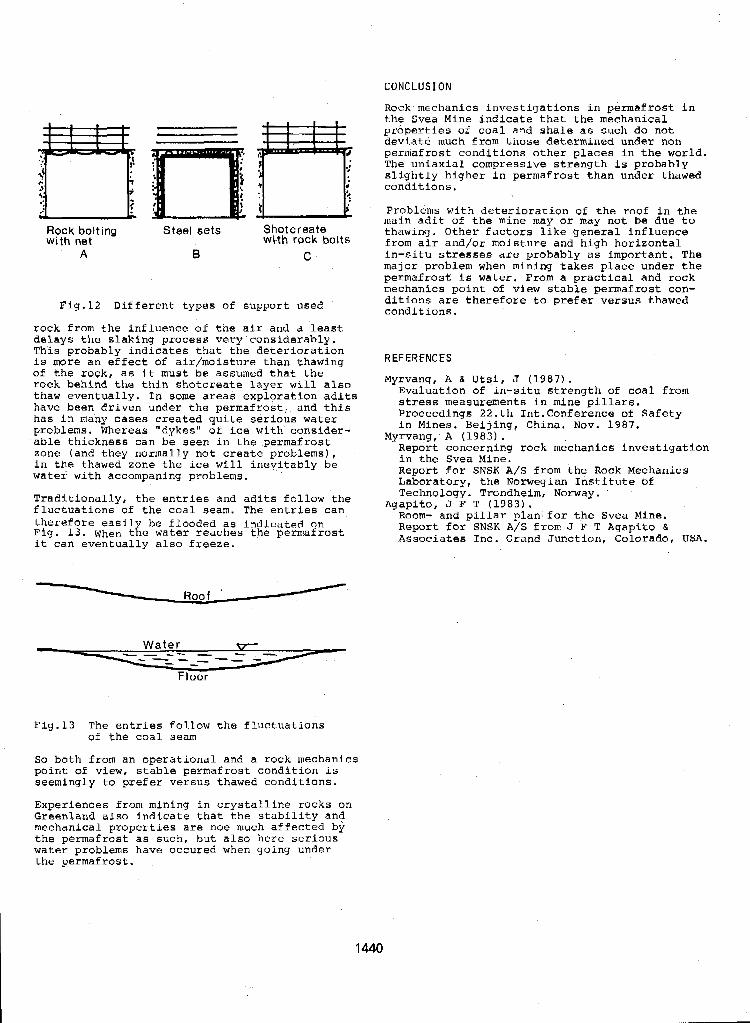
CONCLUSION
R@ck m e c h a n i c s i n v e s t i g a t i o n s i n p e r m a f r o s t i n the Svea Mine i n d i c a t e t h a t t h e m e c h a n i c a l p r o p e r t i e s of coa l and sha l e as such do no t d e v i a t e much from those determined under non pe rmaf ros t cond i t ions other p l a c e s i n the world The u n i a x i a l c o m p r e s s i v e s t r e n g t h is probably s l igh t ly h ighe r i n pe rmaf ros t t han unde r t hawed cond i t ions .
With net Rock bolting Steel sets
A B
Shotcreate wi4h rock bolts
C
Fig .12 Di f fe ren t types o f suppor t used
rock f rom the in f luence of t h e a i r and a least d e l a y s t h e s l a k i n g p r o c e s s v e r y c o n s i d e r a b l y . T h i s p r o b a b l y i n d i c a t e s t h a t t h e d e t e r i o r a t i o n i s more a n e f f e c t of a i r /mo i s tu re t han t hawing of the rock , as it must be assumed t h a t t h e r o c k b e h i n d t h e t h i n s h o t c r e a t e layer w i l l a l s o thaw eventua l ly . I n some a r e a s e x p l o r a t i o n a d i t s have been dr iven under the permafros t : and th i s h a s i n many c a s e s c r e a t e d q u i t e s e r i o u s water problems. Whereas "dykes" of ice wi th ' cons ider - a b l e t h i c k n e s s c a n b e s e e n i n the permafros t zone (and they normally not create problems), i n the thawed zone the i ce w i l l i n e v i t a b l y b e watei with accompaning problems.
main a d i t of t h e mine may ox may no t be due t o Problems w i t h d e t e r i o r a t i o n o f the roof i n t h e
t h a w i n g . O t h e r f a c t o r s l i k e g e n e r a l i n f l u e n c e from a i s a n d / o r m o i s t u r e a n d h i g h h o r i z o n t a l i n - s i t u stresses a r e p r o b a b l y a s i m p o r t a n t . The major problem when min ing t akes p l ace unde r t he permafros t i s water . From a p rac t i ca l and rock mechanics po in t of view stable permafrost con- d i t i o n s are t h e r e f o r e t o p r e f e r v e r s u s thawed cond i t ions .
REFERENCES
MyKVang, A & Utsi, J (1987) . Eva lua t ion o f i n - s i tu s t r eng th o f coal f rom stress measurements i n mine p i l l a r s . Proceedings 22. th 1nt .Conference of Safety i n Mines. Beijing, China. NOV. 1987 .
Report concerning rock mechanics i n v e s t i g a t i o n i n t h e S v e a Mine. Report f o r S N S K A/S from t h e Rock Mechanics Labora tory , the Norweqian I n s t i t u t e bf
Myrvang, A (1983) .
T r a d i t i o n a l l y , t h e e n t r i e s and a d i t s f o l l o w the f l u c t u a t i o n s of t h e c o a l seam. The e n t r i e s c a n t h e r e f o r e e a s i l be f looded as i n d i c a t , a d nn Fig . 13. When txe water r e a c h e s t h e p e m a f r o s t it c a n e v e n t u a l l y a l s o freeze.
Technology. Trondheimi Norway.
Room- and p i l l a r p l a n for t he Svea Mine. Report f o r SNSK A / S from J F T Agapito & Associates Inc. Grand Junct ion, Colorado, USA.
Agapito, J F T (1983) .
Roof
W a t e r
Floor
Fig .13 The e n t r i e s fol low t h e f l u c t u a t i o n s of t h e c o a l seam
So both f rom an operat ional and a rock mechanics p o i n t of view, s t a b l e p e r m a f r o s t c o n d i t i o n i s seemingly t o p re fe r ve r sus t hawed cond i t ions .
Greenland also i n d i c a t e t h a t t h e s t a b i l i t y a n d Experiences from mining i n c r y s t a l l i n e rocks on
mechan ica l p rope r t i e s a r e noe much a f f e c t e d by the p e r m a f r o s t a s s u c h , b u t a l s o h e r e s e r i o u s water problems have occured when going under the pe rmaf ros t .
1440
SETTLEMENTS OF THE FOUNDATIONS ON SEASONALLY FREEZING SOILS V.O. Orlovl and V.V. Fursovz
lAll-Union Research Institute of Bases and Underground Structure, Moscow, USSR 2Tomsk Civil Engineering Institute, Tomsk, USSR
SYNOPSIS The development of ver t ica l diaplacements of,foundatiom to be b u i l t on seasonally freezing heaving m i l a am analyzed i n th ie report. Results of long-term f i e l d t e s t a with the w e of shallow foundation-plates carried out in the Western Siberia are assumed as a basie f o r this atuay.
T i 1 1 the present time it was not paid much at- tent ion to ageaif ic pmpsrtiee and t o pmcedu- m of seasonally freezing soils tes t ing, that i e w problem o f deformation development du- -%awing of seaeonally fzwezing aoi la aa well a% BSgn-variable defomtione occuring at long-term seasonal freezing and thawing o f 80- ils axe studied unauffiaiently. Solution to this problem was one o f the aim# o f the inves- t i g a t i o w undertaken in Tomsk (Siberia) dealing with vertfoal diaplaoemsnts of ahallow founda- t i o m which warn carried out dur;ing the last 8 years on experimental eitee with etrongly
A t experlmsntal s i t e t h e aeaeonally freeaing layer consisted of quaternary loam depoaita. The upper soil layer coneiated of hardplaatic and sof tplaef ic l o w up to 1,2-lr5 m in thick- ness which were underlain by so i l s having the consistence ranging f r o m sof tp las t ic t o yield- plastia. The groundwater table was 1,8-2,8 m below the ground aurfaoe, On the whole the so- ils wre represented by water-eaturated s o f t
In the teete there were used xeinfom concre- t e foundation-plates of an area of 1 2whioh transmitted pressure to the eoil of 0; 0,1;0,2 and 0,3 MBa reapectively. The foundatiowpler- tee were i m t a l l e d a t a depth of 1 ,O and 1,5m while the seaaonal freese and t h a w norm depth m a equal t o 2,2 m. The s ide faoea of the foun- dation-plates were isolated f r o m the effect o f tangent fmat-heave forces, therefore during the teeta the faundation-plates w%re displaced only as a meeult of seasonal f reez i~- thawing of soil8 beneath t h e i r undercride l eve l . The analyse of teat ing reeul te allowed t o draw conclwiona aa t o ver t ica l diaplacements of the foundation-platee depending on the long-term seasonal freezing and thawing of ~ofls and the
enloaded foundation-platee (bo) were heaved praotioally simultaneously with the beginning of soils freezing beneath their underside le- v e l and had the maximmum dieplacements resulted f m m the effect of heaving so i l s deformatioae (hfo=hfmax), After thawing o f soils they we- descended t o the i n i t i a l position and t h e i r 8e- ttlements were equal t o their e levat ion
heaved Boils.
s i l t y lo-.
ressure transmittea t o them.
at soils heaving (S =h 1, Dieplacements of the Loaded founbti8n-flates (hfo) were leea than the unloaded onee (O<P(P,: hf$hfO) where P and S am the pressures tranemitted from thei foddation-plate to the soil and the press- ure o f frost-heaving reapectiveZy, A t thawing o f bwse soils here wre obeerved secondary settZements (S t 1, which were referred t o as. subeiding being equal t o
Hence the total sett lement of shallow founda- '
t ion with consideration for deformationa occu- red a t seaeronal freezing of soila during the past n -yeare may be determined according t o the following equation:
where S - the stabil ized aett lement after lo- ading pof the foundation p r i o r t the begin- ning of eoil seasonal freezing, Sf - the ae- condary sett lement to be a result of i - @ea- eonal free se-thaw cycle. Figurse 1 and 2 i l lust rate the development of vertioal displacements o f the foundation-pla- tea and herrve-measuring marks st different pre+ atlures on e o i l during the paet 3 years of rese- arch. At an inorease of the load impoaed on the foun- dation ite displacements at the expence o f fm0t heaving were increased a t subsequent thawing, When the pmsaum at the foundation underside level became equal t o the pressure o f froat heaving, there was not observed the elevation o f the foundation st freezing of soil beneath it, The settlements thawing had maximum values ( P P r ; hfp=O; 3- So) The maximum additional settlement8 were o b s e r ved a f t e r t h e f i r s t seasonal freeze-thaw cycle. After the second cyole they accounted f o r 30409% of the previous settlement and appeared t o be reducing with time exhibiting 8. trend t o be stopped at the expence of pro-
1441
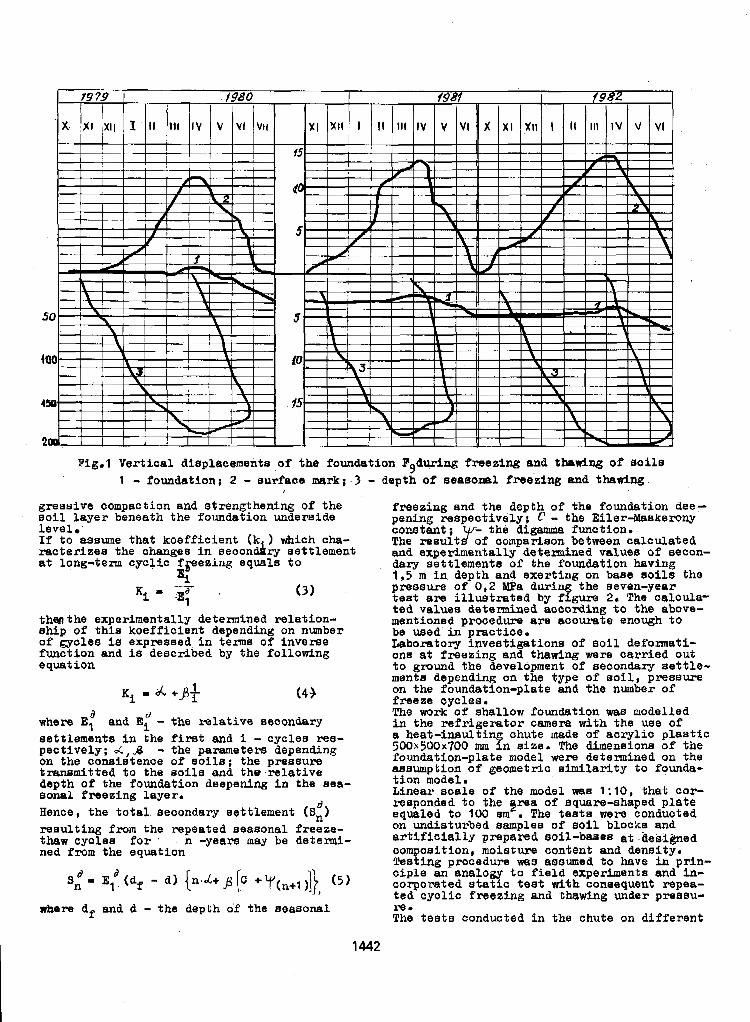
Fig.1 Vertiaal displacements of the foundation F,during f reez ing and thaning o f aoile 1 - foundation ; 2 - surface mrk; . 3
greesive compaction and strengthening of the soil layer beneath the foundation underaide l eve l If t o asaume tha t koef f ic ien t (k ) which cha- mc te r i zea t he changes i n s e c o n d r y settlement a t long-term cycl ic fpeezing equals to
4 Ki - -J$ '
I
(3 1
thenthe experimentally determined relation- sh ip of t h i e koe f f i c i en t depending on number o f gyules i s expressed i n feme o f inverse function and is described by the following e quat ion
Ki = +Br 1 (43
where E: and E, - the relative secondary d
set t lements i n the f irst and i - cyclse ree- psc t ive ly ; A,& - the parameters depenaing on the coneisfence of so i l e ; t he preasure t ransmit ted t o t h e soils and the r e l a t i v e depth of the foundation deepening i n t h e eea- sonal freezing; layer. Hence, the total secondary set t lement (S,)
&
d
- depti; of eeaeonal freezing and thawing
freezing and the depth of the foundation dee- pening respect ively; c - the Eiler-makerony constant ; the d i w fmCt ion* The result of oompariaoa between ca lcu la ted and experimentally determined values of aecon- dary set t lements of the founbt ion having 1,5 m i n depth and exerting on baae e o i l ~ ~ the pressum o f 0,2 MPa during the seven-year t e a t are i l l u e t r a t e d by figure 2. The calcula- ted values determined aocording t o the above- mentionea procream are accurate enough to
Laboratory inveetigatlom of eoil defomat i - be used i n praotioe.
one at freezing and thawing were ca r r i ed out t o ground the development of eecondary ae t t le - menta depending on the type of rjoil , preasu3.e on the foundatlon-plate and the number o f
The work o f shallow foundation was modelled freeze cycles.
in the r e f r i g e r a t o r camem with the use of a beat-insult ing chute made of acrylic p l a e t i c 500x500x700 m i n s i z e . The dimenatone o f the foundation-plate model were determined on the asampt ion o f geometric s i m i l a r i t y t o founda- t i o n moael. Linear w a l e of the model mas 1 : 10, that cor- responded to the frea of aquare-shaped plate eaualed t o 100 m . The t ea t e were conduoted
x-
r e su l t i ng f r o m the repeated seasonal freeze- os undisturbed &mplas of soil blocka and thaw cyclea for ' . n -years may be determi- ar t i f ic ia l ly prepared soi l -bases bt .&r$i@ed ned f r o m the equation oompoeition, moisture content and density.
1L
Testing procedure was aasumed t o have i n pr in- sn 91 E, (df - a) {n*k+ J k *'f(n+l I]}, (5) corporated s t a t i c t e a t with consequent repea-
ted cycl ic f reez ing and thawing under preaau-
The t e s t e Conducted in the chute on d i f f e ren t
d d c iple ELII analogy to f ie ld experiments and in-
where df and d - the depth of the seasonal ?%a
1442
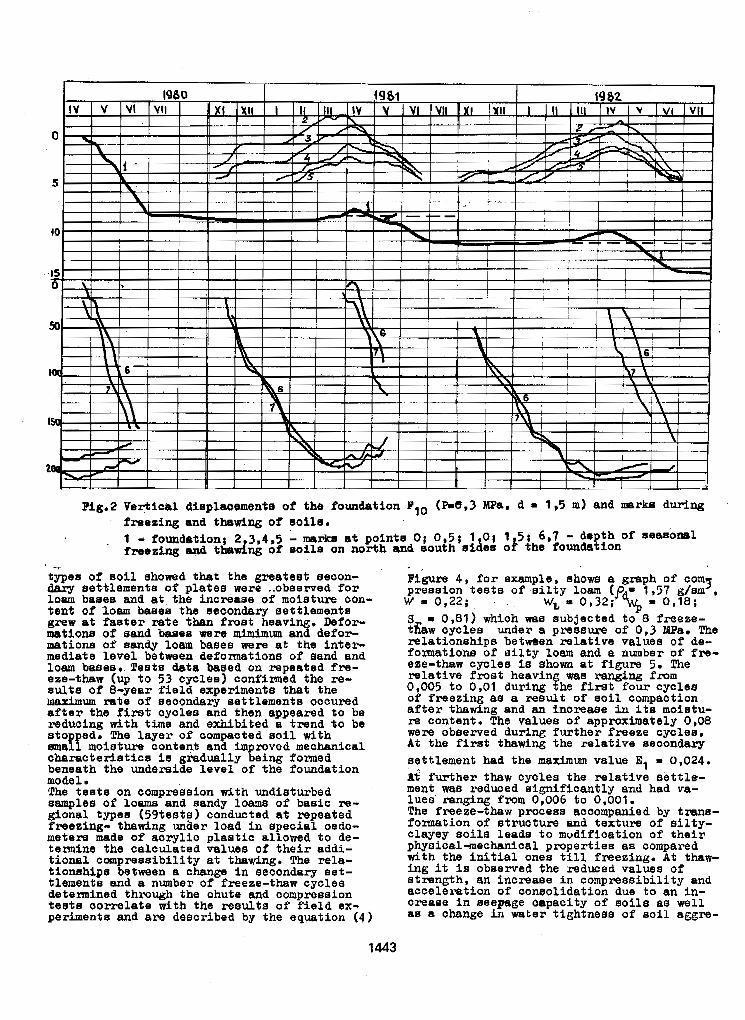
. 1 - foundation; 2 3,4.5 - mrke at points 0 ; 0 . 5 ; 1 0 ; 1 54 6.7 - de t h of aeaabnal freezing and thadng of soils on north and aouth d e 8 0 ) the foundaPion
<;pee o f e o i l showed t b t the greateet eeoon- dary settlemente o f plates were ..obaexvea f o r loam bases and at the increase of moisture con- tent of loam bases the secondary settlements grew at f a a t e r r a t e than Prost heaving. h f o r - matione o f aand bases were mimimum and defor- mations of sandy loam bases were at the i n t e r mediate level between deformations of sand and loam bases. Tests data based on repeated fre- ere-thaw (up t o 53 cyclem) confirmed the r&- s u l t a of 8-year f i e ld experiments that the maximum rate of secondary settlements occured after the fiirat cyoles and than appeared t o be mducing d t h time and exhibited a trend t o be stopped. !The l aye r o f oompaoted eoiZ with
ohamcter ia t ics ie radually being fomed mall moisture oonteqt; and improved mechanical
beneath the unclerade Level of the foundation model I The t e a t s on compreseion with undisturbed samples of loama and sandy l o w o f baaic re- glonal typea (59tests) conducted a t repeated freezing- thawing unaer load in epecial oedo- metera made of acryl ic plaatic allowed t o de- termine the calculated values o f t h e i r addi- t ional Ccrmpmseibility at thawing. The rela- tlonehipe between a change i n secondary aet- tlemente and a number of freeze-thaw cyclee determined through the chute and campresaion t es ta cor re la te with the resultrs of f i e l d ex- periment~! and are described by the equation (4)
1443
pression testa of a i l t y loam Figura 4 I for example, ahowa a graph of corn3
W m 0,22; . , W t = 0132; S - 0 , S l ) which m e eubjectecl t o 8 freeze- t h w cyclee under a pressure of 0 , 3 MPa. The relationships between r e l a t ive values of de- foxmatione of silty loam and a number o f fre- eze-thaw cyoles t a shorn a t figure 5. The re lat ive frost heaving m a ranging from 0,005 t o 0,Ol during the firet four cycles o f freezing as a reeult of s o i l compaction a f t e r thawing and an increase in its moietu- m content, The values of approximately 0,08 were observed during fur ther f reeze cyoles. A t the f i r s t thawing the re la t ive secondary settlement had the maximum value E, = 0,024. A i fu r the r t h a w cyclee the relative s e t t l r - ment WBB reduced s ignif icant ly and had va- lues ranging from 0,006 t o 0.001. The freeze-thaw process accompanied by trrme- ionnation o f st ructure and textum of s i l t y - clayey soils leads to modification of their phye-ical-mechanical propertiea as oompaed with the i n i t i a l ones t i l l freezing. A t thaw- ing i t is obrjarved the reduced values of strength, an increase i n compressibility and acceleration of coneolidation due t o an in- crease i n seepage oapaoity of s o i l s as well as a change i n water tightness of Boil aggm-
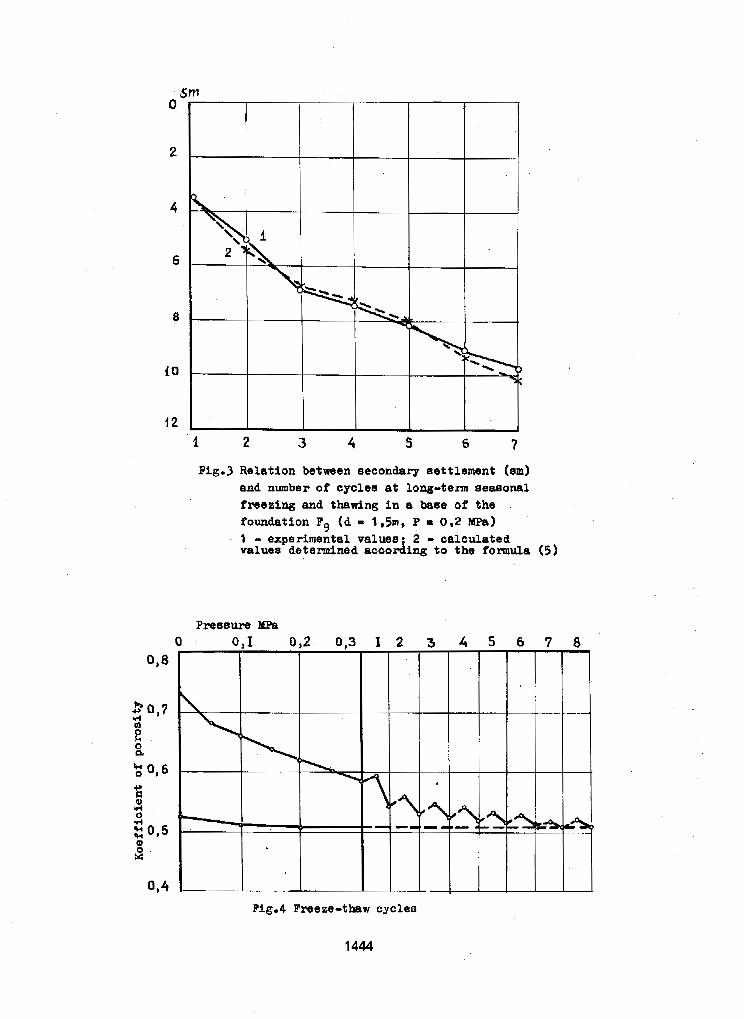
2
4
6
8
io
12 2 3 4 S 6 7
PIg.3 Relation between eecondary eettlement (am) and number o f cyalea at long-term eeamonal freeaing and thawing in a baee of the foundation Fg (d - l ,Sml P 012 ma)
- 1 - experimental valuee: 2 - calculated value8 determined according t o the fornula (5)
Fig.4 Freeze-thaw cyclee
1444
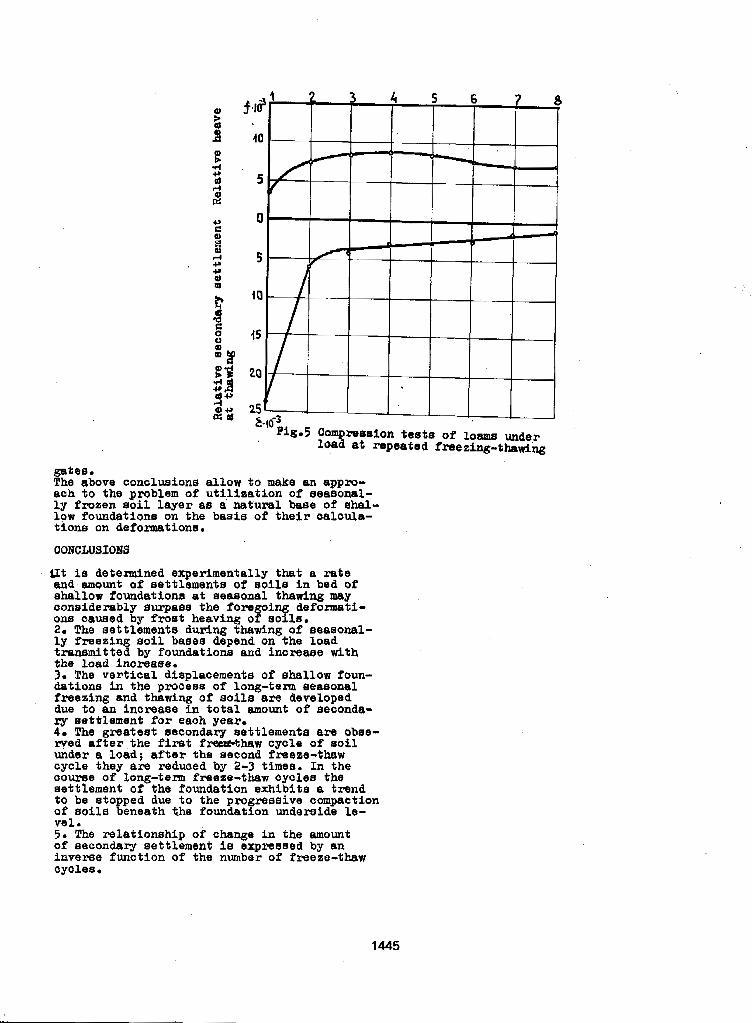
mates. The above conclusiona allow t o make an appro- eoh to the problem o f utilization of seaeonel- ly frozen @oil layer as a nature1 base of ethal- low foundatione on the basis o f their oalcula- tionB on defomationa.
(IONCLUSIONS
' Ut ie detemfned experimentally that a rate and mount of settlements of soila in bed o f ahallow foundations et seasonal thawing may oonsiderably surpaee the fort, i deionnati- ona caused by frost heaving o$s%a. 2. The settlement8 during thawing of eeesonal- ly freezing soil basee depend an the load tranemitted by foundations and inoreaee with the Load inczwaae. 3* The vertical diaplacemente o f shalLow foun- dations In the p r o w s 8 of long-term eeaeonal freesing and thawing of soils are developed due to an increase in total amount o f aeconda- r y eettlemenf f o r each yeax. 4. The gmatest secondary eattlementa are obae- w e d after the firat f-thaw cycle of s o i l under a load; after the eecond fmeze-thaw cycle they are reduced by 2-3 timea. In the aouree of long-term freese-thaw oyclea the trettlrment of the foundation exhibits a trend t o be st0 ped due to the progreesive ampaction o f eoi le %sneeth the foundation underaide le- vel. 5. The relationship of change in the amount of secondary eettlement is expreaeed by an inveree function of the number o f freeze-thaw oy01es.
1445
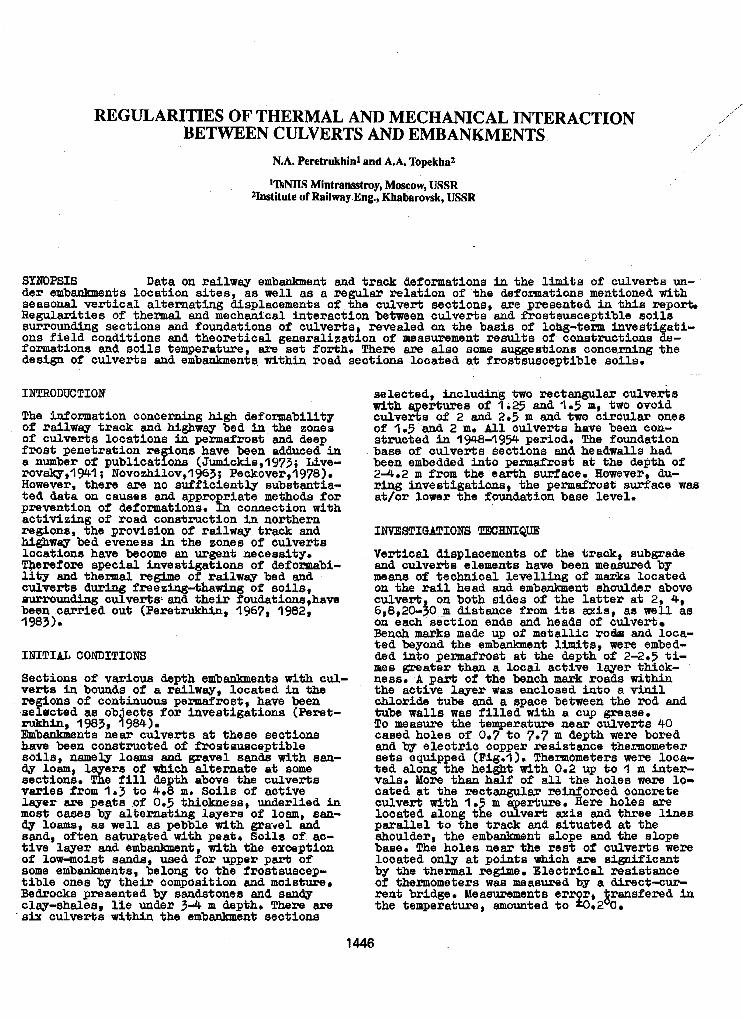
REGULARITIES OF THERMAL AND MECHANICAL INTERACTION BETWEEN CULVERTS AND EMBANKMENTS
N.A. Peretrukhinl and A.A. Topekbaz
'IrSNIIS Mintranastroy, Moscow, USSR 2hstitute of Railway Eng., Khabarovsk, USSR
SYNOPSXS Data ofl r a i l w a y embankment ma track deformations in the limits of culvert8 ufl- der embauhwnts location sites, as we31 as a regular relation of khe deformations mentioned with seasonal verbical alternating displacements of: *he culvert sections, are presented in this report. Regularities o f thermal and mechanical interaction between culverts and frostsusceptible aoila
ons f i e ld conditions and theoretical generaliaatfon 09 measumment results of constructions fe- sursoundfrrg sections and foundations of culverts revealed on the basis of lohg-term investi at i - formations and so i l s temperature, are set fo r th , There are also some suggeseiona concerning the desigu of culverts and ernbmkment;q road sections looated at frostsusceptible so i l s .
INTRODUCTION The Momat ion concerning high deformability of r a i l w a y track and h i g h w a s bed i n the zonea of culverts locations in permafrost and deep frost penetration regLoas have been adduced fa a number of publications (Jumickis,1973; Live- rovw, lYtI ; N0vozhilov,l963; Peckover,l978). However, there are no 8uffSciently substaneia- ted data on causes and appropriate methods f o r prevention of defomationa. In connection with activiziag of road construction ia northern regions, the provision of r a i l w a y track and highway bed eveness in the zone8 of culverbs locations have become an urgent necessity. Tqereiore special hvestigations of deteformabi- l i t y and thermal re& of r a l l w e y bed and culverta during freezbg-thawfag of soi ls , surrouuding culver ts and their foudatioa8,have been carried out (Peret-, 1967, 1982, 1983).
INITIAL CONDITIONS
Sections o f various depth embanhente with cul- verts la bounds of a r a i l w a g , located in the regions 09 contbuoup w r m f r o s t . have been
Fmbs.nhente near culverts at these sections have been constructed of frostsusceptible soile, aameYy loems and gravel sands with am- dy loam, layers of which alternate at some sections. The fill de t h above the culverts v-ies Prom 1.3 t o 4.8 m. so i l s of active layer are peat8 .of 0.5 thickness, undexlied in most cases by a1ternat;i.q layera of loam, san- dy lo-, as well as pebble wlth gravel and
t ive layer aud embanhent, with the exception sand, oftea aatuxated with peat. Soils of ao-
of lowaolat aanas, used fo r upper part; o f some embaulmeata, belong t o the frostauacep- t i b l e ones by theix composition and moisture. Bedrocks presented by sandatones and sanw clay-&ales, l i e under 3-4 m depth. There are six culvexts wit- the embankment sections
selected, includiag two rectangular culvgrts with aperburea of 'I .25 and 'l.5 m, two ovoid culverts of 2 and 2.5 m a d two cboular ones o f 'l.5 and 2 m. AJ.1 culverts have been con- structed in 194.8-199 period. The foundation base of oulverts sections and headwalls had been embedded i n t o permafrost at the depth oi 24.2 m from the earth supface. However, du- r i n g Savestigationsl the permafrost surface w a s at/or lower the fouadatioa baoe level.
INVESTIGATIONS TECHNIQUE
Vertical displaoements of the tsaok, subwade and culverbs elemenljs haw been measured by means of technical levelling of marks located on the rail head and ernbanbent shoulder above culvert, on both sides of the l a t te r at 2* 4, 6,8,20--30..1l distance from i ts axis, aa well as on each section ends and he ads of culvert Bench marks made up of metallic r o b and loca- ted beyond the embankment limits, were embea- ded bat0 permafrost at the depth of 2-2.5 ti- mes greatex than a local active layer tuck- ness. A part of the bench mark roads within the active leyer was enclosed Frrto a v h i l ch lor ide tube an8 a space between the rod and tube walls was f i l l e d with a cup grease. To measure the temperature near culverts 40 cased holes of 0.7 t o 7.7 m depth were bored and by e lec t r ic copper resistance thermometer se t s equipped (Pig.1). Themmeters were loca- ted along the height with 0.2 up t o l m ia te r - valse More than. half of all the holes were 10- cated at the mctanguLar reinforced concrete culvert with I .5 m a erture. Here holes are looated along the cufvert; axis and three lines paral le l to the t rack and situaiied at the shoulder, the embadaneat slope and the slope base. Tbe holes near the rest of culverts were located only at points which are significant by the thermal m g h . ElectrZcal resistance of thermometers was measmd by a dhwct-cur- rent bridge. Mewurements erxor, pansfered Ftl the temperature, amounted t o 4 . 2 C.
1446
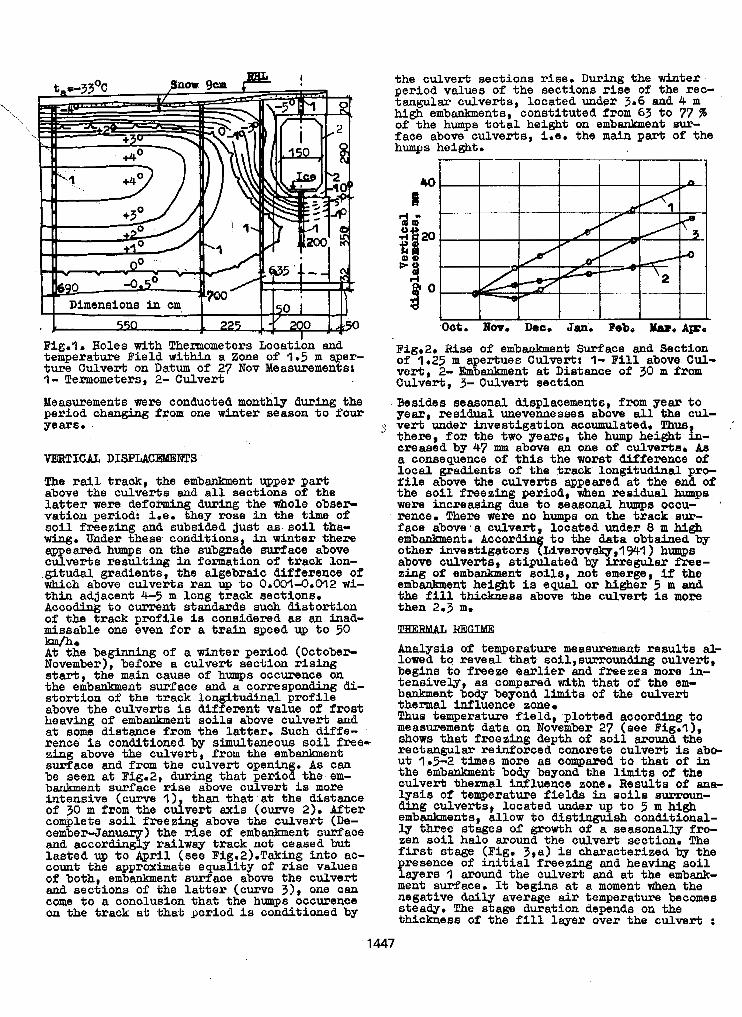
550
Fig.1. Boles with Thermometers Location and temperature Pield withFu a Zone o f 1.5 m q e r - ture Culverti on Datutu of 27 Nov Measurement at I- Termometem, 2- Culvert
Measurements were conducted monthly during the period changing from one whter season t o four ye axe
VERTICAL DI8PLACEMENTS
!the sail track, the embatihent upper p& above the culverts and a l l sections of the l a t t e r were defoxmbg during the whole o b s e r vation period; L e . they rose in the t h of s o i l fxeezhg and subsided just a8 s o i l tha- wag. Under these conditions, in wiaimx there appeared humps on the subsade s w a m above culverts reaulthng in formation of track loa- ,gitudal gradients, the algebraic dilifferenoe of which above culverts ran up t o 0.001-0.012 wi- thin adjacent 4-5 m long track section8. Accodhg t o current standards such Ustoxtion o f the track profile is considered as an -ad- missable one even for a train speea up t o 50 W h A t the beginning of I winter pe rha (October- November), before a culvext section rising start, the m a i n cause of humps occwnce on the embankment surface and a corresponding di- stortion o f the track longitudhal profile above the culvert.8 is different value of froat heaving of embankment soi le above culvert and a t some dietance fxom the lat ter. Such diffe- reace is conditioned by simultaneous s o i l free- z i n g above the culvert, from the embanlanenk a m a c e and from the culvert opening. A s can
banhent surface r i s e above culvert i s mom be seen a t Fig.2, during that period the-em-
intensive (curve I ), than that at the distance o f 30 m from the culvert axis (cume 2). After complete s o i l f r e e ~ i n g above the culvert (De- cemberdanuary) the r ise of embankment surface and accorajngly railwqy track not ceased but Lasted up t o April (see Figm2).Takhg into 8c- count the approximate equality of r i se values of both, embailanent surface above the culvert and sections of the lakter (cumre 3), one can come t o a conalusion that the humps occurence on the track a t that period is conationad by
the culvert sections rise. During the whtef period values of the sections riae of the rec- tangular culvert;^, located under 3.6 and 4 m high embanbents, constituted from 63 t o 77 of the humps total height on embankment sur- face above cuJ.vert;t;8, i.e. the m a i n part of the humps height.
r I I I I I I -1
Fig.2. Use of embalmen* Surface and gection of 1.25 m apertues Culver t : I- F i l l above CUL- verb, 2- Embadanent a t Distance of 30 m f r o m Culvert, 3- Culvert section Besides seasonal displacemeats, from year t o
c vert under investigation acoumulatea. Thw year, residual uneveme8ee~ above a l l the cul-
r' there, for the two yearst the bump height L- '
creased by 47 mm above an one of culverts. As
local gradients of the track longitudLnal pm- a coneeguence of this the worst Wference o f
file above the culvert6 appeared a t the end o f the soi l freezug period, when maiaual humps were increasing due t o seasonal humps occu- *
rence. There were no humps on the track 8ur- face above a culvert, located under 8 m high emb-nt Accor t o the data obtained by other i n v e s t i g a t o x ~ ~ ~ e r o v ~ , , ~ , ) humps above ccilve&8, stipulated 'by irregular free- zing of embankment soila, not emerge, if the embanlunent height is equal o r U g h e x 5 m and *he f i l l thickness above %he culvert; is more then 2.3 m.
THl$RUG IlEGIME
Analysis of temperatwe measurement resul ts d- Lowed t o reveal tha9 soS1,sumounding culvert;, begins t o freeze ear l ie r and freezes more in- tensively, as compared with that of the em- bdcment body beyond limits of the cu lver t thsnnal influence zone Thus temperature field, plotted according t o measurement data on November 27 (see Big.l), shows that freesing depth o f s o i l around the rectangular reinforced concrete cu lver t is ab+ u t 1.5-2 times more as aompared t o thab of in the embaakment body beyond the l-ts of the culvert thennal Wluence zone. Results of ana- lgals o f temperature f ie lds 5~ a o i l s surroun- ding culverts, located under up t o 5 m high embanlanents, allow t o d i o t i n g u i s h conditional- ly three stages of growth o f a seasonally fro- zen s o i l halo around the culvert section. The first stage (Fig. 3,a) i s characterized by the xesence of Fnitial freezing and beavirsg so i l ayere 1 around the culvert; and at the embank-
ment surface. It beghs at a moment when the negative daily average air temperature becomes steady, The stage duration depends on the thhiclmess of the f i l l leyer over the cave& :
1
,1447
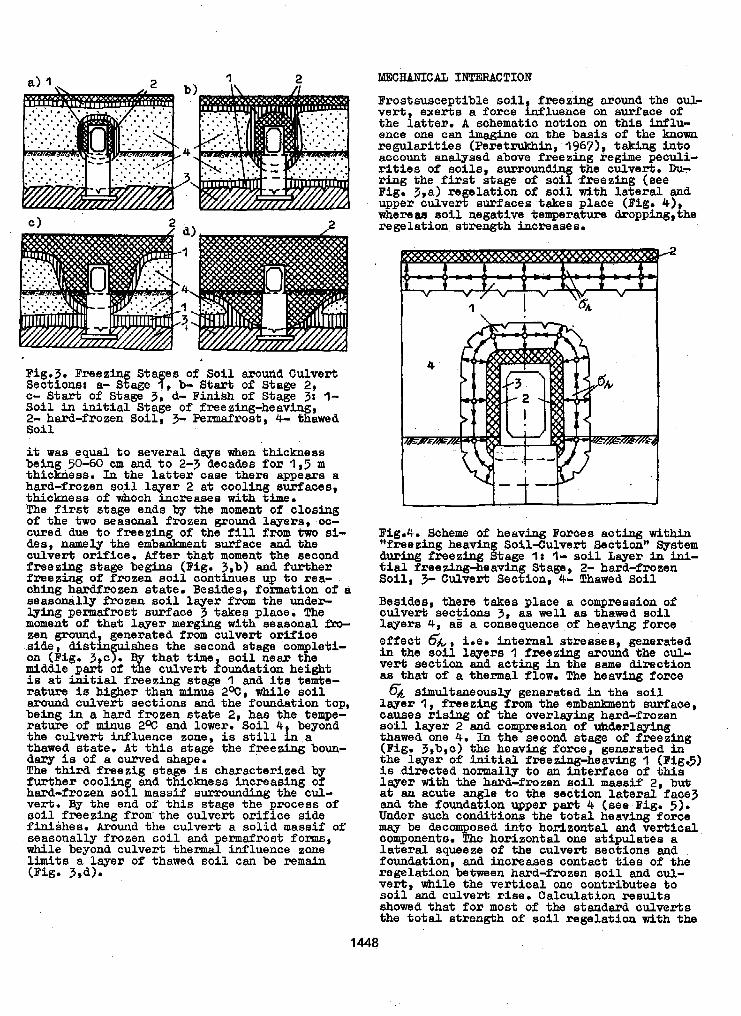
I 2
Pig.3. Freezing Stages of S o i l murid Culver%
c- S t a r t of Stage 3, d- F W B h of Stage 3s 1- Sections: a- Stage I, b- S t a r t of Stage 2,
Soi l in initial Stage o f freezing-heavbg, 2- bard-frozen Soil, 3- Permafrost, 4- thawed Soil
it was equal t o several days when thickness being 50-60 cm and t o 2-3 decades for 1,5 m thfckiess. In the l a t t e r case there appears a hard-frozen soil layer 2 a t cooling suxfaces, thickness o f whoch increases with time. The f i r s t stage ends by the moment of closing o f the two seasonal frozea mound layers, OC- cured due t o freeziag of the fill from two si- des, namely the embaakment surface and the culvert orifice. After that moment the second free5ing stage begins (Fig. 3,b) and further freezing of frozen s o i l conkinues up to xea- chug hardfrozen state. Besides, fornation of a seasonally frozen soil layer from the uaderc- Wing permafrost surface 3 takes place. The moment of thae layer mexg- with seasonal fro- zen ground generated from culvert; orifice aide, dl& shes the second stage completi- on (Fig. 3 ,cpTQ that time, s o i l near the middle p& of the culvert foundation height i s a t i n i t i a l freezing stage 1 and i t a temte- rature i s higher than minus 2%, while so i l arouud culvert sections and the foundation top, being j-u a hard frozen state 2, has the tempe- rature of minus 2% and lower. Soil 4 beyond the culvert W h e n c e zone, is still a thawed state. At th i s stage the f r e e z h g boun- dary i s o f a curved shape. The third freeeig stage is characterized by fur ther cooling and thickness Fncreasing of hard-frozen so i l massif surrounding the cul- verb. By the end of th i s stage the psocess of ~011, freezung from- the culvert oxif ice side finishes. Around the culvert a s o l i d massif of seasonally frozen s o i l and permafrost forms, while beyond culvert thermal influence zone limits a layer of thawed s o i l can be rem& (Fig. 3.d).
mcIIANIcAL ~IVTErnCTION
Frostsusceptible soil f r eez ing aziowd the cul- vert, exerts a force h u e n c e on s m a c e of the lat ter. A schemaeic notion on this influ- ence one can imagine on the basis of the known segularit iee (Pel?etrukhin, 19671, t a k h g l a t o account anaILysad above f reezhg regime peculi- r i t i e s of s o i l s , sumoundiag the culvert. Du- ring the f i r s t stage of soil f r eezbg (see Big. 3,a) regelation of soil with la te ra l and upper culvert surfaces takes place (Fig. 4) whereas soil negative temperature dxopping,ihe regelation strength FZLcreaases.
I I
I I I I
Fig&. Scheme o f heaving Boxces acting wit- "freezing heavlsg SoilXulvert Section" System during f r e e z h g Stage *I t I- so i l Layer in hi- %ial freezing-heaving Stage, 2- hard-froeen S o i l , 3- Culvert Section, 4- Thawed Soil
Besides, there takes place a comgreesion of culver% sectiona 3, as well as thawed s o i l layers 4, a i a coaeequence of heaviag force effect 6;c, i.e. h te rna l s t resses , generated in the soil layers 1 freezing around *he cul- v e d section and acting Fa the same direcrtion as *ha* of a thermal Plow. The heaving force 6, simultaaeously generated ia the s o i l
layer I, freeziag from the embankment surface, causes rising o f the overleyiag hard-frozen soil layer 2 and compxesion of uyldeslayhg thawed one 4. In the second stage of freez$,ng (Fig. 3,b,c) the heaving force, generated in the layer of init ial freezing-heaving I (Fig.5) i a directed nomally t o an interface of this layer with the hara-frozen soil massif 2 , bu* a t &P acute angle to the section Lateral face3 and the foundation upper ;part 4 (aee Fig. 5). Under such conditions the total heaving force m a y be decomposed i n t o horizontal and ver t ica l , componente. The horizontal one stipulates a la-beral squeeze of the culvexk sections and foundation, and Lncreases contact t i e s o f the regelation between hard-frozen s o i l and c u b vert , while the vertical one contributes t o soil and culverb rise. Calculation results showed that f o r most o f the starrdard oulverts the t o t a l strength of soil regelation with the
1448
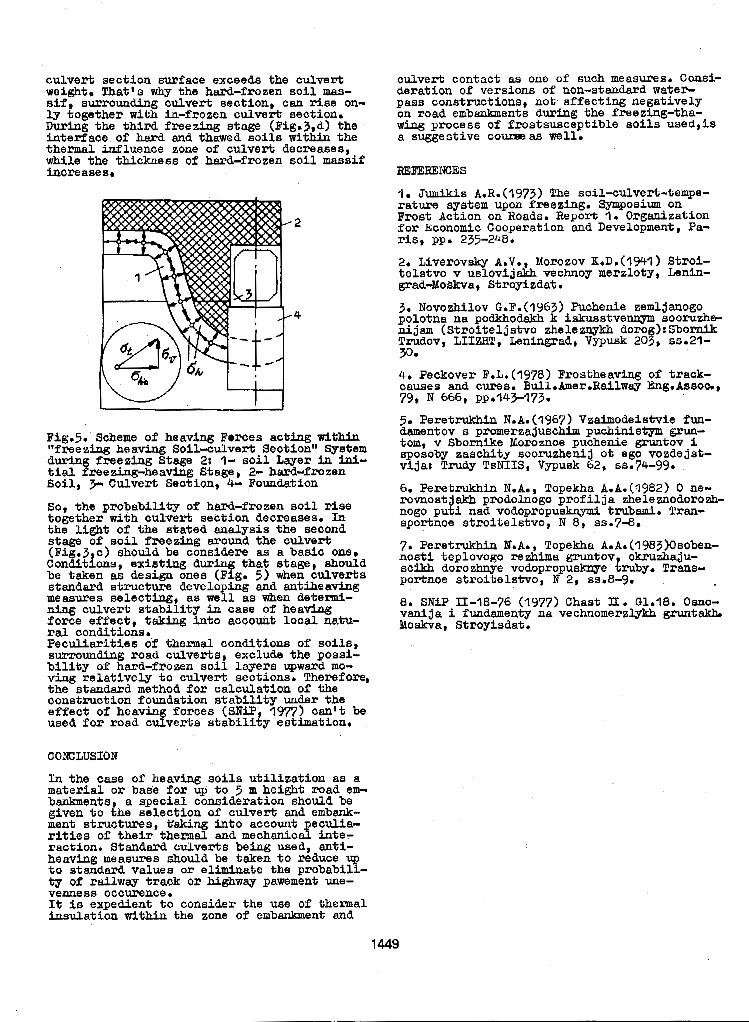
culvert section surface exceeds the culvert culvert contact as one of such mea~mes. Consi- weight. That's why the hard-frozen s o i l mas- deration of versions of non-standard water- sif, surrounding culvert section, can rise on- pass constructions, not a f fec tbg nega t ive ly ly together with b-frozen culvert; section. on road embankments during the freesin$-tha- DurFng the th ixd f reezhg stage (Fig.3,d) the wLng process of frostsusceptible soils used,is b t e r f a c e of hard and thawed s o i l e w i t k i n the thermal W h e n c e zone of culve& decreases,
a suggestive COW as well.
while the t h i c b e s a of hard-frozen soil masrsii Fncre as8 s. REF'EIIEKCES
I . JumUis A.B. (1973) The soil-culvert-fempe- rature system upon freezing. Symposium on Frost Action on Roads. Report 1. Organization f o r Economic Cooperation and Development, Pa- ris, p ~ . 235-248.
20 L i v e r o v w A.V., MOPOZOV K*D*(I94'l) StrOi- te ls tvo v uelovijalrb vechnoy merzloty, LenFn- graadoskva, Stroyizdat.
3. Novozhhplov G.F.(1963) Puchenie zemljanogo polotna na poltkhodakh k iskusstvennym sooruzhhe- nijam (Stroi te l js tvo zheleznykh dorog):SbornFk Tmdov, LITZNT, Leningrad, V y p u s k 203, ss.21- 30.
Fig.5. Scheme of heaving Ferces acting within "freezing heavhg Soil-aulvert Seation" Syatem dwQg f r e e z h g Stage 2: '1- soil Layer in U- tial freezing-heaving Stage, 2- hard-frozen Soil, 3.- Culvert Seation, 4- Foundation
So, the pxwbabili.t;s of hard-frozen s o i l rise together with culvert section decreases. In the l igh t of the stated analysis the second stage of s o i l freaeing arouud the culvert (Fig. 3, c) ahodd be considere a8 a basic oner Conditions, existing d u r i q that stage, should be taken as design ones (Fig. 5) when culverts standard structure develo iag and autihheavin@; measures selectinf, a8 wefl as when d e t e d - niag culvert; stab lit7 in case of heaviasg force effect , tatring l s t o account loo& a&u- r a l conditions. Pecul iar i t ies of thexmal conditions of Soils, s u r r ~ u n d b g road culverbs, exclude the possi- b i l i t y of hard-frozen soil layers upwara mo- v b g re1akiveJ.y t o culvert seations. Therefore, the standard method for calculation of the construction foundation stability under the e f fec t of heaving forcea (SNFP, 1977) can't be used fox road cu lve r t s s t ab i l i t y estimat;ionr
CONCLUSION
In the case of heaving eo i l s u t i l i za t ion as a material OP base f o r wp t o 5 m heigh$ road em- banbnents, a special conaideration should be given t o the selection of culvert and embank- ment s t m o t w s , hki.ng in to account peculia- r i t i e s of t h e i r thermal and mechanical Fnte- raction. Standard culverbs beinng used, anti- heaving measures should be taken t o reduce up to standard values or eliminate the psobabili- t y of railway track ox h i g h w a y pawement me-. venness occwence . It i s expedient t o consider the use of thermal insulation within the zone o f embanlrment: and
1449
5. Peretrukhin N.A.(196?) Vzaimodeistvie fun- damentov s pxomerzajuschim puchiaistym grmn- tom, v Sbornike Moroznoe puchenie grUnt;ov i sposoby zaschity sooruzhenij o t ego vozdejst- vijar Trudy TsNIIS, Vypusk 62, ss.74-99.
6. PeretrukhFn N.A., Tope+ A.A.(lg&) 0 ne- rowtostjakh prodohogo p r o f l l j a zheleznodoronh- nogo p u t i nad vodopropushymi t r u b d . Tran- sportaoe atroi te ls tvo, N 8 , ss.7-8.
8. SNiP IT-18-76 (1977) Chast II. G1.18. Osno- v d j a i fuadamenty na vechomerzlykh grunt akh. Moskva, Stroyisdat.
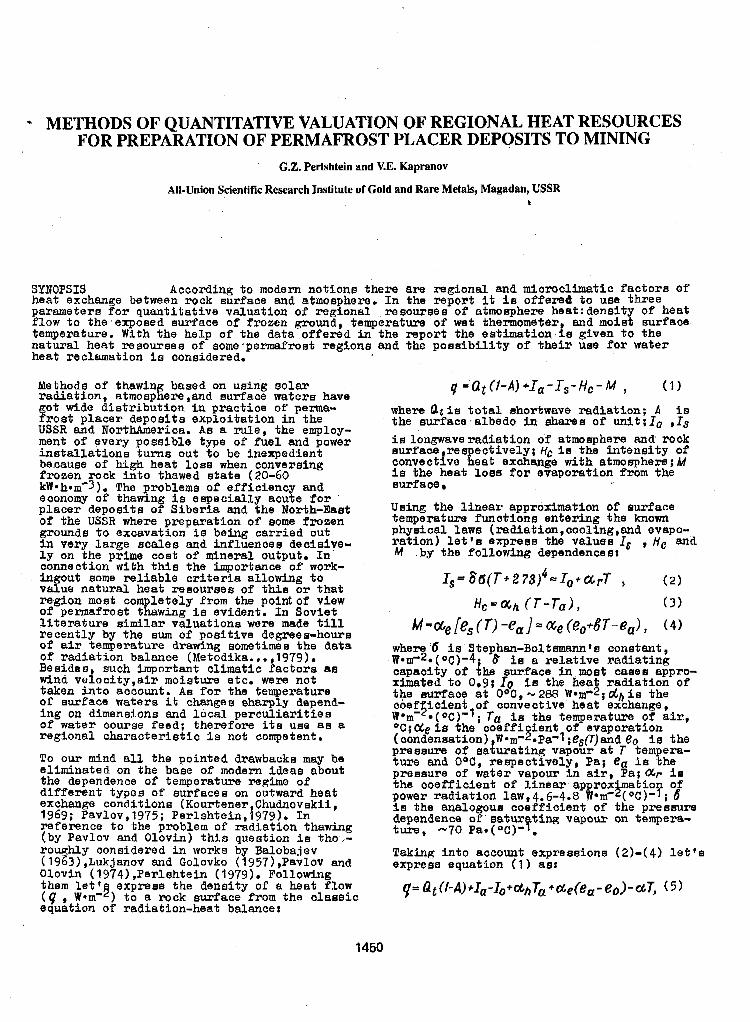
* METHODS OF QUANTITATIVE VALUATION OF REGIONAL HEAT RESOURCES FOR PREPARATION OF PERMAFROST PLACER DEPOSITS TO MINING
G.Z. Perlshtein and V.E. Kapranov
All-Union Scientific Research Institute of Gold and Rare Metals, Magadan, USSR t
SYNOPSIS heat exchange between rock surface and atmomhere. In the report i t is offex%& to use th ree
According to modern not ions there are regional and microclimatic Pactora Of'
parameters for quantitative valuation of regional pesoureen of atmosphere heat:density of heat flow to the,exposed surface o f frozen ground, temperatuwr of wet thermometer and moist surface temperature. With the help o f the data o f fe red in the r e p o r t the eretimation l e given t o the natuxal heat reaoursea of some.permafroat regions and t he posa ib i l i t y of their UBB POr Water heat reclamation i s conaidered.
Methods of thawin baaed on w i n g solax rad ia t ion , atrnoapaare ,and surface water8 have
o t wide d i s t r i b u t i o n i n prac t ioe of pema- roa t p l ace r deposits, exp lo i t a t ion i n t he
USSR and NorthAmerioa. A s a r u l e , the employ- ment of every possible type of fuel and power i m t a l l a t i o n e turns ou t t o be ineapedient because of high heat loss when oonvershg frozen mock i n t o thawed s t a t e (20-60 kWmh0m-3). The problem8 of e f f ic iency and
placer depos i t s of Sibe r i a and the North-East eoonomy of thamng i s especial ly acute for
of the USSR where preparat ion of Borne frozen grounds to excavat ion i s being carr ied out in very l a rge sca les and influencer decisive- l y on the prime coat of mineral output. In connection with t h i n the importance of work- ingout eome re l i ab le c r i t e r i a a l l owing t o value natural heat resowseg of t h i e o r that region most corn l e t e l y from the point of view o f permafrost t R awing i e evident. Tn Soviet l i t e r a t u r e similar valuat ions were made till recent ly by the eum of pos i t ive d e g r e e ~ ~ h o u r s of air temperature drawing eometimes the data o f radiation balance (Metodika.. . ,1979). Besides, such important c l imat ic factors as wind ve loo i ty , a i r moisture etc. were not
o f surface waters i t changes eharply depend- taken into account. As f o r the temperature
ing on dimensions and Loca l percu l ia r i t i es of water courae feed; therefore i ts uae as a reg iona l charac te r ie t ic i s not competent,
To our mind a l l t h e p o i n t e d dxawbacks may be el iminated on the base o f modern ideas about the dependence of temperature regime of d i f f e ren t t ypes of surface8 on outward heat exchange conditione (Kourtener,Chuanovskif, 1969: Pavlov,1975; Perlshtein,l979). In reference to the problem of radiation thawing (by Pavlov and Olovin) tMs queetion is tho .- rou hly considered in works by Balobajev ( 1923) ,Lukjanov and Golovko (1957) ,PavloY and Olovin (1974) ,Parlehtein (1979). Following them l e t t expreee the densi ty of a heat flow (Q , W*mm9) t o a rock surface from the c laee ic equation of radiation-heat balance:
f 4 =at ( i -A)+Ia- I s -Hc-M , (1)
where at i s t o t a l shortwave radiation; A is the eur face 'a lbedo in &ares o f unit; Io ,Is is longwave r ad ia t ion o f atmaphere and rock suxface res eceivel 8 Hc is t he i n t ens i ty O f convectjve Reat exogmge wfth atmosphere; M is the heat lose f o r etvaposatlon from the eurface
UaLng the l inear approximation of surface temperature functions entering the known phyeioal lawa (radiation,oooling,and evapo- r a t ion ) l e t ' s exprees %he valuee I, Hc and M .by the following dependences:
whe 6 is Stephan-Boltmuam's constant, W*rn3*( OC)-4 ; 6 is a re l a t ive r ad ia t ing
ximated t o 0.9; To i s the heat r ad ia t ion of capacity o f the eurface in ,moet cams appro-
the surface at O O C , -288 W*me2tdh i s the coef i c i e n t of oonvective heat exchange, Worn-'*( O C ) - l ; f a is the temperature of air ,
(condensation) W*m-~~P&t-l ;e,(T)and eo i s the pressure o f saiurat tn vapour a t T tempera- ture and OW, respectfvaly, Pa; ea is the presaure of water vapour in air , Pa; U p i s
power r ad ia t ion law, 4.6-4.8 w*m-$c)-P; 6 the coef f ic ien t of Linear approx t i o o f
I s the analogous coef f ic ien t of the preseure
ture, -70 Pa.( OC)-?. dependence o f ' satur ting vapour on tempera-
Taking into account expressions (2)-(4) l e t ' e express equation ( 1 1 as:
is the o o s f f i i e n t o f evaporation
1450
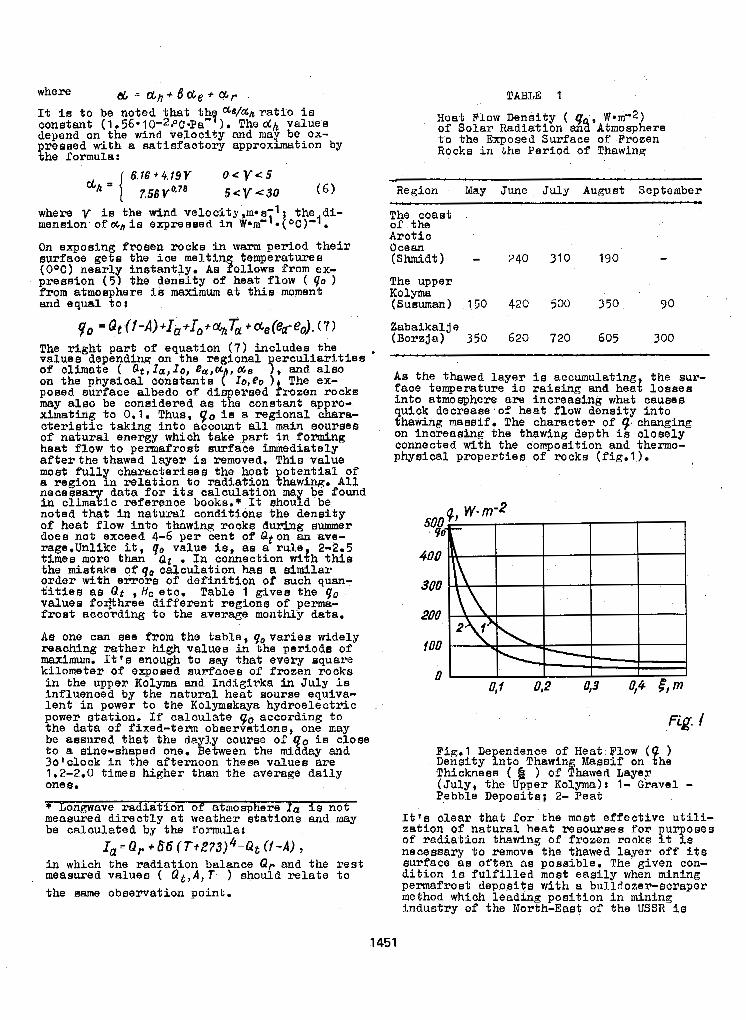
It I s t o be noted that thhfi ae/ah ratio is constant (1.56~10-2PC4%3 1. The d h values
preseed with a satisfactory approximation by depend on the wind ve loc i ty and may be ex-
the formula:
Heat Flow Density ( Q W=n-~-2) of Solar Raaia'tion ant'Atmosphere t o the Exposed Surface of Frozen Rocks in t he Pe r iod o f Thawing
where i s the wind velocity,m*s-l- the di- mension o f O L ~ is expressed i n W * C 1 t O C ) - 1 .
The coast of the
On exposing Proaen rocks in w a r m p e r i o d t h e i r Arc t ic
surface gete the ioe melting temperaturea Ocean
(O°C> near1 ins tan t ly . As follows from ex- presaion (58 the deneity of heat flow ( QO ) from atmosphere 1s maximum at t h i e moment
The upper
and equal to: Kolyma (Susuman) 150 420 500 350 90
(Shmidt) - 240 310 190 -
The r i g h t p a r t o f equation (7) includes the . valuee depending on t h e r e g i o n a l e r c u l i a r i t i e s of climate ( a t , ~ a , 10, eu,cd as 7, and a l s o on the physical constants ( ' I o , e o ) * The ex- po~led surface albedo o f dispersed frozen rocks
ximatwag t o 0.1. hue, 9 . i s a regional cKara- may a l s o be coneidered a8 the constant ap ro-
c t e r i s t i c taking I n t o acoount a l l main soursea of natural energy which take part i n PormInR heat flow t o permafrost surface immediately a l t e r t h e thawed l a y e r i~l removed. This value most f u l l c h a r a c t e r i e e s t h e heat o t e n t i a l of a region Pn r e l a t i o n t o rad ia t ion !hawing. A l l n e c e m a r d a t a f o r i t s ca lcu la t ion ma be found in climaeic referenoe bookam* It shourd be noted tha t i n natura l cona i t ions th8 dens i ty o f heat f low into thawing rocks during summer does not exceed 4-6 per cent of Q, on an ave- rage.Unlike i t , go value is, as a rule 2-2.5 tlmee more than at . I n connect ion wijh this the mistake o f 40 calculat ion has 8 similar order with errors o f def in i t i on of such q u a - Cities 88 Qt , H, e tc . Table l gives the qo values fo$tbree d i f f e ren t r eg ions of perma- f rost according to the average monthly data .
A s one can see f rom the t ab l e , q0 varies widely reaching ra ther high va lues i n t he pe r iod r of maximum. It*s enough t o eay that every rjquare kilometer o f expoeed surfaces of frozen rock@ i n the upper Kolyma and Indigirka in July is influenced by the natural heat Bourse equiva- l e n t i n power t o the Kolymakaya hydroe lec t r ic power s ta t ion . f f ca lcu la te $0 accord ing to the data o f fixed-term observations, one nay be assured that the dayly course o f 0 is close t o a sine-shaped one. Between the m i 3 day and 3O'clook in the af ternoon these valueB are 1.2-2.0 t imes hiEher than the average daily ones . measured d i r e c t l y at weather s ta t ions and may 3 Lonmave r ad ia t ion of atmosphere .fa ie not
be ca lcu la ted by the formula: I a = Q , + & 6 ( T t P 7 3 ) 4 - Q ~ ( i - A ) ,
A n which the radiat ion balance Qp and t h e r e s t measurod values ( Q t , A , T ) should r e l a t e t o the name obsexvation point.
Zabaikal j e (Borzja) 350 620 720 605 300
As the thawed layer l e accumulating the sur- f ace temperature i s raising and he& loseea into atmosphere are increaeing what causes quick decreaae 'of heat Plow dens i ty i n to thawing masflif. The character of 9 , changing on inorearjing the thawing depth i s c lose ly connected with the compoeition and thermo- physical propert iea of rocks (fig.1).
FLg. I
Fig.1 De endence o f Heat Flow ( ) Density ento Thawing Massif on !he Thickness ( ) o f Thawed Layer ( Ju ly , the Upper Kolyma): 1- Gravel - Pebble Deposits; 2- Peat
I t * s c l e a r that f o r t h e moat e f f e c t i v e u t i l i - zat ion o f natural heat resoume s for u rposes of radiation thawing o f frozen rock@ Et l e necessary t o Femove the thawed l aye r of f i t s surface as often as possible. The given con- d i t i o n is f u l f i l l e d most oas i ly when mining permafrost deposits with a bulldoxer-scraper method which leading pos i t ion in min ing indus t ry of the North-Eaet of the USSR i~
1451
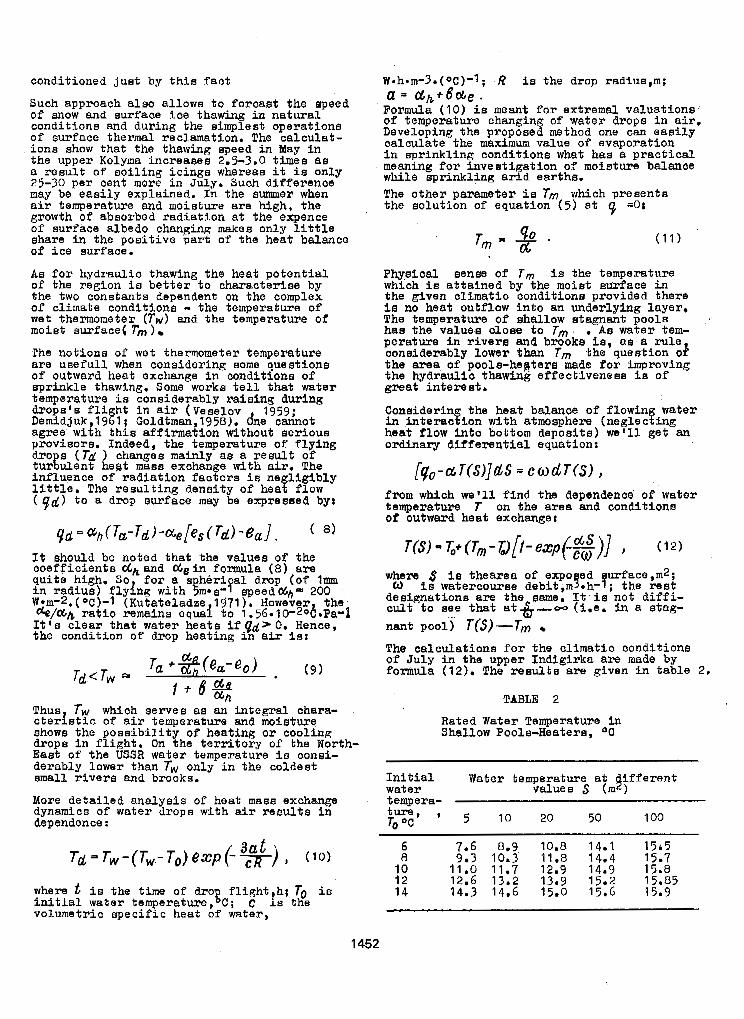
conditioned juat by t h i s f a c t
Such approach also allows to forcast the apeed of snow and surface Ice thawing in natural oondi-tions and during the dmplest operations of surface thermal reclamation. The caloulat- ions show that the thawinff speed i n May in the upper Kolyma increaees 2.5-3.0 times 88 a r e s u l t o f so i l i ng i c ings whereas it i~l only 25-30 per cent more in July. Such difference may be easily explained. In the 8 m e r when a i r temperature and moisture are high, the growth of absorbed radiation at the expence o f surface albedo changing makes only l i t t l e share in the pooi t ive pari of the heat balance of ice suxface.
As fox hydraulic thawing the heat potential of the region i s be t t e r t o cha rac t e r i s e by the two constants dependent on the complex of climate conditions - the temperature of wet thermometer ( T w ) and the temperature o f moist surface( Tm )
The notions of Wet thermometer temperature are use fu l l when conaiderina aome questions of outward heat exchange Fn conditions o f s p r b k l e thawing. Some worke t e l l that water temperature i s considerably ra ia ing during drops'e fli h t i n air (Vesexov 1959- Demidjuk,l9~1; Goldtman,l958). dne ca tho t agree with this affirmation wtthout serious proviBors. Indeed, the temperature o f f l y i n g dro B ( Td ) changes mahly as a result of turgulent heat mass exchange with air. The inf luence of r ad ia t ion f ao to r s i s negl ig ib ly l i t t l e . The result ing density of heat f low ( 4 d ) t o a drop surface may be expreseed by:
It should be noted that the values o f the coef f ic ien ts d h a n d d e i n formula (8) are quite high. So f o r a s heri a1 amp ( o f I m in r ad ius ) f l y lnq w i th &n*s-f speed b+,- 200 W*m-2.( *C)-l (Kutateladze 1971). However, t h e ' &/ah. r a t i o remaina equal t o 1.56090-2oC.Pa-1 It 's c lear tha t water hea te i f qd' 0. Hence , the condition of drop heat ing in air is:
Thus T;u which servea ae & integral chara- c t e r i s t i c of a i r temperature and moiBture shows t he poss ib i l i t y of heating o r cooling dropa i n f l i g h t . On t h e t e r r i t o r y of the North- E a B t o f the USSR water temperature is consi- derably lower than 7. only i n the coldest small. r i v e r s and brooks.
More de ta i led ana lys i s of heat mass exchange dynamics of water drops with a i r r e u u l t s i n dependence :
W-h-m-3.(oC)-l; R i s the drop radius,m;
Formula (IO) i s meant f o r ex t remd va lua t ions ,
Developing the proposed method one can e a s i l y of temperature changing of water dropa i n air.
calculate the maximum value of evaporation i n eprinklina conditions what has a p r a c t i c a l meaning for inves t iga t ion o f moisture balance while sprinkling a r id ear ths . The other parameter is Tm which presents the so lu t ion o f equation ( 5 ) at 9 =Or
a = dh+t?ae.
Physical senae of T m Is the temperature which i s a t t a ined by the moiat surface i n the given climatic conditione provided there is no heat outflow into an underlying layer, Phe temperature of ehallow stagnant pools h a the values c loee to T,. . AB water tem- perature in riverrs and brooks is, a8 a ru l e coneiderably lower than Tm the question o# t he area of poola-heptera made for improving the hydraulic thawing effectiveness is of grea t in te res t .
Considerin the heat balance of flowing water in interecfion with atmosphere (neglecting heet flow Into bottom deposita) we'll pet an ordinary di f fe ren t ia l equa t ion:
[qo-aT(Sl]dS codT(s ) , from which we'll PLnd the depsndencd of water t e m p e r a t w T on the area and conditions of outward heat exchange;
T ( S ) - T , t ( T , - P [ t - e ; c p ~ ~ ~ ~ I ( 1 2 )
where $ is thearea of expo ed urface,m2; W is watercourae debit,mJ*h-f; the re&
designat ions are t he ame. It i a not d i f f i - c u l t t o sere that at&-- (i.e. in a atag- nant poo l ) T(S) " T m The ca lcu la t ions fox the c l imat ic condi t ions o f July in the upper Ind ig i rka are made by formula ( 1 2 ) , The r e s u l t B a= given in t ab le 2,
TABLE 2
Rated Water Temperature in Shallow Pooh-Heatexe, O C
I n i t i a l Water temperature a t I f f e r e n t water values s (m B ) "**.""
tur:, , 7-0 oc 5 10 20 50 100
T d = T , - ( T , - T , ) e x p ( - ~ ) , 3ut (10) 8 6 7.6 8.9 10.8 14*1 15.5 10
9.3 10.3 11.8 14.4 15.7
12 11.0 11.7 12.9 14.9 15.8
where t is the time of drop flisr;ht,h; To i n 14 12.6 13.2 13.9 15.2 15.85 14.3 14.6 15.0 15.6 15.9
init ial water temperature,OC; c i s the volumetr ic specif ic heat o f water,
1452
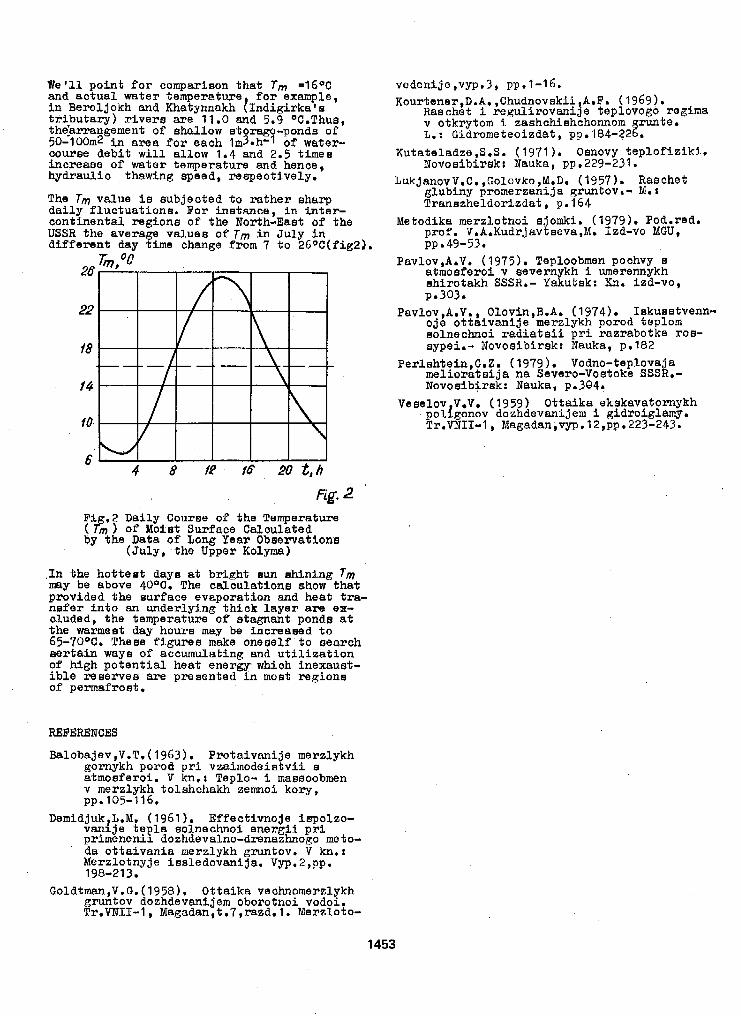
We '31. point for comparison that Tm =16OC and actual water temperature for example, i n Bereljoich and Khatynnakh (Indigirkat B t r i b u t a r y ) r i v e r s a r e 11.0 and 5.9 oC.9?hua, theIarxangement o f shallow storage-ponds o f 50-100m2 i n area f o r each lrn3-h-l of water- courBe debi t will a l l o w 1.4 and 2.5 t imes
hydraul ic thawing speed, respectively. increase of water temperature and hence,
The Tm value is eub jec t ed t o r a the r sha rp d a i l y f l u c t u a t i o n s , F o r i n s t a n c e , i n i n t e r cont inenta l reg ions of the North-East of the USSR the average values o f Tm i n J u l y i n d l f f e r e n t day time change from 7 t o 26°C(fig2).
Fi - 2 Daily Courae of the Temperature ( $m of Moiat Surface Calculated 5y the Data of Long Year Observations
( Ju ly , the Upper Kolyma)
,In t he ho t t e s t days at br ight ~ u n ehining rm may be above 40°C. The ca lcu la t ione show that provided the surface evaporation and heat era- n e f e r i n t o an under ly ing t h i ck l aye r are ex- cluded, the temperature o f stagnant ponde at t he warmeet day hours may be inc reased t o 65-7OoC. TheBe Piguree make oneself t o s e a r c h sertain ways o f accumulating and u t i l i z a t i o n of high po ten t i a l hea t ene rgy which inexaust- i b l e reBerve8 are p r e s e n t e d i n most regiona o f permafrost.
REFERENCES
Balobajev,V.T.(1963). Protaivanije merzlykh gornykh porod p r i vzaimodeistvii s atmosferoi. V kn.: Teplo- i. massoobmen v merzlykh tolahchakh zenmoi kory,
Demidjuk L.M. (1961 ). Effectivnoje ispoLzo- v d j e t e p a solnechnoi e n s r g i i p r i primenmil dozhdevalno-dranazhno~o meto-
pp.105-116,
da o f t a ivan ia merz lykh gmtov . V knmt Merzlotnyje issledovanija. Vyp.2,pp. 198-213.
vedeni j~ ,vyp .3 , pp.1-16. RourteneT,D.A.,Chudnovskil AmF. (1969).
Raechet 1 regulirovanije teplovogo roafma v otkrytom i zashchishchonnom L.: Gidrometeoizdat, ppm184-22!Yte*
Kutateladze,S.S. (1971 ). Osnovy t e p l o f i z i k i . Novoslbirakt Nauka, pp.229-231.
LukjanovV.C.,ColoVko,M.De (1957). Raschet glubiny promerzanija @Untov.- M.: Transzheldorizdat , p. 164
Metodika merzlotnoi ajomki. (1979). Podoredo prof . V.A.Kudrjavteeva,M- Izd-vo MGU, pp . 49-53 .
Pavlov,A.V. (1975). TepLoobmen pochvy s atmoeferoi v severnykh i umerennykh ehirotakh SSSR.- Yakutsk: Kn, izd-vo,
Pavlov,A.V., Oloy+n,B.A. (1974). Iskusstvenn- ode o t t a i v a n q a merzlykh porod teplom Bolnechnoi radiat sii pxi razrabotke xos- 8ypei.- Novoaibirsk; Nauka, pel82
Perlshtein,G.Z. (1979). vodno-teplova'a m e l i o r a t s i j a n a Severo-Vostoke SSS$.- Novoaibirak: Nauka, p.304.
podgonov dozhdevanijem i Eidroiglamy. Tr.VNI1-I, Magadan,vyp.l2,pp.223-~43.
p.303.
Veaelov V.V. (1959) Ottaika ekskavatornykh
Goldfman,V.G.( 1958)- Ottaika vechnamerzlykh
Tr,VNII-l, Yagadan,t.7,razdrl. Meerzloto- gruntov dozhdevaniJem oborotnoi vodoi.
1453
STABILITY OF ROAD SUBGRADES IN THE NORTH OF WEST SIBERIA A.G. Polunovsky and Yu.M. Lyvovitch
Soyuzdornii, USSR
3 mops x3 The xeport considers the peou l i a r i t i e s of natural and c l imat ic oonditione o f West S iber ia tha t should be t a k a n , i n t o aooount at road design ana oonstruction. Frinoiples of providing the s t a b i l i t y of the embankments b u i l t of v a r i o u s s o i l s a r e given. Struotural solu- t i o n s a r e proposed with the use of geotext i le inter layers snd heet- insulat ing mater ia ls .
The development of vas t oil-and-gas regions in the North of West S ibe r i a has required bui l - ding a wide net of roads under complicated engi- neering-geologioal conditions. This network inoludes inter-and ia t raf ie ld t runk roads of
na-ted fox heavy t r a f f i c ?mainly from 200 t o o i l and gaa produoing xe ions, whioh =e deaig-
1500 design vehicules per day).
Engineering eolutions commonly used in road bu-
area due t o the oomplez of unfavourable condi-' i ld ing praot ice m e no5 appl icable t o this
tiona which axe 88 follows:
- t he abeenoe of construct ion industry base as wel l a8 natura l resouroea o f the rook, gra- v e l and s&nd q l l s with a f i l t r a t i o n footor higher then 10 cm/s; -
- short period of above-zero temperatures;
- exoeas moistening of the upper s o i l horiraona;
- d i f f i c u l t i e s i n oonstruction of unshfinkable eubgrades;
- d e f i c i t and high cost of labour resources. A new approach t o road building under such con- ditions provides structural-technologioal solu- t iona aimed at maximum reduced volume8 o f ear t -
basis, s tage road construct ion, the u6e of pse- hworks and their execution on a round-the-year
oaat pavements from reinforced oonorete slabs.
The region i n the Ob-Gnisey downstream i a t e r - fluvs is cbaraoter lzed by extremely unfavourab- le c l imat ic , so i l -hydro logioa l and cryogenic conditions. The d i s t inc t ive f ea tuses o f t h i s a rea are excressive moistening and insufficient
-3- 4 C in the south t o -9- -12 C i n the heat . %vexage annual air temper8ture i s
r l o d iB 60-90 days, winter temperature ie up nor th of the area, a duration of frost lees pe-
t o -50 C , and the winas o f 15-20 m/s blow fre- quently. Strong winda oawe t he anow t ranefer which is oonsiderabla due t o a dry loose natu- 1-9 05 t he f r e sh snow with density 0.03-0.12- g/cm . A thickness of enow cover i n the open
tundra raagea from 20 t o IOOcm, an average one being 20-40cm. T h e r e l i e f is plane , s l igh t ly rugged ana very poorly drained, absolu'6e eleva- tion marks range within 50-120m. The region is ohareoter l s t ia of extremely high swampiness and i s very l a b (up t o a s ) , .there widely o o o w plarle and oonvexo-hummook vest peat bogs wnith peat; deposit depth from 1 t o 4m (mainly about
AB f o r soil oonditions o f the region perma- frost is most common. The l a t t e r , f i r a t of a11 ooncerna with the northen regions where eepere- f s ta l ika o o o w i n the r ive r va l l eys o r n8& t he lakes, with trough tsrlika b e i n g e r h m e l y rare. In the region of Nadym and Urengoi 25- -30% o f the In te r f luve mea fa l l s at the depo- sita thawed from fha surface up t o the depth 4-10m, which form t he unmerged froaen masses. I n the southern regions, development af the frozen masee8 oocws almost exoluaively in the pes t meas . A temperature of the rook at the
- -5 C i n the nor th t o above m r o In the south; deptb of zero annual amplitude varies from -3- frosen gfound beoomes insular and the prooeas runs more aluggishly with aimultaneoua raduo- t i o n i n t h e i c i t y . Among the cover rocks a 00- mplex of sea deposi ts prevai ls wi th l imited oc- cuxenoe of a l luv ia l depoai t s i n the f lood pla- ins and above-flood plain terraoea. These xoclce a r e mainly composed of clay aoils-loam , sandy loam, c lay and more rarely by f i n e sands. In all t i e ca ses t he con ten t o f silt p a r t i c l e s is high ,up t o 50-9W. In the tha- wed oondition theae rocks a r e obafacter ieed by uns tab le s t ruc twe and a r e prone to t he t h ixo - t r o p i c f l u i d i f i o a t i o n under load application,
This is explained by high i o i t y of the rock re- espec ia l ly under multiple loading or vibrat ion.
duoed from I t s surfaoe down along the seotion. The moisture oontent of the f rozen c lay rook8 is 25-6s and is higher than that of thawed ones, which i s 2540%. Sand s o i l ~ t of t h i s TB- gion m e r e f e r r e d t o t h e f i n e silts of vaxioua i o i t y and average moisture content of 20-3" High degree of overwetting i s first . o f a l l , oharao te r i s t i c of the c l a y e o h , but not se l - dom that l a observed f o r the sandy s o i l s . The
2m)
1454
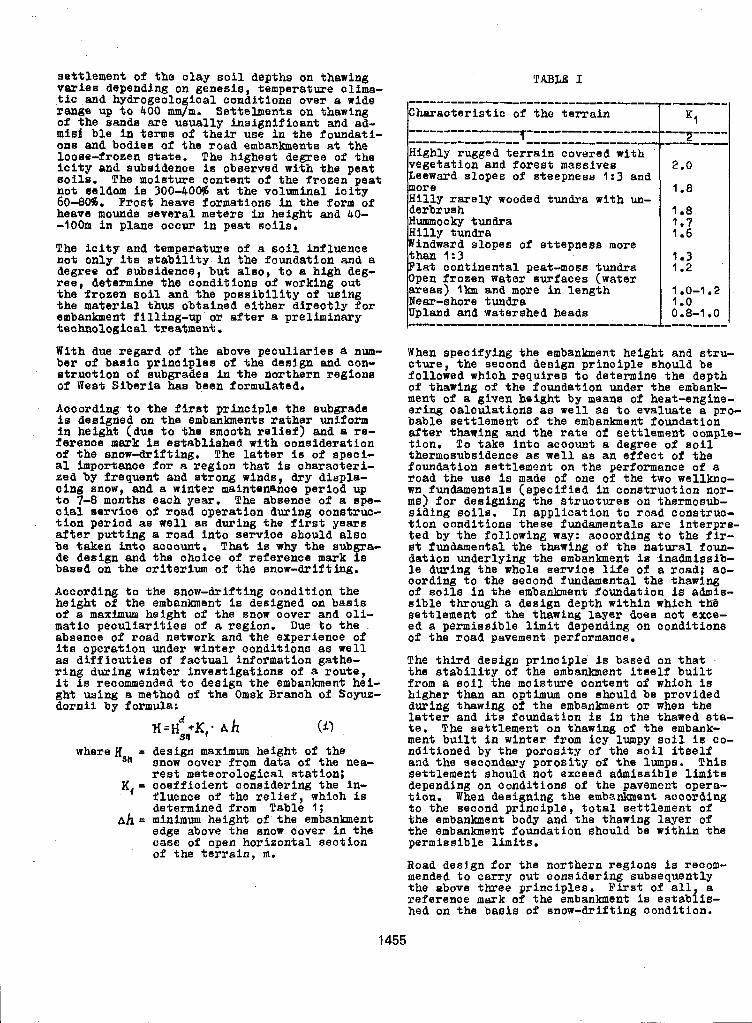
set t lement of the o lay so i l depthe on thawing va r i e s depending on genesis, temperature clima- t i c and hydrogeolo i o a l conditions over a wide range up fo 400 mm$rn. Settelments on thawing o f t he sands are usua l ly ins igni f icant and ad- m i d ble in t e rms of t h e i r use in the foundati- on@ an8 bodies of the road embankments at the looar-frozen state. The highest degree of the i c i t y and subaideaae i s obererved with the peat B o i l s I The moisture content of the frozen peat not aeldom l e 300-400$ a t t he vo lumina l i c i t y 60-80%. Fros t heave formations in the form of heave mounds several meters ~ Y I height and 40- -100m i n plane occur in peat soils.
The i c i t y and temperatuse of a so i l in f luence not only its a t a b i l i t y - i n the foundation and a degree of subeidence, but a lso, to a high de&- reel determine the conditions of working out t he frozen s o i l and t h e p o s s i b i l i t y of uslng the material thus obta ined e i ther d i rec t ly for embankment f i l l ing-up OF a f t e r a preliminary technological treatment . Wlfh due regard of the above pecul iar lea a n u - ber of bas ic p r inc ip les of the deslgn and con- mtruutlon o f subgrades in the northern regions of West Siberia has been formulated.
According to t he f i r e t p r inc ip l e t he subgrade i s designed on the embanhents ra ther uniform i n height (due t o t h e smooth r e l i e f ) and a re- ference nark is established with oonslderation of the snow-drifting, The l a t t e r i s of speoi- a1 importance f o r a region that is oharacter i - sed by frequent ana s t rong winds, dry disple- clng anow, and a winter maintenance period up t o 7-8 months each y e a r . The abeeme of a spe- aia l erervioe of road operation during conatruc- t ion pef iod a8 well a8 during the first years after put t ing a road into service should also be t aken in to a o ~ o u n t . That is why the subgra- de design and the ohooice of reference mark i s based an the or i ter ium o f the snow-drifting.
According to the snow-drift ing oondition the height of the embankment is deeigned on basis of a maximum height of the snow oovex and c l i - mat io pecul ia r i t i es of a region. Due t o the ~
absence of road network and the experience of Its operation under winter conditions a8 well as d i f f i c u t i e s of factual information gathe- ring during winter investigations of a route , it i s recommended t o design the embankment hel- ght w i n g a method of the Omsk Branch o f S o w - dorn i i by formula:
where H,, = design maximum height of the anow oover from data o f the nea- res t meteoro logica l s ta t ion ; If, = ooafflcient oonsiderlng the in- fluence of t h e r e l i e f , whioh i s determined from Table I ;
A h tp minimum height of the embanbent edge above the snow c'over i n the case of open horizontal sect ion of t h e t e r r a i n , m.
T A B U I
b h a r a c t m i s t i c of t h e t e r r a i n """"""""L"""""""""
7 """""-""."-""""""" ~~~
Highly rugged terrain covered with vegetation and forest massive8 Leeward slopes o f steepness 1:3 and mor e Hi l ly r a r e ly wooded tundra with un- derbrush Hummoclry tundra Hilly tundra
than 1:3 Windward slopes of s t tepness more
F la t con t inen ta l peat-moss tundra Open frozen water surfaces (water areas) lh and more i n length New-shore tundra Upland and watershed heads """"""""""_____I_______
""1"
K1 "-2"" """"
2.0
1.8
1 .a 1.7 1.6
1.3 1.2
1.0-1.2 1 .o 0.8-1 e 0 -"I""-
When specifying the embanbent height and stru- c tu re , t he second design p r i n o i p l e should be followed whioh requi res t o determine the depth of thawing o f the foundatlon under the embank- ment of 8. given height by means of heat-engine-
bable settlement of the embanhent foundation er ing oalculat ione as well as to eva lua te a pro-
after thawing and t h e r a t e of set t lement comple- t i on , To take into account 8 degree of s o i l thermosubsidence as well as an e f f e c t of the foundation aettlement on the performance of a road the use Is made of one of the two wellkno- wn fundamentals (spsclf ied in conatruct ion nor- ms) for des igning the s t ruc tures on thermosub- s i a ing soi ls . I n appl ica t ion t o road construc- t ion conditions these fundamentals are interpre- t ed by the following way: aooording t o t h e f i r - st fundamental the thawing of the na tura l foun- dation underlying the embanbent is inadmissib-
cording t o the seeond fundamental the thawing l e during the whole service l i f e of a road; ac-
of s o i l s in the embanbent foundation is admia- sible through a design depth within which tlia set t lement of the thawing layer does not exce- ed a permissible limit depending on conditions o f the road pavement performance.
The t h i r d deeign pr inoip le i s based on t h a t the s t ab i l i t y o f the embankment i t s e l f b u i l t from a soil. the moisture oontsnt of which is higher than an optimum one should be provided during thawing of the embankment ox when the l a t t e r and its foundation is in the thawed sta- t e . The settlement on thawing of the embank- ment b u i l t in win ter from icy lumpy soil is co- nditioned by the porosi ty of t h e s o i l i t s e l f and the secondary porosity of the lumps. This 8ettlemer.t should not exceed admissible limits depending on conditions of the pavement opera- t ion. When designing the embankment acoording t o t he second p r inc ip l e , t o t a l s e t t l emen t of the embankment body and the thawing layer of the embankment foundation should be within the permissible limits.
Road design for the northern regions is reoom- mended to carry out oonsidering subsequently the above three p r inc ip les . F i r s t of a l l , a r e f e r e m e mark of the embankment is es t ab l i s - hed on the baa i s of snow-drifting condition.
1455
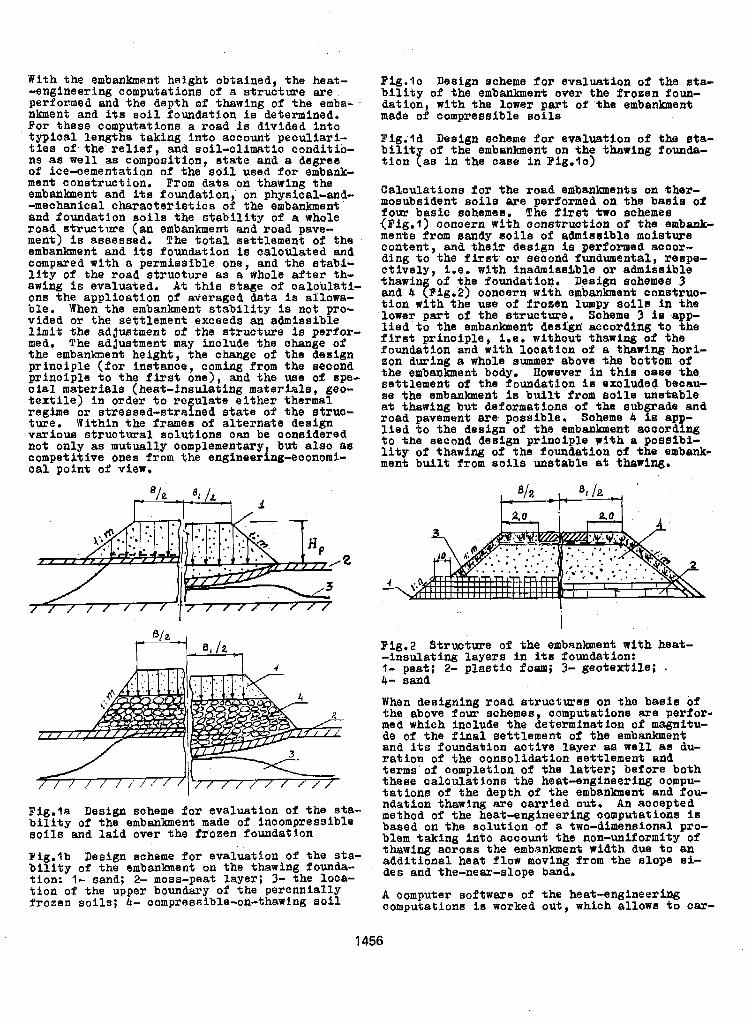
With the embankment height obtained, the heat- -engineering computations o f a s t r u c t m e a r e performed and the depth of thawing of the emba- - nlunent and its soil . foundation Is determined, For these computations a road is divided Into typical lengths taking into account pecul iar i - t i e s of t h e r e l i e f , and soil-climatic conditio- ns as well as composition, state and a degree o f ice-cementatiqn of t he so i l u sed fo r embank- ment construction. From data on thawing the embanhent and its foundation, on physical-and- -mechanical cha rac t e r i s t i c s of the embanlunent and founda t ion so i l s t he s t ab i l i t y of a whole road s t ruc tme (an embankment and road pave- ment) is assessed, The to ta l se t t lement of the embanhant and its foundation is ca lcu la ted and compared with a pexmisaibXe one, and the stabi- l i t y of the road s t ruc tu re as a whole a f t e r t h - awing i s evaluated. A t t h i s s t a g e o f calculaatl-
ble. When the embankment s t a b i l i t y is not pro- on8 the appl ica t ion of averaged data i s allowa-
vided or the settlement exceeds an admissible limit the ' addwtment of the s t ruc ture i e pexfor- med. The adjustment may inolude the change of the embankment height , the change of the design pr inc ip le ( fox instance, coming from the second p r i n c i p l e t o t h e f i r s t one), and the use of spe- c ia l mate r i a l s (hea t - in sda t ing ma te r i a l s , g80- t e x t i l e ) i n o r d e r t o regulate e i ther thermal regime or stressed-strained state o f the struo- ture. Within the frames of a l ternate design v a r i o w s t ruc tu ra l so lu t ions uan be coneidered not only as mutually complementary but also aa competitive ones from the engineering-eoonomi- cal point of view.
@/2 , 81 / A 1
2
Fig.la Design scheme for evaluat ion of the sta- b i l i t y of the embanbent made of incompressible aoils and la id over the frozen foundation
F i g . 4 b Design scheme for evaluation of the s ta - b l l i t y of the embankment on the thawing founda- t ion: 1- sand; 2- moss-peat layer; 3- the loca- t i o n o f the upper boundary of the perennial ly f rozen s o i l s ; 4- oompresaible-on-thawing s o i l
Flg.1c Resign scheme for evaluakion of the s ta- b i l i t y of the embankment over the frozen foun- dat ion, wi th the lower pa r t of the embanlanent made of compreseibla s o i l s
Fig.ld Design saheme for evaluat ion of t he sta- b l l i t of the embankment on the thawing founda- t i o n (as i n the case i n Pig.10)
Calculation8 for the road embanlunents on ther- mosubsident s o i l s a r e performed on the bas ia of
(Pig.1) coneern with construotioa of the embank- four barsia sohemes. The fkst two sohemes
ments from sandy ~ i l s of a8mlasible motstwe content , and theix design is performed aouoy- d i n g t o t h e f i r s t ox second fundumental, respe- c t ive ly , i.e. with inadmisekbble or admissible thawia of the foundatloo. Design sohemea 3 and 4 fFig.2) aonoern with embanhent conertrua- t ion wi th the w e of iroaen lumpy soils i n the .lower part of the s t ruc ture . Scheme 3 i e app- l i e d to the embanwent design according to the f i r s t p r i n c i p l e , 1.e . without thawing of the foundation and with looat ion OS LI thawing hoxi-
the embankment body. However i n t h i s oese the zon during a whole ~ummer above the bottom of
eettlement of the foundation i a excluded beaau- SI the smbsrnlcmeat is b u i l t from so i l s ws t i ab le a t thawing but deformations of the erubgrade and road pavement are possible. Soheme 4 is app- l i e d t o the design of the embanlanent aooox8ing to the second design pxinciple pi th a posaibl - l i t y of t h a w i n g of the foundation of the embank- ment b u i l t from soils unstabls at thawing.
Fig.2 Structure of the embankment with heat- - insulating layexa in its foundation: 4- peat; 2- plas t id foam; 3- geotext i le ; . 4- sand
When designing roed s t ruc tu r s s on the baaie of
me6 which include the determination. o f magnitu- the above four sohemes, aomputationpl are perfor-
de of t he f i na l s e t t l emen t of the embankment and its foundation active layer m wall LIB du- r a t i o n of the consolidation sett lement and terms'of oompletion o f the l a t te r ; before bo th these oaloulations the heat-engineering compu- t a t ions of the depth of the embankment and fou- ndation thawlng a r e oarried out. An acoepted method of the heat-engineering computations i S based on the aolut ion of a two-dimensional pro- blem taking into account the non-uniformity of thawing across the embankment width due t o an addi t ional heat flow moving from the s lope si- des and the-near-slope band.
A computer software of the heat-engineering computations is worked out , which allows t o car-
1456
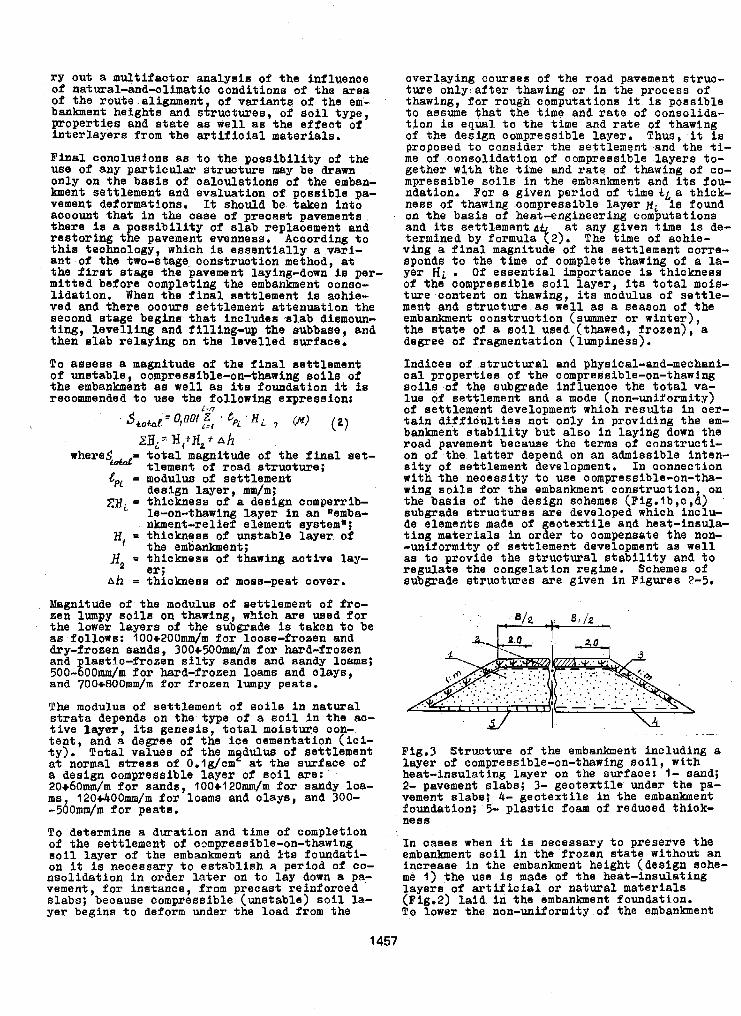
xy out a mult i footor analysis of the inf luence of natural-and-olimetic conditions o f the a rea of the route alignment, of var i an t s o f the em- banben t he igh t s and s t ruc tu res , of s o i l type, p roper t ies and s ta te as well a s t h e e f f e c t o f i n t e r l aye r s from the a r t i f i o i a l materials .
Final conolusions as t o t h e p o s s i b i l i t y of t h e w e of any p a r t i c u l a r s t r w t u r e may be drawn only on the basis of oa loula t lons of the emban- kment eett lament an8 evaluation of posslble pa- vement deformations. It should be taken Into account that in t he ca se 02 precast pavements, t he re is a posn ib i l i t y of slab replaoement and r e s to r ing the pavement evenness. According t o t h i s teohnology, whiah is e s s e n t i a l l y a vari- a n t o f t he two-stage. c o n s t r w t i o n method, at t h e f i r a t s t a g s t h e pavement laying-down i s per- mlttea before completing the embankment conso- l i d a t i o n , When t h e f i n a l a e t t l e m e n t i s aohie- ved and t he re ooouxs se t t lement a t tenuat ion the aeoond s tage begins that Includes ,slab diemoun- t i n g , l e v e l l i n g and f i l l ing-up the subbase, and then slab re lay ing on the l eve l l ed suxfaoe.
To asses8 a magnitude of t he i l n a l Settlement
t he embankment as wel l as I t s foundation i.t is of unstable, compresalble-on-t~wing soils of
seoommended t o use the following expression:
zH,= H,+Ha f ah whareScaLaG= t o t a l magnitude o f t h e f i n a l set-
t lement of road struoture; lpL = modulus of set t lement
design layer, mm/m; Z H ~ 5 thickneea of B design comperrlb-
le-on-thawing layer i n an "emba- nkment-relief element system";
H, = thiakneas o f umtab le l aye r o f the embanbent ;
.H2 = thickness of thawing aative lay-
Ah = thickness o f moss-peak oover. er ;
Magnitude of t he modulus of set t lement o f fro- sea lumpy s o i l s on thawing, which axe w e d for t he l o w e r l aye r s of t he subgrade Is taken t o be aa fallows: 100+200mm/m far loose-frosen and dry-frozen sands, 300+500mm/m f o r hard-frozen and lastlo-frozen s i l t y sands and sandy loams; 500-~0Om/m fox hard-frozen loams and o leys , and 700+800mm/m f o r f r o e e n lumpy peats.
The modulus of set t lement of soils In na tu ra l strata depends on the type of a s o i l i n t h e aa- t i v e layer, its genes is , to ta l mois ture con-
ty) . To ta l values of the m9dulu.s of set t lement t e n t , and a degree of the ice oementation ( icl-
at normal a t r e sa of O.lg/cm a t the surface of a design aompressible l aye r of s o i l m e : 20+60mm/m fo r s ands , 100~120mm/m f o r sandy loe- ma, 120+400mm/m f o r loams and clays, ana 300- -500mm/m for peats .
'Po determine a durat ion and time of completion of the set t lement of compressible-on-thawing s o i l l a y e r o f the embankment and itrr foundati- on it i s necessa ry t o e s t ab l i sh a period of CO- n s o l i d a f i o n i n o r d e r l a t e r on t o lay down a pa- vement, for instance, from precas t re inforced slabs; because compressible (unstable) s o i l la- yer begins to deform under the load from the
1457
overlaying courses of the road pavement s t ruc- t u r e only ,a f te r thawing o r i n the prooess of thawing, for rough computations it is possible t o assume tha t t he time and xate of consolida- t i o n i s equal to the t ime and ratre of thawing of the design oompressible layex. Thus, i f is proposed to ooas ider the sett lement and the ti- me of aonsol idat ion of compreasible layers to- gether with the t ime and r a t e of thawing of co- mpressible Soils in the embanhent and i t s Pou- ndertion. Fox a given period of time tt a thlck- ness of thawing compressible layer H~ i a found on the baeis of heat-engineering computations and i t s eett lament A a t any given time i s de- termined by formula42) . The time o f achie- ving a f i n a l magnitude of the settlement oorxe- sponds to t he t ime of complete thawing of 8 la- yer H; . O f essential importance is thickness o f the oompressible s o i l l aye r , its t o t a l mois- tu re conten t on thawing, its modulus of s e t t l e - ment and Btruotwe as wel l a8 a season of t he embankment construct ion (summer o r winter) , t h e s t a t e o f a soil used (thawed, frozen), a degree of fragmentation (lumpiness).
Indices of s t r u c t u r a l and physical-and-mechanl- c a l p r o p e r t i e s of t he compreesible-on-thawing soi ls of the aubgrade inf luenoe the total va- lue of set t lement and a mode (non-uniformity) of settlement development which r e s u l t e i n o e r - t a in d i f f i au l t i e s no t on ly i n p rov id ing t he em- b a n b e n t a t a b i l i t y b u t also in l ay ing down the road pavement because the terms of cons t ruc t i - on of t h e l a t t e r depend on an admissible inten- s i t y of set t lement development. In oonnection with the n e c e s s i t y t o w e compressible-on-tha- wing soi ls f o r t h e embankment construct ion, on the bas la of the design echemes (Fig.lb,c,d) '
subgrade struotures a r e developed which inclu- de elements made of geotextile ana heat-insula- t i n g m e t e r i a l s i n order t o oompensate the non- "uniformity of set t lement development arr well as t o p rov iae t he s t ruc tu ra l s t ab i l i t y and t o regulate the congelation regime. Schemes of subgrade atruotures a r e given in Figures 2-5,
- .-
F i g . 3 Struc ture of the embanhent including a layer of compressible-on-thawing soil, with heat-inaulat ing Layer on the erurfaoe: 1- land; 2- pavement slabs; 3- g e o t e x t i l e under the pa- vement s labs ; 4- geo tex t i l e i n t he embankment foundation; 5- p l a s t i c foam of reduced thiok- ness
In oaaea when It I s necessary t o preserve the embankment so i l i n t he f rozen s t a t e w i thou t an increaee in the embankment height (design sohe- me 1) t h e w e i s made of the heat- insulat ing layers of art if i c i a l or natura l mater ia l s (Fig.2) la id in the embanbent foundat ion. To lower the non-uniformity of the embanlanent
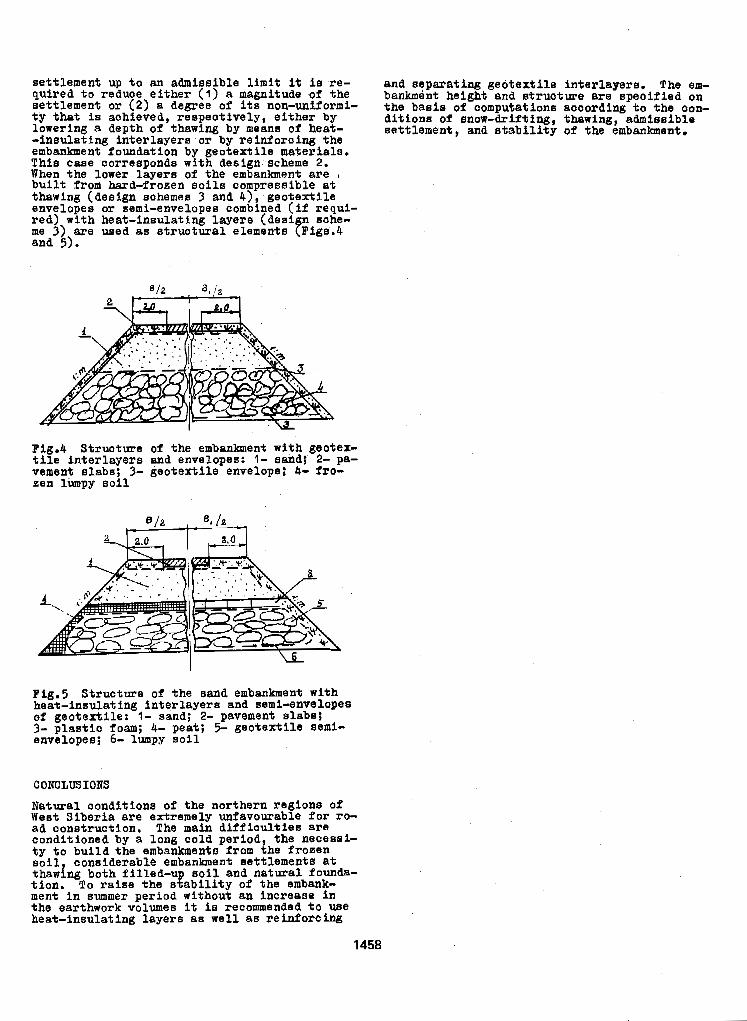
set t lement up t o an admissible limit it i s re- and separating geotexf i le in te r layers . The em- quired t o reduce e l ther (1) a magnitude of the bankment height and s t ructure are speoi f ied 0x1 set t lement or (2) a degree of i t s noa-uniformi- t he baais of oompu.tations according t o the QOn- t y that is achieved, respect ively, e i ther by dif iona of enow-drifting, thawing, admiaaible lowering a depth of thawing by means of heat- - insu la t ing in te r layers or by re infora i rw the
se t t lement , and s t a b i l i t y of t he embanlanent.
embanbent foundation by geotext i le mater ia ls . This case corresponds with design scheme 2, When the lower layers of t he embankment a r e , b u i l t from hard-frozen s o i l s oompxessible a t thawing (design sohemes 3 and 4) geo tex t i l e envelopes o r semi-envelopes combined (if requi- red) with heat- insulat ing layers (deai n sohe- me 3) a r e w e d as etruotural e lements fFigs.4 ana 5).
Fig.4 S t r w t u r e of t he embankment with geoter- t i l e i n t e r l aye r s and envelopes: 1- aand; 2- pa- vement s labs ; 3- geotextile envelope; 4- f r o - 5en lumpy s o i l
Pig.5 S t ruc ture of the sand embankment with heat- insulat ing inter layera and semi-envelopes of gsotex t i le : I - sand; 2- pavement slabbs; 3- p l a s t i o foam; 4- peat; 5- geo tex t i l e semi- envelopes; 6- lumpy soil
coNcLmIoNs Natmal conditiona of the northern regions o f West Siberia are extremely unfavourable fox ro- ad aonstruct lon. The main d i f f i c u l t i e s are conditioned by a l ong c o l d period t he neoeeai- t y t o b u i l d t h e embankments from h e Pxoaen soil considerable embanment sett lements a t thawing both filled-ug soil and n a t w a l f o u n b - t ion . To raise the s t a b i l i t y o f the embank- ment in summer period without an incseage i n the earthwork volumes it is recommended t o w e heat- insulat ing layers as well a s re inforc ing
1458
REFLECTION SEISMIC EXPLORATION AND DATA PROCESSING IN COLD REGIONS
E Porturas
Division of Petr. Eng. and Appl. Geophysics, The Norwegian Institute of Technology, Norway
SYNOPSIS Today s tudies i n cold regions are of great interest because of the i r po ten t ia l economic resources. T h i s paper presents an up-to-date analysis of multichannel seismic reflection methods and data processing problems. The appl icat ion of reflection seismic methods meets par- t i c u l a r d i f f i c u l t i e s which are not found elsewhere. The major question is how the frozen ground thickness and frost breaks affect the seismic sources and wave propagation. The frozen ground a c t s i n the same way as weathering zones do on land seismics, or as a hard sea f loor i n marine operations, very similar to the exploration of transit ion zones. The seismic data processing i s directed towards optimizing data quali ty where noise and spurious events, which tend to mask r e f l ec t ions of i n t e re s t , m u s t be attenuated. The success of any geophysical method i n cold regions will r e ly on its abi l i ty to del ineate boundaries and thickness of the frozen ground. Therefore the understanding of permafrost phenomena, g l ac i a l d r i f t and re la ted geological factors is necessary to achieve good resul ts for resource explorat ion and engineering purposes.
INTRODUCTION
Increased attention is being focused on exploration i n "front ier" areas of the world. These include regions which l i e above h i g h l a t i t u d e s w i t h permafrost and ice occurrence, here these zones are named "cold regions".
The most common methods applied i n the eva- luation of cold regions include reflection, refraction, spot bathymetric s o u n d i n g s and pulse techniques. other sets of geophysical data' have been obtained by airborne magneto- metric, heat flow, gravimetric measurements, and limited shallow coring. Radio echo s o u n d i n g s have been done i n the Antarctic ice uding very strong sources such a s pulse-modulated radar. T h i s method has l imi t a t ions because the echos are affected by re f rac t ion phenomena on the ice surface, ice shelves, crevasses and cracks a t the bottom of the ice. Recently, the measurements of ice thickness have been done u s i n g hel icopters w i t h a mounted impulse radar u n i t . The heli- copter f ly 3 to 5 m above the ice w i t h a velo- c i t y of 5 to 10 knots. The energy is r e f l e c t e d p a r t i a l l y by the ice and by the in te r face between the bottom of the ice and sea water. The difference between t h i s tech- nique and the seismic method is the nature of the energy Source. Electromagnetic waves being used for the radar technique as opposed to s o u n d waves for the seismic method.
I n cold regions, the seismic data available is sparse because of the harshness of the environment and the unstable nature of the ice cover. I ts discontinuity does not allow t h e use of land techniques and maneouvering of marine seismic vessels requires ice-breakers. Therefore seismic exploration i n cold regions
i s a pecul iar mix of land and marine opera- t ions.
The s tudies i n cold regions deal w i t h s imilar problems found when exploring transit ion zones. For instance, the areal extension of frozen ground and t ransi t ion zones var ies a rea l ly and depends largely on deposit ion environments, temperature ( near the freez i n g po in t ) , sa l in i ty , h i s tory of burial and expo- sure, depth, proximity to surface, water sa tura t ion , l i tho logy and s t r e s s f a c t o r s . Seismic reflection techniques are a reasonable approach to the investigation of cold regions both i n terms of economy and time. They pro- vide useful information for estimation of ice thickness, ice bounded, and subsea permafrost extension. These da ta can be used for design and construction of mine shafts, designing su i tab le foundat ion s i tes , o i l and gas Eaci l i - t i e s and to calculate the forces exerted by ice f loes aga ins t s t ruc tures such as platforms s e t on the seabed. Seismic exploration a s s i s t s i n the determination of compressional wave ve loc i t i e s and i n acoustic log interpre- ta t ion i n permafrost. The amount o f work done i n cold regions is large and most of the l i t e ra ture is scat tered. I n t h i s paper a brief presentation of the main problems found both for data acquisit ion and d u r i n g the seismic data processing is given. The examples presented include mostly synthe- t ical ly generated data and they i l l u s t r a t e t h e main steps followed to process a seismic sec- t ion.
1459
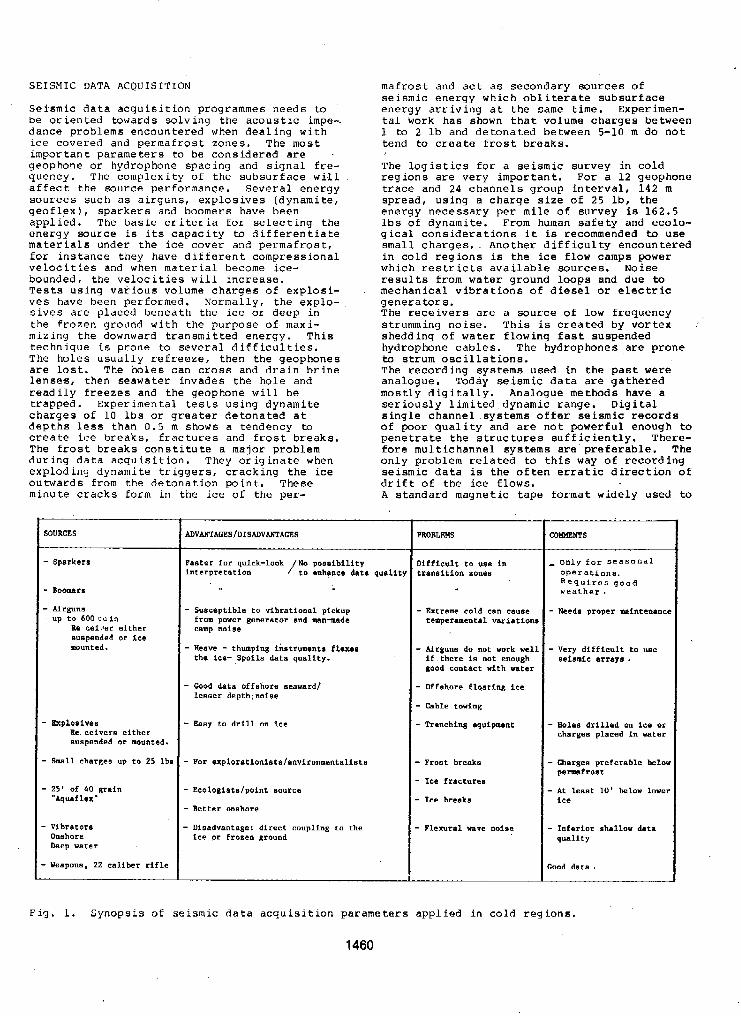
SEISMIC DATA ACQUISIT I ON mafros
Sei-smic data acquis i t ion programmes needs to b e oriented towards solving the acoustic impe-. dance problems encountered when dealing w i t h ice covered and permafrost zones. The most important parameters to be considered are . geophone or hydrophone spacing and s ignal f re- quency. The complexity of the subsurface w i l l affect the source performance. Several energy sources such as airguns, explosives (dynamite, geoflex) , sparkers and boomers have been applied * The basic cr i ter ia for select ing the energy murce is its capac i ty to d i f fe ren t ia te mater ia ls under the ice cover and permafrost, for instance they have different compressional ve loc i t i e s and when material become ice- bounded, the ve loc i t i e s w i l l increase. Tests u s i n g various volume charges of explosi- ves have been performed. Normally, the explo- sives are placed beneath the ice OF deep i n the frozen ground w i t h the purpose of maxi- m i z i n g the downward transmitted energy. T h i s technique i s prone to severa l d i f f icu l t ies . The holes usually refreeze, then the geophones a r e l o s t . The holes can c ross and drain br ine lenses , then seawater invades the hole and readi ly f reezes and the geophone w i l l be trapped. Experimental t e s t s u s i n g dynamite
depths l e s s than 0 . 5 m shows a tendency to charges of 10 l b s or greater detonated a t
create ice breaks, fractures and frost breaks. The f ros t b reaks cons t i tu te a major problem d u r i n g data acquis i t ion. They or ig ina te when explod i n q dynamite triggers, cracking the ice outwards from the detonation point. These minute cracks form i n the ice of the per-
SOURCES
- Sparkers
- Boomers - Airguns
up to 600 cu in Re ceitet either
mounted. suspended or ice
- Exploaives R e ceivers either suspended or mounted.
- Small charges up to 25 lbs
- 25' of 40 grain "Aquaf lex"
- Vibrators Onshore Deep water
- Weapons, 22 caliber rifle
Faster for quick-look No possibility interpretation / t o enhance data quality
- Susceptible to vibrational pickup from power generator and man-made camp noise
- Heave - thumping instruments flexes the ice- Spoils data quality.
- Good data offshore seaward/ lesser depth:noise
- Easy to drill on ice
- For explorationlsts/enviconmuntalists
- Ecologists/point source
- Better onehore - Dlsadvantage: direct coupling to the
ice or frozen ground
t and ac t as secondary sources Of seismic energy which obl i te ia te subsurface energy arriving a t the same time. Experimen- t a l work has shown tha t volume charges between 1 to 2 l b and detonated between 5-10 m do not tend to create f rost breaks.
The l o g i s t i c s f o r a seismic survey i n cold regions are very important. For a 1 2 geophone t race and 24 channels group interval, 142 rn spread, u s i n g a charge size of 25 l b , the energy necessary per mile of survey is 162.5 l b s of dynamite. From human safety and ecolo- g ica l cons idera t ions it is recommended to use small charges. . Another difficulty encountered i n cold regions i s the ice flow camps power which res t r ic t s ava i lab le sources . Noise
mechanical vibrations of d i e se l or e l e c t r i c r e s u l t s from water ground loops and due to
generators. The rece ivers a re a source of low frequency s t rumming noise. T h i s is created by vortex shedding of water flowing f a s t suspended hydrophone cables. The hydrophones are prone to s t r u m osc i l l a t ions . The recording systems used i n the past were analogue. Today seismic data are gathered most ly digi ta l ly . Analogue methods have a ser iously l imited dynamic range. Digital single channel systems offer seismic records of poor qua l i t y and are not powerful enough to pene t ra te the s t ruc turea suf f ic ien t ly . There- fore multichannel systems are preferable. The only problem re la ted to t h i s way o f recording seismic data is the o f t en e r r a t i c d i r ec t ion o f d r i f t o f the ice flows. A standard magnetic tape format widely used to
PROBLEMS
Difficult to use in transition zones
- Extreme cold can cause temperamental variation!
- Airguns do not work wel: if there is nor enough good contact with water
- Offshore flqating ice - Cable towing - Trenching equipment
- Frost breaks - Ice fractures - fce breaks
- Flexural wave noise
COEMENTS
I o n l y f o r s e a s o n a l Operations.
weather. R e q u i r e s good
- Needs proper maintenanca
- Very difficult to w e eeismic arrays.
- Holes drilled on ice or charges placed in water
- Charges preferable belos permafrost
- At least 10' below lower ice
- Inferior shallow data quality
:ood data .
F i g . 1. Synopsis of seismic data acquisition parameters applied i n cold regions.
1460
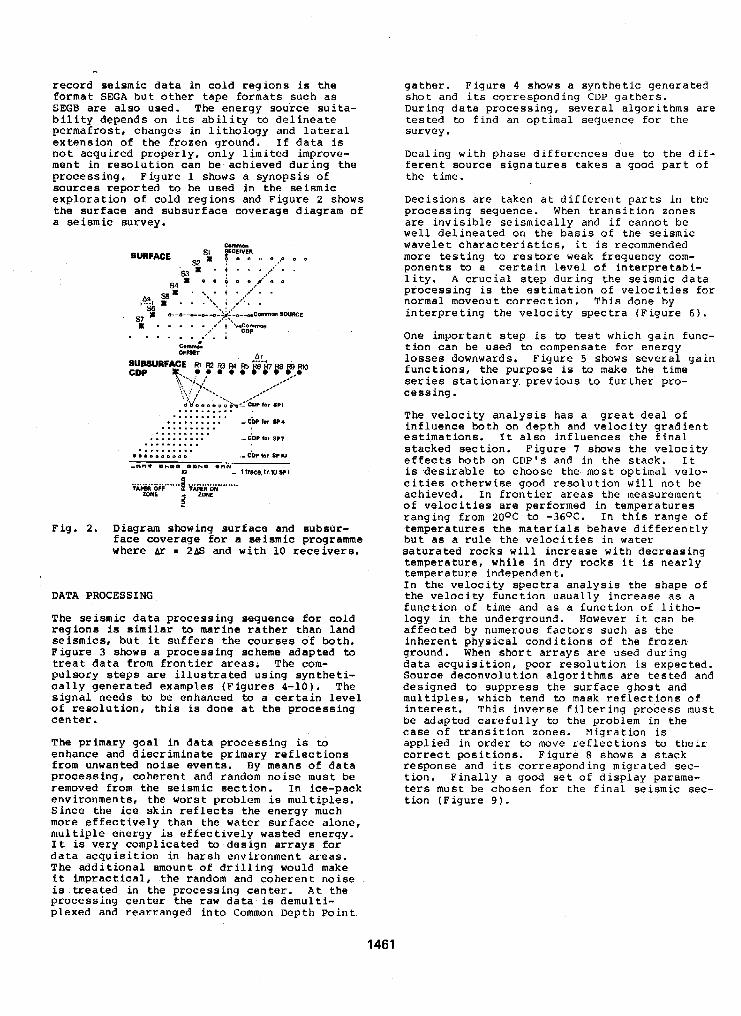
record seismic data i n cold regions is the format SEGA but other tape formats such as SEGB are a l so used. The energy source suita- b i l i t y depends on its ab i l i t y t o de l inea te permafrost, changes i n l i thology and l a t e r a l extension of the frozen ground. If data is not acquired properly, only limited improve- ment i n resolut ion can be achieved during the processing. Figure 1 shows a synopsis of sources reported to be used i n the seismic exploration o f cold regions and Figure 2 shows the surface and subsurface coverage diagram of a seismic survey.
........... .......... ............ c'w *r 8p4
.......... ._ CDP br sP7
~ ~ ~ ~ 0 ~ ~ ~ 0 0 ._ CDP Cr 8P w
YI - I trace, tr.W sy I
.......... .......... .......... .......... -mm* m c m - m m c m t m m
.................. 1 ................... TAPER OFF rww ON
ZONE $ 2ME
F i g . 2 , Diagram showing surface and subsur- face coverage for a aeismic programme where Ar = 2AS ana w i t h 1 0 receivers .
DATA PROCESSING
The seismic data processing sequence for cold regions i s similar to marine rather than land seismics, b u t it suffers the courses of both. Figure 3 shows a processing scheme adapted to t r e a t d a t a from f ront ie r a reas ; The com- pulsory s teps are i l lustrated u s i n g synthet i - cally generated examples (Figures 4-10) . The signal needs to be enhanced to a ce r t a in l eve l of resolut ion, t h i s is done a t t h e processing center . The primary goal i n data processing is to enhance and discriminate primary reflections from unwanted noise events. By means of data processing, coherent and random noise m u s t be removed from the seismic section. I n ice-pack environments, the worst problem i s multiples. Since the ice skin reflects the energy much more eEfectively than the water surface alone, multiple energy is ef fec t ive ly wasted energy. I t is very complicated to design arrays for data acquis i t ion i n harsh environment areas. The addi t ional amount of d r i l l i n g would make it impractical, the random and coherent noise
processing center t h e raw data is demulti- is treated i n t h e processing center. A t the
plexed and rearranged into Common Depth point
gather. Figure 4 shows a synthetic generated shot and i ts corresponding CDP gathers . Dur ing data processing, several algorithms are tested to f i n d an optimal sequence for the survey.
Dealing w i t h phase differences due to the d i f - ferent source signatures takes a good pa r t o f the time.
Decisions are taken a t d i f f e r e n t p a r t s i n the processing sequence. When transit ion zones are invis ible seismical ly and i f cannot be well delineated on the basis of the seismic wavelet character is t ics , i t is recommended more tes t ing to res tore weak frequency com- ponents to a ce r t a in l eve l of interpretabi- l i t y . A cruc ia l s tep d u r i n g the seismic data processing is the estimation of ve loc i t ies for normal moveout correct ion. T h i s done by interpreting the velocity spectra (Figure 6 ) .
One important step is to t e s t which gain func- tion can be used to compensate €or energy losses downwards, Figure 5 shows several gain functions, the purpose is to make the time ser ies s ta t ionary previous to fur ther pro- cessing.
The veloci ty analysis has a great deal of influence both on depth and veloci ty gradient es t imat ions, I t a lso inf luences the f inal stacked section. Figure 7 shows the velocity e f fec ts bo th on CDP's and i n the stack. I t is desirable to choose the most optimal velo- c i t ies o therwise good resolut ion will not be achieved. I n f ront ier areas the measurement of ve loc i t ies a re performed i n temperatures ranging from 20oC to -36oC. I n t h i s range of temperatures the materials behave d i f f e ren t ly b u t a s a ru l e t he ve loc i t i e s i n water saturated rocks will increase w i t h decreasing temperature, while i n d r y rocks it is nearly temperature independent. I n the velocity spectra analysis the shape of the velocity function usually increase as a fun.ction of time and as a function of l i t ho - logy i n the underground. However i t can be affected by numerous f ac to r s such as the inherent physical conditions of the frozen ground. When short arrays are used d u r i n g data acquis i t ion, poor resolut ion is expected. Source deconvolution algorithms are tested and designed to suppress the surface ghost and multiples, which tend to mask r e f l ec t ions of i n t e re s t . T h i s inverse f i l ter ing process m u s t be adapted carefully to the problem i n the case of transition zones. Migration is applied i n order to move r e f l ec t ions to the i r correct posit ions. Figure 8 shows a stack response and its corresponding migrated sec- t ion. Final ly a good s e t of display parame- t e r s m u s t be chosen for the final seismic sec- tion (Figure 9 ) .
1461
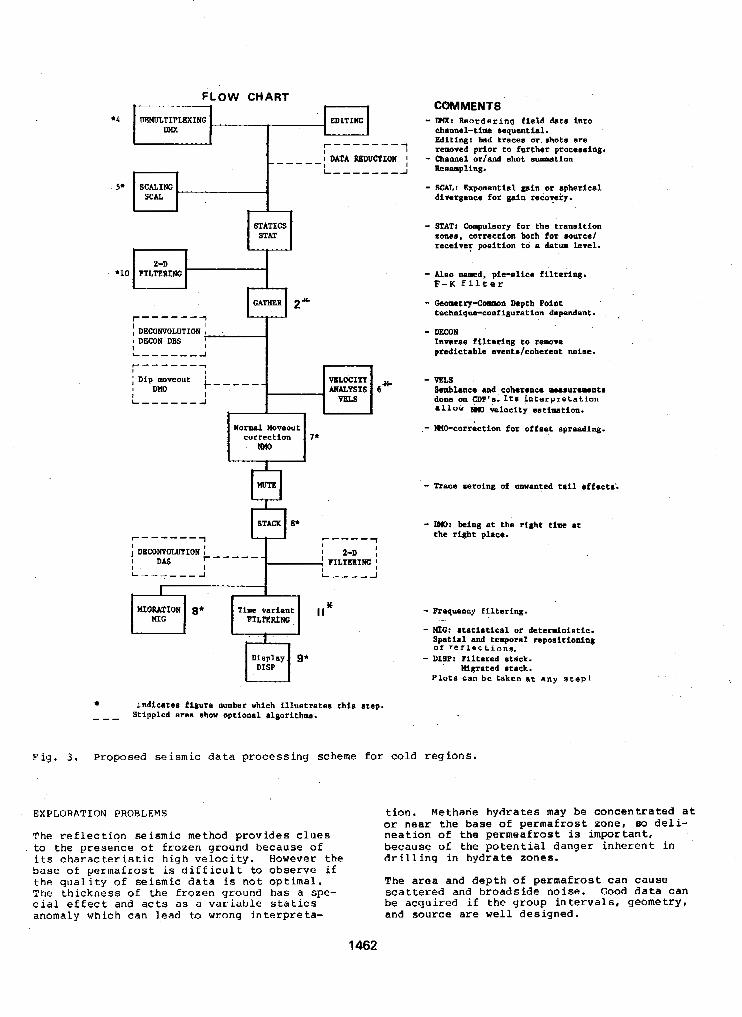
*4
5*
FLOW CHART CWMENTS
Editing: bad traces or shots are channel-time sequential.
DEMULTIPLEXING EUITING * IMX: Reordering field data into
- - - - 1 r e m w d prior to further processing. ""_ I DATA UXDUCTION - Channel or/and shot s m t i o n
m L I ---I I - A BcsamrJli*g*
* SCAL: Ibponential gain or spherical divergence for gain recovety.
- STAT! Compulsory for the transition xones. correction both for source1 receiver poaition td a datum level.
r-------l I DECONVOLUTION > I I DECON DBS I L-"""l
F"""7 I
Dip moveout I DUO I L"""J
Normal Moveout
- NPO named, picslica filtering. F-K f i l t e r
- Gemtry-Comwn Depth Point techniqua-configuration dapendent. ,
- DECON Inverse f i l tWiUg to remove predictable eventm/coherent noise.
- WO-correction for offset aproading.
r------1 8 STACK 8* p"" 1
- Trace aeroing of unwanted tail affects'.
- IIK): king at tha right time at the right place.
- Frequancp filtering. - MIG: mtatiatical or deterdniotic.
Spatial and temporal repositioning
- DISP: Filtered stack. of r e f l e c t i o n a .
Migrated stack. Plota can be taken a t a n y s t e p 1
rndicates figure number vhich illustrates this step. "- Stippled area show optional algorithms.
F i g . 3 . Proposed seismic data processing scheme for cold regions.
EXPLORATION PROBLEMS
The reflection seismic method provides clues to the presence of frozen ground because of i t s cha rac t e r i s t i c h i g h veloci ty . However the base of permafrost is d i f f i c u l t to observe if the quali ty of seismic data is not optimal. The thickness of the frozen ground has a spe- c i a l e f f e c t and ac t s a s a v a r i a b l e s t a t i c s anomaly which can lead to wrong interpre ta-
t ion. Methane hydrates may be concentrated a t or near the base of permafrost zone, 80 de l i - neation of t h e permeafrost is important, because of the potential danger inherent i n d r i l l i n g i n hydrate zones.
The area and depth of permafrost can cause
be acquired i f t h e group intervals, geometry, scat tered and broadside noise. Good data can
and source are well designed.
1462
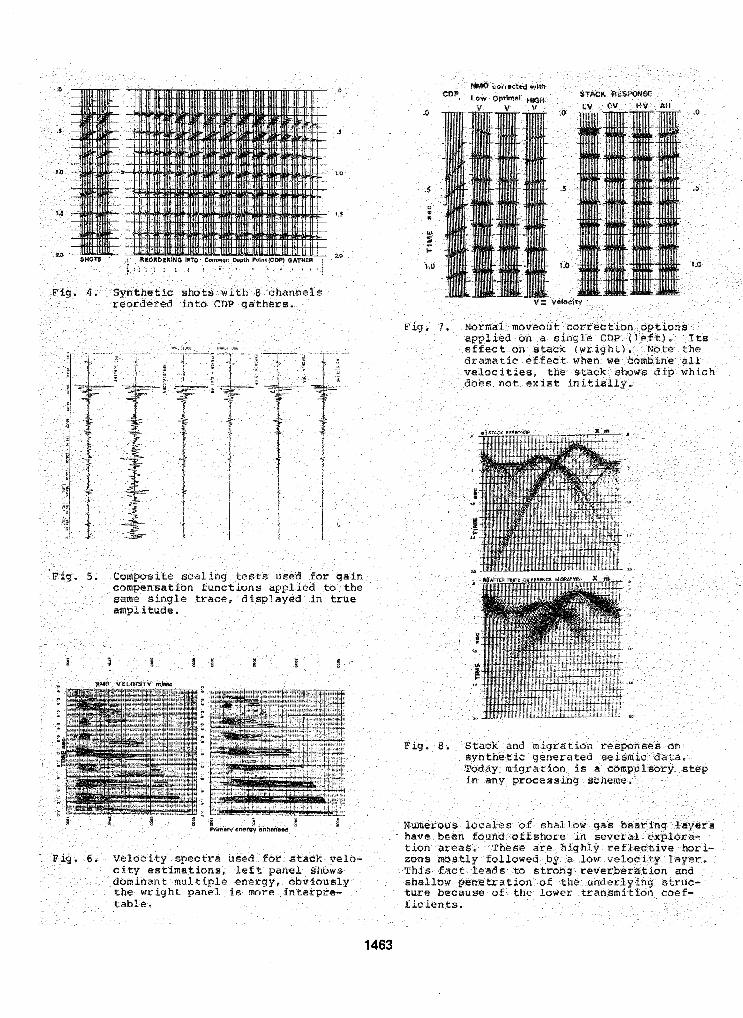
1463
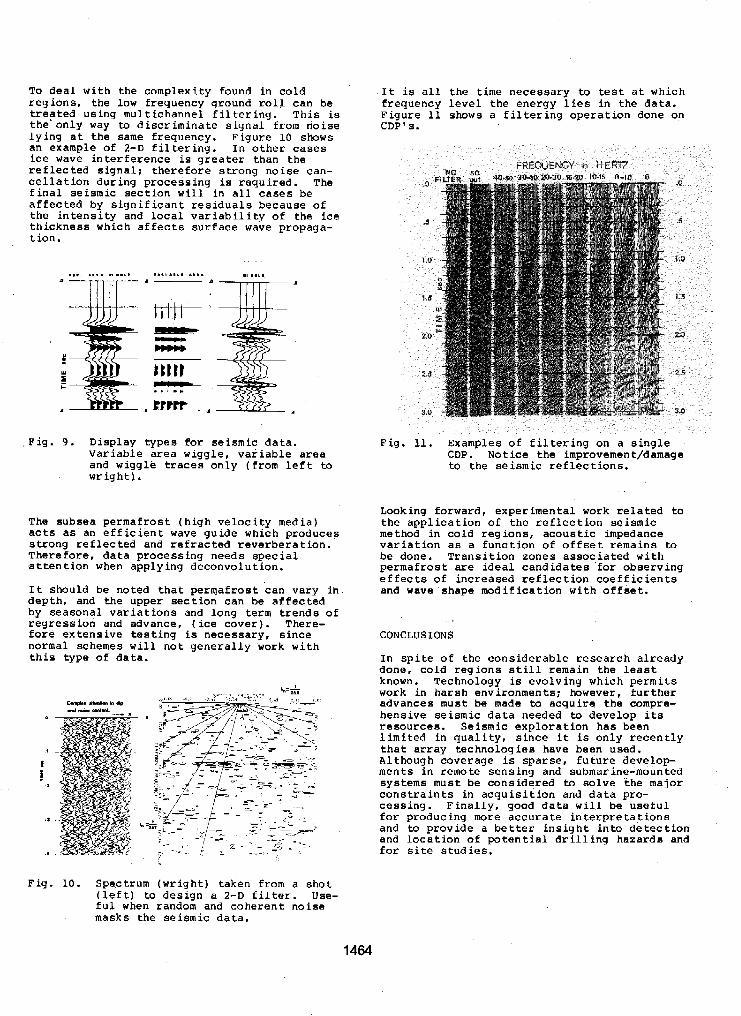
To d e a l w i t h t h e c o m p l e x i t y f o u n d i n c o l d r e g i o n s , t h e low f r equency g round roll can be t r e a t e d u s i n g m u l t i c h a n n e l f i l t e r i n g . T h i s is t h e ' o n l y way to d i s c r i m i n a t e s i g n a l f r o m noise l y i n g a t t h e same f r e q u e n c y . F i g u r e 10 shows an example o f 2-D f i l t e r i n g . I n o t h e r cases ice wave i n t e r f e r e n c e is g r e a t e r t h a n t h e r e f l e c t e d s i g n a l ; t h e r e f o r e s t r o n g n o i s e c a n - c e l l a t i o n d u r i n g p r o c e s s i n g is r e q u i r e d . T h e f i n a l seismic s e c t i o n w i l l i n a l l c a s e s b e a f f e c t e d b y s i g n i f i c a n t r e s i d u a l s b e c a u s e o f t h e i n t e n s i t y and l o c a l v a r i a b i l i t y o f t h e ice t h i c k n e s s w h i c h a f f e c t s s u r f a c e wave propaga- t i o n .
.. .
" A , . .... .....I *..I*,,, C I I A I, ...I
F i g . 9 . D i s p l a y t y p e s f o r seismic d a t a . Variable area w i g g l e , v a r i a b l e area and wiggle traces o n l y ( f r o m l e f t to W r i g h t ) .
T h e s u b s e a p e r m a f r o s t ( h i g h v e l o c i t y m e d i a ) ac t s a s a n e f f i c i e n t wave g u i d e w h i c h p r o d u c e s s t r o n g r e f l e c t e d and r e f r a c t e d r e v e r b e r a t i o n . T h e r e f o r e , d a t a p r o c e s s i n g n e e d s s p e c i a l . a t t e n t i o n when a p p l y i n g d e c o n v o l u t i o n .
I t s h o u l d be n o t e d t h a t p e r m a f r o s t c a n v a r y i n d e p t h , a n d t h e u p p e r s e c t i o n c a n b e a f f e c t e d b y s e a s o n a l v a r i a t i o n s a n d l o n g term t r e n d s o f r e g r e s s i o n a n d a d v a n c e , ( i ce c o v e r ) . T h e r e - f o r e e x t e n s i v e t e s t i n g is n e c e s s a r y , s i n c e normal schemes will n o t g e n e r a l l y work w i th t h i s t y p e of d a t a .
I t is a l l t h e time n e c e s s a r y to test a t w h i c h f r e q u e n c y l e v e l t h e e n e r g y l i e s i n t h e d a t a . F i g u r e 11 shows a f i l t e r i n g o p e r a t i o n d o n e o n CDP's.
F i g . 11. Examples of f i l t e r i n g o n a s i n g l e CDP . Not ice the improvemen t/d amage to t h e seismic r e f l e c t i o n s .
L o o k i n g f o r w a r d , e x p e r i m e n t a l w o r k r e l a t e d to t h e a p p l i c a t i o n o f the r e f l e c t i o n seismic m e t h o d i n c o l d r e g i o n s , a c o u s t i c i m p e d a n c e v a r i a t i o n as a f u n c t i o n o f o f f s e t r e m a i n s to b e d o n e . T r a n s i t i o n z o n e s a s s o c i a t e d w i t h p e r m a f r o s t are i d e a l c a n d i d a t e s for o b s e r v i n g e f f e c t s of i n c r e a s e d r e f l e c t i o n c o e f f i c i e n t s and wave shape mod i f i ca t ion w i t h o f f s e t .
CONCLUSIONS .. I
I n s p i t e o f t h e c o n s i d e r a b l e r e s e a r c h a l r e a d y d o n e , cold r e g i o n s s t i l l r e m a i n t h e l ea s t known. Technology is e v o l v i n g w h i c h p e r m i t s w o r k i n h a r s h e n v i r o n m e n t s ; h o w e v e r , f u r t h e r a d v a n c e s m u s t be made to a c q u i r e t h e c o m p r e - h e n s i v e seismic d a t a n e e d e d to d e v e l o p i ts r e s o u r c e s . S e i s m i c e x p l o r a t i o n h a s b e e n l i m i t e d i n q u a l i t y , s i n c e it is o n l y r e c e n t l y t h a t a r r a y t e c h n o l o g i e s h a v e b e e n u s e d .
m e n t s i n remote s e n s i n g a n d submarine-mounted A l t h o u g h c o v e r a g e is s p a r s e , f u t u r e d e v e l o p -
s y s t e m s m u s t b e c o n s i d e r e d to s o l v e t h e major c o n s t r a i n t s i n a c q u i s i t i o n and d a t a pro- c e s s i n g . F i n a l l y , g o o d d a t a w i l l b e u s e f u l for p r o d u c i n g m o r e a c c u r a t e i n t e r p r e t a t i o n s and to p r o v i d e a b e t t e r i n s i g h t i n t o d e t e c t i o n a n d l o c a t i o n of p o t e n t i a l d r i l l i n g h a z a r d s a n d f o r s i t e s t u d i e s .
F i g . 10. S p e c t r u m ( W r i g h t ) t a k e n f r o m a s h o t ( l e f t ) ta d e s i g n a 2-D f i l t e r . Use- f u l when r andom and cohe ren t no i se masks t he seismic da ta .
1464
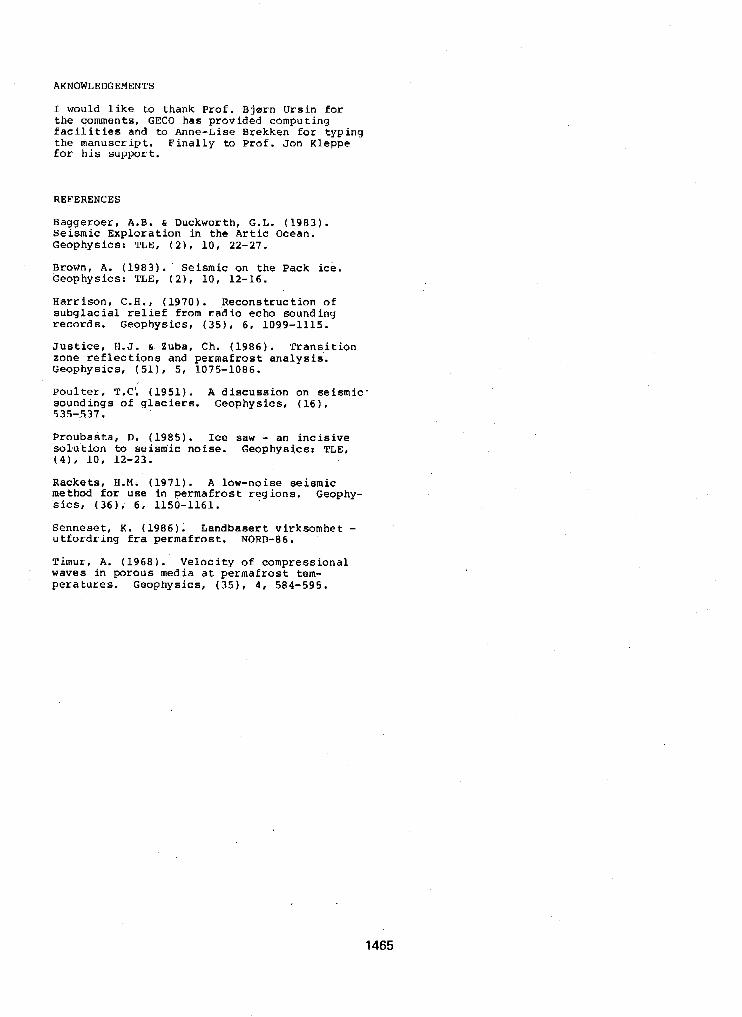
AKNOWLEDGEMENTS
I would l i k e to t h a n k P r o f . B j a r n U r s i n for the comments , GECO has p rovided comput ing f a c i l i t i e s and to Anne-Lise Brekken for t y p i n g t h e m a n u s c r i p t . F i n a l l y to Prof . Jon Kleppe f o r h i s s u p p o r t .
REFERENCES
B a g g e r o e r , A.B. h Duckworth, G.L. ( 1 9 8 3 ) . S e i s m i c E x p l o r a t i o n i n t h e Artic Ocean. Geophys ics : TLE, ( 2 ) I 1 0 , 22-27.
Brown, A. (1983). ' S e i s m i c o n t h e P a c k ice. Geophys ics : TLE, ( 2 ) , 1 0 , 12-16.
H a r r i s o n , C.H. , ( 1 9 7 0 ) . R e c o n s t r u c t i o n of s u b g l a c i a l r e l i e f f r o m rad io echo sound ing records. Geophys ics , (35) , 6 , 1099-1115.
J u s t i c e , H.J. 6 Zuba, Ch. ( 1 9 8 6 ) . T r a n s i t i o n z o n e r e f l e c t i o n s a n d p e r m a f r o s t a n a l y s i s . G e o p h y s i c s , (51) , 5 , 1075-1086.
P o u l t e r , T.C! (1951). A d i s c u s s i o n o n seismic' s o u n d i n g s o f g l a c i e r s . G e o p h y s i c s , (16). 535-.537.
P r o u b a s t a , D. (1985). Ice saw - a n i n c i s i v e s o l u t i o n to seismic no i se . Geophys ic s : TLE, ( 4 ) 1 10, 12-23.
R a c k e t s , H.M. ( 1 9 7 1 ) . A low-noise seismic method f a r u s e i n p e r m a f r o s t r e g i o n s . Geophy- sics, (36) , 6, 1150-1161.
S e n n e s e t , K. ( 1 9 8 6 ) . L a n d b a s e r t v i r k s o m h e t - u t f o r d r i n g fra p e r m a f r o s t . NORD-86.
Timur, A. ( 1 9 6 8 ) . V e l o c i t y of c o m p r e s s i o n a l w a v e s i n p o r o u s media a t p e r m a f r o s t tem- p e r a t u r e s . G e o p h y s i c s , (351, 4 , 584-595.
1465
PROBLEMS OF ARCTIC ROAD CONSTRUCTION AND MAINTENANCE IN FINLAND
S. Saaretainen and J. Vaskelainen
Technical Research Centre of Finland, Geotechnical Laboratory
?.33BLEMS OF ARCTIC ROAD CONSTRUCTION AND EIAINTENANCE IN FINLAND
SYNOPSIS. In the paper, the problems induced by the cold climate to road maintenance and construction in Northern Finland are described and discussed. Methods for the improvement of road on permafrost, frost heave, icing and snow accumulation are presented. According to the experimental design and construction, economical and technically feasible solutions can be achieved by the application of developed thermodynamic background.
1. INTRODUCTION
Finland is located between the latitudes 60 and 70 in the northern hemisphere. The mean annual air temperatures vary from + 6 OC in the south to -2.. . - 3 OC in the north of Finland (fig. 1). The climate is heavily affected by the Golf stream, which smoothes the air temperature variation. In eastern parts of the country, the continental climatic effects are more distinct, and the seasonal temperature variations are relatively larger.
Due to the long cold period and relatively low mean temperature, the effects of frost and Soil freezing are dominant in the behaviour of different structures exposdd to freezing, i.e. soil structures, foundations, hydraulic Structures and others. Due to the fact that the economical activity in the country is concentrated to the southern zone, the basic experience of construction and behaviour of structures is mostly based on practice in a relatively mi,lder climate.
Because of the growing interest in cold regions engineering and the problems reported in the North, a development project was established to study the character and degree of the problems caused at the roads by extreme climatic condi- tions in Finland. This study was started with a general study on the problems involved in road construction and maintenance in Northern Lapland in 1905. The initiative and financial
Waterways Administration ( T V H ) and the Road support were given by the Finnish Roads and
District of Lapland. One responsible participant in the project was VTT, Geotechnical laboratory, which was responsible for the frost investigations and frost engi-
participants were the Road District of Lapland, neering design in the project, and other
which was responsible for site investigations, test construction anr l the monitoring of the be-
haviour of test structures, and Consulting Engineers Viatek Oy, which was responsible for the planning and road engineering design of the structures.
The goals of the project were to produce methods for road reconstruction feasible in these conditions to be used as a technical basis in the north, and to apply the modern cold regions engineering approach in the solution of these specific problems. From this point of view, if carried out on exact methods o f analysis, the experience gained might be used to develop structures in other cold zones as well for the more southern zones as in the permafrost zone.
Fig. 1. Location of the investigation area.
1466
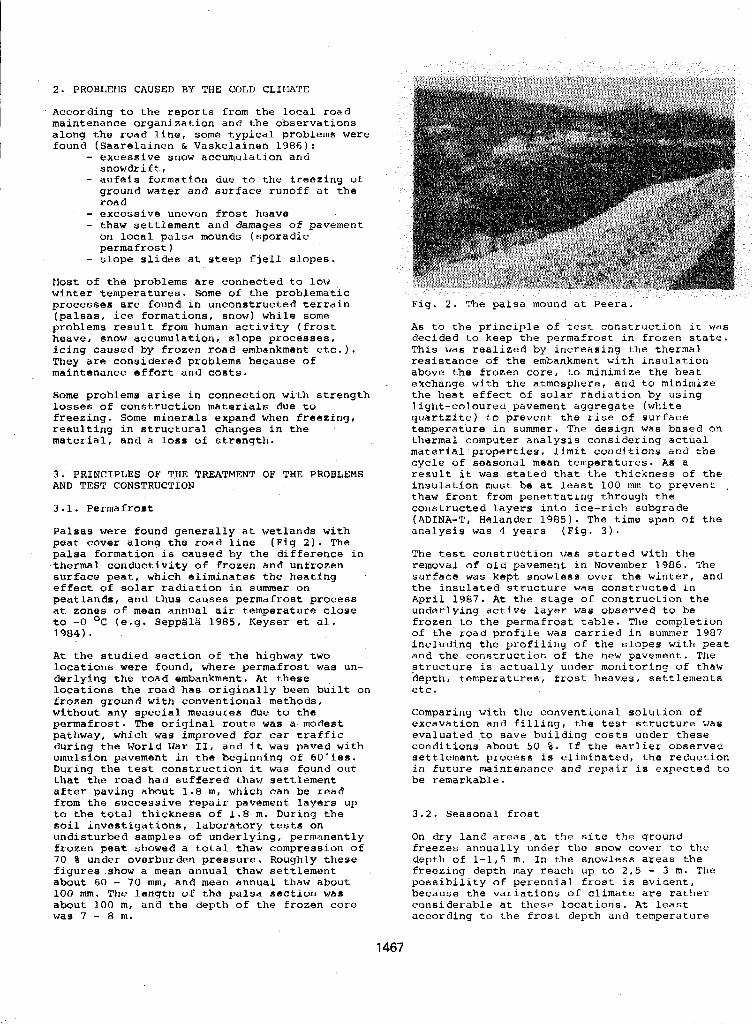
2. PROBLEllS CAUSED BY THE COLD CLIEIATE
According to the reports from the local road maintenance organization and the observations along the road line, some typical problems were found (Saarelainen & Vaskelainen 1986):
- excessive snow accumulation and snowdrift,
- aufeis formation due to the freezing of ground water and surface runaff at the road
- excessive uneven frost heave - thaw settlement and damages of pavement on local palsa mounds (sporadic permafrost)
- slope slides at steep fjell slopes. Host of the problems are connected to low winter temperatures. Some of the problematic processes are found in unconstructed terrain (palsas, ice formations, snow) while some problems result from human activity (frost heave, snow accumulation, slope processes, icing caused by frozen road embankment etc.). They are considered problems because of maintenance effort and costs.
Some problems arise in connection with strength losses of construction materials due to freezing. Some minerals expand when freezing, resulting in structural changes in the material, and a loss of strength.
3 . PRINCIPLES OF THE TREATMENT OF THE PROBLEMS AND TEST CONSTRUCTION
3.1. Permafrost
Palsas were found generally at wetlands with peat cover along the road line (Fig 2 ) . The palsa formation is caused by the difference in ,thermal conductivity of frozen and unfrozen surface peat, which eliminates the heating effect of solar radiation in summer on peatlands, and thus causes permafrost process at zones of mean annual air temperature close to -0 OC (e.g. SeppSlS 1985, Keyser et al. 1984).
At the studied section of the highway two locations were found, where permafrost was un- derlying the road embankment. At these locations the road has originally been built on frozen ground with conventional methods, without any special measures due to the permafrost. The original route was a modest pathway, which was improved for car traffic during the World War 11, and it was paved with emulsion pavement in the beginning of 60'ies. During the test construction it was found out that the road had suffered thaw settlement after paving about 1.8 m, which can be read
to the total thickness of 1.8 m. During the from the successive repair pavement layers up
soil investigations, laboratory tests on undisturbed samples of underlying, permanently frozen peat showed a total thaw compression of 70 8 under overburden pressure. Roughly these figures.show a mean annual thaw settlement about 60 - 70 mm, and mean annual thaw about 100 mm. The length of the palsa section was about 100 m, and the depth of the frozen core was 7 - 8 m.
Fig. 2 . The palsa mound at Peera.
As to the principle of test construction it was decided to keep the permafrost i n frozen state. This was realized by increasing the thermal resistance of the embankment with insulation above the frozen core, to minimize the heat exchange with the atmosphere, and to minimize the heat effect of solar radiation by using light-coloured pavement aggregate (white quartzite) to prevent the rise of surface temperature in summer. The design was based on thermal computer analysis considering actual material properties, limit conditions and the cycle of seasonal mean temperatures. As a result it was stated that the thickness o f the insulation must be at least LOO mm to prevent ,
thaw front from penetrating through the constructed layers into ice-rich subgrade (ADINA-T, Belander 1985). The time span of the analysis was 4 years (Fig. 3 ) .
The test construction vas started with the removal of old pavement in November 1906. The surface was kept snowless over the winter, and the insulated structure was constructed in April 1907. At the stage of construction the underlying active layer was observed to be
of the road profile was carried in summer 1907 frozen to the permafrost table. The completion
including the profiliny of the slopes with peat and the construction of the new pavement. The structure is actually under monitoring of thaw hepth, temperatures, frost heaves, settlements etc.
Comparing with the conventional solution of excavation and filling, the test structure was evaluated to save building costs under these conditions about 50 8 . If the earlier observed settlement process is eliminated, the reduction in future maintenance and repair is expected to be remarkable,
3 . 2 . Seasonal frost
On dry land areas at the site the ground freezes annually under the snow cover to the depth of 1-1,5 m. In the snowless areas the freezing depth may reach up to 2 , 5 - 3 in. The possibility of perennial frost is evident, because the variations of climate are rather considerable at these locations. At least according to the front depth and temperature
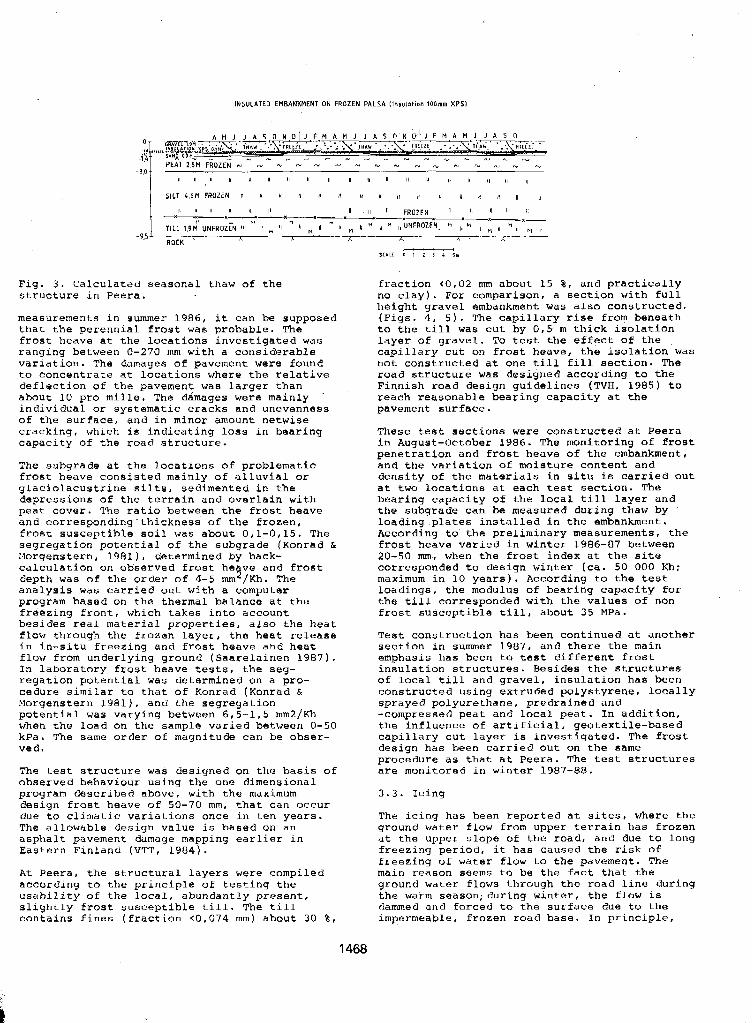
INSULATED EMBANKMENT ON FROZEN PALSA ( lnwlot1on lOQmm XPS1
Fig. 3 . Calculated seasonal thaw of the structure in Peera.
measurements in summer 1986, it can be supposed that the perennial frost was probable. The frost heave at the locations investigated was ranging between 0-270 mm with a considerable variation. The damages of pavement were found to concentrate at locations where the relative deflection o f the pavement was larger than about 10 pro mille. The ddmages were mainly I
individual or systematic cracks and unevenness of the surface, and in minor amount netwise cracking, which is indicating loss in bearing capacity of the road structure.
The subgrade at the locations of problematic frost heave consisted mainly of alluvial or glaciolacustrine silts, seilimented in the depressions of the terrain and overlain with peat cover. The ratio between the frost heave and corresponding-thickness of the frozen, frost susceptible soil was about 0,1-0,15. The segregation potential o f the subgrade (Konrad & Morgenstern, 1981), determined by back- calculation on observed frost heave and frost depth was of the order of 4-5 mm2/Kh. The analysis was carried out with a computer program based on the thermal balance at the freezing front, which takes into account besides real material properties, also the heat flow through the frozen layer, the heat release in in-situ freezing and frost heave and heat flow from underlying ground (Saarelainen 1987). In laboratory frost heave tests, the seg- regation potential was determined on a pro- cedure similar to that o f Konrad (Konrad & Plorgenstern 1981). and the segregation potential was varying between 6,5-1,5 mm2/Kh when the load on the sample varied between 0-50 kPa. The same order of magnitude can be obser- ved.
The test structure waG designed on tlle basis of observed behaviour using the one dimensional program described above, with the maximum design frost heave of 50-70 mm, that can occur due to climatic variations once in ten years. The allowable design value is based on a n asphalt pavement damage mapping earlier in Eastern Finland (VTT, 1904).
At Peera, the structural layers were compiled according to the principle of testing the usability of the local, abundantly present, slighEly frost susceptible till. The till contains f i n e s (fraction <(3,074 m m ) about 30 %,
1468
fraction c O , O 2 mm about 15 $, and practically no clay). For comparison, a section with full height gravel embankment was also constructed. (Figs, 4 , 5). The capillar'y rise from beneath to the till was cut by 0.5 m thick isolation layer of gravel. To test the effect of the capillary cut on frost heave, the isolation was not constructed at one till fill section. The road structure was designed according to the Finnish road design guidelines (TVH, 1985) to reach reasonable bearing capacity at the pavement surface.
These test sections were constructed at Peera
penetration and f ros t heave o f the embankment, in August-October 1986. The monitoring of frost
and the variation of moisture content and density of the materials in situ is carried out
bearing capacity of the local till layer and at two locations at each test section. The
the subgrade can be measured during thaw by ~
loading plates installed in the embankment. According to the preliminary measurements, the frost heave varied in winter 1986-87 between 20-50 nun, when the frost index at the site corresponded to design winter (ca. 50 000 Kh: maximum in 10 years). According to the test loadings, the modulus of bearing capacity for the till corresponded with the values of non frost susceptible till, about 35 MPa.
Test construction has been continued at another section in surrlhler 1987, and there the main emphasis has been to test different frost insulation structures. Besides the structures o f local till and gravel, insulation has been constructed using extruded polystyrene, locally
-compressed peat and local peat. In addition, sprayed polyurethane, predrained and
the influence of artificial, geotextile-based capillary cut layer is investigated. The frost design has been carried out on the same procedure as that at Peera. The test structures are monitored in winter 1987-88.
3 , 3 . Icing
The icing has been reported at sites, where the ground water flow from upper terrain has frozen at the upper slope of the road, and due to long freezing period, it has caused the risk of freezing of water f l o w to the pavement. The main reason seems to be the fact that the ground water flows through the road line during the warm season; during winter, the flow is dammed and forced to the surface due to the impermeable, frozen road base. In principle,
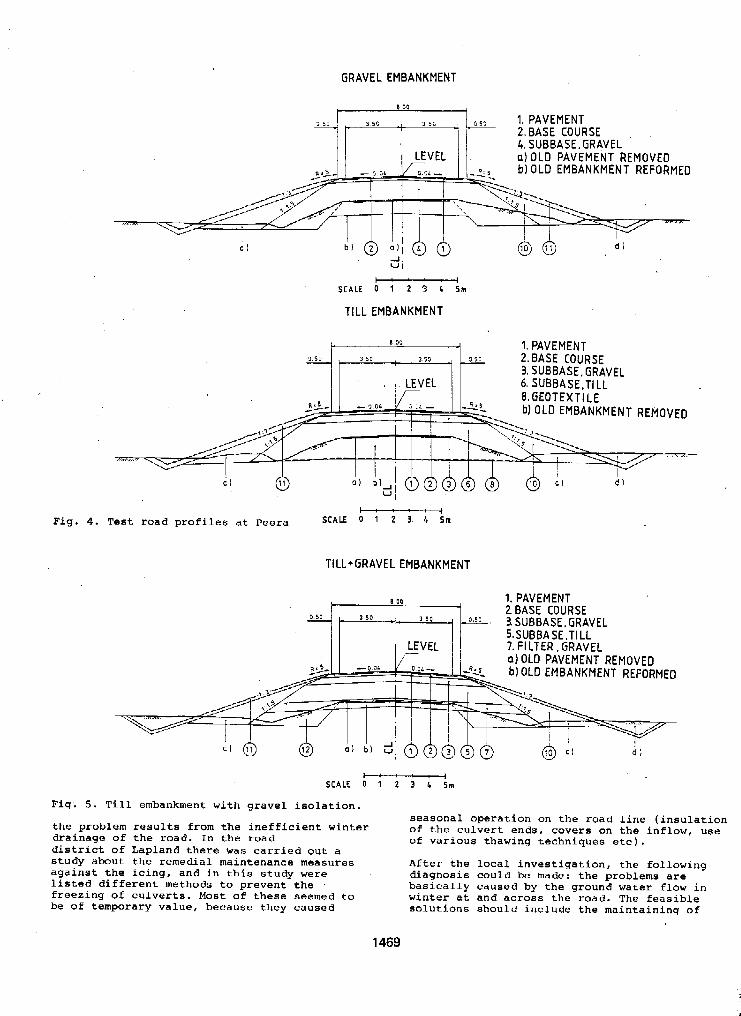
GRAVEL EMBANKMENT
I PO
3 5 E , 3 5 c , 5 5 3 1. PAVEMENT 2. BASE COURSE 4. SUBBASE.GRAVEL
b) OLD EMBANKMENT REFORMED a) OLD PAVEMENT REMOVED
SCALE 0 1 2 3 4 5 m -
TILL EMBANKMENT
1. PAVEMENT 2. BASE COURSE 3. SUBBASE. GRAVEL 6. SUBBASE,t lLL 8.GEOTEXTILE b) OLD EMBANKMENT REMOVED
- Fig. 4. Test road profiles at Peera SCALE ’ * 3’ ‘ ’‘
TILL+GRAVEL EMBANKMENT
8 00 1. PAVEMENT 2 BASE COURSE ’” ‘ Io , 3SUBBASE.GRAVEL
a1 OLD PAVEMENT REMOVED b) OLD EMBANKMENT REFORMED
SCALE 0 1 2 3 I 5 m F
Fig. 5. Till embankment with gravel isolation.
the problem results from the inefficient winter drainage of the road. In the road district of Lapland there was carried o u t a study about the remedial maintenance measures against the icing, and in this study were listed different methods to prevent the freezing o f culverts. Most of these seemed to be of temporary value, because they caused
1469
seasonal operation on the road line (insulation of the culvert ends. covers on the inflow, use of various thawing techniques etc).
After the local investigation, the following diagnosis could be made: the problems are basically caused by the ground water flow in winter at and across the road. The feasible solutions should include the maintaining of
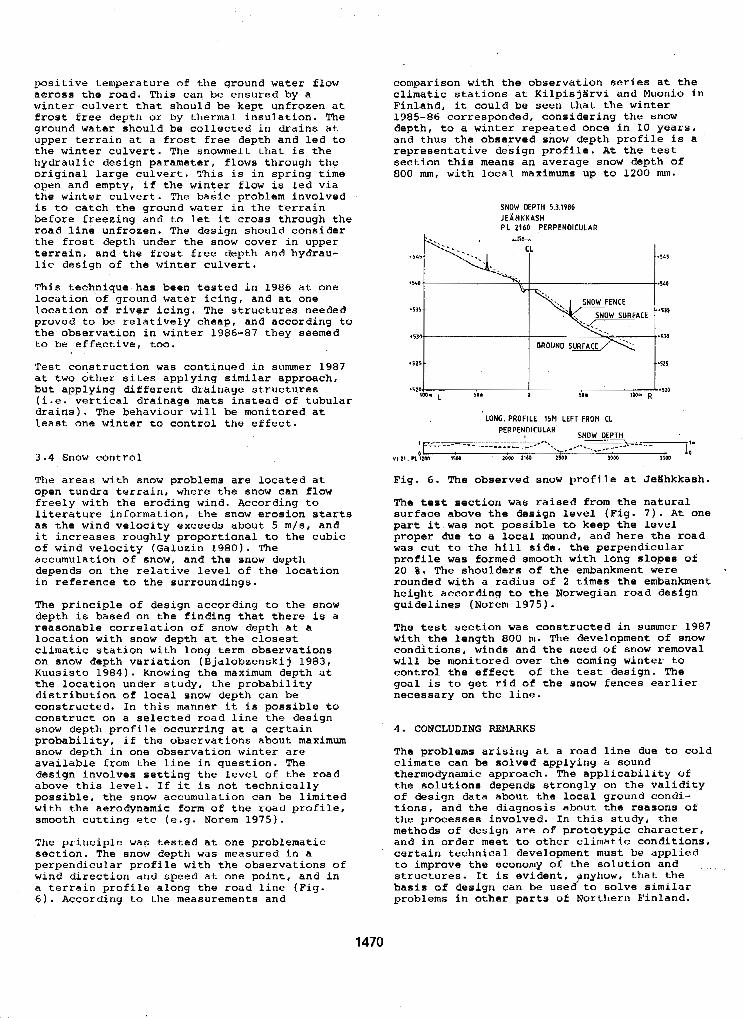
positive temperature of the ground water flow
winter culvert that should be kept unfrozen at across the road. This can be ensured by a
frost free depth or by thermal insulation. The ground water should be collected in drains a t . upper terrain at a frost free depth and led to the winter culvert. The snowmelt that is the hydraulic design parameter, f l o w s through the original large culvert. This is in spring time open and empty, if the winter flow i s led via the winter culvert. The basic problem involved is to-catch the ground water in the terrain before freezing and to let it cross through the road line unfrozen. The design should consider the frost depth under the snow cover in upper terrain, and the frost free depth and hydrau- lic design of the winter culvert.
This technique has been tested in 1986 at one location of ground water icing, and at one
proved to be relatively cheap, and according to location of river icing. The structures needed
the observation in winter 1986-87 they seemed to be effective, too.
Test construction was continued in summer 1987 at two other sites applying similar approach, but applying different drainage structures
drains). The behaviour will be monitored at (i.e. vertical drainage mats instead of tubular
least one winter to control the effect.
3.4 Snow control
The areas with snow problems are located at open tundra terrain, where the snow can flow
literature information, the snow erosion starts freely with the eroding wind. According to
as the wind velocity exceeds about 5 m/s, and it increases roughly proportional to the cubic of wind velocity (Galuzin 1980). The accumulation of snow, and the snow depth depends on the relative level of the location in reference to the surroundings.
The principle o f design according to the snow depth is based on the finding that there is a reasonable correlation of snow depth at a location with snow depth at the closest
on snow depth variation (Bjalobzenskij 1983, climatic station with long term observations
Kuusisto 1984). Knowing the maximum depth at the location under study, the probability distribution of local snow depth can be constructed. In this manner it is possible to construct on a selected road line the design snow depth profile occurring at a certain probability, if the observations about maximum snow depth in one observation winter are available from the line in question. The design involves setting the level of the road above this level. If it is not technically possible, the snow accumulation can be limited with the aerodynamic form of the road profile, smooth cutting etc (e.g. Norem 1975).
The principle was tested at one problematic section. The snow depth was measured in a perpendicular profile with the observations of wind direction and speed at one point, and in a terrain profile along the road line (Fig. 6). According to the measurements and
comparison with the observation series at the climatic stations at Kilpisjsrvi and Muonio in Finland, it could be seen that the winter 1985-86 corresponded, considering the snow depth, to a winter repeated once in 10 years, and thus the observed snow depth profile is a representative design profile. At the test
000 mm, with local maximums up to 1200 nun. section this means an average snow depth of
SNOW DEPTH 5.3.1986 JEAHKKASH P L 21bO PERPENDICULAR
I GROUND 5- \.. . *530
r 5 Z s t t'"' . s l o ~ _ l . s ~ o 100" SO. 50ll 1W. R
LONG. PROFILE 15H LEFT FROM CL PERPENOICULAR.
I . . -. S N X i E P T H
1 "-:"-"" """_ ""*"- '.:.I," >7..L-I~ VI 21. PL!L b ZOW 1160 2500 3000 3500
Fig. 6. "he observed snow profile -at Jeahkkash.
The test section was raised from the natural
part it was not possible to keep the level surface above the design level (Fig. 7 ) . At one
proper due to a local mound, and here the road was cut to the hill side. the perpendicular profile was formed smooth with long slopes of 20 %. The shoulders of the embankment were rounded with a radius of 2 times the embankment height according to the Norwegian road design guidelines (Norem 1975).
with the length 800 m. The development of snow The test section was constructed in summer 1987
conditions, winds and the need of snow removal will be monitored over the corning winter to control the effect of the test design. The goal is to get rid of the snow fences earlier necessary on the line.
4. CONCLUDING REMARKS
The problems arising at a road line due to cold climate can be solved applying a sound thermodynamic approach. The applicability of the solutions depends strongly on the validity of design data about the local ground condi- tions, and the diagnosis about the reasons of
methods of design are of prototypic character, the processes involved. In this study, the
and in order meet to other climatic conditions, certain technical development must be applied to improve the economy o f the solution and structures. It is evident, pnyhow, that the basis of design can be used to solve similar problems in other parts of Northern Finland.
1470
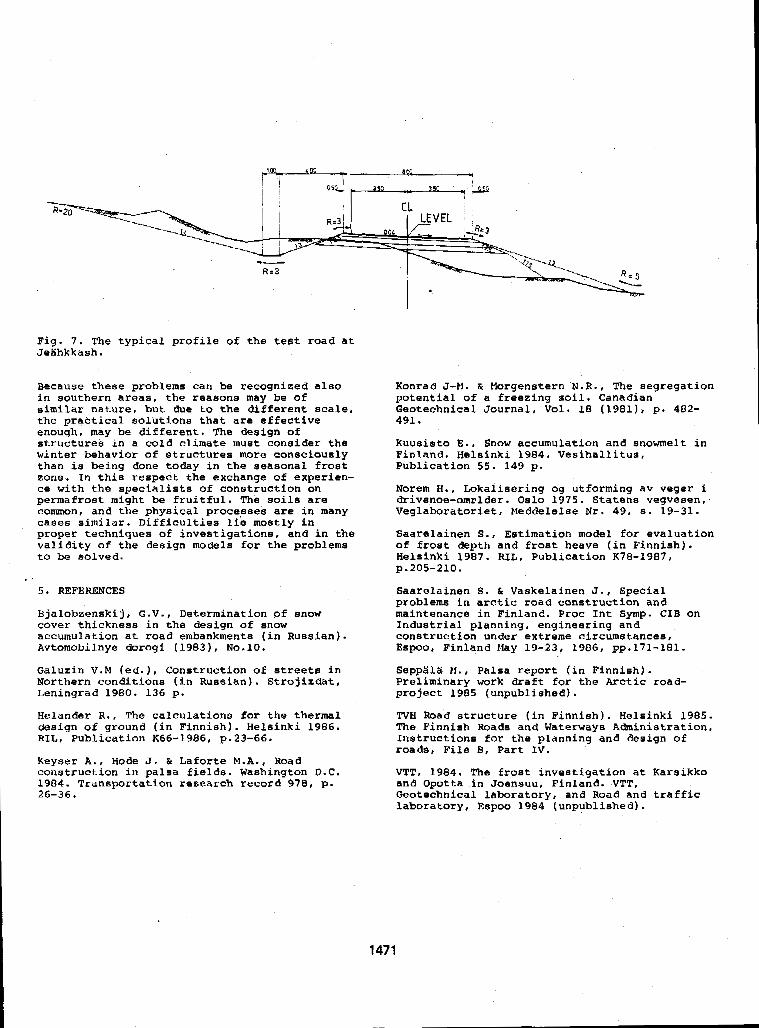
Fig. 7. The typical profile of the teat road at Jeahkkash.
Because these problems can be recognized also in southern areas, the reasons may be of similar nature, but due to the different scale, the practical solutions that are effective enough, may be different. The design of structures in a cold climate must consider the winter behavior o f structures more canaciously than is being done today in the seasonal frost zone. In this respect the exchange of experien-
permafrost might be fruitful. The soils are ce with the specialists of construction on
common, and the physical proce,sses are in many cases similar. Difficulties lie mostly in proper techniques of investigations, and in the validity of the design models €or the problems to be solved.
5 * REFERENCES
Bjalobzenskij, G.V., Determination of snow cover thickness in the design o f snow accumulation at road embankments (in Russian). Avtomobilnye dorogi (1983), No.10.
Galuzin V.M (ea.), Construction of streete in Northern conditions (in Russian). Strojiedat, Leningrad 1980. 136 p.
Helander R., The calculations for the thermal design of ground (in Finnish). Helsinki 1986. RIL, Publication K66-1986, p.23-66.
Keyser A . , Hode J. P Laforte M.A., Road construction in palsa fields. Washington D.C. 1984. Transportation research record 978, p. 26-36.
1471
Konrad J-H. h Morgenetern N . R . , The segregation potential o f a freezing Soil. Canadian Geotechnical Journal, Vol. 18 (1981), p. 482- 491.
Kuusisto E., Snow accumulation and snowmelt in Finland. Helsinki 1984. Veaihallitus, Publication 5 5 . 149 p .
Norem H., Lokaliaering og utforming av veger i drivsnoe-omrlder. Oslo 1975. Statens vegvesen, . Veglaboratoriet, Meddelelse Nr. 49, 8 . 19-31.
Saarelainen S., Estimation model for evaluation of frost depth and frost heave (in Finnish). Helsinki 1987. RIL, Publication K78-1987, p.205-210.
Saarelainen S. & Vaskelainen J., Special problems in arctic road construction and maintenance in Finland. Proc Int Symp. CIB on Industrial planning, engineering and construction under extreme circumstances, EspOO, Finland Nay 19-23, 1906, pp.171-181.
Seppllg i f . , Palsa report (in Finnish). Preliminary work draft for the Arctic road- project 1985 (unpublished).
TVH Road structure (in Finnish). Helsinki 1985. The Finnish Road= and Waterways Administration, Instructions €or the planning and design of roads, Fi le B, Part IV.
VTT. 1984. The frost investigation at Karaikko
Geotechnical laboratory, and Road and traffic and Opotta in Joensuu, Finland. -VTT,
laboratory, Espoo 1984 (unpublished).
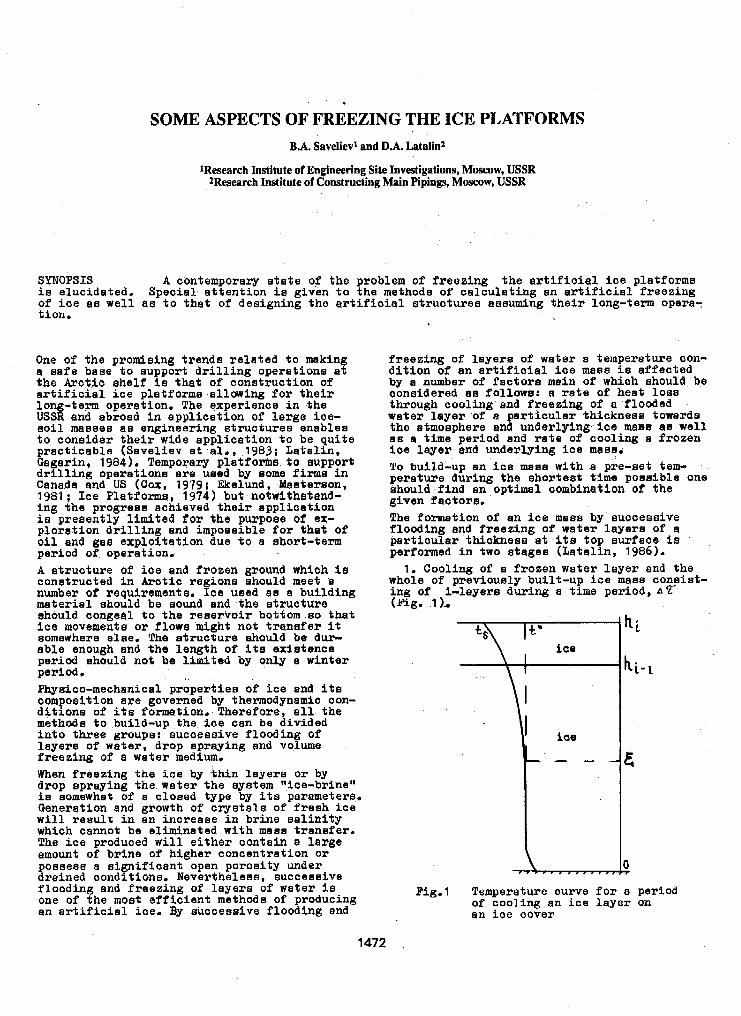
SOME ASPECTS OF FREEZING THE ICE PLATFORMS B.A. Savelied and D.A. L a t a h 2
1Research Institute of Engineering Site Investigations, Moscow, USSR 2Research Institute of Constructing Main Pipings, Moscow, USSR
SYNOPSTS A contemporary s t a t e o? the problem of f r e e z i n g t h e a r t i f i c i a l i c e p l a t f o r m e i s e luc ida ted . Spec ia l a t ten t ion i a g i v e n t o t h e methods o f c a l c u l a t i n g a n a r t i f i c i a l f r e e z i n g of i c e a s w e l l a s t o t h a t o f d e s i g n i n g t h e a r t i f i c i a l s f r u c f u r e e a s e d n g t h e i s l o n g - t e r m o p e r a - t ion.
One of tha p romis ing t rends re la ted to making a a a f a base t o s u p p o r t d r i l l i n g o p e r a t i o n s a t the Arc t ic ehe l f i s t h a t of cons t ruc t ion of a r t i f i c i a l i c e p l a t f o r m e a l l o w i n g f o r t h e i r long-term operation. The experiance i n the USSR and abroad i n a p p l i c a t i o n of l a rge i c s - s o i l masses a s engineering rJtrmoturea enables t o c o n e i d e r t h e i r wide application to be qu i te p rac t i cab le (Save l i ev e t a l . , 1983; Lata l in ,
d r l l l i n g operations are used by mome firms i n Gagarin, 1984). Temporary p l a t f o r m t o aupport
Canada and US ( C o x , 1979; Ekelund, h a t e r s o n , 1981 ; I ce Platforms, 1974) but notwithatand- ing the progrese achieved their appl icat ion i s present ly l imited for the purpose o f ex- p l o r a t i o n d r i l l i n g and imposs ib l e fo r t ha t of oil and gaa exploi ta t ion due t o a ahort-term period of operation. A s t ruc tu re of i c e and frozen ground whioh i~t conetructed in Axotic regions ahould meet a
material should be sound and t h e s t r u c t u r e number of requiremento. Ice used a8 a bui ld ing
i c e movementa o r flows might not t ransfer i t should congeal to the reeer t ro i r bo t tom BO t h a t
ab le enough and the l eng th of i t a exicrtence somewhere elee. The atrucfure should be dur-
period ehould not be limited by only a wintar period. Physico-mechanical propertiee of ice ana i t a
d i t i o n s of i t s formation. Therefore, a l l t h e composition are governed by thermodynamic con-
methods t o ,build-up the ioe can be divided into three groups: aucoessive f looding of
f r eez ing of a water medium. l aye r s of water , drop spraying and volume
When freezing t h e i c e by t h i n l a y e r s o r by drop mpraying the water the system "ioe-bripe" ie somewhat of a eloead type by i ts parameters. Generation and growth of c r y e t a l s of f r e s h i c e will r e s u l t in an i n c r e a s e i n b r i n e s a l i n i t y which cannot be eliminated with masa t ransfer . The i c e produced will e i the r con ta in a l a rge amount of br ine of h igher concent ra t ion o r
drained cond%one, Nevertheleae, successive posaeae a s i i f i c a n t open porosity under
f looding and freezing o f l a y e r s of water i s one of t he most e f f i c i e n t methods of producing an a r t i f i c i a l ice . By succesaive f looding and
f r eez ing o f l aye re of water a temperature con- d i t i o n of a n a r t i f i c i a l i c e mass i s alfeoted by a number of f a c f o r e main o f which ahould be considered as follows: a r e t e of heat losa th rough coo lhg and f r eez ing of a flooded wa te r l aye r 'of a par t icular fhickneas towards the atmosphere and under ly ing ice m a w aa well a8 61 time period and r a t e o f cool ing a f rozen ice l a y e r and under ly ing ice maea. To build-up an i c e maea with a pre-set tem- peratW8 during the ahortest time poesible one should fLnd an optimal combination of t he given factors . The fofmstion of an i c e meBs by'succeasive f looding and freezing of wate r l aye r s of a p a r t i o u l a r ' t h i c k n a s e a t ita fop aurfaccb i e performed i n two s tages (La ta l in , 1986).
1. Cooling of a f rozen wa te r l aye r and the whole of previourrly buil t-up ice mass consis t - ing of i - layers during a time p e r i o d , A r (Fig. 1 1.-
Fig.1 Temperature curve f o r a period
an i ce cover of coo l ing an i ce l aye r on
1472
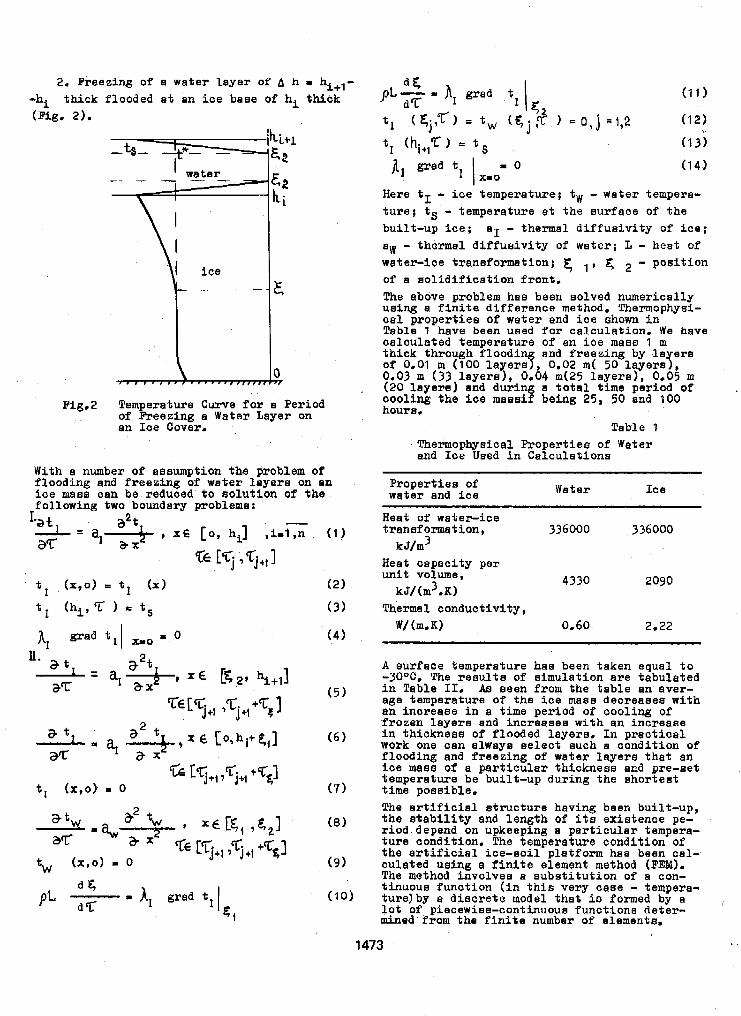
2. Freezing o f a water layer of A h = hi+l- -ha thick flooded at an ice base of h, thick
Big.2 Temperature Curve f o r a Period of Rceezing a Water Layer on an Ios Cover.
With a number of assumption the problem of flooding and freezing of water layers on an ice mase can be reduced to so lu t ion of the following two boundary problame:
Here tI - ice temperature; tW - water tempera- ture; tS - temperature st the surface of the built-up ice; a I - thermal diffusivity of ice; aw - thermal diffuaivity o f water; L - heat of water-ice transformation; 1 , - position of a aolidificetion front. The above problem has been eolved numerically using a finite difference method. Thermophysi- cal properties o f water and ice shown in Table 1 have been ueed for calculation. We have calculated temperature of an ice mass 1 rn thick through floodin and freezing by l a ere o f 0.01 m (1 00 l a e m f , 0.02 m( 50 layeraS, 0.03 m (33 layem?, 0.04 m(25 layere), 0.05 m (20 layere) and during a total tlme period of cooling the ice maeaif being 25, 50 and 100 boure,
Table 1 Thermophysical Properties of Water and Ice Used in Calculations
Propertiea of Water and ice Water Ice
Heat of water-ice tranaformation, 336000 336000 kJ/m3
Heat capacity per unit volume, kY/(m3.K)
W/ (m. K) 0.60 2.22
4330 2090
Thermal conductivity,
A surface temperature has been taken equal to -3OOC. The resulta of simulation are tabulated in Table 11. As men from the table an aver- age temperature OS the ice maae decreaaes with an increase in a time period of cooling of frozen layera and increaaes with an increase in thicknese of flooded layera. In practical work one can elwaye eelect such e condition of flooding and freezing of water layers thet an ice mags of a particular thickness and pre-eef temperature be built-up during the shortest time possible. The artificial efrucfure having been built-up, the etability and length of its existence pe- riod depend on upkeeping a perticuler tempera- ture condition, The temperature condition of the artificial ice-aoil platfomn has been cel- culated using a finite element method (FEY). The method involves a aubetitution o f a con- tinuous funotion (in this very caae - tempera- turelby a discrete model that is formed by a lot of piecewise-oontinuoua functiona defer- mined from the finite number of elemente.
1473
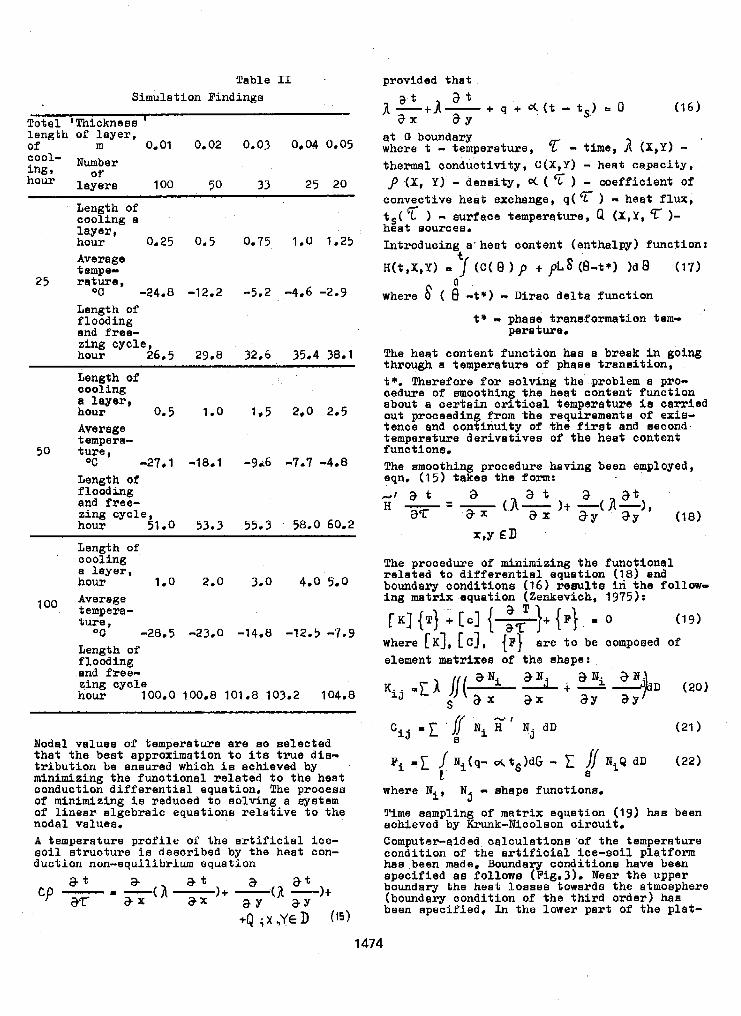
Table I1 Simulation Pindings
Total 'Thickneas ' length of layer, of m O I O l 0.02 0.03 0.04 0.05
- ..
Length of cooling a layer, hour 0.25 0*5 0.75 1.0 1.25
Length of flooding and free- zing cycle, hour 26.5 2908 32.6 35.4 38.1
Length of cooling
hour a layer,
tempera-
0.5 1.0 1.5 2.0 2.5 Average
50 ture, OC -27.1 -18.1 -gd6 -7.7 -4.8
Length o f flooding and free- zing cycle, hour 51.0 53.3 55.3 58.0 60.2
oo Average tempera- ture,
O C -28.5 -23.0 -14.8 -12.5 -7.9 Length of
and free- zing cycle hour 100.0 100.8 101.8 103.2 104.8
flooding
Nodal values of temperature are ao eelected that the beat approximation to ita true ais- tribution be ensured whiah i s achieved by minimizing the functional xelated to the heat conduction differential equation. The procem of minimizing i s reduoed to solving a eyyetem of linear algebraic equations relative to the nodal values. A temperature profile of the artificial i ce - @oil atrUCtUr8 is described by the heat con- duction non-equilibrium equation
provided that
et G boundary where t - temperature, - time, A (X,Y) - '
tharmal conductivity, C(X,U) - heat capacity, p (X, Y) - deneity, oc ( 5 ) - coefficient of convective heat B X O h B n g 8 , q( 'T - heat PLW, tS( Z ) - aurface temperature, P (x,Y, T 1- beat aources. Introducing a' heat content (enthalpy) functiont
H(t,X,Y) I 7 (C( 0 ) p + ,$8 (a&*) I d 8 (17)
where 8 ( f l -t*) - Diraa delta function a
t * - phaae transformation tem- perature.
The heat content function hes a break in going through a temperature of phase transition, t*. Therefore f o r solving the problem a pro-
about a certain critical temperature i s carried cedure o f moothing the heat content function
tenca and continuity of the firat and second out prooeeding from the requirements o f eris-
temperature derivatives of the heat content functions. The amoothing ppocedure having been employed, eqn. (15) takes the form:
The procedure of minimizing the functional related to differential equation (18) and boundary conditions (16) results in the follow- ing matrix equation (Zenkevich, 1975):
(19)
where [K], IC], {F} are to be composed of element metrixee o f the ahape:
where Nil Nj I* ahape fwxotiona.
Time aampling of matrix equation (19) has been achieved by Krunk-Nicoleon circuif. Computer-sided calculationa o f the temperature condition of the artificial ice-soil platform has been made. Boundary conditione have bean specified aa follows (Fig. 3) . Near the upper boundary the heat Losaes towards the atmosphere (boundary condition of the third order) has been specified. In the lower part of the p l a t -
1474
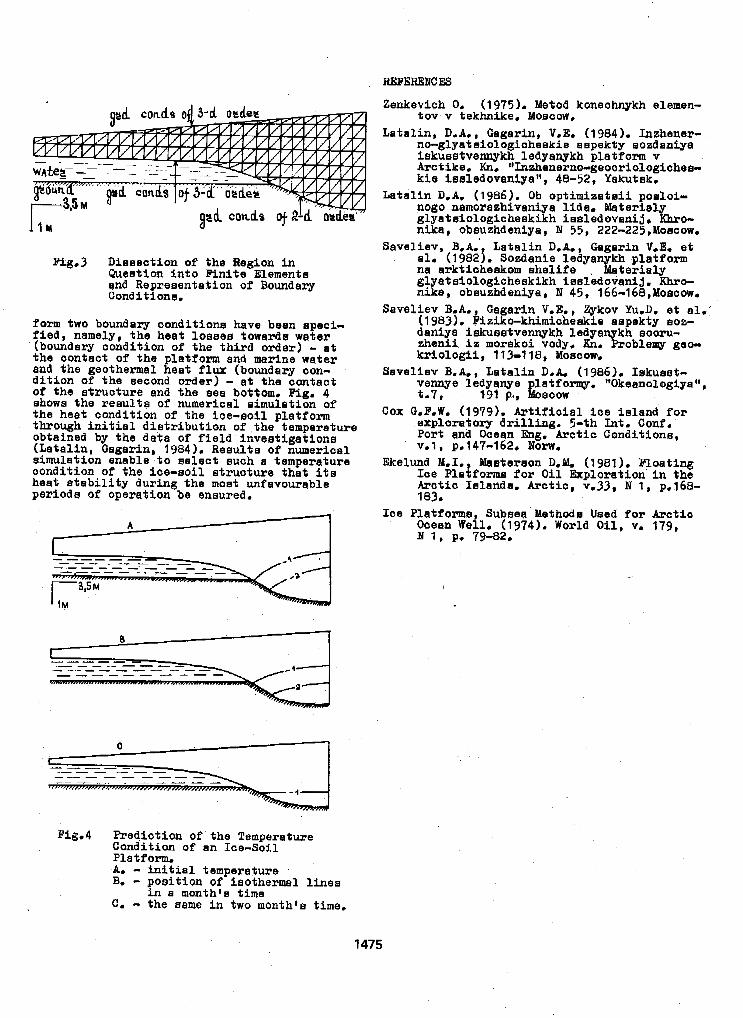
FUDERGNCFS
Zenkevich 0. (1975). Meetod konechnykh elemen- tov v tekhnike. Momow.
LataLin, D.A., Gagarin, V.E. (1984). hzhener- no-glyataiologiaheakie aspekty sozdanfya iekuaetvennykh ledyanykh platform v Arotike. Kn. "Inz~enernocgeocrrologiehee.. kie issledovaniya'l, 48-52, Yakutsk.
Lafa l in D.A. (1986). Ob op t imizs t s i i porsloi- nogo narnorazhivaniys l i d a . Materialy glyateiologicheskikh iasledovenfj. Khro- nika, obsuzhdeniye, B 55, 222-225,Moaoow.
Saveliev, B.A. Lata l in D.A., Gagaxin V.E. e t al. (19821. Sozdanie Xedyanykh platform na erktieheekom ahelife . Mate r i a4 glyateiologicheekikh iealedovenij. Khro- nike, obauzhdeniya, N 45, 166-168,Moacow,
Saveliev LA., Gagarin V.E., Zykov Yu.D. e t 81.' (1 983). Fiziko-khimioheekie aapekty BOB- dsniya ilkusatvennykh ledyanykh sooxu- zheni i is morskoi vody. Kn. Paoblemy gem kr io log i i , 1 13-1 18, MOBCOW',
Savellev B.A., Lata l in D.11. (1986). Tskuset- vennye ledyanye platformy. "OkeanoLogiyall, t.7, 191 p., Modoecow
Cox G.F.W. (1979). f w t i i i o i a l i c e ieland f o r exploratory dri l l ing. 5-th kt. ConP. Port and Ocean Eng. Arctic Conditions, vel , p.147-162. NOW.
Ekelund M.I., Mamtereon D.M. (1981). Bloating Ice Platforme for O i l Exploration i n the Arctic Ielende. Arctic, v.33, N 1 , p.168- 1830
Ice Platforma, Subsea Methods Ueed for Arctia Oasen Well. (1 974). World Oil, v. 179, N 1 , p. 79-82.
Pig.3 Dissection of the Region i n Queation into ITnite Elements end Representation of Boundary Conditione,
form two boundary oonditions have been aped.- f i e d , namely, the heat loeeee fowarda water
' (bounday eondifion o f the th i rd o rder ) - a t the oontact of the platform and marine water and the .geothermal heat flux (boundary con- d i t i o n of the second order) - a t the cantaot o f the a t ruc ture and the BBR bottom, Pig. 4 ahows t h e r e s u l t s of numerical eirnulation of the heat condition of the ice-eoi l platform through i n i t i a l d i e t x i b u t i o n of ,the temperature obtained by the data of f i e ld i nves t iga t ions (Latalin, Gagarin, 1984). Resulte of numerical s imulat ion enable to select euoh a temperature condition of the ice-eoil e t ruc tuse tha t its heat e fab i l i ty dur ing the moat uniavourable period6 of operation be enaured.
I
B I I
Fig.4 Predict ion of the Temperature Condition of an Ice-Soil Platform,
B, - pos i t ion of ieothexmal linea
C. - the aame i n two month,% time.
A. - i n i t i a l t8mpeXatUX8
i n a month's time
1475
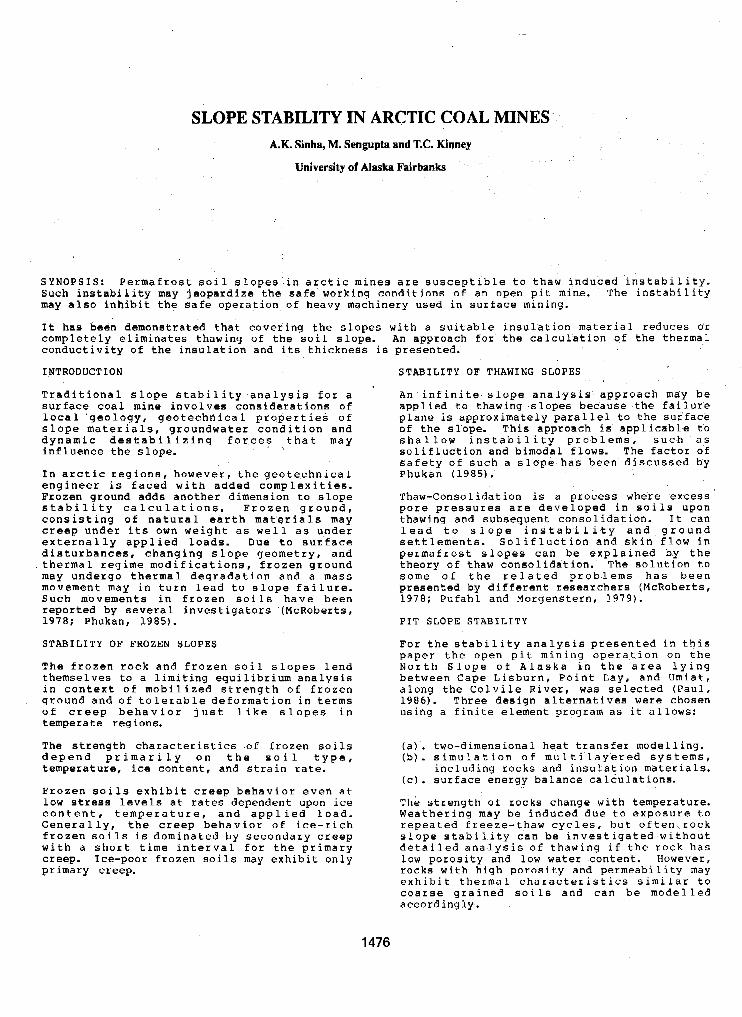
SLOPE STABILITY IN ARCTIC COAL MINES A.K. Sinha, M. Sengupta and T.C. Kinney
University of Alaska Fairbanks
SYNOPSIS: Permafrost soil slopes in arctic mines are susceptible to thaw induced instability. Such instability may jeopardize the safe working conditions of an open pit mine. The instability may also inhibit the safe operation of heavy machinery used in surface mining.
It has been demonstrated that covering the slopes with a suitable insulation material reduces o r completely eliminates thawing of the soil slope. An approach for the calculation of the therma,l conductivity of the insulation and its thickness is presented.
INTRODUCTION
Traditional slope stability analysis for a surface coal mine involves considerations o f local 'geology, geotechnical properties of slope materials, groundwater condition and dynamic destabilizing forces that may influence the slope.
In arctic regions, however, the geotechnical engineer is faced with added complexities. Frozen ground adds another dimension to slope stability calculations. Frozen ground, consisting of natural earth materials may creep under its own weight as well as under externally applied loads. Due to surface disturbances, changing slope geometry, and thermal regime modifications, frozen ground may undergo thermal degradation and a mass movement may in turn lead to slope failure. Such movements in frozen soils have been reported by several investigators '(McRoberts, 1978; Phukan, 1 9 8 5 ) .
STABILITY OF FROZEN SLOPES
The frozen rock and frozen soil slopes lend themselves to a limiting equilibrium analysis in context of mobilized strength of frozen ground and of tolerable deformation in terms of creep behavior just like slopes in temperate regions.
The strength characteristics of frozen soils depend primarily on the soil type, temperature, ice content, and strain rate.
Frozen soils exhibit creep behavior eved at low stress levels at rates dependent upon ice content, temperature, and applied load. Generally, the creep behavior of ice-rich frozen soils is dominated by secondary creep with a short time interval for the primary creep. Ice-poor frozen soils may exhibit only pr imary creep.
STABILITY OF THAWING SLOPES
An infinite slope analysis approach may bC applied to thawing slopes because the failure plane is approximately parallel t o the surface of the slope. This approach is applicable to shallow instability problems, such as solifLuction and bimodal flows. The factor o f safety of such a slope has been discussed by Phukan (1985).
Thaw-Consolidation is a process where excess pore pressures are developed in s o i l s upon thawing and subsequent consolidation. It can lead to slope instability and ground settlements. Solifluction and skin flow in permafrost slopes can be explained by the theory of thaw consolidation. The solution to some o f the related prpblems has been presented by different researchers (McRoberts, 1978; Pufahl and Morgenstern, 1979).
PIT SLOPE STABILITY
For the stability analysis presented in this paper the open pit mining operation on the North Slope of Alaska in the area lying between Cape Lisburn, Point Lay, and Umiat, along the Colvile River, was selected (Paul, 1986). Three design alternatives were chosen using a finite element program as it allows:
( a ) . two-dimensional heat transfer modelling. (b). simulation of multi'layered systems,
including rocks and insulation materials. (c). surface energy balance calculations.
The strength of rocks change with temperature. Weathering may be induced due to exposure to repeated freeze-thaw cycles, but often. rock
detailed analysis of thawing if the rock has slope stability can be investigated without
low porosity and low water content. However, rocks with high porosity and permeability may exhibit thermal characteristics similar to coarse grained s o i l s and can be modelled accordingly.
1476
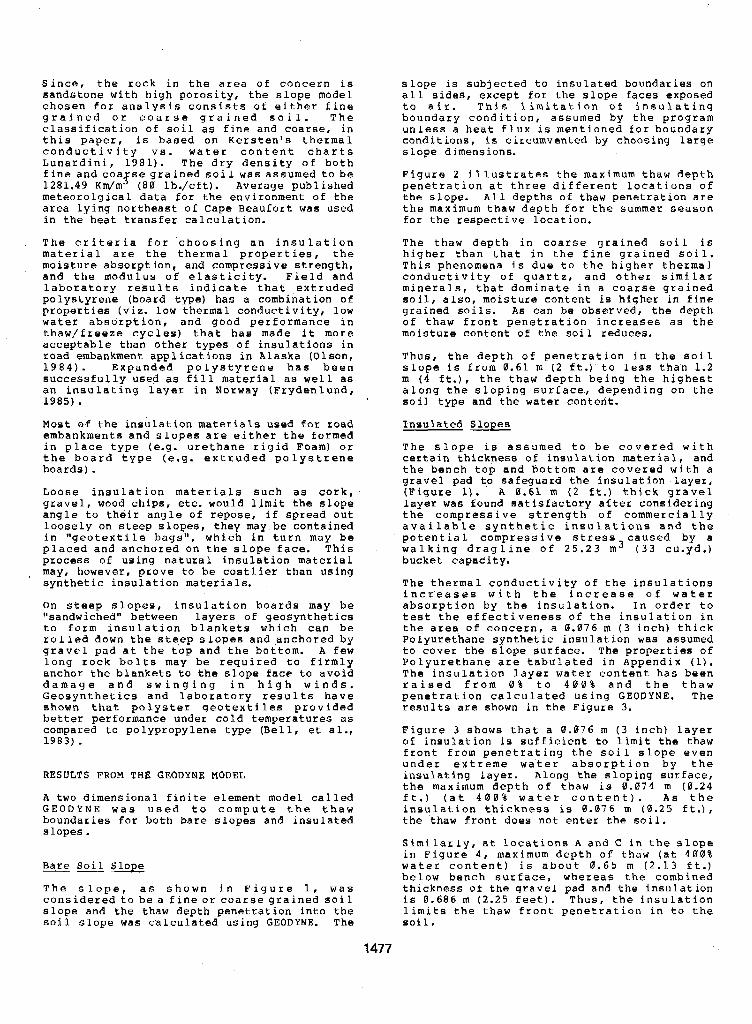
Since, the rock in the area of concern is sandstone with high porosity, the slope model chosen for analysis consists of either fine grained or coarse grained soil. The classification of soil as fine and coarse, in this paper, is based on Kersten's thermal conductivity vs. water content charts Lunardini, 1981). The dry density of both fine and coa segrained soil was assumed to be 1281.49 Km/m f ( 8 0 lb./cft). Average published meteorolgical data for the environment of the area lying northeast of Cape Beaufort was used in the heat transfer calculation.
The criteria for choosing an insulation material are the thermal properties, the moisture absorption, and compressive strength, and the modulus of elasticity. Field and laboratory results indicate that extruded polystyrene (board type) has a combination of properties (viz. low thermal conductivity, low water absorption, and good performance in thaw/freeze cycles) that has made it more acceptable than other types of insulations in road embankment applications in Alaska (Olson, 1984). Expanded polystyrene has been successfully used as fill material as well as an insulating layer in Norway (Frydenlund, 1985).
Most of the insulation materials used for road embankments and slopes are either the formed in place type (e.g. urethane rigid Foam) or the board type (e.g. extruded polystrene boards).
Loose insulation materials such as cork, gravel, wood chips, etc. would limit the slope angle to their angle of repose, if spread out loosely on steep slopes, they may be contained in "geotextile bags", which in turn may be placed and anchored on the slope face. This process of using natural insulation material may, however, prove to be cost1 ier than using synthetic insulation materials.
On steep slopes, insulation boards may be "sandwiched'* between layers of geosynthetics to form insulation blankets which can be rolled down the steep slopes and anchored by gravel pad at the top and the bottom. A few long rock bolts may be required t o firmly anchor the blankets to the slope face t o avoid damage and swinging in high winds. Geosynthetics and laboratory results have shown that polyster geotextiles provided better performance under cold temperatures as compared to polypropylene type (Bell, et al., 1983).
RESULTS FROM THE GEODYNE MODEL
A two dimensional finite element model called G E O D Y N E was used to compute the thaw boundaries for both bare slopes and insulated slopes.
Bare Soil Slope
The slope, as shown in Figure 1, was consideredtobea fine or coarse grained soil slope and the thaw depth penetration into the soil slope was calculated using GEODYNE. The
s l o p e is subjected to insulated boundaries on all sides, except for the slope faces exposed to air. This limitation of insulating boundary condition, assumed by the program unless a heat flux i s mentioned for boundary conditions, i s circumvented by choosing large slope dimensions.
Figure 2 illustrates the maximum thaw depth penetration at three different locations of the slope. A l l depths of thaw penetration are the maximum thaw depth for the summer season €or the respective location.
The thaw depth in coarse grained soil is higher than that in the fine grained soil. This phenomena is due to the higher thermal conductivity of quartz, and other similar minerals, that dominate in a coarse grained soil, also, moisture content is higher in fine grained soils. As can be observed, the depth of thaw front penetration increases as the moisture content of the s o i l reduces.
Thus, the depth of penetration i o the s o i l slope is from 0 . 6 1 m ( 2 ft.) to less than 1.2 m ( 4 ft.) , the thaw depth being the highest along the sloping surface., depending on the s o i l type and the water conteht.
Insulated Slopes
The slope is assumed to be covered with certain thickness of insulation material, and the bench top and bottom are covered with a gravel pad to safeguard the insulation layer, (Figure 1). A 0.61 m ( 2 ft.) thick gravel layer was found satisfactory after considering the compressive strength o f commercially available synthetic insulations and the potential. compressive stress caused by a walking dragline of 25.23 m3 ( 3 3 cu.yd.1 bucket capacity.
The thermal conductivity of the insulations increases with the increase of water absorption by the insulation. In order to test the effectiveness of the insulation in the area. of concern, a 0.076 m ( 3 inch) thick Polyurethane synthetic insulation was assumed to cover the slope surface. The properties of Polyurethane are tabulated in Appendix (1). The insulation l a y e r water content has been raised from 0 % to 4 0 0 % and the thaw penetration calculated using GEODYNE. The results are shown in the Figure 3.
Figure 3 shows that a 0 . 0 7 6 m ( 3 inch) layer of insulation is sufficient t o limit the thaw front from penetrating the soil slope even under extreme water absorption by the
the maximum depth of thaw is 0.074 m ( 0 . 2 4 insulating layer. Along the sloping surface,
ft.) (at 4 0 0 % water content). A s the insulation thickness is 0 .076 m ( 0 . 2 9 ft.), the thaw front does not enter the soil.
Similarly, at locations A and C in the slope in Figure 4 , maximum depth o b thaw (at 4 0 0 % water content) is about 0 . 6 5 m (2.13 ft.) below bench surface, whereas the combined thickness of the gravel pad and the insulation i s 0 .686 m (2.25 feet). Thus, the insulation limits the thaw front penetration i n to the soi 1,
1477
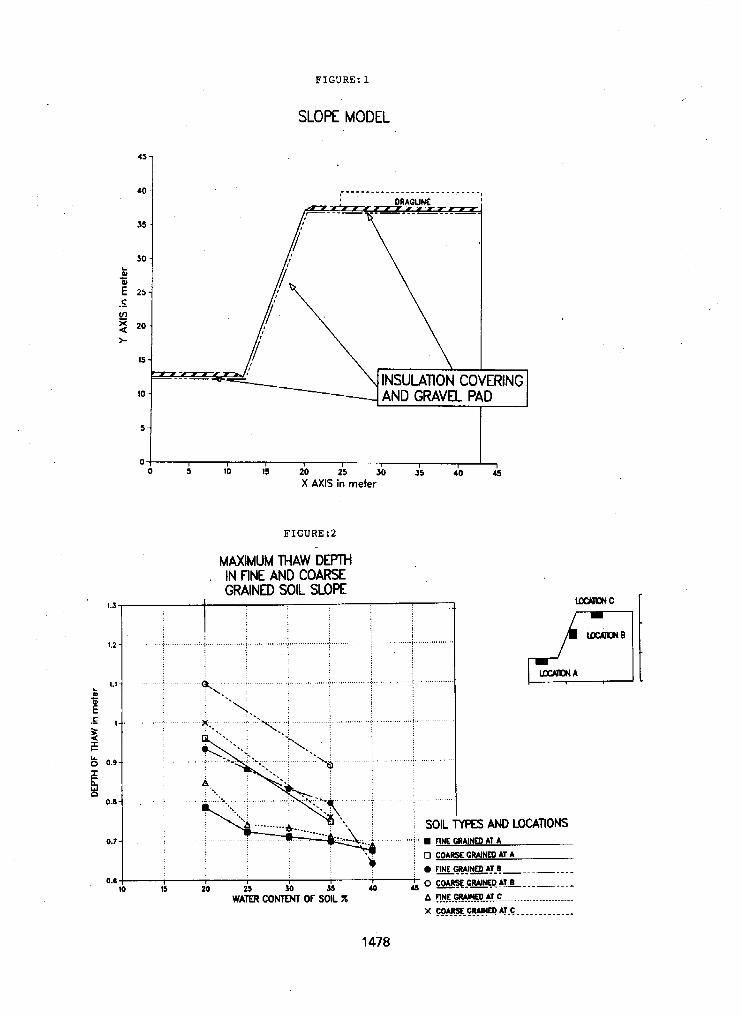
FIGURE: 1
SLOPE MODEL
I, \
4
I I I I I I I 5 10 15 20 25 30 35 40 45
I I
X AXIS in meter
FIGURE:2
MAXIMUM M A W DEPTH IN FINE AND COARSE GRAINED SOIL SLOPE
,... . . . . . . . . , ......... .,.,,,.., ......... .<.., ....................
r 15 20 2s 30 i5 40
WATER CONTENT OF SOIL X
1478
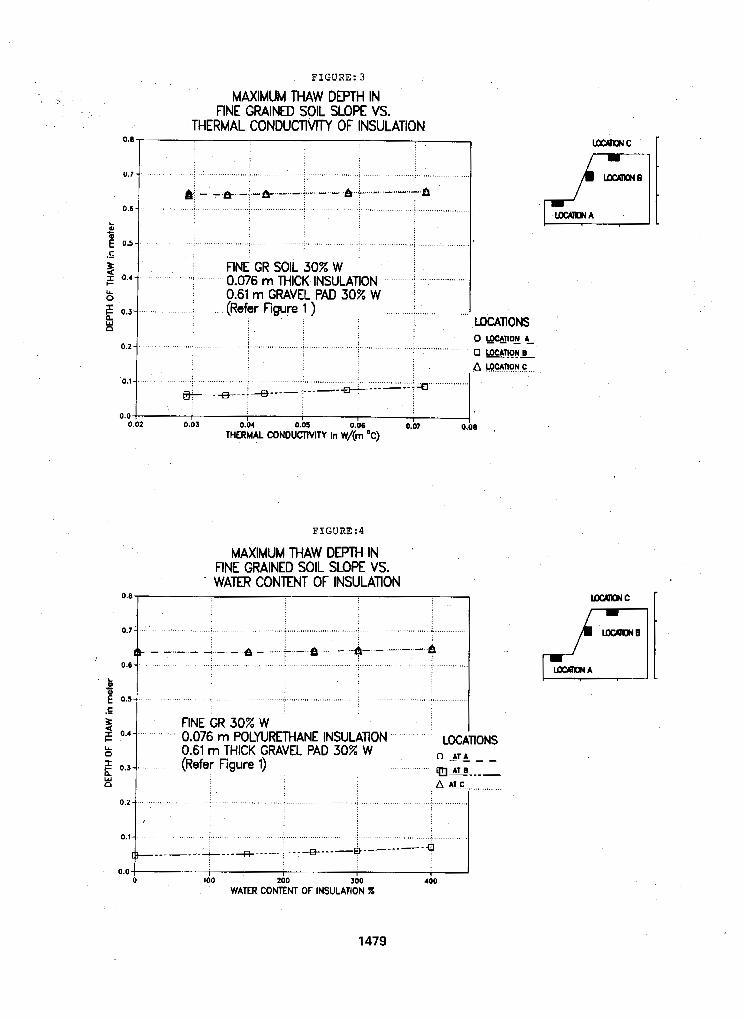
FIGURE: 3
MAXIMUM THAW DEPTH IN FINE GRAINED SOIL SLOPE VS.
THERMAL CONDUCTIVITY OF INSULATION 0.8
0.7 . . . . . . . . . . . . . . . . . . . . . . . . .
I . . . . . . . . . . . . . . . . . . . . . . . . . . . . . ........................ .G
., ..........
, . A ~oer;no!,c,,.. 0.1" . . .: . . . . . . . . . . . ; . . . . . . . . . . ; .................. ! ................... . . ~ ................. e- ""- ;""-:----- ++""""
0.0 , 1 0.02 0.03 0.04 0.05 0.06 0.07
THERMAL CONDUCTIVITY in W/(m 'C)
I 1 0.01
FIGURE:4
MAXIMUM THAW DEPTH IN FINE GRAINED SOIL SLOPE VS. WATER CONTENT OF INSULATION
0.7 i .............
. .
.........
. . . . . . . . . . . . . . . .
3 x 0.4 . FINE GR 30% W I 1 ' ' 0.076 m POLYURETHANE INSULAllON . . ' " ,,' WAnONS
0 ATI - - e"" k I 0.61 m THICK GRAVEL PAD 30% W
0.3 (Refer Figure 1) . . . . . . . . . .
n W . . . . . . . . .
["" ""
9 0.0
0 1 I
100 200 I
300 WATER CONTENT OF INSULATION %
400
1479
The thermal conductivity o f the insulation layer forms another major design criterion. In order to determine a range o f thermal conductivities suitable f o r the area of concern, insulation (water content 0%) with varying thermal conductivity was considered. The K value was raised from 0.0288 w/(m°C) (0.20 Btu/sq.ft.-hr.-'F) to 0.0722 W/(m°C) (0.50 Btu/sg.ft.-hr-OF). It might be observed that while a K value range of 0.0288 W/(m°C) (0.20 Btu/sq.ft.-hr.-OF) is close to extruded polysterene, a material widely recommended f o r road applications (Esch, 1978), that a K value of 0.0722 W/(m°C) (0.50 Btu/sq.ft.-hr.-'F), is close to that of wood chips.
The maximum thaw ,depth along the sloping surface, (Figure 4 location B ) is 0.089 m (0.29 ft.) below the slope surface at K = 0.0722 W/(m°C) (0.50 Btu/sq.ft.-hr.-OF) , while the thickness of the insulation layer is 0.076 m ( 3 inch). The maximum depth of thaw at the locations A and B is about 0.65 m (21.5 ft.) below the bench surface respectively, while there lies a 0.65 m (2.25 ft.) thick combined layer o f gravel pad and insulation. Hence, the insulation layer Limits the thaw front penetration in to the s o i l , f o r locations A and C, but not B.
CONCLUSIONS
It hqs been successfully demonstrated that insulation cover on a slope face reduces the depth of thaw; the effectiveness o f such a measure shall depend on site specific thermal and climatic conditions as well as on the type of the insulation material being used.
The model assumes homogeneity of the slope material as well as homogeneity of insulation covez,bothofwhichare rarelypresent in the field. However, the model allows simulation of multilayered materials and, thereby, allows simulation of true ineitu conditions.
In the case of the finegrained soil slopes in the general vicinity of the Deadfall Syncline area of North Slope, Alaska, an insulation cover of 0.076 m (3 inches) with a thermal conductivity in the range of 0.0288 to 0.0722 W/(m°C) (0.20-0.50 Btu/sq.ft.-hr.-OF) appears to be adequate to inhibit the thaw penetration, other conditions being as specified in the calculations. A 0.12m(4.5 inch) to 0.15m(6 inch) thick insulation cover will provide a non thawing slope, a measure that might be taken for safeguarding thawing slopes.
absorption by the insulation cover, 0% to 400% It has also been demonstrated that water
in the simulations, for the area of concern, has an insignificant effect on thaw depth, other conditions being the same.
REFERENCES
Bell, J.R. et a 1 1983. Properties of Geot4extiles in C o l d Region Application. Proc. on Fourth International Conference on Permafrost, Fairbanks, pp. 123-160.
Berg, R.C. et a1 1978. Thaw Penetration and Permafrost Conditions associated with Livengood t o Prudhoe Bay Road, Alaska. P r o c . o f The Third International Conference on Permafrost, Edmonton, Canada, pp. 616-621.
Esch, D.C. 1978. Road Embankments Design Alternatives Over Permafrost. Proc. of Applied Techniques for Cold Environments, Anchorage, pp. 159-170.
Frydenlund, T.E. 1985. Soft Ground Problems. International Conf. on Plastic Foam in Road Embankments, Oslo, Norway.
Lunardini, V . 3 . 1981. Heat Transfer in- Cold Climate. Van Nostrand Reinhold Company, NJ.
McRoberts, E.C. 1978 LE Geotechnical Engineering for Cold Regions. McGraw- Hill, pp. 363-404.
Olson, M.E. 1984. Synthetic Insulation in Arctic Roadway Embankments. Proc.: Cold Regions Engineering Speciality Conference, pp. 739-751.
Paul, Jyoti Prakash 1986. Fragmentation System Design for an Arctic Surface Coal Mine. M S . Thesis, University of Alaska , Fairbanks.
Phukan, A. 1985. Frozen Ground Engineering. Prent ice-Ha 1 1 International Series in Civil Engineering and Eng. Mechanics, NJ, pp. 200-500.
Pufahl, D.E. and Morgenstern, N.R. 1979. Stabilization .of Planar Landslides in Permafrost. Canadian Geotech. J., vo1.8, 558-580.
APPENDIX I
The GEODYNE is a two dimensional finite element model for time. dependent analysis of freeze-thaw problems.
The two-dimensional form of the differential equation solved by the model can be written in Cartesian coordinates:
(1 ) (2 ) ( 3 ) ( 4 ) ( 5 ) (6) UBI% * " E a (u + Y *) - ( t X w *) - (Xy" +) t Yv$ - 1 0 s - 0
where T = temperature, OC
B1 = the average volumetric heat capacity of the soil mass (kJ/m3); this term is temperature dependent
a 2 = the volumet ic heat capacity of water (kY/m ) 5
u,v = the components of Darcian water velocity in the x an y directions, respectively (m/hr)
1480
t h e r m a l c o n d u c t i v i t y c o e f f i c i e n t s i n t h e x and y directions, respectively (kJ/hr m OC); these terms are temperature dependent
the s o i l thickness normal to the x-y plane ( m)
a thermal source o r sink representing the ef ects of latent heat (kJ/hr m ) ; this term is temperature dependent
a thermal source or sink term representing a thermal flux such.as a surface heat flux o r the flux resulting from the geothermal gradient (kJ/m)
5
Equation (1) represents a generalized, nonlinear statement of the equation describing the flow of heat in a saturatedor unsaturated soil. In reviewing the equation, several comments concerning the assumptions made for each term are appropriate. First, in term (1) of Equation (l), the assumption is made that the heterogeneous soil-water matrix can be represented by a homogeneous approximation using-a single volumetric heat capacity, In general, 8 1 will be temperature dependent, and different values will be used if the local temperature is above or below the freezing temperature. In other words, p 1 is described in a stepwise Eashion, with the step occurring at the phase transformation temperature.
Term ( 2 ) of Equation (1) represents the thermal effects of flowing water in the s o i l matrix, and i s usually called the convection term. This term is derived directly from thermodynamic considerations and can have a profound effect on the behavior o f a thermal regime. At the present time, it is assumed that all values of convective velocity are specified external to the model. If the temperature falls below freezing, the local water velocities are assumed to go to zero at that point. Terms ( 3 ) and (4) represent the diffusive transfer of heat according to the Fourier's analogy. A s with the s o i l properties, the diffusion coefficients are assumed to be stepwise temperature-dependent at the freeze front. It is the analyst's responsibility to specify the correct properties f o r the soil mass above and below the freeze point. A l s o , while not a general situation, it is easily seen that Equation (1) is formulated to simulate anisotropic diffusion properties in the x and y directions. This may be of particular interest in axisymmetric problems. The fifth term oE Equation (1) represents the effects of latent heat. Proper formulation of this term is essential to the solution o f the freeze/thaw problem, and a large number of alternative formulations have been tested. At the present time, this term is formulated as:
0%- 7 (ml - mo,) x ( 2 )
where u1 = the net effective heat source/sink
term to represent the effects f the latent heat of fusion (kJ/hr m s )
1481
A = the latent heat of fusion s o i l matrix (kJ/m 3 )
for the
At = some finite time interval between times to and tl (hr)
ml = the unfrozen moisture content of the soil matrix at the end of the time interval At (fraction of total available unfrozen moisture for phase transformation)
mB = the unfrozen moisture content o f the s o i l matrix at the beginning of the time interval t (fraction of total available unfrozen moisture for phase transformat i on )
Finally, it is assumed that the unfrozen moisture content of a s o i l , m can be approximated as a function of the soil temperature. This relationship has the form:
m - 1 . 0 for T'Tf
where
T = the l oca l temperature ( O C )
Tf = the freezing temperature (OC)
The last term of Equation ( 3 ) represents the effects of heat fluxes. Such f l u x e s may either be specified by the analysis (i.e., the geothermal f l u x ) , or may result from a calculation of a surface heat balance. When done as a surface heat balance, the net surface energy balance flux term is approximated by the relationship:
QNET = Qsw -t QNLW + QTURB - QEVAP (4) where
Qsw = transmitted shortwave radiation flux
QNLw = transmitted net longwave radiation flux
QToRB = turbulent heat transmitted across the surface
QEVAP = evaporative heat f l u x leaving the boundary surface
In general, the terms of Equation ( 4 ) are both surface temperature dependent and functions of one or more atmosphere variables.
THE RESISTANCE TO FROST HEAVE OF VARIOUS CONCRETE CANAL LINING Song, Baoqing, Fan, Xiuting and Sun, Kehan
Qinghai Provincial Institute of Water Conservancy, Xining, China
SYNOPSIS D i f f e r e n t t y p e s o f c a n a l l i n i n g were c o n s t r u c t e d i n a n o b s e r v a t i o n s t a t i o n i n a n a r e a s u b j e c t e d t o s e a s o n a l f r o s t . L i n i n g s i n c l u d e d c o n c r e t e p l a t e s w i t h a t r a p e z o i d a l s e c t i o n , n s h a p e d p l a t e s w i t h a t r a p e z o i d a l s e c t i o n , c o n c r e t e p l a t e s s e t o n b e a m s w i t h a t r a p e z o i d a l s e c t i o n , o v e r h e a d c o n c r e t e p l a t e s w i t h a n a r c b o t t o m , a n a r c h b a r s e c t i o n , a n d a p a r a b o l a s h a p e d p l a t e . T h e , ' s t u d y i n c l u d e d o b s e r v a t i o n s on t h e d i s t r i b u t i o n o f f r o s t h e a v e ; f r o s t d e p t h a n d water c o n t e n t a l o n g c a n a l s e c t i o n s ; m a x i m u m h e a v e d i s p l a c e m e n t a n d r e s i d u a l . f r o s t h e a v e ; a n d t h e d e v e l o p m e n t o f c r a c k s . T h e r e s u l t s s h o w t h a t t h e c o m p l e x c o n c r e t e p l a t e s w i t h a n a r c b o t t o m was t h e b e s t r e s i s t a n t t o f r o s t h e a v e a n d t h e t y p e o f l i n i n g i s s u g g e s t e d f o r u s e i n r e g i o n s s u b j e c t t o s e a s o n a l f r o s t b y t h e a u - t h o r s .
TEST PURPOSE, PROCEDURE A N D METHODOLOGY
I n t r o d u c t i o n
Up- t o n o w , m a n y e n g i n e e r s a n d s c i e n t i s t s c o n t r o l f r o s t d a m a g e o f r i g i d c a n a l l i n i n g s b y l i m i t i n g t h e a l l o w a b l e d i s p l a c e m e n t o f t h e s t r u c t u r e . H o w e v e r , w h a t k i n d o f r i g i d l i n i n g i s m o s t s u i t - a b l e t o m i n i m i z e f r o s t h e a v i n g ? T h i s i s wha t we w a n t t o d i s c u s s i n t h i s p a p e r ,
B a s e d o n f r o s t h e a v e d i s t r i b u t i o n a l o n g a s e c - c i o n of c a n a l w i t h v a r i o u s l i n i n g , we s u g g e s t e d s o m e s t r u c t u r e s w i t h f l e x i b l e j o i n t s a m o n g e a c h l i n i n g b l o c k i n o r d e r t o f i t i n w i t h d i f f e r e n - t i a l f r o s t h e a v e , a n d p r o v i d e d a l l o w a b l e m a x i m u m f r o s t h e a v e f o r d i f f e r e n t t y p e o f l i n i n g . A f t e r a n a l y s i n g t h e e f f e c t o f a n t i - s e e p a g e , e n g i n e e r - i n g cost a n d c o n s t r u c t i o n , t h e a u t h o r s s e l e c t e d r e a d i l y a v a i l a b l e r i g i d c a n a l l i n i n g f o l l o w i n g o b s e r v a t i o n s i n t e s t s e c t i o n s .
F i e l d t e s t s e c t i o n
(i) O b s e r v a t i o n o f t e s t s e c t i o n s T h e f i e l d t e s t s e t u p h a d t h r e e m a i n c o m p o n e n t s :
A , Frost h e a v e p o o l T Q e p o o l h a d a d e p t h o f 3 m a n d a n a r e a o f 600 m . I t was l i n e d o n t h e i n s i d e s u r f a c e w i t h d o u b l e p l a s t i c f i l m . Water s u p p l y was r u n i n g t h r o u g h a n a r r a n g e m e n t o f s u b - s u r f a c e p i p e s s u r r o u n d e d b y g r a v e l ( s e e Fig.1). T h e p o o l w a s f i l l e d w i t h i i g h t l o a m w i t h a d r y d e n s i t y o f a b o u t 1 . 5 2 t / m . B , Water s u p p l y system T h e m a i n p i p e h a s a d i a m e t e r o f 4 . 2 cm a n d i s c o n n e c t e d t o t h e b r a n c h p i p e s o f t h e p o o l a n d i s c o n t r o l l e d b y a v a l v e . T h e p i p e s were f u l l o f water t o s u p p l y water f o r t h e t e s t . D u r i n g f r e e z i n g o f t h e s o i l i n w i n t e r , w a t e r was s u p p l i e d f r o m t h e s u p p l y s y s t e m t o t h e f r o s t h e a v e p o o l i n o r d e r t o k e e p t h e g r o u n d water l e v e l 40 t o 60 cm h i g h e r t h a n t h e p o o l b o t t o m , t h a t i s 9 5 t o 110 cm b e n e a t h t h e b o t t o m of t h e c a n a l l i n i n g s .
C . L i n i n g t y p e s S e v e n d i f f e r e n t t y p e s o f
I
1482
cana l l i n i n g were s e l e c t y d f o r t e s t , e a c h w i t h
T h e t y p e s of l i n i n g i n c l u d e d : a n a r e a o f 5.1 tp 5 . 2 5 m a n d a d e p t h o f 1 . 5 m.
( 1 ) A c o n c r e t e p l a t e w i t h t r a p e z o i d a l s e c t i o n . T h e p l a t e h a d a w i d t h a t t h e b o t t o m af 2 m, a s l o p e o f L : l , a d e p t h o f 1 . 5 m and a w i d t h a t t h e t o p o f 5 . 0 m . T h e p l a t e was c o n s t r u c t e d o f c a s t - i n - p l a c e c o n c r e t e , w i t h a t h i c k n e s s o f 8 cm, a n d t r a n s v e r s e c o n s t r u c t i o n j o i n t s a t i n t e r - v a l s o f 3 m .
( 2 ) A I7 s h a p e d p l a t e w i t h a t r a p e z o i d a l s e c t i o n . s imilar t o t h a t d e s c r i b e d a b o v e . T h e p l a t e a t t h e b o t t o m o f c a n a l wae c a s t - i n - p l a c e c o n c r e t e w i t h a j o i n t a t t h e c e n t r e for a c c o m m o d a t i n g f r o s t h e a v e . T h e s l o p e was l i n e d b y p r e c a s t s h a p e d c o n c r e t e p l a t e s , w i t h a l e n g t h o f 2 . 4 2 m , a w i d t h d'f 0.6 rn a n d a t h i c k n e s s of 7 cm.
u n l i : c m
F i g . 1 T h e S c h e m e o f F r o s t H e a v e Pool
( 3 ) A concrete plate set on beams with a trap- ezoidal section similar to that described in ( 1 ) above. A small beam with a section of 0 . 1 x O . 1 5 m was placed at intervals o f 1 m. The concrete plate was cast-in-place above the beams in order to strengthen its rigidity. ( 4 ) An overhead concrete plate, similar to that described in (1) above, supported on concrete beams. The precast beams were placed fir.st, then the precast concrete plate were placed on the beams. ( 5 ) A complex concrete plate with an arc bottom. The section was designed with a slope of 1:1, a depth of 1.5 m, a top width of 5.0 m, an arc radius of 2.5 m and a chord height of 0.5 m. The arc bottom was,cast-in-place with a thick- ness of 8 cm and with a joint at its centre for accommodating frost heave, The side slopes were
n shape. A joint between the slope and the cast-in-situ or precast concrete plate with a
bottom was provided for accommodaing heave. An expansion joint was provided at intervals of 3 m. ( 6 ) An arch bar with a radius o f 2 . 7 m, a top width of 5.0 m and with a joint at the centre for accommodating heave. The bar was cast-in- place with a thickness of 8 cm. Expansion joints were placed along the canal at intervals of 3 m. (7) A pa:abola shaped plate with a function of Y=0.24 X , a depth o f 1.5 m. a top width of 5 . 0 m and a thickness of 8.0 cm. A joint was con- structed in the centre and expansion joints were provided at intervals of 3 m.
All seven types o f test sections contained 8 parts ( s e e Fig.2) were subjected to the same
conditions, including canal gradient, climatic conditions, type of subsoil, and water supply.
(ii) Field observations Field observations including monitoring air temperatures, frost depths, water content of subsoils, frost heave of lining, development o f crack on the surface o f the lining and residual displacements. The layout of the moisture locations is shown on Fig.3.
RESULTS A N D ANALYSE
Observation res.ults The minimum temperature was -16'C, and the max- imum frost depth was 124 cm. Frost heave of the lining and frost depth were observed 29 times. The development of cracks on lining was described as they occurred. Pertinent obser- vations are summaried i n Table I and on Fig.4.
The soil water content 8 s a function of depth was determined before freezing, at the moment o f maximum frost depth and after thawing. These test results are summaried in Table 11.
Analyse of results (i), As indicated in Table 11, the moisture dis- tribution o f subsoil along the section of canal was almost the same whatever in the condition before freezing, frozen or after thawing. Water content increased from the top to the bottom o f the canal. In additions, the soil moisture con tent in north facing slopes was found to be higher than that in south facing slopes. , '
Fig.2 The Scheme of Different Types oC Canal Structures
1-1 Precast trapezoidal concrete plate 11-11 precast n shaped concrete plate a-IU precast overhead concrete plate upon beams IV-IV cast-in-place concrete plate
V-V complex concrete plate with an arch bottom VI-VI complex cast-in-place concrete plate with
Vm-VlI cast-in-place parabola structure VII-VII cast-in-place arch structure
an arch bottom
1483
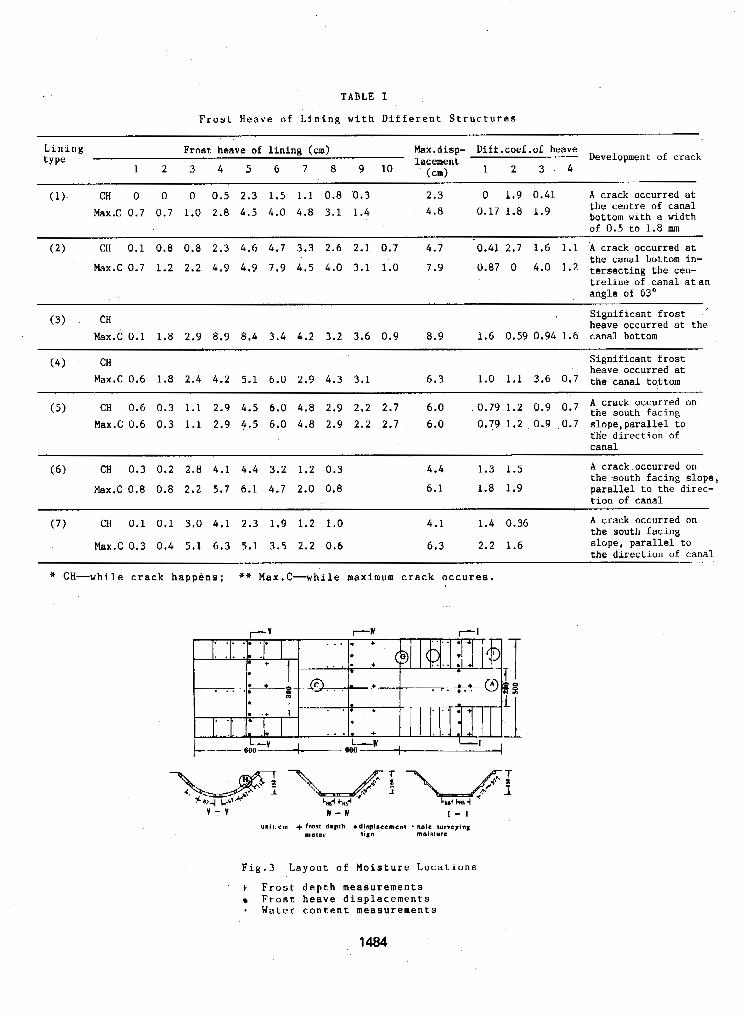
TABLE I
Frost Heave of Lining with Different Structures
Lining Frost heave of lining (cm) Max.disp- Di€f.coef.of heave tY Pe lacement Development of crack
1 2 3 4 5 6 7 8 9 1 0 (cm) 1 2 3 - 4
(1)- CH 0 0 0 0 . 5 2.3 1.5 1.1 0.8 .0.3 2.3 0 1.9 0.41 A crack occurred at Max.C 0.7 0.7 1.0 2 .8 4.5 4.0 4.8 3.1 1.4 4.8 0.17 1.8 1.9 the centre of canal
bottom with a width o f 0.5 to 1.8 mm
(2 ) CH 0.1 0.8 0.8 2 . 3 4.6 4.7 3.3 2.6 2.1 0 .7 4.7 0.41 2.7 1.6 1.1 A crack occurred at
Max.C 0.7 1.2 2.2 4.9 4.9 7.9 4.5 4.0 3.1 1.0 7.9 0.87 0 4.0 1.2 tersectinn the cen- the canal bottom in-
- angle of 63" treline of canal atan
( 3 ) CH , Significant frost '
heave occurred at the Max.C 0.1 1.8 2.9 8.9 8.4 3.4 4.2 3.2 3.6 0.9 8.9 1.6 0.59 0.94 1.6 canal bottom
( 4 ) ' CH - " . . . . . .
Significant frost heave occurred at
Max.C 0.6 1.8 2.4 4.2 5.1 6.0 2.9 4.3 3.1 6 . 3 1.0 1.1 3.6 0.7 the canal tottom
(5) CH 0.6 0.3 1.1 2.9 4.5 6.0 4.8 2.9 2.2 2.7 6.0 .0.79 1.2 0.9 0.7 A the crack south occurred facing On
Max.C 0.6 0.3 1.1 2.9 4.5 6.0 4.8 2.9 2.2 2.7 6.0 0.79 1.2 0.9 0.7 slope!parallel to t'h'e dxection of canal
( 6 ) CH 0.3 0.2 2.8 4.1 4.4 3.2 1.2 0.3 4.4 1.3 1.5 A crack occurred on the south facing slone.
bx.C 0.8 0.8 2.2 5.7 6.1 4.7 2.0 0.8 6.1 1.8 1.9 " * .
parallel to the direc- tion of canal
(7 ) CH 0.1 0.1 3.0 4.1 2.3 1.9 1.2 1.0 4.1 1.4 0.36 A crack occurred on the south facing slope, parallel to the direction of canal
Max.C 0.3 0.4 5.1 6.3 5.1 3.5 2.2 0.6 6 .3 2.2 1.6
* CH-while crack happens; +* Max.C-While maximum crack occurea.
Fig.3 Layout of Moisture Locations
+ Frost depth measurements Frost heave displacements
+ Water content measurements
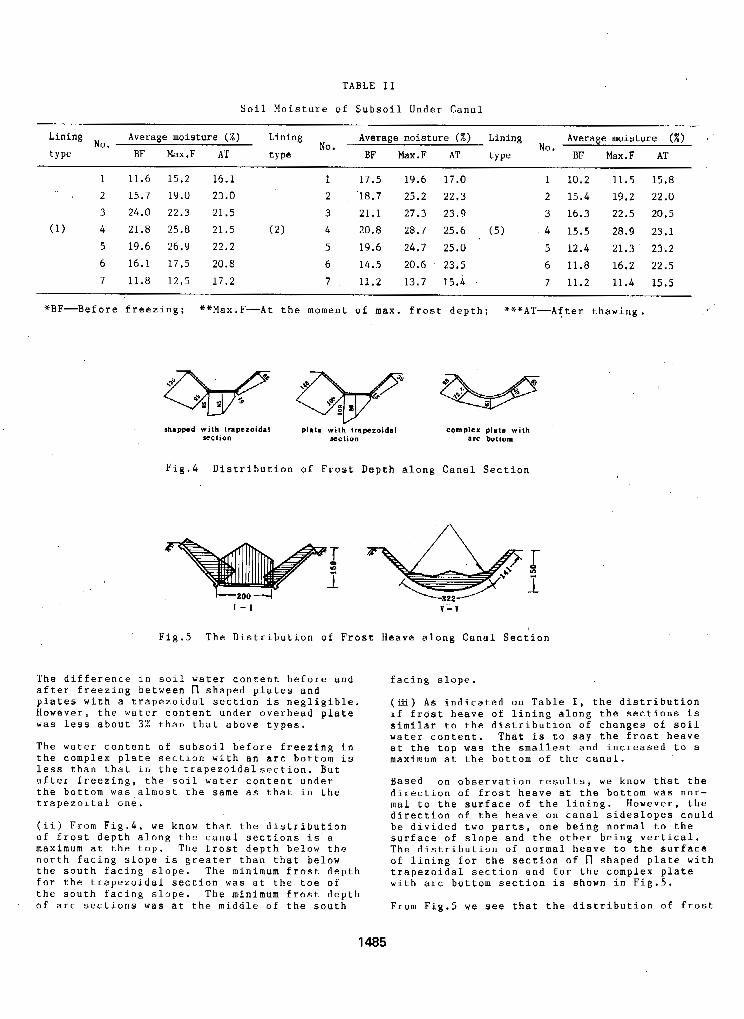
TABLE I 1
Soil Moisture of Subsoil Under Canal
Lining Average moisture ( W ) Lining Average moisture (X) Lining Average moisture ( X ) . No, tY Pe BF Max.F AT type
No. BF Max.F AT type
No. BF Max.F AT
1 11.6 15.2 16.1 1 17.5 19.6 17.0 1 10.2 11.5 15.8
2 15.7 19.0 23.0 2 '18.7 25.2 22.3 2 15.4 19.2 22.0 3 24.0 2 2 . 3 21.5 3 21.1 27.3 23.9 3 16.3 22.5 20.5
(1) 4 21.8 25.8 21.5 ( 2 ) 4 20.8 28.7 25.6 (5) 4 15.5 28.9 23.1
5 19.6 26.9 22.2 5 19.6 24.7 25.0 5 12.4 21.3 23.2 6 16.1 17.5 20.8 6 14.5 20.6 23.5 6 11.8 16.2 22.5 7 11.8 12.5 17.2 7 11.2 13.7 15.4 7 11.2 11.4 15.5
*BF-Before freezing; **Max.F-At the moment o f max. frost depth; ***AT-After thawing.
ahmppcd with trapezoidal plate with Irapezoidal complex plate with section acclion arc bottom
Fig.4 Distribution of Frost Depth along Canal Section
1 - 1
Fig.5 The Distribution of Frost Heave along Canal Section
The difference in soil water content before and after freezing between n shaped plates and plates with a trapezoidal section is negligible. However, the water content under overhead plate was less about 3% than that above types.
The water content of subsoil before freezing in the complex plate section with an arc bottom is less than that in the trapezoidalsection. But after freezing, the soil water content under the bottom was almost the same as that in the trapezoital o n e .
(ii) From Fig.4, we know that the distribution of frost depth along the canal sections is a maximum at the top. The frost depth below the north facing slope is greater than that below the south facing slope. The minimum frost depth €or the trapezoidal section was at the toe of the south facing slope. The minimum frost depth of arc sections was at the middle o f the south
facing slope.
(EL) As indicated on Table I, the distribution if frost heave of lining along the sections is similar to the distribution of changes of soil water content. That is t o say the frost heave at the top was the smallest and increased to a maximum at the bottom of the canal.
Based o n observation results, we know that the direction of frost heave at the bottom was nor- mal to the surface of the lining. However, the direction of the heave o n canal sideslopes could be divided two parts, one being normal to the surface o f s l o p e and the other being vertical. The distribution of normal heave to the surface of lining for the section o f 1 shaped plate with trapezoidal section and €or the complex plate with arc bottom section is shown in Fig.5.
From Fig.5 we see that the distribution of frost
1485
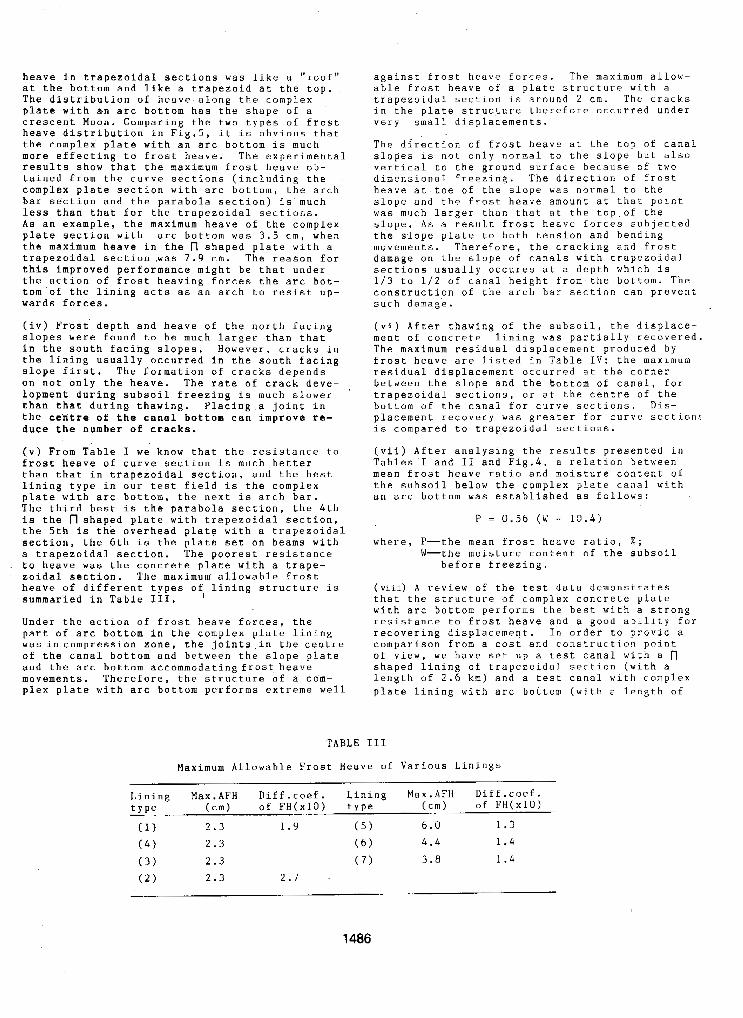
heave in trapezoidal sections was like a " r o o f " at the bottom and like a trapezoid at the top. The distribution of heave along the complex plate with an arc bottom has the shape of a crescent Moon. Comparing the two types o f frost heave distribution in Fig.5, it is obvious that the complex plate with an arc bottom is much more effecting to frost heave. The experimental results show that the maximum frost heave o h - tained from the curve sections (including the complex plate section with arc bottom, the arch bar section and the parabola section) is much less than that for the trapezoidal sections. As an example, the maximum heave of the complex plate section with arc bottom was 3 . 5 cm, when the maximum heave in the n shaped plate with a trapezoidal section .was 7.9 cm. The reason for this improved performance might be that under the action of frost heaving forces the arc bot- tom of the lining acts as an arch to resist u p - wards forces.
(iv) Frost depth and heave of the north facing slopes were found to be much larger than that in the south facing slopes, However, cracks in the lining usually occurred in the south facing slope first. The formation of cracks depends on not only the heave. The rate of crack deve- lopment during subsoil freezing is much slower than that during thawing. Placing a joint in the cehtre of t h e canal bottom can improve re- duce t h e number of cracks.
( v ) From Table I we know that the resistance to Erost heave of curve section is much better than that in trapezoidal section, and the best lining type in our test field is the complex
The third best is the parabola section, the 4th plate with arc bottom, the next is arch bar.
is the n shaped plate with trapezoidal section, the 5th is the overhead plate with a trapezoidal section, the 6th is the plate set on beams with a trapezoidal section. The poorest resistance to heave was the concrete plate with a trape- zoidal section. The maximum allowable frost heave of different types of lining structure is summaried in Table 111. ' Under the action o f frost heave forces, the part of arc bottom in the complex plate lining was in compression zone, the joints.in the centre of the canal bottom and between the slope plate and the arc bottom accommodating frost heave movements. Therefore, the structure of a com- plex plate with arc bottom performs extreme well
able frost heave of a plate structure with a against frost heave forces. The maximum allow-
trapezoidal section is around 2 cm. The cracks j.n the plate structure therefore occurred under very small displacements.
The direction of frost heave at the top o f canal slopes is not only normal to the slope but also vertical to the ground surface because of two dimensional freezing. The direction of frost heave at toe o f the slope was normal t o the slope and the frost heave amount at that point was much larger than that at the top o f the slope, As a result frost heave forces suhjectcd the slope plate to both tension and bending movements. Therefore, the cracking and frost damage o n the slope of canals with trapezoidal sections .usually occures at a depth which i s 1/3 t o 1 / 2 of canal height from the bottom. The construction of the arch bar section can prevent such damage.
(vi) After thawing of the subsoil, the displace- ment of concrete lining was partially recovered. The maximum residual displacement produced by frost heave are listed in Table IV: the maximum residual displacement occurred at the corner between the slope and the bottom o f canal, for trapezoidal sections, or at the centre of the bottom of the canal for curve sections. Dis- placement recovery was greater for curve section: is compared to trapezoidal sections.
Tables I and I1 and Fig.4, a relation between (vii) After analysing the results presented in
mean frost heave ratio and moisture content of
an arc bottom was established as follows: the subsoil below the complex plate canal with
P = 0.56 (W - 1 0 . 4 )
where, P-the mean frost heave ratio, %; W-the moisture content of the subsoil
before freezing.
that the structure o f complex concrete plate (viii) A review of the test data demonstrates
with arc bottom performs the best with a strong resistance to frost heave and a good ability for recovering displacement. In order to provid a comparison from a cost and construction point of view, we have set up a test canal with a n shaped lining of trapezoidal section (with a length o f 2 . 6 km) and a test canal with complex plate lining with arc bottom (with a length of
Lining Max.AFH Diff.coef. Lining Max.AFH Diff.coef. type (cm) of FH(xl0) type (cm) o f FH(xl0) -
1486
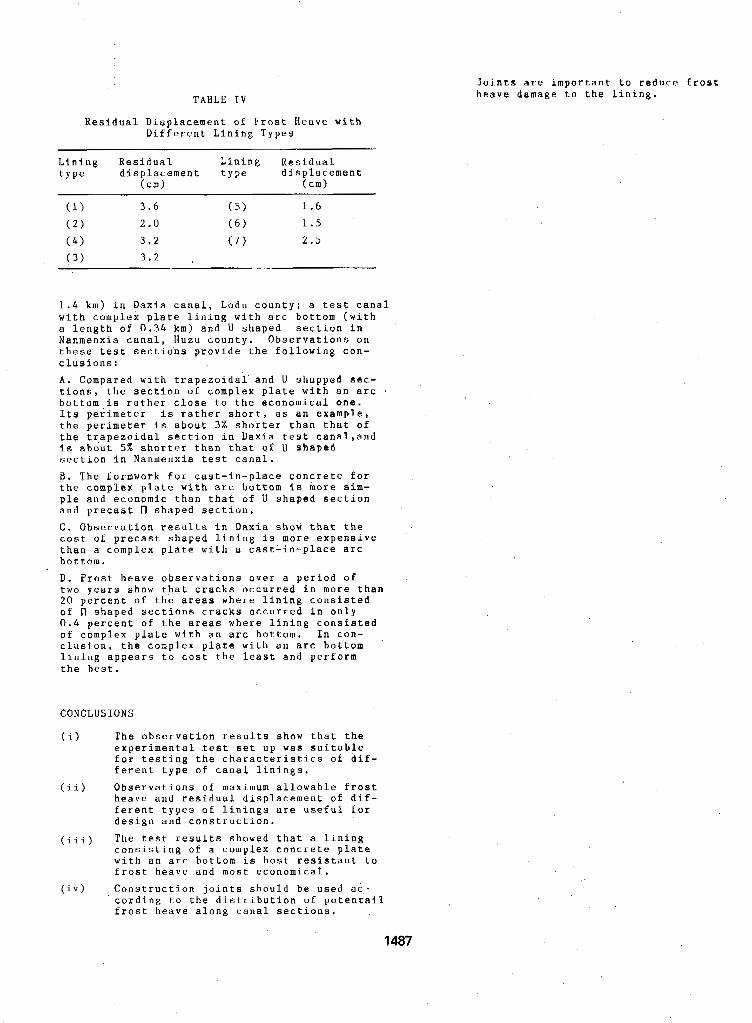
TABLE I V
Residual Displacement of Frost Heave with Different Lining Types
Joj.nts are important to reduce frost heeve damage to the lining.
Lining Residual Lining Residual type displacement type displacement
(cm) (cm)
(1) 3 . 6 ( 5 ) 1 . 6
( 2 ) 2.0 ( 6 ) 1.5
( 4 ) 3 . 2 ( 7 ) 2 . 5 ~ ( 3 ) 3 . 2 .
1 1.4 km) in Daxia canal, Lodu county: a test canal with complex plate lining with arc bottom (with a length of 0 . 3 4 km) and U shaped section in Nanmenxia canal, Huzu county. Observations on these test sections provide the following con- clusions: A . Compared with trapezoidal and U shapped sec- tions, the section of complex plate with an arc t bottom is rather close to the economical one. Its perimeter is rather short, as an example, the perimeter is about 3% shorter than that of the trapezoidal section in Daxia test cana1,and is about 5 % shorter than that o f U shaped section in Nanmenxia test canal. B . The formwork f o r cast-in-place concrete for the complex plate with arc bottom is more sim-
and precast fl shaped section. C. Observation results in Daxia show that the cost of precast shaped Lining is more expensive than a complex plate with a cast-in-place arc bottom. D. F r o s t heave observations over a period of two years show that cracks occurred in more than 20 percent o f the areas where lining consisted of n shaped sections cracks occurred in only 0 . 4 percent of the areas where lining consisted of complex plate with an arc bottom. I n con- clusion, the complex plate with an arc bottom lining appears t o cost the least and perform the best.
l
~ ple and economic than that o f U shaped section
CONCLUSIONS
(i) The observation results show that the experimental .test set u p was suitable for testing the characteristics of dif- ferent type of canal linings.
(ii) Observations of maximum allowable frost heave and residual displacement of dif- ferent types of linings are useful for design and construction.
(iii) The test results showed that a lining
with an arc bottom is host resistant to consisting of a complex concrete plate
frost heave and most economical. (iv) .Construction joints should be used ac-
cording to the distribution of potentail frost heave along canal sections,
1487
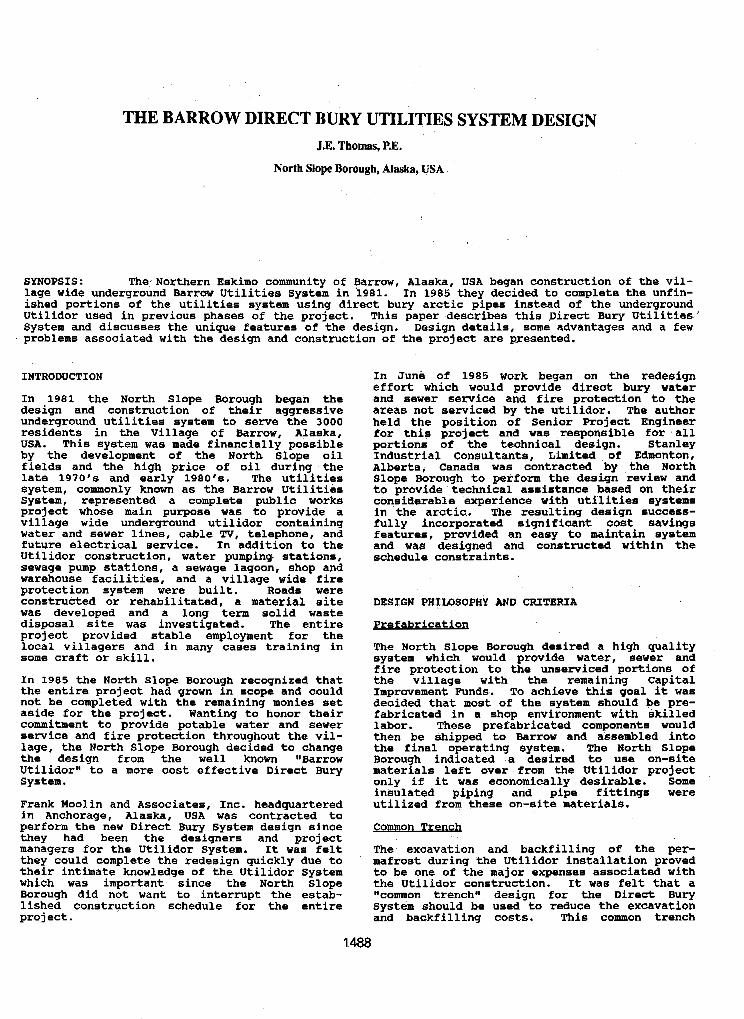
SYNOPSIS: The*Northern Eskimo community of Barrow, Alaska, USA began construction of the vil- lage wide underground BaKrOW Utilities System in 1981. In 1985 they decided to complete the unfin- ished portions of the utilities system using direct bury arctic pipes instead of the underground Utilidor used in previous phases of the project. This paper describes this Direct Bury Utilities' System and discusses the unique features of the design. Design details, some advantages and a few problems associated with the design and construction of the project are presented.
INTRODUCTION
In 1981 the North Slope Borough began the design and construction of their aggressive underground utilities system to serve the 3000 residents in the Village of Barrow, Alaska, USA. This system was made financially possible by the development of the North Slope oil fields and the high price of oil during the late 1970,s and early 1980,s. The utilities system, commonly known as the Barrow Utilities System, represented a complete public works project whose main purpose was to provide a village wide underground utilidor containing water and sewer lines, cable TV, telephone, and future electrical service. In addition to the Utilidor construction, water pumping. stations, sewage pump stations, a sewage lagoon, shop and warehouse facilities, and a village wide fire protection system were built. Roads were constructed or rehabilitated, a material site was developed and a long term solid waste disposal site was investigated. The entire project provided stable employment €or the local villagers and in many cases training in some craft or skill.
In 1985 the North Slope Borough recognized that the entire project had grown in scope and could not be completed with the remaining monies set aside for the project. Wanting to honor their commitment to provide potable water and sewer service and fire protection throughout the vil- lage, the North Slope Borough decided to change the design from the well known "Barrow Utilidor" to a more cost effective Direct Bury System.
Frank Moolin and Associates, Inc. headquartered in Anchorage, Alaska, USA was contracted to perform the new Direct Bury System design since they had been the designers and project managers for the Utilidor System. It was felt they could complete the redesign quickly due to their intimate knowledge of the Utilidor System which was important since the North Slope Borough did not want to interrupt the estab- lished constryction schedule for the entire project .
In June of 1985 work began on the redesign effort which would provide direct bury water and sewer service and fire protection to the areas not serviced by the utilidor. The author held the position of Senior Project Engineer for this project and was responsible for all portions of the technical design. Stanley Industrial Consultants, Limited o f Edmonton, Alberta, Canada was contracted by the North
to provide technical assistance based on their Slope Borough to perform the design review and
considerable experience with utilities systems in the arctic,. The resulting design success- fully incorporated significant cost savings features, provided an easy to maintain system and was designed and constructed within the schedule constraints.
DESIGN PHTLOSOPHY AND CRITERIA
prefabrication
The North Slope Borough desired a high quality system which would provide water, sewer and fire protection to the unserviced portions of the village with the remaining Capital Improvement Funds. To achieve this goal it wae decided that most of the system should be pre- fabricated in a shop environment with skilled labor. These prefabricated components would then be shipped to Barrow and assembled into the final operating system. The North Slope Borough indicated a desired to use on-site materials left over from the Utilidor project only if it was economically desirable. Some insulated piping and pipe fittings were utilized from these on-site materials.
Common Trench
The excavation and backfilling of the per- mafrost during the Utilidor installation proved to be one of the major expenses associated with the Utilidor construction. It was felt that a
System should be used to reduce the excavation ncommon trench" design for the Direct Bury
and backfilling costs. This common trench
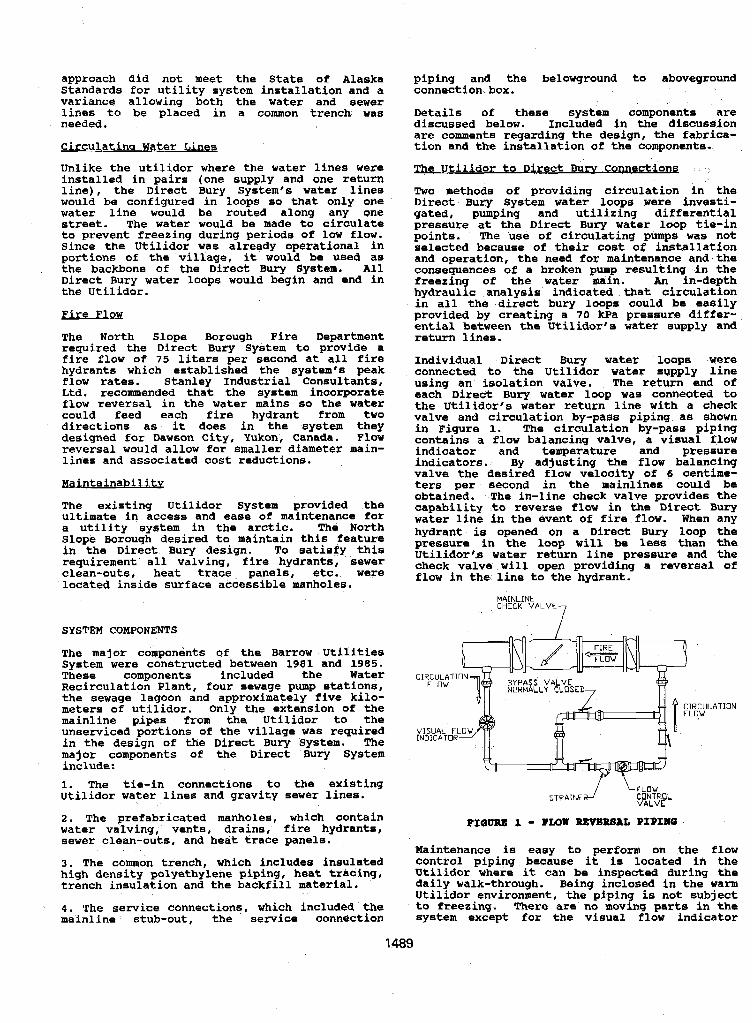
approach did not meet the State of Alaska standards for utility system installation and a variance allowing both the water and sewer
needed. lines to be placed in a common trench was
Unlike the utilidor where the water lines were installed in pairs (one supply and one return line) , the Direct Bury system's water lines would be configured in loops so that only one water line would be routed along any one street. The water would be made to circulate to prevent freezing during periods of low flow. Since the Utilidor waa already operational in portions of the village, it would be used as the backbone of the Direct Bury System. All
the UtiLidor. Direct Bury water loops would begin and end in
EULuQY
The North Slope Borough Fire Department required the Direct Bury System to provide a
hydrants which established the system's peak fire flow o f 75 liters per second at all fire
flow rates. Stanley Industrial Consultants, Ltd. recommended that the system incorporate flow reversal in the water mains so the water could feed each fire hydrant from two directions as it does in the system they designed for DaWsOn City, Yukon; Canada. Flow reversal would allow for smaller diameter main- lines and associated cost reductions.
ElaJntainabilitv
The existing Utilidor System provided the ultimate in access and ease of maintenance for a utility system in the arctic. The North slope Borough desired to maintain this feature in the birect Bury design. To satisfy this requirement all walving, fire hydrants, sewer clean-outs, heat trace. panels, etc. were located inside surface accessible manholes.
SYSTEM COMPONENTS
The major components of the Barrow Utilities
These components included the Water System were constructed between 1981 and 1985.
Recirculation Plant, four sewage pump stations, the sewage lagoon and approximately five kilo- meters of utilidor. Only the extension of the mainline pipes from the Utilidor to the unserviced portions o f the village was required in the design of tHe Direct Bury system. The major components of the Direct Bury System include : 1. The tie-in connections to the existing Utilidor water lines and gravity sewer lines.
2. The prefabricated manholes, which contain water valving; vents, drains, fire hydrants, sewer clean-outs, and heat trace panels.
high density polyethylene piping, heat tracing, 3. The common trench, which includes insulated
trench insulation and the backfill material.
4 . The service connections, which included the mainline stub-out, the service connection
piping and the belowground to aboveground connection.box.
Details of these system components are discussed below. Included in the discuseion are comments regarding the design, the fabrica- tion and the installation of the components..
Utilidor to Direct B u m C a t i o m
Two methods of providing circulation in the Direct ~ u r y system water loops were investi- gated, pumping and utilizing differential pressure at the Direct Bury water loop tie-in points. The use of circulating pumps was not selected because of their cost of installation and operation, the need for maintenance and the consequences of a broken pump resulting in the freezing of the water main. An in-depth hydraulic analysis indicated that circulation in all the direct bury loops could be easily provided by creating a 7 0 kPa pressure differ- sntial between the Utilidor's water supply and return lines.
Individual Direct Bury water loops were connected to the Utilidor water supply line using an isolation valve. The return end of each Direct Bury water loop was conneeted to the Utilidor's water return line with a check valve and circulation by-pass piping as shown in Figure 1. The circulation by-pass piping contains a flow balancing valve, a visual flow
indicators. By adjusting the flow balancing indicator and temperature and pressure
valve the desired flow velocity of 6 centime- ters per second in the mainlines could be obtained. The in-line check valve provides the capability -to reverse flow in tho Direct Bury water line in the event o f fire flow. When any hydrant is opened on a Direct Bury loop the pressure in the loop will be less than the Utilidor's water return Line pressure and the check valve will open providing a reversal of flow in the line to the hydrant.
MAINLINE CHECK VALVE 7
.ATION
B X ~ U I L B a - rmw ~ R B ~ L PIPIMG
Maintenance is easy to perform on the flow control piping because it is located in the Utilidor where it can be inspected during the daily walk-through. Being inclosed in the warm Utilidor environment, the piping is not subject tQ freezing. There are no moving parts in the system except for the visual flow indicator
1489
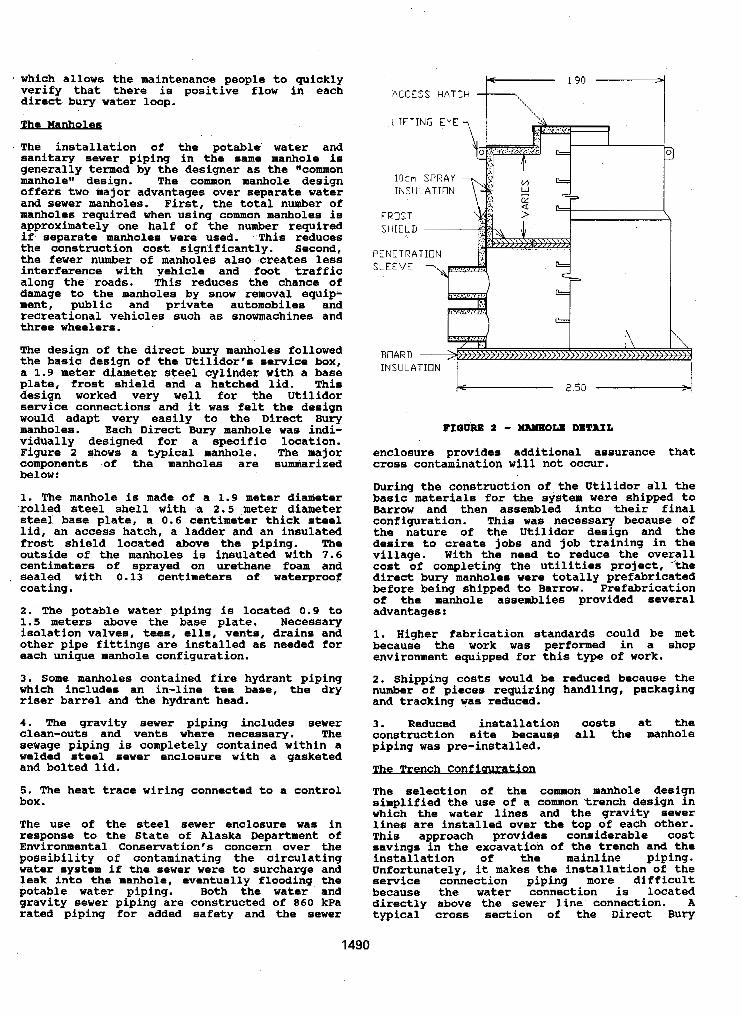
which allows the maintenance people to quickly verify that there is positive flow in each direct bury water loop. - The installation of the potable water and sanitary sewer piping in the same manhole is generally termed by the designer as the "common manhole" design. The common manhole design offers two major advantages over separate water and sewer manholes. First, the total number of manholes required when using common manholes is approximately one half of the number requireU if separate manholes were used. .This reduces the construction cost significantly. Second, the fewer number of manholes also creates less interference with vehicle and foot traffic along the roads. This reduces the chance of ciamage to the manholes by snow removal equip- ment, public and private automobiles and recreational vehicles such as snowmachines and three wheelers.
The design of the direct bury manholes followed the basic design of the Utilidor's service box, a 1.9 meter diameter steel cylinder with a base plate, frost shield and a hatched lid. This design worked very well for the Utilidor service connections and it was felt the design would adapt very easily to the Direct Bury manholes. Each Direct Bury manhole was indi- vidually designed for a specific location. Figure 2 shows a typical manhole. The major components of the manholes are smmiarized below:
1. The manhole is made of a 1.9 meter diameter rolled steel shell with a 2.5 .meter diameter steel base plate, a 0.6 centimeter thick steel lid, an access hatch, a ladder and an insulated frost shield located abwe the piping. The outside of the manholes is insulated with 7.6 centimeters of sprayed on urethane foam and sealed with 0.13 centimeters of waterproof coating.
2. The potable water piping is located 0.9 to 1.5 meters above the base plate. Necessary isolation valves, tees, ells, vents, drains and other pipe fittings are installed as needed for each unique manhole configuration.
3. Soma manholes contained fire hydrant piping which includes an in-line tee base, the dry riser barrel and the hydrant head.
4. The gravity sewer piping includes sewer clean-outs and vents where necessary. The sewage piping is completely contained within a welded steel sewer enclosure with a gasketed and bolted lid.
5. The heat trace wiring connected to a control box.
The use of the steel sewer enclosure was in response to the State of Alaska Department of Environmental Conservation's concern over the possibility of contaminating the circulating water system if the sewer were to surcharge and leak into the manhole, eventually flooding the potable water piping. Both the water and gravity sewer piping are constructed of 860 kPa rated piping for added safety and the sewer
ALCESS HATCH K 1'90 7 l k r l SPRAY INSULATION
FFDST SHIELD
PENETRATION SLEEVE
BOARD INSULATION 1 2.50 "J
FXam 2 - -ow DETAIL
enclosure provides additional assurance that cross contamination will not occur.
During the construction of the Utilidor all the basic materials for the system were shipped to Barrow and then assembled into their final configuration. This was necessary because o'f the nature of the Utilidor design and the desire to create jobs and job training in the village. With the need to reduce the overall cost of completing the utilities project, 'the direct bury manholes were totally prefabricated before being shipped to BaFKOW. Prefabrication of the manhole assemblies provided several advantages:
1. Higher fabrication standards could be met because the work was performed in a shop environment equipped for this type of work.
2. Shipping costs would be reduced because the number of pieces requiring handling, packaging and tracking was reduced.
construction site because all the manhole 3. Reduced installation costs at the
piping was pre-installed, - The selection of the common manhole design simplified the use of a common trench design in which the water lines and the gravity sewer lines are installed over the top of each other. This approach provides considerable cost savings in the excavation of the trench and the installation of the mainline piping. Unfortunately, it makes the installation of the service connection piping more difficult because the water connection ia located directly above the sewer Line connection. h typical cross section o f the Direct Bury
Utilities System trench is shown in Figure 3.
The trench width was fixed by the widest trench the Bortunco Roc-saw could cut with a single pass of its bar and chain. During the Utilidor construction the Roc-saw utilized a 40 centime- ter wide chain to make the Cut6 in the permafrost. This 40 centimeter wide chain would produce a trench which was too narrow to allow proper backfilling of the mainline piping used in the Direct Bury System. Investigation into the maximum cutting width of the Roc-saw revealed that a 60 centimeter wide Chain Could be installed if minor modifications to the cutting bar were performed. A trench width of 60 centimeters provided 11.5 centimeters of clearance on both, sides of an 20 pipe with insulation. This was enough clearance to allow the backfill material to fill the Voids under the haunches of the pipe. Additionally, the few loops requiring a 25 centimeter pipe with insulation could be accommodated.
To facilitate the trench backfilling activities and to provide a more thermally stable instal- lation, the non-frost susceptible (NFS) back- fill material was placed in the trench as a slurry. considerable effort was put into the thermal design of the Direct Bury Systems trench so a minimum burial depth could be utilized without compromising the integrity of the direct bury piping. Results of the thermal model indicated that backfilling with saturated NFS slurry would reduce the seasonal thaw depth in the trench during the first few years of
backfill would reduce the overall thaw operation. The frozen moisture in the slurry penetration due to the increased latent heat of fusion in the slurry compared to that of dry NFS. Based on a -12 degree C soil temperature and a 5 degree C water temperature in the pipe, freezing times during no flow conditions were estimated to be 95 hours to fKaZZle ice formation in a 15 cm insulated pipe.
Tests performed during the Utilidor construc- tion established that the dry NFS material was difficult to compact requiring several passes with a gasoline powered hand operated compactor. The uee of a NFS and water slurry had several construction advantages over the placement o f dry NFS in that it coula be poured
trucks, it would flow around the haunches of evenly into the trench from slowly moving mix-
the pipe and it required no significant compaction effort. Cement vibrators easily settled the slurry around the pipes and moved the slurry along the trench to even out the thickness of the lift. The problems associated with buoyancy floating the piping in the wet slurry were solved by installing wood blocking across the trench at a selected spacing and predetermined elevations and then floating the pipe on top of the slurry until it was held in the proper position by the blocking. No attempts were made to remove the blocking since it would not effect the thermal stability of the trench.
The mainline piping in the trench consisted of 15, 20 and 25 centimeter diameter high density polyethylene pipes with 7.6 centimeters of spray applied polyurethane foam insulation and an extruded polyethylene jacket. This arctic pipe was identical to that used in portions of
1491
the Utilidor System where its historical per- formance was good. A heat trace channel and self regulating 20 kcal per meter heat trace was placed under the insulation for use during the loss of circulation to prevent freeze-up and to thaw frozen lines.
Board insulation was placed in most of the
backfill material. When the pipe burial depth trenches to reduce the thaw penetration in the
was shallow, insulation was placed across the width and vertically along the sides of the trench to prevent thaw penetration from both the sides and the top of the trench. At
placed across the trench width and at the intermediate burial depths insulation was only
deepest depths no trench insulation was needed. Five centimeters of extruded polystyrene board insulation was used in all cases since signifi- cant quantities were left over from the Ut il idor proj ect .
r EXISTING GROUND SURFACE
LOCATOR TAPE - 5 ~n THICK INSULATION
9 I BACKFILL
1’ INSULATED WATER MAIN
INSULATED SEWER MAIN
The State of Alaska Regulations require a separation of at least 3 meters between the water and sewer lines. Discussionk with the Department of Environmental Conservation resulted in the agreement that the common trench design would have a very low cross con- tamination potential because the water and sewer pipes were made of high density polyethylene, insulated and covered with a seamless extruded jacket and the pipes were buried in a nearly impermeable saturated backfill.
Overall, this trench configuration provides good thermal integrity coupled with low con-
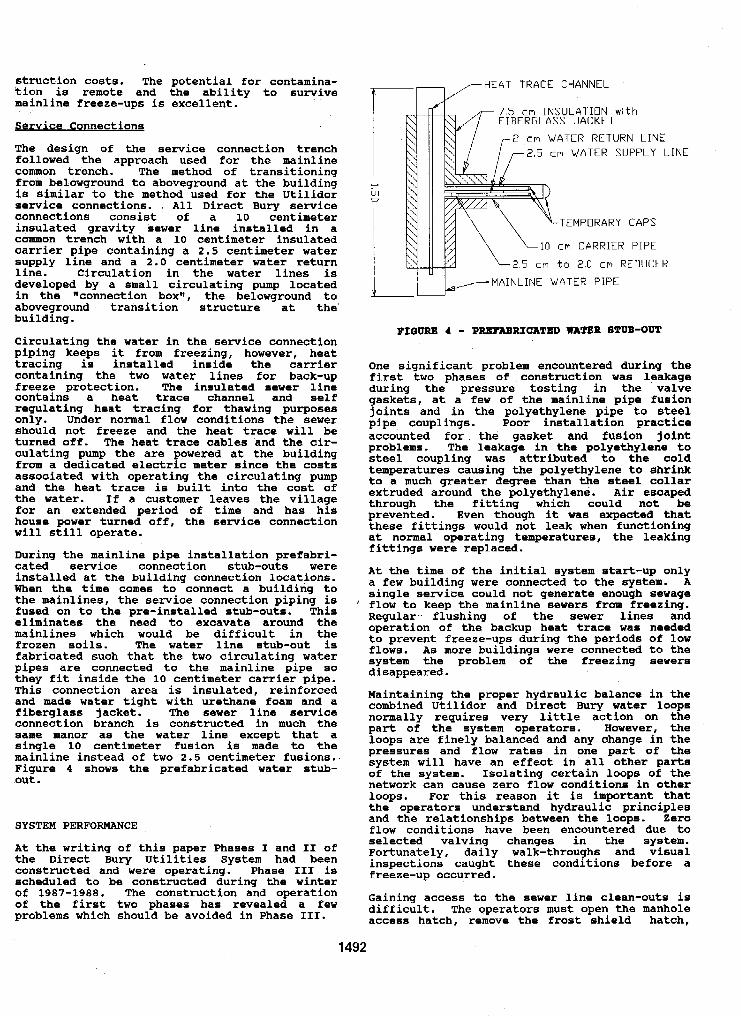
%ion i s remote and the ability to survive struction costs. The potential for contamina-
mainline freeze-ups is excellent.
Service Connections
The design of the service connection trench followed the approach used for the mainline common trench. The method of transitioning from belowground to aboveground at the building i s similar to the method. used for the Utilidor service connections. All Direct Bury service connections consist of a 10 centimeter insulated gravity sewer Line installed in a common trench with a 10 centimeter insulated carrier pipe containing a 2 . 5 centimeter water supply line and a 2.0 centimeter water return line. Circulation in the water lines is developed by a small circulating pump located in the llconnection box'l, the belowground to aboveground transition structure at the' building.
Circulating the water in the service connection piping keeps it from freezing, however, heat tracing is installed inside the carrier containing the two water lines for back-up freeze protection. The insulated sewer Line contains a heat trace channel and self regulating heat tracing for thawing purposes only. Under normal flow conditions the sewer should not freeze and the heat trace will be turned off. The heat trace cables and the cir- culating pump the are powered at the building from a dedicated electric meter since the costs associated with operating the circulating pump and the heat trace is built into the cost of the water. If a customer leaves the village for an extended period of time and has his house power turned off, the service connection will still operate.
During the mainline pipe installation prefabri- cated service connection stub-outs were installed at the building connection locations. When the time comes to connect a building to the mainlines, the service connection piping is fused on to the pre-installed stub-outs. This eliminates the need to excavate around the mainlines which would be difficult in the frozen soils. The water line stub-out is fabricated such that the two circulating water pipes are connected to the mainline pipe so they fit inside the 10 centimeter carrier pipe. This connection area is insulated, reinforced and made water tight with urethane foam and a fiberglass jacket. The sewer line service connection branch is constructed in much the same manor as the water line except that a single 10 centimeter fusion is made to the mainline instead of two 2.5 centimeter fusions. Figure 4 shows the prefabricated water stub- out.
SYSTEM PERFORMANCE
At the writing of this paper Phases I and I1 of the Direct Bury Utilities System had been constructed and were operating. Phase 111 is scheduled to be constructed during the winter of 1987-1988. The construction and operation of the first two phases has revealed a few problems which should be avoided in Phase 111.
7w HEAT TRACE CHANNEL
Y
0 cn
SNE
1 I - MAINLINE WATER PIPE "
One significant problem encountered during the first two phases of construction was leakage during the pressure testing in the valve gaskets, at a few of the mainline pipe fusion joints and in the polyethylene pipe to steel pipe couplings. Poor installation practice accounted for the gasket and fusion joint problems. The leakage in the polyethylene to steel coupling was attributed to the cold temperatures causing the polyethylene to ahrink to a much greater degree than the steel collar
through the fitting which could not be extruded around the polyethyleni. Air escaped
prevented. Even though it was expected that these fittings would not leak when functioning at normal operating temperatures, the leaking fittings were replaced.
At the time of the initial system start-up only a few building were connected to the system. A single service could not generate enough sewage flow ,to keep the mainline sewers from freezing. Regular-. flushing of the sewer lines and operation of the backup heat trace was needed to prevent freeze-ups during the periods of low flows. As more buildings were connected to the system the problem of the freezing sewers disappeared.
Maintaining the proper hydraulic balance in the combined Utilidor and Direct Bury Water loops normally requires very little action on the part of the system operators. However, the loops 3re finely balanced and any change in the pressures and flow rates in one part of the system will have an effect in all other parts of the system. Isolating certain loops of the network can cause zero flow conditions in other loops. For this reason it i s important that the operators understand hydraulic principles and the relationships between the loops. Zero flow conditions have been encountered due to selected valving changes in the system. Fortunately, daily walk-throughs and visual inspections caught these conditions before a freeze-up occurred.
Gaining access to the sewer line clean-outs is difficult. The operators must open the manhole access hatch, remove the frost shield hatch,
1492
climb under the potable water piping, unbolt the sewer enclosure l i d and then remove the clean-out cap. The reverse process is performed when the inspection is completed.
will not replace the sewer enclosure lid with There i s concern that the maintenance personnel the required gasket and bolts because 00 the time consuming effort involved. Signs on the sewer enclosure lid pieces indicate the need to keep the lids bolted in place.
CONCLUSION
The Barrow Direct Bury Utilities System design o€fers a water and sewer distribution system which interfaces well with the Utilidor System. Efforts in the design stage to create a
prefabrication and easy field installation, component type system which allowed for
were successful. This approach to a utilities distribution system should be applicable to most arctic and sub-arctic villages where a buried system i s desired. Utility system designers should visit the Barrow Utilities System to see first hand it's desirable features and to discuss the maintenance aspect@ Of the Bystem With the Direct Bum System operators. Hopefully, good engineering practice and quality construction have provided - the community o f Barrow with many yeara of reliable water and sewer service.
REFERENCES
Greenwood, W (1982) Shallow Buried Insulated Water and Sanitary Sewer Systems in Permafrost Regions.
Sewer/Water Service Connections for Barrow Utilities System. Proc Cold Regions Engr,
Martin, R h Sahlfeld, J (1984).
(1) , 395-400 Shillington, E & MacKinnonj E (1987).
Barrow Utility Syltem, Direct Bury System - The Alternative. Proc 2nd Conf on Cold Regions Envir Engr
Underground Utilidors at Barrow Alaska: A Two Year history. Proc IV Intl Conf on Permafrost
Zirjacks, W h Hwang, C (1983).
1493
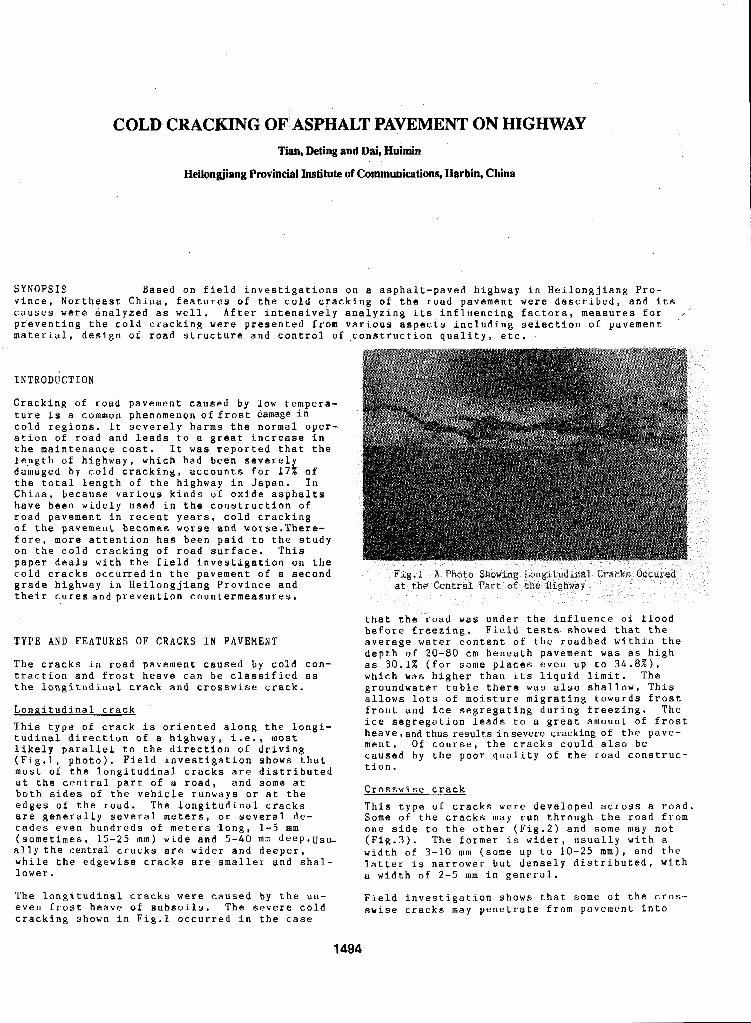
COLD CRACKING OF ASPHALT PAVEMENT ON HIGHWAY Tim, Deting and Dai, Huimin
Heilongjiang Provincial Institute of Communications, Barbin, China
SYNOPSIS Based on field investigations on a asphalt-paved highway in Heilongjiang Pro- vince, Northeast China, features of the cold cracking of the road pavement were described, and its causes were analyzed as well, After intensively analyzing its influencing factors, measures for .I preventing the cold cracking were presented from various aspects including selection of pavement material, design of road structure and control of construction quality. etc.
INTRODUCTION
Cracking of road pavement caused by low tempera- ture is a common phenomenon of frost damage in cold regions. It severely harms the normal oper- ation of road and leads to a great increase i n the maintenance cost. It was reported that the length of highway, which had been severely damaged by cold cracking, accounts for 17% of the total length of the highway in Japan. In China, because various kinds of oxide asphalts have been widely used in the construction o f road pavement in recent years, cold cracking of the pavement becomes worse and worae.There- fore, more attention has been paid to the study on the cold cracking o f road surface. This paper deals with the field investigation on the cold cracks occurredin the pavement of a second grade highway in Heilongjiang Province and their cures and prevention countermeasures.
TYPE AND FEATURES OF CRACKS IN PAVEMENT
The cracks in road pavement caused by cold con- traction and frost heave can be classified as the longitudinal crack and crosswise crack.
Longitudinal crack This type of crack is oriented along the Longi- tudinal direction o f a highway, i.e.. most likely parallel to the direction of driving (Fig.1, photo). Field investigation shows that most of the longitudinal cracks are distributed at the central part of a road, and some at both sides of the vehicle runways or a t the edges of the road. The longitudinal cracks are generally several meters, or several de- cades even hundreds of meters 'long, 1-5 mm (sometimes, 1 5 - 2 5 mm) wide and 5-40 m m deep.usu- ally the central cracks are wider and deeper, while the edgewise cracks are smaller and shal- lower.
The longitudinal cracks were caused by the un- even frost heave of subsoils. The severe cold cracking shown in Fig.1 occurred in the case
1494
that the.road was under the influence of flood before freezing. Field tests showed that the average water content of the roadbed within the depth of 20-80 cm beneath pavement was a s high as 30.1% (for some places even up to 3 4 . 8 X ) , which was higher than its liquid limit. The groundwater table there was also shallow. This allows lots of moisture migrating towards frost front and ice segregating during freezing. The ice segregation leads to a great amount of frost heave,and thus resu1t.s insevere cracking of the pave- ment. Of course, the cracks could also be caused by the poor quality of the road construc- tion.
Crosswise crack This type o f cracks were developed across a road. Some of the cracks may run through the road from one side to the other (Fig.2) and some may not (Fig.3). The former is wider, usually with a width of 3-10 mm (some up to 10-25 mm), and the latter is narrower but densely distributed, with a width of 2-4 mm in general.
Field investigation shows that some u f the cros- swise cracks may penetrate f r o m pavement into
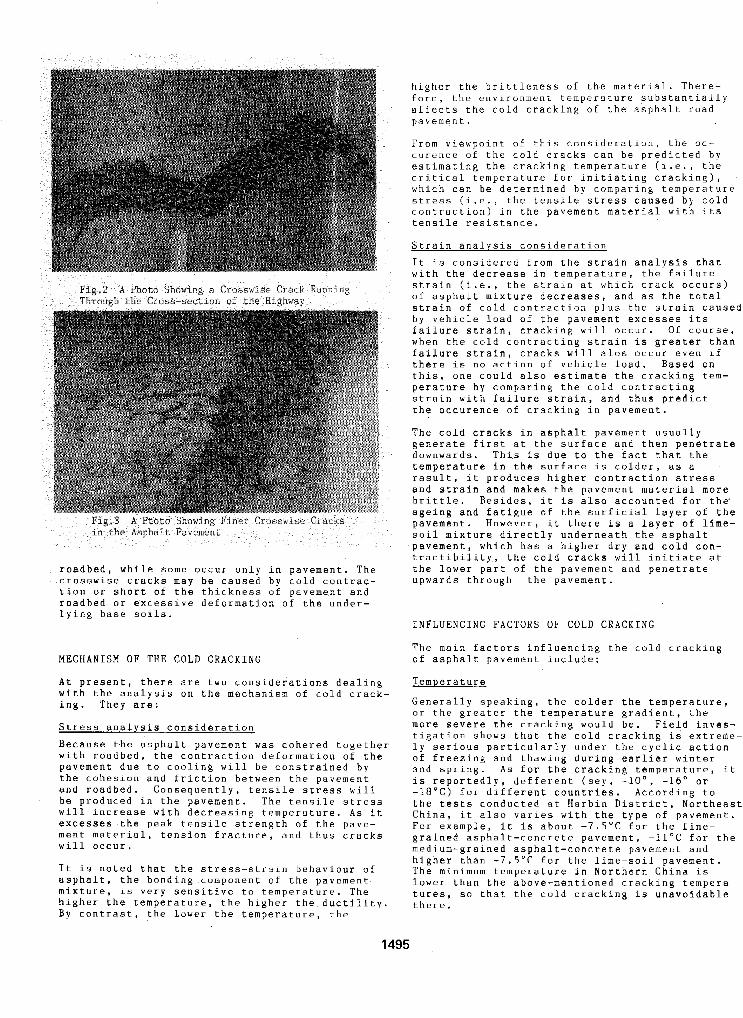
Fig.? A Photo Showi.ng a Crosswise Crack Running Throuah the Cross-section of the Hirhwav
Fig,3 A Ptoto Showing Finer Crosswise Cracks in the Asphalt Pavement
roadbed, while some occur only in pavement. The crosswise cracks may be caused by cold contrac- tion or short of the thickness o f pavement and roadbed or excessive deformatjon o f the under- lying base soils.
MECHANISM OF THE C O L D CRACKING
At present, there are two consi.derations dealing with the analysis on the mechanism o f cold crack- ing. They are:
Stress analysis consideration
Because the asphalt pavement was cohered together with roadbed, the contraction deformation o f the pavement due t o cooling will be constrained by the cohesion and friction between the pavement and roadbed. Consequently, tensile stress will be produced in the pavement. The tensile stress will increase with decreasing temperature. As it excesses the peak tensile strength o f the pave- ment material, tension fracture, and thus cracks will occur.
It is noted that the stress-strain behaviour of asphalt, the bonding component o f the pavement. mixture, is very sensitive to temperature. The higher the temperature, the higher the ductility. By contrast, the lower the temperature, the
higher the brittleness of Lhe material. There-
affects the cold cracking of the asphalt road fore, the cnvironmcnt temperature substantially
pavement.
From viewpoint of this consideration, the oc- curcncc o f the cold cracks can be predicted by estimating the cracking temperature (i.e., the cri-tical temperature for initiating cracking), which can be determined by comparing temperature
contraction) in the pavement material with its stress (i.e., the tensile stress caused by cold
tensile resistance.
Strain analysis consideration
It is considered from the strain analysis that with the decrease in temperature, the failure strain (i.e., the strain at which crack occurs) of asphalt mixture decreases, and as the total. strain of cold contraction plus the strain caused by vehicle load of the pavement excesses its failure strain, cracking will occur. Of course, when the cold contracting strain is greater than failure strain, cracks will alos occur even if there is no action of vehicle load. Based o n this, one could also estimate the cracking tem- perature by comparing the cold contracting strain with failure strain, and thus predict the occurence of cracking in pavement.
The cold cracks in asphalt pavement usually generate first at the surface and then penetrate downwards. This is due to the fact that the temperature in the surface is colder, as a rasult, it produces higher contraction stress and strain and makes the pavement material more brittle. Besides, it is also accounted for the' ageing and fatigue of the surficial layer of the pavement. However, it there is a layer of lime- soil mixture directly underneath the asphalt pavement, which has a higher dry and cold con- tractibility, the cold cracks will initiate at the lower part o f the pavement and penetrate upwards through the pavement,
INFLUENCING FACTORS OF COLD CRACKING
The main factors influencing the cold cracking o f asphalt pavement include:
Temperature
Generally speaking, the colder the temperature, or the greater the temperature gradient, the more severe the cracking would be. Field inves- tigation shows that the cold cracking is extreme- ly serious particularly under the cyclic action
and spring. As for the cracking temperature, it of freezing and thawing during earlier winter
is reportedly, defferent ( s e y , -.lo", -16" o r -18'C) for different countries. According to the tests conducted at Harbin District, Northeast China, it also varies with the type of pavement. For example, it is about -7.5"C for the fine- grained asphalt-concrete pavement, - 1 1 ° C f o r the medium-grained asphalt-concrete pavement and higher than -7.5"C for the lime-soil pavement, 'The minimum temperature in Northern China is lower than the above-mentioned cracking tempera- tures, s o that the cold cracking is unavoidable there.
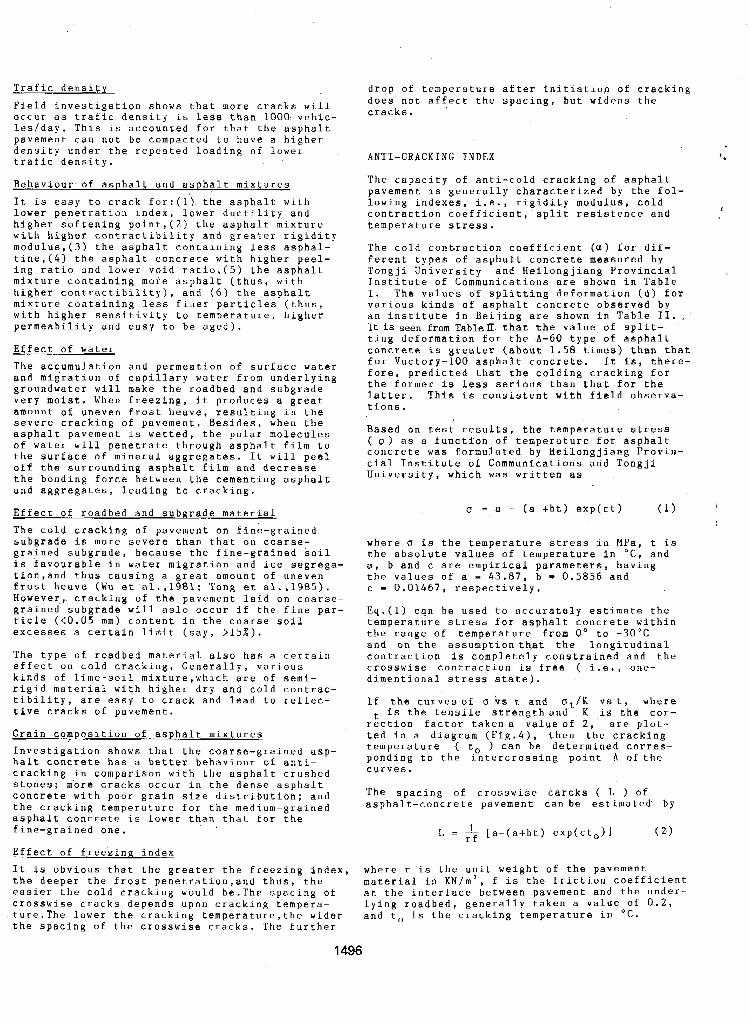
Trafic density
Field investigation shows that more cracks will occur as trafic density is less than 1000 vehic- les/day. This is accounted for that the asphalt pavement can not be compacted to have a higher density under the repeated loading o f lower trafic density.
Behaviour of asphalt and asphalt mixtures It is easy to crack for: (1') the asphalt with lover. penetration index, lower ductility and higher softening point,(2) the asphalt mixture with higher contractibility and greater rigidity modulus,(3) the asphalt containing less asphal- tine,(&) the asphalt concrete with higher peel- ing ratio and lower void ratio,(5) the asphalt mixture containing more asphalt (thus, with higher contractibility), and (6) the asphalt mixture containing less finer particles (thus, with higher sensitivity to temperature, higher permeability and easy to be aged).
Effect of water
The acc,umulation and permeation of surface water and migration of capillary water from underlying groundwater will make the roadbed and subgrade very moist. When freezing, it produces a great amount of uneven frost heave, resulting in the severe cracking of pavement, Besides, when the asphalt pavement is wetted, the,polar molecules of water will penetrate through asphalt film to the surface o f mineral aggregates. It will peel o f f the surrounding asphalt film and decrease the bonding force between the cementing asphalt and aggregates, leading to cracking.
Effect of roadbed and subgrade material
The cold cracking of pavement on fine-grained subgrade is more severe than that on coarse- grained subgrade, because the fine-grained soil is favourable in water migration and ice segrega- tion,and thus causing a great amount o f uneven frost heave (Wu et a1.,1981; Tong et a1.,1985). However,, cracking of the pavement laid on coarse- grained subgrade will aslo occur if the fine par- ticle (<0.05 mm) content in the coarse soil excesses a certain limit (say, > 1 5 % ) .
The type of roadbed material also has a certain effect on cold cracking. Generally, various kinds of lime-soil mixture,which are o f semi- rigid material with higher dry and cold contrac- tibility, are easy to crack and lead t o reflec- tive cracks of pavement.
Grain composition of asphalt mixtures
halt concrete has a better behaviour of anti- Investigation shows that the coarse-grained asp-
cracking in comparison with the asphalt crushed stones: more cracks occur in the dense asphalt concrete with poor grain size distribution; and the cracking temperature for the medium-grained asphalt concrete i s lower than that for the fine-grained one.
Effect of freezinR index
It is obvious that the greater the freezing index, the deeper the frost penetration,and thus, the easier the cold cracking would be.The spacing of crosswise cracks depends upon cracking tempera- ture.The lower the cracking temperature,the wider the spacing of the crosswise cracks. 'The further
drop of temperature after initiation of cracking does not affect the spacing, but widens the cracks.
ANTI-CRACKING INDEX
The capacity of anti-cold cracking of asphalt pavement is generally characterized b y the fol- lowing indexes, i.e., rigidity modulus, cold contraction coefficient, split resistence and temperature stress.
The cold contraction coefficient ( a ) for dif- ferent types of asphalt concrete measured by Tongji University and Heilongjiang Provincial Institute of Communications are shown in Table 1. The values of splitting deformation ( d ) for various kinds of asphalt concrete observed by an institute in Beijing are shown in Table 11. .,
ting deformation for the A-60 type of asphalt It is seen from Tab1e.a that the value of split-
concrete is greater (about 1.58 times) than that for Vactory-100 asphalt concrete. It i s , there- fore, predicted that the colding cracking for the former is less serious than that for the latter. This is consistent with field observa- tions.
Based on test results, the temperature stress ( u ) as a function of temperature for asphalt concrete was formulated by Heilongjiang Provin-
University, which was written as cia1 Institute o f Communications and Tongji
u = a - ( a +bt) exp(ct) ( 1 )
where u is the temperature stress in MPa, t is the absolute values of temperature in 'C, and a, b and c are empirical parameters, having the values of a = 43.87, b = 0.5856 and c = 0 ,01467 , respectively,
Eq.(l) can be used to accurately estimate the temperature stress for asphalt concrete within the range of temperature from 0' to -3O'C and on the assumptionth,at the longitudinal contraction is completely constrained and the crosswise contraction is free ( i.e., one- dimentional stress state).
If the curves of u b s t and ot/K v 6 t, where is the tensile strengthand K is the cor-
rection factor takena valueof 2 , are plot- ted in a diagram (Fig.4), then the cracking temperature ( to ) can be determined corres- ponding to the intercrossing point A ofthe curves.
The spacing of crosswise carcks ( L ) of asphalt-concrete pavement can be estimated by
L = & [a-(a+bt) exp(cto)l ( 2 )
where r i s the unit weight o f the pavement material in KN/m', f is the friction coefficient at the interface between pavement and the under- lying roadbed, generally taken a value O f 0 . 2 , and to is the cracking temperature in 'c.
1496
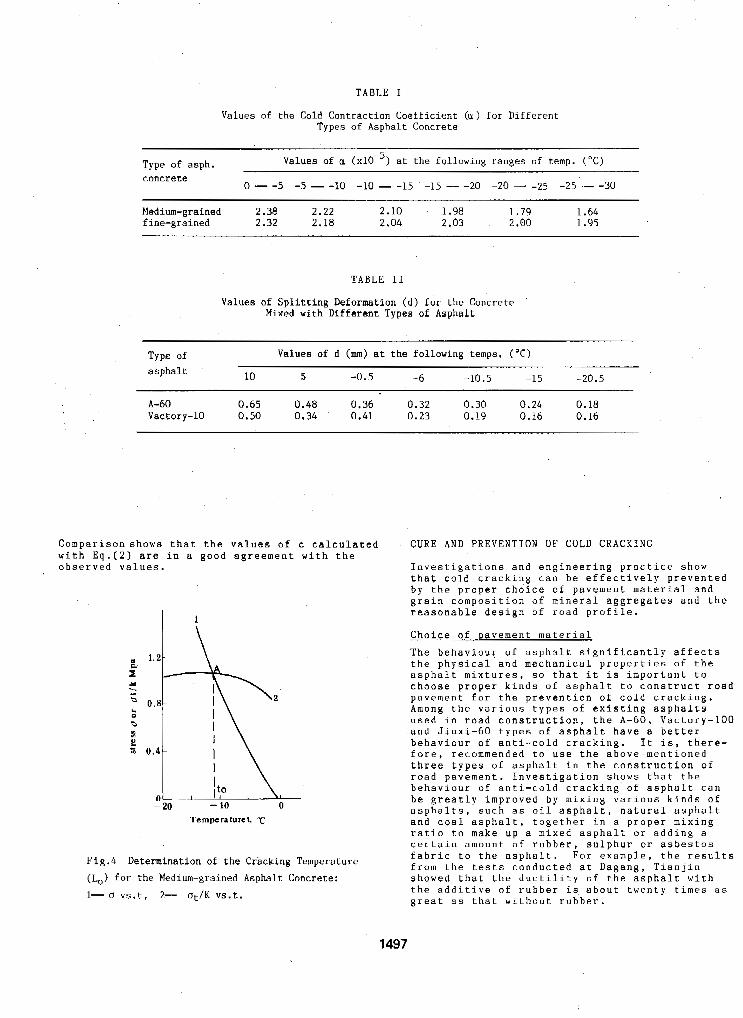
TABLE I
Values of the Cold Contraction Coefficient ( a ) for Different Types of Asphalt Concrete
Type of asph. Values of a ( M 5 ) at the following ranges of temp. ("C) concrete
0 - -5 -5 - -10 -10 - -15 -15 - -20 -20 + -25 -25 - -30
Medium-grained 2.38 2.22 2.10 1.98 1.79 1.64 fine-grained 2.32 2.18 2.04 2.03 2 .oo 1.95
TABLE I1
Values of Splitting Deformation (d) for the Concrete Mixed with Different Types of Asphalt
Type of Values of d (mm) at the following temps. ("C) asphalt 10 5 -0.5 -6 -10.5 -15 -20.5
"" . -
A-60 0.65 0.48 0.36 0.32 0.30 0.24 0.18 Vactory-10 0.50 0.34 0.41 0.23 0.19 0.16 0.16
Comparison shows that the values of c calculated CURE AND PREVENTION OF COLD CRACKING with Eq.(2) are in a good agreement with the observed values. Investigations and engineering practice show
by the proper choice o f pavement material and that co1.d cracking can be effectively prevented
grain composition of mineral aggregates and the reasonable design of road profile.
I 1
Temperaturel. 'C
Fig.4 Determination of the Cracking Temperature (Lo) for the Medium-grained Asphalt Concrete:
1- U vs.t, 2- ot/K vs.t.
Choice o f pavement material
The behaviour of asphalt significantly affects the physical and mechanical properties of the asphalt mixtures, s o that it is important to choose proper kinds of asphalt to construct road pavement for the prevention of cold cracking. Among the various types of existing asphalts used in road construction, the A-60, Vactory-100 and Jinxi-60 types of asphalt have a better behaviour of anti-cold cracking. It is, there- fore, recommended to use the above-mentioned three types of asphalt in the construction of road pavement. Investigation shows that the behaviour of anti-cold cracking of asphalt can be greatly improved by mixing various kinds of asphalts, such as oil asphalt, natural asphalt and coal asphalt, together i n a proper mixing ratio to make up a mixed asphalt or adding a certain amount of rubber, sulphur o r asbestos fabric to the asphalt. For example, the results from the tests conducted at Dagang, Tianjin showed that the ductility of the asphalt with the additive of rubber is about twenty times a s great a s that without rubber.
1497
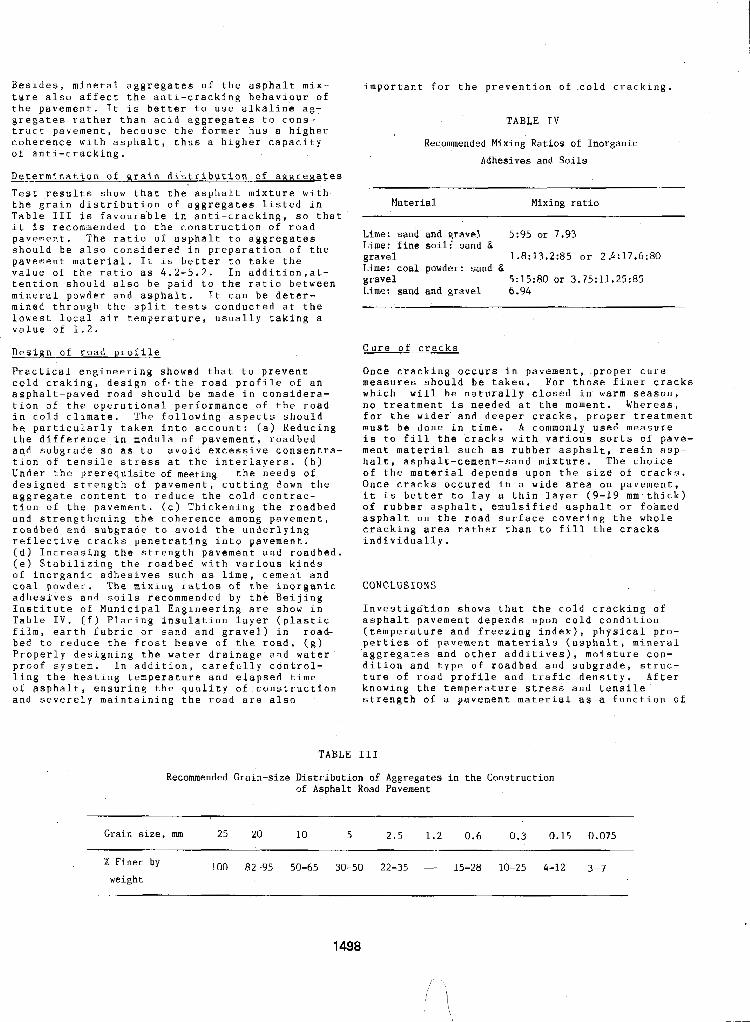
Besides, mineral aggregates of the asphalt mix- ture also affect the anti-cracking behaviour o f the pavement, It i s better to use alkaline ag- gregates rather than acid aggregates to cons- truct pavement, because the former has a higher coherence with asphalt, thus a higher capacity of anti-cracking.
Determination o f grain di'stribution of aaRreRates Test results show that the asphalt mixture with- the grain distribution of aggregates listed in Table I11 is favourable in anti-cracking, s o that it is recommended to the construction o f road pavement. The ratio o f asphalt to aggregates should be a l s o considered in preparation o f the pavement material. It is better to take the value o f the ratio as 4.2-5 .2 . In addition,at- tention should also be paid to the ratio between mineral powder and asphalt. It can be deter- mined through the split tests conducted at the lowest local air temperature, usually taking a value of 1 . 2 .
Design of road profile
Practical engineering showed that to prevent cold craking, design ofhthe road profile o f an asphalt-paved road should be made in considera- tion of the operational performance of the road in cold climate. The following aspects should be particularly taken into account: (a) Reducing the difference in modula o f pavement, roadbed and subgrade s o as to avoid excessive consentra- tion of tensile stress at the interlayers. (b) Under the prerequisite of meeting the needs o f designed strength of pavement, cutting down the aggregate content to reduce the cold contrac- tion of the pavement. (c) Thickening the roadbed and strengthening the coherence among pavement, roadbed and subgrade t o avoid the underlying reflective cracks penetrating into pavement. (d) Increasing the strength pavement and roadbed, (e) Stabilizing the roadbed with various kinds of inorganic adhesives such as lime, cement and coal powder, The mixing ratios of the inorganic adhesives and soils recommended by the Beijing Institute of Municipal Engineering are show in Table IV. (f) Placing insulation layer (plastic film, earth fabric or sand and gravel) in road- bed to reduce the frost heave of the road. ( 9 ) Properly designing the water drainage and water proof system. In addition, carefully c o n t r o l - ling the heating temperature and elapsed time o f asphalt, ensuring the quality of construction and severely maintaining the road are also
TABLE
important for t :he prevention o f .cold cracking.
TABLE IV
Recommended Mixing Ratios of Inorganic Adhesives and Soils
Material Mixing ratio
Lime: sand and gravel 5:95 or 7.93 Lime: fine soili sand & gravel 1.8:13.2:85 or 2.4:17.6:80 Lime: coal powder: sand & gravel 5:15:80 or 3.75:11.25:85 Lime: sand and gravel 6.94
Cure of cracks
Once cracking occurs in pavement, proper cure measures should be taken. For those finer cracks which will be naturally closed in warm season, no treatment is needed at the moment. Whereas, for the wider' and deeper cracks, proper treatment must be done in time. A commonly used measure is to fill the cracks with various sorts o f pave- ment material such as rubber asphalt, resin asp- halt, asphalt-cement-sand mixture. The choice o f the material depends upon the size of cracks. Once cracks occured in a wide area on pavement, it is better to lay a thin layer (9-19 mm thick) o f rubber asphalt, emulsified asphalt or foamed asphalt on the road surface covering the whole cracking area rather than to fill the cracks individually.
CONCLUSIONS
Investigation shows that the cold cracking of asphalt pavement depends u p o n cold condition (temperature and freezing index), physical pro- perties of pavement materials (asphalt, mineral aggregates and other additives), moisture con- dition and type o f roadbed and subgrade, struc- ture o f road profile and trafic density. After knowing the temperature stress and tensile' strength of a pavement material as a function of
111
Recommended Grain-size Distribution of Aggregates in the Construction of Asphalt Road Pavement
Grain size, mm 25 20 10 5 2.5 1.2 0.6 0.3 0.15 0.075
Finer by 100 82-95 50-65 30-50 22-35 - 15-28 10-25 4-12 3-7 weight
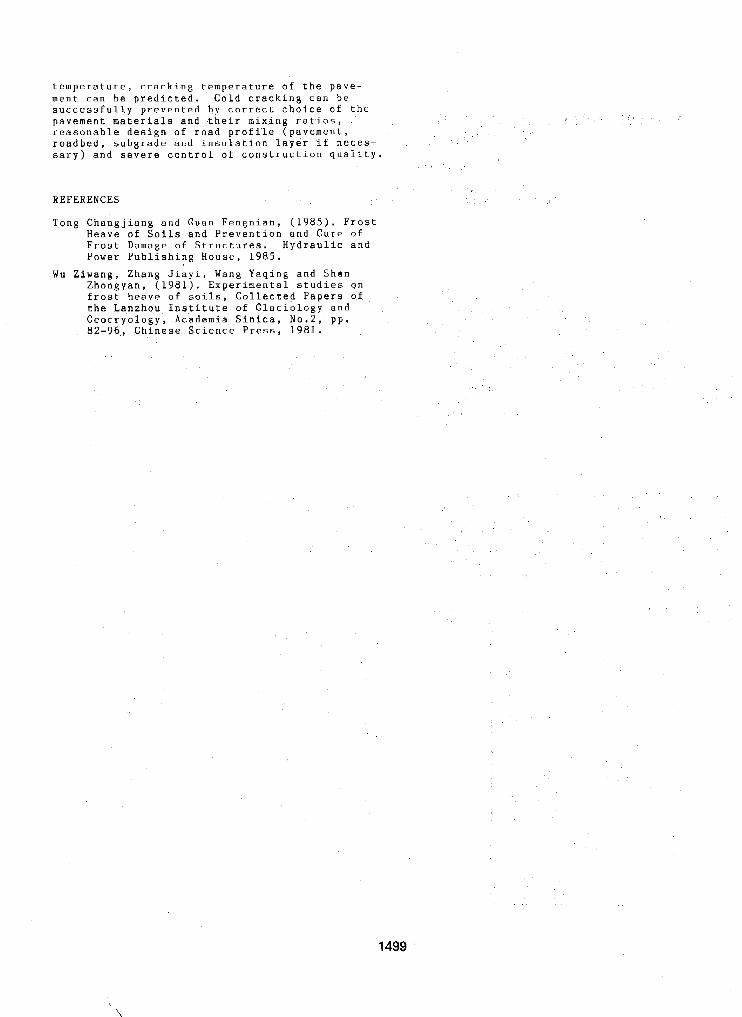
temperature, cracking temperature o f the pave- ment can be predicted. Cold cracking can be successfully prevented by correct choice o f thc pavement materials and their mixing ratios, reasonable design o f road profile (pavement, roadbed, subgrade and insulation layer if neces- sary) and severe control of construction quality
REFERENCES
Tong Changjiang and Guan Fengnian, (1985). Frost Heave o f S o i l s and Prevention and Cure o f Frost Damage of Structures. Hydraulic and Power Publishing House, 1985.
Zhongyan, (1981). Experimental studies o n frost heave of soils, Collected Papers of the Lanzhou Inatitute of Glaciology and Geocryology, Academia Sinica, N o . 2 , pp. 82-96, Chinese Science Press, 1981.
Wu Ziwang, Zhang Jiayi, Wang Yaqing and Shen
1499
AIRPORT NETWORK AND HOUSING CONSTRUCTION PROGRAMMES IN NORTHERN QUEBEC, CANADA
C. Tremblayl and G. Do&
' 1QuCbee Department of Transport Quebec, Canada 2Service des Sols et C h a w s h , Ministere des Transports du Qudbec
SYNOPSIS Some 750 000 square kl lometers o f Quebec t e r r i t o r y a r e i n permafrost zones. Northern Quebec i s f a r from occupied Quebec, underpopulated and underdeveloped, I n 1977, the native peoples (Cries, Naskapis, I n u i t ) Canada and Quebec signed the James Bay & Northern Quebec agreement. To f u l l f i l 1 t h e i r commitments governments a re bu i ld lng hous ing un i ts and es tab l i sh ing an a i r t r a n s p o r t a t i o n network.. I n Quebec, t h e r e a r e g r e a t l y d i f f e r e n t approches t o dea l w i th nor thern cons t ruc t ion p rogrames. The houses a r e b u i l t ctonn f rozen grounds; the a i rstr ips are b u i l t ((in)) permafrost. So a i r p o r t c o n s t r u c t i o n i n a permafrost zone i s ambitions and invo lves a great deal o f
geotechnical condi t ions have t o be deal t w i th by the des igner . In Kangi rsuk, Nor thern Quebec, such a s i t u a t i o n occu- technica l cons iderat ions. Many cons t ra in t s have t o be taken in to account when choosing an a i r s t r i p s i t e ; uneasy
red; The one and o n l y s u i t a b l e s i t e t o l o c a t e t h e runway forced a 5 meter deep c u t i n i c e - r i c h s i l t y s o i l . Troubles were expected; our deficient experience i n working i n permafrost combined t o a l a c k o f r e l e v a n t b i b l i o g r a -
L e t us l o o k a t what we found i n Kangirsuk since 1985. phica l re ferences could not he lp us i n e v a l u a t i n g t h e i r magnitudes. Monitor ing the sensi t ive area was undertaken...
Quebec i s a large eastern Canada province. Wlth more than 1 500 000 square ki lometers i t s area i s more than 15% o f a l l Canadian lands. Compare t o european stan- ta rds i t s s i zes a re qu i te shock ing ; f rom sou th t o no r th say from Montreal t o I v u j i v i k t h e d i s t a n c e i s more than 2 000 k i lometers and Great White River on the west coast (Hudson Bay) i s 1 200 k i lometers away from the Gul f o f St-Lawrence. Our Quebec alone i s w i d e r t h a n a l l t h e nine EEC countr ies.
About o requar te r o f Quebec t e r r i t o r y i s i n a cont in ious permafrost zone, and about 50% approximately 750 000 square ki lometers - i n a discont in ious permafrost zone.
Th is vas t no r the rn a rea w i th i t s pe renn ia l l y f rozen ground and subsoil i s f a r from occupied Quebec, no t very access ib le , and v i r t u a l l y i f no t en t i re l y un inha - bited and/or developed. It i s very appea l ing to the r e s t of Quebec because o f t t s w e a l t h o f n a t u r a l r e s o u r - ces and t h e h y d r o e l e c t r i c p o t e n t i a l o f a l l i t s f r e s h watercourses which f low towards the North, towards the Northern seas.
For centur ies, the nat ive people o f those remote coun- t r i e s , for obvious h i s t w i c a l reasons had very l i t t l e soc ia l , commercial ar admin i s t ra t i ve ma t te rs w i th bo th Quebec and Canada Governments. In ear ly sevent ies the always increasing needs fo r energy and ressources moved up nor th southerners eager to explo id the huge poten- t i a l of the barrens grounds of Nor thern Quebec - James Bay and Hudson Bay inhab i ted f o r l ong t ime by na t i ve Indians and Inu i t . Fo r t he pas t 15 years or so these people have been a t t h e h e a r t o f an innovat ive , o r ig ina l governement scheme which will have a great impact on resource development and, as a r e s u l t , on i n f r a s t r u c t u - r e s o f a l l k i n d s .
I n 1977, when the Canada and Quebec governments, the James Bay Crees, Quebec Naskapis and t h e I n u i t o f Nou- veau-Quebec signed the James Bay and Northern Quebec Agreement, a l l t h e p a r t i e s t o t h e c o n t r a c t were c o m i t - t i n g themselves t o a vast undertaking on a l l n o r t h e r n coasts.
1500
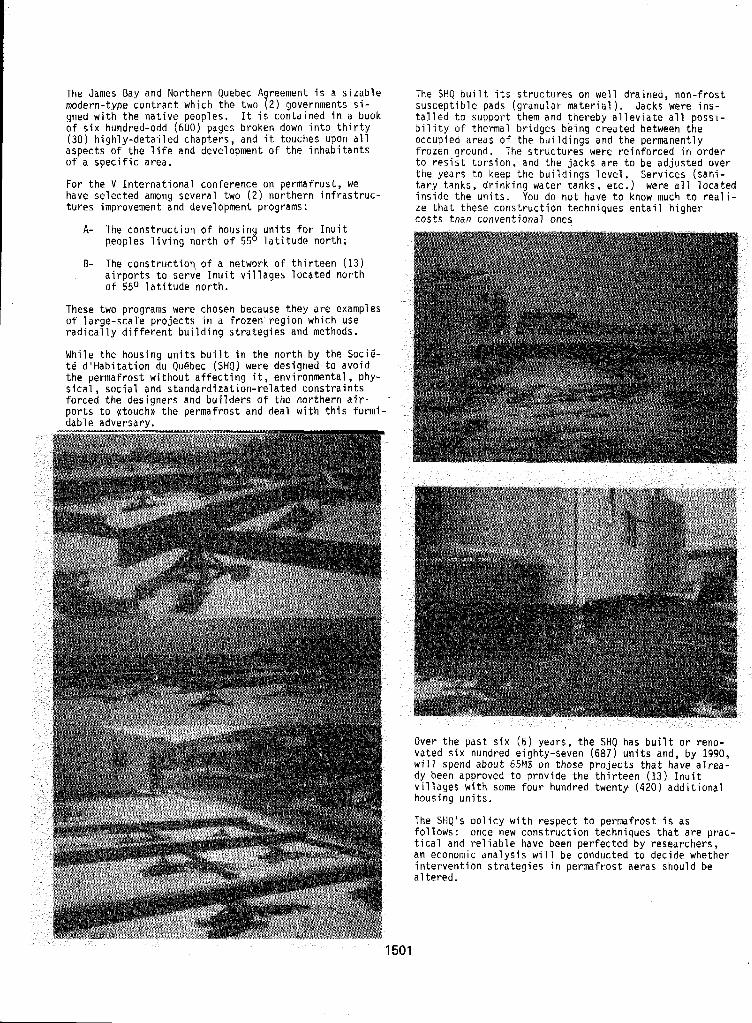
The James Bay and Northern Quebec Agreement i s a sizable modern-type contract which the two ( 2 ) governments s i - gned with the native peoples. I t i s contained in a book of s ix hundred-odd (600) pages broken down in to th i r ty
aspects of t h e l i f e and development of the inhabitants (30) highly-detailed chapters, and it touches upon a l l
of a specific area.
have selected among several two ( 2 ) northern infrastruc- For the V International conference on permafrost, we
tures improvement and development programs:
A- The construction o f housin units for Inuit p.eoples l iving nor th of 55% la t i tude nor th ;
B- The construction, of a network of thir teen (13) a i rports t o serve Inuit villages located north of 550 la t i tude north.
These two programs were chosen because they are examples o f large-scale projects in a frozen region which use radically different building strategles and methods.
t e d'Habitation du Quebec (SHQ) were designed t o avoid While the housing units buil t in the nor th by the SociB-
the permafrost without affecting i t , environmental, phy- s ical , social and standardization-related constraints forced the designers and builders o f the northern air- ports t o cttouch)) the permafrost and deal with th i s formi- dable adversarv.
The SHQ bui l t i t s s t ruc tures on well drained, non-frost susceptible pads (granular material) . Jacks were ins- ta l led t o support them and thereby alleviate all possi- b i l i t y of thermal bridges being created between the occupied areas o f the buildings and the permanently frozen ground. The structures were reinforced in order t o res is t tors ion, a n d the jacks are t o be adjusted over the years t o keep the buildings level. Services (sani- tary tanks, drinking water tanks, etc.) were all located
ze t h a t these construction techniques entail higher inside the units. You do not have t o know much t o rea l i -
costs t h a n conventional ones
Over the past six ( 6 ) years, the SHQ has bui l t or reno- vated s ix hundred eighty-seven (687) units and, by 1990, will spend about 65M$ an those projects that have alrea- dy been approved to provide the thirteen (13) Inuit villages with some four hundred twenty (420) additional housing units.
The S H Q ' s policy with respect t o permafrost i s a s follows: once new construction techniques t h a t are prac- t i ca l and re l iable have been perfected by researchers, an economic analysis will be conducted t o decide whether intervention strategies in permafrost aeras should be a1 tered.
1501
I n 1983, as par t o f the imp lementa t ion of t he James Bay gnd Northern Quebec Agreement, the Canada and Quebec governments concluded an umbrella agreement dea l i ng w i th the cons t ruc t ion o f a network o f t h i r t e e n ( 1 3 ) a i r p o r t s to serve the Inu i t v i l l ages c rea ted and/or recogn ized by the f i rst-ment ionned Agreement.
This lOOMS p r o j e c t s l a t e d f o r c o m p l e t i o n i n 1952 was i n i t i a t e d i n 1984 w i t h t h e c o n s t r u c t i o n o f t h e I v u j i v i k a i r p o r t - a t y p i c a l a i r p o r t w i t h a g r a v e l l a n d i n g s t r i p 1 070 metres by 30 metres ( 3 500' x l o o ' ) , a road from t h e v i l l a g e t o t h e a i r p o r t , a passanger terminal and a hangar for cargo, machinery, tools and vehic les. The runways a re equ ipped w i th l i gh ts and e l e c t r o n i c f l i g h t nav igat ion a ids. All the o the r v i l l ages will be p rov i - ded w i t h s i m i l a r i n f r a s t r u c t u r e s w i t h t h e same physical cha rac te r i s t i cs ,
The summer 1986 cons t ruc t ion con tex t was espec ia l l y event fu l and i n t e r e s t i n g f o r t h e program engineers and designers.
Our f i r s t exper ience wi th the permafrost was a t Kang i r - suk on the western coast o f Ungava Bay. I n t h i s p a r t i - c u l a r case, we were g lad t ha t ded ica ted sc ien t i s t s had worked on f i n d i n g l o g i c a l and r a t i o n a l s o l u t i o n s t o these sensit ive problems and t h a t we could s t i l l count on the determinat ion o f f u l l teams o f researchers t o p rov ide deve lopers w i th techn iques wh ich g rea t ly fac i l i - t a t e t h e i r t a s k .
The second p a r t o f o u r p r e s e n t a t i o n is a summary o f a technical study conducted i n order to guarantee the c o n s t r u c t i o n o f a r e l i a b l e l a n d i n g s t r i p a t K a n g i r s u k and t o improve upon the des ign o f t he p ro jec ts s la ted f o r t h e o t h e r v i l l a g e s .
PART 2 ; Technical Considerations
1. I n t roduc t i on : The context
It i s q u i t e a chal lenging experience working as a s o i l engineer and pavement des igne r f o r an a i r p o r t b u i l d i n g program i n t h e n o r t h b u t , i n some respects, not too rewarding a t a s k . I n f a c t , s o i l s seem t o b e t h e l a s t fac to r taken in to account when choos ing the s i te o f an a i r f i e l d . S o c i a l and environmental considerations are d e a l t w i t h f i r s t as we l l as techn ica l fac to rs which are more c lose ly re la ted t o ae ronau t i cs .
I t then becomes a chal lenge to determine proper pavement design i n view o f t he f ac t t ha t g rave l -wear ing su r faces may n o t j u s t i f y s o p h i s t i c a t e d and expensive design fea- tu res such as i n s u l a t i o n o r thermo probes bu t do deserve good protect ion against poor performance due t O the presence o f pe rmaf ros t i n t he under l y ing t e r ra in .
One m i g h t t h i n k a t f i r s t g l a n c e t h a t a gravel surface r e q u i r e s v e r y l i t t l e d e s i g n e f f o r t on account of t he re - l a t i ve l y l ow i nves tmen t t ha t i t imp l ies and o f t h e easy and cheap maintenance it i s l i a b l e t o r e q u i r e . However, when t e n a i r p o r t s i n v o l v i n g a to ta l inves tment of lSOW$ are concerned, i t becomes wor thwh i l e t o emphasize t e c h n i c a l s t u d i e s i n o r d e r t o o p t i m i z e t h e s t r u c t u r a l designs and therefore long-term performance.
2 . Development L im i ta t j ons
Many f a c t o r s a r e t o be c o n s i d e r e d p r i o r t o t h e s e l e c t i o n of an a i r f i e l d s i t e . Most o f them a r e r e l a t e d t o t h e needs o f t h e community, aeronautical requirements, en- vironmental considerations as we l l as the topographical and geologica l context . These fac to rs make i t v e r y d i f - f i c u l t t o s e l e c t a p r o p e r s i t e even i n a reg ion as vas t and l i t t l e populated as northern Quebec.
Social Requirements: The needs o f t h e community a re a key consideration. The a i r p o r t has t o be as c lose as p o s s i b l e t o t h e v i l l a g e w i t h o u t a i r c r a f t t a k e o f f s and land ings cons t i t u t i ng a danger o r caus ing s t ress . T rad i t iona l hunt ing and gathe- r i n g s i t e s , g r a v e s , t r a i l s , r e f e r e n c e p o i n t s and a rcheo log ica l s i t es must a l so be protected.
Aeronautical Norms:
S t r i c t l o n g i t u d i n a l and t raverse c learence norms have t o be taken in to account when designing the geometry o f an a i r f i e l d . Maximum slope and in f l ec t i on s tandards must a l s o be observed. The o r i e n t a t i o n o f t h e runway can be determined on ly a f ter due c o n s i d e r a t i o n t o t h e d i r e c t i o n of the prevai l ing winds.
Environment : .
The arc t i c tundra cons t i tu tes a very sens i t ive env i ron- ment. For instance,wen a minor change i n t h e t h i n organic layer , may leave scars that could never d isap- pear. Archeological s i tes, nest ing areas, vulnerable streams and visual aspects are some of the impor tant po in ts t o be s tud ied t o eva lua te t he impac t o f t he p ro jec t .
Topography and Geology:
It i s easy t o f i g u r e o u t how cos t and f e a s i b i l i t y o f a p r o j e c t can be a f fec ted by t he re l i e f o f t he t e r ra in . It i s however a l i t t l e b i t more d i f f i c u l t t o determine the ro le p layed by geology. Two major problems have come up s ince the beg inn ing o f the a i rpor t programme-. They a r e t h e r a r i t y o f g r a n u l a r m a t e r i a l s and t h e d i f f i - c u l t i e s o c c u r r i n g i n c u t s e c t i o n s on f r o s t s u s c e p t i b l e s o i l s .
The geo log ica l con tex t caused g r e a t d i f f i c u l t y t o the engineers whi le prospect ing granular mater ia ls and des i - gn ing foudat ions in cu t sec t ions on f r o s t s u s c e p t i b l e so i ls . S ince ill our mind the explo i ta t ion of sand o r g r a v e l p i t s would cause grea t harm to the env i ronment and depr ive Inu i t cornun i t ies o f these scarce ressources , granular mater ia l was t o be produced e s s e n t i a l l y from crushed stone. Besides, the lack of bibl iographical r e f e r e n c e s t h a t d e a l w i t h c o n s t r u c t i o n o f g r a v e l a i r f i e l d pavements i n permafrost areas and our own l a c k o f expe- r i e n c e i n t h a t f i e l d combined t o t h e problems encoutered d u r i n g t h e f i r s t e x c a v a t i o n i n f r o s t s u s c e p t i b l e s o i l s , l e d t o a speci f ic s tudy of the Kangi rsuk a i rpor t .
1502
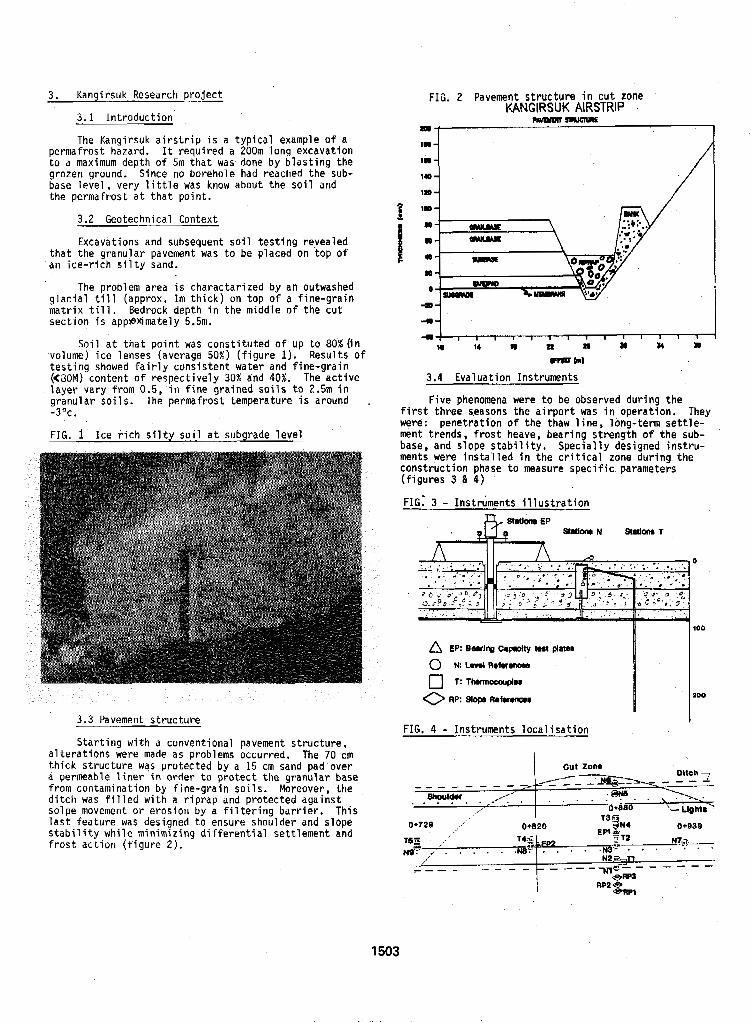
3 . Kangirsuk Research p r o j e c t
3.1 In t roduc t i on
The Kangirsuk a i r s t r i p i s a t y p i c a l example o f a permafrost hazard. It requ i red a 200m long excavat ion t o a maximum depth o f 5m t h a t was done b y b l a s t i n g t h e gro ten ground. Since no borehole had reached the sub- base l e v e l , v e r y l i t t l e was know about the so i l and the permafrost a t t h a t p o i n t .
3.2 Geotechnical Context
Excavations and subsequent s o i l t e s t i n g r e v e a l e d tha t t he g ranu la r pavement was t o be placed on top o f an i c e - r i c h s i l t y sand.
The problem area i s charactar ized by an outwashed
mat r i x till. Bedrock depth in t h e m i d d l e o f t h e c u t g l a c i a l till (approx. Im t h i c k ) on top o f a f ine-gra in
sec t i on i s appsNmately 5.5m.
S o i l a t t h a t p o i n t was cons t i t u ted o f up t o 80% ( in volume) ice lenses (average 50%) ( f igure 1). Results o f t e s t i n g showed f a i r l y c o n s i s t e n t w a t e r and f i ne -g ra in (<30M) c o n t e n t o f r e s p e c t i v e l y 30% and 40%. The a c t i v e layer vary f rom 0.5, i n f i n e g r a i n e d s o i l s t o 2.5m i n granu lar so i l s . The permafrost temperature i s around . -3°C.
FIG. 1 I c e r i c h s i l t y s o i l a t subgrade l e v e l
3.3 Pavement s t ruc tu re
S t a r t i n g w i t h a convent-ional pavement s t ruc tu re , a l t e r a t i o n s were made as problems occurred. The 70 cm t h i c k s t r u c t u r e was protected by a 15 cm sand pad over a permeable l i n e r i n o r d e r t o p r o t e c t t h e g r a n u l a r base from contaminat ion by f ine-grain soi ls. Moreover, the d i t c h was f i l l e d w i t h a r i p r a p and pro tec ted aga ins t solpe movement o r e ros ion by a f i l t e r i n g b a r r i e r . T h i s l a s t f e a t u r e was designed t o ensure shoulder and slope s t a b i l i t y w h i l e m i n i m j z i n g d i f f e r e n t i a l s e t t l e m e n t and f r o s t a c t i o n ( f i g u r e 2 ) .
FIG. 2 Pavement s t r u c t u r e i n c u t zone KANGIRSUK AIRSTRIP
::i 1lO 11D
3.4 Evaluation Instruments
F ive phenomena were t o be observed dur ing the f i r s t t h r e e seasons t h e a i r p o r t was i n operat ion. They were: penet ra t ion o f the thaw l i n e , l o n g - t e r m s e t t l e - ment t rends , f ros t heave, bear ing s t rength o f t he sub- base, and slope s t a b i l i t y . S p e c i a l l y d e s i g n e d i n s t r u - ments were i n s t a l l e d i n t h e c r i t i c a l zone dur ing the cons t ruc t ion phase t o measure s p e c i f i c parameters ( f i g u r e s 3 & 4 )
FIG: 3 - I n s t r u m e n t s i l l u s t r a t i o n
0
100
a EP: B m i % c.plalty kat "8
0 N: L.v.l u e i w m
0 AP: 51- R O h r W .
c] 7: tlurrnocouplw zoo
FIG. 4 - Ins t rumen ts l oca l i sa t i on
I cut zona
1503
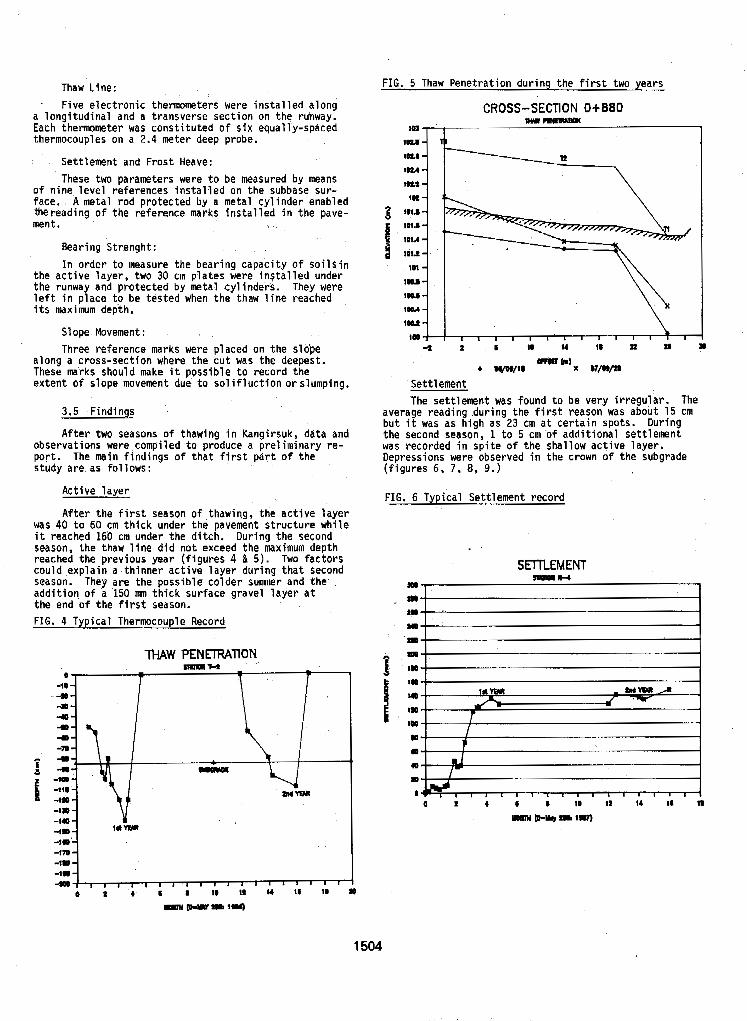
Thaw Line:
. Five e lectronic thermometers were i n s t a l l e d a l o n g a l ong i tud ina l and a t ransverse sect ion on the runway. Each thermometer was cons t i tu ted o f s ix equa l ly -spaced thermocouples on a 2.4 meter deep probe.
Settlement and Fros t Heave: These two parameters were t o be measured by means
of n ine leve l re fe rences ins ta lqed on the subbase sur- face. . A metal rod protected by a metal cyl inder enabled thereading of the re ference marks i n s t a l l e d i n t h e pave- ment.
Bearing Strenght: I n o r d e r t o measure t h e b e a r i n g c a p a c i t y o f s o i l s i n
t h e a c t i v e l a y e r , two 30 cm p la tes were i n s t a l l e d under the runway and protected by meta l cy l inders. They were l e f t i n p l a c e t o be tested when the thaw l i n e reached i t s maximum depth.
S1 ope Movement : Three reference marks were placed on the s lope
along a cross-sec t ion where t h e c u t was the deepest. These mirks should make i t p o s s i b l e t o r e c o r d t h e ex ten t o f slope movement due t o s o l i f l u c t i o n o r slumping.
FIG. 5 Thaw P e n e t r a t i o n d u r i n g t h e f i r s t two years
3.5 Findings
A f t e r two seasons o f thawing i n Kangirsuk, data and observat ions were compiled t o produce a p re l im ina ry re - por t . The main f i n d i n g s o f t h a t f i r s t p a r t o f the study are as fo l l ows :
Ac t i ve l aye r
A f t e r t h e f i r s t season o f thawing, the act ive layer was 40 t o 60 cm t h i c k under the pavement s t ruc tu re wh i l e i t reached 160 cm under the d i tch. Dur ing the second season, the thaw l i n e dJd not exceed the maximum depth reached the previous year (f igures 4 & 5 ) . Two fac to rs could ,exp la in a t h i n n e r a c t i v e l a y e r d u r i n g t h a t second season. They are the poss ib le co lder s u m r and the addi t ion, o f a 150 mn t h i c k s u r f a c e g r a v e l l a y e r a t t he end o f t h e f i r s t season. FIG. 4 Typ ica l Thermocouple Record
CROSS-SECTION 01-880 wwrmlm
Settlement The sett lement was found t o be very i r regu la r . The
average reading .during the f i r s t reason was about 15 cm bu t i t was as high as 23 cm a t cer ta in spo ts . Dur ing the second season, 1 t o 5 cm.of addi t ional set t lement was recorded i n s p i t e o f t h e s h a l l o w a c t i v e l a y e r . Depressions were observed i n t h e crown o f t h e subgrade ( f i g u r e s 6, 7 , 8 , 9.)
FIG. 6 Typical Sett lement record
SmLEMENT
: I
i la ! I
1504
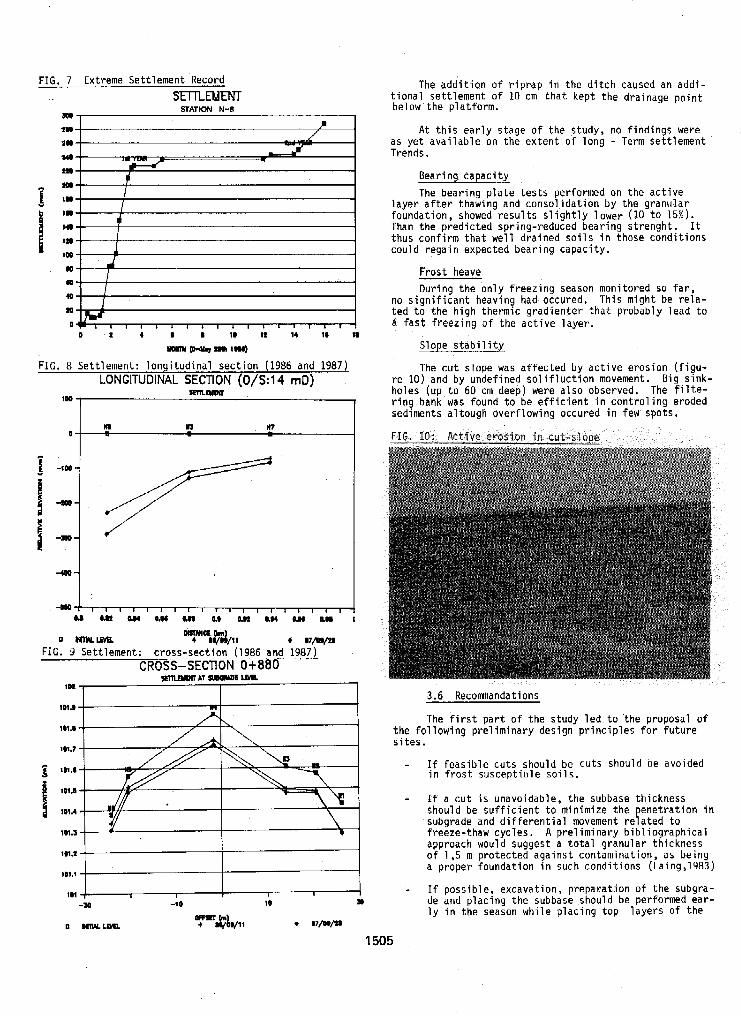
FIG. 7 Extreme Settlement Record mEMENl
STATION N-8 A0
m l(0
mn m rw 1 110
1
1 0 0
. ~ , , , , , , , , 1 1 1 , I . , I 1 8
0 z 4 6 I I O I t 11 16 11
" M 1 - I
LONGITUDINAL SECTION (O/S:l4 mD) FIG. 8 Set t lement : longi tud ina l sect ion (1986 and 1987)
FIG. 9 Sett lement: cross-sect ion (1986 and 1987) CROSS-SECTION 0+880
101.7
a 101.1
g 101.1
9 101.4
101.3
The a d d i t i o n o f r i p r a p i n t h e d i t c h caused an addi- t iona l se t t lement of 10 cm tha t kep t the d ra inage po in t below the p lat form.
A t t h i s e a r l y s t a g e o f t h e s t u d y . no f i nd ings were as ye t ava i l ab le on t h e e x t e n t o f l o n g - Term sett lement Trends.
Bear ing capaci ty
The bear ing p la te tests per formed on t h e a c t i v e l a y e r a f t e r t h a w i n g and consol idat ion by the granular foundat ion, showed r e s u l t s s l i g h t l y l o w e r (10 t o 15%). Than the predicted spr ing-reduced bear ing strenght. It thus con f i rm tha t we l l d ra ined so i l s in those cond i t ions could regain expected bearing capacity.
Frost heave Dur ing the on ly f reez ing season monitored so f a r ,
no s ign i f i can t heav ing had occured. This might be r e l a - ted to the h igh thermic g rad ien fer tha t p robab ly lead to d f as t f reez ing o f t he ac t i ve l aye r .
Slope s t a b i l i t y
The cu t s lope was a f fec ted by ac t i ve e ros ion ( f i gu - re 10) and by u n d e f i n e d s o l i f l u c t i o n movement. h is s ink- holes (up t o 60 cm deep) were also observed. The' f i l t e - r i n g bank was found t o be e f f i c i e n t i n c o n t r o l i n g eroded sediments altough overflowing occured i n few spots.
3.6 Recommandations
The f i r s t p a r t o f t h e s t u d y l e d t o ' t h e p r o p o s a l o f t h e f o l l o w i n g p r e l i m i n a r y d e s i g n p r i n c i p l e s f o r f u t u r e s i t es .
- If feasib le cuts should be cuts should De avoided i n f r o s t s u s c e p t i b l e s o i l s .
- f f a c u t i s unavoidable, the subbase thickness should be s u f f i c i e n t t o m i n i m i z e t h e p e n e t r a t i o n i n subgrade and d i f f e r e n t i a l movement r e l a t e d t o freeze-thaw cycles. A p re l im ina ry b ib l i og raph ica l approach would suggest a to ta l g ranu la r th ickness of 1,5 m protected against contaminat ion, as being a proper foundation i n such conditions (Laing,1983)
- I f possible, excavation, preparation of the subgra- de and p lac ing t he subbase should be performed ear- l y i n t h e season wh i l e p lac ing t op l aye rs of the
1505
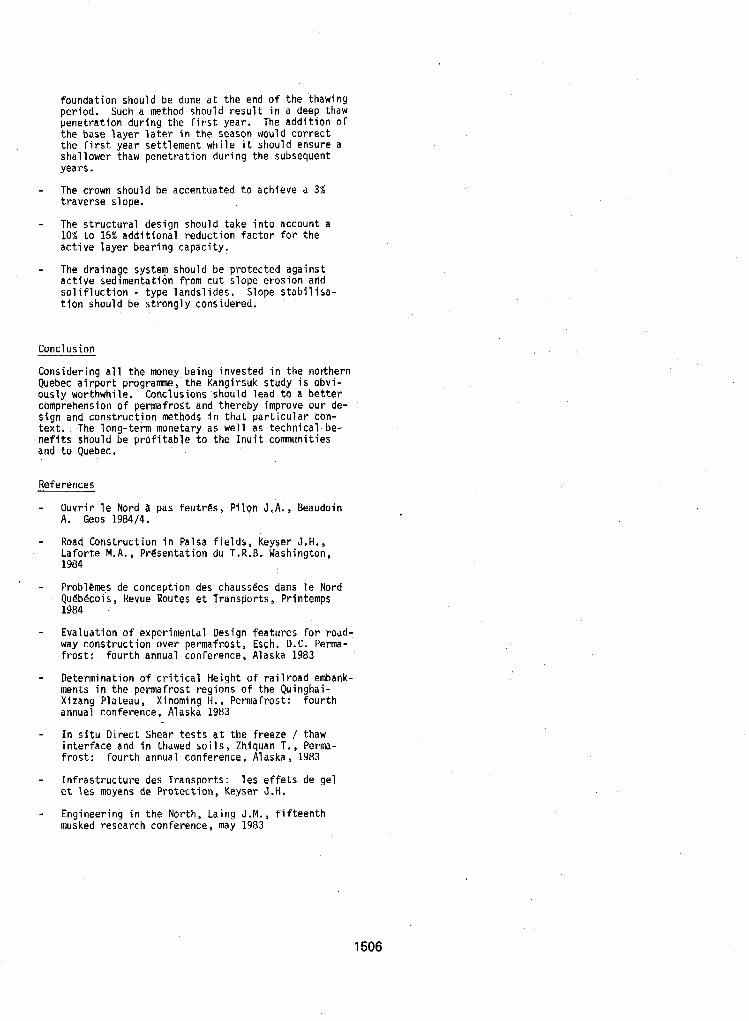
foundation should be done a t t h e end o f the thawing per iod. Such a method s h o u l d r e s u l t i n a deep thaw p e n e t r a t i o n d u r i n g t h e f i r s t y e a r . The add i t i on o f t he base l a y e r l a t e r i n t h e season would co r rec t t h e f i r s t y e a r s e t t l e m e n t w h i l e i t should ensure a shal lower thaw penet ra t ion dur ing the subsequent years.
- The crown should be accentuated to achl'eve a 3% traverse s lope.
- The st ructura l des ign should take in to account a 10% t o 15% a d d i t i o n a l r e d u c t i o n f a c t o r f o r t h e ac t ive layer bear ing capac i ty .
- The drainage system should be pro tec ted aga ins t act ive sedimentat ion f rom cut s lope erosion and s o l i f l u c t i o n - type lands l ides. S lope s tab i l isa- t i on shou ld be strongly considered.
Conclusion
Considering a l l t h e money being invested in the nor thern Quebec a i r p o r t programme, the Kangirsuk study i s obv i - ously worthwhile. Conclusions should lead t o a b e t t e r comprehension o f permafrost and thereby improve our de- '
s i gn and cons t ruc t ion methods i n t h a t p a r t i c u l a r con- tex t . The long-term monetary as well as techn ica l be- ne f i t s shou ld be p r o f i t a b l e t o t h e I n u i t c o m n u n i t i e s and t o Quebec.
Re,ferences
- O u v r i r l e Nord a pas feu t res , P i lon J.A., Beaudoin A. Geos 1984/4.
- Road Construct ion i n Pa lsa f i e lds , Keyser J.H., La fo r te M.A., Presentat ion du T.R.B. Washington, 1984
- Prob lems de conception des chaussees dans l e Nord Quebecois, Revue Routes et Transports, Printemps 1984
- Evaluat ion o f experimental Design features f o r road- way construct ion over permafrost , Esch. D.C. Perma- f r o s t : f o u r t h annual conference, Alaska 1983
- Determination of c r i t i c a l H e i g h t o f r a i l r o a d embank- ments in the permaf ros t reg ions o f the Qu ingha i - Xizang Plateau, Xinoming H., Permafrost: fourth annual conference, Alaska 1983
- I n s i t u D i r e c t Shear t e s t s a t t h e f r e e z e / thaw i n t e r f a c e and i n thawed s o i l s , Zhiquan T., Perma- f r o s t : f o u r t h annual conference, Alaska, 1983
- I n f r a s t r u c t u r e des Transpor ts : les e f fe ts de gel e t l e s moyens de Pro tec t ion , Keyser J.H.
I - Engineering in the Nor th , La ing J.M., f i f t e e n t h musked research conference, may 1983
1506
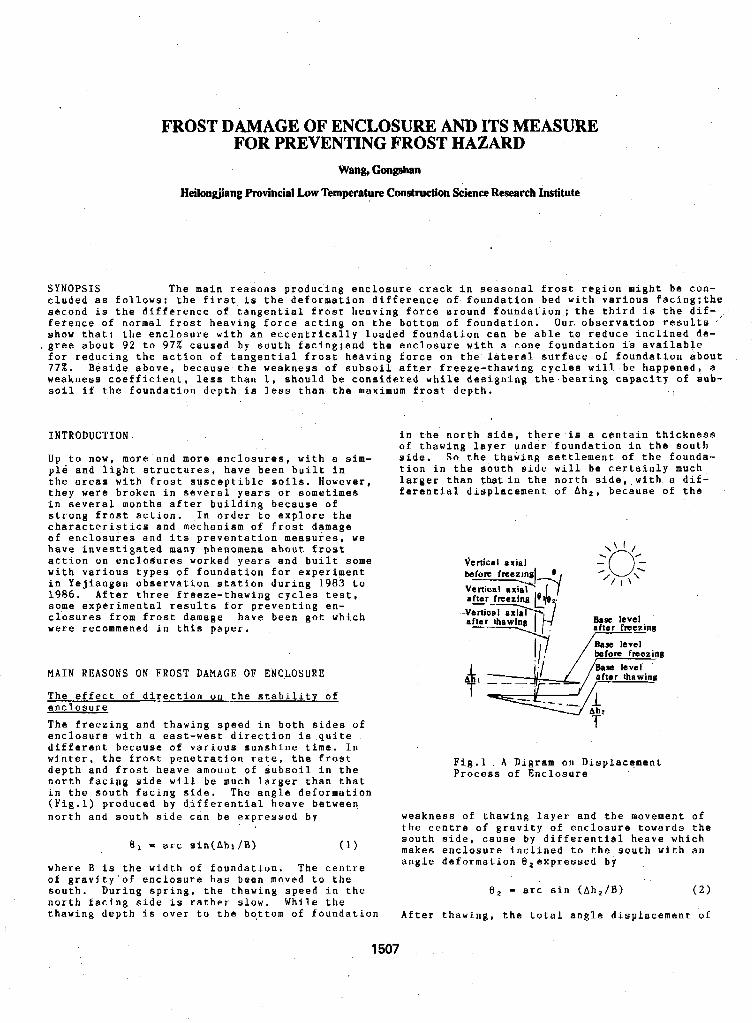
FROST DAMAGE OF ENCLOSURE AND ITS MEASURE FOR PREVENTING FROST HAZARD
Wan& Gongshan
Heilongjiang Provincial Low Temperature Construction Science Research Institute
SYNOPSIS The main reasons producing enclosure crack in seasonal frost region might be con- cluded as follows: the first i s the deformation difference of foundation bed with various facing;the second is the difference of tangential frost heaving f o r c e around foundation; the third is the dif-, ference of normal frost heaving force acting on the bottom of foundation. Our. observation results ' show that: the enclosure with an eccentrically loaded foundation can be able to reduce inclined de- gree about 92 to 9 7 % caused by south fac1ng;and the enclosure with a cone foundation is available for reducing the action of tangential frost heaving force on the lateral surface of foundation about
weakness coefficient, less than 1, should be considered while designing the-bearing capacity of sub- 7 7 % . Beside above, because the weakness of subsoil after freeze-thawing cycles will be happened, a
soil if the foundation depth is less than the maximum frost depth.
INTRODUCTION
Up to now, more and more enclosures, with a sim- ple and light structures, have been built in the areas with frost susceptible soils. However, they were broken in several years or sometimes in several months aEter building because of strong frost action. In order to explore the characteristics and mechanism of frost damage of enclosures and its preventation measures, we have investigated many phenomena about frost action on enclosures worked years and built some with various type$ of foundation for experiment in Yejiangan observation station during 1983 to 1986. After three freeze-thawing cycles test, some experimental results € o r preventing en- closures from frost damage have been got which were recommened in this paper.
MAIN REASONS ON FROST DAMAGE OF ENCLOSURE
The effect of direction on the stability of enclosure The freezing and thawing speed in both sides of enclosure with a east-west direction is quite different because of various sunshine time. In winter. the frost penetration rate, the frost depth and frost heave amount o f subsoil i n the north facing side will be much larger than that in the south facing side. The angle deformation (Fig.1) produced by differential heave between north and south side can be expressed b y
8 1 = arc sin(Ahl/B) ( 1 )
where B is the width of foundation. The centre of gravity o f enclosure has been moved to the south. During spring, the thawing speed in the north facing side is rather slow. While the thawing depth is over to the bo,ttom of foundation
in the north aide, there-is a centain thickness of thawing layer under foundation in the south side. So the thawing settlement of the founda- tion in the south side will be certainly much larger than that in the north side,,with a dif- ferential displacement of A h 2 , because of the
Base level " aPter freezing
/ Bnse level befom frseaina
T ""
Fig.1 A Digram on Displacement Process of Enclosure
weakness of thawing Layer and the movement of the centre of gravity of enclosure towards the south side, cause by differential heave which makes enclosure inclined to the south with an angle deformation Ozexpressed by
e 2 - arc sin (Ah2/B) ( 2 )
After thawing, the total angle displacement of
1507
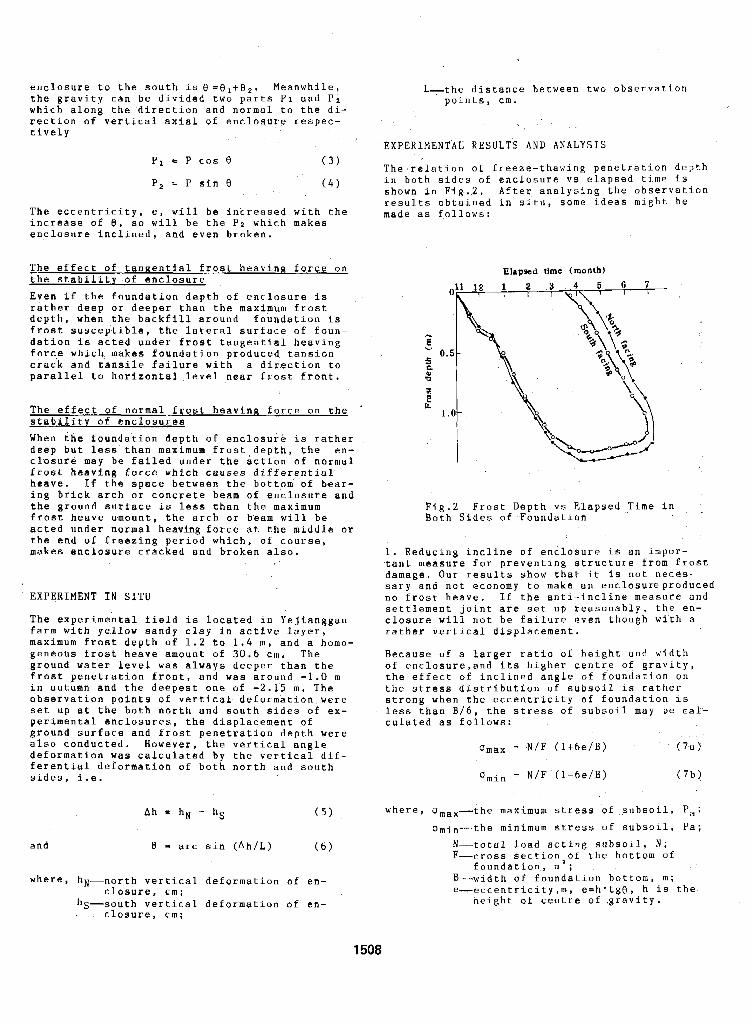
tively
The eccentrici increase of 8 , enclosure incl
enclosure to the south is 8 = e 1 + 8 2 . Meanwhile, the gravity can be divided two parts P I and P 2 which along the direction and normal to the di- rection of vertical axial of enclosure respec-
p1 = P e ( 3 )
P, = P sin 0 ( 4 )
ty, e , will be increased with the
ined, and even broken. s o will be the PZ which makes
The effect of tanRential frost heaving force o n the stability of enclosure Even if the foundation depth of enclosure is
depth, when the backfill around foundation is rather deep or deeper than the maximum frost
frost susceptible, the lateral surface o f foun- dation is acted under frost tangential heaving force which makes foundation produced tansion crack and tansile failure with a direction to parallel to horizontal level near frost front.
The effect of normal frost heaving force on the stability of enclosures When the foundation depth o f enclosure is rather deep but less than maximum frost depth, the en- closure may be failed under the action of normal frost heaving force which causes differential heave. If the space between the bottom of bear- ing brick arch or concrete beam o f enclosure and the ground surface is less than the maximum frost heave amount, the arch or beam will be acted under normal heaving force a t the middle or
makes enclosure cracked and broken also. the end o f freezing period which, of course,
EXPERIMENT IN SITU
The experimental field is located in Yejianggan farm with yellow sandy clay in active layer, maximum frost depth of 1 . 2 to 1 . 4 m, and a homo- geneous frost heave amount of 3 0 . 6 cm. The ground water level was always deeper than the frost penetration front, and was around -1.0 m in autumn and the deepest one of -2.15 m. The observation points of vertical deformation were set up at the both north and south sides of ex- perimental enclosures, the displacement of ground surface and frost penetration depth were also conducted. However, the vertical angle deformation was calculated by the vertical dif- ferential deformation of both north and south sides, i.e.
Ah = hN hS ( 5 )
and 8 = arc sin (Ah/L) ( 6 1
where, hN-north vertical deformation of en-
hS-south vertical deformation of en- closure, cm;
closure, cm;
L-the distance between two observation points, cm.
EXPERIMENTAL RESULTS AND ANALYSIS
The,relation o f freeze-thawing penetration depth in both sides of enclosure vs elapsed time is shown in Fig.2. After analysing the observation results obtained in situ, some ideas might be made as follows:
ElapJsd time (month)
Fig.2 Frost Depth v s Elapsed Time in ,
Both Sides of Foundation
1. Reducing incline o f enclosure is an impor- tant measure for preventing structure from frost damage. Our results show that it is not neces- sary and not economy to make an enclosureproduced no frost heave. If the anti-incline measure and
closure will not be failure even though with a settlement joint are set up reasonably, the en-
rather vertical displacement.
Because of a larger ratio o f height and width of enclosure,and its higher centre of gravity, the effect of inclined angle of foundation o n the stress distribution of subsoil is rather strong when the eccentricity of foundation is
culated as follows: less than B / 6 , the stress of subsoil may De cal-
omax = N/F (1+6e/B) (7a)
Umin = N/F (1-6e/B) (7b)
where, Oma,-the maximum stress of subsoil, Pa; omin--the minimum stress of subsoil, Pa;
N-total load acting subsoil, N; F-cross section20f the bottom of
B-width of foundation bottom, m; e-eccentricity,m, e=h'tge, h is the
neight of centre o f .gravity.
foundation, m ;
1508
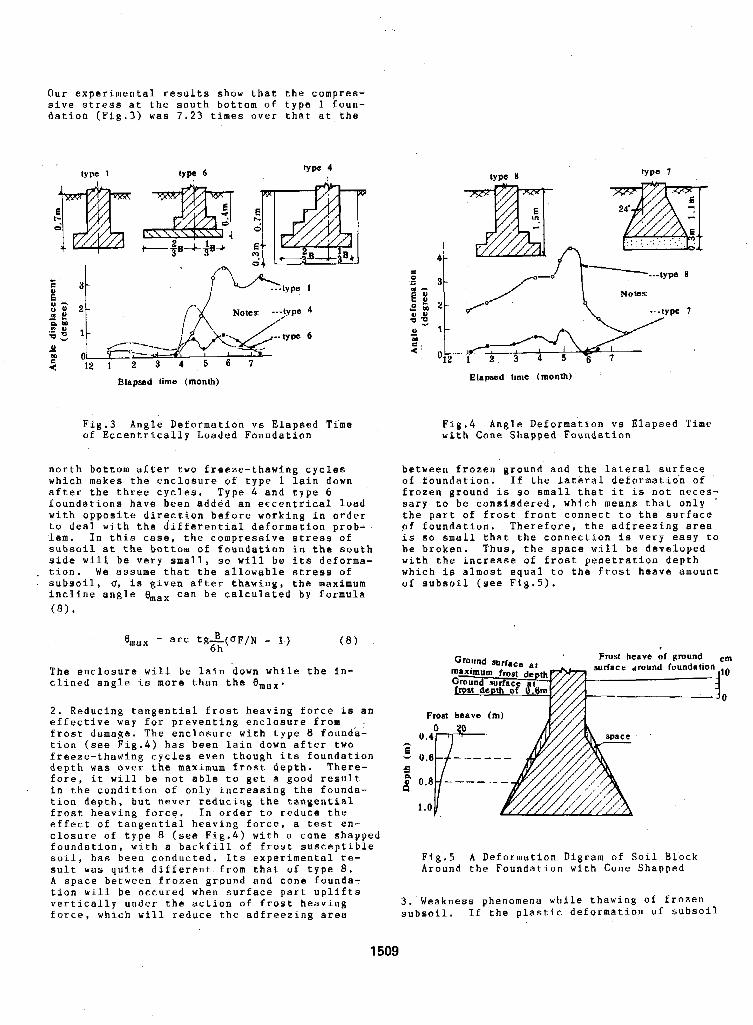
Our experimental results show that the compres- sive stress at the south bottom of type 1 foun- dation (Fig.3) was 7.23 times over that at the
tyue I 'YW 4
I h
"type 1
Elapsed time (month)
Fig.3 Angle Deformation vs Elapsed Time of Eccentrically Loaded Foundation
north bottom after two freeze-thawing cycles which makes the enclosure of type 1 lain down after the three cycles. Type 4 and type 6 foundations have been added an eccentrical load with opposite direction before working in order to deal with the differential deformation prob- lem. In this case, the compressive stress of subsoil at the bottom of foundation in the south side will be very small, s o will b e its deforma- tion. We assume that the allowable stress of subsoil, U, is given after thawing, the maximum incline angle emax can be calculated by formula ( 8 ) I
%ax = arc tgA(,F/N - 1) 6h (8)
The enclosure will be lain .down while the in- clined angle i s more than the emax.
2 . Reducing tangential frost heaving force is an effective way .for preventing enclosure from frost damage. The enclosure with type 8 found'a- tion (see Fig.4) has been lain down after two freeze-thawing cycles even though its foundation depth was over the maximum frost depth. There- fore, it will be not able to get a good result in the condition o f only increasing the founda- tion depth, but never reducing the tangential frost heaving force. In order to reduce the effect o f tangential heaving force, a test en- closure o f type 8 ( s e e Fig.4) with a cone shapped foundation, with a backfill of frost susceptible soil, has been conducted. Its experimental re- sult was quite different from that of type 8. A space between f tion will be occu vertically under force. which will
rozen ground and cone founda: red when surface part uplifts the action of f r o s t heaving reduce the adfreezing area
Elapsed time (month)
Fig.4 Angle Deformation vs Elapsed Time with Cone Shapped Foundation
between frozen ground and the lateral surface of foundation. If the lateral deformation o f frozen ground is so small that it is not neces- sary t o be consisdered, which means that only ' the part of frost front connect to the surface ,of foundation. Therefore, the adfreezing area is so small that the connection is very easy to be broken. Thus, the space will be developed with the increase of frost penetration depth which i s almost equal to the frost heave amount of subsoil ( s e e Fig.5).
Fig.5 A Deformation Digram of Soil Block Around the Foundation with Cone Shapped
3 . Weakness phenomena while thaw subsoil. If the plastic deforma
ing o f frozen tion of subsoil
1509
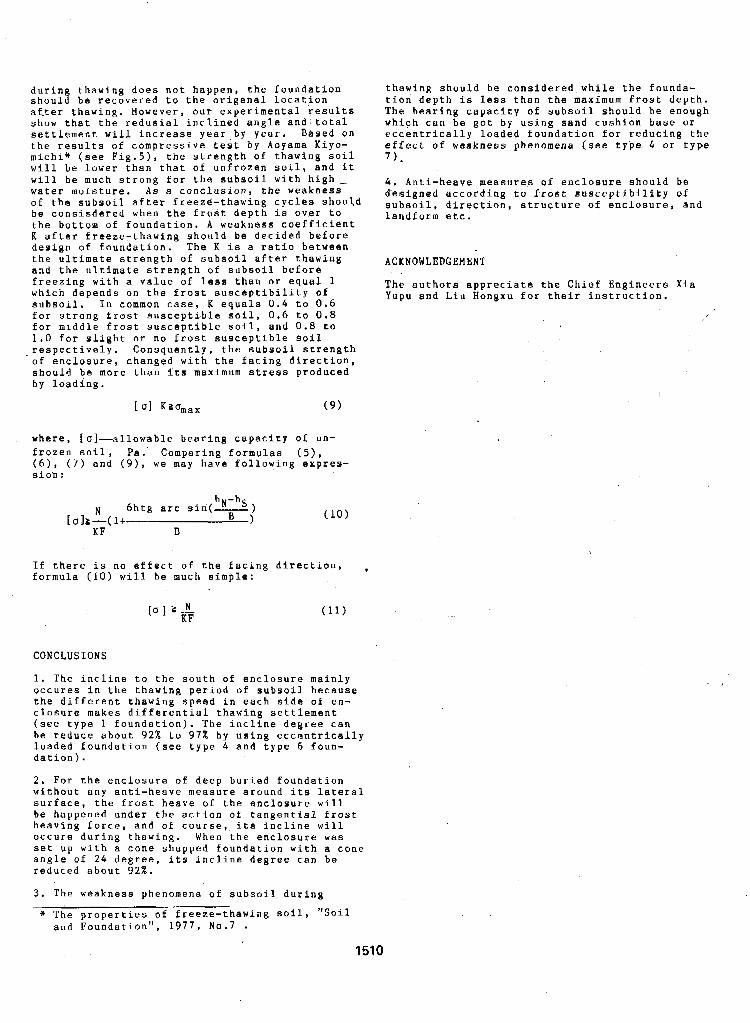
1 .0 tor slight or no trost susceptlale 9011 respectively. Consquently, the subsoil strength of enclosure, changed with the facing direction, should be more than i t s maximum stress produced b y loading.
where, [ol-allowable bearing capacity o f un- frozen soil, Pa.' Comparing formulas ( 5 ) , ( 6 ) , (7) and ( 9 ) , we may have following expres- sion :
N 6htg arc s in ( - ) hN-hS
K F B [ O I & " ( l + B )
N 6htg arc s in ( - ) hN-hS
K F B [ O I & " ( l + B ) (10)
If there is no effect of the facing direction, , formula (10) will be much simple:
[u] z L KF
CONCLUSIONS
1. The incline to the south of enclosure mainly occures in the thawing period of subsoil because the different thawing speed in each side of en- closure makes differential thawing settlement: ( s e e type 1 foundation). The incline degree can be reduce about 92% to 97W b y using eccentrically loaded foundation ( s e e type 4 and type 6 foun- dation).
2 . For the enclosure of deep buried foundation without any anti-heave measure around its lateral surface, the frost heave of the enclosure will be happened under the action of tangential frost heaving force, and of course,.its incline will occure during thawing. When the enclosure was set up with a cone shapped foundation with a cone angle o f 24 degree, its incline degree can be reduced about 9 2 % .
3 . The weakness phenomena o f subsoil during
* The properties of freeze-thawing Soil, "soil and Foundation", 1977 , No.7
1510
APPLICATION OF LIME STABILIZATION ON HIGHWAY PERMAFROST REGION, QINGHAI-XIZANG PLATEAU
Wang, Qing-td, Wu, Jing-mid and Liu, Jian-duz
12nd Highway Eng Bureau of the Ministry of Communication, Xian, Shaanxi, China zThe First Highway Survey and Design Institute of the Ministry of Communications, Xian, Shaanxi, China
SYNOPSI3 Qinghai-Xizang P la t eau I s cha rac t e r i aed by h i g h a l t i t u d e , l o w l a t i t u d e , c o l d tLnd seve re weather, long f r o s t d u r a t i o n and complex hydrogeological condition. Qingzang Highway runs through the h in te r land of permafrost region where ground ice is well developed and bur i ed very c l o s e t o ground surfaoe. It is d i f f i c u l t t o g e t sand and s tone f a r cons t ruc t ion a long t he l i ne unde r the threat f lood from r i v e r y water. So, t he only way for preven t ing i t from frost damage i s t o treat its subgrade with the lime s t a b i l i z e d soil(oalled "lime s t a b i l i z a t i o n m ) , S i n c e 1973, t h e F i r s t Highway Survey and Design I n s t i t u t e i n c o - o p e r a t i o n w i t h the S c i e n c e I n s t i t u t e of the Min i s t ry of Communica- t ions has done a aeries of tests on lime s t a b i l i z a t i o n in l a b o r a t o r i e s and fields. A large number of data have been obtained from f i e l d obse rva t ion m a measurement ut the tested subgrade w i t h the l e n g t h of k i lometers . It l a shown t h a t the a p p l i c a t i o n o f the lime s t a b i l i z a t i o n on highway enginoering i n permafrost reg ion8 i s q u i t e gaod bo th i n aspect o f s t r e n g t h and of s t a b i l i t y .
In t roduc t ion
Solla S t a b i l i z e d w i t h l ime(ca1led "lime s t a b i l i - z a t i o n " ) have b e e n e f f e c t i v e l y a p p l i e d as a kind of material f o r highway engineer ing wide ly in China, b u t it i s still a new o b j e c t of s tudy on i t a a p p l i c a t i o n i n permafrost reglons, y e t we have obtained a series of expexience, succesaful i n p r a c t i c e s , a t o t h e r regions i n China. Qingzang P la t eou is t y p i c a l of parmafroat table lands, spreading over a r e l a t i v e l y large e x t e n t i n r eg ion of moderate and comparatively low L a t i t u d e s i n Qinghai province and Tibet nutono- mous region, with t he highest a l t i t u d e i n the world. I t i s a o l i m a t i c r e g i o n of b i t t e r c o l d and a r i d . The Preez tng season is 7-8 mounths l o n g and the annuul mean atmospheric temperaeure is -4°C t o -7°C the re . The negat ive temperature
mounths, July or August w i th the h ighes t average has been recorded f requent ly a t n i g h t , even i n
t'emperature yearly. I t is lack of r a i n f a l l , t h e annual p r e c i p i t a t i o n i s about 7QQm merely.
land of the permafrost region on the P l a t e a u for Qlngzang I-li$hway I s running through the h in tex-
560 k i lomotres i n l eng th . The a l t i tudes a long t h e Iiiehway 4500-5200 metres, t h e ,ground ices are very abundant everywhere. The major soil c o n s t i t u e n t s in t h i s reg ion are s i l t y and sandy y o i l s o r g rave l $ O i l s . I t is l a c k of s t o n e s and sands to be used f o r highway eng inee r ing a l l a long t he highway Line. Therefore, we have no choice but have t o make a t r ia l t o s tabi l ize the n a t u r a l subgrade y o i l of the highnay with lime as fundamental layer . o f the pavement. Since 1977, t h e First IIighway survey and Design Inst i tute i n co-operation wi th .the Communic:itions Sc ience I n s t i t u t e of the Min i s t ry of Communications have conducted u good deal. of Yimulated road tests, with t y p i c a l s a i l samples under the c l i m a t i c condi t ions which w e andlogous t o t h a t t o b e I n r eg ion of the P l a t e a u , i n l a b o r a t o r i e s . More than ten se~~~ments of t e s t i n g ooaas wi th il t o t a l l ength about 1,6k were e r e c t e d s e p a r a t e l y i n
d i f f e r e n t t y p e s of lime s tab i l ized s o i l subgrade and mat b a s e s t r u c t u r e n t v a r i o u s t e s t i n g f i e l d s and opened t o t r a f P i c . I n d i c e s nere drawn from D series o f data which had been observed upon t h e s t r e n g t h , road s t a b i l i t y nnd t h e pavement smoothness under traffic ope ra t ing du r ing s even gears, which i n a i c a t e d that t h e "lime stabilizia- t i o n " is an e f fec t ive approach t o t rea tment f o r pavement in permafrost region of the P la t eau . The P h i s i c a l P r o p e r t i e s of s o i l 3 and the Chemical Composition of Lime The samples u s e d f o r t e s t i n g of l ime stabilisa- t i o n were made of t y p i c a l o f s o i l , a t our op t ion , i n v a r i o u s a l o n g the Highway, also w i t h which was sampled a t Rnrcha l , fo r purpose t o f u l f i l l com- p a r a t i v e tests. The p h y s i c a l c h a r a c t e r i s t i c s of them are l i s t ed i n t ab l e I
All dm L iY ) !
i
The con ten t s of chomlcal composi t ion in lime ueefor yoil stabilization , tn percentuge by wei+:ht are: Cao, 60-84%: Mgo, O.R-1.5$
1511
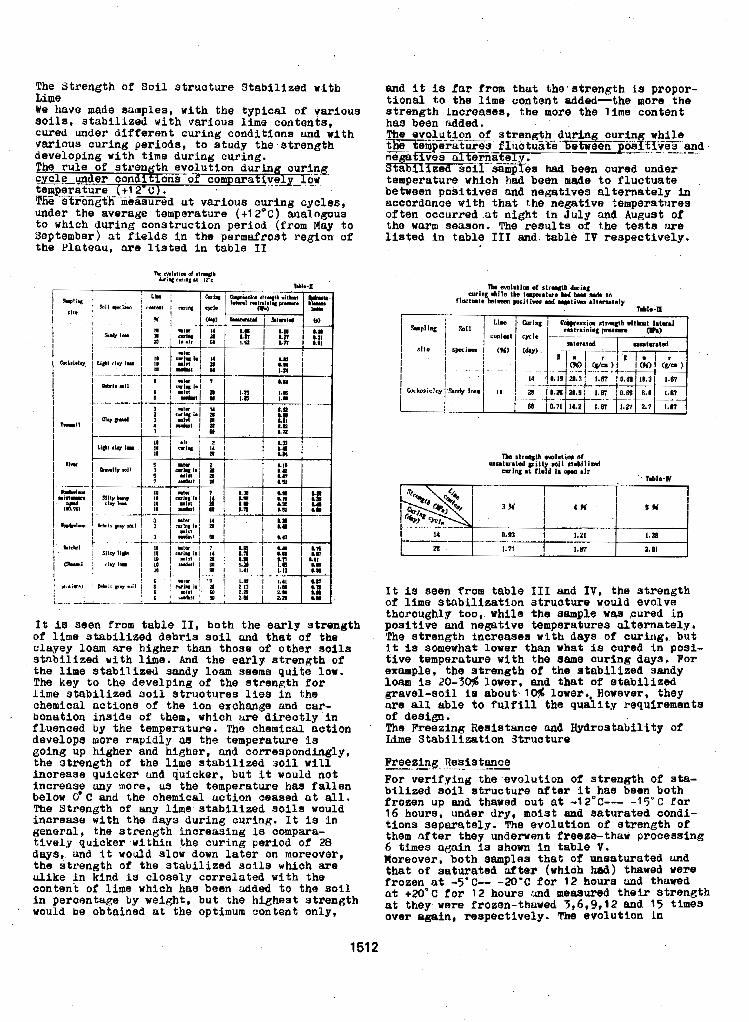
The S t r eng th of S o i l s t r u c t u r e S t a b i l i z e d w i t h Lime We hove made samples, with the t y p i c a l of var ious s o i l s , s t a b i l i z e d w i t h v a r i o u s lime con ten t s , cured under different cur ing condi t iona and wi th various curing per iods , t o s tudy the s t r e n g t h develorrinrr with time during cur ing . The r u i e of s t r eng th evo lu i ion duF lng cur+tIB, cycle under condi t ions of comparativeQ-lqw temperature, ( + I 2" C ) . TIE -s%r%nitti"measured a t v a r i o u s curing cycles, under the average temperature ( t 1 2 O C ) analogous t o which during construct ion per iod (from May t o September) a t f ields I n the permafroat region of the Pla t eau , w e l i s t ed i n table IT
WI.-I r I
i
I -i-
! I !
I - I .A ::-.
It is seen f rom tab le 11, both the e a r l y s t r e n g t h of lime stabil ized d e b r i s s o i l and t h a t o f t h e c layey loam &we higher than those of o t h e r s o i l s s t a b i l i z e d w i t h lime. And t h e e a r l y s t r e n g t h of the lime stabilisecl sandy loam seems q u i t e low. The key t o the deve lp ing of t h e s t r e n g t h for lime s t a b i l i a e d s o i l s t r u c t u r e s lies i n the
bonation i n s i d e of them, which w e d i r e o t l y i n chemical a c t i o n s of t he ion exchange and car-
f luenced by the temperature. The chemicnl act ion develops more r a p i d l y aa the temperature is going up higher ana higher , and correspondingly, the s t r e n g t h of the lime s t a b i l i z e d s o 1 1 will i n c r e a s e q u i c k e r m d q u i c k e r , b u t i t would n o t i n c r e a s e any more, as the temperature h a s fallen below 0' c ana the chemical act ion ceased a t all. The S t r e n g t h of any lime s t a b i l i z e d s o i l s would i n c r e a s e w i t h the days dur ing curing. I t is in gene ra l , the a t r e n g t h i n c r e a s i n g is oompara- t i v e l y q u i c k e r , u i t h i n t h e c u r i n g p e r i o d o f 28 days, and i t would slow down later on moreover, the s t r e n g t h of the s t a b i l i z e d soils which nre d i k e i n k i n d i s c l o s e l y c o r r e l a t e d w i t h the oontent of lime which has been added t o t h e S o i l i n p e r c e n t a g e by weight , but the h i g h e s t s t r e n g t h would be obtained at t h e optimum content only,
and i t is far Prom that t h e , a t r e n g t h i8 propor- t i o n a l t o t h e lime con ten t added-the more the s t r e n g t h i n c r e a s e s , the more t h e lime con ten t has been lldded.
temperature which h'aa been m d e t o f l u c t u a t e between p o s i t i v e s ond n e g a t i v e s a l t e r n a t e l y i n acco rdance w i th t ha t t he nega t ive t empera tu res of ten occur red at n i g h t i n J u l y und August of
l i s t e d i n table 1x1 m d . t a b l e I V r e s p e c t i v e l y . the warm season. The r e s u l t s of the tests me
I m I l .?I 1 1.87 2.01
I t is 390x1 from table I11 and I V , t h e s t r e n g t h of lime s t a b i l i 5 a f i o n s t r u c t u r e would evolve
p o s i t i v e and negative t e m p e r a t u r e s a l t e r n a t e l y . thoroughly too, while t h e sample w a s cured in
The a t r e n g t h inareasea with days of curing, b u t i t i a somewhat lower than what is cured i n posi- t ive t empera ture wi th the ame cur ing days . For
loam is 20-70$ lover, and that of stabil ized example, t h e s t r e n g t h of t he stabilized sandy
grave l - so i l is about 1 Q$ lower €10wever, they are all able t o fulfill the qual i ty requi rementa of des ign . The P reez ina Resistance md Hydros t ab i l i t y of Lime S t a b i l i z a t i o n S t r u c t u r e
Preeing. nes!E%!-!!
b i l i s e d a o i l a t r u c t u r e d t e r it hns been both For v e r i f y i n g t h e e v o l u t i o n of s t r e n g t h of sta-
frozen up and thawed o u t a t -12"~"- -15'~ f o r 16 hours, under dry, moist and sa tu ra t ed cond i -
them after they underwent freeze-thaw process ing t i o n s s e p a r a t e l y . The evo lu t ion of s t r e n g t h of
6 times aga in $a ahown i n table V. Moreover, both samples that o f unsa turo ted a d
f rozen at -5°C" -2O'C f o r 12 houra und thawed t h a t of s a t u r a t e d after (whiah had) thawed mere
u t +2O'c f o r 12 hours and meaaured their s t r e n g t h at they were fromn-thuWed f,6,9,12 and 15 times over again, r e s p e c t i v e l y . The e v o l u t i o n i n
1512
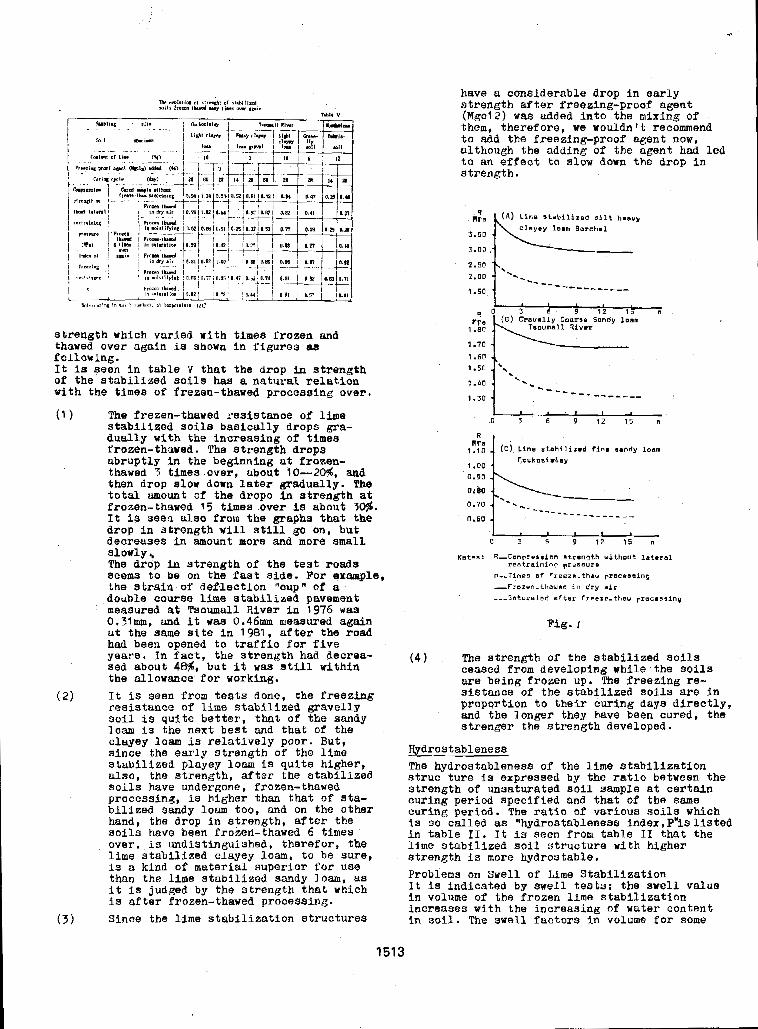
s t r e n g t h which var ied with times f'rozen and thawed over again i s shown in f i g u r e 3 sa fo l lowing . I t i s seen i n table V that t h e drop i n s t r e n g t h of the s t a b i l i z e d s o i l s h a s a natural relation wi th t he times of f rezen-thawed processing over .
The frezen-thawed r 'esistance of l ime s t a b i l i z e d s o i l s b a s i c a l l y d r o p s gra- dually with the i n c r e a s i n g of times frozen-thawed. The S t r e n g t h drops a b r u p t l y la the beginning n t frozen- thawed 3 t imes over, about 10--20$, and then drop OH down l a t e r gradually, The t o t d l m o u n t o f the dropo in s t r e n g t h at frozen-thawed 15 times over is about 7046. It is See2 ulso from t he graphs that the d r o p i n s t r e n g t h will s t i l l go on, but decreases in amount more and more small
The drop in s t r e n g t h of t h e test roada Seem3 t o be on the fast Side. For exaaple , the atraia of d e f l e c t i o n "cup" of a double course lime s t a b i l i z e a pavement measured a t Tsoumall R i v e r i n 1976 was 0.31mm, and i t was 0.46mm measured again at the same site i n 1981, af ter the road had been opened t o t r a f f i c f o r f i v e years. I n f a c t , the s t r e n g t h had decrea- sed about 48$, but It was still within the a l lowance for working. I t is seen f r o m tests done, the f r e e z i n g r e s i s t a n c e of lime stabi l ized g r a v e l l y s o i l i s q u i t e b e t t e r , that of the sandy loam i s the nex t best and t h a t of t h e clayey loam i s r e l a t ive ly poor . Bu t , s i n c e t h e e a r l y s t r e n g t h of the l ime s t a b i l i z e d p l a y e y lorn is q u i t e h i g h e r , ~ l s o , the s t r e n g t h , a f t e r the s t a b i l i z e d S o i l s have undergone, frozen-thawea process ing , i s h ighe r than that o f sta- b i l i z e d sandy loam too, and on the o t h e r hand, the drop i n s t r e n g t h , after the soils have been froierl-thawed 6 times over , i s und i s t ingu i shed , t he re fo r , the lime s t a b i l i z e d c l a y e y loam, t o be s u m , is z kind o f material superior f o r us8 than t h e lime s t a b i l i z e d sandy loam, as i t is judged by the s t rength that which is af te r f rozen- thawed processing. Since the lime s t a b i l i z a t i o n s t r u c t u r e s
slowly
have a c o n s i d e r a b l e d r o p I n e a r l y s t r e n g t h after f reezing-proof agent (Mgcl2) was added i n t o t h e m i x i n g of them, t h e r e f o r e , we wouldn't recommend t o add the f reezing-proof agent now, al though the adding 00 t he agen t had l e d t o an effect t o slow down t he d r o p i n s t r e n g t h .
""-""""~
1.50 - ', 1.60 .i
1.40 . 1.30 -
' "" , " """""
I I
.O S 6 9 1 2 1 5 n
Pig. I
( 4 ) The s t r e n g t h of t h e s t a b i l i z e d s o i l s ceased from developing w h l l e , t h e s o i l s are be ing f rozen up. The f r e e z i n g re- s i s t a n c e of t h e s t a b i l i z e d s o i l s axe in props r t ion t o the i r c u r i n g days d i r e c t l y , and the longer they have been cured, t h e s t r e n g e r t h e s t r e n g t h developed.
Hydrostableness The hydros tab leness o f the lime s t a b i l i z a t i o n s t r u c t u r e is expressed by the r a t i o between the s t r e n g t h of unsa tu ra t ed so i l s ample at c e r t a i n Curing period specified and t h a t of the same curing per iod . The ratio o f v a r i o u s s o i l s which i s 30 ca l l ed as "hydrostublenesa index, Puis l i s ted i n t a b l e 11, I t is seen Prom t a b l e I1 t h a t t h e lime s t a b i l i z e d soil s t r u c t u r e w i t h h igher s t r e n g t h i s more hydros table. Problems on Swell of Lime S t a b i l i z a t i o n I t is indicated by swell tests: the swell value i n volume of t he f rozen lime s t a b i l i z a t i o n Inc reases w i t h t h e i n c r e a s i n g of water con ten t i n sofl. The swell f a c t o r s I n volume for some
1513
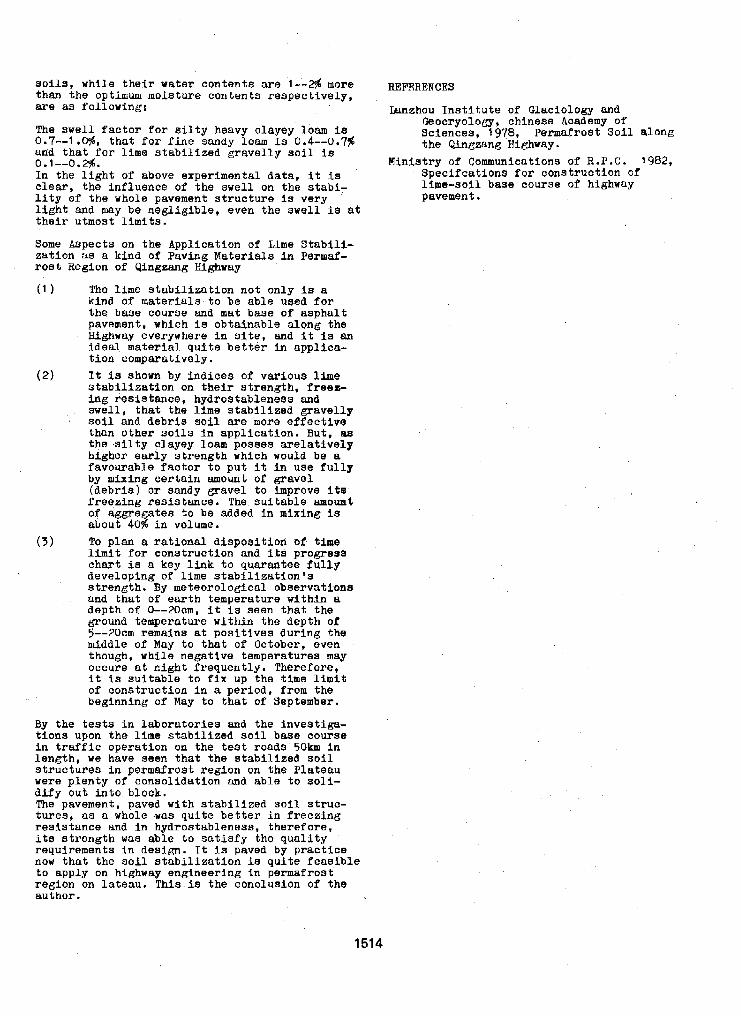
s o i l s , w h i l e their water con ten t s a ~ e 1--& more than t h e optimum mois tu re con ten t s r e spec t ive ly , are as fo l lowing:
The swell f a c t o r f o r s i l t y heavy clayey loam is 0.7--1 .Os , t h a t f o r f i n e sandy loam 1s 0.4--0.7$ and t ha t f o r lime stabilized g r a v e l l y soil i s 0.1--0.2$. In the l i g h t o f above experimental data, i t i s c l e w , t h e I n f l u e n c e of t h e swell on the stabi; lity o f t h e whole pavement s t r u c t u r e I s very l i gh t and may be neg l ig ib l e , even t h e swell i s a t t h e i r u t m o s t limits.
Some Aspects on the Applicat ion of Llme Stabi l i - z a t i o n us a kind o f Paving Materials i n Permaf- r o s t Region of Qingeang Highway
(1 1 The lime s t a b i l i z a t i o n n o t on ly is a kind o f materials t o be able used for the base course and mat base of a s p h a l t pavement, which is ob ta inab le along the Highway everywhers in s i t e , and i t is an i d e a l matexial q u i t e b e t t e r i n appl ica- t ion comparat ively. I t i s shown by i n d i c e s o f var ious lime s t a b i l i z a t i o n on t h e i r s t r e n g t h , free% ing resistance, hydros tab leness and swell, t h a t the lime stabilized g r a v e l l y soil and debris s o i l we more e f f e c t i v e than o ther soils i n a p p l i c a t i o n . But, 88 t h e s i l t y c l a y e y loam p o s s e s a r e l a t i v e l y h ighe r ea r ly s t r eng th wh ich would be a f a v o u r a b l e f a c t o r t o p u t i t i n u s e f u l l y by mix ing cer ta in amount of gravel ( d e b r i s ) o r sandy gravel to improve i f r f r e e z i n g resistance. The s u i t a b l e amount o f aggregates $0 be added i n mixing is about 4046 i n volume. To p l a n a r a t i o n a l d i s p o s i t i o n o f time limit f o r cons t ruc t ion and its progress c h a r t 2s a key l i n k t o q u a r a n t e e f u l l y developing of lime s t a b i l i z a t i o n ' s s t r e n g t h . By meteorological observatkons and t h a t of earth temperature within a depth o f 0--20crn, i t 1s s e e n t h a t the ground temperature within t h e dep th of 5--20crn remain8 at p o s i t i v e s d u r i n g the middle of May t o t h a t of October, even though, while negat ive temperatures may
i t i s s u i t a b l e t o fix up the time limit occure a t c i g h t f r e q u e n t l y . Therefore,
of c o n s t r u c t i o n i n a pe r iod , from the beginning o f May t o t h a t of September,
By the t e a t s i n l a b o r u t o r i e s and the inves t iga - t i o n s upon the lime s t a b i l i z e d s o i l base course i n t r a f f i c o p e r a t i o n on the test roads 50km i n l eng th , we have seen t h a t the s t a b i l i z e d s o i l s t r u c t u r e s I n p e r m a f r o s t r e g i o n on the P l a t enu were p l e n t y o f conso l ida t ion und able t o s o l i - d i f y o u t i n t o b lock . The pavement, paved w i t h s t a b i l i z e d soil a t ruc - t u r e s , as a whole .was q u i t e be t te r i n f r e e z i n g r e s i s t a n c e and i n h y d r o s t a b l e n e s a , t h e r e f o r e , i t a a t r e n g t b was able t o s a t i s f y the q u a l i t y requi rements in design. I t i s paved by p r a c t i c e now t h a t t h e s o i l a t a b i l i z a t i o n is q u i t e feasible to app ly on highway engineer ing in permafros t r eg ion on l a t e a u . This is the conclusion of the au thor -
REFERENCES
h n z h o u I n s t i t u t e of Glaciology and Geocryology, Chinese Academy of Sc iences , 1978, Permafrost S o i l along the Qingzong Highway.
Minis t ry o f Communications o f R.P.C. 1982, S p e c i f c a t i o n s f o r c o n s t r u c t i o n o f l ime-so i l base course o f highway pavement.
1514
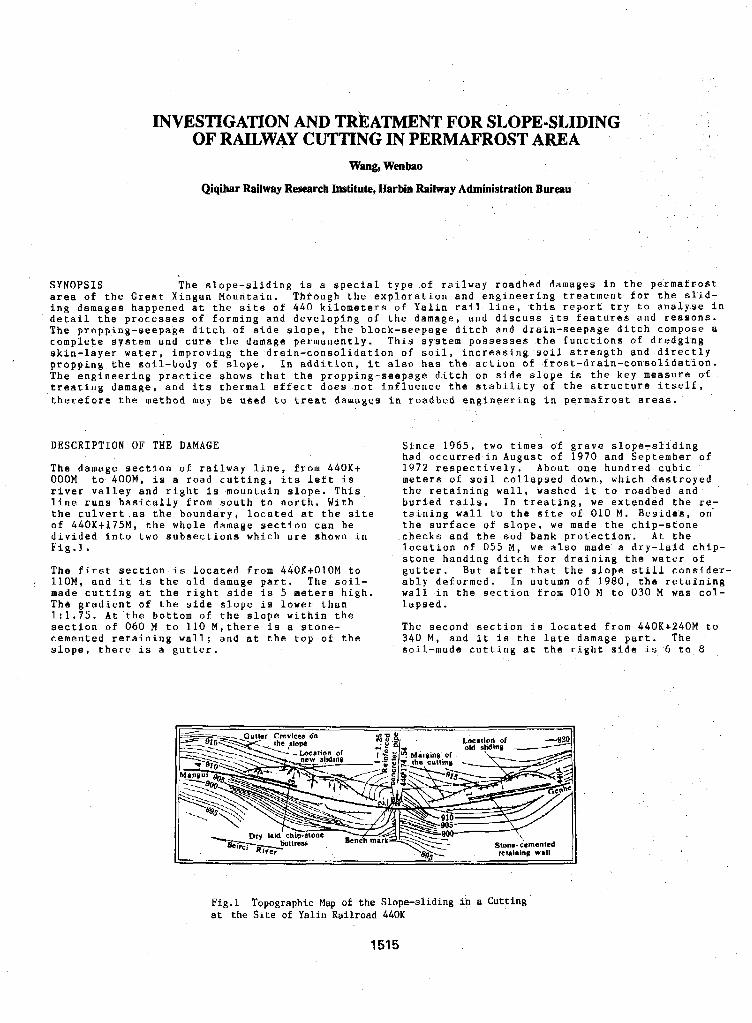
INVESTIGATION AND TR~ATMENT FOR SLOPE-SLIDING OF RAILWAY CUTTING IN PERMAFROST AREA
Wan& Wfmbao
Qiqihar Railway R e a r c h Institute, Harbin Railway Administration Bureau
Fig.1 Topographic Map of the Slope-sliding in a Cutting at the Site of Yalin Railroad 440K
1515
SYNOPSIS The slope-sliding is a special type of railway roadbed damages in the permafrost area of the Great Xingan Mountain. Through the exploration and engineering treatment for the slid- ing damages happened at the site of 440 kilometers o f Yalin rail line, this report try to analyse in detail the processes of forming and developing o f the damage, and discuss its features and reasons. The propping-seepage ditch of side slope, the block-seepage ditch and drain-seepage ditch compose a complete system and cure the damage permanently. This system possesses the functions of dredging skin-layer water, improving the drain-consolidation o f soil, increasing soil strength and directly propping the soil-body of slope, In addition, it also has the action of frost-drain-con-solidation. The engineering practice shows that the propping-seepage ditch on side slope i s the key measure of treating damage, and its thermal effect does not influence the stability of the structure itself, therefore the method may be used to treat damages in roadbed engineering in permafrost areas.
DESCRIPTION OF THE DAMAGE
The damage section of railway line. from 440K+ OOOM to 400M, is a road cutting, its Left is river valley and right is mountain slope. This line runs basically from south to north. With the culvert.as the boundary, located at the site of 440Kt175M, the whole damage section can be divided into two subsections which are shown in Fig. 1 *
The first section is located from 440Kt010M to llOM, and it is the old damage part. The soil- made cutting at the right side is 5 meters high. The gradient of the side slope is lower than 1:1.75. A t the bottom of the slope within the section of 060 M to 110 M,there is a stone- cemented retaining wall; and at the top o f the slope, there is a gutter.
Since 1965, two times o f grave slope-sliding had occurred in August of 1970 and September o f 1972 respectively. About one hundred cubic meters o f soil collapsed down, which destroyed the retaining wall, washed it to roadbed and buried rails. In treating, we extended the re,- taining wall to the site of 010 M. Besides, on the surface of slope, we made the chip-stone
location of 055 M , we also made a dry-laid chip- stone handing ditch for draining the water of gutter. But after that the slope still consider- ably deformed. I n autumn of 1980, the retaining wall in the section from 010 M to 030 M was c o l - lapsed.
The second section is located from 440K+240M to 340 M , and it is the late damage part. The soil-made cutting at the right side is 6 to 8
.checks and the sod bank protection. At the
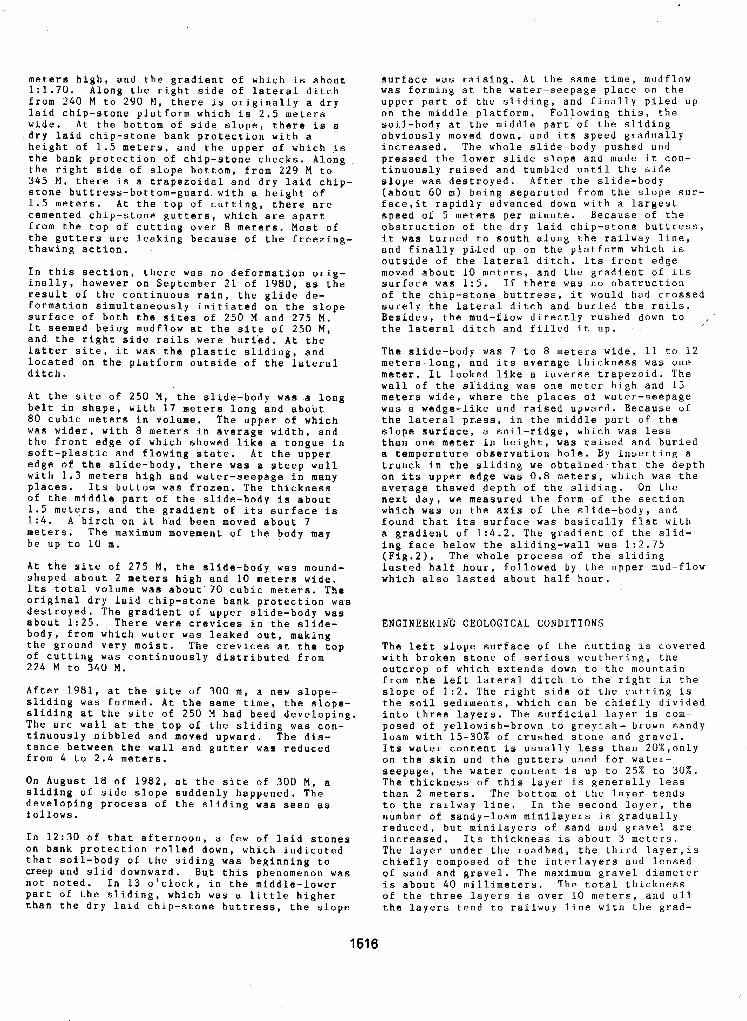
meters high, and the gradient of which is about 1:1.70. Along the right side of lateral ditch from 240 M to 290 M, there is originally a dry laid chip-stone platform which is 2 . 5 meters wide, At the bottom of side slope, there is a dry laid chip-stone bank protection with a height of 1 .5 meters, and the upper o f which i s the bank protection of chip-stone checks. Along the right side of slope bottom, from 229 M to 345 M , there is a trapezoidal and d r y laid chip- stone b u t t r e s s - b o t t o m - g u a r d . w i t h a height of 1.5 meters, At the top of cutting, there are cemented chip-stone gutters, which are apart from the top of cutting over 8 meters. Most of the gutters are leaking because of the freezing- thawing action.
In this section, there was no deformation orig- inally, however on September 21 of 1980, a s the result of the continuous rain, the glide de- formation simultaneously initiated on the slope surface of both the sites of 250 M and 275 M. It seemed being mudflow at the site of 2 5 0 M , and the right side rails were buried. A t the latter site, it was the plastic sliding, and located on the platform outside of the lateral ditch.
At the site of 2 5 0 M , the slide-body was a long belt in shape, with 17 meters long and about 80 cubic meters in volume, The upper of which was wider, with 8 meters in average width, and the front edge of which showed like a tongue in soft-plastic and flowing state. At the upper edge of the slide-body, there was a steep wall with 1 . 3 meters high and water-seepage in many places. Its bottom was frozen, The thickness of the middle part of the slide-body is about 1 . 5 meters, and the gradient of its surface is 1:4. A birch on it had been moved about 7 meters. The maximum movement of the body may be up to 10 m.
At the site of 275 M , the slide-body was mound- shaped about 2 meters high and 10 meters wide. Its total volume was about'70 cubic meters. The original dry laid chip-stone bank protection was destroyed. The gradient of upper slide-body was about 1:25. There were crevices in the slide- body, from which water was leaked out, making the ground very moist. The crevices at the top of cutting was continuously distributed from 224 M to 3 4 0 M.
After 1981, at the site of 300 m, a new slope- sliding was formed, At the same time, the slope- sliding at the site of 2 5 0 M had beed developing. The arc wall at the top of the sliding was con- tinuously nibbled and moved upward. The dis- tance between the wall and gutter was reduced from 4 to 2.4 meters.
On August 18 of 1982, at the site of 300 M , a sliding o f side slope suddenly happened. The developing process of the sliding was seen a s follows.
In 12:30 of that afternoon, a few of laid stones on bank protection rolled down, which indicated that soil-body o f the siding was beginning to creep and slid downward. J3u.t this phenomenon was not noted. In 13 o'clock, in the middle-lower part of the sliding, which was a little higher than the dry laid chip-stone buttress, the slope
surface was raising. At the same time, mudflow was forming at the water-seepage place o n the upper part of the sliding, and finally piled up on the middle platform. Following this, the soil-body at the middle part of the sliding obviously moved down, and its speed gradually increased. The whole slide-body pushed and pressed the lower slide slope and made it con- tinuously raised and tumbled until the side slope was destroyed. After the slide-body (about 60 m) being separated from the slope sur- face,it rapidly advanced down with a largest speed of 5 meters per minute. Because of the obstruction of the dry laid chip-stone buttress, it was turned to south along the railway line, and finally pi.led up on the platform which is outside of the lateral ditch. Its front edge moved about 10 meters, and the gradient of its surface was 1 : 5 . If there was no obstruction of the chip-stone buttress, it would had crossed surely the lateral ditch and buried the rails. Besides, the mud-flow directly rushed down to , the lateral ditch and filled it u p .
The slide-body was 7 to 8 meters wide, 11 to 1 2 meters long, and its average thickness was one meter. It looked like a inverse trapezoid. The wall of the sliding was one meter high and 15 meters wide, where the places of water-seepage was a wedge-like and raised upward. Because of the lateral press, in the middle part of the slope surface, a soil-ridge, which was less than one meter in height, was raised and buried a temperature observation hole. By inserting a trunck in the sliding we obtained that the depth
average thawed depth of the sliding. On the on its upper edge was 0.8 meters, which was the
which was on the axis o f the slide-body, and next day, we measured the form of the section
found that its surface was basically flat with a gradient of 1:4.2. The gradient of the slid- ing face below the sliding-wall was 1 : 2 . 7 5 (Fig.2). The whole process of the sliding lasted half hour, followed by the upper mud-flow which also lasted about half hour.
ENGINEERIN'G GEOLOGICAL CONDITIONS
The left slope surface of the cutting is covered with broken stone o f serious weathering, the Outcrop of which extends down to the mountain from the left lateral ditch t o the right in the slope of 1 : 2 . The right side of the cutting is the soil sediments, which can be chiefly divided into three layers. The surficial layer i s com- posed of yellowish-brown to greyish- brown sandy loam with 15-30% of crushed stone and gravel. Its water content is usually Less than 20%,only on the skin and the gutters used for water-
The thickness of this layer is generally less seepage, the water content is up to 25% to 30%.
than 2 meters. The bottom o f the layer tends to the railway line. In the second layer, the number of sandy-loam minilayers is gradually reduced, but minilayers of sand and gravel are
The layer under the roadbed, the third layer,is increased. Its thickness is about 3 meters.
chiefly composed of the interlayers and lensed of sand and gravel. The maximum gravel diameter
of the three layers is over 10 meters, and all is about 40 millimeters. The total thickness
the layers tend to railway line with the grad-
1516
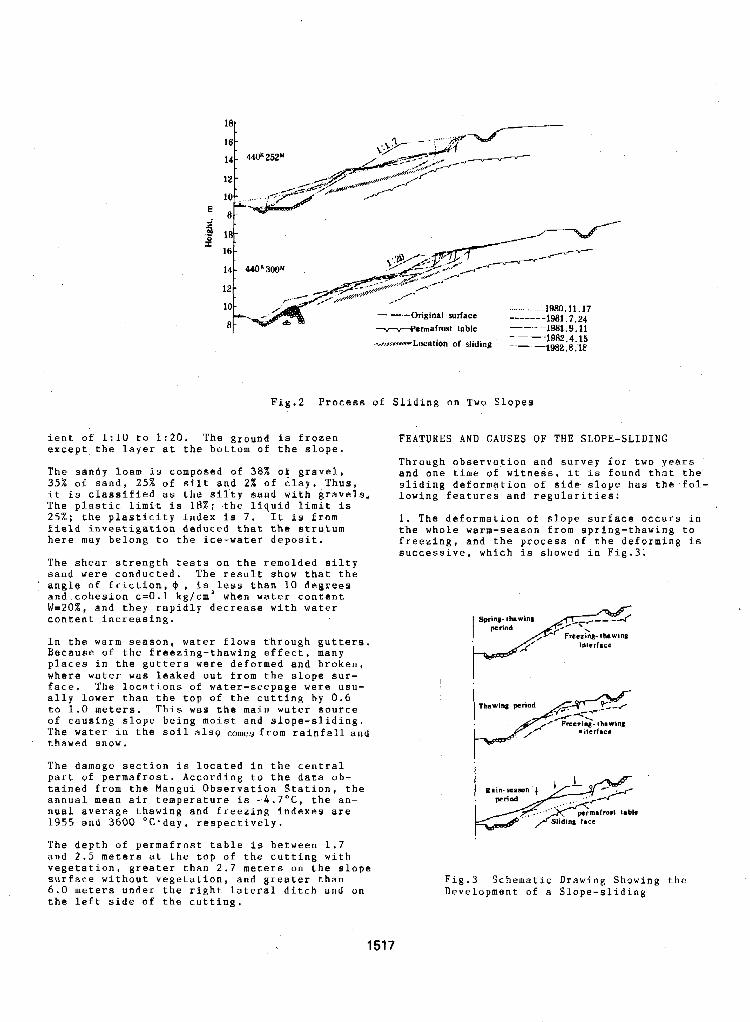
-" .-... , ..1980.11.17 Original S U ~ ~ ~ C E -""" 1981.7.24
-emalms1 table "_ 1981.9.11 -4.Y-Location of sliding - - 1982.4.15
-1982.8.1F
Fig.2 Process of Sliding on Two Slopes
ient of 1 : l O to 1:20. The ground is frozen except the layer at the bottom of the slope.
The sandy loam i s composed of 38% o f gravel, 35X of sand, 25% of silt and 2% o f clay. Thus. it is classified as the silty sand with gravels. The plastic limit is 18%; the liquid limit is 2 5 X ; the plasticity index is 7 . It is from field investigation deduced that the stratum here may belong to the ice-water deposit.
The shear strength tests on the remolded silty sand were conducted, The result show that the angle of friction,@ , islless than 10 degrees and cohesion c=O.1 kg/cm when water content W=20%, and they rapidly decrease with water content increasing.
In the warm season, water flows through gutters, Because of the freezing-thawing effect, 'many places in the gutters were deformed and broken, where water was leaked out from the slope sur-
ally lower than the top of the cutting by 0 . 6 face. The locations of water-seepage were usu-
to 1,0 meters. This was the main water source of causing slope being moist and slope-sliding. The water in the soil also comes from rainfall and thawed snow.
The damage section is located in the central part of permafrost. According to the data ob- tained from the Mangui Observation Station, the annual mean air temperature is - 4 . 7 ' C , the an- nual average thawing and freezing indexes are 1955 and 3600 'C-day, respectively.
The depth of permafrost table is between 1.7 and 2.5 meters at the top of the cutting with vegetation, greater than 2 . 7 meters on the slope surface without vegetation, and greater than 6 . 0 meters under the right lateral ditch and on the left side of the cutting.
FEATURES A N D CAUSES OF THE SLOPE-SLIDING
Through observation and survey for two years and one time of witness, it is found that the sliding deformation of side slope has the fol- l o w i n g features and regularities:
1. The deformation of slope surface occurs in the whole warm-season from spring-thawing to freezing, and the process of the deforming is successive, which is showed in Fig.3.
Sprinp lhawlna
Iwtrtace
Fig.3 Schematic Drawing Showing the Development o f a Slope-sliding
1517
During spring-thawing, along with the gradually thawing of snow and frozen soil, slope deforma- tion is chiefly the creep of surficial layer, which occurs everywhere and frequently. Simul- taneously, crevices form at the top and on the slope surface of the cutting, In the warm-season, the layer of thawed soil gradually becomes thick, and the phreatic water and the leaking water from the gutter obviously act on the slope, so
mud-flow, which will form steep ridges at the that the deformation becomes a small scale of
places of water seepage on the cutting top edge, and continuously nibble and advance upward. Thus the area o f the damage will be enlarged gradual- ly. After enlarging a certain scale, and caused by a long time raining, the considerable scale's sliding of side slope may be happened above the freezing-thawing interface. In small water con- tent, the sliding deformation may be showed as a hard-plastic stack sliding plastic sliding or soft-plastic mud-flow, respectively, which are all happened in the shallow layer and seasonally.
2 . The deforming firstly occurs at the crevices of the cutting top. Since the thawed snow and surface water permeate into ground, the partial sliding deformation on the slope surface will be happened. When the platform or the water accumu-
surface water will gradually permeate into the lation area are formed in the upper side slope,
lower slope surface,which make the strength o f the slope greatly reduced and can not bear its self-weight, thus the sliding deformation will b e happened on the slope surface i n a large scale.
3 . The pattern of slope sliding is usually as follows. On the upper, there is an arc steep precipice or a slide-wall with one meter high; below that, there are water seepage exposures; in the middle part of slope surface, it is steps-like because of the breaking and separa-
there is an obvious tongue-like frontier, on tingofthe soil-body; and in the lower part,
which there exist arc wrinkles or crackles.
4 . The sliding face is from the slide-wall o r crevices on the top of the cutting edge to the lower part of the slope which is higher than the platform about 0.5 to 1.0 meters. Its mid- dle part is controlled by the freezing-thawing interface, but located above it about 1.0 to 2.0 meters.
The side slope is mainly composed of silty sand with gravel, which possesses higher permeabi- lity and maintenance o f water. It will have higher strength when the water content is lower, and the strength will be greatly reduced when it is rich of water. The existence of this kind of soil is the internal cause of the slope-sliding.
The thawed snow, the shallow phreatic water, and especially the leaking water of gutters are the mainly external causes for the sliding.
and the freezing-thawing circles of active layer Furthermore, both the existence o f permafrost
and its effect on soil structure and strength make the internal and external causes mentioned above interacted. This brings about .the accumu- lation of the slope deformafion and affects the integrity and stability of the soil-body of the slope. Thus, in rain-season, a certain scale o f
sliding on the slope may be caused and leads to a damage.
TREATMENT MEASURES
The guiding principles for prevention and cure of the slope sliding are: controlling and dredg- ing the surface water and the phreatic water of surficial layer, increasing the degree o f drain- consolidation and strength of soi1,and construct- ing supporting structures. The measure, which has all the functions mentioned above, is to make propping-seepage ditches on the side slope surface,, which.has, been used in the treatment of the sliding discusses here.
The effects of the propping-seepage ditch in treating the slope-sliding in permafrost area are :
1. It directly blocks and dredges the phreatic water of surficial layer, eliminates the erosion action of water to slope surface and reduces the water content of surficial layer of the slope.
2. It increases the degree of drain-consolida- tion and the strength of soil of the slope.
3 . It directly,props the soil-body of slope sur- face, thus increases its stability and protects the soil-body from sliding down.
4 . It partly changes the temperature regime of permafrost and the freezing-thawing interface, which is favourable to the drain-consolidation of the soil-body of slope surface.
The the and dra fec
TRE
i t
1A
propping-seepage ditch at the side slope, block-seepage ditch on the top of cutting other drain-seepage ditchs, form a perfect n system, which plays a comprehensive ef- of eliminating the damage of slope sliding.
TMENT EFFECTS
The treating engineering has experienced for
effect is good. The deformation and sliding of four rain-seasons, which proved that the draining
slope surface have been eliminated. Therefore, it is considered that the application o f the propping-seepage ditch to the roadbed engineer- ing in permafrost area is successful.
The observation o f ground temperature indicates that the influence of propping-seepage ditch on permafrost is not obvious. It only limitedly increasse the thickness of active layer of the upper slope, which is favourable t o the drain- consolidation of the soil. It also indicates that although the propping-seepage ditch is not located in permafrost layer, it still works well and is not destroyed by freezing-thawing effect.
CONCLUSIONS
(i) U s i n g the original measure o f dry laid chip-stone bank protection is not ef- fective, the reason is that it is a king
1518
of protectional measure for preventing the slope surface from washing and weathering peeling, and can not bear the
However, although the retaining wall and frost heave force and pressure of soil,
the dry laid chip-stone buttress a r e the passive measures, they still can control the area of the damage. The propping- seepage ditch, which has the effects of both drain-consolidation and propping- protection, is a good measure for trea- ting the damage of slope-sliding,,
(ii) In the central part of permafrost area, the propping-seepage ditch of side slope, only partly changes the planar state of temperature field under slope surface, and its effects of drain-consolidation and propping-protection are identical to those in non-frost area.
(iii) The sliding face is from the place of water-seepage under the slide-wall t o the slope surface which is higher than the platform, and the middle part of which is a gentle curved surface, Its gradient of upper part is close to 30 degrees at the upper part, about 1 2 to 15 degrees at the lower part, and 18 to ,
20 degrees at the middle par,t. (iv) The sliding face is not the freezing-
thawing interface, but about 0 . 8 meters higher than the interface,and it is not a smooth plane, but a layer or a band with the thickness of 0.1 to 0.5 meters.
(V) According t o statistics, the sliding deformation usually occurs after a con- tinuous rain about 20 days t o one month.
propping-seepage ditch, its foundation can not be set in permafrost layer.Thus, the foundation must be designed big and save enough based on the calculations on its mechanical stability.
(vi) Because of the thermal effect of the
ACKNOWLEDGEMENT
The author sincerely thanks Messrs Liu Shenjia, Xie Ruitang and Li Yingwu, who were involved in this work.
1519
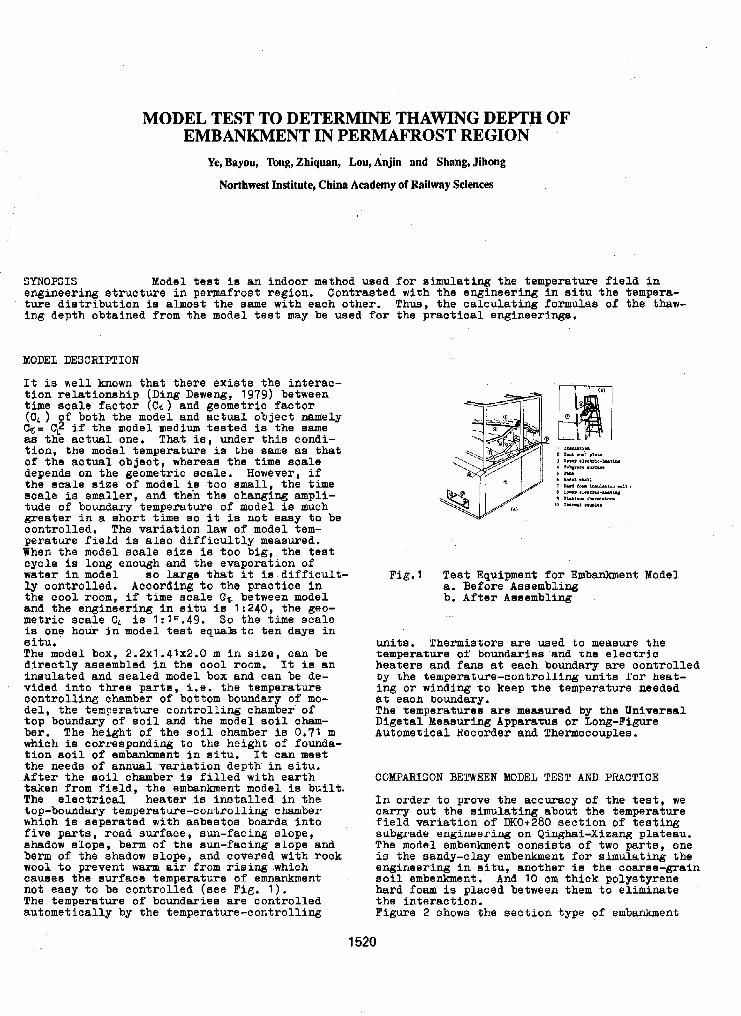
MODEL TEST TO DETERMINE THAWING DEPTH OF EMBANKMENT IN PERMAFROST REGION
Ye, Bayou, Tong, Zhiquan, Lou, Anjin and Shang, Jihong
Northwest Institute, China Academy of Railway Sciences
SYNOPSIS Model test is an indoor method used for simulating the temperature field in engineering structure in permafrost region. Contraeted with the engineering in situ the tempera- ture dietribution is almoat the same with each other. Thus, the calculating formulas of tho thaw- ing depth obtained from the model teat may be used for the practical engineerings.
MODEL DESCRIPTION
It is bell known that there exists the interac- tion relationship (Ding Deweng, 1979) between time scale factor (& ) and geometric factor (C,) $f both the model and actual object namely Q = CL if the model medium teated i a the same as the actual one. That is, under this condi- tion, the model temperature is the sane aa that of the actual object, whereas the time Bcale dependa on the geometric scale. However, if the scale Size of model is too small, the time scale is smaller, and then the changing ampli- tude of boundary temperature o f model is much greater in a ahort time ao it ia not easy to be controlled. The variation law of model tem- perature field is also difficultly measured. When the model scale aize is too big , the teat cycle is long enough and the evaporation of water in model so large that it is difficult- ly controlled. According to the practice in the COOL room, if time scale (3, between model metric scale CL is 1:lC.49. So the time scale and the engineering in aitu is 1:240, the geo-
ie one hour in model teat equabto ten days in situ. The model box, 2.2~1.41~2.0 m in size, can be directly assembled in the cool room. It is an insulated and sealed model box and can be de- vided into three parts, i.e. the temperature controlling chamber of bottom boundary of mo- del, the ternFerature controlling chamber of top boundary of soil and the model soil cham- ber. The height of the soil chamber i s 0.71 m which ie corresponding to the height of founda- tion aoil of embahent in aitu. It can meet
After the eoil chamber is filled with earth .the needs of annual variation depth in situ.
taken from field, the embankment model is built. The electrical heater is installed in the
which is seperated with asbestos boards into top-boundary temperature-controlling chamber
five parts, road awface, aun-facing alope, shadow slope, berm of the sun-facing slope and berm o f the shadow slope, and covered with rock wool to prevent warm air from riaing.which cauaes the surface temperature of emnankment not eaay to be controlled (see Fig. 1 ) . The temperature of boundaries are controlled autometically by the temperature-controlling
1520
Fig.1 Test Equipment for Embankment Model a. Before Aaaambling b. After Assembling
units. 1Chermistora are used to measure the temperature of boundaxlee and the eleczric heaters ana fans at each boundary are controlled by the temperature-c~ntrolling units lor heat- ing or winding to keep the temperature needed at each boundary. The temperatures are measured by the Univeraal Digetal Measuring Apparatua or Long-Figure Autometieal Hecorder and Thermocouples.
COIKPARI3ON BETWEEN MODEL TEST AND PRACTICE
In order to prove the accuracy of the test, we carry out the simulating about the temperature field variation of DK0+280 section of testing subgrade engineering on Qinghai-Xizang plateau. The model embenkment consists of two parts, one is the sandy-clay embenkmsnt for aimulating the engineering in aitu, another is the coarse-grain aoil embenkment, And 10 cm thick polystyrene hard foam is placed between them to eliminate the interaction. Figure 2 shows the section type of embankment
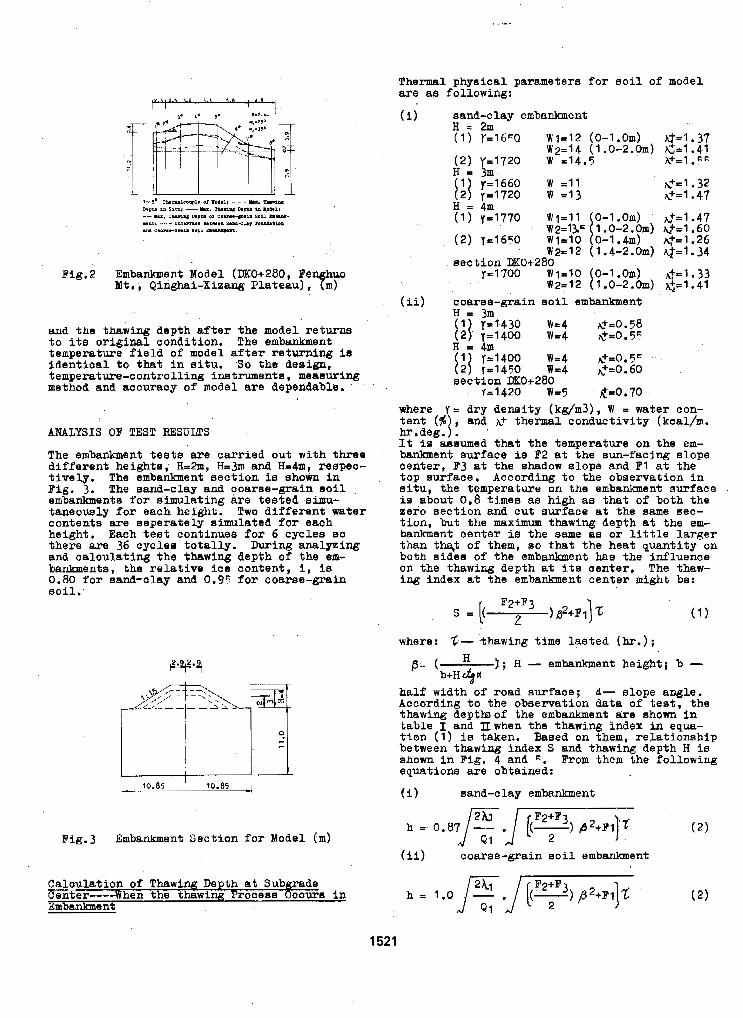
.. .
Fig.2 Embankment Model (IJK0+280, Fe huo Mt., Qinghai-Xizang Plateau) ,Ym)
and the thawing depth after the model returns to its original condition. The embankment temperature field of model after returning is identical to that in situ. So the deeiga, temperature-controlling instruments, measuring method and accuracy o f model are dependable.
ANALYSIS OF TEST RESULTS
The embankment tests a r e carried out with three different heighta, H=2m, H=3m and H=4rm, respec- tively. The embankment section is ahoh in Pig, 3. The sand-clay and coarse-grain moil embanlanenta f o r eimulating ire tested simu- taneouely for each height. Two Bifferent water contents are seperately simulated for each height. Each teat continues for 6 cycles 00 there are 36 cyclae totally. During analping and calculating the thawing depth o f the em- bankments, the relative ice content, i, is 0.80 for aand-clay and 0.95; for coarae-grain soil.
w
Fig.3 Embanlanent Section for Model (m)
Calculation of Thawi De tb at Sub xade Knter----When the t%iG Proteas &cura in Embankment
Thermal physical parameters for soil of model are as following:
(ii) coarse-grain soil embankment
1 ya1430 H i 4 ~+=0.58 2 . r=1400 W04 Qt0.55
H = 3m
1 1 I 1 H = 4m
I r=14oo w=4 k ~ 0 . 5 ~ 2 ~ ~ 1 4 5 0 Wc4 ,+=0.60
r=1420 w=5 k~0.70 section DK0+280
where r = dry density (kg/m3), W = water con-
hr.aeg. tent ($1 . It is assumed that the temperature on the em- banlrment aurface is F2 at the sun-facing slope center, B3 at the ehadow elope and P I at the top aurface, According to the observation in situ, the temperature on the embanhent surface is about 0.8 times as high as that of both the zefo section and cut surface at the aame sec- tion, but the maximum thawing depth at the em- bankment center is the aame as or little larger than tlqt of them, so that the heat quantity on both sides of the embankment has the influence on the thawing depth at ite aenter. The thaw- ing index at the embanhent center might be:
, and h+ thermal conductivity (kcal/m.
where: 7,- thawing time lasted (tu+.);
p= ( b+H d+d
f ; H - embankment height ; b - half width of road surface; d- slope angle. According to the observation data of test, the thawing deptbof the embankment a r e shown in table I and =when the thawing index in equa- t i o n ( 1 ) is taken. Based on them, reLationship between thawing index S and thawing depth H is shown in Fig. 4 and G . Prom them the following epationa are obtained:
i) sand-clay embankment
ii) coarse-grain soil embanhent
1521
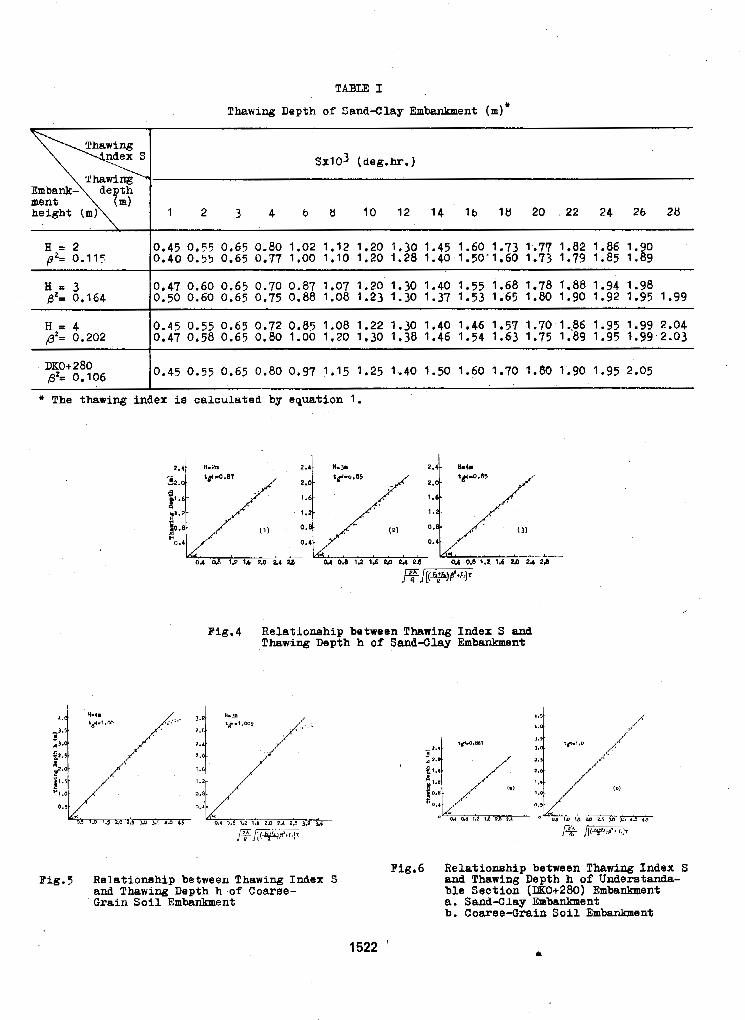
TABLE I
Thawing Depth of Sand4llay Embankment (m)*
B r 2 I 0.45 0.75 0.65 0.80 1.02 1.12 1.20 1.30 1.45 1.60 1.73 1.77 1.82 1.86 1.90 p L 0 . 1 1 7 0 .40 0.55 0.65 0.77 1.00 1.10 1.20 1.28 1.40 1.50'1.60 1.73 1.79 1.85 1.89
H z 3 0.47 0.60 0.65 0.70 0.87 1.07 1.20 1.30 1.40 1.55 1.68 1.78 1.88 1.94 1.98 fit= 0.164 0.50 0.60 0.65 0.75 0.80 1.08 1.23 1.30 1.37 1 . 5 3 1.65 1.80 1.90 1.92 1.97 1.99
H = 4 0.45 0.55 0.65 0.72 0.85 1.08 1.22 1.30 1.40 1.46 1.57 1.70 1.%86 1.95 1.99 2.04 p2= 0.202 0.47 0.58 0.65 0.80 1.00 1.20 1.30 1.38 1.46 1.54 1.63 1.75 1.89 1.95 1.99 2.03
DK0+280 @% 0.106 10.45 0 . 5 5 0.65 0.80 0.97 1.15 1.25 1.40 1.50 1.60 1.70 1.80 1.90 1.95 2.05
* The thawing index is calculated by equation 1 .
Fig.4 Relationehip between Thawing Index S and Thawing Depth h of Sand-Clay Embardanent
2.8 .i 1.2r /
Big.5 Relatiomhip between Thawing Index S and Thawing Depth h of Coarse- Grain Soil Embanlunent
Pig.6 Relatiomhip between Thawing Index S and Thawing Depth h of Underatanda- bLe Section (DK0+280) Embadanent a. Sand-Clay Embankment b. Coaree-lirain S o i l Embankment
1522
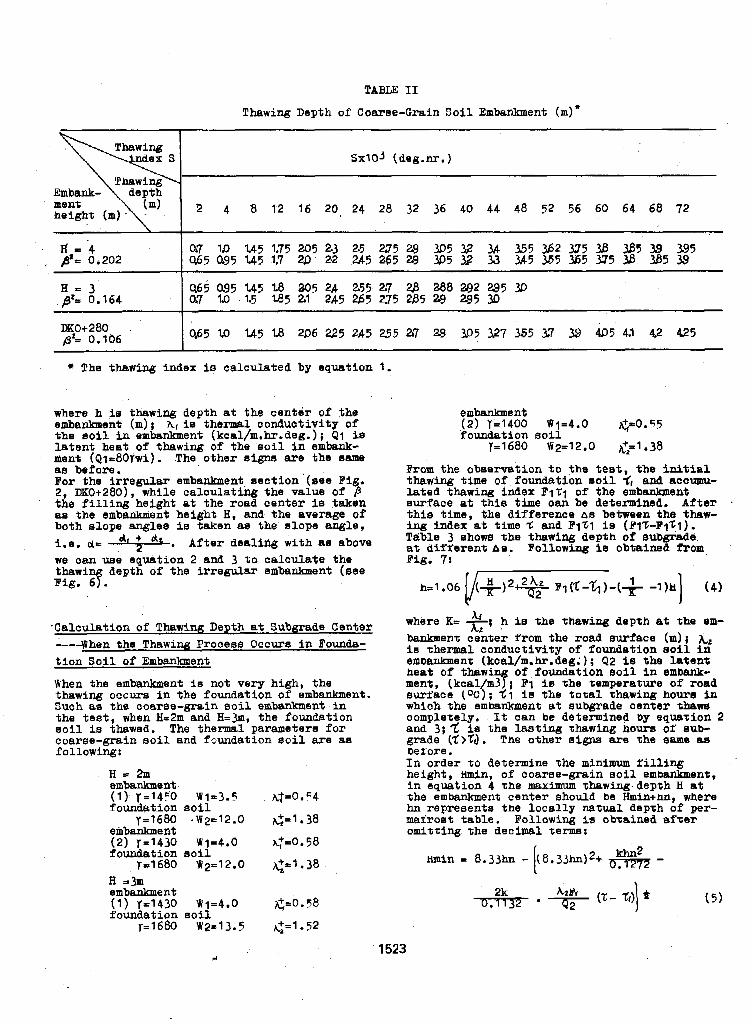
TABLE 11
T h a w i n g Depth o f Comae-Grain Soil Embanhent (m)*
S X I O ~ (deg.nr.1
Embank- ment 2 '4 8 12 16 20 24 28 32 36 40 44 48 52 56 60 64 68 72
II li '4 , re'= 0,202
w5 3 5
22 32
3A 33
39 385
335 39
* The thawing index ie calculated by equation 1.
where h is thawing depth st the center of the embanhmnt (m) ; hf i e thermal condilctivity of the aoil in embankment (koal/m.hr.deg.); QI is la tent heat o f thawing of the Boil in embank- ment (~1=80rwi). The other a i m a r e the m a m e as before. For the irregular embankment aeation '(see Fig. 2, DK0+280), while calculating the value of t he f i l l i ng he igh t at the road center i s taken a8 the embaaent he ight H, and the average of both slope anglee is taken ae the slope angle, i.e. +. After dealing with as above we oan uee equation 2 and 3 to caloulate the t h a w i depth of the i r regular Bmbanlunent (see Big. 3.
,Calculation of Thawing Depth at S u b m d a Center "" When the T h a w i n g Process Occure i n Founda- t i o n S o i l of Embankment
When the embankment i s not very high, the t h a w i n g OOCUTB in the foundat ion o f embankment. Such ae the coarse-grain soil embankment i n the t ee t , when Bz2m and H=%, the foundation s o i l is thawed. The thermal parametera for coaree-grain s o i l and foundation eoil are ae following:
€ I = 2m
(1 ) r=14EO W1~3.5 ht=O. F4
y=1680 *W2=12.0 ~:=1.38
embanhent
foundation soil
embankment (2) r=1430 W1=4.0 c,+,O 58 foundation s o i l
y-1680 Wp12.0 <=1.38 H =3m embmlment (1) Y=1430 W I = foundation s o i l
~ 1 6 8 0 Wp =
embanhnent
foundat ion soi l (2) r=14oo W1=4.0 ~ ~ 0 . 5 5
r=1680 W2=12.0 Cz1.38
From the observation to t he t ea t , the i n i t i a l
l a t ed t h a w i n g index F1T1 of the embaulcment thawing time of foundat ion soi l -ti and accmu-
eurfaoe at t h i s time can be detemined. After this time, the difference os between the thaw- ing Index a t time -C and FlZl l e (BlT-PfCI), Wble 3 ehom the t h a w i n g depth of subpade. at d i f r e r e n t b e . Following ie obtained from Big. 7:
where K= 2 3 h is the tbawing depth at the em- banlrment center from the road Burface (m); is thermal conductivity of foundat ion soi l i n embanlunent (kcal/m.hr.deg;); 42 ie the la ten% heat of t h a w i of foundation soil in embank- ment, (kcal/mv( F1 is the temperature 00 road surface ( 0 ~ ) ; $1 i a t h e t o t a l thawing hour8 i n which the embankment at subgrade center thaw completely. It can be determined by equation 2 and 3; f is %he l a s t i n g thawing hours o r eub- grade (?>To. Th8 other signs are the same as berore . I n order co determine the minimum filling height, Hmin, of coarse-grain s o i l embankment, in equat ion 4 the maximum thawing.depth H a t %he embankment center should be Hmin+nn, where hn represent8 the loca l ly na tua l depth of per- mafroert table . Following is obtained af ter omitting the decimal term:
A he
1523
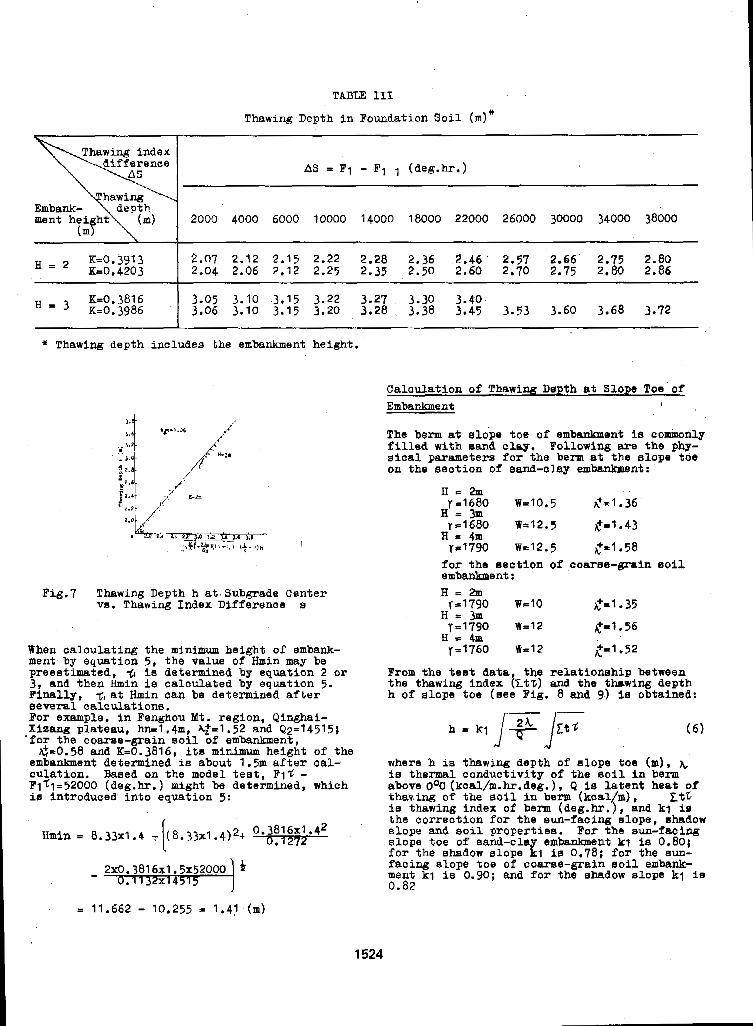
H = 2 K=0.3913 I 2.07 2.12 2.15 2.22 2.28 2.36 .2.46' .2.57 2.66 2.75 2.80 K=0.4203 2.04 2.06 2.12 2.25 2.35 2 .50 2.60 2.70 2.75 2.80 2.86
* Thawing depth includes the embankment height.
Caloulation of ThaWiw Depth at Slope Toe of Embankment
Pig.7 Thawing Depth h at. Subgrade Center vs. Thawing Index Difference a
When calculating the minimum height of embank- ment by equation 5, the value o f Hmin may be preestimated, % ia determined by equation 2 or 3, and then Hmin is calculated by equation 5. Finally, -(,at Hmin can be determined after aeveral calculationa.
Xizang plateau, hn=1,4m, a=1.52 and Q2=14515; POr example. in Fenghou Yt. region, Qinghai-
'for the coaree-grain soil of embankment, 4 ~ 0 . 5 8 and K=0.3816, its minimum height of the
embadanent determined ia about 1.5m after cal- culation. Based on the model teat, - P1$=52000 (deg.hr.) might be determined, which ia introduced into equation 5:
The bexm at elope toe of embmkmenf is aommonly
sical parmetere fox the berm at the slope tol on the section of sand-clay embankment:
filled with s a d clay. Following -9 the phy-
..
t=l. 58 for the eection of coarae-grain aoil emba-ent :
tx1.52
From the test aata the relationship between the thawing index (Xt T ) and tha thawing depth h of slope toe (Bee Big. 8 and 9) i a obtained:
where b is thawing depth of elope toe (m), h is t h e m 1 conductivity of the soil in berm above O°C (kcal/m.hr.deg.), Q i e Latent heat of thav,ing of the soil in berm (kcal/m), StG ie thawing index of berm (dag.&.), and kj io the correction for the sun-facing slope, shadow slope and soil propertieP. For the sun-facing slope toe of sand-clay embankment kt ie 0.80; f o r the ehadow elope kl is 0.78; for the aun- Pacing elope t o e of coarse-grain soil embank- ment kl is 0.90 i and for the shadow slope kq is 0.82
1524
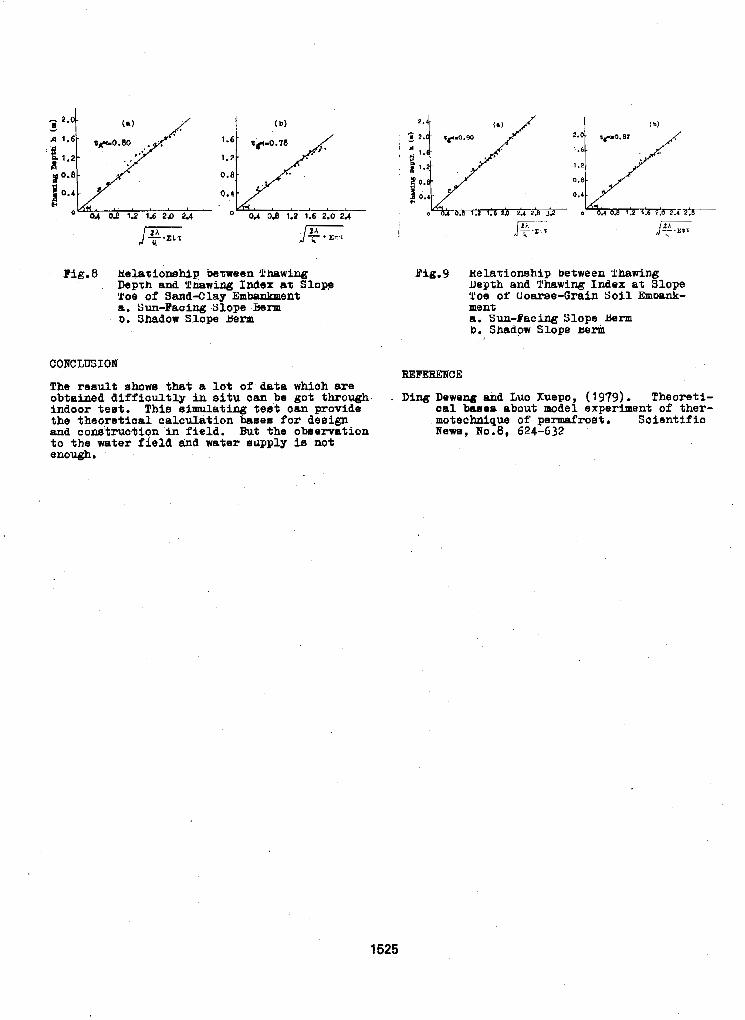
g 1.2 1.2
0.8 0.8
1 0 . 4 tl
OA oa 1.2 lb 2a 2.4 04 0.8 1.2 1.6 2.0 2A
’ Pig.8 Belatiowhip between T h a w i n g Depzh and T n a w i n g Index a% Slopp Toe of S d - C l a y Embadment a. Sun-Fsoing Slope berm b. shadow Slope berm
coNcLusIoN The reault shows that a l o t o f data which are obtained d i f f i c u l t l y in situ can be got through indoor teat . This simulating t e s t can provide the theoretical calculation bases for design and aow’truction in f i e l d . But the observation t o the water f i e l d and water eupply ia not enough.
Pig.9 nela-cioaship between Thawing DepZh and T h a w i n g Index at Slope ’lor o r coarse-Grain S o i l EmPank- ment a. Sun-Pacing Slops Berm b. Shadow Slope ~ I X I
REFEKENCE
D i n g Deweng 8nd Luo Xuepo, (1979). Theoreti- cal base8 about model experiment of ther- moteohnique of permafrost. Scientific
lT0.8, 624-632
1525
STUDIES ON THE PLASTIC-FILM-ENCLOSED FOUNDATION OF SLUICE GATES AND ITS- APPLICATION
Yu, Bofang, Qu, Xiangmin and En, Naicui
Heilongjiang Provincial Institute of Water Conservancy, Harbin, China
SYNOPSIS Based on the field experiments and engineering practice, a new type of soil foun- dation-The plastic-film-enclosed foundation was proposed and applied to the construction of water conservancy projects. Design and construction procedures of the foundation were described. T o ver- ify the reliability of the foundation proposed, three full-scale experimental projects (sluice gates) were constructed in seasonal frost regions. Observation results from the'projects show that the proposed plastic film-enclosed foundation can successfully protect the structures from frost damage.
INTRODUCTION
To solve the problems of frost damage encoun- tered frequently in the construction of hydraulic structures, a new type of soil foundation, i . e . , the plastic film-enclosed foundation has been intengively studied in recent years. Field investigations and engineering practice proved that adopting this type of foundation could greatly reduce the frost heave of structures. Furthermore, it has the advantage of easy to construct and low cost. It is, therefore, an effective measure for preventing frost damage in the construction of the medium- and small-scale hydraulic projects in cold regions.
DESIGN OF THE PLASTIC FILM-ENCLOSED FOUNDATION
Basis of the design of the foundation As well-known, frost susceptibilipy of soil depends chiefly upon moisture, freezing tempera-
ture and soil, the frost susceptibility of the ture and the type of soil. For a given tempera-
soil can be changed by its moisture condition. Investigations have shown that non or negligible amount of frost heave occurs during freezing when the water content in the soil i s less than 'its initial water content causing frost heave, which i s close to the plastic limit of the soil (Wu et al., 1981: Tong, 1982). Based on this fact, the frost heave of a soil can be eliminated or greatly reduced if the water content of the s o i l can be lowered and kept close to or less than its plastic limit. This i s the scientific basis for the design of this type of foundation.
Choice of the enclosinn material At present, various kinds of impermeable films such as plastic film and variety of earth fab- rics, which can be used as the enclosing sheet, are available. When choosing the enclosing material, one should consider its durability, impermeability, strength, cost and construction conditions. The commonly commercial polyvinyl
chloride (plastic) film has the advantage of low permeability, soft, long running period, low cost, and eaey to be constructed, s o that it is a better choice to u8.e this plastic film as the enclosing material for the constructign of the enclosed foundation.
It is know that plastic film has been succes- sfully used in canal construction f o r preventing seepage in Sweden and Norway for 30 years.plas- t i c film has also been used in the construction of canal beds to prevent seepage in the Northest- Wang Farm, Beijing for more than 20 yeara. The buried (used) plastic film was sampled and tested in 1983. Test results (Table I) show that the tensile strength o f the film does not decrease but increases after being used for 18 years. It is predicted from the test that its duration of service may be as long as 30-50 years. In..addition, application of the plastic film to the hydraulic engineering at northeast and w e s t China showed that its physical and mechanical behaviour could fairly meet the needs of engineering design. Based on these, it is decided to choose the polyvinyl chloride plastic film as the enclosing material (anti-permeating sheet) of the enclosed foundation in this study.
Design of the plastic film-enclosed foundation To design the enclosed foundation on frost sus- ceptible soils, it is necessary to know the maximum frost depth, maximum frost heave amount and frost susceptibility grade of the subsoils concerned, and then to determine the thickness (H) of the subsoils needed to be enclosed ac- cording to the thickness of the frost heaving soil as follows:
H Z h - ~ t s (1)
where h i s the thickness of the frost heaving soil,& is the thickness of the foundation slab of a sluice gate and u i s a reduction coeffi- cient, having a value of 0.5 for a small slab (with its width less than frost depth) and 0 . 3 3 3
1526 '
TABLE I
Comparison of the Tensile Strength and Ductility of Plastic Film before and after Being Used for 18 Years
Tensile strength, MPa Ductility ( X ) Thickness Case
m m Cross- Longitudinal Cross- Longitudinal sectional sectional
0.12-0.14 18.87 24.43 2 6 1 . 3 2 2 4 B 0.13-0.15 3 2 . 6 0 33.20 8-40 10-190 A 0.14-0.15 18.10 24.27 2 6 1 . 3 264 B 0.14-0.15 27.10 33.20 4-8 4-40 A
Note: B - Before buried in,l965, A - Sampling in 1983.
for a larger slab, respectively.
To eliminate the effect of frost heave caused by the subsoil around the foundation slab, the dimention at the top of the enclosed soil body must be greater than that of the slab base at least by 0 . 5 m at each side. The lateral sur- face of the enclosed soil body could be vertical, or a slope of 1 on 1,depending upon.the excava- tion st-ability condition of the pit.
The fill material could be any kind of fine- grained soils. But, its unit weight and water content must be carefully controlled during con- struqtion s o a s to meet the requirement of d e - signed bearing capacity and allowable.maximum frost heave of the subsoil.
I n addition, it is better to seperate the en- closed soil foundation into several individual layers with plastic films i n order to reduce moisture migration (thus the frost heave amount). The thickness of each layer is suggested to be
, not greater than 0.35-0.5 m .
The design of overlying structure is in principle the same as the design of usual sluice gate.But, the following two points should be taken into consideration: (1) The buried depth of founda- tion slab can be designed considering only the strength and stability of the structure itself, not the effect of frost heave. (2) Proper anti- frost heaving measures should be taken for the frost susceptible soil behind the side wall of the sluice gate to avoid the gate uplifting due to frost heave.
CONSTRUCTION OF THE PLASTIC FILM-ENCLOSED FOUNDATION
joints between the glued films need to be stag- gered with the width of 15-20 cm. To prevent the film from tearing by stone or tree roots, the exposed surface o f the pit should be care- fully cleaned before laying films.
Fill construction The water content o f the fill must be carefully controlled to meet the needs of design. Stones, hard piece of soil and other hard materials, which may tear the film, should be taken out from the fill, Fill materials should be com- pacted layer by layer with its unit weight meeting design value. Inter-layer insulating sheets will be placed during filling with their joints also staggered. As the height of the fill reaches its design value, the outer enclosing sheets are finally enclosed. By now the con- struction o f the foundation is ccmpleted.
EXPERIMENTAL PROJECTS
Outline of the experimental projects To test the reliability of the plastic-film-
were constructed at Jidong County, Hailin County enclosed foundation, three experimental projects
and Hulan County in Heilongjiang Province,North- east China. F o r the convenience of discussion, they are numbered as No.1, No.2 and No.3 in this paper, respectively.
Some of the natural site conditions for the pro- jects are shown in Table 11. The dimention and form of the foundations and overlying structures for the test. projects are the same. Drawings of the longitudinal section, airview and cross-
and 3 , respectively, in which dimentions are in section of the projects are shown in Figs.l,2
Excavation of pit cm.
posed surface should be as smooth as possible. Observations on the experimental proiects
Placing of enclosinn sheet Frost depth, frost heave amount at ground sur-
Before placing, the purchased small pieces of plastic film should be glued together with an
face and displacement o f structures tested were
overlapped width of 5-10 cm. W h e n placing, all observed once every five days during freezing period. The depth of groundwater table was also
1527
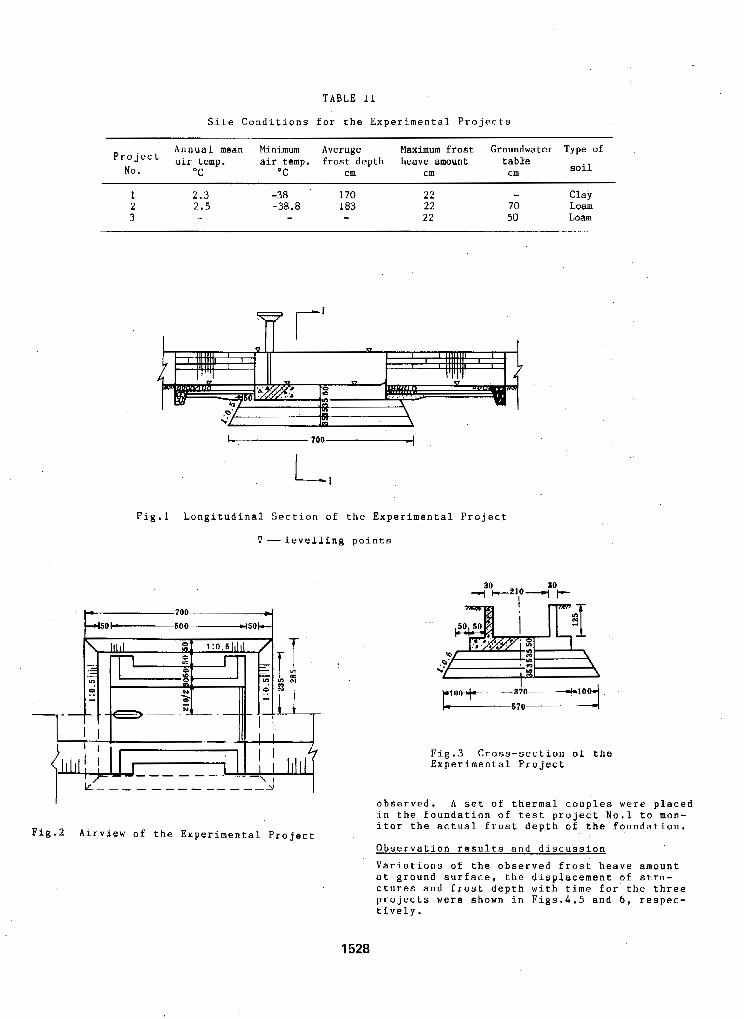
TABLE I1
Site Conditions for the Experimental Projects
Annual mean Minimum Average air temp.
Maximum frost Groundwater Type of air temp. frost depth heave amount table
No. " C O C cm cm cm soil
1 2 3
2 . 3 2.5 -
-30 -38. a -
170 22 - 183 22 70
Clay Loam
- 22 50 Loam
Fig.1 Longitudinal Section of the Experimental Project
V - l e v e l l i n g points
Fig.2 Airview of the Experimental Project
. ..
Fig.3 Cross-section of the Experimental Project
observed. A set o f thermal couples were placed in the foundation of test project No.1 to mon- itor the actual frost depth o f the foundation.
Observation results and discussion
Variations of the observed frost heave amount at ground surface, the displacement of stru- ctures and f r o s t depth with time for the three projects were shown in Figs.4,5 and 6 , respec- tively.
1528
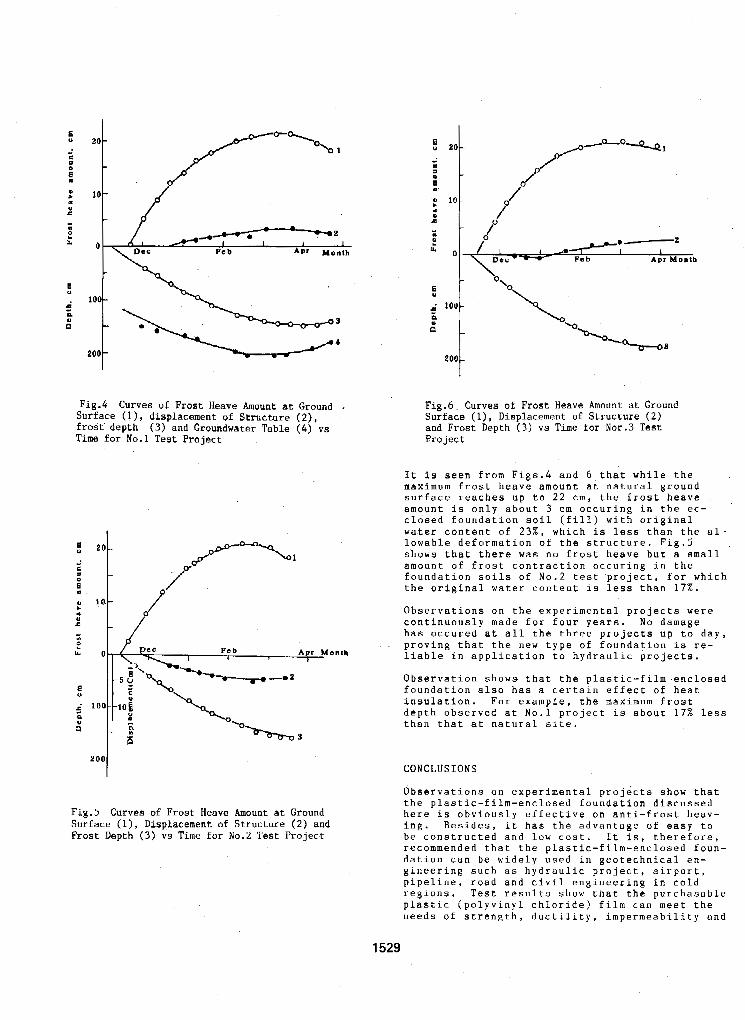
6
A 4
Surface ( l ) , displacement of Structure ( 2 ) , Fig.4 Curves o f Frost Heave Amount at Ground ,
frost depth ( 3 ) and Groundwater Table (4) vs Time for No.1 Test Project
cool Fig.5 Curves of Frost Heave Amount at Ground Surface (l), Displacement of Structure (2) and Frost Depth (3) vs Time €or No.2 Test Project
t Fig.6, Curves of Frost Heave Amount at Ground Surface ( l ) , Displacement of Structure (2) and Frost Depth ( 3 ) vs Time €or Nor.3 Test Project
It i s seen from Figs.4 and 6 that while the maximum frost heave amount at natural ground surface reaches up t o 2 2 cm, the frost heave amount is only about 3 cm occuring in the e c - '
closed foundation soil (fill) with original wa.ter content o f 2 3 X , which is less than the al- lowable deformation of the structure. Fig.5 shows that there was no frost heave b u t a small amount of frost contraction occuring in the foundation soils of No.2 test project, for which the original water content is less than 17X.
Observations on the experimental projects were continuously made for four years. No damage has occured at all the three projects up to day, proving that the new type of foundation is re- liable in application to hydraulic projects.
Observation shows that the plastic-film-enclosed foundation also has a certain effect of heat insulation. For example, the maximum frost depth observed at No.1 project is about 17% less than that at natural site.
CONCLUSIONS
Observations on experimental projects show that the plastic-film-enclosed foundation discussed here is obviously effective on anti-frost heav- ing. Besides, it has the advantage of easy t o be constructed and low cost. It is, therefore, recommended that the plastic-film-enclosed foun- dation can be widely used in geotechnical en- gineering such as hydraulic project, airport, pipeline, road and civil engineering in cold regions. Test results show that the purchasable plastic (polyvinyl chloride) film can meet the needs o f strength, ductiJity, impermeability and
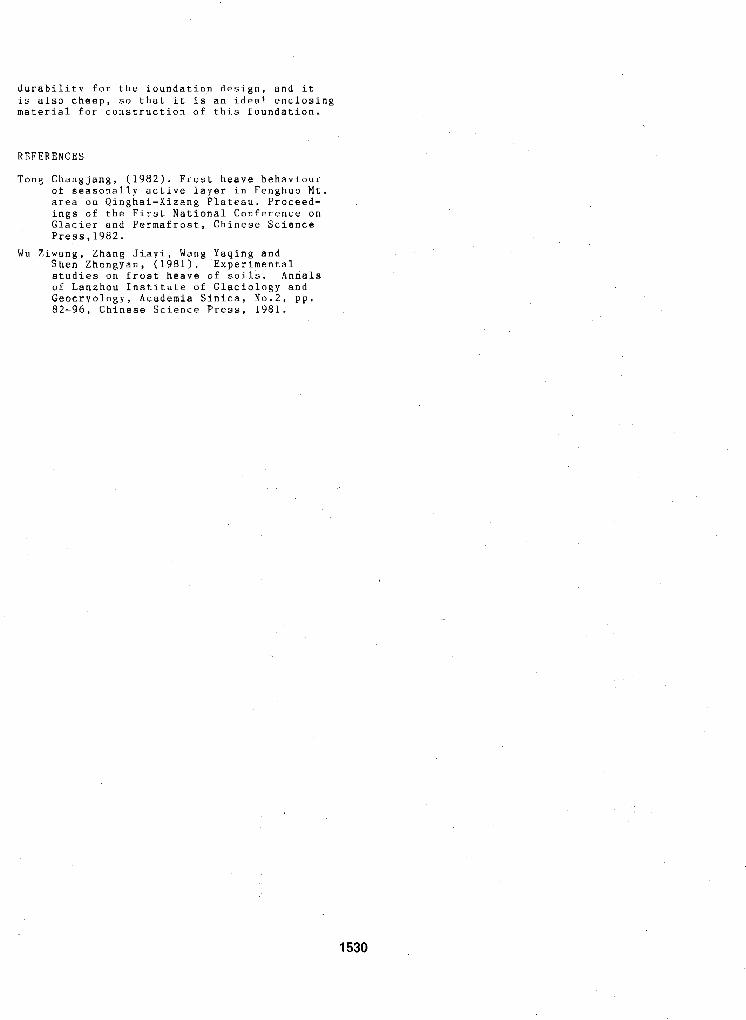
durabi litv for t h e foundation design, and it is also cheep, s o that i c is an ideal enclosing material for construction of this foundation.
REFERENCES
T o n g Changjang, ( 1 9 8 2 ) . Frost heave behaviour of seasonally active layer in Fenghuo Mt. area o n Qinghai-Xizang Plateau. Proceed- ings of the First National Conference on Glacier and Permafrost, Chinese Science Press,1982.
Shen Zhongyan, ( 1 9 8 1 ) . Experimental studies on frost heave of soils. Annals of Lanzhou Institute o f Glaciology and Geocryology, Academia Sinica, N o . 2 , p p . 82-96, Chinese Science Press. 1981.
W u Ziwang, Zhang Jiayi, Wang Yaqing and
1530
GEOCRYOLOGICAL BLOCK OF OIL AND GAS PRODUCING AND TRANSPORTING GEOTECHNICAL SYSTEMS
Y.F. Zakharovl, Y.Y. Podborny2 and G.I. Pushkd
*Engineerinpgmlogical Department, TyumenNIICiprogai, Tyumen, U.S.S.R. aEGM Trust, Urengoi, U.S.S.R.
smoPsxs Safe running of o i l and gaa producing and ~ r a n e p o r t i a g uystame In pamafrost zonm i~ provi8ed by progrese in the dbaign of hydrocarbon projeoting and constant enginemring-geolo- gical monitoring of its condition. To achieve t h i s a epocial progranrme accounting t o t h e chang- ea in mng~~ebTi~g-~eological conditiona of conetmwbiorr. and m i n g af t h e a y s t a w a B worked out
dit ion, t o p rea io t a d pravant hazardoum change@ i n $eologioal environment. ir Wmst Siberia, A the u a m a h a a rpeoial aaxviae was organized to oontrol the syetem'e oon-
To pFovido prolonged and safe running of o i l , gas and condensate produaing and transporting ,
nyetema In permafrost regions It i n v i t a l l y
ment according t o the requiremenfa of aystem neceaeary to maintain their deaign and manage-
analysis. From the eystem analynin point of view 011 and gas f ie lds a B well aa trunk pipe-
gsotechnical systems (GTS? with numerous fraa- l ines repreaunt highly or anised controlled
fornards and feedbaoks between their-subsyn- terns, blocks and elements. Apar t from these intermel relations GTS ketp various outer con( nectionn with natural. mnd mamade environment,
6TS espec ia l ly in thr Northern mgoina o f West I n this multypurpoae functional complexity o f
Siberia the main role belongs t o geocryologic blook of GTS geosphers. Thia most dynamic and
t a r o f i t n ueoond subaystsm - teohosphera - and'xegulates the majority of technological and engineerin~-geol.ogicsl procesaen i n GTS' functioning, whiah often progrssses i n extre- me coriditi0n8, For inert a c e , t o prevent thew- ing o f pipeline permafrost bedding and to avoid t d rmbaidence it was considered nece- ssary to aquj . l izs gan and ground temperaturea and t o apply apeeial constxuction teohniquea
~f due *o t eahologics l d i f f icu l f t iea of GTS and complex cooling dericsn i n as trannport,
funotionfng prevention of parmafxoat thawing does not mean possible if will make menma t o carry out the oontrolled thawing which reduc- e8 the negative aequenoes fa$ gOological en- vironment arnd technouphere, S t i l l , t o achieve t h i a one ha8 t o know the chsraoteriaticn o f geooryologic and geologioal procesaeer i n con- crete engineering-gsologiosl conditions, Typioal elements o f GTS geoeryologioal block are i ce oontent, tpperaturss , aeaaonal thaw- ing a d frrseing depth and velocity, cryogen- io P X W O O U U ~ B , thiokneas of psmafroat and it8 i n t e r r e l a t ion with wstera, cryogags. Duxinp construction and functioning o f the GTS a l l these elamante tend t o a l t e r under the direot effect o f technospheric abjecta o r throught the feedback impeat ~ f t 8 r their net- ion upon geologicaL environment. For example, though it may meem unrelated with pemafxost,
vulnerable block determinen the design chtisac-
prolanged exploitation of gas and condensate plays r e s u l t a i n their qompaction snd Ieada t o the aubstdenos of fieldla Baylight area. This subaidrnce xesulta in fisldla flooding and accumula-bions o f water omuse pemafrost
When large mount of heat ammitting con - thawing.
ry modern o i l and gal producing and transport- s t m c t i o n r ma C I Q T V ~ C ~ U ( i r e . praat ical ly eve:
ing system) appeara i n permafront Eone fhi6 procem reuults i n largeaoale franaformation of permafroat landacapes during GTS aonatxuctd ion whioh causeu permafrost dsgrabtion even
ISU of GTS geoorgologio block e lmen ta t alter- i n l o r Camperature sectionm. Coaarete parmet- a t ions dhpend on engineering-geological atruc- turs, landsoape and meteorologic oonditions o f the t e x r i t o r g , stesngtb of inten:onnec.tionu and character o f acting faotors. !Phe above - mentioned altexations - as a reault of human conotructivs and productive activity - in nouphe- 8gd i n corrOmponding ologlcal en- turn caume i n GTS ohangea i n object# of tech-
viromenta1 maaaen (8.g. grounrfwndat ions aubaidence, basement diqrmption, deformation of buildingn, nsrvice l inen and other a t m a t - urem, environment contaminstian, etc.). To prevent such dangeroua effects i n running o i l and gas producing and transporting GTS the following i s beneficial: a) A t I). deeign 8ta e of OTS creetion conmider i t s geocryologic b 9 ock (denpi t s of i t 8 comp- lexity) in cXose connection with i t a Inner and Outer ,fesdfomedds a d feedbacks with 0th- e r GTS blocka; 2.e. the deaign work should be based on complex engineering-geologic psediot- ion o f the consequences a f GTS functioning, geoaryolbgic f O X m 3 6 t included. b) While operatine; ETS conatanfly receive de- t a i lad in fomat ion concerning current inter- aation between the objects and geological en- vironment, enpeeially frozen, freeeing and thawing so i la , which i a v l t t a l l y naceasary for careful control O V ~ T technological and oneinasring-geological proteases.
A. Projeotion of oil and pas producing Rnd transporting GTS i n pemafrost zone of West
1531
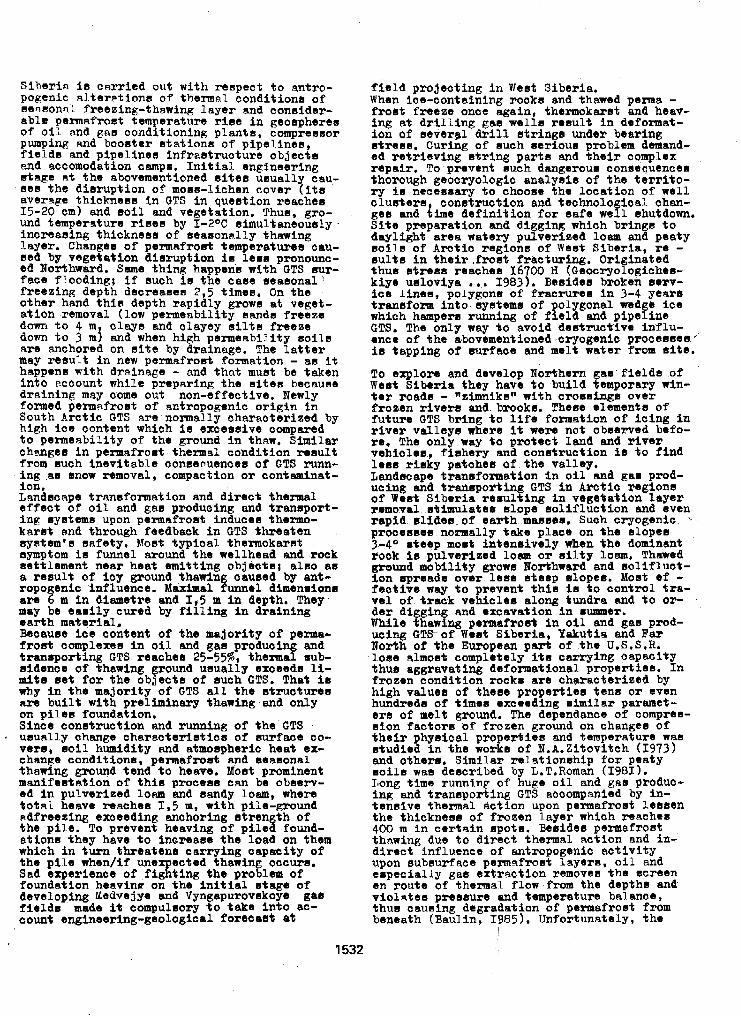
S i b e r i n i .s c ~ r r i e d out with reapec pogenic ~ l . t a r ~ . t i o n n o f thermal con
t t o antro- lditiona of
aesmns; freezing-thawing layer and consider- a b l s permafront temperature rise in geospherea of 01; ma gas conditioning plants , compxesnor pumping Rnd boonfer s t a t ions o f pipelines, f i s ldn an8 pipelines infrnntructure objects End accomodation camps. Init ial . engineering &age R t the abovementioned a i t e a usually cau- s e ~ the diaruption of mons-lichen cover ( i t a aver%@ thickness i n GTS In queation reachen 15-20 cm) and mil and vegetation. Thus, gro- und temperature rises by I -2OC simultaneously - increasing thickness of aeaaonnlly thawing layer. Changeu of permafrost temperatures cau- sed by vegetation disruption i s lean pronounc- ed Northward. Sme thing happena with GTS ayr- face Thoding; i f such i a the cane neasonal freezing depth deareaaea 2,5 times. On the other hand fh ia depth rapid1.y grown at veget- s t ion removal (].ow pemenbil i ty aanda f r t eze down t o 4 m claya and clayey s i l t a freeze down t o 3 ti15 Rnd when high permeability noi la are enchorea on n i t c by drainage, The latter may resu1.t i n new permafrost formation - an it happenn with drainage - and t ha t must be taken in to nccount while preparing the sitea beceusa drdning may come out non-effective. Newly formed permnfrost of mtropogenic origin in South Arctic GTS are normally characterized by high ice content which is 9 X C 9 8 a i V e oompsred to pemsab i l i t y o f the ground i n thmv. Similar chmngea i n permafrost thermal condition result from auch inevitable oonaenuanaea of OTS mnn- ing .BS snow removal, compaction o r contaminat-
Landscape trannfomation m d direct thermal ion,
tfPect o f o i l and gas producing and tranmport- inp ayatema upon permefroat induces thermo- k w a t Rnd through feedback i n OTS threaten syatem'n safety. Most typical fhemokarat . symptom i a Tunnel around the wellhead and rock settlement near heat emitting objeota: also am a renult of icy ground thawing cauaed by ant- ropo enic influence. Maximal funnel dimenuions are f m i n dimnetre and 1,5 m i n depth. They mey be es8ilg cured by f i l l i n g in d ra in ing earth material, Because ice content of the majority of perme- frost comglexes i n a i l and gas produaing and transporting GTS reaches 25-557, thermal sub- sidence of th8WiW ground usually @meeds li- mits aet for the objects of much GTS. That i s why i n the majority of GTS a l l the stmeturea nre b u i l t with preliminary thawing and only on p i l ~ s foundation. Sine8 conrtmction and running of the GTS unuslly change character is t ics of surface co- verm, soil humidity a d atmospheric heat ex- chanpe COnditiOn8, permafront end Iessonal tbawlng ground tend t o heave. Most prominent mmnifestation of thia procesa cRn bs observ- ed in pu'lverieed l o r n and sandy loam, where totm? heave reaches 1 , 5 m, with pile-ground
the piJ.8. To prevent heaving of pils%%l- &freezing exceeding anchoring s t r s n
at ions th8y have t o inemsue the load on them which i n turn threatens oarrging oapmity o f the p i l e when/if unexpected thawing occurs. Sad experience of f ighting the problem of
developing Xedvejye rrnd Pyngepurovnkoye gas foundation hbavinp on the i n i t i a l stage of
f ie ld8 mads it cotnpulnory t o take i n t o BC- count engineering-gsologic.1 fo~eceat at
f i e l d pxojecting in Wesf Siberi8, When ice-containing xocka and thawed penna - frouf f r eeze onae again, thamokaraf and heav- ing et d r i l l i n g gslr wells result i n deformat- ion Of severpl d r i l l atrings under bearing
ad re t r ieving atr ing par ta and .their complex ntrena. Curing o f auch ssrioua problem dsmmd-
repsir. To pssvent such dangeroun conasquences thorough gaocryologic analyaln of the ferxito- r y is nwenaary t o chooae the location o f well cluuterw, conntruction and technologiaal chen- gsa end time definition for safe well nhu-kdown. S i t e prepmation and dtgging which brfngn t o daylight area watery pulverized loam and pse ty a o i l n of Arctic ragions of Weat Siberia, re - thus r t rees reaches X6700 H (Geoczyologichen- sultn i n their .frost fracturing. Originated
trsnafom info ayntema 09 polygonal wibdge toe iae l inea, polygons of fraClWTes i n 3-4 p a r 8
which hamper8 running of f i e l d and pipeline
ence o f the abovementioned .cryogenic procemses,' i a tapping of aurfaoa an8 melt water f'xom sits.
To explom and develop Borfherm gam f i e l d s of Weut Siberia they have t o build tempOr8Ty nin- f a r roads - n z b n i k a n with crossings over frozen T~VWEI and bxookn. Theae dements o f future GTS b ~ i n g t o l i f e fornation of iding i n r iver va l leys whom it were not obmexvea befo- re. The only nay t o protect land and rivex v e h i c h ~ , Iirrhery and conutmetion i s t o find less risky patohea of the val ley . h ~ 1 d B U ~ p 8 tramfoxmation i n o i l and gan prod- ueing and t r ampor t in GTS In Arctic sagions
TM~IOYP~~ nfimulatme slope sol i f lucf ion and even of west Siberia r8SUlfing in vags*ration layer
rapid Elides. of earth maum1m. Suoh cryogenic psocesses normally take placm on tha slopea 3 - 4 O &sap mosf intenaivoly when the domiamit roak is pulvexiaed loem ox a i l t y Loam, rhawod ground mobility grown m f l t h ~ a s d ana a o ~ ~ f l u e t - ion upmads over less skeep mZopeB, Moat ef - fsotivs wag to prevsn% thia is t o control tre- vel of track vehiclem along tunare -a t o or- der digging and excavation in mummer, While %hawing permafrost i n o i l and gea prod- ucing GTiTof Weat Sibe r i a , Yakutis and Far North of tha European par t of the U.S.S.R.
thus aggravating deformationel properties. In Lose almoat completely its cerrging capscity
frozen condition roaks are characterized by high veluss o f thsae properties tens ox even hundreds of timea exceeding simmilar parmet- era of malt ground. The dependance of compres-
t h e i r physical properbiea and temperature wm sion factors o f f rozen ground on changer o f
studied i n t he ~ m k u of N.A.zitovitch (1973) end othexa. Similar relationwhip for peaty so i l s wnaa deacrihed by L.T.Roman (1981). Long tima running of h u p o i l Rnd g ~ s produc- ing and tranaporting GTS Rccompanied by in- tensive thermal action upon permafroat lsssen the thickness of frozen I.aysr which reachan 400 m i n c e r t a i n spots. Beside8 pasma~rost thnwing due t o dirtct thenn~l Rction and in- direct influence of antmpogenic activity upon subsurface pexmlfrost laysxa, oil and especial; y gas extraction rmovea the Screen en route of thermal flow from the depths and v i o l d e s pressure and temperature balance, thua causing dcgrsaatian of pemefrost from beneath (Baulin, I85). Unfortunately, the
k i p ualoviye ... 1983). maiasa broken IOFV-
GTS. The only ray ho avoid deatmctiv* influ-
? 1532
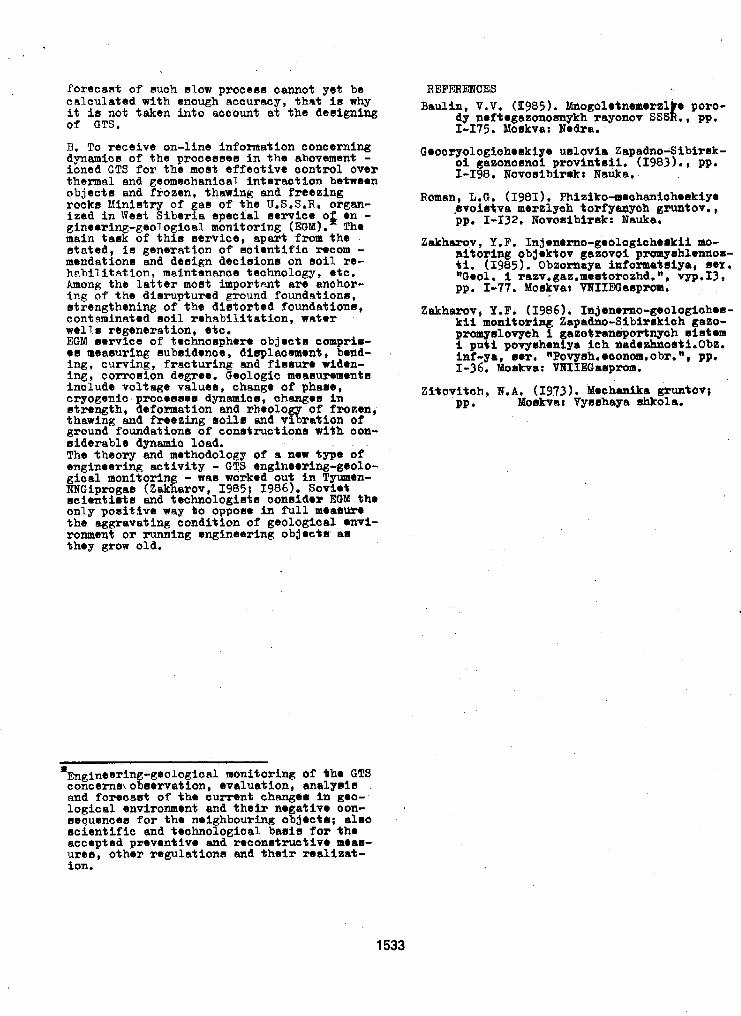
forecaat of nuch nlow process oannot y e t be calculated with enough accuracy, that i n why it is not taken i n fo account at fhs dcaignlng of GTS.
B. To receive on-line information concerning dynsmios of the proceases in the abovernent - ions& GTS Por the most effectI’ive control over thermal and geomechanical inferaeflon between objects and frozen, thawing and Preszing rocka Ministry of gam of the U.S.S.R. organ- I zed in West Sibrxia special aexviccr o r en - gin4asing-geological monitoring (EGM). The main task of t h i s service, apart from the stated, is generation o f scirntif ia mcom - mendationa and demign decisions on s o i l re- habilitation, msintenanoe technology, 4tc. Among the latter moat importent m e anchor- ing of the dimruptured ground foundations, strengthening of the dintorted foundations, contaminated s o i l smhabilitaflon, water we1 1.8 regeneration, stc EGM nerviee o f technoaphera objscfn amprim- em meeruuring subsideme, displaoment, bbnld- ing, curving, fraxlturing and Pisrurr widen- ing, corrosion degree. Geologic msesuxsmmnta include voltage values, change of phase, cryogenic procesneu dynamics, changen in strength, defonnation and rheolog of fromn, thawing =a fmszing a o i ~ s and vt%satiion of ground foundations of constructions with o m - siderable dynamic losd. The theory and methodology of a new t n i a o f emcinesrinp: activity - GTS eminsaxinff-Reolo-
only positive nag f o op@m i n full mrauum the aggravating condition of gmological @vi- ronmmf OT running engineering objectn, au they gTOW old.
1533
Author Index
Afanasenko, V.Ye., 659 Aguirre-Puente, J., 299,324 Ahumada, A.L., 661 Akagawa, Satoshi, 1030 Aksenov, VI., 333 Allard, M., 113,148,199,980 Allen, D., 33 Andersland, O.B., 1165 Anderson, Prestrud S., 666,770 Anisimova, N.P., 290 Arcone, SA., 910,927,988
Bakkehgi, S., 39 Bandis, C., 39 Barry, R.G., 119 Bartoszewski, S., 543 Baulin, V.V., 123 Beaty, A.N.S., 1363 Beget, J.E., 622,672,897 Belloni, S., 678 Ben-Mikoud, K., 980 Bennett, L.P., 683 Berggren, A.-L., 1078 Bevzenko, Y.P., 815 Bianov, G.F., 1036 Bird, K.J., 50 Bjerkelie, D., 546 Blumstengel, W., 689 Booth, G.G., 955,1242 Bosikov, N.P., 695 Bradley, G.P., 1256 Braley, W.A., 1352 Bredesen, B.A., 1206 Bdthauer, S.R., 1312 Bruggers, D., 1301 Buk, E.M., 294 Bukaty, M.B., 462 Burgess, M.M., 916 Burn, C.R., 633,700 Burns, R.A., 949 Burton, B., 436 Buska, J.S., 1039 .
Buvey-Bator, R., 123 Baek-Madsen, C., 552
Caine, N., 349 Cames-Pintaux, A.M., 299 Carbee, D.L., 1200 Carlson, L.E., 1004 Carlson, R.F., 546 Carter, L.D., 706 Carton, A., 712 Chamberlain, E.J., 308, 1045 Chang, R.V., 1298 Chapayev, A.A., 1186 Chekhovskyi, A.L., 123,1368 Chen, Fahu, 903 Chen, X.B., 304 Cheng, Enyuan, 1051,1253 Cheng, Guodong, 308 Chervinskaya, O.P., 537 Chiron, M., 922 Chizhov, A.B., 313 Chmal, H., 44 Chodak, T., 316 Chuvilin, Ye.M., 320,528 Clark, M.J., 558 Cohen-Tenoudji, E, 324 Collett, T.S., 50 Collins, C.M., 56 Cook, J.D., 776 Corapcioglu, Yavuz M., 61 Corte, A.E., 718 Cui, Zhijiu, 724
Dabrowski, K., 754 Dai, Huimin, 1212,1494 Dallimore, S.R., 127,132,224 Delaney, A.J., 910,927,988 Deng, Youseng, S16 Deschatres, M.H., 324 Desmhers, D.T., 67 Devyatkin, V.N., 815 Dijkmans, J.W.A., 728
Ding, Dewen, 329 Ding, Jingkang, 1056 Dolzhin, S., 123 Domaschuk, L., 1060 Do&, G., 1500 Dramis, E , 712 Dredge, L.A., 564 Dubikov, G.I., 333 Dubikov, G.L., 123 Dubina, M.M., 1372 Dufour, S., 1217 Dunaeva, Ye.N., 274 Dyke, L., 138
Eidsmoen, T., 933, 1282 Ek, C., 840 Elchaninov, E.A., 1377 Esch, D., 1223,1292 Esch, D.C., 1352 Etkin, D.A., 73 Evans, K.E., 568 Everett, K.R., 574
Fan, Xiuting, 1482 Fanale, F.P., 284 Fedorov-Davydov, D.C., 749 Fedulov, A.I., 1066 Feldman, G.M., 339 Feng, ling, 107 1 Ferrell, J.E., 1229 Ferrians, Jr., O.J., 734 Fortier, R., 148 Fotiev, S.M., 740 Frmsson, L., 1060 French, H.M., 683,784 Frolov, A.D., 43 1 Fujino, Kazuo, 143 Fukuda, Masami, 253 Fursov, V.V., 144 1 Furuberg, T., 1078 Frarland, K.S., 344 Fprrland, T., 344
Gagarin,V.E., 459 GagnC, R.M., 949 Gahe, E., 148,980 Gallinger, B.J., 568,599 Gavrilov, A.N., 1106 Gavrilov, A.V., 3 13 Gavrilowa, M.K., 78 Giardino, R., 744 Giegerich, H.M., 1382 Gifford, G.P., 1085 Gilichinsky, D.A., 749 Gleason, K.J., 349 Gluza, A., 448,754 Gokhman, M.R., 1413 Good, R.L., 949 Gorbunov, A.P., 154 Gosink, J.P., 355 Goto, Shigeru, 1030 Gotovtsev, S.P., 189 ciranberg, H.B., 67,159 Grave, N.A., 580 Gravis, G.F., 165 Gray, J., 862 Grechishchev, S.E., 1091 Gregerseq, O., 933, 1206 Gregory, Carrington E., 770 Grzes, M., 361 Gubin, S.V., 759 Guo, Mingzhu, 1388 Guo, Pengfei, 583 Gurnell, A.M., 558 Guryanov, LE., 1235
Haeberli, W., 764,937 Hallet, B., 770 '
Hammer, T.A., 955, 1242 Han, Huaguang, 1388 Hanna, A.J., 1247 Harris, C., 776 Harris, S.A., 364,689 Harry, D.G., 784 Haugen, R.K., 56 He, P., 304 Headley, A,, 73 Henry, K., 1096 Hinkel, K.M., 819 Hinzman, L.D., 590 Holden, J.T., 370 Holty, J., 355 Holubec, I., 1217 Hong, Yuping, 1393 Hopkins, D.M., 790
Horiguchi, Kaoru, 377 Huang, Cuilan, 442 Huang, S.L., 943 Huder, J., 937 Humiston, N., 1262 Hunter, J.A., 949 Hunter, J.A.M., 127
Ivanova, N.V., 333 Izakson, V.Yu., 1397 Izuta, H., 522
Jahn, A., 796 Jarrett, P.M., 1363 Jeckel, RP., 170 Jiang, Hongju, 1051 , 1253,1393 Jin, Naicui, 1526 Johnson, E.G., 1256,1318 Johnson, J.B., 1039 Jones, R.H., 370 Jorgenson, M.T., 176 Judge, A., 33 Judge, A X , 971 Juvigne, E., 840
Kadkina, E.L., 1036 Kane, D.L., 590 Kapranov, V.E., 1450 Karczewski, A,, 596 Karlinski, M.I., 1407 Karpov, Y.G., 484 Katasonov, E.M., 801 Kato, Kikuo, 143 Kawasaki, K., 355 Kennedy, F.E., 1262 Kershaw, G.P., 568,599 Kershaw, L.J., 599 Reusen, H.-R., 937 Khastou, B., 324 Khishigt, A., 123 Khlebnikova, G.M., 749 Khrustalev, L.N., 1102,1403 Kidd, J.G., 790 King, L., 183 Kinney, T.C., 1476 Klementowski, J., 44 Klimovsky, I.V., 189
Kondratyev, V.G., 1407 Kondratyeva, K.A., 274 Konischev, V.N., 381
Klysz, P., 84
€Conrad, J.-M., 384
Korolyev, A.A., 1407 Kovalkov, V.P., 805 Krantz, W.B., 349 Kreig, R.A., 56, 176 Krivonogova, N.F., 1268 Kronik, Ya.A., 1106 Knewinski, T.G., 955,1242 Kudoyarov, L.I., 1268 Kudryavtseva, N.N., 749 Kumai, Motov, 390 Kurfurst, P.J., 127 Kuskov, V.V., 961 Kutasov, I.M., 965 Rutvitskaya, N.B., 1413 Kuzmin, G.P., 1298
Labutin, V.N., 1066 Ladanyi, B., 1175 Lafleche, P.T., 97 1 Lalji, D.S., 1271 Landvik, J.Y., 194 Latalin, D.A., 1472 Lavrov, N.P., 1417 Lebedenko, Yu.P., 396,528 Leonard, M.L., 1121 Lewkowicz, A.G., 605 Uvesque, R., 199 Li, Anguo, 1110 Li, Changlin, 1346 Li, Xinguo, 107 Li, Xnrong, 1026 Lin, Fengton, 61 1 Lindh, L., 89 Lindner, L., 84 Lisitsina, O.M., 233 Liu, Hongxu, 11 16 Liu, Jim-du, 15 11 Liu, Jiming, 5 16 Long, E.L., 1277 Lou, Anjin, 1056, 1520 Loubiere, J.-E, 922 Lozano, N., 943 Lu, B.T.D., 1121 Lu, Guowei, 205 Lugovoy, P.N., 1407 Lunardini, V. J., 1 127 Lunne, T., 1282 Lyvovitch, Yu.M., 1454 LAg, J., 977
MacAulay, H.A., 949 Machemehl, J.L., 1422
Mackay, Ross J., 809 Mahar, L., 1121 Makarov, V.I., 1036 Makarov, V.N., 401 Makeev, O.V., 1288 Makogon, Yu.F., 95 Maksimenko, E.S., 1133 Mandarov, A.A., 615 Mangerud, J., 194 Manikian, V., 1301,1422 Marciniak, K., 406,499 Marks, L., 84 Marsh, P., 618 Martel, C.J., 1426 Mason, OK., 622 Matsuda, Kyou, 143 Maximova, L.N., 102 Maximyak, R.V., 11 86 . McHattie, R., 1292 McRoberts, E.C., 1137,1247 Melnikov, E.S., 208 Melnikov, P.I., 1298 Melnikov, V.P., 815, 1143 Meng, Fanjin, 143 1 Michel, E, 33 Migala, K., 44 Miller, R.D., 436 Mirenburg, Yu.S., 1336 Monissey, L.A., 213 Moskalenko, N.G., 165 Murray, B.M., 819 Murray, D.F., 819 Myrvang, A.M., 1435
Na, Wenjie, 11 60 Naidenok, Lye., 1307 Nakano, Yoshisuke, 412 Nelson, F.E., 819 Neukirchner, R. J., 1 147 Nevecherya, V.L., 11 52 Nidowicz, B., 1301 Nieminen, P., 872 Niewiarowski, W., 824 Nikiforov, V.V., 1403 Nixon, J.F., 13 18 Nyberg, R., 89
Ohrai, T., 522 Olovin, B.A., 418 orlov, V.O., 1441 Ostendorf, B., 574 Osterkamp, T.E., 355
Ostroumov, V.E., 425 Outcalt, S.I., 819 Omuf, J.-Cl., 830
Palmer, A.C., 1324 Pan, Baotian, 268 Pancza, A., 830 Panday, S., 61 Pang, Guoliang, 1024 Parameswarm, V.R., 1156 Parmuzin, S.Yu., 1307 Parmuzina, O.Yu., 906 Pathak, R.C., 127 1 Pavlov, A.S., 431 Pavlov, A.V., 165,218 Pelfini, M., 678 Pelletier, Y., 113 Perelmiter, A.D., 1307 Peretrukhin, N.A., 1446 Perfect", E., 436 Perlshtein, G.Z., 1417, 1450 Petrov, E.E., 1397 Pdrez, EL., 834 Phetteplace, G., 1262 Phukan, A,, 1018 Pietrucien, C., 628 Pika, J., 937 Pilon, J.A., 97 1 Piper, D., 370 Pissart, A., 840 Pizhankova, Ye.I., 313 Podborny, Y.Y., 1531 Podenko, L.S., 1143 Poklonny, S.A., 381 Pollard, W.H., 224 Polunovsky, A.G., 1454 Popov, A.I., 230,846 Porturas F., 1459 Postawko, S.E., 284 Prabhakar, V., 1262 Przybylak, R., 406,499 Pullan, S.E., 949 Puschmann, O., 1206 Pushko, G.I., 1531 Pustovoit, G.P., 1102
Qiu, Guoqing, 442 Qu, Xiangmin, 1526
Rampton, V.N., 850
Ratkje, S.K., 344 M v , A., 89
Razbegin, V.N., 11 86 Razumov, V.V., 459 Regairaz, M.C., 856 Repelewska-Pekalowa, J., 448,754 Richard, J., 862 Riddle, C.H., 1312,1318 Riseborough, D.W., 633 Rodzik, J., 543 Rogov, V.V., 381 Romanov, V.P., 454 Romanovsky, N.N., 233,1000 Romanovsky, V.Ye., 102 Roomy, J.W., 1312,1318,1330 Rosenbaum, G.E., 230 Rozhdeswensky, N.Yu., 537 Rothlisberger, H., 937
Saarelainen, S., 1466 Saito, Akira, 1030 Salvail, J.R., 284 Salvigsen, O., 194 Samokhin, A.V., 1397 Samyshin, V.K., 1417 Sasa, Gaichirou, 143 Sato, Seiji, 143 Saveliev, B.A., 459, 1472 Schmid, W., 764 Schmidlin, T.W., 241 Schwartsev, S.L., 462 Seguin, M.K., 113, 148, 199,980 Sellmann, P., 927 Sellmann, P.V., 988 Sengupta, M., 1476 SeppQfi, M., 183,862 Sergeyev, D.O., lo00 Seversky, E.V., 247 Seversky, I.V., 247 Shang, Jihong, 1520 Shchobolev, A.G., 533 Sheng, Wenkun, 442 Shevchenko, L.V., 396 Shi, Shengren, 903 Shields, D.H., 1060 Shirnizu, Osamu, 143 Shramkova, V.N., 1106 Shui, Tieling, 1160 Shur, Yu.L., 867 Shvetsov, P.F., 805 Sinha, A.K., 994,1476 Sirikiewicz, M., 824 Skowron, R., 628 Slepak, M.E., 11 86
Slepak, M.E., 1186 Sletten, R.S., 467,478 Smiraglia, C., 678,712 Smith, M.W., 473,700 Solomatin, VI., 484 Sone, Toshio, 253 Song, Baqing, 1482 Song, Zhengyuan, 1026 Stelzer, D.L., 1165 Stoker, K.J.L., 73 Stubbs, C.W., 770 Sun, Jianzhong, 107 Sun, Kehan, 1482 Sun, Weimin, 11 8 1 Sun, Yuliang, 1171 Szczepanik, W., 406
Takahashi, Nobuyuki, 253 Ter-Martirosyan, Z.G., 533 Theriault, A., 1175 Thomas, H.P., 1229 Thomas, J.E., P.E., 1488 Threlfall, J.L., 558 Tian, Deting, 1212,1494 Tice, A.R., 412,473 Timopheev, E.M., 1407 Titkov, S.N., 259 Tong, Changjiang, 11 8 1 Tong, Zhiquan, 1520 Topekha, A.A., 1446 Tremblay, C., 1500 Trofimov, V.T., 489 Trombotto, D., 263 Trush, N.I., 274 Tsibulsky, V.R.; 218 Tu, Guangzhong, 61 1 Tyurin, A.I., loo0
Ugarov, I.S., 615 Ugolini, F.C., 478 Uusinoka, R., 872 Uvarkin, Yu.T., 123
Vaikmtie, R.A., 484 Van Everdingen, R.O., 639, 1004 Van Huissteden, J., 876 Van Vliet-Lanoe, B., 840,1008 Vandenberghe, J., 876 Vasilchuk, Yu.K., 489 Vaskelainen, J., 1466 Vinson, T.S., 1324, 1330 Vita, C.L., 1330
Vitek, J.D., 744 Volchenkoc, S.Yu., 233 Volkova, V.P., 233,659 Vtyurina, E.A., 882 Vyalov, S.S., 1186,1336
Walters, J.C., 886 Wang, Bingcheng, 1024 Wang, Gongshan, 1507 Wang, Jiacheng, 5 16 Wag, Jianguo, 1014,1341 Wang, Qing-tu, 15 11 Wang, Wenbao, 1515 Wang, Y.Q., 304 Washburn, D.S., 1018 Wayne, W.J., 892 Wilbur, S.C., 897 Williams, P.J., 493 Wojciechowski, K., 543 Wolfe, S.A., 132 Woo, Ming-ko, 644,650, Wdjcik, G., 499, SO5 Wu, Jing-min, 15 11 Wysokinski, L., 84 1
Xie, Yinqi, 1014, 1341 Xie, Youyu, 51 1 Xu, Bomeng, 1346 Xu, Defu, 268 Xu, Ruiqi, 1024 Xu, Shaoxin, 1192 Xu, Shuying, 268,903 Xu, Xiaozu, 5 16
Yakovlev, A.V., 1298 Yamamoto, H., 522 Yang, Xueqin, 1056 Yang, Zhengniang, 650 Yarmak Jr., E., 1277 Yazynin, O.M., 320 Ye, Bayou, 1520 Yershov, E.D., 274,528 Yershov, V.D., 528 Yian, Weijun, 1341 Yu, Bofang, 1526 Yu, Chongyun, 11 8 1
Zabolotnik, S.I., 278 Zaitsev, V.N., 233 Zakharov, Y.E, 1531 Zamolotchikova, S.A., 237,274 Zaretsky, Yu.K., 533
%ling, J.P., 1352 Zavodovski, A.G., 1143 a n t , A.P., 284 Zhang, Weixin, 903 Zhang, Xing, 1026 Zheng, Kaiwen, 442 Zheng, Qipu, 656 Zhigarew, L.A., 906 Zhou, Youcai, 1358 Zhu, Cheng, 724 Zhu, Qiang, 1196 Zhu, Yuanlin, 1200 Zuev, V.A., 462 Zvyagintsev, D.C., 749 Zykov, Yu.D., 537
Related Documents