The African e-Journals Project has digitized full text of articles of eleven social science and humanities journals. This item is from the digital archive maintained by Michigan State University Library. Find more at: http://digital.lib.msu.edu/projects/africanjournals/ Available through a partnership with Scroll down to read the article.

Welcome message from author
This document is posted to help you gain knowledge. Please leave a comment to let me know what you think about it! Share it to your friends and learn new things together.
Transcript

The African e-Journals Project has digitized full text of articles of eleven social science and humanities journals. This item is from the digital archive maintained by Michigan State University Library. Find more at: http://digital.lib.msu.edu/projects/africanjournals/
Available through a partnership with
Scroll down to read the article.
PERIPHERY CAPITALIST DEVELOPMENT-A CASESTUDY OF THE TANZANIAN ECONOMY*
GERHARD TSCHANNERL"
1. INfRODUcnON
The causes of continuing poverty and persistent unemployment in the ThirdWorld have occupied a large number of writers, among them Baran (1957),Jalee (1968), Frank (1969) and Rodney (1972). Some have concentrated onthe flow of wealth from the underdeveloped countries to the metropole, otherson the devastating effect that this continuing exploitation has on the internaldevelopment of the Third World. They all agree that the source of the problemis not to be found within the Third World-such supposed reasons beingculture, climate, population growth, leadership, etc.-but with the interna-tional capitalist system.
The stunted development of the Third World on the periphery ofinternational capitalism has been analysed in some detail by Samir Amin.Central to his argument is the need for the capitalist system to combat thetendency for the rale of profit to fall. The process of capital accumulationhas three ways to offset this tendency:
(i) Increasing the surplus value of production at the centre of thesystem (through greater productivity, monopoly control over prices,etc.), which also increases the explmtarion of the working class,
(ii) Extending capital production in new areas where, through un-equal exchange, the surplus value is relatively greater, and
(ill) Squandering of profits and other unproductive expenditures' whichcannot be profitably invested (1970, p. 197).2
The relationship between developed capitalist countries and the ThirdWorld revolves around the second alternative, the expansion of monopolycapital into new areas. Whatever form it takes-aid, trade investment, tech-nical assistance, "exchange of ideas", t~nol~v transfer-the relationshipis permeated by the drive at the centre for new profitable investments. Thesecomparatively greater profit margins are to be found primarily in agricul-
• An earlJier draft of this paper was presented at the World University ServiceAfrican Regional Seminar on the Relationship of Population Growth to EconomicGrowth, 2-6 May 1974, Dar es Salaam. I am grateful for the comments ofseveral friends, particularly S. Rugumisa and Issa Shivji. They pointed to somefundamental weakness in my approach as regards the failure to deal with theprocess of periphery capitalist development as a whole. In spite of the subsequentrevisions I made, the basic problem with the approach still remains.
.. Gerhard Tschannerl is a Senior Research Fellow, Bureau of Resource Assessment5 and Land Use Planning, University of Pllr ~ Salaam.

ture and mining," aad also to some extent in light industries, but not in UTAFITI
heavy industries. The "comparative advantage" of the periphery countriesis fundamentally the lower cost of labour, while in manufacturing, particularlyin the heavy industries, the advantage goes to the developed capitalistcountries because capital and technical know-how are the decisive factorsfor those activities. Investment in the periphery countries gravitates towardsproduction of exports in agriculture and mining to supply the manufacturingindustries in the centre countries, and under some circumstances towardslight industries for the manufacture of consumer goods.
The speoific form that the domination by international capi'tal takes isa function of the social formation of the underdeveloped country. It is notcorrect, as is often done, to view capitalist development in the Third Worldcountries as the gradual replacement of communa:lism and feuda:lism by thecapitalist mode of production, a unidirectional movement from "ancient"to "modem". One of the characteristics of underdevelopment is that thecapitalist mode, even though it is the most prominent one, continues tocoexist and grows around the pre-capitalist modes. The function of thelatter is thereby transformed, but not eliminated. (See Samir Amin, 1974b.)
The introduction of market relations, which is a pre-requisite formonopoly capitalist penetration, is not synonymous with the replacementof pre-capitalist modes of production. It rather amounts to the creation of asocial formation which can be typified as being periphery capitalist, inwhich the capitalist mode dominates but is intertwined with communalism,feudalism, and to some extent slavery, as the case may be. Thus the vitaltransformation required for capitalist penetration to take place is not thereplacement of pre-capitalist modes but their encirclement, the object ofwhich is to syphon off part of the meagre surplus that is generated underpre-capitalist relations.
Once the now advanced part of the developed capitalist world-Europe,North America, and Japan-passed in their historical development the stagewhere the primitive accumulation of capital dominated, agriculture playeda decisive role in their further advance. But there, unlike what is happeningin the Third World countries today, the surplus generated in agriculture wasre-invested internally, mainly to produce light consumer goods and capitalgoods. Better agricultural implements and machinery meant greater produc-tivity of labour and a higher income to the farmer. This in turn created ademand for mass consumption goods which stimulated the growth of industry.The agricultural labour force which had to leave the land was graduallyabsorbed into industry.
The important characteristic of this development is that it was self-centered. The driving forces in that process were internal to the system.The central determining relationship of a self-centred system, in the past aswell as now, is the interaction between the production of mass consumption~oods and the production of capital goods. The difference between a self- 6

UTAFITI centered and an externalIy-oriented system, according to Samir Amin, canbe shown by a four-sector model of the economy.
(i) Exports,(ii) Mass consumer goods,(ill) Luxury consumer goods,(iv) Capital goods.The determining relationship in a self-centred system is between mass
consumption goods and capital goods. continually raising the productivityof labour and increasing the ability of the masses to buy consumer goods.in an externally-oriented economy, however, the main interaction is betweenexports and luxury consumption goods. The driving force for developmentin the Third World countries is the need for monopoly capital to fight thedeclining rate of profit at the centre by seeking profitable investments in theperiphery. These comparatively greater profits are found in export-orientedagriculture, mining and occasionally in light industries. because the produc-tion costs for similar products are lower there than at the centre due tocheaper labour.
"This is therefore the framework for the essential theory of unequalexchange. The products exported by the periphery are important to theextent that-ceteris paribus, meaning equal productivity-the returnto labour will be less than what it is at the centre. And it can be lessto the extent that society will. by every means-economic and non-economic-be made subject to this new function: provide cheap labourto the export sector." (Amin, 1974a).
But the low earnings of those engaged in producing export commoditiesdo not provide the purchasing power which could stimulate the growth ofa mass consumption goods industry. At the same time parasitic social classesarise within the periphery country which exert a demand for luxury goods.They perform an important function in this mode of development by ensur-ing the smooth flow of exports and by instituting measures which keep thewage rate at a low level. The demand for luxury goods is partly satisfiedby imports, and partly by performing the final stage of their manufacturelocally, known as import substitution. The growth of these relatively capital-intensive industries, which produce primarily consumer durables, not onlyabsorbs a good part of the export earnings, but also a large proportion oflocal capital and other scarce resources (especially skilled man-power). Anadditional constraint on industrial growth is the imposed requirement thatlocal industries must be able to compare with those making similar productsat the centre, i.e .• show a profit within the price structure of the interna-tional market. This requirement, combined with the absence of a sizeabledemand for mass consumption goods. results in the near absence of industries
7 producing mass consumption and capital goods. The growth of the national

economy is severely hampered, leading to a further increase in inequality and UTAFlTI
to impoverishment of the large majority of the population.The result is the marginalisation of the masses. The income of the
peasantry and the proletariat remains low, and unemployment and under-employment tend to rise. Unlike at the centre where cyclical unemploymentis an integral part of the economy and those out of a job are re-absorbedduring an upswing, at the periphery the unemployment is chronic and'permanent. This situation has led to the coining of the term "labour
l.alistocr~Y" for those few who are able to get a regular job, but it is wrongto consider them as a class exploiting the peasants because they are workersand have no control over the means of production; they too are exploited bythe bourgeoisie. The hope for better employment, education for their children,and a more attractive life in the cities makes many peasants leave .the land.This is compounded by the upheavals caused by the gradual transformationof agriculture from a subsistence to a cash economy and a land shortagein certain localities. Artisans, who previously manufactured most of thearticles needed by the peasants, are driven out of business by the competitionfrom imported goods or by locally established industries with a muchgreater capital investment than in the artisans' workshops. Instead offorming the nucleus for the growing manufacture of mass consumptiongoods, their skills cannot be utilised in the capital-intensive productionmethods, and they join the unemployed.
The advocates of population control want us to believe that this situationis caused by over-population. Carefully avoiding an analysis of the socio-economic forces which are ultimately responsible for this condition, theyproduce simple calculations to demonstrate their point. The availableresources in the country, they maintain, have to be divided by the populationto find out how much each person can get. It follows that the smaller thepopulation, the greater the amount available per capita! 4 This kind ofargument rightly assumes (but does not state this assumption) that only acertain proportion of an underdeveloped country's population can be gain-fully employed, producing a surplus for investment in machinery, education,roads, etc. But as long as the country's economy is externally-oriented, un-employment and poverty will persist. The high rate of population increaseis not the cause of these problems but can under some circumstances be acontributing factor.
Although the underdevelopment of the periphery countries is the resultof capital accumulation, the external orientation of their economy must bepursued by appropriate measures within. At an earlier stage of monopolycapitalist development this was achieved by military conquest, and religiousand economic penetration, followed by colonial rule. During tbis phase ofdomination, the introduction of capitalist production relations in the spheresof agriculture, education, wage work, transport, trade, etc., was carried outby the colonial rulers. Through the power of the state they controlled all 8

UTAFITI vital aspects of the economic, political and social life of the colony.The attainment of political independence meant that the power ofthe state was taken over by the country's emerging petty bourgeoisie.By that time capitalist production relations had been introduced to suchan extent that they formed the dominant, although not the sole, mode ofproduction in the social formation of the ex-colony. The particular formof social relations varied somewhat from one country to another, but in allcases did the petty bourgeoisie play a decisive role not only in the strugglefor independence but also in perpetuating and strengthening their relation-ship with the international bourgeoisie. This privileged class was therebyable to move into a position which allowed it to enjoy a "European" patternof consumption. In the economic sphere this minority now continues tocarry out the transformation towards production for the market, the streng-thening of the export sector, and the growth of luxury goods production. Onthe social front it further develops the superstructure in education, culture,ideology, etc., that corresponds to periphery capitalist development.
The emergence of a "parasitic" class manifests itself through theinordinate size of :the service sootor5 in compariSOll1with the industry sector(manufacturing, public utilities, and construction). The contribution of theservice sector to total Gross Domestic Product (GDP) is 40% in Europe,50% in the U.S., and 30-60% in the underdeveloped countries (Amin, 1970,p. 215). For the developed countries the industry sector has about thesame size as the service sector, but for the under-developed countries it ismuch smaller. A similar pattern can be found in the distribution of employ-ment. This points to the parasitic nature of the service sector which is mainlyoriented towards exports and luxury consumption, including an emphasison unproductive investments. An important element in the size of the servicesector is the rapid expansion of the state bureaucracy.
2. TANZANIA'S ECONOMY: PERIPHERY DEVELOPMENTThe Tanzanian policy as stated mainly by President Nyerere and the
party, TANU, aims at a socialist society. The country had inherited a typicalcolonial economy at the time of independence in 1961. A good part of heragriculture had already been transformed into the production of cash cropsand her manufacturing industry consisted almost entirely of the processingof agricultural products for export (Rweyemamu, 1973, p. 111). The locationof towns, the infrastructure (such as the transport network), and private andgovernment services were all geared towards the colonial economy. Throughschooling, religion, and in other ways, a solid foundation had been laid forthe country's transformation to a social formation in which the capitalistmode of production predominates, not as an equal to the colonisers, but asa dependent junior partner on .he periphery of the international capitalistsystem.
9 The shift in official policy towards socialism came in 1967 with the

Arusha Declaration and the subsequent nationalisation of a number of UTAFITI
companies, including all banks. Since that time the public sector of theeconomy has been growing at a faster rate than the private sector, andmost of the large manufacturing companies are now either wholly or partlystate-owned. Rural development is also given considerable importance throughthe formation of nucleated villages, the provision of water supplies, educa-tion, health facilities, and transport.
Since then Tanzania has become for some people a model of a newnon-revolutionary path to socialism for under-developed countries. The firststep in this postulated transformation is a successful struggle by the weak:but growing petty bourgeoisie in alliance with the working class for nationalindependence by democratic means. The second step is the gradual elimina-tion of the ties with monopoly capitalism and a simultaneous build-up of theproductive forces within. Such a progression is historically impossible sincethe petty bourgeoisie, which led the independence struggle in the countriesof sub-Saharan Africa., formed an alliance with the working class only forthe specific purpose of overthrowing colonial rule. Once the petty bourgeoisieacquired state power the reason for the alliance vanished, and the contradic-tions between itself and the working class emerged in fun force. The struggleitself, and the parties that led the struggle, were never guided by a proletarianideology.
The introduction of certain measures by the state, which in the contextof a social formation where the working class is in power would constitutea step forward in the socialist transformation, does not necessarily have thesame effect in the independent countries of Africa, and is likely to havethe opposite effect: to enhance the process of surplus appropriation by theexploiting classes. Measures such as checks on income inequality, nationa-lisation of private property, comprehensive economic planning, administrativedecentralisation and small-scale industries, are necessitated by the peripheralnature of the capi'ta!list formation. Through a low surplus generation 'in com-parison with the central capitalist formations-due to the continuing back-wardness of production-and a flow of part of this surplus from the peripheryto the centre, the dominant classes in the periphery are in a relatively weakposition, serving the international bourgeoisie while at the same time standingin contradiction to it.6 This dual role of these classes which hold the statepower lies aIt the heart of the confusion about whether there exist classes inthe periphery countries. Related in part to the relative backwardness of theproduction forces, the role of the dominant classes at the periphery is ofnecessity markedly different from that at the centre .. The class relations in Tanzania conform in their broad outlines to thoseIn the rest of su?-Sahar~ independ:nt Africa. There is a large peasantry,most.ly engaged m subsistence farmmg but increasingly drawn into com-modIty exchange, a small but militant proletariat, and a petty bourgeoisie. 10

UTAFITI The latter is composed of a number of segments, the most prominent ofwhich-since it merges state power with economic power-is the bureaucraticbourgeoisie, comprising the top political, administrative, and economic func-tionaries of the state (Shivji, 1974, pp. 80-116). Lastly there is the metropolitanbourgeoisie which is the dominant class in the international capitalist system.It is geographticaHy located at the centre and exerts its power over 'the inde-pendent peripheryoountries through the respective petty bourgeoisie incountries where no nationatl bourgeoisie exists.
The structure of Tanzania's economy reflects the prevailing class rela-tions. It will be shown that it is typical of periphery capitalism, with a strongemphasis on the export of agricultural and, to a lesser extent, mineralproducts, and with the virtual absence of domestically-produced capitalgoods. That this was the pattern during colonial rule is well known, butthat it has continued since independence virtually unchanged needs to beempirically demonstrated. If some progress had been made towards disengage-ment from international capitalism, this should be apparent in the relationsof production including the economic structure. To test whether such a shifthas taken place, a time comparison is made for key elements of the economicstructure: foreign trade, the determining relationship (according to SamirAmin's four-sector model), and the distribution between agriculture, industryand services, and their composition.
There has been no significant shift of the economic structure away froma dependency relationship since the Arusha Declaration. Those changes whichhave occurred can be ascribed primarily to two factors. One is the tremendousfall in the world price for sisal and the resulting drop in production, whichbrought sisal down from the number one export crop at the time ofindependence to fifth position by value in ]972. The other is the largeamount of assistance received from China for the building of the Tanzania-Zambia Railway (TAZARA). The loan agreement of 1968 was for 2,865million shill'ings, including Zambia's part and local costs. But this projecthas so far not made a significant impact on the structure of Tanzania'sinternal economv. If the loan for TAZARA and the resulting trade withChina are elimin~ted from Tanzania's foreign trade staJtistics, the pattern whichexisted before the introduction of TAZARA reappears unchanged.
Another large aid project with China is the exploitation of the ironore and coal deposits in the south-western part of the country. An aid agree-ment for 525 million shillings has recently been signed with China "toassist Tamania to construct complete projects, to render technical coopera-tion, to provide equipment and to supply general commodities, and to meetthe local expenses which may be incurred in the implementation of theproject" (Daily News, 2nd ;\pril, 1974). To establish stroh an industry wouldconstitute an important step forward for the growth of a self-centred economy(in contrast to an externally-oriented one), but it cannot in itself lead towards
11 disengagement. This requires a parallel change in the class formation without

which an iron and steel industry will fail to provide the required push UTAFmtowards a rapid growth of the productive forces.
FOREIGN TRADE
The model of periphery capitalist development assigns a decisive roleto foreign trade. The periphery countries carry out a vigorous trade withthe centre countries mainly in the export of primary goods and the importof capital and luxury consumption goods. This constitutes the largest part ofthe trade for the periphery countries, and they trade very little among them-selves. The countries at the centre, on the other hand, trade primarily withone another, and less with the periphery. Thus 80% of the trade of developedcountries takes place between them and 20% with the under-developedworld, while only 20% of the latter's trade takes place within and the restwith the developed countries (S. Amin, 1970, p. 27).
(i) Tanzwua's ExportsThe trade pattern of Tanzania is essentially the one of a country deve-
loping on the periphery of the international capitalist system. Table 1shows that all the main export items are primary products with very little,if any, processing before export. Such processing as does take place isrequired for export in order to reduce the bulk and to avoid spoilage intransport overseas: meat is tinned, tobacco is cured, cotton is ginned, etc.The biggest change from 1962 to 1972 in the relative importance of thevarious items has occurred with sisal, which was by far the most importantexport crop in 1962, accounting for 28% of the total value of exports, anddropping to a mere 7% by 1972. This is due to the fall in the world pricefor sisal and subsequent cut-backs in production. Other changes whichoccurred are the increase in ,the export of cloves from Zanzibar and theexport of SOUlepetroleum products refined frOllI imported crude oil sincethe building of the TIPER Oil Refinery in Dar es Salaam. In all other respectsthe pattern of exports has remained the same since the time of independence.
The total value of exports increased rapidly in the years after inde-pendence but levelled off later on: it rose by 51% from 1962 to 1967, butonly by 25% from 1967 to 1972. The five largest export items in 1972 wereall agricultural products, and together amounted to 60% of total exports byvalue in 1972. Exports make up a large part of total GDP: the value of allexports amounted to 27% of GDP in 1962, 25% in 1967, and 22% in 1972.Total exports, in fact, constituted 46% of the value added in the agriculturesector in 1962, 58% in 1967 and 54% in 1972 (Table 1). The compari-son between the value of exports and the value added in the agriculturesector is, however, not fully valid since other sectors also contribute acertain amount to the value of exports. It is nevertheless evident that alarge proportion of agricultural production is for export, somewhere between22 and 54% of value added in agriculture.1 A similar result Was obtained 12

UTAFITI from the 1967 population census where 30% of the households on theTanzanian mainland reported growing either cotton, coffee or cashewnutsas their main agricultural produce (Egero and Renin, 1973, p. 151).
Table 1: Value of exports 1962-1972 (Per cent of total value of exports; includes E.A.countries)
Commodity 1962 1967 1972
Coffee (unroasted) f1 14 18Cotton 13 15 17Cloves 4 5 11Cashewnuts 4 5 7Sisal (fibre and tow) 28 12 7Petroleum products 0 8 6-Diamonds 10 \3 6tTobacco (unmanufactured) 0 2 3Tea 3 3 2Oilseeds, nuts, and kernel 4 3 2Meat and meat preparations 4 3 2Hides and skins 3 2 2Other 16 16 17
Total 100 100 100
Total value of exportsMillion Shillings 1,141 1,728 2,169
Per cent of total GDP (at current 27 25 22prices)
Per cent of value added in agricul-ture sector (at current prices) 46 58 54
-Figure for 1971 from Economic Survey 1971-72.tFigure for 1971 from Quarterly Statistical Bulletin, September 1973.
Source: Economic Survey 1971-72, Tables 1, 11 and 13. Quarterly Statistical Bulletin,September 1973.
A closer look at trends in the export of agricultural crops reveals greatfluctuations over time (see Appendix C). The output ofa:llthe principalagricultural crops exported from the mainland-coffee, cotton, sisal, cashew-nuts, tea and tobacco-has been rising, except for sisal. The total valueexported for the five crops increased by 27% from 1962 to 1967 and by30% from 1967 to 1972. The increase in the second five-year period, how-ever, occurred only in the last year, with prices as well as quantity exportedhigher for most crops as compared to previous years (Appendix C).
The slow rise in exports and the high fluctuations from one year to the13 other is largely due to adverse terms of trade which Tanzania is confronted

with. Other factors, such as rainfall, transport difficulties, disruptions due UTAFITI
to the villagisation programme, also have a bearing, but they are not themain driving force. The index of export prices for the five crops, givenin Table 2, shows that prices of several crops feH from 1960 to 1966 anddid not improve substantially until 1971. A considerable rise in prices thenoccurred in 1972, which was also parallelled by a substantial increase in thequantity exported for aH five crops, except sisal (Appendix C). The indexof consumer prices is added on the bottom of Table 2. We can see thatconsumer prices far outpaced the export prices vf the five main crops overthe entire period, with the exception of cashewnuts from 1960 to 1970.
Table 2: Export price index of main crops 1960-72 (At current prices; 1960=1(0)
Crop 1960 1966 1967 1968 1969 1970 1971 1972*
Coffee 100 91 93 101 91 92 98 122Cotton 100 102 91 93 90 121 III 117Sisal 100 80 67 57 63 56 57 64Cashewnuts 100 122 114 112 127 130 109 116Tea 100 99 100 94 89 85 83 82
Consumer Indext 100 III 114 118 119 123 127 140
*Estimated from value and quantity of exports. See Appendix C.tRetail price index of goods consumed by wage-earners in Dar es Salaam.Sources: Economic Survey 1971-72, Table 17. Quarterly Statistical Bulletin, September 1973.
Two further characteristics of the Tanzanian pattern of exports, whichis common to all under-developed countries, should be noted. One is thediscontinuity between production to satisfy the domestic demand and theproduction for export. At least three-quarters of the marketed productionof each of the five main export crops, except for tobacco, is exported,swhich means that most Tanzanian export products have no, or only a verysmall internal market: domestic consumption is incidental to the produc-tion of the main export crops. Just the opposite is the case, however, inthe developed countries: their exports are incidental to production for thedomestic market and in general only the spill-over is exported.
The other characteristic concerns the linkages between production ofexport commodities and other sectors of the economy. As can be expectedgiven the nature of these commodities, the linkages are very weak. Domesticinputs into export production-aside from transport and construction-arelimited to small miscellaneous items, such as agricultural insecticides andfertilisers, and cordage and ropes.9 Worse stiU,the production of primarygoods for export creates a demand for other actiVities, notably transport,construction and services, which is incompatible with balanced developmentand channels the meagre proceeds from the foreign sale of these commodi-ties into expenditures which do not stimulate the rest of the economy. 14

UTAFITI (ji) Import.}
A marked shift occurred between 1%0 and 1971 away [mm the importo~ consumer go:)ds and towards capital and intermediate goods. Table 3shows that consumer goods dropped from 35% of the total value of importsin 1967 to' 27% in 1971. The absolute value af imported consumer goods,however, actually increased from 578 to 722 million shillings. while theimport a: capital gODdsincreased 2.1 limes and intermediate goods 1.7 timesin that period. The largest rise occurred for machinery other than transport,which increased by a factor of 2.4. Much of this change is due to' construc-tian of the Tanzania-Zambia Railway (TAZARA): imparts for TAZARAamaunted to 430 million shillings in 1971 (Economic Survey 1971-1972,p. 13). But even if TAZARA is excluded, a strang trend of imports awayfrom consumer goods and towards capital and intermediate goods remains.
Table 3: Composition of imports 1967-71 (Per cent of total value of imports; includes E.A.countries)
Type of Commodity 1967 1971
Consumer goods:(including a portion of passenger cars) 35 27
Intermediate goods:Building and construction materials 14 9Other 27 34Total 41 43
Capital goods:Transport equipment 8 8Other machinery 16 22Total 24 30
Grand total 100 100
Total value of imports, Million Shillings 1,625 2,688
Source: Economic Survey 1971-72, Table 9.
The composition of Tanzania's imports is in confonnity with thegeneral model of periphery capitalist development. It places heavy emphasisan importing capital goods-in fact nearly all the capital goods are imported-while the import of consumer goods has declined, being replaced by localimport-substituting industries. such as those producing beverages. tobaccoproducts, and textiles.
(iii) The Trading PartnersOne of th~ characteristics of periphery capitalist development is that the
underdeveloped countries trade primarily with the .centre and very little15 with one anather. This is also the case for Tanzama. aithough there has

been a trend away from the heavy dependence on U.K. and on the develaped UTAFincapitalist world as a whole.
Table 4 gives the destination of Tanzania's exports. The bulk of thedeveloped capitalist world received 79% of the total exports in 1962-areflection of Tanzania's colonial heritage. This had dropped to 64% by1967 and went down further to 59% in 1972. It is hardly surprising thatexports to U.K. showed the biggest decline, but the share of the otherdeveloped countries also decreased. Exports to socialist countrie's increasedsubstantially from nearly zero in 1962 to 8% in 1972 on account of increasedtrade with China. TIle share of Third World countries including Kenyaalso increased, from 18% in 1962 Lo27% in 1972, which was almost entirelydue to' the spectacular increase af exparts to' Zambia.
Table 4: Destination of exports 1962-72 (Per cent of total value of exports from Tanzania)
Region 1962 1967 1972
Developed Capitalist coun triesU.K. 32.6 27.3 15.0Western Europe (excluding U.K.) 22.7 17.8 17.9North America 10.0 6.8 7.5Japan 3.8 3.9 3.5Hong Kong and Singapore. 6.9 6.8 7.4Others 2.9 1.8 2.0
Total 78.9 64.4 53.2Socialist Countries
China 0 3.4 6.2C.M.E.At 0.3 3.2 1.8
Total 0.3 6.6 8,0Third World
Kenya and Uganda 5.7 4.8 6.2Zambia 0 7.1 8.4India 7.4 6.2 7.9Other African countries 2.4 1.9 2.4Other non-African countries 2.8 4.0 2.4
Total 18.3 24.0 27.2Others unspecified 2.5 5.0 11.4
Grand Total P.:r cent 100,0 100.0 100.0Million Shillings 1,141 1,728 2,160
.Hong Kong and Singapore are included under developed countries because they serve asimportant trading centres for international capitalism.tCouncil for Mutual Economic Assistance comprising Eastern Europe and the USSR.Sources: Economic Survey 1971-72, Tables 12 and 13.E.A. Community Annual Trade Reports
1962, 1967, 1972. Quarterly Statistical Bulletin, September 1973. 16

UTAFITI The saurces af imports, given in Table 5, are similarly distributed.The developed capitalist world furnished 54% af all imports in 1962, 62%in 1967, and 56% in 1972. Even though their share of total importsremained nearly the same, the emphasis shifted away from U.K. to the othercauntries of Western Europe, to' the extent that the latter supplied 25% ofall imports in 1972. The biggest change aver the ten year period was theemergence of China from no trade to the second most important source ofimports in 1972. This raised the share af socialist cauntries from 1% in1962 to' 19% in 1972. This isolated case af trade outside the capitalistsystem-trade with the other socialist countries is insignificant-is due to'Chinese assistance for the Tanzania-Zambia Railway and the related importof goods not directly linked to this project. The propartian of imports fromthe Third World has been falling from 33% in 1962 to 22% in 1972, whichwas due to a rapidly declining share of imports from the other two partnersaf the East African Community, (i.e. mostly from Kenya).
Table 5: Sources of imports 1962-72 (Per cent of total value of imports into Tanzania)
Region 1962 1967 1972
D£'velope£/ Capitalist Caul/triesU.K. 262 23.5 15 8Weslern Europe (excluding U.K.) 12 5 23.1 25.4North America 5.1 8.4 6.2Japan 9.8 4.2 5.6Hong Kong and Singapore. \.6 2.0 0.8Olhers o 7 0.8 2.1
Total 53 5 62 0 55.9Socialist Countries
China 0 4.4 17.3C.M.E.At 0.9 2.8 1.8
Total 0.9 7.2 19.17hird World
Kenya and Uganda 21.5 17.2 11.3India 5.4 2.7 1.4Other African countries \.0 0.4. 0.9Other non-African countries 5.0 7.8 8.7
Total 32 9 28.1 22.3Others unspecified 102 2 7 27
Grand Total: Per cent 100 0 100 0 100 0Million Shillings 1,127 1,625 2,929
.Hong Kong and Singapore are included under developed countries because tbey serve asimportant trading centres for international capitalism.tCouncil for Mutual Economic Assistance comprising Eastern Europe and the USSR.Sourus: Economic Survey 1971-72, Tables 10 and 14. E.A. Community Annual Trade Reports
17 1962,1967, 1972. Quarterly Statistical Bulletin, September 1973.

Trade with Kenya and Uganda has been small compared to the developed DTAnncountries: their combined share of exports remained an the same level ofabout 6% of total exports between 1962 and 1972 (Table 4). Impofltsfrom the two partner states were very prominent in 1962, amaunting to21% af the total. but had dropped to 11% in 1972 (Table 5). ,In ab~l~teterms the value of imports from Kenya and Uganda has been slIghtly nsmgOver this period. Kenya's c.ontribution to' Tanzania's imports is several timesthat of Uganda. This colanial division of production within East AfricastiB c.ontilll7cs taday, aided by Kenya's open-door policy far fareign investment.
:THE DETERMINING RELATIONSHIP
The faur-sector model, discussed in Sectian 2, distinguishes between aself.centred ecoilOmy where the determining relationship is between theproduction of mass consumption and capital goods, and an externally.oriented one where it is between expoT'ts and luxury consumption goods. TO'show the relative size of these four sectors, it is necessary to appropriatelyclassify the relevant industrial activities taking place in Tanzania. The modelis centred around the process of capital accumulation and, therefare, onlycancerns productive activities in ,the sense that through them social wealthis created from nature, which also means that they have a potential forgenerating social surplus. This does not mean that a social surplus resultsfrom every productive activity. When the productive forces are at a lowlevel and there is accordingly a small division of labour, no appreciablesurplus can be produced.
To be included in the four-sector model an industrial activity must,therefare. first meet the condition of being productive and taking place inthe country, and secend af having developed to' an extent where it iscapable of producing a social surplus. A third condition is that it must bein the monetary sector-in distinction frem the subsistence sector-whichmakes it possible fer the baurgeoisie either directly or via an intermediaryclass to appropriate all or part of that surplus value.
A serieus drawback with the four-secter model is that it cannot incor-porate the vital role played by pre-capitalist modes of production whichare present along with the capitalist mode in the social farmations ofthe periphery capitalist ceuntries. But when considering the process ofcapital accumulation-the heart af Tanzania's externally-oriented ecenamy-we cannot quantitatively include the se-called subsistence sector, which fallsmostly under the communal mode of production. It generates very little surplus-the productive force i5 lew and so is the divi~ion ef labour-and is, there-fore. unable to produce a surplus large enough to' be transferred intO' thesphere of the capitalist mode ef productien and contribute to' capital accu-mulation:The subsistence. secter, hawever, is an integral part of the social!oI'1l1atiOl)~.. 9f under-developed countries. While the capitalist mode iscontinuously eroding the ether med~ of production that are. present as 18

'Ul'.\Fm remnants of previous social formations, its own peculiar' growth. on theperiphery of the capitalist system is dependent on the continl,led existenceof these other modes. The relationship is very intricate .and hasmany different aspects to it. Its specific form not only ..varies fromone social formation to another, but depends also .on' local factors; Onlytwo important ways in which the capitalist mode draws on the other modeswill be mentioned here. One is as a reservoir for labour, to which the un-employed return and which a large part of the proletariat never leavescompletely, maintaining a "home" base in agricU'lture through' dose relatives,somerimes even the wife, to supplement the satisfaction of the family's needsand to return to it if he becomes unemployed. The other is the ext~tionof surplus, even though very little is generated, from production under thepre-capitaHst modes through the supply of certain' commodities to thepeasants which the latter cannot produce such as cloth, or have been persuadedto acquire such as electric torches. This exchange, which is in the form ofcommodiJties, money. or labour. power, and when on credit carries anexorbitant interest rate, is unequal.
Table 6: The four-sector distribution in Tanzania 1970
Sector ValueMillion Shs. Per cent
Exports 1,096 43Mass Consumer Goods 981 41Luxury Consumer Goods 307 13Capital goods 16 1
Total 2,400 100
The results of 1he four-sector classification are shown in Table 6.Out of all productive surplus-generating activities in the country's mo~etarysector, which produced a total of 2,400 million shillings in '1970,45 per cejI1twas exported .. The capital goods sector, on the other hand." is virtually non-existent. Mass consumption is three times as large as luxury consumption,but the latter is obviously quite developed. Moreover, its share in tot!llmanufacturing is rising in terms of output as well as employment Whilein 1965 the output of luxury goods amounted to lLl.per cent of allmanufa<;t~ring bYValpe, it was 15.7 ~ .cent in 1970. Its.share ill ~pJoJ-ment rose from 10.6 per cent in 1965 to 12.2 percent in 1970. (See:T~i'-'2.in Appendix. A). The most rapid increase occurr~ in the. manufacture ,offurniture and fixtures. : ;:
SinCe' virtua.Jly. 00 capital goods are produced. the intemotion' which19 determjnes the, growth of Tanzania's economy c~not be: ~tbe

capital goods and the mass consumption goods sectors. The determining UTAFITI
relationship is between the export sector, which is very large, and the luxuryconsumption .vector, which is small but pronounced. Thus the export sectorstimulates the production of luxury goods. The growing luxury sector, inturn, creates a demand for more exports to increase the size of the surplusat the disposal of a privileged minority and to strengthen the ties of thena't'ional ruling dass to the metropolitan bourgeoisie.
Some explanation should be offered about how the four-sector classifi-cation in Table 3.6 is arrived at. The handling of the export sector is con.ceptually easy. It is only necessary to find the total value of exports, regardlessof their industrial origin, at producer value. Complete data for this are,however, not available, and have to be estimated from the to.b. value oftotal exports of 1,686 million shillings in 1970. This figure also includesthe cost of wholesale, transport. public administration,. and in some casesprofit which must be deducted to arrive at the value of productiOn. Acomparison between the price paid to growers and the export price forselected crops shows a difference of around 35%, which when subtractedfrom the value of all exports gives a producer value of 1,096 millionshillings. The different productive sectors contributed to the export f.o.b.value roughly in the following proportion: agriculture, hunting, forestry andfishing, 41 per cent, mining 13 per cent, and manufacturing 4.6 per cent(Input-Output Table, 1969).
The classification of goods into the remaining three categories requiresa breakdown of each industry of the productive sector into components andlifting out the contribution to .:onsumer and capitall goods. Starting withagriculture, hunting, forestry and fishing, the total output in 1969 was 3,874million shillings of which only 2,080 million shillings was in the monetarysector. Of the monetary part 30 per cent consisted of unprocessed exports,28 per cent were inputs to manufacturing, 21 per cent to private consump-tion, and 2I per cent to other activities, mostly contruction and increasein stocks (Input-Output Table, 1969). The only item which falls underconsumer or capital goods is the part for private consumption, and thevalue of its output was 440 million shillings in 1970.
Tbe next productive industry is mining and quarrying. It does notcontribute any consumer or capital goods and besides, only 4 per cent ofits output value was for domestic use (Economic Survey 1971/72, Table 60).
The manufacturing and handicrafts industry is the principal generatorof .consumer .'goods and capital goods and needs more detailed scrutiny.The larger part Of the manufacturing takes place in industrial establishmentswhich are broadly speaking run under capitalist principles, and a smalterpart is contributed by household and cottage industriei The second typeconsists of winemaking, wood carving, furniture making, tailoring, pottery,etc. Not aU those acrivkies fall into the monetary sector and would forthis reason beexcIuded from our model. But a more important consideration 20

UTAFm is that they generate very little surplus, if any, and, therefore, do not playa significant role in quantitative terms for capital accumulation and are,therefore, omitted. As was said before this is. however, a serious limitationof this kind of analysis which cannot properly account for the vital roleof pre-capitalist modes of production in the social formations of the peripherycountries.
It remains now to divide the output of the manufacturing establish-ments into mass consumer, luxury consumer, and capital goods. The classifi-cation depends a good deal on how the different categories are defined. Thefollowing definitions were applied. Consumer goods are finished commoditiesused by households or the state for final consumption (i.e., not producingother commodities). Capital goods are commodities which increase tije.£!..o..<l.uctivityof labour ~j('h gl"lt",!:'llly speakin& mp~n~ lIlaChiVll". Capitalgoods industries. therefore, include metal working, electrical and non.el~tri{:alm~chine"Y, and tran~rtc;qlliP~~nt, but exclude-iii-etaJ fabrica~'tion.10 (After Rweyemamu, 1973, p. 166). There is no obvious definitionof what constitutes a mass and what a luxury consumer good. An industrialactivity is being classified as producing mass or luxury consumer goods,depending on whether it is the workers and peasants or. the petty bourgeoisiein the country which uses the greater part of the total output under thatactivity.
Tanzania produces virtllill!Y..~.Q .•~qlgQQd,f. The only companies whichfall under this category are the Ubungo Farm Implements ManufacturingCompany in Dar es Salaam and the motor vehicle assembling industry, buttheir contribution is extremely small: the sales of Ubungo Farm Implementsamounted to 1.2 million shillings in 1970 and the value added of the motorvehicle assembling and bicycle manufacturing industry to 14.1 millionshillings in 1970,11 Since nearly all the inputs into the latter industry areimported, the value added is the appropriate measure for the domesticshare of the industry's output. Total capital goods,. therefore, amounted to15.8 million shillings in 1970.
Another difficulty with the classification is the aggregate nature of theavailable data which often lumps together under one figure products whichshould be classified differently. For example, even though processed milk,a mass consumer good, is the largest output from the dairy industry, it alsoincludes refined ghee and butter (luxury goods), and unspecified "others"(See Appendix A). Only for industrial activities was such a breakdownavailable, which meant .that the entire output of each activity was claSsifiedaccording to the main item produced under the activity. The dairy industryas a whole. therefore, had to be put with mass consumer goods (See AppendixA). The classification of industrial activities in manufacturing into export.luxury consumer and' mass consumer goods is shown in Table Al in Appen-dix A and summarised in Table 7.
21 Manufactured export goods consist of minor processing mainly of

.Coosists of building materials, producers' supplies, capital goods, intermediate, andservice industries.
agricultural products. such as meat. tea. coffee. cashewnuts, and cotton..2Nearly all the manufactured export commodities come into the category ofconsumer goods. They make up 15 per cent of manufacturing. Luxuryconsumer goods consist mainly of brewery products. cigarettes. furniture.and the manufacture and repair of household appliances. They account for25 per cent of all manufacturing by value added. The remainder are massconsumer goods which make up 36 per cent of the total. Out of the twocategories of consumer goods. luxury goods amount to 41 per cent of the totalconsumer goods production for the domestic 11IDTket. If output rather thanvalue added is considered a similar distribution is obtained.
The figures for output of the two consumer goods categories are slightlyinflated because they also contain the value of import.~ which constitutethe raw materials for some of the goods produced (such as electronic partsfor the assembly of radios). Output was, however. preferred over valueadded for the complete four-sector classification in Table 6 because italso contains the value of the relevant domesticail'ly-made producer goods.which would otherwise have been left out altogether.1•
The last remaining productive industry is el«tricity and water supply.It W3$ left out altogether because data giving the breakdown are difficult toget. and besides the industry's contribution in terms of value is very small.amounting to only about 3 per cent of all productive activities in themonetary sectQr.
Tbe total of the {our-sector diimibution in Table 6 then rC'JPCCSCD;tsthe value of all productive activities in the monetary sector that are capableof producing a social surplus because there is an advanced division oflabour. The .total of 2,400 million shiUings in Table 6 corresponds fairiywell with the figures of 2,341 million shillings also for 1970. obtained bysumming the value added. the monetary surplus-generating part from eachproductive industry. at current prices. H Tbe contributions are: agieulture. '22

UTAFITI mining: hunting. forestry and fishing 1,647 million shill.ings, numng andquarrymg 108 million shillings, and manufacturing 586 million shillings(Economic Survey J971/72, Table 1).
3. SECfORAL DISTRIBUTION OF OUfPUf AND EMPLOYMENf
THREE SECTOR DISTRIBUTION
The relative proportions contributed to' GDP by the agriculture, industry,and service sectorsn 'is: often considered to' be a measure Df the degree ofdevelapntent Dr underdevelopment Df an economy. Bourgeois economists arguethat as a country develops the share of the agriculture sector in the tota:l GDPwill diminish in favour of the industry sectO'r, with yet further progressbeing manifested in a shift from the industry to' the service sector. This hasbeen the historical process in the now advanced capitalist countries and iswrongly used to' describe what is happening now in the underdevelopedworld.lll
One important difference is ,that in the developed COUltltries the movementof the active populatiO'n away frO'm agriculture intO' industry came out ofthe rising productivity in agriculture through the. greater \l5e. of capital andless labour per unit of O'utput This was accoropanied by an increase inper capita income which raised the demand for consumer goods. In theunderdeveloped cO'untries this driving force is absent since the main emphasisthere is on exports and luxury cO'nsumptiO'n goods. The productivity O'flabour in agriculture and the prices paid to' farmers are nO't improvingappreciably. The growth in the other twO'sectors is. therefore, mainly gearedtowards furthering the production and transport of exports, and towardsconsumption goods for a privileged minO'rity of the populatiO'n. In terms ofthe di'$tribution between the three sectors this means that the servicesector is inordinately large compared to' the industry sectO'r.
While during the histO'rical process of growth in the now developedcapitalist countries the contribution of the agriculture sector to' tQta1 GDPand its share of employment declined, the size of the industry sectO'r increased.In the early phase of growth the service sector increased less rapidly than theindustry sector. MQfe recently the share of the service sector has been risingrapidly, particularly in the U.S.
In the periphery countries, on the other hand, the process of growth. issomewb.t different. While the share of the agriculture sector is. declining.1be'~PaPsi()'ll is tlllPng .p1ace more in the service than in the industrysectQr.Rather than indicating a sign of rapid progress, this phenOQJel19Qshows thedistorted structure of the ecOll'OQlYinsofar as the exp(l1lSion of non-produc-tive (lCtivities does not come out of rising productivity of labour in agriculture~ a demand for mass consumption goods. but out of the export orientation
23 iolbe qriculture and in some countries also the industry sootor.
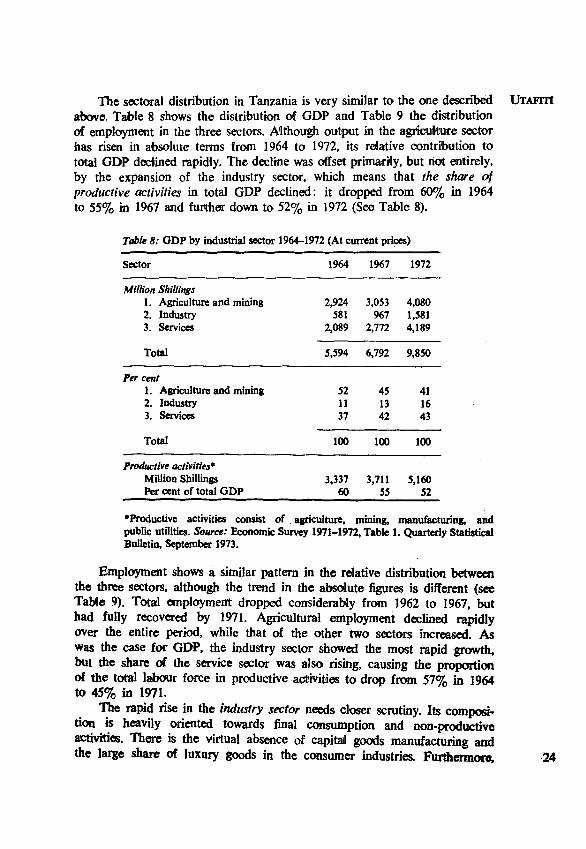
The sectoral distribution in Tanzania is very similar to the one described UrAFITIabove. Table 8 shows the distribution of GDP and Table 9 the distributionof employment in the three sectors. A'lthough output in the agriculture sectorhas risen in absolute terms from ]964 to ]972, its relative contribution tototal GDP declined rapidly. The decline was offset primarily, but riot entirely,by the expansion of the industry sector, which means that the share ofproductive activities in total GDP declined: it dropped from 60% in 1964to 55% in ]%7 and further down to 52% in 1972 (See Table 8).
Table 8: GDP by industrial sector 1964-1972 {At current prices}
Sector 1964 1967 1972
Million Shillings1. Agriculture and mining 2,924 3,053 4,0802. Industry 581 967 1,5813. Services 2,089 2,772 4,189
Total 5,594 6,792 9,850
Per cent1. Agriculture and mining 52 45 412. Industry 11 13 163. Services 37 42 43
Total 100 100 100
Productive activities.Million Shillings 3,337 3,711 5,160Per cent of total GDP 60 55 52
.Productive activities consist of asriculture, mining, manufacturing, andpublic utilities. Source: Economic Survey 1971-1972, Table 1. Quarterly StatisticalBulletin, September 1973.
Employment shows a similar pattern in the relative distribution betweenthe three sectors, although the trend in the absolute figures is different (seeTabte 9). Total employment dropped considerably from 1962 to ]967, buthad fuUy recovered by 1971. Agricultural employment declined rapidlyover the entire period, while that of the other two sectors increased. Aswas the case for GDP, the industry sector showed the most rapid growth.but the share of the service sector was also rising, causing the proportionof the total labour force in productive activities to drop from 57% in 1964to 45% in 1971.
The rapid rise in the industry sector needs closer scrutiny. Its composi-tion .is heavily oriented towards final consumption and non-productiveactivities. There is the virtual absence of capitail goods manufacturing andthe large share of luxury goods in the consumer industries. Furthermore. 24

UTAFITI,
the shar~ of productive activities within the industry sector has not signi-ficantly Increased. Value added in construction amounts to about one-thirdof the industry sector, but the end use of most of its output is for non-productive activities. This means that the proportion of value added inthe industry sector, which consti.tutes intermediate goods, producer supplies,or mass consumer goods-the critical areas for balanced growth-has notexpanded over the eight-year period.
Table 9: Employment by industrial sector. 1962-71
Sector 1962 1964 1967 1971
Number1. Agriculture and mining 202,500 171,400 130,400 115,2002. Industry 70,400 62,000 80,200 118,0003. Services 115,100 117,900 136,200 168,700
Total 397,000 351,300 346,700 401,900
Percentl. Agriculture and mining 51 49 38 292. Industry 20 18 23 293. Services 29 33 39 42
Total 100 100 100 100
Employment in productive activitiestNumber n.a 199,600 168,700 180,600Per cent of total employment n.a 57 49 45
-The figures are for mainland Tanzania. Included are casual workers, but not domesticservants in private households, seasonal workers in peasant agriculture, or military forces.tProductive activities consist of agriculture, mining, manufacturing and public utilities.&urces: Survey of Employment and Earnings 1970. Diagram 2 and Table 14A. EconomicSurvey 1971-72, Table 29.
The conclusion to be drawn is that the faster rise of the industry sector,in comparison with the service sectors, does not represent a significant changein the distorted structure of Tanzania's economy. The service sector has alsogrown in proportion to total GDP, although less rapidly than industry, withthe result that the share of productive activities in total GDP actuallydeclined from 1964 to 1972. Each of the three sectors will now be bridlydiscussed in turn.
DEa.INE IN AGRICULTURE
The rapid decline in agriculture in terms of value added and employ-ment is shown in Tables 8 and 9. The number of people employed even

dropped in absolute terms: 43% les& people were employed in 1971 than UTAFttI
in 1962. About three-quarters of the agricultural labour force is employedin growing sisal, tea, coffee and sugar. By far the largest cause of the declinein employment is the drop of sisal from the number one export crop at thetime of independence to fifth position by va:lue exported in 1972 (fable 1).Employment in the sisal industry declined by 41% from 1966 to 1970(Survey of Employment and Earnings, 1970, p. 25).
Since the figures in Table 8 on GDP include subsistence agricultureand those in Table 9 on employment do DOlt, there '1S a possibNity thatthe decline in plantation agriculture has been offset by a rise in subsistenceagriculture. However, the published data, shows in Table 10, do not exhibitsuch a trend: the value added in agriculture declined about equally in themonetary and the subsistence economy. The share of subsistence in totalagriculture was 55% both in 1967 and 1972.
Table 10: Contribution of agriculture. to GDP 1964-72 (At current prices; inmillion shs.)
1964 1967 1972
Agriculture, million shillings:Monetary economy 1,448 1,281 1,834Subsistence economy 1,342 1,574 2,122
Total agriculture 2,790 2,855 3,956
Agriculture, per cent of total GDP in all sectors:Monetary economy 26 20 18Subsistence economy 24 23 22
Total agriculture SO 43 40
Subsistence economy as per cent of totalagriculture 48 55 55
.A1s0 includes the following activities (their share of the value added in agriculture in 1970is shown in parentheses): animal husbandry (20%>, forestry (7%>, fishing (3%>, hunting(nes!igible). National Accounts of Tanzania 1964-1970, Table II.Smtrcu: Economic Survey 1971-72, Tables 1 and 2. Quarterly Statistical Bulletin, September1973.
The decline of export prices in rdation to domestic consumer prices,which was discussed in Section 3, is also to be found for crops wbich areprimarily produced fur the domestic market. Table 11 ,shows that theconsumer prices paid to growers for many crop have fallen in relation toconsumer prices paid by wage earners in Dar es SalaamY" Only the pricesfor beans and sunflower seed have increased appreciably in real terms whilerice, groundnuts and cashewnuts remained on about the same. level. .The .~

UTAFITI ~ricespaid to gr~ers of,the main staples consumed in the country (except fornce) all dropped m relation to consumer prices: maize, millet, sorghum, andcassava were down in 1972 to 70-800/0 of their 1966 level.
Ta?le 11: Prices paid to growers for selected cropS 1966-72(Index at constant 1966consumerpnces-; 1966=100)
CropPrices paid in
1966 1967 1968 1969 1970 1971 1972 1972Shs. per ton
StaplesMaize 100 88 87 88 78 72 71 263Finger millet 100 95 83 80 92 81 81 516Sorghum 100 72 75 73 86 86 81 387Cassava 100 81 105 67 73 106 68 220Rice 100 101 107 114 124 108 106 565
ugumesMixed beans 100 88 110 135 138 127 128 660Pigeon peas 100 101 97 92 94 100 85 S66
Oil seeds and nutsSunflower seeds 100 104 106 104 124 114 165 564Groundnuts 100 99 99 103 112 9S 103 1,115'Cashewnuts 100 97 93 75 106 97 n.a. 877 (1971)
Consumer price index- 100 102.6 106.2 107.4 110.4 114.7 126.0
-Retail price index of goods consumed by wage earners in Dar es Salaam (Quarterly StatisticalBulletin, September 1973).The 1973 consumer index (with 1966=100) is 132.2.Sources: Statistical Abstract 1970,Table 0.6. Quarterly Statistical Bulletin, September 1973.
The crucial question in regard to prices for agricultural commodities iswhether the productivity of labour has increased. If this was the case,agricultural prices could be lowered and at the same time the income ofagricultural workers raised, provided the productivity increase was suffi-ciently large. This is how agriculture developed historically in the nowadvanced capitalist countries.
It appears, however, that there has not been a subst01ltialproductivityincrease in Tanzania's agriculture, This has been found in various fieldIltumes on agricultural production, IS and is borne out by the low flow ofcapital and those agricultural inputs which would raise the productivityin agriculture, par1licularly agricultural machinery, fertilisers, pesticides. andimproved seeds. The value of domestic production of fertiHsers was 5.5million shillings in 1970 and that of insecticides 5.0 million shilHngs. Theamount of agricultural machinery manufactured, including improved imple-ments, is negligible. (Survey of Industrial Production 1970, Table 19). The
-27 value of imports of these commodities is much larger than the domestic

production, as shown in Table 12. The item "chemicails and fertilisers" UTAFITIincludes aU chemicals not used for final consumption, which means that theportion imported for agriculture is less than what is shown in the table.
Table 12: Import of agricultural producer and capital goods 1963-69 (Value inmillion shillings; at current prices)
1963 1967 1969
Chemicals (for all industries) and fertilisersAgricultural capital goods
Sources: Statistical Abstract 1970,Table E.11(a).
59.3 48.883.8 108.5
88.391.2
These amounts, although much larger than the domestic manufacture ofthese items, are extremely small compared to the total value added inagriculture of 3.074 million shillings in 1969. But more important. their I'lIiteof increase is quite slow. barely exceeding the slight rise in agricultural output.
It should also be noted in passing that the performance of the statefarms, which were intended "to increase rapidly ,the production of cropsand agricultural commodities that offered scope for mechanized productionand to show examples of better agricultural production methods to thesurrounding areas" (Economic Survey 1971.72,p. 74). has not beensatisfac.tory. "Most of the State farms have not attained commercial viability." (Ibid).
Without an appreciable increase in the productivity of labour inagriculture. the drop in the relative prices of many agricultural productsimplies a decline in the per capita income to farmers. This is accompaniedby the failure of agricultural output-for export as well as for the domesticmarket-to rise according to plan19 and by a steady urban migration in spiteof an unemployment problem in the towns.
INDusny SECTOR
As shown in Tables 8 and 9 the industry sector is expanding fastestboth in value added and in employment, although its share of total GDPhas remained very small: value added stood at 11% of total GDP in 1964and at 16% in 1972. The increase was somewhat less in employment: from20% in 1962 to 29% in 1971.This rise in the industry sector could representa decisive move towards disengagement and a more balanced economy,provided it caused a shift away from the structural dependency relationshipdiscussed above. This would imply plaoing less emphasis on exportand luxury consumption goods. and more on mass consumption and capitalgoods. Otherwise the growth in the industry sector would amount mainlyto import substitution for those consumption goods which can be affordedonly by a privileged minority. To examine this situation it is necessary tolook into the composition of the sector. 28

UTAFITl The first division of the industry sector can be made into industries:(i) manufacturing. (ii) public utilities (i.e., electricity and water supply), and(iii) construction. The expansion of value added in the three industries hasbeen about equal, with construction slightly in the lead and public utilitiesslightly lagging behind.
The details of expenditure on construction. given in Table 13 reveal arise in residential and non-residential construction of buildings as well asnon-building construction. One striking change from 1968 to 1971 has beenthe rising share of public expenditure, the latter mainly as a consequenceof the nationalisation of buildings in ]971. It is also of interest to see wbatproportion of newly added buildings are for productive uses and which forfinal consumption. Even if all parastatal and private non-residential build-ings are included in the category of productive use, the share of productiveexpenditure amounted to only 24% of total buildings in 1968and fell to 200/0in 1971 (see Table 13).20
Table 13: Expenditure on construction 1968-71 (Excluding TAZARA; milJion shiUinp)
Type of construction 1968 1971
A. BUILDING SResidential: Public 32.2 92.7
Private 50.9 33.5
Total 83.1 126.2Rural (estimated) 132.7 156.1Non-Residential: Public 160.8 200.0
Private 25.3 23.9
Total 186.1 223.9
Total Buildings 401.9 506.2
B. NON-BUILDING CONSTRUcnON* 326 424
GRAND TOTAL CONSTRUcnON 728 930
Per cent of expenditure on buildings forproductive purposest over total building 24% 20%
.Roads, ferries, bridges, water supply, land improvements, and others.tIncludes all parastatal and private non-residential buildinp.Sources: Economic Survey 1911-72, Table 72.
Turning nOW to the manufacturing industry. it has been shown inTable 7 that out of all consumer goods manufactured in 1970, 200/0were for export, 33% for luxury consumption and 47% for mass consumption
29 by ..value added. Luxury COIlsumergoods, therefore, COIlstituted41% of

all consumer goods produced for the domestic market. Looking back at UrAFITtthe period from 1965 to 1970,the share of the industrial activities producingluxury goods in the total value added in manufacturing steadily increasedin that period: it amounted to 11.3% in 1965 and to 15.3% in 1970. Asimilar, but less pronounced, increase relative to total manufacturing canbe found in employment. (See Table A2).
The value of domestically-manufactureddurable consumer goods is quitesmall but rapidly increasing. Table 14 shows the products of machinerymanufacturing in 1970, a good part of which are consumer durables: thecombined value of cooking stoves, radios and gramophones produced is 3.2million shillings, or 27% of all manufactured machinery.21.Machinerymanufacturing was also the fastest growing industrial activity, constituting1.1% of aN manufacturing in 1965 and 2.1% in 1970. (See Table A2).
Table 14: Composition of machinery manufacturing 1970
Outputthousand Shs.
Non-electrical machinery(Old ISIC code 360)Cooking stoves 1,255Engineering general 168Others 998
Total 2,421
Electrical machinery(Old ISIC code 370)Radios 1,076Gramophones 907Batteries (dry) 7,124Others 358
Total 9,465
Grand Total: all machinery 11,886
Source: Survey of Industrial Production 1970, Table 19.
The value of imported consumer durables remained at approximatelyone-third of all imported consumer goods from 1966 to 1969. The importof consumer durables is much larger than what is manufactured domesricall1y:in 1969 it was 97.5 million shillings (Statistical Abstract 1970, p. 83).
It is worth noting..o.-eventhough it has little bearing on the structure
lof Tanzania's ecOl1'01lly-that the role of parastatal enterprises has sharplyincreased over the years. Their share of value added in total ODP hasgradually risen from 3.2% in 1968 to 9.6% in 1972.22 A similar increase 30

UTAFITI occurred in employment. from 13.0% of all employment in 1968 to 20.4%in 1971. Employment in the private enterprise sector, in contrast, has fallenfrom 40.5% in 1968 to 35% in 1971. (See Appendix B, Table Bl).
SERVICE SECTOR
In an externally-oriented economy the service sector is mainly gearedtowards exports. Its expansion is consequently taking place without strongsupport for the industry sector. It also provides the employment fOF aprivileged minority which wields the state power through administrativeand economic organs.
In Tanzania the share of the service sector in total GDP and employ-ment has been rising (see Tables 8 and 9). The proportion of vailue addedby the different industrial divisions has remained nearly the same from1968 to 1972. The fastest increase occurred in "transport, storage, and com-munication". The nature of the data available on the service sector makesit impossible to analyse its composition and its relationship with the restof the economy in detail. Some indications of this relationship can. however,be found.
1. Transport was heavily oriented towards the construotion and improve-ment of roads from OaT es Salaam to the rest of the country. This, of course, hasalso been motivated by administrative and defence considerations, but Oares Salaam's position as the country's main port cannot be overlooked.The predominance of motor cars and light commercial vehicles among allnewly-registered government vehicles-together they constituted 53% in 1971(See Table l5)-suggests an emphasis an costly means of transport far afew individuals and small quantities of goads, rather than buses (5%) andtractors (7!%). A breakdown of all vehicles newty registered in 1971 inthe country shows similar proportions.
2. The report on trade and commerce in the Economic Survey putsheavy emphasis on exports. Under progress made in 1971/72 it mentionsamong other aspects of international trade that the "development of a cotdchain operation Will increase expoIits of perishables;" and that "exportpromotion activity has been explained by the posting of commercialattach~ to Zambia. Iudy, Egypt, India, and Japan" (p. 119). At dIe sametime the report says that shortage of some commodities did occur in certainareas of the country (p. 118).
3. Tourism is another form of external dependency that distorts theeconomy towards extemally-oriented non-productive activities and providesfurther jobs and income for the "parasitic" segment of the population.This does not mean that tourism is undesirable under all circumstances: itcan play an important role also in a self-centred economy. But its presentorientation towards luxury facilities (certainly not portraying Tanzania asa socialist country) and its growth in the light d. the country's genern1 external
31 orientation make it deepen the noo-colonial dependency relationship.

Table 15: New registration of motor vehicles 1971 (Per cent) UTAFITI
Government All vehiclesType vehicles only (private and
government)
Motor cars 19 26,. . Light commercial (including Land-Rovers) 34 18,
Motor cycles 15 14Lorries and- trucks 19 26
.DuileS @~ coaches 4 5Tractors 7 6Trailers 2 5Others
.Total 100 100
Total number registered 1,175 7,203
Source: Economic Survey 1971-72, Table 78.
_ Finally, the average income of employees in the various divisions oflIte service sector lies above the national average. The average monthly wagefor 1971 was 491 shillings in commerce, 539 in transport and communica-tions, 398 shillings for services in the enterprise sector, and 392 for publicservices. The average for total employment was 380 shillings per month(fable B3)~
3. cONCLUSIONS.. Tanzania's -employment statistics also reftectthe dependent nature ofthe econOmy. -Total wage employment rose by 0.5% in the period of 1963.to 1967. by 2.0% from 1967 to, 1970, and by 7.0% from 1970 to 1971. TheaCcc;lerated rate of additional employment is evident, but one should be~utious not to draw hasty conclusions from this. First, there are indicationsUtat the last year's growth rate has not been ,sustained (see Appendix B).~Ond. ihe composition of employment does not show a shift away from thedependency relationship typical of periphery development; the proportion.emPloyed in, productive activities has been falling. Third, the publishedeinploylnent figures are not a reliable measure because a high proportion ofthe total labour force is casually or seasonally employed.-' ,.Comparing the growth in total employment with that of population'(which is 2.7%), we find that the growth in employment. was below the'~pulation growth with the exception of 1970-71. the last year under review.The reasons for this must be further analysed .
. Wage employment in agriculture dropped sharply since independence('!Clb~e ?) .on account of the general decline in plantation agriculture.particuJarly sisal. This decline was, however, only partly ..offset by a rise 32

UTAFITI in subsistence agriculture, with the result that agricultural production hasstagnated, while its share of GDP actua:i'ly decreased (Table 8). Thereason for this lies primarily with the fail of prices paid to farmers forexported and domestically marketed crops in relation to consumer prices.At the same time there has been little, if any, increase in the productivityof labour in agriculture.
It appears, therefore, that the proportion of the population engagedin agriculture, both monetary and subsistence, has been declining. The numberdisplaced in agriculture is offset (and slightly exceeded) by increased employ-ment in the industry and service sectors. These jobs are found in the towns,and many migrate to urban areas in search of employment: the averagegrowth of urban areas is 6.5% on the mainland. There are, however, notenough jobs for people in the towns, with the result that a good many areunemployed: 7.1% of the urban population actively seeking work cannotfind it. and an additional 4.6% have no work and are not looking for any.(Bienefeld and Sabot, Vol. II, p. 175). The result is continuing unemploy-ment and underemployment of the majority of the population. With declin,ingreal income in agriculture, the peasants do not acquire the purchasing powerto buy consumer goods, and the mass consumer goods industry cannot growat a fast rate.
The impetus for Tanzania's economic growth comes from a differentdirection. Roughly one-third of agricultural production is for export, aboutone-half of which goes to the developed capitalist countries. With a lowdemand for mass consumer goods and the virtual absence of capital goodsproduction, the crucial interaction for internally-oriented growth betweenmass consumer goods and capital goods is absent. Instead, the large exportsector is linked WIth a sizeable luxury consumer goods sector whichdiverts a good part of the surplus from export earnings away from invest-ments in productive (i.e., surplus-generating) activities and into consumptionby a small minority. Employment in all branches of the service sector hasbeen rising. Expenditures on housing, transport, health, etc. put heavy emphasison a high standard of service for a privileged minority. This is also reflectedin the salary structure: the increase in average real wage in the period1966 to 1971 was primarily the result of a sizeable increase in the numberof employees receiving more than shs. 450/- per month.
The outlines of how a small underdeveloped country like Tanzaniacould develop a balanced economy have been discussed by Oive Thomas(1972, 1974). His "first iron law of transformation" is the need for domesticdemand and resource use to converge. The extent to which those two aredisconnected is a measure of structural dependence. His "second iron lawof transformation" is the need 10 bring demand in line with resource use.The "European" consumption pattern which is enjoyed by those on the
33 upper end of the income distribution will have to become interna1ly-orien.ted

ana be based on the locally available resources and the capacity to transform UTAFlTIthese resources for human use.
To accomplish this requires a break with the international capitalistsystem. Otherwise the forces which keep Tanzania in its present dependencyrelationship will continue to attempt by any means possible to retain thecountry on the fringe of the capitalist system. There are a few nations whichhave been able to break away and effect a total transformation of theirsocieties. and their experience offers a valuable insight into how the viciouscycle of poverty and unemployment can be broken.
34

APPENDIX A
CLASSIFICATION OF MANuFACTIJRING INTO EXPORT, MAss CONSUMER ANDLUXURY CONSUMER GOODS
Consumer goods industries are defined according to Rweyemamu asthose producing finished commodities for use by households or the state forfinaI consumption, i.e., for non-productive purposes. This list of activitieswhich manufacture consumer goods is taken from Rweyemamu (1973, pp.166.168, 244-245) with the following modifications:
(i) Printing and publishing (old ISIC code N6. 280) was removed fromthe consumer goods industries because it consists mainly of jobprinting which cannot strictly be considered a final product.
(ii) Pharmace\lltica:ls and insecticides (old ISIC No. 3190), which seemto be included in Rweyemamu's list of consumer goods industries,produce s mainIy agricultural insecticides and fertilisers and is,therefore, not a consumer goods industry.
(in) No separate data could be obtained on glass products (old ISlC No.322); they were, therefore, removed from consumer goods. Mostof the output is in the form of bottles for beer and soft drinks andis imbedded in the output of breweries and soft drinks.
(iv) Non-electrical machinery (old ISIC No. 360) consists mainly ofcooking stoves and was, therefore, added to consumer goods.
Not included under consumer goods are the categories of (a) capitalgoods, (b) building materials, (c) producers' supplies, and (d) other industriesthat do not fit into any other category, mostly intermediate products andservices.
There is no generally accepted definition of what constitutes a domes-tically-used mass consumer good and what a luxury consumer good in theTanzanian context. Rweyemamu (1973, p. 171) only considers those commo-dities which are most obviously consumed only by a better-off minority asluxury goods: brewery products, tobacco manufacturing. and miscellaneousmanufacturing (i.e., smoking pipes, jewe1lery, foam mattresses, etc.). Othereconomists consider all consumer goods in Tanzania as luxury goods becausethey are not normally used by the large majority of the population, thepeasants. The definition adopted for this study lies somewhere between thesetwo viewpoints. An industrial activity was classified as producing for massconsumption or luxury consumption depending on whether the labouringmasses-the workers and peasants-or the national ruling class-the pettybourgeoisie-use the greater part of the output by value in that industrialactivity. Thus dairy products were classified as mass consumption goodsbecause a large part of the milk which accounts for the bulk of the industry'soutput, is consumed by the working class.2I Other products listed under the
35 dairy industry, such as refined ghee and butter, constitute luxury items,

but they are nevertheless included with mass consumption goods because the UTAFITIdata on value added are available only for industria:! activities and not forindividual items produced under each activity.
Value added, Type of consumerthousand Shs. good
Processed milkRefined gheeButterOthers
Total dairy products
14,9342,583
181,214
18,749
Mass consumptionLuxuryLuxury
SOUTce: Survey of Industrial Production 1970, Table 19.
The breakdown of manufacturing into export, mass consumption, andluxury consumption goods is shown in Table Al together with their grossoutput and value added. All exports goods produced in manufacturing. withthe exception of certain chemical products, fali under the category ofconsumer goods, but this fact has no significance for the present analysis.The industrial activities are classified into the three categories accordingto the composition of the output of each. The product mix was obtainedprimarily from the Survey of Industrial Production 1970, Table 19, andthe Directory of Industries 1970. The Table only includes domestically-produced items.
REMARKS ON nm CLASSIFICATION
Exports:-The classification of export industries is taken from Rweyernamu
(1973, p. 172).-Miscellaneous chemical products consist primarily of pyrethrum extract.
Moss Consumption:-Under dairy products the largest item is milk.-Bakery products consist mainly of bread.-More footwear is made of rubber and plastic than of leather, hence new
ISIC codes 358 and 359 had to be included with code 330.-Paper products consist mainly of exercise books.-"Soap, perfumes, and cleaning preparations" consist almost entirely
of laundry ~p.
Luxury Consumption:
-Under furniture, the largest items is wooden furniture, followed bymetal beds and steel furniture. Furniture is bought by the workers andthe petty bourgeoisie for private use. and also by the state. The 36

UTAFITI unnecessarily large quantity and lavish style of government furniture.decided the classification of this item as a luxury good.
-Electrical and non-electrical machinery consists almost entirely ofhousehold appliances, radies, cooking .stoves and gramophones. - (indescending order of size of output) ..
-Miscellaneous manufacturing consists mainly 9f smoking pipes andfoam mattresses.Whether gross output (i.e., not accounting for depreciation) or value
added is used to calculate the relative size of the three categories ofconsumer goods does in this case not make much difference (see Table 7).Value added is the preferred measure because it portrays accurately theactivities taking place in the manufacturing industry, but is limited to thatindustry. Output of manufacturing, on the other hand, also contains' thevalue of inputs into manufacturing, and thereby reflects the orientation ofthe whole economy towards a particular mix of products fqr final~onsump-tion. A problem occurs, however, with double counting. where the outputof one activity in the manufacturing industry is at the same time' an inputinto another manufacturing activity, such as "cotton ginning" delivering to"spinning and weaving of textiles". This has been largely correoted in TableAl by entering the value added in the column on output for four ',industrialactivibies: bakery products (input: grain mi:lIproducts), cocoa, chocolate.a,ndsugar-confectionery (input: sugar factories and refineries), spinnmg andweaving of textiles, and knittingq mills. Another problem arises when partof the inputs into an industry are imported; they are then included in thevalue of ou'tput. No adjustment for this could be made ...
The trend in the manufacture of luxury consumer gaods is given inTable A2. It shows that the share of luxury goc;xlsin total manufacturing hasincreased from 1965 to 1970 for both output and employment. Output in"furniture and futtures" has grown the fastest. "Beveragl:S" and "T()~a~manufaCturing" combined amounted to: tWO"thirds of all luxury consumergoods by output in 1970.
37

Table AI: Classification of manufacturing into mass consumer and luxury consumer goods 1970 UTAFITl
Old Value GrossNewlSI~ ISIC added output
Code Code Industrial activity (Mill. Shs.) (Mill. Shs.)
EXPORT301 201 Slaughtering and meat canning 6.4 56.3312 . 2093 Tea processing 23.4 72.6311 2094 Coffee processing 2.3 10.6310"\. 209S"\. Cashewnut processing and other food313f 2097J products D.e.c. 26.8 36.3321 2311 Cotton ginning 12.6 40.4354 3194 Miscellaneous chemical products n.e.c. 15.9 23.9
Total 87.4 240.1
MASS CONSUMPTION302 202 Dairy products 2.1 18.7306 205 Grain mill products 28.3 165.3307 206 Bakey products 4.8 4.8*308 207 Sugar factories and refineries 34.0 88.0309 208 Cocoa, chocolate, and sugar
confectiOnery 0.3 0.3*305 2091 Vegetable and animal oils and fats 5.9 79.7320 1311 Spinning and weavina of textiles 83.5 83.5.313 131 Knitting mills 8.3 8.3*
330,358,359 141 Footwear and rubber, plasticproducts D.e.C. 9.5 27.1
322,315,326 143"\. Mado-up textile goods, wearing144f apparel, and other textiles, n.e.c. 9.2 9.2
336,337,338 272 Paper and paper products 1.3 4.4327 291 Tanneries and leather finishing S.l 27.4353 3193 Soap, perfumes, and cleaning
preparations 8.0 23.9
Total 200.3 540.8
LUXURY CONSUMPTION317 213 Breweries 50.0 66.3318 214 Soft drinks 2.8 23.1319 220 Tobacco manufacturing 45.3 94.2
335-371 260 Furniture and Fixtures 26.9 45.9374-379 360 Non-electrical machinery 13.4 42.9380-383 370 Electrical machinery395-389 394"\. Jewellery and other miscellaneous
399f manufacturing 2.5 34.5
Total 140.9 306.8TOTAL CONSUMER GOODS 1,428.6 1,087.7
n.e.c. not elsewhere classified.*Value added rather than gross output is entered here to avoid doublo-counting ofinputs into these industries already listed elsewhere in the table (e.g. Bakeries useJI'8in mill products).
SollrCe: Survey of Industrial Production 1970, Tables 18a, 19 and Summary Table UA. 38

UTAFm
39
!;0..
!;o
°r-~-O-('f""jO\.....N tnN -_
V'\oo-"f''''.....N~N--
I~~N r-- 00
"f''''M r-- 00
00 N
0'"_ 00
r- ...,
- 00_ 00
"'''f'00..- 00
-'""';.0_ 00
I~-:N r-_ 00
...,r-"";00_ 00
8i_ r-
N"f'
8i--00N
8!::-'1.-8~_ N.-

APPENDIX B
EMPLOYMENT AND INCOMETable BI shows that the share of employment in the public service
sector has slightly risen from 1967 to 1971. In the enterprise sector there hasbeen a pronounced movement of employees from private enterprises toparastatals over that period.
Total emplCJlyIllenthas risen quite slowly over the years, as Table Blshows. The average annual increase amounted to 0.5% from 1963 to 1967,2.0% from 1967 to 1970, and from 1970 to 1971 it rose by 7.0%. Thisshows that the rate of increase of employment has been rising, which couldbe an indication that the economy :is developing rapidly towards balancedgrowth since it is able to generate a growing number of jobs. There areseveral factors in the Tanzanian context, however, that would argue againstthis conclusion.
1. The spectacular rise in one year might not be sustained in subse-quent years; one has to wait for more recent employment figures.According to preliminary estimates of the Bureau of Statistics,employment in all parastatals which have shown the most rapidrise over the years (Table Bl) rose less rapidly in 1972; the increasewas 9.4% from 1969 to 1970, 24.5% from 1970 to 1971, and 17.00/0from 1971 to 1972 (Analysis of Accounts of Parastatals 1966-71,Table 2, revised).
2. The accelerated increase in employment is not paralleled by anysignificant structural change of the Tanzanian economy away fromthe dependency relationship. The proportion employed :in produc-tive activities has in fact been falling even up to 1972 (Table 9),which is not a healthy sign.
3. About 20% of total employment consists of casllail workers, andseasonal workers in agriculture are excluded altogether. One, there-fore. has to be cautious in using the published data. For example,regular employment (Le., excluding casual workers) increased byonly 1.7% per annum from 1967 to 1970, while the increase intotal employment was 2.6% (Statistical Abstract 1970, Table 5.1;Employment and Earnings 1970, Tables 1 and 6).
The rise of the proportion employed in non-productive activities is alsoevident in the parastatals. Table B2 shows that the proportion in industrywas about constant from 1966 to 1972, while the decline in agriculture wasoffset by a corresponding rise in the service sector. In 1972 roughly halfthe employees were in the industry sector, one quarter in agriculture, andthe other quarter in services.
Turning now to income. Table B3 shows the average wages for differentcategories of activities. The average real wage (Le., at constant consumer 40

UTAFITI Table Bl: Employment in the enterprise and service seCtors 1967-71 (Per cent)
1967 1968 1969 1970 1971
Enterprise sectorParastatal n.a. 13.0 14.3 17.2 20.4Co-operative and nonprofit-
making institutions n.a. 6.9 5.6 3.9 3.0Private enterprise n.a. 40.5 39.1 37.6 35.7Total 63.6 60.4 59.0 58.7 59.1
Public service sectorCentral government 23.1 25.1 25.8 25.4 n.a.Local government 8.5 8.9 10.0 10.5 n.a.EAC and EAC bodies 4.8 5.6 5.2 5.4 n.a.
36.4 39.6 41.0 41.3 40.9
All employmentPercent 100.0 100.0 100.0 100.0 100.0Number of employees 346,741 351,711 367,926 375,635 401,912Index (1963=100) 101.8 103.3 108.1 110.3 118.0
Sources: Economic Survey 1971-72,Table 31.Employment and Earnings 1970, Table 3.
Tobie B2: Employment in parastatal enterprises 1966-1972
Sector 1966 1967 1968 1969 1970 1971 1972
Agriculture 37.9 28.5 41.1 46.1 39.7 32.S 23.3Industry 52.8 45.6 41.0 35.6 36.6 44.7 55.0Services 9.3 25.9 17.9 18.3 23.7 22.8 21.7
Total 100.0 100.0 100.0 100.0 100.0 100.0 100.0
Tot8l no. ofemployees 19,890 26,292 34,690 49,925 54,613 61,988 79,540
&wee: Analysis of Accounts of Parastatals 1966-71, Table 2 (1972 filUm are provisional4] estimates of the Bureau of Statistics).

prices) has been steadily rising from 1966 to 1971 at an annual rate of 4.1%. UTAFITI
It rose much faster in the enterprise sector than in the public service sector,but still the 1971 average was greater in the public services than in the enter-prise sector.
Table B3: Average wages of adult male citizens 1967-71 (Shillines)
1966 1967 1968 1969 1970 1971
Enterprise sectorEstate Agriculture 153 162 158 162 179 177Mining 298 325 360 381 446 523Manufacturing 293 328 331 351 370 427Construction 262 306 343 308 307 267Public utilities 329 335 408 398 464 454Commerce 408 470 519 448 472 491Transport and communications 402 472 462 538 469 539Finance 820 846 835Services 321 375 369 382 374 398
Total enterprise sector 242 277 298 313 329 376Total public service sector 298 299 309 314 352 392GRAND TOTAL 263 286 304 313 340 380
I"dex a/wages (1967=100) at constant 1967 pricesTotal enterprise sector 100.0 111.6 116.0 120.4 123.1 135.5Total public service sector 100.0 97.8 97.6 98.1 10'7.0 114.7GRAND TOTAL 100.0 106.0 108.8 110.0 117.1 126.0
Sources: Economic Survey 1970-71 (Table 29), 1971-72 (Table 34). Statistical Abstract 1970,Tables 5.11 and 5.12.
There is a considerable variation among the industries in the enterprisesector. Agriculture had by far the lowest average in 1971 with 177 shillingsper month, and finance the highest with 835 shillings. "Transport and com-munication," and "mining" were considerably below it. About one quarterof all employees are engaged in agriculture (Economic Survey 1971-72,Table 29).
The figures on average real wages, however, do not reveal the distributionof income. The rise in the national average noted above, from 302 shillingsper month at 1971 prices to 380 shiHings could, perhaps, be due to adecisive improvement for the low-wage earners, or it could be the result .ofincrease at the upper end of the income scale. The income distribution for1966 .is compared with that for 1971 in Figure B1.24.To adjust for inflation,the 1966 money wage was adjusted to 1971 prices. The comparison is, there-fore, between the 1966 real wage and the 1971 money wage. 42

UTAFITI APPENDIX C
Table Cl : Production and export of main cash crops 1962-72. (Excludes exports to Kenyaand Uganda)
1962 1967 1968 1969 1970 1971 1972
Quantity, thousand tonsCoffee:
Total marketed 27 40 52 46 50 46 51Exported (unroasted) 26 45 48 49 45 35 55
Cotton:Total marketed 38 11 51 69 76 66 n.a.Exported 33 61 63 58 61 55 64
Sisal:Total marketed 214 220 197 209 202 181 157Exported 223 204 189 172 217 161 153
Cashewnuts :Total marketed 55 77 117 115 III 126 n.a.Exported 60 11 80 82 77 96 113
Tea:Total marketed 4 7 8 9 9 11 13Exported 4 6 6 8 7 8 9
Tobacco:Total marketed 2 8 7 12 11 12 13Exported
(unmanufactured) 4 5 5 6 5 6
Value of exports, million Shs.Coffee 132 237 265 257 312 227 383Cotton 148 251 283 235 247 245 336Sisal 315 201 159 160 179 134 145Cashewnuts 47 92 107 119 115 120 150Tea 32 43 45 48 42 49 54Tobacco 2 34 40 35 45 43 49
Total of six crops 676 858 899 854 940 818 1,117
Total of all exports, ,million shillings 1,076 1,645 1,585 1,667 1,689 1,735 2,036
Sources: Economic Survey 1971-72, Tables 11, 18 and 48-52.Statistical Abstract 1970, Table 0.1.Quarterly Statistical Bulletin, September 1973.
43

FOOTNOTES UrAFITII. A good portion of unproductive expenditure is made to ensure the long-term
survival and expansion of monopoly capitalism. Under this category fall manyof the state expenditures and private "philanthropic" contributions in the follow-ing fields: military, police, education. propaganda and entertainment, research.various subsidies, unemployment compensation, foreign aid, population control, etc.
2. The page references arc to be the original French text L'ammumulatioll tl /'echcllemondiale (1970). An English translation has recently been published (see listof references).
3. The argument that certain essential raw materials are only available in someunderdeveloped countries and not at the centre has not much validity. It is thecheap labour cost which makes it worthwhile to extract the raw materials. Shouldthese costs rise-as happened recently with petroleum in the Middle East-theadvanced capitalist countries have the capacity to search for raw deposits andto develop substitute products.
4. This exercise has also been carried out for Tanzania by Henin, Mogil, andWestdahl (1973). A much cruder piece is the pamphlet on Tanzania by theInternational Planned Parenthood Federation (1970).
5. Consists of wholesale and retail trade, restaurants and hotels, transport and com-munications, finance and business services, and public administration.
6. See also the discussion on the role of the petty bourgeoisie in Shivji, 1973.7. Mining can be neglected since it contributes only 3% of the value added in the
agriculture sector.8. The average proportion of quantity exported to quantity produced from 1962 to
1972 is as follows: coffee 97%, cotton 89%, sisal 96%, cashewnuts 76%, tea 80%,and tobacce 56%. (See Appendix C).
9. In 1970 the combined value added in the production of agricultural insecticidesand fertilisers was only 10.6 million shillings, that of cordage and ropes 52.6million shillings (Survey of Industrial Production 1970, Table 15). In addition aconsiderable quantity of insecticides and fertilisers was imported.
10. That is the making of iron, steel and other metals.II. Source: N.D.C. 1970, and Survey of Industrial Production 1970, (Summary
Table IIA). Tho}sale of UFI were up to 5.5 million shillings in ]972 (NDC ]972)The Steel Rolling Mills Limited in Tanga is not included because it producesmainly for the construction industry.
12. The value added of manufactured export goods was 87 million shillings in ]970,which constitutes only 8% of the estimated producer value of total exports(Table 6), the remainder coming from agriculture and mining-the primary sector.
13. A comparison of the value of imports with domestic production is of someinterest. Imported consumer goods amounted to 682 million shillings, 240 ofwhich were for TAZARA (Economic Survey 1970-71). It can be assumed thatthe majority of consumer goods imports are in the form of luxury goods.
]4. This compares with 4,363 million shillings value added in the productive indus-tries as a whole (as distinct from the monetary surplus-generating part), andwith 3,232 million shillings of total GDP in 1970. (Economic Survey ]971.72,Table I).
15. Their composition is as follows. Agriculture (Primary Sector): agriculture, huntingfishing, forestry, and mining. Industry (Secondary Sector): manufacturing (includ-ing handicrafts), electricity and water supply, construction. Services (TertiarySector): wholesale and retail trade, restaurants and hotels, transport andcommunication, finance and business services, public administration. The nationalaccounts of capitalist countries list the activities in all three sectors regardless of ,44

UTAFITI whether they are productive activities-in the sense of exploiting nature forman's benefit-or not.
16. See, for example, the detailed structural analysis of developed and underdevelopedcountries made by the patriarch of U.S. national accounting, Simon Kuznets (1971).
17. This appears to be the best available price index for the country as a whole.In spite of certain local variation in prices, the purchasing power of the peasantryhas to be measured in the first instance against prices prevailing in Dar esSalaam and ultimately against the international market, due to Tanzania'sdependency relationship. This consumer index is also used by the CentralStatistical Bureau to adjust the value added of certain items for constant prices.(National ACCounts of Tanzania 1964-1970, p. 8);
18. See, for examples, Yoshida (1972), Angwazi and Ndulu (1973), and von Freyhold(1973).
19. The actual output in 1971 fell considerably short of the Second Five-Year Plantarget for all six principal export crops. (Economic Survey 1971-72).
20. Many of these building serve, however, non-productive purposes, e.g., thoseof the University. On the other hand, all government buildings were excluded,although some of them are used for productive activities. Overall, the percentagesshown are probably too high.
21. By far the largest item, however, was dry batteries, making up 60% of allmanufactured machinery.
22. National Accounts of Tanzania 1964-70, and preliminary estimates by theBureau of Statistics.
23. At least this was the case before the price increase in .oar es Salaam from80 cents to 1 shilling per half litre of regular milk.
24. The graphs were arrived at by connecting points which are determined bythe half-way mark for each salary interval plotted on the horizontal axis, andthe per cent of wage earners in that interval on the vertical axis. This systemwas preferred over a histogram for the sake of a better visual comparison.
REFERENCES
AMIN, SAMIR, "Accumulation and Development: A Theoretical Model", Review ofAfrican Political Economy, Vol. 1. (1974a).
---, "Modes of Production and Social Formations", UFAHAMU (1974 b).---, "Under-Populated Africa", Maji Maji 6, 1972.----, L'accumulatioll a I' echelle mondiale (IFAN Anthropos, Paris, 1970).Recently
published in English a:; Accumulation on a World Scale (Monthly Review, NewYork, 1974). The page references in the text are for the French Edition.
ANGWAZI, J., and B. N.oULU, "An Evaluation of Ujamaa Villages in the Rufiji Area1968-1972", East Africa Universities Social Science Conference, .oar es Salaam,December, 1973.
BARAN, P., The Political Economy of Growth {penguin 1973, .first published 1957).BIENEFELD, M.A. and R.H. SABOT, "The National Urban Mobility, Employment
and Income Survey of Tanzania", (3 Vols., Economic Research Bureau, UniversityoD .oar es Salaam, 1972).
EGERO, B. and R. HENIN (ed.), The Population of Tanzania. An Analysis of the1967 Census, Vol. 6 (Statistical Bureau, 1973).
FRANK, A.G., Capitalism and Underdevelopment in Latin America (Penguin 1971,first published 1969).
HENIN, R.A., N. MOGIL and C. WESTDAHL, "Population Growth and Some45 Aspects of Economic and Social Development in Tanzania", Proceedings of the

ILO National SemiRar on Workers' Education, Population Change and Family UTAPITIPlanning, Mwanza (Tanzania), 10-17 March' 1973.
INTERNATIONAL PLANNED PARENTHOOD FEDERATION, The People ofTanzania (Nairobi, 1970).
JALEE, P., The Pillage of the Third World (Monthly Review, New York, 1968).KUZNETS, S., Economic Growth of Nations (Harvard University, Cambridge,
Massachusetts, 1971).NATIONAL DEVELOPMENT CORPORATION (NDC) , Annual Report 1970, 1972
(Oar es Salaam).RODNEY, W., How Europe Underdel'eloped Africa (Bogle-L'Ouverture, London and
Tanzania Publishing House, Dar es Salaam, 1972).RWEYEMAMU, J., Underdevelopment and Industrialization in Tanzania (Oxford
University Press, 1973).SHIVJI, I., "Class Struggles in Tanzania" (mimeo, University of Dar es Salaam, 1974,
to be published by Heineman).---, et aI., The Silent Class Struggle (Tanzania Publishing House, 1973).THOMAS, CLIVE Y., Dependence and Transformation; The Economics of the Transi-
sion to Socialism (Monthly Review, New York, 1974).---, "The Transition to Socialism: Issues of Economic Strategy in Tanzania
Type Economies" (ERB seminar paper, University of Dar cs Salaam, 1972).UNITED REPUBLIC OF TANZANIA, Analysis of Accounts of Paraatatals 1967-1971.---, Economic Survey 1970-71.---, Economic Survey 1971-72.---, Input-Output Table for Tanzania 1969.----, National Accounts of Tanzania 1964-1970.----, Quarterly Statistical Bulletin, September 1973.---, Statistical Abstract 1966.---, Statistical Abstract 1970.
Survey of Employment and Earnings 1970.---, Survey of Industrial Production 1970.YON FREYHOLD, M., "Rural Development Through Ujamaa Vijijini" (Mimeo,
University of Oar es Salaam, 1973).YOSHIDA, M., "Agricultural Survey of the Lower Rufiji Plain" (BRALUP Seminar
Paper, University of Oar es Salaam, 1972).
46
Related Documents