PERIPHERAL ARTERIAL DISEASE: INCIDENCE, RISK FACTORS, AND DIAGNOSIS by Andrew Althouse B.S., Carnegie Mellon University, 2008 M.A., University of Pittsburgh, 2010 Submitted to the Graduate Faculty of the Graduate School of Public Health in partial fulfillment of the requirements for the degree of Doctor of Philosophy University of Pittsburgh 2013

Welcome message from author
This document is posted to help you gain knowledge. Please leave a comment to let me know what you think about it! Share it to your friends and learn new things together.
Transcript

PERIPHERAL ARTERIAL DISEASE: INCIDENCE, RISK FACTORS, AND
DIAGNOSIS
by
Andrew Althouse
B.S., Carnegie Mellon University, 2008
M.A., University of Pittsburgh, 2010
Submitted to the Graduate Faculty of
the Graduate School of Public Health in partial fulfillment
of the requirements for the degree of
Doctor of Philosophy
University of Pittsburgh
2013

UNIVERSITY OF PITTSBURGH
GRADUATE SCHOOL OF PUBLIC HEALTH
This dissertation was presented
by
Andrew Althouse
It was defended on
July 22, 2013
and approved by
Dissertation Advisor: Maria Mori Brooks, PhD Associate Professor of Epidemiology and Biostatistics
Graduate School of Public Health University of Pittsburgh
Committee Member: Emma Barinas Mitchell, PhD
Assistant Professor of Epidemiology Graduate School of Public Health
University of Pittsburgh
Committee Member: Marnie Bertolet, PhD Assistant Professor of Epidemiology
Graduate School of Public Health University of Pittsburgh
Committee Member: Suresh Mulukutla, MD
Assistant Professor of Medicine and Epidemiology Cardiovascular Institute
School of Medicine University of Pittsburgh
Committee Member: Rebecca Thurston, PhD
Associate Professor of Psychiatry, Psychology, and Epidemiology Department of Psychiatry University of Pittsburgh
ii

Copyright © by Andrew Althouse
2013
iii
ABSTRACT
This dissertation includes three manuscripts related to peripheral arterial disease. The first
examines the effects of assigned glycemic control strategy on the incidence of peripheral arterial
disease in the Bypass Angioplasty Revascularization Investigation 2 Diabetes (BARI 2D) trial.
The BARI 2D results show that patients assigned to control their type 2 diabetes with a strategy
that primarily used insulin sensitizing agents (metformin and/or thiazolidinediones) experienced
fewer incident cases of peripheral arterial disease than patients assigned to a glycemic control
strategy that primarily used insulin providing agents.
The second manuscript extends this work by examining risk factors for peripheral arterial disease
in the BARI 2D trial. The analyses included traditional cardiovascular risk factors as well as
biomarkers indicative of inflammation, coagulation, and fibrinolysis. In patients treated with
insulin sensitizing medications, biomarkers of inflammation and related processes were
associated with lower extremity outcomes while this was not the case for patients treated with
insulin providing medications, a useful mechanistic insight into how the different types of
diabetes drugs may affect the progression of atherosclerosis.
The third manuscript reports the results of a data collection project evaluating the reproducibility
and reliability of two methods for measuring the ankle-brachial index. Reproducibility was
PERIPHERAL ARTERIAL DISEASE: INCIDENCE, RISK FACTORS, AND
DIAGNOSIS
Andrew Althouse, PhD
University of Pittsburgh, 2013
iv
excellent for Doppler-measured ABI, while the Colin oscillometric device showed moderate
reproducibility. Agreement between Colin and Doppler was somewhat poor; therefore, we
would not recommend the Colin device for measuring ABI in clinical settings.
Each manuscript contributes uniquely to public health significance. The first suggests that a
glycemic treatment strategy based on insulin sensitizers may reduce the progression of
atherosclerosis in patients with type 2 diabetes. The second demonstrated that biomarkers of
inflammation and fibrinolysis offer additional predictive value over traditional cardiovascular
risk factors for incidence of PAD in type 2 diabetes patients treated with insulin sensitizing
medications, implying that different types of glycemic control medications may have different
mechanistic effects on the progression of atherosclerosis. The third reinforces current guidelines
that Doppler ABI should remain the primary diagnostic for PAD in clinical and research settings.
v

TABLE OF CONTENTS
ACKNOWLEDGEMENT ....................................................................................................... XIII
1.0 INTRODUCTION ........................................................................................................ 1
1.1 PERIPHERAL ARTERIAL DISEASE ............................................................. 2
1.1.1 Pathophysiology ............................................................................................... 2
1.1.2 Prevalence ......................................................................................................... 6
1.1.3 Morbidity and Mortality ............................................................................... 10
1.1.4 Traditional Cardiovascular Risk Factors .................................................... 13
1.1.5 Novel Risk Factors ......................................................................................... 17
1.2 PERIPHERAL ARTERIAL DISEASE IN TYPE 2 DIABETES ................. 23
1.2.1 Epidemiology .................................................................................................. 23
1.2.2 Clinical Presentation ..................................................................................... 24
1.2.3 Potential Mechanisms.................................................................................... 25
1.3 ANKLE BRACHIAL INDEX ........................................................................... 27
1.3.1 Origin .............................................................................................................. 27
1.3.2 Epidemiology .................................................................................................. 28
1.3.3 Measurement of ABI ..................................................................................... 33
1.3.4 Existing Studies of Oscillometric ABI vs. Doppler ABI ............................. 34
1.3.5 Clinical Significance and Guidelines............................................................ 36
1.4 SUMMARY ........................................................................................................ 37
2.0 SPECIFIC AIMS ........................................................................................................ 38
vi

3.0 MANUSCRIPT 1: FAVORABLE EFFECTS OF INSULIN SENSITIZERS
PERTINENT TO PERIPHERAL ARTERIAL DISEASE IN TYPE 2 DIABETES:
RESULTS FROM THE BYPASS ANGIOPLASTY REVASCULARIZATION
INVESTIGATION 2 DIABETES (BARI 2D) TRIAL ............................................................ 39
3.1 ABSTRACT........................................................................................................ 40
3.2 INTRODUCTION ............................................................................................. 41
3.3 METHODS ......................................................................................................... 42
3.4 RESULTS ........................................................................................................... 47
3.5 DISCUSSION ..................................................................................................... 50
3.6 CONCLUSION .................................................................................................. 54
3.7 TABLES AND FIGURES ................................................................................. 55
4.0 MANUSCRIPT 2: RISK FACTORS FOR PERIPHERAL ARTERIAL
DISEASE IN TYPE 2 DIABETES: RESULTS FROM THE BYPASS ANGIOPLASTY
REVASCULARIZATION INVESTIGATION 2 DIABETES (BARI 2D) TRIAL .............. 65
4.1 ABSTRACT........................................................................................................ 66
4.2 INTRODUCTION ............................................................................................. 67
4.3 METHODS ......................................................................................................... 70
4.4 RESULTS ........................................................................................................... 74
4.5 DISCUSSION ..................................................................................................... 77
4.6 CONCLUSION .................................................................................................. 83
4.7 TABLES AND FIGURES ................................................................................. 84
vii

5.0 MANUSCRIPT 3: MEASUREMENT VARIATION OF THE ANKLE-
BRACHIAL INDEX WITH AUTOMATED OSCILLOMETRIC DEVICE VERSUS
DOPPLER ULTRASOUND ...................................................................................................... 91
5.1 ABSTRACT........................................................................................................ 92
5.2 INTRODUCTION ............................................................................................. 93
5.3 METHODS ......................................................................................................... 96
5.4 RESULTS ......................................................................................................... 102
5.5 DISCUSSION ................................................................................................... 106
5.6 CONCLUSION ................................................................................................ 114
5.7 TABLES AND FIGURES ............................................................................... 115
6.0 SUMMARY OF FINDINGS ................................................................................... 126
7.0 PUBLIC HEALTH SIGNIFICANCE .................................................................... 129
APPENDIX A: DOPPLER ABI TESTING INSTRUCTIONS............................................. 135
APPENDIX B: COLIN VP 1000 TESTING INSTRUCTIONS............................................ 137
BIBLIOGRAPHY ..................................................................................................................... 151
viii

LIST OF TABLES
Table 3-1. Baseline Characteristics of BARI 2D Patients with Normal ABI at Study Entry
(N=1479), by Assigned Glycemic Control Strategy ................................................................. 55
Table 3-2. Cumulative Incidence of Lower Extremity Outcomes, by Assigned Glycemic
Control Strategy, Intention-To-Treat Analysis ........................................................................ 57
Table 3-3. Effects of Assigned Glycemic Control Strategy on Lower Extremity Outcomes
(N=1479) ....................................................................................................................................... 58
Table 3-4. Baseline Characteristics of Participants in Per Protocol Analysis (N=942) ........ 59
Table 3-5. Cumulative Incidence of Lower Extremity Outcomes, by Glycemic Control
Strategy, Per Protocol Analysis (N=942) .................................................................................. 60
Table 3-6. Effects of Glycemic Control Strategy on Lower Extremity Outcomes, Per
Protocol Analysis (N=942) .......................................................................................................... 61
Table 4-1. Baseline Characteristics of Participants Available for PAD Analysis ................. 84
Table 4-2. Associations^ Between Baseline Risk Factors and Incidence of Lower Extremity
Outcomes ..................................................................................................................................... 85
Table 4-3. Multivariate Associations^ Between Selected Variables and Incidence of Lower
Extremity Outcomes ................................................................................................................... 86
Table 4-4. Multivariate Associations^ Between Baseline Risk Factors and Incidence of
Lower Extremity Outcomes ....................................................................................................... 87
Table 4-5. Correlations Between Baseline Values of Candidate Variables ........................... 88
ix

Table 4-6. Associations^ Between Time-Varying Risk Factors and Incidence of Lower
Extremity Outcomes, Stratified By Assigned Glycemic Treatment ....................................... 89
Table 4-7. Multivariate Associations^ Between Time-Varying Risk Factors and Incidence
of Lower Extremity Outcomes, Stratified By Assigned Glycemic Treatment ...................... 90
Table 5-1. Required Sample Sizes to Achieve 80% Power and 90% Power ....................... 115
Table 5-2. Baseline Characteristics of Study Participants .................................................... 116
Table 5-3. Descriptive Statistics of Blood Pressure Measurements ..................................... 117
Table 5-4. Descriptive Statistics of ABI Measurements ........................................................ 118
Table 5-5. Intra-Class Correlations, Linear Correlations, and Mean Absolute Differences
for Primary Comparisons Reported in Text .......................................................................... 119
Table 5-6. Between-Method Agreement by ABI Category ................................................... 120
Table 5-7. Stratified By Caffeine Intake ................................................................................. 121
Table 5-8. Stratified by Exercise Prior to Study Visit ........................................................... 122
x
LIST OF FIGURES
Figure 1-1. Fatty-Streak Formation in Atherosclerosis ............................................................ 3
Figure 1-2. Advanced Plaque Formation in Atherosclerosis .................................................... 4
Figure 1-3. Ethnic-Specific Prevalence of Peripheral Arterial Disease in Men and Women 6
Figure 1-4. Prevalence of Peripheral Arterial Disease in the Atherosclerosis Risk In
Communities (ARIC) Study ......................................................................................................... 9
Figure 1-5. Natural History of Peripheral Arterial Disease .................................................... 10
Figure 1-6. Estimated Survival for Patients with Advanced Peripheral Arterial Disease ... 11
Figure 1-7. Treatment Algorithm for Patients with Known Peripheral Arterial Disease ... 12
Figure 1-8. Biomarkers' Role In Fibrinolysis ........................................................................... 19
Figure 1-9. Patients Stopping during 6-minute walk test according to ABI Category......... 29
Figure 1-10. All-Cause and Cardiovascular Mortality Across the Spectrum of Ankle-
Brachial Index in the Strong Heart Study ................................................................................ 30
Figure 1-11. All-Cause and Cardiovascular Mortality Across the Spectrum of Ankle-
Brachial Index in the Health ABC Study ................................................................................. 31
Figure 3-1. Flowchart of Ankle-Brachial Index Measurements Available in All BARI 2D
Patients (N=2368) ........................................................................................................................ 62
Figure 3-2. Cumulative Incidence of Peripheral Arterial Disease and Related Outcomes, by
Assigned Glycemic Control Strategy ........................................................................................ 63
xi
Figure 3-3. Cumulative Incidence of Peripheral Arterial Disease Among Patients Not On
Insulin at Baseline, by Assigned Glycemic Control Strategy .................................................. 64
Figure 3-4. Cumulative Incidence of Peripheral Arterial Disease Among Patients On
Insulin at Baseline, by Assigned Glycemic Control Strategy .................................................. 64
Figure 5-1. Scatterplot of Colin ABI Measurement #1 vs. Colin ABI Measurement #2 .... 123
Figure 5-2. Bland-Altman Plot of Difference in Colin ABI Measurements vs. Mean Colin
ABI ............................................................................................................................................. 123
Figure 5-3. Scatterplot of Doppler ABI Measurement #1 vs. Doppler ABI Measurement #2
..................................................................................................................................................... 124
Figure 5-4. Bland-Altman Plot of Difference in Doppler ABI Measurements vs. Mean
Doppler ABI .............................................................................................................................. 124
Figure 5-5. Scatterplot of Mean Doppler ABI vs. Mean Colin ABI ..................................... 125
Figure 5-6. Bland-Altman Plot of Between-Method Differences vs. Mean Overall ABI ... 125
xii
ACKNOWLEDGEMENT
This research was expertly advised by Dr. Maria Mori Brooks and significantly aided by active
participation from all five members of the dissertation committee. The author could not have
asked for a better group to guide him throughout this process and is extremely grateful for the
committee’s outstanding contributions. Beyond the officially recognized members of committee,
one more person is worth a special mention:
This work is dedicated to the late Kim Sutton Tyrrell, who sadly passed away in December 2012.
Dr. Sutton Tyrrell was the director of the NHLBI-funded Cardiovascular Epidemiology Training
Program at the University of Pittsburgh during the author’s time as a T-32 trainee and served as
an active member of the author’s dissertation committee until her health no longer permitted.
This research would not have been possible without Dr. Sutton Tyrrell’s influence and vision,
and her contributions should be recognized.
xiii
1.0 INTRODUCTION
Peripheral arterial disease (PAD), also known as peripheral vascular disease (PVD) or lower
extremity arterial disease (LEAD), is one manifestation of atherosclerosis, a chronic disease that
is one of the leading causes of death and disability in the United States.1 The chapter that
follows begins by describing the development of atherosclerosis and how it manifests as PAD.
Following that, the author presents epidemiological statistics to illustrate the prevalence of PAD,
the associated morbidity and mortality, and selected risk factors for PAD. A special section is
then devoted to PAD in patients with type 2 diabetes mellitus (T2DM), since that patient
population is a main focus of this research project. The author also presents a special section
describing the ankle-brachial index (ABI), which is the principal screening tool for PAD and is
utilized in all three manuscripts contained within this dissertation. The section devoted to the
ABI describes its historical development, the epidemiology of the ABI, a brief description of two
methods by which ABI can be measured (supplemented by two Appendices that describe the
respective methods in greater detail), what is known about the comparability of these two
methods, and finally a section describing current guidelines for whom should have an ABI
measurement as well as the clinical significance of the ABI.
1
1.1 PERIPHERAL ARTERIAL DISEASE
1.1.1 Pathophysiology
Atherosclerosis is a complex disease that involves lipid disturbances, endothelial dysfunction,
inflammation, vascular remodeling, and the development of lesions in the arterial wall.2,3,4 The
symptoms and ultimate consequences of an atherosclerotic lesion are dependent on factors such
as the location, size, and stability of the lesion. Atherosclerotic lesions are most prevalent in the
coronary arteries but can also be present in the brain, kidneys, and lower extremities.5
The atherosclerotic process begins when endothelial cells over-express certain molecules in the
setting of an unfavorable serum lipid profile.2,3 These molecules, known as adhesion molecules,
include P-selectins and E-selectins, intercellular adhesion molecules (ICAM), and vascular-cell
adhesion molecules (VCAM).6 Adhesion molecules promote the migration of leukocytes, the
release of cytokines, and the recruitment of monocytes into the intimal layer of the artery; the
recruitment of monocytes into the intima provokes an inflammatory response.
The inflammatory response stimulates the migration and proliferation of smooth muscle cells in
the area of injury. Concurrently, monocytes in the intima develop into macrophages, which are
mediators of the inflammatory response and directly contribute to the atherosclerotic process.
The uptake of modified lipoproteins by macrophages leads to the accumulation of cholesterol
esters and formation of macrophage-derived “foam cells” within the arterial wall. The ensuing
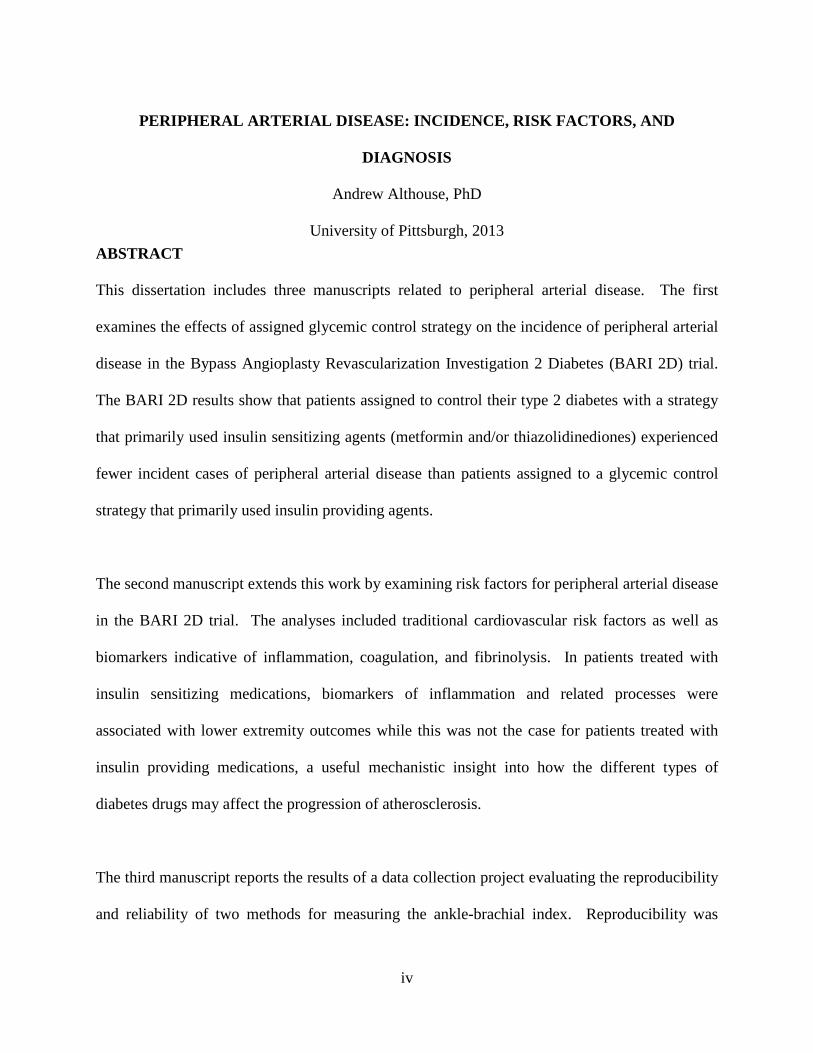
accumulation of lipid-laden cells is referred to as the “fatty streak” (Figure 1-1), the earliest
visible lesion in the atherosclerotic process.
2
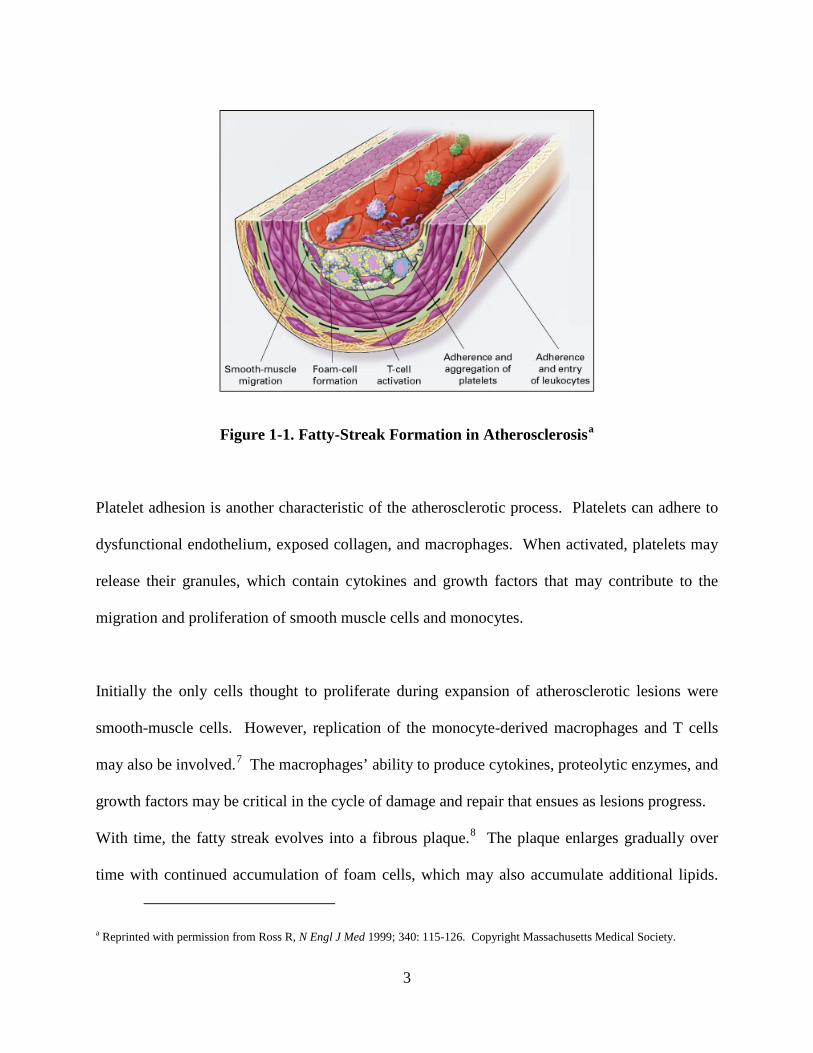
Figure 1-1. Fatty-Streak Formation in Atherosclerosisa
Platelet adhesion is another characteristic of the atherosclerotic process. Platelets can adhere to
dysfunctional endothelium, exposed collagen, and macrophages. When activated, platelets may
release their granules, which contain cytokines and growth factors that may contribute to the
migration and proliferation of smooth muscle cells and monocytes.
Initially the only cells thought to proliferate during expansion of atherosclerotic lesions were
smooth-muscle cells. However, replication of the monocyte-derived macrophages and T cells
may also be involved.7 The macrophages’ ability to produce cytokines, proteolytic enzymes, and
growth factors may be critical in the cycle of damage and repair that ensues as lesions progress.
With time, the fatty streak evolves into a fibrous plaque.8 The plaque enlarges gradually over
time with continued accumulation of foam cells, which may also accumulate additional lipids.
a Reprinted with permission from Ross R, N Engl J Med 1999; 340: 115-126. Copyright Massachusetts Medical Society.
3
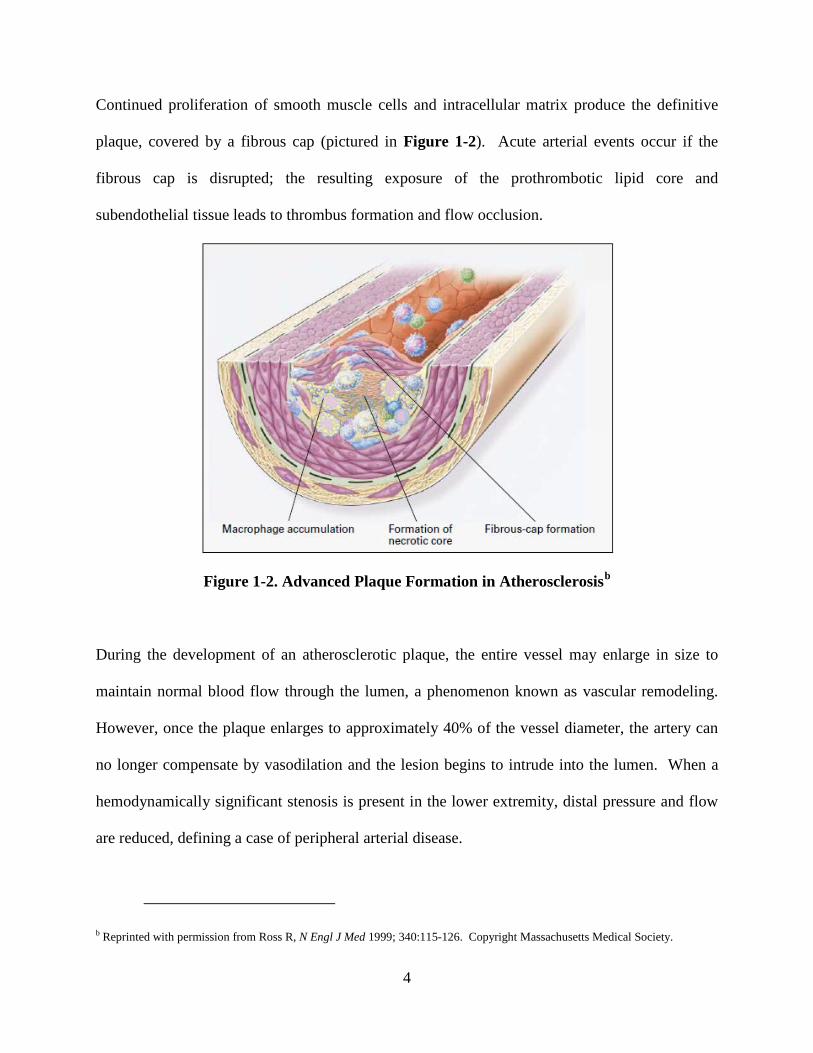
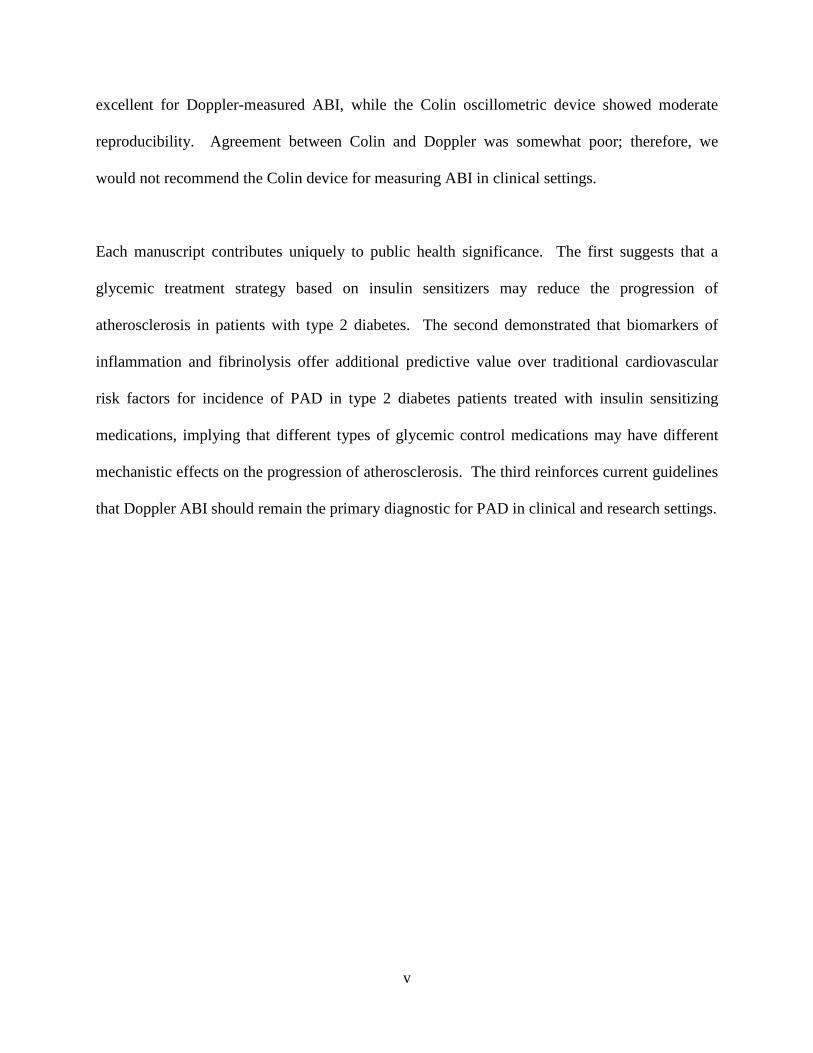
Continued proliferation of smooth muscle cells and intracellular matrix produce the definitive
plaque, covered by a fibrous cap (pictured in Figure 1-2). Acute arterial events occur if the
fibrous cap is disrupted; the resulting exposure of the prothrombotic lipid core and
subendothelial tissue leads to thrombus formation and flow occlusion.
Figure 1-2. Advanced Plaque Formation in Atherosclerosisb
During the development of an atherosclerotic plaque, the entire vessel may enlarge in size to
maintain normal blood flow through the lumen, a phenomenon known as vascular remodeling.
However, once the plaque enlarges to approximately 40% of the vessel diameter, the artery can
no longer compensate by vasodilation and the lesion begins to intrude into the lumen. When a
hemodynamically significant stenosis is present in the lower extremity, distal pressure and flow
are reduced, defining a case of peripheral arterial disease.
b Reprinted with permission from Ross R, N Engl J Med 1999; 340:115-126. Copyright Massachusetts Medical Society.
4
The most frequent presenting symptom in patients with PAD is intermittent claudication, which
is defined as pain in the leg muscles with ambulation. Claudication is caused by arterial
obstruction proximal to affected muscle beds, which limits the normal exercise-induced increase
in blood flow and produces transient muscle ischemia during exercise.9 Many patients with
advanced PAD experience some symptoms of intermittent claudication; however, some elderly
patients assume that leg pain while walking is part of the normal aging process and do not report
their symptoms. Claudication symptoms are typically localized in the calf or thigh, although
pain may begin to appear in the foot for patients with severe cases. In advanced stages of PAD,
tissue perfusion progresses to ischemic ulceration or gangrene, known as critical limb ischemia
(CLI). It is estimated that there is about one annual case of CLI per 100 patients with
intermittent claudication. The prognosis is extremely poor for these patients; one-year mortality
is approximately 25% and major amputation is eventually required in about 50% of CLI
patients.10 This is discussed further in Section 1.1.3 on morbidity and mortality.
Not all patients undergoing a lower-extremity amputation have experienced a steady progression
from claudication to rest pain to CLI to amputation. A 1984 review of 713 patients undergoing
below-knee amputations for ischemia found that more than half had experienced no ischemic
symptoms as recently as 6 months before the amputation.11 This seems counterintuitive, because
atherosclerosis is a chronic disease that develops over years rather than months, but it
demonstrates the complex disease pathology of claudication in PAD patients. One may conclude
that many patients with peripheral atherosclerosis will be asymptomatic until the disease is quite
advanced, highlighting the importance of screening patients with the ankle-brachial index.
5
1.1.2 Prevalence
PAD is typically asymptomatic in its early stages, so it is difficult to ascertain the population
prevalence in the absence of widespread screening. It is also difficult to compare prevalence
estimates because the criterion used to define PAD has evolved over time.12,13,14 The most
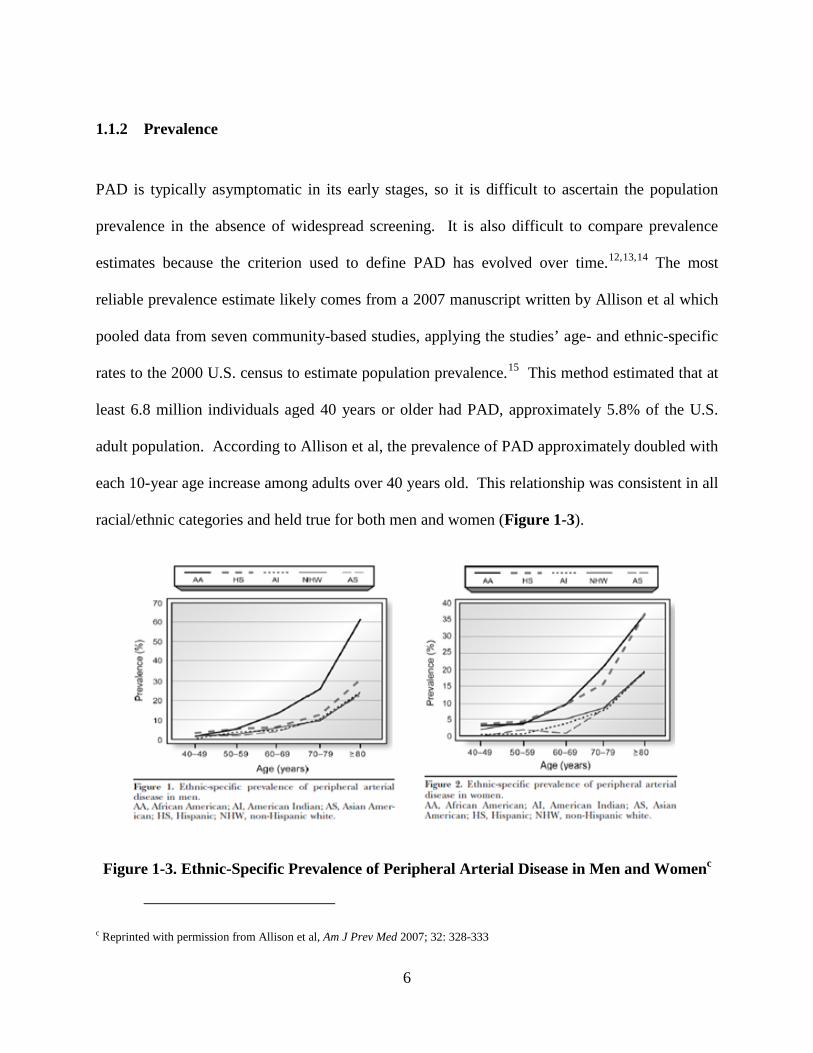
reliable prevalence estimate likely comes from a 2007 manuscript written by Allison et al which
pooled data from seven community-based studies, applying the studies’ age- and ethnic-specific
rates to the 2000 U.S. census to estimate population prevalence.15 This method estimated that at
least 6.8 million individuals aged 40 years or older had PAD, approximately 5.8% of the U.S.
adult population. According to Allison et al, the prevalence of PAD approximately doubled with
each 10-year age increase among adults over 40 years old. This relationship was consistent in all
racial/ethnic categories and held true for both men and women (Figure 1-3).
Figure 1-3. Ethnic-Specific Prevalence of Peripheral Arterial Disease in Men and Womenc
c Reprinted with permission from Allison et al, Am J Prev Med 2007; 32: 328-333
6
Also visible on Figure 1-3 is that African-Americans tended to have greater risk of PAD than
other racial/ethnic groups in Allison’s pooled study. This held true for both men and women,
and the increased risk among African-Americans was especially noticeable in the elderly. The
higher risk among African-Americans in older age groups is consistent with prior research from
the Systolic Hyptertension in the Elderly Program (SHEP),16 which was a clinical trial evaluating
the efficacy of drug therapy for systolic hypertension in the elderly. All participants were at least
60 years old at enrollment and had isolated systolic hypertension, which defines a population
with especially high risk for PAD. The ankle-brachial index was measured at 11 of the 16 SHEP
field centers as part of an ancillary study to assess the prevalence of PAD and risk factors which
might be associated with PAD in the SHEP study population. Participants self-identified as
Black race had greater prevalence of PAD than White study participants in all age categories
among both men and women. In a multivariable logistic regression which adjusted for potential
confounders (age, smoking, body mass index, diabetes, systolic blood pressure, HDL cholesterol,
and existing coronary artery disease) there was a significantly greater risk of PAD in Blacks
compared to White participants (OR=2.51, 95% CI: 1.84-3.41, p<0.001). Therefore, we
conclude that the strong relation of PAD with Black race was not explained by differences in
baseline characteristics between the racial categories. The SHEP investigators also found that,
among Blacks, subgroups that were expected to be at low risk for PAD were not. For example,
Blacks who never smoked had nearly twice the prevalence of PAD as Whites who never smoked.
The National Health and Nutrition Examination Survey (NHANES) data have also been used to
estimate the prevalence of PAD in the United States. Carried out primarily using surveys, the
7
NHANES sample is created using a multistage probability sample of the noninstitutionalized
civilian United States population designed to oversample the elderly, low-income persons,
adolescents, Mexican Americans, and non-Hispanic blacks to provide more reliable estimates for
these population subgroups. NHANES 1999–2000 was the first NHANES survey to perform
ankle-brachial blood pressure measurements on participants, analyzed by Selvin et al14 to
estimate the prevalence of PAD in the year 2000. According to the NHANES 1999-2000 data,
the prevalence of PAD among individuals aged 40 years or older was 4.3% (95% CI 3.1% to
5.5%) in the year 2000, translating to an estimated 5 million adults (95% CI 4 to 7 million) who
would be classified as having PAD. Parallel to the SHEP results, the NHANES data suggested
that PAD disproportionately affects older individuals and Blacks, and the excess PAD
prevalence among Blacks was not explained by other known risk factors. Selvin et al also
performed additional analyses to examine the relationships between PAD and other risk factors;
NHANES data will be referenced further in Sections 1.1.4 (traditional risk factors), 1.1.5 (novel
risk factors) and 1.2.1 (PAD in patients with type 2 diabetes mellitus) where appropriate.
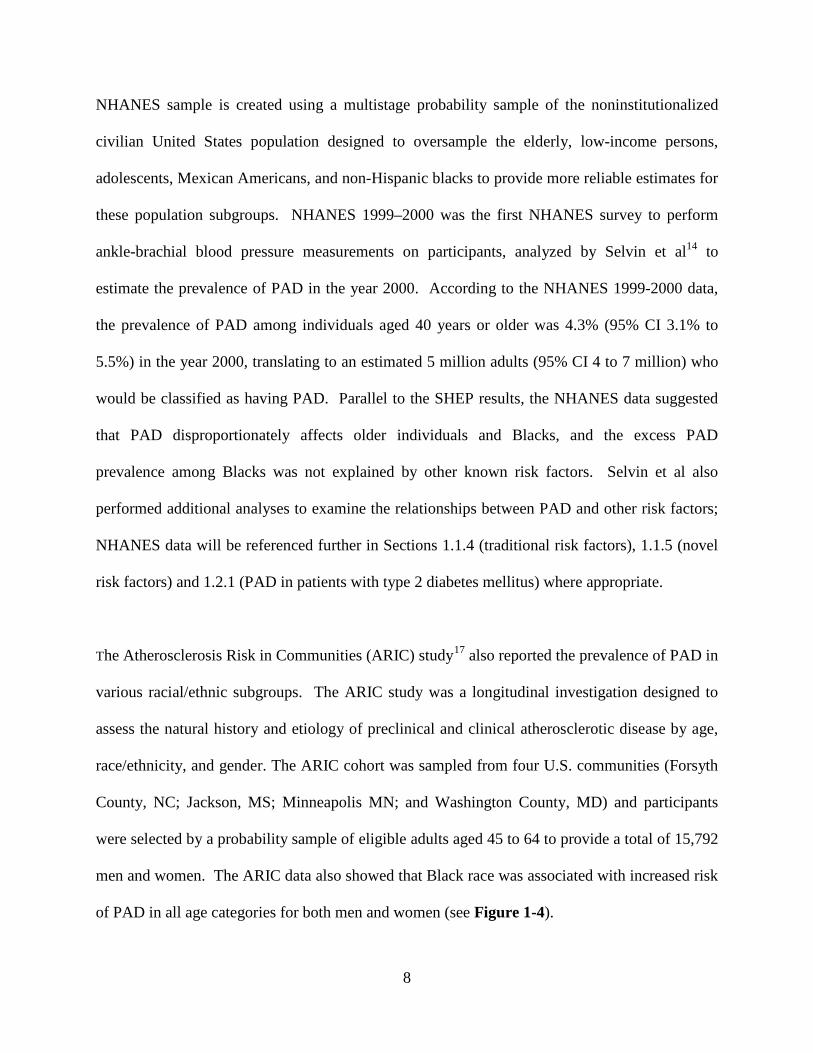
The Atherosclerosis Risk in Communities (ARIC) study17 also reported the prevalence of PAD in
various racial/ethnic subgroups. The ARIC study was a longitudinal investigation designed to
assess the natural history and etiology of preclinical and clinical atherosclerotic disease by age,
race/ethnicity, and gender. The ARIC cohort was sampled from four U.S. communities (Forsyth
County, NC; Jackson, MS; Minneapolis MN; and Washington County, MD) and participants
were selected by a probability sample of eligible adults aged 45 to 64 to provide a total of 15,792
men and women. The ARIC data also showed that Black race was associated with increased risk
of PAD in all age categories for both men and women (see Figure 1-4).
8
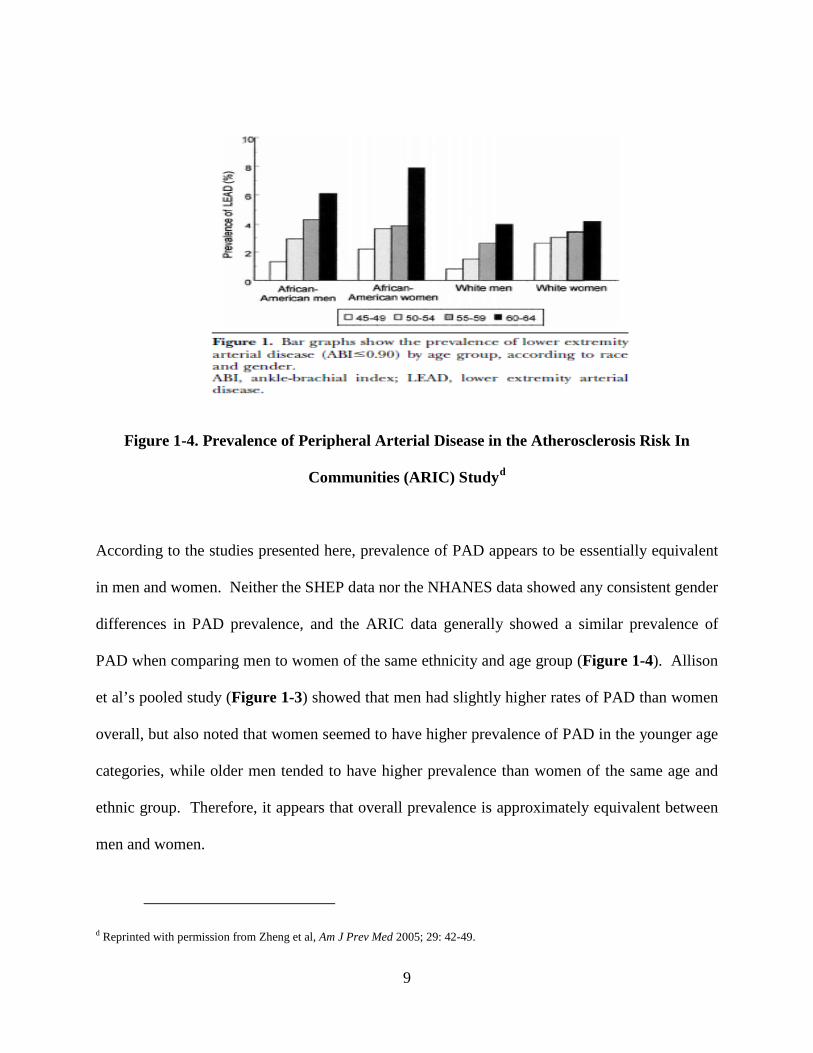
Figure 1-4. Prevalence of Peripheral Arterial Disease in the Atherosclerosis Risk In
Communities (ARIC) Studyd
According to the studies presented here, prevalence of PAD appears to be essentially equivalent
in men and women. Neither the SHEP data nor the NHANES data showed any consistent gender
differences in PAD prevalence, and the ARIC data generally showed a similar prevalence of
PAD when comparing men to women of the same ethnicity and age group (Figure 1-4). Allison
et al’s pooled study (Figure 1-3) showed that men had slightly higher rates of PAD than women
overall, but also noted that women seemed to have higher prevalence of PAD in the younger age
categories, while older men tended to have higher prevalence than women of the same age and
ethnic group. Therefore, it appears that overall prevalence is approximately equivalent between
men and women.
d Reprinted with permission from Zheng et al, Am J Prev Med 2005; 29: 42-49.
9
1.1.3 Morbidity and Mortality
PAD directly increases the risk of functional limitation, physical disability, leg revascularization,
and amputation.18,19,20 While a relatively small proportion (1-3%) of patients with PAD present
with critical limb ischemia (CLI), the prognosis for a patient with such advanced disease is
extremely poor, with an estimated 25% one-year mortality rate and an additional 30% of patients
presenting with CLI likely to undergo amputation within one year (Figure 1-5). Following an
amputation, quality of life tends to suffer as a result, primarily owing to the restricted mobility.21
Figure 1-5. Natural History of Peripheral Arterial Diseasee
e Reprinted with permission from Hirsch et al. Circulation 2006; 113: 1474-1547.
10
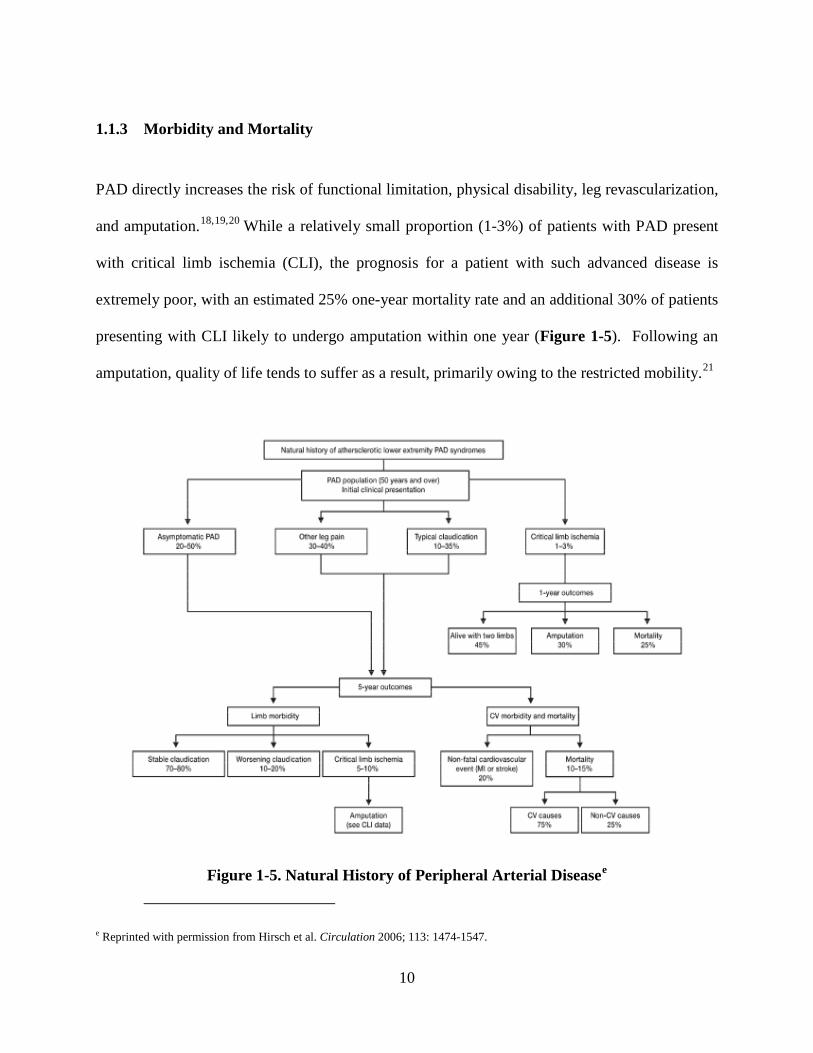
PAD is not only a condition unto itself, but the presence of PAD is also a marker of generalized
systemic atherosclerosis, and therefore PAD is associated with increased risk of cardiovascular
and all-cause mortality.22,23,24,25,26,27 Estimates of the excess mortality risk associated with PAD
vary based on the age distribution and disease status of the population in question, but it is clear
that patients with PAD consistently have higher mortality risk than those free of PAD in all
populations. Figure 1-6 below shows the precipitous decrease in five- and ten-year survival for
patients with intermittent claudication or critical limb ischemia; the mortality risk associated with
asymptomatic PAD will be discussed in more detail in Section 1.3 on the ankle-brachial index.
Figure 1-6. Estimated Survival for Patients with Advanced Peripheral Arterial Diseasef
Admittedly, the relationship between PAD and cardiovascular mortality must be considered in
the context of possible coexisting atherosclerosis in other vascular beds. The cause of death in
f Reprinted with permission from Norgren et al, Eur J Vasc Endovasc Surg 2007; 33: S1-S70.
*IC= Intermittent Claudication; CLI = Critical Limb Ischemia
11
PAD patients is often something other than the lower extremity disease itself, such as coronary
artery disease (CAD). Approximately half of patients with PAD have coexisting CAD.28
However, the relationship between PAD and other CVD events make it a useful marker of
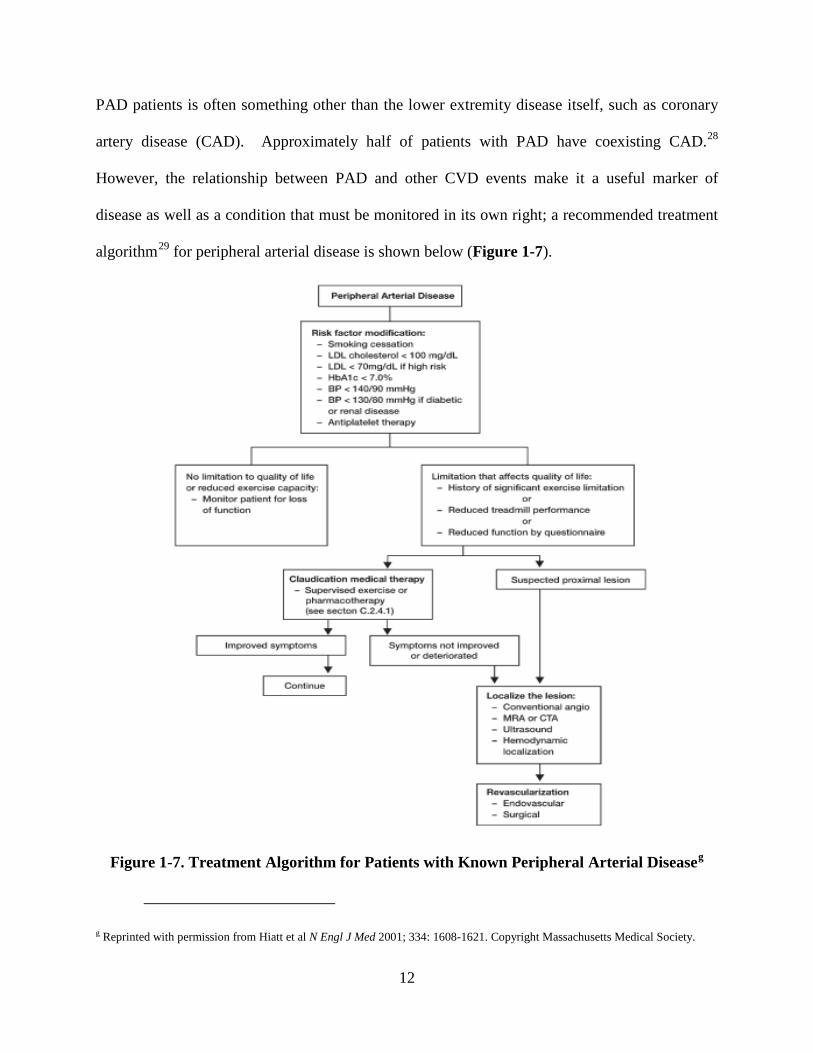
disease as well as a condition that must be monitored in its own right; a recommended treatment
algorithm29 for peripheral arterial disease is shown below (Figure 1-7).
Figure 1-7. Treatment Algorithm for Patients with Known Peripheral Arterial Diseaseg
g Reprinted with permission from Hiatt et al N Engl J Med 2001; 334: 1608-1621. Copyright Massachusetts Medical Society.
12
1.1.4 Traditional Cardiovascular Risk Factors
PAD is generally asymptomatic in its early stages, but it is easily detected by screening at-risk
patients with an ankle-brachial index (ABI). Therefore, to improve early detection of PAD,
knowledge of risk factors is critical to ensure that high-risk patients are screened with an ABI.28
Many of the known risk factors for PAD are well-established as risk factors for atherosclerosis in
all vascular beds, although the magnitude of some risk factors’ effects may vary between PAD
and other atherosclerotic processes. As demonstrated in Figure 1-7, the immediate steps taken
to reduce cardiovascular risk in a patient with diagnosed PAD include smoking cessation,
treatment of dyslipidemia, treatment of hypertension, and glucose lowering, with additional
emphasis on treating these risk factors if a patient is diabetic or has renal disease. Smoking,
dyslipidemia, hypertension, elevated glucose (diabetes), and renal disease are all established risk
factors for cardiovascular disease at large; each will be discussed briefly here.
Cigarette smoking is the strongest risk factor for both onset and progression of PAD, with
estimates ranging from about a twofold greater risk to a fivefold greater risk in current smokers
compared to non-smokers. 14,30,31,32 The NHANES 1999-2000 data showed a significantly
increased risk of PAD (OR=4.23, 95% CI 1.95-9.17, p<0.05) for current smokers compared to
nonsmokers. The relative risk associated with smoking varies due to differences in study
population; smoking increases risk the most in younger, otherwise healthy populations, while the
effect is somewhat smaller in older populations that have a larger overall prevalence of PAD.
Physiologically, smoking impairs vasodilation and attenuates production of endothelium-derived
nitric oxide (NO), both of which retard the development of atherosclerosis, and therefore
13
smoking increases risk of atherosclerosis in all vascular beds.33 Cigarette smoking is more
strongly associated with PAD than it is with coronary disease, although the reason is unknown.
Therefore, all adult smokers should be considered at high risk for PAD. 28
Hypertension is also strongly associated with PAD14,34 showing approximately 1.5- to three-fold
increases in risk, again depending on age and composition of the study population. The
aforementioned NHANES 1999-2000 data showed a moderately increased risk of PAD
(OR=1.75, 95% CI 0.93-3.30), although this was not significant in a fully adjusted model.
Hypertension promotes the development of atherosclerotic plaques by its effects on the
vasculature: arteries exposed to hypertension have increased permeability, allowing oxidized
lipoproteins to migrate into the intima.35 There is also evidence suggesting that hypertension
alters the balance between cellular proliferation and apoptosis.36 Obviously, since systolic blood
pressure is a component of the ankle-brachial index, it would be expected to have some
association with PAD risk. This is discussed further in Section 1.3 on the ABI.
Dyslipidemia is associated with increased risk of PAD, but the magnitude of this relationship is
somewhat smaller than that observed for smoking and hypertension. 14,37 NHANES 1999-2000
data showed a significantly increased risk of PAD (OR=1.67, 95% CI 1.01-2.74, p<0.05) for
participants with hypercholesterolemia. Our view of the role of lipids in atherosclerosis has
evolved over the past several decades, but it has long been established that higher levels of LDL
cholesterol are associated with increased cardiovascular risk, while higher levels of HDL
cholesterol are protective.38 The form of dyslipidemia most common in PAD patients is the
14
combination of low HDL cholesterol and elevated triglyceride levels commonly seen in patients
with diabetes.30
Renal insufficiency is also common in patients with PAD and vice versa.39 However, the
causality of this relationship is not entirely clear. The NHANES data40 showed that the
prevalence of low ABI was six times greater in patients with low creatinine clearance, and this
relationship remained significant after adjusting for known PAD risk factors. The association
between chronic kidney disease (CKD) and PAD is independent of age, ethnicity, diabetes, and
hypertension, and although the exact reason is not known, it may relate to the vascular
inflammation and elevated homocysteine levels seen in CKD.37 However, it is uncertain whether
i) there is a true causal relationship between CKD and PAD or ii) the frequent coexistence of the
two diseases is a reflection of the systemic complications of both atherosclerosis and CKD.
Peripheral arterial disease is also especially common in patients with type 2 diabetes mellitus
(T2DM).14,41 The clinical presentation of PAD also tends to differ in T2DM patients compared
to those free of diabetes. It is believed that the abnormnal cluster of hyperglycemia, elevated
free fatty acids, and insulin resistance observed in T2DM promotes oxidative stress and
endothelial dysfunction, both of which contribute to atherosclerosis. Insulin resistance also
intensifies the systemic inflammatory state, promotes thrombosis, and constrains fibrinolysis.42
The American Diabetes Association recommends a screening ABI every 5 years in patients with
diabetes.43 The relationship between PAD and T2DM will be discussed in much greater depth in
Section 1.2 of this document.
15
Notably, body mass index has generally shown little association with PAD when adjusting for
other cardiovascular risk factors.14,16 Given the strong association between obesity and coronary
artery disease, the lack of association between obesity and PAD is somewhat counterintuitive.
One hypothesis is that PAD is detected less often among obese patients because the principal
diagnostic, the ankle-brachial index, is less sensitive in obese patients because the size of their
ankles makes it difficult to take an accurate blood-pressure reading at the ankle (discussed
further in Section 1.3 on the ankle-brachial index). Another possibility is that obese patients tend
to be less physically active than normal-weight patients and therefore less likely to experience
symptoms of claudication that would prompt a physician to examine the patient further.
As reviewed in this section, cigarette smoking, hypertension, dyslipidemia, renal insufficiency,
and diabetes are independently associated with peripheral arterial disease. However, treatment
targets for these risk factors are generally driven by their respective associations with coronary
artery disease; furthermore, since these relationships are already well-documented, further study
of these relationships is unlikely to provide a great deal of new information. However, it would
be useful to identify additional risk factors beyond the traditional cardiovascular disease risk
factors that may enhance our understanding of the pathophysiology of peripheral arterial disease,
which may eventually lead to potential therapeutic targets for further study.
16
1.1.5 Novel Risk Factors
Inflammation, coagulation, and fibrinolysis are interconnected processes43 and markers related to
each process are associated with coronary atherosclerosis44,45 and peripheral arterial disease.46,47
Several biomarkers of these three processes are associated with PAD in existing cross-sectional
studies, but few of these relationships have been confirmed with data from longitudinal studies.
The Bypass Angioplasty Revascularization Investigation 2 Diabetes (BARI 2D) trial has
longitudinal data on biomarkers related to these processes as well as data on PAD and related
outcomes during follow-up. These data could be used to examine which of these biomarkers are
associated with incident PAD in a population with existing coronary atherosclerosis, which could
help us better understand the systemic atherosclerotic process. The rationale for each
biomarker’s relationship with atherosclerosis (and, by extension, the risk of developing PAD)
will be discussed briefly here.
C-reactive protein (CRP), a marker of inflammation, binds to endothelial cell receptors and also
co-localizes with oxidized LDL in atherosclerotic plaques.48 CRP also promotes leukocyte
adhesion and stimulates endothelial production of procoagulant tissue factor,49 both of which
contribute to an atherogenic environment. CRP also increases production of compounds that
impair fibrinolysis such as plasminogen activator inhibitor-1 (PAI-1)50 and inhibits tissue-type
plasminogen activator (t-PA),51 discussed in the section that follows. The associations between
CRP and these biomarkers illustrate the complexity of the relationship between inflammation,
coagulation, and fibrinolysis. Although discussed with “novel” risk factors for the purposes of
this document, C-reactive protein is well established as a risk factor for cardiovascular disease.52
17
According to Ridker’s seminal paper, CRP evaluation may have the potential to improve
cardiovascular risk prediction models when used as an adjunct to this approach. For each
quintile increase in CRP, the adjusted relative risk of suffering a future cardiovascular event is
estimated to be 26% for men (95% CI 11% to 44%; P<0.005) and 33% for women (95% CI 13%
to 56%; P<0.001). There is also some evidence linking CRP specifically to PAD: NHANES
1999-2000 data also showed that patients in the highest quartile of CRP had a greater risk than
patients in the lowest quartile, although the difference was not statistically significant when
adjusting for other cardiovascular risk factors (OR=1.72, 95% CI 0.74-3.99).
CRP is a marker of inflammation, but as mentioned above it might influence the atherosclerotic
process by increasing production of compounds that impair fibrinolysis, a process in which a
fibrin clot, the product of coagulation, is broken down (see Figure 1-8). The acute fibrinolytic
response to inflammation and coagulation is the release of plasminogen activators. Tissue-type
plasminogen activator (t-PA) is an enzyme found on endothelial cells which catalyzes the
conversion of plasminogen to plasmin, which is the major enzyme responsible for breakdown of
blood clots.53 The increase in plasminogen activation and subsequent plasmin generation
stimulated by t-PA is counteracted by a delayed but sustained increase in plasminogen activator
inhibitor-1 (PAI-1),54 a protein that functions as the principal inhibitor of t-PA and hence is an
inhibitor of fibrinolysis.
18
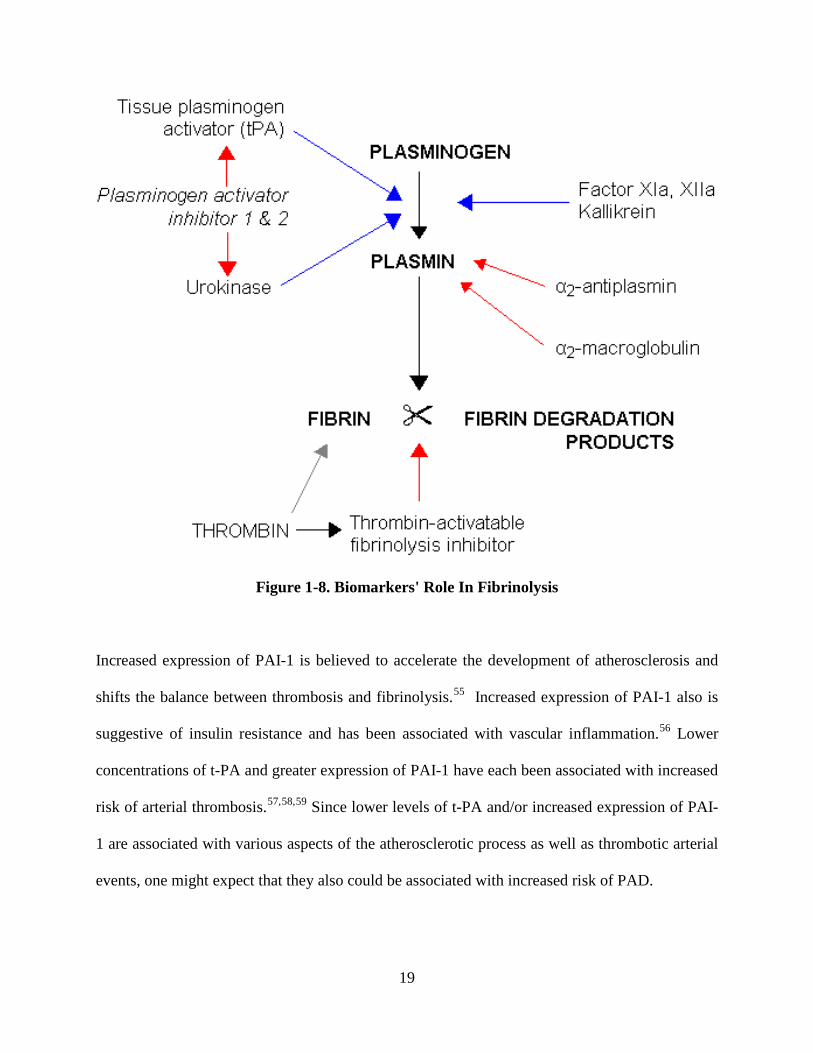
Figure 1-8. Biomarkers' Role In Fibrinolysis
Increased expression of PAI-1 is believed to accelerate the development of atherosclerosis and
shifts the balance between thrombosis and fibrinolysis.55 Increased expression of PAI-1 also is
suggestive of insulin resistance and has been associated with vascular inflammation.56 Lower
concentrations of t-PA and greater expression of PAI-1 have each been associated with increased
risk of arterial thrombosis.57,58,59 Since lower levels of t-PA and/or increased expression of PAI-
1 are associated with various aspects of the atherosclerotic process as well as thrombotic arterial
events, one might expect that they also could be associated with increased risk of PAD.
19
Another marker of fibrinolysis is fibrinogen, a soluble plasma glycoprotein that is converted into
fibrin during coagulation. Fibrinogen is thus a major component of the coagulation cascade and
may affect the formation of atherosclerotic plaques through a number of different pathways:
fibrinogen promotes the binding and production of high-density lipoproteins,60 facilitates the
migration of adhesion molecules to the endothelial surface,61 initiates the proliferation and
migration of smooth muscle cells,62 and mediates the binding of monocytes and endothelial cells
through ICAM-1 and MAC-1.63 Fibrinogen can also stimulate expression of proinflammatory
cytokines on mononuclear cells and induce production of chemokines by endothelial cells and
fibroblasts.64 While fibrinogen is not a primary therapeutic target or first-line screening test, it is
well established as a risk factor for cardiovascular disease.65 There is also some evidence linking
fibrinogen to increased risk of PAD; NHANES 1999-2000 data showed that patients in the
highest quartile of fibrinogen had a greater PAD risk than patients in the lowest quartile of
fibrinogen, although the difference was not statistically significant when adjusting for other
cardiovascular risk factors (OR=1.68, 95% CI 0.67-4.23).
Fibrinogen is converted into fibrin during coagulation; emerging on the other side of the
fibrinolytic process is the fibrin degradation product known as D-dimer, a small protein fragment
which contains two crosslinked D fragments of the fibrinogen protein.66 D-dimers are not
normally present in human blood plasma except when the coagulation system is activated; its
principal use in diagnostic testing is to rule out thrombotic events. However, since the plasma
level of D-dimer is a marker of coagulant and subsequent fibrinolytic activity,67 increased D-
dimer might also be associated with increased risk of PAD. Plasma levels of D-dimer are
generally correlated with t-PA and PAI-1 activity.68 However, D-dimer, t-PA and PAI-1 reflect
20
different aspects of the fibrinolytic system and thus each might provide unique information about
the atherosclerotic process.
There is a plausible biological hypothesis linking each of the aforementioned biomarkers with
developing atherosclerosis, but only C-reactive protein, fibrinogen, and D-dimer have been
identified as risk factors for incident PAD in epidemiological studies. NHANES 1999-2000 data
showed that participants in the highest quartile of CRP and fibrinogen had two-fold increased
risk of prevalent PAD compared with participants in the lowest quartiles.69 Both fibrinogen and
D-dimer have been associated with increased risk of PAD in cross-sectional studies.46,70,71
Fibrinogen and D-dimer were also linked to the progression of PAD in the Edinburgh Artery
Study;72 however, neither was significantly associated with PAD progression after adjusting for
the level of CRP, suggesting that the processes of inflammation, coagulation, and fibrinolysis
may not contribute “independently” to the progression of systemic atherosclerosis but instead
that the processes may be reflective of an overall advancing disease state.
The increased risk associated with higher levels of the respective biomarkers is not isolated to
“incident” disease but also extends to poorer outcomes among individuals with existing PAD. In
patients with existing PAD, the aforementioned biomarkers have been associated with increased
risk of functional decline, failure of lower-extremity revascularization procedures, cardiovascular
mortality and all-cause mortality.73,74,75,76,77,78,79 Although these studies combine to suggest that
inflammation, coagulation, and fibrinolysis may affect the progression of PAD, most of the
existing studies are not ideally suited to describe the association between changes in biomarker
levels and PAD outcomes because they are one of the following designs:
21
i) cross-sectional studies linking current levels of a biomarker to “prevalent” PAD; while
this is a useful exploratory analysis, this study is not well-suited to elucidate temporality.
ii) longitudinal studies whereby a “baseline” level of the risk factor is linked to risk of
incident PAD. This is highly useful to establish risk factors for future disease, but it
would be useful to quantify the relationships between time-varying changes in markers of
inflammation, coagulation, and fibrinolysis and the incidence of PAD to determine
whether changes in any of these markers provide additional predictive value.
Further study of the association between these biomarkers of inflammatory states and impaired
fibrinolysis may improve our understanding of their effects on the development of peripheral
atherosclerosis. The next step in understanding these relationships would be a study with these
biomarkers examined as time-varying covariates to elucidate how changes in biomarkers profiles
may be associated with PAD and/or developing atherosclerosis. If time-varying changes in
selected biomarkers show a significant association with disease, we may be able to better target
high-risk patients who should be screened and/or treated for PAD, and we may also better
understand the mechanism by which atherosclerosis continues to progress throughout the
vasculature in patients with type 2 diabetes mellitus, discussed in the following section.
22
1.2 PERIPHERAL ARTERIAL DISEASE IN TYPE 2 DIABETES
Peripheral arterial disease is highly prevalent in patients with Type 2 Diabetes Mellitus (T2DM).
Furthermore, PAD typically presents earlier and progresses more rapidly in T2DM patients than
in nondiabetic patients. The epidemiology, clinical presentation, and potential mechanisms of
peripheral arterial disease in type 2 diabetes mellitus are discussed below.
1.2.1 Epidemiology
It is well-established that diabetes mellitus is associated with an increased risk of all types of
cardiovascular disease, including peripheral arterial disease. Part of this is likely attributable to
the multifactorial cluster of additional risk factors that often accompany diabetes, such as
hypertension and dyslipidemia. However, elevated glucose levels are generally associated with
increased risk of atherosclerotic disease even after adjustment for coexisting risk factors.
The NHANES data suggest that T2DM patients had approximately threefold greater risk of PAD
than those free from diabetes.14 Patients with diabetes often present with more advanced PAD
and experience worse PAD outcomes than nondiabetic patients.80 Peripheral arterial disease in
patients with diabetes is associated with substantial functional impairment and adversely affects
quality of life.81 PAD patients with diabetes have a higher risk of leg revascularization and
amputation than those without diabetes. 82,83,84 Compared to nondiabetic patients, T2DM
patients with coexisting PAD have a significantly increased risk of cardiovascular mortality.85,86
23
1.2.2 Clinical Presentation
The increased risk of PAD in diabetic patients is likely due to the abnormal metabolic state that
prevails in T2DM. The abnormnal cluster of hyperglycemia, elevated free fatty acids, and
insulin resistance characteristic of patients with diabetes results in oxidative stress and
endothelial dysfunction, states that promote the development of atherosclerostic plaques. As a
result, the distribution of PAD tends to differ slightly between diabetic and nondiabetic patients.
Diabetic patients frequently show involvement of the arteries below the knee, especially the
tibial and peroneal arteries, and PAD is more commonly multi-segmental in diabetic patients. 84
Mobility is especially poor for diabetic patients with PAD. These patients generally have poorer
function than nondiabetic patients with PAD, exhibited by shorter mean walking distance and
slower walking velocity.81 This may be due to associated peripheral neuropathy, differences in
exertional leg symptoms, and overall greater cardiovascular disease burden in diabetic patients.
The decrease in mobility may affect health status and quality of life.20
Some diabetic patients with peripheral neuropathy will have decreased pain perception that may
delay the recognition of PAD.87 Peripheral neuropathy and PAD are both known risk factors for
foot ulceration and gangrene; patients with both conditions are extremely likely to experience a
poor outcome. An estimated 40-60% of diabetic patients with foot ulcers have PAD, which
affects wound healing and leads to the need for revascularization, amputation and possibly
mortality.88 Development of dry gangrene is the end-stage presentation of PAD; once disease
has advanced to this point, a revascularization and/or a major amputation will be required.
24
1.2.3 Potential Mechanisms
Several studies have shown that high levels of glycosylated hemoglobin (HbA1c) are
independently associated with increased risk of PAD in T2DM. Data from the National Health
and Nutrition Examination Survey (NHANES) 1999-2002 showed a positive dose-response
relationship between HbA1c and risk of PAD, with a 2.3-fold relative risk for diabetic patients
with HbA1c<7% and a 2.7-fold relative risk for diabetic patients with HbA1c≥7% compared to
nondiabetic patients.89 The United Kingdom Prospective Diabetes Study (UKPDS) showed that
each 1% increase in HbA1c was associated with a 28% increased risk of PAD.90,91 The
increased risk of PAD incidence associated with poor glycemic control carries over to an
increased risk of severe PAD events; data from the Atherosclerosis Risk in Communities (ARIC)
study showed that the risk of PAD-related hospitalization was 4.5 times greater among patients
in the highest HbA1c tertile than the risk among patients in the lowest HbA1c tertile.92
Despite the association between HbA1c and PAD risk, trials of intensive glucose control have
thus far failed to demonstrate a significant benefit on most cardiovascular outcomes, including
PAD.93 The Veterans Affairs Diabetes Trial (VADT),94 the Action to Control Cardiovascular
Risk in Diabetes (ACCORD) trial95 and the Action in Diabetes and Vascular Disease: Preterax
and Diamicron Modified Release Controlled Evaluation (ADVANCE) trial96 all failed to
demonstrate a benefit of intensive glucose-lowering therapy on macrovascular outcomes, despite
achievement of significantly lower HbA1c levels in those assigned to intensive therapy.
Although HbA1c is a marker of PAD risk, there is no conclusive evidence that lowering HbA1c
reduces the risk of PAD.
25
If glucose control is not the driving factor in PAD risk for T2DM patients, then some other factor
may increase the risk of PAD in this population. Some of the unexplained variation in PAD risk
among T2DM patients might be due to the insulin resistance which prevails in T2DM. Insulin
resistance intensifies the systemic inflammatory state, is prothrombotic, and constrains
fibrinolysis;42 as mentioned in the preceding section, these respective processes are thought to be
involved in the atherosclerotic process. Elevated fibrinogen has been associated with increased
risk of PAD in patients with diabetes,97 but no other studies have specifically examined these
relationships in T2DM patients. Results from the aforementioned BARI 2D trial have shown
that glycemic control strategy focused on improving insulin sensitivity led to changes in
biomarker profiles indicative of a profibrinolytic, antithrombotic, and anti-inflammatory state.98
If longitudinal changes in biomarkers of inflammation, coagulation, and fibrinolysis account for
some of the variation in PAD risk, that may i) partially explain the mechanism of increased risk
of PAD in T2DM patients and ii) suggest a pathway by which insulin sensitizers reduce the risk
of incident PAD, thereby slowing the progression of atherosclerosis in T2DM.
Prior reviews have speculated that insulin sensitizing medications may reduce the risk of incident
PAD in T2DM because of their anti-inflammatory properties and metabolic effects.99,100,101
However, no published data from randomized controlled trials has confirmed this belief. Data
from a randomized controlled trial showing that insulin sensitizing medications reduce the risk of
PAD independent of changes in glycemic control would suggest that improvements in
macrovascular outcomes may be achieved by changing the mechanistic approach to focus on
insulin sensitivity.
26
1.3 ANKLE BRACHIAL INDEX
The ankle-brachial index (ABI) is the principal non-invasive screening technique for peripheral
arterial disease. Also known as ankle-arm index (AAI) or ankle-brachial pressure index (ABPI),
the ABI is simply a ratio of the brachial systolic blood pressure divided by the ankle systolic
blood pressure. Normal ABI values range from 0.91-1.30; an abnormally low ABI is suggestive
of peripheral arterial disease. The origin, epidemiology, measurement, and clinical significance
of the ABI are summarized in the sections to follow.
1.3.1 Origin
Ankle blood pressure first appeared in medical literature in 1950. University of Southern
California physician Travis Winsor reported taking a series of systolic pressure measurements in
patients with peripheral arterial disease, including measurements at the ankle, and showed that
the gradient of pressure reduction along the arterial tree was greater for patients with peripheral
arterial disease than patients with normal arteries.102 In 1956, Gaskell used ankle systolic
pressure to evaluate blood flow before and after an arterial graft in the lower extremity.103
Strandness and colleagues published a series of articles from 1961-66 using ankle systolic
pressures to study various aspects of the occlusive process in the extremities.104,105,106
The first study to report the ratio of ankle pressures to brachial pressures was published in 1968.
Canadian physician Stefan Carter reported that patients with normal arteries generally presented
with an ankle systolic pressure ranging from 100 to 120% of their brachial systolic pressure
(corresponding to an ABI of 1.0-1.2), while all patients with peripheral arterial disease had ankle
pressures below 80% of their brachial pressure (corresponding to an ABI of 0.8 or less).107
27
Carter’s paper also provided statistical evidence that ABI values were lower in patients with
peripheral arterial disease than in patients without PAD. The following year, Carter showed that
the degree of decrease in ABI was correlated with severity of the occlusion among patients with
peripheral arterial disease.108 In 1970, Yao et al confirmed that severity of occlusion was
correlated with degree of decrease in ABI; this study was also the first to report measuring ankle
pressures using the Doppler ultrasound technique still used today.109,110
1.3.2 Epidemiology
The ankle-brachial index was established as a useful tool for the evaluation of peripheral arterial
disease by the end of the 1960’s, but its potential utility as a screening tool for cardiovascular
risk was not established for many years. The relationship between ankle-brachial index and
cardiovascular outcomes was first reported in a large epidemiological study in the early 1990’s.
In 1991, McKenna et al published data from a cohort of 744 patients showing that patients with
ABI ≤ 0.85 had a relative risk of mortality 2.36 times greater than patients with ABI > 0.85, the
first published result to suggest that a low ankle-brachial index was associated with increased
mortality risk.111 Two years later, Newman et al published similar results from 1537 subjects
enrolled in the Systolic Hypertension in the Elderly Program (SHEP) showing that ABI ≤ 0.9
was strongly associated with total mortality (age-adjusted RR=4.1) and cardiovascular mortality
(age-adjusted RR=3.7).112,113 In 1996, Leng et al published data from the Edinburgh Artery
Study showing that low ankle-brachial index was independently associated with coronary heart
disease and myocardial infarction.114 Data from the Framingham Study established that low ABI
was also associated with an increased risk of stroke.115 In addition to the associations with
28
cardiovascular mortality and all-cause mortality, low ankle-brachial index is also associated with
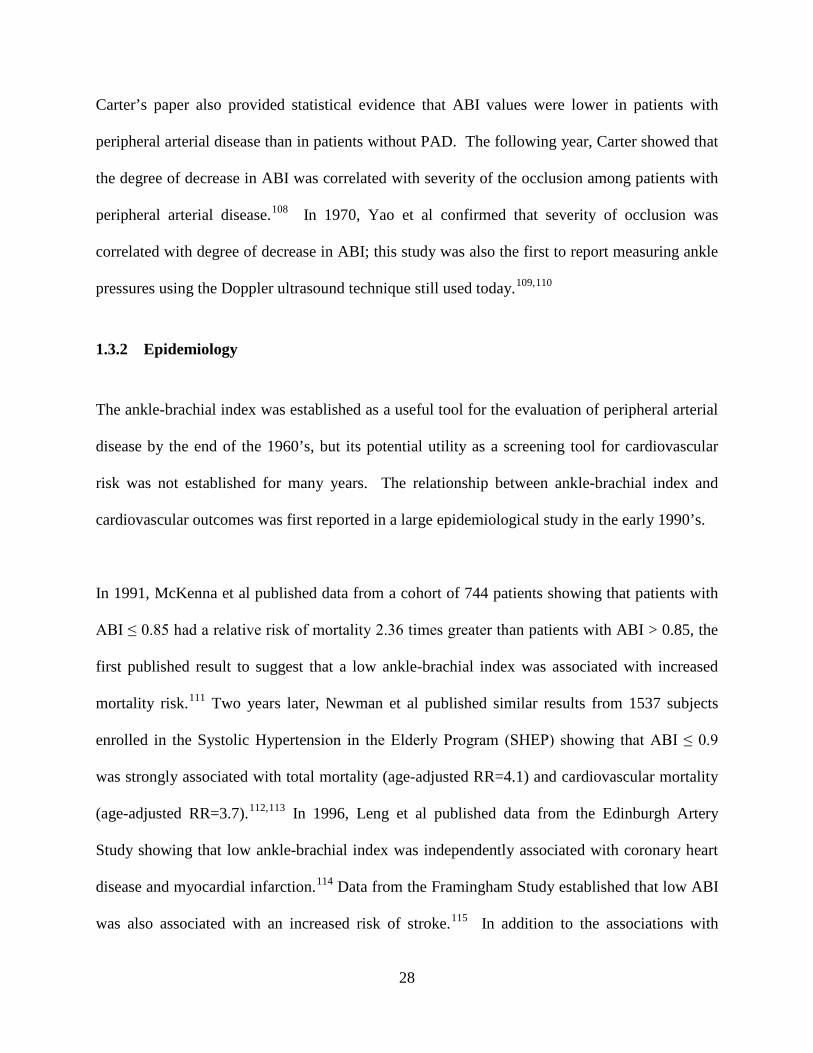
limited physical function (Figure 1-9).18
Figure 1-9. Patients Stopping during 6-minute walk test according to ABI Categoryh
Most early studies focused on the risk in patients with a low ankle-brachial index; each of the
studies described on the previous page compared patients with low ABI to the rest of the
respective study cohort. However, more recent research has examined risk across the entire ABI
spectrum, demonstrating that high ABI may also be indicative of increased cardiovascular risk.
h Reprinted with permission from McDermott MM et al. Ann Intern Med 2002; 136: 873-883
29
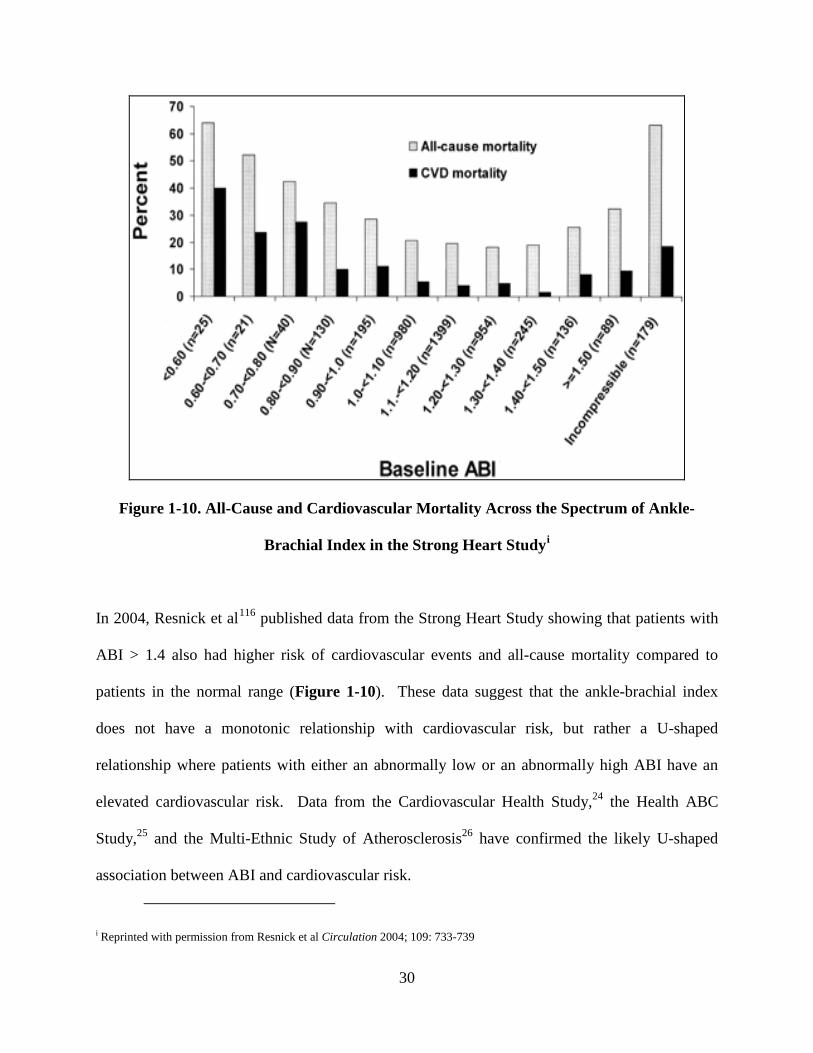
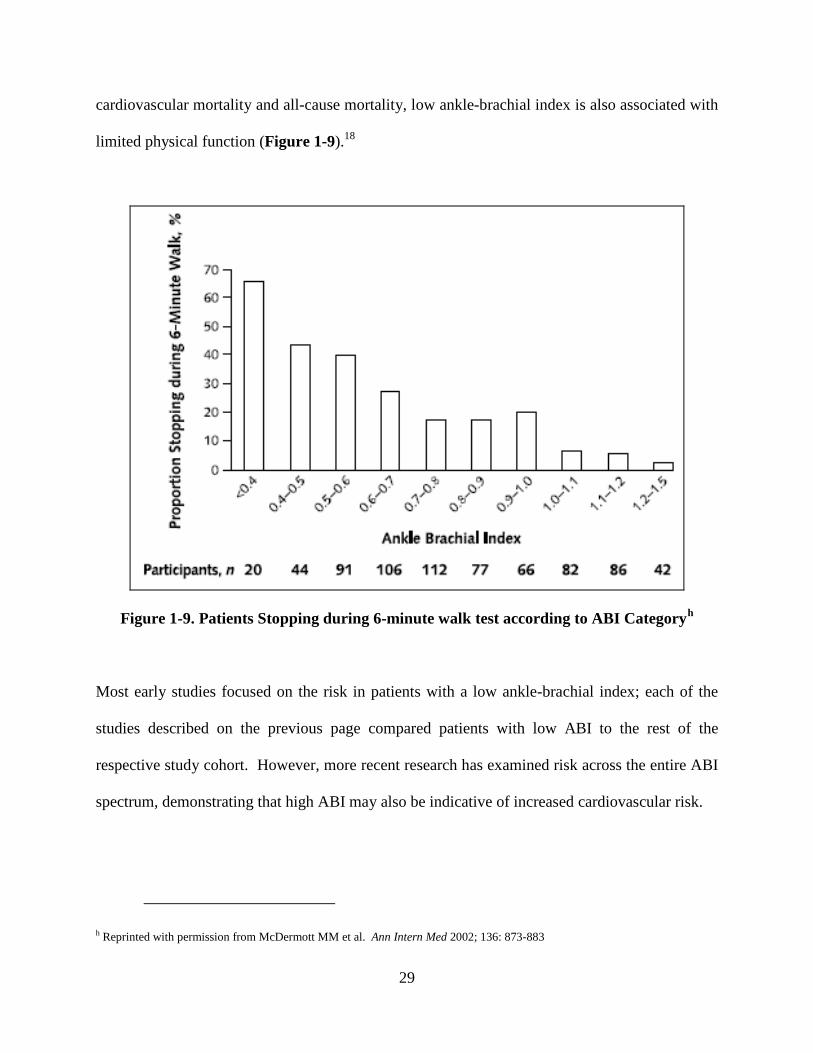
Figure 1-10. All-Cause and Cardiovascular Mortality Across the Spectrum of Ankle-
Brachial Index in the Strong Heart Studyi
In 2004, Resnick et al116 published data from the Strong Heart Study showing that patients with
ABI > 1.4 also had higher risk of cardiovascular events and all-cause mortality compared to
patients in the normal range (Figure 1-10). These data suggest that the ankle-brachial index
does not have a monotonic relationship with cardiovascular risk, but rather a U-shaped
relationship where patients with either an abnormally low or an abnormally high ABI have an
elevated cardiovascular risk. Data from the Cardiovascular Health Study,24 the Health ABC
Study,25 and the Multi-Ethnic Study of Atherosclerosis26 have confirmed the likely U-shaped
association between ABI and cardiovascular risk.
i Reprinted with permission from Resnick et al Circulation 2004; 109: 733-739
30
The physiological mechanism resulting in a high ABI is usually assumed to be medial arterial
calcification (MAC) in the lower extremities. Calcification of a lower extremity artery results in
a falsely high reading of the ankle pressure due to stiffness in the arterial wall. In extreme cases,
this results in a condition known as a “non-compressible” artery in which the ankle pressure
cannot be obliterated. Most studies have shown that patients with non-compressible arteries
have similar cardiovascular risk to those with very low ABI (Figure 1-11). Notably, the
prevalence of high ABI and non-compressible arteries is significantly higher in diabetic patients
than the general population.117
Figure 1-11. All-Cause and Cardiovascular Mortality Across the Spectrum of Ankle-
Brachial Index in the Health ABC Studyj
j Reprinted with permission from Sutton-Tyrrell et al. Stroke 2008; 39: 863-869
31
The role of peripheral arterial disease in this relationship is unclear. Some patients with medial
arterial calcification may have coexisting PAD, but such calcification also can occur in the
absence of any atherosclerotic lesion in the arterial lumen.118 While several studies have shown
elevated risk in patients with high ABI and/or non-compressible arteries, it is uncertain whether
this excess risk is isolated to patients with underlying PAD or driven by some other disease
process. Notably, in a healthy community-based population, persons with high ABI had similar
cardiovascular risk profiles and event rates as persons with normal ABI,119 and the
aforementioned Health ABC data showed that the increased risk at the “high” end of ABI
spectrum was far more pronounced in patients with non-compressible arteries than those with
high ABI.25 Therefore, the use of high ABI as a marker of cardiovascular risk is still somewhat
controversial.
32
1.3.3 Measurement of ABI
The most common technique for assessment of the ankle and arm blood pressure involves a
continuous wave Doppler system, first reported by Yao et al in 1969.109 The protocol for
measuring ankle-brachial index using Doppler ultrasound has been refined over several decades,
but remains generally consistent across the cohort studies referenced above (Strong Heart Study,
ARIC, CHS, MESA, and Health ABC). The full Ultrasound Research Laboratory protocol for
measuring Doppler ABI in the independent data collection project (see Appendix A) was
developed based on the techniques established in these cohort studies.
The ankle-brachial index can also be recorded with an oscillometric device (such as the Colin
VP-1000 pulse waveform analyzer) that allows simultaneous blood pressure measurements at the
right and left brachial and posterior tibial arteries. Testing the reliablity and reproducibility of
ABI measures from this device is a principal aim of the independent data collection project in
this dissertation; the reliability of similar devices has been documented in a few previous studies
and has displayed reasonable agreement with Doppler measurements (a detailed description of
these studies can be found in Section 1.3.4). The full Ultrasound Research Laboratory protocol
used for the VP-1000 in the independent data collection project is included in Appendix B.
33
1.3.4 Existing Studies of Oscillometric ABI vs. Doppler ABI
Verberk et al published a 2012 meta-analysis120 which pooled the results of eighteen studies
(N=3290) comparing oscillometric ABI measurements to the Doppler method and found an
average difference of 0.020 ± 0.018, indicating that oscillometric ABI tended to be higher than
Doppler, although this difference was not statistically significant (p=0.28). The meta-analysis
also reported a pooled linear correlation coefficient of 0.71 between Doppler ABI and
oscillometric ABI. It should be noted that there was substantial heterogeneity between studies
included in the meta-analysis; possible explanations include the use of different oscillometric
devices, variation between study protocols, and differences in study populations.
Among the eighteen studies included in the meta-analysis mentioned above, eleven different
oscillometric devices were used, and only two studies included in the pooled results used the
Colin VP-1000 device available in the Ultrasound Research Laboratory. Two other studies have
compared ankle blood pressures measured with the Colin to those measured with a Doppler
probe, but these studies were not included in the meta-analysis due to lack of ABI data. The four
studies comparing Colin and Doppler are summarized briefly here.
Cortez-Cooper et al (2003)121 compared ankle blood pressure measurements taken with the Colin
to those taken with Doppler in 52 healthy participants. This study showed strong linear
correlation between ankle pressures (r=0.95) taken with Colin versus Doppler. Ankle pressures
measured with Doppler were slightly higher (mean difference = 2.2 mm Hg) than Colin ankle
pressures, but this difference was not statistically significant. Following this study, Nukumizu et
34
al (2007)122 compared Doppler ankle pressures to Colin ankle pressures in 168 participants from
a vascular clinic, all of whom had angiographically confirmed PAD (n=146) or abdominal aortic
aneurysm (n=22). The Colin ankle pressures were slightly higher than Doppler ankle pressures,
on average, but with no significant evidence of a difference. Nukumizu et al did not report a
mean difference, but instead reported the ratios of Colin pressure divided by Doppler pressure
for each participant, noting that 135 of 168 (80%) participants had a Colin ankle pressure within
10 percent of their Doppler ankle pressure.
In the largest study comparing Colin ABI measurements to Doppler ABI measurements, Pan et
al (2007)123 performed a population-based study analyzing data from 946 participants in several
rural villages south of Shanghai. The Doppler ABI measurements were slightly higher than the
Colin ABI measurements (mean difference=0.03). Richart et al (2009)124 also found that
Doppler ABI tended to be slightly greater than Colin ABI in a study of 105 participants but the
difference was not statistically significant. The results from the four prior studies comparing
Colin and Doppler ankle pressures and/or ABI can be synthesized into the following statements:
1) The Colin has displayed reasonable agreement with Doppler in participants with normal ABI.
2) The Colin may be less accurate for patients with extreme values of ABI (both low and high);
in particular, it may provide falsely normal values for patients with very low values of ABI.
3) It is difficult to establish a directional relationship between Colin and Doppler measurements;
three of the four studies suggest that the Doppler tends to report slightly higher ankle
pressures and/or ABI than the Colin, but this could be accounted for by differences in study
populations and protocol.
35
1.3.5 Clinical Significance and Guidelines
As detailed above, the ankle-brachial index provides valuable information about cardiovascular
risk at both ends of the spectrum. Patients with either a low ABI or a high ABI are at increased
cardiovascular risk and should be treated accordingly; as such, the ABI should be considered an
effective, noninvasive screening tool that can be implemented at low cost: the PARTNERS
program demonstrated that ABI technique can be easily performed by both nurses and physicians
in the primary care setting.28 Guidelines established by the American Heart Association125 call
for a screening ABI in high-risk patients meeting one or more of the following criteria:
Individuals with exertional leg symptoms
Individuals with nonhealing wounds
Individuals who are 70 years and older
Individuals who are 50 years and older with a history of smoking or diabetes.
Congruent with the last recommendation in the list above, the American Diabetes Association
recommends that a screening ABI be performed in all diabetic individuals over 50 years of age,
regardless of symptoms. If the patient has a normal ABI (0.91-1.30), it is recommended that the
test be repeated within five years. However, if a patient presents with claudication symptoms, a
screening ABI should be performed immediately regardless of time since the last test.
36
1.4 SUMMARY
The proposed research will produce three unique manuscripts with the principal focus of
improving our knowledge of peripheral arterial disease. This introduction gives an overview of
the prevalence of PAD, the effects of established cardiovascular risk factors on PAD risk,
pertinent background information on selected novel risk factors that may explain part of the
additional risk for PAD in type 2 diabetes, and a history of the principal diagnostic test for PAD
and its utility. The specific aims of the three manuscripts are outlined on the following page.
37
2.0 SPECIFIC AIMS
This dissertation is composed of three manuscripts, each pertaining to peripheral arterial disease.
Specific Aim for Manuscript 1:
Test for difference in PAD incidence between two randomly assigned glycemic control strategies
in a large cohort of T2DM patients free of PAD at study entry. This paper will inform
physicians of the best treatment practice for diabetes patients at high risk for developing PAD.
Specific Aim for Manuscript 2:
Perform longitudinal analysis of the relationship(s) between established CVD risk factors, novel
CVD risk factors, and the incidence of PAD. This paper could improve our knowledge of the
pathophysiology of PAD in diabetes as well as provide insights into the effects of different
glycemic control medications on the progression of atherosclerosis in this population.
Specific Aim for Manuscript 3:
Evaluate the reliability of ankle-brachial index measurements obtained using the Colin VP-1000
pulse waveform analyzer versus the traditional Doppler ultrasound method of measuring ABI.
This project will provide useful quality-control data for the Ultrasound Research Laboratory,
which uses the VP-1000 extensively in research studies, and its findings also may be generalized
to other research settings.
38

3.0 MANUSCRIPT 1: FAVORABLE EFFECTS OF INSULIN SENSITIZERS
PERTINENT TO PERIPHERAL ARTERIAL DISEASE IN TYPE 2 DIABETES:
RESULTS FROM THE BYPASS ANGIOPLASTY REVASCULARIZATION
INVESTIGATION 2 DIABETES (BARI 2D) TRIAL
39
3.1 ABSTRACT
(Oral Presentation at the American Diabetes Association 2012 Scientific Sessions)
Objective: The aim of this manuscript was to report the risk of incident peripheral arterial
disease in a large randomized clinical trial that enrolled participants with stable coronary artery
disease (CAD) and type 2 diabetes and compare the risk between assigned treatment arms.
Research Design and Methods: The Bypass Angioplasty Revascularization Investigation 2
Diabetes (BARI 2D) trial randomly assigned participants to insulin-sensitization (IS) therapy vs.
insulin-providing (IP) therapy for glycemic control. Results showed similar five-year mortality
in the two glycemic treatment arms. In secondary analyses reported here, we examine the effects
of treatment assignment on the incidence of peripheral arterial disease (PAD). 1479 BARI 2D
participants with normal ABI (0.91-1.30) were eligible for analysis. The following PAD-related
outcomes are evaluated in this manuscript: new low ABI ≤0.9, a lower extremity
revascularization, lower extremity amputation, and a composite of the three outcomes.
Results: During an average 4.6 years of follow-up, 303 participants experienced one or more of
the outcomes listed above. Incidence of the composite outcome was significantly lower among
participants assigned to IS therapy than those assigned to IP therapy (16.9% vs. 24.1%;
P<0.001). The difference was significant in time-to-event analysis (HR=0.66, 95% CI [0.51,
0.83], P<0.001) and remained significant after adjustment for in-trial HbA1c (HR=0.76, 95% CI
[0.59, 0.96], P=0.02).
Conclusions: In participants with type 2 diabetes mellitus that are free from PAD, a glycemic
control strategy of insulin sensitization may be the preferred therapeutic strategy to reduce the
incidence of PAD and subsequent outcomes.
40
3.2 INTRODUCTION
Peripheral arterial disease (PAD) is an atherosclerotic condition characterized by chronic
occlusion of the arteries in the lower extremities. Prevalence estimates suggest that at least 5
million Americans have PAD.14,15 The presence of PAD is a marker of generalized systemic
atherosclerosis and is associated with cardiovascular morbidity and mortality.22,23,24,25,26,27
PAD is especially common in patients with type 2 diabetes mellitus.41 PAD progresses more
rapidly80 and leads to worse outcomes84 in type 2 diabetes patients than nondiabetic patients.
Type 2 diabetes patients with PAD have a high risk of functional impairment,81 mobility loss,19
amputation,82 and cardiovascular mortality.85 High levels of glycosylated hemoglobin (HbA1c) is
independently associated with increased risk of PAD in type 2 diabetes, suggesting that poor
glycemic control may be a risk factor for PAD.90,91,92,126 Prior reviews have speculated that
treatment with insulin sensitizers may reduce the risk of PAD in type 2 diabetes patients.99,100,101
However, this has never been demonstrated in a randomized controlled trial.
The Bypass Angioplasty Revascularization Investigation 2 Diabetes (BARI 2D) trial provides an
opportunity to compare the effects of an insulin-sensitizing glycemic control strategy to an
insulin-providing strategy on the incidence of PAD in a cohort of participants with type 2
diabetes and documented stable coronary artery disease. We have previously demonstrated that
mortality and incidence of major cardiovascular events was comparable in the glycemic control
arms.127 In this report, we present the results of secondary analyses undertaken to examine the
association between glycemic treatment assignment and the incidence of PAD.
41
3.3 METHODS
BARI 2D Trial
A detailed explanation of the BARI 2D trial has been published elsewhere.128,129 The primary
aim of the BARI 2D trial was to determine the optimal treatment for participants with type 2
diabetes mellitus and documented stable coronary artery disease (CAD). The BARI 2D trial
utilized a 2x2 factorial design in which participants were assigned at random to initial elective
revascularization with intensive medical therapy (REV) versus intensive medical therapy alone
(MED) while simultaneously assigned at random to an insulin sensitizing (IS) strategy versus an
insulin providing (IP) strategy of glycemic control. All participants were treated medically to
achieve targets of HbA1c < 7.0%, LDL cholesterol < 100 mg/dL, and blood pressure ≤ 130/80
mm Hg. All participants received counseling regarding smoking cessation, weight loss, and
regular exercise.
BARI 2D included 49 clinical sites throughout North America, South America, and Europe and
was coordinated at the University of Pittsburgh. The local institutional review boards approved
trial protocol and all participants provided informed consent. Recruitment began in 2001 and
continued until 2005; treatment continued until the 6-year visit or the last annual visit before
December 1, 2008. The overall study cohort for BARI 2D consisted of 2368 participants. The
primary endpoint for BARI 2D was death from any cause, and the principal secondary endpoint
was a composite of death, myocardial infarction, or stroke. Results for each of these have been
published elsewhere.127 This manuscript reports the results of a post hoc analysis to examine
peripheral arterial disease and related outcomes.
42
Glycemic Control Strategies
All BARI 2D participants were treated with a target HbA1c < 7.0%. Participants assigned to IP
therapy could be treated with sulfonylureas, repaglinide, nateglinide, or insulin itself.
Participants assigned to IS therapy could be treated with thiazolidinedones (glitazones) and/or
metformin. Alpha-glucosidase inhibitors could be used with either treatment assignment. The
trial was not designed to compare specific drugs, but rather to compare the 2 mechanistically
different treatment strategies. A detailed description of the BARI 2D glycemic control protocol
can be found in Magee et al.130 Participants with HbA1c>8.0% while taking the assigned
treatment were permitted to receive the glucose-lowering drugs from the opposite treatment arm
to bring HbA1c within the range 7.0% to 8.0%. Approximately 30% of participants assigned to
IS treatment also required medications from the IP arm, while 10% of participants assigned to IP
treatment required medications from the IS arm. Nearly 90% of participants in both the insulin-
sensitization group and the insulin-provision group were taking their assigned medications at
three years.127
Diagnosis of Peripheral Arterial Disease
The following lower-extremity outcomes were analyzed: recorded decrease in ankle-brachial
index (ABI) to abnormal level (ABI ≤ 0.9), lower extremity revascularization, and lower
extremity amputation. This manuscript reports incidence of each individual outcome as well
incidence of a composite PAD outcome including participants with any one of the individual
outcomes. Only participants with a normal ABI (0.91-1.30) at study entry were eligible for the
primary analysis in this manuscript; the cutoff values for low, normal, and high ABI are chosen
in accordance with values published in an ADA consensus statement on peripheral arterial
43
disease in diabetes. In secondary analysis, we report the incidence of lower extremity
revascularization and amputation among participants with low ABI (<0.9) at study entry.
We have previously reported the baseline prevalence and predictors of abnormal ABI in the
BARI 2D trial.131 Participants with abnormal ABI at study entry were excluded from the
primary analysis in this manuscript because i) participants with low ABI at study entry were
deemed as already having PAD and ii) participants with high ABI and/or non-compressible
arteries are likely to have arterial calcifications that would make it difficult to diagnose PAD
using the ankle-brachial index. Participants with a history of lower extremity revascularization
or lower extremity amputation were also excluded from the primary analysis because of the
likelihood that these participants already suffered from PAD. The algorithm for determining
PAD status in this manuscript is as follows:
Each participant’s ABI was measured at study entry and annually thereafter. All ABI
measurements were taken by certified technicians using a Doppler probe. Participants were
asked to rest in a supine position for 5 minutes, after which the technician recorded the systolic
blood pressure of the brachial artery of both arms and the posterior tibial artery of both ankles.
The higher of the two brachial pressures was used to calculate ABI for each leg, and participants
were classified according to their lowest ABI. Participants with normal ABI (0.91-1.30) at study
entry were defined as incident cases of PAD if they had an ABI≤0.9 during follow-up with a
decrease of at least 0.1 from their baseline measurement.
44
Participants who had a lower extremity revascularization or amputation during follow-up were
included in the composite PAD outcome, even in the absence of a recorded low ABI. We
acknowledge that lower extremity revascularization and amputation may be performed for
reasons other than atherosclerotic PAD, so the incidence of each outcome is reported in this
manuscript as well as the composite PAD outcome to allow reader assessment of practical
implications. Intermittent claudication was not considered as an outcome because BARI 2D did
not employ a validated claudication questionnaire.
Statistical Methods
The primary comparative analyses were performed according to the intention-to-treat principle.
In addition, we performed “per-protocol analyses” that include only participants who remained
on assigned treatment without any use of medications from the opposing treatment arm after the
initial 6 months of the trial when study treatments were to be implemented and adjusted.
Descriptive statistics include means ± SDs and proportions; medians and interquartile ranges are
presented for highly skewed data. Variables were compared between the two randomized
glycemic control strategies (IS vs. IP) using t-tests, Wilcoxon tests, and chi-squared tests for
continuous, skewed continuous, and categorical data, respectively.
Kaplan-Meier estimates of the 5-year event rates were calculated for outcomes of interest and
log-rank tests were used to compare the incidence of each PAD outcome by assigned glycemic
control strategy for patients with normal ABI at baseline, as described above. Time-to-event for
each lower extremity outcome was defined as time from date of randomization to the event (new
low ankle-brachial index, lower extremity revascularization, or lower extremity amputation); for
45
the composite outcome, time-to-event was defined as time from date of randomization to the first
event. In the absence of an event, participants were censored at their last full-protocol follow-up
visit. We performed a second analysis to compare incidence of lower extremity
revascularization and amputation in patients with low ABI at baseline to assess the incidence of
severe outcomes in these patients. We also calculated Kaplan-Meier event rates for the
composite PAD outcome stratified by insulin use at study entry to see if the effects of assigned
glycemic control strategy were consistent regardless of previous use of insulin therapy.
Cox proportional-hazards models were used to estimate hazard ratios and associated 95%
confidence intervals for IS strategy with IP as reference group. Time-to-event was defined in the
same fashion described above. A second model was constructed with in-trial HbA1c included as
a time-varying covariate, updated at the time of each new ABI measurement, to determine
whether potential differences between IS and IP strategy were attenuated by adjustment for
glycemic control. The effects of assigned cardiovascular treatment strategy and the interaction
between the assigned glycemic control strategy and cardiovascular treatment strategy were also
tested. P-values less than 0.05 were considered statistically significant; no adjustment was made
for multiple comparisons.
46
3.4 RESULTS
The BARI 2D study population consisted of 2368 participants with type 2 diabetes mellitus and
stable CAD. Only participants with normal ABI at study entry and no history of PAD were
selected for this paper’s primary analysis. 889 participants were excluded due to history of PAD,
missing baseline ABI, or abnormal baseline ABI, leaving 1479 BARI 2D participants eligible for
this analysis (Figure 3-1). The participants excluded from this analysis were generally older,
heavier, more likely to be smokers, had higher systolic blood pressure, higher pulse pressure, a
longer duration of diabetes, and were more likely to have renal dysfunction at study entry than
those included in this analysis (data not shown). Since many of the participants excluded from
this analysis had a history of PAD, this is consistent with expectations.
Participants included in the intention-to-treat analysis were age 61.9 ± 8.0 years old, 72% male,
and 15% African-American. The distribution of baseline lipid values, blood pressure, glycemic
control, and markers of renal function were similar between the assigned glycemic treatment
groups (Table 3-1). The mean ABI at study entry was 1.10 in the IS group and 1.09 in the IP
group (p=0.23). There were no significant differences in major baseline demographic or clinical
characteristics between the assigned glycemic treatment groups.
Incidence of the composite PAD outcome was significantly lower in the IS arm than in the IP
arm (16.9% vs. 24.1%, p<0.001, event rates for all intention-to-treat comparisons in Table 3-2).
On the time-to-event curve, the difference becomes noticeable after three years and increases
during longer follow-up (Figure 3-2). Examining each clinical outcome separately, participants
47
assigned to IS therapy had a significantly lower rate of low ABI (16.5% vs. 22.7%, p<0.001) and
amputation (0.1% vs. 1.6%, p=0.002) and a moderately lower rate of lower extremity
revascularization (1.1% vs. 2.6%, p=0.07) than those assigned to IP therapy. Among participants
with low ABI at baseline, we observed no significant difference between the IS arm and IP arm
in risk of lower extremity revascularization (7.7% vs. 6.7%, p=0.68) or lower extremity
amputation (3.4% vs. 7.2%, p=0.08).
The lower risk of PAD and related outcomes in participants assigned to IS therapy was also
significant in time-to-event analyses using Cox models (HR for IS vs. IP therapy for composite
outcome=0.66, 95% CI [0.51, 0.83], p<0.001, Table 3-3). The effects of glycemic control
strategy were partially attenuated by adjustment for in-trial HbA1c; however, even with
adjustment for in-trial HbA1c, there was a significantly lower risk of PAD in participants
assigned to IS therapy (adjusted HR for IS vs. IP therapy for composite outcome=0.76, 95% CI
[0.59, 0.96], p=0.02). None of the PAD outcomes were associated with assigned cardiovascular
treatment strategy, and no interactions between glycemic control and cardiovascular treatment
strategies were statistically significant (p>0.10 for all).
Among participants in the per protocol analysis, there were significant baseline differences
between the glycemic control arms in average duration of diabetes, proportion using insulin at
study entry, and HbA1c (Table 3-4) but not in other risk factors such as age, smoking, race or
baseline ABI. As in intention-to-treat analyses, the results generally favor IS therapy for each
outcome (incidence of composite outcome 12.4% vs. 26.0%, p<0.001; event rates for all per-
protocol comparisons shown in Table 3-5). The effects of IS therapy are also significant in per-
48
protocol analyses when using time-to-event analyses (HR for IS vs. IP therapy for composite
outcome= 0.44, 95% CI [0.31, 0.62], p<0.001, Table 3-6). As in the intention-to-treat analyses,
the effect of glycemic control strategy is partially attenuated by adjustment for in-trial HbA1c in
the per-protocol analysis, but still significant (adjusted HR for IS vs. IP therapy for composite
outcome= 0.54, 95% CI [0.37, 0.79], p=0.002).
Insulin treatment at study entry was associated with greater risk of the composite PAD outcome
(patients on insulin: 26.3% vs. patients not on insulin: 18.5%, p=0.01). There was a significant
difference in risk for the composite PAD outcome between the glycemic control arms regardless
of whether participants were receiving insulin at study entry (Figure 3-3 and Figure 3-4). The
incidence of PAD was lower in the IS arm among participants receiving insulin at study entry
(IS: 20.7% vs. IP: 31.9%, p=0.01) and also those not receiving insulin at study entry (IS: 15.6%
vs. IP: 21.3%, p=0.01). The difference in PAD incidence between the IS arm and the IP arm
tended to emerge earlier for participants on insulin at study entry.
49
3.5 DISCUSSION
In a large cohort of participants with stable CAD and type 2 diabetes mellitus, participants
assigned to insulin sensitizing therapy experienced significantly fewer cases of incident PAD
than participants assigned to insulin providing therapy over an average of 4.6 years of clinical
follow-up. The difference in PAD risk between the glycemic control arms was significant
regardless of assigned cardiovascular treatment strategy and consistent in both intention-to-treat
analyses and per-protocol analyses. The results also favored insulin sensitizing therapy for
patients receiving insulin at study entry as well as those not receiving insulin at study entry. This
is the first randomized controlled trial to demonstrate that treatment with insulin sensitizing
agents reduces the risk of incident peripheral arterial disease in participants with type 2 diabetes
mellitus.
The reduction in risk of amputation and/or revascularization with IS therapy was not as
pronounced for patients with low ABI at baseline, although the incidence of each outcome was
still lower for patients assigned to IS therapy than for patients assigned to IP therapy. This could
be explained in two ways. First, perhaps IS therapy does have a benefit for these patients, but
there was insufficient sample size to detect an effect in the subgroup with low ABI at study
entry. Alternatively, it’s possible that the benefit of IS therapy on peripheral outcomes is
lessened in patients with existing PAD because the disease in the lower extremities has advanced
beyond “prevention” of the atherosclerotic process in this vascular bed.
The only previous study to demonstrate a similar result is the PROactive trial, which found that
treatment with pioglitazone versus placebo resulted in a moderate decrease in the rate of leg
50
revascularizations and amputations among participants free from PAD at study entry.83 Notably,
the BARI 2D results demonstrate an even stronger benefit of insulin sensitizing therapy in this
population. This may be explained by the shorter follow-up time in PROactive (three years) than
BARI 2D (five years), since the BARI 2D results showed that the treatment benefit of IS therapy
began to emerge around three years and progressively increased thereafter. It could also be a
result of moderate differences in treatment protocol; PROactive randomly assigned patients to
pioglitazone or placebo in the setting of continued additional diabetes therapy, whereas BARI 2D
assigned patients to insulin sensitizing strategy or insulin providing strategy.
One potential mechanism through which IS treatment may have reduced the risk of PAD
incidence in BARI 2D is better glycemic control; we have previously reported that participants
assigned to IS had lower HbA1c than participants assigned to IP during BARI 2D follow-up.98
However, the treatment difference reported here was significant after adjustment for in-trial
HbA1c, suggesting that IS therapy conferred a benefit beyond better glycemic control.
Furthermore, previous trials of intensive glucose-lowering therapy have not demonstrated a
consistent reduction in macrovascular outcomes. The Veterans Affairs Diabetes Trial (VADT),
the Action to Control Cardiovascular Risk in Diabetes (ACCORD) trial and the Action in
Diabetes and Vascular Disease: Preterax and Diamicron Modified Release Controlled Evaluation
(ADVANCE) trial all failed to demonstrate that intensive glucose-lowering therapy reduced the
risk of macrovascular outcomes.94,95,96 With that in mind, the BARI 2D results are particularly
encouraging because the decreased risk of PAD in participants assigned to insulin sensitizing
therapy was significant even while adjusting for in-trial glycemic control, suggesting that
51
improvements in macrovascular outcomes may be achieved by changing the mechanistic
approach rather than targeting a lower HbA1c.
A second plausible mechanism of the reduced PAD risk with IS therapy may be the anti-
inflammatory effects of thiazolinediones used in the BARI 2D trial, which may retard
atherosclerosis development and progression.132,133 We have previously reported that the IS
strategy led to changes in biomarker profiles indicative of a profibrinolytic, antithrombotic, and
anti-inflammatory state. 98 This could contribute to the lower incidence of PAD in the IS group.
While thiazolinediones have been shown to induce and maintain the regression of carotid intima-
media thickness in participants with type 2 diabetes,134 to our knowledge no previous study has
reported an effect on peripheral arterial disease. However, because the BARI 2D trial was
designed to examine mechanistically different treatment strategies rather than individual drugs,
we cannot say for certain whether thiazolinediones alone were responsible for the reduction in
PAD risk.
It is also plausible that the observed results reflect a harmful effect of IP therapy rather than a
protective benefit of IS therapy. Hyperinsulinemia has long been a known risk factor for
atherosclerosis, although the causality of the relationship is controversial, and the mechanism is
unclear. One study suggests that hyperinsulinemia may promote atherosclerosis by promoting
macrophage foam cell accumulation.135 However, this is not clearly established; further research
is needed to determine the potential atherogenic effects of insulin.
52
To date, no pharmacologic therapies have proven to reduce the risk of incident PAD in type 2
diabetes patients. The Fenofibrate Intervention and Event Lowering in Diabetes (FIELD) study
has reported lower amputation rates in patients assigned to treatment with fenofibrate versus
placebo; however, PAD status at study entry was not reported for the FIELD results, so we are
uncertain whether these findings extend to incident cases of PAD.136 For patients with PAD,
current ACC/AHA guidelines recommend aggressive management of atherosclerotic risk factors
to reduce future cardiovascular events.137 Exercise conditioning138 and smoking cessation139
have proven beneficial effects for those with PAD, but these are generally recommended for all
type 2 diabetes patients regardless of their effects on PAD risk. Notably, while all participants in
BARI 2D received intensive medical therapy, counseling regarding smoking cessation, and
regular exercise, treatment with insulin sensitizing agents still resulted in fewer cases of incident
PAD than treatment with insulin providing agents.
One potential limitation of this research is the composition of the BARI 2D population, which
was restricted to patients with documented coronary artery disease suitable for elective
revascularization and type 2 diabetes mellitus. Given that both of these conditions are
independently associated with peripheral arterial disease, the BARI 2D population is at very high
risk for PAD, and therefore, the findings from this research may not extend to those at lower risk.
Further study will be needed to determine if insulin sensitizing medications offer the same
benefit to lower-risk patients. Additional limitations include the fact that individual drugs cannot
be evaluated because of the trial design, which assigned patients to a mechanistic treatment
strategy rather than a specific drug, and the lack of a standardized claudication questionnaire,
which might have resulted in the diagnosis of a few more PAD cases during follow-up.
53
3.6 CONCLUSION
In summary, we have reported that an insulin sensitizing strategy for glycemic control resulted in
fewer incident PAD cases, lower extremity revascularizations, and lower extremity amputations
than treatment with insulin providing agents in type 2 diabetes patients. The difference between
glycemic treatment arms remained significant with adjustment for in-trial HbA1c, suggesting
that insulin sensitizers confer a benefit independent of glycemic control. Our results suggest that
treatment of type 2 diabetes patients with insulin sensitizers might reduce the morbidity and
treatment cost of PAD in this population.
54
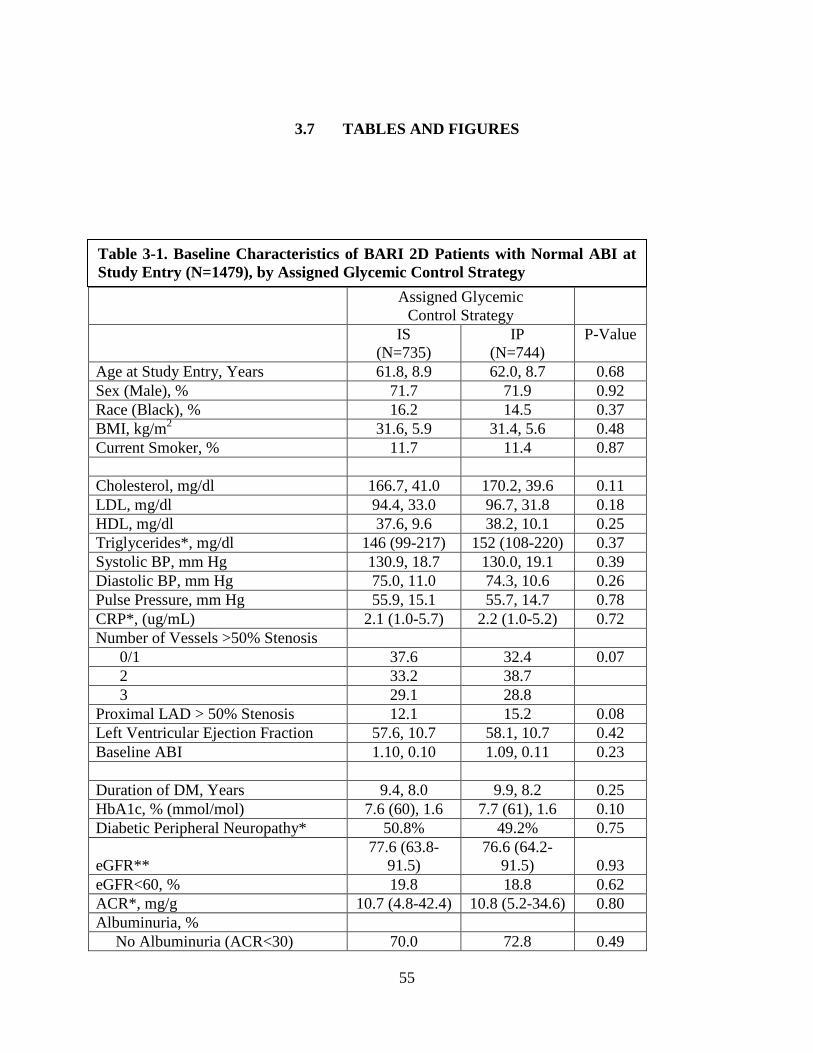
3.7 TABLES AND FIGURES
Assigned Glycemic Control Strategy
IS (N=735)
IP (N=744)
P-Value
Age at Study Entry, Years 61.8, 8.9 62.0, 8.7 0.68 Sex (Male), % 71.7 71.9 0.92 Race (Black), % 16.2 14.5 0.37 BMI, kg/m2 31.6, 5.9 31.4, 5.6 0.48 Current Smoker, % 11.7 11.4 0.87 Cholesterol, mg/dl 166.7, 41.0 170.2, 39.6 0.11 LDL, mg/dl 94.4, 33.0 96.7, 31.8 0.18 HDL, mg/dl 37.6, 9.6 38.2, 10.1 0.25 Triglycerides*, mg/dl 146 (99-217) 152 (108-220) 0.37 Systolic BP, mm Hg 130.9, 18.7 130.0, 19.1 0.39 Diastolic BP, mm Hg 75.0, 11.0 74.3, 10.6 0.26 Pulse Pressure, mm Hg 55.9, 15.1 55.7, 14.7 0.78 CRP*, (ug/mL) 2.1 (1.0-5.7) 2.2 (1.0-5.2) 0.72 Number of Vessels >50% Stenosis 0/1 37.6 32.4 0.07 2 33.2 38.7 3 29.1 28.8 Proximal LAD > 50% Stenosis 12.1 15.2 0.08 Left Ventricular Ejection Fraction 57.6, 10.7 58.1, 10.7 0.42 Baseline ABI 1.10, 0.10 1.09, 0.11 0.23 Duration of DM, Years 9.4, 8.0 9.9, 8.2 0.25 HbA1c, % (mmol/mol) 7.6 (60), 1.6 7.7 (61), 1.6 0.10 Diabetic Peripheral Neuropathy* 50.8% 49.2% 0.75
eGFR** 77.6 (63.8-
91.5) 76.6 (64.2-
91.5) 0.93 eGFR<60, % 19.8 18.8 0.62 ACR*, mg/g 10.7 (4.8-42.4) 10.8 (5.2-34.6) 0.80 Albuminuria, % No Albuminuria (ACR<30) 70.0 72.8 0.49
Table 3-1. Baseline Characteristics of BARI 2D Patients with Normal ABI at Study Entry (N=1479), by Assigned Glycemic Control Strategy
55
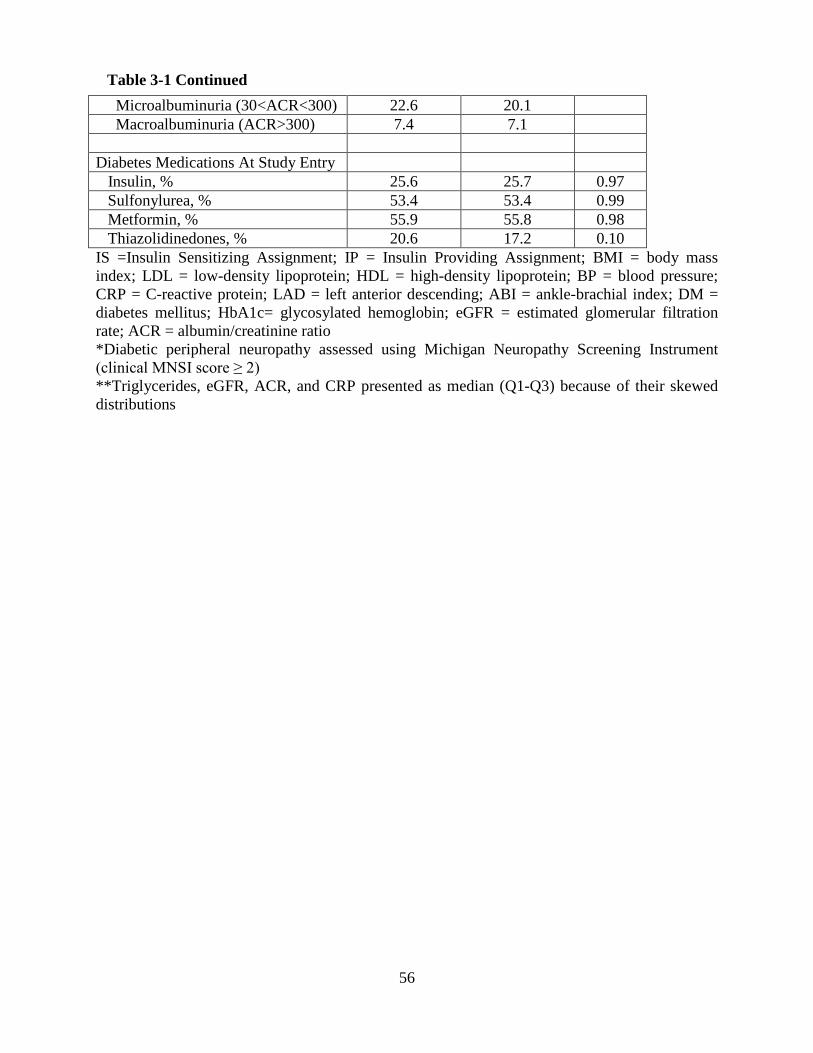
Microalbuminuria (30<ACR<300) 22.6 20.1 Macroalbuminuria (ACR>300) 7.4 7.1 Diabetes Medications At Study Entry Insulin, % 25.6 25.7 0.97 Sulfonylurea, % 53.4 53.4 0.99 Metformin, % 55.9 55.8 0.98 Thiazolidinedones, % 20.6 17.2 0.10 IS =Insulin Sensitizing Assignment; IP = Insulin Providing Assignment; BMI = body mass index; LDL = low-density lipoprotein; HDL = high-density lipoprotein; BP = blood pressure; CRP = C-reactive protein; LAD = left anterior descending; ABI = ankle-brachial index; DM = diabetes mellitus; HbA1c= glycosylated hemoglobin; eGFR = estimated glomerular filtration rate; ACR = albumin/creatinine ratio *Diabetic peripheral neuropathy assessed using Michigan Neuropathy Screening Instrument (clinical MNSI score ≥ 2) **Triglycerides, eGFR, ACR, and CRP presented as median (Q1-Q3) because of their skewed distributions
Table 3-1 Continued
56
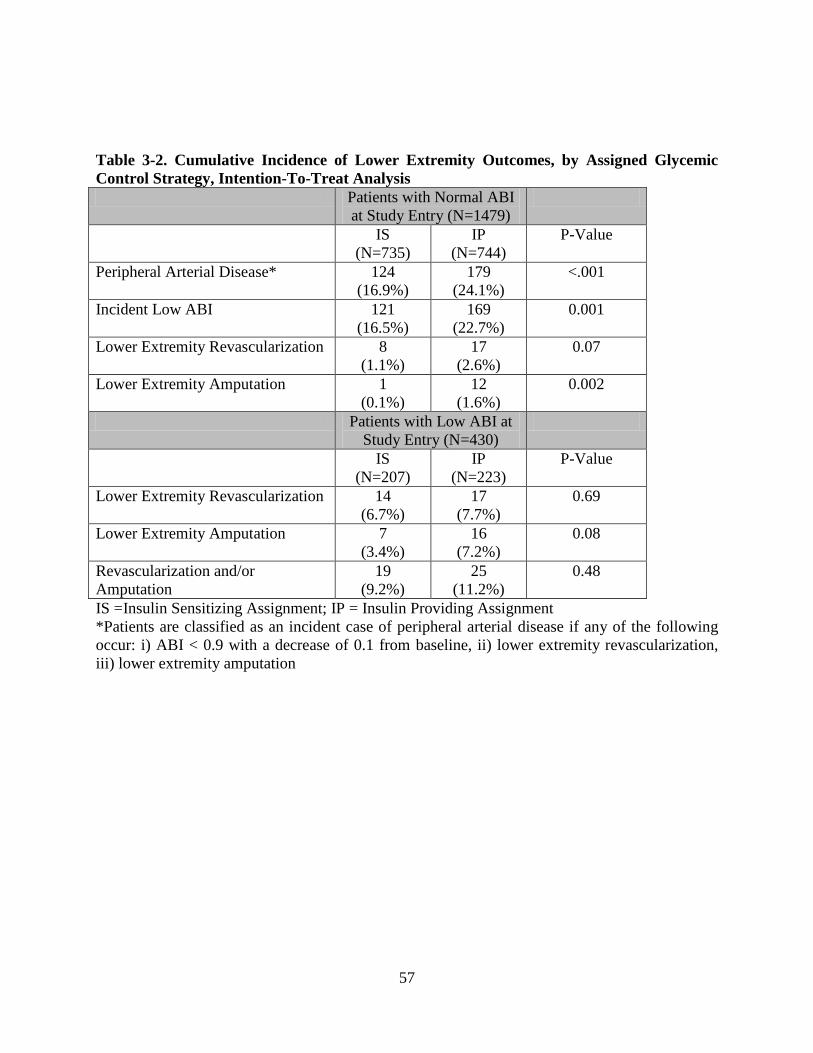
Table 3-2. Cumulative Incidence of Lower Extremity Outcomes, by Assigned Glycemic Control Strategy, Intention-To-Treat Analysis Patients with Normal ABI
at Study Entry (N=1479)
IS (N=735)
IP (N=744)
P-Value
Peripheral Arterial Disease* 124 (16.9%)
179 (24.1%)
<.001
Incident Low ABI 121 (16.5%)
169 (22.7%)
0.001
Lower Extremity Revascularization 8 (1.1%)
17 (2.6%)
0.07
Lower Extremity Amputation 1 (0.1%)
12 (1.6%)
0.002
Patients with Low ABI at Study Entry (N=430)
IS (N=207)
IP (N=223)
P-Value
Lower Extremity Revascularization 14 (6.7%)
17 (7.7%)
0.69
Lower Extremity Amputation 7 (3.4%)
16 (7.2%)
0.08
Revascularization and/or Amputation
19 (9.2%)
25 (11.2%)
0.48
IS =Insulin Sensitizing Assignment; IP = Insulin Providing Assignment *Patients are classified as an incident case of peripheral arterial disease if any of the following occur: i) ABI < 0.9 with a decrease of 0.1 from baseline, ii) lower extremity revascularization, iii) lower extremity amputation
57
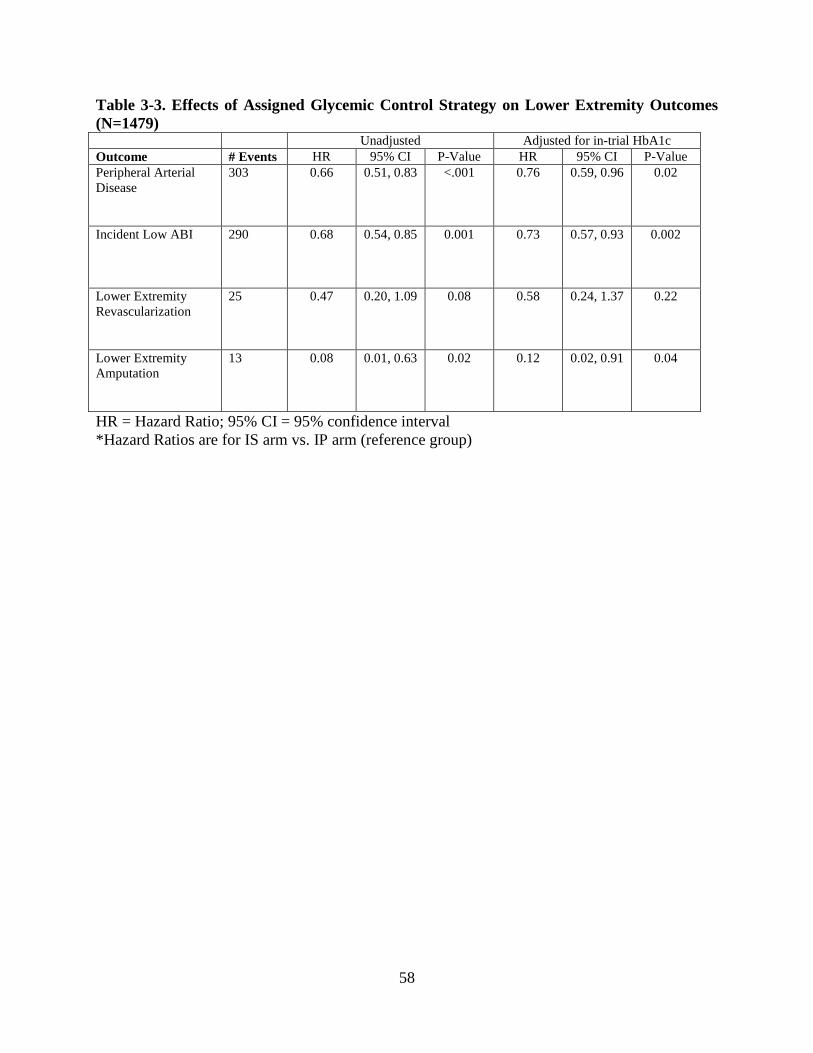
Table 3-3. Effects of Assigned Glycemic Control Strategy on Lower Extremity Outcomes (N=1479) Unadjusted Adjusted for in-trial HbA1c Outcome # Events HR 95% CI P-Value HR 95% CI P-Value Peripheral Arterial Disease
303 0.66 0.51, 0.83 <.001 0.76 0.59, 0.96 0.02
Incident Low ABI 290 0.68 0.54, 0.85 0.001 0.73 0.57, 0.93 0.002
Lower Extremity Revascularization
25 0.47 0.20, 1.09 0.08 0.58 0.24, 1.37 0.22
Lower Extremity Amputation
13 0.08 0.01, 0.63 0.02 0.12 0.02, 0.91 0.04
HR = Hazard Ratio; 95% CI = 95% confidence interval *Hazard Ratios are for IS arm vs. IP arm (reference group)
58
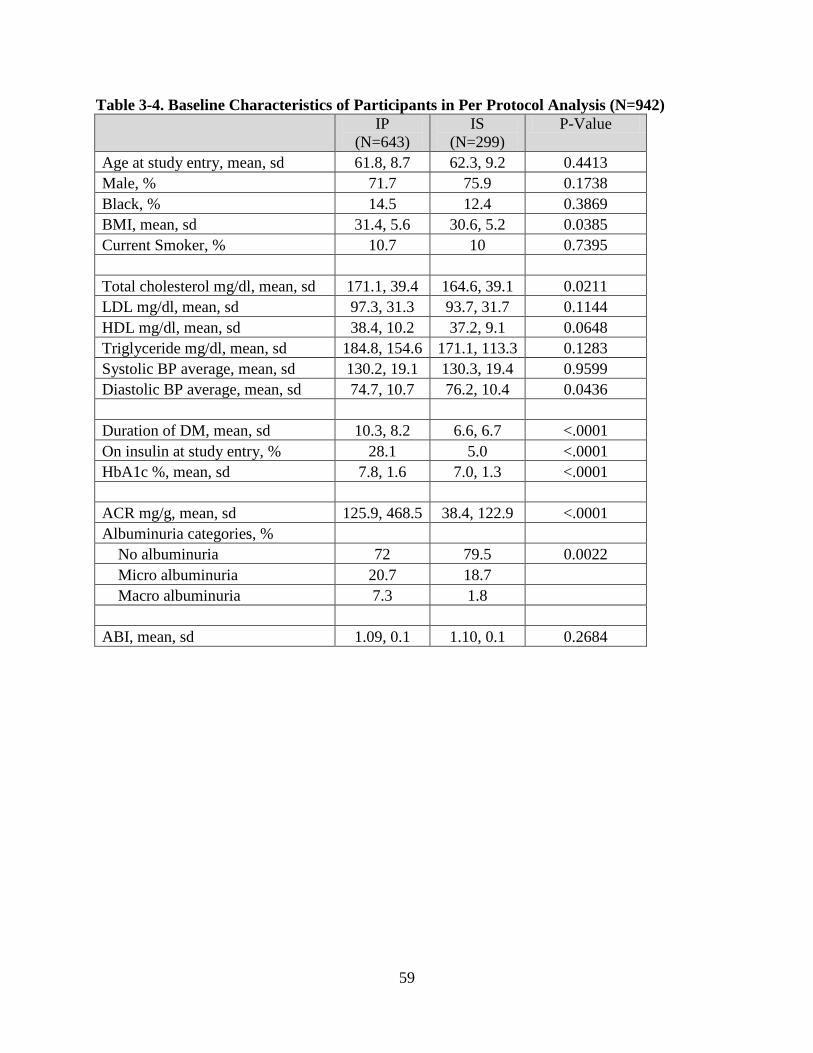
Table 3-4. Baseline Characteristics of Participants in Per Protocol Analysis (N=942) IP
(N=643) IS
(N=299) P-Value
Age at study entry, mean, sd 61.8, 8.7 62.3, 9.2 0.4413 Male, % 71.7 75.9 0.1738 Black, % 14.5 12.4 0.3869 BMI, mean, sd 31.4, 5.6 30.6, 5.2 0.0385 Current Smoker, % 10.7 10 0.7395
Total cholesterol mg/dl, mean, sd 171.1, 39.4 164.6, 39.1 0.0211 LDL mg/dl, mean, sd 97.3, 31.3 93.7, 31.7 0.1144 HDL mg/dl, mean, sd 38.4, 10.2 37.2, 9.1 0.0648 Triglyceride mg/dl, mean, sd 184.8, 154.6 171.1, 113.3 0.1283 Systolic BP average, mean, sd 130.2, 19.1 130.3, 19.4 0.9599 Diastolic BP average, mean, sd 74.7, 10.7 76.2, 10.4 0.0436
Duration of DM, mean, sd 10.3, 8.2 6.6, 6.7 <.0001 On insulin at study entry, % 28.1 5.0 <.0001 HbA1c %, mean, sd 7.8, 1.6 7.0, 1.3 <.0001
ACR mg/g, mean, sd 125.9, 468.5 38.4, 122.9 <.0001 Albuminuria categories, %
No albuminuria 72 79.5 0.0022 Micro albuminuria 20.7 18.7
Macro albuminuria 7.3 1.8
ABI, mean, sd 1.09, 0.1 1.10, 0.1 0.2684
59
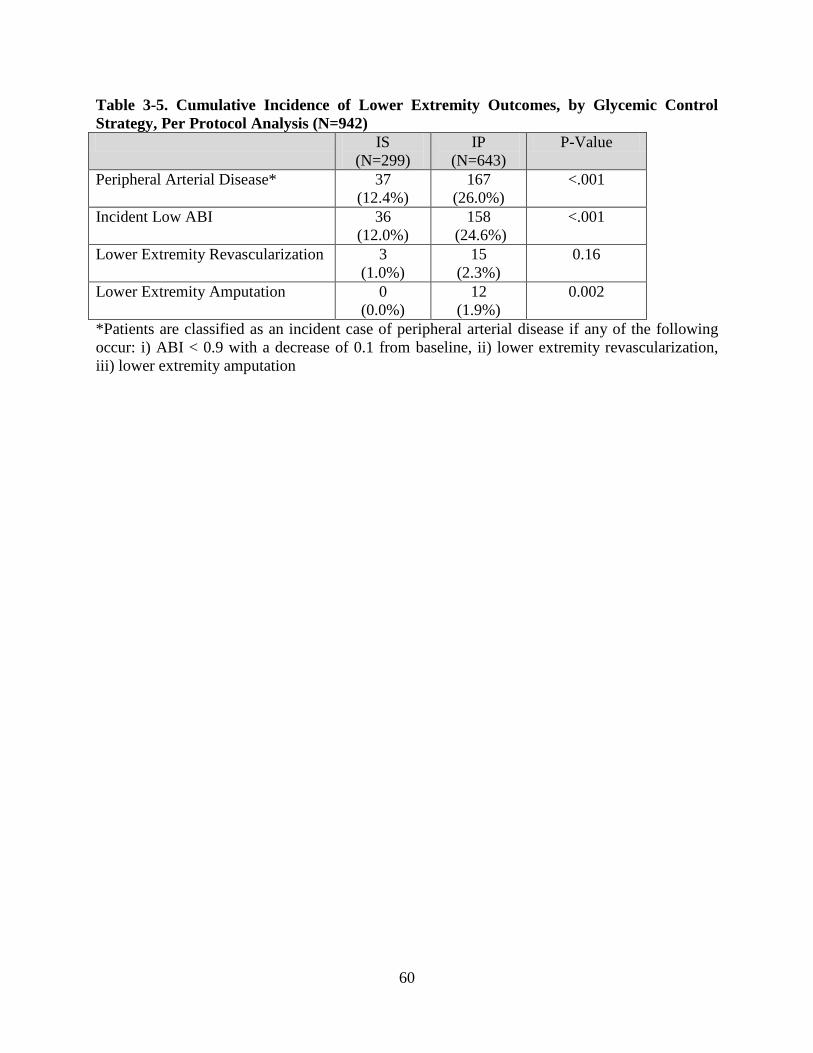
Table 3-5. Cumulative Incidence of Lower Extremity Outcomes, by Glycemic Control Strategy, Per Protocol Analysis (N=942) IS
(N=299) IP
(N=643) P-Value
Peripheral Arterial Disease* 37 (12.4%)
167 (26.0%)
<.001
Incident Low ABI 36 (12.0%)
158 (24.6%)
<.001
Lower Extremity Revascularization 3 (1.0%)
15 (2.3%)
0.16
Lower Extremity Amputation 0 (0.0%)
12 (1.9%)
0.002
*Patients are classified as an incident case of peripheral arterial disease if any of the following occur: i) ABI < 0.9 with a decrease of 0.1 from baseline, ii) lower extremity revascularization, iii) lower extremity amputation
60
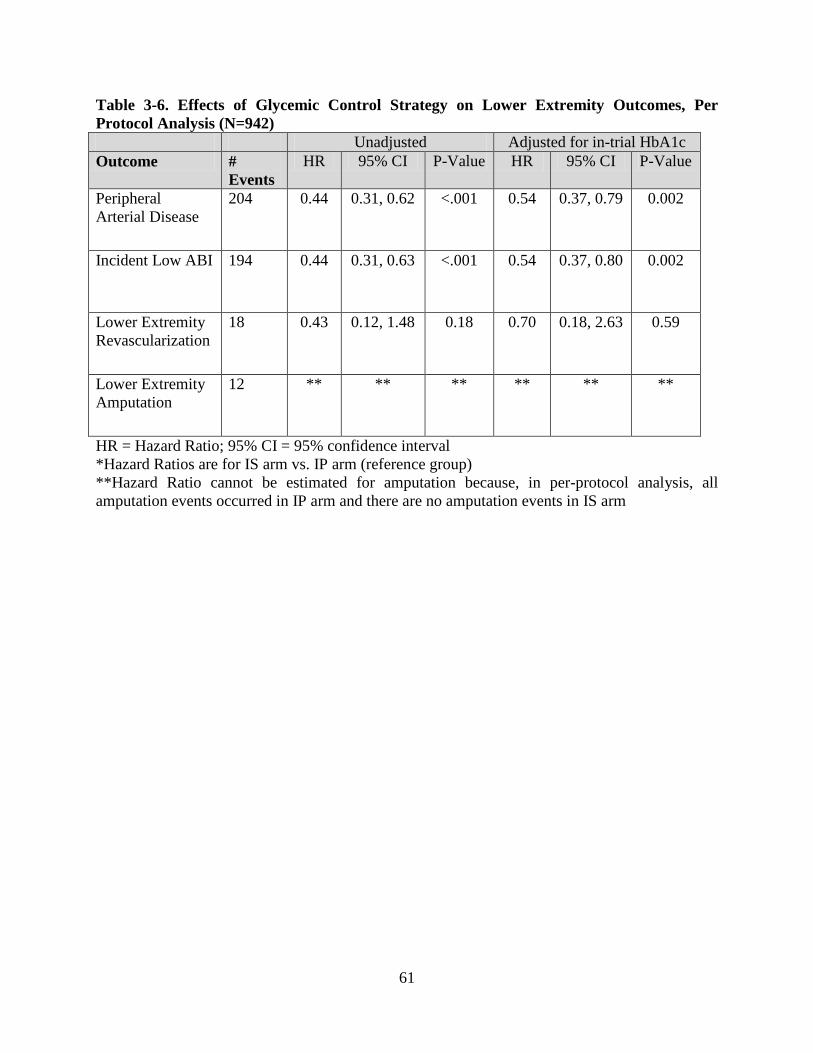
Table 3-6. Effects of Glycemic Control Strategy on Lower Extremity Outcomes, Per Protocol Analysis (N=942) Unadjusted Adjusted for in-trial HbA1c Outcome #
Events HR 95% CI P-Value HR 95% CI P-Value
Peripheral Arterial Disease
204 0.44 0.31, 0.62 <.001 0.54 0.37, 0.79 0.002
Incident Low ABI 194 0.44 0.31, 0.63 <.001 0.54 0.37, 0.80 0.002
Lower Extremity Revascularization
18 0.43 0.12, 1.48 0.18 0.70 0.18, 2.63 0.59
Lower Extremity Amputation
12 ** ** ** ** ** **
HR = Hazard Ratio; 95% CI = 95% confidence interval *Hazard Ratios are for IS arm vs. IP arm (reference group) **Hazard Ratio cannot be estimated for amputation because, in per-protocol analysis, all amputation events occurred in IP arm and there are no amputation events in IS arm
61
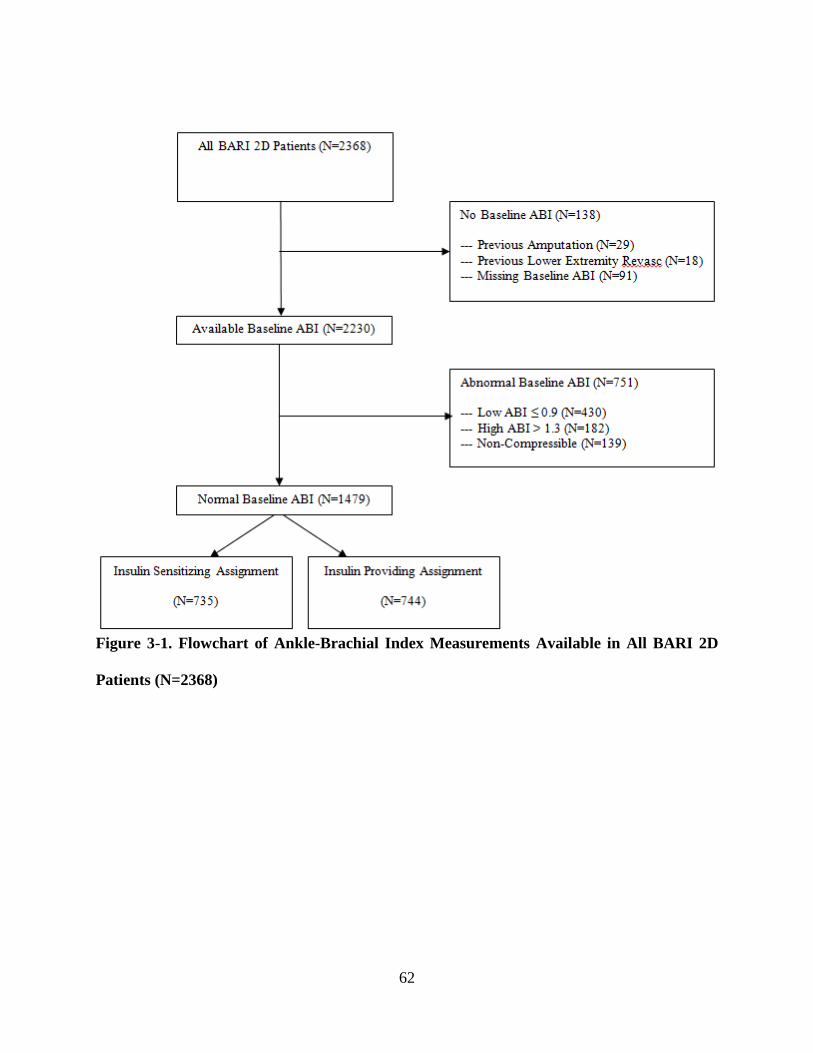
Figure 3-1. Flowchart of Ankle-Brachial Index Measurements Available in All BARI 2D
Patients (N=2368)
62
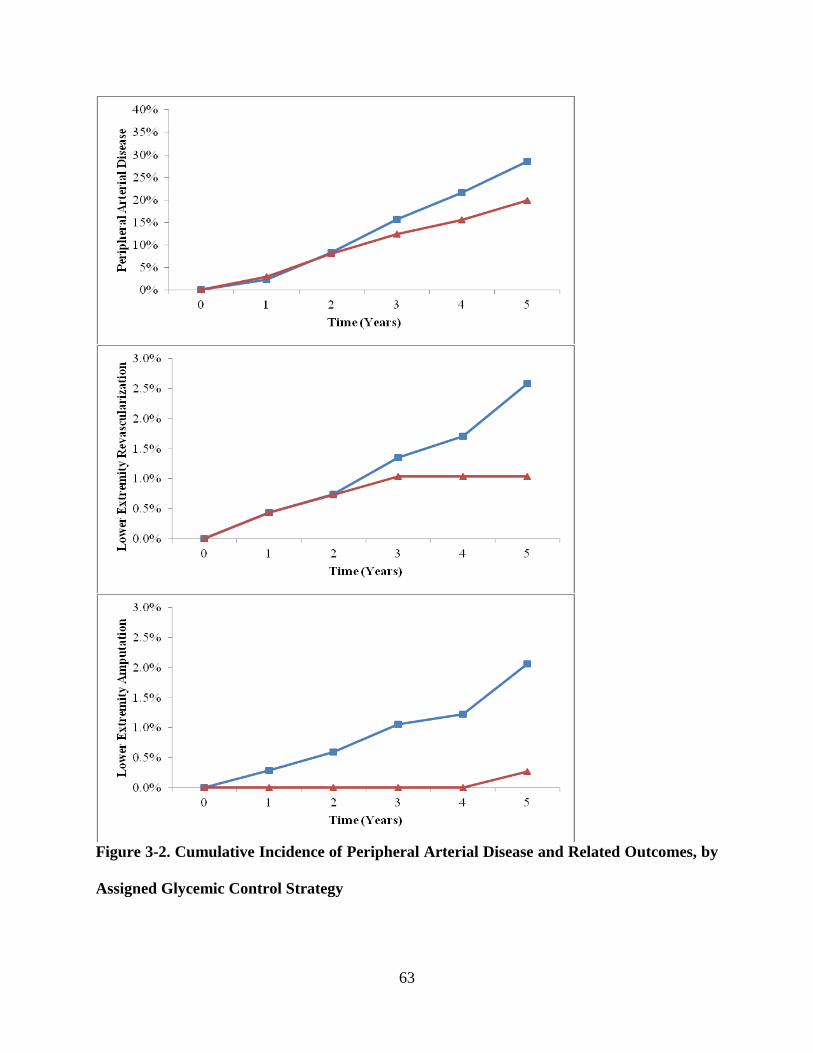
Figure 3-2. Cumulative Incidence of Peripheral Arterial Disease and Related Outcomes, by
Assigned Glycemic Control Strategy
63
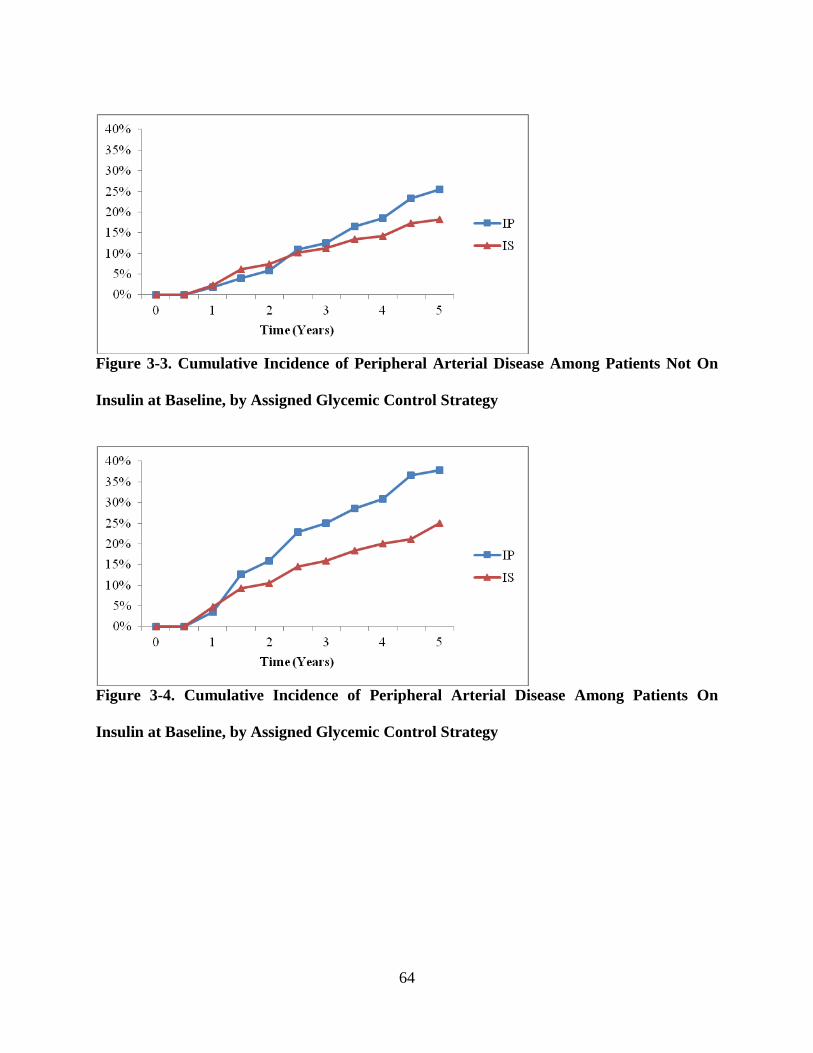
Figure 3-3. Cumulative Incidence of Peripheral Arterial Disease Among Patients Not On
Insulin at Baseline, by Assigned Glycemic Control Strategy
Figure 3-4. Cumulative Incidence of Peripheral Arterial Disease Among Patients On
Insulin at Baseline, by Assigned Glycemic Control Strategy
64

4.0 MANUSCRIPT 2: RISK FACTORS FOR PERIPHERAL ARTERIAL DISEASE
IN TYPE 2 DIABETES: RESULTS FROM THE BYPASS ANGIOPLASTY
REVASCULARIZATION INVESTIGATION 2 DIABETES (BARI 2D) TRIAL
65
4.1 ABSTRACT
(Oral Presentation at the American Heart Association 2012 Scientific Sessions)
Objective: Define risk factors for the incidence of peripheral arterial disease (PAD) in a large
cohort of type 2 diabetes mellitus (T2DM) patients, overall and within the context of two
different assigned glycemic control strategies.
Research Design and Methods: The Bypass Angioplasty Revascularization Investigation 2
Diabetes (BARI 2D) trial randomly assigned participants to insulin-sensitization (IS) therapy vs.
insulin-providing (IP) therapy. In these secondary analyses, we examine baseline risk factors for
the incidence of lower extremity outcomes within the overall cohort and time-varying risk
factors within each assigned treatment arm. 1479 BARI 2D participants with normal ABI (0.91-
1.30) were eligible for analysis. Cox proportional-hazards models were used to define the
association between each risk factor and incidence of lower extremity outcome.
Results: Age, sex, race, and smoking were all significantly associated with lower extremity
outcomes in the BARI 2D cohort. Additional baseline risk factors included systolic blood
pressure, pulse pressure, HbA1c, albumin-creatinine ratio, and C-reactive protein. In stratified
analyses of time-varying covariates, changes in lipids, systolic blood pressure, pulse pressure,
albumin-creatinine ratio, and D-dimer were most predictive among IS patients, while HbA1c was
most predictive among IP patients.
Conclusions: In participants with type 2 diabetes mellitus that are free from PAD, traditional
cardiovascular risk factors accounted for most predictive value of incident lower extremity
outcomes. Inflammatory biomarkers such as C-reactive protein, fibrinogen, and D-dimer also
were associated with increased risk of lower extremity outcomes, but may have more predictive
value in patients treated with insulin sensitizing medications.
66
4.2 INTRODUCTION
Peripheral arterial disease (PAD) is a critical manifestation of atherosclerosis, a chronic disease
that is one of the leading causes of death and disability in the United States.1 Prevalence
estimates of PAD have steadily risen over the past several decades, and recent epidemiological
data suggests that approximately 8 million Americans likely have PAD.12,13,15 Patients with PAD
have increased risk of functional limitation, physical disability, leg revascularization, and
amputation.18,19,20 The presence of PAD is indicative of generalized systemic atherosclerosis and
therefore associated with increased risk of all-cause mortality and cardiovascular
mortality.22,23,24,25,26,27
PAD is especially common among patients with type 2 diabetes mellitus (T2DM). Patients with
T2DM have an abnormal cluster of hyperglycemia, elevated free fatty acids, and insulin
resistance that results in oxidative stress and endothelial dysfunction, key steps in the
atherosclerotic process that could lead to PAD.140,141 NHANES data suggest that patients with
T2DM have a threefold increased risk of PAD compared to the general population.14 PAD also
tends to progress faster and lead to worse outcomes in T2DM patients than in nondiabetic
patients.84 The American Diabetes Association has previously issued a consensus statement with
guidelines for the diagnosis and management of PAD in patients with diabetes, in recognition of
the common nature and severity of this problem.41
In addition to the excess risk for patients with T2DM, previous studies have identified a number
of risk factors for PAD including age, race, smoking, hypertension, and lipids.16,30,31,32,34 The
direction of these relationships generally matches those between the same risk factors and
67
coronary artery disease (CAD), although the magnitude of some relationships varies; for
example, smoking carries a stronger relationship with PAD than it does with CAD. There is also
growing evidence that several biomarkers indicative of inflammation and/or coagulation such as
C-reactive protein (CRP), D-dimer, and fibrinogen may be associated with increased PAD risk
and/or worse outcomes in peripheral arterial disease.73,74,75,76,142,143,144,145
In the context of developing atherosclerosis, CRP, fibrinogen, and D-dimer are indicative of
distinct but related processes pertaining to inflammation, coagulation, and fibrinolysis.146 An
uncontrolled coagulatory response to inflammation may lead to a situation in which coagulation
and/or thrombosis contribute to disease; for example, thrombus formation on a ruptured
atherosclerotic plaque is the pathologic basis of an acute thrombotic event. Even before an acute
event, elevated levels of these biomarkers are indicative of inflammatory and coagulatory
cascades that may correspond with the development of atherosclerosis. The acute fibrinolytic
response to inflammation results in the release of tissue-type plasminogen activator (tPA) and
plasminogen activator inhibitor-1 (PAI-1),54 which may also provide predictive value.
Results from the Bypass Angioplasty Revascularization Investigation 2 Diabetes (BARI 2D) trial
suggest that T2DM patients treated with an insulin sensitizing (IS) regimen experienced
improvements in biomarker profiles not observed in those assigned to an insulin providing (IP)
regimen.98 While this did not result in a reduction in all-cause mortality, patients assigned to the
IS strategy experienced significantly lower incidence of PAD than those assigned to the IP
strategy.147 Therefore, we sought to determine whether the relationship between these changing
biomarker profiles and incidence of PAD is influenced by the assigned glycemic control strategy.
68
All BARI 2D participants had clinically significant atherosclerosis in the coronary arteries at
study entry; however, incidence of new PAD is still informative because it represents the
advancement of generalized atherosclerosis. Identifying risk factors for incident PAD in this
population improve our understanding of how insulin sensitizing and insulin providing
medications affect the progression of atherosclerosis. There is little longitudinal data exploring
how time-varying changes in these biomarkers are associated with new atherosclerosis, and few
existing studies have explored these biomarkers as risk factors for incident PAD in a population
of T2DM patients. Therefore, our principal aim is to establish the associations between
inflammatory biomarkers and incidence of PAD in T2DM patients; as a secondary aim, we aim
to define risk factors for PAD incidence in the context of each of the BARI 2D glycemic control
strategies.
69
4.3 METHODS
BARI 2D Trial
The Bypass Angioplasty Revascularization Investigation 2 Diabetes (BARI 2D) trial was
designed to determine optimal treatment strategy for patients with stable coronary artery disease
and type 2 diabetes mellitus.128 BARI 2D participants were randomly assigned via 2x2 factorial
design to prompt coronary revascularization with intensive medical therapy (REV) versus
intensive medical therapy alone (MED) and simultaneously randomly assigned to either an
insulin sensitizing (IS) glycemic control strategy or an insulin providing (IP) strategy. All
participants were treated medically to achieve targets of HbA1c < 7.0%, LDL cholesterol < 100
mg/dL, and blood pressure ≤ 130/80 mm Hg as well as given counseling for smoking cessation,
weight loss, and exercise. BARI 2D was coordinated at the University of Pittsburgh and
included 49 clinical sites throughout North America, South America, and Europe. Recruitment
began in 2001 and continued until 2005; treatment continued until the 6-year visit or the last
annual visit before December 1, 2008. The overall study cohort for BARI 2D consisted of 2368
participants. The primary endpoint for BARI 2D was death from any cause, and the principal
secondary endpoint was a composite of death, myocardial infarction, or stroke. This manuscript
reports the results of post hoc analyses that examine associations between baseline and time-
varying cardiovascular risk factors and PAD outcomes.
Definition of Lower Extremity Outcomes
The primary outcome reported in this manuscript is a composite lower extremity outcome used
in previous BARI 2D analyses. Participants were considered an “event” if they experienced any
of the following lower extremity outcomes: decrease in ankle-brachial index to abnormal level
70
(ABI ≤ 0.9), lower extremity revascularization, or lower extremity amputation. 1479 participants
with normal ABI (0.91-1.30) at study entry were eligible for the primary analysis in this
manuscript; those with abnormal ABI at baseline were excluded for reasons enumerated
previously. The range for normal ABI is chosen based on guidelines published in a 2003 ADA
consensus statement regarding PAD in diabetes.
Assays of Biomarkers
The biomarker assays used in BARI 2D were previously reported by Sobel et al (34).
Plasminogen activator inhibitor-1 (PAI-1) activity, PAI-1 antigen, tissue plasminogen activator
(tPA), and insulin were measured in the fibrinolysis core laboratory at the University of Vermont
in samples obtained at baseline, 1 month, 3 month, 6 month, and every 6 months thereafter over
5 years of follow-up. PAI-1 activity was assessed using a modified chromogenic substrate
enzymatic assay developed by Chmielewska and Wiman. PAI-1 antigen and tPA levels were
determined with commercially available enzyme-linked immunoassay kits (Trinity Biochcech
PLC, Bray, Wicklow, Ireland). CRP, D-dimer, and fibrinogen were assayed at the same core
laboratory as part of an ancillary study, with data through the first 24 months of follow-up.
Fibronogen was measured by the Claus method, and D-dimer was measured
immunoturbidimetrically with STA-Liatest D-Dimer reagents (Diagnostica Stago, Parsippany,
New Jersey) on a STA Compact (Roche Professional Diagnostics, Basel, Switzerland). HbA1c
was assayed in whole blood samples in the BARI 2D chemistry laboratory in Minneapolis or
core laboratories in Brazil and Europe.
71
Statistical Methods
Baseline descriptive statistics are reported as means ± SDs for continuous variables; medians and
interquartile ranges are presented for skewed data, and proportions are reported for categorical
variables. The baseline distributions of all risk factors and biomarkers were compared across the
assigned glycemic treatment arms using t-tests, Wilcoxon tests, and chi-squared tests for
continuous, skewed continuous and categorical data, respectively. Baseline characteristics are
presented separately for the assigned glycemic treatment arms in order to accompany the
stratified analyses described later in this section.
Cox proportional-hazards models were used to estimate hazard ratios and associated 95%
confidence intervals for the associations between each potential risk factor and composite lower
extremity outcome. Time-to-event was calculated from the date of randomization to first
recorded lower extremity event; participants with no event were censored at their last full-
protocol follow-up visit. Most predictor variables were examined as continuous variables; a log-
transformation was applied to those with skewed distributions and/or nonlinear associations with
outcome. The first series of Cox models were constructed to assess the effects of each risk factor
while adjusting for known PAD risk factors that demonstrated significant univariate associations
with PAD (age, sex, race, and baseline smoking status).
To determine which of the baseline risk factors showed the strongest independent association
with lower extremity outcomes when adjusting for other candidate variables as well as the
aforementioned four “known” risk factors (age, sex, race, and smoking), we constructed a
multivariate model using forward selection with age, sex, race, and baseline smoking status
72

forced to enter the model plus all candidate variables that met a significance level of p≤0.10 also
included in the final multivariate model.
We then performed a similar process using the same risk factors assessed as time-varying
covariates, updating each value annually to be consistent with the availability of updated ABI
measurements (also performed annually). Since previous BARI 2D analyses have shown
differential trends in several candidate variables as well as differences in the incidence of lower
extremity outcomes between glycemic control arms during the trial, we tested for interactions
between assigned glycemic control strategy and each of the time-varying risk factors; there were
several significant interactions between candidate variables and assigned treatment, suggesting
that stratified analyses are appropriate. Within each glycemic control arm, we constructed
separate models for each potential risk factor (adjusting for age, sex, race, and smoking) and then
created multivariate models determined by forward selection, using the same process described
above for the baseline models.
SAS version 9.2 (SAS Institute, Cary, NC) was used for all statistical analyses. Nominal p-
values are reported; p-values less than 0.10 were considered statistically significant in this
exploratory analysis, and no adjustment was made for multiple comparisons.
73
4.4 RESULTS
The BARI 2D trial enrolled 2368 participants with T2DM and coronary artery disease; baseline
characteristics of the study population have been reported previously.129 Of the 2368 BARI 2D
participants, 1479 were eligible for this paper’s primary analyses; the participants excluded were
generally older, heavier, more likely to be current smokers, had higher systolic blood pressure,
higher pulse pressure, and longer duration of diabetes than those included in this analysis. Since
most of those excluded were removed from the analysis due to pre-existing PAD, it is not
surprising that excluded participants generally had more cardiovascular risk factors.
Table 4-1 describes the baseline characteristics of the 1479 participants included in this paper’s
primary analysis. Participants included in our analytic sample were 61.9 ± 8.0 years, 72% male,
15% identified as Black race, and 12% were current smokers. Baseline distributions of BMI,
lipids, blood pressure, HbA1c, albumin-creatinine ratio, and biomarkers of interest were similar
between the assigned glycemic treatment groups; there were no significant differences in major
demographic or clinical characteristics.
Three hundred and three participants (20.5%) experienced one or more of the lower extremity
outcomes included in the composite lower extremity outcome. 290 of these participants had at
least one recorded low ABI during follow up, 25 had a lower extremity revascularization, and 13
required a lower extremity amputation. Table 4-2 displays the associations between baseline
risk factors and incidence of the composite lower extremity outcome when adjusting for age, sex,
race, and baseline smoking status (each of which was significantly associated with the composite
outcome in a multivariate model; see Table 4-3). Baseline HbA1c was significantly associated
74
with the incidence of lower extremity outcomes (HR= 1.19, p<0.01). Systolic blood pressure,
pulse pressure, albumin-creatinine ratio, and C-reactive protein were also significantly associated
with lower extremity outcomes when adjusting for age, sex, race, and smoking.
Table 4-4 displays the results of a forward selection algorithm with age, sex, race, and smoking
forced to enter the model and all other baseline variables shown in Table 2 eligible as candidates.
HbA1c again shows the strongest association (HR=1.19, p<0.01), followed by log-transformed
albumin-creatinine ratio (HR=1.08, p<0.05) and then log-transformed D-dimer (HR=1.15,
p<0.10); the selection algorithm terminates after this step since no other variable is associated
with outcome at p<0.10 significance level with the aforementioned variables included in the
model. Notably, D-dimer did not show a significant relationship in the first set of models, but
was only significantly associated with outcome in models that also adjusted for HbA1c. If D-
dimer is not considered a candidate variable, then CRP would enter the model instead, and if
neither D-dimer nor CRP were candidate variables, then fibrinogen would enter the model; this
is possibly due to correlation between these variables (Table 4-5).
The observed associations are noticeably different when the risk factors are modeled as time-
varying covariates (Table 4-6); recall that these analyses are stratified due to the differential
effects of assigned treatment on risk factors of interest. Among those assigned to IP strategy,
HbA1c is the strongest predictor (p<0.01) with albumin-creatinine ratio the only other candidate
variable showing any significant relationship with the composite lower extremity outcome.
Among those assigned to IS strategy, several predictors show significant relationships including
BMI, lipids, systolic blood pressure, pulse pressure, albumin-creatinine ratio, and D-dimer.
75

Notably, time-varying HbA1c is not a significant predictor for those assigned to IS therapy,
although it was the strongest for those assigned to IP therapy.
When using the forward selection algorithm, the stratified analyses show that the strength of
selected risk factors’ association with outcome varies by glycemic control strategy (Table 4-7).
Age, sex, smoking, and baseline HbA1c are strongly associated with outcome for the IP patients,
while only moderately so for the IS patients. Of the other candidate variables, baseline HbA1c
and change in HbA1c are predictive of outcome in the IP patients, while baseline D-dimer and
change in D-dimer are significantly associated with outcome in the IS patients (only after
adjustment for HbA1c).
76
4.5 DISCUSSION
The BARI 2D trial was a randomized controlled trial designed to determine the optimal
treatment strategy for patients with stable CAD suitable for elective revascularization and
T2DM. All of these participants have clinically significant atherosclerosis in the coronary
arteries; studying the incidence of new PAD and lower extremity outcomes is still informative
because it represents the advancement of atherosclerosis into another vascular bed. Using the
BARI 2D data to identify risk factors for incident PAD in this population may lead to better
mechanistic understanding of how insulin sensitizing and insulin providing medications affect
the progression of atherosclerosis.
Approximately 20% of BARI 2D participants with normal ABI at study entry experienced at
least one lower extremity event (ABI ≤ 0.9, lower extremity revascularization, or lower
extremity amputation) within five years of follow-up. As expected, age, sex, race, and baseline
smoking were significantly associated with incidence of lower extremity outcomes. When
adjusting for the aforementioned risk factors, baseline risk factors predictive of lower extremity
events were high systolic blood pressure, pulse pressure, poor glycemic control (higher HbA1c),
renal dysfunction (high albumin-creatinine ratio), and a marker of inflammation (CRP). With
the exception of pulse pressure, these are all well-established cardiovascular risk factors that
have demonstrated a relationship with PAD incidence in prior research, and the relationship
between pulse pressure and PAD risk is understandable given that pulse pressure is strongly
associated with high systolic blood pressure.
77
It is fascinating to note the variation between glycemic control strategies wherein different risk
factors are predictive of PAD in our time-varying analyses. We know from previous research
that participants assigned to IS therapy experienced improvements in biomarker profiles not
observed in those assigned the IP strategy; in addition to lower HbA1c, participants assigned to
IS therapy had significantly greater in CRP, fibrinogen, tPA, PAI-1 activity, and PAI-1 antigen
than participants assigned to IP therapy.98 However, in the stratified analysis with the biomarkers
viewed as time-varying covariates and adjustment for changes in HbA1c, it was change in D-
dimer that was the most predictive of PAD risk in participants assigned to IS therapy, ironically
the only one of the biomarkers that did not differ over time between the glycemic control arms.
If D-dimer were not considered a candidate variable for this model, then CRP would have
entered the model as a predictor of PAD incidence, and the same is true for fibrinogen. These
relationships were significant only in participants assigned to IS therapy. It is possible that the
improved biomarker profiles in the patients assigned IS therapy signified an environment less
favorable to further development of atherosclerosis than that present in patients assigned to IP
therapy. In contrast, HbA1c showed a much stronger association with the incidence of PAD in
participants assigned to IP therapy.
It is difficult to say why the magnitude of time-varying change in HbA1c’s relationship with
PAD was different in the glycemic treatment arms. Adjusting for age, sex, race, and smoking
status, our results showed a statistically significant 17% increased hazard ratio in those assigned
to IP therapy for each 1% increase in HbA1c, but a nonsignificant 5% increased hazard in those
assigned to IS therapy. One possibility is that the better overall glycemic control in the IS arm
dampened the effects of HbA1c on PAD outcomes by pushing the majority of participants into
78
an HbA1c range where there was relatively little effect of glycemic control on the development
of new atherosclerosis, while a greater proportion of participants in the IP arm remained in a
higher range of HbA1c and therefore may have been in a range where there was more of an
effect on atherosclerosis.
As mentioned briefly above, our baseline models showed relationships generally consistent with
prior research regarding traditional cardiovascular risk factors and PAD. Both systolic blood
pressure (SBP) and pulse pressure were associated with lower extremity outcomes in our
baseline models. Hypertension is not a direct cause of atherosclerosis per se, but it may promote
atherosclerosis by its effects on the vasculature. Arteries exposed to hypertension have increased
permeability, which results in an increased ability of oxidized lipoproteins to migrate into the
intima,35 and hypertension also may affect vascular wall remodeling by altering the balance
between cellular proliferation and apoptosis.36 SBP is one of the components used to calculate
the ankle-brachial index and is also an established predictor of PAD from previous research, so
one would expect a significant association between SBP and PAD incidence. Increased pulse
pressure is generally indicative of arterial stiffness, thought to be more damaging to the heart
than to the peripheral vasculature, so it is interesting to note that pulse pressure also demonstrates
a strong relationship with PAD; however, since pulse pressure is strongly related to SBP, it is not
surprising to see a strong association between pulse pressure and risk of PAD.
HbA1c has demonstrated a positive association with increased risk of PAD in several studies.
The United Kingdom Prospective Diabetes Study (UKPDS) showed that each 1% increase in
HbA1c was associated with a 28% increased risk of PAD,90 later confirmed by a meta-analysis
79
showing the same estimated 28% increased PAD risk per 1% increase in HbA1c.91 Several
plausible biological mechanisms have been proposed to explain a possible relationship between
chronically elevated blood glucose levels and atherosclerosis.148 Glucose can react with many
different proteins, causing structural alterations and subsequently impaired protein and tissue
function; such alterations may contribute to endothelial dysfunction, changes in arterial
distensibility, plaque formation, and atherosclerosis.149,150,151,152
Higher albumin-creatinine ratio, indicative of worsening kidney function, was also predictive of
lower extremity outcomes in BARI 2D. Because the kidney is a highly vascular organ, it could
be argued that systemic atherosclerotic disease could be associated with declining renal function,
but the directionality of this relationship is largely unclear. Cross-sectional data from NHANES
1999-200040 and the Cardiovascular Health Study153 both demonstrated a relationship between
chronic kidney disease and abnormal ABI; however, as cross-sectional studies, these studies
show nothing about temporality. Longitudinal results from the ARIC study suggested that
reduced eGFR was a risk factor for incident PAD,154 and the BARI 2D data presented here also
suggest that higher albumin-creatinine ratio was predictive of incident peripheral arterial disease,
suggesting that renal insufficiency may be causally related to progression of atherosclerosis.
Potential physiological mechanisms by which renal dysfunction might affect the atherosclerotic
process include altered calcium-phosphorus metabolism, homocysteine metabolism,
lipoprotein(a) metabolism and alterations in inflammatory and coagulation pathways.155,156
C-reactive protein, fibrinogen, and D-dimer also showed significant associations with PAD risk
in one or more of the models presented in this paper. Since these biomarkers are representative
80
of distinct but interrelated processes pertaining to inflammation, coagulation, and thrombosis and
their values are somewhat correlated, particularly fibrinogen and CRP, often they would not
show predictive value when placed in models together, but when any one of the three was
considered a candidate variable, they showed a significant association with PAD risk (although,
for fibrinogen, this was only true when viewed as a time-varying covariate; baseline fibrinogen
showed no predictive value for PAD incidence). Both CRP and fibrinogen have been associated
with PAD in cross-sectional studies,143 and fibrinogen has been associated with increased risk of
developing PAD in diabetes.97 NHANES data has also showed that participants in the highest
quartile of CRP and fibrinogen had a 2.0-fold increased odds of prevalent PAD compared with
participants in the lowest quartiles.69 Among individuals with existing PAD, higher levels of
inflammatory biomarkers are associated with increased mortality, increased cardiovascular
mortality, and increased risk of failure of lower-extremity revascularization procedures.77,78,79 To
our knowledge, no previous research has shown changes in D-dimer to be linked to increased
risk of PAD incidence; two studies have shown D-dimer associated with risk of functional
decline in patients with existing PAD.75,76
Our study findings must be considered carefully in context of the trial’s strengths and limitations.
This is a post-hoc secondary analysis of a randomized controlled trial in which all participants
had CAD and T2DM; the effects of these risk factors may be different in the general population.
Several of the biomarkers included in this analysis, including CRP and fibrinogen, were only
collected through 24 months of follow-up, and thus their relationships with PAD risk in our
analyses using time-varying covariates may not be fully accurate. It also should be noted that
our primary outcome was a composite of low ABI, lower extremity revascularization, and lower
81
extremity amputation used in a prior BARI 2D publication on peripheral arterial disease. We felt
this outcome was appropriate because ABI was only measured annually, and wished to capture
lower extremity events of clinical significance that may have occurred without a low ABI being
measured.
We have previously reported the baseline prevalence of PAD in the BARI 2D trial and the
baseline risk factors associated with prevalent PAD at study entry131 as well as the incidence of
PAD in each glycemic control arm. 147 This manuscript extends our previous work by reporting
the associations between traditional and nontraditional risk factors for PAD and lower extremity
outcomes during follow-up. After adjusting for age, sex, race, and smoking, our data showed
that hypertension, HbA1c, albumin-creatinine ratio, and several biomarkers indicative of
inflammation and antithrombotic activity were positively associated with PAD risk. It is
uncertain whether these are causal relationships between the risk factors and PAD, or whether
these are merely reflective of advancing systemic disease. Nonetheless, it appears that in
addition to high HbA1c, several nontraditional risk factors such as CRP, fibrinogen, and D-dimer
may have potential to identify T2DM patients at highest risk for developing further
atherosclerosis.
82
4.6 CONCLUSION
This manuscript reports the associations between traditional and nontraditional risk factors for
PAD and lower extremity outcomes during follow-up. After adjusting for known PAD risk
factors of age, sex, race, and smoking, our data showed that hypertension, HbA1c, renal
dysfunction, and biomarkers indicative of inflammation, coagulation, and fibrinolysis were
positively associated with PAD risk. It is uncertain whether these are causal relationships or
merely reflective of advancing systemic disease. Nonetheless, it appears that in addition to high
HbA1c, several nontraditional risk factors such as CRP, fibrinogen, and D-dimer may have
potential to identify T2DM patients at highest risk for developing further atherosclerosis.
Notably, the markers of inflammation, coagulation, and fibrinolysis were associated with lower
extremity outcomes among patients treated with insulin sensitizing medications, but this was not
the case for patients treated with insulin providing medications, suggesting that these
medications may have a differential effect on these processes and subsequently on the
development of atherosclerosis in patients with type 2 diabetes.
83
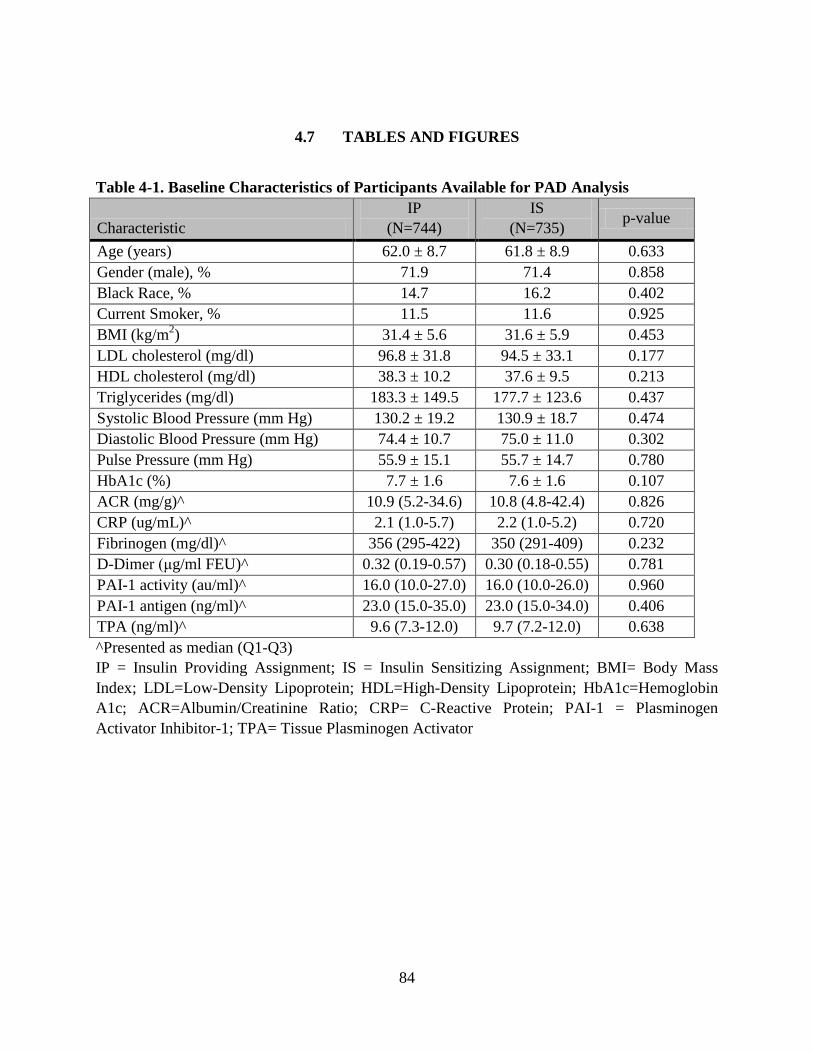
4.7 TABLES AND FIGURES
Table 4-1. Baseline Characteristics of Participants Available for PAD Analysis
Characteristic IP
(N=744) IS
(N=735) p-value
Age (years) 62.0 ± 8.7 61.8 ± 8.9 0.633 Gender (male), % 71.9 71.4 0.858 Black Race, % 14.7 16.2 0.402 Current Smoker, % 11.5 11.6 0.925 BMI (kg/m2) 31.4 ± 5.6 31.6 ± 5.9 0.453 LDL cholesterol (mg/dl) 96.8 ± 31.8 94.5 ± 33.1 0.177 HDL cholesterol (mg/dl) 38.3 ± 10.2 37.6 ± 9.5 0.213 Triglycerides (mg/dl) 183.3 ± 149.5 177.7 ± 123.6 0.437 Systolic Blood Pressure (mm Hg) 130.2 ± 19.2 130.9 ± 18.7 0.474 Diastolic Blood Pressure (mm Hg) 74.4 ± 10.7 75.0 ± 11.0 0.302 Pulse Pressure (mm Hg) 55.9 ± 15.1 55.7 ± 14.7 0.780 HbA1c (%) 7.7 ± 1.6 7.6 ± 1.6 0.107 ACR (mg/g)^ 10.9 (5.2-34.6) 10.8 (4.8-42.4) 0.826 CRP (ug/mL)^ 2.1 (1.0-5.7) 2.2 (1.0-5.2) 0.720 Fibrinogen (mg/dl)^ 356 (295-422) 350 (291-409) 0.232 D-Dimer (μg/ml FEU)^ 0.32 (0.19-0.57) 0.30 (0.18-0.55) 0.781 PAI-1 activity (au/ml)^ 16.0 (10.0-27.0) 16.0 (10.0-26.0) 0.960 PAI-1 antigen (ng/ml)^ 23.0 (15.0-35.0) 23.0 (15.0-34.0) 0.406 TPA (ng/ml)^ 9.6 (7.3-12.0) 9.7 (7.2-12.0) 0.638 ^Presented as median (Q1-Q3) IP = Insulin Providing Assignment; IS = Insulin Sensitizing Assignment; BMI= Body Mass Index; LDL=Low-Density Lipoprotein; HDL=High-Density Lipoprotein; HbA1c=Hemoglobin A1c; ACR=Albumin/Creatinine Ratio; CRP= C-Reactive Protein; PAI-1 = Plasminogen Activator Inhibitor-1; TPA= Tissue Plasminogen Activator
84
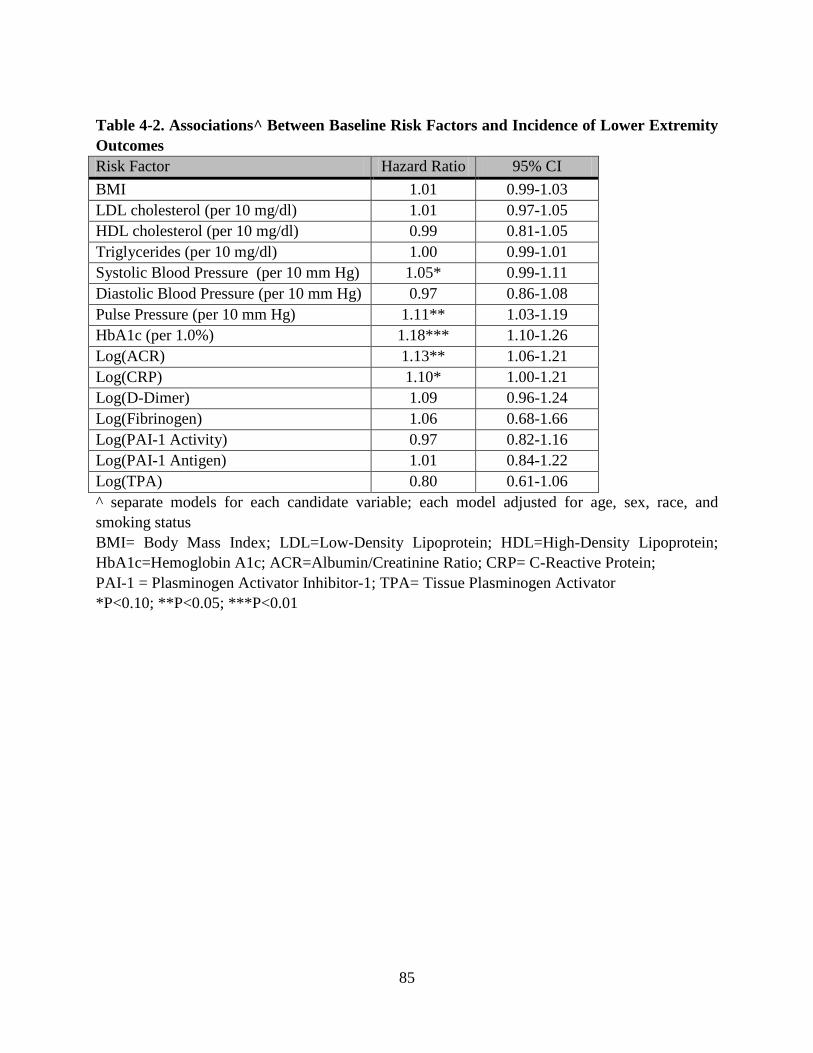
Table 4-2. Associations^ Between Baseline Risk Factors and Incidence of Lower Extremity Outcomes Risk Factor Hazard Ratio 95% CI BMI 1.01 0.99-1.03 LDL cholesterol (per 10 mg/dl) 1.01 0.97-1.05 HDL cholesterol (per 10 mg/dl) 0.99 0.81-1.05 Triglycerides (per 10 mg/dl) 1.00 0.99-1.01 Systolic Blood Pressure (per 10 mm Hg) 1.05* 0.99-1.11 Diastolic Blood Pressure (per 10 mm Hg) 0.97 0.86-1.08 Pulse Pressure (per 10 mm Hg) 1.11** 1.03-1.19 HbA1c (per 1.0%) 1.18*** 1.10-1.26 Log(ACR) 1.13** 1.06-1.21 Log(CRP) 1.10* 1.00-1.21 Log(D-Dimer) 1.09 0.96-1.24 Log(Fibrinogen) 1.06 0.68-1.66 Log(PAI-1 Activity) 0.97 0.82-1.16 Log(PAI-1 Antigen) 1.01 0.84-1.22 Log(TPA) 0.80 0.61-1.06 ^ separate models for each candidate variable; each model adjusted for age, sex, race, and smoking status BMI= Body Mass Index; LDL=Low-Density Lipoprotein; HDL=High-Density Lipoprotein; HbA1c=Hemoglobin A1c; ACR=Albumin/Creatinine Ratio; CRP= C-Reactive Protein; PAI-1 = Plasminogen Activator Inhibitor-1; TPA= Tissue Plasminogen Activator *P<0.10; **P<0.05; ***P<0.01
85
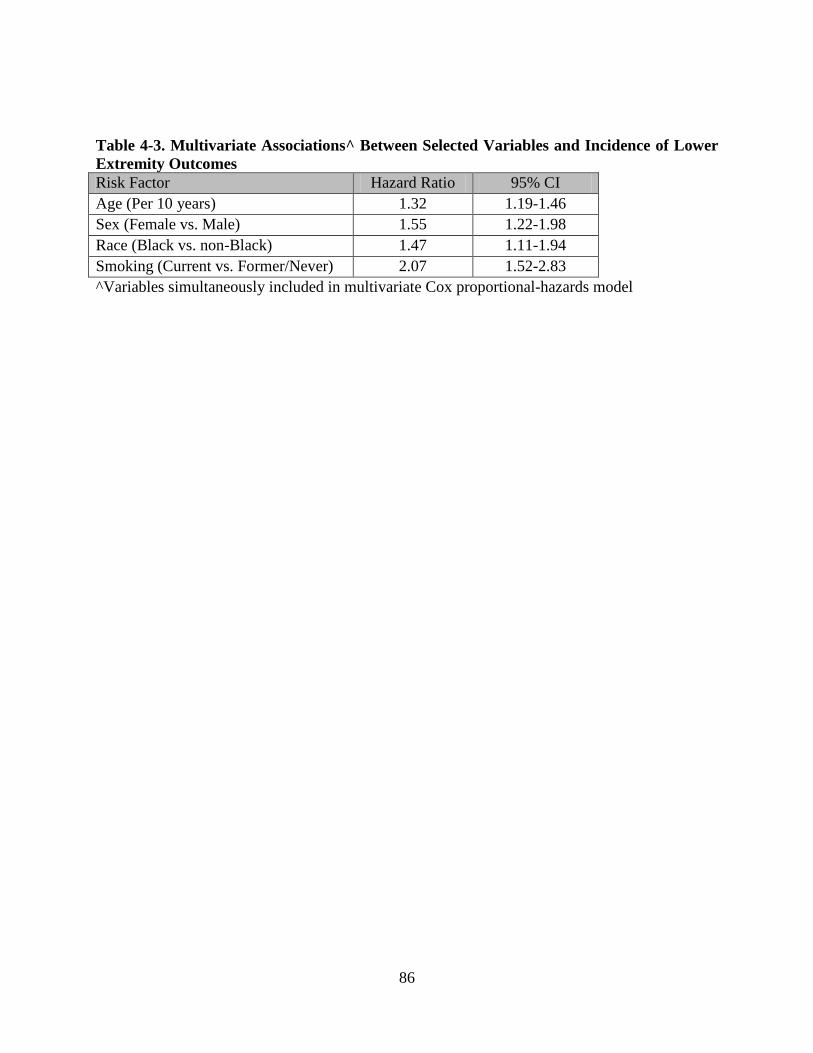
Table 4-3. Multivariate Associations^ Between Selected Variables and Incidence of Lower Extremity Outcomes Risk Factor Hazard Ratio 95% CI Age (Per 10 years) 1.32 1.19-1.46 Sex (Female vs. Male) 1.55 1.22-1.98 Race (Black vs. non-Black) 1.47 1.11-1.94 Smoking (Current vs. Former/Never) 2.07 1.52-2.83 ^Variables simultaneously included in multivariate Cox proportional-hazards model
86
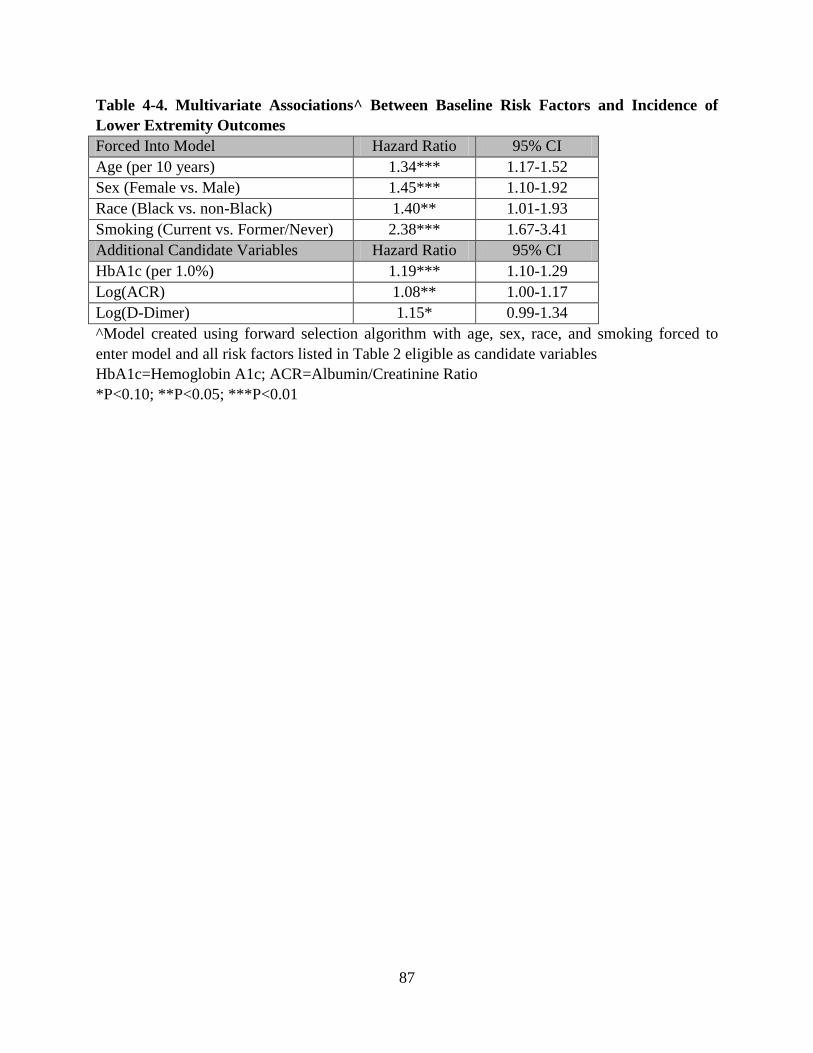
Table 4-4. Multivariate Associations^ Between Baseline Risk Factors and Incidence of Lower Extremity Outcomes Forced Into Model Hazard Ratio 95% CI Age (per 10 years) 1.34*** 1.17-1.52 Sex (Female vs. Male) 1.45*** 1.10-1.92 Race (Black vs. non-Black) 1.40** 1.01-1.93 Smoking (Current vs. Former/Never) 2.38*** 1.67-3.41 Additional Candidate Variables Hazard Ratio 95% CI HbA1c (per 1.0%) 1.19*** 1.10-1.29 Log(ACR) 1.08** 1.00-1.17 Log(D-Dimer) 1.15* 0.99-1.34 ^Model created using forward selection algorithm with age, sex, race, and smoking forced to enter model and all risk factors listed in Table 2 eligible as candidate variables HbA1c=Hemoglobin A1c; ACR=Albumin/Creatinine Ratio *P<0.10; **P<0.05; ***P<0.01
87
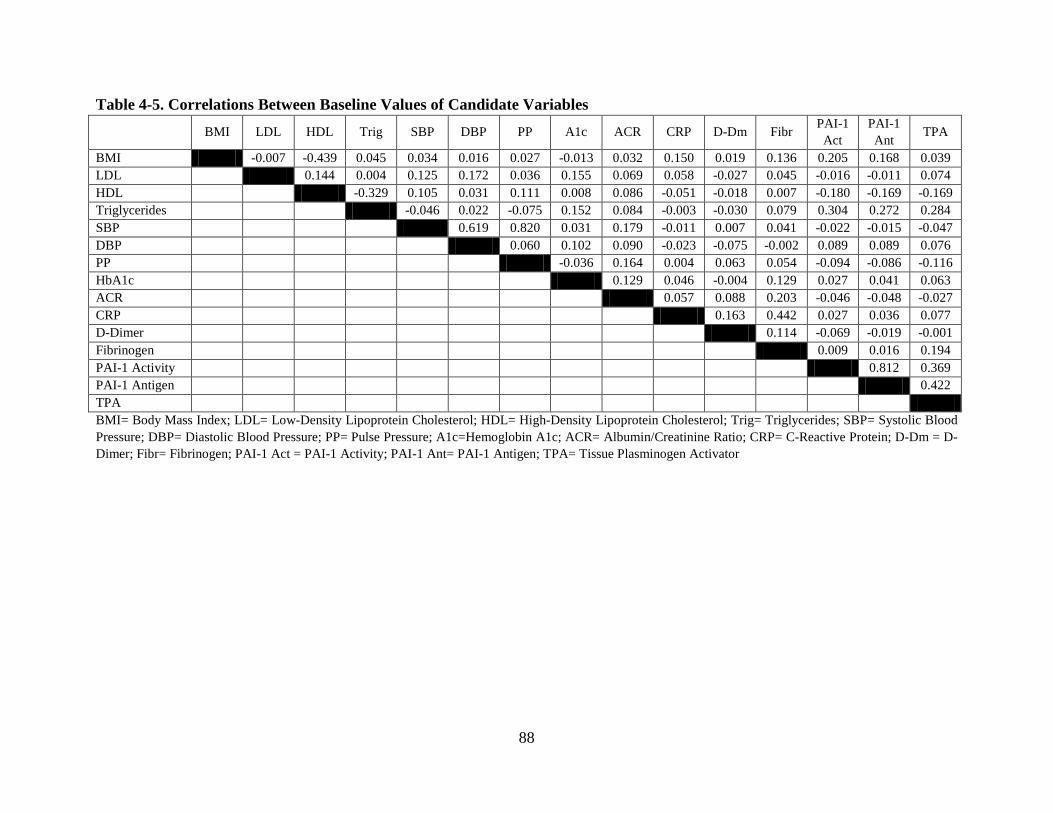
Table 4-5. Correlations Between Baseline Values of Candidate Variables BMI LDL HDL Trig SBP DBP PP A1c ACR CRP D-Dm Fibr PAI-1
Act PAI-1 Ant TPA
BMI -0.007 -0.439 0.045 0.034 0.016 0.027 -0.013 0.032 0.150 0.019 0.136 0.205 0.168 0.039 LDL 0.144 0.004 0.125 0.172 0.036 0.155 0.069 0.058 -0.027 0.045 -0.016 -0.011 0.074 HDL -0.329 0.105 0.031 0.111 0.008 0.086 -0.051 -0.018 0.007 -0.180 -0.169 -0.169 Triglycerides -0.046 0.022 -0.075 0.152 0.084 -0.003 -0.030 0.079 0.304 0.272 0.284 SBP 0.619 0.820 0.031 0.179 -0.011 0.007 0.041 -0.022 -0.015 -0.047 DBP 0.060 0.102 0.090 -0.023 -0.075 -0.002 0.089 0.089 0.076 PP -0.036 0.164 0.004 0.063 0.054 -0.094 -0.086 -0.116 HbA1c 0.129 0.046 -0.004 0.129 0.027 0.041 0.063 ACR 0.057 0.088 0.203 -0.046 -0.048 -0.027 CRP 0.163 0.442 0.027 0.036 0.077 D-Dimer 0.114 -0.069 -0.019 -0.001 Fibrinogen 0.009 0.016 0.194 PAI-1 Activity 0.812 0.369 PAI-1 Antigen 0.422 TPA BMI= Body Mass Index; LDL= Low-Density Lipoprotein Cholesterol; HDL= High-Density Lipoprotein Cholesterol; Trig= Triglycerides; SBP= Systolic Blood Pressure; DBP= Diastolic Blood Pressure; PP= Pulse Pressure; A1c=Hemoglobin A1c; ACR= Albumin/Creatinine Ratio; CRP= C-Reactive Protein; D-Dm = D-Dimer; Fibr= Fibrinogen; PAI-1 Act = PAI-1 Activity; PAI-1 Ant= PAI-1 Antigen; TPA= Tissue Plasminogen Activator
88
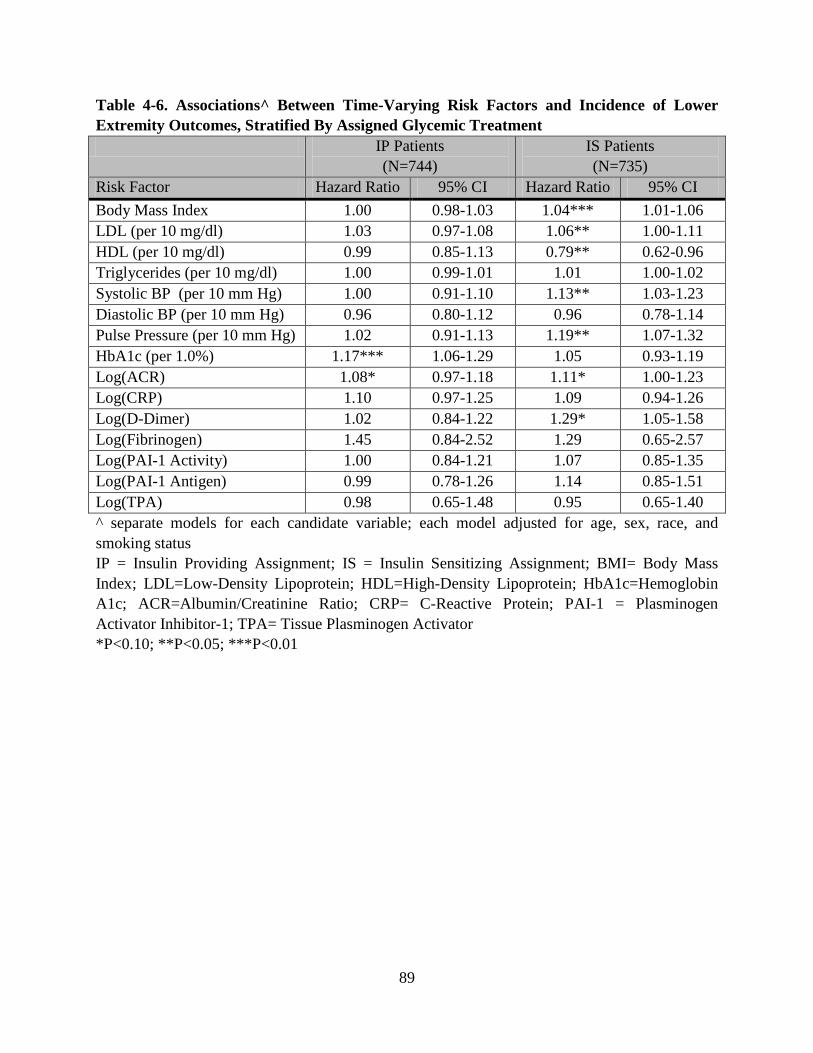
Table 4-6. Associations^ Between Time-Varying Risk Factors and Incidence of Lower Extremity Outcomes, Stratified By Assigned Glycemic Treatment IP Patients
(N=744) IS Patients (N=735)
Risk Factor Hazard Ratio 95% CI Hazard Ratio 95% CI Body Mass Index 1.00 0.98-1.03 1.04*** 1.01-1.06 LDL (per 10 mg/dl) 1.03 0.97-1.08 1.06** 1.00-1.11 HDL (per 10 mg/dl) 0.99 0.85-1.13 0.79** 0.62-0.96 Triglycerides (per 10 mg/dl) 1.00 0.99-1.01 1.01 1.00-1.02 Systolic BP (per 10 mm Hg) 1.00 0.91-1.10 1.13** 1.03-1.23 Diastolic BP (per 10 mm Hg) 0.96 0.80-1.12 0.96 0.78-1.14 Pulse Pressure (per 10 mm Hg) 1.02 0.91-1.13 1.19** 1.07-1.32 HbA1c (per 1.0%) 1.17*** 1.06-1.29 1.05 0.93-1.19 Log(ACR) 1.08* 0.97-1.18 1.11* 1.00-1.23 Log(CRP) 1.10 0.97-1.25 1.09 0.94-1.26 Log(D-Dimer) 1.02 0.84-1.22 1.29* 1.05-1.58 Log(Fibrinogen) 1.45 0.84-2.52 1.29 0.65-2.57 Log(PAI-1 Activity) 1.00 0.84-1.21 1.07 0.85-1.35 Log(PAI-1 Antigen) 0.99 0.78-1.26 1.14 0.85-1.51 Log(TPA) 0.98 0.65-1.48 0.95 0.65-1.40 ^ separate models for each candidate variable; each model adjusted for age, sex, race, and smoking status IP = Insulin Providing Assignment; IS = Insulin Sensitizing Assignment; BMI= Body Mass Index; LDL=Low-Density Lipoprotein; HDL=High-Density Lipoprotein; HbA1c=Hemoglobin A1c; ACR=Albumin/Creatinine Ratio; CRP= C-Reactive Protein; PAI-1 = Plasminogen Activator Inhibitor-1; TPA= Tissue Plasminogen Activator *P<0.10; **P<0.05; ***P<0.01
89
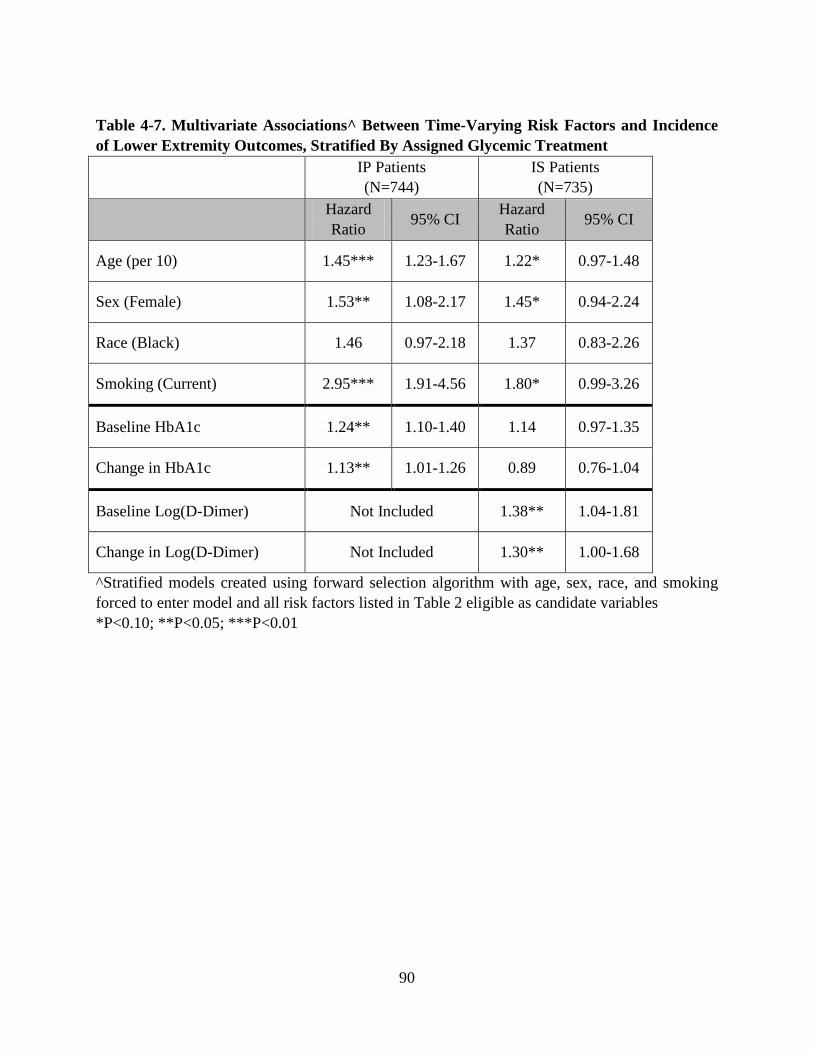
Table 4-7. Multivariate Associations^ Between Time-Varying Risk Factors and Incidence of Lower Extremity Outcomes, Stratified By Assigned Glycemic Treatment IP Patients
(N=744) IS Patients (N=735)
Hazard Ratio 95% CI Hazard
Ratio 95% CI
Age (per 10) 1.45*** 1.23-1.67 1.22* 0.97-1.48
Sex (Female) 1.53** 1.08-2.17 1.45* 0.94-2.24
Race (Black) 1.46 0.97-2.18 1.37 0.83-2.26
Smoking (Current) 2.95*** 1.91-4.56 1.80* 0.99-3.26
Baseline HbA1c 1.24** 1.10-1.40 1.14 0.97-1.35
Change in HbA1c 1.13** 1.01-1.26 0.89 0.76-1.04
Baseline Log(D-Dimer) Not Included 1.38** 1.04-1.81
Change in Log(D-Dimer) Not Included 1.30** 1.00-1.68
^Stratified models created using forward selection algorithm with age, sex, race, and smoking forced to enter model and all risk factors listed in Table 2 eligible as candidate variables *P<0.10; **P<0.05; ***P<0.01
90

5.0 MANUSCRIPT 3: MEASUREMENT VARIATION OF THE ANKLE-BRACHIAL
INDEX WITH AUTOMATED OSCILLOMETRIC DEVICE VERSUS DOPPLER
ULTRASOUND
91
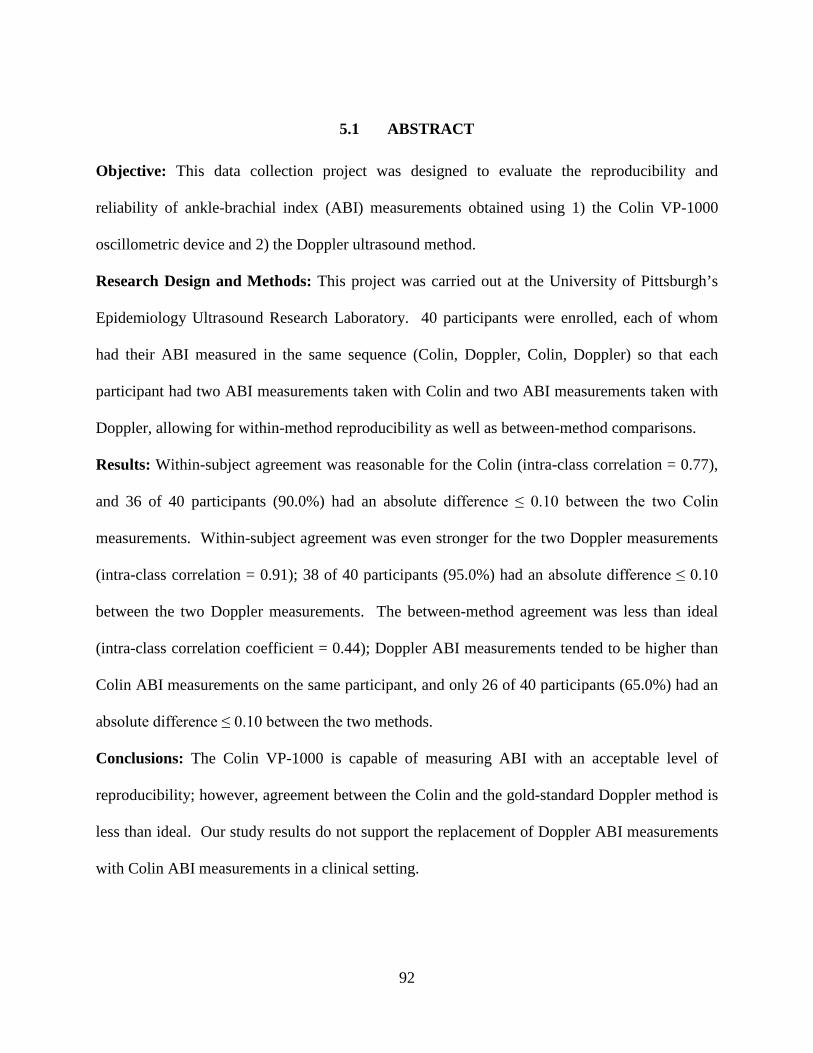
5.1 ABSTRACT
Objective: This data collection project was designed to evaluate the reproducibility and
reliability of ankle-brachial index (ABI) measurements obtained using 1) the Colin VP-1000
oscillometric device and 2) the Doppler ultrasound method.
Research Design and Methods: This project was carried out at the University of Pittsburgh’s
Epidemiology Ultrasound Research Laboratory. 40 participants were enrolled, each of whom
had their ABI measured in the same sequence (Colin, Doppler, Colin, Doppler) so that each
participant had two ABI measurements taken with Colin and two ABI measurements taken with
Doppler, allowing for within-method reproducibility as well as between-method comparisons.
Results: Within-subject agreement was reasonable for the Colin (intra-class correlation = 0.77),
and 36 of 40 participants (90.0%) had an absolute difference ≤ 0.10 between the two Colin
measurements. Within-subject agreement was even stronger for the two Doppler measurements
(intra-class correlation = 0.91); 38 of 40 participants (95.0%) had an absolute difference ≤ 0.10
between the two Doppler measurements. The between-method agreement was less than ideal
(intra-class correlation coefficient = 0.44); Doppler ABI measurements tended to be higher than
Colin ABI measurements on the same participant, and only 26 of 40 participants (65.0%) had an
absolute difference ≤ 0.10 between the two methods.
Conclusions: The Colin VP-1000 is capable of measuring ABI with an acceptable level of
reproducibility; however, agreement between the Colin and the gold-standard Doppler method is
less than ideal. Our study results do not support the replacement of Doppler ABI measurements
with Colin ABI measurements in a clinical setting.
92
5.2 INTRODUCTION
The ankle-brachial index (ABI) is the principal screening technique for peripheral arterial disease
(PAD)157 and an established predictor of cardiovascular morbidity and mortality.23,24,25,26 Also
known as the ankle-arm index (AAI) or ankle-brachial pressure index (ABPI), the ABI is a
simple ratio of the systolic blood pressure measured at the ankle divided by the brachial systolic
blood pressure. ABI measurements ranging from 0.91-1.30 are considered normal; an ABI≤0.9
is suggestive of atherosclerotic PAD, while an ABI>1.3 suggests the presence of medial arterial
calcification, making it difficult to obtain an accurate reading in the lower extremity (1).
Epidemiologic studies have shown that patients with abnormal ABI at either end of the spectrum
have an increased risk of cardiovascular events and mortality.24,25
The most common method of measuring ABI uses a continuous-wave Doppler probe for
detection of arterial flow and a pneumatic cuff to determine systolic blood pressure in each limb.
The pneumatic cuff is placed over the appropriate limb and inflated until arterial flow ceases
noted by the lack of audible sound heard on the Doppler; the cuff is then deflated slowly until the
flow signal reappears, and the cuff pressure at reappearance of a signal is the systolic pressure
for that limb. The systolic pressure at each ankle is divided by the higher of the two brachial
pressures to calculate the ABI for each leg. In 1969, Yao et al published the first study to report
measurement of ankle blood pressures using the Doppler method.109,110 Despite some
controversy regarding appropriate measurement protocol158 and calculation159,160 of the ankle-
brachial index using Doppler, a 2012 AHA Scientific Statement concludes that the Doppler
method is to be the most reliable way to determine ABI and provides guidelines for
standardization.157
93
The principal alternative to the Doppler method relies on oscillometric measurement of blood
pressure at each limb. The Colin VP-1000 oscillometric device allows simultaneous pressure
measurement at each of the brachial arteries as well as the posterior tibial arteries in each ankle.
Oscillometers measure the magnitude of pressure vacillation at each arterial site as the cuffs are
simultaneously deflated from suprasystolic pressures; as pressure in the cuff decreases and
approaches systolic blood pressure, oscillation rapidly increases and eventually reaches a peak,
after which decrease of the cuff pressure causes oscillation to decrease. Systolic blood pressure
is calculated when the oscillation increases rapidly; diastolic blood pressure is calculated when
the oscillation decreases rapidly. The ABI is calculated by dividing the systolic pressure at each
ankle by the higher of the two brachial systolic pressures to establish ABI for each leg.
Automated devices such as the Colin have several advantages over the Doppler method for
measuring ABI. The Doppler method requires a trained sonographer or physician and can still
be prone to measurement biases and errors; in contrast, measuring ABI with the Colin requires
little specialized training and is free of bias. The Doppler method is also time-consuming, while
the Colin reduces the time required to obtain an ABI by measuring all four limbs simultaneously.
The time required for measurement is one of the barriers to the inclusion of ABI in regular office
visits; the ability to measure ABI in less time and without highly trained personnel could make it
more practical to include as part of routine office visits. However, before the Colin can be
recommended for mainstream use, it must be proven accurate and reliable when compared
against the gold-standard Doppler method.
94
Most studies to date have shown reasonable agreement between oscillometric ABI measurements
and Doppler ABI measurements; the aforementioned 2012 AHA Scientific Statement (1) on the
ankle-brachial index concluded that correlation between the two methods is acceptable, although
the studies upon which this statement was based used varying criteria to define an acceptable
level of agreement. It should be noted that some discrepancies may be partially explained by
differences in measurement protocol; for example, most oscillometric devices (including the
Colin described in this manuscript) measure the ankle pressure at the posterior tibial (PT) artery,
while Doppler measurements are sometimes taken at the dorsalis pedis (DP) artery since it can
be easier to locate the DP pulse in the ankle than the PT pulse.
In addition to evaluating agreement between Colin measurements and Doppler measurements,
we must also establish within-method reproducibility for each technique. To date, Doppler
measurements have generally shown slightly better reproducibility than oscillometric ABI
measurements161,162 although oscillometric devices have demonstrated acceptable reproducibility
for use in research studies.163,164 In the present study, we report within-method reproducibility
for ABI measurements taken with the Colin VP-1000 oscillometric device at the Epidemiology
Ultrasound Research Laboratory (URL) at the University of Pittsburgh, as well as within-method
reproducibility for ABI measurements using the traditional Doppler method. We also report
between-method agreement for Colin ABI measurements against Doppler ABI measurements.
95
5.3 METHODS
The URL at the University of Pittsburgh conducts noninvasive vascular testing for
epidemiological research studies, and therefore must evaluate validity and reproducibility of its
research measurements for quality control. The present study has three aims: i) evaluate the
reproducibility of ABI measured with the Colin VP-1000 oscillometric device, ii) evaluate the
reproducibility of ABI measured with the Doppler method, and iii) evaluate agreement between
the two methods.
Participant Recruitment and Enrollment
The study was approved by the Institutional Review Board of the University of Pittsburgh.
Volunteers were recruited through advertisements posted in the URL and the Graduate School of
Public Health at the University of Pittsburgh, as well as verbal invitations issued by the Principal
Investigator and/or laboratory staff members. Fifty-four potential participants agreed to schedule
a study visit; forty (74.1%) attended the scheduled visit and completed all study procedures.
Study Visit Procedure
Participants were greeted at the URL by the principal investigator and gave informed consent.
Next, they completed a pretest questionnaire with information about basic demographics, known
comorbidities of peripheral arterial disease (diabetes, high blood pressure, and high cholesterol)
and three behaviors that might acutely affect ABI: smoking, caffeine consumption, and exercise.
Specifically, participants were asked whether they had smoked, consumed caffeine, or exercised
since midnight; since most visits occurred in the morning or early afternoon, this determines
whether they had performed the behavior within approximately 12 hours of their visit.
96
Participants were also asked to report the time and provide appropriate details (for example, a
participant that reported consumption of caffeine was asked to report the beverage consumed -
i.e. tea, coffee, soft drink, energy drink - as well as the number of cups consumed). Participants
were not asked to refrain from these behaviors, but the data were available to perform sensitivity
analyses. After completing the questionnaire, participants were escorted into an exam room,
asked to remove their socks and shoes, and instructed to rest in the supine position for 5 minutes.
After the rest period, the attending observer entered the room and began the examination.
Clinical Examination
The observer first obtained simultaneous blood pressure readings at the right and left brachial
and posterior tibial arteries using the VP-1000 according to the protocol outlined in Appendix A.
After the first VP-1000 measurement, the observer allowed 5 minutes for the vessels to return to
resting state, then began the sequence of pressure measurements required to calculate ABI using
the Doppler: first the right brachial pressure, then the left brachial pressure, then the right ankle
pressure, and finally the left ankle pressure according to the protocol outlined in Appendix B.
The observer again allowed a 5-minute rest period, and the process was repeated so each
participant had two ABI measurements taken with each method (four ABI measurements total)
in the following sequence: Colin #1, Doppler #1, Colin #2, and Doppler #2. Once all four ABI
measurements were finished, the observer handed the data collection forms to the principal
investigator to verify that form was completed appropriately. The principal investigator asked
the participant if they had any questions or concerns, awarded the participant compensation and
the visit was concluded.
97

Baseline Characteristics of Study Participants
We describe the study population using baseline characteristics from the pretest questionnaire,
reporting means ± standard deviations for continuous variables and proportions for categorical
variables. Much of this data is self-reported on the pretest questionnaire, so accuracy cannot be
guaranteed; however, these are not primary analytical variables in our study
Statistical Methods: Notation
Please refer to the following definitions while reviewing the statistical methods:
Colin1i= first Colin ABI measurement on the ith participant
Colin2i= second Colin ABI measurement on the ith participant
|Colin2i - Colin1i| = absolute value of the difference between the ith participant’s second Colin
ABI and the ith participant’s first Colin ABI
ColinAVGi = average of the two Colin measurements on the ith participant
ColinAVG¯¯¯¯¯¯¯ = overall mean of all participants’ Colin ABI measurements
Doppler1i= first Doppler ABI measurement on the ith participant
Doppler2i= second Doppler ABI measurement on the ith participant
|Doppler2i - Doppler1i| = absolute value of the difference between the ith participant’s second
Doppler ABI and the ith participant’s first Doppler ABI
DopplerAVGi = average of the two Doppler measurements on the ith participant
DopplerAVG¯¯¯¯¯¯¯¯ = overall mean of all participants’ Doppler ABI measurements
98

Statistical Analysis: Within-Method Comparisons
We report the linear correlation coefficient and intra-class correlation coefficient between paired
measurements for each method (i.e. Colin1i vs. Colin2i), and we also report the mean difference
between measurements for each method (i.e. Colin2i - Colin1i) with a 95% confidence interval for
the difference. We produced scatterplots and Bland-Altman plots for a graphical representation.
The Bland-Altman plots show the difference between measurements (i.e. Colin2i - Colin1i) on the
y-axis versus the average of the two measurements (ColinAVGi) on the x-axis, with reference lines
drawn at the limits of agreement (mean difference ± 1.96*SD). We also report the mean
absolute difference (|Colin2i - Colin1i|) and the proportion of participants with absolute difference
< 0.10 between measurements. Each of the analyses described here were performed for both the
Colin measurements and the Doppler measurements.
Statistical Analysis: Between-Method Comparisons
We performed similar statistical analyses to evaluate between-method agreement of the Colin
ABI measurements against the Doppler method. We calculated the linear correlation coefficient
and intra-class correlation coefficient between the averaged measurements of each method
(ColinAVGi vs. DopplerAVGi), and again produced a scatterplot and Bland-Altman plot for
graphical representation. For the between-method comparison, the Bland-Altman plot shows the
difference between the averaged Colin measurements and averaged Doppler measurements
(ColinAVGi - DopplerAVGi) on the y-axis versus the overall average of the paired measurements on
the x-axis. We also report the mean absolute difference (|ColinAVGi - DopplerAVGi|) between
methods and the proportion of subjects with absolute difference < 0.10 between methods.
99
Power and Sample Size
We performed sample size calculations based on an equivalence test for paired means165 with
significance level α = 0.05 and the following hypotheses:
Ho: ColinAVG¯¯¯¯¯¯¯ - DopplerAVG¯¯¯¯¯¯¯¯ ≤ - 0.10 OR ColinAVG¯¯¯¯¯¯¯ - DopplerAVG¯¯¯¯¯¯¯¯ ≥ 0.10
Ha: -0.10 < ColinAVG¯¯¯¯¯¯¯ - DopplerAVG¯¯¯¯¯¯¯¯ < 0.10
We chose 0.10 as the limit of equivalence since ABI is often categorized into intervals of that
width in epidemiologic studies. We assumed standard deviation of 0.15 for both Colin ABI and
Doppler ABI measurements based on previously published studies and expert opinion.164,166
This sample size calculation also requires estimating the between-method correlation; for the
equivalence test specified here, there is a negative association between the between-method
correlation and the required sample size to guarantee a fixed level of power, meaning that
smaller between-method correlation requires a larger sample size to declare equivalence. Thus,
underestimating the between-method correlation is the conservative approach since it yields a
larger sample-size estimate than overestimating the between-method correlation. A systematic
review comparing oscillometric methods and Doppler reported a pooled correlation of 0.71
between methods;120 however, this review included many studies that used oscillometric devices
other than the Colin, so we cannot be certain that the Colin will have the same level of
correlation with Doppler. Therefore, we performed sample size calculations using lower
estimates of the correlation (0.2, 0.4, 0.6), noting that if the actual correlation was greater than
our chosen estimates, we would retain sufficient power to declare equivalence between methods.
100

Under the conditions outlined above, a sample size of 33 pairs with correlation 0.4 (Table 5-1)
has 90% power to detect equivalence when the margin of equivalence is from -0.10 to 0.10 and
the actual mean difference is 0. We set an enrollment target of 40 participants to account for
unusable data. The additional sample size also allowed us to perform useful sensitivity analyses.
101
5.4 RESULTS
Characteristics of Study Participants
Table 5-2 displays baseline characteristics of our study participants. Participants were generally
young (mean age 35.4 ± 11.9 years, range 22-63 years) and the majority self-reported white race
(82.5%), although the sample also included black (7.5%) and Asian (10.0%) participants. The
sample included both males (30.0%) and females (70.0%). Most participants were normal
weight (65.0%) or overweight (22.5%), with five (12.5%) meeting criteria for “obese” according
to BMI (calculated from self-report height and weight). Few participants reported common PAD
comorbidities such as diabetes (5.0%), high blood pressure (10.0%), or high cholesterol (12.5%).
No participants reported smoking within a 12-hour window preceding the visit, 25 participants
(62.5%) reported consuming caffeine prior to their study visit, and 16 participants (40.0%)
reported exercising prior to their study visit.
Distribution of Individual Pressure Measurements
The mean and standard deviation of each pressure component involved in the calculation of ABI
(left brachial, right brachial, left ankle, right ankle) are shown in Table 5-3 for each of the four
ABI measurements performed in this study (Colin #1, Doppler #1, Colin #2, Doppler #2).
Notably, while the brachial pressures were distributed similarly across all four measurements, the
ankle pressures recorded with the gold-standard Doppler method were an average of 7.7 mm Hg
higher than those recorded with the Colin. This difference was present in the first and second
measurement run. Discussed in detail later in this manuscript, the difference in ankle pressures
should manifest itself as slightly higher ABI measurements with the Doppler than with the Colin.
102
Colin Reproducibility
The first Colin measurement and second Colin measurement each have approximately normal
distributions with no significant difference in the mean ABI from the first run to the second run
(first: 1.05 ± 0.11, second: 1.08 ± 0.09, Table 5-4). Within-subject agreement was reasonably
good across the two Colin measurements, with an intra-class correlation coefficient = 0.77 and a
linear correlation coefficient = 0.81 (Figure 5-1). The within-subject differences between the
first and second Colin measurements followed an approximately normal distribution with mean
0.03 (95% CI: -0.03, 0.09). The mean absolute difference was 0.06 (SD=0.04), and 36 of 40
participants (90.0%) had an absolute difference ≤ 0.10 between the two Colin measurements.
Only one of the 40 participants had a difference outside Bland-Altman limits of agreement
(Figure 5-2) calculated based on the distribution of Colin measurements in our study.
Doppler Reproducibility
As reported for the Colin, the distributions of each of the Doppler ABI measurements were
approximately normal with no significant difference in the mean ABI from the first to the second
(first: 1.14 ± 0.13, second: 1.15 ± 0.12, Table 5-4). Within-subject agreement was strong for the
Doppler, with intra-class correlation = 0.91 and linear correlation = 0.92 (Figure 5-3). The
within-subject differences between the first and second Doppler measurements followed an
approximately normal distribution with mean 0.01 (95% CI: -0.05, 0.07). The mean absolute
difference was 0.04 (SD=0.04), and 38 of 40 participants (95.0%) had absolute difference ≤ 0.10
between the two Doppler measurements. Two of 40 participants fell outside Bland-Altman
limits of agreement (Figure 5-4) based on the study distribution of Doppler measurements.
103
Colin vs. Doppler Agreement
The between-method comparison resulted in an intra-class correlation coefficient = 0.44 and
linear correlation coefficient = 0.64 (Figure 5-5). The differences between Colin ABI and
Doppler ABI measurements followed a roughly normal distribution, although there was one
significant outlier (difference of 0.38). Doppler ABI tended to be higher than Colin ABI;
according to the equivalence test described in the power and sample size section, we do not have
sufficient evidence to conclude that the methods are equivalent (mean difference = 0.08, 95% CI:
0.05-0.11, p=0.105). The mean absolute difference between methods was 0.09 (SD=0.09), and
26 of 40 participants (65.0%) had an absolute difference ≤ 0.10 between the respective means for
the two methods. Only one of the 40 participants fell outside the Bland-Altman limits of
agreement (Figure 5-6) calculated based on the distribution of our study data; however, it must
be noted that the limits of agreement are wider for between-method comparison than within-
method comparisons.
We can also evaluate agreement using categories of low, normal, and high ABI defined by AHA
guidelines described in the introduction (Table 5-6). 32 of 40 participants are classified
“normal” by each method, and one participant is deemed “high” by both methods, yielding
categorical agreement for 33 of 40 subjects. However, the kappa statistic is only 0.17, indicative
of poor agreement between the methods. Most of the discordance stemmed from 6 participants
classified as “high” by Doppler and “normal” by Colin, while only one was classified “low” by
Colin and “normal” by Doppler. The lack of any participants with low ABI by both methods
makes it impractical to calculate a kappa statistic for detection of low ABI vs. non-low ABI.
104
Sensitivity Analyses
We also performed analyses stratified by caffeine intake and exercise prior to study visit to see if
results were consistent (Table 5-7). The correlation between Colin measurements was slightly
higher for those who abstained from caffeine compared to those who consumed (r=0.90 for
abstainers vs. r=0.73 for consumers, p=0.13), while the opposite was true for Doppler
measurements (r=0.86 for abstainers vs. r=0.95 for consumers, p=0.13), although neither of these
differences were statistically significant. In the analyses stratified by exercise (Table 5-8), the
correlation coefficient between Colin measurements was lower for those who abstained
compared to those who exercised (r=0.64 vs. r=0.91, p=0.03), while there was little difference
between correlations for Doppler measurements (r=0.90 vs. r=0.95, p=0.30). Mean absolute
differences were distributed similarly for each comparison, suggesting that caffeine intake and
exercise did not significantly alter reproducibility of ABI measurements in this study; it should
be noted that these are based on small groups, so power to detect such differences is limited.
105
5.5 DISCUSSION
We evaluated the reproducibility of ABI measurements taken using both the Colin VP-1000
oscillometric device and the Doppler method at the University of Pittsburgh’s Epidemiology
URL. The Doppler ABI measurements had excellent reproducibility, with an intra-class
correlation > 0.9 and 95% of participants with an absolute difference less than 0.10 between the
two Doppler measurements. Reproducibility of Colin ABI was not quite as strong, but still
showed reasonable agreement with a intra-class correlation > 0.8 and 90% of participants having
an absolute difference less than 0.10 between repeated Colin measurements.
There was significant evidence of nonequivalence between methods; ABI measurements taken
with Doppler were generally higher than Colin measurements on the same participant (mean
difference=0.08), and 14 of 40 (35%) participants had mean Doppler ABI at least 0.10 greater
than their mean Colin ABI, large enough to be clinically significant. Since brachial pressures
were distributed similarly between methods, it appears that the differences in ABI were primarily
driven by the differences in ankle pressures.
One possible explanation is the sequence in which the measurements were taken. Recall that the
first ABI measurement was taken using the Colin, followed by the first sequence of Doppler
measurements, then the Colin again, and finally the Doppler again. If systemic pressure rose
with each measurement, one would expect higher ankle pressures with the Doppler. However,
this seems unlikely because ankle pressures from the second Colin measurement were
significantly lower than both the Doppler measurement that came before it and after it.
106
A second possible explanation is that the time required to take four separate Doppler pressures
may lead to an inaccurate evaluation of inter-site blood pressure ratios; changes in systemic
pressure may occur during the time required to take four separate measurements needed to
calculate ABI.167 In this study, recall that Doppler measurements were taken in the following
sequence: left brachial, right brachial, left ankle, right ankle. This process can take several
minutes, during which the patient may experience changes in systemic pressure. It is also
possible that Doppler ABI is prone to observer error if there are consistent differences in the time
taken to hear the flow signal and record the pressure for the arm compared to the ankle.
A third possible explanation is the difference between the Colin and Doppler measurement sites
used to obtain the ankle pressures. The pressure cuff is placed slightly more distally for ankle
pressure measurement with a Doppler probe than it is for measurement with the Colin; therefore,
it is possible that ankle pressures tend to be higher using the Doppler because of greater distal
amplification of systolic BP generated by pressure-wave reflections within the arterial tree.168
Furthermore, recall that the ankle pressure can be taken at either the dorsalis pedis (DP) or the
posterior tibial (PT) arteries; since the PT pulse is missing or impossible to locate in
approximately 10-20% of the population, the DP is commonly used for Doppler ankle pressure
measurements, and was the measurement site used in this study. However, the Colin always
measures ankle pressure using the PT pulse. There is no published evidence that the DP ankle
pressure differs systematically from the PT ankle pressure, but it is possible that the difference in
measurement site could explain some of the systematic difference, noting that our results showed
Doppler ankle pressures that tended to be higher than Colin ankle pressures.
107
While the Colin ABI tended to be lower than the Doppler in our study, the Colin retains possible
utility as a PAD screening tool if it classifies participants in the same category of low (ABI≤0.9),
normal (0.9<ABI≤1.3), and high (ABI>1.3) as the Doppler method. 33 participants had an ABI
in the “normal” range according to the Doppler, and 32 of these were also identified as “normal”
by their Colin ABI; however, since there were no participants with low ABI according to the
Doppler, we cannot appropriately evaluate the sensitivity of the Colin as a PAD screening tool.
Our study would require a larger sample with more participants outside the “normal” range,
especially in the “low” range since that is indicative of peripheral arterial disease.
Comparison to Previous Studies
Within the last three years, several studies have evaluated validity of various oscillometric
devices against the Doppler method. A 2012 meta-analysis (18) pooled the results of eighteen
studies (N=3290) comparing oscillometric ABI measurements to the Doppler method and found
an average difference of 0.020 ± 0.018, indicating that oscillometric ABI tended to be higher
than Doppler, although this difference was not statistically significant (p=0.28). This conflicts
with our findings that the Doppler measurements were higher than the Colin oscillometric
measurements. The meta-analysis also reports a pooled linear correlation coefficient of 0.71
between Doppler ABI and oscillometric ABI, slightly greater than the linear correlation of 0.64
observed in our study. It should be noted that there was substantial heterogeneity between
studies included in the meta-analysis; possible explanations include the use of different
oscillometric devices, variation between study protocols, and differences in study populations.
108
Among the eighteen studies included in the meta-analysis mentioned above, eleven different
oscillometric devices were used, and only two studies included in the pooled results used the
Colin device (two other studies have compared ankle blood pressures measured with the Colin to
those measured with Doppler, but are not included in the meta-analysis due to lack of ABI data).
The four studies comparing Colin and Doppler measurements are briefly summarized below.
Cortez-Cooper (2003)121 compared ankle blood pressure measurements taken with the Colin to
those taken with Doppler in 52 participants. This study showed strong linear correlation between
ankle pressure measurements (r=0.95) taken with Colin versus Doppler, higher than the
correlation between Colin and Doppler ankle pressures observed in the present study (r=0.8).
Ankle pressures measured with the Doppler were slightly higher than the Colin ankle pressures,
although the mean difference between methods (2.2 mm Hg) was smaller than that observed in
our study (8.0 mm Hg). Direct comparison with our results is difficult because it is not clear
whether the patient or the limb was the unit of analysis, nor is it clear exactly how the methods
are compared (i.e. average of the two limbs; lower of the two limbs). Also, since this study
reported only ankle pressures, we cannot evaluate how its results compare to our ABI results.
Nukumizu (2007)122 compared Doppler ankle pressures to Colin ankle pressures in 168
participants from a vascular clinic, all of whom had angiographically confirmed peripheral
arterial disease (n=146) or abdominal aortic aneurysm (n=22). The Colin ankle pressures were
slightly higher than Doppler ankle pressures, on average; the authors reported the ratios of Colin
pressure divided by Doppler pressure for each participant, and noted that 135 of 168 (80%)
participants had a Colin ankle pressure within 10 percent of their Doppler ankle pressure.
109
Notably, the agreement was significantly worse for PAD patients than non-PAD patients,
suggesting that the Colin may be less reliable in patients with PAD. One limitation which might
influence these results: the study methods do not mention any rest period between Doppler
measurement and Colin measurement. In the absence of a rest period between measurements,
these results may be influenced by artificially elevated readings for Colin ankle pressure.
Pan (2007)123 performed a population-based study analyzing data from 946 participants in
several rural villages south of Shanghai. The Doppler ABI measurements were slightly higher
than the Colin ABI measurements, a similar trend to that observed in our study, although the
between-measurement differences were smaller than those observed in our study (mean
difference=0.03 for Pan et al vs. 0.08 in our study). Pan et al also noted that the gap between
Doppler ABI and Colin ABI increased at higher values of the ABI (greater than 1.2). One
limitation worth noting is that this study only performed a Doppler measurement at the right side,
so they discarded Colin measurements obtained at the left side.
In the most recent published study comparing Colin ABI vs. Doppler ABI, Richart (2009)124
measured ABI in 105 participants from a rural area near Flanders, Belgium. In this study,
Doppler ABI tended to be slightly greater than Colin ABI, concordant with our study results;
however, Richart et al also found that the Colin had better reproducibility than the Doppler,
whereas we found slightly better reproducibility using the Doppler method. This study also
performed a Doppler measurement only at the right arm and ankle, discarding the Colin data
obtained from the left side.
110
The results from the four prior studies comparing Colin and Doppler ankle pressures and/or ABI
combined with the present study can be synthesized into the following statements:
1) The Colin has displayed reasonable agreement with Doppler in participants with normal ABI.
2) The Colin may be less accurate for patients with extreme values of ABI (both low and high);
in particular, it may provide falsely normal values for patients with very low values of ABI.
3) No consistent pattern has emerged to establish a directional relationship between Colin and
Doppler measurements; there is somewhat weak evidence that the Doppler tends to report
slightly higher ankle pressures and/or ABI than the Colin, but this could be accounted for by
differences in study populations and protocol.
4) No consistent pattern has shown that either method has definitively better reproducibility.
Richart et al reported that the Colin had slightly better reproducibility than Doppler ABI,
while our results showed better reproducibility with the Doppler.
5) There is no significant evidence that smoking, exercise, or caffeine intake affects the
reproducibility of ABI measurements taken in the same visit. However, these behaviors may
affect the measurement between visits.
Other Oscillometric Devices
Most studies using other oscillometric devices have found that oscillometric ABI was slightly
greater than Doppler ABI or that there was no difference between methods (18). Other than the
differences in devices, results may vary due to differences in measurement protocol and study
populations (patients referred to vascular laboratories, inclusion of participants with PAD). For
example, Beckman (2006)169 found that ABI measured by the Cas 740 oscillometric device
111
tended to be higher than Doppler, while our study showed the opposite. However, all participants
in this study were referred to the laboratory for evaluation of PAD; since we have noted that the
Colin is less reliable than the Doppler for participants with extreme values of ABI, it is possible
that this pattern of higher ABI with the Cas 740 oscillometric device is driven by the inclusion of
participants with PAD, similar to that described by Nukumizu et al.
Strengths and Limitations
Our findings must be considered in appropriate context of our study’s strengths and limitations.
The principal investigator trained both of the observers that performed ABI measurements during
the study. All four of the ABI measurements on any single participant were performed by the
same observer, and all were performed in a single office visit, eliminating potential concerns due
to interobserver variability and day-to-day variation in blood pressure.
This study also has a few important limitations. Although taking all four measurements in a
single visit eliminates the potential for day-to-day variation in pressures, the Colin and Doppler
measurements were always taken in the same sequence, allowing the possibility that performing
one measurement first influences the readings in subsequent measurements. A rest period was
implemented between each measurement, but the sequence still may have an effect. This study
includes only 40 participants, limiting our ability to perform subgroup analyses and sensitivity
analyses, and our participants comprised a convenience sample of primarily healthy volunteers.
With so few participants demonstrating abnormal ABI values, the generalizability of these
findings is likely limited to participants with normal ABI.
112
It should be noted that we reported our primary results using the patient as the unit of analysis
rather than the limb; we followed this convention because most epidemiological studies consider
the lower of each participant’s left/right ABI as a marker of cardiovascular risk. However, we
performed limb-specific analyses (data not shown) that were consistent with the patient-level
results, showing similar reproducibility within methods and agreement between methods.
Public Health Implications
The ABI is used primarily as a screening tool for PAD in high-risk patients. However, as one of
the least expensive and least invasive markers of systemic atherosclerosis, the ABI could be very
useful for CVD risk assessment in primary care. Both low ABI and high ABI are known to be
predictive of cardiovascular events, and a 2008 meta-analysis showed that ABI provided
additional predictive value when combined with the Framingham Risk Score.170 Changes in ABI
over time also provide predictive value; patients with significant decreases in ABI over time are
proven to have increased risk for cardiovascular morbidity and mortality.171 These results
suggest that judicious use of the ABI in primary care settings has potential to improve public
cardiovascular health.172
Despite this potential, the ABI remains underutilized in primary care.28 According to practicing
physicians, one of the greatest barriers to office-based ABI measurement is the time required for
testing.173 The Colin VP-1000 has potential to mitigate concerns about time by allowing
simultaneous pressure measurements of all four limbs; in addition, obtaining an ABI with the
Colin also requires little specialized training and could be performed by an office assistant.
113
5.6 CONCLUSION
In this report, we present evidence that the Colin VP-1000 oscillometric device is capable of
measuring ABI with a moderate level of reproducibility; however, agreement between the Colin
ABI and the gold-standard Doppler method is less than ideal. Colin ABI measurements were
consistently higher than Doppler ABI measurements performed on the same patient, and there is
not significant evidence of equivalence between methods. While measuring ABI with the Colin
could prove more cost-effective and practical than the Doppler method because it is faster to
perform and requires less training, our study results do not support the replacement of Doppler
ABI measurements with Colin ABI measurements in a clinical setting.
114
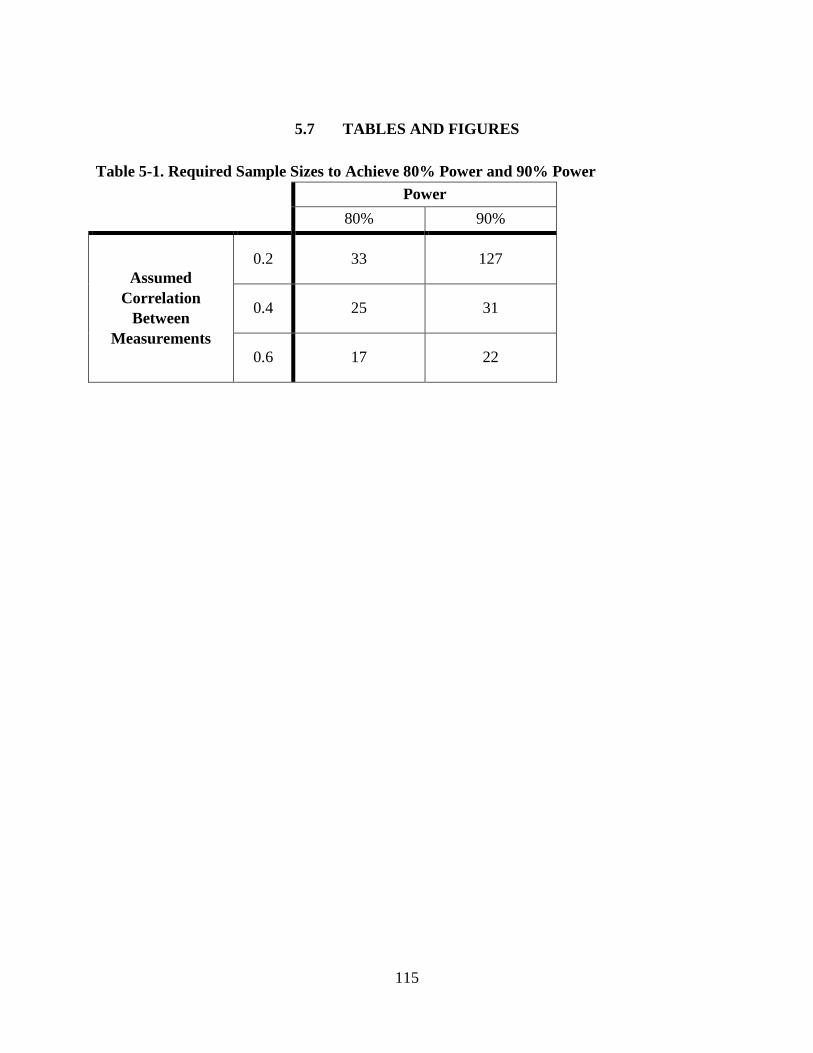
5.7 TABLES AND FIGURES
Table 5-1. Required Sample Sizes to Achieve 80% Power and 90% Power
Power
80% 90%
Assumed Correlation
Between Measurements
0.2 33 127
0.4 25 31
0.6 17 22
115
Table 5-2. Baseline Characteristics of Study Participants Characteristic N=40 Age, years 35.4 ± 11.9 Gender (Female) 70.0% Race White 82.5% Black 7.5% Asian 10.0% Height, inches 66.8 ± 3.6 Weight, pounds 161.2 ± 47.2 BMI, kg/m2 25.3 ± 6.6 BMI “Normal” (18.0-24.9) 65.0% BMI “Overweight” (25.0-29.9) 22.5% BMI “Obese” (>30.0) 12.5% Self-Reported Diabetes 5.0% Self-Reported Hypertension 10.0% Self-Reported Hypercholesterolemia 12.5% Smoke within 12 hours of visit 0.0% Caffeine within 12 hours of visit 62.5% Exercise within 12 hours of visit 40.0% *Variables are presented as mean ± SD unless denoted as a percentage
116
Table 5-3. Descriptive Statistics of Blood Pressure Measurements Left Right Colin #1 Brachial 114.8 ± 12.9 115.9 ± 13.0
Ankle 127.2 ± 16.5 126.1 ± 17.2 Doppler #1 Brachial 115.6 ± 13.8 114.8 ± 13.9
Ankle 135.5 ± 19.2 135.0 ± 18.8 Colin #2 Brachial 114.9 ± 12.2 116.7 ± 12.7
Ankle 129.7 ± 18.1 128.9 ± 18.1 Doppler #2 Brachial 115.8 ± 14.2 114.7 ± 13.3
Ankle 136.4 ± 18.9 136.2 ± 18.5 All statistics reported as Mean ± SD
117

Table 5-4. Descriptive Statistics of ABI Measurements Mean ± SD Median (IQR) Colin #1 1.05 ± 0.11 1.06 (0.98-1.13) Doppler #1 1.14 ± 0.13 1.12 (1.04-1.21) Colin #2 1.08 ± 0.09 1.07 (1.03-1.13) Doppler #2 1.15 ± 0.12 1.12 (1.07-1.21)
118

Table 5-5. Intra-Class Correlations, Linear Correlations, and Mean Absolute Differences for Primary Comparisons Reported in Text Intra-Class Correlation Colin ABI #1 vs Colin ABI #2 0.77 Doppler ABI #1 vs Doppler ABI #2 0.91 Mean Colin ABI vs Mean Doppler ABI 0.44 Linear Correlation Colin ABI #1 vs Colin ABI #2 0.81 Doppler ABI #1 vs Doppler ABI #2 0.92 Mean Colin ABI vs Mean Doppler ABI 0.64 Mean Absolute Difference Colin ABI #1 vs Colin ABI #2 0.06 ± 0.04 Doppler ABI #1 vs Doppler ABI #2 0.04 ± 0.04 Mean Colin ABI vs Mean Doppler ABI 0.09 ± 0.09
119

Table 5-6. Between-Method Agreement by ABI Category Colin ABI ≤ 0.9 0.9 < Colin ABI ≤ 1.3 Colin ABI > 1.3 Doppler ABI ≤ 0.9 0 0 0 0.9 < Doppler ABI ≤ 1.3 1 32 0 Doppler ABI > 1.3 0 6 1
120
Table 5-7. Stratified By Caffeine Intake No Caffeine
(n=15) Caffeine (n=25)
Intra-Class Correlation Colin ABI #1 vs Colin ABI #2 0.83 0.71 Doppler ABI #1 vs Doppler ABI #2 0.86 0.94 Mean Colin ABI vs Mean Doppler ABI 0.71 0.55 Linear Correlation Colin ABI #1 vs Colin ABI #2 0.90 0.73 Doppler ABI #1 vs Doppler ABI #2 0.86 0.95 Mean Colin ABI vs Mean Doppler ABI 0.74 0.57 Mean Absolute Difference Colin ABI #1 vs Colin ABI #2 0.06 ± 0.04 0.06 ± 0.04 Doppler ABI #1 vs Doppler ABI #2 0.06 ± 0.04 0.03 ± 0.03 Mean Colin ABI vs Mean Doppler ABI 0.09 ± 0.07 0.09 ± 0.09
121
Table 5-8. Stratified by Exercise Prior to Study Visit No Exercise
(n=24) Exercise (n=16)
Intra-Class Correlation Colin ABI #1 vs Colin ABI #2 0.61 0.86 Doppler ABI #1 vs Doppler ABI #2 0.90 0.95 Mean Colin ABI vs Mean Doppler ABI 0.45 0.75 Linear Correlation Colin ABI #1 vs Colin ABI #2 0.64 0.91 Doppler ABI #1 vs Doppler ABI #2 0.90 0.95 Mean Colin ABI vs Mean Doppler ABI 0.47 0.78 Mean Absolute Difference Colin ABI #1 vs Colin ABI #2 0.05 ± 0.04 0.06 ± 0.04 Doppler ABI #1 vs Doppler ABI #2 0.04 ± 0.04 0.04 ± 0.03 Mean Colin ABI vs Mean Doppler ABI 0.09 ± 0.09 0.09 ± 0.07
122
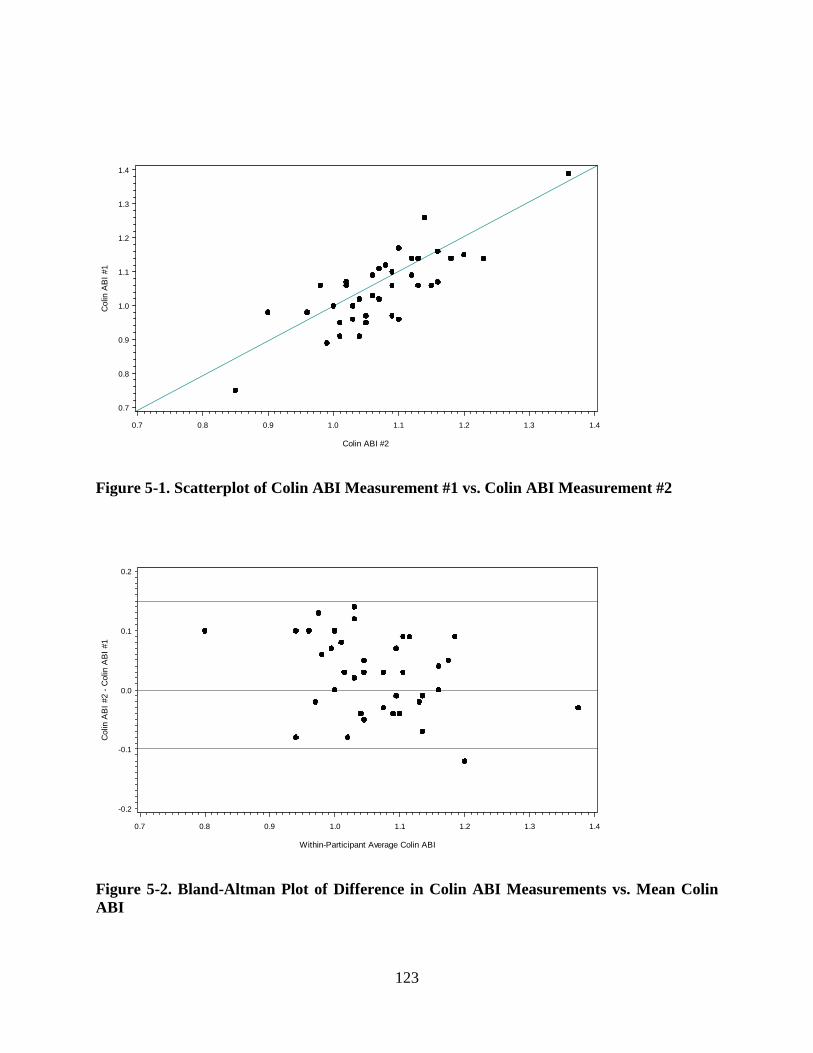
Col
in A
BI #
1
0.7
0.8
0.9
1.0
1.1
1.2
1.3
1.4
Colin ABI #2
0.7 0.8 0.9 1.0 1.1 1.2 1.3 1.4
Figure 5-1. Scatterplot of Colin ABI Measurement #1 vs. Colin ABI Measurement #2
Col
in A
BI #
2 - C
olin
AB
I #1
-0.2
-0.1
0.0
0.1
0.2
Within-Participant Average Colin ABI
0.7 0.8 0.9 1.0 1.1 1.2 1.3 1.4
Figure 5-2. Bland-Altman Plot of Difference in Colin ABI Measurements vs. Mean Colin ABI
123
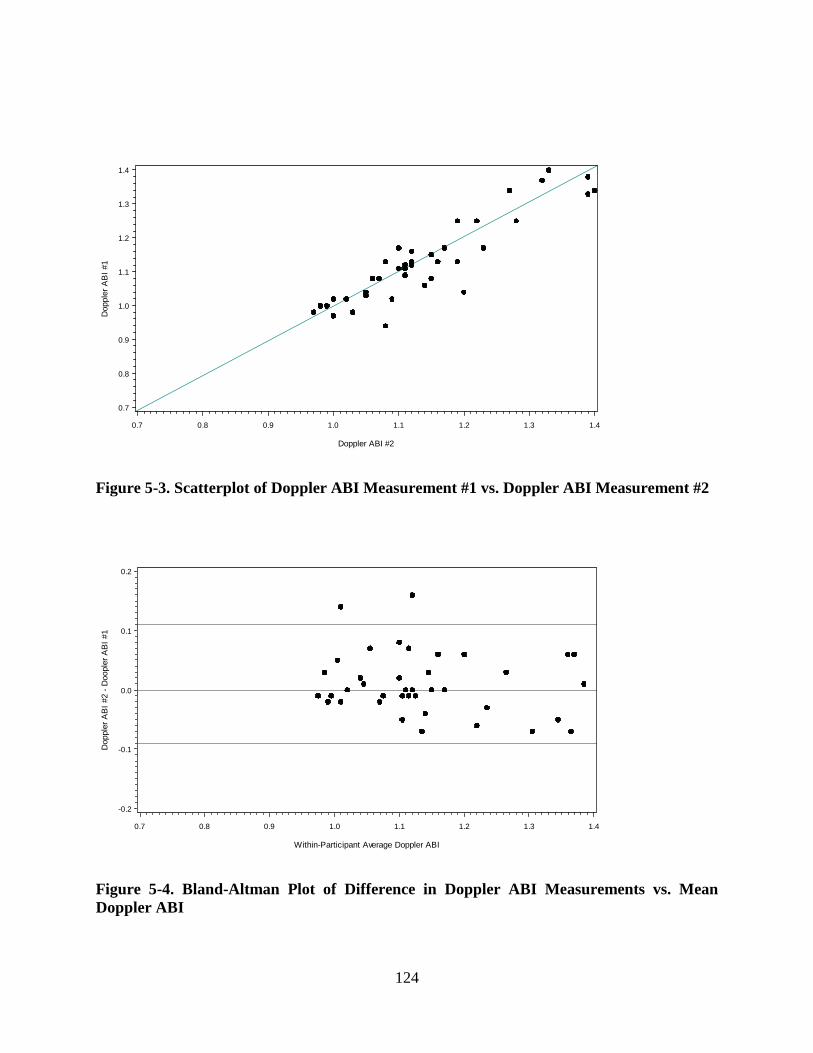
Dop
pler
AB
I #1
0.7
0.8
0.9
1.0
1.1
1.2
1.3
1.4
Doppler ABI #2
0.7 0.8 0.9 1.0 1.1 1.2 1.3 1.4
Figure 5-3. Scatterplot of Doppler ABI Measurement #1 vs. Doppler ABI Measurement #2
Dop
pler
AB
I #2
- Doo
pler
AB
I #1
-0.2
-0.1
0.0
0.1
0.2
Within-Participant Average Doppler ABI
0.7 0.8 0.9 1.0 1.1 1.2 1.3 1.4
Figure 5-4. Bland-Altman Plot of Difference in Doppler ABI Measurements vs. Mean Doppler ABI
124
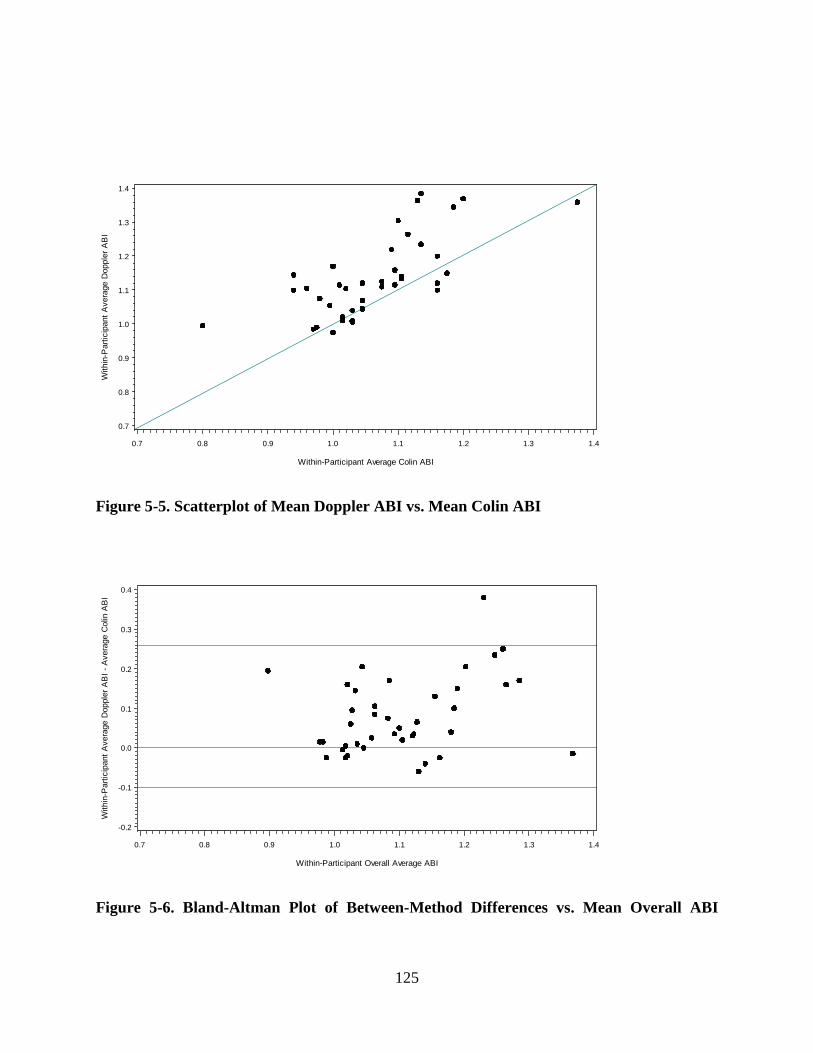
W
ithin
-Par
ticip
ant A
vera
ge D
oppl
er A
BI
0.7
0.8
0.9
1.0
1.1
1.2
1.3
1.4
Within-Participant Average Colin ABI
0.7 0.8 0.9 1.0 1.1 1.2 1.3 1.4
Figure 5-5. Scatterplot of Mean Doppler ABI vs. Mean Colin ABI
With
in-P
artic
ipan
t Ave
rage
Dop
pler
AB
I - A
vera
ge C
olin
AB
I
-0.2
-0.1
0.0
0.1
0.2
0.3
0.4
Within-Participant Overall Average ABI
0.7 0.8 0.9 1.0 1.1 1.2 1.3 1.4
Figure 5-6. Bland-Altman Plot of Between-Method Differences vs. Mean Overall ABI
125
6.0 SUMMARY OF FINDINGS
The first manuscript reports the incidence of peripheral arterial disease (PAD) in the Bypass
Angioplasty Revascularization Investigation 2 Diabetes (BARI 2D) trial. Approximately 20% of
the 1,479 BARI 2D patients free from PAD at baseline were diagnosed with new PAD (defined
as an ankle-brachial index ≤ 0.9 with a decrease of at least 0.1 from the baseline measurement)
or another lower extremity event indicative of advancing PAD (lower extremity
revascularization and/or lower extremity amputation) over an average 4.6 years of follow-up.
The incidence of PAD and other lower extremity outcomes was significantly lower in patients
assigned to an insulin sensitizing strategy than the incidence among those assigned to an insulin
providing strategy (16.9% vs. 24.1%, p<0.001). Therefore, the BARI 2D results suggest that
treatment of type 2 diabetes primarily using insulin sensitizing agents (metformin and/or
thiazolidinediones) may result in lower incidence of PAD than treatment with a glycemic control
strategy using insulin providing agents. Theoretically, this result implies that treatment with
insulin sensitizing medications may slow progression of systemic atherosclerosis in patients with
type 2 diabetes and advanced coronary artery disease. The effect of assigned glycemic control
strategy remained statistically significant in a Cox proportional-hazards model after adjusting for
in-trial HbA1c, suggesting that the insulin sensitizing medications may have conferred a benefit
through a pathway besides improved glycemic control. Possible alternative pathways by which
insulin sensitizing medications may achieve this include their effects on the interrelated
processes of inflammation, coagulation, and fibrinolysis.
126
The second manuscript builds upon the first by examining a number of potential risk factors for
PAD in the BARI 2D trial, first within the entire study cohort and then within the context of the
two glycemic control strategies. The analyses included traditional cardiovascular risk factors
such as body mass index, lipids, blood pressure, and Hb1Ac as well as novel risk factors
indicative of inflammation, coagulation, and fibrinolysis such as C-reactive protein (CRP),
fibrinogen, D-dimer, tissue-type plasminogen activator (t-PA), and plasminogen activator
inhibitor-1 (PAI-1). Cox proportional-hazards models were used to establish independent
associations between the selected baseline risk factors and PAD (while adjusting for age, sex,
race, and smoking status) and then multivariable models were used to see which baseline risk
factors provided the greatest predictive value. Systolic blood pressure, pulse pressure, HbA1c,
albumin-creatinine ratio (ACR), and CRP showed significant associations with PAD in separate
models. When assessed using a multivariate model created using a forward selection algorithm,
three variables (HbA1c, ACR, and D-dimer) showed significant associations with PAD.
A second set of analyses using each risk factor as a time-varying covariate was performed to
assess how longitudinal changes in each risk factor were associated with risk of PAD. These
analyses were stratified by assigned glycemic control strategy because of the possibility that the
treatment strategy could have influenced the value of the risk factors over time as well as the
outcome. Notably, among patients assigned to the insulin providing strategy, only HbA1c and
ACR were significantly associated with lower extremity outcomes, while among patients
assigned to insulin sensitizing strategy a host of traditional cardiovascular risk factors (LDL,
HDL, systolic blood pressure, pulse pressure) as well as D-dimer were significant in models that
adjusted for age, sex, race, and smoking status.
127

In multivariable models, change in HbA1c was the only significant predictor of outcome in the
patients assigned to insulin providing strategy, while D-dimer was the most significant predictor
of outcome in the patients assigned to insulin sensitizing strategy. If D-dimer were not included
as a candidate variable in this analysis, then fibrinogen would have entered the model in our
forward selection algorithm (only for the analysis of patients assigned to insulin sensitizing
strategy). If neither D-dimer nor fibrinogen were included as candidate variables, then CRP
would have entered the model (again, only for patients assigned to insulin sensitizing strategy).
This is noteworthy because the markers of inflammation, coagulation, and fibrinolysis were
associated with lower extremity outcomes among patients treated with insulin sensitizing
medications, but this was not the case for patients treated with insulin providing medications,
thereby suggesting that these medications may have a differential effect on these processes and
subsequently on the development of atherosclerosis in patients with type 2 diabetes.
The third manuscript reports the results of a data collection project evaluating reproducibility and
reliability of two different methods for measuring ankle-brachial index: 1) the Colin VP-1000
oscillometric device and 2) the current gold-standard method involving a Doppler probe. Our
results showed excellent reproducibility for ABI measured with the Doppler, while the Colin
oscillometric device showed moderately good reproducibility but did not match the excellent
reproducibility achieved with Doppler. Agreement between Colin and Doppler was somewhat
poor; therefore, based upon these results, we would not likely recommend the use of Colin ABI
measurements to diagnose peripheral arterial disease in clinical settings.
128

7.0 PUBLIC HEALTH SIGNIFICANCE
The public health significance of this research is primarily derived from the first two manuscripts
regarding the incidence of peripheral arterial disease in patients with type 2 diabetes. The first
manuscript suggests that insulin sensitizing medications (metformin and/or thiazolidinediones)
may reduce the incidence of peripheral arterial disease in patients with type 2 diabetes and stable
coronary artery disease; this can be interpreted as evidence that an insulin sensitizing strategy
reduces the progression of systemic atherosclerosis. The second manuscript builds upon the first
by demonstrating that longitudinal changes in biomarkers of inflammation, coagulation, and
fibrinolysis are predictive of incident peripheral arterial disease in these patients when treated
with insulin sensitizing medications, providing a possible mechanistic insight to how these
medications affect the progression of atherosclerosis differently than treatment with insulin
providing medications. These manuscripts have implications for both 1) clinicians treating
patients with diabetes and 2) bench-science researchers investigating the mechanisms that
influence the development of atherosclerosis.
As published previously, all-cause mortality and cardiovascular mortality was comparable
between the assigned glycemic control arms in BARI 2D. 127 However, the insulin sensitizing
strategy did demonstrate some noteworthy physiological benefits, specifically changes in
biomarker profiles indicative of decreased insulin resistance, an altered balance between
thrombosis and fibrinolysis favoring fibrinolysis, and diminished intensity of the systemic
inflammatory state.98 It was recognized a priori that an association of differences in biomarker
profiles with clinical outcomes might not be evident because the ancillary study of CRP,
129

fibrinogen, and D-dimer was not powered to delineate effects on outcomes. Furthermore, since a
systemic inflammatory state and impaired fibrinolysis are thought to affect clinical outcomes
over prolonged intervals, and this study was carried out in a population that had quite advanced
coronary disease upon study entry, it is unsurprising that beneficial effects of insulin sensitizing
therapy on these biomarkers did not translate into significantly better mortality outcomes during
BARI 2D follow-up.
The research contained in this dissertation provides further ammunition supporting the benefits
of insulin sensitizing therapy and creates at least one fascinating hypothesis. Peripheral arterial
disease is one of the foremost markers of “subclinical” atherosclerosis and, as detailed in this
document’s introduction, is known to be associated with cardiovascular mortality and all-cause
mortality. Therefore, first manuscript’s finding that an insulin sensitizing strategy may reduce
the risk of peripheral arterial disease carries the implication that these drugs may reduce the
progression of atherosclerosis; therefore, it is possible that if they are used earlier in the disease
process and/or in a population with less disease burden, they might reduce the development of
coronary atherosclerosis before disease becomes too advanced to observe a clinical benefit.
Mechanistically, if the effects of insulin sensitizing medications on developing atherosclerosis
occur by their effects on inflammation, coagulation, and fibrinolysis - processes that are not
thought to affect clinical outcomes in the short term, but rather over a prolonged interval - then it
is possible that these medications would result in cardiovascular risk reduction in a study of
patients with less advanced disease at study entry and longer follow-up.
130
Making this argument even more compelling is the second manuscript’s finding that longitudinal
changes in biomarkers such as CRP, fibrinogen, and D-dimer were more closely associated with
PAD outcomes in the patients assigned to treatment with insulin sensitizing therapy. Therefore,
it is possible that patients treated with insulin sensitizing medications that experienced reductions
in the systemic inflammatory state and improved fibrinolysis were protected from the continuing
development of atherosclerosis, but the patients treated with insulin sensitizers that did not
experience these benefits were more prone to the continued development of atherosclerosis
(manifesting itself as an incident case of PAD). Further research should be carried out to
determine whether insulin sensitizing medications do, in fact, affect the development of
atherosclerosis through these specific pathways, particularly if this information can be leveraged
to create new therapeutic targets.
All of the arguments thus far point to a benefit of insulin sensitizing medications; it should be
noted that the American Diabetes Association (ADA) 2013 Clinical Practice Recommendations
recommend an insulin sensitizing drug, metformin, as the first-line therapy for patients with
diabetes.174 Metformin was the most commonly used insulin sensitizing medication in the BARI
2D trial, with over 70% of patients assigned to insulin sensitizing therapy taking metformin at
their three-year study visit. While the “insulin providing versus insulin sensitizing” design used
in the BARI 2D trial is not well-suited to analyze specific medications because of the complex
nature of the glycemic control strategy employed in BARI 2D, it may be reasonably inferred that
the benefits of insulin sensitizing medications on peripheral arterial disease outcomes are at least
in part due to the use of metformin. Therefore, our research supports the current guidelines by
demonstrating an as-yet-unidentified benefit of insulin sensitizing therapy.
131
The ADA 2013 Clinical Practice Recommendations also offer comprehensive guidelines for
cardiovascular risk reduction in patients with type 2 diabetes as follows:
People with diabetes and hypertension should be treated to a systolic blood pressure goal
of < 140 mm Hg; lower systolic blood pressure targets may be appropriate for certain
individuals if it can be achieved without undue treatment burden
LDL-cholesterol targeted statin therapy remains the preferred strategy, targeting an LDL
level of less than 100 mg/dL in individuals without overt CVD and an LDL level of less
than 70 mg/dL in individuals with overt CVD
Statin therapy should be added to lifestyle therapy, regardless of baseline lipid levels, for
diabetic patients that meet one or more of the following criteria:
o Family history of CVD
o Hypertension
o Smoking
o Albuminuria
Aspirin therapy for patients with type 2 diabetes at an increased cardiovascular risk (same
risk factors listed above); clopidogrel may also be considered for those with an aspirin
allergy or in combination with aspirin for especially high-risk patients
All patients are advised not to smoke or use tobacco products
Our findings do not have any specific bearing on the aforementioned recommendations, which
are similar to those presented in Figure 1-8 regarding CVD risk reduction for patients with
peripheral arterial disease. Thus, we conclude that the first two manuscripts support current
practice guidelines by reinforcing the notion that all patients with type 2 diabetes should first be
treated using insulin sensitizing medications when practical.
132
The third manuscript leaves the question of insulin sensitizing medications’ effect on
atherosclerosis to ask a simpler question regarding the diagnosis of peripheral arterial disease:
does the Colin VP-1000 oscillometric device offer potential to measure the ankle-brachial index
(the principal diagnostic tool for PAD) with greater reproducibility than the current gold-
standard technique using a Doppler probe?
According to our data, the answer is no. The reproducibility of ABI measurements taken using
the Colin VP-1000 was inferior to reproducibility of ABI measurements taken using a traditional
Doppler probe in all respects. Agreement between the two methods was mediocre at best,
certainly less than that necessary to declare the Colin VP-1000 equivalent to the Doppler ABI.
Therefore, based on the superior reproducibility displayed by Doppler and the lack of
equivalence between Colin-measured ABI and Doppler-measured ABI, we cannot recommend
the Colin VP-1000 oscillometric device as a replacement for Doppler-measured ABI in research
settings or clinical settings.
In 2012, the American Heart Association issued a Scientific Statement on the measurement and
interpretation of the ankle-brachial index in response to a lack of standards for measurement and
calculation of ABI.157 The AHA Scientific Statement notes that the correlation between
Doppler-derived and oscillometric-determined ankle pressures and ABIs has been “generally
acceptable in most studies with 1 exception” but still recommends that the Doppler method is the
most reliable method to determine ABI and should be considered the gold-standard method. Our
results support this statement, and therefore are in agreement with current AHA guidelines.
133

In summary, the research contained in this dissertation:
1. Documents the incidence of peripheral arterial disease in a defined population from a
randomized controlled trial of patients with type 2 diabetes and coronary artery disease,
illustrating that the atherosclerotic process continues even in those treated aggressively
2. Provides evidence of an as-yet-unidentified benefit of insulin sensitizing medications, the
reduction in risk of incident peripheral arterial disease, thereby supporting current
guidelines regarding the use of insulin sensitizing medications as the first-line therapy for
treatment of type 2 diabetes mellitus
3. Suggests a potential mechanistic pathway through which insulin sensitizing medications
may affect the progression of atherosclerosis, which can be studied to see if the pathways
involved have any promise as therapeutic targets and/or can be better used to identify
those at high risk of developing atherosclerotic plaques
4. Evaluates the reliability and reproducibility of two techniques that can be used to
diagnose peripheral arterial disease and provides evidence that the current gold-standard
method, using a Doppler probe, should remain the principal technique for evaluation of
ABI in research settings and, likely, in clinical settings as well
134

APPENDIX A
Doppler ABI Testing Instructions
1. Patient Preparation
1) Bring the patient into a quiet room at normal room temperature (21-23 C).
2) Instruct the patient to remove their socks and shoes.
3) Instruct the patient to lie in a supine position with the ankles at heart level and the feet
arranged so that the toes are pointed towards the ceiling.
4) Ascertain the appropriate cuff size for each limb
5) Place pressure cuffs approximately 3 cm above the cubital fossa on the arms.
6) Place pressure cuffs approximately 3 cm above the medial malleoulus on the ankle.
7) Allow the patient to remain at rest in the quiet room for 5 minutes.
2. Answer any questions and explain the test using the following sample participant script:
This test will take approximately 5 minutes during which time multiple blood pressures will be
taken on each arm and ankle. While the test is being performed we ask you to hold still, remain
quiet and not fall asleep.
135

3. Brachial Pressure Measurements
1) Locate brachial pulse on the right arm
2) Apply small mound of ultrasound transmission gel to the pulse site
3) Place the tip of the Doppler probe on top of the gel at a 45-degree angle
4) Adjust the Doppler probe to obtain the best audible pulse signal
5) Inflate the pressure cuff 20 mm Hg beyond the last audible signal
6) Deflate cuff (2 mm Hg/sec) until first audible signal (systolic pressure only)
7) Record the pressure at first audible signal
8) Repeat steps (1-7) using the left arm
4. Ankle Pressure Measurements
1) Locate dorsalis pedis (DP) pulse in the right ankle
2) Apply small mound of ultrasound transmission gel to the pulse site
3) Place the tip of the Doppler probe on top of the gel at a 45-degree angle
4) Adjust the Doppler probe to obtain the best audible pulse signal
5) Inflate the pressure cuff 20 mm Hg beyond the last audible signal*
6) Deflate cuff (2 mm Hg/sec) until first audible signal (systolic pressure only)
7) Record the pressure at first audible signal (*note: if the artery cannot be occluded 230
mm Hg, ankle pressure should be recorded as “non-compressible”)
8) Repeat steps (1-7) above using the left ankle
136

APPENDIX B
Colin VP 1000 Testing Instructions
1. Answer any questions and explain the test using the following sample participant script:
This test will take approximately 5 minutes during which time multiple blood pressures will be
taken on each arm and ankle. While the test is being performed we ask you to hold still, remain
quiet and not fall asleep.
2. Anthropometric Measurements: Five anthropometric measures are required on the RIGHT
side prior to the Colin test. All measurements must be taken with a steel measuring tape and
recorded in centimeters on the Colin worksheet. They are described on the following page in
sequence:
137

1) Carotid to suprasternal notch:
Measure the distance from the sampling site of the right carotid artery to the
suprasternal notch.
2) Suprasternal notch to umbilicus:
Measure from the suprasternal notch to the inferior (lower) edge of the umbilicus.
3) Umbilicus to common femoral:
Measure from the inferior (lower) edge of the umbilicus to the sampling site of
the right common femoral artery.
4) Femoral to ankle:
Measure from the sampling site of the right common femoral artery to the medial
malleolus.
5) Suprasternal notch to antecubital fossa:
Measure from the suprasternal notch to the dot placed at the antecubital fossa
6) Calculate Lcf measurement = (#2) + (#3) - (#1)
3. To enter subject information on the Colin ID Input Screen rotate the jog dial to the desired
digit. When the digit desired is displayed in the blue box, depress the jog dial to select. The
selected digit will then appear the ID box. Repeat the previous step to choose all digits. If an
error is made, select the F1 (correction) button and the last digit entered will be deleted. Pressing
New ID will delete the entire ID. When ready, press F3 to confirm. The ID number will appear
in the blue box at the top left-hand corner of the screen.
138

4. Participant information is entered into the next screen.
1) The sex (gender) field is first and defaults to male. If the participant is a female, depress
the jog dial and the screen will be highlighted in blue. Rotate the dial to select female
and depress the jog dial again.
2) Rotate the jog dial to move to the next field; use the jog dial to enter the participant’s
height.
3) Use the jog dial to bypass the Lcf* field (used only with carotid-femoral sensors).
4) Next enter participant’s weight and birth date.
5) The fields to the right of the participant information are already entered. They should be
completed as follows and never changed:
Meas. Part: Both Arms + Legs
Pressurized Right Ankle: AUTO
Pressurized Left Ankle: AUTO
Measurement Times: 1
Wait Time: 10 sec.
Tonometry:
139

5. Choose a cuff appropriate for the patient by selecting the correct size (determined by the
patient’s arm circumference).
Cuff Size (cm)
Limb Circumference (cm) Bladder
Width
Bladder
Length
16-21 8 21
22-26 10 24
27-34 13 30
35-44 16 38
45-52 20 42
Note: Choose the appropriate cuff to avoid any error caused by gap between cuff and ankle in
the measurements. If cuff is too large, the blood pressure measurement may be lower than
actual value. If cuff is too small, measurement may be higher than actual value.
6. To attach the appropriate cuff to the cuff hose, insert the hose and turn it clockwise to lock.
140

7. Wrap the brachial cuffs around bare arms or thin clothing. (When applying the cuff above
clothing, pull the clothing so that it does not bunch up on the side of the artery. If the cuff is
wrapped around the arm with clothing bunched up at the artery site, the blood pressure will
measure higher than the actual value.) Place appropriate cuff on each arm (cuffs are marked for
left and right). The brachial artery runs down the inside of the arm. Attach the cuffs so that the
horizontal artery position mark on the cuff aligns with the artery. See image below:
Apply the cuff with the tubing traveling up the arm towards the shoulder. Wrap the cuff snugly
so that 2 fingers can be placed between the cuff and the arm. At this time, be sure that the index
line is inside the range shown by the arrow mark. See image below:
Note: If the index line does not go inside the range, use a cuff of another size.
141

8. Remove socks or stockings for application of ankle cuffs. The cuffs are marked for right and
left side. Place the cuffs so that the artery position mark is about two finger widths from the top
of the medial malleolus on the inside portion of the leg. See image below:
Note: The sensor cuff segment (see image below) must be in contact with the posterior tibial
artery of the ankle for the purpose of detecting the pulse.
Wrap the lower ankle velcro wrap first then the upper calf velcro wrap. Wrap the cuff so that
there is enough space to fit one finger between the cuff and ankle.
142

Note: If a section of the index line can be seen through the cuffs window, measurements can be
taken. See image below:
143

9. Application of the ECG (electrocardiogram) clips:
To attach the electrodes to the ECG clip, press and hold the button on the side of the right ECG
clip and insert one electrode to the right ECG clip. Release the button to fix the electrode to the
clip. Repeat these steps with the left ECG clip. Remove the protection sheets from all 3
electrodes.
The wrist clips are marked left and right. The left sensor has two electrodes and the right sensor
has one electrode. Apply the clips to medial side of the forearm placing sensors just above the
area where the radial pulse is palpated.
144

10. Application of the PCG (phonocardiogram) sensor:
Take off the protective sheet (light blue) and put it onto the sensor. Remove the cover sheet that
is on the gel pad side. There are three places that the PCG sensor can be placed:
a) The 4th intercostal space to the left of the sternum. (#4 on diagram)
b) The 2nd intercostal space directly over the sternum. (#6 on diagram)
c) The 3rd intercostal space (centered). (#5 on the diagram)
145

11. Verify all fields on the participant information screen are completed and select F3 to confirm.
Note: Take care to avoid mistakes in entering information and numerical values because this
information will be used in determining analysis results and cannot be changed after the fact.
12. The measurement screen should now be in view. Inform the participant to hold still and not
move while the measurements are in progress.
13. Achieve the following on the screen display before the measure is started:
ECG: OK status
PCG: OK status
Note: It is recommended that at least 3-4 meters be flashing on the PCG level when the
measurement starts. While testing can be started even when “OK” is not indicated, the accuracy
may be reduced.
14. Depress the Blue Start Switch to have the cuffs inflate automatically. The measurements
will be recorded for 30-60 seconds and when the measures are complete the cuffs will deflate
automatically.
15. Evaluate the results on the display screen for accuracy. Results are automatically printed
after each run. The machine will prompt you if waveforms are not adequate and will offer
corrective suggestions. Pay attention to screen messages and make changes accordingly (refer to
pages 90 thru 97 of the Operation Manual for a List of Colin Messages/ Troubleshooting for
specific errors and how to make adjustments).
146
16. Depress the Orange Stop Switch to return to the ID Input screen. Re-verify the SWAN IV
ID and depress the F3/Confirm button. Repeat steps 12-15 for the start of the 2nd run.
17. Each print out must be assessed for quality and accuracy. Prior to dismissing the participant
the numbered areas on the Colin print out (see next page) are to be reviewed for correct data
entry.
18. On the Clinical Measurements form, complete all the appropriate boxes for each run
performed and provide comments (if any) from the machine print out.
The following pages contain a sample printout and numbered descriptions of each element on the
Colin printout.
147
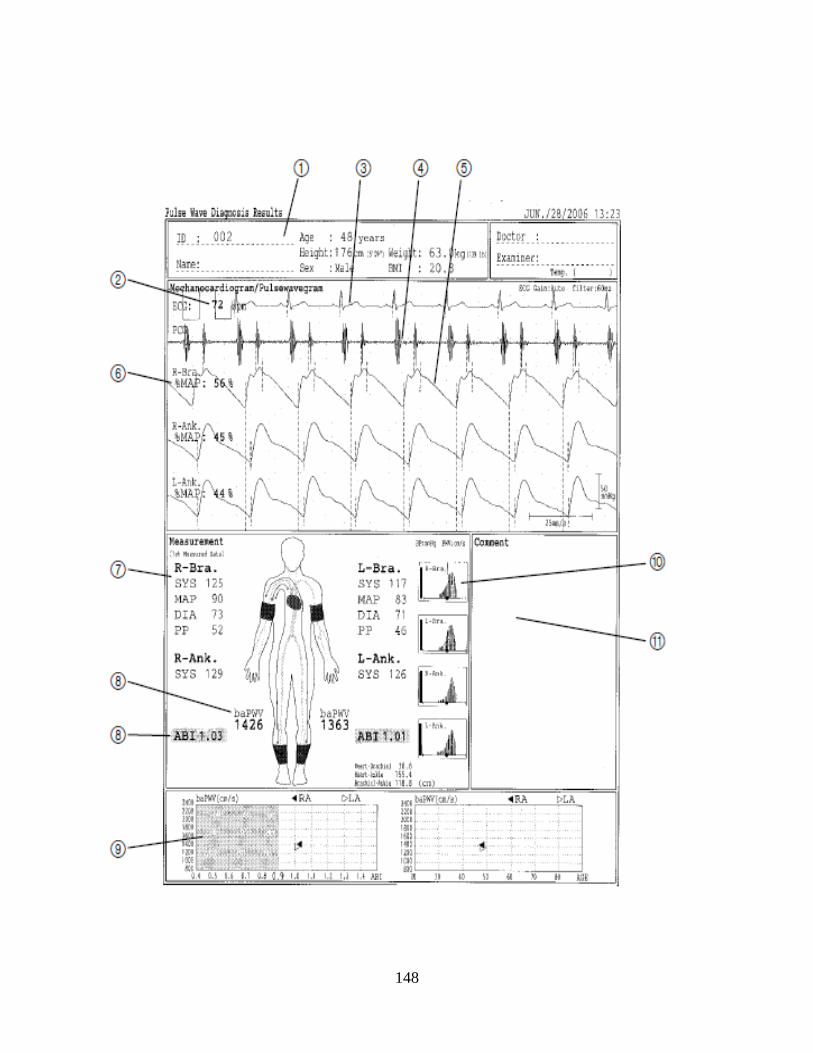
148

149

150

BIBLIOGRAPHY
1 Lloyd-Jones D, Adams RJ, Brown TM, Carnethon M, Dai S, De Simone G, Ferguson TB, Ford E, Furie K, Gillespie C, Go A, Greenlund K, Haase N, Hailpern S, Ho PM, Howard V, Kissela B, Kittner S, Lackland D, Lisabeth L, Marelli A, McDermott MM, Meigs J, Mozaffarian D, Mussolino M, Nichol G, Roger VL, Rosamond W, Sacco R, Sorlie P, Roger VL, Thom T, Wasserthiel-Smoller S, Wong ND, Wylie-Rosett J; on behalf of the American Heart Association Statistics Committee and Stroke Statistics Subcommittee. Heart disease and stroke statistics—2010 update: a report from the American Heart Association. Circulation. 2010; 121:e46–e215. 2 Ross R. Atherosclerosis: an inflammatory disease. N Engl J Med 1999; 340:115-126. 3 Libby P. Inflammation in atherosclerosis. Nature 2002; 420: 868-874. 4 Faxon DP, Fuster V, Libby P, Beckman JA, Hiatt WR, Thompson RW, Topper JN, Annex BH, Rundback JH, Fabunmi RP, Robertson RM, Loscalzo J. Atherosclerotic Vascular Disease Conference Writing Group III: Pathophysiology. Circulation 2004; 109: 2617-2625. 5 Gordon T, Kannel WB. Predisposition to atherosclerosis in the head, heart, and legs: the Framingham Study. JAMA 1972; 221: 661-666. 6 Springer TA, Cybulsky MI. Traffic signals on endothelium for leukocytes in health, inflammation, and atherosclerosis. In: Fuster V, Ross R, Topol EJ, et al. Atherosclerosis and coronary artery disease. Philadelphia, Lippincott-Raven, 1996: 511-538. 7 Rosenfeld ME, Ross R. Macrophage and smooth muscle cell proliferation in atherosclerotic lesions of WHHL and comparably hypercholesterolemic fat-fed rabbits. Arteriosclerosis 1990; 10: 680-687. 8 Crowther MA. Pathogenesis of Atherosclerosis. Hematology 2005; 436-441. 9 Ouriel K. Peripheral arterial disease. Lancet 2001; 358: 1257-64. 10 Luther M, Lepantalo M, Alback A, Matzke S. Amputation rates as a measure of vascular surgical results. Br J Surg 1996; 83: 241-44. 11 Dormandy J, Belcher G, Broos P, Eikelboom B, Laszlo G, Knorad P, Moggi L, Mueller U. Prospective study of 713 below-knee amputations for ischaemia and the effect of a prostacyclin analogue on healing. Br J Surg 1994; 81: 33-37. 12 Criqui MH, Fronek A, Barrett-Connor E, Klauber MR, Gabriel S, Goodman D. The prevalence of peripheral arterial disease in a defined population. Circulation 1985; 71: 510-515. 13 Stoffers HE, Rinkens PE, Kester AD, Kaiser V, Knottnerus JA. The prevalence of asymptomatic and unrecognized peripheral arterial occlusive disease. Int J Epidemiol 1996; 25: 282-290. 14 Selvin E, Erlinger TP. Prevalence of and Risk Factors for Peripheral Arterial Disease in the United States: Results From the National Health and Nutrion Examination Survey, 1999-2000. Circulation 2004; 110: 738-743. 15 Allison MA, Hom E, Denenberg JO, Langer RD, Newman AB, Fabsitz RR, Criqui MH. Ethnic-Specific Prevalence of Peripheral Arterial Disease in the United States. Am J Prev Med 2007; 32:328-333. 16 Newman AB, Sutton-Tyrrell K, Kuller LH. Lower Extremity Arterial Disease in Older Hypertensive Adults. Arter Thromb Vasc Biol 1993; 13: 555-562. 17 Zheng ZJ, Rosamond WD, Chambless LE, Neto FJ, Barnes RW, Hutchinson RG, Tyroler HA, Heiss G. Lower Extremity Arterial Disease Assessed by Ankle-Brachial Index in a Middle-Aged Population of African Americans and Whites: The Atherosclerosis Risk in Communities (ARIC) Study. Am J Prev Med 2005; 29: 42-49. 18 McDermott MM, Greenland P, Liu K, Guralnik JM, Celic L, Criqui MH, Chan C, Martin GJ, Schneider J, Pearce WH, Taylor LM, Clark E. The ankle-brachial index is associated with leg function and physical activity: the Walking and Leg Circulation Study. Ann Intern Med 2002; 136: 873-883. 19 Brach JS, Solomon C, Naydeck BL, Sutton Tyrrell K, Enright PL, Jenny NS, Chaves PM, Newman AB. Incident physical disability in people with lower extremity peripheral arterial disease: the role of cardiovascular disease. J Am Geriatr Soc 2008; 56: 1037-1044. 20 Nehler M, McDermott MM, Treat-Jacobson D, Chetter I, Regensteiner JG. Functional outcomes and quality of life in peripheral arterial disease: current status. Vasc Med 2003; 8: 115-126. 21 Pell JP, Donnan PT, Fowkes FGR, Ruckley CV. Quality of life following lower-limb amputation for peripheral arterial disease. Eur J Vasc Surg 1993; 7: 448-451.
151

22 Criqui MH, Langer RD, Fronek A, Feigelson HS, Klauber MR, McCann TJ, Browner D. Mortality over a period of ten years in patients with peripheral arterial disease. N Engl J Med 1992; 326: 381-86. 23 Newman AB, Sutton-Tyrrell K, Vogt MT, Kuller LH. Morbidity and mortality in hypertensive adults with a low ankle/arm blood pressure index. JAMA. 1993; 270: 487-489. 24 O’Hare AM, Katz R, Shlipak MG, Cushman M, Newman AB. Mortality and Cardiovascular Risk Across the Ankle-Arm Index Spectrum: Results from the Cardiovascular Health Study. Circulation 2006; 113: 388-393. 25 Sutton-Tyrrell K, Venkitachalam L, Kanaya AM, Boudreau R, Harris T, Thompson T, Mackey RH, Visser M, Vaidean GD, Newman AB. Relationship of Ankle Blood Pressures to Cardiovascular Events in Older Adults. Stroke 2008; 39: 863-869. 26 Criqui MH, McClelland RL, McDermott MM, Allison MA, Blumenthal RS, Aboyans V, Ix JH, Burke GL, Liu K, Shea S. The Ankle-Brachial Index and Cardiovascular Events in MESA (Multi-Ethnic Study of Atherosclerosis). J Am Coll Cardiol 2010; 56: 1506-1512. 27 Criqui MH, Ninomiya JK, Wingard DL, Ji M, Fronek A. Progression of Peripheral Arterial Disease Predicts Cardiovascular Disease Morbidity and Mortality. JACC 2008; 52: 1736-1742. 28 Hirsch AT, Criqui MH, Treat-Jacobson D, Regensteiner JG, Creager MA, Olin JW, Krook SH, Hunninghake DB, Comerota AJ, Walsh ME, McDermott MM, Hiatt WR. Peripheral arterial disease detection, awareness, and treatment in primary care. JAMA 2001; 286: 1317-1324. 29 Hiatt WR. Medical Treatment of Peripheral Arterial Disease and Claudication. N Engl J Med 2001; 334: 1608-1621. 30 Fowkes FG, Housley E, Riemersma RA, Macintyre CCA, Cawood EHH, Prescott RJ, Ruckley CV. Smoking, lipids, glucose intolerance, and blood pressure as risk factors for peripheral atherosclerosis compared with ischemic heart disease in the Edinburgh Artery Study. Am J Epidemiol 1992; 135: 331-340. 31 Meijer WT, Hoes AW, Rutgers D, Bots ML, Hofman A, Grobbee D. Peripheral arterial disease in the elderly: the Rotterdam study. Arter Thromb Vasc Biol 1998; 18: 185-192. 32 Price JF, Mowbray PI, Lee AJ, Rumley A, Lowe GD, Fowkes FG. Relationship between smoking and cardiovascular risk factors in the development of peripheral artery disease and coronary artery disease: Edinburgh Artery Study. Eur Heart J 1999; 20: 344-353. 33 Barua RS, Ambrose JA, Eales-Reynolds LJ, DeVoe MC, Zervas JG, Saha DC. Dysfunctional endothelial nitric-oxide biosynthesis in healthy smokers with impaired endothelium-dependent vasodilation. Circulation 2001; 104: 1905-1910. 34 Olin JW. Hypertension and peripheral arterial disease. Vasc Med 2005; 10: 241-246. 35 Alexander RW. Hypertension and the Pathogenesis of Atherosclerosis: Oxidative Stress and the Mediation of Arterial Inflammatory Response: A New Perspective. Hypertension 1995; 25: 155-161. 36 Xu C, Lee S, Singh TM, Sho E, Li X, Sho M, Masuda H, Zarins CK. Molecular mechanisms of aortic wall remodeling in response to hypertension. J Vasc Surg 2001; 33: 57-578. 37 Bartholomew JR, Olin JW. Pathophysiology of peripheral arterial disease and risk factors for its development. Clev Clin J Med 2006; 73: S8-S14. 38 Castelli WP. Cholesterol and lipids in the risk of coronary artery disease: the Framingham Heart Study. Canad J Cardiol 1988; 4; 5-10. 39 Shlipak MG, Fried LF, Crump C, Bleyer AJ, Manoloio TA, Tracy RP, Furberg CD, Psaty BM. Cardiovascular disease risk status in elderly persons with renal insufficiency. Kidney Int 2002; 62: 997-1004. 40 O’Hare AM, Glidden DV, Fox CS, Hsu C. High prevalence of peripheral arterial disease in persons with renal insufficiency: results from the National Health and Nutrition Examination Survey. Circulation 2004; 109: 320-323. 41 American Diabetes Association. Peripheral arterial disease in people with diabetes. Diabetes Care 2003; 26: 3333-3341. 42 Trost S, Pratley R, Sobel B. Impaired fibrinolysis and risk for cardiovascular disease in the metabolic syndrome and type 2 diabetes. Curr Diabetes Rep 2006; 6: 47-54. 43 Levi M, van der Poll T, Buller HR. Bidirectional Relation Between Inflammation and Coagulation. Circulation 2004; 109: 2698-2704. 44 Thogersoen AM, Jansson JH, Boman K, Nilsson TK, Weienehall L, Huhtasaari F, Hallmans G. High plasminogen activator inhibitor and tissue plasminogen activator levels in plasma preced a first acute myocardial infarction in both men and women: evidence for the fibrinolytic system as an independent primary risk factor. Circulation 1998; 98: 2241-2247.
152

45 Sobel BE, Taatjes DL, Schneider DJ. Intramural plasminogen activator inhibitor type-1 and coronary atherosclerosis. Arterioscler Thromb Vasc Biol 2003; 3: 1979-1989. 46 Ridker PM, Stampfer MJ, Rifai N. Novel risk factors for systemic atherosclerosis: a comparison of C-reactive protein, fibrinogen, lipoprotein(a), and standard cholesterol screening as predictors of peripheral vascular disease. JAMA 2001; 285: 2481-2485. 47 Sofi F, Lari B, Rogolino A, Marcucci R, Pratesi G, Dorigo W, Pratesi C, Gensini GF, Abbate R, Prisco D. Thrombophilic risk factors for symptomatic peripheral arterial disease. J Vasc Surg 2005; 41: 255-260. 48 Zwaka TP, Hombach V, Torzewski J. C-reactive protein-mediated low density lipoprotein uptake by macrophages: implications for atherosclerosis. Circulation 2001;103:1194-1197. 49 Cermak J, Key NS, Bach RR, Balla J, Jacob HS, Vercellotti GM. C-reactive protein induces human peripheral blood monocytes to synthesize tissue factor. Blood 1993; 82: 513-520. 50 Devaraj S, Xu DY, Jialal I. C-reactive protein increases plasminogen activator inhibitor-1 expression and activity in human aortic endothelial cells: implications for the metabolic syndrome and atherothrombosis. Circulation 2003; 107: 398–404. 51 Singh U, Devaraj S, Jialal I. C-reactive protein decreases tissue plasminogen activator activity in human aortic endothelial cells: evidence that C-reactive protein is a procoagulant. Arterioscler Thromb Vasc Biol 2005; 25: 2216-2221. 52 Ridker PM. High-sensitivity C-reactive protein: potential adjunct for global risk assessment in the primary prevention of cardiovascular disease. Circulation 2001; 103: 1813–1818. 53 Collen D, Lijnen HR, Todd PA, Goa KL. Tissue-Type Plasminogen Activator. Drugs 1989; 38: 346-388. 54 van der Poll T, Levi M, Buller HR, van Deventer SJ, de Boer JP, Hack CE, ten Cate JW. Fibrinolytic response to tumor necrosis factor in healthy subjects. J Exp Med 1991; 174: 729-732. 55 Izuhara Y, Takahasi S, Nangaku M, Takizawa S, Ishida H, Kurokawa K, van Ypersele de Strihou C, Hirayama N, Miyata T. Inhibition of plasminogen activatory inhibitor-1: its mechanism and effectiveness on coagulation and fibrinolysis. Arterioscler Thromb Vasc Biol 2008; 28: 672-677. 56 Sobel BE, Woodcock-Mitchell J, Schneider DJ, Holt RE, Marutsuka K, Gold H. Increased plasminogen activator inhibitor type-1 in coronoary artery atherectomy specimens from type 2 diabetic compared with non-diabetic patients. Circulation 1998; 97: 2213-2221. 57 Hamsten A, de Faire U, Walidius G, Dahlen G, Szamosi I, Landou C, Blomback M, Wiman B. Plasminogen activator inhibitor in plasma: risk factor for recurrent myocardial infarction. Lancet 1987; 2: 3-9. 58 Mannucci PM, Bernardinelli L, Foco L, Galli M, Ribicini F, Tubaro M, Peyvandi F. Tissue plasminogen activator antigen is strongly associated with myocardial infarction in young women. J Thromb Haemost 2005; 3: 280-286. 59 Thogerson AM, Janssen JH, Boman K, Nilsson TK, Weinehall L, Huhtasaari F, Hallmans G. High plasminogen activator inhibitor and tissue plasminogen activator levels in plasma precede a first acute myocardial infarction in both men and women: evidence for the fibrinolytic system as an independent primary risk factor. Circulation 1998; 98: 2241-2247. 60 Ernst E, Resch KL. Fibrinogen as a cardiovascular risk factor. Ann Intern Med 1993; 118: 956-963. 61 Miyao Y, Yasue H, Ogawa H, Misumi I, Masuda T, Sakamoto T, Morita E. Elevated plasma interleukin-6 levels in patients with acute myocardial infarction. Am Heart J 1993; 126: 1299-1304. 62 Smith EB, Keen GA, Grant A, Stirk C. Fibrinogen in human arterial intima. Arteriosclerosis 1990; 10: 263-275. 63 Harley SL, Sturge J, Powell JT. Regulation by fibrinogen and its products of intercellular adhesion molecule-1 in human saphenous vein endothelial cells. Arterioscler Thromb Vasc Biol 2000; 20: 652-658. 64 Szaba FM, Smiley ST. Roles for thrombin and fibrinogen in cytokine/chemokine production and macrophage adhesion in vivo. Blood 2002; 99: 1053-1059. 65 Ernst E, Koenig W. Fibrinogen and cardiovascular risk. Vasc Med 1997; 2: 115-125. 66 Lip GHY, Lowe GD. Fibrin D-dimer: a useful clinical marker of thrombogenesis? Clinical Science 1995; 89: 205-214. 67 Tracy RP. Thrombin, Inflammation, and Cardiovascular Disease: An Epidemiologic Perspective. Chest 2003;124: 49S-57S. 68 Seljeflot I, Arnesen H. Eritsland J, Smith P. D-dimer test after standardized coagulation. Fibrinolysis 1993; 7; 303-307. 69 Wildman RP, Muntner P, Chen J, Sutton Tyrrell K, He J. Relation of inflammation to peripheral arterial disease in the National Health and Nutrition Examination Survey. Am J Cardiol 2005; 96; 1579-1583.
153
70 Lee AJ, Fowkes FG, Lowe GD, Rumley A. Fibrin D-dimer, haemostatic factors and peripheral arterial disease. Thromb Haemost 1995; 74: 828-832. 71 McDermott MM, Green D, Greenland, P, Liu K, Criqui MH, Chan C, Guralnik JM, Pearce WH, Ridker PM, Taylor L, Rifai N, Schneider JR. Relation of levels of hemostatic factors and inflammatory markers to the ankle brachial index. Am J Cardiol 2003; 92: 194-199. 72 Tzoulaki I, Murray GD, Price JF, Smith FB, Lee AJ, Rumley A, Lowe GD, Fowkes FGR. Hemostatic Markers, Inflammatory Markers, and Progressive Peripheral Atherosclerosis. Am J Epidemiol 2006; 163: 334-341. 73 McDermott MM, Ferrucci L, Guralnik JM, Tian L, Green D, Liu K, Tan J, Liao Y, Pearce WH, Schneider JR, Ridker PM, Rifai N, Hoff F, Criqui MH. Elevated levels of inflammation, d-dimer, and homocysteine are associated with adverse calf muscle characteristics and reduced calf strength in peripheral arterial disease. J Am Coll Cardiol 2007; 50: 897-905. 74 McDermott MM, Liu K, Ferrucci L, Tian L, Guralnik JM, Green D, Tan J, Liao Y, Pearce WH, Schneider JR, McCue K, Ridker PM, Rifai N, Criqui MH. Circulating blood markers and functional impairment in peripheral arterial disease. J Am Geratr Soc 2008; 56: 1504-1510. 75 McDermott MM, Ferrucci L, Liu K, Criqui MH, Greenland P, Green D, Guralnik JM, Ridker PM, Taylor LM, Rifai N, Tian L, Zheng J, Pearce WH, Schneider JR, Vonesh E. D-dimer and inflammatory markers as predictors of functional decline in men and women with and without peripheral arterial disease. J Am Geratr Soc 2005; 53: 1688-1696. 76 McDermott MM, Liu K, Guralnik JM, Ferrucci L, Green D, Greenland P, Tian L, Criqui MH, Lo C, Rifai N, Ridker PM, Zheng J, Pearce WH. Functional decline in patients with and without peripheral arterial disease: predictive value of annual changes in levels of C-reactive protein and D-dimer. J Gerontol A Biol Sci Med Sci 2006; 61: 374-379. 77 Owens CD, Ridker PM, Belkin M, Hamdan AD, Pomposelli F, Logerfo F, Creager MA, Conte MS. Elevated C-reactive protein levels are associated with postoperative events in patients undergoing lower extremity vein bypass surgery. J Vasc Surg 2007; 45: 2-9. 78 Vidula H, Tian L, Liu K, Criqui MH, Ferrucci L, Pearce WH, Greenland P, Green D, Tan J, Garside DB, Guralnik J, Ridker PM, Rifai N, McDermott MM. Biomarkers of inflammation and thrombosis as predictors of near-term mortality in patients with peripheral arterial disease: a cohort study. Ann Intern Med 2008; 148: 85-93. 79 Criqui MH, Ho LA, Denenberg JO, Ridker PM, Wassel CL, McDermott MM. Biomarkers in peripheral arterial disease patients and near- and longer-term mortality. J Vasc Surg 2010; 52: 85-90. 80 Palumbo PJ, O’Fallon M, Osmundson PJ, Zimmerman BR, Langworthy AL, Kazmier FJ. Progression of peripheral arterial occlusive disease in diabetes mellitus. Arch Int Med. 1991; 151: 717-721. 81 Dolan NC, Liu K, Criqui MH, Greenland P, Guralnik JM, Chan C, Schneider JR, Mandapat AL, Martin G, McDermott MM. Peripheral Artery Disease, Diabetes, and Reduced Lower Extremity Functioning. Diabetes Care 2002; 25: 113-120. 82 Adler AI, Boyko EJ, Ahroni JH, Smith DG. Lower-extremity amputation in diabetes. Diab Care 1999; 22:1029-1035. 83 Dormandy JA, Betteridge DJ, Schenthaner G, Pirags V, Norgren L. Impact of peripheral arterial disease in patients with diabetes – results from PROactive. Atherosclerosis 2009; 202: 272-281. 84 Jude EB, Oyibo SO, Chalmers N, Boulton AJ. Peripheral arterial disease in diabetic and nondiabetic patients: a comparison of severity and outcome. Diabetes Care 2001; 24: 1433-1437. 85 Leibson CL, Ransom JE, Olson W, Zimmerman BR, O’Fallon WM, Palumbo PJ. Peripheral arterial disease, diabetes, and mortality. Diabetes Care. 2004; 27: 2843-2849. 86 Norman PE, Davis WA, Bruce DG, Davis TME. Peripheral arterial disease and risk of cardiac death in type 2 diabetes: the Fremantle Diabetes Study. Diabetes Care 2006; 29: 575-580. 87 Jude EB. Intermittent claudication in the patient with diabetes. Br J Diabetes Vasc Dis 2004; 4: 238-242. 88 Moulik PK, Mtonga R, Gill GV. Amputation and mortality in new-onset diabetic foot ulcers stratified by etiology. Diabetes Care 2003; 26: 491-494. 89 Muntner P, Wildman RP, Reynolsd K, DeSalvo KB, Chen J, Fonseca V. Relationship Between HbA1c Level and Peripheral Arterial Disease. Diabetes Care 2005; 28: 1981-1987. 90 Adler AI, Stevens RJ, Neil A, Boulton AJM, Holman RR. UKPDS 59: Hyperglycemia and Other Potentially Modifiable Risk Factors for Peripheral Vascular Disease in Type 2 Diabetes. Diabetes Care 2002; 25: 894-899.
154

91 Selvin E, Marinopolous S, Berkenblit G, Rami T, Brancati FL, Powe NR, Golden SH. Meta-analysis: glycosylated hemoglobin and cardiovascular disease in diabetes mellitus. Ann Intern Med 2004; 141: 421-31. 92 Selvin E, Wattanakit K, Steffes MW, Coresh J, Sharrett AR. HbA1c and Peripheral Arterial Disease in Diabetes: the Atherosclerosis Risk in Communities Study. Diabetes Care 2006; 29: 877-882. 93 Skyler JS, Bergenstal R, Bonow RO, Buse J, Deedwania P, Gale EAM, Howard BV, Kirkman S, Kosiborod, Reaven P, Sherwin RS. Intensive Glycemic Control and the Prevention of Cardiovascular Events: Implications of the ACCORD, ADVANCE, and VA Diabetes Trials. Circulation 2009; 119: 351-357. 94 Duckworth W, Abraira C, Moritz T, Reda D, Emanuele N, Reaven PD, Zieve FJ, Marks J, Davis SD, Hayward R, Warren SR, Goldman S, McCarren M, Vitek ME, Henderson WG, Huang GD. Glucse Control and Vascular Complications in Veterans with Type 2 Diabtes. N Engl J Med 2009; 360: 129-139. 95 The Action to Control Cardiovascular Risk in Diabetes Study Group. Effects of intensive glucose lowering in type 2 diabetes. N Engl J Med 2008; 358: 2545-59. 96 The ADVANCE Collaborative Group. Intensive blood glucose control and vascular outcomes in patients with type 2 diabetes. N Engl J Med 2008; 358: 2560-72. 97 Wattakanit K, Folsom AR, Selvin E, Weatherley BD, Pankow JS, Brancati FL, Hirsch AT. Risk factors for peripheral arterial disease in persons with diabetes: the Atherosclerosis Risk in Communities (ARIC) study. Atherosclerosis 2005; 180: 389-397. 98 Sobel BE, Hardison RG, Genuth S, Brooks MM, McBane RB, Schneider DJ, Pratley RE, Huber K, Wolk R, Krishnaswami A, Frye RL. Profibrinolytic, Antithrombotic, and Antiinflammatory Effects of an Insulin-Sensitizing Strategy in Patients in the Bypass Angioplasty Revascularization Investigation 2 Diabetes (BARI 2D) Trial. Circulation 2011; 124: 695-703. 99 Jude EB, Eleftheriadou I, Tentolouris N. Peripheral arterial disease in diabetes – a review. Diabetic Med 2010; 27: 4-14. 100 Marso SP, Hiatt WR. Peripheral Arterial Disease in Patients With Diabetes. J Am Coll Cardiol 2006; 47: 921-29. 101 Norgren L, Hiatt WR, Dormandy JA, Nehler MR, Harris KA, Fowkes FGR. Inter-Society Consensus for the Management of Peripheral Arterial Disease (TASC II). Eur J Vasv Endovasc Surg 2007; 33: S1-S70. 102 Winsor T. Influence of arterial disease on the systolic blood pressure gradients of the extremity. Am J Med Sci 1950; 220: 117-126. 103 Gaskell P. Rate of blood flow in the foot and calf before and after reconstruction by arterial grafting of an occluded main artery to the lower limb. Clin Sci 1956; 15: 259. 104 Strandness DE, Radke HM, Bell JW. Use of a new simplified plethysmograph in the clinical evaluation of patients with arteriosclerosis obliterans. Surg Gynec Obstet 1961; 112: 751. 105 Strandness DE, Bell JW. Peripheral vascular disease: diagnosis and objective evaluation using a mercury strain gauge. Ann Surg 1965: 161; 1. 106 Strandness DE, Stahler C. Arteriosclerosis obliterans: manner and rate of progression. JAMA 1966; 196: 1. 107 Carter SA. Indirect systolic pressures and pulse waves in arterial occlusive diseases of the lower extremities. Circulation 1968; 37: 624-637. 108 Carter SA. Clinical measurement of systolic pressures in limbs with arterial occlusive disease. JAMA 1969; 207: 1869. 109 Yao ST, Hobbs JT, Irvine WT. Ankle systolic pressure measurements in arterial disease affecting the lower extremities. Br J Surg 1969; l 56: 676-679. 110 Yao ST. Haemodynamic studies in peripheral arterial disease. Br J Surg 1970; 57: 761-766. 111 McKenna M, Wolfson S, Kuller LH. The ratio of ankle and arm arterial pressure as an independent predictor of mortality. Atherosclerosis 1991; 87: 119-128. 112 Newman AB, Sutton Tyrrell K, Vogt MT, Kuller LH. Morbidity and Mortality in Hypertensive Adults with a Low Ankle/Arm Blood Pressure Index. JAMA 1993; 270: 487-489. 113 Newman AB, Sutton Tyrrell K, Kuller LH. Mortality over four years in SHEP participants with a low ankle-arm index. J Am Geriatr Soc 1997; 45: 1472-1478. 114 Leng GC, Fowkes FGR, Lee AJ, Dunbar J, Housley E, Ruckley CV. Use of ankle brachial pressure index to predict cardiovascular events and death: a cohort study. Br Med J 1996; 313: 1440-44. 115 Murabito JM, Evans JC, Larson MG, Nieto K, Levy D, Wilson PWF. The Ankle-Brachial Index in the Elderly and Risk of Stroke, Coronary Disease, and DeathArch Intern Med. 2003;163(16):1939-1942
155

116 Resnick HE, Lindsay RS, McDermott MM, Devereux RB, Jones KL, Fabsitz RR, Howard BV. Relationship of High and Low Ankle Brachial Index to All-Cause and Cardiovascular Disease Mortality: the Strong Heart Study. Circulation 2004; 109: 733-739. 117 Resnick HE, Foster GL. Prevalence of elevated ankle-brachial index in the United States 1999 to 2002. Am J Med 2005; 118: 676-679.. 118 Aboyans V, Ho E, Denenberg JO, Ho LA, Natarajan L, Criqui MH. The association between elevated ankle systolic pressures and peripheral occlusive arterial disease in diabetic and nondiabetic subjects. J Vasc Surg 2008; 48: 1197-1203 119 Wattakanit K, Folsom AR, Duprez DA, Weatherley BD, Hirsch AT. Clinical significance of a high ankle-brachial index: insights from the Atherosclerosis Risk in Communities (ARIC) Study. Atherosclerosis 2007; 190: 459-464. 120 Verberk WJ, Kollias A, Stergiou GS. Automated oscillometric determination of the ankle-brachial index: a systematic review and meta-analysis. Hypertens Res 2012; 35: 883-891. 121 Cortez-Cooper MY, Supak JA, Tanaka H. A new device for automatic measurements of arterial stiffness and ankle-brachial index. Am J Cardiol 2003; 91: 1519-1522. 122 Nukumizu Y, Matsushita M, Sakurai T, Kobayashi M, Nishikimi N, Komori K. Comparison of Doppler and oscillometric ankle blood pressure measurement in patients wit angiographically documented lower extremity arterial occlusive disease. Angiology 2007; 58: 303-308. 123 Pan C, Staessen JA, Li Y, Wang J. Comparison of three measures of the ankle-brachial blood pressure index in a general population. Hypertens Res 2007; 30: 555-561. 124 Richart T, Kuznetsova T, Wizner B, Strujiker-Boudier HA, Staessen JA. Validation of automated oscillometric versus manual measurement of the ankle-brachial index. Hypertens Res 2009; 32: 884-888. 125 Hirsch et al. ACC/AHA 2005 Practice Guidelines. Circulation 2006; 113: 1474-1547. 126 Muntner P, Wildman RP, Reynolds K, DeSalvo KB, Chen J, Fonseca V. Relationship Between HbA1c level and Peripheral Arterial Disease. Diabetes Care 2005; 28: 1981-87. 127 The BARI 2D Study Group. A Randomized Trial of Therapies for Type 2 Diabetes and Coronary Artery Disease. N Engl J Med 2009; 360: 2503-2515. 128 Brooks MM, Frye RL, Genuth S, Detre KM, Nesto R, Soberl BE, Kelsey SF, Orchard TJ. Hypotheses, design, and methods for the Bypass Angioplasty Revascularization Investigation 2 Diabetes (BARI 2D) Trial. Am J Cardiology 2006; 97: 9G-19G. 129 Bypass Angioplasty Revascularization Investigation 2 Diabetes Study Group. Baseline characteristics of patients with diabetes and coronary artery disease enrolled in the Bypass Angioplasty Revascularization Investigation 2 Diabetes (BARI 2D) trial. American Heart Journal 2008 Sep; 156(3): 528-536, 536.e1-5. 130 Magee MF, Isley WL. Rationale, Design, and Methods for Glycemic Control in the Bypass Angioplasty Revascularization Investigation 2 Diabetes (BARI 2D) Trial. Am J Cardiology 2006; 97: 20G-30G. 131 Singh PP, Abbott JD, Lombardero MS, Sutton-Tyrrell K, Woodhead G, Venkitachalam L, Tsapatsaris NP, Piemonte TC, Lago RM, Rutter MK, Nesto RW. The Prevalence and Predictors of an Abnormal Ankle-Brachial Index in the Bypass Angioplasty Revascularization Investigation 2 Diabetes (BARI 2D) Trial. Diabetes Care 2011; 34: 464-467 132 Patel CB, de Lemos JA, Wyne KL, McGuire DK. Thiazolidinediones and risk for atherosclerosis: pleiotropic effects of PPARγ agonism. Diabetes Vasc Dis Res 2006; 3: 65-71. 133 Staels B, Fruchart JC. Therapeutic roles of peroxisome proliferator–activated receptor agonists. Diabetes 2005; 54: 2460-2470. 134 Yamasaki Y, Katakami N, Furukado S, Kitagawa K, Nagatsuka K, Kashiwagi A, Daida H, Kawamori R, Kaku K. Long-term effects of pioglitazone on carotid atherosclerosis in Japanese patients with type 2 diabetes without a recent history of macrovascular morbidity. J Atheroscler Thromb 2010; 17: 1132-1140. 135 Park YM, Kashyap SR, Major JA, Silverstein RL. Insulin promotes macrophage foam cell formation: potential implications in diabetes-related atherosclerosis. Lab Investigation 2012; 92: 1171-1180. 136 Rajamani K, Colman PG, Li Ping L, Best JD, Voysey M, D’Emden MC, Laakso M, Baker JR, Keech AC. Effect of fenofibrate on amputation events in people with type 2 diabetes mellitus (FIELD study): a prespecified analysis of a randomised controlled trial. Lancet 2009; 373: 1780-1788. 137 Gandhi S, Weinberg I, Margey R, Jaff MR. Comprehensive Medical Management of Peripheral Arterial Disease. Prog Card Dis 2011; 54: 2-13.
156

138 Hiatt WR, Regensteiner LG, Hargarten ME, Wolfel EE, Brass EP. Benefit of Exercise Conditioning for Patients with Peripheral Arterial Disease. Circulation 1990; 81: 602-609. 139 Chi UW, Jaff MR. Optimal risk factor modification and medical management of the patient with peripheral arterial disease. Cath Cardiovasc Interv 2008; 71: 475-89. 140 Aljada A. Endothelium, inflammation, and diabetes. Metab Syndr Relat Disord 2003; 1: 3-21. 141 Makimattila S, Virkamaki A, Groop PH, Cockroft J, Utrianen T, Fagerudd J, Yki-Jarvinen H. Chronic hyperglycemia impairs endothelial function and insulin sensitivity via different mechanisms in insulin-dependent diabetes mellitus. Circulation 1996; 94: 1276-1282. 142 McDermott MM, Lloyd-Jones DM. The role of biomarkers and genetics in peripheral arterial disease. J Am Coll Cardiol 2009; 54: 1228-1237. 143 Ridker P, Stampfer M, Rifai N. Novel risk factors for systematic atherosclerosis: a comparison of C-reactive protein, fibrinogen, homocysteine, lipoprotein(a), and standard cholesterol screening as predictors of peripheral arterial disease. JAMA 2001; 295: 2481-2485. 144 Pradhan AD, Shrivastava S, Cook NR, Rifai N, Creager MA, Ridker PM. Systematic peripheral arterial disease in women: nontraditional biomarkers of elevated risk. Circulation 2008; 117: 823-831. 145 Tzoulaki I, Murray GD, Lee AJ, Rumley A, Lowe GD, Fowkes FG. C-reactive protein, interleukin-6, and soluble adhesion molecules as predictors of progressive peripheral atherosclerosis in the general population: the Edinburgh Artery Study. Circulation 2005; 112: 976-983. 146 Levi M, van der Polt T, Buller HR. Biderectional Relation Between Inflammation and Coagulation. Circulation 2004; 109: 2698-2704. 147 Althouse AD, Abbott JD, Sutton Tyrrell K, Forker AD, Lombardero MS, Buitron LV, Pena-Sing I, Tardif JC, Brooks MM. Favorable Effects of Insulin Sensitizers Pertinent to Peripheral Arterial Disease in Type 2 Diabetes: Results from the Bypass Angioplasty Revascularization 2 Diabetes (BARI 2D) Trial. Diabetes Care 2013; published online before print June 4, 2013; doi: 10.2337/dc12-2265. 148 Beckman JA, Creager MA, Libby P. Diabetes and atherosclerosis: epidemiology, pathophysiology, and management. JAMA 2002; 287: 2570-81. 149 Feener EP, King GL. Vascular dysfunction in diabetes mellitus. Lancet 1997; 350 Suppl 1: SI9-13. 150 Vlassara H. Recent progress in advanced glycation end products and diabetic complications. Diabetes 1997; 46 Suppl 2: S19-25. 151 Schmidt AM, Yan SD, Wautier JL, Stern D. Activation of receptor for advanced glycation end products: a mechanism for chronic vascular dysfunction in diabetic vasculopathy and atherosclerosis. Circ Res 1999; 84: 489-97. 152 Sheetz MJ, King GL. Molecular understanding of hyperglycemia’s adverse effects for diabetic complications. JAMA 2002; 288: 2579-88. 153 Ix JH, Katz R, De Boer IH, Kestenbaum BR, Allison MA, Siscovick DS, Newman AB, Sarnak MJ, Shlipak MG, Criqui MH. Association of Chronic Kidney Disease With the Spectrum of Ankle Brachial Index: The CHS (Cardiovascular Health Study). J Am Coll Cardiol 2009; 54: 1176-1184. 154 Wattanakit K, Folsom AR, Selvin E, Croesh J, Hirsch AT, Weatherley BD. Kidney Function and Risk of Peripheral Arterial Disease: Results from the Atherosclerosis Risk in Communities (ARIC) Study. J Am Soc Nephrol 2007; 18: 629-636. 155 Zoccali C, Mallamaci F, Tripepi G. Cardiovascular disease risk status in elderly persons with renal insufficiency. Kidney Int Suppl 2003; Jun: S105-S110. 156 O’Hare AM, Johansen K. Lower-extremity peripheral arterial disease among patients with end-stage renal disease. J Am Soc Nephrol 2001; 12; 2838-2847. 157 Aboyans V, Criqui MH, Abraham P, Allison MA, Creager MA, Diehm C, Fowkes GFR, Hiatt WR, Jonsson B, Lacroix P, Marin B, McDermott MM, Norgren L, Pande RL, Preux PM, Stoffers HEJ, Treat-Jacobson D. Measurement and Interpretation of the Ankle-Brachial Index: A Scientific Statement from the American Heart Association. Circiulation 2012; 126: 2890-2909. 158 Klein S, Hage JJ. Measurement, calculation, and normal range of the ankle-arm index: a bibliometric analysis and recommendation for standardization. Ann Vasc Surg 2006; 20: 282-292. 159 Aboyans V, Lacroix P, Preuz PM, Vergnenegre A, Ferrieres J, Laskar M. Variability of ankle-arm index in general population according to mode of calculation. Int Angiol 2002; 21: 237-243.
157
160 Allison MA, Aboyans V, Granston T, McDermott MM, Kamineni A, Ni H, Criqui MH. The relevance of different methods of calculating the ankle-brachial index: the Multi-Ethnic Study of Atherosclerosis. Am I Epidemiol 2010; 171: 368-376. 161 Weatherley BD, Chambless LE, Heiss G, Catellier DJ, Ellison CR. The reliability of the ankle-brachial index in the Atherosclerosis Risk in Communities (ARIC) study and the NHLBI Family Heart Study (FHS). BMC Cardiovasc Disord 2006; 7. 162 Aboyans V, Lacroix P, Doucet S, Preux PM, Criqui MH, Laskar M. Diagnosis of peripheral arterial disease in general practice: can the ankle-brachial index be measured either by pulse palpation or an automatic blood pressure device? Int J Clin Pract 2008; 62: 1001-1007. 163 Korno M, Eldrup N, Sillesen H. Comparison of ankle-brachial index measured by an automated oscillometric apparatus with that by standard Doppler technique in vascular patients. Eur J Vasc Endovasc Surg 2009; 38: 610-615. 164 Richart T, Kuznetsova T, Wizner B, Strujiker-Boudier HA, Staessen JA. Validation of automated oscillometric versus manual measurement of the ankle-brachial index. Hypertens Res 2009; 32: 884-888. 165 Blackwelder, W.C. 1998. 'Equivalence Trials.' In Encyclopedia of Biostatistics, John Wiley and Sons. New York. Volume 2, 1367-1372. 166 Pan C, Staessen JA, Li Y, Wang J. Comparison of three measures of the ankle-brachial blood pressure index in a general population. Hypertens Res 2007; 30: 555-561. 167 Kimura A, Hashimoto J, Watabe D, Takahashi H, Ohkubo T, Kikuya M, Imai Y. Patient characteristics and factors associated with inter-arm difference of blood pressure measurements in a Japanese population in Ohasama, Japan. J Hypertens 2004; 22: 2277-2283. 168 Avolio AP, Van Bortel LM, Boutouyrie P, Cockroft JR, McEniery CM, Protogerou AD, Roman MJ, Safar ME, Segers P, Smulyan H. Role of pulse pressure amplification in arterial hypertension: experts’ opinion and review of the data. Hypertension 2009; 54: 375-383. 169 Beckman JA, Higgins CO, Gerhard-Herman M. Automated oscillometric determination of the ankle-brachial index provides accuracy necessary for office practice. Hypertension 2006; 47: 35-38. 170 Ankle Brachial Index Collaboration. Ankle Brachial Index Combined With Framingham Risk Score to Predict Cardiovascular Events and Mortality: A Meta-Analysis. JAMA 2008; 300: 197-208. 171 Criqui MH, Ninomiya JK, Wingard DL, Ming J, Fronek A. Progression of peripheral arterial disease predicts cardiovascular disease morbidity and mortality. J Am Coll Cardiol 2008; 52: 1736-1742. 172 Hiatt WR. Can Measuring the Ankle-Brachial Index Improve Public Health? J Am Coll Cardiol 2008; 52: 1743-1744. 173 Mohler ER, Treat-Jacobson D, Reilly MP, Cunningham KE, Miani M, Criqui MH, Hiatt WR, Hirsch AT. Utility and barriers to performance of the ankle-brachial index in primary care practice. Vasc Med 2004; 9: 253-260. 174 American Diabetes Association Clinical Practice Recommendations. Diabetes Care 2013; 36(S1): S1-S110.
158
Related Documents


![ARTERIAL PERIPHERAL VASCULAR DISEASES.ppt [Read-Only]ocw.usu.ac.id/course/download/1110000113-cardiovascular-system/… · arterial peripheral vascular diseases acute arterial occlusion](https://static.cupdf.com/doc/110x72/604e83caf1418f71db611c5a/arterial-peripheral-vascular-read-onlyocwusuacidcoursedownload1110000113-cardiovascular-system.jpg)