ARTICLE IN PRESS Pattern Recognition ( ) – www.elsevier.com/locate/patcog Performance evaluation and optimization for content-based image retrieval Julia Vogel a , ∗ , Bernt Schiele b a Department of Computer Science, Swiss Federal Institute of Technology (ETH) Zurich, Switzerland b Department of Computer Science, Darmstadt University of Technology, Germany Received 30 November 2004; received in revised form 28 October 2005; accepted 28 October 2005 Abstract Performance evaluation of content-based image retrieval (CBIR) systems is an important but still unsolved problem. The reason for its importance is that only performance evaluation allows for comparison and integration of different CBIR systems. We propose an image retrieval system that splits the retrieval process into two stages. Users are querying the system through image description using a set of local semantic concepts and the size of the image area to be covered by the particular concept. In Stage I of the system, only small patches of the image are analyzed whereas in the second stage the patch information is processed and the relevant images are retrieved. In this two-stage retrieval system, the retrieval performance, that is precision and recall, can be modeled statistically. Based on the model, we develop closed-form expressions that allow for the prediction as well as the optimization of the retrieval performance. As shown through experiments, the retrieval precision can be increased by up to 55% and the retrieval recall by up to 25% depending on the user query. 2005 Pattern Recognition Society. Published by Elsevier Ltd. All rights reserved. Keywords: Content-based image retrieval; Performance prediction; Performance characterization; Computer vision; Image semantics 1. Introduction Since long-time performance evaluation of computer vi- sion algorithms has been recognized as being of utmost im- portance for the advancement of the field [1,2]. The goal of performance evaluation or characterization here refers to the analysis of the quality, not the speed, of a particular vision algorithm. Usually, this goal requires the generation of large benchmark sets with hand-labeled or synthetically produced ground truth, a very tedious process often leading to incon- sistent annotations. However, this effort is undertaken regu- larly for some computer vision and pattern recognition ap- plications such as tracking and surveillance with the PETS workshop started in 2000 [3], document analysis with the TREC seri1s carried out for the first time in 1992 [4], face ∗ Corresponding author. Laboratory for Computational Intelligence, Department of Computer Science, University of British Columbia, Vancouver, Canada. Tel.: +1 604 822 6281; fax: +1 604 822 5485. E-mail addresses: [email protected] (J. Vogel), [email protected] (B. Schiele). 0031-3203/$30.00 2005 Pattern Recognition Society. Published by Elsevier Ltd. All rights reserved. doi:10.1016/j.patcog.2005.10.024 recognition [5], and image flow, vehicle detection, symbol and shape recognition [6]. Only recently, as part of TREC 2001, a video track devoted to the research in automatic seg- mentation, indexing, and content-based retrieval of digital video was put together [7]. In addition, the problem of per- formance evaluation and validation was the topic of several dedicated workshops [8–10] and discussions [11–13]. Also in the context of content-base image retrieval (CBIR), performance evaluation of the proposed retrieval systems is essential as argued by Smith [14], or Müller et al. [15]. Performance evaluation is indispensable since it allows the comparison of different systems and the analysis of how those systems perform depending on the applica- tion. Knowing the performance of different algorithms and systems also permits their combination and their integra- tion into larger and more powerful CBIR systems. Some systems, for example, are better to coarsely limit the search space and therefore might be used as the front-end of a larger system. Other systems, on the other hand, might work well on small, preprocessed subsets of the database.

Welcome message from author
This document is posted to help you gain knowledge. Please leave a comment to let me know what you think about it! Share it to your friends and learn new things together.
Transcript
ARTICLE IN PRESS
Pattern Recognition ( ) –www.elsevier.com/locate/patcog
Performance evaluation and optimizationfor content-based image retrieval
Julia Vogela,∗, Bernt Schieleb
aDepartment of Computer Science, Swiss Federal Institute of Technology (ETH) Zurich, SwitzerlandbDepartment of Computer Science, Darmstadt University of Technology, Germany
Received 30 November 2004; received in revised form 28 October 2005; accepted 28 October 2005
Abstract
Performance evaluation of content-based image retrieval (CBIR) systems is an important but still unsolved problem. The reason for itsimportance is that only performance evaluation allows for comparison and integration of different CBIR systems. We propose an imageretrieval system that splits the retrieval process into two stages. Users are querying the system through image description using a set oflocal semantic concepts and the size of the image area to be covered by the particular concept. In Stage I of the system, only small patchesof the image are analyzed whereas in the second stage the patch information is processed and the relevant images are retrieved. In thistwo-stage retrieval system, the retrieval performance, that is precision and recall, can be modeled statistically. Based on the model, wedevelop closed-form expressions that allow for the prediction as well as the optimization of the retrieval performance. As shown throughexperiments, the retrieval precision can be increased by up to 55% and the retrieval recall by up to 25% depending on the user query.� 2005 Pattern Recognition Society. Published by Elsevier Ltd. All rights reserved.
Keywords: Content-based image retrieval; Performance prediction; Performance characterization; Computer vision; Image semantics
1. Introduction
Since long-time performance evaluation of computer vi-sion algorithms has been recognized as being of utmost im-portance for the advancement of the field [1,2]. The goal ofperformance evaluation or characterization here refers to theanalysis of the quality, not the speed, of a particular visionalgorithm. Usually, this goal requires the generation of largebenchmark sets with hand-labeled or synthetically producedground truth, a very tedious process often leading to incon-sistent annotations. However, this effort is undertaken regu-larly for some computer vision and pattern recognition ap-plications such as tracking and surveillance with the PETSworkshop started in 2000 [3], document analysis with theTREC seri1s carried out for the first time in 1992 [4], face
∗ Corresponding author. Laboratory for Computational Intelligence,Department of Computer Science, University of British Columbia,Vancouver, Canada. Tel.: +1 604 822 6281; fax: +1 604 822 5485.
E-mail addresses: [email protected] (J. Vogel),[email protected] (B. Schiele).
0031-3203/$30.00 � 2005 Pattern Recognition Society. Published by Elsevier Ltd. All rights reserved.doi:10.1016/j.patcog.2005.10.024
recognition [5], and image flow, vehicle detection, symboland shape recognition [6]. Only recently, as part of TREC2001, a video track devoted to the research in automatic seg-mentation, indexing, and content-based retrieval of digitalvideo was put together [7]. In addition, the problem of per-formance evaluation and validation was the topic of severaldedicated workshops [8–10] and discussions [11–13].
Also in the context of content-base image retrieval(CBIR), performance evaluation of the proposed retrievalsystems is essential as argued by Smith [14], or Müller etal. [15]. Performance evaluation is indispensable since itallows the comparison of different systems and the analysisof how those systems perform depending on the applica-tion. Knowing the performance of different algorithms andsystems also permits their combination and their integra-tion into larger and more powerful CBIR systems. Somesystems, for example, are better to coarsely limit the searchspace and therefore might be used as the front-end of alarger system. Other systems, on the other hand, mightwork well on small, preprocessed subsets of the database.

2 J. Vogel, B. Schiele / Pattern Recognition ( ) –
ARTICLE IN PRESS
However, evaluation of content-based image retrieval sys-tems is particularly difficult. On a complete system level, theultimate performance measure should be user-centric and re-lated to user satisfaction. Obviously, such performance mea-sures are not only difficult to define but will also vary greatlybetween individual users, tasks and applications, and evenbetween sessions with the same user. Establishing generallyaccepted ground truth in that context seems to be tedious ifnot impossible due to the required amount of consistentlyannotated images. Images are very complex carriers ofinformation. Thus, the hand-annotation of images and thedefinition of benchmark sets is not only application- anduser-dependent but also often ambiguous. In addition, thesemantic gap between the user’s image understanding andthe low-level image representation of the computer compli-cates the definition of benchmarks.
Recognizing the fact that performance evaluation is ex-tremely important and at the same time very difficult, thispaper introduces a two-stage retrieval system which makesperformance characterization manageable. The key idea isthat the user queries the database with high-level semanticconcepts [16,17]. An immediate benefit is that for those localsemantic concepts the acquisition of large amounts of con-sistent ground truth is feasible because the semantic contentof the concepts is less complex than that of full images. Inaddition, the two-stage retrieval process allows to model theretrieval results statistically. Based on the statistical model,we develop closed-form equations for the prediction of re-trieval precision and retrieval recall. In the two-stage re-trieval system it is also possible to optimize the retrievalperformance. The performance optimization uses the resultsof the performance prediction. Depending on the user query,the optimization step resets internal parameters in order toincrease precision and/or recall of the retrieval.
In general, the intention of our system is to unburdenthe user from any parameter settings or complicated querymodes. The query based on local semantic concepts is simi-lar to the way humans describe images. Thus, with the two-stage retrieval system the semantic gap between the imageunderstanding of the user and the computer decreases. Othersystems propose relevance feedback to capture the user’shigh-level query and perception subjectivity (e.g. [18,19]).The downside of these approaches is that the user is requiredto undergo possibly several rounds of feedback, and thatit is not possible to predict or optimize the retrieval qual-ity beforehand. In our system, the performance optimizationstep is transparent to the user. The retrieval performance in-creases without requiring the user to set any parameters. Inaddition, many current retrieval systems follow the query-by-example paradigm in which the user is searching for im-ages based on an example (for an overview of the currentstate of CBIR research refer to Ref. [20]). Our system isbased on the idea that the user describes the desired imageusing a set of semantic concepts.
The rest of the paper is organized as follows: Section 2introduces the two-stage retrieval system and the employed
query mode. In Section 3, closed-form expressions for theretrieval performance in the two-stage system are derived.The performance of the system can be optimized in threeways: in Stage II of the system (Section 4), in Stage I of thesystem (Section 5) or jointly in both stages (Section 6). InSection 7, an additional, approximate optimization methodis introduced that does not require specific database informa-tion. The proposed methods are summarized and discussedin Section 8.
2. Two-stage retrieval system
In the proposed retrieval system, users describe the im-ages they are looking for by using a set of local semanticconcepts (e.g. ‘sky’, ‘water’, ‘building’, ‘rocks’, etc.) and thesize of the image area to be covered by the particular con-cept. Thus, an exemplary query might be: “Search imageswith 20–40% of ‘sky’ ”. Fig. 5 depicts exemplary retrievalresults for that query. Note that here, due to the semanticquery mode, the concept ‘sky’ corresponds to very differentoccurrences of sky (e.g. clear sky, cloudy sky, overcast sky,etc.). The interval-based query mode might seem artificial atfirst sight. However, the user interval could also be mappedto descriptors such as “very little”, “half of”, “most of”, etc.In addition, the combination of the search for several con-cepts in the same images leads to a powerful global imagerepresentation that can be used for scene categorization orretrieval as shown [21].
The technical realization of the retrieval is split into twostages (see Fig. 1). In order to enable the use of conceptsfor querying, the system provides a set of so-called conceptdetectors. In Stage I of the system, the database images areanalyzed by these concept detectors. They return a binarydecision whether a particular image region contains the con-cept (positive patch) or not (negative patch). In the currentimplementation, each image is subdivided into a regular gridof patches each comprising 1% of the image. However, thesystem can be extended to arbitrary patch sizes. In Stage II,the patch-wise information of the concept detectors is pro-cessed according to the user interval to actually retrieve aset of images. The performance optimization affects the se-lection of the appropriate concept detector in Stage I and thesetting of an internal parameter, the so-called system inter-val S = [Slow%, Sup%], in Stage II. Here, the main idea isto internally adapt the system interval in order to compen-sate for some of the concept detectors’ errors and to thusoptimize the system performance.
3. Performance prediction
The goal of the performance prediction is to make a fore-cast on the performance of the retrieval depending on certainparameters. We define the retrieval performance by preci-sion, which is the percentage of the retrieved images thatare also relevant, and recall, which is the percentage of therelevant images that are retrieved. In the remainder of this

ARTICLE IN PRESSJ. Vogel, B. Schiele / Pattern Recognition ( ) – 3
Stage I
Stage II
Input to Retrieval System
Concept Detector
(precision/recall)
User Interval[Ulow%,Uup%]
Retrieval System
Retrieval Results
Image Analysis
Image Database
Image Retrieval
Set of ConceptDetectors
User Query
‘concept’User Interval[Ulowu%,Up%]
sky grass foil. build
Search forImage Content
Fig. 1. Two-stage retrieval system.
section, the prerequisites and the derivations for the perfor-mance prediction are derived separately for each stage.
3.1. Performance of the concept detectors
A valid user query consists of the concept being searchedfor and a user interval U = [Ulow%, Uup%] specifying theamount of the image to be covered by the concept. Since wedivide the image into a grid of 10 × 10 image patches, Ulow
and Uup also correspond to the number of image patches cov-ered by the desired concept. In Stage I of the retrieval system,there exists a multitude of detectors for various concepts.This implies especially that there might be multiple conceptdetectors for one single concept with different performancecharacteristics. According to the user query, the appropriateconcept detector is selected from those detectors, the imagepatches are analyzed and the classification results per patchare passed to Stage II. This analysis stage can be performedoff-line. The performance characteristics of the concept de-tectors are modeled by the probability p for correctly detect-ing a positive patch (true positives) and the probability q forcorrectly detecting a negative image region (true negatives).
The concept detectors are usually trained off-line. InSection 5, we will discuss the learning of the concept de-tectors in more detail. The goal is to have multiple conceptdetectors with varying performance characteristics for eachconcept. This can be obtained by using one classifier withdifferent confidence thresholds or by using different clas-sifiers. In general, any classifier with known performancecharacteristics can be employed such as for example thesemantic classifiers of Town and Sinclair [22] or the texturemodels for automatic annotation of Picard and Minka [23].
3.2. Mathematical framework
The prerequisite for the performance prediction is that theperformance of the employed concept detector is known in
the form of the detectors’ parameters p and q. For now, weassume the concept distribution P(NP ) to be known. Thisassumption will be relaxed in Section 4.3. Precision andrecall without subscript always refer to the overall retrievalperformance.
The derivations are based on the assumption that the con-cept detectors decide independently on each patch. Thus,the probability ptrue(k) and the probability pf alse(k) arebinomially distributed. (N = total number of patches, NP =number of positive patches per image.)
ptrue(k) =(
NP
k
)pk(1 − p)NP −k , (1)
pf alse(k) =(
N − NP
k
)(1 − q)kqN−NP −k . (2)
If a total of i positive patches is to be retrieved, both the truepositives and the false positives add up to the total number ofdetected patches. Thus, the probability to retrieve i positivepatches, given that a particular image has in fact NP truepositive patches, is
P(Nretr = i|NP ) =i∑
j=0
ptrue(i − j)pf alse(j). (3)
Similarly, if the interval U = [Ulow%, Uup%] of positivepatches is searched for, Eq. (3) has to be summed over thisinterval to obtain the probability P(Nretr ∈ U |NP ).1
P(Nretr ∈ U |NP ) =∑i∈U
i∑j=0
ptrue(i − j)pf alse(j). (4)
1Since N=100 in our experiments, the percentages Ulow% and Uup%can be treated as integers in the summations. Otherwise, a normalizingconstant would be necessary.

4 J. Vogel, B. Schiele / Pattern Recognition ( ) –
ARTICLE IN PRESS
If Eq. (4) is weighted with the concept distribution P(NP ),we obtain the probability to retrieve images (not patches!)that satisfy the query U relative to the image database:
Pretr (U) =N∑
NP =0
P(Nretr ∈ U |NP )P (NP ). (5)
Precision and recall depend on the probabilities for relevantimages Prelevant(U) andfor true-positive images Ptrue_pos(U).In order to obtain Ptrue_pos(U), P(Nretr ∈ U |NP ) is onlyweighted with the part of the concept distribution P(NP )
that lies inside the user interval U = [Ulow%, Uup%]:Ptrue_pos(U) =
∑NP ∈U
P (Nretr ∈ U |NP )P (NP ). (6)
The probability that images satisfy the user query dependson the user interval U and the concept distribution:
Prelevant (U) =∑
NP ∈U
P (NP ). (7)
Finally, Eqs. (5)–(7) lead to a closed-form expression forthe probability of precision and the probability of recall:
Pprecision(U) = Ptrue_pos(U)
Pretrieved(U)
=∑
NP ∈UP (Nretr ∈ U |NP )P (NP )∑NNP =0P(Nretr ∈ U |NP )P (NP )
, (8)
Precall(U) = Ptrue_pos(U)
Prelevant (U)
=∑
NP ∈U P (Nretr ∈ U |NP )P (NP )∑NP ∈U P (NP )
. (9)
Thus, with Eqs. (8) and (9), precision and recall of the re-trieval can be predicted. The expressions for precision andrecall have been validated on a database of 1073 images.The database images have been divided into a regular gridof 10 × 10 image patches, and the patches have been man-ually annotated with the concepts ‘sky’, ‘water’, ‘grass’,‘buildings’, ‘face’, and ‘car’. All simulations in the followingare based on this ground truth. Depending on the selecteddetector parameter p and q, the annotations are randomlyfalsified. For the exemplary query [20%, 40%] of ‘sky’(p = 0.9, q = 0.8), the prediction is 22.7% precision and54.5% recall. Simulation of 133 rounds leads to an averageof 22.75% precision (�=0.65%) and an average of 54.52%recall (�=1.8%) which are close to the predicted value. Thehigher standard deviation of the recall is due to the smalleramount of images in the estimation of Prelevant (U) than inthe estimation of Pretrieved(U) (compare Eqs. (8) and (9)).
4. Performance optimization in Stage II
In the following three sections, we will introduce sev-eral methods for performance optimization in our two-
stage retrieval system. The general goal of the performanceoptimization is to increase precision and recall of the imageretrieval. As will be shown, it is possible to optimize preci-sion and recall separately as well as jointly depending onthe user’s request. In this section, we will only introducemethods that concern Stage II of the retrieval system. InSection 5, we discuss the optimization potential of the con-cept detectors in Stage I. In Section 6, it will be shown thata joint optimization of both stages is most beneficial. Fora schematic view of the retrieval system with performanceoptimization see Fig. 2.
The derivation of performance optimization for Stage IIof the retrieval system requires the introduction of an inter-nal parameter: the system interval S=[Slow%, Sup%]. Sincethe detectors’ decisions are only correct with a certain prob-ability, the retrieval performance will vary if the system isqueried internally with a query S = [Slow%, Sup%] that dif-fers from the user interval U = [Ulow%, Uup%]. Intuitively,if the probability is high that the detector makes a false posi-tive decision, it is necessary/sensible to raise the lower limitof the user interval Ulow to Slow =Ulow +X, X > 0. The fol-lowing will formalize this intuition and determine a systeminterval S �= U for internal use that optimizes the retrievalperformance.
First, Eqs. (4)–(9) have to be extended with the internalparameter S. From now on, the probability Pretr to retrieveimages depends only on the system query S instead of theuser interval U because the actual retrieval of the images inthe database is governed only by S.
Pretr (S) =N∑
NP =0
P(Nretr ∈ S|NP )P (NP ), (10)
where
P(Nretr ∈ S|NP ) =∑i∈S
i∑j=0
ptrue(i − j)pf alse(j). (11)
The probability for true-positive images Ptrue_pos dependson both S and U. The retrieval is performed according tothe system interval S, but is evaluated according to the userinterval U:
Ptrue_pos(U, S) =∑
NP ∈U
P (Nretr ∈ S|NP )P (NP ). (12)
Eq. (7) remains valid because only the user interval Udecides whether an image is relevant for the retrieval. Insummary, the probabilities for retrieval precision and recallbecome (compare Eqs. (8) and (9)):
Pprecision(U, S) =∑
NP ∈U P (Nretr ∈ S|NP )P (NP )∑NNP =0 P(Nretr ∈ S|NP )P (NP )
, (13)
Precall(U, S) =∑
NP ∈U P (Nretr ∈ S|NP )P (NP )∑Uup
NP =UlowP (NP )
. (14)

ARTICLE IN PRESSJ. Vogel, B. Schiele / Pattern Recognition ( ) – 5
Stage I
Stage II
Input to Retrieval System
Concept Detector(precision/recall)
User Interval[Ulow%,Uup%]
Retrieval System
Retrieval Results
Image Analysis
Image Database
Image Retrieval
Set of conceptdetectors
User Query
‘concept’User Interval[Ulow%,Uup%]
sky grass foil. build
Query Optimization
IntervalOptimization
DetectorSelection
System Interval[Slow%,Sup%]
Search forImage Content
Fig. 2. Two-stage retrieval system with query optimization.
0 0.1 0.2 0.3 0.4 0.5 0.6 0.7 0.8 0.9 10
0.1
0.2
0.3
0.4
0.5
0.6
0.7
0.8
0.9
1
p = 100%, q = 100%p = 95%, q = 98%p = 90%, q = 96%p = 85%, q = 94%p = 80%, q = 92%
Precall
Ppr
ecis
ion
Fig. 3. Prediction of precision and recall for “10–30% sky” when varyingthe detectors’ performance p and q and the system interval S.
These two equations are a closed-form expression for re-trieval precision and recall when a user interval is given andthe system is queried internally using S. In Section 4.1, analgorithm is presented that maximizes Eqs. (13) and (14)recursively and returns the optimal system interval S.
Fig. 3 illustrates the influence of the system interval S.The tested query is “Find images with 10–30% ‘sky’ ”. Thefive curves correspond to five different sets for p and q asindicated in the legend of the figure. As before the manualannotations were randomly falsified depending on p and q.From left to right Slow and Sup are varied in the follow-ing way: S = [Slow%, Sup%]∈{[18%, 22%], [14%, 26%],[10%, 30%], [6%, 34%], [2%, 38%]} while the user inter-val is U=[10%, 30%] in all cases. As expected, the precisionis very high when the system interval is narrow whereas therecall is low. By increasing the width of the system interval,the recall can be increased at the cost of the precision. The
decrease of the precision is much faster for smaller values ofp and q. This behavior is due to the fact that the user intervalcovers only about 20% of the image. Thus, the probability forthe detection of false positives is much higher than the prob-ability for the detection of false negatives. As a result, manyof the retrieved images are not relevant and the precisiondrops.
4.1. Optimization algorithm
Eqs. (13) and (14) are closed-form expressions for preci-sion and recall depending on the user interval and the systeminterval. This implies that the equations can be evaluatedprior to retrieval making it possible to optimize the expectedperformance prior to retrieval. Because the equations do notallow us to find a closed-form expression for the system in-terval S = [Slow%, Sup%] as a function of user interval anddesired performance, we use a recursive algorithm for ob-taining the system interval that optimizes the retrieval per-formance. The algorithm allows to choose an optimizationconstraint: maximum recall, maximum precision, or jointmaximization of precision and recall. It is also possible toindicate a minimum value for precision and recall.
The algorithm proceeds in two steps. In the first step, aset of system intervals is generated that are most probablyof interest to the user. Starting from the user interval U =[Ulow%, Uup%], precision and recall of that point and itsfour neighbors [Ulow% ± 1%, Uup% ± 1%] are calculatedand stored in a hash table. Recursively, those of the fourneighbors that improve the current performance are used as astarting point and the hash table is updated. Fig. 4 depicts thecomplete search space, that is the precision-recall pairs forall possible system intervals, for the query U =[20%, 40%]of ‘sky’ and the detector parameters p = 0.9 and q = 0.8.Each point in the graph corresponds to a different set ofsystem queries S=[Slow%, Sup%]. Note that two points that

6 J. Vogel, B. Schiele / Pattern Recognition ( ) –
ARTICLE IN PRESS
100%
100%
Maximum Precision
Maximum Recall
User Query
100%
100%
Recall
Pre
cisi
on
Joint Optimization
50%
Fig. 4. Predicted search space for [20%, 40%] of ‘sky’, p = 0.9, q = 0.8.
are close to each other in the plot do not necessarily havesimilar system queries.
In the second step, the algorithm selects the point inthe search space that meets the users’ constraints. The twogray lines in Fig. 4 identify the desired minimum perfor-mance of 50%. The predicted performance of the user in-terval is marked by a black circle while the possible solu-tions are marked by gray circles. From left to right theseare: “Maximum Precision”, “Joint Optimization (of Preci-sion and Recall)” and “Maximum Recall”.
4.2. Results: Stage II performance optimization
Fig. 5 shows the retrieval results corresponding to thequery [20%, 40%] of ‘sky’ (p = 0.9, q = 0.8). The user se-lected the joint optimization of precision and recall. Notethe difference to most other retrieval systems. Since herethe concept ‘sky’ is searched for, the retrieved images arevery diverse but perfectly satisfy the user query. Only thefirst 12 retrieved images are displayed. On top of the displaysome statistics are summarized: the precision was predictedto increase from 22.7% to 80.9%. The actual retrieval re-sulted in a precision of 80.2%. The recall was predicted toincrease from 54.5% to 80.8%. In the actual retrieval, the re-call reached 83.2%. Thus, for this particular query, the preci-sion could be improved by 58% and the recall by 25%. Thebars visualize the relationship between non-relevant (darkgray), relevant (medium gray, left of the non-relevants) andretrieved (light gray) images. The length of the bars corre-spond to the amount of images.
Fig. 6 visualizes some optimization results for theoptimization constraint “maximize recall with precision> 50%” for the queries [10%, 30%] ‘grass’ (p = q = 0.9),[30%, 50%] ‘grass’ (p = q = 0.8), and [10%, 30%] ‘build-ings’ (p = q = 0.9). The retrieval using the user intervalis marked in black whereas optimized retrieval is markedin gray with the arrows pointing from the non-optimized
to the optimized case. The optimized system intervals areS = [17%, 58%] for query 1, S = [37%, 56%] for query 2and S = [15%, 42%] for query 3. They are clearly differentfrom the user intervals. Fig. 6 shows that the optimizationconstraints have been met. The precision increased signifi-cantly at all three queries.
In summary, the experiments of the Stage II performanceoptimization have two main results. First, depending on theuser query, a gain of up to 60% in precision and up to 25%in recall can be reached. These results are obtained by prob-abilistic analysis and the resetting of an internal parameter,the system interval. The performance gain did not requirethe use of better classifiers. Second, the experiments showthat the predicted value of the performance is closely metby the true retrieval performance.
4.3. Approximate performance optimization
Up to now, the assumption was that the concept distri-bution P(NP ) is known. Thus, the results of the previoussections were obtained with the complete knowledge aboutthe concept distribution used in Eqs. (13) and (14). Fig. 7ashows the concept distribution P(NP ) of the concept ‘sky’.However, it is not realistic to have the entire distribution athand. So the dependency of the performance prediction andthe performance optimization was tested using two approx-imate distributions. In the first test, the actual distributionof the concepts was completely neglected. Instead, it wasassumed that the number of patches per image containingthe particular concept, that is the positive patches, are uni-formly distributed: Punif orm(NP )= 1/(N + 1) , where N isthe maximum number of positive patches. The distributionis depicted in Fig. 7b.
In the second test, it was assumed that the a priori prob-ability is available if a particular concept is present in animage or not. That leads to a two-class frequency distribu-tion. Class A is the number of images that do not contain the

ARTICLE IN PRESSJ. Vogel, B. Schiele / Pattern Recognition ( ) – 7
Fig. 5. Retrieval results for [20%, 40%] of ‘sky’, p = 0.9, q = 0.8.
0 20 40 60 80 1000
10
20
30
40
50
60
70
80
90
100
Recall
Pre
cisi
on
Maximization of Recall with Precision > 50%
[10%,30%] "grass", p=q=0.9[30%,50%] "grass", p=q=0.8[10%,30%] "buildings", p=q=0.9[10%,30%] "grass", p=q=0.9, optimized[30%,50%] "grass", p=q=0.8, optimized[10%,30%] "buildings", p=q=0.9, optimized
Fig. 6. Retrieval results of three queries: with/without optimization.
concept at all. Class B is the number of images that do con-tain one or more patches of the desired concept. The uniformdistribution of the previous paragraph has been weightedwith the two-class distribution. That is, Ptwo_class(0) con-tains the information of class A and the information ofclass B has been divided equally to Ptwo_class(NP ), withNP = 1, . . . , 100 (see Fig. 7c).
Both precision and recall are functions of the desiredconcept, of the detectors’ performance specified by pand q and of the user interval U = [Ulow%, Uup%]. Inthe experiments, the parameters were varied as follows:concept ∈ {‘grass’, ‘sky’, ‘buildings’, ‘water’}, p = q ∈{0.95, 0.90, 0.85, 0.80, 0.75, 0.70}, U∈{[10%, 30%], [20%,
40%], [30%, 50%], [40%, 60%], [50%, 90%]}. Table 1shows the results of some exemplary queries. The perfor-mance optimization based on the two approximate distribu-tions is compared to the benchmark optimization results thathave been generated with the complete distribution. The goalis to jointly maximize precision and recall. Table 1 shows

8 J. Vogel, B. Schiele / Pattern Recognition ( ) –
ARTICLE IN PRESS
0 20 40 60 80 100NP NP NP
0.55
0.014
P (
NP)
P (
NP)
P (
NP)
0 20 40 60 80 100
0.045
0.55
0 20 40 60 80 100
0.01
(a) (b) (c)
Fig. 7. Complete concept distribution for ‘sky’ and its approximations. (a) Complete concept distribution “sky”; (b) uniform approximation of (a);(c) twoclass approximation of (a).
Table 1Uniform/two-class vs. complete distribution: joint optimization of precision and recall
User interval Employed distribution System interval (%) Prediction Retrieval mean
Precision (%) Recall (%) Precision (%) Recall (%)
‘Sky’ Complete [18%, 35%] 85.4 88.9 85.2 88.9[10%, 30%] Uniform [18%, 34%] 85.5 86.4 86.9 86.3p = q = 0.90 Two-class [18%, 34%] 82.8 86.4 86.7 86.6
‘Water’ Complete [29%, 44%] 78.6 80.8 78.7 81.2[20%, 40%] Uniform [28%, 43%] 77.8 84.6 76.6 83.6p = q = 0.85 Two-class [29%, 43%] 79.6 81.7 79.8 79.1
‘Sky’ Complete [31%, 47%] 62.9 74.6 62.9 74.6[10%, 30%] Uniform [28%, 43%] 64.0 81.0 53.6 81.3p = q = 0.75 Two-class [31%, 46%] 49.4 71.9 64.1 71.8
‘Grass’ Complete [41%, 53%] 50.0 67.1 51.2 67.4[30%, 50%] Uniform [39%, 51%] 62.8 77.7 38.4 73.4p = q = 0.75 Two-class [40%, 51%] 63.1 73.7 45.1 66.9
that the system intervals are always close to the reference re-sult based on the full distribution. That is Slow and Sup differby only 1% or 2% from the reference. Accordingly, the re-sults of the actual retrieval are similarly close to the referenceretrieval. The performance prediction based on the approxi-mate distributions differs from the actual retrieval, especiallywhen the detectors’ performance specifiers p and q are small.The prediction of the precision is more sensitive to approxi-mations in the concept distribution than the prediction of therecall. Partly, the difference between prediction and actualretrieval exceeds 20%. Although the performance predictionbased on the approximate distribution is not always correct,the results of the actual retrieval are close to the referenceresults. The reason is that the optimized system intervals arevery close to the reference. The correctly estimated systemintervals thus lead to a certain robustness with respect to theprediction. Over all 120 experiments, the optimized systeminterval, and thus the actual retrieval, are slightly better forthe two-class distribution than for the uniform distribution.
It can be concluded that the optimized system intervalsare so close to the benchmark that the actual retrieval re-sults nearly reach the reference values. This is the case eventhough the performance prediction based on the approxi-
mate concept distributions is worse than in the referencecases. Also, often the difference between the reference val-ues and the retrieval based on the approximate distributionsis smaller than the standard deviation of the retrieval. In thecase that the true distribution is sparse, the two-class distri-bution produces better system intervals. The outcome of ex-periments for other user constraints, such as the maximiza-tion of only the recall, is comparable.
5. Performance optimization in Stage I
The performance optimization can be extended to Stage Iof the retrieval system. Since this corresponds to the conceptdetectors, the first part of this section covers the training ofthe concept detectors and the second part the optimizationdepending on these detectors. It is desirable to have multipledetectors per concept with varying detector performance.Having several detectors per concept, during performanceoptimization the optimal one of this set can be selected. Fortraining concept detectors with varying performance charac-teristics, we use AutoClass [24], an unsupervised Bayesianclassification system that includes the search for the optimalnumber of classes.

ARTICLE IN PRESSJ. Vogel, B. Schiele / Pattern Recognition ( ) – 9
5.1. Training of the concept detectors
The training of the concept detectors is performed off-line. For this purpose, 4000 patches hand-labeled with ‘sky’,‘water’, ‘grass’ and ‘buildings’ are used. Therefore, theclasses can be very diverse. For example, a ‘sky’-patchmight comprise cloudy, rainy or sunny sky regions as wellas sky regions during sunset. The patches are representedby 43-bin RGB-color histograms (col64), 43-bin histogramsof third-order MR-SAR texture features (tex64) [25] and(2 × 43)-bin histograms (coltex128) that are combined ofthe 43-bin RGB-color histogram and the 43-bin texturehistograms.
Depending on the feature set, AutoClass finds between100 and 130 clusters in the data. In a supervised mannerit can be determined which of the concept classes are rep-resented by which cluster. Each cluster contains multipleclasses resulting in different class probabilities for each clus-ter. Depending on the feature set, the highest class proba-bility in each cluster ranges from 0.25 to 1. The availabilityof the class probabilities for each cluster provides us withthree methods to obtain multiple classifiers. Firstly, in or-der to improve the precision of the concept detectors, onlyclusters with a class probability higher than a certain thresh-old are accepted. Obviously, this leads to a loss in recall.However, precision and recall of the concept detectors canthus be precisely controlled. Secondly, the classification us-ing one feature set often performs much better for one classthan for another. Thus, it is advantageous to use several fea-ture sets. Thirdly, the classifications of two feature sets canbe combined by means of the cluster precision: all cases areclassified twice and the vote of the cluster with the higherprecision counts.
The performance of various ‘sky’- and ‘grass’-detectorsfor different feature sets and feature combinations is shownin Fig. 8. As expected, the feature sets and combinations per-form differently for different classes. For the ‘sky’-detector,the color feature is not discriminant which lies in the fact,that the ‘sky’ class is very diverse in color. For the ‘grass’-detector, the texture feature fails. This indicates that theemployed texture feature catches primarily the structure onsmall scale and not the larger scale structure that exists ingrass patches. The combination of two classifications as de-scribed above leads to an improvement in performance. Insummary, the “tex64 + coltex128”-detector performs bestfor ‘sky’-patches, whereas ‘grass’-patches are detected bestwith the “col64 + coltex128”-detector.
5.2. Results: Stage I performance optimization
Using the envelopes of the curves in Fig. 8, 13 discrete{Precisiondet , Recalldet } pairs that correspond to differ-ent concept detectors can be obtained. In order to iden-tify the optimal concept detector for a given user query,Eqs. (8) and (9) are evaluated for each of these detector{Precisiondet , Recalldet } pairs.
0 20 40 60 80 10050
60
70
80
90
100
Recall
Pre
cisi
on
Concept: "sky"
col64tex64coltex128col64+coltex128tex64+coltex128
0 20 40 60 80 10050
60
70
80
90
100
Recall
Pre
cisi
on
Concept: "grass"
col64tex64coltex128col64+coltex128tex64+coltex128
(a)
(b)
Fig. 8. Precisiondet vs. Recalldet of various detectors. (a) Various ‘sky’detectors; (b) various ‘grass’ detectors.
0 20 40 60 80 1000
10
20
30
40
50
60
70
80
90
100
Recall in %
Pre
cisi
on in
%
No optimization in Stage II
10-30% grass20-40% grass40-60% grass50-90% grass
Fig. 9. Retrieval optimization in Stage I: predicted retrieval precision andrecall with various ‘grass’-detectors.
In Fig. 9 and in Table 2 (middle column), the result of theStage I performance optimization is summarized. The dia-gram shows the influence of the detectors on the retrieval

10 J. Vogel, B. Schiele / Pattern Recognition ( ) –
ARTICLE IN PRESS
Table 2Best concept detectors for various ‘grass’ queries after optimization inStage I (middle column) and joint interleaved optimization (right column)
Query ‘grass’ Optimization Joint interleavedonly in Stage I optimization
Precisiondet Recalldet Precisiondet Recalldet
(%) (%) (%) (%)
[10%, 30%] 94 72 98 61[20%, 40%] 94 72 94 72[40%, 60%] 88 85 94 72[50%, 90%] 88 83 85 89
performance of a set of ‘grass’ queries. Fig. 9 shows thepredicted overall retrieval performance for each of the fourqueries and for each of the 13 ‘grass’-detectors. The pointsthat belong to the same query but different detectors form anellipsoidal curve. Points in the lower left-hand corner cor-respond to the detector with the highest precision, whereasthe points in the lower right-hand corner correspond to de-tectors with low recall. The circles mark the best overallretrieval performance for each query. The corresponding de-tectors’ performances are listed in the middle column ofTable 2. Note that the best detector is different for eachquery: for example, the query [10%, 30%] ‘grass’will be ex-ecuted best with the {Precisiondet =94%, Recalldet =72%}-‘grass’-detector and the query [50%, 90%] ‘grass’ with the{Precisiondet =88%, Recalldet =83%}-‘grass’-detector. Thissupports our intuition that the retrieval performance canbe improved by providing multiple detectors for the sameconcept.
6. Joint two-stage performance optimization
There are two methods to combine the optimization stagesin the two-stage retrieval system:
• Serial combination determine the best concept detector inStage I as done in the middle column of Table 2. With theperformance characteristics of that detector carry out theStage II optimization in order to find the optimum systeminterval.
• Interleaved combination carry out the Stage II optimiza-tion for all detectors that are available for the requestedconcept in Stage I. Depending on the results, select theoptimum system interval S and the optimum concept de-tector for the retrieval.
Fig. 10 corresponds to Fig. 9 after the second-stage perfor-mance optimization was carried out. The exemplary queriesare the same as in Section 5.2. The optimization constraintis “joint optimization of precision and recall”. The retrievalperformance in Fig. 10 has improved substantially comparedto Fig. 9. The circles mark the best overall retrieval perfor-
0 20 40 60 80 1000
10
20
30
40
50
60
70
80
90
100
Recall in %
Pre
cisi
on in
%
With optimization in Stage II
10-30% grass20-40% grass40-60% grass50-90% grass
Fig. 10. Joint retrieval optimization in Stages I and II: predicted retrievalprecision and recall with various ‘grass’-detectors.
Table 3Comparison of serial vs. interleaved combination of optimization stages
Query ‘grass’ Serial combination Interleaved combination
Precision Recall Precision Recall(%) (%) (%) (%)
[10%, 30%] 86 90 88 91[20%, 40%] 77 79 77 79[40%, 60%] 70 85 71 85[50%, 90%] 85 87 89 89
mance for each query. The concept detectors correspondingto these best retrieval performances are listed in the right col-umn of Table 2. These results correspond to an interleavedcombination of the optimization stages.
For the serial combination of the optimization stages,the detectors of Table 2 (middle column) are used and theStage II optimization is carried out. The first observation isthat for most queries the detector in the middle column ofTable 2 is not the same detector as in the right column. Thus,the performance of the overall retrieval will also differ. Theoverall retrieval performance for serial and for interleavedcombination is analyzed in Table 3. As anticipated, the tableshows that in all cases the interleaved combination of theoptimization stages results in a better retrieval performanceof 1–4% increase in precision and 1–3% increase in recall.Obviously, the interleaved combination is computationallymore demanding than the serial combination because in theinterleaved combination, the optimization algorithm in StageII has to be evaluated for each detector present for a partic-ular concept. In the case that the application is time critical,it might thus be advantageous to decide for the serial com-bination despite the lower performance gain.

ARTICLE IN PRESSJ. Vogel, B. Schiele / Pattern Recognition ( ) – 11
7. Performance optimization by query mapping
Up to now, the user interval was mapped to an internalsystem interval in order to compensate for the wrong deci-sions of the concept detectors depending on the user inter-val, the detectors’ parameters, and the concept distribution.However, the concept distribution is usually not fully avail-able. Therefore, it needs to be estimated or approximated asshown in Section 4.3. Another approach is to only compen-sate for the probabilistic errors of the concept detectors.
Generally, the decision of a concept detector on a partic-ular patch is only correct with the probabilities p and q. Forthat reason, the decision on the complete image is also in-fluenced by those two parameters. The influence of p on thedecision per image is larger when the user is looking for im-ages covered with the concept by more than 50% and viceversa. In Section 3.2, the behavior of the concept detectorswas modeled binomially.
The expected value of a binomially-distributed randomvariable with parameters n and p is E(Xn) = pn. Con-sequently, the expected values for retrieving true-positivepatches (Eq. (1)) and for retrieving false-positive patches(Eq. (2)) are
E{Xtrue,retrieved} = pNP , (15)
E{Xf alse,retrieved} = (1 − q)(N − NP ) (16)
and the expected amount of positive patches that are re-trieved out of NP indeed positive ones is
E{Xretrieved |Np} = pNP + (1 − q)(N − NP ). (17)
We can use Eq. (17) to obtain a mapping from a user intervalU=[Ulow%, Uup%] to a system interval S=[Slow%, Sup%].Assuming that there are NP = Ulow% of a concept in animage, Eq. (17) returns the percentage of image area thatis expected to be retrieved if the detector performs withthe parameters p and q. This expected value can be usedas new lower limit for the system interval Slow because itcompensates for the errors of the concept detector. The newSlow takes into account that, on average and independent ofthe concept distribution, the detectors make wrong decisions.The reasoning for Sup is analogous.
Slow = pUlow + (1 − q)(N − Ulow), (18)
Sup = pUup + (1 − q)(N − Uup). (19)
Implicitly, Eqs. (18) and (19) are based on the assumptionthat the concepts are uniformly distributed. Nonetheless,even with this strong assumption, the performance gain isimmense (see Fig. 11). For the exemplary query [10%, 30%]‘sky’ and p = q = 0.90, the mapped system interval isS = [18%, 34%] and on average the precision is increasedfrom 41% to 87% and the recall from 77% to 87%. The“optimal” system interval is S = [18%, 35%] and the oneobtained with the uniform distribution is S = [18%, 34%].This shows that the system queries are very similar. It also
0 20 40 60 80 1000
10
20
30
40
50
60
70
80
90
100
Pre
cisi
on in
%
Recall in %
10-30% sky, p=q=0.9020-40% water, p=q=0.85
User Queries
Results: Query Mapping
Results: Full Optimization
Fig. 11. Optimization by query mapping: comparison to full optimization.
demonstrates the above mentioned assumption. In Fig. 11,the retrieval results of the optimization by query mappingand by using the full concept distribution as a reference areplotted.
The query [20%, 40%] ‘water’ and p=q =0.85 leads to amapped system interval S = [29%, 43%] and to an averageincrease in precision from 27% to 80%. With the completedistribution the optimized query is S = [29%, 44%] andwith the uniform distribution S = [28%, 43%]. The recalldecreases in this case on average from 86% to 78%. Thisexample demonstrates the limitations of the query-mappingapproach. With the mapping of the user interval to a systeminterval, precision and recall can be maximized only jointly.This can also lead to a decrease of one of the values. Withthe algorithms that were presented in Sections 4.1 and 4.3,precision and recall can also be optimized separately whichis in many situations more desirable.
8. Discussion and conclusion
In this paper, we introduced a two-stage image retrievalsystem that allows us to predict as well as to optimize theretrieval performance. In particular, we developed closed-form equations for retrieval precision and retrieval recallthat are based on a statistical model of the retrieval process.With the closed-form expressions for precision and recall,the performance of the system can be predicted as well asoptimized by adapting an internal parameter according to aset of optimization constraints.
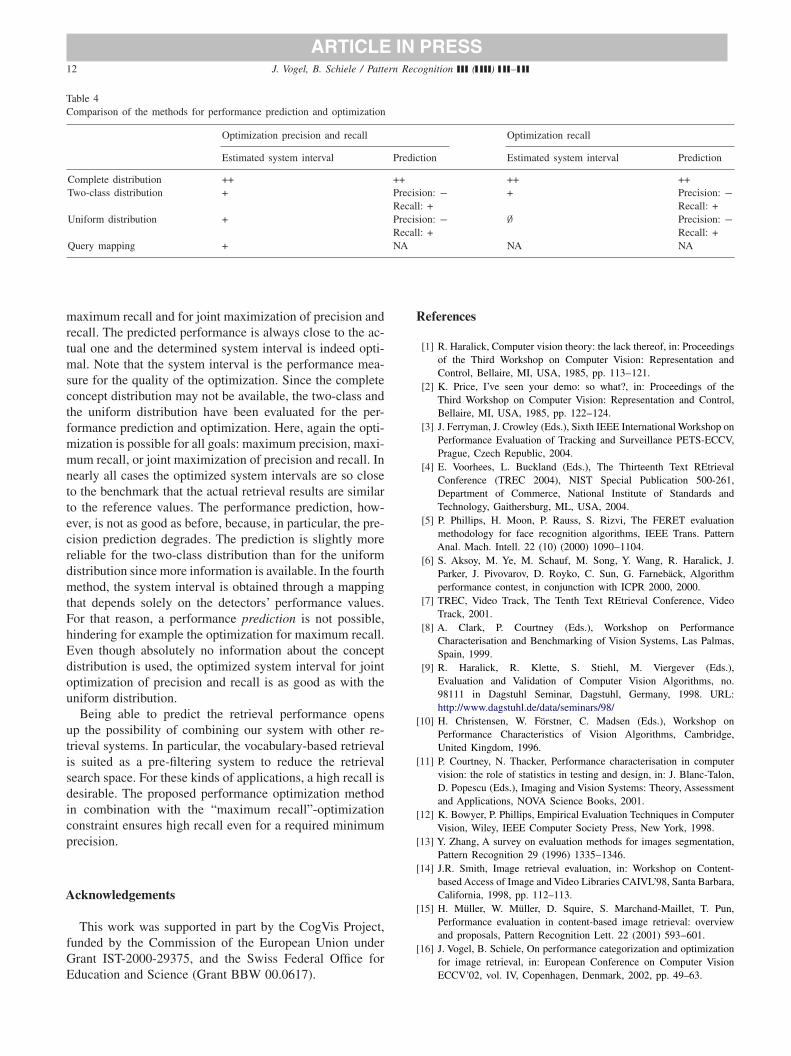
The four prediction and optimization methods are com-pared in Table 4. The best results for both performance pre-diction and optimization are achieved if the complete con-cept distribution is available. In that case, the performancecan be optimized for maximum precision as well as for
12 J. Vogel, B. Schiele / Pattern Recognition ( ) –
ARTICLE IN PRESS
Table 4Comparison of the methods for performance prediction and optimization
Optimization precision and recall Optimization recall
Estimated system interval Prediction Estimated system interval Prediction
Complete distribution ++ ++ ++ ++Two-class distribution + Precision: − + Precision: −
Recall: + Recall: +Uniform distribution + Precision: − ∅ Precision: −
Recall: + Recall: +Query mapping + NA NA NA
maximum recall and for joint maximization of precision andrecall. The predicted performance is always close to the ac-tual one and the determined system interval is indeed opti-mal. Note that the system interval is the performance mea-sure for the quality of the optimization. Since the completeconcept distribution may not be available, the two-class andthe uniform distribution have been evaluated for the per-formance prediction and optimization. Here, again the opti-mization is possible for all goals: maximum precision, maxi-mum recall, or joint maximization of precision and recall. Innearly all cases the optimized system intervals are so closeto the benchmark that the actual retrieval results are similarto the reference values. The performance prediction, how-ever, is not as good as before, because, in particular, the pre-cision prediction degrades. The prediction is slightly morereliable for the two-class distribution than for the uniformdistribution since more information is available. In the fourthmethod, the system interval is obtained through a mappingthat depends solely on the detectors’ performance values.For that reason, a performance prediction is not possible,hindering for example the optimization for maximum recall.Even though absolutely no information about the conceptdistribution is used, the optimized system interval for jointoptimization of precision and recall is as good as with theuniform distribution.
Being able to predict the retrieval performance opensup the possibility of combining our system with other re-trieval systems. In particular, the vocabulary-based retrievalis suited as a pre-filtering system to reduce the retrievalsearch space. For these kinds of applications, a high recall isdesirable. The proposed performance optimization methodin combination with the “maximum recall”-optimizationconstraint ensures high recall even for a required minimumprecision.
Acknowledgements
This work was supported in part by the CogVis Project,funded by the Commission of the European Union underGrant IST-2000-29375, and the Swiss Federal Office forEducation and Science (Grant BBW 00.0617).
References
[1] R. Haralick, Computer vision theory: the lack thereof, in: Proceedingsof the Third Workshop on Computer Vision: Representation andControl, Bellaire, MI, USA, 1985, pp. 113–121.
[2] K. Price, I’ve seen your demo: so what?, in: Proceedings of theThird Workshop on Computer Vision: Representation and Control,Bellaire, MI, USA, 1985, pp. 122–124.
[3] J. Ferryman, J. Crowley (Eds.), Sixth IEEE International Workshop onPerformance Evaluation of Tracking and Surveillance PETS-ECCV,Prague, Czech Republic, 2004.
[4] E. Voorhees, L. Buckland (Eds.), The Thirteenth Text REtrievalConference (TREC 2004), NIST Special Publication 500-261,Department of Commerce, National Institute of Standards andTechnology, Gaithersburg, ML, USA, 2004.
[5] P. Phillips, H. Moon, P. Rauss, S. Rizvi, The FERET evaluationmethodology for face recognition algorithms, IEEE Trans. PatternAnal. Mach. Intell. 22 (10) (2000) 1090–1104.
[6] S. Aksoy, M. Ye, M. Schauf, M. Song, Y. Wang, R. Haralick, J.Parker, J. Pivovarov, D. Royko, C. Sun, G. Farnebäck, Algorithmperformance contest, in conjunction with ICPR 2000, 2000.
[7] TREC, Video Track, The Tenth Text REtrieval Conference, VideoTrack, 2001.
[8] A. Clark, P. Courtney (Eds.), Workshop on PerformanceCharacterisation and Benchmarking of Vision Systems, Las Palmas,Spain, 1999.
[9] R. Haralick, R. Klette, S. Stiehl, M. Viergever (Eds.),Evaluation and Validation of Computer Vision Algorithms, no.98111 in Dagstuhl Seminar, Dagstuhl, Germany, 1998. URL:http://www.dagstuhl.de/data/seminars/98/
[10] H. Christensen, W. Förstner, C. Madsen (Eds.), Workshop onPerformance Characteristics of Vision Algorithms, Cambridge,United Kingdom, 1996.
[11] P. Courtney, N. Thacker, Performance characterisation in computervision: the role of statistics in testing and design, in: J. Blanc-Talon,D. Popescu (Eds.), Imaging and Vision Systems: Theory, Assessmentand Applications, NOVA Science Books, 2001.
[12] K. Bowyer, P. Phillips, Empirical Evaluation Techniques in ComputerVision, Wiley, IEEE Computer Society Press, New York, 1998.
[13] Y. Zhang, A survey on evaluation methods for images segmentation,Pattern Recognition 29 (1996) 1335–1346.
[14] J.R. Smith, Image retrieval evaluation, in: Workshop on Content-based Access of Image and Video Libraries CAIVL’98, Santa Barbara,California, 1998, pp. 112–113.
[15] H. Müller, W. Müller, D. Squire, S. Marchand-Maillet, T. Pun,Performance evaluation in content-based image retrieval: overviewand proposals, Pattern Recognition Lett. 22 (2001) 593–601.
[16] J. Vogel, B. Schiele, On performance categorization and optimizationfor image retrieval, in: European Conference on Computer VisionECCV’02, vol. IV, Copenhagen, Denmark, 2002, pp. 49–63.

ARTICLE IN PRESSJ. Vogel, B. Schiele / Pattern Recognition ( ) – 13
[17] J. Vogel, B. Schiele, Query-dependent performance optimizationfor vocabulary-supported image retrieval, in: German PatternRecognition Symposium DAGM’02, Zurich, Switzerland, 2002,pp. 600–608.
[18] Y. Rui, T. Huang, M. Ortega, S. Mehrotra, Relevance feedback: apower tool for interactive content-based image retrieval, IEEE Trans.Circuits Video Technol. 8 (5) (1998) 644–655.
[19] I. Cox, M. Miller, T. Minka, T. Papathomas, P. Yianilos, Thebayesian image retrieval system, PicHunter: theory, implementationand psychophysical experiments, IEEE Trans. Image Process. 9 (1)(2000) 20–37.
[20] A. Smeulders, M. Worring, S. Santini, A. Gupta, R. Jain,Content-based image retrieval at the end of the early years,IEEE Trans. Pattern Anal. Mach. Intell. 22 (12) (2000)1349–1380.
[21] J. Vogel, B. Schiele, A semantic typicality measure for naturalscene categorization, in: German Pattern Recognition SymposiumDAGM’04, Tübingen, Germany, 2004, pp. 207–215.
[22] C. Town, D. Sinclair, Content based image retrieval usingsemantic visual categories, Tech. Rep. 2000.14, AT&T Laboratories,Cambridge, 2000.
[23] R. Picard, T. Minka, Vision texture for annotation, ACM J.Multimedia Syst. 3 (1) (1995) 3–14.
[24] P. Cheeseman, J. Kelly, M. Self, J. Stutz, W. Taylor, D. Freeman,AutoClass: a bayesian classification system, in: InternationalConference on Machine Learning ICML’88, Ann Arbor, MI, USA,1988, pp. 54–64.
[25] J. Mao, A. Jain, Texture classification and segmentation using multi-resolution simultaneous autoregressive models, Pattern Recognition25 (2) (1992) 173–188.
About the author—JULIA VOGEL holds a M.Sc. degree in Electrical and Computer Engineering from Oregon State University, USA (1998), and a M.Sc.(Dipl. Ing.) degree in Electrical Engineering from the Technical University Karlsruhe, Germany (2000). In December 2004, she received a Ph.D. fromETH Zurich, Switzerland for her thesis “Semantic scene modeling and retrieval”. Her research interests include semantic scene understanding, combinedscene and object recognition, content-based image retrieval, and human scene perception. Funded through a research fellowship from the German ResearchFoundation, Julia is currently a postdoctoral fellow at the Laboratory for Computational Intelligence, University of British Columbia, Vancouver, Canada.
About the author—BERNT SCHIELE is a full professor of Computer Science at Darmstadt University of Technology, Germany. Prior to this appointment,he had been with ETH Zurich, Switzerland and the MIT Media Laboratory, Cambridge, MA, USA. His research interests include computer vision,perceptual computing, statistical learning methods, wearable computers, and integration of multimodal sensor data. Schiele received a Ph.D. in computervision from the INP Grenoble, France.
Related Documents


