Performance Variations Across Response Formats on Reading Comprehension Assessments By Alyson A. Collins Dissertation Submitted to the Faculty of the Graduate School of Vanderbilt University in partial fulfillment of the requirements for the degree of DOCTOR OF PHILOSOPHY in Special Education May, 2015 Nashville, Tennessee Approved: Donald L. Compton, Ph.D. Marcia A. Barnes, Ph.D. Douglas Fuchs, Ph.D. Lynn S. Fuchs, Ph.D.

Welcome message from author
This document is posted to help you gain knowledge. Please leave a comment to let me know what you think about it! Share it to your friends and learn new things together.
Transcript

Performance Variations Across Response Formats on Reading Comprehension Assessments
By
Alyson A. Collins
Dissertation
Submitted to the Faculty of the
Graduate School of Vanderbilt University
in partial fulfillment of the requirements
for the degree of
DOCTOR OF PHILOSOPHY
in
Special Education
May, 2015
Nashville, Tennessee
Approved:
Donald L. Compton, Ph.D.
Marcia A. Barnes, Ph.D.
Douglas Fuchs, Ph.D.
Lynn S. Fuchs, Ph.D.
ii
Copyright © 2015 by Alyson A. Collins
All Rights Reserved

iii
To my amazing husband who supported me throughout this journey
and
To my beautiful daughter who is the greatest blessing in my life

iv
ACKNOWLEDGEMENTS
Many people have been instrumental throughout my time in graduate school, and I am
grateful for their invaluable support. First and foremost, I would to thank my advisor, Don
Compton. He has taught me about the science of research while also ensuring laughter was a part
of our work. I am also thankful for my mentors Lynn and Doug Fuchs. They have helped me
grow as a researcher and writer. I have learned a lot by simply listening to them. In addition, I
am appreciative of the guidance I have received from Marcia Barnes. Her ways with words and
gentle nudging to delve deeper into my research have transformed my cognitive processes.
Furthermore, I extend a huge thank you to Karen Harris and Steve Graham for initially directing
me down this path and for providing a strong foundation for me.
To my Vanderbilt colleagues and specifically my amazing research team, Jenny Gilbert,
Esther Lindström, Johny Daniel, Meg Schiller, and Laura Steacy, thank you for making this
work possible. I am particularly appreciative of the encouragement I received from Esther. I also
would like to thank my former students, their parents, and other fellow teachers I have worked
alongside all of these years. Each friend who has touched both my personal and professional life
is part of the reason I began this journey and why I continue to be passionate about what we do.
Finally, I am indebted to my husband, my daughter, and our families for their
unconditional love and support. I would not have made it to the finish line without them carrying
me along the way. Thank you to our families for patiently waiting for us to come home. As for
my daughter, she is the brightest shining star in my life. I love her more than she will ever know.
Most important, I am grateful for my husband and his endless sacrifices. He has taught me to
take risks and how to relentlessly pursue my goals. I am blessed to have him by my side.

v
TABLE OF CONTENTS
Page
DEDICATION ............................................................................................................................. iii
ACKNOWLEDGEMENTS ......................................................................................................... iv
LIST OF TABLES ...................................................................................................................... vii
LIST OF FIGURES ................................................................................................................... viii
Chapter
I. INTRODUCTION ....................................................................................................................... 1
Understanding Differences Among Comprehension Tests ....................................................................... 3 Assessment Dimensions of Reading Comprehension Tests ..................................................................... 4 The Role of Child Skills in Reading Comprehension Tests ..................................................................... 6 Purpose of the Current Study .................................................................................................................... 9 Research Questions and Hypotheses ...................................................................................................... 10
II. METHOD ................................................................................................................................. 14
Participants .............................................................................................................................................. 14 Sampling Procedure ................................................................................................................................ 16 Measures ................................................................................................................................................. 17 Experimental Procedures and Study Design ........................................................................................... 22 Fidelity of Test Administration ............................................................................................................... 24 Data Entry Procedures ............................................................................................................................ 25 Analytic Strategy .................................................................................................................................... 25
III. RESULTS ............................................................................................................................... 33
Correlations ............................................................................................................................................. 35 Missing Data ........................................................................................................................................... 38 Unconditional Model for Open-Ended and Multiple-Choice Questions ................................................ 38 Research Question 1: Open-Ended and Multiple-Choice Response Formats ........................................ 41 Research Question 2a and 2b: Open-Ended and Multiple-Choice Questions and Genre ....................... 41 Research Question 3a: Open-Ended and Multiple-Choice Questions and Child Skills ......................... 43 Research Question 3b: Response Format and Child Skill Interactions Effects on Responses ............... 46 Unconditional Model for Retell .............................................................................................................. 48 Research Question 4a: Main Effects of Genre and Child Skills on Retell ............................................. 50 Research Question 4b: Genre and Child Skills Interactions Effects on Retell ....................................... 50
IV. DISCUSSION ......................................................................................................................... 52

vi
Open-Ended and Multiple-Choice Response Formats ............................................................................ 52 Text Genre .............................................................................................................................................. 54 Child Skills ............................................................................................................................................. 56 Limitations .............................................................................................................................................. 64 Directions for Future Research ............................................................................................................... 65 Implications for Research, Policy, and Practice ..................................................................................... 68
Appendix
Readability Statistics for the Six Level 4 QRI-5 Passages ..................................................................... 71 REFERENCES ............................................................................................................................. 72

vii
LIST OF TABLES
Table Page 1. Fourth Grade Assessment Batteries and Estimated Time for Administration .......................... 18 2. Item Response Crossed and Cross-Classified Random Effects Model Equations for Research
Questions............................................................................................................................... 27 3. Means and Standard Deviations for Reading Comprehension Measures and Child Skill
Variables for the Full Sample (N = 79) ................................................................................ 34 4. Correlations for Reading Comprehension Measures and Child Skill Covariates in the Full
Sample (N = 79) .................................................................................................................... 37 5. Unconditional Model, Fixed Effects Estimates, and Variance-Covariance Estimates for
Response Format and Genre Models .................................................................................... 40 6. Fixed Effects Estimates and Variance-Covariance Estimates for Response Format and Child
Skill Models .......................................................................................................................... 45 7. Unconditional Model, Fixed Effects Estimates, and Variance-Covariance Estimates for Retell
Models................................................................................................................................... 49
viii
LIST OF FIGURES
Figure Page 1. Response formats and passage type randomized and counterbalanced across students in a 3 × 2
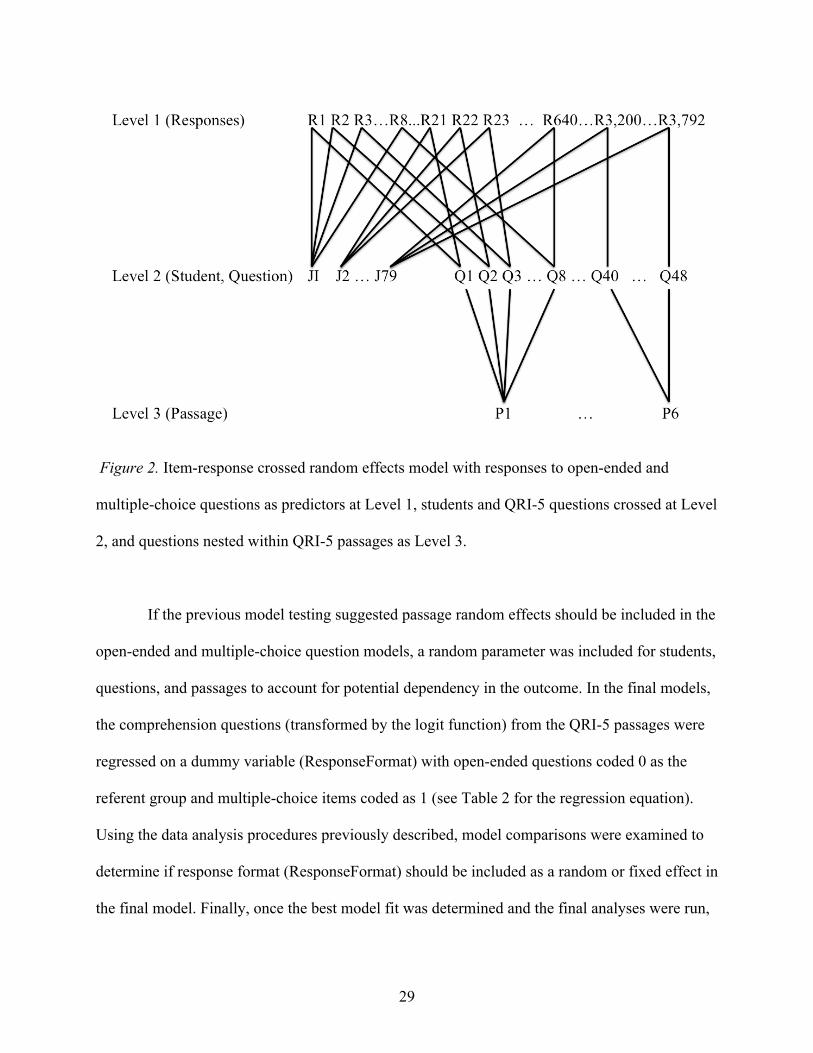
(Response Format × Genre) design. ..................................................................................... 24 2. Item-response crossed random effects model with responses to open-ended and multiple-
choice questions as predictors at Level 1, students and QRI-5 questions crossed at Level 2, and questions nested within QRI-5 passages as Level 3. ...................................................... 29
3. Cross-classified random effects model with retell scores as continuous predictors at Level 1,
and student and QRI-5 passages crossed at Level 2. ............................................................ 32 4. The interaction between response format (i.e., open-ended or multiple-choice questions) and
genre and their effect on the probability of a correct response. ............................................ 43 5. The interaction between response format (i.e., open-ended or multiple-choice questions) and
listening comprehension and their effect on the predicted probability of a correct response................................................................................................................................................ 47
6. The interaction between response format (i.e., open-ended or multiple-choice questions) and
teacher-reported attention and their effect on the predicted probability of a correct response................................................................................................................................................ 48

1
CHAPTER I
INTRODUCTION
Everyday in school students are required to read and comprehend texts across the
curriculum. Whether they are in math, science, social studies, or language arts classes, a
student’s academic success is largely dependent on their ability to understand various types of
text. Because understanding text is a foundational skill students must utilize across subject areas,
a student’s academic achievement is oftentimes associated with his or her performance on a
reading comprehension test. Reading comprehension, however, is a complex, multidimensional
construct, making it a particularly difficult skill to measure (Kintsch & Kintsch, 2005; Perfetti,
Landi, & Oakhill, 2007).
Many recognize reading comprehension is multi-faceted, and successful understanding of
text is oftentimes dependent upon a child’s proficiency in underlying components of this process
(e.g., Kintsch & Kintsch, 2005; Perfetti et al., 2007). Therefore, strengths in skills such as
decoding, word reading, oral language, working memory, knowledge, and self-monitoring may
bolster or inhibit a child’s ability to construct a mental representation of a text (Johnston, Barnes,
& Desrochers, 2008; Kintsch & Kintsch, 2005; Nation, 2007; Perfetti et al., 2007). The
interdependence amongst these underlying cognitive processes, however, makes the
measurement of reading comprehension complicated (Keenan, 2013; Pearson & Hamm, 2005),
and differences in child skills potentially lead to inconsistencies in student outcomes across tests
(Collins, Gilbert, et al., 2014; Keenan, 2013; Keenan & Meenan, 2014). Consequently, many
researchers lack consensus regarding what methods are best for measuring reading

2
comprehension, and many questions remain regarding the validity of commonly utilized
assessments (e.g., Campbell, 2005; Nation & Snowling, 1997).
Much of the disagreement among researchers stems from recent studies suggesting scores
obtained on reading comprehension tests may actually represent a reader’s level of proficiency in
an underlying skill (e.g., decoding, oral language) instead of a true reflection of his or her
understanding of the text (e.g., Cutting & Scarborough, 2006; Keenan, Betjemann, & Olson,
2008). Concerns regarding the role child skills play in reading comprehension have intensified as
more evidence has emerged documenting how a certain child skill (e.g., decoding) may account
for more of the variance on one test, but the same child skill may be less critical for success on a
comparable assessment (e.g., Cutting & Scarborough, 2006; Keenan et al., 2008; Nation &
Snowling, 1997). Therefore, some argue many widely-used reading comprehension assessments
are less closely related to the primary construct they were designed to measure (Collins, Gilbert,
et al., 2014; Keenan, 2013; Keenan & Meenan, 2014; Nation & Snowling, 1997).
To further complicate this rising dissatisfaction among researchers for how reading
comprehension is measured, recent studies show that certain assessment dimensions (e.g.,
response format, text length) may be another source of variance among tests over and above the
contribution of child skills (e.g., Collins, Lindström, & Compton, 2014; Keenan, 2013; Keenan
& Meenan, 2014). Because many comprehension tests vary in response format, text length, genre
structure, and administration procedures, some believe inconsistencies in student performance
may stem from these differences. Too few studies, however, have isolated the effects of these
assessment dimensions on reading comprehension, and even fewer have examined the
relationship between the two sets of variables (i.e., assessment dimensions and child skills)

3
purported to lead to variations in reading comprehension outcomes (Best, Floyd, & Mcnamara,
2008; Francis, Fletcher, Catts, & Tomblin, 2005; Keenan et al., 2008).
Understanding factors that contribute to variations in student performance across
comprehension assessments is important because findings of recent studies suggest differences
among test dimensions and individual child skills may potentially lead to some students being
identified as a student with a reading difficulty (RD) on one reading comprehension measure, but
not another (Collins, Gilbert, et al., 2014; Francis et al., 2005; Keenan, 2013; Keenan & Meenan,
2014). Furthermore, if different reading comprehension tests lead to contradictory decisions in
the identification of students with RD, outcomes on these assessments may ultimately introduce
discrepancies among investigations examining the efficacy of comprehension interventions.
Given the lingering questions about the validity of reading comprehension tests and the
burgeoning dissatisfaction with the inconsistencies in performance across currently available
assessments, more rigorous, high-quality experiments are needed to understand how assessment
dimensions and child skills may relate to outcomes on these measures (Francis et al., 2005;
Keenan, 2013; Pearson & Hamm, 2005).
Understanding Differences Among Comprehension Tests
The purpose of the current study was to extend the existing literature on comprehension
assessments by examining how assessment dimensions and child skills may contribute to
differences in student performance across tests. As previously noted, in the small number of
studies that have recently examined reading comprehension assessments (Best et al., 2008;
Cutting & Scarborough, 2006; Francis et al., 2005; Keenan et al., 2008; Keenan & Meenan,
2014; Kendeou, Papadopoulos, & Spanoudis, 2012; Nation & Snowling, 1997; Spear-Swerling,
2004), two factors are recurrently proposed as potential reasons for differences among tests.
4
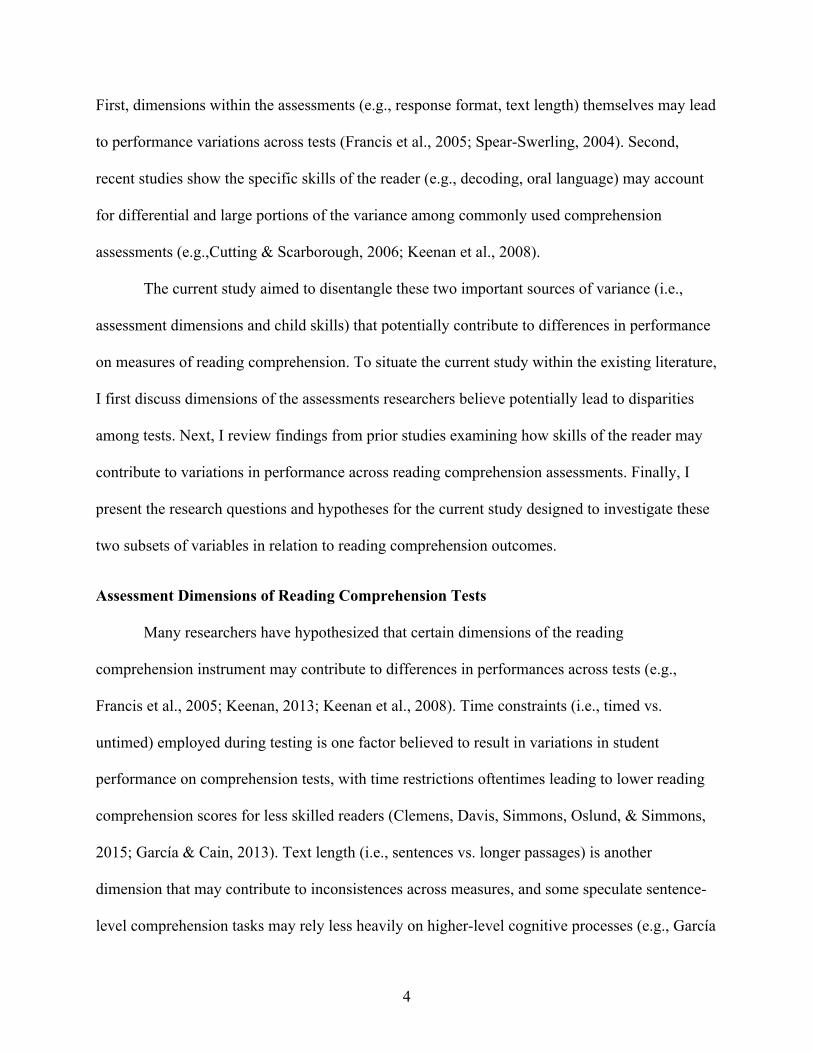
First, dimensions within the assessments (e.g., response format, text length) themselves may lead
to performance variations across tests (Francis et al., 2005; Spear-Swerling, 2004). Second,
recent studies show the specific skills of the reader (e.g., decoding, oral language) may account
for differential and large portions of the variance among commonly used comprehension
assessments (e.g.,Cutting & Scarborough, 2006; Keenan et al., 2008).
The current study aimed to disentangle these two important sources of variance (i.e.,
assessment dimensions and child skills) that potentially contribute to differences in performance
on measures of reading comprehension. To situate the current study within the existing literature,
I first discuss dimensions of the assessments researchers believe potentially lead to disparities
among tests. Next, I review findings from prior studies examining how skills of the reader may
contribute to variations in performance across reading comprehension assessments. Finally, I
present the research questions and hypotheses for the current study designed to investigate these
two subsets of variables in relation to reading comprehension outcomes.
Assessment Dimensions of Reading Comprehension Tests
Many researchers have hypothesized that certain dimensions of the reading
comprehension instrument may contribute to differences in performances across tests (e.g.,
Francis et al., 2005; Keenan, 2013; Keenan et al., 2008). Time constraints (i.e., timed vs.
untimed) employed during testing is one factor believed to result in variations in student
performance on comprehension tests, with time restrictions oftentimes leading to lower reading
comprehension scores for less skilled readers (Clemens, Davis, Simmons, Oslund, & Simmons,
2015; García & Cain, 2013). Text length (i.e., sentences vs. longer passages) is another
dimension that may contribute to inconsistences across measures, and some speculate sentence-
level comprehension tasks may rely less heavily on higher-level cognitive processes (e.g., García

5
& Cain, 2013; Keenan & Meenan, 2014; Spear-Swerling, 2004). Furthermore, simply requiring
students to read a text orally versus silently may lead to different outcomes on the same test,
specifically when comparing the performance of students with RD to those of average readers
(García & Cain, 2013; McCallum, Sharp, Bell, & George, 2004; S. D. Miller & Smith, 1989).
The genre of the text (i.e., narrative vs. expository) may be yet another test feature leading to
discrepancies, and there is evidence to suggest students perform higher on tests of narrative
stories in comparison to assessments that include expository texts (Best et al., 2008; McNamara ,
Ozuru, & Floyd, 2011).
Most relevant to the current study, response format is one assessment dimension
consistently proposed as a factor contributing to variations in performance across reading
comprehension measures (e.g., Francis et al., 2005; Keenan, 2013). Within the current study, the
term response format refers to the method for how comprehension answers are collected from
students (e.g., open-ended questions, multiple choice, retell). One criticism of using different
response formats to assess reading comprehension is that tasks such as multiple-choice, cloze, or
open-ended questions may require different levels of proficiency in certain child skills, which in
turn may account for variations in student performance across tests (Campbell, 2005; Francis et
al., 2005; Johnston et al., 2008; Keenan, 2013; Pearson & Hamm, 2005). To support these
claims, in a meta-analysis comparing the performance of students with RD to typically
developing peers, results revealed considerable variability in the effect sizes across different
response formats (e.g., retell ESg = -0.69, open-ended questions ESg = -1.51, and multiple-choice
tasks ESg = -1.44; Collins, Lindström, et al., 2014). Thus, there is mounting evidence to suggest
response format may be one source of variance among reading comprehension tests.

6
The Role of Child Skills in Reading Comprehension Tests
In addition to studies investigating differences among dimensions of the assessments, a
few researchers have examined how child skills relate to reading comprehension outcomes (e.g.,
Cutting & Scarborough, 2006; Francis et al., 2005; Kendeou et al., 2012) and how deficits in
underlying skills may lead to poor comprehension (e.g., Keenan & Meenan, 2014; Nation &
Snowling, 1997). Generally, studies have shown decoding and word reading account for more of
the variance when reading comprehension measures focus on sentence-level processing and
utilize a cloze response format (Francis et al., 2005; Keenan et al., 2008; Keenan & Meenan,
2014; Kendeou et al., 2012; Nation & Snowling, 1997). Specifically, in a sample of 184 students
ages 7 to 9, Nation and Snowling (1997) found decoding and text reading were strongly
correlated with performance on the Suffolk Reading Scale, a sentence completion cloze test (r =
.77 and .89, respectively). In another study, Spear-Swerling (2004) observed word reading
accuracy was also an important predictor of performance on a state mandated cloze assessment.
Three more recent studies measuring reading comprehension in elementary and secondary
students all reported decoding skill contributed to a large portion of the variance on the
Woodcock-Johnson Passage Comprehension, also a sentence-level cloze task (Francis et al.,
2005; Keenan et al., 2008; Keenan & Meenan, 2014). All of these studies substantiate the
important role of decoding and word reading skill on comprehension outcomes, specifically
when the test focuses on sentence-level processing or uses a cloze format (Keenan et al., 2008;
Spear-Swerling, 2004).
In addition to decoding and word reading, much of the existing literature has examined
how oral language accounts for more of the variance in reading comprehension measures using
longer texts and open-ended question, multiple-choice, or retell response formats (Cutting &

7
Scarborough, 2006; Francis et al., 2005; Keenan et al., 2008; Keenan & Meenan, 2014; Nation &
Snowling, 1997; Spear-Swerling, 2004). Specifically, Nation & Snowling (1997) observed that,
although word recognition was an important predictor of reading comprehension, listening
comprehension skill played a larger role in student performance on the Neale Analysis of
Reading Ability, an open-ended question test. Moreover, Nation and Snowling measured a larger
achievement gap on this test between students with poor listening comprehension skills and
typically developing students in comparison to scores on the Suffolk Reading Scale (i.e., a cloze
sentence task). Similarly, when comparing comprehension performance between students in
grades 2 and 4, Francis et al. (2005) observed stronger language effects for older students, with
language skills more closely related to performance on the Diagnostic Assessment Battery (i.e., a
silent-reading, open-ended question task) and the Gray Oral Reading Test (i.e., an oral-reading,
multiple-choice test). Supporting these findings, Spear-Swerling (2004) reported listening
comprehension and vocabulary to be significant predictors of performance on a subtest of the
Connecticut Mastery Test, an assessment that uses a combination of multiple-choice and open-
ended questions. In this study, oral language skills also made significant contributions to
performance on the Connecticut Mastery Test, a cloze procedure requiring students to read
lengthier passages. Because these findings contradicted the cloze results of Nation and Snowling
(1997), Spear-Swerling hypothesized the importance of oral language in predicting
comprehension on the Connecticut Mastery Test may be a consequence of its longer passages in
contrast to the sentence-level processing required on the Suffolk Reading Scale.
To extend this research, Cutting and Scarborough (2006) investigated the influence of
oral language on outcomes for three widely-used comprehension measures. Ninety-seven
students in grades 1.5 to 10.8 (M = 4.4, SD = 2.2) were administered the Gray Oral Reading Test

8
(i.e., an oral-reading, multiple-choice test), Gates-MacGinitie Reading Test-Revised (i.e., a
silent-reading, multiple-choice test), and the Wechsler Individual Achievement Test (i.e., an
open-ended question test). Although both word recognition and decoding skills accounted for
variance on the Wechsler Individual Achievement Test and Gray Oral Reading Test, once again
oral language was a more important predictor of performance on the Gates-MacGinitie Reading
Test-Revised. Likewise, Keenan et al. (2008) and Keenan and Meenan (2014) found oral
comprehension to explain more of the variance in comprehension outcomes on the Qualitative
Reading Inventory-Third Edition (QRI-3; i.e., an assessment with longer passage that includes
both retell and open-ended questions) and the Gray Oral Reading Test (i.e., an oral reading,
multiple-choice measure), offering additional evidence for the strength of oral language as a
predictor of reading comprehension.
In the extant literature, many studies corroborate the importance of decoding, word
reading, and oral language skills in predicting performance on reading comprehension tests (e.g.,
Cutting & Scarborough, 2006; Keenan et al., 2008). Other variables such as knowledge and
executive function (e.g., attention, working memory), however, may be additional child-level
variables influencing outcomes on reading comprehension tests (e.g., Arrington, Kulesz, Francis,
Fletcher, & Barnes, 2014; Barnes, Dennis, & Haefele-Kalvaitis, 1996; Eason, Goldberg, Young,
Geist, & Cutting, 2012; McNamara & Kintsch, 1996; A. C. Miller et al., 2014). For example, in a
study of 61 third-grade students, knowledge was found to be a statistically significant predictor
of reading comprehension when open-ended question, multiple-choice, and retell response
formats were used with expository texts (Best et al., 2008). In another study examining child
factors related to response accuracy on multiple-choice questions, results indicated higher
probabilities of correct response were associated with higher executive function skills (i.e.,

9
nonverbal reasoning ability and working memory; Miller et al., 2014). A similar study including
participants ages 10 to 14 examined the interaction effects among child skills across different
types of multiple-choice questions and text genres (Eason et al., 2012). Results of this study
indicated higher-order cognitive skills (e.g., inference making, planning and organizing) were
significant predictors of reading comprehension, and students with deficits in these domains had
greater difficulty with questions about expository texts (Eason et al., 2012). Therefore, there is
ample evidence documenting the importance of skills such as knowledge, attention, and working
memory in predicting reading comprehension and how variability in these child skills may
contribute to differences in student performance across comprehension tests (Arrington et al.,
2014; Best et al., 2008; Compton, Miller, Elleman, & Steacy, 2014; Eason et al., 2012; A. C.
Miller et al., 2014).
Purpose of the Current Study
Although research has increasingly focused on identifying sources of variance among
reading comprehension tests, only a small number of studies have investigated both the
underlying child-level variables and the effects of different response formats on performance
outcomes (Pearson & Hamm, 2005). Moreover, in prior studies (e.g., Collins, Lindström, et al.,
2014; Francis et al., 2005; García & Cain, 2013; Keenan & Meenan, 2014), the effects of
response format on reading comprehension have been confounded by other assessment
dimensions (e.g., length of text; oral vs. silent reading of the text). To date, no recent studies
have controlled potentially influential assessment variables (e.g., length of text; oral vs. silent
reading of the text) to isolate the effects of response format on reading comprehension.
Furthermore, within this controlled context, none of the existing studies have investigated how
reading abilities, linguistic and cognitive skills, and strategy use account for variance among

10
student outcomes across response formats. Finally, even fewer studies have investigated how text
genre (i.e., narrative vs. expository) interacts with response format and child skills on reading
comprehension tests (Best et al., 2008; McNamara et al., 2011).
The purpose of the current study was to investigate how response format and child skills
contribute to variations in comprehension performance across two text genres (i.e., expository
and narrative). Across a distribution of child skills (from highly skilled to less skilled), this study
compared student outcomes on three response formats frequently used when assessing reading
comprehension: (a) open-ended questions, (b) multiple-choice questions, and (c) retell. To isolate
the effects of response format, the study design controlled for other assessment dimensions (e.g.,
text length, oral reading) potentially influencing student performance on reading comprehension
tests (Francis et al., 2005; García & Cain, 2013; Keenan, 2013; Pearson & Hamm, 2005).
Because there is some evidence to suggest that text genre may affect a child’s understanding of a
text (Best et al., 2008; Coté, Goldman, & Saul, 1998), the effects of response format on
comprehension of both narrative and expository texts was also examined. The current study
aimed to support researchers, policy makers, and practitioners in understanding the multifaceted
components embedded in reading comprehension measures, and specifically how performance
outcomes may be a product of the response format used in the assessment.
Research Questions and Hypotheses
In summary, the current study aimed to add to the existing literature by addressing four
research questions. The first three research questions focused on differences in the probability of
a correct response between open-ended and multiple-choice questions. These three questions
aimed to measure differences in performance when the same items were administered in
contrasting response formats (i.e., open ended and multiple choice). An additional fourth

11
question addressed variations in student performance on reading comprehension retell. The four
research questions and hypotheses are subsequently presented.
1. Across a distribution of child skills (from highly skilled to less skilled), do students vary
in response accuracy on different reading comprehension response formats (i.e., open-
ended or multiple-choice questions)? Given findings from previous studies (e.g., Collins,
Lindström, et al., 2014), I hypothesized statistically significant differences would be
measured between response formats. Specifically, I expected students would have a
lower probability of a correct response to an open-ended question when compared to the
response accuracy of the same items presented in multiple-choice format.
2a. Across a distribution of child skills (from highly skilled to less skilled), is there a main
effect of text genre (i.e., narrative or expository) on different response formats (i.e., open-
ended or multiple-choice questions) of reading comprehension? I expected all students
would demonstrate higher performance on the narrative texts, regardless of response
format.
2b. Is there an interaction between response format and genre on student response accuracy
on different reading comprehension assessments? I hypothesized a statistically significant
interaction would be revealed, and differences measured between the two genres (i.e.,
expository and narrative) would be greater on open-ended questions in comparison to
multiple-choice items.
3a. Across a distribution of child skills (from highly skilled to less skilled), are there main
effects of child skills (i.e., reading ability, linguistic and cognitive skill, and strategy use)
in predicting response accuracy on different response formats (i.e., open-ended or
multiple-choice questions) of reading comprehension? Findings of prior research

12
suggested reading ability, linguistic and cognitive skills, and strategy use would
contribute to differences in performance across comprehension tests (e.g., Cutting &
Scarborough, 2006; Johnston et al., 2008; Keenan et al., 2008; Keenan & Meenan, 2014).
Therefore, I expected proficiencies in these skills would lead to higher comprehension
performance regardless of response format (i.e., open-ended question, multiple choice).
Specifically, as evidenced in prior research on the QRI-3 (Keenan et al., 2008; Keenan &
Meenan, 2014), I expected strengths in oral language skills would account for more of the
variance on these tests over other reading skills (e.g., decoding). I also aimed to explore
how other child skills (e.g., working memory, attention) may be important predictors of
reading comprehension across different response formats.
3b. Is there an interaction between response format and child skills on student response
accuracy on different reading comprehension assessments? Because prior studies have
not investigated interactions between these two variables, I aimed to explore how child
skills may interact with response format (i.e., open-ended question, multiple choice) in
predicting a correct response.
4a. Across a distribution of child skills (from highly skilled to less skilled), are there main
effects of text genre (i.e., narrative or expository) and child skills (i.e., reading ability,
linguistic and cognitive skill, and strategy use) on reading comprehension retell? Similar
to the hypotheses for my second and third research questions, I expected students would
perform less well on expository retells. I also hypothesized strengths in certain child
skills (e.g., oral language) would predict higher retell performance, while other child
skills (e.g., strategy use) would be less important on this particular response format.

13
4b. Is there an interaction between genre and child skills on reading comprehension retell?
Because prior studies have not investigated interactions between these two variables, I
aimed to explore the interaction effects of genre and child skills on reading
comprehension retell.

14
CHAPTER II
METHOD
Participants
Participants included 82 fourth-grade students from six classrooms in an urban
elementary school located in the southeastern region of the United States. All fourth-grade
students in classrooms of teachers who consented to participation were invited to participate in
the study, regardless of gender, ethnicity, or disability status. My research questions for the
current study aimed to investigate how assessment dimensions and child skills account for
differences in student performance on comprehension assessments. For this reason, students with
a range of abilities, including highly skilled and less skilled students, were recruited to
participate in the study. I also sought to examine the effects of response formats with a grade for
which performance on reading comprehension tests was closely aligned to measures of academic
achievement. Because fourth grade is oftentimes referred to as the year in which children
transition from learning to read to reading to learn, considerable weight is placed on reading
comprehension during this year in school. Therefore, I selected fourth-grade students as the
target sample. Finally, all students were assessed at a single-time point in the fall of 2014, and
this aspect of the study design alleviated any potential attrition problems.
Upon beginning the testing, it was determined by a team of researchers that the
assessment battery was not appropriate for three students. Two of the students were recent
immigrants to the United States and had been living in the country less than eight months. One of
these students did not understand the requirements of the study and failed to assent to
participation in the testing sessions. The second student was unable to accurately answer items

15
on the Oral Comprehension subtest of the Woodcock-Johnson III Tests of Achievement
(Woodcock, McGrew, & Mather, 2001). Given this student’s limited understanding of the
directions and assessment tasks, testing was discontinued. Consequently, both participants with
very limited English were not administered the full battery of assessments and were not included
in the final sample. Finally, a third participant who was receiving special education services for
severe receptive and expressive language disabilities had difficulty completing portions of the
testing as a result of his speech and language impairments. This student was also excluded from
the data analyses. Thus, the final sample resulted in 79 fourth-grade students.
This final sample of 79 fourth graders included 36 males (46%). The ethnicity of the
sample consisted of 31 African American (39%), 3 Asian (4%), 17 Caucasian (22%), 21
Hispanic (27%), and 7 students of other ethnicities (9%). Of the 79 fourth graders, three students
had been previously retained, and seven students were currently identified as English language
learners. Eleven students were identified by the school as students with disabilities, and many of
these students had deficits in more than one domain. The eleven students were identified with the
following disabilities: (a) learning disability (n = 9), (b) speech and language impairment (n = 5),
(c) attention deficit disorder or attention deficit hyperactivity disorder (n = 4), (d) autism (n = 1),
and (e) blindness or visual impairment (n = 1). Eight of the nine students with learning
disabilities demonstrated deficits in reading, and some of these students had comorbid
difficulties in mathematics and reading (n = 5). Teachers reported the students with disabilities
had received special education services for one to four years. Two of the students with
disabilities received their primary instruction in a full inclusion setting supplemented by
approximately 2 ½ hours of support from a teaching assistant each week. The remaining students
received a range of 0 to 10 hours of special education services per week.

16
Sampling Procedure
Principal and fourth-grade teacher consent. Initially, the principal of a local
elementary school was contacted to request permission to meet with the fourth-grade teachers
about participating in the study. Next, teachers were informed of the purpose of the study and
requirements for participation. The six fourth-grade teachers who consented to participation
assisted with the following: (a) distribution and collection of parent consent letters, (b)
scheduling of testing sessions, and (c) completion of the SWAN rating scale of attention and
behavior (J. Swanson et al., 2006) as well as a demographic reporting form for every student for
whom consent and assent was obtained. To compensate teachers for their time and efforts, each
received $30 for distributing and collecting consent letters, and an additional $120 for assisting
with the scheduling of test sessions and completing forms for each participant in their class (i.e.,
a total of $150). At the conclusion of the study, teachers were offered an optional 1-hr consulting
session to review the individual performance of their students who participated in the study.
None of the six teachers withdrew from the study.
Parent consent. Two copies of the parent consent letter were sent home in the backpacks
of all fourth-grade students who were enrolled in the classrooms of consenting teachers. The
parent consent letter requested permission for their child to participate in the study, which
included audio recording each testing session. One copy was signed by the parent and returned to
his or her child’s teacher. Parents kept the second copy for their records. If a response was not
received after approximately one week, a second set of parent consent letters was sent home with
the student. No further attempts were made if a parent did not respond after the second set of
consent letters were distributed.

17
Student assent. Students for whom parent consent was obtained were assented during
the first testing session. A trained research assistant read the assent form aloud to the consented
students. The student assent letter informed students that, if they chose to participate, they would
complete two batteries of assessments. By assenting to participation, they also agreed to the
audio recording of the testing sessions. The letter emphasized that participation was not
mandatory or required, and they may decide to stop participating in the study at any time.
Summary of consent and assent procedures. All consent and assent forms informed
teachers, parents, and students that there were no penalties for failing to consent or assent to
participation in the study. Every teacher, parent, and student was also informed they could
withdraw their child or themselves from the study at any time. Consenting and assenting
participants checked “yes” and signed their names on the consent/assent form to indicate
agreement to participation.
Measures
Table 1 lists the measures administered to students within two 60-min testing sessions.
The measures assessing different cognitive skills were selected based on evidence of prior
studies on the underlying child variables potentially important in predicting reading
comprehension (e.g., Keenan et al., 2008; Nation, 2007). Previous research also supported the
use of these measures with fourth graders, and sufficient data was available to corroborate the
reliability and validity of these assessments. For a random sample of 20% of the participants, a
second examiner reviewed the audio-recordings and independently scored each measure.
Interrater agreement between the two examiners was calculated using the following formula:
Agreements/(Agreements + Disagreements). A description of the assessments and relevant
reliability statistics are subsequently provided.

18
Table 1 Fourth Grade Assessment Batteries and Estimated Time for Administration
Assessment Battery 1 (approximate time 60 min)
Skill Assessed Measure (estimated assessment time) Listening comprehension WJ-III Oral Comprehension (10 min)
Reading comprehensiona QRI-5 Reading Comprehensiona (30 min total/10 min each) • Open-ended questions • Multiple choice • Retell
Nonverbal reasoning WASI Matrix Reasoning (10 min) Domain knowledge WJ-III Academic Knowledge (10 min)
Assessment Battery 2 (approximate time 59 min)
Skill Assessed Measure (estimated assessment time) Vocabulary WJ-III Picture Vocabulary (5 min) Working memory WMTB-C Listening Recall (10 min)
Reading comprehensiona QRI-5 Reading Comprehensiona (30 min total/10 min each) • Open-ended questions • Multiple choice • Retell
Word recognition and decoding
TOWRE-2 Sight Word Efficiency (2 min) TOWRE-2 Phonemic Decoding Efficiency (2 min)
Reading strategies SMALSI Reading and Comprehension Strategies and Student Contextual Learning Scale (10 min)
Teacher Completed Measure Attention SWAN (<5 min per student) Note. Note. WJ-III = Woodcock-Johnson-III Tests of Achievement; QRI-5 = Qualitative Reading Inventory-5; WASI = Wechsler Abbreviated Scale of Intelligence; WMTB-C Working Memory Test Battery for Children, TOWRE-2 = Test of Word Reading Efficiency; SMALSI = School Motivation and Learning Strategies Inventory. aThe QRI-5 includes three formats (i.e., open-ended questions, multiple choice, and retell) across two genres (i.e., narrative and expository) for a total of six passages.
Reading comprehension. Six passages from Level 4 of the Qualitative Reading
Inventory-Fifth Edition (QRI-5; Leslie & Caldwell, 2011) were used to assess reading

19
comprehension of grade-level text. After the examiner asked a brief question to assess the
student’s prior knowledge of the topic, students orally read each passage and completed a short
comprehension assessment. All open-ended questions were read aloud by the examiner as the
student followed along to minimize the potential effects of word recognition difficulties for
children with poor reading skills. After the examiner read the question, the student provided an
oral response to the item. Open-ended questions on the QRI-5 are scored as correct or incorrect,
and the QRI-5 manual reports interrater agreement as .98 (Leslie & Caldwell, 2011). Interrater
agreement for this sample was .93.
For retell, students were asked to recall everything they could remember from the
passage. At the conclusion of the retell, the examiner prompted the students by saying, “Can you
tell me anything else about the passage?” As specified by the QRI-5, retell scores represent the
total number of idea units recalled from the passage. For retell, reliability statistics are not
reported in the QRI-5 manual. In the current study, interrater agreement for the QRI-5 retell
measure was .82.
To investigate the effects of response format on reading comprehension, a multiple-
choice assessment was created for the current study. The open-ended comprehension questions
from the QRI-5 were used as the item stems for each multiple-choice question. The multiple-
choice responses (i.e., answers) were written following guidelines presented in Developing and
Validating Multiple-Choice Test Items (Haladyna, 1999). In addition, two websites, Writing
Multiple-Choice Questions (Center for Teaching Excellence, 2013) and Writing Good Multiple-
Choice Test Questions (The Center for Teaching, 2013) were consulted in creating this measure.
Prior to administering the multiple-choice assessment to the fourth-grade students, a small group
of Vanderbilt University graduate students completed the multiple-choice tests. Items identified
20
to be problematic were revised. All item stems and answer options were read aloud by the
examiner as the student followed along to minimize the potential effects of word recognition
difficulties for children with poor reading skills. For the current fourth-grade sample, Cronbach’s
alpha for the QRI-5 multiple-choice and open-ended items was .80.
Attention and behavior. Attention and inhibition of hyperactivity was measured with a
teacher-reported rating scale, the SWAN (J. Swanson et al., 2006). In the 18-item rating scale,
half of the items are devoted to attention and half to inhibition of hyperactivity. Total raw scores
reflect the overall ratings on each of these subscales. The questions are measured on a 7-point
scale, and reliability is .97. Cronbach’s alpha for this sample was .90.
Domain knowledge. Domain knowledge was measured with the Academic Knowledge
subtests of the Woodcock-Johnson III Tests of Achievement (Woodcock et al., 2001). This
measures includes three subtests addressing questions from the academic areas of science, social
studies, and humanities. Items increase in difficulty, and basal and ceiling rules were applied.
Reliability for children ages 9 and 10 is .85 (McGrew, Schrank, & Woodcock, 2007). Interrater
agreement for this sample was .99.
Learning strategies. Reading and learning strategies were assessed using an adapted
version of the Reading and Comprehension Strategies subtest of the School Motivation and
Learning Strategies Inventory (SMALSI; Stroud & Reynolds, 2006) and the Student Contextual
Learning Scale (Cirino, 2014). The combined inventory measures four aspects of reading
comprehension: (a) previewing, (b) monitoring, (c) reviewing texts, and (d) self-testing to ensure
understanding. Selected items from the two measures also assess effort, motivation, self-
regulation, and strategies in relation to learning. On this test, each item has four possible answer
choices: (a) never, (b) sometimes, (c) often, and (d) almost always. Item were read aloud by the

21
examiner as the student followed along to minimize the potential effects of word recognition
difficulties for children with poor reading skills. Chronbach’s alpha for fourth grade on the
SMALSI Reading and Comprehension Strategies is .78. Internal reliability for the Student
Contextual Learning Scale subtests range from .66 to .88.
Listening comprehension. Listening ability was measured with the Oral Comprehension
subtest of the Woodcock-Johnson III Tests of Achievement (Woodcock et al., 2001). This test
uses a modified cloze procedure to measure listening comprehension. On this test, students are
asked to listen to 1-2 sentence prompts in which a single word has been removed. Students are
asked to provide one word to complete the sentence. Items increase in difficulty, and basal and
ceiling rules were applied. Median reliability for children ages 9 and 10 is .79 (McGrew et al.,
2007). Interrater agreement for this sample was .93.
Nonverbal reasoning. Nonverbal reasoning was assessed with the Matrix Reasoning
subtest of the Wechsler Abbreviated Scale of Intelligence (The Psychological Corporation,
1999). On this assessment, students are presented a series of pictures and asked to select the
image to complete the pattern. Test-retest reliability is .76 (The Psychological Corporation,
1999). Interrater agreement for this sample was .93.
Vocabulary. Vocabulary was assessed with the Picture Vocabulary subtest of the
Woodcock-Johnson III Tests of Achievement (Woodcock et al., 2001). This test measures a
child’s expressive language skills. Students are given a picture and asked to name the
corresponding vocabulary word. Items increase in difficulty, and basal and ceiling rules were
applied. Median reliability for children ages 9 and 10 is .79 (McGrew et al., 2007). Interrater
agreement for this sample was .99.
22
Word recognition and decoding. Word recognition and decoding was assessed with the
Test of Word Reading Efficiency-Second Edition (Torgesen, Wagner, & Rashotte, 2012). For this
test, students are given 45 seconds to read a list of real or nonsense words. For the Sight Word
Efficiency subtest of the Test of Word Reading Efficiency-Second Edition (Torgesen et al., 2012),
test-retest reliability is .90. For the Phonemic Decoding Efficiency subtest of the Test of Word
Reading Efficiency-Second Edition (Torgesen et al., 2012), test-retest reliability is .91. For this
sample, interrater agreement on the Sight Word Efficiency and Phonemic Decoding Efficiency
subtests was .99 and .91, respectively.
Working memory. Working memory was assessed using the Listening Recall subtest
from the Working Memory Test Battery for Children (Pickering & Gathercole, 2001). For this
test, the examiner says a phrase aloud. Immediately after the phrase is presented, the student is
asked to verify the truth of the statement (i.e., true/false) and recall the last word of the sentence.
Items are presented in spans that gradually increase in the number of phrases presented, ranging
from 1 to 6. Items are scored as correct if the last word(s) in the phrase(s) is recalled in the
appropriate order; phrase verification (i.e., true/false) is not scored but serves merely as a
distractor. A ceiling rule of three errors in any span was applied. In a previous study with fifth-
grade children, coefficient alpha was calculated as .85 (Kearns et al., in press). Interrater
agreement for this sample was .99.
Experimental Procedures and Study Design
Students for whom consent and assent was obtained were administered two 60-min
assessment batteries (see Table 1). Testing sessions were conducted one-to-one, and four
research assistants who were graduate students in education administered the assessments. All
testers had experience working with young children as research assistants on other projects

23
and/or as classroom teachers. Examiners audio recorded every testing session to ensure high
reliability and fidelity of test implementation. For each student, the second testing session was
completed within one week after administration of the first assessment battery. For a few
students, school-scheduling conflicts required examiners to shorten the testing sessions. In these
instances, the order of the tests was preserved, and testers completed the assessments on
subsequent days as time allowed.
Most relevant to the research questions, six passages (including three narrative and three
expository passages) selected from the QRI-5 (Leslie & Caldwell, 2011) were administered to all
students using the previously described testing procedures. For each set of narrative and
expository passages, students completed three comprehension measures using the following
response formats: (a) open-ended questions, (b) multiple choice, and (c) retell. Prior to
administering the QRI-5, the readability statistics were examined for each of the Level 4
passages. Although all six passages were identified by the QRI-5 as appropriate for fourth
graders, the readability levels indicated considerable variability across the six passages (see
Appendix). Therefore, to account for potential passage effects, the response formats and passage
types were randomized and counterbalanced across students in a 3 × 2 (Response Format ×
Genre) design. In each testing session, every participant completed all three of the response
types, and response formats for passages were randomly assigned to students within the two sets
of narrative and expository texts (see Figure 1 for a diagram of the study design). In addition to
the QRI-5 passages, research assistants administered a full battery of assessments to measure
additional child skills potentially related to reading comprehension (e.g., word recognition,
listening comprehension). These additional reading and cognitive measures addressed the third

24
and fourth research questions aimed at identifying specific child variables that contribute to
performance on different comprehension response formats.
Figure 1. Response formats and passage type randomized and counterbalanced across students in
a 3 × 2 (Response Format × Genre) design. All participants completed each of the three response
types during the two testing sessions, for a total of six assessments across all sessions.
Fidelity of Test Administration
Fidelity checklists designed to measure adherence to important testing procedures were
created, and fidelity of test implementation was calculated with the following formula:
[Agreements/(Agreements + Disagreements)] × 100. Before administering the assessments to
students, all research assistants were trained to a minimum of 90% fidelity on the testing
procedures for each measure. Using the audio-recorded testing sessions, fidelity of test

25
implementation was calculated for a random sample of 20% of the participants. This random
sample included testing sessions for each of the four examiners, and average fidelity of test
implementation was greater than 94% across all measures.
Data Entry Procedures
For students for whom parent consent and student assent were obtained, each participant
was assigned an identification number, and only these numbers were used to identify students in
the master databases. To maintain confidentiality of the students, only the PI and key study
personnel had access to participant files and study data throughout the duration of the project. To
ensure accuracy and reliability of the data, all scores were double-scored and double-entered by
independent coders, and discrepancies were resolved by the author. The REDCap electronic data
capture tool hosted by Vanderbilt University was used to enter and manage all data (Harris et al.,
2009).
Analytic Strategy
For the first three research questions, item-response crossed random effects models were
used to estimate the logit of a correct response on two reading comprehension measures (i.e.,
open-ended and multiple-choice questions) while simultaneously accounting for both person and
item (i.e., question) variance (Janssen, Schepers, & Peres, 2004; Van den Noortgate, De Boeck,
& Meulders, 2003). For the first set of models investigating Research Questions 1, 2, and 3,
retell was excluded from the analyses. In the study design, the same questions (i.e., items) were
administered to students on both the open-ended and multiple-choice tasks. The retell measure,
however, did not align with the same item scale, and therefore, I was unable to include this
response format in the first set of models. The retell measure was relevant to my fourth research
question and was included in separate cross-classified random effects analyses. Across all
26
models, the fixed parameters are represented as 𝛾s and random parameters are noted as rs (see
Table 2).
In regards to power for the subsequent models, varying methods for examining the item
response crossed random effects models seem to yield little difference in the precision of the
fixed effects (Cho, Partchev, & De Boeck, 2012). For the random effects, although some
methods (e.g., the alternating imputation posterior method) may present larger bias when the
models are used with smaller samples, these same models also tend to result in smaller mean
standard errors (Cho et al., 2012). Therefore, I expected the sample size of 79 students
completing 8 questions across six passages would yield an adequately powered model capable of
detecting statistically significant effects. Likewise, the retell scores for the 79 students across the
six passages were expected to yield a sufficiently powered model for detecting statistically
significant effects of genre and child skills on retell reading comprehension.

27
Table 2 Item Response Crossed and Cross-Classified Random Effects Model Equations for Research Questions
Item response crossed random effects Research Question
Model Equation
1 1 𝑙𝑜𝑔𝑖𝑡 𝜋!"# = 𝛾!!! + 𝛾!"!𝑅𝑒𝑠𝑝𝑜𝑛𝑠𝑒𝐹𝑜𝑟𝑚𝑎𝑡!"(!) + 𝑟!! + 𝑟!!(!) + 𝑟!!! +𝑟!"(!), where all r ~ N(0, σ2).
2a, 2b 2 𝑙𝑜𝑔𝑖𝑡 𝜋!"# =𝛾!!! + 𝛾!"!𝑅𝑒𝑠𝑝𝑜𝑛𝑠𝑒𝐹𝑜𝑟𝑚𝑎𝑡!"(!) +𝛾!"!𝐺𝑒𝑛𝑟𝑒!(!) + 𝛾!"!𝑅𝑒𝑠𝑝𝐹𝑜𝑟𝑚!"(!)× 𝐺𝑒𝑛𝑟𝑒!(!) + 𝑟!! + 𝑟!!(!) + 𝑟!!! +𝑟!"(!), where all r ~ N(0, σ2).
3a 3a 𝑙𝑜𝑔𝑖𝑡 𝜋!"# = 𝛾!!! + 𝛾!"!𝑅𝑒𝑠𝑝𝑜𝑛𝑠𝑒𝐹𝑜𝑟𝑚𝑎𝑡!"(!) + 𝛾!"!𝑉𝑜𝑐𝑎𝑏𝑢𝑙𝑎𝑟𝑦! +𝛾!"!𝑁𝑜𝑛𝑣𝑒𝑟𝑏𝑎𝑙𝑅𝑒𝑎𝑠𝑜𝑛𝑖𝑛𝑔! + 𝛾!"!𝑊𝑜𝑟𝑘𝑖𝑛𝑔𝑀𝑒𝑚𝑜𝑟𝑦! +𝛾!"!𝑊𝑜𝑟𝑑𝑅𝑒𝑐𝑜𝑔𝑖𝑡𝑖𝑜𝑛! + 𝛾!"!𝐷𝑒𝑐𝑜𝑑𝑖𝑛𝑔! + 𝛾!"!𝐿𝑒𝑎𝑟𝑛𝑖𝑛𝑔𝑆𝑡𝑟𝑎𝑡𝑒𝑔𝑖𝑒𝑠! + 𝛾!"!𝐿𝑖𝑠𝑡𝑒𝑛𝑖𝑛𝑔𝐶𝑜𝑚𝑝𝑟𝑒ℎ𝑒𝑛𝑠𝑖𝑜𝑛! + 𝛾!"!𝐷𝑜𝑚𝑎𝑖𝑛𝐾𝑛𝑜𝑤𝑙𝑒𝑑𝑔𝑒! + 𝛾!"!!𝐴𝑡𝑡𝑒𝑛𝑡𝑖𝑜𝑛 + 𝛾!""!𝐵𝑒ℎ𝑎𝑣𝑖𝑜𝑟 + 𝑟!! + 𝑟!!(!) + 𝑟!!! + 𝑟!"(!), where all r ~ N(0, σ2).
3b 3b 𝑙𝑜𝑔𝑖𝑡 𝜋!"# = 𝛾!!! + 𝛾!"!𝑅𝑒𝑠𝑝𝑜𝑛𝑠𝑒𝐹𝑜𝑟𝑚𝑎𝑡!"(!) + 𝛾!"!𝑉𝑜𝑐𝑎𝑏𝑢𝑙𝑎𝑟𝑦! +𝛾!"!𝑁𝑜𝑛𝑣𝑒𝑟𝑏𝑎𝑙𝑅𝑒𝑎𝑠𝑜𝑛𝑖𝑛𝑔! + 𝛾!"!𝑊𝑜𝑟𝑘𝑖𝑛𝑔𝑀𝑒𝑚𝑜𝑟𝑦! +𝛾!"!𝑊𝑜𝑟𝑑𝑅𝑒𝑐𝑜𝑔𝑖𝑡𝑖𝑜𝑛! + 𝛾!"!𝐷𝑒𝑐𝑜𝑑𝑖𝑛𝑔! + 𝛾!"!𝐿𝑒𝑎𝑟𝑛𝑖𝑛𝑔𝑆𝑡𝑟𝑎𝑡𝑒𝑔𝑖𝑒𝑠! + 𝛾!"!𝐿𝑖𝑠𝑡𝑒𝑛𝑖𝑛𝑔𝐶𝑜𝑚𝑝𝑟𝑒ℎ𝑒𝑛𝑠𝑖𝑜𝑛! + 𝛾!"!𝐷𝑜𝑚𝑎𝑖𝑛𝐾𝑛𝑜𝑤𝑙𝑒𝑑𝑔𝑒! + 𝛾!"!!𝐴𝑡𝑡𝑒𝑛𝑡𝑖𝑜𝑛 + 𝛾!""!𝐵𝑒ℎ𝑎𝑣𝑖𝑜𝑟 + 𝛾!"#!𝑅𝑒𝑠𝑝𝑜𝑛𝑠𝑒𝐹𝑜𝑟𝑚𝑎𝑡!(!)×𝑊𝑜𝑟𝑘𝑖𝑛𝑔𝑀𝑒𝑚𝑜𝑟𝑦! +𝛾!"#!𝑅𝑒𝑠𝑝𝑜𝑛𝑠𝑒𝐹𝑜𝑟𝑚𝑎𝑡!"(!)× 𝐿𝑖𝑠𝑡𝑒𝑛𝑖𝑛𝑔𝐶𝑜𝑚𝑝𝑟𝑒ℎ𝑒𝑛𝑠𝑖𝑜𝑛! +𝛾!"#!𝑅𝑒𝑠𝑝𝑜𝑛𝑠𝑒𝐹𝑜𝑟𝑚𝑎𝑡!"(!) ×𝐴𝑡𝑡𝑒𝑛𝑡𝑖𝑜𝑛 + 𝑟!! + 𝑟!!(!) + 𝑟!!! + 𝑟!"(!), where all r ~ N(0, σ2).
4a 4a 𝑅𝑒𝑡𝑒𝑙𝑙 =𝛾!! + 𝛾!"𝐺𝑒𝑛𝑟𝑒!" + 𝛾!"𝑉𝑜𝑐𝑎𝑏𝑢𝑙𝑎𝑟𝑦! + 𝛾!"𝑁𝑜𝑛𝑣𝑒𝑟𝑏𝑎𝑙𝑅𝑒𝑎𝑠𝑜𝑛𝑖𝑛𝑔! +𝛾!!𝑊𝑜𝑟𝑘𝑖𝑛𝑔𝑀𝑒𝑚𝑜𝑟𝑦! + 𝛾!"𝑊𝑜𝑟𝑑𝑅𝑒𝑐𝑜𝑔𝑖𝑡𝑖𝑜𝑛! + 𝛾!"𝐷𝑒𝑐𝑜𝑑𝑖𝑛𝑔! + 𝛾!"𝐿𝑒𝑎𝑟𝑛𝑖𝑛𝑔𝑆𝑡𝑟𝑎𝑡𝑒𝑔𝑖𝑒𝑠! + 𝛾!"𝐿𝑖𝑠𝑡𝑒𝑛𝑖𝑛𝑔𝐶𝑜𝑚𝑝𝑟𝑒ℎ𝑒𝑛𝑠𝑖𝑜𝑛! +𝛾!"𝐷𝑜𝑚𝑎𝑖𝑛𝐾𝑛𝑜𝑤𝑙𝑒𝑑𝑔𝑒! + 𝛾!"!𝐴𝑡𝑡𝑒𝑛𝑡𝑖𝑜𝑛 + 𝛾!""𝐵𝑒ℎ𝑎𝑣𝑖𝑜𝑟 + 𝑟!! + 𝑟!!, where all r ~ N(0, σ2).
4b 4b 𝑅𝑒𝑡𝑒𝑙𝑙 =𝛾!! + 𝛾!"𝐺𝑒𝑛𝑟𝑒!" + 𝛾!"𝑉𝑜𝑐𝑎𝑏𝑢𝑙𝑎𝑟𝑦! + 𝛾!"𝑁𝑜𝑛𝑣𝑒𝑟𝑏𝑎𝑙𝑅𝑒𝑎𝑠𝑜𝑛𝑖𝑛𝑔! +𝛾!"𝑊𝑜𝑟𝑘𝑖𝑛𝑔𝑀𝑒𝑚𝑜𝑟𝑦! + 𝛾!"𝑊𝑜𝑟𝑑𝑅𝑒𝑐𝑜𝑔𝑖𝑡𝑖𝑜𝑛! + 𝛾!"𝐷𝑒𝑐𝑜𝑑𝑖𝑛𝑔! + 𝛾!"𝐿𝑒𝑎𝑟𝑛𝑖𝑛𝑔𝑆𝑡𝑟𝑎𝑡𝑒𝑔𝑖𝑒𝑠! + 𝛾!"𝐿𝑖𝑠𝑡𝑒𝑛𝑖𝑛𝑔𝐶𝑜𝑚𝑝𝑟𝑒ℎ𝑒𝑛𝑠𝑖𝑜𝑛! +𝛾!"𝐷𝑜𝑚𝑎𝑖𝑛𝐾𝑛𝑜𝑤𝑙𝑒𝑑𝑔𝑒! + 𝛾!"!𝐴𝑡𝑡𝑒𝑛𝑡𝑖𝑜𝑛 + 𝛾!""𝐵𝑒ℎ𝑎𝑣𝑖𝑜𝑟 +𝛾!"#𝐺𝑒𝑛𝑟𝑒!"×𝑊𝑜𝑟𝑑𝑅𝑒𝑐𝑜𝑔𝑖𝑡𝑖𝑜𝑛! +𝛾!"#𝐺𝑒𝑛𝑟𝑒!"×𝐿𝑖𝑠𝑡𝑒𝑛𝑖𝑛𝑔𝐶𝑜𝑚𝑝𝑟𝑒ℎ𝑒𝑛𝑠𝑖𝑜𝑛! + 𝑟!! + 𝑟!!, where all r ~ N(0, σ2).
28
Open-ended and multiple-choice models. In the database used to investigate Research
Questions 1, 2, and 3, responses for open-ended and multiple-choice questions were coded 1 for
correct and 0 for incorrect. Within my experimental design, open-ended and multiple-choice
responses (R = 3,792) were crossed between students (J = 79) and questions (Q = 48; see Figure
2). For the open-ended and multiple-choice response formats, each student attempted the same
set of questions. The items, however, were nested in the QRI-5 passages (P = 6). Although
response format and passage type was randomized and counterbalanced across students in a 3 ×
2 (Response Format × Genre) design to alleviate any potential effects of passage, a set of
competing unconditional models were run initially to determine if person, question, and passage
random effects were necessary for fitting the data in the final models. The unconditional model
was used to estimate and compare competing models in terms of Akaike’s (1974) information
criterion (AIC), Schwarz’s (1978) Bayesian information criterion (BIC), and the likelihood ratio
test (LRT) based on a mixed chi-square distribution (Stram & Lee, 1994). The first unconditional
model included all the possible random effects for student (r0j), question (r0q(p)) and passage (r00p;
see Table 2). If it was determined that the estimate of passage effect was small, a priori data
analysis plans were made to remove the random effect, and a second unconditional model was
run. In the simpler model, the LRT statistic was used to determine if the data fit less well in
comparison to the more complex model. Moreover, both the AIC and BIC values were examined
to identify if they were lower in the simpler model. If the simpler model was a better fit for the
data, two more models were run to test the student and question random effects. Decisions
regarding the model fit for the final analyses were selected based on the AIC, BIC, and LRT
statistics.
29
Figure 2. Item-response crossed random effects model with responses to open-ended and
multiple-choice questions as predictors at Level 1, students and QRI-5 questions crossed at Level
2, and questions nested within QRI-5 passages as Level 3.
If the previous model testing suggested passage random effects should be included in the
open-ended and multiple-choice question models, a random parameter was included for students,
questions, and passages to account for potential dependency in the outcome. In the final models,
the comprehension questions (transformed by the logit function) from the QRI-5 passages were
regressed on a dummy variable (ResponseFormat) with open-ended questions coded 0 as the
referent group and multiple-choice items coded as 1 (see Table 2 for the regression equation).
Using the data analysis procedures previously described, model comparisons were examined to
determine if response format (ResponseFormat) should be included as a random or fixed effect in
the final model. Finally, once the best model fit was determined and the final analyses were run,

30
the probability of a correct response was calculated for the referent group (i.e., open-ended
questions) with the following formula:
𝑃!"# = 1
1+ 𝑒!!!!! .
The probability for the contrasting response format (i.e., multiple-choice questions) was
calculated with the formula:
𝑃!"# =1
1+ 𝑒!(!!!!!!!"!).
My second research question aimed to investigate the interaction between response
format (i.e., open-ended or multiple-choice questions) and text genre (i.e., expository or
narrative) on reading comprehension outcomes. In this model, the interaction between the
dummy variable for response format (ResponseFormat) was allowed to interact with a second
dummy variable for genre (Genre). For the genre dummy code, expository passages were coded
0 as the referent group and narrative passages were coded as 1 (i.e., fixed effect; see Table 2,
Model 2).
For my third research question, I examined the relation of child skills to comprehension
outcomes across different response formats (i.e., open-ended or multiple-choice questions). To
address this question, all variables hypothesized to contribute to differences in the probability of
a correct comprehension response were added as main effects to the models (see Table 2, Model
3a). Model 3a included the following ten child skill covariates: (a) vocabulary, (b) nonverbal
reasoning, (c) working memory, (d) word recognition, (e) decoding, (f) learning strategies, (g)
listening comprehension, (h) domain knowledge, (i) attention, and (j) behavior. These variables
were entered as fixed parameters in the model. Planned a priori, if results revealed statistically
significant main effects of child skills in predicting reading comprehension, additional
31
exploratory analyses were conducted to determine the interaction effects between response
format (i.e., open-ended and multiple-choice questions) and child skills on the probability of a
student answering an item correctly (see Table 2, Model 3b).
Retell models. Finally, for my fourth research question, cross-classified random effects
models were run to investigate the main effects of genre and child skills on retell comprehension
performance (see Table 2, Model 4a; Snijders & Bosker, 2011). These models predicted retell
scores at Level 1, which were crossed between student and passage at Level 2. Figure 3 displays
the cross classification of this model in which retell scores (R = 474) were crossed between
students (J = 79) and passages (P = 6). Using the methods previously described, competing
unconditional models were first examined to determine if passage random effects (r0p) should be
included in the retell model. The final model fit was determined given the results of the
unconditional model comparisons. Reduction in student and passage variance when comparing
the unconditional model to subsequent retell models was calculated with the following formula:
[(r010(Basemodel)- r010(Model n))/ r010(Basemodel)]. Model 4a in Table 2 displays the equation examining
the main effects of genre and child skills hypothesized to predict reading comprehension retell
scores. All child skill covariates were entered as fixed effects in this model. Finally, if results
revealed statistically significant main effects of child skills, additional exploratory analyses of
the interactions between genre and child skills were conducted to further investigate their effects
on retell reading comprehension (see Table 2, Model 4b).

32
Figure 3. Cross-classified random effects model with retell scores as continuous predictors at
Level 1, and student and QRI-5 passages crossed at Level 2.

33
CHAPTER III
RESULTS
Table 3 presents descriptive statistics of the full sample for the raw scores and standard
scores of nationally normed tests. Although some of the means were slightly below average,
inspection of the range of standard scores affirmed inclusion of a full range of child skills,
including a distribution of highly skilled to less skilled students (see Table 3). No deviations
from normality were evident upon examination of the histograms for each variable, and no
outliers outside the three interquartile range of the mean were identified as placing undue weight
on the results. To make the regression coefficients easily interpretable across measurement
scales, raw scores for the child skill variables were mean-centered before conducting the data
analyses.

34
Table 3 Means and Standard Deviations for Reading Comprehension Measures and Child Skill Variables for the Full Sample (N = 79)
Measure Raw Scores Standard Scores
M SD Min Max M SD Min Max QRI-5 Multiple choice Total Scores 11.96 2.35 5 16 — — — —
Narrative 6.27 1.22 3 8 — — — — Expository 5.70 1.77 1 8 — — — —
QRI-5 Open-ended question Total Scores 7.87 3.31 1 14 — — — — Narrative 4.22 1.82 0 8 — — — — Expository 3.66 2.21 0 8 — — — —
QRI-5 Retell Total Scores 23.65 9.64 6 48 — — — — Narrative 13.58 6.21 0 29 — — — — Expository 10.06 5.21 0 27 — — — —
SMALSI Reading and Comprehension Strategies and SCLS 88.18 17.91 42 118 — — — —
SWAN Attention 41.95 13.78 16 63 — — — — SWAN Behavior 44.91 12.02 21 63 — — — — TOWRE-2 Sight Word Efficiency 64.81 9.46 28 87 95.54 11.82 58 130 TOWRE-2 Phonemic Decoding Efficiency 30.42 11.95 2 55 94.29 15.38 56 127 WASI Matrix Reasoning 19.97 5.89 5 30 101.01 14.98 64 130 WJ-III Academic Knowledge 43.84 4.68 32 56 93.28 14.35 55 129 WJ-III Picture Vocabulary 22.41 3.02 14 31 94.08 9.61 69 122 WJ-III Oral Comprehension 17.67 3.86 10 29 96.14 12.61 72 135 WMTB-C Listening Recall 11.80 3.14 0 20 98.99 18.90 0 144 Note. Min = minimum; Max = maximum; QRI-5 = Qualitative Reading Inventory-5; SMALSI = School Motivation and Learning Strategies Inventory; SCLS = Student Contextual Learning Scale; TOWRE-2 = Test of Word Reading Efficiency; WASI = Wechsler Abbreviated Scale of Intelligence; WJ-III = Woodcock-Johnson III Tests of Achievement; WMTB-C Working Memory Test Battery for Children.

35
Correlations
Prior to building the models, pairwise correlations for the QRI-5 comprehension
measures and child covariates were calculated (see Table 4). Among the three QRI-5
comprehension response formats, correlations were statistically significant (p <.001), but the
relations between the three tests were modest ranging from .37 to .48 (see Table 4). For the child
skill covariates, a wide range of correlations was observed. Some measures were closely related
(e.g., SWAN Attention and Behavior subscales r = .91, p <.001; Test of Word Reading Efficiency-
Second Edition Sight Word Efficiency and Phonemic Decoding Efficiency subtests r = .76, p
<.001). Other measures such as the learning strategies scale had correlations close to zero with
both the QRI-5 comprehension tests (e.g., r = -.04 between the QRI-5 multiple choice and the
adapted SMALSI Reading and Comprehension Strategies and Student Contextual Learning
Scale) and other child skill covariates (e.g., r = -.02 between the Woodcock-Johnson III Tests of
Achievement Oral Comprehension subtest and the adapted SMALSI Reading and
Comprehension Strategies and Student Contextual Learning Scale).
Some of these correlations were expected and aligned with findings of prior studies. For
example, Collins, Gilbert et al. (2014) found a .47 correlation between the QRI-3 open-ended
question and retell measures, and Keenan et al. (2008) reported a correlation of .41 between the
same two QRI-3 subtests. Although in the current study scores for these measures were
compared across passages, the correlation of .43 calculated for the sample fell within the range
reported in the extant literature (see Table 4). Many prior studies, however, have failed to
examine how child skills, such as domain knowledge and strategy use, account for variance in
comprehension performance across response formats (e.g., Cutting & Scarborough, 2006;
Keenan & Meenan, 2014). Because no prior studies have isolated the effects of response format
36
and used cross-classified multilevel models to examine these relationships, I included all
potential child covariates in the models, regardless of their correlations with other measures.
Each of these child covariates were supported by theoretical models and prior research as being
important and potentially significant predictors of reading comprehension outcomes (Compton et
al., 2014; Keenan et al., 2008; Keenan & Meenan, 2014; Perfetti et al., 2007; H. L. Swanson,
Howard, & Sáez, 2007).

37
Table 4 Correlations for Reading Comprehension Measures and Child Skill Covariates in the Full Sample (N = 79)
Measure 1 2 3 4 5 6 7 8 9 10 11 12 13 1. QRI-5 OE —
2. QRI-5 MC .48*** —
3. QRI-5 Retell .43*** .37*** —
4. SMALSI RCS and SCLS
-.20 -.04 -.03 —
5. SWAN Attention
.25* .49*** .21 .21 —
6. SWAN Behavior
.11 .37*** .11 .14 .91*** —
7. TOWRE-2 SWE
.24* .35** .34** .10 .37*** .35** —
8. TOWRE-2 PDE
.17 .33** .17 .14 .31** .27* .76*** —
9. WASI MR .41*** .36** .27* -.09 .50*** .45*** .05 .11 —
10. WJ-III AK .60*** .40*** .56*** -.11 .35** .23* .51*** .43*** .40*** —
11. WJ-III PV .40*** .26* .46*** -.19 .05 -.01 .27* .32** .27* .66*** —
12. WJ-III OC .61*** .44*** .53*** -.02 .14 .03 .33** .34** .23* .69*** .53*** —
13. WMTB-C LR
.41*** .44*** .12 -.01 .28* .19 .16 .28* .30** .24* .15 .35** —
Note. QRI-5 = Qualitative Reading Inventory-Fifth Edition; OE = Open-ended questions; MC = Multiple-choice questions; SMALSI RCS = School Motivation and Learning Strategies Inventory Reading and Comprehension Strategies; SCLS = Student Contextual Learning Scale; TOWRE-2 = Test of Word Reading Efficiency-Second Edition; SWE = Sight Word Efficiency; PDE = Phonemic Decoding Efficiency; WASI MR = Wechsler Abbreviated Scale of Intelligence Matrix Reasoning; WJ-III = Woodcock-Johnson III Tests of Achievement; AK = Academic Knowledge; PV = Picture Vocabulary; OC = Oral Comprehension; WMTB-C LR = Working Memory Test Battery for Children Listening Recall. *p<.05, **p<.01, ***p<.001

38
Missing Data
Two datasets were prepared to address the proposed research questions. The first dataset
included all variables to be entered into the open-ended and multiple-choice question models. A
second dataset was organized to investigate the research question on retell reading
comprehension. In both databases, students were missing data as a default of the study design.
Because students were randomly assigned to one of three response formats (i.e., open-ended
question, multiple choice, or retell) for each passage, each student had scores for only one of the
three tests per passage. Consequently, students had missing data for the two response formats not
assessed on that particular passage. Prior to running the analyses, all missing data were dropped
to alleviate a lack of statistically significant findings as a consequence of this study design.
Finally, in one instance, a student was not administered question 8 on the multiple-choice test for
passage 1. This missing value was dropped from the final data set to minimize potential
influence on the calculated probabilities of answering an item correctly. For the open-ended and
multiple-choice question dataset, the exclusion of missing data resulted in R = 2,527 total
responses instead of the full R = 3,792 estimated in Figure 2. Likewise, after excluding missing
data in the retell database, the total number of retell scores was R = 158 instead of the full R =
474 estimated in Figure 3.
Unconditional Model for Open-Ended and Multiple-Choice Questions
Before building the models for the first three research questions, two competing
unconditional models were examined to determine the best model fit for the passage effects (i.e.,
random vs. fixed). For the open-ended and multiple-choice question models, a Chi-square test
and AIC, BIC, and LRT fit estimates comparing the two unconditional models indicated there
was not a statistically significant difference in model fit when passage random or fixed effects

39
were included (p = .11; see Table 5). Given the differences in the level of difficulty across
passages observed in the readability statistics (see Appendix), I included passage as a random
effect within all of the models as a more conservative approach to account for potential variance
across the QRI-5 texts. Due to this decision to include passage random effects in each model, no
additional models were tested, and a three-level model with responses at Level 1, students
crossed with questions at Level 2, and questions nested in passages at Level 3 was applied to
examine Research Questions 1, 2, and 3.
This data structure resulted in students who had multiple memberships in response format
groups across two sets of passages (i.e., expository and narrative; Snijders & Bosker, 2011).
Because students were randomly assigned to response format for each passage, the combination
of these group memberships was inconsistent across genres (Snijders & Bosker, 2011). For
example, two students may have been assigned the same combination of response formats for
each of the narrative passages, but these same students may have received different response
formats across the set of expository texts (see Figure 1). Due to this three-level nesting structure,
I was unable to compute the reduction in variance statistics to compare models for the first three
research questions with the unconditional model. To situate the results for the first three research
questions, the unconditional model for open-ended and multiple-choice questions revealed
considerable variance among students (𝑟!! = 0.48), questions (𝑟!!(!) = 0.57), and passages (𝑟!!!=
0.12; see Table 5). Across all children in the full sample (N = 79), this model indicated the
average probability of the average student answering the average question correctly, regardless
of response format, was .61 (p < .01).
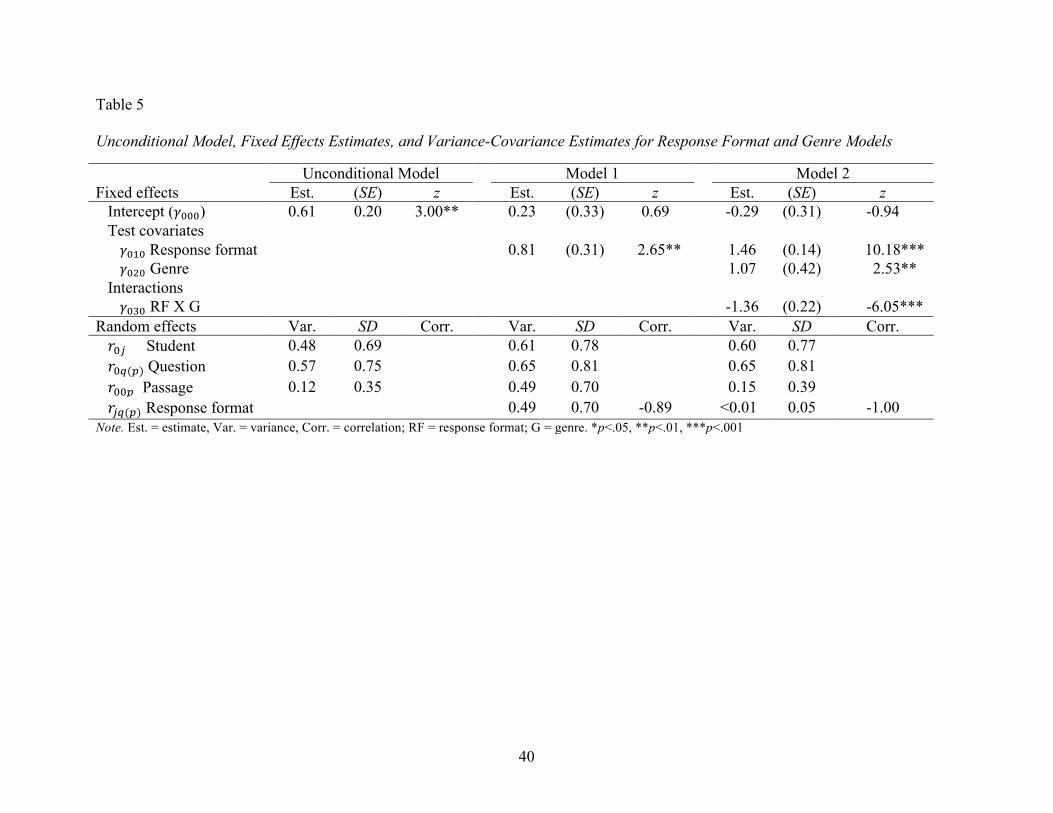
40
Table 5 Unconditional Model, Fixed Effects Estimates, and Variance-Covariance Estimates for Response Format and Genre Models
Unconditional Model Model 1 Model 2 Fixed effects Est. (SE) z Est. (SE) z Est. (SE) z
Intercept (𝛾!!!) 0.61 0.20 3.00** 0.23 (0.33) 0.69 -0.29 (0.31) -0.94 Test covariates 𝛾!"! Response format 0.81 (0.31) 2.65** 1.46 (0.14) 10.18*** 𝛾!"! Genre 1.07 (0.42) 2.53**
Interactions 𝛾!"! RF X G -1.36 (0.22) -6.05***
Random effects Var. SD Corr. Var. SD Corr. Var. SD Corr. 𝑟!! Student 0.48 0.69 0.61 0.78 0.60 0.77 𝑟!!(!) Question 0.57 0.75 0.65 0.81 0.65 0.81 𝑟!!! Passage 0.12 0.35 0.49 0.70 0.15 0.39 𝑟!"(!) Response format 0.49 0.70 -0.89 <0.01 0.05 -1.00
Note. Est. = estimate, Var. = variance, Corr. = correlation; RF = response format; G = genre. *p<.05, **p<.01, ***p<.001

41
Research Question 1: Open-Ended and Multiple-Choice Response Formats
To investigate my first research question, an item-response crossed random effects model
was built to determine the probability of a student answering the same question correctly when it
was presented in an open-ended response format in contrast to administration as a multiple-
choice task. First, two competing models were examined to determine the best model fit for the
response format effects (i.e., random vs. fixed). A mixed Chi-square distribution of the AIC,
BIC, and LRT estimates indicated including response format as a random effect was a better fit
for the model (p < .001). Therefore, response format was entered as a random effect in all of the
models investigating Research Questions 1, 2, and 3. When the dummy variable for response
format (i.e., ResponseFormat) was entered into Model 1 (see Table 5), results revealed
statistically significant effects of question type in predicting the probability of answering an item
correctly when controlling for the effects of student, question, passage, and response format
variance (𝛾!"! = 0.81, z = 2.65, p < .01). Specifically, the estimated probability of a correct
response to an open-ended question was .56. In contrast, for multiple-choice items, the average
predicted probability of a child answering a question correctly was much higher at .74
Research Question 2a and 2b: Open-Ended and Multiple-Choice Questions and Genre
My second research question focused on the main effects of genre (i.e., expository or
narrative) as well as the interaction between response format (i.e., open-ended or multiple-choice
questions) and genre in predicting a correct response. Because in the current study genre type
and response format were randomized and counterbalanced across students in a 3 × 2 (Response
Format × Genre) design, my second research question aimed to parse the effects of these two
assessment dimensions on student response accuracy. Model 2 displays the final model

42
investigating the Response Format × Genre interaction when controlling for student, question,
passage, and response format variance (see Table 5). Results revealed main effects for both
response format (𝛾!"! = 1.46, z = 10.18, p < .001) and genre (𝛾!"! = 1.07, z = 2.53, p = .01). In
this model, statistically significant differences were observed between the likelihood of a correct
response for open-ended and multiple-choice questions, regardless of the text genre, and students
were more likely to answer an item correctly when the response format was multiple choice.
Likewise, Model 2 revealed statistically significant differences in the probability of a correct
response between the two genres (i.e., expository or narrative), regardless of the item response
format. As expected, students were more likely to answer a question correctly about a narrative
story than an expository text. Most important, Model 2 indicated there was a statistically
significant interaction between Response Format × Genre (𝛾!"!= -1.36, z = -6.05, p < .001).
Given the statistically significant interaction effects, the probabilities of answering a
question correctly for each genre and response format were calculated. Figure 4 displays a
graphical depiction of the effects of this interaction. As seen in Figure 4, the probability of a
correct response for an open-ended question on expository texts was .43. When compared to the
.69 likelihood of a student answering a question correctly given an open-ended question on a
narrative text, results indicated students were 26% more likely to answer the item correctly if the
open-ended question was about a narrative passage (see Figure 4). In contrast, for multiple-
choice items, results indicated there was no difference between the likelihood of answering an
item correctly when questions were assessing the comprehension of expository or narrative
passages. The probabilities for students answering multiple-choice items correctly on expository
and narrative texts were .76 and .71, respectively (see Figure 4). Given these results, students
were 34% more likely to answer a multiple-choice item correctly than an open-ended question

43
when comparing the probabilities of a correct response on expository texts. The difference
between the probabilities of a correct response for the two response formats on narrative
passages was trivial (i.e., 2%; see Figure 4).
Figure 4. The interaction between response format (i.e., open-ended or multiple-choice
questions) and genre and their effect on the probability of a correct response.
Research Question 3a: Open-Ended and Multiple-Choice Questions and Child Skills
My third research question examined the main effects of child skills on reading
comprehension in predicting the probability of a student answering a question correctly. As
evidenced in Model 3a (see Table 6), several child skill covariates were statistically significant
predictors of the probability of a correct response. Consistent with other models, response format
was a statistically significant predictor of reading comprehension responses (𝛾!"! = 0.81, z =
2.80, p < .01) when controlling for ten child skills. For the child skill covariates, four coefficients
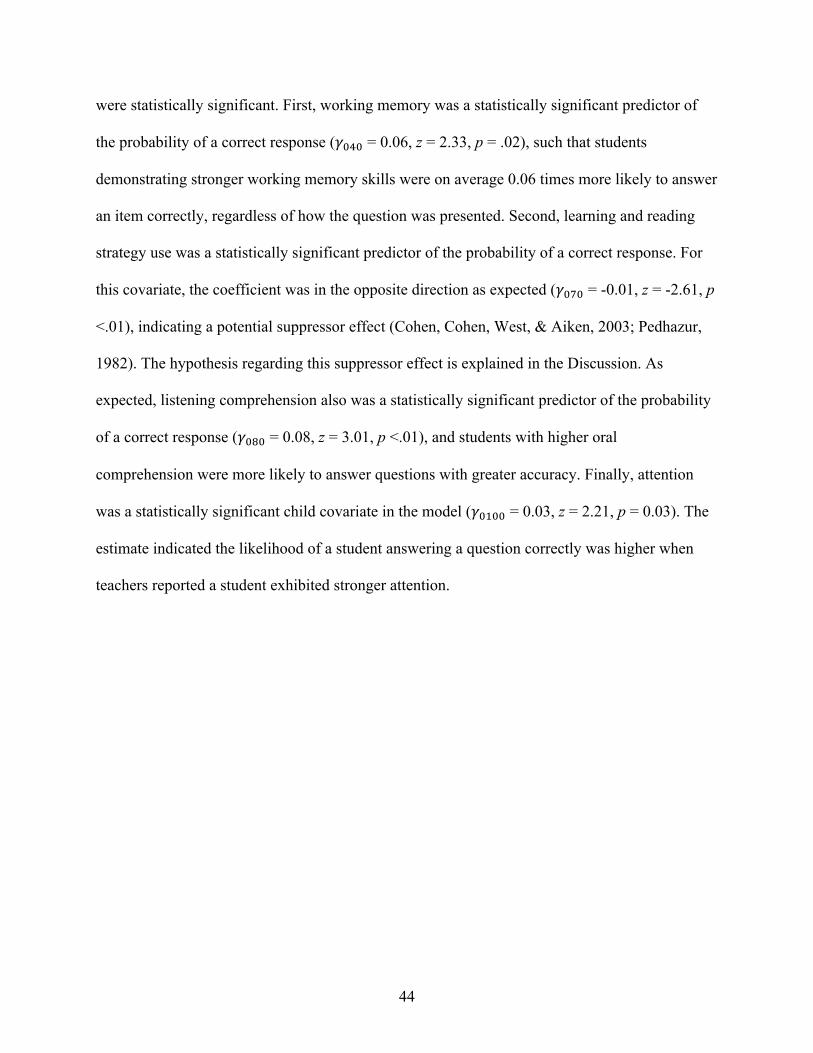
44
were statistically significant. First, working memory was a statistically significant predictor of
the probability of a correct response (𝛾!"! = 0.06, z = 2.33, p = .02), such that students
demonstrating stronger working memory skills were on average 0.06 times more likely to answer
an item correctly, regardless of how the question was presented. Second, learning and reading
strategy use was a statistically significant predictor of the probability of a correct response. For
this covariate, the coefficient was in the opposite direction as expected (𝛾!"! = -0.01, z = -2.61, p
<.01), indicating a potential suppressor effect (Cohen, Cohen, West, & Aiken, 2003; Pedhazur,
1982). The hypothesis regarding this suppressor effect is explained in the Discussion. As
expected, listening comprehension also was a statistically significant predictor of the probability
of a correct response (𝛾!"! = 0.08, z = 3.01, p <.01), and students with higher oral
comprehension were more likely to answer questions with greater accuracy. Finally, attention
was a statistically significant child covariate in the model (𝛾!"!! = 0.03, z = 2.21, p = 0.03). The
estimate indicated the likelihood of a student answering a question correctly was higher when
teachers reported a student exhibited stronger attention.

45
Table 6 Fixed Effects Estimates and Variance-Covariance Estimates for Response Format and Child Skill Models
Model 3a Model 3b Fixed effects Est. (SE) z Est. (SE) z
Intercept (𝛾!!!) 0.23 (0.31) 0.75 0.23 (0.31) 0.76 Test covariates 𝛾!"! Response format 0.81 (0.29) 2.80 ** 0.80 (0.29) 2.75 **
Child covariates 𝛾!"! Vocabulary 0.02 (0.03) 0.63 0.02 (0.03) 0.64 𝛾!"! Nonverbal reasoning 0.01 (0.02) 0.90 0.01 (0.02) 0.95 𝛾!"! Working memory 0.06 (0.02) 2.33 * 0.06 (0.03) 2.13 * 𝛾!"! Word recognition 0.01 (0.01) 1.17 0.01 (0.01) 1.11 𝛾!"! Decoding -0.01 (0.01) -1.36 -0.01 (0.01) -1.18 𝛾!"! Learning strategies -0.01 (<0.01) -2.61 ** -0.01 (<0.01) -2.69 ** 𝛾!"! Listening comprehension 0.08 (0.03) 3.01 ** 0.11 (0.03) 3.72 *** 𝛾!"! Academic knowledge 0.01 (0.03) 0.36 0.01 (0.03) 0.21 𝛾!"!! Attention 0.03 (0.01) 2.21 * 0.02 (0.01) 1.54 𝛾!""! Behavior -0.02 (0.01) -1.25 -0.02 (0.01) -1.31
Interactions 𝛾!"#! RF X WM -0.02 (0.04) -0.42 𝛾!"#! RF X LC -0.07 (0.03) -2.21 * 𝛾!"#! RF X AT 0.02 (0.01) 2.26 *
Random effects Var. SD Corr. Var. SD Corr. 𝑟!! Student 0.15 0.38 0.15 0.39 𝑟!!(!) Question 0.65 0.81 0.66 0.81 𝑟!!! Passage 0.44 0.66 0.43 0.66 𝑟!"(!) Response format 0.42 0.65 -0.89 0.43 0.65 -0.90
Note. Est. = estimate; Var. = variance; Corr. = correlation; MC = multiple-questions; OE = open-ended questions; RF = response format; LS = learning strategies; LC = listening comprehension; AT = attention. *p<.05, **p<.01, ***p<.001
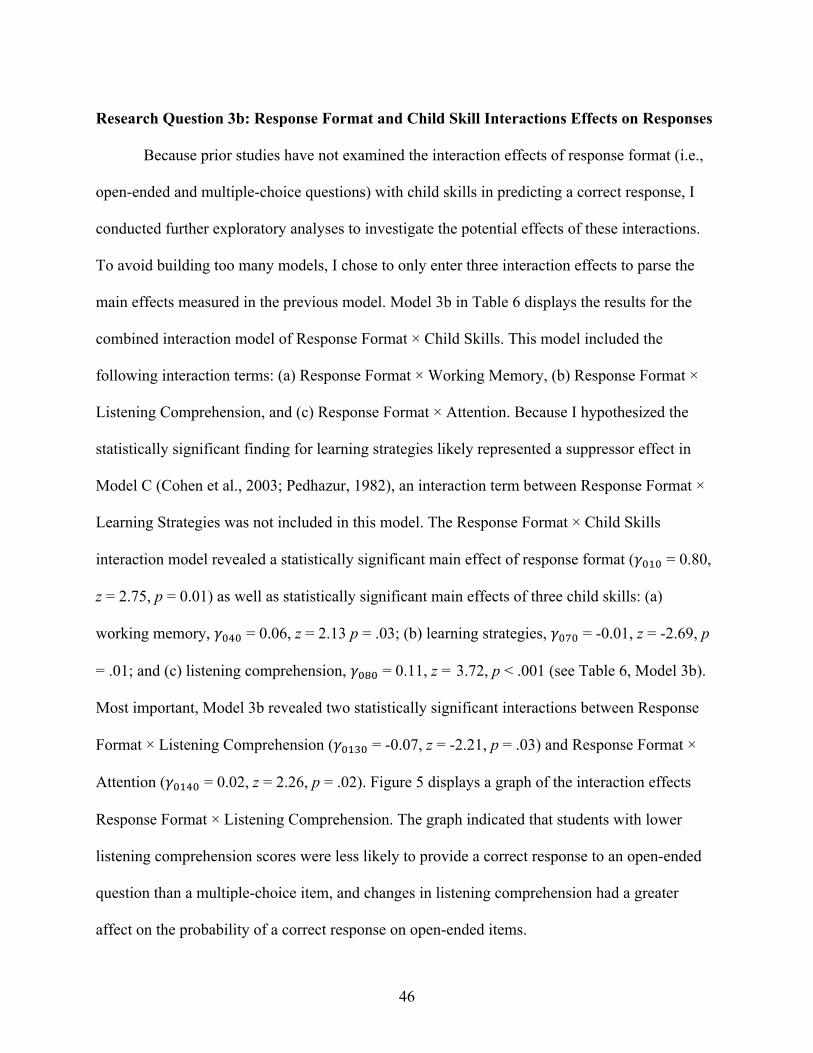
46
Research Question 3b: Response Format and Child Skill Interactions Effects on Responses
Because prior studies have not examined the interaction effects of response format (i.e.,
open-ended and multiple-choice questions) with child skills in predicting a correct response, I
conducted further exploratory analyses to investigate the potential effects of these interactions.
To avoid building too many models, I chose to only enter three interaction effects to parse the
main effects measured in the previous model. Model 3b in Table 6 displays the results for the
combined interaction model of Response Format × Child Skills. This model included the
following interaction terms: (a) Response Format × Working Memory, (b) Response Format ×
Listening Comprehension, and (c) Response Format × Attention. Because I hypothesized the
statistically significant finding for learning strategies likely represented a suppressor effect in
Model C (Cohen et al., 2003; Pedhazur, 1982), an interaction term between Response Format ×
Learning Strategies was not included in this model. The Response Format × Child Skills
interaction model revealed a statistically significant main effect of response format (𝛾!"! = 0.80,
z = 2.75, p = 0.01) as well as statistically significant main effects of three child skills: (a)
working memory, 𝛾!"! = 0.06, z = 2.13 p = .03; (b) learning strategies, 𝛾!"! = -0.01, z = -2.69, p
= .01; and (c) listening comprehension, 𝛾!"! = 0.11, z = 3.72, p < .001 (see Table 6, Model 3b).
Most important, Model 3b revealed two statistically significant interactions between Response
Format × Listening Comprehension (𝛾!"#! = -0.07, z = -2.21, p = .03) and Response Format ×
Attention (𝛾!"#! = 0.02, z = 2.26, p = .02). Figure 5 displays a graph of the interaction effects
Response Format × Listening Comprehension. The graph indicated that students with lower
listening comprehension scores were less likely to provide a correct response to an open-ended
question than a multiple-choice item, and changes in listening comprehension had a greater
affect on the probability of a correct response on open-ended items.

47
Figure 5. The interaction between response format (i.e., open-ended or multiple-choice
questions) and listening comprehension and their effect on the predicted probability of a correct
response.
Figure 6 displays a graph of the interaction effects of Response Format × Attention. In
contrast to the Response Format × Listening Comprehension interaction effect, Figure 6
indicated changes in teacher-reported attention skill had a stronger affect on the probability of a
correct response on the multiple-choice questions. Specifically, Figure 6 shows students at the
upper end of the attention score distribution were more likely to answer a multiple-choice
question correctly in comparison to when the same item was presented in an open-ended
response format.

48
Figure 6. The interaction between response format (i.e., open-ended or multiple-choice
questions) and teacher-reported attention and their effect on the predicted probability of a correct
response.
Unconditional Model for Retell
Utilizing the same data analysis procedures as previously described, I used cross-
classified random effects models to investigate my fourth research question relating to retell
performance. First, I examined two competing unconditional models to determine the best model
fit for passage effects (i.e., random vs. fixed). As expected, a Chi-square test and AIC, BIC, and
LRT fit estimates comparing the two unconditional models indicated including passage as a
random effect offered a better model fit (p < .001). This unconditional model revealed
considerable variance among students (𝑟!! = 15.87) and passages (𝑟!!= 6.25; see Table 7). For
students in the full sample (N = 79), this model indicated the average predicted retell score was
11.90 (p < .001), regardless of passage genre.

49
Table 7 Unconditional Model, Fixed Effects Estimates, and Variance-Covariance Estimates for Retell Models
Unconditional Model Model 4a Model 4b Fixed effects Est. (SE) t Est. (SE) t Est. (SE) t
Intercept (𝛾!!) 11.90 1.16 10.26*** 10.12 (1.05) 9.64 *** 10.12 (1.04) 9.74 *** Test covariates 𝛾!"Genre 3.52 (1.42) 2.47 * 3.52 (1.41) 2.50 *
Child covariates 𝛾!"Vocabulary 0.30 (0.21) 1.43 0.30 (0.21) 1.44 𝛾!" Nonverbal reasoning 0.12 (0.10) 1.23 0.12 (0.10) 1.22 𝛾!" Working memory -0.11 (0.17) -0.69 -0.11 (0.17) -0.69 𝛾!" Word recognition 0.20 (0.08) 2.43 * 0.20 (0.09) 2.19 * 𝛾!" Decoding -0.13 (0.06) -2.12 * -0.13 (0.06) -2.13 * 𝛾!" Learning strategies <0.01 (0.03) 0.03 <0.01 (0.03) 0.04 𝛾!" Listening comprehension 0.39 (0.17) 2.30 * 0.37 (0.19) 1.90 𝛾!" Academic knowledge 0.08 (0.19) 0.46 0.08 (0.19) 0.46 𝛾!"! Attention 0.10 (0.09) 1.08 0.10 (0.09) 1.08 𝛾!"" Behavior -0.12 (0.10) -1.22 -0.12 (0.10) -1.21
Interactions 𝛾!"# G X WR 0.01 (0.07) 0.08 𝛾!"# G X LC 0.05 (0.18) 0.28
Random effects Var. SD Var. SD Var. SD 𝑟!! Student 15.87 3.98 7.17 2.68 6.92 2.63 𝑟!! Passage 6.25 2.50 2.41 1.55 2.33 1.53 Residual 16.02 4.00 16.38 4.05 16.84 4.10
Note. Est. = estimate; Var. = variance; Corr. = correlation; G = genre; WR = word recognition; LC = listening comprehension. *p<.05, **p<.01, ***p<.001
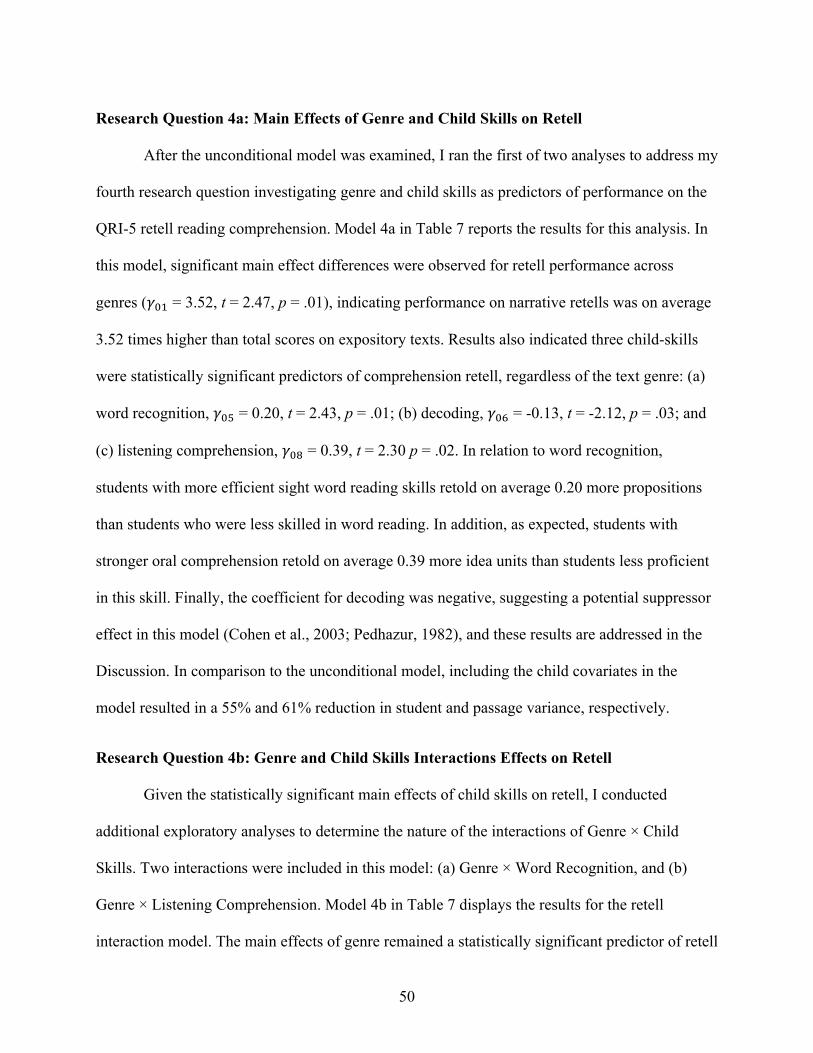
50
Research Question 4a: Main Effects of Genre and Child Skills on Retell
After the unconditional model was examined, I ran the first of two analyses to address my
fourth research question investigating genre and child skills as predictors of performance on the
QRI-5 retell reading comprehension. Model 4a in Table 7 reports the results for this analysis. In
this model, significant main effect differences were observed for retell performance across
genres (𝛾!" = 3.52, t = 2.47, p = .01), indicating performance on narrative retells was on average
3.52 times higher than total scores on expository texts. Results also indicated three child-skills
were statistically significant predictors of comprehension retell, regardless of the text genre: (a)
word recognition, 𝛾!" = 0.20, t = 2.43, p = .01; (b) decoding, 𝛾!" = -0.13, t = -2.12, p = .03; and
(c) listening comprehension, 𝛾!" = 0.39, t = 2.30 p = .02. In relation to word recognition,
students with more efficient sight word reading skills retold on average 0.20 more propositions
than students who were less skilled in word reading. In addition, as expected, students with
stronger oral comprehension retold on average 0.39 more idea units than students less proficient
in this skill. Finally, the coefficient for decoding was negative, suggesting a potential suppressor
effect in this model (Cohen et al., 2003; Pedhazur, 1982), and these results are addressed in the
Discussion. In comparison to the unconditional model, including the child covariates in the
model resulted in a 55% and 61% reduction in student and passage variance, respectively.
Research Question 4b: Genre and Child Skills Interactions Effects on Retell
Given the statistically significant main effects of child skills on retell, I conducted
additional exploratory analyses to determine the nature of the interactions of Genre × Child
Skills. Two interactions were included in this model: (a) Genre × Word Recognition, and (b)
Genre × Listening Comprehension. Model 4b in Table 7 displays the results for the retell
interaction model. The main effects of genre remained a statistically significant predictor of retell

51
scores (𝛾!" = 3.52, t = 2.50, p = .01). The model also revealed a statistically main effect of word
recognition (𝛾!"= 0.20, t = 2.19, p = .03) and decoding (𝛾!" = -0.13, t = -2.13, p = .03). Neither
of the interaction terms, however, was statistically significant, indicating no significant
differences in the effects of word recognition or listening comprehension were measured across
genres. Between the unconditional and interaction models, student variance and passage variance
was reduced by 56% and 63%, respectively. The child skill covariate model without the
interaction terms compared to the new model indicated both student and passage variance was
only reduced by 3% when accounting for the interactions between Genre x Child Skills.
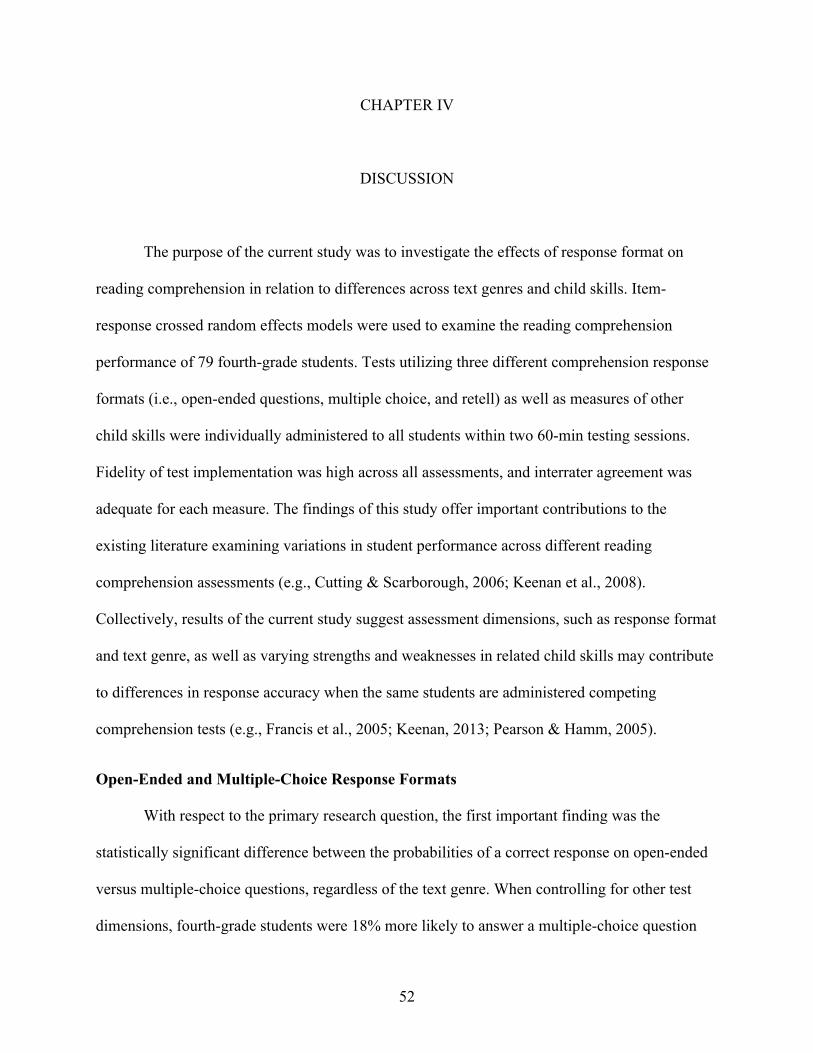
52
CHAPTER IV
DISCUSSION
The purpose of the current study was to investigate the effects of response format on
reading comprehension in relation to differences across text genres and child skills. Item-
response crossed random effects models were used to examine the reading comprehension
performance of 79 fourth-grade students. Tests utilizing three different comprehension response
formats (i.e., open-ended questions, multiple choice, and retell) as well as measures of other
child skills were individually administered to all students within two 60-min testing sessions.
Fidelity of test implementation was high across all assessments, and interrater agreement was
adequate for each measure. The findings of this study offer important contributions to the
existing literature examining variations in student performance across different reading
comprehension assessments (e.g., Cutting & Scarborough, 2006; Keenan et al., 2008).
Collectively, results of the current study suggest assessment dimensions, such as response format
and text genre, as well as varying strengths and weaknesses in related child skills may contribute
to differences in response accuracy when the same students are administered competing
comprehension tests (e.g., Francis et al., 2005; Keenan, 2013; Pearson & Hamm, 2005).
Open-Ended and Multiple-Choice Response Formats
With respect to the primary research question, the first important finding was the
statistically significant difference between the probabilities of a correct response on open-ended
versus multiple-choice questions, regardless of the text genre. When controlling for other test
dimensions, fourth-grade students were 18% more likely to answer a multiple-choice question

53
correctly in comparison to if the same question required an open-ended response. This finding
must be interpreted carefully as there is a 25% probability a four-response multiple-choice
question may be answered correctly simply by a student guessing, and I was unable to account
for this chance probability within the statistical models. When the probability of a correct
response on multiple-choice items is adjusted to account for this 25% chance of a correct
response, the results suggest there may be no difference in response accuracy on open-ended
(56%) and multiple-choice (49%) questions. Given this study limitation, it is possible the
observed differences between the two response formats may represent a scaling effect, and the
statistically significant findings may be a consequence of the incomparable scales for the two
tests. To corroborate the statistically significant differences measured between open-ended and
multiple-choice items, it may be necessary to isolate the effects of response format within
standardized assessments of equivalent normed scales. At the same time, the correlations
between the QRI-5 open-ended and multiple-choice tests were modest at .48, offering evidence
the outcomes on the two comprehension measures may be less closely related. This modest
relation between the two tests coupled with the statistically significant differences measured
between the probabilities of a correct response suggest student response accuracy may vary as a
consequence of the item format, and this difference may be more than due to chance.
In consideration of these findings, it is also important to note that issues may have arisen
from the construction of multiple-choice items based on open-ended questions. Such criticism
stems from the assumption that items created for each of the two response formats may measure
different constructs, with open-ended questions purported to require higher-level cognitive
processing skills (Campbell, 2005; Frederiksen, 1984; Pearson & Hamm, 2005). Therefore, using
multiple-choice stems to generate open-ended responses may result in questions that require less

54
sophisticated, surface-level responses from the participants (Campbell, 2005; Frederiksen, 1984;
Pearson & Hamm, 2005). In the current study, however, items were created in the opposite order,
with open-ended item stems used to construct the multiple-choice questions. Because the open-
ended question stems likely addressed higher-order comprehension skills, I interpret my results
as supporting the supposition that students perform less well on open-ended comprehension tasks
in comparison to commonly implemented multiple-choice formats.
Text Genre
Extending these findings, the results of the current study suggest the genre of text from
which the items are created may contribute to differences in performance across response
formats. Main effects of genre indicated students had a higher probability of a correct response
on narrative passages over expository texts, regardless of the response format. A similar main
effect was also evidenced in the retell models. It is well known that students tend to experience
greater comprehension difficulties when working with expository texts (e.g., Best et al., 2008;
Eason et al., 2012; Olson, 1985), and the findings of this study are consistent with prior research
documenting differences in reading comprehension among these two genres (Best et al., 2008;
Eason et al., 2012). Although expected, one reason for these pronounced differences may relate
to the age of the participants. Some believe prior to fourth grade, students have more exposure to
narrative texts, and their familiarity with this text structure enhances their comprehension
performance (Best et al., 2008; McNamara et al., 2011). Because the sample in the current study
included fourth graders, the results support the hypothesis that fourth-grade students may have
less experience with reading expository texts, and thus they may perform less well on
comprehension tests using this text genre (Best et al., 2008; Eason et al., 2012; García & Cain,
2013).
55
In addition to these findings, model results revealed a statistically significant interaction
between response format and genre, and students were 26% more likely to correctly answer
open-ended questions from narrative passages than expository texts. This finding has relative
implications when considering the order of the testing battery. In my study design, every student
read the narrative passages in session one, and the expository texts during the second testing
session. Because students read the narrative passages first, they were familiarized with the
measures and testing situation, potentially facilitating higher performance on the expository
assessments administered on day two. Despite this possible priming effect, students in the
current study demonstrated more difficulty with generating responses to open-ended questions
on expository texts over other response formats and genres.
Extending this finding, results indicated the probability of a correct response on
expository texts was 34% higher for multiple-choice items than open-ended questions. This
finding is particularly important because a difference of 8% between the two response formats
remains when accounting for the 25% chance of a correct response on a multiple-choice item due
to guessing. Therefore, the findings of the current study offer additional evidence suggesting
variations in performance may result from the administration of different response formats with
expository texts. Given the negligible differences observed between genres on multiple-choice
items, combining open-ended questions with expository texts may place greater demands on
higher cognitive processing skills, making the comprehension task more complex in comparison
to multiple-choice response formats and/or narrative passages (Best et al., 2008; Eason et al.,
2012). Thus, the interaction effects suggest fourth-grade students may perform less well when
assessed on comprehension measures incorporating a combination of these two test features.

56
Child Skills
In addition to the interesting findings for response format and genre, performance
differences in reading comprehension were measured as a function of certain child skills.
Aligning with prior research (e.g., Cutting & Scarborough, 2006; Keenan et al., 2008; Spear-
Swerling, 2004), listening comprehension was a statistically significant predictor of response
accuracy on all three QRI-5 tests (i.e., open-ended questions, multiple choice, and retell). With
respect to this finding, it is important to note the response format of the listening comprehension
measure used in this study. Listening comprehension was measured by performance on the Oral
Comprehension subtest from the Woodcock-Johnson III Tests of Achievement (Woodcock et al.,
2001). This test utilized a modified cloze task, a response format not included in the QRI-5
reading comprehension assessments. I purposefully selected this assessment to minimize overlap
between the reading response formats under investigation and the listening comprehension task.
Controlling for this potential confound, the results of this study are largely consistent with
findings of prior research and substantiate the significant contribution of oral language skills in
predicting reading comprehension outcomes (e.g., Cutting & Scarborough, 2006; Francis et al.,
2005; Keenan et al., 2008; Spear-Swerling, 2004). Moreover, the findings of this study provide
further evidence for how listening comprehension may account for more of the variance on
reading comprehension outcomes in older students (e.g., Francis et al., 2005; García & Cain,
2013; Keenan & Meenan, 2014).
An even more important finding was the interaction between response formats (i.e., open-
ended and multiple-choice questions) and a student’s listening comprehension skill on the
probability of a correct response. Results indicated students who scored lower on the listening
comprehension test were less likely to provide a correct response to an open-ended item, and

57
changes in this oral language skill had a greater influence on the response accuracy of students
on this particular response format. These results extend the findings of Nation and Snowling
(1997) who found larger differences between students with good and poor listening
comprehension skills on open-ended items when these same students were compared on a cloze
measure. Because open-ended questions require students to construct their own responses (in
comparison to multiple-choice tasks that offer suggested answers), I expected oral language
skills would be more closely correlated to this reading comprehension task. Therefore, it is not
surprising if students in this study demonstrated deficits on the listening comprehension test,
students also were likely to have measured difficulties on an expressive reading comprehension
task (i.e., open-ended questions).
Extending these findings, changes in listening comprehension skill had less of an effect
on the probability of a correct response on multiple-choice questions. Prior studies have found
oral language as a significant predictor of reading comprehension on multiple-choice items
(Cutting & Scarborough, 2006; Spear-Swerling, 2004), and the main effects of listening
comprehension suggest that this child skill is closely related to performance on comprehension
tests, regardless of response format. Given the interaction between response format and listening
comprehension, however, it may be students more proficient in oral language may be placed at
an advantage when the reading comprehension task (i.e., open-ended items) relies heavily on
expressive language skills. This conjecture is further substantiated by the stronger correlation of
.61 measured between listening comprehension and the open-ended question measure in relation
to the more modest correlation of .44 calculated between listening comprehension and the
multiple-choice items. Consequently, the results of this study underscore how listening
comprehension is closely related to reading comprehension (e.g., Christopher et al., 2012), and

58
this relationship may become particularly important when the comprehension outcome is
constructed as an expressive oral language task.
Another interesting finding was the main effect of attention, regardless of response
format. This finding is important because it represents how the underlying child skills of which
comprehension performance is dependent upon may surpass those of oral language
(Gernsbacher, Varner, & Faust, 1990). Specific to the current study, results indicated students
were more likely to answer a question correctly if they also exhibited stronger attention skills as
reported by their teachers. This relationship may relate to the longer passages used on the QRI-5.
Because students must demonstrate sustained attention throughout the multi-paragraph text, it is
possible students with weaker attention skills had greater difficulty with planning, self-
monitoring, response inhibition, and sustaining their attention throughout the reading process
(Cutting, Materek, Cole, Levine, & Mahone, 2009; Purvis & Tannock, 1997; Willcutt &
Pennington, 2000; Willcutt, Pennington, Olson, Chhabildas, & Hulslander, 2005). Consequently,
attention deficits may have lead to an inaccurate or incomplete mental representation of the text,
resulting in a lower probability of a correct response.
In addition to the role of attention in reading the texts, attention also may have been
closely related to the processes involved in the completion of the comprehension assessments.
This assumption is evidenced in the interaction measured between response format and attention.
When compared to the interaction between response format and listening comprehension, the
direction of the interaction effect for response format and attention was in the opposite direction.
With attention, the probability of a correct response increased as students demonstrated stronger
attention skills, and this effect was particularly important in predicting response accuracy on
multiple-choice items. In the literature, there is some inconsistent evidence on the role executive

59
function skills (e.g., planning and organizing) play in predicting reading comprehension
responses (A. C. Miller et al., 2014), but a few studies have identified attention as a child skill
closely related to performance on reading comprehension tests (Arrington et al., 2014; Eason et
al., 2012). Aligning with the results of the current study, a recent study by Arrington, Kulesz,
Francis, Fletcher, & Barnes (2014) found direct effects of sustained attention and cognitive
inhibition on reading comprehension on a multiple-choice test, over and above the contribution
of working memory. Likewise, a another study by Eason et al. (2012) found attention skills such
as planning and organizing information were important for comprehension of more complex
expository texts. In the current study, the students who were reported by their teachers as having
weaker attention skills may have dedicated less sustained attention towards differentiating
between correct and incorrect responses on the multiple-choice items. For these students, it also
may be the case that they were less efficient in shifting between mental substructures of ideas
and suppressing irrelevant information (Gernsbacher & Faust, 1991; Gernsbacher et al., 1990).
Consequently, students with weaker attention skills had greater difficulty identifying a correct
response amongst other distractor items. Thus, the findings of this study reiterate the important
role attention plays in reading comprehension, and specifically its potential contribution to
performance on multiple-choice tests.
Along with listening comprehension and attention, working memory was a significant
predictor of a correct response, regardless of how the item was presented (i.e., open ended or
multiple choice). These findings are consistent with recent studies documenting the strong and
direct effects of working memory in predicting reading comprehension performance across
various types of comprehension assessments (Arrington et al., 2014; Cain, Oakhill, & Bryant,
2004; Christopher et al., 2012; Hua & Keenan, 2014; Keenan & Meenan, 2014; A. C. Miller et

60
al., 2014). With regards to the main effects of working memory, two specific aspects of the
current study may explain why strength in this skill contributed to a higher probability of a
correct response on the comprehension items. First, before students were presented questions for
each of the two response formats, the passage was removed from the student’s view. Because
students were not able to refer back to the passage as they completed the comprehension
assessments, students may have been forced to rely more heavily on their ability to retrieve the
content of the passage from their memory. Second, the Working Memory Test Battery for
Children Listening Recall (Pickering & Gathercole, 2001) assessment required students to listen
to a phrase and remember the last word, with the number of words to recall steadily increasing in
each span. Success on this measure likely was dependent upon students having some level of
proficiency in manipulating oral language in their working memory. This assumption is
supported by results of a recent meta-analysis that reported more complex verbal working
memory tasks were better predictors of reading comprehension over simple span tasks (Carretti,
Borella, Cornoldi, & De Beni, 2009). Current findings may suggest that when working memory
tasks place greater demands on a student’s language processing ability, the measure may closely
relate to outcomes on response formats (i.e., open-ended or multiple-choice questions) in which a
large amount of the variance is also accounted for by oral language skills (Carretti et al., 2009;
Cutting & Scarborough, 2006; Francis et al., 2005; Keenan et al., 2008; Keenan & Meenan,
2014; Nation & Snowling, 1997; Spear-Swerling, 2004).
Regardless of the genre of text, results from the fourth research question investigating the
relation of child skills and reading retells corroborated prior research demonstrating how
performance on word recognition and listening comprehension measures are positively
associated with retell scores (Keenan et al., 2008; Keenan & Meenan, 2014). This finding

61
exemplifies the theoretical model of the Simple View of Reading and illustrates how reading
comprehension may be a product of the underlying child skills of word reading and oral
language (Gough & Tunmer, 1986; Hoover & Gough, 1990). Thus, the findings of this study
reiterate how both word reading and listening comprehension are important predictors of reading
retell (Keenan et al., 2008; Keenan & Meenan, 2014). Furthermore, in addition to word reading
and listening comprehension, in the full retell model including all of the child skill covariates,
the student and passage variance was reduced by 56% and 63%, respectively. Overall, the retell
models support both simple and more complex multicomponent theories of reading
comprehension by underscoring the important contribution of underlying child skills in
predicting reading comprehension performance (Gough & Tunmer, 1986; Hoover & Gough,
1990; Keenan, 2013; Kintsch & Kintsch, 2005; Perfetti et al., 2007).
Across all models in the current study, there were a few perplexing findings. First, given
the large literature base supporting cognitive strategy use as a means for improving
comprehension (e.g., Berkeley, Scruggs, & Mastropieri, 2010; Davis, 2010), the direction in
which learning strategies predicted the probability of a student answering an open-ended or
multiple-choice item correctly was unexpected. Similarly, the retell models revealed a main
effect for decoding, but the coefficient was negative, contradicting prior studies evidencing
positive correlations between decoding skill and reading comprehension (e.g., Keenan et al.,
2008; Reed & Vaughn, 2012). The unexpected negative coefficients that were largely
inconsistent with the existing literature suggest a potential suppressor effect was present in the
models. A suppressor effect is a rare instance in which a variable has a zero, or nearly zero,
correlation with the predicted outcome (Pedhazur, 1982). Although statistically significant, the
coefficient for the suppressor variable is typically negative in the regression model (Pedhazur,

62
1982). Upon examination of the correlation between learning strategies and the QRI-5 tests, both
approached zero at -.20 and -.04 for the open-ended and multiple-choice assessments,
respectively. Despite this very weak correlation, learning strategies was a statistically significant
predictor of item responses. Similarly, decoding had a weak correlation of .17 with reading retell,
yet this variable was a statistically significant predictor in the retell models. For both the learning
strategies and decoding main effects, the nearly zero correlations with the dependent variables
paired with the negative coefficients in a direction contradicting findings of prior research
suggest both covariates may represent suppressor effects in the models. Consequently, the results
are not interpretable nor do they contribute important findings that would extend the research on
reading comprehension assessments.
Another puzzling finding was the lack of a main effect for working memory and attention
on retell scores. I expected the free response nature of the retells would place greater demands on
students’ oral language skills and attention-related cognitive processes (Johnston et al., 2008),
and thus higher achievement on measures of these constructs would predict improved outcomes
on reading retells. Despite the significant effects of working memory and attention on the open-
ended and multiple-choice response formats, neither of these predictors was significant in the
retell models. Likewise, word recognition was a significant predictor in the retell models, but not
when predicting the probability of a correct response on an open-ended or multiple-choice
question. These inconsistent findings across response formats invoke the question: What are the
underlying components of each response format that make certain skills like working memory,
attention, or word recognition a more important predictor on one test but not another?
One explanation may be taken from the findings of Keenan and Meenan (2014) who
examined differences in comprehension performance on the QRI-3 open-ended and retell

63
response formats. Results of the Keenan and Meenan study revealed working memory was not as
important for predicting performance on the QRI-3, but working memory played an important
role on tasks taxing memory of text at the sentence level. Pairing the findings of Keenan and
Meenan with results in the current study, it is possible these differences were a consequence of
the structure and cognitive demands of each response format. For both open-ended and multiple-
choice questions, students were asked about a specific aspect of the passage, and these response
formats may have been more closely related to working memory and attention at the sentence
level. In contrast, the less-structured, broader response format of retell may have required
students to rely less heavily on their sentence-level processing of the text and more generally on
their overall mental representation model. If this is the case, word recognition may be important
for alleviating any disruption while students construct a global mental representation of the text
(García & Cain, 2013), but skills associated with sentence-level details may be less critical on
retell tasks. Therefore, it may be working memory and attention were not statistically significant
predictors of reading retell given the response format allowed students to recall information more
freely. Moreover, word reading and listening comprehension may be more dominant predictors
of variance in the retell models, such that other potentially important predictors (e.g., working
memory) were no longer significant (Tighe & Schatschneider, 2013).
A second possible reason for the variability observed across tests may be the very
premise on which this study was based. Increasingly, research has shown many of the widely
available reading comprehension assessments are less closely related to each other than
presumed (Cutting & Scarborough, 2006; Francis et al., 2005; Hua & Keenan, 2014; Keenan et
al., 2008; Keenan & Meenan, 2014; Nation, 2007; Spear-Swerling, 2004). More important, prior
studies have shown that even when comprehension tasks are embedded in the same measure and

64
utilize the same passages, as such is the case with the QRI, correlations between open-ended
questions and retell scores are modest, ranging from .41 to .47 (Collins, Gilbert, et al., 2014;
Keenan et al., 2008). In this study, the correlations among the three different QRI-5 response
formats ranged from .37 to .48, comparable to those reported in prior studies. When considering
the relations among tests alongside the variability in child skill predictors across response
formats, current findings substantiate the complex layers inherent in the assessment of reading
comprehension and the dissonance that exists among different response formats.
Limitations
Although findings of the current study present strong evidence to suggest response
format, genre, and child skills lead to differences in reading comprehension outcomes, the results
must be tempered by several limitations. First, as previously noted, the measured differences
between the open-ended and multiple-choice items may be a result of the inherent 25% chance of
a student answering the multiple-choice items correctly simply due to guessing. Using norm-
referenced standardized measures may alleviate these effects and account for the 25% guessing
probability. Therefore, the statistically significant differences measured in this study between the
two response formats would be strengthened by future studies investigating variations in
response accuracy on standardized comprehension measures. Second, although the multiple-
choice answers were carefully designed using specific guidelines (Center for Teaching
Excellence, 2013; Haladyna, 1999; The Center for Teaching, 2013), the item stems of these
questions were initially written to elicit open-ended constructed responses. Thus, the phrasing of
these questions and overlap among test items may have contributed to measured differences
between the two response formats. The findings of this study would be supported by future
studies constructing separate sets of comparable questions for each of the two response formats

65
and replicating differences in student performance across them (i.e., open-ended or multiple-
choice questions; Pearson & Hamm, 2005). Third, the assessment battery only included one
measure for each child skill (e.g., working memory, listening), and none of the variables were
composites of multiple tests measuring the same construct. Given this potential limitation of the
study design, the specific aspects of each measure should be considered when evaluating the
generalizability of the results. For example, the listening comprehension assessment was a
modified cloze task. Similarly, the working memory measure assessed language recall.
Therefore, using a listening comprehension measure utilizing a different response format or
administering a working memory task involving digit recall may lead to different findings in
future studies of similar designs (Carretti et al., 2009). Fourth, in the existing literature, the
reported range of retell interrater agreement is wide, and oftentimes studies report a lower
percentage of agreements than measured in other domains (Reed & Vaughn, 2012). Although the
retell interrater agreement of .82 in this study was adequate, discrepancies among scores may
diminish the external validity of the results. Finally, relatively little is known about the power of
item-response crossed random effects models, and the sample size (N = 79) may have reduced
the power to detect statistically significant findings in the models (Cho et al., 2012). Future
studies should replicate these experimental procedures with larger samples to determine if other
variables may also be important in predicting response accuracy across different response
formats.
Directions for Future Research
The findings of the current study support and extend prior research suggesting
performance across reading comprehension tests may vary as a consequence of certain
assessment dimensions (e.g., response format, genre) or child skills (e.g., Francis et al., 2005;

66
Keenan et al., 2008). To date, this is the first study to isolate the effects of response format and
investigate differences across measures with item-response crossed analyses. The findings of this
experimental study support the hypothesis that different response formats may lead to variations
in reading comprehension outcomes when controlling for other assessment dimensions (e.g., text
length). The generalizability of these findings, however, is tempered by several limitations, and
future studies should further investigate how response formats may relate to performance on
different tests of reading comprehension. Specifically, in this study, only three response formats
were compared: (a) open-ended questions, (b), multiple choice, and (c) retell. Future studies
should incorporate other response formats not examined in this study (e.g., cloze, sentence
verification tasks) to determine if the tests also lead to differences in student performance.
Another important consideration for future studies is that in the current study students read aloud
six QRI-5 Level 4 reading passages in order to assess their reading comprehension across
response formats. These texts were longer passages likely demanding greater cognitive efforts to
achieve adequate comprehension. Future research should extend the current study by exploring
how other assessment dimensions such as text length or oral versus silent reading of the text may
account for variability in performance across response formats.
Relevant to my third and fourth research questions, the sample in the current study
included students in fourth grade, the year of school many believe represents the shift from
learning to read to reading to learn (Best et al., 2008; McNamara et al., 2011; Snow, 2002). In
this study, word recognition and decoding were not significant predictors of reading
comprehension on multiple-choice and open-ended items. These findings underscore how certain
skills may be critical for reading in the early grades, but their importance may diminish with
increasing age (e.g., Francis et al., 2005; García & Cain, 2013; Johnston et al., 2008; Keenan &

67
Meenan, 2014). More studies, however, are needed isolating the effects of response format on
reading comprehension across varying ages of students to document developmental differences.
Likewise, to diffuse disagreement in the field and broaden our understanding of differences in
student outcomes across response formats, future studies should continue to disentangle how
certain underlying child skills may be important predictors on reading comprehension tests.
Specifically, in this study, we found three interaction between: (a) Response Format × Genre, (b)
Response Format × Listening Comprehension, and (c) Response Format × Attention. Future
studies should delve deeper into the underlying student characteristics that may contribute to
these interaction effects and related differences in performance across tests.
Finally, several predictors such as domain knowledge and vocabulary found in prior
studies to account for large portions of the variance on reading comprehension measures failed to
reach statistical significance in the models (e.g., Best et al., 2008; Compton et al., 2014; Cutting
& Scarborough, 2006). These contradictory findings may result from a lack of statistical power.
However, because listening comprehension was a statistically significant predictor of reading
comprehension across all three response formats, the results in the current study also may
demonstrate how listening comprehension is an omnibus skill in reading comprehension. When
listening comprehension is included as a unique predictor, it may absorb more variance in the
model, making other variables potentially related to listening comprehension (e.g., domain
knowledge, vocabulary) less important. Future studies should continue to investigate
relationships among response formats, genre, and child skills to extend the existing research on
reading comprehension assessments.

68
Implications for Research, Policy, and Practice
The findings of this study offer important implications for researchers, policy makers,
and practitioners regarding the selection, administration, and scoring of reading comprehension
assessments. Increasingly, as more researchers have investigated differences across
comprehension tests, evidence has emerged suggesting many underlying constructs may predict
performance on certain assessments (Francis et al., 2005; Keenan, 2013; Keenan et al., 2008;
Pearson & Hamm, 2005). The current study extends this growing literature base by documenting
the variations that exist across response formats, text genres, and child skills among measures of
reading comprehension. Specifically, given the observed differences in the probability of a
correct response between response formats, my findings suggest the use of different response
formats to assess reading comprehension may lead to variations in student performance.
Therefore, using one measure that incorporates only one response format may not represent an
exact level of a student’s reading comprehension skill (Johnston et al., 2008; Keenan, 2013).
Researchers, policy makers, and practitioners should recognize the test features (e.g., response
format, genre) as well as reading and cognitive skills (e.g., listening comprehension, attention,
word reading) may lead to different outcomes across assessments. Given the complexity in
measuring this construct, more than one test may be needed to accurately measure a student’s
reading comprehension skill, especially when using these assessments to identify students with
comprehension deficits (Johnston et al., 2008; Keenan, 2013; Keenan & Meenan, 2014).
For researchers, policy makers, and practitioners, I caution making high-stakes decisions
based on student achievement on only one comprehension measure. Both in schools and in
research, multiple-choice tests are commonly used as summative measures of reading
comprehension growth. The findings of the current study, however, suggest using a multiple-

69
choice assessment may increase the likelihood of a student answering a question correctly than if
the same item were presented in an open-ended response format. Although it may be costly,
using a combination of response formats or a composite of assessments employing several
different response formats may provide a more accurate representation of a students’ actual level
of reading comprehension. A second recommendation stems from the current results suggesting
students may be more familiar with narrative stories and thus more likely to perform higher on
comprehension tests corresponding with this genre (e.g., Best et al., 2008). Incorporating both
narrative and expository texts into reading comprehension measures while also ensuring both
types of texts are used across different time points may be important when using reading
comprehension assessments to measure academic achievement and evaluate the efficacy of
interventions (Johnston et al., 2008).
As suggested by other researchers, it may also be the case that a battery of assessments
must be administered to control for underlying child skills (e.g., listening comprehension,
working memory) potentially influencing reading comprehension outcomes (e.g., Cain, 2006;
Cutting et al., 2009; Keenan, 2013; Kieffer, Vukovic, & Berry, 2013). Moreover, to effectively
and accurately identify students with RD, this study paired with prior research suggests there are
many layers that must be unveiled in order to identify a student’s core deficits (Keenan, 2013).
The findings of this study underscore the complexity in measuring reading comprehension and
how many underlying child skills must be considered when interpreting student achievement on
related assessments.
In an effort to move to a more comprehensive model of assessing reading comprehension,
researchers, policy makers, and practitioners should begin to evaluate performance on skills
beyond word reading and comprehension to incorporate multicomponent theoretical models of
70
reading comprehension into research, policy, and practice (Cain, 2006; Cutting et al., 2009;
Keenan, 2013; Kieffer et al., 2013; Kintsch & Kintsch, 2005; Perfetti et al., 2007). Although
critics may balk at the recommendation of more testing, there is mounting evidence to suggest
too many variations exist across reading comprehension assessments for one measure to be
sufficient (e.g., Cutting & Scarborough, 2006; Francis et al., 2005; Keenan & Meenan, 2014).
Acknowledging the influence of assessment dimensions such as response format and genre as
well as contributions of other child skills on assessment outcomes may be the only authentic way
to truly measure the complex construct of reading comprehension.

71
APPENDIX
Readability Statistics for the Six Level 4 QRI-5 Passages
Readability Statistic
QRI-5 Level 4 Passages
Johnny Appleseed
Amelia Earhart
Tomie dePaola
The Early Railroads
The Busy Beaver
Plant Structures
for Survival
Automated Readability Index
3.7 3.2 5.6 4.0 3.2 6.8
Flesch-Kincaid Grade Level
4.1 3.9 6.7 4.3 3.3 5.9
Flesche Reading Ease Score
83.3 82.5 73.0 85.5 89.7 76.8
Gunning Fog 5.7 4.9 8.8 6.0 5.9 7.2
Linsear Write Formula 4.6 3.7 7.6 5.4 4.6 6.3
The Coleman-Liau Index
7.0 8.0 7.0 6.0 6.0 9.0
The SMOG Index 5.1 4.4 6.6 4.1 4.2 4.9

72
REFERENCES
Akaike, H. (1974). A new look at the statistical model identification. IEEE Transactions on Automatic Control, 19, 716–723.
Arrington, C. N., Kulesz, P. A., Francis, D. J., Fletcher, J. M., & Barnes, M. A. (2014). The contribution of attentional control and working memory to reading comprehension and decoding. Scientific Studies of Reading, 18, 325–346. doi:10.1080/10888438.2014.902461
Barnes, M. A., Dennis, M., & Haefele-Kalvaitis, J. (1996). The effects of knowledge availability and knowledge accessibility on coherence and elaborative inferencing in children from six to fifteen years of age. Journal of Experimental Child Psychology, 61, 216–241. doi:10.1006/jecp.1996.0015
Berkeley, S., Scruggs, T. E., & Mastropieri, M. A. (2010). Reading comprehension instruction for students with learning disabilities, 1995-2006: A meta-analysis. Remedial and Special Education, 31, 423–436.
Best, R. M., Floyd, R. G., & Mcnamara, D. S. (2008). Differential competencies contributing to children’s comprehension of narrative and expository texts. Reading Psychology, 29, 137–164.
Cain, K. (2006). Individual differences in children’s memory and reading comprehension: An investigation of semantic and inhibitory deficits. Memory, 14, 553–569.
Cain, K., Oakhill, J., & Bryant, P. (2004). Children’s reading comprehension ability: Concurrent prediction by working memory, verbal ability, and component skills. Journal of Educational Psychology, 96, 31-42.
Campbell, J. R. (2005). Single instrument, multiple measures: Considering the use of multiple item formats to assess reading comprehension. In S. G. Paris & S. A. Stahl (Eds.), Children’s reading comprehension and assessment (pp. 347–368). Mahwah, NJ: Lawrence Erlbaum Associates, Inc.
Carretti, B., Borella, E., Cornoldi, C., & De Beni, R. (2009). Role of working memory in explaining the performance of individuals with specific reading comprehension difficulties: A meta-analysis. Learning and Individual Differences, 19, 246–251.
Center for Teaching Excellence, Virginia Commonwealth University. (2013). Writing multiple-choice questions. Retrieved from http://www.vcu.edu/cte/resources/nfrg/12_03_writing_MCQs.htm
Cho, S.-J., Partchev, I., & De Boeck, P. (2012). Parameter estimation of multiple item response profile model. British Journal of Mathematical and Statistical Psychology, 65, 438–466.

73
Christopher, M. E., Miyake, A., Keenan, J. M., Pennington, B., DeFries, J. C., Wadsworth, S. J., … Olson, R. K. (2012). Predicting word reading and comprehension with executive function and speed measures across development: A latent variable analysis. Journal of Experimental Psychology: General, 141, 470–488. doi:10.1037/a0027375
Cirino, P. T. (2014). Student Contextual Learning Scales. Houston, TX: Author.
Clemens, N. H., Davis, J. L., Simmons, L. E., Oslund, E. L., & Simmons, D. C. (2015). Interpreting Secondary Students’ Performance on a Timed, Multiple-Choice Reading Comprehension Assessment The Prevalence and Impact of Non-Attempted Items. Journal of Psychoeducational Assessment, 33, 154–165. doi:10.1177/0734282914547493
Cohen, J., Cohen, P., West, S. G., & Aiken, L. S. (2003). Applied multiple regression/correlation analysis for the behavioral sciences (3rd ed.). New York, NY: Taylor & Francis Group.
Collins, A. A., Gilbert, J. K., Lindström, E. R., Compton, D. L., Steacy, L. M., & Cho, E. (2014). Performance variations across comprehension measures for students with late emerging reading difficulties. Manuscript in preparation.
Collins, A. A., Lindström, E. R., & Compton, D. L. (2014b). Examining the response accuracy of students with reading difficulties and typically developing students on reading comprehension measures: A Meta-Analysis. Manucript in preparation.
Compton, D. L., Miller, A. C., Elleman, A. M., & Steacy, L. M. (2014). Have we forsaken reading theory in the name of “quick fix” interventions for children with reading disability? Scientific Studies of Reading, 18, 55–73. doi:10.1080/10888438.2013.836200
Coté, N., Goldman, S. R., & Saul, E. U. (1998). Students making sense of informational text: Relations between processing and representation. Discourse Processes, 25, 1–53. doi:10.1080/01638539809545019
Cutting, L. E., Materek, A., Cole, C. A. S., Levine, T. M., & Mahone, E. M. (2009). Effects of fluency, oral language, and executive function on reading comprehension performance. Annals of Dyslexia, 59, 34–54. doi:10.1007/s11881-009-0022-0
Cutting, L. E., & Scarborough, H. S. (2006). Prediction of reading comprehension: Relative contributions of word recognition, language proficiency, and other cognitive skills can depend on how comprehension is measured. Scientific Studies of Reading, 10, 277–299. doi:10.1207/s1532799xssr1003_5
Davis, D. S. (2010). A meta-analysis of comprehension strategy instruction for upper elementary and middle school students (Doctoral dissertation). Retrieved from ProQuest Dissertations & Theses Full Text. (AAI3430730)
Eason, S. H., Goldberg, L. F., Young, K. M., Geist, M. C., & Cutting, L. E. (2012). Reader–text interactions: How differential text and question types influence cognitive skills needed for reading comprehension. Journal of Educational Psychology, 104, 515–528.

74
Francis, D. J., Fletcher, J. M., Catts, H. W., & Tomblin, J. B. (2005). Dimensions affecting the assessment of reading comprehension. In S. G. Paris & S. A. Stahl (Eds.), Children’s reading comprehension and assessment (pp. 369–394). Mahwah, NJ: Lawrence Erlbaum Associates, Inc.
Frederiksen, N. (1984). The real test bias: Influences of testing on teaching and learning. American Psychologist, 39, 193–202.
García, J. R., & Cain, K. (2013). Decoding and reading comprehension: A meta-analysis to identify which reader and assessment characteristics influence the strength of the relationship in English. Review of Educational Research, 1-38. doi:10.3102/0034654313499616
Gernsbacher, M. A., & Faust, M. E. (1991). The mechanism of suppression: A component of general comprehension skill. Journal of Experimental Psychology: Learning, Memory, and Cognition, 17, 245–262.
Gernsbacher, M. A., Varner, K. R., & Faust, M. E. (1990). Investigating differences in general comprehension skill. Journal of Experimental Psychology: Learning, Memory, and Cognition, 16, 430–445.
Gough, P. B., & Tunmer, W. E. (1986). Decoding, reading, and reading disability. Remedial and Special Education, 7, 6–10.
Haladyna, T. M. (1999). Developing and validating multiple-choice test items (2nd ed.). Mahwah, NJ: Lawrence Erlbaum Associates, Inc.
Harris, P. A., Taylor, R., Thielke, R., Payne, J., Gonzalez, N., & Conrad, J. G. (2009). Research electronic data capture (REDCap): A metadata-driven methodology and workflow process for providing translational research informatics support. Journal of Biomedical Information, 42, 377–381.
Hoover, W. A., & Gough, P. B. (1990). The simple view of reading. Reading and Writing, 2, 127–160. doi:10.1007/BF00401799
Hua, A. N., & Keenan, J. M. (2014). The role of text memory in inferencing and in comprehension deficits. Scientific Studies of Reading, 6, 415–431. doi:10.1080/10888438.926906
Janssen, R., Schepers, J., & Peres, D. (2004). Models with item and item group predictors. In P. D. Boeck & M. Wilson (Eds.), Explanatory Item Response Models (pp. 189–212). Springer New York.
Johnston, A. M., Barnes, M. A., & Desrochers, A. (2008). Reading comprehension: Developmental processes, individual differences, and interventions. Canadian Psychology, 49, 125-132.

75
Kearns, D. K., Steacy, L. M., Compton, D. L., Gilbert, J. K., Goodwin, A. P., Cho, E., … Collins, A. A. (in press). Modeling polymorphemic word recognition: Exploring differences among children with early-emerging and late-emerging word reading difficulty. Journal of Learning Disabilities.
Keenan, J. M. (2013). Assessment of reading comprehension. In C. A. Stone, E. R. Silliman, B. J. Ehren, & G. P. Wallach (Eds.), Handbook of Language and Literacy: Development and Discorders (2nd ed., pp. 469–484). New York, NY: Guildford Press.
Keenan, J. M., Betjemann, R. S., & Olson, R. K. (2008). Reading comprehension tests vary in the skills they assess: Differential dependence on decoding and oral comprehension. Scientific Studies of Reading, 12, 281–300. doi:10.1080/10888430802132279
Keenan, J. M., & Meenan, C. E. (2014). Test differences in diagnosing reading comprehension deficits. Journal of Learning Disabilities, 47, 125–135. doi:10.1177/0022219412439326
Kendeou, P., Papadopoulos, T. C., & Spanoudis, G. (2012). Processing demands of reading comprehension tests in young readers. Learning and Instruction, 22, 354–367.
Kieffer, M. J., Vukovic, R. K., & Berry, D. (2013). Roles of attention shifting and inhibitory control in fourth-grade reading comprehension. Reading Research Quarterly, 48, 333–348. doi:10.1002/rrq.54
Kintsch, W., & Kintsch, E. (2005). Comprehension. In S. G. Paris & S. A. Stahl (Eds.), Children’s reading comprehension and assessment (pp. 71–92). Mahwah, NJ: Lawrence Erlbaum Associates, Inc.
Leslie, L., & Caldwell, J. (2011). Qualitative Reading Inventory–5. Boston, MA: Pearson Education, Inc.
McCallum, R. S., Sharp, S., Bell, S. M., & George, T. (2004). Silent versus oral reading comprehension and efficiency. Psychology in the Schools, 41, 241–246. doi:10.1002/pits.10152
McGrew, K. S., Schrank, F. A., & Woodcock, R. W. (2007). Woodcock-Johnson III Normative Update: Technical Manual. Rolling Meadows, IL: Riverside Publishing.
McNamara, D. S., & Kintsch, W. (1996). Learning from texts: Effects of prior knowledge and text coherence. Discourse Processes, 22, 247–288. doi:10.1080/01638539609544975
McNamara, D. S., Ozuru, Y., & Floyd, R. G. (2011). Comprehension challenges in the fourth grade: The roles of text cohesion, text genre, and readers’ prior knowledge. International Electronic Journal of Elementary Education, 4, 229–257.
Miller, A. C., Davis, N., Gilbert, J. K., Cho, S.-J., Toste, J. R., Street, J., & Cutting, L. E. (2014). Novel approaches to examine passage, student, and question effects on reading comprehension. Learning Disabilities Research & Practice, 29, 25–35. doi:10.1111/ldrp.12027
76
Miller, S. D., & Smith, D. E. P. (1989). Relations among oral reading, silent reading and listening comprehension of students at differing competency levels. Reading Research and Instruction, 29, 73–84. doi:10.1080/19388079009558006
Nation, K. (2007). Chilldren’s reading comprehension difficulties. In M. J. Snowling & C. Hulme (Eds.), The science of reading: A handbook (pp. 248–265). Malden, MA: Blackwell Publishing Ltd.
Nation, K., & Snowling, M. (1997). Assessing reading difficulties: The validity and utility of current measures of reading skill. British Journal of Educational Psychology, 67, 359–370.
Olson, M. W. (1985). Text type and reader ability: The effects on paraphrase and text-based inference questions. Journal of Reading Behavior, 17, 199–214.
Pearson, P. D., & Hamm, D. N. (2005). The assessment of reading comprehension: A review of practices - Past, present, and future. In S. G. Paris & S. A. Stahl (Eds.), Children’s Reading Comprehension and Assessment (pp. 13–69). Mahwah, NJ: Lawrence Erlbaum Associates, Inc.
Pedhazur, E. J. (1982). Multiple regression in behavioral research: Explanation and prediction (Second Edition). New York, NY: CBS College Publishing.
Perfetti, C. A., Landi, N., & Oakhill, J. (2007). The acquisition of reading comprehension skill. In M. J. Snowling & C. Hulme (Eds.), The science of reading: A handbook (pp. 228–247). Malden, MA: Blackwell Publishing Ltd.
Pickering, S., & Gathercole, S. (2001). Working Memory Test Battery for Children. Pearson: London.
Purvis, K. L., & Tannock, R. (1997). Language abilities in children with attention deficit hyperactivity disorder, reading disabilities, and normal controls. Journal of Abnormal Child Psychology, 25, 133–144.
Reed, D. K., & Vaughn, S. (2012). Retell as an indicator of reading comprehension. Scientific Studies of Reading, 16, 187–217.
Schwarz, G., & others. (1978). Estimating the dimension of a model. The Annals of Statistics, 6, 461–464.
Snijders, T. A. B., & Bosker, R. J. (2011). Multilevel analysis: An introduction to basic and advanced multilevel modeling. Thousand Oaks, CA: SAGE Publications Inc.
Snow, C. (2002). Reading for understanding: Toward and R&D Program of reading comprehension. Santa Monica, CA: RAND

77
Spear-Swerling, L. (2004). Fourth Graders Performance on a State-Mandated Assessment Involving Two Different Measures of Reading Comprehension. Reading Psychology, 25, 121–148. doi:10.1080/02702710490435727
Stram, D. O., & Lee, J. W. (1994). Variance components testing in the longitudinal mixed effects model. Biometrics, 50, 1171–1177.
Stroud, K. C., & Reynolds, C. R. (2006). School Motivation and Learning Strategies Inventory. Los Angeles, CA: Western Psychological Services.
Swanson, L. H., Howard, C. B., & Sáez, L. (2007). Reading comprehension and working memory in children with learning disabilities in reading. In Children’s comprehension problems in oral and written language: A cognitive perspective (pp. 157–189). New York, NY: The Guilford Press.
Swanson, J., Schuck, S., Mann, M., Carlson, C., Hartman, K., Sergeant, J., & McCleary, R. (2006). Categorical and dimensional definitions and evaluations of symptoms of ADHD: The SNAP and SWAN Rating Scales. Retrieved from www.adhd.net
The Center for Teaching, Vanderbilt University. (2013). Writing good multiple-choice test questions. Retrieved from http://cft.vanderbilt.edu/guides-sub-pages/writing-good-multiple-choice-test-questions/
The Psychological Corporation. (1999). Wechsler Abbreviated Scale of Intelligence. San Antonio, TX: The Psychological Corporation.
Tighe, E. L., & Schatschneider, C. (2013). A dominance analysis approach to determining predictor importance in third, seventh, and tenth grade reading comprehension skills. Reading and Writing, 27, 101–127. doi:10.1007/s11145-013-9435-6
Torgesen, J. K., Wagner, R. K., & Rashotte, C. A. (2012). Test of Word Reading Efficiency (2nd ed.). Austin, TX: PRO-ED, Inc.
Van den Noortgate, W., De Boeck, P., & Meulders, M. (2003). Cross-classification multilevel logistic models in psychometrics. Journal of Educational and Behavioral Statistics, 28, 369–386.
Willcutt, E. G., & Pennington, B. F. (2000). Comorbidity of reading disability and attention-deficit/ hyperactivity disorder differences by gender and subtype. Journal of Learning Disabilities, 33, 179–191. doi:10.1177/002221940003300206
Willcutt, E. G., Pennington, B. F., Olson, R. K., Chhabildas, N., & Hulslander, J. (2005). Neuropsychological analyses of comorbidity between reading disability and attention deficit hyperactivity disorder: In search of the common deficit. Developmental Neuropsychology, 27, 35–78.
Woodcock, R. W., McGrew, K. S., & Mather, N. (2001). Woodcock-Johnson III Tests of Achievement. Rolling Meadows, IL: Riverside Publishing.
Related Documents