Annual Report | August 31, 2017 Performance Trust Strategic Bond Fund (Symbol: PTIAX) and Performance Trust Municipal Bond Fund (Symbols: PTIMX, PTRMX) © 2017 PT Asset Management, LLC. All Rights Reserved.

Welcome message from author
This document is posted to help you gain knowledge. Please leave a comment to let me know what you think about it! Share it to your friends and learn new things together.
Transcript
Annual Report | August 31, 2017
Performance Trust Strategic BondFund (Symbol: PTIAX) andPerformance Trust Municipal BondFund (Symbols: PTIMX, PTRMX)
© 2017 PT Asset Management, LLC. All Rights Reserved.


Dear Fellow Shareholders:
Performance Trust Strategic Bond Fund (PTIAX) Annual Management’sDiscussion of Fund Performance: 8/31/2016-8/31/2017
Over the past fiscal year ended August 31, 2017, Performance Trust Strategic Bond Fund (“PTIAX” or the “Fund”) posted areturn of 5.20% compared to 0.49% for the Bloomberg Barclays Aggregate Bond Index. It is particularly pleasing to reportsolid bond fund returns into a rising interest rate environment as interest rates rise prices on most bonds will fall creating adrag on returns that is often difficult to overcome. The chart below shows the Treasury yield curve from the beginning of theperiod and the end. As can be seen, rates were up roughly 50 basis points (0.50%) across the curve.
The single biggest reason for our performance was our large allocation to structured credit in general and to non-agencymortgage backed securities in particular. Structured credit has long been our preferred way to play defense. By that, wemean bonds that will perform relatively well if interest rates should rise.
After the election in November, interest rates on longer dated Treasuries increased sharply. The rate on a 7-year Treasury,as an example, increased 58 basis points during the month and the return on a 7-year Treasury during that month wasroughly -3.50%. In comparison, the residential mortgage-backed securities (RMBS) in our portfolio were up roughly0.47% in November, the collateralized loan obligations (CLOs) were up roughly 0.55%, and the commercial mortgage-backed securities (CMBS) were down approximately 0.69%. It is precisely this lack of sensitivity to changes in interestrates that makes these asset classes so attractive, in our opinion. As the table below shows, our allocation to theseasset classes, collectively, was over 50% throughout the period.
PTIAX Allocations8/31/16 8/31/17
Non-agency RMBS 42.68% 42.55%
CLOs 5.91% 1.66%
CMBS 8.40% 11.48%
Structured Credit 56.99% 55.69%
Cash 4.16% 3.45%
Treasuries 2.36% 0.00%
IG Corporates 3.15% 2.36%
High Yield 0.31% 0.21%
Taxable Muni 14.27% 19.29%
Tax-Exempt Muni 18.76% 19.00%
LETTER FROM THE INVESTMENT ADVISER
PERFORMANCE TRUST MUTUAL FUNDS (PTIAX, PTIMX, PTRMX) PAGE 3
PERFORMANCE TRUST MUTUAL FUNDS (PTIAX, PTIMX, PTRMX) PAGE 4
LETTER FROM THE INVESTMENT ADVISER
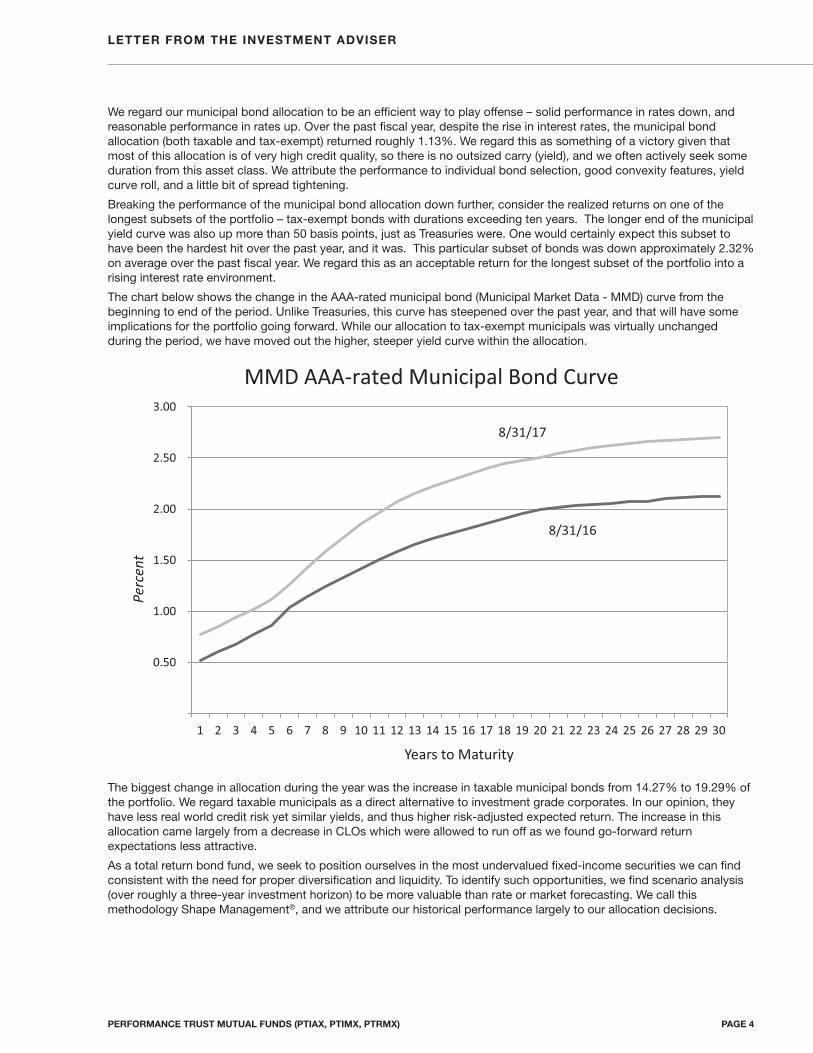
We regard our municipal bond allocation to be an efficient way to play offense – solid performance in rates down, andreasonable performance in rates up. Over the past fiscal year, despite the rise in interest rates, the municipal bondallocation (both taxable and tax-exempt) returned roughly 1.13%. We regard this as something of a victory given thatmost of this allocation is of very high credit quality, so there is no outsized carry (yield), and we often actively seek someduration from this asset class. We attribute the performance to individual bond selection, good convexity features, yieldcurve roll, and a little bit of spread tightening.
Breaking the performance of the municipal bond allocation down further, consider the realized returns on one of thelongest subsets of the portfolio – tax-exempt bonds with durations exceeding ten years. The longer end of the municipalyield curve was also up more than 50 basis points, just as Treasuries were. One would certainly expect this subset tohave been the hardest hit over the past year, and it was. This particular subset of bonds was down approximately 2.32%on average over the past fiscal year. We regard this as an acceptable return for the longest subset of the portfolio into arising interest rate environment.
The chart below shows the change in the AAA-rated municipal bond (Municipal Market Data - MMD) curve from thebeginning to end of the period. Unlike Treasuries, this curve has steepened over the past year, and that will have someimplications for the portfolio going forward. While our allocation to tax-exempt municipals was virtually unchangedduring the period, we have moved out the higher, steeper yield curve within the allocation.
The biggest change in allocation during the year was the increase in taxable municipal bonds from 14.27% to 19.29% ofthe portfolio. We regard taxable municipals as a direct alternative to investment grade corporates. In our opinion, theyhave less real world credit risk yet similar yields, and thus higher risk-adjusted expected return. The increase in thisallocation came largely from a decrease in CLOs which were allowed to run off as we found go-forward returnexpectations less attractive.
As a total return bond fund, we seek to position ourselves in the most undervalued fixed-income securities we can findconsistent with the need for proper diversification and liquidity. To identify such opportunities, we find scenario analysis(over roughly a three-year investment horizon) to be more valuable than rate or market forecasting. We call thismethodology Shape Management®, and we attribute our historical performance largely to our allocation decisions.

Performance Trust Municipal Bond Fund (PTIMX, PTRMX) Annual Management’sDiscussion of Fund Performance: 8/31/2016-8/31/2017
We are often asked questions regarding why we use a non-traditional methodology to evaluate risk and return (ShapeManagement®). The performance of the Institutional Class shares of the Performance Trust Municipal Bond Fund(“PTIMX” or the “Fund”) over the last twelve months demonstrates the pitfalls of using the conventional yield andduration metrics as proxies for true return and risk, respectively. PTIMX’s twelve-month return, ended August 31, 2017,was 0.50%, modestly lower than the Bloomberg Barclays Municipal Bond Index return of 0.88%. PTIMX’s under-performance relative to the benchmark can be attributed to its duration (interest rate sensitivity) of 6.8 years relative tothe benchmark’s duration of 5.13 years. Over the twelve-month period, 10-year municipal bond rates rose 0.44%,negatively impacting municipal bond prices. Despite the negative price effects from higher interest rates, PTIMX wasable to generate alpha by selecting bonds that provide positive total returns, even in a moderately higher rateenvironment. However, using duration and yield to estimate performance would have resulted in a negative return of0.43% ((-)6.8 year duration multiplied by the 0.44% increase in rates, plus the twelve-month dividend yield of 2.56%).
Divergence between actual performance and “projected” performance are the result of various risk and returncomponents that are not captured in a projection generated by yield and duration. Examples of return found outside ofthe traditional yield metric include spread tightening and rolling the yield curve. Examples of risk not captured in thetraditional duration metric include extension risk and negative convexity. Without incorporating these additionalcomponents, projected return can vary significantly from realized performance. As a result, we have shifted away fromyield/duration and adopted Shape Management®, which incorporates many of the components above. In short, ShapeManagement® leads us to pick bonds based on what we believe to be a fuller picture of performance.
Using Shape Management® as our guide, we navigated a twelve-month period, which began with the surprise victory ofDonald Trump in the U.S. presidential election. Rates moved sharply higher as investors expected policies ranging fromtransportation to tax reform that would lead to an inflationary environment. However, rates moderated as it became clearthat many of the items on the Trump administration’s agenda would not pass in their original form, as evidenced by thefailure of health care reform within the Senate. Market interest rates were also restrained by persistently low inflationdata, despite a growing economy. However, the Federal Reserve did increase short term rates three times over thetwelve-month period. The net result of these events was moderately higher rates.
There were three major themes in PTIMX over this period: (1) an overweight in alternative minimum tax bonds, (2) anunderweight in low-credit quality, and (3) a focus on investment in the intermediate areas of the yield curve. First, afterDonald Trump’s election, his Administration quickly identified tax reform, which included the repeal of the alternativeminimum tax (AMT), as a key policy objective. As a result, we dramatically increased our exposure to bonds subject tothe AMT, speculating that, should the AMT be repealed, AMT bonds would no longer trade with a penalty associatedwith their tax treatment. We took PTIMX’s AMT exposure up from 5.97% at the beginning of the period to 13.46% at theend of the period. We estimate that AMT spreads have tightened by 0.1%-0.15% over that time. Second, we havecontinued to maintain more than half of PTIMX in AA or better credit. Spreads remain compressed and may havetightened further as investors reach for yield in a limited supply market. Finally, as the front end of the yield curvecontinues to rise with the Fed’s tightening program, we focused our investments in the intermediate areas of the yieldcurve where the yield pick-up is still pronounced.
Looking forward, we continue to review the impact of current events, such as Washington politics and natural disasters,on the performance of borrowers’ credit and the municipal market. Additionally, using Shape Management®, we continueto balance the risk we take with potential total return outcomes over a medium term horizon, moving away from thetraditional performance “forecasting” metrics. In terms of our current portfolio themes, we may opportunistically reduceour exposure to AMT as spreads continue to compress. Additionally, we believe it is prudent to remain in higher-ratedcredit given the historically high prices the market is demanding for lower-rated credit. Should spreads widen, PTIMX willbe well positioned to take advantage of cheaper lower quality debt by rotating out of higher quality bonds. Finally, as theFed’s tightening process continues to lift the front-end of the yield curve, we will maintain our position in bonds withintermediate-length maturities to take advantage of both yield curve and credit roll as our bonds shorten over time.
Past performance is not indicative of future returns. The views in this report were those of the Funds’ Managers as ofAugust 31, 2017 and may not reflect the views of the Funds’ Managers on the date this Report is first published oranytime thereafter. These views are intended to assist shareholders of the Funds in understanding their investments in theFunds and do not constitute investment advice.
LETTER FROM THE INVESTMENT ADVISER
PERFORMANCE TRUST MUTUAL FUNDS (PTIAX, PTIMX, PTRMX) PAGE 5
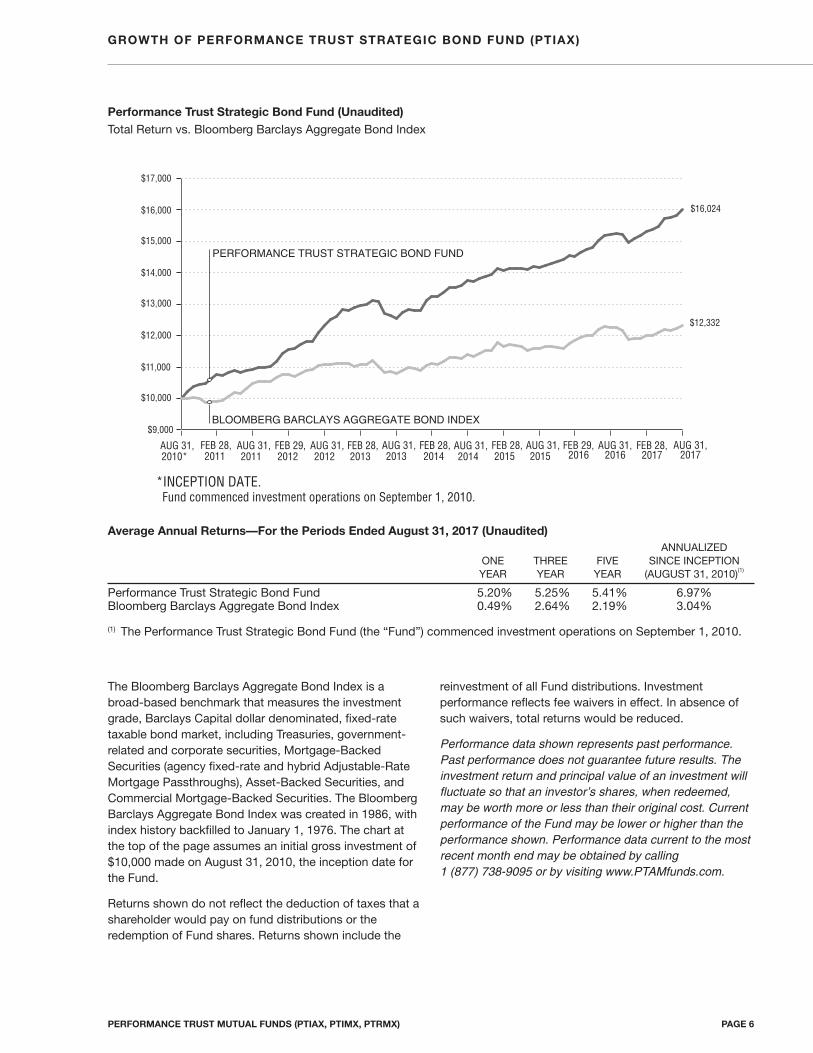
Performance Trust Strategic Bond Fund (Unaudited)Total Return vs. Bloomberg Barclays Aggregate Bond Index
PERFORMANCE TRUST MUTUAL FUNDS (PTIAX, PTIMX, PTRMX) PAGE 6
The Bloomberg Barclays Aggregate Bond Index is abroad-based benchmark that measures the investmentgrade, Barclays Capital dollar denominated, fixed-ratetaxable bond market, including Treasuries, government-related and corporate securities, Mortgage-BackedSecurities (agency fixed-rate and hybrid Adjustable-RateMortgage Passthroughs), Asset-Backed Securities, andCommercial Mortgage-Backed Securities. The BloombergBarclays Aggregate Bond Index was created in 1986, withindex history backfilled to January 1, 1976. The chart atthe top of the page assumes an initial gross investment of$10,000 made on August 31, 2010, the inception date forthe Fund.
Returns shown do not reflect the deduction of taxes that ashareholder would pay on fund distributions or theredemption of Fund shares. Returns shown include the
reinvestment of all Fund distributions. Investmentperformance reflects fee waivers in effect. In absence ofsuch waivers, total returns would be reduced.
Performance data shown represents past performance.Past performance does not guarantee future results. Theinvestment return and principal value of an investment willfluctuate so that an investor’s shares, when redeemed,may be worth more or less than their original cost. Currentperformance of the Fund may be lower or higher than theperformance shown. Performance data current to the mostrecent month end may be obtained by calling 1 (877) 738-9095 or by visiting www.PTAMfunds.com.
Average Annual Returns—For the Periods Ended August 31, 2017 (Unaudited) ANNUALIZED
ONE THREE FIVE SINCE INCEPTIONYEAR YEAR YEAR (AUGUST 31, 2010)(1)
Performance Trust Strategic Bond Fund 5.20% 5.25% 5.41% 6.97%Bloomberg Barclays Aggregate Bond Index 0.49% 2.64% 2.19% 3.04%
(1) The Performance Trust Strategic Bond Fund (the “Fund”) commenced investment operations on September 1, 2010.
GROWTH OF PERFORMANCE TRUST STRATEGIC BOND FUND (PTIAX)
PERFORMANCE TRUST STRATEGIC BOND FUND
$9,000
$10,000
$11,000
$12,000
$13,000
$14,000
$15,000
$16,000
$17,000
$12,332
AUG 31,2010*
FEB 28,2011
AUG 31,2011
FEB 29,2012
AUG 31,2012
BLOOMBERG BARCLAYS AGGREGATE BOND INDEX
*INCEPTION DATE. Fund commenced investment operations on September 1, 2010.
FEB 28,2013
AUG 31,2013
FEB 28,2014
AUG 31,2014
FEB 28,2015
AUG 31,2015
FEB 29,2016
AUG 31,2016
$16,024
FEB 28,2017
AUG 31,2017

Allocation of Portfolio Holdings (% of Investments) (Unaudited)As of August 31, 2017
MORTGAGE BACKED SECURITIES
MUNICIPAL BONDS
SHORT-TERM INVESTMENTS
ASSET BACKED SECURITIES
CORPORATE BONDS
CLOSED-END MUTUAL FUNDS
3.70%
51.40%
4.50%
37.90%
0.20%
2.30%
PERFORMANCE TRUST MUTUAL FUNDS (PTIAX, PTIMX, PTRMX) PAGE 7
PERFORMANCE TRUST STRATEGIC BOND FUND (PTIAX)

Performance Trust Municipal Bond Fund – Institutional Class (Unaudited)Total Return vs. Bloomberg Barclays Municipal Bond Index
$950,000
$1,000,000
$1,050,000
$1,100,000
$1,150,000
$1,200,000
$1,250,000
$1,300,000
$1,350,000
$1,400,000
$1,450,000
$1,500,000
JUN 30,2011*
AUG 31,2011
FEB 29,2012
AUG 31,2012
$1,310,526
FEB 28,2013
BLOOMBERG BARCLAYS MUNICIPAL BOND INDEX
PERFORMANCE TRUST MUNICIPAL
BOND FUND – INSTITUTIONAL CLASS
*INCEPTION DATE.
AUG 31,2013
FEB 28,2014
AUG 31,2014
FEB 28,2015
AUG 31,2015
$1,470,157
FEB 29,2016
FEB 28,2017
AUG 31,2016
AUG 31,2017
The Bloomberg Barclays Municipal Bond Index is a rulesbased, market-value-weighted index engineered for thelong-term tax-exempt bond market. The index tracksgeneral obligation bonds, revenue bonds, insured bonds,and pre-refunded bonds rated Baa3/ BBB or higher by atleast two of the ratings agencies: Moody’s, S&P and Fitch.The Bloomberg Barclays Municipal Bond Index wascreated in 1986, with index history backfilled to January 1,1976. The chart at the top of the page assumes an initialgross investment of $1,000,000 made on June 30, 2011,the inception date for the Institutional Class shares of thePerformance Trust Municipal Bond Fund (the “Fund”).
Returns shown do not reflect the deduction of taxes that ashareholder would pay on Fund distributions or theredemption of Fund shares. Returns shown include thereinvestment of all Fund distributions. Investmentperformance reflects fee waivers in effect. In absence ofsuch waivers, total returns would be reduced.
Performance data shown represents past performance.Past performance does not guarantee future results. Theinvestment return and principal value of an investment willfluctuate so that an investor’s shares, when redeemed,may be worth more or less than their original cost. Currentperformance of the Fund may be lower or higher than theperformance shown. Performance data current to the mostrecent month end may be obtained by calling 1 (877) 738-9095 or by visiting www.PTAMfunds.com.
Average Annual Returns—For the Periods Ended August 31, 2017 (Unaudited) ANNUALIZED
ONE THREE FIVE SINCE INCEPTIONYEAR YEAR YEAR (JUNE 30, 2011)
Performance Trust Municipal Bond Fund –Institutional Class 0.50% 4.38% 4.38% 6.45%
Bloomberg Barclays Municipal Bond Index 0.88% 3.40% 3.23% 4.48%
PERFORMANCE TRUST MUTUAL FUNDS (PTIAX, PTIMX, PTRMX) PAGE 8
GROWTH OF PERFORMANCE TRUST MUNICIPAL BOND FUND (PTIMX)

Performance Trust Municipal Bond Fund – Retail Class (Unaudited)Total Return vs. Bloomberg Barclays Municipal Bond Index
$9,000
$9,500
$10,000
$10,500
$11,000
$11,500
$12,000
$12,500
SEP 28,2012*
$11,655
FEB 28,2013
PERFORMANCE TRUST MUNICIPALBOND FUND – RETAIL CLASS
BLOOMBERG BARCLAYS MUNICIPAL BOND INDEX
*INCEPTION DATE.
AUG 31,2013
FEB 28,2014
AUG 31,2014
FEB 28,2015
AUG 31,2015
FEB 29,2016
AUG 31,2016
$12,169
FEB 28,2017
AUG 31,2017
PERFORMANCE TRUST MUTUAL FUNDS (PTIAX, PTIMX, PTRMX) PAGE 9
The Bloomberg Barclays Municipal Bond Index is a rulesbased, market-value-weighted index engineered for thelong-term tax-exempt bond market. The index tracksgeneral obligation bonds, revenue bonds, insured bonds,and pre-refunded bonds rated Baa3/ BBB or higher by atleast two of the ratings agencies: Moody’s, S&P and Fitch.The Bloomberg Barclays Municipal Bond Index wascreated in 1986, with index history backfilled to January 1,1976. The chart at the top of the page assumes an initialgross investment of $10,000 made on September 28, 2012, the inception date for the RetailClass shares of the Performance Trust Municipal BondFund (the “Fund”).
Returns shown do not reflect the deduction of taxes that ashareholder would pay on Fund distributions or theredemption of Fund shares. Returns shown include thereinvestment of all Fund distributions. Investmentperformance reflects fee waivers in effect. In absence ofsuch waivers, total returns would be reduced.
Performance data shown represents past performance.Past performance does not guarantee future results. Theinvestment return and principal value of an investment willfluctuate so that an investor’s shares, when redeemed,may be worth more or less than their original cost. Currentperformance of the Fund may be lower or higher than theperformance shown. Performance data current to the mostrecent month end may be obtained by calling 1 (877) 738-9095 or by visiting www.PTAMfunds.com.
Average Annual Returns—For the Periods Ended August 31, 2017 (Unaudited) ANNUALIZED
ONE THREE SINCE INCEPTIONYEAR YEAR (SEPTEMBER 28, 2012)
Performance Trust Municipal Bond Fund – Retail Class 0.24% 4.16% 4.07%Bloomberg Barclays Municipal Bond Index 0.88% 3.40% 3.16%
GROWTH OF PERFORMANCE TRUST MUNICIPAL BOND FUND (PTRMX)
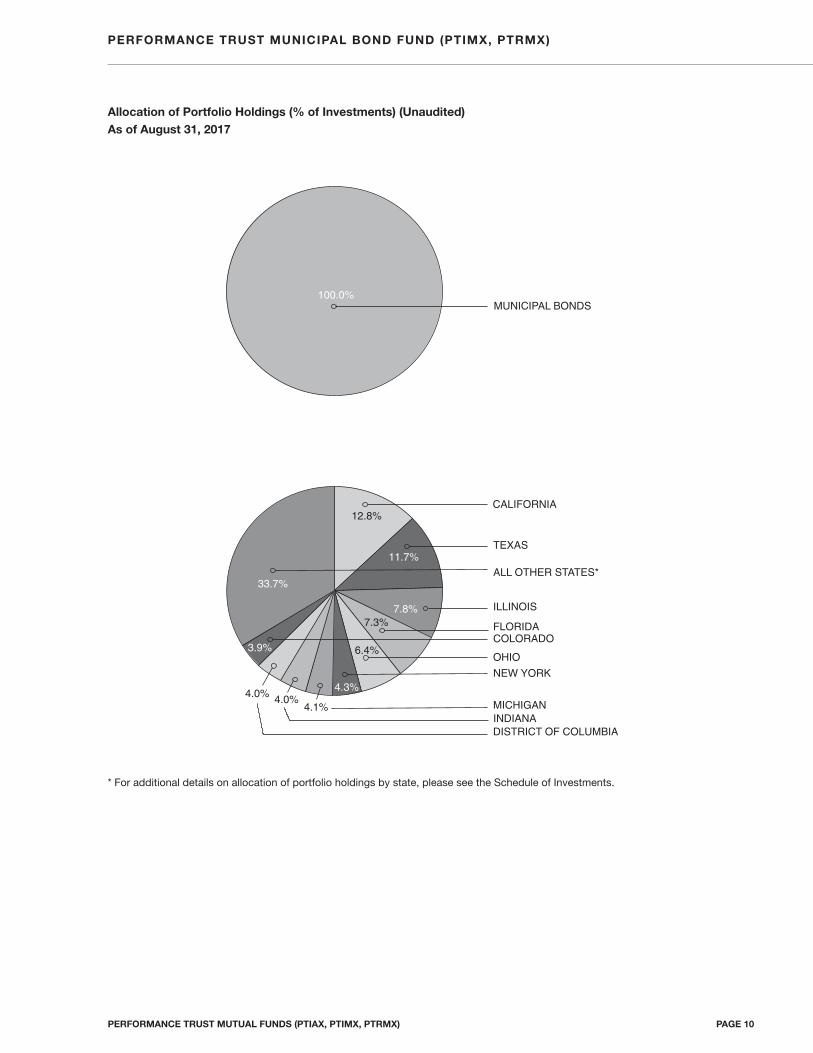
Allocation of Portfolio Holdings (% of Investments) (Unaudited)As of August 31, 2017
CALIFORNIA
TEXAS
ILLINOIS
FLORIDA
OHIO
NEW YORK
MICHIGANINDIANA DISTRICT OF COLUMBIA
COLORADO
ALL OTHER STATES*33.7%
12.8%
7.8%
11.7%
4.3%
4.1% 4.0% 4.0%
3.9% 6.4%
7.3%
MUNICIPAL BONDS100.0%
PERFORMANCE TRUST MUTUAL FUNDS (PTIAX, PTIMX, PTRMX) PAGE 10
* For additional details on allocation of portfolio holdings by state, please see the Schedule of Investments.
PERFORMANCE TRUST MUNICIPAL BOND FUND (PTIMX, PTRMX)
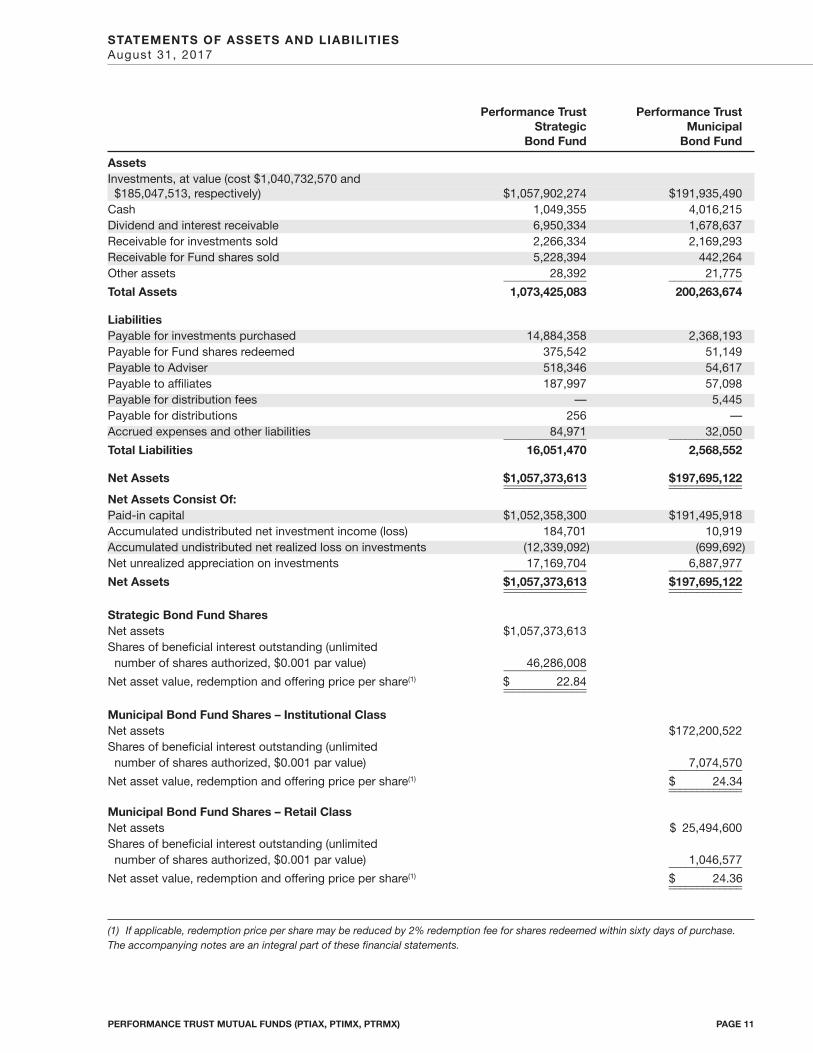
STATEMENTS OF ASSETS AND LIABILITIESAugust 31, 2017
PERFORMANCE TRUST MUTUAL FUNDS (PTIAX, PTIMX, PTRMX) PAGE 11
Performance Trust Performance TrustStrategic Municipal
Bond Fund Bond Fund
AssetsInvestments, at value (cost $1,040,732,570 and $185,047,513, respectively) $1,057,902,274 $191,935,490
Cash 1,049,355 4,016,215Dividend and interest receivable 6,950,334 1,678,637Receivable for investments sold 2,266,334 2,169,293Receivable for Fund shares sold 5,228,394 442,264Other assets 28,392 21,775______________ _____________Total Assets 1,073,425,083 200,263,674
LiabilitiesPayable for investments purchased 14,884,358 2,368,193Payable for Fund shares redeemed 375,542 51,149Payable to Adviser 518,346 54,617Payable to affiliates 187,997 57,098Payable for distribution fees — 5,445Payable for distributions 256 —Accrued expenses and other liabilities 84,971 32,050______________ _____________Total Liabilities 16,051,470 2,568,552
Net Assets $1,057,373,613 $197,695,122______________ ___________________________ _____________Net Assets Consist Of:Paid-in capital $1,052,358,300 $191,495,918Accumulated undistributed net investment income (loss) 184,701 10,919Accumulated undistributed net realized loss on investments (12,339,092) (699,692)Net unrealized appreciation on investments 17,169,704 6,887,977______________ _____________Net Assets $1,057,373,613 $197,695,122______________ ___________________________ _____________
Strategic Bond Fund SharesNet assets $1,057,373,613Shares of beneficial interest outstanding (unlimited
number of shares authorized, $0.001 par value) 46,286,008______________Net asset value, redemption and offering price per share(1) $ 22.84____________________________
Municipal Bond Fund Shares – Institutional ClassNet assets $172,200,522Shares of beneficial interest outstanding (unlimited
number of shares authorized, $0.001 par value) 7,074,570_____________Net asset value, redemption and offering price per share(1) $ 24.34__________________________
Municipal Bond Fund Shares – Retail ClassNet assets $ 25,494,600Shares of beneficial interest outstanding (unlimited
number of shares authorized, $0.001 par value) 1,046,577_____________Net asset value, redemption and offering price per share(1) $ 24.36__________________________
(1) If applicable, redemption price per share may be reduced by 2% redemption fee for shares redeemed within sixty days of purchase.The accompanying notes are an integral part of these financial statements.

ASSET BACKED SECURITIES–3.69%
ACE Securities Corp Home Equity Loan Trust
2006-ASAP4, 1.394%(1 Month LIBOR USD + 0.160%), 08/25/2036 (a) $ 774,752 $ 748,663
Apidos CLO XIV2013-14A, 4.804% (3 Month LIBOR USD + 3.500%), 04/15/2025 (a) 2,460,000 2,460,000
Ares XXVI CLO Ltd.2013-1A, 4.054% (3 Month LIBOR USD + 2.750%), 04/15/2025 (a) 500,000 501,907
Ares XXVII CLO Ltd.3.653% (3 Month LIBOR USD + 2.400%), 07/28/2029 (a) 1,750,000 1,766,233
BlueMountain CLO Ltd.2015-1A, 5.054% (3 Month LIBOR USD + 3.750%), 04/13/2027 (a) 2,000,000 2,028,924
2012-2A, 3.916% (3 Month LIBOR USD + 2.600%), 11/20/2028 (a) 1,000,000 1,013,820
Carrington Mortgage Loan Trust2006-NC3, 1.334% (1 Month LIBOR USD + 0.100%), 08/25/2036 (a) 611,912 609,161
CSMC Trust2006-CF1, 5.000%, 11/25/2035 (b) 2,565,000 2,432,913
Equity One Mortgage Pass-Through Trust2003-1, 4.860%, 08/25/2033 (c) 2,495,486 2,504,8262003-3, 4.868%, 12/25/2033 (c) 1,312,633 1,266,461
Finn Square CLO Ltd.2012-1A, 4.896% (3 Month LIBOR USD + 3.600%), 12/24/2023 (a) 1,500,000 1,502,136
Freddie Mac Multifamily Structured Pass Through CertificatesK062, 0.439%, 12/25/2026 (c)(d) 94,825,218 2,498,009
Galaxy XIX CLO Ltd.2015-19A, 0.000% (3 Month LIBOR USD + 1.700%), 07/24/2030 (a) 4,000,000 4,006,716
Home Equity Loan Trust2007-FRE1, 1.364% (1 Month LIBORUSD + 0.130%), 04/25/2037 (a) 211,463 211,834
MASTR Asset Securitization Trust2002-NC1, 4.384% (1 Month LIBOR USD + 3.150%), 10/25/2032 (a) 395,876 396,732
Octagon Investment Partners 24 Ltd.2015-1A, 3.266% (3 Month LIBOR USD + 1.950%), 05/21/2027 (a) 960,000 960,482
Ownit Mortgage Loan Trust2005-1, 2.329% (1 Month LIBOR
USD + 1.100%), 09/25/2035 (a) $ 4,761,892 $ 4,622,284
Popular ABS Mortgage Pass-Through Trust2004-4, 4.495%, 09/25/2034 (b) 1,556,068 1,330,776
RAMP Trust2003-RS4, 4.018%, 03/25/2033 (c) 106,745 107,1962006-RS6, 1.414% (1 Month LIBOR USD + 0.180%), 11/25/2036 (a) 1,696,932 1,573,905
Renaissance Home Equity Loan Trust2005-1, 5.016%, 05/25/2035 (b) 920,066 945,498
Specialty Underwriting & Residential Finance Trust2006-BC2, 4.009%, 02/25/2037 (b) 1,130,216 607,121
Structured Asset Investment Loan Trust2006-4, 1.364% (1 Month LIBOR
USD + 0.130%), 07/25/2036 (a) 2,259,280 1,842,374
Tryon Park CLO Ltd.2013-1A, 3.904% (3 Month LIBOR USD + 2.600%), 07/15/2025 (a) 1,800,000 1,816,389
2013-1A, 4.804% (3 Month LIBOR USD + 3.500%), 07/15/2025 (a) 1,250,000 1,263,981______________
TOTAL ASSET BACKED SECURITIES (Cost $38,154,625) 39,018,341______________
CORPORATE BONDS–2.34%
Astoria Financial Corp.3.500%, 06/08/2020 2,250,000 2,281,581
AT&T, Inc.3.900%, 08/14/2027 1,200,000 1,212,9094.900%, 08/14/2037 1,200,000 1,216,0765.150%, 02/14/2050 1,200,000 1,215,284
Baptist Health South Florida, Inc.4.590%, 08/15/2021 645,000 699,800
Catholic Health Initiatives2.950%, 11/01/2022 2,000,000 1,974,721
Customers Bancorp, Inc.3.950%, 06/30/2022 2,000,000 2,022,500
Enterprise Financial Services Corp.4.750% (3 Month LIBOR
USD + 3.390%), 11/01/2026 (a) 500,000 506,250
Flagstar Bancorp, Inc.6.125%, 07/15/2021 2,000,000 2,143,665
Flushing Financial Corp.5.250% (3 Month LIBOR
USD + 3.440%), 12/15/2026 (a) 2,000,000 2,067,500
PERFORMANCE TRUST STRATEGIC BOND FUND — SCHEDULE OF INVESTMENTSAugust 31, 2017
PERFORMANCE TRUST MUTUAL FUNDS (PTIAX, PTIMX, PTRMX) PAGE 12
Percentages are stated as a percent of net assets.The accompanying notes are an integral part of these financial statements.
PRINCIPALAMOUNT VALUE
PRINCIPALAMOUNT VALUE

Fulton Financial Corp.3.600%, 03/16/2022 $ 1,000,000 $ 1,014,968
Hanmi Financial Corp.5.450% (3 Month LIBOR USD + 3.320%), 03/30/2027 (a) 3,000,000 3,096,861
Memorial Health Services3.496%, 05/01/2022 575,000 595,012
NexBank Capital, Inc.5.500% (3 Month LIBOR USD + 4.360%), 03/16/2026 (a) 500,000 504,375
Preferred Bank6.000% (3 Month LIBOR USD + 4.670%), 06/15/2026 (a) 1,000,000 1,065,000
Towne Bank4.500% (3 Month LIBOR USD + 2.550%), 07/30/2027 (a) 3,000,000 3,086,250______________
TOTAL CORPORATE BONDS (Cost $24,119,611) 24,702,752______________
MORTGAGE BACKED SECURITIES–51.41%
Adjustable Rate Mortgage Trust2005-3, 3.497%, 07/25/2035 (c) 1,314,135 1,258,749
Alternative Loan Trust2004-30CB, 5.500%, 03/25/2020 122,644 122,9042005-11CB, 5.500%, 06/25/2035 1,030,684 1,013,5302006-J3, 5.750%, 05/25/2026 912,511 812,0902004-27CB, 6.000%, 12/25/2034 507,528 498,0062004-29CB, 5.375%, 01/25/2035 110,096 110,4452004-28CB, 6.000%, 01/25/2035 910,366 914,0422005-6CB, 7.500%, 04/25/2035 399,569 434,7072005-21CB, 5.250%, 06/25/2035 3,649,346 3,465,4822005-11CB, 5.500%, 06/25/2035 1,028,014 1,010,9042005-21CB, 6.000%, 06/25/2035 1,776,801 1,797,8512005-43, 3.728%, 09/25/2035 (c) 737,758 699,1032005-40CB, 5.500%, 10/25/2035 98,436 88,4582005-63, 3.220%, 11/25/2035 (c) 2,201,050 1,997,0712005-52CB, 5.500%, 11/25/2035 108,482 103,2982005-52CB, 5.500%, 11/25/2035 238,394 227,0012005-52CB, 5.500%, 11/25/2035 44,913 42,7672005-54CB, 5.500%, 11/25/2035 1,393,911 1,246,6652005-J13, 5.500%, 11/25/2035 218,091 200,5392005-65CB, 0.000%, 12/25/2035 (e) 1,869,073 1,241,1792005-64CB, 5.500%, 12/25/2035 93,575 92,2682005-65CB, 5.500%, 01/25/2036 261,707 244,2792005-73CB, 5.750%, 01/25/2036 532,516 447,4152005-86CB, 5.500%, 02/25/2036 282,679 246,4682005-86CB, 5.500%, 02/25/2036 1,880,574 1,717,9302006-4CB, 1.934% (1 Month LIBOR USD + 0.700%), 04/25/2036 (a) 656,005 426,214
2006-6CB, 5.500%, 05/25/2036 256,018 236,4072006-12CB, 5.750% (1 Month LIBOR
USD + 5.750%), 05/25/2036 (a) 999,498 821,811
Alternative Loan Trust (Cont.)2006-16CB, 6.000%, 06/25/2036 $ 283,780 $ 240,4742006-19CB, 1.634% (1 Month LIBOR
USD + 0.400%), 08/25/2036 (a) 1,428,379 1,047,2722006-24CB, 5.750%, 06/25/2036 502,994 422,9662006-19CB, 6.000%, 08/25/2036 286,223 252,2672006-19CB, 6.000% (1 Month LIBOR
USD + 1.000%), 08/25/2036 (a) 2,147,146 1,892,4242006-31CB, 6.000%, 11/25/2036 48,405 39,4392006-32CB, 5.500%, 11/25/2036 319,489 278,8412006-32CB, 6.000%, 11/25/2036 1,608,395 1,468,5822006-41CB, 6.000%, 01/25/2037 1,028,807 883,9582006-43CB, 6.000%, 02/25/2037 346,426 305,2962007-4CB, 5.750%, 04/25/2037 3,261,322 3,069,2082007-8CB, 6.000%, 05/25/2037 592,944 523,4712008-2R, 6.000%, 08/25/2037 (c) 10,943,049 9,034,567
American Home MortgageInvestment Trust
2006-2, 6.250%, 06/25/2036 (b) 2,984,641 1,348,432
Banc of America Alternative Loan Trust2006-3, 6.000%, 04/25/2036 632,693 638,5892005-2, 5.500%, 03/25/2035 944,058 937,7822005-5, 5.500%, 06/25/2035 351,889 332,8242005-5, 6.000%, 06/25/2035 1,719,286 1,694,2382005-11, 5.750%, 12/25/2035 210,156 191,4062005-12, 5.750%, 01/25/2036 803,255 749,0872006-1, 6.500%, 02/25/2036 2,896,806 2,828,1212006-3, 6.000%, 04/25/2036 7,413,635 7,347,1512006-9, 1.634% (1 Month LIBOR
USD + 0.400%), 01/25/2037 (a) 2,269,416 1,810,2822006-9, 6.000%, 01/25/2037 502,255 449,6822007-1, 6.156%, 04/25/2037 (c) 703,493 626,1632006-4, 6.500%, 05/25/2046 2,705,934 2,683,6562006-5, 6.000%, 06/25/2046 575,830 526,317
Banc of America Funding Trust2003-3, 5.500%, 10/25/2033 535,155 551,8512004-1, 6.000%, 02/25/2034 1,910,777 2,094,0822004-1, 6.000%, 03/25/2034 10,069,288 11,207,6112007-4, 5.500%, 11/25/2034 1,403,614 1,438,9962005-3, 5.500%, 06/25/2035 161,857 170,5732005-4, 5.500%, 08/25/2035 117,377 122,1722005-5, 5.500%, 09/25/2035 638,310 658,9632005-5, 5.500%, 09/25/2035 1,407,686 1,490,6632005-7, 5.750%, 11/25/2035 77,236 79,0402005-7, 6.000%, 11/25/2035 420,320 428,0402006-B, 3.456%, 03/20/2036 (c) 1,649,271 1,485,2162006-5, 5.750%, 09/25/2036 1,144,687 1,107,5632006-7, 6.000%, 09/25/2036 1,979,174 1,846,0462007-1, 6.189%, 01/25/2037 (b) 1,737,348 1,614,3622007-2, 1.294% (1 Month LIBOR
USD + 0.060%), 03/25/2037 (a) 1,217,739 965,006
PERFORMANCE TRUST STRATEGIC BOND FUND — SCHEDULE OF INVESTMENTS (CONT.)August 31, 2017
PERFORMANCE TRUST MUTUAL FUNDS (PTIAX, PTIMX, PTRMX) PAGE 13
Percentages are stated as a percent of net assets.The accompanying notes are an integral part of these financial statements.
PRINCIPALAMOUNT VALUE
PRINCIPALAMOUNT VALUE
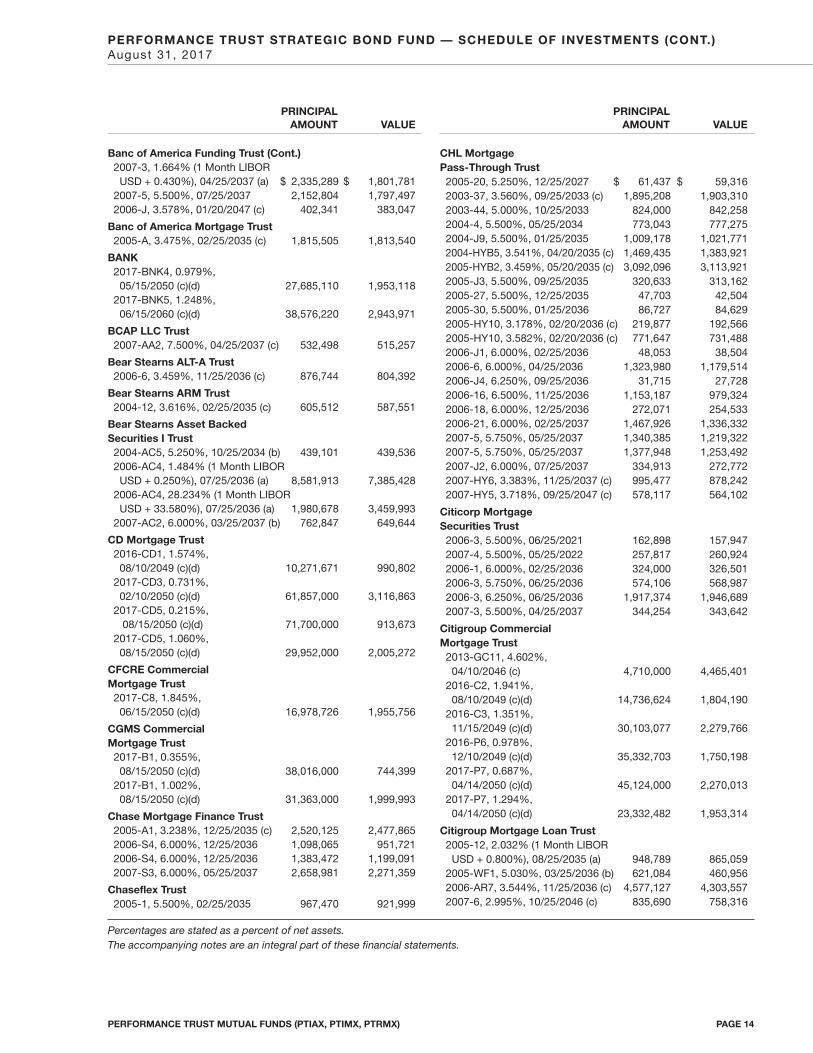
Banc of America Funding Trust (Cont.)2007-3, 1.664% (1 Month LIBOR USD + 0.430%), 04/25/2037 (a) $ 2,335,289 $ 1,801,781
2007-5, 5.500%, 07/25/2037 2,152,804 1,797,4972006-J, 3.578%, 01/20/2047 (c) 402,341 383,047
Banc of America Mortgage Trust2005-A, 3.475%, 02/25/2035 (c) 1,815,505 1,813,540
BANK2017-BNK4, 0.979%, 05/15/2050 (c)(d) 27,685,110 1,953,118
2017-BNK5, 1.248%, 06/15/2060 (c)(d) 38,576,220 2,943,971
BCAP LLC Trust2007-AA2, 7.500%, 04/25/2037 (c) 532,498 515,257
Bear Stearns ALT-A Trust2006-6, 3.459%, 11/25/2036 (c) 876,744 804,392
Bear Stearns ARM Trust2004-12, 3.616%, 02/25/2035 (c) 605,512 587,551
Bear Stearns Asset Backed Securities I Trust
2004-AC5, 5.250%, 10/25/2034 (b) 439,101 439,5362006-AC4, 1.484% (1 Month LIBORUSD + 0.250%), 07/25/2036 (a) 8,581,913 7,385,428
2006-AC4, 28.234% (1 Month LIBOR USD + 33.580%), 07/25/2036 (a) 1,980,678 3,459,993
2007-AC2, 6.000%, 03/25/2037 (b) 762,847 649,644
CD Mortgage Trust2016-CD1, 1.574%, 08/10/2049 (c)(d) 10,271,671 990,802
2017-CD3, 0.731%,02/10/2050 (c)(d) 61,857,000 3,116,863
2017-CD5, 0.215%,08/15/2050 (c)(d) 71,700,000 913,673
2017-CD5, 1.060%, 08/15/2050 (c)(d) 29,952,000 2,005,272
CFCRE Commercial Mortgage Trust
2017-C8, 1.845%, 06/15/2050 (c)(d) 16,978,726 1,955,756
CGMS Commercial Mortgage Trust
2017-B1, 0.355%, 08/15/2050 (c)(d) 38,016,000 744,399
2017-B1, 1.002%, 08/15/2050 (c)(d) 31,363,000 1,999,993
Chase Mortgage Finance Trust2005-A1, 3.238%, 12/25/2035 (c) 2,520,125 2,477,8652006-S4, 6.000%, 12/25/2036 1,098,065 951,7212006-S4, 6.000%, 12/25/2036 1,383,472 1,199,0912007-S3, 6.000%, 05/25/2037 2,658,981 2,271,359
Chaseflex Trust2005-1, 5.500%, 02/25/2035 967,470 921,999
CHL Mortgage Pass-Through Trust2005-20, 5.250%, 12/25/2027 $ 61,437 $ 59,3162003-37, 3.560%, 09/25/2033 (c) 1,895,208 1,903,3102003-44, 5.000%, 10/25/2033 824,000 842,2582004-4, 5.500%, 05/25/2034 773,043 777,2752004-J9, 5.500%, 01/25/2035 1,009,178 1,021,7712004-HYB5, 3.541%, 04/20/2035 (c) 1,469,435 1,383,9212005-HYB2, 3.459%, 05/20/2035 (c) 3,092,096 3,113,9212005-J3, 5.500%, 09/25/2035 320,633 313,1622005-27, 5.500%, 12/25/2035 47,703 42,5042005-30, 5.500%, 01/25/2036 86,727 84,6292005-HY10, 3.178%, 02/20/2036 (c) 219,877 192,5662005-HY10, 3.582%, 02/20/2036 (c) 771,647 731,4882006-J1, 6.000%, 02/25/2036 48,053 38,5042006-6, 6.000%, 04/25/2036 1,323,980 1,179,5142006-J4, 6.250%, 09/25/2036 31,715 27,7282006-16, 6.500%, 11/25/2036 1,153,187 979,3242006-18, 6.000%, 12/25/2036 272,071 254,5332006-21, 6.000%, 02/25/2037 1,467,926 1,336,3322007-5, 5.750%, 05/25/2037 1,340,385 1,219,3222007-5, 5.750%, 05/25/2037 1,377,948 1,253,4922007-J2, 6.000%, 07/25/2037 334,913 272,7722007-HY6, 3.383%, 11/25/2037 (c) 995,477 878,2422007-HY5, 3.718%, 09/25/2047 (c) 578,117 564,102
Citicorp Mortgage Securities Trust2006-3, 5.500%, 06/25/2021 162,898 157,9472007-4, 5.500%, 05/25/2022 257,817 260,9242006-1, 6.000%, 02/25/2036 324,000 326,5012006-3, 5.750%, 06/25/2036 574,106 568,9872006-3, 6.250%, 06/25/2036 1,917,374 1,946,6892007-3, 5.500%, 04/25/2037 344,254 343,642
Citigroup Commercial Mortgage Trust2013-GC11, 4.602%, 04/10/2046 (c) 4,710,000 4,465,401
2016-C2, 1.941%, 08/10/2049 (c)(d) 14,736,624 1,804,190
2016-C3, 1.351%, 11/15/2049 (c)(d) 30,103,077 2,279,766
2016-P6, 0.978%, 12/10/2049 (c)(d) 35,332,703 1,750,198
2017-P7, 0.687%, 04/14/2050 (c)(d) 45,124,000 2,270,013
2017-P7, 1.294%, 04/14/2050 (c)(d) 23,332,482 1,953,314
Citigroup Mortgage Loan Trust2005-12, 2.032% (1 Month LIBOR
USD + 0.800%), 08/25/2035 (a) 948,789 865,0592005-WF1, 5.030%, 03/25/2036 (b) 621,084 460,9562006-AR7, 3.544%, 11/25/2036 (c) 4,577,127 4,303,5572007-6, 2.995%, 10/25/2046 (c) 835,690 758,316
PERFORMANCE TRUST STRATEGIC BOND FUND — SCHEDULE OF INVESTMENTS (CONT.)August 31, 2017
PERFORMANCE TRUST MUTUAL FUNDS (PTIAX, PTIMX, PTRMX) PAGE 14
Percentages are stated as a percent of net assets.The accompanying notes are an integral part of these financial statements.
PRINCIPALAMOUNT VALUE
PRINCIPALAMOUNT VALUE

Citigroup Mortgage Loan Trust (Cont.)
2004-2, 9.250%, 08/25/2033 $ 150,604 $ 165,4032005-WF1, 5.330%, 11/25/2034 (b) 2,742,380 2,763,0832005-1, 3.112%, 04/25/2035 (c) 1,326,176 1,301,3532005-2, 3.238%, 05/25/2035 (c) 1,393,383 1,409,1622005-7, 3.286%, 09/25/2035 (c) 1,673,324 1,543,785
CitiMortgage Alternative Loan Trust
2006-A1, 5.250%, 03/25/2021 43,340 43,7072007-A4, 5.500%, 04/25/2022 61,844 62,4702006-A2, 1.834% (1 Month LIBOR USD + 0.600%), 05/25/2036 (a) 1,125,072 909,334
2006-A3, 1.834% (1 Month LIBOR USD + 0.600%), 07/25/2036 (a) 372,624 300,201
2007-A1, 6.000%, 01/25/2037 1,309,960 1,238,220
COMM Mortgage Trust2014-CR18, 4.456%, 07/17/2047 (c) 4,024,000 4,302,6602014-CR20, 0.176%, 11/10/2047 (c)(d) 135,999,000 1,180,349
2014-CR21, 0.125%, 12/10/2047 (c)(d) 83,516,000 461,392
2013-CR11, 1.303%, 08/10/2050 (c)(d) 24,341,479 1,181,672
Credit Suisse First Boston Mortgage Securities Corp.2004-7, 5.250%, 10/25/2019 17,517 17,7352004-8, 5.500%, 12/25/2034 1,236,243 1,168,0012005-3, 5.500%, 07/25/2035 840,015 843,2892005-10, 5.500%, 11/25/2035 3,554,989 3,494,5502005-10, 5.750%, 11/25/2035 100,114 88,1372005-10, 6.000%, 11/25/2035 396,335 249,2392005-8, 7.000%, 09/25/2035 1,928,290 1,537,691
Credit Suisse Mortgage Capital Mortgage Backed Trust2006-2, 6.000%, 03/25/2036 2,464,789 1,866,030
CSAIL Commercial Mortgage Trust2015-C3, 1.009%, 08/15/2048 (c)(d) 68,515,605 3,118,378
2015-C1, 4.044%, 04/15/2050 (c) 2,130,000 2,212,7512017-C8, 0.465%, 06/15/2050 (c)(d) 74,773,000 2,445,384
CSMC2007-4R, 1.200%, 10/26/2036 (c) 401,665 347,991
CSMC Mortgage-Backed Trust2007-5, 5.000%, 10/25/2024 68,599 68,6362007-5, 6.000%, 10/25/2024 1,392,664 1,408,7602006-1, 5.500%, 02/25/2036 398,062 383,2512006-1, 5.500%, 02/25/2036 110,685 109,0172011-13R, 3.388%, 02/27/2036 (c) 5,482,827 4,320,5972006-2, 5.750%, 03/25/2036 1,489,946 1,406,539
CSMC Mortgage-Backed Trust (Cont.)2006-4, 6.000%, 05/25/2036 $ 519,463 $ 452,3032006-4, 6.000% (1 Month LIBOR
USD + 1.000%), 05/25/2036 (a) 594,909 517,9942006-4, 7.000%, 05/25/2036 710,395 402,9722006-7, 6.000%, 08/25/2036 1,148,476 1,120,7172007-2, 5.750%, 03/25/2037 274,634 244,0662007-3, 5.500%, 04/25/2037 1,506,488 1,490,0972007-3, 5.500%, 04/25/2037 1,015,045 1,004,001
DBJPM Mortgage Trust2017-C6, 0.395%, 06/10/2050 (c)(d) 97,787,000 2,563,887
2017-C6, 1.186%, 06/10/2050 (c)(d) 36,150,278 2,698,214
Deutsche Alt-A Securities Mortgage Loan Trust2005-3, 1.734% (1 Month LIBOR
USD + 0.500%), 05/25/2035 (a) 2,935,084 2,543,6122005-6, 5.500%, 12/25/2035 2,941,459 2,704,847
Deutsche Alt-B Securities Mortgage Loan Trust2006-AB4, 1.334% (1 Month LIBOR
USD + 0.100%), 10/25/2036 (a) 1,183,400 908,209
First Horizon Alternative MortgageSecurities Trust2005-FA10, 5.250%, 12/25/2020 114,258 111,2992005-FA11, 5.250%, 02/25/2021 159,546 160,7382006-FA6, 5.750%, 11/25/2021 47,290 46,2252004-AA6, 3.031%, 01/25/2035 (c) 704,335 695,3532006-FA1, 5.750%, 04/25/2036 3,316,163 2,809,5082006-FA1, 6.000%, 04/25/2036 890,206 768,6442006-FA2, 6.000%, 05/25/2036 3,277,944 2,671,2252006-FA5, 6.250%, 08/25/2036 4,852,030 3,943,3962006-FA6, 6.250%, 11/25/2036 1,148,379 944,3782007-FA4, 6.250%, 08/25/2037 (c) 757,029 607,198
First Horizon Mortgage Pass-Through Trust2006-2, 6.000%, 08/25/2036 1,881,212 1,712,584
Freddie Mac Multifamily StructuredPass Through CertificatesK723, 1.079%, 08/25/2023 (c)(d) 55,056,725 2,605,477K725, 0.845%, 01/25/2024 (c)(d) 23,828,152 955,063K726, 1.018%, 07/25/2049 (c)(d) 27,914,664 1,358,769K058, 1.058%, 08/25/2026 (c)(d) 14,561,125 1,009,791K059, 0.437%, 09/25/2026 (c)(d) 29,154,665 723,085K061, 0.170%, 11/25/2026 (c)(d) 72,512,000 558,814K061, 0.305%, 11/25/2026 (c)(d) 112,059,878 1,792,207K062, 0.299%, 12/25/2026 (c)(d) 79,423,000 1,385,201K063, 0.426%, 01/25/2027 (c)(d) 70,498,364 1,731,228K064, 0.745%, 03/25/2027 (c)(d) 32,971,602 1,642,210K065, 0.688%, 05/25/2027 (c)(d) 34,315,800 1,678,259K066, 0.891%, 06/25/2027 (c)(d) 32,200,000 2,006,485
PERFORMANCE TRUST STRATEGIC BOND FUND — SCHEDULE OF INVESTMENTS (CONT.)August 31, 2017
PERFORMANCE TRUST MUTUAL FUNDS (PTIAX, PTIMX, PTRMX) PAGE 15
Percentages are stated as a percent of net assets.The accompanying notes are an integral part of these financial statements.
PRINCIPALAMOUNT VALUE
PRINCIPALAMOUNT VALUE

GMACM Mortgage Loan Trust2004-J2, 5.500%, 06/25/2034 $ 91,988 $ 91,358
GS Mortgage Securities Trust2013-GC14, 4.922%, 08/10/2046 (c) 2,500,000 2,402,857
GSAA Home Equity Trust2005-12, 5.069%, 09/25/2035 (c) 48,685 42,1022006-6, 6.121%, 03/25/2036 (b) 91,179 50,5892006-15, 6.192%, 09/25/2036 (b) 2,502,506 1,349,9862006-18, 5.682%, 11/25/2036 (b) 2,383,304 1,209,7702007-7, 1.414% (1 Month LIBOR USD + 0.180%), 07/25/2037 (a) 4,074,946 3,909,668
GSAA Trust2005-1, 5.760%, 11/25/2034 (b) 2,000,000 2,031,634
GSR Mortgage Loan Trust2005-4F, 6.500%, 04/25/2020 162,100 168,0652004-15F, 6.000%, 12/25/2034 4,171,699 4,473,0732005-1F, 6.000%, 01/25/2035 41,164 41,6502005-AR4, 3.541%, 07/25/2035 (c) 1,066,178 994,0272005-6F, 5.250%, 07/25/2035 231,504 241,5952005-7F, 6.000%, 09/25/2035 74,938 80,1442005-AR5, 3.598%, 10/25/2035 (c) 1,087,825 1,083,5572005-AR7, 3.222%, 11/25/2035 (c) 690,317 681,7082005-9F, 6.000%, 01/25/2036 936,574 830,0692006-2F, 5.750%, 02/25/2036 1,234,633 1,194,729
HarborView Mortgage Loan Trust2006-6, 3.635%, 08/19/2036 (c) 1,403,032 1,289,201
Homebanc Mortgage Trust2006-1, 3.138%, 04/25/2037 (a) 896,545 841,632
Impac CMB Trust2005-5, 1.734% (1 Month LIBOR USD + 0.500%), 08/25/2035 (a) 1,439,099 1,344,141
Impac Secured Assets CMN Owner Trust
2004-2, 4.662%, 08/25/2034 (b) 1,155,560 1,164,266
IndyMac IMSC Mortgage Loan Trust2007-AR1, 3.391%, 06/25/2037 (c) 777,598 692,546
IndyMac INDA Mortgage Loan Trust2007-AR1, 3.568%, 03/25/2037 (c) 760,941 743,841
IndyMac INDX Mortgage Loan Trust2005-AR3, 3.456%, 04/25/2035 (c) 2,097,400 1,957,2682005-AR23, 3.195%, 11/25/2035 (c) 2,353,266 2,068,9822005-AR35, 3.221%, 02/25/2036 (c) 1,984,510 1,712,4612006-AR3, 3.285%, 03/25/2036 (c) 957,276 895,3832006-AR25, 3.311%, 09/25/2036 (c) 3,630,857 3,404,1362006-AR25, 3.586%, 09/25/2036 (c) 3,832,365 3,349,896
JP Morgan Alternative Loan Trust2005-S1, 5.500%, 12/25/2035 205,718 204,0682005-S1, 5.500%, 12/25/2035 154,872 153,6302006-S2, 6.050%, 05/25/2036 (b) 19,465 18,8632006-A5, 3.005%, 10/25/2036 (c) 3,835,845 3,768,6342008-R4, 6.000%, 12/27/2036 4,156,391 3,434,213
JP Morgan Chase Commercial Mortgage Securities Trust2007-CB20, 0.041%, 02/12/2051 (c)(d) $33,430,419 $ 334
JP Morgan Mortgage Trust2004-A6, 3.202%, 12/25/2034 (c) 463,572 443,1102005-S3, 5.750%, 01/25/2036 86,360 75,823
JP Morgan Resecuritization Trust2009-7, 5.390%, 07/27/2037 (c) 1,003,844 1,030,855
JPMBB Commercial Mortgage Securities Trust2013-C12, 4.222%, 07/15/2045 (c) 3,000,000 2,785,133
JPMCC Commercial Mortgage Securities Trust2017-JP5, 1.273%, 03/15/2050 (c)(d) 19,823,248 1,447,589
2017-JP6, 0.780%, 07/15/2050 (c)(d) 68,830,000 3,965,000
LCCM2017-LC26, 1.700%, 07/12/2050 (c)(d) 36,950,785 3,925,090
Lehman Mortgage Trust2005-2, 5.500%, 12/25/2035 2,976,418 2,709,8862005-2, 5.750%, 12/25/2035 1,240,535 1,142,1712005-3, 1.734% (1 Month LIBOR
USD + 0.500%), 01/25/2036 (a) 1,730,375 1,276,4002005-3, 3.516% (1 Month LIBOR
USD + 4.750%), 01/25/2036 (a)(d) 1,730,375 258,9782005-3, 5.500%, 01/25/2036 435,070 374,6412006-1, 5.500%, 02/25/2036 765,180 703,6652006-2, 5.843%, 04/25/2036 (c) 75,645 69,0952007-4, 5.750%, 05/25/2037 3,977,711 3,295,4472007-4, 5.750%, 05/25/2037 1,820,463 1,508,2142007-5, 6.000%, 06/25/2037 3,674,102 2,538,2042007-6, 5.390%, 07/25/2037 (c) 170,804 132,125
Lehman XS Trust2005-6, 5.420%, 11/25/2035 (b) 3,171,668 3,180,525
MASTR Adjustable Rate Mortgages Trust2004-4, 2.992%, 05/25/2034 (c) 157,186 149,6382005-1, 3.342%, 02/25/2035 (c) 213,642 212,707
MASTR Alternative Loan Trust2003-5, 5.904%, 08/25/2033 (c) 1,680,394 1,602,3392003-7, 6.250%, 11/25/2033 727,256 750,7652004-6, 5.500%, 07/25/2034 776,269 799,1662004-6, 6.000%, 07/25/2034 499,886 517,6632004-11, 6.500%, 10/25/2034 1,831,136 1,993,3112006-3, 6.500%, 07/25/2036 1,520,341 1,062,077
MASTR Asset Securitization Trust2006-1, 1.684% (1 Month LIBOR
USD + 0.450%), 05/25/2036 (a) 1,156,189 673,112
PERFORMANCE TRUST STRATEGIC BOND FUND — SCHEDULE OF INVESTMENTS (CONT.)August 31, 2017
PERFORMANCE TRUST MUTUAL FUNDS (PTIAX, PTIMX, PTRMX) PAGE 16
Percentages are stated as a percent of net assets.The accompanying notes are an integral part of these financial statements.
PRINCIPALAMOUNT VALUE
PRINCIPALAMOUNT VALUE
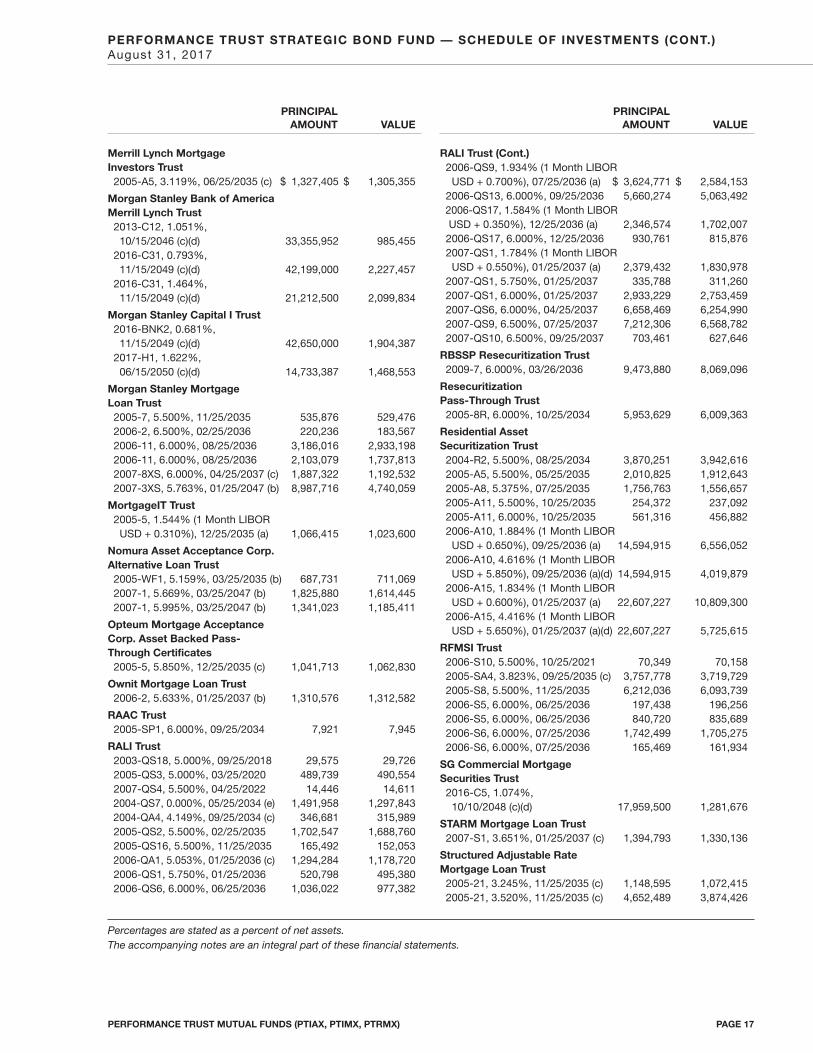
Merrill Lynch Mortgage Investors Trust
2005-A5, 3.119%, 06/25/2035 (c) $ 1,327,405 $ 1,305,355
Morgan Stanley Bank of America Merrill Lynch Trust
2013-C12, 1.051%, 10/15/2046 (c)(d) 33,355,952 985,455
2016-C31, 0.793%, 11/15/2049 (c)(d) 42,199,000 2,227,457
2016-C31, 1.464%, 11/15/2049 (c)(d) 21,212,500 2,099,834
Morgan Stanley Capital I Trust2016-BNK2, 0.681%, 11/15/2049 (c)(d) 42,650,000 1,904,387
2017-H1, 1.622%, 06/15/2050 (c)(d) 14,733,387 1,468,553
Morgan Stanley Mortgage Loan Trust
2005-7, 5.500%, 11/25/2035 535,876 529,4762006-2, 6.500%, 02/25/2036 220,236 183,5672006-11, 6.000%, 08/25/2036 3,186,016 2,933,1982006-11, 6.000%, 08/25/2036 2,103,079 1,737,8132007-8XS, 6.000%, 04/25/2037 (c) 1,887,322 1,192,5322007-3XS, 5.763%, 01/25/2047 (b) 8,987,716 4,740,059
MortgageIT Trust2005-5, 1.544% (1 Month LIBOR USD + 0.310%), 12/25/2035 (a) 1,066,415 1,023,600
Nomura Asset Acceptance Corp. Alternative Loan Trust
2005-WF1, 5.159%, 03/25/2035 (b) 687,731 711,0692007-1, 5.669%, 03/25/2047 (b) 1,825,880 1,614,4452007-1, 5.995%, 03/25/2047 (b) 1,341,023 1,185,411
Opteum Mortgage Acceptance Corp. Asset Backed Pass-Through Certificates2005-5, 5.850%, 12/25/2035 (c) 1,041,713 1,062,830
Ownit Mortgage Loan Trust2006-2, 5.633%, 01/25/2037 (b) 1,310,576 1,312,582
RAAC Trust2005-SP1, 6.000%, 09/25/2034 7,921 7,945
RALI Trust2003-QS18, 5.000%, 09/25/2018 29,575 29,7262005-QS3, 5.000%, 03/25/2020 489,739 490,5542007-QS4, 5.500%, 04/25/2022 14,446 14,6112004-QS7, 0.000%, 05/25/2034 (e) 1,491,958 1,297,8432004-QA4, 4.149%, 09/25/2034 (c) 346,681 315,9892005-QS2, 5.500%, 02/25/2035 1,702,547 1,688,7602005-QS16, 5.500%, 11/25/2035 165,492 152,0532006-QA1, 5.053%, 01/25/2036 (c) 1,294,284 1,178,7202006-QS1, 5.750%, 01/25/2036 520,798 495,3802006-QS6, 6.000%, 06/25/2036 1,036,022 977,382
RALI Trust (Cont.)2006-QS9, 1.934% (1 Month LIBOR USD + 0.700%), 07/25/2036 (a) $ 3,624,771 $ 2,584,153
2006-QS13, 6.000%, 09/25/2036 5,660,274 5,063,4922006-QS17, 1.584% (1 Month LIBORUSD + 0.350%), 12/25/2036 (a) 2,346,574 1,702,007
2006-QS17, 6.000%, 12/25/2036 930,761 815,8762007-QS1, 1.784% (1 Month LIBORUSD + 0.550%), 01/25/2037 (a) 2,379,432 1,830,978
2007-QS1, 5.750%, 01/25/2037 335,788 311,2602007-QS1, 6.000%, 01/25/2037 2,933,229 2,753,4592007-QS6, 6.000%, 04/25/2037 6,658,469 6,254,9902007-QS9, 6.500%, 07/25/2037 7,212,306 6,568,7822007-QS10, 6.500%, 09/25/2037 703,461 627,646
RBSSP Resecuritization Trust2009-7, 6.000%, 03/26/2036 9,473,880 8,069,096
Resecuritization Pass-Through Trust2005-8R, 6.000%, 10/25/2034 5,953,629 6,009,363
Residential Asset Securitization Trust2004-R2, 5.500%, 08/25/2034 3,870,251 3,942,6162005-A5, 5.500%, 05/25/2035 2,010,825 1,912,6432005-A8, 5.375%, 07/25/2035 1,756,763 1,556,6572005-A11, 5.500%, 10/25/2035 254,372 237,0922005-A11, 6.000%, 10/25/2035 561,316 456,8822006-A10, 1.884% (1 Month LIBOR
USD + 0.650%), 09/25/2036 (a) 14,594,915 6,556,0522006-A10, 4.616% (1 Month LIBOR
USD + 5.850%), 09/25/2036 (a)(d) 14,594,915 4,019,8792006-A15, 1.834% (1 Month LIBOR
USD + 0.600%), 01/25/2037 (a) 22,607,227 10,809,3002006-A15, 4.416% (1 Month LIBOR
USD + 5.650%), 01/25/2037 (a)(d) 22,607,227 5,725,615
RFMSI Trust2006-S10, 5.500%, 10/25/2021 70,349 70,1582005-SA4, 3.823%, 09/25/2035 (c) 3,757,778 3,719,7292005-S8, 5.500%, 11/25/2035 6,212,036 6,093,7392006-S5, 6.000%, 06/25/2036 197,438 196,2562006-S5, 6.000%, 06/25/2036 840,720 835,6892006-S6, 6.000%, 07/25/2036 1,742,499 1,705,2752006-S6, 6.000%, 07/25/2036 165,469 161,934
SG Commercial Mortgage Securities Trust2016-C5, 1.074%, 10/10/2048 (c)(d) 17,959,500 1,281,676
STARM Mortgage Loan Trust2007-S1, 3.651%, 01/25/2037 (c) 1,394,793 1,330,136
Structured Adjustable RateMortgage Loan Trust2005-21, 3.245%, 11/25/2035 (c) 1,148,595 1,072,4152005-21, 3.520%, 11/25/2035 (c) 4,652,489 3,874,426
PERFORMANCE TRUST STRATEGIC BOND FUND — SCHEDULE OF INVESTMENTS (CONT.)August 31, 2017
PERFORMANCE TRUST MUTUAL FUNDS (PTIAX, PTIMX, PTRMX) PAGE 17
Percentages are stated as a percent of net assets.The accompanying notes are an integral part of these financial statements.
PRINCIPALAMOUNT VALUE
PRINCIPALAMOUNT VALUE

Structured Adjustable RateMortgage Loan Trust (Cont.)2006-1, 3.331%, 02/25/2036 (c) $ 941,464 $ 843,3372006-1, 3.392%, 02/25/2036 (c) 2,118,343 2,049,2952006-4, 3.515%, 05/25/2036 (c) 1,425,483 1,239,7602006-12, 3.478%, 01/25/2037 (c) 1,383,391 1,185,5562007-9, 2.955% (6 Month LIBOR USD + 1.500%), 10/25/2037 (c) 1,841,012 1,587,606
Structured Asset Securities Corp. Mortgage Pass-Through Certificates
2004-18H, 4.750%, 10/25/2034 987,524 1,016,060
Structured Asset Securities Corp. Trust
2005-17, 5.500%, 10/25/2035 690,888 711,730
Suntrust Alternative Loan Trust2005-1F, 6.000%, 12/25/2035 6,534,222 6,457,320
TBW Mortgage-Backed Trust2006-2, 5.500%, 07/25/2036 279,019 241,763
Thornburg Mortgage Securities Trust
2004-1, 2.544%, 03/25/2044 (c) 423,640 409,089
UBS Commercial Mortgage Trust2012-C1, 5.730%, 05/10/2045 (c) 2,000,000 2,043,4372017-C1, 1.060%, 06/15/2050 (c)(d) 13,000,000 1,021,271
2017-C1, 1.778%, 06/15/2050 (c)(d) 8,786,470 1,028,519
2017-C3, 0.487%, 08/15/2050 (c)(d) 67,762,500 2,585,194
2017-C3, 1.291%, 08/15/2050 (c)(d) 25,000,000 2,015,270
2017-C2, 1.310%, 08/15/2050 (c)(d) 31,077,000 2,642,754
UBS-Barclays Commercial Mortgage Trust
2012-C2, 1.537%, 05/10/2063 (c)(d) 27,052,743 1,409,935
WaMu Mortgage Pass-Through Certificates
2004-S2, 6.000%, 06/25/2034 162,829 172,0732007-HY7, 3.333%, 07/25/2037 (c) 670,517 572,882
Washington Mutual Mortgage Pass-Through Certificates2005-6, 6.500%, 08/25/2035 744,280 699,8402005-9, 5.500%, 11/25/2035 1,014,038 942,1342007-HY2, 3.260%, 04/25/2037 (c) 2,460,859 1,910,308
Wells Fargo Alternative Loan2007-PA1, 6.000%, 03/25/2037 2,148,664 1,965,607
Wells Fargo Commercial Mortgage Trust2016-LC24, 1.161%, 10/15/2049 (c)(d) $11,717,835 $ 921,856
2017-RB1, 0.877%,03/15/2050 (c)(d) 38,474,561 2,455,585
2017-C39, 1.294%, 09/15/2050 (c)(d) 23,260,953 2,001,714
Wells Fargo Mortgage Backed Securities Trust2005-AR5, 3.281%, 04/25/2035 (c) 1,285,515 1,291,2142005-AR4, 3.329%, 04/25/2035 (c) 952,918 961,1202005-7, 5.250%, 09/25/2035 668,000 671,2692005-9, 5.250%, 10/25/2035 337,641 339,5862005-9, 5.500%, 10/25/2035 1,535,198 1,568,1042005-12, 5.500%, 11/25/2035 1,280,916 1,314,3942006-4, 1.934% (1 Month LIBOR USD + 0.700%), 04/25/2036 (a) 591,316 582,714
2006-4, 5.750%, 04/25/2036 642,824 638,6362006-11, 6.000%, 09/25/2036 719,586 692,3312006-AR18, 3.092%, 11/25/2036 (c) 401,145 393,0242007-10, 6.000%, 07/25/2037 1,097,899 1,092,7932007-12, 5.500%, 09/25/2037 1,076,922 1,079,8822007-13, 6.000%, 09/25/2037 933,585 942,619
WFRBS Commercial Mortgage Trust2012-C8, 5.056%, 08/15/2045 (c) 2,500,000 2,458,3902012-C9, 4.957%, 11/15/2045 (c) 3,936,000 3,856,600______________
TOTAL MORTGAGE BACKED SECURITIES (Cost $538,982,661) 543,557,312______________
MUNICIPAL BONDS–37.91%
Alaska–0.13%
Borough of North Slope, AK5.426%, 06/30/2023 1,235,000 1,393,290______________
Arizona–0.28%
City of Phoenix Civic Improvement Corp.5.500%, 07/01/2034 665,000 859,6795.500%, 07/01/2033 910,000 1,172,1355.500%, 07/01/2031 730,000 930,421______________
2,962,235______________
California–5.51%
Baldwin Park/Monrovia School Facilities Grant Financing Authority7.000%, 06/01/2027 1,950,000 2,338,635
Bay Area Toll Authority5.000%, 04/01/2028 3,465,000 4,412,955
Citrus Community College District0.000%, 06/01/2033 1,000,000 594,700
PERFORMANCE TRUST STRATEGIC BOND FUND — SCHEDULE OF INVESTMENTS (CONT.)August 31, 2017
PERFORMANCE TRUST MUTUAL FUNDS (PTIAX, PTIMX, PTRMX) PAGE 18
Percentages are stated as a percent of net assets.The accompanying notes are an integral part of these financial statements.
PRINCIPALAMOUNT VALUE
PRINCIPALAMOUNT VALUE

California (Cont.)
City of Industry, CA4.000%, 01/01/2028 $ 2,860,000 $ 2,987,728
City of Los Angeles Department of Airports
5.000%, 05/15/2033 1,500,000 1,766,895
City of Los Angeles, CA2.840%, 09/01/2024 4,195,000 4,321,2703.000%, 09/01/2026 4,320,000 4,416,206
City of Los Angeles, CA Wastewater System Revenue2.857%, 06/01/2024 2,750,000 2,845,452
City of Oakland, CA3.000%, 01/15/2027 3,100,000 3,151,491
City of Santa Maria, CA Water & Wastewater Revenue
0.000%, 08/01/2022 650,000 582,576
City of South Lake Tahoe, CA4.000%, 06/01/2027 1,600,000 1,653,408
City of Union City, CA0.000%, 07/01/2025 2,105,000 1,558,374
Clovis Unified School District0.000%, 08/01/2028 1,500,000 1,114,8900.000%, 08/01/2027 1,125,000 867,679
Contra Costa County Redevelopment Agency Successor Agency2.500%, 08/01/2023 550,000 551,4462.750%, 08/01/2024 600,000 605,550
County of Sonoma, CA6.000%, 12/01/2029 1,495,000 1,781,621
M-S-R Energy Authority7.000%, 11/01/2034 3,500,000 5,109,825
Oakland Alameda County Coliseum Authority3.643%, 02/01/2025 3,000,000 3,136,590
Palmdale Elementary School District
0.000%, 08/01/2029 540,000 361,503
Poway Unified School District0.000%, 08/01/2034 5,360,000 3,001,546
State of California5.250%, 08/01/2032 1,775,000 2,296,246
University of California3.063%, 07/01/2025 8,000,000 8,257,120
Yosemite Community College District
0.000%, 08/01/2034 1,000,000 564,660______________58,278,366______________
Colorado–0.23%
Board of Governors of Colorado State University System
5.000%, 03/01/2029 $ 1,105,000 $ 1,376,830
Colorado Educational & Cultural Facilities Authority3.285%, 03/01/2028 1,000,000 1,024,920______________
2,401,750______________
Connecticut–0.43%
State of Connecticut Special Tax Revenue5.000%, 09/01/2036 4,000,000 4,598,840______________
District of Columbia–1.01%
Metropolitan Washington Airports Authority Dulles Toll Road Revenue8.000%, 10/01/2047 7,000,000 10,712,800______________
Florida–0.97%
City of Gainesville, FL0.000%, 10/01/2028 1,300,000 840,3330.000%, 10/01/2027 4,610,000 3,125,119
County of Miami-Dade, FL0.000%, 10/01/2034 755,000 932,350
Greater Orlando Aviation Authority5.000%, 10/01/2042 1,750,000 2,027,3575.000%, 10/01/2035 2,000,000 2,343,200
Seminole County Industrial Development Authority
0.000%, 12/28/2021 580,000 629,7410.000%, 12/28/2021 325,000 347,246______________
10,245,346______________
Hawaii–0.40%
City & County of Honolulu, HI5.000%, 10/01/2030 1,995,000 2,545,540
State of Hawaii Airports System Revenue3.025%, 07/01/2025 400,000 406,4843.125%, 07/01/2026 645,000 658,2033.225%, 07/01/2027 600,000 614,616______________
4,224,843______________
Illinois–2.97%
Boone Mchenry & Dekalb Counties Community Unit School District 1000.000%, 12/01/2022 660,000 592,535
Chicago Board of Education0.000%, 12/01/2022 1,640,000 1,476,951
Chicago O’Hare International Airport5.000%, 01/01/2037 1,000,000 1,141,420
PERFORMANCE TRUST STRATEGIC BOND FUND — SCHEDULE OF INVESTMENTS (CONT.)August 31, 2017
PERFORMANCE TRUST MUTUAL FUNDS (PTIAX, PTIMX, PTRMX) PAGE 19
Percentages are stated as a percent of net assets.The accompanying notes are an integral part of these financial statements.
PRINCIPALAMOUNT VALUE
PRINCIPALAMOUNT VALUE

Illinois (Cont.)
City of Chicago, IL Waterworks Revenue
5.750%, 11/01/2030 $ 2,155,000 $ 2,660,175
DeKalb Kane & LaSalle Counties Etc. Community College District No. 523 Kishwaukee0.000%, 02/01/2025 275,000 201,8360.000%, 02/01/2023 850,000 710,175
Illinois Finance Authority5.000%, 07/01/2035 2,750,000 3,242,3605.000%, 08/15/2035 1,485,000 1,741,430
Kendall & Kane Counties Community Unit School District No. 115
0.000%, 01/01/2022 2,340,000 2,182,471
Metropolitan Pier & Exposition Authority0.000%, 06/15/2033 5,000,000 2,660,400
Metropolitan Water Reclamation District of Greater Chicago
5.000%, 12/01/2041 2,500,000 2,844,400
Regional Transportation Authority6.000%, 07/01/2033 5,000,000 6,576,400
South Suburban College Community School District No. 5100.000%, 12/01/2022 1,000,000 875,300
Southwestern Illinois Development Authority7.030%, 04/15/2032 675,000 745,477
State of Illinois5.750%, 01/01/2037 3,000,000 3,470,190
Will County Elementary School District No. 1225.250%, 10/01/2023 310,000 328,575______________
31,450,095______________
Indiana–2.06%
Indiana Finance Authority5.000%, 10/01/2041 4,290,000 4,919,086
Indiana Municipal Power Agency5.000%, 01/01/2039 2,535,000 2,933,7305.000%, 01/01/2036 6,340,000 7,385,4035.000%, 01/01/2042 4,185,000 4,804,757
Northern Indiana Commuter Transportation District5.000%, 07/01/2035 1,570,000 1,799,879______________
21,842,855______________
Kentucky–0.99%
County of Warren, KY3.921%, 12/01/2031 $ 750,000 $ 763,7554.397%, 12/01/2038 1,500,000 1,570,845
Kentucky State Property & Building Commission5.000%, 02/01/2032 1,150,000 1,316,923
Louisville Regional Airport Authority
3.483%, 07/01/2023 1,000,000 1,048,3703.683%, 07/01/2024 5,450,000 5,779,725______________
10,479,618______________
Louisiana–0.11%
City of New Orleans, LA8.800%, 12/01/2039 1,000,000 1,153,660______________
Massachusetts–0.06%
Massachusetts State College Building Authority
5.932%, 05/01/2040 490,000 612,642______________
Michigan–1.86%
Comstock Park Public Schools2.750%, 05/01/2023 1,500,000 1,525,650
Detroit City School District5.250%, 05/01/2027 1,065,000 1,291,3557.747%, 05/01/2039 2,050,000 2,890,131
Michigan Finance Authority2.610%, 11/01/2025 1,930,000 1,902,8832.710%, 11/01/2026 4,000,000 3,874,2406.396%, 09/01/2024 1,320,000 1,607,140
Romeo Community School District5.000%, 05/01/2036 995,000 1,149,733
Ypsilanti Michigan School District2.620%, 05/01/2023 5,500,000 5,459,190______________
19,700,322______________
Minnesota–1.10%
City of Rochester, MN5.000%, 11/15/2035 6,000,000 7,771,2005.000%, 11/15/2033 3,000,000 3,868,020______________
11,639,220______________
Missouri–0.34%
St. Louis School District5.950%, 04/01/2024 235,000 277,2516.100%, 04/01/2025 2,750,000 3,316,087______________
3,593,338______________
Nevada–0.19%
Clark County School District5.510%, 06/15/2024 1,830,000 2,040,249______________
PERFORMANCE TRUST STRATEGIC BOND FUND — SCHEDULE OF INVESTMENTS (CONT.)August 31, 2017
PERFORMANCE TRUST MUTUAL FUNDS (PTIAX, PTIMX, PTRMX) PAGE 20
Percentages are stated as a percent of net assets.The accompanying notes are an integral part of these financial statements.
PRINCIPALAMOUNT VALUE
PRINCIPALAMOUNT VALUE

New Jersey–1.57%
New Jersey Economic Development Authority0.000%, 02/15/2023 $ 5,394,000 $ 4,546,117
New Jersey Educational Facilities Authority
2.504%, 07/01/2023 1,355,000 1,343,509
New Jersey Institute of Technology
3.323%, 07/01/2024 2,985,000 3,092,132
New Jersey Transportation Trust Fund Authority0.000%, 12/15/2027 10,085,000 7,624,966______________
16,606,724______________
New York–4.56%
City of New York, NY5.000%, 12/01/2037 10,000,000 11,850,700
Dutchess County Local Development Corp.
4.550%, 07/01/2022 1,055,000 1,112,571
Monroe County Industrial Development Corp.3.622%, 07/01/2024 2,525,000 2,650,568
New York City Transitional Finance Authority Building Aid Revenue4.800%, 07/15/2026 4,000,000 4,439,120
New York City Transitional Finance Authority Future Tax Secured Revenue2.850%, 02/01/2024 5,000,000 5,110,1503.010%, 08/01/2024 2,370,000 2,442,7353.150%, 11/01/2025 1,075,000 1,109,8735.000%, 08/01/2038 10,000,000 11,919,500
New York Liberty Development Corp.5.250%, 10/01/2035 1,000,000 1,278,030
New York State Urban Development Corp.
3.120%, 03/15/2025 5,000,000 5,155,2003.420%, 03/15/2028 1,080,000 1,124,853______________
48,193,300______________
Ohio–0.64%
Cincinnati City School District5.250%, 12/01/2031 2,685,000 3,463,8655.250%, 12/01/2030 2,100,000 2,703,393
Sycamore Community City School District
5.850%, 12/01/2028 500,000 611,080______________6,778,338______________
Oregon–0.19%
Washington County School District No. 15 Forest Grove5.909%, 06/15/2026 $ 1,600,000 $ 1,969,392______________
Pennsylvania–2.84%
Carbon County Hospital Authority3.377%, 11/15/2023 1,000,000 1,039,8603.677%, 11/15/2025 1,000,000 1,052,070
City of Harrisburg, PA0.000%, 04/01/2019 380,000 369,801
City of York, PA0.000%, 02/01/2023 740,000 653,561
Delaware Valley Regional Finance Authority5.500%, 08/01/2028 4,045,000 4,962,446
Pennsylvania Economic Development Financing Authority5.000%, 06/30/2026 1,025,000 1,230,1955.000%, 12/31/2030 1,000,000 1,152,2205.201%, 06/15/2020 1,290,000 1,378,094
Pennsylvania Turnpike Commission0.000%, 12/01/2038 2,865,000 3,663,1890.000%, 12/01/2030 2,415,000 3,107,2606.250%, 06/01/2033 4,925,000 6,286,122
Philadelphia Authority for Industrial Development0.000%, 04/15/2022 5,837,000 5,124,477______________
30,019,295______________
Puerto Rico–0.03%
Puerto Rico Sales Tax Financing Corp.0.000%, 08/01/2032 3,850,000 366,751______________
South Carolina–0.70%
City of Greer, SC5.500%, 09/01/2032 2,000,000 2,606,440
South Carolina Public Service Authority
2.388%, 12/01/2023 5,000,000 4,756,150______________7,362,590______________
Tennessee–0.39%
State of Tennessee4.182%, 08/01/2031 3,625,000 4,120,791______________
Texas–6.23%
Central Texas Turnpike System0.000%, 08/15/2027 2,345,000 1,849,853
City of Dallas, TX0.000%, 02/15/2030 1,910,000 1,181,7740.000%, 02/15/2026 2,525,000 1,885,342
PERFORMANCE TRUST STRATEGIC BOND FUND — SCHEDULE OF INVESTMENTS (CONT.)August 31, 2017
PERFORMANCE TRUST MUTUAL FUNDS (PTIAX, PTIMX, PTRMX) PAGE 21
Percentages are stated as a percent of net assets.The accompanying notes are an integral part of these financial statements.
PRINCIPALAMOUNT VALUE
PRINCIPALAMOUNT VALUE
Texas (Cont.)
City of Dallas, TX Waterworks & Sewer System Revenue
5.000%, 10/01/2036 $ 5,400,000 $ 6,431,400
City of El Paso, TX5.000%, 08/15/2035 3,085,000 3,607,877
City of Houston, TX6.290%, 03/01/2032 4,300,000 5,252,794
City of Irving, TX7.375%, 08/15/2044 3,500,000 3,830,680
County of Galveston, TX5.905%, 02/01/2029 2,580,000 3,074,328
Dallas Area Rapid Transit5.250%, 12/01/2030 835,000 1,085,792
El Paso Independent School District
1.550%, 08/15/2025 6,175,000 5,665,995
New Hope Cultural Education Facilities Corp.
4.000%, 08/01/2020 625,000 636,212
North Texas Tollway Authority0.000%, 01/01/2031 6,910,000 4,503,592
State of Texas3.201%, 10/01/2026 5,000,000 5,215,450
Texas A&M University2.549%, 05/15/2024 5,335,000 5,412,411
Texas Municipal Gas Acquisition & Supply Corp. I
6.250%, 12/15/2026 5,150,000 6,331,925
Texas Public Finance Authority8.250%, 07/01/2024 3,000,000 3,172,740
University of Houston2.800%, 02/15/2024 6,570,000 6,726,038______________
65,864,203______________
Utah–0.10%
Ogden City Redevelopment Agency3.000%, 04/01/2023 1,000,000 1,020,480______________
Virgin Islands–0.21%
Virgin Islands Public Finance Authority
5.000%, 10/01/2017 1,240,000 1,232,5485.000%, 10/01/2018 1,000,000 948,100______________
2,180,648______________
Washington–0.55%
Chelan County Public Utility District No. 1
0.000%, 06/01/2029 3,595,000 2,534,691
Washington (Cont.)
Port of Seattle, WA2.836%, 05/01/2024 $ 3,185,000 $ 3,236,501______________
5,771,192______________
West Virginia–0.44%
Tobacco Settlement Finance Authority7.467%, 06/01/2047 2,380,000 2,291,417
West Virginia University0.000%, 04/01/2030 3,460,000 2,341,728______________
4,633,145______________
Wisconsin–0.82%
Public Finance Authority3.930%, 12/15/2025 1,660,000 1,739,9125.000%, 03/01/2041 4,850,000 5,556,3065.000%, 05/15/2032 1,275,000 1,382,750______________
8,678,968______________
TOTAL MUNICIPAL BONDS (Cost $389,895,460) 400,895,286______________
CLOSED-END MUTUAL FUNDS–0.20%Invesco High Income Trust II 143,246 2,144,393______________
TOTAL CLOSED-END MUTUAL FUNDS (Cost $1,996,023) 2,144,393______________
SHORT-TERM INVESTMENTS–4.50%First American Treasury Obligations Fund–Class Z, 0.867% (f) 47,584,190 47,584,190______________
TOTAL SHORT-TERM INVESTMENTS (Cost $47,584,190) 47,584,190______________
Total Investments (Cost $1,040,732,570)–100.05% 1,057,902,274______________
Liabilities in Excess of Other Assets–(0.05)% (528,661)______________
TOTAL NET ASSETS–100.00% $1,057,373,613____________________________
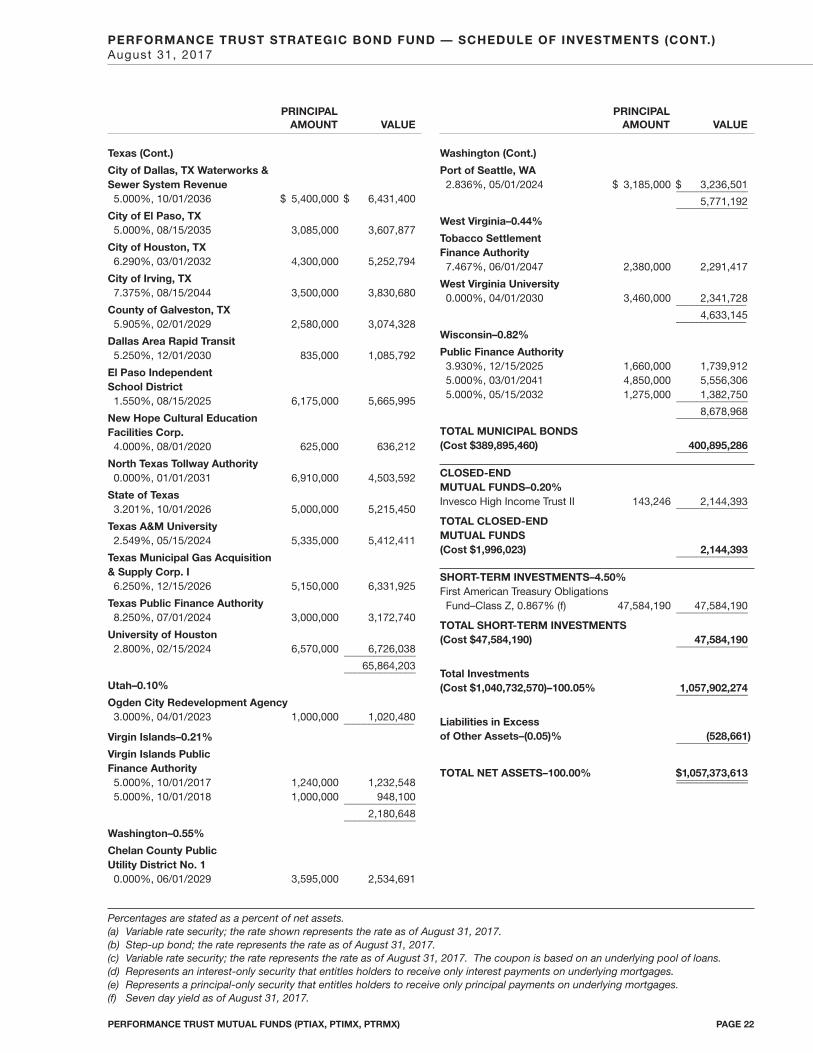
PERFORMANCE TRUST STRATEGIC BOND FUND — SCHEDULE OF INVESTMENTS (CONT.)August 31, 2017
PERFORMANCE TRUST MUTUAL FUNDS (PTIAX, PTIMX, PTRMX) PAGE 22
Percentages are stated as a percent of net assets.(a) Variable rate security; the rate shown represents the rate as of August 31, 2017.(b) Step-up bond; the rate represents the rate as of August 31, 2017.(c) Variable rate security; the rate represents the rate as of August 31, 2017. The coupon is based on an underlying pool of loans.(d) Represents an interest-only security that entitles holders to receive only interest payments on underlying mortgages.(e) Represents a principal-only security that entitles holders to receive only principal payments on underlying mortgages.(f) Seven day yield as of August 31, 2017.
PRINCIPALAMOUNT VALUE
PRINCIPALAMOUNT VALUE

MUNICIPAL BONDS–97.09%
Alabama–0.61%
Lower Alabama Gas District5.000%, 09/01/2031 $1,005,000 $ 1,207,688_____________
Arizona–0.50%
Florence Town, Inc. Industrial Development Authority5.000%, 07/01/2023 385,000 412,235
Industrial Development Authority of the City of Phoenix
5.000%, 06/01/2027 500,000 568,900_____________981,135_____________
Arkansas–0.60%
Arkansas Development Finance Authority
5.000%, 02/01/2022 400,000 457,224
Pulaski County Public Facilities Board
5.250%, 07/01/2024 675,000 730,762_____________1,187,986_____________
California–12.42%
Abag Finance Authority for Nonprofit Corporations5.000%, 07/01/2021 250,000 282,655
Bay Area Toll Authority5.000%, 04/01/2028 2,000,000 2,547,160
California Statewide Communities Development Authority5.000%, 08/15/2028 750,000 909,045
City of Los Angeles Department of Airports
5.000%, 05/15/2033 1,000,000 1,177,930
Clovis Unified School District0.000%, 08/01/2028 2,000,000 1,486,520
Corona-Norco Unified School District
0.000%, 08/01/2024 480,000 421,262
El Segundo Unified School District0.000%, 08/01/2023 545,000 491,448
Foothill-Eastern Transportation Corridor Agency
0.000%, 01/15/2023 500,000 440,930
M-S-R Energy Authority7.000%, 11/01/2034 1,160,000 1,693,542
Norman Y Mineta San Jose International Airport SJC
5.000%, 03/01/2041 750,000 865,673
California (Cont.)
Palmdale Elementary School District0.000%, 08/01/2028 $ 500,000 $ 350,310
Redondo Beach Unified School District0.000%, 08/01/2031 900,000 927,693
San Diego County Regional Airport Authority
5.000%, 07/01/2042 250,000 289,937
San Francisco City & County Airport Commission5.000%, 05/01/2041 1,500,000 1,712,340
San Joaquin Hills Transportation Corridor Agency
5.000%, 01/15/2029 550,000 638,270
San Juan Unified School District0.000%, 08/01/2022 500,000 460,850
Saratoga Union School District0.000%, 09/01/2023 510,000 457,042
Simi Valley Unified School District5.000%, 08/01/2027 1,000,000 1,277,580
St. Helena Unified School District0.000%, 06/01/2036 2,150,000 2,179,541
State of California5.000%, 08/01/2036 5,000,000 5,939,350_____________
24,549,078_____________
Colorado–3.84%
City & County of Denver, CO Airport System Revenue5.250%, 11/15/2028 500,000 598,685
E-470 Public Highway Authority0.000%, 09/01/2023 270,000 236,9950.000%, 09/01/2022 700,000 637,014
Regional Transportation District5.000%, 11/01/2034 5,000,000 6,109,550_____________
7,582,244_____________
Connecticut–1.87%
Connecticut State Health & Educational Facility Authority2.875%, 09/01/2020 900,000 900,1895.000%, 07/01/2026 345,000 383,675
State of Connecticut Clean Water Fund–State Revolving Fund
5.000%, 05/01/2035 2,000,000 2,407,380_____________3,691,244_____________
PERFORMANCE TRUST MUNICIPAL BOND FUND — SCHEDULE OF INVESTMENTSAugust 31, 2017
PERFORMANCE TRUST MUTUAL FUNDS (PTIAX, PTIMX, PTRMX) PAGE 23
Percentages are stated as a percent of net assets.The accompanying notes are an integral part of these financial statements.
PRINCIPALAMOUNT VALUE
PRINCIPALAMOUNT VALUE

District of Columbia–3.89%
District of Columbia5.000%, 06/01/2041 $5,000,000 $ 5,925,350
Metropolitan Washington Airports Authority5.000%, 10/01/2032 1,500,000 1,771,890_____________
7,697,240_____________
Florida–7.05%
Citizens Property Insurance Corp.5.000%, 06/01/2022 560,000 654,864
City of Belle Isle, FL5.500%, 10/01/2022 325,000 342,095
City of Hialeah, FL5.000%, 12/01/2029 500,000 594,555
City of Lakeland, FL Department of Electric Utilities
5.250%, 10/01/2028 1,000,000 1,299,330
City of Orlando, FL5.000%, 11/01/2038 1,000,000 1,161,530
County of Miami-Dade Seaport Department5.750%, 10/01/2028 545,000 655,041
County of Miami-Dade, FL5.250%, 10/01/2030 1,000,000 1,291,820
County of Miami-Dade, FL Aviation Revenue
5.000%, 10/01/2038 1,300,000 1,482,091
Greater Orlando Aviation Authority5.000%, 10/01/2046 1,500,000 1,722,510
Hollywood Community Redevelopment Agency5.000%, 03/01/2024 800,000 933,656
Key West Utility Board5.000%, 10/01/2023 500,000 598,270
Miami Beach Health Facilities Authority
5.000%, 11/15/2023 590,000 689,209
Seminole County Industrial Development Authority0.000%, 12/28/2021 905,000 966,947
Tampa Bay Water6.000%, 10/01/2029 1,025,000 1,390,761
Venetian Community Development District5.000%, 05/01/2023 145,000 151,168_____________
13,933,847_____________
Georgia–1.52%
Americus & Sumter County Hospital Authority5.125%, 05/15/2023 $ 400,000 $ 425,824
City of Atlanta, GA Water & Wastewater Revenue
5.500%, 11/01/2027 1,500,000 1,873,995
Savannah Hospital Authority5.500%, 07/01/2027 590,000 701,463_____________
3,001,282_____________
Guam–0.54%
Guam Government Waterworks Authority
5.625%, 07/01/2040 1,000,000 1,067,340_____________
Hawaii–2.30%
City & County of Honolulu, HI5.000%, 10/01/2030 1,000,000 1,275,960
State of Hawaii5.000%, 05/01/2034 2,000,000 2,413,060
University of Hawaii5.000%, 10/01/2024 700,000 861,105_____________
4,550,125_____________
Illinois–7.54%
Boone & Winnebago Counties Community Unit School District No. 200
0.000%, 01/01/2024 1,200,000 1,014,816
Boone Mchenry & Dekalb Counties Community Unit School District 1000.000%, 12/01/2024 475,000 397,6940.000%, 12/01/2023 1,135,000 1,000,060
Chicago Board of Education0.000%, 12/01/2022 740,000 666,429
Chicago O’Hare International Airport5.000%, 01/01/2037 1,000,000 1,141,4205.000%, 01/01/2029 450,000 524,808
Chicago Transit Authority5.000%, 06/01/2024 750,000 881,295
Cook County School District No. 103 Lyons
0.000%, 12/01/2022 850,000 751,349
DeKalb Kane & LaSalle Counties Etc. Community College District No. 523 Kishwaukee0.000%, 02/01/2023 1,000,000 835,500
PERFORMANCE TRUST MUNICIPAL BOND FUND — SCHEDULE OF INVESTMENTS (CONT.)August 31, 2017
PERFORMANCE TRUST MUTUAL FUNDS (PTIAX, PTIMX, PTRMX) PAGE 24
Percentages are stated as a percent of net assets.The accompanying notes are an integral part of these financial statements.
PRINCIPALAMOUNT VALUE
PRINCIPALAMOUNT VALUE
Illinois (Cont.)
Illinois Finance Authority0.000%, 07/15/2025 $1,605,000 $ 1,372,6445.000%, 01/01/2034 500,000 562,140
Kendall & Kane Counties Community Unit School District No. 1150.000%, 01/01/2021 875,000 833,481
Metropolitan Pier & Exposition Authority0.000%, 06/15/2026 1,930,000 1,459,485
Metropolitan Water Reclamation District of Greater Chicago
5.000%, 12/01/2041 1,000,000 1,137,760
Railsplitter Tobacco Settlement Authority
6.000%, 06/01/2028 580,000 659,286
State of Illinois5.000%, 06/15/2023 1,035,000 1,202,908
Will County Community Unit School District No. 201-U Crete-Monee
0.000%, 11/01/2020 430,000 401,9640.000%, 11/01/2020 60,000 57,870_____________
14,900,909_____________
Indiana–3.91%
City of Valparaiso, IN6.750%, 01/01/2034 500,000 590,450
Indiana Finance Authority5.000%, 09/01/2036 1,000,000 1,137,0905.500%, 11/15/2026 500,000 555,9506.000%, 08/01/2039 1,135,000 1,219,762
Indiana Health Facility Financing Authority
5.000%, 11/15/2034 1,000,000 1,173,590
Indiana Municipal Power Agency5.000%, 01/01/2042 1,000,000 1,148,090
Northern Indiana Commuter Transportation District5.000%, 07/01/2033 1,130,000 1,305,839
Shelbyville Central Renovation School Building Corp.
5.000%, 07/15/2024 500,000 594,150_____________7,724,921_____________
Kentucky–0.75%
Grant County School District Finance Corp.
1.400%, 08/01/2022 375,000 373,234
Kentucky (Cont.)
Kentucky Economic Development Finance Authority5.000%, 05/15/2026 $1,000,000 $ 1,111,530_____________
1,484,764_____________
Louisiana–1.81%
City of Shreveport, LA Water & Sewer Revenue5.000%, 12/01/2027 1,000,000 1,201,500
Louisiana Energy & Power Authority5.250%, 06/01/2028 410,000 485,768
Louisiana Local Government Environmental Facilities & Community Development Authority5.000%, 12/01/2025 715,000 863,842
Louisiana State Citizens Property Insurance Corp.5.000%, 06/01/2022 500,000 585,705
Tobacco Settlement Financing Corp.5.000%, 05/15/2022 400,000 450,604_____________
3,587,419_____________
Massachusetts–0.07%
Massachusetts Educational Financing Authority4.500%, 07/01/2024 135,000 145,908_____________
Michigan–3.99%
Battle Creek School District5.000%, 05/01/2037 775,000 882,190
Brandon School District5.000%, 05/01/2032 1,550,000 1,779,927
Charter Township of Commerce, MI5.000%, 12/01/2038 1,000,000 1,163,170
Detroit City School District5.250%, 05/01/2027 650,000 788,151
Michigan Finance Authority3.875%, 10/01/2023 250,000 268,6605.000%, 05/01/2021 300,000 336,726
Michigan State Building Authority5.000%, 04/15/2023 900,000 1,070,415
South Lyon Community Schools5.000%, 05/01/2025 1,000,000 1,199,310
Sturgis Public School District5.000%, 05/01/2024 340,000 407,922_____________
7,896,471_____________
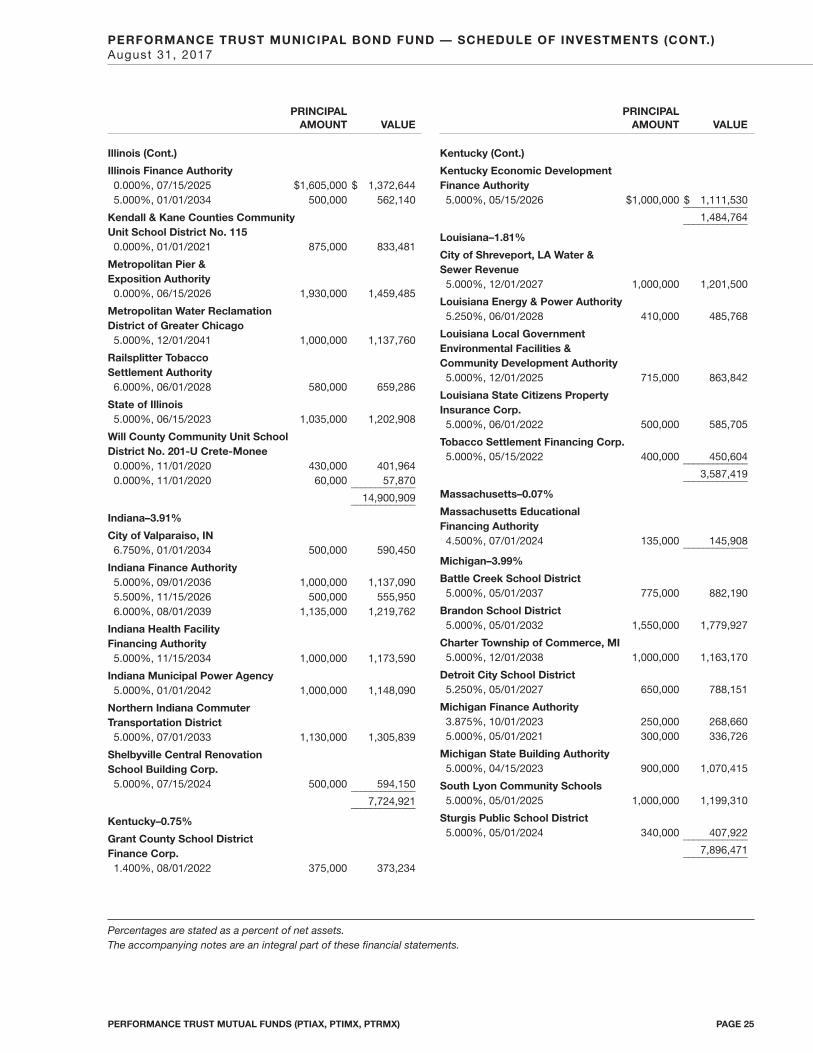
PERFORMANCE TRUST MUNICIPAL BOND FUND — SCHEDULE OF INVESTMENTS (CONT.)August 31, 2017
PERFORMANCE TRUST MUTUAL FUNDS (PTIAX, PTIMX, PTRMX) PAGE 25
Percentages are stated as a percent of net assets.The accompanying notes are an integral part of these financial statements.
PRINCIPALAMOUNT VALUE
PRINCIPALAMOUNT VALUE

Minnesota–1.00%
City of Rochester, MN5.000%, 11/15/2034 $ 845,000 $ 1,091,875
Minneapolis-St. Paul Metropolitan Airports Commission
5.000%, 01/01/2041 750,000 883,823_____________1,975,698_____________
Mississippi–0.48%
Mississippi Development Bank5.000%, 04/01/2026 800,000 954,760_____________
Missouri–0.33%
City of Kansas City, MO0.000%, 02/01/2023 740,000 655,041_____________
Nevada–1.07%
Las Vegas Special ImprovementDistrict No. 808 & 8105.000%, 09/01/2031 1,150,000 1,374,423
City of Reno, NV5.000%, 06/01/2023 625,000 737,250_____________
2,111,673_____________
New Jersey–1.26%
Garden State Preservation Trust5.750%, 11/01/2028 455,000 561,802
New Jersey Economic Development Authority5.000%, 06/15/2023 550,000 604,4835.500%, 01/01/2027 300,000 350,769
New Jersey Higher Education Student Assistance Authority5.000%, 12/01/2022 500,000 568,070
New Jersey Transportation Trust Fund Authority0.000%, 12/15/2027 545,000 412,058_____________
2,497,182_____________
New York–4.16%
Build NYC Resource Corp.5.000%, 08/01/2027 300,000 353,4755.000%, 08/01/2029 200,000 232,2265.000%, 08/01/2024 235,000 279,9065.000%, 08/01/2026 350,000 416,808
Housing Development Corp.3.500%, 02/15/2048 2,250,000 2,316,060
New York City Transitional Finance Authority Future Tax Secured Revenue
5.000%, 08/01/2038 2,000,000 2,383,900
New York Liberty Development Corp.5.250%, 10/01/2035 $ 610,000 $ 779,599
Port Authority of New York& New Jersey
5.000%, 10/15/2027 645,000 764,6285.000%, 12/01/2032 600,000 697,758_____________
8,224,360_____________
North Carolina–0.64%
North Carolina Medical Care Commission5.000%, 06/01/2028 500,000 632,660
Raleigh Durham Airport Authority5.000%, 05/01/2028 525,000 628,409_____________
1,261,069_____________
North Dakota–0.67%
City of Mandan, ND2.750%, 09/01/2041 1,330,000 1,327,353_____________
Ohio–6.21%
Akron Bath Copley Joint Township Hospital District
5.000%, 11/15/2023 300,000 344,310
City of Akron, OH5.000%, 12/01/2022 540,000 638,707
City of Cleveland, OH5.000%, 10/01/2037 1,000,000 1,135,740
Cleveland Municipal School District5.000%, 12/01/2029 965,000 1,124,534
County of Cuyahoga, OH5.000%, 12/01/2023 1,000,000 1,202,3205.500%, 02/15/2052 1,300,000 1,444,482
County of Franklin, OH5.000%, 05/15/2027 635,000 758,177
Dayton City School District5.000%, 11/01/2031 1,000,000 1,250,250
Cleveland–Cuyahoga CountyPort Authority5.000%, 08/01/2022 500,000 571,975
Marysville Exempted Village School District
5.000%, 12/01/2029 1,180,000 1,394,453
Olentangy Local School District5.000%, 12/01/2031 1,000,000 1,203,990
State of Ohio5.000%, 01/01/2033 1,000,000 1,209,920_____________
12,278,858_____________
PERFORMANCE TRUST MUNICIPAL BOND FUND — SCHEDULE OF INVESTMENTS (CONT.)August 31, 2017
PERFORMANCE TRUST MUTUAL FUNDS (PTIAX, PTIMX, PTRMX) PAGE 26
Percentages are stated as a percent of net assets.The accompanying notes are an integral part of these financial statements.
PRINCIPALAMOUNT VALUE
PRINCIPALAMOUNT VALUE
Oregon–1.11%
Medford Hospital Facilities Authority5.000%, 10/01/2024 $ 450,000 $ 520,938
Port of Portland, OR Airport Revenue
5.000%, 07/01/2042 1,000,000 1,150,100
Salem-Keizer School District No. 24J0.000%, 06/15/2025 600,000 514,782_____________
2,185,820_____________
Pennsylvania–3.77%
Delaware County Authority5.000%, 06/01/2023 200,000 200,280
Delaware Valley Regional Financial Authority
5.500%, 08/01/2028 2,040,000 2,502,692
Hopewell Area School District0.000%, 09/01/2026 900,000 702,261
Pennsylvania Economic Development Financing Authority
5.000%, 06/30/2028 750,000 877,455
Pennsylvania Turnpike Commission0.000%, 12/01/2038 2,000,000 2,557,2000.000%, 12/01/2030 475,000 611,159_____________
7,451,047_____________
Puerto Rico–0.95%
Puerto Rico Public Finance Corp.6.000%, 08/01/2026 965,000 1,240,1706.000%, 08/01/2026 490,000 629,723_____________
1,869,893_____________
Rhode Island–1.28%
Rhode Island Commerce Corp.5.000%, 06/15/2024 500,000 605,870
Rhode Island Health & Educational Building Corp.
5.000%, 06/01/2025 500,000 590,965
Rhode Island Student Loan Authority5.000%, 12/01/2023 905,000 1,034,297
Tobacco Settlement Financing Corp.2.250%, 06/01/2041 305,000 305,708_____________
2,536,840_____________
South Carolina–1.01%
City of Greer, SC5.500%, 09/01/2032 1,000,000 1,303,220
South Carolina Public Service Authority5.000%, 01/01/2032 660,000 684,057_____________
1,987,277_____________
Texas–11.32%
Alamo Regional Mobility Authority5.000%, 06/15/2039 $1,070,000 $ 1,236,642
Arlington Higher Education Finance Corp.5.000%, 02/15/2030 1,000,000 1,173,230
Austin Community College District5.000%, 08/01/2024 730,000 889,987
City of Fort Worth, TX5.250%, 03/01/2036 1,800,000 2,104,182
County of Harris, TX5.000%, 08/15/2034 1,000,000 1,185,980
Dallas Area Rapid Transit5.250%, 12/01/2031 800,000 1,043,072
Dallas/Fort Worth International Airport5.000%, 11/01/2038 1,805,000 1,969,616
Grapevine-Colleyville Independent School District0.000%, 08/15/2025 555,000 462,465
Harris County-Houston Sports Authority5.000%, 11/15/2027 500,000 580,720
Laredo Community College District5.000%, 08/01/2029 885,000 1,038,591
New Hope Cultural Education Facilities Corp.3.000%, 11/15/2021 600,000 595,0805.000%, 07/01/2046 1,000,000 1,112,130
North East Independent School District5.250%, 02/01/2030 1,000,000 1,312,940
North Texas Tollway Authority6.200%, 01/01/2042 1,030,000 1,307,894
Port Freeport, TX5.950%, 05/15/2033 1,100,000 1,160,467
South Texas College5.000%, 08/15/2032 1,000,000 1,178,930
State of Texas5.500%, 08/01/2033 1,000,000 1,234,500
Tarrant County Cultural Education Facilities Finance Corp.3.875%, 11/15/2022 1,500,000 1,504,695
Texas Municipal Gas Acquisition & Supply Corp. I6.250%, 12/15/2026 1,050,000 1,290,975_____________
22,382,096_____________
PERFORMANCE TRUST MUNICIPAL BOND FUND — SCHEDULE OF INVESTMENTS (CONT.)August 31, 2017
PERFORMANCE TRUST MUTUAL FUNDS (PTIAX, PTIMX, PTRMX) PAGE 27
Percentages are stated as a percent of net assets.The accompanying notes are an integral part of these financial statements.
PRINCIPALAMOUNT VALUE
PRINCIPALAMOUNT VALUE

Utah–2.31%
County of Weber, UT5.750%, 01/15/2033 $ 570,000 $ 687,414
Salt Lake City Corp. Airport Revenue5.000%, 07/01/2042 2,000,000 2,314,000
University of Utah5.000%, 08/01/2031 1,000,000 1,210,850
Utah State Charter School Finance Authority
6.300%, 07/15/2032 335,000 358,872_____________4,571,136_____________
Vermont–0.16%
Vermont Economic Development Authority5.000%, 05/01/2021 300,000 324,924_____________
Virgin Islands–0.98%
Virgin Islands Public Finance Authority
5.000%, 10/01/2017 1,000,000 993,9905.000%, 10/01/2018 1,000,000 948,100_____________
1,942,090_____________
Virginia–0.22%
Virginia Small Business Financing Authority
4.500%, 01/01/2023 135,000 150,0355.000%, 01/01/2027 250,000 277,602_____________
427,637_____________
Washington–2.43%
Chelan County Public Utility District No. 1
0.000%, 06/01/2026 450,000 359,401
Port of Seattle, WA5.000%, 04/01/2022 500,000 580,845
Washington Health Care Facilities Authority
5.000%, 01/01/2025 1,000,000 1,201,0305.000%, 10/01/2038 1,445,000 1,657,271
Washington State Housing Finance Commission
4.375%, 01/01/2021 1,000,000 1,000,310_____________4,798,857_____________
Wisconsin–2.52%
County of Milwaukee, WI Airport Revenue
5.000%, 12/01/2028 $1,000,000 $ 1,172,580
Plateville Redevelopment Authority5.000%, 07/01/2022 650,000 692,321
Public Finance Authority3.000%, 11/15/2022 1,935,000 1,943,5335.250%, 05/15/2037 500,000 545,240
Wisconsin Health & EducationalFacilities Authority5.000%, 08/15/2027 535,000 628,604_____________
4,982,278_____________
TOTAL MUNICIPAL BONDS (Cost $185,047,513) 191,935,490_____________
Total Investments (Cost $185,047,513)–97.09% 191,935,490_____________
Other Assets in Excess of Liabilities–2.91% 5,759,632_____________
TOTAL NET ASSETS–100.00% $197,695,122__________________________
PERFORMANCE TRUST MUNICIPAL BOND FUND — SCHEDULE OF INVESTMENTS (CONT.)August 31, 2017
PERFORMANCE TRUST MUTUAL FUNDS (PTIAX, PTIMX, PTRMX) PAGE 28
Percentages are stated as a percent of net assets.The accompanying notes are an integral part of these financial statements.
PRINCIPALAMOUNT VALUE
PRINCIPALAMOUNT VALUE

Performance Trust Performance TrustStrategic Municipal
Bond Fund Bond Fund
Investment IncomeInterest income $46,723,441 $ 5,479,388Dividend income 152,557 —___________ ___________Total Investment Income 46,875,998 5,479,388___________ ___________
ExpensesAdvisory fees 5,036,158 694,751Administration and accounting fees 693,759 233,471Transfer agent fees and expenses 271,135 70,812Federal and state registration fees 114,597 58,704Reports to shareholders 90,916 11,775Custody fees 65,833 9,523Audit and tax fees 19,013 18,501Legal fees 15,988 10,462Chief Compliance Officer fees 13,086 13,086Trustees’ fees 7,046 7,046Distribution fees – Retail Class — 37,123Other expenses 31,004 11,514___________ ___________Total Expenses 6,358,535 1,176,768Expense recovery or (waivers) by Adviser (Note 4) – net — (154,601)___________ ___________Net Expenses 6,358,535 1,022,167___________ ___________
Net Investment Income 40,517,463 4,457,221___________ ___________
Realized and Unrealized Gain (Loss) on InvestmentsNet realized gain (loss) on:Investments (2,156,064) (699,172)Change in net unrealized appreciation (depreciation) on investments 8,716,781 (2,115,464)___________ ___________Net Realized and Unrealized Gain (Loss) on Investments 6,560,717 (2,814,636)___________ ___________
Net Increase in Net Assets from Operations $47,078,180 $ 1,642,585___________ ______________________ ___________
STATEMENTS OF OPERATIONSFor the Year Ended August 31, 2017
PERFORMANCE TRUST MUTUAL FUNDS (PTIAX, PTIMX, PTRMX) PAGE 29
The accompanying notes are an integral part of these financial statements.
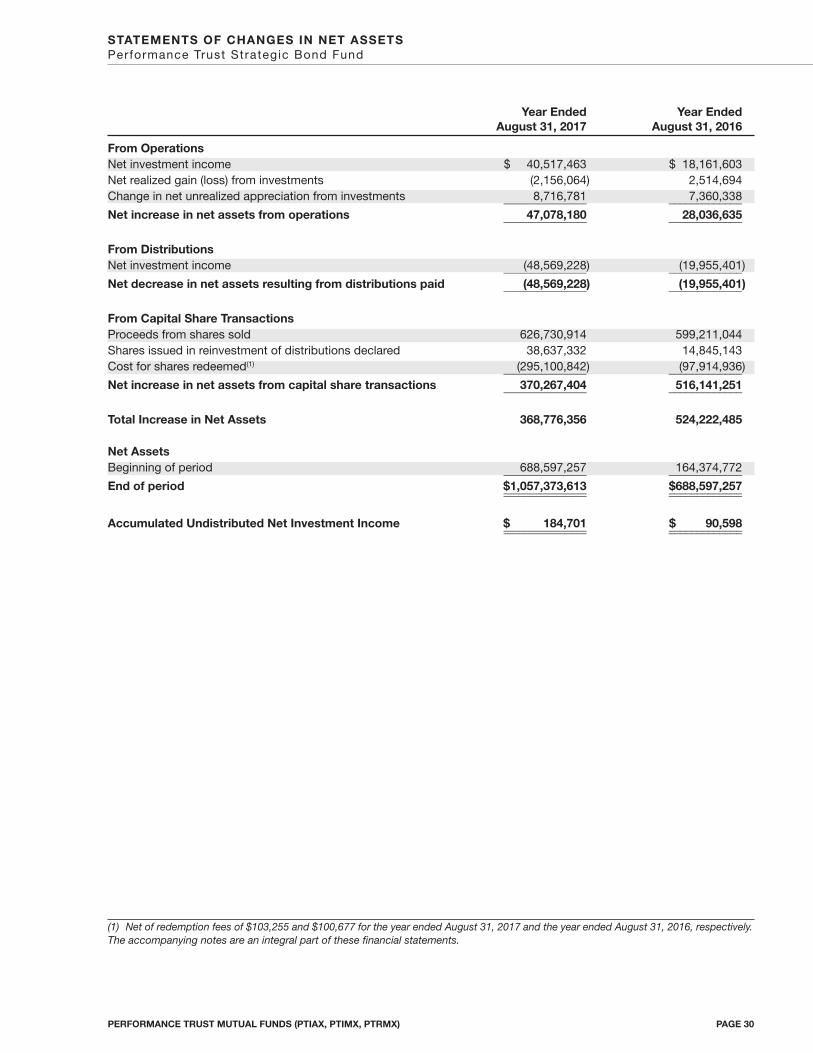
Year Ended Year EndedAugust 31, 2017 August 31, 2016
From OperationsNet investment income $ 40,517,463 $ 18,161,603Net realized gain (loss) from investments (2,156,064) 2,514,694Change in net unrealized appreciation from investments 8,716,781 7,360,338______________ _____________Net increase in net assets from operations 47,078,180 28,036,635______________ _____________
From DistributionsNet investment income (48,569,228) (19,955,401)______________ _____________Net decrease in net assets resulting from distributions paid (48,569,228) (19,955,401)______________ _____________
From Capital Share TransactionsProceeds from shares sold 626,730,914 599,211,044Shares issued in reinvestment of distributions declared 38,637,332 14,845,143Cost for shares redeemed(1) (295,100,842) (97,914,936)______________ _____________Net increase in net assets from capital share transactions 370,267,404 516,141,251______________ _____________
Total Increase in Net Assets 368,776,356 524,222,485
Net AssetsBeginning of period 688,597,257 164,374,772______________ _____________End of period $1,057,373,613 $688,597,257______________ ___________________________ _____________
Accumulated Undistributed Net Investment Income $ 184,701 $ 90,598______________ ___________________________ _____________
STATEMENTS OF CHANGES IN NET ASSETSPerformance Trust Strategic Bond Fund
PERFORMANCE TRUST MUTUAL FUNDS (PTIAX, PTIMX, PTRMX) PAGE 30
(1) Net of redemption fees of $103,255 and $100,677 for the year ended August 31, 2017 and the year ended August 31, 2016, respectively.The accompanying notes are an integral part of these financial statements.

Year Ended Year EndedAugust 31, 2017 August 31, 2016
From OperationsNet investment income $ 4,457,221 $ 2,588,806Net realized gain (loss) from investments (699,172) 404,818Change in net unrealized appreciation (depreciation) from investments (2,115,464) 6,812,740_____________ _____________Net increase in net assets from operations 1,642,585 9,806,364_____________ _____________
From DistributionsNet investment income – Institutional Class (3,818,627) (2,118,941)Net investment income – Retail Class (632,981) (478,103)Net realized gain on investments – Institutional Class (66,516) —Net realized gain on investments – Retail Class (12,990) —_____________ _____________Net decrease in net assets resulting from distributions paid (4,531,114) (2,597,044)_____________ _____________
From Capital Share TransactionsProceeds from shares sold – Institutional Class 99,550,514 87,009,114Proceeds from shares sold – Retail Class 10,704,569 26,757,906Shares issued in reinvestment of distributions declared – Institutional Class 2,975,868 1,589,311Shares issued in reinvestment of distributions declared – Retail Class 567,578 424,217Cost for shares redeemed – Institutional Class(1) (57,789,500) (28,281,814)Cost for shares redeemed – Retail Class(2) (16,634,968) (7,231,357)_____________ _____________Net increase in net assets from capital share transactions 39,374,061 80,267,377_____________ _____________
Total Increase in Net Assets 36,485,532 87,476,697
Net AssetsBeginning of period 161,209,590 73,732,893_____________ _____________End of period $197,695,122 $161,209,590_____________ __________________________ _____________
Accumulated Undistributed Net Investment Income $ 10,919 $ 5,339_____________ __________________________ _____________
STATEMENTS OF CHANGES IN NET ASSETSPerformance Trust Municipal Bond Fund
PERFORMANCE TRUST MUTUAL FUNDS (PTIAX, PTIMX, PTRMX) PAGE 31
(1) Net of redemption fees of $6,272 and $12,797 for the year ended August 31, 2017 and the year ended August 31, 2016, respectively.(2) Net of redemption fees of $2,138 and $14,164 for the year ended August 31, 2017 and the year ended August 31, 2016, respectively.The accompanying notes are an integral part of these financial statements.

Year Year Year Year YearEnded Ended Ended Ended Ended
August 31, August 31, August 31, August 31, August 31, 2017 2016 2015 2014 2013
Net Asset Value, Beginning of Year $22.98 $22.53 $22.91 $21.86 $22.39_______ _______ _______ _______ _______
Income/(loss) from investment operations:Net investment income(1) 1.09 1.17 0.98 0.89 0.76Net realized and unrealized gain/(loss) on investments(2) 0.05 0.46 (0.28) 1.17 (0.34)_______ _______ _______ _______ _______
Total from investment operations 1.14 1.63 0.70 2.06 0.42_______ _______ _______ _______ _______
Less distributions paid:From net investment income (1.28) (1.19) (1.08) (1.01) (0.88)From net realized gain on investments — — — — (0.07)_______ _______ _______ _______ _______
Total distributions paid (1.28) (1.19) (1.08) (1.01) (0.95)_______ _______ _______ _______ _______
Paid-in capital from redemption fees (Note 2) 0.00(3) 0.01 0.00(3) 0.00(3) 0.00(3)_______ _______ _______ _______ _______
Net Asset Value, End of Year $22.84 $22.98 $22.53 $22.91 $21.86_______ _______ _______ _______ ______________ _______ _______ _______ _______
Total Return 5.20% 7.48% 3.13% 9.62% 1.79%
Supplemental Data and Ratios:Net assets at end of year (000’s) $1,057,374 $688,597 $164,375 $151,230 $188,605
Ratio of expenses to average net assets:Before waiver and expense reimbursement 0.76% 0.79% 0.84% 0.86% 0.87%After waiver and expense reimbursement 0.76% 0.79% 0.84% 0.94% 0.95%
Ratio of net investment income to average net assets:
Before waiver and expense reimbursement 4.83% 5.14% 4.31% 4.02% 3.42%After waiver and expense reimbursement 4.83% 5.14% 4.31% 3.94% 3.34%
Portfolio turnover rate 78.53% 45.58% 80.49% 53.47% 67.22%
PERFORMANCE TRUST STRATEGIC BOND FUND — FINANCIAL HIGHLIGHTSPer Share Data for a Share Outstanding Throughout Each Year
PERFORMANCE TRUST MUTUAL FUNDS (PTIAX, PTIMX, PTRMX) PAGE 32
(1) Per share net investment income was calculated using the average shares outstanding method.(2) Realized gains and losses per share in the caption are balancing amounts necessary to reconcile the change in net asset value per
share for the period, and may not reconcile with the aggregate gains and losses in the Statement of Operations due to sharetransactions for the period.
(3) Rounds to less than 0.5 cent per share.The accompanying notes are an integral part of these financial statements.

Year Year Year Year YearEnded Ended Ended Ended Ended
August 31, August 31, August 31, August 31, August 31,2017 2016 2015 2014 2013
Institutional Class Shares
Net Asset Value, Beginning of Year $24.87 $23.26 $23.07 $21.16 $22.81_______ _______ _______ _______ _______
Income/(loss) from investment operations:Net investment income(1) 0.62 0.57 0.61 0.71 0.79Net realized and unrealized
gain/(loss) on investments (0.53) 1.59 0.18 1.91 (1.46)_______ _______ _______ _______ _______
Total from investment operations 0.09 2.16 0.79 2.62 (0.67)_______ _______ _______ _______ _______
Less distributions paid:From net investment income (0.61) (0.55) (0.60) (0.71) (0.77)From net realized gain on investments (0.01) — — — (0.21)_______ _______ _______ _______ _______
Total distributions paid (0.62) (0.55) (0.60) (0.71) (0.98)_______ _______ _______ _______ _______
Paid-in capital from redemption fees (Note 2)(2) 0.00 0.00 0.00 0.00 0.00_______ _______ _______ _______ _______
Net Asset Value, End of Year $24.34 $24.87 $23.26 $23.07 $21.16_______ _______ _______ _______ ______________ _______ _______ _______ _______
Total Return 0.50% 9.43% 3.41% 12.58% (3.20)%
Supplemental Data and Ratios:Net assets at end of year (000’s) $172,201 $129,466 $63,257 $41,000 $36,474
Ratio of expenses to average net assets:Before waiver and expense reimbursement 0.66% 0.73% 0.86% 1.05% 1.23%After waiver and expense reimbursement 0.55% 0.55% 0.55% 0.55% 0.55%
Ratio of net investment income to average net assets:
Before waiver and expense reimbursement 2.50% 2.16% 2.30% 2.73% 2.78%After waiver and expense reimbursement 2.61% 2.34% 2.61% 3.23% 3.46%
Portfolio turnover rate 42.53% 13.66% 31.83% 62.87% 118.50%
PERFORMANCE TRUST MUNICIPAL BOND FUND — FINANCIAL HIGHLIGHTSPer Share Data for a Share Outstanding Throughout Each Year
PERFORMANCE TRUST MUTUAL FUNDS (PTIAX, PTIMX, PTRMX) PAGE 33
(1) Per share net investment income was calculated using the average shares outstanding method.(2) Rounds to less than 0.5 cent per share.The accompanying notes are an integral part of these financial statements.

Year Year Year Year PeriodEnded Ended Ended Ended Ended
August 31, August 31, August 31, August 31, August 31,2017 2016 2015 2014 2013(1)
Retail Class Shares
Net Asset Value, Beginning of Year/Period $24.91 $23.30 $23.09 $21.18 $22.96_______ _______ _______ _______ _______
Income/(loss) from investment operations:Net investment income(2) 0.56 0.50 0.55 0.67 0.67Net realized and unrealized gain/(loss) on investments (0.53) 1.60 0.17 1.88 (1.70)_______ _______ _______ _______ _______
Total from investment operations 0.03 2.10 0.72 2.55 (1.03)_______ _______ _______ _______ _______
Less distributions paid:From net investment income (0.57) (0.51) (0.54) (0.66) (0.66)From net realized gain on investments (0.01) — — — (0.21)_______ _______ _______ _______ _______
Total distributions paid (0.58) (0.51) (0.54) (0.66) (0.87)_______ _______ _______ _______ _______
Paid-in capital from redemption fees (Note 2) 0.00(5) 0.02 0.03 0.02 0.12_______ _______ _______ _______ _______
Net Asset Value, End of Year/Period $24.36 $24.91 $23.30 $23.09 $21.18_______ _______ _______ _______ ______________ _______ _______ _______ _______
Total Return(3) 0.24% 9.20% 3.29% 12.33% (4.15)%
Supplemental Data and Ratios:Net assets at end of year/period (000’s) $25,495 $31,744 $10,476 $4,154 $228
Ratio of expenses to average net assets:Before waiver and expense reimbursement(4) 0.80% 0.85% 1.10% 1.33% 1.45%After waiver and expense reimbursement(4) 0.80% 0.80% 0.80% 0.80% 0.80%
Ratio of net investment incometo average net assets:
Before waiver and expense reimbursement(4) 2.34% 2.02% 2.05% 2.47% 2.57%After waiver and expense reimbursement(4) 2.34% 2.07% 2.35% 3.00% 3.22%
Portfolio turnover rate(3) 42.53% 13.66% 31.83% 62.87% 118.50%
PERFORMANCE TRUST MUNICIPAL BOND FUND — FINANCIAL HIGHLIGHTSPer Share Data for a Share Outstanding Throughout Each Year/Per iod
PERFORMANCE TRUST MUTUAL FUNDS (PTIAX, PTIMX, PTRMX) PAGE 34
(1) The Retail Class shares commenced operations on September 28, 2012.(2) Per share net investment income was calculated using the average shares outstanding method.(3) Not annualized for periods less than one year.(4) Annualized for periods less than one year.(5) Rounds to less than 0.5 cent per share.The accompanying notes are an integral part of these financial statements.

1. OrganizationTrust for Professional Managers (the “Trust”) was organizedas a Delaware statutory trust under a Declaration of Trustdated May 29, 2001. The Trust is registered under theInvestment Company Act of 1940, as amended (the “1940Act”), as an open-end management investment company.The Performance Trust Mutual Funds (the “Funds”) arecomprised of the Performance Trust Strategic Bond Fund (the“Strategic Bond Fund”), formerly known as the PerformanceTrust Total Return Bond Fund, and the Performance TrustMunicipal Bond Fund (the “Municipal Bond Fund”), eachrepresenting a distinct diversified series with their owninvestment objectives and policies within the Trust. Theinvestment objective of the Strategic Bond Fund is topurchase undervalued fixed income assets and achieveinvestment returns through interest income and potentialcapital appreciation. The investment objective of theMunicipal Bond Fund is to provide a high level of currentinterest income that is substantially exempt from regularfederal income taxes and is consistent with preservation ofcapital. The Trust may issue an unlimited number of shares ofbeneficial interest at $0.001 par value. The assets of theFunds are segregated, and a shareholder’s interest is limitedto the Fund in which shares are held. The Strategic BondFund commenced investment operations on September 1,2010. The Municipal Bond Fund commenced investmentoperations on June 30, 2011 and September 28, 2012 for theInstitutional and Retail Class shares, respectively. Retail Classshares are subject to a 0.25% Rule 12b-1 distribution andservice fee. Each class of shares has identical rights andprivileges except with respect to distribution fees, and votingrights on matters affecting a single class of shares. Costsincurred by the Funds in connection with the organizationand the initial public offering of shares were paid by PT AssetManagement, LLC (the “Adviser”), the Funds’ investmentadviser. The Funds are investment companies andaccordingly follow the investment company accounting andreporting guidance of the Financial Accounting StandardsBoard (FASB) Accounting Standard Codification Topic 946“Financial Services—Investment Companies”.
2. Significant Accounting Policies The following is a summary of significant accounting policiesconsistently followed by the Funds in the preparation of thefinancial statements. These policies are in conformity withgenerally accepted accounting principles in the United Statesof America (“GAAP”).
a. Investment Valuation Each security owned by the Funds that is listed on asecurities exchange is valued at its last sale price on thatexchange on the date as of which assets are valued. If thesecurity is listed on more than one exchange, the Funds willuse the price of the exchange that the Funds generallyconsider to be the principal exchange on which the security istraded. Portfolio securities listed on the NASDAQ StockMarket, Inc. (“NASDAQ”) will be valued at the NASDAQOfficial Closing Price, which may not necessarily represent thelast sale price. If there has been no sale on such exchange oron NASDAQ on such day, the security is valued at the meanbetween the most recent bid and asked prices on such day orthe security shall be valued at the latest sales price on the
“composite market” for the day such security is being valued.The composite market is defined as a consolidation of thetrade information provided by national securities and foreignexchanges and over-the-counter markets as published by anapproved independent pricing service (a “Pricing Service”).
Debt securities, such as U.S. government securities, corporatesecurities, municipal securities and asset-backed andmortgage-backed securities, including short-term debtinstruments having a maturity of 60 days or less, are valued atthe mean between the bid and ask prices provided by a PricingService. Pricing Services may use various valuationmethodologies such as the mean between the bid and theasked prices, matrix pricing and other analytical pricing modelsas well as market transactions and dealer quotations. If a priceis not available from a Pricing Service, the most recentquotation obtained from one or more broker-dealers known tofollow the issue will be obtained. Quotations will be valued atthe mean between the bid and the offer. Any discount orpremium is accreted or amortized over the expected life of therespective security using the constant yield 2 method.
Money market funds, demand notes and repurchaseagreements are valued at cost. If cost does not representcurrent market value the securities will be priced at fair value.
Redeemable securities issued by open-end, registeredinvestment companies are valued at the NAVs of suchcompanies for purchase and/or redemption orders placed onthat day. All exchange-traded funds are valued at the lastreported sale price on the exchange on which the security isprincipally traded.
If market quotations are not readily available, a security orother asset will be valued at its fair value as determined underfair value pricing procedures approved by the Board ofTrustees. These fair value pricing procedures will also be usedto price a security when corporate events, events in thesecurities market and/or world events cause the Adviser tobelieve that a security’s last sale price may not reflect itsactual fair value. The intended effect of using fair value pricingprocedures is to ensure that the Funds are accurately priced.The Board of Trustees will regularly evaluate whether theFunds’ fair value pricing procedures continue to beappropriate in light of the specific circumstances of the Fundsand the quality of prices obtained through the application ofsuch procedures by the Trust’s valuation committee.
Financial Accounting Standards Board (“FASB”) AccountingStandards Codification, “Fair Value Measurements andDisclosures” Topic 820 (“ASC 820”), establishes anauthoritative definition of fair value and sets out a hierarchy formeasuring fair value. ASC 820 requires an entity to evaluatecertain factors to determine whether there has been asignificant decrease in volume and level of activity for thesecurity such that recent transactions and quoted prices maynot be determinative of fair value and further analysis andadjustment may be necessary to estimate fair value. ASC 820also requires enhanced disclosure regarding the inputs andvaluation techniques used to measure fair value as well asexpanded disclosure of valuation levels for each class ofinvestments. These inputs are summarized in the three broadlevels listed below:
PERFORMANCE TRUST MUTUAL FUNDS – NOTES TO FINANCIAL STATEMENTSAugust 31, 2017
PERFORMANCE TRUST MUTUAL FUNDS (PTIAX, PTIMX, PTRMX) PAGE 35

» Level 1: Quoted prices in active markets for identicalsecurities.
» Level 2: Other significant observable inputs (includingquoted prices for similar securities, interest rates,prepayment speeds, credit risk, etc.).
» Level 3: Significant unobservable inputs (including a Fund’sown assumptions in determining the fair value of investments).
The inputs or methodology used for valuing securities are notnecessarily an indication of the risk associated with investingin those securities. The following is a summary of the inputsused to value the Funds’ investments carried at fair value asof August 31, 2017:
Performance Trust Strategic Bond Fund
Level 1 Level 2 Level 3 Total
Fixed Income
AssetBackedSecurities $ — $ 39,018,341 $ — $ 39,018,341
Corporate Bonds — 24,702,752 — 24,702,752
Mortgage BackedSecurities — 543,557,312 — 543,557,312
Municipal Bonds — 400,895,286 — 400,895,286
Total Fixed Income — 1,008,173,691 — 1,008,173,691
EquityClosed-End Mutual Funds 2,144,393 — — 2,144,393
Total Equity 2,144,393 — — 2,144,393
Short-Term Investments 47,584,190 — — 47,584,190
TotalInvestments in Securities $49,728,583 $1,008,173,691 $ — $1,057,902,274
Performance Trust Municipal Bond Fund
Level 1 Level 2 Level 3 Total
Fixed Income
Municipal Bonds $ — $ 191,935,490 $ — $ 191,935,490
Total FixedIncome — 191,935,490 — 191,935,490
Total Investments in Securities $ — $ 191,935,490 $ — $ 191,935,490
During the year ended August 31, 2017, there were no transfersbetween Levels for the Funds. It is the Funds’ policy to recordtransfers between Levels as of the end of the reporting period.The Funds did not hold any financial derivative instrumentsduring the year ended August 31, 2017.
b. Short PositionsThe Funds may sell a security they do not own in anticipation ofa decline in the fair value of that security. When a Fund sells asecurity short, it must borrow the security sold short and deliverit to the broker-dealer through which it made the short sale. A
gain, limited to the price at which a Fund sold the security short,or a loss, unlimited in size, will be recognized upon thetermination of a short sale. The Funds are liable for anydividends or interest payable on securities while those securitiesare in a short position. Such amounts are recorded on the ex-dividend date as a dividend expense. As collateral for its shortpositions, the Funds are required under the 1940 Act tomaintain segregated assets consisting of cash, cash equivalentsor liquid securities. The segregated assets are valued consistentwith Note 2a above. The amount of segregated assets arerequired to be adjusted daily to reflect changes in the fair valueof the securities sold short. As of August 31, 2017, the Fundsdid not have any open short positions and accordingly did nothave securities or cash held as collateral.
c. Federal Income Taxes The Funds intend to comply with the requirements ofSubchapter M of the Internal Revenue Code necessary toqualify as a regulated investment company and to make therequisite distributions of income and capital gains to theirshareholders sufficient to relieve them from all or substantiallyall federal income taxes. Therefore, no federal income taxprovision has been provided.
As of and during the year ended August 31, 2017, the Fundsdid not have a liability for any unrecognized tax benefits. TheFunds recognize interest and penalties, if any, related touncertain tax benefits as income tax expense in theStatements of Operations. During the year ended August 31,2017, the Funds did not incur any interest or penalties. TheFunds are not subject to examination by U.S. taxing authoritiesfor the tax periods prior to the year ended August 31, 2014.
d. Distributions to Shareholders The Funds will distribute any net investment income monthly.The Funds will distribute any net realized long- or short-termcapital gains at least annually. Distributions from net realizedgains for book purposes may include short-term capital gains.All short-term capital gains are included in ordinary income fortax purposes. Distributions to shareholders are recorded onthe ex-dividend date. The Funds may also pay a specialdistribution at the end of the calendar year to comply withfederal tax requirements. Income and capital gain distributionsmay differ from GAAP, primarily due to timing differences in therecognition of income, gains and losses by the Funds. To theextent that these differences are attributable to permanentbook and tax accounting differences, the components of netassets have been adjusted.
e. Use of Estimates The preparation of financial statements in conformity withGAAP requires management to make estimates andassumptions that affect the reported amounts of assets andliabilities and disclosure of contingent assets and liabilities atthe date of the financial statements and the reported amountsof revenues and expenses during the reporting period. Actualresults could differ from those estimates.
f. Share ValuationThe NAV per share of the Funds is calculated by dividing thesum of the value of the securities held by the Funds, pluscash or other assets, minus all liabilities (including estimatedaccrued expenses) by the total number of shares outstanding
PERFORMANCE TRUST MUTUAL FUNDS – NOTES TO FINANCIAL STATEMENTS (CONT.)August 31, 2017
PERFORMANCE TRUST MUTUAL FUNDS (PTIAX, PTIMX, PTRMX) PAGE 36

for the Funds, rounded to the nearest cent. The Funds’ shareswill not be priced on the days on which the New York StockExchange (“NYSE”) is closed for trading. The Funds charge a2.00% redemption fee on shares redeemed within sixty daysof purchase. These fees are deducted from the redemptionproceeds otherwise payable to the shareholder. The Fundswill retain the fee charged as an increase in paid-in capital andsuch fees become part of the Funds’ daily NAV calculation.For the year ended August 31, 2017, the Funds collectedredemption fees of $103,255 and $8,410 for the StrategicBond Fund and Municipal Bond Fund, respectively.
g. Allocation of Income, Expenses and Gains/LossesIncome, expenses (other than those deemed attributable to aspecific share class), and gains and losses of the MunicipalBond Fund are allocated daily to each class of shares basedupon the ratio of net assets represented by each class as apercentage of the net assets of the Municipal Bond Fund.Expenses deemed directly attributable to a class of shares arerecorded by the specific class. Most expenses are allocatedby class based on relative net assets. Distribution and service(Rule 12b-1) fees are expensed at 0.25% of average daily netassets of the Retail Class shares of the Municipal Bond Fund.Expenses associated with a specific fund in the Trust arecharged to that fund. Common expenses of the Trust aretypically allocated evenly between the funds of the Trust, or byother equitable means.
h. OtherInvestment transactions are recorded on the trade date. TheFunds determine the gain or loss from investment transactionson the basis of identified cost basis by comparing the originalcost of the security lot sold with the net sale proceeds.Dividend income, less foreign withholding tax, is recognized onthe ex-dividend date and interest income is recognized on anaccrual basis. Discounts premium and interest only strips areaccreted or amortized over the expected life of the respectivesecurities using the constant yield 2 method. Gains and losseson principal payments of mortgage backed securities(paydown gains and losses) are included as an adjustment tointerest income in the Statements of Operations.
3. Federal Tax Matters The tax character of distributions paid during the years endedAugust 31, 2017 and August 31, 2016 was as follows:
PERFORMANCE TRUST STRATEGIC BOND FUND
YEAR ENDED YEAR ENDEDAUGUST 31, 2017 AUGUST 31, 2016
Ordinary Income $48,569,228 $19,955,401Tax-Exempt Income — —Long-Term Capital Gain — —
PERFORMANCE TRUST MUNICIPAL BOND FUND
YEAR ENDED YEAR ENDEDAUGUST 31, 2017 AUGUST 31, 2016
Ordinary Income $ 21,230 $ 16,033Tax-Exempt Income 4,430,411 2,581,011Long-Term Capital Gain 79,473 —
As of August 31, 2017, the components of accumulatedearnings (losses) on a tax basis were as follows:
PERFORMANCE TRUST STRATEGIC BOND FUND
Cost basis of investments for federal income tax purposes $1,040,723,915______________________________Gross tax unrealized appreciation $ 27,642,066Gross tax unrealized depreciation (10,463,707)_______________Net tax unrealized appreciation 17,178,359
Undistributed ordinary income 175,775
Undistributed long-term capital gain —_______________Total distributable earnings 175,775
Other accumulated losses (12,338,821)_______________Total accumulated gains $ 5,015,313______________________________
PERFORMANCE TRUST MUNICIPAL BOND FUND
Cost basis of investments for federal income tax purposes $185,047,513__________________________Gross tax unrealized appreciation $ 7,292,875
Gross tax unrealized depreciation (404,898)_____________Net tax unrealized appreciation 6,887,977
Undistributed ordinary income 10,919
Undistributed long-term capital gain —_____________Total distributable earnings 10,919
Other accumulated losses (699,692)_____________Total accumulated gains $ 6,199,204__________________________
The difference between book-basis and tax-basis unrealizedappreciation (depreciation) is attributable primarily to the taxdeferral of losses on wash sale adjustments.
At August 31, 2017, the Strategic Bond Fund and MunicipalBond Fund had short-term capital loss carryovers of$12,338,565 and $699,692, respectively. These losses will becarried forward indefinitely to offset future realized capitalgains. To the extent the Funds realize future net capital gains,taxable distributions to their shareholders will be offset by anyunused capital loss carryovers.
GAAP requires that certain components of net assets relating topermanent differences be reclassified between financial and taxreporting. These reclassifications have no effect on net assetsor net asset value per share. For the year ended August 31,2017, the following reclassifications were made for permanenttax differences on the Statements of Assets and Liabilities:
STRATEGIC MUNICIPALBOND FUND BOND FUND
Accumulated undistributed net investment income/(loss) $ 8,145,868 $ (33)Accumulated undistributed netrealized gain/(loss) $(8,145,868) $ 33Paid in capital $ — $ —
4. Investment Adviser The Trust has an Investment Advisory Agreement (the“Agreement”) with the Adviser to furnish investment advisoryservices to the Funds. Under the terms of the Agreement, theFunds compensate the Adviser for its management servicesat the annual rate of 0.60% for the Strategic Bond Fund and0.40% for the Municipal Bond Fund of the respective Fund’saverage daily net assets.
PERFORMANCE TRUST MUTUAL FUNDS – NOTES TO FINANCIAL STATEMENTS (CONT.)August 31, 2017
PERFORMANCE TRUST MUTUAL FUNDS (PTIAX, PTIMX, PTRMX) PAGE 37

The Adviser has contractually agreed to waive itsmanagement fee and/or reimburse the Funds’ other expensesat least through December 29, 2018 at the discretion of theAdviser and the Board of Trustees, to the extent necessary toensure that the total operating fund expenses (exclusive offront-end or contingent deferred sales loads, taxes, leverage,interest, brokerage commissions, expenses incurred inconnection with any merger or reorganization, dividends orinterest expense on short positions, acquired fund fees andexpenses and extraordinary expenses such as litigation) donot exceed 0.95%, 0.55% and 0.80% (the “ExpenseLimitation Cap”) of the average daily net assets of theStrategic Bond Fund and Municipal Bond Fund – InstitutionalClass and Retail Class, respectively. For the year endedAugust 31, 2017, expenses of $155,808 for the MunicipalBond Fund – Institutional Class were waived and $1,207 wererecouped for the Municipal Bond Fund – Retail Class by theAdviser. Any such waiver or reimbursement is subject to lateradjustment to allow the Adviser to recover amounts waived orreimbursed to the extent actual fees and expenses for a fiscalperiod do not exceed the lesser of: (1) the Expense LimitationCap in place at the time of the waiver and/or reimbursement;or (2) the Expense Limitation Cap in place at the time ofrecovery; provided, however, that the Adviser shall only beentitled to recover such amounts for a period of three yearsfrom the date such amount was waived or reimbursed.
The following table shows the remaining waived or reimbursedexpenses subject to potential recovery expiring by:
STRATEGIC MUNICIPALBOND FUND BOND FUND
August 31, 2018 $ — $185,341August 31, 2019 $ — $173,405August 31, 2020 $ — $154,601
5. Distribution and Shareholder Servicing PlanThe Trust has adopted a plan pursuant to Rule 12b-1 underthe 1940 Act (the “12b-1 Plan”), on behalf of the MunicipalBond Fund, which authorizes it to pay Foreside Fund Services,LLC (the “Distributor”) a distribution and service (12b-1) fee of0.25% of the Municipal Bond Fund’s average daily net assetsfor Retail Class shares, for services to prospective Fundshareholders and distribution of Municipal Bond Fund shares.The Distributor earned fees of $37,123 from Retail Classshares during the year ended August 31, 2017.
6. Related Party TransactionsU.S. Bancorp Fund Services, LLC (“USBFS” or the“Administrator”) acts as the Funds’ Administrator and FundAccountant under an Administration Agreement. TheAdministrator performs various administrative and accountingservices including: preparing various federal and stateregulatory filings, reports and returns for the Funds; preparingreports and materials to be supplied to the Trustees; monitoringthe activities of the Funds’ custodian, transfer agent andaccountants; coordinating the preparation and payment of theFunds’ expenses; and reviewing the Funds’ expense accruals.USBFS also serves as the transfer agent to the Funds. U.S.Bank, N.A. (“US Bank”), an affiliate of USBFS, serves as eachFund’s custodian. Fees incurred for the year ended August 31,2017, and owed as of August 31, 2017 are as follows:
Administration and Accounting Incurred Owed
Strategic Bond Fund $693,759 $127,616Municipal Bond Fund $233,471 $ 41,729
Transfer Agency Incurred Owed
Strategic Bond Fund $271,135 $46,125Municipal Bond Fund $ 70,812 $11,503
Custody Incurred Owed
Strategic Bond Fund $65,833 $12,086Municipal Bond Fund $ 9,523 $ 1,696
The Funds each have a line of credit with US Bank (see Note 10).
Certain officers of the Funds are also employees of USBFS. ATrustee of the Trust is affiliated with USBFS and US Bank.
The Trust’s Chief Compliance Officer is also an employee ofUSBFS. Each Fund’s allocation of the Trust’s Chief ComplianceOfficer fee incurred for the year ended August 31, 2017, andowed as of August 31, 2017 are as follows:
Incurred Owed
Strategic Bond Fund $13,086 $2,170Municipal Bond Fund $13,086 $2,170
7. Capital Share Transactions Transactions in shares of the Funds were as follows:
STRATEGIC BOND FUND
YEAR ENDED YEAR ENDEDAUGUST 31, 2017 AUGUST 31, 2016
Shares sold 27,698,634 26,324,577Shares issued to holders in reinvestment of distributions 1,711,655 652,729Shares redeemed (13,085,417) (4,312,665)_________________________________Net increase 16,324,872 22,664,641__________________________________________________________________
MUNICIPAL BOND FUND – INSTITUTIONAL CLASS
YEAR ENDED YEAR ENDEDAUGUST 31, 2017 AUGUST 31, 2016
Shares sold 4,184,167 3,577,783Shares issued to holders in reinvestment of distributions 124,855 65,311Shares redeemed (2,440,313) (1,157,364)________________________________Net increase 1,868,709 2,485,730________________________________________________________________
MUNICIPAL BOND FUND – RETAIL CLASS
YEAR ENDED YEAR ENDEDAUGUST 31, 2017 AUGUST 31, 2016
Shares sold 445,479 1,100,834Shares issued to holders in reinvestment of distributions 23,789 17,377Shares redeemed (697,181) (293,293)________________________________Net increase (decrease) (227,913) 824,918________________________________________________________________
PERFORMANCE TRUST MUTUAL FUNDS – NOTES TO FINANCIAL STATEMENTS (CONT.)August 31, 2017
PERFORMANCE TRUST MUTUAL FUNDS (PTIAX, PTIMX, PTRMX) PAGE 38

8. Investment Transactions
The aggregate purchases and sales of securities, excludingshort-term investments, for the Funds for the year endedAugust 31, 2017, are summarized below.
STRATEGIC MUNICIPALBOND FUND BOND FUND
Purchases U.S. Government $ 97,474,557 $ —Other 887,373,774 112,753,369SalesU.S. Government $113,389,559 $ —Other 533,188,802 71,385,759
9. Beneficial OwnershipThe beneficial ownership, either directly or indirectly, of morethan 25% of the voting securities of a fund creates apresumption of control of a fund, under Section 2(a)(9) of the1940 Act. At August 31, 2017, National Financial ServicesCorp. for the benefit of its customers, held 33.46% of theStrategic Bond Fund’s outstanding shares. At August 31,2017, National Financial Services Corp. and Charles Schwab& Company, Inc., for the benefit of its customers, held 26.24%and 25.42%, respectively, of the Municipal Bond Fund’soutstanding Institutional Class shares. At August 31, 2017,National Financial Services Corp. and Charles Schwab &Company, Inc., for the benefit of its customers, held 65.76%and 29.15%, respectively of the Municipal Bond Fund’soutstanding Retail Class shares.
10. Line of CreditAt August 31, 2017, the Strategic Bond Fund and theMunicipal Bond Fund each had a line of credit which matureson August 11, 2018 with a maximum borrowing equal to thelessor of $100,000,000 and $15,000,000, respectively, or 20%and 33.33%, respectively, of the fair value of unencumberedassets of each fund. These secured lines of credit are intendedto provide short-term financing, if necessary, subject to certainrestrictions, in connection with shareholder redemptions. TheFunds’ securities serve as collateral for the lines of credit. Thecredit facility is with the Funds’ custodian, US Bank. Interestwas accrued at the bank’s prime rate of 3.50% throughDecember 14, 2016, 3.75% from December 15, 2016 throughMarch 15, 2017, 4.00% from March 16, 2017 through June 14,2017 and 4.25% thereafter. The following table providesinformation regarding usage of the line of credit for the yearended August 31, 2017 for the Funds:
Average Maximum Date ofDays Amount of Interest Amount of Maximum
Utilized Borrowing Expense Borrowing Borrowing
StrategicBondFund 9 $1,087,778 $1,038 $2,038,000 2/16/2017
Municipal Bond Fund — N/A N/A N/A N/A
The Funds did not have any outstanding balances on the linesof credit at August 31, 2017.
11. Subsequent EventsOn September 28, 2017, distributions from ordinary income of$4,580,738, $356,646 and $45,762 for the Strategic BondFund and Municipal Bond Fund – Institutional Class and RetailClass, respectively, were declared and paid by the Funds toshareholders of record on September 27, 2017.
PERFORMANCE TRUST MUTUAL FUNDS – NOTES TO FINANCIAL STATEMENTS (CONT.)August 31, 2017
PERFORMANCE TRUST MUTUAL FUNDS (PTIAX, PTIMX, PTRMX) PAGE 39
To the Shareholders of Performance Trust Mutual Funds andBoard of Trustees of Trust for Professional Managers
We have audited the accompanying statements of assets and liabilities, including the schedules of investments, of Performance TrustMutual Funds, comprising the Performance Trust Strategic Bond Fund and the Performance Trust Municipal Bond Fund (the “Funds”),each a series of the Trust for Professional Managers, as of August 31, 2017, and the related statements of operations for the year thenended, the statements of changes in net assets for each of the two years in the period then ended, and the financial highlights for eachof the five periods in the period then ended. These financial statements and financial highlights are the responsibility of the Funds’management. Our responsibility is to express an opinion on these financial statements and financial highlights based on our audits.
We conducted our audits in accordance with the standards of the Public Company Accounting Oversight Board (United States). Thosestandards require that we plan and perform the audit to obtain reasonable assurance about whether the financial statements andfinancial highlights are free of material misstatement. An audit includes examining, on a test basis, evidence supporting the amountsand disclosures in the financial statements. Our procedures included confirmation of securities owned as of August 31, 2017, bycorrespondence with the custodian and brokers or by other appropriate auditing procedures where replies from brokers were notreceived. An audit also includes assessing the accounting principles used and significant estimates made by management, as well asevaluating the overall financial statement presentation. We believe that our audits provide a reasonable basis for our opinion.
In our opinion, the financial statements and financial highlights referred to above present fairly, in all material respects, the financial positionof each of the Funds constituting the Performance Trust Mutual Funds as of August 31, 2017, the results of their operations for the yearthen ended, the changes in their net assets for each of the two years in the period then ended, and the financial highlights for each of thefive periods in the period then ended, in conformity with accounting principles generally accepted in the United States of America.
COHEN & COMPANY, LTD.Cleveland, OhioOctober 27, 2017
REPORT OF INDEPENDENT REGISTERED PUBLIC ACCOUNTING FIRM
PERFORMANCE TRUST MUTUAL FUNDS (PTIAX, PTIMX, PTRMX) PAGE 40

We collect non-public personal information about you fromthe following sources:
» information we receive about you on applications orother forms;
» information you give us orally; and
» information about your transactions with us or others.
We do not disclose any non-public personal informationabout our shareholders or former shareholders without theshareholder’s authorization, except as permitted by law orin response to inquiries from governmental authorities. Wemay share information with affiliated parties andunaffiliated third parties with whom we have contracts forservicing the Funds. We will provide unaffiliated third
parties with only the information necessary to carry outtheir assigned responsibility. All shareholder records willbe disposed of in accordance with applicable law. Wemaintain physical, electronic and procedural safeguards toprotect your non-public personal information and requirethird parties to treat your nonpublic personal informationwith the same high degree of confidentiality.
In the event that you hold shares of the Funds through afinancial intermediary, including, but not limited to, abroker-dealer, bank or trust company, the privacy policy of your financial intermediary would govern how yournon-public personal information would be shared withunaffiliated third parties.
NOTICE OF PRIVACY POLICY & PRACTICES
PERFORMANCE TRUST MUTUAL FUNDS (PTIAX, PTIMX, PTRMX) PAGE 41

As a shareholder of the Funds, you incur two types ofcosts: (1) transaction costs, including redemption feesand (2) ongoing costs, including management fees,distribution and service (12b-1) fees (Municipal BondFund – Retail Class only) and other Fund expenses. Thisexample is intended to help you understand your ongoingcosts (in dollars) of investing in the Funds and to comparethese costs with the ongoing costs of investing in othermutual funds.
The Example is based on an investment of $1,000invested at the beginning of the period and held for theentire period (3/1/17 – 8/31/17).
Actual ExpensesThe first line of each of the tables below providesinformation about actual account values and actualexpenses for each Fund. However, the tables do notinclude shareholder specific fees, such as the $15.00 feecharged to IRA accounts, or the $15.00 fee charged for wireredemptions. The tables also do not include portfoliotrading commissions and related trading costs. You will becharged a redemption fee equal to 2.00% of the net amountof the redemption if you redeem your shares of the Fundswithin 60 days of the purchase. You may use theinformation in this line, together with the amount youinvested, to estimate the expenses that you paid over theperiod. Simply divide your account value by $1,000 (forexample, an $8,600 account value divided by $1,000 = 8.6),
then multiply the result by the number in the first line underthe heading entitled “Expenses Paid During Period” toestimate the expenses you paid on your account during thisperiod.
Hypothetical Example for Comparison PurposesThe second line of each of the tables below providesinformation about hypothetical account values andhypothetical expenses based on the actual expense ratiosfor each Fund and an assumed rate of return of 5% peryear before expenses, which is not the Fund’s actualreturn. The hypothetical account values and expensesmay not be used to estimate the actual ending accountbalance or expenses you paid for the period. You may usethis information to compare the ongoing costs of investingin the Funds and other funds. To do so, compare this 5%hypothetical example with the 5% hypothetical examplesthat appear in the shareholder reports of the other funds.
Please note that the expenses shown in the tables aremeant to highlight your ongoing costs only and do notreflect any transactional costs, such as sales charges(loads), redemption fees, or exchange fees. Therefore, thesecond line of each of the tables is useful in comparingongoing costs only, and will not help you determine therelative total cost of owning different funds. In addition, ifthese transactional costs were included, your costs wouldhave been higher.
EXPENSE EXAMPLEPeriod Ended August 31, 2017 (Unaudited)
PERFORMANCE TRUST MUTUAL FUNDS (PTIAX, PTIMX, PTRMX) PAGE 42
EXPENSES PAIDDURING PERIOD
PERFORMANCE TRUST BEGINNING ACCOUNT VALUE ENDING ACCOUNT VALUE MARCH 1, 2017 –STRATEGIC BOND FUND MARCH 1, 2017 AUGUST 31, 2017 AUGUST 31, 2017*
Actual $1,000 $1,046.10 $7.88Hypothetical(5% annual return before expenses) $1,000 $1,042.30 $7.86
* Expenses are equal to the Fund’s annualized expense ratio of 0.77%, multiplied by the average account value over the period,multiplied by 184/365 to reflect the one-half year period.
EXPENSES PAIDPERFORMANCE TRUST DURING PERIODMUNICIPAL BOND FUND – BEGINNING ACCOUNT VALUE ENDING ACCOUNT VALUE MARCH 1, 2017 –INSTITUTIONAL CLASS MARCH 1, 2017 AUGUST 31, 2017 AUGUST 31, 2017*
Actual $1,000 $1,048.10 $5.63Hypothetical(5% annual return before expenses) $1,000 $1,044.50 $5.62
* Expenses are equal to the Fund’s annualized expense ratio of 0.55%, multiplied by the average account value over the period,multiplied by 184/365 to reflect the one-half year period.
EXPENSES PAIDPERFORMANCE TRUST DURING PERIODMUNICIPAL BOND FUND – BEGINNING ACCOUNT VALUE ENDING ACCOUNT VALUE MARCH 1, 2017 –RETAIL CLASS MARCH 1, 2017 AUGUST 31, 2017 AUGUST 31, 2017*
Actual $1,000 $1,046.30 $8.19Hypothetical(5% annual return before expenses) $1,000 $1,042.00 $8.17
* Expenses are equal to the Fund’s annualized expense ratio of 0.80%, multiplied by the average account value over the period,multiplied by 184/365 to reflect the one-half year period.
The Board of Trustees (the “Trustees”) of Trust for ProfessionalManagers (the “Trust”) met in person on August 18, 2017 toconsider the renewal of the Investment Advisory Agreement (the“Agreement”) between the Trust, on behalf of the PerformanceTrust Municipal Bond Fund (the “Municipal Bond Fund”) and thePerformance Trust Strategic Bond Fund (the “Strategic BondFund”) (each, a “Fund,” and together, the “Funds”), each a series ofthe Trust, and PT Asset Management, LLC, the Funds’ investmentadviser (the “Adviser”). The Trustees also met at a prior meetingheld on June 14, 2017 (the “June 14, 2017 meeting”) to reviewmaterials related to the renewal of the Agreement. Prior to thesemeetings, the Trustees requested and received materials to assistthem in considering the renewal of the Agreement. The materialsprovided contained information with respect to the factorsenumerated below, including a copy of the Agreement, amemorandum prepared by the Trust’s outside legal counseldiscussing in detail the Trustees’ fiduciary obligations and thefactors they should assess in considering the renewal of theAgreement, detailed comparative information relating to the Funds’performance, as well as the management fees and other expensesof the Funds, due diligence materials relating to the Adviser(including a due diligence questionnaire completed on behalf of theFunds by the Adviser, the Adviser’s Form ADV, select financialstatements of the Adviser, bibliographic information of the Adviser’skey management and compliance personnel, comparative feeinformation for the Funds and the Adviser’s other separately-managed accounts and a summary detailing key provisions of theAdviser’s written compliance program, including its code of ethics)and other pertinent information. The Trustees also receivedinformation periodically throughout the year that was relevant tothe Agreement renewal process, including performance,management fee and other expense information. Based on theirevaluation of the information provided by the Adviser, inconjunction with the Funds’ other service providers, the Trustees,by a unanimous vote (including a separate vote of the Trustees whoare not “interested persons,” as that term is defined in theInvestment Company Act of 1940, as amended (the “IndependentTrustees”)), approved the continuation of the Agreement for anadditional one-year term ending August 31, 2018.
DISCUSSION OF FACTORS CONSIDEREDIn considering the renewal of the Agreement and reaching theirconclusions, the Trustees reviewed and analyzed various factorsthat they determined were relevant, including the factorsenumerated below.
1. NATURE, EXTENT AND QUALITY OF SERVICESPROVIDED TO THE FUNDSThe Trustees considered the nature, extent and quality ofservices provided by the Adviser to the Funds and the amountof time devoted to the Funds’ affairs by the Adviser’s staff. TheTrustees considered the Adviser’s specific responsibilities in allaspects of day-to-day management of the Funds, as well asthe qualifications, experience and responsibilities of G. MichaelPlaiss, co-portfolio manager for the Performance TrustStrategic Bond Fund and portfolio manager of the PerformanceTrust Municipal Bond Fund, and Anthony J. Harris, co-portfoliomanager for the Performance Trust Strategic Bond Fund, aswell as other key personnel at the Adviser involved in the day-to-day activities of the Funds. The Trustees reviewedinformation provided by the Adviser in a due diligencesummary, including the structure of the Adviser’s complianceprogram and discussed the Adviser’s marketing activity and itscontinuing commitment to the Funds. The Trustees noted that
during the course of the prior year they had met with theAdviser in person to discuss various performance, marketingand compliance issues. The Trustees also noted any servicesthat extended beyond portfolio management, and theyconsidered the brokerage practices of the Adviser. TheTrustees discussed in detail the Adviser’s handling ofcompliance matters, including the reports of the Trust’s chiefcompliance officer to the Trustees on the effectiveness of theAdviser’s compliance program. The Trustees concluded thatthe Adviser had sufficient quality and depth of personnel,resources, investment methods and compliance policies andprocedures essential to performing its duties under theAgreement and that the nature, overall quality and extent of themanagement services provided to the Funds, as well as theAdviser’s compliance program, were satisfactory and reliable.
2. INVESTMENT PERFORMANCE OF THE FUNDS AND THEADVISERThe Trustees discussed the performance of each Fund for theyear-to-date, one-year, three-year and five-year periods endedApril 30, 2017. In assessing the quality of the portfoliomanagement services delivered by the Adviser, the Trusteesalso compared the short-term and longer-term performance ofthe Funds on both an absolute basis and in comparison to abenchmark index (the Bloomberg Barclays Aggregate BondIndex for the Performance Trust Strategic Bond Fund and theBloomberg Barclays Municipal Bond Index for thePerformance Trust Municipal Bond Fund) and in comparison toa peer group of similar funds as constructed by datapresented by Morningstar Direct (a peer group of U.S. open-end multi-sector bond funds for the Performance TrustStrategic Bond Fund and a peer group of U.S. open-endmunicipal national intermediate funds for the PerformanceTrust Municipal Bond Fund) (each a “Morningstar PeerGroup”). The Trustees noted the Adviser’s representation thatit does not calculate composite performance for its separately-managed accounts and as such the Adviser could not providecomposite performance information for those accounts.
The Trustees noted that the Performance Trust Strategic BondFund’s performance for the three-year and five-year periodsended April 30, 2017 was above the Morningstar Peer Groupmedians, and ranked in the top percentile among the funds inthe Morningstar Peer Group for three-year period. The Trusteesalso noted the Fund’s performance for the year-to-date andone-year periods was below the Morningstar Peer Groupmedian. The Trustees also noted that for the quarter, one-year,three-year, five-year and since inception periods ended March31, 2017, the Performance Trust Strategic Bond Fundoutperformed the Bloomberg Barclays Aggregate Bond Index.
The Trustees noted the performance for the Institutional Classshares of the Performance Trust Municipal Bond Fund for theyear-to-date, three-year and five-year periods ended April 30,2017 ranked above its Morningstar Peer Group median, andranked in the top percentile among the funds in the MorningstarPeer Group for the year-to-date period. The Trustees alsonoted the performance for the Institutional Class shares of thePerformance Trust Municipal Bond Fund for the one-year periodended April 30, 2017 ranked below its Morningstar Peer Groupmedian. The Trustees noted for the quarter, three-year, five-yearand since inception periods ended March 31, 2017, theInstitutional Class shares of the Performance Trust MunicipalBond Fund outperformed the Bloomberg Barclays MunicipalBond Index. The Trustees further noted the Institutional Class
BASIS FOR TRUSTEES’ APPROVAL OF INVESTMENT ADVISORY AGREEMENT(Unaudited)
PERFORMANCE TRUST MUTUAL FUNDS (PTIAX, PTIMX, PTRMX) PAGE 43
shares of the Performance Trust Municipal Bond Fundunderperformed the Bloomberg Barclays Municipal Bond Indexfor the one-year period ended March 31, 2017.
After considering all of the information, the Trusteesconcluded that the performance obtained by the Adviser forthe Funds was satisfactory under current market conditions.Although past performance is not a guarantee or indication offuture results, the Trustees determined that the Funds andtheir shareholders were likely to benefit from the Adviser’scontinued management.
3. COSTS OF SERVICES PROVIDED AND PROFITSREALIZED BY THE ADVISERThe Trustees considered the cost of services and the structureof the Adviser’s fees, including a review of the expenseanalyses and other pertinent material with respect to theFunds. The Trustees reviewed the related statisticalinformation and other materials provided, including thecomparative expenses, expense components and peer groupselections. The Trustees considered the cost structure of eachFund relative to its Morningstar Peer Group and the Adviser’sseparately-managed accounts and private funds, as well asthe fee waivers and expense reimbursements of the Adviserwith respect to the Performance Trust Municipal Bond Fund.
The Trustees also considered the overall profitability of theAdviser, reviewing the Adviser’s financial information andnoting that the Adviser had provided subsidies for the Funds’operations since each Fund’s inception and had not fullyrecouped those subsidies for the Performance Trust MunicipalBond Fund. The Trustees also examined the level of profitsthat could be expected to accrue to the Adviser from the feespayable under the Agreement and the expense subsidizationsundertaken by the Adviser, as well as the Funds’ brokeragecommissions, noting that the Adviser makes no effort to seeksoft dollar arrangements. These considerations were basedon materials requested by the Trustees and the Funds’administrator specifically for the June 14, 2017 meeting andthe August 18, 2017 meeting at which the Agreement wasformally considered, as well as the reports made by theAdviser over the course of the year.
The Trustees noted that the Performance Trust Strategic BondFund’s contractual management fee of 0.60% was above itsMorningstar Peer Group average of 0.54%. The Trusteesobserved that the Performance Trust Strategic Bond Fundwas operating below its expense cap of 0.95%. The Trusteesnoted the Performance Trust Strategic Bond Fund’s totalexpense ratio of 0.76% was above its Morningstar PeerGroup average (which excludes Rule 12b-1 fees) of 0.72%.The Trustees then compared the fees paid by thePerformance Trust Strategic Bond Fund to fees paid byseparately-managed accounts and private funds of theAdviser with similar investment strategies.
The Trustees noted that the Performance Trust MunicipalBond Fund’s contractual management fee of 0.40% was justbelow the Morningstar Peer Group average of 0.41%. TheTrustees observed that the Performance Trust Municipal BondFund’s total expense ratio (net of fee waivers and expensereimbursements) of 0.55% for its Institutional Class shareswas equal to the Morningstar Peer Group average (whichexcludes Rule 12b-1 fees). The Trustees then compared thefees paid by the Performance Trust Municipal Bond Fund tofees paid by separately-managed accounts and private fundsof the Adviser with similar investment strategies.
The Trustees concluded that the Funds’ expenses and themanagement fees paid to the Adviser were fair andreasonable in light of the comparative performance, expense
and management fee information. The Trustees furtherconcluded, based on a profitability analysis prepared by theAdviser, that while the Adviser was not realizing profits inconnection with its management of the Funds, the Advisermaintained adequate profit levels to support its services to theFunds from the revenues of its overall investment advisorybusiness, despite its subsidies to support the PerformanceTrust Municipal Bond Fund’s operations.
4. EXTENT OF ECONOMIES OF SCALE AS THE FUNDS GROWThe Trustees compared each Fund’s expenses relative to itspeer group and discussed realized and potential economies ofscale. The Trustees also reviewed the structure of eachFund’s management fee and whether each Fund was largeenough to generate economies of scale for shareholders orwhether economies of scale would be expected to be realizedas Fund assets grow (and if so, how those economies of scalewere being or would be shared with shareholders). TheTrustees reviewed all fee waivers and expensereimbursements by the Adviser with respect to the Funds.The Trustees noted that the Funds’ management feestructures did not contain any breakpoint reductions as theFunds’ assets grow in size, but that the Adviser had providedinformation to the Trustees including that the Adviser willcontinue to review the fee structures and evaluatecircumstances that may warrant a breakpoint in the feestructures. With respect to the Adviser’s fee structures andany applicable expense waivers, the Trustees concluded thatthe current fee structures were reasonable and reflected asharing of economies of scale between the Adviser and theFunds at the Funds’ current asset levels.
5. BENEFITS DERIVED FROM THE RELATIONSHIP WITHTHE FUNDSThe Trustees considered the direct and indirect benefits thatcould be received by the Adviser from its association with theFunds. The Trustees examined the brokerage andcommissions of the Adviser with respect to the Funds. TheTrustees noted that the Adviser receives no soft dollar benefitswith respect to its management of the Funds. The Trusteesconcluded that the benefits the Adviser may receive, such asgreater name recognition or press coverage, appear to bereasonable, and in many cases may benefit the Funds.
CONCLUSIONSThe Trustees considered all of the foregoing factors. Inconsidering the renewal of the Advisory Agreement, the Trusteesdid not identify any one factor as all-important, but ratherconsidered these factors collectively in light of each Fund’ssurrounding circumstances. Based on this review, the Trustees,including a majority of the Independent Trustees, approved thecontinuation of the Advisory Agreement for an additional termending August 31, 2018 as being in the best interests of eachFund and its shareholders.
BASIS FOR TRUSTEES’ APPROVAL OF INVESTMENT ADVISORY AGREEMENT (CONT.)(Unaudited)
PERFORMANCE TRUST MUTUAL FUNDS (PTIAX, PTIMX, PTRMX) PAGE 44
Availability of Proxy Voting InformationThe Funds have adopted proxy voting policies andprocedures that delegate to the Adviser the authority tovote proxies. A description of the Funds’ proxy votingpolicies and procedures is available without charge, uponrequest, by calling the Funds toll free at 1 (877) 738-9095.A description of these policies and procedures is alsoincluded in the Funds’ Statement of AdditionalInformation, which is available on the SEC’s website athttp://www.sec.gov.
The Funds’ proxy voting record for the most recent 12-month period ended June 30 is available withoutcharge, upon request, by calling toll free, 1 (877) 738-9095,or by accessing the SEC’s website at http://www.sec.gov.
Portfolio HoldingsThe Funds file their complete schedule of portfolioholdings with the SEC four times each fiscal year atquarter-ends. The Funds file their schedule of portfolioholdings with the SEC on Form N-Q (first and thirdquarters) and Form N-CSR (second and fourth quarters).Shareholders may view the Funds’ Forms N-CSR and N-Qon the SEC’s website at http://www.sec.gov. Forms N-CSR and N-Q may also be reviewed and copied at theSEC’s Public Reference Room in Washington, D.C.Information on the SEC’s Public Reference Room may beobtained by calling 1 (202) 551-8090 (direct) or 1 (800) SEC-0330 (general SEC number).
HouseholdingIn an effort to decrease costs, the Funds intend to reducethe number of duplicate prospectuses and annual andsemi-annual reports you receive by sending only one copyof each to those addresses shared by two or moreaccounts and to shareholders the Funds reasonablybelieve are from the same family or household. Onceimplemented, if you would like to discontinuehouseholding for your accounts, please call toll-free at1-877-738-9095 to request individual copies of thesedocuments. Once the Funds receive notice to stophouseholding, the Funds will begin sending individualcopies 30 days after receiving your request. This policydoes not apply to account statements.
Forward Looking StatementsExcept for historical information contained in this reportfor the Funds, the matters discussed in this report mayconstitute forward-looking statements made pursuant tothe safe-harbor provisions of the Private SecuritiesLitigation Reform Act of 1995. These include any adviseror portfolio manager predictions, assessments, analysesor outlooks for individual securities, industries, marketsectors and/or markets. These statements involve risksand uncertainties. In addition to the general risksdescribed for the Funds in the most recent prospectus,other factors bearing on this report include the accuracy ofthe Adviser’s or portfolio manager’s data, forecasts andpredictions, and the appropriateness of the investmentprograms designed by the adviser or portfolio manager toimplement their strategies efficiently and effectively. Anyone or more of these factors, as well as other risksaffecting the securities markets and investmentinstruments generally, could cause the actual results of theFunds to differ materially as compared to benchmarksassociated with the Funds.
IndemnificationUnder the Trust’s organizational documents, its officersand Trustees are indemnified against certain liabilitiesarising out of the performance of their duties to the Funds.In addition, in the normal course of business, the Fundsenter into contracts that provide general indemnification toother parties. The Funds’ maximum exposure under thesearrangements is unknown as this would involve futureclaims that may be made against the Funds that have notyet occurred. However, the Funds have not had priorclaims or losses pursuant to these contracts and expectthe risk of loss to be remote.
Information About TrusteesThe business and affairs of the Trust are managed underthe direction of the Trust’s Board of Trustees. Informationpertaining to the Trustees of the Trust is set forth below.The Funds’ Statement of Additional Information includesadditional information about the Trustees and is available,without charge, upon request by calling 1 (877) 738-9095.
ADDITIONAL INFORMATION(Unaudited)
PERFORMANCE TRUST MUTUAL FUNDS (PTIAX, PTIMX, PTRMX) PAGE 45

OTHERNUMBER OF PRINCIPAL DIRECTORSHIPS
NAME, POSITION(S) TERM OF OFFICE PORTFOLIOS IN OCCUPATION(S) HELD BY TRUSTEEADDRESS, AND HELD WITH THE AND LENGTH OF TRUST OVERSEEN DURING THE DURING THE PASTYEAR OF BIRTH TRUST TIME SERVED BY TRUSTEE PAST FIVE YEARS FIVE YEARS
Independent Trustees
Michael D. Trustee Indefinite Term; 31 Professor, Department of Independent Akers, Ph.D. Since August 22, Accounting, Marquette Trustee, USA 615 E. Michigan St. 2001 University (2004 –present); MUTUALS (an Milwaukee, WI Chair, Department of open-end 53202 Accounting, Marquette investment Year of Birth: 1955 University (2004–2017). company with one
portfolio).
Gary A. Drska Trustee Indefinite Term; 31 Pilot, Frontier/Midwest Independent615 E. Michigan St. Since August 22, Airlines, Inc. (airline company) Trustee, USA Milwaukee, WI 2001 (1986–present). MUTUALS (an 53202 open-end Year of Birth: 1956 investment
company with one portfolio).
Jonas B. Siegel Trustee Indefinite Term; 31 Retired (2011–present); Independent615 E. Michigan St. Since October 23, Managing Director, Chief Trustee, Gottex Milwaukee, WI 2009 Administrative Officer (“CAO”) Trust (an open-end 53202 and Chief Compliance Officer investmentYear of Birth: 1943 (“CCO”), Granite Capital company with
International Group, L.P. one portfolio) (an investment management (2010–2016); firm) (1994–2011). Independent
Manager, Ramius IDF fund complex (two closed-end investment companies) (2010–2015); Independent Trustee, Gottex Multi-Asset Endowment fund complex (three closed-end investment companies) (2010–2015); Independent Trustee, Gottex Multi-Alternatives fund complex (threeclosed-end investment companies) (2010–2015).
INDEPENDENT TRUSTEES(Unaudited)
PERFORMANCE TRUST MUTUAL FUNDS (PTIAX, PTIMX, PTRMX) PAGE 46

OTHERNUMBER OF PRINCIPAL DIRECTORSHIPS
NAME, POSITION(S) TERM OF OFFICE PORTFOLIOS IN OCCUPATION(S) HELD BY TRUSTEEADDRESS, AND HELD WITH THE AND LENGTH OF TRUST OVERSEEN DURING THE DURING THE PASTYEAR OF BIRTH TRUST TIME SERVED BY TRUSTEE PAST FIVE YEARS FIVE YEARS
Interested Trustee and Officers
Joseph C. Chairperson Indefinite Term; 31 President (2017–present); Trustee, Buffalo Neuberger* and Trustee Since August 22, Chief Operating Officer Funds (an open-end 615 E. Michigan St. 2001 (2016–present); Executive investment Milwaukee, WI Vice President, U.S. Bancorp company with ten 53202 Fund Services, LLC portfolios); Trustee, Year of Birth: 1962 (1994–2017). USA MUTUALS
(an open-end investment company with one portfolio).
John P. Buckel President Indefinite Term; N/A Vice President, U.S. Bancorp N/A615 E. Michigan St. and Principal Since January 24, Fund Services, LLC Milwaukee, WI Executive 2013 (2004–present).53202 OfficerYear of Birth: 1957
Jennifer A. Lima Vice President, Indefinite Term; N/A Vice President, U.S. Bancorp N/A615 E. Michigan St. Treasurer Since January 24, Fund Services, LLC Milwaukee, WI and Principal 2013 (2002–present).53202 Financial andYear of Birth: 1974 Accounting
Officer
Elizabeth B. Scalf Chief Indefinite Term; N/A Vice President, U.S. Bancorp N/A615 E. Michigan St. Compliance Effective July 1, Fund Services, LLC Milwaukee, WI Officer, Vice 2017 (February 2017–present); 53202 President and Vice President and Year of Birth: 1985 Anti-Money Assistant CCO, Heartland
Laundering Advisors, Inc. (December Officer 2016–January 2017);
Vice President and CCO, Heartland Group, Inc. (May 2016–November 2016); Vice President, CCO and Senior Legal Counsel (May 2016–November 2016), Assistant CCO and Senior Legal Counsel (January 2016–April 2016), Senior Legal and Compliance Counsel (2013–2015), Legal and Compliance Counsel (2011–2013), Heartland Advisors, Inc.
Adam W. Smith Secretary Indefinite Term; N/A Assistant Vice President, N/A615 E. Michigan St. Since May 29, U.S. Bancorp Fund Milwaukee, WI 2015 Services, LLC53202 (2012–present).Year of Birth: 1981
INTERESTED TRUSTEE AND OFFICERS(Unaudited)
PERFORMANCE TRUST MUTUAL FUNDS (PTIAX, PTIMX, PTRMX) PAGE 47
* Mr. Neuberger is an “interested person” of the Trust as defined by the 1940 Act by virtue of the fact that he is a board member and aninterested person of Quasar Distributors, LLC who acts as principal underwriter for several series of the Trust, but not the Funds.

OTHERNUMBER OF PRINCIPAL DIRECTORSHIPS
NAME, POSITION(S) TERM OF OFFICE PORTFOLIOS IN OCCUPATION(S) HELD BY TRUSTEEADDRESS, AND HELD WITH THE AND LENGTH OF TRUST OVERSEEN DURING THE DURING THE PASTYEAR OF BIRTH TRUST TIME SERVED BY TRUSTEE PAST FIVE YEARS FIVE YEARS
Officers
Cullen O. Small Assistant Indefinite Term; N/A Assistant Vice President, N/A615 E. Michigan St. Treasurer Since January 22, U.S. Bancorp Fund Milwaukee, WI 2015 Services, LLC 53202 (2010–present).Year of Birth: 1987
Kelly A. Burns Assistant Indefinite Term; N/A Assistant Vice President, N/A615 E. Michigan St. Treasurer Since April 23, U.S. Bancorp Fund Milwaukee, WI 2015 Services, LLC 53202 (2011–present).Year of Birth: 1987
Melissa Aguinaga Assistant Indefinite Term; N/A Assistant Vice President, N/A615 E. Michigan St. Treasurer Since July 1, U.S. Bancorp Fund Milwaukee, WI 2015 Services, LLC 53202 (2010–present).Year of Birth: 1987
INTERESTED TRUSTEE AND OFFICERS(Unaudited)
PERFORMANCE TRUST MUTUAL FUNDS (PTIAX, PTIMX, PTRMX) PAGE 48

(This Page Intentionally Left Blank.)


Investment AdviserPT Asset Management, LLC500 W. Madison, Suite 470Chicago, IL 60661
888.282.3220www.PTAMfunds.com
Fund Administrator, Transfer Agent,and Fund AccountantU.S. Bancorp Fund Services, LLC615 East Michigan StreetMilwaukee, WI 53202
CustodianU.S. Bank, N.A.Custody Operations1555 N. RiverCenter Drive, Suite 302Milwaukee, WI 53212
Legal CounselGodfrey & Kahn, S.C.833 East Michigan Street, Suite 1800Milwaukee, WI 53202
Independent RegisteredPublic Accounting FirmCohen & Company, Ltd.1350 Euclid Avenue, Suite 800Cleveland, OH 44115
DistributorForeside Fund Services, LLC3 Canal Plaza, Suite 100Portland, ME 04101
This report has been prepared for shareholdersand may be distributed to others only if precededor accompanied by a current prospectus.
The Performance Trust Mutual Funds are distributedby Foreside Fund Services, LLC
Related Documents