6 Performance Testing in the Cloud Using MBPeT Fredrik Abbors, Tanwir Ahmad, Dragos Truscan, and Ivan Porres Department of Information Technologies ˚ Abo Akademi University, Turku, Finland Email: {fredrik.abbors, tanwir.ahmed, dragos.truscan, ivan.porres}@abo.fi Abstract–We present a model-based performance testing approach using the MBPeT tool. We use of probabilistic timed automata to model the user profiles and to generate synthetic workload. The MBPeT generates the load in a distributed fashion and applies it in real-time to the system under test, while measuring several key performance indicators, such as response time, throughput, error rate, etc. At the end of the test session, a detailed test report is provided. MBPeT has a distributed architecture and supports load generation distributed over multiple machines. New generation nodes are allocated dynamically during load generation. In this book chapter, we will present the MBPeT tool, its architecture, and demonstrate its applicability with a set of experiments on a case study. We also show that using abstract models for describing the user profiles allows us quickly experiment di↵erent load mixes and detect worst case scenarios. Keywords-Performance testing, model-based testing, MBPeT, cloud. 6.1 Introduction Software testing is the process of identifying incorrect behavior of a system, also known as revealing defects. Uncovering these defects, typically, consists of running a batch of software tests (test suite ) against the software itself. In some sense, a second software artefact is built to test the primary one. This is normally referred to as functional testing. A software test compares the actual output of the system with the expected output for a particular 191

Welcome message from author
This document is posted to help you gain knowledge. Please leave a comment to let me know what you think about it! Share it to your friends and learn new things together.
Transcript

6 Performance Testing in the Cloud UsingMBPeT
Fredrik Abbors, Tanwir Ahmad, Dragos Truscan, and Ivan PorresDepartment of Information TechnologiesAbo Akademi University, Turku, FinlandEmail: {fredrik.abbors, tanwir.ahmed, dragos.truscan, ivan.porres}@abo.fi
Abstract–We present a model-based performance testing approach usingthe MBPeT tool. We use of probabilistic timed automata to model the userprofiles and to generate synthetic workload. The MBPeT generates the loadin a distributed fashion and applies it in real-time to the system under test,while measuring several key performance indicators, such as response time,throughput, error rate, etc. At the end of the test session, a detailed testreport is provided. MBPeT has a distributed architecture and supports loadgeneration distributed over multiple machines. New generation nodes areallocated dynamically during load generation. In this book chapter, we willpresent the MBPeT tool, its architecture, and demonstrate its applicabilitywith a set of experiments on a case study. We also show that using abstractmodels for describing the user profiles allows us quickly experiment di↵erentload mixes and detect worst case scenarios.
Keywords-Performance testing, model-based testing, MBPeT, cloud.
6.1 Introduction
Software testing is the process of identifying incorrect behavior of a system,also known as revealing defects. Uncovering these defects, typically, consistsof running a batch of software tests (test suite) against the software itself.In some sense, a second software artefact is built to test the primary one.This is normally referred to as functional testing. A software test comparesthe actual output of the system with the expected output for a particular
191
192 F. Abbors, T. Ahmad, D. Truscan, and I. Porres
known input. If the actual output is the same as the expected output thetest passes, otherwise a test fails and a defect is found. Software testingis also the means to assess the quality of a software product. The fewerthe defects found during testing, the higher the quality is of that softwareproduct. However, not all software defects are related to functionality. Somesystems may stop functioning or may prevent other users to access the systemsimple because the system is under a heavy workload with which it cannotcope. Performance testing is the means of detecting such errors.
Performance testing is the process of determining how a software systemperforms in terms of responsiveness and stability under a particular workload.The purpose of the workload is that it should match the expected workload(the load that normal users put on the system when using it) as closely aspossible. This can be achieved by running a series of tests in parallel, butinstead of focusing on the right output the focus is shifted towards measuringnon-functional aspects, i.e. the time between input and output (responsetime) or number of requests processed in a second (throughput).
Traditionally, performance testing has been conducted by running a num-ber of predefined scenarios (or scripts) in parallel. One drawback to thisapproach is that real users do not behave as static scripts. This can also leadto certain paths in the system being left untested or that certain cachingmechanisms in the system kick in due the repetitiveness of the test scripts.
Software testing can be extremely time consuming and costly. In 2005,Caper Jones - chief scientist of Software Productivity Research in Mas-sachusetts - estimated that as much as 60 percent of the software work inthe United States was related to detecting and fixing defects [1]. Anotherdrawback is that software testing, as well as performance testing, involvestedious manual work when creating test cases. A software system typicallyundergoes a lot of changes during its lifetime. Whenever a piece of code ischanged, a test has to be updated or created to show that the change didnot break any existing functionality or introduce any new defects. This addsmore time and cost to testing. In the case of performance testing this impliesthat one has to be able to benchmark quickly and e↵ectively to check if theperformance of the system is a↵ected by the change of the code.
Research e↵ort have be put into solving this dilemma. One of the mostpromising techniques is Model-Based Testing (MBT). In MBT, the centralartefact is a system model. The idea is that the model represents the behav-ior or the use of the system. Tests are then automatically generated formthe model. In MBT the focus has shifted from manually creating tests tomaintaining a model that represents the behavior of the system. Due to thefact that tests are automatically generated from a model, MBT copes betterwith changing requirements and code than traditional testing. Research has

Performance Testing in the Cloud Using MBPeT 193
shown that MBT could reduce the total testing costs with 15 percent [8].MBT has mostly been targeted towards functional testing, however, thereexist a few tools that utilizes the power of MBT in the domain of perfor-mance testing. In our research we make use of the advantages of MBT inour performance testing approach.
MBPeT is a Python-based tool for performance testing. Load is generatedfrom probabilistic timed automata (PTA) models describing the behavior ofgroups of virtual users. The models are then executed in parallel to get asemi-random workload mix. The abstract PTA models are easy to create andupdate, facilitating quick iteration cycles. During the load generation phase,the tool also monitors di↵erent key performance indicators (KPIs) such asresponse times, throughput, memory, CPU, disk, etc. The MBPeT tool has adistributed architecture where one master node controls several slave node orload generator. This facilitates deployment to a cloud environment. Besidesmonitoring, the tool also produces a performance test report at the end ofthe test. The report contains information about the monitored KPIs, such asresponse times, throughput etc, but also graphs showing how CPU, memory,disk, network utilization varied during a performance test session.
The rest of the report is structured as follows: we briefly enumerateseveral related works in the following section. Then, is Section 6.3, we brieflydescribe the load generation process. In Section 6.4, we give an overview ofthe architecture of the tool. In Section 6.5, we describe how the workloadmodels are created and discuss the probabilistic timed automata formalism.In Section 6.6, we discuss the performance testing process in more detail.In Section 6.7, we present a auction web service case study and a series ofexperiments using our tool. Finally, in Section 6.8 we present our conclusionsand discuss future work.
6.2 Related Work
There exist a plethora of commercial performance testing tools. In the fol-lowing, we briefly enumerate couple of popular performance testing tools.FABAN is an open source framework for developing and running multi-tierserver benchmarks [18]. FABAN has a distributed architecture meaning loadcan be generated from multiple machines. The tool has three main com-ponents: A harness - for automating the process of a benchmark run andproviding a container for the benchmark driver code, a Driver framework -provides an API for people to develop load drivers, and an Analysis tool - toprovide comprehensive analysis of the data gathers for a test. Load is gen-erated by running multiple scripts in parallel. JMeter [19] is an open source

194 F. Abbors, T. Ahmad, D. Truscan, and I. Porres
Java tool for load testing and measuring performance, with the focus on webapplications. Jmeter can be set up in a distributed fashion and load is gener-ated from manually created scenarios that are run in parallel. Httperf [6] isa tool for measuring the performance of web servers. Its aim is to facilitatethe construction of both micro and macro-level benchmarks. Httperf can beset up to run on multiple machines and load is generated from pre-definedscripts. LoadRunner [7] is a performance testing tool from Hewlett-Packardfor examining system behavior and performance. The tool can be run in adistributed fashion and load is generated from pre-recorded scenarios.
Recently several authors have focused on using models for performanceanalysis and estimation, as well as for load generation. Barna et al., [2]present a model-based testing approach to test the performance of a trans-actional system. The authors make use of an iterative approach to findthe workload stress vectors of a system. An adaptive framework will thendrive the system along these stress vectors until a performance stress goalis reached. They use a system model, represented as a two-layered queuingnetwork, and they use analytical techniques to find a workload mix that willsaturate a specific system resource. Their approach di↵ers from ours in thesense that they use a model of the system instead of testing against a realimplementation of a system.
Other related approaches can be found in [16] and [15]. In the former, theauthors have focused on generating valid traces or a synthetic workload forinter-dependent requests typically found in sessions when using web appli-cations. They describe an application model that captures the dependenciesfor such systems by using Extended Finite State Machines (EFSMs). Com-bined with a workload model that describes session inter-arrival rates andparameter distributions, their tool SWAT outputs valid session traces thatare executed using a modified version of httperf [12]. The main use of thetool is to perform a sensitivity analysis on the system when di↵erent param-eters in the workload are changed, e.g., session length, distribution, thinktime, etc. In the latter, the authors suggest a tool that generates represen-tative user behavior traces from a set of Customer Behavior Model Graphs(CBMG). The CBMG are obtained from execution logs of the system andthey use a modified version of the httperf utility to generate the tra�c fromtheir traces. The methods di↵er from our approach in the sense they bothfocus on the trace generation and let other tools take care of generating theload/tra�c for the system, while we do on-the-fly load generation from ourmodels.
Denaro [4] proposes an approach for early performance testing of dis-tributed software when the software is built using middleware componentstechnologies, such as J2EE or CORBA. Most of the overall performance of

Performance Testing in the Cloud Using MBPeT 195
such a system is determined by the use and configuration of the middleware(e.g. databases). They also note that the coupling between the middlewareand the application architecture determines the actual performance. Basedon architectural designs of an application the authors can derive application-specific performance tests that can be executed on the early available mid-dleware platform that is used to build the application with. This approachdi↵ers from ours in that the authors mainly target distributed systems andtesting of the performance of middleware components.
6.3 The Performance Testing Process
In this section we are briefly going to describe the steps of the performancetesting process. A more detailed description is given in Section 6.6.
6.3.1 Model Creation
Before we start generation load for the system we first have to create aload profile or a load model that describe the behavior of the users. Sincewe can not have a model for each individual user we have to create one orseveral models that represent the behavior for a larger group of users. Thesemodels describe how a groups of virtual users (VUs) behave and they aresimplified models of how a real users would behave. Section 6.5 gives moredetails of how the models are constructed. Essentially, we use probabilistictimed automata (PTA) to specify user behavior which describe in an abstractway the sequence of actions a VU can execute against the system and theirprobabilistic distribution.
6.3.2 Model Validation
Once the models have been created they are checked for consistency and cor-rectness. For instance, we check that the models have a start and end point,that there are no syntactical errors in the models, and that the probabilitiesand actions have been defined correctly. Once the models have been checkedby the MBPeT tool we start generating load for the system under test (SUT).
6.3.3 Test Setup
Before we can actually start generating load we need to set up everythingcorrectly so that the MBPeT can connect to the SUT and generate the ap-propriate amount of load. To do that one have to fill in a settings file. Thisfile contains e.g., the IP-address of the SUT, what load models to use, how
196 F. Abbors, T. Ahmad, D. Truscan, and I. Porres
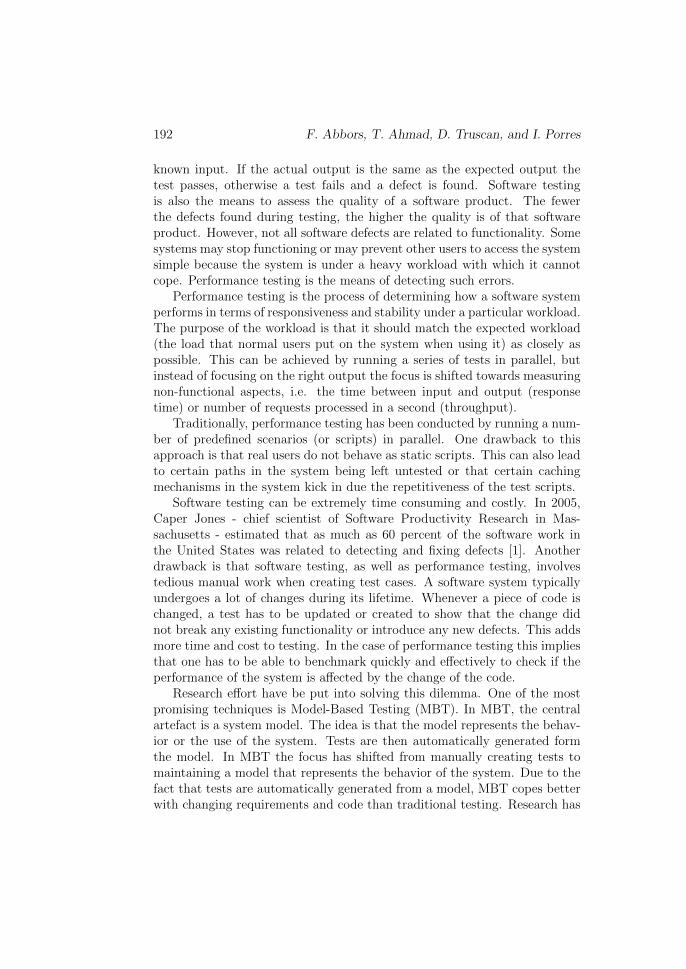
many parallel virtual users to simulate, ramp up period, and the duration ofthe performance test. The MBPeT tool needs this information in order tobe able to generate the right amount of load.
The tester also needs to implement an adapter for the tool. Every SUTwill have its own adapter implementation. The purpose of the adapter isto translate the abstract actions found in the model into concrete actionsunderstandable by the SUT. In case of a web page, a browse action wouldneed to be translated into a HTTP GET request.
6.3.4 Load Generation
Once everything is set up, load generation begins. The MBPeT tool generatesload from the models by starting a new process for every simulated user.Inside that process load is generated by executing the PTA model. For moredetails please see Section 6.6.2. Please see Section 6.5.2 for more informationon PTAs.
6.3.5 Monitoring
During the load testing phase the MBPeT tool monitors the tra�c sent onthe network to the SUT. The tool monitors the throughput and responsetime for every action sent to the system. If there is a possibility to connectto the SUT remotely, the MBPeT tool can also monitor the utilization of theCPU, memory, network, disk, etc. This information can be very useful whentrying to identify potential bottlenecks in the system. Once the test run iscomplete and all information is gathered, the tool will create a test report.
6.3.6 Test Reporting
The test report contains information about the parameters monitored duringthe performance test. It gives statistical values of the mean and max responsetime for individual actions and displays graphs that show how the reponestime varied over time when the load increases. If the tool can be connectedremotely to the SUT, the test report will also show how the CPU, memory,and disk was utilized over time when the load was applied to the SUT. Both ofthese sources of information can be helpful when trying to pin the a potentialbottleneck in the system.

Performance Testing in the Cloud Using MBPeT 197
6.4 MBPeT Tool Architecture
MBPeT has a distributed architecture. It consists of two types of nodes: amaster node and slave nodes. A single master node is responsible of initiatingand controlling multiple remote slave nodes, as shown in Figure 6.1. Slavenodes are designed to be identical and generic, in a sense that they do nothave prior knowledge of the SUT, its interfaces, or the workload models. Thatis why for each test session, the master gathers and parses all the requiredinformation regarding the SUT and the configuration for each test sessionand sends that information to all the slave nodes. Once all slaves have beeninitialized, the master begins the load generation process by starting a singleslave while rest of the slaves are idling.
Master Node
Slave Node 1
Slave Node 2
Slave Node N
.
.
.
SUT Network Adapter
Adap
ter
Adap
ter
Adap
ter
Figure 6.1: Distributed architecture of MBPeT tool
6.4.1 The Master Node
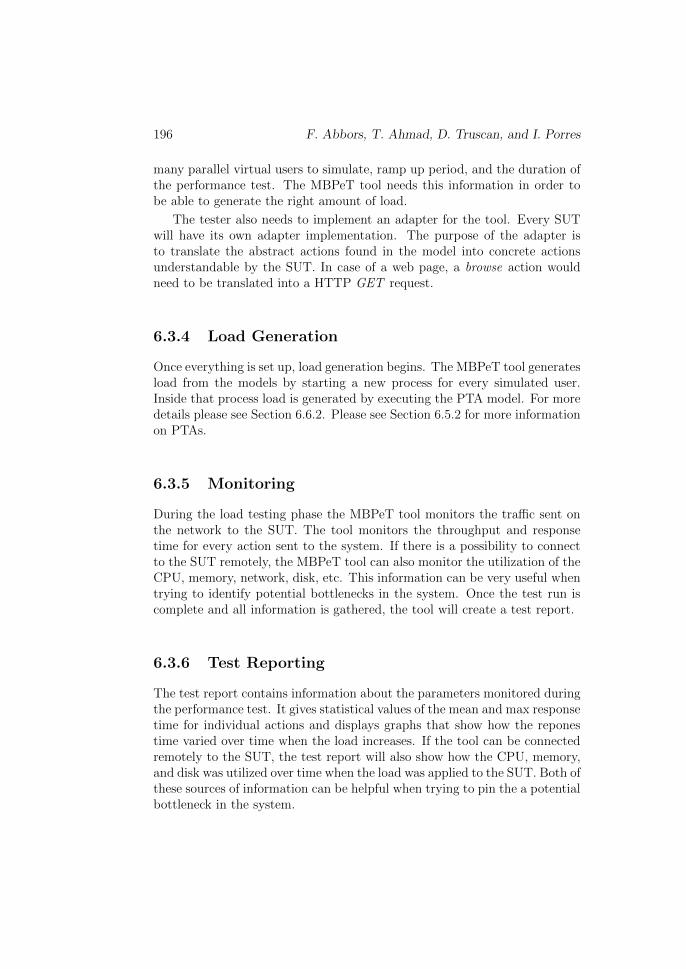
The internal architecture of the master node is shown in Figure 6.2. Itcontains the following components:
Core Module
The core module of the master node controls the activities of other modulesas well as the flow of information among them. It initiates the di↵erentmodules when their services are required. The core module takes as inputthe following information and distributes it among all the slave nodes:
198 F. Abbors, T. Ahmad, D. Truscan, and I. Porres
Master Node
Model Validator Models
Configuration
User DB
User-Resource Data Base
Core
Test Report Creator
Test Report
Slave node 1
Slave Controller 1
User Input
User Output Slave node N
Slave Controller N
..... .....
Resource utilization at SUT
Trace File
Figure 6.2: Master Node
1. User Models: PTA models are employed to mimic the dynamic behav-ior of the users. Each case-study can have multiple models to representdi↵erent types of users. User models are expressed in DOT language[5].
2. Test Configuration: It is a collection of di↵erent parameters, that aredefined in a Settings file, which is a case-study specific. A Settingsfile specifies the necessary information about the case-study and thisinformation is later used by the tool to run the experiment. Thereare some mandatory parameters in the Settings file, which have beenlisted below with the brief description. These parameters can also beprovided as command-line arguments to the master node.
(a) Test duration: It defines the duration of a test session in seconds.
(b) Number of users : It specifies the maximum number of concurrentusers for a test session.
(c) Ramp: The ramp period is specified for all types of users. It canbe defined in two ways. One way is to specify it as a percentage
Performance Testing in the Cloud Using MBPeT 199
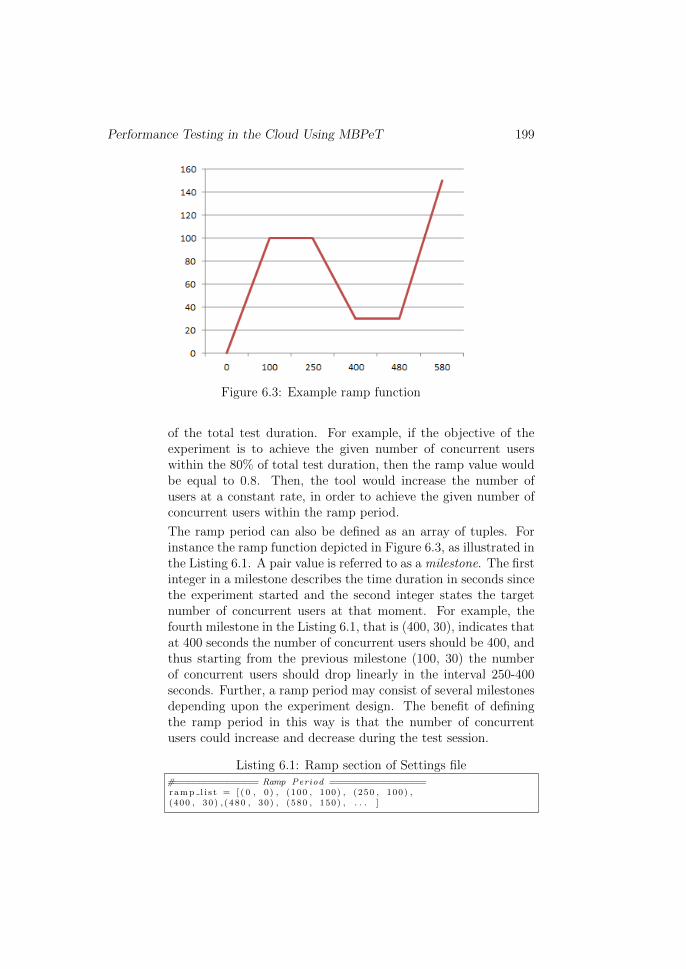
Figure 6.3: Example ramp function
of the total test duration. For example, if the objective of theexperiment is to achieve the given number of concurrent userswithin the 80% of total test duration, then the ramp value wouldbe equal to 0.8. Then, the tool would increase the number ofusers at a constant rate, in order to achieve the given number ofconcurrent users within the ramp period.
The ramp period can also be defined as an array of tuples. Forinstance the ramp function depicted in Figure 6.3, as illustrated inthe Listing 6.1. A pair value is referred to as a milestone. The firstinteger in a milestone describes the time duration in seconds sincethe experiment started and the second integer states the targetnumber of concurrent users at that moment. For example, thefourth milestone in the Listing 6.1, that is (400, 30), indicates thatat 400 seconds the number of concurrent users should be 400, andthus starting from the previous milestone (100, 30) the numberof concurrent users should drop linearly in the interval 250-400seconds. Further, a ramp period may consist of several milestonesdepending upon the experiment design. The benefit of definingthe ramp period in this way is that the number of concurrentusers could increase and decrease during the test session.
Listing 6.1: Ramp section of Settings file#=============== Ramp Period =================
r amp l i s t = [ ( 0 , 0 ) , (100 , 100) , (250 , 100) ,(400 , 30 ) , (480 , 30) , (580 , 150) , . . . ]
200 F. Abbors, T. Ahmad, D. Truscan, and I. Porres
(d) Monitoring interval : It specifies how often a slave node shouldcheck and report its own local resource utilization level for satu-ration.
(e) Resource utilization threshold : It is a percentage value which de-fines the upper limit of local resource load at the slave node. Aslave node is considered to be saturated if the limit is exceeded.
(f) Models folder : A path to a folder which contains all the usermodels.
(g) Test report folder : The tool will save the test report at this givenpath.
In addition to mandatory parameters, the Settings file can containother parameters, which are related to a particular case-study only.For example, if a SUT is a web server then the IP address of the webserver would be an additional parameter in the Settings file.
3. Adapter: This is a case-study specific module which is used to commu-nicate with SUT. This module translates each action interpreted fromthe PTA model into a form that is understandable by the SUT, forinstance a HTTP request. It also parses the response from the SUTand measures the response time.
4. Number of Slaves: This number tells the master node how many slavenodes that are participating in the test session.
Two test databases are used by MBPeT: a user database and a userresource database. The user database contains all the information regardingusers such as usernames, passwords or name spaces. In certain cases, thecurrent state of the SUT must be captured, in order to be able to addressat load generation time data dependencies between successive requests. Assuch, the user resource database is used to store references to the resources(e.g. files) available on the SUT for di↵erent users. The core module of themaster node uses an instance of the test adapter to query the SUT and savethat data in the user resource database.
Further, the core module remotely controls the Dstat1 tool on SUT viaSSH protocol. Dstat is a tool that provides detailed information about thesystem resource utilization in real-time. It logs the system resources utiliza-tion information after every specific time interval, one second by default. Thedelay between each update is specified in the command along with the namesof resources to be monitored. This tool creates a log file in which it appends
1http://dag.wieers.com/home-made/dstat/
Performance Testing in the Cloud Using MBPeT 201
a row of information for each resource column after every update. The logfile generated by the Dstat tool is used as basis for generating the test report,including graphs on how SUT’s KPIs vary during the test session.
Model Validation Module
The Model Validator module validates the load models. It performs di↵erentnumbers of syntactic checks on all models and generates a report.This reportgives error descriptions and the location in model where the error occurred.A model with syntax anomalies could lead to inconclusive results. Thereforeit is important to ensure that the all given models are well-formed and nosyntax mistakes have been made in implementing the models. Examples ofcouple of validation rules are:
• Each model should have an initial and a final state
• All transitions have either probabilities or actions
• The sum of probabilities of transitions originating from a location is 1.
• All locations are statically reachable
Slave Controller Module
For each slave node there is an instance of SlaveController module in themaster node. The purpose of the SlaveController module is to act as a bridgebetween slave nodes and the core master process and to control the slavenodes until the end of the test. The benefit of this architecture is to keep themaster core process light and active, and more scalable. The SlaveControllercommunicates with master core process only in few special cases, so that thecore process could perform other tasks instead of communicating with slavenodes. Moreover, it also increases the parallelism in our architecture, all theSlaveControllers and the master’s core processes could execute in parallel ondi↵erent processor cores. Owning to the e�cient usage of available resources,the master can perform more tasks in less period of time. A similar approachhas been employed at the slave node, where each user is simulated as anindependent process for the performance gain.
Test Report Creation Module
This module performs two tasks: Data Aggregation and Report Creation. Inthe first task, it combines the test results data from all slaves into an internalrepresentation. Further, it retrieves the log file generated by the Dstat tool
202 F. Abbors, T. Ahmad, D. Truscan, and I. Porres
from the SUT via Secure File Transfer Protocol (SFTP). The second task ofthis module is to calculate di↵erent statistical indicators and render a testreport based on the aggregated data.
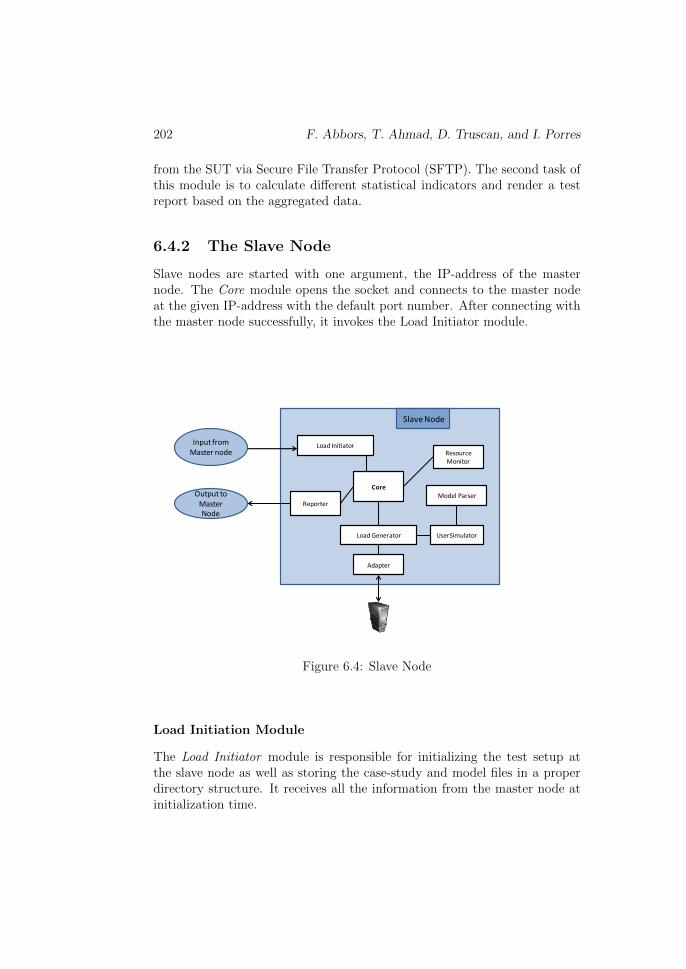
6.4.2 The Slave Node
Slave nodes are started with one argument, the IP-address of the masternode. The Core module opens the socket and connects to the master nodeat the given IP-address with the default port number. After connecting withthe master node successfully, it invokes the Load Initiator module.
Slave Node
Load Initiator
Adapter
Resource Monitor
Reporter
Input from Master node
Output to Master Node
Core
Load Generator UserSimulator
Model Parser
Figure 6.4: Slave Node
Load Initiation Module
The Load Initiator module is responsible for initializing the test setup atthe slave node as well as storing the case-study and model files in a properdirectory structure. It receives all the information from the master node atinitialization time.

Performance Testing in the Cloud Using MBPeT 203
Model Parser Module
The Model Parser module reads the PTA model into an internal structure.It is a helper module that facilitates the UserSimulator module to performdi↵erent operations on the PTA model.
Load Generation Module
The purpose of this module is to generate load for the SUT at the desiredrate, by creating and maintaining the desired number of concurrent virtualusers. It uses the UserSimulator module to simulate virtual users where eachinstance of UserSimulator presents a separate user with unique user ID andsession. The UserSimultor utilizes the Model Parser module to get the user’saction from the user model and uses the Adapter module to perform theaction. Then it waits for a specified period of time (i.e. the user think time)before performing the next action, which is chosen based on the probabilisticdistribution.
Resource Monitoring Module
The Resource Monitor module runs as a separate thread and wakes up regu-larly after a specified time period. It performs two tasks every time it wakesup: 1) checks the local resource utilization level and saves the readings, 2) cal-culates the average of resource utilizations over a certain number of previousconsecutive readings. The value obtained from the second task is comparedwith resource utilization threshold value, defined in the test configuration.If the calculated average is above a set threshold value of 80 percent, thenit means that the slave node is about to saturate and the master will benotified. When a slave is getting saturated, its current number of generatedusers is kept constant, and additional slaves will be delegated to generate themore load.
Reporter Module
All the data that has been gathered during the load generation is dumpedinto files. The Load Generator creates a separate data file for each user;it means that the total number of simulation data files would be equal tothe total number of concurrent users. In order to reduce the communicationdelay, all these data files are packed into a zip file, and sent to the master atthe end of the test session.
204 F. Abbors, T. Ahmad, D. Truscan, and I. Porres
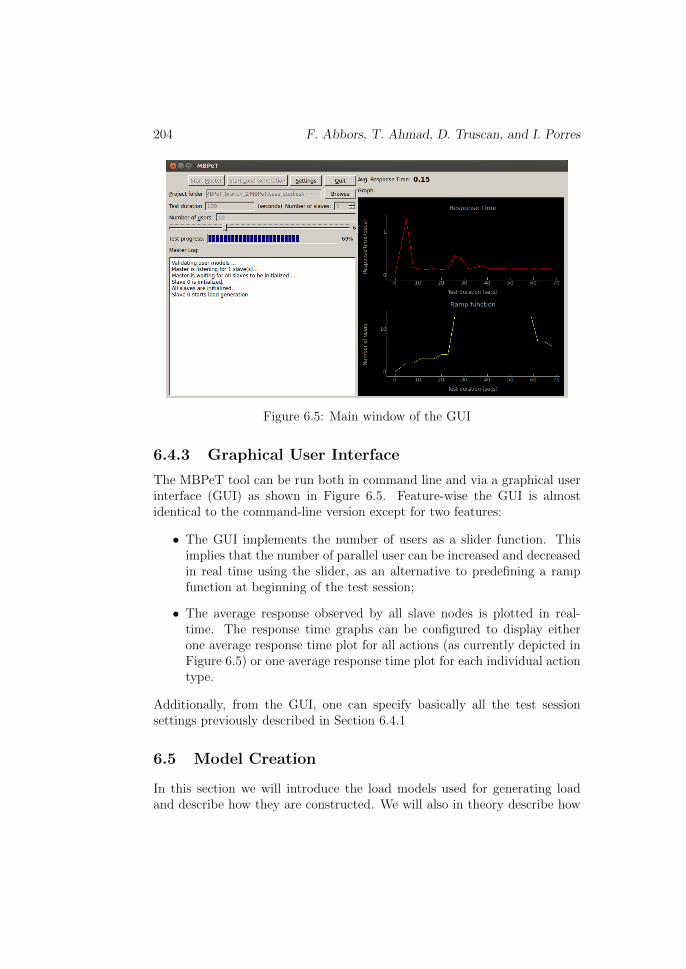
Figure 6.5: Main window of the GUI
6.4.3 Graphical User Interface
The MBPeT tool can be run both in command line and via a graphical userinterface (GUI) as shown in Figure 6.5. Feature-wise the GUI is almostidentical to the command-line version except for two features:
• The GUI implements the number of users as a slider function. Thisimplies that the number of parallel user can be increased and decreasedin real time using the slider, as an alternative to predefining a rampfunction at beginning of the test session;
• The average response observed by all slave nodes is plotted in real-time. The response time graphs can be configured to display eitherone average response time plot for all actions (as currently depicted inFigure 6.5) or one average response time plot for each individual actiontype.
Additionally, from the GUI, one can specify basically all the test sessionsettings previously described in Section 6.4.1
6.5 Model Creation
In this section we will introduce the load models used for generating loadand describe how they are constructed. We will also in theory describe how
Performance Testing in the Cloud Using MBPeT 205
load is generated from these models.
6.5.1 Workload Characterization
Traditionally, performance analysis starts first with identifying key perfor-mance scenarios, based on the idea that certain scenarios are more frequentthan others or certain scenarios impact more on the performance of the sys-tem than other scenarios. A performance scenario is a sequence of actionsperformed by an identified group of users [13]. In some cases, key perfor-mance scenarios can consist of only one action, for example ”browse”, in thecase of a web-based system. In the case of Amazon online store, examplesof key performance scenarios could be: searching for a product, then addingone or more products into the shopping cart and finally pay for them. In thefirst example, only one action is sent to the system, namely ”browse”. Inthe second example, several actions would have to be sent to the server, e.g.”login”, ”search”,”add-to-cart”,”checkout”, etc.
In order to build the workload model, we start by looking and analyzingthe requirements and the system specifications, respectively. During thisphase we try to get an understanding of how the system is used, what arethe di↵erent types of users, and what are the key performance scenariosthat will impact most on the performance of the system. A user type ischaracterized by the distribution and the types of actions if performs.
The main sources of information for workload characterization are: Ser-vice Level Agreements (SLAs), system specifications and standards, andserver execution logs [11]. By studying these sources we identify the inputs ofthe system with respect to types of transactions (actions), transferred files,file sizes, arrival rates, etc. following the generic guidelines discussed in [3]. Inaddition, we extract information regarding the KPIs, such as the number ofconcurrent users the system should support, expected throughput, responsetimes, expected resource utilization demands etc. for di↵erent actions undera given load.
We use the following steps in analyzing the workload:
1. Identify the actions that can be executed against the system.
(a) Analyze what are the required input data and output data for eachaction. For instance, what is the request type, its parameters, etc.
(b) Identify dependencies between actions. For example, a user cannot execute a logout action before a login action.
2. Identify what classes (types) of users execute each action

206 F. Abbors, T. Ahmad, D. Truscan, and I. Porres
3. Identify the most relevant user types.
4. Define the distribution of actions that is performed by each user type.
5. Define an average think time per action for each user type.
Table 6.1 shows an example of a user type specification, its actions, actiondependencies, and think time ordered in a tabular format. Based on thisinformation we build a workload model described as a probabilistic timedautomata or PTA.
Action Dependency User Type 1 User Type 2Think time Frequency Think Time Frequency
a
1
t
1
f
1
t
2
f
2
a
2
a
1
t
3
f
3
a
3
a
1
t
4
f
4
a
4
a
2
t
5
f
5
a
5
a
4
t
6
f
6
t
7
f
7
a
6
a
3
t
8
f
8
Table 6.1: Example of user types and their actions
6.5.2 Workload Modeling Using PTA
The results of the workload characterization are aggregated in a workloadmodel similar to the one in Figure 6.6, which mimics the real workload un-der study. One such workload model is created for each identified user type.Basically, the model will depict the sequence of actions a user type can per-form and their arrival rate, as a combination of the probability that an actionis executed and the think time of the user for that action. In addition, wealso identify the user types and their probabilistic distribution. A concreteexample will be given in Section 6.7.
All the information that is extracted from the previous phase is aggre-gated in a workload model which is describes as a probabilistic timed au-tomaton (PTA). A PTA is similar to a state machine in the sense that aPTA consists of a set of locations connected with each other via a set oftransitions. However, a PTA also include the notion of time and probabil-ities. Time is modeled as an invariant clock constraint on transitions andincrease at the same rate as real time.
A probabilistic timed automaton (PTA) is defined [9] as T = (L,C,inv,Act, E, �) where:
• a set of locations L;
Performance Testing in the Cloud Using MBPeT 207
• a finite set of clocks C;
• an invariant condition inv : L ! Z;
• a finite set of actions Act;
• an action enabledness function E : L ⇥ Act ! Z;
• a transition probability function � : (L ⇥ Act) ! D(2C ⇥ L).
In the above definitions, Z is a set of clock zones. A clock zone is a setof clock values, which is a union of a set of clock regions. � is a proba-bilistic transition function. Informally, the behavior of a probabilistic timedautomaton is as follows: In a certain location l, an action a can be chosenwhen a clock variable reaches its value with a certain probability if the actionis enabled in that location l. If the action a is chosen, then the probability ofmoving to a new location l’ is given by �[l,a](C’,l’), where C’ is a particularset of clocks to be reset upon firing of the transitions. Figure 6.6 gives anexample of a probabilistic timed automata.
The syntax of the automata is as follows: Every transition has an initiallocation and an end location. Each location is transitively connected from theinitial location. The transitions can be labeled with three di↵erent values: aprobability value, an action, and a clock. The probability indicates the chanceof that transition being taken. The action describes what action to take whenthe transition is used, and the clock indicates how long to wait before firingthe transition. Every automaton has an end location, depicted with a doublecircle, that will eventually be reached. It is possible to specify loops in theautomaton. It is important to notice that the sum of the probabilities on alloutgoing transitions from a given location must be equal to 1. For example,consider location 2 in Figure 6.6: for the PTA to be complete the followingmust apply: p1 + p2 + p3 = p4 + p5 = 1.
6.6 Performance Testing Process
In this section we describe the performance testing process. Figure 6.7 showsthe three steps involved in the process. In the following, we will discuss thethree steps in more detail.
6.6.1 Test Setup
Every test run starts with a test setup. In each test setup, there is one masternode that carries out the entire test session and generates a report. The

208 F. Abbors, T. Ahmad, D. Truscan, and I. Porres
Figure 6.6: Example of a probabilistic timed automaton.
user only interacts with the master node by initializing it with the requiredparameters (mentioned in the Section 6.4.1) and getting the test report atthe end of the test run. The parameter given to the master is the projectfolder. This folder contains all the files needed for load generation, such asthe adapter code, the settings file (if command line mode is used) and otheruser specific files.
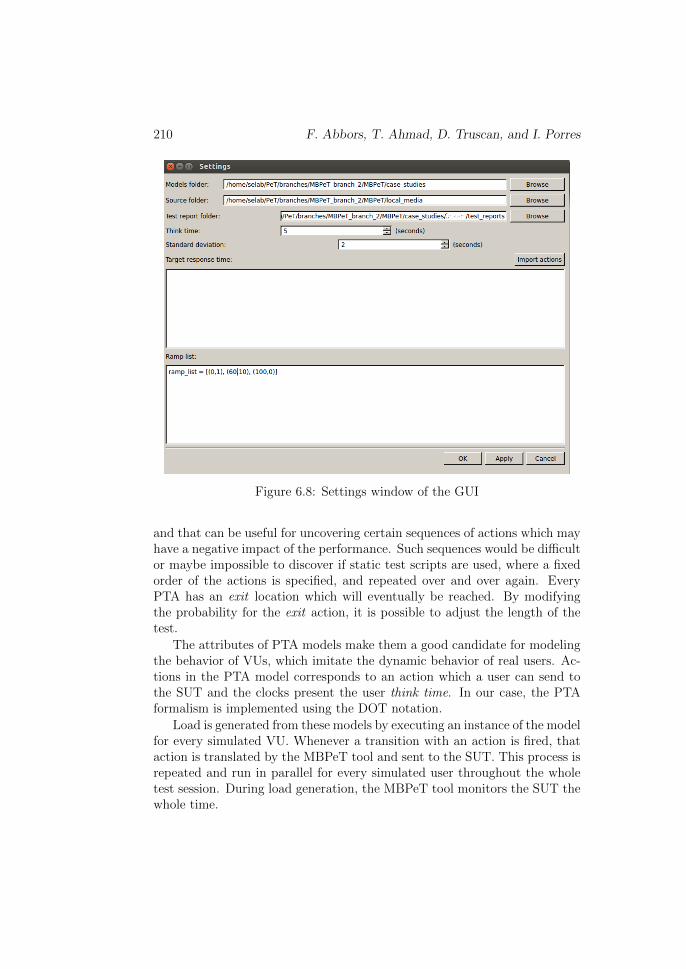
The adapter file and the settings file are the most important. The adapterfiles explains how the abstract actions found in the load models are translatedto concrete actions. The settings file contain information about the testsession, such as the location of the load models, IP-address to the SUT, theramp function, test duration, etc. The same information can also be set fromthe GUI via the Settings button, see Figure 6.8. In here, the user is requiredto enter the same information as given in the settings file. Additionally, thepath to the adapter file and the load models have to be given.
As one may notice in Figure 6.8, the user has the option of defining anaverage think time for the models and its standard deviation. If these optionsare used, the individual think time specified in the models for each action

Performance Testing in the Cloud Using MBPeT 209
Figure 6.7: MBPeT tool activity diagram
will be ignored and the one specified in the GUI will be used.Once the required information has been given, the master node sets up the
test environment. After that, it invokes the Model Validator. This modulevalidates the syntax of user models. If the validation fails, it gives the usera choice whether the user wants to continue or not to load generation. Ifthe user decides to continue or the validation was successful, then the masterenters into the next phase.
6.6.2 Load Generation
Load is generated for the models based on the same principles as described insection 6.5.2. The load generation is based on a deterministic choice with aprobabilistic policy. This introduces certain randomness into the test process
210 F. Abbors, T. Ahmad, D. Truscan, and I. Porres
Figure 6.8: Settings window of the GUI
and that can be useful for uncovering certain sequences of actions which mayhave a negative impact of the performance. Such sequences would be di�cultor maybe impossible to discover if static test scripts are used, where a fixedorder of the actions is specified, and repeated over and over again. EveryPTA has an exit location which will eventually be reached. By modifyingthe probability for the exit action, it is possible to adjust the length of thetest.
The attributes of PTA models make them a good candidate for modelingthe behavior of VUs, which imitate the dynamic behavior of real users. Ac-tions in the PTA model corresponds to an action which a user can send tothe SUT and the clocks present the user think time. In our case, the PTAformalism is implemented using the DOT notation.
Load is generated from these models by executing an instance of the modelfor every simulated VU. Whenever a transition with an action is fired, thataction is translated by the MBPeT tool and sent to the SUT. This process isrepeated and run in parallel for every simulated user throughout the wholetest session. During load generation, the MBPeT tool monitors the SUT thewhole time.
Performance Testing in the Cloud Using MBPeT 211
6.6.3 Test Reporting
After each test run the MBPeT tool generates a test report based on themonitored data. It is the slave nodes that are responsible for the monitoringand they report the values back to the master node which later creates thereport.
Every slave node will monitor the communication with the SUT andcollecting the data needed for test report. The slave node will start a timerevery time and action is sent to the system. When a response is received,the timer is stopped and the response code together with the action nameand response time is stored. This data is later sent to the master node whichwill aggregate the data and produce a report.
The slave node will also monitor its own resources so it does not getsaturated and becomes the bottleneck during load generation. The slavenode monitors is own CPU, memory, and disk utilization and sends theinformation to the master node. The master node the data is plotted ingraphs and included in the test report.
It is the test report creation module of the master node that is responsiblefor creating test report. This module performs two tasks: aggregating datareceived from the slave nodes and creating a test report. Data aggregationconsists of combining data received from the slave nodes together into andinternal representation. Based on the received data, di↵erent kinds of statis-tical values are computer, e.g. mean and max response times, throughput,etc. Values such as response time and throughput plotted as graphs so thetester can see how the di↵erent values varies over time. Figures of the testreport will later be shown throughout Section 6.7.
The final task of the test report creation module is to render all the valuesand graphs into a report. The final report is rendered as a HTML document.
6.7 Experiments
In this section we will describe a set of experiments carried out with theMBPeT tool on a case study. The system tested in the case study is anHTTP based auction web service.
6.7.1 YAAS
YAAS is a web application and a web service for creating and participatingin auctions. An auction site is a good example of a service o↵ered as a webapplication. It facilitates a community of users interested in buying or sellingdiverse items, where any user including guest user can view all the auctions

212 F. Abbors, T. Ahmad, D. Truscan, and I. Porres
and all authenticated users, except seller of an item, can bid on the auctionagainst other users.
The web application is implemented in Python language using theDjango2 web-framework. In addition to HTML pages, YAAS also has aRESTful [10] web service interface. The web service interface has variousAPIs to support di↵erent operations, including:
Browse API It returns the list of all active auctions.
Search API It allows to search auctions by title.
Get Auction This API returns an auction against the given Auction-ID.
Bids It is used to the get the list of all the bids have been made to aparticular auction.
Make Bid Allows and authenticated user to place a bid on a particularauction.
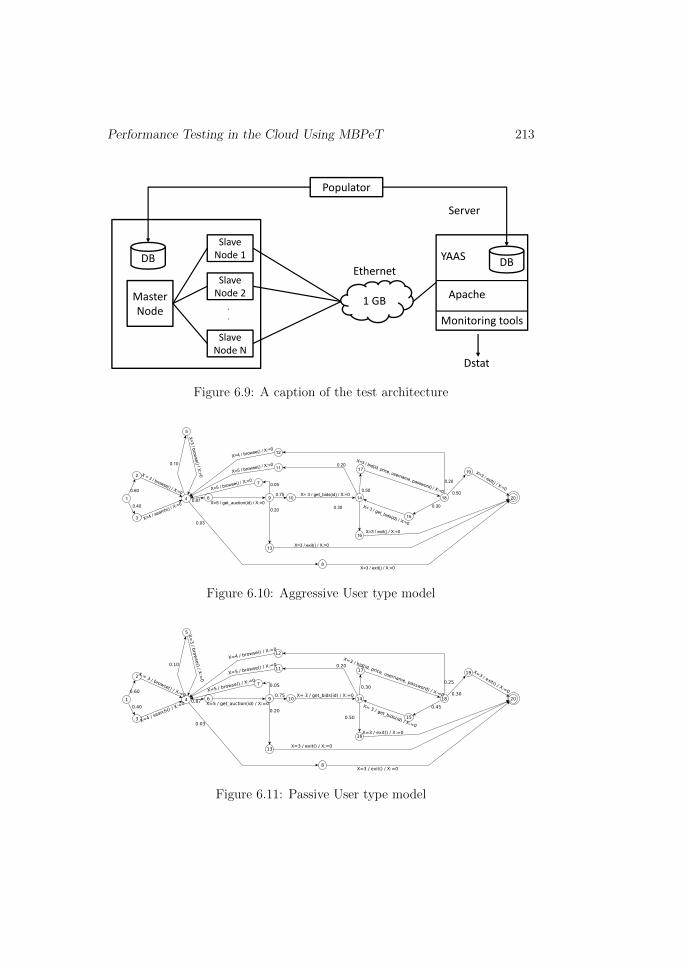
6.7.2 Test Architecture
A setup of the test architecture can be seen in Figure 6.9. The server runs aninstance of the YAAS application on top of an Apache web server. All nodes(master, slaves, and the server) feature an 8-core CPU, 16GB of memory,1Gb Ethernet, 7200 rpm hard drive, and Fedora 16 operating system. Thenodes were connected via a 1Gb ethernet over which the data were sent.
A populator script is used to generate input data (i.e., populate the testdatabases) on both the client and server side, before each test session. Thisensures that the test data on either sides is consistent and easy to rebuildafter each test session.
6.7.3 Load Models
The test database of the application is configured with a script to have 1000users. Each user has exactly one auction and each auction has one startingbid.
In order to identify the di↵erent type of users for the YAAS application,we have used the AWStats3 tool. This tool analyzes the Apache server accesslogs to generate a report on the YAAS application usage. Based on thatreport, we discovered three types of users; aggressive, passive and non-bidder.
2https://www.djangoproject.com/3http://awstats.sourceforge.net
Performance Testing in the Cloud Using MBPeT 213
1�GB
Slave�Node 1
Slave�Node 2Master�
Node
Slave�Node N
.
. Monitoring tools
Apache
YAASDB DB
Populator
Ethernet
Server
Dstat
Figure 6.9: A caption of the test architecture
Figure 6.10: Aggressive User type model
Figure 6.11: Passive User type model
214 F. Abbors, T. Ahmad, D. Truscan, and I. Porres
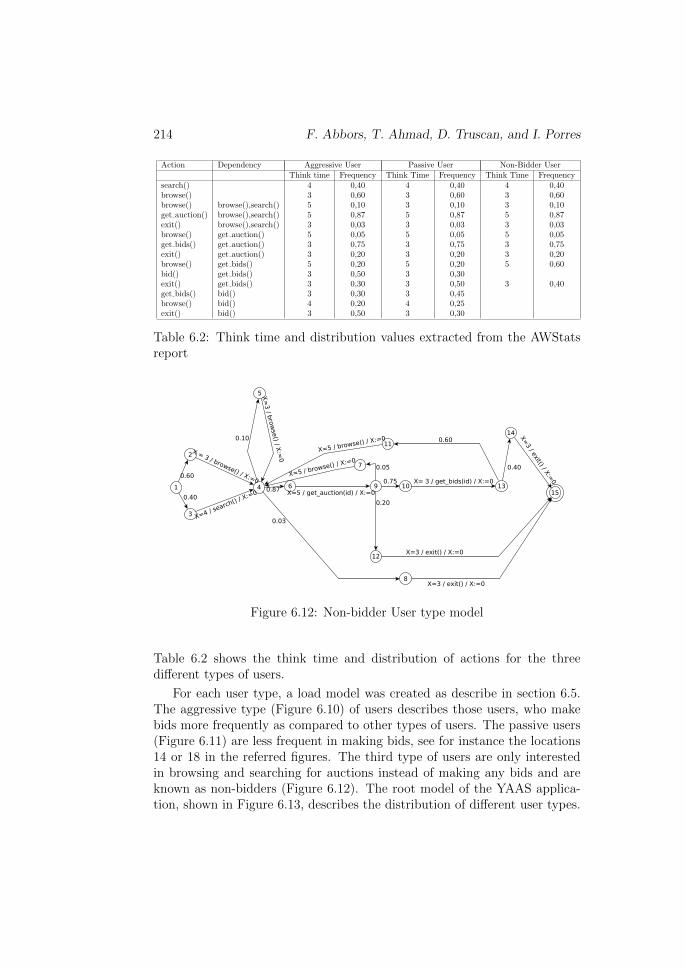
Action Dependency Aggressive User Passive User Non-Bidder UserThink time Frequency Think Time Frequency Think Time Frequency
search() 4 0,40 4 0,40 4 0,40browse() 3 0,60 3 0,60 3 0,60browse() browse(),search() 5 0,10 3 0,10 3 0,10get auction() browse(),search() 5 0,87 5 0,87 5 0,87exit() browse(),search() 3 0,03 3 0,03 3 0,03browse() get auction() 5 0,05 5 0,05 5 0,05get bids() get auction() 3 0,75 3 0,75 3 0,75exit() get auction() 3 0,20 3 0,20 3 0,20browse() get bids() 5 0,20 5 0,20 5 0,60bid() get bids() 3 0,50 3 0,30exit() get bids() 3 0,30 3 0,50 3 0,40get bids() bid() 3 0,30 3 0,45browse() bid() 4 0,20 4 0,25exit() bid() 3 0,50 3 0,30
Table 6.2: Think time and distribution values extracted from the AWStatsreport
Figure 6.12: Non-bidder User type model
Table 6.2 shows the think time and distribution of actions for the threedi↵erent types of users.
For each user type, a load model was created as describe in section 6.5.The aggressive type (Figure 6.10) of users describes those users, who makebids more frequently as compared to other types of users. The passive users(Figure 6.11) are less frequent in making bids, see for instance the locations14 or 18 in the referred figures. The third type of users are only interestedin browsing and searching for auctions instead of making any bids and areknown as non-bidders (Figure 6.12). The root model of the YAAS applica-tion, shown in Figure 6.13, describes the distribution of di↵erent user types.

Performance Testing in the Cloud Using MBPeT 215
Based on the AWStats analysis, we determined that the almost 30% of totalusers who visited the YAAS, were very frequently in making bids, whereasrest of 50% users made bids occasionally. The rest of the users were notinterested in making bids at all. This distribution is depicted by the modelin Figure 6.13.
Figure 6.13: YAAS Root model
The models of all these user types were provided to the MBPeT tool tosimulate them as virtual users. For example, the model of an aggressive usertype, shown in Figure 6.10, shows that the user will start from the location1, and from this location the user will select either browse or search actionbased on a probabilistic choice. Before performing the action, the slave willwait for the think time corresponding to the selected action. Eventually, theuser will reach the final location (i.e. location 20 ) by performing the exitaction and terminate the current user session. Similarly, the other models ofpassive and non-bidder user type have the same structure but with di↵erentprobabilities and distribution of actions.
6.7.4 Experiment 1
The goal of this experiment was to set the target response time for eachaction and observe at what point the average response time of the actionexceed the target value. The experiment ran for 20 minutes. The maximumnumber of concurrent users was set to 300 and the ramp up value was 0.9that the tool would increase the number of concurrent users with the passageof time to achieve the value of 300 concurrent users when the 90% of testduration time has been passed.
The resulting test report has various sections, where each section presentsthe di↵erent perspective of the results. The first section, shown in Figure6.14, contains the information about the test session including, test startedtime, test duration, target number of concurrent of users, etc. The Total

216 F. Abbors, T. Ahmad, D. Truscan, and I. Porres
#################### Master Stats #######################
This test was executed at: 2013-07-01 16:54:47
Duration of the test: 20 min
Target number of concurrent users: 300
Total number of generated users: 27536
Measured Request rate (MRR): 27.68 req/s
Number of NON-BIDDER_USER: 6296 (23.0)%
Number of AGGRESSIVE_USER: 9087 (33.0)%
Number of PASSIVE_USER: 12153 (44.0)%
Average number of action per user: 91 actions
Figure 6.14: Test Report 1 - Section 1: General information
######## AVERAGE/MAX RESPONSE TIME per METHOD CALL ##########
NON-BIDDER_USER (23.0 %) PASSIVE_USER (44.0 %) AGGRESSIVE_USER (33.0 %)Method Call Average (sec) Max (sec) Average (sec) Max (sec) Average (sec) Max (sec)
GET_AUCTION(ID) 3.04 23.95 2.85 23.67 2.93 24.71
BROWSE() 5.44 21.25 5.66 21.7 5.68 21.29
GET_BIDS(ID) 3.59 27.37 3.63 25.8 3.65 24.87
BID(ID,PRICE,USERNAME,PASSWORD) 0.0 0.0 8.26 33.44 8.11 36.84
SEARCH(STRING) 3.36 12.86 3.26 15.84 3.47 15.79
Figure 6.15: Test Report 1 - Section 2: Average and Maximum response timeof SUT per action or method call
number of generated users in the report describes that the tool had simulated27536 numbers of virtual users. The Measured Request Rate (MRR) depictsthe average number of requests per second which were made to the SUTduring the load generation process. Moreover, it also shows the distributionof total number of user generated which is very close to what we have definedin the root model (Figure 6.13). This section is useful to see the summarizedview of the entire test session.
In the second section of the test report, we could observe the SUT perfor-mance for each action separately, and identify which actions have respondedwith more delay than the others, and which actions should be optimized toincrease the performance of the SUT. As from the table in Figure 6.15, itappears that the action BID(ID, PRICE, USERNAME, PASSWORD) haslarger average and maximum response time than the other actions. The non-bidder users do not perform the BID action that is why we have zero responsetime in the column of NON-BIDDER USER against the BID action.
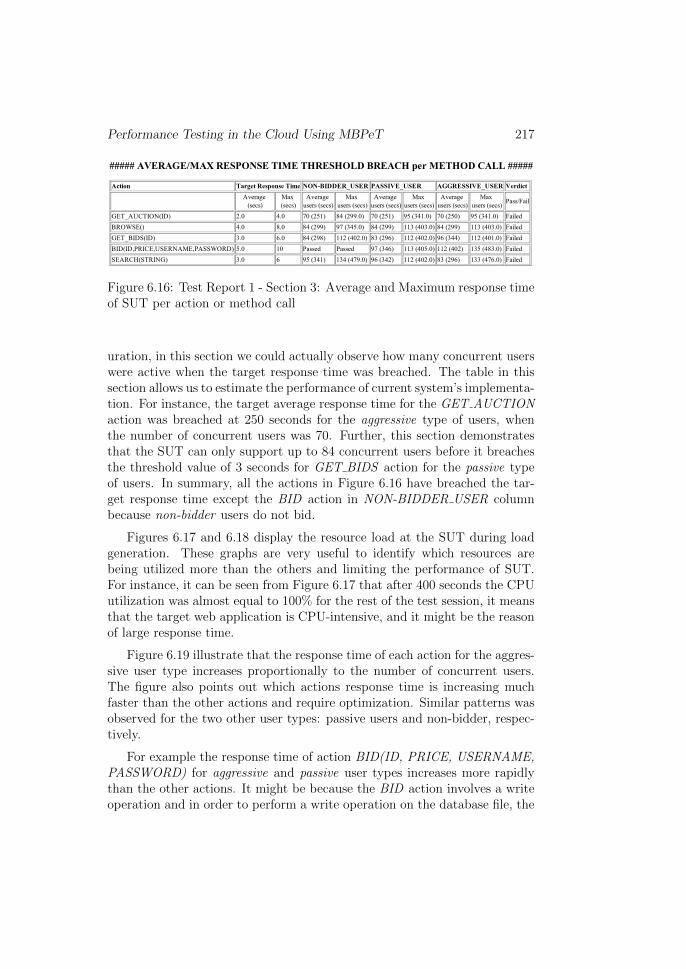
Section three (shown in Figure 6.16) of the test report presents a com-parison of the SUTs desired performance against the measured performance.As we had defined the target response time for each action in the test config-
Performance Testing in the Cloud Using MBPeT 217
##### AVERAGE/MAX RESPONSE TIME THRESHOLD BREACH per METHOD CALL #####
Action Target Response Time NON-BIDDER_USER PASSIVE_USER AGGRESSIVE_USER VerdictAverage
(secs)
Max
(secs)
Average
users (secs)
Max
users (secs)
Average
users (secs)
Max
users (secs)
Average
users (secs)
Max
users (secs)Pass/Fail
GET_AUCTION(ID) 2.0 4.0 70 (251) 84 (299.0) 70 (251) 95 (341.0) 70 (250) 95 (341.0) Failed
BROWSE() 4.0 8.0 84 (299) 97 (345.0) 84 (299) 113 (403.0) 84 (299) 113 (403.0) Failed
GET_BIDS(ID) 3.0 6.0 84 (298) 112 (402.0) 83 (296) 112 (402.0) 96 (344) 112 (401.0) Failed
BID(ID,PRICE,USERNAME,PASSWORD) 5.0 10 Passed Passed 97 (346) 113 (405.0) 112 (402) 135 (483.0) Failed
SEARCH(STRING) 3.0 6 95 (341) 134 (479.0) 96 (342) 112 (402.0) 83 (296) 133 (476.0) Failed
Figure 6.16: Test Report 1 - Section 3: Average and Maximum response timeof SUT per action or method call
uration, in this section we could actually observe how many concurrent userswere active when the target response time was breached. The table in thissection allows us to estimate the performance of current system’s implementa-tion. For instance, the target average response time for the GET AUCTIONaction was breached at 250 seconds for the aggressive type of users, whenthe number of concurrent users was 70. Further, this section demonstratesthat the SUT can only support up to 84 concurrent users before it breachesthe threshold value of 3 seconds for GET BIDS action for the passive typeof users. In summary, all the actions in Figure 6.16 have breached the tar-get response time except the BID action in NON-BIDDER USER columnbecause non-bidder users do not bid.
Figures 6.17 and 6.18 display the resource load at the SUT during loadgeneration. These graphs are very useful to identify which resources arebeing utilized more than the others and limiting the performance of SUT.For instance, it can be seen from Figure 6.17 that after 400 seconds the CPUutilization was almost equal to 100% for the rest of the test session, it meansthat the target web application is CPU-intensive, and it might be the reasonof large response time.
Figure 6.19 illustrate that the response time of each action for the aggres-sive user type increases proportionally to the number of concurrent users.The figure also points out which actions response time is increasing muchfaster than the other actions and require optimization. Similar patterns wasobserved for the two other user types: passive users and non-bidder, respec-tively.
For example the response time of action BID(ID, PRICE, USERNAME,PASSWORD) for aggressive and passive user types increases more rapidlythan the other actions. It might be because the BID action involves a writeoperation and in order to perform a write operation on the database file, the

218 F. Abbors, T. Ahmad, D. Truscan, and I. Porres
Figure 6.17: Test Report 1 - SUT CPU and memory utilization
Figure 6.18: Test Report 1 - SUT network and disk utilization
SQLite4 database has to deny the all new access requests to the databaseand wait until all previous operations (including read and write operations)have been completed.
Section four of the test report provides miscellaneous information about
4http://www.sqlite.org/

Performance Testing in the Cloud Using MBPeT 219
Figure 6.19: Test Report 1 - Response time of aggressive user type per action
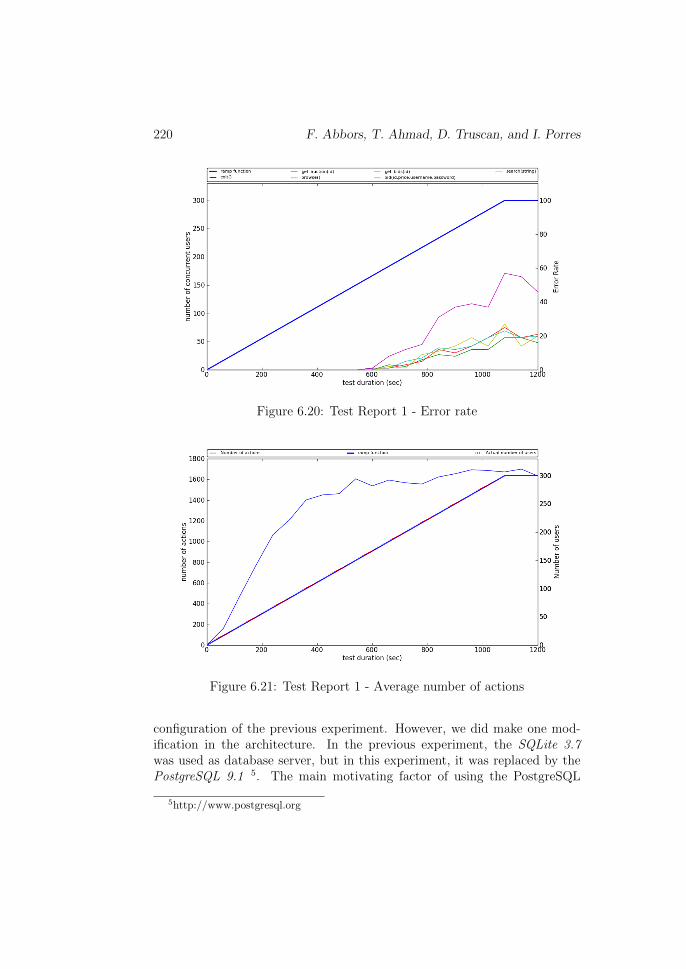
the test session. For example, the first erroneous response was recordedat 520 seconds (according to Figure 6.20) and at that time the tool wasgenerating load at the maximum rate, that is 1600 actions/seconds, shownin Figure 6.21. Similarly, Figure 6.20 displays that there was no error untilthe number of consecutive users exceeded 150, after this point errors beganto appear and increased steeply proportional to the number of consecutiveusers.
A further deep analysis of the test report showed that the database couldbe the bottleneck. Owning to the fact a sqlite database has been used forthis experiment, the application has to block the entire database before some-thing can be written to it. It could explain the larger response time of BIDactions compared to other actions. This is because the web application hadto perform a write operation to the database in order to execute the BIDaction. Further, before each write operation, sqlite creates a rollback jour-nal file, an exact copy of original database file, to preserve the integrity ofdatabase [17]. This could also delay the processing of a write operation andthus cause a larger response time.
6.7.5 Experiment 2
In the second experiment, we wanted to verify the hypothesis, which weproposed in the previous experiment: database could be the performance bot-tleneck. We ran the second experiment for 20 minutes with the same test
220 F. Abbors, T. Ahmad, D. Truscan, and I. Porres
Figure 6.20: Test Report 1 - Error rate
Figure 6.21: Test Report 1 - Average number of actions
configuration of the previous experiment. However, we did make one mod-ification in the architecture. In the previous experiment, the SQLite 3.7was used as database server, but in this experiment, it was replaced by thePostgreSQL 9.1 5. The main motivating factor of using the PostgreSQL
5http://www.postgresql.org

Performance Testing in the Cloud Using MBPeT 221
#################### Master Stats #######################
This test was executed at: 2013-07-01 17:37:38
Duration of the test: 20 min
Target number of concurrent users: 300
Total number of generated users: 35851
Measured Request rate (MRR): 39.21 req/s
Number of AGGRESSIVE_USER: 11950 (33.0)%
Number of NON-BIDDER_USER: 7697 (21.0)%
Number of PASSIVE_USER: 16204 (45.0)%
Average number of action per user: 119 actions
Figure 6.22: Test Report 2 - Section 1: global information
Figure 6.23: Test Report 2 - Error rate
database is that it supports the better concurrent access to the data thanthe SQLite. The PostgreSQL database uses the Multiversion ConcurrencyControl (MVCC) model instead of simple locking. In MVCC, di↵erent locksare acquired for the read and write operations, it means that the both oper-ations can be performed simultaneously without blocking each other [14].
In the section 1 of Test report 2 (Figure 6.22) shows that the MeasuredRequest Rate (MRR) increased by 42%. Additionally, each user performedaveragely 30% more actions in this experiment.
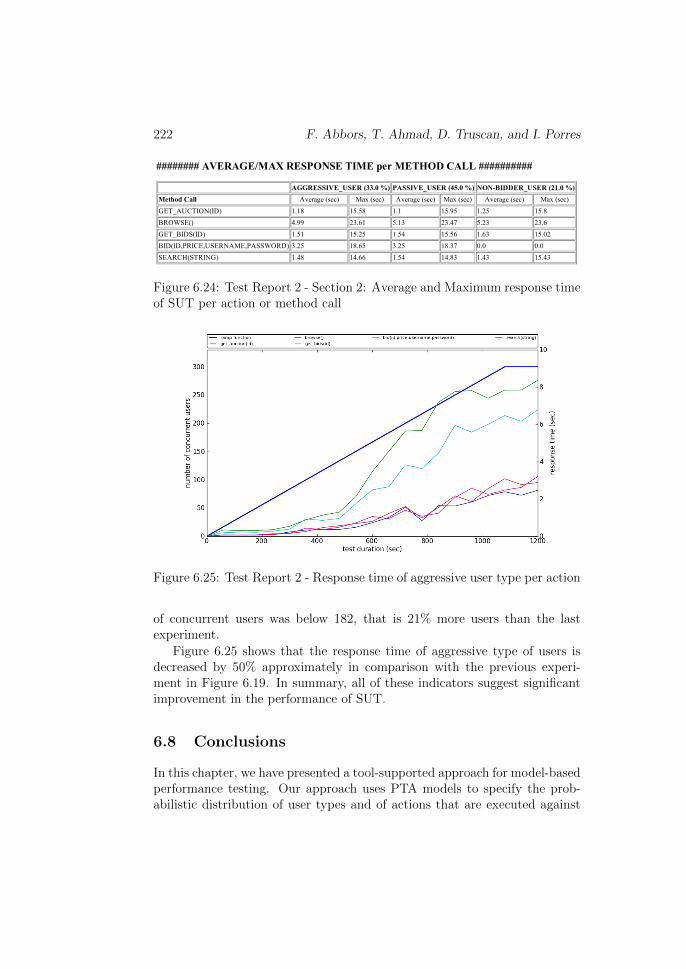
Similarly in the second section (Figure 6.24), the average and maximumresponse time of all action decreased by almost 47%. Moreover, the errorrate section (Figure 6.23) depicts that there was no error until the number
222 F. Abbors, T. Ahmad, D. Truscan, and I. Porres
######## AVERAGE/MAX RESPONSE TIME per METHOD CALL ##########
AGGRESSIVE_USER (33.0 %) PASSIVE_USER (45.0 %) NON-BIDDER_USER (21.0 %)Method Call Average (sec) Max (sec) Average (sec) Max (sec) Average (sec) Max (sec)
GET_AUCTION(ID) 1.18 15.58 1.1 15.95 1.25 15.8
BROWSE() 4.99 23.61 5.13 23.47 5.23 23.6
GET_BIDS(ID) 1.51 15.25 1.54 15.56 1.63 15.02
BID(ID,PRICE,USERNAME,PASSWORD) 3.25 18.65 3.25 18.37 0.0 0.0
SEARCH(STRING) 1.48 14.66 1.54 14.83 1.43 15.43
Figure 6.24: Test Report 2 - Section 2: Average and Maximum response timeof SUT per action or method call
Figure 6.25: Test Report 2 - Response time of aggressive user type per action
of concurrent users was below 182, that is 21% more users than the lastexperiment.
Figure 6.25 shows that the response time of aggressive type of users isdecreased by 50% approximately in comparison with the previous experi-ment in Figure 6.19. In summary, all of these indicators suggest significantimprovement in the performance of SUT.
6.8 Conclusions
In this chapter, we have presented a tool-supported approach for model-basedperformance testing. Our approach uses PTA models to specify the prob-abilistic distribution of user types and of actions that are executed against

REFERENCES 223
the system.The approach is supported by the MBPeT tool, which has a distributed
scalable architecture, targeted to cloud-based environments allowing it togenerate load at high rates. The tool generates load in online mode andmonitors di↵erent KPIs including the resource utilization of the SUT. It canbe run both in command line and in GUI mode, respectively. The formerfacilitates the integration of the tool in automated test frameworks, whereasthe latter allows the user to interact with the SUT and visualize in real-timeits performance depending on the number of concurrent users.
Using our modeling approach, the e↵ort necessary to create and updatethe user profiles is reduced. The adapter required to interface with the SUThas to be implemented only once and then it can be reused. As shown in theexperiments, the tool allows quick exploration of the performance space bytrying out di↵erent load mixes. In addition, preliminary experiments haveshown that the synthetic load generated from probabilistic models has ingeneral a stronger impact on the SUT compared to static scripts.
We have also showed that the tool us su�cient enough in finding per-formance bottlenecks and that the tool can handle large amounts of parallelvirtual users. The tool benefits from its distributed architecture in the sensethat it can easily be integrated in a cloud environment where thousands ofconcurrent virtual users need to be simulated.
Future work will be targeted towards improving the methods for creatingthe user profiles from historic data and providing more detailed analysis ofthe test results. So far, the MBPeT tool has been used for testing webservices however, we plan also to address also web applications, as well asother types of communicating systems.
References
[1] Ashlish Jolly. Historical Perspective in Optimising Software TestingE↵orts. 2013. url: http://www.indianmba.com/Faculty\_Column/FC139/fc139.html.
[2] C. Barna, M. Litoiu, and H. Ghanbari. “Model-based performancetesting (NIER track)”. In: Proceedings of the 33rd International Con-ference on Software Engineering. ICSE ’11. Waikiki, Honolulu, HI,USA: ACM, 2011, pp. 872–875. isbn: 978-1-4503-0445-0. doi: 10.1145/1985793.1985930.

224 F. Abbors, T. Ahmad, D. Truscan, and I. Porres
[3] M. Calzarossa, L. Massari, and D. Tessera. “Workload Characteriza-tion Issues and Methodologies”. In: Performance Evaluation: Originsand Directions. London, UK, UK: Springer-Verlag, 2000, pp. 459–481.isbn: 3-540-67193-5.
[4] G. Denaro, A. Polini, and W. Emmerich. “Early performance testingof distributed software applications”. In: Proceedings of the 4th inter-national workshop on Software and performance. WOSP ’04. RedwoodShores, California: ACM, 2004, pp. 94–103. isbn: 1-58113-673-0. doi:10.1145/974044.974059.
[5] E. Gansner, E. Koutsofios, and S North. Drawing draphs with dot. On-line at http://www.graphviz.org/Documentation/dotguide.pdf. 2006.url: http://www.graphviz.org/Documentation/dotguide.pdf.
[6] Hewlett-Packard. httperf. retrieved: October, 2012. url: http://www.hpl.hp.com/research/linux/httperf/httperf-man-0.9.txt.
[7] HP. HP LoadRunner. 2013. url: http://www8.hp.com/us/en/software-solutions/software.html?compURI=1175451\#.URz7wqWou8E.
[8] ITEA 2. ITEA 2 D-MINT project result leaflet: Model-based testingcuts development costs. 2013. url: http://www.itea2.org/project/result/download/result/5519?file=06014\_D\_MINT\_Project\_Leaflet\_results\_oct\_10.pdf.
[9] M. Jurdzinski et al. “Concavely-Priced Probabilistic Timed Au-tomata”. In: Proc. 20th International Conference on ConcurrencyTheory (CONCUR’09). Ed. by M. Bravetti and G. Zavattaro.Vol. 5710. LNCS. Springer, 2009, pp. 415–430.
[10] L. Richardson and S. Ruby. RESTful Web Services. O’Reilly Media.2007.
[11] D. A. Menasce and V. Almeida. Capacity Planning for Web Services:metrics, models, and methods. 1st. Upper Saddle River, NJ, USA:Prentice Hall PTR, 2001. isbn: 0130659037.
[12] D. Mosberger and T. Jin. “httperfa tool for measuring web server per-formance”. In: SIGMETRICS Perform. Eval. Rev. 26.3 (Dec. 1998),pp. 31–37. issn: 0163-5999. doi: 10 . 1145 / 306225 . 306235. url:http://doi.acm.org/10.1145/306225.306235.
[13] D. C. Petriu and H. Shen. “Applying the UML Performance Profile:Graph Grammar-based Derivation of LQN Models from UML Speci-fications”. In: Springer-Verlag, 2002, pp. 159–177.

[14] PostgreSQL. Concurrency Control. retrieved: March, 2013. url: http://www.postgresql.org/docs/9.1/static/mvcc-intro.html.
[15] G. Ru↵o et al. “WALTy: A User Behavior Tailored Tool for Eval-uating Web Application Performance”. In: Network Computing andApplications, IEEE International Symposium on 0 (2004), pp. 77–86.doi: http://doi.ieeecomputersociety.org/10.1109/NCA.2004.1347765.
[16] M. Shams, D. Krishnamurthy, and B. Far. “A model-based approachfor testing the performance of web applications”. In: SOQUA ’06: Pro-ceedings of the 3rd international workshop on Software quality assur-ance. Portland, Oregon: ACM, 2006, pp. 54–61. isbn: 1-59593-584-3.doi: http://doi.acm.org/10.1145/1188895.1188909.
[17] SQLite. File Locking And Concurrency In SQLite Version 3. retrieved:March, 2013. url: http://www.sqlite.org/lockingv3.html.
[18] Sun. Faban Harness and Benchmark Framework. 2013. url: http://java.net/projects/faban/.
[19] The Apache Software Foundation. Apache JMeter. Retrieved: Octo-ber, 2012. url: http://jmeter.apache.org/.
225
View publication statsView publication stats
Related Documents