Abstract This document contains a summary of the benchmarks executed for the PRIMERGY RX600 S4. The PRIMERGY RX600 S4 performance data are compared with the data of other PRIMERGY models and discussed. In addition to the benchmark results, an explanation has been included for each benchmark and for the benchmark envi- ronment. Contents Technical Data ........................................................................................................................................................2 SPECcpu2006.........................................................................................................................................................3 SPECjbb2005........................................................................................................................................................10 SPECweb2005 ......................................................................................................................................................16 StorageBench .......................................................................................................................................................21 OLTP-2..................................................................................................................................................................26 TPC-E ...................................................................................................................................................................29 SAP SD .................................................................................................................................................................33 Terminal Server.....................................................................................................................................................37 vServCon ..............................................................................................................................................................43 Literature ...............................................................................................................................................................48 Contact ..................................................................................................................................................................49 Performance Report PRIMERGY RX600 S4 Version 2.2b November 2009 Pages 49

Welcome message from author
This document is posted to help you gain knowledge. Please leave a comment to let me know what you think about it! Share it to your friends and learn new things together.
Transcript

Abstract This document contains a summary of the benchmarks executed for the PRIMERGY RX600 S4.
The PRIMERGY RX600 S4 performance data are compared with the data of other PRIMERGY models and discussed. In addition to the benchmark results, an explanation has been included for each benchmark and for the benchmark envi-ronment.
Contents
Technical Data ........................................................................................................................................................ 2
SPECcpu2006 ......................................................................................................................................................... 3
SPECjbb2005 ........................................................................................................................................................ 10
SPECweb2005 ...................................................................................................................................................... 16
StorageBench ....................................................................................................................................................... 21
OLTP-2.................................................................................................................................................................. 26
TPC-E ................................................................................................................................................................... 29
SAP SD ................................................................................................................................................................. 33
Terminal Server ..................................................................................................................................................... 37
vServCon .............................................................................................................................................................. 43
Literature ............................................................................................................................................................... 48
Contact .................................................................................................................................................................. 49
Performance Report PRIMERGY RX600 S4
Version 2.2b November 2009
Pages 49
White Paper Performance Report PRIMERGY RX600 S4 Version: 2.2b, November 2009
© Fujitsu Technology Solutions 2009 Page 2 (49)
Technical Data The PRIMERGY RX600 S4 is a space-saving 4-socket rack server which takes up just 4 height units. It has the Intel 7300 chip set, Intel Xeon processors, 4-way interleaved registered enhanced ECC PC2-5300F DDR2-SDRAM, a front-side bus with 1067 MHz timing, an 8-port SAS RAID controller with 512 MB cache, two dual GBit Ethernet controllers, eight PCI slots (4 PCI-Express x8, 4 PCI-Express x4) and eight drive slots for SAS hard disks.
See Data sheet PRIMERGY RX600 S4 for detailed technical information.

White Paper Performance Report PRIMERGY RX600 S4 Version: 2.2b, November 2009
© Fujitsu Technology Solutions 2009 Page 3 (49)
SPECcpu2006
Benchmark description SPECcpu2006 is a benchmark to measure system efficiency during integer and floating point operations. It consists of an integer test suite containing 12 applications and a floating point test suite containing 17 applications which are extremely computing-intensive and concentrate on the CPU and memory. Other components, such as disk I/O and network, are not measured by this benchmark.
SPECcpu2006 is not bound to a specific operating system. The benchmark is available as source code and is compiled before the actual benchmark. Therefore, the compiler version used and its optimization settings have an influence on the measurement result.
SPECcpu2006 contains two different methods of performance measurement: The first method (SPECint2006 and SPECfp2006) determines the time required to complete a single task. The second method (SPECint_rate2006 and SPECfp_rate2006) determines the throughput, i.e. how many tasks can be completed in parallel. Both methods are addi-tionally subdivided into two measuring runs, "base" and "peak", which differ in the way the compiler optimization is used. The "base" values are always used when results are published, the "peak" values are optional.
Benchmark Arithmetic Type Compiler optimization
Measuring result Application
SPECint2006 integer peak aggressive speed single threaded
SPECint_base2006 integer base conservative
SPECint_rate2006 integer peak aggressive throughput multithreaded
SPECint_rate_base2006 integer base conservative
SPECfp2006 floating point peak aggressive speed single threaded
SPECfp_base2006 floating point base conservative
SPECfp_rate2006 floating point peak aggressive throughput multithreaded
SPECfp_rate_base2006 floating point base conservative
The results represent the geometric mean of normalized ratios determined for the individual benchmarks. Compared with the arithmetic mean, the geometric mean results in the event of differingly high single results in a weighting in favor of the lower single results. “Normalized“ means measuring how fast the test system runs in comparison to a reference system. The value of “1“ was determined for the SPECint_base2006, SPECint_rate_base2006, SPECfp_base2006 and SPECfp_rate_base2006 results of the reference system. Thus a SPECint_base2006 value of 2 means for example that the measuring system has executed this benchmark approximately twice as fast as the reference system. A SPECfp_rate_base2006 value of 4 means that the measuring system has executed this benchmark about 4/[# base copies] times as fast as the reference system. “# base copies“ here specifies how many parallel instances of the bench-mark have been executed.
We do not submit all SPECcpu2006 measurements for publication at SPEC. So not all results appear on SPEC’s web sites. As we archive the log data for all measurements, we are able to prove the correct realization of the measurements any time.
Benchmark results The PRIMERGY RX600 S4 was measured with two different processor versions of the Xeon series:
Xeon E7220, E7310, E7330 and X7350 (Tigerton)
Xeon E7430, L7445, E7450 and X7460 (Dunnington)
The results of the Tigerton processors are based on measurements, in which the SPECcpu benchmark programs were compiled with the Intel C++/Fortran compiler 10.1 and run under SUSE Linux Enterprise Server 10 SP1 (64-bit). The SPECcpu benchmark programs were compiled with the Intel C++/Fortran compiler 11.0 for the Dunnington processors and run under SUSE Linux Enterprise Server 10 SP2 (64-bit).
SPEC®, SPECint®, SPECfp® and the SPEC logo are registered trademarks of the Standard Performance Evaluation
Corporation (SPEC).

White Paper Performance Report PRIMERGY RX600 S4 Version: 2.2b, November 2009
© Fujitsu Technology Solutions 2009 Page 4 (49)
The results in bold print in the two following tables have been published at http://www.spec.org.
Processor Cores GHz L2 cache L3 cache TDP SPECint_rate_base2006 SPECint_rate2006
2 chips 4 chips 2 chips 4 chips
Xeon E7220 2 2.93 4 MB per core n/a 80 watt 62.0 119 74.8 142
Xeon E7310 4 1.60 4 MB per chip n/a 80 watt 63.6 115 70.3 126
Xeon E7330 4 2.40 6 MB per chip n/a 80 watt 85.1 151 94.9 177
Xeon X7350 4 2.93 8 MB per chip n/a 130 watt 99.0 175 112 210
Xeon E7430 4 2.13 6 MB per chip 12 MB per chip 90 watt n/a 180 n/a 194
Xeon L7445 4 2.13 6 MB per chip 12 MB per chip 50 watt n/a 179 n/a 194
Xeon E7450 6 2.40 9 MB per chip 12 MB per chip 90 watt n/a 235 n/a 252
Xeon X7460 6 2.67 9 MB per chip 16 MB per chip 130 watt 144 269 159 291
The SPECint_rate_2006 results of the Tigerton processors are 10-21% and those of the Dunnington processors are 7-10% above the SPECint_rate_base2006 results.
Processor Cores GHz L2 cache L3 cache TDP SPECfp_rate_base2006 SPECfp_rate2006
2 chips 4 chips 2 chips 4 chips
Xeon E7220 2 2.93 4 MB per core n/a 80 watt 44.4 82.3 47.8 88.4
Xeon E7310 4 1.60 4 MB per chip n/a 80 watt 45.4 82.3 48.0 87.3
Xeon E7330 4 2.40 6 MB per chip n/a 80 watt 55.2 97.6 58.4 104
Xeon X7350 4 2.93 8 MB per chip n/a 130 watt 60.6 107 64.3 117
Xeon E7430 4 2.13 6 MB per chip 12 MB per chip 90 watt n/a 110 n/a 116
Xeon L7445 4 2.13 6 MB per chip 12 MB per chip 50 watt n/a 110 n/a 116
Xeon E7450 6 2.40 9 MB per chip 12 MB per chip 90 watt n/a 130 n/a 139
Xeon X7460 6 2.67 9 MB per chip 16 MB per chip 130 watt 73.7 142 81.2 156

White Paper Performance Report PRIMERGY RX600 S4 Version: 2.2b, November 2009
© Fujitsu Technology Solutions 2009 Page 5 (49)
The SPECfp_rate_2006 results of the Tigerton processors are 6-9% and those of the Dunnington processors are 5-10% above the SPECfp_rate_base2006 results.
Comparative measurements, which illustrate the influence of compiler versions on the throughput of the server, were performed with the Xeon X7460 processor. Versions 10.1 and 11.0 of the Intel C++/Fortran compiler were used for the compilation of the benchmark programs. The measurements were made in an identical hardware and software environ-ment. The measurements show that the choice of the compiler is of considerable significance for the benchmark results.

White Paper Performance Report PRIMERGY RX600 S4 Version: 2.2b, November 2009
© Fujitsu Technology Solutions 2009 Page 6 (49)
In August 2008 the PRIMERGY RX600 S4 was measured with four Xeon X7460 processors. The SPECcpu benchmark programs were compiled with the Intel C++/Fortran compiler 10.1 and run under SUSE Linux Enterprise Server 10 SP2 (64-bit). The PRIMERGY RX600 S4 achieved both the best SPECint_rate_base2006 result
1 and the best
SPECint_rate2006 result2 of all servers with Intel Xeon
processors.
Source: http://www.spec.org/cpu2006/results, as of September 2, 2007
1 Competitive benchmark results stated above reflect results published as of September 2, 2008. The comparison
presented above is based on the best performing servers with Intel Xeon processors currently shipping by IBM, Lenovo and Fujitsu Siemens Computers, now operating under the name of Fujitsu. For the latest SPECint_rate_base2006 benchmark results, visit http://www.spec.org/cpu2006/results.
2 Competitive benchmark results stated above reflect results published as of September 2, 2008. The comparison
presented above is based on the best performing servers with Intel Xeon processors currently shipping by Acer, Dell, Lenovo and Fujitsu Siemens Computers, now operating under the name of Fujitsu. For the latest SPECint_rate2006 benchmark results, visit http://www.spec.org/cpu2006/results.

White Paper Performance Report PRIMERGY RX600 S4 Version: 2.2b, November 2009
© Fujitsu Technology Solutions 2009 Page 7 (49)
In August 2008 the PRIMERGY RX600 S4 was measured with four Xeon X7460 processors. The SPECcpu benchmark programs were compiled with the Intel C++/Fortran compiler 11.0 and run under SUSE Linux Enterprise Server 10 SP2 (64-bit). The PRIMERGY RX600 S4 achieved both the best SPECfp_rate_base2006 result as well as the best SPECfp_rate2006 result of all servers with Intel Xeon processors.
3
Source: http://www.spec.org/cpu2006/results, as of September 18, 2007
In September 2008 the PRIMERGY RX600 S4 was measured with four Xeon X7460 processors. The SPECcpu benchmark programs were compiled with the Intel C++/Fortran compiler 11.0 and run under SUSE Linux Enterprise Server 10 SP2 (64-bit). The PRIMERGY RX600 S4 achieved both the best SPECint_rate_base2006 result and, together with servers from other manu-facturers, the best SPECint_rate2006 result of all servers with Intel Xeon proc-essors.
4
Source: http://www.spec.org/cpu2006/results, as of September 16, 2007
3 Competitive benchmark results stated above reflect results published as of September 18, 2008. The comparison
presented above is based on the best performing servers with Intel Xeon processors currently shipping by Dell, HP and Fujitsu Siemens Computers, now operating under the name of Fujitsu. For the latest SPECfp_rate_base2006 and SPECfp_rate2006 benchmark results, visit http://www.spec.org/cpu2006/results.
4 Competitive benchmark results stated above reflect results published as of September 16, 2008. The comparison
presented above is based on the best performing servers with Intel Xeon processors currently shipping by Dell, HP and Fujitsu Siemens Computers, now operating under the name of Fujitsu. For the latest SPECint_rate_base2006 and SPECint_rate2006 benchmark results, visit http://www.spec.org/cpu2006/results.

White Paper Performance Report PRIMERGY RX600 S4 Version: 2.2b, November 2009
© Fujitsu Technology Solutions 2009 Page 8 (49)
The two adjacent diagrams illustrate the differences in performance between the current best mono, dual and quad-processor rack servers of the PRIMERGY series. The PRIMERGY RX600 S4 surpasses the result of the currently most powerful mono-processor system PRIMERGY RX100 S5 by more than 275% in the integer test suite and almost 200% in the floating-point test suite. In comparison with the cur-rently most powerful dual-processor system PRIMERGY RX200 S4 the PRIMERGY RX600 S4 achieves a plus of about 90%.
The two diagrams below put the PRIMERGY RX600 S4 in relation to its predecessor, the PRIMERGY RX600 S3, with the maximum configuration levels. In the integer test suite an increase of +256% was achieved for SPECint_rate_base2006 and +261% for SPECint_rate2006. In the floating-point test suite the growth for SPECfp_rate_base2006 is +143% and for SPECfp_rate2006 +159%.
White Paper Performance Report PRIMERGY RX600 S4 Version: 2.2b, November 2009
© Fujitsu Technology Solutions 2009 Page 9 (49)
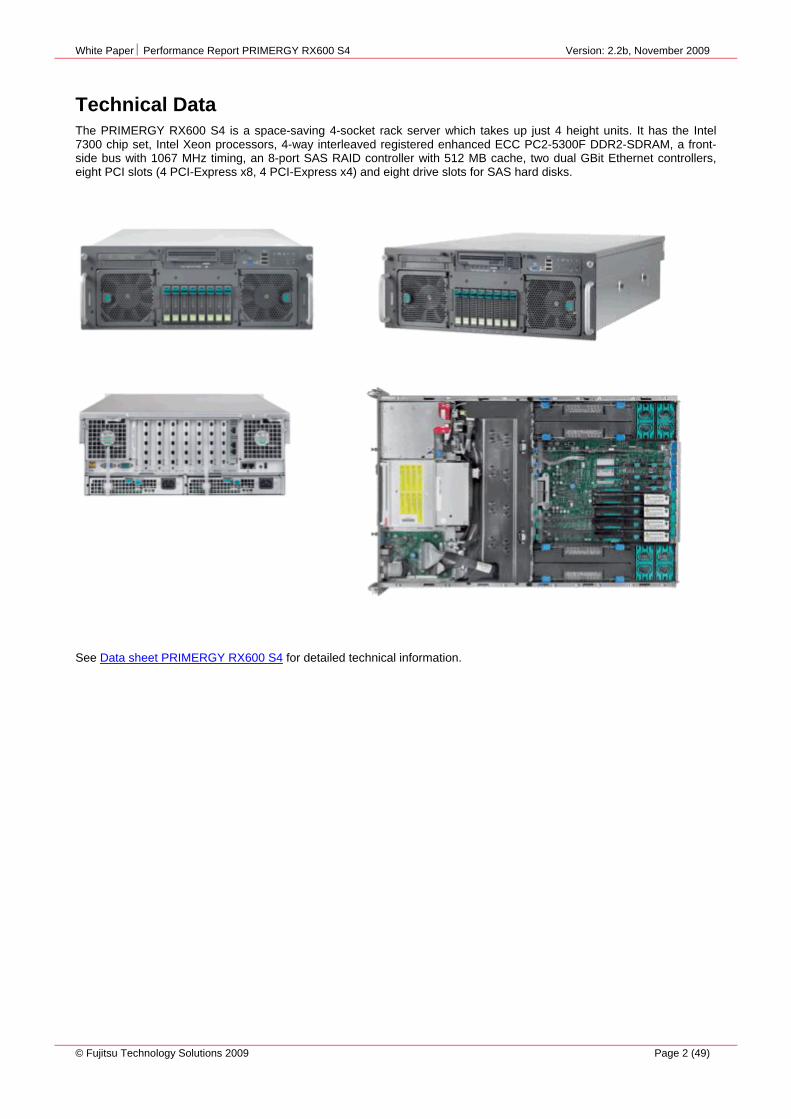
Benchmark environment* All SPECcpu2006 measurements were performed on a PRIMERGY RX600 S4 with the following hardware and software configuration:
Hardware
Model PRIMERGY RX600 S4
CPU Xeon E7220, E7310, E7330 and X7350 Xeon E7430, L7445, E7450 and X7460
Number of CPUs 2, 4
Primary Cache 32 kB instruction + 32 kB data on chip, per core
Secondary Cache
Xeon E7220: 4 MB (I+D) on chip, per core Xeon E7310: 4 MB (I+D) on chip, per chip Xeon E7330, E7430 and L7445: 6 MB (I+D) on chip, per chip Xeon X7350: 8 MB (I+D) on chip, per chip Xeon E7450 and X7460: 9 MB (I+D) on chip, per chip
Other Cache Xeon E7430, L7445 and E7450: 12 MB (I+D) on chip, per chip Xeon X7460: 16 MB (I+D) on chip, per chip others: none
Memory 16 x 4 GB PC2-5300F DDR2-SDRAM
Software
Operating System Xeon E7220, E7310, E7330 and X7350: SUSE Linux Enterprise Server 10 SP1 (64-bit) Xeon E7430, L7445, E7450 and X7460: SUSE Linux Enterprise Server 10 SP2 (64-bit)
Compiler Xeon E7220, E7310, E7330, X7350 and X7460: Intel C++/Fortran Compiler 10.1 Xeon E7430, L7445, E7450 and X7460: Intel C++/Fortran Compiler 11.0
* Some components may not be available in all countries / sales regions.

White Paper Performance Report PRIMERGY RX600 S4 Version: 2.2b, November 2009
© Fujitsu Technology Solutions 2009 Page 10 (49)
SPECjbb2005
Benchmark description SPECjbb2005 is a Java business benchmark that focuses on the performance of Java server platforms. It is essentially a modernized version of SPECjbb2000 with the main differences being:
The transactions have become more complex in order to cover a greater functional scope.
The working set of the benchmark has been enlarged to the extent that the total system load has increased.
SPECjbb2000 allows only one active Java Virtual Machine instance (JVM), whereas SPECjbb2005 permits several instances, which in turn achieves greater closeness to reality, particularly with large systems.
On the software side SPECjbb2005 measures the implementations of the JVM, JIT (Just-In-Time) compiler, garbage collection, threads and some aspects of the operating system. As far as hardware is concerned, it measures the effi-ciency of the CPUs and caches, the memory subsystem and the scalability of shared memory systems (SMP). Disk and network I/O are irrelevant.
SPECjbb2005 emulates a 3-tier client/server system that is typical for modern business process applications with em-phasis on the middle tier system:
Clients generate the load, consisting of driver threads, which on the basis of the TPC-C benchmark generate OLTP accesses to a database without thinking times.
The middle-tier system implements the business processes and the updating of the database.
The database takes on the data management and is emulated by Java objects that are in the memory. Transaction logging is implemented on an XML basis.
The major advantage of this benchmark is that it includes all three tiers that run together on a single host. The perform-ance of the middle tier is measured, thus avoiding large-scale hardware installations and making direct comparisons possible between SPECjbb2005 results of different systems. Client and database emulation are also written in Java.
SPECjbb2005 only needs the operating system as well as a Java Virtual Machine with J2SE 5.0 features.
The scaling unit is a warehouse with approx. 25 MB Java objects. Precisely one Java thread per warehouse executes the operations on these objects. The business operations are assumed by TPC-C:
New Order Entry
Payment
Order Status Inquiry
Delivery
Stock Level Supervision
Customer Report
However, these are the only features SPECjbb2005 and TPC-C have in common. The results of the two benchmarks are not comparable.
SPECjbb2005 has 2 performance metrics:
bops (business operations per second) is the overall rate of all business operations performed per second.
bops/JVM is the ratio of the first metrics and the number of active JVM instances.
In comparisons of various SPECjbb2005 results it is necessary to state both metrics.
The following rules, according to which a compliant benchmark run has to be performed, are the basis for these metrics:
A compliant benchmark run consists of a sequence of measuring points with an increasing number of warehouses (and thus of threads) with the number in each case being increased by one warehouse. The run is started at one warehouse up through 2*MaxWhm but not less than 8 warehouses. MaxWhm is the number of warehouses with the highest opera-tion rate per second the benchmark expects. Per default the benchmark equates MaxWH with the number of CPUs visi-ble by the operating system. The metrics bops is the arithmetic average of all measured operation rates with between MaxWhm warehouses and 2*MaxWhm warehouses.
SPEC®, SPECjbb® and the SPEC logo are registered trademarks of the Standard Performance Evaluation
Corporation (SPEC).

White Paper Performance Report PRIMERGY RX600 S4 Version: 2.2b, November 2009
© Fujitsu Technology Solutions 2009 Page 11 (49)
Benchmark results In August 2007 the PRIMERGY RX600 S4 was measured with four Xeon X7350 processors and a memory of 64 GB PC2-5300F DDR2-SDRAM. The measurement was taken under Windows Server 2003 R2 Enterprise x64 Edition. As JVM, eight instances of JRockit(R) 6.0 P27.4.0 (build P27.4.0-3-86647-1.6.0_02-20070801-1931-windows-x86_64) by BEA were used.
The PRIMERGY RX600 S4 achieved the best result of all servers with 4 processors and thus also outperformed provid-
ers of servers with other processor types. With the measurement of the PRIMERGY RX600 S4 all measured values between 2 and 4 warehouses were incorporated in the benchmark result. With the measurement of the IMB System p 570 this applies to all measured values between 4 and 8 warehouses.
Source: http://www.spec.org/jbb2005/results, as of September 30, 2007
In August 2008 the PRIMERGY RX600 S4 was measured with four Xeon X7460 processors and a memory of 64 GB PC2-5300F DDR2-SDRAM. The measurement was taken under Windows Server 2003 R2 Enterprise x64 Edition. As JVM, four instances of JRockit(R) 6.0 P27.5.0 (build P27.5.0-5_o_CR371811_CR374296-100684-1.6.0_03-20080702-1651-windows-x86_64) by Oracle were used. In September 2008 further measurements were made with two and four Xeon E7310 and Xeon E7330 processors. In this case, four JVM instances were used for the measurements with two processors and eight JVM instances for the measurements with four processors.
Competitive benchmark results stated above reflect results published as of September 30, 2007. The comparison
presented above is based on the best performing servers with 4 processors currently shipping by IBM and Fujitsu Siemens Computers, now operating under the name of Fujitsu. For the latest SPECjbb2005 benchmark results, visit http://www.spec.org/jbb2005/results.

White Paper Performance Report PRIMERGY RX600 S4 Version: 2.2b, November 2009
© Fujitsu Technology Solutions 2009 Page 12 (49)
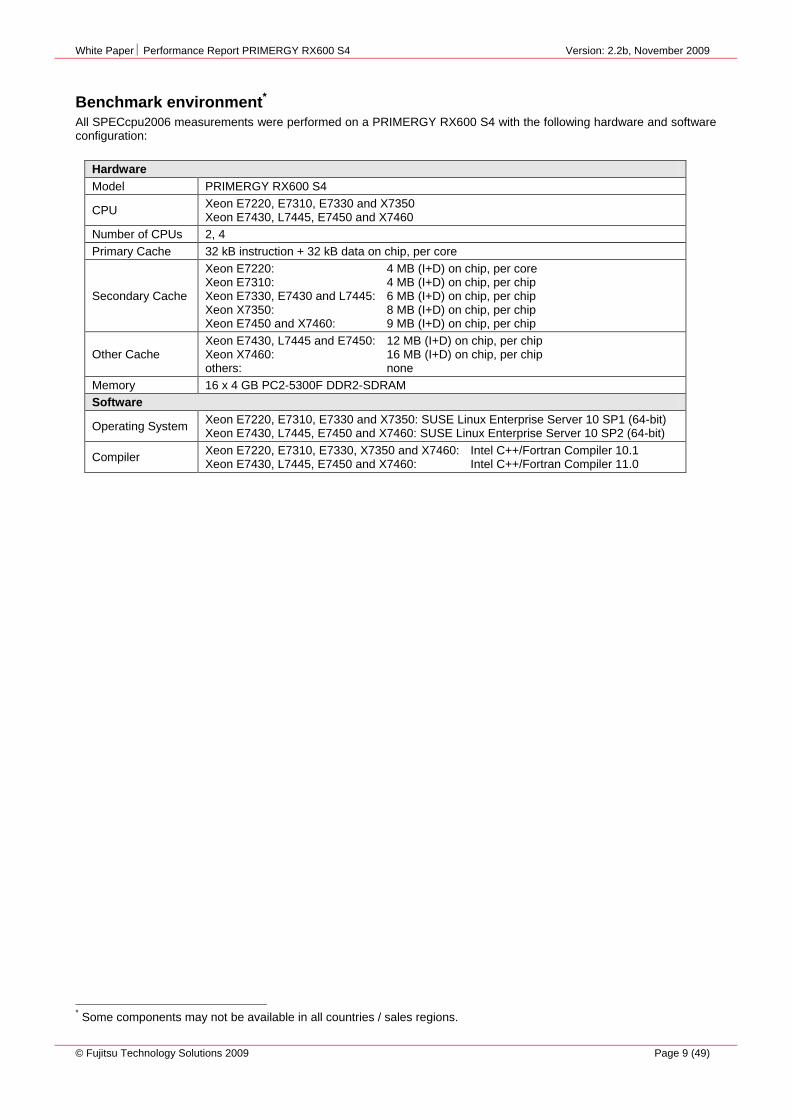
In February 2009 the PRIMERGY RX600 S4 was again measured with four Xeon X7460 processors and a memory of 64 GB PC2-5300F DDR2-SDRAM. The measurement was taken under Windows Server 2003 R2 Enterprise x64 Edition. As JVM, four instances of JRockit(R) 6 P28.0.0 (build P28.0.0-8-109238-1.6.0_05-20090130-1408-windows-x86_64) by Oracle were used.
The PRIMERGY RX600 S4 achieved the best result of all servers with 4 Intel processors. With the measurements all measured values between 6 and 12 warehouses were incorporated in the benchmark result.
Source: http://www.spec.org/jbb2005/results, as of March 26, 2009
Competitive benchmark results stated above reflect results published as of March 26, 2009. The comparison
presented above is based on the best performing servers with 4 Intel processors currently shipping by Dell and Fujitsu Siemens Computers, now operating under the name of Fujitsu. For the latest SPECjbb2005 benchmark results, visit http://www.spec.org/jbb2005/results.
White Paper Performance Report PRIMERGY RX600 S4 Version: 2.2b, November 2009
© Fujitsu Technology Solutions 2009 Page 13 (49)
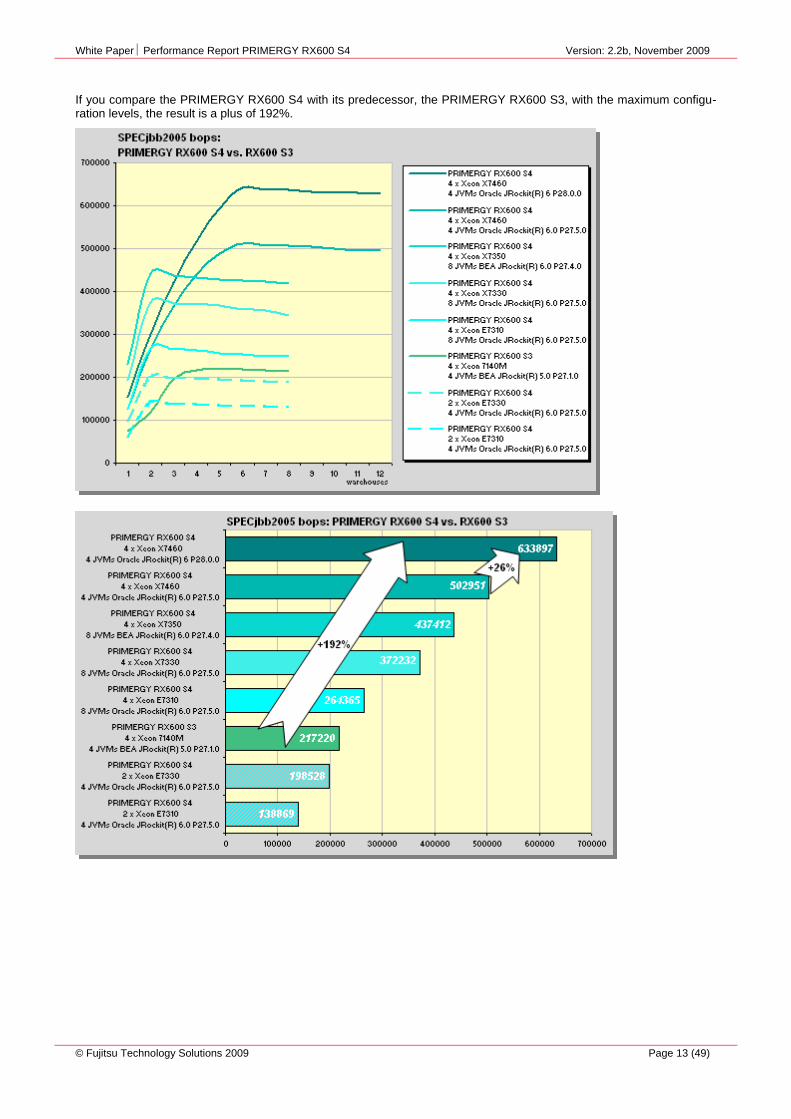
If you compare the PRIMERGY RX600 S4 with its predecessor, the PRIMERGY RX600 S3, with the maximum configu-ration levels, the result is a plus of 192%.

White Paper Performance Report PRIMERGY RX600 S4 Version: 2.2b, November 2009
© Fujitsu Technology Solutions 2009 Page 14 (49)
The two diagrams below illustrate the differences in performance between the currently best mono, dual and quad-proc-essor rack servers of the PRIMERGY series. The PRIMERGY RX600 S4 surpasses the result of the presently most powerful mono-processor system PRIMERGY RX150 S5 by 200% and the result of the currently most powerful dual-processor system PRIMERGY RX200 S4 by 72%. For the PRIMERGY RX600 S4 the measurement results of between 6 and 12 warehouses and for the other servers measurement results of between 2 and 4 warehouses were incorporated in the benchmark result.

White Paper Performance Report PRIMERGY RX600 S4 Version: 2.2b, November 2009
© Fujitsu Technology Solutions 2009 Page 15 (49)
Benchmark environment* The SPECjbb2005 measurement was performed on a PRIMERGY RX600 S4 with the following hardware and software configuration:
Hardware
Model PRIMERGY RX600 S4
CPU Xeon E7310, E7330, X7350 and X7460
Number of chips Xeon E7310 and E7330: 2 chips, 8 cores, 4 cores per chip Xeon E7310, E7330 and X7350: 4 chips, 16 cores, 4 cores per chip Xeon X7460: 4 chips, 24 cores, 6 cores per chip
Primary Cache 32 kB instruction + 32 kB data on chip, per core
Secondary Cache
Xeon E7310: 4 MB (I+D) on chip, per chip Xeon E7330: 6 MB (I+D) on chip, per chip Xeon X7350: 8 MB (I+D) on chip, per chip Xeon X7460: 9 MB (I+D) on chip, per chip
Other Cache Xeon X7460: 16 MB (I+D) on chip, per chip others: none
Memory 16 x 4 GB PC2-5300F DDR2-SDRAM
Software
Operating System Windows Server 2003 R2 Enterprise x64 Edition
JVM Version
Xeon X7350: BEA JRockit(R) 6.0 P27.4.0 (build P27.4.0-3-86647-1.6.0_02-20070801-1931-windows-x86_64)
others: Oracle JRockit(R) 6.0 P27.5.0 (build P27.5.0-5_o_CR371811_CR374296-100684-1.6.0_03-20080702-1651-windows-x86_64)
In addition
Xeon X7460: Oracle JRockit(R) 6 P28.0.0 (build P28.0.0-8-109238-1.6.0_05-20090130-1408-windows-x86_64)
* Some components may not be available in all countries / sales regions.

White Paper Performance Report PRIMERGY RX600 S4 Version: 2.2b, November 2009
© Fujitsu Technology Solutions 2009 Page 16 (49)
SPECweb2005
Benchmark description SPECweb2005 is the next generation web server benchmark developed by the Open Systems Group (OSG) of the Standard Performance Evaluation Corporation (SPEC). It is the successor of SPECweb99 and SPECweb99_SSL and it measures the performance of a HTTP server under a standardized load of static and dynamic requests. The new version includes many sophisticated and state-of-the-art enhancements to meet the modern demands of Web users of today and tomorrow.
Contrary to its predecessor version, SPECweb2005 is split into three different workloads, which are based on real-world web-server applications:
- SPECweb2005_Banking – Emulates typical online banking requests, such as login/logoff, account status, bank transfers, displaying and changing user profiles, etc. Login includes the setting up an SSL connection that will be used for all following activities.
- SPECweb2005_Ecommerce – Simulates an online transaction in the computer business. Users can look through the pages, view goods, put them in their shopping carts and purchase the products. Activities in the initial phases of the connection use non-encrypted connections. As soon as an order is to be sent off, the connections are SSL-en-crypted.
- SPECweb2005_Support – Emulates requests coming in on a support web site. Users can search through the page, view lists of available products and download the related files. Requests are always non-encrypted.
The requests of all three workloads refer to dynamically generated contents and static files of various sizes. Intervals between requests ("think times") vary. The distribution of the requests and the think times are controlled by tables and functions. Average values for these parameters are laid down in configuration files and are monitored by the sequencing unit.
SPECweb2005 is not tied to a particular operating system or to a particular web server. The benchmark environment consists of several components. Each client system runs a load generator program setting up connections to the web server, sending page requests and receiving web pages in response to the requests. A prime client initializes the other systems, monitors the test procedure, collects the results and evaluates them. The web server, also referred to as "Sys-tem Under Test" (SUT), comprises the hardware and software used to handle the requests. A new feature is the back-end simulator (BeSim) that emulates the database and application components of the entire application. The web server communicates with the BeSim via HTTP requests to obtain any additional information required. The sequencer and the client programs are written in Java and are divided into individual threads, each of which emulates a virtual user session.
All three workloads pass various phases during the test. In the ramp-up phase, the load-generating threads are started one after another. This is followed by a warm-up phase initializing the measurement. Any previously recorded results and errors are deleted before the actual measuring interval begins. During the measuring phase all requests and responses are recorded in the final results. In the ramp-down phase which now follows the threads are stopped, followed by an idle phase, before the next test iteration begins with another ramp-up phase. Thus altogether three iterations are performed for each workload.
The number of generated threads is defined separately for each workload, according to the performance of the SUT in the test configuration. To determine the results, the clients measure for each requested page the time between the sending of the request and the arrival of all the data of the requested page. The response times for embedded image files are also included in the calculation. The result takes all those pages into account that meet particular QoS (Quality of Service) criteria. For this purpose the responses are assigned to the following categories according to response times (Banking and Ecommerce) and transfer rates (Support) within the workloads:
- GOOD – response time < 2s (Banking), < 3s (Ecommerce); transfer rate > 99000 bytes/s (Support)
- TOLERABLE – response time < 4s (Banking), < 5s (Ecommerce); transfer rate > 95000 bytes/s (Support)
- FAILED – response time > 4s (Banking), > 5s (Ecommerce); transfer rate < 95000 bytes/s (Support)
In all three test iterations at least 95% of all responses must fall into category GOOD and 99% into category TOLERABLE for the workload result to be valid. A regular overall result requires valid partial results in all three workloads with the same system configuration.
The individual results are named after the workloads and indicate the maximum number of user sessions that can be handled by the system under test with the QoS criteria being met. They thus allow a system to be assessed under differ-ent realistic conditions. To calculate the overall result, each partial result is related to a reference value; then the geomet-ric mean of these three values is calculated, multiplied by 100. The overall result (SPECweb2005) thus indicates the relative performance of the measured system in relation to the reference system.
SPEC®, SPECweb® and the SPEC logo are registered trademarks of the Standard Performance Evaluation
Corporation (SPEC).

White Paper Performance Report PRIMERGY RX600 S4 Version: 2.2b, November 2009
© Fujitsu Technology Solutions 2009 Page 17 (49)
Benchmark results In May 2008 the PRIMERGY RX600 S4 was measured with four Xeon X7350 processors and 72 GB PC2-5300F DDR2-SDRAM. Four quad port Intel PRO/1000PT (PCIe) and one Intel PRO/1000 (onboard) were used for the network. Two FibreCAT CX500, each with 75 hard disks of type Seagate ST336753 with 36 GB and 15 krpm, which were connected via a Qlogic QLE2462 fibre channel controller, were used as disk subsystem. Two RAID 5 arrays were formed each consisting of 75 hard disks. These were combined to form a RAID 0. The operating system was resident on a Seagate ST936751SS hard disk in connection with the onboard SAS controller. The measurement was performed using the HTTP software Accoria Rock JSP/Servlet Container v1.3.2 (x86_64) under Red Hat Enterprise Linux 5.1 (2.6.18-53.el5 x86_64).
The PRIMERGY RX600 S4 achieved the best SPECweb2005 result of all servers worldwide .
Source: http://www.spec.org/web2005/results, as of June 9, 2008
In November 2008 the PRIMERGY RX600 S4 was measured with four Xeon X7460 processors and 64 GB PC2-5300F DDR2-SDRAM. Four quad port Intel PRO/1000PT (PCIe) and one Intel PRO/1000 (onboard) were used for the network. Four FibreCAT SX40, each with 12 hard disks of type Seagate ST3300656SS with 300 GB and 15 krpm, which were connected via an LSI SAS MegaRAID 8880EM2 controller, were used as disk subsystem. Two RAID 0 arrays were formed each consisting of 24 hard disks. These were combined to form a RAID 0. The log files were on four hard disks of type Seagate ST973401SS, the operating system on a hard disk of type Seagate ST936751SS: These five hard disks were operated via the onboard SAS controller. HTTP software and operating system were equivalent to those of the measurement of May 2008.
Again the PRIMERGY RX600 S4 achieved the best SPECweb2005 result of all servers worldwide .
Source: http://www.spec.org/web2005/results, as of December 23, 2008
Competitive benchmark results stated above reflect results published as of June 9, 2008. The comparison presented
above is based on the four best performing servers currently shipping by Fujitsu, HP, Sun and Fujitsu Siemens Computers, now operating under the name of Fujitsu. For the latest SPECweb2005 benchmark results, visit http://www.spec.org/web2005/results.
Competitive benchmark results stated above reflect results published as of December 23, 2008. The comparison presented above is based on the three best performing servers currently shipping by HP and Fujitsu Siemens Computers, now operating under the name of Fujitsu. For the latest SPECweb2005 benchmark results, visit http://www.spec.org/web2005/results.

White Paper Performance Report PRIMERGY RX600 S4 Version: 2.2b, November 2009
© Fujitsu Technology Solutions 2009 Page 18 (49)
In February 2009 the PRIMERGY RX600 S4 was measured with four Xeon X7460 processors and 128 GB PC2-5300F DDR2-SDRAM. Five quad port Intel PRO/1000PT (PCIe) and one Intel PRO/1000 (onboard) were used for the network. Two FibreCAT CX500, each with 60 hard disks of type Seagate ST336753 with 36 GB and 15 krpm, which were con-nected via an Emulex LPe11002 fibre channel controller, were used as disk subsystem. Two RAID 0 arrays were formed each consisting of 60 hard disks. These were combined to form a RAID 0. The log files were on four hard disks of type Seagate ST973401SS, the operating system on a hard disk of type Seagate ST936751SS: These five hard disks were operated via the onboard SAS controller. The measurement was performed under Red Hat Enterprise Linux 5.1 (2.6.18-53.el5 x86_64). The HTTP software was equivalent to that of the measurement of May 2008.
As customary the PRIMERGY RX600 S4 achieved the best SPECweb2005 result of all servers worldwide .
Source: http://www.spec.org/web2005/results, as of March 13, 2009
Compared with the PRIMERGY RX600 S3, which had also set a SPECweb2005 world record in September 2006, the PRIMERGY RX600 S4 improved the throughput performance by 245%
Competitive benchmark results stated above reflect results published as of March 13, 2009. The comparison
presented above is based on the four best performing servers currently shipping by Sun, HP and Fujitsu. For the latest SPECweb2005 benchmark results, visit http://www.spec.org/web2005/results.

White Paper Performance Report PRIMERGY RX600 S4 Version: 2.2b, November 2009
© Fujitsu Technology Solutions 2009 Page 19 (49)
Benchmark environment* Measurement of May 2008 Measurement of December 2008
64 PRIMERGY RX100 S3 1 x Pentium D 820 2 GB RAM 2 x Broadcom NetXtreme (onboard) Windows Server 2003 SE SP1
PRIMERGY RX600 S4
4 Xeon X7350 72 GB PC2-5300F DDR2-SDRAM
1 Qlogic QLE2462 fibre channel controller
4 quad channel Intel PRO/1000PT (PCIe)
1 Intel PRO/1000PT (onboard) Operating system: Red Hat Enterprise Linux 5.1 (2.6.18-53.el5 x86_64) HTTP software: Accoria Rock Web Server v1.4.7 (x86_64)
● ● ● ● ● ● ● ● ● ●
Disk subsystem
2 FibreCAT CX500
with 150 36 GB Seagate ST336753
64 PRIMERGY RX100 S3 1 x Pentium D 820 2 GB RAM 2 x Broadcom NetXtreme (onboard) Windows Server 2003 SE SP1
PRIMERGY RX600 S4
4 Xeon X7460 64 GB PC2-5300F DDR2-SDRAM
1 LSI Fusion MPT SAS/RAID 1078I controller (onboard)
1 LSI SAS/MegaRAID 8880EM2 controller
4 quad channel Intel PRO/1000PT (PCIe)
1 Intel PRO/1000PT (onboard) Operating system: Red Hat Enterprise Linux 5.1 (2.6.18-53.el5 x86_64) HTTP software: Accoria Rock Web Server v1.4.7 (x86_64)
● ● ● ● ● ● ● ● ● ●
Disk subsystem
4 FibreCAT SX40
with 48 hard disks (300 GB, 3.5”, 15 krpm)

White Paper Performance Report PRIMERGY RX600 S4 Version: 2.2b, November 2009
© Fujitsu Technology Solutions 2009 Page 20 (49)
Measurement of February 2009
* Some components may not be available in all countries / sales regions.
60 PRIMERGY RX100 S3 1 x Pentium D 820 2 GB RAM 2 x Broadcom NetXtreme (onboard) Windows Server 2003 SE SP1
PRIMERGY RX600 S4
4 Xeon X7460 128 GB PC2-5300F DDR2-SDRAM
1 Emulex LPe11002 fibre channel controller
5 quad channel Intel PRO/1000PT (PCIe)
1 Intel PRO/1000PT (onboard) Operating system: Red Hat Enterprise Linux 5.2 (2.6.18-92.el5 x86_64) HTTP software: Accoria Rock Web Server v1.4.7 (x86_64)
● ● ● ● ● ● ● ● ● ●
Disk subsystem
2 FibreCAT CX500
with 120 36 GB Seagate ST336753

White Paper Performance Report PRIMERGY RX600 S4 Version: 2.2b, November 2009
© Fujitsu Technology Solutions 2009 Page 21 (49)
StorageBench
Benchmark description To estimate the capability of disk subsystems Fujitsu Technology Solutions defined a benchmark called StorageBench to compare the different storage systems connected to a system. To do this StorageBench makes use of the Iometer measuring tool developed by Intel combined with a defined set of load profiles that occur in real customer applications and a defined measuring scenario.
Measuring tool
Since the end of 2001 Iometer has been a project at http://SourceForge.net and is ported to various platforms and en-hanced by a group of international developers. Iometer consists of a user interface for Windows systems and the so-called “dynamo” which is available for various platforms. For some years now it has been possible to download these two components under “Intel Open Source License” from http://www.iometer.org/ or http://sourceforge.net/projects/iometer.
Iometer gives you the opportunity to reproduce the behavior of real applications as far as accesses to IO subsystems are concerned. For this purpose, you can among other things configure the block sizes to be used, the type of access, such as sequential read or write, random read or write and also combinations of these. As a result Iometer provides a text file with comma separated values (.csv) containing basic parameters, such as throughput per second, transactions per sec-ond and average response time for the respective access pattern. This method permits the efficiency of various subsys-tems with certain access patterns to be compared. Iometer is in a position to access not only subsystems with a file sys-tem, but also so-called raw devices.
With Iometer it is possible to simulate and measure the access patterns of various applications, but the file cache of the operating system remains disregarded and operation is in blocks on a single test file.
Load profile
The manner in which applications access the mass storage system considerably influences the performance of a storage system. Examples of various access patterns of a number of applications:
Application Access pattern
Database (data transfer) random, 67% read, 33% write, 8 KB (SQL Server)
Database (log file) sequential, 100% write, 64 KB blocks
Backup sequential, 100% read, 64 KB blocks
Restore sequential, 100% write, 64 KB blocks
Video streaming sequential, 100% read, blocks ≥ 64 KB
File server random, 67% read, 33% write, 64 KB blocks
Web server random, 100% read, 64 KB blocks
Operating system random, 40% read, 60% write, blocks ≥ 4 KB
File copy random, 50% read, 50% write, 64 KB blocks
From this four distinctive profiles were derived:
Load profile Access Access pattern Block size
Load tool
read write
Streaming sequential 100% 64 KB Iometer
Restore sequential 100% 64 KB Iometer
Database random 67% 33% 8 KB Iometer
File server random 67% 33% 64 KB Iometer
All four profiles were generated with Iometer.

White Paper Performance Report PRIMERGY RX600 S4 Version: 2.2b, November 2009
© Fujitsu Technology Solutions 2009 Page 22 (49)
Measurement scenario
In order to obtain comparable measurement results it is important to perform all the measurements in identical, repro-ducible environments. This is why StorageBench is based, in addition to the load profile described above, on the follow-ing regulations:
Since real-life customer configurations work only in exceptional situations with raw devices, performance measurements of internal disks are always conducted on disks containing file systems. NTFS is used for Windows and ext3 for Linux, even if higher performance could possibly be achieved with other file systems or raw devices.
Hard disks are among the most error-prone components of a computer system. This is why RAID controllers are used in server systems in order to prevent data loss through hard disk failure. Here several hard disks are put together to form a “Redundant Array of Independent Disks”, known as RAID in short – with the data being spread over several hard disks in such a way that all the data is retained even if one hard disk fails – except with RAID 0. The most usual methods of organizing hard disks in arrays are the RAID levels RAID 0, RAID 1, RAID 5, RAID 6, RAID 10, RAID 50 and RAID 60. Information about the basics of various RAID arrays is to be found in the paper Performance Report - Modular RAID for PRIMERGY.
Depending on the number of disks and the installed controller, the possible RAID configurations are used for the StorageBench analyses of the PRIMERGY servers. For systems with two hard disks we use RAID 1 and RAID 0, for three and more hard disks we also use RAID 1E and RAID 5 and, where applicable, further RAID levels – provided that the controller supports these RAID levels.
Regardless of the size of the hard disk, a measurement file with the size of 8 GB is always used for the measurement.
In the evaluation of the efficiency of I/O subsystems, processor performance and memory configuration do not play a significant role in today’s systems - a possible bottleneck usually affects the hard disks and the RAID controller, and not CPU and memory. Therefore, various configuration alternatives with CPU and memory need not be analyzed under StorageBench.
Measurement results
For each load profile StorageBench provides various key indicators: e.g. “data throughput” in megabytes per second, in short MB/s, “transaction rate” in I/O operations per second, in short IO/s, and “latency time” or also “mean access time” in ms. For sequential load profiles data throughput is the normal indicator, whereas for random load profiles with their small block sizes the transaction rate is normally used. Throughput and transaction rate are directly proportional to each other and can be calculated according to the formula
Data throughput [MB/s] = Transaction rate [Disk-I/O s-1
] × Block size [MB]
Transaction rate [Disk-I/O s-1
] = Data throughput [MB/s] / Block size [MB]
Benchmark results The PRIMERGY RX600 S4 is equipped with the LSI MegaRAID SAS 1078 controller from the “Modular RAID” family. The controller is supplied as a riser card with the PRIMERGY RX600 S4 and offers the user a complete RAID solution. Support is provided for RAID levels 0, 1, 5, 6, 10, 50 and 60. This controller is on offer with a 512 MB cache. The con-troller cache can be protected against power failure by an optional battery backup unit (BBU). The controller supports up to 240 hard disks.
Various 2½" SAS hard disks can be connected to the controller. Depending on the performance and capacity required, it is possible to select the appropriate disk subsystem. The PRIMERGY RX600 S4 offers eight hot-plug bays for 2½" SAS hard disks.
The following hard disks can be chosen for the PRIMERGY RX600 S4:
2½" SAS hard disks with a capacity of 36 GB, 73 GB and 146 GB (10 krpm)
2½" SAS hard disks with a capacity of 36 GB and 73 GB (15 krpm)
RAID support
The RAID array defines the way in which data is treated as regards availability. How quickly the data is transferred in the respective RAID array context depends largely on the data throughput of the hard disks. The throughput continues to be affected by the RAID level used and the access pattern as well as by the controller and disk cache settings. Since the LSI MegaRAID SAS 1078 controller has a cache, the impact of both the controller cache and disk cache parameters on the overall throughput was examined during the measurements.
The hard disk cache has influence on disk I/O performance. Unfortunately, this is frequently seen as a security problem in the event of a power failure and is therefore disabled. On the other hand, it was for a good reason integrated by the hard disk manufacturers to increase write performance. For performance reasons it is advisable to enable the disk

White Paper Performance Report PRIMERGY RX600 S4 Version: 2.2b, November 2009
© Fujitsu Technology Solutions 2009 Page 23 (49)
cache. The by far larger cache for I/O accesses and thus a potential security risk for data loss in the event of a power failure is in any case in the main memory and is administered by the operating system. To prevent data losses it is ad-visable to equip the system with an uninterruptible power supply (UPS).
The number of hard disks configured for the measurements in a RAID array was defined depending on the RAID level. In the test setup two hard disks were connected to the controller and configured as a RAID 1. 2½" SAS hard disks with 10 krpm and 15 krpm were used for the measurements and the influence of the rotational speed of the hard disks on the throughputs was examined for sequential read / write and with random access.
Two series of measurements were performed. One with disabled caches (Off), in other words »No Read-ahead«, »Write-through«, »I/O direct« and »Disk cache disabled« and one with optimal cache settings (Optimal), that is »No Read-ahead«, »Write-through«, »I/O direct« and »Disk cache enabled«. These cache settings can be used with a mixture of access patterns to achieve the best throughputs.
The diagram for RAID 1 shows that for all access patterns throughput increases as the rotational speed rises. If hard disks with a rotational speed of 15 krpm instead of hard disks with 10 krpm are used for sequential read in RAID 1, the
result is an increase in throughput of about 20%. If a hard disk with a rotational speed of 15 krpm is used for sequential write in RAID 1 and with enabled disk cache instead of hard disks with a rotational speed of 10 krpm, the result is an increase in throughput of about 18%. A particular increase in throughput for sequential write can be achieved by enabling the disk cache. The throughput increases by 47% for the 2½" hard disks with 10 krpm and by about 62% for the 2½" hard disks with 15 krpm.
The diagram opposite shows that for random access with a 67% read share the disk cache also plays an important role in throughput improvement. The increase in throughput in the two hard disk types due to the enabling of the disk cache is about 15%.
If you compare the throughput of the 2½" SAS hard disks with 10 krpm and 15 krpm, you see that the throughput of the faster hard disk for random access with 8 KB and 64 KB blocks is about 22% higher than with the slower hard disk.
With a mixture of access patterns the cache settings that were used for the measurements in RAID 1 result on average in the best throughputs. With special access patterns, e.g. random access in RAID 1, it is possible to achieve even higher throughputs by enabling the controller cache, that is to say by using the controller cache options »No Read-ahead«, »Write-back«, »I/O direct« and »Disk cache enabled«. However, in this case it is vital to protect the controller cache against any power failure with a BBU in order to avoid data loss.
White Paper Performance Report PRIMERGY RX600 S4 Version: 2.2b, November 2009
© Fujitsu Technology Solutions 2009 Page 24 (49)
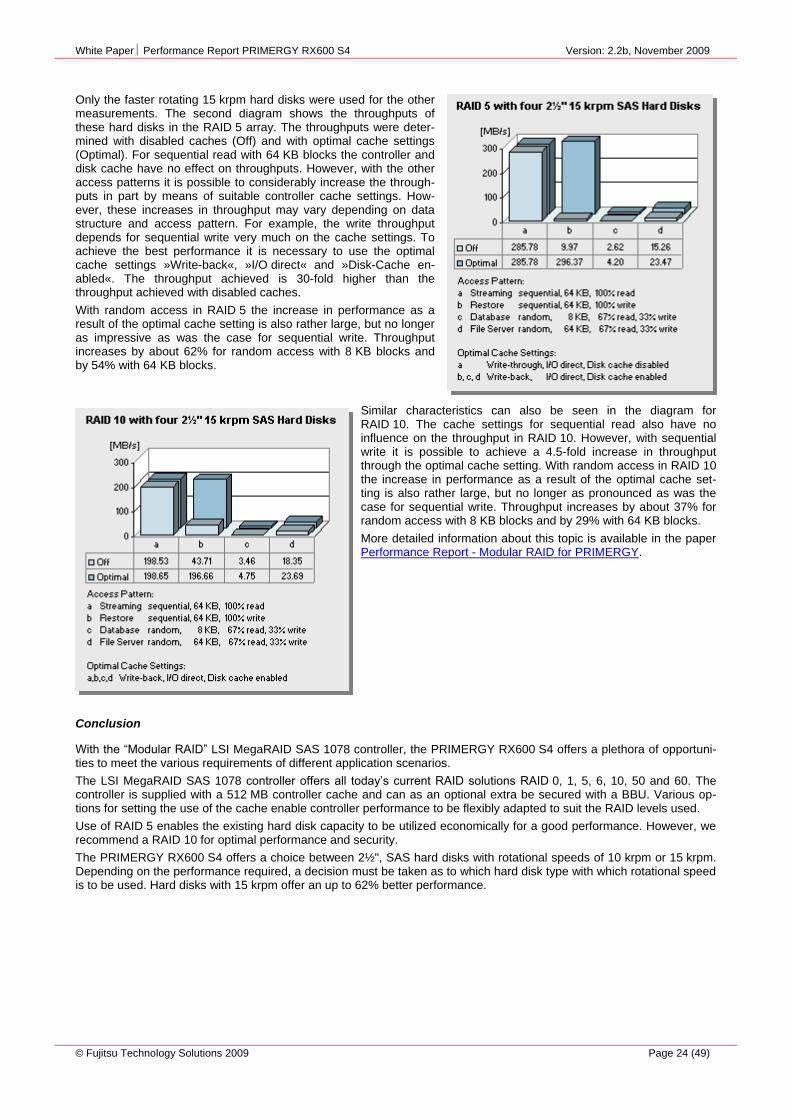
Only the faster rotating 15 krpm hard disks were used for the other measurements. The second diagram shows the throughputs of these hard disks in the RAID 5 array. The throughputs were deter-mined with disabled caches (Off) and with optimal cache settings (Optimal). For sequential read with 64 KB blocks the controller and disk cache have no effect on throughputs. However, with the other access patterns it is possible to considerably increase the through-puts in part by means of suitable controller cache settings. How-ever, these increases in throughput may vary depending on data structure and access pattern. For example, the write throughput depends for sequential write very much on the cache settings. To achieve the best performance it is necessary to use the optimal cache settings »Write-back«, »I/O direct« and »Disk-Cache en-abled«. The throughput achieved is 30-fold higher than the throughput achieved with disabled caches.
With random access in RAID 5 the increase in performance as a result of the optimal cache setting is also rather large, but no longer as impressive as was the case for sequential write. Throughput increases by about 62% for random access with 8 KB blocks and by 54% with 64 KB blocks.
Similar characteristics can also be seen in the diagram for RAID 10. The cache settings for sequential read also have no influence on the throughput in RAID 10. However, with sequential write it is possible to achieve a 4.5-fold increase in throughput through the optimal cache setting. With random access in RAID 10 the increase in performance as a result of the optimal cache set-ting is also rather large, but no longer as pronounced as was the case for sequential write. Throughput increases by about 37% for random access with 8 KB blocks and by 29% with 64 KB blocks.
More detailed information about this topic is available in the paper Performance Report - Modular RAID for PRIMERGY.
Conclusion
With the “Modular RAID” LSI MegaRAID SAS 1078 controller, the PRIMERGY RX600 S4 offers a plethora of opportuni-ties to meet the various requirements of different application scenarios.
The LSI MegaRAID SAS 1078 controller offers all today’s current RAID solutions RAID 0, 1, 5, 6, 10, 50 and 60. The controller is supplied with a 512 MB controller cache and can as an optional extra be secured with a BBU. Various op-tions for setting the use of the cache enable controller performance to be flexibly adapted to suit the RAID levels used.
Use of RAID 5 enables the existing hard disk capacity to be utilized economically for a good performance. However, we recommend a RAID 10 for optimal performance and security.
The PRIMERGY RX600 S4 offers a choice between 2½", SAS hard disks with rotational speeds of 10 krpm or 15 krpm. Depending on the performance required, a decision must be taken as to which hard disk type with which rotational speed is to be used. Hard disks with 15 krpm offer an up to 62% better performance.

White Paper Performance Report PRIMERGY RX600 S4 Version: 2.2b, November 2009
© Fujitsu Technology Solutions 2009 Page 25 (49)
Benchmark environment* All the measurements presented here were performed with the hardware and software components listed below.
Component Details
Server PRIMERGY RX600 S4
Operating system Windows Server 2003, Enterprise Edition Version: 5.2.3790 Service Pack 1 Build 3790
File system NTFS
Measuring tool Iometer 27.07.2006
Measurement data Measurement file of 8 GB
Controller LSI MegaRAID SAS 1078 Product: LSI RAID 5/6 SAS 1078 Driver name: msas2k3.sys, driver version: 2.17.0.32 Controller cache: 512 MB
Hard Disk SAS, 2½", 10 krpm Seagate ST973402SS, 73 GB
Hard Disk SAS, 2½", 15 krpm Seagate ST973451SS, 73 GB
* Some components may not be available in all countries / sales regions.

White Paper Performance Report PRIMERGY RX600 S4 Version: 2.2b, November 2009
© Fujitsu Technology Solutions 2009 Page 26 (49)
OLTP-2
Benchmark description OLTP stands for Online Transaction Processing. The OLTP-2 benchmark is based on the typical application scenario of a database solution. In OLTP-2 database access is simulated and the number of transactions achieved per second (tps) determined as the unit of measurement for the performance of the system measured.
In contrast to benchmarks such as SPECint and TPC-E, which were standardized by independent bodies and for which adherence to the respective rules and regulations are monitored, OLTP-2 is an internal benchmark of Fujitsu Technology Solutions. The partially enormous hardware and time expenditure for standardized benchmarks has been reduced to a reasonable degree in OLTP-2 so that a variety of configurations can be measured within an acceptable period of time.
Even if the two benchmarks OLTP-2 and TPC-E simulate similar application scenarios using the same workload, the results cannot be compared or even treated as equal, as the two benchmarks use different methods to simulate user load. OLTP-2 values are typically similar to TPC-E values. A direct comparison, or even referring to the OLTP-2 result as TPC-E, is not permitted, especially because there is no price-performance calculation.
Benchmark results The PRIMERGY RX600 S4 was measured with Intel Xeon Processors series 73xx and 74xx at a memory size of 64 GB, 128 GB and 256 GB. All results were determined on the basis of the operating system Microsoft Windows Server 2008 Enterprise x64 Edition and the database SQL Server 2008 Enterprise x64 Edition. OLTP-2 benchmark results depend to a great degree on the configuration options of a system with hard disks and their controllers. Therefore, two configuration levels of the disk subsystem with 240 and 336 SAS hard disks were used for the measurements. See the Benchmark environment section for further information on the system configuration.
The diagram below shows the OLTP-2 performance data for the PRIMERGY RX600 S4 with Intel Xeon series 73xx processors (E7220, E7310, E7330 and X7350) and a disk subsystem with 224 disk drives.
The scaling over all processor types is about +60% to+ 63% and quite equal for two and four processors. There is an exceptionally good scaling from two to four CPUs with up to +83%. The memory scaling from 64 GB to 128 GB is +4% to +5% and from 128 GB to 256 GB 1% to 2%. This depends on the workload of the OLTP-2 benchmark and is not typical for all database applications.
167.56
200.60
245.42
273.39
308.14
371.83
453.10
501.23
165.25
197.73
241.79
269.22
301.65
363.83
443.13
489.96
159.62
190.13
231.82
258.22
289.22
346.50
421.12
464.59
0
100
200
300
400
500
tps
Xeon
E7220
Xeon
E7310
Xeon
E7330
Xeon
X7350
Xeon
E7220
Xeon
E7310
Xeon
E7330
Xeon
X7350
64 GB
128 GB
256 GB
RAM
OLTP-2: PRIMERGY RX600 S4 with 2 and 4 Xeon processors 73xx
bold numbers: measured results
others: calculated results
+80-83%
+60-63%
+62-63%
White Paper Performance Report PRIMERGY RX600 S4 Version: 2.2b, November 2009
© Fujitsu Technology Solutions 2009 Page 27 (49)
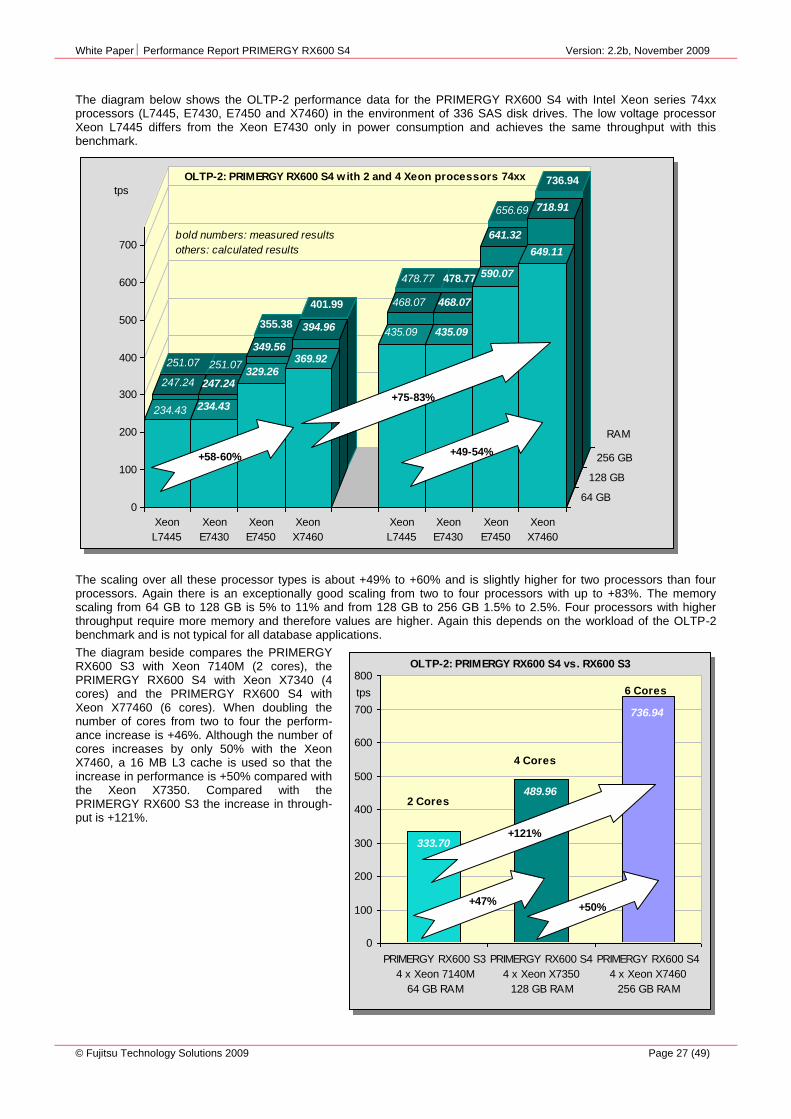
The diagram below shows the OLTP-2 performance data for the PRIMERGY RX600 S4 with Intel Xeon series 74xx processors (L7445, E7430, E7450 and X7460) in the environment of 336 SAS disk drives. The low voltage processor Xeon L7445 differs from the Xeon E7430 only in power consumption and achieves the same throughput with this benchmark.
The scaling over all these processor types is about +49% to +60% and is slightly higher for two processors than four processors. Again there is an exceptionally good scaling from two to four processors with up to +83%. The memory scaling from 64 GB to 128 GB is 5% to 11% and from 128 GB to 256 GB 1.5% to 2.5%. Four processors with higher throughput require more memory and therefore values are higher. Again this depends on the workload of the OLTP-2 benchmark and is not typical for all database applications.
The diagram beside compares the PRIMERGY RX600 S3 with Xeon 7140M (2 cores), the PRIMERGY RX600 S4 with Xeon X7340 (4 cores) and the PRIMERGY RX600 S4 with Xeon X77460 (6 cores). When doubling the number of cores from two to four the perform-ance increase is +46%. Although the number of cores increases by only 50% with the Xeon X7460, a 16 MB L3 cache is used so that the increase in performance is +50% compared with the Xeon X7350. Compared with the PRIMERGY RX600 S3 the increase in through-put is +121%.
251.07 251.07
355.38
401.99
478.77 478.77
656.69
736.94
247.24 247.24
349.56
394.96
468.07 468.07
641.32
718.91
234.43 234.43
329.26
369.92
435.09 435.09
590.07
649.11
0
100
200
300
400
500
600
700
tps
Xeon
L7445
Xeon
E7430
Xeon
E7450
Xeon
X7460
Xeon
L7445
Xeon
E7430
Xeon
E7450
Xeon
X7460
64 GB
128 GB
256 GB
RAM
OLTP-2: PRIMERGY RX600 S4 with 2 and 4 Xeon processors 74xx
bold numbers: measured results
others: calculated results
+75-83%
+49-54%+58-60%
OLTP-2: PRIMERGY RX600 S4 vs. RX600 S3
333.70
489.96
736.94
0
100
200
300
400
500
600
700
800
PRIMERGY RX600 S3
4 x Xeon 7140M
64 GB RAM
PRIMERGY RX600 S4
4 x Xeon X7350
128 GB RAM
PRIMERGY RX600 S4
4 x Xeon X7460
256 GB RAM
tps
+47%+50%
+121%
2 Cores
6 Cores
4 Cores
OLTP-2: PRIMERGY RX600 S4 vs. RX600 S3
333.70
489.96
736.94
0
100
200
300
400
500
600
700
800
PRIMERGY RX600 S3
4 x Xeon 7140M
64 GB RAM
PRIMERGY RX600 S4
4 x Xeon X7350
128 GB RAM
PRIMERGY RX600 S4
4 x Xeon X7460
256 GB RAM
tps
+47%+50%
+121%
2 Cores
6 Cores
4 Cores

White Paper Performance Report PRIMERGY RX600 S4 Version: 2.2b, November 2009
© Fujitsu Technology Solutions 2009 Page 28 (49)
Benchmark environment* The disk subsystem was used in two configuration levels for the OLTP-2 measurements of the PRIMERGY RX600 S4. On the one hand with 240 SAS disk drives, 20 FibreCAT SX40 and 4 LSI SAS RAID controllers and on the other hand with 336 SAS disk drives, 28 FibreCAT SX40 and 5 LSI SAS RAID controllers. These configurations are identical with the environment used with the TPC-E measurements. The operating system was Microsoft Windows Server 2008 Enterprise x64 Edition and database was SQL Server 2008 Enterprise x64 Edition. The processor types, number of processors as well as the amount of memory were varied for the OLTP-2 measurements. The following two pictures show the rack environment with front-end PRIMERGY RX300 S4 (Tier A), database server PRIMERGY RX600 S4 (Tier B) and the disk subsystem FibreCAT SX40. Load-generators (Driver Systems) were two PRIMERGY Econel 200.
Test environment with disk subsystem with 240 SAS disk drives
Tier A
PRIMERGY RX300 S4
2x Intel Xeon E5405 2.00 GHz
4 GB memory
1x 250 GB SATA drive
Onboard 1 GBit/s
Dual-port LAN 1 GBit/s
Tier B
PRIMERGY RX600 S4
2/4x Intel Xeon X73xx series
64/128/256 GB memory
2x 36 GB 15K SAS drives
6x 146 GB 10K SAS drives
Onboard SAS RAID controller
4x SAS RAID controller
Storage
1x PRIMECENTER rack
20x FibreCAT SX40
Disk drives:
120x 73 GB 15K SAS
120x 146 GB 15K SAS
Test environment with disk subsystem with 336 SAS disk drives
Tier A
PRIMERGY RX300 S4
2x Intel Xeon E5405 2.00 GHz
4 GB memory
1x 250 GB SATA drive
Onboard 1 GBit/s
Dual-port LAN 1 GBit/s
Tier B
PRIMERGY RX600 S4
2/4x Intel Xeon X74xx series
64/128/256 GB memory
2x 36 GB 15K SAS drives
6x 146 GB 10K SAS drives
Onboard SAS RAID controller
5x SAS RAID controller
Storage
2x PRIMECENTER rack
28x FibreCAT SX40
Disk drives:
192x 73 GB 15K SAS
144x 146 GB 15K SAS
* Some components may not be available in all countries / sales regions.
2 driver systems
2 Driver Systems
White Paper Performance Report PRIMERGY RX600 S4 Version: 2.2b, November 2009
© Fujitsu Technology Solutions 2009 Page 29 (49)
TPC-E
Benchmark description The TPC-E benchmark measures the performance of online transaction processing systems or shortly OLTP and is based on a complex database and a number of different transaction types that are executed on it. TPC-E is not only a hardware-independent but also a software-independent benchmark and can thus be run on every test platform, i.e. pro-prietary or open. In addition to the results of the measurement, all the details of the systems measured and the measur-ing method must also be explained in a measurement report (Full Disclosure Report or FDR). Consequently, this ensures that the measurement meets all benchmark requirements and is reproducible. TPC-E does not just measure an individ-ual server, but a rather extensive system configuration. Keys to performance in this respect are the database server, disk I/O and network communication.
The performance metric is tpsE, where tps means transactions per second. tpsE is the average number of Trade-Result-Transactions, that are executed within a second. The TPC-E-standard defines a result as tpsE-rate, the price per per-formance value (e.g. $/tpsE) and the availability date of the measured configuration.
Further information can be found in the document Benchmark-Overview TPC-E.
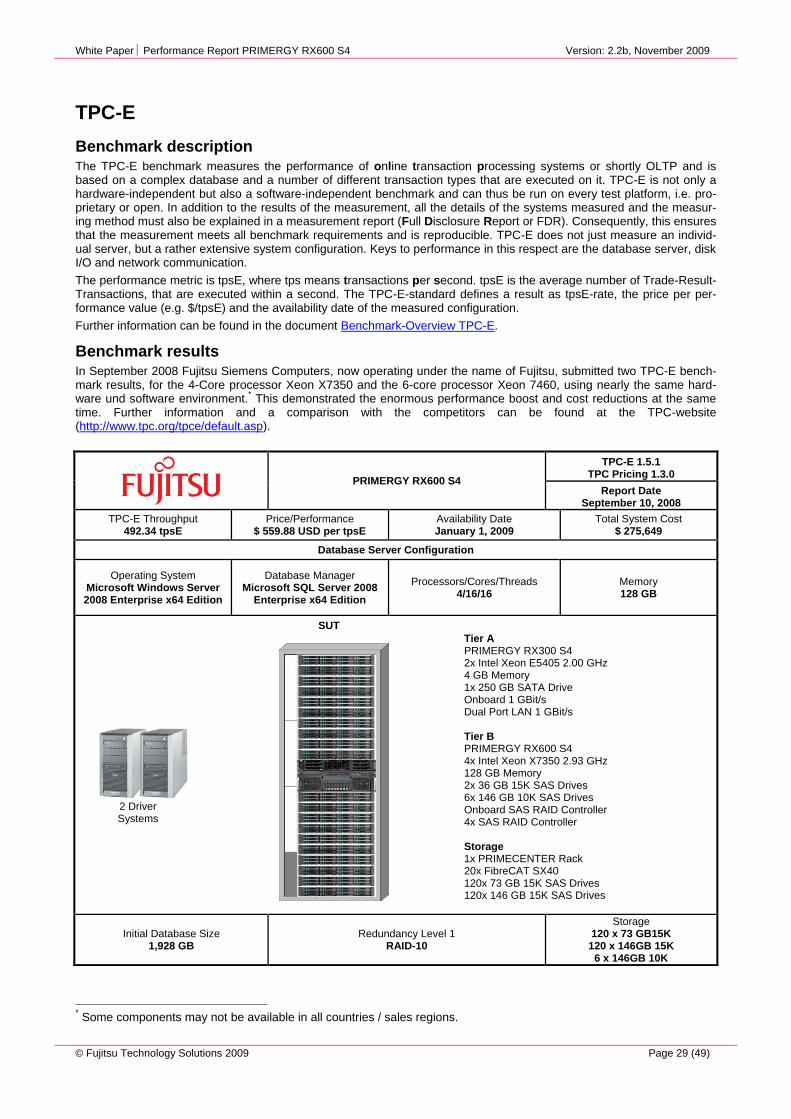
Benchmark results In September 2008 Fujitsu Siemens Computers, now operating under the name of Fujitsu, submitted two TPC-E bench-mark results, for the 4-Core processor Xeon X7350 and the 6-core processor Xeon 7460, using nearly the same hard-ware und software environment.
* This demonstrated the enormous performance boost and cost reductions at the same
time. Further information and a comparison with the competitors can be found at the TPC-website (http://www.tpc.org/tpce/default.asp).
PRIMERGY RX600 S4
TPC-E 1.5.1 TPC Pricing 1.3.0
Report Date September 10, 2008
TPC-E Throughput 492.34 tpsE
Price/Performance $ 559.88 USD per tpsE
Availability Date January 1, 2009
Total System Cost $ 275,649
Database Server Configuration
Operating System Microsoft Windows Server 2008 Enterprise x64 Edition
Database Manager Microsoft SQL Server 2008
Enterprise x64 Edition
Processors/Cores/Threads 4/16/16
Memory 128 GB
Initial Database Size 1,928 GB
Redundancy Level 1 RAID-10
Storage 120 x 73 GB15K
120 x 146GB 15K 6 x 146GB 10K
* Some components may not be available in all countries / sales regions.
SUT
Tier A PRIMERGY RX300 S4 2x Intel Xeon E5405 2.00 GHz 4 GB Memory 1x 250 GB SATA Drive Onboard 1 GBit/s Dual Port LAN 1 GBit/s Tier B PRIMERGY RX600 S4 4x Intel Xeon X7350 2.93 GHz 128 GB Memory 2x 36 GB 15K SAS Drives 6x 146 GB 10K SAS Drives Onboard SAS RAID Controller 4x SAS RAID Controller Storage 1x PRIMECENTER Rack 20x FibreCAT SX40 120x 73 GB 15K SAS Drives 120x 146 GB 15K SAS Drives
2 Driver Systems

White Paper Performance Report PRIMERGY RX600 S4 Version: 2.2b, November 2009
© Fujitsu Technology Solutions 2009 Page 30 (49)
PRIMERGY RX600 S4
TPC-E 1.5.1 TPC Pricing 1.3.0
Report Date September 5, 2008
TPC-E Throughput 721.40 tpsE
Price/Performance $ 459.71 USD per tpsE
Availability Date January 1, 2009
Total System Cost $ 331,637
Database Server Configuration
Operating System Microsoft Windows Server 2008 Enterprise x64 Edition
Database Manager Microsoft SQL Server 2008
Enterprise x64 Edition
Processors/Cores/Threads 4/24/24
Memory 128 GB
Initial Database Size 2,798 GB
Redundancy Level 1 RAID-10
Storage 192 x 73 GB15K
144 x 146GB 15K 6 x 146GB 10K
In September 2008 Fujitsu Siemens Computer, now operating under the name of Fujitsu, is represented with three re-sults in the TPC-E list, after earlier submission of PRIMERGY TX300 S4 in Mai 2008.
System and Processor Throughput Price / Performance Availability Date
TX300 S4 with 2x Xeon X5460 317.45 tpsE $ 523.49 pro tpsE August 30th, 2008
RX600 S4 with 4x Xeon X7350 492.34 tpsE $ 559.88 pro tpsE January 1st, 2009
RX600 S4 with 4x Xeon X7460 721.40 tpsE $ 459.71 pro tpsE January 1st, 2009
SUT
Tier A PRIMERGY RX300 S4 2x Intel Xeon E5405 2.00 GHz 4 GB Memory 1x 250 GB SATA Drive Onboard 1 GBit/s Dual Port LAN 1 GBit/s Tier B PRIMERGY RX600 S4 4x Intel Xeon X7460 2.66 GHz 128 GB Memory 2x 36 GB 15K SAS Drives 6x 146 GB 10K SAS Drives Onboard SAS RAID Controller 5x SAS RAID Controller Storage 2x PRIMECENTER Rack 28x FibreCAT SX40 192x 73 GB 15K SAS Drives 144x 146 GB 15K SAS Drives
2 Driver Systems
White Paper Performance Report PRIMERGY RX600 S4 Version: 2.2b, November 2009
© Fujitsu Technology Solutions 2009 Page 31 (49)
721.40
492.34
317.45
$460
$560$523
0.00
100.00
200.00
300.00
400.00
500.00
600.00
700.00
800.00
PRIM ERGY TX300 S4
2 x Xeon X5460
64 GB RAM
PRIM ERGY RX600 S4
4 x Xeon X7350
128 GB RAM
PRIM ERGY RX600 S4
4 x Xeon X7460
128 GB RAM
$
$100
$200
$300
$400
$500
$600
+127
+51%
+46%
TPC-E: PRIMERGY RX600 S4 vs. TX300
tpsE $/tpsE
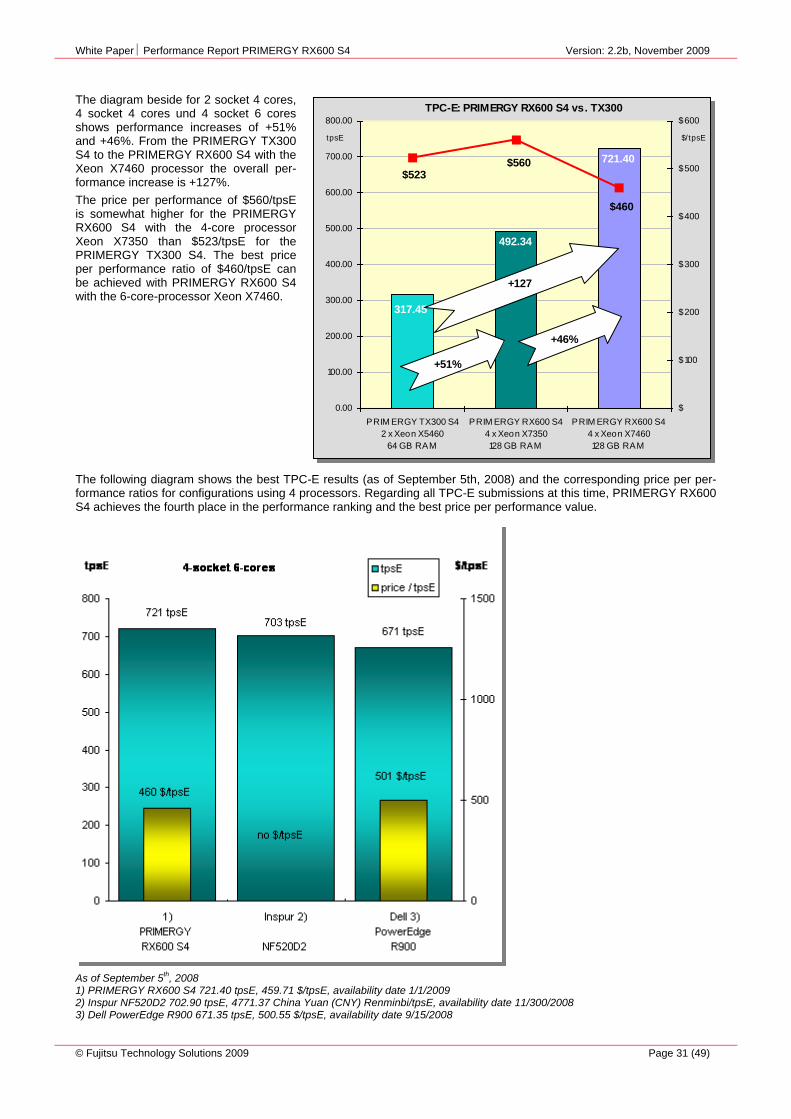
The diagram beside for 2 socket 4 cores, 4 socket 4 cores und 4 socket 6 cores shows performance increases of +51% and +46%. From the PRIMERGY TX300 S4 to the PRIMERGY RX600 S4 with the Xeon X7460 processor the overall per-formance increase is +127%.
The price per performance of $560/tpsE is somewhat higher for the PRIMERGY RX600 S4 with the 4-core processor Xeon X7350 than $523/tpsE for the PRIMERGY TX300 S4. The best price per performance ratio of $460/tpsE can be achieved with PRIMERGY RX600 S4 with the 6-core-processor Xeon X7460.
The following diagram shows the best TPC-E results (as of September 5th, 2008) and the corresponding price per per-formance ratios for configurations using 4 processors. Regarding all TPC-E submissions at this time, PRIMERGY RX600 S4 achieves the fourth place in the performance ranking and the best price per performance value.
As of September 5th, 2008
1) PRIMERGY RX600 S4 721.40 tpsE, 459.71 $/tpsE, availability date 1/1/2009 2) Inspur NF520D2 702.90 tpsE, 4771.37 China Yuan (CNY) Renminbi/tpsE, availability date 11/300/2008 3) Dell PowerEdge R900 671.35 tpsE, 500.55 $/tpsE, availability date 9/15/2008

White Paper Performance Report PRIMERGY RX600 S4 Version: 2.2b, November 2009
© Fujitsu Technology Solutions 2009 Page 32 (49)
The following diagram shows the best TPC-E results (as of September 10th, 2008) and the corresponding price per performance ratios for configurations using 4 processors und 4 cores per processor. The RIMERGY RX600 S4 achieves the best performance and the best price per performance ratio in this class.
As of September 10th, 2008
1) PRIMERGY RX600 S4 492.34 tpsE, 559.88 $/tpsE, availability date 1/1/2009 2) IBM System x3850 M2 479.51 tpsE, 1591.20 $/tpsE, availability date 8/30/2008 3) Dell PowerEdge R900 451.29 tpsE, 734.25 $/tpsE, availability date 8/31/2008 4) IBM System x3850 M2 419.80 tpsE, 1527.25 $/tpsE, availability date 12/07/2007

White Paper Performance Report PRIMERGY RX600 S4 Version: 2.2b, November 2009
© Fujitsu Technology Solutions 2009 Page 33 (49)
System R/3 Standard Application Benchmark
Benchmark description The application software SAP system R/3 consists of seven business administration modules for managing all standard business processes:
FI Financial Accounting MM Materials Management SD Sales (Sales and Distribution) PP Production and planning WM Warehouse Management) PS Project System HR Human Resources This application software is in turn based on a database so that an R/3 configuration consists in addition to the support-ing hardware of the software components operating system, database and the R/3 software itself.
To verify the configuration and performance of an R/3 application system, SAP AG has developed the system R/3 Standard Application Benchmark. The benchmark analyses the performance of the entire system and is thus a measure for the quality of the integration of the single components.
The benchmark differentiates between a two-tier and a three-tier configuration. With the two-tier configuration, the R/3 application and the database are installed on one server. With a three-tier configuration, the individual components of the R/3 application can be distributed over several servers and another server takes over the database.
A complete specification of the benchmark developed by SAP AG, Walldorf, Germany is under http://www.sap.com/benchmark.
Benchmark results With the certification number 2008004, SAP certifies that the PRIMERGY RX600 S4, equipped with 4 Xeon X7350 proc-essors (with SAP ECC 6.0 and SQL Server 2005 (64-bit)), attained the following results on January 17, 2008 under Windows Server 2003 Enterprise x64 Edition SP2:
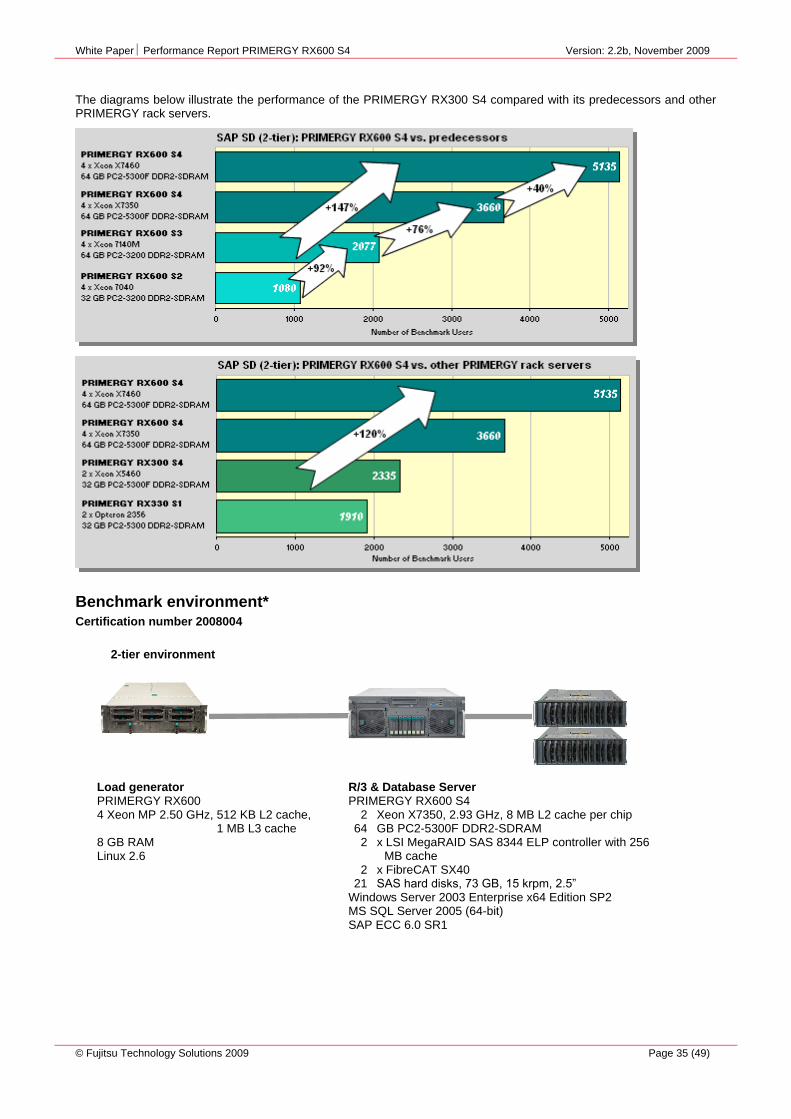
Number of benchmark users 3660 SD (Sales & Distribution)
Average dialog response time 1.99 seconds
Throughput
Fully Processed Order Line items / hour 366330
Dialog steps / hour 1099000
SAPS 18320
Average DB request time (dia/upd) 0.030 sec / 0.020 sec
CPU utilization central server 98%
Operating System central server Windows Server 2003 Enterprise x64 Edition SP2
RDBMS SQL Server 2005 (64-bit)
SAP ECC Release 6.0
Configuration Central Server PRIMERGY RX600 S4
4 Xeon X7350, 2.93 GHz, 8 MB L2 cache per chip, 64 GB RAM

White Paper Performance Report PRIMERGY RX600 S4 Version: 2.2b, November 2009
© Fujitsu Technology Solutions 2009 Page 34 (49)
With the certification number 2007074, SAP certifies that the PRIMERGY RX600 S4, equipped with 4 Xeon X7350 proc-essors (with SAP ECC 6.0 and SQL Server 2005 (64-bit)), attained the following results on November 7, 2007 under Windows Server 2003 Enterprise x64 Edition SP2 on VMware ESX Server 3.0.2:
Number of benchmark users 470 SD (Sales & Distribution)
Average dialog response time 1.91 seconds
Throughput
Fully Processed Order Line items / hour 47330
Dialog steps / hour 142000
SAPS 2370
Average DB request time (dia/upd) 0.019 sec / 0.049 sec
CPU utilization of central server 12%
CPU utilization inside virtual machine 99%
Operating System central server Windows Server 2003 Enterprise x64 Edition SP2 on VMware ESX Server 3.0.2 (using 2 virtual CPUs)
RDBMS SQL Server 2005 (64-bit)
SAP ECC Release 6.0
Configuration Central Server PRIMERGY RX600 S4
4 Xeon X7350, 2.93 GHz, 8 MB L2 cache per chip, 32 GB RAM
With the certification number 2008060, SAP certifies that the PRIMERGY RX600 S4, equipped with 4 Xeon X7460 proc-essors (with SAP ECC 6.0 and SQL Server 2005 (64-bit)), attained the following results on September 25, 2008 under Windows Server 2003 Enterprise x64 Edition SP2:
Number of benchmark users 5135 SD (Sales & Distribution)
Average dialog response time 1.98 seconds
Throughput
Fully Processed Order Line items / hour 514330
Dialog steps / hour 1543000
SAPS 25720
Average DB request time (dia/upd) 0.016 sec / 0.015 sec
CPU utilization central server 98%
Operating System central server Windows Server 2003 Enterprise x64 Edition SP2
RDBMS SQL Server 2005 (64-bit)
SAP ECC Release 6.0
Configuration Central Server PRIMERGY RX600 S4
4 Xeon X7460, 2.67 GHz, 3 MB L2 cache per 2 cores, 16 MB L3 cache per chip, 64 GB RAM
White Paper Performance Report PRIMERGY RX600 S4 Version: 2.2b, November 2009
© Fujitsu Technology Solutions 2009 Page 35 (49)
The diagrams below illustrate the performance of the PRIMERGY RX300 S4 compared with its predecessors and other PRIMERGY rack servers.
Benchmark environment* Certification number 2008004
2-tier environment
Load generator PRIMERGY RX600 4 Xeon MP 2.50 GHz, 512 KB L2 cache, 1 MB L3 cache 8 GB RAM Linux 2.6
R/3 & Database Server PRIMERGY RX600 S4 2 Xeon X7350, 2.93 GHz, 8 MB L2 cache per chip 64 GB PC2-5300F DDR2-SDRAM 2 x LSI MegaRAID SAS 8344 ELP controller with 256
MB cache 2 x FibreCAT SX40 21 SAS hard disks, 73 GB, 15 krpm, 2.5” Windows Server 2003 Enterprise x64 Edition SP2 MS SQL Server 2005 (64-bit) SAP ECC 6.0 SR1

White Paper Performance Report PRIMERGY RX600 S4 Version: 2.2b, November 2009
© Fujitsu Technology Solutions 2009 Page 36 (49)
Certification number 2007074: Certification number 2008060
* Some components may not be available in all countries / sales regions.
R/3 & Database Server PRIMERGY RX600 S4 2 Xeon X7350, 2.93 GHz, 8 MB L2 cache per chip 32 GB PC2-5300F DDR2-SDRAM 2 SAS hard disk, 73 GB, 15 krpm VMware ESX Server 3.0.2 Windows Server 2003 Enterprise x64 Edition SP2 MS SQL Server 2005 (64-bit) SAP ECC 6.0 SR1
2-tier environment
Load generator PRIMERGY RX600 4 Xeon MP 2.50 GHz, 512 KB SLC, 1 MB TLC 8 GB RAM Linux 2.6
2-tier environment
Load generator PRIMERGY RX600 4 Xeon MP 2.50 GHz, 512 KB L2 cache, 1 MB L3 cache 8 GB RAM Linux 2.6
R/3 & Database Server PRIMERGY RX600 S4 2 Xeon X7460, 2.67 GHz, 16 MB L3 cache per chip 64 GB PC2-5300F DDR2-SDRAM 2 x LSI MegaRAID SAS 8344 ELP controller with 256
MB cache 2 x FibreCAT SX40 21 SAS hard disks, 73 GB, 15 krpm, 2.5” Windows Server 2003 Enterprise x64 Edition SP2 MS SQL Server 2005 (64-bit) SAP ECC 6.0 SR1
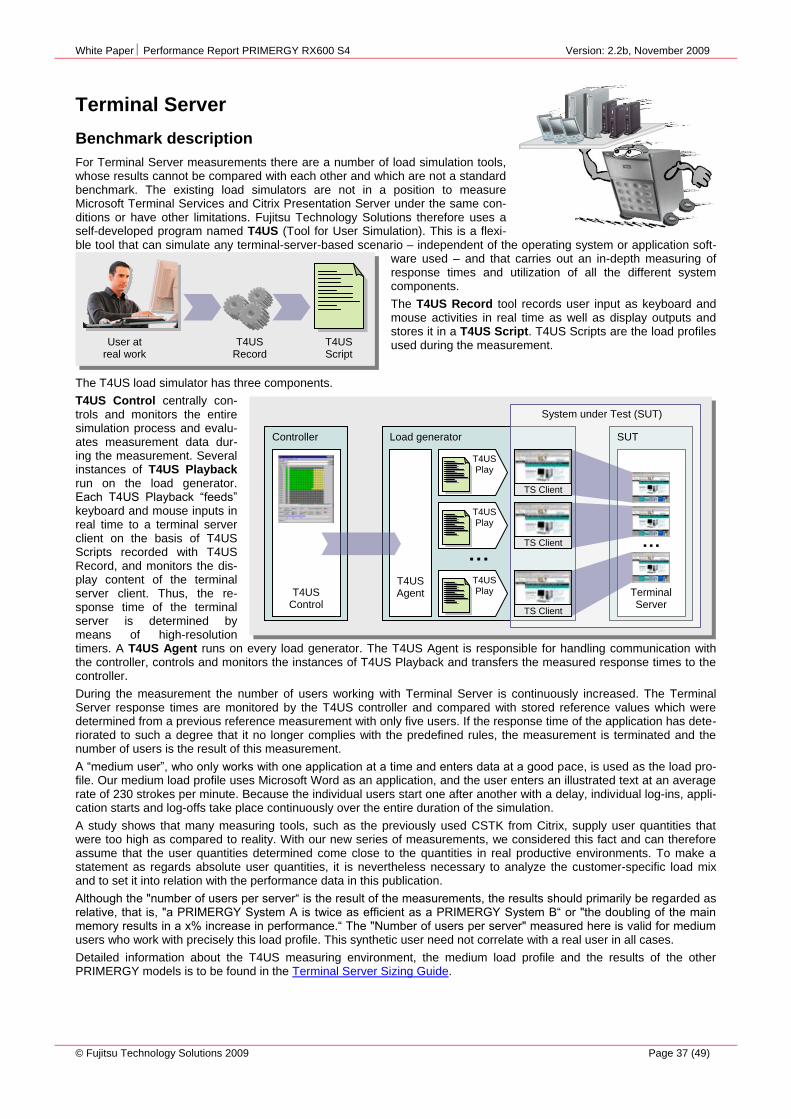
White Paper Performance Report PRIMERGY RX600 S4 Version: 2.2b, November 2009
© Fujitsu Technology Solutions 2009 Page 37 (49)
T4US Play
T4US Agent
Load generator
…
T4US Play
T4US Play
TS Client
TS Client
Terminal Server
…
TS Client
System under Test (SUT)
SUT
T4US Control
Controller
T4US Record
T4US Script
User at real work
Terminal Server
Benchmark description
For Terminal Server measurements there are a number of load simulation tools, whose results cannot be compared with each other and which are not a standard benchmark. The existing load simulators are not in a position to measure Microsoft Terminal Services and Citrix Presentation Server under the same con-ditions or have other limitations. Fujitsu Technology Solutions therefore uses a self-developed program named T4US (Tool for User Simulation). This is a flexi-ble tool that can simulate any terminal-server-based scenario – independent of the operating system or application soft-
ware used – and that carries out an in-depth measuring of response times and utilization of all the different system components.
The T4US Record tool records user input as keyboard and mouse activities in real time as well as display outputs and stores it in a T4US Script. T4US Scripts are the load profiles used during the measurement.
The T4US load simulator has three components.
T4US Control centrally con-trols and monitors the entire simulation process and evalu-ates measurement data dur-ing the measurement. Several instances of T4US Playback run on the load generator. Each T4US Playback “feeds” keyboard and mouse inputs in real time to a terminal server client on the basis of T4US Scripts recorded with T4US Record, and monitors the dis-play content of the terminal server client. Thus, the re-sponse time of the terminal server is determined by means of high-resolution timers. A T4US Agent runs on every load generator. The T4US Agent is responsible for handling communication with the controller, controls and monitors the instances of T4US Playback and transfers the measured response times to the controller.
During the measurement the number of users working with Terminal Server is continuously increased. The Terminal Server response times are monitored by the T4US controller and compared with stored reference values which were determined from a previous reference measurement with only five users. If the response time of the application has dete-riorated to such a degree that it no longer complies with the predefined rules, the measurement is terminated and the number of users is the result of this measurement.
A “medium user”, who only works with one application at a time and enters data at a good pace, is used as the load pro-file. Our medium load profile uses Microsoft Word as an application, and the user enters an illustrated text at an average rate of 230 strokes per minute. Because the individual users start one after another with a delay, individual log-ins, appli-cation starts and log-offs take place continuously over the entire duration of the simulation.
A study shows that many measuring tools, such as the previously used CSTK from Citrix, supply user quantities that were too high as compared to reality. With our new series of measurements, we considered this fact and can therefore assume that the user quantities determined come close to the quantities in real productive environments. To make a statement as regards absolute user quantities, it is nevertheless necessary to analyze the customer-specific load mix and to set it into relation with the performance data in this publication.
Although the "number of users per server“ is the result of the measurements, the results should primarily be regarded as relative, that is, "a PRIMERGY System A is twice as efficient as a PRIMERGY System B“ or "the doubling of the main memory results in a x% increase in performance.“ The "Number of users per server" measured here is valid for medium users who work with precisely this load profile. This synthetic user need not correlate with a real user in all cases.
Detailed information about the T4US measuring environment, the medium load profile and the results of the other PRIMERGY models is to be found in the Terminal Server Sizing Guide.
White Paper Performance Report PRIMERGY RX600 S4 Version: 2.2b, November 2009
© Fujitsu Technology Solutions 2009 Page 38 (49)
Benchmark results In the PRIMERGY RX600 S4, Intel Xeon processors are used, which are currently available in two versions: with two CPU cores (“Dual-Core”) or with four CPU cores (“Quad-Core”) per chip. Both 32-bit and 64-bit operating systems can run on these processors. The 32-bit and 64-bit versions of Windows Server 2003 R2 are based on the same code basis and are therefore directly comparable. Furthermore, apart from a few additional services and tools, Windows Server 2003 R2 is identical to Windows Server 2003 Service Pack 1. For the 64-bit measurements, the same general conditions as for the 32-bit measurements were used. In both cases, the simulated users worked with the medium load profile when Microsoft Office 2003 was used. For the measurements the medium load profile was used on the one hand and in addi-tion a variation of the medium load profile with a reduction in logon/logoff transactions. Moreover, the different behavior of Microsoft Terminal Services and Citrix Presentation Server was also analyzed.
All installations for which no optimizations were performed on the server or client are standard. The only settings that are changed to subject all PRIMERGYs to the same test conditions are the following ones:
The page file of the operating system was set to a fixed size of 16 GB.
With Citrix, the restriction to 100 users per server – pre-set by the integrated load balancing – had to be lifted.
The following performance-relevant factors are critical for a terminal server system:
Computing performance
Main memory
Disk subsystem
Network
Network
A Terminal Server-based infrastructure is substantially influenced by the underlying network infrastructure. Because we are discussing the performance of an individual Terminal Server in this case, the network has been dimensioned in such a way that it does not represent a bottleneck.
Disk subsystem
The disk subsystem is a further performance-relevant component. In the measurement environment used here the oper-ating system incl. swap file is saved on one partition and the users’ data on a second partition of the Terminal Server – with the partitions being on a RAID-0 array of two hard disks each. This configuration is used to ensure that the meas-urement results between the various PRIMERGY systems are comparable and that the disk subsystem does not become a bottleneck during measuring. However, this does not mandatory correspond to the real customer configuration, be-cause there the user data is typically placed on appropriate disk subsystems or external file servers. To achieve maxi-mum throughput, all caches, including the write caches, have been activated. Hard-disk write caches make a consider-able contribution toward increasing performance and it is recommended - also in productive use – to make use of this functionality, which is available on all hard disks. In this regard, it is advisable to use a UPS to protect against power failures and the data loss that these entail.
Computing performance
Below is a list of the measured processors with their technical features:
Xeon E7220, 2.93 GHz, 1067 MHz front-side bus, 2 x 4 MB L2 cache, 80 watt
Xeon E7310, 1.60 GHz, 1067 MHz front-side bus, 2 x 2 MB L2 cache, 80 watt
Xeon E7330, 2.40 GHz, 1067 MHz front-side bus, 2 x 3 MB L2 cache, 80 watt
Xeon X7350, 2.93 GHz, 1067 MHz front-side bus, 2 x 4 MB L2 cache, 130 watt
The processor Xeon E7220 has two cores per chip (Dual-Core), whereas the processors of the series x73xx have four cores per chip (Quad-Core). The L2 cache is 4 MB per core with the Dual-Core E7220 processor, that is 8 MB for two cores. In the Quad-Core x73xx processors the L2 cache is assigned to two cores each and with a higher CPU clock frequency a larger L2 cache of up to 8 MB is also available in this processor type. Thus, the Xeon X7350 processor has for example an L2 cache of 8 MB in total with two cores each having joint access to a 4 MB L2 cache. Hyper-Threading is not offered in the current Xeon processors.
When regarding computing performance, the system was always configured with adequate main memory so that this component does not represent a bottleneck.
The measurements were made under 64-bit Windows 2003 R2. In application scenarios, in which the limitations of 32-bit architecture as regards missing internal operating system structures or restricted virtual address space make the utiliza-tion of the CPU resources impossible, changing to a 64-bit operating system is beneficial. The 32-bit version from Windows is no longer a match to modern servers in particular with a high number of powerful Dual- or Quad-Core proc-essors, like the PRIMERGY RX600 S4, and the modern 64-bit version should be used to be able to make effective use of the performance of the hardware. A detailed discussion of Terminal Server under x64 can be found in the document Terminal Server Sizing Guide - 64-bit Technology (see Literature).

White Paper Performance Report PRIMERGY RX600 S4 Version: 2.2b, November 2009
© Fujitsu Technology Solutions 2009 Page 39 (49)
The following diagram shows all measurement results of the PRIMERGY RX600 S4 equipped with various processors.
The scope of performance measured with the “Medium User” load profile under Microsoft Terminal Server ranges from 162 users (one Xeon E7220) to 272 users (four Xeon X7350s). With Citrix Presentation Server 4.0 the number of users is generally about 7% lower, which is shown in the comparison of the meas-urements with the Xeon E7220 processor. The explanation for this is to be found in the somewhat higher resource consump-tion per Citrix user on account of additional func-tionality.
With an increasing clock frequency and larger L2
cache the number of users that the system can manage under Terminal Server also increases. Two Dual-Core Xeon E7220 processors provide somewhat more performance than one Quad-Core Xeon X7350 processor, which can be explained by the larger L2 cache of the Dual-Core processor. It is noticeable in the measuring results that the perform-ance increase in the upper performance spectrum of the processors can hardly be transformed into a larger number of users by the higher clock frequency or an additional processor. Doubling the number of processors only leads to a per-formance increase ranging between approximately 52% and 11% when a second processor is added and is even lower for an increase to four processors. This is due to the fact that an increase for example from four to eight processor cores is less effective than from two to four cores. A more detailed analysis also shows that even in the measurements with two Quad-Core processors their cores were only subjected to about 40% - 60% load, although there was neither a bottleneck in the network nor on the disks, in other words the benchmark could not fully utilize the system’s CPU performance. A reason for this behavior is to be found in the load profile of the benchmark: a “medium user”, who is only working with one application and entering data rapidly, is used as the load profile. In our medium load profile, Microsoft Word is used as the application and the user writes an illustrated text with an average input rate of 230 characters per minute, taking about 15 minutes in total. The user then logs off and on again and edits another text. Since users are started on a staggered basis, logging on and off as well as application starts continuously take place during the entire period of measurement. And the outcome in particular of these numerous logons and logoffs is that the CPU performance cannot be fully utilized.
This is why measurements were per-formed with selected processors with a slightly modified load profile. Every user now writes an illustrated text two times, in other words logging off and back on about every half an hour, which results in a halving of the logon/logoff operations. The modified load also of course brings about different maximum numbers of users. However, it is interesting to note that as a result of the modified load the processors could be better utilized in the measurements with two and four proces-sors particularly (about 70% - 80% with two CPUs) and that the measured scaling improved with the Quad-Core processors from two to four CPUs from a maximum of 8% to a maximum of 21%.

White Paper Performance Report PRIMERGY RX600 S4 Version: 2.2b, November 2009
© Fujitsu Technology Solutions 2009 Page 40 (49)
Main memory
The main memory has the greatest influence on the performance of the terminal server. This is particularly re-flected in the response time. As and when required, Windows acquires fur-ther virtual memory by relocating (swapping) data currently not needed from the main memory (RAM) to the swap file on the hard disk. However, since disk accesses are about a thou-sand times slower than memory ac-cesses, this results directly in a break-down in performance and a rapid in-crease in response times.
With terminal server, the memory re-quirements increase in proportion with the number of users. This is also the case with the PRIMERGY RX600 S4 as the two diagrams for the 32-bit and 64-bit systems illustrate. When the occupied memory calculated from “Available MBytes,” the “committed” memory, and the “Working Set” is shown as a graph, a linear development can be observed that rises with the increasing number of users. The increase in the straight line is steeper with the 64-bit operating system.
The 32-bit operating system (Windows Server 2003 Enterprise Edition with Microsoft Terminal Services) has basic requirements of 128 MB, and another 20 MB is needed per user or client. The basic requirement of the 64-bit system increases to approximately 150 MB. In the measuring scenario, however, all users work with the same application. And that is why all user groups have the same memory requirements. How-ever, the memory requirements depend on the applications used and must therefore be calculated on a customer-specific basis. In this regard, it should be noted that the overall system performance is determined by the weakest component. Add to this the fact that the internal structures and
virtual address space are restricted due to the architecture of the 32-bit operating system so that the maximum memory configuration of the PRIMERGY RX600 S4 of 128 GB cannot be used for Terminal Server under the 32-bit system.
Applications with memory and without CPU limitations benefit in particular from the 64-bit architecture. In this context it should be men-tioned, however, that 64-bit operating systems and 64-bit applications generally require more main memory than the 32-bit versions be-cause all the address pointers of 64-bit sys-tems are twice as wide. This can in extreme cases mean that the memory required by 64-bit is twice as large when compared with 32-bit. As shown in the diagram opposite, the same user who started the desktop and is working with Microsoft Word 2003, uses ap-proximately 60% more main memory com-pared with the 32-bit system. In both cases, the application run by the terminal server user is Microsoft Word, which at present only exists as a 32-bit version. The Microsoft Terminal Services as part of the operating system are provided as a 64-bit version.
(Medium-load profile, Microsoft Office 2003, Microsoft Terminal Services)

White Paper Performance Report PRIMERGY RX600 S4 Version: 2.2b, November 2009
© Fujitsu Technology Solutions 2009 Page 41 (49)
Since the memory is for the most part the restricting factor, the formula
can be used to calculate the required memory for a specified number of users or the number of users
for a specified volume of memory.
Summary
The PRIMERGY system RX600 S4 is an efficient and configurable server with up to 16 CPU cores that has an optimal place in the scale-up scenario. In practice, Terminal Server environments are more likely to be configured as a terminal server farm in a scale-out scenario on the basis of dual-socket systems, in which excellent scaling is achieved through simply adding further servers.
The following diagram shows the PRIMERGY RX600 S4 in comparison with other PRIMERGY systems. This presenta-tion uses the maximum achievable number of users of each PRIMERGY system as the maximum value that was achieved with an optimal hardware configuration and the best operating system (32-bit or 64-bit). There is no exact de-marcation where the performance of one model ends and that of the next, more powerful one begins. Every PRIMERGY model covers a certain bandwidth and there are overlaps between the systems.
The PRIMERGY RX600 S4 as a high-end server system can in conjunction with a 64-bit operating system manage more users than under a 32-bit operating system, in which the limitation to the kernel structures restricts the number of users.

White Paper Performance Report PRIMERGY RX600 S4 Version: 2.2b, November 2009
© Fujitsu Technology Solutions 2009 Page 42 (49)
Benchmark environment* The figure below shows the environment in which the terminal server performance measurements are implemented.
A load-generator can simulate a great number of users because the applications run on the server. With the terminal server protocols, only keyboard input and mouse clicks are transferred to the server and changes to the screen content to the client. Thus, a large network bandwidth is not needed. The connection of the load simulators to the terminal server (also called “system under test” (SUT)) was established by means of a 100-Mbit Ethernet network where the terminal server was connected through the gigabit uplink. The user profiles were stored on the terminal server. The users’ files to be read and written during the measurement were also maintained locally on the terminal server. The infrastructure server also located in the SUT network provides basic services such as Active Directory, DNS, and Terminal Services Licensing. Log-in of the simulated users was always effected to the Active Directory.
* Some components may not be available in all countries / sales regions.
System Under Test (SUT): The terminal server runs the Microsoft Terminal Services, that are included in the operating system. Microsoft Office 2003 was used as Terminal Server application. No additional software was installed on the terminal server.
Hardware
Model PRIMERGY RX600 S4
Processor 1 - 4 Xeon E7220, E7310, E7330, X7350
Memory up to 16 GB
Network Interface 1 × 1-GBit LAN Intel 82575EB (onboard)
Disk Subsystem 1 × SAS Controller (LSI1078) 4 × 2.5" SAS disks, 15 krpm, 2 × RAID 0
Software
Operating System Windows Server 2003 Enterprise Edition R2 Windows Server 2003 Enterprise x64 Edition R2
Version Service Pack 1 (Build 1830)
Network Protocol TCP/IP
Disk Organization 1 volume used for operating system 1 volume used for data
Terminal Server Software
Microsoft Terminal Services Citrix Presentation Server 4.0 x64
Application Microsoft Office 2003 (32-bit)
T4US Measurement Environment: The load generators simulate different users working with the terminal server. One T4US controller centrally controls and monitors the entire simulation process. The infrastructure server provides basic services.
Load Generator Hardware
Model PRIMERGY RX100 S3
# of Load Generators 20
Processor Pentium D 940
Memory 2 GB
Network Interface 2 × 1 GBit LAN
T4US Controller and Infrastructure Server Hardware
Model PRIMERGY C200
Processor 2 × Pentium III 1.40 MHz
Memory 1.5 GB
Network Interface 2 × 100 MBit LAN
Software
Operating System Windows Server 2003 Standard Edition SP1
Network Protocol TCP/IP
RDP Client 5.2.3790.1830
ICA Client 9.00.32649, 32-bit
T4US Version 3.3
T4US Load Profile Medium Load Profile Medium Load Profile (2 × Word)
PRIMERGY C200 T4US Control
Network for system
under Test
> 20 PRIMERGY dual-server Windows Server 2003
TS Client T4US Agent, T4US Playback Each simulates up to 30 users
Network for controlling the
simulation
PRIMERGY C200 Windows Server 2003
Active Directory Terminal Server
Licensing Service
PRIMERGY Windows Server 2003
Enterprise Edition
Infrastructure server
switched 100 MBit
Load generators Controller for the
simulation
switched 100 MBit
Server under test
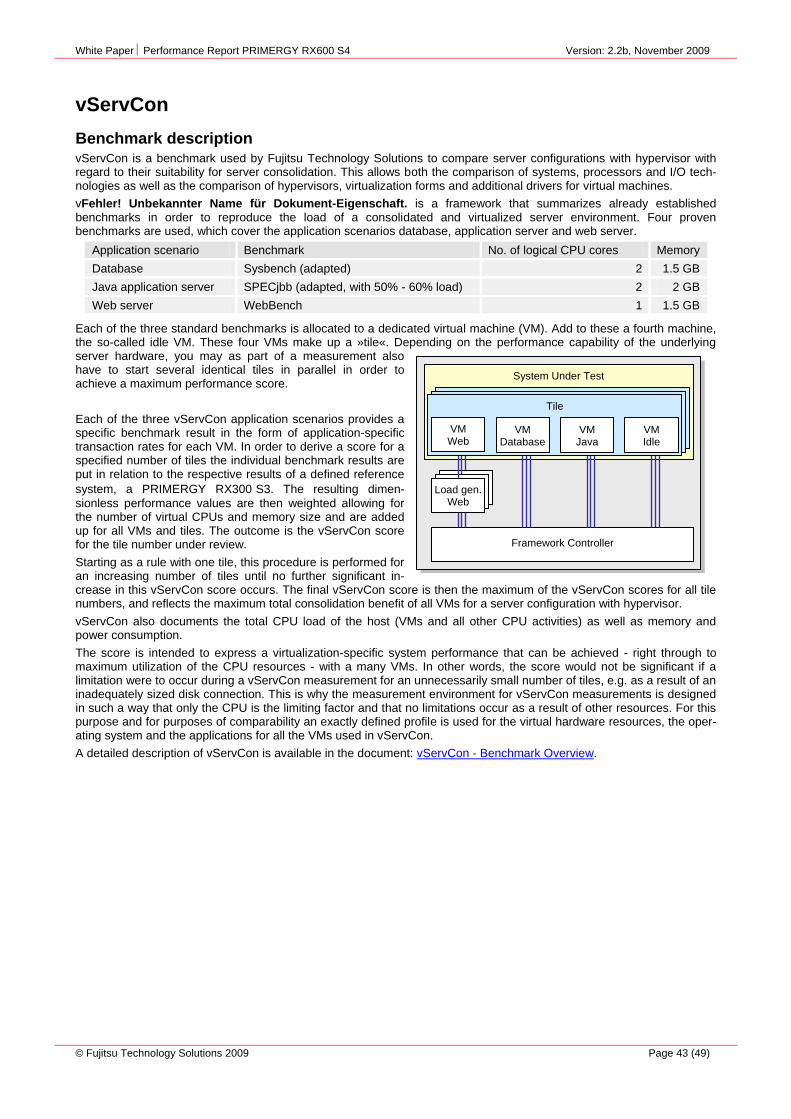
White Paper Performance Report PRIMERGY RX600 S4 Version: 2.2b, November 2009
© Fujitsu Technology Solutions 2009 Page 43 (49)
vServCon
Benchmark description vServCon is a benchmark used by Fujitsu Technology Solutions to compare server configurations with hypervisor with regard to their suitability for server consolidation. This allows both the comparison of systems, processors and I/O tech-nologies as well as the comparison of hypervisors, virtualization forms and additional drivers for virtual machines.
vFehler! Unbekannter Name für Dokument-Eigenschaft. is a framework that summarizes already established benchmarks in order to reproduce the load of a consolidated and virtualized server environment. Four proven benchmarks are used, which cover the application scenarios database, application server and web server.
Application scenario Benchmark No. of logical CPU cores Memory
Database Sysbench (adapted) 2 1.5 GB
Java application server SPECjbb (adapted, with 50% - 60% load) 2 2 GB
Web server WebBench 1 1.5 GB
Each of the three standard benchmarks is allocated to a dedicated virtual machine (VM). Add to these a fourth machine, the so-called idle VM. These four VMs make up a »tile«. Depending on the performance capability of the underlying server hardware, you may as part of a measurement also have to start several identical tiles in parallel in order to achieve a maximum performance score.
Each of the three vServCon application scenarios provides a specific benchmark result in the form of application-specific transaction rates for each VM. In order to derive a score for a specified number of tiles the individual benchmark results are put in relation to the respective results of a defined reference
system, a PRIMERGY RX300 S3. The resulting dimen-
sionless performance values are then weighted allowing for the number of virtual CPUs and memory size and are added up for all VMs and tiles. The outcome is the vServCon score for the tile number under review.
Starting as a rule with one tile, this procedure is performed for an increasing number of tiles until no further significant in-crease in this vServCon score occurs. The final vServCon score is then the maximum of the vServCon scores for all tile numbers, and reflects the maximum total consolidation benefit of all VMs for a server configuration with hypervisor.
vServCon also documents the total CPU load of the host (VMs and all other CPU activities) as well as memory and power consumption.
The score is intended to express a virtualization-specific system performance that can be achieved - right through to maximum utilization of the CPU resources - with a many VMs. In other words, the score would not be significant if a limitation were to occur during a vServCon measurement for an unnecessarily small number of tiles, e.g. as a result of an inadequately sized disk connection. This is why the measurement environment for vServCon measurements is designed in such a way that only the CPU is the limiting factor and that no limitations occur as a result of other resources. For this purpose and for purposes of comparability an exactly defined profile is used for the virtual hardware resources, the oper-ating system and the applications for all the VMs used in vServCon.
A detailed description of vServCon is available in the document: vServCon - Benchmark Overview.
System Under Test
Load gen. Web
Load gen. Web
Load gen. Web
Framework Controller
Tile Tile Tile
VM Web
VM Java
VM Idle
VM Database
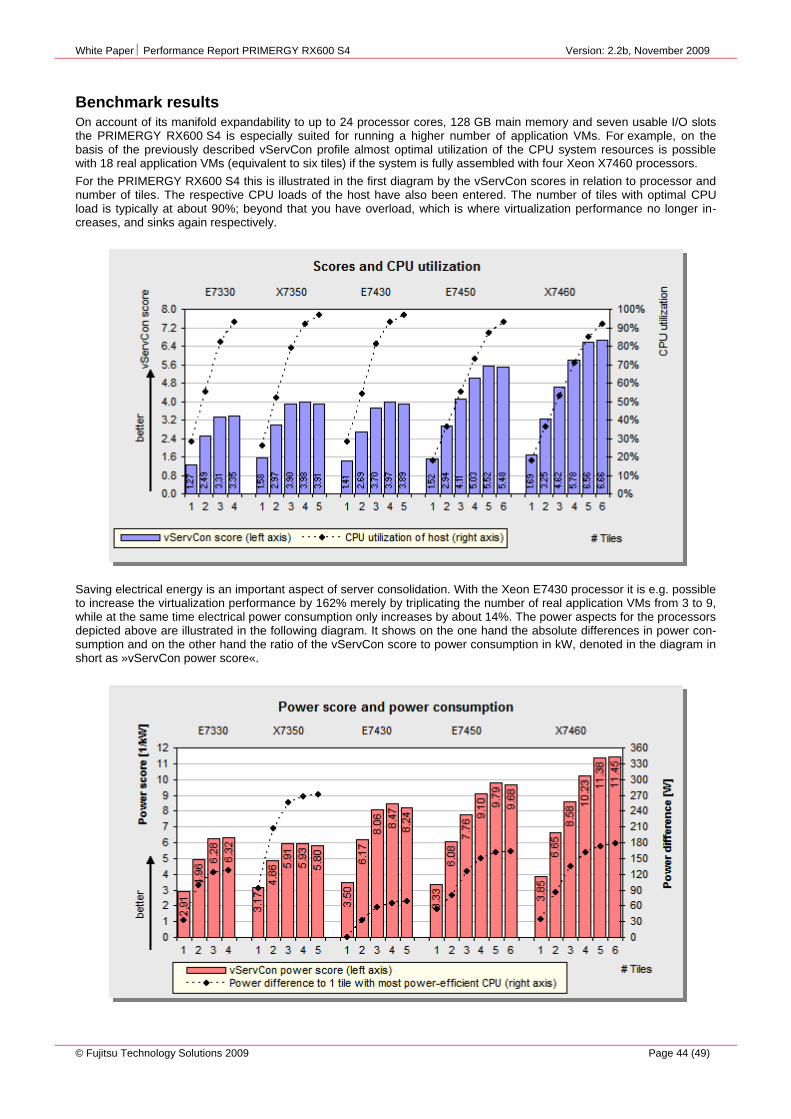
White Paper Performance Report PRIMERGY RX600 S4 Version: 2.2b, November 2009
© Fujitsu Technology Solutions 2009 Page 44 (49)
Benchmark results On account of its manifold expandability to up to 24 processor cores, 128 GB main memory and seven usable I/O slots the PRIMERGY RX600 S4 is especially suited for running a higher number of application VMs. For example, on the basis of the previously described vServCon profile almost optimal utilization of the CPU system resources is possible with 18 real application VMs (equivalent to six tiles) if the system is fully assembled with four Xeon X7460 processors.
For the PRIMERGY RX600 S4 this is illustrated in the first diagram by the vServCon scores in relation to processor and number of tiles. The respective CPU loads of the host have also been entered. The number of tiles with optimal CPU load is typically at about 90%; beyond that you have overload, which is where virtualization performance no longer in-creases, and sinks again respectively.
Saving electrical energy is an important aspect of server consolidation. With the Xeon E7430 processor it is e.g. possible to increase the virtualization performance by 162% merely by triplicating the number of real application VMs from 3 to 9, while at the same time electrical power consumption only increases by about 14%. The power aspects for the processors depicted above are illustrated in the following diagram. It shows on the one hand the absolute differences in power con-sumption and on the other hand the ratio of the vServCon score to power consumption in kW, denoted in the diagram in short as »vServCon power score«.
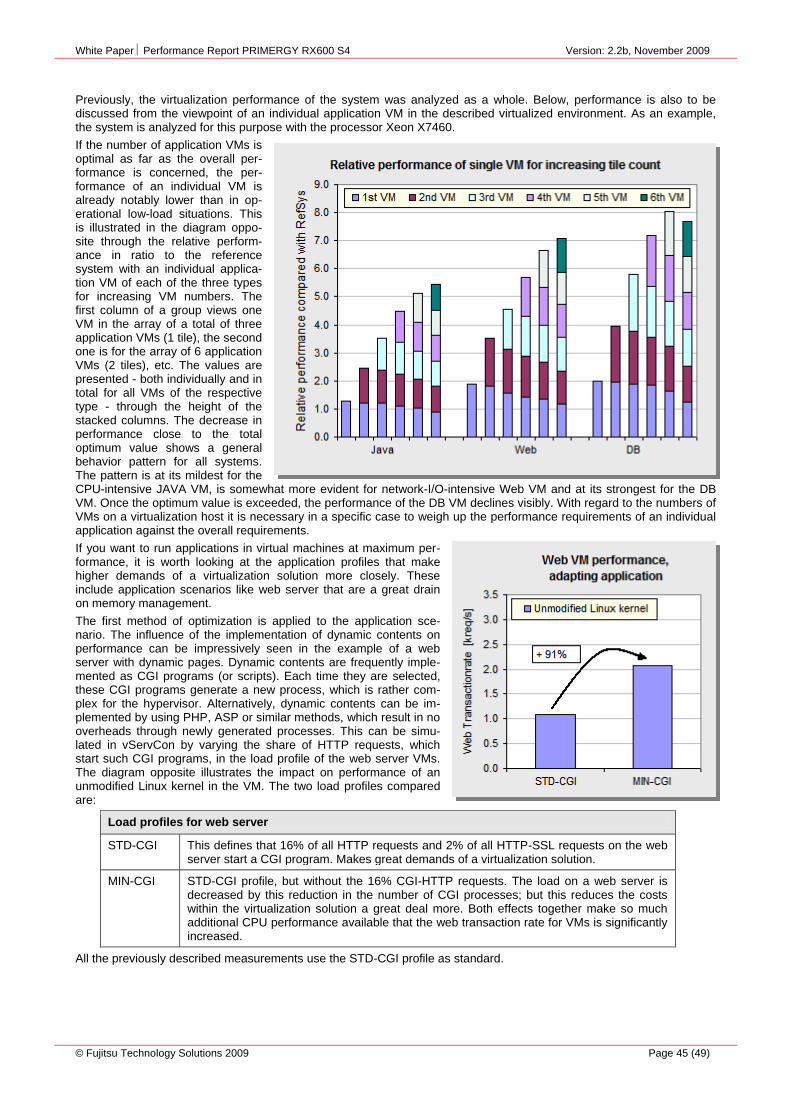
White Paper Performance Report PRIMERGY RX600 S4 Version: 2.2b, November 2009
© Fujitsu Technology Solutions 2009 Page 45 (49)
Previously, the virtualization performance of the system was analyzed as a whole. Below, performance is also to be discussed from the viewpoint of an individual application VM in the described virtualized environment. As an example, the system is analyzed for this purpose with the processor Xeon X7460.
If the number of application VMs is optimal as far as the overall per-formance is concerned, the per-formance of an individual VM is already notably lower than in op-erational low-load situations. This is illustrated in the diagram oppo-site through the relative perform-ance in ratio to the reference system with an individual applica-tion VM of each of the three types for increasing VM numbers. The first column of a group views one VM in the array of a total of three application VMs (1 tile), the second one is for the array of 6 application VMs (2 tiles), etc. The values are presented - both individually and in total for all VMs of the respective type - through the height of the stacked columns. The decrease in performance close to the total optimum value shows a general behavior pattern for all systems. The pattern is at its mildest for the CPU-intensive JAVA VM, is somewhat more evident for network-I/O-intensive Web VM and at its strongest for the DB VM. Once the optimum value is exceeded, the performance of the DB VM declines visibly. With regard to the numbers of VMs on a virtualization host it is necessary in a specific case to weigh up the performance requirements of an individual application against the overall requirements.
If you want to run applications in virtual machines at maximum per-formance, it is worth looking at the application profiles that make higher demands of a virtualization solution more closely. These include application scenarios like web server that are a great drain on memory management.
The first method of optimization is applied to the application sce-nario. The influence of the implementation of dynamic contents on performance can be impressively seen in the example of a web server with dynamic pages. Dynamic contents are frequently imple-mented as CGI programs (or scripts). Each time they are selected, these CGI programs generate a new process, which is rather com-plex for the hypervisor. Alternatively, dynamic contents can be im-plemented by using PHP, ASP or similar methods, which result in no overheads through newly generated processes. This can be simu-lated in vServCon by varying the share of HTTP requests, which start such CGI programs, in the load profile of the web server VMs. The diagram opposite illustrates the impact on performance of an unmodified Linux kernel in the VM. The two load profiles compared are:
Load profiles for web server
STD-CGI This defines that 16% of all HTTP requests and 2% of all HTTP-SSL requests on the web server start a CGI program. Makes great demands of a virtualization solution.
MIN-CGI STD-CGI profile, but without the 16% CGI-HTTP requests. The load on a web server is decreased by this reduction in the number of CGI processes; but this reduces the costs within the virtualization solution a great deal more. Both effects together make so much additional CPU performance available that the web transaction rate for VMs is significantly increased.
All the previously described measurements use the STD-CGI profile as standard.
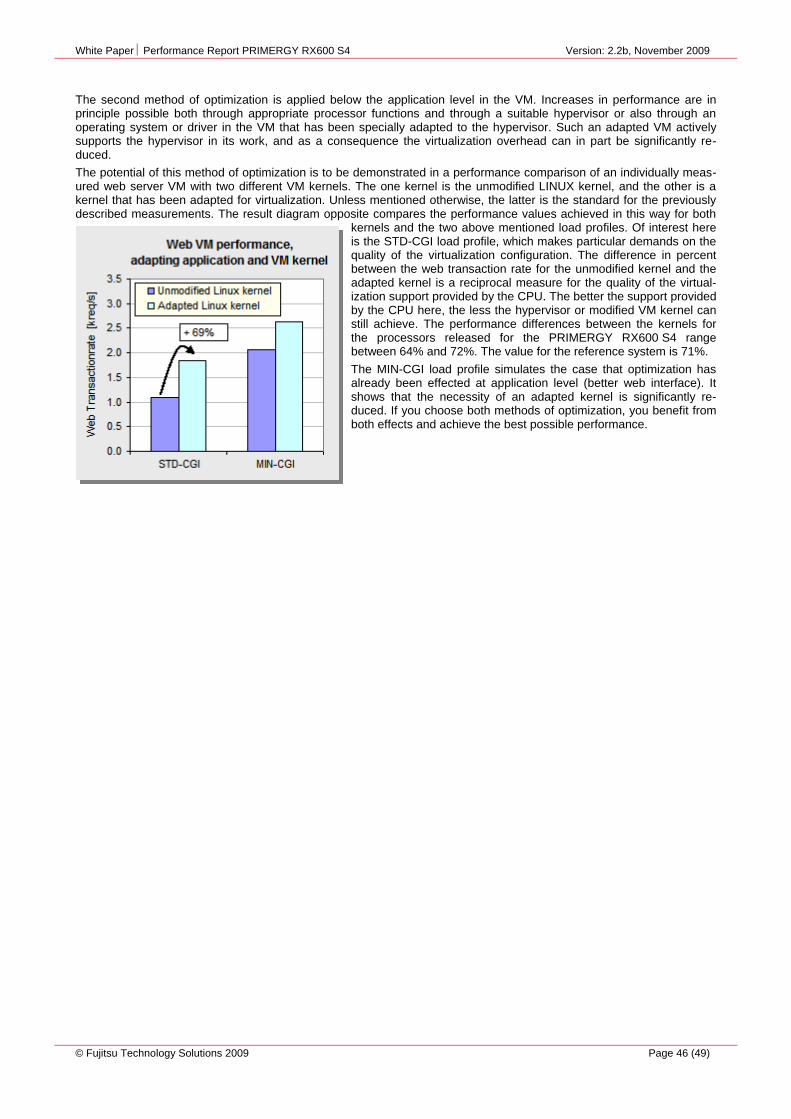
White Paper Performance Report PRIMERGY RX600 S4 Version: 2.2b, November 2009
© Fujitsu Technology Solutions 2009 Page 46 (49)
The second method of optimization is applied below the application level in the VM. Increases in performance are in principle possible both through appropriate processor functions and through a suitable hypervisor or also through an operating system or driver in the VM that has been specially adapted to the hypervisor. Such an adapted VM actively supports the hypervisor in its work, and as a consequence the virtualization overhead can in part be significantly re-duced.
The potential of this method of optimization is to be demonstrated in a performance comparison of an individually meas-ured web server VM with two different VM kernels. The one kernel is the unmodified LINUX kernel, and the other is a kernel that has been adapted for virtualization. Unless mentioned otherwise, the latter is the standard for the previously described measurements. The result diagram opposite compares the performance values achieved in this way for both
kernels and the two above mentioned load profiles. Of interest here is the STD-CGI load profile, which makes particular demands on the quality of the virtualization configuration. The difference in percent between the web transaction rate for the unmodified kernel and the adapted kernel is a reciprocal measure for the quality of the virtual-ization support provided by the CPU. The better the support provided by the CPU here, the less the hypervisor or modified VM kernel can still achieve. The performance differences between the kernels for the processors released for the PRIMERGY RX600 S4 range between 64% and 72%. The value for the reference system is 71%.
The MIN-CGI load profile simulates the case that optimization has already been effected at application level (better web interface). It shows that the necessity of an adapted kernel is significantly re-duced. If you choose both methods of optimization, you benefit from both effects and achieve the best possible performance.

White Paper Performance Report PRIMERGY RX600 S4 Version: 2.2b, November 2009
© Fujitsu Technology Solutions 2009 Page 47 (49)
Benchmark environment* The measurements were made with the environment described below:
(*) Performance related, see: http://kb.vmware.com/selfservice/microsites/search.do?language=en_US&cmd=displayKC&externalId=1007361
* Some components may not be available in all countries / sales regions.
Load generator BX600
Disk Subsystem FibreCAT CX500
Fehler! Unbekannter Name für Dokument-
Eigenschaft. Framework Controller
Fehler! Unbekannter Name für Dokument-Eigenschaft. Benchmark Environment System Under Test (SUT)
Tile 1
VM
Web
VM
Data
base
VM
Java
VM
Idle
…
Tile n
VM
Web
VM
Data
base
VM
Java
VM
Idle
1 GBit LAN 1 GBit LAN
SUT Hardware
Model PRIMERGY RX600 S4
Processor 4 × Xeon E7330 (2.40 GHz) 4 × Xeon X7350 (2.93 GHz) 4 × Xeon E7430 (2.13 GHz) 4 × Xeon E7450 (2.40 GHz) 4 × Xeon X7460 (2.67 GHz)
Memory 32 GB
Network interface 2 × 1-GBit LAN (onboard); one for load, one for control
Disk Subsystem No internal hard disks were used, solely one storage system FibreCAT CX500. One 50 GB LUN per tile for the »virtual disk files« of the VMs. Each LUN is a RAID 0 array consisting of 6 Seagate ST373454 disks (15 krpm)
Storage connection Via FC controller Qlogic QLE 2460
SUT Software
Operating system Hypervisor VMware ESX Server. For Hexa-Core processors: Vmkernel.Boot.cpuCellSize = 6 (*)
Version Version 3.5.0 build 110268, update 2
BIOS Version 1.16A; default settings
SUT: Virtualization-specific details
Web server VM kernel, original
SLES10 SP2, 32-bit, 2.6.16.60-0.23-smp
Web server VM Kernel, adapted
SLES10 SP2, 32-bit, 2.6.16.60-0.23-vmi (kernel with VMware VMI interface)
General details Described in Benchmark Overview vServCon
Load Generator Hardware
Model 4 server blades per tile in PRIMERGY BX600 S2 chassis
Processor X86 Family 15, Model 4, Stepping 1, Genuine Intel 3000 MHz
Memory 1 – 2 GB
Network interface 2 × 1 GBit LAN each
Operating system W2K3 EE

White Paper Performance Report PRIMERGY RX600 S4 Version: 2.2b, November 2009
© Fujitsu Technology Solutions 2009 Page 48 (49)
Literature
PRIMERGY Systems http://ts.fujitsu.com/primergy
PRIMERGY RX600 S4 Data sheet http://docs.ts.fujitsu.com/dl.aspx?id=1eba666c-6759-4e0d-a0c4-1f2e2540c920
PRIMERGY Performance http://ts.fujitsu.com/products/standard_servers/primergy_bov.html
OLTP-2 Benchmark Overview OLTP-2 http://docs.ts.fujitsu.com/dl.aspx?id=e6f7a4c9-aff6-4598-b199-836053214d3f
SAP SD
http://www.sap.com/benchmark
Benchmark Overview SAP SD http://docs.ts.fujitsu.com/dl.aspx?id=0a1e69a6-e366-4fd1-a1a6-0dd93148ea10
SPECcpu2006
http://www.spec.org/osg/cpu2006
Benchmark Overview SPECcpu2006 http://docs.ts.fujitsu.com/dl.aspx?id=1a427c16-12bf-41b0-9ca3-4cc360ef14ce
SPECjbb2005
http://www.spec.org/jbb2005
Benchmark Overview SPECjbb2005 http://docs.ts.fujitsu.com/dl.aspx?id=5411e8f9-8c56-4ee9-9b3b-98981ab3e820
SPECweb2005
http://www.spec.org/web2005
Benchmark Overview SPECweb2005 http://docs.ts.fujitsu.com/dl.aspx?id=efbe8db4-7b1b-481e-bdee-66bdfa624b57
StorageBench
Performance Report – Modular RAID for PRIMERGY http://docs.ts.fujitsu.com/dl.aspx?id=8f6d5779-2405-4cdd-8268-1f948ba050e6
http://www.iometer.org
Terminal Server
Terminal Server Sizing Guide (EN) http://docs.ts.fujitsu.com/dl.aspx?id=377f3a1c-54ce-4224-8322-3008ac213e41
Terminal Server Sizing Guide - 64-bit Technology(EN) http://docs.ts.fujitsu.com/dl.aspx?id=e7855bd2-d981-4ef5-bf3c-365efe2c0a8c
Microsoft Windows 2003 and Terminal Services http://www.microsoft.com/terminalserver
Citrix http://www.citrix.com
TPC-E
http://www.tpc.org/tpce
Benchmark Overview TPC-E http://docs.ts.fujitsu.com/dl.aspx?id=da0ce7b7-3d80-48cd-9b3a-d12e0b40ed6d
vServCon Benchmark Overview vServCon http://docs.ts.fujitsu.com/dl.aspx?id=b953d1f3-6f98-4b93-95f5-8c8ba3db4e59
White Paper Performance Report PRIMERGY RX600 S4 Version: 2.2b, November 2009
Delivery subject to availability, specifications subject to change without notice, correction of errors and omissions excepted. All conditions quoted (TCs) are recommended cost prices in EURO excl. VAT (unless stated otherwise in the text). All hardware and software names used are brand names and/or trademarks of their respective holders. Copyright © Fujitsu Technology Solutions GmbH 2009
Published by department: Enterprise Products PRIMERGY Server PRIMERGY Performance Lab mailto:[email protected]
Internet: http://ts.fujitsu.com/primergy
Extranet: http://partners.ts.fujitsu.com/com/products/servers/primergy
Contact
PRIMERGY Hardware
PRIMERGY Product Marketing
mailto:[email protected]
PRIMERGY Performance and Benchmarks
PRIMERGY Performance and Benchmarks
mailto:[email protected]
Related Documents